UNITED STATES
SECURITIES AND EXCHANGE COMMISSION
Washington, D.C. 20549
FORM N-CSR
CERTIFIED SHAREHOLDER REPORT OF REGISTERED
MANAGEMENT INVESTMENT COMPANY
| Investment Company Act file number | 811-22680 | |
| Ultimus Managers Trust |
| (Exact name of registrant as specified in charter) |
| 225 Pictoria Drive, Suite 450 Cincinnati, Ohio | 45246 |
| (Address of principal executive offices) | (Zip code) |
Karen Jacoppo-Wood
| Ultimus Fund Solutions, LLC 225 Pictoria Drive, Suite 450 Cincinnati, Ohio 45246_ |
| (Name and address of agent for service) |
| Registrant's telephone number, including area code: | (513) 587-3400 | |
| Date of fiscal year end: | August 31 | |
| | | |
| Date of reporting period: | February 29, 2024 | |
Form N-CSR is to be used by management investment companies to file reports with the Commission not later than 10 days after the transmission to stockholders of any report that is required to be transmitted to stockholders under Rule 30e-1 under the Investment Company Act of 1940 (17 CFR 270.30e-1). The Commission may use the information provided on Form N-CSR in its regulatory, disclosure review, inspection, and policymaking roles.
A registrant is required to disclose the information specified by Form N-CSR, and the Commission will make this information public. A registrant is not required to respond to the collection of information contained in Form N-CSR unless the Form displays a currently valid Office of Management and Budget ("OMB") control number. Please direct comments concerning the accuracy of the information collection burden estimate and any suggestions for reducing the burden to the Secretary, Securities and Exchange Commission, 450 Fifth Street, NW, Washington, DC 20549-0609. The OMB has reviewed this collection of information under the clearance requirements of 44 U.S.C. § 3507.
| Item 1. | Reports to Stockholders. |

BLUE CURRENT GLOBAL DIVIDEND FUND
INSTITUTIONAL CLASS (BCGDX)
Semi-Annual Report
February 29, 2024
(Unaudited)
| BLUE CURRENT GLOBAL DIVIDEND FUND | |
| LETTER TO SHAREHOLDERS | March 20, 2024 |
Dear Shareholders,
PERFORMANCE SUMMARY
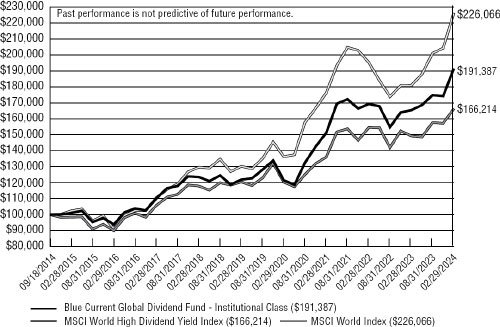
To seek to achieve its investment objective, the Blue Current Global Dividend Fund (the “Fund”) invests in dividend-paying stocks globally and aims to construct a portfolio of companies that are committed to dividend growth and offering an attractive yield. Although we do not manage the Fund to track or beat an index, the Fund returned +9.47% over the six-month period ended February 29, 2024, as compared to its benchmark, the MSCI World High Dividend Yield Index (the “Index”), which returned +5.44% over the same period. Since its inception, the Fund has produced an annualized return of +7.11%, which compares to a +5.53% annualized return for the Index.
| | Total Returns for period ended February 29th, 2024 |
| | | Trailing 1 | Trailing 3 | Trailing 5 | Since |
| Fund Name | QTD (Since | Year (Since | Year (Since | Year (Since | Inception |
| (Institutional Share Class) | 11/30/23) | 2/28/23) | 2/28/21) | 2/28/19) | (9/18/14) |
| Blue Current Global Dividend | 9.88% | 15.71% | 8.16% | 9.43% | 7.11% |
| MSCI World High Div Yield Net Index | 5.71% | 11.32% | 6.89% | 6.65% | 5.53% |
Source: Bloomberg
Past performance is not predictive of future performance. Investment results and principal value will fluctuate so that shares, when redeemed, may be worth more or less than their original cost. Current performance may be higher or lower than the performance data quoted. Performance data current to the most recent month end is available by calling 1-800-514-3583.
For the recent quarter ended February 29, 2024, the Technology sector was the largest contributor to the Fund’s performance, returning +24.9% and adding +3.5% to the Fund’s return. The Health Care sector returned +10.2% (contributing +1.4%), while the Consumer Discretionary sector returned +26.1% (contributing +1.3%). The lowest contributors or detractors to the Fund’s performance by sector for the QTD were Energy (-0.3% return/ -0.1% contribution), Materials (+10.6% return / +0.5% contribution), and Real Estate (+16.7% return / +0.3% contribution).
From an individual stock standpoint, the top five contributors to the recent quarter were Broadcom (+41.1% return / +1.5% contribution), Dick’s Sporting Goods (+37.7% return/ +0.8% contribution), Merck (+25.0% return / +0.7% contribution), Qualcomm (+22.9% return / +0.6% contribution), and Hitachi (+21.4% return / +0.5% contribution). The bottom five contributors included Schlumberger (-6.1% return / -0.1% contribution), Albertsons (-6.5% return / -0.1% contribution), BNP Paribas (-4.9% return / -0.1% contribution), Daikin Industries (-5.6% return / -0.1% contribution), and Shell (-3.5% return / -0.1% contribution).
Reminiscent of the launch of the Internet back in the late 1990s, the development of Artificial Intelligence (AI) has captured investor interest and has arguably been the strongest thematic contributor to recent stock market gains. Because the technology sector has a tradition of distributing and growing dividends over time, the Fund has been investing in technology stocks since the Fund launched in 2014. Many technology subsectors, including semiconductors, semiconductor equipment manufacturers, and select software companies have been significant dividend payers for many years and are included in the Fund’s eligible investment universe. As of quarter end, the Fund held the following positions that are directly benefitting from investor interest in AI: Microsoft, Broadcom, BE Semiconductor, Taiwan Semiconductor, and Qualcomm. The Fund does not hold a position in Nvidia, due to its lack of dividend payments. While we continue to be enthused about the long-term outlook and revenue opportunities stemming from AI adoption, we are mindful of our mandate to remain diversified and to seek to direct capital to the highest quality, attractively valued businesses that return cash flow to shareholders.
During the recent quarter, we initiated positions in Thales, Mitsubishi UFJ Financial, and HCA Healthcare and exited positions in OCI, Sanofi, Yara, and Michelin. Thales is a global technology company with underlying exposures to aerospace, defense and digital security, all of which have secular growth drivers. Japanese financial institutions, such as Mitsubishi UFJ Financial, are arguably the main benefactors of higher interest rates in Japan, while HCA Healthcare for its long-term earnings given the increased need for healthcare (via the US aging population), and quality geographic footprint benefitting from population growth. Healthcare labor costs are also beginning to normalize, resulting in cost savings to healthcare companies. We sold OCI, a global leader in fertilizer and chemicals, during the quarter as the company unexpectantly announced a significant reorganization of its business, deciding to exit multiple assets which altered our growth outlook. Sanofi announced a change to the company’s medium-term research and development outlook, resulting in a material decline to our earnings expectations for the business. Yara was one of our smaller positions in the portfolio and we did not see any improvement in the company’s end markets during our ownership period, leading us to an exit. Lastly, Michelin is a business that we continue to admire but our thesis was predicated on the continued adoption of electric vehicles, a trend that appears to be weakening.
Our exposure by geography (excluding cash) is approximately 50% US and 50% non-US.
PHILOSOPHY & OBJECTIVES
The Fund utilizes the investment team’s expertise in growing cash flow through what we believe is a niche universe of high-quality, dividend-paying companies with sustainable business models and dividend policies. The primary objectives are to pay a stable and increasing dividend each quarter and deliver attractive long-term capital appreciation to investors.
The Fund’s investment team concentrates on a select portfolio of 25-50 companies across developed markets that meet our stringent qualities. We focus on companies that we believe have a strong history of rewarding shareholders and the financial ability
to continue to increase their dividends over time. We also focus on the future earnings potential of each company and strive to purchase those businesses when they are trading at a discount to their true value.
OUTLOOK SUMMARY
The enthusiasm that punctuated the end of 2023 has spilled into 2024, sending many global equity markets, such as the S&P 500 Index, to new highs. Also similar to 2024, growth stocks (primarily the “Magnificent 7”) continue to lead equity markets; however, green shoots of broadening equity participation are encouraging and creating interest in dividend payers. The healthcare and energy sectors, both of which are represented in the Fund, are also off to a strong start this year after struggling in 2023. Stock price advances appear to be supported by strengthening earnings expectations across several industries.
The unknowns in 2024 that could negatively impact the equity markets continue to be concerns on inflation and the Federal Reserve (the “Fed”) policy with respect to interest rates. While the consensus is for the Fed to cut interest rates beginning in the second half of 2024, inflationary pressures may continue to keep the consumer price index above the Fed’s preferred target of 2.0%. Potential catalysts for higher prices include government policies such as the Inflation Reduction Act, the Creating Helpful Incentives to Produce Semiconductors (CHIPS) Act, rampant deficit spending, and deglobalization, which may result in relocation of manufacturing to higher cost regions. Away from these secular trends, geopolitical pressures are resulting in higher energy prices which may be excluded from core inflation calculations but have the possibility of trickling through to impact both the services and manufacturing economies.
Globally, near-recessionary conditions continue to plague the rest of the developed world, leading to continued price declines and more cover for central banks to lower interest rates. The UK, Germany, and France continue to highlight price deceleration which may lead to the European Central Bank lowering interest rates. The bright spot continues to be the European services economy as global tourism remains robust, especially in Southern Europe where regional economic biases are more tied to travel.
Japan’s monetary cycle remains countertrend to the rest of the developed world with the Bank of Japan (BOJ) raising interest rates in the face of slowing inflationary data, resulting in higher equity prices as investors cheer the exit from negative rates.
We are excited about the prospects for 2024 and believe that many of the secular economic growth drivers, including AI, automation, energy transition, and a robust consumer, are investable via our dividend growth universe and we believe that having a global perspective will be rewarding in this environment.
Sincerely,
 |  |
| | |
| Henry “Harry” M. T. Jones | Dennis Sabo, CFA |
| Co-Portfolio Manager | Co-Portfolio Manager |
Disclosure and Risk Summary
The Letter to Shareholders seeks to describe some of the current opinions and views of the financial markets of Edge Capital Group, LLC (the “Adviser”). Although the Adviser believes it has a reasonable basis for any opinions or views expressed, actual results may differ, sometimes significantly so, from those expected or expressed. The securities held by the Fund that are discussed in the Letter to Shareholders were held during the period covered by this Report. They do not comprise the entire investment portfolio of the Fund, may be sold at any time and may no longer be held by the Fund. For a complete list of securities held in the Fund as of February 29, 2024, please see the Schedule of Investments section of the semi-annual report. The opinions of the Adviser with respect to those securities may change at any time.
The opinions expressed herein are those of the Adviser, and the report is not meant as legal, tax, or financial advice. You should consult your own professional advisors as to the legal, tax, financial, or other matters relevant to the suitability of investing. The external data presented in this report have been obtained from independent sources (as noted) and are believed to be accurate, but no independent verification has been made and accuracy is not guaranteed. The information contained in this report is not intended to address the needs of any particular investor.
The information contained in this document does not constitute an offer to sell any securities nor a solicitation to purchase any securities. Index returns reflect the reinvestment of dividends. An investor should consider the investment objectives, risks, charges and expenses of the Fund carefully before investing. The Fund’s prospectus contains this and other important information. To obtain a copy of the Fund’s prospectus please visit our website at www.bluecurrentfunds.com or call 1-800-514-3583 and a copy will be sent to you free of charge. Please read the prospectus carefully before you invest. The Blue Current Global Dividend Fund is distributed by Ultimus Fund Distributors, LLC.
Statements in the Letter to Shareholders that reflect projections or expectations for future financial or economic performance of the Fund and the market in general and statements of the Fund’s plans and objectives for future operations are forward-looking statements. No assurance can be given that actual results or events will not differ materially from those projected, estimated, assumed, or anticipated in any such forward- looking statements. Important factors that could result in such differences, in addition to factors noted with such forward-looking statements include, without limitation, general economic conditions, such as inflation, recession, and interest rates.
PAST PERFORMANCE CANNOT BE CONSTRUED AS AN INDICATOR OF FUTURE RESULTS BECAUSE OF, AMONG OTHER THINGS, POSSIBLE DIFFERENCES IN MARKET CONDITIONS, INVESTMENT STRATEGY, AND REGULATORY CLIMATE. THERE IS NO ASSURANCE THAT THE FUND WILL ACHIEVE ITS INVESTMENT OBJECTIVE. INVESTMENT RESULTS AND PRINCIPAL VALUE WILL FLUCTUATE SO THAT SHARES, WHEN REDEEMED, MAY BE WORTH MORE OR LESS THAN THEIR ORIGINAL COST. CURRENT PERFORMANCE MAY BE HIGHER OR LOWER THAN THE PERFORMANCE DATA QUOTED. PERFORMANCE DATA CURRENT TO THE MOST RECENT MONTH END IS AVAILABLE BY CALLING 1-800-514-3583. THE FUND INVESTS PRIMARILY IN DIVIDEND PAYING COMPANIES AND IT IS POSSIBLE THESE COMPANIES MAY ELIMINATE OR REDUCE THEIR DIVIDEND PAYMENTS. INDEX INFORMATION (I) IS INCLUDED MERELY TO SHOW THE GENERAL TREND IN THE EQUITY MARKETS FOR THE PERIOD INDICATED AND IS NOT INTENDED TO IMPLY THAT THE FUND’S PORTFOLIO WILL BE SIMILAR TO THE INDICES EITHER IN COMPOSITION OR RISK AND (II) HAS BEEN OBTAINED FROM SOURCES BELIEVED TO BE ACCURATE.
| BLUE CURRENT GLOBAL DIVIDEND FUND |
| PERFORMANCE INFORMATION |
| February 29, 2024 (Unaudited) |
Comparison of the Change in Value of a $100,000 Investment in
Blue Current Global Dividend Fund -
Institutional Class vs. the MSCI World High Dividend Yield Index
and the MSCI World Index
| | | |
| | Average Annual Total Returns (for the periods ended February 29, 2024) | |
| | | |
| | | | | | | | | Since | |
| | | 1 Year | | 3 Years | | 5 Years | | Inception(b) | |
| | Blue Current Global Dividend Fund - Institutional Class(a) | 15.71% | | 8.16% | | 9.43% | | 7.11% | |
| | MSCI World High Dividend Yield Index | 11.32% | | 6.89% | | 6.65% | | 5.53% | |
| | MSCI World Index | 24.96% | | 8.64% | | 11.66% | | 9.02% | |
| | | | | | | | | | |
| (a) | The Fund’s total returns do not reflect the deduction of taxes a shareholder would pay on Fund distributions or the redemption of Fund shares. |
| (b) | The Fund commenced operations on September 18, 2014. |
BLUE CURRENT GLOBAL DIVIDEND FUND
PORTFOLIO INFORMATION
February 29, 2024 (Unaudited) |
Sector Diversification
(% of Net Assets)
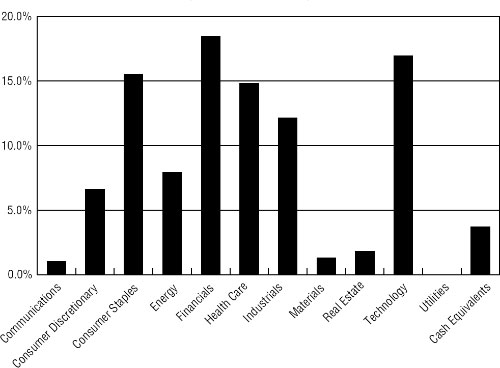
| Top Ten Equity Holdings |
| | | |
| Security Description | | % of Net Assets |
| Broadcom, Inc. | | 3.9% |
| RTX Corporation | | 3.8% |
| Microsoft Corporation | | 3.7% |
| Morgan Stanley | | 3.4% |
| Hitachi Ltd. - ADR | | 3.4% |
| Coca-Cola Company (The) | | 3.4% |
| RELX plc - ADR | | 3.2% |
| QUALCOMM Inc. | | 3.1% |
| Walmart, Inc. | | 3.1% |
| Merck & Company, Inc. | | 3.0% |
| BLUE CURRENT GLOBAL DIVIDEND FUND |
| SCHEDULE OF INVESTMENTS |
| February 29, 2024 (Unaudited) |
| COMMON STOCKS — 96.3% | | Shares | | | Value | |
| Communications — 1.0% | | | | | | | | |
| Internet Media & Services — 1.0% | | | | | | | | |
| Meta Platforms, Inc. - Class A | | | 1,400 | | | $ | 686,182 | |
| | | | | | | | | |
| Consumer Discretionary — 6.6% | | | | | | | | |
| Automotive — 3.8% | | | | | | | | |
| Dr. Ing. h.c. F. Porsche AG | | | 8,000 | | | | 748,044 | |
| Stellantis N.V. | | | 68,000 | | | | 1,785,680 | |
| | | | | | | | 2,533,724 | |
| Retail - Discretionary — 2.8% | | | | | | | | |
| Dick’s Sporting Goods, Inc. | | | 10,500 | | | | 1,867,845 | |
| | | | | | | | | |
| Consumer Staples — 15.5% | | | | | | | | |
| Beverages — 6.3% | | | | | | | | |
| Coca-Cola Company (The) | | | 37,635 | | | | 2,258,853 | |
| Coca-Cola Europacific Partners plc | | | 28,730 | | | | 1,971,740 | |
| | | | | | | | 4,230,593 | |
| Food — 2.7% | | | | | | | | |
| Danone S.A. - ADR | | | 31,000 | | | | 395,560 | |
| Danone S.A. | | | 22,500 | | | | 1,435,819 | |
| | | | | | | | 1,831,379 | |
| Retail - Consumer Staples — 6.5% | | | | | | | | |
| Albertsons Companies, Inc. - Class A | | | 60,000 | | | | 1,216,800 | |
| Koninklijke Ahold Delhaize N.V. | | | 35,400 | | | | 1,054,325 | |
| Walmart, Inc. | | | 35,550 | | | | 2,083,585 | |
| | | | | | | | 4,354,710 | |
| Energy — 7.9% | | | | | | | | |
| Oil & Gas Producers — 6.2% | | | | | | | | |
| BP plc | | | 267,000 | | | | 1,551,357 | |
| Shell plc - ADR | | | 15,180 | | | | 953,760 | |
| Targa Resources Corporation | | | 16,560 | | | | 1,626,854 | |
| | | | | | | | 4,131,971 | |
| Oil & Gas Services & Equipment — 1.7% | | | | | | | | |
| Schlumberger Ltd. | | | 24,350 | | | | 1,176,835 | |
| | | | | | | | | |
| Financials — 18.4% | | | | | | | | |
| Banking — 13.0% | | | | | | | | |
| BNP Paribas S.A. | | | 25,600 | | | | 1,536,581 | |
| DBS Group Holdings Ltd. - ADR | | | 12,359 | | | | 1,226,507 | |
| JPMorgan Chase & Company | | | 7,700 | | | | 1,432,662 | |
| Mitsubishi UFJ Financial Group, Inc. - ADR | | | 177,000 | | | | 1,817,790 | |
| BLUE CURRENT GLOBAL DIVIDEND FUND |
| SCHEDULE OF INVESTMENTS (Unaudited) (Continued) |
| COMMON STOCKS — 96.3% (Continued) | | Shares | | | Value | |
| Financials — 18.4% (Continued) | | | | | | | | |
| Banking — 13.0% (Continued) | | | | | | | | |
| National Bank of Canada | | | 15,400 | | | $ | 1,201,989 | |
| Truist Financial Corporation | | | 43,000 | | | | 1,504,140 | |
| | | | | | | | 8,719,669 | |
| Institutional Financial Services — 3.4% | | | | | | | | |
| Morgan Stanley | | | 26,700 | | | | 2,297,268 | |
| | | | | | | | | |
| Insurance — 2.0% | | | | | | | | |
| Allianz SE - ADR | | | 20,000 | | | | 547,200 | |
| Allianz SE | | | 2,900 | | | | 796,536 | |
| | | | | | | | 1,343,736 | |
| Health Care — 14.8% | | | | | | | | |
| Biotech & Pharma — 10.0% | | | | | | | | |
| AstraZeneca plc - ADR | | | 26,300 | | | | 1,687,408 | |
| Johnson & Johnson | | | 9,862 | | | | 1,591,530 | |
| Merck & Company, Inc. | | | 15,800 | | | | 2,008,970 | |
| Novo Nordisk A/S - ADR | | | 11,800 | | | | 1,413,286 | |
| | | | | | | | 6,701,194 | |
| Health Care Facilities & Services — 2.5% | | | | | | | | |
| HCA Healthcare, Inc. | | | 5,500 | | | | 1,714,350 | |
| | | | | | | | | |
| Medical Equipment & Devices — 2.3% | | | | | | | | |
| Medtronic plc | | | 18,400 | | | | 1,533,824 | |
| | | | | | | | | |
| Industrials — 12.1% | | | | | | | | |
| Aerospace & Defense — 6.2% | | | | | | | | |
| RTX Corporation | | | 28,295 | | | | 2,537,212 | |
| Thales S.A. | | | 10,800 | | | | 1,601,858 | |
| | | | | | | | 4,139,070 | |
| Diversified Industrials — 3.4% | | | | | | | | |
| Hitachi Ltd. - ADR | | | 13,500 | | | | 2,273,535 | |
| | | | | | | | | |
| Electrical Equipment — 0.8% | | | | | | | | |
| Daikin Industries Ltd. - ADR | | | 40,000 | | | | 560,800 | |
| | | | | | | | | |
| Transportation & Logistics — 1.7% | | | | | | | | |
| Deutsche Post AG | | | 24,711 | | | | 1,147,482 | |
| | | | | | | | | |
| Materials — 1.3% | | | | | | | | |
| Chemicals — 1.3% | | | | | | | | |
| Air Liquide S.A. | | | 4,268 | | | | 867,521 | |
| BLUE CURRENT GLOBAL DIVIDEND FUND |
| SCHEDULE OF INVESTMENTS (Unaudited) (Continued) |
| COMMON STOCKS — 96.3% (Continued) | | Shares | | | Value | |
| Real Estate — 1.8% | | | | | | | | |
| REITs — 1.8% | | | | | | | | |
| Prologis, Inc. | | | 8,900 | | | $ | 1,186,103 | |
| | | | | | | | | |
| Technology — 16.9% | | | | | | | | |
| Semiconductors — 10.0% | | | | | | | | |
| BE Semiconductor Industries N.V. | | | 4,560 | | | | 825,934 | |
| Broadcom, Inc. | | | 2,020 | | | | 2,626,990 | |
| QUALCOMM, Inc. | | | 13,284 | | | | 2,096,082 | |
| Taiwan Semiconductor Manufacturing Company Ltd. - ADR | | | 9,000 | | | | 1,158,030 | |
| | | | | | | | 6,707,036 | |
| Software — 3.7% | | | | | | | | |
| Microsoft Corporation | | | 6,020 | | | | 2,490,113 | |
| | | | | | | | | |
| Technology Services — 3.2% | | | | | | | | |
| RELX plc - ADR | | | 49,500 | | | | 2,174,040 | |
| | | | | | | | | |
| Total Common Stocks (Cost $47,793,214) | | | | | | $ | 64,668,980 | |
| | | | | | | |
| MONEY MARKET FUNDS — 2.0% | | Shares | | | Value | |
| First American Government Obligations Fund - Class Z, 5.19% (a) (Cost $1,319,859) | | | 1,319,859 | | | $ | 1,319,859 | |
| | | | | | | | | |
| Investments at Value — 98.3% (Cost $49,113,073) | | | | | | $ | 65,988,839 | |
| | | | | | | | | |
| Other Assets in Excess of Liabilities — 1.7% | | | | | | | 1,123,148 | |
| | | | | | | | | |
| Net Assets — 100.0% | | | | | | $ | 67,111,987 | |
A/S - Aktieselskab
ADR - American Depositary Receipt
AG - Aktiengesellschaft
N.V. - Naamloze Vennootschap
plc - Public Limited Company
S.A. - Societe Anonyme
SE - Societe Europaea
| (a) | The rate shown is the 7-day effective yield as of February 29, 2024. See accompanying notes to financial statements. |
| BLUE CURRENT GLOBAL DIVIDEND FUND |
| SUMMARY OF COMMON STOCKS BY COUNTRY |
| February 29, 2024 (Unaudited) |
| | | | | | % of Net | |
| Country | | Value | | | Assets | |
| United States | | $ | 32,402,374 | | | | 48.3 | % |
| United Kingdom | | | 8,338,305 | | | | 12.4 | % |
| France | | | 5,837,339 | | | | 8.7 | % |
| Japan | | | 4,652,125 | | | | 6.9 | % |
| Netherlands | | | 3,665,939 | | | | 5.5 | % |
| Germany | | | 3,239,262 | | | | 4.8 | % |
| Ireland | | | 1,533,824 | | | | 2.3 | % |
| Denmark | | | 1,413,286 | | | | 2.1 | % |
| Singapore | | | 1,226,507 | | | | 1.8 | % |
| Canada | | | 1,201,989 | | | | 1.8 | % |
| Taiwan Province of China | | | 1,158,030 | | | | 1.7 | % |
| | | $ | 64,668,980 | | | | 96.3 | % |
See accompanying notes to financial statements.
| BLUE CURRENT GLOBAL DIVIDEND FUND |
| STATEMENT OF ASSETS AND LIABILITIES |
| February 29, 2024 (Unaudited) |
| ASSETS | | | |
| Investments in securities: | | | | |
| At cost | | $ | 49,113,073 | |
| At value (Note 2) | | $ | 65,988,839 | |
| Cash denominated in foreign currency (Cost $509,432) | | | 517,909 | |
| Receivable for capital shares sold | | | 27,775 | |
| Receivable for securities sold | | | 406,572 | |
| Dividends receivable | | | 136,581 | |
| Reclaims receivable | | | 86,727 | |
| Other assets | | | 19,162 | |
| Total assets | | | 67,183,565 | |
| | | | | |
| LIABILITIES | | | | |
| Payable for capital shares redeemed | | | 2,856 | |
| Payable to Adviser (Note 4) | | | 31,503 | |
| Payable to administrator (Note 4) | | | 24,426 | |
| Other accrued expenses | | | 12,793 | |
| Total liabilities | | | 71,578 | |
| | | | | |
| CONTINGENCIES AND COMMITMENTS (Note 6) | | | — | |
| | | | | |
| NET ASSETS | | $ | 67,111,987 | |
| | | | | |
| NET ASSETS CONSIST OF: | | | | |
| Paid-in capital | | $ | 50,531,803 | |
| Accumulated earnings | | | 16,580,184 | |
| NET ASSETS | | $ | 67,111,987 | |
| | | | | |
| PRICING OF INSTITUTIONAL SHARES (Note 1) | | | | |
| Net assets applicable to Institutional Shares | | $ | 67,111,987 | |
| Shares of Institutional Shares outstanding (unlimited number of shares authorized, no par value) | | | 4,643,269 | |
| Net asset value, offering and redemption price per share (a) (Note 2) | | $ | 14.45 | |
| (a) | Redemption fee may apply to redemptions of shares held for 7 days or less. |
See accompanying notes to financial statements.
| BLUE CURRENT GLOBAL DIVIDEND FUND |
| STATEMENT OF OPERATIONS |
| For the Six Months Ended February 29, 2024 (Unaudited) |
| INVESTMENT INCOME | | | | |
| Dividends | | $ | 777,265 | |
| | | | | |
| EXPENSES | | | | |
| Management fees (Note 4) | | | 311,630 | |
| Administration fees (Note 4) | | | 33,012 | |
| Fund accounting fees (Note 4) | | | 22,839 | |
| Legal fees | | | 14,069 | |
| Registration and filing fees | | | 10,323 | |
| Transfer agent fees (Note 4) | | | 10,012 | |
| Trustees’ fees and expenses (Note 4) | | | 9,835 | |
| Custodian and bank service fees | | | 9,026 | |
| Audit and tax services fees | | | 8,750 | |
| Compliance fees and expenses (Note 4) | | | 6,159 | |
| Shareholder reporting expenses | | | 4,986 | |
| Pricing fees | | | 2,340 | |
| Postage and supplies | | | 1,859 | |
| Insurance expense | | | 1,535 | |
| Other expenses | | | 10,076 | |
| Total expenses | | | 456,451 | |
| Fee reductions by the Adviser (Note 4) | | | (144,821 | ) |
| Net expenses | | | 311,630 | |
| | | | | |
| NET INVESTMENT INCOME | | | 465,635 | |
| | | | | |
| REALIZED AND UNREALIZED GAINS (LOSSES) ON INVESTMENTS AND FOREIGN CURRENCIES | | | | |
| Net realized gains (losses) from: | | | | |
| Investments | | | 317,291 | |
| Foreign currency transactions (Note 2) | | | (1,174 | ) |
| Net change in unrealized appreciation (depreciation) on: | | | | |
| Investments | | | 5,153,993 | |
| Foreign currency translation (Note 2) | | | (1,223 | ) |
| NET REALIZED AND UNREALIZED GAINS ON INVESTMENTS AND FOREIGN CURRENCIES | | | 5,468,887 | |
| | | | | |
| NET INCREASE IN NET ASSETS RESULTING FROM OPERATIONS | | $ | 5,934,522 | |
See accompanying notes to financial statements.
| BLUE CURRENT GLOBAL DIVIDEND FUND |
| STATEMENTS OF CHANGES IN NET ASSETS |
| | | Six Months | | | | |
| | | Ended | | | Year | |
| | | February, 29, | | | Ended | |
| | | 2024 | | | August 31, | |
| | | (Unaudited) | | | 2023 | |
| FROM OPERATIONS | | | | | | | | |
| Net investment income | | $ | 465,635 | | | $ | 1,252,877 | |
| Net realized gains (losses) from: | | | | | | | | |
| Investments | | | 317,291 | | | | (830,014 | ) |
| Foreign currency transactions | | | (1,174 | ) | | | (19,754 | ) |
| Net change in unrealized appreciation (depreciation) on: | | | | | | | | |
| Investments | | | 5,153,993 | | | | 6,482,263 | |
| Foreign currency transactions | | | (1,223 | ) | | | 9,714 | |
| Net increase in net assets from operations | | | 5,934,522 | | | | 6,895,086 | |
| | | | | | | | | |
| DISTRIBUTIONS TO SHAREHOLDERS | | | | | | | | |
| Institutional Shares | | | (428,103 | ) | | | (2,877,521 | ) |
| | | | | | | | | |
| FROM CAPITAL SHARE TRANSACTIONS | | | | | | | | |
| Institutional Shares | | | | | | | | |
| Proceeds from shares sold | | | 4,312,712 | | | | 13,681,146 | |
| Net asset value of shares issued in reinvestment of distributions to shareholders | | | 257,711 | | | | 1,931,129 | |
| Proceeds from redemption fees collected (Note 2) | | | 102 | | | | 2,099 | |
| Payments for shares redeemed | | | (5,769,425 | ) | | | (8,113,526 | ) |
| Net increase (decrease) in Institutional Shares net assets from capital share transactions | | | (1,198,900 | ) | | | 7,500,848 | |
| | | | | | | | | |
| TOTAL INCREASE IN NET ASSETS | | | 4,307,519 | | | | 11,518,413 | |
| | | | | | | | | |
| NET ASSETS | | | | | | | | |
| Beginning of period | | | 62,804,468 | | | | 51,286,055 | |
| End of period | | $ | 67,111,987 | | | $ | 62,804,468 | |
| | | | | | | | | |
| CAPITAL SHARES ACTIVITY | | | | | | | | |
| Shares sold | | | 323,297 | | | | 1,067,000 | |
| Shares reinvested | | | 19,451 | | | | 154,015 | |
| Shares redeemed | | | (425,997 | ) | | | (631,425 | ) |
| Net increase in shares outstanding | | | (83,249 | ) | | | 589,590 | |
| Shares outstanding, beginning of period | | | 4,726,518 | | | | 4,136,928 | |
| Shares outstanding, end of period | | | 4,643,269 | | | | 4,726,518 | |
See accompanying notes to financial statements.
| BLUE CURRENT GLOBAL DIVIDEND FUND |
| INSTITUTIONAL SHARES |
| FINANCIAL HIGHLIGHTS |
Per Share Data for a Share Outstanding Throughout Each Period
| | | Six Months | | | | | | | | | | | | | | | | |
| | | Ended | | | Year | | | Year | | | Year | | | Year | | | Year | |
| | | February 29, | | | Ended | | | Ended | | | Ended | | | Ended | | | Ended | |
| | | 2024 | | | August 31, | | | August 31, | | | August 31, | | | August 31, | | | August 31, | |
| | | (Unaudited) | | | 2023 | | | 2022 | | | 2021 | | | 2020 | | | 2019 | |
| Net asset value at beginning of period | | $ | 13.29 | | | $ | 12.40 | | | $ | 15.06 | | | $ | 11.74 | | | $ | 11.62 | | | $ | 11.47 | |
| Income (loss) from investment operations: | | | | | | | | | | | | | | | | | | | | | | | | |
| Net investment income | | | 0.10 | | | | 0.28 | | | | 0.48 | | | | 0.17 | | | | 0.24 | | | | 0.22 | |
| Net realized and unrealized gains (losses) on investments and foreign currencies | | | 1.15 | | | | 1.28 | | | | (1.88 | ) | | | 3.32 | | | | 0.16 | (a) | | | 0.11 | |
| Total from investment operations | | | 1.25 | | | | 1.56 | | | | (1.40 | ) | | | 3.49 | | | | 0.40 | | | | 0.33 | |
| Less distributions from: | | | | | | | | | | | | | | | | | | | | | | | | |
| Net investment income | | | (0.09 | ) | | | (0.28 | ) | | | (0.49 | ) | | | (0.17 | ) | | | (0.20 | ) | | | (0.18 | ) |
| Net realized gains | | | — | | | | (0.39 | ) | | | (0.77 | ) | | | — | | | | (0.08 | ) | | | — | |
| Total distributions | | | (0.09 | ) | | | (0.67 | ) | | | (1.26 | ) | | | (0.17 | ) | | | (0.28 | ) | | | (0.18 | ) |
| Proceeds from redemption fees collected (Note 2) | | | 0.00 | (b) | | | 0.00 | (b) | | | 0.00 | (b) | | | — | | | | 0.00 | (b) | | | 0.00 | (b) |
| Net asset value at end of period | | $ | 14.45 | | | $ | 13.29 | | | $ | 12.40 | | | $ | 15.06 | | | $ | 11.74 | | | $ | 11.62 | |
| Total return (c) | | | 9.47 | % (d) | | | 12.94 | % | | | (10.12 | %) | | | 29.91 | % | | | 3.46 | % | | | 2.91 | % |
| Net assets at end of period (000’s) | | $ | 67,112 | | | $ | 62,804 | | | $ | 51,286 | | | $ | 52,031 | | | $ | 42,039 | | | $ | 62,302 | |
| Ratios/supplementary data: | | | | | | | | | | | | | | | | | | | | | | | | |
| Ratio of total expenses to average net assets | | | 1.45 | % (e) | | | 1.48 | % | | | 1.49 | % | | | 1.48 | % | | | 1.48 | % | | | 1.43 | % |
| Ratio of net expenses to average net assets (f) | | | 0.99 | % (e) | | | 0.99 | % | | | 0.99 | % | | | 0.99 | % | | | 0.99 | % | | | 0.99 | % |
| Ratio of net investment income to average net assets (f) | | | 1.48 | % (e) | | | 2.18 | % | | | 3.43 | % | | | 1.27 | % | | | 1.94 | % | | | 1.87 | % |
| Portfolio turnover rate | | | 23 | % (d) | | | 60 | % | | | 60 | % | | | 53 | % | | | 66 | % | | | 46 | % |
| (a) | Represents a balancing figure from other amounts in the financial highlights table that captures all other changes affecting net asset value per share. This per share amount does not correlate to the aggregate of net realized and unrealized losses on the Statement of Operations for the same period. |
| (b) | Amount rounds to less than $0.01 per share. |
| (c) | Total return is a measure of the change in value of an investment in the Fund over periods covered, which assumes any dividends and capital gain distributions are reinvested in shares of the Fund. The returns shown do not reflect the deduction of taxes a shareholder would pay on Fund distributions or the redemption of Fund shares. The total returns would be lower if the Adviser had not reduced management fees (Note 4). |
| (f) | Ratio was determined after management fee reductions by the Adviser (Note 4). |
See accompanying notes to financial statements.
| BLUE CURRENT GLOBAL DIVIDEND FUND |
| NOTES TO FINANCIAL STATEMENTS |
| February 29, 2024 (Unaudited) |
1. Organization
Blue Current Global Dividend Fund (the “Fund”) is a diversified series of Ultimus Managers Trust (the “Trust”), an open-end investment company established as an Ohio business trust under a Declaration of Trust dated February 28, 2012. Other series of the Trust are not incorporated in this report.
The investment objective of the Fund is to seek current income and capital appreciation.
The Fund currently offers one class of shares: Institutional Class shares (sold without any sales loads or distribution fees and subject to a $100,000 initial investment requirement).
2. Significant Accounting Policies
The following is a summary of the Fund’s significant accounting policies. The policies are in conformity with accounting principles generally accepted in the United States of America (“GAAP”). The Fund follows accounting and reporting guidance under Financial Accounting Standards Board Accounting Standards Codification Topic 946, “Financial Services – Investment Companies.”
Regulatory update – Tailored Shareholder Reports for Mutual Funds and Exchange-Traded Funds (“ETFs”) – Effective January 24, 2023, the Securities and Exchange Commission (the “SEC”) adopted rule and form amendments to require mutual funds and ETFs to transmit concise and visually engaging streamlined annual and semiannual reports to shareholders that highlight key information. Other information, including financial statements, will no longer appear in a streamlined shareholder report but must be available online, delivered free of charge upon request, and filed on a semiannual basis on Form N-CSR. The rule and form amendments have a compliance date of July 24, 2024. At this time, management is evaluating the impact of these amendments on the shareholder reports for the Fund.
Securities valuation – The Fund values its portfolio securities including common stocks at fair value as of the close of regular trading on the New York Stock Exchange (the “NYSE”) (normally 4:00 p.m. Eastern Time) on each day the NYSE is open for business. The Fund generally values its listed securities on the basis of the security’s last sale price on the security’s primary exchange, if available, otherwise at the exchange’s most recently quoted mean price. NASDAQ-listed securities are valued at the NASDAQ Official Closing Price. Investments representing shares of other open-end investment companies, other than exchange-traded funds, if any, but including money market funds, are valued at their net asset value (“NAV”) as reported by such companies. When using a quoted price and when the market is considered active, the security will be classified as Level 1 within the fair value hierarchy (see below). In the event that market quotations are not readily available or are considered unreliable due to market or other events, the Fund values its securities and other assets at fair value as determined by Edge Capital Group, LLC (the “Adviser”),
| BLUE CURRENT GLOBAL DIVIDEND FUND |
| NOTES TO FINANCIAL STATEMENTS (Unaudited) (Continued) |
as the Fund’s valuation designee, in accordance with procedures adopted by the Board of Trustees (the “Board”) pursuant to Rule 2a-5 under the Investment Company Act of 1940, as amended (the “1940 Act”). Under these procedures, the securities will be classified as Level 2 or 3 within the fair value hierarchy, depending on the inputs used. Unavailable or unreliable market quotes may be due to the following factors: a substantial bid-ask spread; infrequent sales resulting in stale prices; insufficient trading volume; small trade sizes; a temporary lapse in any reliable pricing source; and actions of the securities or futures markets, such as the suspension or limitation of trading. As a result, the prices of securities used to calculate the Fund’s NAV may differ from quoted or published prices for the same securities. Securities traded on foreign exchanges are typically fair valued by an independent pricing service and translated from the local currency into U.S. dollars using currency exchange rates supplied by an independent pricing service. GAAP establishes a single authoritative definition of fair value, sets out a framework for measuring fair value, and requires additional disclosures about fair value measurements.
Various inputs are used in determining the value of the Fund’s investments. These inputs are summarized in the three broad levels listed below:
| ● | Level 1 – quoted prices in active markets for identical securities |
| ● | Level 2 – other significant observable inputs |
| ● | Level 3 – significant unobservable inputs |
The inputs or methods used for valuing securities are not necessarily an indication of the risks associated with investing in those securities. The inputs used to measure fair value may fall into different levels of the fair value hierarchy. In such cases, for disclosure purposes, the level in the fair value hierarchy within which the fair value measurement falls in its entirety is determined based on the lowest level input that is significant to the fair value measurement.
The Fund’s foreign equity securities actively traded in foreign markets may be classified as Level 2 despite the availability of closing prices because such securities are typically fair valued by an independent pricing service. The Board has authorized the Fund to retain an independent pricing service to determine the fair value of its foreign securities because the value of such securities may be materially affected by events occurring before the Fund’s pricing time but after the close of the primary markets or exchanges on which such foreign securities are traded. These intervening events might be country-specific (e.g., natural disaster, economic or political developments, interest rate change); issuer specific (e.g., earnings report or merger announcement); or U.S. market-specific (such as a significant movement in the U.S. market that is deemed to affect the value of foreign securities). The pricing service uses an automated system that incorporates a model based on multiple parameters, including a security’s local closing price, relevant general
| BLUE CURRENT GLOBAL DIVIDEND FUND |
| NOTES TO FINANCIAL STATEMENTS (Unaudited) (Continued) |
and sector indices, currency fluctuations, trading in depositary receipts and futures, if applicable, and/or research valuations by its staff, in determining what it believes is the fair value of the securities.
The following is a summary of the Fund’s investments based on the inputs used to value the investments as of February 29, 2024:
| Investments in Securities: | | Level 1 | | | Level 2 | | | Level 3 | | | Total | |
| Common Stocks | | $ | 53,103,523 | | | $ | 11,565,457 | | | $ | — | | | $ | 64,668,980 | |
| Money Market Funds | | | 1,319,859 | | | | — | | | | — | | | | 1,319,859 | |
| Total | | $ | 54,423,382 | | | $ | 11,565,457 | | | $ | — | | | $ | 65,988,839 | |
| | | | | | | | | | | | | | | | | |
Refer to the Fund’s Schedule of Investments for a listing of the common stocks by sector and industry type. The Fund did not have any assets or liabilities that were measured at fair value on a recurring basis using significant unobservable inputs (Level 3) as of or during the six months ended February 29, 2024.
Foreign currency translation – Securities and other assets and liabilities denominated in or expected to settle in foreign currencies are translated into U.S. dollars based on exchange rates on the following basis:
| A. | The fair values of investment securities and other assets and liabilities are translated as of the close of the NYSE each day. |
| B. | Purchases and sales of investment securities and income and expenses are translated at the rate of exchange prevailing as of 4:00 p.m. Eastern Time on the respective date of such transactions. |
| C. | The Fund does not isolate that portion of the results of operations caused by changes in foreign exchange rates on investments from those caused by changes in market prices of securities held. Such fluctuations are included with the net realized and unrealized gains or losses on investments. |
Reported net realized foreign exchange gains or losses arise from 1) purchases and sales of foreign currencies, 2) currency gains or losses realized between the trade and settlement dates on securities transactions and 3) the difference between the amounts of dividends and foreign withholding taxes recorded on the Fund’s books and the U.S. dollar equivalent of the amounts actually received or paid. Reported net unrealized foreign exchange gains and losses arise from changes in the value of assets and liabilities that result from changes in exchange rates.
The Fund may be subject to foreign taxes related to foreign income received, capital gain on the sale of securities and certain foreign currency transactions (a portion of which may be reclaimable). All foreign taxes are recorded in accordance with the applicable regulations and rates that exist in the foreign jurisdictions in which the Fund invests.
| BLUE CURRENT GLOBAL DIVIDEND FUND |
| NOTES TO FINANCIAL STATEMENTS (Unaudited) (Continued) |
Share valuation – The NAV per share of the Fund is calculated daily by dividing the total value of the assets, less liabilities, by the number of shares outstanding. The offering price and redemption price per share of the Fund is equal to the NAV per share, except that shareholders of the Fund are subject to a redemption fee equal to 2.00% of the value of Fund shares redeemed within 7 days of purchase, excluding involuntary redemptions of accounts that fall below the minimum investment amount or the redemption of Fund shares representing reinvested dividends, capital gain distributions, or capital appreciation. During the periods ended February 29, 2024 and August 31, 2023, proceeds from redemption fees, recorded in capital, totaled $102 and $2,099, respectively.
Investment income – Dividend income is recorded on the ex-dividend date. Non-cash dividends included in dividend income, if any, are recorded at the fair value of the security received. Interest income is accrued as earned. The Fund may invest in real estate investment trusts (“REITs”) that pay distributions to their shareholders based on available funds from operations. It is common for these distributions to exceed the REIT’s taxable earnings and profits resulting in the excess portion of such distribution to be designated as return of capital. Distributions received from REITs are generally recorded as dividend income and, if necessary, are reclassified annually in accordance with tax information provided by the underlying REITs. The Fund may also invest in master limited partnerships (“MLPs”) whose distributions generally are comprised of ordinary income, capital gains and return of capital from the MLP. For financial statement purposes, the Fund records all income received as ordinary income. This amount may be subsequently revised based on information received from the MLPs after their tax reporting periods are concluded, as the actual character of these distributions is not known until after the fiscal year end of the Fund. Withholding taxes on foreign dividends have been recorded for in accordance with the Fund’s understanding of the applicable country’s tax rules and rates.
Investment transactions – Investment transactions are accounted for on the trade date. Realized gains and losses on investments sold are determined on a specific identification basis.
Common expenses – Common expenses of the Trust are allocated among the Fund and the other series of the Trust based on the relative net assets of each series, the number of series in the Trust, or the nature of the services performed and the relative applicability to each series.
Distributions to shareholders – Distributions to shareholders arising from net investment income are declared and paid quarterly to shareholders. Net realized capital gains, if any, are distributed at least annually. The amount of distributions from net investment income and net realized capital gains are determined in accordance with federal income
| BLUE CURRENT GLOBAL DIVIDEND FUND |
| NOTES TO FINANCIAL STATEMENTS (Unaudited) (Continued) |
tax regulations, which may differ from GAAP. Dividends and distributions to shareholders are recorded on the ex-dividend date. The tax character of distributions paid during the periods ended February 29, 2024 and August 31, 2023 was as follows:
| | | Ordinary | | | Long-Term | | | Total | |
| Periods Ended | | Income | | | Capital Gains | | | Distributions | |
| February 29, 2024 | | $ | 428,103 | | | $ | — | | | $ | 428,103 | |
| August 31, 2023 | | $ | 1,231,192 | | | $ | 1,646,329 | | | $ | 2,877,521 | |
On March 28, 2024, the Fund paid an ordinary income dividend of $0.0684 per share to shareholders of record on March 27, 2024.
Estimates – The preparation of financial statements in conformity with GAAP requires management to make estimates and assumptions that affect the reported amounts of assets and liabilities and disclosure of contingent assets and liabilities, each as of the date of the financial statements, and the reported amounts of increase (decrease) in net assets from operations during the reporting period. Actual results could differ from those estimates.
Federal income tax – The Fund has qualified and intends to continue to qualify as a regulated investment company under the Internal Revenue Code of 1986, as amended (the “Code”). Qualification generally will relieve the Fund of liability for federal income taxes to the extent 100% of its net investment income and net realized capital gains are distributed in accordance with the Code.
In order to avoid imposition of the excise tax applicable to regulated investment companies, it is also the Fund’s intention to declare as dividends in each calendar year at least 98% of its net investment income (earned during the calendar year) and 98.2% of its net realized capital gains (earned during the 12 months ended October 31) plus undistributed amounts from prior years.
The following information is computed on a tax basis for each item as of August 31, 2023:
| | | | | |
| Tax cost of investments | | $ | 50,685,146 | |
| Gross unrealized appreciation | | $ | 12,450,627 | |
| Gross unrealized depreciation | | | (727,197 | ) |
| Net unrealized appreciation on investments | | | 11,723,430 | |
| Net unrealized appreciation on foreign currency translation | | | 8,033 | |
| Undistributed ordinary income | | | 172,272 | |
| Accumulated capital and other losses | | | (829,970 | ) |
| Distributable earnings | | $ | 11,073,765 | |
| | | | | |
| BLUE CURRENT GLOBAL DIVIDEND FUND |
| NOTES TO FINANCIAL STATEMENTS (Unaudited) (Continued) |
The federal tax cost, unrealized appreciation (depreciation) as of February 29, 2024 was as follows:
| | | | | |
| Tax cost of investments | | $ | 49,111,415 | |
| Gross unrealized appreciation | | $ | 17,179,721 | |
| Gross unrealized depreciation | | | (302,297 | ) |
| Net unrealized appreciation on investments | | $ | 16,877,424 | |
| Net unrealized appreciation on foreign currency translation | | $ | 6,810 | |
| | | | | |
The difference between the federal income tax cost of investments and the financial cost is due to certain timing differences in the recognition of capital gains or losses under income tax regulations and GAAP. These “book/tax” differences are temporary in nature and are primarily due to the tax deferral of losses on wash sales and the tax treatment of the cost of securities received as in-kind subscriptions at the inception of the Fund.
As of August 31, 2023, the Fund had short-term capital loss carryforwards of $829,970 for federal income tax purposes. These capital loss carryforwards, which do not expire, may be utilized in the current and future years to offset net realized capital gains, if any.
The Fund recognizes the tax benefits or expenses of uncertain tax positions only when the position is “more likely than not” to be sustained assuming examination by tax authorities. Management has reviewed the Fund’s tax positions for the current and all open tax years (generally, three years) and has concluded that no provision for unrecognized tax benefits or expenses is required in these financial statements. The Fund identifies its major tax jurisdiction as U.S. federal. The Fund recognizes interest and penalties, if any, related to unrecognized tax benefits as income tax on the Statement of Operations. During the six months ended February 29, 2024, the Fund did not incur any interest or penalties.
3. Investment Transactions
During the six months ended February 29, 2024, cost of purchases and proceeds from sales of investment securities, other than short-term investments, were $15,383,032 and $13,387,596, respectively.
4. Transactions with Related Parties
INVESTMENT ADVISORY AGREEMENT
The Fund’s investments are managed by the Adviser pursuant to the terms of an Investment Advisory Agreement. Under the Investment Advisory Agreement, the Fund pays the Adviser a management fee, computed and accrued daily and paid monthly, at the annual rate of 0.99% of its average daily net assets.
| BLUE CURRENT GLOBAL DIVIDEND FUND |
| NOTES TO FINANCIAL STATEMENTS (Unaudited) (Continued) |
Pursuant to an Expense Limitation Agreement between the Fund and the Adviser (the “ELA”), the Adviser had agreed, until January 1, 2026, to reduce its management fees and reimburse other expenses to limit total annual operating expenses (exclusive of brokerage costs; taxes; interest; borrowing costs such as interest and dividends expenses on securities sold short; costs to organize the Fund; acquired fund fees and expenses; and extraordinary expenses such as litigation and merger or reorganization costs and other expenses not incurred in the ordinary course of the Fund’s business) to an amount not exceeding 0.99% of the average daily net assets of the Institutional Class shares. Accordingly, under the ELA, the Adviser reduced its management fees in the amount of $144,821 during the six months ended February 29, 2024.
Under the terms of the ELA, management fee reductions and expense reimbursements by the Adviser are subject to repayment by the Fund for a period of three years after such fees and expenses were incurred, provided that the repayments do not cause the Fund’s total annual operating expenses to exceed the lesser of (i) the expense limitation then in effect, if any, and (ii) the expense limitation in effect at the time the expenses to be repaid were incurred. As of February 29, 2024, the Adviser may seek recoupment of investment advisory fee reductions in the amount of $799,905 no later than the dates stated below:
| August 31, 2024 | | $ | 117,585 | |
| August 31, 2025 | | | 259,923 | |
| August 31, 2026 | | | 277,576 | |
| February 28, 2027 | | | 144,821 | |
| Total | | $ | 799,905 | |
| | | | | |
OTHER SERVICE PROVIDERS
Ultimus Fund Solutions, LLC (“Ultimus”) provides administration, fund accounting, and transfer agency services to the Fund. The Fund pays Ultimus fees in accordance with the agreements for such services. In addition, the Fund pays out-of-pocket expenses including, but not limited to, postage, supplies, and certain costs related to the pricing of the Fund’s portfolio securities.
Under the terms of a Consulting Agreement with the Trust, Northern Lights Compliance Services, LLC (“NLCS”) provides an Anti-Money Laundering Officer to the Trust, as well as related compliance services. Under the terms of the agreement, NLCS receives fees from the Fund. NLCS is a wholly-owned subsidiary of Ultimus.
Under the terms of a Distribution Agreement with the Trust, Ultimus Fund Distributors, LLC (the “Distributor”) serves as principal underwriter to the Fund. The Distributor is a wholly-owned subsidiary of Ultimus. The Distributor is compensated by the Adviser (not the Fund) for acting as principal underwriter.
Certain officers of the Trust are also officers of Ultimus and are not paid by the Fund for serving in such capacities.
| BLUE CURRENT GLOBAL DIVIDEND FUND |
| NOTES TO FINANCIAL STATEMENTS (Unaudited) (Continued) |
TRUSTEE COMPENSATION
Each member of the Board (a “Trustee”) who is not an “interested person” (as defined by the 1940 Act, as amended) of the Trust (“Independent Trustee”) receives an annual retainer and meeting fees, plus reimbursements for travel and other meeting-related expenses.
PRINCIPAL HOLDER OF FUND SHARES
As of February 29, 2024, the following shareholder owned of record 25% or more of the outstanding shares of the Fund:
| Name of Record Owner | % Ownership |
| Pershing, LLC (for the benefit of multiple shareholders) | 70% |
A beneficial owner of 25% or more of the Fund’s outstanding shares may be considered a controlling person. The shareholder’s vote could have a more significant effect on matters presented at a shareholders’ meeting.
5. Foreign Investment Risk
Compared with investing in the U.S., investing in foreign markets involves a greater degree and variety of risk. Investors in foreign markets may face delayed settlements, currency controls, and adverse economic developments as well as higher overall transaction costs. In addition, fluctuations in the U.S. dollar’s value versus other currencies may erode or reverse gains or increase losses from investments denominated in foreign currencies. Foreign governments may expropriate assets, impose capital or currency controls, impose punitive taxes, impose limits on ownership or nationalize a company or industry. Any of these actions could have a severe effect on security prices and impair an investor’s ability to bring its capital or income back to the U.S. The value of foreign securities may be affected by incomplete, less frequent, or inaccurate financial information about their issuers, social upheavals, or political actions ranging from tax code changes to government collapse. Foreign companies may also receive less coverage by market analysts than U.S. companies and may be subject to different reporting standards or regulatory requirements than those applicable to U.S. companies.
6. Contingencies and Commitments
The Fund indemnifies the Trust’s officers and Trustees for certain liabilities that might arise from their performance of their duties to the Fund. Additionally, in the normal course of business, the Fund enters into contracts that contain a variety of representations, warranties, and general indemnifications. The Fund’s maximum exposure under these arrangements is unknown, as this would involve future claims that may be made against the Fund that have not yet occurred. However, based on experience, the Fund expects the risk of loss to be remote.
| BLUE CURRENT GLOBAL DIVIDEND FUND |
| NOTES TO FINANCIAL STATEMENTS (Unaudited) (Continued) |
7. Subsequent Events
The Fund is required to recognize in the financial statements the effects of all subsequent events that provide additional evidence about conditions that existed as of the date of the Statement of Assets and Liabilities. For non-recognized subsequent events that must be disclosed to keep the financial statements from being misleading, the Fund is required to disclose the nature of the event as well as an estimate of its financial effect, or a statement that such an estimate cannot be made. Management has evaluated subsequent events through the issuance of these financial statements and has noted no such events other than the ordinary income dividend paid on March 28, 2024, as discussed in Note 2.
| BLUE CURRENT GLOBAL DIVIDEND FUND |
| ABOUT YOUR FUND’S EXPENSES (Unaudited) |
We believe it is important for you to understand the impact of costs on your investment. As a shareholder of the Fund, you incur ongoing costs, including management fees and other operating expenses. The following examples are intended to help you understand your ongoing costs (in dollars) of investing in the Fund and to compare these costs with the ongoing costs of investing in other mutual funds.
A mutual fund’s ongoing costs are expressed as a percentage of its average net assets. This figure is known as the expense ratio. The expenses in the table below are based on an investment of $1,000 made at the beginning of the most recent period (September 1, 2023) and held until the end of the period (February 29, 2024).
The table below illustrates the Fund’s ongoing costs in two ways:
Actual fund return – This section helps you to estimate the actual expenses that you paid over the period. The “Ending Account Value” shown is derived from the Fund’s actual return, and the fourth column shows the dollar amount of operating expenses that would have been paid by an investor who started with $1,000 in the Fund. You may use the information here, together with the amount you invested, to estimate the expenses that you paid over the period.
To do so, simply divide your account value by $1,000 (for example, an $8,600 account value divided by $1,000 = 8.6), then multiply the result by the number given for the Fund under the heading “Expenses Paid During Period.”
Hypothetical 5% return – This section is intended to help you compare the Fund’s ongoing costs with those of other mutual funds. It assumes that the Fund had an annual return of 5% before expenses during the period shown, but that the expense ratio is unchanged. In this case, because the return used is not the Fund’s actual return, the results do not apply to your investment. The example is useful in making comparisons because the U.S. Securities and Exchange Commission (the “SEC”) requires all mutual funds to calculate expenses based on a 5% return. You can assess the Fund’s ongoing costs by comparing this hypothetical example with the hypothetical examples that appear in shareholder reports of other funds.
Note that expenses shown in the table are meant to highlight and help you compare ongoing costs only. The Fund does not charge sales loads. However, a redemption fee of 2% is applied on the sale of shares held for less than 7 days.
The calculations assume no shares were bought or sold during the period. Your actual costs may have been higher or lower, depending on the amount of your investment and the timing of any purchases or redemptions.
| BLUE CURRENT GLOBAL DIVIDEND FUND |
| ABOUT YOUR FUND’S EXPENSES (Unaudited) (Continued) |
More information about the Fund’s expenses can be found in this report. For additional information on operating expenses and other shareholder costs, please refer to the Fund’s prospectus.
| | | Beginning | | Ending | | | | |
| | | Account Value | | Account Value | | | | Expenses |
| | | September 1, | | February 29, | | Net Expense | | Paid During |
| Institutional Class | | 2023 | | 2024 | | Ratio(a) | | Period(b) |
| Based on Actual Fund Return | | $1,000.00 | | $1,094.70 | | 0.99% | | $5.16 |
| Based on Hypothetical 5% Return (before expenses) | | $1,000.00 | | $1,019.94 | | 0.99% | | $4.97 |
| (a) | Annualized, based on the Fund’s expenses for the previous six month period. |
| (b) | Expenses are equal to the Fund’s annualized net expense ratio multiplied by the average account value over the period, multiplied by 182/366 (to reflect the one-half year period). |
| BLUE CURRENT GLOBAL DIVIDEND FUND |
| OTHER INFORMATION (Unaudited) |
A description of the policies and procedures that the Fund uses to vote proxies relating to portfolio securities is available without charge upon request by calling 1-800-514-3583, or on the SEC’s website at www.sec.gov. Information regarding how the Fund voted proxies relating to portfolio securities during the most recent 12-month period ended June 30 is also available without charge upon request by calling 1-800-514-3583, or on the SEC’s website at www.sec.gov.
The Trust files a complete listing of portfolio holdings for the Fund with the SEC as of the end of the first and third quarters of each fiscal year an exhibit to Form N-PORT. These filings are available upon request by calling 1-800-514-3583. Furthermore, you may obtain a copy of the filings on the SEC’s website at www.sec.gov and on the Fund’s website www.bluecurrentfunds.com.
| BLUE CURRENT GLOBAL DIVIDEND FUND |
| LIQUIDITY RISK MANAGEMENT PROGRAM (Unaudited) |
The Fund has adopted and implemented a written liquidity risk management program (the “Program”) as required by Rule 22e-4 (the “Liquidity Rule”) under the Investment Company Act of 1940, as amended. The Program is reasonably designed to assess and manage the Fund’s liquidity risk, taking into consideration, among other factors, the Fund’s investment strategy and the liquidity of its portfolio investments during normal and reasonably foreseeable stressed conditions; its short- and long-term cash flow projections; and its cash holdings and access to other funding sources. The Fund’s Board of Trustees (the “Board”) approved the appointment of the Liquidity Administrator Committee, comprising of the Fund’s Adviser and certain Trust officers, to be responsible for the Program’s administration and oversight and for reporting to the Board on at least an annual basis regarding the Program’s operation and effectiveness. The annual written report assessing the Program (the “Report”) was presented to the Board at the October 16-17, 2023 Board meeting and covered the period from June 1, 2022 to May 31, 2023 (the “Review Period”).
During the Review Period, the Fund did not experience unusual stress or disruption to its operations related to purchase and redemption activity. Also, during the Review Period, the Fund held adequate levels of cash and highly liquid investments to meet shareholder redemption activities in accordance with applicable requirements. The Report concluded that the Program is reasonably designed to prevent violation of the Liquidity Rule and the Program has been effectively implemented.
CUSTOMER PRIVACY NOTICE
| FACTS | WHAT DOES THE BLUE CURRENT GLOBAL DIVIDEND FUND (the “Fund”) DO WITH YOUR PERSONAL INFORMATION? |
| |
| Why? | Financial companies choose how they share your personal information. Federal law gives consumers the right to limit some but not all sharing. Federal law also requires us to tell you how we collect, share, and protect your personal information. Please read this notice carefully to understand what we do. |
| |
| What? | The types of personal information we collect and share depend on the product or service you have with us. This information can include: ■ Social Security number ■ Assets ■ Retirement Assets ■ Transaction History ■ Checking Account Information ■ Purchase History ■ Account Balances ■ Account Transactions ■ Wire Transfer Instructions When you are no longer our customer, we continue to share your information as described in this notice. |
| |
| How? | All financial companies need to share your personal information to run their everyday business. In the section below, we list the reasons financial companies can share their customers’ personal information; the reasons the Fund chooses to share; and whether you can limit this sharing. |
| Reasons we can share your personal information | Does the
Fund share? | Can you limit
this sharing? |
For our everyday business purposes –
Such as to process your transactions, maintain your account(s), respond to court orders and legal investigations, or report to credit bureaus | Yes | No |
For our marketing purposes –
to offer our products and services to you | No | We don’t share |
| For joint marketing with other financial companies | No | We don’t share |
For our affiliates’ everyday business purposes –
information about your transactions and experiences | No | We don’t share |
For our affiliates’ everyday business purposes –
information about your creditworthiness | No | We don’t share |
| For nonaffiliates to market to you | No | We don’t share |
| Questions? | Call 1-800-514-3583 |
| Who we are |
| Who is providing this notice? | Blue Current Global Dividend Fund Ultimus Fund Distributors, LLC (Distributor) Ultimus Fund Solutions, LLC (Administrator) |
| What we do |
| How does the Fund protect my personal information? | To protect your personal information from unauthorized access and use, we use security measures that comply with federal law. These measures include computer safeguards and secured files and buildings. Our service providers are held accountable for adhering to strict policies and procedures to prevent any misuse of your nonpublic personal information. |
| How does the Fund collect my personal information? | We collect your personal information, for example, when you ■ Open an account ■ Provide account information ■ Give us your contact information ■ Make deposits or withdrawals from your account ■ Make a wire transfer ■ Tell us where to send the money ■ Tell us who receives the money ■ Show your government-issued ID ■ Show your driver’s license We also collect your personal information from other companies. |
| Why can’t I limit all sharing? | Federal law gives you the right to limit only ■ Sharing for affiliates’ everyday business purposes – information about your creditworthiness ■ Affiliates from using your information to market to you ■ Sharing for nonaffiliates to market to you State laws and individual companies may give you additional rights to limit sharing. |
| |
| Definitions |
| Affiliates | Companies related by common ownership or control. They can be financial and nonfinancial companies. ■ Edge Capital Group, LLC, the investment adviser to the Fund, could be deemed to be an affiliate. |
| Nonaffiliates | Companies not related by common ownership or control. They can be financial and nonfinancial companies ■ The Fund does not share with nonaffiliates so they can market to you. |
| Joint marketing | A formal agreement between nonaffiliated financial companies that together market financial products or services to you. ■ The Fund does not jointly market. |
This page intentionally left blank.
This page intentionally left blank.
This page intentionally left blank.
Blue-SAR-24

Semi-Annual Report
February 29, 2024
(Unaudited)
| MARSHFIELD CONCENTRATED OPPORTUNITY FUND | |
| LETTER TO SHAREHOLDERS (Unaudited) | March 27, 2024 |
From September 1, 2023 through February 29, 2024, the Marshfield Concentrated Opportunity Fund (the “Fund”) produced a cumulative total return of 17.58% compared to 13.93% for the S&P 500® Index.
Since the Fund’s inception in late 2015, we have used these letters to reiterate what we believe to be important aspects of our investment approach that we would want to know about if we were outside shareholders (we are, of course, shareholders ourselves). Such aspects include the facts that: (a) we don’t pay much attention to the macroeconomic and political environment; and (b) we definitely refrain from predicting economic or political events and trends because we don’t think those are useful activities; but (c) we try to pay attention to discrete current domestic and global developments that we believe bear directly on our stocks and the businesses they represent. This last consideration allows us to understand something about how the companies in the Fund’s portfolio perform in different environments, both in terms of their inherent operating flexibility and in terms of management’s ability to pivot in the face of sudden changes in the external environment.
Various significant events during the last few years have provided good opportunities for us to see how the companies in the Fund’s portfolio perform under stress. Perhaps obviously, those events have included the pandemic, the war in Ukraine, the Federal Reserve’s energetic raising of interest rates and, as a partially related matter, the problems that either have developed or are developing in the banking industry. Our companies’ reactions to these events, both initial and over time, tell us a lot about their resilience and ability to pivot when faced with both challenging conditions and the opportunities that emerged from those challenges. The supply chain upheaval that was exacerbated by the war in Ukraine affirmatively advantaged Fund holding Expeditors International, a global logistics company, which tends to benefit from such turmoil. Other Fund holdings that rely on complex supply chains—such as Fastenal, TJX Corporation, and Ross Stores—were able to get product to customers with relatively few hitches as logistics snarls intensified but the companies’ internal systems and strategies were mostly able to adjust. As for rising interest rates, companies such as the homebuilder NVR and the insurance and reinsurance (and mortgage insurer) company Arch Capital were able to conduct business as usual, albeit at a somewhat dampened level, in the case of the former, and thrive due to a hardening pricing environment, in the case of the latter.
Even if we have views about broad industry trends, we make our decisions on a bottom-up basis. Irrespective of the external climate, we ask ourselves about the “whether”: whether a stock is cheap enough to buy (or expensive enough to sell); whether the company has a sufficient moat around its business which cannot easily be penetrated by competitors and/or it has a sufficiently differentiated strategy from its competitors; and whether the company’s corporate culture is appropriate to its business. As managers, we feel comfortable making a judgment about those aspects of a business, thereby making sure our investments can withstand shocks and not only survive, but thrive in any type of external environment. The turmoil in the banking sector, to date anyway, has not had a noticeable impact on the companies in the Fund’s portfolio, except providing us with an opportunity to add to our position in Discover Financial (see discussion below). While we are ultimately bystanders to those events and how they will shape the world, we
continuously monitor their impact on the portfolio companies in the Fund by taking their vitals—examining their financial health, strategy, and choices—as circumstances unfold over time.
Prices in the US equity market increased surprisingly rapidly during the six months ended February 29, 2024. We don’t, however, spend time thinking about the reasons for overall market movements, as the answer, indiscernible as it is, is of no practical relevance to us and to how we invest. We do, as noted above, spend most of our time analyzing what the companies in the Fund’s portfolio (and other companies that we might want to own in the future) are doing given the environment in which they operate.
We believe that the portfolio has continued to benefit from our emphasis on not just resilience but also operational expertise that we look for and have built into our investment process. Stocks in the portfolio which did particularly well and also materially affected performance during this six month period include Strategic Education, (which returned 42.95%), Progressive Corporation (which returned 42.02%), and Discover Financial (which returned 34.01%). Strategic Education is a volatile stock and this time the volatility worked in our favor—and of course we were helped by the optimistic market; Progressive Corporation continued to perform well (actually better than we had foreseen); and Discover Financial received a takeover offer from Capital One. Stocks in our portfolio which lagged both the market and the rest of our portfolio the most included: Expeditors International (which returned 2.48%); TJX Corporation (which returned 7.20%); and Moody’s Corporation (which returned 12.65%).
Our historical track record is one of limited turnover, and that was true again during the past six months. We added to one existing position, increasing our position in Discover Financial. We sold all of our small remaining position in Union Pacific, due to both its relatively high price and our growing skepticism that the Class I railroads could continue to grow either pricing (at a rate faster than inflation) or volumes. We pared back our Strategic Education position largely out of caution and our desire to not own, across our portfolios, too much of the overall float of any individual company. Finally, we trimmed our Arch Capital position due solely to price appreciation.
Our approach in any environment is to stick to our investment discipline. That means: 1) understanding as best we can what’s real and what’s fantasy; 2) acting with equanimity to exploit the misjudgments of the crowd; 3) being patient and not pulling the trigger before our buy or sell price has been reached; and 4) always pulling the trigger when the buy or sell price is reached, save in extenuating circumstances, i.e., our overall investment theory has been compromised. These things won’t change. Process and discipline (enabled by patience) are why we believe investors choose to invest in the Fund, and we take our mandate to preserve capital and generate risk-adjusted returns very seriously.
We thank you for the opportunity to invest your money and for your confidence in our process, discipline, and patience.
Sincerely,
| Elise J. Hoffmann | Christopher M. Niemczewski | Chad Goldberg |
| Portfolio Manager | Portfolio Manager | Portfolio Manager |
Past performance is not predictive of future performance. Investment results and principal value will fluctuate so that shares, when redeemed, may be worth more or less than their original cost. Current performance may be higher or lower than the performance data quoted. Performance data current to the most recent month-end are available by calling 1-855-691-5288.
An investor should consider the investment objectives, risks, charges and expenses of the Fund carefully before investing. The Fund’s prospectus contains this and other important information. To obtain a copy of the Fund’s prospectus please visit our website at www.MarshfieldFunds.com or call 1-855-691-5288 and a copy will be sent to you free of charge. Please read the prospectus carefully before you invest. The Fund is distributed by Ultimus Fund Distributors, LLC.
The Letter to Shareholders seeks to describe some of the Adviser’s current opinions and views of the financial markets. Although the Adviser believes it has a reasonable basis for any opinions or views expressed, actual results may differ, sometimes significantly so, from those expected or expressed. The securities held by the Fund that are discussed in the Letter to Shareholders were held during the period covered by this Report. They do not comprise the entire investment portfolio of the Fund, may be sold at any time, and may no longer be held by the Fund. For a complete list of securities held by the Fund as of February 29, 2024, please see the Schedule of Investments section of the semi-annual report. The opinions of the Fund’s adviser with respect to those securities may change at any time.
Statements in the Letter to Shareholders that reflect projections or expectations for future financial or economic performance of the Fund and the market in general and statements of the Fund’s plans and objectives for future operations are forward-looking statements. No assurance can be given that actual results or events will not differ materially from those projected, estimated, assumed, or anticipated in any such forward-looking statements. Important factors that could result in such differences, in addition to factors noted with such forward-looking statements, include, without limitation, general economic conditions, such as inflation, recession, and interest rates. Past performance is not a guarantee of future results.
| MARSHFIELD CONCENTRATED OPPORTUNITY FUND |
| PORTFOLIO INFORMATION |
| February 29, 2024 (Unaudited) |
| Portfolio Allocation (% of Net Assets) |
| | | | |
| Sector Allocation | | % of Net Assets | |
| Retail Trade | | | 30.1 | % |
| Finance and Insurance | | | 27.2 | % |
| Accommodation and Food Services | | | 4.8 | % |
| Manufacturing | | | 4.7 | % |
| Construction | | | 3.9 | % |
| Transportation and Warehousing | | | 3.4 | % |
| Administrative and Support and Waste Management and Remediation Services | | | 3.1 | % |
| Educational Services | | | 3.1 | % |
| Information | | | 2.8 | % |
| Wholesale Trade | | | 2.7 | % |
| Money Market Funds | | | 13.9 | % |
| Net Other Assets (Liabilities) | | | 0.3 | % |
| | | | 100.0 | % |
| | | | |
| Top 10 Equity Holdings |
| | | | |
| Security Description | | % of Net Assets | |
| Ross Stores, Inc. | | | 9.5 | % |
| AutoZone, Inc. | | | 9.0 | % |
| Arch Capital Group Ltd. | | | 6.1 | % |
| O’Reilly Automotive, Inc. | | | 6.0 | % |
| TJX Companies, Inc. (The) | | | 5.6 | % |
| Domino’s Pizza, Inc. | | | 4.8 | % |
| Cummins, Inc. | | | 4.7 | % |
| Goldman Sachs Group, Inc. (The) | | | 4.7 | % |
| Mastercard, Inc. - Class A | | | 4.7 | % |
| Visa, Inc. - Class A | | | 4.3 | % |
| MARSHFIELD CONCENTRATED OPPORTUNITY FUND |
| SCHEDULE OF INVESTMENTS |
| February 29, 2024 (Unaudited) |
| COMMON STOCKS — 85.8% | | Shares | | | Value | |
| Accommodation and Food Services — 4.8% | | | | | | | | |
| Restaurants and Other Eating Places — 4.8% | | | | | | | | |
| Domino’s Pizza, Inc. | | | 82,033 | | | $ | 36,779,495 | |
| | | | | | | | | |
| Administrative and Support and Waste Management and Remediation Services — 3.1% | | | | | | | | |
| Credit Bureaus — 3.1% | | | | | | | | |
| Moody’s Corporation | | | 62,354 | | | | 23,658,355 | |
| | | | | | | | | |
| Construction — 3.9% | | | | | | | | |
| Residential Building Construction — 3.9% | | | | | | | | |
| NVR, Inc. (a) | | | 3,868 | | | | 29,495,705 | |
| | | | | | | | | |
| Educational Services — 3.1% | | | | | | | | |
| Colleges, Universities, and Professional Schools — 3.1% | | | | | | | | |
| Strategic Education, Inc. | | | 215,184 | | | | 23,840,235 | |
| | | | | | | | | |
| Finance and Insurance — 27.2% | | | | | | | | |
| Credit Card Issuing — 3.5% | | | | | | | | |
| Discover Financial Services | | | 222,174 | | | | 26,816,402 | |
| | | | | | | | | |
| Direct Insurance (except Life, Health, and Medical) | | | | | | | | |
| Carriers — 10.0% | | | | | | | | |
| Arch Capital Group Ltd. (a) | | | 533,382 | | | | 46,718,930 | |
| Progressive Corporation (The) | | | 153,672 | | | | 29,130,064 | |
| | | | | | | | 75,848,994 | |
| Financial Transactions Processing, Reserve, and | | | | | | | | |
| Clearinghouse Activities — 9.0% | | | | | | | | |
| Mastercard, Inc. - Class A | | | 75,239 | | | | 35,720,468 | |
| Visa, Inc. - Class A | | | 115,752 | | | | 32,716,145 | |
| | | | | | | | 68,436,613 | |
| Investment Banking and Securities Intermediation — 4.7% | | | | | | | | |
| Goldman Sachs Group, Inc. (The) | | | 92,593 | | | | 36,023,306 | |
| | | | | | | | | |
| Information — 2.8% | | | | | | | | |
| Motion Picture and Video Production — 2.8% | | | | | | | | |
| Walt Disney Company (The) | | | 187,440 | | | | 20,914,555 | |
| | | | | | | | | |
| Manufacturing — 4.7% | | | | | | | | |
| Engine, Turbine, and Power Transmission Equipment — 4.7% | | | | | | | | |
| Cummins, Inc. | | | 134,573 | | | | 36,147,653 | |
| MARSHFIELD CONCENTRATED OPPORTUNITY FUND |
| SCHEDULE OF INVESTMENTS (Unaudited) (Continued) |
| COMMON STOCKS — 85.8% (Continued) | | Shares | | | Value | |
| Retail Trade — 30.1% | | | | | | | | |
| Automotive Parts and Accessories Retailers — 15.0% | | | | | | | | |
| AutoZone, Inc. (a) | | | 22,850 | | | $ | 68,687,557 | |
| O’Reilly Automotive, Inc. (a) | | | 42,263 | | | | 45,957,631 | |
| | | | | | | | 114,645,188 | |
| Clothing and Clothing Accessories Retailers — 15.1% | | | | | | | | |
| Ross Stores, Inc. | | | 485,688 | | | | 72,348,085 | |
| TJX Companies, Inc. (The) | | | 429,709 | | | | 42,601,350 | |
| | | | | | | | 114,949,435 | |
| Transportation and Warehousing — 3.4% | | | | | | | | |
| Freight Transportation Arrangement — 3.4% | | | | | | | | |
| Expeditors International of Washington, Inc. | | | 218,806 | | | | 26,169,198 | |
| | | | | | | | | |
| Wholesale Trade — 2.7% | | | | | | | | |
| Industrial Supplies Merchant Wholesalers — 2.7% | | | | | | | | |
| Fastenal Company | | | 282,278 | | | | 20,609,117 | |
| | | | | | | | | |
| Total Common Stocks (Cost $432,294,501) | | | | | | $ | 654,334,251 | |
| | | | | | | |
| MONEY MARKET FUNDS — 13.9% | | Shares | | | Value | |
| Goldman Sachs Financial Square Funds - Treasury Instruments Fund - Institutional Shares, 5.17% (b) | | | 79,201,870 | | | $ | 79,201,870 | |
| Vanguard Treasury Money Market Fund - Investor Shares, 5.29% (b) | | | 26,926,377 | | | | 26,926,377 | |
| Total Money Market Funds (Cost $106,128,247) | | | | | | $ | 106,128,247 | |
| | | | | | | | | |
| Investments at Value — 99.7% (Cost $538,422,748) | | | | | | $ | 760,462,498 | |
| | | | | | | | | |
| Other Assets in Excess of Liabilities — 0.3% | | | | | | | 1,990,834 | |
| | | | | | | | | |
| Net Assets — 100.0% | | | | | | $ | 762,453,332 | |
| (a) | Non-income producing security. |
| (b) | The rate shown is the 7-day effective yield as of February 29, 2024. |
See accompanying notes to financial statements.
| MARSHFIELD CONCENTRATED OPPORTUNITY FUND |
| STATEMENT OF ASSETS AND LIABILITIES |
| February 29, 2024 (Unaudited) |
| ASSETS | | | | |
| Investments in securities: | | | | |
| At cost | | $ | 538,422,748 | |
| At value (Note 2) | | $ | 760,462,498 | |
| Receivable for capital shares sold | | | 2,550,706 | |
| Recievable for investment securities sold | | | 1,334,795 | |
| Dividends receivable | | | 1,319,781 | |
| Other assets | | | 41,431 | |
| Total assets | | | 765,709,211 | |
| | | | | |
| LIABILITIES | | | | |
| Payable for capital shares redeemed | | | 500,528 | |
| Payable for investment securities purchased | | | 2,186,204 | |
| Payable to Adviser (Note 4) | | | 466,511 | |
| Payable to administrator (Note 4) | | | 60,780 | |
| Other accrued expenses | | | 41,856 | |
| Total liabilities | | | 3,255,879 | |
| | | | | |
| CONTINGENCIES AND COMMITMENTS (Note 5) | | | — | |
| | | | | |
| NET ASSETS | | $ | 762,453,332 | |
| | | | | |
| NET ASSETS CONSIST OF: | | | | |
| Paid-in capital | | $ | 534,539,547 | |
| Accumulated earnings | | | 227,913,785 | |
| NET ASSETS | | $ | 762,453,332 | |
| | | | | |
| Shares of beneficial interest outstanding (unlimited number of shares authorized, no par value) | | | 24,768,506 | |
| | | | | |
| Net asset value, offering price and redemption price per share (Note 2) | | $ | 30.78 | |
See accompanying notes to financial statements.
| MARSHFIELD CONCENTRATED OPPORTUNITY FUND |
| STATEMENT OF OPERATIONS |
| For the Six Months Ended February 29, 2024 (Unaudited) |
| INVESTMENT INCOME | | | | |
| Dividend income | | $ | 4,837,832 | |
| | | | | |
| EXPENSES | | | | |
| Management fees (Note 4) | | | 2,886,525 | |
| Administration fees (Note 4) | | | 197,267 | |
| Registration and filing fees | | | 53,407 | |
| Fund accounting fees (Note 4) | | | 44,760 | |
| Custody and bank service fees | | | 33,016 | |
| Compliance fees and expenses (Note 4) | | | 31,556 | |
| Transfer agent fees (Note 4) | | | 30,767 | |
| Postage and supplies | | | 17,640 | |
| Legal fees | | | 13,755 | |
| Trustees’ fees and expenses (Note 4) | | | 9,835 | |
| Audit and tax services fees | | | 8,250 | |
| Shareholder reporting expenses | | | 5,245 | |
| Insurance expense | | | 2,935 | |
| Other expenses | | | 8,409 | |
| Total expenses | | | 3,343,367 | |
| Less fee reductions by the Adviser (Note 4) | | | (335,304 | ) |
| Net expenses | | | 3,008,063 | |
| | | | | |
| NET INVESTMENT INCOME | | | 1,829,769 | |
| | | | | |
| REALIZED AND UNREALIZED GAINS ON INVESTMENTS | | | | |
| Net realized gains from investment transactions | | | 4,971,439 | |
| Net change in unrealized appreciation (depreciation) on investments | | | 100,079,605 | |
| NET REALIZED AND UNREALIZED GAINS ON INVESTMENTS | | | 105,051,044 | |
| | | | | |
| NET INCREASE IN NET ASSETS RESULTING FROM OPERATIONS | | $ | 106,880,813 | |
See accompanying notes to financial statements.
| MARSHFIELD CONCENTRATED OPPORTUNITY FUND |
| STATEMENTS OF CHANGES IN NET ASSETS |
| | | Six Months | | | | |
| | | Ended | | | Year | |
| | | February 29, | | | Ended | |
| | | 2024 | | | August 31, | |
| | | (Unaudited) | | | 2023 | |
| FROM OPERATIONS | | | | | | | | |
| Net investment income | | $ | 1,829,769 | | | $ | 2,528,395 | |
| Net realized gains from investment transactions ... | | | 4,971,439 | | | | 3,540 | |
| Net change in unrealized appreciation (depreciation) on investments | | | 100,079,605 | | | | 73,206,553 | |
| Net increase in net assets resulting from operations | | | 106,880,813 | | | | 75,738,488 | |
| | | | | | | | | |
| DISTRIBUTIONS TO SHAREHOLDERS (Note 2) | | | (2,918,097 | ) | | | (1,316,545 | ) |
| | | | | | | | | |
| CAPITAL SHARE TRANSACTIONS | | | | | | | | |
| Proceeds from shares sold | | | 174,080,949 | | | | 210,124,396 | |
| Net asset value of shares issued in reinvestment of distributions to shareholders | | | 2,835,203 | | | | 1,285,302 | |
| Proceeds from redemption fees collected (Note 2) | | | 80,192 | | | | 167,152 | |
| Payments for shares redeemed | | | (51,546,272 | ) | | | (64,534,655 | ) |
| Net increase in net assets from capital share transactions | | | 125,450,072 | | | | 147,042,195 | |
| | | | | | | | | |
| TOTAL INCREASE IN NET ASSETS | | | 229,412,788 | | | | 221,464,138 | |
| | | | | | | | | |
| NET ASSETS | | | | | | | | |
| Beginning of period | | | 533,040,544 | | | | 311,576,406 | |
| End of period | | $ | 762,453,332 | | | $ | 533,040,544 | |
| | | | | | | | | |
| CAPITAL SHARES ACTIVITY | | | | | | | | |
| Shares sold | | | 6,262,756 | | | | 8,504,444 | |
| Shares reinvested | | | 101,802 | | | | 53,733 | |
| Shares redeemed | | | (1,866,731 | ) | | | (2,627,359 | ) |
| Net increase in shares outstanding | | | 4,497,827 | | | | 5,930,818 | |
| Shares outstanding at beginning of period | | | 20,270,679 | | | | 14,339,861 | |
| Shares outstanding at end of period | | | 24,768,506 | | | | 20,270,679 | |
See accompanying notes to financial statements.
| MARSHFIELD CONCENTRATED OPPORTUNITY FUND |
| FINANCIAL HIGHLIGHTS |
Per Share Data for a Share Outstanding Throughout Each Period
| | | Six Months | | | | | | | | | | | | | | | | |
| | | Ended | | | Year | | | Year | | | Year | | | Year | | | Year | |
| | | February 29, | | | Ended | | | Ended | | | Ended | | | Ended | | | Ended | |
| | | 2024 | | | August 31, | | | August 31, | | | August 31, | | | August 31, | | | August 31, | |
| | | (Unaudited) | | | 2023 | | | 2022 | | | 2021 | | | 2020 | | | 2019 | |
| Net asset value at beginning of period | | $ | 26.30 | | | $ | 21.73 | | | $ | 23.76 | | | $ | 20.10 | | | $ | 17.65 | | | $ | 15.37 | |
| Income (loss) from investment operations: | | | | | | | | | | | | | | | | | | | | | | | | |
| Net investment income (loss) | | | 0.07 | | | | 0.13 | | | | (0.01 | ) | | | (0.06 | ) | | | (0.02 | ) | | | 0.02 | |
| Net realized and unrealized gains (losses) on investments | | | 4.54 | | | | 4.51 | | | | (0.46 | ) | | | 4.27 | | | | 2.72 | | | | 2.53 | |
| Total from investment operations | | | 4.61 | | | | 4.64 | | | | (0.47 | ) | | | 4.21 | | | | 2.70 | | | | 2.55 | |
| Less distributions from: | | | | | | | | | | | | | | | | | | | | | | | | |
| Net investment income | | | (0.13 | ) | | | (0.03 | ) | | | — | | | | — | | | | (0.02 | ) | | | (0.00 | ) (a) |
| Net realized gains | | | — | | | | (0.05 | ) | | | (1.56 | ) | | | (0.56 | ) | | | (0.24 | ) | | | (0.27 | ) |
| Total distributions | | | (0.13 | ) | | | (0.08 | ) | | | (1.56 | ) | | | (0.56 | ) | | | (0.26 | ) | | | (0.27 | ) |
| Proceeds from redemption fees collected (Note 2) | | | 0.00 | (a) | | | 0.01 | | | | 0.00 | (a) | | | 0.01 | | | | 0.01 | | | | 0.00 | (a) |
| Net asset value at end of period | | $ | 30.78 | | | $ | 26.30 | | | $ | 21.73 | | | $ | 23.76 | | | $ | 20.10 | | | $ | 17.65 | |
| Total return (b) | | | 17.58 | % (c) | | | 21.46 | % | | | (2.21 | %) | | | 21.44 | % | | | 15.47 | % | | | 17.12 | % |
| Net assets at end of period (000’s) | | $ | 762,453 | | | $ | 533,041 | | | $ | 311,576 | | | $ | 286,116 | | | $ | 202,381 | | | $ | 88,589 | |
| Ratios/supplementary data: | | | | | | | | | | | | | | | | | | | | | | | | |
| Ratio of total expenses to average net assets | | | 1.10 | % (d) | | | 1.11 | % | | | 1.14 | % | | | 1.15 | % | | | 1.23 | % | | | 1.48 | % |
| Ratio of net expenses to average net assets (e) | | | 0.99 | % (d) | | | 0.99 | % | | | 0.99 | % | | | 1.01 | % | | | 1.10 | % | | | 1.10 | % |
| Ratio of net investment income (loss) to average net assets (e) | | | 0.60 | % (d) | | | 0.61 | % | | | (0.04 | %) | | | (0.31 | %) | | | (0.10 | %) | | | 0.22 | % |
| Portfolio turnover rate | | | 7 | % (c) | | | 0 | % | | | 3 | % | | | 24 | % | | | 14 | % | | | 14 | % |
| (a) | Amount rounds to less than $0.01 per share. |
| (b) | Total return is a measure of the change in value of an investment in the Fund over the periods covered. The returns shown do not reflect the deduction of taxes a shareholders would pay on Fund distributions, if any, or the redemption of Fund shares. The total returns would be lower if the Adviser had not reduced management fees and/or reimbursed expenses (Note 4). |
| (e) | Ratio was determined after management fee reductions and/or expense reimbursements (Note 4). |
See accompanying notes to financial statements.
| MARSHFIELD CONCENTRATED OPPORTUNITY FUND |
| NOTES TO FINANCIAL STATEMENTS |
| February 29, 2024 (Unaudited) |
1. Organization
Marshfield Concentrated Opportunity Fund (the “Fund”) is a non-diversified series of Ultimus Managers Trust (the “Trust”), an open-end investment company established as an Ohio business trust under a Declaration of Trust dated February 28, 2012. Other series of the Trust are not incorporated in this report.
The investment objective of the Fund is to seek the dual goals of capital preservation and the long-term growth of principal, while targeting a pattern of performance at variance with that of the market.
2. Significant Accounting Policies
The Fund follows accounting and reporting guidance under Financial Accounting Standards Board Accounting Standards Codification Topic 946, “Financial Services – Investment Companies.” The following is a summary of the Fund’s significant accounting policies used in the preparation of its financial statements. These policies are in conformity with accounting principles generally accepted in the United States of America (“GAAP”).
Regulatory update – Tailored Shareholder Reports for Mutual Funds and Exchange-Traded Funds (“ETFs”) - Effective January 24, 2023, the Securities and Exchange Commission (the “SEC”) adopted rule and form amendments to require mutual funds and ETFs to transmit concise and visually engaging streamlined annual and semiannual reports to shareholders that highlight key information. Other information, including financial statements, will no longer appear in a streamlined shareholder report but must be available online, delivered free of charge upon request, and filed on a semiannual basis on Form N-CSR. The rule and form amendments have a compliance date of July 24, 2024. At this time, management is evaluating the impact of these amendments on the shareholder reports for the Fund.
Securities valuation – The Fund values its portfolio securities at fair value as of the close of regular trading on the New York Stock Exchange (the “NYSE”) (normally 4:00 p.m. Eastern time) on each business day the NYSE is open for business. The Fund values its listed securities, including common stocks, on the basis of the security’s last sale price on the security’s primary exchange, if available, otherwise at the exchange’s most recently quoted mean price. NASDAQ-listed securities are valued at the NASDAQ Official Closing Price. Investments representing shares of other registered open-end investment companies that are not listed on an exchange, including money market funds, are valued at their net asset value (“NAV”) as reported by such companies. When using a quoted price and when the market is considered active, the security will be classified as Level 1 within the fair value hierarchy (see below). Fixed income securities, if any, are generally valued using prices provided by an independent pricing service. The independent pricing service uses information with respect to transactions in bonds, quotations from bond dealers, market transactions in comparable securities, and various relationships
| MARSHFIELD CONCENTRATED OPPORTUNITY FUND |
| NOTES TO FINANCIAL STATEMENTS (Continued) |
between securities in determining these prices. In the event that market quotations are not readily available or are considered unreliable due to market or other events, the Fund values its securities and other assets at fair value as determined by Marshfield Associates, Inc. (the “Adviser”), as the Fund’s valuation designee, in accordance with procedures adopted by the Board of Trustees (the “Board”) pursuant to Rule 2a-5 under the Investment Company Act of 1940, as amended (the “1940 Act”). Under these procedures, the securities will be classified as Level 2 or 3 within the fair value hierarchy, depending on the inputs used. Unavailable or unreliable market quotes may be due to the following factors: a substantial bid-ask spread; infrequent sales resulting in stale prices; insufficient trading volume; small trade sizes; a temporary lapse in any reliable pricing source; and actions of the securities or futures markets, such as the suspension or limitation of trading. As a result, the prices of securities used to calculate the Fund’s NAV may differ from quoted or published prices for the same securities.
GAAP establishes a single authoritative definition of fair value, sets out a framework for measuring fair value, and requires additional disclosures about fair value measurements.
Various inputs are used in determining the value of the Fund’s investments. These inputs are summarized in the three broad levels listed below:
| ● | Level 1 – quoted prices in active markets for identical securities |
| ● | Level 2 – other significant observable inputs |
| ● | Level 3 – significant unobservable inputs |
Fixed income securities held by the Fund, if any, are classified as Level 2 since values are based on prices provided by an independent pricing service that utilizes various “other significant observable inputs” including bid and ask quotations, prices of similar securities, and interest rates, among other factors.
The inputs or methods used for valuing securities are not necessarily an indication of the risks associated with investing in those securities. The inputs used to measure fair value may fall into different levels of the fair value hierarchy. In such cases, for disclosure purposes, the level in the fair value hierarchy within which the fair value measurement falls in its entirety is determined based on the lowest level input that is significant to the fair value measurement.
The following is a summary of the Fund’s investments by the inputs used to value the investments as of February 29, 2024:
| | | Level 1 | | | Level 2 | | | Level 3 | | | Total | |
| Common Stocks | | $ | 654,334,251 | | | $ | — | | | $ | — | | | $ | 654,334,251 | |
| Money Market Funds | | | 106,128,247 | | | | — | | | | — | | | | 106,128,247 | |
| Total | | $ | 760,462,498 | | | $ | — | | | $ | — | | | $ | 760,462,498 | |
| | | | | | | | | | | | | | | | | |
| MARSHFIELD CONCENTRATED OPPORTUNITY FUND |
| NOTES TO FINANCIAL STATEMENTS (Continued) |
Refer to the Fund’s Schedule of Investments for a listing of the common stocks by sector and industry type. The Fund did not hold derivative instruments or any assets or liabilities that were measured at fair value on a recurring basis using significant unobservable inputs (Level 3) as of or during the six months ended February 29, 2024.
Share valuation – The NAV per share of the Fund is calculated daily by dividing the total value of the Fund’s assets, less liabilities, by the number of shares outstanding. The offering price and redemption price per share of the Fund is equal to the NAV, except that shares of the Fund are subject to a redemption fee of 2% if redeemed within 90 days of the date of purchase. During the periods ended February 29, 2024 and August 31, 2023, proceeds from the redemption fees, recorded in capital, totaled $80,192 and $167,152, respectively.
Investment income – Dividend income is recorded on the ex-dividend date. Non-cash dividends included in dividend income, if any, are recorded at the fair value of the security received. Interest income is accrued as earned.
Investment transactions – Investment transactions are accounted for on the trade date. Realized gains and losses on investments sold are determined on a specific identification basis.
Common expenses – Common expenses of the Trust are allocated among the Fund and the other series of the Trust based on the relative net assets of each series, the number of series in the Trust, or the nature of the services performed and the relative applicability to each series.
Distributions to shareholders – The Fund will distribute to shareholders any net investment income dividends and net realized capital gains distributions at least once each year. The amount of such dividends and distributions are determined in accordance with federal income tax regulations, which may differ from GAAP. Dividends and distributions are recorded on the ex-dividend date. The tax character of the Fund’s distributions paid to shareholders during the periods ended February 29, 2024 and August 31, 2023 was as follows:
| | | | | | Long-Term | | | | |
| Period | | Ordinary | | | Capital | | | Total | |
| Ended | | Income | | | Gains | | | Distributions | |
| 2/29/2024 | | $ | 2,918,097 | | | $ | — | | | $ | 2,918,097 | |
| 8/31/2023 | | $ | 533,709 | | | $ | 782,836 | | | $ | 1,316,545 | |
Estimates – The preparation of financial statements in conformity with GAAP requires management to make estimates and assumptions that affect the reported amounts of assets and liabilities and disclosure of contingent assets and liabilities
| MARSHFIELD CONCENTRATED OPPORTUNITY FUND |
| NOTES TO FINANCIAL STATEMENTS (Continued) |
as of the date of the financial statements and the reported amounts of increase (decrease) in net assets from operations during the reporting period. Actual results could differ from those estimates.
Federal income tax – The Fund has qualified and intends to continue to qualify as a regulated investment company under the Internal Revenue Code of 1986, as amended (the “Code”). Qualification generally will relieve the Fund of liability for federal income taxes to the extent 100% of its net investment income and net realized capital gains are distributed in accordance with the Code.
In order to avoid imposition of the excise tax applicable to regulated investment companies, it is also the Fund’s intention to declare as dividends in each calendar year at least 98% of its net investment income (earned during the calendar year) and 98.2% of its net realized capital gains (earned during the 12 months ended October 31) plus undistributed amounts from prior years.
The following information is computed on a tax basis for each item as of August 31, 2023:
| | | | | |
| Tax cost of investments | | $ | 415,985,051 | |
| Gross unrealized appreciation | | $ | 129,439,755 | |
| Gross unrealized depreciation | | | (7,486,912 | ) |
| Net unrealized appreciation | | | 121,952,843 | |
| Undistributed ordinary income | | | 1,998,226 | |
| Distributable earnings | | $ | 123,951,069 | |
| | | | | |
The federal tax cost, unrealized appreciation (depreciation) as of February 29, 2024 is as follows:
| | | | | |
| Tax cost of investments | | $ | 538,430,050 | |
| Gross unrealized appreciation | | $ | 222,365,414 | |
| Gross unrealized depreciation | | | (332,966 | ) |
| Net unrealized appreciation | | $ | 222,032,448 | |
| | | | | |
The values of the federal income tax cost of investments and the financial statement cost of investments may be temporarily different (“book/tax differences”). These book/tax differences are due to the timing of the recognition of capital gains or losses under income tax regulations and GAAP, primarily due to the tax deferral of losses on wash sales.
The Fund recognizes the tax benefits or expenses of uncertain tax positions only when the position is “more likely than not” to be sustained assuming examination by tax authorities. Management has reviewed the Fund’s tax positions for the current
| MARSHFIELD CONCENTRATED OPPORTUNITY FUND |
| NOTES TO FINANCIAL STATEMENTS (Continued) |
and all open tax years (generally, three years) and has concluded that no provision for unrecognized tax benefits or expenses is required in these financial statements. The Fund identifies its major tax jurisdiction as U.S. Federal.
The Fund recognizes interest and penalties, if any, related to unrecognized tax benefits as income tax on the Statement of Operations. During the six months ended February 29, 2024, the Fund did not incur any interest or penalties.
3. Investment Transactions
During the six months ended February 29, 2024, cost of purchases and proceeds from sales of investment securities, other than short-term investments, were $102,620,196 and $40,877,537, respectively.
4. Transactions with Related Parties
INVESTMENT ADVISORY AGREEMENT
The Fund’s investments are managed by the Adviser pursuant to the terms of an Investment Advisory Agreement. Under the Investment Advisory Agreement, the Fund pays the Adviser a management fee, computed and accrued daily and paid monthly, at the annual rate of 0.95% of its average daily net assets.
Pursuant to an Expense Limitation Agreement (“ELA”) between the Fund and the Adviser, the Adviser has contractually agreed, until January 1, 2025, to reduce its management fees and reimburse other expenses to limit total annual operating expenses (exclusive of brokerage costs; taxes; interest; borrowing costs such as interest and dividend expenses on securities sold short; costs to organize the Fund; acquired fund fees and expenses; extraordinary expenses such as litigation and merger or reorganization costs and other expenses not incurred in the ordinary course of the Fund’s business), to an amount not exceeding 0.99% of the Fund’s average daily net assets. Accordingly, during the six months ended February 29, 2024, the Adviser reduced its management fees by $335,304.
Under the terms of the ELA, investment advisory fee reductions and expense reimbursements by the Adviser are subject to repayment by the Fund for a period of 36 months after such fees and expenses were incurred, provided the repayments do not cause total annual operating expenses to exceed the lesser of: (i) the expense limitation then in effect, if any, and (ii) the expense limitation in effect at the time the expenses to be repaid were incurred. As of February 29, 2024, the Adviser may seek repayment of management fee reductions and expense reimbursements in the amount of $1,502,188 no later than the dates as stated below:
| August 31, 2024 | | $ | 211,993 | |
| August 31, 2025 | | | 442,622 | |
| August 31, 2026 | | | 512,269 | |
| February 28, 2027 | | | 335,304 | |
| Total | | $ | 1,502,188 | |
| | | | | |
| MARSHFIELD CONCENTRATED OPPORTUNITY FUND |
| NOTES TO FINANCIAL STATEMENTS (Continued) |
OTHER SERVICE PROVIDERS
Ultimus Fund Solutions, LLC (“Ultimus”) provides administration, fund accounting, and transfer agency services to the Fund. The Fund pays Ultimus fees in accordance with the agreements for such services. In addition, the Fund pays out-of-pocket expenses including, but not limited to, postage, supplies, and certain costs related to the pricing of the Fund’s portfolio securities.
Under the terms of a Consulting Agreement with the Trust, Northern Lights Compliance Services, LLC (“NLCS”) provides an Anti-Money Laundering Officer to the Trust, as well as related compliance services. Under the terms of the agreement, NLCS receives fees from the Fund. NLCS is a wholly-owned subsidiary of Ultimus.
Under the terms of a Distribution Agreement with the Trust, Ultimus Fund Distributors, LLC (the “Distributor”) serves as principal underwriter to the Fund. The Distributor is a wholly -owned subsidiary of Ultimus. The Distributor is compensated by the Adviser (not the Fund) for acting as principal underwriter.
Certain officers of the Trust are also officers of Ultimus and are not paid by the Trust or the Fund for serving in such capacities.
TRUSTEE COMPENSATION
Each member of the Board (a “Trustee”) who is not an “interested person” (as defined by the 1940 Act, as amended) of the Trust (“Independent Trustee”) receives an annual retainer and meeting fees, plus reimbursement for travel and other meeting-related expenses.
PRINCIPAL HOLDER OF FUND SHARES
As of February 29, 2024, the following shareholder owned of record 25% or more of the outstanding shares of the Fund:
| Name of Record Owner | | % Ownership |
| RBC Capital Markets, LLC (for the benefit of its customers) | | 53% |
A beneficial owner of 25% or more of the Fund’s outstanding shares may be considered a controlling person. That shareholder’s vote could have a more significant effect on matters presented at a shareholders’ meeting.
5. Contingencies and Commitments
The Fund indemnifies the Trust’s officers and Trustees for certain liabilities that might arise from their performance of their duties to the Fund. Additionally, in the normal course of business the Fund enters into contracts that contain a variety of representations and warranties and which provide general indemnifications. The
| MARSHFIELD CONCENTRATED OPPORTUNITY FUND |
| NOTES TO FINANCIAL STATEMENTS (Continued) |
Fund’s maximum exposure under these arrangements is unknown, as this would involve future claims that may be made against the Fund that have not yet occurred. However, based on experience, the Fund expects the risk of loss to be remote.
6. Non-Diversification Risk
The Fund is a “non-diversified fund,” which means that it may invest more of its assets in the securities of a single issuer or a small number of issuers than a diversified fund. Non-diversification increases the risk that the Fund’s share price could decrease to a larger extent than a Fund that is diversified because of the poor performance of a single investment.
7. Sector Risk
If a Fund has significant investments in the securities of issuers in industries within a particular business sector, any development generally affecting that sector will have a greater impact on the value of the net assets of the Fund than would be the case if the Fund did not have significant investments in that sector. This may increase the risk of loss of an investment in a Fund and increase the volatility of a Fund’s NAV per share. From time to time, circumstances may affect a particular sector and the companies within such sector. For instance, economic or market factors, regulation or deregulation, and technological or other developments, may negatively impact all companies in a particular sector and therefore the value of a Fund’s portfolio could be adversely affected if it has significant holdings of securities of issuers in that sector. As of February 29, 2024, the Fund had 30.1% of the value of its net assets invested in stocks in the Retail Trade sector and 27.2% of the value of its net assets invested in stocks in the Finance and Insurance sector.
8. Subsequent Event
The Fund is required to recognize in the financial statements the effects of all subsequent events that provide additional evidence about conditions that existed as of the date of the Statement of Assets and Liabilities. For non-recognized subsequent events that must be disclosed to keep the financial statements from being misleading, the Fund is required to disclose the nature of the event as well as an estimate of its financial effect, or a statement that such an estimate cannot be made. Management has evaluated subsequent events through the issuance of these financial statements and has noted no such events.
| MARSHFIELD CONCENTRATED OPPORTUNITY FUND |
| ABOUT YOUR FUND’S EXPENSES (Unaudited) |
We believe it is important for you to understand the impact of costs on your investment. As a shareholder of the Fund, you incur two types of cost: (1) transaction costs, including redemption fees; and (2) ongoing costs, including management fees and other operating expenses. The following examples are intended to help you understand your ongoing costs (in dollars) of investing in the Fund and to compare these costs with the ongoing costs of investing in other mutual funds.
A mutual fund’s ongoing costs are expressed as a percentage of its average net assets. This figure is known as the expense ratio. The expenses in the table below are based on an investment of $1,000 made at the beginning of the most recent period (September 1, 2023) and held until the end of the period (February 29, 2024).
The table below illustrates the Fund’s ongoing costs in two ways:
Actual fund return – This section helps you to estimate the actual expenses that you paid over the period. The “Ending Account Value” shown is derived from the Fund’s actual return, and the fourth column shows the dollar amount of operating expenses that would have been paid by an investor who started with $1,000 in the Fund. You may use the information here, together with the amount you invested, to estimate the expenses that you paid over the period.
To do so, simply divide your account value by $1,000 (for example, an $8,600 account value divided by $1,000 = 8.6), then multiply the result by the number given for the Fund under the heading “Expenses Paid During Period.”
Hypothetical 5% return – This section is intended to help you compare the Fund’s ongoing costs with those of other mutual funds. It assumes that the Fund had an annual return of 5% before expenses during the period shown, but that the expense ratio is unchanged. In this case, because the return used is not the Fund’s actual return, the results do not apply to your investment. The example is useful in making comparisons because the U.S. Securities and Exchange Commission (“SEC”) requires all mutual funds to calculate expenses based on a 5% return. You can assess the Fund’s ongoing costs by comparing this hypothetical example with the hypothetical examples that appear in shareholder reports of other funds.
Note that expenses shown in the table are meant to highlight and help you compare ongoing costs only. The Fund does not charge sales loads. However, a redemption fee of 2% is applied on the sale of shares held for less than 90 days.
The calculations assume no shares were bought or sold during the period. Your actual costs may have been higher or lower, depending on the amount of your investment and the timing of any purchases or redemptions.
More information about the Fund’s expenses can be found in this report. For additional information on operating expenses and other shareholder costs, please refer to the Fund’s prospectus.
| MARSHFIELD CONCENTRATED OPPORTUNITY FUND |
| ABOUT YOUR FUND’S EXPENSES (Unaudited) (Continued) |
| | | Beginning | | Ending | | | | |
| | | Account Value | | Account Value | | Net | | Expenses |
| | | September 1, | | February 29, | | Expense | | Paid During |
| | | 2023 | | 2024 | | Ratio (a) | | Period (b) |
| Based on Actual Fund Return | | $1,000.00 | | $1,175.80 | | 0.99% | | $5.36 |
| Based on Hypothetical 5% Return (before expenses) | | $1,000.00 | | $1,019.94 | | 0.99% | | $4.97 |
| (a) | Annualized, based on the Fund’s most recent one-half year expenses. |
| (b) | Expenses are equal to the Fund’s annualized net expense ratio multiplied by the average account value over the period, multiplied by 182/366 (to reflect the one-half year period). |
| OTHER INFORMATION (Unaudited) |
A description of the policies and procedures that the Fund uses to vote proxies relating to portfolio securities is available without charge upon request by calling toll-free 1-855-691-5288, or on the SEC’s website at www.sec.gov. Information regarding how the Fund voted proxies relating to portfolio securities during the most recent 12-month period ended June 30 is available without charge upon request by calling toll-free 1-855-691-5288, or on the SEC’s website at www.sec.gov.
The Trust files a complete listing of portfolio holdings for the Fund with the SEC as of the end of the first and third quarters of each fiscal year as an exhibit to its reports on Form N-PORT. These filings are available upon request by calling 1-855-691-5288. Furthermore, you may obtain a copy of the filings on the SEC’s website at www.sec.gov. and on the Fund’s website www.marshfieldfunds.com.
| MARSHFIELD CONCENTRATED OPPORTUNITY FUND |
| DISCLOSURE REGARDING APPROVAL OF INVESTMENT ADVISORY |
| AGREEMENT (Unaudited) |
The Board of Trustees (the “Board”), including the Independent Trustees voting separately, has reviewed and approved the continuance of the Marshfield Concentrated Opportunity Fund’s (the “Fund”) Investment Advisory Agreement with Marshfield Associates, Inc. (the “Adviser” or “Marshfield”) for an additional one-year term. The Board approved the continuance of the Investment Advisory Agreement at a meeting held on October 16-17, 2023 (the “Meeting”), at which all of the Trustees were present.
Prior to the Meeting, Marshfield provided a response to a letter sent by the counsel to the Independent Trustees, on their behalf, requesting various information relevant to the Independent Trustees’ consideration of the renewal of the Investment Advisory Agreement with respect to the Fund. In approving the continuance of the Investment Advisory Agreement, the Independent Trustees considered all information they deemed reasonably necessary to evaluate the terms of the Agreement. The principal areas of review by the Independent Trustees were (1) the nature, extent and quality of the services provided by Marshfield, (2) the investment performance of the Fund, (3) the costs of the services provided and profits realized by Marshfield from Marshfield’s relationship with the Fund, (4) the financial condition of Marshfield, (5) the fall out benefits derived by Marshfield and its affiliates from their relationships with the Fund and (6) the extent to which economies of scale would be realized as the Fund grows and whether advisory fee levels reflect those economies of scale for the benefit of the Fund’s shareholders. The Independent Trustees’ evaluation of the quality of Marshfield’s services also took into consideration their knowledge gained through presentations and reports from Marshfield over the course of the preceding year. The Independent Trustees’ analysis of these factors is set forth below.
Nature, Extent and Quality of Services
The Board evaluated the level and depth of knowledge of Marshfield, including the professional experience and qualifications of senior personnel. In evaluating the quality of services provided by Marshfield, the Board took into account its familiarity with Marshfield’s senior management through Board meetings, discussions and reports during the preceding year. The Board also took into account Marshfield’s compliance policies and procedures based on discussion with Marshfield and the CCO. The quality of administrative and other services, including Marshfield’s role in coordinating the activities of the Fund’s other service providers, was also considered. The Board also considered Marshfield’s relationship with its affiliates and the resources available to them, as well as any potential conflicts of interest. The Board discussed the nature and extent of the services provided by Marshfield including, without limitation, Marshfield’s provision of a continuous investment program for the Fund. The Board considered the qualifications and experience of Marshfield’s portfolio managers who are responsible for the day-to day management of the Fund’s portfolio, as well as the qualifications of other individuals at Marshfield who provide services to the Fund. The Board also considered Marshfield’s
| MARSHFIELD CONCENTRATED OPPORTUNITY FUND |
| DISCLOSURE REGARDING APPROVAL OF INVESTMENT ADVISORY |
| AGREEMENT (Unaudited) (Continued) |
succession planning for the portfolio managers of the Fund. The Board concluded that it was satisfied with the nature, extent and quality of services provided to the Fund by Marshfield under the Investment Advisory Agreement.
Advisory Fees and Expenses and Comparative Accounts
The Board compared the advisory fee and total expense ratio for the Fund with various comparative data. In particular, the Board compared the Fund’s advisory fee and overall expense ratio to the median advisory fees and expense ratios for its custom peer group provided by Broadridge and fees charged to Marshfield’s other client accounts. In reviewing the comparison in fees and expense ratios between the Fund and comparable funds, the Board also considered the differences in types of funds being compared, the styles of investment management, the size of the Fund relative to the comparable funds, and the nature of the investment strategies. The Board also considered Marshfield’s commitment to limit the Fund’s expenses under the Expense Limitation Agreement (the “ELA”) until at least January 1, 2025. The Board noted that the 0.95% advisory fee for the Fund was higher than the median and average for the other funds in its Broadridge custom peer group. The Board further noted that the overall net expense ratio for the Fund of 0.99% was lower than the median expense ratio and only one basis point higher than the average expense ratio for the other funds in the Fund’s custom peer group.
The Board also compared the fees paid by the Fund to the fees paid by other clients of Marshfield and considered the similarities and differences in services received by such other clients as compared to the services received by the Fund. The Board noted that the fee structure of the Fund differed from the fees applicable to Marshfield’s other clients due in large part to the additional regulatory and compliance requirements of managing an investment company registered under the 1940 Act as compared to separately managed accounts.
Fund Performance
The Board also considered, among other data, the Fund’s performance results during certain periods ended July 31, 2023, and noted that the Board reviews on a quarterly basis detailed information about the Fund’s performance results, portfolio composition and investment strategies. The Board noted that the Fund had outperformed its peers for the one-, three- and five-year periods. The Board further noted that the Fund’s performance was comparable to other accounts managed by Marshfield over all periods. The Board also took into account current market conditions and their effect on the Fund’s performance as described by Marshfield.
Economies of Scale
The Board also considered the effect of the Fund’s growth and size on its performance and expenses. The Board noted that Marshfield limited fees and/or reimbursed expenses for the Fund in order to reduce the Fund’s operating expenses to targeted levels. The Board considered the effective advisory fee under the
| MARSHFIELD CONCENTRATED OPPORTUNITY FUND |
| DISCLOSURE REGARDING APPROVAL OF INVESTMENT ADVISORY |
| AGREEMENT (Unaudited) (Continued) |
Investment Advisory Agreement as a percentage of assets at different asset levels and possible economies of scale that might be realized if the assets of the Fund increased. The Board noted that the advisory fee schedule for the Fund currently did not have breakpoints, and considered Marshfield’s assertion that adding breakpoints was not appropriate at this time. The Board noted that if the Fund’s assets increase over time, the Fund might realize other economies of scale if assets increase proportionally more than certain other expenses.
Financial Condition of the Adviser and Adviser Profitability
Additionally, the Board took into consideration the financial condition and profitability of Marshfield and the direct and indirect benefits derived by Marshfield and its affiliates from their relationship with the Fund. The information considered by the Board included operating profit margin information for Marshfield’s business as a whole. The Board considered Marshfield’s commitment to contractually limit the Fund’s net operating expenses. The Board reviewed the profitability of Marshfield’s relationship with the Fund both before and after tax expenses, and also considered whether Marshfield has the financial wherewithal to continue to provide services to the Fund, noting its ongoing commitment to provide support and resources to the Fund as needed.
Fall-Out Benefits
The Board also noted that Marshfield derives benefits to its reputation and other benefits from its association with the Fund. The Board recognized that Marshfield should be entitled to earn a reasonable level of profits in exchange for the level of services it provides to the Fund and the entrepreneurial risk that it assumes as investment adviser. Based upon its review, the Board concluded that Marshfield’s level of profitability, if any, from its relationship with the Fund was reasonable and not excessive.
In considering the renewal of the Investment Advisory Agreement, the Board, including the Independent Trustees, did not identify any single factor as controlling, and each Trustee may have attributed different weights to the various factors. The Trustees evaluated all information available to them. The Board concluded the following: (a) Marshfield demonstrated that it possesses the capability and resources to perform the duties required of it under the Investment Advisory Agreement; (b) Marshfield maintains an appropriate compliance program; (c) the overall performance of the Fund is satisfactory relative to the performance of funds with similar investment objectives and relevant indices; and (d) the Fund’s advisory fees are reasonable in light of the services received by the Fund from Marshfield and the other factors considered. Based on their conclusions, the Trustees determined with respect to the Fund that continuation of the Investment Advisory Agreement was in the best interests of the Fund and its shareholders.
| MARSHFIELD CONCENTRATED OPPORTUNITY FUND |
| LIQUIDITY RISK MANAGEMENT PROGRAM (Unaudited) |
The Fund has adopted and implemented a written liquidity risk management program (the “Program”) as required by Rule 22e-4 (the “Liquidity Rule”) under the Investment Company Act of 1940, as amended. The Program is reasonably designed to assess and manage the Fund’s liquidity risk, taking into consideration, among other factors, the Fund’s investment strategy and the liquidity of its portfolio investments during normal and reasonably foreseeable stressed conditions; its short- and long-term cash flow projections; and its cash holdings and access to other funding sources. The Fund’s Board of Trustees (the “Board”) approved the appointment of the Liquidity Administrator Committee, comprising of the Fund’s Adviser and certain Trust officers, to be responsible for the Program’s administration and oversight and for reporting to the Board on at least an annual basis regarding the Program’s operation and effectiveness. The annual written report assessing the Program (the “Report”) was presented to the Board at the October 16-17, 2023 Board meeting and covered the period from June 1, 2022 to May 31, 2023 (the “Review Period”).
During the Review Period, the Fund did not experience unusual stress or disruption to its operations related to purchase and redemption activity. Also, during the Review Period, the Fund held adequate levels of cash and highly liquid investments to meet shareholder redemption activities in accordance with applicable requirements. The Report concluded that the Program is reasonably designed to prevent violation of the Liquidity Rule and the Program has been effectively implemented.
CUSTOMER PRIVACY NOTICE |
| FACTS | WHAT DOES THE MARSHFIELD CONCENTRATED OPPORTUNITY FUND (the “Fund”) DO WITH YOUR PERSONAL INFORMATION? |
| |
| Why? | Financial companies choose how they share your personal information. Federal law gives consumers the right to limit some but not all sharing. Federal law also requires us to tell you how we collect, share, and protect your personal information. Please read this notice carefully to understand what we do. |
| | |
| What? | The types of personal information we collect and share depend on the product or service you have with us. This information can include: ■ Social Security number ■ Assets ■ Retirement Assets ■ Transaction History ■ Checking Account Information ■ Purchase History ■ Account Balances ■ Account Transactions ■ Wire Transfer Instructions When you are no longer our customer, we continue to share your information as described in this notice. |
| | |
| How? | All financial companies need to share your personal information to run their everyday business. In the section below, we list the reasons financial companies can share their customers’ personal information; the reasons the Fund chooses to share; and whether you can limit this sharing. |
Reasons we can share your personal
information | Does the Fund share? | Can you limit this sharing? |
| For our everyday business purposes – Such as to process your transactions, maintain your account(s), respond to court orders and legal investigations, or report to credit bureaus | Yes | No |
| For our marketing purposes – to offer our products and services to you | No | We don’t share |
| For joint marketing with other financial companies | No | We don’t share |
| For our affiliates’ everyday business purposes – information about your transactions and experiences | No | We don’t share |
| For our affiliates’ everyday business purposes – information about your creditworthiness | No | We don’t share |
| For nonaffiliates to market to you | No | We don’t share |
| Questions? | Call 1-855-691-5288 |
| Who we are |
| Who is providing this notice? | Marshfield Concentrated Opportunity Fund Ultimus Fund Distributors, LLC (Distributor) Ultimus Fund Solutions, LLC (Administrator) |
| What we do |
| How does the Fund protect my personal information? | To protect your personal information from unauthorized access and use, we use security measures that comply with federal law. These measures include computer safeguards and secured files and buildings. Our service providers are held accountable for adhering to strict policies and procedures to prevent any misuse of your nonpublic personal information. |
| How does the Fund collect my personal information? | We collect your personal information, for example, when you ■ Open an account ■ Provide account information ■ Give us your contact information ■ Make deposits or withdrawals from your account ■ Make a wire transfer ■ Tell us where to send the money ■ Tell us who receives the money ■ Show your government-issued ID ■ Show your driver’s license We also collect your personal information from other companies. |
| Why can’t I limit all sharing? | Federal law gives you the right to limit only ■ Sharing for affiliates’ everyday business purposes – information about your creditworthiness ■ Affiliates from using your information to market to you ■ Sharing for nonaffiliates to market to you State laws and individual companies may give you additional rights to limit sharing. |
| Definitions |
| Affiliates | Companies related by common ownership or control. They can be financial and nonfinancial companies. ■ Marshfield Associates, Inc., the investment adviser to the Fund, could be deemed to be an affiliate. |
| Nonaffiliates | Companies not related by common ownership or control. They can be financial and nonfinancial companies ■ The Fund does not share with nonaffiliates so they can market to you. |
| Joint marketing | A formal agreement between nonaffiliated financial companies that together market financial products or services to you. ■ The Fund does not jointly market. |
Marshfield-SAR-24
MEEHAN FOCUS FUND
SEMI-ANNUAL REPORT
February 29, 2024
(Unaudited)
| This report is for the information of the shareholders of Meehan Focus Fund. Its use in connection with any offering of the Fund’s shares is authorized only in a case of concurrent or prior delivery of the Fund’s current prospectus. Investors should refer to the Fund’s prospectus for a description of risk factors associated with investments in the Fund. |
| Meehan Focus Fund | Distributor: |
| A Series of Ultimus Managers Trust | Ultimus Fund Distributors, LLC |
| 7250 Woodmont Avenue, Suite 315 | 225 Pictoria Drive, Suite 450 |
| Bethesda, MD 20814 | Cincinnati, OH 45246 |
| (866) 884-5968 | (800) 933-8413 |
| MEEHAN FOCUS FUND | |
| LETTER TO SHAREHOLDERS (Unaudited) | March 27, 2024 |
Dear Fellow Shareholders,1
The Meehan Focus Fund (“the Fund”) gained 17.54% through the first six months of its 2024 fiscal year2; the Fund’s net asset value (“NAV”) per share on February 29, 2024 was an all-time high of $52.16. The Fund’s performance over the past six months ended February 29, 2024 exceeded both the S&P 500 Total Return Index and the S&P 500 Value Index. The Fund has outperformed its benchmarks over the past three-year, five-year, and since inception periods ended February 29, 2024.
We are proud to note that the Fund recently received the 2024 LSEG Lipper Fund Award in the Large Cap Core 5-Year Performance category. The Fund was ranked number 1 of 156 funds in the Large Cap Core category for the five-year period ending November 30, 2023, based on risk-adjusted returns.3 The Fund’s 2023 calendar-year return was 35.5%.
The Fund’s 2024 fiscal year got off to a rocky start as a modest market decline in September accelerated in October, reaching a low on October 27. This decline in stock prices coincided with an unexpectedly steep rise in bond yields, which saw the yield on the 10-year Treasury soar from just over 4% at the end of August, to nearly 5% at its peak on October 19.
October’s sharp stock market decline was followed by an even sharper rally that continued through February. The rally was sparked by declining interest rates and a return to corporate earnings growth and sustained by encouraging words from the Federal Reserve (Fed) regarding interest rate policy, among other positives.
S&P 500 earnings have now notched two consecutive quarters of growth, rising 4.8% and 4.0%, respectively, in 2023’s third and fourth quarters, reversing a streak of three consecutive declines. Analysts currently forecast earnings growth of 3.3% in 2024’s first quarter and 11.0% for all of 2024.
| 1 | The views expressed herein are not meant as investment advice. Although some of the described portfolio holdings were viewed favorably as of the date of this letter, there is no guarantee that the Fund will continue to hold these securities in the future. Please consider the investment objectives, risks, charges, and expenses of the Fund before investing. Contact the Fund at (866) 884-5968 for a copy of the Fund’s prospectus, which contains this and other important information about the Fund. Read the prospectus carefully before investing. |
| 2 | Past performance does not guarantee future results. Performance data quoted above represents past performance, and the investment return and principal value of an investment will fluctuate so that an investor’s shares, when redeemed, may be worth more or less than their original cost. Current performance may be lower or higher than the performance data quoted. To obtain more current performance information, please call (866) 884-5968. |
| 3 | The LSEG Lipper Fund Awards, granted annually, highlight funds and fund companies that have excelled in delivering consistently strong risk-adjusted performance relative to their peers. The LSEG Lipper Fund Awards are based on the Lipper Leader for Consistent Return rating, which is a risk-adjusted performance measure calculated over 36, 60, and 120 months. The fund with the highest Lipper Leader for Consistent Return (Effective Return) value in each eligible classification wins the LSEG Lipper Fund Award. For more information, see lipperfundawards.com. Although LSEG Lipper makes reasonable efforts to ensure the accuracy and reliability of the data contained herein, the accuracy is not guaranteed by LSEG Lipper. |
A growing economy and strong job market underpin the stock market. The U.S. economy closed out a solid 2023 with annualized fourth quarter Growth Domestic Product (GDP) growth of 3.2%, and current projections from the Atlanta Fed’s GDPNow model estimate first quarter 2024 GDP will rise at a 2.1% annualized rate. Job growth remains robust, averaging more than 230,000 new jobs per month over the past six months, and unemployment has now been below 4% for 25 straight months. Strength in the services sector of the economy, which has now expanded for 14 consecutive months, continues to more than offset softness in manufacturing.
Investors remain focused on the Fed’s monetary policy and commentary. Despite stronger than expected inflation readings in January and February, the Fed again held rates steady in March and reaffirmed its December forecast of three rate cuts in 2024. The Fed’s interest rate decision and forecasts, combined with Chairman Powell’s characterization of financial conditions as “tight” and recent inflation readings as “bumps,” were welcomed by investors as further confirmation that interest rate cuts are on the way, likely in late spring or early summer.
Stock markets climbed higher around the world in February, as Japan and Europe also hit new all-time highs. Economically, however, the United States remains a bright spot. The outlook elsewhere remains challenging, with Japan and Europe either in, or narrowly escaping recession and China struggling under the weight of an ongoing real estate crisis and consumer gloom.
Outlook
We view the S&P 500 as fairly valued at a forward price-to-earnings ratio of 20.6, modestly higher than its 5-year average of 18.8. Looking forward, our outlook for stocks and the economy for the remainder of 2024 remains cautiously optimistic. We believe that if the economy and corporate earnings maintain their current growth trajectories, the stage will be set for stocks to extend their gains this year.
There are risks to our outlook, including the potential for ongoing wars in Ukraine and the Middle East and geopolitical tensions with China to metastasize into broader conflicts. Closer to home, the chance that Fed interest rate cuts are postponed or do not satisfy market expectations, gridlock on Capitol Hill, and the 2024 election cycle also have the potential to disrupt the markets.
Portfolio Review
The accompanying Schedule of Investments identifies the Fund’s investments and their market value as of February 29, 2024. Over the past six months, long-term holdings United Rentals, Microsoft and Broadcom made the largest positive contributions to the Fund’s performance. These positive contributions were partially offset by weaker results from Apple, Deere and Bristol-Myers Squib.
United Rentals
United Rentals’ stock gained 46.1% over the past six months ended February 29, 2024, lifted by stronger-than-anticipated demand for construction equipment, as the Fed-induced recession that many anticipated in 2022 did not materialize. The company reported record full-year revenue of $14.3 billion in its fiscal year ended December 31, 2023, and record
adjusted earnings per share of $40.74, representing year-over-year increases of 23.1% and 25.4%, respectively. In addition, management released an enhanced capital allocation strategy with the aim of further deleveraging its balance sheet to maintain stable growth, financial flexibility, and increase shareholder value. At fiscal year-end, the company’s net leverage ratio was 1.6x, in line with its new target. United Rentals sees continued opportunity as it capitalizes on the multi-year tailwinds across energy and power, infrastructure, and manufacturing.
Microsoft Corp
Microsoft shares gained 26.7% over the past six months ended February 29, 2024, boosted by continued strength across its businesses. The company posted record revenue of $118.5 billion for the six months ended December 31, 2023, an increase of 15.3% from the same period a year prior. It reported adjusted earnings per share of $5.92 in the same period, representing 26.8% year-over-year growth. In addition to solid earnings, November 1 marked the release of Microsoft 365 Copilot, an AI assistant for Microsoft 365 applications, available to enterprise customers for $30/month per user as the company introduced the first product aimed at monetizing its AI technology. Microsoft has been more successful with the rollout of its AI products than key competitors, in part due to its strategic partnership with OpenAI and the integration of its ChatGPT technology into Microsoft’s Bing and 365 Copilot.
Broadcom
Broadcom designs, develops, and supplies semiconductors that are key inputs for wireless companies and companies developing AI and related products. Broadcom’s shares rose 42.0% over the six months ending February 29, 2024, powered by increasing profit margins and growth potential fueled by its AI semiconductor business. For the six months ended January 31, 2024, Broadcom reported revenue of $21.3 billion, a 19.4% increase from the prior-year period, and adjusted earnings per share rose to $22.05, up 6% over the same period. We believe Broadcom has multiple attractive growth avenues to pursue, and the acquisition of cloud infrastructure and business mobility software company VMWare, completed in November 2023, should provide a further boost to profit margins.
Apple, Inc.
Apple’s shares declined 3.7% over the past six months ended February 29, 2024, as it has struggled to grow revenue in recent quarters. Apple posted mixed results for its fiscal year ended September 30, 2023, as adjusted earnings per share grew 0.3% to $6.13 while revenue declined 3% to $383.3 billion year-over-year. Its fiscal first quarter ended December 30, 2023, and showed improvement with year-over-year revenue and adjusted earnings per shares growth of 2% and 16%, respectively. Bright spots included record services revenue of $23.1 billion that buoyed its revenue and lifted gross margins from 43% to 46%. Economic difficulties in China, where sales declined 13% in the most recent quarter, partially offset positive results in other businesses. Notwithstanding recent adversity, Apple has shown it can continue to generate margin growth by shifting its sales mix to more profitable revenue streams. Although Apple is just entering the AI arena, it remains highly profitable and generates significant free cash flow. With the release of its new Apple Vision Pro headset and its installed base of active devices reaching a new record of 2.2 billion, Apple’s ecosystem continues to offer growth opportunities.
Deere & Company
Deere’s shares fell 10.2% over the past six months ended February 29, 2024, on worries of a slowdown in farmer spending on new machinery and equipment. Deere reported outstanding results for its fiscal year ended October 29, 2023, including a 49% year-over-year rise in adjusted earnings per share to $34.69, and a 17.3% jump in revenue to $61.2 billion. The quarter ended January 31, 2024, however, revealed signs of a slowdown impacting the entire agricultural sector as revenue and adjusted earnings dipped 4% and 5%, respectively, from the year-ago period. Deere’s brand strength and extensive dealer network reinforce its position as the leading manufacturer of agricultural equipment, and we view its current issues as short term. The company continues to invest and incorporate innovative technologies into their equipment that enhance farmer productivity and we believe will set the stage for long-term growth.
Bristol-Myers Squibb
Shares of long-term Fund holding Bristol-Myers Squibb fell 17.8% over the past six months ended February 29, 2024, as the company tried to offset impending patent losses with new drug launches; we sold the Fund’s position in December 2023 at a modest loss.
We made several changes to the Fund’s portfolio over the past six months. In addition to Bristol-Myers Squibb, we also sold the Fund’s positions in Malibu Boats, Citigroup, and Sandoz Group, realizing a modest loss on Malibu and modest gains on Citigroup and Sandoz Group. We added one new holding to the Fund’s portfolio, Nvidia, and added to existing positions in Thermo-Fisher Scientific, Deere, Williams-Sonoma, Shell, Johnson Controls, and Charles Schwab.
Conclusion
We appreciate your confidence in our management of the Fund and look forward to continued success. You can check the Fund’s NAV online at any time by typing in the Fund’s ticker symbol (MEFOX) into most stock quotation services. Please do not hesitate to contact us if you have any questions regarding your investment in the Fund.
Sincerely,
 |  |
| Thomas P. Meehan | Paul P. Meehan |
| Portfolio Managers, Meehan Focus Fund | |
Past performance is not predictive of future performance. Investment results and principal value will fluctuate so that shares, when redeemed, may be worth more or less than their original cost. Current performance may be higher or lower than the performance data quoted. Performance data current to the most recent month end are available by calling 1-866-884-5968.
An investor should consider the investment objectives, risks, charges and expenses of the Fund carefully before investing. The Fund’s prospectus contains this and other important information. To obtain a copy of the Fund’s prospectus visit the Fund’s website at
www.meehanmutualfunds.com or call 1-866-884-5968 and a copy will be sent to you free of charge. Please read the prospectus carefully before you invest. The Meehan Focus Fund is distributed by Ultimus Fund Distributors, LLC.
This Letter to Shareholders seeks to describe some of the Adviser’s current opinions and views of the financial markets. Although the Adviser believes it has a reasonable basis for any opinions or views expressed, actual results may differ, sometimes significantly so, from those expected or expressed. The securities held by the Fund that are discussed in the Letter to Shareholders were held during the period covered by this Report. They do not comprise the entire investment portfolio of the Fund, may be sold at any time and may no longer be held by the Fund. For a complete list of securities held by the Fund as of February 29, 2024, please see the Schedule of Investments section of the semi-annual report. The opinions of the Adviser with respect to those securities may change at any time.
Statements in the Letter to Shareholders that reflect projections or expectations for future financial or economic performance of the Fund and the market in general and statements of the Fund’s plans and objectives for future operations are forward-looking statements. No assurance can be given that actual results or events will not differ materially from those projected, estimated, assumed, or anticipated in any such forward-looking statements. Important factors that could result in such differences, in addition to factors noted with such forward-looking statements include, without limitation, general economic conditions, such as inflation, recession, and interest rates.
| MEEHAN FOCUS FUND |
| PERFORMANCE INFORMATION |
| February 29, 2024 (Unaudited) |
Comparison of Change in Value of a $10,000 Investment in the
Meehan Focus Fund vs. the S&P 500® Total Return Index*
and the S&P 500® Value Index*
| | Average Annual Total Returns (For Periods Ended February 29, 2024) | |
| | | |
| | | 1 Year | | 5 Years | | 10 Years | |
| | Meehan Focus Fund (a) | 38.20% | | 17.80% | | 11.85% | |
| | S&P 500® Total Return Index | 30.45% | | 14.76% | | 12.70% | |
| | S&P 500® Value Index | 21.68% | | 12.49% | | 10.41% | |
| | | | | | | | |
| * | The above graph depicts the performance of the Fund versus the S&P 500® Total Return Index and the S&P 500® Value Index. It is important to note that the Fund is a professionally managed mutual fund; the S&P 500® Total Return Index by Standard & Poor’s Corp. is a capitalization-weighted index comprised of 500 issues listed on various exchanges, representing the performance of the stock market generally; and the S&P 500® Value Index measures value stocks using three factors: the ratios of book value, earnings, and sales to price. Constituents are drawn from the S&P 500® Total Return Index. An index is not an investment product available for purchase. The Fund’s performance assumes the reinvestment of all dividends and all capital gains. Index returns assume reinvestment of dividends but, unlike the Fund’s returns, do not reflect any fees or expenses. |
| (a) | Performance presented represents historical data. The investment return and principal value of an investment will fluctuate so that an investor’s shares, when redeemed, may be worth more or less than their original cost. The Fund’s past performance is not indicative of future performance. The table and graph above do not reflect the deduction of taxes that a shareholder would pay on Fund distributions or the redemption of Fund shares. Current performance may be lower or higher than the performance data quoted. To obtain more current performance information, please contact (866) 884-5968. As disclosed in the Fund’s December 29, 2023 prospectus, the Fund’s total annual operating expenses are 1.01%. |
| MEEHAN FOCUS FUND |
| PORTFOLIO INFORMATION |
| February 29, 2024 (Unaudited) |
Sector Diversification (% of Net Assets)
| Top 10 Equity Holdings |
| |
| | % of |
| Security Description | Net Assets |
| Microsoft Corporation | 11.2% |
| United Rentals, Inc. | 8.6% |
| Apple, Inc. | 8.1% |
| Berkshire Hathaway, Inc. - Class B | 7.8% |
| Lowe’s Companies, Inc. | 7.3% |
| Alphabet, Inc. - Classes A and C | 6.5% |
| Broadcom, Inc. | 5.9% |
| Amazon.com, Inc. | 5.3% |
| Applied Materials, Inc. | 5.2% |
| Vertex Pharmaceuticals, Inc. | 4.5% |
| MEEHAN FOCUS FUND |
| SCHEDULE OF INVESTMENTS |
| February 29, 2024 (Unaudited) |
| COMMON STOCKS — 98.1% | | Shares | | | Value | |
| Communications — 6.5% | | | | | | | | |
| Internet Media & Services — 6.5% | | | | | | | | |
| Alphabet, Inc. - Class A (a) | | | 29,900 | | | $ | 4,139,954 | |
| Alphabet, Inc. - Class C (a) | | | 34,830 | | | | 4,868,537 | |
| | | | | | | | 9,008,491 | |
| Consumer Discretionary — 16.8% | | | | | | | | |
| E-Commerce Discretionary — 5.3% | | | | | | | | |
| Amazon.com, Inc. (a) | | | 41,435 | | | | 7,324,051 | |
| | | | | | | | | |
| Home Construction — 1.9% | | | | | | | | |
| Lennar Corporation - Class A | | | 16,000 | | | | 2,536,160 | |
| | | | | | | | | |
| Retail - Discretionary — 9.6% | | | | | | | | |
| Lowe’s Companies, Inc. | | | 41,630 | | | | 10,019,092 | |
| Williams-Sonoma, Inc. | | | 13,430 | | | | 3,163,168 | |
| | | | | | | | 13,182,260 | |
| Energy — 2.4% | | | | | | | | |
| Oil & Gas Producers — 2.4% | | | | | | | | |
| Shell plc - ADR | | | 52,850 | | | | 3,320,566 | |
| | | | | | | | | |
| Financials — 13.8% | | | | | | | | |
| Asset Management — 6.0% | | | | | | | | |
| BlackRock, Inc. | | | 2,925 | | | | 2,373,169 | |
| Blackstone, Inc. | | | 12,200 | | | | 1,559,404 | |
| Charles Schwab Corporation (The) | | | 65,000 | | | | 4,340,700 | |
| | | | | | | | 8,273,273 | |
| Insurance — 7.8% | | | | | | | | |
| Berkshire Hathaway, Inc. - Class B (a) | | | 26,050 | | | | 10,664,870 | |
| | | | | | | | | |
| Health Care — 10.5% | | | | | | | | |
| Biotech & Pharma — 6.0% | | | | | | | | |
| Novartis AG - ADR | | | 20,420 | | | | 2,061,807 | |
| Vertex Pharmaceuticals, Inc. (a) | | | 14,800 | | | | 6,226,952 | |
| | | | | | | | 8,288,759 | |
| MEEHAN FOCUS FUND |
| SCHEDULE OF INVESTMENTS (Continued) |
| COMMON STOCKS — 98.1% (Continued) | | Shares | | | Value | |
| Health Care — 10.5% (Continued) | | | | | | | | |
| Health Care Facilities & Services — 2.4% | | | | | | | | |
| CVS Health Corporation | | | 44,000 | | | $ | 3,272,280 | |
| | | | | | | | | |
| Medical Equipment & Devices — 2.1% | | | | | | | | |
| Thermo Fisher Scientific, Inc. | | | 5,000 | | | | 2,850,900 | |
| | | | | | | | | |
| Industrials — 12.3% | | | | | | | | |
| Electrical Equipment — 1.6% | | | | | | | | |
| Johnson Controls International plc | | | 37,275 | | | | 2,209,289 | |
| | | | | | | | | |
| Industrial Support Services — 8.6% | | | | | | | | |
| United Rentals, Inc. | | | 17,050 | | | | 11,820,254 | |
| | | | | | | | | |
| Machinery — 2.1% | | | | | | | | |
| Deere & Company | | | 7,800 | | | | 2,847,390 | |
| | | | | | | | | |
| Technology — 35.8% | | | | | | | | |
| Semiconductors — 14.2% | | | | | | | | |
| Applied Materials, Inc. | | | 35,365 | | | | 7,130,292 | |
| Broadcom, Inc. | | | 6,245 | | | | 8,121,560 | |
| NVIDIA Corporation | | | 5,460 | | | | 4,319,515 | |
| | | | | | | | 19,571,367 | |
| Software — 11.2% | | | | | | | | |
| Microsoft Corporation | | | 37,035 | | | | 15,319,157 | |
| | | | | | | | | |
| Technology Hardware — 8.1% | | | | | | | | |
| Apple, Inc. | | | 61,795 | | | | 11,169,446 | |
| | | | | | | | | |
| Technology Services — 2.3% | | | | | | | | |
| Visa, Inc. - Class A | | | 11,000 | | | | 3,109,040 | |
| | | | | | | | | |
| Total Common Stocks (Cost $42,233,198) | | | | | | $ | 134,767,553 | |
| MEEHAN FOCUS FUND |
| SCHEDULE OF INVESTMENTS (Continued) |
| MONEY MARKET FUNDS — 1.9% | | Shares | | | Value | |
| Allspring Heritage Money Market Fund - Institutional Class, 5.35% (b) (Cost $2,587,419) | | | 2,586,126 | | | $ | 2,587,419 | |
| | | | | | | | | |
| Investments at Value — 100.0% (Cost $44,820,617) | | | | | | $ | 137,354,972 | |
| | | | | | | | | |
| Liabilities in Excess of Other Assets — (0.0)% (c) | | | | | | | (23,976 | ) |
| | | | | | | | | |
| Net Assets — 100.0% | | | | | | $ | 137,330,996 | |
ADR - American Depositary Receipt
AG - Aktiengesellschaft
plc - Public Limited Company
| (a) | Non-income producing security. |
| (b) | The rate shown is the 7-day effective yield as of February 29, 2024. |
| (c) | Percentage rounds to less than 0.1%. |
See accompanying notes to financial statements.
| MEEHAN FOCUS FUND |
| STATEMENT OF ASSETS AND LIABILITIES |
| February 29, 2024 (Unaudited) |
| ASSETS | | | | |
| Investments in securities: | | | | |
| At cost | | $ | 44,820,617 | |
| At value (Note 2) | | $ | 137,354,972 | |
| Dividends receivable | | | 94,218 | |
| Foreign tax reclaims receivable | | | 8,065 | |
| Other assets | | | 12,907 | |
| TOTAL ASSETS | | | 137,470,162 | |
| | | | | |
| LIABILITIES | | | | |
| Payable to Adviser (Note 4) | | | 91,514 | |
| Payable to administrator (Note 4) | | | 35,069 | |
| Other accrued expenses | | | 12,583 | |
| TOTAL LIABILITIES | | | 139,166 | |
| | | | | |
| CONTINGENCIES AND COMMITMENTS (NOTE 5) | | | — | |
| | | | | |
| NET ASSETS | | $ | 137,330,996 | |
| | | | | |
| NET ASSETS CONSIST OF: | | | | |
| Paid-in capital | | | 44,710,876 | |
| Accumulated earnings | | | 92,620,120 | |
| NET ASSETS | | $ | 137,330,996 | |
| | | | | |
| Shares of beneficial interest outstanding (unlimited number of shares authorized, no par value) | | | 2,632,931 | |
| | | | | |
| Net asset value, offering price and redemption price per share (a) (Note 2) | | $ | 52.16 | |
| (a) | Redemption price may differ from the net asset value per share depending upon the length of time held. |
See accompanying notes to financial statements.
| MEEHAN FOCUS FUND |
| STATEMENT OF OPERATIONS |
| For the Six Months Ended February 29, 2024 (Unaudited) |
| INVESTMENT INCOME | | | | |
| Dividend income | | $ | 737,137 | |
| | | | | |
| EXPENSES | | | | |
| Management fees (Note 4) | | | 480,269 | |
| Administration fees (Note 4) | | | 59,424 | |
| Fund accounting fees (Note 4) | | | 23,180 | |
| Legal fees | | | 14,069 | |
| Transfer agent fees (Note 4) | | | 10,302 | |
| Trustees’ fees and expenses (Note 4) | | | 9,835 | |
| Audit and tax services fees | | | 8,250 | |
| Registration and filing fees | | | 7,077 | |
| Compliance fees and expenses (Note 4) | | | 7,050 | |
| Custody and bank service fees | | | 6,744 | |
| Shareholder reporting expenses | | | 4,988 | |
| Postage and supplies | | | 2,870 | |
| Insurance expense | | | 1,706 | |
| Other expenses | | | 7,964 | |
| TOTAL EXPENSES | | | 643,728 | |
| Less fee reductions by the Adviser (Note 4) | | | (43,392 | ) |
| NET EXPENSES | | | 600,336 | |
| | | | | |
| NET INVESTMENT INCOME | | | 166,801 | |
| | | | | |
| REALIZED AND UNREALIZED GAINS ON INVESTMENTS | | | | |
| Net realized gains from investments | | | 19,807 | |
| Net change in unrealized appreciation (depreciation) on investments | | | 20,241,599 | |
| NET REALIZED AND UNREALIZED GAINS ON INVESTMENTS | | | 20,261,406 | |
| | | | | |
| NET INCREASE IN NET ASSETS FROM OPERATIONS | | $ | 20,428,207 | |
See accompanying notes to financial statements.
| MEEHAN FOCUS FUND |
| STATEMENTS OF CHANGES IN NET ASSETS |
| | | Six Months | | | | |
| | | Ended | | | Year | |
| | | February 29, | | | Ended | |
| | | 2024 | | | August 31, | |
| | | (Unaudited) | | | 2023 | |
| FROM OPERATIONS | | | | | | | | |
| Net investment income | | $ | 166,801 | | | $ | 459,729 | |
| Net realized gains from investments | | | 19,807 | | | | 7,648 | |
| Net realized gains from in-kind redemptions (Note 2) | | | — | | | | 1,354,124 | |
| Net change in unrealized appreciation (depreciation) on investments | | | 20,241,599 | | | | 18,461,667 | |
| Net increase in net assets resulting from operations | | | 20,428,207 | | | | 20,283,168 | |
| | | | | | | | | |
| DISTRIBUTIONS TO SHAREHOLDERS (Note 2) | | | (464,317 | ) | | | (735,325 | ) |
| | | | | | | | | |
| CAPITAL SHARE TRANSACTIONS | | | | | | | | |
| Proceeds from shares sold | | | 1,878,146 | | | | 1,908,332 | |
| Net asset value of shares issued in reinvestment of distributions to shareholders | | | 452,405 | | | | 729,471 | |
| Payments for shares redeemed | | | (799,545 | ) | | | (3,331,232 | ) |
| Net increase (decrease) in net assets from capital share transactions | | | 1,531,006 | | | | (693,429 | ) |
| | | | | | | | | |
| TOTAL INCREASE IN NET ASSETS | | | 21,494,896 | | | | 18,854,414 | |
| | | | | | | | | |
| NET ASSETS | | | | | | | | |
| Beginning of period | | | 115,836,100 | | | | 96,981,686 | |
| End of period | | $ | 137,330,996 | | | $ | 115,836,100 | |
| | | | | | | | | |
| CAPITAL SHARE ACTIVITY | | | | | | | | |
| Shares sold | | | 40,626 | | | | 48,962 | |
| Shares reinvested | | | 9,341 | | | | 20,445 | |
| Shares redeemed | | | (17,493 | ) | | | (86,789 | ) |
| Net increase (decrease) in shares outstanding | | | 32,474 | | | | (17,382 | ) |
| Shares outstanding at beginning of period | | | 2,600,457 | | | | 2,617,839 | |
| Shares outstanding at end of period | | | 2,632,931 | | | | 2,600,457 | |
See accompanying notes to financial statements.
| MEEHAN FOCUS FUND |
| FINANCIAL HIGHLIGHTS |
Per Share Data for a Share Outstanding Throughout Each Period
| | | Six Months | | | | | | | | | | | | Ten | | | | | | | |
| | | Ended | | | Year | | | Year | | | Year | | | Months | | | Year | | | Year | |
| | | Feb. 29, | | | Ended | | | Ended | | | Ended | | | Ended | | | Ended | | | Ended | |
| | | 2024 | | | August 31, | | | August 31, | | | August 31, | | | August 31, | | | Oct. 31, | | | Oct. 31, | |
| | | (Unaudited) | | | 2023 | | | 2022 | | | 2021 | | | 2020 (a) | | | 2019 | | | 2018 | |
| Net asset value at beginning of period | | $ | 44.54 | | | $ | 37.05 | | | $ | 44.21 | | | $ | 32.80 | | | $ | 27.98 | | | $ | 24.99 | | | $ | 24.13 | |
| Income (loss) from investment operations: | | | | | | | | | | | | | | | | | | | | | | | | | | | | |
| Net investment income (b) | | | 0.06 | | | | 0.18 | | | | 0.01 | | | | 0.03 | | | | 0.14 | | | | 0.21 | | | | 0.14 | |
| Net realized and unrealized gains (losses) on investments | | | 7.74 | | | | 7.60 | | | | (5.56 | ) | | | 11.76 | | | | 5.71 | | | | 3.42 | | | | 0.86 | |
| Total from investment operations | | | 7.80 | | | | 7.78 | | | | (5.55 | ) | | | 11.79 | | | | 5.85 | | | | 3.63 | | | | 1.00 | |
| Less distributions from: | | | | | | | | | | | | | | | | | | | | | | | | | | | | |
| Net investment income | | | (0.18 | ) | | | (0.05 | ) | | | (0.01 | ) | | | (0.12 | ) | | | (0.20 | ) | | | (0.15 | ) | | | (0.14 | ) |
| Net realized gains | | | — | | | | (0.24 | ) | | | (1.60 | ) | | | (0.26 | ) | | | (0.83 | ) | | | (0.49 | ) | | | — | |
| Total distributions | | | (0.18 | ) | | | (0.29 | ) | | | (1.61 | ) | | | (0.38 | ) | | | (1.03 | ) | | | (0.64 | ) | | | (0.14 | ) |
| Net asset value at end of period | | $ | 52.16 | | | $ | 44.54 | | | $ | 37.05 | | | $ | 44.21 | | | $ | 32.80 | | | $ | 27.98 | | | $ | 24.99 | |
| Total return (c) | | | 17.54 | %(d) | | | 21.18 | % | | | (13.23 | %) | | | 36.25 | % | | | 21.38 | %(d) | | | 15.16 | % | | | 4.15 | % |
| Net assets at end of period (000’s) | | $ | 137,331 | | | $ | 115,836 | | | $ | 96,982 | | | $ | 106,288 | | | $ | 80,538 | | | $ | 67,566 | | | $ | 65,818 | |
| Ratios/supplementary data: | | | | | | | | | | | | | | | | | | | | | | | | | | | | |
| Ratio of total expenses to average net assets (e) | | | 1.07 | %(f) | | | 1.09 | % | | | 1.08 | % | | | 1.09 | % | | | 1.16 | %(f) | | | 1.17 | % | | | 1.12 | % |
| Ratio of net expenses to average net assets (e)(g) | | | 1.00 | %(f) | | | 1.00 | % | | | 1.00 | % | | | 1.00 | % | | | 1.00 | %(f) | | | 1.00 | % | | | 1.00 | % |
| Ratio of net investment income to average net assets (b)(e)(g) | | | 0.28 | %(f) | | | 0.45 | % | | | 0.03 | % | | | 0.07 | % | | | 0.58 | %(f) | | | 0.77 | % | | | 0.54 | % |
| Portfolio turnover rate | | | 3 | %(d) | | | 6 | % | | | 13 | % | | | 4 | % | | | 16 | %(d) | | | 20 | % | | | 20 | % |
| (a) | Fund changed fiscal year to August 31. |
| (b) | Recognition of net investment income by the Fund is affected by the timing of the declaration of dividends by the underlying investment companies, if any, in which the Fund invests. |
| (c) | Total return is a measure of the change in value of an investment in the Fund over the period covered. The returns shown do not reflect the deduction of taxes a shareholder would pay on Fund distributions, if any, or the redemption of Fund shares. Had the Adviser not reduced its fees, total returns would have been lower. |
| (e) | The ratios of expenses and net investment income to average net assets do not reflect the Fund’s proportionate share of expenses of the underlying investments companies, if any, in which the Fund invests. |
| (g) | Ratio was determined after management fee reductions (Note 4). |
See accompanying notes to financial statements.
| MEEHAN FOCUS FUND |
| NOTES TO FINANCIAL STATEMENTS |
| February 29, 2024 (Unaudited) |
Meehan Focus Fund (the “Fund”) is a non-diversified series of Ultimus Managers Trust (the “Trust”). The Trust is an open-end management investment company registered under the Investment Company Act of 1940, as amended (the “1940 Act”). The Fund was reorganized into the Trust on October 23, 2017. It was formerly a series of Meehan Mutual Funds, Inc.
The Fund’s investment objective is to seek long-term growth of capital.
| 2. | Significant Accounting Policies |
The Fund follows accounting and reporting guidance under Financial Accounting Standards Board Accounting Standards Codification Topic 946, “Financial Services – Investment Companies.” The following is a summary of the Fund’s significant accounting policies used in the preparation of its financial statements. These policies are in conformity with accounting principals generally accepted in the United States of America (“GAAP”).
Regulatory update – Tailored Shareholder Reports for Mutual Funds and Exchange-Traded Funds (“ETFs”) – Effective January 24, 2023, the Securities and Exchange Commission (the “SEC”) adopted rule and form amendments to require mutual funds and ETFs to transmit concise and visually engaging streamlined annual and semiannual reports to shareholders that highlight key information. Other information, including financial statements, will no longer appear in a streamlined shareholder report but must be available online, delivered free of charge upon request, and filed on a semiannual basis on Form N-CSR. The rule and form amendments have a compliance date of July 24, 2024. At this time, management is evaluating the impact of these amendments on the shareholder reports for the Fund.
Securities valuation – The Fund’s portfolio securities are valued at fair value as of the close of regular trading on the New York Stock Exchange (the “NYSE”) (normally 4:00 p.m. Eastern Time) on each business day the NYSE is open. Securities, including common stocks and exchange-traded funds (“ETFs”), if any, listed on the NYSE or other exchanges are valued on the basis of their last sale price on the exchanges on which they are primarily traded. If there are no sales on that day, the securities are valued at the closing mean price on the NYSE or other primary exchange for that day. NASDAQ listed securities are valued at the NASDAQ Official Closing Price. If there are no sales on that day, the securities are valued at the last mean price as reported by NASDAQ. Securities traded in the over-the-counter market are valued at the last reported sale price, if available, otherwise at the most recently quoted mean price. Investments representing shares of money market funds and other open-end investment companies, except for ETFs, are valued at their net asset value (“NAV”) as reported by such companies. When using a quoted price and when the market is considered active, the security will be classified as Level 1 within the fair value hierarchy (see below). In the event that market quotations are not readily available or are considered unreliable due to market or other events, the Fund values its securities and other
| MEEHAN FOCUS FUND |
| NOTES TO FINANCIAL STATEMENTS (Continued) |
assets at fair value as determined by Edgemoor Investment Advisors, Inc. (the “Adviser”), as the Fund’s valuation designee, in accordance with procedures adopted by the Board of Trustees (the “Board”) pursuant to Rule 2a-5 under the 1940 Act. Under these procedures, the securities will be classified as Level 2 or 3 within the fair value hierarchy, depending on the inputs used. Unavailable or unreliable market quotes may be due to the following factors: a substantial bid-ask spread; infrequent sales resulting in stale prices; insufficient trading volume; small trade sizes; a temporary lapse in any reliable pricing source; and actions of the securities or futures markets, such as suspension or limitation of trading. As a result, the prices of securities used to calculate the Fund’s NAV may differ from quoted or published prices for the same securities.
GAAP establishes a single authoritative definition of fair value, sets out a framework for measuring fair value and requires additional disclosures about fair value measurements.
Various inputs are used in determining the value of the Fund’s investments. These inputs are summarized in the three broad levels listed below:
| ● | Level 1 – quoted prices in active markets for identical securities |
| ● | Level 2 – other significant observable inputs |
| ● | Level 3 – significant unobservable inputs |
The inputs or methodology used for valuing securities are not necessarily an indication of the risks associated with investing in those securities. The inputs used to measure fair value may fall into different levels of the fair value hierarchy. In such cases, for disclosure purposes, the level in the fair value hierarchy within which the fair value measurement falls in its entirety is determined based on the lowest level input that is significant to the fair value measurement.
The following is a summary of the Fund’s investments by the inputs used to value the investments as of February 29, 2024:
| | | Level 1 | | | Level 2 | | | Level 3 | | | Total | |
| Common Stocks | | $ | 134,767,553 | | | $ | — | | | $ | — | | | $ | 134,767,553 | |
| Money Market Funds | | | 2,587,419 | | | | — | | | | — | | | | 2,587,419 | |
| Total | | $ | 137,354,972 | | | $ | — | | | $ | — | | | $ | 137,354,972 | |
| | | | | | | | | | | | | | | | | |
Refer to the Fund’s Schedule of Investments for a listing of the common stocks by sector and industry type. The Fund did not hold derivative instruments or any assets or liabilities that were measured at fair value on a recurring basis using significant unobservable inputs (Level 3) as of or during the six months ended February 29, 2024.
| MEEHAN FOCUS FUND |
| NOTES TO FINANCIAL STATEMENTS (Continued) |
Foreign currency translation – Securities and other assets and liabilities denominated in or expected to settle in foreign currencies, if any, are translated into U.S. dollars based on exchange rates on the following basis:
| A. | The fair values of investment securities and other assets and liabilities are translated as of the close of the NYSE each day. |
| B. | Purchases and sales of investment securities and income and expenses are translated at the rate of exchange prevailing as of 4:00 p.m. Eastern Time on the respective date of such transactions. |
| C. | The Fund does not isolate that portion of the results of operations caused by changes in foreign exchange rates on investments from those caused by changes in market prices of securities held. Such fluctuations are included with the net realized and unrealized gains or losses on investments. |
Reported net realized foreign exchange gains or losses arise from 1) purchases and sales of foreign currencies and 2) the difference between the amounts of dividends and foreign withholding taxes recorded on the Fund’s books and the U.S. dollar equivalent of the amounts actually received or paid. Reported net unrealized foreign exchange gains and losses arise from changes in the value of assets and liabilities that result from changes in exchange rates.
Share valuation – The NAV per share of the Fund is calculated daily by dividing the total value of the Fund’s assets, less liabilities, by the number of shares outstanding. The offering price and redemption price per share of the Fund is equal to the NAV per share, except that shares of the Fund are subject to a redemption fee of 2% if redeemed within 7 calendar days of the date of purchase. No redemption fees were collected by the Fund during the periods ended February 29, 2024 and August 31, 2023.
Investment income – Dividend income is recorded on the ex-dividend date. Non-cash dividends included in dividend income, if any, are recorded at the fair value of the security received. Interest income is accrued as earned. Withholding taxes on foreign dividends have been recorded in accordance with the Fund’s understanding of the applicable country’s rules and tax rates.
Investment transactions – Investment transactions are accounted for on the trade date. Realized gains and losses on investments sold are determined on a specific identification basis.
Common expenses – Common expenses of the Trust are allocated among the Fund and the other series of the Trust based on the relative net assets of each series, the number of series in the Trust, or the nature of the services performed and the relative applicability to each series.
Distributions to shareholders – Distributions to shareholders arising from net investment income and net realized capital gains, if any, are distributed at least once each year. Distributions to shareholders are recorded on the ex-dividend date. The amount of distributions from net investment income and net realized capital gains are determined in
| MEEHAN FOCUS FUND |
| NOTES TO FINANCIAL STATEMENTS (Continued) |
accordance with federal income tax regulations, which may differ from GAAP. The tax character of distributions paid during the periods ended February 29, 2024 and August 31, 2023 was as follows:
| | | Ordinary | | | Long-Term | | | Total | |
| Period Ended | | Income | | | Capital Gains | | | Distributions | |
| February 29, 2024 | | $ | 464,317 | | | $ | — | | | $ | 464,317 | |
| August 31, 2023 | | $ | 129,696 | | | $ | 605,629 | | | $ | 735,325 | |
| | | | | | | | | | | | | |
Estimates – The preparation of financial statements in conformity with GAAP requires management to make estimates and assumptions that affect the reported amounts of assets and liabilities and disclosure of contingent assets and liabilities as of the date of the financial statements and the reported amounts of increase (decrease) in net assets from operations during the reporting period. Actual results could differ from those estimates.
Federal income tax – The Fund has qualified and intends to continue to qualify each year as a “regulated investment company” under Subchapter M of the Internal Revenue Code of 1986, as amended (the “Code”). By so qualifying, the Fund will not be subject to federal income taxes to the extent that it distributes its net investment income and any net realized capital gains in accordance with the Code.
In order to avoid imposition of the excise tax applicable to regulated investment companies, it is also the Fund’s intention to declare as dividends in each calendar year at least 98% of its net investment income (earned during the calendar year) and 98.2% of its net realized capital gains (earned during the twelve months ended October 31) plus undistributed amounts from prior years.
The following information is computed on a tax basis for each item as of February 29, 2024:
| Tax cost of investments | | $ | 44,820,617 | |
| Gross unrealized appreciation | | $ | 92,554,719 | |
| Gross unrealized depreciation | | | (20,364 | ) |
| Net unrealized appreciation | | | 92,534,355 | |
| Accumulated ordinary income | | | 65,958 | |
| Other gains | | | 19,807 | |
| Accumulated earnings | | $ | 92,620,120 | |
| | | | | |
During the year ended August 31, 2023, a shareholder took delivery of securities from the Fund, rather than cash, in exchange for the redemption of shares. The total fair value of these in-kind redemptions was $1,500,000 for 39,370 shares of the Fund. The Fund realized $1,354,124 of net capital gains resulting from the in-kind redemptions. The Fund recognizes a gain on in-kind redemptions to the extent that the value of the distributed securities on the date of redemption exceeds the cost of those securities and recognizes a loss to the extent
| MEEHAN FOCUS FUND |
| NOTES TO FINANCIAL STATEMENTS (Continued) |
that the cost of those securities exceeds the value of the distributed securities on the date of redemption. Such net gains are not taxable to the Fund and are not required to be distributed to shareholders.
The Fund recognizes the tax benefits or expenses of uncertain tax positions only when the position is “more likely than not” to be sustained assuming examination by tax authorities. Management has reviewed the Fund’s tax positions taken on federal income tax returns for the current and all open tax years (generally, three years) and has concluded that no provision for unrecognized tax benefits or expenses is required in these financial statements and does not expect this to change over the next twelve months. The Fund identifies its major tax jurisdiction as U.S. Federal.
The Fund recognizes interest and penalties, if any, related to unrecognized tax benefits as income tax on the Statement of Operations. During the six months ended February 29, 2024, the Fund did not incur any interest or penalties.
| 3. | Investment Transactions |
During the six months ended February 29, 2024, the cost of purchases and proceeds from sales of investment securities, other than short-term investments, were $7,862,301 and $3,515,630, respectively.
| 4. | Transactions with Related Parties |
INVESTMENT ADVISORY AGREEMENT
The Fund’s investments are managed by the Adviser pursuant to the terms of an Investment Advisory Agreement. Under the Investment Advisory Agreement, the Fund pays the Adviser a management fee, computed and accrued daily and paid monthly, at the annual rate of 0.80% of its average daily net assets.
Pursuant to an Expense Limitation Agreement (“ELA”), the Adviser has contractually agreed, until March 1, 2025, to reduce management fees and reimburse other expenses to the extent necessary to limit total annual operating expenses (exclusive of brokerage costs; taxes; interest; borrowing costs such as interest and dividend expenses on securities sold short; costs to organize the Fund; acquired fund fees and expenses; and extraordinary expenses, such as litigation and merger or reorganization costs and other expenses not incurred in the ordinary course of the Fund’s business) to an amount not exceeding 1.00% of the Fund’s average daily net assets. Accordingly, during the six months ended February 29, 2024, the Adviser reduced its management fees in the amount of $43,392.
Under the terms of the ELA, management fee reductions and expense reimbursements by the Adviser are subject to repayment by the Fund for a period of 36 months after such fees and expenses were incurred, provided the repayments do not cause total annual operating expenses to exceed the lesser of: (i) the expense limitation then in effect, if any, and (ii)
| MEEHAN FOCUS FUND |
| NOTES TO FINANCIAL STATEMENTS (Continued) |
the expense limitation in effect at the time the expenses to be repaid were incurred. As of February 29, 2024, the Adviser may seek recoupment of management fee reductions totaling $258,251 no later than the dates listed below:
| August 31, 2024 | | $ | 40,201 | |
| August 31, 2025 | | | 84,560 | |
| August 31, 2026 | | | 90,098 | |
| February 28, 2027 | | | 43,392 | |
| Total | | $ | 258,251 | |
| | | | | |
OTHER SERVICE PROVIDERS
Ultimus Fund Solutions, LLC (“Ultimus”) provides administration, fund accounting and transfer agency services to the Fund. The Fund pays Ultimus fees in accordance with the agreements for such services. In addition, the Fund pays out-of-pocket expenses including, but not limited to, postage, supplies, and certain costs related to the pricing of the Fund’s portfolio securities.
Under the terms of a Consulting Agreement with the Trust, Northern Lights Compliance Services, LLC (“NLCS”) provides an Anti-Money Laundering Officer to the Trust, as well as related compliance services. Under the terms of the agreement, NLCS receives fees from the Fund. NLCS is a wholly-owned subsidiary of Ultimus.
Under the terms of a Distribution Agreement with the Trust, Ultimus Fund Distributors, LLC (the “Distributor”) serves as the principal underwriter to the Fund. The Distributor is a wholly-owned subsidiary of Ultimus. The Distributor is compensated by the Adviser (not the Fund) for acting as principal underwriter.
Certain officers of the Trust are also officers of Ultimus and are not paid by the Trust or the Fund for serving in such capacities.
TRUSTEE COMPENSATION
Each member of the Board (a “Trustee”) who is not an “interested person” (as defined by the 1940 Act, as amended) of the Trust (“Independent Trustee”) receives an annual retainer and meetings fees, plus reimbursement for travel and other meeting-related expenses.
| 5. | Contingencies and Commitments |
The Fund indemnifies the Trust’s officers and Trustees for certain liabilities that might arise from their performance of their duties to the Fund. Additionally, in the normal course of business the Fund enters into contracts that contain a variety of representations and warranties and which provide general indemnifications. The Fund’s maximum exposure under these arrangements is unknown, as this would involve future claims that may be made against the Fund that have not yet occurred. However, based on experience, the Trust expects the risk of loss to be remote.
| MEEHAN FOCUS FUND |
| NOTES TO FINANCIAL STATEMENTS (Continued) |
| 6. | Non-Diversification Risk |
The Fund is a non-diversified Fund. As a result, the Fund’s holdings may be more concentrated in a limited number of securities and the value of its shares may be more sensitive than a diversified fund to any single economic, business, political, or regulatory occurrence.
If a Fund has significant investments in the securities of issuers within a particular sector, any development affecting that sector will have a greater impact on the value of the net assets of the Fund than would be the case if the Fund did not have significant investments in that sector. In addition, this may increase the risk of loss in the Fund and increase the volatility of the Fund’s NAV per share. Occasionally, market conditions, regulatory changes or other developments may negatively impact a particular sector. As of February 29, 2024, the Fund had 35.8% of the value of its net assets invested in stocks within the Technology sector.
The Fund is required to recognize in the financial statements the effects of all subsequent events that provide additional evidence about conditions that existed as of the date of the Statement of Assets and Liabilities. For non-recognized subsequent events that must be disclosed to keep the financial statements from being misleading, the Fund is required to disclose the nature of the event as well as an estimate of its financial effect, or a statement that such an estimate cannot be made. Management has evaluated subsequent events through the issuance of these financial statements and has noted no such events.
| MEEHAN FOCUS FUND |
| ABOUT YOUR FUND’S EXPENSES (Unaudited) |
We believe it is important for you to understand the impact of costs on your investment. As a shareholder of the Fund, you may incur two types of costs: (1) transaction costs, including redemption fees; and (2) ongoing costs, including management fees and other expenses. The following examples are intended to help you understand your ongoing costs (in dollars) of investing in the Fund and to compare these costs with the ongoing costs of investing in other mutual funds.
A mutual fund’s ongoing costs are expressed as a percentage of its average net assets. This figure is known as the expense ratio. The expenses in the table below are based on an investment of $1,000 made at the beginning of the most recent period (September 1, 2023) and held until the end of the period (February 29, 2024).
The table below illustrates the Fund’s ongoing costs in two ways:
Actual fund return – This section helps you to estimate the actual expenses that you paid over the period. The “Ending Account Value” shown is derived from the Fund’s actual return, and the third column shows the dollar amount of operating expenses that would have been paid by an investor who started with $1,000 in the Fund. You may use the information here, together with the amount you invested, to estimate the expenses that you paid over the period.
To do so, simply divide your account value by $1,000 (for example, an $8,600 account value divided by $1,000 = 8.6), then multiply the result by the number given for the Fund under the heading “Expenses Paid During Period.”
Hypothetical 5% return – This section is intended to help you compare the Fund’s ongoing costs with those of other mutual funds. It assumes that the Fund had an annual return of 5% before expenses during the period shown, but that the expense ratio is unchanged. In this case, because the return used is not the Fund’s actual return, the results do not apply to your investment. The example is useful in making comparisons because the U.S. Securities and Exchange Commission (the “SEC”) requires all mutual funds to calculate expenses based on a 5% return. You can assess the Fund’s ongoing costs by comparing this hypothetical example with the hypothetical examples that appear in shareholder reports of other funds.
Note that expenses shown in the table are meant to highlight and help you compare ongoing costs only. The Fund does not charge sales loads. However, a redemption fee of 2% is applied on the sale of shares of the Fund held for less than 7 calendar days.
The calculations assume no shares were bought or sold during the period. Your actual costs may have been higher or lower, depending on the amount of your investment and the timing of any purchases or redemptions.
More information about the Fund’s expenses, including historical annual expense ratios, can be found in this report. For additional information on operating expenses and other shareholder costs, please refer to the Fund’s prospectus.
| MEEHAN FOCUS FUND |
| ABOUT YOUR FUND’S EXPENSES (Unaudited) (Continued) |
| | | Beginning | | | Ending | | | | |
| | | Account Value | | | Account Value | | | Expenses | |
| | | September 1, | | | February 29, | | | Paid During | |
| | | 2023 | | | 2024 | | | Period * | |
| Based on Actual Fund Return | | $ | 1,000.00 | | | $ | 1,175.40 | | | $ | 5.41 | |
| Based on Hypothetical 5% Return (before expenses) | | $ | 1,000.00 | | | $ | 1,019.89 | | | $ | 5.02 | |
| * | Expenses are equal to the Fund’s annualized net expense ratio of 1.00% for the period, multiplied by the average account value over the period, multiplied by 182/366 (to reflect the one-half year period). |
| OTHER INFORMATION (Unaudited) |
A description of the policies and procedures that the Fund uses to vote proxies relating to portfolio securities is available without charge upon request by calling toll-free 1-866-884-5968, or on the SEC’s website at www.sec.gov. Information regarding how the Fund voted proxies relating to portfolio securities during the most recent 12-month period ended June 30 is available without charge upon request by calling toll-free 1-866-884-5968, or on the SEC’s website at www.sec.gov.
The Trust files a complete listing of portfolio holdings for the Fund with the SEC as of the end of the first and third quarters of each fiscal year as an exhibit to its reports on Form N-PORT. These filings are available upon request by calling 1-866-884-5968. Furthermore, you may obtain a copy of the filings on the SEC’s website at www.sec.gov and on the Fund’s website www.meehanmutualfunds.com.
| MEEHAN FOCUS FUND |
| DISCLOSURE REGARDING APPROVAL OF INVESTMENT |
| ADVISORY AGREEMENT (Unaudited) |
The Board of Trustees (the “Board”), including the Independent Trustees voting separately, has reviewed and approved the continuance of the Meehan Focus Fund’s (the “Fund”) Investment Advisory Agreement with Edgemoor Investment Advisors, Inc. (the “Adviser” or “Edgemoor”) for an additional one-year term. The Board approved the continuance of the Investment Advisory Agreement at a meeting held on October 16-17, 2023, at which all of the Trustees were present.
Prior to the Meeting, Edgemoor provided a response to a letter sent by the counsel to the Independent Trustees, on their behalf, requesting various information relevant to the Independent Trustees’ consideration of the renewal of the Investment Advisory Agreement with respect to the Fund. In approving the continuance of the Investment Advisory Agreement, the Independent Trustees considered all information they deemed reasonably necessary to evaluate the terms of the Agreement. The principal areas of review by the Independent Trustees were (1) the nature, extent and quality of the services provided by Edgemoor, (2) the investment performance of the Fund, (3) the costs of the services provided and profits realized by Edgemoor from Edgemoor’s relationship with the Fund, (4) the financial condition of Edgemoor, (5) the fall out benefits derived by Edgemoor and its affiliates from their relationships with the Fund and (6) the extent to which economies of scale would be realized as the Fund grows and whether advisory fee levels reflect those economies of scale for the benefit of the Fund’s shareholders. The Independent Trustees’ evaluation of the quality of Edgemoor’s services also took into consideration their knowledge gained through presentations and reports from Edgemoor over the course of the preceding year. The Independent Trustees’ analysis of these factors is set forth below.
Nature, Extent and Quality of Services
The Board evaluated the level and depth of knowledge of Edgemoor, including the professional experience and qualifications of senior personnel. In evaluating the quality of services provided by Edgemoor, the Board took into account its familiarity with Edgemoor’s senior management through Board meetings, discussions and reports during the preceding year. The Board also took into account Edgemoor’s compliance policies and procedures based on discussion with Edgemoor and the CCO. The quality of administrative and other services, including Edgemoor’s role in coordinating the activities of the Fund’s other service providers, was also considered. The Board also considered Edgemoor’s relationship with its affiliates and the resources available to them, as well as any potential conflicts of interest. The Board discussed the nature and extent of the services provided by Edgemoor including, without limitation, Edgemoor’s provision of a continuous investment program for the Fund. The Board considered the qualifications and experience of Edgemoor’s portfolio managers who are responsible for the day-to day management of the Fund’s portfolio, as well as the qualifications of other individuals at Edgemoor who provide services to the Fund. The Board also considered Edgemoor’s succession planning for the portfolio managers of the Fund. The Board concluded that it was satisfied with the nature, extent and quality of services provided to the Fund by Edgemoor under the Investment Advisory Agreement.
| MEEHAN FOCUS FUND |
| DISCLOSURE REGARDING APPROVAL OF INVESTMENT |
| ADVISORY AGREEMENT (Unaudited) (Continued) |
Advisory Fees and Expenses and Comparative Accounts
The Board compared the advisory fee and total expense ratio for the Fund with various comparative data. In particular, the Board compared the Fund’s advisory fee and overall expense ratio to the median advisory fees and expense ratios for its custom peer group provided by Broadridge and fees charged to Edgemoor’s other client accounts. In reviewing the comparison in fees and expense ratios between the Fund and comparable funds, the Board also considered the differences in types of funds being compared, the styles of investment management, the size of the Fund relative to the comparable funds, and the nature of the investment strategies. The Board also considered Edgemoor’s commitment to limit the Fund’s expenses under the Expense Limitation Agreement (the “ELA”) until at least March 1, 2025. The Board noted that the 0.80% advisory fee for the Fund was higher than the median and average for the other funds in its Broadridge custom peer group. The Board further noted that the overall net expense ratio for the Fund of 1.00% was higher than the median expense ratio for the other funds in the Fund’s custom peer group but noted the Adviser’s response to the Board’s request for information that, with two exceptions, peer group fund fees that were materially lower than the Fund have considerably higher asset levels than the Fund and therefore presumably benefit from greater economies of scale.
The Board also compared the fees paid by the Fund to the fees paid by other clients of Edgemoor and considered the similarities and differences in services received by such other clients as compared to the services received by the Fund. The Board noted that the fee structure of the Fund differed from the fees applicable to Edgemoor’s other clients due in large part to such clients being separately managed accounts (“SMAs”) that individually negotiate their advisory fees and that such fees tend to vary across SMAs. The Board also noted that the regulatory requirements applicable to SMAs are lower than for registered investment companies.
Fund Performance
The Board also considered, among other data, the Fund’s performance results during certain periods ended July 31, 2023, and noted that the Board reviews on a quarterly basis detailed information about the Fund’s performance results, portfolio composition and investment strategies. The Board noted that the Fund had outperformed the peer group median for the one-, three- and five-year periods.
Economies of Scale
The Board also considered the effect of the Fund’s growth and size on its performance and expenses. The Board noted that Edgemoor limited fees and/or reimbursed expenses for the Fund in order to reduce the Fund’s operating expenses to targeted levels. The Board considered the effective advisory fee under the Investment Advisory Agreement as a percentage of assets at different asset levels and possible economies of scale that might be realized if the assets of the Fund increased. The Board noted that the advisory fee schedule for the Fund currently did not have breakpoints, and considered Edgemoor’s assertion that
| MEEHAN FOCUS FUND |
DISCLOSURE REGARDING APPROVAL OF INVESTMENT
ADVISORY AGREEMENT (Unaudited) (Continued) |
adding breakpoints was not appropriate at this time. The Board noted that if the Fund’s assets increase over time, the Fund might realize other economies of scale if assets increase proportionally more than certain other expenses.
Financial Condition of the Adviser and Adviser Profitability
Additionally, the Board took into consideration the financial condition and profitability of Edgemoor and the direct and indirect benefits derived by Edgemoor and its affiliates from their relationship with the Fund. The information considered by the Board included operating profit margin information for Edgemoor’s business as a whole. The Board considered Edgemoor’s commitment to contractually limit the Fund’s net operating expenses. The Board reviewed the profitability of Edgemoor’s relationship with the Fund both before and after tax expenses, and also considered whether Edgemoor has the financial wherewithal to continue to provide services to the Fund, noting its ongoing commitment to provide support and resources to the Fund as needed.
Fall-Out Benefits
The Board also noted that Edgemoor derives benefits to its reputation and other benefits from its association with the Fund. The Board recognized that Edgemoor should be entitled to earn a reasonable level of profits in exchange for the level of services it provides to the Fund and the entrepreneurial risk that it assumes as investment adviser. Based upon its review, the Board concluded that Edgemoor’s level of profitability, if any, from its relationship with the Fund was reasonable and not excessive.
In considering the renewal of the Investment Advisory Agreement, the Board, including the Independent Trustees, did not identify any single factor as controlling, and each Trustee may have attributed different weights to the various factors. The Trustees evaluated all information available to them. The Board concluded the following: (a) Edgemoor demonstrated that it possesses the capability and resources to perform the duties required of it under the Investment Advisory Agreement; (b) Edgemoor maintains an appropriate compliance program; (c) the overall performance of the Fund is satisfactory relative to the performance of funds with similar investment objectives and relevant indices; and (d) the Fund’s advisory fees are reasonable in light of the services received by the Fund from Edgemoor and the other factors considered. Based on their conclusions, the Trustees determined with respect to the Fund that continuation of the Investment Advisory Agreement was in the best interests of the Fund and its shareholders.
| MEEHAN FOCUS FUND |
| LIQUIDITY RISK MANAGEMENT PROGRAM (Unaudited) |
The Fund has adopted and implemented a written liquidity risk management program (the “Program”) as required by Rule 22e-4 (the “Liquidity Rule”) under the Investment Company Act of 1940, as amended. The Program is reasonably designed to assess and manage the Fund’s liquidity risk, taking into consideration, among other factors, the Fund’s investment strategy and the liquidity of its portfolio investments during normal and reasonably foreseeable stressed conditions; its short- and long-term cash flow projections; and its cash holdings and access to other funding sources. The Fund’s Board of Trustees (the “Board”) approved the appointment of the Liquidity Administrator Committee, comprising of the Fund’s Adviser and certain Trust officers, to be responsible for the Program’s administration and oversight and for reporting to the Board on at least an annual basis regarding the Program’s operation and effectiveness. The annual written report assessing the Program (the “Report”) was presented to the Board at the October 16-17, 2023 Board meeting and covered the period from June 1, 2022 to May 31, 2023 (the “Review Period”).
During the Review Period, the Fund did not experience unusual stress or disruption to its operations related to purchase and redemption activity. Also, during the Review Period, the Fund held adequate levels of cash and highly liquid investments to meet shareholder redemption activities in accordance with applicable requirements. The Report concluded that the Program is reasonably designed to prevent violation of the Liquidity Rule and the Program has been effectively implemented.
CUSTOMER PRIVACY NOTICE
| FACTS | WHAT DOES THE MEEHAN FOCUS FUND (the “Fund”) DO WITH YOUR PERSONAL INFORMATION? |
| | |
| Why? | Financial companies choose how they share your personal information. Federal law gives consumers the right to limit some but not all sharing. Federal law also requires us to tell you how we collect, share, and protect your personal information. Please read this notice carefully to understand what we do. |
| | |
| What? | The types of personal information we collect and share depend on the product or service you have with us. This information can include: ■ Social Security number ■ Assets ■ Retirement Assets ■ Transaction History ■ Checking Account Information ■ Purchase History ■ Account Balances ■ Account Transactions ■ Wire Transfer Instructions When you are no longer our customer, we continue to share your information as described in this notice. |
| | |
| How? | All financial companies need to share your personal information to run their everyday business. In the section below, we list the reasons financial companies can share their customers’ personal information; the reasons the Fund chooses to share; and whether you can limit this sharing. |
| Reasons we can share your personal information | Does the
Fund share? | Can you limit
this sharing? |
| For our everyday business purposes – Such as to process your transactions, maintain your account(s), respond to court orders and legal investigations, or report to credit bureaus | Yes | No |
| For our marketing purposes – to offer our products and services to you | No | We don’t share |
| For joint marketing with other financial companies | No | We don’t share |
| For our affiliates’ everyday business purposes – information about your transactions and experiences | No | We don’t share |
| For our affiliates’ everyday business purposes – information about your creditworthiness | No | We don’t share |
| For nonaffiliates to market to you | No | We don’t share |
| Questions? | Call 1-866-884-5968 |
| Who we are |
| Who is providing this notice? | Meehan Focus Fund Ultimus Fund Distributors, LLC (Distributor) Ultimus Fund Solutions, LLC (Administrator) |
| What we do |
| How does the Fund protect my personal information? | To protect your personal information from unauthorized access and use, we use security measures that comply with federal law. These measures include computer safeguards and secured files and buildings. Our service providers are held accountable for adhering to strict policies and procedures to prevent any misuse of your nonpublic personal information. |
| How does the Fund collect my personal information? | We collect your personal information, for example, when you ■ Open an account ■ Provide account information ■ Give us your contact information ■ Make deposits or withdrawals from your account ■ Make a wire transfer ■ Tell us where to send the money ■ Tell us who receives the money ■ Show your government-issued ID ■ Show your driver’s license We also collect your personal information from other companies. |
| Why can’t I limit all sharing? | Federal law gives you the right to limit only ■ Sharing for affiliates’ everyday business purposes – information about your creditworthiness ■ Affiliates from using your information to market to you ■ Sharing for nonaffiliates to market to you State laws and individual companies may give you additional rights to limit sharing. |
| | |
| Definitions |
| Affiliates | Companies related by common ownership or control. They can be financial and nonfinancial companies. ■ Edgemoor Investment Advisors, Inc., the investment adviser to the Fund, could be deemed to be an affiliate. |
| Nonaffiliates | Companies not related by common ownership or control. They can be financial and nonfinancial companies ■ The Fund does not share with nonaffiliates so they can market to you. |
| Joint marketing | A formal agreement between nonaffiliated financial companies that together market financial products or services to you. ■ The Fund does not jointly market. |
Meehan-SAR-24
Item 2. Code of Ethics.
Not required
Item 3. Audit Committee Financial Expert.
Not required
Item 4. Principal Accountant Fees and Services.
Not required
Item 5. Audit Committee of Listed Registrants.
Not applicable
Item 6. Schedule of Investments.
| (a) | Not applicable [schedule filed with Item 1] |
Item 7. Disclosure of Proxy Voting Policies and Procedures for Closed-End Management Investment Companies.
Not applicable
| Item 8. | Portfolio Managers of Closed-End Management Investment Companies. |
Not applicable
Item 9. Purchases of Equity Securities by Closed-End Management Investment Company and Affiliated Purchasers.
Not applicable
Item 10. Submission of Matters to a Vote of Security Holders.
There has been no material changes to the manner in which shareholders may recommend nominees to the Registrant’s Board of Trustees or the Nominations & Governance Committee (the “Committee”). The Registrant does not have formal procedures by which shareholders may recommend nominees to the Registrant’s Board of Trustees. While the Registrant does not have formal procedure, the Committee shall to the extent required under applicable law, when identifying potential candidates for the position of Independent Trustee, consider any such candidate recommended by a shareholder.
Item 11. Controls and Procedures.
(a) Based on their evaluation of the registrant’s disclosure controls and procedures (as defined in Rule 30a-3(c) under the Investment Company Act of 1940) as of a date within 90 days of the filing date of this report, the registrant’s principal executive officer and principal financial officer have concluded that such disclosure controls and procedures are reasonably designed and are operating effectively to ensure that material information relating to the registrant, including its consolidated subsidiaries, is made known to them by others within those entities, particularly during the period in which this report is being prepared, and that the information required in filings on Form N-CSR is recorded, processed, summarized, and reported on a timely basis.
(b) There were no changes in the registrant’s internal control over financial reporting (as defined in Rule 30a-3(d) under the Investment Company Act of 1940) that occurred during the period covered by this report that have materially affected, or are reasonably likely to materially affect, the registrant’s internal control over financial reporting.
Item 12. Disclosure of Securities Lending Activities for Closed-End Management Investment Companies.
Not applicable
File the exhibits listed below as part of this Form. Letter or number the exhibits in the sequence indicated.
(a)(1) Any code of ethics, or amendment thereto, that is the subject of the disclosure required by Item 2, to the extent that the registrant intends to satisfy the Item 2 requirements through filing of an exhibit: Not required
(a)(2) A separate certification for each principal executive officer and principal financial officer of the registrant as required by Rule 30a-2(a) under the Act (17 CFR 270.30a-2(a)): Attached hereto
(1) Not applicable
(2) Change in the registrant’s independent public accountants: Not applicable
(b) Certifications required by Rule 30a-2(b) under the Act (17 CFR 270.30a-2(b)): Attached hereto
Exhibit 99.CERT Certifications required by Rule 30a-2(a) under the Act
Exhibit 99.906CERT Certifications required by Rule 30a-2(b) under the Act
SIGNATURES
Pursuant to the requirements of the Securities Exchange Act of 1934 and the Investment Company Act of 1940, the registrant has duly caused this report to be signed on its behalf by the undersigned, thereunto duly authorized.
| (Registrant) | Ultimus Managers Trust | | |
| | | | |
| By (Signature and Title)* | /s/ Todd E. Heim | |
| | | Todd E. Heim, President and Principal Executive Officer | |
| | | | |
| Date | May 1, 2024 | | |
| | | | |
| Pursuant to the requirements of the Securities Exchange Act of 1934 and the Investment Company Act of 1940, this report has been signed below by the following persons on behalf of the registrant and in the capacities and on the dates indicated. |
| | | | |
| By (Signature and Title)* | /s/ Todd E. Heim | |
| | | Todd E. Heim, President and Principal Executive Officer | |
| | | | |
| Date | May 1, 2024 | | |
| | | | |
| By (Signature and Title)* | /s/ Daniel D. Bauer | |
| | | Daniel D. Bauer, Treasurer and Principal Financial Officer | |
| | | | |
| Date | May 1, 2024 | | |
* Print the name and title of each signing officer under his or her signature.