UNITED STATES
SECURITIES AND EXCHANGE COMMISSION
Washington, D.C. 20549
FORM N-CSR
CERTIFIED SHAREHOLDER REPORT OF REGISTERED
MANAGEMENT INVESTMENT COMPANIES
| Investment Company Act file number | 811-22680 | |
| Ultimus Managers Trust |
| (Exact name of registrant as specified in charter) |
| 225 Pictoria Drive, Suite 450 Cincinnati, Ohio | 45246 |
| (Address of principal executive offices) | (Zip code) |
Karen Jacoppo-Wood
| Ultimus Fund Solutions, LLC 225 Pictoria Drive, Suite 450 Cincinnati, Ohio 45246_ |
| (Name and address of agent for service) |
| Registrant's telephone number, including area code: | (513) 587-3400 | |
| Date of fiscal year end: | November 30 | |
| | | |
| Date of reporting period: | May 31, 2023 | |
Form N-CSR is to be used by management investment companies to file reports with the Commission not later than 10 days after the transmission to stockholders of any report that is required to be transmitted to stockholders under Rule 30e-1 under the Investment Company Act of 1940 (17 CFR 270.30e-1). The Commission may use the information provided on Form N-CSR in its regulatory, disclosure review, inspection, and policymaking roles.
A registrant is required to disclose the information specified by Form N-CSR, and the Commission will make this information public. A registrant is not required to respond to the collection of information contained in Form N-CSR unless the Form displays a currently valid Office of Management and Budget ("OMB") control number. Please direct comments concerning the accuracy of the information collection burden estimate and any suggestions for reducing the burden to the Secretary, Securities and Exchange Commission, 450 Fifth Street, NW, Washington, DC 20549-0609. The OMB has reviewed this collection of information under the clearance requirements of 44 U.S.C. § 3507.
Explanatory Note: The Registrant is filing this amendment to its Form N-CSR for the fiscal period ended May 31, 2023, originally filed with the Securities and Exchange Commission on July 31, 2023 (Accession Number 0001580642-23-003871). The sole purpose of this amendment is to an exhibit from the Funds' former independent registered public accounting firm as required pursuant to Item 304(a) of Regulation S-K, as amended, as an exhibit to the Form N-CSR filing. Except as set forth above, this amendment does not amend, update or change any other items or disclosures found in the original Form N-CSR filing.
| Item 1. | Reports to Stockholders. |
(a).

LYRICAL U.S. VALUE EQUITY FUND
Institutional Class (LYRIX)
Investor Class (LYRBX)
A Class (LYRAX)
C Class (LYRCX)
LYRICAL INTERNATIONAL VALUE EQUITY FUND
Institutional Class (LYRWX)
Investor Class (LYRNX)
A Class (LYRVX)
C Class (LYRZX)
Semi-Annual Report
May 31, 2023
(Unaudited)
| LYRICAL FUNDS | May 31, 2023 |
| LETTER TO SHAREHOLDERS | (Unaudited) |
Dear Fellow Shareholders,
Enclosed is the Semi-Annual Report to shareholders of the Lyrical U.S. Value Equity Fund (the “U.S. Fund”) and Lyrical International Value Equity Fund (the “International Fund”) (collectively, the “Funds”). On behalf of the Funds and their investment adviser, Lyrical Asset Management LP, I would like to thank you for your investment.
Lyrical U.S. Value Equity
In the last six months, our value approach is down 5.0%, driven by concerns around the recent banking crisis, which negatively impacted cheaper priced stocks. Fundamentally, our portfolio companies are doing well. Nearly every stock is tracking in line with our expectations, at odds with the unusual volatility of stock prices. It seems clear to us that fundamentals are not driving the market. Rather, it seems the banking crisis has sent bond yields tumbling, driving a reinflation of growth stock valuations, especially the mega-caps. It also drove a decline in most other stocks, but especially value stocks.
Our price-to-earnings (P/E) spread versus the S&P 500® Index (S&P 500) is over 100% and our P/E of 9.4, reflecting the extreme negativity discounted in our stock valuations. What is uncommon about Lyrical’s portfolios is not just how cheap our portfolios are but also their attractive growth. Throughout our history our portfolios have had a discounted P/E to the S&P 500 with comparable growth. Currently, our growth profile is much better than that, with not just comparable growth, but superior growth. In fact, this continues to be the best growth profile in our firm’s history.
Since its launch on February 4, 2013 through May 31, 2023, the U.S. Fund’s Institutional Class has produced a cumulative total return of +153.09%, compared to the +240.95% cumulative total return for the S&P 500. For the six months ended May 31, 2023, the U.S. Fund’s Institutional Class has produced a total return of -4.98%, compared to the +3.33% total return for the S&P 500.
For the six months ended May 31, 2023, the three positions that most positively impacted performance were Broadcom Inc. (AVGO), Uber Technologies, Inc. (UBER), and Flex Ltd. (FLEX) with contributions of 245 basis points (bps) (up 49%), 117 bps (up 30%) and 58 bps (up 16%), respectively; conversely, the three positions that most negatively impacted performance were Centene Corporation (CNC), Cigna Group (CI), and Gen Digital Inc. (GEN) which detracted 131 bps (down 29%), 125 bps (down 24%) and 80 bps (down 23%), respectively. Please see the following for commentary on these stocks for the period:
Broadcom Inc. (AVGO) up 49%: Broadcom continues to deliver strong earnings growth despite macroeconomic weakness seen across the IT supply chain, driven by its portfolio diversification combined with its exposure to large customers and strategic IT infrastructure spending. In addition, Broadcom established itself as the 2nd largest AI semiconductor supplier behind NVIDIA, and, in our opinion, only a few companies are ready to power this wave of AI. Also, Apple announced a multibillion-
dollar component supply agreement with Broadcom. The partnership provides significant predictability for Broadcom and provides Apple with supply assurance from their most strategic semiconductor partner. The multi-year supply agreement is, in our opinion, reflective of Broadcom’s technology leadership and its track record of stellar execution supporting a large customer like Apple.
Uber Technologies, Inc. (UBER) up 30%: Uber is demonstrating the benefits of scale and management’s focus on cost efficiency is driving significant operating leverage. The street is starting to notice, and estimates continue to be revised higher. Investments required to build a dominant rides and delivery platform are a drag on profitability in the near term, but at target margins, the stock is trading for 11x 2023 P/E.
Flex Ltd. (FLEX) up 16%: Flex continues to deliver strong earnings growth given its exposure to secularly growing markets, share gains, and solid execution on margin improvement plans. Additionally, in February, Flex completed the IPO of its solar business, Nextracker, at $24 per share. Flex retains a 61% stake in Nextracker and now investors can easily value Flex’s legacy electronic manufacturing services business separately. Excluding Nextracker, Flex is trading at 7.5x P/E.
Centene Corporation. (CNC) down 29%: Centene is down on concerns over member enrollment. Emergency measures enacted in response to the COVID-19 pandemic to expand government sponsored healthcare will be removed in 2023. As the leading provider of Managed Medicaid in the U.S., Centene benefitted from an increase in members that were previously ineligible for Medicaid. Beginning in 2Q23, states began redetermining the threshold for Medicaid eligibility. This means that some of the members picked up during the pandemic would no longer be eligible. This is a minor headwind to earnings per share (EPS) growth, and Centene is still expected to grow EPS 12% in 2023 and 4% in 2024.
Cigna Group (CI) down 24%: Cigna is down due to increasing scrutiny towards Pharmacy Benefit Managers’ (PBM) business practices by lawmakers as prescription drug affordability continues to be an issue within the U.S. healthcare system. We believe Cigna’s PBM business is not as exposed to proposed legislation as it once was given changes to pricing methodologies implemented in recent years. While we agree that prescription drug affordability is a critical issue, we think the role of PBMs is broadly misunderstood and that they do play a meaningful role in lowering healthcare costs, increasing the prevalence of generics, and improving health outcomes. The PBM concerns led to significant multiple compression year-to-date as next 12-month EPS estimates have increased 6% throughout the year, while the P/E dropped to under 10x, from 13x as of year-end 2022. It is also worth mentioning that Cigna outperformed the S&P 500 by 66% in 2022, which is likely a factor contributing to Cigna’s performance in 2023.
Gen Digital Inc. (GEN) down 23%: The balance sheet is an overhang from the transformational Avast deal, completed last year. We believe the debt levels are manageable and, on the positive side, the benefits of the merger are showing up in results. Gen Digital is a leading global consumer cyber safety provider, with a subscription software business that is highly attractive. The company has 50%+
operating margins and little capital employed, resulting in extraordinary returns on invested capital and abundant free cash flow. The merger with Avast significantly increased the company’s addressable market. Gen Digital trades at less than 9x NTM EPS. By 2027, we believe the company should generate about $2.50 of EPS, adjusting for higher interest rates on variable rate loans and on debt as it matures.
In analyzing the U.S. Fund portfolio’s performance attribution, we find it helpful to examine both the investment success rate and any skew in the distribution of returns. Over the life of the U.S. Fund, 73% of the U.S. Fund’s investments posted gains, and 52% outperformed the S&P 500. Skew has been a positive factor, as the U.S. Fund’s outperformers have outperformed by 198%, while our underperformers have underperformed by 90% over the life of the U.S. Fund. For the six-month period ended May 31, 2023, 26% of the U.S. Fund’s investments posted gains, and 23% outperformed the S&P 500. For the six-month period, skew has been a negative factor as the U.S. Fund’s outperformers have outperformed by 16%, while its underperformers have underperformed by 18%.
During the life of the U.S. Fund, we have sold fifty-two positions, as ten companies announced they were being acquired, twenty-six approached our estimates of fair value, for five we lost conviction in our investment thesis, for one the company announced or completed acquisitions which increased the complexity and decreased analyzability and for ten the risk/reward became less compelling than other investment opportunities. For each sale we added a new position from our pipeline of investment opportunities.
As of May 31, 2023, the valuation of our portfolio is 9.4 times the next twelve months consensus earnings. The S&P 500 has a valuation of 18.3 times earnings on this same basis, a premium of 94.7% over the U.S. Fund.
Lyrical International Value Equity
In March 2020, we launched the Lyrical International Value Equity Fund to apply our value strategy to the international space. Our portfolio is constructed to be balanced and diversified across approximately 25-40 positions, giving us exposure to as many different types of companies and situations as possible without sacrificing our strict investment standards.
Since its launch on March 2, 2020 through May 31, 2023, the Lyrical International Value Equity Fund – Institutional Class has produced a total return of +20.45%, compared to the +21.71% total return for the MSCI EAFE. For the six months ended May 31, 2023, the International Fund’s Institutional Class produced a total return of +1.33% compared to the total return for the MSCI EAFE of +6.89%.
For the six months ended May 2023, the three positions that most positively impacted performance were Fairfax Financial Holdings Limited (FFH-CA), Bollore SE (BOL-FR), and Sony Group Corporation (6758-JP) with contributions of 125 basis points (bps) (up 28%), 89 bps (up 16%) and 61 bps (up 17%), respectively; conversely, the three positions that most negatively impacted performance were Liberty Global Plc Class C (LBTYK-US), CNH Industrial NV (CNHI-US), and Teleperformance SA (TEP-FR) which detracted 67 bps (down 18%), 57 bps (down 14%) and 45 bps (down 11%), respectively. Our commentary on these stocks for the period follows:
Fairfax Financial Holdings Limited (FFH-CA) up 28%: Fairfax is a Canadian insurance business overseen by value investor (and major shareholder) Prem Watsa. This diversified insurance business is managed as a series of decentralized business units, each incentivized to maximize underwriting profit rather than grow premiums. This focus on profit over revenues has produced a leading underwriting track record, with an average 95% combined ratio for more than three decades. With interest rates at record lows in the past ten years, Fairfax reduced exposure to long-dated bonds. Fairfax therefore benefits in a rising rate environment, such as we have seen during the past six months, since the company can increase yields on its bond investments. Furthermore, the company is rapidly expanding premium growth, as the company is finding highly profitable underwriting opportunities, given increased pricing through the industry.
Bollore SE (BOL-FR) up 16%: Bollore is a collection of high-quality assets, most notably Universal Music Group (which was spun out of Vivendi) and logistics. The company is managed by an owner-operator, Vincent Bollore, who has a long-term track record of shareholder returns. Bollore is up during the period as it announced an acquisition offer for its logistics business and instituted a share repurchase plan.
Sony Group Corporation (6758-JP) up 17%: Sony is a global leader in entertainment, with a top three position in: video games, music, and film production. This is an IP-driven content company which controls one of the widest entertainment libraries in the world, including the second largest collection of music rights and time-tested assets like Spider-Man and Jeopardy. Over the past six months, EPS estimates have increased modestly, with most of the price improvement coming from multiple expansion.
Liberty Global Plc Class C (LBTYK-US) down 18%: Liberty Global is a US-based holding company of leading European telecommunications operators. The holding company is debt-free and holds more than 75% of its market capitalization in cash and securities. Liberty’s operating subsidiaries include: Virgin Media in the UK, Telenet in Belgium, and UPC in Switzerland. Each subsidiary is a leader in European fixed line and mobile telecommunications, with the #1 or #2 market position. The stock is down during the period, despite stable fundamentals, as there are concerns about competitive pressures in European cable markets. We believe the stock is priced for those concerns and see significant upside to intrinsic value.
CNH Industrial NV (CNHI-US) down 14%: CNH Industrial operates in the agriculture and construction industries with over 90% of profits coming from its agriculture segment, where it is the #2 global player. CNH designs, manufactures, and distributes a full line of farm machinery, including tractors, combines, and harvesters. CNH is a high-quality business, with a healthy balance sheet that generates a 20% return on capital. CNH benefits from attractive secular trends in farming, producing equipment that is increasingly equipped with advanced precision-agriculture technologies. For example, a smart combine automates adjustments, previously made by a skilled operator, by using cameras and sensors to detect changes in crop conditions. These technologies have directly resulted in 1-2% annualized crop yield improvements over
the past 20 years. The stock is down over the period, despite earnings estimates up 11% as there are concerns about the impact from a weak macroeconomic environment.
Teleperformance SA (TEP-FR) down 11%: Teleperformance is the world’s largest Business Process Outsourcing (BPO) provider. The company outsources all functions of customer experience for its clients, including customer service and analytics, and helps manage business processes, back-office, and IT. Concerns around the proliferation of artificial intelligence have recently weighed on the stock, which is down more than 30% year-to-date. We believe AI fears are overblown, given that the company has consistently implemented new technology to reduce human volumes, which reduces costs for clients while improving margins. The company estimates that about 5% of volumes each year have historically been lost due to implanting new tech like chatbots, machine learning, and, more recently, artificial intelligence. Despite this volume cannibalization, Teleperformance has continued to grow more than 10% per year organically as it handles increasingly complex work, takes share from the weaker competitors that make up ~90% of the industry, and benefits from the ~70% of industry volumes that remain insourced.
In analyzing the International Fund portfolio’s performance attribution, we find it helpful to examine both the investment success rate and any skew in the distribution of returns. Over the life of the International Fund, 56% of the International Fund’s investments posted gains, and 46% outperformed the MSCI EAFE. Skew has been a positive factor, as the International Fund’s outperformers have outperformed by 50%, while our underperformers have underperformed by 31% over the life of the International Fund. For the six-month period ended May 31, 2023, 58% of the International Fund’s investments posted gains, and 50% outperformed the MSCI EAFE. For the six-month period, skew has been a negative factor as the International Fund’s outperformers have outperformed by 11%, while our underperformers have underperformed by 15%.
During the life of the International Fund, we have sold 21 positions, as two companies announced they were being acquired, seven approached our estimates of fair value, for eight we lost conviction in our thesis, and for four the risk/reward became less compelling than other investment opportunities. For each sale we added a new position from our pipeline of investment opportunities.
As of May 31, 2023, the valuation of our portfolio is 9.3x the next twelve months consensus earnings. The MSCI EAFE has a valuation of 12.7x earnings on this same basis, a premium of 37% over the International Fund.
Thank you for your continued trust and interest in Lyrical Asset Management.
Sincerely,
Andrew Wellington
Portfolio Manager
Past performance is not predictive of future performance. Investment results and principal value will fluctuate so that shares, when redeemed, may be worth more or less than their original cost. Current performance may be higher or lower than the performance data quoted. Performance data current to the most recent month end are available by calling 1-888-884-8099.
An investor should consider the investment objectives, risks, charges and expenses of the Funds carefully before investing. The Funds’ prospectus contains this and other important information. To obtain a copy of the Funds’ prospectus please visit the Funds’ website at www.lyricalvaluefunds.com or call 1-888-884-8099 and a copy will be sent to you free of charge. Please read the prospectus carefully before you invest. The Funds are distributed by Ultimus Fund Distributors, LLC.
The Letter to Shareholders seeks to describe some of the Adviser’s current opinions and views of the financial markets. Although the Adviser believes it has a reasonable basis for any opinions or views expressed, actual results may differ, sometimes significantly so, from those expected or expressed. The securities held by the Funds that are discussed in the Letter to Shareholders were held during the period covered by this Report. They do not comprise the entire investment portfolios of the Funds, may be sold at any time, and may no longer be held by the Funds. For a complete list of securities held by the Funds as of May 31, 2023, please see the Schedules of Investments section of this Report. The opinions of the Adviser with respect to those securities may change at any time.
Statements in the Letter to Shareholders that reflect projections or expectations for future financial or economic performance of the Funds and the market in general and statements of the Funds’ plans and objectives for future operations are forward-looking statements. No assurance can be given that actual results or events will not differ materially from those projected, estimated, assumed, or anticipated in any such forward- looking statements. Important factors that could result in such differences, in addition to factors noted with such forward-looking statements include, without limitation, general economic conditions, such as inflation, recession, and interest rates. Past performance is not a guarantee of future results.
| LYRICAL U.S. VALUE EQUITY FUND |
| PORTFOLIO INFORMATION |
| May 31, 2023 (Unaudited) |
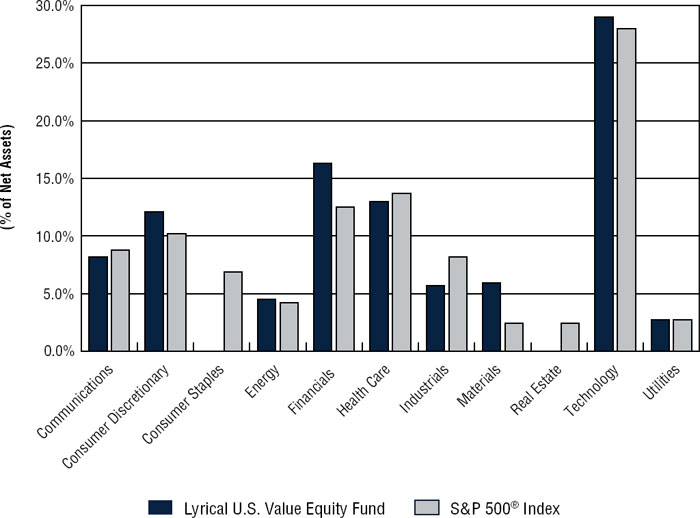
Lyrical U.S. Value Equity Fund vs. S&P 500® Index
Sector Diversification
Top Ten Equity Holdings
| | | % of |
| Security Description | | Net Assets |
| United Rentals, Inc. | | 5.7% |
| Uber Technologies, Inc. | | 5.6% |
| Broadcom, Inc. | | 5.6% |
| HCA Healthcare, Inc. | | 5.3% |
| Ameriprise Financial, Inc. | | 4.7% |
| Suncor Energy, Inc. | | 4.5% |
| Flex Ltd. | | 4.2% |
| Cigna Group (The) | | 4.1% |
| Global Payments, Inc. | | 4.0% |
| eBay, Inc. | | 3.8% |
| LYRICAL INTERNATIONAL VALUE EQUITY FUND |
| PORTFOLIO INFORMATION |
| May 31, 2023 (Unaudited) |
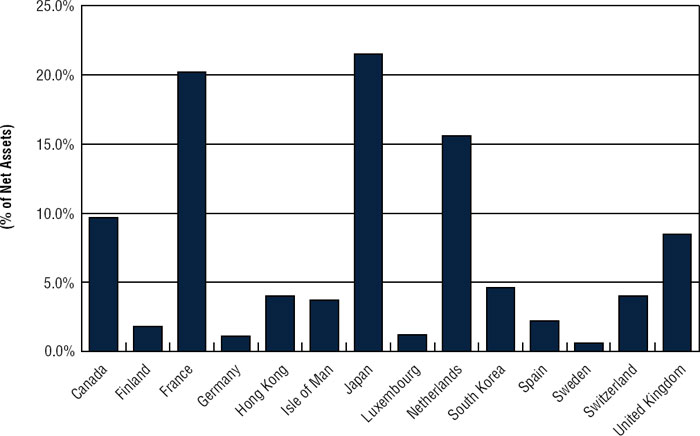
Lyrical International Value Equity Fund
Country Diversification
Top Ten Equity Holdings
| | | % of |
| Security Description | | Net Assets |
| Bollore SE | | 4.7% |
| ITOCHU Corporation | | 4.6% |
| Samsung Electronics Company Ltd. | | 4.6% |
| Exor N.V. | | 4.5% |
| Fairfax Financial Holdings Ltd. | | 4.5% |
| Nintendo Company Ltd. - ADR | | 4.3% |
| Sony Group Corporation | | 4.3% |
| Julius Baer Group Ltd. | | 4.0% |
| Ashtead Group plc | | 4.0% |
| AerCap Holdings N.V. | | 4.0% |
| LYRICAL U.S. VALUE EQUITY FUND |
| SCHEDULE OF INVESTMENTS |
| May 31, 2023 (Unaudited) |
| COMMON STOCKS — 97.4% | | Shares | | | Value | |
| Communications — 8.2% | | | | | | | | |
| Cable & Satellite — 2.6% | | | | | | | | |
| Liberty Global plc - Series C (a) | | | 787,442 | | | $ | 13,402,263 | |
| | | | | | | | | |
| Internet Media & Services — 5.6% | | | | | | | | |
| Uber Technologies, Inc. (a) | | | 745,538 | | | | 28,278,256 | |
| | | | | | | | | |
| Consumer Discretionary — 12.1% | | | | | | | | |
| Apparel & Textile Products — 0.5% | | | | | | | | |
| Hanesbrands, Inc. | | | 594,677 | | | | 2,444,123 | |
| | | | | | | | | |
| Automotive — 3.2% | | | | | | | | |
| Adient plc (a) | | | 138,714 | | | | 4,673,275 | |
| Lear Corporation | | | 96,247 | | | | 11,805,657 | |
| | | | | | | | 16,478,932 | |
| E-Commerce Discretionary — 3.8% | | | | | | | | |
| eBay, Inc. | | | 452,228 | | | | 19,237,779 | |
| | | | | | | | | |
| Home & Office Products — 2.6% | | | | | | | | |
| Whirlpool Corporation | | | 102,477 | | | | 13,249,251 | |
| | | | | | | | | |
| Retail - Discretionary — 2.0% | | | | | | | | |
| Lithia Motors, Inc. | | | 42,361 | | | | 9,881,974 | |
| | | | | | | | | |
| Energy — 4.5% | | | | | | | | |
| Oil & Gas Producers — 4.5% | | | | | | | | |
| Suncor Energy, Inc. | | | 807,375 | | | | 22,606,500 | |
| | | | | | | | | |
| Financials — 16.3% | | | | | | | | |
| Asset Management — 6.8% | | | | | | | | |
| Affiliated Managers Group, Inc. | | | 77,181 | | | | 10,735,105 | |
| Ameriprise Financial, Inc. | | | 79,849 | | | | 23,832,531 | |
| | | | | | | | 34,567,636 | |
| Insurance — 4.4% | | | | | | | | |
| Assurant, Inc. | | | 97,156 | | | | 11,657,749 | |
| Primerica, Inc. | | | 58,848 | | | | 10,711,513 | |
| | | | | | | | 22,369,262 | |
| Specialty Finance — 5.1% | | | | | | | | |
| AerCap Holdings N.V. (a) | | | 279,003 | | | | 15,925,491 | |
| Air Lease Corporation | | | 196,573 | | | | 7,473,705 | |
| Bread Financial Holdings, Inc. | | | 85,942 | | | | 2,421,846 | |
| | | | | | | | 25,821,042 | |
| LYRICAL U.S. VALUE EQUITY FUND |
| SCHEDULE OF INVESTMENTS (Continued) |
| COMMON STOCKS — 97.4% (Continued) | | Shares | | | Value | |
| Health Care — 13.0% | | | | | | | | |
| Health Care Facilities & Services — 13.0% | | | | | | | | |
| Centene Corporation (a) | | | 294,445 | | | $ | 18,376,312 | |
| Cigna Group (The) | | | 84,838 | | | | 20,989,770 | |
| HCA Healthcare, Inc. | | | 101,198 | | | | 26,735,500 | |
| | | | | | | | 66,101,582 | |
| Industrials — 5.7% | | | | | | | | |
| Industrial Support Services — 5.7% | | | | | | | | |
| United Rentals, Inc. | | | 87,452 | | | | 29,190,603 | |
| | | | | | | | | |
| Materials — 5.9% | | | | | | | | |
| Chemicals — 3.3% | | | | | | | | |
| Celanese Corporation | | | 161,435 | | | | 16,792,468 | |
| | | | | | | | | |
| Containers & Packaging — 2.6% | | | | | | | | |
| Berry Global Group, Inc. | | | 228,799 | | | | 13,089,591 | |
| | | | | | | | | |
| Technology — 29.0% | | | | | | | | |
| Semiconductors — 5.6% | | | | | | | | |
| Broadcom, Inc. | | | 34,933 | | | | 28,224,467 | |
| | | | | | | | | |
| Software — 4.3% | | | | | | | | |
| Concentrix Corporation | | | 79,917 | | | | 7,008,721 | |
| Gen Digital, Inc. | | | 858,301 | | | | 15,054,599 | |
| | | | | | | | 22,063,320 | |
| Technology Hardware — 15.1% | | | | | | | | |
| Arrow Electronics, Inc. (a) | | | 127,652 | | | | 16,165,849 | |
| CommScope Holding Company, Inc. (a) | | | 326,386 | | | | 1,357,766 | |
| F5, Inc. (a) | | | 97,123 | | | | 14,333,412 | |
| Flex Ltd. (a) | | | 834,071 | | | | 21,177,063 | |
| TD SYNNEX Corporation | | | 96,619 | | | | 8,635,806 | |
| Western Digital Corporation (a) | | | 386,065 | | | | 14,952,298 | |
| | | | | | | | 76,622,194 | |
| Technology Services — 4.0% | | | | | | | | |
| Global Payments, Inc. | | | 209,411 | | | | 20,457,360 | |
| | | | | | | | | |
| Utilities — 2.7% | | | | | | | | |
| Electric Utilities — 2.7% | | | | | | | | |
| NRG Energy, Inc. | | | 398,368 | | | | 13,460,855 | |
| | | | | | | | | |
| Total Common Stocks (Cost $420,967,766) | | | | | | $ | 494,339,458 | |
| LYRICAL U.S. VALUE EQUITY FUND |
| SCHEDULE OF INVESTMENTS (Continued) |
| MONEY MARKET FUNDS — 0.5% | | Shares | | | Value | |
| Invesco Treasury Portfolio - Institutional Class, 5.04% (b) (Cost $2,843,122) | | | 2,843,122 | | | $ | 2,843,122 | |
| | | | | | | | | |
| Investments at Value — 97.9% (Cost $423,810,888) | | | | | | $ | 497,182,580 | |
| | | | | | | | | |
| Other Assets in Excess of Liabilities — 2.1% | | | | | | | 10,550,281 | |
| | | | | | | | | |
| Net Assets — 100.0% | | | | | | $ | 507,732,861 | |
N.V. - Naamloze Vennootschap
plc - Public Limited Company
| (a) | Non-income producing security. |
| (b) | The rate shown is the 7-day effective yield as of May 31, 2023. |
See accompanying notes to financial statements.
| LYRICAL INTERNATIONAL VALUE EQUITY FUND |
| SCHEDULE OF INVESTMENTS |
| May 31, 2023 (Unaudited) |
| COMMON STOCKS — 98.7% | | Shares | | | Value | |
| Canada — 9.7% | | | | | | | | |
| Fairfax Financial Holdings Ltd. | | | 681 | | | $ | 488,773 | |
| Linamar Corporation | | | 3,891 | | | | 172,253 | |
| Suncor Energy, Inc. | | | 14,003 | | | | 392,084 | |
| | | | | | | | 1,053,110 | |
| Finland — 1.8% | | | | | | | | |
| Konecranes OYJ | | | 5,314 | | | | 198,778 | |
| | | | | | | | | |
| France — 20.2% | | | | | | | | |
| ALD S.A. | | | 34,251 | | | | 369,579 | |
| Bollore SE | | | 79,336 | | | | 508,936 | |
| Elis S.A. | | | 13,942 | | | | 241,876 | |
| Rexel S.A. | | | 18,170 | | | | 372,944 | |
| SPIE S.A. | | | 10,410 | | | | 309,495 | |
| Teleperformance | | | 2,670 | | | | 399,454 | |
| | | | | | | | 2,202,284 | |
| Germany — 1.1% | | | | | | | | |
| Auto1 Group SE (a) | | | 14,411 | | | | 124,125 | |
| | | | | | | | | |
| Hong Kong — 4.0% | | | | | | | | |
| CK Hutchison Holdings Ltd. | | | 71,542 | | | | 431,297 | |
| | | | | | | | | |
| Isle of Man — 3.7% | | | | | | | | |
| Entain plc | | | 24,459 | | | | 403,115 | |
| | | | | | | | | |
| Japan — 21.5% | | | | | | | | |
| Air Water, Inc. | | | 14,698 | | | | 192,531 | |
| ITOCHU Corporation | | | 14,781 | | | | 498,891 | |
| Kinden Corporation | | | 12,995 | | | | 169,631 | |
| Kyudenko Corporation | | | 4,624 | | | | 122,246 | |
| Nintendo Company Ltd. - ADR | | | 44,400 | | | | 469,308 | |
| SK Kaken Company Ltd. | | | 76 | | | | 22,444 | |
| Sony Group Corporation | | | 4,961 | | | | 465,164 | |
| Suzuki Motor Corporation | | | 12,367 | | | | 407,162 | |
| | | | | | | | 2,347,377 | |
| Luxembourg — 1.2% | | | | | | | | |
| Ardagh Metal Packaging S.A. | | | 37,323 | | | | 134,736 | |
| | | | | | | | | |
| Netherlands — 15.6% | | | | | | | | |
| AerCap Holdings N.V. (a) | | | 7,653 | | | | 436,833 | |
| CNH Industrial N.V. | | | 29,400 | | | | 377,202 | |
| LYRICAL INTERNATIONAL VALUE EQUITY FUND |
| SCHEDULE OF INVESTMENTS (Continued) |
| COMMON STOCKS — 98.7% (Continued) | | Shares | | | Value | |
| Netherlands — 15.6% (Continued) | | | | | | | | |
| Euronext N.V. | | | 5,874 | | | $ | 391,877 | |
| Exor N.V. (a) | | | 5,891 | | | | 489,138 | |
| | | | | | | | 1,695,050 | |
| South Korea — 4.6% | | | | | | | | |
| Samsung Electronics Company Ltd. | | | 367 | | | | 495,083 | |
| | | | | | | | | |
| Spain — 2.2% | | | | | | | | |
| Grupo Catalana Occidente S.A. | | | 7,692 | | | | 238,469 | |
| | | | | | | | | |
| Sweden — 0.6% | | | | | | | | |
| Intrum AB | | | 9,173 | | | | 65,795 | |
| | | | | | | | | |
| Switzerland — 4.0% | | | | | | | | |
| Julius Baer Group Ltd. | | | 7,132 | | | | 437,935 | |
| | | | | | | | | |
| United Kingdom — 8.5% | | | | | | | | |
| Ashtead Group plc | | | 7,167 | | | | 437,623 | |
| Babcock International Group plc (a) | | | 33,551 | | | | 128,470 | |
| Liberty Global plc - Series C (a) | | | 21,309 | | | | 362,679 | |
| | | | | | | | 928,772 | |
| | | | | | | | | |
| Total Common Stocks (Cost $10,978,801) | | | | | | $ | 10,755,926 | |
| LYRICAL INTERNATIONAL VALUE EQUITY FUND |
| SCHEDULE OF INVESTMENTS (Continued) |
| MONEY MARKET FUNDS — 0.4% | | Shares | | | Value | |
| Invesco Treasury Portfolio - Institutional Class, 5.04% (b) (Cost $46,444) | | | 46,444 | | | $ | 46,444 | |
| | | | | | | | | |
| Investments at Value — 99.1% (Cost $11,025,245) | | | | | | $ | 10,802,370 | |
| | | | | | | | | |
| Other Assets in Excess of Liabilities — 0.9% | | | | | | | 97,152 | |
| | | | | | | | | |
| Net Assets — 100.0% | | | | | | $ | 10,899,522 | |
AB - Aktiebolag
ADR - American Depositary Receipt
N.V. - Naamloze Vennootschap
OYJ - Julkinen Osakeyhtio
plc - Public Limited Company
S.A. - Societe Anonyme
SE - Societe Europaea
| (a) | Non-income producing security. |
| (b) | The rate shown is the 7-day effective yield as of May 31, 2023. |
See accompanying notes to financial statements.
| LYRICAL INTERNATIONAL VALUE EQUITY FUND |
| SCHEDULE OF INVESTMENTS (Continued) |
| | | % of | |
| Common Stocks by Sector/Industry | | Net Assets | |
| Communications — 9.1% | | | | |
| Cable & Satellite | | | 3.3 | % |
| Entertainment Content | | | 4.7 | % |
| Internet Media & Services | | | 1.1 | % |
| Consumer Discretionary — 12.4% | | | | |
| Automotive | | | 5.3 | % |
| Leisure Facilities & Services | | | 3.7 | % |
| Retail — Discretionary | | | 3.4 | % |
| Consumer Staples — 8.5% | | | | |
| Retail — Consumer Staples | | | 3.9 | % |
| Wholesale — Consumer Staples | | | 4.6 | % |
| Energy — 3.6% | | | | |
| Oil & Gas Producers | | | 3.6 | % |
| Financials — 23.4% | | | | |
| Asset Management | | | 8.5 | % |
| Institutional Financial Services | | | 3.6 | % |
| Insurance | | | 6.7 | % |
| Specialty Finance | | | 4.6 | % |
| Industrials — 21.7% | | | | |
| Commercial Support Services | | | 2.2 | % |
| Engineering & Construction | | | 5.5 | % |
| Industrial Support Services | | | 7.5 | % |
| Machinery | | | 5.3 | % |
| Transportation & Logistics | | | 1.2 | % |
| Materials — 3.2% | | | | |
| Chemicals | | | 2.0 | % |
| Containers & Packaging | | | 1.2 | % |
| Technology — 16.8% | | | | |
| Technology Hardware | | | 13.1 | % |
| Technology Services | | | 3.7 | % |
| | | | 98.7 | % |
See accompanying notes to financial statements.
| LYRICAL FUNDS |
| STATEMENTS OF ASSETS AND LIABILITIES |
| May 31, 2023 (Unaudited) |
| | | Lyrical | | | Lyrical | |
| | | U.S. Value | | | International | |
| | | Equity Fund | | | Value Equity Fund | |
| ASSETS | | | | | | | | |
| Investments in securities: | | | | | | | | |
| At cost | | $ | 423,810,888 | | | $ | 11,025,245 | |
| At value (Note 2) | | $ | 497,182,580 | | | $ | 10,802,370 | |
| Receivable for capital shares sold | | | 711,325 | | | | — | |
| Receivable for investment securities sold | | | 10,886,024 | | | | — | |
| Receivable from Adviser (Note 4) | | | — | | | | 14,041 | |
| Dividends receivable | | | 590,044 | | | | 88,852 | |
| Tax reclaims receivable | | | — | | | | 1,218 | |
| Other assets | | | 40,976 | | | | 14,364 | |
| Total assets | | | 509,410,949 | | | | 10,920,845 | |
| | | | | | | | | |
| LIABILITIES | | | | | | | | |
| Payable for capital shares redeemed | | | 1,250,256 | | | | — | |
| Payable to Adviser (Note 4) | | | 344,787 | | | | — | |
| Payable to administrator (Note 4) | | | 60,697 | | | | 12,101 | |
| Accrued distribution fees (Note 4) | | | 7,700 | | | | 62 | |
| Other accrued expenses | | | 14,648 | | | | 9,160 | |
| Total liabilities | | | 1,678,088 | | | | 21,323 | |
| | | | | | | | | |
| NET ASSETS | | $ | 507,732,861 | | | $ | 10,899,522 | |
| | | | | | | | | |
| NET ASSETS CONSIST OF: | | | | | | | | |
| Paid-in capital | | $ | 476,525,124 | | | $ | 11,187,888 | |
| Accumulated earnings (deficit) | | | 31,207,737 | | | | (288,366 | ) |
| NET ASSETS | | $ | 507,732,861 | | | $ | 10,899,522 | |
| | | | | | | | | |
| NET ASSET VALUE PER SHARE: | | | | | | | | |
| INSTITUTIONAL CLASS | | | | | | | | |
| Net assets applicable to Institutional Class | | $ | 500,172,690 | | | $ | 10,573,646 | |
| Institutional Class shares of beneficial interest outstanding (unlimited number of shares authorized, no par value) | | | 27,595,032 | | | | 961,347 | |
| Net asset value, offering price and redemption price per share (Note 2) | | $ | 18.13 | | | $ | 11.00 | |
| INVESTOR CLASS | | | | | | | | |
| Net assets applicable to Investor Class | | $ | 7,131,688 | | | $ | 314,379 | |
| Investor Class shares of beneficial interest outstanding (unlimited number of shares authorized, no par value) | | | 396,396 | | | | 28,685 | |
| Net asset value, offering price and redemption price per share (Note 2) | | $ | 17.99 | | | $ | 10.96 | |
See accompanying notes to financial statements.
| LYRICAL FUNDS |
| STATEMENTS OF ASSETS AND LIABILITIES |
| May 31, 2023 (Unaudited)(Continued) |
| | | Lyrical | | | Lyrical | |
| | | U.S. Value | | | International | |
| | | Equity Fund | | | Value Equity Fund | |
| NET ASSET VALUE PER SHARE: | | | | | | | | |
| A Class | | | | | | | | |
| Net assets applicable to A Class | | $ | 45,532 | | | $ | 5,768 | |
| A Class shares of beneficial interest outstanding (unlimited number of shares authorized, no par value) | | | 2,516 | | | | 525 | |
| Net asset value and redemption price per share (Note 2) | | $ | 18.10 | | | $ | 10.99 | |
| Maximum sales charge | | | 5.75 | % | | | 5.75 | % |
| Maximum offering price per share (Note 2) | | $ | 19.20 | | | $ | 11.66 | |
| C Class | | | | | | | | |
| Net assets applicable to C Class | | $ | 382,951 | | | $ | 5,729 | |
| C Class shares of beneficial interest outstanding (unlimited number of shares authorized, no par value) | | | 21,285 | | | | 523 | |
| Net asset value, offering price and redemption price per share (Note 2) | | $ | 17.99 | | | $ | 10.95 | |
| Redemption price per share with CDSC fee (Note 2)(a) | | $ | 17.81 | | | $ | 10.84 | |
| (a) | A contingent deferred sales charge (“CDSC”) of 1.00% is charged on C Class shares redeemed within one year of purchase. Redemption price per share is equal to net asset value less any redemption fee or CDSC. |
See accompanying notes to financial statements.
| LYRICAL FUNDS |
| STATEMENTS OF OPERATIONS |
| Six Months Ended May 31, 2023 (Unaudited) |
| | | Lyrical | | | Lyrical | |
| | | U.S. Value | | | International | |
| | | Equity Fund | | | Value Equity Fund | |
| INVESTMENT INCOME | | | | | | | | |
| Dividend income | | $ | 4,939,335 | | | $ | 208,776 | |
| Foreign witholding taxes on dividends | | | (122,425 | ) | | | (22,950 | ) |
| Total investment income | | | 4,816,910 | | | | 185,826 | |
| | | | | | | | | |
| EXPENSES | | | | | | | | |
| Management fees (Note 4) | | | 2,642,934 | | | | 34,994 | |
| Administration fees (Note 4) | | | 248,770 | | | | 15,000 | |
| Transfer agent fees (Notes 2 and 4) | | | 88,549 | | | | 24,000 | |
| Fund accounting fees (Note 4) | | | 52,534 | | | | 27,416 | |
| Registration and filing fees (Notes 2 and 4) | | | 44,284 | | | | 7,851 | |
| Custody and bank service fees | | | 31,355 | | | | 9,689 | |
| Compliance fees and expenses (Note 4) | | | 32,211 | | | | 6,141 | |
| Legal fees | | | 18,741 | | | | 18,741 | |
| Postage and supplies | | | 19,133 | | | | 3,870 | |
| Borrowing costs (Note 5) | | | 22,057 | | | | — | |
| Trustees’ fees and expenses (Note 4) | | | 9,891 | | | | 9,891 | |
| Audit and tax services fees | | | 8,200 | | | | 8,500 | |
| Networking fees | | | 13,996 | | | | 196 | |
| Distribution fees (Notes 2 and 4) | | | 10,425 | | | | 1,141 | |
| Insurance expense | | | 4,255 | | | | 1,581 | |
| Printing of shareholder reports | | | 2,675 | | | | 2,675 | |
| Other expenses | | | 11,290 | | | | 14,601 | |
| Total expenses | | | 3,261,300 | | | | 186,287 | |
| Less fees reduced and/or expenses reimbursed by Adviser (Note 4) | | | (150,576 | ) | | | (144,384 | ) |
| Net expenses | | | 3,110,724 | | | | 41,903 | |
| | | | | | | | | |
| NET INVESTMENT INCOME | | | 1,706,186 | | | | 143,923 | |
| | | | | | | | | |
| REALIZED AND UNREALIZED LOSSES ON INVESTMENTS AND FOREIGN CURRENCIES | | | | | | | | |
| Net realized losses from investment transactions | | | (10,057,575 | ) | | | (96,053 | ) |
| Net realized losses from foreign currency transactions (Note 2) | | | (8,359 | ) | | | (19,182 | ) |
| Net change in unrealized appreciation (depreciation) on investments | | | (18,214,184 | ) | | | (279,557 | ) |
| Net change in unrealized appreciation (depreciation) on foreign currency translation | | | — | | | | (1,137 | ) |
| NET REALIZED AND UNREALIZED LOSSES ON INVESTMENTS AND FOREIGN CURRENCIES | | | (28,280,118 | ) | | | (395,929 | ) |
| | | | | | | | | |
| NET DECREASE IN NET ASSETS RESULTING FROM OPERATIONS | | $ | (26,573,932 | ) | | $ | (252,006 | ) |
See accompanying notes to financial statements.
| LYRICAL U.S. VALUE EQUITY FUND |
| STATEMENTS OF CHANGES IN NET ASSETS |
| | | Six Months | | | Year/Period | |
| | | Ended | | | Ended | |
| | | May 31, 2023 | | | November 30, | |
| | | (Unaudited) | | | 2022 (a) | |
| FROM OPERATIONS | | | | | | | | |
| Net investment income | | $ | 1,706,186 | | | $ | 2,436,467 | |
| Net realized gains (losses) from investment transactions | | | (10,057,575 | ) | | | 35,705,756 | |
| Net realized losses from foreign currency transactions | | | (8,359 | ) | | | (19,887 | ) |
| Net change in unrealized appreciation (depreciation) on investments | | | (18,214,184 | ) | | | (89,054,197 | ) |
| Net decrease in net assets resulting from operations | | | (26,573,932 | ) | | | (50,931,861 | ) |
| | | | | | | | | |
| FROM DISTRIBUTIONS TO SHAREHOLDERS (Note 2) | | | | | | | | |
| Institutional Class | | | (2,731,975 | ) | | | (32,015,143 | ) |
| Investor Class | | | (10,806 | ) | | | (365,422 | ) |
| A Class | | | (59 | ) | | | (649 | ) |
| C Class | | | (76 | ) | | | (1,456 | ) |
| Decrease in net assets from distributions to shareholders | | | (2,742,916 | ) | | | (32,382,670 | ) |
| | | | | | | | | |
| CAPITAL SHARE TRANSACTIONS | | | | | | | | |
| Institutional Class | | | | | | | | |
| Proceeds from shares sold | | | 98,273,909 | | | | 228,168,460 | |
| Net asset value of shares issued in reinvestment of distributions to shareholders | | | 1,435,956 | | | | 20,933,647 | |
| Payments for shares redeemed | | | (225,925,518 | ) | | | (207,336,929 | ) |
| Net increase (decrease) in Institutional Class net assets from capital share transactions | | | (126,215,653 | ) | | | 41,765,178 | |
| | | | | | | | | |
| Investor Class | | | | | | | | |
| Proceeds from shares sold | | | 1,185,965 | | | | 3,176,497 | |
| Net asset value of shares issued in reinvestment of distributions to shareholders | | | 8,706 | | | | 294,749 | |
| Payments for shares redeemed | | | (1,413,955 | ) | | | (3,002,926 | ) |
| Net increase (decrease) in Investor Class net assets from capital share transactions | | | (219,284 | ) | | | 468,320 | |
| | | | | | | | | |
| A Class | | | | | | | | |
| Proceeds from shares sold | | | 34,983 | | | | 12,505 | |
| Net asset value of shares issued in reinvestment of distributions to shareholders | | | 59 | | | | 649 | |
| Net increase in A Class net assets from capital share transactions | | | 35,042 | | | | 13,154 | |
| | | | | | | | | |
| C Class | | | | | | | | |
| Proceeds from shares sold | | | 369,297 | | | | 29,900 | |
| Net asset value of shares issued in reinvestment of distributions to shareholders | | | 76 | | | | 1,168 | |
| Net increase in C Class net assets from capital share transactions | | | 369,373 | | | | 31,068 | |
| | | | | | | | | |
| TOTAL DECREASE IN NET ASSETS | | | (155,347,370 | ) | | | (41,036,811 | ) |
| LYRICAL U.S. VALUE EQUITY FUND |
| STATEMENTS OF CHANGES IN NET ASSETS (Continued) |
| | | Six Months | | | Year/Period | |
| | | Ended | | | Ended | |
| | | May 31, 2023 | | | November 30, | |
| | | (Unaudited) | | | 2022 (a) | |
| NET ASSETS | | | | | | | | |
| Beginning of period | | $ | 663,080,231 | | | $ | 704,117,042 | |
| End of period | | $ | 507,732,861 | | | $ | 663,080,231 | |
| | | | | | | | | |
| CAPITAL SHARE ACTIVITY | | | | | | | | |
| Institutional Class | | | | | | | | |
| Shares sold | | | 5,385,153 | | | | 11,152,241 | |
| Shares issued in reinvestment of distributions to shareholders | | | 79,467 | | | | 1,087,720 | |
| Shares redeemed | | | (12,065,937 | ) | | | (10,280,853 | ) |
| Net increase (decrease) in shares outstanding | | | (6,601,317 | ) | | | 1,959,108 | |
| Shares outstanding at beginning of period | | | 34,196,349 | | | | 32,237,241 | |
| Shares outstanding at end of period | | | 27,595,032 | | | | 34,196,349 | |
| | | | | | | | | |
| Investor Class | | | | | | | | |
| Shares sold | | | 64,177 | | | | 156,531 | |
| Shares issued in reinvestment of distributions to shareholders | | | 485 | | | | 15,521 | |
| Shares redeemed | | | (76,747 | ) | | | (149,533 | ) |
| Net increase (decrease) in shares outstanding | | | (12,085 | ) | | | 22,519 | |
| Shares outstanding at beginning of period | | | 408,481 | | | | 385,962 | |
| Shares outstanding at end of period | | | 396,396 | | | | 408,481 | |
| | | | | | | | | |
| A Class | | | | | | | | |
| Shares sold | | | 1,785 | | | | 694 | |
| Shares issued in reinvestment of distributions to shareholders | | | 3 | | | | 34 | |
| Net increase in shares outstanding | | | 1,788 | | | | 728 | |
| Shares outstanding at beginning of period | | | 728 | | | | — | |
| Shares outstanding at end of period | | | 2,516 | | | | 728 | |
| | | | | | | | | |
| C Class | | | | | | | | |
| Shares sold | | | 19,661 | | | | 1,559 | |
| Shares issued in reinvestment of distributions to shareholders | | | 4 | | | | 61 | |
| Net increase in shares outstanding | | | 19,665 | | | | 1,620 | |
| Shares outstanding at beginning of period | | | 1,620 | | | | — | |
| Shares outstanding at end of period | | | 21,285 | | | | 1,620 | |
| (a) | For A Class shares and C Class shares, represents the period from commencement of operations (July 5, 2022) through November 30, 2022. |
See accompanying notes to financial statements.
| LYRICAL INTERNATIONAL VALUE EQUITY FUND |
| STATEMENTS OF CHANGES IN NET ASSETS |
| | | Six Months | | | Year/Period | |
| | | Ended | | | Ended | |
| | | May 31, 2023 | | | November 30, | |
| | | (Unaudited) | | | 2022 (a) | |
| FROM OPERATIONS | | | | | | | | |
| Net investment income | | $ | 143,923 | | | $ | 19,668 | |
| Net realized losses from investment transactions | | | (96,053 | ) | | | (25,807 | ) |
| Net realized losses from foreign currency transactions | | | (19,182 | ) | | | (2,524 | ) |
| Net change in unrealized appreciation (depreciation) on investments | | | (279,557 | ) | | | (150,999 | ) |
| Net change in unrealized appreciation (depreciation) on foreign currency translation | | | (1,137 | ) | | | 168 | |
| Net decrease in net assets resulting from operations | | | (252,006 | ) | | | (159,494 | ) |
| | | | | | | | | |
| FROM DISTRIBUTIONS TO SHAREHOLDERS (Note 2) | | | | | | | | |
| Institutional Class | | | (37,129 | ) | | | (1,356 | ) |
| Investor Class | | | (25,670 | ) | | | (1,020 | ) |
| A Class | | | (161 | ) | | | (6 | ) |
| C Class | | | (142 | ) | | | (6 | ) |
| Decrease in net assets from distributions to shareholders | | | (63,102 | ) | | | (2,388 | ) |
| | | | | | | | | |
| CAPITAL SHARE TRANSACTIONS | | | | | | | | |
| Institutional Class | | | | | | | | |
| Proceeds from shares sold | | | 10,378,886 | | | | 238,165 | |
| Net asset value of shares issued in reinvestment of distributions to shareholders | | | 37,129 | | | | 1,356 | |
| Payments for shares redeemed | | | (789,277 | ) | | | (243,923 | ) |
| Net increase (decrease) in Institutional Class net assets from capital share transactions | | | 9,626,738 | | | | (4,402 | ) |
| | | | | | | | | |
| Investor Class | | | | | | | | |
| Proceeds from shares sold | | | 4,912 | | | | 71,533 | |
| Net asset value of shares issued in reinvestment of distributions to shareholders | | | 25,670 | | | | 1,020 | |
| Payments for shares redeemed | | | (667,563 | ) | | | (173,241 | ) |
| Net decrease in Investor Class net assets from capital share transactions | | | (636,981 | ) | | | (100,688 | ) |
| | | | | | | | | |
| A Class | | | | | | | | |
| Proceeds from shares sold | | | — | | | | 5,000 | |
| Net asset value of shares issued in reinvestment of distributions to shareholders | | | 161 | | | | 6 | |
| Net increase in A Class net assets from capital share transactions | | | 161 | | | | 5,006 | |
| | | | | | | | | |
| C Class | | | | | | | | |
| Proceeds from shares sold | | | — | | | | 5,000 | |
| Net asset value of shares issued in reinvestment of distributions to shareholders | | | 142 | | | | 6 | |
| Net increase in C Class net assets from capital share transactions | | | 142 | | | | 5,006 | |
| | | | | | | | | |
| TOTAL INCREASE (DECREASE) IN NET ASSETS | | | 8,674,952 | | | | (256,960 | ) |
| LYRICAL INTERNATIONAL VALUE EQUITY FUND |
| STATEMENTS OF CHANGES IN NET ASSETS (Continued) |
| | | Six Months | | | Year/Period | |
| | | Ended | | | Ended | |
| | | May 31, 2023 | | | November 30, | |
| | | (Unaudited) | | | 2022 (a) | |
| NET ASSETS | | | | | | | | |
| Beginning of period | | $ | 2,224,570 | | | $ | 2,481,530 | |
| End of period | | $ | 10,899,522 | | | $ | 2,224,570 | |
| | | | | | | | | |
| CAPITAL SHARE ACTIVITY | | | | | | | | |
| Institutional Class | | | | | | | | |
| Shares sold | | | 914,586 | | | | 19,901 | |
| Shares issued in reinvestment of distributions to shareholders | | | 3,480 | | | | 121 | |
| Shares redeemed | | | (69,847 | ) | | | (19,456 | ) |
| Net increase in shares outstanding | | | 848,219 | | | | 566 | |
| Shares outstanding at beginning of period | | | 113,128 | | | | 112,562 | |
| Shares outstanding at end of period | | | 961,347 | | | | 113,128 | |
| | | | | | | | | |
| Investor Class | | | | | | | | |
| Shares sold | | | 442 | | | | 6,518 | |
| Shares issued in reinvestment of distributions to shareholders | | | 2,413 | | | | 92 | |
| Shares redeemed | | | (59,234 | ) | | | (15,454 | ) |
| Net decrease in shares outstanding | | | (56,379 | ) | | | (8,844 | ) |
| Shares outstanding at beginning of period | | | 85,064 | | | | 93,908 | |
| Shares outstanding at end of period | | | 28,685 | | | | 85,064 | |
| | | | | | | | | |
| A Class | | | | | | | | |
| Shares sold | | | — | | | | 509 | |
| Shares issued in reinvestment of distributions to shareholders | | | 15 | | | | 1 | |
| Net increase in shares outstanding | | | 15 | | | | 510 | |
| Shares outstanding at beginning of period | | | 510 | | | | — | |
| Shares outstanding at end of period | | | 525 | | | | 510 | |
| | | | | | | | | |
| C Class | | | | | | | | |
| Shares sold | | | — | | | | 509 | |
| Shares issued in reinvestment of distributions to shareholders | | | 13 | | | | 1 | |
| Net increase in shares outstanding | | | 13 | | | | 510 | |
| Shares outstanding at beginning of period | | | 510 | | | | — | |
| Shares outstanding at end of period | | | 523 | | | | 510 | |
| (a) | For A Class shares and C Class shares, represents the period from commencement of operations (July 5, 2022) through November 30, 2022. |
See accompanying notes to financial statements.
| LYRICAL U.S. VALUE EQUITY FUND |
| INSTITUTIONAL CLASS |
| FINANCIAL HIGHLIGHTS |
Per Share Data for a Share Outstanding Throughout Each Period:
| | | Six Months | | | | | | | | | | | | | | | | |
| | | Ended | | | Year | | | Year | | | Year | | | Year | | | Year | |
| | | May 31, | | | Ended | | | Ended | | | Ended | | | Ended | | | Ended | |
| | | 2023 | | | Nov. 30, | | | Nov. 30, | | | Nov. 30, | | | Nov. 30, | | | Nov. 30, | |
| | | (Unaudited) | | | 2022 | | | 2021 | | | 2020 | | | 2019 | | | 2018 | |
| Net asset value at beginning of period | | $ | 19.16 | | | $ | 21.59 | | | $ | 16.68 | | | $ | 15.91 | | | $ | 15.55 | | | $ | 18.62 | |
| Income (loss) from investment operations: | | | | | | | | | | | | | | | | | | | | | | | | |
| Net investment income (a) | | | 0.05 | | | | 0.07 | | | | 0.03 | | | | 0.10 | | | | 0.05 | | | | 0.03 | |
| Net realized and unrealized gains (losses) on investments and foreign currencies | | | (1.00 | ) | | | (1.54 | ) | | | 5.02 | | | | 0.72 | (b) | | | 0.76 | | | | (1.70 | ) |
| Total from investment operations | | | (0.95 | ) | | | (1.47 | ) | | | 5.05 | | | | 0.82 | | | | 0.81 | | | | (1.67 | ) |
| Less distributions from: | | | | | | | | | | | | | | | | | | | | | | | | |
| Net investment income | | | (0.08 | ) | | | (0.03 | ) | | | (0.14 | ) | | | (0.05 | ) | | | (0.05 | ) | | | (0.01 | ) |
| Net realized gains | | | — | | | | (0.93 | ) | | | — | | | | — | | | | (0.40 | ) | | | (1.39 | ) |
| Total distributions | | | (0.08 | ) | | | (0.96 | ) | | | (0.14 | ) | | | (0.05 | ) | | | (0.45 | ) | | | (1.40 | ) |
| Net asset value at end of period | | $ | 18.13 | | | $ | 19.16 | | | $ | 21.59 | | | $ | 16.68 | | | $ | 15.91 | | | $ | 15.55 | |
| Total return (c) | | | (4.98 | %) (d) | | | (6.81 | %) | | | 30.44 | % | | | 5.16 | % | | | 5.03 | % | | | (9.02 | %) |
| Net assets at end of period (000’s) | | $ | 500,173 | | | $ | 655,277 | | | $ | 695,847 | | | $ | 327,121 | | | $ | 617,686 | | | $ | 907,366 | |
| Ratios/supplementary data: | | | | | | | | | | | | | | | | | | | | | | | | |
| Ratio of total expenses to average net assets | | | 1.04 | % (e) | | | 1.02 | % | | | 1.01 | % | | | 1.25 | % | | | 1.41 | % | | | 1.37 | % |
| Ratio of net expenses to average net assets | | | 1.00 | % (e)(f)(g) | | | 0.99 | % (f) | | | 0.99 | % (f) | | | 1.22 | % (f) | | | 1.41 | % | | | 1.37 | % |
| Ratio of net investment income to average net assets | | | 0.55 | % (e)(f) | | | 0.36 | % (f) | | | 0.13 | % (f) | | | 0.73 | % (f) | | | 0.36 | % | | | 0.17 | % |
| Portfolio turnover rate (h) | | | 12 | % (d) | | | 24 | % | | | 14 | % | | | 30 | % | | | 33 | % | | | 39 | % |
| (a) | Per share net investment income has been determined on the basis of average number of shares outstanding during the period. |
| | |
| (b) | Represents a balancing figure derived from other amounts in the financial highlights table that captures all other changes affecting net asset value per share. This per share amount does not correlate to the aggregate of the net realized and unrealized losses on the Statements of Operations for the same year. |
| | |
| (c) | Total return is a measure of the change in value of an investment in the Fund over the periods covered. The returns shown do not reflect the deduction of taxes a shareholder would pay on Fund distributions, if any, or the redemption of Fund shares. The total return would have been lower if the Adviser had not reduced fees and/or reimbursed expenses (Note 4). |
| | |
| (d) | Not annualized. |
| | |
| (e) | Annualized. |
| | |
| (f) | Ratio was determined after fee reductions and/or expense reimbursements (Note 4). |
| | |
| (g) | Includes 0.01% of borrowing costs (Note 5). |
| | |
| (h) | Portfolio turnover is calculated on the basis on the Fund as a whole without distinguishing among the classes of shares. |
| | |
See accompanying notes to financial statements.
| LYRICAL U.S. VALUE EQUITY FUND |
| INVESTOR CLASS |
| FINANCIAL HIGHLIGHTS |
Per Share Data for a Share Outstanding Throughout Each Period:
| | | Six Months | | | | | | | | | | | | | | | | |
| | | Ended | | | Year | | | Year | | | Year | | | Year | | | Year | |
| | | May 31, | | | Ended | | | Ended | | | Ended | | | Ended | | | Ended | |
| | | 2023 | | | Nov. 30, | | | Nov. 30, | | | Nov. 30, | | | Nov. 30, | | | Nov. 30, | |
| | | (Unaudited) | | | 2022 | | | 2021 | | | 2020 | | | 2019 | | | 2018 | |
| Net asset value at beginning of period | | $ | 18.99 | | | $ | 21.43 | | | $ | 16.56 | | | $ | 15.78 | | | $ | 15.43 | | | $ | 18.54 | |
| Income (loss) from investment operations: | | | | | | | | | | | | | | | | | | | | | | | | |
| Net investment income (loss) (a) | | | 0.03 | | | | 0.02 | | | | (0.02 | ) | | | 0.07 | | | | 0.02 | | | | (0.03 | ) |
| Net realized and unrealized gains (losses) on investments and foreign currencies | | | (1.00 | ) | | | (1.53 | ) | | | 4.98 | | | | 0.71 | (b) | | | 0.73 | | | | (1.69 | ) |
| Total from investment operations | | | (0.97 | ) | | | (1.51 | ) | | | 4.96 | | | | 0.78 | | | | 0.75 | | | | (1.72 | ) |
| Less distributions from: | | | | | | | | | | | | | | | | | | | | | | | | |
| Net investment income | | | (0.03 | ) | | | — | | | | (0.09 | ) | | | — | | | | — | | | | — | |
| Net realized gains | | | — | | | | (0.93 | ) | | | — | | | | — | | | | (0.40 | ) | | | (1.39 | ) |
| Total distributions | | | (0.03 | ) | | | (0.93 | ) | | | (0.09 | ) | | | — | | | | (0.40 | ) | | | (1.39 | ) |
| Net asset value at end of period | | $ | 17.99 | | | $ | 18.99 | | | $ | 21.43 | | | $ | 16.56 | | | $ | 15.78 | | | $ | 15.43 | |
| Total return (c) | | | (5.12 | %) (d) | | | (7.03 | %) | | | 30.10 | % | | | 4.94 | % | | | 4.89 | % | | | (9.30 | %) |
| Net assets at end of period (000’s) | | $ | 7,132 | | | $ | 7,758 | | | $ | 8,270 | | | $ | 4,914 | | | $ | 6,682 | | | $ | 19,811 | |
| Ratios/supplementary data: | | | | | | | | | | | | | | | | | | | | | | | | |
| Ratio of total expenses to average net assets | | | 1.74 | % (e) | | | 1.74 | % | | | 1.79 | % | | | 2.02 | % | | | 2.03 | % | | | 1.72 | % |
| Ratio of net expenses to average net assets (f) | | | 1.25 | % (e)(g) | | | 1.24 | % | | | 1.24 | % | | | 1.44 | % | | | 1.70 | % | | | 1.70 | % |
| Ratio of net investment income (loss) to average net assets (f) | | | 0.30 | % (e) | | | 0.10 | % | | | (0.12 | %) | | | 0.53 | % | | | 0.10 | % | | | (0.18 | %) |
| Portfolio turnover rate (h) | | | 12 | % (d) | | | 24 | % | | | 14 | % | | | 30 | % | | | 33 | % | | | 39 | % |
| (a) | Per share net investment income (loss) has been determined on the basis of average number of shares outstanding during the period. |
| | |
| (b) | Represents a balancing figure derived from other amounts in the financial highlights table that captures all other changes affecting net asset value per share. This per share amount does not correlate to the aggregate of the net realized and unrealized losses on the Statements of Operations for the same year. |
| | |
| (c) | Total return is a measure of the change in value of an investment in the Fund over the periods covered. The returns shown do not reflect the deduction of taxes a shareholder would pay on Fund distributions, if any, or the redemption of Fund shares. The total return would have been lower if the Adviser had not reduced fees and/or reimbursed expenses (Note 4). |
| | |
| (d) | Not annualized. |
| | |
| (e) | Annualized. |
| | |
| (f) | Ratio was determined after fee reductions and/or expense reimbursements (Note 4). |
| | |
| (g) | Includes 0.01% of borrowing costs (Note 5). |
| | |
| (h) | Portfolio turnover is calculated on the basis on the Fund as a whole without distinguishing among the classes of shares. |
| | |
See accompanying notes to financial statements.
| LYRICAL U.S. VALUE EQUITY FUND |
| A CLASS |
| FINANCIAL HIGHLIGHTS |
Per Share Data for a Share Outstanding Throughout Each Period:
| | | Six Months | | | | |
| | | Ended | | | Period | |
| | | May 31, | | | Ended | |
| | | 2023 | | | Nov. 30, | |
| | | (Unaudited) | | | 2022 (a) | |
| Net asset value at beginning of period | | $ | 19.14 | | | $ | 18.23 | |
| Income (loss) from investment operations: | | | | | | | | |
| Net investment income (b) | | | 0.03 | | | | 0.03 | |
| Net realized and unrealized gains (losses) on investments and foreign currencies | | | (1.00 | ) | | | 1.81 | (c) |
| Total from investment operations | | | (0.97 | ) | | | 1.84 | |
| Less distributions from: | | | | | | | | |
| Net investment income | | | (0.07 | ) | | | — | |
| Net realized gains | | | — | | | | (0.93 | ) |
| Total distributions | | | (0.07 | ) | | | (0.93 | ) |
| Net asset value at end of period | | $ | 18.10 | | | $ | 19.14 | |
| Total return (d) | | | (5.09 | %) (e) | | | 10.12 | % (e) |
| Net assets at end of period (000’s) | | $ | 46 | | | $ | 14 | |
| Ratios/supplementary data: | | | | | | | | |
| Ratio of total expenses to average net assets | | | 45.19 | % (f) | | | 176.77 | % (f) |
| Ratio of net expenses to average net assets (g) | | | 1.25 | % (f)(h) | | | 1.24 | % (f) |
| Ratio of net investment income to average net assets (g) | | | 0.35 | % (f) | | | 0.36 | % (f) |
| Portfolio turnover rate (i) | | | 12 | % (e) | | | 24 | % |
| (a) | Represents the period from the commencement of operations (July 5, 2022) through November 30, 2022. |
| | |
| (b) | Per share net investment income has been determined on the basis of average number of shares outstanding during the period. |
| | |
| (c) | Represents a balancing figure derived from other amounts in the financial highlights table that captures all other changes affecting net asset value per share. This per share amount does not correlate to the aggregate of the net realized and unrealized losses on the Statements of Operations for the same period. |
| | |
| (d) | Total return is a measure of the change in value of an investment in the Fund over the period covered. The returns shown do not reflect the deduction of taxes a shareholder would pay on Fund distributions, if any, or the redemption of Fund shares. The total return would have been lower if the Adviser had not reduced fees and/or reimbursed expenses (Note 4). Calculation does not reflect sales load. |
| | |
| (e) | Not annualized. |
| | |
| (f) | Annualized. |
| | |
| (g) | Ratio was determined after fee reductions and/or expense reimbursements (Note 4). |
| | |
| (h) | Includes 0.01% of borrowing costs (Note 5). |
| | |
| (i) | Portfolio turnover is calculated on the basis on the Fund as a whole without distinguishing among the classes of shares. |
| | |
See accompanying notes to financial statements.
| LYRICAL U.S. VALUE EQUITY FUND |
| C CLASS |
| FINANCIAL HIGHLIGHTS |
Per Share Data for a Share Outstanding Throughout Each Period:
| | | Six Months | | | | |
| | | Ended | | | Period | |
| | | May 31, | | | Ended | |
| | | 2023 | | | Nov. 30, | |
| | | (Unaudited) | | | 2022 (a) | |
| Net asset value at beginning of period | | $ | 19.08 | | | $ | 18.23 | |
| Income (loss) from investment operations: | | | | | | | | |
| Net investment loss (b) | | | (0.04 | ) | | | (0.03 | ) |
| Net realized and unrealized gains (losses) on investments and foreign currencies | | | (1.00 | ) | | | 1.81 | (c) |
| Total from investment operations | | | (1.04 | ) | | | 1.78 | |
| Less distributions from: | | | | | | | | |
| Net investment income | | | (0.05 | ) | | | — | |
| Net realized gains | | | — | | | | (0.93 | ) |
| Total distributions | | | (0.05 | ) | | | (0.93 | ) |
| Net asset value at end of period | | $ | 17.99 | | | $ | 19.08 | |
| Total return (d) | | | (5.47 | %) (e) | | | 9.79 | % (e) |
| Net assets at end of period (000’s) | | $ | 383 | | | $ | 31 | |
| Ratios/supplementary data: | | | | | | | | |
| Ratio of total expenses to average net assets | | | 9.26 | % (f) | | | 196.90 | % (f) |
| Ratio of net expenses to average net assets (g) | | | 2.00 | % (f)(h) | | | 1.99 | % (f) |
| Ratio of net investment loss to average net assets (g) | | | (0.46 | %) (f) | | | (0.36 | %) (f) |
| Portfolio turnover rate (i) | | | 12 | % (e) | | | 24 | % |
| (a) | Represents the period from the commencement of operations (July 5, 2022) through November 30, 2022. |
| | |
| (b) | Per share net investment loss has been determined on the basis of average number of shares outstanding during the period. |
| | |
| (c) | Represents a balancing figure derived from other amounts in the financial highlights table that captures all other changes affecting net asset value per share. This per share amount does not correlate to the aggregate of the net realized and unrealized losses on the Statements of Operations for the same period. |
| | |
| (d) | Total return is a measure of the change in value of an investment in the Fund over the period covered. The returns shown do not reflect the deduction of taxes a shareholder would pay on Fund distributions, if any, or the redemption of Fund shares. The total return would have been lower if the Adviser had not reduced fees and/or reimbursed expenses (Note 4). Calculation does not reflect CDSC. |
| | |
| (e) | Not annualized. |
| | |
| (f) | Annualized. |
| | |
| (g) | Ratio was determined after fee reductions and/or expense reimbursements (Note 4). |
| | |
| (h) | Includes 0.01% of borrowing costs (Note 5). |
| | |
| (i) | Portfolio turnover is calculated on the basis on the Fund as a whole without distinguishing among the classes of shares. |
| | |
See accompanying notes to financial statements.
| LYRICAL INTERNATIONAL VALUE EQUITY FUND |
| INSTITUTIONAL CLASS |
| FINANCIAL HIGHLIGHTS |
Per Share Data for a Share Outstanding Throughout Each Period:
| | | Six Months | | | | | | | | | | |
| | | Ended | | | Year | | | Year | | | Period | |
| | | May 31, | | | Ended | | | Ended | | | Ended | |
| | | 2023 | | | Nov. 30, | | | Nov. 30, | | | Nov. 30, | |
| | | (Unaudited) | | | 2022 | | | 2021 | | | 2020 (a) | |
| Net asset value at beginning of period | | $ | 11.19 | | | $ | 12.03 | | | $ | 11.02 | | | $ | 10.00 | |
| Income (loss) from investment operations: | | | | | | | | | | | | | | | | |
| Net investment income (b) | | | 0.18 | | | | 0.11 | | | | 0.05 | | | | 0.05 | |
| Net realized and unrealized gains (losses) on investments and foreign currencies | | | (0.04 | ) | | | (0.94 | ) | | | 1.69 | | | | 0.97 | |
| Total from investment operations | | | 0.14 | | | | (0.83 | ) | | | 1.74 | | | | 1.02 | |
| Less distributions from: | | | | | | | | | | | | | | | | |
| Net investment income | | | (0.33 | ) | | | — | | | | (0.05 | ) | | | — | |
| Net realized gains | | | — | | | | (0.01 | ) | | | (0.68 | ) | | | — | |
| Total distributions | | | (0.33 | ) | | | (0.01 | ) | | | (0.73 | ) | | | — | |
| Net asset value at end of period | | $ | 11.00 | | | $ | 11.19 | | | $ | 12.03 | | | $ | 11.02 | |
| Total return (c) | | | 1.33 | % (d) | | | (6.88 | %) | | | 15.84 | % | | | 10.20 | % (d) |
| Net assets at end of period (000’s) | | $ | 10,574 | | | $ | 1,266 | | | $ | 1,355 | | | $ | 613 | |
| Ratios/supplementary data: | | | | | | | | | | | | | | | | |
| Ratio of total expenses to average net assets | | | 3.98 | % (e) | | | 12.32 | % | | | 11.34 | % | | | 21.16 | % (e) |
| Ratio of net expenses to average net assets (f) | | | 0.99 | % (e) | | | 0.99 | % | | | 0.99 | % | | | 1.03 | % (e) |
| Ratio of net investment income to average net assets (f) | | | 3.70 | % (e) | | | 1.00 | % | | | 0.36 | % | | | 0.72 | % (e) |
| Portfolio turnover rate (g) | | | 34 | % (d) | | | 33 | % | | | 34 | % | | | 25 | % (d) |
| (a) | Represents the period from the commencement of operations (March 2, 2020) through November 30, 2020. |
| | |
| (b) | Per share net investment income has been determined on the basis of average number of shares outstanding during the period. |
| | |
| (c) | Total return is a measure of the change in value of an investment in the Fund over the periods covered. The returns shown do not reflect the deduction of taxes a shareholder would pay on Fund distributions, if any, or the redemption of Fund shares. The total return would have been lower if the Adviser had not reduced fees and reimbursed expenses (Note 4). |
| | |
| (d) | Not annualized. |
| | |
| (e) | Annualized. |
| | |
| (f) | Ratio was determined after fee reductions and expense reimbursements (Note 4). |
| | |
| (g) | Portfolio turnover is calculated on the basis on the Fund as a whole without distinguishing among the classes of shares. |
| | |
See accompanying notes to financial statements.
| LYRICAL INTERNATIONAL VALUE EQUITY FUND |
| INVESTOR CLASS |
| FINANCIAL HIGHLIGHTS |
Per Share Data for a Share Outstanding Throughout Each Period:
| | | Six Months | | | | | | | | | | |
| | | Ended | | | Year | | | Year | | | Period | |
| | | May 31, | | | Ended | | | Ended | | | Ended | |
| | | 2023 | | | Nov. 30, | | | Nov. 30, | | | Nov. 30, | |
| | | (Unaudited) | | | 2022 | | | 2021 | | | 2020 (a) | |
| Net asset value at beginning of period | | $ | 11.13 | | | $ | 12.00 | | | $ | 11.00 | | | $ | 10.00 | |
| Income (loss) from investment operations: | | | | | | | | | | | | | | | | |
| Net investment income (b) | | | 0.07 | | | | 0.08 | | | | 0.02 | | | | 0.04 | |
| Net realized and unrealized gains (losses) on investments and foreign currencies | | | 0.06 | (c) | | | (0.94 | ) | | | 1.69 | | | | 0.96 | |
| Total from investment operations | | | 0.13 | | | | (0.86 | ) | | | 1.71 | | | | 1.00 | |
| Less distributions from: | | | | | | | | | | | | | | | | |
| Net investment income | | | (0.30 | ) | | | — | | | | (0.03 | ) | | | — | |
| Net realized gains | | | — | | | | (0.01 | ) | | | (0.68 | ) | | | — | |
| Total distributions | | | (0.30 | ) | | | (0.01 | ) | | | (0.71 | ) | | | — | |
| Net asset value at end of period | | $ | 10.96 | | | $ | 11.13 | | | $ | 12.00 | | | $ | 11.00 | |
| Total return (d) | | | 1.26 | % (e) | | | (7.15 | %) | | | 15.60 | % | | | 10.00 | % (e) |
| Net assets at end of period (000’s) | | $ | 314 | | | $ | 947 | | | $ | 1,127 | | | $ | 663 | |
| Ratios/supplementary data: | | | | | | | | | | | | | | | | |
| Ratio of total expenses to average net assets | | | 5.64 | % (f) | | | 12.90 | % | | | 11.70 | % | | | 21.14 | % (f) |
| Ratio of net expenses to average net assets (g) | | | 1.24 | % (f) | | | 1.24 | % | | | 1.24 | % | | | 1.27 | % (f) |
| Ratio of net investment income to average net assets (g) | | | 1.64 | % (f) | | | 0.76 | % | | | 0.16 | % | | | 0.52 | % (f) |
| Portfolio turnover rate (h) | | | 34 | % (e) | | | 33 | % | | | 34 | % | | | 25 | % (e) |
| (a) | Represents the period from the commencement of operations (July 5, 2022) through November 30, 2022. |
| | |
| (b) | Per share net investment income has been determined on the basis of average number of shares outstanding during the period. |
| | |
| (c) | Represents a balancing figure derived from other amounts in the financial highlights table that captures all other changes affecting net asset value per share. This per share amount does not correlate to the aggregate of the net realized and unrealized losses on the Statements of Operations for the same period. |
| | |
| (d) | Total return is a measure of the change in value of an investment in the Fund over the period covered. The returns shown do not reflect the deduction of taxes a shareholder would pay on Fund distributions, if any, or the redemption of Fund shares. The total return would have been lower if the Adviser had not reduced fees and reimbursed expenses (Note 4). |
| | |
| (e) | Not annualized. |
| | |
| (f) | Annualized. |
| | |
| (g) | Ratio was determined after fee reductions and/or expense reimbursements (Note 4). |
| | |
| (h) | Portfolio turnover is calculated on the basis on the Fund as a whole without distinguishing among the classes of shares. |
| | |
See accompanying notes to financial statements.
| LYRICAL INTERNATIONAL VALUE EQUITY FUND |
| A CLASS |
| FINANCIAL HIGHLIGHTS |
Per Share Data for a Share Outstanding Throughout Each Period:
| | | Six Months | | | | |
| | | Ended | | | Period | |
| | | May 31, | | | Ended | |
| | | 2023 | | | Nov. 30, | |
| | | (Unaudited) | | | 2022 (a) | |
| Net asset value at beginning of period | | $ | 11.18 | | | $ | 9.82 | |
| Income from investment operations: | | | | | | | | |
| Net investment income (b) | | | 0.11 | | | | 0.01 | |
| Net realized and unrealized gains on investments and foreign currencies | | | 0.02 | (c) | | | 1.36 | (c) |
| Total from investment operations | | | 0.13 | | | | 1.37 | |
| Less distributions from: | | | | | | | | |
| Net investment income | | | (0.32 | ) | | | — | |
| Net realized gains | | | — | | | | (0.01 | ) |
| Total distributions | | | (0.32 | ) | | | (0.01 | ) |
| Net asset value at end of period | | $ | 10.99 | | | $ | 11.18 | |
| Total return (d) | | | 1.21 | % (e) | | | 13.97 | % (e) |
| Net assets at end of period | | $ | 5,768 | | | $ | 5,700 | |
| Ratios/supplementary data: | | | | | | | | |
| Ratio of total expenses to average net assets | | | 247.73 | % (f) | | | 264.21 | % (f) |
| Ratio of net expenses to average net assets (g) | | | 1.24 | % (f) | | | 1.24 | % (f) |
| Ratio of net investment income to average net assets (g) | | | 2.39 | % (f) | | | 0.14 | % (f) |
| Portfolio turnover rate (h) | | | 34 | % (e) | | | 33 | % |
| (a) | Represents the period from the commencement of operations (July 5, 2022) through November 30, 2022. |
| | |
| (b) | Per share net investment income has been determined on the basis of average number of shares outstanding during the period. |
| | |
| (c) | Represents a balancing figure derived from other amounts in the financial highlights table that captures all other changes affecting net asset value per share. This per share amount does not correlate to the aggregate of the net realized and unrealized losses on the Statements of Operations for the same period. |
| | |
| (d) | Total return is a measure of the change in value of an investment in the Fund over the period covered. The returns shown do not reflect the deduction of taxes a shareholder would pay on Fund distributions, if any, or the redemption of Fund shares. The total return would have been lower if the Adviser had not reduced fees and reimbursed expenses (Note 4). Calculation does not reflect sales load. |
| | |
| (e) | Not annualized. |
| | |
| (f) | Annualized. |
| | |
| (g) | Ratio was determined after fee reductions and expense reimbursements (Note 4). |
| | |
| (h) | Portfolio turnover is calculated on the basis on the Fund as a whole without distinguishing among the classes of shares. |
| | |
See accompanying notes to financial statements.
| LYRICAL INTERNATIONAL VALUE EQUITY FUND |
| C CLASS |
| FINANCIAL HIGHLIGHTS |
Per Share Data for a Share Outstanding Throughout Each Period:
| | | Six Months | | | | |
| | | Ended | | | Period | |
| | | May 31, | | | Ended | |
| | | 2023 | | | Nov. 30, | |
| | | (Unaudited) | | | 2022 (a) | |
| Net asset value at beginning of period | | $ | 11.15 | | | $ | 9.82 | |
| Income (loss) from investment operations: | | | | | | | | |
| Net investment income (loss) (b) | | | 0.07 | | | | (0.03 | ) |
| Net realized and unrealized gains on investments and foreign currencies | | | 0.01 | (c) | | | 1.37 | (c) |
| Total from investment operations | | | 0.08 | | | | 1.34 | |
| Less distributions from: | | | | | | | | |
| Net investment income | | | (0.28 | ) | | | — | |
| Net realized gains | | | — | | | | (0.01 | ) |
| Total distributions | | | (0.28 | ) | | | (0.01 | ) |
| Net asset value at end of period | | $ | 10.95 | | | $ | 11.15 | |
| Total return (d) | | | 0.77 | % (e) | | | 13.67 | % (e) |
| Net assets at end of period | | $ | 5,729 | | | $ | 5,682 | |
| Ratios/supplementary data: | | | | | | | | |
| Ratio of total expenses to average net assets | | | 249.69 | % (f) | | | 265.34 | % (f) |
| Ratio of net expenses to average net assets (g) | | | 1.99 | % (f) | | | 1.99 | % (f) |
| Ratio of net investment income (loss) to average net assets (g) | | | 1.65 | % (f) | | | (0.60 | %) (f) |
| Portfolio turnover rate (h) | | | 34 | % (e) | | | 33 | % |
| (a) | Represents the period from the commencement of operations (July 5, 2022) through November 30, 2022. |
| | |
| (b) | Per share net investment income (loss) has been determined on the basis of average number of shares outstanding during the period. |
| | |
| (c) | Represents a balancing figure derived from other amounts in the financial highlights table that captures all other changes affecting net asset value per share. This per share amount does not correlate to the aggregate of the net realized and unrealized losses on the Statements of Operations for the same period. |
| | |
| (d) | Total return is a measure of the change in value of an investment in the Fund over the period covered. The returns shown do not reflect the deduction of taxes a shareholder would pay on Fund distributions, if any, or the redemption of Fund shares. The total return would have been lower if the Adviser had not reduced fees and reimbursed expenses (Note 4). Calculation does not reflect CDSC. |
| | |
| (e) | Not annualized. |
| | |
| (f) | Annualized. |
| | |
| (g) | Ratio was determined after fee reductions and expense reimbursements (Note 4). |
| | |
| (h) | Portfolio turnover is calculated on the basis on the Fund as a whole without distinguishing among the classes of shares. |
| | |
See accompanying notes to financial statements.
| LYRICAL FUNDS |
| NOTES TO FINANCIAL STATEMENTS |
| May 31, 2023 (Unaudited) |
1. Organization
Lyrical U.S. Value Equity Fund and Lyrical International Value Equity Fund (individually, a “Fund” and collectively, the “Funds”) are each a diversified series of Ultimus Managers Trust (the “Trust”), an open-end investment company established as an Ohio business trust under a Declaration of Trust dated February 28, 2012. Other series of the Trust are not incorporated in this report. Lyrical U.S. Value Equity Fund commenced operations on February 4, 2013. Lyrical International Value Equity Fund commenced operations on March 2, 2020.
The investment objective of each Fund is to seek to achieve long-term capital growth.
Each Fund currently offers four classes of shares: Institutional Class shares (sold without any sales loads and distribution and/or shareholder service fees and requiring a $100,000 initial investment), Investor Class shares (sold without any sales loads, but subject to a distribution and/or shareholder service fee of up to 0.25% of the average daily net assets attributable to Investor Class shares, and requiring a $2,500 initial investment), A Class shares (sold subject to an initial maximum front end sales load of 5.75% and a distribution and/or shareholder service fee of up to 0.25% of the average daily net assets attributable to A Class shares, and requiring a $1,000 initial investment and for purchases of $1,000,000 or more, a front end sales load is not charged, but a 1.00% contingent deferred sales charge (“CDSC”) may be charged if redeemed during the first 18 months), and C Class shares (sold subject to a CDSC fee of 1.00% if the shares are redeemed within 12 months after the original purchase of the shares and a distribution and/or shareholder servicing fee of up to 1.00% of the average daily net assets attributable to C Class shares, and requiring a $1,000 initial investment) (each a “Class”). Each share class represents an ownership interest in the same investment portfolio.
2. Significant Accounting Policies
The following is a summary of the Funds’ significant accounting policies. The policies are in conformity with accounting principles generally accepted in the United States of America (“GAAP”). The Funds follow accounting and reporting guidance under Financial Accounting Standards Board Accounting Standards Codification Topic 946, “Financial Services – Investment Companies.”
Securities valuation – Each Fund values its portfolio securities at market value as of the close of regular trading on the New York Stock Exchange (the “NYSE”) (normally 4:00 p.m. Eastern time) on each business day the NYSE is open for business. The Funds value their listed securities on the basis of the security’s last sale price on the security’s primary exchange, if available, otherwise at the exchange’s most recently quoted mean price. NASDAQ-listed securities are valued at the NASDAQ Official Closing Price. Investments representing shares of money market funds and other open-end investment companies are valued at their net asset value (“NAV”) as reported by such companies.
| LYRICAL FUNDS |
| NOTES TO FINANCIAL STATEMENTS (Continued) |
When using a quoted price and when the market is considered active, the security will be classified as Level 1 within the fair value hierarchy (see below). In the event that market quotations are not readily available or are considered unreliable due to market or other events, the Funds value their securities and other assets at fair value as determined by Lyrical Asset Management L.P. (the “Adviser”), as the valuation designee, in accordance with procedures adopted by the Board of Trustees (the “Board”) pursuant to Rule 2a-5 under the Investment Company Act of 1940, as amended (the “1940 Act”). Under these procedures, the securities will be classified as Level 2 or 3 within the fair value hierarchy, depending on the inputs used. Unavailable or unreliable market quotes may be due to the following factors: a substantial bid-ask spread; infrequent sales resulting in stale prices; insufficient trading volume; small trade sizes; a temporary lapse in any reliable pricing source; and actions of the securities or futures markets, such as the suspension or limitation of trading. As a result, the prices of securities used to calculate each Fund’s NAV may differ from quoted or published prices for the same securities.
GAAP establishes a single authoritative definition of fair value, sets out a framework for measuring fair value, and requires additional disclosures about fair value measurements.
Various inputs are used in determining the value of each Fund’s investments. These inputs are summarized in the three broad levels listed below:
| ● | Level 1 – quoted prices in active markets for identical securities |
| ● | Level 2 – other significant observable inputs |
| ● | Level 3 – significant unobservable inputs |
The inputs or methods used for valuing securities are not necessarily an indication of the risks associated with investing in those securities. The inputs used to measure fair value may fall into different levels of the fair value hierarchy. In such cases, for disclosure purposes, the level in the fair value hierarchy within which the fair value measurement falls in its entirety is determined based on the lowest level input that is significant to the fair value measurement.
Lyrical International Value Equity Fund’s foreign equity securities actively traded in foreign markets may be classified as Level 2 despite the availability of closing prices because such securities are typically fair valued by an independent pricing service. The Board has authorized the Fund to retain an independent pricing service to determine the fair value of its foreign securities because the value of such securities may be materially affected by events occurring before the Fund’s pricing time but after the close of the primary markets or exchanges on which such foreign securities are traded. These intervening events might be country-specific (e.g., natural disaster, economic or political developments, interest rate change); issuer specific (e.g., earnings report or merger announcement); or U.S. market-specific (such as a significant movement in the U.S. market that is deemed to affect the value of foreign securities). The pricing service uses an automated system that incorporates a model based on multiple parameters, including a security’s local closing
| LYRICAL FUNDS |
| NOTES TO FINANCIAL STATEMENTS (Continued) |
price, relevant general and sector indices, currency fluctuations, trading in depositary receipts and futures, if applicable, and/or research valuations by its staff, in determining what it believes is the fair value of the securities.
The following is a summary of each Fund’s investments by the inputs used to value the investments as of May 31, 2023:
| Lyrical U.S. Value Equity Fund | | Level 1 | | | Level 2 | | | Level 3 | | | Total | |
| Common Stocks | | $ | 494,339,458 | | | $ | — | | | $ | — | | | $ | 494,339,458 | |
| Money Market Funds | | | 2,843,122 | | | | — | | | | — | | | | 2,843,122 | |
| Total | | $ | 497,182,580 | | | $ | — | | | $ | — | | | $ | 497,182,580 | |
| | | | | | | | | | | | | | | | | |
| Lyrical International Value Equity Fund | | Level 1 | | | Level 2 | | | Level 3 | | | Total | |
| Common Stocks | | $ | 3,328,951 | | | $ | 7,426,975 | | | $ | — | | | $ | 10,755,926 | |
| Money Market Funds | | | 46,444 | | | | — | | | | — | | | | 46,444 | |
| Total | | $ | 3,375,395 | | | $ | 7,426,975 | | | $ | — | | | $ | 10,802,370 | |
| | | | | | | | | | | | | | | | | |
| * | With respect to foreign equity securities that are principally traded on a market outside the United States, the Board has approved the utilization of an independent fair value pricing service to evaluate the effect of market fluctuations on these securities after the close of trading in that foreign market. To the extent that securities are valued using this service, they will be classified as Level 2 securities. |
Refer to each Fund’s Schedule of Investments for a listing of securities by sector and industry type or geographical region. The Funds did not hold any derivative instruments or any assets or liabilities that were measured at fair value on a recurring basis using significant unobservable inputs (Level 3) as of or during the six months ended May 31, 2023.
Share valuation – The NAV per share of each class of each Fund is calculated daily by dividing the total value of the assets attributable to that class, less liabilities attributable to that class, by the number of shares outstanding of that class. The offering price and redemption price per share of each class of each Fund is equal to the NAV per share of such class.
Investment income – Dividend income is recorded on the ex-dividend date. Interest income is accrued as earned. Non-cash dividends included in dividend income, if any, are recorded at the fair value of the security received. Withholding taxes on foreign dividends have been recorded in accordance with the Funds’ understanding of the applicable country’s rules and tax rates.
Investment transactions – Investment transactions are accounted for on the trade date. Realized gains and losses on investments sold are determined on a specific identification basis.
| LYRICAL FUNDS |
| NOTES TO FINANCIAL STATEMENTS (Continued) |
Foreign currency translation – Securities and other assets and liabilities denominated in or expected to settle in foreign currencies, if any, are translated into U.S. dollars based on exchange rates on the following basis:
| A. | The fair values of investment securities and other assets and liabilities are translated as of the close of the NYSE each day. |
| B. | Purchases and sales of investment securities and income and expenses are translated at the rate of exchange prevailing as of 4:00 p.m. Eastern time on the respective date of such transactions. |
| C. | The Funds do not isolate that portion of the results of operations caused by changes in foreign exchange rates on investments from those caused by changes in market prices of securities held. Such fluctuations are included with the net realized and unrealized gains or losses on investments. |
Reported net realized foreign exchange gains or losses arise from 1) purchases and sales of foreign currencies, 2) currency gains or losses realized between trade and settlement dates on securities transactions, and 3) the difference between the amounts of dividends and foreign withholding taxes recorded on each Fund’s books and the U.S. dollar equivalent of the amounts actually received or paid. Reported net unrealized foreign exchange gains and losses arise from changes in the value of assets and liabilities other than investments in securities that result from changes in exchange rates.
Allocation between classes – Investment income earned, realized capital gains and losses, and unrealized appreciation and depreciation are allocated daily to each class of a Fund based upon its proportionate share of total net assets of that Fund. Class-specific expenses are charged directly to the class incurring the expense. Common expenses which are not attributable to a specific class are allocated daily to each class of shares of a Fund based upon its proportionate share of total net assets of that Fund. Distribution fees, registration and filing fees and transfer agent fees are class specific expenses. For the six months ending May 31, 202 class specific expenses were as follows:
Lyrical U.S. Value Equity Fund
| Expenses | | Institutional | | | Investor | | | A Class | | | C Class | | | Total | |
| Distribution fees | | $ | — | | | $ | 9,277 | | | $ | 43 | | | $ | 1,105 | | | $ | 10,425 | |
| Registration and filing fees | | | 31,985 | | | | 8,550 | | | | 1,671 | | | | 2,078 | | | | 44,284 | |
| Transfer Agent fees | | | 67,279 | | | | 9,270 | | | | 6,000 | | | | 6,000 | | | | 88,549 | |
| | | | | | | | | | | | | | | | | | | | | |
| Lyrical International Value Equity Fund | | | | | | | | | | | | | |
| | | | | | | | | | | | | | | | |
| Expenses | | | | | | | | | | | | | | | |
| Distribution fees | | $ | — | | | $ | 1,105 | | | $ | 7 | | | $ | 29 | | | $ | 1,141 | |
| Registration and filing fees | | | 3,905 | | | | 1,784 | | | | 1,081 | | | | 1,081 | | | | 7,851 | |
| Transfer Agent fees | | | 6,000 | | | | 6,000 | | | | 6,000 | | | | 6,000 | | | | 24,000 | |
| LYRICAL FUNDS |
| NOTES TO FINANCIAL STATEMENTS (Continued) |
Common expenses – Common expenses of the Trust are allocated among the Funds and the other series of the Trust based on the relative net assets of each series, the number of series in the Trust, or the nature of the services performed and the relative applicability to each series.
Distributions to shareholders – Each Fund distributes to shareholders any net investment income dividends and net realized capital gains distributions at least once each year. The amount of such dividends and distributions are determined in accordance with federal income tax regulations, which may differ from GAAP. Dividends and distributions to shareholders are recorded on the ex-dividend date. The Funds may utilize earnings and profits distributed to shareholders on redemption of shares as part of the dividends paid deduction for income tax purposes. The tax character of distributions paid to shareholders by the Funds during the periods ended May 31, 2023 and November 30, 2022 was as follows:
| | | Period | | Ordinary | | | Long-Term | | | Total | |
| | | Ended | | Income | | | Capital Gains | | | Distributions | |
| Lyrical U.S. Value Equity Fund | | 5/31/2023 | | $ | 2,742,916 | | | $ | — | | | $ | 2,742,916 | |
| | | 11/30/2022 | | $ | 4,003,098 | | | $ | 28,379,572 | | | $ | 32,382,670 | |
| | | | | | | | | | | | | | | |
| Lyrical International Value Equity Fund | | 5/31/2023 | | $ | 63,102 | | | $ | — | | | $ | 63,102 | |
| | | 11/30/2022 | | $ | 2,388 | | | $ | — | | | $ | 2,388 | |
Estimates – The preparation of financial statements in conformity with GAAP requires management to make estimates and assumptions that affect the reported amounts of assets and liabilities and disclosure of contingent assets and liabilities as of the date of the financial statements and the reported amounts of increase (decrease) in net assets from operations during the reporting period. Actual results could differ from those estimates.
Federal income tax – Each Fund has qualified and intends to continue to qualify as a regulated investment company under the Internal Revenue Code of 1986, as amended (the “Code”). Qualification generally will relieve the Funds of liability for federal income taxes to the extent 100% of their net investment income and net realized capital gains are distributed in accordance with the Code.
In order to avoid imposition of the excise tax applicable to regulated investment companies, it is also each Fund’s intention to declare as dividends in each calendar year at least 98% of its net investment income (earned during the calendar year) and 98.2% of its net realized capital gains (earned during the twelve months ended October 31) plus undistributed amounts from prior years.
| LYRICAL FUNDS |
| NOTES TO FINANCIAL STATEMENTS (Continued) |
The following information is computed on a tax basis for each item as of November 30, 2022:
| | | Lyrical | | | Lyrical | |
| | | U.S. Value | | | International Value | |
| | | Equity Fund | | | Equity Fund | |
| Tax cost of investments | | $ | 602,624,485 | | | $ | 2,230,919 | |
| Gross unrealized appreciation | | $ | 158,674,884 | | | $ | 286,934 | |
| Gross unrealized depreciation | | | (90,208,954 | ) | | | (302,003 | ) |
| Net unrealized appreciation (depreciation) | | | 68,465,930 | | | | (15,069 | ) |
| Net unrealized appreciation on foreign currency translation | | | — | | | | 98 | |
| Undistributed ordinary income | | | 2,233,078 | | | | 63,095 | |
| Accumulated capital and other losses | | | (10,174,423 | ) | | | (21,382 | ) |
| Accumulated earnings | | $ | 60,524,585 | | | $ | 26,742 | |
| | | | | | | | | |
As of November 30, 2022, the Funds had the following capital loss carryforwards for federal income tax purposes, which may be carried forward indefinitely:
| | | Lyrical U.S. Equity | | | Lyrical International | |
| | | Value Fund | | | Equity Value Fund | |
| No expiration - short-term | | $ | — | | | $ | 21,382 | |
| No expiration - long-term | | $ | — | | | $ | — | |
These capital loss carryforwards are available to offset net realized capital gains in the current and future years, thereby reducing taxable gain distributions.
The federal tax cost, unrealized appreciation (depreciation) as of May 31, 2023 is as follows:
| | | Lyrical | | | Lyrical | |
| | | U.S. Value | | | International Value | |
| | | Equity Fund | | | Equity Fund | |
| Cost of portfolio investments | | $ | 448,412,125 | | | $ | 11,117,843 | |
| Gross unrealized appreciation | | $ | 121,358,675 | | | $ | 550,956 | |
| Gross unrealized depreciation | | | (72,588,220 | ) | | | (866,429 | ) |
| Net unrealized appreciation (depreciation) | | $ | 48,770,455 | | | $ | (315,473 | ) |
| Net unrealized depreciation on foreign currency translation | | $ | — | | | $ | (1,039 | ) |
| | | | | | | | | |
The difference between the federal income tax cost of portfolio investments and the financial statement cost of investments for each Fund is due to certain timing differences in the recognition of capital gains or losses under income tax regulations and GAAP. These “book/tax” differences are temporary in nature and are primarily due to the tax deferral of losses on wash sales and holdings classified as passive foreign investment companies.
| LYRICAL FUNDS |
| NOTES TO FINANCIAL STATEMENTS (Continued) |
The Funds recognize the tax benefits or expenses of uncertain tax positions only when the position is “more likely than not” of being sustained assuming examination by tax authorities. Management has reviewed each Fund’s tax positions for the current and all open tax years (generally, three years) and has concluded that no provision for unrecognized tax benefits or expenses is required in these financial statements. The Funds identify their major tax jurisdiction as U.S. Federal.
The Funds recognize interest and penalties, if any, related to unrecognized tax benefits as income tax expense on the Statements of Operations. During the six months ended May 31, 2023, the Funds did not incur any interest or penalties.
3. Investment Transactions
During the six months ended May 31, 2023, cost of purchases and proceeds from sales of investment securities, other than short-term investments, amounted to $75,784,915 and $218,164,513, respectively, for Lyrical U.S. Value Equity Fund and $11,520,272 and $2,588,717, respectively, for Lyrical International Value Equity Fund.
4. Transactions with Related Parties
INVESTMENT ADVISORY AGREEMENT
The Funds’ investments are managed by the Adviser pursuant to the terms of an Investment Advisory Agreement. The Funds pay the Adviser a management fee, computed and accrued daily and paid monthly, at the annual rate of 0.85% of average daily net assets. During the six months ended May 31, 2023, the Adviser earned $2,642,934 and $34,994 of fees under the Investment Advisory Agreement for Lyrical U.S. Value Equity Fund and Lyrical International Value Equity Fund, respectively.
Pursuant to an Expense Limitation Agreement (“ELA”) between each Fund and the Adviser, the Adviser has contractually agreed, until April 1, 2024, to reduce management fees and reimburse other operating expenses to limit total annual operating expenses of each Fund (exclusive of brokerage costs; taxes; interest; borrowing costs such as interest and dividend expenses on securities sold short; costs to organize the Fund; acquired fund fees and expenses; extraordinary expenses such as litigation and merger or reorganization costs; and other expenses not incurred in the ordinary course of the Fund’s business) to an amount not exceeding the following percentages of average daily net assets attributable to each respective class:
| Institutional Class | Investor Class | A Class | C Class |
| 0.99% | 1.24% | 1.24% | 1.99% |
| LYRICAL FUNDS |
| NOTES TO FINANCIAL STATEMENTS (Continued) |
Accordingly, during the six months ended May 31, 2023, the Adviser reduced fees and reimbursed other operating expenses of $150,576 for Lyrical U.S. Value Equity Fund and $144,384 for Lyrical International Value Equity Fund.
Under the terms of the ELA, management fee reductions and expense reimbursements by the Adviser are subject to repayment by the Funds for a period of three years after such fees and expenses were incurred, provided that the repayments do not cause total annual fund operating expenses to exceed the lesser of: (i) the expense limitation then in effect, if any, and (ii) the expense limitation in effect at the time the expenses to be repaid were incurred. As of May 31, 2023, the Adviser may seek repayment of management fee reductions and expense reimbursements no later than the dates below:
| | | November 30, | | | November 30, | | | November 30, | | | May 31, | | | | |
| | | 2023 | | | 2024 | | | 2025 | | | 2025 | | | Total | |
| Lyrical U.S. Value Equity Fund | | $ | 106,364 | | | $ | 189,462 | | | $ | 225,900 | | | $ | 150,576 | | | $ | 672,302 | |
| Lyrical International Value Equity Fund | | $ | 98,711 | | | $ | 229,164 | | | $ | 262,691 | | | $ | 144,384 | | | $ | 734,950 | |
OTHER SERVICE PROVIDERS
Ultimus Fund Solutions, LLC (“Ultimus”) provides administration, fund accounting, compliance and transfer agency services to the Funds. The Funds pay Ultimus fees in accordance with the agreements for such services. In addition, the Funds pay out-of-pocket expenses including, but not limited to, postage, supplies, and certain costs related to the pricing of the Funds’ portfolio securities.
Under the terms of a Distribution Agreement with the Trust, Ultimus Fund Distributors, LLC (the “Distributor”) serves as the principal underwriter to the Funds. The Distributor is a wholly-owned subsidiary of Ultimus. The Distributor is compensated partially by the Adviser and partially by the Investor Class, A Class and C Class shares of each Fund for acting as principal underwriter.
A Trustee and certain officers of the Trust are also officers of Ultimus and are not paid by the Funds for serving in such capacities.
DISTRIBUTION PLAN
The Funds have adopted a plan of distribution (the “Plan”), pursuant to Rule 12b-1 under the 1940 Act, which permits Investor Class, A Class and C Class shares of each Fund to directly incur or reimburse the Funds’ principal underwriter for certain expenses related to the distribution of its shares. The annual limitation for payment of expenses pursuant to the Plan is 0.25% of each Fund’s average daily net assets allocable to Investor Class
| LYRICAL FUNDS |
| NOTES TO FINANCIAL STATEMENTS (Continued) |
shares and A Class shares, and 1.00% of each Fund’s average daily net assets allocable to C Class shares. The Funds have not adopted a plan of distribution with respect to the Institutional Class shares.
TRUSTEE COMPENSATION
Each member of the Board (a “Trustee”) who is not an “interested person” (as defined by the 1940 Act, as amended) of the Trust (“Independent Trustee”) receives a $1,300 annual retainer from each Fund, except for the Board Chairperson who receives a $1,700 annual retainer from each Fund, and the Audit Committee Chairperson who receives a $1,500 annual retainer from each Fund, paid in quarterly installments. Each Independent Trustee also receives from each Fund a fee of $550 for each Board meeting attended plus reimbursement for travel and other meeting-related expenses.
PRINCIPAL HOLDERS OF FUND SHARES
As of May 31, 2023, the following shareholders owned of record 25% or more of the outstanding shares of a Class of the Funds:
| NAME OF RECORD OWNERS | % Ownership |
| Lyrical U.S. Value Equity Fund - A Class | |
| Pershing, LLC (for the benefit of its customers) | 65% |
| Lyrical International Value Equity Fund - Institutional Class | |
| National Financial Services, LLC | 92% |
| Lyrical International Value Equity Fund - Investor Class | |
| Pershing, LLC (for the benefit of its customers) | 89% |
| Lyrical International Value Equity Fund - A Class | |
| Lyrical Asset Management L.P. | 100% |
| Lyrical International Value Equity Fund - C Class | |
| Lyrical Asset Management L.P. | 100% |
A beneficial owner of 25% or more of a Fund’s outstanding shares may be considered a controlling person of the Fund. That shareholder’s vote could have a more significant effect on matters presented at a shareholders’ meeting.
5. Borrowing Costs
From time to time, the Funds may have an overdrawn cash balance at the custodian due to redemptions or market movements. When this occurs, the Funds will incur borrowing costs charged by the custodian. During the six months ended May 31, 2023, Lyrical U.S. Value Equity Fund and Lyrical International Value Equity Fund incurred borrowing costs in the amount of $22,057 and $0, respectively.
| LYRICAL FUNDS |
| NOTES TO FINANCIAL STATEMENTS (Continued) |
6. Sector Risk
If a Fund has significant investments in the securities of issuers within a particular sector, any development affecting that sector will have a greater impact on the value of the net assets of the Fund than would be the case if the Fund did not have significant investments in that sector. In addition, this may increase the risk of loss in the Fund and increase the volatility of the Fund’s NAV per share. For instance, economic or market factors, regulatory changes or other developments may negatively impact all companies in a particular sector, and therefore the value of the Fund’s portfolio will be adversely affected. As of May 31, 2023, Lyrical U.S. Value Equity Fund had 29.0% of the value of its net assets invested in stocks within the Technology sector.
7. Contingencies and Commitments
The Funds indemnify the Trust’s officers and Trustees for certain liabilities that might arise from their performance of their duties to the Funds. Additionally, in the normal course of business the Funds enter into contracts that contain a variety of representations and warranties and which provide general indemnifications. The Funds’ maximum exposure under these arrangements is unknown, as this would involve future claims that may be made against the Funds that have not yet occurred. However, based on experience, the Funds expect the risk of loss to be remote.
8. Subsequent Events
The Funds are required to recognize in the financial statements the effects of all subsequent events that provide additional evidence about conditions that existed as of the date of the Statement of Assets and Liabilities. For non-recognized subsequent events that must be disclosed to keep the financial statements from being misleading, the Funds are required to disclose the nature of the event as well as an estimate of its financial effect, or a statement that such an estimate cannot be made. Management has evaluated subsequent events through the issuance of these financial statements and has noted no such events.
| LYRICAL FUNDS |
| CHANGE IN INDEPENDENT REGISTERED |
| PUBLIC ACCOUNTING FIRM (Unaudited) |
On March 13, 2023, BBD LLP (“BBD”) ceased to serve as the independent registered public accounting firm of Lyrical U.S. Value Equity Fund and Lyrical International Value Equity Fund (the “Funds”), each a series of Ultimus Managers Trust. The Audit Committee of the Board of Trustees approved the replacement of BBD as a result of Cohen & Company, Ltd.’s (“Cohen”) acquisition of BBD’s Investment Management Group.
The report of BBD on the financial statements of the Funds as of and for the fiscal years ended 2022 and 2021 did not contain an adverse opinion or a disclaimer of opinion, and were not qualified or modified as to uncertainties, audit scope or accounting principles. During the fiscal years ended 2022 and 2021, and during the subsequent interim period through March 13, 2023: (i) there were no disagreements between the registrant and BBD on any matter of accounting principles or practices, financial statement disclosure, or auditing scope or procedure, which disagreements, if not resolved to the satisfaction of BBD, would have caused it to make reference to the subject matter of the disagreements in its report on the financial statements of the Funds for such years or interim period; and (ii) there were no “reportable events,” as defined in Item 304(a)(1)(v) of Regulation S-K under the Securities Exchange Act of 1934, as amended.
On April 21, 2023, the Audit Committee of the Board of Trustees also recommended and approved the appointment of Cohen as the Funds’ independent registered public accounting firm for the fiscal year ending November 30, 2023.
During the fiscal years ended 2022 and 2021, and during the subsequent interim period through March 13, 2023, neither the registrant, nor anyone acting on its behalf, consulted with Cohen on behalf of the Funds regarding the application of accounting principles to a specified transaction (either completed or proposed), the type of audit opinion that might be rendered on the Funds’ financial statements, or any matter that was either: (i) the subject of a “disagreement,” as defined in Item 304(a)(1)(iv) of Regulation S-K and the instructions thereto; or (ii) “reportable events,” as defined in Item 304(a)(1)(v) of Regulation S-K.
| LYRICAL FUNDS |
| ABOUT YOUR FUNDS’ EXPENSES (Unaudited) |
We believe it is important for you to understand the impact of costs on your investment. As a shareholder of the Funds, you incur ongoing costs, including management fees, class-specific expenses (such as distribution fees) and other operating expenses. The following examples are intended to help you understand your ongoing costs (in dollars) of investing in the Funds and to compare these costs with the ongoing costs of investing in other mutual funds.
A mutual fund’s ongoing costs are expressed as a percentage of its average net assets. This figure is known as the expense ratio. The expenses in the tables below are based on an investment of $1,000 made at the beginning of the most recent period (December 1, 2022) and held until the end of the period (May 31, 2023).
The tables below illustrate each Fund’s ongoing costs in two ways:
Actual fund return – The first line for each share class helps you to estimate the actual expenses that you paid over the period. The “Ending Account Value” shown is derived from each Fund’s actual return, and the fourth column shows the dollar amount of operating expenses that would have been paid by an investor who started with $1,000 in the Funds. You may use the information here, together with the amount you invested, to estimate the expenses that you paid over the period.
To do so, simply divide your account value by $1,000 (for example, an $8,600 account value divided by $1,000 = 8.6), then multiply the result by the number given for the Funds under the heading “Expenses Paid During Period.”
Hypothetical 5% return – The second line for each share class is intended to help you compare each Fund’s ongoing costs with those of other mutual funds. It assumes that the Funds had an annual return of 5% before expenses during the period shown, but that the expense ratio is unchanged. In this case, because the return used is not each Fund’s actual return, the results do not apply to your investment. The example is useful in making comparisons because the U.S. Securities and Exchange Commission (the “SEC”) requires all mutual funds to calculate expenses based on a 5% return. You can assess each Fund’s ongoing costs by comparing this hypothetical example with the hypothetical examples that appear in shareholder reports of other funds.
Note that expenses shown in the table are meant to highlight and help you compare ongoing costs only.
The calculations assume no shares were bought or sold during the period. Your actual costs may have been higher or lower, depending on the amount of your investment and the timing of any purchases or redemptions.
| LYRICAL FUNDS |
| ABOUT YOUR FUNDS’ EXPENSES (Unaudited) (Continued) |
More information about each Fund’s expenses can be found in this report. For additional information on operating expenses and other shareholder costs, please refer to each Fund’s prospectus.
| | Beginning | Ending | Net | Expenses |
| | Account Value | Account Value | Expense | Paid During |
| | December 1, 2022 | May 31, 2023 | Ratio(a) | Period(b) |
| Lyrical U.S. Value Equity Fund | | | | |
| Institutional Class | | | | |
| Based on Actual Fund Return | $ 1,000.00 | $ 950.20 | 1.00% | $ 4.86 |
| Based on Hypothetical 5% Return (before expenses) | $ 1,000.00 | $ 1,019.95 | 1.00% | $ 5.04 |
| Investor Class | | | | |
| Based on Actual Fund Return | $ 1,000.00 | $ 948.80 | 1.25% | $ 6.07 |
| Based on Hypothetical 5% Return (before expenses) | $ 1,000.00 | $ 1,018.70 | 1.25% | $ 6.29 |
| A Class | | | | |
| Based on Actual Fund Return | $ 1,000.00 | $ 949.10 | 1.25% | $ 6.07 |
| Based on Hypothetical 5% Return (before expenses) | $ 1,000.00 | $ 1,018.70 | 1.25% | $ 6.29 |
| C Class | | | | |
| Based on Actual Fund Return | $ 1,000.00 | $ 945.30 | 2.00% | $ 9.70 |
| Based on Hypothetical 5% Return (before expenses) | $ 1,000.00 | $ 1,014.96 | 2.00% | $ 10.05 |
| (a) | Annualized, based on each Class’s most recent one-half year expenses. |
| (b) | Expenses are equal to each Class’s annualized net expense ratio multiplied by the average account value over the period, multiplied by 182/365 (to reflect the one-half year period). |
| LYRICAL FUNDS |
| ABOUT YOUR FUNDS’ EXPENSES (Unaudited) (Continued) |
| | Beginning | Ending | Net | Expenses |
| | Account Value | Account Value | Expense | Paid During |
| | December 1, 2022 | May 31, 2023 | Ratio(a) | Period(b) |
| Lyrical International Value Equity Fund | | | | |
| Institutional Class | | | | |
| Based on Actual Fund Return | $ 1,000.00 | $ 1,013.30 | 0.99% | $ 4.97 |
| Based on Hypothetical 5% Return (before expenses) | $ 1,000.00 | $ 1,020.00 | 0.99% | $ 4.99 |
| Investor Class | | | | |
| Based on Actual Fund Return | $ 1,000.00 | $ 1,012.60 | 1.24% | $ 6.22 |
| Based on Hypothetical 5% Return (before expenses) | $ 1,000.00 | $ 1,018.75 | 1.24% | $ 6.24 |
| A Class | | | | |
| Based on Actual Fund Return | $ 1,000.00 | $ 1,012.10 | 1.24% | $ 6.22 |
| Based on Hypothetical 5% Return (before expenses) | $ 1,000.00 | $ 1,018.75 | 1.24% | $ 6.24 |
| C Class | | | | |
| Based on Actual Fund Return | $ 1,000.00 | $ 1,007.70 | 1.99% | $ 9.96 |
| Based on Hypothetical 5% Return (before expenses) | $ 1,000.00 | $ 1,015.01 | 1.99% | $ 10.00 |
| (a) | Annualized, based on each Class’s most recent one-half year expenses. |
| (b) | Expenses are equal to each Class’s annualized net expense ratio multiplied by the average account value over the period, multiplied by 182/365 (to reflect the one-half year period). |
| LYRICAL FUNDS |
| OTHER INFORMATION (Unaudited) |
A description of the policies and procedures that the Funds use to vote proxies relating to portfolio securities is available without charge upon request by calling toll-free 1-888-884-8099, or on the SEC’s website at www.sec.gov. Information regarding how the Funds voted proxies relating to portfolio securities during the most recent 12-month period ended June 30 is available without charge upon request by calling toll-free 1-888-884-8099, or on the SEC’s website at www.sec.gov.
The Trust files a complete listing of portfolio holdings for the Funds with the SEC as of the end of the first and third quarters of each fiscal year as an exhibit to its reports on Form N-PORT. These filings are available upon request by calling 1-888-884-8099. Furthermore, you may obtain a copy of the filings on the SEC’s website at www.sec.gov and the Funds’ website at www.lyricalvaluefunds.com.
| LYRICAL U.S. VALUE EQUITY FUND AND LYRICAL INTERNATIONAL VALUE EQUITY FUND DISCLOSURE REGARDING APPROVAL OF INVESTMENT ADVISORY AGREEMENT (Unaudited) |
The Board of Trustees (the “Board”), including the Independent Trustees voting separately, has reviewed and approved the Funds’ Investment Advisory Agreement with Lyrical Asset Management LP (the “Adviser” or “Lyrical”) for an additional one-year term (the “Agreement”). The Board approved the Agreement at a meeting held on April 19-21, 2023, at which all of the Trustees were present.
In deciding whether to approve the continuation of the Agreement, the Board recalled its review of the materials related to the Funds and Lyrical throughout the preceding twelve months and its numerous discussions with Trust Management and Lyrical about the operations and performance of the Funds during that period. The Board further considered those materials and discussions and other numerous factors, including the following:
The nature, extent, and quality of the services provided by Lyrical. In this regard, the Board reviewed the services being provided by Lyrical to each of the Funds including, without limitation, providing a continuous investment program for the Fund, adhering to the Fund’s investment restrictions, complying with the Trust’s policies and procedures, and voting proxies on behalf of the Fund. The Board considered the qualifications and experience of Lyrical’s portfolio managers who are responsible for the day-to-day management of each of the Funds, as well as the qualifications and experience of the other individuals at Lyrical who provide services to the Fund. The Board concluded that the quality, extent, and nature of the services provided by Lyrical to each of the Funds were satisfactory and adequate.
The investment performance of the Funds. In this regard, the Board compared the performance of each of the Funds with the performance of its benchmark index, custom peer group, and Morningstar category. The Board concluded that the investment performance of each of the Funds has been satisfactory.
The costs of the services provided and profits realized by Lyrical and its affiliates from their relationship with the Funds. In this regard, the Board considered Lyrical’s staffing, methods of operating, its financial condition, the asset level of each of the Funds; the overall expenses of each of the Funds, including the advisory fee; and the differences in fees and services to Lyrical’s other similar clients. The Board considered the current and anticipated profitability of each of the Funds to Lyrical, if any. The Board concluded that advisory fee to be paid to Lyrical by each of the Funds is reasonable in light of the nature and quality of services provided by Lyrical.
The extent to which economics of scale would be realized as the Funds grow and whether advisory fee levels reflect these economies of scale for the benefit of the Funds’ investors. In this regard, the Board considered that each of the Funds’ fee arrangements with Lyrical each involve both the advisory fee and the Funds’ limitation agreement (“ELA”). The Board determined that while the advisory fee rates remain the same as asset levels increased, the shareholders of each Fund have experienced in the past, and will experience in the
| LYRICAL U.S. VALUE EQUITY FUND AND LYRICAL INTERNATIONAL VALUE EQUITY FUND DISCLOSURE REGARDING APPROVAL OF INVESTMENT ADVISORY AGREEMENT (Unaudited) (Continued) |
future, benefits from the ELA. The Board concluded that the advisory fee for each Fund was reasonable in light of the information that was provided to the Trustees by Lyrical with respect to economies of scale.
After further discussion of the factors noted above and in reliance on the information provided by Lyrical and Trust Management, and taking into account the totality of all factors discussed and information presented at this Meeting and previous meetings, the Board indicated its agreement to approve the continuance of the Agreement for each of the Funds. It was noted that in the Trustees’ deliberations regarding the approval of the continuance of the Agreement, the Trustees did not identify any particular information or factor that was all-important or controlling, and that each individual Trustee may have attributed different weights to various factors listed above. After full consideration of the above factors as well as other factors, the Board unanimously concluded that approval of the continuance of the Agreement was in the best interests of the Funds and their shareholders.
Customer Privacy Notice
| FACTS | WHAT DO THE LYRICAL U.S. VALUE EQUITY FUND AND THE LYRICAL INTERNATIONAL VALUE EQUITY FUND (THE “FUNDS”) DO WITH YOUR PERSONAL INFORMATION? |
| | |
| Why? | Financial companies choose how they share your personal information. Federal law gives consumers the right to limit some but not all sharing. Federal law also requires us to tell you how we collect, share, and protect your personal information. Please read this notice carefully to understand what we do. |
| | |
| What? | The types of personal information we collect and share depend on the product or service you have with us. This information can include: ■ Social Security number ■ Assets ■ Retirement Assets ■ Transaction History ■ Checking Account Information ■ Purchase History ■ Account Balances ■ Account Transactions ■ Wire Transfer Instructions When you are no longer our customer, we continue to share your information as described in this notice. |
| | |
| How? | All financial companies need to share your personal information to run their everyday business. In the section below, we list the reasons financial companies can share their customers’ personal information; the reasons the Funds chooses to share; and whether you can limit this sharing. |
| Reasons we can share your personal information | Do the
Funds share? | Can you limit
this sharing? |
For our everyday business purposes –
Such as to process your transactions, maintain your account(s), respond to court orders and legal investigations, or report to credit bureaus | Yes | No |
For our marketing purposes –
to offer our products and services to you | No | We don’t share |
| For joint marketing with other financial companies | No | We don’t share |
For our affiliates’ everyday business purposes –
information about your transactions and experiences | No | We don’t share |
For our affiliates’ everyday business purposes –
information about your creditworthiness | No | We don’t share |
| For nonaffiliates to market to you | No | We don’t share |
| Questions? | Call 1-888-884-8099 |
| Who we are |
| Who is providing this notice? | Lyrical U.S. Value Equity Fund Lyrical International Value Equity Fund Ultimus Fund Distributors, LLC (Distributor) Ultimus Fund Solutions, LLC (Administrator) |
| What we do |
| How do the Funds protect my personal information? | To protect your personal information from unauthorized access and use, we use security measures that comply with federal law. These measures include computer safeguards and secured files and buildings. Our service providers are held accountable for adhering to strict policies and procedures to prevent any misuse of your nonpublic personal information. |
| How do the Funds collect my personal information? | We collect your personal information, for example, when you ■ Open an account ■ Provide account information ■ Give us your contact information ■ Make deposits or withdrawals from your account ■ Make a wire transfer ■ Tell us where to send the money ■ Tell us who receives the money ■ Show your government-issued ID ■ Show your driver’s license We also collect your personal information from other companies. |
| Why can’t I limit all sharing? | Federal law gives you the right to limit only ■ Sharing for affiliates’ everyday business purposes – information about your creditworthiness ■ Affiliates from using your information to market to you ■ Sharing for nonaffiliates to market to you State laws and individual companies may give you additional rights to limit sharing. |
| |
| Definitions |
| Affiliates | Companies related by common ownership or control. They can be financial and nonfinancial companies. ■ Lyrical Asset Management LP, the investment adviser to the Funds, could be deemed to be an affiliate. |
| Nonaffiliates | Companies not related by common ownership or control. They can be financial and nonfinancial companies ■ The Funds do not share with nonaffiliates so they can market to you. |
| Joint marketing | A formal agreement between nonaffiliated financial companies that together market financial products or services to you. ■ The Funds do not jointly market. |
LYRICAL-SAR-23
U.S. VALUE ETF
(USVT)
Semi-Annual Report
May 31, 2023
(Unaudited)
| U.S. VALUE ETF | May 31, 2023 |
| LETTER TO SHAREHOLDERS | (Unaudited) |
Dear Fellow Shareholders,
Enclosed is the Semi-Annual Report to shareholders of U.S. Value ETF (“USVT”). We would like to thank you for your investment.
U.S Value ETF
U.S. Value ETF (the “Fund”) is designed for those seeking value exposure through a passive management process. USVT aims to track the investment results (before fees and expenses) of the Lyrical U.S. Value Index (the “Index”). The Index, developed by Lyrical Asset Management LP, seeks to represent the potential benefits of deep value investing by using proprietary investment screens to identify the cheapest quintile of 200 stocks from a universe of potential investment candidates of the top 1,000 US stocks by market capitalization, based on one year forward median analyst projected price to earnings ratio.
Since its launch on September 13, 2021 through May 31, 2023, USVT has produced a cumulative total return of -1.11%, compared to the Index return of -0.30%, and to the +5.28% cumulative total return for S&P 500® Value Index (the “S&P 500 Value”). For the six months ended May 31, 2023, USVT produced a total return of -11.41% compared to the total return for the S&P 500 Value of +0.83%. Over this same period, 30% of USVT’s investments have posted gains and 26% outperformed the S&P 500® Value Index.
As of May 31, 2023, the valuation of our portfolio is 7.3 times the next twelve months consensus earnings. The S&P 500® Value Index has a valuation of 16.3 times earnings on this same basis, a premium of 123.29% over the Fund.
Thank you for your continued trust and interest in USVT.
Sincerely,
Lyrical Asset Management LP
Past performance is not predictive of future performance. Investment results and principal value will fluctuate so that shares, when redeemed, may be worth more or less than their original cost. Current performance may be higher or lower than the performance data quoted. Performance data current to the most recent month end are available by calling 1-888-884-8099.
An investor should consider the investment objectives, risks, charges and expenses of the fund carefully before investing. The fund’s prospectus contains this and other important information. To obtain a copy of the fund’s prospectus please visit the fund’s website at www.usvalueetf.com or call 1-888-884-8099 and a copy will be sent to you free of charge. Please read the prospectus carefully before you invest. The fund is distributed by Northern Lights Distributors, LLC.
The Letter to Shareholders seeks to describe some of the Adviser’s current opinions and views of the financial markets. Although the Adviser believes it has a reasonable basis for any opinions or views expressed, actual results may differ, sometimes significantly so, from those expected or expressed. The securities held by the fund that are discussed in the Letter to Shareholders were held during the period covered by this Report. They do not comprise the entire investment portfolios of the fund, may be sold at any time, and may no longer be held by the Fund. For a complete list of securities held by the fund as of May 31, 2023, please see the Schedules of Investments section of this Report. The opinions of the Adviser with respect to those securities may change at any time.
Statements in the Letter to Shareholders that reflect projections or expectations for future financial or economic performance of the Fund and the market in general and statements of the Fund’s plans and objectives for future operations are forward-looking statements. No assurance can be given that actual results or events will not differ materially from those projected, estimated, assumed, or anticipated in any such forward- looking statements. Important factors that could result in such differences, in addition to factors noted with such forward-looking statements include, without limitation, general economic conditions, such as inflation, recession, and interest rates. Past performance is not a guarantee of future results.
| U.S. VALUE ETF |
| PORTFOLIO INFORMATION |
| May 31, 2023 (Unaudited) |
U.S. Value ETF vs. S&P 500® Index Sector Diversification
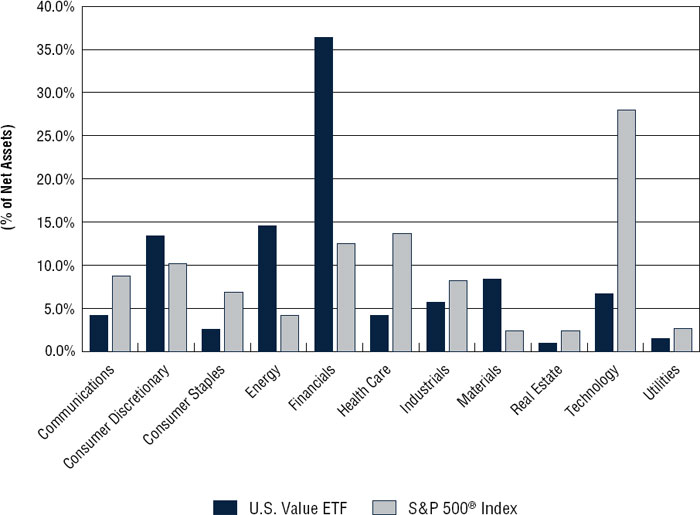
Top Ten Equity Holdings
| | | % of |
| Security Description | | Net Assets |
| AppLovin Corporation - Class A | | 0.8% |
| XP, Inc. - Class A | | 0.7% |
| First Citizens BancShares, Inc. - Class A | | 0.7% |
| Flex Ltd. | | 0.6% |
| New York Community Bancorp, Inc. | | 0.6% |
| American Airlines Group, Inc. | | 0.6% |
| Toll Brothers, Inc. | | 0.6% |
| United Airlines Holdings, Inc. | | 0.6% |
| PulteGroup, Inc. | | 0.6% |
| Vontier Corporation | | 0.6% |
| U.S. VALUE ETF |
| SCHEDULE OF INVESTMENTS |
| May 31, 2023 (Unaudited) |
| COMMON STOCKS — 98.7% | | Shares | | | Value | |
| Communications — 4.2% | | | | | | | | |
| Cable & Satellite — 1.0% | | | | | | | | |
| Charter Communications, Inc. - Class A (a) | | | 82 | | | $ | 26,744 | |
| Comcast Corporation - Class A | | | 752 | | | | 29,592 | |
| | | | | | | | 56,336 | |
| Entertainment Content — 1.3% | | | | | | | | |
| AppLovin Corporation - Class A (a) | | | 1,749 | | | | 43,741 | |
| Fox Corporation - Class A | | | 843 | | | | 26,302 | |
| | | | | | | | 70,043 | |
| Internet Media & Services — 0.6% | | | | | | | | |
| Expedia Group, Inc. (a) | | | 315 | | | | 30,149 | |
| | | | | | | | | |
| Publishing & Broadcasting — 0.4% | | | | | | | | |
| Nexstar Media Group, Inc. | | | 161 | | | | 24,298 | |
| | | | | | | | | |
| Telecommunications — 0.9% | | | | | | | | |
| AT&T, Inc. | | | 1,433 | | | | 22,541 | |
| Verizon Communications, Inc. | | | 728 | | | | 25,939 | |
| | | | | | | | 48,480 | |
| Consumer Discretionary — 13.4% | | | | | | | | |
| Apparel & Textile Products — 1.8% | | | | | | | | |
| Capri Holdings Ltd. (a) | | | 651 | | | | 22,850 | |
| PVH Corporation | | | 326 | | | | 28,043 | |
| Tapestry, Inc. | | | 682 | | | | 27,294 | |
| VF Corporation | | | 1,311 | | | | 22,575 | |
| | | | | | | | 100,762 | |
| Automotive — 1.9% | | | | | | | | |
| BorgWarner, Inc. | | | 594 | | | | 26,332 | |
| Ford Motor Company | | | 2,296 | | | | 27,552 | |
| General Motors Company | | | 828 | | | | 26,835 | |
| Harley-Davidson, Inc. | | | 779 | | | | 24,235 | |
| | | | | | | | 104,954 | |
| E-Commerce Discretionary — 0.5% | | | | | | | | |
| eBay, Inc. | | | 656 | | | | 27,906 | |
| | | | | | | | | |
| Home & Office Products — 0.5% | | | | | | | | |
| Whirlpool Corporation | | | 213 | | | | 27,539 | |
| | | | | | | | | |
| Home Construction — 2.8% | | | | | | | | |
| D.R. Horton, Inc. | | | 292 | | | | 31,197 | |
| Lennar Corporation - Class A | | | 275 | | | | 29,458 | |
| Meritage Homes Corporation | | | 241 | | | | 27,795 | |
| U.S. VALUE ETF |
| SCHEDULE OF INVESTMENTS (Continued) |
| COMMON STOCKS — 98.7% (Continued) | | Shares | | | Value | |
| Consumer Discretionary — 13.4% (Continued) | | | | | | | | |
| Home Construction — 2.8% (Continued) | | | | | | | | |
| PulteGroup, Inc. | | | 483 | | | $ | 31,917 | |
| Toll Brothers, Inc. | | | 479 | | | | 32,428 | |
| | | | | | | | 152,795 | |
| Leisure Facilities & Services — 0.5% | | | | | | | | |
| Penn Entertainment, Inc. (a) | | | 974 | | | | 24,389 | |
| | | | | | | | | |
| Leisure Products — 0.5% | | | | | | | | |
| Brunswick Corporation | | | 352 | | | | 26,576 | |
| | | | | | | | | |
| Retail - Discretionary — 4.9% | | | | | | | | |
| Academy Sports & Outdoors, Inc. | | | 423 | | | | 20,710 | |
| Asbury Automotive Group, Inc. (a) | | | 139 | | | | 29,066 | |
| AutoNation, Inc. (a) | | | 216 | | | | 28,279 | |
| Avis Budget Group, Inc. (a) | | | 158 | | | | 26,511 | |
| Dick’s Sporting Goods, Inc. | | | 207 | | | | 26,395 | |
| Hertz Global Holdings, Inc. (a) | | | 1,824 | | | | 28,600 | |
| Lithia Motors, Inc. | | | 128 | | | | 29,859 | |
| Macy’s, Inc. | | | 1,628 | | | | 22,125 | |
| Penske Automotive Group, Inc. | | | 205 | | | | 28,335 | |
| Williams-Sonoma, Inc. | | | 242 | | | | 27,469 | |
| | | | | | | | 267,349 | |
| Consumer Staples — 2.6% | | | | | | | | |
| Food — 0.6% | | | | | | | | |
| Darling Ingredients, Inc. (a) | | | 486 | | | | 30,803 | |
| | | | | | | | | |
| Retail - Consumer Staples — 1.0% | | | | | | | | |
| Albertsons Companies, Inc. - Class A | | | 1,387 | | | | 28,240 | |
| Walgreens Boots Alliance, Inc. | | | 800 | | | | 24,296 | |
| | | | | | | | 52,536 | |
| Tobacco & Cannabis — 0.5% | | | | | | | | |
| Altria Group, Inc. | | | 636 | | | | 28,251 | |
| | | | | | | | | |
| Wholesale - Consumer Staples — 0.5% | | | | | | | | |
| Bunge Ltd. | | | 307 | | | | 28,440 | |
| | | | | | | | | |
| Energy — 14.6% | | | | | | | | |
| Oil & Gas Producers — 14.2% | | | | | | | | |
| Antero Resources Corporation (a) | | | 1,203 | | | | 24,553 | |
| APA Corporation | | | 707 | | | | 22,468 | |
| Chord Energy Corporation | | | 201 | | | | 28,751 | |
| Civitas Resources, Inc. | | | 388 | | | | 25,918 | |
| U.S. VALUE ETF |
| SCHEDULE OF INVESTMENTS (Continued) |
| COMMON STOCKS — 98.7% (Continued) | | Shares | | | Value | |
| Energy — 14.6% (Continued) | | | | | | | | |
| Oil & Gas Producers — 14.2% (Continued) | | | | | | | | |
| ConocoPhillips | | | 262 | | | $ | 26,017 | |
| Coterra Energy, Inc. | | | 1,111 | | | | 25,831 | |
| DCP Midstream, L.P. | | | 684 | | | | 28,448 | |
| Devon Energy Corporation | | | 518 | | | | 23,880 | |
| Diamondback Energy, Inc. | | | 196 | | | | 24,921 | |
| Energy Transfer, L.P. | | | 2,242 | | | | 27,801 | |
| Enterprise Products Partners, L.P. | | | 1,066 | | | | 27,002 | |
| EOG Resources, Inc. | | | 236 | | | | 25,320 | |
| EQT Corporation | | | 870 | | | | 30,251 | |
| HF Sinclair Corporation | | | 617 | | | | 25,568 | |
| Marathon Oil Corporation | | | 1,115 | | | | 24,708 | |
| Marathon Petroleum Corporation | | | 219 | | | | 22,975 | |
| Matador Resources Company | | | 546 | | | | 24,008 | |
| MPLX, L.P. | | | 823 | | | | 27,439 | |
| Murphy Oil Corporation | | | 740 | | | | 25,752 | |
| New Fortress Energy, Inc. | | | 928 | | | | 24,379 | |
| Ovintiv, Inc. | | | 740 | | | | 24,472 | |
| PBF Energy, Inc. - Class A | | | 718 | | | | 26,430 | |
| PDC Energy, Inc. | | | 415 | | | | 28,477 | |
| Phillips 66 | | | 269 | | | | 24,643 | |
| Pioneer Natural Resources Company | | | 126 | | | | 25,129 | |
| Plains All American Pipeline, L.P. | | | 2,182 | | | | 28,191 | |
| Range Resources Corporation | | | 1,054 | | | | 28,848 | |
| Southwestern Energy Company (a) | | | 5,544 | | | | 26,445 | |
| Valero Energy Corporation | | | 215 | | | | 23,014 | |
| Western Midstream Partners, L.P. | | | 1,059 | | | | 26,729 | |
| | | | | | | | 778,368 | |
| Oil & Gas Services & Equipment — 0.4% | | | | | | | | |
| Halliburton Company | | | 846 | | | | 24,238 | |
| | | | | | | | | |
| Financials — 36.4% | | | | | | | | |
| Asset Management — 5.2% | | | | | | | | |
| Affiliated Managers Group, Inc. | | | 204 | | | | 28,374 | |
| Ameriprise Financial, Inc. | | | 93 | | | | 27,758 | |
| Apollo Global Management, Inc. | | | 441 | | | | 29,481 | |
| U.S. VALUE ETF |
| SCHEDULE OF INVESTMENTS (Continued) |
| COMMON STOCKS — 98.7% (Continued) | | Shares | | | Value | |
| Financials — 36.4% (Continued) | | | | | | | | |
| Asset Management — 5.2% (Continued) | | | | | | | | |
| Carlyle Group, Inc. (The) | | | 931 | | | $ | 25,519 | |
| Invesco Ltd. | | | 1,720 | | | | 24,734 | |
| LPL Financial Holdings, Inc. | | | 143 | | | | 27,854 | |
| Owl Rock Capital Corporation | | | 2,216 | | | | 29,760 | |
| Raymond James Financial, Inc. | | | 308 | | | | 27,828 | |
| Stifel Financial Corporation | | | 482 | | | | 26,785 | |
| XP, Inc. - Class A (a) | | | 2,060 | | | | 36,358 | |
| | | | | | | | 284,451 | |
| Banking — 14.5% | | | | | | | | |
| Bank of America Corporation | | | 1,002 | | | | 27,846 | |
| BOK Financial Corporation | | | 347 | | | | 28,218 | |
| Citigroup, Inc. | | | 605 | | | | 26,814 | |
| Citizens Financial Group, Inc. | | | 968 | | | | 24,955 | |
| Columbia Banking System, Inc. | | | 1,283 | | | | 25,698 | |
| Comerica, Inc. | | | 643 | | | | 23,212 | |
| Credicorp Ltd. | | | 218 | | | | 28,220 | |
| Cullen/Frost Bankers, Inc. | | | 273 | | | | 27,355 | |
| East West Bancorp, Inc. | | | 530 | | | | 25,361 | |
| Fifth Third Bancorp | | | 1,077 | | | | 26,139 | |
| First Citizens BancShares, Inc. - Class A | | | 29 | | | | 36,169 | |
| First Horizon Corporation | | | 1,553 | | | | 16,011 | |
| Home BancShares Inc. | | | 1,349 | | | | 28,963 | |
| Huntington Bancshares, Inc. | | | 2,525 | | | | 26,033 | |
| JPMorgan Chase & Company | | | 222 | | | | 30,128 | |
| KeyCorp | | | 2,328 | | | | 21,744 | |
| M&T Bank Corporation | | | 245 | | | | 29,194 | |
| New York Community Bancorp, Inc. | | | 3,186 | | | | 32,752 | |
| PNC Financial Services Group, Inc. (The) | | | 236 | | | | 27,336 | |
| Prosperity Bancshares, Inc. | | | 467 | | | | 26,703 | |
| Regions Financial Corporation | | | 1,556 | | | | 26,872 | |
| SouthState Corporation | | | 417 | | | | 26,071 | |
| Synovus Financial Corporation | | | 951 | | | | 25,763 | |
| Truist Financial Corporation | | | 845 | | | | 25,747 | |
| US Bancorp | | | 809 | | | | 24,189 | |
| Valley National Bancorp | | | 3,340 | | | | 24,649 | |
| Webster Financial Corporation | | | 748 | | | | 26,591 | |
| Wells Fargo & Company | | | 721 | | | | 28,703 | |
| Wintrust Financial Corporation | | | 393 | | | | 24,983 | |
| Zions Bancorporation N.A. | | | 918 | | | | 25,052 | |
| | | | | | | | 797,471 | |
| U.S. VALUE ETF |
| SCHEDULE OF INVESTMENTS (Continued) |
| COMMON STOCKS — 98.7% (Continued) | | Shares | | | Value | |
| Financials — 36.4% (Continued) | | | | | | | | |
| Institutional Financial Services — 1.9% | | | | | | | | |
| Bank of New York Mellon Corporation (The) | | | 619 | | | $ | 24,884 | |
| Evercore, Inc. - Class A | | | 237 | | | | 25,584 | |
| Goldman Sachs Group, Inc. (The) | | | 86 | | | | 27,856 | |
| State Street Corporation | | | 363 | | | | 24,691 | |
| | | | | | | | 103,015 | |
| Insurance — 8.0% | | | | | | | | |
| American Financial Group, Inc. | | | 235 | | | | 26,383 | |
| American International Group, Inc. | | | 554 | | | | 29,268 | |
| Assurant, Inc. | | | 242 | | | | 29,038 | |
| Axis Capital Holdings Ltd. | | | 517 | | | | 26,832 | |
| Chubb Ltd. | | | 143 | | | | 26,569 | |
| Equitable Holdings, Inc. | | | 1,131 | | | | 27,755 | |
| Everest Re Group Ltd. | | | 79 | | | | 26,862 | |
| Globe Life, Inc. | | | 267 | | | | 27,549 | |
| Hartford Financial Services Group, Inc. (The) | | | 404 | | | | 27,682 | |
| MetLife, Inc. | | | 479 | | | | 23,734 | |
| Old Republic International Corporation | | | 1,123 | | | | 27,502 | |
| Prudential Financial, Inc. | | | 337 | | | | 26,519 | |
| Reinsurance Group of America, Inc. | | | 209 | | | | 29,260 | |
| RenaissanceRe Holdings Ltd. | | | 141 | | | | 26,560 | |
| Unum Group | | | 716 | | | | 31,110 | |
| Voya Financial, Inc. | | | 386 | | | | 26,171 | |
| | | | | | | | 438,794 | |
| Specialty Finance — 6.8% | | | | | | | | |
| AerCap Holdings N.V. (a) | | | 513 | | | | 29,282 | |
| AGNC Investment Corporation | | | 2,844 | | | | 26,136 | |
| Air Lease Corporation | | | 719 | | | | 27,336 | |
| Ally Financial, Inc. | | | 1,079 | | | | 28,777 | |
| Annaly Capital Management, Inc. | | | 1,478 | | | | 27,905 | |
| Capital One Financial Corporation | | | 298 | | | | 31,054 | |
| Credit Acceptance Corporation (a) | | | 60 | | | | 26,741 | |
| Discover Financial Services | | | 285 | | | | 29,281 | |
| Essent Group Ltd. | | | 689 | | | | 30,433 | |
| Fidelity National Financial, Inc. | | | 801 | | | | 27,346 | |
| OneMain Holdings, Inc. | | | 762 | | | | 28,849 | |
| Starwood Property Trust, Inc. | | | 1,652 | | | | 28,993 | |
| Synchrony Financial | | | 961 | | | | 29,753 | |
| | | | | | | | 371,886 | |
| Health Care — 4.2% | | | | | | | | |
| Biotech & Pharma — 2.8% | | | | | | | | |
| Bristol-Myers Squibb Company | | | 405 | | | | 26,098 | |
| U.S. VALUE ETF |
| SCHEDULE OF INVESTMENTS (Continued) |
| COMMON STOCKS — 98.7% (Continued) | | Shares | | | Value | |
| Health Care — 4.2% (Continued) | | | | | | | | |
| Biotech & Pharma — 2.8% (Continued) | | | | | | | | |
| Jazz Pharmaceuticals plc (a) | | | 196 | | | $ | 25,119 | |
| Organon & Company | | | 1,193 | | | | 23,132 | |
| Royalty Pharma plc - Class A | | | 783 | | | | 25,635 | |
| United Therapeutics Corporation (a) | | | 123 | | | | 25,798 | |
| Viatris, Inc. | | | 2,884 | | | | 26,389 | |
| | | | | | | | 152,171 | |
| Health Care Facilities & Services — 1.4% | | | | | | | | |
| Centene Corporation (a) | | | 412 | | | | 25,713 | |
| Cigna Group (The) | | | 108 | | | | 26,721 | |
| CVS Health Corporation | | | 379 | | | | 25,783 | |
| | | | | | | | 78,217 | |
| Industrials — 5.7% | | | | | | | | |
| Commercial Support Services — 0.5% | | | | | | | | |
| H&R Block, Inc. | | | 831 | | | | 24,805 | |
| | | | | | | | | |
| Electrical Equipment — 1.0% | | | | | | | | |
| Atkore, Inc. (a) | | | 218 | | | | 25,456 | |
| Vontier Corporation | | | 1,065 | | | | 31,566 | |
| | | | | | | | 57,022 | |
| Industrial Support Services — 1.0% | | | | | | | | |
| United Rentals, Inc. | | | 77 | | | | 25,702 | |
| WESCO International, Inc. | | | 209 | | | | 28,712 | |
| | | | | | | | 54,414 | |
| Machinery — 0.9% | | | | | | | | |
| AGCO Corporation | | | 228 | | | | 25,144 | |
| CNH Industrial N.V. | | | 1,954 | | | | 25,070 | |
| | | | | | | | 50,214 | |
| Transportation & Logistics — 2.3% | | | | | | | | |
| Alaska Air Group, Inc. (a) | | | 675 | | | | 30,328 | |
| American Airlines Group, Inc. (a) | | | 2,209 | | | | 32,649 | |
| Delta Air Lines, Inc. (a) | | | 857 | | | | 31,135 | |
| United Airlines Holdings, Inc. (a) | | | 682 | | | | 32,371 | |
| | | | | | | | 126,483 | |
| Materials — 8.4% | | | | | | | | |
| Chemicals — 3.6% | | | | | | | | |
| Albemarle Corporation | | | 141 | | | | 27,288 | |
| Celanese Corporation | | | 258 | | | | 26,837 | |
| CF Industries Holdings, Inc. | | | 371 | | | | 22,820 | |
| Chemours Company (The) | | | 947 | | | | 25,086 | |
| Eastman Chemical Company | | | 343 | | | | 26,442 | |
| U.S. VALUE ETF |
| SCHEDULE OF INVESTMENTS (Continued) |
| COMMON STOCKS — 98.7% (Continued) | | Shares | | | Value | |
| Materials — 8.4% (Continued) | | | | | | | | |
| Chemicals — 3.6% (Continued) | | | | | | | | |
| LyondellBasell Industries N.V. - Class A | | | 298 | | | $ | 25,491 | |
| Mosaic Company (The) | | | 612 | | | | 19,560 | |
| Olin Corporation | | | 495 | | | | 23,418 | |
| | | | | | | | 196,942 | |
| Construction Materials — 0.6% | | | | | | | | |
| Owens Corning | | | 292 | | | | 31,048 | |
| | | | | | | | | |
| Containers & Packaging — 2.0% | | | | | | | | |
| Berry Global Group, Inc. | | | 488 | | | | 27,918 | |
| Graphic Packaging Holding Company | | | 1,151 | | | | 27,509 | |
| Sonoco Products Company | | | 473 | | | | 28,315 | |
| WestRock Company | | | 942 | | | | 26,385 | |
| | | | | | | | 110,127 | |
| Forestry, Paper & Wood Products — 0.5% | | | | | | | | |
| UFP Industries, Inc. | | | 362 | | | | 28,272 | |
| | | | | | | | | |
| Metals & Mining — 0.4% | | | | | | | | |
| Cleveland-Cliffs, Inc. (a) | | | 1,583 | | | | 21,972 | |
| | | | | | | | | |
| Steel — 1.3% | | | | | | | | |
| Commercial Metals Company | | | 600 | | | | 25,650 | |
| Steel Dynamics, Inc. | | | 272 | | | | 24,997 | |
| United States Steel Corporation | | | 1,089 | | | | 22,782 | |
| | | | | | | | 73,429 | |
| Real Estate — 1.0% | | | | | | | | |
| Real Estate Services — 0.5% | | | | | | | | |
| Jones Lang LaSalle, Inc. (a) | | | 211 | | | | 29,611 | |
| | | | | | | | | |
| REITs — 0.5% | | | | | | | | |
| Medical Properties Trust, Inc. | | | 3,358 | | | | 27,704 | |
| | | | | | | | | |
| Technology — 6.7% | | | | | | | | |
| Semiconductors — 0.6% | | | | | | | | |
| Coherent Corporation (a) | | | 840 | | | | 31,046 | |
| | | | | | | | | |
| Software — 0.9% | | | | | | | | |
| Concentrix Corporation | | | 255 | | | | 22,364 | |
| Gen Digital, Inc. | | | 1,615 | | | | 28,327 | |
| | | | | | | | 50,691 | |
| U.S. VALUE ETF |
| SCHEDULE OF INVESTMENTS (Continued) |
| COMMON STOCKS — 98.7% (Continued) | | Shares | | | Value | |
| Technology — 6.7% (Continued) | | | | | | | | |
| Technology Hardware — 3.7% | | | | | | | | |
| Arrow Electronics, Inc. (a) | | | 240 | | | $ | 30,394 | |
| Dell Technologies, Inc. - Class C | | | 671 | | | | 30,068 | |
| Flex Ltd. (a) | | | 1,315 | | | | 33,387 | |
| Hewlett Packard Enterprise Company | | | 1,785 | | | | 25,740 | |
| HP, Inc. | | | 957 | | | | 27,810 | |
| Jabil, Inc. | | | 340 | | | | 30,436 | |
| TD SYNNEX Corporation | | | 305 | | | | 27,261 | |
| | | | | | | | 205,096 | |
| Technology Services — 1.5% | | | | | | | | |
| DXC Technology Company (a) | | | 1,121 | | | | 28,059 | |
| Fidelity National Information Services, Inc. | | | 505 | | | | 27,558 | |
| Global Payments, Inc. | | | 267 | | | | 26,083 | |
| | | | | | | | 81,700 | |
| Utilities — 1.5% | | | | | | | | |
| Electric Utilities — 1.0% | | | | | | | | |
| NRG Energy, Inc. | | | 797 | | | | 26,931 | |
| Vistra Corporation | | | 1,152 | | | | 27,614 | |
| | | | | | | | 54,545 | |
| Gas & Water Utilities — 0.5% | | | | | | | | |
| National Fuel Gas Company | | | 506 | | | | 25,760 | |
| | | | | | | | | |
| Investments at Value — 98.7% (Cost $6,130,579) | | | | | | $ | 5,411,098 | |
| | | | | | | | | |
| Other Assets in Excess of Liabilities — 1.3% | | | | | | | 69,040 | |
| | | | | | | | | |
| Net Assets — 100.0% | | | | | | $ | 5,480,138 | |
N.A. - National Association
N.V. - Naamloze Vennootschap
plc - Public Limited Company
REIT - Real Estate Investment Trust
| (a) | Non-income producing security. |
See accompanying notes to financial statements.
| U.S. VALUE ETF |
| STATEMENT OF ASSETS AND LIABILITIES |
| May 31, 2023 (Unaudited) |
| ASSETS | | | | |
| Investments in securities: | | | | |
| At cost | | $ | 6,130,579 | |
| At value (Note 2) | | $ | 5,411,098 | |
| Cash | | | 47,793 | |
| Receivable from Adviser (Note 4) | | | 71 | |
| Dividends receivable | | | 14,520 | |
| Other assets | | | 12,811 | |
| Total assets | | | 5,486,293 | |
| | | | | |
| LIABILITIES | | | | |
| Payable to administrator (Note 4) | | | 5,167 | |
| Other accrued expenses | | | 988 | |
| Total liabilities | | | 6,155 | |
| | | | | |
| NET ASSETS | | $ | 5,480,138 | |
| | | | | |
| NET ASSETS CONSIST OF: | | | | |
| Paid-in capital | | $ | 5,833,179 | |
| Accumulated deficit | | | (353,041 | ) |
| NET ASSETS | | $ | 5,480,138 | |
| | | | | |
| Shares of beneficial interest outstanding (unlimited number of shares authorized, no par value) | | | 225,000 | |
| | | | | |
| Net asset value, offering price and redemption price per share (Note 2) | | $ | 24.36 | |
See accompanying notes to financial statements.
| U.S. VALUE ETF |
| STATEMENT OF OPERATIONS |
| Six Months Ended May 31, 2023 (Unaudited) |
| INVESTMENT INCOME | | | | |
| Dividend income | | $ | 201,372 | |
| Foreign withholding taxes on dividends | | | (219 | ) |
| Total investment income | | | 201,153 | |
| | | | | |
| EXPENSES | | | | |
| Management fees (Note 4) | | | 29,310 | |
| Administration fees (Note 4) | | | 25,000 | |
| Custody fees | | | 17,841 | |
| Legal fees | | | 11,213 | |
| Trustees’ fees and expenses (Note 4) | | | 9,891 | |
| Postage and supplies | | | 8,500 | |
| Audit and tax services fees | | | 7,500 | |
| Compliance fees and expenses (Note 4) | | | 6,141 | |
| Transfer agent fees | | | 5,000 | |
| Registration and filing fees | | | 2,252 | |
| Other expenses | | | 7,932 | |
| Total expenses | | | 130,580 | |
| Less fees reduced and expenses reimbursed by Adviser (Note 4) | | | (98,804 | ) |
| Net expenses | | | 31,776 | |
| | | | | |
| NET INVESTMENT INCOME | | | 169,377 | |
| | | | | |
| REALIZED AND UNREALIZED GAINS (LOSSES) ON INVESTMENTS AND FOREIGN CURRENCIES | | | | |
| Net realized gains (losses) from: | | | | |
| Investments | | | (25,366 | ) |
| In-kind redemptions (Note 3) | | | 367,570 | |
| Foreign currency transactions | | | (7 | ) |
| Net change in unrealized appreciation (depreciation) on investments | | | (1,832,805 | ) |
| NET REALIZED AND UNREALIZED LOSSES ON INVESTMENTS | | | (1,490,608 | ) |
| | | | | |
| NET DECREASE IN NET ASSETS RESULTING FROM OPERATIONS | | $ | (1,321,231 | ) |
See accompanying notes to financial statements.
| U.S. VALUE ETF |
| STATEMENTS OF CHANGES IN NET ASSETS |
| | | Six Months Ended | | | Year Ended | |
| | | May 31, 2023 | | | November 30, | |
| | | (Unaudited) | | | 2022 | |
| FROM OPERATIONS | | | | | | | | |
| Net investment income | | $ | 169,377 | | | $ | 166,296 | |
| Net realized gains (losses) from: | | | | | | | | |
| Investments | | | (25,366 | ) | | | (127,161 | ) |
| In-kind redemptions (Note 3) | | | 367,570 | | | | — | |
| Foreign currency transactions | | | (7 | ) | | | 17 | |
| Net change in unrealized appreciation (depreciation) on investments | | | (1,832,805 | ) | | | 1,181,070 | |
| Net increase (decrease) in net assets resulting from operations | | | (1,321,231 | ) | | | 1,220,222 | |
| | | | | | | | | |
| FROM DISTRIBUTIONS TO SHAREHOLDERS (NOTE 2) | | | (180,300 | ) | | | (18,687 | ) |
| | | | | | | | | |
| FROM CAPITAL SHARE TRANSACTIONS | | | | | | | | |
| Proceeds from shares issued | | | 5,195,850 | | | | 11,607,421 | |
| Payments for shares redeemed | | | (14,171,576 | ) | | | — | |
| Net increase (decrease) in net assets for capital share transactions | | | (8,975,726 | ) | | | 11,607,421 | |
| | | | | | | | | |
| TOTAL INCREASE (DECREASE) IN NET ASSETS | | | (10,477,257 | ) | | | 12,808,956 | |
| | | | | | | | | |
| NET ASSETS | | | | | | | | |
| Beginning of period | | | 15,957,395 | | | | 3,148,439 | |
| End of period | | $ | 5,480,138 | | | | 15,957,395 | |
| | | | | | | | �� | |
| SHARE TRANSACTIONS | | | | | | | | |
| Shares issued | | | 200,000 | | | | 450,000 | |
| Shares redeemed | | | (550,000 | ) | | | — | |
| Net increase (decrease) in shares outstanding | | | (350,000 | ) | | | 450,000 | |
| Shares outstanding at beginning of period | | | 575,000 | | | | 125,000 | |
| Shares outstanding at end of period | | | 225,000 | | | | 575,000 | |
See accompanying notes to financial statements.
| U.S. VALUE ETF |
| FINANCIAL HIGHLIGHTS |
Per Share Data for a Share Outstanding Throughout Each Period:
| | | Six Months | | | | | | | |
| | | Ended | | | | | | | |
| | | May 31, | | | Year Ended | | | Period Ended | |
| | | 2023 | | | Nov. 30, | | | Nov. 30, | |
| | | (Unaudited) | | | 2022 | | | 2021 (a) | |
| Net asset value at beginning of period | | $ | 27.75 | | | $ | 25.19 | | | $ | 25.00 | |
| Income (loss) from investment operations: | | | | | | | | | | | | |
| Net investment income (b) | | | 0.35 | | | | 0.65 | | | | 0.13 | |
| Net realized and unrealized gains (losses) on investments and foreign currencies | | | (3.50 | ) | | | 2.06 | | | | 0.06 | (c) |
| Total from investment operations | | | (3.15 | ) | | | 2.71 | | | | 0.19 | |
| Less distributions to shareholders from: | | | | | | | | | | | | |
| Net investment income | | | (0.24 | ) | | | (0.15 | ) | | | — | |
| Net asset value at end of period | | $ | 24.36 | | | $ | 27.75 | | | $ | 25.19 | |
| Market price at end of period | | $ | 24.36 | | | $ | 27.73 | | | $ | 25.21 | |
| Total return (d) | | | (11.40 | %) (e) | | | 10.79 | % | | | 0.76 | % (e) |
| Total return at market (f) | | | (11.30 | %) (e) | | | 10.58 | % | | | 0.84 | % (e) |
| Net assets at end of period (000’s) | | $ | 5,480 | | | $ | 15,957 | | | $ | 3,148 | |
| Ratios/supplementary data: | | | | | | | | | | | | |
| Ratio of total expenses to average net assets | | | 2.01 | % (g) | | | 3.47 | % | | | 10.04 | % (g) |
| Ratio of net expenses to average net assets (h) | | | 0.49 | % (g) | | | 0.49 | % | | | 0.49 | % (g) |
| Ratio of net investment income to average net assets (h) | | | 2.61 | % (g) | | | 2.51 | % | | | 2.31 | % (g) |
| Portfolio turnover rate (i) | | | 43 | % (e) | | | 77 | % | | | 23 | % (e) |
| (a) | Represents the period from the commencement of operations (September 14, 2021) through November 30, 2021. |
| (b) | Per share net investment income has been determined on the basis of average number of shares outstanding during the period. |
| (c) | Represents a balancing figure derived from other amounts in the financial highlights table that captures all other changes affecting net asset value per share. This per share amount does not correlate to the aggregate of the net realized and unrealized losses on the Statement of Operations for the same period. |
| (d) | Net asset value total return is calculated assuming an initial investment made at the net asset value at the beginning of the period, reinvestment of all dividends and distributions at net asset value during the period, if any, and redemption on the last day of the period at net asset value. This percentage is not an indication of the performance of a shareholder’s investment in the Fund based on market value due to differences between the market price of the shares and the net asset value per share of the Fund. |
| (f) | Market value total return is calculated assuming an initial investment made at the market value at the beginning of the period, reinvestment of all dividends and distributions at net asset value during the period, if any, and redemption on the last day of the period at market value. Market value is determined by the composite closing price. Composite closing security price is defined as the last reported sale price from any primary listing market (e.g., NYSE Arca) or participating regional exchanges or markets. The composite closing price is the last reported sale price from any of the eligible sources, regardless of volume and not an average price and may have occurred on a date prior to the close of the reporting period. Market value may be greater or less than net asset value, depending on the Fund’s closing price on the listing market. |
| (h) | Ratio was determined after fee reductions and expense reimbursements (Note 4). |
| (i) | Portfolio turnover rate excludes securities received or delivered from in-kind processing of creations or redemptions (Note 3). |
See accompanying notes to financial statements.
| U.S. VALUE ETF |
| NOTES TO FINANCIAL STATEMENTS |
| May 31, 2023 |
1. Organization
U.S. Value ETF (the “Fund”) is a diversified series of Ultimus Managers Trust (the “Trust”), an open-end investment company established as an Ohio business trust under a Declaration of Trust dated February 28, 2012. Other series of the Trust are not incorporated in this report.
The Fund is an exchange-traded fund (“ETF”). The investment objective of the Fund is to seek to track the investment results (before fees and expenses) of the Lyrical U.S. Value Index.
Shares of the Fund are listed and traded on the NYSE Arca, Inc. Market prices for the Shares may be different from their net asset value (“NAV”). The Fund issues and redeems Shares on a continuous basis at NAV only in large blocks of Shares, of at least 25,000 Shares, (“Creation Units”). Creation Units are issued and redeemed principally in-kind for securities included in a specified universe. Once created, Shares generally trade in the secondary market at market prices that change throughout the day in amounts that differ from a Creation Unit.
2. Significant Accounting Policies
The following is a summary of the Fund’s significant accounting policies. The policies are in conformity with accounting principles generally accepted in the United States of America (“GAAP”). The Fund follows accounting and reporting guidance under Financial Accounting Standards Board Accounting Standards Codification Topic 946, “Financial Services – Investment Companies.”
Securities valuation – The Fund values its portfolio securities at market value as of the close of regular trading on the New York Stock Exchange (the “NYSE”) (normally 4:00 p.m. Eastern time) on each business day the NYSE is open for business. The Fund values its listed securities on the basis of the security’s last sale price on the security’s primary exchange, if available, otherwise at the exchange’s most recently quoted mean price. NASDAQ-listed securities are valued at the NASDAQ Official Closing Price. When using a quoted price and when the market is considered active, the security will be classified as Level 1 within the fair value hierarchy (see below). In the event that market quotations are not readily available or are considered unreliable due to market or other events, the Fund values its securities and other assets at fair value as determined by Lyrical Asset Management L.P. (the “Adviser”), as the valuation designee, in accordance with procedures adopted by the Board of Trustees (the “Board”) pursuant to Rule 2a-5 under the Investment Company Act of 1940, as amended (the “1940 Act”). Under these procedures, the securities will be classified as Level 2 or 3 within the fair value hierarchy, depending on the inputs used. Unavailable or unreliable market quotes may be due to the following factors: a substantial bid-ask spread; infrequent sales resulting in stale prices; insufficient trading volume; small trade sizes; a temporary lapse in any reliable pricing
| U.S. VALUE ETF |
| NOTES TO FINANCIAL STATEMENTS (Continued) |
source; and actions of the securities or futures markets, such as the suspension or limitation of trading. As a result, the prices of securities used to calculate the Fund’s NAV may differ from quoted or published prices for the same securities.
GAAP establishes a single authoritative definition of fair value, sets out a framework for measuring fair value, and requires additional disclosures about fair value measurements.
Various inputs are used in determining the value of the Fund’s investments. These inputs are summarized in the three broad levels listed below:
| ● | Level 1 – quoted prices in active markets for identical securities |
| ● | Level 2 – other significant observable inputs |
| ● | Level 3 – significant unobservable inputs |
The inputs or methods used for valuing securities are not necessarily an indication of the risks associated with investing in those securities. The inputs used to measure fair value may fall into different levels of the fair value hierarchy. In such cases, for disclosure purposes, the level in the fair value hierarchy within which the fair value measurement falls in its entirety is determined based on the lowest level input that is significant to the fair value measurement.
The following is a summary of the Fund’s investments by the inputs used to value the investments as of May 31, 2023:
| | | Level 1 | | | Level 2 | | | Level 3 | | | Total | |
| Common Stocks | | $ | 5,411,098 | | | $ | — | | | $ | — | | | $ | 5,411,098 | |
| Total | | $ | 5,411,098 | | | $ | — | | | $ | — | | | $ | 5,411,098 | |
| | | | | | | | | | | | | | | | | |
Refer to the Fund’s Schedule of Investments for a listing of securities by sector and industry type. The Fund did not hold any derivative instruments or any assets or liabilities that were measured at fair value on a recurring basis using significant unobservable inputs (Level 3) as of or during the six months ended May 31, 2023.
Cash – The Fund’s cash, if any, is held in a bank account with balances which may exceed the Federal Deposit Insurance Corporation (FDIC) limit of $250,000. The cash balance reflected on the Statement of Assets and Liabilities for the Fund represents the amount held as of May 31, 2023.
Share valuation – The NAV per share of the Fund is calculated daily by dividing the total value of the assets, less the liabilities, by the number of shares outstanding. The offering price and redemption price per share is equal to the NAV per share.
| U.S. VALUE ETF |
| NOTES TO FINANCIAL STATEMENTS (Continued) |
Investment income – Dividend income is recorded on the ex-dividend date. Interest income, if any, is accrued as earned. Non-cash dividends included in dividend income, if any, are recorded at the fair value of the security received. Withholding taxes on foreign dividends, if any, have been recorded in accordance with the Fund’s understanding of the applicable country’s rules and tax rates.
Investment transactions – Investment transactions are accounted for on the trade date. Realized gains and losses on investments sold are determined on a specific identification basis.
Common expenses – Common expenses of the Trust are allocated among the Fund and the other series of the Trust based on the relative net assets of each series, the number of series in the Trust, or the nature of the services performed and the relative applicability to each series.
Distributions to shareholders – The Fund distributes to shareholders any net investment income dividends and net realized capital gains distributions at least once each year. The amount of such dividends and distributions are determined in accordance with federal income tax regulations, which may differ from GAAP. Dividends and distributions to shareholders are recorded on the ex-dividend date. The tax character of distributions paid to shareholders during the six months ended May 31, 2023 and the year ended November 30, 2022 were as follows:
| | | | | | Long-Term | | | Total | |
| Period Ended | | Ordinary Income | | | Capital Gains | | | Distributions | |
| 5/31/2023 | | $ | 180,300 | | | $ | — | | | $ | 180,300 | |
| 11/30/2022 | | | 18,659 | | | | 28 | | | | 18,687 | |
Estimates – The preparation of financial statements in conformity with GAAP requires management to make estimates and assumptions that affect the reported amounts of assets and liabilities and disclosure of contingent assets and liabilities as of the date of the financial statements and the reported amounts of increase (decrease) in net assets from operations during the reporting period. Actual results could differ from those estimates.
Federal income tax – The Fund has qualified and intends to continue to qualify as a regulated investment company under the Internal Revenue Code of 1986, as amended (the “Code”). Qualification generally will relieve the Fund of liability for federal income taxes to the extent 100% of its net investment income and net realized capital gains are distributed in accordance with the Code.
In order to avoid imposition of the excise tax applicable to regulated investment companies, it is also the Fund’s intention to declare as dividends in each calendar year at least 98% of its net investment income (earned during the calendar year) and 98.2% of its net realized capital gains (earned during the twelve months ended October 31) plus undistributed amounts from prior years.
| U.S. VALUE ETF |
| NOTES TO FINANCIAL STATEMENTS (Continued) |
The following information was computed on a tax basis for each item as of November 30, 2022, the Fund’s most recent fiscal year end:
| Tax cost of investments | | $ | 14,723,736 | |
| Gross unrealized appreciation | | $ | 1,605,410 | |
| Gross unrealized depreciation | | | (480,504 | ) |
| Net unrealized appreciation | | | 1,124,906 | |
| Undistributed ordinary income | | | 132,643 | |
| Accumulated capital and other losses | | | (109,059 | ) |
| Distributable earnings | | $ | 1,148,490 | |
| | | | | |
As of November 30, 2022, the Fund had the following capital loss carryforwards for federal income tax purposes, which may be carried forward indefinitely of $68,385 short-term and $40,674 long-term. These capital loss carryforwards are available to offset net realized capital gains in the current and future years, thereby reducing taxable gain distributions.
The federal tax cost, unrealized appreciation (depreciation) as of May 31, 2023 is as follows:
| Tax cost of investments | | $ | 6,118,998 | |
| Gross unrealized appreciation | | $ | 173,008 | |
| Gross unrealized depreciation | | | (880,908 | ) |
| Net unrealized depreciation | | | (707,900 | ) |
| | | | | |
The difference between the federal income tax cost of investments and the financial statement cost of investments for the Fund is due to certain timing differences in the recognition of capital gains or losses under income tax regulations and GAAP. These “book/tax” differences are temporary in nature and are primarily due to the tax deferral losses on wash sales, holdings classified as passive foreign investment companies, publicly traded partnerships and real estate investment trusts.
The Fund recognizes the tax benefits or expenses of uncertain tax positions only when the position is “more likely than not” of being sustained assuming examination by tax authorities. Management has reviewed the Fund’s tax positions for the current and all open tax years (generally, three years) and has concluded that no provision for unrecognized tax benefits or expenses is required in these financial statements. The Fund identifies its major tax jurisdiction as U.S. Federal.
The Fund recognizes interest and penalties, if any, related to unrecognized tax benefits as income tax expense on the Statement of Operations. During the period ended May 31, 2023, the Fund did not incur any interest or penalties.
| U.S. VALUE ETF |
| NOTES TO FINANCIAL STATEMENTS (Continued) |
3. Investment Transactions
During the six months ended May 31, 2023, cost of purchases and proceeds from sales of investment securities, excluding in-kind transactions and short-term investments, amounted to $5,194,660 and $5,196,371, respectively. Purchases and sales of in-kind transactions for the six months ended May 31, 2023 amounted to $5,125,581 and $13,987,612, respectively. There were realized gains of $367,570 from in-kind transactions during the six months ended May 31, 2023.
4. Transactions with Related Parties
INVESTMENT ADVISORY AGREEMENT
The Fund’s investments are managed by the Adviser pursuant to the terms of an Investment Advisory Agreement. The Fund pays the Adviser a management fee, computed and accrued daily and paid monthly, at the annual rate of 0.45% of average daily net assets. During the six months ended May 31, 2023, the Adviser earned $29,310 of fees under the Investment Advisory Agreement.
Pursuant to an Expense Limitation Agreement (“ELA”) between the Fund and the Adviser, the Adviser has contractually agreed, until July 30, 2024, to reduce the management fees and reimburse other operating expenses to limit total annual operating expenses of the Fund (exclusive of brokerage costs; taxes; interest; borrowing costs such as interest and dividend expenses on securities sold short; costs to organize the Fund; acquired fund fees and expenses; extraordinary expenses such as litigation and merger or reorganization costs; and other expenses not incurred in the ordinary course of the Fund’s business) to an amount not exceeding 0.49% of the average daily net assets of the Fund’s shares.
Accordingly, during the six months ended May 31, 2023, the Adviser did not collect any of its management fees from the Fund and reimbursed other operating expenses of $69,494.
Under the terms of the ELA, management fee reductions and expense reimbursements by the Adviser are subject to repayment by the Funds for a period of three years after such fees and expenses were incurred, provided that the repayments do not cause total annual fund operating expenses to exceed the lesser of (i) the expense limitation then in effect, if any, and (ii) the expense limitation in effect at the time the expenses to be repaid were incurred. As of May 31, 2023, the Adviser may seek repayment of management fee reductions and expense reimbursements no later than the dates below:
| November 30, 2024 | November 30, 2025 | May 31, 2026 | Total |
| $43,752 | $197,434 | $98,804 | $339,990 |
| U.S. VALUE ETF |
| NOTES TO FINANCIAL STATEMENTS (Continued) |
OTHER SERVICE PROVIDERS
Ultimus Fund Solutions, LLC (“Ultimus”) provides administration, fund accounting and compliance services to the Fund. The Fund pays Ultimus fees in accordance with the agreements for such services. In addition, the Fund pays out-of-pocket expenses including, but not limited to, postage, supplies, and certain costs related to the pricing of the Fund’s portfolio securities.
Under the terms of a Distribution Agreement with the Trust, Northern Lights Distributors, LLC (the “Distributor”) serves as the principal underwriter to the Fund. The Distributor is a wholly-owned subsidiary of Ultimus. The Distributor is compensated by the Adviser for acting as principal underwriter.
A Trustee and certain officers of the Trust are also officers of Ultimus and are not paid by the Fund for serving in such capacities.
TRUSTEE COMPENSATION
Each member of the Board (a “Trustee”) who is not an “interested person” (as defined by the 1940 Act, as amended) of the Trust (“Independent Trustee”) receives a $1,300 annual retainer from the Fund, except for the Board Chairperson who receives a $1,700 annual retainer from the Fund, and the Audit Committee Chairperson who receives a $1,500 annual retainer from the Fund, paid in quarterly installments. Each Independent Trustee also receives from the Fund a fee of $550 for each Board meeting attended plus reimbursement for travel and other meeting-related expenses. Prior to October 17, 2022, no additional annual retainer was specifically designated for the Audit Committee Chairperson.
5. Capital Share Transactions
Shares are not individually redeemable and may be redeemed by the Fund at NAV only in large blocks known as “Creation Units” of 25,000 shares. Only Authorized Participants (“APs”) or transactions done through an Authorized Participant (“AP”) are permitted to purchase or redeem Creation Units from the Fund. An AP is either (i) a broker-dealer or other participant in the clearing process through the Continuous Net Settlement System of the National Securities Clearing Corporation or (ii) a Depository Trust Company participant and, in each case, must have executed a Participant Agreement with the Distributor. Such transactions are generally permitted on an in-kind basis, with a balancing cash component to equate the transaction to the NAV per share of the Fund on the transaction date. Cash may be substituted equivalent to the value of certain securities generally when they are not available in sufficient quantity for delivery, not eligible for trading by the AP or as a result of other market circumstances. Realized gains (losses) resulting from in-kind redemption of shares, if any, are reflected separately on the Statement of Operations. The Fund charges APs standard creation and redemption transaction fees (“Transaction Fees”) to offset transfer and other transaction costs associated with the issuance and redemption of Creation Units. The standard creation and redemption transaction fees are
| U.S. VALUE ETF |
| NOTES TO FINANCIAL STATEMENTS (Continued) |
set forth in the table below. The standard creation transaction fee is charged to the AP on the day such AP creates a Creation Unit, and is the same regardless of the number of Creation Units purchased by the AP on the applicable business day. Similarly, the standard redemption transaction fee is charged to the AP on the day such AP redeems a Creation Unit, and is the same regardless of the number of Creation Units redeemed by the AP on the applicable business day. Creations and redemptions for cash (when cash creations and redemptions (in whole or in part) are available or specified) are also subject to an additional charge (up to the maximum amounts shown in the table below). This charge is intended to compensate for brokerage, tax, foreign exchange, execution, price movement and other costs and expenses related to cash transactions (which may, in certain instances, be based on a good faith estimate of transaction costs). For the six months ended May 31, 2023, the Fund received $5,600 in transaction fees.
The Transaction Fees for the Fund are listed in the table below:
| | Maximum Additional Variable |
| Fee for In-Kind and Cash Purchases | Change for Cash Purchases* |
| $800 | 2.00%* |
| * | As a percentage of the amount invested. |
6. Investment Risks
ETF Risk
The NAV of the Fund can fluctuate up or down, and a shareholder could lose money investing in the Fund if the prices of the securities owned by the Fund decline. In addition, the Fund may be subject to the following risks: (1) the market price of the Fund’s shares may trade above or below its NAV; (2) an active trading market for the Fund’s shares may not develop or be maintained; or (3) trading of the Fund’s shares may be halted if the listing exchange’s officials deem such action appropriate, the shares are delisted from the exchange, or the activation of market-wide “circuit breakers” (which are tied to large decreases in stock prices) halts stock trading generally.
Sector Risk
If the Fund has significant investments in the securities of issuers within a particular sector, any development affecting that sector will have a greater impact on the value of the net assets of the Fund than would be the case if the Fund did not have significant investments in that sector. In addition, this may increase the risk of loss in the Fund and increase the volatility of the Fund’s NAV per share. For instance, economic or market factors, regulatory changes or other developments may negatively impact all companies in a particular sector, and therefore the value of the Fund’s portfolio will be adversely affected. As of May 31, 2023, the Fund had 36.4% of the value of its net assets invested in stocks within the Financials sector.
| U.S. VALUE ETF |
| NOTES TO FINANCIAL STATEMENTS (Continued) |
7. Contingencies and Commitments
The Fund indemnifies the Trust’s officers and Trustees for certain liabilities that might arise from their performance of their duties to the Fund. Additionally, in the normal course of business the Fund enters into contracts that contain a variety of representations and warranties and which provide general indemnifications. The Fund’s maximum exposure under these arrangements is unknown, as this would involve future claims that may be made against the Fund that have not yet occurred. However, based on experience, the Fund expects the risk of loss to be remote.
8. Subsequent Events
The Fund is required to recognize in the financial statements the effects of all subsequent events that provide additional evidence about conditions that existed as of the date of the Statement of Assets and Liabilities. For non-recognized subsequent events that must be disclosed to keep the financial statements from being misleading, the Fund is required to disclose the nature of the event as well as an estimate of its financial effect, or a statement that such an estimate cannot be made. Management has evaluated subsequent events through the issuance of these financial statements and has noted no such events.
| U.S. VALUE ETF |
| CHANGE IN INDEPENDENT REGISTERED |
| PUBLIC ACCOUNTING FIRM |
On March 13, 2023, BBD LLP (“BBD”) ceased to serve as the independent registered public accounting firm of U.S. Value ETF (the “Fund”), a series of Ultimus Managers Trust. The Audit Committee of the Board of Trustees approved the replacement of BBD as a result of Cohen & Company, Ltd.’s (“Cohen”) acquisition of BBD’s investment management group.
The report of BBD on the financial statements of the Fund as of and for the fiscal year ended 2022 and period ended 2021 did not contain an adverse opinion or a disclaimer of opinion, and were not qualified or modified as to uncertainties, audit scope or accounting principles. During the fiscal year ended 2022 and period ended 2021, and during the subsequent interim period through March 13, 2023: (i) there were no disagreements between the registrant and BBD on any matter of accounting principles or practices, financial statement disclosure, or auditing scope or procedure, which disagreements, if not resolved to the satisfaction of BBD, would have caused it to make reference to the subject matter of the disagreements in its report on the financial statements of the Fund for such years or interim period; and (ii) there were no “reportable events,” as defined in Item 304(a)(1)(v) of Regulation S-K under the Securities Exchange Act of 1934, as amended.
On April 21, 2023, the Audit Committee of the Board of Trustees also recommended and approved the appointment of Cohen as the Fund’s independent registered public accounting firm for the fiscal year ending November 30, 2023.
During the fiscal year ended 2022 and period ended 2021, and during the subsequent interim period through March 13, 2023, neither the registrant, nor anyone acting on its behalf, consulted with Cohen on behalf of the Fund regarding the application of accounting principles to a specified transaction (either completed or proposed), the type of audit opinion that might be rendered on the Fund’s financial statements, or any matter that was either: (i) the subject of a “disagreement,” as defined in Item 304(a)(1)(iv) of Regulation S-K and the instructions thereto; or (ii) “reportable events,” as defined in Item 304(a)(1)(v) of Regulation S-K.
| U.S. VALUE ETF |
| ABOUT YOUR FUND’S EXPENSES (Unaudited) |
We believe it is important for you to understand the impact of costs on your investment. As a shareholder of the Fund, you may incur two types of costs: (1) transactions costs, including commissions on trading, as applicable; and (2) ongoing costs, including investment advisory fees and other operating expenses. The following examples are intended to help you understand your ongoing costs (in dollars) of investing in the Fund and to compare these costs with the ongoing costs of investing in other mutual funds.
A mutual fund’s ongoing costs are expressed as a percentage of its average net assets. This figure is known as the expense ratio. The expenses in the table below are based on an investment of $1,000 made at the beginning of the most recent period (December 1, 2022) and held until the end of the period (May 31, 2023).
The table below illustrates the Fund’s ongoing costs in two ways:
Actual fund return – This section helps you to estimate the actual expenses that you paid over the period. The “Ending Account Value” shown is derived from the Fund’s actual return, and the fourth column shows the dollar amount of operating expenses that would have been paid by an investor who started with $1,000 in the Fund. You may use the information here, together with the amount you invested, to estimate the expenses that you paid over the period.
To do so, simply divide your account value by $1,000 (for example, an $8,600 account value divided by $1,000 = 8.6), then multiply the result by the number given for the Fund under the heading “Expenses Paid During Period.”
Hypothetical 5% return – This section is intended to help you compare the Fund’s ongoing costs with those of other mutual funds. It assumes that the Fund had an annual return of 5% before expenses during the period shown, but that the expense ratio is unchanged. In this case, because the return used is not the Fund’s actual return, the results do not apply to your investment. The example is useful in making comparisons because the U.S. Securities and Exchange Commission (the “SEC”) requires all mutual funds to calculate expenses based on a 5% return. You can assess the Fund’s ongoing costs by comparing this hypothetical example with the hypothetical examples that appear in shareholder reports of other funds.
Note that expenses shown in the table are meant to highlight and help you compare ongoing costs only and do not reflect any transactional costs. Further, the expenses do not include any brokerage commissions on investors’ purchases or redemptions of Fund shares as described in the Fund’s prospectus.
The calculations assume no shares were bought or sold during the period. Your actual costs may have been higher or lower, depending on the amount of your investment and the timing of any purchases or redemptions.
| U.S. VALUE ETF |
| ABOUT YOUR FUND’S EXPENSES (Unaudited) (Continued) |
More information about the Fund’s expenses can be found in this report. For additional information on operating expenses and other shareholder costs, please refer to the Fund’s prospectus.
| | Beginning | Ending | Net | Expenses |
| | Account Value | Account Value | Expense | Paid During |
| | December 1, 2022 | May 31, 2023 | Ratio(a) | Period(b) |
| Based on Actual Fund Return | $1,000.00 | $886.00 | 0.49% | $2.30 |
| Based on Hypothetical 5% Return (before expenses) | $1,000.00 | $1,022.49 | 0.49% | $2.47 |
| (a) | Annualized, based on the Fund’s most recent one-half year expenses. |
| (b) | Expenses are equal to the Fund’s annualized net expense ratio multiplied by the average account value over the period, multiplied by 182/365 (to reflect the one-half year period). |
| U.S. VALUE ETF |
| OTHER INFORMATION (Unaudited) |
A description of the policies and procedures that the Fund uses to vote proxies relating to portfolio securities is available without charge upon request by calling toll-free 1-833-825-8383, or on the SEC’s website at www.sec.gov. Information regarding how the Fund voted proxies relating to portfolio securities during the most recent period ended June 30 will be available without charge upon request by calling toll-free 1-833-825-8383, or on the SEC’s website at www.sec.gov.
The Trust files a complete listing of portfolio holdings for the Fund with the SEC as of the end of the first and third quarters of each fiscal year as an exhibit to its reports on Form N-PORT. These filings are available upon request by calling 1-833-825-8383. Furthermore, you may obtain a copy of the filings on the SEC’s website at www.sec.gov and on the Fund’s website at www.usvalueetf.com.
| LYRICAL U.S. VALUE ETF DISCLOSURE REGARDING APPROVAL OF INVESTMENT ADVISORY AGREEMENT (Unaudited) |
The Board of Trustees (the “Board”), including the Independent Trustees voting separately, has reviewed and approved the Fund’s Investment Advisory Agreement with Lyrical Asset Management LP (the “Adviser” or “Lyrical”) for an additional one-year term (the “Agreement”). The Board approved the Agreement at a meeting held on April 19-21, 2023, at which all of the Trustees were present.
In deciding whether to approve the continuation of the Agreement, the Board recalled its review of the materials related to the Fund and Lyrical throughout the preceding twelve months and its numerous discussions with Trust Management and Lyrical about the operations and performance of the Fund during that period. The Board further considered those materials and discussions and other numerous factors, including the following:
The nature, extent, and quality of the services provided by Lyrical. In this regard, the Board reviewed the services being provided by Lyrical to the Fund including, without limitation, providing a continuous investment program for the Fund, adhering to the Fund’s investment restrictions, complying with the Trust’s policies and procedures, and voting proxies on behalf of the Fund. The Board considered the qualifications and experience of Lyrical’s portfolio managers who are responsible for the day-to-day management of the Fund, as well as the qualifications and experience of the other individuals at Lyrical who provide services to the Fund. The Board concluded that the quality, extent, and nature of the services provided by Lyrical to the Fund were satisfactory and adequate.
The investment performance of the Fund. In this regard, the Board compared the performance of the Fund with the performance of its benchmark index, custom peer group, and Morningstar category. The Board concluded that the investment performance of the Fund has been satisfactory.
The costs of the services provided and profits realized by Lyrical and its affiliates from their relationship with the Fund. In this regard, the Board considered Lyrical’s staffing, methods of operating, its financial condition, the asset level of the Fund; the overall expenses of the Fund, including the advisory fee; and the differences in fees and services to Lyrical’s other similar clients. The Board considered the current and anticipated profitability of the Fund to Lyrical, if any. The Board concluded that advisory fee to be paid to Lyrical by the Fund is reasonable in light of the nature and quality of services provided by Lyrical.
The extent to which economics of scale would be realized as the Fund grows and whether advisory fee levels reflect these economies of scale for the benefit of the Fund’s investors. In this regard, the Board considered that the Fund’s fee arrangements with Lyrical each involve both the advisory fee and the Fund’s limitation agreement (“ELA”). The Board determined that while the advisory fee rates remain the same as asset levels increased, the shareholders of the Fund have experienced in the past, and will experience in the future, benefits from the ELA. The Board concluded that the advisory fee for the Fund was reasonable in light of the information that was provided to the Trustees by Lyrical with respect to economies of scale.
| LYRICAL U.S. VALUE ETF DISCLOSURE REGARDING APPROVAL OF INVESTMENT ADVISORY AGREEMENT (Unaudited) (Continued) |
After further discussion of the factors noted above and in reliance on the information provided by Lyrical and Trust Management, and taking into account the totality of all factors discussed and information presented at this Meeting and previous meetings, the Board indicated its agreement to approve the continuance of the Agreement for the Fund. It was noted that in the Trustees’ deliberations regarding the approval of the continuance of the Agreement, the Trustees did not identify any particular information or factor that was all-important or controlling, and that each individual Trustee may have attributed different weights to various factors listed above. After full consideration of the above factors as well as other factors, the Board unanimously concluded that approval of the continuance of the Agreement was in the best interests of the Fund and its shareholders.
This page intentionally left blank.
This page intentionally left blank.
This page intentionally left blank.
Q3 All-Season Systematic Opportunities Fund
Institutional Class (QASOX)
Q3 All-Season Tactical Fund
Institutional Class (QAITX)
C Class (QACTX)
Semi-Annual Report
May 31, 2023
(Unaudited)
| Q3 ALL-SEASON FUNDS | |
| LETTER TO SHAREHOLDERS (Unaudited) | May 31, 2023 |
Dear Shareholders:
This Semi-Annual report for the Q3 All-Season Funds covers the period December 1, 2022 through May 31, 2023. The All-Season Funds are a series of Funds advised by Q3 Asset Management, which are actively managed using systematic, quantitative approaches to asset allocation in order to adjust to evolving market environments.
Q3 All-Season Systematic Opportunities Fund (QASOX) (Formerly, Q3 All-Season Sector Rotation Fund)
For the period, the Fund had a return of 2.02% versus a return of 0.91% for the Dow Jones Moderate Target Risk Index during the same timeframe. The Fund’s investment objective is to seek long-term growth of capital over a complete market cycle.
The Fund began the period fully invested in equities with an emphasis on defensive sectors as the equity markets in 2022 were roiled by growth-based sectors such as technology. Into the new year, the Fund shifted slightly towards growth sectors as the markets began their rebound. When the Fund ceased its sector trading in March, it had generally been overweight in value and defensive sectors.
Prior to March 30, 2023, the Fund was named Q3 All-Season Sector Rotation Fund and employed a proprietary rules-based analytical approach in which it invested in shares of other investment companies and similar products in an attempt to invest in sectors and subsectors which exhibited recent relative performance strength. From that point forward and as described in a Prospectus Supplement dated January 25, 2023 and an updated Prospectus dated March 30, 2023, the Fund’s strategy changed. The new strategy employs Q3 Asset Management’s tactical, systematic trading strategy that relies primarily on a proprietary model incorporating mean-reversion analysis. “Mean reversion” is defined as the concept that the market price of a security will return to a price within its recent historical trading range. For additional detail, please refer to the Fund’s prospectus, available at www.q3allseasonfunds.com. April and May were both positive months for the Fund as it was able to take advantage of a range-bound S&P 500. This was accomplished through several short-term trades when the market experienced brief setbacks. Positions were then sold shortly thereafter as the Index recovered.
Q3 All-Season Tactical Fund (QAITX, QACTX)
The Fund returned 4.85% for the Institutional class shares and 4.24% for the C class shares, versus a return of 0.93% for the Dow Jones Moderate Target Risk Index for the period. The Fund’s investment objective seeks a positive rate of return over a calendar year regardless of market conditions.
As both equity and bond markets deteriorated throughout 2022, the Fund struggled to find footing. The historic decoupling of equites and Treasury bonds ran counter to the decades of historical testing that went into generating the bond portion of the Fund’s signal. When equities fall precipitously, bonds – and especially Treasuries – are often viewed as a “safe haven” asset. That was not the case in 2022, as that asset class fell more than 15%.
Coming into 2023, the Fund began to participate in the upside moves in the NASDAQ 100 Index. As such, it stayed heavily invested for much of the period from January to May 2023, with 10-20% bond holdings when volatility increased. The Fund has been able to post solid gains over this time by being in the right direction of that Index. Should the NASDAQ 100 Index turn lower, the Fund can quickly change course and revert to cash or bond holdings.
Very truly yours,
| Brad Giaimo | Bruce Greig | Adam Quiring |
Past performance is not predictive of future performance. Investment results and principal value will fluctuate so that shares, when redeemed, may be worth more or less than their original cost. Current performance may be higher or lower than the performance data quoted.
An investor should consider the investment objectives, risks, charges and expenses of a Fund carefully before investing. The Funds’ prospectus contains this and other important information. Please read the prospectus carefully before you invest. The Funds are distributed by Ultimus Fund Distributors, LLC. The Letter to Shareholders seeks to describe some of the Adviser’s current opinions and views of the financial markets. Although the Adviser believes it has a reasonable basis for any opinions or views expressed, actual results may differ, sometimes significantly so, from those expected or expressed. The securities held by the Funds that are discussed in the Letter to Shareholders were held during the period covered by this Report. They may not comprise the entire investment portfolio of a Fund, may be sold at any time, and may no longer be held by the Fund. For a complete list of securities held by each Fund as of May 31, 2023, please see the Schedules of Investments sections of the Semi-Annual Report. The opinions of the Funds’ adviser with respect to those securities may change at any time.
Statements in the Letter to Shareholders that reflect projections or expectations for future financial or economic performance of a Fund and the market in general and statements of a Fund’s plans and objectives for future operations are forward-looking statements. No assurance can be given that actual results or events will not differ materially from those projected, estimated, assumed, or anticipated in any such forward-looking statements. Important factors that could result in such differences, in addition to factors noted with such forward-looking statements, include, without limitation, general economic conditions, such as inflation, recession, and interest rates.
| Q3 ALL-SEASON FUNDS |
| PORTFOLIO INFORMATION |
| May 31, 2023 (Unaudited) |
Q3 ALL-SEASON SYSTEMATIC OPPORTUNITIES FUND
Sector Diversification (% of Net Assets)
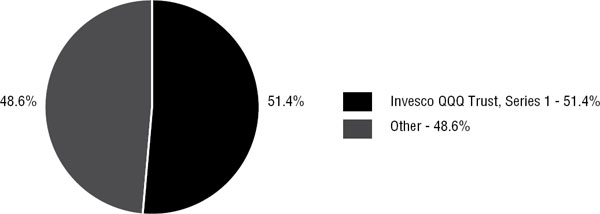
Q3 ALL-SEASON TACTICAL FUND
Sector Diversification (% of Net Assets)
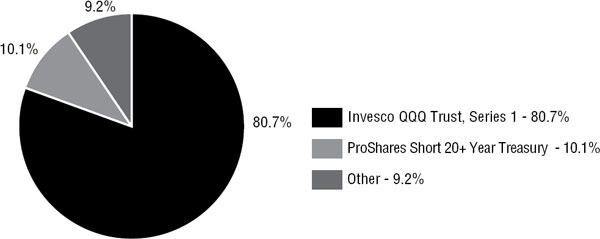
| Q3 ALL-SEASON SYSTEMATIC OPPORTUNITIES FUND |
| SCHEDULE OF INVESTMENTS |
| May 31, 2023 (Unaudited) |
| EXCHANGE-TRADED FUNDS — 51.4% | | Shares | | | Value | |
| Invesco QQQ Trust, Series 1 (Cost $44,115,633) | | | 126,100 | | | $ | 43,881,539 | |
| | | | | | | | | |
| MONEY MARKET FUNDS — 99.6% | | Shares | | | Value | |
| First American Government Obligations Fund - Class X, 4.97% (a) (Cost $85,064,829) | | | 85,064,829 | | | $ | 85,064,829 | |
| | | | | | | | | |
| Investments at Value — 151.0% (Cost $129,180,462) | | | | | | $ | 128,946,368 | |
| | | | | | | | | |
| Liabilities in Excess of Other Assets — (51.0%) | | | | | | | (43,576,568 | ) |
| | | | | | | | | |
| Net Assets — 100.0% | | | | | | $ | 85,369,800 | |
| (a) | The rate shown is the 7-day effective yield as of May 31, 2023. |
See accompanying notes to financial statements.
| Q3 ALL-SEASON TACTICAL FUND |
| SCHEDULE OF INVESTMENTS |
| May 31, 2023 (Unaudited) |
| EXCHANGE-TRADED FUNDS — 90.8% | | Shares | | | Value | |
| Invesco QQQ Trust, Series 1 | | | 95,000 | | | $ | 33,059,050 | |
| ProShares Short 20+ Year Treasury | | | 190,000 | | | | 4,157,200 | |
| Total Exchange-Traded Funds (Cost $33,531,052) | | | | | | $ | 37,216,250 | |
| | | | | | | | | |
| MONEY MARKET FUNDS — 9.8% | | Shares | | | Value | |
| First American Government Obligations Fund - Class X, 4.97% (a) (Cost $4,019,483) | | | 4,019,483 | | | $ | 4,019,483 | |
| | | | | | | | | |
| Investments at Value — 100.6% (Cost $37,550,535) | | | | | | $ | 41,235,733 | |
| | | | | | | | | |
| Liabilities in Excess of Other Assets — (0.6%) | | | | | | | (260,962 | ) |
| | | | | | | | | |
| Net Assets — 100.0% | | | | | | $ | 40,974,771 | |
| (a) | The rate shown is the 7-day effective yield as of May 31, 2023. |
See accompanying notes to financial statements.
| Q3 ALL-SEASON FUNDS |
| STATEMENTS OF ASSETS AND LIABILITIES |
| May 31, 2023 (Unaudited) |
| | | Q3 All-Season | | | Q3 All-Season | |
| | | Systematic | | | Tactical | |
| | | Opportunities Fund | | | Fund | |
| ASSETS | | | | | | | | |
| Investments in securities: | | | | | | | | |
| At cost | | $ | 129,180,462 | | | $ | 37,550,535 | |
| At value (Note 2) | | $ | 128,946,368 | | | $ | 41,235,733 | |
| Receivable for capital shares sold | | | 130,344 | | | | 2,632 | |
| Receivable for investment securities sold | | | — | | | | 4,083,542 | |
| Dividend receivable | | | 248,643 | | | | 11,227 | |
| Other assets | | | 16,728 | | | | 25,495 | |
| Total assets | | | 129,342,083 | | | | 45,358,629 | |
| | | | | | | | | |
| LIABILITIES | | | | | | | | |
| Payable for capital shares redeemed | | | 90,491 | | | | 113,827 | |
| Payable for investment securities purchased | | | 43,748,125 | | | | 4,201,875 | |
| Payable to Adviser (Note 4) | | | 107,424 | | | | 34,189 | |
| Payable to administrator (Note 4) | | | 12,308 | | | | 10,944 | |
| Accrued distribution fees (Note 4) | | | — | | | | 3,448 | |
| Other accrued expenses | | | 13,935 | | | | 19,575 | |
| Total liabilities | | | 43,972,283 | | | | 4,383,858 | |
| | | | | | | | | |
| NET ASSETS | | $ | 85,369,800 | | | $ | 40,974,771 | |
| | | | | | | | | |
| NET ASSETS CONSIST OF: | | | | | | | | |
| Paid-in capital | | $ | 82,771,159 | | | $ | 72,792,534 | |
| Accumulated earnings (deficit) | | | 2,598,641 | | | | (31,817,763 | ) |
| NET ASSETS | | $ | 85,369,800 | | | $ | 40,974,771 | |
| | | | | | | | | |
| NET ASSET VALUE PER SHARE: | | | | | | | | |
| INSTITUTIONAL CLASS | | | | | | | | |
| Net assets applicable to Institutional Class | | $ | 85,369,800 | | | $ | 38,751,375 | |
| Institutional Class shares of beneficial interest outstanding (unlimited number of shares authorized, no par value) | | | 8,904,839 | | | | 4,373,105 | |
| Net asset value, offering price and redemption price per share (Note 2) | | $ | 9.59 | | | $ | 8.86 | |
| | | | | | | | | |
| C CLASS | | | | | | | | |
| Net assets applicable to C Class | | | N/A | | | $ | 2,223,396 | |
| C Class shares of beneficial interest outstanding (unlimited number of shares authorized, no par value) | | | N/A | | | | 258,501 | |
| Net asset value, offering price and redemption price per share (Note 2) | | | N/A | | | $ | 8.60 | |
See accompanying notes to financial statements.
| Q3 ALL-SEASON FUNDS |
| STATEMENTS OF OPERATIONS |
| Six Months Ended May 31, 2023 (Unaudited) |
| | | Q3 All-Season | | | Q3 All-Season | |
| | | Systematic | | | Tactical | |
| | | Opportunities Fund | | | Fund | |
| INVESTMENT INCOME | | | | | | | | |
| Dividend income | | $ | 434,657 | | | $ | 340,034 | |
| | | | | | | | | |
| EXPENSES | | | | | | | | |
| Management fees (Note 4) | | | 120,443 | | | | 209,551 | |
| Administration fees (Note 4) | | | 21,367 | | | | 20,860 | |
| Fund accounting fees (Note 4) | | | 16,712 | | | | 20,686 | |
| Registration and filing fees | | | 10,788 | | | | 2,288 | |
| Registration fees - Institutional Class | | | 3,197 | | | | 10,805 | |
| Registration fees - C Class | | | — | | | | 4,139 | |
| Transfer agent fees (Note 4) | | | 9,300 | | | | 18,600 | |
| Legal fees | | | 12,955 | | | | 14,830 | |
| Borrowing costs (Note 5) | | | — | | | | 24,544 | |
| Trustees’ fees and expenses (Note 4) | | | 9,836 | | | | 9,836 | |
| Audit and tax services fees | | | 8,000 | | | | 8,000 | |
| Compliance fees (Note 4) | | | 6,000 | | | | 6,000 | |
| Distribution fees - C Class (Note 4) | | | — | | | | 11,577 | |
| Custody and bank service fees | | | 4,933 | | | | 4,494 | |
| Postage and supplies | | | 1,933 | | | | 5,718 | |
| Shareholder reporting expenses | | | 3,645 | | | | 1,765 | |
| Insurance | | | 1,590 | | | | 1,930 | |
| Other expenses | | | 5,067 | | | | 8,108 | |
| Total expenses | | | 235,766 | | | | 383,731 | |
| Management fees reduced by the Adviser (Note 4) | | | (53,913 | ) | | | (231 | ) |
| Mangement fees recouped (Note 4) | | | 51,806 | | | | — | |
| Net expenses | | | 233,659 | | | | 383,500 | |
| | | | | | | | | |
| NET INVESTMENT INCOME (LOSS) | | | 200,998 | | | | (43,466 | ) |
| | | | | | | | | |
| REALIZED AND UNREALIZED GAINS (LOSSES) ON INVESTMENTS | | | | | | | | |
| Net realized gains (losses) from investment transactions | | | 3,378,427 | | | | (2,436,214 | ) |
| Net change in unrealized appreciation (depreciation) on investments | | | (403,751 | ) | | | 3,813,664 | |
| NET REALIZED AND UNREALIZED GAINS ON INVESTMENTS | | | 2,974,676 | | | | 1,377,450 | |
| | | | | | | | | |
| NET INCREASE IN NET ASSETS RESULTING FROM OPERATIONS | | $ | 3,175,674 | | | $ | 1,333,984 | |
See accompanying notes to financial statements.
| Q3 ALL-SEASON SYSTEMATIC OPPORTUNITIES FUND |
| STATEMENTS OF CHANGES IN NET ASSETS |
| | | Six Months | | | | |
| | | Ended | | | Year Ended | |
| | | May 31, 2023 | | | November 30, | |
| | | (Unaudited) | | | 2022 | |
| FROM OPERATIONS | | | | | | | | |
| Net investment income (loss) | | $ | 200,998 | | | $ | (17,865 | ) |
| Net realized gains (losses) from investment transactions | | | 3,378,427 | | | | (718,014 | ) |
| Net change in unrealized appreciation (depreciation) on investments | | | (403,751 | ) | | | 383,941 | |
| Net increase (decrease) in net assets resulting from operations | | | 3,175,674 | | | | (351,938 | ) |
| | | | | | | | | |
| FROM DISTRIBUTIONS TO SHAREHOLDERS (Note 2) | | | | | | | | |
| Investor Class | | | — | | | | (25,197 | ) |
| Institutional Class | | | — | | | | (364,646 | ) |
| Decrease in net assets from distributions to shareholders | | | — | | | | (389,843 | ) |
| | | | | | | | | |
| CAPITAL SHARE TRANSACTIONS | | | | | | | | |
| Investor Class | | | | | | | | |
| Proceeds from shares sold | | | — | | | | 29,989 | |
| Net asset value of shares issued in reinvestment of distributions to shareholders | | | — | | | | 25,197 | |
| Payments for shares redeemed | | | — | | | | (267,450 | ) |
| Shares exchanged for Institutional Class (Note 1) | | | — | | | | (120,399 | ) |
| Net decrease in Investor Class net assets from capital share transactions | | | — | | | | (332,663 | ) |
| | | | | | | | | |
| Institutional Class | | | | | | | | |
| Proceeds from shares sold | | | 88,172,372 | | | | 576,162 | |
| Shares exchanged from Investor Class (Note 1) | | | — | | | | 120,399 | |
| Net asset value of shares issued in reinvestment of distributions to shareholders | | | — | | | | 364,646 | |
| Payments for shares redeemed | | | (9,409,431 | ) | | | (2,992,283 | ) |
| Net increase (decrease) in Institutional Class net assets from capital share transactions | | | 78,762,941 | | | | (1,931,076 | ) |
| | | | | | | | | |
| TOTAL INCREASE (DECREASE) IN NET ASSETS | | | 81,938,615 | | | | (3,005,520 | ) |
| | | | | | | | | |
| NET ASSETS | | | | | | | | |
| Beginning of period | | | 3,431,185 | | | | 6,436,705 | |
| End of period | | $ | 85,369,800 | | | $ | 3,431,185 | |
See accompanying notes to financial statements.
| Q3 ALL-SEASON SYSTEMATIC OPPORTUNITIES FUND |
| STATEMENTS OF CHANGES IN NET ASSETS (Continued) |
| | | Six Months | | | | |
| | | Ended | | | Year Ended | |
| | | May 31, 2023 | | | November 30, | |
| | | (Unaudited) | | | 2022 | |
| CAPITAL SHARE ACTIVITY | | | | | | | | |
| Investor Class | | | | | | | | |
| Shares sold | | | — | | | | 2,842 | |
| Shares reinvested | | | — | | | | 2,434 | |
| Shares redeemed | | | — | | | | (29,212 | ) |
| Shares exchanged for Institutional Class (Note 1) | | | — | | | | (13,163 | ) |
| Net decrease in shares outstanding | | | — | | | | (37,099 | ) |
| Shares outstanding at beginning of period | | | — | | | | 37,099 | |
| Shares outstanding at end of period | | | — | | | | — | |
| | | | | | | | | |
| Institutional Class | | | | | | | | |
| Shares sold | | | 9,553,520 | | | | 59,129 | |
| Shares issued in connection with exchange of Investor Class shares (Note 1) | | | — | | | | 13,078 | |
| Shares reinvested | | | — | | | | 35,062 | |
| Shares redeemed | | | (1,013,757 | ) | | | (317,006 | ) |
| Net increase (decrease) in shares outstanding | | | 8,539,763 | | | | (209,737 | ) |
| Shares outstanding at beginning of period | | | 365,076 | | | | 574,813 | |
| Shares outstanding at end of period | | | 8,904,839 | | | | 365,076 | |
See accompanying notes to financial statements.
| Q3 ALL-SEASON TACTICAL FUND |
| STATEMENTS OF CHANGES IN NET ASSETS |
| | | Six Months | | | | |
| | | Ended | | | Year Ended | |
| | | May 31, 2023 | | | November 30, | |
| | | (Unaudited) | | | 2022 | |
| FROM OPERATIONS | | | | | | | | |
| Net investment loss | | $ | (43,466 | ) | | $ | (629,543 | ) |
| Net realized losses from investment transactions | | | (2,436,214 | ) | | | (30,854,182 | ) |
| Net change in unrealized appreciation (depreciation) on investments | | | 3,813,664 | | | | (16,296,905 | ) |
| Net increase (decrease) in net assets resulting from operations | | | 1,333,984 | | | | (47,780,630 | ) |
| | | | | | | | | |
| FROM DISTRIBUTIONS TO SHAREHOLDERS (Note 2) | | | | | | | | |
| Investor Class | | | — | | | | (81,800 | ) |
| Institutional Class | | | — | | | | (10,837,041 | ) |
| C Class | | | — | | | | (250,466 | ) |
| Decrease in net assets from distributions to shareholders | | | — | | | | (11,169,307 | ) |
| | | | | | | | | |
| CAPITAL SHARE TRANSACTIONS | | | | | | | | |
| Investor Class | | | | | | | | |
| Proceeds from shares sold | | | — | | | | 109,163 | |
| Net asset value of shares issued in reinvestment of distributions to shareholders | | | — | | | | 81,347 | |
| Payments for shares redeemed | | | — | | | | (592,521 | ) |
| Shares exchanged for Institutional Class (Note 1) | | | — | | | | (280,169 | ) |
| Net decrease in Investor Class net assets from capital share transactions | | | — | | | | (682,180 | ) |
| | | | | | | | | |
| Institutional Class | | | | | | | | |
| Proceeds from shares sold | | | 69,714,083 | | | | 83,567,837 | |
| Shares exchanged from Investor Class (Note 1) | | | — | | | | 280,169 | |
| Net asset value of shares issued in reinvestment of distributions to shareholders | | | — | | | | 10,595,038 | |
| Payments for shares redeemed | | | (83,104,357 | ) | | | (135,500,819 | ) |
| Net decrease in Institutional Class net assets from capital share transactions | | | (13,390,274 | ) | | | (41,057,775 | ) |
| | | | | | | | | |
| C Class | | | | | | | | |
| Proceeds from shares sold | | | 18,385 | | | | 1,603,514 | |
| Net asset value of shares issued in reinvestment of distributions to shareholders | | | — | | | | 149,400 | |
| Payments for shares redeemed | | | (548,778 | ) | | | (648,356 | ) |
| Net increase (decrease) in C Class net assets from capital share transactions | | | (530,393 | ) | | | 1,104,558 | |
| | | | | | | | | |
| TOTAL DECREASE IN NET ASSETS | | | (12,586,683 | ) | | | (99,585,334 | ) |
| | | | | | | | | |
| NET ASSETS | | | | | | | | |
| Beginning of period | | | 53,561,454 | | | | 153,146,788 | |
| End of period | | $ | 40,974,771 | | | $ | 53,561,454 | |
See accompanying notes to financial statements.
| Q3 ALL-SEASON TACTICAL FUND |
| STATEMENTS OF CHANGES IN NET ASSETS (Continued) |
| | | Six Months | | | | |
| | | Ended | | | Year Ended | |
| | | May 31, 2023 | | | November 30, | |
| | | (Unaudited) | | | 2022 | |
| CAPITAL SHARE ACTIVITY | | | | | | | | |
| Investor Class | | | | | | | | |
| Shares sold | | | — | | | | 9,427 | |
| Shares reinvested | | | — | | | | 6,466 | |
| Shares redeemed | | | — | | | | (63,402 | ) |
| Shares exchanged for Institutional Class (Note 1) | | | — | | | | (31,382 | ) |
| Net decrease in shares outstanding | | | — | | | | (78,891 | ) |
| Shares outstanding at beginning of period | | | — | | | | 78,891 | |
| Shares outstanding at end of period | | | — | | | | — | |
| | | | | | | | | |
| Institutional Class | | | | | | | | |
| Shares sold | | | 8,491,978 | | | | 7,986,972 | |
| Shares issued in connection with exchange of Investor Class shares (Note 1) | | | — | | | | 30,727 | |
| Shares reinvested | | | — | | | | 829,682 | |
| Shares redeemed | | | (10,138,970 | ) | | | (13,613,101 | ) |
| Net decrease in shares outstanding | | | (1,646,992 | ) | | | (4,765,720 | ) |
| Shares outstanding at beginning of period | | | 6,020,097 | | | | 10,785,817 | |
| Shares outstanding at end of period | | | 4,373,105 | | | | 6,020,097 | |
| | | | | | | | | |
| C Class | | | | | | | | |
| Shares sold | | | 2,333 | | | | 141,191 | |
| Shares reinvested | | | — | | | | 11,848 | |
| Shares redeemed | | | (70,007 | ) | | | (65,679 | ) |
| Net increase (decrease) in shares outstanding | | | (67,674 | ) | | | 87,360 | |
| Shares outstanding at beginning of period | | | 326,175 | | | | 238,815 | |
| Shares outstanding at end of period | | | 258,501 | | | | 326,175 | |
See accompanying notes to financial statements.
| Q3 ALL-SEASON SYSTEMATIC OPPORTUNITIES FUND |
| INSTITUTIONAL CLASS |
| FINANCIAL HIGHLIGHTS |
Per Share Data for a Share Outstanding Throughout Each Period:
| | | Six Months | | | | | | | | | | |
| | | Ended | | | Year Ended | | | Year Ended | | | Period Ended | |
| | | May 31, 2023 | | | November 30, | | | November 30, | | | November 30, | |
| | | (Unaudited) | | | 2022 | | | 2021 | | | 2020 (a) | |
| Net asset value at beginning of period | | $ | 9.40 | | | $ | 10.52 | | | $ | 9.94 | | | $ | 10.00 | |
| Income (loss) from investment operations: | | | | | | | | | | | | | | | | |
| Net investment income (loss) (b)(c) | | | 0.08 | | | | (0.03 | ) | | | (0.13 | ) | | | (0.11 | ) |
| Net realized and unrealized gains (losses) on investments | | | 0.11 | | | | (0.45 | ) | | | 0.71 | | | | 0.05 | (d) |
| Total from investment operations | | | 0.19 | | | | (0.48 | ) | | | 0.58 | | | | (0.06 | ) |
| Less distributions from: | | | | | | | | | | | | | | | | |
| Net realized gains | | | — | | | | (0.64 | ) | | | — | | | | — | |
| Net asset value at end of period | | $ | 9.59 | | | $ | 9.40 | | | $ | 10.52 | | | $ | 9.94 | |
| Total return (e) | | | 2.02 | % (f) | | | (5.14 | %) | | | 5.83 | % | | | (0.60 | %) (f) |
| Net assets at end of period (000’s) | | $ | 85,370 | | | $ | 3,431 | | | $ | 6,048 | | | $ | 4,491 | |
| Ratios/supplementary data: | | | | | | | | | | | | | | | | |
| Ratio of total expenses to average net assets (g) | | | 1.96 | % (h) | | | 5.46 | % | | | 4.20 | % | | | 6.10 | % (h) |
| Ratio of net expenses to average net assets (g)(i) | | | 1.94 | % (h) | | | 1.94 | % | | | 1.94 | % | | | 1.94 | % (h) |
| Ratio of net investment income (loss) to average net assets (c)(g)(i) | | | 1.67 | % (h) | | | (0.34 | %) | | | (1.19 | %) | | | (1.31 | %) (h) |
| Portfolio turnover rate | | | 4076 | % (f)(j) | | | 517 | % | | | 441 | % | | | 523 | % (f) |
| (a) | Represents the period from the commencement of operations (December 30, 2019) through November 30, 2020. |
| | |
| (b) | Per share net investment income (loss) has been determined on the basis of average number of shares outstanding during the period. |
| | |
| (c) | Recognition of net investment income (loss) by the Fund is affected by the timing of the declaration of dividends by the underlying companies in which the Fund invests. |
| | |
| (d) | Represents a balancing figure derived from other amounts in the financial highlights table that captures all other changes affecting net asset value per share. This per share amount does not correlate to the aggregate of the net realized and unrealized losses on the Statements of Operations for the same period. |
| | |
| (e) | Total return is a measure of the change in value of an investment in the Fund over the periods covered. The returns shown do not reflect the deduction of taxes a shareholder would pay on Fund distributions, if any, or the redemption of Fund shares. The total returns would be lower if the Adviser had not reduced management fees and/or reimbursed expenses (Note 4). |
| | |
| (f) | Not annualized. |
| | |
| (g) | The ratios of expenses and net investment income (loss) to average net assets do not reflect the Fund’s proportionate share of expenses of the underlying investment companies in which the Fund invests. |
| | |
| (h) | Annualized. |
| | |
| (i) | Ratio was determined after fee recoupments, reductions and/or expense reimbursements (Note 4). |
| | |
| (j) | Given market conditions during the period, the Fund rotated assets into and out of positions on a periodic basis and the Fund’s portfolio was traded frequently. |
| | |
See accompanying notes to financial statements.
| Q3 ALL-SEASON TACTICAL FUND |
| INSTITUTIONAL CLASS |
| FINANCIAL HIGHLIGHTS |
Per Share Data for a Share Outstanding Throughout Each Period:
| | | Six Months | | | | | | | | | | |
| | | Ended | | | Year Ended | | | Year Ended | | | Period Ended | |
| | | May 31, 2023 | | | November 30, | | | November 30, | | | November 30, | |
| | | (Unaudited) | | | 2022 | | | 2021 | | | 2020 (a) | |
| Net asset value at beginning of period | | $ | 8.45 | | | $ | 13.80 | | | $ | 12.06 | | | $ | 10.00 | |
| Income (loss) from investment operations: | | | | | | | | | | | | | | | | |
| Net investment loss (b)(c) | | | (0.01 | ) | | | (0.06 | ) | | | (0.09 | ) | | | (0.11 | ) |
| Net realized and unrealized gains (losses) on investments | | | 0.42 | | | | (4.30 | ) | | | 2.72 | | | | 2.17 | |
| Total from investment operations | | | 0.41 | | | | (4.36 | ) | | | 2.63 | | | | 2.06 | |
| Less distributions from: | | | | | | | | | | | | | | | | |
| Net realized gains | | | — | | | | (0.99 | ) | | | (0.89 | ) | | | — | |
| Net asset value at end of period | | $ | 8.86 | | | $ | 8.45 | | | $ | 13.80 | | | $ | 12.06 | |
| Total return (d) | | | 4.85 | % (f) | | | (34.03 | %) | | | 23.10 | % (e) | | | 20.60 | % (f) |
| Net assets at end of period (000’s) | | $ | 38,751 | | | $ | 50,871 | | | $ | 148,813 | | | $ | 71,884 | |
| Ratios/supplementary data: | | | | | | | | | | | | | | | | |
| Ratio of total expenses to average net assets (g) | | | 1.76 | % (h) | | | 1.36 | % | | | 1.32 | % | | | 1.55 | % (h) |
| Ratio of net expenses to average net assets excluding borrowing costs (g) | | | 1.64 | % (h) | | | 1.36 | % | | | 1.32 | % | | | 1.55 | % (h) |
| Ratio of net investment loss to average net assets (c)(g) | | | (0.13 | %) (h) | | | (0.59 | %) | | | (0.73 | %) | | | (1.10 | %) (h) |
| Portfolio turnover rate (i) | | | 1488 | % (f) | | | 3770 | % | | | 1639 | % | | | 3078 | % (f) |
| (a) | Represents the period from the commencement of operations (December 30, 2019) through November 30, 2020. |
| | |
| (b) | Per share net investment loss has been determined on the basis of average number of shares outstanding during the period. |
| | |
| (c) | Recognition of net investment loss by the Fund is affected by the timing of the declaration of dividends by the underlying companies in which the Fund invests. |
| | |
| (d) | Total return is a measure of the change in value of an investment in the Fund over the periods covered. The returns shown do not reflect the deduction of taxes a shareholder would pay on Fund distributions, if any, or the redemption of Fund shares. |
| | |
| (e) | During the year ended November 30, 2021, the Fund received a payment from the Advisor of $336,826 for losses realized on the disposal of the investments purchased in violation of investment restrictions, which otherwise would have reduced the total return by 0.27%. |
| | |
| (f) | Not annualized. |
| | |
| (g) | The ratios of expenses and net investment loss to average net assets do not reflect the Fund’s proportionate share of expenses of the underlying investment companies in which the Fund invests. |
| | |
| (h) | Annualized. |
| | |
| (i) | Given market conditions during the period, the Fund rotated assets into, and out of, positions on a periodic basis due to its tactical trading mandate, and the Fund’s portfolio was therefore traded frequently. |
| | |
See accompanying notes to financial statements.
| Q3 ALL-SEASON TACTICAL FUND |
| C SHARE CLASS |
| FINANCIAL HIGHLIGHTS |
Per Share Data for a Share Outstanding Throughout Each Period:
| | | Six Months | | | | | | | |
| | | Ended | | | Year Ended | | | Period Ended | |
| | | May 31, 2023 | | | November 30, | | | November 30, | |
| | | (Unaudited) | | | 2022 | | | 2021 (a) | |
| Net asset value at beginning of period | | $ | 8.25 | | | $ | 13.65 | | | $ | 11.53 | |
| Income (loss) from investment operations: | | | | | | | | | | | | |
| Net investment loss (b)(c) | | | (0.06 | ) | | | (0.17 | ) | | | (0.22 | ) |
| Net realized and unrealized gains (losses) on investments | | | 0.41 | | | | (4.24 | ) | | | 2.34 | |
| Total from investment operations | | | 0.35 | | | | (4.41 | ) | | | 2.12 | |
| Less distributions from: | | | | | | | | | | | | |
| Net realized gains | | | — | | | | (0.99 | ) | | | — | |
| Net asset value at end of period | | $ | 8.60 | | | $ | 8.25 | | | $ | 13.65 | |
| Total return (d) | | | 4.24 | % (f) | | | (34.82 | %) | | | 18.39 | % (e)(f) |
| Net assets at end of period (000’s) | | $ | 2,223 | | | $ | 2,690 | | | $ | 3,260 | |
| Ratios/supplementary data: | | | | | | | | | | | | |
| Ratio of total expenses to average net assets (g) | | | 3.12 | % (h) | | | 2.65 | % | | | 2.72 | % (h) |
| Ratio of net expenses to average net assets excluding borrowing costs (g) | | | 2.94 | % (h) | | | 2.65 | % | | | 2.72 | % (h) |
| Ratio of net investment loss to average net assets (c)(g) | | | (1.50 | %) (h) | | | (1.73 | %) | | | (2.42 | %) (h) |
| Portfolio turnover rate (i) | | | 1488 | % (f) | | | 3770 | % | | | 1639 | % (j) |
| (a) | Represents the period from the commencement of operations (March 18, 2021) through November 30, 2021. |
| | |
| (b) | Per share net investment loss has been determined on the basis of average number of shares outstanding during the period. |
| | |
| (c) | Recognition of net investment loss by the Fund is affected by the timing of the declaration of dividends by the underlying companies in which the Fund invests. |
| | |
| (d) | Total return is a measure of the change in value of an investment in the Fund over the period covered. The returns shown does not reflect the deduction of taxes a shareholder would pay on Fund distributions, if any, or the redemption of Fund shares. |
| | |
| (e) | During the year ended November 30, 2021, the Fund received a payment from the Advisor of $336,826 for losses realized on the disposal of the investments purchased in violation of investment restrictions, which otherwise would have reduced the total return by 0.27%. |
| | |
| (f) | Not annualized. |
| | |
| (g) | The ratios of expenses and net investment loss to average net assets do not reflect the Fund’s proportionate share of expenses of the underlying investment companies in which the Fund invests. |
| | |
| (h) | Annualized. |
| | |
| (i) | Given market conditions during the period, the Fund rotated assets into, and out of, positions on a periodic basis due to its tactical trading mandate, and the Fund’s portfolio was traded frequently. |
| | |
| (j) | Represents the year ended November 30, 2021. |
| | |
See accompanying notes to financial statements.
| Q3 ALL-SEASON FUNDS |
| NOTES TO FINANCIAL STATEMENTS |
| May 31, 2023 (Unaudited) |
1. Organization
Q3 All-Season Systematic Opportunities Fund (formerly, Q3 All-Season Sector Rotation Fund) (individually, a “Fund” and collectively, the “Funds”) are each a diversified series of Ultimus Managers Trust (the “Trust”), an open-end investment company established as an Ohio business trust under a Declaration of Trust dated February 28, 2012. Other series of the Trust are not incorporated in this report. The Funds commenced operations on December 30, 2019.
Q3 All-Season Systematic Opportunities Fund seeks to achieve capital appreciation.
Q3 All-Season Tactical Fund seeks a positive rate of return over a calendar year regardless of market conditions.
The Q3 All-Season Systematic Opportunities Fund currently offers one class of shares: Institutional Class shares (sold without any sales loads, but subject to an administrative services plan fee of up to 0.25% and requiring a $100,000 initial investment). Prior to August 30, 2022, Q3 All-Season Systematic Opportunities Fund offered two classes of shares: Investor Class shares (sold without any sales loads, but subject to a distribution and/or shareholder service fee of up to 0.25% of the average daily net assets attributable to Investor Class shares and requiring a $1,250 minimum initial investment) and Institutional Class shares (sold without any sales loads, but subject to an administrative services plan fee of up to 0.25% and requiring a $500,000 initial investment). On August 30, 2022, all existing Investor Class shares were converted into Institutional Class shares at the Institutional Class net asset value (“NAV”) per share as of August 29, 2022, which was $9.21. After August 30, 2022, Investor Class shares were no longer offered.
The Q3 All-Season Tactical Fund currently offers two classes of shares: Institutional Class shares (sold without any sales loads, but subject to an administrative services plan fee of up to 0.25% and requiring a $100,000 initial investment) and C Class shares (sold without any sales loads, but subject to a distribution and/or shareholder service fee of up to 1.00% of the average daily net assets attributable to C Class shares and requiring a $1,000 minimum initial investment). Each share class represents an ownership interest in the same investment portfolio. Prior to August 30, 2022, Q3 All-Season Tactical Fund offered three classes of shares: Investor Class shares (sold without any sales loads, but subject to a distribution and/or shareholder service fee of up to 0.25% of the average daily net assets attributable to Investor Class shares and requiring a $1,250 minimum initial investment), Institutional Class shares (sold without any sales loads, but subject to an administrative services plan fee of up to 0.25% and requiring a $500,000 initial investment) and C Class shares (sold without any sales loads, but subject to a distribution and/or shareholder service fee of up to 1.00% of the average daily net assets attributable to C Class shares and requiring a $1,000 minimum initial investment). On August 30,
| Q3 ALL-SEASON FUNDS |
| NOTES TO FINANCIAL STATEMENTS (Continued) |
2022, all existing Investor Class shares were converted into Institutional Class shares at the Institutional Class NAV per share as of August 29, 2022, which was $9.12. After August 30, 2022, Investor Class shares were no longer offered.
2. Significant Accounting Policies
The following is a summary of the Funds’ significant accounting policies. The policies are in conformity with accounting principles generally accepted in the United States of America (“GAAP”). The Funds follow accounting and reporting guidance under Financial Accounting Standards Board Accounting Standards Codification Topic 946, “Financial Services – Investment Companies.”
Securities valuation – Each Fund values its portfolio securities at market value as of the close of regular trading on the New York Stock Exchange (the “NYSE”) (normally 4:00 p.m. Eastern time) on each business day the NYSE is open for business. Exchange-traded funds (“ETFs”) are valued at the security’s last sale price on the primary exchange, if available, otherwise at the exchange’s most recently quoted mean price. Investments representing shares of other open-end investment companies, except ETFs but including money market funds, are valued at their net asset value (“NAV”) as reported by such companies. When using a quoted price and when the market is considered active, these securities will be classified as Level 1 within the fair value hierarchy (see below). In the event that market quotations are not readily available or are considered unreliable due to market or other events, the Funds value their securities and other assets at fair value as determined by Q3 Asset Management Corporation (the “Adviser”) as the Fund’s valuation designee, in accordance with procedures adopted by the Board of Trustees of the Trust (the “Board”) pursuant to Rule 2a-5 under the Investment company Act of 1940, as amended (the “1940 Act”). Under these procedures, the securities will be classified as Level 2 or 3 within the fair value hierarchy, depending on the inputs used. Unavailable or unreliable market quotes may be due to the following factors: a substantial bid-ask spread; infrequent sales resulting in stale prices; insufficient trading volume; small trade sizes; a temporary lapse in any reliable pricing source; and actions of the securities or futures markets, such as the suspension or limitation of trading. As a result, the prices of securities used to calculate each Fund’s NAV may differ from quoted or published prices for the same securities.
GAAP establishes a single authoritative definition of fair value, sets out a framework for measuring fair value, and requires additional disclosures about fair value measurements.
Various inputs are used in determining the value of each Fund’s investments. These inputs are summarized in the three broad levels listed below:
| ● | Level 1 – quoted prices in active markets for identical securities |
| ● | Level 2 – other significant observable inputs |
| ● | Level 3 – significant unobservable inputs |
| Q3 ALL-SEASON FUNDS |
| NOTES TO FINANCIAL STATEMENTS (Continued) |
The inputs or methods used for valuing securities are not necessarily an indication of the risks associated with investing in those securities. The inputs used to measure fair value may fall into different levels of the fair value hierarchy. In such cases, for disclosure purposes, the level in the fair value hierarchy within which the fair value measurement falls in its entirety is determined based on the lowest level input that is significant to the fair value measurement.
The following is a summary of each Fund’s investments and the inputs used to value the investments as of May 31, 2023:
| Q3 All-Season Systematic Opportunities Fund | | Level 1 | | | Level 2 | | | Level 3 | | | Total | |
| Exchange-Traded Funds | | $ | 43,881,539 | | | $ | — | | | $ | — | | | $ | 43,881,539 | |
| Money Market Funds | | | 85,064,829 | | | | — | | | | — | | | | 85,064,829 | |
| Total | | $ | 128,946,368 | | | $ | — | | | $ | — | | | $ | 128,946,368 | |
| | | | | | | | | | | | | | | | | |
| Q3 All-Season Tactical Fund | | Level 1 | | | Level 2 | | | Level 3 | | | Total | |
| Exchange-Traded Funds | | $ | 37,216,250 | | | $ | — | | | $ | — | | | $ | 37,216,250 | |
| Money Market Funds | | | 4,019,483 | | | | — | | | | — | | | | 4,019,483 | |
| Total | | $ | 41,235,733 | | | $ | — | | | $ | — | | | $ | 41,235,733 | |
| | | | | | | | | | | | | | | | | |
The Funds did not hold any derivative instruments or any assets or liabilities that were measured at fair value on a recurring basis using significant unobservable inputs (Level 3) as of or during the six months ended May 31, 2023.
Share valuation – The NAV per share of each class of each Fund is calculated daily by dividing the total value of the assets attributable to that class, less liabilities attributable to that class, by the number of shares outstanding of that class. The offering price and redemption price per share of each class of each Fund is equal to the NAV per share of such class.
Investment income – Dividend income is recorded on the ex-dividend date. Non-cash dividends included in dividend income, if any, are recorded at the fair value of the security received.
Investment transactions – Investment transactions are accounted for on the trade date. Realized gains and losses on investments sold are determined on a specific identification basis.
Allocation between classes – Investment income earned, realized capital gains and losses, and unrealized appreciation and depreciation are allocated daily to each Class of a Fund based upon its proportionate share of total net assets of that Fund. Class-specific expenses are charged directly to the class incurring the expense. Common expenses
| Q3 ALL-SEASON FUNDS |
| NOTES TO FINANCIAL STATEMENTS (Continued) |
which are not attributable to a specific class are allocated daily to each class of shares of a Fund based upon its proportionate share of total net assets of that Fund. Distribution fees and registration and filing fees are class specific expenses.
Common expenses – Common expenses of the Trust are allocated among the Funds and the other series of the Trust based on the relative net assets of each series, the number of series in the Trust, or the nature of the services performed and the relative applicability to each series.
Distributions to shareholders – Dividends arising from net investment income, if any, are declared and paid quarterly to shareholders of each Fund. Net realized capital gains, if any, are distributed at least once each year. The amount of such dividends and distributions are determined in accordance with federal income tax regulations, which may differ from GAAP. Dividends and distributions to shareholders are recorded on the ex-dividend date. The tax character of distributions paid to shareholders by the Funds during the periods ended May 31, 2023 and November 30, 2022 was as follows:
| | | Period | | Ordinary | | | Long-Term | | | Total | |
| | | Ended | | Income | | | Capital Gains | | | Distributions | |
| Q3 All-Season Systematic Opportunities Fund | | 5/31/2023 | | $ | — | | | $ | — | | | $ | — | |
| | | 11/30/2022 | | $ | 353,795 | | | $ | 36,048 | | | $ | 389,843 | |
| Q3 All-Season Tactical Fund | | 5/31/2023 | | $ | — | | | $ | — | | | $ | — | |
| | | 11/30/2022 | | $ | 11,169,307 | | | $ | — | | | $ | 11,169,307 | |
Estimates – The preparation of financial statements in conformity with GAAP requires management to make estimates and assumptions that affect the reported amounts of assets and liabilities and disclosure of contingent assets and liabilities as of the date of the financial statements and the reported amounts of increase (decrease) in net assets from operations during the reporting period. Actual results could differ from those estimates.
Federal income tax – Each Fund has qualified and intends to continue to qualify as a regulated investment company under the Internal Revenue Code of 1986, as amended (the “Code”). Qualification generally will relieve the Funds of liability for federal income taxes to the extent 100% of their net investment income and net realized capital gains are distributed in accordance with the Code.
In order to avoid imposition of the excise tax applicable to regulated investment companies, it is also each Fund’s intention to declare as dividends in each calendar year at least 98% of its net investment income (earned during the calendar year) and 98.2% of its net realized capital gains (earned during the twelve months ended October 31) plus undistributed amounts from prior years.
| Q3 ALL-SEASON FUNDS |
| NOTES TO FINANCIAL STATEMENTS (Continued) |
The following information is computed on a tax basis for each item as of November 30, 2022:
| | | Q3 All-Season | | | | |
| | | Systematic | | | Q3 All-Season | |
| | | Opportunities Fund | | | Tactical Fund | |
| Tax cost of portfolio investments | | $ | 3,260,765 | | | $ | 103,241,655 | |
| Gross unrealized appreciation | | $ | 166,693 | | | $ | — | |
| Gross unrealized depreciation | | | — | | | | (5,368,911 | ) |
| Net unrealized appreciation (depreciation) | | | 166,693 | | | | (5,368,911 | ) |
| Accumulated capital and other losses | | | (743,726 | ) | | | (27,782,836 | ) |
| Accumulated deficit | | $ | (577,033 | ) | | $ | (33,151,747 | ) |
| | | | | | | | | |
The federal tax cost, unrealized appreciation (depreciation) as of May 31, 2023 is as follows:
| | | Q3 All-Season | | | | |
| | | Systematic | | | Q3 All-Season | |
| | | Opportunities Fund | | | Tactical Fund | |
| Tax cost of portfolio investments | | $ | 129,788,694 | | | $ | 37,556,428 | |
| Gross unrealized appreciation | | $ | 14,494 | | | $ | 3,723,980 | |
| Gross unrealized depreciation | | | (857,120 | ) | | | (44,675 | ) |
| Net unrealized appreciation (depreciation) | | $ | (842,326 | ) | | $ | 3,679,305 | |
| | | | | | | | | |
The difference between the federal income tax cost of portfolio investments and the financial statement cost of portfolio investments for the Funds is due to certain timing differences in the recognition of capital gains or losses under income tax regulations and GAAP. These “book/tax” differences are temporary in nature and are primarily due to the tax deferral of losses on wash sales.
As of November 30, 2022, Q3 All-Season Systematic Opportunities Fund and Q3 All-Season Tactical Fund had short-term capital loss carryfowards (“CLCFs”) for income tax purposes in the amount of $725,861 and $27,209,957, respectively. These CLCFs, which do not expire, may be utilized in the current and future years to offset net realized capital gains, if any, prior to distributing such gains to shareholders.
The Funds recognize the tax benefits or expenses of uncertain tax positions only when the position is “more likely than not” of being sustained assuming examination by tax authorities. Management has reviewed each Fund’s tax positions for the current and all open tax years (generally, three years) and has concluded that no provision for unrecognized tax benefits or expenses is required in these financial statements. The Funds identify their major tax jurisdiction as U.S. Federal.
| Q3 ALL-SEASON FUNDS |
| NOTES TO FINANCIAL STATEMENTS (Continued) |
The Fund’s recognize interest and penalties, if any, related to unrecognized tax benefits as income tax expense on the Statements of Operations. During the six months ended May 31, 2023, the Funds did not incur any interest or penalties.
3. Investment Transactions
For the six months ended May 31, 2023, cost of purchases and proceeds from sales of investment securities, other than short-term investments, amounted to $377,101,275, and $337,890,680, respectively, for Q3 All-Season Systematic Opportunities Fund and $473,501,643 and $486,821,694, respectively, for Q3 All-Season Tactical Fund.
4. Transactions with Related Parties
INVESTMENT MANAGEMENT AGREEMENT
The Funds’ investments are managed by the Adviser pursuant to the terms of an Investment Advisory Agreement. Each Fund pays the Adviser a management fee, computed and accrued daily and paid monthly, at the annual rate of 1.00% of average daily net assets. During the six months ended May 31, 2023, the Adviser earned $120,443 and $209,551 of fees under the Investment Management Agreement for Q3 All-Season Systematic Opportunities Fund and Q3 All-Season Tactical Fund, respectively.
Pursuant to an Expense Limitation Agreement (“ELA”) between each Fund and the Adviser, the Adviser has contractually agreed, until March 31, 2024, to reduce management fees and reimburse other expenses to the extent necessary to limit total annual fund operating expenses of each Fund (exclusive of brokerage costs; taxes; interest; borrowing costs such as interest and dividend expenses on securities sold short; costs to organize the Fund; acquired fund fees and expenses; extraordinary expenses such as litigation and merger or reorganization costs; and other expenses not incurred in the ordinary course of the Fund’s business) to an amount not exceeding the following percentages of average daily net assets attributable to each respective class, if applicable:
| Institutional Class | C Class |
| 1.94% | 2.94% |
Accordingly, during the six months ended May 31, 2023, the Adviser reduced management fees in the amount of $53,913 for Q3 All-Season Systematic Opportunities Fund and $231 related to Class C for Q3 All-Season Tactical Fund.
Under the terms of the ELA, management fee reductions and expense reimbursements by the Adviser are subject to repayment by the Funds for a period of thirty-six months after the date on which such fees and expenses were incurred or waived, provided that the repayments do not cause total annual fund operating expenses (exclusive of such reductions and reimbursements) to exceed: (i) the expense limitation then in effect, if any, and (ii) the expense limitation in effect at the time the expenses to be repaid were incurred.
| Q3 ALL-SEASON FUNDS |
| NOTES TO FINANCIAL STATEMENTS (Continued) |
During the six months ended May 31, 2023, the Adviser recouped $51,806 of prior years’ of management fee reductions and expense reimbursements. As of May 31, 2023, the Adviser may seek repayment of management fee reductions and expense reimbursements no later than the dates below:
| | | Q3 All-Season | | | | |
| | | Systematic | | | Q3 All-Season | |
| | | Opportunities Fund | | | Tactical Fund | |
| November 30, 2023 | | $ | 63,843 | | | $ | — | |
| November 30, 2024 | | | 139,638 | | | | — | |
| November 30, 2025 | | | 166,410 | | | | — | |
| May 31, 2026 | | | 53,913 | | | | 231 | |
| Total | | $ | 423,804 | | | $ | 231 | |
| | | | | | | | | |
OTHER SERVICE PROVIDERS
Ultimus Fund Solutions, LLC (“Ultimus”) provides administration, fund accounting, compliance and transfer agency services to the Funds. The Funds pay Ultimus fees in accordance with the agreements for such services. In addition, the Funds pay out-of-pocket expenses including, but not limited to, postage, supplies, and certain costs related to the pricing of the Funds’ portfolio securities.
Under the terms of a Distribution Agreement with the Trust, Ultimus Fund Distributors, LLC (the “Distributor”) serves as the principal underwriter to the Funds. The Distributor is a wholly-owned subsidiary of Ultimus. The Distributor is compensated partially by the Adviser and partially by the C Class shares of Q3 All-Season Tactical Fund for acting as principal underwriter.
A Trustee and certain officers of the Trust are also officers of Ultimus and are not paid by the Funds for serving such capacities.
DISTRIBUTION PLAN
The Q3 All-Season Tactical Fund has adopted a plan of distribution (the “Plan”), pursuant to Rule 12b-1 under the 1940 Act, which permits C Class shares of the Q3 All-Season Tactical Fund to directly incur or reimburse the Funds’ principal underwriter for certain expenses related to the distribution of its shares. The annual limitation for payment of expenses pursuant to the Plan 1.00% of the Q3 All-Season Tactical Fund’s average daily net assets allocable to C Class shares. The Funds have not adopted a plan of distribution with respect to the Institutional Class shares. During the six months ended May 31, 2023, the C Class shares of Q3 All-Season Tactical Fund incurred $11,577 of distribution fees under the Plan.
| Q3 ALL-SEASON FUNDS |
| NOTES TO FINANCIAL STATEMENTS (Continued) |
ADMINISTRATIVE SERVICES PLAN
The Trust has adopted an Administrative Services Plan (the “Administrative Service Plan”) for the Institutional Shares of the Funds. The Administrative Service Plan allows the Funds to use the net assets of the Institutional Shares to pay financial intermediaries that provide services relating to Institutional Shares. The Administrative Service Plan permits payments for the provision of certain administrative, recordkeeping and other non-distribution related services to Institutional Share shareholders. The Administrative Service Plan permits the Funds to make service fee payments at an annual rate of up to 0.25% of each Fund’s average daily net assets attributable to its Institutional Shares. During the six months ended May 31, 2023, no fees were incurred by the Funds under the Administrative Service Plan.
TRUSTEE COMPENSATION
Each member of the Board (a “Trustee”) who is not an “interested person” (as defined by the 1940 Act, as amended) of the Trust (“Independent Trustee”) receives a $1,300 annual retainer from each Fund, except for the Audit Chairperson who receives a $1,500 annual retainer from each Fund and the Board Chairperson who receives a $1,700 annual retainer from each Fund, paid in quarterly installments. Each Independent Trustee also receives from each Fund a fee of $550 for each Board meeting attended plus reimbursement for travel and other meeting-related expenses.
PRINCIPAL HOLDERS OF FUND SHARES
As of May 31, 2023, the following shareholders owned of record 25% or more of the outstanding shares of the share classes of the Funds:
| NAME OF RECORD OWNER | % Ownership |
| Q3 All-Season Systematic Opportunities Fund - Institutional Class | |
| E*TRADE Savings Bank (for the benefit of its customers) | 78% |
| Q3 All-Season Tactical Fund - Institutional Class | |
| E*TRADE Savings Bank (for the benefit of its customers) | 67% |
| Q3 All-Season Tactical Fund - C Class | |
| Pershing LLC (for the benefit of its customers) | 88% |
A beneficial owner of 25% or more of a Fund’s outstanding shares may be considered a controlling person of the Fund. That shareholder’s vote could have a more significant effect on matters presented at a shareholders’ meeting.
5. Borrowing Costs
From time to time, the Funds may have an overdrawn cash balance at the custodian due to redemptions or market movements. When this occurs, the Funds will incur borrowing costs charged by the custodian. Accordingly, during the six months ended May 31, 2023, Q3 All-Season Tactical Fund incurred $24,544 of borrowing cost charged by the custodian.
| Q3 ALL-SEASON FUNDS |
| NOTES TO FINANCIAL STATEMENTS (Continued) |
6. Investments in Other Investment Companies
Each Fund may invest a significant portion of its assets in shares of one or more investment companies, including ETFs, open-end mutual funds and money market mutual funds. Each Fund will incur additional indirect expenses (acquired fund fees and expenses) to the extent it invests in shares of other investment companies. As of May 31, 2023, Q3 All-Season Systematic Opportunities Fund had 51.4% of the value of its net assets invested in Invesco QQQ Trust, Series 1 (“QQQ”), an ETF that tracks the Nasdaq 100 Index. As of May 31, 2023, Q3 All-Season Tactical Fund had 80.7% of the value of its net assets invested in QQQ and 10.1% of the value of its net assets invested in ProShares Short 20+ Year Treasury (“TBF”), an ETF that corresponds to the inverse (-1x) of the daily performance of the ICE U.S. Treasury 20+ Year Bond Index. The financial statements of QQQ and TBF can be found at www.sec.gov.
In order to maintain sufficient liquidity to implement investment strategies, or for temporary defensive purposes, a Fund may at times invest a significant portion of its assets in shares of a money market fund. As of May 31, 2023, Q3 All-Season Systematic Opportunities Fund had 99.6% of the value of its net assets invested in shares of First American Government Obligations Fund - Class X (“FGXXX”), a money market fund registered under the 1940 Act. An investment in a money market fund is not insured or guaranteed by the Federal Deposit Insurance Corporation or any other government agency, entity or person. While investor losses in money market funds have been rare, they are possible. A Fund incurs additional indirect expenses due to acquired fund fees and expenses to the extent it invests in shares of money market funds. The financial statements for FGXXX can be found at www.sec.gov.
7. Contingencies and Commitments
The Funds indemnify the Trust’s officers and Trustees for certain liabilities that might arise from their performance of their duties to the Funds. Additionally, in the normal course of business the Funds enter into contracts that contain a variety of representations and warranties and which provide general indemnifications. The Funds’ maximum exposure under these arrangements is unknown, as this would involve future claims that may be made against the Funds that have not yet occurred. However, based on experience, the Funds expect the risk of loss to be remote.
8. Subsequent Events
The Funds are required to recognize in the financial statements the effects of all subsequent events that provide additional evidence about conditions that existed as of the date of the Statements of Assets and Liabilities. For non-recognized subsequent events that must be disclosed to keep the financial statements from being misleading, the Funds are required to disclose the nature of the event as well as an estimate of its financial
| Q3 ALL-SEASON FUNDS |
| NOTES TO FINANCIAL STATEMENTS (Continued) |
effect, or a statement that such an estimate cannot be made. Management has evaluated subsequent events through the issuance of these financial statements and has noted no such events.
| Q3 ALL-SEASON FUNDS |
| CHANGE IN INDEPENDENT REGISTERED PUBLIC ACCOUNTING FIRM (Unaudited) |
On March 13, 2023, BBD LLP (“BBD”) ceased to serve as the independent registered public accounting firm of Q3 All-Season Systematic Opportunities Fund and Q3 All-Season Tactical Fund (the “Funds”), a series of Ultimus Managers Trust. The Audit Committee of the Board of Trustees approved the replacement of BBD as a result of Cohen & Company, Ltd.’s (“Cohen”) acquisition of BBD’s Investment Management Group.
The report of BBD on the financial statements of the Funds as of and for the fiscal years ended 2022 and 2021 did not contain an adverse opinion or a disclaimer of opinion, and were not qualified or modified as to uncertainties, audit scope or accounting principles. During the fiscal years ended 2022 and 2021, and during the subsequent interim period through March 13, 2023: (i) there were no disagreements between the registrant and BBD on any matter of accounting principles or practices, financial statement disclosure, or auditing scope or procedure, which disagreements, if not resolved to the satisfaction of BBD, would have caused it to make reference to the subject matter of the disagreements in its report on the financial statements of the Funds for such years or interim period; and (ii) there were no “reportable events,” as defined in Item 304(a)(1)(v) of Regulation S-K under the Securities Exchange Act of 1934, as amended.
On April 21, 2023, the Audit Committee of the Board of Trustees also recommended and approved the appointment of Cohen as the Funds’ independent registered public accounting firm for the fiscal year ending November 30, 2023.
During the fiscal years ended 2022 and 2021, and during the subsequent interim period through March 13, 2023, neither the registrant, nor anyone acting on its behalf, consulted with Cohen on behalf of the Funds regarding the application of accounting principles to a specified transaction (either completed or proposed), the type of audit opinion that might be rendered on the Funds’ financial statements, or any matter that was either: (i) the subject of a “disagreement,” as defined in Item 304(a)(1)(iv) of Regulation S-K and the instructions thereto; or (ii) “reportable events,” as defined in Item 304(a)(1)(v) of Regulation S-K.
| Q3 ALL-SEASON FUNDS |
| ABOUT YOUR FUNDS’ EXPENSES (Unaudited) |
We believe it is important for you to understand the impact of costs on your investment. As a shareholder of the Funds, you incur ongoing costs, including management fees, class-specific expenses (such as distribution fees) and other operating expenses. The following examples are intended to help you understand your ongoing costs (in dollars) of investing in the Funds and to compare these costs with the ongoing costs of investing in other mutual funds.
A mutual fund’s ongoing costs are expressed as a percentage of its average net assets. This figure is known as the expense ratio. The expenses in the table below are based on an investment of $1,000 made at the beginning of the most recent period (December 1, 2022) and held until the end of the period (May 31, 2023).
The table below illustrates each Fund’s ongoing costs in two ways:
Actual fund return – The first line for each share class helps you to estimate the actual expenses that you paid over the period. The “Ending Account Value” shown is derived from each Fund’s actual return, and the fourth column shows the dollar amount of operating expenses that would have been paid by an investor who started with $1,000 in the Funds. You may use the information here, together with the amount you invested, to estimate the expenses that you paid over the period.
To do so, simply divide your account value by $1,000 (for example, an $8,600 account value divided by $1,000 = 8.6), then multiply the result by the number given for the Funds under the heading “Expenses Paid During Period.”
Hypothetical 5% return – The second line for each share class is intended to help you compare each Fund’s ongoing costs with those of other mutual funds. It assumes that the Funds had an annual return of 5% before expenses during the period shown, but that the expense ratio is unchanged. In this case, because the return used is not each Fund’s actual return, the results do not apply to your investment. The example is useful in making comparisons because the U.S. Securities and Exchange Commission (the “SEC”) requires all mutual funds to calculate expenses based on a 5% return. You can assess each Fund’s ongoing costs by comparing this hypothetical example with the hypothetical examples that appear in shareholder reports of other funds.
Note that expenses shown in the table are meant to highlight and help you compare ongoing costs only. The Funds do not charge transaction fees, such as purchase or redemption fees, nor do they charge a “sales load.”
The calculations assume no shares were bought or sold during the period. Your actual costs may have been higher or lower, depending on the amount of your investment and the timing of any purchases or redemptions.
| Q3 ALL-SEASON FUNDS |
| ABOUT YOUR FUNDS’ EXPENSES (Unaudited) (Continued) |
More information about each Fund’s expenses can be found in this report. For additional information on operating expenses and other shareholder costs, please refer to each Fund’s prospectus.
| | Beginning | | | |
| | Account Value | Ending | Net | Expenses |
| | December 1, | Account Value | Expense | Paid During |
| | 2022 | May 31, 2023 | Ratio (a) | Period (b) |
| Q3 All-Season Systematic Opportunities Fund | | | | |
| Institutional Class | | | | |
| Based on Actual Fund Return | $1,000.00 | $1,020.20 | 1.94% | $ 9.77 |
| Based on Hypothetical 5% Return (before expenses) | $1,000.00 | $1,015.46 | 1.94% | $ 9.75 |
| | | | | |
| Q3 All-Season Tactical Fund | | | | |
| Institutional Class | | | | |
| Based on Actual Fund Return | $1,000.00 | $1,048.50 | 1.76% | $ 8.99 |
| Based on Hypothetical 5% Return (before expenses) | $1,000.00 | $1,016.16 | 1.76% | $ 8.85 |
| C Class | | | | |
| Based on Actual Fund Return | $1,000.00 | $1,042.40 | 3.10% | $15.79 |
| Based on Hypothetical 5% Return (before expenses) | $1,000.00 | $1,009.47 | 3.10% | $15.53 |
| (a) | Annualized, based on each Class’s most recent one-half year expenses. |
| (b) | Expenses are equal to each Class’s annualized net expense ratio multiplied by the average account value over the period, multiplied by 182/365 (to reflect the one-half year period), for Actual Fund Return and Hypothetical 5% Return information, respectively. |
| Q3 ALL-SEASON FUNDS |
| OTHER INFORMATION (Unaudited) |
A description of the policies and procedures that the Funds use to vote proxies relating to portfolio securities is available without charge upon request by calling toll-free 1-855-784-2399, or on the SEC’s website at www.sec.gov. Information regarding how the Funds voted proxies relating to portfolio securities during the most recent 12-month period ended June 30 is available without charge upon request by calling toll-free 1-855-784-2399, or on the SEC’s website at www.sec.gov.
The Trust files a complete listing of portfolio holdings for the Funds with the SEC as of the end of the first and third quarters of each fiscal year as an exhibit to its reports on Form N-PORT. These filings are available upon request by calling 1-855-784-2399. Furthermore, you may obtain a copy of the filings on the SEC’s website at www.sec.gov and on the Funds’ website at www.Q3AllSeasonfunds.com.
| FACTS | WHAT DO THE Q3 ALL-SEASON SYSTEMATIC OPPORTUNITIES FUND AND THE Q3 ALL-SEASON TACTICAL FUND (the “Funds”) DO WITH YOUR PERSONAL INFORMATION? |
| | |
| Why? | Financial companies choose how they share your personal information. Federal law gives consumers the right to limit some but not all sharing. Federal law also requires us to tell you how we collect, share, and protect your personal information. Please read this notice carefully to understand what we do. |
| | |
| What? | The types of personal information we collect and share depend on the product or service you have with us. This information can include: ● Social Security number ● Assets ● Retirement Assets ● Transaction History ● Checking Account Information ● Purchase History ● Account Balances ● Account Transactions ● Wire Transfer Instructions When you are no longer our customer, we continue to share your information as described in this notice. |
| | |
| How? | All financial companies need to share your personal information to run their everyday business. In the section below, we list the reasons financial companies can share their customers’ personal information; the reasons the Funds choose to share; and whether you can limit this sharing. |
| Reasons we can share your personal information | Do the Funds
share? | Can you limit
this sharing? |
For our everyday business purposes –
Such as to process your transactions, maintain your account(s), respond to court orders and legal investigations, or report to credit bureaus | Yes | No |
For our marketing purposes –
to offer our products and services to you | No | We don’t share |
| For joint marketing with other financial companies | No | We don’t share |
For our affiliates’ everyday business purposes –
information about your transactions and experiences | No | We don’t share |
For our affiliates’ everyday business purposes –
information about your creditworthiness | No | We don’t share |
| For nonaffiliates to market to you | No | We don’t share |
| Questions? | Call 1-855-784-2399 |
| Who we are |
| Who is providing this notice? | Q3 All-Season Systematic Opportunities Fund Q3 All-Season Tactical Fund Ultimus Fund Distributors, LLC (Distributor) Ultimus Fund Solutions, LLC (Administrator) |
| What we do |
| How do the Funds protect my personal information? | To protect your personal information from unauthorized access and use, we use security measures that comply with federal law. These measures include computer safeguards and secured files and buildings. Our service providers are held accountable for adhering to strict policies and procedures to prevent any misuse of your nonpublic personal information. |
| How do the Funds collect my personal information? | We collect your personal information, for example, when you ● Open an account ● Provide account information ● Give us your contact information ● Make deposits or withdrawals from your account ● Make a wire transfer ● Tell us where to send the money ● Tell us who receives the money ● Show your government-issued ID ● Show your driver’s license We also collect your personal information from other companies. |
| Why can’t I limit all sharing? | Federal law gives you the right to limit only ● Sharing for affiliates’ everyday business purposes – information about your creditworthiness ● Affiliates from using your information to market to you ● Sharing for nonaffiliates to market to you State laws and individual companies may give you additional rights to limit sharing. |
| |
| Definitions |
| Affiliates | Companies related by common ownership or control. They can be financial and nonfinancial companies. ● Q3 Asset Management Corporation, the investment adviser to the Funds, could be deemed to be an affiliate. |
| Nonaffiliates | Companies not related by common ownership or control. They can be financial and nonfinancial companies ● The Funds do not share with nonaffiliates so they can market to you. |
| Joint marketing | A formal agreement between nonaffiliated financial companies that together market financial products or services to you. ● The Funds do not jointly market. |
This page intentionally left blank.
This page intentionally left blank.
This page intentionally left blank.
Q3-SAR-23
Q3 All-Season Active Rotation ETF
(QVOY)
Semi-Annual Report
May 31, 2023
(Unaudited)
| Q3 ALL-SEASON ACTIVE ROTATION ETF | |
| LETTER TO SHAREHOLDERS (Unaudited) | May 31, 2023 |
Dear Shareholders:
This Semi-Annual report for the Q3 All-Season Active Rotation ETF covers the period December 6, 2022 (Inception date) through May 31, 2023. The ETF is advised by Q3 Asset Management, and is actively managed using systematic, quantitative approaches to asset allocation in order to adjust to evolving market environments.
Q3 All-Season Active Rotation ETF (QVOY)
The All-Season Rotation ETF was incepted on December 6, 2022.
For the period beginning December 6, 2022 and ending May 31, 20023, the Fund had a return of 2.95% versus a return of 1.83% for the Dow Jones Moderate Target Risk Index during the same timeframe. The Fund’s investment objective is to seek long-term growth of capital over a complete market cycle.
The ETF began the period invested with a value tilt, as much of 2022 saw dramatic declines in nearly every equity sector. During this time, the ETF was able to take advantage of upside moves in defensive holdings such as Gold, Industrials, and Oil Services.
As the markets began to rally in early 2023, the ETF rotated away from value holdings and began to favor more growth-related positions. Core equity holdings in Large Cap Growth and NASDAQ 100 funds led to outperformance in the later months of the six-month period.
The All-Season Rotation ETF was able to nimbly move from value to growth in response to the market. This was made possible as the ETF is monitored on a weekly basis, enabling it to participate in those sectors of the market showing potential for outsized gains. Holdings in liquid alternative funds, which included Platinum, Gold, and Global Carbon, comprise 15% of the ETF and helped to lower overall volatility as these positions tend to have low correlation to both equities and bonds.
Very truly yours,
| Brad Giaimo | Bruce Greig | Adam Quiring |
Past performance is not predictive of future performance. Investment results and principal value will fluctuate so that shares, when redeemed, may be worth more or less than their original cost. Current performance may be higher or lower than the performance data quoted.
An investor should consider the investment objectives, risks, charges and expenses of a Fund carefully before investing. The Fund’s prospectus contains this and other important information. Please read the prospectus carefully before you invest. The Fund is distributed by Northern Lights Distributors, LLC. The Letter to Shareholders seeks to describe some of the Adviser’s current opinions and views of the financial markets. Although the Adviser believes it has a reasonable basis for any opinions or views expressed, actual results may
differ, sometimes significantly so, from those expected or expressed. The securities held by the Fund that are discussed in the Letter to Shareholders were held during the period covered by this Report. They may not comprise the entire investment portfolio of the Fund, may be sold at any time, and may no longer be held by the Fund. For a complete list of securities held by each Fund as of May 31, 2023, please see the Schedule of Investments sections of the Semi-Annual Report. The opinions of the Fund’s adviser with respect to those securities may change at any time.
Statements in the Letter to Shareholders that reflect projections or expectations for future financial or economic performance of the Fund and the market in general and statements of the Fund’s plans and objectives for future operations are forward-looking statements. No assurance can be given that actual results or events will not differ materially from those projected, estimated, assumed, or anticipated in any such forward-looking statements. Important factors that could result in such differences, in addition to factors noted with such forward-looking statements, include, without limitation, general economic conditions, such as inflation, recession, and interest rates.
| Q3 ALL-SEASON ACTIVE ROTATION ETF |
| PORTFOLIO INFORMATION |
| May 31, 2023 (Unaudited) |
Sector Diversification (% of Net Assets)
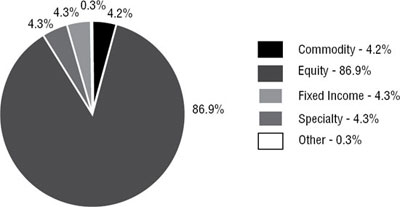
Top Ten Equity Holdings
| | % of Net |
| Security Description | Assets |
| Technology Select Sector SPDR Fund | 14.4% |
| Schwab U.S. Large-Cap Growth ETF | 14.3% |
| Invesco QQQ Trust, Series 1 | 14.0% |
| SPDR S&P Homebuilders ETF | 13.1% |
| Consumer Discretionary Select Sector SPDR Fund | 13.1% |
| Vanguard FTSE Europe ETF | 12.7% |
| Amplify Transformational Data Sharing ETF | 5.4% |
| Invesco CurrencyShares Euro Currency Trust | 4.3% |
| abrdn Physical Platinum Shares ETF | 4.1% |
| iShares 20+ Year Treasury Bond ETF | 1.5% |
| Q3 ALL-SEASON ACTIVE ROTATION ETF |
| SCHEDULE OF INVESTMENTS |
| May 31, 2023 (Unaudited) |
| EXCHANGE-TRADED FUNDS — 99.7% | | Shares | | | Value | |
| abrdn Physical Platinum Shares ETF (a) | | | 25,234 | | | $ | 2,326,827 | |
| Amplify Transformational Data Sharing ETF (a) | | | 150,000 | | | | 3,022,500 | |
| Consumer Discretionary Select Sector SPDR Fund | | | 48,450 | | | | 7,345,505 | |
| Invesco CurrencyShares Euro Currency Trust | | | 24,326 | | | | 2,401,220 | |
| Invesco QQQ Trust, Series 1 | | | 22,512 | | | | 7,833,951 | |
| iShares 20+ Year Treasury Bond ETF | | | 7,971 | | | | 820,933 | |
| iShares Broad USD High Yield Corporate Bond ETF | | | 23,000 | | | | 801,780 | |
| Schwab U.S. Large-Cap Growth ETF | | | 114,060 | | | | 8,016,137 | |
| SPDR Bloomberg Investment Grade Floating Rate ETF | | | 26,300 | | | | 806,621 | |
| SPDR S&P Homebuilders ETF | | | 106,952 | | | | 7,367,923 | |
| Technology Select Sector SPDR Fund | | | 49,183 | | | | 8,079,783 | |
| Vanguard FTSE Europe ETF | | | 118,088 | | | | 7,111,259 | |
| Total Exchange-Traded Funds — 99.7% (Cost $54,385,532) | | | | | | $ | 55,934,439 | |
| | | | | | | | | |
| Other Assets in Excess of Liabilities — 0.3% | | | | | | | 176,651 | |
| | | | | | | | | |
| Net Assets — 100.0% | | | | | | $ | 56,111,090 | |
| (a) | Non-income producing security. |
See accompanying notes to financial statements.
| Q3 ALL-SEASON ACTIVE ROTATION ETF |
| STATEMENT OF ASSETS AND LIABILITIES |
| May 31, 2023 (Unaudited) |
| ASSETS | | | | |
| Investments in securities: | | | | |
| At cost | | $ | 54,385,532 | |
| At value (Note 2) | | $ | 55,934,439 | |
| Cash (Note 2) | | | 235,322 | |
| Receivable for investment securities sold | | | 4,575,539 | |
| Total assets | | | 60,745,300 | |
| | | | | |
| LIABILITIES | | | | |
| Payable for investment securities purchased | | | 4,593,088 | |
| Payable to Adviser (Note 4) | | | 21,235 | |
| Payable to administrator (Note 4) | | | 6,458 | |
| Other accrued expenses and liabilities | | | 13,429 | |
| Total liabilities | | | 4,634,210 | |
| | | | | |
| NET ASSETS | | $ | 56,111,090 | |
| | | | | |
| NET ASSETS CONSIST OF: | | | | |
| Paid-in capital | | $ | 55,280,504 | |
| Accumulated earnings | | | 830,586 | |
| NET ASSETS | | $ | 56,111,090 | |
| | | | | |
| Shares of beneficial interest outstanding (unlimited number of shares authorized, no par value) | | | 2,190,000 | |
| | | | | |
| Net asset value, offering price and redemption price per share (Note 2) | | $ | 25.62 | |
See accompanying notes to financial statements.
| Q3 ALL-SEASON ACTIVE ROTATION ETF |
| STATEMENT OF OPERATIONS |
| Period Ended May 31, 2023 (Unaudited)(a) |
| INVESTMENT INCOME | | | | |
| Dividend income | | $ | 415,689 | |
| | | | | |
| EXPENSES | | | | |
| Management fees (Note 4) | | | 162,516 | |
| Legal fees | | | 31,523 | |
| Administration fees (Note 4) | | | 21,895 | |
| Custody fees | | | 12,333 | |
| Trustees’ fees and expenses (Note 4) | | | 9,634 | |
| Fund accounting fees (Note 4) | | | 8,028 | |
| Compliance fees (Note 4) | | | 8,000 | |
| Borrowing costs (Note 6) | | | 7,004 | |
| Transfer agent fees | | | 4,998 | |
| Shareholder reporting expenses | | | 4,177 | |
| Registration and filing fees | | | 2,163 | |
| Other expenses | | | 22,236 | |
| Total expenses | | | 294,507 | |
| Management fees reduced by the Adviser (Note 4) | | | (14,988 | ) |
| Net expenses | | | 279,519 | |
| | | | | |
| NET INVESTMENT INCOME | | | 136,170 | |
| | | | | |
| REALIZED AND UNREALIZED GAINS (LOSSES) ON INVESTMENTS AND FOREIGN CURRENCIES | | | | |
| Net realized losses from investment transactions | | | (636,444 | ) |
| Net realized gains from in-kind transactions (Note 3) | | | 7,912 | |
| Net change in unrealized appreciation (depreciation) on investments | | | 1,548,907 | |
| NET REALIZED AND UNREALIZED GAINS ON INVESTMENTS | | | 920,375 | |
| | | | | |
| NET INCREASE IN NET ASSETS RESULTING FROM OPERATIONS | | $ | 1,056,545 | |
| (a) | Represents the period from commencement of operations (December 6, 2022) through May 31, 2023. |
See accompanying notes to financial statements.
| Q3 ALL-SEASON ACTIVE ROTATION ETF |
| STATEMENT OF CHANGES IN NET ASSETS |
| | | Period Ended | |
| | | May 31, | |
| | | 2023 | |
| | | (Unaudited)(a) | |
| FROM OPERATIONS | | | | |
| Net investment income | | $ | 136,170 | |
| Net realized losses from investment transactions | | | (636,444 | ) |
| Net realized gains from in-kind transactions (Note 3) | | | 7,912 | |
| Net change in unrealized appreciation (depreciation) on investments | | | 1,548,907 | |
| Net increase in net assets resulting from operations | | | 1,056,545 | |
| | | | | |
| FROM DISTRIBUTIONS TO SHAREHOLDERS (NOTE 2) | | | (225,959 | ) |
| | | | | |
| FROM CAPITAL SHARE TRANSACTIONS | | | | |
| Proceeds from shares issued | | | 61,200,858 | |
| Payments for shares redeemed | | | (5,920,354 | ) |
| Net increase in net assets from capital share transactions | | | 55,280,504 | |
| | | | | |
| TOTAL INCREASE IN NET ASSETS | | | 56,111,090 | |
| | | | | |
| NET ASSETS | | | | |
| Beginning of period | | | — | |
| End of period | | $ | 56,111,090 | |
| | | | | |
| SHARE TRANSACTIONS | | | | |
| Shares issued | | | 2,430,000 | |
| Shares redeemed | | | (240,000 | ) |
| Net increase in shares outstanding | | | 2,190,000 | |
| Shares outstanding at beginning of period | | | — | |
| Shares outstanding at end of period | | | 2,190,000 | |
| (a) | Represents the period from the commencement of operations (December 6, 2022) through May 31, 2023. |
See accompanying notes to financial statements.
| Q3 ALL-SEASON ACTIVE ROTATION ETF |
| FINANCIAL HIGHLIGHTS |
Per Share Data for a Share Outstanding Throughout the Period:
| | | Period Ended | |
| | | May 31, | |
| | | 2023 | |
| | | (Unaudited)(a) | |
| Net asset value at beginning of period | | $ | 25.00 | |
| Income from investment operations: | | | | |
| Net investment income (b) | | | 0.07 | |
| Net realized and unrealized gains on investments | | | 0.66 | |
| Total from investment operations | | | 0.73 | |
| Less distributions to shareholders from: | | | | |
| Net investment income | | | (0.11 | ) |
| Net asset value at end of period | | $ | 25.62 | |
| Market price at end of period | | $ | 25.58 | |
| Total return (c) | | | 2.95 | % (d) |
| Total return at market (e) | | | 2.79 | % (d) |
| Net assets at end of period (000’s) | | $ | 56,111 | |
| Ratios/supplementary data: | | | | |
| Ratio of total expenses to average net assets | | | 1.18 | % (f) |
| Ratio of net expenses to average net assets (g) | | | 1.12 | % (f)(h) |
| Ratio of net investment income to average net assets (g) | | | 0.54 | % (f) |
| Portfolio turnover rate (i) | | | 314 | % (d) |
| (a) | Represents the period from the commencement of operations (December 6, 2022) through May 31, 2023. |
| (b) | Per share net investment income has been determined on the basis of average number of shares outstanding during the period. |
| (c) | Net asset value total return is calculated assuming an initial investment made at the net asset value at the beginning of the period, reinvestment of all dividends and distributions at net asset value during the period, if any, and redemption on the last day of the period at net asset value. This percentage is not an indication of the performance of a shareholder’s investment in the Fund based on market value due to differences between the market price of the shares and the net asset value per share of the Fund. |
| (e) | Market value total return is calculated assuming an initial investment made at the market value at the beginning of the period, reinvestment of all dividends and distributions at net asset value during the period, if any, and redemption on the last day of the period at market value. Market value is determined by the composite closing price. Composite closing security price is defined as the last reported sale price from any primary listing market (e.g., Cboe BZX) or participating regional exchanges or markets. The composite closing price is the last reported sale price from any of the eligible sources, regardless of volume and not an average price and may have occurred on a date prior to the close of the reporting period. Market value may be greater or less than net asset value, depending on the Fund’s closing price on the listing market. |
| (g) | Ratio was determined after fee reductions (Note 4). |
| (h) | Includes 0.03% of borrowing costs (Note 6). |
| (i) | Portfolio turnover rate excludes securities received or delivered from in-kind processing of creations or redemptions (Note 3). |
See accompanying notes to financial statements.
| Q3 ALL-SEASON ACTIVE ROTATION ETF |
| NOTES TO FINANCIAL STATEMENTS |
| May 31, 2023 (Unaudited) |
1. Organization
Q3 All-Season Active Rotation ETF (the “Fund”) is a diversified series of Ultimus Managers Trust (the “Trust”), an open-end investment company established as an Ohio business trust under a Declaration of Trust dated February 28, 2012. Other series of the Trust are not incorporated in this report. The Fund commenced operations on December 6, 2022.
The Fund is an exchange-traded fund (“ETF”). The investment objective of the Fund is to achieve long-term growth of capital.
Shares of the Fund are listed and traded on the Cboe BZX Exchange, Inc. Market prices for the Shares may be different from their net asset value (“NAV”.) The Fund issues and redeems shares solely to certain financial institutions such as registered broker-dealers and banks that have entered into agreements with the Fund’s distributor (“Authorized Participants” or “APs”) on a continuous basis at net asset value per share (“NAV”) in aggregations of a specified number of shares called “Creation Units.” Creation Units generally are issued in exchange for a basket of securities (“Deposit Securities”), together with the deposit of a specified cash payment (“Balancing Amount”). Shares are not individually redeemable, but are redeemable only in Creation Unit aggregations, and generally in exchange for portfolio securities and a specified cash payment. A Creation Unit of the Fund consists of a block of shares.
2. Significant Accounting Policies
The following is a summary of the Fund’s significant accounting policies. The policies are in conformity with accounting principles generally accepted in the United States of America (“GAAP”). The Fund follows accounting and reporting guidance under Financial Accounting Standards Board Accounting Standards Codification Topic 946, “Financial Services – Investment Companies.”
Securities valuation – The Fund values its portfolio securities at market value as of the close of regular trading on the New York Stock Exchange (the “NYSE”) (normally 4:00 p.m. Eastern time) on each business day the NYSE is open for business. ETFs are valued at the securities last sale price on the primary exchange, if available, otherwise at the exchange’s most recently quoted mean price. When using a quoted price and when the market is considered active, the security will be classified as Level 1 within the fair value hierarchy (see below). In the event that market quotations are not readily available or are considered unreliable due to market or other events, the Fund values its securities and other assets at fair value as determined by Q3 Asset Management (the “Adviser”), as the valuation designee, in accordance with procedures adopted by the Board of Trustees (the “Board”) pursuant to Rule 2a-5 under the Investment Company Act of 1940, as amended (the “1940 Act”). Under these procedures, the securities will be classified as Level 2 or 3 within the fair value hierarchy, depending on the inputs used. Unavailable
| Q3 ALL-SEASON ACTIVE ROTATION ETF |
| NOTES TO FINANCIAL STATEMENTS (Unaudited) (Continued) |
or unreliable market quotes may be due to the following factors: a substantial bid-ask spread; infrequent sales resulting in stale prices; insufficient trading volume; small trade sizes; a temporary lapse in any reliable pricing source; and actions of the securities or futures markets, such as the suspension or limitation of trading. As a result, the prices of securities used to calculate the Fund’s NAV may differ from quoted or published prices for the same securities.
GAAP establishes a single authoritative definition of fair value, sets out a framework for measuring fair value, and requires additional disclosures about fair value measurements.
Various inputs are used in determining the value of the Fund’s investments. These inputs are summarized in the three broad levels listed below:
| ● | Level 1 – quoted prices in active markets for identical securities |
| ● | Level 2 – other significant observable inputs |
| ● | Level 3 – significant unobservable inputs |
The inputs or methods used for valuing securities are not necessarily an indication of the risks associated with investing in those securities. The inputs used to measure fair value may fall into different levels of the fair value hierarchy. In such cases, for disclosure purposes, the level in the fair value hierarchy within which the fair value measurement falls in its entirety is determined based on the lowest level input that is significant to the fair value measurement.
The following is a summary of the Fund’s investments by the inputs used to value the investments as of May 31, 2023:
| | | Level 1 | | | Level 2 | | | Level 3 | | | Total | |
| Exchange-Traded Funds | | $ | 55,934,439 | | | $ | — | | | $ | — | | | $ | 55,934,439 | |
| Total | | $ | 55,934,439 | | | $ | — | | | $ | — | | | $ | 55,934,439 | |
| | | | | | | | | | | | | | | | | |
Refer to the Fund’s Schedule of Investments for a listing of securities by sector and industry type. The Fund did not hold any derivative instruments or any assets or liabilities that were measured at fair value on a recurring basis using significant unobservable inputs (Level 3) as of or during the period ended May 31, 2023.
Cash – The Fund’s cash, if any, is held in a bank account with balances which may exceed the Federal Deposit Insurance Corporation (FDIC) limit of $250,000. The cash balance reflected on the Statement of Assets and Liabilities for the Fund represents the amount held as of May 31, 2023.
Share valuation – Individual shares of an ETF may be purchased and sold only on a national securities exchange through a broker-dealer. Lack of liquidity in an ETF could result in the ETF being more volatile than its underlying securities. The price of such shares is based on market price, and because ETF shares trade at market prices rather
| Q3 ALL-SEASON ACTIVE ROTATION ETF |
| NOTES TO FINANCIAL STATEMENTS (Unaudited) (Continued) |
than NAV, shares may trade at a price greater than NAV (a premium) or less than NAV (a discount). The market price of an ETF’s shares, like the price of any exchange-traded security, includes a “bid ask spread” charged by the exchange specialists, market makers or other participants that trade the particular security. The bid ask spread often increases significantly during times of market disruption, which means that, to the extent that the Fund invests directly in an ETF, the shares of that ETF may trade at a greater discount at a time when the Fund wishes to sell its shares.
Investment income – Dividend income is recorded on the ex-dividend date. Interest income, if any, is accrued as earned. Non-cash dividends included in dividend income, if any, are recorded at the fair value of the security received.
Investment transactions – Investment transactions are accounted for on the trade date. Realized gains and losses on investments sold are determined on a specific identification basis.
Common expenses – Common expenses of the Trust are allocated among the Fund and the other series of the Trust based on the relative net assets of each series, the number of series in the Trust, or the nature of the services performed and the relative applicability to each series.
Distributions to shareholders – Dividends arising from net investment income, if any, are declared and paid quarterly to shareholders of the Fund. Net realized capital gains, if any, are distributed at least once each year. The amount of such dividends and distributions are determined in accordance with federal income tax regulations, which may differ from GAAP. Dividends and distributions to shareholders are recorded on the ex-dividend date. The tax character of distributions paid to shareholders by the Fund during the period ended May 31, 2023 was as follows:
| Period | | Ordinary | | | Long-Term | | | Total | |
| Ended | | Income | | | Capital Gains | | | Distributions | |
| 5/31/2023 | | $ | 225,959 | | | $ | — | | | $ | 225,959 | |
Estimates – The preparation of financial statements in conformity with GAAP requires management to make estimates and assumptions that affect the reported amounts of assets and liabilities and disclosure of contingent assets and liabilities as of the date of the financial statements and the reported amounts of increase (decrease) in net assets from operations during the reporting period. Actual results could differ from those estimates.
Federal income tax – The Fund intends to qualify as a regulated investment company under the Internal Revenue Code of 1986, as amended (the “Code”). Qualification generally will relieve the Fund of liability for federal income taxes to the extent 100% of its net investment income and net realized capital gains are distributed in accordance with the Code.
| Q3 ALL-SEASON ACTIVE ROTATION ETF |
| NOTES TO FINANCIAL STATEMENTS (Unaudited) (Continued) |
In order to avoid imposition of the excise tax applicable to regulated investment companies, it is also the Fund’s intention to declare as dividends in each calendar year at least 98% of its net investment income (earned during the calendar year) and 98.2% of its net realized capital gains (earned during the twelve months ended October 31) plus undistributed amounts from prior years.
The following information was computed on a tax basis for each item as of May 31, 2023:
| Tax cost of portfolio investments | | $ | 54,385,532 | |
| Gross unrealized appreciation | | $ | 2,368,867 | |
| Gross unrealized depreciation | | | (819,960 | ) |
| Net unrealized appreciation | | | 1,548,907 | |
| | | | | |
The Fund recognizes the tax benefits or expenses of uncertain tax positions only when the position is “more likely than not” of being sustained assuming examination by tax authorities. Management has reviewed the Fund’s tax positions for the current tax year and has concluded that no provision for unrecognized tax benefits or expenses is required in these financial statements. The Fund identifies its major tax jurisdiction as U.S. Federal.
The Fund recognizes interest and penalties, if any, related to unrecognized tax benefits as income tax expense on the Statement of Operations. During the period ended May 31, 2023, the Fund did not incur any interest or penalties.
3. Investment Transactions
During the period ended May 31, 2023, cost of purchases and proceeds from sales of investment securities, excluding in-kind transactions and short-term investments, amounted to $169,508,324 and $168,945,446, respectively. Purchases and sales of in-kind transactions for the period ended May 31, 2023 amounted to $60,174,276 and $5,723,090, respectively. There were realized gains of $7,912 from in-kind transactions during the period ended May 31, 2023.
4. Transactions with Related Parties
INVESTMENT ADVISORY AGREEMENT
The Fund’s investments are managed by the Adviser pursuant to the terms of an Investment Advisory Agreement. The Fund pays the Adviser a management fee, computed and accrued daily and paid monthly, at the annual rate of 0.65% of average daily net assets. During the period ended May 31, 2023, the Adviser earned $162,516 of fees under the Investment Advisory Agreement.
Pursuant to an Expense Limitation Agreement (“ELA”) between the Fund and the Adviser, the Adviser has contractually agreed, until March 31, 2024 to reduce the management fees and to reimburse Fund expenses to the extent necessary to limit Annual Fund Operating Expenses (exclusive of brokerage costs; taxes; interest; borrowing costs such as interest
| Q3 ALL-SEASON ACTIVE ROTATION ETF |
| NOTES TO FINANCIAL STATEMENTS (Unaudited) (Continued) |
and dividend expenses on securities sold short; costs to organize the Fund; Acquired Fund fees and expenses; extraordinary expenses such as litigation and merger or reorganization costs; and other expenses not incurred in the ordinary course of the Fund’s business) to an amount not exceeding 1.09% of the Fund’s shares.
Accordingly, during the six months ended May 31, 2023, the Adviser reimbursed other operating expenses of $14,988.
Under the terms of the ELA, management fee reductions and expense reimbursements by the Adviser are subject to repayment by the Funds for a period of three years after the date on which such fees and expenses were incurred, provided that the repayments do not cause Total Annual Operating Expenses (exclusive of such reductions and reimbursements) to exceed (i) the expense limitation then in effect, if any, and (ii) the expense limitation in effect at the time the expenses to be repaid were incurred. As of May 31, 2023, the Adviser may seek repayment of management fee reductions and expense reimbursements no later than the dates below:
OTHER SERVICE PROVIDERS
Ultimus Fund Solutions, LLC (“Ultimus”) provides administration and fund accounting services to the Fund. The Fund pays Ultimus fees in accordance with the agreements for such services. In addition, the Fund pays out-of-pocket expenses including, but not limited to, postage, supplies, and certain costs related to the pricing of the Fund’s portfolio securities.
Under the terms of a Distribution Agreement with the Trust, Northern Lights Distributors, LLC (the “Distributor”) serves as the principal underwriter to the Fund. The Distributor is compensated by the Adviser for acting as principal underwriter.
A Trustee and certain officers of the Trust are also officers of Ultimus and are not paid by the Fund for serving in such capacities.
TRUSTEE COMPENSATION
Each member of the Board (a “Trustee”) who is not an “interested person” (as defined by the 1940 Act, as amended) of the Trust (“Independent Trustee”) receives a $1,300 annual retainer from the Fund, except for the Board Chairperson who receives a $1,700 annual retainer from the Fund and the Audit Committee Chairperson who receives a $1,500 annual retainer from the Fund, paid in quarterly installments. Each Independent Trustee also receives from the Fund a fee of $550 for each Board meeting attended plus reimbursement for travel and other meeting-related expenses.
| Q3 ALL-SEASON ACTIVE ROTATION ETF |
| NOTES TO FINANCIAL STATEMENTS (Unaudited) (Continued) |
5. Capital Share Transactions
Only certain financial institutions such as registered broker-dealers and banks that have entered into agreements with the Fund’s Distributor (“Authorized Participants” or “APs”) may acquire shares directly from the Fund and tender their shares for redemption directly to the Fund. Such purchases and redemptions are made at NAV per share and only in large blocks, or Creation Units, of shares. Purchases and redemptions directly with the Fund must follow the Fund’s procedures, which are described in the Fund’s Statement of Additional Information (“SAI”).
A creation transaction, which is subject to acceptance by the Fund’s Distributor and the Fund, generally takes place when an AP deposits into the Fund a designated portfolio of securities (“Deposit Securities”) (including any portion of such securities for which cash may be substituted) and a specified amount of cash approximating the holdings of the Fund in exchange for a specified number of Creation Units. The composition of such portfolio generally corresponds pro rata to the holdings of the Fund. However, the Fund may, in certain circumstances, offer Creation Units partially or solely for cash. Similarly, shares can be redeemed only in Creation Units, generally for a designated portfolio of securities (including any portion of such securities for which cash may be substituted) held by the Fund and a specified amount of cash. Except when aggregated in Creation Units, shares are not redeemable. The prices at which creations and redemptions occur are based on the next calculation of NAV after a creation or redemption order is received in an acceptable form under the AP agreement. Realized gains (losses) resulting from in-kind redemption of shares, if any, are reflected separately on the Statement of Operations
The Fund charges APs standard creation and redemption transaction fees (“Transaction Fees”) to offset transfer and other transaction costs associated with the issuance and redemption of Creation Units. The standard creation and redemption transaction fees are set forth in the table below. The standard creation transaction fee is charged to the AP on the day such AP creates a Creation Unit, and is the same regardless of the number of Creation Units purchased by the AP on the applicable business day. Similarly, the standard redemption transaction fee is charged to the AP on the day such AP redeems a Creation Unit, and is the same regardless of the number of Creation Units redeemed by the AP on the applicable business day. Creations and redemptions for cash (when cash creations and redemptions (in whole or in part) are available or specified) are also subject to an additional charge (up to the maximum amounts shown in the table below). This charge is intended to compensate for brokerage, tax, foreign exchange, execution, price movement and other costs and expenses related to cash transactions (which may, in certain instances, be based on a good faith estimate of transaction costs). For the period ended May 31, 2023, the Fund received $7,200 in transaction fees.
| Q3 ALL-SEASON ACTIVE ROTATION ETF |
| NOTES TO FINANCIAL STATEMENTS (Unaudited) (Continued) |
The Transaction Fees for the Fund are listed in the table below:
| | Maximum Additional Variable Change for Cash |
| Fee for In-Kind and Cash Purchases | Purchases* |
| $200 | 200 basis points (2.0)% |
| * | As a percentage of the amount invested. |
6. Borrowing costs
From time to time the Fund may have an overdrawn cash balance at the custodian due to redemptions or market movements. When this occurs, the Fund will incur borrowing costs charged by the custodian. Accordingly, during the period ended May 31, 2023, the Fund incurred $7,004 in borrowing costs charged by the custodian.
7. Investments in Other Investments Companies
Each Fund may invest a significant portion of its assets in shares of one or more investment companies, including ETFs, open-end mutual funds and money market mutual funds. Each Fund will incur additional indirect expenses (acquired fund fees and expenses) to the extent it invests in shares of other investment companies. As of May 31, 2023, the Fund had 99.7% of the value of its net assets invested in ETFs. The financial statements of these ETFs can be found at www.sec.gov.
8. Contingencies and Commitments
The Fund indemnifies the Trust’s officers and Trustees for certain liabilities that might arise from their performance of their duties to the Fund. Additionally, in the normal course of business the Fund enters into contracts that contain a variety of representations and warranties and which provide general indemnifications. The Fund’s maximum exposure under these arrangements is unknown, as this would involve future claims that may be made against the Fund that have not yet occurred. However, based on experience, the Fund expects the risk of loss to be remote.
9. Subsequent Events
The Fund is required to recognize in the financial statements the effects of all subsequent events that provide additional evidence about conditions that existed as of the date of the Statement of Assets and Liabilities. For non-recognized subsequent events that must be disclosed to keep the financial statements from being misleading, the Fund is required to disclose the nature of the event as well as an estimate of its financial effect, or a statement that such an estimate cannot be made. Management has evaluated subsequent events through the issuance of these financial statements and has noted no such events.
| Q3 ALL-SEASON ACTIVE ROTATION ETF |
| CHANGE IN INDEPENDENT REGISTERED PUBLIC ACCOUNTING FIRM (Unaudited) |
On March 13, 2023, BBD LLP (“BBD”) ceased to serve as the independent registered public accounting firm Q3 All-Season Active Rotation ETF (the “Fund”), each a series of Ultimus Managers Trust. The Audit Committee of the Board of Trustees approved the replacement of BBD as a result of Cohen & Company, Ltd.’s (“Cohen”) acquisition of BBD’s investment management group.
On April 21, 2023, the Audit Committee of the Board of Trustees also recommended and approved the appointment of Cohen as the Fund’s independent registered public accounting firm for the fiscal year ending November 30, 2023.
| Q3 ALL-SEASON ACTIVE ROTATION ETF |
| DISCLOSURE REGARDING APPROVAL OF INVESTMENT ADVISORY AGREEMENT (Unaudited) |
The Board of Trustees (the “Board”), including the Independent Trustees voting separately, has reviewed and approved the Fund’s Investment Advisory Agreement with Q3 Asset Management Corporation (the “Adviser” or “Q3AM”) for an initial two-year term (the “Advisory Agreement”). The Board approved the Advisory Agreement at a meeting held on October 17–18, 2022, at which all of the Trustees were present.
Prior to the Board meeting, Q3AM provided a response to a letter sent by the counsel to the Independent Trustees, on their behalf, requesting various information relevant to the Independent Trustees’ consideration of the initial approval of the Advisory Agreement with respect to the Fund. In approving the entering into of the Advisory Agreement, the Independent Trustees considered all information they deemed reasonably necessary to evaluate the terms of the Agreement. The principal areas of review by the Independent Trustees were (i) the nature, extent and quality of the services to be provided by the Adviser, (ii) the investment capabilities and experience of the Adviser, (iii) the estimated costs of the services to be provided and anticipated profits to be realized by the Adviser from its relationship with the Fund, (iv) the other “fall-out” benefits expected to be derived by Adviser from its relationship with the Fund and (v) the extent to which economies of scale would be realized as the Fund grows and whether management fee levels reflect those economies of scale for the benefit of the Fund’s investors. The Independent Trustees’ evaluation of the quality of Q3AM’s services to be provided to the Fund also took into consideration their knowledge gained through presentations and reports from the Adviser regarding other funds managed by the Adviser over the course of the preceding year. The Independent Trustees’ analysis of these factors is set forth below.
The nature, extent, and quality of the services to be provided by Q3AM. In this regard, the Board considered the responsibilities Q3AM would have under the Advisory Agreement for the Fund. The Board also considered the proposed services that Q3AM would provide to the Fund including, without limitation, providing a continuous investment program for the Fund, Q3AM’s procedures for assuring compliance with the Fund’s investment objective and limitations, complying with the Trust’s policies and procedures and voting proxies on behalf of the Fund. The Board considered the qualifications and experience of Q3AM’s portfolio managers who will be responsible for the day-to day management of the Fund’s portfolio, as well as the qualifications of other individuals at Q3AM who provide services to the Fund. The Board concluded that the quality, extent, and nature of the services to be provided by Q3AM to the Fund were satisfactory and adequate.
The investment management capabilities and experience of Q3AM. In this regard, the Board considered the investment management experience of Q3AM and its personnel. The Board considered its discussion with representatives of Q3AM regarding the investment objective and strategies for the Fund and Q3AM’s experience and plans for implementing such strategies. In particular, the Board considered the information from Q3AM regarding prior experience managing other accounts that had similar investment
| Q3 ALL-SEASON ACTIVE ROTATION ETF |
| DISCLOSURE REGARDING APPROVAL OF INVESTMENT ADVISORY AGREEMENT (Unaudited) (Continued) |
objectives and strategies as the Fund. After consideration of these and other factors, the Board determined that Q3AM has the requisite knowledge and experience to serve as investment adviser for the Fund.
The estimated costs of the services to be provided and anticipated profits to be realized by Q3AM and its affiliates from the relationship with the Fund. In this regard, the Board considered the proposed management fee for the Fund and proposed overall expense ratio, each as compared to the other funds in its custom peer group and Morningstar category and to the fees charged by Q3AM to other clients with comparable mandates to the Fund. The Board considered the anticipated profitability of Q3AM from the Fund and the potential indirect benefits that Q3AM would receive from its management of the Fund. The Board concluded that the advisory fee to be paid to Q3AM by the Fund is reasonable in light of the nature and quality of the services to be provided by Q3AM.
The extent to which the Fund and its investors would benefit from economies of scale. In this regard, the Board considered the Advisory Agreement and the expense limitation agreement (the “ELA”). The Board considered economies of scale in connection with the Fund if Fund assets grow and the extent to which the benefits of any such economies of scale may be shared with the Fund and Fund shareholders. The Board noted that the Fund would benefit from the ELA and the Board will review going forward the advisory fee arrangement as necessary. Based on this evaluation, the Board concluded that the proposed advisory fee for the Fund was reasonable in light of the information that was provided to the Board by Q3AM with respect to economies of scale.
After further discussion of the factors noted above and in reliance on the information provided by Q3AM and Trust Management and taking into account the totality of all factors discussed and information presented, the Board indicated its desire to approve the Advisory Agreement and the ELA. It was noted that in the Trustees’ deliberations regarding the approval of the Advisory Agreement, the Trustees did not identify any particular information or factor that was all-important or controlling, and that each individual Trustee may have attributed different weights to the various factors listed above. After full consideration of the above factors as well as other factors, the Board unanimously concluded that approval of the Advisory Agreement was in the best interests of the Fund and its shareholders.
| Q3 ALL-SEASON ACTIVE ROTATION ETF |
| ABOUT YOUR FUND’S EXPENSES (Unaudited) |
We believe it is important for you to understand the impact of costs on your investment. As a shareholder of the Fund, you may incur two types of costs: (1) transactions costs, including commissions on trading, as applicable; and (2) ongoing costs, including investment advisory fees and other operating expenses. The following examples are intended to help you understand your ongoing costs (in dollars) of investing in the Fund and to compare these costs with the ongoing costs of investing in other mutual funds.
A mutual fund’s ongoing costs are expressed as a percentage of its average net assets. This figure is known as the expense ratio. The expenses in the table below are based on an investment of $1,000 made at the beginning of the most recent period (December 1, 2022) and held until the end of the period (May 31, 2023).
The table below illustrates the Fund’s ongoing costs in two ways:
Actual fund return – This section helps you to estimate the actual expenses that you paid over the period. The “Ending Account Value” shown is derived from the Fund’s actual return, and the fourth column shows the dollar amount of operating expenses that would have been paid by an investor who started with $1,000 in the Fund. You may use the information here, together with the amount you invested, to estimate the expenses that you paid over the period.
To do so, simply divide your account value by $1,000 (for example, an $8,600 account value divided by $1,000 = 8.6), then multiply the result by the number given for the Fund under the heading “Expenses Paid During Period.”
Hypothetical 5% return – This section is intended to help you compare the Fund’s ongoing costs with those of other mutual funds. It assumes that the Fund had an annual return of 5% before expenses during the period shown, but that the expense ratio is unchanged. In this case, because the return used is not the Fund’s actual return, the results do not apply to your investment. The example is useful in making comparisons because the U.S. Securities and Exchange Commission (the “SEC”) requires all mutual funds to calculate expenses based on a 5% return. You can assess the Fund’s ongoing costs by comparing this hypothetical example with the hypothetical examples that appear in shareholder reports of other funds.
Note that expenses shown in the table are meant to highlight and help you compare ongoing costs only and do not reflect any transactional costs. Further, the expenses do not include any brokerage commissions on investors’ purchases or redemptions of Fund shares as described in the Fund’s prospectus.
The calculations assume no shares were bought or sold during the period. Your actual costs may have been higher or lower, depending on the amount of your investment and the timing of any purchases or redemptions.
| Q3 ALL-SEASON ACTIVE ROTATION ETF |
| ABOUT YOUR FUND’S EXPENSES (Unaudited) (Continued) |
More information about the Fund’s expenses can be found in this report. For additional information on operating expenses and other shareholder costs, please refer to the Fund’s prospectus.
| | Beginning | | | |
| | Account Value | Ending | Net | Expenses |
| | December 1, | Account Value | Expense | Paid During |
| | 2022(a) | May 31, 2023 | Ratio(b) | Period (c) |
| Q3 All-Season Active Rotation ETF | | | | |
| Based on Actual Fund Return | $1,000.00 | $1,029.50 | 1.12% | $ 5.51 |
| Based on Hypothetical 5% Return (before expenses) | $1,000.00 | $1,019.35 | 1.12% | $ 5.64 |
| (a) | Beginning Account Value is as of December 6, 2022 (date of commencement of operations) for the Actual Fund Return information. |
| (b) | Annualized, based on the Fund’s expenses during the period since the commencement of operations. |
| (c) | Expenses are equal to the Fund’s annualized net expense ratio multiplied by the average account value over the period, multiplied by 177/365 (to reflect the period from the commencement of operations) and 182/365 (to reflect the one-half year period), for Actual Fund Return and Hypothetical 5% Return information, respectively. |
| Q3 ALL-SEASON ACTIVE ROTATION ETF |
| OTHER INFORMATION (Unaudited) |
A description of the policies and procedures that the Fund uses to vote proxies relating to portfolio securities is available without charge upon request by calling toll-free 1-888-348-1255, or on the SEC’s website at www.sec.gov. Information regarding how the Fund voted proxies relating to portfolio securities during the most recent period ended June 30 will be available without charge upon request by calling toll-free 1-888-348-1255, or on the SEC’s website at www.sec.gov.
The Trust files a complete listing of portfolio holdings for the Fund with the SEC as of the end of the first and third quarters of each fiscal year as an exhibit to its reports on Form N-PORT. These filings are available upon request by calling 1-888-348-1255. Furthermore, you may obtain a copy of the filings on the SEC’s website at www.sec.gov and on the Fund’s website at www.q3allseasonfunds.com.
| FACTS | WHAT DOES THE Q3 ALL-SEASON ACTIVE ROTATION ETF DO WITH YOUR PERSONAL INFORMATION? |
| | |
| Why? | Financial companies choose how they share your personal information. Federal law gives consumers the right to limit some but not all sharing. Federal law also requires us to tell you how we collect, share, and protect your personal information. Please read this notice carefully to understand what we do. |
| | |
| What? | The types of personal information we collect and share depend on the product or service you have with us. This information can include: ● Social Security number ● Assets ● Retirement Assets ● Transaction History ● Checking Account Information ● Purchase History ● Account Balances ● Account Transactions ● Wire Transfer Instructions When you are no longer our customer, we continue to share your information as described in this notice. |
| | |
| How? | All financial companies need to share your personal information to run their everyday business. In the section below, we list the reasons financial companies can share their customers’ personal information; the reasons the Funds choose to share; and whether you can limit this sharing. |
| Reasons we can share your personal information | Do the Funds
share? | Can you limit
this sharing? |
For our everyday business purposes –
Such as to process your transactions, maintain your account(s), respond to court orders and legal investigations, or report to credit bureaus | Yes | No |
For our marketing purposes –
to offer our products and services to you | No | We don’t share |
| For joint marketing with other financial companies | No | We don’t share |
For our affiliates’ everyday business purposes –
information about your transactions and experiences | No | We don’t share |
For our affiliates’ everyday business purposes –
information about your creditworthiness | No | We don’t share |
| For nonaffiliates to market to you | No | We don’t share |
| Questions? | Call 1-855-784-2399 |
| Who we are |
| Who is providing this notice? | Q3 All-Season Active Rotation ETF Ultimus Fund Distributors, LLC (Distributor) Ultimus Fund Solutions, LLC (Administrator) |
| What we do |
| How do the Funds protect my personal information? | To protect your personal information from unauthorized access and use, we use security measures that comply with federal law. These measures include computer safeguards and secured files and buildings. Our service providers are held accountable for adhering to strict policies and procedures to prevent any misuse of your nonpublic personal information. |
| How do the Funds collect my personal information? | We collect your personal information, for example, when you ● Open an account ● Provide account information ● Give us your contact information ● Make deposits or withdrawals from your account ● Make a wire transfer ● Tell us where to send the money ● Tell us who receives the money ● Show your government-issued ID ● Show your driver’s license We also collect your personal information from other companies. |
| Why can’t I limit all sharing? | Federal law gives you the right to limit only ● Sharing for affiliates’ everyday business purposes – information about your creditworthiness ● Affiliates from using your information to market to you ● Sharing for nonaffiliates to market to you State laws and individual companies may give you additional rights to limit sharing. |
| |
| Definitions |
| Affiliates | Companies related by common ownership or control. They can be financial and nonfinancial companies. ● Q3 Asset Management Corporation, the investment adviser to the Funds, could be deemed to be an affiliate. |
| Nonaffiliates | Companies not related by common ownership or control. They can be financial and nonfinancial companies ● The Funds do not share with nonaffiliates so they can market to you. |
| Joint marketing | A formal agreement between nonaffiliated financial companies that together market financial products or services to you. ● The Funds do not jointly market. |
This page intentionally left blank.
This page intentionally left blank.
Q3-SAR-23
(b). Not applicable
Item 2. Code of Ethics.
Not required
Item 3. Audit Committee Financial Expert.
Not required
Item 4. Principal Accountant Fees and Services.
Not required
Item 5. Audit Committee of Listed Registrants.
Not applicable
Item 6. Schedule of Investments.
| (a) | Not applicable [schedule filed with Item 1] |
Item 7. Disclosure of Proxy Voting Policies and Procedures for Closed-End Management Investment Companies.
Not applicable
| Item 8. | Portfolio Managers of Closed-End Management Investment Companies. |
Not applicable
Item 9. Purchases of Equity Securities by Closed-End Management Investment Company and Affiliated Purchasers.
Not applicable
Item 10. Submission of Matters to a Vote of Security Holders.
There has been no material changes to the manner in which shareholders may recommend nominees to the Registrant’s Board of Trustees or the Nominations & Governance Committee (the “Committee”). The Registrant does not have formal procedures by which shareholders may recommend nominees to the Registrant’s Board of Trustees. While the Registrant does not have formal procedure, the Committee shall to the extent required under applicable law, when identifying potential candidates for the position of Independent Trustee, consider any such candidate recommended by a shareholder.
Item 11. Controls and Procedures.
(a) Based on their evaluation of the registrant’s disclosure controls and procedures (as defined in Rule 30a-3(c) under the Investment Company Act of 1940) as of a date within 90 days of the filing date of this report, the registrant’s principal executive officer and principal financial officer have concluded that such disclosure controls and procedures are reasonably designed and are operating effectively to ensure that material information relating to the registrant, including its consolidated subsidiaries, is made known to them by others within those entities, particularly during the period in which this report is being prepared, and that the information required in filings on Form N-CSR is recorded, processed, summarized, and reported on a timely basis.
(b) There were no changes in the registrant’s internal control over financial reporting (as defined in Rule 30a-3(d) under the Investment Company Act of 1940) that occurred during the period covered by this report that have materially affected, or are reasonably likely to materially affect, the registrant’s internal control over financial reporting.
Item 12. Disclosure of Securities Lending Activities for Closed-End Management Investment Companies.
Not applicable
File the exhibits listed below as part of this Form. Letter or number the exhibits in the sequence indicated.
(a)(1) Any code of ethics, or amendment thereto, that is the subject of the disclosure required by Item 2, to the extent that the registrant intends to satisfy the Item 2 requirements through filing of an exhibit: Not required
(a)(2) A separate certification for each principal executive officer and principal financial officer of the registrant as required by Rule 30a-2(a) under the Act (17 CFR 270.30a-2(a)): Attached hereto
(1) Not Applicable
(2) Change in the registrant’s independent public accountants. Attached hereto
(b) Certifications required by Rule 30a-2(b) under the Act (17 CFR 270.30a-2(b)): Attached hereto
Exhibit 99.CERT Certifications required by Rule 30a-2(a) under the Act
Exhibit 99.906CERT Certifications required by Rule 30a-2(b) under the Act
Exhibit 99.IND PUB ACCT Change in registrant’s independent public accounting.
SIGNATURES
Pursuant to the requirements of the Securities Exchange Act of 1934 and the Investment Company Act of 1940, the registrant has duly caused this report to be signed on its behalf by the undersigned, thereunto duly authorized.
| (Registrant) | Ultimus Managers Trust | | |
| | | | |
| By (Signature and Title)* | /s/ Todd E. Heim | |
| | | Todd E. Heim, President | |
| | | | |
| Date | February 23, 2024 | | |
| | | | |
| Pursuant to the requirements of the Securities Exchange Act of 1934 and the Investment Company Act of 1940, this report has been signed below by the following persons on behalf of the registrant and in the capacities and on the dates indicated. |
| | | |
| By (Signature and Title)* | /s/ Todd E. Heim |
| | | Todd E. Heim, Principal Executive Officer |
| | | |
| Date | February 23, 2024 | |
| | | |
| By (Signature and Title)* | /s/ Daniel D. Bauer |
| | | Daniel D. Bauer, Treasurer and Principal Financial Officer |
| | | |
| Date | February 23, 2024 | |
* Print the name and title of each signing officer under his or her signature.