UNITED STATES
SECURITIES AND EXCHANGE COMMISSION
Washington, D.C. 20549
FORM N-CSR
CERTIFIED SHAREHOLDER REPORT OF REGISTERED
MANAGEMENT INVESTMENT COMPANIES
Investment Company Act file number: (811-22708)
Brown Advisory Funds
(Exact name of Registrant as specified in charter)
901 South Bond Street Suite 400
Baltimore, MD 21231
(Address of principal executive offices) (Zip code)
David M. Churchill
President
Brown Advisory Funds
901 South Bond Street Suite 400
Baltimore, MD 21231
(Name and address of agent for service)
(410) 537-5400
Registrant's telephone number, including area code
Date of fiscal year end: June 30
Date of reporting period: June 30, 2013
Item 1. Reports to Stockholders.
ANNUAL REPORT
June 30, 2013
Brown Advisory Growth Equity Fund
Brown Advisory Value Equity Fund
Brown Advisory Flexible Equity Fund
Brown Advisory Small-Cap Growth Fund
Brown Advisory Small-Cap Fundamental Value Fund
Brown Advisory Opportunity Fund
Brown Advisory Maryland Bond Fund
Brown Advisory Intermediate Income Fund
Brown Advisory Tactical Bond Fund
Brown Advisory Equity Income Fund
Brown Advisory Sustainable Growth Fund
Brown Advisory Tax Exempt Bond Fund
Brown Advisory Emerging Markets Fund
The views in the report contained herein were those of the Funds’ investment adviser, Brown Advisory, LLC, as of June 30, 2013 and may not reflect their views on the date this report is first published or anytime thereafter. This report may contain discussions about certain investments both held and not held in the portfolio as of June 30, 2013. All current and future holdings are subject to risk and are subject to change. While these views are intended to assist shareholders in understanding their investment in each Fund, they do not constitute investment advice, are not a guarantee of future performance and are not intended as an offer or solicitation with respect to the purchase or sale of any security. Performance figures include the reinvestment of dividend and capital gain distributions.
The Global Industry Classification Standard (GICS®) was developed by and is the exclusive property of MSCI, Inc. and Standard & Poor’s Financial Services LLC (“S&P”). GICS® is a service mark of MSCI, Inc. and S&P and has been licensed for use by the Administrator, U.S. Bancorp Fund Services, LLC.
TABLE OF CONTENTS
| Brown Advisory Growth Equity Fund | |||
| A Message to our Shareholders, June 30, 2013 | 1 | ||
| Performance Chart and Analysis | 3 | ||
| Schedule of Investments, June 30, 2013 | 4 | ||
| Brown Advisory Value Equity Fund | |||
| A Message to our Shareholders, June 30, 2013 | 5 | ||
| Performance Chart and Analysis | 7 | ||
| Schedule of Investments, June 30, 2013 | 8 | ||
| Brown Advisory Flexible Equity Fund | |||
| A Message to our Shareholders, June 30, 2013 | 9 | ||
| Performance Chart and Analysis | 11 | ||
| Schedule of Investments, June 30, 2013 | 12 | ||
| Brown Advisory Small-Cap Growth Fund | |||
| A Message to our Shareholders, June 30, 2013 | 13 | ||
| Performance Chart and Analysis | 15 | ||
| Schedule of Investments, June 30, 2013 | 16 | ||
| Brown Advisory Small-Cap Fundamental Value Fund | |||
| A Message to our Shareholders, June 30, 2013 | 18 | ||
| Performance Chart and Analysis | 20 | ||
| Schedule of Investments, June 30, 2013 | 21 | ||
| Brown Advisory Opportunity Fund | |||
| A Message to our Shareholders, June 30, 2013 | 22 | ||
| Performance Chart and Analysis | 24 | ||
| Schedule of Investments, June 30, 2013 | 25 | ||
| Brown Advisory Maryland Bond Fund | |||
| A Message to our Shareholders, June 30, 2013 | 27 | ||
| Performance Chart and Analysis | 28 | ||
| Schedule of Investments, June 30, 2013 | 29 | ||
| Brown Advisory Intermediate Income Fund | |||
| A Message to our Shareholders, June 30, 2013 | 35 | ||
| Performance Chart and Analysis | 36 | ||
| Schedule of Investments, June 30, 2013 | 37 | ||
| Brown Advisory Tactical Bond Fund | |||
| A Message to our Shareholders, June 30, 2013 | 40 | ||
| Performance Chart and Analysis | 41 | ||
| Schedule of Investments, June 30, 2013 | 42 | ||
| Brown Advisory Equity Income Fund | |||
| A Message to our Shareholders, June 30, 2013 | 43 | ||
| Performance Chart and Analysis | 46 | ||
| Schedule of Investments, June 30, 2013 | 47 | ||
| Brown Advisory Sustainable Growth Fund | |||
| A Message to our Shareholders, June 30, 2013 | 48 | ||
| Performance Chart and Analysis | 50 | ||
| Schedule of Investments, June 30, 2013 | 51 | ||
| Brown Advisory Tax Exempt Bond Fund | |||
| A Message to our Shareholders, June 30, 2013 | 52 | ||
| Performance Chart and Analysis | 53 | ||
| Schedule of Investments, June 30, 2013 | 54 | ||
| Brown Advisory Emerging Markets Fund | |||
| A Message to our Shareholders, June 30, 2013 | 57 | ||
| Performance Chart and Analysis | 59 | ||
| Schedule of Investments, June 30, 2013 | 60 | ||
| Statements of Assets and Liabilities | 62 | ||
| Statements of Operations | 64 | ||
| Statements of Changes in Net Assets | 66 | ||
| Financial Highlights | 75 | ||
| Notes to Financial Statements | 105 | ||
| Report of Independent Registered Public Accounting Firm | 119 | ||
| Additional Information | 120 | ||
GLOSSARY OF TERMS
Alpha refers to the abnormal rate of return on a security or portfolio in excess of what would be predicted by an equilibrium model like the capital asset pricing model (CAPM).
Barclays 1-10 Year Blended Municipal Bond Index is a market index of high quality, domestic fixed income securities with maturities of less than 10 years.
Barclays Intermediate U.S. Aggregate Bond Index represents domestic taxable investment-grade bonds with index components for government and corporate securities, mortgage pass-through securities and asset-backed securities with average maturities and durations in the intermediate range. This index represents a sector of the Barclays Capital (formerly Lehman Brothers) U.S. Aggregate Index.
Barclays Intermediate Government/Credit Bond Index represents intermediate and long-term government and investment grade corporate debt securities having maturities of greater than one year.
Barclays U.S. Corporate High Yield Bond Index is a widely-recognized, market value-weighted index which covers the universe of fixed-rate, non-investment grade debt.
Barclays U.S. Corporate Investment Grade Index is composed of publicly issued U.S. dollar-denominated, investment grade, SEC-registered corporate bonds issued by industrial, utility, and financial companies. All bonds have at least one year to maturity.
Basis point is a unit that is equal to 1/100th of 1%, and is used to denote the change in a financial instrument. The basis point is commonly used for calculating changes in interest rates, equity indexes and the yield of a fixed-income security. 1% is equal to 100 basis points.
Beta is a measure of the volatility, or systematic risk, of a security or a portfolio in comparison to the market as a whole.
Book value is the net asset value of a company, calculated by total assets minus intangible assets (patents, goodwill) and liabilities.
Cash flow measures the cash generating capability of a company by adding non-cash charges (e.g. depreciation) and interest expense to pretax income.
Correlation is a statistical measurement of how two securities move in relation to each other.
Dividend Yield is a financial ratio that shows how much a company pays out in dividends each year relative to its share price. In the absence of any capital gains, the dividend yield is the return on investment for a stock.
Duration is a measure of the sensitivity of the price of a fixed-income investment to a change in interest rates. Duration is expressed as a number of years. Rising interest rates mean falling bond prices, while declining interest rates mean rising bond prices.
Earnings growth is a measure of growth in a company’s net income over a specific period, often one year. The term can apply to actual data from previous periods or estimated data for future periods.
Earnings per share (EPS) is calculated by taking the total earnings divided by the number of shares outstanding.
Earnings Yield is the earnings per share for the most recent 12-month period divided by the current market price per share. The earnings yield shows the percentage of each dollar invested in the stock that was earned by the company.
EBITDA is the Earnings Before Interest, Taxes, Depreciation and Amortization. An approximate measure of a company’s operating cash flow based on data from the company’s income statement.
Free Cash Flow is the operating cash flows (net income plus amortization and depreciation) minus capital expenditures and dividends. Free cash flow is the amount of cash that a company has left over after it has paid all of its expenses, including investments.
G-20 (more formally, the Group of Twenty Finance Ministers and Central Bank Governors) is a group of finance ministers and central bank governors from 20 economies: 19 of the world’s largest national economies, plus the European Union.
Gross Domestic Product (GDP) is the monetary value of all the goods and services produced by an economy over a specified period. It includes consumption, government purchases, investments, and exports minus imports.
MCSI EAFE Index is a free float-adjusted market capitalization weighted index that is designed to measure the equity market performance of developed markets, excluding the U.S.& Canada.
MSCI Emerging Markets Index is a free float-adjusted market capitalization index that is designed to measure equity market performance in the global emerging markets.
Price to earnings ratio (P/E) is a common tool for comparing the prices of different common stocks and is calculated by dividing the current market price of a stock by the earnings per share.
Forward price to earnings ratio uses forecasted earnings, rather than current earnings, to calculate the price to earnings ratio.
Return on Capital is a return from an investment that is not considered income. The return of capital is when some or all of the money an investor has in an investment is paid back to him or her, thus decreasing the value of the investment.
GLOSSARY OF TERMS
Russell 1000® Growth Index measures the performance of the large-cap growth segment of the of the U.S. equity universe. It includes those Russell 1000® companies with higher price-to-book and higher forecasted growth values.
Russell 1000® Value Index measures the performance of the large-cap value segment of the U.S. equity universe. It includes those Russell 1000® companies with lower price-to-book ratios and lower expected growth values.
Russell 2000® Growth Index measures the performance of the small-cap growth segment of the U.S. equity universe. It includes those Russell 2000® companies with higher price-to-value ratios and higher forecasted growth values.
Russell 2000® Index measures the performance of the 2,000 smallest companies in the Russell 3000® Index.
Russell 2000® Value Index measures the performance of the small-cap value segment of the U.S. equity universe. It includes those Russell 2000® companies with lower price-to-book ratios and lower forecasted growth values.
Russell 3000® Index measures the performance of the 3,000 largest U.S. companies representing approximately 98% of the investable U.S. equity market.
S&P 500 Index (“S&P 500”) is a market-value weighted index representing the performance of 500 widely held, publicly traded large capitalization stocks.
The broad based market indexes referenced in the following management commentaries are considered representative of their indicated market, the indexes are unmanaged and do not reflect the deduction of fees, such as, investment management and fund accounting fees, or taxes associated with a mutual fund. Investors cannot invest directly in an index.
(This Page Intentionally Left Blank.)
A Message to Our Shareholders
June 30, 2013
Dear Shareholder:
During the 12-month period ended June 30, 2013, the Brown Advisory Growth Equity Fund Investor Shares (the “Fund”) increased 17.67% in value. During the same period, the Fund’s benchmark, the Russell 1000® Growth Index, increased 17.07%.
The U.S. stock market has produced robust returns, and we are pleased that the Growth Equity Fund has managed to outperform its benchmark during this 12-month period. While performance of the portfolio has been robust, the road has not been completely devoid of potholes. Those who are familiar with our approach know that it involves a relatively concentrated portfolio of best-in-breed business models. This approach is not designed to closely track the benchmark, and at times the performance will deviate substantially from that of the benchmark. This tends to occur when a particular segment of the market is dominated by thematic trading that has little connection with the underlying fundamentals of the individual businesses. A classic example of this occurred in April as the prolonged period of low interest rates created an insatiable demand for high-dividend-paying stocks (including those in our benchmark). We do not hold many of these stocks in the portfolio for the simple reason that they do not meet our minimum growth criteria. Dividend yield is not a significant factor in our investment process; we are generally interested in companies with ample opportunities to reinvest capital in their businesses as opposed to paying it out to shareholders. In fact, we would have had to materially deviate from our investment philosophy in order to hold many of the stocks that outperformed during this period. Fortunately, this bubble began to deflate in the months of May and June, during which the fund performed much better on a relative and absolute basis.
From an individual stock perspective, Charles Schwab was one of our best performing names for the year. Charles Schwab is a premier financial services company catering to a growing segment of the U.S. wealth-management market. The company grew its asset base at a record pace last year and has become the preferred portfolio platform for independent financial advisors catering to the mass affluent market. Despite the rapidly growing asset base, earnings per share growth have lagged due to the drag created by low interest rates. As incremental data is released showing continued improvement in the U.S. economy, the stock has advanced ahead of the anticipated rise in rates.
One of our worst performing stocks was this year was longtime holding—Coach. The competitive dynamics in the marketplace for women’s fashion accessories has changed rapidly in the last year. The successful IPO of Michael Kors and the emergence of brands such as Tory Burch negatively impacted recent sales. Prior to February of this year, the company reported 12 consecutive quarters of double-digit sales growth. In the past, Coach’s adept management team has been able to defend its dominant market position, but the new competitors are well capitalized and well managed. Having owned the stock for nearly five years, we made the difficult decision to bid adieu. We no longer believed that Coach would be able to sustainably exceed our growth hurdle going forward, so we exited the position.
We added three new names to the portfolio during the year and sold two, bringing the total portfolio to 33 positions. We typically fund newly initiated positions by selling a preexisting one; however, we had not replaced Cisco, which was sold in 2011, so we took the opportunity to get back to our target level of 33. In addition to Coach, we sold Canadian Natural Resources to fund the purchase of Ecolab. While a big part of Ecolab’s business is industrial cleaning solutions for the medical and hospitality industries, the company has recently made acquisitions in the energy space. We decided to fund this purchase with another energy business, given that energy is a large part of our growth thesis. We also added two consumer stocks to the portfolio: Starbucks and Whole Foods. Both of these companies have built premier brands in their respective categories, Starbucks in handcrafted coffee beverages and Whole Foods in natural and organic food options. These are great examples of companies with extraordinary brands and growth strategies that may lead to long-term earnings growth. We scour the investable universe for these types of companies that possess the ability to potentially grow their earnings per share at or above our 14% hurdle rate and trade at a valuation that could offer investors more upside potential than downside risk.
Sincerely,
Kenneth M. Stuzin, CFA
Portfolio Manager
1
A Message to Our Shareholders
June 30, 2013
Past performance is not a guarantee of future results.
Mutual fund investing involves risk. Principal loss is possible. Investments in smaller and medium capitalization companies generally carry greater risk than is customarily associated with larger companies for various reasons such as narrower markets, limited financial resources and less liquid stock. The value of the Fund’s investments in REITs may change in response to changes in the real estate market such as declines in the value of real estate, lack of available capital or financing opportunities, and increases in property taxes or operating costs. Investments in foreign securities entail certain risks not associated with investments in domestic securities, such as volatility of currency exchange rates, and in some cases, political and economic instability and relatively illiquid markets. The Fund may invest in ETFs, which may trade at a discount to the aggregate value of the underlying securities and although expense ratios for ETFs are generally low, frequent trading of ETFs by the Fund can generate brokerage expenses. Earnings growth is not a measure of the Fund’s future performance.
Fund holdings and sector allocations are subject to change and should not be considered a recommendation to buy or sell any security. For a complete list of fund holdings, please refer to the Schedule of Investments provided in this report.
Definitions for terms and indices are provided in the Glossary of Terms.
2
Performance Chart and Analysis
June 30, 2013
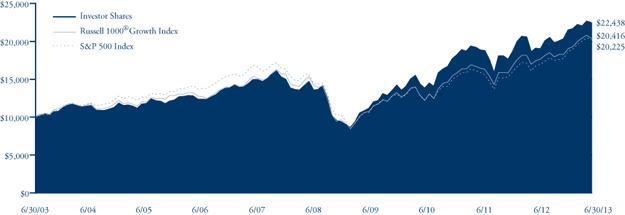
COMPARISON OF CHANGE IN VALUE OF A $10,000 INVESTMENT
The following chart reflects the change in value of a hypothetical $10,000 investment, including reinvested dividends and distributions, in the Fund as measured against a broad-based securities market index. The Russell 1000® Growth Index measures the performance of the large-cap growth segment of the U.S. equity universe. It includes those Russell 1000® companies with higher price-to-book and higher forecasted growth values. The S&P 500 Index is a market-value weighted index representing the performance of 500 widely held, publicly traded large capitalization stocks. The indexes are unmanaged and do not reflect the deduction of fees, such as investment management fees. Investors cannot invest directly in an index.
| Average Annual Total Return | One | Five | Ten | |
| as of 6/30/13 | Year | Year | Year | |
Institutional Shares1 | 17.85% | 10.79% | 8.58% | |
| Investor Shares | 17.67% | 10.62% | 8.42% | |
Advisor Shares2 | 17.43% | 10.24% | 8.04% | |
Russell 1000® Growth Index | 17.07% | 7.47% | 7.40% | |
| S&P 500 Index | 20.60% | 7.01% | 7.30% |
| Institutional Shares | Investor Shares | Advisor Shares | |
Gross Expense Ratio3 | 0.78% | 0.93% | 1.18% |
Net Expense Ratio3 | 0.78% | 0.93% | 1.18% |
Past performance does not guarantee future results. The performance data quoted represents past performance and current returns may be lower or higher. The investment return and net asset value will fluctuate so that an investor’s shares, when redeemed, may be worth more or less than the original cost. To obtain performance information current to the most recent month end, please visit our website at brownadvisoryfunds.com/performance.html. The performance table and graph above do not reflect the deduction of taxes that a shareholder would pay on Fund distributions or the redemption of Fund shares. Investment performance reflects periods during which fee waivers were in effect. In the absence of such waivers, total return would have been reduced. Performance data does not reflect the imposition of the redemption fee of 1.00% on shares redeemed within 14 days, and if it did, performance would have been lower.
| 1 | Performance information for the Institutional Shares, prior to commencement of operations on October 19, 2012, is based on the performance of Investor Shares, and adjusted for the lower expenses applicable to Institutional Shares. |
| 2 | Performance information for Advisor Shares, prior to commencement of operations on May 18, 2006, is based on the performance of Investor Shares, and adjusted for the higher expenses applicable to Advisor Shares. |
| 3 | Per the Fund’s prospectus dated October 19, 2012. |
3
Schedule of Investments
June 30, 2013
| Shares | Security Description | Value $ | ||||||
| Common Stocks — 97.2% | ||||||||
| Consumer Discretionary — 6.5% | ||||||||
| 424,413 | Fossil Group, Inc.* | 43,846,107 | ||||||
| 1,110,747 | Starbucks Corp. | 72,742,821 | ||||||
| 116,588,928 | ||||||||
| Consumer Staples — 11.4% | ||||||||
| 417,032 | Costco Wholesale Corp. | 46,111,228 | ||||||
| 802,369 | Estee Lauder Companies, Inc. | 52,771,809 | ||||||
| 744,080 | Mead Johnson Nutrition Co. | 58,953,458 | ||||||
| 910,697 | Whole Foods Market, Inc. | 46,882,682 | ||||||
| 204,719,177 | ||||||||
| Energy — 9.8% | ||||||||
| 377,087 | Core Laboratories NV | 57,189,014 | ||||||
| 1,061,793 | FMC Technologies, Inc.* | 59,120,634 | ||||||
| 820,713 | Schlumberger, Ltd. | 58,812,294 | ||||||
| 175,121,942 | ||||||||
| Financials — 3.5% | ||||||||
| 2,909,975 | Charles Schwab Corp. | 61,778,769 | ||||||
| Health Care — 15.1% | ||||||||
| 560,638 | Covance, Inc.* | 42,686,977 | ||||||
| 387,942 | DaVita, Inc.* | 46,863,394 | ||||||
| 1,252,399 | Express Scripts, Inc.* | 77,260,494 | ||||||
| 426,584 | IDEXX Laboratories, Inc.* | 38,298,712 | ||||||
| 130,146 | Intuitive Surgical, Inc.* | 65,929,361 | ||||||
| 271,038,938 | ||||||||
| Industrials — 13.0% | ||||||||
| 944,672 | Danaher Corp. | 59,797,737 | ||||||
| 1,045,945 | Fluor Corp. | 62,034,998 | ||||||
| 428,212 | Roper Industries, Inc. | 53,192,495 | ||||||
| 524,167 | Stericycle, Inc.* | 57,883,762 | ||||||
| 232,908,992 | ||||||||
| Information Technology — 35.1% | ||||||||
| 626,634 | Accenture PLC | 45,092,583 | ||||||
| 611,003 | Amphenol Corp. | 47,621,574 | ||||||
| 466,746 | ANSYS, Inc.* | 34,119,133 | ||||||
| 180,620 | Apple, Inc. | 71,539,969 | ||||||
| 573,772 | Citrix Systems, Inc.* | 34,615,665 | ||||||
| 395,649 | Cognizant Technology Solutions Corp.* | 24,771,584 | ||||||
| 2,083,207 | Genpact Limited | 40,080,903 | ||||||
| 89,442 | Google, Inc.* | 78,742,053 | ||||||
| 115,058 | Mastercard, Inc. | 66,100,821 | ||||||
| 1,120,950 | National Instruments Corp. | 31,319,343 | ||||||
| 1,328,055 | NetApp, Inc.* | 50,173,918 | ||||||
| 1,108,359 | QUALCOMM, Inc. | 67,698,568 | ||||||
| 986,896 | Salesforce.com, Inc.* | 37,679,689 | ||||||
| 629,555,803 | ||||||||
| Materials — 2.8% | ||||||||
| 588,534 | Ecolab, Inc. | 50,137,212 | ||||||
| Total Common Stocks (Cost $1,453,783,707) | 1,741,849,761 | |||||||
| Short-Term Investments — 3.3% | ||||||||
| Money Market Funds — 3.3% | ||||||||
| 59,370,540 | DWS Cash Account Trust — Government | |||||||
| & Agency Securities Portfolio, 0.03%# | 59,370,540 | |||||||
| Total Short-Term Investments (Cost $59,370,540) | 59,370,540 | |||||||
| Total Investments — 100.5% (Cost $1,513,154,247) | 1,801,220,301 | |||||||
| Liabilities in Excess of Other Assets — (0.5)% | (9,777,480 | ) | ||||||
| NET ASSETS — 100.0% | $ | 1,791,442,821 | ||||||
| PORTFOLIO HOLDINGS | ||||
| % of Net Assets | ||||
| Information Technology | 35.1 | % | ||
| Health Care | 15.1 | % | ||
| Industrials | 13.0 | % | ||
| Consumer Staples | 11.4 | % | ||
| Energy | 9.8 | % | ||
| Consumer Discretionary | 6.5 | % | ||
| Financials | 3.5 | % | ||
| Money Market Funds | 3.3 | % | ||
| Materials | 2.8 | % | ||
| Other Assets and Liabilities | (0.5 | )% | ||
| 100.0 | % | |||
| * | Non-Income Producing |
| # | Annualized seven-day yield as of June 30, 2013. |
The accompanying notes are an integral part of these financial statements.
4
A Message to Our Shareholders
June 30, 2013
Dear Shareholder:
During the 12-month period ended June 30, 2013, the Brown Advisory Value Equity Fund Investor Shares (the “Fund”) posted a positive return of 21.91%. During the same period, the Russell 1000® Value Index, the Fund’s benchmark, increased 25.32%.
The U.S. business cycle has been showing improvement, in contrast to persistently low confidence in Europe, a recent slowdown in China and weakness in Brazil and Russia due to falling commodity prices. We have overweight positions in global cyclicals, especially technology, based on a belief that technology companies and other cyclicals such as energy, industrials and materials offer investment opportunities that are attractively priced and have the potential to deliver strong or improving profits over time. That being said, technology was the largest detractor from performance over the past 12 months.
Leading contributors to performance this fiscal year included Eaton Corp. PLC, MetLife Inc., Paccar Inc., Best Buy Company Inc. and Charles Schwab Corp. Industrial and financial names were the biggest performance contributors during the year. Improved balance sheets, a recovery in housing and increased bank willingness to make loans have already driven strong gains within financials. We find financials particularly attractive due to their long runway for operating improvement, as well as historically low valuations even after recent price appreciation. Despite more than a decade of valuation compression, investors remain skeptical of this sector, as it appears that even the average value portfolio is materially underweight financials.
Performance detractors during the 12-month period include Apple Inc., Freeport-McMoRan Copper & Gold Inc., Canadian Natural Resources Ltd., Hologic Inc. and CARBO Ceramics Inc. Information technology, materials and energy names were the largest performance detractors during the period. Technology remains one of the more inexpensive sectors in the market. Long accused of hoarding cash, technology companies are now showing a greater willingness to return cash to shareholders. We look for technology firms that are global leaders with the ability to generate strong free cash flow and high returns on capital; notably, a number of our holdings announced plans for the return of capital.
During the year, we initiated positions in Abercrombie & Fitch Co. Cl A, Best Buy Company Inc., Canadian Natural Resources Ltd. Charles Schwab Corp., CheckPoint Software Technologies Ltd., Cisco Systems Inc., Deckers Outdoor Corp., FirstMerit Corp., Hartford Financial Services Group Inc., Hologic Inc., Kennametal Inc., Regions Financial Corp., SunTrust Banks Inc. and Terex Corp.
Positions in the following companies were eliminated: 3M Co., ACE Ltd., BMC Software Inc., CA Inc., Chubb Corp., Dell Inc., Diageo PLC ADS, Emerson Electric Co., Harris Corp., Illinois Tool Works Inc., Johnson & Johnson, Lowe’s Cos., PepsiCo Inc., Prudential Financial Inc., Southwestern Energy Co. and Tiffany & Co.
We have positioned the portfolio for a world after zero-interest-rate policies—a view that the typical value portfolio has not yet embraced. We are placing particular emphasis on compelling opportunities arising within the financial and technology sectors, and focusing on delivering a diversified portfolio of materially undervalued stocks of fundamentally strong companies that have the potential to produce attractive risk-adjusted returns over time with what we believe to be a high margin of safety. Given the market’s heightened sensitivity to Federal Reserve policy actions and rate expectations, we are confident the Fund is well-positioned to outperform from ongoing improvement in economic growth.
Sincerely,
Richard M. Bernstein, CFA
Portfolio Manager
5
A Message to Our Shareholders
June 30, 2013
Past performance is not a guarantee of future results.
Mutual fund investing involves risk. Principal loss is possible. Investments in medium capitalization companies generally carry greater risk than is customarily associated with larger companies for various reasons such as narrower markets, limited financial resources and less liquid stock. The value of the Fund’s investments in REITs may change in response to changes in the real estate market such as declines in the value of real estate, lack of available capital or financing opportunities, and increases in property taxes or operating costs. The Fund may invest in ETFs, which may trade at a discount to the aggregate value of the underlying securities and although expense ratios for ETFs are generally low, frequent trading of ETFs by the Fund can generate brokerage expenses. Investments in foreign securities entail certain risks not associated with investments in domestic securities, such as volatility of currency exchange rates, and in some cases, political and economic instability and relatively illiquid markets. These risks are greater for investments in emerging markets. Diversification does not guarantee a profit or protect from loss in a declining market.
Fund holdings and sector allocations are subject to change and should not be considered a recommendation to buy or sell any security. For a complete list of fund holdings, please refer to the Schedule of Investments provided in this report.
Definitions for terms and indices are provided in the Glossary on Terms.
6
Performance Chart and Analysis
June 30, 2013
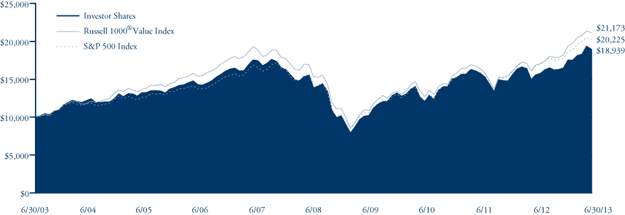
COMPARISON OF CHANGE IN VALUE OF A $10,000 INVESTMENT
The following chart reflects the change in value of a hypothetical $10,000 investment, including reinvested dividends and distributions, in the Fund as measured against a broad-based securities market index. The Russell 1000® Value Index measures the performance of the large-cap value segment of the U.S. equity universe. It includes those Russell 1000® companies with lower price-to-book ratios and lower expected growth values. The S&P 500 Index is a market-value weighted index representing the performance of 500 widely held, publicly traded large capitalization stocks. The indexes are unmanaged and do not reflect the deduction of fees, such as investment management fees. Investors cannot invest directly in an index.
| Average Annual Total Return | One | Five | Ten |
| as of 6/30/13 | Year | Year | Year |
Institutional Shares1 | 22.06% | 6.66% | 6.75% |
| Investor Shares | 21.91% | 6.50% | 6.59% |
Advisor Shares2 | 21.63% | 6.14% | 6.20% |
Russell 1000® Value Index | 25.32% | 6.67% | 7.79% |
| S&P 500 Index | 20.60% | 7.01% | 7.30% |
| Institutional Shares | Investor Shares | Advisor Shares | |
Gross Expense Ratio3 | 0.79% | 0.94% | 1.19% |
Net Expense Ratio3 | 0.79% | 0.94% | 1.19% |
Past performance does not guarantee future results. The performance data quoted represents past performance and current returns may be lower or higher. The investment return and net asset value will fluctuate so that an investor’s shares, when redeemed, may be worth more or less than the original cost. To obtain performance information current to the most recent month end, please visit our website at brownadvisoryfunds.com/performance.html. The performance table and graph above do not reflect the deduction of taxes that a shareholder would pay on Fund distributions or the redemption of Fund shares. Investment performance reflects periods during which fee waivers were in effect. In the absence of such waivers, total return would have been reduced. Performance data does not reflect the imposition of the redemption fee of 1.00% on shares redeemed within 14 days, and if it did, performance would have been lower.
| 1 | Performance information for the Institutional Shares, prior to commencement of operations on October 19, 2012, is based on the performance of Investor Shares, and adjusted for the lower expenses applicable to Institutional Shares. |
| 2 | Performance information for Advisor Shares, prior to commencement of operations on April 25, 2006, is based on the performance of Investor Shares, and adjusted for the higher expenses applicable to Advisor Shares. |
| 3 | Per the Fund’s prospectus dated October 19, 2012. |
7
Schedule of Investments
June 30, 2013
| Shares | Security Description | Value $ | ||||||
| Common Stocks — 93.7% | ||||||||
| Consumer Discretionary — 9.4% | ||||||||
| 65,070 | Abercrombie & Fitch Co. | 2,944,417 | ||||||
| 186,615 | Best Buy, Inc. | 5,100,188 | ||||||
| 64,322 | Deckers Outdoor Corp.* | 3,248,904 | ||||||
| 127,158 | Guess?, Inc. | 3,945,713 | ||||||
| 15,239,222 | ||||||||
| Energy — 13.3% | ||||||||
| 123,931 | Canadian Natural Resources, Ltd. | 3,502,290 | ||||||
| 29,754 | Carbo Ceramics, Inc. | 2,006,312 | ||||||
| 28,460 | Cimarex Energy Co. | 1,849,616 | ||||||
| 63,131 | National Oilwell Varco, Inc. | 4,349,726 | ||||||
| 46,931 | Occidental Petroleum Corp. | 4,187,653 | ||||||
| 79,720 | Schlumberger, Ltd. | 5,712,735 | ||||||
| 21,608,332 | ||||||||
| Financials — 27.1% | ||||||||
| 308,603 | Charles Schwab Corp. | 6,551,642 | ||||||
| 124,245 | FirstMerit Corp. | 2,488,627 | ||||||
| 162,175 | Hartford Financial Services Group, Inc. | 5,014,451 | ||||||
| 47,108 | M&T Bank Corp. | 5,264,319 | ||||||
| 138,484 | MetLife, Inc. | 6,337,028 | ||||||
| 78,730 | Northern Trust Corp. | 4,558,467 | ||||||
| 35,475 | PNC Financial Services Group, Inc. | 2,586,837 | ||||||
| 590,586 | Regions Financial Corp. | 5,628,284 | ||||||
| 176,826 | SunTrust Banks, Inc. | 5,582,397 | ||||||
| 44,012,052 | ||||||||
| Health Care — 6.1% | ||||||||
| 134,855 | Hologic, Inc.* | 2,602,702 | ||||||
| 79,680 | Merck & Co., Inc. | 3,701,136 | ||||||
| 50,740 | Novartis AG ADR | 3,587,825 | ||||||
| 9,891,663 | ||||||||
| Industrials — 12.3% | ||||||||
| 62,090 | Eaton Corp PLC | 4,086,143 | ||||||
| 82,454 | Fluor Corp. | 4,890,347 | ||||||
| 115,433 | Kennametal, Inc. | 4,482,263 | ||||||
| 79,892 | PACCAR, Inc. | 4,287,005 | ||||||
| 85,435 | Terex Corp.* | 2,246,940 | ||||||
| 19,992,698 | ||||||||
| Information Technology — 20.9% | ||||||||
| 13,272 | Apple, Inc. | 5,256,774 | ||||||
| 47,930 | Check Point Software Technologies Ltd.* | 2,381,163 | ||||||
| 178,565 | Cisco Systems, Inc. | 4,340,915 | ||||||
| 101,825 | Microchip Technology, Inc. | 3,792,981 | ||||||
| 132,915 | Microsoft Corp. | 4,589,555 | ||||||
| 114,990 | NetApp, Inc.* | 4,344,322 | ||||||
| 130,397 | Oracle Corp. | 4,005,796 | ||||||
| 86,925 | QUALCOMM, Inc. | 5,309,379 | ||||||
| 34,020,885 | ||||||||
| Materials — 4.6% | ||||||||
| 65,690 | E.I. du Pont de Nemours & Co. | 3,448,725 | ||||||
| 147,770 | Freeport-McMoRan Copper & Gold, Inc. | 4,079,930 | ||||||
| 7,528,655 | ||||||||
| Total Common Stocks (Cost $127,645,520) | 152,293,507 | |||||||
| Short-Term Investments — 5.9% | ||||||||
| Money Market Funds — 5.9% | ||||||||
| 9,547,184 | DWS Cash Account Trust — Government | |||||||
| & Agency Securities Portfolio, 0.03%# | 9,547,184 | |||||||
| Total Short-Term Investments (Cost $9,547,184) | 9,547,184 | |||||||
| Total Investments — 99.6% (Cost $137,192,704) | 161,840,691 | |||||||
| Other Assets in Excess of Liabilities — 0.4% | 585,662 | |||||||
| NET ASSETS — 100.0% | $ | 162,426,353 | ||||||
| PORTFOLIO HOLDINGS | ||||
| % of Net Assets | ||||
| Financials | 27.1 | % | ||
| Information Technology | 20.9 | % | ||
| Energy | 13.3 | % | ||
| Industrials | 12.3 | % | ||
| Consumer Discretionary | 9.4 | % | ||
| Health Care | 6.1 | % | ||
| Money Market Funds | 5.9 | % | ||
| Materials | 4.6 | % | ||
| Other Assets and Liabilities | 0.4 | % | ||
| 100.0 | % | |||
ADR — American Depositary Receipt
| * | Non-Income Producing |
| # | Annualized seven-day yield as of June 30, 2013. |
The accompanying notes are an integral part of these financial statements.
8
A Message to Our Shareholders
June 30, 2013
Dear Shareholder:
During the 12-month period ended June 30, 2013, the Brown Advisory Flexible Equity Fund Investor Shares (the “Fund”) returned 27.51%, exceeding the 20.60% return of the S&P 500 Index, the Fund’s benchmark. Stock selection, that is identifying individual companies for their attractive business characteristics at times when these attributes are not reflected in the share price, is the basic investment strategy employed by the Fund. In the last year, the Fund benefited heavily from the selections of companies classified within the consumer discretionary and the information technology areas of the market and economy.
The biggest contributors to the Fund’s results in the 12-month period were Internet search and advertising leader Google (GOOG); credit card transaction processor MasterCard (MA); leading used-car retailer CarMax Inc. (KMX); Berkshire Hathaway Inc. CL B (BRK.B), a diversified holding company with insurance, railroad, utilities and other business channels that is best known for its chairman Warren Buffett; and consumer electronics retailer Best Buy Co. Inc. (BBY). Google, Berkshire Hathaway Inc. CL B and MasterCard are among the largest holdings in the portfolio. Except for Best Buy, all of the top performers are long-term holdings in the Fund, and we have written exclusively about each in prior shareholder reports.
We initiated a position in Best Buy because we were impressed with the new CEO and CFO. Best Buy is a turnaround situation where we believe that new management will significantly improve efficiency and customer experience, which should lead to gains in profit performance. The stock has been a strong performer as investors have responded well to the initiatives of new management.
The only significant detractor to the Fund’s performance was Apple Inc. (AAPL), a manufacturer of various personal digital, computing and communications devices. Apple is going through a resetting of investor expectations after several years of rapid growth in revenues and earnings. The price-performance gap has narrowed between Apple’s innovative products and its competitors, causing Apple’s business performance to flatten and the stock to retreat. While we expect gradual margin pressure over time, we believe that Apple will continue to innovate, grow earnings and reward shareholders.
Additional new holdings since our December 31, 2012, semiannual report to shareholders include Bed Bath & Beyond Inc. (BBBY), Charles Schwab Corp. (SCHW), J.P. Morgan Chase & Co. (JPM), United Rentals (URI) and Zoetis (ZTS).
Leading home retailer Bed Bath & Beyond and diversified financial services and banking institution J.P. Morgan are both well-managed companies that were trading at a discount to their past valuations. Charles Schwab is an exceptionally well-run financial services firm with depressed earnings due to the current low-interest-rate environment. We believe that even a moderate rise in rates will lead to a meaningful boost in earnings for the firm, an outcome that we did not believe was accurately reflected in the stock’s valuation.
Leader in the equipment-rental industry United Rentals has benefited from a growing preference among equipment users for renting versus owning equipment that is not used frequently. With one of the largest rental networks in the industry, URI should have some scale advantages in competing with smaller companies as well. Though the business is capital intensive, URI appears to be a good allocator of capital, earning attractive returns on equity, and the valuation seems reasonable considering its business characteristics and opportunity.
Zoetis is a leading global producer of medicine and vaccinations for pets and livestock. Our position was established through Pfizer’s recent exchange offer to its shareholders of its remaining interest in Zoetis, a former subsidiary that issued shares in an initial public offering earlier this year. The tender offer allowed Pfizer shareholders to obtain Zoetis shares at a discount to its market price, and we participated due to this pricing opportunity.
We eliminated aftermarket auto parts retailer Advance Auto Parts (AAP), health care product manufacturer Johnson & Johnson (JNJ), heavy-truck manufacturer PACCAR (PCAR) and insurance company Renaissance Re (RNR) in favor of other opportunities with better return potential in our view. For example, in comparing JNJ and JPM, at the time of the investment, we believe that JPM shares were more attractively valued than JNJ despite their similar growth rates.
About a year after the inception date of the Fund, in October 2007, the stock market reached an all-time high but declined subsequently to a low point in March 2009. The market has since recovered and is once again at another all-time high.
While the stock market posted a strong 20.60% return for the 12-month period as measured by the S&P 500 Index, the 10-year U.S. Treasury return was negative, declining 4.2%. The 10-year Treasury yield increased from 1.67% to 2.52%. Bonds compete with equities for investor money. With the increase in bond yields, bonds became somewhat more competitive with stocks in terms of prospective returns, but we believe that equities still look substantially more attractive than bonds at current interest rate levels. The
9
A Message to Our Shareholders
June 30, 2013
price/earnings (P/E) ratio of the S&P 500 Index is about 16 times earnings for the last 12 months. Inverting this P/E ratio to put earnings over price gives an earnings yield of 6.25%, of which roughly 2% is paid to investors in the form of a dividend yield and the balance is retained and invested within the companies for growth. Alternatively, the approximate 2.5% yield on 10-year U.S. Treasuries is the P/E equivalent of 40 times earnings. Stocks appear to have the advantage, and bond yields would have to rise quite a bit to equalize this edge.
We look for bargains among long-term attractive businesses, which often arise due to short-term investor perceptions, temporary business difficulties or unrecognized catalysts of positive change. We seek to manage the portfolio to produce attractive returns and outperform market benchmarks while being conscious of the risks undertaken in doing so. We are optimistic about the long-term outlook for equities of good companies purchased at reasonable prices, and our ability to find them.
Sincerely,
R. Hutchings Vernon, CFA
Portfolio Manager
Michael L. Foss, CFA
Portfolio Manager
Past performance is not a guarantee of future results.
Mutual fund investing involves risk. Principal loss is possible. The Flexible Equity Fund may invest in securities of foreign issuers. Investments in such securities entail certain risks not associated with investments in domestic securities, such as volatility of currency exchange rates, and in some cases, political and economic instability and relatively illiquid markets. These risks are greater for investments in emerging markets. The value of the Fund’s investments in REITs may change in response to changes in the real estate market such as declines in the value of real estate, lack of available capital or financing opportunities, and increases in property taxes or operating costs. The Fund may invest in ETFs, which may trade at a discount to the aggregate value of the underlying securities and although expense ratios for ETFs are generally low, frequent trading of ETFs by the Fund can generate brokerage expenses. Investments in smaller companies generally carry greater risk than is customarily associated with larger companies for various reasons such as narrower markets, limited financial resources and less liquid stock. Investments in debt securities typically decrease in value when interest rates rise. This risk is usually greater for longer term debt securities. Investments in lower-rated and non-rated securities present a greater risk of loss to principal and interest than higher-rated securities.
Stocks are generally perceived to have more financial risk than bonds in that bond holders have a claim on firm operations or assets that is senior to that of equity holders. In addition, stock prices are generally more volatile than bond prices. Investments in debt securities typically decrease in value when interest rates rise. This risk is usually greater for longer-term debt securities. A stock may trade with more or less liquidity than a bond depending on the number of shares and bonds outstanding, the size of the company, and the demand for the securities. Similarly, the transaction costs involved in trading a stock may be more or less than a particular bond depending on the factors mentioned above and whether the stock or bond trades upon an exchange. Depending on the entity issuing the bond, it may or may or may not afford additional protections to the investor, such as a guarantee of return of principal by a government or bond insurance company. There is typically no guarantee of any kind associated with the purchase of an individual stock. Bonds are often owned by individuals interested in current income while stocks are generally owned by individuals seeking price appreciation with income a secondary concern. The tax treatment of returns of bonds and stocks also differs given differential tax treatment of income versus capital gain.
Fund holdings and sector allocations are subject to change and should not be considered a recommendation to buy or sell any security. For a complete list of fund holdings, please refer to the Schedule of Investments provided in this report.
Definitions for terms and indices are provided in the Glossary of Terms.
10
Performance Chart and Analysis
June 30, 2013
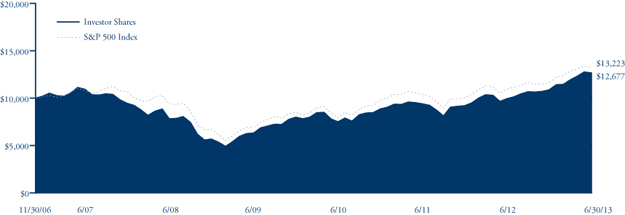
COMPARISON OF CHANGE IN VALUE OF A $10,000 INVESTMENT
The following chart reflects the change in value of a hypothetical $10,000 investment, including reinvested dividends and distributions, in the Fund as measured against the broad-based securities market index. The S&P 500 (“Index”) is a market-value weighted index representing the performance of 500 widely held, publicly traded large capitalization stocks. The Index is unmanaged and does not reflect the deduction of fees, such as investment management fees. Investors cannot invest directly in an index.
| Since | ||||
| Average Annual Total Return | One | Five | Inception | |
| as of 6/30/13 | Year | Year | (11/30/06) | |
Institutional Shares1 | 27.65% | 10.32% | 3.82% | |
| Investor Shares | 27.51% | 10.17% | 3.67% | |
Advisor Shares2 | 27.25% | 9.85% | 3.38% | |
| S&P 500 Index | 20.60% | 7.01% | 4.34% |
| Institutional Shares | Investor Shares | Advisor Shares | |
Gross Expense Ratio3 | 0.95% | 1.10% | 1.35% |
Net Expense Ratio3 | 0.95% | 1.10% | 1.35% |
Past performance does not guarantee future results. The performance data quoted represents past performance and current returns may be lower or higher. The investment return and net asset value will fluctuate so that an investor’s shares, when redeemed, may be worth more or less than the original cost. To obtain performance information current to the most recent month end, please visit our website at brownadvisoryfunds.com/performance.html. The performance table and graph above do not reflect the deduction of taxes that a shareholder would pay on Fund distributions or the redemption of Fund shares. Investment performance reflects periods during which fee waivers were in effect. In the absence of such waivers, total return would have been reduced. Performance data does not reflect the imposition of the redemption fee of 1.00% on shares redeemed within 14 days, and if it did, performance would have been lower.
| 1 | Performance information for the Institutional Shares, prior to commencement of operations on October 19, 2012, is based on the performance of Investor Shares, and adjusted for the lower expenses applicable to Institutional Shares. |
| 2 | Performance information for Advisor Shares, prior to commencement of operations on January 24, 2007, is based on the performance of Investor Shares, and adjusted for the higher expenses applicable to Advisor Shares. |
| 3 | Per the Fund’s prospectus dated October 19, 2012. |
11
Schedule of Investments
June 30, 2013
| Shares | Security Description | Value $ | ||||||
| Common Stocks — 93.6% | ||||||||
| Consumer Discretionary — 19.5% | ||||||||
| 57,802 | Aaron’s, Inc. | 1,619,034 | ||||||
| 22,157 | Bed Bath & Beyond, Inc.* | 1,570,931 | ||||||
| 98,371 | Best Buy, Inc. | 2,688,479 | ||||||
| 40,764 | CarMax, Inc.* | 1,881,666 | ||||||
| 34,596 | General Motors Co.* | 1,152,393 | ||||||
| 43,576 | Lowe’s Companies, Inc. | 1,782,258 | ||||||
| 20,072 | Time Warner Cable, Inc. | 2,257,699 | ||||||
| 32,989 | TJX Companies, Inc. | 1,651,429 | ||||||
| 43,832 | Walt Disney Co. | 2,767,991 | ||||||
| 17,371,880 | ||||||||
| Consumer Staples — 3.5% | ||||||||
| 12,745 | Kraft Foods Group, Inc. | 712,063 | ||||||
| 38,692 | Mondelez International, Inc. | 1,103,883 | ||||||
| 15,792 | PepsiCo, Inc. | 1,291,628 | ||||||
| 3,107,574 | ||||||||
| Energy — 7.8% | ||||||||
| 74,514 | Kinder Morgan, Inc. | 2,842,709 | ||||||
| 20,103 | Occidental Petroleum Corp. | 1,793,791 | ||||||
| 37,444 | Southwestern Energy Co.* | 1,367,829 | ||||||
| 15,775 | Total S.A. ADR | 768,242 | ||||||
| 2,875 | World Fuel Services Corp. | 114,943 | ||||||
| 6,887,514 | ||||||||
| Financials — 21.7% | ||||||||
| 19,470 | American Express Co. | 1,455,577 | ||||||
| 64,035 | Bank of America Corp. | 823,490 | ||||||
| 32,232 | Berkshire Hathaway, Inc.* | 3,607,405 | ||||||
| 93,072 | Charles Schwab Corp. | 1,975,919 | ||||||
| 27,508 | CME Group, Inc. | 2,090,058 | ||||||
| 11,102 | Franklin Resources, Inc. | 1,510,094 | ||||||
| 33,957 | JPMorgan Chase & Co. | 1,792,590 | ||||||
| 135,879 | Regions Financial Corp. | 1,294,927 | ||||||
| 16,761 | T. Rowe Price Group, Inc. | 1,226,067 | ||||||
| 85,724 | Wells Fargo Co. | 3,537,830 | ||||||
| 19,313,957 | ||||||||
| Health Care — 8.8% | ||||||||
| 43,074 | Express Scripts, Inc.* | 2,657,235 | ||||||
| 30,875 | Merck & Co., Inc. | 1,434,144 | ||||||
| 46,467 | Pfizer, Inc. | 1,301,541 | ||||||
| 29,315 | Wellpoint, Inc. | 2,399,139 | ||||||
| 7,792,059 | ||||||||
| Industrials — 9.4% | ||||||||
| 31,317 | Canadian National Railway Co. | 3,046,205 | ||||||
| 10,469 | Canadian Pacific Railway Ltd. | 1,270,727 | ||||||
| 49,228 | Owens Corning* | 1,923,830 | ||||||
| 9,272 | United Rentals, Inc.* | 462,766 | ||||||
| 18,194 | United Technologies Corp. | 1,690,950 | ||||||
| 8,394,478 | ||||||||
| Information Technology — 21.0% | ||||||||
| 25,308 | Accenture PLC | 1,821,164 | ||||||
| 4,202 | Apple, Inc. | 1,664,328 | ||||||
| 4,740 | Google, Inc.* | 4,172,954 | ||||||
| 4,796 | International Business Machines Corp. | 916,564 | ||||||
| 5,971 | Mastercard, Inc. | 3,430,339 | ||||||
| 71,811 | Microsoft Corp. | 2,479,634 | ||||||
| 28,041 | QUALCOMM, Inc. | 1,712,744 | ||||||
| 13,690 | Visa, Inc. | 2,501,847 | ||||||
| 18,699,574 | ||||||||
| Telecommunication Services — 1.9% | ||||||||
| 22,805 | Crown Castle International Corp.* | 1,650,854 | ||||||
| Total Common Stocks (Cost $65,303,076) | 83,217,890 | |||||||
| Warrants — 0.4% | ||||||||
| 34,500 | Kinder Morgan, Inc.* | 176,640 | ||||||
| 12,000 | Wells Fargo Co.* | 164,040 | ||||||
| Total Warrants (Cost $172,574) | 340,680 | |||||||
| Short-Term Investments — 5.5% | ||||||||
| Money Market Funds — 5.5% | ||||||||
| 4,937,430 | DWS Cash Account Trust — Government | |||||||
| & Agency Securities Portfolio, 0.03%# | 4,937,430 | |||||||
| Total Short-Term Investments (Cost $4,937,430) | 4,937,430 | |||||||
| Total Investments — 99.5% (Cost $70,413,080) | 88,496,000 | |||||||
| Other Assets in Excess of Liabilities — 0.5% | 414,149 | |||||||
| NET ASSETS — 100.0% | $ | 88,910,149 | ||||||
| PORTFOLIO HOLDINGS | ||||
| % of Net Assets | ||||
| Financials | 21.7 | % | ||
| Information Technology | 21.0 | % | ||
| Consumer Discretionary | 19.5 | % | ||
| Industrials | 9.4 | % | ||
| Health Care | 8.8 | % | ||
| Energy | 7.8 | % | ||
| Money Market Funds | 5.5 | % | ||
| Consumer Staples | 3.5 | % | ||
| Telecommunication Services | 1.9 | % | ||
| Warrants | 0.4 | % | ||
| Other Assets and Liabilities | 0.5 | % | ||
| 100.0 | % | |||
| ADR — American Depositary Receipt | |
| * | Non-Income Producing |
| # | Annualized seven-day yield as of June 30, 2013. |
The accompanying notes are an integral part of these financial statements.
12
A Message to Our Shareholders
June 30, 2013
Dear Shareholder:
During the 12-month period ended June 30, 2013, the Brown Advisory Small-Cap Growth Fund Investor Shares (the “Fund”) increased in value 22.68%. During the same period, the Russell 2000® Growth Index, the Fund’s primary benchmark, rose 23.67%. The portfolio results were once again driven by individual stock selection, a byproduct of our bottom-up investment process that is centered on rigorous company and end-market due diligence.
The strong rise in equity prices over the last 12 months can be attributed largely to two factors. First, the U.S. economy showed some positive momentum in the form of rising employment, an improving housing market and an uptick in consumer spending. Second, the Federal Reserve continued its highly stimulative monetary policies, producing lower interest rates and rising asset values. The central goal of the Fed is to foster enough momentum in the broader economy via wealth effects and increased lending such that the economy approaches full employment, reaching “escape velocity” and allowing the Fed to “taper” its quantitative easing. Equity prices have certainly responded, but we will have to wait and see whether the real economy gains steam or remains stuck in the new normal of 1.5 to 2% GDP growth. It is important to remember that we are currently in the midst of a global monetary experiment the likes of which the world has never seen. Whether it is an answer to our economic woes or produces vast unintended consequences will only be known in the months and years to come.
From an individual stock perspective, which again is the focus of our investment process, it was a relatively fruitful period. The top five contributors to the portfolio generated approximately 744 basis points to performance, while the bottom five contributors represented a negative contribution of 254 basis points. The driver of the performance spread between the top five and the bottom five was both position sizes and absolute price performance—the positive contributors were larger weightings and had greater percentage moves.
The largest contributor for the 12 months ended June 30, 2013 was Interactive Intelligence, a leader in contact center management software. The company was originally purchased at roughly $275M in market capitalization during a period of stock price weakness as the business transitioned from licensing software on a perpetual basis to a subscription model. During our extensive due diligence process, we became enamored by Interactive’s technological leadership, competitive positioning, strong management and relative obscurity. We opportunistically added to our position at attractive valuation levels as we grew more confident in the firm’s outlook, and the 83% rise in the stock on better-than-expected growth had an outsized impact on overall portfolio returns.
The largest detractor during the period was Mercury Computer Systems, a leading defense subcontractor in the C4ISR (command, control, communications, computers, intelligence, surveillance and reconnaissance) market. Although the company operates in one of the most strategic areas of the defense market where spending is poised to actually grow over time, the looming specter of sequestration caused numerous delays in large programs, stunting growth and profitability. We exited the position with the view that the stock may be “dead money” for a prolonged period of time as the Defense Department adjusts to its new budget requirements.
In sum, the trailing 12 months were a solid absolute and relative performance period for the strategy. Despite the market’s rise, we remain confident in our ability to generate new ideas as we continue to invest in our analytical team and process. This is evidenced by the diverse array of new ideas added to the portfolio in the last year, filling the slots vacated by positions that were acquired, achieved our price objective or violated the investment thesis.
We appreciate the support of our shareholders and will work hard for them again in the next year.
Sincerely,
Christopher A. Berrier
Portfolio Manager
Timothy W. Hathaway, CFA
Portfolio Manager
13
A Message to Our Shareholders
June 30, 2013
Past performance is not a guarantee of future results.
Mutual fund investing involves risk. Principal loss is possible. Investments in smaller companies generally carry greater risk than is customarily associated with larger companies for various reasons such as narrower markets, limited financial resources and less liquid stock. The value of the Fund’s investments in REITs may change in response to changes in the real estate market such as declines in the value of real estate, lack of available capital or financing opportunities, and increases in property taxes or operating costs. The Fund may invest in ETFs, which may trade at a discount to the aggregate value of the underlying securities and although expense ratios for ETFs are generally low, frequent trading of ETFs by the Fund can generate brokerage expenses. Investments in foreign securities entail certain risks not associated with investments in domestic securities, such as volatility of currency exchange rates, and in some cases, political and economic instability and relatively illiquid markets. These risks are greater for investments in emerging markets. Privately Placement issued securities are restricted securities that are not publicly traded. Delay or difficulty in selling such securities may result in a loss to the Fund.
Fund holdings and sector allocations are subject to change and should not be considered a recommendation to buy or sell any security. For a complete list of fund holdings, please refer to the Schedule of Investments provided in this report.
Diversification does not assure a profit nor protect against loss in a declining market.
Definitions for terms and indices are provided in the Glossary of Terms.
14
Performance Chart and Analysis
June 30, 2013
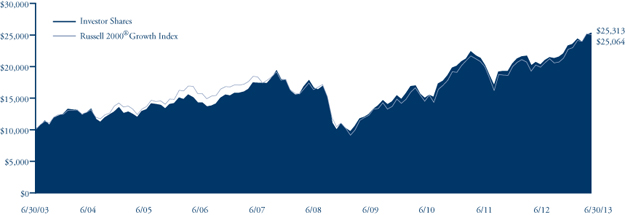
COMPARISON OF CHANGE IN VALUE OF A $10,000 INVESTMENT
The following chart reflects the change in value of a hypothetical $10,000 investment, including reinvested dividends and distributions, in the Fund compared with the broad-based securities market index. The Russell 2000® Growth Index (“Index”) measures the performance of the small-cap growth segment of the U.S. equity universe. It includes those Russell 2000® companies with higher price-to-value ratios and higher forecasted growth values. The Index is unmanaged and does not reflect the deduction of fees, such as investment management fees. Investors cannot invest directly in an index.
| Average Annual Total Return | One | Five | Ten | |
| as of 6/30/13 | Year | Year | Year | |
| Institutional Shares | 22.84% | 8.76% | 9.55% | |
| Investor Shares | 22.68% | 8.79% | 9.73% | |
Advisor Shares1 | 22.45% | 8.39% | 9.31% | |
Russell 2000® Growth Index | 23.67% | 8.89% | 9.62% |
| Institutional Shares | Investor Shares | Advisor Shares | |
Gross Expense Ratio2 | 1.03% | 1.18% | 1.43% |
Net Expense Ratio2 | 1.03% | 1.18% | 1.43% |
Past performance does not guarantee future results. The performance data quoted represents past performance and current returns may be lower or higher. The investment return and net asset value will fluctuate so that an investor’s shares, when redeemed, may be worth more or less than the original cost. To obtain performance information current to the most recent month end, please visit our website at brownadvisoryfunds.com/performance.html. The performance table and graph above do not reflect the deduction of taxes that a shareholder would pay on Fund distributions or the redemption of Fund shares. Investment performance reflects periods during which fee waivers were in effect. In the absence of such waivers, total return would have been reduced. Performance data does not reflect the imposition of the redemption fee of 1.00% on shares redeemed within 14 days, and if it did, performance would have been lower.
| 1 | Performance information for Advisor Shares, prior to commencement of operations on April 25, 2006, is based on the performance of Investor Shares, and adjusted for the higher expenses applicable to Advisor Shares. |
| 2 | Per the Fund’s prospectus dated October 19, 2012. |
15
Schedule of Investments
June 30, 2013
| Shares | Security Description | Value $ | ||||||
| Common Stocks — 95.1% | ||||||||
| Consumer Discretionary — 11.1% | ||||||||
| 84,791 | ANN INC.* | 2,815,061 | ||||||
| 73,692 | Ascent Capital Group, Inc.* | 5,753,134 | ||||||
| 81,156 | BJ’s Restaurants, Inc.* | 3,010,888 | ||||||
| 68,040 | Harman International Industries, Inc. | 3,687,768 | ||||||
| 220,692 | HomeAway, Inc.* | 7,137,179 | ||||||
| 19,849 | Monro Muffler Brake, Inc. | 953,744 | ||||||
| 817,867 | Quiksilver, Inc.* | 5,267,064 | ||||||
| 180,931 | SHFL Entertainment, Inc.* | 3,204,288 | ||||||
| 15,696 | Vitamin Shoppe, Inc.* | 703,809 | ||||||
| 32,532,935 | ||||||||
| Consumer Staples — 1.8% | ||||||||
| 61,117 | PriceSmart, Inc. | 5,355,683 | ||||||
| Energy — 3.4% | ||||||||
| 210,913 | Helix Energy Solutions Group, Inc. Co.* | 4,859,435 | ||||||
| 127,118 | World Fuel Services Corp. | 5,082,178 | ||||||
| 9,941,613 | ||||||||
| Financials — 1.9% | ||||||||
| 105,944 | Prosperity Bancshares, Inc. | 5,486,840 | ||||||
| Health Care — 14.0% | ||||||||
| 183,921 | Ariad Pharmaceuticals, Inc.* | 3,216,778 | ||||||
| 60,570 | Catamaran Corp.* | 2,950,970 | ||||||
| 83,058 | Charles River Laboratories | |||||||
| International, Inc.* | 3,407,870 | |||||||
| 106,689 | Covance, Inc.* | 8,123,301 | ||||||
| 198,223 | Endologix, Inc.* | 2,632,401 | ||||||
| 63,876 | Henry Schein, Inc.* | 6,116,127 | ||||||
| 40,041 | IDEXX Laboratories, Inc.* | 3,594,881 | ||||||
| 220,942 | Incyte Corp.* | 4,860,724 | ||||||
| 120,649 | Seattle Genetics, Inc.* | 3,795,618 | ||||||
| 145,062 | Volcano Corporation* | 2,629,974 | ||||||
| 41,328,644 | ||||||||
| Industrials — 25.8% | ||||||||
| 40,236 | Acuity Brands, Inc. | 3,038,623 | ||||||
| 91,473 | Advisory Board Company* | 4,998,999 | ||||||
| 46,999 | Colfax Corp.* | 2,449,118 | ||||||
| 84,422 | Corporate Executive Board Co. | 5,337,159 | ||||||
| 128,334 | DigitalGlobe, Inc.* | 3,979,637 | ||||||
| 98,327 | HEICO Corp. | 4,952,731 | ||||||
| 118,901 | Hexcel Corp.* | 4,048,579 | ||||||
| 95,960 | IDEX Corp. | 5,163,608 | ||||||
| 405,915 | Knight Transportation, Inc. | 6,827,490 | ||||||
| 91,052 | Landstar System, Inc. | 4,689,178 | ||||||
| 118,496 | Quanex Building Products Corp. | 1,995,473 | ||||||
| 198,659 | Roadrunner Transportation | |||||||
| Services Holdings, Inc.* | 5,530,666 | |||||||
| 109,800 | United Rentals, Inc.* | 5,480,118 | ||||||
| 362,531 | UTi Worldwide, Inc. | 5,970,886 | ||||||
| 17,593 | Valmont Industries, Inc. | 2,517,382 | ||||||
| 213,291 | Waste Connections, Inc. | 8,774,792 | ||||||
| 75,754,439 | ||||||||
| Information Technology — 35.4% | ||||||||
| 532,535 | Accelrys, Inc.* | 4,473,294 | ||||||
| 386,606 | Applied Micro Circuits Corp.* | 3,402,133 | ||||||
| 259,335 | Broadridge Financial Solutions, Inc. | 6,893,124 | ||||||
| 123,287 | Broadsoft, Inc.* | 3,402,721 | ||||||
| 71,862 | Cavium, Inc.* | 2,541,759 | ||||||
| 69,784 | CommVault Systems, Inc.* | 5,295,908 | ||||||
| 35,938 | Concur Technologies, Inc.* | 2,924,634 | ||||||
| 235,866 | CoreLogic, Inc.* | 5,465,015 | ||||||
| 42,689 | CoStar Group, Inc.* | 5,509,869 | ||||||
| 285,215 | ExactTarget, Inc.* | 9,617,450 | ||||||
| 305,247 | EXFO, Inc.*† | 1,361,402 | ||||||
| 276,616 | Genpact Limited | 5,322,092 | ||||||
| 95,269 | Global Payments, Inc. | 4,412,860 | ||||||
| 207,753 | Informatica Corp.* | 7,267,200 | ||||||
| 227,998 | Interactive Intelligence Group, Inc.* | 11,764,697 | ||||||
| 92,115 | MAXIMUS, Inc. | 6,860,725 | ||||||
| 211,366 | Pegasystems, Inc. | 7,000,442 | ||||||
| 209,883 | Riverbed Technology, Inc.* | 3,265,779 | ||||||
| 183,389 | Sapient Corp.* | 2,395,060 | ||||||
| 41,188 | Ultimate Software Group, Inc.* | 4,830,941 | ||||||
| 104,007,105 | ||||||||
| Materials — 1.7% | ||||||||
| 76,651 | Rockwood Holdings, Inc. | 4,907,964 | ||||||
| Total Common Stocks (Cost $204,025,354) | 279,315,223 | |||||||
| Private Placements — 0.6% | ||||||||
| 16,000 | Greenspring Global Partners IV-B, L.P.*^† | 1,702,086 | ||||||
| 34,769 | Greenspring Global Partners V-B, L.P.*~† | 38,474 | ||||||
| Total Private Placements (Cost $1,238,657) | 1,740,560 | |||||||
The accompanying notes are an integral part of these financial statements.
16
Schedule of Investments
June 30, 2013
| Shares | Security Description | Value $ | ||||||
| Short-Term Investments — 4.2% | ||||||||
| Money Market Funds — 4.2% | ||||||||
| 12,386,446 | DWS Cash Account Trust — Government | |||||||
| & Agency Securities Portfolio, 0.03%# | 12,386,446 | |||||||
| Total Short-Term Investments (Cost $12,386,446) | 12,386,446 | |||||||
| Total Investments — 99.9% (Cost $217,650,457) | 293,442,229 | |||||||
| Other Assets in Excess of Liabilities — 0.1% | 424,240 | |||||||
| NET ASSETS — 100.0% | $ | 293,866,469 | ||||||
| PORTFOLIO HOLDINGS | ||||
| % of Net Assets | ||||
| Information Technology | 35.4 | % | ||
| Industrials | 25.8 | % | ||
| Health Care | 14.0 | % | ||
| Consumer Discretionary | 11.1 | % | ||
| Money Market Funds | 4.2 | % | ||
| Energy | 3.4 | % | ||
| Financials | 1.9 | % | ||
| Consumer Staples | 1.8 | % | ||
| Materials | 1.7 | % | ||
| Private Placements | 0.6 | % | ||
| Other Assets and Liabilities | 0.1 | % | ||
| 100.0 | % | |||
| * | Non-Income Producing |
| ^ | Security is exempt from registration under Rule 144A of the Securities Act of 1933. Security is fair valued under the supervision of the Board of Trustees and was acquired from February 2008 to May 2013 as part of a $2,000,000 capital commitment. At June 30, 2013, $1,600,000 of the capital commitment has been fulfilled by the Fund. |
| ~ | Security is exempt from registration under Rule 144A of the Securities Act of 1933. Security is fair valued under the supervision of the Board of Trustees and was acquired from October 2012 to May 2013 as part of a $100,000 capital commitment. At June 30, 2013, $34,769 of the capital commitment has been fulfilled by the Fund. |
| † | All or a portion of this security is considered illiquid. At June 30, 2013, the total market value of securities considered illiquid was $2,585,697 or 0.9% of net assets. |
| # | Annualized seven-day yield as of June 30, 2013. |
The accompanying notes are an integral part of these financial statements.
17
A Message to Our Shareholders
June 30, 2013
Dear Shareholder:
During the 12-month period ended June 30, 2013, the Brown Advisory Small-Cap Fundamental Value Fund Investor Shares (the “Fund”) increased 28.64% in value. During the same period, the Russell 2000® Value Index, the Fund’s benchmark, increased 24.76%. The Fund’s investment process focuses on companies that we believe can generate significant levels of sustainable free cash flow and have management teams that focus on demonstrating effective capital allocation. Our research process seeks to identify valuation disparities overlooked by the market, and these valuation gaps not only provide what we believe to be a margin of safety, but also have the potential to generate additional returns.
Over the last 12 months, the Fund’s relative outperformance resulted from a combination of strong absolute performance in the consumer discretionary sector (up 46%) as well as meaningful stock selection in industrials, financials and information technology. Despite being underweight in the industrials (11.9% vs. 12.6%) and financials (31.2% vs. 37.4%) sectors, the Fund’s investments significantly outperformed the benchmark. During the 12-month period, industrials were up 27% and financials were up 23% for the Index. During the same period, the Fund’s industrial investments were up 52% and its financial investments were up 28%. The Fund also benefited from its lack of exposure to the utilities sector, whose returns lagged the Index’s by a wide margin (14.75% vs. 24.75%).
The Fund benefited from merger and acquisition (M&A) activity during the past year. In the health care space, both AMERIGROUP and PSS World Medical were acquired by larger strategic buyers at very attractive premiums. During the fourth quarter of 2012, it was rumored that Gardner Denver, a diversified industrial company, was putting itself up for sale. As the stock traded up and above a value that we felt was a reasonable sale price, the Fund exited its position.
Strong contributors to performance during the 12-month period included TriMas and EchoStar. Both positions have been large longtime holdings in the Fund. TriMas is an industrial company with a diverse portfolio of attractive cash-flow-generating businesses. The management team at TriMas has done an excellent job of allocating capital to grow the business both organically and through merger and acquisition activity. EchoStar successfully launched EchoStar XVII, a high-throughput satellite that dramatically expands the company’s satellite broadband offerings. EchoStar’s subscriber growth has accelerated since the satellite’s launch.
GameStop has been one of the Fund’s more controversial stocks over the last few years as some investors questioned the long-term viability of the firm’s business model, as online and casual gaming began to take share from traditional video games. The Fund first purchased GameStop in 2009 under the assumption that even if we assigned a zero terminal value to the business, the company’s current enterprise value was equal to four years’ worth of free cash flow. The management team has done an admirable job of allocating capital over the last few years by shrinking the store base, buying back almost a third of the outstanding shares and initiating a substantial dividend. During the last 12 months, investors have gotten excited about the upcoming gaming cycle and GameStop’s long-term positioning. As a result of this newfound excitement, GameStop’s stock more than doubled and was a strong contributor to the Fund’s performance.
DigitalGlobe was also a strong contributor over the past 12 months. In 2012, the company announced the acquisition of its largest competitor in what has proved to be a highly accretive transaction for its shareholders.
Boingo Wireless was the largest detractor to performance over the last year. Boingo operates and manages one of the largest Wi-Fi footprints in the world. The company’s performance was negatively impacted by a number of airports switching from paid access to a free Wi-Fi model. The company saw a slowdown in its paid retail subscriber base as a result of some these developments as well. We believe that these issues are transitory in nature, and Boingo remains well positioned to potentially benefit from the continued growth of mobile data demand.
Gulf Island was the second-largest detractor for the period. The company has had difficulty executing some recent contract wins for constructing large deep-water drilling platforms. We became concerned with the company’s ability to convert these contract revenues into free cash flow, and the Fund exited the position during the period.
During the period, the Fund added 17 investments and exited 14. Six of the new holdings were in the consumer discretionary sector, four were in financials, two in industrials, two in materials, and one each in consumer staples, technology and energy. Despite the rise in the equity markets over the last 12 months, the Fund has been able to find new investments that meet our investment criteria. Each new investment must be able to generate a sustainable level of free cash flow, management must have a disciplined capital allocation framework, and we must feel that we are buying it at an attractive discount to its underlying value.
18
A Message to Our Shareholders
June 30, 2013
The sales were across a variety of sectors. Both of our sales in the health care sector, one of our industrials and one in telecom were due to takeouts. Over half of our remaining sales were due to disagreements over sudden changes in management’s capital-allocation plans.
Since inception, the Fund has been consistent in its investment approach. We believe that companies that can generate substantial levels of free cash flow should be able to weather challenging economic periods and should enable us to generate attractive risk-adjusted returns for our investors over the long term.
Sincerely,
J. David Schuster
Portfolio Manager
Past performance is not a guarantee of future results.
Investments in smaller companies generally carry greater risk than is customarily associated with larger companies for various reasons such as narrower markets, limited financial resources and less liquid stock. The value of the Fund’s investments in REITs may change in response to changes in the real estate market such as declines in the value of real estate, lack of available capital or financing opportunities, and increases in property taxes or operating costs. The Fund may invest in ETFs, which may trade at a discount to the aggregate value of the underlying securities and although expense ratios for ETFs are generally low, frequent trading of ETFs by the Fund can generate brokerage expenses. Investments in debt securities typically decrease in value when interest rates rise. This risk is usually greater for longer-term debt securities. Investments in foreign securities entail certain risks not associated with investments in domestic securities, such as volatility of currency exchange rates, and in some cases, political and economic instability and relatively illiquid markets. The risks of investments in derivatives, including options, futures contracts and options on futures contracts include imperfect correlation between the value of these instruments and the underlying assets; risks of default by the other party to the derivative transactions; risks that the transactions may result in losses that partially or completely offset gains in portfolio positions; and risks that the derivative transactions may not be liquid.
Fund holdings and sector allocations are subject to change and should not be considered a recommendation to buy or sell any security. For a complete list of fund holdings, please refer to the Schedule of Investments provided in this report.
Definitions for terms and indices are provided in the Glossary of Terms.
19
Performance Chart and Analysis
June 30, 2013
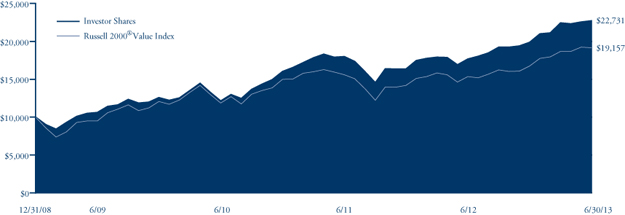
COMPARISON OF CHANGE IN VALUE OF A $10,000 INVESTMENT
The following chart reflects the change in value of a hypothetical $10,000 investment, including reinvested dividends and distributions, in the Fund as measured against a broad-based securities market index. The Russell 2000® Value Index (“Index”) measures the performance of small-cap value segment of the U.S. equity universe. It includes those Russell 2000® companies with lower price-to-book ratios and lower forecasted growth values. The Index is unmanaged and does not reflect the deduction of fees, such as investment management fees. Investors cannot invest directly in an index.
| Since | |||||
| Average Annual Total Return | One | Inception | |||
| as of 6/30/13 | Year | (12/31/08) | |||
Institutional Shares1 | 28.78% | 20.21% | |||
| Investor Shares | 28.64% | 20.04% | |||
Advisor Shares2 | 28.28% | 19.74% | |||
Russell 2000® Value Index | 24.76% | 15.56% |
| Institutional Shares | Investor Shares | Advisor Shares | |
Gross Expense Ratio3 | 1.13% | 1.28% | 1.53% |
Net Expense Ratio3 | 1.13% | 1.28% | 1.53% |
Past performance does not guarantee future results. The performance data quoted represents past performance and current returns may be lower or higher. The investment return and net asset value will fluctuate so that an investor’s shares, when redeemed, may be worth more or less than the original cost. To obtain performance information current to the most recent month end, please visit our website at brownadvisoryfunds.com/performance.html. The performance table and graph above do not reflect the deduction of taxes that a shareholder would pay on Fund distributions or the redemption of Fund shares. Investment performance reflects periods during which fee waivers were in effect. In the absence of such waivers, total return would have been reduced. Performance data does not reflect the imposition of the redemption fee of 1.00% on shares redeemed within 14 days, and if it did, performance would have been lower.
| 1 | Performance information for the Institutional Shares, prior to commencement of operations on October 19, 2012, is based on the performance of Investor Shares, and adjusted for the lower expenses applicable to Institutional Shares. |
| 2 | Performance information for Advisor Shares, prior to commencement on July 28, 2011, is based on the performance of Investor Shares, and adjusted for the higher expenses applicable to Advisor Shares. |
| 3 | Per the Fund’s prospectus dated October 19, 2012. |
20
Schedule of Investments
June 30, 2013
| Shares | Security Description | Value $ | ||||||
| Common Stocks — 94.4% | ||||||||
| Consumer Discretionary — 15.1% | ||||||||
| 153,190 | Ascent Capital Group, Inc.* | 11,959,543 | ||||||
| 143,415 | Cato Corp. | 3,579,638 | ||||||
| 267,763 | Core-Mark Holding Co., Inc. | 17,002,951 | ||||||
| 2,002,829 | Denny’s Corp.* | 11,255,899 | ||||||
| 192,327 | Destination Maternity Corp. | 4,731,244 | ||||||
| 47,925 | GameStop Corp. | 2,014,288 | ||||||
| 36,208 | Mac-Gray Corp. | 514,154 | ||||||
| 336,680 | Starz* | 7,440,628 | ||||||
| 58,498,345 | ||||||||
| Consumer Staples — 5.3% | ||||||||
| 67,201 | Casey’s General Stores, Inc. | 4,042,812 | ||||||
| 344,969 | Susser Holdings Corp.* | 16,517,116 | ||||||
| 20,559,928 | ||||||||
| Energy — 6.2% | ||||||||
| 90,084 | Bristow Group, Inc. | 5,884,287 | ||||||
| 364,420 | RigNet, Inc.*† | 9,285,422 | ||||||
| 112,898 | Susser Petroleum Partners LP | 3,307,911 | ||||||
| 142,916 | World Fuel Services Corp. | 5,713,782 | ||||||
| 24,191,402 | ||||||||
| Financials — 29.4% | ||||||||
| 471,362 | American Equity Investment Life Holding Co. | 7,400,383 | ||||||
| 162,427 | Assurant, Inc. | 8,269,159 | ||||||
| 1,190,976 | CapitalSource, Inc. | 11,171,355 | ||||||
| 385,423 | Capitol Federal Financial, Inc. | 4,679,035 | ||||||
| 438,754 | CYS Investments, Inc. | 4,040,924 | ||||||
| 248,135 | FirstMerit Corp. | 4,970,144 | ||||||
| 1,124,583 | GFI Group, Inc. | 4,397,120 | ||||||
| 141,480 | Kemper Corp. | 4,845,690 | ||||||
| 798,975 | Maiden Holdings Ltd. | 8,964,499 | ||||||
| 1,088,513 | MFA Financial, Inc. | 9,197,935 | ||||||
| 336,520 | OceanFirst Financial Corp.† | 5,232,886 | ||||||
| 304,955 | Oritani Financial Corp. | 4,781,694 | ||||||
| 177,180 | Pacific Premier Bancorp, Inc.* | 2,165,140 | ||||||
| 521,212 | PHH Corp.* | 10,622,301 | ||||||
| 226,422 | Renasant Corp. | 5,511,111 | ||||||
| 3,219,889 | Synovus Financial Corp. | 9,402,076 | ||||||
| 760,068 | TFS Financial Corp.* | 8,512,762 | ||||||
| 114,164,214 | ||||||||
| Health Care — 1.9% | ||||||||
| 222,721 | Air Methods Corp. | 7,545,787 | ||||||
| Industrials — 14.0% | ||||||||
| 221,175 | Actuant Corp. | 7,292,140 | ||||||
| 113,944 | Albany International Corp. | 3,757,873 | ||||||
| 258,147 | DigitalGlobe, Inc.* | 8,005,138 | ||||||
| 288,439 | Fly Leasing Ltd. ADR | 4,860,197 | ||||||
| 195,090 | Kadant, Inc. | 5,885,865 | ||||||
| 207,579 | Thermon Group Holdings, Inc.* | 4,234,612 | ||||||
| 380,463 | TMS International Corp.* | 5,642,266 | ||||||
| 393,328 | TriMas Corp.* | 14,663,268 | ||||||
| 54,341,359 | ||||||||
| Information Technology — 18.1% | ||||||||
| 494,629 | Broadridge Financial Solutions, Inc. | 13,147,239 | ||||||
| 493,247 | CoreLogic, Inc.* | 11,428,533 | ||||||
| 89,086 | DST Systems, Inc. | 5,819,988 | ||||||
| 463,622 | Echostar Corp.* | 18,132,256 | ||||||
| 101,635 | MAXIMUS, Inc. | 7,569,775 | ||||||
| 96,815 | Measurement Specialties, Inc.* | 4,504,802 | ||||||
| 91,186 | MTS Systems Corp. | 5,161,128 | ||||||
| 279,539 | Vishay Precision Group, Inc.* | 4,232,220 | ||||||
| 69,995,941 | ||||||||
| Materials — 2.4% | ||||||||
| 121,859 | Innophos Holdings, Inc. | 5,748,089 | ||||||
| 162,511 | KMG Chemicals, Inc.† | 3,428,982 | ||||||
| 9,177,071 | ||||||||
| Telecommunication Services — 2.0% | ||||||||
| 607,700 | Boingo Wireless, Inc.* | 3,773,817 | ||||||
| 858,324 | Orbcomm, Inc.* | 3,853,875 | ||||||
| 7,627,692 | ||||||||
| Total Common Stocks (Cost $300,725,459) | 366,101,739 | |||||||
| Real Estate Investment Trusts — 2.0% | ||||||||
| 318,052 | Starwood Property Trust, Inc. | 7,871,787 | ||||||
| Total Real Estate Investment Trusts (Cost $7,236,510) | 7,871,787 | |||||||
| Short-Term Investments — 3.8% | ||||||||
| Money Market Funds — 3.8% | ||||||||
| 14,725,169 | DWS Cash Account Trust — Government | |||||||
| & Agency Securities Portfolio, 0.03%# | 14,725,169 | |||||||
| Total Short-Term Investments (Cost $14,725,169) | 14,725,169 | |||||||
| Total Investments — 100.2% (Cost $322,687,138) | 388,698,695 | |||||||
| Liabilities in Excess of Other Assets — (0.2)% | (855,723 | ) | ||||||
| NET ASSETS — 100.0% | $ | 387,842,972 | ||||||
| PORTFOLIO HOLDINGS | ||||
| % of Net Assets | ||||
| Financials | 29.4 | % | ||
| Information Technology | 18.1 | % | ||
| Consumer Discretionary | 15.1 | % | ||
| Industrials | 14.0 | % | ||
| Energy | 6.2 | % | ||
| Consumer Staples | 5.3 | % | ||
| Money Market Funds | 3.8 | % | ||
| Materials | 2.4 | % | ||
| Real Estate Investment Trusts | 2.0 | % | ||
| Telecommunication Services | 2.0 | % | ||
| Health Care | 1.9 | % | ||
| Other Assets and Liabilities | (0.2 | )% | ||
| 100.0 | % | |||
ADR — American Depositary Receipt
| * | Non-Income Producing |
| † | All or a portion of this security is considered illiquid. At June 30, 2013, the total market value of securities considered illiquid was $7,004,020 or 1.8% of net assets. |
| # | Annualized seven-day yield as of June 30, 2013. |
The accompanying notes are an integral part of these financial statements.
21
A Message to Our Shareholders
June 30, 2013
Dear Shareholder:
During the 12-month period ended June 30, 2013, the Brown Advisory Opportunity Fund (the “Fund”) increased 23.65% in value. During the same period, the Russell 3000® Index, the Fund’s benchmark, increased 21.46%.
Equity markets in the U.S. marched higher over the course of the year as investor optimism strengthened based on the belief that the economic recovery would continue. The Fund outpaced its benchmark during this period by acting on a number of opportunities that presented themselves over the course of the last 12 months. This activity resulted in a higher-than-average level of turnover for the Fund, primarily in the first few months of 2013. We also increased the number of holdings in the portfolio, and as of the end of the fiscal year, we held 73 positions, as compared to 58 at the end of the previous fiscal year.
We dramatically repositioned the financial sector of the portfolio. The industry has moved quickly from a quagmire of malfeasance, massive capital deficits and earnings deficiencies to a much healthier scenario of substantial capital surpluses and the reestablishment of credible earnings track records. Payouts to shareholders are increasing rapidly and have substantial room for further improvement. Valuations remain at historical discounts, leaving further upside if interest rates rise. We initiated positions in a number of high-quality financial institutions such as J.P. Morgan, SunTrust, Regions Financial, The Hartford and Prosperity Bancshares. Many of these new positions, as well as a number of existing financial services names, were positive contributors for the year.
We also took advantage of several opportunities within the consumer portion of the portfolio with the addition of Deckers (makers of UGG-branded footwear and apparel) and Best Buy. These two companies are in the midst of transforming their businesses, which in turn may potentially create significant shareholder value for patient investors. The market effectively had given up on these two companies, creating an excellent risk-to-reward valuation scenario for their stocks. This has started to play out, and both have made nice positive contributions to the portfolio since we purchased them.
Our best-performing sector was industrials, driven by strong performance from stocks such as United Rentals. The company rents industrial equipment to construction companies, manufacturers, utilities and municipalities. While the business is relatively simple, it is an extremely well-run company and operates with very high margins. This company is a good example of the type of excellent business models that we look to hold for the long-term.
On the negative side, our performance in the health care sector has been the largest disappointment. In fact, it was the only sector that produced a negative contribution for the year. Some of the performance deficit was due to the poor results of several stocks we owned, such as HMS Holdings and Express Scripts. However, much of the underperformance was attributable to those that we did not own. Biotechnology stocks in general have vastly outperformed this year as the industry has made a sharp rebound. We take a conservative view toward investing in biotechnology, preferring to focus on companies with drugs in the latter stages of clinical trials and those with marketable drugs. We added two drug companies to the portfolio this year: Seattle Genetics and Ariad Pharmaceuticals. Both of these companies have products with good indications and strong pipelines for future growth. We continuously monitor the biotech landscape for potential opportunities that are suitable for the Fund.
Sincerely,
Maneesh Bajaj, CFA
Portfolio Manager
Eric Gordon, CFA
Portfolio Manager
Paul Li, Ph.D., CFA
Portfolio Manager
22
A Message to Our Shareholders
June 30, 2013
Past performance is not a guarantee of future results.
Mutual fund investing involves risk. Principal loss is possible. The Fund invests in small and medium capitalization companies which carry greater risk than is associated with larger companies for various reasons, such as narrower markets, limited financial resources and less liquid stock. The value of the Fund’s investments in REITs may change in response to changes in the real estate market such as declines in the value of real estate, lack of available capital or financing opportunities, and increases in property taxes or operating costs. The Fund may invest in ETFs, which may trade at a discount to the aggregate value of the underlying securities and although expense ratios for ETFs are generally low, frequent trading of ETFs by the Fund can generate brokerage expenses. Investments in foreign securities entail certain risks not associated with investments in domestic securities, such as volatility of currency exchange rates, and in some cases, political and economic instability and relatively illiquid markets. These risks are greater for investments in emerging markets.
Diversification does not assure a profit or protect against loss in a declining market.
Fund holdings and sector allocations are subject to change and should not be considered a recommendation to buy or sell any security. For a complete list of fund holdings, please refer to the Schedule of Investments provided in this report.
Definitions for terms and indices are provided in the Glossary of Terms.
23
Performance Chart and Analysis
June 30, 2013
COMPARISON OF CHANGE IN VALUE OF A $10,000 INVESTMENT
The following chart reflects the change in value of a hypothetical $10,000 investment, including reinvested dividends and distributions, in the Fund as measured against the broad-based securities market index. The Russell 3000® Index (“Index”) measures the performance of the 3,000 largest U.S. companies representing approximately 98% of the investable U.S. equity market. The Index is unmanaged and does not reflect the deduction of fees, such as investment management fees. Investors cannot invest directly in an index.
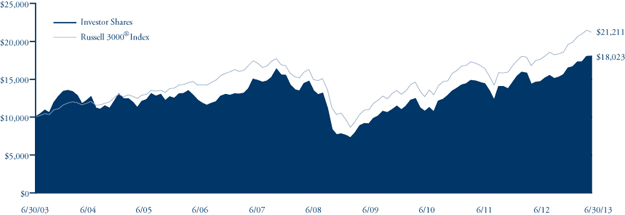
| Average Annual Total Return | One | Five | Ten | |
| as of 6/30/13 | Year | Year | Year | |
| Investor Shares | 23.65% | 5.97% | 6.07% | |
Russell 3000® Index | 21.46% | 7.25% | 7.81% |
| Investor Shares | |
Gross Expense Ratio1 | 1.77% |
Net Expense Ratio1 | 1.51% |
Past performance does not guarantee future results. The performance data quoted represents past performance and current returns may be lower or higher. The investment return and net asset value will fluctuate so that an investor’s shares, when redeemed, may be worth more or less than the original cost. To obtain performance information current to the most recent month end, please visit our website at brownadvisoryfunds.com/performance.html. The performance table and graph above do not reflect the deduction of taxes that a shareholder would pay on Fund distributions or the redemption of Fund shares. Investment performance reflects periods during which fee waivers were in effect. In the absence of such waivers, total return would have been reduced. Performance data does not reflect the imposition of the redemption fee of 1.00% on shares redeemed within 14 days, and if it did, performance would have been lower.
| 1 | Per the Fund’s prospectus dated October 19, 2012. |
24
Schedule of Investments
June 30, 2013
| Shares | Security Description | Value $ | ||||||
| Common Stocks — 97.0% | ||||||||
| Consumer Discretionary — 13.6% | ||||||||
| 3,422 | Best Buy, Inc. | 93,523 | ||||||
| 355 | Chipotle Mexican Grill, Inc.* | 129,344 | ||||||
| 2,131 | Coach, Inc. | 121,659 | ||||||
| 2,281 | Deckers Outdoor Corp.* | 115,213 | ||||||
| 1,004 | Fossil Group, Inc.* | 103,723 | ||||||
| 4,469 | Guess?, Inc. | 138,673 | ||||||
| 4,352 | HomeAway, Inc.* | 140,744 | ||||||
| 3,422 | Lowe’s Companies, Inc. | 139,960 | ||||||
| 1,933 | Monro Muffler Brake, Inc. | 92,881 | ||||||
| 2,662 | Starbucks Corp. | 174,335 | ||||||
| 1,250,055 | ||||||||
| Consumer Staples — 7.5% | ||||||||
| 2,009 | Estee Lauder Companies, Inc. | 132,132 | ||||||
| 1,997 | Mead Johnson Nutrition Co. | 158,222 | ||||||
| 1,702 | PriceSmart, Inc. | 149,146 | ||||||
| 2,495 | Susser Holdings Corp.* | 119,461 | ||||||
| 2,448 | Whole Foods Market, Inc. | 126,023 | ||||||
| 684,984 | ||||||||
| Energy — 9.0% | ||||||||
| 4,248 | Canadian Natural Resources, Ltd. | 120,048 | ||||||
| 1,198 | Core Laboratories NV | 181,689 | ||||||
| 2,240 | FMC Technologies, Inc.* | 124,723 | ||||||
| 2,408 | Helix Energy Solutions Group, Inc. Co.* | 55,480 | ||||||
| 1,574 | National Oilwell Varco, Inc. | 108,449 | ||||||
| 2,020 | Schlumberger, Ltd. | 144,753 | ||||||
| 2,526 | Southwestern Energy Co.* | 92,275 | ||||||
| 827,417 | ||||||||
| Financials — 16.3% | ||||||||
| 11,248 | Charles Schwab Corp. | 238,795 | ||||||
| 4,287 | FirstMerit Corp. | 85,869 | ||||||
| 3,465 | Hartford Financial Services Group, Inc. | 107,138 | ||||||
| 1,750 | JPMorgan Chase & Co. | 92,382 | ||||||
| 1,389 | M&T Bank Corp. | 155,221 | ||||||
| 2,308 | MetLife, Inc. | 105,614 | ||||||
| 1,860 | Prosperity Bancshares, Inc. | 96,329 | ||||||
| 11,009 | Regions Financial Corp. | 104,916 | ||||||
| 6,436 | SunTrust Banks, Inc. | 203,184 | ||||||
| 32,626 | Synovus Financial Corp. | 95,268 | ||||||
| 8,173 | TFS Financial Corp.* | 91,538 | ||||||
| 2,756 | Wells Fargo Co. | 113,740 | ||||||
| 1,489,994 | ||||||||
| Health Care — 10.3% | ||||||||
| 5,069 | Ariad Pharmaceuticals, Inc.* | 88,657 | ||||||
| 1,096 | athenahealth, Inc.* | 92,853 | ||||||
| 1,764 | Covance, Inc.* | 134,311 | ||||||
| 1,108 | DaVita, Inc.* | 133,846 | ||||||
| 2,327 | Express Scripts, Inc.* | 143,553 | ||||||
| 2,905 | HMS Holdings Corp.* | 67,686 | ||||||
| 4,476 | Incyte Corp.* | 98,472 | ||||||
| 192 | Intuitive Surgical, Inc.* | 97,263 | ||||||
| 2,886 | Seattle Genetics, Inc.* | 90,794 | ||||||
| 947,435 | ||||||||
| Industrials — 12.4% | ||||||||
| 3,246 | Colfax Corp.* | 169,149 | ||||||
| 721 | FedEx Corp. | 71,076 | ||||||
| 1,339 | Fluor Corp. | 79,416 | ||||||
| 2,831 | HEICO Corp. | 142,598 | ||||||
| 9,531 | Knight Transportation, Inc. | 160,312 | ||||||
| 4,461 | Sensata Technologies Holding NV* | 155,689 | ||||||
| 1,552 | Stericycle, Inc.* | 171,387 | ||||||
| 3,017 | TMS International Corp.* | 44,742 | ||||||
| 2,908 | United Rentals, Inc.* | 145,138 | ||||||
| 1,139,507 | ||||||||
| Information Technology — 24.6% | ||||||||
| 10,750 | Accelrys, Inc.* | 90,300 | ||||||
| 615 | Apple, Inc. | 243,589 | ||||||
| 13,346 | Applied Micro Circuits Corp.* | 117,445 | ||||||
| 1,934 | Check Point Software Technologies Ltd.* | 96,081 | ||||||
| 1,781 | Citrix Systems, Inc.* | 107,448 | ||||||
| 3,170 | CoreLogic, Inc.* | 73,449 | ||||||
| 4,568 | EPAM Systems, Inc.* | 124,158 | ||||||
| 5,588 | Genpact Limited | 107,513 | ||||||
| 85 | Google, Inc.* | 74,831 | ||||||
| 4,642 | Microsemi Corp.* | 105,606 | ||||||
| 2,696 | MTS Systems Corp. | 152,594 | ||||||
| 3,480 | National Instruments Corp. | 97,231 | ||||||
| 2,457 | NetApp, Inc.* | 92,826 | ||||||
| 4,797 | Pegasystems, Inc. | 158,877 | ||||||
| 4,289 | QUALCOMM, Inc. | 261,972 | ||||||
| 4,181 | Riverbed Technology, Inc.* | 65,056 | ||||||
| 3,282 | Salesforce.com, Inc.* | 125,307 | ||||||
| 871 | Visa, Inc. | 159,175 | ||||||
| 2,253,458 | ||||||||
| Materials — 3.3% | ||||||||
| 1,432 | Ecolab, Inc. | 121,992 | ||||||
| 994 | Praxair, Inc. | 114,469 | ||||||
| 1,030 | Rockwood Holdings, Inc. | 65,951 | ||||||
| 302,412 | ||||||||
| Total Common Stocks (Cost $7,017,210) | 8,895,262 | |||||||
The accompanying notes are an integral part of these financial statements.
25
Schedule of Investments
June 30, 2013
| Shares | Security Description | Value $ | ||||||
| Short-Term Investments — 1.5% | ||||||||
| Money Market Funds — 1.5% | ||||||||
| 142,267 | DWS Cash Account Trust — Government | |||||||
| & Agency Securities Portfolio, 0.03%# | 142,267 | |||||||
| Total Short-Term Investments (Cost $142,267) | 142,267 | |||||||
| Total Investments — 98.5% (Cost $7,159,477) | 9,037,529 | |||||||
| Other Assets in Excess of Liabilities — 1.5% | 135,592 | |||||||
| NET ASSETS — 100.0% | $ | 9,173,121 | ||||||
| PORTFOLIO HOLDINGS | ||||
| % of Net Assets | ||||
| Information Technology | 24.6 | % | ||
| Financials | 16.3 | % | ||
| Consumer Discretionary | 13.6 | % | ||
| Industrials | 12.4 | % | ||
| Health Care | 10.3 | % | ||
| Energy | 9.0 | % | ||
| Consumer Staples | 7.5 | % | ||
| Materials | 3.3 | % | ||
| Money Market Funds | 1.5 | % | ||
| Other Assets and Liabilities | 1.5 | % | ||
| 100.0 | % | |||
| * | Non-Income Producing |
| # | Annualized seven-day yield as of June 30, 2013. |
The accompanying notes are an integral part of these financial statements.
26
A Message to Our Shareholders
June 30, 2013
Dear Shareholder:
For the 12-month period ended June 30, 2013, the Brown Advisory Maryland Bond Fund (the “Fund”) returned -0.25%, versus the Fund’s benchmark, the Barclays 1-10 Year Blended Municipal Bond Index, which returned 0.34%. The Fund’s duration was slightly shorter than the benchmark; however, our higher-yielding sectors such as housing and health care largely accounted for our underperformance.
Recently, fixed income markets have experienced one of the most challenging periods in a decade, as investors began to rethink the U.S. Federal Reserve’s monetary strategy, given improving economic growth. After falling mildly during April, the 10-year Treasury yield suffered its worst two-month period since 2003, rising 81 basis points throughout May and June. This broad-based rise in yields was touched off by some seemingly benign comments by Federal Reserve Chairman Ben Bernanke. The chairman suggested that the economy was strengthening and the time would soon come when the central bank would reduce the pace of open-market bond purchases (dubbed quantitative easing or QE), prompting a strong (and negative) response from both stocks and bonds.
The recent declines we saw in the muni market were largely driven by technical factors and the Treasury market sell-off, and not due to credit quality, in our opinion. Treasury yields rose due to uncertainty about the course of action the Fed might take with regard to quantitative easing. Assets were pulled from virtually all fixed income sectors, munis included. The muni market had to absorb the largest level of outflows since late 2012 at a time when supply has been increasing only modestly. Our view is that the negative returns are more in sympathy with Treasuries and a decline in liquidity and not evidence of deterioration in overall muni credit.
During this time of volatility, we have been able to keep cash available to take advantage of opportunities created by the selloff, and we are buying bonds selectively at higher yields. We do not see rates declining to their historic lows. Nor do we believe that economic conditions warrant sustained increases in yields in the future. What we do see and expect is increased volatility. With volatility comes an opportunity to find value in market dislocations. We believe that our core philosophy of seeking bonds that are underpriced on a fundamental basis, rather than chasing yield, is especially well positioned in this market. We have been maintaining our discipline—slightly short benchmark duration, high-quality core holdings and opportunities in revenue sectors for yield.
The Fund seeks to provide a high level of current income consistent with preservation of principal within an intermediate-term maturity structure.
Sincerely,
Monica M. Hausner
Portfolio Manager
Past performance is not a guarantee of future results.
Mutual fund investing involves risk. Principal loss is possible. The Fund is non-diversified which means it may invest a large percentage of its assets in the securities of fewer issuers. Investment in a limited number of issuers exposes the Fund to greater market risk than if its assets were diversified among a greater number of issuers. The Fund is also subject to interest rate risk which is the risk that debt securities in the Fund’s portfolio will decline in value because of an increase in market interest rates. Municipal securities are subject to adverse political or economic factors, including changes in the tax law. Income from tax-exempt funds may be subject to state and local taxes and a portion of income may be subject to the federal alternative minimum tax for certain investors.
Fund holdings and sector allocations are subject to change and should not be considered a recommendation to buy or sell any security. For a complete list of fund holdings, please refer to the Schedule of Investments provided in this report.
Definitions for terms and indices are provided in the Glossary of Terms.
27
Performance Chart and Analysis
June 30, 2013
COMPARISON OF CHANGE IN VALUE OF A $10,000 INVESTMENT
The following chart reflects the change in value of a hypothetical $10,000 investment, including reinvested dividends and distributions, in the Fund as measured against the broad-based municipal bond index. The Barclays 1-10 Year Blended Municipal Bond Index (“Index”) is a market index of high quality, domestic fixed income securities with maturities of less than 10 years. The Index is unmanaged and does not reflect the deduction of fees, such as investment management fees. Investors cannot invest directly in an index.
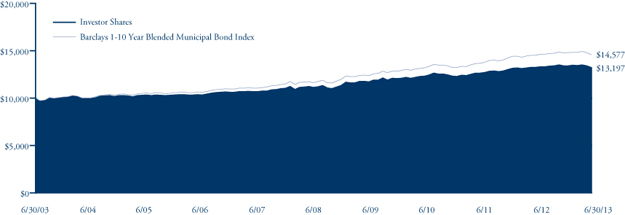
| Average Annual Total Return | One | Five | Ten | |
| as of 6/30/13 | Year | Year | Year | |
| Investor Shares | -0.25% | 3.48% | 2.81% | |
| Barclays 1-10 Year Blended | ||||
| Municipal Bond Index | 0.34% | 4.60% | 3.84% |
| Investor Shares | |
Gross Expense Ratio1 | 0.54% |
Net Expense Ratio1 | 0.54% |
Past performance does not guarantee future results. The performance data quoted represents past performance and current returns may be lower or higher. The investment return and net asset value will fluctuate so that an investor’s shares, when redeemed, may be worth more or less than the original cost. To obtain performance information current to the most recent month end, please visit our website at brownadvisoryfunds.com/performance.html. The performance table and graph above do not reflect the deduction of taxes that a shareholder would pay on Fund distributions or the redemption of Fund shares. Investment performance reflects periods during which fee waivers were in effect. In the absence of such waivers, total return would have been reduced. Performance data does not reflect the imposition of the redemption fee of 1.00% on shares redeemed within 14 days, and if it did, performance would have been lower.
1 Per the Fund’s prospectus dated October 19, 2012.
28
Schedule of Investments
June 30, 2013
| Par Value | Security Description | Rate | Maturity | Value $ | |||||||||
| Municipal Bonds — 96.5% | |||||||||||||
| General Obligation Bonds — 35.1% | |||||||||||||
| 565,000 | Anne Arundel County Maryland Consolidated General Improvements | 5.00 | % | 03/01/2015 | 607,867 | ||||||||
| 500,000 | Anne Arundel County Maryland Consolidated General Improvements | 4.00 | % | 04/01/2015 | 530,960 | ||||||||
| 880,000 | Anne Arundel County Maryland Consolidated General Improvements | 4.00 | % | 04/01/2017 | 974,398 | ||||||||
| 250,000 | Anne Arundel County Maryland Consolidated General Improvements Callable 3/1/2017 @ 100^ | 5.00 | % | 03/01/2018 | 280,853 | ||||||||
| 2,000,000 | Anne Arundel County Maryland Consolidated General Improvements | 5.00 | % | 04/01/2018 | 2,330,080 | ||||||||
| 1,230,000 | Anne Arundel County Maryland Consolidated Water & Sewer Callable 3/1/2015 @ 100^ | 5.00 | % | 03/01/2017 | 1,313,246 | ||||||||
| 1,055,000 | Baltimore County Maryland Consolidated Public Improvement | 5.00 | % | 08/01/2013 | 1,059,684 | ||||||||
| 900,000 | Baltimore County Maryland Consolidated Public Improvement | 5.00 | % | 09/01/2015 | 987,525 | ||||||||
| 1,280,000 | Baltimore County Maryland Consolidated Public Improvement AGM Insured Series A | 5.00 | % | 10/15/2015 | 1,409,126 | ||||||||
| 2,000,000 | Baltimore County Maryland Pension Funding | 5.00 | % | 08/01/2013 | 2,008,880 | ||||||||
| 225,000 | Baltimore County Maryland Pension Funding | 5.00 | % | 08/01/2014 | 236,799 | ||||||||
| 2,000,000 | Baltimore County Maryland Pension Funding | 5.00 | % | 08/01/2014 | 2,104,880 | ||||||||
| 575,000 | Baltimore County Maryland Pension Funding | 5.00 | % | 08/01/2015 | 628,935 | ||||||||
| 250,000 | Baltimore Maryland Consolidated Public Improvement | 5.00 | % | 10/15/2015 | 275,220 | ||||||||
| 440,000 | Baltimore Maryland Consolidated Public Improvement NATL-RE Insured Series A | 5.00 | % | 10/15/2014 | 467,161 | ||||||||
| 1,275,000 | Calvert County Maryland General Obligation | 4.00 | % | 04/01/2014 | 1,311,988 | ||||||||
| 1,000,000 | Calvert County Maryland General Obligation | 3.00 | % | 07/15/2016 | 1,065,590 | ||||||||
| 500,000 | Calvert County Maryland General Obligation | 5.00 | % | 07/15/2017 | 576,855 | ||||||||
| 200,000 | Carroll County Maryland County Commissioners Consolidated Public Improvement | 4.00 | % | 10/01/2014 | 209,506 | ||||||||
| 1,000,000 | Carroll County Maryland County Commissioners Consolidated Public Improvement | 5.00 | % | 11/01/2015 | 1,104,080 | ||||||||
| 500,000 | Carroll County Maryland County Commissioners Consolidated Public Improvement | 4.00 | % | 12/01/2015 | 541,705 | ||||||||
| 1,080,000 | Charles County Maryland County Commissioners Consolidated Public Improvement | 5.00 | % | 03/01/2014 | 1,115,392 | ||||||||
| 1,930,000 | Charles County Maryland County Commissioners Consolidated Public Improvement Series A | 5.00 | % | 02/01/2015 | 2,070,369 | ||||||||
| 660,000 | Charles County Maryland County Commissioners Consolidated Public Improvement | ||||||||||||
| Callable 3/1/2015 @ 100^ | 4.25 | % | 03/01/2016 | 701,824 | |||||||||
| 2,000,000 | Charles County Maryland County Commissioners Consolidated Public Improvement | 4.00 | % | 11/01/2018 | 2,259,880 | ||||||||
| 470,000 | Cumberland Maryland Public Improvement Assured Guaranty Insured | 5.00 | % | 09/01/2018 | 543,649 | ||||||||
| 2,000,000 | Frederick County Maryland Consolidated Public Improvement Series A | 4.00 | % | 02/01/2016 | 2,163,540 | ||||||||
| 200,000 | Frederick County Maryland Public Facilities | 5.00 | % | 08/01/2014 | 210,444 | ||||||||
| 500,000 | Frederick County Maryland Public Facilities | 5.25 | % | 11/01/2018 | 595,835 | ||||||||
| 500,000 | Frederick County Maryland Public Facilities | 5.25 | % | 11/01/2021 | 613,620 | ||||||||
| 500,000 | Frederick County Maryland Series C | 4.00 | % | 12/01/2013 | 508,120 | ||||||||
| 375,000 | Frederick County Maryland Special Obligation Urbana | ||||||||||||
| Community Development Authority Series A | 4.00 | % | 07/01/2017 | 406,091 | |||||||||
| 150,000 | Harford County Maryland Consolidated Public Improvement | 4.50 | % | 12/01/2014 | 159,081 | ||||||||
| 330,000 | Harford County Maryland Consolidated Public Improvement | 5.00 | % | 07/01/2015 | 359,812 | ||||||||
| 200,000 | Harford County Maryland Consolidated Public Improvement | 5.00 | % | 12/01/2015 | 221,494 | ||||||||
| 600,000 | Harford County Maryland Consolidated Public Improvement Series A | 5.00 | % | 07/01/2016 | 674,568 | ||||||||
| 300,000 | Harford County Maryland Consolidated Public Improvement | 4.00 | % | 02/15/2017 | 331,896 | ||||||||
| 2,870,000 | Harford County Maryland Consolidated Public Improvement | 5.00 | % | 07/01/2017 | 3,307,790 | ||||||||
| 510,000 | Howard County Maryland Consolidated Public Improvement Series A | 5.00 | % | 08/15/2013 | 513,223 | ||||||||
| 500,000 | Howard County Maryland Consolidated Public Improvement Series A | 5.00 | % | 02/15/2017 | 570,940 | ||||||||
| 685,000 | Howard County Maryland Consolidated Public Improvement Project Series A | 5.00 | % | 08/15/2014 | 722,154 | ||||||||
| 2,000,000 | Howard County Maryland Consolidated Public Improvement Project Series A | 4.00 | % | 04/15/2015 | 2,126,000 | ||||||||
| 300,000 | Howard County Maryland Consolidated Public Improvement Project Series A | 5.00 | % | 08/15/2015 | 328,422 | ||||||||
| 560,000 | Howard County Maryland Metropolitan District Series A | 4.00 | % | 02/15/2015 | 592,519 | ||||||||
| 2,020,000 | Howard County Maryland Metropolitan District Project Series B | 5.00 | % | 08/15/2016 | 2,279,772 | ||||||||
| 1,500,000 | Illinois State | 4.00 | % | 07/01/2016 | 1,601,685 | ||||||||
| 210,000 | Maryland National Capital Park & Planning Commission | ||||||||||||
| Park Acquisition & Development Series MM-2 | 3.00 | % | 11/01/2015 | 221,573 | |||||||||
| 515,000 | Maryland National Capital Park & Planning Commission Park Acquisition & Development | 4.00 | % | 01/15/2021 | 581,986 | ||||||||
| 2,170,000 | Maryland State & Local Facilities Loan | 5.00 | % | 08/01/2014 | 2,283,795 | ||||||||
| 500,000 | Maryland State & Local Facilities Loan 2nd Series A | 5.00 | % | 08/01/2015 | 546,900 | ||||||||
| 550,000 | Maryland State & Local Facilities Loan | 5.00 | % | 08/01/2015 | 601,590 | ||||||||
| 350,000 | Maryland State & Local Facilities Loan | 4.00 | % | 11/01/2015 | 378,294 | ||||||||
The accompanying notes are an integral part of these financial statements.
29
Schedule of Investments
June 30, 2013
| Par Value | Security Description | Rate | Maturity | Value $ | |||||||||
| Municipal Bonds — (Continued) | |||||||||||||
| General Obligation Bonds — (Continued) | |||||||||||||
| 725,000 | Maryland State & Local Facilities Loan 2nd Series A | 4.00 | % | 08/01/2016 | 795,383 | ||||||||
| 500,000 | Maryland State & Local Facilities Loan | 5.00 | % | 08/01/2016 | 563,775 | ||||||||
| 575,000 | Maryland State & Local Facilities Loan | 5.50 | % | 03/01/2017 | 667,995 | ||||||||
| 390,000 | Maryland State & Local Facilities Loan 1st Series | 5.00 | % | 03/15/2017 | 446,542 | ||||||||
| 3,000,000 | Maryland State & Local Facilities Loan 2nd Series | 5.00 | % | 08/01/2017 | 3,470,310 | ||||||||
| 1,000,000 | Maryland State & Local Facilities Loan 2nd Series, Callable 8/1/2017 @ 100^ | 5.00 | % | 08/01/2018 | 1,144,420 | ||||||||
| 125,000 | Maryland State & Local Facilities Loan Capital Improvement 1st Series A | 5.25 | % | 03/01/2015 | 135,049 | ||||||||
| 2,500,000 | Maryland State Local Facilities First Series C, Callable 3/1/2019 @ 100^ | 4.00 | % | 03/01/2022 | 2,724,925 | ||||||||
| 425,000 | Montgomery County Maryland Consolidated Public Improvement Series A | 5.00 | % | 07/01/2014 | 445,651 | ||||||||
| 565,000 | Montgomery County Maryland Consolidated Public Improvement Series A | 5.00 | % | 08/01/2014 | 594,629 | ||||||||
| 1,000,000 | Montgomery County Maryland Consolidated Public Improvement Series A | 5.00 | % | 11/01/2014 | 1,063,880 | ||||||||
| 2,175,000 | Montgomery County Maryland Consolidated Public Improvement Series A | 5.00 | % | 05/01/2015 | 2,356,221 | ||||||||
| 565,000 | Montgomery County Maryland Consolidated Public Improvement Series A | 5.00 | % | 08/01/2015 | 617,997 | ||||||||
| 500,000 | Montgomery County Maryland Consolidated Public Improvement Series A, Callable 9/1/2014 @ 100^ | 5.00 | % | 09/01/2015 | 525,850 | ||||||||
| 1,745,000 | Montgomery County Maryland Consolidated Public Improvement Series A | 5.00 | % | 05/01/2016 | 1,952,079 | ||||||||
| 2,000,000 | Montgomery County Maryland Consolidated Public Improvement Series A | 5.00 | % | 08/01/2016 | 2,255,100 | ||||||||
| 1,790,000 | Prince Georges County Maryland Consolidated Public Improvement | 5.00 | % | 09/15/2014 | 1,893,927 | ||||||||
| 1,690,000 | Prince Georges County Maryland Consolidated Public Improvement | 3.00 | % | 03/01/2015 | 1,762,467 | ||||||||
| 250,000 | Prince Georges County Maryland Consolidated Public Improvement | 4.00 | % | 03/01/2015 | 264,888 | ||||||||
| 750,000 | Prince Georges County Maryland Consolidated Public Improvement Series A | 5.00 | % | 07/15/2015 | 818,970 | ||||||||
| 1,275,000 | Prince Georges County Maryland Consolidated Public Improvement | 5.00 | % | 09/15/2015 | 1,401,034 | ||||||||
| 2,400,000 | Prince Georges County Maryland Consolidated Public Improvement | 5.00 | % | 08/01/2016 | 2,706,120 | ||||||||
| 200,000 | St Mary’s County Maryland | 3.00 | % | 07/15/2016 | 213,244 | ||||||||
| 565,000 | Washington County Maryland — Public Improvement | 4.50 | % | 01/01/2015 | 598,697 | ||||||||
| 640,000 | Washington County Maryland — Public Improvement | 4.00 | % | 01/01/2018 | 711,859 | ||||||||
| 250,000 | Washington Suburban Sanitary District Maryland Consolidated Public Improvement Series A | 4.00 | % | 06/01/2015 | 266,925 | ||||||||
| 200,000 | Washington Suburban Sanitary District Maryland Sewage Disposal | 5.00 | % | 06/01/2016 | 224,328 | ||||||||
| 1,500,000 | Washington Suburban Sanitation District — General Construction Callable 6/1/2014 @ 100^ | 4.00 | % | 06/01/2015 | 1,548,900 | ||||||||
| 210,000 | Washington Suburban Sanitation District — Sewage Disposal | 4.00 | % | 06/01/2014 | 217,423 | ||||||||
| 1,500,000 | Washington Suburban Sanitation District Consolidated Public Improvement | 5.00 | % | 06/01/2015 | 1,630,260 | ||||||||
| 1,500,000 | Washington Suburban Sanitation District Consolidated Public Improvement | 5.00 | % | 06/01/2016 | 1,682,460 | ||||||||
| 1,330,000 | Wicomico County Maryland AGM Insured | 3.00 | % | 12/01/2014 | 1,380,593 | ||||||||
| 1,000,000 | Worcester County Maryland Public Improvement | 5.00 | % | 10/01/2016 | 1,130,650 | ||||||||
| 500,000 | Worcester County Maryland Public Improvement | 5.00 | % | 10/01/2017 | 579,090 | ||||||||
| 88,409,237 | |||||||||||||
| Revenue Bonds — 57.5% | |||||||||||||
| 500,000 | Baltimore County Maryland Economic Development Various Garrison Forest School Incorporate# | 3.00 | % | 10/01/2031 | 517,045 | ||||||||
| 390,000 | Baltimore Maryland Wastewater Project Series C | 3.00 | % | 07/01/2013 | 390,094 | ||||||||
| 405,000 | Baltimore Maryland Wastewater Project Series A | 3.40 | % | 07/01/2016 | 435,610 | ||||||||
| 360,000 | Baltimore Maryland Wastewater Project Series A, Callable 7/1/2018 @ 100 AGM Insured^ | 5.00 | % | 07/01/2020 | 410,850 | ||||||||
| 1,000,000 | Baltimore Maryland Wastewater Project Series C, Callable 7/1/2016 @ 100 AMBAC Insured^ | 5.00 | % | 07/01/2021 | 1,101,820 | ||||||||
| 1,000,000 | Chicago Illinois O’Hare International Airport Refunding General Airport Third Lien Series B | 5.25 | % | 01/01/2018 | 1,150,150 | ||||||||
| 1,000,000 | Cobb County Georgia Kennestone Hospital Refunding Revenue Anticipation Certificates | ||||||||||||
| Callable 4/1/2023 @ 100^ | 5.00 | % | 04/01/2024 | 1,129,670 | |||||||||
| 1,000,000 | Cobb County Georgia Kennestone Hospital Refunding Revenue Anticipation Certificates | ||||||||||||
| Callable 4/1/2023 @ 100^ | 5.00 | % | 04/01/2028 | 1,090,210 | |||||||||
| 2,855,000 | Colorado Health Facilities Authority Revenue Refunding Covenant Retirement | 5.00 | % | 12/01/2022 | 3,089,110 | ||||||||
| 2,500,000 | Frederick County Maryland Special Obligation Subordinated Urbana | ||||||||||||
| Community Development Authority Series B, Callable 7/1/2020 @ 100^ | 5.50 | % | 07/01/2040 | 2,347,475 | |||||||||
| 1,275,000 | Georgia State Housing & Finance Authority | 1.35 | % | 06/01/2018 | 1,251,540 | ||||||||
| 835,000 | Georgia State Housing & Finance Authority | 1.45 | % | 12/01/2018 | 817,757 | ||||||||
| 1,390,000 | Georgia State Housing & Finance Authority | 1.70 | % | 06/01/2019 | 1,347,633 | ||||||||
| 750,000 | Illinois Finance Authority Northwestern Memorial Callable 8/15/2022 @ 100^ | 4.00 | % | 08/15/2033 | 701,602 | ||||||||
| 3,377,406 | Illinois Housing Development Authority Series A, Callable 1/01/2023 @ 100^ | 2.45 | % | 06/01/2043 | 3,324,955 | ||||||||
The accompanying notes are an integral part of these financial statements.
30
Schedule of Investments
June 30, 2013
| Par Value | Security Description | Rate | Maturity | Value $ | |||||||||
| Municipal Bonds — (Continued) | |||||||||||||
| Revenue Bonds — (Continued) | |||||||||||||
| 1,000,000 | Indiana Finance Authority Hospital Revenue Community Health Network Series A | 5.00 | % | 05/01/2023 | 1,097,290 | ||||||||
| 1,000,000 | Lower Colorado River Authority Texas Revenue Refunding Series A, Callable 05/15/2020 @ 100^ | 5.00 | % | 05/15/2021 | 1,133,340 | ||||||||
| 2,000,000 | Lower Colorado River Authority Texas Revenue Refunding | 5.00 | % | 05/15/2021 | 2,335,100 | ||||||||
| 1,100,000 | Lower Colorado River Authority Texas Revenue Refunding Series B | 5.00 | % | 05/15/2021 | 1,284,305 | ||||||||
| 500,000 | Maryland Environmental Service Revenue Mid Shore III Regional Landfill Callable 11/1/2020 @ 100^ | 5.00 | % | 11/01/2022 | 567,895 | ||||||||
| 200,000 | Maryland State Community Development Administration — Residential Program Series E | 3.80 | % | 09/01/2013 | 201,160 | ||||||||
| 500,000 | Maryland State Community Development Administration — Residential Program Series G | 4.10 | % | 09/01/2014 | 519,425 | ||||||||
| 1,000,000 | Maryland State Community Development Administration — Residential Program Series C | 3.85 | % | 09/01/2015 | 1,057,120 | ||||||||
| 585,000 | Maryland State Community Development Administration — Single Family Housing Series A | 1.00 | % | 03/01/2014 | 587,556 | ||||||||
| 500,000 | Maryland State Community Development Administration Local Government Infrastructure — A-1 | ||||||||||||
| Callable 6/1/2020 @ 100^ | 3.50 | % | 06/01/2022 | 523,175 | |||||||||
| 300,000 | Maryland State Community Development Administration Non AMT Non Ace — | ||||||||||||
| Single Family Housing | 1.90 | % | 03/01/2016 | 305,487 | |||||||||
| 175,000 | Maryland State Community Development Administration Non AMT Non Ace — | ||||||||||||
| Single Family Housing | 2.05 | % | 09/01/2016 | 178,280 | |||||||||
| 1,000,000 | Maryland State Department of Transportation | 5.25 | % | 12/15/2014 | 1,072,740 | ||||||||
| 200,000 | Maryland State Department of Transportation | 5.00 | % | 03/01/2015 | 215,174 | ||||||||
| 100,000 | Maryland State Department of Transportation | 5.00 | % | 06/01/2015 | 108,643 | ||||||||
| 3,200,000 | Maryland State Department of Transportation | 4.00 | % | 02/15/2016 | 3,470,176 | ||||||||
| 1,300,000 | Maryland State Department of Transportation | 5.25 | % | 12/15/2016 | 1,492,764 | ||||||||
| 1,325,000 | Maryland State Department of Transportation | 5.00 | % | 02/15/2017 | 1,512,487 | ||||||||
| 1,400,000 | Maryland State Department of Transportation | 5.00 | % | 06/01/2019 | 1,666,392 | ||||||||
| 500,000 | Maryland State Department of Transportation Callable 5/15/2017 @ 100^ | 4.00 | % | 05/15/2020 | 538,260 | ||||||||
| 700,000 | Maryland State Department of Transportation 2nd Issue, Callable 9/1/2018 @ 100^ | 4.00 | % | 09/01/2021 | 755,832 | ||||||||
| 100,000 | Maryland State Economic Development Corporation — Salisbury University Project | 5.00 | % | 06/01/2022 | 104,786 | ||||||||
| 100,000 | Maryland State Economic Development Corporation — Salisbury University Project | 4.00 | % | 06/01/2023 | 95,645 | ||||||||
| 200,000 | Maryland State Economic Development Corporation — Salisbury University Project^ | 5.00 | % | 06/01/2027 | 202,652 | ||||||||
| 400,000 | Maryland State Economic Development Corporation — Senior Student Housing | ||||||||||||
| Towson University Project Callable 07/01/2022 @ 100^ | 5.00 | % | 07/01/2027 | 417,992 | |||||||||
| 500,000 | Maryland State Economic Development Corporation — University of Maryland | ||||||||||||
| College Park Project Callable 6/1/2016 @ 100 CIFG Insured^ | 5.00 | % | 06/01/2022 | 519,270 | |||||||||
| 255,000 | Maryland State Health & Higher Educational Facilities — Adventist Health Care Series A, | ||||||||||||
| Callable 1/1/2013 @ 101^ | 5.00 | % | 01/01/2014 | 258,305 | |||||||||
| 455,000 | Maryland State Health & Higher Educational Facilities — Adventist Health Care Series A | 5.00 | % | 01/01/2022 | 502,729 | ||||||||
| 2,110,000 | Maryland State Health & Higher Educational Facilities — Adventist Health Care Series A, | ||||||||||||
| Callable 1/1/2022 @ 100^ | 5.50 | % | 01/01/2023 | 2,376,852 | |||||||||
| 735,000 | Maryland State Health & Higher Educational Facilities — Anne Arundel Health System, Inc. | 4.00 | % | 07/01/2014 | 760,879 | ||||||||
| 385,000 | Maryland State Health & Higher Educational Facilities — Anne Arundel Health System, Inc. | 4.00 | % | 07/01/2016 | 417,294 | ||||||||
| 1,395,000 | Maryland State Health & Higher Educational Facilities — Charlestown Community Project | 5.00 | % | 01/01/2018 | 1,515,500 | ||||||||
| 650,000 | Maryland State Health & Higher Educational Facilities — Edenwald Series A, | ||||||||||||
| Callable 7/1/2016 @ 100^ | 5.20 | % | 01/01/2024 | 655,571 | |||||||||
| 1,185,000 | Maryland State Health & Higher Educational Facilities — FHA Insured Mortgage | ||||||||||||
| Western Maryland Health Series A | 5.00 | % | 07/01/2014 | 1,232,447 | |||||||||
| 390,000 | Maryland State Health & Higher Educational Facilities — Greater Baltimore Medical Center Series A, | ||||||||||||
| Callable 7/1/2022 @ 100^ | 5.00 | % | 07/01/2023 | 440,981 | |||||||||
| 1,995,000 | Maryland State Health & Higher Educational Facilities — Greater Baltimore Medical Center | 5.00 | % | 07/01/2021 | 2,248,465 | ||||||||
| 1,000,000 | Maryland State Health & Higher Educational Facilities — Greater Baltimore Medical Center | ||||||||||||
| Callable 7/1/2021 @ 100^ | 5.00 | % | 07/01/2023 | 1,090,840 | |||||||||
| 575,000 | Maryland State Health & Higher Educational Facilities — Greater Baltimore Medical Center | ||||||||||||
| Callable 7/1/2021 @ 100^ | 5.25 | % | 07/01/2024 | 628,372 | |||||||||
| 250,000 | Maryland State Health & Higher Educational Facilities — Greater Baltimore Medical Center | ||||||||||||
| Callable 7/1/2021 @ 100^ | 5.25 | % | 07/01/2025 | 269,900 | |||||||||
| 1,500,000 | Maryland State Health & Higher Educational Facilities — Johns Hopkins Health System | ||||||||||||
| Callable 07/01/2022 @ 100^ | 5.00 | % | 07/01/2023 | 1,727,010 | |||||||||
The accompanying notes are an integral part of these financial statements.
31
Schedule of Investments
June 30, 2013
| Par Value | Security Description | Rate | Maturity | Value $ | |||||||||
| Municipal Bonds — (Continued) | |||||||||||||
| Revenue Bonds — (Continued) | |||||||||||||
| 3,400,000 | Maryland State Health & Higher Educational Facilities — Johns Hopkins Health System | ||||||||||||
| Callable 5/15/2020 @ 100^ | 5.00 | % | 05/15/2040 | 3,499,484 | |||||||||
| 350,000 | Maryland State Health & Higher Educational Facilities — Johns Hopkins Health System Series B# | 4.30 | % | 05/15/2048 | 372,327 | ||||||||
| 115,000 | Maryland State Health & Higher Educational Facilities — Johns Hopkins Hospital | 5.00 | % | 05/15/2021 | 133,617 | ||||||||
| 250,000 | Maryland State Health & Higher Educational Facilities — Johns Hopkins University Series A | 5.00 | % | 07/01/2013 | 250,100 | ||||||||
| 500,000 | Maryland State Health & Higher Educational Facilities — Johns Hopkins University Series A | 5.00 | % | 07/01/2018 | 583,485 | ||||||||
| 3,000,000 | Maryland State Health & Higher Educational Facilities — Johns Hopkins University | ||||||||||||
| Callable 07/01/2022 @ 100^ | 5.00 | % | 07/01/2023 | 3,545,910 | |||||||||
| 200,000 | Maryland State Health & Higher Educational Facilities — Kennedy Krieger Institute | 4.38 | % | 07/01/2013 | 200,066 | ||||||||
| 685,000 | Maryland State Health & Higher Educational Facilities — Lifebridge Health | 5.00 | % | 07/01/2015 | 735,717 | ||||||||
| 500,000 | Maryland State Health & Higher Educational Facilities — Lifebridge Health | 5.00 | % | 07/01/2017 | 556,280 | ||||||||
| 250,000 | Maryland State Health & Higher Educational Facilities — Lifebridge Health | ||||||||||||
| Callable 7/1/2017 @ 100^ | 5.00 | % | 07/01/2018 | 279,060 | |||||||||
| 250,000 | Maryland State Health & Higher Educational Facilities — Lifebridge Health | 5.00 | % | 07/01/2019 | 282,438 | ||||||||
| 100,000 | Maryland State Health & Higher Educational Facilities — Lifebridge Health | ||||||||||||
| Callable 7/1/2021 @ 100^ | 6.00 | % | 07/01/2022 | 117,942 | |||||||||
| 520,000 | Maryland State Health & Higher Educational Facilities — Lifebridge Health | ||||||||||||
| Callable 7/1/2021 @ 100^ | 5.25 | % | 07/01/2024 | 568,266 | |||||||||
| 250,000 | Maryland State Health & Higher Educational Facilities — Medstar Health | 4.38 | % | 08/15/2013 | 251,298 | ||||||||
| 725,000 | Maryland State Health & Higher Educational Facilities — Medstar Health | 5.00 | % | 08/15/2014 | 759,626 | ||||||||
| 2,600,000 | Maryland State Health & Higher Educational Facilities — Medstar Health | 5.00 | % | 08/15/2016 | 2,883,166 | ||||||||
| 355,000 | Maryland State Health & Higher Educational Facilities — Medstar Health | 5.00 | % | 08/15/2021 | 404,686 | ||||||||
| 500,000 | Maryland State Health & Higher Educational Facilities — Medstar Health | 5.00 | % | 08/15/2023 | 562,415 | ||||||||
| 3,565,000 | Maryland State Health & Higher Educational Facilities — Medstar Health | ||||||||||||
| Callable 5/15/2016 @ 100^ | 4.75 | % | 05/15/2042 | 3,545,392 | |||||||||
| 500,000 | Maryland State Health & Higher Educational Facilities — Mercy Medical Center | ||||||||||||
| Callable 7/1/2022 @ 100^ | 5.00 | % | 07/01/2024 | 538,295 | |||||||||
| 1,000,000 | Maryland State Health & Higher Educational Facilities — Mercy Medical Center | ||||||||||||
| Callable 7/1/2021 @ 100^ | 6.00 | % | 07/01/2025 | 1,127,500 | |||||||||
| 1,130,000 | Maryland State Health & Higher Educational Facilities — Mercy Medical Center | ||||||||||||
| Callable 7/1/2021 @ 100^ | 6.25 | % | 07/01/2031 | 1,248,548 | |||||||||
| 200,000 | Maryland State Health & Higher Educational Facilities — Mercy Ridge Series A, | ||||||||||||
| Callable 7/1/2017 @ 100^ | 5.00 | % | 07/01/2026 | 208,128 | |||||||||
| 135,000 | Maryland State Health & Higher Educational Facilities — Mercy Ridge Series A, | ||||||||||||
| Callable 7/1/2017 @ 100^ | 5.00 | % | 07/01/2027 | 139,929 | |||||||||
| 200,000 | Maryland State Health & Higher Educational Facilities — Mercy Ridge Callable 7/1/2017 @ 100^ | 4.50 | % | 07/01/2035 | 185,862 | ||||||||
| 1,000,000 | Maryland State Health & Higher Educational Facilities — Peninsula Regional Medical Center | ||||||||||||
| Callable 7/1/2016 @ 100^ | 5.00 | % | 07/01/2026 | 1,021,680 | |||||||||
| 965,000 | Maryland State Health & Higher Educational Facilities — University of Maryland Medical System | 4.00 | % | 07/01/2015 | 1,023,508 | ||||||||
| 500,000 | Maryland State Health & Higher Educational Facilities — University of Maryland Medical System | 4.00 | % | 07/01/2015 | 526,830 | ||||||||
| 260,000 | Maryland State Health & Higher Educational Facilities — University of Maryland | ||||||||||||
| Medical System Series F | 5.00 | % | 07/01/2018 | 295,407 | |||||||||
| 250,000 | Maryland State Health & Higher Educational Facilities — University of Maryland Medical System | 5.00 | % | 07/01/2020 | 290,040 | ||||||||
| 400,000 | Maryland State Health & Higher Educational Facilities — University of Maryland Medical System | 5.00 | % | 07/01/2021 | 462,748 | ||||||||
| 400,000 | Maryland State Health & Higher Educational Facilities — University of Maryland Medical System | 5.00 | % | 07/01/2022 | 462,404 | ||||||||
| 500,000 | Maryland State Health & Higher Educational Facilities — University of Maryland | ||||||||||||
| Medical System Callable 7/1/2018 @ 100 AMBAC Insured^ | 5.50 | % | 07/01/2024 | 554,070 | |||||||||
| 250,000 | Maryland State Health & Higher Educational Facilities — University of Maryland | ||||||||||||
| Medical System Callable 7/1/2019 @ 100^ | 5.00 | % | 07/01/2034 | 259,380 | |||||||||
| 400,000 | Maryland State Health & Higher Educational Facilities — University of Maryland | ||||||||||||
| Medical System AMBAC Insured | 4.00 | % | 07/01/2013 | 400,104 | |||||||||
| 1,995,000 | Maryland State Health & Higher Educational Facilities — Upper Chesapeake Hospitals | 5.50 | % | 01/01/2018 | 2,126,989 | ||||||||
| 250,000 | Maryland State Health & Higher Educational Facilities — Washington Christian Academy | ||||||||||||
| Callable 1/1/2017 @ 100^† | 5.25 | % | 07/01/2018 | 69,962 | |||||||||
The accompanying notes are an integral part of these financial statements.
32
Schedule of Investments
June 30, 2013
| Par Value | Security Description | Rate | Maturity | Value $ | |||||||||
| Municipal Bonds — (Continued) | |||||||||||||
| Revenue Bonds — (Continued) | |||||||||||||
| 240,000 | Maryland State Health & Higher Educational Facilities — Western Medical Health Series A, | ||||||||||||
| Callable 7/1/2016 @ 100 NATL-RE FHA 242 Insured^ | 5.00 | % | 01/01/2025 | 256,692 | |||||||||
| 1,750,000 | Maryland State Industrial Development Financing Authority Multi-Modal# | 2.00 | % | 09/01/2040 | 1,781,010 | ||||||||
| 750,000 | Maryland State Transportation Authority Series A | 3.00 | % | 07/01/2016 | 797,798 | ||||||||
| 990,000 | Maryland State Transportation Authority Series A | 5.00 | % | 07/01/2018 | 1,156,340 | ||||||||
| 570,000 | Maryland State Transportation Authority Callable 7/1/2018 @ 100^ | 5.00 | % | 07/01/2021 | 646,437 | ||||||||
| 4,255,000 | Maryland State Transportation Authority Airport Refunding Baltimore/Washington | 5.00 | % | 03/01/2022 | 4,928,949 | ||||||||
| 2,660,000 | Maryland State Transportation Authority Transportation | 5.00 | % | 07/01/2017 | 3,059,532 | ||||||||
| 970,000 | Maryland State Transportation Authority Transportation Facilities Project Series 2009A, | ||||||||||||
| Callable 7/1/2019 @ 100^ | 5.00 | % | 07/01/2022 | 1,109,922 | |||||||||
| 1,815,000 | Maryland State Transportation Authority Transportation Refunding | 5.00 | % | 07/01/2020 | 2,167,473 | ||||||||
| 1,715,000 | Maryland State Water Quality Financing | 5.00 | % | 03/01/2015 | 1,844,825 | ||||||||
| 500,000 | Maryland State Water Quality Financing Series A | 5.00 | % | 09/01/2015 | 548,510 | ||||||||
| 500,000 | Maryland State Water Quality Financing — Administrative Revolving Loan Fund | 5.00 | % | 03/01/2017 | 567,955 | ||||||||
| 350,000 | Maryland State Water Quality Financing — Administrative Revolving Loan Fund | 5.00 | % | 03/01/2018 | 403,602 | ||||||||
| 300,000 | Maryland State Water Quality Financing — Administrative Revolving Loan Fund | ||||||||||||
| Callable 3/1/2018 @ 100^ | 4.00 | % | 03/01/2019 | 328,884 | |||||||||
| 265,000 | Maryland State Water Quality Financing — Administrative Revolving Loan Fund Series A, | ||||||||||||
| Callable 3/1/2018 @ 100^ | 5.00 | % | 03/01/2019 | 307,098 | |||||||||
| 2,055,000 | Miami-Dade County Florida Expressway Authority | 5.00 | % | 07/01/2018 | 2,363,332 | ||||||||
| 855,000 | Montgomery County Maryland Housing Opportunities Revenue Bonds | 1.60 | % | 07/01/2018 | 843,218 | ||||||||
| 950,000 | Montgomery County Maryland Parking Revenue System Project Bethesda Parking Lot District | 4.00 | % | 06/01/2015 | 1,011,342 | ||||||||
| 1,385,000 | Montgomery County Maryland Parking Revenue System Project Bethesda Parking Lot District | 4.00 | % | 06/01/2015 | 1,474,429 | ||||||||
| 1,000,000 | Nebraska Investment Finance Authority Housing Single Revenue Bonds | 2.50 | % | 09/01/2022 | 956,760 | ||||||||
| 1,455,000 | New Mexico State Mortgage Finance Authority^ | 2.85 | % | 07/01/2043 | 1,478,920 | ||||||||
| 700,000 | New York State Mortgage Agency Revenue | 0.85 | % | 04/01/2016 | 696,206 | ||||||||
| 500,000 | Oklahoma State Municipal Power Authority Callable 01/01/2023 @ 100^ | 4.00 | % | 01/01/2043 | 456,340 | ||||||||
| 450,000 | Oregon Health & Science University Series E, Callable 07/01/2022 @ 100^ | 5.00 | % | 07/01/2025 | 505,287 | ||||||||
| 2,500,000 | Puerto Rico Sales Tax Financing Corp. Revenue Bonds 100.000000, 08/01/2019^ | 5.00 | % | 08/01/2024 | 2,568,975 | ||||||||
| 250,000 | Railsplitter Tobacco Settlement Authority | 5.00 | % | 06/01/2016 | 274,425 | ||||||||
| 4,000,000 | Railsplitter Tobacco Settlement Authority | 5.25 | % | 06/01/2020 | 4,608,400 | ||||||||
| 805,000 | St. Mary’s College Maryland Revenues Academic Fees | 3.00 | % | 09/01/2017 | 854,797 | ||||||||
| 735,000 | St. Mary’s College Maryland Revenues Academic Fees | 3.00 | % | 09/01/2018 | 778,380 | ||||||||
| 3,000,000 | Tobacco Settlement Financing Corp. | 5.00 | % | 06/01/2017 | 3,373,110 | ||||||||
| 2,540,000 | Tobacco Settlement Financing Corp.^ | 5.00 | % | 06/01/2018 | 2,841,523 | ||||||||
| 2,000,000 | University of Maryland System Auxiliary Series A | 4.00 | % | 04/01/2014 | 2,058,260 | ||||||||
| 350,000 | University of Maryland System Auxiliary Series D | 4.00 | % | 04/01/2014 | 360,195 | ||||||||
| 350,000 | University of Maryland System Auxiliary Facility & Tuition Revenue | 5.00 | % | 04/01/2015 | 377,794 | ||||||||
| 1,000,000 | University of Maryland System Auxiliary Facility & Tuition Revenue Series D | 3.00 | % | 04/01/2015 | 1,044,430 | ||||||||
| 500,000 | University of Maryland System Auxiliary Facility & Tuition Revenue Series B | 3.75 | % | 10/01/2015 | 535,795 | ||||||||
| 500,000 | University of Maryland System Auxiliary Facility & Tuition Revenue Series B | 4.00 | % | 10/01/2016 | 550,330 | ||||||||
| 1,500,000 | University of Maryland System Auxiliary Refunding Series A | 4.00 | % | 04/01/2017 | 1,660,755 | ||||||||
| 1,100,000 | University of Maryland University Revenues Various Revolving — A-RMKT# | 1.50 | % | 07/01/2023 | 1,077,054 | ||||||||
| 500,000 | University of Maryland System Auxiliary Facility & Tuition Revenue Series A, | ||||||||||||
| Callable 4/1/2017 @ 100^ | 4.00 | % | 04/01/2020 | 537,480 | |||||||||
| 4,405,000 | University System of Maryland — Auxiliary Facility & Tuition | 5.00 | % | 04/01/2016 | 4,910,606 | ||||||||
| 1,085,000 | Wisconsin State Health & Higher Education Aspirus, Inc. | 5.00 | % | 08/15/2020 | 1,241,511 | ||||||||
| 145,010,952 | |||||||||||||
| Refunded Bonds — 3.9% | |||||||||||||
| 725,000 | Baltimore County Maryland Catholic Health Initiatives Series A, Callable 9/1/2016 @ 100^ | 5.00 | % | 09/01/2019 | 817,126 | ||||||||
| 500,000 | Baltimore Maryland Project Revenue Water Project Series A, Callable 7/1/2013 @ 100^ | 5.00 | % | 07/01/2033 | 500,195 | ||||||||
| 195,000 | Calvert County Maryland Refunding | 4.00 | % | 04/01/2014 | 200,528 | ||||||||
| 250,000 | Frederick County Maryland Public Facilities Callable 8/1/2015 @ 100^ | 5.00 | % | 08/01/2016 | 273,258 | ||||||||
| 500,000 | Maryland State & Local Facilities Loan 1st Series, Callable 8/1/2014 @ 100^ | 5.00 | % | 08/01/2015 | 525,885 | ||||||||
The accompanying notes are an integral part of these financial statements.
33
Schedule of Investments
June 30, 2013
| Par | ||||||||||||||
| Value/Shares | Security Description | Rate | Maturity | Value $ | ||||||||||
| Municipal Bonds — (Continued) | ||||||||||||||
| Refunded Bonds — (Continued) | ||||||||||||||
| 300,000 | Maryland State & Local Facilities Loan 2nd Series, Callable 8/1/2013 @ 100^ | 5.00 | % | 08/01/2014 | 301,311 | |||||||||
| 665,000 | Maryland State & Local Facilities Loan 2nd Series A, Callable 8/1/2015 @ 100^ | 5.00 | % | 08/01/2017 | 727,596 | |||||||||
| 600,000 | Maryland State & Local Facilities Loan Callable 2/15/2015 @ 100^ | 5.00 | % | 02/15/2018 | 644,046 | |||||||||
| 500,000 | Maryland State & Local Facilities Loan Callable 3/1/2017 @ 100^ | 5.00 | % | 03/01/2019 | 570,425 | |||||||||
| 1,280,000 | Maryland State Health & Higher Educational Facilities — FHA Insured Mortgage | |||||||||||||
| Western Maryland Health | 5.00 | % | 07/01/2013 | 1,280,435 | ||||||||||
| 250,000 | Maryland State Health & Higher Educational Facilities — Goucher College Callable 7/1/2014 @ 100^ | 4.50 | % | 07/01/2019 | 260,708 | |||||||||
| 500,000 | Maryland State Health & Higher Educational Facilities — Lifebridge Health Series A, | |||||||||||||
| Prerefunded 7/1/2014 @ 100^ | 4.00 | % | 07/01/2017 | 518,330 | ||||||||||
| 500,000 | Montgomery County Maryland Consolidated Public Improvement Series A, Callable 4/1/2014 @ 100^ | 5.00 | % | 04/01/2017 | 518,040 | |||||||||
| 1,700,000 | Montgomery County Maryland Consolidated Public Improvement Series A, Callable 5/1/2017 @ 100^ | 5.00 | % | 05/01/2018 | 1,948,217 | |||||||||
| 500,000 | Morgan State University Maryland Academic & Auxiliary Facilities Fees Revenue | |||||||||||||
| Callable 07/01/2013 @ 100^ | 5.00 | % | 07/01/2020 | 500,195 | ||||||||||
| 250,000 | University of Maryland System Auxiliary Facility & Tuition Revenue Series A, | |||||||||||||
| Callable 10/1/2016 @ 100^ | 5.00 | % | 10/01/2019 | 282,878 | ||||||||||
| 9,869,173 | ||||||||||||||
| Total Municipal Bonds (Cost $240,159,890) | 243,289,362 | |||||||||||||
| Short-Term Investments — 2.2% | ||||||||||||||
| Money Market Fund — 2.2% | ||||||||||||||
| 5,665,855 | DWS Cash Account Trust — Tax-Exempt Portfolio, 0.01%* | 5,665,855 | ||||||||||||
| Total Short-Term Investments (Cost $5,665,855) | 5,665,855 | |||||||||||||
| Total Investments — 98.7% (Cost $245,825,745) | 248,955,217 | |||||||||||||
| Other Assets in Excess of Liabilities — 1.3% | 3,211,119 | |||||||||||||
| NET ASSETS — 100.0% | $ | 252,166,336 | ||||||||||||
| PORTFOLIO HOLDINGS | ||||
| % of Net Assets | ||||
| Revenue Bonds | 57.5 | % | ||
| General Obligation Bonds | 35.1 | % | ||
| Refunded Bonds | 3.9 | % | ||
| Money Market Funds | 2.2 | % | ||
| Other Assets and Liabilities | 1.3 | % | ||
| 100.0 | % | |||
| ^ | Continuously callable with 30 days notice. |
| # | Variable rate security. Rate disclosed is as of June 30, 2013. |
| † | Security is in default and did not make its most recent payment of interest. This security is considered illiquid. At June 30, 2013, the total market value of securities considered illiquid was $69,962 or 0.0% of net assets. |
| * | Annualized seven-day yield as of June 30, 2013. |
The accompanying notes are an integral part of these financial statements.
34
A Message to Our Shareholders
June 30, 2013
Dear Shareholder:
For the 12-month period ended June 30, 2013, the Brown Advisory Intermediate Income Fund Investor Shares (the “Fund”) declined by 0.72%, slightly worse than the Fund’s benchmark, the Barclays Intermediate U.S. Aggregate Bond Index, which declined 0.12%.
Recently, fixed income markets have experienced one of the most challenging periods in a decade, as investors began to rethink the U.S. Federal Reserve’s monetary strategy given improving economic growth. After falling mildly during April, the 10-year Treasury yield suffered its worst two-month period since 2003, rising 81 basis points in May and June. This broad-based rise in yields was touched off by some seemingly benign comments by Federal Reserve Chairman Ben Bernanke. The chairman suggested that the economy was strengthening and the time would soon come when the central bank would reduce the pace of open-market bond purchases (dubbed quantitative easing or QE), prompting a strong (and negative) response from both stocks and bonds.
The market’s current volatility may create opportunities. Both municipal and taxable bond funds may experience outflows, which, given the illiquidity of certain types of bonds, can cause securities to become mispriced. We also see a dichotomy emerging—and therefore a potential investment opportunity—in the market for corporate and credit-exposed bonds. Typically, rising rates are accompanied by rising inflation and a narrowing of credit spreads, all common occurrences during a period of economic improvement. But in May and June, credit spreads moved wider, implying that credit risk was rising, and long-term inflation expectations declined, as measured by the Treasury Inflation-Protected Securities (TIPS) market. In bond bear markets dating back 20 years, we have never seen credit spreads widen when bond yields rose.
Because of the uncertainty and volatility that pervades the market at the moment, we are optimistic about our ability to find these sorts of dislocations. We believe that our core philosophy of seeking bonds that are underpriced on a fundamental basis, rather than chasing yield, is especially well positioned in this market.
Sincerely,
Paul D. Corbin
Portfolio Manager
Past performance is not a guarantee of future results.
Mutual fund investing involves risk. Principal loss is possible. The Fund is subject to interest rate risk which is the risk that debt securities in the Fund’s portfolio will decline in value because of increases in market interest rates. Investments in Asset Backed and Mortgage Backed Securities include additional risks that investors should be aware of such as credit risk, prepayment risk, possible illiquidity and default, as well as increased susceptibility to adverse economic developments. Inflation-indexed bonds see the principal value of the security increased as the Consumer Price Index increases. Should the Consumer Price Index decline, those securities should be adversely impacted.
Fund holdings and sector allocations are subject to change and should not be considered a recommendation to buy or sell any security. For a complete list of fund holdings, please refer to the Schedule of Investments provided in this report.
Definitions for terms and indices are provided in the Glossary of Terms.
35
Performance Chart and Analysis
June 30, 2013
COMPARISON OF CHANGE IN VALUE OF A $10,000 INVESTMENT
The following chart reflects the change in value of a hypothetical $10,000 investment, including reinvested dividends and distributions, in the Fund as measured against the broad-based securities market index. The Barclays Intermediate U.S. Aggregate Bond Index (“Index”) represents domestic taxable investment grade bonds, with index components for government and corporate securities, mortgage pass-through securities, and asset-backed securities with average maturities and durations in the intermediate range. The Index is unmanaged and does not reflect the deduction of fees, such as investment management fees. Investors cannot invest directly in an index.
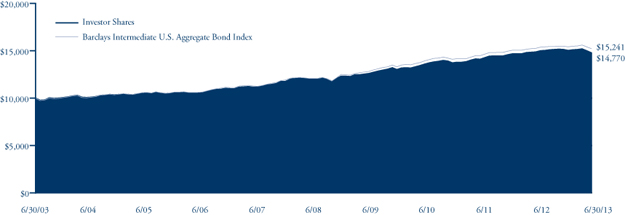
| Average Annual Total Return | One | Five | Ten | |
| as of 6/30/13 | Year | Year | Year | |
| Investor Shares | -0.72% | 4.13% | 3.98% | |
| Advisor Shares | -0.87% | 3.92% | 3.72% | |
| Barclays Intermediate | ||||
| U.S. Aggregate Bond Index | -0.12% | 4.76% | 4.30% |
| Investor Shares | Advisor Shares | |
Gross Expense Ratio1 | 0.53% | 0.78% |
Net Expense Ratio1 | 0.53% | 0.78% |
Past performance does not guarantee future results. The performance data quoted represents past performance and current returns may be lower or higher. The investment return and net asset value will fluctuate so that an investor’s shares, when redeemed, may be worth more or less than the original cost. To obtain performance information current to the most recent month end, please visit our website at brownadvisoryfunds.com/performance.html. The performance table and graph above do not reflect the deduction of taxes that a shareholder would pay on Fund distributions or the redemption of Fund shares. Investment performance reflects periods during which fee waivers were in effect. In the absence of such waivers, total return would have been reduced. Performance data does not reflect the imposition of the redemption fee of 1.00% on shares redeemed within 14 days, and if it did, performance would have been lower.
1 Per the Fund’s prospectus dated October 19, 2012.
36
Schedule of Investments
June 30, 2013
| Par Value | Security Description | Rate | Maturity | Value $ | |||||||||
| Corporate Bonds & Notes — 34.2% | |||||||||||||
| 2,460,000 | Alleghany Corp. | 4.95 | % | 06/27/2022 | 2,603,807 | ||||||||
| 3,000,000 | American Express Co. | 7.00 | % | 03/19/2018 | 3,612,951 | ||||||||
| 3,040,000 | AT&T, Inc. | 0.80 | % | 12/01/2015 | 3,027,916 | ||||||||
| 2,575,000 | Bank Of America Corp. | 6.00 | % | 09/01/2017 | 2,889,140 | ||||||||
| 2,850,000 | Boston Properties Limited Partnership Callable 08/15/2020 @ 100^ | 5.63 | % | 11/15/2020 | 3,239,507 | ||||||||
| 2,855,000 | Caterpillar Financial Services Corp. | 2.65 | % | 04/01/2016 | 2,975,130 | ||||||||
| 2,955,000 | Celgene Corp. | 2.45 | % | 10/15/2015 | 3,044,879 | ||||||||
| 2,970,000 | Eastman Chemical Co. | 2.40 | % | 06/01/2017 | 2,977,960 | ||||||||
| 2,685,000 | Ecolab, Inc. | 1.45 | % | 12/08/2017 | 2,610,668 | ||||||||
| 3,010,000 | FedEx Corp. | 8.00 | % | 01/15/2019 | 3,809,299 | ||||||||
| 9,000,000 | FHLMC Callable 08/14/2013 @ 100^ | 2.00 | % | 08/14/2017 | 9,018,531 | ||||||||
| 2,800,000 | FMC Technologies, Inc. | 2.00 | % | 10/01/2017 | 2,756,393 | ||||||||
| 3,160,000 | FNMA Callable 01/15/2015 @ 100^ | 0.65 | % | 01/15/2016 | 3,158,294 | ||||||||
| 3,000,000 | Goldman Sachs Group, Inc.# | 1.27 | % | 02/07/2014 | 3,008,265 | ||||||||
| 2,750,000 | GTE Corp. | 6.84 | % | 04/15/2018 | 3,272,808 | ||||||||
| 3,000,000 | JP Morgan Chase & Co. | 6.30 | % | 04/23/2019 | 3,489,408 | ||||||||
| 2,560,000 | Kellogg Co. | 4.15 | % | 11/15/2019 | 2,752,814 | ||||||||
| 3,000,000 | Markel Corp. | 5.35 | % | 06/01/2021 | 3,241,971 | ||||||||
| 3,000,000 | Medco Health Solutions, Inc. | 4.13 | % | 09/15/2020 | 3,090,678 | ||||||||
| 3,000,000 | Morgan Stanley | 3.80 | % | 04/29/2016 | 3,122,271 | ||||||||
| 3,000,000 | Oneok, Inc. Callable 11/01/2021 @ 100^ | 4.25 | % | 02/01/2022 | 2,956,833 | ||||||||
| 2,105,000 | Pepsico, Inc. | 7.90 | % | 11/01/2018 | 2,699,182 | ||||||||
| 3,500,000 | Provident Bank of Maryland Callable 05/01/2013 @ 100^ | 9.50 | % | 05/01/2018 | 3,469,403 | ||||||||
| 1,610,000 | Saint Barnabas Health System~ | 4.00 | % | 07/01/2028 | 1,485,888 | ||||||||
| 1,233,000 | Southwest Airlines Co. | 5.13 | % | 03/01/2017 | 1,330,369 | ||||||||
| 2,750,000 | Starbucks Corp. | 6.25 | % | 08/15/2017 | 3,195,670 | ||||||||
| 2,250,000 | Sutter Health | 1.09 | % | 08/15/2053 | 2,227,489 | ||||||||
| 2,742,000 | W.R. Berkley Corp. | 6.15 | % | 08/15/2019 | 3,068,767 | ||||||||
| Total Corporate Bonds & Notes (Cost $87,725,127) | 88,136,291 | ||||||||||||
| Mortgage Backed Securities — 27.8% | |||||||||||||
| 7,238 | FHLMC, Pool# C00210 | 8.00 | % | 01/01/2023 | 8,453 | ||||||||
| 579,531 | FHLMC, Pool# 1B0889# | 2.39 | % | 05/01/2033 | 612,785 | ||||||||
| 601,849 | FHLMC, Pool# 1J0203# | 2.45 | % | 04/01/2035 | 638,049 | ||||||||
| 5,300,000 | FHLMC REMIC, Series 3571 | 4.00 | % | 09/15/2024 | 5,683,794 | ||||||||
| 6,000,000 | FHLMC REMIC, Series 3800 | 3.50 | % | 02/15/2026 | 6,351,939 | ||||||||
| 395,344 | FHLMC REMIC, Series 2782 | 4.00 | % | 11/15/2033 | 417,420 | ||||||||
| 3,652 | FNMA, Pool# 433646 | 6.00 | % | 10/01/2013 | 3,671 | ||||||||
| 12,545 | FNMA, Pool# 409589 | 9.50 | % | 11/01/2015 | 12,633 | ||||||||
| 70,706 | FNMA, Pool# 254089 | 6.00 | % | 12/01/2016 | 74,976 | ||||||||
| 285,172 | FNMA, Pool# 842239 | 5.00 | % | 09/01/2020 | 303,744 | ||||||||
| 5,187,502 | FNMA, Pool# AJ5336 | 3.00 | % | 11/01/2026 | 5,351,429 | ||||||||
| 4,911,002 | FNMA, Pool# AP4509 | 3.00 | % | 09/01/2027 | 5,067,166 | ||||||||
| 8,495,006 | FNMA, Pool# AB6644 | 2.50 | % | 10/01/2027 | 8,561,495 | ||||||||
| 5,061,751 | FNMA, Pool# AB6780 | 2.50 | % | 11/01/2027 | 5,101,371 | ||||||||
| 2,667,308 | FNMA, Pool# AQ5078 | 3.00 | % | 12/01/2027 | 2,754,144 | ||||||||
| 23,332 | FNMA, Pool# 539082 | 7.00 | % | 08/01/2028 | 27,184 | ||||||||
| 66,033 | FNMA, Pool# 625536 | 6.00 | % | 01/01/2032 | 72,733 | ||||||||
| 83,684 | FNMA, Pool# 628837 | 6.50 | % | 03/01/2032 | 96,342 | ||||||||
| 289,938 | FNMA, Pool# 663238 | 5.50 | % | 09/01/2032 | 317,260 | ||||||||
| 76,945 | FNMA, Pool# 744805# | 2.02 | % | 11/01/2033 | 80,808 | ||||||||
| 99,746 | FNMA, Pool# 741373# | 2.41 | % | 12/01/2033 | 105,747 | ||||||||
| 79,014 | FNMA, Pool# 764342# | 2.02 | % | 02/01/2034 | 82,991 | ||||||||
| 240,872 | FNMA, Pool# 848817 | 5.00 | % | 01/01/2036 | 259,382 | ||||||||
| 842,944 | FNMA, Pool# 866920# | 2.54 | % | 02/01/2036 | 899,166 | ||||||||
| 5,029,541 | FNMA, Pool# AA7686 | 4.50 | % | 06/01/2039 | 5,432,211 | ||||||||
| 2,855,308 | FNMA, Pool# AC4824# | 3.59 | % | 10/01/2039 | 3,033,362 | ||||||||
The accompanying notes are an integral part of these financial statements.
37
Schedule of Investments
June 30, 2013
| Par | |||||||||||||
| Value/Shares | Security Description | Rate | Maturity | Value $ | |||||||||
| Mortgage Backed Securities — (Continued) | |||||||||||||
| 8,149,788 | FNMA, Pool# AQ9044 | 3.50 | % | 12/01/2042 | 8,286,831 | ||||||||
| 3,000,000 | FNMA REMIC Trust, Series 2010-112 | 4.00 | % | 10/25/2025 | 3,209,997 | ||||||||
| 4,091,603 | FNMA REMIC Trust, Series 2012-15# | 0.74 | % | 03/25/2042 | 4,138,863 | ||||||||
| 190,075 | GNMA, Pool# 781450 | 5.00 | % | 06/15/2017 | 204,559 | ||||||||
| 31,997 | GNMA, Pool# 487110 | 6.50 | % | 04/15/2029 | 36,881 | ||||||||
| 62,399 | GNMA, Pool# 781186 | 9.00 | % | 06/15/2030 | 68,479 | ||||||||
| 7,173 | GNMA, Pool# 571166 | 7.00 | % | 08/15/2031 | 8,383 | ||||||||
| 827,194 | GNMA, Series 2008-1-PA | 4.50 | % | 12/20/2036 | 845,503 | ||||||||
| 3,000,000 | GNMA REMIC Trust, Series 2010-124 | 2.72 | % | 05/16/2037 | 3,089,484 | ||||||||
| 297,245 | GNMA REMIC Trust, Series 2004-12 | 4.81 | % | 08/16/2032 | 297,811 | ||||||||
| Total Mortgage Backed Securities (Cost $71,002,325) | 71,537,046 | ||||||||||||
| U.S. Treasury Notes — 17.0% | |||||||||||||
| 19,840,743 | United States Treasury Notes | 0.13 | % | 01/15/2023 | 19,256,374 | ||||||||
| 19,047,285 | United States Treasury Notes | 0.13 | % | 04/15/2018 | 19,553,218 | ||||||||
| 5,000,000 | United States Treasury Notes | 1.25 | % | 10/31/2015 | 5,092,580 | ||||||||
| Total U.S. Treasury Notes (Cost $44,789,017) | 43,902,172 | ||||||||||||
| Municipal Bonds — 11.9% | |||||||||||||
| 2,505,000 | Delaware State Housing Authority Taxable Callable 01/01/2021 @ 100^ | 2.75 | % | 12/01/2041 | 2,448,537 | ||||||||
| 670,000 | District of Columbia Income Tax Secured Revenue Bonds, Series 2010F | 4.71 | % | 12/01/2022 | 742,199 | ||||||||
| 1,545,000 | Florida Hurricane Catastrophe Revenue Bonds | 2.11 | % | 07/01/2018 | 1,504,227 | ||||||||
| 6,089,258 | Illinois Housing Development Authority Revenue Bonds Callable 01/01/2023 @ 100^ | 2.75 | % | 06/01/2043 | 5,923,752 | ||||||||
| 1,000,000 | Illinois State Sales Tax Revenue Taxable Building | 2.30 | % | 06/15/2019 | 985,700 | ||||||||
| 1,560,000 | Indiana State Bond Bank Revenue | 1.02 | % | 07/15/2016 | 1,543,152 | ||||||||
| 3,200,000 | Maryland State Health & Higher Education Revenue Bonds | 3.99 | % | 07/01/2028 | 2,989,088 | ||||||||
| 290,000 | Metropolitan Washington District of Columbia Airports Taxable Series C | ||||||||||||
| Callable 10/01/2015 @ 100^ | 5.69 | % | 10/01/2030 | 307,188 | |||||||||
| 3,989,011 | Minnesota State Housing Finance Agency Homeownership Finance Bonds^ | 2.70 | % | 09/01/2041 | 3,851,111 | ||||||||
| 750,000 | Missouri State Housing Development Commission Callable 11/01/2019 @ 100^ | 2.65 | % | 11/01/2040 | 716,835 | ||||||||
| 2,750,000 | Port Authority New York & New Jersey Consolidated One Hundred Fifty Seventh Series | 5.31 | % | 12/01/2019 | 3,151,913 | ||||||||
| 425,000 | Tift County Georgia Hospital Authority Revenue Callable 12/01/2022 @ 100^ | 4.00 | % | 12/01/2042 | 363,354 | ||||||||
| 6,037,921 | Virginia State Housing Development Authority Homeo Tax Mtg Bds | 3.25 | % | 08/25/2042 | 6,047,038 | ||||||||
| Total Municipal Bonds (Cost $30,922,465) | 30,574,094 | ||||||||||||
| Asset Backed Securities — 4.9% | |||||||||||||
| 5,350,000 | Ally Master Owner Trust 2012-4, Series A | 1.72 | % | 07/15/2019 | 5,305,785 | ||||||||
| 3,000,000 | Avis Budget Rental Funding LLC 2010-3, Series B† | 6.74 | % | 05/20/2016 | 3,232,314 | ||||||||
| 3,000,000 | Avis Budget Rental Funding LLC 2012-3, Series A† | 2.10 | % | 03/20/2019 | 2,950,038 | ||||||||
| 1,175,000 | Ford Credit Floorplan Master Owner Trust 2013-1, Series C | 1.37 | % | 01/15/2018 | 1,171,441 | ||||||||
| Total Asset Backed Securities (Cost $12,878,713) | 12,659,578 | ||||||||||||
| Short-Term Investments — 2.3% | |||||||||||||
| Money Market Funds — 2.3% | |||||||||||||
| 5,999,868 | DWS Cash Account Trust — Government & Agency Securities Portfolio, 0.03%* | 5,999,868 | |||||||||||
| Total Short-Term Investments (Cost $5,999,868) | 5,999,868 | ||||||||||||
| Total Investments — 98.1% (Cost $253,317,515) | 252,809,049 | ||||||||||||
| Other Assets in Excess of Liabilities — 1.9% | 4,882,803 | ||||||||||||
| NET ASSETS — 100.0% | $ | 257,691,852 | |||||||||||
The accompanying notes are an integral part of these financial statements.
38
Schedule of Investments
June 30, 2013
| PORTFOLIO HOLDINGS | ||||
| % of Net Assets | ||||
| Corporate Bonds & Notes | 34.2 | % | ||
| Mortgage Backed Securities | 27.8 | % | ||
| U.S. Treasury Notes | 17.0 | % | ||
| Municipal Bonds | 11.9 | % | ||
| Asset Backed Securities | 4.9 | % | ||
| Money Market Funds | 2.3 | % | ||
| Other Assets and Liabilities | 1.9 | % | ||
| 100.0 | % | |||
| ^ | Continuously callable with 30 days notice. |
| # | Variable rate security. Rate disclosed is as of June 30, 2013. |
| † | Security exempt from registration under Rule 144A of the Securities Act of 1933. These securities may be resold in transactions exempt from registration, normally to qualified, institutional buyers. At June 30, 2013 the value of these securities amounted to $6,182,352 or 2.4% of net assets. |
| ~ | Security is fair valued under supervision of the Board of Trustees. |
| * | Annualized seven-day yield as of June 30, 2013. |
The accompanying notes are an integral part of these financial statements.
39
A Message to Our Shareholders
June 30, 2013
Dear Shareholder:
During the 12-month period ending June 30, 2013, the Brown Advisory Tactical Bond Fund (the “Fund”) was up 2.09%. During the same period, the Barclays Intermediate U.S. Aggregate Bond Index, the Fund’s benchmark, declined by 0.12%.
Recently, fixed income markets have experienced one of the most challenging periods in a decade, as investors began to rethink the U.S. Federal Reserve’s monetary strategy, given improving economic growth. After falling mildly during April, the 10-year Treasury yield suffered its worst two-month period since 2003, rising 81 basis points throughout May and June. This broad-based rise in yields was touched off by some seemingly benign comments by Federal Reserve Chairman Ben Bernanke. The chairman suggested that the economy was strengthening and the time would soon come when the central bank would reduce the pace of open-market bond purchases (dubbed quantitative easing or QE), prompting a strong (and negative) response from both stocks and bonds.
The Fund’s strategy is to make tactical investments in four fixed income sectors: high-yield corporate bonds, municipals, Treasuries and Treasury Inflation-Protected Securities (TIPS). During the last 12-months, the Fund has made a very successful long position in high-yield, as our indicators forecasted that default rates would stay low and volatility would decline. This accounted for the bulk of the positive return during the period.
Positioning in TIPS was mixed. The Fund was long TIPS from August to March and enjoyed strong absolute and relative return during that period. The position was exited in March, and thus the fund avoided a significant downturn in TIPS during April and May. We re-entered that market in June believing that the diminished inflation expectations were overdone, but that proved not to be the case.
Municipals detracted from performance, as we were unable to time entries into this market well enough to offset generally rising interest rates. Treasuries positions had little effect as we chose to keep those positions in short maturities.
This period reflected the Fund’s core strategy well, namely to seek returns that are not directly related to movement in interest rates. We know we will get some positions right and some positions wrong, but we believe that our balanced approach will produce results that have higher upside without materially more downside than the bond market as a whole. Thus, we believe that this strategy offers significant upside and a good diversifier away from traditional bond strategies.
Sincerely,
Thomas D.D. Graff, CFA
Portfolio Manager
Past performance is not a guarantee of future results.
Mutual fund investing involves risk. Principal loss is possible. Investments in debt securities typically decrease in value when interest rates rise. This risk is usually greater for longer-term debt securities. Investments in lower-rated and non-rated securities present a greater risk of loss to principal and interest than higher-rated securities. Municipal securities are subject to adverse political or economic factors, including changes in the tax law. Inflation-indexed bonds see the principal value of the security increased as the Consumer Price Index increases. Should the Consumer Price Index decline, those securities should be adversely impacted. A non-diversified fund may concentrate its assets in fewer individual holdings than a diversified fund. Therefore, non-diversified Fund is more exposed to individual stock volatility than a diversified fund. The fund may make short sales of securities, which involve the risk that losses in a security may exceed the original amount invested in that security. The risks of investments in derivatives, including options on futures contracts and options on futures contracts include imperfect correlation between the value of these instruments and the underlying assets; risks of default by the other party to the derivative transactions; risks that the transactions may result in losses that partially or completely offset gains in portfolio positions; and risks that the derivative transactions may not be liquid. Income from tax-exempt securities may be subject to state and local taxes and a portion of income may be subject to the federal alternative minimum tax for certain investors.
Diversification does not assure a profit or protect against loss in a declining market.
Fund holdings and sector allocations are subject to change and should not be considered a recommendation to buy or sell any security. For a complete list of fund holdings, please refer to the Schedule of Investments provided in this report.
Definitions for terms and indices are provided in the Glossary of Terms.
40
Performance Chart and Analysis
June 30, 2013
COMPARISON OF CHANGE IN VALUE OF A $10,000 INVESTMENT
The following chart reflects the change in value of a hypothetical $10,000 investment, including reinvested dividends and distributions, in the Fund as measured against a broad-based bond index. The Barclays Intermediate U.S. Aggregate Bond Index (“Index”) represents domestic taxable investment grade bonds, with index components for government and corporate securities, mortgage pass-through securities, and asset-backed securities with average maturities and durations in the intermediate range. The Index is unmanaged and does not reflect the deduction of fees, such as investment management fees. Investors cannot invest directly in an index.
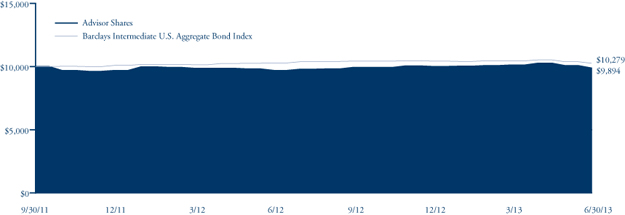
| Since | ||||
| Average Annual Total Return | One | Inception | ||
| as of 6/30/13 | Year | (9/30/11) | ||
| Advisor Shares | 2.09% | -0.61% | ||
| Barclays Intermediate | ||||
| U.S. Aggregate Bond Index | -0.12% | 1.59% |
| Advisor Shares | |
Gross Expense Ratio1 | 1.43% |
Net Expense Ratio1 | 1.43% |
Past performance does not guarantee future results. The performance data quoted represents past performance and current returns may be lower or higher. The investment return and net asset value will fluctuate so that an investor’s shares, when redeemed, may be worth more or less than the original cost. To obtain performance information current to the most recent month end, please visit our website at brownadvisoryfunds.com/performance.html. The performance table and graph above do not reflect the deduction of taxes that a shareholder would pay on Fund distributions or the redemption of Fund shares. Performance data does not reflect the imposition of the redemption fee of 1.00% on shares redeemed within 14 days, and if it did, performance would have been lower.
1 Per the Fund’s prospectus dated October 19, 2012.
41
Schedule of Investments
June 30, 2013
| Par | |||||||||||||
| Value/Shares | Security Description | Rate | Maturity | Value $ | |||||||||
| U.S. Treasury Notes — 57.9% | |||||||||||||
| 8,663,640 | United States Treasury Note | 0.13 | % | 01/15/2023 | 8,408,470 | ||||||||
| 2,220,000 | United States Treasury Note | 1.25 | % | 09/30/2015 | 2,260,670 | ||||||||
| 2,000,000 | United States Treasury Note | 2.00 | % | 01/31/2016 | 2,075,624 | ||||||||
| 2,000,000 | United States Treasury Note | 1.75 | % | 05/31/2016 | 2,063,046 | ||||||||
| Total U.S. Treasury Notes (Cost $15,099,772) | 14,807,810 | ||||||||||||
| Municipal Bonds — 9.4% | |||||||||||||
| 1,000,000 | Colorado Springs Colorado Utilities Revenue | 5.00 | % | 11/15/2021 | 1,191,810 | ||||||||
| 1,000,000 | New York State Urban Development Corp. Revenue Income Tax Revenue Bonds | 5.50 | % | 03/15/2023 | 1,222,860 | ||||||||
| Total Municipal Bonds (Cost $2,550,203) | 2,414,670 | ||||||||||||
| Short-Term Investments — 28.6% | |||||||||||||
| U.S. Treasury Bills — 27.4% | |||||||||||||
| 7,000,000 | United States Treasury Bills | 6,998,251 | |||||||||||
| Money Market Funds — 1.2% | |||||||||||||
| 307,978 | DWS Cash Account Trust — Government & Agency Securities Portfolio, 0.03%* | 307,978 | |||||||||||
| Total Short-Term Investments (Cost $7,306,229) | 7,306,229 | ||||||||||||
| Total Investments — 95.9% (Cost $24,956,204) | 24,528,709 | ||||||||||||
| Other Assets in Excess of Liabilities — 4.1% | 1,041,682 | ||||||||||||
| NET ASSETS — 100.0% | $ | 25,570,391 | |||||||||||
Credit Default Swap Contracts — Sell Protection#
| Termination | Notional | Unrealized | ||||||||||||
| Counterparty | Reference Entity | Rate | Date | Amount† | Appreciation | |||||||||
| Goldman Sachs | Markit CDX North American High Yield Index Series 19 | 5.00% | 12/20/17 | $ | 7,500,000 | $ | 405,149 | |||||||
| # | If the Fund is a seller of protection and a credit event occurs, i.e. bankruptcy or failure to pay, as defined under the terms of that particular swap agreement, the Fund will either (i) pay to the buyer of the protection an amount up to or equal to the notional amount of the swap and take delivery of the reference obligations or underlying securities comprising the reference index or (ii) pay a net settlement amount in the form of cash or securities up to or equal to the notional amount of the swap less the recovery value of the reference obligation or underlying securities comprising the reference index. |
| † | The maximum potential amount (if, after a credit event the value of the related obligation or obligations were determined to have a value of zero) the Fund could be required to pay as seller of credit protection or entitled to as a buyer of credit protection if a credit event occurs as defined under the terms of that particular swap agreement. |
| PORTFOLIO HOLDINGS | ||||
| % of Net Assets | ||||
| U.S. Treasury Notes | 57.9 | % | ||
| U.S. Treasury Bills | 27.4 | % | ||
| Municipal Bonds | 9.4 | % | ||
| Money Market Funds | 1.2 | % | ||
| Other Assets and Liabilities | 4.1 | % | ||
| 100.0 | % | |||
| * | Annualized seven-day yield as of June 30, 2013. |
The accompanying notes are an integral part of these financial statements.
42
A Message to Our Shareholders
June 30, 2013
Dear Shareholder:
During the 12-month period ended June 30, 2013, the Brown Advisory Equity Income Fund Investor Shares (the “Fund”) increased 19.62% in value. The S&P 500 Index, the Fund’s benchmark, increased 20.60% in value during the same period.
The stock market’s robust performance over the past 12 months has been the result of good earnings growth combined with rising valuations off of a low starting point. Animal spirits are finally returning to investors, owing to a strong recovery in personal wealth, low interest rate expectations, a stable economic outlook and below-average equity valuations. Indeed, U.S. equity mutual fund inflows in January snapped a 21-month streak of outflows.
The Fund experienced both good relative performance to its benchmark in a period when the stock market was very strong, and less volatility than the market (posting a 12-month beta of 0.74). This combination reveals that good stock-picking has produced outperformance, or alpha. Additionally, the Fund continues to perform well in down-markets. It notably outperformed during the two months of the past year when the Index declined.
From a sector perspective, the Fund had strong relative returns in the consumer discretionary and information technology sectors. Within the consumer discretionary sector, myopically negative consensus views on GameStop, Inc. and Best Buy Co., Inc. produced two great bargain turnaround opportunities. GameStop, Inc. and Best Buy Co., Inc. returned 139% and 76%, respectively, for the Fund over the 12-month period.
The consensus view on GameStop, Inc. a year ago reflected fears that future video-game purchases would shift to online downloads and away from in-store purchases. We saw things differently. We view GameStop, Inc. as a well-managed company that is embracing all forms of distribution and boasts a loyal customer base and terrific employees. Its used-game business will be tough to displace ahead of the first upgrade in gaming consoles in seven years. We were able to acquire our position at single-digit multiples of cash flow and earnings, with a high, growing dividend yield that is well supported by earnings. Our nonconsensus investment in Best Buy Co., Inc. focused on a new management team’s cost-cutting and execution efforts, while the consensus view was overly focused on the Internet retailing threat. We believe that there remain many layers of improved execution and enhanced retailing practices ahead for Best Buy Co., Inc.
Within information technology, all of our holdings outperformed the sector benchmark. The Fund did not hold Apple Inc. for most of the period when the stock performed poorly, which actually helped relative performance given the company’s large weighting within the sector benchmark. Sometimes, it is what you do not own that can be as important as what you do own.
Our relative performance was weaker in the financials sector. While our absolute performance was a healthy 19%, the Fund could not keep up with the strong 35% return from the Index’s financial sector. We did not hold any stocks in two of the strongest sub-sectors: life insurance and investment banking. We consider many of the names within both of these subsectors to be lower quality in nature. Additionally, some of the Fund’s financial holdings with higher dividend yields such as Valley National Bancorp., Redwood Trust, Inc. and two preferred stocks of Public Storage performed relatively poorly.
Portfolio turnover for the Fund was 21%. Six new names were added and six positions were eliminated over the past year. Additionally, Kraft Inc. separated into two companies, Kraft Foods Group and Mondelez International, and AbbVie was spun out of Abbott Laboratories. Kraft Foods, Mondelez and AbbVie continue to be held by the Fund.
Three new financial service names were acquired. We believe J.P. Morgan is one of the better managed money center banks and is well positioned to take advantage of improving capital and lending markets. It has a growing dividend that is well covered by earnings. The stock’s low valuation is the result of neglect as investor attention has been primarily focused on the business recoveries of weaker banks.
FirstMerit is a mid-cap bank based in Ohio. Conservative purchase accounting employed by the company in a recent acquisition has created an opportunity for us to capitalize on what we believe is a mispriced stock. Adjusting for this acquisition, the transaction looks highly accretive and the stock looks inexpensive in our view.
Redwood Trust is a mortgage-REIT whose primary business is to purchase and securitize jumbo mortgage loans. Management has a great record in assessing credit and a sparkling reputation with its securitization partners. The stock sold off steeply as interest rates rose, allowing us to acquire shares just above book value and at a well-supported dividend yield of over 6%.
43
A Message to Our Shareholders
June 30, 2013
In the information technology sector, Apple was purchased near its 52-week low as consensus fears about its future growth look overblown. The stock’s valuation is highly attractive, while its new capital allocation policy of returning $100 billion to shareholders over the next 10 quarters is tremendously shareholder-friendly.
We eliminated Consolidated Edison and Wisconsin Energy, two highly regarded utilities that also became highly valued during the past year. Home improvement retailer Lowe’s was sold after the stock hit our internal price target. Abbott Labs was eliminated after the spinoff of AbbVie because its dividend was too low to qualify for inclusion in the portfolio.
Two names were eliminated because of deteriorating fundamentals. Valley National, a conservatively run bank in New Jersey, has struggled to maintain its earnings in this ultra-low interest rate environment. As a result, its current earnings do not support its high dividend. CenturyLink was the only company to cut its dividend while the Fund held its shares. Despite the dividend being well covered by cash flow, we believe that this cut signals more trouble down the road for the company than investors may realize.
Two main questions confront our Fund shareholders from here. First, can the Fund continue its recent outperformance amid a strong stock market? Also, has the so-called dividend stock “fad” played out? We can address these questions in turn.
We acknowledge that the Fund’s performance over the past year was unusually good relative to a sharply rising S&P 500 Index. We say “unusually” because the portfolio is oriented toward conservative, higher-quality companies. These historically lower-beta stocks will tend to keep the Fund from outperforming a strong stock market. So, while the Fund had a strong year, we cannot always expect this type of result in a strongly rising stock market.
We invest for total return, balancing the individual attributes of current yield, growth, valuation and business quality. Based on the portfolio’s composition and our historical results, we expect to see meaningful relative outperformance more often in declining equity markets than in rising markets.
In many cases, the dividend yields from individual stocks are not as compelling as they were just 18 months ago. Yet, we remain steadfastly enthusiastic about equity income stocks in general, given our approach. The dividend stock “fad” worries mainly refer to the potential over-valuation in the market of equities, as they have been seen as little more than bond proxies. These proxies tend to be companies with high yields but little growth potential and are often found in the utilities, telecom and REIT sectors. In general, we agree that many bond proxies remain unattractively priced. However, we have recently been able to selectively invest in a few REIT securities that we believe offer solid future total-return potential.
Dividend growth is one of the pillars of our investment philosophy, but it is an attribute rarely considered in the current conventional lament over the dividend “fad.” It is an important component to the portfolio’s total return because it allows for growth in income, something a bond cannot do. Thus, what may appear to be a low starting yield can become a good long-term income producer. For example, a company with a starting yield of 2.5% that is growing its dividend 10% per year will generate a yield on original cost of 4% after five years. A U.S. Treasury bond with a starting yield of 2.5% will continue to generate that same 2.5% yield after five years.
Dividend growth is not only derived from earnings growth but also from a company’s increasing commitment to its dividend, expressed through a rising dividend payout ratio (POR). An important aspect of the Fund’s strategy is to search for companies with low PORs combined with managements willing to increase them. Current holdings Microsoft Corp., Apple Inc. and Wal-Mart Stores Inc. are examples of companies that are growing their dividends faster than earnings. Considering that the broader market’s POR remains well below its historical average, we believe that growing dividends are a very real and important secular trend.
The Fund’s growing income stream starts with an above-average yield, as every investment must have a starting yield greater than the S&P 500 Index. But in the end, the Fund’s primary goal is to seek total return rather than absolute yield. Dividend yield and growth represent meaningful components to this total return, in addition to an expanding valuation. Dividends offer you, the Fund’s shareholders, a diversified return stream that is not solely reliant on capital appreciation and can provide some ballast in tougher times.
Sincerely,
Michael L. Foss, CFA
Portfolio Manager
Brian W. Graney, CFA
Portfolio Manager
44
A Message to Our Shareholders
June 30, 2013
Past performance does not guarantee future results.
Mutual fund investing involves risk. Principal loss is possible. Investments in debt securities typically decrease in value when interest rates rise. This risk is usually greater for longer-term debt securities. Investments in lower-rated and non-rated securities present a greater risk of loss to principal and interest than higher-rated securities. Investments in smaller and medium capitalization companies generally carry greater risk than is customarily associated with larger companies for various reasons such as narrower markets, limited financial resources and less liquid stock. The value of the Fund’s investments in REITs and Real Estate may change in response to changes in the real estate market such as declines in the value of real estate, lack of available capital or financing opportunities, and increases in property taxes or operating costs. The Fund may invest in ETFs, which may trade at a discount to the aggregate value of the underlying securities and although expense ratios for ETFs are generally low, frequent trading of ETFs by the Fund can generate brokerage expenses. Investments in foreign securities entail certain risks not associated with investments in domestic securities, such as volatility of currency exchange rates, and in some cases, political and economic instability and relatively illiquid markets. Investing in Master Limited Partnerships (“MLPs”) entails risk related to fluctuations in energy prices, decreases in supply of or demand for energy commodities, unique tax consequences due to the partnership structure and various other risks. Privately Placement issued securities are restricted securities that are not publicly traded. Delay or difficulty in selling such securities may result in a loss to the Fund.
Fund holdings and sector allocations are subject to change and should not be considered a recommendation to buy or sell any security. For a complete list of fund holdings, please refer to the Schedule of Investments provided in this report.
Definitions for terms and indices are provided in the Glossary of Terms.
45
Performance Chart and Analysis
June 30, 2013
COMPARISON OF CHANGE IN VALUE OF A $10,000 INVESTMENT
The following chart reflects the change in value of a hypothetical $10,000 investment, including reinvested dividends and distributions, in the Fund as measured against the broad-based securities market index. The S&P 500 (“Index”) is a market-value weighted index representing the performance of 500 widely held, publicly traded large capitalization stocks. The Index is unmanaged and does not reflect the deduction of fees, such as investment management fees. Investors cannot invest directly in an index.
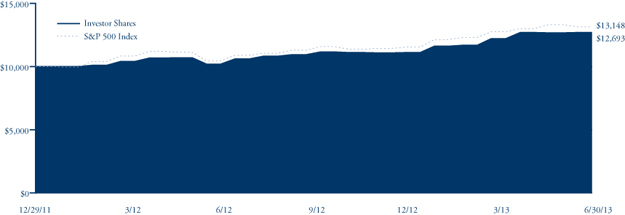
| Since | ||||
| Average Annual Total Return | One | Inception | ||
| as of 6/30/13 | Year | (12/29/11) | ||
Institutional Shares1 | 19.80% | 17.35% | ||
| Investor Shares | 19.62% | 17.18% | ||
| Advisor Shares | 19.33% | 16.87% | ||
| S&P 500 Index | 20.60% | 19.96% |
| Institutional Shares | Investor Shares | Advisor Shares | |
Gross Expense Ratio2 | 0.87% | 1.02% | 1.27% |
Net Expense Ratio2 | 0.87% | 1.02% | 1.27% |
Past performance does not guarantee future results. The performance data quoted represents past performance and current returns may be lower or higher. The investment return and net asset value will fluctuate so that an investor’s shares, when redeemed, may be worth more or less than the original cost. To obtain performance information current to the most recent month end, please visit our website at brownadvisoryfunds.com/performance.html. The performance table and graph above do not reflect the deduction of taxes that a shareholder would pay on Fund distributions or the redemption of Fund shares. Performance data does not reflect the imposition of the redemption fee of 1.00% on shares redeemed within 14 days, and if it did, performance would have been lower.
| 1 | Performance information for the Institutional Shares, prior to commencement of operations on October 19, 2012, is based on the performance of Investor Shares, and adjusted for the lower expenses applicable to Institutional Shares. |
| 2 | Per the Fund’s prospectus dated October 19, 2012. |
46
Schedule of Investments
June 30, 2013
| Shares | Security Description | Value $ | ||||||
| Common Stocks — 88.9% | ||||||||
| Consumer Discretionary — 12.8% | ||||||||
| 158,735 | Best Buy, Inc. | 4,338,227 | ||||||
| 30,214 | Coach, Inc. | 1,724,917 | ||||||
| 50,555 | GameStop Corp. | 2,124,827 | ||||||
| 45,898 | McDonald’s Corp. | 4,543,902 | ||||||
| 17,619 | Tiffany & Co. | 1,283,368 | ||||||
| 33,587 | Time Warner Cable, Inc. | 3,777,866 | ||||||
| 23,986 | V.F. Corp. | 4,630,737 | ||||||
| 22,423,844 | ||||||||
| Consumer Staples — 17.0% | ||||||||
| 191,217 | Altria Group, Inc. | 6,690,683 | ||||||
| 74,925 | Coca-Cola Co. | 3,005,242 | ||||||
| 63,117 | Kraft Foods Group, Inc. | 3,526,347 | ||||||
| 119,032 | Mondelez International, Inc. | 3,395,983 | ||||||
| 30,363 | PepsiCo, Inc. | 2,483,390 | ||||||
| 43,929 | Philip Morris International, Inc. | 3,805,130 | ||||||
| 91,231 | Unilever NV | 3,586,290 | ||||||
| 46,279 | Wal-Mart Stores, Inc. | 3,447,322 | ||||||
| 29,940,387 | ||||||||
| Energy — 9.5% | ||||||||
| 193,832 | Kinder Morgan, Inc. | 7,394,691 | ||||||
| 42,558 | Occidental Petroleum Corp. | 3,797,450 | ||||||
| 112,861 | Total S.A. ADR | 5,496,331 | ||||||
| 16,688,472 | ||||||||
| Financials — 13.5% | ||||||||
| 76,109 | Cincinnati Financial Corp. | 3,493,403 | ||||||
| 48,584 | Erie Indemnity Co. | 3,871,659 | ||||||
| 93,392 | FirstMerit Corp. | 1,870,642 | ||||||
| 78,015 | JPMorgan Chase & Co. | 4,118,412 | ||||||
| 38,576 | M&T Bank Corp. | 4,310,868 | ||||||
| 173,208 | OneBeacon Insurance Group, Ltd. | 2,508,052 | ||||||
| 48,867 | T. Rowe Price Group, Inc. | 3,574,621 | ||||||
| 23,747,657 | ||||||||
| Health Care — 12.4% | ||||||||
| 74,929 | AbbVie, Inc. | 3,097,565 | ||||||
| 51,034 | Johnson & Johnson | 4,381,779 | ||||||
| 113,331 | Merck & Co., Inc. | 5,264,225 | ||||||
| 76,085 | Novartis AG ADR | 5,379,970 | ||||||
| 131,614 | Pfizer, Inc. | 3,686,508 | ||||||
| 21,810,047 | ||||||||
| Industrials — 6.2% | ||||||||
| 133,830 | Healthcare Services Group, Inc. | 3,281,512 | ||||||
| 68,767 | PACCAR, Inc. | 3,690,037 | ||||||
| 42,551 | United Technologies Corp. | 3,954,690 | ||||||
| 10,926,239 | ||||||||
| Information Technology — 13.1% | ||||||||
| 63,617 | Accenture PLC | 4,577,879 | ||||||
| 7,803 | Apple, Inc. | 3,090,612 | ||||||
| 79,308 | Automatic Data Processing, Inc. | 5,461,149 | ||||||
| 99,194 | Microchip Technology, Inc. | 3,694,977 | ||||||
| 178,873 | Microsoft Corp. | 6,176,485 | ||||||
| 23,001,102 | ||||||||
| Materials — 2.2% | ||||||||
| 34,325 | E.I. du Pont de Nemours & Co. | 1,802,063 | ||||||
| 18,802 | Praxair, Inc. | 2,165,238 | ||||||
| 3,967,301 | ||||||||
| Telecommunication Services — 0.9% | ||||||||
| 220,911 | Windstream Corp. | 1,703,224 | ||||||
| Utilities — 1.3% | ||||||||
| 40,572 | Dominion Resources, Inc. | 2,305,301 | ||||||
| Total Common Stocks (Cost $132,000,639) | 156,513,574 | |||||||
| Preferred Stocks — 3.4% | ||||||||
| 130,689 | Public Storage, Inc. — Series S | 3,267,225 | ||||||
| 100,880 | Public Storage, Inc. — Series O† | 2,640,030 | ||||||
| Total Preferred Stocks (Cost $6,150,665) | 5,907,255 | |||||||
| Real Estate Investment Trusts — 3.2% | ||||||||
| 79,425 | Plum Creek Timber Co., Inc. | 3,706,765 | ||||||
| 118,536 | Redwood Trust, Inc. | 2,015,112 | ||||||
| Total Real Estate Investment Trusts (Cost $5,201,559) | 5,721,877 | |||||||
| Short-Term Investments — 4.7% | ||||||||
| Money Market Funds — 4.7% | ||||||||
| 8,246,731 | DWS Cash Account Trust — Government | |||||||
| & Agency Securities Portfolio, 0.03%# | 8,246,731 | |||||||
| Total Short-Term Investments (Cost $8,246,731) | 8,246,731 | |||||||
| Total Investments — 100.2% (Cost $151,599,594) | 176,389,437 | |||||||
| Liabilities in Excess of Other Assets — (0.2)% | (432,499 | ) | ||||||
| NET ASSETS — 100.0% | $ | 175,956,938 | ||||||
| PORTFOLIO HOLDINGS | ||||
| % of Net Assets | ||||
| Consumer Staples | 17.0 | % | ||
| Financials | 13.5 | % | ||
| Information Technology | 13.1 | % | ||
| Consumer Discretionary | 12.8 | % | ||
| Health Care | 12.4 | % | ||
| Energy | 9.5 | % | ||
| Industrials | 6.2 | % | ||
| Money Market Funds | 4.7 | % | ||
| Preferred Stocks | 3.4 | % | ||
| Real Estate Investment Trusts | 3.2 | % | ||
| Materials | 2.2 | % | ||
| Utilities | 1.3 | % | ||
| Telecommunication Services | 0.9 | % | ||
| Other Assets and Liabilities | (0.2 | )% | ||
| 100.0 | % | |||
ADR — American Depositary Receipt
| # | Annualized seven-day yield as of June 30, 2013. |
| † | A portion of this security is considered illiquid. At June 30, 2013, the total market value of securities considered illiquid was $1,184,554 or 0.7% of net assets. |
The accompanying notes are an integral part of these financial statements.
47
A Message to Our Shareholders
June 30, 2013
Dear Shareholder:
During the 12-month period ended June 30, 2013, the Brown Advisory Sustainable Growth Fund Advisor Shares (the “Fund”) increased 16.07% in value. During the same period, the Russell 1000® Growth Index, the Fund’s benchmark, increased 17.07% in value.
Investor sentiment has improved substantially over the last 12 months as fears over a eurozone collapse and a potential U.S. fiscal shutdown appear to have subsided. Central banks around the world have aggressively loosened monetary policy to revive growth, which has driven interest rates to decade-low levels. Despite the dovish stance, inflation continues to remain subdued, which has placed the focus of the Federal Reserve squarely on improving the lackluster job market. Given the steady pace of global economic output and a dim outlook for bonds, investors have once again embraced equities, and markets have reached record highs. Rather than chase the rising tide, we remain highly selective in our approach and committed to bottom-up, fundamentally driven analysis to navigate the market environment.
We invest in top-quality companies with sustainable competitive advantages. We believe that one compelling way for a company to gain a competitive advantage is to develop and leverage its positive environmental attributes. This has been a focus of our strategy since inception and one that we believe is particularly beneficial, since much of the investment world still largely ignores the value inherent in these environmental business advantages (or what we have come to call EBA). A company’s EBA may enhance shareholder value in several ways, from growing revenue with new products, to reducing costs through efficiency, to enhancing brand and customer loyalty through demonstrated environmental commitment. It is important to note that we view a company’s EBA entirely through a financial lens—evaluating its potential for contributing to a company’s business results and ultimately its stock price.
From an individual security perspective, Google, ARM Holdings, LKQ, Wabtec and Nike were all solid performers for the year. Each company is using its EBA to help drive financial performance and become more competitive versus its peers.
For example, ARM’s market opportunity is growing as semiconductor companies increasingly adopt its energy-efficient processor technology. By leveraging its low-energy design technology into servers, networking equipment and microprocessors, ARM has improved its prospects while many rival semiconductor companies have suffered from a weak PC demand environment.
Apple, EMC, Sigma Aldrich, Clean Harbors and Mettler-Toledo were our top negative contributors during the year as slowing revenue growth negatively impacted near-term investor sentiment.
Slowing smartphone growth and the absence of a new product to offset the shortfall from the existing portfolio have hurt Apple’s gross margins and led investors to question the company’s long-term prospects for innovation-led growth. We remain committed to our position in Apple based on the strength of the company’s product ecosystem, the value of its brand and its leadership position in consumer electronics.
During the period, we made several new additions to the portfolio, including Chipotle Mexican Grill, Salesforce.com, Cerner, Middleby, Qualcomm and IHS. Chipotle has developed a loyal customer base driven by high-quality ingredients and expeditious service, which has translated into impressive operating margins and free cash flow generation. We expect new store openings and increased traffic at its existing stores to drive strong growth. Salesforce.com has a leading position in some of the fastest-growing markets in the broader software industry, including cloud-computing and software-as-a-service. Customers have embraced cloud-based software due to its relative ease of deployment, low cost and low-energy profile. Cerner is a leading provider of software to hospitals and health care organizations to help them become more efficient and less wasteful and provide better outcomes for patients. Increased regulatory burdens on hospitals have driven a large replacement cycle for IT systems, and Cerner is gaining share from less-innovative competitors. Middleby is a global provider of energy-efficient cooking equipment primarily to the commercial restaurant industry. We believe Middleby has a long runway of growth ahead of it due to the company’s strong innovation pipeline and its recent entrance into the residential market. Qualcomm is a leading semiconductor chipset provider to the wireless communication industry. We believe that the company’s ARM-based SnapDragon processor in notebooks and tablets should provide incremental growth above an already solid handset outlook. Finally, IHS is the leading global provider of critical technical information to customers in the energy, aerospace, electronics and automotive industries. Continued strong growth in the Environmental, Health and Safety division, we believe, should help sustain healthy financial results for the company going forward.
We eliminated Mettler-Toledo, Sigma-Aldrich, Denbury Resources, Johnson Controls and Autodesk. In each case, while our investment thesis remained intact, we elected to reallocate capital to companies with better growth prospects.
48
A Message to Our Shareholders
June 30, 2013
We invest at the intersection of strong fundamentals and sustainable competitive advantages driven by EBA. We believe that the degree to which companies incorporate environmental strategies into their revenue and cost plans will be a key determinant in their success going forward. In fact, we are already seeing this divergence in performance play out across multiple companies in our portfolio that are using their environmental strategy to distance themselves from their competitors.
We thank our investors for their confidence in our approach and look forward to communicating our progress at the next opportunity.
Sincerely,
Karina Funk
Portfolio Manager
David Powell
Portfolio Manager
Past performance is not a guarantee of future results.
Mutual fund investing involves risk. Principal loss is possible. The Fund’s investment focus on environmental factors could cause it to make or avoid investments that could result in the Fund underperforming similar funds that do not have an environmental focus. Investments in smaller capitalization companies generally carry greater risk than is customarily associated with larger companies for various reasons such as narrower markets, limited financial resources and less liquid stock. Investments in foreign securities entail certain risks not associated with investments in domestic securities, such as volatility of currency exchange rates, and in some cases, political and economic instability and relatively illiquid markets. These risks are greater for investments in emerging markets.
Fund holdings and sector allocations are subject to change and should not be considered a recommendation to buy or sell any security. For a complete list of fund holdings, please refer to the Schedule of Investments provided in this report.
Definitions for terms and indices are provided in the Glossary of Terms.
49
Performance Chart and Analysis
June 30, 2013
COMPARISON OF CHANGE IN VALUE OF A $10,000 INVESTMENT
The following chart reflects the change in value of a hypothetical $10,000 investment, including reinvested dividends and distributions, in the Fund as measured against a broad-based securities market index. The Russell 1000® Growth Index measures the performance of the large-cap growth segment of the U.S. equity universe. It includes those Russell 1000® companies with higher price-to-book and higher forecasted growth values. The index is unmanaged and does not reflect the deduction of fees, such as investment management fees. Investors cannot invest directly in an index.
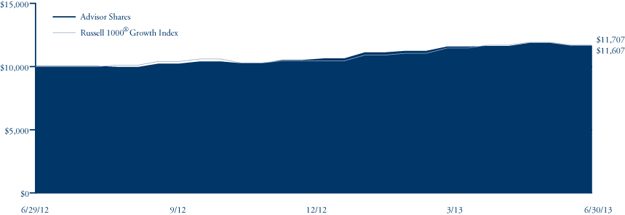
| Since | ||||
| Average Annual Total Return | One | Inception | ||
| as of 6/30/13 | Year | (6/29/12) | ||
| Institutional Shares | 16.47% | 16.42% | ||
| Investor Shares | 16.27% | 16.22% | ||
| Advisor Shares | 16.07% | 16.02% | ||
Russell 1000® Growth Index | 17.07% | 17.02% |
| Institutional Shares | Investor Shares | Advisor Shares | |
Gross Expense Ratio1 | 1.25% | 1.40% | 1.65% |
Net Expense Ratio1 | 1.00% | 1.15% | 1.35% |
Past performance does not guarantee future results. The performance data quoted represents past performance and current returns may be lower or higher. The investment return and net asset value will fluctuate so that an investor’s shares, when redeemed, may be worth more or less than the original cost. To obtain performance information current to the most recent month end, please visit our website at brownadvisoryfunds.com/performance.html. The performance table and graph above do not reflect the deduction of taxes that a shareholder would pay on Fund distributions or the redemption of Fund shares. Performance data does not reflect the imposition of the redemption fee of 1.00% on shares redeemed within 14 days, and if it did, performance would have been lower.
| 1 | Per the Fund’s prospectus dated October 19, 2012. |
50
Schedule of Investments
June 30, 2013
| Shares | Security Description | Value $ | ||||||
| Common Stocks — 96.3% | ||||||||
| Consumer Discretionary — 15.6% | ||||||||
| 51,039 | BorgWarner, Inc.* | 4,397,010 | ||||||
| 9,824 | Chipotle Mexican Grill, Inc.* | 3,579,374 | ||||||
| 225,759 | LKQ Corp.* | 5,813,294 | ||||||
| 74,607 | Nike, Inc. | 4,750,974 | ||||||
| 77,037 | Starbucks Corp. | 5,045,153 | ||||||
| 90,478 | TJX Companies, Inc. | 4,529,329 | ||||||
| 28,115,134 | ||||||||
| Consumer Staples — 4.5% | ||||||||
| 68,247 | Church & Dwight Co., Inc. | 4,211,522 | ||||||
| 77,373 | Whole Foods Market, Inc. | 3,983,162 | ||||||
| 8,194,684 | ||||||||
| Health Care — 4.6% | ||||||||
| 35,236 | Cerner Corp.* | 3,385,827 | ||||||
| 49,004 | Waters Corp.* | 4,902,850 | ||||||
| 8,288,677 | ||||||||
| Industrials — 32.1% | ||||||||
| 23,595 | Acuity Brands, Inc. | 1,781,894 | ||||||
| 50,152 | Canadian National Railway Co. | 4,878,285 | ||||||
| 80,399 | Clean Harbors, Inc.* | 4,062,562 | ||||||
| 24,901 | Cummins, Inc. | 2,700,762 | ||||||
| 117,069 | Danaher Corp. | 7,410,468 | ||||||
| 47,079 | IHS, Inc.* | 4,914,106 | ||||||
| 61,009 | J.B. Hunt Transport Services, Inc. | 4,407,290 | ||||||
| 21,864 | Middleby Corp.* | 3,718,848 | ||||||
| 50,613 | Pall Corp. | 3,362,222 | ||||||
| 60,492 | Stericycle, Inc.* | 6,680,132 | ||||||
| 116,639 | Verisk Analytics, Inc.* | 6,963,348 | ||||||
| 129,256 | Wabtec Corp. | 6,906,148 | ||||||
| 57,786,065 | ||||||||
| Information Technology — 31.8% | ||||||||
| 88,301 | Accenture PLC | 6,354,140 | ||||||
| 60,480 | ANSYS, Inc.* | 4,421,088 | ||||||
| 14,645 | Apple, Inc. | 5,800,592 | ||||||
| 92,852 | Arm Holdings PLC ADR | 3,359,385 | ||||||
| 174,729 | EMC Corp.* | 4,127,099 | ||||||
| 8,385 | Google, Inc.* | 7,381,903 | ||||||
| 24,736 | International Business Machines Corp. | 4,727,297 | ||||||
| 91,810 | Intuit, Inc. | 5,603,164 | ||||||
| 107,289 | QUALCOMM, Inc. | 6,553,212 | ||||||
| 94,935 | Salesforce.com, Inc.* | 3,624,618 | ||||||
| 210,148 | Trimble Navigation, Ltd.* | 5,465,950 | ||||||
| 57,418,448 | ||||||||
| Materials — 7.7% | ||||||||
| 84,595 | Ecolab, Inc. | 7,206,648 | ||||||
| 57,390 | Praxair, Inc. | 6,609,032 | ||||||
| 13,815,680 | ||||||||
| Total Common Stocks (Cost $145,245,096) | 173,618,688 | |||||||
| Short-Term Investments — 3.6% | ||||||||
| Money Market Funds — 3.6% | ||||||||
| 6,471,573 | DWS Cash Account Trust — Government | |||||||
| & Agency Securities Portfolio, 0.03%# | 6,471,573 | |||||||
| Total Short-Term Investments (Cost $6,471,573) | 6,471,573 | |||||||
| Total Investments — 99.9% (Cost $151,716,669) | 180,090,261 | |||||||
| Other Assets in Excess of Liabilities — 0.1% | 239,433 | |||||||
| NET ASSETS — 100.0% | $ | 180,329,694 | ||||||
| PORTFOLIO HOLDINGS | ||||
| % of Net Assets | ||||
| Industrials | 32.1 | % | ||
| Information Technology | 31.8 | % | ||
| Consumer Discretionary | 15.6 | % | ||
| Materials | 7.7 | % | ||
| Health Care | 4.6 | % | ||
| Consumer Staples | 4.5 | % | ||
| Money Market Funds | 3.6 | % | ||
| Other Assets and Liabilities | 0.1 | % | ||
| 100.0 | % | |||
ADR — American Depositary Receipt
| * | Non-Income Producing |
| # | Annualized seven-day yield as of June 30, 2013. |
The accompanying notes are an integral part of these financial statements.
51
A Message to Our Shareholders
June 30, 2013
Dear Shareholder:
During the 12-month period ended June 30, 2013, the Brown Advisory Tax-Exempt Bond Fund (the “Fund”) increased 0.03% in value. During the same period, the Barclays 1-10 Year Blended Municipal Bond Index, the Fund’s benchmark, increased 0.34% in value.
Over the past couple of months, fixed income markets have experienced one of the most challenging periods in a decade, as investors began to rethink the U.S. Federal Reserve’s monetary strategy given improving economic growth. Municipal bond yields followed U.S. Treasury yields higher in early May as national employment statistics began to modestly surprise to the upside. In June, Federal Reserve Chairman Ben Bernanke touched off another sharp increase in yields when his seemingly benign comments related to the timing of the Federal Reserve’s quantitative-easing exit strategy prompted a negative move in both stocks and bonds. All told, yields for 10-year AAA-rated municipal bonds increased by roughly 100 basis-points over the last two months of the quarter.
The speed and severity of the interest rate move caught many investors by surprise and assets were promptly pulled from virtually all fixed income sectors. Municipal bond mutual funds collectively experienced over $16 billion in net outflows during June, representing about 3% of the industry’s total assets under management. These outflows exacerbated the negative movement in municipal bond values, as many fund managers were forced to liquidate holdings into a market that temporarily had very few interested buyers. This liquidity mismatch caused a brief period where both interest rates and credit spreads moved against investors.
We believe that the decline in June in the muni-bond market was driven by technical factors rather than deterioration in overall credit quality. The Fund remains overweight revenue-backed issues compared to the Index, and we believe that these sectors should provide stable revenue streams and upside potential as the U.S. economy improves.
We believe that this period of volatility affords the Fund an opportunity to take advantage of market dislocations by purchasing bonds at what we believe are attractive relative levels. We believe our core philosophy of seeking bonds that are underpriced on a fundamental basis makes us especially well-positioned in this type of market.
Sincerely,
Stephen M. Shutz, CFA
Portfolio Manager
Past performance is not a guarantee of future results.
Mutual fund investing involves risk. Principal loss is possible. The Fund is non-diversified, meaning it may invest in fewer individual holdings than a diversified fund. Therefore, the Fund is more exposed to individual stock volatility than a diversified fund. Investments in debt securities typically decrease in value when interest rates rise. This risk is usually greater for longer-term debt securities. Investments in lower-rated and non-rated securities present a greater risk of loss to principal and interest than higher-rated securities. Municipal securities are subject to adverse political or economic factors, including changes in the tax law. Income from tax-exempt funds may be subject to state and local taxes and a portion of income may be subject to the federal and/or state alternative minimum tax for certain investors. Federal income tax rules will apply to any capital gains distribution.
Fund holdings and sector allocations are subject to change and should not be considered a recommendation to buy or sell any security. For a complete list of fund holdings, please refer to the Schedule of Investments provided in this report.
Definitions for terms and indices are provided in the Glossary of Terms.
52
Performance Chart and Analysis
June 30, 2013
COMPARISON OF CHANGE IN VALUE OF A $10,000 INVESTMENT
The following chart reflects the change in value of a hypothetical $10,000 investment, including reinvested dividends and distributions, in the Fund as measured against the broad-based municipal bond index. The Barclays 1-10 Year Blended Municipal Bond Index (“Index”) is a market index of high quality, domestic fixed income securities with maturities of less than 10 years. The Index is unmanaged and does not reflect the deduction of fees, such as investment management fees. Investors cannot invest directly in an index.
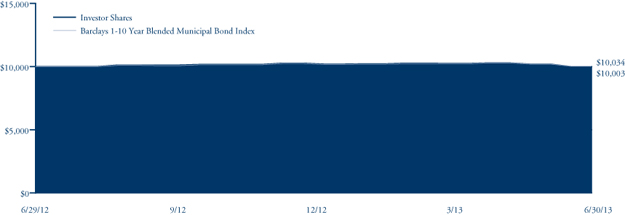
| Since | ||||
| Average Annual Total Return | One | Inception | ||
| as of 6/30/13 | Year | (6/29/12) | ||
| Investor Shares | 0.03% | 0.03% | ||
| Barclays 1-10 Year Blended | ||||
| Municipal Bond Index | 0.34% | 0.34% |
| Investor Shares | |
Gross Expense Ratio1 | 0.60% |
Net Expense Ratio1 | 0.60% |
Past performance does not guarantee future results. The performance data quoted represents past performance and current returns may be lower or higher. The investment return and net asset value will fluctuate so that an investor’s shares, when redeemed, may be worth more or less than the original cost. To obtain performance information current to the most recent month end, please visit our website at brownadvisoryfunds.com/performance.html. The performance table and graph above do not reflect the deduction of taxes that a shareholder would pay on Fund distributions or the redemption of Fund shares. Performance data does not reflect the imposition of the redemption fee of 1.00% on shares redeemed within 14 days, and if it did, performance would have been lower.
| 1 | Per the Fund’s prospectus dated October 19, 2012. |
53
Schedule of Investments
June 30, 2013
| Par Value | Security Description | Rate | Maturity | Value $ | |||||||||
| Municipal Bonds — 97.7% | |||||||||||||
| General Obligation Bonds — 21.6% | |||||||||||||
| 665,000 | Charleston County Capital Improvement | 4.00 | % | 11/01/2013 | 673,685 | ||||||||
| 1,045,000 | Chicago Illinois | 5.25 | % | 01/01/2020 | 1,193,693 | ||||||||
| 2,500,000 | City of Chicago — Modern Schools Across Chicago Series A | 5.00 | % | 12/01/2019 | 2,837,150 | ||||||||
| 400,000 | City of Leawood Improvement Series A | 2.00 | % | 09/01/2013 | 401,276 | ||||||||
| 650,000 | City of Leawood Improvement Series A | 2.00 | % | 09/01/2014 | 663,526 | ||||||||
| 2,000,000 | City of Rochester Series 1 | 4.00 | % | 08/15/2016 | 2,182,620 | ||||||||
| 1,000,000 | Cook County Series A | 5.00 | % | 11/15/2019 | 1,146,660 | ||||||||
| 2,000,000 | Cook County Callable 11/15/2019 @ 100^ | 5.00 | % | 11/15/2021 | 2,253,860 | ||||||||
| 1,785,000 | De Soto Texas Independent School District | 3.00 | % | 08/15/2016 | 1,900,454 | ||||||||
| 1,150,000 | Honolulu Hawaii City & County | 4.00 | % | 08/01/2016 | 1,258,686 | ||||||||
| 1,570,000 | Hurst Euless Bedford Texas Independent School Buildings | 5.00 | % | 08/15/2017 | 1,810,006 | ||||||||
| 750,000 | Illinois State | 5.50 | % | 08/01/2013 | 753,578 | ||||||||
| 1,500,000 | Illinois State | 4.00 | % | 07/01/2016 | 1,601,685 | ||||||||
| 1,000,000 | Las Vegas Water District — Water Bonds Series B | 4.00 | % | 06/01/2016 | 1,084,170 | ||||||||
| 1,315,000 | Metropolitan Government of Nashville & Davidson County — | ||||||||||||
| District Energy System Tax Refunding Series A | 3.00 | % | 10/01/2015 | 1,388,259 | |||||||||
| 1,000,000 | Midland Texas Independent School District | 2.00 | % | 02/15/2015 | 1,025,190 | ||||||||
| 2,000,000 | New York New York Series J | 5.00 | % | 08/01/2016 | 2,247,880 | ||||||||
| 1,310,000 | North Central Wisconsin Technical College District Promissory Notes | 2.00 | % | 09/01/2014 | 1,335,231 | ||||||||
| 1,500,000 | Ohio State Third Frontier | 3.13 | % | 11/01/2014 | 1,556,985 | ||||||||
| 1,200,000 | Oxford Alabama Series B | 2.00 | % | 09/01/2014 | 1,219,380 | ||||||||
| 1,000,000 | Richardson Texas Independent School District | 3.00 | % | 02/15/2015 | 1,039,420 | ||||||||
| 2,000,000 | State of Illinois | 4.00 | % | 08/01/2014 | 2,067,380 | ||||||||
| 2,000,000 | State of Minnesota — State Trunk Highway Series B | 5.00 | % | 08/01/2015 | 2,187,600 | ||||||||
| 1,010,000 | State of Wisconsin Series A | 5.00 | % | 05/01/2015 | 1,093,507 | ||||||||
| 34,921,881 | |||||||||||||
| Revenue Bonds — 66.7% | |||||||||||||
| 700,000 | Alabama 21st Century Authority — Tobacco Settlement Series A | 4.00 | % | 06/01/2015 | 739,277 | ||||||||
| 175,000 | Allegheny County Pennsylvania Hospital Development Authority | 5.00 | % | 10/15/2018 | 201,119 | ||||||||
| 500,000 | Arizona Health Facilities Authority Hospital — Phoenix Children’s Hospital Series A | 5.00 | % | 02/01/2020 | 566,310 | ||||||||
| 1,850,000 | Arizona Health Facilities Authority Hospital — Phoenix Children’s Hospital Series A | 5.00 | % | 02/01/2021 | 2,088,188 | ||||||||
| 1,050,000 | Broward County — Airport System Non-AMT Series Q-1 | 5.00 | % | 10/01/2019 | 1,217,979 | ||||||||
| 2,000,000 | City of Chicago — Chicago O’Hare International Airport Third Lien Non-AMT Series B | 5.00 | % | 01/01/2017 | 2,220,240 | ||||||||
| 1,500,000 | City of Lincoln — Lincoln Electric System | 4.00 | % | 09/01/2015 | 1,611,090 | ||||||||
| 1,400,000 | City of Miami Beach Health Facilities Authority — Mount Sinai Medical Center of Florida | ||||||||||||
| Callable 11/15/2022 @ 100^ | 4.00 | % | 11/15/2025 | 1,283,716 | |||||||||
| 1,415,000 | City of Miami Beach Health Facilities Authority Hospital — | ||||||||||||
| Mount Sinai Medical Center of Florida | 5.00 | % | 11/15/2021 | 1,548,477 | |||||||||
| 2,000,000 | City of Philadelphia — Water & Wastewater | 5.25 | % | 12/15/2014 | 2,077,640 | ||||||||
| 1,205,000 | Cobb County Georgia Kennestone Hospital Revenue Anticipation Certificates | ||||||||||||
| Callable 4/1/2023 @ 100^ | 5.00 | % | 04/01/2028 | 1,313,703 | |||||||||
| 1,635,000 | Collier County Florida — Gas Tax Refunding Callable 6/1/2020 @ 100^ | 5.00 | % | 06/01/2021 | 1,832,099 | ||||||||
| 300,000 | Colorado Health Facilities Authority — Covenant Retirement Communities | 5.00 | % | 12/01/2020 | 332,778 | ||||||||
| 2,405,000 | Colorado Health Facilities Authority Revenue & Refunding — Covenant Retirement | ||||||||||||
| Communities, Inc. Series A, Callable 12/01/2022 @ 100^ | 5.00 | % | 12/01/2027 | 2,449,709 | |||||||||
| 205,000 | Connecticut State Health & Education Facilities Authority — Bridgeport Hospital Series D | 5.00 | % | 07/01/2020 | 233,171 | ||||||||
| 335,000 | Cook County Sales Tax Revenue | 4.00 | % | 11/15/2015 | 360,001 | ||||||||
| 750,000 | Dallas/Fort Worth International Airport Joint Revenue Improvement Series C | 4.00 | % | 11/01/2017 | 825,900 | ||||||||
| 1,000,000 | Denver Colorado Urban Renewal Authority Tax Increase Revenue Bonds^ | 5.00 | % | 12/01/2023 | 1,114,270 | ||||||||
| 1,000,000 | Georgia State Housing & Finance Authority | 1.75 | % | 12/01/2019 | 965,710 | ||||||||
| 500,000 | Georgia State Housing & Finance Authority | 2.00 | % | 06/01/2020 | 486,110 | ||||||||
| 500,000 | Georgia State Housing & Finance Authority | 2.10 | % | 12/01/2020 | 483,595 | ||||||||
| 750,000 | Illinois Finance Authority Northwestern Memorial Callable 8/15/2022 @ 100^ | 4.00 | % | 08/15/2033 | 701,603 | ||||||||
| 2,682,057 | Illinois Housing Development Authority Series A, Callable 1/01/2023 @ 100^ | 2.45 | % | 06/01/2043 | 2,640,405 | ||||||||
| 475,000 | Indiana Finance Authority — First Lien Wastewater Utility Series A | 4.00 | % | 10/01/2016 | 516,529 | ||||||||
The accompanying notes are an integral part of these financial statements.
54
Schedule of Investments
June 30, 2013
| Par Value | Security Description | Rate | Maturity | Value $ | |||||||||
| Revenue Bonds — (Continued) | |||||||||||||
| 1,500,000 | Indiana Finance Authority Hospital Revenue Community Health Network Series A | 5.00 | % | 05/01/2023 | 1,645,935 | ||||||||
| 500,000 | Indianapolis Local Public Improvement Bond Bank Refunding Series B | 3.00 | % | 02/01/2016 | 525,570 | ||||||||
| 1,000,000 | Iowa Finance Authority Health Facilities — Mercy Medical Center Project | ||||||||||||
| Callable 08/15/2022 @ 100^ | 5.00 | % | 08/15/2026 | 1,075,830 | |||||||||
| 1,820,000 | JEA Electric System Subordinated Series B | 5.00 | % | 10/01/2017 | 2,091,326 | ||||||||
| 1,280,000 | Kansas Development Finance Authority — Wichita State University Series A, | ||||||||||||
| Callable 06/01/2020 @ 100^ | 5.00 | % | 06/01/2021 | 1,466,701 | |||||||||
| 2,250,000 | Kansas Development Finance Authority Hospital Revenue — | ||||||||||||
| Adventist Health System/Subelt Obligated Group Callable 05/15/2022 @ 100^ | 5.00 | % | 11/15/2028 | 2,390,760 | |||||||||
| 1,035,000 | Lower Colorado River Authority Refunding Series B | 5.00 | % | 05/15/2018 | 1,188,490 | ||||||||
| 1,000,000 | Lower Colorado River Authority Texas Revenue Series B | 5.00 | % | 05/15/2021 | 1,167,550 | ||||||||
| 1,000,000 | Maryland Health & Higher Educational Facilities Authority — Greater Baltimore Medical Center | 3.50 | % | 07/01/2015 | 1,048,660 | ||||||||
| 2,500,000 | Metropolitan Government of Nashville & Davidson County Electric System Series A | 5.00 | % | 05/15/2016 | 2,790,650 | ||||||||
| 1,500,000 | Miami-Dade County — Transit System Sales Surtax | 3.00 | % | 07/01/2015 | 1,567,620 | ||||||||
| 1,000,000 | Miami-Dade County Florida Expressway Authority | 5.00 | % | 07/01/2019 | 1,157,420 | ||||||||
| 2,500,000 | Miami-Dade County Florida Transit System Sales Surtax Callable 07/01/2022 @ 100^ | 5.00 | % | 07/01/2023 | 2,808,200 | ||||||||
| 1,250,000 | Monroe County Georgia Development Authority Pollution Revenue Bonds# | 2.40 | % | 01/01/2039 | 1,196,625 | ||||||||
| 460,000 | Monroeville Finance Authority — UPMC | 3.00 | % | 02/15/2014 | 467,070 | ||||||||
| 1,250,000 | Monroeville Finance Authority — UPMC | 5.00 | % | 02/15/2027 | 1,329,188 | ||||||||
| 1,345,000 | Montana State Board of Housing^ | 3.25 | % | 12/01/2028 | 1,266,748 | ||||||||
| 1,000,000 | Montgomery County Higher Education & Health Authority — Abington Memorial | ||||||||||||
| Hospital Obligated Group Series A, Callable 06/01/2022 @ 100^ | 5.00 | % | 06/01/2024 | 1,095,960 | |||||||||
| 1,000,000 | Nebraska State Investment Finance Authority Single Family Housing Revenue Bonds^ | 2.75 | % | 03/01/2024 | 941,480 | ||||||||
| 1,700,000 | Nebraska State Investment Finance Authority Single Family Housing Revenue Bonds^ | 2.75 | % | 09/01/2024 | 1,592,883 | ||||||||
| 1,415,000 | New Hampshire State Municipal Bond Bank | 5.50 | % | 08/15/2018 | 1,672,318 | ||||||||
| 250,000 | New Jersey Health Care Facilities Financing Authority — Barnabas Health Issue | ||||||||||||
| Callable 07/01/2022 @ 100^ | 5.00 | % | 07/01/2023 | 273,703 | |||||||||
| 1,000,000 | New Jersey Health Care Facilities Financing Authority — Barnabas Health Issue | ||||||||||||
| Callable 07/01/2022 @ 100^ | 5.00 | % | 07/01/2024 | 1,071,110 | |||||||||
| 1,020,000 | New Jersey Health Care Facilities Financing Authority — Barnabas Health Issue | ||||||||||||
| Callable 07/01/2022 @ 100^ | 4.00 | % | 07/01/2026 | 984,331 | |||||||||
| 480,000 | New Jersey Transportation Trust Fund Authority — Transportation System | 5.25 | % | 12/15/2013 | 491,155 | ||||||||
| 2,000,000 | New Mexico State Mortgage Finance Authority^ | 2.85 | % | 07/01/2043 | 2,032,880 | ||||||||
| 1,000,000 | New York City New York Transitional Finance Authority Future Tax Secured Bonds | 5.00 | % | 02/01/2017 | 1,131,860 | ||||||||
| 2,500,000 | New York City Transitional Finance Authority Future Tax Secured Tax-Exempt Subordinate Series B | 5.00 | % | 11/01/2016 | 2,833,675 | ||||||||
| 2,000,000 | New York State Mortgage Agency Revenue | 1.15 | % | 10/01/2017 | 1,975,300 | ||||||||
| 500,000 | New York State Thruway Authority Personal Income Tax Revenue Bonds^ | 5.00 | % | 03/15/2024 | 577,585 | ||||||||
| 1,000,000 | North Carolina Eastern Municipal Power Agency — Power System Series D | 5.00 | % | 01/01/2016 | 1,099,630 | ||||||||
| 500,000 | North Carolina Medical Care Commission Health Care Facilities — WakeMed Series A | 2.00 | % | 10/01/2013 | 501,970 | ||||||||
| 500,000 | North Dakota Housing Finance Agency — Housing Finance Program Non-AMT | 2.80 | % | 01/01/2022 | 483,175 | ||||||||
| 650,000 | North Dakota Housing Finance Agency — Housing Finance Program Non-AMT | 2.80 | % | 07/01/2022 | 627,763 | ||||||||
| 1,000,000 | North Jersey District Water Supply Commission Revenue Bonds | 4.00 | % | 07/01/2016 | 1,085,130 | ||||||||
| 1,500,000 | Ohio University General Receipts Athens | 5.00 | % | 12/01/2016 | 1,692,615 | ||||||||
| 2,000,000 | Pennsylvania Higher Educational Facilities Authority — University of Pennsylvania | ||||||||||||
| Health System Series A, Callable 08/15/2022 @ 100^ | 5.00 | % | 08/15/2026 | 2,188,060 | |||||||||
| 100,000 | Philadelphia Pennsylvania Water & Wastewater | 3.00 | % | 06/15/2016 | 105,686 | ||||||||
| 360,000 | Philadelphia Pennsylvania Water & Wastewater | 5.00 | % | 11/01/2019 | 417,956 | ||||||||
| 500,000 | Phoenix Arizona Civic Transportation Bonds | 5.00 | % | 07/01/2020 | 583,055 | ||||||||
| 1,500,000 | Public Utility No. 1 of Clark County — Generating System Refunding | 5.00 | % | 01/01/2016 | 1,647,090 | ||||||||
| 2,500,000 | Puerto Rico Sales Tax Financing Corp. Revenue Bonds 100, 08/01/2019^ | 5.00 | % | 08/01/2024 | 2,568,975 | ||||||||
| 750,000 | Purdue University Student Fee Series AA | 4.00 | % | 07/01/2014 | 778,657 | ||||||||
| 2,500,000 | Railsplitter Tobacco Settlement Authority | 5.25 | % | 06/01/2020 | 2,880,250 | ||||||||
| 1,340,000 | Rhode Island Clean Water Finance Agency — Water Pollution Control Series B | 3.00 | % | 10/01/2015 | 1,412,950 | ||||||||
| 1,855,000 | South Florida Water Management District — Land Acquisition Refunding | 5.25 | % | 10/01/2014 | 1,961,978 | ||||||||
| 2,090,000 | State of Connecticut Health & Educational Facilities Authority — Bridgeport Hospital Series D | 5.00 | % | 07/01/2018 | 2,379,946 | ||||||||
| 1,000,000 | State of Illinois Department of Employment Security — Unemployment | ||||||||||||
| Insurance Fund Building Receipts Series A | 5.00 | % | 06/15/2016 | 1,118,820 | |||||||||
The accompanying notes are an integral part of these financial statements.
55
Schedule of Investments
June 30, 2013
| Par | |||||||||||||
| Value/Shares | Security Description | Rate | Maturity | Value $ | |||||||||
| Revenue Bonds — (Continued) | |||||||||||||
| 1,025,000 | Tennessee Housing Development Agency Residential Financing Revenue Bonds | 1.95 | % | 01/01/2020 | 996,146 | ||||||||
| 1,250,000 | Tennessee Housing Development Agency Residential Financing Revenue Bonds | 2.25 | % | 01/01/2021 | 1,206,212 | ||||||||
| 2,000,000 | Tobacco Settlement Financing Corp. | 5.00 | % | 06/01/2017 | 2,248,740 | ||||||||
| 1,000,000 | Tobacco Settlement Financing Corp.^ | 5.00 | % | 06/01/2018 | 1,118,710 | ||||||||
| 1,500,000 | Triborough Bridge & Tunnel Authority — MTA Bridges & Tunnels Refunding Series B | 5.00 | % | 11/15/2016 | 1,699,485 | ||||||||
| 1,000,000 | Tucson Arizona Water System Revenue Bonds | 3.00 | % | 07/01/2015 | 1,046,110 | ||||||||
| 1,000,000 | Tyler Health Facilities Development Corporation — Mother Frances Hospital | ||||||||||||
| Regional Health Care Center Callable 07/01/2021 @ 100^ | 5.13 | % | 07/01/2022 | 1,100,910 | |||||||||
| 1,770,000 | University of Colorado Hospital Authority Series A, Callable 11/15/2022 @ 100^ | 5.00 | % | 11/15/2036 | 1,824,038 | ||||||||
| 1,170,000 | Wisconsin Health & Educational Facilities Authority — Froedtert Health, Inc. | ||||||||||||
| Obligated Group Series A, Callable 10/01/2022 @ 100^ | 5.00 | % | 04/01/2032 | 1,212,916 | |||||||||
| 2,080,000 | Wisconsin State Health & Higher Education Aspirus, Inc. | 5.00 | % | 08/15/2023 | 2,330,224 | ||||||||
| 107,985,399 | |||||||||||||
| Refunded Bonds — 9.4% | |||||||||||||
| 750,000 | Blue Mountain School District Callable 10/01/2014 @ 100^ | 4.45 | % | 10/01/2026 | 789,300 | ||||||||
| 1,000,000 | Charleston South Carolina Educational Excellence Financing Corp. Callable 12/1/2014 @ 100^ | 5.00 | % | 12/01/2016 | 1,066,610 | ||||||||
| 500,000 | City of Miami Florida Healthcare Facilities Authority Healthcare System — | ||||||||||||
| Catholic Health East Series B, Callable 11/15/2013 @ 100^ | 5.13 | % | 11/15/2024 | 509,120 | |||||||||
| 700,000 | Dormitory Authority of the State of New York — Columbia University Callable 07/01/2013 @ 100^ | 5.13 | % | 07/01/2021 | 700,273 | ||||||||
| 1,765,000 | Fort Bend Independent School District — Unlimited Tax School Building | ||||||||||||
| Callable 08/15/2014 @ 100^ | 5.00 | % | 08/15/2020 | 1,859,180 | |||||||||
| 600,000 | Garden State Preservation Trust — Open Space & Farmland Preservation Series A, | ||||||||||||
| Callable 11/01/2015 @ 100^ | 5.80 | % | 11/01/2018 | 669,564 | |||||||||
| 650,000 | Honolulu Hawaii City & County Series B, Callable 7/01/2014 @ 100^ | 5.00 | % | 07/01/2016 | 680,972 | ||||||||
| 1,485,000 | Medical University Hospital Authority South Carolina Series A, Callable 08/15/2014 @ 100^ | 5.25 | % | 08/15/2027 | 1,549,998 | ||||||||
| 2,105,000 | Municipality of Anchorage, Alaska 2005 (Schools) Series A, Callable 03/01/2015 @ 100^ | 5.00 | % | 03/01/2020 | 2,262,117 | ||||||||
| 2,080,000 | New Jersey Educational Facilities Authority — Montclair State University Callable 07/01/2015 @ 100^ | 5.00 | % | 07/01/2032 | 2,264,829 | ||||||||
| 1,000,000 | Orange County Florida Health Facilities Authority Callable 01/01/2015 @ 100^ | 5.00 | % | 01/01/2029 | 1,068,560 | ||||||||
| 600,000 | St Johns County Florida Water & Sewer Callable 06/01/2014 @ 34.327^ | 0.00 | % | 06/01/2034 | 204,090 | ||||||||
| 1,535,000 | University of Texas System — Permanent University Fund Series B, Callable 07/01/2014 @ 100^ | 5.00 | % | 07/01/2026 | 1,608,465 | ||||||||
| 15,233,078 | |||||||||||||
| Total Municipal Bonds (Cost $161,791,570) | 158,140,358 | ||||||||||||
| Short-Term Investments — 6.5% | |||||||||||||
| Money Market Fund — 6.5% | |||||||||||||
| 10,613,587 | DWS Cash Account Trust — Tax-Exempt Portfolio, 0.01%* | 10,613,587 | |||||||||||
| Total Short-Term Investments (Cost $10,613,587) | 10,613,587 | ||||||||||||
| Total Investments — 104.2% (Cost $172,405,157) | 168,753,945 | ||||||||||||
| Liabilities in Excess of Other Assets — (4.2)% | (6,862,661 | ) | |||||||||||
| NET ASSETS — 100.0% | $ | 161,891,284 | |||||||||||
| PORTFOLIO HOLDINGS | ||||
| % of Net Assets | ||||
| Revenue Bonds | 66.7 | % | ||
| General Obligation Bonds | 21.6 | % | ||
| Refunded Bonds | 9.4 | % | ||
| Money Market Funds | 6.5 | % | ||
| Other Assets and Liabilities | (4.2 | )% | ||
| 100.0 | % | |||
| ^ | Continuously callable with 30 days notice. |
| # | Variable rate security. Rate disclosed is as of June 30, 2013. |
| * | Annualized seven-day yield as of June 30, 2013. |
The accompanying notes are an integral part of these financial statements.
56
A Message to Our Shareholders
June 30, 2013
Dear Shareholder:
The Brown Advisory Emerging Markets Fund Institutional Shares (the “Fund”) commenced operations on December 12, 2012. During the period from inception on December 12, 2012 to June 30, 2013, the Fund returned -4.77%, which is a negative total return of 3.52% versus the Fund’s benchmark, the MSCI Emerging Markets Index, which returned -8.29%.
Since inception to June 30, 2013, emerging markets have gone through a testing period, particularly during May and June. Ben Bernanke’s announcement of the Federal Reserve’s intention to taper quantitative easing at the June Federal Reserve meeting coincided with riots in both Turkey and Brazil. This came at a time when the U.S. budget deficit was at its lowest level since 2008, which ultimately contributed to a tightening in the money supply and affected trade flows and credit markets globally, particularly in Brazil, China and Mexico. The dollar’s appreciation during this period also put pressure on funding costs. The Fund’s relative outperformance has been attributable to its focus on investing in quality stocks in often-overlooked sectors that concentrate on good capital management. Some portfolio businesses are exporters of non-commoditized products, which also stand to benefit from any dollar appreciation.
During the first quarter of 2013, the Fund acquired Turkish glass and chemicals manufacturer Turk Sise Cam. The company has enjoyed 68% market share in all its business segments in Turkey and also has operations throughout Eastern Europe and Egypt. The stock was trading at a forward price to earnings ratio of 10 and below book value.
From an individual stock perspective, the Fund’s performance during the first quarter was largely driven by holdings in Turkey and the ASEAN region. Anadolu Efes and Anadolu Hayat both performed strongly, as did two Southeast Asian telecoms stocks, Telekomunikasi in Indonesia and PLDT in the Philippines. Metro Bank also performed strongly, generating a 13.7% return ahead of the Index, which was down more than 1.5% over the three-month period. AAC Technologies was the best-performing stock for the quarter, producing a positive total return of 38.9% for the period.
Detracting from first-quarter performance were a number of South African holdings including Shoprite and Tiger Brands, which underperformed the Index by -22.8% and -12.9% respectively. Technology holdings, specifically HTC and Melfas, also struggled with Melfas posting the weakest performance for the period, declining -28.5%.
Over the second quarter, we sold some of the Fund’s more expensive positions to purchase stocks in less fashionable sectors and at cheaper valuations. One of the most interesting additions is Aksa Akrilic, which was initially purchased at 5.8x price-to-earnings. It boasts one of the world’s largest acrylic plants in Turkey, the second largest acrylic market globally after China. The company is also the first in two decades to enter the carbon fiber business with a commercial solution. Water utility subsidiary of Inversiones Aguas Metropolitan, Aguas Andinas, was added as a direct and more liquid substitute for Inversiones Aguas, and Russian snow-tire manufacturer Nokian Renkaat was purchased due to its relatively attractive 14x price-to-earnings valuation in April.
HTC and Melfas were later sold in the second quarter due to weak performance persistence. The main replacement for this shift has been Samsung Electronics. Its component business has transformed over the past decade from a key liability to a key asset as competition has eroded. The stock meanwhile has traded around 9x price-to-earnings with earnest discussion of a more active dividend policy, which would raise its yield above its meager 0.6% level. We also sold Anadolu Efes due to regulation, a weak operating environment and high valuation, which was a timely decision given the unrest that ensued in Turkey in early June.
The Fund posted strong relative performance during the second quarter, outperforming the MSCI Emerging Markets Index by 4.34% (the Fund returned -3.74% while the Index returned -8.08%). Aksa Akrilik was the top performer for the quarter and largest position in the Fund at quarter-end, representing 3.5% of total net assets. Our Taiwanese holdings performed well and added 1.10% to the Fund’s return during the period, including President Chain Store, Far Eastone and Taiwan Semiconductor.
In contrast, financial holdings AFP Habitat and Anadolu Hayat both underperformed during the second quarter, detracting -1.20% from the Fund’s performance. Habitat’s decline followed concerns that the incoming presidential administration in Chile will introduce measures to increase competition in the Chilean Pension Fund market, while Hayat sold off following a proposal to increase insurance regulation in Turkey.
Recently, we have positioned the portfolio away from expensive consumer staples and remain committed to buying quality stocks with growing dividend streams and compelling value.
Sincerely,
Edward Lam
Portfolio Manager
57
A Message to Our Shareholders
June 30, 2013
Past performance is not a guarantee of future results.
Mutual fund investing involves risk. Principal loss is possible. Investments in foreign securities entail certain risks not associated with investments in domestic securities, such as volatility of currency exchange rates, and in some cases, political and economic instability and relatively illiquid markets. These risks are greater for investments in emerging markets. Derivatives may involve certain costs and risks such as liquidity, interest rate, market, credit, management, and the risk that a position could not be closed when most advantageous. Investing in derivatives could lose more than the amount invested. The Fund invests in smaller companies which carry greater risk than is associated with larger companies for various reasons, such as narrower markets, limited financial resources and less liquid stock. The Fund may invest in ETFs, which may trade at a discount to the aggregate value of the underlying securities and although expense ratios for ETFs are generally low, frequent trading of ETFs by the Fund can generate brokerage expenses. Multi-investment management styles may lead to higher transaction expenses compared to single investment management styles. Outcomes depend on the skill of the sub-advisor and the advisor and the allocation of assets among them.
Fund holdings and sector allocations are subject to change and should not be considered a recommendation to buy or sell any security. For a complete list of fund holdings, please refer to the Schedule of Investments provided in this report.
Definitions for terms and indices are provided in the Glossary of Terms.
58
Performance Chart and Analysis
June 30, 2013
COMPARISON OF CHANGE IN VALUE OF A $1,000,000 INVESTMENT
The following chart reflects the change in value of a hypothetical $1,000,000 investment, including reinvested dividends and distributions, in the Fund as measured against a broad-based securities market index. The MSCI Emerging Markets Index is a free float-adjusted market capitalization index that is designed to measure equity market performance in the global emerging markets. The index is unmanaged and does not reflect the deduction of fees, such as investment management fees. Investors cannot invest directly in an index.
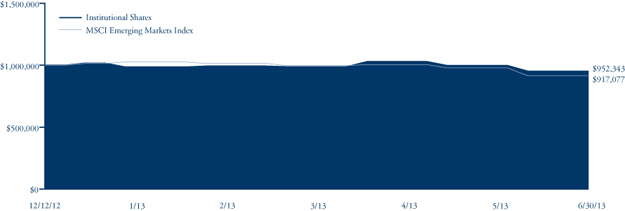
| Since | ||||
| Cumulative Total Return | Inception | |||
| as of 6/30/13 | (12/12/12) | |||
| Institutional Shares | -4.77% | |||
| Investor Shares | -4.87% | |||
| Advisor Shares | -5.07% | |||
| MSCI Emerging Markets Index | -8.29% |
| Institutional Shares | Investor Shares | Advisor Shares | |
Gross Expense Ratio1 | 1.30% | 1.45% | 1.70% |
Net Expense Ratio1 | 1.30% | 1.45% | 1.70% |
Past performance does not guarantee future results. The performance data quoted represents past performance and current returns may be lower or higher. The investment return and net asset value will fluctuate so that an investor’s shares, when redeemed, may be worth more or less than the original cost. To obtain performance information current to the most recent month end, please visit our website at brownadvisoryfunds.com/performance.html. The performance table and graph above do not reflect the deduction of taxes that a shareholder would pay on Fund distributions or the redemption of Fund shares. Performance data does not reflect the imposition of the redemption fee of 1.00% on shares redeemed within 14 days, and if it did, performance would have been lower. Short-term performance, in particular, is not a good indication of the Fund’s future performance, and an investment should not be made based solely on returns.
| 1 | Per the Fund’s prospectus dated December 3, 2012. |
59
Schedule of Investments
June 30, 2013
| Shares | Security Description | Value $ | ||||||
| Common Stocks — 85.6% | ||||||||
| Brazil — 6.0% | ||||||||
| 136,720 | Cielo S.A. | 3,425,735 | ||||||
| 123,400 | Natura Cosmeticos S.A. | 2,698,779 | ||||||
| 164,900 | Souza Cruz S.A. | 2,035,985 | ||||||
| 8,160,499 | ||||||||
| Chile — 7.0% | ||||||||
| 1,753,577 | AFP Habitat S.A. | 2,578,333 | ||||||
| 1,597,787 | Aguas Andinas S.A. | 1,138,154 | ||||||
| 232,048 | Cia Cervecerias Unidas S.A. | 3,313,666 | ||||||
| 1,220,368 | Inversiones Aguas Metropolitan | 2,382,822 | ||||||
| 9,412,975 | ||||||||
| China — 6.2% | ||||||||
| 742,000 | AAC Technologies Holdings, Inc. | 4,162,972 | ||||||
| 405,000 | China Mobile Ltd. | 4,194,526 | ||||||
| 8,357,498 | ||||||||
| Finland — 1.7% | ||||||||
| 57,450 | Nokian Renkaat | 2,337,701 | ||||||
| Indonesia — 5.2% | ||||||||
| 1,228,000 | Semen Indonesia Persero Tbk PT | 2,109,084 | ||||||
| 1,374,683 | Tambang Batubara Bukit Asam | 1,829,548 | ||||||
| 2,731,000 | Telekomunikasi Indonesia | 3,041,401 | ||||||
| 6,980,033 | ||||||||
| Korea — 8.2% | ||||||||
| 54,950 | KT&G Corp. | 3,565,501 | ||||||
| 25,590 | NCSoft Corp. | 3,606,773 | ||||||
| 3,278 | Samsung Electronic | 3,831,406 | ||||||
| 11,003,680 | ||||||||
| Luxembourg — 1.3% | ||||||||
| 24,577 | Millicom International Cellular | 1,770,093 | ||||||
| Malaysia — 5.8% | ||||||||
| 134,800 | British American Tobacco Malay | 2,536,019 | ||||||
| 556,200 | Public Bank BHD | 2,997,804 | ||||||
| 1,170,400 | Top Glove Corp. | 2,311,535 | ||||||
| 7,845,358 | ||||||||
| Morocco — 1.2% | ||||||||
| 136,015 | Maroc Telecom S.A. | 1,579,078 | ||||||
| Philippines — 6.3% | ||||||||
| 4,286,561 | Aboitiz Power Corp. | 3,449,447 | ||||||
| 867,230 | Metropolitan Bank & Trust | 2,218,489 | ||||||
| 41,355 | Philippine Long Distance Corp. | 2,808,604 | ||||||
| 8,476,540 | ||||||||
| Poland — 4.9% | ||||||||
| 60,654 | Bank Pekao S.A. | 2,737,604 | ||||||
| 31,844 | Powszechny Zaklad Ubezpieczen | 3,923,587 | ||||||
| 6,661,191 | ||||||||
| South Africa — 8.9% | ||||||||
| 188,274 | Foschini Group Ltd. | 1,878,804 | ||||||
| 1,051,064 | Nampak Ltd. | 3,496,115 | ||||||
| 871,617 | Sanlam Ltd. | 4,050,664 | ||||||
| 28,781 | Shoprite Holding Ltd. | 540,635 | ||||||
| 70,746 | Tiger Brands Ltd. | 2,112,506 | ||||||
| 12,078,724 | ||||||||
| Taiwan — 10.1% | ||||||||
| 1,300,000 | Far EasTone Telecommunications | 3,484,138 | ||||||
| 179,000 | Formosa International Hotels | 2,094,831 | ||||||
| 624,000 | President Chain Store Corp. | 4,078,976 | ||||||
| 1,114,000 | Taiwan Semiconductor Manufacturing Co. | 4,032,787 | ||||||
| 13,690,732 | ||||||||
| Thailand — 1.9% | ||||||||
| 475,800 | Siam Commercial Bank | 2,620,047 | ||||||
| Turkey — 6.9% | ||||||||
| 1,318,177 | Aksa | 4,626,678 | ||||||
| 1,185,658 | Anadolu Hayat Emeklilik AS | 2,614,550 | ||||||
| 1,474,634 | Turkiye Sise Ve Cam Fabrikalari | 2,062,618 | ||||||
| 9,303,846 | ||||||||
| United Arab Emirates — 4.0% | ||||||||
| 427,655 | First Gulf Bank | 1,860,541 | ||||||
| 1,165,467 | National Bank Abu Dhabi | 3,581,859 | ||||||
| 5,442,400 | ||||||||
| Total Common Stocks (Cost $120,499,912) | 115,720,395 | |||||||
| Preferred Stocks — 2.2% | ||||||||
| Brazil — 2.2% | ||||||||
| 312,000 | AES Tiete S.A. | 2,920,958 | ||||||
| Total Preferred Stocks (Cost $3,339,957) | 2,920,958 | |||||||
| Exchange Traded Funds — 0.6% | ||||||||
| India — 0.6% | ||||||||
| 38,900 | iShares S&P India Nifty 50 Index Fund | 867,859 | ||||||
| Total Exchange Traded Funds (Cost $970,372) | 867,859 | |||||||
| Short-Term Investments — 10.0% | ||||||||
| Money Market Funds — 10.0% | ||||||||
| 13,488,238 | DWS Cash Account Trust — Government | |||||||
| & Agency Securities Portfolio, 0.03%# | 13,488,238 | |||||||
| Total Short-Term Investments (Cost $13,488,238) | 13,488,238 | |||||||
| Total Investments — 98.4% (Cost $138,298,479) | 132,997,450 | |||||||
| Other Assets in Excess of Liabilities — 1.6% | 2,201,446 | |||||||
| NET ASSETS — 100.0% | $ | 135,198,896 | ||||||
The accompanying notes are an integral part of these financial statements.
60
Schedule of Investments
June 30, 2013
| PORTFOLIO HOLDINGS | ||||
| % of Net Assets | ||||
| Taiwan | 10.1 | % | ||
| Money Market Funds | 10.0 | % | ||
| South Africa | 8.9 | % | ||
| Brazil | 8.2 | % | ||
| Korea | 8.2 | % | ||
| Chile | 7.0 | % | ||
| Turkey | 6.9 | % | ||
| Philippines | 6.3 | % | ||
| China | 6.2 | % | ||
| Malaysia | 5.8 | % | ||
| Indonesia | 5.2 | % | ||
| Poland | 4.9 | % | ||
| United Arab Emirates | 4.0 | % | ||
| Thailand | 1.9 | % | ||
| Finland | 1.7 | % | ||
| Luxembourg | 1.3 | % | ||
| Morocco | 1.2 | % | ||
| India | 0.6 | % | ||
| Other Assets and Liabilities | 1.6 | % | ||
| 100.0 | % | |||
| # | Annualized seven-day yield as of June 30, 2013. |
The accompanying notes are an integral part of these financial statements.
61
Statements of Assets and Liabilities
June 30, 2013
| BROWN | BROWN | BROWN | BROWN | BROWN | ||||||||||||||||
| ADVISORY | ADVISORY | ADVISORY | ADVISORY | ADVISORY | ||||||||||||||||
| GROWTH | VALUE | FLEXIBLE | SMALL-CAP | SMALL-CAP | ||||||||||||||||
| EQUITY | EQUITY | EQUITY | GROWTH | FUNDAMENTAL | ||||||||||||||||
| FUND | FUND | FUND | FUND | VALUE FUND | ||||||||||||||||
| ASSETS | ||||||||||||||||||||
| Investments: | ||||||||||||||||||||
| Total investments, at cost | $ | 1,513,154,247 | $ | 137,192,704 | $ | 70,413,080 | $ | 217,650,457 | $ | 322,687,138 | ||||||||||
| Net unrealized appreciation (depreciation) | 288,066,054 | 24,647,987 | 18,082,920 | 75,791,772 | 66,011,557 | |||||||||||||||
| Total investments, at market value | 1,801,220,301 | 161,840,691 | 88,496,000 | 293,442,229 | 388,698,695 | |||||||||||||||
| Cash | — | — | 9,461 | — | — | |||||||||||||||
| Foreign Currency | — | — | — | — | — | |||||||||||||||
| Unrealized appreciation on swaps | — | — | — | — | — | |||||||||||||||
| Receivables: | ||||||||||||||||||||
| Investment securities sold | 5,783,561 | — | 59,349 | 462,293 | 2,271,328 | |||||||||||||||
| Fund shares sold | 7,955,757 | 475,278 | 873,841 | 107,130 | 1,687,760 | |||||||||||||||
| Interest and dividends | 875,949 | 337,684 | 71,202 | 157,559 | 578,253 | |||||||||||||||
| Prepaid expenses and other assets | 121,404 | 44,651 | 37,638 | 50,235 | 51,259 | |||||||||||||||
| Total Assets | 1,815,956,972 | 162,698,304 | 89,547,491 | 294,219,446 | 393,287,295 | |||||||||||||||
| LIABILITIES | ||||||||||||||||||||
| Payables: | ||||||||||||||||||||
| Investment securities purchased | 22,126,817 | 120,549 | 531,862 | — | 5,003,237 | |||||||||||||||
| Upfront swap payments received | — | — | — | — | — | |||||||||||||||
| Fund shares redeemed | 845,470 | 5,000 | 7,500 | 34,943 | 17,683 | |||||||||||||||
| Distributions | — | — | — | — | — | |||||||||||||||
| Accrued Liabilities: | ||||||||||||||||||||
| Investment advisor fees, net | 874,825 | 76,905 | 49,380 | 204,057 | 261,971 | |||||||||||||||
| Administration, accounting, and transfer agent fees | 166,128 | 16,155 | 6,826 | 28,587 | 35,162 | |||||||||||||||
| Custodian fees | 9,541 | 1,949 | 825 | 2,168 | 4,008 | |||||||||||||||
| Service fees | 204,646 | 19,225 | 10,201 | 35,082 | 46,101 | |||||||||||||||
| Business management fees | 72,902 | 6,409 | 3,414 | 12,003 | 15,410 | |||||||||||||||
| Distribution fees | 12,854 | 1,102 | 1,454 | 3,581 | 17,838 | |||||||||||||||
| Other expenses | 200,968 | 24,657 | 25,880 | 32,556 | 42,913 | |||||||||||||||
| Total Liabilities | 24,514,151 | 271,951 | 637,342 | 352,977 | 5,444,323 | |||||||||||||||
| NET ASSETS | $ | 1,791,442,821 | $ | 162,426,353 | $ | 88,910,149 | $ | 293,866,469 | $ | 387,842,972 | ||||||||||
| COMPONENTS OF NET ASSETS | ||||||||||||||||||||
| Paid-in capital | $ | 1,521,878,417 | $ | 152,361,517 | $ | 75,996,586 | $ | 213,664,140 | $ | 317,660,124 | ||||||||||
| Undistributed (Accumulated) net investment income (loss) | (1,374,373 | ) | 1,442,921 | 100,229 | 205,885 | 2,053,423 | ||||||||||||||
| Accumulated net realized gain (loss) | (17,127,277 | ) | (16,026,072 | ) | (5,269,586 | ) | 4,204,672 | 2,117,868 | ||||||||||||
| Unrealized appreciation (depreciation) on investments | 288,066,054 | 24,647,987 | 18,082,920 | 75,791,772 | 66,011,557 | |||||||||||||||
| Unrealized appreciation (depreciation) on swaps | — | — | — | — | — | |||||||||||||||
| Unrealized appreciation (depreciation) on foreign receivables | — | — | — | — | — | |||||||||||||||
| NET ASSETS | $ | 1,791,442,821 | $ | 162,426,353 | $ | 88,910,149 | $ | 293,866,469 | $ | 387,842,972 | ||||||||||
| COMPUTATION OF NET ASSET VALUE | ||||||||||||||||||||
| Institutional Shares: | ||||||||||||||||||||
| Net assets | $ | 116,575,231 | $ | 11,501 | $ | 11,811 | $ | 7,346,646 | $ | 1,061,384 | ||||||||||
| Shares outstanding (unlimited shares authorized) | 7,187,988 | 780 | 962 | 231,972 | 52,899 | |||||||||||||||
| Net asset value per share | $ | 16.22 | $ | 14.74 | $ | 12.28 | $ | 31.67 | $ | 20.06 | ||||||||||
| Investor Shares: | ||||||||||||||||||||
| Net assets | $ | 1,653,389,358 | $ | 160,799,573 | $ | 82,783,307 | $ | 281,026,936 | $ | 371,017,582 | ||||||||||
| Shares outstanding (unlimited shares authorized) | 101,996,128 | 10,907,061 | 6,743,365 | 17,605,492 | 18,496,880 | |||||||||||||||
| Net asset value per share | $ | 16.21 | $ | 14.74 | $ | 12.28 | $ | 15.96 | $ | 20.06 | ||||||||||
| Advisor Shares: | ||||||||||||||||||||
| Net assets | $ | 21,478,232 | $ | 1,615,279 | $ | 6,115,031 | $ | 5,492,887 | $ | 15,764,006 | ||||||||||
| Shares outstanding (unlimited shares authorized) | 1,361,323 | 109,008 | 497,973 | 356,089 | 787,772 | |||||||||||||||
| Net asset value per share | $ | 15.78 | $ | 14.82 | $ | 12.28 | $ | 15.43 | $ | 20.01 | ||||||||||
The accompanying notes are an integral part of these financial statements.
62
Statements of Assets and Liabilities
June 30, 2013
| BROWN | BROWN | BROWN | BROWN | BROWN | BROWN | |||||||||||||||||||||||||
| BROWN | ADVISORY | ADVISORY | BROWN | ADVISORY | ADVISORY | ADVISORY | ADVISORY | |||||||||||||||||||||||
| ADVISORY | MARYLAND | INTERMEDIATE | ADVISORY | EQUITY | SUSTAINABLE | TAX EXEMPT | EMERGING | |||||||||||||||||||||||
| OPPORTUNITY | BOND | INCOME | TACTICAL | INCOME | GROWTH | BOND | MARKETS | |||||||||||||||||||||||
| FUND | FUND | FUND | BOND FUND | FUND | FUND | FUND | FUND | |||||||||||||||||||||||
| $ | 7,159,477 | $ | 245,825,745 | $ | 253,317,515 | $ | 24,956,204 | $ | 151,599,594 | $ | 151,716,669 | $ | 172,405,157 | $ | 138,298,479 | |||||||||||||||
| 1,878,052 | 3,129,472 | (508,466 | ) | (427,495 | ) | 24,789,843 | 28,373,592 | (3,651,212 | ) | (5,301,029 | ) | |||||||||||||||||||
| 9,037,529 | 248,955,217 | 252,809,049 | 24,528,709 | 176,389,437 | 180,090,261 | 168,753,945 | 132,997,450 | |||||||||||||||||||||||
| — | — | — | 680,000 | — | 17,370 | — | 49 | |||||||||||||||||||||||
| — | — | — | — | — | — | — | 81,826 | |||||||||||||||||||||||
| — | — | — | 405,149 | — | — | — | — | |||||||||||||||||||||||
| 136,183 | 4,699,413 | 3,625,390 | — | 459,729 | 947,980 | — | — | |||||||||||||||||||||||
| 137,169 | 7,007 | 493,235 | 769 | 184,537 | 52,455 | 191,614 | 2,457,297 | |||||||||||||||||||||||
| 6,065 | 3,189,957 | 1,306,782 | 58,390 | 506,297 | 74,661 | 1,560,567 | 180,165 | |||||||||||||||||||||||
| 20,198 | 7,553 | 45,048 | 21,132 | 40,076 | 49,717 | 28,350 | 34,501 | |||||||||||||||||||||||
| 9,337,144 | 256,859,147 | 258,279,504 | 25,694,149 | 177,580,076 | 181,232,444 | 170,534,476 | 135,751,288 | |||||||||||||||||||||||
| 131,214 | 4,218,128 | — | — | 339,288 | 598,596 | 8,147,958 | 366,022 | |||||||||||||||||||||||
| — | — | — | 67,650 | — | — | — | — | |||||||||||||||||||||||
| 4,227 | 12,838 | 155,133 | — | 378,014 | 33,488 | 226,667 | — | |||||||||||||||||||||||
| — | 319,204 | 275,965 | — | 733,880 | — | 143,001 | — | |||||||||||||||||||||||
| 5,222 | 63,417 | 65,024 | 12,926 | 86,954 | 88,973 | 40,370 | 95,116 | |||||||||||||||||||||||
| 1,356 | 27,522 | 24,198 | 2,749 | 17,879 | 18,986 | 22,417 | 11,164 | |||||||||||||||||||||||
| 683 | 1,416 | 1,782 | 404 | 1,858 | 1,121 | 973 | 36,128 | |||||||||||||||||||||||
| 1,117 | 10,569 | 10,837 | 3,232 | 21,737 | 18,495 | 6,728 | 1,454 | |||||||||||||||||||||||
| 372 | 10,569 | 10,837 | 1,077 | 7,246 | 7,414 | 6,729 | 5,284 | |||||||||||||||||||||||
| — | — | 13,026 | 15,462 | 1,896 | 80,124 | — | 695 | |||||||||||||||||||||||
| 19,832 | 29,148 | 30,850 | 20,258 | 34,386 | 55,553 | 48,349 | 36,529 | |||||||||||||||||||||||
| 164,023 | 4,692,811 | 587,652 | 123,758 | 1,623,138 | 902,750 | 8,643,192 | 552,392 | |||||||||||||||||||||||
| $ | 9,173,121 | $ | 252,166,336 | $ | 257,691,852 | $ | 25,570,391 | $ | 175,956,938 | $ | 180,329,694 | $ | 161,891,284 | $ | 135,198,896 | |||||||||||||||
| $ | 14,716,948 | $ | 247,328,922 | $ | 253,832,857 | $ | 26,549,065 | $ | 147,760,437 | $ | 172,694,256 | $ | 165,515,511 | $ | 141,750,095 | |||||||||||||||
| (24,827 | ) | — | (180,031 | ) | (294,236 | ) | — | (268,549 | ) | — | 919,023 | |||||||||||||||||||
| (7,397,052 | ) | 1,707,942 | 4,547,492 | (662,092 | ) | 3,406,658 | (20,469,508 | ) | 26,985 | (2,162,388 | ) | |||||||||||||||||||
| 1,878,052 | 3,129,472 | (508,466 | ) | (427,495 | ) | 24,789,843 | 28,373,592 | (3,651,212 | ) | (5,301,029 | ) | |||||||||||||||||||
| — | — | — | 405,149 | — | — | — | — | |||||||||||||||||||||||
| — | — | — | — | — | (97 | ) | — | (6,805 | ) | |||||||||||||||||||||
| $ | 9,173,121 | $ | 252,166,336 | $ | 257,691,852 | $ | 25,570,391 | $ | 175,956,938 | $ | 180,329,694 | $ | 161,891,284 | $ | 135,198,896 | |||||||||||||||
| $ | — | $ | — | $ | — | $ | — | $ | 11,148 | $ | 32,045,447 | $ | — | $ | 122,514,524 | |||||||||||||||
| — | — | — | — | 917 | 2,752,332 | — | 12,874,364 | |||||||||||||||||||||||
| $ | — | $ | — | $ | — | $ | — | $ | 12.16 | $ | 11.64 | $ | — | $ | 9.52 | |||||||||||||||
| $ | 9,173,121 | $ | 252,166,336 | $ | 241,542,542 | $ | — | $ | 173,599,456 | $ | 24,028,247 | $ | 161,891,284 | $ | 11,694,842 | |||||||||||||||
| 495,547 | 23,335,478 | 22,254,389 | — | 14,281,402 | 2,067,370 | 16,454,466 | 1,229,933 | |||||||||||||||||||||||
| $ | 18.51 | $ | 10.81 | $ | 10.85 | $ | — | $ | 12.16 | $ | 11.62 | $ | 9.84 | $ | 9.51 | |||||||||||||||
| $ | — | $ | — | $ | 16,149,310 | $ | 25,570,391 | $ | 2,346,334 | $ | 124,256,000 | $ | — | $ | 989,530 | |||||||||||||||
| — | — | 1,516,089 | 2,642,218 | 193,242 | 10,714,570 | — | 104,239 | |||||||||||||||||||||||
| $ | — | $ | — | $ | 10.65 | $ | 9.68 | $ | 12.14 | $ | 11.60 | $ | — | $ | 9.49 | |||||||||||||||
The accompanying notes are an integral part of these financial statements.
63
Statements of Operations
For the Year Ended June 30, 2013
| BROWN | BROWN | BROWN | BROWN | BROWN | ||||||||||||||||
| ADVISORY | ADVISORY | ADVISORY | ADVISORY | ADVISORY | ||||||||||||||||
| GROWTH | VALUE | FLEXIBLE | SMALL-CAP | SMALL-CAP | ||||||||||||||||
| EQUITY | EQUITY | EQUITY | GROWTH | FUNDAMENTAL | ||||||||||||||||
| FUND | FUND | FUND | FUND | VALUE FUND | ||||||||||||||||
| INVESTMENT INCOME | ||||||||||||||||||||
| Dividend income | $ | 13,928,626 | $ | 3,770,511 | $ | 870,690 | $ | 2,055,993 | $ | 5,798,170 | ||||||||||
| Less: foreign taxes withheld | (65,235 | ) | (22,659 | ) | (12,794 | ) | — | (3,178 | ) | |||||||||||
| Interest Income | 12,263 | 1,292 | 817 | 4,064 | 3,606 | |||||||||||||||
| Total investment income | 13,875,654 | 3,749,144 | 858,713 | 2,060,057 | 5,798,598 | |||||||||||||||
| EXPENSES | ||||||||||||||||||||
| Investment advisor fees | 8,225,445 | 976,999 | 344,512 | 2,259,172 | 2,362,042 | |||||||||||||||
| Administration, accounting, and transfer agent fees | 727,218 | 89,044 | 30,640 | 144,670 | 154,312 | |||||||||||||||
| Service fees | 1,561,137 | 178,242 | 65,578 | 302,033 | 337,639 | |||||||||||||||
| Business management fees | 488,587 | 51,560 | 19,831 | 92,134 | 102,333 | |||||||||||||||
| Distribution fees | 39,509 | 4,768 | 3,695 | 10,212 | 18,373 | |||||||||||||||
| Custodian fees | 42,717 | 8,765 | 3,247 | 11,719 | 17,018 | |||||||||||||||
| Insurance fees | 45,582 | 4,369 | 2,094 | 7,916 | 9,322 | |||||||||||||||
| Registration fees | 185,430 | 42,927 | 42,891 | 48,995 | 67,608 | |||||||||||||||
| Professional fees | 128,777 | 30,065 | 23,012 | 39,540 | 41,989 | |||||||||||||||
| Trustees’ fees and expenses | 97,731 | 12,094 | 5,096 | 20,208 | 21,147 | |||||||||||||||
| Miscellaneous expenses | 252,541 | 25,339 | 13,373 | 36,837 | 35,449 | |||||||||||||||
| Total Expenses | 11,794,674 | 1,424,172 | 553,969 | 2,973,436 | 3,167,232 | |||||||||||||||
| Fees (waived) and expenses reimbursed | — | — | 49,286 | — | — | |||||||||||||||
| Net Expenses | 11,794,674 | 1,424,172 | 603,255 | 2,973,436 | 3,167,232 | |||||||||||||||
| NET INVESTMENT INCOME (LOSS) | 2,080,980 | 2,324,972 | 255,458 | (913,379 | ) | 2,631,366 | ||||||||||||||
| NET REALIZED AND UNREALIZED GAIN (LOSS) | ||||||||||||||||||||
| Net realized gain (loss) on: | ||||||||||||||||||||
| Investments | (5,648,207 | ) | 13,481,067 | 381,342 | 19,273,284 | 15,854,801 | ||||||||||||||
| Swaps | — | — | — | — | — | |||||||||||||||
| Net realized gain (loss) | (5,648,207 | ) | 13,481,067 | 381,342 | 19,273,284 | 15,854,801 | ||||||||||||||
| Net change in unrealized appreciation (depreciation) on: | ||||||||||||||||||||
| Investments | 202,185,339 | 13,485,570 | 11,667,415 | 34,372,117 | 45,698,631 | |||||||||||||||
| Swaps | — | — | — | — | — | |||||||||||||||
| Foreign receivables | (603 | ) | — | (81 | ) | — | — | |||||||||||||
| Net change in unrealized appreciation (depreciation) | 202,184,736 | 13,485,570 | 11,667,334 | 34,372,117 | 45,698,631 | |||||||||||||||
| NET REALIZED AND UNREALIZED GAIN (LOSS) | 196,536,529 | 26,966,637 | 12,048,676 | 53,645,401 | 61,553,432 | |||||||||||||||
| INCREASE (DECREASE) IN | ||||||||||||||||||||
| NET ASSETS FROM OPERATIONS | $ | 198,617,509 | $ | 29,291,609 | $ | 12,304,134 | $ | 52,732,022 | $ | 64,184,798 | ||||||||||
| * | Commenced operations on December 12, 2012. The information presented is for the period from December 12, 2012 to June 30, 2013. |
The accompanying notes are an integral part of these financial statements.
64
Statements of Operations
For the Year Ended June 30, 2013
| BROWN | BROWN | BROWN | BROWN | BROWN | BROWN | |||||||||||||||||||||||||
| BROWN | ADVISORY | ADVISORY | BROWN | ADVISORY | ADVISORY | ADVISORY | ADVISORY | |||||||||||||||||||||||
| ADVISORY | MARYLAND | INTERMEDIATE | ADVISORY | EQUITY | SUSTAINABLE | TAX EXEMPT | EMERGING | |||||||||||||||||||||||
| OPPORTUNITY | BOND | INCOME | TACTICAL | INCOME | GROWTH | BOND | MARKETS | |||||||||||||||||||||||
| FUND | FUND | FUND | BOND FUND | FUND | FUND | FUND | FUND* | |||||||||||||||||||||||
| $ | 105,222 | $ | — | $ | — | $ | 4,421 | $ | 5,159,362 | $ | 1,095,810 | $ | — | $ | 2,412,558 | |||||||||||||||
| (460 | ) | — | — | — | (138,745 | ) | (10,810 | ) | — | (361,747 | ) | |||||||||||||||||||
| 41 | 6,258,151 | 6,465,460 | 128,266 | 2,354 | 1,191 | 2,940,838 | 1,646 | |||||||||||||||||||||||
| 104,803 | 6,258,151 | 6,465,460 | 132,687 | 5,022,971 | 1,086,191 | 2,940,838 | 2,052,457 | |||||||||||||||||||||||
| 77,211 | 824,027 | 935,001 | 163,221 | 961,690 | 736,669 | 463,933 | 516,418 | |||||||||||||||||||||||
| 6,010 | 204,140 | 180,848 | 16,832 | 88,023 | 70,895 | 111,633 | 35,001 | |||||||||||||||||||||||
| 10,370 | 131,020 | 145,302 | 25,288 | 188,454 | 154,197 | 77,322 | 7,049 | |||||||||||||||||||||||
| 3,028 | 93,113 | 102,649 | 8,429 | 56,579 | 61,389 | 77,322 | 28,690 | |||||||||||||||||||||||
| — | — | 46,117 | 62,836 | 3,140 | 221,644 | — | 699 | |||||||||||||||||||||||
| 3,556 | 8,472 | 11,150 | 1,728 | 12,380 | 7,266 | 5,880 | 140,260 | |||||||||||||||||||||||
| 733 | 7,812 | 8,252 | 1,327 | 5,189 | 5,013 | 4,691 | 1,634 | |||||||||||||||||||||||
| 18,324 | 7,638 | 44,114 | 28,914 | 66,922 | 64,312 | 46,468 | 40,286 | |||||||||||||||||||||||
| 19,182 | 39,231 | 41,564 | 29,870 | 32,471 | 33,330 | 33,267 | 24,179 | |||||||||||||||||||||||
| 1,713 | 21,117 | 22,490 | 3,468 | 12,616 | 8,980 | 12,204 | 4,359 | |||||||||||||||||||||||
| 8,288 | 36,690 | 42,255 | 9,497 | 25,812 | 62,660 | 25,010 | 19,077 | |||||||||||||||||||||||
| 148,415 | 1,373,260 | 1,579,742 | 351,410 | 1,453,276 | 1,426,355 | 857,730 | 817,652 | |||||||||||||||||||||||
| (18,972 | ) | — | — | — | — | — | — | — | ||||||||||||||||||||||
| 129,443 | 1,373,260 | 1,579,742 | 351,410 | 1,453,276 | 1,426,355 | 857,730 | 817,652 | |||||||||||||||||||||||
| (24,640 | ) | 4,884,891 | 4,885,718 | (218,723 | ) | 3,569,695 | (340,164 | ) | 2,083,108 | 1,234,805 | ||||||||||||||||||||
| 644,942 | 1,708,121 | 5,538,948 | (26,188 | ) | 1,842,110 | 1,276,044 | 607,053 | (2,474,598 | ) | |||||||||||||||||||||
| — | — | — | 942,505 | — | — | — | — | |||||||||||||||||||||||
| 644,942 | 1,708,121 | 5,538,948 | 916,317 | 1,842,110 | 1,276,044 | 607,053 | (2,474,598 | ) | ||||||||||||||||||||||
| 1,222,400 | (7,327,698 | ) | (11,603,288 | ) | (477,080 | ) | 21,873,753 | 22,091,996 | (3,651,212 | ) | (5,301,029 | ) | ||||||||||||||||||
| — | — | — | 250,196 | — | — | — | — | |||||||||||||||||||||||
| — | — | — | — | — | (97 | ) | — | (6,805 | ) | |||||||||||||||||||||
| 1,222,400 | (7,327,698 | ) | (11,603,288 | ) | (226,884 | ) | 21,873,753 | 22,091,899 | (3,651,212 | ) | (5,307,834 | ) | ||||||||||||||||||
| 1,867,342 | (5,619,577 | ) | (6,064,340 | ) | 689,433 | 23,715,863 | 23,367,943 | (3,044,159 | ) | (7,782,432 | ) | |||||||||||||||||||
| $ | 1,842,702 | $ | (734,686 | ) | $ | (1,178,622 | ) | $ | 470,710 | $ | 27,285,558 | $ | 23,027,779 | $ | (961,051 | ) | $ | (6,547,627 | ) | |||||||||||
The accompanying notes are an integral part of these financial statements.
www.brownadvisoryfunds.com
65
Statements of Changes in Net Assets
| BROWN ADVISORY | BROWN ADVISORY | |||||||||||||||
| GROWTH EQUITY FUND | VALUE EQUITY FUND | |||||||||||||||
| Year Ended | Year Ended | Year Ended | Year Ended | |||||||||||||
| June 30, | June 30, | June 30, | June 30, | |||||||||||||
| 2013 | 2012 | 2013 | 2012 | |||||||||||||
| OPERATIONS | ||||||||||||||||
| Net investment income (loss) | $ | 2,080,980 | $ | (2,436,300 | ) | $ | 2,324,972 | $ | 2,073,641 | |||||||
| Net realized gains (losses) on investments | (5,648,207 | ) | (7,603,841 | ) | 13,481,067 | 4,014,286 | ||||||||||
| Net change in unrealized appreciation (depreciation) | 202,184,736 | 26,867,623 | 13,485,570 | (10,383,021 | ) | |||||||||||
| Increase (Decrease) in Net Assets from Operations | 198,617,509 | 16,827,482 | 29,291,609 | (4,295,094 | ) | |||||||||||
| DISTRIBUTIONS TO SHAREHOLDERS FROM | ||||||||||||||||
| Net investment income: | ||||||||||||||||
| Institutional Shares* | (65,974 | ) | — | (178 | ) | — | ||||||||||
| Investor Shares* | (1,975,839 | ) | — | (2,400,157 | ) | (1,077,231 | ) | |||||||||
| Advisor Shares | (13,229 | ) | — | (25,371 | ) | (16,059 | ) | |||||||||
| Total Distributions to Shareholders | (2,055,042 | ) | — | (2,425,706 | ) | (1,093,290 | ) | |||||||||
| CAPITAL SHARE TRANSACTIONS | ||||||||||||||||
| Sale of shares: | ||||||||||||||||
| Institutional Shares* | 113,544,951 | — | 10,000 | — | ||||||||||||
| Investor Shares* | 820,532,267 | 622,435,463 | 27,858,672 | 30,664,573 | ||||||||||||
| Advisor Shares | 9,830,221 | 6,387,227 | 3,075 | 6,400 | ||||||||||||
| Reinvestment of distributions: | ||||||||||||||||
| Institutional Shares* | 65,974 | — | 178 | — | ||||||||||||
| Investor Shares* | 1,709,853 | — | 441,858 | 220,008 | ||||||||||||
| Advisor Shares | 12,373 | — | 22,592 | 15,025 | ||||||||||||
| Redemption of shares: | ||||||||||||||||
| Institutional Shares* | (2,895,661 | ) | — | — | — | |||||||||||
| Investor Shares* | (311,681,632 | ) | (147,946,087 | ) | (50,239,650 | ) | (47,240,323 | ) | ||||||||
| Advisor Shares | (2,403,058 | ) | (491,541 | ) | (963,619 | ) | (764,260 | ) | ||||||||
| Redemption fees: | ||||||||||||||||
| Institutional Shares* | 428 | — | — | — | ||||||||||||
| Investor Shares* | 11,002 | 15,194 | 13 | — | ||||||||||||
| Advisor Shares | 6 | 420 | — | — | ||||||||||||
| Increase (Decrease) from Capital Share Transactions | 628,726,724 | 480,400,676 | (22,866,881 | ) | (17,098,577 | ) | ||||||||||
| Increase (Decrease) in Net Assets | 825,289,191 | 497,228,158 | 3,999,022 | (22,486,961 | ) | |||||||||||
| NET ASSETS | ||||||||||||||||
| Beginning of year | 966,153,630 | 468,925,472 | 158,427,331 | 180,914,292 | ||||||||||||
| End of year | $ | 1,791,442,821 | $ | 966,153,630 | $ | 162,426,353 | $ | 158,427,331 | ||||||||
| Undistributed (Accumulated) net investment income (loss) | $ | (1,374,373 | ) | $ | (1,400,353 | ) | $ | 1,442,921 | $ | 1,543,544 | ||||||
| SHARE TRANSACTIONS | ||||||||||||||||
| Sale of shares: | ||||||||||||||||
| Institutional Shares* | 7,369,370 | — | 766 | — | ||||||||||||
| Investor Shares* | 53,330,610 | 46,402,321 | 2,000,983 | 2,515,981 | ||||||||||||
| Advisor Shares | 659,189 | 470,667 | 203 | 536 | ||||||||||||
| Reinvestment of distributions: | ||||||||||||||||
| Institutional Shares* | 4,494 | — | 14 | — | ||||||||||||
| Investor Shares* | 116,475 | — | 34,466 | 19,933 | ||||||||||||
| Advisor Shares | 865 | — | 1,752 | 1,351 | ||||||||||||
| Redemption of shares: | ||||||||||||||||
| Institutional Shares* | (185,876 | ) | — | — | — | |||||||||||
| Investor Shares* | (20,618,203 | ) | (11,210,638 | ) | (3,829,558 | ) | (4,005,686 | ) | ||||||||
| Advisor Shares | (160,608 | ) | (36,725 | ) | (71,094 | ) | (61,068 | ) | ||||||||
| Increase (Decrease) from Capital Share Transactions | 40,516,316 | 35,625,625 | (1,862,468 | ) | (1,528,953 | ) | ||||||||||
| * | On October 19, 2012, the existing Institutional Share Class became the Investor Share Class and a new Institutional Share Class was opened. The Institutional Share Class presented is the new Institutional Share Class that opened on October 19, 2012. The previous Institutional Class is presented as the Investor Shares. |
The accompanying notes are an integral part of these financial statements.
66
Statements of Changes in Net Assets
| BROWN ADVISORY | BROWN ADVISORY | |||||||||||||||
| FLEXIBLE EQUITY FUND | SMALL-CAP GROWTH FUND | |||||||||||||||
| Year Ended | Year Ended | Year Ended | Year Ended | |||||||||||||
| June 30, | June 30, | June 30, | June 30, | |||||||||||||
| 2013 | 2012 | 2013 | 2012 | |||||||||||||
| OPERATIONS | ||||||||||||||||
| Net investment income (loss) | $ | 255,458 | $ | 165,242 | $ | (913,379 | ) | $ | (1,744,069 | ) | ||||||
| Net realized gains on investments | 381,342 | 179,759 | 19,273,284 | 14,453,565 | ||||||||||||
| Net change in unrealized appreciation (depreciation) | 11,667,334 | 1,889,975 | 34,372,117 | (19,552,454 | ) | |||||||||||
| Increase (Decrease) in Net Assets from Operations | 12,304,134 | 2,234,976 | 52,732,022 | (6,842,958 | ) | |||||||||||
| DISTRIBUTIONS TO SHAREHOLDERS FROM | ||||||||||||||||
| Net investment income: | ||||||||||||||||
| Institutional Shares* | (58 | ) | — | — | — | |||||||||||
| Investor Shares* | (230,035 | ) | (85,007 | ) | — | — | ||||||||||
| Advisor Shares | (3,699 | ) | (1,523 | ) | — | — | ||||||||||
| Net realized gain: | ||||||||||||||||
| Institutional Shares* | — | — | (633,269 | ) | (73,162 | ) | ||||||||||
| Investor Shares* | — | — | (21,015,379 | ) | (3,842,848 | ) | ||||||||||
| Advisor Shares | — | — | (286,575 | ) | (54,833 | ) | ||||||||||
| Total Distributions to Shareholders | (233,792 | ) | (86,530 | ) | (21,935,223 | ) | (3,970,843 | ) | ||||||||
| CAPITAL SHARE TRANSACTIONS | ||||||||||||||||
| Sale of shares: | ||||||||||||||||
| Institutional Shares* | 10,000 | — | 15,705 | — | ||||||||||||
| Investor Shares* | 37,446,111 | 10,180,637 | 56,559,441 | 43,190,866 | ||||||||||||
| Advisor Shares | 5,167,925 | 108,609 | 2,148,049 | 197,687 | ||||||||||||
| Reinvestment of distributions: | ||||||||||||||||
| Institutional Shares* | 58 | — | 572,119 | 66,476 | ||||||||||||
| Investor Shares* | 81,645 | 30,361 | 16,467,524 | 3,760,940 | ||||||||||||
| Advisor Shares | 2,102 | 827 | 256,880 | 53,054 | ||||||||||||
| Redemption of shares: | ||||||||||||||||
| Institutional Shares* | — | — | (1,017,846 | ) | (1,480,741 | ) | ||||||||||
| Investor Shares* | (4,044,749 | ) | (1,664,779 | ) | (36,724,238 | ) | (29,596,306 | ) | ||||||||
| Advisor Shares | (379,541 | ) | (334,558 | ) | (338,790 | ) | (312,843 | ) | ||||||||
| Redemption fees: | ||||||||||||||||
| Institutional Shares* | — | — | — | — | ||||||||||||
| Investor Shares* | 137 | — | 515 | 1 | ||||||||||||
| Advisor Shares | — | — | — | 192 | ||||||||||||
| Increase from Capital Share Transactions | 38,283,688 | 8,321,097 | 37,939,359 | 15,879,326 | ||||||||||||
| Increase in Net Assets | 50,354,030 | 10,469,543 | 68,736,158 | 5,065,525 | ||||||||||||
| NET ASSETS | ||||||||||||||||
| Beginning of year | 38,556,119 | 28,086,576 | 225,130,311 | 220,064,786 | ||||||||||||
| End of year | $ | 88,910,149 | $ | 38,556,119 | $ | 293,866,469 | $ | 225,130,311 | ||||||||
| Undistributed (Accumulated) net investment income (loss) | $ | 100,229 | $ | 78,520 | $ | 205,885 | $ | (823,341 | ) | |||||||
| SHARE TRANSACTIONS | ||||||||||||||||
| Sale of shares: | ||||||||||||||||
| Institutional Shares* | 956 | — | 585 | — | ||||||||||||
| Investor Shares* | 3,227,028 | 1,121,346 | 3,844,440 | 3,115,075 | ||||||||||||
| Advisor Shares | 419,254 | 11,574 | 152,517 | 13,862 | ||||||||||||
| Reinvestment of distributions: | ||||||||||||||||
| Institutional Shares* | 6 | — | 21,292 | 2,528 | ||||||||||||
| Investor Shares* | 7,754 | 3,389 | 1,214,419 | 283,417 | ||||||||||||
| Advisor Shares | 200 | 92 | 19,579 | 4,122 | ||||||||||||
| Redemption of shares: | ||||||||||||||||
| Institutional Shares* | — | — | (34,801 | ) | (52,999 | ) | ||||||||||
| Investor Shares* | (364,307 | ) | (179,858 | ) | (2,500,764 | ) | (2,164,522 | ) | ||||||||
| Advisor Shares | (32,988 | ) | (37,438 | ) | (23,431 | ) | (22,943 | ) | ||||||||
| Increase from Capital Share Transactions | 3,257,903 | 919,105 | 2,693,836 | 1,178,540 | ||||||||||||
| * | On October 19, 2012, the existing D Shares of the Small-Cap Growth Fund became Institutional Shares and a new Institutional Share Class was opened in the Flexible Equity Fund. The Institutional Share Class presented is the previous D Share class of the Small-Cap Growth Fund and the new Institutional Share Class for the Flexible Equity Fund. On October 19, 2012, the existing Institutional Shares of the Flexible Equity Fund became Investor Shares. |
The accompanying notes are an integral part of these financial statements.
67
Statements of Changes in Net Assets
| BROWN ADVISORY SMALL-CAP | BROWN ADVISORY | |||||||||||||||
| FUNDAMENTAL VALUE FUND | OPPORTUNITY FUND | |||||||||||||||
| Year Ended | Year Ended | Year Ended | Year Ended | |||||||||||||
| June 30, | June 30, | June 30, | June 30, | |||||||||||||
| 2013 | 2012 | 2013 | 2012 | |||||||||||||
| OPERATIONS | ||||||||||||||||
| Net investment income (loss) | $ | 2,631,366 | $ | 970,693 | $ | (24,640 | ) | $ | (54,457 | ) | ||||||
| Net realized gains (losses) on investments | 15,854,801 | (2,839,760 | ) | 644,942 | 1,408,478 | |||||||||||
| Net change in unrealized appreciation (depreciation) | 45,698,631 | 3,792,492 | 1,222,400 | (1,468,623 | ) | |||||||||||
| Increase (Decrease) in Net Assets from Operations | 64,184,798 | 1,923,425 | 1,842,702 | (114,602 | ) | |||||||||||
| DISTRIBUTIONS TO SHAREHOLDERS FROM | ||||||||||||||||
| Net investment income: | ||||||||||||||||
| Institutional Shares* | (44 | ) | — | — | — | |||||||||||
| Investor Shares* | (862,851 | ) | (903,557 | ) | — | — | ||||||||||
| Advisor Shares | (1,100 | ) | (412 | ) | — | — | ||||||||||
| Net realized gain: | ||||||||||||||||
| Institutional Shares* | — | — | — | — | ||||||||||||
| Investor Shares* | — | (5,200,860 | ) | — | — | |||||||||||
| Advisor Shares | — | (2,631 | ) | — | — | |||||||||||
| Total Distributions to Shareholders | (863,995 | ) | (6,107,460 | ) | — | — | ||||||||||
| CAPITAL SHARE TRANSACTIONS | ||||||||||||||||
| Sale of shares: | ||||||||||||||||
| Institutional Shares* | 1,048,500 | — | — | — | ||||||||||||
| Investor Shares* | 134,389,272 | 58,223,609 | 383,175 | 783,304 | ||||||||||||
| Advisor Shares | 13,977,201 | 189,035 | — | — | ||||||||||||
| Reinvestment of distributions: | ||||||||||||||||
| Institutional Shares* | 44 | — | — | — | ||||||||||||
| Investor Shares* | 163,746 | 5,171,177 | — | — | ||||||||||||
| Advisor Shares | 988 | 2,758 | — | — | ||||||||||||
| Redemption of shares: | ||||||||||||||||
| Institutional Shares* | (11,977 | ) | — | — | — | |||||||||||
| Investor Shares* | (19,906,645 | ) | (29,614,794 | ) | (1,539,347 | ) | (3,873,961 | ) | ||||||||
| Advisor Shares | (276,993 | ) | (10,300 | ) | — | — | ||||||||||
| Redemption fees: | ||||||||||||||||
| Institutional Shares* | — | — | — | — | ||||||||||||
| Investor Shares* | 1,147 | 169 | — | — | ||||||||||||
| Advisor Shares | — | — | — | — | ||||||||||||
| Shares issued in connection with the acquisition of | ||||||||||||||||
| Brown Advisory Small Companies Fund: | ||||||||||||||||
| Institutional Shares* | — | — | — | — | ||||||||||||
| Investor Shares* | — | 57,519,913 | — | — | ||||||||||||
| Advisor Shares | — | 302,052 | — | — | ||||||||||||
| Increase (Decrease) from Capital Share Transactions | 129,385,283 | 91,783,619 | (1,156,172 | ) | (3,090,657 | ) | ||||||||||
| Increase (Decrease) in Net Assets | 192,706,086 | 87,599,584 | 686,530 | (3,205,259 | ) | |||||||||||
| NET ASSETS | ||||||||||||||||
| Beginning of year | 195,136,886 | 107,537,302 | 8,486,591 | 11,691,850 | ||||||||||||
| End of year | $ | 387,842,972 | $ | 195,136,886 | $ | 9,173,121 | $ | 8,486,591 | ||||||||
| Undistributed (Accumulated) net investment income (loss) | $ | 2,053,423 | $ | 243,450 | $ | (24,827 | ) | $ | (26,215 | ) | ||||||
The accompanying notes are an integral part of these financial statements.
68
Statements of Changes in Net Assets
| BROWN ADVISORY SMALL-CAP | BROWN ADVISORY | |||||||||||||||
| FUNDAMENTAL VALUE FUND | OPPORTUNITY FUND | |||||||||||||||
| Year Ended | Year Ended | Year Ended | Year Ended | |||||||||||||
| June 30, | June 30, | June 30, | June 30, | |||||||||||||
| 2013 | 2012 | 2013 | 2012 | |||||||||||||
| SHARE TRANSACTIONS | ||||||||||||||||
| Sale of shares: | ||||||||||||||||
| Institutional Shares* | 53,495 | — | — | — | ||||||||||||
| Investor Shares* | 7,167,523 | 3,632,761 | 22,201 | 50,933 | ||||||||||||
| Advisor Shares | 775,604 | 5,957 | — | — | ||||||||||||
| Reinvestment of distributions: | ||||||||||||||||
| Institutional Shares* | 3 | — | — | — | ||||||||||||
| Investor Shares* | 9,335 | 362,077 | — | — | ||||||||||||
| Advisor Shares | 57 | 193 | — | — | ||||||||||||
| Redemption of shares: | ||||||||||||||||
| Institutional Shares* | (599 | ) | — | — | — | |||||||||||
| Investor Shares* | (1,120,225 | ) | (1,965,789 | ) | (93,623 | ) | (266,404 | ) | ||||||||
| Advisor Shares | (14,632 | ) | (660 | ) | — | — | ||||||||||
| Shares issued in connection with the acquisition of | ||||||||||||||||
| Brown Advisory Small Companies Fund: | ||||||||||||||||
| Institutional Shares* | — | — | — | — | ||||||||||||
| Investor Shares* | — | 4,045,741 | — | — | ||||||||||||
| Advisor Shares | — | 21,253 | — | — | ||||||||||||
| Increase (Decrease) from Capital Share Transactions | 6,870,561 | 6,101,533 | (71,422 | ) | (215,471 | ) | ||||||||||
| * | On October 19, 2012, the existing Institutional Share Class became the Investor Share Class. A new Institutional Share Class was opened on October 19, 2012 in the Small-Cap Fundamental Value Fund. The Institutional Share Class presented is the new Institutional Share Class that opened on October 19, 2012. The previous Institutional Class is presented as the Investor Shares. |
The accompanying notes are an integral part of these financial statements.
69
Statements of Changes in Net Assets
| BROWN ADVISORY | BROWN ADVISORY | |||||||||||||||
| MARYLAND BOND FUND | INTERMEDIATE INCOME FUND | |||||||||||||||
| Year Ended | Year Ended | Year Ended | Year Ended | |||||||||||||
| June 30, | June 30, | June 30, | June 30, | |||||||||||||
| 2013 | 2012 | 2013 | 2012 | |||||||||||||
| OPERATIONS | ||||||||||||||||
| Net investment income | $ | 4,884,891 | $ | 4,925,581 | $ | 4,885,718 | $ | 6,325,157 | ||||||||
| Net realized gains on investments | 1,708,121 | 885,054 | 5,538,948 | 7,032,300 | ||||||||||||
| Net change in unrealized appreciation (depreciation) | (7,327,698 | ) | 3,810,287 | (11,603,288 | ) | 2,025,544 | ||||||||||
| Increase (Decrease) in Net Assets from Operations | (734,686 | ) | 9,620,922 | (1,178,622 | ) | 15,383,001 | ||||||||||
| DISTRIBUTIONS TO SHAREHOLDERS FROM | ||||||||||||||||
| Net investment income: | ||||||||||||||||
| Investor Shares* | (4,884,891 | ) | (4,925,581 | ) | (6,094,190 | ) | (6,088,969 | ) | ||||||||
| Advisor Shares | — | — | (369,069 | ) | (442,920 | ) | ||||||||||
| Net realized gain: | ||||||||||||||||
| Investor Shares* | (455,702 | ) | (923,336 | ) | (5,050,407 | ) | (5,996,378 | ) | ||||||||
| Advisor Shares | — | — | (344,796 | ) | (500,794 | ) | ||||||||||
| Total Distributions to Shareholders | (5,340,593 | ) | (5,848,917 | ) | (11,858,462 | ) | (13,029,061 | ) | ||||||||
| CAPITAL SHARE TRANSACTIONS | ||||||||||||||||
| Sale of shares: | ||||||||||||||||
| Investor Shares* | 85,262,666 | 104,405,674 | 86,127,669 | 105,291,963 | ||||||||||||
| Advisor Shares | — | — | 283,788 | 414,584 | ||||||||||||
| Reinvestment of distributions: | ||||||||||||||||
| Investor Shares* | 821,746 | 1,629,724 | 5,190,762 | 7,027,677 | ||||||||||||
| Advisor Shares | — | — | 460,726 | 620,654 | ||||||||||||
| Redemption of shares: | ||||||||||||||||
| Investor Shares* | (77,931,410 | ) | (47,904,316 | ) | (130,115,548 | ) | (77,798,037 | ) | ||||||||
| Advisor Shares | — | — | (3,315,606 | ) | (4,310,803 | ) | ||||||||||
| Redemption fees: | ||||||||||||||||
| Investor Shares* | 1,520 | 4,006 | 1,372 | 1,232 | ||||||||||||
| Advisor Shares | — | — | — | 485 | ||||||||||||
| Increase (Decrease) from Capital Share Transactions | 8,154,522 | 58,135,088 | (41,366,837 | ) | 31,247,755 | |||||||||||
| Increase (Decrease) in Net Assets | 2,079,243 | 61,907,093 | (54,403,921 | ) | 33,601,695 | |||||||||||
| NET ASSETS | ||||||||||||||||
| Beginning of year | 250,087,093 | 188,180,000 | 312,095,773 | 278,494,078 | ||||||||||||
| End of year | $ | 252,166,336 | $ | 250,087,093 | $ | 257,691,852 | $ | 312,095,773 | ||||||||
| Undistributed (Accumulated) net investment income (loss) | $ | — | $ | — | $ | (180,031 | ) | $ | 843,885 | |||||||
| SHARE TRANSACTIONS | ||||||||||||||||
| Sale of shares: | ||||||||||||||||
| Investor Shares* | 7,681,767 | 9,476,837 | 7,632,294 | 9,258,122 | ||||||||||||
| Advisor Shares | — | — | 25,311 | 37,289 | ||||||||||||
| Reinvestment of distributions: | ||||||||||||||||
| Investor Shares* | 74,031 | 148,602 | 460,203 | 623,756 | ||||||||||||
| Advisor Shares | — | — | 41,621 | 55,906 | ||||||||||||
| Redemption of shares: | ||||||||||||||||
| Investor Shares* | (7,036,820 | ) | (4,346,682 | ) | (11,577,396 | ) | (6,829,627 | ) | ||||||||
| Advisor Shares | — | — | (301,177 | ) | (385,939 | ) | ||||||||||
| Increase (Decrease) from Capital Share Transactions | 718,978 | 5,278,757 | (3,719,144 | ) | 2,759,507 | |||||||||||
| * | On October 19, 2012, Institutional Shares were renamed Investor Shares. |
The accompanying notes are an integral part of these financial statements.
70
Statements of Changes in Net Assets
| BROWN ADVISORY | BROWN ADVISORY | |||||||||||||||
| TACTICAL BOND FUND | EQUITY INCOME FUND | |||||||||||||||
| Year Ended | Period Ended | Year Ended | Period Ended | |||||||||||||
| June 30, | June 30, | June 30, | June 30, | |||||||||||||
| 2013 | 2012* | 2013 | 2012^ | |||||||||||||
| OPERATIONS | ||||||||||||||||
| Net investment income (loss) | $ | (218,723 | ) | $ | (139,506 | ) | $ | 3,569,695 | $ | 1,143,491 | ||||||
| Net realized gains (losses) on investments and swaps | 916,317 | (980,342 | ) | 1,842,110 | 595,345 | |||||||||||
| Net change in unrealized appreciation (depreciation) | (226,884 | ) | 204,538 | 21,873,753 | 2,916,090 | |||||||||||
| Increase (Decrease) in Net Assets from Operations | 470,710 | (915,310 | ) | 27,285,558 | 4,654,926 | |||||||||||
| DISTRIBUTIONS TO SHAREHOLDERS FROM | ||||||||||||||||
| Net investment income: | ||||||||||||||||
| Institutional Shares** | — | — | (214 | ) | — | |||||||||||
| Investor Shares** | — | — | (3,830,549 | ) | (1,137,518 | ) | ||||||||||
| Advisor Shares | (492,870 | ) | (41,204 | ) | (33,737 | ) | (4,794 | ) | ||||||||
| Net realized gain: | ||||||||||||||||
| Institutional Shares** | — | — | (68 | ) | — | |||||||||||
| Investor Shares** | — | — | (1,030,451 | ) | — | |||||||||||
| Advisor Shares | — | — | (6,589 | ) | — | |||||||||||
| Total Distributions to Shareholders | (492,870 | ) | (41,204 | ) | (4,901,608 | ) | (1,142,312 | ) | ||||||||
| CAPITAL SHARE TRANSACTIONS | ||||||||||||||||
| Sale of shares: | ||||||||||||||||
| Institutional Shares** | — | — | 10,000 | — | ||||||||||||
| Investor Shares** | — | — | 74,267,932 | 105,209,640 | ||||||||||||
| Advisor Shares | 6,133,204 | 39,433,260 | 1,557,286 | 672,066 | ||||||||||||
| Reinvestment of distributions: | ||||||||||||||||
| Institutional Shares** | — | — | 148 | — | ||||||||||||
| Investor Shares** | — | — | 1,582,535 | 167,048 | ||||||||||||
| Advisor Shares | 87,886 | 11,173 | 31,524 | 3,979 | ||||||||||||
| Redemption of shares: | ||||||||||||||||
| Institutional Shares** | — | — | — | — | ||||||||||||
| Investor Shares** | — | — | (30,534,656 | ) | (2,806,823 | ) | ||||||||||
| Advisor Shares | (10,169,608 | ) | (8,950,833 | ) | (53,111 | ) | (52,132 | ) | ||||||||
| Redemption fees: | ||||||||||||||||
| Institutional Shares** | — | — | — | — | ||||||||||||
| Investor Shares** | — | — | 395 | 4,543 | ||||||||||||
| Advisor Shares | 48 | 3,935 | — | — | ||||||||||||
| Increase (Decrease) from Capital Share Transactions | (3,948,470 | ) | 30,497,535 | 46,862,053 | 103,198,321 | |||||||||||
| Increase (Decrease) in Net Assets | (3,970,630 | ) | 29,541,021 | 69,246,003 | 106,710,935 | |||||||||||
| NET ASSETS | ||||||||||||||||
| Beginning of year/period | 29,541,021 | — | 106,710,935 | — | ||||||||||||
| End of year/period | $ | 25,570,391 | $ | 29,541,021 | $ | 175,956,938 | $ | 106,710,935 | ||||||||
| Undistributed (Accumulated) net investment income (loss) | $ | (294,236 | ) | $ | (53,705 | ) | $ | — | $ | 1,179 | ||||||
| SHARE TRANSACTIONS | ||||||||||||||||
| Sale of shares: | ||||||||||||||||
| Institutional Shares** | — | — | 903 | — | ||||||||||||
| Investor Shares** | — | — | 6,703,721 | 10,372,079 | ||||||||||||
| Advisor Shares | 614,124 | 3,966,688 | 134,623 | 65,399 | ||||||||||||
| Reinvestment of distributions: | ||||||||||||||||
| Institutional Shares** | — | — | 14 | — | ||||||||||||
| Investor Shares** | — | — | 142,013 | 15,834 | ||||||||||||
| Advisor Shares | 8,968 | 1,154 | 2,752 | 378 | ||||||||||||
| Redemption of shares: | ||||||||||||||||
| Institutional Shares** | — | — | — | — | ||||||||||||
| Investor Shares** | — | — | (2,679,756 | ) | (272,489 | ) | ||||||||||
| Advisor Shares | (1,033,345 | ) | (915,371 | ) | (4,810 | ) | (5,100 | ) | ||||||||
| Increase (Decrease) from Capital Share Transactions | (410,253 | ) | 3,052,471 | 4,299,460 | 10,176,101 | |||||||||||
| * | Commenced operations on September 30, 2011. The information presented is for the period from September 30, 2011 to June 30, 2012. |
| ^ | Commenced operations on December 29, 2011. The information presented is for the period from December 29 to June 30, 2012. |
| ** | On October 19, 2012, the existing Institutional Share Class became the Investor Share Class and a new Institutional Share Class was opened. The Institutional Share Class presented is the new Institutional Share Class that opened on October 19, 2012. The previous Institutional Class is presented as the Investor Shares. |
The accompanying notes are an integral part of these financial statements.
71
Statements of Changes in Net Assets
| BROWN ADVISORY | BROWN ADVISORY | |||||||||||||||
| SUSTAINABLE GROWTH FUND | TAX EXEMPT BOND FUND | |||||||||||||||
| Year Ended | Period Ended | Year Ended | Period Ended | |||||||||||||
| June 30, | June 30, | June 30, | June 30, | |||||||||||||
| 2013 | 2012* | 2013 | 2012* | |||||||||||||
| OPERATIONS | ||||||||||||||||
| Net investment income (loss) | $ | (340,164 | ) | $ | — | $ | 2,083,108 | $ | — | |||||||
| Net realized gains on investments | 1,276,044 | — | 607,053 | — | ||||||||||||
| Net change in unrealized appreciation (depreciation) | 22,091,899 | — | (3,651,212 | ) | — | |||||||||||
| Increase (Decrease) in Net Assets from Operations | 23,027,779 | — | (961,051 | ) | — | |||||||||||
| DISTRIBUTIONS TO SHAREHOLDERS FROM | ||||||||||||||||
| Net investment income: | ||||||||||||||||
| Institutional Shares | — | — | — | — | ||||||||||||
| Investor Shares | — | — | (2,083,108 | ) | — | |||||||||||
| Advisor Shares | — | — | — | — | ||||||||||||
| Net realized gain: | ||||||||||||||||
| Institutional Shares | (15,485 | ) | — | — | — | |||||||||||
| Investor Shares | (6,011 | ) | — | (580,068 | ) | — | ||||||||||
| Advisor Shares | (74,045 | ) | — | — | — | |||||||||||
| Total Distributions to Shareholders | (95,541 | ) | — | (2,663,176 | ) | — | ||||||||||
| CAPITAL SHARE TRANSACTIONS | ||||||||||||||||
| Sale of shares: | ||||||||||||||||
| Institutional Shares | 9,555,134 | 25,000 | — | — | ||||||||||||
| Investor Shares | 22,800,938 | 25,000 | 231,803,244 | 25,000 | ||||||||||||
| Advisor Shares | 3,880,586 | 25,000 | — | — | ||||||||||||
| Reinvestment of distributions: | ||||||||||||||||
| Institutional Shares | 12,794 | — | — | — | ||||||||||||
| Investor Shares | 5,078 | — | 805,800 | — | ||||||||||||
| Advisor Shares | 69,128 | — | — | — | ||||||||||||
| Redemption of shares: | ||||||||||||||||
| Institutional Shares | (7,809,453 | ) | — | — | — | |||||||||||
| Investor Shares | (732,413 | ) | — | (67,119,557 | ) | — | ||||||||||
| Advisor Shares | (23,490,114 | ) | — | — | — | |||||||||||
| Redemption fees: | ||||||||||||||||
| Institutional Shares | — | — | — | — | ||||||||||||
| Investor Shares | — | — | 1,024 | — | ||||||||||||
| Advisor Shares | 195 | — | — | — | ||||||||||||
| Shares issued in connection with the acquisition of | ||||||||||||||||
| Winslow Green Growth Fund: | ||||||||||||||||
| Institutional Shares | 26,493,967 | — | — | — | ||||||||||||
| Investor Shares | — | — | — | — | ||||||||||||
| Advisor Shares | 126,536,616 | — | — | — | ||||||||||||
| Increase from Capital Share Transactions | 157,322,456 | 75,000 | 165,490,511 | 25,000 | ||||||||||||
| Increase in Net Assets | 180,254,694 | 75,000 | 161,866,284 | 25,000 | ||||||||||||
| NET ASSETS | ||||||||||||||||
| Beginning of year/period | 75,000 | — | 25,000 | — | ||||||||||||
| End of year/period | $ | 180,329,694 | $ | 75,000 | $ | 161,891,284 | $ | 25,000 | ||||||||
| Undistributed (Accumulated) net investment income (loss) | $ | (268,549 | ) | $ | — | $ | — | $ | — | |||||||
The accompanying notes are an integral part of these financial statements.
72
Statements of Changes in Net Assets
| BROWN ADVISORY | BROWN ADVISORY | |||||||||||||||
| SUSTAINABLE GROWTH FUND | TAX EXEMPT BOND FUND | |||||||||||||||
| Year Ended | Period Ended | Year Ended | Period Ended | |||||||||||||
| June 30, | June 30, | June 30, | June 30, | |||||||||||||
| 2013 | 2012* | 2013 | 2012* | |||||||||||||
| SHARE TRANSACTIONS | ||||||||||||||||
| Sale of shares: | ||||||||||||||||
| Institutional Shares | 840,318 | 2,500 | — | — | ||||||||||||
| Investor Shares | 2,129,178 | 2,500 | 23,009,054 | 2,500 | ||||||||||||
| Advisor Shares | 348,027 | 2,500 | — | — | ||||||||||||
| Reinvestment of distributions: | ||||||||||||||||
| Institutional Shares | 1,213 | — | — | — | ||||||||||||
| Investor Shares | 482 | — | 79,465 | — | ||||||||||||
| Advisor Shares | 6,565 | — | — | — | ||||||||||||
| Redemption of shares: | ||||||||||||||||
| Institutional Shares | (703,890 | ) | — | — | — | |||||||||||
| Investor Shares | (64,790 | ) | — | (6,636,553 | ) | — | ||||||||||
| Advisor Shares | (2,134,017 | ) | — | — | — | |||||||||||
| Shares issued in connection with the acquisition of | ||||||||||||||||
| Winslow Green Growth Fund: | ||||||||||||||||
| Institutional Shares | 2,612,191 | — | — | — | ||||||||||||
| Investor Shares | — | — | — | — | ||||||||||||
| Advisor Shares | 12,491,495 | — | — | — | ||||||||||||
| Increase from Capital Share Transactions | 15,526,772 | 7,500 | 16,451,966 | 2,500 | ||||||||||||
| * | Commenced operations on June 29, 2012. The information presented is for the period from June 29, 2012 to June 30, 2012. |
The accompanying notes are an integral part of these financial statements.
73
Statements of Changes in Net Assets
| BROWN ADVISORY | ||||
| EMERGING MARKETS FUND | ||||
| Period Ended | ||||
| June 30, | ||||
| 2013* | ||||
| OPERATIONS | ||||
| Net investment income | $ | 1,234,805 | ||
| Net realized losses on investments | (2,474,598 | ) | ||
| Net change in unrealized appreciation (depreciation) | (5,307,834 | ) | ||
| Decrease in Net Assets from Operations | (6,547,627 | ) | ||
| DISTRIBUTIONS TO SHAREHOLDERS FROM | ||||
| Net investment income: | ||||
| Institutional Shares | (25,072 | ) | ||
| Investor Shares | (1,228 | ) | ||
| Advisor Shares | (46 | ) | ||
| Total Distributions to Shareholders | (26,346 | ) | ||
| CAPITAL SHARE TRANSACTIONS | ||||
| Sale of shares: | ||||
| Institutional Shares | 129,847,886 | |||
| Investor Shares | 14,723,368 | |||
| Advisor Shares | 1,047,755 | |||
| Reinvestment of distributions: | ||||
| Institutional Shares | 1,716 | |||
| Investor Shares | 737 | |||
| Advisor Shares | 46 | |||
| Redemption of shares: | ||||
| Institutional Shares | (1,480,131 | ) | ||
| Investor Shares | (2,359,346 | ) | ||
| Advisor Shares | (10,103 | ) | ||
| Redemption fees: | ||||
| Institutional Shares | 941 | |||
| Investor Shares | — | |||
| Advisor Shares | — | |||
| Increase from Capital Share Transactions | 141,772,869 | |||
| Increase in Net Assets | 135,198,896 | |||
| NET ASSETS | ||||
| Beginning of period | — | |||
| End of period | $ | 135,198,896 | ||
| Undistributed net investment income | $ | 919,023 | ||
| SHARE TRANSACTIONS | ||||
| Sale of shares: | ||||
| Institutional Shares | 13,026,064 | |||
| Investor Shares | 1,467,686 | |||
| Advisor Shares | 105,235 | |||
| Reinvestment of distributions: | ||||
| Institutional Shares | 169 | |||
| Investor Shares | 73 | |||
| Advisor Shares | 4 | |||
| Redemption of shares: | ||||
| Institutional Shares | (151,869 | ) | ||
| Investor Shares | (237,826 | ) | ||
| Advisor Shares | (1,000 | ) | ||
| Increase from Capital Share Transactions | 14,208,536 | |||
| * | Commenced operations on December 12, 2012. The information presented is for the period from December 12, 2012 to June 30, 2013. |
The accompanying notes are an integral part of these financial statements.
74
Financial Highlights
These financial highlights reflect selected per share data and ratios for a share outstanding of each Fund throughout each period.
BROWN ADVISORY GROWTH EQUITY FUND
INSTITUTIONAL SHARES
| Period Ended | ||||
| June 30, | ||||
| 2013(f) | ||||
| Net Asset Value, Beginning of Period | $ | 14.58 | ||
| Net Investment Income(a) | 0.01 | |||
| Net Realized And Unrealized Gains | 1.66 | |||
| Total from Investment Operations | $ | 1.67 | ||
| Distributions: | ||||
| from Net Investment Income | (0.03 | ) | ||
| Total Distributions to Shareholders | $ | (0.03 | ) | |
| Redemption Fees(a) | — | (e) | ||
| Net Asset Value, End of Period | $ | 16.22 | ||
| Total Return | 11.49 | %(b) | ||
| Net Assets at End of Period (000’s Omitted) | $ | 116,575 | ||
| Ratios to Average Net Assets: | ||||
| Net Investment Income | 0.30 | %(c) | ||
| Net Expenses | 0.78 | %(c) | ||
| Gross Expenses(d) | 0.78 | %(c) | ||
| Portfolio Turnover Rate | 40 | % | ||
| (a) | Calculated based on average shares outstanding during the period. |
| (b) | Not annualized. |
| (c) | Annualized. |
| (d) | Reflects the expense ratio excluding any waivers and/or expense reimbursements. |
| (e) | Less than $0.01 per share. |
| (f) | Commenced operations on October 19, 2012. The information presented is for the period from October 19, 2012 to June 30, 2013. |
The accompanying notes are an integral part of these financial statements.
www.brownadvisoryfunds.com
75
Financial Highlights
These financial highlights reflect selected per share data and ratios for a share outstanding of each Fund throughout each year / period.
BROWN ADVISORY GROWTH EQUITY FUND
INVESTOR SHARES*
| Year / Period Ended: | ||||||||||||||||||||||||
| June 30, | June 30, | June 30, | June 30, | May 31, | May 31, | |||||||||||||||||||
| 2013 | 2012 | 2011 | 2010(f) | 2010 | 2009 | |||||||||||||||||||
| Net Asset Value, Beginning of Year / Period | $ | 13.80 | $ | 13.63 | $ | 9.99 | $ | 10.39 | $ | 7.83 | $ | 10.66 | ||||||||||||
| Net Investment Income (Loss)(a) | 0.03 | (0.05 | ) | (0.04 | ) | (0.01 | ) | (0.06 | ) | (0.03 | ) | |||||||||||||
| Net Realized And Unrealized Gains (Losses) | 2.41 | 0.22 | 3.68 | (0.39 | ) | 2.62 | (2.77 | ) | ||||||||||||||||
| Total from Investment Operations | $ | 2.44 | $ | 0.17 | $ | 3.64 | $ | (0.40 | ) | $ | 2.56 | $ | (2.80 | ) | ||||||||||
| Distributions: | ||||||||||||||||||||||||
| from Net Investment Income | (0.03 | ) | — | — | — | — | — | |||||||||||||||||
| from Net Realized Gains | — | — | — | — | — | (0.03 | ) | |||||||||||||||||
| Total Distributions to Shareholders | $ | (0.03 | ) | $ | — | $ | — | $ | — | $ | — | $ | (0.03 | ) | ||||||||||
| Redemption Fees(a) | — | (e) | — | (e) | — | (e) | — | (e) | — | (e) | — | |||||||||||||
| Net Asset Value, End of Year / Period | $ | 16.21 | $ | 13.80 | $ | 13.63 | $ | 9.99 | $ | 10.39 | $ | 7.83 | ||||||||||||
| Total Return | 17.67 | % | 1.25 | % | 36.44 | % | (3.85 | )%(b) | 32.69 | % | (26.26 | )% | ||||||||||||
| Net Assets at End of Year / Period (000’s Omitted) | $ | 1,653,389 | $ | 954,560 | $ | 463,228 | $ | 96,889 | $ | 97,136 | $ | 52,792 | ||||||||||||
| Ratios to Average Net Assets: | ||||||||||||||||||||||||
| Net Investment Income (Loss) | 0.17 | % | (0.35 | )% | (0.29 | )% | (0.76 | )%(c) | (0.56 | )% | (0.42 | )% | ||||||||||||
| Net Expenses | 0.91 | % | 0.90 | % | 0.94 | % | 1.00 | %(c) | 1.10 | % | 1.13 | % | ||||||||||||
| Gross Expenses(d) | 0.91 | % | 0.90 | % | 0.94 | % | 1.00 | %(c) | 1.10 | % | 1.13 | % | ||||||||||||
| Portfolio Turnover Rate | 40 | % | 58 | % | 30 | % | 1 | %(b) | 34 | % | 70 | % | ||||||||||||
| (a) | Calculated based on average shares outstanding during the year / period. |
| (b) | Not annualized. |
| (c) | Annualized. |
| (d) | Reflects the expense ratio excluding any waivers and/or expense reimbursements. |
| (e) | Less than $0.01 per share. |
| (f) | Effective June 1, 2010, the Fund changed its fiscal year end from May 31 to June 30. The information presented is for the period from June 1, 2010 to June 30, 2010. |
| * | Prior to October 19, 2012, Investor Shares were known as Institutional Shares. |
The accompanying notes are an integral part of these financial statements.
76
Financial Highlights
These financial highlights reflect selected per share data and ratios for a share outstanding of each Fund throughout each year / period.
BROWN ADVISORY GROWTH EQUITY FUND
ADVISOR SHARES*
| Year / Period Ended: | ||||||||||||||||||||||||
| June 30, | June 30, | June 30, | June 30, | May 31, | May 31, | |||||||||||||||||||
| 2013 | 2012 | 2011 | 2010(g) | 2010 | 2009 | |||||||||||||||||||
| Net Asset Value, Beginning of Year / Period | $ | 13.45 | $ | 13.31 | $ | 9.80 | $ | 10.20 | $ | 7.72 | $ | 10.55 | ||||||||||||
| Net Investment Loss(a) | (0.01 | ) | (0.07 | ) | (0.09 | ) | (0.01 | ) | (0.10 | ) | (0.07 | ) | ||||||||||||
| Net Realized And Unrealized Gains (Losses) | 2.35 | 0.21 | 3.60 | (0.39 | ) | 2.58 | (2.73 | ) | ||||||||||||||||
| Total from Investment Operations | $ | 2.34 | $ | 0.14 | $ | 3.51 | $ | (0.40 | ) | $ | 2.48 | $ | (2.80 | ) | ||||||||||
| Distributions: | ||||||||||||||||||||||||
| from Net Investment Income | (0.01 | ) | — | — | — | — | — | |||||||||||||||||
| from Net Realized Gains | — | — | — | — | — | (0.03 | ) | |||||||||||||||||
| Total Distributions to Shareholders | $ | (0.01 | ) | $ | — | $ | — | $ | — | $ | — | $ | (0.03 | ) | ||||||||||
| Redemption Fees(a) | — | (f) | — | (f) | — | — | — | — | ||||||||||||||||
| Net Asset Value, End of Year / Period | $ | 15.78 | $ | 13.45 | $ | 13.31 | $ | 9.80 | $ | 10.20 | $ | 7.72 | ||||||||||||
| Total Return(b) | 17.43 | % | 1.05 | % | 35.82 | % | (3.92 | )%(c) | 32.12 | % | (26.54 | )% | ||||||||||||
| Net Assets at End of Year / Period (000’s Omitted) | $ | 21,478 | $ | 11,593 | $ | 5,698 | $ | 6,027 | $ | 6,287 | $ | 4,755 | ||||||||||||
| Ratios to Average Net Assets: | ||||||||||||||||||||||||
| Net Investment Loss | (0.07 | )% | (0.55 | )% | (0.74 | )% | (1.21 | )%(d) | (1.02 | )% | (0.89 | )% | ||||||||||||
| Net Expenses | 1.15 | % | 1.10 | % | 1.39 | % | 1.45 | %(d) | 1.56 | % | 1.60 | % | ||||||||||||
| Gross Expenses(e) | 1.15 | % | 1.10 | % | 1.39 | % | 1.45 | %(d) | 1.56 | % | 1.66 | % | ||||||||||||
| Portfolio Turnover Rate | 40 | % | 58 | % | 30 | % | 1 | %(c) | 34 | % | 70 | % | ||||||||||||
| (a) | Calculated based on average shares outstanding during the year / period. |
| (b) | Total return does not include the effects of sales charges which existed for Advisor Shares (then known as A Shares) for periods ended June 30, 2011 and earlier. |
| (c) | Not annualized. |
| (d) | Annualized. |
| (e) | Reflects the expense ratio excluding any waivers and/or expense reimbursements. |
| (f) | Less than $0.01 per share. |
| (g) | Effective June 1, 2010, the Fund changed its fiscal year end from May 31 to June 30. The information presented is for the period from June 1, 2010 to June 30, 2010. |
| * | Prior to July 1, 2011, Advisor Shares were known as A Shares. |
The accompanying notes are an integral part of these financial statements.
77
Financial Highlights
These financial highlights reflect selected per share data and ratios for a share outstanding of each Fund throughout each period.
BROWN ADVISORY VALUE EQUITY FUND
INSTITUTIONAL SHARES
| Period Ended | ||||
| June 30, | ||||
| 2013(e) | ||||
| Net Asset Value, Beginning of Period | $ | 13.05 | ||
| Net Investment Income(a) | 0.18 | |||
| Net Realized And Unrealized Gains | 1.74 | |||
| Total from Investment Operations | $ | 1.92 | ||
| Distributions: | ||||
| from Net Investment Income | (0.23 | ) | ||
| Total Distributions to Shareholders | $ | (0.23 | ) | |
| Redemption Fees(a) | — | |||
| Net Asset Value, End of Period | $ | 14.74 | ||
| Total Return | 14.99 | %(b) | ||
| Net Assets at End of Period (000’s Omitted) | $ | 12 | ||
| Ratios to Average Net Assets: | ||||
| Net Investment Income | 1.67 | %(c) | ||
| Net Expenses | 0.81 | %(c) | ||
| Gross Expenses(d) | 0.81 | %(c) | ||
| Portfolio Turnover Rate | 57 | % | ||
| (a) | Calculated based on average shares outstanding during the period. |
| (b) | Not annualized. |
| (c) | Annualized. |
| (d) | Reflects the expense ratio excluding any waivers and/or expense reimbursements. |
| (e) | Commenced operations on October 19, 2012. The information presented is for the period from October 19, 2012 to June 30, 2013. |
The accompanying notes are an integral part of these financial statements.
78
Financial Highlights
These financial highlights reflect selected per share data and ratios for a share outstanding of each Fund throughout each year / period.
BROWN ADVISORY VALUE EQUITY FUND
INVESTOR SHARES*
| Year / Period Ended: | ||||||||||||||||||||||||
| June 30, | June 30, | June 30, | June 30, | May 31, | May 31, | |||||||||||||||||||
| 2013 | 2012 | 2011 | 2010(f) | 2010 | 2009 | |||||||||||||||||||
| Net Asset Value, Beginning of Year / Period | $ | 12.30 | $ | 12.56 | $ | 9.69 | $ | 10.18 | $ | 8.34 | $ | 13.07 | ||||||||||||
| Net Investment Income(a) | 0.21 | 0.15 | 0.16 | 0.01 | 0.15 | 0.20 | ||||||||||||||||||
| Net Realized And Unrealized Gains (Losses) | 2.45 | (0.33 | ) | 2.83 | (0.47 | ) | 1.89 | (4.72 | ) | |||||||||||||||
| Total from Investment Operations | $ | 2.66 | $ | (0.18 | ) | $ | 2.99 | $ | (0.46 | ) | $ | 2.04 | $ | (4.52 | ) | |||||||||
| Distributions: | ||||||||||||||||||||||||
| from Net Investment Income | (0.22 | ) | (0.08 | ) | (0.12 | ) | (0.03 | ) | (0.20 | ) | (0.21 | ) | ||||||||||||
| from Net Realized Gains | — | — | — | — | — | — | ||||||||||||||||||
| Total Distributions to Shareholders | $ | (0.22 | ) | $ | (0.08 | ) | $ | (0.12 | ) | $ | (0.03 | ) | $ | (0.20 | ) | $ | (0.21 | ) | ||||||
| Payments by affiliates | — | — | — | — | (e) | — | — | |||||||||||||||||
| Redemption Fees(a) | — | (e) | — | — | (e) | — | — | (e) | — | |||||||||||||||
| Net Asset Value, End of Year / Period | $ | 14.74 | $ | 12.30 | $ | 12.56 | $ | 9.69 | $ | 10.18 | $ | 8.34 | ||||||||||||
| Total Return | 21.91 | % | (1.35 | )% | 30.90 | % | (4.47 | )%(b) | 24.52 | % | (34.73 | )% | ||||||||||||
| Net Assets at End of Year / Period (000’s Omitted) | $ | 160,800 | $ | 156,226 | $ | 177,918 | $ | 135,709 | $ | 147,337 | $ | 109,188 | ||||||||||||
| Ratios to Average Net Assets: | ||||||||||||||||||||||||
| Net Investment Income | 1.54 | % | 1.27 | % | 1.34 | % | 0.79 | %(c) | 1.51 | % | 2.17 | % | ||||||||||||
| Net Expenses | 0.94 | % | 0.91 | % | 0.93 | % | 0.97 | %(c) | 1.03 | % | 1.06 | % | ||||||||||||
| Gross Expenses(d) | 0.94 | % | 0.91 | % | 0.93 | % | 0.97 | %(c) | 1.03 | % | 1.06 | % | ||||||||||||
| Portfolio Turnover Rate | 57 | % | 72 | % | 64 | % | 7 | %(b) | 62 | % | 108 | % | ||||||||||||
| (a) | Calculated based on average shares outstanding during the year / period. |
| (b) | Not annualized. |
| (c) | Annualized. |
| (d) | Reflects the expense ratio excluding any waivers and/or expense reimbursements. |
| (e) | Less than $0.01 per share. |
| (f) | Effective June 1, 2010, the Fund changed its fiscal year end from May 31 to June 30. The information presented is for the period from June 1, 2010 to June 30, 2010. |
| * | Prior to October 19, 2012, Investor Shares were known as Institutional Shares. |
The accompanying notes are an integral part of these financial statements.
79
Financial Highlights
These financial highlights reflect selected per share data and ratios for a share outstanding of each Fund throughout each year / period.
BROWN ADVISORY VALUE EQUITY FUND
ADVISOR SHARES*
| Year / Period Ended: | ||||||||||||||||||||||||
| June 30, | June 30, | June 30, | June 30, | May 31, | May 31, | |||||||||||||||||||
| 2013 | 2012 | 2011 | 2010(g) | 2010 | 2009 | |||||||||||||||||||
| Net Asset Value, Beginning of Year / Period | $ | 12.36 | $ | 12.62 | $ | 9.74 | $ | 10.23 | $ | 8.37 | $ | 13.11 | ||||||||||||
| Net Investment Income(a) | 0.16 | 0.13 | 0.10 | — | (f) | 0.11 | 0.16 | |||||||||||||||||
| Net Realized And Unrealized Gains (Losses) | 2.49 | (0.32 | ) | 2.84 | (0.47 | ) | 1.90 | (4.74 | ) | |||||||||||||||
| Total from Investment Operations | $ | 2.65 | $ | (0.19 | ) | $ | 2.94 | $ | (0.47 | ) | $ | 2.01 | $ | (4.58 | ) | |||||||||
| Distributions: | ||||||||||||||||||||||||
| from Net Investment Income | (0.19 | ) | (0.07 | ) | (0.06 | ) | (0.02 | ) | (0.15 | ) | (0.16 | ) | ||||||||||||
| Total Distributions to Shareholders | $ | (0.19 | ) | $ | (0.07 | ) | $ | (0.06 | ) | $ | (0.02 | ) | $ | (0.15 | ) | $ | (0.16 | ) | ||||||
| Payments by affiliates | — | — | — | — | (f) | — | — | |||||||||||||||||
| Redemption Fees(a) | — | — | — | — | — | — | ||||||||||||||||||
| Net Asset Value, End of Year / Period | $ | 14.82 | $ | 12.36 | $ | 12.62 | $ | 9.74 | $ | 10.23 | $ | 8.37 | ||||||||||||
| Total Return(b) | 21.63 | % | (1.45 | )% | 30.28 | % | (4.57 | )%(c) | 24.08 | % | (35.04 | )% | ||||||||||||
| Net Assets at End of Year / Period (000’s Omitted) | $ | 1,615 | $ | 2,201 | $ | 2,996 | $ | 4,868 | $ | 5,196 | $ | 5,116 | ||||||||||||
| Ratios to Average Net Assets: | ||||||||||||||||||||||||
| Net Investment Income | 1.31 | % | 1.07 | % | 0.89 | % | 0.34 | %(d) | 1.05 | % | 1.67 | % | ||||||||||||
| Net Expenses | 1.17 | % | 1.11 | % | 1.38 | % | 1.42 | %(d) | 1.49 | % | 1.58 | % | ||||||||||||
| Gross Expenses(e) | 1.17 | % | 1.11 | % | 1.38 | % | 1.42 | %(d) | 1.49 | % | 1.58 | % | ||||||||||||
| Portfolio Turnover Rate | 57 | % | 72 | % | 64 | % | 7 | %(c) | 62 | % | 108 | % | ||||||||||||
| (a) | Calculated based on average shares outstanding during the year / period. |
| (b) | Total return does not include the effects of sales charges which existed for Advisor Shares (then known as A Shares) for periods ended June 30, 2011 and earlier. |
| (c) | Not annualized. |
| (d) | Annualized. |
| (e) | Reflects the expense ratio excluding any waivers and/or expense reimbursements. |
| (f) | Less than $0.01 per share. |
| (g) | Effective June 1, 2010, the Fund changed its fiscal year end from May 31 to June 30. The information presented is for the period from June 1, 2010 to June 30, 2010. |
| * | Prior to July 1, 2011, Advisor Shares were known as A Shares. |
The accompanying notes are an integral part of these financial statements.
80
Financial Highlights
These financial highlights reflect selected per share data and ratios for a share outstanding of each Fund throughout each period.
BROWN ADVISORY FLEXIBLE EQUITY FUND
INSTITUTIONAL SHARES
| Period Ended | ||||
| June 30, | ||||
| 2013(e) | ||||
| Net Asset Value, Beginning of Period | $ | 10.46 | ||
| Net Investment Income(a) | 0.06 | |||
| Net Realized And Unrealized Gains | 1.82 | |||
| Total from Investment Operations | $ | 1.88 | ||
| Distributions: | ||||
| from Net Investment Income | (0.06 | ) | ||
| Total Distributions to Shareholders | $ | (0.06 | ) | |
| Redemption Fees(a) | — | |||
| Net Asset Value, End of Period | $ | 12.28 | ||
| Total Return | 18.07 | %(b) | ||
| Net Assets at End of Period (000’s Omitted) | $ | 12 | ||
| Ratios to Average Net Assets: | ||||
| Net Investment Income | 0.65 | %(c) | ||
| Net Expenses | 1.00 | %(c) | ||
| Gross Expenses(d) | 0.88 | %(c) | ||
| Portfolio Turnover Rate | 12 | % | ||
| (a) | Calculated based on average shares outstanding during the period. |
| (b) | Not annualized. |
| (c) | Annualized. |
| (d) | Reflects the expense ratio excluding any waivers or recoupments. |
| (e) | Commenced operations on October 19, 2012. The information presented is for the period from October 19, 2012 to June 30, 2013. |
The accompanying notes are an integral part of these financial statements.
81
Financial Highlights
These financial highlights reflect selected per share data and ratios for a share outstanding of each Fund throughout each year / period.
BROWN ADVISORY FLEXIBLE EQUITY FUND
INVESTOR SHARES*
| Year / Period Ended: | ||||||||||||||||||||||||||||
| June 30, | June 30, | June 30, | June 30, | May 31, | May 31, | October 31, | ||||||||||||||||||||||
| 2013 | 2012 | 2011 | 2010(f) | 2010 | 2009(g) | 2008 | ||||||||||||||||||||||
| Net Asset Value, Beginning of Year / Period | $ | 9.68 | $ | 9.16 | $ | 7.33 | $ | 7.62 | $ | 6.16 | $ | 6.14 | $ | 10.38 | ||||||||||||||
| Net Investment Income(a) | 0.05 | 0.05 | 0.02 | — | (e) | 0.05 | 0.03 | 0.04 | ||||||||||||||||||||
| Net Realized And Unrealized Gains (Losses) | 2.60 | 0.50 | 1.83 | (0.28 | ) | 1.45 | 0.02 | (4.20 | ) | |||||||||||||||||||
| Total from Investment Operations | $ | 2.65 | $ | 0.55 | $ | 1.85 | $ | (0.28 | ) | $ | 1.50 | $ | 0.05 | $ | (4.16 | ) | ||||||||||||
| Distributions: | ||||||||||||||||||||||||||||
| from Net Investment Income | (0.05 | ) | (0.03 | ) | (0.02 | ) | (0.01 | ) | (0.04 | ) | (0.03 | ) | (0.05 | ) | ||||||||||||||
| from Net Realized Gains | — | — | — | — | — | — | (0.03 | ) | ||||||||||||||||||||
| from Return of Capital | — | — | — | (e) | — | — | — | (e) | — | |||||||||||||||||||
| Total Distributions to Shareholders | $ | (0.05 | ) | $ | (0.03 | ) | $ | (0.02 | ) | $ | (0.01 | ) | $ | (0.04 | ) | $ | (0.03 | ) | $ | (0.08 | ) | |||||||
| Redemption Fees(a) | — | — | — | (e) | — | — | — | — | ||||||||||||||||||||
| Net Asset Value, End of Year / Period | $ | 12.28 | $ | 9.68 | $ | 9.16 | $ | 7.33 | $ | 7.62 | $ | 6.16 | $ | 6.14 | ||||||||||||||
| Total Return(b) | 27.51 | % | 5.98 | % | 25.27 | % | (3.69 | )%(b) | 24.39 | % | 0.88 | %(b) | (40.37 | )% | ||||||||||||||
| Net Assets at End of Year / Period (000’s Omitted) | $ | 82,783 | $ | 37,477 | $ | 26,827 | $ | 18,108 | $ | 17,777 | $ | 12,416 | $ | 16,379 | ||||||||||||||
| Ratios to Average Net Assets: | ||||||||||||||||||||||||||||
| Net Investment Income | 0.50 | % | 0.52 | % | 0.28 | % | 0.38 | %(c) | 0.61 | % | 1.06 | %(c) | 0.46 | % | ||||||||||||||
| Net Expenses | 1.15 | % | 1.15 | % | 1.15 | % | 1.15 | %(c) | 1.11 | % | 1.14 | %(c) | 1.10 | % | ||||||||||||||
| Gross Expenses(d) | 1.05 | % | 1.18 | % | 1.32 | % | 1.48 | %(c) | 1.61 | % | 2.18 | %(c) | 3.07 | % | ||||||||||||||
| Portfolio Turnover Rate | 12 | % | 19 | % | 33 | % | 1 | %(c) | 22 | % | 16 | %(c) | 27 | % | ||||||||||||||
| (a) | Calculated based on average shares outstanding during the year / period. |
| (b) | Not annualized. |
| (c) | Annualized. |
| (d) | Reflects the expense ratio excluding any waivers or recoupments. |
| (e) | Less than $0.01 per share. |
| (f) | Effective June 1, 2010, the Fund changed its fiscal year end from May 31 to June 30. The information presented is for the period from June 1, 2010 to June 30, 2010. |
| (g) | Effective November 1, 2008, the Fund changed its fiscal year end from October 31 to May 31. The information presented is for the period from November 1, 2008 to May 31, 2009. |
| * | Prior to October 19, 2012, Investor Shares were known as Institutional Shares. |
The accompanying notes are an integral part of these financial statements.
82
Financial Highlights
These financial highlights reflect selected per share data and ratios for a share outstanding of each Fund throughout each year / period.
BROWN ADVISORY FLEXIBLE EQUITY FUND
ADVISOR SHARES*
| Year / Period Ended: | ||||||||||||||||||||||||||||
| June 30, | June 30, | June 30, | June 30, | May 31, | May 31, | October 31, | ||||||||||||||||||||||
| 2013 | 2012 | 2011 | 2010(g) | 2010 | 2009(h) | 2008 | ||||||||||||||||||||||
| Net Asset Value, Beginning Year / Period | $ | 9.68 | $ | 9.17 | $ | 7.33 | $ | 7.62 | $ | 6.17 | $ | 6.14 | $ | 10.36 | ||||||||||||||
| Net Investment Income(a) | 0.02 | 0.03 | 0.01 | — | (f) | 0.02 | 0.02 | 0.02 | ||||||||||||||||||||
| Net Realized And Unrealized Gains (Losses) | 2.61 | 0.49 | 1.84 | (0.29 | ) | 1.45 | 0.01 | (4.21 | ) | |||||||||||||||||||
| Total from Investment Operations | $ | 2.63 | $ | 0.52 | $ | 1.85 | $ | (0.29 | ) | $ | 1.47 | $ | 0.03 | $ | (4.19 | ) | ||||||||||||
| Distributions: | ||||||||||||||||||||||||||||
| from Net Investment Income | (0.03 | ) | (0.01 | ) | (0.01 | ) | — | (f) | (0.02 | ) | — | (f) | — | |||||||||||||||
| from Net Realized Gains | — | — | — | — | — | — | (0.03 | ) | ||||||||||||||||||||
| from Return of Capital | — | — | — | (f) | — | — | — | (f) | — | |||||||||||||||||||
| Total Distributions to Shareholders | $ | (0.03 | ) | $ | (0.01 | ) | $ | (0.01 | ) | $ | — | $ | (0.02 | ) | $ | — | (f) | $ | (0.03 | ) | ||||||||
| Redemption Fees(a) | — | — | — | — | — | — | — | |||||||||||||||||||||
| Net Asset Value, End of Year / Period | $ | 12.28 | $ | 9.68 | $ | 9.17 | $ | 7.33 | $ | 7.62 | $ | 6.17 | $ | 6.14 | ||||||||||||||
| Total Return(b) | 27.25 | % | 5.73 | % | 25.18 | % | (3.75 | )%(c) | 23.88 | % | 0.55 | %(c) | (40.55 | )% | ||||||||||||||
| Net Assets at End of Year / Period (000’s Omitted) | $ | 6,115 | $ | 1,079 | $ | 1,259 | $ | 955 | $ | 992 | $ | 1,005 | $ | 1,080 | ||||||||||||||
| Ratios to Average Net Assets: | ||||||||||||||||||||||||||||
| Net Investment Income | 0.30 | % | 0.32 | % | 0.08 | % | 0.18 | %(d) | 0.37 | % | 0.79 | %(d) | 0.24 | % | ||||||||||||||
| Net Expenses | 1.35 | % | 1.35 | % | 1.35 | % | 1.35 | %(d) | 1.35 | % | 1.42 | %(d) | 1.35 | % | ||||||||||||||
| Gross Expenses(e) | 1.30 | % | 1.38 | % | 1.53 | % | 1.68 | %(d) | 1.85 | % | 2.70 | %(d) | 4.32 | % | ||||||||||||||
| Portfolio Turnover Rate | 12 | % | 19 | % | 33 | % | 1 | %(c) | 22 | % | 16 | %(c) | 27 | % | ||||||||||||||
| (a) | Calculated based on average shares outstanding during the year / period. |
| (b) | Total return does not include the effects of sales charges which existed for Advisor Shares (then known as A Shares) for periods ended June 30, 2011 and earlier. |
| (c) | Not annualized. |
| (d) | Annualized. |
| (e) | Reflects the expense ratio excluding any waivers and/or expense reimbursements. |
| (f) | Less than $0.01 per share. |
| (g) | Effective June 1, 2010, the Fund changed its fiscal year end from May 31 to June 30. The information presented is for the period from June 1, 2010 to June 30, 2010. |
| (h) | Effective November 1, 2008, the Fund changed its fiscal year end from October 31 to May 31. The information presented is for the period from November 1, 2008 to May 31, 2009. |
| * | Prior to July 1, 2011, Advisor Shares were known as A Shares. |
The accompanying notes are an integral part of these financial statements.
83
Financial Highlights
These financial highlights reflect selected per share data and ratios for a share outstanding of each Fund throughout each year / period.
BROWN ADVISORY SMALL-CAP GROWTH FUND
INSTITUTIONAL SHARES*
| Year / Period Ended: | ||||||||||||||||||||||||
| June 30, | June 30, | June 30, | June 30, | May 31, | May 31, | |||||||||||||||||||
| 2013 | 2012 | 2011 | 2010(e) | 2010 | 2009 | |||||||||||||||||||
| Net Asset Value, Beginning of Year / Period | $ | 28.36 | $ | 29.56 | $ | 20.75 | $ | 21.67 | $ | 16.64 | $ | 25.32 | ||||||||||||
| Net Investment Loss(a) | (0.07 | ) | (0.21 | ) | (0.21 | ) | (0.02 | ) | (0.23 | ) | (0.23 | ) | ||||||||||||
| Net Realized And Unrealized Gains (Losses) | 6.07 | (0.72 | ) | 9.02 | (0.90 | ) | 5.26 | (8.09 | ) | |||||||||||||||
| Total from Investment Operations | $ | 6.00 | $ | (0.93 | ) | $ | 8.81 | $ | (0.92 | ) | $ | 5.03 | $ | (8.32 | ) | |||||||||
| Distributions: | ||||||||||||||||||||||||
| from Net Realized Gains | (2.69 | ) | (0.27 | ) | — | — | — | (0.36 | ) | |||||||||||||||
| Total Distributions to Shareholders | $ | (2.69 | ) | $ | (0.27 | ) | $ | — | $ | — | $ | — | $ | (0.36 | ) | |||||||||
| Redemption Fees(a) | — | — | — | — | — | — | ||||||||||||||||||
| Net Asset Value, End of Year / Period | $ | 31.67 | $ | 28.36 | $ | 29.56 | $ | 20.75 | $ | 21.67 | $ | 16.64 | ||||||||||||
| Total Return | 22.84 | % | (3.08 | )% | 42.46 | % | (4.25 | )%(b) | 30.23 | % | (32.61 | )% | ||||||||||||
| Net Assets at End of Year / Period (000’s Omitted) | $ | 7,347 | $ | 6,944 | $ | 8,732 | $ | 7,065 | $ | 7,400 | $ | 6,931 | ||||||||||||
| Ratios to Average Net Assets: | ||||||||||||||||||||||||
| Net Investment Loss | (0.24 | )% | (0.77 | )% | (0.80 | )% | (0.92 | )%(c) | (1.12 | )% | (1.26 | )% | ||||||||||||
| Net Expenses | 1.05 | % | 1.11 | % | 1.13 | % | 1.17 | %(c) | 1.49 | % | 1.65 | % | ||||||||||||
| Gross Expenses(d) | 1.05 | % | 1.11 | % | 1.13 | % | 1.17 | %(c) | 1.49 | % | 1.65 | % | ||||||||||||
| Portfolio Turnover Rate | 48 | % | 66 | % | 61 | % | 7 | %(b) | 71 | % | 90 | % | ||||||||||||
| (a) | Calculated based on average shares outstanding during the year / period. |
| (b) | Not annualized. |
| (c) | Annualized. |
| (d) | Reflects the expense ratio excluding any waivers and/or expense reimbursements. |
| (e) | Effective June 1, 2010, the Fund changed its fiscal year end from May 31 to June 30. The information presented is for the period from June 1, 2010 to June 30, 2010. |
| * | Prior to October 19, 2012, Institutional Shares were known as D Shares. |
The accompanying notes are an integral part of these financial statements.
84
Financial Highlights
These financial highlights reflect selected per share data and ratios for a share outstanding of each Fund throughout each year / period.
BROWN ADVISORY SMALL-CAP GROWTH FUND
INVESTOR SHARES*
| Year / Period Ended: | ||||||||||||||||||||||||
| June 30, | June 30, | June 30, | June 30, | May 31, | May 31, | |||||||||||||||||||
| 2013 | 2012 | 2011 | 2010(f) | 2010 | 2009 | |||||||||||||||||||
| Net Asset Value, Beginning of Year / Period | $ | 14.31 | $ | 15.07 | $ | 10.58 | $ | 11.06 | $ | 8.47 | $ | 13.17 | ||||||||||||
| Net Investment Loss(a) | (0.05 | ) | (0.11 | ) | (0.11 | ) | (0.01 | ) | (0.10 | ) | (0.09 | ) | ||||||||||||
| Net Realized And Unrealized Gains (Losses) | 3.06 | (0.38 | ) | 4.60 | (0.47 | ) | 2.69 | (4.25 | ) | |||||||||||||||
| Total from Investment Operations | $ | 3.01 | $ | (0.49 | ) | $ | 4.49 | $ | (0.48 | ) | $ | 2.59 | $ | (4.34 | ) | |||||||||
| Distributions: | ||||||||||||||||||||||||
| from Net Realized Gains | (1.36 | ) | (0.27 | ) | — | — | — | (0.36 | ) | |||||||||||||||
| Total Distributions to Shareholders | $ | (1.36 | ) | $ | (0.27 | ) | $ | — | $ | — | $ | — | $ | (0.36 | ) | |||||||||
| Redemption Fees(a) | — | (e) | — | (e) | — | — | (e) | — | (e) | — | ||||||||||||||
| Net Asset Value, End of Year / Period | $ | 15.96 | $ | 14.31 | $ | 15.07 | $ | 10.58 | $ | 11.06 | $ | 8.47 | ||||||||||||
| Total Return | 22.68 | % | (3.12 | )% | 42.44 | % | (4.34 | )%(b) | 30.58 | % | (32.47 | )% | ||||||||||||
| Net Assets at End of Year / Period (000’s Omitted) | $ | 281,027 | $ | 215,311 | $ | 208,222 | $ | 139,647 | $ | 145,293 | $ | 95,007 | ||||||||||||
| Ratios to Average Net Assets: | ||||||||||||||||||||||||
| Net Investment Loss | (0.36 | )% | (0.82 | )% | (0.85 | )% | (0.97 | )%(c) | (0.95 | )% | (0.96 | )% | ||||||||||||
| Net Expenses | 1.17 | % | 1.16 | % | 1.18 | % | 1.22 | %(c) | 1.32 | % | 1.35 | % | ||||||||||||
| Gross Expenses(d) | 1.17 | % | 1.16 | % | 1.18 | % | 1.22 | %(c) | 1.32 | % | 1.35 | % | ||||||||||||
| Portfolio Turnover Rate | 48 | % | 66 | % | 61 | % | 7 | %(b) | 71 | % | 90 | % | ||||||||||||
| (a) | Calculated based on average shares outstanding during the year / period. |
| (b) | Not annualized. |
| (c) | Annualized. |
| (d) | Reflects the expense ratio excluding any waivers and/or expense reimbursements. |
| (e) | Less than $0.01 per share. |
| (f) | Effective June 1, 2010, the Fund changed its fiscal year end from May 31 to June 30. The information presented is for the period from June 1, 2010 to June 30, 2010. |
| * | Prior to October 19, 2012, Investor Shares were known as Institutional Shares. |
The accompanying notes are an integral part of these financial statements.
85
Financial Highlights
These financial highlights reflect selected per share data and ratios for a share outstanding of each Fund throughout each year / period.
BROWN ADVISORY SMALL-CAP GROWTH FUND
ADVISOR SHARES*
| Year / Period Ended: | ||||||||||||||||||||||||
| June 30, | June 30, | June 30, | June 30, | May 31, | May 31, | |||||||||||||||||||
| 2013 | 2012 | 2011 | 2010(g) | 2010 | 2009 | |||||||||||||||||||
| Net Asset Value, Beginning of Year / Period | $ | 13.86 | $ | 14.65 | $ | 10.34 | $ | 10.80 | $ | 8.32 | $ | 12.99 | ||||||||||||
| Net Investment Loss(a) | (0.09 | ) | (0.14 | ) | (0.18 | ) | (0.01 | ) | (0.14 | ) | (0.13 | ) | ||||||||||||
| Net Realized And Unrealized Gains (Losses) | 2.97 | (0.38 | ) | 4.49 | (0.45 | ) | 2.62 | (4.18 | ) | |||||||||||||||
| Total from Investment Operations | $ | 2.88 | $ | (0.52 | ) | $ | 4.31 | $ | (0.46 | ) | $ | 2.48 | $ | (4.31 | ) | |||||||||
| Distributions: | ||||||||||||||||||||||||
| from Net Realized Gains | (1.31 | ) | (0.27 | ) | — | — | — | (0.36 | ) | |||||||||||||||
| Total Distributions to Shareholders | $ | (1.31 | ) | $ | (0.27 | ) | $ | — | $ | — | $ | — | $ | (0.36 | ) | |||||||||
| Redemption Fees(a) | — | — | (f) | — | — | — | — | |||||||||||||||||
| Net Asset Value, End of Year / Period | $ | 15.43 | $ | 13.86 | $ | 14.65 | $ | 10.34 | $ | 10.80 | $ | 8.32 | ||||||||||||
| Total Return(b) | 22.45 | % | (3.41 | )% | 41.68 | % | (4.26 | )%(c) | 29.81 | % | (32.69 | )% | ||||||||||||
| Net Assets at End of Year / Period (000’s Omitted) | $ | 5,493 | $ | 2,875 | $ | 3,110 | $ | 4,075 | $ | 4,254 | $ | 2,615 | ||||||||||||
| Ratios to Average Net Assets: | ||||||||||||||||||||||||
| Net Investment Loss | (0.60 | )% | (1.07 | )% | (1.36 | )% | (1.42 | )%(d) | (1.41 | )% | (1.46 | )% | ||||||||||||
| Net Expenses | 1.41 | % | 1.41 | % | 1.69 | % | 1.67 | %(d) | 1.78 | % | 1.85 | % | ||||||||||||
| Gross Expenses(e) | 1.41 | % | 1.41 | % | 1.69 | % | 1.67 | %(d) | 1.78 | % | 1.93 | % | ||||||||||||
| Portfolio Turnover Rate | 48 | % | 66 | % | 61 | % | 7 | %(c) | 71 | % | 90 | % | ||||||||||||
| (a) | Calculated based on average shares outstanding during the year / period. |
| (b) | Total return does not include the effects of sales charges which existed for Advisor Shares (then known as A Shares) for periods ended June 30, 2011 and earlier. |
| (c) | Not annualized. |
| (d) | Annualized. |
| (e) | Reflects the expense ratio excluding any waivers and/or expense reimbursements. |
| (f) | Less than $0.01 per share. |
| (g) | Effective June 1, 2010, the Fund changed its fiscal year end from May 31 to June 30. The information presented is for the period from June 1, 2010 to June 30, 2010. |
| * | Prior to July 1, 2011, Advisor Shares were known as A Shares. |
The accompanying notes are an integral part of these financial statements.
86
Financial Highlights
These financial highlights reflect selected per share data and ratios for a share outstanding of each Fund throughout each period.
BROWN ADVISORY SMALL-CAP FUNDAMENTAL VALUE FUND
INSTITUTIONAL SHARES
| Period Ended | ||||
| June 30, | ||||
| 2013(e) | ||||
| Net Asset Value, Beginning of Period | $ | 16.77 | ||
| Net Investment Income(a) | 0.06 | |||
| Net Realized And Unrealized Gains | 3.30 | |||
| Total from Investment Operations | $ | 3.36 | ||
| Distributions: | ||||
| from Net Investment Income | (0.07 | ) | ||
| Total Distributions to Shareholders | $ | (0.07 | ) | |
| Redemption Fees(a) | — | |||
| Net Asset Value, End of Period | $ | 20.06 | ||
| Total Return | 20.13 | %(b) | ||
| Net Assets at End of Period (000’s Omitted) | $ | 1,061 | ||
| Ratios to Average Net Assets: | ||||
| Net Investment Income | 1.14 | %(c) | ||
| Net Expenses | 1.05 | %(c) | ||
| Gross Expenses(d) | 1.05 | %(c) | ||
| Portfolio Turnover Rate | 34 | % | ||
| (a) | Calculated based on average shares outstanding during the period. |
| (b) | Not annualized. |
| (c) | Annualized. |
| (d) | Reflects the expense ratio excluding any waivers and/or expense reimbursements. |
| (e) | Commenced operations on October 19, 2012. The information presented is for the period from October 19, 2012 to June 30, 2013. |
The accompanying notes are an integral part of these financial statements.
87
Financial Highlights
These financial highlights reflect selected per share data and ratios for a share outstanding of each Fund throughout each year / period.
BROWN ADVISORY SMALL-CAP FUNDAMENTAL VALUE FUND
INVESTOR SHARES*
| Year / Period Ended: | ||||||||||||||||||||||||
| June 30, | June 30, | June 30, | June 30, | May 31, | May 31, | |||||||||||||||||||
| 2013 | 2012 | 2011 | 2010(f) | 2010 | 2009(g) | |||||||||||||||||||
| Net Asset Value, Beginning of Year / Period | $ | 15.65 | $ | 16.89 | $ | 11.92 | $ | 13.03 | $ | 10.48 | $ | 10.00 | ||||||||||||
| Net Investment Income (Loss)(a) | 0.18 | 0.10 | 0.11 | 0.01 | (0.02 | ) | (0.01 | ) | ||||||||||||||||
| Net Realized And Unrealized Gains (Losses) | 4.29 | (0.51 | ) | 5.54 | (1.12 | ) | 2.80 | 0.50 | ||||||||||||||||
| Total from Investment Operations | $ | 4.47 | $ | (0.41 | ) | $ | 5.65 | $ | (1.11 | ) | $ | 2.78 | $ | 0.49 | ||||||||||
| Distributions: | ||||||||||||||||||||||||
| from Net Investment Income | (0.06 | ) | (0.12 | ) | (0.08 | ) | — | (0.05 | ) | — | ||||||||||||||
| from Net Realized Gains | — | (0.71 | ) | (0.60 | ) | — | (0.18 | ) | — | |||||||||||||||
| from Return of Capital | — | — | — | — | — | (0.01 | ) | |||||||||||||||||
| Total Distributions to Shareholders | $ | (0.06 | ) | $ | (0.83 | ) | $ | (0.68 | ) | $ | — | $ | (0.23 | ) | $ | (0.01 | ) | |||||||
| Redemption Fees(a) | — | (e) | — | (e) | — | (e) | — | — | — | |||||||||||||||
| Net Asset Value, End of Year / Period | $ | 20.06 | $ | 15.65 | $ | 16.89 | $ | 11.92 | $ | 13.03 | $ | 10.48 | ||||||||||||
| Total Return | 28.64 | % | (1.90 | )% | 48.20 | % | (8.52 | )%(b) | 26.70 | % | 4.86 | %(b) | ||||||||||||
| Net Assets at End of Year / Period (000’s Omitted) | $ | 371,018 | $ | 194,719 | $ | 107,537 | $ | 37,207 | $ | 37,629 | $ | 14,620 | ||||||||||||
| Ratios to Average Net Assets: | ||||||||||||||||||||||||
| Net Investment Income (Loss) | 1.01 | % | 0.64 | % | 0.70 | % | 0.91 | %(c) | (0.14 | )% | (0.22 | )%(c) | ||||||||||||
| Net Expenses | 1.18 | % | 1.19 | % | 1.24 | % | 1.36 | %(c) | 1.47 | % | 1.50 | %(c) | ||||||||||||
| Gross Expenses(d) | 1.18 | % | 1.19 | % | 1.24 | % | 1.36 | %(c) | 1.62 | % | 2.91 | %(c) | ||||||||||||
| Portfolio Turnover Rate | 34 | % | 36 | % | 67 | % | 2 | %(b) | 82 | % | 29 | %(b) | ||||||||||||
| (a) | Calculated based on average shares outstanding during the year / period. |
| (b) | Not annualized. |
| (c) | Annualized. |
| (d) | Reflects the expense ratio excluding any waivers and/or expense reimbursements. |
| (e) | Less than $0.01 per share. |
| (f) | Effective June 1, 2010, the Fund changed its fiscal year end from May 31 to June 30. The information presented is for the period from June 1, 2010 to June 30, 2010. |
| (g) | Commenced operations on December 31,2008 |
| * | Prior to October 19, 2012, Investor Shares were known as Institutional Shares. |
The accompanying notes are an integral part of these financial statements.
88
Financial Highlights
These financial highlights reflect selected per share data and ratios for a share outstanding of each Fund throughout each year / period.
BROWN ADVISORY SMALL-CAP FUNDAMENTAL VALUE FUND
ADVISOR SHARES
| Year / Period Ended: | ||||||||
| June 30, | June 30, | |||||||
| 2013 | 2012(f) | |||||||
| Net Asset Value, Beginning of Year / Period | $ | 15.63 | $ | 16.39 | ||||
| Net Investment Income(a) | 0.03 | 0.07 | ||||||
| Net Realized And Unrealized Gains (Losses) | 4.38 | (0.01 | ) | |||||
| Total from Investment Operations | $ | 4.41 | $ | 0.06 | ||||
| Distributions: | ||||||||
| from Net Investment Income | (0.03 | ) | (0.11 | ) | ||||
| from Net Realized Gains | — | (0.71 | ) | |||||
| Total Distributions to Shareholders | $ | (0.03 | ) | $ | (0.82 | ) | ||
| Redemption Fees(a) | — | — | (e) | |||||
| Net Asset Value, End of Year / Period | $ | 20.01 | $ | 15.63 | ||||
| Total Return | 28.28 | % | 0.90 | %(b) | ||||
| Net Assets at End of Year / Period (000’s Omitted) | $ | 15,764 | $ | 418 | ||||
| Ratios to Average Net Assets: | ||||||||
| Net Investment Income | 0.75 | % | 0.44 | %(c) | ||||
| Net Expenses | 1.44 | % | 1.39 | %(c) | ||||
| Gross Expenses(d) | 1.44 | % | 1.39 | %(c) | ||||
| Portfolio Turnover Rate | 34 | % | 36 | % | ||||
| (a) | Calculated based on average shares outstanding during the year / period. |
| (b) | Not annualized. |
| (c) | Annualized. |
| (d) | Reflects the expense ratio excluding any waivers and/or expense reimbursements. |
| (e) | Less than $0.01 per share. |
| (f) | Advisor Shares commenced operations July 28, 2011. |
The accompanying notes are an integral part of these financial statements.
89
Financial Highlights
These financial highlights reflect selected per share data and ratios for a share outstanding of each Fund throughout each year / period.
BROWN ADVISORY OPPORTUNITY FUND
INVESTOR SHARES*
| Year / Period Ended: | ||||||||||||||||||||||||
| June 30, | June 30, | June 30, | June 30, | May 31, | May 31, | |||||||||||||||||||
| 2013 | 2012 | 2011 | 2010(e) | 2010 | 2009 | |||||||||||||||||||
| Net Asset Value, Beginning of Year / Period | $ | 14.97 | $ | 14.94 | $ | 11.03 | $ | 11.51 | $ | 9.40 | $ | 15.10 | ||||||||||||
| Net Investment Loss(a) | (0.05 | ) | (0.09 | ) | (0.10 | ) | (0.01 | ) | (0.03 | ) | (0.10 | ) | ||||||||||||
| Net Realized And Unrealized Gains (Losses) | 3.59 | 0.12 | 4.01 | (0.47 | ) | 2.14 | (5.60 | ) | ||||||||||||||||
| Total from Investment Operations | $ | 3.54 | $ | 0.03 | $ | 3.91 | $ | (0.48 | ) | $ | 2.11 | $ | (5.70 | ) | ||||||||||
| Redemption Fees(a) | — | — | — | — | — | — | ||||||||||||||||||
| Net Asset Value, End of Year / Period | $ | 18.51 | $ | 14.97 | $ | 14.94 | $ | 11.03 | $ | 11.51 | $ | 9.40 | ||||||||||||
| Total Return | 23.65 | % | 0.20 | % | 35.45 | % | (4.17 | )%(b) | 22.45 | % | (37.75 | )% | ||||||||||||
| Net Assets at End of Year / Period (000’s Omitted) | $ | 9,173 | $ | 8,487 | $ | 11,692 | $ | 13,498 | $ | 14,863 | $ | 16,537 | ||||||||||||
| Ratios to Average Net Assets: | ||||||||||||||||||||||||
| Net Investment Loss | (0.29 | )% | (0.59 | )% | (0.75 | )% | (0.84 | )%(c) | (0.29 | )% | (0.96 | )% | ||||||||||||
| Net Expenses | 1.50 | % | 1.50 | % | 1.50 | % | 1.50 | %(c) | 1.50 | % | 1.50 | % | ||||||||||||
| Gross Expenses(d) | 1.72 | % | 1.74 | % | 1.78 | % | 1.68 | %(c) | 1.75 | % | 1.67 | % | ||||||||||||
| Portfolio Turnover Rate | 54 | % | 76 | % | 65 | % | 3 | %(b) | 97 | % | 151 | % | ||||||||||||
| (a) | Calculated based on average shares outstanding during the year / period. |
| (b) | Not annualized. |
| (c) | Annualized. |
| (d) | Reflects the expense ratio excluding any waivers and/or expense reimbursements. |
| (e) | Effective June 1, 2010, the Fund changed its fiscal year end from May 31 to June 30. The information presented is for the period from June 1, 2010 to June 30, 2010. |
| * | Prior to October 19, 2012, Investor Shares were known as Institutional Shares. |
The accompanying notes are an integral part of these financial statements.
90
Financial Highlights
These financial highlights reflect selected per share data and ratios for a share outstanding of each Fund throughout each year / period.
BROWN ADVISORY MARYLAND BOND FUND
INVESTOR SHARES*
| Year / Period Ended: | ||||||||||||||||||||||||
| June 30, | June 30, | June 30, | June 30, | May 31, | May 31, | |||||||||||||||||||
| 2013 | 2012 | 2011 | 2010(f) | 2010 | 2009 | |||||||||||||||||||
| Net Asset Value, Beginning of Year / Period | $ | 11.06 | $ | 10.85 | $ | 10.81 | $ | 10.81 | $ | 10.62 | $ | 10.42 | ||||||||||||
| Net Investment Income(a) | 0.21 | 0.25 | 0.25 | 0.02 | 0.25 | 0.31 | ||||||||||||||||||
| Net Realized And Unrealized Gains (Losses) | (0.23 | ) | 0.26 | 0.04 | — | 0.19 | 0.21 | |||||||||||||||||
| Total from Investment Operations | $ | (0.02 | ) | $ | 0.51 | $ | 0.29 | $ | 0.02 | $ | 0.44 | $ | 0.52 | |||||||||||
| Distributions: | ||||||||||||||||||||||||
| from Net Investment Income | (0.21 | ) | (0.25 | ) | (0.25 | ) | (0.02 | ) | (0.25 | ) | (0.32 | ) | ||||||||||||
| from Net Realized Gains | (0.02 | ) | (0.05 | ) | — | — | — | — | ||||||||||||||||
| Total Distributions to Shareholders | $ | (0.23 | ) | $ | (0.30 | ) | $ | (0.25 | ) | $ | (0.02 | ) | $ | (0.25 | ) | $ | (0.32 | ) | ||||||
| Redemption Fees(a) | — | (e) | — | (e) | — | — | (e) | — | (e) | — | ||||||||||||||
| Net Asset Value, End of Year / Period | $ | 10.81 | $ | 11.06 | $ | 10.85 | $ | 10.81 | $ | 10.81 | $ | 10.62 | ||||||||||||
| Total Return | (0.25 | )% | 4.69 | % | 2.74 | % | 0.19 | %(b) | 4.21 | % | 5.06 | % | ||||||||||||
| Net Assets at End of Year / Period (000’s Omitted) | $ | 252,166 | $ | 250,087 | $ | 188,180 | $ | 192,077 | $ | 187,288 | $ | 170,970 | ||||||||||||
| Ratios to Average Net Assets: | ||||||||||||||||||||||||
| Net Investment Income | 1.86 | % | 2.23 | % | 2.33 | % | 2.36 | %(c) | 2.32 | % | 2.93 | % | ||||||||||||
| Net Expenses | 0.52 | % | 0.51 | % | 0.51 | % | 0.54 | %(c) | 0.62 | % | 0.46 | % | ||||||||||||
| Gross Expenses(d) | 0.52 | % | 0.51 | % | 0.51 | % | 0.54 | %(c) | 0.62 | % | 0.70 | % | ||||||||||||
| Portfolio Turnover Rate | 30 | % | 16 | % | 29 | % | 1 | %(b) | 8 | % | 9 | % | ||||||||||||
| (a) | Calculated based on average shares outstanding during the year / period. |
| (b) | Not annualized. |
| (c) | Annualized. |
| (d) | Reflects the expense ratio excluding any waivers and/or expense reimbursements. |
| (e) | Less than $0.01 per share. |
| (f) | Effective June 1, 2010, the Fund changed its fiscal year end from May 31 to June 30. The information presented is for the period from June 1, 2010 to June 30, 2010. |
| * | Prior to October 19, 2012, Investor Shares were known as Institutional Shares. |
The accompanying notes are an integral part of these financial statements.
91
Financial Highlights
These financial highlights reflect selected per share data and ratios for a share outstanding of each Fund throughout each year / period.
BROWN ADVISORY INTERMEDIATE INCOME FUND
INVESTOR SHARES*
| Year / Period Ended: | ||||||||||||||||||||||||
| June 30, | June 30, | June 30, | June 30, | May 31, | May 31, | |||||||||||||||||||
| 2013 | 2012 | 2011 | 2010(f) | 2010 | 2009 | |||||||||||||||||||
| Net Asset Value, Beginning of Year / Period | $ | 11.37 | $ | 11.28 | $ | 11.23 | $ | 11.13 | $ | 10.76 | $ | 10.76 | ||||||||||||
| Net Investment Income(a) | 0.19 | 0.24 | 0.31 | 0.03 | 0.38 | 0.42 | ||||||||||||||||||
| Net Realized And Unrealized Gains (Losses) | (0.26 | ) | 0.36 | 0.11 | 0.10 | 0.38 | 0.02 | |||||||||||||||||
| Total from Investment Operations | $ | (0.07 | ) | $ | 0.60 | $ | 0.42 | $ | 0.13 | $ | 0.76 | $ | 0.44 | |||||||||||
| Distributions: | ||||||||||||||||||||||||
| from Net Investment Income | (0.25 | ) | (0.25 | ) | (0.33 | ) | (0.03 | ) | (0.39 | ) | (0.42 | ) | ||||||||||||
| from Net Realized Gains | (0.20 | ) | (0.26 | ) | (0.04 | ) | — | — | (0.02 | ) | ||||||||||||||
| Total Distributions to Shareholders | $ | (0.45 | ) | $ | (0.51 | ) | $ | (0.37 | ) | $ | (0.03 | ) | $ | (0.39 | ) | $ | (0.44 | ) | ||||||
| Redemption Fees(a) | — | (e) | — | (e) | — | (e) | — | (e) | — | (e) | — | |||||||||||||
| Net Asset Value, End of Year / Period | $ | 10.85 | $ | 11.37 | $ | 11.28 | $ | 11.23 | $ | 11.13 | $ | 10.76 | ||||||||||||
| Total Return | (0.72 | )% | 5.42 | % | 3.84 | % | 1.20 | %(b) | 7.17 | % | 4.24 | % | ||||||||||||
| Net Assets at End of Year / Period (000’s Omitted) | $ | 241,543 | $ | 292,556 | $ | 255,847 | $ | 280,537 | $ | 270,658 | $ | 190,708 | ||||||||||||
| Ratios to Average Net Assets: | ||||||||||||||||||||||||
| Net Investment Income | 1.66 | % | 2.15 | % | 2.75 | % | 3.23 | %(c) | 3.45 | % | 3.97 | % | ||||||||||||
| Net Expenses | 0.52 | % | 0.50 | % | 0.52 | % | 0.53 | %(c) | 0.61 | % | 0.63 | % | ||||||||||||
| Gross Expenses(d) | 0.52 | % | 0.50 | % | 0.52 | % | 0.53 | %(c) | 0.61 | % | 0.63 | % | ||||||||||||
| Portfolio Turnover Rate | 111 | % | 75 | % | 84 | % | 6 | %(b) | 25 | % | 32 | % | ||||||||||||
| (a) | Calculated based on average shares outstanding during the year / period. |
| (b) | Not annualized. |
| (c) | Annualized. |
| (d) | Reflects the expense ratio excluding any waivers and/or expense reimbursements. |
| (e) | Less than $0.01 per share. |
| (f) | Effective June 1, 2010, the Fund changed its fiscal year end from May 31 to June 30. The information presented is for the period from June 1, 2010 to June 30, 2010. |
| * | Prior to October 19, 2012, Investor Shares were known as Institutional Shares. |
The accompanying notes are an integral part of these financial statements.
92
Financial Highlights
These financial highlights reflect selected per share data and ratios for a share outstanding of each Fund throughout each year / period.
BROWN ADVISORY INTERMEDIATE INCOME FUND
ADVISOR SHARES*
| Year / Period Ended: | ||||||||||||||||||||||||
| June 30, | June 30, | June 30, | June 30, | May 31, | May 31, | |||||||||||||||||||
| 2013 | 2012 | 2011 | 2010(g) | 2010 | 2009 | |||||||||||||||||||
| Net Asset Value, Beginning of Year / Period | $ | 11.16 | $ | 11.08 | $ | 11.04 | $ | 10.95 | $ | 10.59 | $ | 10.60 | ||||||||||||
| Net Investment Income(a) | 0.16 | 0.22 | 0.28 | 0.03 | 0.35 | 0.39 | ||||||||||||||||||
| Net Realized And Unrealized Gains (Losses) | (0.25 | ) | 0.35 | 0.11 | 0.09 | 0.38 | 0.02 | |||||||||||||||||
| Total from Investment Operations | $ | (0.09 | ) | $ | 0.57 | $ | 0.39 | $ | 0.12 | $ | 0.73 | $ | 0.41 | |||||||||||
| Distributions: | ||||||||||||||||||||||||
| from Net Investment Income | (0.22 | ) | (0.23 | ) | (0.31 | ) | (0.03 | ) | (0.37 | ) | (0.40 | ) | ||||||||||||
| from Net Realized Gains | (0.20 | ) | (0.26 | ) | (0.04 | ) | — | — | (0.02 | ) | ||||||||||||||
| Total Distributions to Shareholders | $ | (0.42 | ) | $ | (0.49 | ) | $ | (0.35 | ) | $ | (0.03 | ) | $ | (0.37 | ) | $ | (0.42 | ) | ||||||
| Redemption Fees(a) | — | — | (f) | — | — | — | — | |||||||||||||||||
| Net Asset Value, End of Year / Period | $ | 10.65 | $ | 11.16 | $ | 11.08 | $ | 11.04 | $ | 10.95 | $ | 10.59 | ||||||||||||
| Total Return(b) | (0.87 | )% | 5.21 | % | 3.60 | % | 1.11 | %(c) | 6.98 | % | 3.97 | % | ||||||||||||
| Net Assets at End of Year / Period (000’s Omitted) | $ | 16,149 | $ | 19,540 | $ | 22,647 | $ | 31,607 | $ | 31,415 | $ | 28,090 | ||||||||||||
| Ratios to Average Net Assets: | ||||||||||||||||||||||||
| Net Investment Income | 1.43 | % | 1.94 | % | 2.54 | % | 3.03 | %(d) | 3.24 | % | 3.73 | % | ||||||||||||
| Net Expenses | 0.75 | % | 0.71 | % | 0.72 | % | 0.73 | %(d) | 0.82 | % | 0.87 | % | ||||||||||||
| Gross Expenses(e) | 0.75 | % | 0.71 | % | 0.72 | % | 0.73 | %(d) | 0.82 | % | 0.87 | % | ||||||||||||
| Portfolio Turnover Rate | 111 | % | 75 | % | 84 | % | 6 | %(c) | 25 | % | 32 | % | ||||||||||||
| (a) | Calculated based on average shares outstanding during the year / period. |
| (b) | Total return does not include the effects of sales charges which existed for Advisor Shares (then known as A Shares) for periods ended June 30, 2011 and earlier. |
| (c) | Not annualized. |
| (d) | Annualized. |
| (e) | Reflects the expense ratio excluding any waivers and/or expense reimbursements. |
| (f) | Less than $0.01 per share. |
| (g) | Effective June 1, 2010, the Fund changed its fiscal year end from May 31 to June 30. The information presented is for the period from June 1, 2010 to June 30, 2010. |
| * | Prior to July 1, 2011, Advisor Shares were known as A Shares. |
The accompanying notes are an integral part of these financial statements.
93
Financial Highlights
These financial highlights reflect selected per share data and ratios for a share outstanding of each Fund throughout each year / period.
BROWN ADVISORY TACTICAL BOND FUND
ADVISOR SHARES
| Year / Period Ended: | ||||||||
| June 30, | June 30, | |||||||
| 2013 | 2012(f) | |||||||
| Net Asset Value, Beginning of Year / Period | $ | 9.68 | $ | 10.00 | ||||
| Net Investment Loss(a) | (0.09 | ) | (0.04 | ) | ||||
| Net Realized And Unrealized Gains (Losses) | 0.29 | (0.27 | ) | |||||
| Total from Investment Operations | $ | 0.20 | $ | (0.31 | ) | |||
| Distributions: | ||||||||
| from Net Investment Income | (0.20 | ) | (0.01 | ) | ||||
| Total Distributions to Shareholders | $ | (0.20 | ) | $ | (0.01 | ) | ||
| Redemption Fees(a) | — | (e) | — | (e) | ||||
| Net Asset Value, End of Year / Period | $ | 9.68 | $ | 9.68 | ||||
| Total Return | 2.09 | % | (3.09 | )%(b) | ||||
| Net Assets at End of Year / Period (000’s Omitted) | $ | 25,570 | $ | 29,541 | ||||
| Ratios to Average Net Assets: | ||||||||
| Net Investment Loss | (0.87 | )% | (0.56 | )%(c) | ||||
| Net Expenses | 1.40 | % | 1.40 | %(c) | ||||
| Gross Expenses(d) | 1.40 | % | 1.40 | %(c) | ||||
| Portfolio Turnover Rate | 992 | % | 1290 | %(b) | ||||
| (a) | Calculated based on average shares outstanding during the year / period. |
| (b) | Not annualized. |
| (c) | Annualized. |
| (d) | Reflects the expense ratio excluding any waivers and/or expense reimbursements. |
| (e) | Less than $0.01 per share. |
| (f) | Commenced operations on September 30, 2011. The information presented is for the period from September 30, 2011 to June 30, 2012. |
The accompanying notes are an integral part of these financial statements.
94
Financial Highlights
These financial highlights reflect selected per share data and ratios for a share outstanding of each Fund throughout each period.
BROWN ADVISORY EQUITY INCOME FUND
INSTITUTIONAL SHARES
| Period Ended | ||||
| June 30, | ||||
| 2013(e) | ||||
| Net Asset Value, Beginning of Period | $ | 11.07 | ||
| Net Investment Income(a) | 0.21 | |||
| Net Realized And Unrealized Gains | 1.19 | |||
| Total from Investment Operations | $ | 1.40 | ||
| Distributions: | ||||
| from Net Investment Income | (0.23 | ) | ||
| from Net Realized Gains | (0.08 | ) | ||
| Total Distributions to Shareholders | $ | (0.31 | ) | |
| Redemption Fees(a) | — | |||
| Net Asset Value, End of Period | $ | 12.16 | ||
| Total Return | 12.88 | %(b) | ||
| Net Assets at End of Period (000’s Omitted) | $ | 11 | ||
| Ratios to Average Net Assets: | ||||
| Net Investment Income | 2.53 | %(c) | ||
| Net Expenses | 0.80 | %(c) | ||
| Gross Expenses(d) | 0.80 | %(c) | ||
| Portfolio Turnover Rate | 21 | % | ||
| (a) | Calculated based on average shares outstanding during the period. |
| (b) | Not annualized. |
| (c) | Annualized. |
| (d) | Reflects the expense ratio excluding any waivers and/or expense reimbursements. |
| (e) | Commenced operations on October 19, 2012. The information presented is for the period from October 19, 2012 to June 30, 2013. |
The accompanying notes are an integral part of these financial statements.
95
Financial Highlights
These financial highlights reflect selected per share data and ratios for a share outstanding of each Fund throughout each year / period.
BROWN ADVISORY EQUITY INCOME FUND
INVESTOR SHARES*
| Year / Period Ended: | ||||||||
| June 30, | June 30, | |||||||
| 2013 | 2012(f) | |||||||
| Net Asset Value, Beginning of Year / Period | $ | 10.49 | $ | 10.00 | ||||
| Net Investment Income(a) | 0.27 | 0.15 | ||||||
| Net Realized And Unrealized Gains | 1.76 | 0.46 | ||||||
| Total from Investment Operations | $ | 2.03 | $ | 0.61 | ||||
| Distributions: | ||||||||
| from Net Investment Income | (0.28 | ) | (0.12 | ) | ||||
| from Net Realized Gains | (0.08 | ) | — | |||||
| Total Distributions to Shareholders | $ | (0.36 | ) | $ | (0.12 | ) | ||
| Redemption Fees(a) | — | (e) | — | (e) | ||||
| Net Asset Value, End of Year / Period | $ | 12.16 | $ | 10.49 | ||||
| Total Return | 19.62 | % | 6.11 | %(b) | ||||
| Net Assets at End of Year / Period (000’s Omitted) | $ | 173,599 | $ | 106,075 | ||||
| Ratios to Average Net Assets: | ||||||||
| Net Investment Income | 2.37 | % | 2.82 | %(c) | ||||
| Net Expenses | 0.96 | % | 0.99 | %(c) | ||||
| Gross Expenses(d) | 0.96 | % | 0.99 | %(c) | ||||
| Portfolio Turnover Rate | 21 | % | 14 | %(b) | ||||
| (a) | Calculated based on average shares outstanding during the year / period. |
| (b) | Not annualized. |
| (c) | Annualized. |
| (d) | Reflects the expense ratio excluding any waivers and/or expense reimbursements. |
| (e) | Less than $0.01 per share. |
| (f) | Commenced operations on December 29, 2011. The information presented is for the period from December 29, 2011 to June 30, 2012. |
| * | Prior to October 19, 2012, Investor Shares were known as Institutional Shares. |
The accompanying notes are an integral part of these financial statements.
96
Financial Highlights
These financial highlights reflect selected per share data and ratios for a share outstanding of each Fund throughout each year / period.
BROWN ADVISORY EQUITY INCOME FUND
ADVISOR SHARES
| Year / Period Ended: | ||||||||
| June 30, | June 30, | |||||||
| 2013 | 2012(f) | |||||||
| Net Asset Value, Beginning of Year / Period | $ | 10.48 | $ | 10.00 | ||||
| Net Investment Income(a) | 0.25 | 0.14 | ||||||
| Net Realized And Unrealized Gains (Losses)(a) | 1.75 | 0.46 | ||||||
| Total from Investment Operations | $ | 2.00 | $ | 0.60 | ||||
| Distributions: | ||||||||
| from Net Investment Income | (0.26 | ) | (0.12 | ) | ||||
| from Net Realized Gains | (0.08 | ) | — | |||||
| Total Distributions to Shareholders | $ | (0.34 | ) | $ | (0.12 | ) | ||
| Redemption Fees(a) | — | — | (e) | |||||
| Net Asset Value, End of Year / Period | $ | 12.14 | $ | 10.48 | ||||
| Total Return | 19.33 | % | 5.95 | %(b) | ||||
| Net Assets at End of Year / Period (000’s Omitted) | $ | 2,346 | $ | 636 | ||||
| Ratios to Average Net Assets: | ||||||||
| Net Investment Income | 2.13 | % | 2.60 | %(c) | ||||
| Net Expenses | 1.20 | % | 1.19 | %(c) | ||||
| Gross Expenses(d) | 1.20 | % | 1.19 | %(c) | ||||
| Portfolio Turnover Rate | 21 | % | 14 | %(b) | ||||
| (a) | Calculated based on average shares outstanding during the period. |
| (b) | Not annualized. |
| (c) | Annualized. |
| (d) | Reflects the expense ratio excluding any waivers and/or expense reimbursements. |
| (e) | Less than $0.01 per share. |
| (f) | Commenced operations on December 29, 2011. The information presented is for the period from December 29, 2011 to June 30, 2012. |
The accompanying notes are an integral part of these financial statements.
97
Financial Highlights
These financial highlights reflect selected per share data and ratios for a share outstanding of each Fund throughout the year.
BROWN ADVISORY SUSTAINABLE GROWTH FUND*
INSTITUTIONAL SHARES
| Year Ended | ||||
| June 30, | ||||
| 2013 | ||||
| Net Asset Value, Beginning of Year | $ | 10.00 | ||
| Net Investment Income(a) | — | |||
| Net Realized And Unrealized Gains | 1.65 | |||
| Total from Investment Operations | $ | 1.65 | ||
| �� | ||||
| Distributions: | ||||
| from Net Realized Gains | (0.01 | ) | ||
| Total Distributions to Shareholders | $ | (0.01 | ) | |
| Redemption Fees(a) | — | |||
| Net Asset Value, End of Year | $ | 11.64 | ||
| Total Return | 16.47 | % | ||
| Net Assets at End of Year (000’s Omitted) | $ | 32,045 | ||
| Ratios to Average Net Assets: | ||||
| Net Investment Income | 0.03 | % | ||
| Net Expenses | 0.86 | % | ||
| Gross Expenses(b) | 0.86 | % | ||
| Portfolio Turnover Rate | 30 | % | ||
| (a) | Calculated based on average shares outstanding during the year. |
| (b) | Reflects the expense ratio excluding any waivers and/or expense reimbursements. |
| * | Commenced operations on June 29, 2012. No financial highlights are presented for the period from June 29, 2012 to June 30, 2012, as the Fund did not make any investments, earn any income or incur any expenses during the period. |
The accompanying notes are an integral part of these financial statements.
98
Financial Highlights
These financial highlights reflect selected per share data and ratios for a share outstanding of each Fund throughout the year.
BROWN ADVISORY SUSTAINABLE GROWTH FUND*
INVESTOR SHARES
| Year Ended | ||||
| June 30, | ||||
| 2013 | ||||
| Net Asset Value, Beginning of Year | $ | 10.00 | ||
| Net Investment Loss(a) | (0.01 | ) | ||
| Net Realized And Unrealized Gains | 1.64 | |||
| Total from Investment Operations | $ | 1.63 | ||
| Distributions: | ||||
| from Net Realized Gains | (0.01 | ) | ||
| Total Distributions to Shareholders | $ | (0.01 | ) | |
| Redemption Fees(a) | — | |||
| Net Asset Value, End of Year | $ | 11.62 | ||
| Total Return | 16.27 | % | ||
| Net Assets at End of Year (000’s Omitted) | $ | 24,028 | ||
| Ratios to Average Net Assets: | ||||
| Net Investment Loss | (0.12 | )% | ||
| Net Expenses | 1.01 | % | ||
| Gross Expenses(b) | 1.01 | % | ||
| Portfolio Turnover Rate | 30 | % | ||
| (a) | Calculated based on average shares outstanding during the year. |
| (b) | Reflects the expense ratio excluding any waivers and/or expense reimbursements. |
| * | Commenced operations on June 29, 2012. No financial highlights are presented for the period from June 29, 2012 to June 30, 2012, as the Fund did not make any investments, earn any income or incur any expenses during the period. |
The accompanying notes are an integral part of these financial statements.
99
Financial Highlights
These financial highlights reflect selected per share data and ratios for a share outstanding of each Fund throughout the year.
BROWN ADVISORY SUSTAINABLE GROWTH FUND*
ADVISOR SHARES
| Year Ended | ||||
| June 30, | ||||
| 2013 | ||||
| Net Asset Value, Beginning of Year | $ | 10.00 | ||
| Net Investment Loss(a) | (0.04 | ) | ||
| Net Realized And Unrealized Gains(a) | 1.65 | |||
| Total from Investment Operations | $ | 1.61 | ||
| Distributions: | ||||
| from Net Realized Gains | (0.01 | ) | ||
| Total Distributions to Shareholders | $ | (0.01 | ) | |
| Redemption Fees(a) | — | (c) | ||
| Net Asset Value, End of Year | $ | 11.60 | ||
| Total Return | 16.07 | % | ||
| Net Assets at End of Year (000’s Omitted) | $ | 124,256 | ||
| Ratios to Average Net Assets: | ||||
| Net Investment Loss | (0.37 | )% | ||
| Net Expenses | 1.26 | % | ||
| Gross Expenses(b) | 1.26 | % | ||
| Portfolio Turnover Rate | 30 | % | ||
| (a) | Calculated based on average shares outstanding during the year. |
| (b) | Reflects the expense ratio excluding any waivers and/or expense reimbursements. |
| (c) | Less than $0.01 per share. |
| * | Commenced operations on June 29, 2012. No financial highlights are presented for the period from June 29, 2012 to June 30, 2012, as the Fund did not make any investments, earn any income or incur any expenses during the period. |
The accompanying notes are an integral part of these financial statements.
100
Financial Highlights
These financial highlights reflect selected per share data and ratios for a share outstanding of each Fund throughout the year.
BROWN ADVISORY TAX EXEMPT BOND FUND*
INVESTOR SHARES
| Year Ended | ||||
| June 30, | ||||
| 2013 | ||||
| Net Asset Value, Beginning of Year | $ | 10.00 | ||
| Net Investment Income(a) | 0.13 | |||
| Net Realized And Unrealized Losses | (0.12 | ) | ||
| Total from Investment Operations | $ | 0.01 | ||
| Distributions: | ||||
| from Net Investment Income | (0.13 | ) | ||
| from Net Realized Gains | (0.04 | ) | ||
| Total Distributions to Shareholders | $ | (0.17 | ) | |
| Redemption Fees(a) | — | (c) | ||
| Net Asset Value, End of Year | $ | 9.84 | ||
| Total Return | 0.03 | % | ||
| Net Assets at End of Year (000’s Omitted) | $ | 161,891 | ||
| Ratios to Average Net Assets: | ||||
| Net Investment Income | 1.35 | % | ||
| Net Expenses | 0.55 | % | ||
| Gross Expenses(b) | 0.55 | % | ||
| Portfolio Turnover Rate | 87 | % | ||
| (a) | Calculated based on average shares outstanding during the year. |
| (b) | Reflects the expense ratio excluding any waivers and/or expense reimbursements. |
| (c) | Less than $0.01 per share. |
| * | Commenced operations on June 29, 2012. No financial highlights are presented for the period from June 29, 2012 to June 30, 2012, as the Fund did not make any investments, earn any income or incur any expenses during the period. |
The accompanying notes are an integral part of these financial statements.
101
Financial Highlights
These financial highlights reflect selected per share data and ratios for a share outstanding of each Fund throughout the period.
BROWN ADVISORY EMERGING MARKETS FUND
INSTITUTIONAL SHARES
| Period Ended | ||||
| June 30, | ||||
| 2013(f) | ||||
| Net Asset Value, Beginning of Period | $ | 10.00 | ||
| Net Investment Income(a) | 0.12 | |||
| Net Realized And Unrealized Losses | (0.60 | ) | ||
| Total from Investment Operations | $ | (0.48 | ) | |
| Distributions: | ||||
| from Net Investment Income | — | (e) | ||
| Total Distributions to Shareholders | $ | — | (e) | |
| Redemption Fees(a) | — | (e) | ||
| Net Asset Value, End of Period | $ | 9.52 | ||
| Total Return | (4.77 | )%(b) | ||
| Net Assets at End of Period (000’s Omitted) | $ | 122,515 | ||
| Ratios to Average Net Assets: | ||||
| Net Investment Income | 2.17 | %(c) | ||
| Net Expenses | 1.41 | %(c) | ||
| Gross Expenses(d) | 1.41 | %(c) | ||
| Portfolio Turnover Rate | 19 | %(b) | ||
| (a) | Calculated based on average shares outstanding during the period. |
| (b) | Not annualized. |
| (c) | Annualized. |
| (d) | Reflects the expense ratio excluding any waivers and/or expense reimbursements. |
| (e) | Less than $0.01 per share. |
| (f) | Commenced operations on December 12, 2012. The information presented is for the period from December 12, 2012 to June 30, 2013. |
The accompanying notes are an integral part of these financial statements.
102
Financial Highlights
These financial highlights reflect selected per share data and ratios for a share outstanding of each Fund throughout the period.
BROWN ADVISORY EMERGING MARKETS FUND
INVESTOR SHARES
| Period Ended | ||||
| June 30, | ||||
| 2013(f) | ||||
| Net Asset Value, Beginning of Period | $ | 10.00 | ||
| Net Investment Income(a) | 0.11 | |||
| Net Realized And Unrealized Losses | (0.60 | ) | ||
| Total from Investment Operations | $ | (0.49 | ) | |
| Distributions: | ||||
| from Net Investment Income | — | (e) | ||
| Total Distributions to Shareholders | $ | — | (e) | |
| Redemption Fees(a) | — | |||
| Net Asset Value, End of Period | $ | 9.51 | ||
| Total Return | (4.87 | )%(b) | ||
| Net Assets at End of Period (000’s Omitted) | $ | 11,695 | ||
| Ratios to Average Net Assets: | ||||
| Net Investment Income | 2.02 | %(c) | ||
| Net Expenses | 1.56 | %(c) | ||
| Gross Expenses(d) | 1.56 | %(c) | ||
| Portfolio Turnover Rate | 19 | %(b) | ||
| (a) | Calculated based on average shares outstanding during the period. |
| (b) | Not annualized. |
| (c) | Annualized. |
| (d) | Reflects the expense ratio excluding any waivers and/or expense reimbursements. |
| (e) | Less than $0.01 per share. |
| (f) | Commenced operations on December 12, 2012. The information presented is for the period from December 12, 2012 to June 30, 2013. |
The accompanying notes are an integral part of these financial statements.
103
Financial Highlights
These financial highlights reflect selected per share data and ratios for a share outstanding of each Fund throughout the period.
BROWN ADVISORY EMERGING MARKETS FUND
ADVISOR SHARES
| Period Ended | ||||
| June 30, | ||||
| 2013(f) | ||||
| Net Asset Value, Beginning of Period | $ | 10.00 | ||
| 000 | ||||
| Net Investment Income(a) | 0.10 | |||
| Net Realized And Unrealized Losses(a) | (0.61 | ) | ||
| Total from Investment Operations | $ | (0.51 | ) | |
| Distributions: | ||||
| from Net Investment Income | — | (e) | ||
| Total Distributions to Shareholders | $ | — | (e) | |
| Redemption Fees(a) | — | |||
| Net Asset Value, End of Period | $ | 9.49 | ||
| Total Return | (5.07 | )%(b) | ||
| Net Assets at End of Period (000’s Omitted) | $ | 990 | ||
| Ratios to Average Net Assets: | ||||
| Net Investment Income | 1.77 | %(c) | ||
| Net Expenses | 1.81 | %(c) | ||
| Gross Expenses(d) | 1.81 | %(c) | ||
| Portfolio Turnover Rate | 19 | %(b) | ||
| (a) | Calculated based on average shares outstanding during the period. |
| (b) | Not annualized. |
| (c) | Annualized. |
| (d) | Reflects the expense ratio excluding any waivers and/or expense reimbursements. |
| (e) | Less than $0.01 per share. |
| (f) | Commenced operations on December 12, 2012. The information presented is for the period from December 12, 2012 to June 30, 2013. |
The accompanying notes are an integral part of these financial statements.
www.brownadvisoryfunds.com
104
Notes to Financial Statements
June 30, 2013
Note 1. Organization
The Brown Advisory Growth Equity Fund (“Growth Equity Fund”), Brown Advisory Value Equity Fund (“Value Equity Fund”), Brown Advisory Flexible Equity Fund (“Flexible Equity Fund”), Brown Advisory Small-Cap Growth Fund (“Small-Cap Growth Fund”), Brown Advisory Small-Cap Fundamental Value Fund (“Small-Cap Fundamental Value Fund”), Brown Advisory Opportunity Fund (“Opportunity Fund”), Brown Advisory Maryland Bond Fund (“Maryland Bond Fund”), Brown Advisory Intermediate Income Fund (“Intermediate Income Fund”), Brown Advisory Tactical Bond Fund (“Tactical Bond Fund”), Brown Advisory Equity Income Fund (“Equity Income Fund”), Brown Advisory Sustainable Growth Fund (“Sustainable Growth Fund”), Brown Advisory Tax Exempt Bond Fund (“Tax Exempt Bond Fund”) and Brown Advisory Emerging Markets Fund (“Emerging Markets Fund”) (individually a “Fund,” and collectively, the “Funds”) are each a series of shares of beneficial interest of Brown Advisory Funds (the “Trust”), which is registered under the Investment Company Act of 1940 as an open-ended management investment company. Prior to October 19, 2012, the Funds, except for the Sustainable Growth Fund, Tax Exempt Bond Fund and Emerging Markets Fund, were series of Professionally Managed Portfolios Trust. Prior to April 12, 2010, the Funds, except for the Tactical Bond Fund, Equity Income Fund, Sustainable Growth Fund, Tax Exempt Bond Fund and Emerging Markets Fund, each of which had yet to commence operations, were part of the Forum Funds Trust.
The Funds commenced operations as follows:
| Institutional | Investor | Advisor | |
| Shares | Shares | Shares | |
| Growth Equity Fund | 10/19/2012 | 6/28/1999* | 5/18/2006** |
| Value Equity Fund | 10/19/2012 | 1/28/2003* | 4/25/2006** |
| Flexible Equity Fund# | 10/19/2012 | 11/30/2006* | 1/24/2007** |
| Small-Cap Growth Fund | 9/20/2002*** | 6/28/1999* | 4/25/2006** |
| Small-Cap Fundamental Value Fund | 10/19/2012 | 12/31/2008* | 7/28/2011 |
| Opportunity Fund | — | 6/29/1998* | — |
| Maryland Bond Fund | — | 12/21/2000* | — |
| Intermediate Income Fund | — | 11/2/1995* | 5/13/1991** |
| Tactical Bond Fund | — | — | 9/30/2011 |
| Equity Income Fund | 10/19/2012 | 12/29/2011* | 12/29/2011 |
| Sustainable Growth Fund^ | 6/29/2012 | 6/29/2012 | 6/29/2012 |
| Tax Exempt Bond Fund | — | 6/29/2012 | — |
| Emerging Markets Fund | 12/12/2012 | 12/12/2012 | 12/12/2012 |
_________________________
| # | Known as the Brown Advisory Flexible Value Fund prior to August 15, 2013. Referred to throughout this Annual Report as the Brown Advisory Flexible Equity Fund or Flexible Equity Fund. | |
| ^ | Known as the Brown Advisory Winslow Sustainability Fund prior to July 1, 2013. Referred to throughout this Annual Report as the Brown Advisory Sustainable Growth Fund or Sustainable Growth Fund. | |
| * | Prior to October 19, 2012, Investor Shares were known as Institutional Shares. | |
| ** | Prior to July 1, 2011, Advisor Shares were known as A Shares. | |
| *** | Prior to October 19, 2012, Small-Cap Growth Fund Institutional Shares were known as D Shares. |
Each share class has equal rights as to earnings and assets except that each class bears different shareholder servicing and distribution expenses. Each share class has exclusive voting rights with respect to matters that affect just that class. Income, expenses (other than expenses attributable to a specific class), and realized and unrealized gains or losses on investments are allocated to each share class on its relative net assets.
The investment objective of Growth Equity Fund and Small-Cap Growth Fund is to achieve capital appreciation by primarily investing in equity securities. The investment objective of Value Equity Fund and Tactical Bond Fund is to achieve capital appreciation. The investment objective of Small-Cap Fundamental Value Fund and Opportunity Fund is to achieve long-term capital appreciation. Flexible Equity Fund’s investment objective is to achieve long-term growth of capital. Maryland Bond Fund’s investment objective is to provide a high level of current income exempt from both Federal and Maryland State income taxes without undue risk. Intermediate Income Fund’s investment objective is to provide a high level of current income consistent with preservation of principal within an intermediate-term maturity structure. Equity Income Fund’s investment objective is to provide current dividend yield and dividend growth. Sustainable Growth Fund’s investment objective is to seek capital appreciation by investing at least 80% of its net
105
Notes to Financial Statements
June 30, 2013
Note 2. Significant Accounting Policies
The following is a summary of significant accounting policies consistently followed by the Funds. These policies are in conformity with accounting principles generally accepted in the United States of America.
A. Security Valuation – Equity securities that are traded on a national securities exchange, except those listed on the NASDAQ Global Market® (“NASDAQ”), are valued at the last reported sale price on the exchange on which the security is principally traded. Securities traded on NASDAQ will be valued at the NASDAQ Official Closing Price (“NOCP”). If, on a particular day, an exchange-traded or NASDAQ security does not trade, then the mean between the most recent quoted bid and asked prices will be used. All equity securities that are not traded on a listed exchange are valued at the last sale price in the over-the counter market. If a non-exchange traded security does not trade on a particular day, then the mean between the last quoted closing bid and asked price will be used.
For foreign securities that are traded on foreign exchanges, the Funds have selected Interactive Data Corporation (“IDC”) to provide pricing data for those such securities that are held by the Funds. The use of IDC’s pricing services with respect to these foreign exchange traded securities is designed to capture events occurring after a foreign exchange closes that may affect the value of certain holdings of the Funds that are traded on those foreign exchanges. The Funds utilize a confidence interval when determining whether or not to utilize these prices provided by IDC. The confidence interval is a measure of the relationship that each foreign exchange traded security has to movements in various indices and the price of the foreign exchange traded security’s corresponding American Depositary Receipt, if one exists. IDC provides a confidence interval for each foreign exchange traded security for which it provides a price. If the confidence interval provided by IDC is equal to or greater than a predefined level utilized by the Funds, the Funds will value that foreign exchange traded security at that price. If the confidence interval provided by IDC is less than the predefined level utilized by the Funds, the Funds will value that foreign exchange traded security at the preceding closing price on its respective foreign exchange, or, if there were no transactions on the preceding day, at the mean between the bid and the asked prices.
Debt securities are valued by using the mean between the closing bid and asked prices provided by an independent pricing service. If the closing bid and asked prices are not readily available, the independent pricing service may provide a price determined by a matrix pricing method. These techniques generally consider such factors as yields or prices of bonds of comparable quality, type of issue, coupon, maturity, ratings and general market conditions. In the absence of a price from a pricing service, securities are valued at their respective fair values as determined in good faith by the Board of Trustees.
Fixed income debt instruments, such as commercial paper, banker’s acceptances and U.S. Treasury Bills, having a maturity of less than 60 days are valued at amortized cost. Any discount or premium is accreted or amortized on a straight-line basis until maturity.
Exchange traded options are valued at the composite price, using the National Best Bid and Offer quotes (NBBO). NBBO consists of the highest bid price and lowest ask price across any of the exchanges on which an option is quoted, thus providing a view across the entire U.S. options marketplace. Specifically, composite pricing calculates the mean of the highest bid price and lowest ask price across the exchanges where the option is traded.
Securities for which quotations are not readily available are valued at their respective fair values as determined in good faith by the Board of Trustees. When a security is “fair valued,” consideration is given to the facts and circumstances relevant to the particular situation, including a review of various factors set forth in the pricing procedures adopted by the Funds’ Board of Trustees. Fair value pricing is an inherently subjective process, and no single standard exists for determining fair value. Different funds could reasonably arrive at different values for the same security. The use of fair value pricing by a fund may cause the net asset value of its shares to differ significantly from the net asset value that would be calculated without regard to such considerations. As of June 30, 2013, the Small-Cap Growth Fund held fair valued securities with a market value of $1,740,560 or 0.6% of total net assets and the Intermediate Income Fund held fair valued securities with a market value of $1,485,888 or 0.6% of total net assets.
As described above, the Funds’ utilize various methods to measure the fair value of most of their investments on a recurring basis. U.S. GAAP establishes a hierarchy that prioritizes inputs to valuations methods. The three levels of inputs are:
Level 1 – Unadjusted quoted prices in active markets for identical assets or liabilities that the Funds have the ability to access.
106
Notes to Financial Statements
June 30, 2013
Level 2 – Observable inputs other than quoted prices included in Level 1 that are observable for the asset or liability, either directly or indirectly. These inputs may include quoted prices for the identical instrument on an inactive market, prices for similar instruments, interest rates, prepayment speeds, credit risk, yield curves, default rates and similar data.
Level 3 – Unobservable inputs for the asset or liability, to the extent relevant observable inputs are not available; representing the Funds’ own assumptions about the assumptions a market participant would use in valuing the asset or liability, and would be based on the best information available.
The availability of observable inputs can vary from security to security and is affected by a wide variety of factors, including, for example, the type of security, whether the security is new and not yet established in the marketplace, the liquidity of markets, and other characteristics particular to the security. To the extent that valuation is based on models or inputs that are less observable or unobservable in the market, the determination of fair value requires more judgment. Accordingly, the degree of judgment exercised in determining fair value is greatest for instruments categorized in Level 3.
The inputs used to measure fair value may fall into different levels of the fair value hierarchy. In such cases, for disclosure purposes, the level in the fair value hierarchy within which the fair value measurement falls in its entirety, is determined based on the lowest level input that is significant to the fair value measurement in its entirety.
The following is a summary of the inputs used to value the Funds’ investments as of June 30, 2013:
| Level 1 | Level 2 | Level 3 | ||||||||||
| Growth Equity Fund | ||||||||||||
| Common Stocks | $ | 1,741,849,761 | $ | — | $ | — | ||||||
| Short-Term Investments | 59,370,540 | — | — | |||||||||
| Total Investments in Securities | $ | 1,801,220,301 | $ | — | $ | — | ||||||
| Level 1 | Level 2 | Level 3 | ||||||||||
| Value Equity Fund | ||||||||||||
| Common Stocks | $ | 152,293,507 | $ | — | $ | — | ||||||
| Short-Term Investments | 9,547,184 | — | — | |||||||||
| Total Investments in Securities | $ | 161,840,691 | $ | — | $ | — | ||||||
| Level 1 | Level 2 | Level 3 | ||||||||||
| Flexible Equity Fund | ||||||||||||
| Common Stocks | $ | 83,217,890 | $ | — | $ | — | ||||||
| Warrants | 340,680 | — | — | |||||||||
| Short-Term Investments | 4,937,430 | — | — | |||||||||
| Total Investments in Securities | $ | 88,496,000 | $ | — | $ | — | ||||||
| Level 1 | Level 2 | Level 3 | ||||||||||
| Small-Cap Growth Fund | ||||||||||||
| Common Stocks | $ | 279,315,223 | $ | — | $ | — | ||||||
| Private Placements | — | — | 1,740,560 | |||||||||
| Short-Term Investments | 12,386,446 | — | — | |||||||||
| Total Investments in Securities | $ | 291,701,669 | $ | — | $ | 1,740,560 | ||||||
| Level 1 | Level 2 | Level 3 | ||||||||||
| Small-Cap Fundamental Value Fund | ||||||||||||
| Common Stocks | $ | 366,101,739 | $ | — | $ | — | ||||||
| Real Estate Investment Trusts | 7,871,787 | — | — | |||||||||
| Short-Term Investments | 14,725,169 | — | — | |||||||||
| Total Investments in Securities | $ | 388,698,695 | $ | — | $ | — | ||||||
107
Notes to Financial Statements
June 30, 2013
| Level 1 | Level 2 | Level 3 | ||||||||||
| Opportunity Fund | ||||||||||||
| Common Stocks | $ | 8,895,262 | $ | — | $ | — | ||||||
| Short-Term Investments | 142,267 | — | — | |||||||||
| Total Investments in Securities | $ | 9,037,529 | $ | — | $ | — | ||||||
| Level 1 | Level 2 | Level 3 | ||||||||||
| Maryland Bond Fund | ||||||||||||
| Municipal Bonds | $ | — | $ | 243,289,362 | $ | — | ||||||
| Short-Term Investments | 5,665,855 | — | — | |||||||||
| Total Investments in Securities | $ | 5,665,855 | $ | 243,289,362 | $ | — | ||||||
| Level 1 | Level 2 | Level 3 | ||||||||||
| Intermediate Income Fund | ||||||||||||
| Corporate Bonds & Notes | $ | — | $ | 86,650,403 | $ | 1,485,888 | ||||||
| Mortgage Backed Securities | — | 71,537,046 | — | |||||||||
| U.S. Treasury Notes | — | 43,902,172 | — | |||||||||
| Municipal Bonds | — | 30,574,094 | — | |||||||||
| Asset Backed Securities | — | 12,659,578 | — | |||||||||
| Short-Term Investments | 5,999,868 | — | — | |||||||||
| Total Investments in Securities | $ | 5,999,868 | $ | 245,323,293 | $ | 1,485,888 | ||||||
| Level 1 | Level 2 | Level 3 | ||||||||||
| Tactical Bond Fund | ||||||||||||
| U.S. Treasury Notes | $ | — | $ | 14,807,810 | $ | — | ||||||
| Municipal Bonds | — | 2,414,670 | — | |||||||||
| Short-Term Investments | 307,978 | 6,998,251 | — | |||||||||
| Total Investments in Securities | $ | 307,978 | $ | 24,220,731 | $ | — | ||||||
| Credit Default Swaps | $ | — | $ | 405,149 | $ | — | ||||||
| Level 1 | Level 2 | Level 3 | ||||||||||
| Equity Income Fund | ||||||||||||
| Common Stocks | $ | 156,513,574 | $ | — | $ | — | ||||||
| Preferred Stocks | 5,907,255 | — | — | |||||||||
| Real Estate Investment Trusts | 5,721,877 | — | — | |||||||||
| Short-Term Investments | 8,246,731 | — | — | |||||||||
| Total Investments in Securities | $ | 176,389,437 | $ | — | $ | — | ||||||
| Level 1 | Level 2 | Level 3 | ||||||||||
| Sustainable Growth Fund | ||||||||||||
| Common Stocks | $ | 173,618,688 | $ | — | $ | — | ||||||
| Short-Term Investments | 6,471,573 | — | — | |||||||||
| Total Investments in Securities | $ | 180,090,261 | $ | — | $ | — | ||||||
| Level 1 | Level 2 | Level 3 | ||||||||||
| Tax Exempt Bond Fund | ||||||||||||
| Municipal Bonds | $ | — | $ | 158,140,358 | $ | — | ||||||
| Short-Term Investments | 10,613,587 | — | — | |||||||||
| Total Investments in Securities | $ | 10,613,587 | $ | 158,140,358 | $ | — | ||||||
108
Notes to Financial Statements
June 30, 2013
| Level 1 | Level 2 | Level 3 | ||||||||||
| Emerging Markets Fund | ||||||||||||
| Common Stocks | $ | 19,885,009 | $ | 95,835,386 | $ | — | ||||||
| Preferred Stocks | 2,920,958 | — | — | |||||||||
| Exchange Traded Funds | 867,859 | — | — | |||||||||
| Short-Term Investments | 13,488,238 | — | — | |||||||||
| Total Investments in Securities | $ | 37,162,064 | $ | 95,835,386 | $ | — | ||||||
None of the Funds had transfers into or out of Levels 1, 2 and 3 during the year ended June 30, 2013.
The following is a reconciliation of Level 3 securities for which significant unobservable inputs were used to determine fair value.
| Small-Cap Growth Fund | ||||
| Balance as of June 30, 2012 | $ | 1,569,903 | ||
| Purchases | 334,769 | |||
| Returns of Capital | (335,000 | ) | ||
| Change in Unrealized Appreciation | 170,888 | |||
| Balance as of June 30, 2013 | $ | 1,740,560 | ||
The inputs utilized in valuing these securities consist of annual audited financial statements and quarterly capital statements which are provided by the issuer. These valuations are adjusted periodically for certain events (additional contributions of capital made by the Fund, distributions to the Fund made by the issuer, etc) that may occur prior to receipt of the next quarterly capital statement or Annual Report.
| Intermediate Income Fund | ||||
| Balance as of June 30, 2012 | $ | — | ||
| Purchases | 1,933,198 | |||
| Accretion of Discount | 1,926 | |||
| Sales | (383,550 | ) | ||
| Realized Losses | (1,498 | ) | ||
| Change in Unrealized Depreciation | (64,188 | ) | ||
| Balance as of June 30, 2013 | $ | 1,485,888 | ||
The inputs utilized in valuing this security consist of actual purchases and sales of the security in the open market. The prices of these transactions are then adjusted for current interest rate and market conditions to a benchmark, generally the 10 Year U.S. Treasury Note. At times, open bid and ask prices are utilized as well.
B. Securities Transactions and Investment Income – Investment securities transactions are accounted for on the trade date. Discounts/premiums on debt securities purchased are accreted/amortized over the life of the respective securities using the effective interest method. Dividend income is recorded on the ex-dividend date. Interest income is recorded on an accrual basis. Foreign dividend income is recorded on the ex-dividend date or as soon as practical after a Fund determines the existence of a dividend declaration after exercising reasonable due diligence. Income and capital gains on some foreign securities may be subject to foreign withholding taxes, which are accrued as applicable. Identified cost of investments sold is used to determine the gain and loss for both financial statement and Federal income tax purposes. Distributions deemed to be a return of capital are recorded as a reduction of the cost of the related investments.
C. Foreign Currency – Investment securities and other assets and liabilities denominated in foreign currencies are translated into U.S. Dollar amounts at the date of valuation. Purchases and sales of investment securities and income and expense items denominated in foreign currencies are translated into U.S. Dollar amounts on the respective dates of such transactions.
The Funds do not isolate the portion of the results of operations resulting from changes in foreign exchange rates on investments from the fluctuations arising from changes in market prices of securities held. Such fluctuations are included with the net realized and unrealized gain or loss from investments.
109
Notes to Financial Statements
June 30, 2013
The Funds report net realized foreign exchange gains and losses that arise from sales of foreign currencies, currency gain or losses realized between the trade and settlement dates on securities transactions, and the difference between the amounts of dividends, interest, and foreign withholding taxes recorded on the Fund’s books and the U.S. Dollar equivalent of the amounts actually received or paid. Net unrealized foreign exchange gains and losses arise from changes in the fair values of the assets and liabilities, other than investments in securities at fiscal year end, resulting from changes in exchange rates.
D. Options – The Funds may invest in options. When a Fund writes an option, an amount equal to the premium received by a Fund is recorded as a liability and is subsequently adjusted to the current value of the option written. Premiums received from writing options that expire unexercised are treated by a Fund on the expiration date as realized gain from investments. The difference between the premium and the amount paid on effecting a closing purchase transaction, including brokerage commissions, is also treated as a realized gain, or if the premium is less than the amount paid for closing purchase transaction, as a realized loss. If a call option is exercised, the premium is added to the proceeds from the sale of the underlying security or currency determining whether a Fund has a realized gain or loss. If a put option is exercised, the premium reduces the cost basis of the securities purchase by a Fund. A Fund, as a writer of an option, bears the market risk of an unfavorable change in the price of the security underlying the written option.
When a Fund purchases an option, an amount equal to the premium paid by a Fund is recorded as an investment and is subsequently adjusted to the current value of the option purchased. If an option expires on the stipulated expiration date or if a Fund enters into a closing sale transaction, a gain or loss is realized. If a call option is exercised, the cost of the security acquired is increased by the premium paid for the call. If a put option is exercised, a gain or loss is realized from the sale of the underlying security, and the proceeds from such sale are decreased by the premium originally paid. Written and purchased options are non-income producing securities.
No options were held by the Funds during the year ended June 30, 2013.
E. Distributions to Shareholders – For the Maryland Bond Fund and Tax Exempt Bond Fund distributions of net investment income, if any, are declared daily and paid monthly. Distributions to shareholders of net investment income, if any, are declared and paid monthly for the Intermediate Income Fund and quarterly for the Equity Income Fund. The remaining Funds declare and pay net investment income, if any, at least annually. Distributions to shareholders of net capital gains, if any, are declared and paid at least annually. Distributions are recorded on the ex-dividend date.
F. Use of Estimates – The preparation of financial statements in conformity with accounting principles generally accepted in the United States of America requires management to make estimates and assumptions that affect the reported amounts of assets and liabilities at the date of the financial statements and the reported amount of revenue and expenses during the reporting period. Actual results could differ from those estimates.
G. Federal Taxes – Each Fund has elected to be taxed as a “regulated investment company” and intends to distribute substantially all taxable income to its shareholders and otherwise comply with the provisions of the Internal Revenue Code applicable to regulated investment companies. Therefore, no provision for federal income taxes or excise taxes has been made.
The Funds recognize tax benefits of uncertain tax positions only where the position is “more likely than not” to be sustained assuming examination by tax authorities.
The Funds have analyzed their tax positions and have concluded that no liability for unrecognized tax benefits should be recorded related to uncertain income tax positions taken on returns filed for open tax years as of June 30, 2013. The Funds identify their major tax jurisdictions as U.S. Federal and Delaware State; however the Funds are not aware of any tax position for which it is reasonably possible that the total amounts of unrecognized tax benefits will change materially in the next year.
H. Redemption Fees – A shareholder who redeems or exchanges shares of the Funds within fourteen days of purchase will incur a redemption fee of 1.00% of the current net asset value of shares redeemed or exchanged, subject to certain exceptions. The fee is charged for the benefit of the remaining shareholders and will be paid to the Fund to help offset transaction costs. The fee is accounted for as an addition to paid-in capital. Each Fund reserves the right to modify the terms of or terminate the fee at any time. There are limited exceptions to the imposition of the redemption fee.
I. Guarantees and Indemnifications – In the normal course of business, the Funds enter into contracts with service providers that contain general indemnification clauses. The Funds’ maximum exposure under these arrangements is unknown as this would involve future claims that may be made against the Funds that have not yet occurred. However, based on experience, the Funds expect the risk of loss to be remote.
110
Notes to Financial Statements
June 30, 2013
J. Subsequent Events – In preparing these financial statements, the Funds have evaluated events and transactions for potential recognition through the date the financial statements were issued.
K. Recent Accounting Pronouncements – In December 2011, FASB issued ASU No. 2011-11 related to disclosures about offsetting assets and liabilities. The amendments in this ASU require an entity to disclose information about offsetting and related arrangements to enable users of its financial statements to understand the effect of those arrangements on its financial position. The ASU is effective for annual reporting periods beginning on or after January 1, 2013, and interim periods within those annual periods. The guidance requires retrospective application for all comparative periods presented.
On January 31, 2013, FASB issued Accounting Standards Update No. 2013-01 “Clarifying the Scope of Disclosures about Offsetting Assets and Liabilities” (“ASU 2013-01”). ASU 2013-01 limits the scope of the new balance sheet offsetting disclosures to the following financial instruments, to the extent they are offset in the financial statements or subject to an enforceable master netting arrangement or similar agreement: (i) recognized derivative instruments accounted for under ASC 815 (Derivatives and Hedging); (ii) repurchase agreements and reverse repurchase agreements; and (iii) securities borrowing and securities lending transactions. The disclosures are required irrespective of whether the transactions are offset in the statement of assets and liabilities. The effective date and transition of the disclosure requirements in ASU 2011-11 remain unchanged.
At this time, Management is evaluating the implications of ASU 2011-11 and ASU 2013-01 and their impact on the Funds’ financial statements.
Note 3. Commitments and Other Related Party Transactions
Investment Adviser – The Adviser does business under the name of Brown Advisory, LLC. Pursuant to an investment advisory agreement, the Adviser receives an advisory fee, accrued daily and payable monthly from each Fund at an annual rate of the Fund’s average annual daily net assets as follows:
| Annual Advisory Fee | |
| Growth Equity Fund | 0.60% |
| Value Equity Fund | 0.60% |
| Flexible Equity Fund | 0.60% |
| Small-Cap Growth Fund | 0.85% |
| Small-Cap Fundamental Value Fund | 0.85% |
| Opportunity Fund | 0.85% |
| Maryland Bond Fund | 0.30% |
| Intermediate Income Fund | 0.30% |
| Tactical Bond Fund | 0.60% |
| Equity Income Fund | 0.60% |
| Sustainable Growth Fund | 0.60% |
| Tax Exempt Bond Fund | 0.30% |
| Emerging Markets Fund* | 0.90% |
| * | Subject to the general oversight of the Adviser and Board of Trustees during the period ended June 30, 2013, Somerset Capital Management, LLP (“Somerset”), served as sub-adviser to the Emerging Markets Fund and made investment decisions on its behalf. Somerset is compensated for its services by the Adviser. |
The Adviser is also entitled to receive a business management fee of 0.05%, accrued daily and payable monthly, of the Funds’ average daily net assets in exchange for its management and oversight of the non-investment advisory services provided to the Funds and the Trust.
111
Notes to Financial Statements
June 30, 2013
Fee Waivers and Expense Reimbursements – The Adviser has contractually agreed to waive a portion of its fees and reimburse certain expenses to limit total annual operating expenses for each or the class’ average daily net assets for the Funds noted below:
| Institutional Shares | Investor Shares | Advisor Shares | |
| Growth Equity Fund | 1.00% | 1.15% | 1.35% |
| Value Equity Fund | 1.00% | 1.15% | 1.35% |
| Flexible Equity Fund | 1.00% | 1.15% | 1.35% |
| Small-Cap Growth Fund | 1.25% | 1.40% | 1.60% |
| Small-Cap Fundamental Value Fund | 1.25% | 1.40% | 1.60% |
| Opportunity Fund | 1.35% | 1.50% | 1.70% |
| Maryland Bond Fund | 0.55% | 0.60% | 0.80% |
| Intermediate Income Fund | 0.55% | 0.60% | 0.80% |
| Tactical Bond Fund | 1.40% | 1.55% | 1.75% |
| Equity Income Fund | 1.00% | 1.15% | 1.35% |
| Sustainable Growth Fund | 1.00% | 1.15% | 1.35% |
| Tax Exempt Bond Fund | 0.55% | 0.60% | 0.80% |
| Emerging Markets Fund | 1.60% | 1.75% | 2.00% |
These expense caps are in place indefinitely. For the year ended June 30, 2013, the Adviser waived $18,972 in expenses for the Opportunity Fund and recouped $49,286 in previously waived fees from the Flexible Equity Fund. The Adviser is permitted to seek reimbursement from the Funds for fees waived and/or Fund expenses it pays over the following three years after such payment. The Funds must pay their current ordinary operating expenses before the Adviser is entitled to any reimbursement of fees and/or expenses. At June 30, 2013, the cumulative amounts of previously waived fees that the Adviser may recoup from the Flexible Equity Fund and Opportunity Fund were $18,551 and $77,138, respectively. During the year ended June 30, 2013, $6,276 of fees previously waived by the Adviser in the Opportunity Fund expired without being recouped. The Adviser may recoup portions of the above amounts no later than the dates below:
| June 30, | ||||||||||||
| 2014 | 2015 | 2016 | ||||||||||
| Flexible Equity Fund | $ | 9,506 | $ | 9,045 | $ | — | ||||||
| Opportunity Fund | 35,673 | 22,493 | 18,972 | |||||||||
As of the date these financial statements were issued, the Adviser has recouped the entirety of the $18,551 in previously waived fees that existed as of June 30, 2013 in the Flexible Equity Fund.
Distribution – Quasar Distributors, LLC (“the Distributor”) serves as principal underwriter for shares of the Funds, and acts as each Fund’s Distributor in a continuous public offering of each Fund’s shares. The Distributor is an affiliate of the Administrator.
Under a Distribution Plan adopted pursuant to Rule 12b-1 under the Act (“Distribution Plan”), each Fund pays the Distributor or any other entity as authorized by the Board, as compensation for the distribution-related and/or shareholder services provided by such entities an aggregate fee equal to 0.25% of the average daily net assets of Advisor Shares for each Fund. The Distributor may pay any or all amounts received under the Rule 12b-1 Plan to other persons, including the Adviser, for any distribution or service activity.
The Trust has also adopted a Shareholder Service Plan under which each Fund may pay a fee of up to 0.15% of the average daily net assets of each Fund’s Investor and Advisor Shares (except for the Maryland Bond Fund, Intermediate Income Fund and Tax Exempt Bond Fund, which may pay a fee of up to 0.05%) for shareholder services provided to the Funds by financial institutions, including the Adviser.
Other Service Providers – U.S. Bancorp Fund Services, LLC (“USBFS”), an indirect wholly-owned subsidiary of U.S. Bancorp, serves as the Funds’ Administrator (“Administrator”), and in that capacity, performs various administrative and accounting services for the Funds. USBFS also serves as the Funds’ fund accountant and transfer agent. Certain officers of the Trust are employees of USBFS and the Funds’ custodian, U.S. Bank N.A., is an affiliate of the Administrator.
112
Notes to Financial Statements
June 30, 2013
Note 4. Purchases and Sales of Securities
The cost of purchases and the proceeds from sales of investment securities (including maturities), other than short-term investments for the year ended June 30, 2013 were as follows:
| Investment Securities | ||||||||
| Purchases | Sales | |||||||
| Growth Equity Fund | $ | 1,118,770,243 | $ | 506,138,795 | ||||
| Value Equity Fund | 83,212,152 | 114,083,527 | ||||||
| Flexible Equity Fund | 40,124,144 | 5,957,261 | ||||||
| Small-Cap Growth Fund | 121,786,232 | 114,730,089 | ||||||
| Small-Cap Fundamental Value Fund | 209,930,248 | 87,842,696 | ||||||
| Opportunity Fund | 4,579,312 | 5,733,030 | ||||||
| Maryland Bond Fund | 93,075,906 | 73,799,761 | ||||||
| Intermediate Income Fund | 309,402,829 | 330,312,038 | ||||||
| Tactical Bond Fund | 159,128,660 | 158,166,804 | ||||||
| Equity Income Fund | 72,848,155 | 29,533,180 | ||||||
| Sustainable Growth Fund | 179,046,050 | 34,956,000 | ||||||
| Tax Exempt Bond Fund | 285,009,837 | 121,780,375 | ||||||
| Emerging Markets Fund | 143,848,216 | 16,875,584 | ||||||
The Intermediate Income Fund purchased $129,141,576 and sold $119,281,835 in U.S. Government securities for the year ended June 30, 2013. The Tactical Bond Fund purchased $96,192,858 and sold $91,805,518 in U.S. Government securities for the year ended June 30, 2013. Purchases and sales of U.S. Government securities are included in the totals above and include U.S. Treasury Bonds and Notes.
Note 5. Federal Income Tax and Distribution Information
At June 30, 2013, the components of distributable earnings (accumulated losses) on a tax basis were as follows:
| Small-Cap | ||||||||||||||||||||
| Growth Equity | Value Equity | Flexible Equity | Small-Cap | Fundamental | ||||||||||||||||
| Fund | Fund | Fund | Growth Fund | Value Fund | ||||||||||||||||
| Tax Cost of Investments | $ | 1,520,756,670 | $ | 138,770,855 | $ | 70,451,229 | $ | 219,357,853 | $ | 324,519,178 | ||||||||||
| Gross Tax Unrealized Appreciation | 317,095,694 | 27,022,175 | 18,923,847 | 79,726,024 | 72,113,709 | |||||||||||||||
| Gross Tax Unrealized Depreciation | (36,632,063 | ) | (3,952,339 | ) | (879,076 | ) | (5,641,648 | ) | (7,934,192 | ) | ||||||||||
| Net Tax Unrealized Appreciation (Depreciation) | 280,463,631 | 23,069,836 | 18,044,771 | 74,084,376 | 64,179,517 | |||||||||||||||
| Undistributed Ordinary Income | — | 1,442,921 | 100,229 | 759,319 | 3,557,076 | |||||||||||||||
| Undistributed Long-Term Capital Gain | — | — | — | 5,358,634 | 8,604,720 | |||||||||||||||
| Total Distributable Earnings | — | 1,442,921 | 100,229 | 6,117,953 | 12,161,796 | |||||||||||||||
| Capital Loss Carryforwards | (6,387,206 | ) | (14,447,921 | ) | (5,231,437 | ) | — | (6,158,465 | ) | |||||||||||
| Other Accumulated Losses | (4,512,021 | ) | — | — | — | — | ||||||||||||||
| Total Accumulated Earnings (Losses) | $ | 269,564,404 | $ | 10,064,836 | $ | 12,913,563 | $ | 80,202,329 | $ | 70,182,848 | ||||||||||
113
Notes to Financial Statements
June 30, 2013
| Opportunity | Maryland | Intermediate | Tactical | Equity | ||||||||||||||||
| Fund | Bond Fund | Income Fund | Bond Fund | Income Fund | ||||||||||||||||
| Tax Cost of Investments | $ | 7,225,885 | $ | 245,825,745 | $ | 253,317,528 | $ | 24,957,157 | $ | 150,163,826 | ||||||||||
| Gross Tax Unrealized Appreciation | 1,942,990 | 5,302,689 | 3,963,836 | 393,690 | 27,968,265 | |||||||||||||||
| Gross Tax Unrealized Depreciation | (131,346 | ) | (2,173,217 | ) | (4,472,315 | ) | (822,138 | ) | (1,742,654 | ) | ||||||||||
| Net Tax Unrealized Appreciation (Depreciation) | 1,811,644 | 3,129,472 | (508,479 | ) | (428,448 | ) | 26,225,611 | |||||||||||||
| Net Tax Unrealized | ||||||||||||||||||||
| Appreciation (Depreciation) on Swaps | — | — | — | 405,149 | — | |||||||||||||||
| Undistributed Ordinary Income | — | 319,204 | 469,200 | 110,913 | 437,136 | |||||||||||||||
| Undistributed Long-Term Capital Gain | — | 1,707,942 | 4,174,239 | — | 1,533,754 | |||||||||||||||
| Total Distributable Earnings | — | 2,027,146 | 4,643,439 | 110,913 | 1,970,890 | |||||||||||||||
| Capital Loss Carryforwards | (7,330,644 | ) | — | — | (661,139 | ) | — | |||||||||||||
| Other Accumulated Losses | (24,827 | ) | (319,204 | ) | (275,965 | ) | (405,149 | ) | — | |||||||||||
| Total Accumulated Earnings (Losses) | $ | (5,543,827 | ) | $ | 4,837,414 | $ | 3,858,995 | $ | (978,674 | ) | $ | 28,196,501 | ||||||||
| Sustainable | Tax Exempt | Emerging | ||||||||||||||||||
| Growth Fund | Bond Fund | Markets Fund | ||||||||||||||||||
| Tax Cost of Investments | $ | 151,801,958 | $ | 172,405,157 | $ | 138,408,372 | ||||||||||||||
| Gross Tax Unrealized Appreciation | 32,746,943 | 72,734 | 4,570,911 | |||||||||||||||||
| Gross Tax Unrealized Depreciation | (4,458,640 | ) | (3,723,946 | ) | (9,981,833 | ) | ||||||||||||||
| Net Tax Unrealized Appreciation (Depreciation) | 28,288,303 | (3,651,212 | ) | (5,410,922 | ) | |||||||||||||||
| Net Tax Unrealized Appreciation (Depreciation) | ||||||||||||||||||||
| on Foreign Receivables | (97 | ) | — | (6,805 | ) | |||||||||||||||
| Undistributed Ordinary Income | — | 169,986 | 919,023 | |||||||||||||||||
| Undistributed Long-Term Capital Gain | — | — | — | |||||||||||||||||
| Total Distributable Earnings | — | 169,986 | 919,023 | |||||||||||||||||
| Capital Loss Carryforwards | (20,384,219 | ) | — | — | ||||||||||||||||
| Other Accumulated Losses | (268,549 | ) | (143,001 | ) | (2,052,495 | ) | ||||||||||||||
| Total Accumulated Earnings (Losses) | $ | 7,635,438 | $ | (3,624,227 | ) | $ | (6,551,199 | ) | ||||||||||||
The differences between components of distributable earnings on a tax basis and the amounts reflected in the Statements of Assets and Liabilities are primarily due to wash sales, post-October losses and distributions payable.
At June 30, 2013, the following capital loss carryforwards were available:
| Expiring | Expiring | Expiring | Expiring | Expiring | Infinite | Infinite | ||||||||||||||||||||||||||
| 2014 | 2015 | 2016 | 2017 | 2018 | Short-Term | Long-Term | Total | |||||||||||||||||||||||||
| Growth Equity Fund | $ | — | $ | — | $ | — | $ | 2,391,686 | $ | 6,142 | $ | 2,200,350 | $ | 1,789,028 | $ | 6,387,206 | ||||||||||||||||
| Value Equity Fund | — | — | — | 13,498,818 | 949,103 | — | — | 14,447,921 | ||||||||||||||||||||||||
| Flexible Equity Fund | — | 1,950,064 | — | 3,281,373 | — | — | — | 5,231,437 | ||||||||||||||||||||||||
| Small-Cap Growth Fund | — | — | — | — | — | — | — | — | ||||||||||||||||||||||||
| Small-Cap Fundamental Value Fund | — | — | 6,158,465 | * | — | — | — | — | 6,158,465 | * | ||||||||||||||||||||||
| Opportunity Fund | — | — | 6,595,708 | 734,936 | — | — | — | 7,330,644 | ||||||||||||||||||||||||
| Maryland Bond Fund | — | — | — | — | — | — | — | — | ||||||||||||||||||||||||
| Intermediate Income Fund | — | — | — | — | — | — | — | — | ||||||||||||||||||||||||
| Tactical Bond Fund | — | — | — | — | — | 661,139 | — | 661,139 | ||||||||||||||||||||||||
| Equity Income Fund | — | — | — | — | — | — | — | — | ||||||||||||||||||||||||
| Sustainable Growth Fund | — | — | — | — | — | 20,384,219 | ** | — | 20,384,219 | ** | ||||||||||||||||||||||
| Tax Exempt Bond Fund | — | — | — | — | — | — | — | — | ||||||||||||||||||||||||
| Emerging Markets Fund | — | — | — | — | — | — | — | — | ||||||||||||||||||||||||
| * | Acquired in connection with the merger of the Brown Advisory Small Companies Fund. The amount vests ratably and becomes available to use over the next three fiscal years ending on June 30, 2016. |
| ** | Acquired in connection with the merger of the Winslow Green Growth Fund. As of June 30, 2013, $1,932,919 is available to the Fund. The remaining amount of $18,451,300 will vest ratably and become available to use by the Fund over the next four fiscal years ending June 30, 2017. |
114
Notes to Financial Statements
June 30, 2013
Distributions during the fiscal years ended as noted were characterized for tax purposes as follows:
| Tax Exempt Income | Ordinary Income | |||||||||||||||
| June 30, | June 30, | June 30, | June 30, | |||||||||||||
| 2013 | 2012 | 2013 | 2012 | |||||||||||||
| Growth Equity Fund | $ | — | $ | — | $ | 2,055,042 | $ | — | ||||||||
| Value Equity Fund | — | — | 2,425,706 | 1,093,290 | ||||||||||||
| Flexible Equity Fund | — | — | 233,792 | 86,530 | ||||||||||||
| Small-Cap Growth Fund | — | — | — | — | ||||||||||||
| Small-Cap Fundamental Value Fund | — | — | 863,995 | 3,721,134 | ||||||||||||
| Opportunity Fund | — | — | — | — | ||||||||||||
| Maryland Bond Fund | 4,878,494 | 4,918,773 | 51,425 | 6,808 | ||||||||||||
| Intermediate Income Fund | — | — | 10,441,954 | 7,508,580 | ||||||||||||
| Tactical Bond Fund | — | — | 492,870 | 41,204 | ||||||||||||
| Equity Income Fund | — | — | 4,522,065 | 1,142,312 | ||||||||||||
| Sustainable Growth Fund | — | — | 95,541 | — | ||||||||||||
| Tax Exempt Bond Fund | 2,082,988 | — | 580,188 | — | ||||||||||||
| Emerging Markets Fund | — | N/A | 26,346 | N/A | ||||||||||||
| Long-Term Capital Gain^ | ||||||||||||||||
| June 30, | June 30, | |||||||||||||||
| 2013 | 2012 | |||||||||||||||
| Growth Equity Fund | $ | — | $ | — | ||||||||||||
| Value Equity Fund | — | — | ||||||||||||||
| Flexible Equity Fund | — | — | ||||||||||||||
| Small-Cap Growth Fund | 21,935,223 | 3,970,843 | ||||||||||||||
| Small-Cap Fundamental Value Fund | — | 2,386,326 | ||||||||||||||
| Opportunity Fund | — | — | ||||||||||||||
| Maryland Bond Fund | 410,674 | 923,336 | ||||||||||||||
| Intermediate Income Fund | 1,416,508 | 5,520,481 | ||||||||||||||
| Tactical Bond Fund | — | — | ||||||||||||||
| Equity Income Fund | 379,543 | — | ||||||||||||||
| Sustainable Growth Fund | — | — | ||||||||||||||
| Tax Exempt Bond Fund | — | — | ||||||||||||||
| Emerging Markets Fund | — | N/A | ||||||||||||||
_________________________
| ^ | Designated as a long-term capital gain dividend, pursuant to Internal Revenue Code Section 852(b)(3). |
115
Notes to Financial Statements
June 30, 2013
On the Statements of Assets and Liabilities, as a result of net operating losses incurred, adjustments to holdings of Real Estate Investment Trusts, currency gains and losses, distribution reclassifications and income adjustments to asset-backed security transactions, certain amounts of income, realized gains, and paid-in capital have been reclassified for the year ended June 30, 2013. These reclassifications have no impact on the net assets of the Funds:
| Undistributed | Accumulated | |||||||||||
| Net Investment | Net Realized | Paid-in | ||||||||||
| Income (Loss) | Gain (Loss) | Capital | ||||||||||
| Growth Equity Fund | $ | 42 | $ | (42 | ) | $ | — | |||||
| Value Equity Fund | 111 | (112 | ) | 1 | ||||||||
| Flexible Equity Fund | 43 | (43 | ) | — | ||||||||
| Small-Cap Growth Fund | 1,942,605 | (1,942,606 | ) | 1 | ||||||||
| Small-Cap Fundamental Value Fund | 42,602 | (42,601 | ) | (1 | ) | |||||||
| Opportunity Fund | 26,028 | 30,502,264 | (30,528,292 | ) | ||||||||
| Maryland Bond Fund | — | — | — | |||||||||
| Intermediate Income Fund | 553,625 | (553,625 | ) | — | ||||||||
| Tactical Bond Fund | 471,062 | (471,062 | ) | — | ||||||||
| Equity Income Fund | 293,626 | (293,626 | ) | — | ||||||||
| Sustainable Growth Fund | 71,615 | (21,650,011 | ) | 21,578,396 | ||||||||
| Tax Exempt Bond Fund | — | — | — | |||||||||
| Emerging Markets Fund | (289,436 | ) | 312,210 | (22,774 | ) | |||||||
At June 30, 2013, the Funds deferred, on a tax basis:
| Post-October | Post-October | Post-December | ||||||||||
| Capital Losses | Currency Losses | Ordinary Losses | ||||||||||
| Growth Equity Fund | $ | 3,137,648 | $ | — | $ | 1,374,373 | ||||||
| Value Equity Fund | — | — | — | |||||||||
| Flexible Equity Fund | — | — | — | |||||||||
| Small-Cap Growth Fund | — | — | — | |||||||||
| Small-Cap Fundamental Value Fund | — | — | — | |||||||||
| Opportunity Fund | — | — | 24,827 | |||||||||
| Maryland Bond Fund | — | — | — | |||||||||
| Intermediate Income Fund | — | — | — | |||||||||
| Tactical Bond Fund | — | — | — | |||||||||
| Equity Income Fund | — | — | — | |||||||||
| Sustainable Growth Fund | — | — | 268,549 | |||||||||
| Tax Exempt Bond Fund | — | — | — | |||||||||
| Emerging Markets Fund | 2,052,495 | — | — | |||||||||
Note 6. Concentration of Risk
Maryland Bond Fund, Tactical Bond Fund and the Tax Exempt Bond Fund are non-diversified and may focus their investments in the securities of a limited number of issuers. Concentration of Maryland Bond Fund in securities of a limited amount of issuers exposes the Fund to greater market risk and potential monetary losses than if its assets were invested more heavily in issuers located outside of Maryland and therefore, it is more susceptible to economic, environmental and political factors adversely affecting issuers of Maryland municipal securities than would be comparable tax-exempt mutual funds that invest nationally. These factors may have an adverse affect on the issuers’ ability to meet their continued obligations to pay interest and principal to investors and therefore impact the value of the Fund’s investments and NAV.
Investors in bond funds should anticipate fluctuations in price, especially for longer-term issues and in environments of rising interest rates. Generally bond prices fall when interest rates rise and vice versa. This effect is usually more pronounced for longer-term securities.
116
Notes to Financial Statements
June 30, 2013
Note 7. Credit Default Swap Agreements
The Tactical Bond Fund may invest in credit default swap agreements. Credit default swap agreements involve one party making a stream of payments (generally referred to as the buyer of protection) to another party (the seller of protection) in exchange for the right to receive a specified return in the event of a default or other credit event in respect of a referenced entity, obligation or index. As a seller of protection on credit default swap agreements, a Fund will generally receive from the buyer of protection a fixed rate of income throughout the term of the swap. As the seller, a Fund would effectively add leverage to its portfolio because, in addition to its total net assets, the Fund would be subject to investment exposure on the notional amount of the swap.
If a Fund is a seller of protection and a credit event occurs, as defined under the terms of that particular swap agreement, the Fund will either (i) pay to the buyer of protection an amount equal to the notional amount of the swap and take delivery of the referenced obligation, other deliverable obligations or underlying securities comprising the referenced index or (ii) pay a net settlement amount in the form of cash or securities equal to the notional amount of the swap less the recovery value of the referenced obligation or underlying securities comprising the referenced index. If a Fund is a buyer of protection and a credit event occurs, as defined under the terms of that particular swap agreement, the Fund will either (i) receive from the seller of protection an amount equal to the notional amount of the swap and deliver the referenced obligation, other deliverable obligations or underlying securities comprising the referenced index or (ii) receive a net settlement amount in the form of cash or securities equal to the notional amount of the swap less the recovery value of the referenced obligation or underlying securities comprising the referenced index. Recovery values are typically estimated by market makers considering either industry standard recovery rates or entity specific factors and considerations until a credit event occurs.
Credit default swap agreements on credit indices involve one party making a stream of payments to another party in exchange for the right to receive a specified return in the event of a write-down, principal shortfall, interest shortfall or default some or all of the referenced entities comprising the credit index. A credit index is a basket of credit instruments or exposures typically designed to be representative of some part of the credit market as a whole. Components of the indices may include, but are not limited to, investment grade securities, high yield securities, asset-backed securities, emerging markets, and/or various credit ratings within each sector. Credit indices are typically traded using credit default swaps with standardized terms including a fixed spread and standard maturity dates. An index credit default swap references all the names in the index, and if there is a default, the credit event is settled based on that name’s weight in the index.
The effect of derivative instruments on the Statements of Assets and Liabilities as of June 30, 2013 is as follows:
| Unrealized | |||
| Derivatives not accounted | Statement of Assets | Appreciation | |
| Fund | For as hedging instruments | and Liabilities Location | (Depreciation) |
| Tactical Bond Fund | Credit Default Swap Contracts | Unrealized appreciation | |
| (depreciation) on swaps | $405,149 |
The effect of derivative instruments on the Statements of Operations for the year ended June 30, 2013 is as follows:
| Change in Unrealized | ||||
| Appreciation | ||||
| Derivatives not accounted | Location of Gain (Loss) | Realized Gain (Loss) | (Depreciation) | |
| Fund | For as hedging instruments | on Derivatives in income | on Derivatives | on Derivatives |
| Tactical Bond Fund | Credit Default Swap Contracts | Net Realized and Unrealized | ||
| Gain (Loss) | $942,505 | $250,196 |
Note 8. Merger of Funds
As of the close of business on October 19, 2012, pursuant to an Agreement and Plan of Reorganization previously approved by the Funds’ Board of Trustees, all of the assets, subject to the liabilities, of the Winslow Green Growth Fund (“Green Growth Fund”) were transferred to the Sustainable Growth Fund in exchange for shares of the Sustainable Growth Fund of equal value. The purpose of the transaction was to combine two funds with comparable investment objectives and strategies. Institutional Shares of the Green Growth Fund were exchanged for Institutional Shares of the Sustainable Growth Fund and Investor Shares of the Green Growth Fund were exchanged for Advisor Shares of the Sustainable Growth Fund. The exchange ratio was 1.386 for Institutional Shares and 1.362 for Investor into Advisor Shares. The net asset values of the Sustainable Growth Fund’s Institutional and Advisor Shares on the close
117
Notes to Financial Statements
June 30, 2013
The components of net assets immediately before the acquisition were as follows:
| Accumulated | Net | |||||||||||||||||||
| Accumulated | net realized | Unrealized | ||||||||||||||||||
| Capital | net investment | gain/(loss) on | Appreciation/ | Net | ||||||||||||||||
| Stock | income/(loss) | investments | (Depreciation) | Assets | ||||||||||||||||
| Sustainable Growth Fund | $ | 8,836,542 | $ | (5,164 | ) | $ | (3,291 | ) | $ | 99,040 | $ | 8,927,127 | ||||||||
| Green Growth Fund | 274,619,904 | (1,196,207 | ) | (126,674,711 | ) | 6,281,597 | 153,030,583 | |||||||||||||
| Total | $ | 283,456,446 | $ | (1,201,371 | ) | $ | (126,678,002 | ) | $ | 6,380,637 | $ | 161,957,710 | ||||||||
118
Report of Independent Registered Public Accounting Firm
To the Board of Trustees and Shareholders
Brown Advisory Funds
We have audited the accompanying statements of assets and liabilities of Brown Advisory Growth Equity Fund, Brown Advisory Value Equity Fund, Brown Advisory Flexible Equity Fund (formerly known as Brown Advisory Flexible Value Fund), Brown Advisory Small-Cap Growth Fund, Brown Advisory Small-Cap Fundamental Value Fund, Brown Advisory Opportunity Fund, Brown Advisory Maryland Bond Fund, Brown Advisory Intermediate Income Fund, Brown Advisory Tactical Bond Fund, Brown Advisory Equity Income Fund, Brown Advisory Sustainable Growth Fund (formerly known as Brown Advisory Winslow Sustainability Fund), Brown Advisory Tax Exempt Bond Fund, and Brown Advisory Emerging Markets Fund (collectively the “Funds”), each a series of Brown Advisory Funds (the “Trust”), including the schedules of investments as of June 30, 2013, and the related statements of operations, the statements of changes in net assets and the financial highlights for the periods indicated thereon. These financial statements and financial highlights are the responsibility of the Trust’s management. Our responsibility is to express an opinion on these financial statements and financial highlights based on our audits.
We conducted our audits in accordance with the standards of the Public Company Accounting Oversight Board (United States). Those standards require that we plan and perform the audits to obtain reasonable assurance about whether the financial statements and financial highlights are free of material misstatement. The Funds are not required to have, nor were we engaged to perform an audit of its internal control over financial reporting. Our audits included consideration of internal control over financial reporting as a basis for designing audit procedures that are appropriate in the circumstances, but not for the purpose of expressing an opinion on the effectiveness of the Funds’ internal control over financial reporting. Accordingly, we express no such opinion. An audit includes examining, on a test basis, evidence supporting the amounts and disclosures in the financial statements. Our procedures included confirmation of securities owned as of June 30, 2013, by correspondence with the custodian and brokers or by other appropriate auditing procedures when replies from brokers were not received. An audit also includes assessing the accounting principles used and significant estimates made by management, as well as evaluating the overall financial statement presentation. We believe that our audits provide a reasonable basis for our opinion.
In our opinion, the financial statements and financial highlights referred to above present fairly, in all material respects, the financial position of Brown Advisory Growth Equity Fund, Brown Advisory Value Equity Fund, Brown Advisory Flexible Equity Fund, Brown Advisory Small-Cap Growth Fund, Brown Advisory Small-Cap Fundamental Value Fund, Brown Advisory Opportunity Fund, Brown Advisory Maryland Bond Fund, Brown Advisory Intermediate Income Fund, Brown Advisory Tactical Bond Fund, Brown Advisory Equity Income Fund, Brown Advisory Sustainable Growth Fund, Brown Advisory Tax Exempt Bond Fund, and Brown Advisory Emerging Markets Fund as of June 30, 2013, the results of their operations, the changes in their net assets and the financial highlights for the periods indicated thereon, in conformity with accounting principles generally accepted in the United States of America.
| TAIT, WELLER & BAKER LLP |
Philadelphia, Pennsylvania
August 28, 2013
119
Expense Example For the Six Months Ended June 30, 2013 (Unaudited)
As a shareholder of a Fund you incur two types of costs: (1) transaction costs, including redemption fees and exchange fees; and (2) ongoing costs, including investment advisory fees; distribution and/or service fees; and other Fund expenses. This example is intended to help you understand your ongoing costs (in dollars) of investing in a Fund and to compare these costs with the ongoing costs of investing in other mutual funds. The example is based on an investment of $1,000 invested at the beginning of the period and held for the entire period (January 1, 2013 – June 30, 2013).
Actual Expenses
The “Actual Return” row in the following table provides information about actual account values based on actual returns and actual expenses. As a shareholder you will be assessed fees for outgoing wire transfers, returned checks and stop payment orders at prevailing rates charged by U.S. Bancorp Fund Services, LLC, the Funds’ transfer agent. If you request that a redemption be made by wire transfer, currently, the Funds’ transfer agent charges a $15.00 fee. You will be charged a redemption fee equal to 1.00% of the net amount of the redemption if you redeem your shares less than 14 days after you purchase, with certain limited exceptions. Individual Retirement Accounts (“IRA”) that are held directly at the Funds will be charged a $15.00 annual maintenance fee. IRAs held by broker-dealers or through other means, may or may not incur an annual maintenance fee. Yet, if IRAs maintenance fees are charged to accounts held elsewhere, the fees charged may be more or may be less than $15.00. To the extent the Funds invest in shares of other investment companies as part of their investment strategy, you will indirectly bear your proportionate share of any fees and expenses charged by the underlying funds in which the Funds invest in addition to the expenses of the Funds. Actual expenses of the underlying funds may vary. These expenses are not included in the example below. The example below includes, but is not limited to, investment advisory, shareholder servicing, fund accounting, custody and transfer agent fees. However, the example below does not include portfolio trading commissions and related expenses and other extraordinary expenses as determined under generally accepted accounting principles. You may use the information in this line, together with the amount you invested, to estimate the expenses that you paid over the period. Simply divide your account value by $1,000 (for example, an $8,600 account value divided by $1,000 = 8.6). Then, multiply the result by the number in the first line under the heading entitled “Expenses Paid During Period” to estimate the expenses you paid on your account during this period.
Hypothetical Example for Comparison Purposes
The “Hypothetical Return” row in the following table provides information about hypothetical account values based on a hypothetical return and hypothetical expenses based on the Funds’ actual expense ratio and an assumed rate of return of 5% per year before expenses, which is not the Funds’ actual return. The hypothetical account values and expenses may not be used to estimate the actual ending account balance or expenses you paid for the period. You may use this information to compare the ongoing costs of investing in the Funds and other funds. To do so, compare this 5% hypothetical example with the 5% hypothetical examples that appear in the shareholder reports of the other funds. Please note that the expenses shown in the table are meant to highlight your ongoing costs only and do not reflect any transactional costs, such as sales charges (loads), redemption fees or exchange fees. Therefore, the Hypothetical information in the table is useful in comparing ongoing costs only and will not help you determine the relative total costs of owning different funds. In addition, if these transactional costs were included, your costs would have been higher.
| Beginning | Ending | Annualized | ||
| Account Value | Account Value | Expenses Paid | Expense | |
| January 1, 2013 | June 30, 2013 | During the Period* | Ratio* | |
| Growth Equity Fund | ||||
| Institutional Shares | ||||
| Actual Return | $1,000 | $1,105 | $4.07 | 0.78% |
| Hypothetical (5% annual return before expenses) | $1,000 | $1,021 | $3.91 | 0.78% |
| Investor Shares | ||||
| Actual Return | $1,000 | $1,104 | $4.85 | 0.93% |
| Hypothetical (5% annual return before expenses) | $1,000 | $1,020 | $4.66 | 0.93% |
| Advisor Shares | ||||
| Actual Return | $1,000 | $1,103 | $6.15 | 1.18% |
| Hypothetical (5% annual return before expenses) | $1,000 | $1,019 | $5.91 | 1.18% |
120
Expense Example For the Six Months Ended June 30, 2013 (Unaudited)
| Beginning | Ending | Annualized | ||
| Account Value | Account Value | Expenses Paid | Expense | |
| January 1, 2013 | June 30, 2013 | During the Period* | Ratio* | |
| Value Equity Fund | ||||
| Institutional Shares | ||||
| Actual Return | $1,000 | $1,151 | $4.37 | 0.82% |
| Hypothetical (5% annual return before expenses) | $1,000 | $1,021 | $4.11 | 0.82% |
| Investor Shares | ||||
| Actual Return | $1,000 | $1,150 | $5.17 | 0.97% |
| Hypothetical (5% annual return before expenses) | $1,000 | $1,020 | $4.86 | 0.97% |
| Advisor Shares | ||||
| Actual Return | $1,000 | $1,149 | $6.50 | 1.22% |
| Hypothetical (5% annual return before expenses) | $1,000 | $1,019 | $6.11 | 1.22% |
| Flexible Equity Fund | ||||
| Institutional Shares | ||||
| Actual Return | $1,000 | $1,166 | $5.37 | 1.00% |
| Hypothetical (5% annual return before expenses) | $1,000 | $1,020 | $5.01 | 1.00% |
| Investor Shares | ||||
| Actual Return | $1,000 | $1,166 | $6.18 | 1.15% |
| Hypothetical (5% annual return before expenses) | $1,000 | $1,019 | $5.76 | 1.15% |
| Advisor Shares | ||||
| Actual Return | $1,000 | $1,165 | $7.25 | 1.35% |
| Hypothetical (5% annual return before expenses) | $1,000 | $1,018 | $6.76 | 1.35% |
| Small-Cap Growth Fund | ||||
| Institutional Shares | ||||
| Actual Return | $1,000 | $1,151 | $5.55 | 1.04% |
| Hypothetical (5% annual return before expenses) | $1,000 | $1,020 | $5.21 | 1.04% |
| Investor Shares | ||||
| Actual Return | $1,000 | $1,150 | $6.34 | 1.19% |
| Hypothetical (5% annual return before expenses) | $1,000 | $1,019 | $5.96 | 1.19% |
| Advisor Shares | ||||
| Actual Return | $1,000 | $1,149 | $7.67 | 1.44% |
| Hypothetical (5% annual return before expenses) | $1,000 | $1,018 | $7.20 | 1.44% |
| Small-Cap Fundamental Value Fund | ||||
| Institutional Shares | ||||
| Actual Return | $1,000 | $1,144 | $5.53 | 1.04% |
| Hypothetical (5% annual return before expenses) | $1,000 | $1,020 | $5.21 | 1.04% |
| Investor Shares | ||||
| Actual Return | $1,000 | $1,144 | $6.33 | 1.19% |
| Hypothetical (5% annual return before expenses) | $1,000 | $1,019 | $5.96 | 1.19% |
| Advisor Shares | ||||
| Actual Return | $1,000 | $1,142 | $7.65 | 1.44% |
| Hypothetical (5% annual return before expenses) | $1,000 | $1,018 | $7.20 | 1.44% |
| Opportunity Fund | ||||
| Investor Shares | ||||
| Actual Return | $1,000 | $1,157 | $8.02 | 1.50% |
| Hypothetical (5% annual return before expenses) | $1,000 | $1,017 | $7.50 | 1.50% |
121
Expense Example For the Six Months Ended June 30, 2013 (Unaudited)
| Beginning | Ending | Annualized | ||
| Account Value | Account Value | Expenses Paid | Expense | |
| January 1, 2013 | June 30, 2013 | During the Period* | Ratio* | |
| Maryland Bond Fund | ||||
| Investor Shares | ||||
| Actual Return | $1,000 | $985 | $2.66 | 0.54% |
| Hypothetical (5% annual return before expenses) | $1,000 | $1,022 | $2.71 | 0.54% |
| Intermediate Income Fund | ||||
| Investor Shares | ||||
| Actual Return | $1,000 | $976 | $2.65 | 0.54% |
| Hypothetical (5% annual return before expenses) | $1,000 | $1,022 | $2.71 | 0.54% |
| Advisor Shares | ||||
| Actual Return | $1,000 | $975 | $3.87 | 0.79% |
| Hypothetical (5% annual return before expenses) | $1,000 | $1,021 | $3.96 | 0.79% |
| Tactical Bond Fund | ||||
| Advisor Shares | ||||
| Actual Return | $1,000 | $988 | $6.36 | 1.29% |
| Hypothetical (5% annual return before expenses) | $1,000 | $1,018 | $6.46 | 1.29% |
| Equity Income Fund | ||||
| Institutional Shares | ||||
| Actual Return | $1,000 | $1,142 | $4.25 | 0.80% |
| Hypothetical (5% annual return before expenses) | $1,000 | $1,021 | $4.01 | 0.80% |
| Investor Shares | ||||
| Actual Return | $1,000 | $1,141 | $5.04 | 0.95% |
| Hypothetical (5% annual return before expenses) | $1,000 | $1,020 | $4.76 | 0.95% |
Advisor Shares | ||||
| Actual Return | $1,000 | $1,139 | $6.37 | 1.20% |
| Hypothetical (5% annual return before expenses) | $1,000 | $1,019 | $6.01 | 1.20% |
| Sustainable Growth Fund | ||||
| Institutional Shares | ||||
| Actual Return | $1,000 | $1,097 | $4.37 | 0.84% |
| Hypothetical (5% annual return before expenses) | $1,000 | $1,021 | $4.21 | 0.84% |
| Investor Shares | ||||
| Actual Return | $1,000 | $1,096 | $5.15 | 0.99% |
| Hypothetical (5% annual return before expenses) | $1,000 | $1,020 | $4.96 | 0.99% |
| Advisor Shares | ||||
| Actual Return | $1,000 | $1,095 | $6.44 | 1.24% |
| Hypothetical (5% annual return before expenses) | $1,000 | $1,019 | $6.21 | 1.24% |
| Tax Exempt Bond Fund | ||||
| Investor Shares | ||||
| Actual Return | $1,000 | $981 | $2.80 | 0.57% |
| Hypothetical (5% annual return before expenses) | $1,000 | $1,022 | $2.86 | 0.57% |
122
Expense Example For the Six Months Ended June 30, 2013 (Unaudited)
| Beginning | Ending | Annualized | ||
| Account Value | Account Value | Expenses Paid | Expense | |
| January 1, 2013 | June 30, 2013 | During the Period* | Ratio* | |
| Emerging Markets Fund | ||||
| Institutional Shares | ||||
| Actual Return | $1,000 | $937 | $6.82 | 1.42% |
| Hypothetical (5% annual return before expenses) | $1,000 | $1,018 | $7.10 | 1.42% |
| Investor Shares | ||||
| Actual Return | $1,000 | $936 | $7.54 | 1.57% |
| Hypothetical (5% annual return before expenses) | $1,000 | $1,017 | $7.85 | 1.57% |
| Advisor Shares | ||||
| Actual Return | $1,000 | $934 | $8.73 | 1.82% |
| Hypothetical (5% annual return before expenses) | $1,000 | $1,016 | $9.10 | 1.82% |
_________________________
| * | The calculations are based on expenses incurred during the most recent six-month period. The dollar amounts shown as expenses paid during the period are equal to the annualized six-month expense ratio multiplied by the average account value during the period, multiplied by the number of days in the most recent six-month period divided by the number of days in the Funds’ current fiscal year. |
www.brownadvisoryfunds.com
123
Trustees and Executive Officers
The Board is responsible for the overall management of the Trust, including general supervision and review of the investment activities of the Funds. The Board, in turn, elects the Officers of the Trust, who are responsible for administering the day-to-day operations of the Trust and each of the Funds. The current Trustees and Officers of the Trust, their ages and positions with the Trust, term of office with the Trust and length of time served, their principal occupations for the past five years and other directorships held during the past five years are set forth in the table below.
| Number of | |||||
| Portfolios | Other | ||||
| Term of | in Fund | Directorships | |||
| Office and | Complex | Held During | |||
| Name, Age | Position with | Length of | Principal Occupation(s) | Overseen by | the Past |
| and Address | the Trust | Time Served | During Past 5 Years | Trustees | 5 Years |
Independent Trustees of the Trust(1) | |||||
| Henry H. Hopkins | Trustee | Indefinite Term; | Retired; Formerly, Vice President and Chief | 13 | None. |
| Age: 70 | Since May 2012 | Legal Counsel, T. Rowe Price Associates, Inc. | |||
| c/o Brown Advisory, LLC | (investment management firm) (1998 to 2008). | ||||
| 901 South Bond Street | |||||
| Suite 400 | |||||
| Baltimore, MD 21231 | |||||
| Kyle P. Legg | Trustee | Indefinite Term; | Retired; Formerly President and Chief Executive | 13 | Director, SunTrust |
| Age: 61 | Since May 2012 | Officer, Legg Mason Capital Management, LLC | Banks, Inc. (bank | ||
| c/o Brown Advisory, LLC | (investment management firm) (2006 to 2009). | holding company) | |||
| 901 South Bond Street | (since 2011); | ||||
| Suite 400 | Director, Eastman | ||||
| Baltimore, MD 21231 | Kodak Co. (printing | ||||
| equipment and supplies | |||||
| company) (since 2010). | |||||
| Thomas F. O’Neil III | Trustee | Indefinite Term; | President, Saranac Group LLC (strategic | 13 | None. |
| Age: 56 | Since May 2012 | consulting firm) (since 2010); Formerly, Executive | |||
| c/o Brown Advisory, LLC | Vice Chairman (previously, Senior Vice President, | ||||
| 901 South Bond Street | General Counsel and Secretary) WellCare Health | ||||
| Suite 400 | Plans, Inc. (managed healthcare organization) | ||||
| Baltimore, MD 21231 | (2008 to 2009); Formerly, Partner and Joint | ||||
| Global Practice Group Leader, DLA Piper US LLP | |||||
| (law firm) (2002 to 2008). | |||||
| Neal F. Triplett, CFA | Trustee | Indefinite Term; | President, DUMAC, Inc. (university endowment | 13 | None. |
| Age: 42 | Since May 2012 | investment organization) (since 1999). | |||
| c/o Brown Advisory, LLC | |||||
| 901 South Bond Street | |||||
| Suite 400 | |||||
| Baltimore, MD 21231 | |||||
124
Trustees and Executive Officers
| Number of | |||||
| Portfolios | Other | ||||
| Term of | in Fund | Directorships | |||
| Office and | Complex | Held During | |||
| Name, Age | Position with | Length of | Principal Occupation(s) | Overseen by | the Past |
| and Address | the Trust | Time Served | During Past 5 Years | Trustees | 5 Years |
| Interested Trustees and Officers of the Trust | |||||
Michael D. Hankin(2) | Trustee | Indefinite Term | President and Chief Executive Officer, Brown | 13 | None. |
| Age: 55 | Since May 2012 | Advisory Incorporated and affiliates (investment | |||
| c/o Brown Advisory | management firm) (since 1993). | ||||
| Incorporated | |||||
| 901 South Bond Street | |||||
| Suite 400 | |||||
| Baltimore, MD 21231 | |||||
Joseph R. Hardiman(2) | Chairman | Indefinite Term; | Business Consultant (financial services industry | 13 | Director of Franklin |
| Age: 76 | and Trustee | Since May 2012 | consulting) (since 1997); Formerly; Director of | Resources, Inc. | |
| c/o Brown Advisory, LLC | Brown Advisory Incorporated (investment | (investment | |||
| 901 South Bond Street | management firm) (2001 to 2012). | management firm) | |||
| Suite 400 | (2005 to 2013). | ||||
| Baltimore, MD 21231 | |||||
| David M. Churchill | President/ | Indefinite Term; | Chief Financial Officer, Brown Advisory | Not | Not |
| Age: 47 | Principal | Since May 2012 | Incorporated and affiliates (investment | Applicable. | Applicable. |
| c/o Brown Advisory | Executive | management firm) (since 1993). | |||
| Incorporated | Officer | ||||
| 901 South Bond Street | |||||
| Suite 400 | |||||
| Baltimore, MD 21231 | |||||
| Jason T. Meix | Treasurer/ | Indefinite Term; | Vice President, U.S. Bancorp Fund | Not | Not |
| Age: 34 | Principal | Since May 2012 | Services, LLC (fund administrative services firm) | Applicable. | Applicable. |
| c/o Brown Advisory, LLC | Financial | (since 2008); Formerly, Senior Associate, | |||
| 901 South Bond Street | Officer | PricewaterhouseCoopers LLP (independent | |||
| Suite 400 | registered public accounting firm) (2005 to 2008). | ||||
| Baltimore, MD 21231 | |||||
| Tyler J. Mills | Vice President | Indefinite Term; | Mutual Fund Product Manager, Brown Advisory, | Not | Not |
| Age: 33 | Since May 2012 | LLC (investment management firm) (since 2009); | Applicable. | Applicable. | |
| c/o Brown Advisory | Senior Consultant, Accenture LLP (management | ||||
| Incorporated | consulting firm) (2008 to 2009). | ||||
| 901 South Bond Street | |||||
| Suite 400 | |||||
| Baltimore, MD 21231 | |||||
| Edward L. Paz | Secretary | Indefinite Term; | Vice President and Counsel, U.S. Bancorp Fund | Not | Not |
| Age: 42 | Since May 2012 | Services, LLC (fund administrative services firm) | Applicable. | Applicable. | |
| c/o Brown Advisory, LLC | (since 2007); Formerly, Associate, Godfrey & | ||||
| 901 South Bond Street | Kahn, S.C. (law firm) (2005 to 2007). | ||||
| Suite 400 | |||||
| Baltimore, MD 21231 | |||||
| Brett D. Rogers | Chief | Indefinite Term; | Chief Compliance Officer, Brown Advisory | Not | Not |
| Age: 37 | Compliance | Since May 2012 | Incorporated and affiliates (investment | Applicable. | Applicable. |
| c/o Brown Advisory | Officer | management firm) (since 2009); Formerly, | |||
| Incorporated | Director, Compliance and Risk, Deutsche Asset | ||||
| 901 South Bond Street | Anti-Money | Indefinite Term: | Management (investment management firm) | ||
| Suite 400 | Laundering | Since May 2012 | (2003 to 2009). | ||
| Baltimore, MD 21231 | Officer | ||||
| (1) | The Trustees of the Trust who are not “interested persons” of the Trust as defined in the 1940 Act (“Independent Trustees”). |
| (2) | Mr. Hankin is considered an “interested person” of the Trust, as defined in the 1940 Act, because of his current position with Brown Advisory Incorporated, the parent company of the Adviser, and Mr. Hardiman is considered an “interested person” of the Trust, as defined in the 1940 Act, because of his previous position with Brown Advisory Incorporated and his ownership interest in Brown Advisory Incorporated. |
125
Information About Proxy Voting (Unaudited)
A description of the policies and procedures that the Funds use to determine how to vote proxies relating to portfolio securities is available without charge upon request by calling toll-free at 800-540-6807 and by accessing the Funds’ website at www.brownadvisoryfunds.com. Furthermore, you can obtain the description on the SEC’s website at www.sec.gov.
Information regarding how the Funds voted proxies relating to portfolio securities during the 12-month period ended June 30 is available without charge, by calling toll-free at 800-540-6807. In addition, you can obtain the Funds’ proxy voting records on the SEC’s website at www.sec.gov.
Information About the Portfolio Holdings (Unaudited)
The Funds file their complete schedule of portfolio holdings for their first and third fiscal quarters with the SEC on Form N-Q. The Funds’ Form N-Q is available without charge, upon request, by calling toll-free at 800-540-6807. Furthermore, you can obtain the Form N-Q on the SEC’s website at www.sec.gov. The Funds’ schedules of portfolio holdings are posted on their website at www.brownadvisoryfunds.com within ten business days after calendar quarter end.
Householding (Unaudited)
In an effort to decrease costs, the Funds will reduce the number of duplicate Prospectuses and annual and semi-annual reports that you receive by sending only one copy of each to those addresses shown by two or more accounts. Please call the Transfer Agent toll free at 1-800-540-6807 to request individual copies of these documents. The Funds will begin sending individual copies 30 days after receiving your request. This policy does not apply to account statements.
Federal Tax Status of Dividends Declared during the Tax Year (Unaudited)
For Federal income tax purposes, distributions from short-term capital gains are classified as ordinary income. The percentage of ordinary income distributions designated as qualifying for the corporate dividend received deduction (“DRD”), the individual qualified dividend rate (“QDI”), the qualifying interest income exempt from U.S. tax for foreign shareholders (“QII”) and the qualifying short-term capital gain distributions exempt from U.S. tax for foreign shareholders (“QSTCG”) is presented below.
| Income Distributions | ||||||||||||||||||||
| Exempt from | ||||||||||||||||||||
| Federal Tax | QDI | DRD | QII | QSTCG | ||||||||||||||||
| Growth Equity Fund | 0.00 | % | 100.00 | % | 100.00 | % | 0.09 | % | 0.00 | % | ||||||||||
| Value Equity Fund | 0.00 | % | 100.00 | % | 100.00 | % | 0.05 | % | 0.00 | % | ||||||||||
| Flexible Equity Fund | 0.00 | % | 100.00 | % | 100.00 | % | 0.10 | % | 0.00 | % | ||||||||||
| Small-Cap Growth Fund | 0.00 | % | 0.00 | % | 0.00 | % | 0.00 | % | 0.00 | % | ||||||||||
| Small-Cap Fundamental Value Fund | 0.00 | % | 100.00 | % | 65.44 | % | 0.03 | % | 0.00 | % | ||||||||||
| Opportunity Fund | 0.00 | % | 0.00 | % | 0.00 | % | 0.00 | % | 0.00 | % | ||||||||||
| Maryland Bond Fund | 98.96 | % | 0.00 | % | 0.00 | % | 100.00 | % | 87.56 | % | ||||||||||
| Intermediate Income Fund | 0.00 | % | 0.00 | % | 0.00 | % | 94.31 | % | 38.10 | % | ||||||||||
| Tactical Bond Fund | 0.00 | % | 0.00 | % | 0.00 | % | 42.84 | % | 0.00 | % | ||||||||||
| Equity Income Fund | 0.00 | % | 97.98 | % | 85.19 | % | 0.03 | % | 14.54 | % | ||||||||||
| Sustainable Growth Fund | 0.00 | % | 0.00 | % | 0.00 | % | 0.00 | % | 100.00 | % | ||||||||||
| Tax Exempt Bond Fund | 78.21 | % | 0.00 | % | 0.00 | % | 100.00 | % | 99.98 | % | ||||||||||
| Emerging Markets Fund | 0.00 | % | 100.00 | % | 0.00 | % | 0.08 | % | 0.00 | % | ||||||||||
126
Special Meeting of Shareholders (Unaudited)
At a special meeting of the shareholders, held on September 26, 2012, shares were voted as follows on the reorganization of the Funds from the Professionally Managed Portfolios Trust into Brown Advisory Funds:
| For | Against | Abstain | ||||||||||
| Growth Equity Fund | 33,262,083 | 1,015,825 | 1,259,710 | |||||||||
| Value Equity Fund | 10,498,106 | 3,111 | 965 | |||||||||
| Flexible Value Fund | 3,176,017 | 0 | 1,019 | |||||||||
| Small-Cap Growth Fund | 13,231,298 | 10,972 | 9,134 | |||||||||
| Small-Cap Fundamental Value Fund | 11,504,214 | 0 | 3,773 | |||||||||
| Opportunity Fund | 371,476 | 1,136 | 2,498 | |||||||||
| Maryland Bond Fund | 16,966,614 | 10,995 | 49,953 | |||||||||
| Intermediate Income Fund | 21,688,491 | 325,534 | 348,930 | |||||||||
| Tactical Bond Fund | 2,795,258 | 0 | 2,510 | |||||||||
| Equity Income Fund | 9,447,161 | 5,052 | 19,068 | |||||||||
| Winslow Green Growth Fund | 5,569,836 | 161,673 | 447,091 | |||||||||
127
BROWN ADVISORY FUNDS
At Brown Advisory Funds, we believe that you deserve sincere and open communication on all issues relating to our relationship.
In this spirit, we wish to provide to you a summary of certain of our policies relating to confidentiality and privacy of shareholder information.
CONFIDENTIALITY AND PRIVACY POLICY
Brown Advisory Funds takes confidentiality of your personal information and privacy of your account very seriously.
Our commitment to safeguard your personal information goes beyond our legal obligations, and the principles that guide the way in which we conduct business are built upon the core values of trust, confidence and integrity. By adhering to the practices described in this policy, we affirm our continuing commitment to protecting your privacy.
Brown Advisory Funds collects only relevant information from shareholders that the law allows or requires us to have in order to conduct our business and properly service you. We obtain non-public financial and other personal information (“Personal Information”) about you directly (e.g., information on account applications and other forms, such as your name, address, and social security number, and information provided to access account information or conduct account transactions online, such as password, account number, e-mail address, and alternate telephone number), and indirectly (e.g., information about your transactions with us, such as transaction amounts, account balance and account holdings).
We maintain physical, electronic and procedural safeguards that comply with applicable laws and regulations to protect your Personal Information, and we continually assess new technology with the aim of adding new safeguards to those we have in place. For example, we take many measures to protect your Personal Information while it is stored electronically.
In the normal conduct of our business, it may become necessary for us to share your Personal Information with companies who are under contract to perform services on behalf of Brown Advisory Funds. For example, those who may receive this information include the companies that provide Brown Advisory Funds with transfer agent, technology and administrative services, as well as the investment adviser, Brown Investment Advisory Incorporated, who is an affiliate of Brown Advisory Funds. If you maintain a retirement/educational custodial account directly with Brown Advisory Funds, we may also disclose your Personal Information to the custodian for that account for shareholder servicing purposes. We limit access to your Personal Information to only those employees of Brown Advisory Funds’ service providers with a business reason to know such information.
We do not sell Personal Information about current or former shareholders or their accounts to any third parties, and we have policies and procedures intended to prevent the disclosure of such Personal Information to third parties unless necessary to support the operations and administration of the Brown Advisory Funds, the Brown Advisory Funds’ compliance with applicable laws and regulations, or as otherwise permitted by law.
We strive to keep our records of your information accurate, and we take immediate steps to correct errors. If there are any inaccuracies in your statements or in any other communications from us, please contact us or contact your investment professional.
This is our policy as of June 2012. This privacy policy applies to individuals, and we reserve the right to change any or all of the principles, along with related provisions, at any time.
www.brownadvisoryfunds.com
128
(This Page Intentionally Left Blank.)
INVESTMENT ADVISER
Brown Advisory, LLC
901 South Bond Street, Suite 400
Baltimore, MD 21231
www.brownadvisory.com
DISTRIBUTOR
Quasar Distributors, LLC
615 East Michigan Street
Milwaukee, WI 53202
CUSTODIAN
U.S. Bank, N.A.
Custody Operations
1555 North RiverCenter Drive, Suite 302
Milwaukee, WI 53212
TRANSFER AGENT
U.S. Bancorp Fund Services, LLC
P.O. Box 701
Milwaukee, WI 53201-0701
(800) 540-6807
INDEPENDENT REGISTERED PUBLIC ACCOUNTING FIRM
Tait, Weller & Baker LLP
1818 Market Street, Suite 2400
Philadelphia, PA 19103
LEGAL COUNSEL
Dechert, LLP
1900 K Street, NW
Washington, DC 20006
| Institutional Shares | Investor Shares | Advisor Shares | |||||||||||||
| Symbol | CUSIP | Symbol | CUSIP | Symbol | CUSIP | ||||||||||
| Growth Equity Fund | BAFGX | 115233702 | BIAGX | 115233504 | BAGAX | 115233603 | |||||||||
| Value Equity Fund | BAFVX | 115233876 | BIAVX | 115233801 | BAVAX | 115233884 | |||||||||
| Flexible Equity Fund | BAFFX | 115233843 | BIAFX | 115233868 | BAFAX | 115233850 | |||||||||
| Small-Cap Growth Fund | BAFSX | 115233819 | BIASX | 115233835 | BASAX | 115233827 | |||||||||
| Small-Cap Fundamental Value Fund | BAFUX | 115233777 | BIAUX | 115233793 | BAUAX | 115233785 | |||||||||
| Opportunity Fund | — | — | BIAOX | 115233769 | — | — | |||||||||
| Maryland Bond Fund | — | — | BIAMX | 115233751 | — | — | |||||||||
| Intermediate Income Fund | — | — | BIAIX | 115233744 | BAIAX | 115233736 | |||||||||
| Tactical Bond Fund | — | — | — | — | BATBX | 115233710 | |||||||||
| Equity Income Fund | BAFDX | 115233660 | BIADX | 115233686 | BADAX | 115233678 | |||||||||
| Sustainable Growth Fund | BAFWX | 115233207 | BIAWX | 115233306 | BAWAX | 115233405 | |||||||||
| Tax Exempt Bond Fund | — | — | BIAEX | 115233108 | — | — | |||||||||
| Emerging Markets Fund | BAFQX | 115233652 | BIAQX | 115233645 | BAQAX | 115233637 | |||||||||
This report is submitted for the general information of the shareholders of each Fund. It is not authorized for distribution to prospective investors unless preceded or accompanied by an effective prospectus, which includes information regarding the Funds’ risks, objectives, fees and expenses, experience of their management, and other information.
Item 2. Code of Ethics.
The registrant has adopted a code of ethics that applies to the registrant’s principal executive officer and principal financial officer. The registrant has not made any amendments to its code of ethics during the period covered by this report. The registrant has not granted any waivers from any provisions of the code of ethics during the period covered by this report.
A copy of the registrant’s Code of Ethics is filed herewith.
Item 3. Audit Committee Financial Expert.
The Registrant’s Board of Trustees has not designated an audit committee financial expert. The Registrant has determined that it will retain the services of an independent third party to assist it if circumstances arise that require specific investment company auditing expertise.
Item 4. Principal Accountant Fees and Services.
The Registrant has engaged its principal accountant to perform audit services, audit-related services, tax services and other services during the past two fiscal years. “Audit services” refer to performing an audit of the Registrant's annual financial statements or services that are normally provided by the accountant in connection with statutory and regulatory filings or engagements for those fiscal years. “Audit-related services” refer to the assurance and related services by the principal accountant that are reasonably related to the performance of the audit. “Tax services” refer to professional services rendered by the principal accountant for tax compliance, tax advice, and tax planning. There were no “Other services” provided by the principal accountant. The following table details the aggregate fees billed or expected to be billed for each of the last two fiscal years for audit fees, audit-related fees, tax fees and other fees by the principal accountant.
Brown Advisory Growth Equity Fund
| FYE 6/30/2013 | FYE 6/30/2012 | |
| Audit Fees | $16,700 | $15,200 |
| Audit-Related Fees | N/A | N/A |
| Tax Fees | $2,400 | $2,400 |
| All Other Fees | N/A | N/A |
Brown Advisory Value Equity Fund
| FYE 6/30/2013 | FYE 6/30/2012 | |
| Audit Fees | $16,700 | $15,200 |
| Audit-Related Fees | N/A | N/A |
| Tax Fees | $2,400 | $2,400 |
| All Other Fees | N/A | N/A |
Brown Advisory Flexible Equity Fund
| FYE 6/30/2013 | FYE 6/30/2012 | |
| Audit Fees | $16,700 | $15,200 |
| Audit-Related Fees | N/A | N/A |
| Tax Fees | $2,400 | $2,400 |
| All Other Fees | N/A | N/A |
Brown Advisory Small-Cap Growth Fund
| FYE 6/30/2013 | FYE 6/30/2012 | |
| Audit Fees | $15,200 | $15,200 |
| Audit-Related Fees | N/A | N/A |
| Tax Fees | $2,400 | $2,400 |
| All Other Fees | N/A | N/A |
Brown Advisory Small-Cap Fundamental Value Fund
| FYE 6/30/2013 | FYE 6/30/2012 | |
| Audit Fees | $16,700 | $15,200 |
| Audit-Related Fees | N/A | N/A |
| Tax Fees | $2,400 | $2,400 |
| All Other Fees | N/A | N/A |
Brown Advisory Opportunity Fund
| FYE 6/30/2013 | FYE 6/30/2012 | |
| Audit Fees | $15,200 | $15,200 |
| Audit-Related Fees | N/A | N/A |
| Tax Fees | $2,400 | $2,400 |
| All Other Fees | N/A | N/A |
Brown Advisory Maryland Bond Fund
| FYE 6/30/2013 | FYE 6/30/2012 | |
| Audit Fees | $15,200 | $15,200 |
| Audit-Related Fees | N/A | N/A |
| Tax Fees | $2,400 | $2,400 |
| All Other Fees | N/A | N/A |
Brown Advisory Intermediate Income Fund
| FYE 6/30/2013 | FYE 6/30/2012 | |
| Audit Fees | $15,200 | $15,200 |
| Audit-Related Fees | N/A | N/A |
| Tax Fees | $2,400 | $2,400 |
| All Other Fees | N/A | N/A |
Brown Advisory Tactical Bond Fund
| FYE 6/30/2013 | FYE 6/30/2012 | |
| Audit Fees | $15,200 | $15,200 |
| Audit-Related Fees | N/A | N/A |
| Tax Fees | $2,400 | $2,400 |
| All Other Fees | N/A | N/A |
Brown Advisory Equity Income Fund
| FYE 6/30/2013 | FYE 6/30/2012 | |
| Audit Fees | $16,700 | $15,200 |
| Audit-Related Fees | N/A | N/A |
| Tax Fees | $2,400 | $2,400 |
| All Other Fees | N/A | N/A |
Brown Advisory Sustainable Growth Fund
| FYE 6/30/2013 | FYE 6/30/2012 | |
| Audit Fees | $15,200 | $750 |
| Audit-Related Fees | N/A | N/A |
| Tax Fees | $2,400 | N/A |
| All Other Fees | N/A | N/A |
Brown Advisory Tax Exempt Bond Fund
| FYE 6/30/2013 | FYE 6/30/2012 | |
| Audit Fees | $15,200 | $750 |
| Audit-Related Fees | N/A | N/A |
| Tax Fees | $2,400 | N/A |
| All Other Fees | N/A | N/A |
Brown Advisory Emerging Markets Fund
| FYE 6/30/2012 | FYE 6/30/2012 | |
| Audit Fees | $15,200 | N/A |
| Audit-Related Fees | N/A | N/A |
| Tax Fees | $2,400 | N/A |
| All Other Fees | N/A | N/A |
The audit committee has adopted pre-approval policies and procedures that require the audit committee to pre-approve all audit and non-audit services of the Registrant, including services provided to any entity affiliated with the Registrant. All of the principal accountant’s hours spent on auditing the Registrant’s financial statements were attributed to work performed by full-time permanent employees of the principal accountant. (If more than 50 percent of the accountant’s hours were spent to audit the Registrant's financial statements for the most recent fiscal year, state how many hours were attributed to work performed by persons other than the principal accountant's full-time, permanent employees.)
The following table indicates the non-audit fees billed or expected to be billed by the Registrant’s accountant for services to the Registrant and to the Registrant’s investment adviser (and any other controlling entity, etc.—not sub-adviser) for the last two fiscal years. The audit committee of the board of trustees has considered whether the provision of non-audit services that were rendered to the Registrant's investment adviser is compatible with maintaining the principal accountant's independence and has concluded that the provision of such non-audit services by the accountant has not compromised the accountant’s independence.
Brown Advisory Growth Equity Fund
| Non-Audit Related Fees | FYE 6/30/2013 | FYE 6/30/2012 |
| Registrant | N/A | N/A |
| Registrant’s Investment Adviser | N/A | N/A |
Brown Advisory Value Equity Fund
| Non-Audit Related Fees | FYE 6/30/2013 | FYE 6/30/2012 |
| Registrant | N/A | N/A |
| Registrant’s Investment Adviser | N/A | N/A |
Brown Advisory Flexible Equity Fund
| Non-Audit Related Fees | FYE 6/30/2013 | FYE 6/30/2012 |
| Registrant | N/A | N/A |
| Registrant’s Investment Adviser | N/A | N/A |
Brown Advisory Small-Cap Growth Fund
| Non-Audit Related Fees | FYE 6/30/2013 | FYE 6/30/2012 |
| Registrant | N/A | N/A |
| Registrant’s Investment Adviser | N/A | N/A |
Brown Advisory Small-Cap Fundamental Value Fund
| Non-Audit Related Fees | FYE 6/30/2013 | FYE 6/30/2012 |
| Registrant | N/A | N/A |
| Registrant’s Investment Adviser | N/A | N/A |
Brown Advisory Opportunity Fund
| Non-Audit Related Fees | FYE 6/30/2013 | FYE 6/30/2012 |
| Registrant | N/A | N/A |
| Registrant’s Investment Adviser | N/A | N/A |
Brown Advisory Maryland Bond Fund
| Non-Audit Related Fees | FYE 6/30/2013 | FYE 6/30/2012 |
| Registrant | N/A | N/A |
| Registrant’s Investment Adviser | N/A | N/A |
Brown Advisory Intermediate Income Fund
| Non-Audit Related Fees | FYE 6/30/2013 | FYE 6/30/2012 |
| Registrant | N/A | N/A |
| Registrant’s Investment Adviser | N/A | N/A |
Brown Advisory Tactical Bond Fund
| Non-Audit Related Fees | FYE 6/30/2013 | FYE 6/30/2012 |
| Registrant | N/A | N/A |
| Registrant’s Investment Adviser | N/A | N/A |
Brown Advisory Equity Income Fund
| Non-Audit Related Fees | FYE 6/30/2013 | FYE 6/30/2012 |
| Registrant | N/A | N/A |
| Registrant’s Investment Adviser | N/A | N/A |
Brown Advisory Sustainable Growth Fund
| Non-Audit Related Fees | FYE 6/30/2013 | FYE 6/30/2012 |
| Registrant | N/A | N/A |
| Registrant’s Investment Adviser | N/A | N/A |
Brown Advisory Tax Exempt Bond Fund
| Non-Audit Related Fees | FYE 6/30/2013 | FYE 6/30/2012 |
| Registrant | N/A | N/A |
| Registrant’s Investment Adviser | N/A | N/A |
Brown Advisory Emerging Markets Fund
| Non-Audit Related Fees | FYE 6/30/2013 | FYE 6/30/2012 |
| Registrant | N/A | N/A |
| Registrant’s Investment Adviser | N/A | N/A |
Item 5. Audit Committee of Listed Registrants.
Not applicable to registrants who are not listed issuers (as defined in Rule 10A-3 under the Securities Exchange Act of 1934).
Item 6. Schedule of Investments.
Schedule of Investments is included as part of the report to shareholders filed under Item 1 of this Form.
Item 7. Disclosure of Proxy Voting Policies and Procedures for Closed-End Management Investment Companies.
Not applicable to open-end investment companies.
Item 8. Portfolio Managers of Closed-End Management Investment Companies.
Not applicable to open-end investment companies.
Item 9. Purchases of Equity Securities by Closed-End Management Investment Company and Affiliated Purchasers.
Not applicable to open-end investment companies.
Item 10. Submission of Matters to a Vote of Security Holders.
There have been no material changes to the procedures by which shareholders may recommend nominees to the registrant’s board of trustees.
Item 11. Controls and Procedures.
| (a) | The Registrant’s President and Treasurer have reviewed the Registrant's disclosure controls and procedures (as defined in Rule 30a-3(c) under the Investment Company Act of 1940 (the “Act”)) as of a date within 90 days of the filing of this report, as required by Rule 30a-3(b) under the Act and Rules 13a-15(b) or 15d-15(b) under the Securities Exchange Act of 1934. Based on their review, such officers have concluded that the disclosure controls and procedures are effective in ensuring that information required to be disclosed in this report is appropriately recorded, processed, summarized and reported and made known to them by others within the Registrant and by the Registrant’s service provider. |
| (b) | There were no changes in the Registrant's internal control over financial reporting (as defined in Rule 30a-3(d) under the Act) that occurred during the second fiscal quarter of the period covered by this report that has materially affected, or is reasonably likely to materially affect, the Registrant's internal control over financial reporting. |
Item 12. Exhibits.
| (a) | (1) Any code of ethics or amendment thereto, that is subject of the disclosure required by Item 2, to the extent that the registrant intends to satisfy Item 2 requirements through filing an exhibit. Incorporate by reference to previous Form N-CSR filing. |
(2) Certifications pursuant to Section 302 of the Sarbanes-Oxley Act of 2002. Furnished herewith.
(3) Any written solicitation to purchase securities under Rule 23c-1 under the Act sent or given during the period covered by the report by or on behalf of the registrant to 10 or more persons. Not applicable to open-end investment companies.
| (b) | Certification pursuant to Section 906 of the Sarbanes-Oxley Act of 2002. Furnished herewith. |
SIGNATURES
Pursuant to the requirements of the Securities Exchange Act of 1934 and the Investment Company Act of 1940, the Registrant has duly caused this report to be signed on its behalf by the undersigned, thereunto duly authorized.
(Registrant)
By (Signature and Title)* /s/David M. Churchill
David M. Churchill, President
Date September 4, 2013
Pursuant to the requirements of the Securities Exchange Act of 1934 and the Investment Company Act of 1940, this report has been signed below by the following persons on behalf of the Registrant and in the capacities and on the dates indicated.
By (Signature and Title)* /s/David M. Churchill
David M. Churchill, President
Date September 4, 2013
Jason T. Meix, Treasurer
Date September 5, 2013
* Print the name and title of each signing officer under his or her signature.