UNITED STATES
SECURITIES AND EXCHANGE COMMISSION
Washington, D.C. 20549
FORM N-CSR
CERTIFIED SHAREHOLDER REPORT OF REGISTERED
MANAGEMENT INVESTMENT COMPANIES
Investment Company Act file number: (811-22708)
Brown Advisory Funds
(Exact name of Registrant as specified in charter)
901 South Bond Street Suite 400
Baltimore, MD 21231
(Address of principal executive offices) (Zip code)
David M. Churchill
President
Brown Advisory Funds
901 South Bond Street Suite 400
Baltimore, MD 21231
(Name and address of agent for service)
(410) 537-5400
Registrant's telephone number, including area code
Date of fiscal year end: June 30
Date of reporting period: June 30, 2015
Item 1. Reports to Stockholders.
ANNUAL REPORT
June 30, 2015
Brown Advisory Growth Equity Fund
Brown Advisory Value Equity Fund
Brown Advisory Flexible Equity Fund
Brown Advisory Equity Income Fund
Brown Advisory Sustainable Growth Fund
Brown Advisory Small-Cap Growth Fund
Brown Advisory Small-Cap Fundamental Value Fund
Brown Advisory Opportunity Fund
Brown Advisory Multi-Strategy Fund
Brown Advisory Intermediate Income Fund
Brown Advisory Total Return Fund
Brown Advisory Strategic Bond Fund
Brown Advisory Maryland Bond Fund
Brown Advisory Tax Exempt Bond Fund
Brown Advisory Mortgage Securities Fund
Brown Advisory – WMC Strategic European Equity Fund
Brown Advisory – WMC Japan Alpha Opportunities Fund
Brown Advisory – Somerset Emerging Markets Fund
Brown Advisory Emerging Markets Small-Cap Fund
The views in the report contained herein were those of the Funds’ investment adviser, Brown Advisory LLC, or, for the sub-advised funds, of the respective sub-adviser, as of June 30, 2015 and may not reflect their views on the date this report is first published or anytime thereafter. This report may contain discussions about certain investments both held and not held in the portfolio as of June 30, 2015. All current and future holdings are subject to risk and are subject to change. While these views are intended to assist shareholders in understanding their investment in each Fund, they do not constitute investment advice, are not a guarantee of future performance and are not intended as an offer or solicitation with respect to the purchase or sale of any security. Performance figures include the reinvestment of dividend and capital gain distributions.
The Global Industry Classification Standard (GICS®) was developed by and is the exclusive property of MSCI, Inc. and Standard & Poor’s Financial Services LLC (“S&P”). GICS® is a service mark of MSCI, Inc. and S&P and has been licensed for use by the Administrator, U.S. Bancorp Fund Services, LLC.
TOPIX Index Values and TOPIX Marks are subject to the proprietary rights owned by the Tokyo Stock Exchange, Inc.
TABLE OF CONTENTS
| Brown Advisory Growth Equity Fund | |
| A Message to our Shareholders, June 30, 2015 | 1 |
| Performance Chart and Analysis | 3 |
| Schedule of Investments, June 30, 2015 | 4 |
| Brown Advisory Value Equity Fund | |
| A Message to our Shareholders, June 30, 2015 | 5 |
| Performance Chart and Analysis | 7 |
| Schedule of Investments, June 30, 2015 | 8 |
| Brown Advisory Flexible Equity Fund | |
| A Message to our Shareholders, June 30, 2015 | 9 |
| Performance Chart and Analysis | 11 |
| Schedule of Investments, June 30, 2015 | 12 |
| Brown Advisory Equity Income Fund | |
| A Message to our Shareholders, June 30, 2015 | 13 |
| Performance Chart and Analysis | 15 |
| Schedule of Investments, June 30, 2015 | 16 |
| Brown Advisory Sustainable Growth Fund | |
| A Message to our Shareholders, June 30, 2015 | 17 |
| Performance Chart and Analysis | 19 |
| Schedule of Investments, June 30, 2015 | 20 |
| Brown Advisory Small-Cap Growth Fund | |
| A Message to our Shareholders, June 30, 2015 | 21 |
| Performance Chart and Analysis | 23 |
| Schedule of Investments, June 30, 2015 | 24 |
| Brown Advisory Small-Cap Fundamental Value Fund | |
| A Message to our Shareholders, June 30, 2015 | 26 |
| Performance Chart and Analysis | 28 |
| Schedule of Investments, June 30, 2015 | 29 |
| Brown Advisory Opportunity Fund | |
| A Message to our Shareholders, June 30, 2015 | 30 |
| Performance Chart and Analysis | 32 |
| Schedule of Investments, June 30, 2015 | 33 |
| Brown Advisory Multi-Strategy Fund | |
| A Message to our Shareholders, June 30, 2015 | 35 |
| Performance Chart and Analysis | 36 |
| Schedule of Investments, June 30, 2015 | 37 |
| Brown Advisory Intermediate Income Fund | |
| A Message to our Shareholders, June 30, 2015 | 38 |
| Performance Chart and Analysis | 39 |
| Schedule of Investments, June 30, 2015 | 40 |
| Brown Advisory Total Return Fund | |
| A Message to our Shareholders, June 30, 2015 | 43 |
| Performance Chart and Analysis | 44 |
| Schedule of Investments, June 30, 2015 | 45 |
| Brown Advisory Strategic Bond Fund | |
| A Message to our Shareholders, June 30, 2015 | 48 |
| Performance Chart and Analysis | 50 |
| Schedule of Investments, June 30, 2015 | 51 |
| Brown Advisory Maryland Bond Fund | |
| A Message to our Shareholders, June 30, 2015 | 54 |
| Performance Chart and Analysis | 55 |
| Schedule of Investments, June 30, 2015 | 56 |
| Brown Advisory Tax Exempt Bond Fund | |
| A Message to our Shareholders, June 30, 2015 | 60 |
| Performance Chart and Analysis | 61 |
| Schedule of Investments, June 30, 2015 | 62 |
| Brown Advisory Mortgage Securities Fund | |
| A Message to our Shareholders, June 30, 2015 | 65 |
| Performance Chart and Analysis | 66 |
| Schedule of Investments, June 30, 2015 | 67 |
| Brown Advisory – WMC Strategic European Equity Fund | |
| A Message to our Shareholders, June 30, 2015 | 72 |
| Performance Chart and Analysis | 74 |
| Schedule of Investments, June 30, 2015 | 75 |
| Brown Advisory – WMC Japan Alpha Opportunities Fund | |
| A Message to our Shareholders, June 30, 2015 | 77 |
| Performance Chart and Analysis | 79 |
| Schedule of Investments, June 30, 2015 | 80 |
| Brown Advisory – Somerset Emerging Markets Fund | |
| A Message to our Shareholders, June 30, 2015 | 83 |
| Performance Chart and Analysis | 85 |
| Schedule of Investments, June 30, 2015 | 86 |
| Brown Advisory Emerging Markets Small-Cap Fund | |
| A Message to our Shareholders, June 30, 2015 | 88 |
| Performance Chart and Analysis | 90 |
| Schedule of Investments, June 30, 2015 | 91 |
| Statements of Assets and Liabilities | 94 |
| Statements of Operations | 99 |
| Statements of Changes in Net Assets | 104 |
| Financial Highlights | 114 |
| Notes to Financial Statements | 158 |
| Report of Independent Registered Public Accounting Firm | 180 |
| Additional Information | 181 |
GLOSSARY OF TERMS
Alpha refers to the abnormal rate of return on a security or portfolio in excess of what would be predicted by an equilibrium model like the capital asset pricing model (CAPM).
Barclays 1-10 Year Blended Municipal Bond Index is a market index of high quality, domestic fixed income securities with maturities of less than 10 years.
Barclays Intermediate US Aggregate Bond Index represents domestic taxable investment-grade bonds with index components for government and corporate securities, mortgage pass-through securities and asset-backed securities with average maturities and durations in the intermediate range. This index represents a sector of the Barclays US Aggregate Bond Index.
Barclays Mortgage Backed Securities Index is a market value-weighted index which covers the mortgage-backed securities component of the Barclays US Aggregate Bond Index. The index is composed of agency mortgage-backed passthrough securities of the Government National Mortgage Association (Ginnie Mae), the Federal National Mortgage Association (Fannie Mae), and the Federal Home Loan Mortgage Corporation (Freddie Mac) with a minimum $150 million par amount outstanding and a weighted-average maturity of at least 1 year. The index includes reinvestment of income.
Barclays US Aggregate Bond Index is a broad-based benchmark that measures the investment grade, US dollar-denominated, fixed-rate taxable bond market. The index includes Treasuries, government-related and corporate securities, MBS, ABS and CMBS.
Basis point is a unit that is equal to 1/100th of 1%, and is used to denote the change in a financial instrument. The basis point is commonly used for calculating changes in interest rates, equity indexes and the yield of a fixed-income security. 1% is equal to 100 basis points.
Beta is a measure of the volatility, or systematic risk, of a security or a portfolio in comparison to the market as a whole.
Book value is the net asset value of a company, calculated by total assets minus intangible assets (patents, goodwill) and liabilities.
Cash flow measures the cash generating capability of a company by adding non-cash charges (e.g. depreciation) and interest expense to pretax income.
Correlation is a statistical measurement of how two securities move in relation to each other.
Dividend Yield is a financial ratio that shows how much a company pays out in dividends each year relative to its share price. In the absence of any capital gains, the dividend yield is the return on investment for a stock.
Downside Capture is a statistical measure of a fund’s performance in down markets. For example, a fund with downside capture of 90% would only have declined 90% as much as the related index during the same down market period.
Duration is a measure of the sensitivity of the price of a fixed-income investment to a change in interest rates. Duration is expressed as a number of years. Rising interest rates mean falling bond prices, while declining interest rates mean rising bond prices.
Earnings growth is a measure of growth in a company’s net income over a specific period, often one year. The term can apply to actual data from previous periods or estimated data for future periods.
Earnings per share (EPS) is calculated by taking the total earnings divided by the number of shares outstanding.
Earnings Yield is the earnings per share for the most recent 12-month period divided by the current market price per share. The earnings yield shows the percentage of each dollar invested in the stock that was earned by the company.
EBITDA is the Earnings Before Interest, Taxes, Depreciation and Amortization. An approximate measure of a company’s operating cash flow based on data from the company’s income statement.
Enterprise Value (EV) is a measure of a company’s value, often used as an alternative to straightforward market capitalization. Enterprise Value is calculated as market capitalization plus debt, minority interest and preferred shares, minus total cash and cash equivalents.
Forward price to earnings ratio uses forecasted earnings, rather than current earnings, to calculate the price to earnings ratio.
Free Cash Flow is the operating cash flows (net income plus amortization and depreciation) minus capital expenditures and dividends. Free cash flow is the amount of cash that a company has left over after it has paid all of its expenses, including investments.
Gross Domestic Product (GDP) is the monetary value of all the goods and services produced by an economy over a specified period. It includes consumption, government purchases, investments, and exports minus imports.
MSCI All Country World Index ex-U.S. is a market capitalization weighted index designed to provide a broad measure of stock performance throughout the world, with the exception of U.S.-based companies.
MSCI Emerging Markets Index is a free float-adjusted market capitalization index that is designed to measure equity market performance in the global emerging markets.
GLOSSARY OF TERMS
MSCI Emerging Markets Small-Cap Index is a free float-adjusted market capitalization index that is designed to measure small cap equity market performance in the global emerging markets.
MSCI Europe Index is an index that captures large and mid cap representation across 15 developed market countries in Europe.
Price to Book Value Ratio is ratio used to compare a stock’s market value to its book value. It is calculated by dividing the current closing price of the stock by the latest quarter’s book value per share.
Price to earnings ratio (P/E) is a common tool for comparing the prices of different common stocks and is calculated by dividing the current market price of a stock by the earnings per share.
Return of Capital (ROC) is a return from an investment that is not considered income. The return of capital is when some or all of the money an investor has in an investment is paid back to him or her, thus decreasing the value of the investment.
Return on Capital Employed (ROCE) is a financial ratio that measures a company’s profitability and the efficiency with which its capital is employed. Return on Capital Employed (ROCE) is calculated as: ROCE = Earnings Before Interest and Tax (EBIT) / Capital Employed.
Return on Equity (ROE) is the amount of net income returned as a percentage of shareholders equity. Return on equity measures a corporation’s profitability by revealing how much profit a company generates with the money shareholders have invested.
Return on Invested Capital (ROIC) is a calculation used to assess a company’s efficiency at allocating the capital under its control to profitable investments. ROIC is typically calculated by taking a company’s net income, subtracting dividends the company paid out and dividing that amount by the company’s total capital.
Russell 1000® Growth Index measures the performance of the large-cap growth segment of the of the U.S. equity universe. It includes those Russell 1000® companies with higher price to book value ratios and higher forecasted growth values.
Russell 1000® Value Index measures the performance of the large-cap value segment of the U.S. equity universe. It includes those Russell 1000® companies with lower price to book value ratios and lower expected growth values.
Russell 2000® Growth Index measures the performance of the small-cap growth segment of the U.S. equity universe. It includes those Russell 2000® companies with higher price to book value ratios and higher forecasted growth values.
Russell 2000® Index measures the performance of the 2,000 smallest companies in the Russell 3000® Index.
Russell 2000® Value Index measures the performance of the small-cap value segment of the U.S. equity universe. It includes those Russell 2000® companies with lower price to book value ratios and lower forecasted growth values.
Russell 3000® Index measures the performance of the 3,000 largest U.S. companies representing approximately 98% of the investable U.S. equity market.
S&P Balanced Equity and Bond – Moderate Index is the moderate profile of the S&P Balanced Equity and Bond Series which combines investable S&P indices for core equity and fixed income to provide a regulary rebalanced multi-asset measure for conservative, moderate and growth risk-reward profiles.
S&P 500 Index (“S&P 500”) is a market-value weighted index representing the performance of 500 widely held, publicly traded large capitalization stocks.
Tier 1 Capital Ratio is a comparison between a banking firm’s core equity capital and total risk-weighted assets. A firm’s core equity capital is known as its Tier 1 capital and is the measure of a bank’s financial strength based on the sum of its equity capital and disclosed reserves, and sometimes non-redeemable, non-cumulative preferred stock. A firm’s risk-weighted assets include all assets that the firm holds that are systematically weighted for credit risk. Central banks typically develop the weighting scale for different asset classes, such as cash and coins, which have zero risk, versus a letter or credit, which carries more risk.
TOPIX Total Return U.S. Dollar Hedged Index is a market capitalization-weighted index of all companies listed on the First Section of the Tokyo Stock Exchange, hedged to eliminate the impact of the change in value between the US Dollar and Japanese Yen.
Turnover refers to a fund buying or selling securities. (The fund “turns over” its portfolio.) A fund pays transaction costs, such as commissions, when it buys and sells securities. Additionally, a higher turnover rate may result in higher taxes when the fund shares are held in a taxable account.
Yield Curve is a line that plots the yields of securities having equal credit quality but different maturity dates.
Yield Spread is the difference between yields on differing securities, calculated by deducting the yield of one security from another.
The broad based market indexes referenced in the following management commentaries are considered representative of their indicated market, the indexes are unmanaged and do not reflect the deduction of fees, such as, investment management and fund accounting fees, or taxes associated with a mutual fund. Investors cannot invest directly in an index.
Brown Advisory Growth Equity Fund
A Message to Our Shareholders
June 30, 2015
Dear Shareholder:
During the year ended June 30, 2015, the Brown Advisory Growth Equity Fund Investor Shares (the “Fund”) increased 9.54% in value. During the same period, the Russell 1000® Growth Index (the “Index”), the Fund’s benchmark, increased 10.56%.
Despite heightened volatility due to the market’s infatuation with geopolitical matters, the Fund managed to deliver a positive return for the reporting period. While absolute performance was satisfactory, the Fund return trailed the Index return by 1.02%. This is not necessarily surprising given the current market environment where fundamental growth characteristics have taken a backseat to other factors such as dividend yield. In this low interest rate environment the marginal investor is generally more concerned with generating income from their equity portfolio than long term earnings growth.
After struggling for the first two quarters of the fiscal year, our technology holdings turned the corner and the sector was the biggest positive contributor to returns for the full period. Several of our technology positions reported decent fundamental results, but their stock prices were slow to react due to the incessant preoccupation with yield amongst technology investors. One of our best performing stocks was a recent addition to the portfolio NXP Semiconductors (“NXP”). NXP is a technology leader in several fast-growing segments of the semiconductor industry. Their technology is a critical component in smartphones for applications such as Apple Pay. NXP also announced they will acquire Freescale Semiconductor, a key supplier to the automotive industry. The deal was well received by the marketplace, in recognition of the complementary nature of the two companies’ business lines and the large potential for synergies. QUALCOMM was a drag on performance as the company wrestled with regulatory issues in China. While these issues were ultimately resolved, we eliminated QUALCOMM in order to fund the purchase of NXP as we view their potential growth opportunities to be more attractive.
Amazon.com and TripAdvisor, are two recent additions to the consumer sector that made sizable positive contributions to performance. Both of these stocks were trading at attractive valuations due to misperceptions about their long term potential. However, not all of our consumer stocks performed as well. Discovery Communications was a disappointment, and our investment thesis for it began to deteriorate late last year. It has become apparent that the cable TV landscape, in the U.S. and increasingly abroad, is changing rapidly, due in part to streaming online video offerings such as Netflix. It was fortunate timing that Amazon.com, a company that we have followed for a number of years, traded down to a level that presented, in our opinion, an exceptional level of upside potential relative to downside risk, and we built a position using the proceeds from the sale of Discovery Communications shares.
Energy was the biggest drag on performance, and we did make several changes to the complexion of our energy exposure during the year. We eliminated our position in Core Laboratories, a stock that we had held for almost three-and-a-half years. We built our broad energy sector investment parameters around a range of potential oil prices, bound by demand destruction at the high end and reduced production at the other extreme. The Organization of the Petroleum Exporting Countries decision in November to protect market share rather than defend price has kept global oil markets oversupplied in recent months, allowing for a prolonged period of low oil prices below the range described above. This will probably push down earnings this year for our energy-related holdings, as producing companies reduce investment. We view Core Laboratories’ business model and valuation, compared with our other energy holdings, to be more susceptible should oil prices remain lower for longer. With so much uncertainty in the oil market, handicapping spot price movements went from extremely difficult to virtually impossible. However, we continue to monitor the energy sector landscape for potential opportunities and potential pitfalls going forward.
It is our belief that, in the long-run, the quality of business models determines our potential success as investors. It has always been this way, and while we should never simply extrapolate the past into the future, the market’s regard for best-in-breed, sustainable growth companies rarely dwindle. That is why business models remain our most important focus as investors. One can potentially recover from many mistakes as an investor: paying too much for a stock, poor timing of a trade, even mediocre management teams. A terminal mistake in our view is buying businesses that cannot contend with impending competition or disruptive technology. Such mistakes can render an investment worthless. That is why we say that our most important technique with respect to attempting to protect and grow our investors’ capital is owning leading businesses. We acknowledge that from time to time, the marginal investor will focus on other things: the strength of the dollar and how it affects translational accounting, the current
www.brownadvisoryfunds.com
1
Brown Advisory Growth Equity Fund
A Message to Our Shareholders
June 30, 2015
interest rate environment, one’s desire to seek out yield, and the immediate gratification of owning a stock that’s going up. Those and other issues will catch the fancy of many investors. But for long-term investors such considerations fade away when compared with the overarching importance of sound businesses. Given the issues that we have faced over the last two years, we try mightily to remind ourselves of this truth.
Sincerely,
Kenneth M. Stuzin, CFA
Portfolio Manager
Past performance is not a guarantee of future results.
Mutual fund investing involves risk. Principal loss is possible. Investments in smaller and medium capitalization companies generally carry greater risk than is customarily associated with larger companies for various reasons such as narrower markets, limited financial resources and less liquid stock. The value of the Fund’s investments in REITs may change in response to changes in the real estate market such as declines in the value of real estate, lack of available capital or financing opportunities, and increases in property taxes or operating costs. Investments in foreign securities entail certain risks not associated with investments in domestic securities, such as volatility of currency exchange rates, and in some cases, political and economic instability and relatively illiquid markets. The Fund may invest in ETFs, which may trade at a discount to the aggregate value of the underlying securities and although expense ratios for ETFs are generally low, frequent trading of ETFs by the Fund can generate brokerage expenses. Earnings growth is not a measure of the Fund’s future performance.
Fund holdings and sector allocations are subject to change and should not be considered a recommendation to buy or sell any security. For a complete list of fund holdings, please refer to the Schedule of Investments provided in this report.
Definitions for terms and indices are provided in the Glossary of Terms.
www.brownadvisoryfunds.com
2
Brown Advisory Growth Equity Fund
Performance Chart and Analysis
June 30, 2015
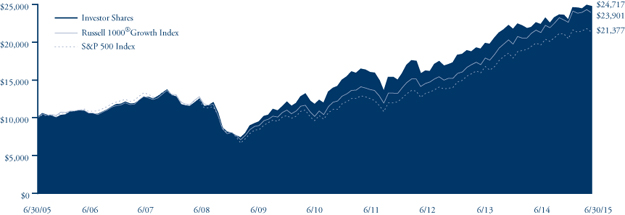
COMPARISON OF CHANGE IN VALUE OF A $10,000 INVESTMENT
The following chart reflects the change in value of a hypothetical $10,000 investment, including reinvested dividends and distributions, in the Fund as measured against broad-based securities market indices. The Russell 1000® Growth Index measures the performance of the large-cap growth segment of the U.S. equity universe. It includes those Russell 1000® companies with higher price to book and higher forecasted growth values. The S&P 500 Index is a market-value weighted index representing the performance of 500 widely held, publicly traded large capitalization stocks. The indexes are unmanaged and do not reflect the deduction of fees, such as investment management fees. Investors cannot invest directly in an index.
| Average Annual Total Return | One | Five | Ten | ||
| as of 6/30/15 | Year | Year | Year | ||
Institutional Shares1 | 9.73% | 16.24% | 9.63% | ||
| Investor Shares | 9.54% | 16.08% | 9.47% | ||
Advisor Shares2 | 9.28% | 15.76% | 9.09% | ||
Russell 1000® Growth Index | 10.56% | 18.59% | 9.10% | ||
| S&P 500 Index | 7.42% | 17.34% | 7.89% |
| Institutional Shares | Investor Shares | Advisor Shares | ||
Gross Expense Ratio3 | 0.74% | 0.89% | 1.14% | |
Net Expense Ratio3 | 0.74% | 0.89% | 1.14% |
Past performance does not guarantee future results. The performance data quoted represents past performance and current returns may be lower or higher. The investment return and net asset value will fluctuate so that an investor’s shares, when redeemed, may be worth more or less than the original cost. To obtain performance information current to the most recent month end, please visit our website at brownadvisoryfunds.com/performance.html. The performance table and graph above do not reflect the deduction of taxes that a shareholder would pay on Fund distributions or the redemption of Fund shares. Investment performance reflects periods during which fee waivers were in effect. In the absence of such waivers, total return would have been reduced. Performance data does not reflect the imposition of the redemption fee of 1.00% on shares redeemed within 14 days, and if it did, performance would have been lower.
| 1 | Performance information for the Institutional Shares, prior to commencement of operations on October 19, 2012, is based on the performance of Investor Shares, and adjusted for the lower expenses applicable to Institutional Shares. |
| 2 | Performance information for Advisor Shares, prior to commencement of operations on May 18, 2006, is based on the performance of Investor Shares, and adjusted for the higher expenses applicable to Advisor Shares. |
| 3 | Per the Fund’s prospectus dated October 31, 2014. |
www.brownadvisoryfunds.com
3
Brown Advisory Growth Equity Fund
Schedule of Investments
June 30, 2015
| Shares | Security Description | Value $ | |||||
| Common Stocks — 97.5% | |||||||
| Consumer Discretionary — 11.8% | |||||||
| 245,135 | Amazon.com, Inc.* | 106,410,652 | |||||
| 1,983,531 | Starbucks Corp. | 106,347,014 | |||||
| 874,240 | TripAdvisor, Inc.* | 76,181,274 | |||||
| 288,938,940 | |||||||
| Consumer Staples — 11.6% | |||||||
| 536,318 | Costco Wholesale Corp. | 72,435,109 | |||||
| 989,524 | Estee Lauder Companies, Inc. | 85,752,150 | |||||
| 835,528 | Mead Johnson Nutrition Co. | 75,381,336 | |||||
| 1,245,313 | Whole Foods Market, Inc. | 49,115,145 | |||||
| 282,683,740 | |||||||
| Energy — 4.5% | |||||||
| 1,226,818 | FMC Technologies, Inc.* | 50,900,679 | |||||
| 685,702 | Schlumberger NV | 59,100,655 | |||||
| 110,001,334 | |||||||
| Financials — 4.3% | |||||||
| 3,222,518 | Charles Schwab Corp. | 105,215,213 | |||||
| Health Care — 17.1% | |||||||
| 203,876 | Alexion Pharmaceuticals, Inc.* | 36,854,665 | |||||
| 1,047,784 | Bristol-Myers Squibb Co. | 69,719,547 | |||||
| 791,619 | DaVita HealthCare Partners, Inc.* | 62,909,962 | |||||
| 1,182,065 | Express Scripts Holding Co.* | 105,132,861 | |||||
| 517,636 | Gilead Sciences, Inc. | 60,604,823 | |||||
| 172,126 | Intuitive Surgical, Inc.* | 83,395,047 | |||||
| 418,616,905 | |||||||
| Industrials — 11.5% | |||||||
| 980,892 | Colfax Corp.* | 45,268,166 | |||||
| 1,008,578 | Danaher Corp. | 86,324,191 | |||||
| 1,478,201 | Fastenal Co. | 62,350,518 | |||||
| 652,958 | Stericycle, Inc.* | 87,437,606 | |||||
| 281,380,481 | |||||||
| Information Technology — 33.6% | |||||||
| 1,386,454 | Amphenol Corp. | 80,372,738 | |||||
| 514,937 | ANSYS, Inc.* | 46,982,852 | |||||
| 689,924 | Apple, Inc. | 86,533,718 | |||||
| 1,146,038 | Cognizant Technology Solutions Corp.* | 70,011,461 | |||||
| 1,054,371 | Facebook, Inc.* | 90,428,129 | |||||
| 2,511,482 | Genpact, Ltd.* | 53,569,911 | |||||
| 70,692 | Google, Inc. — Class A* | 38,176,508 | |||||
| 71,732 | Google, Inc. — Class C* | 37,337,223 | |||||
| 1,196,796 | National Instruments Corp. | 35,257,610 | |||||
| 354,820 | NetSuite, Inc.* | 32,554,735 | |||||
| 722,475 | NXP Semiconductors NV* | 70,947,045 | |||||
| 1,139,474 | salesforce.com, Inc.* | 79,341,575 | |||||
| 1,513,676 | Visa, Inc. | 101,643,343 | |||||
| 823,156,848 | |||||||
| Materials — 3.1% | |||||||
| 672,652 | Ecolab, Inc. | 76,056,761 | |||||
| Total Common Stocks (Cost $1,663,739,114) | 2,386,050,222 | ||||||
| Short-Term Investments — 2.6% | |||||||
| Money Market Funds — 2.6% | |||||||
| 63,003,604 | DWS Cash Account Trust — Government | ||||||
| & Agency Securities Portfolio — | |||||||
| Institutional Shares, 0.04%# | 63,003,604 | ||||||
| Total Short-Term Investments (Cost $63,003,604) | 63,003,604 | ||||||
| Total Investments — 100.1% (Cost $1,726,742,718) | 2,449,053,826 | ||||||
| Liabilities in Excess of Other Assets — (0.1)% | (2,044,110 | ) | |||||
| NET ASSETS — 100.0% | $ | 2,447,009,716 | |||||
PORTFOLIO HOLDINGS
% of Net Assets
| Information Technology | 33.6% |
| Health Care | 17.1% |
| Consumer Discretionary | 11.8% |
| Consumer Staples | 11.6% |
| Industrials | 11.5% |
| Energy | 4.5% |
| Financials | 4.3% |
| Materials | 3.1% |
| Money Market Funds | 2.6% |
| Other Assets and Liabilities | (0.1)% |
| 100.0% |
| * | Non-Income Producing |
| # | Annualized seven-day yield as of June 30, 2015. |
The accompanying notes are an integral part of these financial statements.
www.brownadvisoryfunds.com
4
Brown Advisory Value Equity Fund
A Message to Our Shareholders
June 30, 2015
Dear Shareholder:
During the year ended June 30, 2015, the Brown Advisory Value Equity Fund Investor Shares (the “Fund”) declined -2.35% while, the Russell 1000® Value Index, the Fund’s benchmark, increased 4.13%.
Most of our underperformance was concentrated in the energy sector. A combination of collapsing oil prices, an advancing U.S. dollar and slowing growth among economies outside the U.S. put notable pressure on the Fund. Stock-specific weakness in our commodity-related holdings hurt our relative performance in the industrials and materials sectors.
The fundamental energy industry picture appeared relatively benign in late 2014, but the severe downturn following the Organization of the Petroleum Exporting Countries decision in November to maintain production far exceeded many people’s expectations. At the time, we were disproportionately impacted by our overweight mix of oil services and production companies. They lagged the integrated oil majors and refiners, as oil prices declined more than 40% during the fourth quarter of 2014. Given the greater uncertainty in energy markets, we have since right-sized and rebalanced our energy holdings. We believe that this portfolio decision has mitigated some of the downside risk but still affords us an opportunity to capture potential upside returns if and when the market recovers.
While the end of 2014 was by all accounts a challenging one for the strategy, the Fund has enjoyed better absolute and relative returns through the first six months of 2015. Strong stock selection in the technology and financial sectors along with a market rotation away from utilities were the biggest contributors to performance, though not enough to offset the macro pressures weighing on global cyclical stocks.
Within technology, a main driver was the surfacing of value driven by corporate action and investor activism. Activist involvement in Informatica led to its eventual sale to private equity investors. eBay, a stock we believed was inexpensive relative to the sum of its business parts, announced plans to spin off PayPal. CommScope announced that it was acquiring TE Connectivity businesses in a highly accretive deal that is expected to generate significant costs savings and expand its product offerings. These value-unlocking events remind us that while we are aware of the “top-down” economic influences that can weigh on our holdings, our portfolio is built from the “bottom up,” one stock at a time. We favor companies whose underlying worth is not appreciated in the market.
We believe that many of our financial services stocks are well positioned for rising interest rates, and our interest-sensitive names—including Charles Schwab, Northern Trust and Synovus Financial—performed well during the reporting period. Rising rate expectations also drove investors away from high-yielding sectors such as utilities. Utilities were the third worst-performing sector in the benchmark, down in absolute returns, and our absence of exposure to the sector also contributed favorably. We expect that investors should continue to rotate out of defensive utilities into more cyclically sensitive sectors should the U.S. economic outlook further improve.
During the period, the Fund added 22 investments while eliminating 11 holdings. The portfolio activity was spread widely across sectors. As mentioned earlier, a meaningful portion of our activity was related to repositioning our energy exposure while commodity prices remained weak and commodity-exposed companies work through a bottoming process. Specifically, we swapped out of Canadian Natural Resources, Schlumberger and Freeport-McMoRan in favor of Plains GP Holdings, Oceaneering and Suncor Energy. Within financials, we maintain a large absolute exposure to the sector but have diversified away from some of our regional banks into asset managers T. Rowe Price and Ameriprise and into attractively priced real-estate companies W.P. Carey and Forest City Enterprises. Within consumer names—particularly staples—we have found long-term investment opportunities in Unilever and Philip Morris, quality businesses that were oversold on concerns of slowing emerging markets and the strengthening dollar. AbbVie and General Electric are similarly inexpensive, high-quality relative value opportunities that have the potential to generate steady returns over our holding period. Copa Holdings, Viacom, Micron and Yahoo! are portfolio additions that represent depressed value situations that are out of favor and in our view offer prospects of turning around their businesses from current low-expectation levels.
www.brownadvisoryfunds.com
5
Brown Advisory Value Equity Fund
A Message to Our Shareholders
June 30, 2015
Our robust portfolio activity reflects a commitment to searching for value in all market environments and our willingness to invest for the long term, even though macro themes garner much of the market’s attention. At moments during the reporting period, our approach fell short of our standards for performance. However, our portfolio nevertheless has traded at a valuation discount to its benchmark, and we strongly believe that our focus on attractively priced global leaders with steady growth or improving prospects has the potential to create long-term shareholder value. We believe that we are being adequately compensated for near-term risks and that our patience and valuation discipline could be rewarded over time.
Sincerely,
Rick M. Bernstein, CFA
Portfolio Manager
Doron S. Eisenberg, CFA
Portfolio Manager
Michael L. Foss, CFA
Portfolio Manager
Past performance is not a guarantee of future results.
Mutual fund investing involves risk. Principal loss is possible. Investments in medium capitalization companies generally carry greater risk than is customarily associated with larger companies for various reasons such as narrower markets, limited financial resources and less liquid stock. The value of the Fund’s investments in REITs may change in response to changes in the real estate market such as declines in the value of real estate, lack of available capital or financing opportunities, and increases in property taxes or operating costs. The Fund may invest in ETFs, which may trade at a discount to the aggregate value of the underlying securities and although expense ratios for ETFs are generally low, frequent trading of ETFs by the Fund can generate brokerage expenses. Investments in foreign securities entail certain risks not associated with investments in domestic securities, such as volatility of currency exchange rates, and in some cases, political and economic instability and relatively illiquid markets. These risks are greater for investments in emerging markets. Diversification does not guarantee a profit or protect from loss in a declining market.
Fund holdings and sector allocations are subject to change and should not be considered a recommendation to buy or sell any security. For a complete list of fund holdings, please refer to the Schedule of Investments provided in this report.
Definitions for terms and indices are provided in the Glossary on Terms.
www.brownadvisoryfunds.com
6
Brown Advisory Value Equity Fund
Performance Chart and Analysis
June 30, 2015
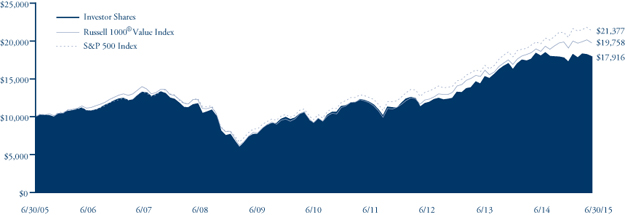
COMPARISON OF CHANGE IN VALUE OF A $10,000 INVESTMENT
The following chart reflects the change in value of a hypothetical $10,000 investment, including reinvested dividends and distributions, in the Fund as measured against broad-based securities market indices. The Russell 1000® Value Index measures the performance of the large-cap value segment of the U.S. equity universe. It includes those Russell 1000® companies with lower price to book ratios and lower expected growth values. The S&P 500 Index is a market-value weighted index representing the performance of 500 widely held, publicly traded large capitalization stocks. The indexes are unmanaged and do not reflect the deduction of fees, such as investment management fees. Investors cannot invest directly in an index.
| Average Annual Total Return | One | Five | Ten | ||
| as of 6/30/15 | Year | Year | Year | ||
Institutional Shares1 | -2.20% | 14.70% | 6.16% | ||
| Investor Shares | -2.35% | 14.54% | 6.00% | ||
Advisor Shares2 | -2.61% | 14.23% | 5.61% | ||
Russell 1000® Value Index | 4.13% | 16.50% | 7.05% | ||
| S&P 500 Index | 7.42% | 17.34% | 7.89% |
| Institutional Shares | Investor Shares | Advisor Shares | ||
Gross Expense Ratio3 | 0.77% | 0.92% | 1.17% | |
Net Expense Ratio3 | 0.77% | 0.92% | 1.17% |
Past performance does not guarantee future results. The performance data quoted represents past performance and current returns may be lower or higher. The investment return and net asset value will fluctuate so that an investor’s shares, when redeemed, may be worth more or less than the original cost. To obtain performance information current to the most recent month end, please visit our website at brownadvisoryfunds.com/performance.html. The performance table and graph above do not reflect the deduction of taxes that a shareholder would pay on Fund distributions or the redemption of Fund shares. Investment performance reflects periods during which fee waivers were in effect. In the absence of such waivers, total return would have been reduced. Performance data does not reflect the imposition of the redemption fee of 1.00% on shares redeemed within 14 days, and if it did, performance would have been lower.
| 1 | Performance information for the Institutional Shares, prior to commencement of operations on October 19, 2012, is based on the performance of Investor Shares, and adjusted for the lower expenses applicable to Institutional Shares. |
| 2 | Performance information for Advisor Shares, prior to commencement of operations on April 25, 2006, is based on the performance of Investor Shares, and adjusted for the higher expenses applicable to Advisor Shares. |
| 3 | Per the Fund’s prospectus dated October 31, 2014. |
www.brownadvisoryfunds.com
7
Brown Advisory Value Equity Fund
Schedule of Investments
June 30, 2015
| Shares | Security Description | Value $ | |||||
| Common Stocks — 96.4% | |||||||
| Consumer Discretionary — 12.0% | |||||||
| 86,607 | Best Buy, Inc. | 2,824,254 | |||||
| 111,199 | Coach, Inc. | 3,848,598 | |||||
| 79,634 | Discovery Communications, Inc.* | 2,648,627 | |||||
| 87,645 | GameStop Corp. | 3,765,229 | |||||
| 105,366 | Garmin, Ltd. | 4,628,728 | |||||
| 37,302 | Viacom, Inc. | 2,411,201 | |||||
| 20,126,637 | |||||||
| Consumer Staples — 4.4% | |||||||
| 37,368 | Philip Morris International, Inc. | 2,995,792 | |||||
| 103,071 | Unilever NV ADR | 4,312,491 | |||||
| 7,308,283 | |||||||
| Energy — 11.5% | |||||||
| 103,689 | ENSCO PLC | 2,309,154 | |||||
| 67,173 | National Oilwell Varco, Inc. | 3,243,112 | |||||
| 48,193 | Occidental Petroleum Corp. | 3,747,970 | |||||
| 76,949 | Oceaneering International, Inc. | 3,585,054 | |||||
| 121,225 | Plains GP Holdings L.P. | 3,132,454 | |||||
| 118,378 | Suncor Energy, Inc. | 3,257,763 | |||||
| 19,275,507 | |||||||
| Financials — 22.3% | |||||||
| 27,049 | Ameriprise Financial, Inc. | 3,379,232 | |||||
| 145,630 | Charles Schwab Corp. | 4,754,820 | |||||
| 75,095 | Forest City Enterprises, Inc.* | 1,659,599 | |||||
| 96,030 | JPMorgan Chase & Co. | 6,506,993 | |||||
| 61,027 | Northern Trust Corp. | 4,666,124 | |||||
| 509,867 | Regions Financial Corp. | 5,282,222 | |||||
| 118,215 | SunTrust Banks, Inc. | 5,085,609 | |||||
| 141,589 | Synovus Financial Corp. | 4,363,773 | |||||
| 21,863 | T. Rowe Price Group, Inc. | 1,699,411 | |||||
| 37,397,783 | |||||||
| Health Care — 17.4% | |||||||
| 78,603 | AbbVie, Inc. | 5,281,336 | |||||
| 38,378 | Baxter International, Inc. | 2,683,773 | |||||
| 145,465 | Hologic, Inc.* | 5,536,398 | |||||
| 41,468 | Merck & Co., Inc. | 2,360,773 | |||||
| 37,919 | Novartis AG ADR | 3,728,954 | |||||
| 84,420 | Sanofi S.A. ADR | 4,181,323 | |||||
| 91,600 | Teva Pharmaceutical Industries, Ltd. ADR | 5,413,560 | |||||
| 29,186,117 | |||||||
| Industrials — 6.6% | |||||||
| 22,154 | Copa Holdings S.A. | 1,829,699 | |||||
| 90,692 | General Electric Co. | 2,409,686 | |||||
| 106,908 | Joy Global, Inc. | 3,870,070 | |||||
| 47,904 | PACCAR, Inc. | 3,056,754 | |||||
| 11,166,209 | |||||||
| Information Technology — 20.3% | |||||||
| 40,378 | Apple, Inc. | 5,064,411 | |||||
| 39,817 | Check Point Software Technologies, Ltd.* | 3,167,442 | |||||
| 176,474 | Cisco Systems, Inc. | 4,845,976 | |||||
| 109,053 | CommScope Holdings Co, Inc.* | 3,327,207 | |||||
| 46,171 | eBay, Inc.* | 2,781,341 | |||||
| 43,531 | Microchip Technology, Inc. | 2,064,458 | |||||
| 43,620 | Micron Technology, Inc.* | 821,801 | |||||
| 61,809 | Microsoft Corp. | 2,728,867 | |||||
| 61,139 | NetApp, Inc. | 1,929,547 | |||||
| 82,528 | QUALCOMM, Inc. | 5,168,729 | |||||
| 57,683 | Yahoo, Inc.* | 2,266,365 | |||||
| 34,166,144 | |||||||
| Materials — 1.9% | |||||||
| 105,134 | Potash Corp. of Saskatchewan, Inc. | 3,256,000 | |||||
| Total Common Stocks (Cost $134,639,527) | 161,882,680 | ||||||
| Real Estate Investment Trusts — 0.8% | |||||||
| 23,420 | W.P. Carey, Inc. | 1,380,375 | |||||
| Total Real Estate Investment Trusts (Cost $1,329,451) | 1,380,375 | ||||||
| Short-Term Investments — 3.3% | |||||||
| Money Market Funds — 3.3% | |||||||
| 5,505,105 | DWS Cash Account Trust — Government | ||||||
| & Agency Securities Portfolio — | |||||||
| Institutional Shares, 0.04%# | 5,505,105 | ||||||
| Total Short-Term Investments (Cost $5,505,105) | 5,505,105 | ||||||
| Total Investments — 100.5% (Cost $141,474,083) | 168,768,160 | ||||||
| Liabilities in Excess of Other Assets — (0.5)% | (762,664 | ) | |||||
| NET ASSETS — 100.0% | $ | 168,005,496 | |||||
PORTFOLIO HOLDINGS
% of Net Assets
| Financials | 22.3% |
| Information Technology | 20.3% |
| Health Care | 17.4% |
| Consumer Discretionary | 12.0% |
| Energy | 11.5% |
| Industrials | 6.6% |
| Consumer Staples | 4.4% |
| Money Market Funds | 3.3% |
| Materials | 1.9% |
| Real Estate Investment Trusts | 0.8% |
| Other Assets and Liabilities | (0.5)% |
| 100.0% |
ADR — American Depositary Receipt
| * | Non-Income Producing |
| # | Annualized seven-day yield as of June 30, 2015. |
The accompanying notes are an integral part of these financial statements.
www.brownadvisoryfunds.com
8
Brown Advisory Flexible Equity Fund
A Message to Our Shareholders
June 30, 2015
Dear Shareholder:
During the year ended June 30, 2015, the Brown Advisory Flexible Equity Fund Investor Shares (the “Fund”) increased 7.92% in value. The S&P 500 Index, the Fund’s benchmark, increased 7.42% during the same period.
We repeat our message from our Semi-Annual Report that investors may anticipate lower returns on equities in the next three- and five-year periods compared with past performance. Stock valuations, economic activity and investor sentiment are higher today compared with the past, so investors may temper their expectations. Our thinking is summed up by a quote from John Templeton, the late investor and philanthropist: “Bull markets are born on pessimism, grow on skepticism, mature on optimism and die on euphoria.” A review of stock market history—whether the broad stock market, notable sectors or individual companies—reveals a consistent pattern in which investor emotion tugs equity prices up or down. To use Templeton’s phrasing, our best characterization of the current U.S. equity market is that it is maturing on optimism.
That is not to say we are bearish. The U.S. economy’s long-term record of innovation, development and adaptation supports an optimistic outlook. The cycles in investor emotions referenced in the Templeton quote occur around a rising long-term trend of economic progress. Also, the broad valuation of stocks, though higher than we prefer for the rate of future returns, is not excessive in our view, particularly in an environment of unusually low interest rates.
The biggest contributors to the Fund’s results during the year ended June 30, 2015 were Anthem Inc., a managed care company; Visa, Inc., a global payments processor; Edwards Lifesciences, a manufacturer of devices to treat cardiovascular disease; Walt Disney, a diversified leisure and entertainment business; and Express Scripts, a pharmacy benefits manager. These top contributors benefited from good business results and rising valuations.
The most significant detractors to the Fund’s performance were Copa Holdings, a Latin American airline; National Oilwell Varco, a manufacturer of equipment for oil and gas drilling; Occidental Petroleum, an integrated energy company; QUALCOMM, a wireless communications company; and American Express, a global provider of financial services. Copa’s shares declined due to disappointing earnings stemming from pricing pressures in its market resulting from economic pressures in its Central and South American markets. National Oilwell Varco and Occidental Petroleum shares fell with the decline in the price of oil. Both QUALCOMM and American Express declined when each lost a significant customer, but those are temporary setbacks in our view.
Interestingly, there is a common trait held by both our best and worst contributors listed above. This trait is share repurchases. We view share repurchases as an effective capital discipline for businesses generating more cash from their business than they can immediately and profitably redeploy in their business. Obviously, buying your own stock may not immediately result in a higher share price, but when financed internally and performed with good judgment on price to value, it may be beneficial for continuing shareholders. We are less a fan of repurchases done just to offset stock and option grants for employee incentives.
We added one new holding since our December 31, 2014, Semi-Annual Report to shareholders. Oceaneering International (“OII”) provides services for off-shore oil exploration and production, especially remotely operated vehicle services for installing, inspecting and maintaining equipment deep under water. Lower oil prices obviously challenge most oil-related businesses, but to the extent that lower prices are temporary, the share price declines present an opportunity. OII is a leader in its field, with a strong balance sheet and historically good returns on its invested capital. We believe that it will prosper over time as oil markets normalize.
We eliminated two small energy-related holdings, California Resources Corp. and NOW Inc. in part to fund our purchase of OII. Both were 2014 spin-offs from other portfolio companies. We eliminated our investment in Time Warner Cable (“TWC”) at a nice gain because of concerns about prospective regulation of the cable industry and completion of its deal to be acquired by Comcast. Once Comcast cancelled its deal for TWC, we were not surprised that Charter Communications made a subsequent bid, but we were surprised by how much higher it was. Thus, we sold too soon judging from the subsequent events.
While we are always looking for better ideas, we like the business prospects of our current holdings and, importantly, what we are paying for these companies when compared with the broader market.
We researched quite a few companies in the past few months. This is an ongoing process, but the March-to-June period is the high point for the number of annual reports and proxies that arrive from companies. Always notable among these is the Berkshire Hathaway annual report and its letter from CEO Warren Buffett. This year marks the 50th year since Buffett took control of Berkshire, and the latest report reflects on the past, present and future of this enterprise, which is among the largest holdings in the Fund. His letter is available at www.berkshirehathaway.com. Our notes from the recent annual shareholders meeting at Berkshire are available at www.brownadvisory.com.
www.brownadvisoryfunds.com
9
Brown Advisory Flexible Equity Fund
A Message to Our Shareholders
June 30, 2015
The Flexible Equity strategy looks broadly for what we believe are bargains among long-term attractive businesses with shareholder-oriented managers. Bargains can arise because of short-term investor perceptions and temporary business difficulties that are likely to improve. Attractively priced companies can also appear because they are undiscovered opportunities or are making unrecognized changes for the better.
Sincerely,
R. Hutchings Vernon, CFA
Portfolio Manager
Michael L. Foss, CFA
Portfolio Manager
Past performance is not a guarantee of future results.
Mutual fund investing involves risk. Principal loss is possible. The Flexible Equity Fund may invest in securities of foreign issuers. Investments in such securities entail certain risks not associated with investments in domestic securities, such as volatility of currency exchange rates, and in some cases, political and economic instability and relatively illiquid markets. These risks are greater for investments in emerging markets. The value of the Fund’s investments in REITs may change in response to changes in the real estate market such as declines in the value of real estate, lack of available capital or financing opportunities, and increases in property taxes or operating costs. The Fund may invest in ETFs, which may trade at a discount to the aggregate value of the underlying securities and although expense ratios for ETFs are generally low, frequent trading of ETFs by the Fund can generate brokerage expenses. Investments in smaller companies generally carry greater risk than is customarily associated with larger companies for various reasons such as narrower markets, limited financial resources and less liquid stock. Investments in debt securities typically decrease in value when interest rates rise. This risk is usually greater for longer term debt securities. Investments in lower-rated and non-rated securities present a greater risk of loss to principal and interest than higher-rated securities.
Fund holdings and sector allocations are subject to change and should not be considered a recommendation to buy or sell any security. For a complete list of fund holdings, please refer to the Schedule of Investments provided in this report.
Definitions for terms and indices are provided in the Glossary of Terms.
www.brownadvisoryfunds.com
10
Brown Advisory Flexible Equity Fund
Performance Chart and Analysis
June 30, 2015
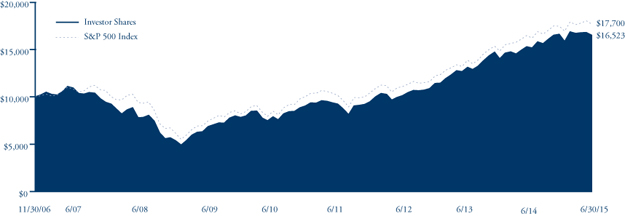
COMPARISON OF CHANGE IN VALUE OF A $10,000 INVESTMENT
The following chart reflects the change in value of a hypothetical $10,000 investment, including reinvested dividends and distributions, in the Fund as measured against the broad-based securities market index. The S&P 500 (“Index”) is a market-value weighted index representing the performance of 500 widely held, publicly traded large capitalization stocks. The Index is unmanaged and does not reflect the deduction of fees, such as investment management fees. Investors cannot invest directly in an index.
| Since | |||||
| Average Annual Total Return | One | Five | Inception | ||
| as of 6/30/15 | Year | Year | (11/30/06) | ||
Institutional Shares1 | 8.09% | 17.34% | 6.19% | ||
| Investor Shares | 7.92% | 17.15% | 6.03% | ||
Advisor Shares2 | 7.68% | 16.93% | 5.75% | ||
| S&P 500 Index | 7.42% | 17.34% | 6.88% |
| Institutional Shares | Investor Shares | Advisor Shares | ||
Gross Expense Ratio3 | 0.81% | 0.96% | 1.21% | |
Net Expense Ratio3 | 0.81% | 0.96% | 1.21% |
Past performance does not guarantee future results. The performance data quoted represents past performance and current returns may be lower or higher. The investment return and net asset value will fluctuate so that an investor’s shares, when redeemed, may be worth more or less than the original cost. To obtain performance information current to the most recent month end, please visit our website at brownadvisoryfunds.com/performance.html. The performance table and graph above do not reflect the deduction of taxes that a shareholder would pay on Fund distributions or the redemption of Fund shares. Investment performance reflects periods during which fee waivers were in effect. In the absence of such waivers, total return would have been reduced. Performance data does not reflect the imposition of the redemption fee of 1.00% on shares redeemed within 14 days, and if it did, performance would have been lower.
| 1 | Performance information for the Institutional Shares, prior to commencement of operations on October 19, 2012, is based on the performance of Investor Shares, and adjusted for the lower expenses applicable to Institutional Shares. |
| 2 | Performance information for Advisor Shares, prior to commencement of operations on January 24, 2007, is based on the performance of Investor Shares, and adjusted for the higher expenses applicable to Advisor Shares. |
| 3 | Per the Fund’s prospectus dated October 31, 2014. |
www.brownadvisoryfunds.com
11
Brown Advisory Flexible Equity Fund
Schedule of Investments
June 30, 2015
| Shares | Security Description | Value $ | |||||
| Common Stocks — 93.9% | |||||||
| Consumer Discretionary — 15.5% | |||||||
| 199,269 | Best Buy, Inc. | 6,498,162 | |||||
| 97,914 | CarMax, Inc.* | 6,482,886 | |||||
| 113,494 | Lowe’s Companies, Inc. | 7,600,693 | |||||
| 7,258 | Priceline Group, Inc.* | 8,356,644 | |||||
| 78,060 | TJX Companies, Inc. | 5,165,230 | |||||
| 86,541 | Walt Disney Co. | 9,877,790 | |||||
| 43,981,405 | |||||||
| Consumer Staples — 1.3% | |||||||
| 38,500 | PepsiCo, Inc. | 3,593,590 | |||||
| Energy — 7.6% | |||||||
| 231,513 | Kinder Morgan, Inc. | 8,887,784 | |||||
| 75,875 | National Oilwell Varco, Inc. | 3,663,245 | |||||
| 80,008 | Occidental Petroleum Corp. | 6,222,222 | |||||
| 58,318 | Oceaneering International, Inc. | 2,717,036 | |||||
| 21,490,287 | |||||||
| Financials — 19.5% | |||||||
| 49,782 | American Express Co. | 3,869,057 | |||||
| 146,584 | Bank of America Corp. | 2,494,860 | |||||
| 96,004 | Berkshire Hathaway, Inc.* | 13,067,104 | |||||
| 247,843 | Charles Schwab Corp. | 8,092,074 | |||||
| 80,626 | Franklin Resources, Inc. | 3,953,093 | |||||
| 101,007 | JPMorgan Chase & Co. | 6,844,234 | |||||
| 333,345 | Regions Financial Corp. | 3,453,454 | |||||
| 22,755 | T. Rowe Price Group, Inc. | 1,768,746 | |||||
| 214,479 | Wells Fargo Co. | 12,062,299 | |||||
| 55,604,921 | |||||||
| Health Care — 12.7% | |||||||
| 56,029 | Anthem, Inc. | 9,196,600 | |||||
| 42,077 | Edwards Lifesciences Corp.* | 5,993,027 | |||||
| 128,163 | Express Scripts Holding Co.* | 11,398,818 | |||||
| 46,441 | Merck & Co., Inc. | 2,643,886 | |||||
| 117,400 | Teva Pharmaceutical Industries, Ltd. ADR | 6,938,340 | |||||
| 36,170,671 | |||||||
| Industrials — 10.5% | |||||||
| 153,786 | Canadian National Railway Co. | 8,881,141 | |||||
| 15,450 | Canadian Pacific Railway, Ltd. | 2,475,554 | |||||
| 57,797 | Copa Holdings S.A. | 4,773,454 | |||||
| 87,362 | Owens Corning | 3,603,683 | |||||
| 57,700 | United Rentals, Inc* | 5,055,674 | |||||
| 46,730 | United Technologies Corp. | 5,183,759 | |||||
| 29,973,265 | |||||||
| Information Technology — 25.5% | |||||||
| 65,402 | Accenture PLC | 6,329,606 | |||||
| 62,786 | Apple, Inc. | 7,874,934 | |||||
| 108,592 | eBay, Inc.* | 6,541,582 | |||||
| 7,139 | Google, Inc. — Class A* | 3,855,345 | |||||
| 13,078 | Google, Inc. — Class C* | 6,807,230 | |||||
| 18,061 | International Business Machines Corp. | 2,937,802 | |||||
| 98,308 | MasterCard, Inc. | 9,189,832 | |||||
| 146,234 | Microsoft Corp. | 6,456,231 | |||||
| 107,726 | QUALCOMM, Inc. | 6,746,879 | |||||
| 235,044 | Visa, Inc. | 15,783,205 | |||||
| 72,522,646 | |||||||
| Telecommunication Services — 1.3% | |||||||
| 45,185 | Crown Castle International Corp. | 3,628,355 | |||||
| Total Common Stocks (Cost $214,586,835) | 266,965,140 | ||||||
| Warrants — 0.2% | |||||||
| 20,000 | Wells Fargo Co.* | 449,800 | |||||
| Total Warrants (Cost $221,300) | 449,800 | ||||||
| Short-Term Investments — 5.5% | |||||||
| Money Market Funds — 5.5% | |||||||
| 15,684,814 | DWS Cash Account Trust — Government | ||||||
| & Agency Securities Portfolio — | |||||||
| Institutional Shares, 0.04%# | 15,684,814 | ||||||
| Total Short-Term Investments (Cost $15,684,814) | 15,684,814 | ||||||
| Total Investments — 99.6% (Cost $230,492,949) | 283,099,754 | ||||||
| Other Assets in Excess of Liabilities — 0.4% | 1,248,867 | ||||||
| NET ASSETS — 100.0% | $ | 284,348,621 | |||||
PORTFOLIO HOLDINGS
% of Net Assets
| Information Technology | 25.5% |
| Financials | 19.5% |
| Consumer Discretionary | 15.5% |
| Health Care | 12.7% |
| Industrials | 10.5% |
| Energy | 7.6% |
| Money Market Funds | 5.5% |
| Consumer Staples | 1.3% |
| Telecommunication Services | 1.3% |
| Warrants | 0.2% |
| Other Assets and Liabilities | 0.4% |
| 100.0% |
ADR — American Depositary Receipt
| * | Non-Income Producing |
| # | Annualized seven-day yield as of June 30, 2015. |
The accompanying notes are an integral part of these financial statements.
www.brownadvisoryfunds.com
12
Brown Advisory Equity Income Fund
A Message to Our Shareholders
June 30, 2015
Dear Shareholder:
During the year ended June 30, 2015, the Brown Advisory Equity Income Fund Investor Shares (the “Fund”) rose 2.45%. The S&P 500 Index, the Fund’s benchmark, increased 7.42% during the same period.
Returns to U.S. large-cap equity investors in the past year look reasonable. This return, however, was not broad based. We believe two themes held several sectors back: (1) retreating oil and related commodity prices and (2) fears of rising interest rates. Oil prices peaked almost exactly one year ago, then declined approximately 50% over this past year. Most other industrial commodities have also seen meaningful price declines, including iron ore and copper. Meanwhile, high valuation combined with fears of rising interest rates led to poor performance in the utilities, Real Estate Investment Trusts (“REIT”) and telecom sectors.
Worries over rising interest rates impacted all income-oriented investments, especially during the first half of 2015. The Fund held up well against many of these alternatives. The Fund’s incremental investments have been skewed toward dividend growth, and it has avoided the most expensive bond proxies in the utility, telecom and REIT sectors. However, the Fund could not keep pace with the broader large cap indices because of its income orientation, combined with the strong performance of traditional growth stocks within the S&P 500 Index.
For the Fund’s benchmark, strong performance from the health care, consumer discretionary and information technology sectors over the past year more than made up for a significant decline in the energy sector caused by lower commodity prices. Despite meaningful weightings to the health care and consumer discretionary sectors throughout the period, the performance of the Fund’s holdings in these sectors did not keep pace. The Fund’s best-performing consumer discretionary name was mass retailer Target, which is in the midst of a sweeping operational turnaround. AbbVie was the biggest contributor among the Fund’s health care holdings due to better-than-expected earnings from its growing global pharmaceutical portfolio.
The Fund’s information technology holdings managed to keep pace with the benchmark’s performance, led by strong returns from Apple and Automated Data Processing. However, the Fund remains under-weight the benchmark in the technology sector. It has been a challenge to find enough names in the information technology sector that fit the Fund’s preference for stocks with high dividend yields and growth prospects at attractive valuations.
Two of the Fund’s worst-performing stocks during the year were Ensco and Total, both in the energy sector. Ensco was eliminated after the offshore driller’s financial results deteriorated faster and more substantially than originally anticipated amid falling energy prices. The Fund’s position in integrated oil and gas company Total was reduced.
Overall, the Fund’s preference for pipeline companies such as Plains and Kinder Morgan was a benefit during the year, driving relative outperformance in the energy sector compared to the benchmark. The Fund also benefited from its lack of exposure to the utilities sector, which also performed poorly during the period.
Portfolio turnover for the Fund was 18% over the past year, down from the annual average since inception. Opportunities have been fewer, and we like how the portfolio is currently positioned. The Fund added General Electric following the announcement by the conglomerate’s management team that it would exit most financial-related business areas and refocus on the company’s core industrial products in an effort to improve shareholder returns. Black Stone Minerals LP was also added after the mineral right owner’s recent initial public offering garnered a tepid response from investors because of near-term worries about the direction of oil and natural gas prices.
Among the Fund’s eliminations during the past year, Time Warner Cable was sold as the stock advanced ahead of a buyout proposal from rival cable operator Charter Communications. Also, one series of the Fund’s preferred stock holdings of Public Storage, an operator of self-storage facilities, was called away by the company during the period.
When we look back to the launch of the Fund nearly four years ago, we believe that many of its attributes remain as compelling today as they did then. While the absolute yield is a bit lower and valuation a bit higher than at launch, we believe the yield spread over many stock and bond indices remains high and the beta/risk remains low. We believe the growth profile has improved, and the quality of the companies we invest in remain top of mind for us.
Sincerely,
Mike Foss, CFA
Portfolio Manager
Brian Graney, CFA
Portfolio Manager
www.brownadvisoryfunds.com
13
Brown Advisory Equity Income Fund
A Message to Our Shareholders
June 30, 2015
Past performance does not guarantee future results.
Mutual fund investing involves risk. Principal loss is possible. Investments in debt securities typically decrease in value when interest rates rise. This risk is usually greater for longer-term debt securities. Investments in lower-rated and non-rated securities present a greater risk of loss to principal and interest than higher-rated securities. Investments in smaller and medium capitalization companies generally carry greater risk than is customarily associated with larger companies for various reasons such as narrower markets, limited financial resources and less liquid stock. The value of the Fund’s investments in REITs and Real Estate may change in response to changes in the real estate market such as declines in the value of real estate, lack of available capital or financing opportunities, and increases in property taxes or operating costs. The Fund may invest in ETFs, which may trade at a discount to the aggregate value of the underlying securities and although expense ratios for ETFs are generally low, frequent trading of ETFs by the Fund can generate brokerage expenses. Investments in foreign securities entail certain risks not associated with investments in domestic securities, such as volatility of currency exchange rates, and in some cases, political and economic instability and relatively illiquid markets. Investing in Master Limited Partnerships (“MLPs”) entails risk related to fluctuations in energy prices, decreases in supply of or demand for energy commodities, unique tax consequences due to the partnership structure and various other risks. Privately Placement issued securities are restricted securities that are not publicly traded. Delay or difficulty in selling such securities may result in a loss to the Fund.
Fund holdings and sector allocations are subject to change and should not be considered a recommendation to buy or sell any security. For a complete list of fund holdings, please refer to the Schedule of Investments provided in this report.
Definitions for terms and indices are provided in the Glossary of Terms.
www.brownadvisoryfunds.com
14
Brown Advisory Equity Income Fund
Performance Chart and Analysis
June 30, 2015
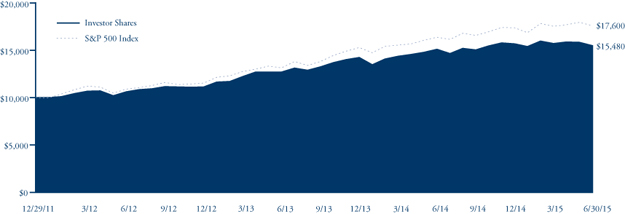
COMPARISON OF CHANGE IN VALUE OF A $10,000 INVESTMENT
The following chart reflects the change in value of a hypothetical $10,000 investment, including reinvested dividends and distributions, in the Fund as measured against a broad-based securities market index. The S&P 500 (“Index”) is a market-value weighted index representing the performance of 500 widely held, publicly traded large capitalization stocks. The Index is unmanaged and does not reflect the deduction of fees, such as investment management fees. Investors cannot invest directly in an index.
| Since | ||||
| Average Annual Total Return | One | Inception | ||
| as of 6/30/15 | Year | (12/29/11) | ||
Institutional Shares1 | 2.60% | 13.47% | ||
| Investor Shares | 2.45% | 13.28% | ||
| Advisor Shares | 2.19% | 13.00% | ||
| S&P 500 Index | 7.42% | 17.51% |
| Institutional Shares | Investor Shares | Advisor Shares | ||
Gross Expense Ratio2 | 0.78% | 0.93% | 1.18% | |
Net Expense Ratio2 | 0.78% | 0.93% | 1.18% |
Past performance does not guarantee future results. The performance data quoted represents past performance and current returns may be lower or higher. The investment return and net asset value will fluctuate so that an investor’s shares, when redeemed, may be worth more or less than the original cost. To obtain performance information current to the most recent month end, please visit our website at brownadvisoryfunds.com/performance.html. The performance table and graph above do not reflect the deduction of taxes that a shareholder would pay on Fund distributions or the redemption of Fund shares. Performance data does not reflect the imposition of the redemption fee of 1.00% on shares redeemed within 14 days, and if it did, performance would have been lower.
| 1 | Performance information for the Institutional Shares, prior to commencement of operations on October 19, 2012, is based on the performance of Investor Shares, and adjusted for the lower expenses applicable to Institutional Shares. |
| 2 | Per the Fund’s prospectus dated October 31, 2014. |
www.brownadvisoryfunds.com
15
Brown Advisory Equity Income Fund
Schedule of Investments
June 30, 2015
| Shares | Security Description | Value $ | |||||
| Common Stocks — 85.2% | |||||||
| Consumer Discretionary — 12.8% | |||||||
| 112,382 | Best Buy, Inc. | 3,664,777 | |||||
| 105,202 | GameStop Corp. | 4,519,478 | |||||
| 121,424 | Garmin, Ltd. | 5,334,156 | |||||
| 32,541 | McDonald’s Corp. | 3,093,673 | |||||
| 55,324 | Target Corp. | 4,516,098 | |||||
| 72,696 | V.F. Corp. | 5,069,819 | |||||
| 26,198,001 | |||||||
| Consumer Staples — 10.7% | |||||||
| 169,460 | Altria Group, Inc. | 8,288,289 | |||||
| 71,602 | Coca-Cola Co. | 2,808,947 | |||||
| 68,407 | Philip Morris International, Inc. | 5,484,189 | |||||
| 127,191 | Unilever NV ADR | 5,321,671 | |||||
| 21,903,096 | |||||||
| Energy — 11.9% | |||||||
| 144,230 | Black Stone Minerals L.P.* | 2,483,641 | |||||
| 208,372 | Kinder Morgan, Inc. | 7,999,401 | |||||
| 59,589 | Occidental Petroleum Corp. | 4,634,237 | |||||
| 310,749 | Plains GP Holdings L.P. | 8,029,754 | |||||
| 23,160 | Total S.A. ADR | 1,138,777 | |||||
| 24,285,810 | |||||||
| Financials — 10.7% | |||||||
| 65,329 | Cincinnati Financial Corp. | 3,278,209 | |||||
| 45,536 | Erie Indemnity Co. | 3,737,139 | |||||
| 80,688 | JPMorgan Chase & Co. | 5,467,419 | |||||
| 118,013 | OneBeacon Insurance Group, Ltd. | 1,712,369 | |||||
| 30,755 | T. Rowe Price Group, Inc. | 2,390,586 | |||||
| 93,183 | Wells Fargo Co. | 5,240,612 | |||||
| 21,826,334 | |||||||
| Health Care — 13.4% | |||||||
| 95,642 | AbbVie, Inc. | 6,426,186 | |||||
| 47,320 | Johnson & Johnson | 4,611,807 | |||||
| 72,405 | Merck & Co., Inc. | 4,122,017 | |||||
| 68,736 | Novartis AG ADR | 6,759,498 | |||||
| 92,681 | Teva Pharmaceutical Industries, Ltd. ADR | 5,477,447 | |||||
| 27,396,955 | |||||||
| Industrials — 10.5% | |||||||
| 23,624 | Copa Holdings S.A. | 1,951,106 | |||||
| 115,677 | General Electric Co. | 3,073,538 | |||||
| 125,575 | Healthcare Services Group, Inc. | 4,150,254 | |||||
| 84,452 | Nielsen Holdings NV | 3,780,916 | |||||
| 56,784 | PACCAR, Inc. | 3,623,387 | |||||
| 43,382 | United Technologies Corp. | 4,812,365 | |||||
| 21,391,566 | |||||||
| Information Technology — 13.1% | |||||||
| 42,531 | Accenture PLC | 4,116,150 | |||||
| 37,831 | Apple, Inc. | 4,744,953 | |||||
| 74,523 | Automatic Data Processing, Inc. | 5,978,980 | |||||
| 151,335 | Microsoft Corp. | 6,681,440 | |||||
| 82,815 | QUALCOMM, Inc. | 5,186,704 | |||||
| 26,708,227 | |||||||
| Materials — 1.2% | |||||||
| 20,528 | Praxair, Inc. | 2,454,123 | |||||
| Telecommunication Services — 0.9% | |||||||
| 53,663 | Rogers Communications, Inc. | 1,906,646 | |||||
| Total Common Stocks (Cost $133,928,449) | 174,070,758 | ||||||
| Preferred Stocks — 2.2% | |||||||
| 177,771 | Public Storage, Inc. — Series S | 4,412,276 | |||||
| Total Preferred Stocks (Cost $4,385,693) | 4,412,276 | ||||||
| Real Estate Investment Trusts — 6.7% | |||||||
| 111,460 | Plum Creek Timber Co., Inc. | 4,521,932 | |||||
| 220,971 | Redwood Trust, Inc. | 3,469,245 | |||||
| 94,607 | W.P. Carey, Inc. | 5,576,137 | |||||
| Total Real Estate Investment Trusts (Cost $14,272,871) | 13,567,314 | ||||||
| Short-Term Investments — 5.6% | |||||||
| Money Market Funds — 5.6% | |||||||
| 11,540,445 | DWS Cash Account Trust — Government | ||||||
| & Agency Securities Portfolio — | |||||||
| Institutional Shares, 0.04%# | 11,540,445 | ||||||
| Total Short-Term Investments (Cost $11,540,445) | 11,540,445 | ||||||
| Total Investments — 99.7% (Cost $164,127,458) | 203,590,793 | ||||||
| Other Assets in Excess of Liabilities — 0.3% | 692,567 | ||||||
| NET ASSETS — 100.0% | $ | 204,283,360 | |||||
PORTFOLIO HOLDINGS
% of Net Assets
| Health Care | 13.4% |
| Information Technology | 13.1% |
| Consumer Discretionary | 12.8% |
| Energy | 11.9% |
| Consumer Staples | 10.7% |
| Financials | 10.7% |
| Industrials | 10.5% |
| Real Estate Investment Trusts | 6.7% |
| Money Market Funds | 5.6% |
| Preferred Stocks | 2.2% |
| Materials | 1.2% |
| Telecommunication Services | 0.9% |
| Other Assets and Liabilities | 0.3% |
| 100.0% |
ADR — American Depositary Receipt
| * | Non-Income Producing |
| # | Annualized seven-day yield as of June 30, 2015. |
The accompanying notes are an integral part of these financial statements.
www.brownadvisoryfunds.com
16
Brown Advisory Sustainable Growth Fund
A Message to Our Shareholders
June 30, 2015
Dear Shareholder:
During the year ended June 30, 2015, the Brown Advisory Sustainable Growth Fund Advisor Shares (the “Fund”) increased 13.03% in value. During the same period, the Russell 1000® Growth Index, the Fund’s benchmark, increased 10.56%.
The Fund benefited from strong stock selection in industrials, led by Pall and A.O. Smith. Several consumer discretionary stocks also fueled the gains, including Nike and Amazon.com. We were helped by not having any direct exposure to energy, a sector that experienced significant pressure due to declining commodity prices.
We have been particularly active within health care and over the past year increased our allocation in the sector to 14% of the portfolio from 7% after identifying several names that met our stringent investment criteria. While some of our top health care performers, Novo Nordisk, Bristol-Myers Squibb and Cerner, logged 20% to 40% stock increases during the year, we did not participate in the 40% to 80% stock moves from companies that are sizeable positions in the benchmark. Therefore, our stock selection did not keep up with the benchmark in this sector, but we are very excited about the long-term potential of the new health care companies we added. Alexion Pharmaceuticals is focused on providing life-transforming treatments to patients with severe and life-threatening rare diseases for which there are no effective options. The company’s treatment solution avoids the excessive energy, water and packaging waste associated with kidney dialysis (an alternative treatment) or continued misdiagnoses and ineffective treatments, which are common problems with rare diseases. Bristol-Myers has a large opportunity in cancer immunotherapy which, we believe, will revolutionize how cancer will be treated. We are particularly attracted to Bristol’s leadership in developing PD1 immunotherapy for lung cancer and the company’s large pipeline for use in multiple tumor types in earlier lines of therapy for cancer treatment. IDEXX Laboratories is a leading provider of veterinarian diagnostic, reference lab and consulting services. It is a leading innovator in the industry with a research and development budget that is many times greater than its nearest competitor. The company’s environmental business advantage (EBA) is centered on its water-testing technology, and its poultry and dairy diagnostics. The two businesses help ensure the safety and quality of water and food and together represent a meaningful portion of sales and operating profits. Novo Nordisk is a market leader in the treatment of diabetes. The company has long embraced sustainability to improve product quality and performance while reducing production costs.
Our single greatest contributor to performance over the year was Pall Corporation. On May 13, 2015, Danaher announced its intention to acquire Pall for nearly $14 billion, a 28% premium to its closing price on the day before the Wall Street Journal first reported that Pall was nearing the completion of an auction process to sell itself. As of the end of June, Pall was a meaningful position in the portfolio, and we benefited considerably from the proposed transaction. Pall is a great example of the type of company we look for not only within industrials but across the broader investment landscape. While growth investors may perceive industrials as being overly cyclical, we have historically found excellent opportunities within the sector that meet our investment criteria, including strong fundamentals, compelling valuations and environmental strategies that cut costs, drive revenue growth or improve franchise value. Recall that we have had an overweight to industrials since the beginning of the strategy because we have been able to identify high-quality companies like Pall. While we are disappointed to see Pall leave the portfolio as a stand-alone company, we are happy to continue to own it through Danaher, another holding in the portfolio.
As an ongoing practice, we continually look to strengthen the portfolio by identifying companies with what we believe are attractive business models and greater long-term growth prospects than those that we already own. This past year was no different. We eliminated a number of names, including Trimble Navigation, Stratasys, Whole Foods, LKQ, IHS, eBay, Cummins, Qualcomm and Borg Warner. These eliminations were due to deteriorating growth prospects or due to a swap with a new name that we believe has more favorable prospects. Many of these new holdings are ideas from our information technology sector research, including Amazon.com, Facebook, NXP Semiconductor and TE Connectivity. We also sold Rockwood Holdings after it was acquired by Albemarle and Waters due to management attrition, which left the strategic direction of the company in question.
Another new holding since our last shareholder letter is Acuity Brands. Acuity is a leading lighting systems provider in North America. More than 40% of sales come from energy-efficient LED lighting and controls versus close to zero just a few years ago. Acuity’s vast breadth of energy-efficient lighting options add value to both new construction and retrofit projects because of the higher quality of light and electricity savings. Finally, we added Delphi Automotive given that the company is at the forefront of the fastest-growing trends in the industry: safety, efficiency and communications. Delphi’s environmental business advantage is its leadership position in offering solutions to vehicle manufacturers to meet tighter regulations for safety, emissions and fuel economy.
www.brownadvisoryfunds.com
17
Brown Advisory Sustainable Growth Fund
A Message to Our Shareholders
June 30, 2015
To conclude, we made a number of changes to the portfolio over the past year, many of which were incrementally additive to performance. We are pleased with our results and believe that our investment philosophy—seeking companies with strong fundamentals, the potential for sustainable competitive advantages including EBA and compelling valuation—has helped identify a group of what we believe are high-quality companies that have the potential to perform well over time.
Sincerely,
Karina Funk, CFA
Portfolio Manager
David B. Powell, CFA
Portfolio Manager
Past performance is not a guarantee of future results.
Mutual fund investing involves risk. Principal loss is possible. The Fund’s investment focus on environmental factors could cause it to make or avoid investments that could result in the Fund underperforming similar funds that do not have an environmental focus. Investments in smaller capitalization companies generally carry greater risk than is customarily associated with larger companies for various reasons such as narrower markets, limited financial resources and less liquid stock. Investments in foreign securities entail certain risks not associated with investments in domestic securities, such as volatility of currency exchange rates, and in some cases, political and economic instability and relatively illiquid markets. These risks are greater for investments in emerging markets.
Fund holdings and sector allocations are subject to change and should not be considered a recommendation to buy or sell any security. For a complete list of fund holdings, please refer to the Schedule of Investments provided in this report.
Definitions for terms and indices are provided in the Glossary of Terms.
www.brownadvisoryfunds.com
18
Brown Advisory Sustainable Growth Fund
Performance Chart and Analysis
June 30, 2015
COMPARISON OF CHANGE IN VALUE OF A $10,000 INVESTMENT
The following chart reflects the change in value of a hypothetical $10,000 investment, including reinvested dividends and distributions, in the Fund as measured against a broad-based securities market index. The Russell 1000® Growth Index measures the performance of the large-cap growth segment of the U.S. equity universe. It includes those Russell 1000® companies with higher price to book and higher forecasted growth values. The index is unmanaged and does not reflect the deduction of fees, such as investment management fees. Investors cannot invest directly in an index.
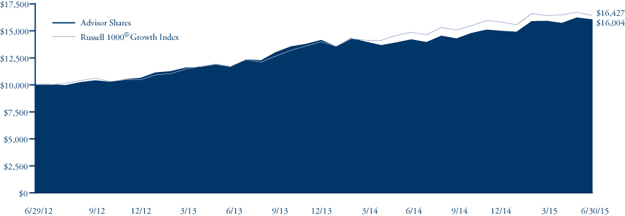
| Since | ||||
| Average Annual Total Return | One | Inception | ||
| as of 6/30/15 | Year | (6/29/12) | ||
| Institutional Shares | 13.50% | 17.42% | ||
| Investor Shares | 13.34% | 17.22% | ||
| Advisor Shares | 13.03% | 16.95% | ||
Russell 1000® Growth Index | 10.56% | 17.97% |
| Institutional Shares | Investor Shares | Advisor Shares | ||
Gross Expense Ratio1 | 0.77% | 0.92% | 1.17% | |
Net Expense Ratio1 | 0.77% | 0.92% | 1.17% |
Past performance does not guarantee future results. The performance data quoted represents past performance and current returns may be lower or higher. The investment return and net asset value will fluctuate so that an investor’s shares, when redeemed, may be worth more or less than the original cost. To obtain performance information current to the most recent month end, please visit our website at brownadvisoryfunds.com/performance.html. The performance table and graph above do not reflect the deduction of taxes that a shareholder would pay on Fund distributions or the redemption of Fund shares. Performance data does not reflect the imposition of the redemption fee of 1.00% on shares redeemed within 14 days, and if it did, performance would have been lower.
| 1 | Per the Fund’s prospectus dated October 31, 2014. |
www.brownadvisoryfunds.com
19
Brown Advisory Sustainable Growth Fund
Schedule of Investments
June 30, 2015
| Shares | Security Description | Value $ | |||||
| Common Stocks — 96.2% | |||||||
| Consumer Discretionary — 17.4% | |||||||
| 19,421 | Amazon.com, Inc.* | 8,430,462 | |||||
| 7,435 | Chipotle Mexican Grill, Inc.* | 4,498,100 | |||||
| 63,912 | Delphi Automotive PLC | 5,438,272 | |||||
| 67,492 | Nike, Inc. | 7,290,486 | |||||
| 136,650 | Starbucks Corp. | 7,326,490 | |||||
| 72,299 | TJX Companies, Inc. | 4,784,025 | |||||
| 37,767,835 | |||||||
| Health Care — 16.1% | |||||||
| 28,090 | Alexion Pharmaceuticals, Inc.* | 5,077,829 | |||||
| 98,077 | Bristol-Myers Squibb Co. | 6,526,044 | |||||
| 90,438 | Cerner Corp.* | 6,245,648 | |||||
| 67,684 | IDEXX Laboratories, Inc.* | 4,341,252 | |||||
| 74,735 | Novo Nordisk A.S. | 4,092,489 | |||||
| 66,274 | Thermo Fisher Scientific, Inc. | 8,599,714 | |||||
| 34,882,976 | |||||||
| Industrials — 29.3% | |||||||
| 104,603 | A. O. Smith Corp. | 7,529,324 | |||||
| 26,193 | Acuity Brands, Inc. | 4,714,216 | |||||
| 72,171 | Canadian National Railway Co. | 4,167,875 | |||||
| 104,158 | Danaher Corp. | 8,914,883 | |||||
| 51,981 | J.B. Hunt Transport Services, Inc. | 4,267,120 | |||||
| 36,406 | Middleby Corp.* | 4,085,846 | |||||
| 40,337 | Pall Corp. | 5,019,940 | |||||
| 59,224 | Stericycle, Inc.* | 7,930,686 | |||||
| 113,961 | Verisk Analytics, Inc.* | 8,291,802 | |||||
| 89,861 | Westinghouse Air Brake Technologies Corp. | 8,468,501 | |||||
| 63,390,193 | |||||||
| Information Technology — 30.0% | |||||||
| 83,772 | Akamai Technologies, Inc.* | 5,848,961 | |||||
| 39,739 | Apple, Inc. | 4,984,264 | |||||
| 79,093 | Arm Holdings PLC ADR | 3,896,912 | |||||
| 102,353 | Facebook, Inc.* | 8,778,305 | |||||
| 8,653 | Google, Inc. — Class A* | 4,672,966 | |||||
| 3,267 | Google, Inc. — Class C* | 1,700,506 | |||||
| 58,134 | Intuit, Inc. | 5,858,163 | |||||
| 66,659 | NXP Semiconductors NV* | 6,545,914 | |||||
| 76,850 | salesforce.com, Inc.* | 5,351,066 | |||||
| 125,626 | TE Connectivity, Ltd. | 8,077,752 | |||||
| 135,625 | Visa, Inc. | 9,107,219 | |||||
| 64,822,028 | |||||||
| Materials — 3.4% | |||||||
| 52,109 | Ecolab, Inc. | 5,891,964 | |||||
| 12,358 | Praxair, Inc. | 1,477,399 | |||||
| 7,369,363 | |||||||
| Total Common Stocks (Cost $141,729,276) | 208,232,395 | ||||||
| Short-Term Investments — 3.9% | |||||||
| Money Market Funds — 3.9% | |||||||
| 8,340,722 | DWS Cash Account Trust — Government | ||||||
| & Agency Securities Portfolio — | |||||||
| Institutional Shares, 0.04%# | 8,340,722 | ||||||
| Total Short-Term Investments (Cost $8,340,722) | 8,340,722 | ||||||
| Total Investments — 100.1% (Cost $150,069,998) | 216,573,117 | ||||||
| Liabilities in Excess of Other Assets — (0.1)% | (168,483 | ) | |||||
| NET ASSETS — 100.0% | $ | 216,404,634 | |||||
PORTFOLIO HOLDINGS
% of Net Assets
| Information Technology | 30.0% |
| Industrials | 29.3% |
| Consumer Discretionary | 17.4% |
| Health Care | 16.1% |
| Money Market Funds | 3.9% |
| Materials | 3.4% |
| Other Assets and Liabilities | (0.1)% |
| 100.0% |
ADR — American Depositary Receipt
| * | Non-Income Producing |
| # | Annualized seven-day yield as of June 30, 2015. |
The accompanying notes are an integral part of these financial statements.
www.brownadvisoryfunds.com
20
Brown Advisory Small-Cap Growth Fund
A Message to Our Shareholders
June 30, 2015
Dear Shareholder:
During the year ended June 30, 2015, the Brown Advisory Small-Cap Growth Fund Investor Shares (the “Fund”) rose 12.86% in value. During the same period, the Russell 2000® Growth Index, the Fund’s benchmark, increased 12.34%.
Driven by modest improvement in the U.S. economy and highly accommodative Federal Reserve monetary policy (i.e., zero percent interest rates), small-cap equities extended their long-term run. While earnings growth has been supportive, multiple expansion has played a large part in the recent market appreciation. With a dearth of sustained growth in the developed world and unappealing return on what are perceived to be safer assets, investors have been increasingly willing to pay a higher and higher price for the shares of companies that have secular growth dynamics. Furthermore, merger and acquisition activity has remained robust, which historically has been supportive of the relative valuation of small-cap equities and their absolute and relative returns.
While the overall environment for smaller growth companies has been exceptionally favorable of late, we constantly remind ourselves that, in the world of equity prices, it is change at the margin that matters most. For this reason, we remain diligent in understanding the expectations embedded in the individual stocks we own and those that fall into our extensive new idea pipeline. A core tenet of this strategy has always been to drive return through individual stock selection against a specific investment thesis, but to maintain discipline around diversification and valuation dynamics to ensure that we have the potential to achieve the best risk-adjusted returns possible.
Heading into fiscal year 2016, we are wholly focused on the things we can control. First, we continue to build out the top of our idea funnel via hundreds of company management interactions per quarter. It is likely that the number of companies we know and understand deeply that we do not own has never been higher. Secondly, we continue to stress test the portfolio in seeking to ensure that our original investment theses remain intact and that we are incremental buyers over the long-term. And third, we remain committed to driving a collaborative process that takes advantage of the breadth of knowledge across our entire research team and the robust investment network possessed by our firm. By focusing on these process elements, we are hopeful that we are not only positioned to do well in strong equity markets, but we have the potential to capitalize on opportunities and perform relatively well should more volatile market times lay ahead.
During the past year, portfolio returns were driven entirely by security selection, while sector allocation remained a headwind. The primary detractor at the subsector level was our meaningful underweight in biotechnology. Importantly, however, our stock picking in the vertical has been strong, with two of our top five performers coming from the area. In such a high-risk area, our goal is to positively skew the outcome set by setting a high hurdle for scientific efficacy backed by strong data, the size of the addressable market opportunity, balance sheet strength, management acumen and pipeline value, if applicable. As always, we tend to emphasize the companies we own and spend less time focusing on what the benchmark owns, in keeping with our non-benchmark-oriented philosophy.
Overall, sector allocation did not change dramatically during the past year. We were overweight in industrials and information technology, and underweight in consumer discretionary, energy, health care and materials. At times, the Global Industry Classification Standard (GICS) methodology does not necessarily align with our internal view of the appropriate sector designations for our holdings. When making our internal adjustments, our weighting in consumer discretionary, health care and financials increases, while our weighting in information technology and industrials decreases. We believe that the portfolio remains relatively eclectic and diverse despite its above-average concentration as measured by the weight of our top 10 holdings and the total number of positions owned.
Our top and bottom contributors for the year were spread across many sectors, with no particular sector driving performance on either side of the ledger. Fair Isaac Corporation was the largest contributor to performance. The company put up solid results with a positive forward outlook. Fair Isaac’s management team has executed well against its long-term plan to drive the “consumerization” of its FICO score product and to increase the proportion of its business sold on a subscription basis. MAXIMUS, a multiyear holding, was the second largest contributor. The company reported solid, double-digit growth, as numerous states and some international governments outsourced the administration of their health care and human services programs. Receptos, a clinical-stage biopharmaceutical company, had excellent returns during the period due to strong clinical data supporting its multiple sclerosis franchise. Broadridge, the fund’s largest holding, and Dyax Corp., an earlier-stage biotechnology company, rounded out the Fund’s top-five contributors for the trailing 12 months.
www.brownadvisoryfunds.com
21
Brown Advisory Small-Cap Growth Fund
A Message to Our Shareholders
June 30, 2015
There was no apparent theme to the detractors for the trailing 12 months. Helix Energy Solutions, a leader in well intervention services, declined with the price of oil. Fortunately, we exited the majority of our position at relatively attractive prices, muting the negative impact of our lone energy holding. Interactive Intelligence, a leading contact center software company, pulled back approximately 20% as it continues to transition its revenue model from license to subscription, which is a long-term positive but optically negative in the short run. E2 Open, a relatively small position, saw its revenue outlook impaired as three meaningful customers were acquired, leading to the loss of their business. Ascent Capital Group, a home security company, and Applied Micro Circuits, a semiconductor holding, made up the remainder of our bottom five contributors.
We added a number of new holdings during the past year, which reflects a healthy pipeline driven by a productive team effort. The recent additions replaced companies that were eliminated due to merger and acquisition activity, lower conviction in our original investment thesis or attainment of our long-term price objectives. The period turnover was relatively low, consistent with our history and in line with our desire to be business owners and not stock traders.
In sum, we have been heavily engaged in due diligence over the past year, conducting face-to-face meetings with the management teams of the majority of our portfolio companies along with dozens of other companies that we are considering as potential new ideas for the portfolio. We seek companies that offer us the potential for growth (through large and/or growing end markets and a differentiated product, service or business model), the potential for sustainable results (through favorable competitive positioning and/or strong management), and the potential for value creation (through high or improving margins and capital efficiency). We look to purchase these businesses at what we believe are attractive prices when we have a non-consensus view. We will maintain this discipline going forward as we strive for competitive risk-adjusted returns across the small-cap growth asset class.
Sincerely,
Christopher A. Berrier
Portfolio Manager
Past performance is not a guarantee of future results.
Mutual fund investing involves risk. Principal loss is possible. Investments in smaller companies generally carry greater risk than is customarily associated with larger companies for various reasons such as narrower markets, limited financial resources and less liquid stock. The value of the Fund’s investments in REITs may change in response to changes in the real estate market such as declines in the value of real estate, lack of available capital or financing opportunities, and increases in property taxes or operating costs. The Fund may invest in ETFs, which may trade at a discount to the aggregate value of the underlying securities and although expense ratios for ETFs are generally low, frequent trading of ETFs by the Fund can generate brokerage expenses. Earnings growth is not representative of the fund’s future performance. Diversification does not assure a profit, nor does it protect against a loss in a declining market. Investments in foreign securities entail certain risks not associated with investments in domestic securities, such as volatility of currency exchange rates, and in some cases, political and economic instability and relatively illiquid markets. These risks are greater for investments in emerging markets. Privately Placement issued securities are restricted securities that are not publicly traded. Delay or difficulty in selling such securities may result in a loss to the Fund.
Fund holdings and sector allocations are subject to change and should not be considered a recommendation to buy or sell any security. For a complete list of fund holdings, please refer to the Schedule of Investments provided in this report.
Definitions for terms and indices are provided in the Glossary of Terms.
www.brownadvisoryfunds.com
22
Brown Advisory Small-Cap Growth Fund
Performance Chart and Analysis
June 30, 2015
COMPARISON OF CHANGE IN VALUE OF A $10,000 INVESTMENT
The following chart reflects the change in value of a hypothetical $10,000 investment, including reinvested dividends and distributions, in the Fund compared with the broad-based securities market index. The Russell 2000® Growth Index (“Index”) measures the performance of the small-cap growth segment of the U.S. equity universe. It includes those Russell 2000® companies with higher price to book value ratios and higher forecasted growth values. The Index is unmanaged and does not reflect the deduction of fees, such as investment management fees. Investors cannot invest directly in an index.
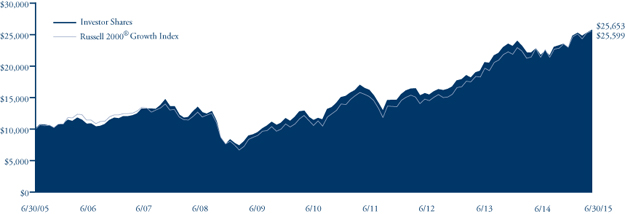
| Average Annual Total Return | One | Five | Ten | ||
| as of 6/30/15 | Year | Year | Year | ||
| Institutional Shares | 12.98% | 17.84% | 9.76% | ||
| Investor Shares | 12.86% | 17.74% | 9.88% | ||
Advisor Shares1 | 12.54% | 17.36% | 9.45% | ||
Russell 2000® Growth Index | 12.34% | 19.33% | 9.86% |
| Institutional Shares | Investor Shares | Advisor Shares | ||
Gross Expense Ratio2 | 1.01% | 1.16% | 1.41% | |
Net Expense Ratio2 | 1.01% | 1.16% | 1.41% |
Past performance does not guarantee future results. The performance data quoted represents past performance and current returns may be lower or higher. The investment return and net asset value will fluctuate so that an investor’s shares, when redeemed, may be worth more or less than the original cost. To obtain performance information current to the most recent month end, please visit our website at brownadvisoryfunds.com/performance.html. The performance table and graph above do not reflect the deduction of taxes that a shareholder would pay on Fund distributions or the redemption of Fund shares. Investment performance reflects periods during which fee waivers were in effect. In the absence of such waivers, total return would have been reduced. Performance data does not reflect the imposition of the redemption fee of 1.00% on shares redeemed within 14 days, and if it did, performance would have been lower.
| 1 | Performance information for Advisor Shares, prior to commencement of operations on April 25, 2006, is based on the performance of Investor Shares, and adjusted for the higher expenses applicable to Advisor Shares. |
| 2 | Per the Fund’s prospectus dated October 31, 2014. |
www.brownadvisoryfunds.com
23
Brown Advisory Small-Cap Growth Fund
Schedule of Investments
June 30, 2015
| Shares | Security Description | Value $ | |||||
| Common Stocks — 94.9% | |||||||
| Consumer Discretionary — 6.9% | |||||||
| 61,580 | 2U, Inc.* | 1,982,260 | |||||
| 81,315 | Ascent Capital Group, Inc.* | 3,475,403 | |||||
| 75,516 | Black Diamond, Inc.* | 697,768 | |||||
| 115,927 | Bright Horizons Family Solutions, Inc.* | 6,700,581 | |||||
| 14,328 | CoStar Group, Inc.* | 2,883,653 | |||||
| 27,971 | Krispy Kreme Doughnuts, Inc.* | 538,722 | |||||
| 98,111 | Liberty TripAdvisor Holdings, Inc.* | 3,161,136 | |||||
| 19,439,523 | |||||||
| Consumer Staples — 2.1% | |||||||
| 25,459 | PriceSmart, Inc. | 2,322,879 | |||||
| 45,058 | Treehouse Foods, Inc.* | 3,651,050 | |||||
| 5,973,929 | |||||||
| Financials — 6.8% | |||||||
| 118,440 | Capitol Acquisition Corp. II* | 1,249,542 | |||||
| 84,020 | City National Corp. | 7,594,568 | |||||
| 125,571 | ConnectOne Bancorp, Inc. | 2,703,543 | |||||
| 60,883 | Patriot National, Inc.* | 974,128 | |||||
| 115,246 | Prosperity Bancshares, Inc. | 6,654,304 | |||||
| 19,176,085 | |||||||
| Health Care — 15.9% | |||||||
| 47,772 | Acceleron Pharma, Inc.* | 1,511,506 | |||||
| 14,976 | Alder Biopharmaceuticals, Inc.* | 793,279 | |||||
| 49,373 | Cardiovascular Systems, Inc.* | 1,305,916 | |||||
| 87,875 | Charles River Laboratories International, Inc.* | 6,181,127 | |||||
| 37,948 | Coherus BioSciences, Inc.* | 1,096,697 | |||||
| 118,191 | Dyax Corp.* | 3,132,062 | |||||
| 9,348 | Endologix, Inc.* | 143,398 | |||||
| 41,741 | Henry Schein, Inc.* | 5,932,231 | |||||
| 71,248 | IDEXX Laboratories, Inc.* | 4,569,847 | |||||
| 28,605 | Incyte Corp.* | 2,980,927 | |||||
| 12,778 | Laboratory Corp. of America Holdings* | 1,548,949 | |||||
| 59,179 | Medidata Solutions, Inc.* | 3,214,603 | |||||
| 139,906 | Novadaq Technologies, Inc.* | 1,694,262 | |||||
| 66,197 | Omeros Corp.* | 1,190,884 | |||||
| 19,414 | Receptos, Inc.* | 3,689,631 | |||||
| 2,174 | Teladoc, Inc.* | 41,306 | |||||
| 19,506 | Ultragenyx Pharmaceutical, Inc.* | 1,997,219 | |||||
| 89,038 | WuXi PharmaTech, Inc. ADR* | 3,762,746 | |||||
| 44,786,590 | |||||||
| Industrials — 24.9% | |||||||
| 94,398 | Advisory Board Company* | 5,160,739 | |||||
| 86,371 | CEB, Inc. | 7,519,459 | |||||
| 40,552 | Colfax Corp.* | 1,871,475 | |||||
| 92,339 | DigitalGlobe, Inc.* | 2,566,101 | |||||
| 91,085 | ESCO Technologies, Inc. | 3,407,490 | |||||
| 96,360 | Healthcare Services Group, Inc. | 3,184,698 | |||||
| 90,850 | HEICO Corp. | 5,296,555 | |||||
| 123,191 | Hexcel Corp. | 6,127,520 | |||||
| 66,630 | IDEX Corp. | 5,235,785 | |||||
| 189,487 | Knight Transportation, Inc. | 5,066,882 | |||||
| 80,274 | Landstar System, Inc. | 5,367,922 | |||||
| 108,849 | Roadrunner Transportation Systems, Inc.* | 2,808,304 | |||||
| 75,922 | Team, Inc.* | 3,055,861 | |||||
| 204,881 | Waste Connections, Inc. | 9,653,993 | |||||
| 68,504 | Woodward, Inc. | 3,767,035 | |||||
| 70,089,819 | |||||||
| Information Technology — 36.7% | |||||||
| 89,582 | Blackbaud, Inc. | 5,101,695 | |||||
| 200,148 | Broadridge Financial Solutions, Inc. | 10,009,401 | |||||
| 202,103 | BroadSoft, Inc.* | 6,986,701 | |||||
| 55,784 | Cavium, Inc.* | 3,838,497 | |||||
| 130,442 | CoreLogic, Inc.* | 5,177,243 | |||||
| 23,871 | Demandware, Inc.* | 1,696,751 | |||||
| 75,042 | Electronics For Imaging, Inc.* | 3,265,077 | |||||
| 91,797 | Fair Isaac Corp. | 8,333,332 | |||||
| 211,056 | Genpact, Ltd.* | 4,501,824 | |||||
| 18,236 | Global Payments, Inc. | 1,886,514 | |||||
| 109,798 | HomeAway, Inc.* | 3,416,914 | |||||
| 83,453 | Informatica Corp.* | 4,044,967 | |||||
| 196,643 | Interactive Intelligence Group, Inc.* | 8,744,714 | |||||
| 113,113 | M/A-COM Technology Solutions Holdings, Inc.* | 4,326,572 | |||||
| 125,587 | MAXIMUS, Inc. | 8,254,834 | |||||
| 28,289 | Monotype Imaging Holdings, Inc. | 682,048 | |||||
| 169,725 | Pegasystems, Inc. | 3,885,005 | |||||
| 21,247 | SPS Commerce, Inc.* | 1,398,053 | |||||
| 99,567 | Synchronoss Technologies, Inc.* | 4,553,199 | |||||
| 33,500 | Ultimate Software Group, Inc.* | 5,505,390 | |||||
| 31,850 | WEX, Inc.* | 3,629,944 | |||||
| 188,028 | Xoom Corp.* | 3,958,930 | |||||
| 103,197,605 | |||||||
| Telecommunication Services — 1.6% | |||||||
| 134,749 | Cogent Communications Holdings, Inc. | 4,559,906 | |||||
| Total Common Stocks (Cost $173,277,727) | 267,223,457 | ||||||
| Private Placements — 0.9% | |||||||
| 18,000 | Greenspring Global Partners IV-B, L.P.*†^ | 2,557,825 | |||||
| 74,769 | Greenspring Global Partners V-B, L.P.*†~ | 107,782 | |||||
| Total Private Placements (Cost $764,907) | 2,665,607 | ||||||
The accompanying notes are an integral part of these financial statements.
www.brownadvisoryfunds.com
24
Brown Advisory Small-Cap Growth Fund
Schedule of Investments
June 30, 2015
| Shares | Security Description | Value $ | |||||
| Short-Term Investments — 4.6% | |||||||
| Money Market Funds — 4.6% | |||||||
| 12,768,180 | DWS Cash Account Trust — Government | ||||||
| & Agency Securities Portfolio — | |||||||
| Institutional Shares, 0.04%# | 12,768,180 | ||||||
| Total Short-Term Investments (Cost $12,768,180) | 12,768,180 | ||||||
| Total Investments — 100.4% (Cost $186,810,814) | 282,657,244 | ||||||
| Liabilities in Excess of Other Assets — (0.4)% | (1,042,788 | ) | |||||
| NET ASSETS — 100.0% | $ | 281,614,456 | |||||
PORTFOLIO HOLDINGS
% of Net Assets
| Information Technology | 36.7% |
| Industrials | 24.9% |
| Health Care | 15.9% |
| Consumer Discretionary | 6.9% |
| Financials | 6.8% |
| Money Market Funds | 4.6% |
| Consumer Staples | 2.1% |
| Telecommunication Services | 1.6% |
| Private Placements | 0.9% |
| Other Assets and Liabilities | (0.4)% |
| 100.0% |
ADR — American Depositary Receipt
| * | Non-Income Producing |
| ^ | Security is exempt from registration under Regulation D of the Securities Act of 1933. Security is fair valued under the supervision of the Board of Trustees and was acquired from February 2008 to February 2015 as part of a $2,000,000 capital commitment. At June 30, 2015, $1,800,000 of the capital commitment has been fulfilled by the Fund. |
| ~ | Security is exempt from registration under Regulation D of the Securities Act of 1933. Security is fair valued under the supervision of the Board of Trustees and was acquired from October 2012 to June 2015 as part of a $100,000 capital commitment. At June 30, 2015, $74,769 of the capital commitment has been fulfilled by the Fund. |
| † | All or a portion of this security is considered illiquid. At June 30, 2015, the total market value of securities considered illiquid was $2,665,607 or 0.9% of net assets. |
| # | Annualized seven-day yield as of June 30, 2015. |
The accompanying notes are an integral part of these financial statements.
www.brownadvisoryfunds.com
25
Brown Advisory Small-Cap Fundamental Value Fund
A Message to Our Shareholders
June 30, 2015
Dear Shareholder:
During the year ended June 30, 2015, the Brown Advisory Small-Cap Fundamental Value Fund Investor Shares (the “Fund”) increased 3.90% in value. During the same period, the Russell 2000® Value Index, the Fund’s benchmark, increased 0.78%.
For the year ended June 30, 2015, the Fund’s relative outperformance resulted from a combination of strong absolute performance in consumer discretionary (up 21%) and consumer staples (up 36%) as well as meaningful stock selection in energy, information technology and financials. Despite being underweight in the financials (31% vs. 40%) and consumer staples (1.9% vs. 2.7%) sectors, the Fund outperformed its benchmark.
Denny’s was the Fund’s largest individual contributor to performance during the year. Denny’s reported improving same-store sales as the year progressed, as the company’s remodel program and new advertising campaign drove increasing traffic to its restaurants. The company raised 2014 guidance after its third-quarter report, and the management team has continued to return money to shareholders through an aggressive share-repurchase program. From the start of the year through the end of September 2014, Denny’s bought back 6% of its outstanding shares. Core-Mark and Broadridge also contributed to returns, with both benefiting from solid operational performance and commendable capital-allocation decisions.
The largest detractor from performance was RigNet. Recall, one year ago, RigNet was the Fund’s largest contributor. Over the past year, RigNet fell because of the declining price of oil and geopolitical unrest. EnPro Industries also fell during the period as the company felt the impact from energy end markets slowing.
The fund added 14 new names over the course of the year. Sizeable additions included Diamond Resorts, Clearwater Paper and Cash America. Diamond Resorts is a timeshare and hospitality services company that makes money in three ways: managing resorts, selling vacation ownership interests (timeshares) and financing the sales of the vacation ownership interests (VOIs). Diamond was formed in 2007 when timeshare veteran Stephen Cloobeck and his company Diamond Resorts LLC, in partnership with Soros Strategic Partners, took private the Sunterra Corp. Sunterra was a troubled company that went through bankruptcy and an accounting scandal. After these issues, Stephen Cloobeck removed all remaining Sunterra management, naming David Palmer as president and CEO, and hired current CFO Alan Bentley. Both David and Alan have previous experience working with and restructuring distressed companies. The new owners cleaned up the business, reduced leverage and took it public as Diamond in 2013. We believe that the stock is undervalued at 7x EBITDA and a high single-digit free cash flow (FCF) yield. The low valuation is partly because the timeshare industry overall, and Diamond in particular, suffers from negative perceptions due to the history of bad actors in the space. We believe this is misplaced in the case of Diamond, as its current management team has demonstrated its commitment to cleaning up the mess of the old Sunterra. More importantly, we believe that Diamond’s cash flows deserve a considerably higher valuation due to the nature of its management contracts (cost-plus arrangements with homeowners associations, none of which has ever been terminated), inventory-light model (Diamond does not need to build new resorts to grow) and large net-operating loss balance. We see a number of potential catalysts ahead that may close the valuation gap, including the upcoming spin-off of Starwood’s timeshare business later in 2015 that should further focus investors’ attention on the space.
Clearwater is a leading North American producer of private-label tissue and paperboard products. We believe that Clearwater is on the verge of seeing significant margin expansion and growth in free cash flow that is currently underappreciated by the market today. The management team at Clearwater has done an admirable job utilizing the cash flows from its strong paperboard platform to develop a leading private-label tissue business in the predictable and relatively consolidated North American market. We believe that completion of its Shelby, N.C., through air dried facility is a significant catalyst for Clearwater for a number of reasons: the new capacity may allow it to close the “quality gap” with the branded manufacturers and still maintain lower prices; it enhances the existing platform to gain increasing market share from consumer acceptance of quality private-label products; it yields operational efficiencies that have the potential to help drive margins closer to long-term targets (15-17%); and it sets up an inflection point in free cash flow growth and return of capital to shareholders as capex drops by 60% from 2012 levels.
Cash America International is one of the largest pawn lenders in the United States, with nearly $265 million in pawn loan balances across 21 states and 860 lending locations. In October 2014, the company announced its intention to spin out its legacy e-commerce lending segment Enova into a separate publically traded company. We believe that the spin created a near pure play pawn lender in CSH which, in our opinion, generates more stable free cash flow and faces less regulatory risk than its e-commerce counterpart. This follows several recent strategic exits from other non-core markets. The company could be in a net cash position following the sale of its remaining 20% stake in the spin-co which, in conjunction with strong free cash flow generation, has the potential to allow the company to begin a more meaningful return of capital. At the time we established our initial position, CSH was trading at less than 6x 2015E adjusted EBITDA, well below close peer comparables.
www.brownadvisoryfunds.com
26
Brown Advisory Small-Cap Fundamental Value Fund
A Message to Our Shareholders
June 30, 2015
During the year, there were nine deletions from the Fund’s portfolio, three of which were a result of corporate actions. We sold Susser Petroleum after the announcement of the Susser Holdings transaction with Energy Transfer Partners. NorthStar Realty Finance Corp completed its announced spin-off on July 1 of NorthStar Asset Management, and we sold our remaining stake in the realty-finance company to increase our position in the new asset-management spin-off. GFI Group was subject to a bidding war between CME Group and BGC Partners, and we sold our position in excess of the current buyout offer as market participants began speculating.
While valuations have risen over the long-term, the rapid ascent from the lows during the second half of 2014 is especially remarkable. Valuation multiples have increased from less than 8.5x to nearly 10.0x. This is due to a 12% rise in share prices and to reduced expectations for operating performance in 2015. As part of our portfolio management process, we remain mindful of the risks (and short opportunities) associated with higher valuations. We are tracking the higher prices and will trim positions when appropriate. Despite the rise in equity prices, we believe that our pipeline is strong and should allow us to continue to seek out attractive investment opportunities.
Sincerely,
J. David Schuster
Portfolio Manager
Past performance is not a guarantee of future results.
Investments in smaller companies generally carry greater risk than is customarily associated with larger companies for various reasons such as narrower markets, limited financial resources and less liquid stock. The value of the Fund’s investments in REITs may change in response to changes in the real estate market such as declines in the value of real estate, lack of available capital or financing opportunities, and increases in property taxes or operating costs. The Fund may invest in ETFs, which may trade at a discount to the aggregate value of the underlying securities and although expense ratios for ETFs are generally low, frequent trading of ETFs by the Fund can generate brokerage expenses. Investments in debt securities typically decrease in value when interest rates rise. This risk is usually greater for longer-term debt securities. Investments in foreign securities entail certain risks not associated with investments in domestic securities, such as volatility of currency exchange rates, and in some cases, political and economic instability and relatively illiquid markets. The risks of investments in derivatives, including options, futures contracts and options on futures contracts include imperfect correlation between the value of these instruments and the underlying assets; risks of default by the other party to the derivative transactions; risks that the transactions may result in losses that partially or completely offset gains in portfolio positions; and risks that the derivative transactions may not be liquid. Private Placement issued securities are restricted securities that are not publicly traded. Delay or difficulty in selling such securities may result in a loss to the Fund.
Fund holdings and sector allocations are subject to change and should not be considered a recommendation to buy or sell any security. For a complete list of fund holdings, please refer to the Schedule of Investments provided in this report.
Definitions for terms and indices are provided in the Glossary of Terms.
www.brownadvisoryfunds.com
27
Brown Advisory Small-Cap Fundamental Value Fund
Performance Chart and Analysis
June 30, 2015
COMPARISON OF CHANGE IN VALUE OF A $10,000 INVESTMENT
The following chart reflects the change in value of a hypothetical $10,000 investment, including reinvested dividends and distributions, in the Fund as measured against a broad-based securities market index. The Russell 2000® Value Index (“Index”) measures the performance of small-cap value segment of the U.S. equity universe. It includes those Russell 2000® companies with lower price to book ratios and lower forecasted growth values. The Index is unmanaged and does not reflect the deduction of fees, such as investment management fees. Investors cannot invest directly in an index.
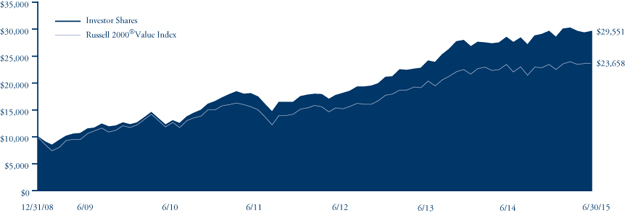
| Since | |||||
| Average Annual Total Return | One | Five | Inception | ||
| as of 6/30/15 | Year | Year | (12/31/08) | ||
Institutional Shares1 | 4.04% | 19.62% | 18.33% | ||
| Investor Shares | 3.90% | 19.45% | 18.15% | ||
Advisor Shares2 | 3.61% | 19.15% | 17.86% | ||
Russell 2000® Value Index | 0.78% | 14.81% | 14.17% |
| Institutional Shares | Investor Shares | Advisor Shares | ||
Gross Expense Ratio3 | 1.08% | 1.23% | 1.48% | |
Net Expense Ratio3 | 1.08% | 1.23% | 1.48% |
Past performance does not guarantee future results. The performance data quoted represents past performance and current returns may be lower or higher. The investment return and net asset value will fluctuate so that an investor’s shares, when redeemed, may be worth more or less than the original cost. To obtain performance information current to the most recent month end, please visit our website at brownadvisoryfunds.com/performance.html. The performance table and graph above do not reflect the deduction of taxes that a shareholder would pay on Fund distributions or the redemption of Fund shares. Investment performance reflects periods during which fee waivers were in effect. In the absence of such waivers, total return would have been reduced. Performance data does not reflect the imposition of the redemption fee of 1.00% on shares redeemed within 14 days, and if it did, performance would have been lower.
| 1 | Performance information for the Institutional Shares, prior to commencement of operations on October 19, 2012, is based on the performance of Investor Shares, and adjusted for the lower expenses applicable to Institutional Shares. |
| 2 | Performance information for Advisor Shares, prior to commencement on July 28, 2011, is based on the performance of Investor Shares, and adjusted for the higher expenses applicable to Advisor Shares. |
| 3 | Per the Fund’s prospectus dated October 31, 2014. |
www.brownadvisoryfunds.com
28
Brown Advisory Small-Cap Fundamental Value Fund
Schedule of Investments
June 30, 2015
| Shares | Security Description | Value $ | |||||
| Common Stocks — 92.9% | |||||||
| Consumer Discretionary — 14.0% | |||||||
| 256,965 | Ascent Capital Group, Inc.* | 10,982,684 | |||||
| 330,753 | Cato Corp | 12,819,986 | |||||
| 469,546 | Core-Mark Holding Co., Inc. | 27,820,600 | |||||
| 322,396 | Culp, Inc. | 9,994,276 | |||||
| 1,935,431 | Denny’s Corp.* | 22,470,354 | |||||
| 617,676 | Destination Maternity Corp. | 7,202,102 | |||||
| 721,583 | Diamond Resorts International, Inc.* | 22,765,944 | |||||
| 211,808 | Starz, Inc.* | 9,472,054 | |||||
| 123,528,000 | |||||||
| Consumer Staples — 1.3% | |||||||
| 124,292 | Casey’s General Stores, Inc. | 11,899,716 | |||||
| Energy — 4.5% | |||||||
| 182,986 | Bristow Group, Inc. | 9,753,154 | |||||
| 455,350 | Exterran Holdings, Inc. | 14,867,177 | |||||
| 493,714 | RigNet, Inc.* | 15,092,837 | |||||
| 39,713,168 | |||||||
| Financials — 30.4% | |||||||
| 1,843,664 | American Capital, Ltd.* | 24,981,647 | |||||
| 479,907 | American Equity Investment Life Holding Co. | 12,947,891 | |||||
| 271,373 | Assurant, Inc. | 18,181,991 | |||||
| 559,314 | Capitol Federal Financial, Inc. | 6,734,141 | |||||
| 825,161 | Cash America International, Inc. | 21,610,967 | |||||
| 167,565 | Farmers Capital Bank Corp.* | 4,763,873 | |||||
| 987,431 | Forest City Enterprises, Inc.* | 21,822,225 | |||||
| 645,626 | Maiden Holdings, Ltd. | 10,187,978 | |||||
| 355,615 | Medley Management, Inc.† | 4,210,482 | |||||
| 479,907 | National General Holdings Corp. | 9,996,463 | |||||
| 858,996 | NorthStar Asset Management Group, Inc. | 15,882,836 | |||||
| 336,520 | OceanFirst Financial Corp.† | 6,276,098 | |||||
| 769,917 | Oritani Financial Corp. | 12,357,168 | |||||
| 303,823 | Pacific Premier Bancorp, Inc.* | 5,152,838 | |||||
| 307,966 | Patriot National, Inc.* | 4,927,456 | |||||
| 263,085 | Renasant Corp. | 8,576,571 | |||||
| 173,650 | StanCorp Financial Group, Inc. | 13,129,676 | |||||
| 1,039,911 | Synovus Financial Corp. | 32,050,057 | |||||
| 2,037,698 | TFS Financial Corp.† | 34,274,080 | |||||
| 268,064,438 | |||||||
| Health Care — 2.8% | |||||||
| 147,080 | Addus HomeCare Corp.* | 4,097,649 | |||||
| 497,170 | Air Methods Corp.* | 20,553,008 | |||||
| 24,650,657 | |||||||
| Industrials — 15.4% | |||||||
| 797,542 | Albany International Corp.† | 31,742,172 | |||||
| 508,214 | DigitalGlobe, Inc.* | 14,123,267 | |||||
| 539,600 | EnPro Industries, Inc. | 30,875,912 | |||||
| 883,855 | Federal Signal Corp. | 13,178,278 | |||||
| 393,712 | Kadant, Inc. | 18,583,207 | |||||
| 579,338 | McGrath RentCorp | 17,629,255 | |||||
| 292,085 | Thermon Group Holdings, Inc.* | 7,030,486 | |||||
| 90,370 | TriMas Corp.* | 2,674,952 | |||||
| 135,837,529 | |||||||
| Information Technology — 13.1% | |||||||
| 473,657 | Broadridge Financial Solutions, Inc. | 23,687,586 | |||||
| 266,081 | CoreLogic, Inc.* | 10,560,755 | |||||
| 838,973 | CTS Corp.† | 16,167,010 | |||||
| 65,598 | DST Systems, Inc. | 8,264,036 | |||||
| 604,198 | EchoStar Corp.* | 29,412,359 | |||||
| 349,397 | Electro Rent Corp. | 3,794,451 | |||||
| 187,083 | MAXIMUS, Inc. | 12,296,966 | |||||
| 169,174 | MTS Systems Corp. | 11,664,547 | |||||
| 115,847,710 | |||||||
| Materials — 9.0% | |||||||
| 392,209 | Clearwater Paper Corp.* | 22,473,576 | |||||
| 276,204 | Deltic Timber Corp. | 18,682,439 | |||||
| 317,635 | Innophos Holdings, Inc. | 16,720,306 | |||||
| 142,756 | KMG Chemicals, Inc. | 3,631,713 | |||||
| 296,922 | Neenah Paper, Inc. | 17,506,521 | |||||
| 79,014,555 | |||||||
| Telecommunication Services — 2.4% | |||||||
| 310,729 | Atlantic Tele-Network, Inc. | 21,465,159 | |||||
| Total Common Stocks (Cost $683,161,423) | 820,020,932 | ||||||
| Real Estate Investment Trusts — 3.0% | |||||||
| 1,444,460 | Campus Crest Communities, Inc. | 8,002,309 | |||||
| 2,558,342 | MFA Financial, Inc. | 18,906,147 | |||||
| Total Real Estate Investment Trusts (Cost $29,856,810) | 26,908,456 | ||||||
| Short-Term Investments — 3.9% | |||||||
| Money Market Funds — 3.9% | |||||||
| 34,048,210 | DWS Cash Account Trust — Government | ||||||
| & Agency Securities Portfolio — | |||||||
| Institutional Shares, 0.04%# | 34,048,210 | ||||||
| Total Short-Term Investments (Cost $34,048,210) | 34,048,210 | ||||||
| Total Investments — 99.8% (Cost $747,066,443) | 880,977,598 | ||||||
| Other Assets in Excess of Liabilities — 0.2% | 1,602,770 | ||||||
| NET ASSETS — 100.0% | $ | 882,580,368 | |||||
PORTFOLIO HOLDINGS
% of Net Assets
| Financials | 30.4% |
| Industrials | 15.4% |
| Consumer Discretionary | 14.0% |
| Information Technology | 13.1% |
| Materials | 9.0% |
| Energy | 4.5% |
| Money Market Funds | 3.9% |
| Real Estate Investment Trusts | 3.0% |
| Health Care | 2.8% |
| Telecommunication Services | 2.4% |
| Consumer Staples | 1.3% |
| Other Assets and Liabilities | 0.2% |
| 100.0% |
| * | Non-Income Producing |
| † | All or a portion of this security is considered illiquid. At June 30, 2015, the total market value of securities considered illiquid was $24,003,547 or 2.7% of net assets. |
| # | Annualized seven-day yield as of June 30, 2015. |
The accompanying notes are an integral part of these financial statements.
www.brownadvisoryfunds.com
29
Brown Advisory Opportunity Fund
A Message to Our Shareholders
June 30, 2015
Dear Shareholder:
During the year ended June 30, 2015 the Brown Advisory Opportunity Fund (the “Fund”) increased 7.39% in value. During the same period, the Russell 3000® Index, the Fund’s benchmark, increased 7.29%.
Consumer discretionary and healthcare stocks were the biggest positive contributors to performance this period. Biotechnology continued to outperform the broader market and portfolio stock selection within the health care sector was very strong for the year. Receptos which is our largest biotechnology holding, was our best performing stock overall. The company has a robust drug development program and it is currently developing a drug for the treatment of multiple sclerosis with promising efficacy and safety indications. In July after the fiscal-year end, news was released that the company would be acquired by Celgene. In terms of the consumer stocks, Under Armour, the fast growing sports apparel company, continued to perform well as it grows its topline revenue at an impressive pace.
Energy has been a challenging sector over the course of the last 12 months. The swooning price of crude oil dragged the entire energy sector down during the first half of the fiscal year. Many industrial companies with exposure to the energy complex have also come under pressure as well. The decline was exacerbated when the Organization of the Petroleum Exporting Countries, which controls the majority of excess oil production capacity, announced that it would not reduce production levels in order to support the price of crude. We held several quality crude oil-related businesses in the portfolio which corrected sharply when expectations for profitability declined in response to lower oil prices. We consolidated our positions into what we view as the highest quality companies that offer specialized technology to the marketplace. Historically, the best opportunities for long-term outperformance in the energy sector have been during periods when oil prices are low. Yet we are cognizant of the fact that a recovery may take some time to play out.
Despite the fact that markets continue to trade higher on an absolute basis, market volatility has increased, and we have been able to find opportunities that we believe have either been ignored or misunderstood by Wall Street. We will continue to populate the portfolio with these ideas as we believe that this approach has the potential to produce competitive returns over the long-term.
Sincerely,
Maneesh Bajaj, CFA
Portfolio Manager
Eric Gordon, CFA
Portfolio Manager
Paul Li, Ph.D., CFA
Portfolio Manager
www.brownadvisoryfunds.com
30
Brown Advisory Opportunity Fund
A Message to Our Shareholders
June 30, 2015
Past performance is not a guarantee of future results.
Mutual fund investing involves risk. Principal loss is possible. The Fund invests in small and medium capitalization companies which carry greater risk than is associated with larger companies for various reasons, such as narrower markets, limited financial resources and less liquid stock. The value of the Fund’s investments in REITs may change in response to changes in the real estate market such as declines in the value of real estate, lack of available capital or financing opportunities, and increases in property taxes or operating costs. The Fund may invest in ETFs, which may trade at a discount to the aggregate value of the underlying securities and although expense ratios for ETFs are generally low, frequent trading of ETFs by the Fund can generate brokerage expenses. Investments in foreign securities entail certain risks not associated with investments in domestic securities, such as volatility of currency exchange rates, and in some cases, political and economic instability and relatively illiquid markets. These risks are greater for investments in emerging markets. Private Placement issued securities are restricted securities that are not publicly traded. Delay or difficulty in selling such securities may result in a loss to the Fund.
Diversification does not assure a profit or protect against loss in a declining market.
Fund holdings and sector allocations are subject to change and should not be considered a recommendation to buy or sell any security. For a complete list of fund holdings, please refer to the Schedule of Investments provided in this report.
Definitions for terms and indices are provided in the Glossary of Terms.
www.brownadvisoryfunds.com
31
Brown Advisory Opportunity Fund
Performance Chart and Analysis
June 30, 2015
COMPARISON OF CHANGE IN VALUE OF A $10,000 INVESTMENT
The following chart reflects the change in value of a hypothetical $10,000 investment, including reinvested dividends and distributions, in the Fund as measured against the broad-based securities market index. The Russell 3000® Index (“Index”) measures the performance of the 3,000 largest U.S. companies representing approximately 98% of the investable U.S. equity market. The Index is unmanaged and does not reflect the deduction of fees, such as investment management fees. Investors cannot invest directly in an index.
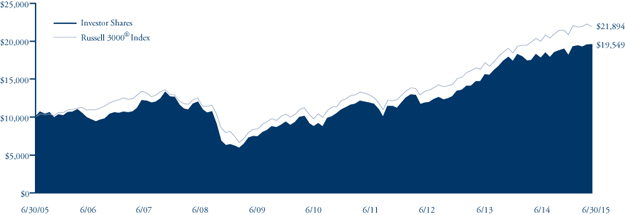
| Average Annual Total Return | One | Five | Ten | ||
| as of 6/30/15 | Year | Year | Year | ||
| Investor Shares | 7.39% | 17.49% | 6.93% | ||
Russell 3000® Index | 7.29% | 17.54% | 8.15% |
| Investor Shares | ||
Gross Expense Ratio1 | 1.56% | |
Net Expense Ratio1 | 1.54% |
Past performance does not guarantee future results. The performance data quoted represents past performance and current returns may be lower or higher. The investment return and net asset value will fluctuate so that an investor’s shares, when redeemed, may be worth more or less than the original cost. To obtain performance information current to the most recent month end, please visit our website at brownadvisoryfunds.com/performance.html. The performance table and graph above do not reflect the deduction of taxes that a shareholder would pay on Fund distributions or the redemption of Fund shares. Investment performance reflects periods during which fee waivers were in effect. In the absence of such waivers, total return would have been reduced. Performance data does not reflect the imposition of the redemption fee of 1.00% on shares redeemed within 14 days, and if it did, performance would have been lower.
| 1 | Per the Fund’s prospectus dated October 31, 2014. |
www.brownadvisoryfunds.com
32
Brown Advisory Opportunity Fund
Schedule of Investments
June 30, 2015
| Shares | Security Description | Value $ | |||||
| Common Stocks — 98.0% | |||||||
| Consumer Discretionary — 17.1% | |||||||
| 6,703 | 2U, Inc.* | 215,770 | |||||
| 1,000 | Alibaba Group Holding, Ltd.* | 82,270 | |||||
| 443 | Amazon.com, Inc.* | 192,302 | |||||
| 4,239 | Best Buy, Inc. | 138,234 | |||||
| 3,028 | Bright Horizons Family Solutions, Inc.* | 175,018 | |||||
| 171 | Chipotle Mexican Grill, Inc.* | 103,453 | |||||
| 1,914 | Garmin, Ltd. | 84,082 | |||||
| 7,322 | Krispy Kreme Doughnuts, Inc.* | 141,022 | |||||
| 2,191 | Lowe’s Companies, Inc. | 146,731 | |||||
| 151 | Priceline Group, Inc.* | 173,857 | |||||
| 3,165 | Starbucks Corp. | 169,691 | |||||
| 2,534 | Under Armour, Inc.* | 211,437 | |||||
| 1,833,867 | |||||||
| Consumer Staples — 4.4% | |||||||
| 1,424 | Estee Lauder Companies, Inc. | 123,404 | |||||
| 1,540 | Mead Johnson Nutrition Co. | 138,939 | |||||
| 1,702 | PriceSmart, Inc. | 155,290 | |||||
| 1,388 | Whole Foods Market, Inc. | 54,743 | |||||
| 472,376 | |||||||
| Energy — 6.1% | |||||||
| 1,501 | FMC Technologies, Inc.* | 62,276 | |||||
| 2,762 | Occidental Petroleum Corp. | 214,801 | |||||
| 4,732 | Oceaneering International, Inc. | 220,464 | |||||
| 1,914 | Phillips 66 | 154,192 | |||||
| 651,733 | |||||||
| Financials — 16.8% | |||||||
| 11,902 | American Capital, Ltd.* | 161,272 | |||||
| 1,421 | Ameriprise Financial, Inc. | 177,526 | |||||
| 6,902 | Charles Schwab Corp. | 225,350 | |||||
| 2,946 | ConnectOne Bancorp, Inc. | 63,427 | |||||
| 5,894 | Forest City Enterprises, Inc.* | 130,258 | |||||
| 3,468 | JPMorgan Chase & Co. | 234,992 | |||||
| 1,914 | Prosperity Bancshares, Inc. | 110,514 | |||||
| 1,738 | Realogy Holdings Corp.* | 81,199 | |||||
| 11,009 | Regions Financial Corp. | 114,053 | |||||
| 2,888 | SunTrust Banks, Inc. | 124,242 | |||||
| 5,821 | Synovus Financial Corp. | 179,403 | |||||
| 11,546 | TFS Financial Corp. | 194,204 | |||||
| 1,796,440 | |||||||
| Health Care — 15.8% | |||||||
| 1,539 | Acceleron Pharma, Inc.* | 48,694 | |||||
| 1,293 | athenahealth, Inc.* | 148,152 | |||||
| 2,126 | Baxter International, Inc. | 148,671 | |||||
| 2,495 | Bristol-Myers Squibb Co. | 166,017 | |||||
| 991 | Coherus BioSciences, Inc.* | 28,640 | |||||
| 2,269 | DaVita HealthCare Partners, Inc.* | 180,317 | |||||
| 5,306 | Dyax Corp.* | 140,609 | |||||
| 2,702 | Express Scripts Holding Co.* | 240,316 | |||||
| 413 | Intuitive Surgical, Inc.* | 200,099 | |||||
| 822 | Merck & Co., Inc. | 46,796 | |||||
| 2,194 | Omeros Corp.* | 39,470 | |||||
| 920 | Receptos, Inc.* | 174,846 | |||||
| 11,976 | Tandem Diabetes Care, Inc.* | 129,820 | |||||
| 1,692,447 | |||||||
| Industrials — 11.2% | |||||||
| 2,427 | Albany International Corp. | 96,595 | |||||
| 3,751 | Colfax Corp.* | 173,109 | |||||
| 1,412 | EnPro Industries, Inc. | 80,795 | |||||
| 2,106 | Fastenal Co. | 88,831 | |||||
| 5,164 | General Electric Co. | 137,207 | |||||
| 2,481 | HEICO Corp. | 144,642 | |||||
| 2,048 | Hexcel Corp. | 101,867 | |||||
| 2,904 | McGrath RentCorp | 88,369 | |||||
| 1,703 | United Rentals, Inc.* | 149,217 | |||||
| 2,629 | Woodward, Inc. | 144,569 | |||||
| 1,205,201 | |||||||
| Information Technology — 23.4% | |||||||
| 2,706 | Apple, Inc. | 339,400 | |||||
| 4,294 | BroadSoft, Inc.* | 148,444 | |||||
| 1,934 | Check Point Software Technologies, Ltd.* | 153,850 | |||||
| 1,731 | Demandware, Inc.* | 123,039 | |||||
| 2,223 | eBay, Inc.* | 133,913 | |||||
| 5,191 | Electro Rent Corp. | 56,374 | |||||
| 1,466 | Facebook, Inc.* | 125,731 | |||||
| 2,460 | Fair Isaac Corp. | 223,319 | |||||
| 143 | Google, Inc. — Class A* | 77,226 | |||||
| 143 | Google, Inc. — Class C* | 74,433 | |||||
| 2,763 | Interactive Intelligence Group, Inc.* | 122,871 | |||||
| 3,584 | M/A-COM Technology Solutions Holdings, Inc.* | 137,088 | |||||
| 2,991 | National Instruments Corp. | 88,115 | |||||
| 1,579 | NXP Semiconductors NV* | 155,058 | |||||
| 4,511 | Pegasystems, Inc. | 103,257 | |||||
| 2,246 | salesforce.com, Inc.* | 156,389 | |||||
| 2,573 | Stratasys, Ltd.* | 89,875 | |||||
| 2,960 | Visa, Inc. | 198,764 | |||||
| 2,507,146 | |||||||
| Materials — 2.6% | |||||||
| 1,711 | Ecolab, Inc. | 193,463 | |||||
| 692 | Praxair, Inc. | 82,728 | |||||
| 276,191 | |||||||
| Telecommunication Services — 0.6% | |||||||
| 2,350 | Zayo Group Holdings, Inc.* | 60,442 | |||||
| Total Common Stocks (Cost $7,781,369) | 10,495,843 | ||||||
The accompanying notes are an integral part of these financial statements.
www.brownadvisoryfunds.com
33
Brown Advisory Opportunity Fund
Schedule of Investments
June 30, 2015
| Shares | Security Description | Value $ | |||||
| Short-Term Investments — 2.0% | |||||||
| Money Market Funds — 2.0% | |||||||
| 210,435 | DWS Cash Account Trust — Government | ||||||
| & Agency Securities Portfolio — | |||||||
| Institutional Shares, 0.04%# | 210,435 | ||||||
| Total Short-Term Investments (Cost $210,435) | 210,435 | ||||||
| Total Investments — 100.0% (Cost $7,991,804) | 10,706,278 | ||||||
| Liabilities in Excess of Other Assets — 0.0% | (984 | ) | |||||
| NET ASSETS — 100.0% | $ | 10,705,294 | |||||
PORTFOLIO HOLDINGS
% of Net Assets
| Information Technology | 23.4% |
| Consumer Discretionary | 17.1% |
| Financials | 16.8% |
| Health Care | 15.8% |
| Industrials | 11.2% |
| Energy | 6.1% |
| Consumer Staples | 4.4% |
| Materials | 2.6% |
| Money Market Funds | 2.0% |
| Telecommunication Services | 0.6% |
| Other Assets and Liabilities | 0.0% |
| 100.0% |
ADR — American Depositary Receipt
| * | Non-Income Producing |
| # | Annualized seven-day yield as of June 30, 2015. |
The accompanying notes are an integral part of these financial statements.
www.brownadvisoryfunds.com
34
Brown Advisory Multi-Strategy Fund
A Message to Our Shareholders
June 30, 2015
Dear Shareholder:
As of June 30, 2015, the Brown Advisory Multi-Strategy Fund (the “Fund”) increased 1.23% in value since its inception on October 31, 2014. During the same period, the S&P Balanced Equity and Bond – Moderate Index, the Fund’s benchmark, increased 2.56%.
Since the inception of the Fund, financial markets have been quite choppy, driven by macroeconomic and political events (e.g., potential Federal Reserve action, Greek crisis, China slowdown, etc.) more than underlying company fundamentals. Overall, market performance has been subdued, with U.S., international and bond markets all producing small, positive returns. Security selection has been challenged in this market, particularly in the U.S. equity and fixed income markets.
The largest contributor to performance was the Brown Advisory Emerging Market Small-Cap Fund, which has generated a 17.00% return (versus 4.74% for the MSCI Emerging Markets Small-Cap Index), since it was added to the Multi-Strategy Fund in November. The strong performance of the Brown Advisory Emerging Markets Small-Cap Fund was driven by its emphasis on opportunities in emerging Asia. In particular, it was overweight China and Hong Kong from November to April, then aggressively took profits before the Chinese equity market fell in June.
The largest detractor was the Brown Advisory Value Equity Fund, which was eliminated from the portfolio in January. From the inception of the Fund to when it was sold in January, the Brown Advisory Value Equity Fund declined 4.4% in value (versus +0.4% for the Russell 1000® Value Index). The underperformance was driven by an overweight exposure to the energy sector while oil prices fell significantly. Additional detractors from the relative performance of the Fund were the Brown Advisory Flexible Equity Fund and the Brown Advisory Total Return Bond Fund. These are the Fund’s two largest underlying holdings, and both underperformed their respective indices by just over 1%.
Overall, the market environment has been somewhat challenging as macroeconomic and political headlines drove stock and bond prices. Additionally, equity market valuations have moved significantly higher over the last three years, and interest rates remain at historical lows. Putting this together, we do not believe that this is an attractive environment for making significant asset allocation or geographic tilts. However, we believe that all the macro headlines have created distortions within many markets that can be taken advantage of by conducting deep, fundamental, security-specific research and implementing decisions with a long-term time horizon. Furthermore, stock market and credit market correlations have declined, so we believe that moving forward, the market will differentiate more between securities. Therefore, we believe that the key driver of performance over the coming quarters will be individual security selection. We have confidence that our underlying managers can add value in this environment.
Sincerely,
Paul Chew, CFA
Portfolio Manager
Past performance is not a guarantee of future results.
Mutual fund investing involves risk. Principal loss is possible. The Fund is considered a “funds of funds” and an investor will indirectly bear the principal risks and its share of the fees and expenses of the underlying funds. Shareholders will pay higher expenses than they would if they invested directly in the underlying funds. The Fund may invest in foreign securities, which involve political, economic and currency risks, greater volatility and differences in accounting methods. Investments in small and medium capitalization companies generally carry greater risk than is customarily associated with larger companies for various reasons, such as narrower markets, limited financial resources and less liquid stock. The Fund may invest in ETFs, which may trade at a discount to the aggregate value of the underlying securities and although expense ratios for ETFs are generally low, frequent trading of ETFs by the Fund can generate brokerage expenses. Investments in debt securities typically decrease in value when interest rates rise. This risk is usually greater for longer-term debt securities. Investments in lower rated and non-rated securities present a greater risk of loss to principal and interest than higher rated securities. Investments in asset-backed and mortgage-backed securities include additional risks that an investor should be aware of, including credit risk, prepayment risk, possible illiquidity and default, as well as increased susceptibility to adverse economic developments. In addition, the Fund is susceptible to risks from investments in derivatives, U.S. Government securities, private placements, REITs and municipal securities.
Fund holdings and sector allocations are subject to change and should not be considered as a recommendation to buy or sell any security. For a complete list of fund holdings, please refer to the Schedule of Investments provided in this report.
Definitions for terms and indices are provided in the Glossary of Terms.
www.brownadvisoryfunds.com
35
Brown Advisory Multi-Strategy Fund
Performance Chart and Analysis
June 30, 2015
COMPARISON OF CHANGE IN VALUE OF A $1,000,000 INVESTMENT
The following chart reflects the change in value of a hypothetical $1,000,000 investment, including reinvested dividends and distributions, in the Fund as measured against a broad-based securities market index. The S&P Balanced Equity and Bond – Moderate Index is the moderate profile of the S&P Balanced Equity and Bond Series which combines investable S&P indices for core equity and fixed income to provide a regulary rebalanced multi-asset measure for conservative, moderate and growth risk-reward profiles. The index is unmanaged and does not reflect the deduction of fees, such as investment management fees. Investors cannot invest directly in an index.
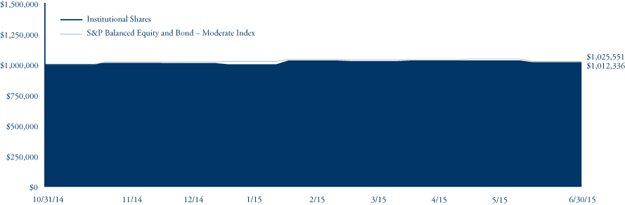
| Since | |||
| Cumulative Total Return | Inception | ||
| as of 6/30/15 | (10/31/14) | ||
| Institutional Shares | 1.23% | ||
| S&P Balanced Equity and Bond – Moderate Index | 2.56% | ||
| Institutional Shares | |||
Gross Expense Ratio1 | 1.80% | ||
Net Expense Ratio1 | 1.80% |
Past performance does not guarantee future results. The performance data quoted represents past performance and current returns may be lower or higher. The investment return and net asset value will fluctuate so that an investor’s shares, when redeemed, may be worth more or less than the original cost. To obtain performance information current to the most recent month end, please visit our website at brownadvisoryfunds.com/performance.html. The performance table and graph above do not reflect the deduction of taxes that a shareholder would pay on Fund distributions or the redemption of Fund shares. Investment performance reflects periods during which fee waivers were in effect. In the absence of such waivers, total return would have been reduced. Performance data does not reflect the imposition of the redemption fee of 1.00% on shares redeemed within 14 days, and if it did, performance would have been lower. Short-term performance, in particular, is not a good indication of the Fund’s future performance, and an investment should not be made based solely on returns.
| 1 | Per the Fund’s prospectus dated October 31, 2014, as amended May 7, 2015. |
www.brownadvisoryfunds.com
36
Brown Advisory Multi-Strategy Fund
Schedule of Investments
June 30, 2015
| Shares | Security Description | Value $ | |||||
| Affiliated Mutual Funds (Note 3) — 96.6% | |||||||
| Domestic Equity Funds — 41.6% | |||||||
| 44,560 | Brown Advisory Flexible Equity Fund — | ||||||
| Institutional Shares | 709,389 | ||||||
| 6,884 | Brown Advisory Small-Cap | ||||||
| Fundamental Value Fund — | |||||||
| Institutional Shares | 162,521 | ||||||
| 2,580 | Brown Advisory Small-Cap Growth Fund* — | ||||||
| Institutional Shares | 92,664 | ||||||
| 964,574 | |||||||
| Foreign Equity Funds — 18.0% | |||||||
| 12,069 | Brown Advisory — Somerset Emerging | ||||||
| Markets Fund — Institutional Shares | 117,555 | ||||||
| 20,215 | Brown Advisory — WMC Strategic | ||||||
| European Equity Fund — Institutional Shares | 206,191 | ||||||
| 8,038 | Brown Advisory Emerging | ||||||
| Markets Small-Cap Fund* — | |||||||
| Institutional Shares | 94,042 | ||||||
| 417,788 | |||||||
| Bond Funds — 37.0% | |||||||
| 23,630 | Brown Advisory Strategic Bond Fund — | ||||||
| Investor Shares | 232,283 | ||||||
| 63,740 | Brown Advisory Total Return Fund — | ||||||
| Institutional Shares | 626,562 | ||||||
| 858,845 | |||||||
| Total Affiliated Mutual Funds (Cost $2,209,444) | 2,241,207 | ||||||
| Short-Term Investments — 3.3% | |||||||
| Money Market Funds — 3.3% | |||||||
| 75,322 | DWS Cash Account Trust — Government | ||||||
| & Agency Securities Portfolio — | |||||||
| Institutional Shares, 0.04%# | 75,322 | ||||||
| Total Short-Term Investments (Cost $75,322) | 75,322 | ||||||
| Total Investments — 99.9% (Cost $2,284,766) | 2,316,529 | ||||||
| Other Assets in Excess of Liabilities — 0.1% | 2,693 | ||||||
| NET ASSETS — 100.0% | $ | 2,319,222 | |||||
PORTFOLIO HOLDINGS
% of Net Assets
| Domestic Equity Funds | 41.6% |
| Bond Funds | 37.0% |
| Foreign Equity Funds | 18.0% |
| Money Market Funds | 3.3% |
| Other Assets and Liabilities | 0.1% |
| 100.0% |
| * | Non-Income Producing |
| # | Annualized seven-day yield as of June 30, 2015. |
The accompanying notes are an integral part of these financial statements.
www.brownadvisoryfunds.com
37
Brown Advisory Intermediate Income Fund
A Message to Our Shareholders
June 30, 2015
Dear Shareholder,
For the year ended June 30, 2015, the Brown Advisory Intermediate Income Fund Investor Shares (the “Fund”) returned 1.01%, lagging the Fund’s benchmark, the Barclays Intermediate U.S. Aggregate Bond Index, which returned 1.89%.
Throughout the year, we positioned the Fund conservatively with regard to duration in the belief that interest rates were more likely to rise than to fall. We were also positioned in anticipation of a flattening yield curve (shorter rates rising more quickly than longer rates) and expressed that view generally by holding floating-rate corporate bonds and longer, tax-exempt municipal bonds. These securities were relatively inexpensive (higher yields) compared with their taxable counterparts in the Treasury or corporate markets. Although the yield curve flattened, with 10-year Treasuries falling from 2.53% to 2.35% and shorter rates rising amid expectations of an approaching Fed “lift off” from the zero rate policy, much of this appropriate positioning languished because of declining municipal bond prices. A large portion of the supply for the first half of 2015 was related to refundings of existing issues. This, combined with credit concerns in Puerto Rico and Chicago, kept the tax-free market on edge and seemed to cause a supply/demand imbalance.
During this time of increased volatility, we remain focused on our core philosophy of seeking sectors and bonds that we believe are underpriced on a fundamental basis while maintaining the core stability that investors may expect from what we believe is a high-quality, intermediate bond fund.
Sincerely,
Paul D. Corbin
Portfolio Manager
Past performance is not a guarantee of future results.
Mutual fund investing involves risk. Principal loss is possible. The Fund is subject to interest rate risk which is the risk that debt securities in the Fund’s portfolio will decline in value because of increases in market interest rates. Investments in Asset Backed and Mortgage Backed Securities include additional risks that investors should be aware of such as credit risk, prepayment risk, possible illiquidity and default, as well as increased susceptibility to adverse economic developments. Investments in debt securities typically decrease in value when interest rates rise. The risk is usually greater for longer-term debt securities. Inflation-indexed bonds see the principal value of the security increased as the Consumer Price Index increases. Should the Consumer Price Index decline, those securities should be adversely impacted.
Fund holdings and sector allocations are subject to change and should not be considered a recommendation to buy or sell any security. For a complete list of fund holdings, please refer to the Schedule of Investments provided in this report.
Definitions for terms and indices are provided in the Glossary of Terms.
www.brownadvisoryfunds.com
38
Brown Advisory Intermediate Income Fund
Performance Chart and Analysis
June 30, 2015
COMPARISON OF CHANGE IN VALUE OF A $10,000 INVESTMENT
The following chart reflects the change in value of a hypothetical $10,000 investment, including reinvested dividends and distributions, in the Fund as measured against a broad-based bond index. The Barclays Intermediate US Aggregate Bond Index (“Index”) represents domestic taxable investment grade bonds, with index components for government and corporate securities, mortgage pass-through securities, and asset-backed securities with average maturities and durations in the intermediate range. The Index is unmanaged and does not reflect the deduction of fees, such as investment management fees. Investors cannot invest directly in an index.
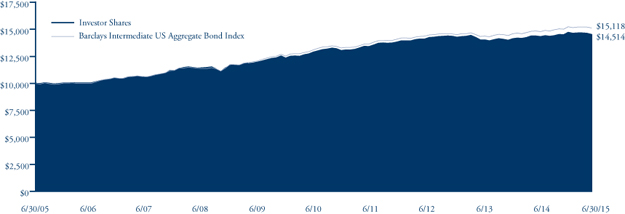
| Average Annual Total Return | One | Five | Ten | ||
| as of 6/30/15 | Year | Year | Year | ||
| Investor Shares | 1.01% | 2.42% | 3.80% | ||
| Advisor Shares | 0.78% | 2.19% | 3.54% | ||
| Barclays Intermediate US Aggregate Bond Index | 1.89% | 2.89% | 4.22% | ||
| Investor Shares | Advisor Shares | ||
Gross Expense Ratio1 | 0.63% | 0.88% | |
Net Expense Ratio1 | 0.57% | 0.82% |
Past performance does not guarantee future results. The performance data quoted represents past performance and current returns may be lower or higher. The investment return and net asset value will fluctuate so that an investor’s shares, when redeemed, may be worth more or less than the original cost. To obtain performance information current to the most recent month end, please visit our website at brownadvisoryfunds.com/performance.html. The performance table and graph above do not reflect the deduction of taxes that a shareholder would pay on Fund distributions or the redemption of Fund shares. Investment performance reflects periods during which fee waivers were in effect. In the absence of such waivers, total return would have been reduced. Performance data does not reflect the imposition of the redemption fee of 1.00% on shares redeemed within 14 days, and if it did, performance would have been lower.
| 1 | Per the Fund’s prospectus dated October 31, 2014. |
www.brownadvisoryfunds.com
39
Brown Advisory Intermediate Income Fund
Schedule of Investments
June 30, 2015
| Par Value | Security Description | Rate | Maturity | Value $ | ||||||||
| Corporate Bonds & Notes — 26.8% | ||||||||||||
| 1,520,000 | 21st Century Fox America, Inc. | 3.00 | % | 09/15/2022 | 1,487,495 | |||||||
| 1,525,000 | American Express Credit Corp.# | 0.76 | % | 08/15/2019 | 1,508,030 | |||||||
| 1,548,000 | BB&T Corp. Callable 12/15/2019 @ 100#^ | 0.99 | % | 01/15/2020 | 1,545,811 | |||||||
| 1,515,000 | Bed Bath & Beyond, Inc. Callable 05/01/2024 @ 100^ | 3.75 | % | 08/01/2024 | 1,514,106 | |||||||
| 1,480,000 | Celgene Corp. | 2.30 | % | 08/15/2018 | 1,503,451 | |||||||
| 1,590,000 | Columbia Property Trust Operating Partnership L.P. Callable 01/01/2025 @ 100^ | 4.15 | % | 04/01/2025 | 1,586,543 | |||||||
| 1,610,000 | Education Realty Operating Partnership L.P. Callable 09/01/2024 @ 100^ | 4.60 | % | 12/01/2024 | 1,624,205 | |||||||
| 1,485,000 | First American Financial Corp. | 4.60 | % | 11/15/2024 | 1,501,090 | |||||||
| 1,510,000 | FMC Technologies, Inc. | 2.00 | % | 10/01/2017 | 1,508,768 | |||||||
| 1,495,000 | Healthcare Trust of America, Inc. Callable 05/15/2021 @ 100^ | 3.38 | % | 07/15/2021 | 1,489,448 | |||||||
| 1,490,000 | JB Hunt Transport Services, Inc. | 2.40 | % | 03/15/2019 | 1,504,900 | |||||||
| 1,500,000 | Kinder Morgan Energy Partners LP Callable 01/01/2021 @ 100^ | 3.50 | % | 03/01/2021 | 1,480,882 | |||||||
| 2,265,000 | Lowe’s Cos, Inc.# | 0.70 | % | 09/10/2019 | 2,268,982 | |||||||
| 1,495,000 | Morgan Stanley# | 1.42 | % | 01/27/2020 | 1,517,249 | |||||||
| 1,580,000 | Morgan Stanley | 3.95 | % | 04/23/2027 | 1,493,214 | |||||||
| 1,565,000 | Providence Health & Services Floating Note# | 1.22 | % | 10/01/2017 | 1,574,809 | |||||||
| 1,595,000 | Retail Properties of America, Inc. Callable 12/15/2024 @ 100^ | 4.00 | % | 03/15/2025 | 1,550,354 | |||||||
| 2,275,000 | Royal Bank of Canada# | 0.80 | % | 03/06/2020 | 2,279,605 | |||||||
| 1,330,000 | Saint Barnabas Health System | 4.00 | % | 07/01/2028 | 1,326,265 | |||||||
| 1,615,000 | Sunoco Logistics Partners Operations L.P. Callable 01/01/2024 @ 100^ | 4.25 | % | 04/01/2024 | 1,571,049 | |||||||
| 2,250,000 | Sutter Health | 1.09 | % | 08/15/2053 | 2,250,871 | |||||||
| 2,185,000 | Verizon Communications, Inc.# | 2.04 | % | 09/14/2018 | 2,262,233 | |||||||
| 2,265,000 | Wells Fargo & Co.# | 0.81 | % | 07/20/2016 | 2,273,847 | |||||||
| 1,470,000 | Zions Bancorporation Callable 05/11/2023 @100^ | 4.50 | % | 06/13/2023 | 1,503,519 | |||||||
| Total Corporate Bonds & Notes (Cost $40,295,779) | 40,126,726 | |||||||||||
| Municipal Bonds — 21.7% | ||||||||||||
| 870,000 | Central Texas Turnpike System Callable 08/15/2024 @ 100^ | 5.00 | % | 08/15/2042 | 922,940 | |||||||
| 670,000 | District of Columbia Income Tax Secured Revenue Bonds, Series 2010F | 4.71 | % | 12/01/2022 | 744,859 | |||||||
| 1,495,000 | Florida Hurricane Catastrophe Revenue Bonds | 2.11 | % | 07/01/2018 | 1,512,297 | |||||||
| 1,000,000 | Illinois State Sales Tax Revenue | 2.30 | % | 06/15/2019 | 1,016,810 | |||||||
| 2,400,000 | Indiana Finance Authority Callable 06/01/2025 @ 100^ | 5.00 | % | 12/01/2031 | 2,661,216 | |||||||
| 1,560,000 | Indiana State Bond Bank Revenue | 1.02 | % | 07/15/2016 | 1,565,913 | |||||||
| 745,000 | Lakeland Florida Hospital System Callable 11/15/2024 @ 100^ | 5.00 | % | 11/15/2034 | 808,496 | |||||||
| 3,200,000 | Maryland State Health & Higher Education Revenue Bonds | 3.99 | % | 07/01/2028 | 3,096,576 | |||||||
| 850,000 | Metropolitan Transportation Authority Callable 11/15/2024 @ 100^ | 5.00 | % | 11/15/2030 | 962,744 | |||||||
| 5,735,000 | Michigan, State of | 2.55 | % | 11/01/2015 | 5,775,374 | |||||||
| 1,500,000 | New Jersey Transportation Trust Fund Authority Callable 12/15/2020 @ 100^ | 6.10 | % | 12/15/2028 | 1,568,025 | |||||||
| 1,420,000 | New York City TFA Future Tax Callable 08/01/2024 @ 100^ | 5.00 | % | 08/01/2032 | 1,620,717 | |||||||
| 1,420,000 | New York City Water & Sewer System Callable 06/15/2024 @ 100^ | 5.00 | % | 06/15/2036 | 1,597,088 | |||||||
| 720,000 | New York State Dormitory Authority Callable 02/15/2024 @ 100^ | 5.00 | % | 02/15/2030 | 823,694 | |||||||
| 1,700,000 | New York State Thruway Authority Callable 01/01/2025 @ 100^ | 5.00 | % | 01/01/2027 | 1,989,272 | |||||||
| 1,000,000 | North Texas Tollway Authority Callable 01/01/2024 @ 100^ | 5.00 | % | 01/01/2031 | 1,097,920 | |||||||
| 1,420,000 | Pennsylvania Turnpike Commission Callable 12/01/2024 @ 100^ | 5.00 | % | 12/01/2034 | 1,568,021 | |||||||
| 2,750,000 | Port Authority New York & New Jersey | 5.31 | % | 12/01/2019 | 3,095,345 | |||||||
| Total Municipal Bonds (Cost $32,823,127) | 32,427,307 | |||||||||||
| Mortgage Backed Securities — 6.6% | ||||||||||||
| 4,203 | FHLMC PC, Pool# C00210 | 8.00 | % | 01/01/2023 | 4,877 | |||||||
| 384,078 | FHLMC PC, Pool# 1B0889# | 2.26 | % | 05/01/2033 | 406,856 | |||||||
| 290,560 | FHLMC PC, Pool# 1J0203# | 2.28 | % | 04/01/2035 | 309,523 | |||||||
| 3,463,670 | FHLMC PC, Pool# Q2-5749 | 4.00 | % | 04/01/2044 | 3,668,864 | |||||||
| 182,380 | FHLMC REMIC, Series 2782 | 4.00 | % | 11/15/2033 | 190,072 | |||||||
| 18,707 | FNMA, Pool# 254089 | 6.00 | % | 12/01/2016 | 19,169 | |||||||
| 284,574 | FNMA, Pool# 842239 | 5.00 | % | 09/01/2020 | 302,683 | |||||||
| 20,233 | FNMA, Pool# 539082 | 7.00 | % | 08/01/2028 | 20,521 | |||||||
| 28,359 | FNMA, Pool# 625536 | 6.00 | % | 01/01/2032 | 32,189 | |||||||
The accompanying notes are an integral part of these financial statements.
www.brownadvisoryfunds.com
40
Brown Advisory Intermediate Income Fund
Schedule of Investments
June 30, 2015
| Par | ||||||||||||
| Value/Shares | Security Description | Rate | Maturity | Value $ | ||||||||
| Mortgage Backed Securities — (Continued) | ||||||||||||
| 41,850 | FNMA, Pool# 628837 | 6.50 | % | 03/01/2032 | 48,101 | |||||||
| 189,233 | FNMA, Pool# 663238 | 5.50 | % | 09/01/2032 | 213,754 | |||||||
| 40,479 | FNMA, Pool# 744805# | 1.89 | % | 11/01/2033 | 41,330 | |||||||
| 42,821 | FNMA, Pool# 741373# | 2.41 | % | 12/01/2033 | 44,837 | |||||||
| 72,209 | FNMA, Pool# 764342# | 1.90 | % | 02/01/2034 | 74,819 | |||||||
| 97,314 | FNMA, Pool# 848817 | 5.00 | % | 01/01/2036 | 107,620 | |||||||
| 1,957,416 | FNMA, Pool# AS1474 | 4.50 | % | 01/01/2044 | 2,120,740 | |||||||
| 1,271,864 | FNMA, Pool# AV7911 | 4.50 | % | 01/01/2044 | 1,377,581 | |||||||
| 2,497,493 | FNMA REMIC Trust, Series 2013-115† | 3.00 | % | 04/25/2031 | 369,559 | |||||||
| 53,910 | GNMA, Pool# 781450 | 5.00 | % | 06/15/2017 | 55,805 | |||||||
| 24,337 | GNMA, Pool# 487110 | 6.50 | % | 04/15/2029 | 28,609 | |||||||
| 33,706 | GNMA, Pool# 781186 | 9.00 | % | 06/15/2030 | 39,457 | |||||||
| 6,730 | GNMA, Pool# 571166 | 7.00 | % | 08/15/2031 | 6,967 | |||||||
| 2,878,284 | GNMA REMIC Trust, Series 2013-79† | 3.00 | % | 01/20/2042 | 416,361 | |||||||
| Total Mortgage Backed Securities (Cost $9,570,028) | 9,900,294 | |||||||||||
| Asset Backed Securities — 5.0% | ||||||||||||
| 1,500,000 | Madison Park Funding XVII, Ltd.#~ | 2.28 | % | 07/21/2027 | 1,504,650 | |||||||
| 1,500,000 | Octagon Investment Partners 24, Ltd., Series A-2#~ | 2.23 | % | 05/21/2027 | 1,500,000 | |||||||
| 1,500,000 | Octagon Investment Partners XXII, Ltd., Series B-2#~ | 2.58 | % | 11/25/2025 | 1,502,321 | |||||||
| 1,500,000 | OZLM XIII, Ltd.#~ | 2.38 | % | 07/30/2027 | 1,484,295 | |||||||
| 1,500,000 | Stewart Park CLO, Ltd., Series 2015-1#~ | 2.27 | % | 04/15/2026 | 1,500,000 | |||||||
| Total Asset Backed Securities (Cost $7,490,145) | 7,491,266 | |||||||||||
| U.S. Treasury Notes — 13.6% | ||||||||||||
| 5,000,000 | United States Treasury Note | 1.25 | % | 10/31/2015 | 5,019,725 | |||||||
| 4,655,000 | United States Treasury Note | 0.38 | % | 02/15/2016 | 4,661,182 | |||||||
| 4,665,000 | United States Treasury Note | 0.63 | % | 10/15/2016 | 4,677,754 | |||||||
| 6,133,369 | United States Treasury Note | 0.25 | % | 01/15/2025 | 6,025,556 | |||||||
| Total U.S. Treasury Notes (Cost $20,571,390) | 20,384,217 | |||||||||||
| Affiliated Mutual Funds (Note 3) — 22.7% | ||||||||||||
| 3,372,927 | Brown Advisory Mortgage Securities Fund — Institutional Shares | 33,931,642 | ||||||||||
| Total Affiliated Mutual Funds (Cost $34,234,761) | 33,931,642 | |||||||||||
| Short-Term Investments — 4.1% | ||||||||||||
| Money Market Funds — 4.1% | ||||||||||||
| 6,092,078 | DWS Cash Account Trust — Government & Agency Securities Portfolio — Institutional Shares, 0.04%* | 6,092,078 | ||||||||||
| Total Short-Term Investments (Cost $6,092,078) | 6,092,078 | |||||||||||
| Total Investments — 100.5% (Cost $151,077,308) | 150,353,530 | |||||||||||
| Liabilities in Excess of Other Assets — (0.5)% | (740,170 | ) | ||||||||||
| NET ASSETS — 100.0% | $ | 149,613,360 | ||||||||||
The accompanying notes are an integral part of these financial statements.
www.brownadvisoryfunds.com
41
Brown Advisory Intermediate Income Fund
Schedule of Investments
June 30, 2015
PORTFOLIO HOLDINGS
% of Net Assets
| Corporate Bonds & Notes | 26.8% |
| Affiliated Mutual Funds | 22.7% |
| Municipal Bonds | 21.7% |
| U.S. Treasury Notes | 13.6% |
| Mortgage Backed Securities | 6.6% |
| Asset Backed Securities | 5.0% |
| Money Market Funds | 4.1% |
| Other Assets and Liabilities | (0.5)% |
| 100.0% |
| ^ | Continuously callable with 30 days notice. |
| # | Variable rate security. Rate disclosed is as of June 30, 2015. |
| † | Interest Only Security |
| ~ | Security exempt from registration under Rule 144A of the Securities Act of 1933. These securities may be resold in transactions exempt from registration, normally to qualified institutional buyers. At June 30, 2015, the value of these securities amounted to $7,491,266 or 5.0% of net assets. |
| * | Annualized seven-day yield as of June 30, 2015. |
The accompanying notes are an integral part of these financial statements.
www.brownadvisoryfunds.com
42
Brown Advisory Total Return Fund
A Message to Our Shareholders
June 30, 2015
Dear Shareholder:
The Brown Advisory Total Return Fund Institutional Shares (the “Fund”) commenced operations on October 30, 2014. From the inception of the Fund on October 30, 2014 to June 30, 2015, the Fund returned -0.60%, compared with the 0.59% return for the Barclays US Aggregate Bond Index, the Fund’s benchmark.
The Fund’s strategy is to combine bottom-up credit selection with macroeconomic positioning, both concentrated in our highest-conviction ideas. We analyze macro ideas based on scenario analysis as opposed to point forecasts, and we look for investment positioning that can perform reasonably well in various macro scenarios.
For the period, the Fund was mostly neutral weighted on duration but positioned for the yield curve to flatten. This positioning was a good example of our scenario-based macro process. We believed that if interest rates were to rise, it would be because the economy seemed to be improving and Federal Reserve rate hikes were seen as coming sooner. This would likely cause short- and intermediate-term rates to rise more than long-term rates. At the same time, we saw a few reasons why rates might fall, including increasing foreign demand and/or a downgrade in the long-term growth prospects for the U.S. Both of these outcomes would be more likely to benefit longer-term bonds more than short- or intermediate-term bonds.
Instead, the yield curve has steepened significantly, particularly from March through June, which has hurt the Fund’s relative performance. This was primarily due to the market pricing that the start of rate tightening by the Fed would be postponed until 2016. While we disagree with that view, more importantly, we think that there is a very narrow scope for further delay. For the pace and degree of rate hikes to be priced even slower and lower than what is currently expected, a recession would likely need to start very soon.
Offsetting the curve steepening was strong performance from our bottom-up selections in credit and securitized bonds. Since inception, our corporate positions in the fund are up 1.70% vs. 0.78% for credits within the Barclays US Aggregate Bond Index. Among the best performers were Cornerstone Chemicals, Dollar Tree, Interface Security and Ineos.
Looking forward, we are analyzing corporate bonds as though we are late in the business cycle. We do not know exactly how late, but we are operating under the assumption that a recession could come in the next few years. Hence, we are focused on credits with low cyclicality. We believe that our disciplined credit process has the potential to add value whether credit is widening or tightening and that this has the potential to be a key driver of performance going forward.
Sincerely,
Thomas D.D. Graff, CFA
Portfolio Manager
Past performance is not a guarantee of future results.
Mutual fund investing involves risk. Principal loss is possible. Investments in debt securities typically decrease in value when interest rates rise. This risk is usually greater for longer-term debt securities. Investments in Asset-Backed and Mortgage-Backed securities include additional risks that investor should be aware of including credit risk, prepayment risk, possible illiquidity and default, as well as increased susceptibility to adverse economic developments. Investments in lower rated and non-rated securities present a great risk of loss to principal and interest than higher rated securities. In addition, the fund is susceptible to risks from investments in derivatives, U.S. Government securities, and changes in interest rates. Income from tax-exempt funds may be subject to state and local taxes and a portion of income may be subject to the Federal Alternative minimum tax for certain investors.
Fund holdings and sector allocations are subject to change and should not be considered a recommendation to buy or sell any security. For a complete list of fund holdings, please refer to the Schedule of Investments provided in this report.
Definitions for terms and indices are provided in the Glossary of Terms.
www.brownadvisoryfunds.com
43
Brown Advisory Total Return Fund
Performance Chart and Analysis
June 30, 2015
COMPARISON OF CHANGE IN VALUE OF A $1,000,000 INVESTMENT
The following chart reflects the change in value of a hypothetical $1,000,000 investment, including reinvested dividends and distributions, in the Fund as measured against a broad-based securities market index. The Barclays US Aggregate Bond Index is a broad-based benchmark that measures the investment grade US dollar-denominated, fixed rate taxable bond market. The index includes Treasuries, government-related and corporate securities, MBS, ABS and CMBS. The index is unmanaged and does not reflect the deduction of fees, such as investment management fees. Investors cannot invest directly in an index.

| Since | |||
| Cumulative Total Return | Inception | ||
| as of 6/30/15 | (10/30/14) | ||
| Institutional Shares | -0.60% | ||
| Investor Shares | -0.63% | ||
| Barclays US Aggregate Bond Index | 0.59% | ||
| Institutional Shares | Investor Shares | ||
Gross Expense Ratio1 | 0.51% | 0.56% | |
Net Expense Ratio1 | 0.51% | 0.56% |
Past performance does not guarantee future results. The performance data quoted represents past performance and current returns may be lower or higher. The investment return and net asset value will fluctuate so that an investor’s shares, when redeemed, may be worth more or less than the original cost. To obtain performance information current to the most recent month end, please visit our website at brownadvisoryfunds.com/performance.html. The performance table and graph above do not reflect the deduction of taxes that a shareholder would pay on Fund distributions or the redemption of Fund shares. Performance data does not reflect the imposition of the redemption fee of 1.00% on shares redeemed within 14 days, and if it did, performance would have been lower. Short-term performance, in particular, is not a good indication of the Fund’s future performance, and an investment should not be made based solely on returns.
| 1 | Per the Fund’s prospectus dated October 31, 2014. |
www.brownadvisoryfunds.com
44
Brown Advisory Total Return Fund
Schedule of Investments
June 30, 2015
| Par Value | Security Description | Rate | Maturity | Value $ | ||||||||
| Mortgage Backed Securities — 38.6% | ||||||||||||
| 1,183,649 | FHLMC PC, Pool# C9-1818 | 4.00 | % | 02/01/2035 | 1,266,125 | |||||||
| 2,866,231 | FHLMC PC, Pool# Q2-7788 | 4.00 | % | 08/01/2044 | 3,047,622 | |||||||
| 297,458 | FHLMC PC, Pool# Q3-0222 | 4.00 | % | 12/01/2044 | 316,394 | |||||||
| 584,029 | FHLMC PC, Pool# Q3-0148 | 4.00 | % | 12/01/2044 | 619,046 | |||||||
| 297,598 | FHLMC PC, Pool# Q3-0223 | 4.00 | % | 12/01/2044 | 316,066 | |||||||
| 5,059,524 | FHLMC Remic, Series 4094+ | 2.50 | % | 03/15/2027 | 411,879 | |||||||
| 804,124 | FHLMC Remic, Series 4107+ | 3.00 | % | 08/15/2027 | 188,562 | |||||||
| 1,533,435 | FHLMC Remic, Series 4203+ | 3.00 | % | 04/15/2033 | 182,581 | |||||||
| 2,854,691 | FHLMC Remic, Series 4143+ | 3.50 | % | 09/15/2042 | 451,760 | |||||||
| 1,140,000 | FHLMC Remic, Series 4495+ | 3.50 | % | 07/15/2045 | 310,650 | |||||||
| 3,000,000 | FHLMC Remic, Series 4495 | 2.50 | % | 07/15/2045 | 2,716,875 | |||||||
| 2,516,130 | FNMA, Pool# AS2249 | 4.00 | % | 04/01/2039 | 2,673,837 | |||||||
| 950,321 | FNMA, Pool# AL6768 | 6.00 | % | 05/01/2041 | 1,080,697 | |||||||
| 173,915 | FNMA, Pool# AB9017 | 3.00 | % | 04/01/2043 | 174,176 | |||||||
| 967,142 | FNMA, Pool# AY6139 | 3.50 | % | 02/01/2044 | 999,703 | |||||||
| 2,465,315 | FNMA, Pool# AV8070 | 3.50 | % | 05/01/2044 | 2,547,321 | |||||||
| 297,405 | FNMA, Pool# AX9501 | 4.50 | % | 12/01/2044 | 322,625 | |||||||
| 596,808 | FNMA, Pool# AY0674 | 3.50 | % | 02/01/2045 | 616,816 | |||||||
| 970,548 | FNMA, Pool# MA2193 | 4.50 | % | 02/01/2045 | 1,053,057 | |||||||
| 995,277 | FNMA, Pool# AY0677 | 3.50 | % | 03/01/2045 | 1,031,793 | |||||||
| 995,769 | FNMA, Pool# AY0678 | 3.50 | % | 03/01/2045 | 1,029,151 | |||||||
| 798,873 | FNMA, Pool# AZ2001 | 3.50 | % | 05/01/2045 | 825,654 | |||||||
| 1,794,406 | FNMA Remic Trust, Series 2013-24+ | 3.00 | % | 11/25/2040 | 315,143 | |||||||
| 5,000,000 | FNMA, 4.0%, Due TBA July | 4.00 | % | 07/15/2045 | 5,297,793 | |||||||
| 4,000,000 | GNMA, 3.5%, Due TBA July | 3.50 | % | 07/15/2045 | 4,151,719 | |||||||
| Total Mortgage Backed Securities (Cost $32,122,452) | 31,947,045 | |||||||||||
| Asset Backed Securities — 30.1% | ||||||||||||
| 750,000 | Freddie Mac STACR Debt Notes, Series 2014-DN1# | 2.39 | % | 02/26/2024 | 751,483 | |||||||
| 770,000 | Freddie Mac STACR Debt Notes, Series 2014-DN2# | 1.83 | % | 04/25/2024 | 752,618 | |||||||
| 1,150,000 | Freddie Mac STACR Debt Notes, Series 2014-DN3# | 2.58 | % | 08/26/2024 | 1,155,599 | |||||||
| 1,000,000 | Freddie Mac STACR Debt Notes, Series 2015-DN1# | 2.58 | % | 01/27/2025 | 1,006,989 | |||||||
| 700,000 | Freddie Mac STACR Debt Notes, Series 2015-DNA1# | 2.04 | % | 10/25/2027 | 688,669 | |||||||
| 2,000,000 | Freddie Mac STACR Debt Notes, Series 2015-DNA2# | 2.79 | % | 12/27/2027 | 2,006,800 | |||||||
| 1,500,000 | Highbridge Loan Management, Series 4a-2014 A2a #^ | 2.33 | % | 07/28/2025 | 1,490,994 | |||||||
| 1,000,000 | Highbridge Loan Management, Series 6a-2015 C#^ | 3.34 | % | 05/05/2027 | 994,800 | |||||||
| 750,000 | Jamestown CLO III, Ltd. 2013-3A A2A, Series FLT#^ | 2.23 | % | 01/15/2026 | 748,901 | |||||||
| 810,000 | Madison Park Funding XVII, Ltd., Series 2015-17A#^ | 2.28 | % | 07/21/2027 | 812,511 | |||||||
| 500,000 | Madison Park Funding XVII, Ltd., Series 2015-17A#^ | 3.18 | % | 07/21/2027 | 499,950 | |||||||
| 1,300,000 | Magnetite XII, Series 2015-12#^ | 2.52 | % | 04/15/2027 | 1,304,160 | |||||||
| 750,000 | Magnetite XII, Series 2015-12#^ | 3.36 | % | 04/15/2027 | 751,425 | |||||||
| 1,750,000 | Marathon CLO VI Ltd 2014-6A A2, Series 2014-6#^ | 2.33 | % | 05/13/2025 | 1,738,800 | |||||||
| 750,000 | Octagon Investment Partners 24, Ltd., Series A-2#^ | 2.23 | % | 05/21/2027 | 750,000 | |||||||
| 1,000,000 | Octagon Investment Partners XXII, Ltd., Series B-2#^ | 2.58 | % | 11/25/2025 | 1,001,547 | |||||||
| 2,000,000 | Octagon Investment Partners XXII, Ltd., Series C-1#^ | 3.53 | % | 11/25/2025 | 2,009,895 | |||||||
| 1,000,000 | OZLM Funding, Ltd., Series 2013-4#^ | 2.03 | % | 07/22/2025 | 988,800 | |||||||
| 750,000 | OZLM IX, Ltd. 2014-9A B#^ | 3.58 | % | 01/20/2027 | 753,825 | |||||||
| 1,000,000 | OZLM XIII, Ltd.#^ | 2.38 | % | 07/30/2027 | 989,530 | |||||||
| 1,000,000 | Stewart Park CLO, Ltd., Series 2015-1#^ | 2.27 | % | 04/15/2026 | 1,000,000 | |||||||
| 1,000,000 | Stewart Park CLO, Ltd., Series 2015-1#^ | 3.17 | % | 04/15/2026 | 1,000,000 | |||||||
| 750,000 | Sudbury Mill CLO, Ltd., Series 2013#^ | 3.27 | % | 01/20/2026 | 735,675 | |||||||
| 1,000,000 | Symphony CLO XIV, Ltd.#^ | 2.22 | % | 07/14/2026 | 1,001,000 | |||||||
| Total Asset Backed Securities (Cost $24,826,597) | 24,933,971 | |||||||||||
| Corporate Bonds & Notes — 23.6% | ||||||||||||
| 800,000 | Ally Financial, Inc. | 3.60 | % | 05/21/2018 | 802,000 | |||||||
| 810,000 | Bed Bath & Beyond, Inc. Callable 05/01/2024 @ 100~ | 3.75 | % | 08/01/2024 | 809,522 | |||||||
The accompanying notes are an integral part of these financial statements.
www.brownadvisoryfunds.com
45
Brown Advisory Total Return Fund
Schedule of Investments
June 30, 2015
| Par | ||||||||||||
| Value/Shares | Security Description | Rate | Maturity | Value $ | ||||||||
| Corporate Bonds & Notes — (Continued) | ||||||||||||
| 380,000 | Boyd Gaming Corp. Callable 07/01/2016 @ 105~ | 9.00 | % | 07/01/2020 | 414,200 | |||||||
| 840,000 | Capital One Financial Co. Callable 06/01/2020 @ 100#~ | 5.55 | % | 12/29/2049 | 834,750 | |||||||
| 750,000 | Carrols Restaurant Group, Inc. Callable 05/01/2018 @ 104^~ | 8.00 | % | 05/01/2022 | 791,250 | |||||||
| 1,085,000 | CIT Group, Inc.^ | 5.50 | % | 02/15/2019 | 1,133,825 | |||||||
| 795,000 | Columbia Property Trust Operating Partnership L.P. Callable 01/01/2025 @ 100~ | 4.15 | % | 04/01/2025 | 793,272 | |||||||
| 500,000 | Cornerstone Chemical Co. Callable 07/31/2015 @ 107^~ | 9.38 | % | 03/15/2018 | 527,500 | |||||||
| 720,000 | E*TRADE Financial Corp. Callable 11/15/2017 @ 104~ | 5.38 | % | 11/15/2022 | 739,800 | |||||||
| 770,000 | Education Realty Operating Partnership L.P. Callable 09/01/2024 @ 100~ | 4.60 | % | 12/01/2024 | 776,794 | |||||||
| 600,000 | Family Tree Escrow, LLC Callable 03/01/2017 @ 103^~ | 5.25 | % | 03/01/2020 | 630,750 | |||||||
| 720,000 | First American Financial Corp. | 4.60 | % | 11/15/2024 | 727,801 | |||||||
| 795,000 | Healthcare Trust of America, Inc. Callable 05/15/2021 @ 100~ | 3.38 | % | 07/15/2021 | 792,047 | |||||||
| 750,000 | INEOS Group Holdings S.A. Callable 02/15/2016 @ 103^~ | 5.88 | % | 02/15/2019 | 756,562 | |||||||
| 250,000 | Interface Security Systems Holdings, Inc. Callable 07/15/2015 @ 105~ | 9.25 | % | 01/15/2018 | 252,500 | |||||||
| 790,000 | JB Hunt Transport Services, Inc. | 2.40 | % | 03/15/2019 | 797,900 | |||||||
| 700,000 | Kinder Morgan Energy Partners LP Callable 01/01/2021 @ 100~ | 3.50 | % | 03/01/2021 | 691,079 | |||||||
| 730,000 | Legg Mason, Inc. | 5.63 | % | 01/15/2044 | 781,713 | |||||||
| 790,000 | Methanex Corp. Callable 09/01/2024 @ 100~ | 4.25 | % | 12/01/2024 | 784,743 | |||||||
| 400,000 | Monitronics International, Inc. Callable 04/01/2016 @ 105~ | 9.13 | % | 04/01/2020 | 388,000 | |||||||
| 850,000 | Morgan Stanley | 3.95 | % | 04/23/2027 | 803,311 | |||||||
| 810,000 | Retail Properties of America, Inc. Callable 12/15/2024 @ 100~ | 4.00 | % | 03/15/2025 | 787,327 | |||||||
| 770,000 | Rockwood Specialties Group, Inc. Callable 10/15/2015 @ 103~ | 4.63 | % | 10/15/2020 | 802,725 | |||||||
| 715,000 | Royal Caribbean Cruises, Ltd. | 5.25 | % | 11/15/2022 | 743,105 | |||||||
| 795,000 | Sunoco Logistics Partners Operations L.P. Callable 01/01/2024 @ 100~ | 4.25 | % | 04/01/2024 | 773,365 | |||||||
| 600,000 | Swedbank AB Callable 03/17/2020 @ 100#~ | 5.50 | % | 12/29/2049 | 589,057 | |||||||
| 780,000 | Zions Bancorporation Callable 05/11/2023 @100~ | 4.50 | % | 06/13/2023 | 797,786 | |||||||
| Total Corporate Bonds & Notes (Cost $19,673,320) | 19,522,684 | |||||||||||
| Municipal Bonds — 2.9% | ||||||||||||
| 400,000 | Bay Area Toll Authority | 7.04 | % | 04/01/2050 | 549,060 | |||||||
| 115,000 | California State | 7.55 | % | 04/01/2039 | 166,355 | |||||||
| 1,300,000 | Health Care Authority for Baptist Health | 5.50 | % | 11/15/2043 | 1,251,016 | |||||||
| 410,000 | Port Authority of New York and New Jersey Callable 10/15/2024 @ 100~ | 4.43 | % | 10/15/2034 | 418,680 | |||||||
| Total Municipal Bonds (Cost $2,529,091) | 2,385,111 | |||||||||||
| U.S. Treasury Notes — 10.7% | ||||||||||||
| 4,040,631 | United States Treasury Inflation Indexed Note | 0.25 | % | 01/15/2025 | 3,969,605 | |||||||
| 233,500 | United States Treasury Note† | 0.25 | % | 07/15/2015 | 233,527 | |||||||
| 2,400,000 | United States Treasury Note† | 1.25 | % | 10/31/2015 | 2,409,468 | |||||||
| 1,475,000 | United States Treasury Note | 0.38 | % | 02/15/2016 | 1,476,959 | |||||||
| 780,000 | United States Treasury Note | 2.00 | % | 02/15/2025 | 757,880 | |||||||
| Total U.S. Treasury Notes (Cost $9,004,315) | 8,847,439 | |||||||||||
| Short-Term Investments — 9.1% | ||||||||||||
| Money Market Funds — 9.1% | ||||||||||||
| 7,562,435 | DWS Cash Account Trust — Government & Agency Securities Portfolio — Institutional Shares, 0.04%* | 7,562,435 | ||||||||||
| Total Short-Term Investments (Cost $7,562,435) | 7,562,435 | |||||||||||
| Total Investments — 115.0% (Cost $95,718,210) | 95,198,685 | |||||||||||
| Liabilities in Excess of Other Assets — (15.0)% | (12,383,145 | ) | ||||||||||
| NET ASSETS — 100.0% | $ | 82,815,540 | ||||||||||
| ~ | Continuously callable with 30 days notice. |
| ^ | Security exempt from registration under Rule 144A of the Securities Act of 1933. These securities may be resold in transactions exempt from registration, normally to qualified institutional buyers. At June 30, 2015, the value of these securities amounted to $22,411,700 or 27.1% of net assets. |
| + | Interest Only Security |
| † | All or a portion of this security is pledged as collateral in connection with open futures contracts. |
| # | Variable rate security. Rate disclosed is as of June 30, 2015. |
| * | Annualized seven-day yield as of June 30, 2015. |
The accompanying notes are an integral part of these financial statements.
www.brownadvisoryfunds.com
46
Brown Advisory Total Return Fund
Schedule of Investments
June 30, 2015
Futures Contracts — Long (Note 8)
| Issue | Contracts | Expiration Date | Notional Amount | Unrealized Depreciation | ||||||||||
| U.S. Treasury Long Bond Futures September 2015 | 40 | 09/30/2015 | $ | 6,083,842 | $ | (50,092 | ) | |||||||
| U.S. Treasury Ultra Bond Futures September 2015 | 61 | 09/30/2015 | 9,525,268 | (127,456 | ) | |||||||||
| $ | 15,609,110 | $ | (177,548 | ) | ||||||||||
Futures Contracts — Short (Note 8)
| Issue | Contracts | Expiration Date | Notional Amount | Unrealized Appreciation | ||||||||||
| U.S. Treasury 5-Year Note Futures September 2015 | (105) | 10/05/2015 | $ | (12,524,523 | ) | $ | 2,453 | |||||||
| U.S. Treasury 10-Year Note Futures September 2015 | (65) | 09/30/2015 | (8,236,569 | ) | 35,397 | |||||||||
| $ | (20,761,092 | ) | $ | 37,850 | ||||||||||
PORTFOLIO HOLDINGS
% of Net Assets
| Mortgage Backed Securities | 38.6% |
| Asset Backed Securities | 30.1% |
| Corporate Bonds & Notes | 23.6% |
| U.S. Treasury Notes | 10.7% |
| Money Market Funds | 9.1% |
| Municipal Bonds | 2.9% |
| Other Assets and Liabilities | (15.0)% |
| 100.0% |
The accompanying notes are an integral part of these financial statements.
www.brownadvisoryfunds.com
47
Brown Advisory Strategic Bond Fund
A Message to Our Shareholders
June 30, 2015
Dear Shareholder:
For the year ended June 30, 2015, the Brown Advisory Strategic Bond Fund Advisor Shares (the “Fund”) declined -1.80%. The Barclays Intermediate US Aggregate Bond Index, the Fund’s benchmark, returned 1.89%.
The Fund’s strategy combines bottom-up credit selection with opportunistic sector allocation, and concentrates the portfolio in our highest-conviction ideas. We analyze investment ideas using rigorous underwriting standards and deep fundamental analysis to determine a bond’s appropriate risk-adjusted return.
The Fund attempts to mitigate duration risk and has operated with a duration roughly half that of the benchmark. As such, the Fund has been managed with a duration of between one and two years. This has been relatively consistent, as we are not attempting to generate meaningful alpha by taking a position on duration.
During the year, we increased our exposure to structured products from zero to just under 50% at fiscal year-end. Our allocation to this sector consists primarily of collateralized loan obligation double and single A-rated tranches and, to a lesser extent, government-sponsored enterprise risk-sharing instruments and interest-only mortgage backed securities. These instruments have been additive to performance during the period and continue to provide compelling risk-adjusted return while helping to mitigate duration risk, as they are primarily floating-rate instruments.
Our best-performing corporate bonds came from our high-yield credit selection. These names include Cornerstone Chemicals, Perstorp Holdings, Interface Security, Carrols Restaurants, Ineos Group Holdings and Dollar Tree. The contribution from these performers has been largely offset by an investment made in the coal sector, in particular, Peabody Energy. The position was put on in mid-March and built through the end of June. We believe that the market technicals have overshot the fundamentals, creating a deep value opportunity, and that our thesis remains intact.
Looking forward, we are analyzing corporate bonds as though we are late in the business cycle. We do not know exactly how late, but we are operating under the assumption that a recession could come in the next few years. Hence, we are focused on credits with low cyclicality and deep value. We believe that our disciplined credit process has the potential to add value whether credit is widening or tightening and that this process has the potential to be a key driver of performance going forward.
Sincerely,
Robert H. Snyder
Portfolio Manager
Thomas D.D. Graff, CFA
Portfolio Manager
www.brownadvisoryfunds.com
48
Brown Advisory Strategic Bond Fund
A Message to Our Shareholders
June 30, 2015
Past performance is not a guarantee of future results.
Mutual fund investing involves risk. Principal loss is possible. Investments in debt securities typically decrease in value when interest rates rise. This risk is usually greater for longer-term debt securities. Investments in lower-rated and non-rated securities present a greater risk of loss to principal and interest than higher-rated securities. Municipal securities are subject to adverse political or economic factors, including changes in the tax law. Inflation-indexed bonds see the principal value of the security increased as the Consumer Price Index increases. Should the Consumer Price Index decline, those securities should be adversely impacted. A non-diversified fund may concentrate its assets in fewer individual holdings than a diversified fund. Therefore, non-diversified Fund is more exposed to individual stock volatility than a diversified fund. The fund may make short sales of securities, which involve the risk that losses in a security may exceed the original amount invested in that security. The risks of investments in derivatives, including options on futures contracts and options on futures contracts include imperfect correlation between the value of these instruments and the underlying assets; risks of default by the other party to the derivative transactions; risks that the transactions may result in losses that partially or completely offset gains in portfolio positions; and risks that the derivative transactions may not be liquid. Income from tax-exempt securities may be subject to state and local taxes and a portion of income may be subject to the federal alternative minimum tax for certain investors. Bond ratings are grades given to bonds that indicate their credit quality as determined by a private independent rating service such as Standard & Poor’s. The firm evaluates a bond issuer’s financial strength, or its ability to pay a bond’s principal and interest in a timely fashion. Ratings are expressed as letters ranging from ‘AAA’, which is the highest grade, to ‘D’, which is the lowest grade. In limited situations when the rating agency has not issued a formal rating, the Advisor will classify the security as non-rated.
Diversification does not assure a profit or protect against loss in a declining market.
Fund holdings and sector allocations are subject to change and should not be considered a recommendation to buy or sell any security. For a complete list of fund holdings, please refer to the Schedule of Investments provided in this report.
Definitions for terms and indices are provided in the Glossary of Terms.
www.brownadvisoryfunds.com
49
Brown Advisory Strategic Bond Fund
Performance Chart and Analysis
June 30, 2015
COMPARISON OF CHANGE IN VALUE OF A $10,000 INVESTMENT
The following chart reflects the change in value of a hypothetical $10,000 investment, including reinvested dividends and distributions, in the Fund as measured against a broad-based bond index. The Barclays Intermediate US Aggregate Bond Index (“Index”) represents domestic taxable investment grade bonds, with index components for government and corporate securities, mortgage pass-through securities, and asset-backed securities with average maturities and durations in the intermediate range. The Index is unmanaged and does not reflect the deduction of fees, such as investment management fees. Investors cannot invest directly in an index.
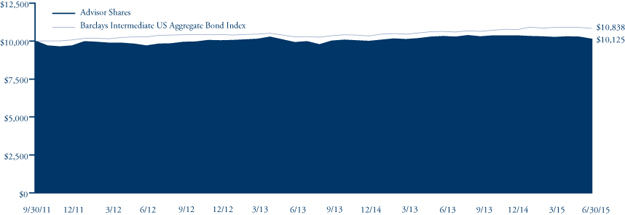
| Since | ||||
| Average Annual Total Return | One | Inception | ||
| as of 6/30/15 | Year | (9/30/11) | ||
Investor Shares1 | -1.48% | 0.61% | ||
| Advisor Shares | -1.80% | 0.33% | ||
| Barclays Intermediate US Aggregate Bond Index | 1.89% | 2.17% | ||
| Investor Shares | Advisor Shares | ||
Gross Expense Ratio2 | 0.79% | 1.04% | |
Net Expense Ratio2 | 0.71% | 0.96% |
Past performance does not guarantee future results. The performance data quoted represents past performance and current returns may be lower or higher. The investment return and net asset value will fluctuate so that an investor’s shares, when redeemed, may be worth more or less than the original cost. To obtain performance information current to the most recent month end, please visit our website at brownadvisoryfunds.com/performance.html. The performance table and graph above do not reflect the deduction of taxes that a shareholder would pay on Fund distributions or the redemption of Fund shares. Investment performance reflects periods during which fee waivers were in effect. In the absence of such waivers, total return would have been reduced. Performance data does not reflect the imposition of the redemption fee of 1.00% on shares redeemed within 14 days, and if it did, performance would have been lower.
| 1 | Performance information for the Investor Shares, prior to commencement of operations on October 31, 2014, is based on the performance of Advisor Shares, and adjusted for the lower expenses applicable to Investor Shares. |
| 2 | Per the Fund’s prospectus dated October 31, 2014. |
www.brownadvisoryfunds.com
50
Brown Advisory Strategic Bond Fund
Schedule of Investments
June 30, 2015
| Par Value | Security Description | Rate | Maturity | Value $ | ||||||||
| Corporate Bonds & Notes — 47.0% | ||||||||||||
| 600,000 | Ally Financial, Inc. | 3.60 | % | 05/21/2018 | 601,500 | |||||||
| 1,000,000 | Boyd Gaming Corp. Callable 07/01/2016 @ 105~ | 9.00 | % | 07/01/2020 | 1,090,000 | |||||||
| 600,000 | Capital One Financial Co. Callable 06/01/2020 @ 100#~ | 5.55 | % | 12/29/2049 | 596,250 | |||||||
| 1,000,000 | Carrols Restaurant Group, Inc. Callable 05/01/2018 @ 104^~ | 8.00 | % | 05/01/2022 | 1,055,000 | |||||||
| 600,000 | Chemours Co. Callable 05/15/2018 @ 105 $604,483^~ | 6.63 | % | 05/15/2023 | 582,750 | |||||||
| 750,000 | CIT Group, Inc.^ | 5.50 | % | 02/15/2019 | 783,750 | |||||||
| 600,000 | Cloud Peak Energy Resources, LLC. Callable 08/03/2015 @ 104~ | 8.50 | % | 12/15/2019 | 511,500 | |||||||
| 555,000 | Columbia Property Trust Operating Partnership L.P. Callable 01/01/2025 @ 100~ | 4.15 | % | 04/01/2025 | 553,793 | |||||||
| 750,000 | Community Health Systems, Inc. Callable 02/01/2017 @ 104~ | 5.13 | % | 08/01/2021 | 765,937 | |||||||
| 600,000 | Constellation Brands, Inc. | 4.25 | % | 05/01/2023 | 592,500 | |||||||
| 500,000 | Cornerstone Chemical Co. Callable 08/03/2015 @ 107^~ | 9.38 | % | 03/15/2018 | 527,500 | |||||||
| 250,000 | Crown Americas, LLC Callable 02/01/2016 @ 103~ | 6.25 | % | 02/01/2021 | 261,875 | |||||||
| 480,000 | Discover Bank | 4.25 | % | 03/13/2026 | 476,252 | |||||||
| 500,000 | Dynegy, Inc. Callable 11/01/2018 @ 104^~ | 7.38 | % | 11/01/2022 | 526,250 | |||||||
| 500,000 | Dynegy, Inc. Callable 11/01/2019 @ 104^~ | 7.63 | % | 11/01/2024 | 531,250 | |||||||
| 250,000 | E*TRADE Financial Corp. Callable 11/15/2017 @ 104~ | 5.38 | % | 11/15/2022 | 256,875 | |||||||
| 750,000 | Education Realty Operating Partnership L.P. Callable 09/01/2024 @ 100~ | 4.60 | % | 12/01/2024 | 756,617 | |||||||
| 750,000 | Family Tree Escrow, LLC Callable 03/01/2017 @ 103^~ | 5.25 | % | 03/01/2020 | 788,437 | |||||||
| 405,000 | First American Financial Corp. | 4.60 | % | 11/15/2024 | 409,388 | |||||||
| 575,000 | Health Care REIT, Inc. Callable 10/15/2021 @ 100~ | 5.25 | % | 01/15/2022 | 629,845 | |||||||
| 500,000 | Healthcare Trust of America, Inc. Callable 05/15/2021 @ 100~ | 3.38 | % | 07/15/2021 | 498,143 | |||||||
| 750,000 | INEOS Group Holdings S.A. Callable 02/15/2016 @ 103^~ | 5.88 | % | 02/15/2019 | 756,563 | |||||||
| 1,250,000 | Interface Master Holdings, Inc. Callable 08/03/2015 @ 106^~ | 12.50 | % | 08/01/2018 | 1,204,688 | |||||||
| 750,000 | Interface Security Systems Holdings, Inc. Callalbe 08/03/2015 @ 105~ | 9.25 | % | 01/15/2018 | 757,500 | |||||||
| 670,000 | Kinder Morgan, Inc. Callable 03/01/2025 @ 100~ | 4.30 | % | 06/01/2025 | 648,099 | |||||||
| 250,000 | Kinetic Concepts, Inc. Callable 11/01/2015 @ 105~ | 10.50 | % | 11/01/2018 | 267,505 | |||||||
| 250,000 | Kinetic Concepts, Inc. Callable 11/01/2015 @ 106~ | 12.50 | % | 11/01/2019 | 270,625 | |||||||
| 1,000,000 | Lear Corp. Callable 01/15/2020 @ 103~ | 5.25 | % | 01/15/2025 | 987,500 | |||||||
| 850,000 | Legg Mason, Inc. | 5.63 | % | 01/15/2044 | 910,214 | |||||||
| 1,000,000 | Monitronics International, Inc. Callable 04/01/2016 @ 105~ | 9.13 | % | 04/01/2020 | 970,000 | |||||||
| 1,100,000 | Morgan Stanley | 3.95 | % | 04/23/2027 | 1,039,579 | |||||||
| 600,000 | National Retail Properties, Inc. Callable 07/15/2022 @ 100~ | 3.80 | % | 10/15/2022 | 607,144 | |||||||
| 500,000 | Packaging Corp. of America Callable 08/01/2023 @ 100~ | 4.50 | % | 11/01/2023 | 516,518 | |||||||
| 1,500,000 | Peabody Energy Corp. | 6.50 | % | 09/15/2020 | 517,500 | |||||||
| 550,000 | Peabody Energy Corp. | 6.25 | % | 11/15/2021 | 189,750 | |||||||
| 40,000 | Peabody Energy Corp. | 7.88 | % | 11/01/2026 | 13,600 | |||||||
| 1,000,000 | Perstorp Holding AB Callable 08/03/2015^~ | 8.75 | % | 05/15/2017 | 1,045,000 | |||||||
| 250,000 | Perstorp Holding AB Callable 08/03/2015 @ 108^~ | 11.00 | % | 08/15/2017 | 265,625 | |||||||
| 565,000 | Retail Properties of America, Inc. Callable 12/15/2024 @ 100~ | 4.00 | % | 03/15/2025 | 549,185 | |||||||
| 650,000 | Royal Caribbean Cruises, Ltd. | 5.25 | % | 11/15/2022 | 675,550 | |||||||
| 500,000 | Sealed Air Corp. Callable 09/01/2022 @ 100 $491,763^~ | 4.88 | % | 12/01/2022 | 494,375 | |||||||
| 600,000 | Swedbank AB Callable 03/17/2020 @ 101#~ | 5.50 | % | 12/29/2049 | 589,057 | |||||||
| 750,000 | United Rentals North America, Inc. Callable 07/15/2018 @ 103~ | 4.63 | % | 07/15/2023 | 738,263 | |||||||
| 500,000 | United Rentals North America, Inc. Callable 07/15/2020 @ 103~ | 5.50 | % | 07/15/2025 | 485,000 | |||||||
| 850,000 | Verizon Communications, Inc. | 6.55 | % | 09/15/2043 | 997,753 | |||||||
| 530,000 | Zions Bancorporation Callable 05/11/2023 @100~ | 4.50 | % | 06/13/2023 | 542,085 | |||||||
| Total Corporate Bonds & Notes (Cost $29,601,228) | 28,834,090 | |||||||||||
| Asset Backed Securities — 44.6% | ||||||||||||
| 750,000 | Freddie Mac STACR Debt Notes, Series 2014-DN1# | 2.38 | % | 02/26/2024 | 751,483 | |||||||
| 750,000 | Freddie Mac STACR Debt Notes, Series 2014-DN2# | 1.83 | % | 04/25/2024 | 733,069 | |||||||
| 850,000 | Freddie Mac STACR Debt Notes, Series 2014-DN3# | 2.58 | % | 08/26/2024 | 854,138 | |||||||
| 500,000 | Freddie Mac STACR Debt Notes, Series 2015-DN1# | 2.58 | % | 01/27/2025 | 503,495 | |||||||
| 700,000 | Freddie Mac STACR Debt Notes, Series 2015-DNA1# | 2.04 | % | 10/25/2027 | 688,669 | |||||||
| 1,200,000 | Freddie Mac STACR Debt Notes, Series 2015-DNA2# | 2.79 | % | 12/27/2027 | 1,204,080 | |||||||
| 1,500,000 | Highbridge Loan Management, Series 4a-2014 A2a#^ | 2.33 | % | 07/28/2025 | 1,490,994 | |||||||
The accompanying notes are an integral part of these financial statements.
www.brownadvisoryfunds.com
51
Brown Advisory Strategic Bond Fund
Schedule of Investments
June 30, 2015
| Par | ||||||||||||
| Value/Shares | Security Description | Rate | Maturity | Value $ | ||||||||
| Asset Backed Securities — (Continued) | ||||||||||||
| 2,000,000 | Highbridge Loan Management, Series 6A-2015 C#^ | 3.34 | % | 05/05/2027 | 1,989,600 | |||||||
| 750,000 | Jamestown CLO III, Ltd. 2013-3A A2A, Series FLT#^ | 2.23 | % | 01/15/2026 | 748,901 | |||||||
| 825,000 | Madison Park Funding XVII, Ltd., Series 2015-17A#^ | 2.28 | % | 07/21/2027 | 827,558 | |||||||
| 500,000 | Madison Park Funding XVII, Ltd., Series 2015-17A#^ | 3.18 | % | 07/21/2027 | 499,950 | |||||||
| 1,300,000 | Magnetite XII, Series 2015-12#^ | 2.52 | % | 04/15/2027 | 1,304,160 | |||||||
| 750,000 | Magnetite XII, Series 2015-12#^ | 3.36 | % | 04/15/2027 | 751,425 | |||||||
| 1,250,000 | Marathon CLO VI Ltd 2014-6A A2, Series 2014-6#^ | 2.33 | % | 05/13/2025 | 1,242,000 | |||||||
| 1,030,000 | Marathon CLO VI Ltd 2014-6A B, Series 2014-6#^ | 3.13 | % | 05/13/2025 | 1,011,357 | |||||||
| 750,000 | Octagon Investment Partners 24, Ltd., Series A-2#^ | 2.23 | % | 05/21/2027 | 750,000 | |||||||
| 1,000,000 | Octagon Investment Partners XXII, Ltd., Series B-2#^ | 2.58 | % | 11/25/2025 | 1,001,547 | |||||||
| 2,000,000 | Octagon Investment Partners XXII, Ltd., Series C-1#^ | 3.53 | % | 11/25/2025 | 2,009,895 | |||||||
| 1,000,000 | OZLM Funding, Ltd., Series 2013-4#^ | 2.03 | % | 07/22/2025 | 988,800 | |||||||
| 750,000 | OZLM IX, Ltd. 2014-9A B#^ | 3.58 | % | 01/20/2027 | 753,825 | |||||||
| 1,000,000 | OZLM XIII, Ltd.#^ | 2.38 | % | 07/30/2027 | 989,530 | |||||||
| 1,000,000 | Stewart Park CLO, Ltd., Series 2015-1#^ | 2.27 | % | 04/15/2026 | 1,000,000 | |||||||
| 1,000,000 | Stewart Park CLO, Ltd., Series 2015-1#^ | 3.17 | % | 04/15/2026 | 1,000,000 | |||||||
| 750,000 | Sudbury Mill CLO, Ltd., Series 2013#^ | 3.27 | % | 01/20/2026 | 735,675 | |||||||
| 1,500,000 | Symphony CLO XIV, Ltd.#^ | 2.22 | % | 07/14/2026 | 1,501,500 | |||||||
| 1,000,000 | Voya CLO 2015-1, Ltd.#^ | 2.36 | % | 04/18/2027 | 1,001,900 | |||||||
| 1,000,000 | Voya CLO 2015-1, Ltd.#^ | 3.26 | % | 04/18/2027 | 1,001,200 | |||||||
| Total Asset Backed Securities (Cost $27,230,668) | 27,334,751 | |||||||||||
| Municipal Bonds — 3.4% | ||||||||||||
| 250,000 | Alachua County Health Facilities Authority Callable 12/01/2024 @ 100~ | 5.00 | % | 12/01/2033 | 270,985 | |||||||
| 250,000 | Franklin County Health Care Facilities Friendship Village Callable 11/15/2024 @ 100~ | 5.00 | % | 11/15/2034 | 266,453 | |||||||
| 755,000 | Health Care Authority for Baptist Health | 5.50 | % | 11/15/2043 | 725,631 | |||||||
| 335,000 | Houston Texas Airport System | 5.00 | % | 07/15/2020 | 354,319 | |||||||
| 200,000 | Houston Texas Airport System | 5.00 | % | 07/15/2020 | 214,278 | |||||||
| 250,000 | Wisconsin Health & Educational Facilities Authority Callable 05/01/2024 @ 100~ | 5.00 | % | 05/01/2027 | 270,025 | |||||||
| Total Municipal Bonds (Cost $2,177,168) | 2,101,691 | |||||||||||
| Mortgage Backed Securities — 2.1% | ||||||||||||
| 804,123 | FHLMC Remic, Series 4107+ | 3.00 | % | 08/15/2027 | 188,562 | |||||||
| 2,854,691 | FHLMC Remic, Series 4143+ | 3.50 | % | 09/15/2042 | 451,760 | |||||||
| 1,300,000 | FHLMC Remic, Series 4495+ | 3.50 | % | 07/15/2045 | 354,250 | |||||||
| 1,794,406 | FNMA Remic Trust, Series 2013-24+ | 3.00 | % | 11/25/2040 | 315,142 | |||||||
| Total Mortgage Backed Securities (Cost $1,284,108) | 1,309,714 | |||||||||||
| Mutual Funds — 1.8% | ||||||||||||
| 8,613 | Blackrock MuniYield Michigan Quality Fund II | 107,404 | ||||||||||
| 10,000 | Blackrock MuniYield Michigan Quality Fund | 133,000 | ||||||||||
| 5,060 | Eaton Vance Massachusetts Municipal Bond Fund | 69,828 | ||||||||||
| 8,000 | Nuveen Massachusetts Premium Income Municipal Fund | 106,080 | ||||||||||
| 14,476 | PIMCO California Municipal Income Fund II | 135,351 | ||||||||||
| 13,341 | PIMCO California Municipal Income Fund III | 137,279 | ||||||||||
| 11,168 | PIMCO New York Municipal Income Fund II | 131,447 | ||||||||||
| 1,030 | PIMCO New York Municipal Income Fund III | 9,569 | ||||||||||
| 13,000 | Pioneer Mun High Income Advantage Trust | 162,240 | ||||||||||
| 7,875 | Pioneer Mun High Income Trust | 95,445 | ||||||||||
| Total Mutual Funds (Cost $1,135,895) | 1,087,643 | |||||||||||
The accompanying notes are an integral part of these financial statements.
www.brownadvisoryfunds.com
52
Brown Advisory Strategic Bond Fund
Schedule of Investments
June 30, 2015
| Contracts/ | |||||||
| Par Value/ | |||||||
| Shares | Security Description | Value $ | |||||
| Purchased Options — 0.1% | |||||||
| Put Options — 0.1% | |||||||
| 60 | U.S. Treasury 10-Year Futures Option September 2015, Expiration 8/21/2015, Strike Price $123.00† | 14,062 | |||||
| 15 | U.S. Treasury 10-Year Futures Option September 2015, Expiration 8/21/2015, Strike Price $126.00† | 16,641 | |||||
| 80 | U.S. Treasury 5-Year Futures Option September 2015, Expiration 8/21/2015, Strike Price $117.00† | 6,250 | |||||
| 20 | U.S. Treasury 5-Year Futures Option September 2015, Expiration 8/21/2015, Strike Price $118.50† | 7,031 | |||||
| Total Purchased Options (Cost $92,291) | 43,984 | ||||||
| Short-Term Investments — 1.8% | |||||||
| U.S. Treasury Bills — 1.6% | |||||||
| 1,000,000 | United States Treasury Bill` | 999,915 | |||||
| Money Market Funds — 0.2% | |||||||
| 121,981 | DWS Cash Account Trust — Government & Agency Securities Portfolio — Institutional Shares, 0.04%* | 121,981 | |||||
| Total Short-Term Investments (Cost $1,121,896) | 1,121,896 | ||||||
| Total Investments — 100.8% (Cost $62,643,254) | 61,833,769 | ||||||
| Liabilities in Excess of Other Assets — (0.8)% | (461,935 | ) | |||||
| NET ASSETS — 100.0% | $ | 61,371,834 | |||||
| ~ | Continuously callable with 30 days notice. |
| † | Non-Income Producing |
| ^ | Security exempt from registration under Rule 144A of the Securities Act of 1933. These securities may be resold in transactions exempt from registration, normally to qualified institutional buyers. At June 30, 2015, the value of these securities amounted to $31,161,005 or 50.8% of net assets. |
| + | Interest Only Security |
| ` | A portion of this security is pledged as collateral in connection with open futures contracts. |
| # | Variable rate security. Rate disclosed is as of June 30, 2015. |
| * | Annualized seven-day yield as of June 30, 2015. |
Futures Contracts — Short (Note 8)
| Unrealized Appreciation | ||||||||||||||
| Issue | Contracts | Expiration Date | Notional Amount | (Depreciation) | ||||||||||
| U.S. Treasury 5-Year Note Futures September 2015 | (50) | 10/05/2015 | $ | (5,943,829 | ) | $ | (19,062 | ) | ||||||
| U.S. Treasury 10-Year Note Futures September 2015 | (20) | 09/30/2015 | (2,514,980 | ) | (8,457 | ) | ||||||||
| U.S. Treasury Long Bond Futures September 2015 | (5) | 09/30/2015 | (755,332 | ) | 1,113 | |||||||||
| $ | (9,214,141 | ) | $ | (26,406 | ) | |||||||||
PORTFOLIO HOLDINGS
% of Net Assets
| Corporate Bonds & Notes | 47.0% |
| Asset Backed Securities | 44.6% |
| Municipal Bonds | 3.4% |
| Mortgage Backed Securities | 2.1% |
| Mutual Funds | 1.8% |
| U.S. Treasury Bills | 1.6% |
| Money Market Funds | 0.2% |
| Purchased Options | 0.1% |
| Other Assets and Liabilities | (0.8)% |
| 100.0% |
The accompanying notes are an integral part of these financial statements.
www.brownadvisoryfunds.com
53
Brown Advisory Maryland Bond Fund
A Message to Our Shareholders
June 30, 2015
Dear Shareholder:
During the year ended June 30, 2015, the Brown Advisory Maryland Bond Fund (the “Fund”) increased 0.58% in value. During the same period, the Barclays 1-10 Year Blended Municipal Bond Index (the “Index”), the Fund’s benchmark, increased 1.74%.
During the year, the Fund was mostly neutral weighted on duration but positioned for the yield curve to flatten. We believed that if interest rates were to rise, it would be because the economy seemed to be improving and Federal Reserve rate hikes were seen on the near-term horizon. This would, in turn, cause short- and intermediate-term rates to rise more than long-term rates. At the same time, we saw a few reasons why rates might fall, including increasing foreign demand and/or a downgrade in the long-term growth prospects for the U.S. Both of these outcomes would be more likely to benefit longer-term bonds more than short- or intermediate-term bonds.
Instead, the municipal yield curve steepened significantly for the first half of 2015, which hurt the Fund’s relative performance. This was primarily due to the uncertainty around when the Fed would begin its rate-tightening cycle and the market’s presumption that hikes would not begin until 2016. In contrast, our tone on the market is constructive. While longer-maturity yields have increased around the uncertain timing of Fed “lift off,” we see limited risk of additional curve steepening due to the softer overall global economic outlook. As a result, we maintain our overweight to the intermediate and longer-maturity portion of the municipal yield curve.
Offsetting the curve steepening was strong performance from our bottom-up selection in municipal sector and individual credit selection. The Fund maintains an overweight to revenue-backed issues where we believe there is a potential upside thesis. Of those sectors, health-care-related credits such as not-for-profit hospitals and senior living were the largest contributor. On a combined basis, these holdings returned 3.95% for the period versus the Index’s health care return of 2.80%. The fund maintained a combined overweight of roughly 10% to these two sectors during the period, which contributed 44 basis points of relative outperformance. The portfolio also benefited from strong returns in several other revenue-backed sectors during the period, including transportation (+3.61%), public power (+2.09%) and higher education (+1.41%).
Looking forward, we believe that the Fund is well positioned to navigate potentially choppy waters as we are likely to begin the first Fed tightening cycle in 11 years. We hold a large weighting to short-term, high-quality bonds that have the potential to provide stability to the portfolio as the Fed begins raising rates. We also remain committed to our view that broad credit quality across the municipal market is improving, but we believe that relative valuation and credit selection will play an increasingly important role in future performance. We focus on our core philosophy of seeking sectors and bonds that we believe are underpriced on a fundamental basis, while maintaining the core stability that investors may expect from a high-quality municipal bond fund.
Sincerely,
Stephen M. Shutz, CFA
Portfolio Manager
Past performance is not a guarantee of future results.
Mutual fund investing involves risk. Principal loss is possible. The Fund is non-diversified which means it may invest a large percentage of its assets in the securities of fewer issuers. Investment in a limited number of issuers exposes the Fund to greater market risk than if its assets were diversified among a greater number of issuers. The Fund is also subject to interest rate risk which is the risk that debt securities in the Fund’s portfolio will decline in value because of an increase in market interest rates. Municipal securities are subject to adverse political or economic factors, including changes in the tax law. Income from tax-exempt funds may be subject to state and local taxes and a portion of income may be subject to the federal alternative minimum tax for certain investors.
Fund holdings and sector allocations are subject to change and should not be considered a recommendation to buy or sell any security. For a complete list of fund holdings, please refer to the Schedule of Investments provided in this report.
Definitions for terms and indices are provided in the Glossary of Terms.
www.brownadvisoryfunds.com
54
Brown Advisory Maryland Bond Fund
Performance Chart and Analysis
June 30, 2015
COMPARISON OF CHANGE IN VALUE OF A $10,000 INVESTMENT
The following chart reflects the change in value of a hypothetical $10,000 investment, including reinvested dividends and distributions, in the Fund as measured against the broad-based municipal bond index. The Barclays 1-10 Year Blended Municipal Bond Index (“Index”) is a market index of high quality, domestic fixed income securities with maturities of less than 10 years. The Index is unmanaged and does not reflect the deduction of fees, such as investment management fees. Investors cannot invest directly in an index.
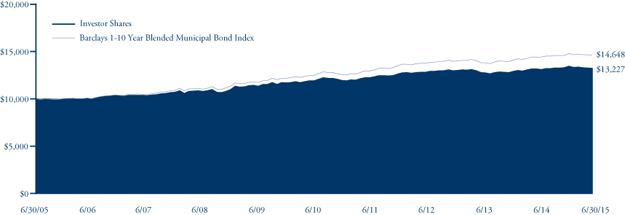
| Average Annual Total Return | One | Five | Ten | ||
| as of 6/30/15 | Year | Year | Year | ||
| Investor Shares | 0.58% | 2.13% | 2.84% | ||
| Barclays 1-10 Year Blended Municipal Bond Index | 1.74% | 3.22% | 3.89% | ||
| Investor Shares | ||
Gross Expense Ratio1 | 0.52% | |
Net Expense Ratio1 | 0.52% |
Past performance does not guarantee future results. The performance data quoted represents past performance and current returns may be lower or higher. The investment return and net asset value will fluctuate so that an investor’s shares, when redeemed, may be worth more or less than the original cost. To obtain performance information current to the most recent month end, please visit our website at brownadvisoryfunds.com/performance.html. The performance table and graph above do not reflect the deduction of taxes that a shareholder would pay on Fund distributions or the redemption of Fund shares. Investment performance reflects periods during which fee waivers were in effect. In the absence of such waivers, total return would have been reduced. Performance data does not reflect the imposition of the redemption fee of 1.00% on shares redeemed within 14 days, and if it did, performance would have been lower.
| 1 | Per the Fund’s prospectus dated October 31, 2014. |
www.brownadvisoryfunds.com
55
Brown Advisory Maryland Bond Fund
Schedule of Investments
June 30, 2015
| Par Value | Security Description | Rate | Maturity | Value $ | ||||||||
| Municipal Bonds — 99.1% | ||||||||||||
| General Obligation Bonds — 45.2% | ||||||||||||
| 3,500,000 | Anne Arundel County Maryland Consolidated General Improvements | 5.00 | % | 04/01/2017 | 3,769,710 | |||||||
| 5,075,000 | Anne Arundel County Maryland Consolidated General Improvements Callable 4/01/2024 @ 100^ | 5.00 | % | 04/01/2030 | 5,940,490 | |||||||
| 860,000 | Anne Arundel County Maryland Consolidated General Improvements Callable 4/01/2025 @ 100^ | 5.00 | % | 04/01/2030 | 1,017,234 | |||||||
| 1,425,000 | Baltimore County Maryland Consolidated Public Improvement | 5.00 | % | 09/01/2015 | 1,436,771 | |||||||
| 1,280,000 | Baltimore County Maryland Consolidated Public Improvement | 5.00 | % | 10/15/2015 | 1,298,227 | |||||||
| 250,000 | Baltimore County Maryland Consolidated Public Improvement | 5.00 | % | 10/15/2015 | 253,560 | |||||||
| 315,000 | Baltimore County Maryland Consolidated Public Improvement | 5.00 | % | 11/01/2015 | 320,144 | |||||||
| 1,000,000 | Baltimore County Maryland Consolidated Public Improvement | 5.00 | % | 02/01/2016 | 1,028,060 | |||||||
| 500,000 | Baltimore County Maryland Consolidated Public Improvement | 5.00 | % | 08/01/2016 | 525,335 | |||||||
| 450,000 | Baltimore County Maryland Consolidated Public Improvement Series A | 3.00 | % | 10/15/2016 | 465,080 | |||||||
| 2,070,000 | Baltimore County Maryland Consolidated Public Improvement | 5.00 | % | 10/15/2016 | 2,192,648 | |||||||
| 575,000 | Baltimore County Maryland Consolidated Public Improvement Series A | 5.00 | % | 11/01/2017 | 631,419 | |||||||
| 2,025,000 | Baltimore County Maryland Metropolitan District | 4.00 | % | 08/01/2016 | 2,105,676 | |||||||
| 575,000 | Baltimore County Maryland Pension Funding | 5.00 | % | 08/01/2015 | 577,415 | |||||||
| 790,000 | Carroll County Maryland Public Improvement | 3.00 | % | 11/01/2015 | 797,600 | |||||||
| 1,000,000 | Carroll County Maryland Public Improvement | 5.00 | % | 11/01/2015 | 1,016,330 | |||||||
| 500,000 | Carroll County Maryland Public Improvement | 4.00 | % | 12/01/2015 | 508,080 | |||||||
| 3,000,000 | Frederick City Maryland Consolidated Public Improvement | 5.00 | % | 09/01/2016 | 3,163,470 | |||||||
| 1,820,000 | Frederick County Maryland Consolidated Public Public Improvement | 4.00 | % | 02/01/2016 | 1,860,531 | |||||||
| 1,040,000 | Frederick County Maryland Public Facilities Series A | 3.00 | % | 08/01/2016 | 1,070,056 | |||||||
| 330,000 | Harford County Maryland Consolidated Public Improvement | 5.00 | % | 07/01/2015 | 330,046 | |||||||
| 200,000 | Harford County Maryland Consolidated Public Improvement | 5.00 | % | 12/01/2015 | 204,072 | |||||||
| 1,000,000 | Harford County Maryland Consolidated Public Improvement | 5.00 | % | 03/15/2016 | 1,033,590 | |||||||
| 300,000 | Howard County Maryland Consolidated Public Improvement Project Series A | 5.00 | % | 08/15/2015 | 301,830 | |||||||
| 1,000,000 | Howard County Maryland Consolidated Public Improvement Project Series A | 5.00 | % | 02/15/2016 | 1,029,870 | |||||||
| 2,020,000 | Howard County Maryland Metropolitan District Project Series B | 5.00 | % | 08/15/2016 | 2,125,666 | |||||||
| 945,000 | Maryland National Capital Park & Planning Commission | 3.00 | % | 01/15/2016 | 959,326 | |||||||
| 1,250,000 | Maryland State | 5.00 | % | 07/15/2015 | 1,252,550 | |||||||
| 550,000 | Maryland State | 5.00 | % | 08/01/2015 | 552,310 | |||||||
| 5,000,000 | Maryland State | 5.00 | % | 08/01/2015 | 5,021,000 | |||||||
| 735,000 | Maryland State | 5.50 | % | 08/01/2015 | 738,403 | |||||||
| 1,290,000 | Maryland State | 5.00 | % | 08/01/2015 | 1,295,418 | |||||||
| 500,000 | Maryland State 2nd Series A | 5.00 | % | 08/01/2015 | 502,100 | |||||||
| 1,000,000 | Maryland State | 5.00 | % | 03/15/2016 | 1,033,730 | |||||||
| 3,505,000 | Maryland State | 5.00 | % | 03/15/2016 | 3,623,224 | |||||||
| 6,335,000 | Maryland State 2nd Series B | 5.00 | % | 08/01/2016 | 6,655,994 | |||||||
| 500,000 | Maryland State | 5.00 | % | 08/01/2016 | 525,335 | |||||||
| 715,000 | Maryland State | 5.25 | % | 03/01/2017 | 770,734 | |||||||
| 1,000,000 | Maryland State 1st Series B | 5.00 | % | 03/15/2017 | 1,075,330 | |||||||
| 665,000 | Maryland State 2nd Series A, Callable 8/1/2015 @ 100^ | 5.00 | % | 08/01/2017 | 667,733 | |||||||
| 835,000 | Maryland State 2nd Series B | 5.25 | % | 08/15/2017 | 915,327 | |||||||
| 10,000,000 | Maryland State | 5.00 | % | 08/01/2024 | 12,301,300 | |||||||
| 565,000 | Montgomery County Maryland Consolidated Public Improvement Series A | 5.00 | % | 08/01/2015 | 567,373 | |||||||
| 1,495,000 | Montgomery County Maryland Consolidated Public Improvement Series A | 5.00 | % | 05/01/2016 | 1,554,187 | |||||||
| 2,000,000 | Montgomery County Maryland Consolidated Public Improvement Series A | 5.00 | % | 08/01/2016 | 2,101,340 | |||||||
| 825,000 | Montgomery County Maryland Consolidated Public Improvement | 5.00 | % | 11/01/2016 | 875,309 | |||||||
| 750,000 | Prince Georges County Maryland Public Improvement Series A | 5.00 | % | 07/15/2015 | 751,530 | |||||||
| 1,275,000 | Prince Georges County Maryland Public Improvement | 5.00 | % | 09/15/2015 | 1,287,941 | |||||||
| 2,400,000 | Prince Georges County Maryland Public Improvement | 5.00 | % | 08/01/2016 | 2,521,608 | |||||||
| 800,000 | Prince Georges County Maryland Public Improvement Series A | 5.00 | % | 09/01/2016 | 843,328 | |||||||
| 200,000 | Washington Suburban Sanitary District | 5.00 | % | 06/01/2016 | 208,674 | |||||||
| 1,500,000 | Washington Suburban Sanitary District | 5.00 | % | 06/01/2016 | 1,565,055 | |||||||
| 1,100,000 | Washington Suburban Sanitary District | 4.00 | % | 06/01/2016 | 1,137,609 | |||||||
| 1,215,000 | Washington Suburban Sanitary District | 5.00 | % | 06/01/2017 | 1,316,416 | |||||||
The accompanying notes are an integral part of these financial statements.
www.brownadvisoryfunds.com
56
Brown Advisory Maryland Bond Fund
Schedule of Investments
June 30, 2015
| Par Value | Security Description | Rate | Maturity | Value $ | ||||||||
| Municipal Bonds — (Continued) | ||||||||||||
| General Obligation Bonds — (Continued) | ||||||||||||
| 2,405,000 | Worcester County | 5.00 | % | 03/01/2016 | 2,481,479 | |||||||
| 90,104,573 | ||||||||||||
| Refunded Bonds — 2.3% | ||||||||||||
| 180,000 | Frederick County Maryland Prerefunded Consolidated Public Improvement Series | 4.00 | % | 02/01/2016 | 183,895 | |||||||
| 250,000 | Frederick County Maryland Public Facilities Callable 8/01/2015 @ 100^ | 5.00 | % | 08/01/2016 | 251,030 | |||||||
| 445,000 | Maryland State Health & Higher Educational Facilities Callable 7/01/2016 @ 100^ | 5.00 | % | 07/01/2023 | 465,444 | |||||||
| 515,000 | Maryland State Health & Higher Educational Facilities Callable 7/01/2016 @ 100^ | 5.00 | % | 01/01/2026 | 538,659 | |||||||
| 365,000 | Maryland State Health & Higher Educational Facilities Callable 7/01/2016 @ 100^ | 5.00 | % | 07/01/2026 | 381,768 | |||||||
| 1,660,000 | Maryland State Health & Higher Educational Facilities Callable 10/01/2015 @ 100^ | 4.75 | % | 10/01/2033 | 1,678,808 | |||||||
| 1,000,000 | Maryland State Health & Higher Educational Facilities Callable 10/01/2015 @ 100^ | 5.00 | % | 10/01/2040 | 1,011,970 | |||||||
| 4,511,574 | ||||||||||||
| Revenue Bonds — 51.6% | ||||||||||||
| 1,385,000 | Alabama 21st Century Authority | 5.00 | % | 06/01/2019 | 1,562,723 | |||||||
| 2,250,000 | Alachua County Health Shands Teaching Hospital Callable 12/01/2024 @ 100^ | 5.00 | % | 12/01/2034 | 2,431,485 | |||||||
| 500,000 | Alexandria Industrial Development Authority Callable 10/01/2025 @ 100^ | 5.00 | % | 10/01/2030 | 538,850 | |||||||
| 500,000 | Baltimore County Maryland Economic Development Various Garrison Forest School Incorporate # | 3.00 | % | 10/01/2031 | 510,140 | |||||||
| 520,000 | Baltimore Maryland Callable 6/15/2024 @ 100^ | 5.00 | % | 06/15/2030 | 564,528 | |||||||
| 670,000 | Baltimore Maryland Callable 6/15/2024 @ 100^ | 5.00 | % | 06/15/2033 | 721,061 | |||||||
| 1,485,000 | Baltimore Maryland Wastewater Project Series E | 4.00 | % | 07/01/2015 | 1,485,163 | |||||||
| 405,000 | Baltimore Maryland Wastewater Project Series A | 3.40 | % | 07/01/2016 | 417,352 | |||||||
| 1,000,000 | Baltimore Maryland Wastewater Project | 5.00 | % | 07/01/2016 | 1,046,820 | |||||||
| 1,400,000 | Baltimore Maryland Wastewater Project Series D, Callable 1/01/2024 @ 100^ | 5.00 | % | 07/01/2029 | 1,614,438 | |||||||
| 2,000,000 | Baltimore Maryland Wastewater Project Callable 1/01/2025 @ 100^ | 5.00 | % | 07/01/2031 | 2,298,280 | |||||||
| 5,000,000 | Baltimore Maryland Wastewater Project Series D, Callable 1/01/2024 @ 100^ | 5.00 | % | 07/01/2038 | 5,574,700 | |||||||
| 1,000,000 | California Tobacco Securitization Agency | 4.00 | % | 06/01/2018 | 1,068,920 | |||||||
| 255,000 | Chicago Illinois Midway International Airport Callable 1/01/2024 @ 100^ | 5.00 | % | 01/01/2027 | 287,719 | |||||||
| 3,000,000 | Citizens Property Insurance Corp. Callable 12/01/2024 @ 100^ | 5.00 | % | 06/01/2025 | 3,482,910 | |||||||
| 2,855,000 | Colorado Health Facilities Authority Revenue Covenant Retirement | 5.00 | % | 12/01/2022 | 3,131,478 | |||||||
| 1,550,000 | Franklin County Health Care Facilities Friendship Village Callable 11/15/2024 @ 100^ | 5.00 | % | 11/15/2034 | 1,652,005 | |||||||
| 2,460,000 | Frederick County Maryland Special Obligation Subordinated Urbana Community | |||||||||||
| Development Authority Series B, Callable 7/01/2020 @ 100^ | 5.50 | % | 07/01/2040 | 2,494,096 | ||||||||
| 375,000 | Frederick County Maryland Special Obligation Urbana Community Development Authority Series A | 4.00 | % | 07/01/2017 | 396,022 | |||||||
| 900,000 | Houston Texas Airport System | 5.00 | % | 07/15/2020 | 964,251 | |||||||
| 1,100,000 | Houston Texas Airport System | 5.00 | % | 07/15/2020 | 1,163,437 | |||||||
| 550,000 | Idaho Health Facilities Authority Revenue Series A, Callable 3/01/2024 @ 100^ | 5.00 | % | 03/01/2034 | 593,901 | |||||||
| 750,000 | Indiana Finance Authority Series A, Callable 9/15/2024 @ 100^ | 5.00 | % | 09/15/2028 | 827,183 | |||||||
| 700,000 | Jurupa California Public Financing Authority Series A, Callable 9/01/2024 @ 100^ | 5.00 | % | 09/01/2025 | 809,445 | |||||||
| 1,920,000 | Lower Colorado River Authority Series A, Callable 5/15/2022 @ 100^ | 5.00 | % | 05/15/2029 | 2,131,699 | |||||||
| 500,000 | Maryland Economic Development Corp. Callable 6/01/2016 @ 100^ | 5.00 | % | 06/01/2022 | 517,445 | |||||||
| 1,185,000 | Maryland Economic Development Corp. Callable 7/01/2017 @ 100^ | 5.25 | % | 07/01/2024 | 1,273,034 | |||||||
| 1,000,000 | Maryland Economic Development Corp.# | 2.55 | % | 12/01/2025 | 999,990 | |||||||
| 700,000 | Maryland Economic Development Corp. Callable 6/01/2023 @ 100^ | 5.00 | % | 06/01/2027 | 759,766 | |||||||
| 400,000 | Maryland Economic Development Corp. Callable 7/01/2022 @ 100^ | 5.00 | % | 07/01/2027 | 429,912 | |||||||
| 850,000 | Maryland Economic Development Corp. Callable 7/01/2025 @ 100^ | 5.00 | % | 07/01/2031 | 911,532 | |||||||
| 1,250,000 | Maryland Industrial Development Financing Authority Series B# | 1.10 | % | 09/01/2040 | 1,251,375 | |||||||
| 1,750,000 | Maryland Industrial Development Financing Authority# | 2.00 | % | 09/01/2040 | 1,754,550 | |||||||
| 495,000 | Maryland State Community Development Administration | 0.15 | % | 09/01/2015 | 494,777 | |||||||
| 1,000,000 | Maryland State Community Development Administration Series C | 3.85 | % | 09/01/2015 | 1,005,770 | |||||||
| 440,000 | Maryland State Community Development Administration | 0.25 | % | 03/01/2016 | 439,652 | |||||||
| 250,000 | Maryland State Community Development Administration | 0.40 | % | 09/01/2016 | 249,640 | |||||||
| 1,255,000 | Maryland State Community Development Administration | 2.75 | % | 03/01/2024 | 1,244,935 | |||||||
| 1,050,000 | Maryland State Community Development Administration Callable 3/01/2024 @ 100^ | 2.80 | % | 09/01/2024 | 1,041,558 | |||||||
| 500,000 | Maryland State Community Development Administration Callable 3/01/2024 @ 100^ | 2.90 | % | 03/01/2025 | 497,360 | |||||||
The accompanying notes are an integral part of these financial statements.
www.brownadvisoryfunds.com
57
Brown Advisory Maryland Bond Fund
Schedule of Investments
June 30, 2015
| Par | ||||||||||||
| Value/Shares | Security Description | Rate | Maturity | Value $ | ||||||||
| Municipal Bonds — (Continued) | ||||||||||||
| Revenue Bonds — (Continued) | ||||||||||||
| 745,000 | Maryland State Community Development Administration Callable 3/01/2024 @ 100^ | 2.95 | % | 09/01/2025 | 741,521 | |||||||
| 3,200,000 | Maryland State Department of Transportation | 4.00 | % | 02/15/2016 | 3,274,592 | |||||||
| 1,000,000 | Maryland State Department of Transportation | 5.50 | % | 02/01/2017 | 1,078,020 | |||||||
| 2,000,000 | Maryland State Department of Transportation | 5.00 | % | 05/01/2017 | 2,158,660 | |||||||
| 1,500,000 | Maryland State Department of Transportation | 5.00 | % | 06/01/2017 | 1,623,705 | |||||||
| 500,000 | Maryland State Department of Transportation Callable 5/15/2017 @ 100^ | 4.00 | % | 05/15/2020 | 526,560 | |||||||
| 500,000 | Maryland State Health & Higher Educational Facilities | 5.00 | % | 07/01/2017 | 533,940 | |||||||
| 1,395,000 | Maryland State Health & Higher Educational Facilities | 5.00 | % | 01/01/2018 | 1,482,425 | |||||||
| 260,000 | Maryland State Health & Higher Educational Facilities Series F | 5.00 | % | 07/01/2018 | 286,985 | |||||||
| 250,000 | Maryland State Health & Higher Educational Facilities Callable 7/01/2017 @ 100^ | 5.00 | % | 07/01/2018 | 269,235 | |||||||
| 1,000,000 | Maryland State Health & Higher Educational Facilities Callable 7/1/2021 @ 100^ | 5.00 | % | 07/01/2023 | 1,135,580 | |||||||
| 500,000 | Maryland State Health & Higher Educational Facilities | 5.00 | % | 08/15/2023 | 588,935 | |||||||
| 650,000 | Maryland State Health & Higher Educational Facilities Series A, Callable 7/01/2016 @ 100^ | 5.20 | % | 01/01/2024 | 665,061 | |||||||
| 500,000 | Maryland State Health & Higher Educational Facilities Callable 7/01/2018 @ 100^ | 5.50 | % | 07/01/2024 | 549,930 | |||||||
| 500,000 | Maryland State Health & Higher Educational Facilities Callable 7/1/2022 @ 100^ | 5.00 | % | 07/01/2024 | 549,485 | |||||||
| 240,000 | Maryland State Health & Higher Educational Facilities Series A, Callable 7/01/2016 @ 100^ | 5.00 | % | 01/01/2025 | 251,026 | |||||||
| 1,000,000 | Maryland State Health & Higher Educational Facilities Callable 7/1/2021 @ 100^ | 6.00 | % | 07/01/2025 | 1,136,630 | |||||||
| 1,500,000 | Maryland State Health & Higher Educational Facilities | 5.00 | % | 07/01/2025 | 1,698,015 | |||||||
| 1,250,000 | Maryland State Health & Higher Educational Facilities Callable 7/01/2024 @ 100^ | 5.00 | % | 07/01/2025 | 1,404,013 | |||||||
| 420,000 | Maryland State Health & Higher Educational Facilities Callable 7/01/2025 @ 100^ | 5.00 | % | 07/01/2026 | 481,958 | |||||||
| 1,000,000 | Maryland State Health & Higher Educational Facilities Callable 7/01/2016 @ 100^ | 5.00 | % | 07/01/2026 | 1,045,940 | |||||||
| 1,605,000 | Maryland State Health & Higher Educational Facilities Callable 7/01/2024 @ 100^ | 5.00 | % | 07/01/2028 | 1,816,025 | |||||||
| 100,000 | Maryland State Health & Higher Educational Facilities Callable 10/01/2024 @ 100^ | 4.00 | % | 10/01/2030 | 104,482 | |||||||
| 1,130,000 | Maryland State Health & Higher Educational Facilities Callable 7/1/2021 @ 100^ | 6.25 | % | 07/01/2031 | 1,277,024 | |||||||
| 300,000 | Maryland State Health & Higher Educational Facilities Callable 10/01/2024 @ 100^ | 4.00 | % | 10/01/2031 | 312,237 | |||||||
| 1,250,000 | Maryland State Health & Higher Educational Facilities Callable 2/15/2025 @ 100^ | 5.00 | % | 08/15/2033 | 1,362,025 | |||||||
| 250,000 | Maryland State Health & Higher Educational Facilities Callable 7/01/2019 @ 100^ | 5.00 | % | 07/01/2034 | 268,140 | |||||||
| 200,000 | Maryland State Health & Higher Educational Facilities Callable 7/01/2017 @ 100^ | 4.50 | % | 07/01/2035 | 201,580 | |||||||
| 1,000,000 | Maryland State Health & Higher Educational Facilities Series A, Callable 7/01/2016 @ 100^ | 5.40 | % | 01/01/2037 | 1,017,280 | |||||||
| 3,290,000 | Maryland State Health & Higher Educational Facilities Callable 8/15/2023 @ 100^ | 5.00 | % | 08/15/2038 | 3,608,209 | |||||||
| 3,400,000 | Maryland State Health & Higher Educational Facilities Callable 5/15/2020 @ 100^ | 5.00 | % | 05/15/2040 | 3,707,768 | |||||||
| 750,000 | Maryland State Transportation Authority Series A | 3.00 | % | 07/01/2016 | 770,340 | |||||||
| 4,255,000 | Maryland State Transportation Authority | 5.00 | % | 03/01/2022 | 4,943,544 | |||||||
| 500,000 | Maryland State Water Quality Financing Series A | 5.00 | % | 09/01/2015 | 504,120 | |||||||
| 2,820,000 | Maryland State Water Quality Financing | 5.00 | % | 03/01/2017 | 3,025,973 | |||||||
| 630,000 | Nassau County Local Economic Assistance Corp. Callable 07/01/2024 @ 100^ | 5.00 | % | 07/01/2026 | 711,793 | |||||||
| 1,000,000 | Pompano Beach, Florida Callable 09/01/2016 @ 100^ | 5.00 | % | 09/01/2044 | 1,064,610 | |||||||
| 1,000,000 | Private Colleges & Universities Authority | 5.00 | % | 04/01/2023 | 1,144,850 | |||||||
| 250,000 | Railsplitter Tobacco Settlement Authority | 5.00 | % | 06/01/2016 | 259,940 | |||||||
| 3,000,000 | Tobacco Settlement Financing Corp. | 5.00 | % | 06/01/2017 | 3,209,130 | |||||||
| 500,000 | University System of Maryland Series B | 3.75 | % | 10/01/2015 | 504,590 | |||||||
| 1,000,000 | University System of Maryland | 5.00 | % | 04/01/2016 | 1,036,010 | |||||||
| 102,971,788 | ||||||||||||
| Total Municipal Bonds (Cost $195,882,234) | 197,587,935 | |||||||||||
| Short-Term Investments — 0.1% | ||||||||||||
| Money Market Funds — 0.1% | ||||||||||||
| 229,361 | DWS Cash Account Trust — Tax-Exempt Portfolio — Institutional Shares, 0.01%* | 229,361 | ||||||||||
| Total Short-Term Investments (Cost $229,361) | 229,361 | |||||||||||
| Total Investments — 99.2% (Cost $196,111,595) | 197,817,296 | |||||||||||
| Other Assets in Excess of Liabilities — 0.8% | 1,651,835 | |||||||||||
| TOTAL NET ASSETS — 100.0% | $ | 199,469,131 | ||||||||||
The accompanying notes are an integral part of these financial statements.
www.brownadvisoryfunds.com
58
Brown Advisory Maryland Bond Fund
Schedule of Investments
June 30, 2015
PORTFOLIO HOLDINGS
% of Net Assets
| Revenue Bonds | 51.6% |
| General Obligation Bonds | 45.2% |
| Refunded Bonds | 2.3% |
| Money Market Funds | 0.1% |
| Other Assets and Liabilities | 0.8% |
| 100.0% |
| ^ | Continuously callable with 30 days notice. |
| # | Variable rate security. Rate disclosed is as of June 30, 2015. |
| * | Annualized seven-day yield as of June 30, 2015. |
The accompanying notes are an integral part of these financial statements.
www.brownadvisoryfunds.com
59
Brown Advisory Tax Exempt Bond Fund
A Message to Our Shareholders
June 30, 2015
Dear Shareholder:
During the year ended June 30, 2015, the Brown Advisory Tax Exempt Bond Fund (the “Fund”) increased 0.78% in value. During the same period, the Barclays 1-10 Year Blended Municipal Bond Index, the Fund’s benchmark, increased 1.74%.
For the period, the Fund was mostly neutral weighted on duration but positioned for the yield curve to flatten. We believed that if interest rates were to rise, it would be because the economy seemed to be improving and Federal Reserve rate hikes were seen on the near-term horizon. This would, in turn, cause short- and intermediate-term rates to rise more than long-term rates. At the same time, we saw a few reasons why rates might fall, including increasing foreign demand and/or a downgrade in the long-term growth prospects for the U.S. Both of these outcomes would be more likely to benefit longer-term bonds more than short- or intermediate-term bonds.
Instead, the municipal yield curve steepened significantly for the first half of 2015, which hurt the Fund’s relative performance. This was primarily due to the uncertainty around when the Fed would begin its rate-tightening cycle and the market’s presumption that hikes would not begin until 2016. In contrast, our tone on the market is constructive. While longer-maturity yields have increased around the uncertain timing of Fed “lift off,” we see limited risk of additional curve steepening due to the softer overall global economic outlook. As a result, we maintain our overweight to the intermediate and longer-maturity portion of the municipal yield curve.
Offsetting the curve steepening was strong performance from our bottom-up selection in municipal sector and individual credit selection. The Fund maintains an overweight to revenue-backed issues where we believe there is a potential upside thesis. Of those sectors, health-care-related credits such as not-for-profit hospitals and senior living were the largest contributor. On a combined basis, these holdings returned 2.93% for the period versus the Index’s health care return of 2.80%. The fund maintained a combined overweight of roughly 10% to these two sectors during the period, which contributed 40 basis points of relative outperformance. The portfolio also benefited from strong returns in several other revenue-backed sectors during the period, including transportation (+3.64%), public power (+3.48%) and higher education (+3.01%).
Looking forward, we believe that the Fund is well positioned to navigate potentially choppy waters as we are likely to begin the first Fed tightening cycle in 11 years. We hold a large weighting to short-term, high-quality bonds that should provide stability to the portfolio as the Fed begins raising rates. We also remain committed to our view that broad credit quality across the municipal market is improving, but we believe that relative valuation and credit selection will play an increasingly important role in future performance. We focus on our core philosophy of seeking sectors and bonds that we believe are underpriced on a fundamental basis, while maintaining the core stability that investors should expect from a high-quality municipal bond fund.
Sincerely,
Stephen M. Shutz, CFA
Portfolio Manager
Past performance is not a guarantee of future results.
Mutual fund investing involves risk. Principal loss is possible. The Fund is non-diversified which means it may invest a large percentage of its assets in the securities of fewer issuers. Concentration in a limited number of issuers exposes the Fund to greater market risk than if its assets were diversified among a greater number of issuers. The Fund is also subject to interest rate risk which is the risk that debt securities in the Fund’s portfolio will decline in value because of an increase in market interest rates. This risk is usually greater for longer-term debt securities. Income from tax-exempt funds may be subject to state and local taxes and a portion of income may be subject to the Federal Alternative minimum tax for certain investors.
Fund holdings and sector allocations are subject to change and should not be considered a recommendation to buy or sell any security. For a complete list of fund holdings, please refer to the Schedule of Investments provided in this report.
Definitions for terms and indices are provided in the Glossary of Terms.
www.brownadvisoryfunds.com
60
Brown Advisory Tax Exempt Bond Fund
Performance Chart and Analysis
June 30, 2015
COMPARISON OF CHANGE IN VALUE OF A $10,000 INVESTMENT
The following chart reflects the change in value of a hypothetical $10,000 investment, including reinvested dividends and distributions, in the Fund as measured against the broad-based municipal bond index. The Barclays 1-10 Year Blended Municipal Bond Index (“Index”) is a market index of high quality, domestic fixed income securities with maturities of less than 10 years. The Index is unmanaged and does not reflect the deduction of fees, such as investment management fees. Investors cannot invest directly in an index.
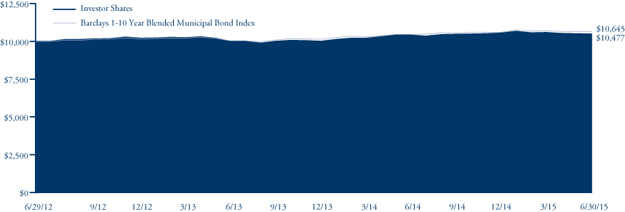
| Since | ||||
| Average Annual Total Return | One | Inception | ||
| as of 6/30/15 | Year | (6/29/12) | ||
| Investor Shares | 0.78% | 1.56% | ||
| Barclays 1-10 Year Blended Municipal Bond Index | 1.74% | 2.10% | ||
| Investor Shares | ||
Gross Expense Ratio1 | 0.53% | |
Net Expense Ratio1 | 0.53% |
Past performance does not guarantee future results. The performance data quoted represents past performance and current returns may be lower or higher. The investment return and net asset value will fluctuate so that an investor’s shares, when redeemed, may be worth more or less than the original cost. To obtain performance information current to the most recent month end, please visit our website at brownadvisoryfunds.com/performance.html. The performance table and graph above do not reflect the deduction of taxes that a shareholder would pay on Fund distributions or the redemption of Fund shares. Performance data does not reflect the imposition of the redemption fee of 1.00% on shares redeemed within 14 days, and if it did, performance would have been lower.
| 1 | Per the Fund’s prospectus dated October 31, 2014. |
www.brownadvisoryfunds.com
61
Brown Advisory Tax Exempt Bond Fund
Schedule of Investments
June 30, 2015
| Par Value | Security Description | Rate | Maturity | Value $ | ||||||||
| Municipal Bonds — 97.8% | ||||||||||||
| General Obligation Bonds — 26.4% | ||||||||||||
| 2,980,000 | Adams Colorado 12 Five Star Schools | 3.00 | % | 12/15/2015 | 3,019,038 | |||||||
| 5,200,000 | Albuquerque New Mexico | 5.00 | % | 07/01/2016 | 5,446,168 | |||||||
| 1,135,000 | Alpine Utah School District | 5.00 | % | 03/15/2016 | 1,173,125 | |||||||
| 3,120,000 | Arapahoe County School District No 5 Cherry Creek | 5.00 | % | 12/15/2016 | 3,324,578 | |||||||
| 1,885,000 | Beaver Area School District | 3.00 | % | 09/01/2017 | 1,965,942 | |||||||
| 1,300,000 | Bloomington Independent School District | 5.00 | % | 02/01/2017 | 1,390,818 | |||||||
| 975,000 | Burnsville-Eagan-Savage Independent School District | 2.00 | % | 02/01/2016 | 984,136 | |||||||
| 1,500,000 | Cheshire Connecticut | 4.00 | % | 08/01/2015 | 1,504,950 | |||||||
| 895,000 | Coon Rapids Minnesota, City of | 2.00 | % | 02/01/2016 | 903,664 | |||||||
| 1,750,000 | Fort Bend Independent School District | 3.00 | % | 08/15/2016 | 1,802,745 | |||||||
| 1,360,000 | Fountain Hills Arizona, Town of | 2.00 | % | 07/01/2016 | 1,380,522 | |||||||
| 1,320,000 | Gwinnett County School District | 5.00 | % | 02/01/2016 | 1,357,039 | |||||||
| 1,185,000 | Harris County Texas Improvement | 5.00 | % | 09/01/2015 | 1,194,658 | |||||||
| 975,000 | Harris County Texas Improvement | 5.00 | % | 09/01/2016 | 1,025,719 | |||||||
| 500,000 | Houston Community College System | 5.00 | % | 04/15/2017 | 537,155 | |||||||
| 3,630,000 | Hurst Euless Bedford Independent School District | 5.00 | % | 08/15/2016 | 3,820,865 | |||||||
| 1,000,000 | Illinois, State of | 4.00 | % | 07/01/2016 | 1,026,810 | |||||||
| 750,000 | Jefferson County Board of Education | 4.00 | % | 05/01/2017 | 792,480 | |||||||
| 1,325,000 | Kaufman, County of | 3.00 | % | 02/15/2018 | 1,382,068 | |||||||
| 1,250,000 | King County Public Hospital District No 2 | 5.00 | % | 12/01/2015 | 1,275,375 | |||||||
| 690,000 | Lexington-Fayette Urban County Government | 5.00 | % | 01/01/2016 | 706,491 | |||||||
| 1,250,000 | Lufkin Independent School District | 2.00 | % | 08/15/2015 | 1,252,937 | |||||||
| 725,000 | Maricopa County Union High School District No 216 Agua Fria | 4.00 | % | 07/01/2016 | 750,056 | |||||||
| 1,000,000 | Maryland, State of | 5.00 | % | 08/01/2015 | 1,004,200 | |||||||
| 2,000,000 | McKinney Independent School District | 5.00 | % | 02/15/2016 | 2,059,960 | |||||||
| 530,000 | McLeod Minnesota, County of | 2.00 | % | 02/01/2016 | 534,966 | |||||||
| 1,000,000 | Milwaukee Wisconsin Metropolitan Sewage District | 5.50 | % | 10/01/2015 | 1,013,580 | |||||||
| 1,315,000 | Nashville & Davidson County Tennessee Series A | 3.00 | % | 10/01/2015 | 1,324,586 | |||||||
| 1,000,000 | New York New York Series C | 5.00 | % | 08/01/2015 | 1,004,180 | |||||||
| 1,000,000 | New York New York Series J | 5.00 | % | 08/01/2016 | 1,049,660 | |||||||
| 890,000 | Oil City Area School District | 0.60 | % | 05/15/2016 | 890,240 | |||||||
| 2,065,000 | Pierce Washington, County of | 3.00 | % | 08/01/2017 | 2,153,671 | |||||||
| 3,000,000 | Pleasant Prairie Wisconsin, Village of | 5.00 | % | 09/01/2016 | 3,162,000 | |||||||
| 1,570,000 | Pratville Alabama | 3.00 | % | 11/01/2017 | 1,644,010 | |||||||
| 775,000 | Royal Oak Michigan School District | 5.00 | % | 05/01/2016 | 804,683 | |||||||
| 2,455,000 | South Washington County Independent School District | 5.00 | % | 02/01/2017 | 2,625,696 | |||||||
| 1,100,000 | South Windsor Connecticut | 5.00 | % | 08/15/2015 | 1,106,600 | |||||||
| 685,000 | West Contra Costa Unified School District | 4.00 | % | 08/01/2017 | 729,265 | |||||||
| 59,124,636 | ||||||||||||
| Refunded Bonds — 13.5% | ||||||||||||
| 1,635,000 | Cape Girardeau Municipal Library District Callable 03/01/2016 @ 100^ | 4.50 | % | 03/01/2027 | 1,680,764 | |||||||
| 1,760,000 | District of Columbia Callable 01/01/2016 @ 100^ | 5.00 | % | 01/01/2019 | 1,801,571 | |||||||
| 3,000,000 | Easton Area School District Callable 04/01/2016 @ 100^ | 7.50 | % | 04/01/2021 | 3,160,980 | |||||||
| 2,835,000 | Easton Area School District Callable 04/01/2016 @ 100^ | 7.50 | % | 04/01/2022 | 2,987,126 | |||||||
| 2,000,000 | Greater Arizona Development Authority Callable 08/01/2016 @ 100^ | 5.00 | % | 08/01/2022 | 2,099,480 | |||||||
| 1,375,000 | Indiana State Office Building Commission | 5.25 | % | 07/01/2015 | 1,375,192 | |||||||
| 3,420,000 | Louisville & Jefferson County Water Callable 11/15/2016 @ 100^ | 5.00 | % | 11/15/2028 | 3,628,894 | |||||||
| 1,490,000 | Marion & Clackamas Counties Oregon Callable 06/15/2016 @ 100^ | 4.38 | % | 06/15/2021 | 1,547,097 | |||||||
| 1,370,000 | Montgomery, County of Callable 10/15/2016 @ 100^ | 5.00 | % | 10/15/2028 | 1,449,830 | |||||||
| 2,500,000 | Nevada System of Higher Education Callable 01/01/2016 @ 100^ | 5.00 | % | 07/01/2026 | 2,559,950 | |||||||
| 1,425,000 | New Jersey Economic Development Authority Callable 09/01/2015 @ 100^ | 5.25 | % | 09/01/2019 | 1,437,056 | |||||||
| 1,000,000 | Pierce County School District Callable 06/01/2016 @ 100^ | 5.00 | % | 12/01/2024 | 1,042,490 | |||||||
| 500,000 | Shaler Area School District Callable 09/01/2016 @ 100^ | 5.25 | % | 09/01/2028 | 528,105 | |||||||
| 1,000,000 | Socorro Independent School District Callable 08/15/2016 @ 100^ | 5.00 | % | 08/15/2026 | 1,052,170 | |||||||
The accompanying notes are an integral part of these financial statements.
www.brownadvisoryfunds.com
62
Brown Advisory Tax Exempt Bond Fund
Schedule of Investments
June 30, 2015
| Par Value | Security Description | Rate | Maturity | Value $ | ||||||||
| Municipal Bonds — (Continued) | ||||||||||||
| Refunded Bonds — (Continued) | ||||||||||||
| 500,000 | Terrace Park Ohio, Village of Callable 12/01/2015 @ 100^ | 5.00 | % | 12/01/2021 | 509,985 | |||||||
| 3,510,000 | University Medical Center Corp. Callable 07/01/2015 @ 100^ | 5.00 | % | 07/01/2035 | 3,510,456 | |||||||
| 30,371,146 | ||||||||||||
| Revenue Bonds — 57.9% | ||||||||||||
| 1,500,000 | Alabama 21st Century Authority — Tobacco Settlement | 5.00 | % | 06/01/2017 | 1,614,960 | |||||||
| 750,000 | Anaheim Public Financing Authority | 5.00 | % | 05/01/2016 | 778,485 | |||||||
| 750,000 | Anaheim Public Financing Authority | 5.00 | % | 05/01/2017 | 807,345 | |||||||
| 1,085,000 | Arizona State Lottery Revenue | 5.00 | % | 07/01/2017 | 1,172,874 | |||||||
| 2,120,000 | Atlanta Georgia Water & Wastewater Revenue Callable 05/01/2025 @ 100^ | 5.00 | % | 11/01/2032 | 2,432,043 | |||||||
| 660,000 | Austin Community College District | 5.00 | % | 02/01/2016 | 677,681 | |||||||
| 1,000,000 | Broward County Florida Airport System Revenue | 5.00 | % | 10/01/2016 | 1,055,730 | |||||||
| 1,080,000 | Cathedral City Redevelopment Successor Agency | 3.00 | % | 08/01/2016 | 1,108,242 | |||||||
| 2,970,000 | Central Texas Turnpike System Callable 8/15/2024 @ 100^ | 5.00 | % | 08/15/2027 | 3,329,251 | |||||||
| 2,400,000 | Central Texas Turnpike System Callable 08/15/2024 @ 100^ | 5.00 | % | 08/15/2037 | 2,593,296 | |||||||
| 3,000,000 | Chicago Midway International Airport Callable 01/01/2024 @ 100^ | 5.00 | % | 01/01/2028 | 3,356,550 | |||||||
| 3,000,000 | Citizens Property Insurance Corp.^ | 5.00 | % | 06/01/2025 | 3,482,910 | |||||||
| 300,000 | Colorado Health Facilities Authority | 5.00 | % | 12/01/2020 | 329,637 | |||||||
| 1,300,000 | Colorado Health Facilities Authority Series A, Callable 12/01/2022 @ 100^ | 5.00 | % | 12/01/2027 | 1,374,997 | |||||||
| 1,000,000 | Colorado Health Facilities Authority Callable 06/01/2025 @ 100^ | 5.00 | % | 12/01/2035 | 1,049,830 | |||||||
| 335,000 | Cook County Sales Tax Revenue | 4.00 | % | 11/15/2015 | 339,777 | |||||||
| 500,000 | Dallas/Fort Worth International Airport | 5.00 | % | 11/01/2015 | 508,065 | |||||||
| 1,600,000 | Delaware Transportation Authority | 5.00 | % | 07/01/2015 | 1,600,224 | |||||||
| 5,000,000 | Denver Health & Hospital Authority Callable 12/01/2023 @ 100^ | 5.00 | % | 12/01/2039 | 5,225,100 | |||||||
| 1,935,000 | Denver Urban Renewal Authority Callable 12/01/2015 @ 100^ | 5.00 | % | 12/01/2017 | 1,972,636 | |||||||
| 1,700,000 | Educational Enhancement Funding Corp. | 5.00 | % | 06/01/2023 | 1,958,774 | |||||||
| 645,000 | Fairfax County Economic Development Authority | 5.00 | % | 06/01/2016 | 672,425 | |||||||
| 1,050,000 | Florida Department of Environmental Protection | 3.00 | % | 07/01/2015 | 1,050,084 | |||||||
| 2,200,000 | Franklin Ohio Health Care, County of Callable 11/15/2024 @ 100^ | 5.00 | % | 11/15/2044 | 2,322,034 | |||||||
| 500,000 | Greenville County School District | 5.00 | % | 12/01/2015 | 510,195 | |||||||
| 2,570,000 | Hamilton County Convention Facilities Authority | 2.00 | % | 12/01/2015 | 2,588,298 | |||||||
| 1,000,000 | Harris County-Houston Sports Authority Callable 11/15/2024 @ 100^ | 5.00 | % | 11/15/2053 | 1,058,090 | |||||||
| 1,100,000 | Houston Texas Airport System | 5.00 | % | 07/15/2020 | 1,163,437 | |||||||
| 900,000 | Houston Texas Airport System | 5.00 | % | 07/15/2020 | 964,251 | |||||||
| 2,700,000 | Illinois Finance Authority | 5.00 | % | 08/15/2016 | 2,833,137 | |||||||
| 2,000,000 | Illinois Finance Authority Callable 05/15/2024 @ 100^ | 5.00 | % | 11/15/2034 | 2,189,960 | |||||||
| 1,000,000 | Indiana Finance Authority | 5.00 | % | 02/01/2016 | 1,028,260 | |||||||
| 1,000,000 | Indiana Finance Authority Callable 09/15/2024 @ 100^ | 5.00 | % | 09/15/2025 | 1,137,880 | |||||||
| 1,000,000 | Indiana Finance Authority Series A, Callable 09/15/2024 @ 100^ | 5.00 | % | 09/15/2028 | 1,102,910 | |||||||
| 1,150,000 | Iowa State University | 2.00 | % | 07/01/2015 | 1,150,057 | |||||||
| 1,500,000 | IPS Multi-School Building Corp. | 5.00 | % | 07/15/2018 | 1,672,200 | |||||||
| 425,000 | Jurupa California Public Financing Authority | 4.00 | % | 09/01/2016 | 440,993 | |||||||
| 2,205,000 | Kansas Development Finance Authority | 5.00 | % | 06/01/2016 | 2,296,794 | |||||||
| 2,000,000 | Kansas Development Finance Authority | 5.00 | % | 05/01/2017 | 2,153,060 | |||||||
| 1,500,000 | Lincoln Nebraska — Lincoln Electric System | 4.00 | % | 09/01/2015 | 1,509,840 | |||||||
| 2,200,000 | Maryland Health & Higher Educational Facilities Authority Callable 07/01/2025 @ 100^ | 5.00 | % | 07/01/2033 | 2,373,316 | |||||||
| 2,000,000 | Metropolitan Washington Airports Authority | 5.00 | % | 10/01/2016 | 2,106,660 | |||||||
| 2,500,000 | Miami Beach Florida Health Facilities Callable 11/15/2024 @ 100^ | 5.00 | % | 11/15/2039 | 2,656,550 | |||||||
| 2,130,000 | Miami-Dade County Florida Aviation | 5.00 | % | 10/01/2017 | 2,310,283 | |||||||
| 625,000 | Missouri State Environmental Improvement & Energy Resources Authority Callable 01/01/2025 @ 100^ | 5.00 | % | 01/01/2027 | 723,769 | |||||||
| 1,500,000 | Montgomery County Industrial Development Authority# | 2.55 | % | 06/01/2029 | 1,499,985 | |||||||
| 1,250,000 | Nashville & Davidson County Tennessee | 5.00 | % | 07/01/2016 | 1,308,263 | |||||||
| 1,900,000 | New Hope Cultural Education Facilities Corp. Callable 08/01/2023 @ 100^ | 5.00 | % | 08/01/2039 | 1,939,938 | |||||||
| 1,295,000 | New York City Transitional Finance Authority Future Tax Secured Revenue | 5.00 | % | 11/01/2015 | 1,316,290 | |||||||
| 170,000 | New York City Transitional Finance Authority Future Tax Secured Revenue | 5.00 | % | 11/01/2015 | 172,715 | |||||||
The accompanying notes are an integral part of these financial statements.
www.brownadvisoryfunds.com
63
Brown Advisory Tax Exempt Bond Fund
Schedule of Investments
June 30, 2015
| Par | ||||||||||||
| Value/Shares | Security Description | Rate | Maturity | Value $ | ||||||||
| Municipal Bonds — (Continued) | ||||||||||||
| Revenue Bonds — (Continued) | ||||||||||||
| 1,000,000 | New York City Transitional Finance Authority Future Tax Secured Revenue | 5.00 | % | 11/01/2015 | 1,016,440 | |||||||
| 2,000,000 | New York Metropolitan Transportation Authority Callable 05/15/2023 @ 100^ | 5.00 | % | 11/15/2042 | 2,176,140 | |||||||
| 1,000,000 | New York State Dormitory Authority | 4.00 | % | 10/01/2015 | 1,009,660 | |||||||
| 2,780,000 | New York State Dormitory Authority | 5.00 | % | 02/15/2016 | 2,863,400 | |||||||
| 1,730,000 | New York State Environmental Facilities Corp. | 2.00 | % | 11/15/2015 | 1,742,283 | |||||||
| 1,760,000 | Niagara County New York Tobacco | 5.00 | % | 05/15/2024 | 2,043,853 | |||||||
| 980,000 | Oklahoma Development Finance Authority | 3.00 | % | 06/01/2017 | 1,022,130 | |||||||
| 1,250,000 | Palm Beach County Florida Health Corp. Callable 12/01/2024 @ 100^ | 5.00 | % | 12/01/2031 | 1,371,438 | |||||||
| 3,000,000 | Pennsylvania Turnpike Commission Callable 12/01/2024 @ 100^ | 5.00 | % | 12/01/2038 | 3,260,430 | |||||||
| 3,000,000 | Pennsylvania Turnpike Commission Callable 12/01/2024 @ 100^ | 5.00 | % | 12/01/2044 | 3,243,210 | |||||||
| 2,205,000 | Pompano Beach, Florida Callable 09/01/2016 @ 100^ | 5.00 | % | 09/01/2044 | 2,347,465 | |||||||
| 5,000,000 | Public Finance Authority | 5.00 | % | 06/01/2025 | 5,744,050 | |||||||
| 755,000 | Railsplitter Tobacco Settlement Authority | 5.00 | % | 06/01/2017 | 810,319 | |||||||
| 1,340,000 | Rhode Island Clean Water Finance Agency — Water Pollution Control Series B | 3.00 | % | 10/01/2015 | 1,349,648 | |||||||
| 4,000,000 | Skagit County Washington Public Hospital District Callable 12/01/2023 @ 100^ | 5.00 | % | 12/01/2037 | 4,131,640 | |||||||
| 2,000,000 | Tobacco Settlement Financing Corp. | 5.00 | % | 06/01/2017 | 2,139,420 | |||||||
| 2,550,000 | Tobacco Settlement Financing Corp. Louisiana Revenue Bonds | 5.00 | % | 05/15/2019 | 2,850,594 | |||||||
| 1,000,000 | Tucson Arizona Water System Revenue Bonds | 3.00 | % | 07/01/2015 | 1,000,080 | |||||||
| 850,000 | Tulsa County Industrial Authority | 4.00 | % | 09/01/2016 | 884,221 | |||||||
| 820,000 | Vigo, County of Indiana EDC | 2.00 | % | 01/15/2017 | 833,292 | |||||||
| 830,000 | Vigo, County of Indiana EDC | 2.00 | % | 07/15/2017 | 844,874 | |||||||
| 1,775,000 | Virginia College Building Authority | 4.00 | % | 09/01/2016 | 1,850,793 | |||||||
| 1,450,000 | Wayne County Michigan Airport Callable 12/01/2024 @ 100^ | 5.00 | % | 12/01/2039 | 1,608,471 | |||||||
| 1,360,000 | Wisconsin Health & Educational Facilities Authority Callable 05/01/2024 @ 100^ | 5.00 | % | 05/01/2027 | 1,468,936 | |||||||
| 1,000,000 | Wisconsin Health & Educational Facilities Authority Callable 08/15/2024 @ 100^ | 5.00 | % | 08/15/2034 | 1,080,940 | |||||||
| 129,713,808 | ||||||||||||
| Total Municipal Bonds (Cost $220,183,271) | 219,209,590 | |||||||||||
| Short-Term Investments — 4.0% | ||||||||||||
| Money Market Funds — 4.0% | ||||||||||||
| 8,972,522 | DWS Cash Account Trust — Tax-Exempt Portfolio — Institutional Shares, 0.01% (Cost $8,972,522)* | 8,972,522 | ||||||||||
| Total Short-Term Investments (Cost $8,972,522) | 8,972,522 | |||||||||||
| Total Investments — 101.8% (Cost $229,155,793) | 228,182,112 | |||||||||||
| Liabilities in Excess of Other Assets — (1.8)% | (4,027,637 | ) | ||||||||||
| TOTAL NET ASSETS — 100.0% | $ | 224,154,475 | ||||||||||
PORTFOLIO HOLDINGS
% of Net Assets
| Revenue Bonds | 57.9% |
| General Obligation Bonds | 26.4% |
| Refunded Bonds | 13.5% |
| Money Market Funds | 4.0% |
| Other Assets and Liabilities | (1.8)% |
| 100.0% |
| ^ | Continuously callable with 30 days notice. |
| # | Variable rate security. Rate disclosed is as of June 30, 2015. |
| ~ | Zero coupon bond. Rate disclosed is yield to maturity as of June 30, 2015. |
| * | Annualized seven-day yield as of June 30, 2015. |
The accompanying notes are an integral part of these financial statements.
www.brownadvisoryfunds.com
64
Brown Advisory Mortgage Securities Fund
A Message to Our Shareholders
June 30, 2015
Dear Shareholder:
During the year ended June 30, 2015, the Brown Advisory Mortgage Securities Fund Investor Shares (the “Fund”) rose 2.68%, leading the Barclays Mortgage Backed Securities Index which increased 2.28%.
The Fund’s investment process is centered on finding mortgage-related bonds that we believe will enjoy potentially advantageous principal payment speeds. This generally involves finding pools where the characteristics of the underlying borrowers mute their incentive to refinance the loan. This includes loans with smaller loan balances, lower equity, recent purchases, etc. The last 12 months are a perfect example of this process in action. Measured point-to-point, mortgage rates are only mildly lower for the period. According to Freddie Mac, the average 30-year mortgage rate was 4.02% at the end of June, down from 4.14% a year ago. However, rates fell as low as 3.59% over the course of the period. Even brief periods of much lower rates can touch off a refinancing wave, which tends to harm returns for investors in mortgage-backed securities (“MBS”). Because the loans within our pools had somewhat diminished refinance incentive and/or ability, these pools paid much slower than the average pool with the same underlying mortgage rate. In the months immediately after rates fell considerably (March-May 2015), our conditional prepayment rate (a measure of prepayments) was 6.1 vs. the coupon-matched average pool of 15.3.
The slower prepayment rate of our pools allowed the fund to collect more income than it otherwise would have. In addition, the favorable characteristics of the loans within our pools became more sought after as rates fell. Hence, the Fund also enjoyed price appreciation beyond what the average pool saw during this period. We were able to sell many pools where our original cost was very similar to generic pools, but where the sale price was 50 to 75 basis points higher than generics at time of sale. When rates rose again in May and June 2015, we were able to reinvest at the prices close to generics again.
Looking forward, demand for high-quality mortgage securities remains robust, with banks and money managers adding significantly to holdings in recent months. MBS tend to perform well during periods of mildly rising interest rates, and we believe our portfolio specifically is well positioned for such an event. However, the core of our investment process will remain focused on prepayment analysis, where we believe we have the best chance of delivering attractive investment performance.
Sincerely,
Thomas D.D. Graff, CFA
Portfolio Manager
Past performance is not a guarantee of future results.
Mutual fund investing involves risk. Principal loss is possible. Investments in debt securities typically decrease in value when interest rates rise. This risk is usually greater for longer-term debt securities. Investments in Asset-Backed and Mortgage-Backed securities include additional risks that investor should be aware of including credit risk, prepayment risk, possible illiquidity and default, as well as increased susceptibility to adverse economic developments. Certain fixed income securities held by the Fund may be difficult (or impossible) to sell at the time and at the price the Adviser would like. As a result, the Fund may have to hold these securities longer than it would like and may forego other investment opportunities. Issuers may experience an acceleration in prepayments of mortgage loans or other receivables backing the issuers’ fixed income securities when interest rates decline, which can shorten the maturity of the security, force the Fund to invest in securities with lower interest rates, and reduce the Fund’s return. Issuers may decrease prepayments of principal when interest rates increase, extending the maturity of a fixed income security and causing the value of the security to decline. Investing involves risk. Principal loss is possible. Investors should consult a tax professional for advice and information concerning the tax features of mortgage backed securities and fixed coupon bonds. Mortgage-backed securities (MBS) are bonds secured by a mortgage or collection of mortgages. Diversification does not assure a profit nor protect against loss in a declining market. Investing involves risk. Principal loss is possible. Investors should consult a tax professional for advice and information concerning the tax features of mortgage backed securities and fixed coupon bonds.
Fund holdings and sector allocations are subject to change and should not be considered a recommendation to buy or sell any security. For a complete list of fund holdings, please refer to the Schedule of Investments provided in this report.
Definitions for terms and indices are provided in the Glossary of Terms.
www.brownadvisoryfunds.com
65
Brown Advisory Mortgage Securities Fund
Performance Chart and Analysis
June 30, 2015
COMPARISON OF CHANGE IN VALUE OF A $10,000 INVESTMENT
The following chart reflects the change in value of a hypothetical $10,000 investment, including reinvested dividends and distributions, in the Fund as measured against a broad-based bond index. The Barclays Mortgage Backed Securities Index is a market value-weighted index which covers the mortgage-backed securities component of the Barclays US Aggregate Bond Index. The index is composed of agency mortgage-backed passthrough securities of the Government National Mortgage Association (Ginnie Mae), the Federal National Mortgage Association (Fannie Mae), and the Federal Home Loan Mortgage Corporation (Freddie Mac) with a minimum $150 million par amount outstanding and a weighted-average maturity of at least 1 year. The index includes reinvestment of income. Investors cannot invest directly in an index.
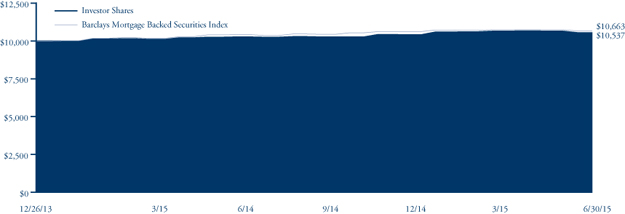
| Since | ||||
| Cumulative Total Return | One | Inception | ||
| as of 6/30/15 | Year | (12/26/13) | ||
Institutional Shares1 | 2.74% | 3.57% | ||
| Investor Shares | 2.68% | 3.52% | ||
| Barclays Mortgage Backed Securities Index | 2.28% | 4.35% | ||
| Institutional Shares | Investor Shares | ||
Gross Expense Ratio2 | 0.53% | 0.58% | |
Net Expense Ratio2 | 0.53% | 0.58% |
Past performance does not guarantee future results. The performance data quoted represents past performance and current returns may be lower or higher. The investment return and net asset value will fluctuate so that an investor’s shares, when redeemed, may be worth more or less than the original cost. To obtain performance information current to the most recent month end, please visit our website at brownadvisoryfunds.com/performance.html. The performance table and graph above do not reflect the deduction of taxes that a shareholder would pay on Fund distributions or the redemption of Fund shares. Performance data does not reflect the imposition of the redemption fee of 1.00% on shares redeemed within 14 days, and if it did, performance would have been lower. Short-term performance, in particular, is not a good indication of the Fund’s future performance, and an investment should not be made based solely on returns.
| 1 | Performance information for the Institutional Shares, prior to commencement of operations on May 13, 2014, is based on the performance of the Investor Shares, and adjusted for the lower expenses applicable to the Institutional Shares. |
| 2 | Per the Fund’s prospectus dated October 31, 2014. |
www.brownadvisoryfunds.com
66
Brown Advisory Mortgage Securities Fund
Schedule of Investments
June 30, 2015
| Par Value | Security Description | Rate | Maturity | Value $ | ||||||||
| Mortgage Backed Securities — 88.8% | ||||||||||||
| 33,684 | Federal Home Loan Banks, Series SB-2016 Callable 7/25/2015 @ 100^ | 4.89 | % | 12/23/2016 | 35,161 | |||||||
| 120,744 | Federal Home Loan Banks, Series MI-2017 Callable 7/25/2015 @ 100^ | 4.78 | % | 01/25/2017 | 127,750 | |||||||
| 188 | FHLMC PC, Pool# G1-1357 | 5.50 | % | 01/01/2018 | 195 | |||||||
| 850 | FHLMC PC, Pool# E0-1488 | 5.00 | % | 10/01/2018 | 888 | |||||||
| 429 | FHLMC PC, Pool# C9-0242 | 6.00 | % | 12/01/2018 | 485 | |||||||
| 11,052 | FHLMC PC, Pool# G1-1778 | 5.50 | % | 10/01/2020 | 11,973 | |||||||
| 282 | FHLMC PC, Pool# G1-1924 | 5.50 | % | 03/01/2021 | 305 | |||||||
| 932 | FHLMC PC, Pool# C9-0428 | 6.00 | % | 03/01/2021 | 1,054 | |||||||
| 129 | FHLMC PC, Pool# J0-1540 | 5.00 | % | 04/01/2021 | 135 | |||||||
| 1,076 | FHLMC PC, Pool# G1-2110 | 5.50 | % | 06/01/2021 | 1,170 | |||||||
| 1,203 | FHLMC PC, Pool# G1-2522 | 5.00 | % | 02/01/2022 | 1,302 | |||||||
| 2,038 | FHLMC PC, Pool# G1-2600 | 5.50 | % | 03/01/2022 | 2,221 | |||||||
| 1,361 | FHLMC PC, Pool# G1-2710 | 5.50 | % | 07/01/2022 | 1,486 | |||||||
| 84 | FHLMC PC, Pool# 84-5640# | 2.30 | % | 08/01/2023 | 87 | |||||||
| 20,956 | FHLMC PC, Pool# G1-3584 | 4.50 | % | 06/01/2024 | 22,320 | |||||||
| 46,604 | FHLMC PC, Pool# J1-1196 | 4.50 | % | 11/01/2024 | 49,771 | |||||||
| 7 | FHLMC PC, Pool# C3-6309 | 7.00 | % | 02/01/2030 | 7 | |||||||
| 82 | FHLMC PC, Pool# G0-1317 | 7.00 | % | 10/01/2031 | 97 | |||||||
| 14 | FHLMC PC, Pool# C5-8701 | 7.00 | % | 10/01/2031 | 14 | |||||||
| 47 | FHLMC PC, Pool# G0-1391 | 7.00 | % | 04/01/2032 | 56 | |||||||
| 179,444 | FHLMC PC, Pool# 1B0889# | 2.15 | % | 05/01/2033 | 190,086 | |||||||
| 19,715 | FHLMC PC, Pool# 1B-1275# | 2.28 | % | 10/01/2033 | 21,051 | |||||||
| 3,958,317 | FHLMC PC, Pool# C9-1818 | 4.00 | % | 02/01/2035 | 4,234,131 | |||||||
| 264,410 | FHLMC PC, Pool# 1J0203# | 2.28 | % | 04/01/2035 | 281,666 | |||||||
| 1,460 | FHLMC PC, Pool# A4-6671 | 5.00 | % | 08/01/2035 | 1,609 | |||||||
| 1,722 | FHLMC PC, Pool #G0-8079 | 5.00 | % | 09/01/2035 | 1,905 | |||||||
| 13,716 | FHLMC PC, Pool# 1B-3950# | 5.42 | % | 11/01/2035 | 14,038 | |||||||
| 97,834 | FHLMC PC, Pool# 1L-1263# | 2.50 | % | 03/01/2036 | 104,364 | |||||||
| 12,537 | FHLMC PC, Pool# 1J-1317# | 2.42 | % | 04/01/2036 | 13,379 | |||||||
| 5,334 | FHLMC PC, Pool# 1G-2408# | 2.19 | % | 06/01/2036 | 5,643 | |||||||
| 12,953 | FHLMC PC, Pool# 84-7625# | 1.95 | % | 07/01/2036 | 13,634 | |||||||
| 10,094 | FHLMC PC, Pool# G0-2274 | 5.00 | % | 07/01/2036 | 11,135 | |||||||
| 441 | FHLMC PC, Pool# A5-9220 | 5.00 | % | 04/01/2037 | 486 | |||||||
| 7,079 | FHLMC PC, Pool# 1J-0573# | 2.47 | % | 08/01/2037 | 7,591 | |||||||
| 4,727 | FHLMC PC, Pool# 1B-4292# | 2.41 | % | 09/01/2038 | 4,927 | |||||||
| 2,299,326 | FHLMC PC, Pool# Q1-9875 | 4.00 | % | 07/01/2043 | 2,441,238 | |||||||
| 6,951,313 | FHLMC PC, Pool# Q2-7788 | 4.00 | % | 08/01/2044 | 7,391,230 | |||||||
| 13,236,136 | FHLMC PC, Pool# Q2-8300 | 3.50 | % | 09/01/2044 | 13,679,181 | |||||||
| 2,236,325 | FHLMC PC, Pool# Q3-0222 | 4.00 | % | 12/01/2044 | 2,378,689 | |||||||
| 1,872,510 | FHLMC PC, Pool# Q3-0223 | 4.00 | % | 12/01/2044 | 1,988,710 | |||||||
| 3,335,276 | FHLMC PC, Pool# Q3-2218 | 4.00 | % | 03/01/2045 | 3,542,224 | |||||||
| 13,788,469 | FHLMC REMIC, Series 4318~ | 2.50 | % | 08/15/2022 | 970,763 | |||||||
| 10,381,919 | FHLMC REMIC, Series 4329~ | 2.50 | % | 01/15/2023 | 789,836 | |||||||
| 184,752 | FHLMC REMIC, Series 3571 | 4.00 | % | 09/15/2024 | 195,801 | |||||||
| 7,160 | FHLMC REMIC, Series 3636 | 4.00 | % | 08/15/2027 | 7,168 | |||||||
| 2,358,471 | FHLMC REMIC, Series 4092~ | 3.00 | % | 09/15/2031 | 306,053 | |||||||
| 9,664,188 | FHLMC REMIC, Series 4186~ | 3.00 | % | 03/15/2033 | 1,488,488 | |||||||
| 8,441,815 | FHLMC REMIC, Series 4203~ | 3.00 | % | 04/15/2033 | 1,005,137 | |||||||
| 3,503,849 | FHLMC REMIC, Series 4309~ | 3.00 | % | 08/15/2039 | 509,910 | |||||||
| 571,773 | FHLMC REMIC, Series 3878 | 3.00 | % | 04/15/2041 | 590,164 | |||||||
| 1,943,640 | FHLMC REMIC, Series 4144 | 2.50 | % | 12/15/2042 | 1,694,924 | |||||||
| 5,514,837 | FHLMC REMIC, Series 4144 | 2.50 | % | 12/15/2042 | 4,834,088 | |||||||
| 2,292,400 | FHLMC REMIC, Series 4153 | 2.50 | % | 01/15/2043 | 1,959,242 | |||||||
| 5,449,756 | FHLMC REMIC, Series 4495+ | 3.50 | % | 07/15/2045 | 1,485,059 | |||||||
| 13,895,146 | FHLMC REMIC, Series 4495 | 2.50 | % | 07/15/2045 | 12,583,792 | |||||||
| 1,243 | FNMA, Pool# 576086 | 6.00 | % | 03/01/2016 | 1,250 | |||||||
The accompanying notes are an integral part of these financial statements.
www.brownadvisoryfunds.com
67
Brown Advisory Mortgage Securities Fund
Schedule of Investments
June 30, 2015
| Par Value | Security Description | Rate | Maturity | Value $ | ||||||||
| Mortgage Backed Securities — (Continued) | ||||||||||||
| 23,306 | FNMA, Pool# 254089 | 6.00 | % | 12/01/2016 | 23,881 | |||||||
| 184 | FNMA, Pool# 555013 | 5.50 | % | 11/01/2017 | 191 | |||||||
| 1,300 | FNMA, Pool# 725544 | 5.50 | % | 12/01/2017 | 1,338 | |||||||
| 10,978 | FNMA, Pool# 763020 | 3.50 | % | 08/01/2018 | 11,585 | |||||||
| 46,594 | FNMA, Pool# 744697 | 4.50 | % | 10/01/2018 | 48,562 | |||||||
| 12,411 | FNMA, Pool# 725185 | 5.00 | % | 02/01/2019 | 13,183 | |||||||
| 46,376 | FNMA, Pool# 803941# | 2.44 | % | 11/01/2019 | 47,197 | |||||||
| 12,286 | FNMA, Pool# 255626 | 5.00 | % | 03/01/2020 | 13,184 | |||||||
| 64,387 | FNMA, Pool# 970382 | 4.50 | % | 03/01/2023 | 67,985 | |||||||
| 877 | FNMA, Pool# 303585 | 7.00 | % | 10/01/2025 | 1,018 | |||||||
| 1,123 | FNMA, Pool# 303713 | 6.50 | % | 02/01/2026 | 1,291 | |||||||
| 13,315 | FNMA, Pool# 539082 | 7.00 | % | 08/01/2028 | 13,504 | |||||||
| 2,828 | FNMA, Pool# 592751 | 7.00 | % | 06/01/2031 | 2,998 | |||||||
| 25,523 | FNMA, Pool# 625536 | 6.00 | % | 01/01/2032 | 28,970 | |||||||
| 39,235 | FNMA, Pool# 628837 | 6.50 | % | 03/01/2032 | 45,094 | |||||||
| 835 | FNMA, Pool# 555531 | 5.50 | % | 06/01/2033 | 943 | |||||||
| 998 | FNMA, Pool# 555591 | 5.50 | % | 07/01/2033 | 1,126 | |||||||
| 48,859 | FNMA, Pool# 748643# | 1.93 | % | 09/01/2033 | 51,350 | |||||||
| 1,084 | FNMA, Pool# 555876 | 5.50 | % | 10/01/2033 | 1,233 | |||||||
| 60,299 | FNMA, Pool# 744805# | 1.89 | % | 11/01/2033 | 61,568 | |||||||
| 109,011 | FNMA, Pool# 741373# | 2.41 | % | 12/01/2033 | 114,141 | |||||||
| 86,386 | FNMA, Pool# 764342# | 1.90 | % | 02/01/2034 | 89,509 | |||||||
| 3,274 | FNMA, Pool# 725424 | 5.50 | % | 04/01/2034 | 3,694 | |||||||
| 138,240 | FNMA, Pool# 780488# | 1.89 | % | 07/01/2034 | 142,461 | |||||||
| 39,571 | FNMA, Pool# 796283 | 5.50 | % | 12/01/2034 | 44,429 | |||||||
| 1,430 | FNMA, Pool# 735022 | 5.50 | % | 12/01/2034 | 1,614 | |||||||
| 12,053 | FNMA, Pool# 735263# | 2.11 | % | 01/01/2035 | 12,790 | |||||||
| 5,044 | FNMA, Pool# 821252# | 2.14 | % | 05/01/2035 | 5,363 | |||||||
| 1,164 | FNMA, Pool# 255706 | 5.50 | % | 05/01/2035 | 1,312 | |||||||
| 88 | FNMA, Pool# 735580 | 5.00 | % | 06/01/2035 | 98 | |||||||
| 127,479 | FNMA, Pool# 836715# | 2.36 | % | 10/01/2035 | 128,179 | |||||||
| 169,199 | FNMA, Pool# 836335# | 5.34 | % | 10/01/2035 | 172,791 | |||||||
| 8,798 | FNMA, Pool# 851372# | 2.30 | % | 12/01/2035 | 9,356 | |||||||
| 170 | FNMA, Pool# 849496 | 5.50 | % | 12/01/2035 | 191 | |||||||
| 1,712 | FNMA, Pool# 256022 | 5.50 | % | 12/01/2035 | 1,926 | |||||||
| 32,915 | FNMA, Pool# 848817 | 5.00 | % | 01/01/2036 | 36,401 | |||||||
| 1,948 | FNMA, Pool# 256059 | 5.50 | % | 01/01/2036 | 2,189 | |||||||
| 1,214 | FNMA, Pool# 845341 | 5.50 | % | 01/01/2036 | 1,367 | |||||||
| 3,134 | FNMA, Pool# 880371# | 2.32 | % | 02/01/2036 | 3,344 | |||||||
| 93,114 | FNMA, Pool# 865849# | 2.14 | % | 03/01/2036 | 99,336 | |||||||
| 5,269 | FNMA, Pool# 891332# | 2.03 | % | 04/01/2036 | 5,558 | |||||||
| 4,543 | FNMA, Pool# 745480# | 5.69 | % | 04/01/2036 | 4,875 | |||||||
| 120,866 | FNMA, Pool# 882017# | 1.93 | % | 05/01/2036 | 127,276 | |||||||
| 3,218 | FNMA, Pool# 901006# | 2.13 | % | 09/01/2036 | 3,429 | |||||||
| 11,022 | FNMA, Pool# 902188# | 2.30 | % | 11/01/2036 | 11,788 | |||||||
| 253 | FNMA, Pool# 905690 | 5.50 | % | 12/01/2036 | 284 | |||||||
| 90,603 | FNMA, Pool# 888445# | 2.18 | % | 04/01/2037 | 97,797 | |||||||
| 11,198 | FNMA, Pool# 888463# | 5.78 | % | 05/01/2037 | 11,972 | |||||||
| 501 | FNMA, Pool# 960392 | 5.50 | % | 12/01/2037 | 563 | |||||||
| 6,748 | FNMA, Pool# 933628# | 5.15 | % | 07/01/2038 | 7,180 | |||||||
| 6,847 | FNMA, Pool# 965185# | 1.74 | % | 09/01/2038 | 7,259 | |||||||
| 5,870,971 | FNMA, Pool# AS2249 | 4.00 | % | 04/01/2039 | 6,238,953 | |||||||
| 20,771 | FNMA, Pool# AC4824# | 2.25 | % | 10/01/2039 | 22,145 | |||||||
| 11,500 | FNMA, Pool# AH4794 | 5.00 | % | 02/01/2041 | 12,772 | |||||||
| 31,158 | FNMA, Pool# AI1170 | 5.00 | % | 04/01/2041 | 34,527 | |||||||
| 5,166,690 | FNMA, Pool# AL6768 | 6.00 | % | 05/01/2041 | 5,875,517 | |||||||
The accompanying notes are an integral part of these financial statements.
www.brownadvisoryfunds.com
68
Brown Advisory Mortgage Securities Fund
Schedule of Investments
June 30, 2015
| Par Value | Security Description | Rate | Maturity | Value $ | ||||||||
| Mortgage Backed Securities — (Continued) | ||||||||||||
| 708,035 | FNMA, Pool# MA1065 | 4.00 | % | 05/01/2042 | 753,394 | |||||||
| 16,996 | FNMA, Pool# AR1150 | 3.00 | % | 01/01/2043 | 17,029 | |||||||
| 2,422,873 | FNMA, Pool# AU5029 | 4.50 | % | 10/01/2043 | 2,624,077 | |||||||
| 1,206,919 | FNMA, Pool# AV6078 | 4.00 | % | 11/01/2043 | 1,285,588 | |||||||
| 1,102,843 | FNMA, Pool# AS1429 | 4.00 | % | 12/01/2043 | 1,174,725 | |||||||
| 3,662,375 | FNMA, Pool# AY6139 | 3.50 | % | 02/01/2044 | 3,785,679 | |||||||
| 1,661,326 | FNMA, Pool# AW2834 | 4.50 | % | 07/01/2044 | 1,798,792 | |||||||
| 1,727,706 | FNMA, Pool# AS2985 | 4.00 | % | 08/01/2044 | 1,840,915 | |||||||
| 3,359,628 | FNMA, Pool# AX1574 | 4.50 | % | 08/01/2044 | 3,643,225 | |||||||
| 1,054,681 | FNMA, Pool# AS3485 | 4.00 | % | 09/01/2044 | 1,123,794 | |||||||
| 1,756,212 | FNMA, Pool# AX5008 | 3.50 | % | 10/01/2044 | 1,817,025 | |||||||
| 2,376,720 | FNMA, Pool# AX8509 | 4.00 | % | 11/01/2044 | 2,525,138 | |||||||
| 1,091,705 | FNMA, Pool# AV8872 | 4.50 | % | 12/01/2044 | 1,184,514 | |||||||
| 1,225,552 | FNMA, Pool# AX9501 | 4.50 | % | 12/01/2044 | 1,329,480 | |||||||
| 7,785,584 | FNMA, Pool# AX7758 | 4.00 | % | 01/01/2045 | 8,271,778 | |||||||
| 4,173,233 | FNMA, Pool# AY0674 | 3.50 | % | 02/01/2045 | 4,313,138 | |||||||
| 1,550,742 | FNMA, Pool# AY4463 | 4.00 | % | 02/01/2045 | 1,647,098 | |||||||
| 248,639 | FNMA, Pool# AY1007 | 4.00 | % | 02/01/2045 | 264,127 | |||||||
| 1,959,398 | FNMA, Pool# AY3072 | 4.00 | % | 02/01/2045 | 2,087,202 | |||||||
| 2,073,658 | FNMA, Pool# AY1601 | 4.00 | % | 02/01/2045 | 2,202,833 | |||||||
| 527,718 | FNMA, Pool# AY3851 | 4.50 | % | 02/01/2045 | 572,665 | |||||||
| 2,229,812 | FNMA, Pool# MA2193 | 4.50 | % | 02/01/2045 | 2,419,376 | |||||||
| 2,831,429 | FNMA, Pool# AY0678 | 3.50 | % | 03/01/2045 | 2,926,349 | |||||||
| 1,677,611 | FNMA, Pool# AY0677 | 3.50 | % | 03/01/2045 | 1,739,161 | |||||||
| 3,162,761 | FNMA, Pool# AY6275 | 4.00 | % | 03/01/2045 | 3,359,293 | |||||||
| 1,334,843 | FNMA, Pool# AY3854 | 4.50 | % | 04/01/2045 | 1,449,149 | |||||||
| 3,352,251 | FNMA, Pool# AZ2001 | 3.50 | % | 05/01/2045 | 3,464,631 | |||||||
| 1,885,098 | FNMA, Pool# AZ2000 | 3.50 | % | 05/01/2045 | 1,953,088 | |||||||
| 2,012,169 | FNMA, Pool# AY9118 | 4.00 | % | 05/01/2045 | 2,138,453 | |||||||
| 1,911,648 | FNMA, Pool# AY9108 | 4.00 | % | 05/01/2045 | 2,031,029 | |||||||
| 3,322,169 | FNMA, Pool# AZ3212 | 3.50 | % | 06/01/2045 | 3,436,721 | |||||||
| 1,002,840 | FNMA, Pool# AZ4154 | 4.00 | % | 06/01/2045 | 1,068,252 | |||||||
| 3,125,673 | FNMA, Pool# AY8830 | 4.00 | % | 06/01/2045 | 3,330,517 | |||||||
| 2,155,454 | FNMA, Pool# AZ1915 | 4.00 | % | 06/01/2045 | 2,290,386 | |||||||
| 332,885 | FNMA REMIC Trust, Series 2003-122 | 4.00 | % | 12/25/2018 | 346,046 | |||||||
| 98 | FNMA REMIC Trust, Series 1990-105 | 6.50 | % | 09/25/2020 | 105 | |||||||
| 13,549 | FNMA REMIC Trust, Series 2012-1 | 1.75 | % | 12/25/2021 | 13,738 | |||||||
| 1,017,827 | FNMA REMIC Trust, Series 2011-18 | 4.00 | % | 10/25/2025 | 1,036,604 | |||||||
| 5,255,477 | FNMA REMIC Trust, Series 2012-139~ | 2.50 | % | 12/25/2027 | 526,785 | |||||||
| 355,225 | FNMA REMIC Trust, Series 2013-15~ | 3.00 | % | 03/25/2028 | 42,725 | |||||||
| 16,042,297 | FNMA REMIC Trust, Series 2014-14~ | 3.00 | % | 04/25/2031 | 1,858,131 | |||||||
| 4,706,704 | FNMA REMIC Trust, Series 2013-115~ | 3.00 | % | 04/25/2031 | 696,460 | |||||||
| 12,221,770 | FNMA REMIC Trust, Series 2013-104~ | 3.00 | % | 08/25/2032 | 1,571,817 | |||||||
| 13,918,861 | FNMA REMIC Trust, Series 2013-45~ | 3.00 | % | 05/25/2033 | 2,582,429 | |||||||
| 11,857,319 | FNMA REMIC Trust, Series 2013-24~ | 3.00 | % | 11/25/2040 | 2,082,442 | |||||||
| 620,326 | FNMA REMIC Trust, Series 2012-10# | 0.74 | % | 02/25/2042 | 625,863 | |||||||
| 2,285,451 | FNMA REMIC Trust, Series 2013-34~ | 3.00 | % | 05/25/2042 | 353,684 | |||||||
| 15,868,202 | FNMA REMIC Trust, Series 2012-146~ | 3.00 | % | 11/25/2042 | 2,143,818 | |||||||
| 10,248,666 | FNMA REMIC Trust, Series 2013-20~ | 3.50 | % | 11/25/2042 | 1,495,629 | |||||||
| 18,677 | FNMA REMIC Trust, Series 2003-W10 | 4.30 | % | 06/25/2043 | 19,988 | |||||||
| 6,483 | FNMA REMIC Trust, Series 2003-W12 | 4.48 | % | 06/25/2043 | 6,929 | |||||||
| 38,896 | FNMA REMIC Trust, Series 2003-W12 | 4.55 | % | 06/25/2043 | 42,269 | |||||||
| 20,975 | FNMA REMIC Trust, Series 2003-W12 | 4.68 | % | 06/25/2043 | 22,561 | |||||||
| 24,471 | FNMA REMIC Trust, Series 2003-W12 | 5.00 | % | 06/25/2043 | 26,418 | |||||||
| 21 | GNMA, Pool# 180963X | 9.50 | % | 11/15/2016 | 21 | |||||||
| 536 | GNMA, Pool# 781403X | 6.00 | % | 02/15/2017 | 551 | |||||||
The accompanying notes are an integral part of these financial statements.
www.brownadvisoryfunds.com
69
Brown Advisory Mortgage Securities Fund
Schedule of Investments
June 30, 2015
| Par | ||||||||||||
| Value/Shares | Security Description | Rate | Maturity | Value $ | ||||||||
| Mortgage Backed Securities — (Continued) | ||||||||||||
| 99 | GNMA, Pool# 198708X | 9.50 | % | 04/15/2017 | 100 | |||||||
| 21,746 | GNMA, Pool# 595167X | 5.50 | % | 11/15/2017 | 22,460 | |||||||
| 11,044 | GNMA, Pool# 552929X | 5.00 | % | 12/15/2017 | 11,624 | |||||||
| 2,076 | GNMA, Pool# 607669X | 5.00 | % | 02/15/2018 | 2,196 | |||||||
| 7,322 | GNMA, Pool# 594102X | 4.50 | % | 09/15/2018 | 7,682 | |||||||
| 11,338 | GNMA, Pool# 780576X | 7.00 | % | 12/15/2022 | 12,929 | |||||||
| 48,350 | GNMA, Pool# 723460X | 4.00 | % | 12/15/2024 | 51,510 | |||||||
| 1,695 | GNMA, Pool# 780195X | 8.00 | % | 07/15/2025 | 1,988 | |||||||
| 16,427 | GNMA, Pool# 487110 | 6.50 | % | 04/15/2029 | 19,311 | |||||||
| 355 | GNMA, Pool# 536231X | 9.00 | % | 07/15/2030 | 357 | |||||||
| 5,330 | GNMA, Pool# 571166 | 7.00 | % | 08/15/2031 | 5,517 | |||||||
| 5,758 | GNMA, Pool# 004017M | 6.00 | % | 08/20/2037 | 6,619 | |||||||
| 3,640 | GNMA, Pool# 565240X | 6.50 | % | 09/15/2037 | 4,187 | |||||||
| 4,070 | GNMA, Pool# 676322X | 7.00 | % | 09/15/2037 | 4,482 | |||||||
| 14,919 | GNMA, Pool# 646058X | 6.00 | % | 11/15/2037 | 17,060 | |||||||
| 15,790 | GNMA REMIC Trust, Series 201-03 | 3.00 | % | 01/16/2027 | 16,476 | |||||||
| 18,741,023 | GNMA REMIC Trust, Series 2013-170~ | 2.50 | % | 05/16/2028 | 1,758,095 | |||||||
| 1,599,455 | GNMA REMIC Trust, Series 2013-168~ | 2.50 | % | 11/16/2028 | 156,120 | |||||||
| 1,443 | GNMA REMIC Trust, Series 2003-97 | 4.50 | % | 03/20/2033 | 1,510 | |||||||
| 41,872 | GNMA REMIC Trust, Series 2010-32 | 3.00 | % | 03/20/2036 | 41,908 | |||||||
| 16,335 | GNMA REMIC Trust, Series 2010-2 | 4.00 | % | 01/20/2038 | 16,866 | |||||||
| 682,000 | GNMA REMIC Trust, Series 2011-156 | 2.00 | % | 04/20/2040 | 555,866 | |||||||
| 12,712,422 | GNMA REMIC Trust, Series 2013-79~ | 3.00 | % | 01/20/2042 | 1,838,928 | |||||||
| 831,612 | GNMA REMIC Trust, Series 2012-97 | 2.00 | % | 08/16/2042 | 691,589 | |||||||
| 1,045,248 | GNMA REMIC Trust, Series 2011-121# | 0.58 | % | 03/16/2043 | 1,036,604 | |||||||
| 725,000 | GNMA REMIC Trust, Series 2012-44 | 2.95 | % | 08/16/2043 | 724,393 | |||||||
| 9,500,000 | GNMA REMIC Trust, Series 2014-104 | 3.50 | % | 07/16/2044 | 9,583,153 | |||||||
| 133,174 | GNMA REMIC Trust, Series 2011-126 | 2.65 | % | 01/16/2045 | 133,621 | |||||||
| 6,867,000 | GNMA REMIC Trust, Series 2013-85# | 2.86 | % | 02/16/2049 | 6,160,159 | |||||||
| 8,000,000 | GNMA REMIC Trust, Series 2013-73# | 2.67 | % | 10/16/2052 | 7,261,456 | |||||||
| 8,000,000 | GNMA, 3.5%, Due TBA July | 3.50 | % | 07/15/2045 | 8,303,439 | |||||||
| Total Mortgage Backed Securities (Cost $209,630,979) | 208,585,495 | |||||||||||
| Asset Backed Securities — 12.2% | ||||||||||||
| 3,320,000 | Freddie Mac STACR Debt Notes, Series 2014-DN1# | 2.38 | % | 02/26/2024 | 3,326,565 | |||||||
| 6,500,000 | Freddie Mac STACR Debt Notes, Series 2014-DN2# | 1.83 | % | 04/25/2024 | 6,353,265 | |||||||
| 4,500,000 | Freddie Mac STACR Debt Notes, Series 2014-DN4# | 2.59 | % | 10/25/2024 | 4,518,529 | |||||||
| 4,500,000 | Freddie Mac STACR Debt Notes, Series 2015-DN1# | 2.58 | % | 01/27/2025 | 4,531,448 | |||||||
| 3,600,000 | Freddie Mac STACR Debt Notes, Series 2015-DNA1 | 2.04 | % | 10/25/2027 | 3,541,728 | |||||||
| 5,600,000 | Freddie Mac STACR Debt Notes, Series 2015-DNA2 | 2.79 | % | 12/27/2027 | 5,619,040 | |||||||
| 695,747 | SLM Student Loan Trust 2007-1, Series 2007-1# | 0.34 | % | 01/25/2022 | 694,785 | |||||||
| Total Asset Backed Securities (Cost $28,665,492) | 28,585,360 | |||||||||||
| Local Government Housing Agency Bonds — 1.3% | ||||||||||||
| 2,040,000 | Delaware State Housing Authority Callable 1/1/2021 @ 100^ | 2.75 | % | 12/01/2041 | 2,041,040 | |||||||
| 1,050,000 | Missouri Housing Development Commission Callable 11/1/2019 @ 100^ | 2.65 | % | 11/01/2040 | 1,040,760 | |||||||
| Total Local Government Housing Agency Bonds (Cost $2,907,004) | 3,081,800 | |||||||||||
| Short-Term Investments — 7.5% | ||||||||||||
| Money Market Funds — 7.5% | ||||||||||||
| 17,616,421 | DWS Cash Account Trust — Government & Agency Securities Portfolio — Institutional Shares, 0.04%* | 17,616,421 | ||||||||||
| Total Short-Term Investments (Cost $17,616,421) | 17,616,421 | |||||||||||
| Total Investments — 109.8% (Cost $258,819,896) | 257,869,076 | |||||||||||
| Liabilities in Excess of Other Assets — (9.8)% | (22,920,610 | ) | ||||||||||
| NET ASSETS — 100.0% | $ | 234,948,466 | ||||||||||
The accompanying notes are an integral part of these financial statements.
www.brownadvisoryfunds.com
70
Brown Advisory Mortgage Securities Fund
Schedule of Investments
June 30, 2015
PORTFOLIO HOLDINGS
% of Net Assets
| Mortgage Backed Securities | 88.8% |
| Asset Backed Securities | 12.2% |
| Money Market Funds | 7.5% |
| Local Government Housing Agency Bonds | 1.3% |
| Other Assets and Liabilities | (9.8)% |
| 100.0% |
| ^ | Continuously callable with 30 days notice. |
| # | Variable rate security. Rate disclosed is as of June 30, 2015. |
| ~ | Interest Only Security |
| * | Annualized seven-day yield as of June 30, 2015. |
The accompanying notes are an integral part of these financial statements.
www.brownadvisoryfunds.com
71
Brown Advisory – WMC Strategic European Equity Fund
A Message to Our Shareholders
June 30, 2015
Dear Shareholder:
During the year ended June 30, 2015, the Brown Advisory - WMC Strategic European Equity Fund Institutional Shares (the “Fund”) declined -1.42%. During the same period, the MSCI Europe Index, the Fund’s benchmark, fell -7.65%. The Fund thus outperformed the benchmark by 6.23%.
We take a bottom-up approach to building the portfolio where we aim to identify companies that we believe benefit from a structural growth advantage, are competitively well positioned and attractively valued. This fundamental process leads us to hold certain sector over- and underweights.
Despite sluggish absolute performance over the period, the Fund outperformed its benchmark due to strong stock selection. Selection within the financials, consumer staples and industrials sectors contributed to relative performance. Sector allocation, a result of the bottom-up stock selection process, also was a strong contributor to relative results. Our underweight to energy helped, especially in the light of uncertainty around the oil price. In contrast, our industrials overweight impaired performance, although this was more than offset by the energy underweight. Part of the industrials underperformance was linked to concerns over a faltering oil price. However, for many of our industrials holdings, this is less of an issue than the market might perceive. Our industrials holdings tend to be more capital-goods oriented and have a very strong competitive position in their respective markets, so they have been relatively insulated from the oil-related sell-off.
Top contributors to relative returns during the period included Julius Baer and UBS, as well as not owning Royal Dutch Shell. Shares of Julius Baer, a Switzerland-based provider of private banking services, performed well over the period. The company has reported consistently positive results with positive execution news about its recent acquisition and related cost-cutting measures. The stock also strengthened on the clarity provided by the company’s announcement around the U.S. Department of Justice settlement. The market viewed this positively, with many applauding improved prospects for the potential for an earlier share buyback schedule. Shares of Royal Dutch Shell, a U.K.-based global integrated oil and gas company, fell after an announced earnings miss due to upstream weakness (Australian dollar depreciating). The stock moved lower because the company did not reduce capital expenditures in response to low oil prices, given its lack of flexibility due to some projects. Our results were stronger than the benchmark, partly because we don’t hold Royal Dutch Shell. Shares of UBS, a Switzerland-based global financial-services provider, rose during the period on news regarding its settlement with the U.S. Department of Justice’s currency (FX) litigation case.
Top detractors from relative returns included not owning Novartis and positions in Alfa Laval and SKF. Shares of Novartis, a Switzerland-based pharmaceutical company, rose during the period following positive results in a trial of its chronic heart failure medicine. Not holding this benchmark constituent hurt relative results during the period. Shares of Alfa Laval, a Sweden-based provider of specialized products and engineering products, fell as the company suffered because of concerns over marine and diesel business as well as the sell-off related to oil and gas. We eliminated the position during the period. Sweden-based global supplier of roller bearings and seals, SKF, underperformed after the company’s first-quarter results showed continued challenges to organic revenue growth. We eliminated the position during the period.
We reviewed our holdings during the period and initiated new positions in L’Oreal, Booker Group and UBS. We like L’Oreal’s structural growth profile and, in our view, the company is well diversified from a geographic perspective and has benefitted from strong brand loyalty. We believe that the company has a strong return on capital profile, generates a meaningful amount of free cash flow and has a high-quality balance sheet. We believe that Booker Group, a U.K.-based leading wholesale (cash and carry) grocery producer, is a high-quality company with a healthy growth outlook and a strong competitive position. In particular, we are attracted by the company’s strong historic track record of shareholder return and capital allocation and an impressive focus on customer satisfaction. In our view, the company’s top-line growth prospects are attractive, especially as it operates within a highly fragmented competitor market. We initiated a position in Schindler, a Switzerland-based manufacturer and installer of elevators and escalators. As well as having a strong focus on technology, the company has over recent years shown an increasing focus on its customer relationships. The company has a strong long-term profitability profile.
We eliminated Diageo based on more near-term questions about the competitive environment. We also eliminated ING, the Netherlands-based financial services company, due to concerns about its balance sheet.
We continue to believe that companies will have to deliver on the hopes for a broad earnings recovery. The low-growth environment appears to be with us for some time, and we expect that many companies will be challenged by that. As a result, stock picking should be very important going forward. We have already noticed that the market reacts quite drastically to unexpected results in
www.brownadvisoryfunds.com
72
Brown Advisory – WMC Strategic European Equity Fund
A Message to Our Shareholders
June 30, 2015
earnings. Stocks that disappoint are being hit hard, while those companies that are going to deliver or continue to deliver are being rewarded. We still see a significant disconnect between valuations in the peripheral (e.g., Italy and Spain) versus core (e.g., Germany and Sweden) areas of Europe as well as higher-quality and lower-quality areas. In the peripheral areas, investor demand and expectations have driven stock prices higher despite a lack of notable improvements in earnings revisions. This is in contrast to the core area of Europe, where valuations do not seem to fully price in the level of expected earnings. In terms of our portfolio, the relative premium versus the broad market continues to trend at historically low levels, despite a recent modest increase. This reflects much of what we have seen in the market more broadly. After a period of low valuation dispersion, it appears that fundamentals seem to again matter more, resulting in increasing dispersion. This in turn should favor stock-picking investment approaches. As a side note, we have been watching the developments in Greece. Although the probability of Greece exiting the Eurozone seems to be higher than before the referendum, our base case is that this will not change the long-term trajectory of the Eurozone. This event does not change the way we manage the Fund. The portfolio has no direct exposure to Greek stocks and only very limited indirect exposure through some of the companies we hold in the portfolio. As always, we look for attractively valued companies with what we believe are long-term growth advantages and strong competitive positions.
Sincerely,
C. Dirk Enderlein, CFA
Portfolio Manager
Past performance is not a guarantee of future results.
Mutual fund investing involves risk. Principal loss is possible. Investments focused in a single geographic region may be exposed to greater risk than investments diversified among various geographies. Investments in foreign securities entail certain risks not associated with investments in domestic securities, such as volatility of currency exchange rates, and in some cases, political and economic instability and relatively illiquid markets. These risks are greater in emerging markets. Investments in smaller and medium capitalization companies generally carry greater risk than is customarily associated with larger companies for various reasons such as narrower markets, limited financial resources and less liquid stock. The Fund may invest in ETFs, which may trade at a discount to the aggregate value of the underlying securities and although expense ratios for ETFs are generally low, frequent trading of ETFs by the Fund can generate brokerage expenses. The value of investments in REITs may change in response to changes in the real estate market such as declines in the value of real estate, lack of available capital or financing opportunities, and increases in property taxes or operating costs. Derivatives involve risks different from, and in certain cases, greater than the risks presented by more traditional investments. Investors will indirectly bear the principal risks and its share of the fees and expenses of the Fund’s investment in other Investment Companies.
Fund holdings and sector allocations are subject to change and should not be considered a recommendation to buy or sell any security. For a complete list of fund holdings, please refer to the Schedule of Investments provided in this report.
Definitions for terms and indices are provided in the Glossary of Terms.
www.brownadvisoryfunds.com
73
Brown Advisory – WMC Strategic European Equity Fund
Performance Chart and Analysis
June 30, 2015
COMPARISON OF CHANGE IN VALUE OF A $1,000,000 INVESTMENT
The following chart reflects the change in value of a hypothetical $1,000,000 investment, including reinvested dividends and distributions, in the Fund as measured against a broad-based securities market index. The MSCI Europe Index is an index that captures large and mid cap representation across 15 developed market countries in Europe. The index is unmanaged and does not reflect the deduction of fees, such as investment management fees. Investors cannot invest directly in an index.
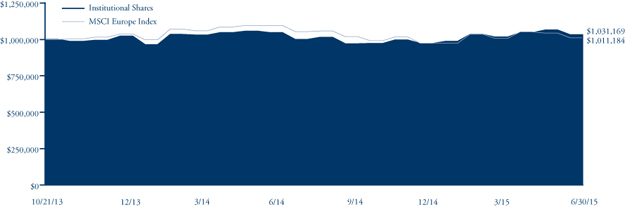
| Since | ||||
| Average Annual Total Return | One | Inception | ||
| as of 6/30/15 | Year | (10/21/13) | ||
| Institutional Shares | -1.42% | 1.83% | ||
| Investor Shares | -1.56% | 1.69% | ||
| Advisor Shares | -1.78% | 1.50% | ||
| MSCI Europe Index | -7.65% | 0.66% |
| Institutional Shares | Investor Shares | Advisor Shares | ||
Gross Expense Ratio1 | 1.23% | 1.38% | 1.63% | |
Net Expense Ratio1 | 1.23% | 1.38% | 1.63% |
Past performance does not guarantee future results. The performance data quoted represents past performance and current returns may be lower or higher. The investment return and net asset value will fluctuate so that an investor’s shares, when redeemed, may be worth more or less than the original cost. To obtain performance information current to the most recent month end, please visit our website at brownadvisoryfunds.com/performance.html. The performance table and graph above do not reflect the deduction of taxes that a shareholder would pay on Fund distributions or the redemption of Fund shares. Performance data does not reflect the imposition of the redemption fee of 1.00% on shares redeemed within 14 days, and if it did, performance would have been lower. Short-term performance, in particular, is not a good indication of the Fund’s future performance, and an investment should not be made based solely on returns.
| 1 | Per the Fund’s prospectus dated October 31, 2014. |
www.brownadvisoryfunds.com
74
Brown Advisory – WMC Strategic European Equity Fund
Schedule of Investments
June 30, 2015
| Shares | Security Description | Value $ | |||||
| Common Stocks — 98.6% | |||||||
| Belgium — 4.1% | |||||||
| 57,526 | Anheuser-Busch InBev S.A. | 6,922,719 | |||||
| 57,891 | UCB S.A. | 4,162,675 | |||||
| 11,085,394 | |||||||
| Denmark — 5.0% | |||||||
| 264,263 | DSV A/S | 8,557,083 | |||||
| 117,242 | H. Lundbeck A/S* | 2,255,797 | |||||
| 31,100 | Royal Unibrew A/S | 1,062,968 | |||||
| 132,803 | Spar Nord Bank A/S | 1,469,572 | |||||
| 13,345,420 | |||||||
| Finland — 4.6% | |||||||
| 205,675 | Kone OYJ | 8,348,374 | |||||
| 82,035 | Sampo OYJ | 3,866,070 | |||||
| 12,214,444 | |||||||
| France — 11.5% | |||||||
| 114,533 | Edenred S.A. | 2,829,974 | |||||
| 141,071 | Legrand S.A. | 7,939,759 | |||||
| 39,740 | L’Oreal S.A. | 7,110,336 | |||||
| 54,958 | Pernod Ricard S.A. | 6,353,294 | |||||
| 64,648 | Sanofi | 6,395,636 | |||||
| 30,628,999 | |||||||
| Germany — 8.2% | |||||||
| 50,088 | Bayer AG | 7,014,344 | |||||
| 6,304 | Hugo Boss AG | 704,764 | |||||
| 409,864 | Infineon Technologies AG | 5,086,256 | |||||
| 30,117 | NORMA Group SE | 1,522,816 | |||||
| 102,987 | ProSiebenSat.1 Media AG | 5,086,963 | |||||
| 58,380 | United Internet AG | 2,594,708 | |||||
| 22,009,851 | |||||||
| Italy — 3.0% | |||||||
| 88,543 | Banca Generali S.p.A. | 3,117,900 | |||||
| 49,920 | DiaSorin S.p.A. | 2,280,423 | |||||
| 86,436 | Salvatore Ferragam S.p.A. | 2,596,542 | |||||
| 7,994,865 | |||||||
| Netherlands — 4.2% | |||||||
| 36,276 | ASML Holding NV | 3,773,344 | |||||
| 97,346 | Heineken NV | 7,400,978 | |||||
| 11,174,322 | |||||||
| Spain — 0.5% | |||||||
| 21,435 | Viscofan S.A. | 1,296,699 | |||||
| Sweden — 8.6% | |||||||
| 340,001 | Assa Abloy AB | 6,400,794 | |||||
| 259,149 | Atlas Copco AB | 7,250,552 | |||||
| 242,477 | Cloetta AB* | 733,742 | |||||
| 311,405 | Nordea Bank AB | 3,883,767 | |||||
| 250,859 | Trelleborg AB | 4,639,064 | |||||
| 22,907,919 | |||||||
| Switzerland — 18.9% | |||||||
| 618 | BELIMO Holding AG | 1,474,025 | |||||
| 75,986 | Cie Financiere Richemont S.A. | 6,175,981 | |||||
| 6,050 | Daetwyler Holding AG | 718,664 | |||||
| 16,229 | Geberit AG | 5,410,662 | |||||
| 876 | Givaudan S.A. | 1,516,624 | |||||
| 2,712 | INFICON Holding AG | 926,770 | |||||
| 160,274 | Julius Baer Gruppe AG | 8,993,610 | |||||
| 30,318 | Kuehne & Nagel International AG | 4,025,720 | |||||
| 1,028 | LEM Holding S.A. | 789,958 | |||||
| 229 | Lindt & Spruengli AG | 1,211,268 | |||||
| 14,479 | Roche Holding, Ltd. | 4,059,789 | |||||
| 18,479 | Schindler Holding Ltd. | 3,022,262 | |||||
| 19,446 | Tecan Trading AG | 2,329,698 | |||||
| 464,687 | UBS Group | 9,859,021 | |||||
| 50,514,052 | |||||||
| United Kingdom — 30.0% | |||||||
| 123,826 | Berendsen | 1,982,181 | |||||
| 2,105,411 | Booker Group | 5,566,871 | |||||
| 266,676 | British American Tobacco PLC | 14,358,415 | |||||
| 358,010 | Compass Group | 5,921,144 | |||||
| 160,553 | Essentra PLC | 2,503,809 | |||||
| 215,745 | Halma PLC | 2,581,553 | |||||
| 132,381 | Jardine Lloyd Thompson Group PLC | 2,173,277 | |||||
| 342,384 | Prudential PLC | 8,251,250 | |||||
| 102,218 | Reckitt Benckiser Group PLC | 8,814,645 | |||||
| 760,326 | Saga PLC | 2,627,045 | |||||
| 433,323 | Smith & Nephew PLC | 7,330,605 | |||||
| 157,058 | Spectris PLC | 5,203,520 | |||||
| 79,234 | Spirax-Sarco Engineering PLC | 4,225,934 | |||||
| 148,219 | SSP Group PLC | 667,922 | |||||
| 105,981 | SuperGroup PLC* | 2,046,550 | |||||
| 47,199 | Victrex PLC | 1,430,610 | |||||
| 142,456 | WH Smith PLC | 3,416,329 | |||||
| 12,543 | Whitbread PLC | 974,451 | |||||
| 80,076,111 | |||||||
| Total Common Stocks (Cost $252,219,391) | 263,248,076 | ||||||
| Short-Term Investments — 2.7% | |||||||
| Money Market Funds — 2.7% | |||||||
| 7,214,519 | DWS Cash Account Trust — Government | ||||||
| & Agency Securities Portfolio — | |||||||
| Institutional Shares, 0.04%# | 7,214,519 | ||||||
| Total Short-Term Investments (Cost $7,214,519) | 7,214,519 | ||||||
| Total Investments — 101.3% (Cost $259,433,910) | 270,462,595 | ||||||
| Liabilities in Excess of Other Assets — (1.3)% | (3,364,868 | ) | |||||
| NET ASSETS — 100.0% | $ | 267,097,727 | |||||
The accompanying notes are an integral part of these financial statements.
www.brownadvisoryfunds.com
75
Brown Advisory – WMC Strategic European Equity Fund
Schedule of Investments
June 30, 2015
PORTFOLIO HOLDINGS
% of Net Assets
| United Kingdom | 30.0% |
| Switzerland | 18.9% |
| France | 11.5% |
| Sweden | 8.6% |
| Germany | 8.2% |
| Denmark | 5.0% |
| Finland | 4.6% |
| Netherlands | 4.2% |
| Belgium | 4.1% |
| Italy | 3.0% |
| Money Market Funds | 2.7% |
| Spain | 0.5% |
| Other Assets and Liabilities | (1.3)% |
| 100.0% |
| * | Non-Income Producing |
| # | Annualized seven-day yield as of June 30, 2015. |
The accompanying notes are an integral part of these financial statements.
www.brownadvisoryfunds.com
76
Brown Advisory – WMC Japan Alpha Opportunities Fund
A Message to Our Shareholders
June 30, 2015
Dear Shareholder:
During the year ended June 30, 2015, the Brown Advisory - WMC Japan Alpha Opportunities Fund Institutional Shares (the “Fund”) increased 28.62% in value. During the same period, the TOPIX Total Return U.S. Dollar Hedged Index, the Fund’s benchmark, rose 30.95%.
Strong performance in Japanese equities led the region higher in local currency terms during the period. Several market-friendly policies—the extension of the quantitative/qualitative easing by the Bank of Japan (“BOJ”), public pension fund reform, postponement of the second-round sales tax hike and re-election of the Liberal Democratic Party government—led to continued foreign buying and yen weakness. In the second half of the period, the Japanese economy expanded, beating forecasts. Japan’s trade deficit shrank to approximately $3.5 billion US dollars in February, well below the approximately $8 billion forecast, as exports jumped a better-than-expected 2.4%, while lower oil prices helped reduce the cost of imports. A strong pickup in business investment and inventory buildup led the expansion. The jobless rate unexpectedly fell to 3.3%, the lowest level since April 1997, and Japan’s Purchasing Managers Index composite exceeded estimates. This market optimism more than offset weaknesses created by concerns over global risks, such as U.S. tapering, falling energy prices and concerns around Greece.
From a factor perspective, momentum, quality, safety and growth were the best-performing factors across Japan, while leverage and volatility were among the worst-performing factors. The portfolio’s bias toward smaller-cap names, along with underweights to momentum and growth, created a headwind and contributed to underperformance.
Sector allocation, a result of bottom-up stock selection by the underlying managers, weighed on relative returns during the period. Our overweight allocations to information technology and materials detracted from relative performance, while our underweight to the industrials, telecommunication service and consumer staples sectors aided relative performance. Stock selection contributed to relative returns, particularly due to positive results within the industrials, materials and financials sectors. This was partially offset by negative selection within the information technology and consumer discretionary sectors.
Top relative detractors included manufacturer of semiconductor, computer and communication equipment Fujitsu, oil and natural gas exploration and production company Inpex and steel manufacturer Yamato Kogyo. Top relative contributors included our underweight position in telecommunication and Internet businesses provider Softbank, not owning automobile manufacturer Toyota Motor and our position in Japanese mega bank Mizuho Financial.
During the period, the team eliminated the portfolio’s position in Denso, an auto parts supplier. The stock underperformed early in the year due to weak earnings in FY 3/15 (weaker-than-expected demand in Japan/ASEAN, as well as high startup expenses for recently opened production plants). Shares rebounded in the second quarter 2015 and the company announced a share buyback. We used this share strength to exit our position, as we believe the upside looks limited. We added Fujitsu, the largest IT service company in Japan, after the company reported extraordinary losses worth approximately $245 million US dollars and lowered guidance. While the market perceived these actions negatively, we believe this is an indication that Fujitsu’s management is getting serious in terms of restructuring by reducing exposure to non-core legacy assets and refocusing on more stable, higher-margin IT services.
The Fund utilized currency forwards during the period to hedge against the fluctuation in the yen as it relates to the securities held in the portfolio. These positions positively contributed to the Fund’s absolute performance during the period, as the Japanese yen depreciated 21.2% compared to the US dollar.
In Japan, there is still skepticism about the recovery and the normalization of inflation. However, we continue to see change on a macro and a micro level. At the macro level, the BOJ remains committed to its balance sheet expansion, and the economy is still benefiting from lower energy prices and a weaker yen. At the micro level, companies are adopting the new corporate governance code, which became effective in June and holds them accountable for improving returns to shareholders. These factors, coupled with our earnings growth expectations, continue to underpin our positive outlook for the Japanese equity market. This being said, valuations have risen given the strong market performance over the first half of the year. At this point, we are not overly concerned. We believe that the continued improvement in economic fundamentals may be supportive of equity valuations.
Sincerely,
Kent M. Stahl, CFA
Portfolio Manager
Gregg R. Thomas, CFA
Portfolio Manager
www.brownadvisoryfunds.com
77
Brown Advisory – WMC Japan Alpha Opportunities Fund
A Message to Our Shareholders
June 30, 2015
Past performance is not a guarantee of future results.
Mutual fund investing involves risk. Principal loss is possible. Investments focused in a single geographic region may be exposed to greater risk than investments diversified among various geographies. Investments in foreign securities entail certain risks not associated with investments in domestic securities, such as volatility of currency exchange rates, and in some cases, political and economic instability and relatively illiquid markets. These risks are greater in emerging markets. Investments in smaller and medium capitalization companies generally carry greater risk than is customarily associated with larger companies for various reasons such as narrower markets, limited financial resources and less liquid stock. The Fund may invest in ETFs, which may trade at a discount to the aggregate value of the underlying securities and although expense ratios for ETFs are generally low, frequent trading of ETFs by the Fund can generate brokerage expenses. The value of investments in REITs may change in response to changes in the real estate market such as declines in the value of real estate, lack of available capital or financing opportunities, and increases in property taxes or operating costs. Derivatives involve risks different from, and in certain cases, greater than the risks presented by more traditional investments. Investors will indirectly bear the principal risks and its share of the fees and expenses of the Fund’s investment in other Investment Companies. Earnings growth is not representative of the fund’s future performance.
Fund holdings and sector allocations are subject to change and should not be considered a recommendation to buy or sell any security. For a complete list of fund holdings, please refer to the Schedule of Investments provided in this report.
Definitions for terms and indices are provided in the Glossary of Terms.
www.brownadvisoryfunds.com
78
Brown Advisory – WMC Japan Alpha Opportunities Fund
Performance Chart and Analysis
June 30, 2015
COMPARISON OF CHANGE IN VALUE OF A $1,000,000 INVESTMENT
The following chart reflects the change in value of a hypothetical $1,000,000 investment, including reinvested dividends and distributions, in the Fund as measured against a broad-based securities market index. The TOPIX Total Return U.S. Dollar Hedged Index is a market capitalization-weighted index of all companies listed on the First Section of the Tokyo Stock Exchange. The index is unmanaged and does not reflect the deduction of fees, such as investment management fees. Investors cannot invest directly in an index.
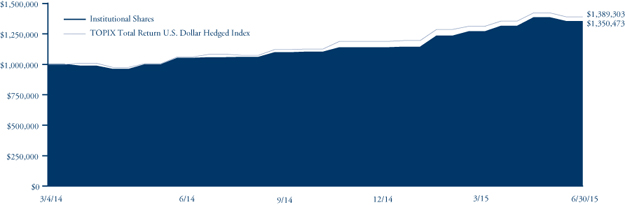
| Since | ||||
| Average Annual Total Return | One | Inception | ||
| as of 6/30/15 | Year | (3/4/14) | ||
| Institutional Shares | 28.62% | 25.49% | ||
| Investor Shares | 28.57% | 25.37% | ||
| Advisor Shares | 28.22% | 25.02% | ||
| TOPIX Total Return U.S. Dollar Hedged Index | 30.95% | 28.21% | ||
| Institutional Shares | Investor Shares | Advisor Shares | ||
Gross Expense Ratio1 | 1.21% | 1.36% | 1.61% | |
Net Expense Ratio1 | 1.21% | 1.36% | 1.61% |
Past performance does not guarantee future results. The performance data quoted represents past performance and current returns may be lower or higher. The investment return and net asset value will fluctuate so that an investor’s shares, when redeemed, may be worth more or less than the original cost. To obtain performance information current to the most recent month end, please visit our website at brownadvisoryfunds.com/performance.html. The performance table and graph above do not reflect the deduction of taxes that a shareholder would pay on Fund distributions or the redemption of Fund shares. Performance data does not reflect the imposition of the redemption fee of 1.00% on shares redeemed within 14 days, and if it did, performance would have been lower. Short-term performance, in particular, is not a good indication of the Fund’s future performance, and an investment should not be made based solely on returns.
| 1 | Per the Fund’s prospectus dated October 31, 2014. |
www.brownadvisoryfunds.com
79
Brown Advisory – WMC Japan Alpha Opportunities Fund
Schedule of Investments
June 30, 2015
| Shares | Security Description | Value $ | |||||
| Common Stocks — 92.1% | |||||||
| Japan — 92.1% | |||||||
| Consumer Discretionary — 24.2% | |||||||
| 256,400 | Adastria Holdings Co., Ltd. | 9,166,406 | |||||
| 168,300 | Aeon Delight Co., Ltd. | 5,157,007 | |||||
| 495,200 | Aisan Industry Co., Ltd. | 4,644,486 | |||||
| 138,900 | Artnature, Inc. | 1,295,585 | |||||
| 272,200 | Avex Group Holdings, Inc. | 4,776,283 | |||||
| 331,400 | Bandai Namco Holdings, Inc. | 6,404,158 | |||||
| 71,300 | Benesse Holdings, Inc. | 1,787,449 | |||||
| 126,300 | Cookpad, Inc. | 2,290,005 | |||||
| 108,000 | Cyber Agent, Inc. | 5,123,573 | |||||
| 229,600 | DaikyoNishikawa Co. | 7,845,764 | |||||
| 177,700 | Doutor Nichires Holdings Co., Ltd. | 3,114,468 | |||||
| 267,200 | En-Japan, Inc. | 4,790,766 | |||||
| 277,900 | Exedy Corp. | 6,938,704 | |||||
| 753,000 | Funai Electric Co., Ltd. | 8,374,904 | |||||
| 150,200 | Gendai Agency, Inc. | 835,665 | |||||
| 156,200 | H2O Retailing Co. | 3,252,697 | |||||
| 698,300 | Honda Motor Co., Ltd. | 22,568,952 | |||||
| 439,120 | Honeys Co., Ltd. | 3,729,550 | |||||
| 58,900 | Hoshizaki Electric Co., Ltd. | 3,464,466 | |||||
| 359,500 | Iida Group Holdings Co., Ltd. | 5,715,088 | |||||
| 556,900 | Keihin Corp. | 7,979,509 | |||||
| 133,600 | K’s Holdings Corp. | 4,811,816 | |||||
| 388,800 | Kuroda Electric Co., Ltd. | 7,235,650 | |||||
| 748,100 | Mazda Motor Corp. | 14,639,421 | |||||
| 289,400 | Moshi Moshi Hotline, Inc. | 3,238,121 | |||||
| 434,400 | NGK Spark Plug Co., Ltd. | 12,030,354 | |||||
| 901,400 | Nikon Corp. | 10,417,206 | |||||
| 120,530 | Nintendo Co., Ltd. | 20,107,724 | |||||
| 1,386,880 | Nippon Television Holdings, Inc. | 24,498,531 | |||||
| 611,400 | Nishimatsuya Chain Co., Ltd. | 6,151,140 | |||||
| 232,100 | Nissin Kogyo Co., Ltd. | 3,828,891 | |||||
| 295,500 | Pal Co., Ltd. | 9,703,339 | |||||
| 4,155,900 | Pioneer Corp. | 7,566,702 | |||||
| 101,300 | Proto Corp. | 1,631,598 | |||||
| 1,460,110 | Rakuten, Inc. | 23,572,208 | |||||
| 24,440 | Ryohin Keikaku Co., Ltd. | 4,739,369 | |||||
| 77,500 | Shimamura Co. | 8,136,663 | |||||
| 430,500 | Takata Corp. | 4,685,561 | |||||
| 391,000 | TechnoPro Holdings, Inc. | 9,840,826 | |||||
| 1,486,000 | Teijin, Ltd. | 5,766,365 | |||||
| 56,100 | Temp Holdings Co., Ltd. | 2,024,557 | |||||
| 230,300 | Tenma Corp. | 3,962,149 | |||||
| 306,000 | Tokai Rika Co., Ltd. | 7,643,177 | |||||
| 334,200 | Toyo Tire & Rubber Co., Ltd. | 7,062,326 | |||||
| 468,700 | Toyoda Gosei Co., Ltd. | 11,297,671 | |||||
| 630,900 | Toyota Boshoku Corp. | 10,631,878 | |||||
| 260,160 | Toyota Industries Corp. | 14,815,176 | |||||
| 64,500 | TPR Co., Ltd. | 1,936,352 | |||||
| 747,700 | TV Asahi Holdings Corp. | 12,552,079 | |||||
| 103,600 | United Arrows, Ltd. | 3,246,136 | |||||
| 352,700 | Xebio Co., Ltd. | 6,889,437 | |||||
| 202,700 | Yondoshi Holdings, Inc. | 4,921,770 | |||||
| 388,839,678 | |||||||
| Consumer Staples — 3.2% | |||||||
| 152,500 | Ain Pharmaciez, Inc. | 7,072,378 | |||||
| 307,480 | Asahi Group Holdings, Ltd. | 9,765,007 | |||||
| 257,300 | Cawachi, Ltd. | 3,870,470 | |||||
| 313,700 | Rohto Pharmaceutical Co., Ltd. | 5,174,634 | |||||
| 247,700 | Seven & I Holdings Co., Ltd. | 10,632,679 | |||||
| 131,200 | Tsuruha Holdings, Inc. | 10,205,403 | |||||
| 123,700 | Welcia Holdings Co., Ltd. | 5,646,745 | |||||
| 52,367,316 | |||||||
| Energy — 1.6% | |||||||
| 1,511,740 | Inpex Corp. | 17,159,690 | |||||
| 288,700 | Japan Petroleum Exploration Co. | 9,180,669 | |||||
| 26,340,359 | |||||||
| Financials — 18.5% | |||||||
| 786,900 | Dai-ichi Life Insurance Co., Ltd. | 15,452,766 | |||||
| 386,000 | Eighteenth Bank, Ltd. | 1,182,671 | |||||
| 252,100 | IBJ Leasing Co., Ltd. | 5,853,190 | |||||
| 86,500 | Ichiyoshi Securities Co., Ltd. | 844,578 | |||||
| 1,222,900 | Kenedix, Inc. | 4,699,092 | |||||
| 2,900,900 | Leopalace 21 Corp. | 17,778,960 | |||||
| 7,455,040 | Mitsubishi UFJ Financial Group, Inc. | 53,635,034 | |||||
| 1,313,500 | Mitsubishi UFJ Lease & Finance Co., Ltd. | 7,182,816 | |||||
| 11,220,700 | Mizuho Financial Group, Inc. | 24,278,594 | |||||
| 651,000 | NTT Urban Development Corp. | 6,466,276 | |||||
| 489,000 | Oita Bank, Ltd. | 2,083,510 | |||||
| 6,924,600 | Shinsei Bank, Ltd. | 13,954,887 | |||||
| 1,031,885 | Sony Financial Holdings, Inc. | 18,067,069 | |||||
| 965,335 | Sumitomo Mitsui Financial Group, Inc. | 42,975,945 | |||||
| 2,943,420 | T&D Holdings, Inc. | 43,879,115 | |||||
| 485,200 | Takara Leben Co., Ltd. | 2,884,981 | |||||
| 542,000 | Tochigi Bank, Ltd. | 3,086,601 | |||||
| 371,750 | Tokio Marine Holdings, Inc. | 15,460,748 | |||||
| 169,040 | Tokyo TY Financial Group, Inc. | 5,741,468 | |||||
| 615,000 | Yamanashi Chuo Bank, Ltd. | 2,906,471 | |||||
| 240,700 | Zenkoku Hosho Co., Ltd. | 8,567,335 | |||||
| 296,982,107 | |||||||
| Health Care — 6.0% | |||||||
| 86,000 | Asahi Intecc Co., Ltd. | 5,891,979 | |||||
| 231,500 | CMIC Holdings Co., Ltd. | 3,230,735 | |||||
| 484,800 | Daiichi Sankyo Co., Ltd. | 8,959,378 | |||||
| 251,000 | Eisai Co., Ltd. | 16,828,204 | |||||
| 5,700 | EPS Holdings, Inc.* | 69,163 | |||||
| 143,000 | Message Co., Ltd. | 3,855,675 | |||||
| 203,000 | Nippon Shinyaku Co., Ltd. | 6,219,035 | |||||
| 223,900 | Olympus Corp. | 7,730,149 | |||||
| 119,225 | Shionogi & Co., Ltd. | 4,620,355 | |||||
| 90,860 | Suzuken Co., Ltd. | 2,906,885 | |||||
| 740,500 | Takeda Pharmaceutical Co., Ltd. | 35,742,936 | |||||
| 96,054,494 | |||||||
| Industrials — 10.8% | |||||||
| 188,200 | Amada Co., Ltd. | 1,986,470 | |||||
| 187,200 | Bunka Shutter Co., Ltd. | 1,476,166 | |||||
| 295,500 | Daifuku Co., Ltd. | 4,545,821 | |||||
| 168,400 | Daiseki Co., Ltd. | 3,257,514 | |||||
| 326,800 | Denyo Co., Ltd. | 5,296,495 | |||||
The accompanying notes are an integral part of these financial statements.
www.brownadvisoryfunds.com
80
Brown Advisory – WMC Japan Alpha Opportunities Fund
Schedule of Investments
June 30, 2015
| Shares | Security Description | Value $ | |||||
| Common Stocks — (Continued) | |||||||
| Japan — (Continued) | |||||||
| Industrials — (Continued) | |||||||
| 347,700 | DMG Mori Seiki Co. | 6,705,217 | |||||
| 82,800 | Eagle Industry Co., Ltd. | 1,925,339 | |||||
| 70,800 | East Japan Railway Co. | 6,364,866 | |||||
| 148,100 | Fuji Machine Manufacturing Co., Ltd. | 1,549,841 | |||||
| 333,100 | Hino Motors, Ltd. | 4,117,866 | |||||
| 303,900 | Hisaka Works, Ltd. | 2,762,214 | |||||
| 354,200 | Hitachi Chemical Co., Ltd. | 6,379,504 | |||||
| 911,140 | Hitachi Metals, Ltd. | 14,007,376 | |||||
| 117,000 | Hitachi Transport System, Ltd. | 1,941,982 | |||||
| 2,240,000 | Hitachi, Ltd. | 14,756,110 | |||||
| 942,400 | Hosiden Corp. | 5,768,303 | |||||
| 1,317,000 | IHI Corp. | 6,132,180 | |||||
| 166,400 | Jamco Corp. | 5,462,539 | |||||
| 2,207,000 | Japan Steel Works, Ltd. | 9,120,254 | |||||
| 1,054,000 | Kawasaki Heavy Industries, Ltd. | 4,912,896 | |||||
| 157,000 | Kubota Corp. | 2,489,452 | |||||
| 331,000 | Kyudenko Corp. | 5,944,161 | |||||
| 430,000 | Makino Milling Machine Co., Ltd. | 4,335,280 | |||||
| 83,600 | METAWATER Co., Ltd. | 2,124,411 | |||||
| 225,800 | Nippon Densetsu Kogyo Co., Ltd. | 3,974,305 | |||||
| 725,500 | Sanwa Holdings Corp. | 6,103,361 | |||||
| 856,740 | Sumitomo Electric Industries, Ltd. | 13,260,063 | |||||
| 22,725 | Tomoe Engineering Co., Ltd. | 309,140 | |||||
| 1,442,000 | Toshiba Machine Co., Ltd. | 6,604,853 | |||||
| 1,922,000 | Toyo Engineering Corp. | 4,565,359 | |||||
| 189,000 | Tsubakimoto Chain Co. | 1,846,247 | |||||
| 558,400 | Ushio, Inc. | 7,268,483 | |||||
| 698,900 | Yumeshin Holdings Co., Ltd. | 4,456,230 | |||||
| 65,200 | Zuiko Corp. | 2,247,492 | |||||
| 173,997,790 | |||||||
| Information Technology — 16.6% | |||||||
| 63,400 | Alpha Systems, Inc. | 1,015,312 | |||||
| 562,400 | Canon, Inc. | 18,243,345 | |||||
| 597,400 | DeNA Co., Ltd. | 11,740,549 | |||||
| 167,000 | Digital Garage, Inc. | 2,221,879 | |||||
| 567,966 | Ferrotec Corp. | 3,998,231 | |||||
| 7,742,320 | Fujitsu, Ltd. | 43,259,041 | |||||
| 1,262,100 | GREE, Inc. | 7,370,289 | |||||
| 80,300 | Horiba, Ltd. | 3,261,828 | |||||
| 418,700 | Infomart Corp. | 5,288,793 | |||||
| 31,400 | Iriso Electronics Co., Ltd. | 2,225,335 | |||||
| 401,600 | Itochu Techno-Solutions Corp. | 10,001,314 | |||||
| 119,300 | Japan Digital Laboratory Co., Ltd. | 1,666,844 | |||||
| 256,900 | Melco Holdings, Inc. | 4,850,150 | |||||
| 257,400 | Mimasu Semiconductor Industry Co., Ltd. | 2,588,334 | |||||
| 211,700 | Miraial Co., Ltd. | 2,388,625 | |||||
| 1,144,600 | Mitsubishi Electric Corp. | 14,779,879 | |||||
| 361,200 | Mitsumi Electric Co., Ltd. | 2,449,175 | |||||
| 821,200 | NET One Systems Co., Ltd. | 5,764,962 | |||||
| 211,700 | Nexon Co., Ltd. | 2,914,580 | |||||
| 926,200 | Nichicon Corp. | 7,531,638 | |||||
| 218,200 | Nippon Ceramic Co., Ltd. | 3,035,969 | |||||
| 41,800 | OBIC Co., Ltd. | 1,863,558 | |||||
| 288,900 | Outsourcing, Inc. | 4,941,561 | |||||
| 976,300 | Ricoh Co., Ltd. | 10,113,457 | |||||
| 161,100 | Rohm Co., Ltd. | 10,793,556 | |||||
| 1,990,000 | Sanken Electric Co. | 12,295,734 | |||||
| 2,106,000 | SCREEN Holdings Co., Ltd. | 13,253,506 | |||||
| 437,400 | SCSK Corp. | 13,338,255 | |||||
| 171,000 | Shimadzu Corp. | 2,320,840 | |||||
| 486,600 | Shinkawa, Ltd. | 4,319,556 | |||||
| 1,293,500 | Shinko Electric Industries Co., Ltd. | 9,326,794 | |||||
| 215,900 | SoftBank Corp. | 12,717,156 | |||||
| 279,400 | SUMCO Corp. | 3,494,460 | |||||
| 18,300 | TDK Corp. | 1,401,277 | |||||
| 378,300 | Tokyo Seimitsu Co., Ltd. | 8,288,764 | |||||
| 148,500 | Yaskawa Electric Corp. | 1,899,383 | |||||
| 266,963,929 | |||||||
| Materials — 9.4% | |||||||
| 321,000 | Aichi Steel Corp. | 1,434,315 | |||||
| 269,500 | Chubu Steel Plate Co., Ltd. | 1,187,765 | |||||
| 146,900 | Daicel Corp. | 1,885,049 | |||||
| 154,000 | Fujimi, Inc. | 2,316,587 | |||||
| 685,480 | JSR Corp. | 12,100,989 | |||||
| 3,365,000 | Kobe Steel, Ltd. | 5,661,318 | |||||
| 358,600 | Kyoei Steel, Ltd. | 6,626,307 | |||||
| 271,300 | Maruichi Steel Tube, Ltd. | 6,733,754 | |||||
| 2,423,500 | Mitsubishi Gas Chemical Co., Inc. | 13,569,790 | |||||
| 3,728,100 | Mitsubishi Materials Corp. | 14,314,860 | |||||
| 3,455,000 | Mitsui Chemicals, Inc. | 12,836,279 | |||||
| 201,700 | Neturen Co., Ltd. | 1,454,128 | |||||
| 339,000 | Nippon Shokubai Co., Ltd. | 4,637,196 | |||||
| 117,900 | Nitto Denko Corp. | 9,682,225 | |||||
| 107,200 | Osaka Titanium Technologies Co., Ltd. | 2,875,974 | |||||
| 83,900 | Shin-etsu Chemical Co., Ltd. | 5,202,715 | |||||
| 1,406,000 | Showa Denko KK | 1,861,888 | |||||
| 1,694,000 | Sumitomo Bakelite Co., Ltd. | 7,674,057 | |||||
| 641,300 | Sumitomo Riko Co., Ltd. | 5,113,707 | |||||
| 1,685,000 | Taiheiyo Cement Corp. | 4,927,588 | |||||
| 139,385 | Tokyo Ohka Kogyo Co., Ltd. | 3,954,117 | |||||
| 1,563,900 | Tokyo Steel Manufacturing Co., Ltd. | 11,505,056 | |||||
| 392,300 | Toyo Kohan Co., Ltd. | 1,946,511 | |||||
| 348,900 | Yamato Kogyo Co., Ltd. | 8,149,650 | |||||
| 922,000 | Yodogawa Steel Works, Ltd. | 4,021,163 | |||||
| 151,672,988 | |||||||
| Telecommunication Services — 1.8% | |||||||
| 792,340 | Nippon Telegraph & Telephone Corp. | 28,695,192 | |||||
| Total Common Stocks (Cost $1,321,658,087) | 1,481,913,853 | ||||||
| Mutual Funds — 0.4% | |||||||
| Japan — 0.4% | |||||||
| 516,830 | Nomura AM TOPIX ETF | 7,098,838 | |||||
| Total Mutual Funds (Cost $6,775,314) | 7,098,838 | ||||||
The accompanying notes are an integral part of these financial statements.
www.brownadvisoryfunds.com
81
Brown Advisory – WMC Japan Alpha Opportunities Fund
Schedule of Investments
June 30, 2015
| Shares | Security Description | Value $ | |||||
| Short-Term Investments — 9.1% | |||||||
| Money Market Funds — 9.1% | |||||||
| 146,056,519 | DWS Cash Account Trust — Government | ||||||
| & Agency Securities Portfolio — | |||||||
| Institutional Shares, 0.04%# | 146,056,519 | ||||||
| Total Short-Term Investments (Cost $146,056,519) | 146,056,519 | ||||||
| Total Investments — 101.6% (Cost $1,474,489,920) | 1,635,069,210 | ||||||
| Liabilities in Excess of Other Assets — (1.6)% | (25,558,167 | ) | |||||
| NET ASSETS — 100.0% | $ | 1,609,511,043 | |||||
PORTFOLIO HOLDINGS
% of Net Assets
| Consumer Discretionary | 24.2% |
| Financials | 18.5% |
| Information Technology | 16.6% |
| Industrials | 10.8% |
| Materials | 9.4% |
| Money Market Funds | 9.1% |
| Health Care | 6.0% |
| Consumer Staples | 3.2% |
| Telecommunication Services | 1.8% |
| Energy | 1.6% |
| Mutual Funds | 0.4% |
| Other Assets and Liabilities | (1.6)% |
| 100.0% |
| * | Non-Income Producing |
| # | Annualized seven-day yield as of June 30, 2015. |
Forward Currency Exchange Contracts (Note 7)
The Brown Advisory – WMC Japan Alpha Opportunities Fund had the following outstanding contracts as of June 30, 2015:
| Settlement | Unrealized | |||||||||||
| Currency to be Delivered | Currency to be Received | Date | Counterparty | Depreciation | ||||||||
| Japanese Yen | 86,318,807,000 | U.S. Dollars | 696,032,407 | 07/31/2015 | Deustche Bank AG | $ | (9,322,584 | ) | ||||
| Japanese Yen | 86,318,807,000 | U.S. Dollars | 695,608,364 | 07/31/2015 | State Street Capital Markets | (9,736,583 | ) | |||||
| $ | (19,059,167 | ) | ||||||||||
Futures Contracts Long — (Note 8)
The Brown Advisory – WMC Japan Alpha Opportunities Fund had the following open long futures contracts as of June 30, 2015:
| Issue | Contracts | Expiration Date | Notional Amount | Unrealized Depreciation |
TOPIX Index Futures Contracts | 700 | 09/11/2015 | $94,540,875 | $(1,281,897) |
The accompanying notes are an integral part of these financial statements.
www.brownadvisoryfunds.com
82
Brown Advisory – Somerset Emerging Markets Fund
A Message to Our Shareholders
June 30, 2015
Dear Shareholder,
During the year ended June 30, 2015, the Brown Advisory – Somerset Emerging Markets Fund Institutional Shares (the “Fund”) returned -3.22% compared with a return of -5.12% for the MSCI Emerging Markets Index, the Fund’s benchmark. Emerging markets were volatile during the period, with the issues of China and the oil price particularly salient. The Fund is notably underweight in both China and energy compared to the benchmark, which represented an opportunity cost for us during the period. The oil price collapse and Chinese data tend to confirm that emerging market economic data remains very weak.
We believe that the emerging-market consumer story remains fundamentally weak and overvalued, and we have been more focused on cheaper export stocks, insurance companies and others. This has helped the Fund in terms of performance. From a country perspective, our weighting in Brazil contributed strongly to relative performance, with Porto Seguro and Cielo in particular performing well recently. By far the biggest detractor from relative performance during the year was our under-weighting in China. We remain underweight in China, but we expect the market to be increasingly volatile over the next six months. We think China is at the start of a non-performing loan (NPL) cycle, and because of the growth dynamic it has had over the last five to 10 years, it is potentially at the start of quite a bad NPL cycle.
Our investments in India were affected by the fact that until January 2015, we were unable to invest in locally listed stocks for regulatory reasons. Because of this, we used Indian ETFs to make up our Indian weighting. Subsequent to regulatory approval, we built positions in underlying stocks Axis Bank, HCL Technologies, Wipro and Shriram Transport Finance over a number of months. This external regulatory factor necessarily impacted our investment strategy and performance, but we are optimistic for the future of our Indian investments.
In terms of portfolio activity, there were a moderate number of buys and sells, and portfolio turnover during the past 12 months was 22%. In March, we sold our position in AAC Technologies, a stock we had held since the Fund’s inception. Although it remains the top company in efficiently manufacturing acoustic equipment for mobile handsets, its lead has narrowed and we sold it at a full valuation on 21x P/E. More recently, we sold our position in BAT Malaysia. The tobacco company tried to raise prices in 4Q 2014, but quickly reversed this increase as price elasticity of demand for tobacco seems to have increased. This is something we are seeing in some other markets too, so we took the opportunity to sell at an attractive valuation. One stock that did not work during the period was our investment in Tianhe Chemicals. We sold our position in 4Q 2014 because of questions over its end-user customers and accounting. Although the allegations were not proven, there are undoubtedly some corporate governance issues at the company, so we decided to sell. Other sales during the period were Top Glove (expensive), Maroc Telecom (margins under pressure from higher costs, taxes and regulation) and Nokian Renkaat (expensive, and uncertain future profitability).
During the year, we added a total of 11 new positions to the portfolio. Samsung Fire & Marine is a Korean insurer with good underwriting discipline, and we bought the stock in February 2015 after it had sold off significantly. More recently, we added Turk Telekom, the incumbent fixed line operator in Turkey. The mobile business has been underperforming for the last decade or so, and we think it is now turning around as churn rates have come down and margins on the mobile side of the business have gone up substantially. There have also been a couple of trading positions added during the period. In 1Q 2015, we bought Union National Bank in Abu Dhabi after it had sold off sharply. More recently, we added a small position in Hero MotoCorp after it had also de-rated.
In terms of outlook, we think that emerging markets economic data remains weak, but we are positive longer term, as the bear market is now four to six years old and restructuring of some economies and markets has now taken place. The Chinese market has the potential to be increasingly volatile over the next 6 to 12 months. In terms of the opportunities that we are seeing, they still tend to be in industrials, exporters, and possibly commodities, where we feel that valuations are more attractive. The cash level in the portfolio has been slightly elevated because of healthy inflows and a cautious stance taken to investment in the current environment.
Sincerely,
Edward Lam
Portfolio Manager
Edward Robertson
Portfolio Manager
www.brownadvisoryfunds.com
83
Brown Advisory – Somerset Emerging Markets Fund
A Message to Our Shareholders
June 30, 2015
Past performance is not a guarantee of future results.
Mutual fund investing involves risk. Principal loss is possible. The Fund may invest in ETFs, which may trade at a discount to the aggregate value of the underlying securities and although expense ratios for ETFs are generally low, frequent trading of ETFs by the Fund can generate brokerage expenses. The Fund may invest in foreign securities which involve greater volatility and political, economic and currency risks and differences in accounting methods. These risks are greater in emerging markets. Derivatives may involve certain costs and risks such as liquidity, interest rate, market, credit, management, and the risk that a position could not be closed when most advantageous. Investing in derivatives could lose more than the amount invested. The Fund invests in smaller companies which carry greater risk than is associated with larger companies for various reasons, such as narrower markets, limited financial resources and less liquid stock. Investments in debt securities typically decrease in value when interest rates rise. This risk is usually greater for longer-term debt securities.
Fund holdings and sector allocations are subject to change and should not be considered a recommendation to buy or sell any security. For a complete list of fund holdings, please refer to the Schedule of Investments provided in this report.
Definitions for terms and indices are provided in the Glossary of Terms.
www.brownadvisoryfunds.com
84
Brown Advisory – Somerset Emerging Markets Fund
Performance Chart and Analysis
June 30, 2015
COMPARISON OF CHANGE IN VALUE OF A $1,000,000 INVESTMENT
The following chart reflects the change in value of a hypothetical $1,000,000 investment, including reinvested dividends and distributions, in the Fund as measured against a broad-based securities market index. The MSCI Emerging Markets Index is a free float-adjusted market capitalization index that is designed to measure equity market performance in the global emerging markets. The index is unmanaged and does not reflect the deduction of fees, such as investment management fees. Investors cannot invest directly in an index.
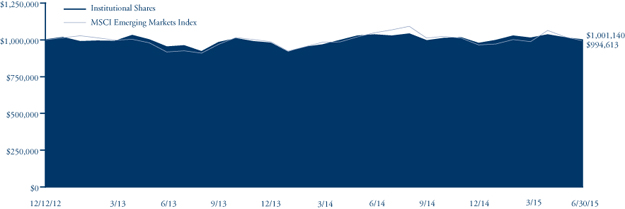
| Since | ||||
| Average Annual Total Return | One | Inception | ||
| as of 6/30/15 | Year | (12/12/12) | ||
| Institutional Shares | -3.22% | 0.04% | ||
| Investor Shares | -3.33% | -0.08% | ||
| Advisor Shares | -3.60% | -0.39% | ||
| MSCI Emerging Markets Index | -5.12% | -0.21% |
| Institutional Shares | Investor Shares | Advisor Shares | ||
Gross Expense Ratio1 | 1.28% | 1.43% | 1.68% | |
Net Expense Ratio1 | 1.28% | 1.43% | 1.68% |
Past performance does not guarantee future results. The performance data quoted represents past performance and current returns may be lower or higher. The investment return and net asset value will fluctuate so that an investor’s shares, when redeemed, may be worth more or less than the original cost. To obtain performance information current to the most recent month end, please visit our website at brownadvisoryfunds.com/performance.html. The performance table and graph above do not reflect the deduction of taxes that a shareholder would pay on Fund distributions or the redemption of Fund shares. Performance data does not reflect the imposition of the redemption fee of 1.00% on shares redeemed within 14 days, and if it did, performance would have been lower. Short-term performance, in particular, is not a good indication of the Fund’s future performance, and an investment should not be made based solely on returns.
| 1 | Per the Fund’s prospectus dated October 31, 2014. |
www.brownadvisoryfunds.com
85
Brown Advisory – Somerset Emerging Markets Fund
Schedule of Investments
June 30, 2015
| Shares | Security Description | Value $ | |||||
| Common Stocks — 86.8% | |||||||
| Brazil — 5.9% | |||||||
| 271,608 | Cielo S.A. | 3,839,430 | |||||
| 1,102,890 | Porto Seguro S.A. | 14,675,166 | |||||
| 382,211 | Smiles S.A. | 6,478,569 | |||||
| 24,993,165 | |||||||
| Chile — 3.3% | |||||||
| 3,221,349 | AFP Habitat S.A.† | 4,320,406 | |||||
| 4,855,311 | Aguas Andinas S.A. | 2,765,039 | |||||
| 446,473 | Cia Cervecerias Unidas S.A. | 4,739,030 | |||||
| 1,399,468 | Inversiones Aguas Metropolitan† | 2,125,685 | |||||
| 13,950,160 | |||||||
| China — 4.1% | |||||||
| 1,368,500 | China Mobile, Ltd. | 17,508,473 | |||||
| Hungary — 4.4% | |||||||
| 956,889 | OTP Bank PLC | 18,911,979 | |||||
| India — 11.9% | |||||||
| 1,705,233 | Axis Bank, Ltd. | 14,948,497 | |||||
| 936,906 | HCL Technologies, Ltd. | 13,532,024 | |||||
| 79,883 | Hero MotoCorp, Ltd. | 3,164,611 | |||||
| 1,065,349 | Power Grid Corp. | 2,326,170 | |||||
| 353,632 | Shriram Transport Finance Co., Ltd. | 4,738,446 | |||||
| 1,407,209 | Wipro, Ltd. | 12,077,569 | |||||
| 50,787,317 | |||||||
| Indonesia — 1.9% | |||||||
| 35,856,900 | Telekomunikasi Indonesia | 7,859,627 | |||||
| Luxembourg — 1.3% | |||||||
| 77,649 | Millicom International Cellular | 5,728,162 | |||||
| Malaysia — 0.4% | |||||||
| 331,390 | Public Bank Berhad | 1,643,796 | |||||
| Philippines — 7.5% | |||||||
| 10,861,635 | Aboitiz Power Corp.† | 10,952,728 | |||||
| 5,644,835 | Metropolitan Bank & Trust | 11,765,840 | |||||
| 144,155 | Philippine Long Distance Corp. | 8,981,681 | |||||
| 31,700,249 | |||||||
| Poland — 4.5% | |||||||
| 110,362 | Bank Pekao S.A. | 5,281,137 | |||||
| 118,917 | Powszechny Zaklad Ubezpieczen S.A. | 13,683,362 | |||||
| 18,964,499 | |||||||
| Portugal — 0.5% | |||||||
| 164,963 | Jeronimo Martins SGPS S.A. | 2,127,028 | |||||
| South Africa — 6.6% | |||||||
| 2,498,530 | Nampak, Ltd. | 6,939,218 | |||||
| 2,704,732 | Sanlam, Ltd. | 14,723,399 | |||||
| 447,679 | Shoprite Holding, Ltd. | 6,381,205 | |||||
| 28,043,822 | |||||||
| South Korea — 13.6% | |||||||
| 65,173 | KT&G Corp. | 5,544,774 | |||||
| 26,065 | NCSoft Corp. | 4,631,679 | |||||
| 523,278 | Nexen Tire Corp. | 5,859,366 | |||||
| 14,563 | Samsung Electronics Co., Ltd. | 16,522,979 | |||||
| 51,006 | Samsung Fire & Marine Insurance Co., Ltd. | 13,440,143 | |||||
| 317,873 | SK Hynix, Inc. | 12,047,870 | |||||
| 58,046,811 | |||||||
| Taiwan — 10.5% | |||||||
| 485,000 | eMemory Technology, Inc. | 6,529,415 | |||||
| 206,710 | Formosa International Hotels | 1,741,958 | |||||
| 2,462,400 | Merry Electronics Co. | 5,703,652 | |||||
| 8,134,000 | Pou Chen Corp. | 11,603,106 | |||||
| 897,000 | President Chain Store Corp. | 6,306,310 | |||||
| 2,853,000 | Taiwan Semiconductor Manufacturing Co. | 12,977,211 | |||||
| 44,861,652 | |||||||
| Thailand — 0.4% | |||||||
| 1,780,500 | Samart Corp. PCL | 1,486,558 | |||||
| Turkey — 6.9% | |||||||
| 1,760,661 | Aksa Akrilik Kimya Sanayii† | 7,197,404 | |||||
| 2,194,145 | Anadolu Hayat Emeklilik A/S† | 4,601,024 | |||||
| 4,710,639 | Turk Telekomunikasyon A/S | 12,391,331 | |||||
| 3,968,484 | Turkiye Sise ve Cam Fabrikalari A/S | 5,345,407 | |||||
| 29,535,166 | |||||||
| United Arab Emirates — 3.1% | |||||||
| 1,440,693 | First Gulf Bank | 5,945,055 | |||||
| 1,965,670 | National Bank Abu Dhabi† | 5,875,951 | |||||
| 710,345 | Union National Bank | 1,310,599 | |||||
| 13,131,605 | |||||||
| Total Common Stocks (Cost $370,212,507) | 369,280,069 | ||||||
| Preferred Stocks — 1.4% | |||||||
| Brazil — 1.4% | |||||||
| 1,085,300 | AES Tiete S.A. | 6,059,891 | |||||
| Total Preferred Stocks (Cost $7,783,030) | 6,059,891 | ||||||
| Warrants — 0.0% | |||||||
| Thailand — 0.0% | |||||||
| 400,760 | Samart Corp. PCL | 34,647 | |||||
| Total Warrants (Cost $36,190) | 34,647 | ||||||
| Short-Term Investments — 11.5% | |||||||
| Money Market Funds — 11.5% | |||||||
| 48,935,847 | DWS Cash Account Trust — Government | ||||||
| & Agency Securities Portfolio — | |||||||
| Institutional Shares, 0.04%# | 48,935,847 | ||||||
| Total Short-Term Investments (Cost $48,935,847) | 48,935,847 | ||||||
| Total Investments — 99.7% (Cost $426,967,574) | 424,310,454 | ||||||
| Other Assets in Excess of Liabilities — 0.3% | 1,081,356 | ||||||
| NET ASSETS — 100.0% | $ | 425,391,810 | |||||
The accompanying notes are an integral part of these financial statements.
www.brownadvisoryfunds.com
86
Brown Advisory – Somerset Emerging Markets Fund
Schedule of Investments
June 30, 2015
PORTFOLIO HOLDINGS
% of Net Assets
| South Korea | 13.6% |
| India | 11.9% |
| Money Market Funds | 11.5% |
| Taiwan | 10.5% |
| Philippines | 7.5% |
| Brazil | 7.3% |
| Turkey | 6.9% |
| South Africa | 6.6% |
| Poland | 4.5% |
| Hungary | 4.4% |
| China | 4.1% |
| Chile | 3.3% |
| United Arab Emirates | 3.1% |
| Indonesia | 1.9% |
| Luxembourg | 1.3% |
| Portugal | 0.5% |
| Malaysia | 0.4% |
| Thailand | 0.4% |
| Other Assets and Liabilities | 0.3% |
| 100.0% |
| † | All or a portion of this security is considered illiquid. At June 30, 2015, the total market value of securities considered illiquid was $19,870,555 or 4.7% of net assets. |
| # | Annualized seven-day yield as of June 30, 2015. |
The accompanying notes are an integral part of these financial statements.
www.brownadvisoryfunds.com
87
Brown Advisory Emerging Markets Small-Cap Fund
A Message to Our Shareholders
June 30, 2015
Dear Shareholder:
Since its inception on November 21, 2014, the Brown Advisory Emerging Markets Small-Cap Fund Institutional Shares (the “Fund”) increased 17.00%. During the same period, the MSCI Emerging Markets Small-Cap Index, the Fund’s benchmark, increased 4.74%.
Asia ex-Japan:
The main contributors to outperformance were holdings in South Korea. The companies in the Fund delivered better-than-expected earnings and saw consensus upgrades, which further supported share prices. The Fund also benefited from the Chinese equity rally, and took profit until April, ahead of the recent market correction.
From an individual stock perspective, the following names were key contributors.
| • | Guotai Junan, a Chinese securities broker, rose 135% as trading on the Shanghai-Hong Kong Stock Connect jumped on the relaxation of rules allowing Chinese mainland fund managers to invest in Hong Kong. | |
| • | Korea Kolmar, a Korean cosmetics manufacturer, rose 101% as the company delivered better-than-expected earnings. Investors grew optimistic about the company’s plans to expand its capacity and reach overseas. | |
| • | China Power International, a Chinese power producer, rose 55%. Talk of a merger between China Power’s parent company and State Nuclear Power Tech Corp. and continued talk of an asset injection announcement helped propel the stock higher. |
The following names were key detractors.
| • | Ezion Holdings, a Singaporean offshore marine company, fell 32% as lower oil prices impaired the outlook for the sector. Investor concerns were raised over its contracts and earnings outlook. | |
| • | Bloomage Biotechnology, a Chinese medical beauty supplier, fell 25% after reporting weaker-than-expected earnings. The company reported earnings growth of 66% year-on-year for 2014 but guided for slower growth in the first half of this year. | |
| • | Towngas China, a Chinese gas supplier, fell 9% due to slowing industrial demand growth. Also, gas sales volume growth slowed to 10% year-on-year from 13% during the previous year. |
Overall, Asia ex-Japan continues to trade at what we believe are attractive valuations and we believe its growth profile remains robust. The manager maintains an optimistic outlook for stocks in the region over the medium to long term. The Fund retains its quality bias, favoring companies that we feel are conservatively capitalized with a long-term track record.
Non-Asia ex-Japan:
The Fund continues to have no direct exposure to non-Asia ex-Japan stock markets. We do believe that the Fund will gain relative exposure to these markets over time as opportunities arise.
We continue to believe that the key to generating excess returns is to identify smaller emerging companies across regions that are not fully priced by the market. Our investment discipline combines a value-oriented process with a search for higher-quality growth companies. By investing with managers that apply this discipline in markets that are realizing stronger economic growth, we believe that we can potentially deliver favorable results over various market cycles.
Sincerely,
Paul Chew, CFA
Portfolio Manager
www.brownadvisoryfunds.com
88
Brown Advisory Emerging Markets Small-Cap Fund
A Message to Our Shareholders
June 30, 2015
Past performance is not a guarantee of future results.
Mutual fund investing involves risk. Principal loss is possible. The Fund may invest in foreign securities which involve political, economic and currency risks, greater volatility and differences in accounting methods. These risks are greater for investments in emerging markets. Derivatives may involve certain costs and risks such as liquidity, interest rate, market, credit, management, and the risk that a position could not be closed when most advantageous. Investing in derivatives could lose more than the amount invested. Investments in small and medium capitalization companies generally carry greater risk than is customarily associated with larger companies for various reasons such as narrower markets, limited financial resources and less liquid stock. The Fund may invest in ETFs, which may trade at a discount to the aggregate value of the underlying securities and although expense ratios for ETFs are generally low, frequent trading of ETFs by the Fund can generate brokerage expenses. In addition, the fund is susceptible to risks from investments in derivatives, private placements, REITs, and its investments in other investment companies.
Fund holdings and sector allocations are subject to change and should not be considered a recommendation to buy or sell any security. For a complete list of fund holdings, please refer to the Schedule of Investments provided in this report.
Definitions for terms and indices are provided in the Glossary of Terms.
www.brownadvisoryfunds.com
89
Brown Advisory Emerging Markets Small-Cap Fund
Performance Chart and Analysis
June 30, 2015
COMPARISON OF CHANGE IN VALUE OF A $1,000,000 INVESTMENT
The following chart reflects the change in value of a hypothetical $1,000,000 investment, including reinvested dividends and distributions, in the Fund as measured against a broad-based securities market index. The MSCI Emerging Markets Small-Cap Index is a free float-adjusted market capitalization index that is designed to measure small cap equity market performance in the global emerging markets. The index is unmanaged and does not reflect the deduction of fees, such as investment management fees. Investors cannot invest directly in an index.
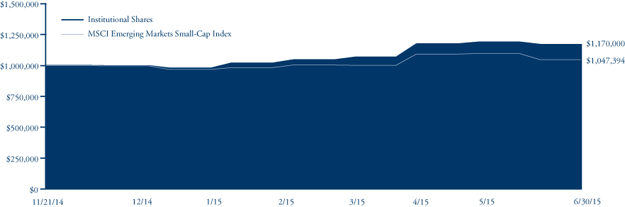
| Since | |||
| Cumulative Total Return | Inception | ||
| as of 6/30/15 | (11/21/14) | ||
| Institutional Shares | 17.00% | ||
| Investor Shares | 16.90% | ||
| MSCI Emerging Markets Small-Cap Index | 4.74% | ||
| Institutional Shares | Investor Shares | ||
Gross Expense Ratio1 | 1.72% | 1.87% | |
Net Expense Ratio1 | 1.72% | 1.87% |
Past performance does not guarantee future results. The performance data quoted represents past performance and current returns may be lower or higher. The investment return and net asset value will fluctuate so that an investor’s shares, when redeemed, may be worth more or less than the original cost. To obtain performance information current to the most recent month end, please visit our website at brownadvisoryfunds.com/performance.html. The performance table and graph above do not reflect the deduction of taxes that a shareholder would pay on Fund distributions or the redemption of Fund shares. Performance data does not reflect the imposition of the redemption fee of 1.00% on shares redeemed within 14 days, and if it did, performance would have been lower. Short-term performance, in particular, is not a good indication of the Fund’s future performance, and an investment should not be made based solely on returns.
| 1 | Per the Fund’s prospectus dated October 31, 2014. |
www.brownadvisoryfunds.com
90
Brown Advisory Emerging Markets Small-Cap Fund
Schedule of Investments
June 30, 2015
| Shares | Security Description | Value $ | |||||
| Common Stocks — 91.2% | |||||||
| China — 27.8% | |||||||
| 1,312,500 | Bloomage Biotechno Corp., Ltd.† | 2,314,471 | |||||
| 2,068,000 | China Medical System Holdings, Ltd. | 2,895,189 | |||||
| 11,255,000 | China Power International Development, Ltd. | 8,569,562 | |||||
| 1,218,000 | China State Construction International | ||||||
| Holdings, Ltd. | 2,191,171 | ||||||
| 1,784,800 | China Taiping Insurance Holdings Co., Ltd.* | 6,389,893 | |||||
| 3,596,000 | China Travel International Investment | ||||||
| Hong Kong, Ltd. | 1,578,587 | ||||||
| 6,696,000 | CITIC Telecom International Holdings, Ltd. | 3,104,592 | |||||
| 237,000 | Great Wall Motor Co., Ltd. | 1,161,832 | |||||
| 2,321,000 | Lee & Man Paper Manufacturing, Ltd. | 1,479,077 | |||||
| 1,675,000 | Luye Pharma Group, Ltd.* | 1,790,664 | |||||
| 1,454,000 | Nexteer Automotive Group, Ltd. | 1,513,992 | |||||
| 6,342,000 | SSY Group, Ltd. | 2,307,208 | |||||
| 2,306,000 | Sunny Optical Technology Co., Ltd. | 5,019,471 | |||||
| 747,500 | Techtronic Industries Co., Ltd. | 2,444,046 | |||||
| 1,357,000 | Tong Ren Tang Technologies Co., Ltd. | 2,295,850 | |||||
| 4,120,000 | Towngas China Co., Ltd. | 3,763,872 | |||||
| 2,580,000 | Wasion Group Holdings, Ltd. | 3,976,528 | |||||
| 6,652,000 | Xinyi Solar Holdings, Ltd. | 2,755,900 | |||||
| 1,420,000 | Zhejiang Expressway Co., Ltd. | 1,969,318 | |||||
| 57,521,223 | |||||||
| India — 9.6% | |||||||
| 227,387 | Aurobindo Pharma, Ltd. | 5,182,275 | |||||
| 857,166 | Exide Industries, Ltd. | 1,993,463 | |||||
| 269,398 | Glenmark Pharmaceuticals, Ltd. | 4,205,748 | |||||
| 492,308 | UPL, Ltd. | 4,134,556 | |||||
| 330,685 | Yes Bank, Ltd. | 4,377,104 | |||||
| 19,893,146 | |||||||
| Indonesia — 2.0% | |||||||
| 1,451,900 | Matahari Department Store TBK | 1,799,482 | |||||
| 10,523,200 | Matahari Putra Prima TBK† | 2,325,505 | |||||
| 4,124,987 | |||||||
| Malaysia — 2.4% | |||||||
| 4,524,000 | Malakoff Corp. Bhd. | 2,098,330 | |||||
| 2,521,700 | Westports Holdings Bhd. | 2,827,895 | |||||
| 4,926,225 | |||||||
| Philippines — 5.1% | |||||||
| 21,953,000 | Megaworld Corp. | 2,314,809 | |||||
| 1,217,200 | Robinsons Retail Holdings, Inc. | 2,009,770 | |||||
| 1,107,880 | Security Bank Corp.† | 3,967,557 | |||||
| 712,200 | Semirara Mining & Power Corp. | 2,249,423 | |||||
| 10,541,559 | |||||||
| Singapore — 4.0% | |||||||
| 1,237,000 | Comfortdelgro Corp., Ltd. | 2,872,747 | |||||
| 3,900,600 | Ezion Holdings, Ltd. | 2,964,207 | |||||
| 1,038,000 | M1, Ltd. | 2,497,003 | |||||
| 8,333,957 | |||||||
| South Korea — 25.4% | |||||||
| 22,744 | Cuckoo Electronics Co., Ltd. | 5,708,329 | |||||
| 89,875 | Dongbu Insurance Co., Ltd. | 4,544,768 | |||||
| 15,329 | E-Mart Co., Ltd | 3,173,201 | |||||
| 73,905 | Halla Visteon Climate Control Corp. | 2,552,746 | |||||
| 22,532 | Hana Tour Service, Inc. | 2,571,435 | |||||
| 37,819 | Hotel Shilla Co., Ltd. | 3,780,764 | |||||
| 57,357 | Hyundai Department Store Co., Ltd. | 7,548,980 | |||||
| 42,305 | KEPCO Plant Service & Engineering Co., Ltd. | 4,475,315 | |||||
| 109,279 | Korea Kolmar Co., Ltd. | 9,937,130 | |||||
| 53,957 | Loen Entertainment, Inc. | 3,893,577 | |||||
| 8,794 | Medy-Tox, Inc. | 4,387,998 | |||||
| 52,574,243 | |||||||
| Taiwan — 10.0% | |||||||
| 235,000 | Catcher Technology Co., Ltd. | 2,937,972 | |||||
| 336,000 | Cleanaway Co., Ltd. | 1,988,548 | |||||
| 267,000 | King Slide Works Co., Ltd. | 3,561,128 | |||||
| 3,041,000 | King’s Town Bank† | 2,639,954 | |||||
| 20,000 | LARGAN Precision Co., Ltd. | 2,283,017 | |||||
| 369,000 | Merida Industry Co., Ltd. | 2,392,742 | |||||
| 194,000 | PChome Online, Inc. | 3,202,388 | |||||
| 109,000 | St Shine Optical Co., Ltd. | 1,732,627 | |||||
| 20,738,376 | |||||||
| Thailand — 4.9% | |||||||
| 629,200 | Bumrungrad Hospital Public Co., Ltd. | 3,475,747 | |||||
| 3,385,421 | Major Cineplex Group Public Co., Ltd. | 3,374,425 | |||||
| 3,041,500 | Thaicom Public Co., Ltd. | 3,147,996 | |||||
| 9,998,168 | |||||||
| Total Common Stocks (Cost $174,782,746) | 188,651,884 | ||||||
| Real Estate Investment Trusts — 1.1% | |||||||
| Singapore — 1.1% | |||||||
| 3,026,200 | Mapletree Greater China Commercial Trust | 2,290,884 | |||||
| Total Real Estate Investment Trusts (Cost $2,338,739) | 2,290,884 | ||||||
| Warrants — 0.0% | |||||||
| China — 0.0% | |||||||
| 86,250 | Ju Teng International Holdings, Ltd. | 5,285 | |||||
| Total Warrants (Cost $—) | 5,285 | ||||||
| Short-Term Investments — 6.6% | |||||||
| Money Market Funds — 6.6% | |||||||
| 13,719,684 | DWS Cash Account Trust — Government | ||||||
| & Agency Securities Portfolio — | |||||||
| Institutional Shares, 0.04%# | 13,719,684 | ||||||
| Total Short-Term Investments (Cost $13,719,684) | 13,719,684 | ||||||
| Total Investments — 98.9% (Cost $190,841,169) | 204,667,737 | ||||||
| Other Assets in Excess of Liabilities — 1.1% | 2,225,183 | ||||||
| NET ASSETS — 100.0% | $ | 206,892,920 | |||||
The accompanying notes are an integral part of these financial statements.
www.brownadvisoryfunds.com
91
Brown Advisory Emerging Markets Small-Cap Fund
Schedule of Investments
June 30, 2015
PORTFOLIO HOLDINGS
% of Net Assets
| China | 27.8% |
| South Korea | 25.4% |
| Taiwan | 10.0% |
| India | 9.6% |
| Money Market Funds | 6.6% |
| Philippines | 5.1% |
| Singapore | 5.1% |
| Thailand | 4.9% |
| Indonesia | 2.0% |
| Malaysia | 2.4% |
| Other Assets and Liabilities | 1.1% |
| 100.0% |
| † | All or a portion of this security is considered illiquid. At June 30, 2015, the total market value of securities considered illiquid was $2,130,495 or 1.0% of net assets. |
| * | Non-Income Producing |
| # | Annualized seven-day yield as of June 30, 2015. |
The accompanying notes are an integral part of these financial statements.
www.brownadvisoryfunds.com
92
(This Page Intentionally Left Blank.)
93
Statements of Assets and Liabilities
June 30, 2015
| BROWN | BROWN | BROWN | BROWN | |||||||||||||
| ADVISORY | ADVISORY | ADVISORY | ADVISORY | |||||||||||||
| GROWTH | VALUE | FLEXIBLE | EQUITY | |||||||||||||
| EQUITY | EQUITY | EQUITY | INCOME | |||||||||||||
| FUND | FUND | FUND | FUND | |||||||||||||
| ASSETS | ||||||||||||||||
| Investments: | ||||||||||||||||
| Total investments, at cost | $ | 1,726,742,718 | $ | 141,474,083 | $ | 230,492,949 | $ | 164,127,458 | ||||||||
| Net unrealized appreciation | 722,311,108 | 27,294,077 | 52,606,805 | 39,463,335 | ||||||||||||
| Total investments, at market value | 2,449,053,826 | 168,768,160 | 283,099,754 | 203,590,793 | ||||||||||||
| Cash | — | 54,940 | — | 61,926 | ||||||||||||
| Receivables: | ||||||||||||||||
| Investment securities sold | — | 1,263,785 | 775,908 | 1,031,956 | ||||||||||||
| Fund shares sold | 1,910,848 | — | 717,976 | 50 | ||||||||||||
| Interest and dividends | 1,383,357 | 294,806 | 213,436 | 576,769 | ||||||||||||
| Prepaid expenses and other assets | 45,286 | 28,596 | 36,190 | 28,853 | ||||||||||||
| Total Assets | 2,452,393,317 | 170,410,287 | 284,843,264 | 205,290,347 | ||||||||||||
| LIABILITIES | ||||||||||||||||
| Payables: | ||||||||||||||||
| Investment securities purchased | — | 2,213,484 | — | — | ||||||||||||
| Fund shares redeemed | 3,451,188 | 34,111 | 229,452 | 219,842 | ||||||||||||
| Distributions | — | — | — | 603,958 | ||||||||||||
| Accrued Liabilities: | ||||||||||||||||
| Investment advisory fees | 1,228,057 | 85,906 | 143,459 | 103,707 | ||||||||||||
| Administration, accounting, and transfer agent fees | 167,409 | 12,270 | 19,559 | 13,925 | ||||||||||||
| Custodian fees | 12,840 | 1,744 | 3,973 | 1,350 | ||||||||||||
| Service fees | 274,877 | 21,475 | 35,326 | 23,646 | ||||||||||||
| Business management fees | 102,338 | 7,159 | 11,955 | 8,642 | ||||||||||||
| Distribution fees | 28,402 | 748 | 8,537 | 2,040 | ||||||||||||
| Other liabilities | 118,490 | 27,894 | 42,382 | 29,877 | ||||||||||||
| Total Liabilities | 5,383,601 | 2,404,791 | 494,643 | 1,006,987 | ||||||||||||
| NET ASSETS | $ | 2,447,009,716 | $ | 168,005,496 | $ | 284,348,621 | $ | 204,283,360 | ||||||||
| COMPONENTS OF NET ASSETS | ||||||||||||||||
| Paid-in capital | $ | 1,630,893,400 | $ | 124,299,564 | $ | 231,695,375 | $ | 161,946,030 | ||||||||
| Undistributed net investment income | — | 1,760,722 | 826,205 | — | ||||||||||||
| Accumulated net realized gain (loss) | 93,805,208 | 14,651,133 | (779,453 | ) | 2,873,995 | |||||||||||
| Unrealized appreciation on investments | 722,311,108 | 27,294,077 | 52,606,805 | 39,463,335 | ||||||||||||
| Unrealized depreciation – foreign receivables | — | — | (311 | ) | — | |||||||||||
| NET ASSETS | $ | 2,447,009,716 | $ | 168,005,496 | $ | 284,348,621 | $ | 204,283,360 | ||||||||
| COMPUTATION OF NET ASSET VALUE | ||||||||||||||||
| Institutional Shares: | ||||||||||||||||
| Net assets | $ | 259,097,848 | $ | 14,090 | $ | 4,240,089 | $ | 18,134,438 | ||||||||
| Shares outstanding (unlimited shares authorized) | 12,743,909 | 804 | 266,328 | 1,380,386 | ||||||||||||
| Net asset value per share | $ | 20.33 | $ | 17.52 | $ | 15.92 | $ | 13.14 | ||||||||
| Investor Shares: | ||||||||||||||||
| Net assets | $ | 2,143,324,777 | $ | 166,808,422 | $ | 268,568,648 | $ | 183,001,323 | ||||||||
| Shares outstanding (unlimited shares authorized) | 105,788,132 | 9,522,476 | 16,901,366 | 13,938,598 | ||||||||||||
| Net asset value per share | $ | 20.26 | $ | 17.52 | $ | 15.89 | $ | 13.13 | ||||||||
| Advisor Shares: | ||||||||||||||||
| Net assets | $ | 44,587,091 | $ | 1,182,984 | $ | 11,539,884 | $ | 3,147,599 | ||||||||
| Shares outstanding (unlimited shares authorized) | 2,274,834 | 67,126 | 726,832 | 240,073 | ||||||||||||
| Net asset value per share | $ | 19.60 | $ | 17.62 | $ | 15.88 | $ | 13.11 | ||||||||
The accompanying notes are an integral part of these financial statements.
www.brownadvisoryfunds.com
94
Statements of Assets and Liabilities
June 30, 2015
| BROWN | BROWN | BROWN | ||||||||||||||
| ADVISORY | ADVISORY | ADVISORY | BROWN | |||||||||||||
| SUSTAINABLE | SMALL-CAP | SMALL-CAP | ADVISORY | |||||||||||||
| GROWTH | GROWTH | FUNDAMENTAL | OPPORTUNITY | |||||||||||||
| FUND | FUND | VALUE FUND | FUND | |||||||||||||
| ASSETS | ||||||||||||||||
| Investments: | ||||||||||||||||
| Total investments, at cost | $ | 150,069,998 | $ | 186,810,814 | $ | 747,066,443 | $ | 7,991,804 | ||||||||
| Net unrealized appreciation | 66,503,119 | 95,846,430 | 133,911,155 | 2,714,474 | ||||||||||||
| Total investments, at market value | 216,573,117 | 282,657,244 | 880,977,598 | 10,706,278 | ||||||||||||
| Cash | — | 57,389 | 21,356 | 976 | ||||||||||||
| Receivables: | ||||||||||||||||
| Fund shares sold | 89,268 | 409,609 | 1,540,176 | — | ||||||||||||
| Interest and dividends | 73,621 | 101,153 | 1,342,085 | 10,056 | ||||||||||||
| Prepaid expenses and other assets | 39,300 | 36,499 | 79,979 | 17,793 | ||||||||||||
| Total Assets | 216,775,306 | 283,261,894 | 883,961,194 | 10,735,103 | ||||||||||||
| LIABILITIES | ||||||||||||||||
| Payables: | ||||||||||||||||
| Investment securities purchased | — | 1,207,582 | 155,734 | — | ||||||||||||
| Fund shares redeemed | 102,046 | 141,086 | 299,579 | — | ||||||||||||
| Accrued Liabilities: | ||||||||||||||||
| Investment advisory fees, net | 108,455 | 197,925 | 615,709 | 6,745 | ||||||||||||
| Administration, accounting, and transfer agent fees | 15,253 | 18,861 | 54,909 | 1,289 | ||||||||||||
| Custodian fees | 1,685 | 2,193 | 6,189 | 237 | ||||||||||||
| Service fees | 19,133 | 33,294 | 99,496 | 1,344 | ||||||||||||
| Business management fees | 9,038 | 11,643 | 36,218 | 448 | ||||||||||||
| Distribution fees | 85,408 | 3,884 | 36,564 | — | ||||||||||||
| Other liabilities | 29,654 | 30,970 | 76,428 | 19,746 | ||||||||||||
| Total Liabilities | 370,672 | 1,647,438 | 1,380,826 | 29,809 | ||||||||||||
| NET ASSETS | $ | 216,404,634 | $ | 281,614,456 | $ | 882,580,368 | $ | 10,705,294 | ||||||||
| COMPONENTS OF NET ASSETS | ||||||||||||||||
| Paid-in capital | $ | 149,128,373 | $ | 161,757,648 | $ | 738,963,505 | $ | 13,062,817 | ||||||||
| Undistributed (Accumulated) net investment income (loss) | (429,774 | ) | (536,612 | ) | — | (39,115 | ) | |||||||||
| Accumulated net realized gain (loss) | 1,203,040 | 24,546,990 | 9,705,708 | (5,032,882 | ) | |||||||||||
| Unrealized appreciation on investments | 66,503,119 | 95,846,430 | 133,911,155 | 2,714,474 | ||||||||||||
| Unrealized depreciation – foreign receivables | (124 | ) | — | — | — | |||||||||||
| NET ASSETS | $ | 216,404,634 | $ | 281,614,456 | $ | 882,580,368 | $ | 10,705,294 | ||||||||
| COMPUTATION OF NET ASSET VALUE | ||||||||||||||||
| Institutional Shares: | ||||||||||||||||
| Net assets | $ | 67,789,368 | $ | 12,840,696 | $ | 75,994,027 | $ | — | ||||||||
| Shares outstanding (unlimited shares authorized) | 4,320,537 | 357,573 | 3,218,951 | — | ||||||||||||
| Net asset value per share | $ | 15.69 | $ | 35.91 | $ | 23.61 | $ | — | ||||||||
| Investor Shares: | ||||||||||||||||
| Net assets | $ | 11,205,687 | $ | 262,425,719 | $ | 748,003,091 | $ | 10,705,294 | ||||||||
| Shares outstanding (unlimited shares authorized) | 717,761 | 14,542,115 | 31,711,015 | 433,583 | ||||||||||||
| Net asset value per share | $ | 15.61 | $ | 18.05 | $ | 23.59 | $ | 24.69 | ||||||||
| Advisor Shares: | ||||||||||||||||
| Net assets | $ | 137,409,579 | $ | 6,348,041 | $ | 58,583,250 | $ | — | ||||||||
| Shares outstanding (unlimited shares authorized) | 8,866,303 | 365,802 | 2,494,774 | — | ||||||||||||
| Net asset value per share | $ | 15.50 | $ | 17.35 | $ | 23.48 | $ | — | ||||||||
The accompanying notes are an integral part of these financial statements.
www.brownadvisoryfunds.com
95
Statements of Assets and Liabilities
June 30, 2015
| BROWN | BROWN | BROWN | BROWN | |||||||||||||
| ADVISORY | ADVISORY | ADVISORY | ADVISORY | |||||||||||||
| MULTI- | INTERMEDIATE | TOTAL | STRATEGIC | |||||||||||||
| STRATEGY | INCOME | RETURN | BOND | |||||||||||||
| FUND | FUND | FUND | FUND | |||||||||||||
| ASSETS | ||||||||||||||||
| Investments: | ||||||||||||||||
| Total investments – unaffiliated, at cost | $ | 75,322 | $ | 116,842,547 | $ | 95,718,210 | $ | 62,643,254 | ||||||||
| Total investments – affiliated, at cost (Note 3) | 2,209,444 | 34,234,761 | — | — | ||||||||||||
| Total cost of investments | 2,284,766 | 151,077,308 | 95,718,210 | 62,643,254 | ||||||||||||
| Net unrealized depreciation – unaffiliated | — | (420,659 | ) | (519,525 | ) | (809,485 | ) | |||||||||
| Net unrealized appreciation (depreciation) – affiliated (Note 3) | 31,763 | (303,119 | ) | — | — | |||||||||||
| Total unrealized appreciation (depreciation) | 31,763 | (723,778 | ) | (519,525 | ) | (809,485 | ) | |||||||||
| Total investments, at market value | 2,316,529 | 150,353,530 | 95,198,685 | 61,833,769 | ||||||||||||
| Deposit at broker – futures contracts (Note 8) | — | — | 368,140 | 246,338 | ||||||||||||
| Gross unrealized appreciation – futures contracts (Note 8) | — | — | 37,850 | 1,113 | ||||||||||||
| Receivables: | ||||||||||||||||
| Investment securities sold | — | 365,264 | 629,727 | — | ||||||||||||
| Fund shares sold | — | 120,000 | 125,800 | 50,000 | ||||||||||||
| Interest and dividends | 1,295 | 728,530 | 497,696 | 689,452 | ||||||||||||
| Expense Reimbursement due from Adviser, net | 1,035 | — | — | — | ||||||||||||
| Prepaid expenses and other assets | 15,781 | 28,393 | 22,950 | 23,819 | ||||||||||||
| Total Assets | 2,334,640 | 151,595,717 | 96,880,848 | 62,844,491 | ||||||||||||
| LIABILITIES | ||||||||||||||||
| Gross unrealized depreciation – futures contracts (Note 8) | — | — | 177,548 | 27,519 | ||||||||||||
| Payables: | ||||||||||||||||
| Investment securities purchased | — | 1,484,295 | 13,466,078 | 1,347,445 | ||||||||||||
| Fund shares redeemed | — | 220,385 | 213,188 | 40,000 | ||||||||||||
| Distributions | — | 190,234 | 149,572 | — | ||||||||||||
| Interest expense – line of credit (Note 9) | 225 | — | — | — | ||||||||||||
| Accrued Liabilities: | ||||||||||||||||
| Investment advisory fees, net | — | 28,701 | 20,582 | 18,918 | ||||||||||||
| Administration, accounting, and transfer agent fees | 219 | 12,311 | 7,558 | 6,047 | ||||||||||||
| Custodian fees | 348 | 1,311 | 1,283 | 1,599 | ||||||||||||
| Service fees | — | 6,183 | 380 | 2,542 | ||||||||||||
| Business management fees | 99 | 6,183 | 3,430 | 2,542 | ||||||||||||
| Distribution fees | — | 6,145 | — | — | ||||||||||||
| Other liabilities | 14,527 | 26,609 | 25,689 | 26,045 | ||||||||||||
| Total Liabilities | 15,418 | 1,982,357 | 14,065,308 | 1,472,657 | ||||||||||||
| NET ASSETS | $ | 2,319,222 | $ | 149,613,360 | $ | 82,815,540 | $ | 61,371,834 | ||||||||
| COMPONENTS OF NET ASSETS | ||||||||||||||||
| Paid-in capital | $ | 2,295,877 | 149,873,500 | $ | 84,455,384 | $ | 62,711,272 | |||||||||
| Accumulated net investment income (loss) | (10,237 | ) | (190,234 | ) | 5,632 | 772,240 | ||||||||||
| Accumulated net realized gain (loss) | 1,819 | 653,872 | (986,253 | ) | (1,275,787 | ) | ||||||||||
| Unrealized appreciation (depreciation) on investments | 31,763 | (723,778 | ) | (519,525 | ) | (809,485 | ) | |||||||||
| Unrealized depreciation – futures contracts (Note 8) | — | — | (139,698 | ) | (26,406 | ) | ||||||||||
| NET ASSETS | $ | 2,319,222 | $ | 149,613,360 | $ | 82,815,540 | $ | 61,371,834 | ||||||||
| COMPUTATION OF NET ASSET VALUE | ||||||||||||||||
| Institutional Shares: | ||||||||||||||||
| Net assets | $ | 2,319,222 | $ | — | $ | 73,734,831 | $ | — | ||||||||
| Shares outstanding (unlimited shares authorized) | 230,272 | — | 7,497,309 | — | ||||||||||||
| Net asset value per share | $ | 10.07 | $ | — | $ | 9.83 | $ | — | ||||||||
| Investor Shares: | ||||||||||||||||
| Net assets | $ | — | $ | 140,005,738 | $ | 9,080,709 | $ | 59,679,700 | ||||||||
| Shares outstanding (unlimited shares authorized) | — | 13,173,364 | 923,429 | 6,071,910 | ||||||||||||
| Net asset value per share | $ | — | $ | 10.63 | $ | 9.83 | $ | 9.83 | ||||||||
| Advisor Shares: | ||||||||||||||||
| Net assets | $ | — | $ | 9,607,622 | $ | — | $ | 1,692,134 | ||||||||
| Shares outstanding (unlimited shares authorized) | — | 922,116 | — | 172,388 | ||||||||||||
| Net asset value per share | $ | — | $ | 10.42 | $ | — | $ | 9.82 | ||||||||
The accompanying notes are an integral part of these financial statements.
www.brownadvisoryfunds.com
96
Statements of Assets and Liabilities
June 30, 2015
| BROWN | ||||||||||||||||
| BROWN | BROWN | BROWN | ADVISORY – | |||||||||||||
| ADVISORY | ADVISORY | ADVISORY | WMC | |||||||||||||
| MARYLAND | TAX EXEMPT | MORTGAGE | STRATEGIC | |||||||||||||
| BOND | BOND | SECURITIES | EUROPEAN | |||||||||||||
| FUND | FUND | FUND | EQUITY FUND | |||||||||||||
| ASSETS | ||||||||||||||||
| Investments: | ||||||||||||||||
| Total investments, at cost | $ | 196,111,595 | $ | 229,155,793 | $ | 258,819,896 | $ | 259,433,910 | ||||||||
| Net unrealized appreciation (depreciation) | 1,705,701 | (973,681 | ) | (950,820 | ) | 11,028,685 | ||||||||||
| Total investments, at market value | 197,817,296 | 228,182,112 | 257,869,076 | 270,462,595 | ||||||||||||
| Cash | — | — | — | 55,247 | ||||||||||||
| Foreign currency (Cost of $—, $—, $— | ||||||||||||||||
| and $172,182, respectively) | — | — | — | 172,182 | ||||||||||||
| Receivables: | ||||||||||||||||
| Investment securities sold | 1,077,135 | — | 19,865,154 | — | ||||||||||||
| Fund shares sold | 34,410 | 75,000 | 6,675,000 | 159,750 | ||||||||||||
| Interest and dividends | 2,852,983 | 2,390,521 | 971,293 | 796,585 | ||||||||||||
| Prepaid expenses and other assets | 6,187 | 21,792 | 27,346 | 29,372 | ||||||||||||
| Total Assets | 201,788,011 | 230,669,425 | 285,407,869 | 271,675,731 | ||||||||||||
| LIABILITIES | ||||||||||||||||
| Payables: | ||||||||||||||||
| Investment securities purchased | 1,689,450 | 5,923,455 | 49,421,640 | 4,215,073 | ||||||||||||
| Fund shares redeemed | 273,449 | 219,444 | 432,019 | 61,058 | ||||||||||||
| Distributions | 238,788 | 246,851 | 479,818 | — | ||||||||||||
| Accrued Liabilities: | ||||||||||||||||
| Investment advisory fees | 49,734 | 55,053 | 57,342 | 197,392 | ||||||||||||
| Administration, accounting, and transfer agent fees | 19,902 | 20,043 | 23,155 | 18,808 | ||||||||||||
| Custodian fees | 1,196 | 1,312 | 2,656 | 36,517 | ||||||||||||
| Service fees | 8,289 | 9,176 | 1,187 | 3,344 | ||||||||||||
| Business management fees | 8,289 | 9,176 | 9,557 | 10,966 | ||||||||||||
| Distribution fees | — | — | — | 579 | ||||||||||||
| Other liabilities | 29,783 | 30,440 | 32,029 | 34,267 | ||||||||||||
| Total Liabilities | 2,318,880 | 6,514,950 | 50,459,403 | 4,578,004 | ||||||||||||
| NET ASSETS | $ | 199,469,131 | $ | 224,154,475 | $ | 234,948,466 | $ | 267,097,727 | ||||||||
| COMPONENTS OF NET ASSETS | ||||||||||||||||
| Paid-in capital | $ | 197,877,644 | $ | 226,538,466 | $ | 234,845,846 | $ | 265,950,530 | ||||||||
| Accumulated net investment income (loss) | 28 | (123 | ) | 16,572 | 2,991,719 | |||||||||||
| Accumulated net realized gain (loss) | (114,242 | ) | (1,410,187 | ) | 1,036,868 | (12,850,014 | ) | |||||||||
| Unrealized appreciation (depreciation) on investments | 1,705,701 | (973,681 | ) | (950,820 | ) | 11,028,685 | ||||||||||
| Unrealized depreciation – foreign receivables | — | — | — | (23,193 | ) | |||||||||||
| NET ASSETS | $ | 199,469,131 | $ | 224,154,475 | $ | 234,948,466 | $ | 267,097,727 | ||||||||
| COMPUTATION OF NET ASSET VALUE | ||||||||||||||||
| Institutional Shares: | ||||||||||||||||
| Net assets | $ | — | $ | — | $ | 206,299,331 | $ | 240,181,901 | ||||||||
| Shares outstanding (unlimited shares authorized) | — | — | 20,499,646 | 23,543,884 | ||||||||||||
| Net asset value per share | $ | — | $ | — | $ | 10.06 | $ | 10.20 | ||||||||
| Investor Shares: | ||||||||||||||||
| Net assets | $ | 199,469,131 | $ | 224,154,475 | $ | 28,649,135 | $ | 25,840,283 | ||||||||
| Shares outstanding (unlimited shares authorized) | 18,730,882 | 22,576,784 | 2,846,463 | 2,535,149 | ||||||||||||
| Net asset value per share | $ | 10.65 | $ | 9.93 | $ | 10.06 | $ | 10.19 | ||||||||
| Advisor Shares: | ||||||||||||||||
| Net assets | $ | — | $ | — | $ | — | $ | 1,075,543 | ||||||||
| Shares outstanding (unlimited shares authorized) | — | — | — | 105,783 | ||||||||||||
| Net asset value per share | $ | — | $ | — | $ | — | $ | 10.17 | ||||||||
The accompanying notes are an integral part of these financial statements.
www.brownadvisoryfunds.com
97
Statements of Assets and Liabilities
June 30, 2015
| BROWN ADVISORY – | ||||||||||||||
| WMC JAPAN ALPHA | BROWN ADVISORY – | BROWN ADVISORY | ||||||||||||
| OPPORTUNITIES | SOMERSET EMERGING | EMERGING MARKETS | ||||||||||||
| FUND | MARKETS FUND | SMALL-CAP FUND | ||||||||||||
| ASSETS | ||||||||||||||
| Investments: | ||||||||||||||
| Total investments, at cost | $ | 1,474,489,920 | $ | 426,967,574 | $ | 190,841,169 | ||||||||
| Net unrealized appreciation (depreciation) | 160,579,290 | (2,657,120 | ) | 13,826,568 | ||||||||||
| Total investments, at market value | 1,635,069,210 | 424,310,454 | 204,667,737 | |||||||||||
| Cash | 632,984 | — | 276,866 | |||||||||||
| Foreign currency (Cost of $22,139, $212,755 and $3,863, respectively) | 22,139 | 213,123 | 3,863 | |||||||||||
| Deposit at broker – futures contracts (Note 8) | 4,343,266 | — | — | |||||||||||
| Gross unrealized appreciation – futures contracts (Note 8) | — | — | — | |||||||||||
| Gross unrealized appreciation – | ||||||||||||||
| forward foreign currency contracts (Note 7) | — | — | — | |||||||||||
| Receivables: | ||||||||||||||
| Investment securities sold | 28,830,790 | 38,037 | 1,836,785 | |||||||||||
| Fund shares sold | 5,568,556 | 2,827,605 | 785,235 | |||||||||||
| Interest and dividends | 2,016,263 | 971,603 | 433,537 | |||||||||||
| Prepaid expenses and other assets | 30,570 | 81,928 | 26,099 | |||||||||||
| Total Assets | 1,676,513,778 | 428,442,750 | 208,030,122 | |||||||||||
| LIABILITIES | ||||||||||||||
| Gross unrealized depreciation – futures contracts (Note 8) | 1,281,897 | — | — | |||||||||||
| Gross unrealized depreciation – | ||||||||||||||
| forward foreign currency contracts (Note 7) | 19,059,167 | — | — | |||||||||||
| Payables: | ||||||||||||||
| Investment securities purchased | 23,226,711 | 2,119,342 | 796,481 | |||||||||||
| Fund shares redeemed | 21,724,759 | 10,500 | — | |||||||||||
| Due to custodian | — | 417,386 | — | |||||||||||
| Accrued Liabilities: | ||||||||||||||
| Investment advisory fees | 1,355,309 | 294,083 | 206,850 | |||||||||||
| Administration, accounting, and transfer agent fees | 116,111 | 28,794 | 15,990 | |||||||||||
| Custodian fees | 59,060 | 91,378 | 65,610 | |||||||||||
| Service fees | 3,338 | 16,693 | 2,184 | |||||||||||
| Business management fees | 67,765 | 16,338 | 8,274 | |||||||||||
| Distribution fees | 615 | 573 | — | |||||||||||
| Other liabilities | 108,003 | 55,853 | 41,813 | |||||||||||
| Total Liabilities | 67,002,735 | 3,050,940 | 1,137,202 | |||||||||||
| NET ASSETS | $ | 1,609,511,043 | $ | 425,391,810 | $ | 206,892,920 | ||||||||
| COMPONENTS OF NET ASSETS | ||||||||||||||
| Paid-in capital | $ | 1,263,739,080 | $ | 433,019,186 | $ | 184,991,249 | ||||||||
| Undistributed net investment income | 173,902,253 | 2,706,260 | — | |||||||||||
| Accumulated net realized gain (loss) | 31,706,021 | (7,651,248 | ) | 8,073,960 | ||||||||||
| Unrealized appreciation (depreciation) on investments | 160,579,290 | (2,657,120 | ) | 13,826,568 | ||||||||||
| Unrealized depreciation – futures contracts (Note 8) | (1,281,897 | ) | — | — | ||||||||||
| Unrealized depreciation – forward foreign currency contracts (Note 7) | (19,059,167 | ) | — | — | ||||||||||
| Unrealized appreciation (depreciation) – foreign receivables | (74,537 | ) | (25,268 | ) | 1,143 | |||||||||
| NET ASSETS | $ | 1,609,511,043 | $ | 425,391,810 | $ | 206,892,920 | ||||||||
| COMPUTATION OF NET ASSET VALUE | ||||||||||||||
| Institutional Shares: | ||||||||||||||
| Net assets | $ | 1,582,213,548 | $ | 268,530,328 | $ | 187,900,735 | ||||||||
| Shares outstanding (unlimited shares authorized) | 123,279,671 | 27,558,166 | 16,057,532 | |||||||||||
| Net asset value per share | $ | 12.83 | $ | 9.74 | $ | 11.70 | ||||||||
| Investor Shares: | ||||||||||||||
| Net assets | $ | 25,627,956 | $ | 155,919,248 | $ | 18,992,185 | ||||||||
| Shares outstanding (unlimited shares authorized) | 1,998,916 | 16,026,279 | 1,624,470 | |||||||||||
| Net asset value per share | $ | 12.82 | $ | 9.73 | $ | 11.69 | ||||||||
| Advisor Shares: | ||||||||||||||
| Net assets | $ | 1,669,539 | $ | 942,234 | $ | — | ||||||||
| Shares outstanding (unlimited shares authorized) | 130,510 | 97,101 | — | |||||||||||
| Net asset value per share | $ | 12.79 | $ | 9.70 | $ | — | ||||||||
The accompanying notes are an integral part of these financial statements.
www.brownadvisoryfunds.com
98
Statements of Operations
For the Year Ended June 30, 2015
| BROWN | BROWN | BROWN | BROWN | |||||||||||||
| ADVISORY | ADVISORY | ADVISORY | ADVISORY | |||||||||||||
| GROWTH | VALUE | FLEXIBLE | EQUITY | |||||||||||||
| EQUITY | EQUITY | EQUITY | INCOME | |||||||||||||
| FUND | FUND | FUND | FUND | |||||||||||||
| INVESTMENT INCOME | ||||||||||||||||
| Dividend income | $ | 21,063,753 | $ | 4,951,744 | $ | 3,636,081 | $ | 6,115,092 | ||||||||
| Less: foreign taxes withheld | (107,213 | ) | (148,608 | ) | (40,813 | ) | (110,175 | ) | ||||||||
| Interest Income | 19,212 | 2,017 | 5,313 | 4,139 | ||||||||||||
| Total investment income | 20,975,752 | 4,805,153 | 3,600,581 | 6,009,056 | ||||||||||||
| EXPENSES | ||||||||||||||||
| Investment advisory fees | 15,543,334 | 1,290,351 | 1,424,258 | 1,238,356 | ||||||||||||
| Service fees | 3,514,633 | 322,557 | 352,347 | 282,316 | ||||||||||||
| Business management fees | 1,295,278 | 107,529 | 118,688 | 103,196 | ||||||||||||
| Administration, accounting, and transfer agent fees | 995,486 | 84,000 | 93,659 | 80,349 | ||||||||||||
| Miscellaneous expenses | 234,096 | 21,593 | 26,642 | 22,295 | ||||||||||||
| Professional fees | 200,841 | 33,861 | 34,954 | 33,017 | ||||||||||||
| Trustee fees and expenses | 131,113 | 10,839 | 12,502 | 10,506 | ||||||||||||
| Distribution fees | 118,106 | 3,526 | 32,844 | 8,029 | ||||||||||||
| Registration fees | 99,906 | 43,595 | 62,426 | 44,796 | ||||||||||||
| Custodian fees | 80,244 | 9,511 | 16,829 | 7,042 | ||||||||||||
| Insurance fees | 49,747 | 4,467 | 3,348 | 3,616 | ||||||||||||
| Total Expenses | 22,262,784 | 1,931,829 | 2,178,497 | 1,833,518 | ||||||||||||
| NET INVESTMENT INCOME (LOSS) | (1,287,032 | ) | 2,873,324 | 1,422,084 | 4,175,538 | |||||||||||
| NET REALIZED AND UNREALIZED GAIN (LOSS) | ||||||||||||||||
| Net realized gain on investments | 142,498,453 | 20,505,998 | 2,577,056 | 4,209,370 | ||||||||||||
| Net change in unrealized appreciation (depreciation) on: | ||||||||||||||||
| Investments | 95,329,685 | (28,872,930 | ) | 11,769,709 | (3,425,955 | ) | ||||||||||
| Foreign receivables | — | — | (311 | ) | 181 | |||||||||||
| Net change in unrealized appreciation (depreciation) | 95,329,685 | (28,872,930 | ) | 11,769,398 | (3,425,774 | ) | ||||||||||
| NET REALIZED AND UNREALIZED GAIN (LOSS) | 237,828,138 | (8,366,932 | ) | 14,346,454 | 783,596 | |||||||||||
| INCREASE (DECREASE) IN NET ASSETS FROM OPERATIONS | $ | 236,541,106 | $ | (5,493,608 | ) | $ | 15,768,538 | $ | 4,959,134 | |||||||
The accompanying notes are an integral part of these financial statements.
www.brownadvisoryfunds.com
99
Statements of Operations
For the Year Ended June 30, 2015
| BROWN | BROWN | BROWN | ||||||||||||||
| ADVISORY | ADVISORY | ADVISORY | BROWN | |||||||||||||
| SUSTAINABLE | SMALL-CAP | SMALL-CAP | ADVISORY | |||||||||||||
| GROWTH | GROWTH | FUNDAMENTAL | OPPORTUNITY | |||||||||||||
| FUND | FUND | VALUE FUND | FUND | |||||||||||||
| INVESTMENT INCOME | ||||||||||||||||
| Dividend income | $ | 1,382,347 | $ | 1,348,159 | $ | 9,991,297 | $ | 107,742 | ||||||||
| Less: foreign taxes withheld | (22,510 | ) | (1,115 | ) | (4,126 | ) | (520 | ) | ||||||||
| Interest Income | 2,189 | 3,733 | 10,436 | 76 | ||||||||||||
| Total investment income | 1,362,026 | 1,350,777 | 9,997,607 | 107,298 | ||||||||||||
| EXPENSES | ||||||||||||||||
| Investment advisory fees | 1,265,870 | 2,365,665 | 6,040,352 | 98,121 | ||||||||||||
| Distribution fees | 329,981 | 15,390 | 102,981 | — | ||||||||||||
| Service fees | 265,733 | 401,897 | 1,004,728 | 17,315 | ||||||||||||
| Registration fees | 41,507 | 44,511 | 95,610 | 19,773 | ||||||||||||
| Professional fees | 33,281 | 37,921 | 66,786 | 19,350 | ||||||||||||
| Business management fees | 105,489 | 139,157 | 355,315 | 5,772 | ||||||||||||
| Administration, accounting, and transfer agent fees | 86,585 | 108,866 | 272,124 | 7,633 | ||||||||||||
| Miscellaneous expenses | 28,345 | 29,653 | 66,238 | 4,430 | ||||||||||||
| Custodian fees | 8,101 | 11,683 | 28,144 | 1,239 | ||||||||||||
| Trustee fees and expenses | 10,712 | 14,023 | 35,964 | 594 | ||||||||||||
| Insurance fees | 3,774 | 5,245 | 10,916 | 212 | ||||||||||||
| Total Expenses | 2,179,378 | 3,174,011 | 8,079,158 | 174,439 | ||||||||||||
| Expenses waived by adviser – expense cap (Note 3) | — | — | — | (1,285 | ) | |||||||||||
| Net Expenses | 2,179,378 | 3,174,011 | 8,079,158 | 173,154 | ||||||||||||
| NET INVESTMENT INCOME (LOSS) | (817,352 | ) | (1,823,234 | ) | 1,918,449 | (65,856 | ) | |||||||||
| NET REALIZED AND UNREALIZED GAIN (LOSS) | ||||||||||||||||
| Net realized gain on investments | 17,678,513 | 38,675,691 | 32,140,185 | 1,367,669 | ||||||||||||
| Net change in unrealized appreciation (depreciation) | 9,157,231 | (4,311,804 | ) | (8,864,807 | ) | (474,987 | ) | |||||||||
| NET REALIZED AND UNREALIZED GAIN | 26,835,744 | 34,363,887 | 23,275,378 | 892,682 | ||||||||||||
| INCREASE IN NET ASSETS FROM OPERATIONS | $ | 26,018,392 | $ | 32,540,653 | $ | 25,193,827 | $ | 826,826 | ||||||||
The accompanying notes are an integral part of these financial statements.
www.brownadvisoryfunds.com
100
Statements of Operations
For the Year/Period Ended June 30, 2015
| BROWN | BROWN | BROWN | BROWN | |||||||||||||
| ADVISORY | ADVISORY | ADVISORY | ADVISORY | |||||||||||||
| MULTI- | INTERMEDIATE | TOTAL | STRATEGIC | |||||||||||||
| STRATEGY | INCOME | RETURN | BOND | |||||||||||||
| FUND* | FUND | FUND** | FUND | |||||||||||||
| INVESTMENT INCOME | ||||||||||||||||
| Dividend income – unaffiliated | $ | — | $ | — | $ | — | $ | 43,002 | ||||||||
| Dividend income – affiliated (Note 3) | 9,769 | 966,550 | — | — | ||||||||||||
| Less: foreign taxes withheld | — | — | — | — | ||||||||||||
| Interest Income | 18 | 3,032,896 | 1,075,175 | 1,251,190 | ||||||||||||
| Total investment income | 9,787 | 3,999,446 | 1,075,175 | 1,294,192 | ||||||||||||
| EXPENSES | ||||||||||||||||
| Investment advisory fees | 3,797 | 537,744 | 132,441 | 182,098 | ||||||||||||
| Service fees | — | 89,624 | 6,997 | 28,816 | ||||||||||||
| Business management fees | 633 | 89,624 | 22,074 | 20,745 | ||||||||||||
| Administration, accounting, and transfer agent fees | 587 | 80,251 | 24,320 | 24,730 | ||||||||||||
| Registration fees | 13,724 | 35,801 | 28,479 | 32,511 | ||||||||||||
| Miscellaneous expenses | 5,335 | 19,452 | 10,921 | 9,380 | ||||||||||||
| Professional fees | 12,627 | 31,583 | 15,001 | 21,254 | ||||||||||||
| Distribution fees | — | 26,501 | — | 27,412 | ||||||||||||
| Trustee fees and expenses | 69 | 8,938 | 2,411 | 2,177 | ||||||||||||
| Custodian fees | 1,577 | 7,983 | 4,269 | 4,679 | ||||||||||||
| Insurance fees | 21 | 3,940 | 82 | 441 | ||||||||||||
| Interest expense – line of credit (Note 9) | 225 | — | — | — | ||||||||||||
| Total Expenses | 38,595 | 931,441 | 246,995 | 354,243 | ||||||||||||
| Expenses waived by adviser – expense cap (Note 3) | (20,377 | ) | — | — | (7,500 | ) | ||||||||||
| Expenses waived by adviser – investments in affiliates (Note 3) | — | (99,465 | ) | — | — | |||||||||||
| Net Expenses | 18,218 | 831,976 | 246,995 | 346,743 | ||||||||||||
| NET INVESTMENT INCOME (LOSS) | (8,431 | ) | 3,167,470 | 828,180 | 947,449 | |||||||||||
| NET REALIZED AND UNREALIZED GAIN (LOSS) | ||||||||||||||||
| Net realized gain (loss) on: | ||||||||||||||||
| Investments – unaffiliated | — | 848,288 | 29,046 | (299,199 | ) | |||||||||||
| Investments – affiliated (Note 3) | (2,804 | ) | 44,761 | — | — | |||||||||||
| Credit default swaps (Note 6) | — | — | — | (158,389 | ) | |||||||||||
| Futures contracts (Note 8) | — | — | (1,001,045 | ) | (369,898 | ) | ||||||||||
| Capital gain distribution from other RIC – affiliated (Note 3) | 5,211 | 238,536 | — | — | ||||||||||||
| Net realized gain (loss) | 2,407 | 1,131,585 | (971,999 | ) | (827,486 | ) | ||||||||||
| Net change in unrealized appreciation (depreciation) on: | ||||||||||||||||
| Investments – unaffiliated | — | (2,092,876 | ) | (519,525 | ) | (950,081 | ) | |||||||||
| Investments – affiliated (Note 3) | 31,763 | (311,986 | ) | — | — | |||||||||||
| Credit default swaps (Note 6) | — | — | — | (151,550 | ) | |||||||||||
| Futures contracts (Note 8) | — | — | (139,698 | ) | (26,406 | ) | ||||||||||
| Net change in unrealized appreciation (depreciation) | 31,763 | (2,404,862 | ) | (659,223 | ) | (1,128,037 | ) | |||||||||
| NET REALIZED AND UNREALIZED GAIN (LOSS) | 34,170 | (1,273,277 | ) | (1,631,222 | ) | (1,955,523 | ) | |||||||||
| INCREASE (DECREASE) IN NET ASSETS FROM OPERATIONS | $ | 25,739 | $ | 1,894,193 | $ | (803,042 | ) | $ | (1,008,074 | ) | ||||||
| * | Commenced operations on October 31, 2014. The information presented is for the period from October 31, 2014 to June 30, 2015. | |
| ** | Commenced operations on October 30, 2014. The information presented is for the period from October 30, 2014 to June 30, 2015. |
The accompanying notes are an integral part of these financial statements.
www.brownadvisoryfunds.com
101
Statements of Operations
For the Year Ended June 30, 2015
| BROWN | ||||||||||||||||
| BROWN | BROWN | BROWN | ADVISORY – | |||||||||||||
| ADVISORY | ADVISORY | ADVISORY | WMC | |||||||||||||
| MARYLAND | TAX EXEMPT | MORTGAGE | STRATEGIC | |||||||||||||
| BOND | BOND | SECURITIES | EUROPEAN | |||||||||||||
| FUND | FUND | FUND | EQUITY FUND | |||||||||||||
| INVESTMENT INCOME | ||||||||||||||||
| Dividend income | $ | — | $ | — | $ | — | $ | 6,360,920 | ||||||||
| Less: foreign taxes withheld | — | — | — | (769,591 | ) | |||||||||||
| Interest Income | 4,505,413 | 5,003,395 | 6,738,559 | 1,091 | ||||||||||||
| Total investment income | 4,505,413 | 5,003,395 | 6,738,559 | 5,592,420 | ||||||||||||
| EXPENSES | ||||||||||||||||
| Investment advisory fees | 627,902 | 659,060 | 641,728 | 2,033,872 | ||||||||||||
| Distribution fees | — | — | — | 1,310 | ||||||||||||
| Service fees | 104,650 | 109,843 | 19,286 | 30,139 | ||||||||||||
| Registration fees | 7,711 | 36,368 | 45,304 | 63,943 | ||||||||||||
| Professional fees | 33,258 | 34,004 | 27,855 | 28,560 | ||||||||||||
| Business management fees | 104,650 | 109,843 | 106,955 | 112,993 | ||||||||||||
| Administration, accounting, and transfer agent fees | 109,141 | 109,735 | 123,962 | 94,786 | ||||||||||||
| Miscellaneous expenses | 20,669 | 18,163 | 21,570 | 20,080 | ||||||||||||
| Custodian fees | 6,890 | 7,882 | 14,981 | 173,655 | ||||||||||||
| Trustee fees and expenses | 10,557 | 11,404 | 11,028 | 11,762 | ||||||||||||
| Insurance fees | 3,683 | 3,728 | 3,507 | 3,751 | ||||||||||||
| Total Expenses | 1,029,111 | 1,100,030 | 1,016,176 | 2,574,851 | ||||||||||||
| NET INVESTMENT INCOME | 3,476,302 | 3,903,365 | 5,722,383 | 3,017,569 | ||||||||||||
| NET REALIZED AND UNREALIZED GAIN (LOSS) | ||||||||||||||||
| Net realized gain (loss) on investments | 585,355 | (946,691 | ) | 2,379,466 | (12,510,798 | ) | ||||||||||
| Net change in unrealized appreciation (depreciation) on: | ||||||||||||||||
| Investments | (2,821,647 | ) | (1,400,710 | ) | (2,496,970 | ) | 3,980,302 | |||||||||
| Foreign receivables | — | — | — | (21,102 | ) | |||||||||||
| Net change in unrealized appreciation (depreciation) | (2,821,647 | ) | (1,400,710 | ) | (2,496,970 | ) | 3,959,200 | |||||||||
| NET REALIZED AND UNREALIZED LOSS | (2,236,292 | ) | (2,347,401 | ) | (117,504 | ) | (8,551,598 | ) | ||||||||
| INCREASE (DECREASE) IN NET ASSETS FROM OPERATIONS | $ | 1,240,010 | $ | 1,555,964 | $ | 5,604,879 | $ | (5,534,029 | ) | |||||||
The accompanying notes are an integral part of these financial statements.
www.brownadvisoryfunds.com
102
Statements of Operations
For the Year/Period Ended June 30, 2015
| BROWN ADVISORY – | ||||||||||||||
| WMC JAPAN ALPHA | BROWN ADVISORY – | BROWN ADVISORY | ||||||||||||
| OPPORTUNITIES | SOMERSET EMERGING | EMERGING MARKETS | ||||||||||||
| FUND | MARKETS FUND | SMALL-CAP FUND* | ||||||||||||
| INVESTMENT INCOME | ||||||||||||||
| Dividend income | $ | 22,870,852 | $ | 8,072,262 | $ | 1,718,701 | ||||||||
| Less: foreign taxes withheld | (2,284,381 | ) | (1,105,459 | ) | (111,807 | ) | ||||||||
| Interest Income | 35,459 | 12,861 | 2,358 | |||||||||||
| Total investment income | 20,621,930 | 6,979,664 | 1,609,252 | |||||||||||
| EXPENSES | ||||||||||||||
| Investment advisory fees | 13,264,147 | 2,484,673 | 957,062 | |||||||||||
| Business management fees | 663,207 | 138,037 | 38,282 | |||||||||||
| Administration, accounting, and transfer agent fees | 546,622 | 118,055 | 36,552 | |||||||||||
| Custodian fees | 320,183 | 455,530 | 287,516 | |||||||||||
| Miscellaneous expenses | 136,743 | 30,866 | 20,016 | |||||||||||
| Registration fees | 108,291 | 80,309 | 40,153 | |||||||||||
| Professional fees | 107,303 | 37,627 | 17,245 | |||||||||||
| Trustee fees and expenses | 69,658 | 14,320 | 4,418 | |||||||||||
| Service fees | 20,736 | 74,265 | 8,627 | |||||||||||
| Insurance fees | 19,862 | 4,343 | 200 | |||||||||||
| Distribution fees | 894 | 1,588 | — | |||||||||||
| Total Expenses | 15,257,646 | 3,439,613 | 1,410,071 | |||||||||||
| NET INVESTMENT INCOME | 5,364,284 | 3,540,051 | 199,181 | |||||||||||
| NET REALIZED AND UNREALIZED GAIN (LOSS) | ||||||||||||||
| Net realized gain on: | ||||||||||||||
| Investments | 23,539,492 | 2,204,829 | 7,874,779 | |||||||||||
| Futures contracts (Note 8) | 23,591,577 | — | — | |||||||||||
| Forward foreign currency contracts (Note 7) | 221,111,367 | — | — | |||||||||||
| Net realized gain | 268,242,436 | 2,204,829 | 7,874,779 | |||||||||||
| Net change in unrealized appreciation (depreciation) on: | ||||||||||||||
| Investments | 90,933,858 | (16,477,298 | ) | 13,826,568 | ||||||||||
| Futures contracts (Note 8) | (2,451,491 | ) | — | — | ||||||||||
| Forward foreign currency contracts (Note 7) | (12,603,858 | ) | — | — | ||||||||||
| Foreign receivables | (83,979 | ) | (25,646 | ) | 1,143 | |||||||||
| Net change in unrealized appreciation (depreciation) | 75,794,530 | (16,502,944 | ) | 13,827,711 | ||||||||||
| NET REALIZED AND UNREALIZED GAIN (LOSS) | 344,036,966 | (14,298,115 | ) | 21,702,490 | ||||||||||
| INCREASE (DECREASE) IN NET ASSETS FROM OPERATIONS | $ | 349,401,250 | $ | (10,758,064 | ) | $ | 21,901,671 | |||||||
| * | Commenced operations on November 21, 2014. The information presented is for the period from November 21, 2014 to June 30, 2015. |
The accompanying notes are an integral part of these financial statements.
www.brownadvisoryfunds.com
103
Statements of Changes in Net Assets
| BROWN ADVISORY | BROWN ADVISORY | |||||||||||||||
| GROWTH EQUITY FUND | VALUE EQUITY FUND | |||||||||||||||
| Year Ended | Year Ended | Year Ended | Year Ended | |||||||||||||
| June 30, | June 30, | June 30, | June 30, | |||||||||||||
| 2015 | 2014 | 2015 | 2014 | |||||||||||||
| OPERATIONS | ||||||||||||||||
| Net investment income (loss) | $ | (1,287,032 | ) | $ | (3,026,706 | ) | $ | 2,873,324 | $ | 2,447,782 | ||||||
| Net realized gains | 142,498,453 | 68,484,570 | 20,505,998 | 16,997,084 | ||||||||||||
| Net change in unrealized appreciation (depreciation) | 95,329,685 | 338,915,369 | (28,872,930 | ) | 31,519,020 | |||||||||||
| Increase (Decrease) in Net Assets from Operations | 236,541,106 | 404,373,233 | (5,493,608 | ) | 50,963,886 | |||||||||||
| DISTRIBUTIONS TO SHAREHOLDERS FROM | ||||||||||||||||
| Net investment income: | ||||||||||||||||
| Institutional Shares | — | — | (835 | ) | (128 | ) | ||||||||||
| Investor Shares | — | — | (3,161,833 | ) | (1,812,794 | ) | ||||||||||
| Advisor Shares | — | — | (16,853 | ) | (10,159 | ) | ||||||||||
| Net realized gain: | ||||||||||||||||
| Institutional Shares | (7,762,347 | ) | (946,386 | ) | (1,614 | ) | — | |||||||||
| Investor Shares | (69,561,007 | ) | (14,286,774 | ) | (6,779,611 | ) | — | |||||||||
| Advisor Shares | (1,508,212 | ) | (297,701 | ) | (45,355 | ) | — | |||||||||
| Total Distributions to Shareholders | (78,831,566 | ) | (15,530,861 | ) | (10,006,101 | ) | (1,823,081 | ) | ||||||||
| CAPITAL SHARE TRANSACTIONS | ||||||||||||||||
| Sale of shares: | ||||||||||||||||
| Institutional Shares | 67,603,650 | 114,398,361 | 43,422 | — | ||||||||||||
| Investor Shares | 259,807,081 | 1,019,160,535 | 13,675,935 | 43,671,979 | ||||||||||||
| Advisor Shares | 3,854,264 | 32,019,095 | 58,887 | 500 | ||||||||||||
| Reinvestment of distributions: | ||||||||||||||||
| Institutional Shares | 7,222,086 | 912,323 | 1,614 | — | ||||||||||||
| Investor Shares | 62,066,866 | 13,350,521 | 4,242,468 | 322,261 | ||||||||||||
| Advisor Shares | 1,473,353 | 290,801 | 51,115 | 8,720 | ||||||||||||
| Redemption of shares: | ||||||||||||||||
| Institutional Shares | (65,507,889 | ) | (23,531,450 | ) | (40,675 | ) | — | |||||||||
| Investor Shares | (814,445,647 | ) | (547,273,104 | ) | (77,385,552 | ) | (11,853,550 | ) | ||||||||
| Advisor Shares | (12,071,342 | ) | (10,321,727 | ) | (457,798 | ) | (401,578 | ) | ||||||||
| Redemption fees: | ||||||||||||||||
| Institutional Shares | 139 | 154 | — | — | ||||||||||||
| Investor Shares | 2,014 | 4,850 | — | 193 | ||||||||||||
| Advisor Shares | 47 | 2 | 106 | — | ||||||||||||
| Increase (Decrease) from Capital Share Transactions | (489,995,378 | ) | 599,010,361 | (59,810,478 | ) | 31,748,525 | ||||||||||
| Increase (Decrease) in Net Assets | (332,285,838 | ) | 987,852,733 | (75,310,187 | ) | 80,889,330 | ||||||||||
| NET ASSETS | ||||||||||||||||
| Beginning of year | 2,779,295,554 | 1,791,442,821 | 243,315,683 | 162,426,353 | ||||||||||||
| End of year | $ | 2,447,009,716 | $ | 2,779,295,554 | $ | 168,005,496 | $ | 243,315,683 | ||||||||
| Undistributed net investment income | $ | — | $ | — | $ | 1,760,722 | $ | 2,067,371 | ||||||||
| SHARE TRANSACTIONS | ||||||||||||||||
| Sale of shares: | ||||||||||||||||
| Institutional Shares | 3,477,138 | 6,267,064 | 2,358 | — | ||||||||||||
| Investor Shares | 13,244,976 | 58,154,868 | 751,004 | 2,658,481 | ||||||||||||
| Advisor Shares | 204,051 | 1,829,286 | 3,309 | 31 | ||||||||||||
| Reinvestment of distributions: | ||||||||||||||||
| Institutional Shares | 369,039 | 49,444 | 91 | — | ||||||||||||
| Investor Shares | 3,179,655 | 739,231 | 240,913 | 18,628 | ||||||||||||
| Advisor Shares | 77,914 | 16,570 | 2,883 | 500 | ||||||||||||
| Redemption of shares: | ||||||||||||||||
| Institutional Shares | (3,331,028 | ) | (1,275,736 | ) | (2,425 | ) | — | |||||||||
| Investor Shares | (41,587,352 | ) | (29,939,374 | ) | (4,361,257 | ) | (692,354 | ) | ||||||||
| Advisor Shares | (634,323 | ) | (579,987 | ) | (25,841 | ) | (22,764 | ) | ||||||||
| Increase (Decrease) from Capital Share Transactions | (24,999,930 | ) | 35,261,366 | (3,388,965 | ) | 1,962,522 | ||||||||||
The accompanying notes are an integral part of these financial statements.
www.brownadvisoryfunds.com
104
Statements of Changes in Net Assets
| BROWN ADVISORY | BROWN ADVISORY | |||||||||||||||
| FLEXIBLE EQUITY FUND | EQUITY INCOME FUND | |||||||||||||||
| Year Ended | Year Ended | Year Ended | Year Ended | |||||||||||||
| June 30, | June 30, | June 30, | June 30, | |||||||||||||
| 2015 | 2014 | 2015 | 2014 | |||||||||||||
| OPERATIONS | ||||||||||||||||
| Net investment income | $ | 1,422,084 | $ | 710,542 | $ | 4,175,538 | $ | 3,893,279 | ||||||||
| Net realized gains | 2,577,056 | 1,912,542 | 4,209,370 | 11,151,487 | ||||||||||||
| Net change in unrealized appreciation (depreciation) | 11,769,398 | 22,754,176 | (3,425,774 | ) | 18,099,266 | |||||||||||
| Increase in Net Assets from Operations | 15,768,538 | 25,377,260 | 4,959,134 | 33,144,032 | ||||||||||||
| DISTRIBUTIONS TO SHAREHOLDERS FROM | ||||||||||||||||
| Net investment income: | ||||||||||||||||
| Institutional Shares | (672 | ) | (7,405 | ) | (393,937 | ) | (132,683 | ) | ||||||||
| Investor Shares | (980,117 | ) | (368,373 | ) | (3,734,830 | ) | (3,811,080 | ) | ||||||||
| Advisor Shares | (20,673 | ) | (28,875 | ) | (56,365 | ) | (56,126 | ) | ||||||||
| Net realized gain: | ||||||||||||||||
| Institutional Shares | — | — | (823,551 | ) | (411 | ) | ||||||||||
| Investor Shares | — | — | (8,462,343 | ) | (6,248,858 | ) | ||||||||||
| Advisor Shares | — | — | (144,101 | ) | (98,052 | ) | ||||||||||
| Total Distributions to Shareholders | (1,001,462 | ) | (404,653 | ) | (13,615,127 | ) | (10,347,210 | ) | ||||||||
| CAPITAL SHARE TRANSACTIONS | ||||||||||||||||
| Sale of shares: | ||||||||||||||||
| Institutional Shares | 4,491,198 | 2,923,927 | 425,083 | 16,604,412 | ||||||||||||
| Investor Shares | 126,514,218 | 69,789,625 | 24,779,203 | 20,766,881 | ||||||||||||
| Advisor Shares | 4,346,413 | 11,380,969 | 232,804 | 702,263 | ||||||||||||
| Reinvestment of distributions: | ||||||||||||||||
| Institutional Shares | — | — | 1,111,862 | 108,931 | ||||||||||||
| Investor Shares | 371,990 | 180,778 | 5,450,611 | 4,310,334 | ||||||||||||
| Advisor Shares | 19,373 | 27,104 | 184,935 | 144,327 | ||||||||||||
| Redemption of shares: | ||||||||||||||||
| Institutional Shares | (3,560,985 | ) | (134,923 | ) | (307,761 | ) | — | |||||||||
| Investor Shares | (34,603,086 | ) | (12,584,573 | ) | (19,832,624 | ) | (39,823,968 | ) | ||||||||
| Advisor Shares | (8,570,686 | ) | (4,893,918 | ) | (437,250 | ) | (234,450 | ) | ||||||||
| Redemption fees: | ||||||||||||||||
| Institutional Shares | — | — | — | — | ||||||||||||
| Investor Shares | 852 | 322 | — | — | ||||||||||||
| Advisor Shares | — | 191 | — | — | ||||||||||||
| Increase from Capital Share Transactions | 89,009,287 | 66,689,502 | 11,606,863 | 2,578,730 | ||||||||||||
| Increase in Net Assets | 103,776,363 | 91,662,109 | 2,950,870 | 25,375,552 | ||||||||||||
| NET ASSETS | ||||||||||||||||
| Beginning of year | 180,572,258 | 88,910,149 | 201,332,490 | 175,956,938 | ||||||||||||
| End of year | $ | 284,348,621 | $ | 180,572,258 | $ | 204,283,360 | $ | 201,332,490 | ||||||||
| Undistributed net investment income | $ | 826,205 | $ | 406,100 | $ | — | $ | — | ||||||||
| SHARE TRANSACTIONS | ||||||||||||||||
| Sale of shares: | ||||||||||||||||
| Institutional Shares | 286,808 | 220,376 | 31,623 | 1,280,070 | ||||||||||||
| Investor Shares | 8,056,850 | 5,170,097 | 1,827,033 | 1,621,159 | ||||||||||||
| Advisor Shares | 276,507 | 867,329 | 17,249 | 54,858 | ||||||||||||
| Reinvestment of distributions: | ||||||||||||||||
| Institutional Shares | — | — | 82,255 | 8,097 | ||||||||||||
| Investor Shares | 23,062 | 12,758 | 403,046 | 339,005 | ||||||||||||
| Advisor Shares | 1,201 | 1,913 | 13,700 | 11,304 | ||||||||||||
| Redemption of shares: | ||||||||||||||||
| Institutional Shares | (231,546 | ) | (10,272 | ) | (22,576 | ) | — | |||||||||
| Investor Shares | (2,175,833 | ) | (928,933 | ) | (1,463,547 | ) | (3,069,500 | ) | ||||||||
| Advisor Shares | (555,109 | ) | (362,982 | ) | (32,018 | ) | (18,262 | ) | ||||||||
| Increase from Capital Share Transactions | 5,681,940 | 4,970,286 | 856,765 | 226,731 | ||||||||||||
The accompanying notes are an integral part of these financial statements.
www.brownadvisoryfunds.com
105
Statements of Changes in Net Assets
| BROWN ADVISORY | BROWN ADVISORY | |||||||||||||||
| SUSTAINABLE GROWTH FUND | SMALL-CAP GROWTH FUND | |||||||||||||||
| Year Ended | Year Ended | Year Ended | Year Ended | |||||||||||||
| June 30, | June 30, | June 30, | June 30, | |||||||||||||
| 2015 | 2014 | 2015 | 2014 | |||||||||||||
| OPERATIONS | ||||||||||||||||
| Net investment loss | $ | (817,352 | ) | $ | (611,908 | ) | $ | (1,823,234 | ) | $ | (2,463,016 | ) | ||||
| Net realized gains | 17,678,513 | 10,473,938 | 38,675,691 | 31,585,276 | ||||||||||||
| Net change in unrealized appreciation (depreciation) | 9,157,231 | 28,972,269 | (4,311,804 | ) | 24,366,462 | |||||||||||
| Increase in Net Assets from Operations | 26,018,392 | 38,834,299 | 32,540,653 | 53,488,722 | ||||||||||||
| DISTRIBUTIONS TO SHAREHOLDERS FROM | ||||||||||||||||
| Net realized gain: | ||||||||||||||||
| Institutional Shares | (655,994 | ) | (303,352 | ) | (978,695 | ) | (369,008 | ) | ||||||||
| Investor Shares | (998,289 | ) | (384,995 | ) | (30,219,392 | ) | (13,816,372 | ) | ||||||||
| Advisor Shares | (2,685,927 | ) | (1,452,293 | ) | (686,814 | ) | (304,670 | ) | ||||||||
| Total Distributions to Shareholders | (4,340,210 | ) | (2,140,640 | ) | (31,884,901 | ) | (14,490,050 | ) | ||||||||
| CAPITAL SHARE TRANSACTIONS | ||||||||||||||||
| Sale of shares: | ||||||||||||||||
| Institutional Shares | 43,518,158 | 5,077,590 | 5,495,343 | 2,951,287 | ||||||||||||
| Investor Shares | 6,918,710 | 19,256,931 | 18,679,499 | 26,226,777 | ||||||||||||
| Advisor Shares | 10,366,384 | 6,421,891 | 1,729,263 | 2,139,136 | ||||||||||||
| Reinvestment of distributions: | ||||||||||||||||
| Institutional Shares | 523,469 | 240,303 | 867,109 | 336,338 | ||||||||||||
| Investor Shares | 577,035 | 218,672 | 17,079,397 | 7,763,483 | ||||||||||||
| Advisor Shares | 2,496,115 | 1,353,148 | 522,789 | 185,410 | ||||||||||||
| Redemption of shares: | ||||||||||||||||
| Institutional Shares | (9,300,080 | ) | (12,964,879 | ) | (2,442,148 | ) | (2,934,502 | ) | ||||||||
| Investor Shares | (48,880,467 | ) | (2,502,788 | ) | (58,853,998 | ) | (67,246,745 | ) | ||||||||
| Advisor Shares | (21,536,336 | ) | (24,082,304 | ) | (3,203,139 | ) | (1,202,041 | ) | ||||||||
| Redemption fees: | ||||||||||||||||
| Institutional Shares | — | — | — | — | ||||||||||||
| Investor Shares | 59 | — | 233 | 72 | ||||||||||||
| Advisor Shares | 463 | 1,025 | — | — | ||||||||||||
| Decrease from Capital Share Transactions | (15,316,490 | ) | (6,980,411 | ) | (20,125,652 | ) | (31,780,785 | ) | ||||||||
| Increase (Decrease) in Net Assets | 6,361,692 | 29,713,248 | (19,469,900 | ) | 7,217,887 | |||||||||||
| NET ASSETS | ||||||||||||||||
| Beginning of year | 210,042,942 | 180,329,694 | 301,084,356 | 293,866,469 | ||||||||||||
| End of year | $ | 216,404,634 | $ | 210,042,942 | $ | 281,614,456 | $ | 301,084,356 | ||||||||
| Accumulated net investment loss | $ | (429,774 | ) | $ | (297,381 | ) | $ | (536,612 | ) | $ | (425,777 | ) | ||||
| SHARE TRANSACTIONS | ||||||||||||||||
| Sale of shares: | ||||||||||||||||
| Institutional Shares | 2,737,848 | 376,843 | 164,079 | 78,822 | ||||||||||||
| Investor Shares | 469,873 | 1,428,380 | 1,066,313 | 1,462,019 | ||||||||||||
| Advisor Shares | 675,203 | 481,546 | 102,159 | 121,903 | ||||||||||||
| Reinvestment of distributions: | ||||||||||||||||
| Institutional Shares | 35,538 | 17,853 | 26,324 | 9,512 | ||||||||||||
| Investor Shares | 39,334 | 16,295 | 1,031,365 | 435,906 | ||||||||||||
| Advisor Shares | 171,201 | 101,132 | 32,776 | 10,786 | ||||||||||||
| Redemption of shares: | ||||||||||||||||
| Institutional Shares | (605,631 | ) | (994,246 | ) | (69,833 | ) | (83,303 | ) | ||||||||
| Investor Shares | (3,121,284 | ) | (182,207 | ) | (3,366,097 | ) | (3,692,883 | ) | ||||||||
| Advisor Shares | (1,472,472 | ) | (1,804,877 | ) | (188,820 | ) | (69,091 | ) | ||||||||
| Decrease from Capital Share Transactions | (1,070,390 | ) | (559,281 | ) | (1,201,734 | ) | (1,726,329 | ) | ||||||||
The accompanying notes are an integral part of these financial statements.
www.brownadvisoryfunds.com
106
Statements of Changes in Net Assets
| BROWN ADVISORY SMALL-CAP | BROWN ADVISORY | |||||||||||||||
| FUNDAMENTAL VALUE FUND | OPPORTUNITY FUND | |||||||||||||||
| Year Ended | Year Ended | Year Ended | Year Ended | |||||||||||||
| June 30, | June 30, | June 30, | June 30, | |||||||||||||
| 2015 | 2014 | 2015 | 2014 | |||||||||||||
| OPERATIONS | ||||||||||||||||
| Net investment income (loss) | $ | 1,918,449 | $ | 1,840,245 | $ | (65,856 | ) | $ | (68,001 | ) | ||||||
| Net realized gains | 32,140,185 | 29,407,001 | 1,367,669 | 996,471 | ||||||||||||
| Net change in unrealized appreciation (depreciation) | (8,864,807 | ) | 76,764,405 | (474,987 | ) | 1,311,409 | ||||||||||
| Increase in Net Assets from Operations | 25,193,827 | 108,011,651 | 826,826 | 2,239,879 | ||||||||||||
| DISTRIBUTIONS TO SHAREHOLDERS FROM | ||||||||||||||||
| Net investment income: | ||||||||||||||||
| Institutional Shares | (194,841 | ) | (140,496 | ) | — | — | ||||||||||
| Investor Shares | (2,670,756 | ) | (3,540,086 | ) | — | — | ||||||||||
| Advisor Shares | (125,977 | ) | (95,529 | ) | — | — | ||||||||||
| Net realized gain: | ||||||||||||||||
| Institutional Shares | (1,600,207 | ) | (670,124 | ) | — | — | ||||||||||
| Investor Shares | (28,747,296 | ) | (19,658,734 | ) | — | — | ||||||||||
| Advisor Shares | (1,814,795 | ) | (760,942 | ) | — | — | ||||||||||
| Total Distributions to Shareholders | (35,153,872 | ) | (24,865,911 | ) | — | — | ||||||||||
| CAPITAL SHARE TRANSACTIONS | ||||||||||||||||
| Sale of shares: | ||||||||||||||||
| Institutional Shares | 59,718,016 | 17,839,759 | — | — | ||||||||||||
| Investor Shares | 268,908,004 | 172,880,303 | 882,037 | 1,317,533 | ||||||||||||
| Advisor Shares | 45,406,706 | 5,013,486 | — | — | ||||||||||||
| Reinvestment of distributions: | ||||||||||||||||
| Institutional Shares | 1,724,030 | 801,537 | — | — | ||||||||||||
| Investor Shares | 17,869,434 | 12,588,210 | — | — | ||||||||||||
| Advisor Shares | 1,911,251 | 851,303 | — | — | ||||||||||||
| Redemption of shares: | ||||||||||||||||
| Institutional Shares | (4,249,966 | ) | (1,162,598 | ) | — | — | ||||||||||
| Investor Shares | (97,894,196 | ) | (67,733,638 | ) | (2,684,538 | ) | (1,049,564 | ) | ||||||||
| Advisor Shares | (9,586,430 | ) | (3,337,506 | ) | — | — | ||||||||||
| Redemption fees: | ||||||||||||||||
| Institutional Shares | 15 | — | — | — | ||||||||||||
| Investor Shares | 1,692 | 635 | — | — | ||||||||||||
| Advisor Shares | 1,622 | 32 | — | — | ||||||||||||
| Increase (Decrease) from Capital Share Transactions | 283,810,178 | 137,741,523 | (1,802,501 | ) | 267,969 | |||||||||||
| Increase (Decrease) in Net Assets | 273,850,133 | 220,887,263 | (975,675 | ) | 2,507,848 | |||||||||||
| NET ASSETS | ||||||||||||||||
| Beginning of year | 608,730,235 | 387,842,972 | 11,680,969 | 9,173,121 | ||||||||||||
| End of year | $ | 882,580,368 | $ | 608,730,235 | $ | 10,705,294 | $ | 11,680,969 | ||||||||
| Undistributed (Accumulated) net investment income (loss) | $ | — | $ | 58,682 | $ | (39,115 | ) | $ | (34,133 | ) | ||||||
| SHARE TRANSACTIONS | ||||||||||||||||
| Sale of shares: | ||||||||||||||||
| Institutional Shares | 2,510,304 | 777,261 | — | — | ||||||||||||
| Investor Shares | 11,368,688 | 7,643,580 | 38,108 | 60,945 | ||||||||||||
| Advisor Shares | 1,923,210 | 217,599 | — | — | ||||||||||||
| Reinvestment of distributions: | ||||||||||||||||
| Institutional Shares | 73,145 | 34,883 | — | — | ||||||||||||
| Investor Shares | 758,465 | 549,691 | — | — | ||||||||||||
| Advisor Shares | 81,364 | 37,268 | — | — | ||||||||||||
| Redemption of shares: | ||||||||||||||||
| Institutional Shares | (179,005 | ) | (50,536 | ) | — | — | ||||||||||
| Investor Shares | (4,131,656 | ) | (2,974,633 | ) | (112,655 | ) | (48,362 | ) | ||||||||
| Advisor Shares | (406,882 | ) | (145,557 | ) | — | — | ||||||||||
| Increase (Decrease) from Capital Share Transactions | 11,997,633 | 6,089,556 | (74,547 | ) | 12,583 | |||||||||||
The accompanying notes are an integral part of these financial statements.
www.brownadvisoryfunds.com
107
Statements of Changes in Net Assets
| BROWN ADVISORY | BROWN ADVISORY | |||||||||||||
| MULTI-STRATEGY FUND | INTERMEDIATE INCOME FUND | |||||||||||||
| Period Ended | Year Ended | Year Ended | ||||||||||||
| June 30, | June 30, | June 30, | ||||||||||||
| 2015* | 2015 | 2014 | ||||||||||||
| OPERATIONS | ||||||||||||||
| Net investment income (loss) | $ | (8,431 | ) | $ | 3,167,470 | $ | 3,598,494 | |||||||
| Net realized gains | 2,407 | 1,131,585 | 41,616 | |||||||||||
| Net change in unrealized appreciation (depreciation) | 31,763 | (2,404,862 | ) | 2,189,550 | ||||||||||
| Increase in Net Assets from Operations | 25,739 | 1,894,193 | 5,829,660 | |||||||||||
| DISTRIBUTIONS TO SHAREHOLDERS FROM | ||||||||||||||
| Net investment income: | ||||||||||||||
| Institutional Shares | (2,394 | ) | — | — | ||||||||||
| Investor Shares | — | (3,342,529 | ) | (3,569,560 | ) | |||||||||
| Advisor Shares | — | (190,222 | ) | (193,169 | ) | |||||||||
| Net realized gain: | ||||||||||||||
| Institutional Shares | — | — | — | |||||||||||
| Investor Shares | — | — | (4,271,648 | ) | ||||||||||
| Advisor Shares | — | — | (275,860 | ) | ||||||||||
| Total Distributions to Shareholders | (2,394 | ) | (3,532,751 | ) | (8,310,237 | ) | ||||||||
| CAPITAL SHARE TRANSACTIONS | ||||||||||||||
| Sale of shares: | ||||||||||||||
| Institutional Shares | 3,213,113 | — | — | |||||||||||
| Investor Shares | — | 29,017,096 | 78,227,331 | |||||||||||
| Advisor Shares | — | 29,024 | 448,258 | |||||||||||
| Reinvestment of distributions: | ||||||||||||||
| Institutional Shares | 1,862 | — | — | |||||||||||
| Investor Shares | — | 742,197 | 3,631,333 | |||||||||||
| Advisor Shares | — | 117,261 | 314,913 | |||||||||||
| Redemption of shares: | ||||||||||||||
| Institutional Shares | (919,098 | ) | — | — | ||||||||||
| Investor Shares | — | (95,596,082 | ) | (113,719,031 | ) | |||||||||
| Advisor Shares | — | (3,041,900 | ) | (4,129,873 | ) | |||||||||
| Redemption fees: | ||||||||||||||
| Institutional Shares | — | — | — | |||||||||||
| Investor Shares | — | 66 | 50 | |||||||||||
| Advisor Shares | — | — | — | |||||||||||
| Increase (Decrease) from Capital Share Transactions | 2,295,877 | (68,732,338 | ) | (35,227,019 | ) | |||||||||
| Increase (Decrease) in Net Assets | 2,319,222 | (70,370,896 | ) | (37,707,596 | ) | |||||||||
| NET ASSETS | ||||||||||||||
| Beginning of period/year | — | 219,984,256 | 257,691,852 | |||||||||||
| End of period/year | $ | 2,319,222 | $ | 149,613,360 | $ | 219,984,256 | ||||||||
| Accumulated net investment loss | $ | (10,237 | ) | $ | (190,234 | ) | $ | (219,785 | ) | |||||
| SHARE TRANSACTIONS | ||||||||||||||
| Sale of shares: | ||||||||||||||
| Institutional Shares | 320,283 | — | — | |||||||||||
| Investor Shares | — | 2,702,238 | 7,311,163 | |||||||||||
| Advisor Shares | — | 2,759 | 42,887 | |||||||||||
| Reinvestment of distributions: | ||||||||||||||
| Institutional Shares | 185 | — | — | |||||||||||
| Investor Shares | — | 69,244 | 342,553 | |||||||||||
| Advisor Shares | — | 11,158 | 30,195 | |||||||||||
| Redemption of shares: | ||||||||||||||
| Institutional Shares | (90,196 | ) | — | — | ||||||||||
| Investor Shares | — | (8,904,829 | ) | (10,601,394 | ) | |||||||||
| Advisor Shares | — | (289,204 | ) | (391,768 | ) | |||||||||
| Increase (Decrease) from Capital Share Transactions | 230,272 | (6,408,634 | ) | (3,266,364 | ) | |||||||||
| * | Commenced operations on October 31, 2014. The information presented is for the period from October 31, 2014 to June 30, 2015. |
The accompanying notes are an integral part of these financial statements.
www.brownadvisoryfunds.com
108
Statements of Changes in Net Assets
| BROWN ADVISORY | BROWN ADVISORY | ||||||||||||
| TOTAL RETURN FUND | STRATEGIC BOND FUND | ||||||||||||
| Period Ended | Year Ended | Year Ended | |||||||||||
| June 30, | June 30, | June 30, | |||||||||||
| 2015* | 2015 | 2014 | |||||||||||
| OPERATIONS | |||||||||||||
| Net investment income (loss) | $ | 828,180 | $ | 947,449 | $ | (17,668 | ) | ||||||
| Net realized gains (losses) | (971,999 | ) | (827,486 | ) | 662,074 | ||||||||
| Net change in unrealized appreciation (depreciation) | (659,223 | ) | (1,128,037 | ) | 314,492 | ||||||||
| Increase (Decrease) in Net Assets from Operations | (803,042 | ) | (1,008,074 | ) | 958,898 | ||||||||
| DISTRIBUTIONS TO SHAREHOLDERS FROM | |||||||||||||
| Net investment income: | |||||||||||||
| Institutional Shares | (682,226 | ) | — | — | |||||||||
| Investor Shares | (154,576 | ) | (184,113 | ) | — | ||||||||
| Advisor Shares | — | (16,546 | ) | (110,929 | ) | ||||||||
| Total Distributions to Shareholders | (836,802 | ) | (200,659 | ) | (110,929 | ) | |||||||
| CAPITAL SHARE TRANSACTIONS | |||||||||||||
| Sale of shares: | |||||||||||||
| Institutional Shares | 77,851,406 | — | — | ||||||||||
| Investor Shares | 65,246,223 | 63,812,872 | — | ||||||||||
| Advisor Shares | — | 660,164 | 4,168,994 | ||||||||||
| Reinvestment of distributions: | |||||||||||||
| Institutional Shares | 14,220 | — | — | ||||||||||
| Investor Shares | 79,537 | 10,665 | — | ||||||||||
| Advisor Shares | — | 12,621 | 15,079 | ||||||||||
| Redemption of shares: | |||||||||||||
| Institutional Shares | (1,951,607 | ) | — | — | |||||||||
| Investor Shares | (56,784,565 | ) | (2,931,241 | ) | — | ||||||||
| Advisor Shares | — | (23,383,633 | ) | �� | (6,203,314 | ) | |||||||
| Redemption fees: | |||||||||||||
| Institutional Shares | — | — | — | ||||||||||
| Investor Shares | 170 | — | — | ||||||||||
| Advisor Shares | — | — | — | ||||||||||
| Increase (Decrease) from Capital Share Transactions | 84,455,384 | 38,181,448 | (2,019,241 | ) | |||||||||
| Increase (Decrease) in Net Assets | 82,815,540 | 36,972,715 | (1,171,272 | ) | |||||||||
| NET ASSETS | |||||||||||||
| Beginning of period/year | — | 24,399,119 | 25,570,391 | ||||||||||
| End of period/year | $ | 82,815,540 | $ | 61,371,834 | $ | 24,399,119 | |||||||
| Undistributed (Accumulated) net investment income (loss) | $ | 5,632 | $ | 772,240 | $ | (138,070 | ) | ||||||
| SHARE TRANSACTIONS | |||||||||||||
| Sale of shares: | |||||||||||||
| Institutional Shares | 7,692,250 | — | — | ||||||||||
| Investor Shares | 6,514,215 | 6,365,336 | — | ||||||||||
| Advisor Shares | — | 65,803 | 426,035 | ||||||||||
| Reinvestment of distributions: | |||||||||||||
| Institutional Shares | 1,421 | — | — | ||||||||||
| Investor Shares | 7,947 | 1,063 | — | ||||||||||
| Advisor Shares | — | 1,257 | 1,553 | ||||||||||
| Redemption of shares: | |||||||||||||
| Institutional Shares | (196,362 | ) | — | — | |||||||||
| Investor Shares | (5,598,733 | ) | (294,489 | ) | — | ||||||||
| Advisor Shares | — | (2,326,028 | ) | (638,450 | ) | ||||||||
| Increase (Decrease) from Capital Share Transactions | 8,420,738 | 3,812,942 | (210,862 | ) | |||||||||
| * | Commenced operations on October 30, 2014. The information presented is for the period from October 30, 2014 to June 30, 2015. |
The accompanying notes are an integral part of these financial statements.
www.brownadvisoryfunds.com
109
Statements of Changes in Net Assets
| BROWN ADVISORY | BROWN ADVISORY TAX | |||||||||||||||
| MARYLAND BOND FUND | EXEMPT BOND FUND | |||||||||||||||
| Year Ended | Year Ended | Year Ended | Year Ended | |||||||||||||
| June 30, | June 30, | June 30, | June 30, | |||||||||||||
| 2015 | 2014 | 2015 | 2014 | |||||||||||||
| OPERATIONS | ||||||||||||||||
| Net investment income | $ | 3,476,302 | $ | 4,437,861 | $ | 3,903,365 | $ | 3,305,444 | ||||||||
| Net realized gains (losses) | 585,355 | 341,254 | (946,691 | ) | (463,496 | ) | ||||||||||
| Net change in unrealized appreciation (depreciation) | (2,821,647 | ) | 1,397,876 | (1,400,710 | ) | 4,078,241 | ||||||||||
| Increase in Net Assets from Operations | 1,240,010 | 6,176,991 | 1,555,964 | 6,920,189 | ||||||||||||
| DISTRIBUTIONS TO SHAREHOLDERS FROM | ||||||||||||||||
| Net investment income: | ||||||||||||||||
| Investor Shares | (3,476,302 | ) | (4,437,861 | ) | (3,903,365 | ) | (3,305,444 | ) | ||||||||
| Net realized gain: | ||||||||||||||||
| Investor Shares | (1,040,851 | ) | (1,707,914 | ) | — | (27,107 | ) | |||||||||
| Total Distributions to Shareholders | (4,517,153 | ) | (6,145,775 | ) | (3,903,365 | ) | (3,332,551 | ) | ||||||||
| CAPITAL SHARE TRANSACTIONS | ||||||||||||||||
| Sale of shares: | ||||||||||||||||
| Investor Shares | 53,347,422 | 134,290,934 | 97,415,938 | 225,415,569 | ||||||||||||
| Reinvestment of distributions: | ||||||||||||||||
| Investor Shares | 1,121,200 | 1,556,130 | 850,588 | 557,364 | ||||||||||||
| Redemption of shares: | ||||||||||||||||
| Investor Shares | (57,440,183 | ) | (182,327,223 | ) | (76,942,910 | ) | (186,274,382 | ) | ||||||||
| Redemption fees: | ||||||||||||||||
| Investor Shares | 442 | — | 787 | — | ||||||||||||
| Increase (Decrease) from Capital Share Transactions | (2,971,119 | ) | (46,480,159 | ) | 21,324,403 | 39,698,551 | ||||||||||
| Increase (Decrease) in Net Assets | (6,248,262 | ) | (46,448,943 | ) | 18,977,002 | 43,286,189 | ||||||||||
| NET ASSETS | ||||||||||||||||
| Beginning of year | 205,717,393 | 252,166,336 | 205,177,473 | 161,891,284 | ||||||||||||
| End of year | $ | 199,469,131 | $ | 205,717,393 | $ | 224,154,475 | $ | 205,177,473 | ||||||||
| Undistributed (Accumulated) net investment income (loss) | $ | 28 | $ | 28 | $ | (123 | ) | $ | (123 | ) | ||||||
| SHARE TRANSACTIONS | ||||||||||||||||
| Sale of shares: | ||||||||||||||||
| Investor Shares | 4,947,707 | 12,545,458 | 9,696,551 | 22,962,219 | ||||||||||||
| Reinvestment of distributions: | ||||||||||||||||
| Investor Shares | 104,124 | 145,627 | 84,697 | 56,344 | ||||||||||||
| Redemption of shares: | ||||||||||||||||
| Investor Shares | (5,332,469 | ) | (17,015,043 | ) | (7,659,517 | ) | (19,017,976 | ) | ||||||||
| Increase (Decrease) from Capital Share Transactions | (280,638 | ) | (4,323,958 | ) | 2,121,731 | 4,000,587 | ||||||||||
The accompanying notes are an integral part of these financial statements.
www.brownadvisoryfunds.com
110
Statements of Changes in Net Assets
| BROWN ADVISORY – | ||||||||||||||||
| BROWN ADVISORY | WMC STRATEGIC | |||||||||||||||
| MORTGAGE SECURITIES FUND | EUROPEAN EQUITY FUND | |||||||||||||||
| Year Ended | Period Ended | Year Ended | Period Ended | |||||||||||||
| June 30, | June 30, | June 30, | June 30, | |||||||||||||
| 2015 | 2014* | 2015 | 2014** | |||||||||||||
| OPERATIONS | ||||||||||||||||
| Net investment income | $ | 5,722,383 | $ | 1,578,439 | $ | 3,017,569 | $ | 2,146,513 | ||||||||
| Net realized gains (losses) | 2,379,466 | 920,861 | (12,510,798 | ) | (347,221 | ) | ||||||||||
| Net change in unrealized appreciation (depreciation) | (2,496,970 | ) | 1,546,150 | 3,959,200 | 7,046,292 | |||||||||||
| Increase (Decrease) in Net Assets from Operations | 5,604,879 | 4,045,450 | (5,534,029 | ) | 8,845,584 | |||||||||||
| DISTRIBUTIONS TO SHAREHOLDERS FROM | ||||||||||||||||
| Net investment income: | ||||||||||||||||
| Institutional Shares | (5,220,946 | ) | (322,103 | ) | (2,028,155 | ) | — | |||||||||
| Investor Shares | (1,048,373 | ) | (1,381,608 | ) | (161,265 | ) | — | |||||||||
| Advisor Shares | — | — | (3,195 | ) | — | |||||||||||
| Net realized gain: | ||||||||||||||||
| Institutional Shares | (1,220,433 | ) | — | — | — | |||||||||||
| Investor Shares | (354,459 | ) | — | — | — | |||||||||||
| Advisor Shares | — | — | — | — | ||||||||||||
| Total Distributions to Shareholders | (7,844,211 | ) | (1,703,711 | ) | (2,192,615 | ) | — | |||||||||
| CAPITAL SHARE TRANSACTIONS | ||||||||||||||||
| Sale of shares: | ||||||||||||||||
| Institutional Shares | 120,438,550 | 133,244,915 | 128,250,563 | 199,664,123 | ||||||||||||
| Investor Shares | 15,997,743 | 200,853,490 | 14,088,732 | 17,731,422 | ||||||||||||
| Advisor Shares | — | — | 1,072,184 | 286,619 | ||||||||||||
| Reinvestment of distributions: | ||||||||||||||||
| Institutional Shares | 1,264,476 | 15,168 | 136,737 | — | ||||||||||||
| Investor Shares | 752,471 | 362,917 | 131,427 | — | ||||||||||||
| Advisor Shares | — | — | 2,681 | — | ||||||||||||
| Redemption of shares: | ||||||||||||||||
| Institutional Shares | (44,771,378 | ) | (1,880,000 | ) | (83,625,059 | ) | (5,104,407 | ) | ||||||||
| Investor Shares | (55,685,240 | ) | (135,747,053 | ) | (5,873,578 | ) | (501,971 | ) | ||||||||
| Advisor Shares | — | — | (230,575 | ) | (55,235 | ) | ||||||||||
| Redemption fees: | ||||||||||||||||
| Institutional Shares | — | — | — | — | ||||||||||||
| Investor Shares | — | — | 5,075 | — | ||||||||||||
| Advisor Shares | — | — | 49 | — | ||||||||||||
| Increase from Capital Share Transactions | 37,996,622 | 196,849,437 | 53,958,236 | 212,020,551 | ||||||||||||
| Increase in Net Assets | 35,757,290 | 199,191,176 | 46,231,592 | 220,866,135 | ||||||||||||
| NET ASSETS | ||||||||||||||||
| Beginning of year/period | 199,191,176 | — | 220,866,135 | — | ||||||||||||
| End of year/period | $ | 234,948,466 | $ | 199,191,176 | $ | 267,097,727 | $ | 220,866,135 | ||||||||
| Undistributed net investment income | $ | 16,572 | $ | 48,689 | $ | 2,991,719 | $ | 2,146,536 | ||||||||
| SHARE TRANSACTIONS | ||||||||||||||||
| Sale of shares: | ||||||||||||||||
| Institutional Shares | 11,840,919 | 13,118,411 | 12,789,191 | 19,876,042 | ||||||||||||
| Investor Shares | 1,573,302 | 20,017,629 | 1,385,487 | 1,773,327 | ||||||||||||
| Advisor Shares | — | — | 105,099 | 28,371 | ||||||||||||
| Reinvestment of distributions: | ||||||||||||||||
| Institutional Shares | 125,482 | 1,493 | 14,053 | — | ||||||||||||
| Investor Shares | 74,490 | 35,819 | 13,521 | — | ||||||||||||
| Advisor Shares | — | — | 276 | — | ||||||||||||
| Redemption of shares: | ||||||||||||||||
| Institutional Shares | (4,401,492 | ) | (185,167 | ) | (8,631,771 | ) | (503,631 | ) | ||||||||
| Investor Shares | (5,472,951 | ) | (13,381,826 | ) | (587,647 | ) | (49,539 | ) | ||||||||
| Advisor Shares | — | — | (22,565 | ) | (5,398 | ) | ||||||||||
| Increase from Capital Share Transactions | 3,739,750 | 19,606,359 | 5,065,644 | 21,119,172 | ||||||||||||
| * | Commenced operations on December 26, 2013. The information presented is for the period from December 26, 2013 to June 30, 2014. | |
| ** | Commenced operations on October 21, 2013. The information presented is for the period from October 21, 2013 to June 30, 2014. |
The accompanying notes are an integral part of these financial statements.
www.brownadvisoryfunds.com
111
Statements of Changes in Net Assets
| BROWN | ||||||||||||||||||||
| ADVISORY | ||||||||||||||||||||
| EMERGING | ||||||||||||||||||||
| BROWN ADVISORY – | BROWN ADVISORY – | MARKETS | ||||||||||||||||||
| WMC JAPAN ALPHA | SOMSERSET EMERGING | SMALL-CAP | ||||||||||||||||||
| OPPORTUNITIES FUND | MARKETS FUND | FUND | ||||||||||||||||||
| Year Ended | Period Ended | Year Ended | Year Ended | Period Ended | ||||||||||||||||
| June 30, | June 30, | June 30, | June 30, | June 30, | ||||||||||||||||
| 2015 | 2014* | 2015 | 2014 | 2015** | ||||||||||||||||
| OPERATIONS | ||||||||||||||||||||
| Net investment income | $ | 5,364,284 | $ | 4,466,253 | $ | 3,540,051 | $ | 3,341,554 | $ | 199,181 | ||||||||||
| Net realized gains (losses) | 268,242,436 | (7,534,618 | ) | 2,204,829 | (7,237,279 | ) | 7,874,779 | |||||||||||||
| Net change in unrealized appreciation (depreciation) | 75,794,530 | 64,369,159 | (16,502,944 | ) | 19,128,390 | 13,827,711 | ||||||||||||||
| Increase (Decrease) in Net Assets from Operations | 349,401,250 | 61,300,794 | (10,758,064 | ) | 15,232,665 | 21,901,671 | ||||||||||||||
| DISTRIBUTIONS TO SHAREHOLDERS FROM | ||||||||||||||||||||
| Net investment income: | ||||||||||||||||||||
| Institutional Shares | (56,510,560 | ) | — | (3,242,870 | ) | (1,597,073 | ) | — | ||||||||||||
| Investor Shares | (515,706 | ) | — | (540,676 | ) | (155,756 | ) | — | ||||||||||||
| Advisor Shares | (5,171 | ) | — | (6,119 | ) | (8,284 | ) | — | ||||||||||||
| Net realized gain: | ||||||||||||||||||||
| Institutional Shares | (7,825,633 | ) | — | — | — | — | ||||||||||||||
| Investor Shares | (72,262 | ) | — | — | — | — | ||||||||||||||
| Advisor Shares | (749 | ) | — | — | — | — | ||||||||||||||
| Total Distributions to Shareholders | (64,930,081 | ) | — | (3,789,665 | ) | (1,761,113 | ) | — | ||||||||||||
| CAPITAL SHARE TRANSACTIONS | ||||||||||||||||||||
| Sale of shares: | ||||||||||||||||||||
| Institutional Shares | 429,017,811 | 1,031,575,751 | 122,818,655 | 87,865,122 | 172,179,444 | |||||||||||||||
| Investor Shares | 19,702,437 | 4,455,791 | 146,036,626 | 12,800,049 | 19,556,483 | |||||||||||||||
| Advisor Shares | 1,666,578 | 54,786 | 558,959 | 92,326 | — | |||||||||||||||
| Reinvestment of distributions: | ||||||||||||||||||||
| Institutional Shares | 2,070,113 | — | 490,258 | 117,284 | — | |||||||||||||||
| Investor Shares | 586,590 | — | 429,370 | 111,069 | — | |||||||||||||||
| Advisor Shares | 5,920 | — | 6,119 | 8,284 | — | |||||||||||||||
| Redemption of shares: | ||||||||||||||||||||
| Institutional Shares | (210,662,995 | ) | (12,008,108 | ) | (37,255,938 | ) | (28,796,591 | ) | (4,525,254 | ) | ||||||||||
| Investor Shares | (2,531,378 | ) | (80,811 | ) | (11,527,368 | ) | (1,766,244 | ) | (2,219,470 | ) | ||||||||||
| Advisor Shares | (115,120 | ) | — | (116,905 | ) | (601,984 | ) | — | ||||||||||||
| Redemption fees: | ||||||||||||||||||||
| Institutional Shares | 443 | — | — | — | 46 | |||||||||||||||
| Investor Shares | 1,272 | — | — | — | — | |||||||||||||||
| Advisor Shares | — | — | — | — | — | |||||||||||||||
| Increase from Capital Share Transactions | 239,741,671 | 1,023,997,409 | 221,439,776 | 69,829,315 | 184,991,249 | |||||||||||||||
| Increase in Net Assets | 524,212,840 | 1,085,298,203 | 206,892,047 | 83,300,867 | 206,892,920 | |||||||||||||||
| NET ASSETS | ||||||||||||||||||||
| Beginning of year/period | 1,085,298,203 | — | 218,499,763 | 135,198,896 | — | |||||||||||||||
| End of year/period | $ | 1,609,511,043 | $ | 1,085,298,203 | $ | 425,391,810 | $ | 218,499,763 | $ | 206,892,920 | ||||||||||
| Undistributed (Accumulated) net investment income (loss) | $ | 173,902,253 | $ | (813,416 | ) | $ | 2,706,260 | $ | 2,310,343 | $ | — | |||||||||
The accompanying notes are an integral part of these financial statements.
www.brownadvisoryfunds.com
112
Statements of Changes in Net Assets
| BROWN | ||||||||||||||||||||
| ADVISORY | ||||||||||||||||||||
| EMERGING | ||||||||||||||||||||
| BROWN ADVISORY – | BROWN ADVISORY – | MARKETS | ||||||||||||||||||
| WMC JAPAN ALPHA | SOMSERSET EMERGING | SMALL-CAP | ||||||||||||||||||
| OPPORTUNITIES FUND | MARKETS FUND | FUND | ||||||||||||||||||
| Year Ended | Period Ended | Year Ended | Year Ended | Period Ended | ||||||||||||||||
| June 30, | June 30, | June 30, | June 30, | June 30, | ||||||||||||||||
| 2015 | 2014* | 2015 | 2014 | 2015** | ||||||||||||||||
| SHARE TRANSACTIONS | ||||||||||||||||||||
| Sale of shares: | ||||||||||||||||||||
| Institutional Shares | 37,938,780 | 104,178,148 | 12,355,851 | 9,071,496 | 16,476,173 | |||||||||||||||
| Investor Shares | 1,726,060 | 438,918 | 14,781,054 | 1,323,455 | 1,814,477 | |||||||||||||||
| Advisor Shares | 133,674 | 5,619 | 56,038 | 9,530 | — | |||||||||||||||
| Reinvestment of distributions: | ||||||||||||||||||||
| Institutional Shares | 188,021 | — | 51,770 | 12,230 | — | |||||||||||||||
| Investor Shares | 53,278 | — | 45,388 | 11,594 | — | |||||||||||||||
| Advisor Shares | 538 | — | 647 | 865 | — | |||||||||||||||
| Redemption of shares: | ||||||||||||||||||||
| Institutional Shares | (17,819,683 | ) | (1,205,595 | ) | (3,801,894 | ) | (3,005,651 | ) | (418,641 | ) | ||||||||||
| Investor Shares | (211,427 | ) | (7,913 | ) | (1,179,864 | ) | (185,281 | ) | (190,007 | ) | ||||||||||
| Advisor Shares | (9,321 | ) | — | (11,945 | ) | (62,273 | ) | — | ||||||||||||
| Increase from Capital Share Transactions | 21,999,920 | 103,409,177 | 22,297,045 | 7,175,965 | 17,682,002 | |||||||||||||||
| * | Commenced operations on March 4, 2014. The information presented is for the period from March 4, 2014 to June 30, 2014. | |
| ** | Commenced operations on November 21, 2014. The information presented is for the period from November 21, 2014 to June 30, 2015. |
The accompanying notes are an integral part of these financial statements.
www.brownadvisoryfunds.com
113
Financial Highlights
These financial highlights reflect selected per share data and ratios for a share outstanding of the Fund throughout each year / period.
BROWN ADVISORY GROWTH EQUITY FUND
INSTITUTIONAL SHARES
| Year / Period Ended: | ||||||||||||
| June 30, | June 30, | June 30, | ||||||||||
| 2015 | 2014 | 2013(g) | ||||||||||
| Net Asset Value, Beginning of Year / Period | $ | 19.10 | $ | 16.22 | $ | 14.58 | ||||||
| Net Investment Income(a) | 0.02 | — | 0.01 | |||||||||
| Net Realized And Unrealized Gains | 1.82 | 2.99 | 1.66 | |||||||||
| Total from Investment Operations | $ | 1.84 | $ | 2.99 | $ | 1.67 | ||||||
| Distributions: | ||||||||||||
| from Net Investment Income | — | — | (0.03 | ) | ||||||||
| from Net Realized Gains | (0.61 | ) | (0.11 | ) | — | |||||||
| Total Distributions to Shareholders | $ | (0.61 | ) | $ | (0.11 | ) | $ | (0.03 | ) | |||
| Redemption fees(a) | — | (e) | — | (e) | — | (e) | ||||||
| Net Asset Value, End of Year / Period | $ | 20.33 | $ | 19.10 | $ | 16.22 | ||||||
| Total Return | 9.73 | % | 18.46 | % | 11.49 | %(b) | ||||||
| Net Assets at End of Year / Period (000’s Omitted) | $ | 259,098 | $ | 233,627 | $ | 116,575 | ||||||
| Ratios to Average Net Assets: | ||||||||||||
| Net Investment Income | 0.09 | % | 0.03 | % | 0.30 | %(c) | ||||||
| Net Expenses | 0.72 | % | 0.74 | % | 0.78 | %(c) | ||||||
| Gross Expenses(d) | 0.72 | % | 0.74 | % | 0.78 | %(c) | ||||||
| Portfolio Turnover Rate | 24 | % | 25 | % | 40 | %(f) | ||||||
| (a) | Calculated based on average shares outstanding during the year / period. |
| (b) | Not annualized. |
| (c) | Annualized. |
| (d) | Reflects the expense ratio excluding any waivers and/or expense reimbursements. |
| (e) | Less than $0.01 per share. |
| (f) | Reflects portfolio turnover at the Fund level for the year ended June 30, 2013. |
| (g) | Commenced operations on October 19, 2012. The information presented is for the period from October 19, 2012 to June 30, 2013. |
The accompanying notes are an integral part of these financial statements.
www.brownadvisoryfunds.com
114
Financial Highlights
These financial highlights reflect selected per share data and ratios for a share outstanding of the Fund throughout each year.
BROWN ADVISORY GROWTH EQUITY FUND
INVESTOR SHARES*
| Year Ended: | ||||||||||||||||||||
| June 30, | June 30, | June 30, | June 30, | June 30, | ||||||||||||||||
| 2015 | 2014 | 2013 | 2012 | 2011 | ||||||||||||||||
| Net Asset Value, Beginning of Year | $ | 19.07 | $ | 16.21 | $ | 13.80 | $ | 13.63 | $ | 9.99 | ||||||||||
| Net Investment Income (Loss)(a) | (0.01 | ) | (0.02 | ) | 0.03 | (0.05 | ) | (0.04 | ) | |||||||||||
| Net Realized And Unrealized Gains (Losses) | 1.81 | 2.99 | 2.41 | 0.22 | 3.68 | |||||||||||||||
| Total from Investment Operations | $ | 1.80 | $ | 2.97 | $ | 2.44 | $ | 0.17 | $ | 3.64 | ||||||||||
| Distributions: | ||||||||||||||||||||
| from Net Investment Income | — | — | (0.03 | ) | — | — | ||||||||||||||
| from Net Realized Gains | (0.61 | ) | (0.11 | ) | — | — | — | |||||||||||||
| Total Distributions to Shareholders | $ | (0.61 | ) | $ | (0.11 | ) | $ | (0.03 | ) | $ | — | $ | — | |||||||
| Redemption fees(a) | — | (c) | — | (c) | — | (c) | — | (c) | — | (c) | ||||||||||
| Net Asset Value, End of Year | $ | 20.26 | $ | 19.07 | $ | 16.21 | $ | 13.80 | $ | 13.63 | ||||||||||
| Total Return | 9.54 | % | 18.35 | % | 17.67 | % | 1.25 | % | 36.44 | % | ||||||||||
| Net Assets at End of Year (000’s Omitted) | $ | 2,143,325 | $ | 2,497,036 | $ | 1,653,389 | $ | 954,560 | $ | 463,228 | ||||||||||
| Ratios to Average Net Assets: | ||||||||||||||||||||
| Net Investment Income (Loss) | (0.06 | )% | (0.12 | )% | 0.17 | % | (0.35 | )% | (0.29 | )% | ||||||||||
| Net Expenses | 0.87 | % | 0.89 | % | 0.91 | % | 0.90 | % | 0.94 | % | ||||||||||
| Gross Expenses(b) | 0.87 | % | 0.89 | % | 0.91 | % | 0.90 | % | 0.94 | % | ||||||||||
| Portfolio Turnover Rate | 24 | % | 25 | % | 40 | % | 58 | % | 30 | % | ||||||||||
| (a) | Calculated based on average shares outstanding during the year. |
| (b) | Reflects the expense ratio excluding any waivers and/or expense reimbursements. |
| (c) | Less than $0.01 per share. |
| * | Prior to October 19, 2012, Investor Shares were known as Institutional Shares. |
The accompanying notes are an integral part of these financial statements.
www.brownadvisoryfunds.com
115
Financial Highlights
These financial highlights reflect selected per share data and ratios for a share outstanding of the Fund throughout each year.
BROWN ADVISORY GROWTH EQUITY FUND
ADVISOR SHARES*
| Year Ended: | ||||||||||||||||||||
| June 30, | June 30, | June 30, | June 30, | June 30, | ||||||||||||||||
| 2015 | 2014 | 2013 | 2012 | 2011 | ||||||||||||||||
| Net Asset Value, Beginning of Year | $ | 18.51 | $ | 15.78 | $ | 13.45 | $ | 13.31 | $ | 9.80 | ||||||||||
| Net Investment Loss(a) | (0.06 | ) | (0.07 | ) | (0.01 | ) | (0.07 | ) | (0.09 | ) | ||||||||||
| Net Realized And Unrealized Gains (Losses) | 1.76 | 2.91 | 2.35 | 0.21 | 3.60 | |||||||||||||||
| Total from Investment Operations | $ | 1.70 | $ | 2.84 | $ | 2.34 | $ | 0.14 | $ | 3.51 | ||||||||||
| Distributions: | ||||||||||||||||||||
| from Net Investment Income | — | — | (0.01 | ) | — | — | ||||||||||||||
| from Net Realized Gains | (0.61 | ) | (0.11 | ) | — | — | — | |||||||||||||
| Total Distributions to Shareholders | $ | (0.61 | ) | $ | (0.11 | ) | $ | (0.01 | ) | $ | — | $ | — | |||||||
| Redemption fees(a) | — | (d) | — | (d) | — | (d) | — | (d) | — | |||||||||||
| Net Asset Value, End of Year | $ | 19.60 | $ | 18.51 | $ | 15.78 | $ | 13.45 | $ | 13.31 | ||||||||||
| Total Return(b) | 9.28 | % | 18.02 | % | 17.43 | % | 1.05 | % | 35.82 | % | ||||||||||
| Net Assets at End of Year (000’s Omitted) | $ | 44,587 | $ | 48,632 | $ | 21,478 | $ | 11,593 | $ | 5,698 | ||||||||||
| Ratios to Average Net Assets: | ||||||||||||||||||||
| Net Investment Loss | (0.31 | )% | (0.37 | )% | (0.07 | )% | (0.55 | )% | (0.74 | )% | ||||||||||
| Net Expenses | 1.12 | % | 1.14 | % | 1.15 | % | 1.10 | % | 1.39 | % | ||||||||||
| Gross Expenses(c) | 1.12 | % | 1.14 | % | 1.15 | % | 1.10 | % | 1.39 | % | ||||||||||
| Portfolio Turnover Rate | 24 | % | 25 | % | 40 | % | 58 | % | 30 | % | ||||||||||
| (a) | Calculated based on average shares outstanding during the year. |
| (b) | Total return does not include the effects of sales charges which existed for Advisor Shares (then known as A Shares) for year ended June 30, 2011. |
| (c) | Reflects the expense ratio excluding any waivers and/or expense reimbursements. |
| (d) | Less than $0.01 per share. |
| * | Prior to July 1, 2011, Advisor Shares were known as A Shares. |
The accompanying notes are an integral part of these financial statements.
www.brownadvisoryfunds.com
116
Financial Highlights
These financial highlights reflect selected per share data and ratios for a share outstanding of the Fund throughout each year / period.
BROWN ADVISORY VALUE EQUITY FUND
INSTITUTIONAL SHARES
| Year / Period Ended: | ||||||||||||
| June 30, | June 30, | June 30, | ||||||||||
| 2015 | 2014 | 2013(f) | ||||||||||
| Net Asset Value, Beginning of Year / Period | $ | 18.75 | $ | 14.74 | $ | 13.05 | ||||||
| Net Investment Income(a) | 0.27 | 0.22 | 0.18 | |||||||||
| Net Realized And Unrealized Gains (Losses) | (0.68 | ) | 3.95 | 1.74 | ||||||||
| Total from Investment Operations | $ | (0.41 | ) | $ | 4.17 | $ | 1.92 | |||||
| Distributions: | ||||||||||||
| from Net Investment Income | (0.28 | ) | (0.16 | ) | (0.23 | ) | ||||||
| from Net Realized Gains | (0.54 | ) | — | — | ||||||||
| Total Distributions to Shareholders | $ | (0.82 | ) | $ | (0.16 | ) | $ | (0.23 | ) | |||
| Redemption fees(a) | — | — | — | |||||||||
| Net Asset Value, End of Year / Period | $ | 17.52 | $ | 18.75 | $ | 14.74 | ||||||
| Total Return | (2.20 | )% | 28.41 | % | 14.99 | %(b) | ||||||
| Net Assets at End of Year / Period (000’s Omitted) | $ | 14 | $ | 15 | $ | 12 | ||||||
| Ratios to Average Net Assets: | ||||||||||||
| Net Investment Income | 1.49 | % | 1.31 | % | 1.67 | %(c) | ||||||
| Net Expenses | 0.75 | % | 0.77 | % | 0.81 | %(c) | ||||||
| Gross Expenses(d) | 0.75 | % | 0.77 | % | 0.81 | %(c) | ||||||
| Portfolio Turnover Rate | 45 | % | 37 | % | 57 | %(e) | ||||||
| (a) | Calculated based on average shares outstanding during the year / period. |
| (b) | Not annualized. |
| (c) | Annualized. |
| (d) | Reflects the expense ratio excluding any waivers and/or expense reimbursements. |
| (e) | Reflects portfolio turnover at the Fund level for the year ended June 30, 2013. |
| (f) | Commenced operations on October 19, 2012. The information presented is for the period from October 19, 2012 to June 30, 2013. |
The accompanying notes are an integral part of these financial statements.
www.brownadvisoryfunds.com
117
Financial Highlights
These financial highlights reflect selected per share data and ratios for a share outstanding of the Fund throughout each year.
BROWN ADVISORY VALUE EQUITY FUND
INVESTOR SHARES*
| Year Ended: | ||||||||||||||||||||
| June 30, | June 30, | June 30, | June 30, | June 30, | ||||||||||||||||
| 2015 | 2014 | 2013 | 2012 | 2011 | ||||||||||||||||
| Net Asset Value, Beginning of Year | $ | 18.75 | $ | 14.74 | $ | 12.30 | $ | 12.56 | $ | 9.69 | ||||||||||
| Net Investment Income(a) | 0.24 | 0.20 | 0.21 | 0.15 | 0.16 | |||||||||||||||
| Net Realized And Unrealized Gains (Losses) | (0.68 | ) | 3.95 | 2.45 | (0.33 | ) | 2.83 | |||||||||||||
| Total from Investment Operations | $ | (0.44 | ) | $ | 4.15 | $ | 2.66 | $ | (0.18 | ) | $ | 2.99 | ||||||||
| Distributions: | ||||||||||||||||||||
| from Net Investment Income | (0.25 | ) | (0.14 | ) | (0.22 | ) | (0.08 | ) | (0.12 | ) | ||||||||||
| from Net Realized Gains | (0.54 | ) | — | — | — | — | ||||||||||||||
| Total Distributions to Shareholders | $ | (0.79 | ) | $ | (0.14 | ) | $ | (0.22 | ) | $ | (0.08 | ) | $ | (0.12 | ) | |||||
| Redemption fees(a) | — | — | (c) | — | (c) | — | — | (c) | ||||||||||||
| Net Asset Value, End of Year | $ | 17.52 | $ | 18.75 | $ | 14.74 | $ | 12.30 | $ | 12.56 | ||||||||||
| Total Return | (2.35 | )% | 28.26 | % | 21.91 | % | (1.35 | )% | 30.90 | % | ||||||||||
| Net Assets at End of Year (000’s Omitted) | $ | 166,808 | $ | 241,666 | $ | 160,800 | $ | 156,226 | $ | 177,918 | ||||||||||
| Ratios to Average Net Assets: | ||||||||||||||||||||
| Net Investment Income | 1.34 | % | 1.16 | % | 1.54 | % | 1.27 | % | 1.34 | % | ||||||||||
| Net Expenses | 0.90 | % | 0.92 | % | 0.94 | % | 0.91 | % | 0.93 | % | ||||||||||
| Gross Expenses(b) | 0.90 | % | 0.92 | % | 0.94 | % | 0.91 | % | 0.93 | % | ||||||||||
| Portfolio Turnover Rate | 45 | % | 37 | % | 57 | % | 72 | % | 64 | % | ||||||||||
| (a) | Calculated based on average shares outstanding during the year. |
| (b) | Reflects the expense ratio excluding any waivers and/or expense reimbursements. |
| (c) | Less than $0.01 per share. |
| * | Prior to October 19, 2012, Investor Shares were known as Institutional Shares. |
The accompanying notes are an integral part of these financial statements.
www.brownadvisoryfunds.com
118
Financial Highlights
These financial highlights reflect selected per share data and ratios for a share outstanding of the Fund throughout each year.
BROWN ADVISORY VALUE EQUITY FUND
ADVISOR SHARES*
| Year Ended: | ||||||||||||||||||||
| June 30, | June 30, | June 30, | June 30, | June 30, | ||||||||||||||||
| 2015 | 2014 | 2013 | 2012 | 2011 | ||||||||||||||||
| Net Asset Value, Beginning of Year | $ | 18.85 | $ | 14.82 | $ | 12.36 | $ | 12.62 | $ | 9.74 | ||||||||||
| Net Investment Income(a) | 0.20 | 0.15 | 0.16 | 0.13 | 0.10 | |||||||||||||||
| Net Realized And Unrealized Gains (Losses) | (0.69 | ) | 3.98 | 2.49 | (0.32 | ) | 2.84 | |||||||||||||
| Total from Investment Operations | $ | (0.49 | ) | $ | 4.13 | $ | 2.65 | $ | (0.19 | ) | $ | 2.94 | ||||||||
| Distributions: | ||||||||||||||||||||
| from Net Investment Income | (0.20 | ) | (0.10 | ) | (0.19 | ) | (0.07 | ) | (0.06 | ) | ||||||||||
| from Realized Gains | (0.54 | ) | — | — | — | — | ||||||||||||||
| Total Distributions to Shareholders | $ | (0.74 | ) | $ | (0.10 | ) | $ | (0.19 | ) | $ | (0.07 | ) | $ | (0.06 | ) | |||||
| Redemption fees(a) | — | (d) | — | — | — | — | ||||||||||||||
| �� | ||||||||||||||||||||
| Net Asset Value, End of Year | $ | 17.62 | $ | 18.85 | $ | 14.82 | $ | 12.36 | $ | 12.62 | ||||||||||
| Total Return(b) | (2.61 | )% | 27.90 | % | 21.63 | % | (1.45 | )% | 30.28 | % | ||||||||||
| Net Assets at End of Year (000’s Omitted) | $ | 1,183 | $ | 1,635 | $ | 1,615 | $ | 2,201 | $ | 2,996 | ||||||||||
| Ratios to Average Net Assets: | ||||||||||||||||||||
| Net Investment Income | 1.09 | % | 0.91 | % | 1.31 | % | 1.07 | % | 0.89 | % | ||||||||||
| Net Expenses | 1.15 | % | 1.17 | % | 1.17 | % | 1.11 | % | 1.38 | % | ||||||||||
| Gross Expenses(c) | 1.15 | % | 1.17 | % | 1.17 | % | 1.11 | % | 1.38 | % | ||||||||||
| Portfolio Turnover Rate | 45 | % | 37 | % | 57 | % | 72 | % | 64 | % | ||||||||||
| (a) | Calculated based on average shares outstanding during the year. |
| (b) | Total return does not include the effects of sales charges which existed for Advisor Shares (then known as A Shares) for year ended June 30, 2011. |
| (c) | Reflects the expense ratio excluding any waivers and/or expense reimbursements. |
| (d) | Less than $0.01 per share. |
| * | Prior to July 1, 2011, Advisor Shares were known as A Shares. |
The accompanying notes are an integral part of these financial statements.
www.brownadvisoryfunds.com
119
Financial Highlights
These financial highlights reflect selected per share data and ratios for a share outstanding of the Fund throughout each year / period.
BROWN ADVISORY FLEXIBLE EQUITY FUND
INSTITUTIONAL SHARES
| Year / Period Ended: | ||||||||||||
| June 30, | June 30, | June 30, | ||||||||||
| 2015 | 2014 | 2013(f) | ||||||||||
| Net Asset Value, Beginning of Year / Period | $ | 14.81 | $ | 12.28 | $ | 10.46 | ||||||
| Net Investment Income(a) | 0.12 | 0.09 | 0.06 | |||||||||
| Net Realized And Unrealized Gains | 1.08 | 2.49 | 1.82 | |||||||||
| Total from Investment Operations | $ | 1.20 | $ | 2.58 | $ | 1.88 | ||||||
| Distributions: | ||||||||||||
| from Net Investment Income | (0.09 | ) | (0.05 | ) | (0.06 | ) | ||||||
| Total Distributions to Shareholders | $ | (0.09 | ) | $ | (0.05 | ) | $ | (0.06 | ) | |||
| Redemption fees(a) | — | — | — | |||||||||
| Net Asset Value, End of Year / Period | $ | 15.92 | $ | 14.81 | $ | 12.28 | ||||||
| Total Return | 8.09 | % | 21.06 | % | 18.07 | %(b) | ||||||
| Net Assets at End of Year / Period (000’s Omitted) | $ | 4,240 | $ | 3,126 | $ | 12 | ||||||
| Ratios to Average Net Assets: | ||||||||||||
| Net Investment Income | 0.76 | % | 0.66 | % | 0.65 | %(c) | ||||||
| Net Expenses | 0.76 | % | 0.82 | % | 1.00 | %(c) | ||||||
| Gross Expenses(d) | 0.76 | % | 0.81 | % | 0.88 | %(c) | ||||||
| Portfolio Turnover Rate | 7 | % | 15 | % | 12 | %(e) | ||||||
| (a) | Calculated based on average shares outstanding during the year / period. |
| (b) | Not annualized. |
| (c) | Annualized. |
| (d) | Reflects the expense ratio excluding any waivers or recoupments. |
| (e) | Reflects portfolio turnover at the Fund level for the year ended June 30, 2013. |
| (f) | Commenced operations on October 19, 2012. The information presented is for the period from October 19, 2012 to June 30, 2013. |
The accompanying notes are an integral part of these financial statements.
www.brownadvisoryfunds.com
120
Financial Highlights
These financial highlights reflect selected per share data and ratios for a share outstanding of the Fund throughout each year.
BROWN ADVISORY FLEXIBLE EQUITY FUND
INVESTOR SHARES*
| Year Ended: | ||||||||||||||||||||
| June 30, | June 30, | June 30, | June 30, | June 30, | ||||||||||||||||
| 2015 | 2014 | 2013 | 2012 | 2011 | ||||||||||||||||
| Net Asset Value, Beginning of Year | $ | 14.79 | $ | 12.28 | $ | 9.68 | $ | 9.16 | $ | 7.33 | ||||||||||
| Net Investment Income(a) | 0.10 | 0.07 | 0.05 | 0.05 | 0.02 | |||||||||||||||
| Net Realized And Unrealized Gains (Losses) | 1.07 | 2.48 | 2.60 | 0.50 | 1.83 | |||||||||||||||
| Total from Investment Operations | $ | 1.17 | $ | 2.55 | $ | 2.65 | $ | 0.55 | $ | 1.85 | ||||||||||
| Distributions: | ||||||||||||||||||||
| from Net Investment Income | (0.07 | ) | (0.04 | ) | (0.05 | ) | (0.03 | ) | (0.02 | ) | ||||||||||
| from Return of Capital | — | — | — | — | — | (c) | ||||||||||||||
| Total Distributions to Shareholders | $ | (0.07 | ) | $ | (0.04 | ) | $ | (0.05 | ) | $ | (0.03 | ) | $ | (0.02 | ) | |||||
| Redemption fees(a) | — | (c) | — | (c) | — | — | — | |||||||||||||
| Net Asset Value, End of Year | $ | 15.89 | $ | 14.79 | $ | 12.28 | $ | 9.68 | $ | 9.16 | ||||||||||
| Total Return | 7.92 | % | 20.78 | % | 27.51 | % | 5.98 | % | 25.27 | % | ||||||||||
| Net Assets at End of Year (000’s Omitted) | $ | 268,569 | $ | 162,615 | $ | 82,783 | $ | 37,477 | $ | 26,827 | ||||||||||
| Ratios to Average Net Assets: | ||||||||||||||||||||
| Net Investment Income | 0.61 | % | 0.51 | % | 0.50 | % | 0.52 | % | 0.28 | % | ||||||||||
| Net Expenses | 0.91 | % | 0.97 | % | 1.15 | % | 1.15 | % | 1.15 | % | ||||||||||
| Gross Expenses(b) | 0.91 | % | 0.96 | % | 1.05 | % | 1.18 | % | 1.32 | % | ||||||||||
| Portfolio Turnover Rate | 7 | % | 15 | % | 12 | % | 19 | % | 33 | % | ||||||||||
| (a) | Calculated based on average shares outstanding during the year. |
| (b) | Reflects the expense ratio excluding any waivers or recoupments. |
| (c) | Less than $0.01 per share. |
| * | Prior to October 19, 2012, Investor Shares were known as Institutional Shares. |
The accompanying notes are an integral part of these financial statements.
www.brownadvisoryfunds.com
121
Financial Highlights
These financial highlights reflect selected per share data and ratios for a share outstanding of the Fund throughout each year.
BROWN ADVISORY FLEXIBLE EQUITY FUND
ADVISOR SHARES*
| Year Ended: | ||||||||||||||||||||
| June 30, | June 30, | June 30, | June 30, | June 30, | ||||||||||||||||
| 2015 | 2014 | 2013 | 2012 | 2011 | ||||||||||||||||
| Net Asset Value, Beginning of Year | $ | 14.77 | $ | 12.28 | $ | 9.68 | $ | 9.17 | $ | 7.33 | ||||||||||
| Net Investment Income(a) | 0.06 | 0.04 | 0.02 | 0.03 | 0.01 | |||||||||||||||
| Net Realized And Unrealized Gains (Losses) | 1.07 | 2.48 | 2.61 | 0.49 | 1.84 | |||||||||||||||
| Total from Investment Operations | $ | 1.13 | $ | 2.52 | $ | 2.63 | $ | 0.52 | $ | 1.85 | ||||||||||
| Distributions: | ||||||||||||||||||||
| from Net Investment Income | (0.02 | ) | (0.03 | ) | (0.03 | ) | (0.01 | ) | (0.01 | ) | ||||||||||
| from Return of Capital | — | — | — | — | — | (d) | ||||||||||||||
| Total Distributions to Shareholders | $ | (0.02 | ) | $ | (0.03 | ) | $ | (0.03 | ) | $ | (0.01 | ) | $ | (0.01 | ) | |||||
| Redemption fees(a) | — | — | — | — | — | (d) | ||||||||||||||
| Net Asset Value, End of Year | $ | 15.88 | $ | 14.77 | $ | 12.28 | $ | 9.68 | $ | 9.17 | ||||||||||
| Total Return(b) | 7.68 | % | 20.52 | % | 27.25 | % | 5.73 | % | 25.18 | % | ||||||||||
| Net Assets at End of Year (000’s Omitted) | $ | 11,540 | $ | 14,831 | $ | 6,115 | $ | 1,079 | $ | 1,259 | ||||||||||
| Ratios to Average Net Assets: | ||||||||||||||||||||
| Net Investment Income | 0.36 | % | 0.26 | % | 0.30 | % | 0.32 | % | 0.08 | % | ||||||||||
| Net Expenses | 1.16 | % | 1.22 | % | 1.35 | % | 1.35 | % | 1.35 | % | ||||||||||
| Gross Expenses(c) | 1.16 | % | 1.21 | % | 1.30 | % | 1.38 | % | 1.53 | % | ||||||||||
| Portfolio Turnover Rate | 7 | % | 15 | % | 12 | % | 19 | % | 33 | % | ||||||||||
| (a) | Calculated based on average shares outstanding during the year. |
| (b) | Total return does not include the effects of sales charges which existed for Advisor Shares (then known as A Shares) for year ended June 30, 2011. |
| (c) | Reflects the expense ratio excluding any waivers or recoupments. |
| (d) | Less than $0.01 per share. |
| * | Prior to July 1, 2011, Advisor Shares were known as A Shares. |
The accompanying notes are an integral part of these financial statements.
www.brownadvisoryfunds.com
122
Financial Highlights
These financial highlights reflect selected per share data and ratios for a share outstanding of the Fund throughout each year / period.
BROWN ADVISORY EQUITY INCOME FUND
INSTITUTIONAL SHARES
| Year / Period Ended: | ||||||||||||
| June 30, | June 30, | June 30, | ||||||||||
| 2015 | 2014 | 2013(f) | ||||||||||
| Net Asset Value, Beginning of Year / Period | $ | 13.70 | $ | 12.16 | $ | 11.07 | ||||||
| Net Investment Income(a) | 0.29 | 0.29 | 0.21 | |||||||||
| Net Realized And Unrealized Gains | 0.08 | 1.99 | 1.19 | |||||||||
| Total from Investment Operations | $ | 0.37 | $ | 2.28 | $ | 1.40 | ||||||
| Distributions: | ||||||||||||
| from Net Investment Income | (0.30 | ) | (0.29 | ) | (0.23 | ) | ||||||
| from Net Realized Gains | (0.63 | ) | (0.45 | ) | (0.08 | ) | ||||||
| Total Distributions to Shareholders | $ | (0.93 | ) | $ | (0.74 | ) | $ | (0.31 | ) | |||
| Redemption fees(a) | — | — | — | |||||||||
| Net Asset Value, End of Year / Period | $ | 13.14 | $ | 13.70 | $ | 12.16 | ||||||
| Total Return | 2.60 | % | 19.30 | % | 12.88 | %(b) | ||||||
| Net Assets at End of Year / Period (000’s Omitted) | $ | 18,134 | $ | 17,663 | $ | 11 | ||||||
| Ratios to Average Net Assets: | ||||||||||||
| Net Investment Income | 2.16 | % | 2.23 | % | 2.53 | %(c) | ||||||
| Net Expenses | 0.75 | % | 0.77 | % | 0.80 | %(c) | ||||||
| Gross Expenses(d) | 0.75 | % | 0.77 | % | 0.80 | %(c) | ||||||
| Portfolio Turnover Rate | 18 | % | 32 | % | 21 | %(e) | ||||||
| (a) | Calculated based on average shares outstanding during the year / period. |
| (b) | Not annualized. |
| (c) | Annualized. |
| (d) | Reflects the expense ratio excluding any waivers and/or expense reimbursements. |
| (e) | Reflects portfolio turnover at the Fund level for the year ended June 30, 2013. |
| (f) | Commenced operations on October 19, 2012. The information presented is for the period from October 19, 2012 to June 30, 2013. |
The accompanying notes are an integral part of these financial statements.
www.brownadvisoryfunds.com
123
Financial Highlights
These financial highlights reflect selected per share data and ratios for a share outstanding of the Fund throughout each year / period.
BROWN ADVISORY EQUITY INCOME FUND
INVESTOR SHARES*
| Year / Period Ended: | ||||||||||||||||
| June 30, | June 30, | June 30, | June 30, | |||||||||||||
| 2015 | 2014 | 2013 | 2012(f) | |||||||||||||
| Net Asset Value, Beginning of Year / Period | $ | 13.69 | $ | 12.16 | $ | 10.49 | $ | 10.00 | ||||||||
| Net Investment Income(a) | 0.27 | 0.27 | 0.27 | 0.15 | ||||||||||||
| Net Realized And Unrealized Gains | 0.08 | 1.98 | 1.76 | 0.46 | ||||||||||||
| Total from Investment Operations | $ | 0.35 | $ | 2.25 | $ | 2.03 | $ | 0.61 | ||||||||
| Distributions: | ||||||||||||||||
| from Net Investment Income | (0.28 | ) | (0.27 | ) | (0.28 | ) | (0.12 | ) | ||||||||
| from Net Realized Gains | (0.63 | ) | (0.45 | ) | (0.08 | ) | — | |||||||||
| Total Distributions to Shareholders | $ | (0.91 | ) | $ | (0.72 | ) | $ | (0.36 | ) | $ | (0.12 | ) | ||||
| Redemption fees(a) | — | — | — | (e) | — | (e) | ||||||||||
| Net Asset Value, End of Year / Period | $ | 13.13 | $ | 13.69 | $ | 12.16 | $ | 10.49 | ||||||||
| Total Return | 2.45 | % | 19.04 | % | 19.62 | % | 6.11 | %(b) | ||||||||
| Net Assets at End of Year / Period (000’s Omitted) | $ | 183,001 | $ | 180,372 | $ | 173,599 | $ | 106,075 | ||||||||
| Ratios to Average Net Assets: | ||||||||||||||||
| Net Investment Income | 2.01 | % | 2.08 | % | 2.37 | % | 2.82 | %(c) | ||||||||
| Net Expenses | 0.90 | % | 0.92 | % | 0.96 | % | 0.99 | %(c) | ||||||||
| Gross Expenses(d) | 0.90 | % | 0.92 | % | 0.96 | % | 0.99 | %(c) | ||||||||
| Portfolio Turnover Rate | 18 | % | 32 | % | 21 | % | 14 | %(b) | ||||||||
| (a) | Calculated based on average shares outstanding during the year / period. |
| (b) | Not annualized. |
| (c) | Annualized. |
| (d) | Reflects the expense ratio excluding any waivers and/or expense reimbursements. |
| (e) | Less than $0.01 per share. |
| (f) | Commenced operations on December 29, 2011. The information presented is for the period from December 29, 2011 to June 30, 2012. |
| * | Prior to October 19, 2012, Investor Shares were known as Institutional Shares. |
The accompanying notes are an integral part of these financial statements.
www.brownadvisoryfunds.com
124
Financial Highlights
These financial highlights reflect selected per share data and ratios for a share outstanding of the Fund throughout each year / period.
BROWN ADVISORY EQUITY INCOME FUND
ADVISOR SHARES
| Year / Period Ended: | ||||||||||||||||
| June 30, | June 30, | June 30, | June 30, | |||||||||||||
| 2015 | 2014 | 2013 | 2012(f) | |||||||||||||
| Net Asset Value, Beginning of Year / Period | $ | 13.67 | $ | 12.14 | $ | 10.48 | $ | 10.00 | ||||||||
| Net Investment Income(a) | 0.24 | 0.24 | 0.25 | 0.14 | ||||||||||||
| Net Realized And Unrealized Gains | 0.07 | 1.98 | 1.75 | 0.46 | ||||||||||||
| Total from Investment Operations | $ | 0.31 | $ | 2.22 | $ | 2.00 | $ | 0.60 | ||||||||
| Distributions: | ||||||||||||||||
| from Net Investment Income | (0.24 | ) | (0.24 | ) | (0.26 | ) | (0.12 | ) | ||||||||
| from Net Realized Gains | (0.63 | ) | (0.45 | ) | (0.08 | ) | — | |||||||||
| Total Distributions to Shareholders | $ | (0.87 | ) | $ | (0.69 | ) | $ | (0.34 | ) | $ | (0.12 | ) | ||||
| Redemption fees(a) | — | — | — | — | (e) | |||||||||||
| Net Asset Value, End of Year / Period | $ | 13.11 | $ | 13.67 | $ | 12.14 | $ | 10.48 | ||||||||
| Total Return | 2.19 | % | 18.79 | % | 19.33 | % | 5.95 | %(b) | ||||||||
| Net Assets at End of Year / Period (000’s Omitted) | $ | 3,148 | $ | 3,298 | $ | 2,346 | $ | 636 | ||||||||
| Ratios to Average Net Assets: | ||||||||||||||||
| Net Investment Income | 1.76 | % | 1.83 | % | 2.13 | % | 2.60 | %(c) | ||||||||
| Net Expenses | 1.15 | % | 1.17 | % | 1.20 | % | 1.19 | %(c) | ||||||||
| Gross Expenses(d) | 1.15 | % | 1.17 | % | 1.20 | % | 1.19 | %(c) | ||||||||
| Portfolio Turnover Rate | 18 | % | 32 | % | 21 | % | 14 | %(b) | ||||||||
| (a) | Calculated based on average shares outstanding during the year / period. |
| (b) | Not annualized. |
| (c) | Annualized. |
| (d) | Reflects the expense ratio excluding any waivers and/or expense reimbursements. |
| (e) | Less than $0.01 per share. |
| (f) | Commenced operations on December 29, 2011. The information presented is for the period from December 29, 2011 to June 30, 2012. |
The accompanying notes are an integral part of these financial statements.
www.brownadvisoryfunds.com
125
Financial Highlights
These financial highlights reflect selected per share data and ratios for a share outstanding of the Fund throughout each year.
BROWN ADVISORY SUSTAINABLE GROWTH FUND*
INSTITUTIONAL SHARES
| Year Ended: | ||||||||||||
| June 30, | June 30, | June 30, | ||||||||||
| 2015 | 2014 | 2013 | ||||||||||
| Net Asset Value, Beginning of Year | $ | 14.11 | $ | 11.64 | $ | 10.00 | ||||||
| Net Investment Income (Loss)(a) | (0.02 | ) | — | — | ||||||||
| Net Realized And Unrealized Gains | 1.91 | 2.61 | 1.65 | |||||||||
| Total from Investment Operations | $ | 1.89 | $ | 2.61 | $ | 1.65 | ||||||
| Distributions: | ||||||||||||
| from Net Realized Gains | (0.31 | ) | (0.14 | ) | (0.01 | ) | ||||||
| Total Distributions to Shareholders | $ | (0.31 | ) | $ | (0.14 | ) | $ | (0.01 | ) | |||
| Redemption fees(a) | — | (c) | — | — | ||||||||
| Net Asset Value, End of Year | $ | 15.69 | $ | 14.11 | $ | 11.64 | ||||||
| Total Return | 13.50 | % | 22.51 | % | 16.47 | % | ||||||
| Net Assets at End of Year (000’s Omitted) | $ | 67,789 | $ | 30,374 | $ | 32,045 | ||||||
| Ratios to Average Net Assets: | ||||||||||||
| Net Investment Income (Loss) | (0.11 | )% | (0.01 | )% | 0.03 | % | ||||||
| Net Expenses | 0.75 | % | 0.77 | % | 0.86 | % | ||||||
| Gross Expenses(b) | 0.75 | % | 0.77 | % | 0.86 | % | ||||||
| Portfolio Turnover Rate | 37 | % | 30 | % | 30 | % | ||||||
| (a) | Calculated based on average shares outstanding during the year. |
| (b) | Reflects the expense ratio excluding any waivers and/or expense reimbursements. |
| (c) | Less than $0.01 per share. |
| * | Commenced operations on June 29, 2012. No financial highlights are presented for the period from June 29, 2012 to June 30, 2012, as the Fund did not make any investments, earn any income or incur any expenses during the period. |
The accompanying notes are an integral part of these financial statements.
www.brownadvisoryfunds.com
126
Financial Highlights
These financial highlights reflect selected per share data and ratios for a share outstanding of the Fund throughout each year.
BROWN ADVISORY SUSTAINABLE GROWTH FUND*
INVESTOR SHARES
| Year Ended: | ||||||||||||
| June 30, | June 30, | June 30, | ||||||||||
| 2015 | 2014 | 2013 | ||||||||||
| Net Asset Value, Beginning of Year | $ | 14.06 | $ | 11.62 | $ | 10.00 | ||||||
| Net Investment Loss(a) | (0.04 | ) | (0.02 | ) | (0.01 | ) | ||||||
| Net Realized And Unrealized Gains | 1.90 | 2.60 | 1.64 | |||||||||
| Total from Investment Operations | $ | 1.86 | $ | 2.58 | $ | 1.63 | ||||||
| Distributions: | ||||||||||||
| from Net Realized Gains | (0.31 | ) | (0.14 | ) | (0.01 | ) | ||||||
| Total Distributions to Shareholders | $ | (0.31 | ) | $ | (0.14 | ) | $ | (0.01 | ) | |||
| Redemption fees(a) | — | (c) | — | — | ||||||||
| Net Asset Value, End of Year | $ | 15.61 | $ | 14.06 | $ | 11.62 | ||||||
| Total Return | 13.34 | % | 22.29 | % | 16.27 | % | ||||||
| Net Assets at End of Year (000’s Omitted) | $ | 11,206 | $ | 46,823 | $ | 24,028 | ||||||
| Ratios to Average Net Assets: | ||||||||||||
| Net Investment Loss | (0.26 | )% | (0.16 | )% | (0.12 | )% | ||||||
| Net Expenses | 0.90 | % | 0.92 | % | 1.01 | % | ||||||
| Gross Expenses(b) | 0.90 | % | 0.92 | % | 1.01 | % | ||||||
| Portfolio Turnover Rate | 37 | % | 30 | % | 30 | % | ||||||
| (a) | Calculated based on average shares outstanding during the year. |
| (b) | Reflects the expense ratio excluding any waivers and/or expense reimbursements. |
| (c) | Less than $0.01 per share. |
| * | Commenced operations on June 29, 2012. No financial highlights are presented for the period from June 29, 2012 to June 30, 2012, as the Fund did not make any investments, earn any income or incur any expenses during the period. |
The accompanying notes are an integral part of these financial statements.
www.brownadvisoryfunds.com
127
Financial Highlights
These financial highlights reflect selected per share data and ratios for a share outstanding of the Fund throughout each year.
BROWN ADVISORY SUSTAINABLE GROWTH FUND*
ADVISOR SHARES
| Year Ended: | ||||||||||||
| June 30, | June 30, | June 30, | ||||||||||
| 2015 | 2014 | 2013 | ||||||||||
| Net Asset Value, Beginning of Year | $ | 14.00 | $ | 11.60 | $ | 10.00 | ||||||
| Net Investment Loss(a) | (0.07 | ) | (0.05 | ) | (0.04 | ) | ||||||
| Net Realized And Unrealized Gains | 1.88 | 2.59 | 1.65 | |||||||||
| Total from Investment Operations | $ | 1.81 | $ | 2.54 | $ | 1.61 | ||||||
| Distributions: | ||||||||||||
| from Net Realized Gains | (0.31 | ) | (0.14 | ) | (0.01 | ) | ||||||
| Total Distributions to Shareholders | $ | (0.31 | ) | $ | (0.14 | ) | $ | (0.01 | ) | |||
| Redemption fees(a) | — | (c) | — | (c) | — | (c) | ||||||
| Net Asset Value, End of Year | $ | 15.50 | $ | 14.00 | $ | 11.60 | ||||||
| Total Return | 13.03 | % | 21.99 | % | 16.07 | % | ||||||
| Net Assets at End of Year (000’s Omitted) | $ | 137,410 | $ | 132,846 | $ | 124,256 | ||||||
| Ratios to Average Net Assets: | ||||||||||||
| Net Investment Loss | (0.51 | )% | (0.41 | )% | (0.37 | )% | ||||||
| Net Expenses | 1.15 | % | 1.17 | % | 1.26 | % | ||||||
| Gross Expenses(b) | 1.15 | % | 1.17 | % | 1.26 | % | ||||||
| Portfolio Turnover Rate | 37 | % | 30 | % | 30 | % | ||||||
| (a) | Calculated based on average shares outstanding during the year. |
| (b) | Reflects the expense ratio excluding any waivers and/or expense reimbursements. |
| (c) | Less than $0.01 per share. |
| * | Commenced operations on June 29, 2012. No financial highlights are presented for the period from June 29, 2012 to June 30, 2012, as the Fund did not make any investments, earn any income or incur any expenses during the period. |
The accompanying notes are an integral part of these financial statements.
www.brownadvisoryfunds.com
128
Financial Highlights
These financial highlights reflect selected per share data and ratios for a share outstanding of the Fund throughout each year.
BROWN ADVISORY SMALL-CAP GROWTH FUND
INSTITUTIONAL SHARES*
| Year Ended: | ||||||||||||||||||||
| June 30, | June 30, | June 30, | June 30, | June 30, | ||||||||||||||||
| 2015 | 2014 | 2013 | 2012 | 2011 | ||||||||||||||||
| Net Asset Value, Beginning of Year | $ | 35.85 | $ | 31.67 | $ | 28.36 | $ | 29.56 | $ | 20.75 | ||||||||||
| Net Investment Loss(a) | (0.18 | ) | (0.22 | ) | (0.07 | ) | (0.21 | ) | (0.21 | ) | ||||||||||
| Net Realized And Unrealized Gains (Losses) | 4.45 | 6.08 | 6.07 | (0.72 | ) | 9.02 | ||||||||||||||
| Total from Investment Operations | $ | 4.27 | $ | 5.86 | $ | 6.00 | $ | (0.93 | ) | $ | 8.81 | |||||||||
| Distributions: | ||||||||||||||||||||
| from Net Realized Gains | (4.21 | ) | (1.68 | ) | (2.69 | ) | (0.27 | ) | — | |||||||||||
| Total Distributions to Shareholders | $ | (4.21 | ) | $ | (1.68 | ) | $ | (2.69 | ) | $ | (0.27 | ) | $ | — | ||||||
| Redemption fees(a) | — | — | — | — | — | |||||||||||||||
| Net Asset Value, End of Year | $ | 35.91 | $ | 35.85 | $ | 31.67 | $ | 28.36 | $ | 29.56 | ||||||||||
| Total Return | 12.98 | % | 18.59 | % | 22.84 | % | (3.08 | )% | 42.46 | % | ||||||||||
| Net Assets at End of Year (000’s Omitted) | $ | 12,841 | $ | 8,497 | $ | 7,347 | $ | 6,944 | $ | 8,732 | ||||||||||
| Ratios to Average Net Assets: | ||||||||||||||||||||
| Net Investment Loss | (0.51 | )% | (0.63 | )% | (0.24 | )% | (0.77 | )% | (0.80 | )% | ||||||||||
| Net Expenses | 0.99 | % | 1.01 | % | 1.05 | % | 1.11 | % | 1.13 | % | ||||||||||
| Gross Expenses(b) | 0.99 | % | 1.01 | % | 1.05 | % | 1.11 | % | 1.13 | % | ||||||||||
| Portfolio Turnover Rate | 28 | % | 19 | % | 48 | % | 66 | % | 61 | % | ||||||||||
| (a) | Calculated based on average shares outstanding during the year. |
| (b) | Reflects the expense ratio excluding any waivers and/or expense reimbursements. |
| * | Prior to October 19, 2012, Institutional Shares were known as D Shares. |
The accompanying notes are an integral part of these financial statements.
www.brownadvisoryfunds.com
129
Financial Highlights
These financial highlights reflect selected per share data and ratios for a share outstanding of the Fund throughout each year.
BROWN ADVISORY SMALL-CAP GROWTH FUND
INVESTOR SHARES*
| Year Ended: | ||||||||||||||||||||
| June 30, | June 30, | June 30, | June 30, | June 30, | ||||||||||||||||
| 2015 | 2014 | 2013 | 2012 | 2011 | ||||||||||||||||
| Net Asset Value, Beginning of Year | $ | 18.04 | $ | 15.96 | $ | 14.31 | $ | 15.07 | $ | 10.58 | ||||||||||
| Net Investment Loss(a) | (0.11 | ) | (0.14 | ) | (0.05 | ) | (0.11 | ) | (0.11 | ) | ||||||||||
| Net Realized And Unrealized Gains (Losses) | 2.24 | 3.07 | 3.06 | (0.38 | ) | 4.60 | ||||||||||||||
| Total from Investment Operations | $ | 2.13 | $ | 2.93 | $ | 3.01 | $ | (0.49 | ) | $ | 4.49 | |||||||||
| Distributions: | ||||||||||||||||||||
| from Net Realized Gains | (2.12 | ) | (0.85 | ) | (1.36 | ) | (0.27 | ) | — | |||||||||||
| Total Distributions to Shareholders | $ | (2.12 | ) | $ | (0.85 | ) | $ | (1.36 | ) | $ | (0.27 | ) | $ | — | ||||||
| Redemption fees(a) | — | (c) | — | (c) | — | (c) | — | (c) | — | |||||||||||
| Net Asset Value, End of Year | $ | 18.05 | $ | 18.04 | $ | 15.96 | $ | 14.31 | $ | 15.07 | ||||||||||
| Total Return | 12.86 | % | 18.42 | % | 22.68 | % | (3.12 | )% | 42.44 | % | ||||||||||
| Net Assets at End of Yeard (000’s Omitted) | $ | 262,426 | $ | 285,287 | $ | 281,027 | $ | 215,311 | $ | 208,222 | ||||||||||
| Ratios to Average Net Assets: | ||||||||||||||||||||
| Net Investment Loss | (0.66 | )% | (0.78 | )% | (0.36 | )% | (0.82 | )% | (0.85 | )% | ||||||||||
| Net Expenses | 1.14 | % | 1.16 | % | 1.17 | % | 1.16 | % | 1.18 | % | ||||||||||
| Gross Expenses(b) | 1.14 | % | 1.16 | % | 1.17 | % | 1.16 | % | 1.18 | % | ||||||||||
| Portfolio Turnover Rate | 28 | % | 19 | % | 48 | % | 66 | % | 61 | % | ||||||||||
| (a) | Calculated based on average shares outstanding during the year. |
| (b) | Reflects the expense ratio excluding any waivers and/or expense reimbursements. |
| (c) | Less than $0.01 per share. |
| * | Prior to October 19, 2012, Investor Shares were known as Institutional Shares. |
The accompanying notes are an integral part of these financial statements.
www.brownadvisoryfunds.com
130
Financial Highlights
These financial highlights reflect selected per share data and ratios for a share outstanding of the Fund throughout each year.
BROWN ADVISORY SMALL-CAP GROWTH FUND
ADVISOR SHARES*
| Year Ended: | ||||||||||||||||||||
| June 30, | June 30, | June 30, | June 30, | June 30, | ||||||||||||||||
| 2015 | 2014 | 2013 | 2012 | 2011 | ||||||||||||||||
| Net Asset Value, Beginning of Year | $ | 17.39 | $ | 15.43 | $ | 13.86 | $ | 14.65 | $ | 10.34 | ||||||||||
| Net Investment Loss(a) | (0.15 | ) | (0.18 | ) | (0.09 | ) | (0.14 | ) | (0.18 | ) | ||||||||||
| Net Realized And Unrealized Gains (Losses) | 2.15 | 2.96 | 2.97 | (0.38 | ) | 4.49 | ||||||||||||||
| Total from Investment Operations | $ | 2.00 | $ | 2.78 | $ | 2.88 | $ | (0.52 | ) | $ | 4.31 | |||||||||
| Distributions: | ||||||||||||||||||||
| from Net Realized Gains | (2.04 | ) | (0.82 | ) | (1.31 | ) | (0.27 | ) | — | |||||||||||
| Total Distributions to Shareholders | $ | (2.04 | ) | $ | (0.82 | ) | $ | (1.31 | ) | $ | (0.27 | ) | $ | — | ||||||
| Redemption fees(a) | — | — | — | — | (d) | — | ||||||||||||||
| Net Asset Value, End of Year | $ | 17.35 | $ | 17.39 | $ | 15.43 | $ | 13.86 | $ | 14.65 | ||||||||||
| Total Return(b) | 12.54 | % | 18.07 | % | 22.45 | % | (3.41 | )% | 41.68 | % | ||||||||||
| Net Assets at End of Year (000’s Omitted) | $ | 6,348 | $ | 7,300 | $ | 5,493 | $ | 2,875 | $ | 3,110 | ||||||||||
| Ratios to Average Net Assets: | ||||||||||||||||||||
| Net Investment Loss | (0.91 | )% | (1.03 | )% | (0.60 | )% | (1.07 | )% | (1.36 | )% | ||||||||||
| Net Expenses | 1.39 | % | 1.41 | % | 1.41 | % | 1.41 | % | 1.69 | % | ||||||||||
| Gross Expenses(c) | 1.39 | % | 1.41 | % | 1.41 | % | 1.41 | % | 1.69 | % | ||||||||||
| Portfolio Turnover Rate | 28 | % | 19 | % | 48 | % | 66 | % | 61 | % | ||||||||||
| (a) | Calculated based on average shares outstanding during the year. |
| (b) | Total return does not include the effects of sales charges which existed for Advisor Shares (then known as A Shares) for year ended June 30, 2011. |
| (c) | Reflects the expense ratio excluding any waivers and/or expense reimbursements. |
| (d) | Less than $0.01 per share. |
| * | Prior to July 1, 2011, Advisor Shares were known as A Shares. |
The accompanying notes are an integral part of these financial statements.
www.brownadvisoryfunds.com
131
Financial Highlights
These financial highlights reflect selected per share data and ratios for a share outstanding of the Fund throughout each year / period.
BROWN ADVISORY SMALL-CAP FUNDAMENTAL VALUE FUND
INSTITUTIONAL SHARES
| Year / Period Ended: | ||||||||||||
| June 30, | June 30, | June 30, | ||||||||||
| 2015 | 2014 | 2013(g) | ||||||||||
| Net Asset Value, Beginning of Year / Period | $ | 23.96 | $ | 20.06 | $ | 16.77 | ||||||
| Net Investment Income(a) | 0.10 | 0.12 | 0.06 | |||||||||
| Net Realized And Unrealized Gains | 0.86 | 4.91 | 3.30 | |||||||||
| Total from Investment Operations | $ | 0.96 | $ | 5.03 | $ | 3.36 | ||||||
| Distributions: | ||||||||||||
| from Net Investment Income | (0.14 | ) | (0.19 | ) | (0.07 | ) | ||||||
| from Net Realized Gains | (1.17 | ) | (0.94 | ) | — | |||||||
| Total Distributions to Shareholders | $ | (1.31 | ) | $ | (1.13 | ) | $ | (0.07 | ) | |||
| Redemption fees(a) | — | (e) | — | — | ||||||||
| Net Asset Value, End of Year / Period | $ | 23.61 | $ | 23.96 | $ | 20.06 | ||||||
| Total Return | 4.04 | % | 25.37 | % | 20.13 | %(b) | ||||||
| Net Assets at End of Year / Period (000’s Omitted) | $ | 75,994 | $ | 19,515 | $ | 1,061 | ||||||
| Ratios to Average Net Assets: | ||||||||||||
| Net Investment Income | 0.43 | % | 0.51 | % | 1.14 | %(c) | ||||||
| Net Expenses | 0.98 | % | 1.00 | % | 1.05 | %(c) | ||||||
| Gross Expenses(d) | 0.98 | % | 1.00 | % | 1.05 | %(c) | ||||||
| Portfolio Turnover Rate | 26 | % | 30 | % | 34 | %(f) | ||||||
| (a) | Calculated based on average shares outstanding during the year / period. |
| (b) | Not annualized. |
| (c) | Annualized. |
| (d) | Reflects the expense ratio excluding any waivers and/or expense reimbursements. |
| (e) | Less than $0.01 per share. |
| (f) | Reflects portfolio turnover at the Fund level for the year ended June 30, 2013. |
| (g) | Commenced operations on October 19, 2012. The information presented is for the period from October 19, 2012 to June 30, 2013. |
The accompanying notes are an integral part of these financial statements.
www.brownadvisoryfunds.com
132
Financial Highlights
These financial highlights reflect selected per share data and ratios for a share outstanding of the Fund throughout each year.
BROWN ADVISORY SMALL-CAP FUNDAMENTAL VALUE FUND
INVESTOR SHARES*
| Year Ended: | ||||||||||||||||||||
| June 30, | June 30, | June 30, | June 30, | June 30, | ||||||||||||||||
| 2015 | 2014 | 2013 | 2012 | 2011 | ||||||||||||||||
| Net Asset Value, Beginning of Year | $ | 23.94 | $ | 20.06 | $ | 15.65 | $ | 16.89 | $ | 11.92 | ||||||||||
| Net Investment Income (Loss)(a) | 0.07 | 0.08 | 0.18 | 0.10 | 0.11 | |||||||||||||||
| Net Realized And Unrealized Gains (Losses) | 0.86 | 4.90 | 4.29 | (0.51 | ) | 5.54 | ||||||||||||||
| Total from Investment Operations | $ | 0.93 | $ | 4.98 | $ | 4.47 | $ | (0.41 | ) | $ | 5.65 | |||||||||
| Distributions: | ||||||||||||||||||||
| from Net Investment Income | (0.11 | ) | (0.16 | ) | (0.06 | ) | (0.12 | ) | (0.08 | ) | ||||||||||
| from Net Realized Gains | (1.17 | ) | (0.94 | ) | — | (0.71 | ) | (0.60 | ) | |||||||||||
| Total Distributions to Shareholders | $ | (1.28 | ) | $ | (1.10 | ) | $ | (0.06 | ) | $ | (0.83 | ) | $ | (0.68 | ) | |||||
| Redemption fees(a) | — | (c) | — | (c) | — | (c) | — | (c) | — | (c) | ||||||||||
| Net Asset Value, End of Year | $ | 23.59 | $ | 23.94 | $ | 20.06 | $ | 15.65 | $ | 16.89 | ||||||||||
| Total Return | 3.90 | % | 25.13 | % | 28.64 | % | (1.90 | )% | 48.20 | % | ||||||||||
| Net Assets at End of Year (000’s Omitted) | $ | 748,003 | $ | 567,799 | $ | 371,018 | $ | 194,719 | $ | 107,537 | ||||||||||
| Ratios to Average Net Assets: | ||||||||||||||||||||
| Net Investment Income (Loss) | 0.28 | % | 0.36 | % | 1.01 | % | 0.64 | % | 0.70 | % | ||||||||||
| Net Expenses | 1.13 | % | 1.15 | % | 1.18 | % | 1.19 | % | 1.24 | % | ||||||||||
| Gross Expenses(b) | 1.13 | % | 1.15 | % | 1.18 | % | 1.19 | % | 1.24 | % | ||||||||||
| Portfolio Turnover Rate | 26 | % | 30 | % | 34 | % | 36 | % | 67 | % | ||||||||||
| (a) | Calculated based on average shares outstanding during the year. |
| (b) | Reflects the expense ratio excluding any waivers and/or expense reimbursements. |
| (c) | Less than $0.01 per share. |
| * | Prior to October 19, 2012, Investor Shares were known as Institutional Shares. |
The accompanying notes are an integral part of these financial statements.
www.brownadvisoryfunds.com
133
Financial Highlights
These financial highlights reflect selected per share data and ratios for a share outstanding of the Fund throughout each year / period.
BROWN ADVISORY SMALL-CAP FUNDAMENTAL VALUE FUND
ADVISOR SHARES
| Year / Period Ended: | ||||||||||||||||
| June 30, | June 30, | June 30, | June 30, | |||||||||||||
| 2015 | 2014 | 2013 | 2012(g) | |||||||||||||
| Net Asset Value, Beginning of Year / Period | $ | 23.87 | $ | 20.01 | $ | 15.63 | $ | 16.39 | ||||||||
| Net Investment Income(a) | 0.01 | 0.02 | 0.03 | 0.07 | ||||||||||||
| Net Realized And Unrealized Gains (Losses) | 0.85 | 4.89 | 4.38 | (0.01 | ) | |||||||||||
| Total from Investment Operations | $ | 0.86 | $ | 4.91 | $ | 4.41 | $ | 0.06 | ||||||||
| Distributions: | ||||||||||||||||
| from Net Investment Income | (0.08 | ) | (0.11 | ) | (0.03 | ) | (0.11 | ) | ||||||||
| from Net Realized Gains | (1.17 | ) | (0.94 | ) | — | (0.71 | ) | |||||||||
| Total Distributions to Shareholders | $ | (1.25 | ) | $ | (1.05 | ) | $ | (0.03 | ) | $ | (0.82 | ) | ||||
| Redemption fees(a) | — | (e) | — | (e) | — | — | (e) | |||||||||
| Net Asset Value, End of Year / Period | $ | 23.48 | $ | 23.87 | $ | 20.01 | $ | 15.63 | ||||||||
| Total Return | 3.61 | % | 24.83 | % | 28.28 | % | 0.90 | %(b) | ||||||||
| Net Assets at End of Year / Period (000’s Omitted) | $ | 58,583 | $ | 21,416 | $ | 15,764 | $ | 418 | ||||||||
| Ratios to Average Net Assets: | ||||||||||||||||
| Net Investment Income | 0.03 | % | 0.11 | % | 0.75 | % | 0.44 | %(c) | ||||||||
| Net Expenses | 1.38 | % | 1.40 | % | 1.44 | % | 1.39 | %(c) | ||||||||
| Gross Expenses(d) | 1.38 | % | 1.40 | % | 1.44 | % | 1.39 | %(c) | ||||||||
| Portfolio Turnover Rate | 26 | % | 30 | % | 34 | % | 36 | %(f) | ||||||||
| (a) | Calculated based on average shares outstanding during the year / period. |
| (b) | Not annualized. |
| (c) | Annualized. |
| (d) | Reflects the expense ratio excluding any waivers and/or expense reimbursements. |
| (e) | Less than $0.01 per share. |
| (f) | Reflects portfolio turnover at the Fund level for the year ended June 30, 2012. |
| (g) | Advisor Shares commenced operations July 28, 2011. The information presented is for the period from July 28, 2011 to June 30, 2012. |
The accompanying notes are an integral part of these financial statements.
www.brownadvisoryfunds.com
134
Financial Highlights
These financial highlights reflect selected per share data and ratios for a share outstanding of the Fund throughout each year.
BROWN ADVISORY OPPORTUNITY FUND
INVESTOR SHARES*
| Year Ended: | ||||||||||||||||||||
| June 30, | June 30, | June 30, | June 30, | June 30, | ||||||||||||||||
| 2015 | 2014 | 2013 | 2012 | 2011 | ||||||||||||||||
| Net Asset Value, Beginning of Year | $ | 22.99 | $ | 18.51 | $ | 14.97 | $ | 14.94 | $ | 11.03 | ||||||||||
| Net Investment Loss(a) | (0.13 | ) | (0.13 | ) | (0.05 | ) | (0.09 | ) | (0.10 | ) | ||||||||||
| Net Realized And Unrealized Gains (Losses) | 1.83 | 4.61 | 3.59 | 0.12 | 4.01 | |||||||||||||||
| Total from Investment Operations | $ | 1.70 | $ | 4.48 | $ | 3.54 | $ | 0.03 | $ | 3.91 | ||||||||||
| Redemption fees(a) | — | — | — | — | — | |||||||||||||||
| Net Asset Value, End of Year | $ | 24.69 | $ | 22.99 | $ | 18.51 | $ | 14.97 | $ | 14.94 | ||||||||||
| Total Return | 7.39 | % | 24.20 | % | 23.65 | % | 0.20 | % | 35.45 | % | ||||||||||
| Net Assets at End of Year (000’s Omitted) | $ | 10,705 | $ | 11,681 | $ | 9,173 | $ | 8,487 | $ | 11,692 | ||||||||||
| Ratios to Average Net Assets: | ||||||||||||||||||||
| Net Investment Loss | (0.57 | )% | (0.63 | )% | (0.29 | )% | (0.59 | )% | (0.75 | )% | ||||||||||
| Net Expenses | 1.50 | % | 1.50 | % | 1.50 | % | 1.50 | % | 1.50 | % | ||||||||||
| Gross Expenses(b) | 1.51 | % | 1.52 | % | 1.72 | % | 1.74 | % | 1.78 | % | ||||||||||
| Portfolio Turnover Rate | 44 | % | 41 | % | 54 | % | 76 | % | 65 | % | ||||||||||
| (a) | Calculated based on average shares outstanding during the year. |
| (b) | Reflects the expense ratio excluding any waivers and/or expense reimbursements. |
| * | Prior to October 19, 2012, Investor Shares were known as Institutional Shares. |
The accompanying notes are an integral part of these financial statements.
www.brownadvisoryfunds.com
135
Financial Highlights
These financial highlights reflect selected per share data and ratios for a share outstanding of the Fund throughout the period.
BROWN ADVISORY MULTI-STRATEGY FUND
INSTITUTIONAL SHARES
| Period Ended | ||||
| June 30, | ||||
| 2015(f) | ||||
| Net Asset Value, Beginning of Period | $ | 10.00 | ||
| Net Investment Loss(a) | (0.05 | ) | ||
| Net Realized And Unrealized Gains | 0.17 | |||
| Total from Investment Operations | $ | 0.12 | ||
| Distributions: | ||||
| from Net Investment Income | (0.05 | ) | ||
| Total Distributions to Shareholders | $ | (0.05 | ) | |
| Redemption fees(a) | — | |||
| Net Asset Value, End of Period | $ | 10.07 | ||
| Total Return | 1.23 | %(b) | ||
| Net Assets at End of Period (000’s Omitted) | $ | 2,319 | ||
| Ratios to Average Net Assets: | ||||
| Net Investment Loss(g) | (0.67 | )%(c) | ||
| Net Expenses(h) | 1.44 | %(c)(e) | ||
| Gross Expenses(d)(h) | 3.05 | %(c) | ||
| Portfolio Turnover Rate | 53 | %(b) | ||
| (a) | Calculated based on average shares outstanding during the period. |
| (b) | Not annualized. |
| (c) | Annualized. |
| (d) | Reflects the expense ratio excluding any waivers and/or expense reimbursements. |
| (e) | Effective May 7, 2015, the Fund lowered its expense cap from 1.60% to 1.10%. For the period from May 7, 2015 to June 30, 2015, the net expense ratio was 1.10%. |
| (f) | Commenced operations on October 31, 2014. The information presented is for the period from October 31, 2014 to June 30, 2015. |
| (g) | The Net Investment Loss ratio includes income actually earned and received by the Fund from the dividend distributions made to it by the underlying investment companies in which it invests, as disclosed on the Statement of Operations and in further detail within the “Investments in Affiliates – Multi-Strategy Fund” section of Note 3. The Net Investment Loss ratio does not include any other pro-rata amounts of the net investment income of the underlying investment companies in which it invests. |
| (h) | The Gross and Net Expense ratios include the actual gross and net expenses incurred by the Fund as disclosed on the Statement of Operations. The Gross and Net Expense ratios do not include any other pro-rata amounts of expenses incurred by the underlying investment companies in which the Fund invests (known as Acquired Fund Fees and Expenses). |
The accompanying notes are an integral part of these financial statements.
www.brownadvisoryfunds.com
136
Financial Highlights
These financial highlights reflect selected per share data and ratios for a share outstanding of the Fund throughout each year.
BROWN ADVISORY INTERMEDIATE INCOME FUND
INVESTOR SHARES*
| Year Ended: | ||||||||||||||||||||
| June 30, | June 30, | June 30, | June 30, | June 30, | ||||||||||||||||
| 2015 | 2014 | 2013 | 2012 | 2011 | ||||||||||||||||
| Net Asset Value, Beginning of Year | $ | 10.74 | $ | 10.85 | $ | 11.37 | $ | 11.28 | $ | 11.23 | ||||||||||
| Net Investment Income(a) | 0.19 | 0.17 | 0.19 | 0.24 | 0.31 | |||||||||||||||
| Net Realized And Unrealized Gains (Losses) | (0.08 | ) | 0.12 | (0.26 | ) | 0.36 | 0.11 | |||||||||||||
| Total from Investment Operations | $ | 0.11 | $ | 0.29 | $ | (0.07 | ) | $ | 0.60 | $ | 0.42 | |||||||||
| Distributions: | ||||||||||||||||||||
| from Net Investment Income | (0.22 | ) | (0.18 | ) | (0.25 | ) | (0.25 | ) | (0.33 | ) | ||||||||||
| from Net Realized Gains | — | (0.22 | ) | (0.20 | ) | (0.26 | ) | (0.04 | ) | |||||||||||
| Total Distributions to Shareholders | $ | (0.22 | ) | $ | (0.40 | ) | $ | (0.45 | ) | $ | (0.51 | ) | $ | (0.37 | ) | |||||
| Redemption fees(a) | — | (e) | — | (e) | — | (e) | — | (e) | — | (e) | ||||||||||
| Net Asset Value, End of Year | $ | 10.63 | $ | 10.74 | $ | 10.85 | $ | 11.37 | $ | 11.28 | ||||||||||
| Total Return | 1.01 | % | 2.66 | % | (0.72 | )% | 5.42 | % | 3.84 | % | ||||||||||
| Net Assets at End of Year (000’s Omitted) | $ | 140,006 | $ | 207,371 | $ | 241,543 | $ | 292,556 | $ | 255,847 | ||||||||||
| Ratios to Average Net Assets: | ||||||||||||||||||||
| Net Investment Income(b) | 1.78 | % | 1.54 | % | 1.66 | % | 2.15 | % | 2.75 | % | ||||||||||
| Net Expenses(c) | 0.45 | % | 0.52 | % | 0.52 | % | 0.50 | % | 0.52 | % | ||||||||||
| Gross Expenses(c)(d) | 0.50 | % | 0.52 | % | 0.52 | % | 0.50 | % | 0.52 | % | ||||||||||
| Portfolio Turnover Rate | 130 | % | 162 | % | 111 | % | 75 | % | 84 | % | ||||||||||
| (a) | Calculated based on average shares outstanding during the year. |
| (b) | The Net Investment Income ratio includes income actually earned by the Fund from its investments in fixed income securities as well as from dividend distributions made to it by the underlying investment companies in which it invests, as disclosed on the Statement of Operations and in further detail within the “Investments in Affiliates – Intermediate Income Fund” section of Note 3. The Net Investment Income ratio does not include any other pro-rata amounts of the net investment income of the underlying investment companies in which it invests. |
| (c) | The Gross and Net Expense ratios include the actual gross and net expenses incurred by the Fund as disclosed on the Statement of Operations. The Gross and Net Expense ratios do not include any other pro-rata amounts of expenses incurred by the underlying investment companies in which the Fund invests (known as Acquired Fund Fees and Expenses). For further details regarding the expenses waived in this fund, refer to the “Investments in Affiliates – Intermediate Income Fund” section of Note 3. |
| (d) | Reflects the expense ratio excluding any waivers and/or expense reimbursements. |
| (e) | Less than $0.01 per share. |
| * | Prior to October 19, 2012, Investor Shares were known as Institutional Shares. |
The accompanying notes are an integral part of these financial statements.
www.brownadvisoryfunds.com
137
Financial Highlights
These financial highlights reflect selected per share data and ratios for a share outstanding of the Fund throughout each year.
BROWN ADVISORY INTERMEDIATE INCOME FUND
ADVISOR SHARES*
| Year Ended: | ||||||||||||||||||||
| June 30, | June 30, | June 30, | June 30, | June 30, | ||||||||||||||||
| 2015 | 2014 | 2013 | 2012 | 2011 | ||||||||||||||||
| Net Asset Value, Beginning of Year | $ | 10.53 | $ | 10.65 | $ | 11.16 | $ | 11.08 | $ | 11.04 | ||||||||||
| Net Investment Income(a) | 0.16 | 0.14 | 0.16 | 0.22 | 0.28 | |||||||||||||||
| Net Realized And Unrealized Gains (Losses) | (0.08 | ) | 0.11 | (0.25 | ) | 0.35 | 0.11 | |||||||||||||
| Total from Investment Operations | $ | 0.08 | $ | 0.25 | $ | (0.09 | ) | $ | 0.57 | $ | 0.39 | |||||||||
| Distributions: | ||||||||||||||||||||
| from Net Investment Income | (0.19 | ) | (0.15 | ) | (0.22 | ) | (0.23 | ) | (0.31 | ) | ||||||||||
| from Net Realized Gains | — | (0.22 | ) | (0.20 | ) | (0.26 | ) | (0.04 | ) | |||||||||||
| Total Distributions to Shareholders | $ | (0.19 | ) | $ | (0.37 | ) | $ | (0.42 | ) | $ | (0.49 | ) | $ | (0.35 | ) | |||||
| Redemption fees(a) | — | — | — | — | (f) | — | ||||||||||||||
| Net Asset Value, End of Year | $ | 10.42 | $ | 10.53 | $ | 10.65 | $ | 11.16 | $ | 11.08 | ||||||||||
| Total Return(b) | 0.78 | % | 2.36 | % | (0.87 | )% | 5.21 | % | 3.60 | % | ||||||||||
| Net Assets at End of Year (000’s Omitted) | $ | 9,608 | $ | 12,613 | $ | 16,149 | $ | 19,540 | $ | 22,647 | ||||||||||
| Ratios to Average Net Assets: | ||||||||||||||||||||
| Net Investment Income(c) | 1.53 | % | 1.29 | % | 1.43 | % | 1.94 | % | 2.54 | % | ||||||||||
| Net Expenses(d) | 0.70 | % | 0.77 | % | 0.75 | % | 0.71 | % | 0.72 | % | ||||||||||
| Gross Expenses(d)(e) | 0.75 | % | 0.77 | % | 0.75 | % | 0.71 | % | 0.72 | % | ||||||||||
| Portfolio Turnover Rate | 130 | % | 162 | % | 111 | % | 75 | % | 84 | % | ||||||||||
| (a) | Calculated based on average shares outstanding during the year. |
| (b) | Total return does not include the effects of sales charges which existed for Advisor Shares (then known as A Shares) for year ended June 30, 2011. |
| (c) | The Net Investment Income ratio includes income actually earned by the Fund from its investments in fixed income securities as well as from dividend distributions made to it by the underlying investment companies in which it invests, as disclosed on the Statement of Operations and in further detail within the “Investments in Affiliates – Intermediate Income Fund” section of Note 3. The Net Investment Income ratio does not include any other pro-rata amounts of the net investment income of the underlying investment companies in which it invests. |
| (d) | The Gross and Net Expense ratios include the actual gross and net expenses incurred by the Fund as disclosed on the Statement of Operations. The Gross and Net Expense ratios do not include any other pro-rata amounts of expenses incurred by the underlying investment companies in which the Fund invests (known as Acquired Fund Fees and Expenses). For further details regarding the expenses waived in this fund, refer to the “Investments in Affiliates – Intermediate Income Fund” section of Note 3. |
| (e) | Reflects the expense ratio excluding any waivers and/or expense reimbursements. |
| (f) | Less than $0.01 per share. |
| * | Prior to July 1, 2011, Advisor Shares were known as A Shares. |
The accompanying notes are an integral part of these financial statements.
www.brownadvisoryfunds.com
138
Financial Highlights
These financial highlights reflect selected per share data and ratios for a share outstanding of the Fund throughout the period.
BROWN ADVISORY TOTAL RETURN FUND
INSTITUTIONAL SHARES
| Period Ended | ||||
| June 30, | ||||
| 2015(e) | ||||
| Net Asset Value, Beginning of Period | $ | 10.00 | ||
| Net Investment Income(a) | 0.13 | |||
| Net Realized And Unrealized Losses | (0.19 | ) | ||
| Total from Investment Operations | $ | (0.06 | ) | |
| Distributions: | ||||
| from Net Investment Income | (0.11 | ) | ||
| Total Distributions to Shareholders | $ | (0.11 | ) | |
| Redemption fees(a) | — | |||
| Net Asset Value, End of Period | $ | 9.83 | ||
| Total Return | (0.60 | )%(b) | ||
| Net Assets at End of Period (000’s Omitted) | $ | 73,735 | ||
| Ratios to Average Net Assets: | ||||
| Net Investment Income | 1.89 | %(c) | ||
| Net Expenses | 0.54 | %(c) | ||
| Gross Expenses(d) | 0.54 | %(c) | ||
| Portfolio Turnover Rate | 235 | %(b) | ||
| (a) | Calculated based on average shares outstanding during the period. |
| (b) | Not annualized. |
| (c) | Annualized. |
| (d) | Reflects the expense ratio excluding any waivers and/or expense reimbursements. |
| (e) | Commenced operations on October 30, 2014. The information presented is for the period from October 30, 2014 to June 30, 2015. |
The accompanying notes are an integral part of these financial statements.
www.brownadvisoryfunds.com
139
Financial Highlights
These financial highlights reflect selected per share data and ratios for a share outstanding of the Fund throughout the period.
BROWN ADVISORY TOTAL RETURN FUND
INVESTOR SHARES
| Period Ended | ||||
| June 30, | ||||
| 2015(e) | ||||
| Net Asset Value, Beginning of Period | $ | 10.00 | ||
| Net Investment Income(a) | 0.12 | |||
| Net Realized And Unrealized Losses | (0.18 | ) | ||
| Total from Investment Operations | $ | (0.06 | ) | |
| Distributions: | ||||
| from Net Investment Income | (0.11 | ) | ||
| Total Distributions to Shareholders | $ | (0.11 | ) | |
| Redemption fees(a) | — | |||
| Net Asset Value, End of Period | $ | 9.83 | ||
| Total Return | (0.63 | )%(b) | ||
| Net Assets at End of Period (000’s Omitted) | $ | 9,081 | ||
| Ratios to Average Net Assets: | ||||
| Net Investment Income | 1.84 | %(c) | ||
| Net Expenses | 0.59 | %(c) | ||
| Gross Expenses(d) | 0.59 | %(c) | ||
| Portfolio Turnover Rate | 235 | %(b) | ||
| (a) | Calculated based on average shares outstanding during the period. |
| (b) | Not annualized. |
| (c) | Annualized. |
| (d) | Reflects the expense ratio excluding any waivers and/or expense reimbursements. |
| (e) | Commenced operations on October 30, 2014. The information presented is for the period from October 30, 2014 to June 30, 2015. |
The accompanying notes are an integral part of these financial statements.
www.brownadvisoryfunds.com
140
Financial Highlights
These financial highlights reflect selected per share data and ratios for a share outstanding of the Fund throughout the period.
BROWN ADVISORY STRATEGIC BOND FUND
INVESTOR SHARES
| Period Ended | ||||
| June 30, | ||||
| 2015(f) | ||||
| Net Asset Value, Beginning of Period | $ | 10.07 | ||
| Net Investment Income(a) | 0.16 | |||
| Net Realized And Unrealized Gains (Losses) | (0.35 | ) | ||
| Total from Investment Operations | $ | (0.19 | ) | |
| Distributions: | ||||
| from Net Investment Income | (0.05 | ) | ||
| Total Distributions to Shareholders | $ | (0.05 | ) | |
| Redemption fees(a) | — | |||
| Net Asset Value, End of Period | $ | 9.83 | ||
| Total Return | (1.85 | )%(b) | ||
| Net Assets at End of Period (000’s Omitted) | $ | 59,680 | ||
| Ratios to Average Net Assets: | ||||
| Net Investment Income | 2.42 | %(c) | ||
| Net Expenses | 0.70 | %(c) | ||
| Gross Expenses(d) | 0.72 | %(c) | ||
| Portfolio Turnover Rate | 317 | %(e) | ||
| (a) | Calculated based on average shares outstanding during the period. |
| (b) | Not annualized |
| (c) | Annualized |
| (d) | Reflects the expense ratio excluding any waivers and/or expense reimbursements. |
| (e) | Reflects portfolio turnover at the Fund level for the year ended June 30, 2015. |
| (f) | Commenced operations on October 31, 2014. The information presented, other than portfolio turnover, is for the period from October 31, 2014 to June 30, 2015. Portfolio Turnover is calculated at the fund level and is for the entire year ended June 30, 2015. |
The accompanying notes are an integral part of these financial statements.
www.brownadvisoryfunds.com
141
Financial Highlights
These financial highlights reflect selected per share data and ratios for a share outstanding of the Fund throughout each year / period.
BROWN ADVISORY STRATEGIC BOND FUND
ADVISOR SHARES
| Year / Period Ended: | ||||||||||||||||
| June 30, | June 30, | June 30, | June 30, | |||||||||||||
| 2015 | 2014 | 2013 | 2012(g) | |||||||||||||
| Net Asset Value, Beginning of Year / Period | $ | 10.04 | $ | 9.68 | $ | 9.68 | $ | 10.00 | ||||||||
| Net Investment Income (Loss)(a) | 0.19 | (0.01 | ) | (0.09 | ) | (0.04 | ) | |||||||||
| Net Realized And Unrealized Gains (Losses) | (0.37 | ) | 0.42 | 0.29 | (0.27 | ) | ||||||||||
| Total from Investment Operations | $ | (0.18 | ) | $ | 0.41 | $ | 0.20 | $ | (0.31 | ) | ||||||
| Distributions: | ||||||||||||||||
| from Net Investment Income | (0.04 | ) | (0.05 | ) | (0.20 | ) | (0.01 | ) | ||||||||
| Total Distributions to Shareholders | $ | (0.04 | ) | $ | (0.05 | ) | $ | (0.20 | ) | $ | (0.01 | ) | ||||
| Redemption fees(a) | — | — | — | (e) | — | (e) | ||||||||||
| Net Asset Value, End of Year / Period | $ | 9.82 | $ | 10.04 | $ | 9.68 | $ | 9.68 | ||||||||
| Total Return | (1.80 | )% | 4.22 | % | 2.09 | % | (3.09 | )%(b) | ||||||||
| Net Assets at End of Year / Period (000’s Omitted) | $ | 1,692 | $ | 24,399 | $ | 25,570 | $ | 29,541 | ||||||||
| Ratios to Average Net Assets: | ||||||||||||||||
| Net Investment Income (Loss) | 1.91 | % | (0.07 | )% | (0.87 | )% | (0.56 | )%(c) | ||||||||
| Net Expenses | 1.21 | %(f) | 1.33 | % | 1.40 | % | 1.40 | %(c) | ||||||||
| Gross Expenses(d) | 1.22 | %(f) | 1.33 | % | 1.40 | % | 1.40 | %(c) | ||||||||
| Portfolio Turnover Rate | 317 | % | 1010 | % | 992 | % | 1290 | %(b) | ||||||||
| (a) | Calculated based on average shares outstanding during the year / period. |
| (b) | Not annualized |
| (c) | Annualized |
| (d) | Reflects the expense ratio excluding any waivers and/or expense reimbursements. |
| (e) | Less than $0.01 per share. |
| (f) | On October 31, 2014, the expense cap for this share class was lowered to 0.95%. For the period from October 31, 2014 to June 30, 2015, the net and gross expense ratios were 0.95% and 0.97%, respectively. |
| (g) | Commenced operations on September 30, 2011. The information presented is for the period from September 30, 2011 to June 30, 2012. |
The accompanying notes are an integral part of these financial statements.
www.brownadvisoryfunds.com
142
Financial Highlights
These financial highlights reflect selected per share data and ratios for a share outstanding of the Fund throughout each year.
BROWN ADVISORY MARYLAND BOND FUND
INVESTOR SHARES*
| Year Ended: | ||||||||||||||||||||
| June 30, | June 30, | June 30, | June 30, | June 30, | ||||||||||||||||
| 2015 | 2014 | 2013 | 2012 | 2011 | ||||||||||||||||
| Net Asset Value, Beginning of Year | $ | 10.82 | $ | 10.81 | $ | 11.06 | $ | 10.85 | $ | 10.81 | ||||||||||
| Net Investment Income(a) | 0.18 | 0.21 | 0.21 | 0.25 | 0.25 | |||||||||||||||
| Net Realized And Unrealized Gains (Losses) | (0.12 | ) | 0.10 | (0.23 | ) | 0.26 | 0.04 | |||||||||||||
| Total from Investment Operations | $ | 0.06 | $ | 0.31 | $ | (0.02 | ) | $ | 0.51 | $ | 0.29 | |||||||||
| Distributions: | ||||||||||||||||||||
| from Net Investment Income | (0.18 | ) | (0.21 | ) | (0.21 | ) | (0.25 | ) | (0.25 | ) | ||||||||||
| from Net Realized Gains | (0.05 | ) | (0.09 | ) | (0.02 | ) | (0.05 | ) | — | |||||||||||
| Total Distributions to Shareholders | $ | (0.23 | ) | $ | (0.30 | ) | $ | (0.23 | ) | $ | (0.30 | ) | $ | (0.25 | ) | |||||
| Redemption fees(a) | — | (c) | — | — | (c) | — | (c) | — | ||||||||||||
| Net Asset Value, End of Year | $ | 10.65 | $ | 10.82 | $ | 10.81 | $ | 11.06 | $ | 10.85 | ||||||||||
| Total Return | 0.58 | % | 2.94 | % | (0.25 | )% | 4.69 | % | 2.74 | % | ||||||||||
| Net Assets at End of Year (000’s Omitted) | $ | 199,469 | $ | 205,717 | $ | 252,166 | $ | 250,087 | $ | 188,180 | ||||||||||
| Ratios to Average Net Assets: | ||||||||||||||||||||
| Net Investment Income | 1.66 | % | 1.99 | % | 1.86 | % | 2.23 | % | 2.33 | % | ||||||||||
| Net Expenses | 0.49 | % | 0.52 | % | 0.52 | % | 0.51 | % | 0.51 | % | ||||||||||
| Gross Expenses(b) | 0.49 | % | 0.52 | % | 0.52 | % | 0.51 | % | 0.51 | % | ||||||||||
| Portfolio Turnover Rate | 61 | % | 56 | % | 30 | % | 16 | % | 29 | % | ||||||||||
| (a) | Calculated based on average shares outstanding during the year. |
| (b) | Reflects the expense ratio excluding any waivers and/or expense reimbursements. |
| (c) | Less than $0.01 per share. |
| * | Prior to October 19, 2012, Investor Shares were known as Institutional Shares. |
The accompanying notes are an integral part of these financial statements.
www.brownadvisoryfunds.com
143
Financial Highlights
These financial highlights reflect selected per share data and ratios for a share outstanding of each Fund throughout each year.
BROWN ADVISORY TAX EXEMPT BOND FUND*
INVESTOR SHARES
| Year Ended: | ||||||||||||
| June 30, | June 30, | June 30, | ||||||||||
| 2015 | 2014 | 2013 | ||||||||||
| Net Asset Value, Beginning of Year | $ | 10.03 | $ | 9.84 | $ | 10.00 | ||||||
| Net Investment Income(a) | 0.18 | 0.19 | 0.13 | |||||||||
| Net Realized And Unrealized Gains (Losses) | (0.10 | ) | 0.19 | (0.12 | ) | |||||||
| Total from Investment Operations | $ | 0.08 | $ | 0.38 | $ | 0.01 | ||||||
| Distributions: | ||||||||||||
| from Net Investment Income | (0.18 | ) | (0.19 | ) | (0.13 | ) | ||||||
| from Net Realized Gains | — | — | (e) | (0.04 | ) | |||||||
| Total Distributions to Shareholders | $ | (0.18 | ) | $ | (0.19 | ) | $ | (0.17 | ) | |||
| Redemption fees(a) | — | (c) | — | — | (c) | |||||||
| Net Asset Value, End of Year | $ | 9.93 | $ | 10.03 | $ | 9.84 | ||||||
| Total Return | 0.78 | % | 3.94 | % | 0.03 | % | ||||||
| Net Assets at End of Year (000’s Omitted) | $ | 224,154 | $ | 205,177 | $ | 161,891 | ||||||
| Ratios to Average Net Assets: | ||||||||||||
| Net Investment Income | 1.78 | % | 1.96 | % | 1.35 | % | ||||||
| Net Expenses | 0.50 | % | 0.52 | % | 0.55 | % | ||||||
| Gross Expenses(b) | 0.50 | % | 0.52 | % | 0.55 | % | ||||||
| Portfolio Turnover Rate | 109 | % | 157 | % | 87 | % | ||||||
| (a) | Calculated based on average shares outstanding during the year. |
| (b) | Reflects the expense ratio excluding any waivers and/or expense reimbursements. |
| (c) | Less than $0.01 per share. |
| * | Commenced operations on June 29, 2012. No financial highlights are presented for the period from June 29, 2012 to June 30, 2012, as the Fund did not make any investments, earn any income or incur any expenses during the period. |
The accompanying notes are an integral part of these financial statements.
www.brownadvisoryfunds.com
144
Financial Highlights
These financial highlights reflect selected per share data and ratios for a share outstanding of the Fund throughout each year / period.
BROWN ADVISORY MORTGAGE SECURITIES FUND
INSTITUTIONAL SHARES
| Year / Period Ended: | ||||||||
| June 30, | June 30, | |||||||
| 2015 | 2014(e) | |||||||
| Net Asset Value, Beginning of Year / Period | $ | 10.16 | $ | 10.15 | ||||
| Net Investment Income(a) | 0.27 | 0.03 | ||||||
| Net Realized And Unrealized Gains | 0.01 | 0.02 | ||||||
| Total from Investment Operations | $ | 0.28 | $ | 0.05 | ||||
| Distributions: | ||||||||
| from Net Investment Income | (0.30 | ) | (0.04 | ) | ||||
| from Realized Gains | (0.08 | ) | — | |||||
| Total Distributions to Shareholders | $ | (0.38 | ) | $ | (0.04 | ) | ||
| Redemption fees(a) | — | — | ||||||
| Net Asset Value, End of Year / Period | $ | 10.06 | $ | 10.16 | ||||
| Total Return | 2.74 | % | 0.49 | %(b) | ||||
| Net Assets at End of Year / Period (000’s Omitted) | $ | 206,299 | $ | 131,415 | ||||
| Ratios to Average Net Assets: | ||||||||
| Net Investment Income | 2.68 | % | 1.98 | %(c) | ||||
| Net Expenses | 0.47 | % | 0.52 | %(c) | ||||
| Gross Expenses(d) | 0.47 | % | 0.52 | %(c) | ||||
| Portfolio Turnover Rate | 147 | % | 88 | %(b) | ||||
| (a) | Calculated based on average shares outstanding during the year / period. |
| (b) | Not annualized. |
| (c) | Annualized. |
| (d) | Reflects the expense ratio excluding any waivers and/or expense reimbursements. |
| (e) | Commenced operations on May 13, 2014. The information presented is for the period from May 13, 2014 to June 30, 2014. |
The accompanying notes are an integral part of these financial statements.
www.brownadvisoryfunds.com
145
Financial Highlights
These financial highlights reflect selected per share data and ratios for a share outstanding of the Fund throughout each year / period.
BROWN ADVISORY MORTGAGE SECURITIES FUND
INVESTOR SHARES
| Year / Period Ended | ||||||||
| June 30, | June 30, | |||||||
| 2015 | 2014(e) | |||||||
| Net Asset Value, Beginning of Year / Period | $ | 10.16 | $ | 10.00 | ||||
| Net Investment Income(a) | 0.27 | 0.10 | ||||||
| Net Realized And Unrealized Gains | — | 0.16 | ||||||
| Total from Investment Operations | $ | 0.27 | $ | 0.26 | ||||
| Distributions: | ||||||||
| from Net Investment Income | (0.29 | ) | (0.10 | ) | ||||
| from Realized Gains | (0.08 | ) | — | |||||
| Total Distributions to Shareholders | $ | (0.37 | ) | $ | (0.10 | ) | ||
| Redemption fees(a) | — | — | ||||||
| Net Asset Value, End of Year / Period | $ | 10.06 | $ | 10.16 | ||||
| Total Return | 2.68 | % | 2.62 | %(b) | ||||
| Net Assets at End of Year / Period (000’s Omitted) | $ | 28,649 | $ | 67,776 | ||||
| Ratios to Average Net Assets: | ||||||||
| Net Investment Income | 2.63 | % | 1.93 | %(c) | ||||
| Net Expenses | 0.52 | % | 0.57 | %(c) | ||||
| Gross Expenses(d) | 0.52 | % | 0.57 | %(c) | ||||
| Portfolio Turnover Rate | 147 | % | 88 | %(b) | ||||
| (a) | Calculated based on average shares outstanding during the year / period. |
| (b) | Not annualized. |
| (c) | Annualized. |
| (d) | Reflects the expense ratio excluding any waivers and/or expense reimbursements. |
| (e) | Commenced operations on December 26, 2013. The information presented is for the period from December 26, 2013 to June 30, 2014. |
The accompanying notes are an integral part of these financial statements.
www.brownadvisoryfunds.com
146
Financial Highlights
These financial highlights reflect selected per share data and ratios for a share outstanding of the Fund throughout each year / period.
BROWN ADVISORY – WMC STRATEGIC EUROPEAN EQUITY FUND
INSTITUTIONAL SHARES
| Year / Period Ended: | ||||||||
| June 30, | June 30, | |||||||
| 2015 | 2014(e) | |||||||
| Net Asset Value, Beginning of Year / Period | $ | 10.46 | $ | 10.00 | ||||
| Net Investment Income (Loss)(a) | 0.14 | 0.14 | ||||||
| Net Realized And Unrealized Gains (Losses) | (0.29 | ) | 0.32 | |||||
| Total from Investment Operations | $ | (0.15 | ) | $ | 0.46 | |||
| Distributions: | ||||||||
| from Net Investment Income | (0.11 | ) | — | |||||
| Total Distributions to Shareholders | $ | (0.11 | ) | $ | — | |||
| Redemption fees(a) | — | — | ||||||
| Net Asset Value, End of Year / Period | $ | 10.20 | $ | 10.46 | ||||
| Total Return | (1.42 | )% | 4.60 | %(b) | ||||
| Net Assets at End of Year / Period (000’s Omitted) | $ | 240,182 | $ | 202,616 | ||||
| Ratios to Average Net Assets: | ||||||||
| Net Investment Income (Loss) | 1.35 | % | 2.01 | %(c) | ||||
| Net Expenses | 1.13 | % | 1.23 | %(c) | ||||
| Gross Expenses(d) | 1.13 | % | 1.23 | %(c) | ||||
| Portfolio Turnover Rate | 48 | % | 25 | %(b) | ||||
| (a) | Calculated based on average shares outstanding during the year / period. |
| (b) | Not annualized. |
| (c) | Annualized. |
| (d) | Reflects the expense ratio excluding any waivers and/or expense reimbursements. |
| (e) | Commenced operations on October 21, 2013. The information presented is for the period from October 21, 2013 to June 30, 2014. |
The accompanying notes are an integral part of these financial statements.
www.brownadvisoryfunds.com
147
Financial Highlights
These financial highlights reflect selected per share data and ratios for a share outstanding of the Fund throughout each Year / Period.
BROWN ADVISORY – WMC STRATEGIC EUROPEAN EQUITY FUND
INVESTOR SHARES
| Year / Period Ended: | ||||||||
| June 30, | June 30, | |||||||
| 2015 | 2014(f) | |||||||
| Net Asset Value, Beginning of Year / Period | $ | 10.45 | $ | 10.00 | ||||
| Net Investment Income (Loss)(a) | 0.12 | 0.13 | ||||||
| Net Realized And Unrealized Gains (Losses) | (0.29 | ) | 0.32 | |||||
| Total from Investment Operations | $ | (0.17 | ) | $ | 0.45 | |||
| Distributions: | ||||||||
| from Net Investment Income | (0.09 | ) | — | |||||
| Total Distributions to Shareholders | $ | (0.09 | ) | $ | — | |||
| Redemption fees(a) | — | (e) | — | |||||
| Net Asset Value, End of Year / Period | $ | 10.19 | $ | 10.45 | ||||
| Total Return | (1.56 | )% | 4.50 | %(b) | ||||
| Net Assets at End of Year / Period (000’s Omitted) | $ | 25,840 | $ | 18,011 | ||||
| Ratios to Average Net Assets: | ||||||||
| Net Investment Income (Loss) | 1.20 | % | 1.86 | %(c) | ||||
| Net Expenses | 1.28 | % | 1.38 | %(c) | ||||
| Gross Expenses(d) | 1.28 | % | 1.38 | %(c) | ||||
| Portfolio Turnover Rate | 48 | % | 25 | %(b) | ||||
| (a) | Calculated based on average shares outstanding during the year / period. |
| (b) | Not annualized. |
| (c) | Annualized. |
| (d) | Reflects the expense ratio excluding any waivers and/or expense reimbursements. |
| (e) | Less than $0.01 per share. |
| (f) | Commenced operations on October 21, 2013. The information presented is for the period from October 21, 2013 to June 30, 2014. |
The accompanying notes are an integral part of these financial statements.
www.brownadvisoryfunds.com
148
Financial Highlights
These financial highlights reflect selected per share data and ratios for a share outstanding of the Fund throughout each Year / Period.
BROWN ADVISORY – WMC STRATEGIC EUROPEAN EQUITY FUND
ADVISOR SHARES
| Year / Period Ended: | ||||||||
| June 30, | June 30, | |||||||
| 2015 | 2014(f) | |||||||
| Net Asset Value, Beginning of Year / Period | $ | 10.44 | $ | 10.00 | ||||
| Net Investment Income (Loss)(a) | 0.10 | 0.11 | ||||||
| Net Realized And Unrealized Gains (Losses) | (0.29 | ) | 0.33 | |||||
| Total from Investment Operations | $ | (0.19 | ) | $ | 0.44 | |||
| Distributions: | ||||||||
| from Net Investment Income | (0.08 | ) | — | |||||
| Total Distributions to Shareholders | $ | (0.08 | ) | $ | — | |||
| Redemption fees(a) | — | (e) | — | |||||
| Net Asset Value, End of Year / Period | $ | 10.17 | $ | 10.44 | ||||
| Total Return | (1.78 | )% | 4.40 | %(b) | ||||
| Net Assets at End of Year / Period (000’s Omitted) | $ | 1,076 | $ | 240 | ||||
| Ratios to Average Net Assets: | ||||||||
| Net Investment Income (Loss) | 0.95 | % | 1.61 | %(c) | ||||
| Net Expenses | 1.53 | % | 1.63 | %(c) | ||||
| Gross Expenses(d) | 1.53 | % | 1.63 | %(c) | ||||
| Portfolio Turnover Rate | 48 | % | 25 | %(b) | ||||
| (a) | Calculated based on average shares outstanding during the year / period. |
| (b) | Not annualized. |
| (c) | Annualized. |
| (d) | Reflects the expense ratio excluding any waivers and/or expense reimbursements. |
| (e) | Less than $0.01 per share. |
| (f) | Commenced operations on October 21, 2013. The information presented is for the period from October 21, 2013 to June 30, 2014. |
The accompanying notes are an integral part of these financial statements.
www.brownadvisoryfunds.com
149
Financial Highlights
These financial highlights reflect selected per share data and ratios for a share outstanding of the Fund throughout each Year / Period.
BROWN ADVISORY – WMC JAPAN ALPHA OPPORTUNITIES FUND
INSTITUTIONAL SHARES
| Year / Period Ended: | ||||||||
| June 30, | June 30, | |||||||
| 2015 | 2014(f) | |||||||
| Net Asset Value, Beginning of Year / Period | $ | 10.50 | $ | 10.00 | ||||
| Net Investment Income (Loss)(a) | 0.05 | 0.05 | ||||||
| Net Realized And Unrealized Gains | 2.86 | 0.45 | ||||||
| Total from Investment Operations | $ | 2.91 | $ | 0.50 | ||||
| Distributions: | ||||||||
| from Net Investment Income | (0.51 | ) | — | |||||
| from Realized Gains | (0.07 | ) | — | |||||
| Total Distributions to Shareholders | $ | (0.58 | ) | $ | — | |||
| Redemption fees(a) | — | (e) | — | |||||
| Net Asset Value, End of Year / Period | $ | 12.83 | $ | 10.50 | ||||
| Total Return | 28.62 | % | 5.00 | %(b) | ||||
| Net Assets at End of Year / Period (000’s Omitted) | $ | 1,582,214 | $ | 1,080,717 | ||||
| Ratios to Average Net Assets: | ||||||||
| Net Investment Income (Loss) | 0.41 | % | 1.59 | %(c) | ||||
| Net Expenses | 1.15 | % | 1.21 | %(c) | ||||
| Gross Expenses(d) | 1.15 | % | 1.21 | %(c) | ||||
| Portfolio Turnover Rate | 70 | % | 26 | %(b) | ||||
| (a) | Calculated based on average shares outstanding during the year / period. |
| (b) | Not annualized. |
| (c) | Annualized. |
| (d) | Reflects the expense ratio excluding any waivers and/or expense reimbursements. |
| (e) | Less than $0.01 per share. |
| (f) | Commenced operations on March 4, 2014. The information presented is for the period from March 4, 2014 to June 30, 2014. |
The accompanying notes are an integral part of these financial statements.
www.brownadvisoryfunds.com
150
Financial Highlights
These financial highlights reflect selected per share data and ratios for a share outstanding of the Fund throughout each Year / Period.
BROWN ADVISORY – WMC JAPAN ALPHA OPPORTUNITIES FUND
INVESTOR SHARES
| Year / Period Ended: | ||||||||
| June 30, | June 30, | |||||||
| 2015 | 2014(f) | |||||||
| Net Asset Value, Beginning of Year / Period | $ | 10.49 | $ | 10.00 | ||||
| Net Investment Income (Loss)(a) | 0.03 | 0.05 | ||||||
| Net Realized And Unrealized Gains | 2.87 | 0.44 | ||||||
| Total from Investment Operations | $ | 2.90 | $ | 0.49 | ||||
| Distributions: | ||||||||
| from Net Investment Income | (0.50 | ) | — | |||||
| from Realized Gains | (0.07 | ) | — | |||||
| Total Distributions to Shareholders | $ | (0.57 | ) | $ | — | |||
| Redemption fees(a) | — | (e) | — | |||||
| Net Asset Value, End of Year / Period | $ | 12.82 | $ | 10.49 | ||||
| Total Return | 28.57 | % | 4.90 | %(b) | ||||
| Net Assets at End of Period (000’s Omitted) | $ | 25,628 | $ | 4,522 | ||||
| Ratios to Average Net Assets: | ||||||||
| Net Investment Income (Loss) | 0.26 | % | 1.44 | %(c) | ||||
| Net Expenses | 1.30 | % | 1.36 | %(c) | ||||
| Gross Expenses(d) | 1.30 | % | 1.36 | %(c) | ||||
| Portfolio Turnover Rate | 70 | % | 26 | %(b) | ||||
| (a) | Calculated based on average shares outstanding during the year / period. |
| (b) | Not annualized. |
| (c) | Annualized. |
| (d) | Reflects the expense ratio excluding any waivers and/or expense reimbursements. |
| (e) | Less than $0.01 per share. |
| (f) | Commenced operations on March 4, 2014. The information presented is for the period from March 4, 2014 to June 30, 2014. |
The accompanying notes are an integral part of these financial statements.
www.brownadvisoryfunds.com
151
Financial Highlights
These financial highlights reflect selected per share data and ratios for a share outstanding of the Fund throughout each year / period.
BROWN ADVISORY – WMC JAPAN ALPHA OPPORTUNITIES FUND
ADVISOR SHARES
| Year / Period Ended: | ||||||||
| June 30, | June 30, | |||||||
| 2015 | 2014(e) | |||||||
| Net Asset Value, Beginning of Year / Period | $ | 10.48 | $ | 10.00 | ||||
| Net Investment Income (Loss)(a) | — | 0.04 | ||||||
| Net Realized And Unrealized Gains | 2.87 | 0.44 | ||||||
| Total from Investment Operations | $ | 2.87 | $ | 0.48 | ||||
| Distributions: | ||||||||
| from Net Investment Income | (0.49 | ) | — | |||||
| from Realized Gains | (0.07 | ) | — | |||||
| Total Distributions to Shareholders | $ | (0.56 | ) | $ | — | |||
| Redemption fees(a) | — | — | ||||||
| Net Asset Value, End of Year / Period | $ | 12.79 | $ | 10.48 | ||||
| Total Return | 28.22 | % | 4.80 | %(b) | ||||
| Net Assets at End of Year / Period (000’s Omitted) | $ | 1,670 | $ | 59 | ||||
| Ratios to Average Net Assets: | ||||||||
| Net Investment Income (Loss) | 0.01 | % | 1.19 | %(c) | ||||
| Net Expenses | 1.55 | % | 1.61 | %(c) | ||||
| Gross Expenses(d) | 1.55 | % | 1.61 | %(c) | ||||
| Portfolio Turnover Rate | 70 | % | 26 | %(b) | ||||
| (a) | Calculated based on average shares outstanding during the year / period. |
| (b) | Not annualized. |
| (c) | Annualized. |
| (d) | Reflects the expense ratio excluding any waivers and/or expense reimbursements. |
| (e) | Commenced operations on March 4, 2014. The information presented is for the period from March 4, 2014 to June 30, 2014. |
The accompanying notes are an integral part of these financial statements.
www.brownadvisoryfunds.com
152
Financial Highlights
These financial highlights reflect selected per share data and ratios for a share outstanding of the Fund throughout each year / period.
BROWN ADVISORY – SOMERSET EMERGING MARKETS FUND
INSTITUTIONAL SHARES
| Year / Period Ended: | ||||||||||||
| June 30, | June 30, | June 30, | ||||||||||
| 2015 | 2014 | 2013(f) | ||||||||||
| Net Asset Value, Beginning of Year / Period | $ | 10.22 | $ | 9.52 | $ | 10.00 | ||||||
| Net Investment Income(a) | 0.13 | 0.20 | 0.12 | |||||||||
| Net Realized And Unrealized Gains (Losses) | (0.46 | ) | 0.61 | (0.60 | ) | |||||||
| Total from Investment Operations | $ | (0.33 | ) | $ | 0.81 | $ | (0.48 | ) | ||||
| Distributions: | ||||||||||||
| from Net Investment Income | (0.15 | ) | (0.11 | ) | — | (e) | ||||||
| Total Distributions to Shareholders | $ | (0.15 | ) | $ | (0.11 | ) | $ | — | (e) | |||
| Redemption fees(a) | — | — | — | (e) | ||||||||
| Net Asset Value, End of Year / Period | $ | 9.74 | $ | 10.22 | $ | 9.52 | ||||||
| Total Return | (3.22 | )% | 8.62 | % | (4.77 | )%(b) | ||||||
| Net Assets at End of Year / Period (000’s Omitted) | $ | 268,530 | $ | 193,676 | $ | 122,515 | ||||||
| Ratios to Average Net Assets: | ||||||||||||
| Net Investment Income | 1.31 | % | 2.08 | % | 2.17 | %(c) | ||||||
| Net Expenses | 1.22 | % | 1.25 | % | 1.41 | %(c) | ||||||
| Gross Expenses(d) | 1.22 | % | 1.25 | % | 1.41 | %(c) | ||||||
| Portfolio Turnover Rate | 22 | % | 19 | % | 19 | %(b) | ||||||
| (a) | Calculated based on average shares outstanding during the year / period. |
| (b) | Not annualized. |
| (c) | Annualized. |
| (d) | Reflects the expense ratio excluding any waivers and/or expense reimbursements. |
| (e) | Less than $0.01 per share. |
| (f) | Commenced operations on December 12, 2012. The information presented is for the period from December 12, 2012 to June 30, 2013. |
The accompanying notes are an integral part of these financial statements.
www.brownadvisoryfunds.com
153
Financial Highlights
These financial highlights reflect selected per share data and ratios for a share outstanding of the Fund throughout each year / period.
BROWN ADVISORY – SOMERSET EMERGING MARKETS FUND
INVESTOR SHARES
| Year / Period Ended: | ||||||||||||
| June 30, | June 30, | June 30, | ||||||||||
| 2015 | 2014 | 2013(f) | ||||||||||
| Net Asset Value, Beginning of Year / Period | $ | 10.21 | $ | 9.51 | $ | 10.00 | ||||||
| Net Investment Income(a) | 0.11 | 0.19 | 0.11 | |||||||||
| Net Realized And Unrealized Gains (Losses) | (0.45 | ) | 0.61 | (0.60 | ) | |||||||
| Total from Investment Operations | $ | (0.34 | ) | $ | 0.80 | $ | (0.49 | ) | ||||
| Distributions: | ||||||||||||
| from Net Investment Income | (0.14 | ) | (0.10 | ) | — | (e) | ||||||
| Total Distributions to Shareholders | $ | (0.14 | ) | $ | (0.10 | ) | $ | — | (e) | |||
| Redemption fees(a) | — | — | — | |||||||||
| Net Asset Value, End of Year / Period | $ | 9.73 | $ | 10.21 | $ | 9.51 | ||||||
| Total Return | (3.33 | )% | 8.51 | % | (4.87 | )%(b) | ||||||
| Net Assets at End of Year / Period (000’s Omitted) | $ | 155,919 | $ | 24,291 | $ | 11,695 | ||||||
| Ratios to Average Net Assets: | ||||||||||||
| Net Investment Income | 1.16 | % | 1.93 | % | 2.02 | %(c) | ||||||
| Net Expenses | 1.37 | % | 1.40 | % | 1.56 | %(c) | ||||||
| Gross Expenses(d) | 1.37 | % | 1.40 | % | 1.56 | %(c) | ||||||
| Portfolio Turnover Rate | 22 | % | 19 | % | 19 | %(b) | ||||||
| (a) | Calculated based on average shares outstanding during the year / period. |
| (b) | Not annualized. |
| (c) | Annualized. |
| (d) | Reflects the expense ratio excluding any waivers and/or expense reimbursements. |
| (e) | Less than $0.01 per share. |
| (f) | Commenced operations on December 12, 2012. The information presented is for the period from December 12, 2012 to June 30, 2013. |
The accompanying notes are an integral part of these financial statements.
www.brownadvisoryfunds.com
154
Financial Highlights
These financial highlights reflect selected per share data and ratios for a share outstanding of the Fund throughout each year / period.
BROWN ADVISORY – SOMERSET EMERGING MARKETS FUND
ADVISOR SHARES
| Year / Period Ended: | ||||||||||||
| June 30, | June 30, | June 30, | ||||||||||
| 2015 | 2014 | 2013(f) | ||||||||||
| Net Asset Value, Beginning of Year / Period | $ | 10.18 | $ | 9.49 | $ | 10.00 | ||||||
| Net Investment Income(a) | 0.09 | 0.16 | 0.10 | |||||||||
| Net Realized And Unrealized Gains (Losses) | (0.46 | ) | 0.61 | (0.61 | ) | |||||||
| Total from Investment Operations | $ | (0.37 | ) | $ | 0.77 | $ | (0.51 | ) | ||||
| Distributions: | ||||||||||||
| from Net Investment Income | (0.11 | ) | (0.08 | ) | — | (e) | ||||||
| Total Distributions to Shareholders | $ | (0.11 | ) | $ | (0.08 | ) | $ | — | (e) | |||
| Redemption fees(a) | — | — | — | |||||||||
| Net Asset Value, End of Year / Period | $ | 9.70 | $ | 10.18 | $ | 9.49 | ||||||
| Total Return | (3.60 | )% | 8.19 | % | (5.07 | )%(b) | ||||||
| Net Assets at End of Year / Period (000’s Omitted) | $ | 942 | $ | 533 | $ | 990 | ||||||
| Ratios to Average Net Assets: | ||||||||||||
| Net Investment Income | 0.91 | % | 1.68 | % | 1.77 | %(c) | ||||||
| Net Expenses | 1.62 | % | 1.65 | % | 1.81 | %(c) | ||||||
| Gross Expenses(d) | 1.62 | % | 1.65 | % | 1.81 | %(c) | ||||||
| Portfolio Turnover Rate | 22 | % | 19 | % | 19 | %(b) | ||||||
| (a) | Calculated based on average shares outstanding during the year / period. |
| (b) | Not annualized. |
| (c) | Annualized. |
| (d) | Reflects the expense ratio excluding any waivers and/or expense reimbursements. |
| (e) | Less than $0.01 per share. |
| (f) | Commenced operations on December 12, 2012. The information presented is for the period from December 12, 2012 to June 30, 2013. |
The accompanying notes are an integral part of these financial statements.
www.brownadvisoryfunds.com
155
Financial Highlights
These financial highlights reflect selected per share data and ratios for a share outstanding of the Fund throughout the period.
BROWN ADVISORY EMERGING MARKETS SMALL-CAP FUND
INSTITUTIONAL SHARES
| Period Ended | ||||
| June 30, | ||||
| 2015(e) | ||||
| Net Asset Value, Beginning of Period | $ | 10.00 | ||
| Net Investment Income(a) | 0.02 | |||
| Net Realized And Unrealized Gains | 1.68 | |||
| Total from Investment Operations | $ | 1.70 | ||
| Redemption fees(a) | — | |||
| Net Asset Value, End of Period | $ | 11.70 | ||
| Total Return | 17.00 | %(b) | ||
| Net Assets at End of Period (000’s Omitted) | $ | 187,901 | ||
| Ratios to Average Net Assets: | ||||
| Net Investment Income | 0.27 | %(c) | ||
| Net Expenses | 1.83 | %(c) | ||
| Gross Expenses(d) | 1.83 | %(c) | ||
| Portfolio Turnover Rate | 89 | %(b) | ||
| (a) | Calculated based on average shares outstanding during the period. |
| (b) | Not annualized. |
| (c) | Annualized. |
| (d) | Reflects the expense ratio excluding any waivers and/or expense reimbursements. |
| (e) | Commenced operations on November 21, 2014. The information presented is for the period from November 21, 2014 to June 30, 2015. |
The accompanying notes are an integral part of these financial statements.
www.brownadvisoryfunds.com
156
Financial Highlights
These financial highlights reflect selected per share data and ratios for a share outstanding of the Fund throughout the period.
BROWN ADVISORY EMERGING MARKETS SMALL-CAP FUND
INVESTOR SHARES
| Period Ended | ||||
| June 30, | ||||
| 2015(e) | ||||
| Net Asset Value, Beginning of Period | $ | 10.00 | ||
| Net Investment Income(a) | 0.01 | |||
| Net Realized And Unrealized Gains | 1.68 | |||
| Total from Investment Operations | $ | 1.69 | ||
| Redemption fees(a) | — | |||
| Net Asset Value, End of Period | $ | 11.69 | ||
| Total Return | 16.90 | %(b) | ||
| Net Assets at End of Period (000’s Omitted) | $ | 18,992 | ||
| Ratios to Average Net Assets: | ||||
| Net Investment Income | 0.12 | %(c) | ||
| Net Expenses | 1.98 | %(c) | ||
| Gross Expenses(d) | 1.98 | %(c) | ||
| Portfolio Turnover Rate | 89 | %(b) | ||
| (a) | Calculated based on average shares outstanding during the period. |
| (b) | Not annualized. |
| (c) | Annualized. |
| (d) | Reflects the expense ratio excluding any waivers and/or expense reimbursements. |
| (e) | Commenced operations on November 21, 2014. The information presented is for the period from November 21, 2014 to June 30, 2015. |
The accompanying notes are an integral part of these financial statements.
www.brownadvisoryfunds.com
157
Notes to Financial Statements
June 30, 2015
Note 1. Organization
The Brown Advisory Growth Equity Fund (“Growth Equity Fund”), Brown Advisory Value Equity Fund (“Value Equity Fund”), Brown Advisory Flexible Equity Fund (“Flexible Equity Fund”), Brown Advisory Equity Income Fund (“Equity Income Fund”), Brown Advisory Sustainable Growth Fund (“Sustainable Growth Fund”), Brown Advisory Small-Cap Growth Fund (“Small-Cap Growth Fund”), Brown Advisory Small-Cap Fundamental Value Fund (“Small-Cap Fundamental Value Fund”), Brown Advisory Opportunity Fund (“Opportunity Fund”), Brown Advisory Multi-Strategy Fund (“Multi-Strategy Fund”), Brown Advisory Intermediate Income Fund (“Intermediate Income Fund”), Brown Advisory Total Return Fund (“Total Return Fund”), Brown Advisory Strategic Bond Fund (“Strategic Bond Fund”) which was known as the Tactical Bond Fund prior to October 31, 2014, Brown Advisory Maryland Bond Fund (“Maryland Bond Fund”), Brown Advisory Tax Exempt Bond Fund (“Tax Exempt Bond Fund”), Brown Advisory Mortgage Securities Fund (“Mortgage Securities Fund”), Brown Advisory – WMC Strategic European Equity Fund (“Strategic European Equity Fund”), Brown Advisory – WMC Japan Alpha Opportunities Fund (“Japan Alpha Opportunities Fund”), Brown Advisory – Somerset Emerging Markets Fund (“Emerging Markets Fund”) and Brown Advisory Emerging Markets Small-Cap Fund (“Emerging Markets Small-Cap Fund”) (individually a “Fund,” and collectively, the “Funds”) are each a series of shares of beneficial interest of Brown Advisory Funds (the “Trust”), which is registered under the Investment Company Act of 1940 as an open-ended management investment company. Prior to October 19, 2012, the Funds, except for the Sustainable Growth Fund, Multi-Strategy Fund, Total Return Fund, Tax Exempt Bond Fund, Mortgage Securities Fund, Strategic European Equity Fund, Japan Alpha Opportunities Fund, Emerging Markets Fund, and Emerging Markets Small-Cap Fund, were series of Professionally Managed Portfolios Trust. Prior to April 12, 2010, the Funds, except for the Equity Income Fund, Sustainable Growth Fund, Multi-Strategy Fund, Total Return Fund, Strategic Bond Fund, Tax Exempt Bond Fund, Mortgage Securities Fund, Strategic European Equity Fund, Japan Alpha Opportunities Fund, Emerging Markets Fund, and Emerging Markets Small-Cap Fund, each of which had yet to commence operations, were part of the Forum Funds Trust.
The Funds commenced operations as follows:
| Institutional | Investor | Advisor | ||||||
| Shares | Shares | Shares | ||||||
| Growth Equity Fund | 10/19/2012 | 6/28/1999 | * | 5/18/2006 | ** | |||
| Value Equity Fund | 10/19/2012 | 1/28/2003 | * | 4/25/2006 | ** | |||
| Flexible Equity Fund | 10/19/2012 | 11/30/2006 | * | 1/24/2007 | ** | |||
| Equity Income Fund | 10/19/2012 | 12/29/2011 | * | 12/29/2011 | ||||
| Sustainable Growth Fund | 6/29/2012 | 6/29/2012 | 6/29/2012 | |||||
| Small-Cap Growth Fund | 9/20/2002 | *** | 6/28/1999 | * | 4/25/2006 | ** | ||
| Small-Cap Fundamental Value Fund | 10/19/2012 | 12/31/2008 | * | 7/28/2011 | ||||
| Opportunity Fund | — | 6/29/1998 | * | — | ||||
| Multi-Strategy Fund | 10/31/2014 | — | — | |||||
| Intermediate Income Fund | — | 11/2/1995 | * | 5/13/1991 | ** | |||
| Total Return Fund | 10/30/2014 | 10/30/2014 | — | |||||
| Strategic Bond Fund^ | — | 10/31/2014 | 9/30/2011 | |||||
| Maryland Bond Fund | — | 12/21/2000 | * | — | ||||
| Tax Exempt Bond Fund | — | 6/29/2012 | — | |||||
| Mortgage Securities Fund | 5/13/2014 | 12/26/2013 | — | |||||
| Strategic European Equity Fund | 10/21/2013 | 10/21/2013 | 10/21/2013 | |||||
| Japan Alpha Opportunities Fund | 3/4/2014 | 3/4/2014 | 3/4/2014 | |||||
| Emerging Markets Fund | 12/12/2012 | 12/12/2012 | 12/12/2012 | |||||
| Emerging Markets Small-Cap Fund | 11/21/2014 | 11/21/2014 | — | |||||
| ^ | Known as the Brown Advisory Tactical Bond Fund prior to October 31, 2014. | |
| * | Prior to October 19, 2012, Investor Shares were known as Institutional Shares. | |
| ** | Prior to July 1, 2011, Advisor Shares were known as A Shares. | |
| *** | Prior to October 19, 2012, Small-Cap Growth Fund Institutional Shares were known as D Shares. |
Each share class has equal rights as to earnings and assets except that each class bears different shareholder servicing and distribution expenses. Each share class has exclusive voting rights with respect to matters that affect just that class. Income, expenses (other than expenses attributable to a specific class), and realized and unrealized gains or losses on investments are allocated to each share class on its relative net assets.
www.brownadvisoryfunds.com
158
Notes to Financial Statements
June 30, 2015
The investment objective of Growth Equity Fund and Small-Cap Growth Fund is to achieve capital appreciation by primarily investing in equity securities. The investment objective of Value Equity Fund is to achieve capital appreciation. The investment objective of Small-Cap Fundamental Value Fund and Opportunity Fund is to achieve long-term capital appreciation. Flexible Equity Fund’s investment objective is to achieve long-term growth of capital. Maryland Bond Fund’s investment objective is to provide a high level of current income exempt from both Federal and Maryland State income taxes without undue risk. Intermediate Income Fund’s investment objective is to provide a high level of current income consistent with preservation of principal within an intermediate-term maturity structure. Equity Income Fund’s investment objective is to provide current dividend yield and dividend growth. Sustainable Growth Fund’s investment objective is to seek capital appreciation by investing at least 80% of its net assets in equity securities of environmentally sustainable domestic companies. The investment objective of the Strategic Bond Fund is to achieve capital appreciation and income with a low correlation to interest rate movements. Tax Exempt Bond Fund’s investment objective is to seek to provide a high level of current income exempt from Federal income tax by investing primarily in intermediate-term investment grade municipal bonds. The investment objective of the Emerging Markets Fund is to seek to achieve total return by investing principally in equity securities issued by companies established or operating in emerging markets. The investment objective of the Strategic European Equity Fund seeks to achieve total return by investing principally in equity securities issued by companies established or operating in Europe. The investment objective of the Mortgage Securities Fund seeks to maximize total return consistent with preservation of capital. The investment objective of the Japan Alpha Opportunities Fund seeks to achieve total return by investing principally in equity securities of companies which are domiciled in or exercise the predominant part of their economic activity in Japan, while also limiting exposure to fluctuations between the value of the Japanese yen and the U.S. dollar. Multi-Strategy Fund’s investment objective is to achieve long-term capital appreciation and current income. The investment objective of the Total Return fund is to provide a competitive total return consistent with preservation of principal. The Emerging Markets Small-Cap Fund’s investment objective is to achieve total return by investing principally in equity securities issued by small-capitalization companies established or operating in emerging markets.
Note 2. Significant Accounting Policies
The following is a summary of significant accounting policies consistently followed by the Funds. These policies are in conformity with accounting principles generally accepted in the United States of America.
A. Security Valuation – The Funds have adopted fair valuation accounting standards which establish and authoritative definition of fair value and set out a hierarchy for measuring fair value. These standards require additional disclosures about the various inputs and valuation techniques used to develop the measurements of fair value and a discussion of changes in valuation techniques and related inputs, if any, during the period. These inputs are summarized in the three broad levels listed below:
| Level 1 – | Quoted prices in active markets for identical securities. |
| Level 2 – | Evaluated price based on other significant observable inputs (including quoted prices for similar securities, interest rates, prepayment spreads, credit risk, etc). |
| Level 3 – | Significant unobservable inputs (including the Fund’s own assumptions in determining the fair value of investments). |
The inputs or methodology used for valuing securities are not necessarily an indication of the risk associated with investing in those securities.
Equity securities that are traded on a national securities exchange, except those listed on the NASDAQ Global Market® (“NASDAQ”), are valued at the last reported sale price on the exchange on which the security is principally traded. Securities traded on NASDAQ will be valued at the NASDAQ Official Closing Price (“NOCP”). If, on a particular day, an exchange-traded or NASDAQ security does not trade, then the mean between the most recent quoted bid and asked prices will be used. All equity securities that are not traded on a listed exchange are valued at the last sale price in the over-the counter market. If a non-exchange traded security does not trade on a particular day, then the mean between the last quoted closing bid and asked price will be used. Such domestic equity securities are typically categorized as Level 1 securities.
For foreign securities that are traded on foreign exchanges, the Funds have selected Interactive Data Corporation (“IDC”) to provide pricing data for those such securities that are held by the Funds. The use of IDC’s pricing services with respect to these foreign exchange traded securities is designed to capture events occurring after a foreign exchange closes that may affect the value of certain holdings of the Funds that are traded on those foreign exchanges. The Funds utilize a confidence interval when determining whether or not to utilize these prices provided by IDC. The confidence interval is a measure of the relationship that
www.brownadvisoryfunds.com
159
Notes to Financial Statements
June 30, 2015
each foreign exchange traded security has to movements in various indices and the price of the foreign exchange traded security’s corresponding American Depositary Receipt, if one exists. IDC provides a confidence interval for each foreign exchange traded security for which it provides a price. If the confidence interval provided by IDC is equal to or greater than a predefined level utilized by the Funds, the Funds will value that foreign exchange traded security at that price. If the confidence interval provided by IDC is less than the predefined level utilized by the Funds, the Funds will value that foreign exchange traded security at the preceding closing price on its respective foreign exchange, or, if there were no transactions on the preceding day, at the mean between the bid and the asked prices. Such foreign securities are typically categorized as Level 2 securities. Foreign securities for which the local market closing prices are utilized are typically categorized as Level 1 securities.
Debt securities are valued by using the mean between the closing bid and asked prices provided by an independent pricing service. If the closing bid and asked prices are not readily available, the independent pricing service may provide a price determined by a matrix pricing method. These techniques generally consider such factors as yields or prices of bonds of comparable quality, type of issue, coupon, maturity, ratings and general market conditions. Fixed income debt instruments, such as commercial paper, banker’s acceptances and U.S. Treasury Bills, having a maturity of less than 60 days are valued at amortized cost. Any discount or premium is accreted or amortized on a straight-line basis until maturity. Such debt securities are typically categorized as Level 2.
Exchange traded options are valued at the composite price, using the National Best Bid and Offer quotes (NBBO). NBBO consists of the highest bid price and lowest ask price across any of the exchanges on which an option is quoted, thus providing a view across the entire U.S. options marketplace. Specifically, composite pricing calculates the mean of the highest bid price and lowest ask price across the exchanges where the option is traded. Such options are typically categorized as Level 2.
Futures contracts are generally valued at the settlement prices established each day on the exchange on which they are traded and are categorized as Level 1 securities.
Forward foreign currency contracts are valued at the prevailing forward exchange rate of the underlying currencies and are categorized as Level 2 securities.
Credit default swaps are valued based upon the daily closing price of the underlying index or reference entity and are categorized as Level 2 securities.
Securities for which quotations are not readily available are valued at their respective fair values as determined in good faith under guidelines and procedures adopted by the Board of Trustees. These are generally considered Level 3 securities. When a security is “fair valued,” consideration is given to the facts and circumstances relevant to the particular situation, including a review of various factors set forth in the guidelines and procedures adopted by the Board of Trustees. Fair value pricing is an inherently subjective process, and no single standard exists for determining fair value. Different funds could reasonably arrive at different values for the same security. The use of fair value pricing by a fund may cause the net asset value of its shares to differ significantly from the net asset value that would be calculated without regard to such considerations. As of June 30, 2015, the Small-Cap Growth Fund was the only fund that held any fair valued securities. As of June 30, 2015, the Small-Cap Growth Fund held fair valued securities with a total market value of $2,665,607 or 0.9% of total net assets.
The following is a summary of inputs used to value the Funds’ investments as of June 30, 2015:
| Level 1 | Level 2 | Level 3 | ||||||||||
| Growth Equity Fund | ||||||||||||
| Common Stocks | $ | 2,386,050,222 | $ | — | $ | — | ||||||
| Short-Term Investments | 63,003,604 | — | — | |||||||||
| Total Investments in Securities | $ | 2,449,053,826 | $ | — | $ | — | ||||||
| Level 1 | Level 2 | Level 3 | ||||||||||
| Value Equity Fund | ||||||||||||
| Common Stocks | $ | 161,882,680 | $ | — | $ | — | ||||||
| Real Estate Investment Trusts | 1,380,375 | — | — | |||||||||
| Short-Term Investments | 5,505,105 | — | — | |||||||||
| Total Investments in Securities | $ | 168,768,160 | $ | — | $ | — | ||||||
www.brownadvisoryfunds.com
160
Notes to Financial Statements
June 30, 2015
| Level 1 | Level 2 | Level 3 | ||||||||||
| Flexible Equity Fund | ||||||||||||
| Common Stocks | $ | 266,965,140 | $ | — | $ | — | ||||||
| Warrants | 449,800 | — | — | |||||||||
| Short-Term Investments | 15,684,814 | — | — | |||||||||
| Total Investments in Securities | $ | 283,099,754 | $ | — | $ | — | ||||||
| Level 1 | Level 2 | Level 3 | ||||||||||
| Equity Income Fund | ||||||||||||
| Common Stocks | $ | 174,070,758 | $ | — | $ | — | ||||||
| Preferred Stocks | 4,412,276 | — | — | |||||||||
| Real Estate Investment Trusts | 13,567,314 | — | — | |||||||||
| Short-Term Investments | 11,540,445 | — | — | |||||||||
| Total Investments in Securities | $ | 203,590,793 | $ | — | $ | — | ||||||
| Level 1 | Level 2 | Level 3 | ||||||||||
| Sustainable Growth Fund | ||||||||||||
| Common Stocks | $ | 208,232,395 | $ | — | $ | — | ||||||
| Short-Term Investments | 8,340,722 | — | — | |||||||||
| Total Investments in Securities | $ | 216,573,117 | $ | — | $ | — | ||||||
| Level 1 | Level 2 | Level 3 | ||||||||||
| Small-Cap Growth Fund | ||||||||||||
| Common Stocks | $ | 267,223,457 | $ | — | $ | — | ||||||
| Private Placements | — | — | 2,665,607 | |||||||||
| Short-Term Investments | 12,768,180 | — | — | |||||||||
| Total Investments in Securities | $ | 279,991,637 | $ | — | $ | 2,665,607 | ||||||
| Level 1 | Level 2 | Level 3 | ||||||||||
| Small-Cap Fundamental Value Fund | ||||||||||||
| Common Stocks | $ | 820,020,932 | $ | — | $ | — | ||||||
| Real Estate Investment Trusts | 26,908,456 | — | — | |||||||||
| Short-Term Investments | 34,048,210 | — | — | |||||||||
| Total Investments in Securities | $ | 880,977,598 | $ | — | $ | — | ||||||
| Level 1 | Level 2 | Level 3 | ||||||||||
| Opportunity Fund | ||||||||||||
| Common Stocks | $ | 10,495,843 | $ | — | $ | — | ||||||
| Short-Term Investments | 210,435 | — | — | |||||||||
| Total Investments in Securities | $ | 10,706,278 | $ | — | $ | — | ||||||
| Level 1 | Level 2 | Level 3 | ||||||||||
| Multi-Strategy Fund | ||||||||||||
| Affiliated Mutual Funds | $ | 2,241,207 | $ | — | $ | — | ||||||
| Short-Term Investments | 75,322 | — | — | |||||||||
| Total Investments in Securities | $ | 2,316,529 | $ | — | $ | — | ||||||
| Level 1 | Level 2 | Level 3 | ||||||||||
| Intermediate Income Fund | ||||||||||||
| Corporate Bonds & Notes | $ | — | $ | 40,126,726 | $ | — | ||||||
| Municipal Bonds | — | 32,427,307 | — | |||||||||
| Mortgage Backed Securities | — | 9,900,294 | — | |||||||||
| Asset Backed Securities | — | 7,491,266 | — | |||||||||
| U.S. Treasury Notes | — | 20,384,217 | — | |||||||||
| Affiliated Mutual Funds | 33,931,642 | — | — | |||||||||
| Short-Term Investments | 6,092,078 | — | — | |||||||||
| Total Investments in Securities | $ | 40,023,720 | $ | 110,329,810 | $ | — | ||||||
www.brownadvisoryfunds.com
161
Notes to Financial Statements
June 30, 2015
| Level 1 | Level 2 | Level 3 | ||||||||||
| Total Return Fund | ||||||||||||
| Mortgage Backed Securities | $ | — | $ | 31,947,045 | $ | — | ||||||
| Asset Backed Securities | — | 24,933,971 | — | |||||||||
| Corporate Bonds & Notes | — | 19,522,684 | — | |||||||||
| Municipal Bonds | — | 2,385,111 | — | |||||||||
| U.S. Treasury Notes | — | 8,847,439 | — | |||||||||
| Short-Term Investments | 7,562,435 | — | — | |||||||||
| Total Investments in Securities | $ | 7,562,435 | $ | 87,636,250 | $ | — | ||||||
| Future Contracts – Long* | $ | (177,548 | ) | $ | — | $ | — | |||||
| Future Contracts – Short* | $ | 37,850 | $ | — | $ | — | ||||||
| * Unrealized Appreciation (Depreciation) | ||||||||||||
| Level 1 | Level 2 | Level 3 | ||||||||||
| Strategic Bond Fund | ||||||||||||
| Corporate Bonds & Notes | $ | — | $ | 28,834,090 | $ | — | ||||||
| Asset Backed Securities | — | 27,334,751 | — | |||||||||
| Municipal Bonds | — | 2,101,691 | — | |||||||||
| Mortgage Backed Securities | — | 1,309,714 | ||||||||||
| Mutual Funds | 1,087,643 | — | — | |||||||||
| Purchased Options | 43,984 | — | — | |||||||||
| Short-Term Investments | 121,981 | 999,915 | — | |||||||||
| Total Investments in Securities | $ | 1,253,608 | $ | 60,580,161 | $ | — | ||||||
| Future Contracts – Short* | $ | (26,406 | ) | $ | — | $ | — | |||||
| * Unrealized Appreciation (Depreciation) | ||||||||||||
| Level 1 | Level 2 | Level 3 | ||||||||||
| Maryland Bond Fund | ||||||||||||
| Municipal Bonds | $ | — | $ | 197,587,935 | $ | — | ||||||
| Short-Term Investments | 229,361 | — | — | |||||||||
| Total Investments in Securities | $ | 229,361 | $ | 197,587,935 | $ | — | ||||||
| Level 1 | Level 2 | Level 3 | ||||||||||
| Tax Exempt Bond Fund | ||||||||||||
| Municipal Bonds | $ | — | $ | 219,209,590 | $ | — | ||||||
| Short-Term Investments | 8,972,522 | — | — | |||||||||
| Total Investments in Securities | $ | 8,972,522 | $ | 219,209,590 | $ | — | ||||||
| Level 1 | Level 2 | Level 3 | ||||||||||
| Mortgage Securities Fund | ||||||||||||
| Mortgage Backed Securities | $ | — | $ | 208,585,495 | $ | — | ||||||
| Asset Backed Securities | — | 28,585,360 | — | |||||||||
| Local Government Housing Agency Bonds | — | 3,081,800 | — | |||||||||
| Short-Term Investments | 17,616,421 | — | — | |||||||||
| Total Investments in Securities | $ | 17,616,421 | $ | 240,252,655 | $ | — | ||||||
| Level 1 | Level 2 | Level 3 | ||||||||||
| Strategic European Equity Fund | ||||||||||||
| Common Stocks: | ||||||||||||
| Belgium | $ | — | $ | 11,085,394 | $ | — | ||||||
| Denmark | — | 13,345,420 | — | |||||||||
| Finland | — | 12,214,444 | — | |||||||||
| France | — | 30,628,999 | — | |||||||||
| Germany | — | 22,009,851 | — | |||||||||
| Italy | — | 7,994,865 | — | |||||||||
| Netherlands | — | 11,174,322 | — | |||||||||
| Spain | — | 1,296,699 | — | |||||||||
| Sweden | — | 22,907,919 | — | |||||||||
| Switzerland | 2,400,795 | 48,113,257 | — | |||||||||
| United Kingdom | 5,341,517 | 74,734,594 | — | |||||||||
| Short-Term Investments | 7,214,519 | — | — | |||||||||
| Total Investments in Securities | $ | 14,956,831 | $ | 255,505,764 | $ | — | ||||||
www.brownadvisoryfunds.com
162
Notes to Financial Statements
June 30, 2015
| Level 1 | Level 2 | Level 3 | ||||||||||
| Japan Alpha Opportunities Fund | ||||||||||||
| Common Stocks: | ||||||||||||
| Consumer Discretionary | $ | — | $ | 388,839,678 | — | |||||||
| Consumer Staples | — | 52,367,316 | — | |||||||||
| Energy | — | 26,340,359 | — | |||||||||
| Financials | — | 296,982,107 | — | |||||||||
| Health Care | — | 96,054,494 | — | |||||||||
| Industrials | 2,124,411 | 171,873,379 | — | |||||||||
| Information Technology | — | 266,963,929 | — | |||||||||
| Materials | — | 151,672,988 | — | |||||||||
| Telecommunication Services | — | 28,695,192 | — | |||||||||
| Mutual Funds | 7,098,838 | — | — | |||||||||
| Short-Term Investments | 146,056,519 | — | — | |||||||||
| Total Investments in Securities | $ | 155,279,768 | $ | 1,479,789,442 | $ | — | ||||||
| Forward Foreign Currency Exchange Contracts* | $ | — | $ | (19,059,167 | ) | $ | — | |||||
| Futures Contracts – Long* | $ | (1,281,897 | ) | $ | — | $ | — | |||||
| * Unrealized Appreciation (Depreciation) | ||||||||||||
| Level 1 | Level 2 | Level 3 | ||||||||||
| Emerging Markets Fund | ||||||||||||
| Common Stocks: | ||||||||||||
| Brazil | $ | 24,993,165 | $ | — | $ | — | ||||||
| Chile | 2,125,685 | 11,824,475 | — | |||||||||
| China | — | 17,508,473 | — | |||||||||
| Hungary | — | 18,911,979 | — | |||||||||
| India | 13,532,024 | 37,255,293 | — | |||||||||
| Indonesia | — | 7,859,627 | — | |||||||||
| Luxembourg | — | 5,728,162 | — | |||||||||
| Malaysia | — | 1,643,796 | — | |||||||||
| Philippines | — | 31,700,249 | — | |||||||||
| Poland | 13,683,362 | 5,281,137 | — | |||||||||
| Portugal | — | 2,127,028 | — | |||||||||
| South Africa | — | 28,043,822 | — | |||||||||
| South Korea | 5,544,774 | 52,502,037 | — | |||||||||
| Taiwan | — | 44,861,652 | — | |||||||||
| Thailand | — | 1,486,558 | — | |||||||||
| Turkey | 17,736,738 | 11,798,428 | — | |||||||||
| United Arab Emirates | — | 13,131,605 | — | |||||||||
| Preferred Stocks | 6,059,891 | — | — | |||||||||
| Warrants | 34,647 | — | — | |||||||||
| Short-Term Investments | 48,935,847 | — | — | |||||||||
| Total Investments in Securities | $ | 132,646,133 | $ | 291,664,321 | $ | — | ||||||
www.brownadvisoryfunds.com
163
Notes to Financial Statements
June 30, 2015
| Level 1 | Level 2 | Level 3 | ||||||||||
| Emerging Markets Small-Cap Fund | ||||||||||||
| Common Stocks: | ||||||||||||
| China | $ | — | $ | 57,521,223 | $ | — | ||||||
| India | 4,205,748 | 15,687,398 | — | |||||||||
| Indonesia | — | 4,124,987 | — | |||||||||
| Malaysia | 2,098,330 | 2,827,895 | — | |||||||||
| Philippines | 2,009,770 | 8,531,789 | — | |||||||||
| Singapore | — | 8,333,957 | — | |||||||||
| South Korea | 4,475,315 | 48,098,928 | — | |||||||||
| Taiwan | — | 20,738,376 | — | |||||||||
| Thailand | — | 9,998,168 | — | |||||||||
| Real Estate Investment Trusts | — | 2,290,884 | — | |||||||||
| Warrants | 5,285 | — | — | |||||||||
| Short-Term Investments | 13,719,684 | — | — | |||||||||
| Total Investments in Securities | $ | 26,514,132 | $ | 178,153,605 | $ | — | ||||||
The following is a reconciliation of Level 3 securities for which significant unobservable inputs were used to determine fair value.
| Small-Cap Growth Fund | ||||
| Balance as of June 30, 2014 | $ | 2,305,498 | ||
| Purchases | 160,000 | |||
| Returns of Capital | (343,750 | ) | ||
| Change in Unrealized Appreciation | 543,859 | |||
| Balance as of June 30, 2015 | $ | 2,665,607 | ||
The inputs utilized in valuing these securities consist of annual audited financial statements and quarterly capital statements which are provided by the issuer. These valuations are adjusted periodically for certain events (additional contributions of capital or purchases made by the Fund, distributions to the Fund made by the issuer, etc) that may occur prior to receipt of the next quarterly capital statement or Annual Report.
B. Securities Transactions and Investment Income – Investment securities transactions are accounted for on the trade date. Discounts/premiums on debt securities purchased are accreted/amortized over the life of the respective securities using the effective interest method. Dividend income is recorded on the ex-dividend date. Interest income is recorded on an accrual basis. Foreign dividend income is recorded on the ex-dividend date or as soon as practical after a Fund determines the existence of a dividend declaration after exercising reasonable due diligence. Income and capital gains on some foreign securities may be subject to foreign withholding taxes, which are accrued as applicable. Identified cost of investments sold is used to determine the gain and loss for both financial statement and Federal income tax purposes. Distributions deemed to be a return of capital are recorded as a reduction of the cost of the related investments.
C. Foreign Currency – Investment securities and other assets and liabilities denominated in foreign currencies are translated into U.S. Dollar amounts at the date of valuation. Purchases and sales of investment securities and income and expense items denominated in foreign currencies are translated into U.S. Dollar amounts on the respective dates of such transactions.
The Funds do not isolate the portion of the results of operations resulting from changes in foreign exchange rates on investments from the fluctuations arising from changes in market prices of securities held. Such fluctuations are included with the net realized and unrealized gain or loss from investments.
The Funds report net realized foreign exchange gains and losses that arise from sales of foreign currencies, currency gains or losses realized between the trade and settlement dates on securities transactions, and the difference between the amounts of dividends, interest, and foreign withholding taxes recorded on the Fund’s books and the U.S. Dollar equivalent of the amounts actually received or paid. Net unrealized foreign exchange gains and losses arise from changes in the fair values of the assets and liabilities, other than investments in securities at fiscal year end, resulting from changes in exchange rates.
www.brownadvisoryfunds.com
164
Notes to Financial Statements
June 30, 2015
The Japan Alpha Opportunities Fund invests in forward foreign currency contracts (see Note 7) in order to limit exposure to the fluctuations in value of the Japanese Yen. The Japan Alpha Opportunities Fund does isolate realized and unrealized gains and losses from forward foreign currency exchange contracts. These amounts are presented separately from realized and unrealized gains and losses from investments in the financial statements.
D. Options – The Funds may invest in options. When a Fund writes an option, an amount equal to the premium received by a Fund is recorded as a liability and is subsequently adjusted to the current value of the option written. Premiums received from writing options that expire unexercised are treated by a Fund on the expiration date as realized gain from investments. The difference between the premium and the amount paid on effecting a closing purchase transaction, including brokerage commissions, is also treated as a realized gain, or if the premium is less than the amount paid for closing purchase transaction, as a realized loss. If a call option is exercised, the premium is added to the proceeds from the sale of the underlying security or currency determining whether a Fund has a realized gain or loss. If a put option is exercised, the premium reduces the cost basis of the securities purchase by a Fund. A Fund, as a writer of an option, bears the market risk of an unfavorable change in the price of the security underlying the written option.
When a Fund purchases an option, an amount equal to the premium paid by a Fund is recorded as an investment and is subsequently adjusted to the current value of the option purchased. If an option expires on the stipulated expiration date or if a Fund enters into a closing sale transaction, a gain or loss is realized. If a call option is exercised, the cost of the security acquired is increased by the premium paid for the call. If a put option is exercised, a gain or loss is realized from the sale of the underlying security, and the proceeds from such sale are decreased by the premium originally paid. Written and purchased options are non- income producing securities.
As of June 30, 2015, the Strategic Bond Fund held purchased options with a total market value of $43,984 or 0.1% of total net assets.
E. Distributions to Shareholders – For the Maryland Bond Fund and Tax Exempt Bond Fund distributions of net investment income, if any, are declared daily and paid monthly. Distributions to shareholders of net investment income, if any, are declared and paid monthly for the Intermediate Income Fund, the Total Return Fund, the Strategic Bond Fund, and the Mortgage Securities Fund and quarterly for the Equity Income Fund. The remaining Funds declare and pay net investment income, if any, at least annually. Distributions to shareholders of net capital gains, if any, are declared and paid at least annually. Distributions are recorded on the ex-dividend date.
F. Use of Estimates – The preparation of financial statements in conformity with accounting principles generally accepted in the United States of America requires management to make estimates and assumptions that affect the reported amounts of assets and liabilities at the date of the financial statements and the reported amount of revenue and expenses during the reporting period. Actual results could differ from those estimates.
G. Federal Taxes – Each Fund has elected to be taxed as a “regulated investment company” and intends to distribute substantially all taxable income to its shareholders and otherwise comply with the provisions of the Internal Revenue Code applicable to regulated investment companies. Therefore, no provision for federal income taxes or excise taxes has been made.
The Funds recognize tax benefits of uncertain tax positions only where the position is “more likely than not” to be sustained assuming examination by tax authorities.
The Funds have analyzed their tax positions and have concluded that no liability for unrecognized tax benefits should be recorded related to uncertain income tax positions taken on returns filed for open tax years as of June 30, 2015. The Funds identify their major tax jurisdictions as U.S. Federal and Delaware State; however the Funds are not aware of any tax position for which it is reasonably possible that the total amounts of unrecognized tax benefits will change materially in the next year.
H. Redemption Fees – A shareholder who redeems or exchanges shares of the Funds within fourteen days of purchase will incur a redemption fee of 1.00% of the current net asset value of shares redeemed or exchanged, subject to certain exceptions. The fee is charged for the benefit of the remaining shareholders and will be paid to the Fund to help offset transaction costs. The fee is accounted for as an addition to paid-in capital. Each Fund reserves the right to modify the terms of or terminate the fee at any time. There are limited exceptions to the imposition of the redemption fee.
www.brownadvisoryfunds.com
165
Notes to Financial Statements
June 30, 2015
I. Guarantees and Indemnifications – In the normal course of business, the Funds enter into contracts with service providers that contain general indemnification clauses. The Funds’ maximum exposure under these arrangements is unknown as this would involve future claims that may be made against the Funds that have not yet occurred. However, based on experience, the Funds expect the risk of loss to be remote.
J. Subsequent Events – In preparing these financial statements, the Funds have evaluated events and transactions for potential recognition through the date the financial statements were issued. Refer to Note 10 for details regarding the proposed reorganization of the Opportunity Fund.
Note 3. Commitments and Other Affiliated Party Transactions
Investment Adviser – Brown Advisory LLC serves as Investment Adviser (“the Adviser”) to the Funds. Pursuant to investment advisory agreements, the Adviser receives an advisory fee, accrued daily and payable monthly, from each Fund at an annual rate of the Fund’s average daily net assets as follows:
| Annual Advisory Fee | |
| Growth Equity Fund | 0.60% |
| Value Equity Fund | 0.60% |
| Flexible Equity Fund | 0.60% |
| Equity Income Fund | 0.60% |
| Sustainable Growth Fund | 0.60% |
| Small-Cap Growth Fund | 0.85% |
| Small-Cap Fundamental Value Fund | 0.85% |
| Opportunity Fund | 0.85% |
| Multi-Strategy Fund | 0.30% |
| Intermediate Income Fund | 0.30% |
| Total Return Fund | 0.30% |
| Strategic Bond Fund | 0.40% |
| Maryland Bond Fund | 0.30% |
| Tax Exempt Bond Fund | 0.30% |
| Mortgage Securities Fund | 0.30% |
| Strategic European Equity Fund* | 0.90% |
| Japan Alpha Opportunities Fund* | 1.00% |
| Emerging Markets Fund** | 0.90% |
| Emerging Markets Small-Cap Fund*** | 1.25% |
| * | Subject to the general oversight of the Adviser and Board of Trustees during the period ended June 30, 2015. Wellington Management Company, LLC (“Wellington”), served as sub-adviser to the Strategic European Equity Fund and the Japan Alpha Opportunities Fund and made investment decisions on their behalf. Wellington is compensated for its services by the Adviser. | |
| ** | Subject to the general oversight of the Adviser and Board of Trustees during the period ended June 30, 2015, Somerset Capital Management, LLP (“Somerset”), served as sub-adviser to the Emerging Markets Fund and made investment decisions on its behalf. Somerset is compensated for its services by the Adviser. | |
| *** | Subject to the general oversight of the Adviser and Board of Trustees during the period ended June 30, 2015, Macquarie Funds Management Hong Kong Limited (“MFMHKL”), served as sub-adviser to the Emerging Markets Small-Cap Fund and made investment decisions on its behalf. MFMHKL is compensated for its services by the Adviser. |
The Adviser is also entitled to receive an annual business management fee of 0.05%, accrued daily and payable monthly, of the Funds’ average daily net assets in exchange for its management and oversight of the non-investment advisory services provided to the Funds and the Trust.
www.brownadvisoryfunds.com
166
Notes to Financial Statements
June 30, 2015
Fee Waivers and Expense Reimbursements (Operating Expense Caps) – The Adviser has contractually agreed to waive a portion of its fees and reimburse certain expenses to limit total annual operating expenses for each or the class’ average daily net assets for the Funds noted below:
| Institutional Shares | Investor Shares | Advisor Shares | |
| Growth Equity Fund | 1.00% | 1.15% | 1.35% |
| Value Equity Fund | 1.00% | 1.15% | 1.35% |
| Flexible Equity Fund | 1.00% | 1.15% | 1.35% |
| Equity Income Fund | 1.00% | 1.15% | 1.35% |
| Sustainable Growth Fund | 1.00% | 1.15% | 1.35% |
| Small-Cap Growth Fund | 1.25% | 1.40% | 1.60% |
| Small-Cap Fundamental Value Fund | 1.25% | 1.40% | 1.60% |
| Opportunity Fund | 1.35% | 1.50% | 1.70% |
| Multi-Strategy Fund | 1.10% | 1.25% | 1.50% |
| Intermediate Income Fund | 0.55% | 0.60% | 0.80% |
| Total Return Fund | 0.55% | 0.60% | 0.80% |
| Strategic Bond Fund | 0.65% | 0.70% | 0.95% |
| Maryland Bond Fund | 0.55% | 0.60% | 0.80% |
| Tax Exempt Bond Fund | 0.55% | 0.60% | 0.80% |
| Mortgage Securities Fund | 0.55% | 0.60% | 0.80% |
| Strategic European Equity Fund | 1.60% | 1.75% | 2.00% |
| Japan Alpha Opportunities Fund | 1.70% | 1.85% | 2.10% |
| Emerging Markets Fund | 1.60% | 1.75% | 2.00% |
| Emerging Markets Small-Cap Fund | 1.95% | 2.10% | 2.35% |
For the year/period ended June 30, 2015, the Adviser waived $1,285 in expenses for the Opportunity Fund, $20,377 in expenses for the Multi-Strategy Fund and $7,500 in expenses for the Strategic Bond Fund. The Adviser is permitted to seek reimbursement from the Funds for fees waived and/or Fund expenses it pays over the following three years after such payment. The Funds must pay their current ordinary operating expenses before the Adviser is entitled to any reimbursement of fees and/or expenses. At June 30, 2015, the cumulative amounts of previously waived fees that the Adviser may recoup from the Funds is shown below:
| June 30, | ||||||||||||||||
| 2016 | 2017 | 2018 | Total | |||||||||||||
| Opportunity Fund | $ | 18,972 | $ | 2,527 | $ | 1,285 | $ | 22,784 | ||||||||
| Multi-Strategy Fund | — | — | 20,377 | 20,377 | ||||||||||||
| Strategic Bond Fund | — | — | 7,500 | 7,500 | ||||||||||||
Distribution – Quasar Distributors, LLC (“the Distributor”) serves as principal underwriter for shares of the Funds, and acts as each Fund’s Distributor in a continuous public offering of each Fund’s shares. The Distributor is an affiliate of the Administrator.
Under a Distribution Plan adopted pursuant to Rule 12b-1 under the Act (“Distribution Plan”), each Fund pays the Distributor or any other entity as authorized by the Board, as compensation for the distribution-related and/or shareholder services provided by such entities an aggregate fee equal to 0.25% of the average daily net assets of Advisor Shares for each Fund. The Distributor may pay any or all amounts received under the Rule 12b-1 Plan to other persons, including the Adviser, for any distribution or service activity.
The Trust has also adopted a Shareholder Service Plan under which each Fund may pay a fee of up to 0.15% of the average daily net assets of each Fund’s Investor and Advisor Shares (except for the Maryland Bond Fund, Intermediate Income Fund, Tax Exempt Bond Fund, Mortgage Securities Fund, Total Return Fund and Strategic Bond Fund, which may pay a fee of up to 0.05%) for shareholder services provided to the Funds by financial institutions, including the Adviser.
www.brownadvisoryfunds.com
167
Notes to Financial Statements
June 30, 2015
Investments in Affiliates – Intermediate Income Fund
The Intermediate Income Fund and Mortgage Securities Fund are considered affiliates since Brown Advisory LLC is the Adviser to both of the Funds. In seeking to achieve its investment objective, the Intermediate Income Fund invests a portion of its assets into the Mortgage Securities Fund. As of June 30, 2015, the Intermediate Income Fund owned shares of the Mortgage Securities Fund with a total market value of $33,931,642, or 22.7% of the Intermediate Income Fund’s net assets.
The Intermediate Income Fund has entered into a Fee Waiver Agreement (“the Agreement”) with the Adviser. Per the Agreement, the Intermediate Income Fund will waive Advisory Fees in an amount equal to the Advisory Fees earned by the Mortgage Securities Fund on the assets invested into it by the Intermediate Income Fund. For example, if the Intermediate Income Fund owned $10,000,000 worth of the Mortgage Securities Fund for an entire year, it would waive, on an annual basis, $30,000 in Advisory Fees ($10,000,000 multiplied by 0.30%, the annual Advisory Fee ratio for the Mortgage Securities Fund). During the year ended June 30, 2015, the Intermediate Income Fund waived $99,465 in Advisory Fees per the terms of the Agreement. This is a permanent waiver of fees and these waived fees may not be recouped by the Adviser at any time in the future.
See the table below for details of the Intermediate Income Fund’s investment in the Mortgage Securities Fund for the year ended June 30, 2015:
| Beginning | Purchases | Proceeds | Ending | |||||||||||||||||||||||||||||
| Market Value; | at Cost; | from Sales; | Unrealized | Market Value; | Capital | |||||||||||||||||||||||||||
| Affiliated | [# of shares held] | [# of shares | [# of | Depreciation | Realized | [# of shares held} | Dividend | Gains | ||||||||||||||||||||||||
| Investment | 7/1/2014 | purchased] | shares sold] | 6/30/2015 | Gains | 6/30/2015 | Income | Distributions | ||||||||||||||||||||||||
| Mortgage Securities Fund | $ | 25,008,867 | $ | 20,775,000 | $ | 11,585,000 | $ | (303,119 | ) | $ | 44,761 | $ | 33,931,642 | $ | 996,550 | $ | 238,536 | |||||||||||||||
| [2,461,503 | ] | [2,047,274 | ] | [1,135,850 | ] | [3,372,927 | ] | |||||||||||||||||||||||||
Investments in Affiliates – Multi-Strategy Fund
The Multi-Strategy Fund invests in affiliated Brown Advisory Funds. As of June 30, 2015, the Multi-Strategy Fund owned shares of affiliated Brown Advisory Funds with a total market value of $2,241,207, or 96.6% of the Multi-Strategy Fund’s net assets.
See the table below for details of the Multi-Strategy Fund investment in affiliated Brown Advisory Funds during the period ended June 30, 2015:
| Beginning | Purchases | Proceeds | Unrealized | Ending | ||||||||||||||||||||||||||||
| Market Value; | at Cost; | from Sales; | Appreciation | Market Value; | Capital | |||||||||||||||||||||||||||
| Affiliated | [# of shares held] | [# of shares | [# of | (Depreciation) | Realized | [# of shares held] | Dividend | Gains | ||||||||||||||||||||||||
| Investment | 10/31/2014 | purchased] | shares sold] | 6/30/2015 | Gains | 6/30/2015 | Income | Distributions | ||||||||||||||||||||||||
| Total Return Fund | $ | �� | $ | 897,523 | $ | 246,090 | $ | (16,635 | ) | $ | (8,236 | ) | $ | 626,562 | $ | 7,312 | $ | — | ||||||||||||||
| [— | ] | [88,698 | ] | [24,958 | ] | [63,740 | ] | �� | ||||||||||||||||||||||||
| Flexible Equity Fund | $ | — | $ | 1,003,798 | $ | 321,539 | $ | 21,861 | $ | 5,269 | $ | 709,389 | $ | 613 | $ | — | ||||||||||||||||
| [— | ] | [64,386 | ] | [19,826 | ] | [44,560 | ] | |||||||||||||||||||||||||
| Small-Cap | $ | — | $ | 234,997 | $ | 74,517 | $ | 4,002 | $ | (1,961 | ) | $ | 162,521 | $ | 237 | $ | 1,942 | |||||||||||||||
| Fundamental | ||||||||||||||||||||||||||||||||
| Value Fund | ||||||||||||||||||||||||||||||||
| [— | ] | [10,054 | ] | [3,170 | ] | [6,884 | ] | |||||||||||||||||||||||||
| Strategic Bond Fund | $ | — | $ | 330,096 | $ | 93,326 | $ | (3,400 | ) | $ | (1,087 | ) | $ | 232,283 | $ | 221 | $ | — | ||||||||||||||
| [— | ] | [33,038 | ] | [9,408 | ] | [23,630 | ] | |||||||||||||||||||||||||
| WMC Strategic | $ | — | $ | 278,721 | $ | 83,345 | $ | 7,743 | $ | 3,072 | $ | 206,191 | $ | 437 | $ | — | ||||||||||||||||
| European | ||||||||||||||||||||||||||||||||
| Equity Fund | ||||||||||||||||||||||||||||||||
| [— | ] | [28,291 | ] | [8,076 | ] | [20,215 | ] | |||||||||||||||||||||||||
| Value Equity Fund | $ | — | $ | 44,614 | $ | 40,675 | $ | — | $ | (3,939 | ) | $ | — | $ | 617 | $ | 1,192 | |||||||||||||||
| [— | ] | [2,425 | ] | [2,425 | ] | [— | ] | |||||||||||||||||||||||||
| Somerset Emerging | $ | — | $ | 167,034 | $ | 46,963 | $ | (1,156 | ) | $ | (1,360 | ) | $ | 117,555 | $ | 332 | $ | — | ||||||||||||||
| Markets Fund | ||||||||||||||||||||||||||||||||
| [— | ] | [16,905 | ] | [4,836 | ] | [12,069 | ] | |||||||||||||||||||||||||
www.brownadvisoryfunds.com
168
Notes to Financial Statements
June 30, 2015
| Beginning | Purchases | Proceeds | Unrealized | Ending | ||||||||||||||||||||||||||||
| Market Value; | at Cost; | from Sales; | Appreciation | Market Value; | Capital | |||||||||||||||||||||||||||
| Affiliated | [# of shares held] | [# of shares | [# of | (Depreciation) | Realized | [# of shares held] | Dividend | Gains | ||||||||||||||||||||||||
| Investment | 10/31/2014 | purchased] | shares sold] | 6/30/2015 | Gains | 6/30/2015 | Income | Distributions | ||||||||||||||||||||||||
| Small-Cap | $ | — | $ | 120,956 | $ | 37,803 | $ | 8,691 | $ | 820 | $ | 92,664 | $ | — | $ | 2,077 | ||||||||||||||||
| Growth Fund | ||||||||||||||||||||||||||||||||
| [— | ] | [3,633 | ] | [1,053 | ] | [2,580 | ] | |||||||||||||||||||||||||
| Emerging Markets | $ | — | $ | 124,082 | $ | 45,315 | $ | 10,657 | $ | 4,618 | $ | 94,042 | $ | — | $ | — | ||||||||||||||||
| Small-Cap Fund | ||||||||||||||||||||||||||||||||
| [— | ] | [11,915 | ] | [3,877 | ] | [8,038 | ] | |||||||||||||||||||||||||
| Totals | $ | 2,241,207 | $ | 9,769 | $ | 5,211 | ||||||||||||||||||||||||||
Other Service Providers – U.S. Bancorp Fund Services, LLC (“USBFS”), an indirect wholly-owned subsidiary of U.S. Bancorp, serves as the Funds’ Administrator (“Administrator”), and in that capacity, performs various administrative and accounting services for the Funds. USBFS also serves as the Funds’ fund accountant and transfer agent. Certain officers of the Trust are employees of USBFS and the Funds’ custodian, U.S. Bank, N.A., is an affiliate of the Administrator. Fees paid to USBFS and U.S. Bank, N.A. for its services can be found in the Statements of Operations as “Administration, transfer agent and accounting fees” and “Custodian fees”, respectively. Additional amounts for miscellaneous expenses may be paid by the Funds to USBFS and included in “Miscellaneous expenses” in the Statements of Operations.
Note 4. Purchases and Sales of Securities
The cost of purchases and the proceeds from sales of investment securities (including maturities), other than short-term investments, for the year/period ended were as follows:
| Investment Securities | ||||||||
| Purchases | Sales | |||||||
| Growth Equity Fund | $ | 605,412,838 | $ | 1,166,722,043 | ||||
| Value Equity Fund | 94,269,416 | 156,121,753 | ||||||
| Flexible Equity Fund | 99,931,883 | 15,321,432 | ||||||
| Equity Income Fund | 34,672,502 | 34,206,256 | ||||||
| Sustainable Growth Fund | 75,204,978 | 97,796,268 | ||||||
| Small-Cap Growth Fund | 75,303,543 | 105,542,710 | ||||||
| Small-Cap Fundamental Value Fund | 411,364,872 | 175,507,962 | ||||||
| Opportunity Fund | 4,987,428 | 6,860,081 | ||||||
| Multi-Strategy Fund | 3,201,821 | 989,572 | ||||||
| Intermediate Income Fund | 215,704,261 | 282,543,791 | ||||||
| Total Return Fund | 219,439,313 | 135,311,141 | ||||||
| Strategic Bond Fund | 154,723,197 | 109,060,743 | ||||||
| Maryland Bond Fund | 118,811,479 | 118,061,923 | ||||||
| Tax Exempt Bond Fund | 255,025,787 | 217,222,503 | ||||||
| Mortgage Securities Fund | 372,196,276 | 320,102,286 | ||||||
| Strategic European Equity Fund | 161,105,321 | 106,854,235 | ||||||
| Japan Alpha Opportunities Fund | 1,193,854,758 | 834,002,757 | ||||||
| Emerging Markets Fund | 259,217,161 | 53,262,684 | ||||||
| Emerging Markets Small-Cap Fund | 263,380,006 | 94,464,015 | ||||||
The Intermediate Income Fund purchased $98,347,945 and sold $145,235,933 in U.S. Government securities for the year ended June 30, 2015. The Strategic Bond Fund purchased $8,331,178 and sold $17,085,462 in U.S. Government securities for the year ended June 30, 2015. The Total Return Fund purchased $31,302,871 and sold $22,790,102 in U.S. Government securities for the period ended June 30, 2015. Purchases and sales of U.S. Government securities are included in the totals above and include U.S. Treasury Bonds and Notes.
www.brownadvisoryfunds.com
169
Notes to Financial Statements
June 30, 2015
Note 5. Federal Income Tax and Distribution Information
At June 30, 2015, the components of distributable earnings (accumulated losses) on a tax basis were as follows:
| Growth Equity | Value Equity | Flexible Equity | Equity Income | |||||||||||||
| Fund | Fund | Fund | Fund | |||||||||||||
| Tax Cost of Investments | $ | 1,732,024,834 | $ | 142,899,549 | $ | 230,709,021 | $ | 163,039,068 | ||||||||
| Gross tax unrealized appreciation | 742,012,778 | 34,651,142 | 61,007,422 | 43,814,635 | ||||||||||||
| Gross tax unrealized depreciation | (24,983,786 | ) | (8,782,531 | ) | (8,616,689 | ) | (3,262,910 | ) | ||||||||
| Net tax unrealized appreciation | 717,028,992 | 25,868,611 | 52,390,733 | 40,551,725 | ||||||||||||
| Net unrealized depreciation on foreign receivables | — | — | (311 | ) | — | |||||||||||
| Undistributed ordinary income | — | 3,830,901 | 826,205 | — | ||||||||||||
| Undistributed long-term capital gain | 99,087,324 | 14,006,420 | — | 1,785,605 | ||||||||||||
| Total distributable earnings | 99,087,324 | 17,837,321 | 826,205 | 1,785,605 | ||||||||||||
| Other accumulated losses | — | — | (563,381 | ) | — | |||||||||||
| Total accumulated earnings | $ | 816,116,316 | $ | 43,705,932 | $ | 52,653,246 | $ | 42,337,330 | ||||||||
| Sustainable | Small-Cap | |||||||||||||||
| Growth | Small-Cap | Fundamental | Opportunity | |||||||||||||
| Fund | Growth Fund | Value Fund | Fund | |||||||||||||
| Tax Cost of Investments | $ | 150,123,347 | $ | 187,644,966 | $ | 748,243,733 | $ | 8,002,293 | ||||||||
| Gross tax unrealized appreciation | 66,638,959 | 97,497,396 | 174,189,045 | 3,039,602 | ||||||||||||
| Gross tax unrealized depreciation | (189,189 | ) | (2,485,118 | ) | (41,455,180 | ) | (335,617 | ) | ||||||||
| Net tax unrealized appreciation | 66,449,770 | 95,012,278 | 132,733,865 | 2,703,985 | ||||||||||||
| Net unrealized depreciation on foreign receivables | (124 | ) | — | — | — | |||||||||||
| Undistributed ordinary income | — | 763,358 | — | — | ||||||||||||
| Undistributed long-term capital gain | 10,482,038 | 24,907,663 | 17,190,395 | — | ||||||||||||
| Total distributable earnings | 10,482,038 | 25,671,021 | 17,190,395 | — | ||||||||||||
| Other accumulated losses | (9,655,423 | ) | (826,491 | ) | (6,307,397 | ) | (5,061,508 | ) | ||||||||
| Total accumulated earnings (losses) | $ | 67,276,261 | $ | 119,856,808 | $ | 143,616,863 | $ | (2,357,523 | ) | |||||||
| Multi-Strategy | Intermediate | Total Return | Strategic Bond | |||||||||||||
| Fund | Income Fund | Fund | Fund | |||||||||||||
| Tax Cost of Investments | $ | 2,291,426 | $ | 151,246,322 | $ | 95,719,844 | $ | 62,651,379 | ||||||||
| Gross tax unrealized appreciation | 54,944 | 843,551 | 274,395 | 285,766 | ||||||||||||
| Gross tax unrealized depreciation | (29,841 | ) | (1,736,343 | ) | (795,554 | ) | (1,103,376 | ) | ||||||||
| Net tax unrealized appreciation (depreciation) | 25,103 | (892,792 | ) | (521,159 | ) | (817,610 | ) | |||||||||
| Undistributed ordinary income | 3,855 | 453,444 | 155,204 | 772,240 | ||||||||||||
| Undistributed long-term capital gain | 4,624 | 369,442 | — | — | ||||||||||||
| Total distributable earnings | 8,479 | 822,886 | 155,204 | 772,240 | ||||||||||||
| Other accumulated losses | (10,237 | ) | (190,234 | ) | (1,273,889 | ) | (1,294,068 | ) | ||||||||
| Total accumulated earnings (losses) | $ | 23,345 | $ | (260,140 | ) | $ | (1,639,844 | ) | $ | (1,339,438 | ) | |||||
www.brownadvisoryfunds.com
170
Notes to Financial Statements
June 30, 2015
| Strategic | ||||||||||||||||
| Maryland | Tax Exempt | Mortgage | European | |||||||||||||
| Bond Fund | Bond Fund | Securities Fund | Equity Fund | |||||||||||||
| Tax Cost of Investments | $ | 196,111,595 | $ | 229,155,793 | $ | 258,819,896 | $ | 263,175,221 | ||||||||
| Gross tax unrealized appreciation | 2,287,599 | 697,698 | 1,826,615 | 16,846,844 | ||||||||||||
| Gross tax unrealized depreciation | (581,898 | ) | (1,671,379 | ) | (2,777,435 | ) | (9,559,470 | ) | ||||||||
| Net tax unrealized appreciation (depreciation) | 1,705,701 | (973,681 | ) | (950,820 | ) | 7,287,374 | ||||||||||
| Net unrealized depreciation on foreign receivables | — | — | — | (23,193 | ) | |||||||||||
| Undistributed ordinary income | 246,879 | ^ | 246,728 | ^ | 16,572 | 2,991,719 | ||||||||||
| Undistributed long-term capital gain | — | — | 1,036,868 | — | ||||||||||||
| Total distributable earnings | 246,879 | ^ | 246,728 | ^ | 1,053,440 | 2,991,719 | ||||||||||
| Other accumulated losses | (361,093 | ) | (1,657,038 | ) | — | (9,108,703 | ) | |||||||||
| Total accumulated earnings (losses) | $ | 1,591,487 | $ | (2,383,991 | ) | $ | 102,620 | $ | 1,147,197 | |||||||
| Japan Alpha | Emerging | Emerging | ||||||||||||||
| Opportunities | Markets | Markets | ||||||||||||||
| Fund | Fund | Small-Cap Fund | ||||||||||||||
| Tax Cost of Investments | $ | 1,503,128,164 | $ | 427,153,696 | $ | 191,270,422 | ||||||||||
| Gross tax unrealized appreciation | 294,307,554 | 21,610,472 | 23,744,134 | |||||||||||||
| Gross tax unrealized depreciation | (162,366,508 | ) | (24,453,714 | ) | (10,346,819 | ) | ||||||||||
| Net tax unrealized appreciation (depreciation) | 131,941,046 | (2,843,242 | ) | 13,397,315 | ||||||||||||
| Net unrealized appreciation (depreciation) on foreign receivables | (74,537 | ) | (25,268 | ) | 1,143 | |||||||||||
| Undistributed ordinary income | 215,448,004 | 2,706,260 | 8,503,213 | |||||||||||||
| Undistributed long-term capital gain | 17,516,617 | — | — | |||||||||||||
| Total distributable earnings | 232,964,621 | 2,706,260 | 8,503,213 | |||||||||||||
| Other accumulated losses | (19,059,167 | ) | (7,465,126 | ) | — | |||||||||||
| Total accumulated earnings (losses) | $ | 345,771,963 | $ | (7,627,376 | ) | $ | 21,901,671 | |||||||||
^ Represents tax exempt income.
The differences between components of distributable earnings on a tax basis and the amounts reflected in the Statements of Assets and Liabilities are primarily due to wash sales, post-October losses, post-December ordinary losses and distributions payable.
www.brownadvisoryfunds.com
171
Notes to Financial Statements
June 30, 2015
At June 30, 2015, the following capital loss carryforwards were available:
| Expiring | Expiring | Expiring | Infinite | Infinite | ||||||||||||||||||||
| 2016 | 2017 | 2018 | Short-Term | Long-Term | Total | |||||||||||||||||||
| Growth Equity Fund | $ | — | $ | — | $ | — | $ | — | $ | — | $ | — | ||||||||||||
| Value Equity Fund | — | — | — | — | — | — | ||||||||||||||||||
| Flexible Equity Fund | — | 563,381 | — | — | — | 563,381 | ||||||||||||||||||
| Equity Income Fund | — | — | — | — | — | — | ||||||||||||||||||
| Sustainable Growth Fund | — | — | — | 9,225,649 | * | — | 9,225,649 | * | ||||||||||||||||
| Small-Cap Growth Fund | — | — | — | — | — | — | ||||||||||||||||||
| Small-Cap Fundamental Value Fund | 2,052,821 | ** | — | — | — | — | 2,052,821 | ** | ||||||||||||||||
| Opportunity Fund | 4,287,457 | 734,936 | — | — | — | 5,022,393 | ||||||||||||||||||
| Multi-Strategy Fund | — | — | — | — | — | — | ||||||||||||||||||
| Intermediate Income Fund | — | — | — | — | — | — | ||||||||||||||||||
| Total Return Fund | — | — | — | — | — | — | ||||||||||||||||||
| Strategic Bond Fund | — | — | — | 55,293 | — | 55,293 | ||||||||||||||||||
| Maryland Bond Fund | — | — | — | — | — | — | ||||||||||||||||||
| Tax Exempt Bond Fund | — | — | — | — | 1,095,810 | 1,095,810 | ||||||||||||||||||
| Mortgage Securities Fund | — | — | — | — | — | — | ||||||||||||||||||
| Strategic European Equity Fund | — | — | — | 6,721,930 | 2,386,773 | 9,108,703 | ||||||||||||||||||
| Japan Alpha Opportunities Fund | — | — | — | — | — | — | ||||||||||||||||||
| Emerging Markets Fund | — | — | — | 7,465,126 | — | 7,465,126 | ||||||||||||||||||
| Emerging Markets Small-Cap Fund | — | — | — | — | — | — | ||||||||||||||||||
| * | Acquired in connection with the merger of the Winslow Green Growth Fund. The amount vests ratably and becomes available to use over the next two fiscal years ending on June 30, 2017. | |
| ** | Acquired in connection with the merger of the Brown Advisory Small Companies Fund. The amount has vested ratably and becomes available to use over the next fiscal year ending on June 30, 2016. |
Distributions during the fiscal periods ended as noted were characterized for tax purposes as follows:
| Tax Exempt Income | Ordinary Income | |||||||||||||||
| June 30, 2015 | June 30, 2014 | June 30, 2015 | June 30, 2014 | |||||||||||||
| Growth Equity Fund | $ | — | $ | — | $ | 10,853,820 | $ | — | ||||||||
| Value Equity Fund | — | — | 4,810,520 | 1,823,081 | ||||||||||||
| Flexible Equity Fund | — | — | 1,001,462 | 404,653 | ||||||||||||
| Equity Income Fund | — | — | 5,266,833 | 5,646,162 | ||||||||||||
| Sustainable Growth Fund | — | — | — | — | ||||||||||||
| Small-Cap Growth Fund | — | — | — | 1,881,236 | ||||||||||||
| Small-Cap Fundamental Value Fund | — | — | 8,008,331 | 9,553,188 | ||||||||||||
| Opportunity Fund | — | — | — | — | ||||||||||||
| Multi-Strategy Fund | — | N/A | 2,394 | N/A | ||||||||||||
| Intermediate Income Fund | — | — | 3,532,751 | 4,135,996 | ||||||||||||
| Total Return Fund | — | N/A | 836,802 | N/A | ||||||||||||
| Strategic Bond Fund | — | — | 200,659 | 110,929 | ||||||||||||
| Maryland Bond Fund | 3,466,082 | 4,420,903 | 10,220 | 16,958 | ||||||||||||
| Tax Exempt Bond Fund | 3,896,216 | 3,290,873 | 7,149 | 41,678 | ||||||||||||
| Mortgage Securities Fund | — | — | 7,844,211 | 1,703,711 | ||||||||||||
| Strategic European Equity Fund | — | — | 2,192,615 | — | ||||||||||||
| Japan Alpha Opportunities Fund | — | — | 64,930,081 | — | ||||||||||||
| Emerging Markets Fund | — | — | 3,789,665 | 1,761,113 | ||||||||||||
| Emerging Markets Small-Cap Fund | — | N/A | — | N/A | ||||||||||||
www.brownadvisoryfunds.com
172
Notes to Financial Statements
June 30, 2015
| Long-Term Capital Gain^ | ||||||||
| June 30, 2015 | June 30, 2014 | |||||||
| Growth Equity Fund | $ | 67,977,746 | $ | 15,530,861 | ||||
| Value Equity Fund | 5,195,581 | — | ||||||
| Flexible Equity Fund | — | — | ||||||
| Equity Income Fund | 8,348,294 | 4,701,048 | ||||||
| Sustainable Growth Fund | 4,340,210 | 2,140,640 | ||||||
| Small-Cap Growth Fund | 31,884,901 | 12,608,814 | ||||||
| Small-Cap Fundamental Value Fund | 27,145,541 | 15,312,723 | ||||||
| Opportunity Fund | — | — | ||||||
| Multi-Strategy Fund | — | N/A | ||||||
| Intermediate Income Fund | — | 4,174,241 | ||||||
| Total Return Fund | — | N/A | ||||||
| Strategic Bond Fund | — | — | ||||||
| Maryland Bond Fund | 1,040,851 | 1,707,914 | ||||||
| Tax Exempt Bond Fund | — | — | ||||||
| Mortgage Securities Fund | — | — | ||||||
| Strategic European Equity Fund | — | — | ||||||
| Japan Alpha Opportunities Fund | — | — | ||||||
| Emerging Markets Fund | — | — | ||||||
| Emerging Markets Small-Cap Fund | — | N/A | ||||||
| ^ | Designated as a long-term capital gain dividend, pursuant to Internal Revenue Code Section 852(b)(3). |
On the Statements of Assets and Liabilities, as a result of net operating losses incurred, adjustments to holdings of Real Estate Investment Trusts, currency gains and losses, distribution reclassifications and income adjustments to asset-backed security transactions, certain amounts of income, realized gains, and paid-in capital have been reclassified for the year ended June 30, 2015. These reclassifications have no impact on the net assets of the Funds:
| Undistributed | Accumulated | |||||||||||
| Net Investment | Net Realized | Paid-in | ||||||||||
| Income (Loss) | Gain (Loss) | Capital | ||||||||||
| Growth Equity Fund | $ | 1,287,032 | $ | (1,287,032 | ) | $ | — | |||||
| Value Equity Fund | (452 | ) | 452 | — | ||||||||
| Flexible Equity Fund | (517 | ) | 517 | — | ||||||||
| Equity Income Fund | 9,594 | (9,594 | ) | — | ||||||||
| Sustainable Growth Fund | 684,959 | 849 | (685,808 | ) | ||||||||
| Small-Cap Growth Fund | 1,712,399 | (1,712,344 | ) | (55 | ) | |||||||
| Small-Cap Fundamental Value Fund | 1,014,443 | (781,089 | ) | (233,354 | ) | |||||||
| Opportunity Fund | 60,874 | 16 | (60,890 | ) | ||||||||
| Multi-Strategy Fund | 588 | (588 | ) | — | ||||||||
| Intermediate Income Fund | 394,832 | (394,832 | ) | — | ||||||||
| Total Return Fund | 14,254 | (14,254 | ) | — | ||||||||
| Strategic Bond Fund | 163,520 | (163,520 | ) | — | ||||||||
| Maryland Bond Fund | — | — | — | |||||||||
| Tax Exempt Bond Fund | — | (1 | ) | 1 | ||||||||
| Mortgage Securities Fund | 514,819 | (514,819 | ) | — | ||||||||
| Strategic European Equity Fund | 20,229 | (20,229 | ) | — | ||||||||
| Japan Alpha Opportunities Fund | 226,382,822 | (226,382,822 | ) | — | ||||||||
| Emerging Markets Fund | 645,531 | (645,531 | ) | — | ||||||||
| Emerging Markets Small-Cap Fund | (199,181 | ) | 199,181 | — | ||||||||
www.brownadvisoryfunds.com
173
Notes to Financial Statements
June 30, 2015
At June 30, 2015, the Funds deferred, on a tax basis:
| Post-October | Post-October | Post-December | ||||||||||
| Capital Losses | Currency Losses | Ordinary Losses | ||||||||||
| Growth Equity Fund | $ | — | $ | — | $ | — | ||||||
| Value Equity Fund | — | — | — | |||||||||
| Flexible Equity Fund | — | — | — | |||||||||
| Equity Income Fund | — | — | — | |||||||||
| Sustainable Growth Fund | — | — | 429,774 | |||||||||
| Small-Cap Growth Fund | — | — | 826,491 | |||||||||
| Small-Cap Fundamental Value Fund | 4,254,576 | — | — | |||||||||
| Opportunity Fund | — | — | 39,115 | |||||||||
| Multi-Strategy Fund | — | — | 10,237 | |||||||||
| Intermediate Income Fund | — | — | — | |||||||||
| Total Return Fund | 1,124,317 | — | — | |||||||||
| Strategic Bond Fund | 1,238,775 | — | — | |||||||||
| Maryland Bond Fund | 114,242 | — | — | |||||||||
| Tax Exempt Bond Fund | 314,377 | — | — | |||||||||
| Mortgage Securities Fund | — | — | — | |||||||||
| Strategic European Equity Fund | — | — | — | |||||||||
| Japan Alpha Opportunities Fund | — | — | — | |||||||||
| Emerging Markets Fund | — | — | — | |||||||||
| Emerging Markets Small-Cap Fund | — | — | — | |||||||||
Note 6. Strategic Bond Fund – Credit Default Swap Agreements
The Strategic Bond Fund may invest in credit default swap agreements. Credit default swap agreements involve one party making a stream of payments (generally referred to as the buyer of protection) to another party (the seller of protection) in exchange for the right to receive a specified return in the event of a default or other credit event in respect of a referenced entity, obligation or index. As a seller of protection on credit default swap agreements, a Fund will generally receive from the buyer of protection a fixed rate of income throughout the term of the swap. As the seller, a Fund would effectively add leverage to its portfolio because, in addition to its total net assets, the Fund would be subject to investment exposure on the notional amount of the swap.
If a Fund is a seller of protection and a credit event occurs, as defined under the terms of that particular swap agreement, the Fund will either (i) pay to the buyer of protection an amount equal to the notional amount of the swap and take delivery of the referenced obligation, other deliverable obligations or underlying securities comprising the referenced index or (ii) pay a net settlement amount in the form of cash or securities equal to the notional amount of the swap less the recovery value of the referenced obligation or underlying securities comprising the referenced index. If a Fund is a buyer of protection and a credit event occurs, as defined under the terms of that particular swap agreement, the Fund will either (i) receive from the seller of protection an amount equal to the notional amount of the swap and deliver the referenced obligation, other deliverable obligations or underlying securities comprising the referenced index or (ii) receive a net settlement amount in the form of cash or securities equal to the notional amount of the swap less the recovery value of the referenced obligation or underlying securities comprising the referenced index. Recovery values are typically estimated by market makers considering either industry standard recovery rates or entity specific factors and considerations until a credit event occurs.
Credit default swap agreements on credit indices involve one party making a stream of payments to another party in exchange for the right to receive a specified return in the event of a write-down, principal shortfall, interest shortfall or default some or all of the referenced entities comprising the credit index. A credit index is a basket of credit instruments or exposures typically designed to be representative of some part of the credit market as a whole. Components of the indices may include, but are not limited to, investment grade securities, high yield securities, asset-backed securities, emerging markets, and/or various credit ratings within each sector. Credit indices are typically traded using credit default swaps with standardized terms including a fixed spread and standard maturity dates. An index credit default swap references all the names in the index, and if there is a default, the credit event is settled based on that name’s weight in the index.
www.brownadvisoryfunds.com
174
Notes to Financial Statements
June 30, 2015
The Strategic Bond Fund did not hold any credit default swap contracts as of June 30, 2015.
The effect of credit default swap contracts on the Statements of Operations for the year ended June 30, 2015 is as follows:
| Derivatives not accounted | |||
| Fund | for as hedging instruments | Statement of Operations Location | Amount |
| Strategic Bond Fund | Credit Default Swap Contracts | Net realized gain (loss) – | |
| credit default swap contracts | $(158,389) | ||
| Strategic Bond Fund | Credit Default Swap Contracts | Net change in unrealized | |
| appreciation (depreciation) – | |||
| credit default swap contracts | $(151,550) |
For the year ended June 30, 2015, the average notional amount of credit default swaps outstanding was $6,268,095.
Note 7. Japan Alpha Opportunities Fund – Forward Foreign Currency Contracts
The majority of the Japan Alpha Opportunities Fund’s assets are denominated in Japanese Yen. The Japan Alpha Opportunities Fund seeks to offset or hedge its exposure to the Japanese Yen by entering into forward foreign currency contracts. A forward foreign currency contract is a commitment to purchase or sell a foreign currency at a future date at an agreed upon price. Typically, the Japan Alpha Opportunities Fund will have a net position in forward foreign currency contracts that commits the Fund to sell Japanese Yen in return for U.S. Dollars. These contracts are traded over-the-counter and not on an organized exchange. The contracts are marked-to-market daily and the change in market value is recorded as unrealized appreciation or depreciation. When the contract is closed, a realized gain or loss equal to the difference between the value at the time it was opened and the value at the time it was closed is recorded. The realized gains or losses are reported in the Statement of Operations as net realized gains or losses from forward foreign currency contracts. Unrealized appreciation on forward foreign currency contracts and unrealized depreciation on forward foreign currency contracts is reported in the Statement of Assets and Liabilities for those contracts that remain open as of year end. Risks may arise from the potential inability of a counterparty to meet the terms of the contract. There is generally no collateral exchanged by the Fund or counterparty to the contract in connection with these contracts. The Fund’s risk of loss from counterparty credit risk on these contracts is generally limited to the aggregate unrealized appreciation on open contracts on a counterparty by counterparty basis. The Fund attempts to mitigate counterparty credit risk by only entering into agreements with counterparties that it believes have the financial resources to honor their obligations and by monitoring the financial stability of those counterparties.
The effect of forward foreign currency contracts on the Statements of Assets and Liabilities as of June 30, 2015 is as follows:
| Derivatives not accounted | Statement of Assets | ||
| Fund | for as hedging instruments | and Liabilities Location | Amount |
| Japan Alpha Opportunities Fund | Forward Foreign Currency Contracts | Assets: Gross unrealized | |
| appreciation – forward foreign | |||
| currency contracts | $ — | ||
| Japan Alpha Opportunities Fund | Forward Foreign Currency Contracts | Liabilities: Gross unrealized | |
| depreciation – forward foreign | |||
| currency contracts | $ 19,059,167 |
The effect of forward foreign currency contracts on the Statements of Operations for the year ended June 30, 2015 is as follows:
| Derivatives not accounted | Statement of | ||
| Fund | for as hedging instruments | Operations Location | Amount |
| Japan Alpha Opportunities Fund | Forward Foreign Currency Contracts | Net realized gain (loss) – | |
| forward foreign currency contracts | $ 221,111,367 | ||
| Japan Alpha Opportunities Fund | Forward Foreign Currency Contracts | Net change in unrealized | |
| appreciation (depreciation) – | |||
| forward foreign currency contracts | $ (12,603,858) |
As of June 30, 2015, the Japan Alpha Opportunities Fund had open forward foreign currency contracts with an original market value, in U.S. Dollars, of $1,391,640,771. For the year ended June 30, 2015, the average original market value, in U.S. Dollars, of forward foreign currency contracts held by the Fund was $1,269,856,769. Typically, the Fund will seek to offset all or nearly all of
www.brownadvisoryfunds.com
175
Notes to Financial Statements
June 30, 2015
its exposure to the Japanese Yen through the use of forward foreign currency contracts. Therefore, the amount of open forward foreign currency contracts outstanding at any given time is likely to be similar to the total net assets of the Fund at that time.
Offsetting Assets & Liabilities – Forward Foreign Currency Contracts
To facilitate the Japan Alpha Opportunities Fund’s investment in forward foreign currency contracts, the Fund has entered into agreements with counterparties that dictate the terms under which the Fund and the counterparty will enter into such agreements. Under these agreements, both the Fund and the counterparty may be allowed to combine amounts owed to or receivable from the other and settle all outstanding obligations on a “net basis”.
Consequently, some funds may choose to present such assets or liabilities related to forward foreign currency contracts or other derivatives on a net basis in their Statements of Assets and Liabilities. The Japan Alpha Opportunities Fund does not present any assets or liabilities related to forward foreign currency contracts in such a manner; rather, the Fund presents the gross amounts of assets and the gross amounts of liabilities related to forward foreign currency contracts in the Statements of Assets and Liabilities. In order to facilitate comparability amongst different funds, the table below shows what the Japan Alpha Opportunities Fund’s Statement of Assets and Liabilities accounts related to forward foreign currency contracts would look like if it did choose to offset, or present on a net basis, assets and liabilities related to forward foreign currency contracts. At June 30, 2015, the Japan Alpha Opportunities Fund had two open forward foreign currency contracts open with two distinct counterparties, and each contract was in a position of having unrealized depreciation. Therefore, there are no amounts that may be offset by the Fund in the Statement of Assets and Liabilities, as shown in the table below:
| Assets: | ||||||||||||||||||||||||
| Gross Amounts | Net Amounts | Gross Amounts Not Offset | ||||||||||||||||||||||
| Gross | Offset in the | Presented in | in the Statement of | |||||||||||||||||||||
| Amounts of | Statement | the Statement | Assets & Liabilities | |||||||||||||||||||||
| Unrealized Appreciation on | Recognized | of Assets | of Assets | Financial | Collateral | |||||||||||||||||||
| Forward Foreign Currency Contracts | Assets | & Liabilities | & Liabilities | Instruments | Received | Net Amount | ||||||||||||||||||
| Counterparty: | ||||||||||||||||||||||||
| Deustche Bank AG | $ | — | $ | — | $ | — | $ | — | $ | — | $ | — | ||||||||||||
| State Street Capital Markets | — | — | — | — | — | — | ||||||||||||||||||
| Total | $ | — | $ | — | $ | — | $ | — | $ | — | $ | — | ||||||||||||
| Liabilities: | ||||||||||||||||||||||||
| Gross Amounts | Net Amounts | Gross Amounts Not Offset | ||||||||||||||||||||||
| Gross | Offset in the | Presented in | in the Statement of | |||||||||||||||||||||
| Amounts of | Statement | the Statement | Assets & Liabilities | |||||||||||||||||||||
| Unrealized Depreciation on | Recognized | of Assets | of Assets | Financial | Collateral | |||||||||||||||||||
| Forward Foreign Currency Contracts | Liabilities | & Liabilities | & Liabilities | Instruments | Pledged | Net Amount | ||||||||||||||||||
| Counterparty: | ||||||||||||||||||||||||
| Deustche Bank AG | $ | 9,322,584 | $ | — | $ | 9,322,584 | $ | — | $ | — | $ | 9,322,584 | ||||||||||||
| State Street Capital Markets | 9,736,583 | — | 9,736,583 | — | — | 9,736,583 | ||||||||||||||||||
| Total | $ | 19,059,167 | $ | — | $ | 19,059,167 | $ | — | $ | — | $ | 19,059,167 | ||||||||||||
Note 8. Futures Contracts
The Total Return Fund, Strategic Bond Fund and Japan Alpha Opportunities Fund invest in futures contracts.
Futures Contracts
The Total Return Fund, Strategic Bond Fund and Japan Alpha Opportunities Fund invest in futures contracts. At the time a Fund purchases or enters into a futures contract, the Fund deposits and maintains as collateral an initial margin with the broker, as required by the terms of the contract. Pursuant to the contract, the Fund agrees to receive from or pay to the broker an amount of cash equal to the daily fluctuation in the value of the contract. Such receipts or payments are known as variation margin and are recorded by the Fund as unrealized gains or losses on futures contracts. The daily settlement of variation margin between the Fund and the broker serves to reduce counterparty risk to the Fund. The use of long futures contracts by the Funds subjects them to a risk of loss in excess of the amounts shown on the Statements of Assets and Liabilities and up to the total notional amount of the futures contract as shown in the Schedule of Investments. The use of short futures contracts by the Funds subjects them to a
www.brownadvisoryfunds.com
176
Notes to Financial Statements
June 30, 2015
risk of loss in excess of the amounts shown on the Statements of Assets and Liabilities and, hypothetically, up to an unlimited amount of loss that could exceed the notional amount of the futures contract as shown in the Schedule of Investments.
The effect of futures contracts on the Statements of Assets and Liabilities as of June 30, 2015 is as follows:
| Derivatives not accounted | Statement of Assets | |||||
| Fund | for as hedging instruments | and Liabilities Location | Amount | |||
| Total Return Fund | Futures Contracts | Gross unrealized appreciation – | ||||
| futures contracts | $ | 37,850 | ||||
| Total Return Fund | Futures Contracts | Gross unrealized depreciation – | ||||
| futures contracts | $ | 177,548 | ||||
| Strategic Bond Fund | Futures Contracts | Gross unrealized appreciation – | ||||
| futures contracts | $ | 1,113 | ||||
| Strategic Bond Fund | Futures Contracts | Gross unrealized depreciation – | ||||
| futures contracts | $ | 27,519 | ||||
| Japan Alpha Opportunities Fund | Futures Contracts | Gross unrealized appreciation – | ||||
| futures contracts | $ | — | ||||
| Japan Alpha Opportunities Fund | Futures Contracts | Gross unrealized depreciation – | ||||
| futures contracts | $ | 1,281,897 | ||||
The effect of futures contracts on the Statements of Operations for the period/year ended June 30, 2015 is as follows:
| Derivatives not accounted | Statement of Assets | |||||
| Fund | for as hedging instruments | and Liabilities Location | Amount | |||
| Total Return Fund | Futures Contracts | Net realized gain (loss) – | ||||
| futures contracts | $ | (1,001,045 | ) | |||
| Total Return Fund | Futures Contracts | Net change in unrealized | ||||
| appreciation (depreciation) – | ||||||
| futures contracts | $ | (139,698 | ) | |||
| Strategic Bond Fund | Futures Contracts | Net realized gain (loss) – | ||||
| futures contracts | $ | (369,898 | ) | |||
| Strategic Bond Fund | Futures Contracts | Net change in unrealized | ||||
| appreciation (depreciation) – | ||||||
| futures contracts | $ | (26,406 | ) | |||
| Japan Alpha Opportunities Fund | Futures Contracts | Net realized gain (loss) – | ||||
| futures contracts | $ | 23,591,577 | ||||
| Japan Alpha Opportunities Fund | Futures Contracts | Net change in unrealized | ||||
| appreciation (depreciation) – | ||||||
| futures contracts | $ | (2,451,491 | ) | |||
As of June 30, 2015, the Total Return Fund and Japan Alpha Opportunities Fund had long open futures contracts with notional fair values of $15,431,562 and $93,258,978, respectively. During the period/year ended June 30, 2015, the average notional fair value of long futures contracts held by the Total Return Fund and Japan Alpha Opportunities Fund were $7,118,883 and $94,116,979, respectively.
At June 30, 2015, the Total Return Fund and Strategic Bond Fund had short open futures contracts with notional fair values of $20,723,242 and $9,240,547, respectively. During the period/year ended June 30, 2015, the average notional fair value of the short future contracts held by the Total Return Fund and Strategic Bond Fund were $15,464,936 and $9,592,203, respectively.
Offsetting Assets & Liabilities – Futures Contracts
To facilitate the Fund’s investment in futures contracts, the Funds have entered into agreements with counterparties that dictate the terms under which the Funds and the counterparty will enter into such agreements. Under these agreements, both the Funds
www.brownadvisoryfunds.com
177
Notes to Financial Statements
June 30, 2015
and the counterparty may be allowed to combine amounts owed to or receivable from the other and settle all outstanding obligations on a “net basis.” In order to facilitate comparability amongst different funds, the table below shows what the Funds’ Statement of Assets and Liabilities accounts related to futures contracts would look like if they choose to offset, or present on a net basis, assets and liabilities related to futures contracts.
| Assets: | ||||||||||||||||||||||||
| Gross Amounts | Net Amounts | Gross Amounts Not Offset | ||||||||||||||||||||||
| Gross | Offset in the | Presented in | in the Statement of | |||||||||||||||||||||
| Amounts of | Statement | the Statement | Assets & Liabilities | |||||||||||||||||||||
| Recognized | of Assets | of Assets | Financial | Collateral | ||||||||||||||||||||
| Description | Assets | & Liabilities | & Liabilities | Instruments | Received | Net Amount | ||||||||||||||||||
| Total Return Fund | ||||||||||||||||||||||||
| Futures Contracts | $ | 37,850 | $ | (37,850 | ) | $ | — | $ | — | $ | — | $ | — | |||||||||||
| Strategic Bond Fund | ||||||||||||||||||||||||
| Futures Contracts | 1,113 | (1,113 | ) | — | — | — | — | |||||||||||||||||
| Japan Alpha Opportunities Fund | ||||||||||||||||||||||||
| Futures Contract | — | — | — | — | — | — | ||||||||||||||||||
| Liabilities: | ||||||||||||||||||||||||
| Gross Amounts | Net Amounts | Gross Amounts Not Offset | ||||||||||||||||||||||
| Gross | Offset in the | Presented in | in the Statement of | |||||||||||||||||||||
| Amounts of | Statement | the Statement | Assets & Liabilities | |||||||||||||||||||||
| Recognized | of Assets | of Assets | Financial | Collateral | ||||||||||||||||||||
| Description | Liabilities | & Liabilities | & Liabilities | Instruments | Pledged | Net Amount | ||||||||||||||||||
| Total Return Fund | ||||||||||||||||||||||||
| Futures Contracts | $ | 177,548 | $ | (37,850 | ) | $ | 139,698 | $ | — | $ | 139,698 | $ | — | |||||||||||
| Strategic Bond Fund | ||||||||||||||||||||||||
| Futures Contracts | 27,519 | (1,113 | ) | 26,406 | — | 26,406 | — | |||||||||||||||||
| Japan Alpha Opportunities Fund | ||||||||||||||||||||||||
| Futures Contract | 1,281,897 | — | 1,281,897 | — | 1,281,897 | — | ||||||||||||||||||
Note 9. Line of Credit
As of June 30, 2015, Brown Advisory Funds has an unsecured line of credit of up to $100,000,000 with U.S. Bank, N.A. The interest rate on the line of credit as of June 30, 2015 was 3.25% (prime rate). During the year ended June 30, 2015, the only Brown Advisory Fund to utilize the line of credit was the Multi-Strategy Fund, which had a maximum outstanding balance of $832,000 and an average daily balance outstanding of $10,314. The total interest expense incurred by the Multi-Strategy Fund under the terms of the line of credit was $225. As of June 30, 2015, none of the Funds had any amounts outstanding under the line of credit.
Note 10. Proposed Reorganization of Opportunity Fund
The Board of Trustees of Brown Advisory Funds (the “Trust”) has recently approved an Agreement and Plan of Reorganization (the “Plan”) relating to the Opportunity Fund (the “Fund”) pursuant to which the Fund would be reorganized with and into the Brown Advisory Global Leaders Fund (the “Acquiring Fund”), which is another investment series of the Trust. The Plan sets forth the terms and conditions by which the Fund would transfer all of its assets to the Acquiring Fund in exchange for shares of the Acquiring Fund and would then subsequently distribute those Acquiring Fund shares to the Fund’s shareholders in complete liquidation of the Fund (the “Reorganization”).
Shareholders of the Fund will receive an Information Statement/Prospectus containing information about the Acquiring Fund and about the terms and conditions of the Reorganization. In accordance with applicable regulatory provisions, shareholders of the Fund are not required to vote with respect to the Reorganization.
www.brownadvisoryfunds.com
178
Notes to Financial Statements
June 30, 2015
The Reorganization is scheduled to be completed on or about October 23, 2015, or on such other date as the officers of the Trust may determine (the “Closing Date”). As of the close of business on the Closing Date, shareholders of the Fund will receive shares of the Acquiring Fund having an aggregate net asset value equal to the aggregate net asset value of the shareholders’ shares of the Fund. Shareholders of the Fund may continue to redeem their shares, or exchange their shares for shares of any of the other Brown Advisory Funds offered by the Trust until the Closing Date.
Effective as of the close of business on August 14, 2015, in anticipation of the Reorganization, Investor Shares of the Fund will no longer be sold to new investors. Existing shareholders of the Fund may continue to purchase Investor Shares after this date and will continue to be eligible to exchange their shares of the Fund for other Brown Advisory Funds until on or about the Closing Date.
No sales load or other transactional fees will be imposed as a result of the Reorganization. The expenses of the Reorganization will be borne entirely by Brown Advisory LLC, the investment adviser to the Funds.
It is anticipated that the Reorganization will qualify as a tax-free transaction for Federal income tax purposes, and, as a result, it is anticipated that shareholders of the Fund will not recognize any gain or loss in connection with the carrying out of the Reorganization.
In determining to vote in favor the Reorganization, the Board of Trustees of the Trust carefully considered the terms and conditions of the Reorganization and concluded that the proposed transaction was in the best interest of each of the Funds and their shareholders and that it would not result in a dilution of the shareholders of either Fund.
If you have any questions, please call the Fund at 1-800-540-6807 (toll free) or 414-203-9064.
www.brownadvisoryfunds.com
179
Report of Independent Registered Public Accounting Firm
To the Board of Trustees and Shareholders
Brown Advisory Funds
We have audited the accompanying statements of assets and liabilities of Brown Advisory Growth Equity Fund, Brown Advisory Value Equity Fund, Brown Advisory Flexible Equity Fund, Brown Advisory Equity Income Fund, Brown Advisory Sustainable Growth Fund, Brown Advisory Small-Cap Growth Fund, Brown Advisory Small-Cap Fundamental Value Fund, Brown Advisory Opportunity Fund, Brown Advisory Multi- Strategy Fund, Brown Advisory Intermediate Income Fund, Brown Advisory Total Return Fund, Brown Advisory Strategic Bond Fund (formerly the Brown Advisory Tactical Bond Fund), Brown Advisory Maryland Bond Fund, Brown Advisory Tax-Exempt Bond Fund, Brown Advisory Mortgage Securities Fund, Brown Advisory-WMC Strategic European Equity Fund, Brown Advisory – WMC Japan Alpha Opportunities Fund, Brown Advisory – Somerset Emerging Markets Fund, and Brown Advisory Emerging Markets Small-Cap Fund (collectively the “Funds”), each a series of Brown Advisory Funds (the “Trust”), including the schedules of investments as of June 30, 2015, and the related statements of operations, the statements of changes in net assets and the financial highlights for the periods indicated thereon. These financial statements and financial highlights are the responsibility of the Trust’s management. Our responsibility is to express an opinion on these financial statements and financial highlights based on our audits.
We conducted our audits in accordance with the standards of the Public Company Accounting Oversight Board (United States). Those standards require that we plan and perform the audits to obtain reasonable assurance about whether the financial statements and financial highlights are free of material misstatement. The Funds are not required to have, nor were we engaged to perform an audit of its internal control over financial reporting. Our audits included consideration of internal control over financial reporting as a basis for designing audit procedures that are appropriate in the circumstances, but not for the purpose of expressing an opinion on the effectiveness of the Funds’ internal control over financial reporting. Accordingly, we express no such opinion. An audit includes examining, on a test basis, evidence supporting the amounts and disclosures in the financial statements. Our procedures included confirmation of securities owned as of June 30, 2015, by correspondence with the custodian and brokers or by other appropriate auditing procedures when replies from brokers were not received. An audit also includes assessing the accounting principles used and significant estimates made by management, as well as evaluating the overall financial statement presentation. We believe that our audits provide a reasonable basis for our opinion.
In our opinion, the financial statements and financial highlights referred to above present fairly, in all material respects, the financial position of Brown Advisory Growth Equity Fund, Brown Advisory Value Equity Fund, Brown Advisory Flexible Equity Fund, Brown Advisory Equity Income Fund, Brown Advisory Sustainable Growth Fund, Brown Advisory Small-Cap Growth Fund, Brown Advisory Small-Cap Fundamental Value Fund, Brown Advisory Opportunity Fund, Brown Advisory Multi – Strategy Fund, Brown Advisory Intermediate Income Fund, Brown Advisory Total Return Fund, Brown Advisory Strategic Bond Fund (formerly the Brown Advisory Tactical Bond Fund), Brown Advisory Maryland Bond Fund, Brown Advisory Tax-Exempt Bond Fund, Brown Advisory Mortgage Securities Fund, Brown Advisory-WMC Strategic European Equity Fund, Brown Advisory – WMC Japan Alpha Opportunities Fund, Brown Advisory – Somerset Emerging Markets Fund, and Brown Advisory Emerging Markets Small-Cap Fund as of June 30, 2015, the results of their operations, the changes in their net assets and the financial highlights for the periods indicated thereon, in conformity with accounting principles generally accepted in the United States of America.
TAIT, WELLER & BAKER LLP
Philadelphia, Pennsylvania
August 28, 2015
www.brownadvisoryfunds.com
180
Expense Example For the Six Months Ended June 30, 2015 (Unaudited)
As a shareholder of a Fund you incur two types of costs: (1) transaction costs, including redemption fees and exchange fees; and (2) ongoing costs, including investment advisory fees; distribution and/or service fees; and other Fund expenses. This example is intended to help you understand your ongoing costs (in dollars) of investing in a Fund and to compare these costs with the ongoing costs of investing in other mutual funds. The example is based on an investment of $1,000 invested at the beginning of the six month period and held for the entire period (January 1, 2015 – June 30, 2015).
Actual Expenses
The “Actual Return” row in the following table provides information about actual account values based on actual returns and actual expenses. As a shareholder you will be assessed fees for outgoing wire transfers, returned checks and stop payment orders at prevailing rates charged by U.S. Bancorp Fund Services, LLC, the Funds’ transfer agent. If you request that a redemption be made by wire transfer, currently, the Funds’ transfer agent charges a $15.00 fee. You will be charged a redemption fee equal to 1.00% of the net amount of the redemption if you redeem your shares less than 14 days after you purchase, with certain limited exceptions. Individual Retirement Accounts (“IRA”) that are held directly at the Funds will be charged a $15.00 annual maintenance fee. IRAs held by broker-dealers or through other means, may or may not incur an annual maintenance fee. Yet, if IRAs maintenance fees are charged to accounts held elsewhere, the fees charged may be more or may be less than $15.00. To the extent the Funds invest in shares of other investment companies as part of their investment strategy, you will indirectly bear your proportionate share of any fees and expenses charged by the underlying funds in which the Funds invest in addition to the expenses of the Funds. Actual expenses of the underlying funds may vary. These expenses are not included in the example below. The example below includes, but is not limited to, investment advisory, shareholder servicing, fund accounting, custody and transfer agent fees. However, the example below does not include portfolio trading commissions and related expenses and other extraordinary expenses as determined under generally accepted accounting principles. You may use the information in this line, together with the amount you invested, to estimate the expenses that you paid over the period. Simply divide your account value by $1,000 (for example, an $8,600 account value divided by $1,000 = 8.6). Then, multiply the result by the number in the first line under the heading entitled “Expenses Paid During the Period” to estimate the expenses you paid on your account during this period.
Hypothetical Example for Comparison Purposes
The “Hypothetical Return” row in the following table provides information about hypothetical account values based on a hypothetical return and hypothetical expenses based on the Funds’ actual expense ratio and an assumed rate of return of 5% per year before expenses, which is not the Funds’ actual return. The hypothetical account values and expenses may not be used to estimate the actual ending account balance or expenses you paid for the period. You may use this information to compare the ongoing costs of investing in the Funds and other funds. To do so, compare this 5% hypothetical example with the 5% hypothetical examples that appear in the shareholder reports of the other funds. Please note that the expenses shown in the table are meant to highlight your ongoing costs only and do not reflect any transactional costs, such as sales charges (loads), redemption fees or exchange fees. Therefore, the Hypothetical information in the table is useful in comparing ongoing costs only and will not help you determine the relative total costs of owning different funds. In addition, if these transactional costs were included, your costs would have been higher.
| Beginning | Ending | Annualized | ||
| Account Value | Account Value | Expenses Paid | Net Expense | |
| January 1, 2015 | June 30, 2015 | During the Period* | Ratio* | |
| Growth Equity Fund | ||||
| Institutional Shares | ||||
| Actual Return | $1,000 | $1,049 | $3.66 | 0.72% |
| Hypothetical (5% annual return before expenses) | $1,000 | $1,021 | $3.61 | 0.72% |
| Investor Shares | ||||
| Actual Return | $1,000 | $1,048 | $4.42 | 0.87% |
| Hypothetical (5% annual return before expenses) | $1,000 | $1,020 | $4.36 | 0.87% |
| Advisor Shares | ||||
| Actual Return | $1,000 | $1,046 | $5.68 | 1.12% |
| Hypothetical (5% annual return before expenses) | $1,000 | $1,019 | $5.61 | 1.12% |
www.brownadvisoryfunds.com
181
Expense Example For the Six Months Ended June 30, 2015 (Unaudited)
| Beginning | Ending | Annualized | ||
| Account Value | Account Value | Expenses Paid | Net Expense | |
| January 1, 2015 | June 30, 2015 | During the Period* | Ratio* | |
| Value Equity Fund | ||||
| Institutional Shares | ||||
| Actual Return | $1,000 | $1,008 | $3.73 | 0.75% |
| Hypothetical (5% annual return before expenses) | $1,000 | $1,021 | $3.76 | 0.75% |
| Investor Shares | ||||
| Actual Return | $1,000 | $1,008 | $4.48 | 0.90% |
| Hypothetical (5% annual return before expenses) | $1,000 | $1,020 | $4.51 | 0.90% |
| Advisor Shares | ||||
| Actual Return | $1,000 | $1,006 | $5.72 | 1.15% |
| Hypothetical (5% annual return before expenses) | $1,000 | $1,019 | $5.76 | 1.15% |
| Flexible Equity Fund | ||||
| Institutional Shares | ||||
| Actual Return | $1,000 | $996 | $3.71 | 0.75% |
| Hypothetical (5% annual return before expenses) | $1,000 | $1,021 | $3.76 | 0.75% |
| Investor Shares | ||||
| Actual Return | $1,000 | $995 | $4.45 | 0.90% |
| Hypothetical (5% annual return before expenses) | $1,000 | $1,020 | $4.51 | 0.90% |
| Advisor Shares | ||||
| Actual Return | $1,000 | $994 | $5.68 | 1.15% |
| Hypothetical (5% annual return before expenses) | $1,000 | $1,019 | $5.76 | 1.15% |
| Equity Income Fund | ||||
| Institutional Shares | ||||
| Actual Return | $1,000 | $988 | $3.70 | 0.75% |
| Hypothetical (5% annual return before expenses) | $1,000 | $1,021 | $3.76 | 0.75% |
| Investor Shares | ||||
| Actual Return | $1,000 | $987 | $4.43 | 0.90% |
| Hypothetical (5% annual return before expenses) | $1,000 | $1,020 | $4.51 | 0.90% |
| Advisor Shares | ||||
| Actual Return | $1,000 | $985 | $5.66 | 1.15% |
| Hypothetical (5% annual return before expenses) | $1,000 | $1,019 | $5.76 | 1.15% |
| Sustainable Growth Fund | ||||
| Institutional Shares | ||||
| Actual Return | $1,000 | $1,074 | $3.86 | 0.75% |
| Hypothetical (5% annual return before expenses) | $1,000 | $1,021 | $3.76 | 0.75% |
| Investor Shares | ||||
| Actual Return | $1,000 | $1,073 | $4.63 | 0.90% |
| Hypothetical (5% annual return before expenses) | $1,000 | $1,020 | $4.51 | 0.90% |
| Advisor Shares | ||||
| Actual Return | $1,000 | $1,072 | $5.91 | 1.15% |
| Hypothetical (5% annual return before expenses) | $1,000 | $1,019 | $5.76 | 1.15% |
www.brownadvisoryfunds.com
182
Expense Example For the Six Months Ended June 30, 2015 (Unaudited)
| Beginning | Ending | Annualized | ||
| Account Value | Account Value | Expenses Paid | Net Expense | |
| January 1, 2015 | June 30, 2015 | During the Period* | Ratio* | |
| Small-Cap Growth Fund | ||||
| Institutional Shares | ||||
| Actual Return | $1,000 | $1,094 | $5.14 | 0.99% |
| Hypothetical (5% annual return before expenses) | $1,000 | $1,020 | $4.96 | 0.99% |
| Investor Shares | ||||
| Actual Return | $1,000 | $1,093 | $5.92 | 1.14% |
| Hypothetical (5% annual return before expenses) | $1,000 | $1,019 | $5.71 | 1.14% |
| Advisor Shares | ||||
| Actual Return | $1,000 | $1,091 | $7.21 | 1.39% |
| Hypothetical (5% annual return before expenses) | $1,000 | $1,018 | $6.95 | 1.39% |
| Small-Cap Fundamental Value Fund | ||||
| Institutional Shares | ||||
| Actual Return | $1,000 | $1,000 | $4.86 | 0.98% |
| Hypothetical (5% annual return before expenses) | $1,000 | $1,020 | $4.91 | 0.98% |
| Investor Shares | ||||
| Actual Return | $1,000 | $1,000 | $5.60 | 1.13% |
| Hypothetical (5% annual return before expenses) | $1,000 | $1,019 | $5.66 | 1.13% |
| Advisor Shares | ||||
| Actual Return | $1,000 | $998 | $6.84 | 1.38% |
| Hypothetical (5% annual return before expenses) | $1,000 | $1,018 | $6.90 | 1.38% |
| Opportunity Fund | ||||
| Investor Shares | ||||
| Actual Return | $1,000 | $1,032 | $7.56 | 1.50% |
| Hypothetical (5% annual return before expenses) | $1,000 | $1,017 | $7.50 | 1.50% |
| Multi-Strategy Fund | ||||
| Institutional Shares | ||||
| Actual Return | $1,000 | $1,006 | $7.13 | 1.43% |
| Hypothetical (5% annual return before expenses) | $1,000 | $1,018 | $7.17 | 1.43% |
| Intermediate Income Fund | ||||
| Investor Shares | ||||
| Actual Return | $1,000 | $1,003 | $2.20 | 0.44% |
| Hypothetical (5% annual return before expenses) | $1,000 | $1,023 | $2.22 | 0.44% |
| Advisor Shares | ||||
| Actual Return | $1,000 | $1,002 | $3.44 | 0.69% |
| Hypothetical (5% annual return before expenses) | $1,000 | $1,021 | $3.47 | 0.69% |
| Total Return Fund | ||||
| Institutional Shares | ||||
| Actual Return | $1,000 | $988 | $2.69 | 0.54% |
| Hypothetical (5% annual return before expenses) | $1,000 | $1,022 | $2.73 | 0.54% |
| Investor Shares | ||||
| Actual Return | $1,000 | $987 | $2.93 | 0.59% |
| Hypothetical (5% annual return before expenses) | $1,000 | $1,022 | $2.98 | 0.59% |
www.brownadvisoryfunds.com
183
Expense Example For the Six Months Ended June 30, 2015 (Unaudited)
| Beginning | Ending | Annualized | ||
| Account Value | Account Value | Expenses Paid | Net Expense | |
| January 1, 2015 | June 30, 2015 | During the Period* | Ratio* | |
| Strategic Bond Fund | ||||
| Investor Shares | ||||
| Actual Return | $1,000 | $980 | $3.44 | 0.70% |
| Hypothetical (5% annual return before expenses) | $1,000 | $1,021 | $3.51 | 0.70% |
| Advisor Shares | ||||
| Actual Return | $1,000 | $979 | $4.66 | 0.95% |
| Hypothetical (5% annual return before expenses) | $1,000 | $1,020 | $4.76 | 0.95% |
| Maryland Bond Fund | ||||
| Investor Shares | ||||
| Actual Return | $1,000 | $996 | $2.43 | 0.49% |
| Hypothetical (5% annual return before expenses) | $1,000 | $1,022 | $2.46 | 0.49% |
| Tax Exempt Bond Fund | ||||
| Investor Shares | ||||
| Actual Return | $1,000 | $993 | $2.47 | 0.50% |
| Hypothetical (5% annual return before expenses) | $1,000 | $1,022 | $2.51 | 0.50% |
| Mortgage Securities Fund | ||||
| Institutional Shares | ||||
| Actual Return | $1,000 | $1,013 | $2.31 | 0.46% |
| Hypothetical (5% annual return before expenses) | $1,000 | $1,022 | $2.33 | 0.46% |
| Investor Shares | ||||
| Actual Return | $1,000 | $1,013 | $2.56 | 0.51% |
| Hypothetical (5% annual return before expenses) | $1,000 | $1,022 | $2.58 | 0.51% |
| Strategic European Equity Fund | ||||
| Institutional Shares | ||||
| Actual Return | $1,000 | $1,063 | $5.73 | 1.12% |
| Hypothetical (5% annual return before expenses) | $1,000 | $1,019 | $5.61 | 1.12% |
| Investor Shares | ||||
| Actual Return | $1,000 | $1,063 | $6.49 | 1.27% |
| Hypothetical (5% annual return before expenses) | $1,000 | $1,018 | $6.36 | 1.27% |
| Advisor Shares | ||||
| Actual Return | $1,000 | $1,062 | $7.77 | 1.52% |
| Hypothetical (5% annual return before expenses) | $1,000 | $1,017 | $7.60 | 1.52% |
| Japan Alpha Opportunities Fund | ||||
| Institutional Shares | ||||
| Actual Return | $1,000 | $1,190 | $6.25 | 1.15% |
| Hypothetical (5% annual return before expenses) | $1,000 | $1,019 | $5.76 | 1.15% |
| Investor Shares | ||||
| Actual Return | $1,000 | $1,189 | $7.06 | 1.30% |
| Hypothetical (5% annual return before expenses) | $1,000 | $1,018 | $6.51 | 1.30% |
| Advisor Shares | ||||
| Actual Return | $1,000 | $1,188 | $8.41 | 1.45% |
| Hypothetical (5% annual return before expenses) | $1,000 | $1,017 | $7.75 | 1.45% |
www.brownadvisoryfunds.com
184
Expense Example For the Six Months Ended June 30, 2015 (Unaudited)
| Beginning | Ending | Annualized | ||
| Account Value | Account Value | Expenses Paid | Net Expense | |
| January 1, 2015 | June 30, 2015 | During the Period* | Ratio* | |
| Emerging Markets Fund | ||||
| Institutional Shares | ||||
| Actual Return | $1,000 | $1,025 | $6.28 | 1.25% |
| Hypothetical (5% annual return before expenses) | $1,000 | $1,019 | $6.26 | 1.25% |
| Investor Shares | ||||
| Actual Return | $1,000 | $1,025 | $7.03 | 1.40% |
| Hypothetical (5% annual return before expenses) | $1,000 | $1,018 | $7.00 | 1.40% |
| Advisor Shares | ||||
| Actual Return | $1,000 | $1,023 | $8.28 | 1.65% |
| Hypothetical (5% annual return before expenses) | $1,000 | $1,017 | $8.25 | 1.65% |
| Emerging Markets Small-Cap Fund | ||||
| Institutional Shares | ||||
| Actual Return | $1,000 | $1,198 | $10.04 | 1.84% |
| Hypothetical (5% annual return before expenses) | $1,000 | $1,016 | $9.20 | 1.84% |
| Investor Shares | ||||
| Actual Return | $1,000 | $1,197 | $10.85 | 1.99% |
| Hypothetical (5% annual return before expenses) | $1,000 | $1,015 | $9.95 | 1.99% |
| * | The calculations are based on expenses incurred during the most recent six-month period ended as of the date of this report. The dollar amounts shown as expenses paid during the period are equal to the annualized six-month net expense ratio multiplied by the average account value during the period, multiplied by the number of days in the most recent six-month period divided by the number of days in the Funds’ fiscal year ended as of the date of this report. |
www.brownadvisoryfunds.com
185
Trustees and Executive Officers
The Board is responsible for the overall management of the Trust, including general supervision and review of the investment activities of the Funds. The Board, in turn, elects the Officers of the Trust, who are responsible for administering the day-to-day operations of the Trust and each of the Funds. The current Trustees and Officers of the Trust, their ages and positions with the Trust, term of office with the Trust and length of time served, their principal occupations for the past five years and other directorships held during the past five years are set forth in the table below.
| Number of | |||||
| Portfolios | Other | ||||
| Term of | in Fund | Directorships | |||
| Office and | Complex | Held During | |||
| Name, Age | Position with | Length of | Principal Occupation(s) | Overseen by | the Past |
| and Address | the Trust | Time Served | During Past 5 Years | Trustees | 5 Years(2) |
Independent Trustees of the Trust(1) | |||||
| Henry H. Hopkins | Trustee | Indefinite Term; | Retired; Formerly, Vice President and Chief | 20 | None. |
| Age: 72 | Since May 2012 | Legal Counsel, T. Rowe Price Associates, Inc. | |||
| c/o Brown Advisory LLC | (investment management firm) (1998 to 2008). | ||||
| 901 South Bond Street | |||||
| Suite 400 | |||||
| Baltimore, MD 21231 | |||||
| Kyle P. Legg | Trustee | Indefinite Term; | Retired; Formerly President and Chief Executive | 20 | Director, SunTrust |
| Age: 63 | Since May 2012 | Officer, Legg Mason Capital Management, LLC | Banks, Inc. (bank | ||
| c/o Brown Advisory LLC | (investment management firm) (2006 to 2009). | holding company) | |||
| 901 South Bond Street | (since 2011); Director, | ||||
| Suite 400 | OM Asset Management | ||||
| Baltimore, MD 21231 | plc (asset management | ||||
| holding company) | |||||
| (since 2014); Director, | |||||
| Eastman Kodak Co. | |||||
| (printing equipment | |||||
| and supplies company) | |||||
| (2010 to 2013). | |||||
| Thomas F. O’Neil III | Trustee | Indefinite Term; | President, The Saranac Group LLC (strategic | 20 | None. |
| Age: 58 | Since May 2012 | consulting firm) (since 2010); Formerly, Executive | |||
| c/o Brown Advisory LLC | Vice Chairman (previously, Senior Vice President, | ||||
| 901 South Bond Street | General Counsel and Secretary) WellCare Health | ||||
| Suite 400 | Plans, Inc. (managed healthcare organization) | ||||
| Baltimore, MD 21231 | (2008 to 2009); Formerly, Partner and Joint | ||||
| Global Practice Group Leader, DLA Piper US LLP | |||||
| (law firm) (2002 to 2008). | |||||
| Neal F. Triplett, CFA | Trustee | Indefinite Term; | President, DUMAC, Inc. (university endowment | 20 | None. |
| Age: 44 | Since May 2012 | investment organization) (since 1999). | |||
| c/o Brown Advisory LLC | |||||
| 901 South Bond Street | |||||
| Suite 400 | |||||
| Baltimore, MD 21231 | |||||
www.brownadvisoryfunds.com
186
Trustees and Executive Officers
| Number of | |||||
| Portfolios | Other | ||||
| Term of | in Fund | Directorships | |||
| Office and | Complex | Held During | |||
| Name, Age | Position with | Length of | Principal Occupation(s) | Overseen by | the Past |
| and Address | the Trust | Time Served | During Past 5 Years | Trustees | 5 Years(2) |
| Interested Trustees and Officers of the Trust | |||||
Michael D. Hankin(3) | Trustee | Indefinite Term | President and Chief Executive Officer, Brown | 20 | None. |
| Age: 57 | Since May 2012 | Advisory Incorporated and affiliates (investment | |||
| c/o Brown Advisory | management firm) (since 1993). | ||||
| Incorporated | |||||
| 901 South Bond Street | |||||
| Suite 400 | |||||
| Baltimore, MD 21231 | |||||
Joseph R. Hardiman(3) | Chairman | Indefinite Term; | Business Consultant (financial services industry | 20 | Director of Franklin |
| Age: 78 | and Trustee | Since May 2012 | consulting) (since 1997); Formerly; Director of | Resources, Inc. | |
| c/o Brown Advisory LLC | Brown Advisory Incorporated (investment | (investment | |||
| 901 South Bond Street | management firm) (2001 to 2012). | management firm) | |||
| Suite 400 | (2005 to 2013). | ||||
| Baltimore, MD 21231 | |||||
| David M. Churchill | President/ | Indefinite Term; | Chief Operating Officer and Chief Financial | Not | Not |
| Age: 50 | Principal | Since May 2012 | Officer, Brown Advisory Incorporated and | Applicable. | Applicable. |
| c/o Brown Advisory | Executive | affiliates (investment management firm) | |||
| Incorporated | Officer | (since 1993). | |||
| 901 South Bond Street | |||||
| Suite 400 | |||||
| Baltimore, MD 21231 | |||||
| Jason T. Meix | Treasurer/ | Indefinite Term; | Vice President, U.S. Bancorp Fund | Not | Not |
| Age: 36 | Principal | Since May 2012 | Services, LLC (fund administrative services firm) | Applicable. | Applicable. |
| c/o Brown Advisory LLC | Financial | (since 2008). | |||
| 901 South Bond Street | Officer | ||||
| Suite 400 | |||||
| Baltimore, MD 21231 | |||||
| Edward L. Paz | Secretary | Indefinite Term; | Vice President and Counsel, U.S. Bancorp Fund | Not | Not |
| Age: 44 | Since May 2012 | Services, LLC (fund administrative services firm) | Applicable. | Applicable. | |
| c/o Brown Advisory LLC | (since 2007). | ||||
| 901 South Bond Street | |||||
| Suite 400 | |||||
| Baltimore, MD 21231 | |||||
| Brett D. Rogers | Chief | Indefinite Term; | General Counsel and Chief Compliance | Not | Not |
| Age: 39 | Compliance | Since May 2012 | Officer, Brown Advisory Incorporated and | Applicable. | Applicable. |
| c/o Brown Advisory | Officer | affiliates (investment management firm) | |||
| Incorporated | (since 2009); Formerly, Director, Compliance | ||||
| 901 South Bond Street | Anti-Money | Indefinite Term: | and Risk, Deutsche Asset Management | ||
| Suite 400 | Laundering | Since May 2012 | (investment management firm) (2003 to 2009). | ||
| Baltimore, MD 21231 | Officer | ||||
| (1) | The Trustees of the Trust who are not “interested persons” of the Trust as defined in the 1940 Act (“Independent Trustees”). |
| (2) | The directorships disclosed in this column include only the directorships of those companies that a Trustee serves on that are required to report to the SEC under applicable Federal securities laws including publicly traded corporations that are registered with the SEC under the 1934 Act and investment companies that are registered with the SEC under the 1940 Act, and it therefore excludes various other types of directorships that the Trustees of the Trust may currently hold in other types of organizations, including private companies and not-for-profit organizations, which are expressly excluded from the disclosure requirements for mutual fund board members. |
| (3) | Mr. Hankin is considered an “interested person” of the Trust, as defined in the 1940 Act, because of his current position with Brown Advisory Incorporated, the parent company of the Adviser, and Mr. Hardiman is considered an “interested person” of the Trust, as defined in the 1940 Act, because of his previous position with Brown Advisory Incorporated and his ownership interest in Brown Advisory Incorporated. |
www.brownadvisoryfunds.com
187
Information About Proxy Voting (Unaudited)
A description of the policies and procedures that the Funds use to determine how to vote proxies relating to portfolio securities is available without charge upon request by calling toll-free at 800-540-6807 and by accessing the Funds’ website at www.brownadvisoryfunds.com. Furthermore, you can obtain the description on the SEC’s website at www.sec.gov.
Information regarding how the Funds voted proxies relating to portfolio securities during the 12-month period ended June 30 is available without charge, by calling toll-free at 800-540-6807. In addition, you can obtain the Funds’ proxy voting records on the SEC’s website at www.sec.gov.
Information About the Portfolio Holdings (Unaudited)
The Funds file their complete schedule of portfolio holdings for their first and third fiscal quarters with the SEC on Form N-Q. The Funds’ Form N-Q is available without charge, upon request, by calling toll-free at 800-540-6807. Furthermore, you can obtain the Form N-Q on the SEC’s website at www.sec.gov. The Funds’ schedules of portfolio holdings are posted on their website at www.brownadvisoryfunds.com within ten business days after calendar quarter end.
Householding (Unaudited)
In an effort to decrease costs, the Funds will reduce the number of duplicate Prospectuses and annual and semi-annual reports that you receive by sending only one copy of each to those addresses shown by two or more accounts. Please call the Transfer Agent toll free at 1-800-540-6807 to request individual copies of these documents. The Funds will begin sending individual copies 30 days after receiving your request. This policy does not apply to account statements.
Federal Tax Status of Dividends Declared during the Tax Year (Unaudited)
For Federal Income Tax purposes, distributions from short-term capital gains are classified as ordinary income. The percentage of ordinary income distributions designated as qualifying for the corporate dividend received deduction (“DRD”), the individual qualified dividend rate (“QDI”), the qualifying interest income exempt from U.S. tax for foreign shareholders (“QII”) and the qualifying short-term capital gain distributions exempt from U.S. tax for foreign shareholders (“QSTCG”) is presented below:
| Income Distributions | |||||||||||||||||
| Exempt from Federal Tax | QDI | DRD | QII | QSTCG | |||||||||||||
| Growth Equity Fund | 0.00 | % | 100.00 | % | 100.00 | % | 0.07 | % | 100.00 | % | |||||||
| Value Equity Fund | 0.00 | % | 85.60 | % | 72.75 | % | 0.04 | % | 33.90 | % | |||||||
| Flexible Equity Fund | 0.00 | % | 100.00 | % | 100.00 | % | 0.14 | % | 0.00 | % | |||||||
| Equity Income Fund | 0.00 | % | 100.00 | % | 85.83 | % | 0.06 | % | 20.70 | % | |||||||
| Sustainable Growth Fund | 0.00 | % | 0.00 | % | 0.00 | % | 0.00 | % | 0.00 | % | |||||||
| Small-Cap Growth Fund | 0.00 | % | 0.00 | % | 0.00 | % | 0.00 | % | 0.00 | % | |||||||
| Small-Cap Fundamental Value Fund | 0.00 | % | 64.71 | % | 63.02 | % | 0.06 | % | 62.64 | % | |||||||
| Opportunity Fund | 0.00 | % | 0.00 | % | 0.00 | % | 0.00 | % | 0.00 | % | |||||||
| Multi-Strategy Fund | 0.00 | % | 17.31 | % | 0.00 | % | 0.07 | % | 0.00 | % | |||||||
| Intermediate Income Fund | 0.00 | % | 0.00 | % | 0.00 | % | 73.58 | % | 0.00 | % | |||||||
| Total Return Fund | 0.00 | % | 0.00 | % | 0.00 | % | 100.00 | % | 0.00 | % | |||||||
| Strategic Bond Fund | 0.00 | % | 0.00 | % | 0.00 | % | 94.23 | % | 0.00 | % | |||||||
| Maryland Bond Fund | 99.71 | % | 0.00 | % | 0.00 | % | 100.00 | % | 0.00 | % | |||||||
| Tax Exempt Bond Fund | 99.82 | % | 0.00 | % | 0.00 | % | 100.00 | % | 0.00 | % | |||||||
| Mortgage Securities Fund | 0.00 | % | 0.00 | % | 0.00 | % | 96.93 | % | 20.08 | % | |||||||
| Strategic European Equity Fund | 0.00 | % | 100.00 | % | 0.00 | % | 0.02 | % | 0.00 | % | |||||||
| Japan Alpha Opportunities Fund | 0.00 | % | 15.51 | % | 0.00 | % | 0.02 | % | 12.16 | % | |||||||
| Emerging Markets Fund | 0.00 | % | 88.49 | % | 3.12 | % | 0.10 | % | 0.00 | % | |||||||
| Emerging Markets Small-Cap Fund | 0.00 | % | 0.00 | % | 0.00 | % | 0.00 | % | 0.00 | % | |||||||
The Funds, as applicable, intend to elect to pass through to shareholders the credit for taxes paid to foreign countries. For the period / year ended June 30, 2015, the Strategic European Equity Fund, Japan Alpha Opportunities Fund, Emerging Markets Fund and Emerging Markets Small-Cap Fund had gross foreign income of $6,360,920, $22,870,852, $8,072,262 and $1,718,701, respectively, and foreign taxes paid of $529,900, $2,284,381, $1,090,223 and $111,807, respectively.
www.brownadvisoryfunds.com
188
BROWN ADVISORY FUNDS
At Brown Advisory, we believe that you deserve frank and open communication on all aspects of our relationship. In this spirit, we provide this annual summary of our policies relating to confidentiality and privacy of client information, mutual funds, conflicts of interest, trading commissions, proxy voting and Form ADV annual notice.
CONFIDENTIALITY AND PRIVACY POLICY
Brown Advisory takes the confidentiality of your personal information and the privacy of your account very seriously. Our commitment to safeguard your personal information goes beyond our legal obligation to process your transactions accurately and securely. Whether we serve you online, in person, on the telephone or by mail, the principles that guide the way in which we conduct business are built upon the core values of trust and integrity.
We limit access to your personal information to only those employees with a business reason to know such information. We train and consistently remind all employees to respect client privacy and to recognize the importance of the confidentiality of such information. Those who violate our privacy policy are subject to disciplinary action. This commitment also applies to the sharing of information among Brown Advisory and its affiliates.
We maintain physical, electronic and procedural safeguards that comply with applicable laws and regulations to protect your personal information, including various measures to protect your personal information while it is stored electronically.
Federal law requires us to inform you that we have on record personal information about you and that we obtain such information from you directly (e.g., information you provide to us on account applications and other forms, such as your name, address, social security number, occupation, assets and income) and indirectly (e.g., information on our computer systems about your transactions with us, such as your account balance and account holdings). Any personal information you choose to provide is kept confidential and allows us to: (i) provide better and more complete investment and strategic advice; (ii) develop new services that meet additional needs you may have; and, (iii) comply with legal and regulatory requirements.
In addition, in the normal conduct of our business, it may become necessary for us to share information relating to our clients that we have on record, as described above, with companies not affiliated with us who are under contract to perform services on our behalf. For example, we have contracted with companies to assist us in complying with anti-terrorist and anti-money laundering statutory requirements (including the identification and reporting of activities that may involve terrorist acts or money laundering activities), companies that provide clearing services, and other vendors that provide services directly related to your account relationship with us. Our agreements with these companies require that they keep your information confidential and not use such information for any unrelated purpose.
We do not sell information about you to third parties, and we do not otherwise disclose information to third parties without your permission or unless required by law.
www.brownadvisoryfunds.com
189
INVESTMENT ADVISER
Brown Advisory LLC
901 South Bond Street, Suite 400
Baltimore, MD 21231
www.brownadvisory.com
DISTRIBUTOR
Quasar Distributors, LLC
615 East Michigan Street
Milwaukee, WI 53202
CUSTODIAN
U.S. Bank, N.A.
Custody Operations
1555 North RiverCenter Drive, Suite 302
Milwaukee, WI 53212
TRANSFER AGENT
U.S. Bancorp Fund Services, LLC
P.O. Box 701
Milwaukee, WI 53201-0701
(800) 540-6807
INDEPENDENT REGISTERED PUBLIC ACCOUNTING FIRM
Tait, Weller & Baker LLP
1818 Market Street, Suite 2400
Philadelphia, PA 19103
LEGAL COUNSEL
Dechert, LLP
1900 K Street, NW
Washington, DC 20006
| Institutional Shares | Investor Shares | Advisor Shares | |||||||||||||
| Symbol | CUSIP | Symbol | CUSIP | Symbol | CUSIP | ||||||||||
| Growth Equity Fund | BAFGX | 115233702 | BIAGX | 115233504 | BAGAX | 115233603 | |||||||||
| Value Equity Fund | BAFVX | 115233876 | BIAVX | 115233801 | BAVAX | 115233884 | |||||||||
| Flexible Equity Fund | BAFFX | 115233843 | BIAFX | 115233868 | BAFAX | 115233850 | |||||||||
| Equity Income Fund | BAFDX | 115233660 | BIADX | 115233686 | BADAX | 115233678 | |||||||||
| Sustainable Growth Fund | BAFWX | 115233207 | BIAWX | 115233306 | BAWAX | 115233405 | |||||||||
| Small-Cap Growth Fund | BAFSX | 115233819 | BIASX | 115233835 | BASAX | 115233827 | |||||||||
| Small-Cap Fundamental Value Fund | BAUUX | 115233777 | BIAUX | 115233793 | BAUAX | 115233785 | |||||||||
| Opportunity Fund | — | — | BIAOX | 115233769 | — | — | |||||||||
| Multi-Strategy Fund | BAFRX | 115233488 | — | — | — | — | |||||||||
| Intermediate Income Fund | — | — | BIAIX | 115233744 | BAIAX | 115233736 | |||||||||
| Total Return Fund | BAFTX | 115233538 | BIATX | 115233520 | — | — | |||||||||
| Strategic Bond Fund | — | — | BIABX | 115233470 | BATBX | 115233710 | |||||||||
| Maryland Bond Fund | — | — | BIAMX | 115233751 | — | — | |||||||||
| Tax Exempt Bond Fund | — | — | BIAEX | 115233108 | — | — | |||||||||
| Mortgage Securities Fund | BAFZX | 115233546 | BIAZX | 115233587 | — | — | |||||||||
| WMC Strategic European Equity Fund | BAFHX | 115233629 | BIAHX | 115233611 | BAHAX | 115233595 | |||||||||
| WMC Japan Alpha Opportunities Fund | BAFJX | 115233579 | BIAJX | 115233561 | BAJAX | 115233553 | |||||||||
| Somerset Emerging Markets Fund | BAFQX | 115233652 | BIAQX | 115233645 | BAQAX | 115233637 | |||||||||
| Emerging Markets Small-Cap Fund | BAFNX | 115233512 | BIANX | 115233496 | — | — | |||||||||
This report is submitted for the general information of the shareholders of each Fund. It is not authorized for distribution to prospective investors unless preceded or accompanied by an effective prospectus, which includes information regarding the Funds’ risks, objectives, fees and expenses, experience of their management, and other information.
BX-ANNUAL
Item 2. Code of Ethics.
The registrant has adopted a code of ethics that applies to the registrant’s principal executive officer and principal financial officer. The registrant has not made any amendments to its code of ethics during the period covered by this report. The registrant has not granted any waivers from any provisions of the code of ethics during the period covered by this report.
A copy of the registrant’s Code of Ethics is filed herewith.
Item 3. Audit Committee Financial Expert.
The Registrant’s Board of Trustees has not designated an audit committee financial expert. The Registrant has determined that it will retain the services of an independent third party to assist it if circumstances arise that require specific investment company auditing expertise.
Item 4. Principal Accountant Fees and Services.
The Registrant has engaged its principal accountant to perform audit services, audit-related services, tax services and other services during the past two fiscal years. “Audit services” refer to performing an audit of the Registrant's annual financial statements or services that are normally provided by the accountant in connection with statutory and regulatory filings or engagements for those fiscal years. “Audit-related services” refer to the assurance and related services by the principal accountant that are reasonably related to the performance of the audit. “Tax services” refer to professional services rendered by the principal accountant for tax compliance, tax advice, and tax planning. There were no “Other services” provided by the principal accountant. The following table details the aggregate fees billed or expected to be billed for each of the last two fiscal years for audit fees, audit-related fees, tax fees and other fees by the principal accountant.
Brown Advisory Growth Equity Fund
| FYE 6/30/2015 | FYE 6/30/2014 | |
| Audit Fees | $16,000 | $15,700 |
| Audit-Related Fees | N/A | N/A |
| Tax Fees | $2,600 | $2,500 |
| All Other Fees | N/A | N/A |
Brown Advisory Value Equity Fund
| FYE 6/30/2015 | FYE 6/30/2014 | |
| Audit Fees | $16,000 | $15,700 |
| Audit-Related Fees | N/A | N/A |
| Tax Fees | $2,600 | $2,500 |
| All Other Fees | N/A | N/A |
Brown Advisory Flexible Equity Fund
| FYE 6/30/2015 | FYE 6/30/2014 | |
| Audit Fees | $16,000 | $15,700 |
| Audit-Related Fees | N/A | N/A |
| Tax Fees | $2,600 | $2,500 |
| All Other Fees | N/A | N/A |
Brown Advisory Equity Income Fund
| FYE 6/30/2015 | FYE 6/30/2014 | |
| Audit Fees | $16,000 | $15,700 |
| Audit-Related Fees | N/A | N/A |
| Tax Fees | $2,600 | $2,500 |
| All Other Fees | N/A | N/A |
Brown Advisory Sustainable Growth Fund
| FYE 6/30/2015 | FYE 6/30/2014 | |
| Audit Fees | $16,000 | $15,700 |
| Audit-Related Fees | N/A | N/A |
| Tax Fees | $2,600 | $2,500 |
| All Other Fees | N/A | N/A |
Brown Advisory Small-Cap Growth Fund
| FYE 6/30/2015 | FYE 6/30/2014 | |
| Audit Fees | $16,000 | $15,700 |
| Audit-Related Fees | N/A | N/A |
| Tax Fees | $2,600 | $2,500 |
| All Other Fees | N/A | N/A |
Brown Advisory Small-Cap Fundamental Value Fund
| FYE 6/30/2015 | FYE 6/30/2014 | |
| Audit Fees | $16,000 | $15,700 |
| Audit-Related Fees | N/A | N/A |
| Tax Fees | $2,600 | $2,500 |
| All Other Fees | N/A | N/A |
Brown Advisory Opportunity Fund
| FYE 6/30/2015 | FYE 6/30/2014 | |
| Audit Fees | $16,000 | $15,700 |
| Audit-Related Fees | N/A | N/A |
| Tax Fees | $2,600 | $2,500 |
| All Other Fees | N/A | N/A |
Brown Advisory Multi-Strategy Fund
| FYE 6/30/2015 | FYE 6/30/2014 | |
| Audit Fees | $10,000 | N/A |
| Audit-Related Fees | N/A | N/A |
| Tax Fees | $2,500 | N/A |
| All Other Fees | N/A | N/A |
Brown Advisory Intermediate Income Fund
| FYE 6/30/2015 | FYE 6/30/2014 | |
| Audit Fees | $16,000 | $15,700 |
| Audit-Related Fees | N/A | N/A |
| Tax Fees | $2,600 | $2,500 |
| All Other Fees | N/A | N/A |
Brown Advisory Total Return Fund
| FYE 6/30/2015 | FYE 6/30/2014 | |
| Audit Fees | $10,000 | N/A |
| Audit-Related Fees | N/A | N/A |
| Tax Fees | $2,500 | N/A |
| All Other Fees | N/A | N/A |
Brown Advisory Strategic Bond Fund
| FYE 6/30/2015 | FYE 6/30/2014 | |
| Audit Fees | $16,000 | $15,700 |
| Audit-Related Fees | N/A | N/A |
| Tax Fees | $2,600 | $2,500 |
| All Other Fees | N/A | N/A |
Brown Advisory Maryland Bond Fund
| FYE 6/30/2015 | FYE 6/30/2014 | |
| Audit Fees | $16,000 | $15,700 |
| Audit-Related Fees | N/A | N/A |
| Tax Fees | $2,600 | $2,500 |
| All Other Fees | N/A | N/A |
Brown Advisory Tax Exempt Bond Fund
| FYE 6/30/2015 | FYE 6/30/2014 | |
| Audit Fees | $16,000 | $15,700 |
| Audit-Related Fees | N/A | N/A |
| Tax Fees | $2,600 | $2,500 |
| All Other Fees | N/A | N/A |
Brown Advisory Mortgage Securities Fund
| FYE 6/30/2015 | FYE 6/30/2014 | |
| Audit Fees | $16,000 | $10,000 |
| Audit-Related Fees | N/A | N/A |
| Tax Fees | $2,600 | $2,400 |
| All Other Fees | N/A | N/A |
Brown Advisory – WMC Strategic European Equity Fund
| FYE 6/30/2015 | FYE 6/30/2014 | |
| Audit Fees | $16,000 | $10,000 |
| Audit-Related Fees | N/A | N/A |
| Tax Fees | $2,600 | $2,400 |
| All Other Fees | N/A | N/A |
Brown Advisor – WMC Japan Alpha Opportunities Fund
| FYE 6/30/2015 | FYE 6/30/2014 | |
| Audit Fees | $16,000 | $10,000 |
| Audit-Related Fees | N/A | N/A |
| Tax Fees | $2,600 | $2,400 |
| All Other Fees | N/A | N/A |
Brown Advisory – Somerset Emerging Markets Fund
| FYE 6/30/2015 | FYE 6/30/2014 | |
| Audit Fees | $16,000 | $15,700 |
| Audit-Related Fees | N/A | N/A |
| Tax Fees | $2,600 | $2,500 |
| All Other Fees | N/A | N/A |
Brown Advisory Emerging Markets Small-Cap Fund
| FYE 6/30/2015 | FYE 6/30/2014 | |
| Audit Fees | $10,000 | N/A |
| Audit-Related Fees | N/A | N/A |
| Tax Fees | $2,500 | N/A |
| All Other Fees | N/A | N/A |
The audit committee has adopted pre-approval policies and procedures that require the audit committee to pre-approve all audit and non-audit services of the Registrant, including services provided to any entity affiliated with the Registrant. All of the principal accountant’s hours spent on auditing the Registrant’s financial statements were attributed to work performed by full-time permanent employees of the principal accountant. (If more than 50 percent of the accountant’s hours were spent to audit the Registrant's financial statements for the most recent fiscal year, state how many hours were attributed to work performed by persons other than the principal accountant's full-time, permanent employees.)
The following table indicates the non-audit fees billed or expected to be billed by the Registrant’s accountant for services to the Registrant and to the Registrant’s investment adviser (and any other controlling entity, etc.—not sub-adviser) for the last two fiscal years. The audit committee of the board of trustees has considered whether the provision of non-audit services that were rendered to the Registrant's investment adviser is compatible with maintaining the principal accountant's independence and has concluded that the provision of such non-audit services by the accountant has not compromised the accountant’s independence.
Brown Advisory Growth Equity Fund
| Non-Audit Related Fees | FYE 6/30/2015 | FYE 6/30/2014 |
| Registrant | N/A | N/A |
| Registrant’s Investment Adviser | N/A | N/A |
Brown Advisory Value Equity Fund
| Non-Audit Related Fees | FYE 6/30/2015 | FYE 6/30/2014 |
| Registrant | N/A | N/A |
| Registrant’s Investment Adviser | N/A | N/A |
Brown Advisory Flexible Equity Fund
| Non-Audit Related Fees | FYE 6/30/2015 | FYE 6/30/2014 |
| Registrant | N/A | N/A |
| Registrant’s Investment Adviser | N/A | N/A |
Brown Advisory Equity Income Fund
| Non-Audit Related Fees | FYE 6/30/2015 | FYE 6/30/2014 |
| Registrant | N/A | N/A |
| Registrant’s Investment Adviser | N/A | N/A |
Brown Advisory Sustainable Growth Fund
| Non-Audit Related Fees | FYE 6/30/2015 | FYE 6/30/2014 |
| Registrant | N/A | N/A |
| Registrant’s Investment Adviser | N/A | N/A |
Brown Advisory Small-Cap Growth Fund
| Non-Audit Related Fees | FYE 6/30/2015 | FYE 6/30/2014 |
| Registrant | N/A | N/A |
| Registrant’s Investment Adviser | N/A | N/A |
Brown Advisory Small-Cap Fundamental Value Fund
| Non-Audit Related Fees | FYE 6/30/2015 | FYE 6/30/2014 |
| Registrant | N/A | N/A |
| Registrant’s Investment Adviser | N/A | N/A |
Brown Advisory Opportunity Fund
| Non-Audit Related Fees | FYE 6/30/2015 | FYE 6/30/2014 |
| Registrant | N/A | N/A |
| Registrant’s Investment Adviser | N/A | N/A |
Brown Advisory Multi-Strategy Fund
| Non-Audit Related Fees | FYE 6/30/2015 | FYE 6/30/2014 |
| Registrant | N/A | N/A |
| Registrant’s Investment Adviser | N/A | N/A |
Brown Advisory Intermediate Income Fund
| Non-Audit Related Fees | FYE 6/30/2015 | FYE 6/30/2014 |
| Registrant | N/A | N/A |
| Registrant’s Investment Adviser | N/A | N/A |
Brown Advisory Total Return Fund
| Non-Audit Related Fees | FYE 6/30/2015 | FYE 6/30/2014 |
| Registrant | N/A | N/A |
| Registrant’s Investment Adviser | N/A | N/A |
Brown Advisory Strategic Bond Fund
| Non-Audit Related Fees | FYE 6/30/2015 | FYE 6/30/2014 |
| Registrant | N/A | N/A |
| Registrant’s Investment Adviser | N/A | N/A |
Brown Advisory Maryland Bond Fund
| Non-Audit Related Fees | FYE 6/30/2015 | FYE 6/30/2014 |
| Registrant | N/A | N/A |
| Registrant’s Investment Adviser | N/A | N/A |
Brown Advisory Tax Exempt Bond Fund
| Non-Audit Related Fees | FYE 6/30/2015 | FYE 6/30/2014 |
| Registrant | N/A | N/A |
| Registrant’s Investment Adviser | N/A | N/A |
Brown Advisory Mortgage Securities Fund
| Non-Audit Related Fees | FYE 6/30/2015 | FYE 6/30/2014 |
| Registrant | N/A | N/A |
| Registrant’s Investment Adviser | N/A | N/A |
Brown Advisory – WMC Strategic European Equity Fund
| Non-Audit Related Fees | FYE 6/30/2015 | FYE 6/30/2014 |
| Registrant | N/A | N/A |
| Registrant’s Investment Adviser | N/A | N/A |
Brown Advisor – WMC Japan Alpha Opportunities Fund
| Non-Audit Related Fees | FYE 6/30/2015 | FYE 6/30/2014 |
| Registrant | N/A | N/A |
| Registrant’s Investment Adviser | N/A | N/A |
Brown Advisory - Somerset Emerging Markets Fund
| Non-Audit Related Fees | FYE 6/30/2015 | FYE 6/30/2014 |
| Registrant | N/A | N/A |
| Registrant’s Investment Adviser | N/A | N/A |
Brown Advisory Emerging Markets Small-Cap Fund
| Non-Audit Related Fees | FYE 6/30/2015 | FYE 6/30/2014 |
| Registrant | N/A | N/A |
| Registrant’s Investment Adviser | N/A | N/A |
Item 5. Audit Committee of Listed Registrants.
Not applicable to registrants who are not listed issuers (as defined in Rule 10A-3 under the Securities Exchange Act of 1934).
Item 6. Schedule of Investments.
Schedule of Investments is included as part of the report to shareholders filed under Item 1 of this Form.
Item 7. Disclosure of Proxy Voting Policies and Procedures for Closed-End Management Investment Companies.
Not applicable to open-end investment companies.
Item 8. Portfolio Managers of Closed-End Management Investment Companies.
Not applicable to open-end investment companies.
Item 9. Purchases of Equity Securities by Closed-End Management Investment Company and Affiliated Purchasers.
Not applicable to open-end investment companies.
Item 10. Submission of Matters to a Vote of Security Holders.
There have been no material changes to the procedures by which shareholders may recommend nominees to the registrant’s board of trustees.
Item 11. Controls and Procedures.
| (a) | The Registrant’s President and Treasurer have reviewed the Registrant's disclosure controls and procedures (as defined in Rule 30a-3(c) under the Investment Company Act of 1940 (the “Act”)) as of a date within 90 days of the filing of this report, as required by Rule 30a-3(b) under the Act and Rules 13a-15(b) or 15d-15(b) under the Securities Exchange Act of 1934. Based on their review, such officers have concluded that the disclosure controls and procedures are effective in ensuring that information required to be disclosed in this report is appropriately recorded, processed, summarized and reported and made known to them by others within the Registrant and by the Registrant’s service provider. |
| (b) | There were no changes in the Registrant's internal control over financial reporting (as defined in Rule 30a-3(d) under the Act) that occurred during the second fiscal quarter of the period covered by this report that has materially affected, or is reasonably likely to materially affect, the Registrant's internal control over financial reporting. |
Item 12. Exhibits.
| (a) | (1) Any code of ethics or amendment thereto, that is subject of the disclosure required by Item 2, to the extent that the registrant intends to satisfy Item 2 requirements through filing an exhibit. Incorporate by reference to previous Form N-CSR filing. |
(2) Certifications pursuant to Section 302 of the Sarbanes-Oxley Act of 2002. Furnished herewith.
(3) Any written solicitation to purchase securities under Rule 23c-1 under the Act sent or given during the period covered by the report by or on behalf of the registrant to 10 or more persons. Not applicable to open-end investment companies.
| (b) | Certification pursuant to Section 906 of the Sarbanes-Oxley Act of 2002. Furnished herewith. |
SIGNATURES
Pursuant to the requirements of the Securities Exchange Act of 1934 and the Investment Company Act of 1940, the Registrant has duly caused this report to be signed on its behalf by the undersigned, thereunto duly authorized.
(Registrant)
By (Signature and Title)* /s/ David M. Churchill
David M. Churchill, President
Date September 3, 2015
Pursuant to the requirements of the Securities Exchange Act of 1934 and the Investment Company Act of 1940, this report has been signed below by the following persons on behalf of the Registrant and in the capacities and on the dates indicated.
By (Signature and Title)* /s/David M. Churchill
David M. Churchill, President
Date September 3, 2015
By (Signature and Title)* /s/Jason T. Meix
Jason T. Meix, Treasurer
Date September 3, 2015
* Print the name and title of each signing officer under his or her signature.