UNITED STATES
SECURITIES AND EXCHANGE COMMISSION
Washington, D.C. 20549
SECURITIES AND EXCHANGE COMMISSION
Washington, D.C. 20549
FORM N-CSR
CERTIFIED SHAREHOLDER REPORT OF REGISTERED
MANAGEMENT INVESTMENT COMPANIES
Investment Company Act file number: (811-22708)
Brown Advisory Funds
(Exact name of Registrant as specified in charter)
(Exact name of Registrant as specified in charter)
901 South Bond Street Suite 400
Baltimore, MD 21231
(Address of principal executive offices) (Zip code)
(Address of principal executive offices) (Zip code)
David M. Churchill
Principal Executive Officer
Brown Advisory Funds
901 South Bond Street Suite 400
Baltimore, MD 21231
(Name and address of agent for service)
(Name and address of agent for service)
(410) 537-5400
Registrant's telephone number, including area code
Date of fiscal year end: June 30
Date of reporting period: June 30, 2017
Item 1. Reports to Stockholders.
ANNUAL REPORT
June 30, 2017
Brown Advisory Growth Equity Fund
Brown Advisory Flexible Equity Fund
Brown Advisory Equity Income Fund
Brown Advisory Sustainable Growth Fund
Brown Advisory Small-Cap Growth Fund
Brown Advisory Small-Cap Fundamental Value Fund
Brown Advisory Global Leaders Fund
Brown Advisory Intermediate Income Fund
Brown Advisory Total Return Fund
Brown Advisory Strategic Bond Fund
Brown Advisory Maryland Bond Fund
Brown Advisory Tax Exempt Bond Fund
Brown Advisory Mortgage Securities Fund
Brown Advisory – WMC Strategic European Equity Fund
Brown Advisory – WMC Japan Alpha Opportunities Fund
Brown Advisory – Somerset Emerging Markets Fund
Brown Advisory – Macquarie Asia New Stars Fund
TABLE OF CONTENTS
| Brown Advisory Growth Equity Fund | 1 | |
| Brown Advisory Flexible Equity Fund | 5 | |
| Brown Advisory Equity Income Fund | 9 | |
| Brown Advisory Sustainable Growth Fund | 13 | |
| Brown Advisory Small-Cap Growth Fund | 17 | |
| Brown Advisory Small-Cap Fundamental Value Fund | 22 | |
| Brown Advisory Global Leaders Fund | 26 | |
| Brown Advisory Intermediate Income Fund | 30 | |
| Brown Advisory Total Return Fund | 34 | |
| Brown Advisory Strategic Bond Fund | 41 | |
| Brown Advisory Maryland Bond Fund | 51 | |
| Brown Advisory Tax Exempt Bond Fund | 56 | |
| Brown Advisory Mortgage Securities Fund | 61 | |
| Brown Advisory – WMC Strategic European Equity Fund | 76 | |
| Brown Advisory – WMC Japan Alpha Opportunities Fund | 80 | |
| Brown Advisory – Somerset Emerging Markets Fund | 86 | |
| Brown Advisory – Macquarie Asia New Stars Fund | 90 | |
| Statements of Assets and Liabilities | 94 | |
| Statements of Operations | 99 | |
| Statements of Changes in Net Assets | 104 | |
| Financial Highlights | 113 | |
| Notes to Financial Statements | 120 | |
| Report of Independent Registered Public Accounting Firm | 135 | |
| Additional Information | 136 |
The views in the report contained herein were those of the Funds’ investment adviser, Brown Advisory LLC, or, for the sub-advised funds, of the respective sub-adviser, as of June 30, 2017 and may not reflect their views on the date this report is first published or anytime thereafter. This report may contain discussions about certain investments both held and not held in the portfolio as of June 30, 2017. All current and future holdings are subject to risk and are subject to change. While these views are intended to assist shareholders in understanding their investment in each Fund, they do not constitute investment advice, are not a guarantee of future performance and are not intended as an offer or solicitation with respect to the purchase or sale of any security. Performance figures include the reinvestment of dividend and capital gain distributions.
The Global Industry Classification Standard (GICS®) was developed by and is the exclusive property of MSCI, Inc. and Standard & Poor’s Financial Services LLC (“S&P”). GICS® is a service mark of MSCI, Inc. and S&P and has been licensed for use by the Administrator, U.S. Bancorp Fund Services, LLC.
TOPIX Index Values and TOPIX Marks are subject to the proprietary rights owned by the Tokyo Stock Exchange, Inc.
GLOSSARY OF TERMS
Alpha refers to the abnormal rate of return on a security or portfolio in excess of what would be predicted by an equilibrium model like the capital asset pricing model (CAPM).
Bloomberg Barclays 1-10 Year Blended Municipal Bond Index is a market index of high quality, domestic fixed income securities with maturities of less than 10 years.
Bloomberg Barclays Intermediate US Aggregate Bond Index represents domestic taxable investment-grade bonds with index components for government and corporate securities, mortgage pass-through securities and asset-backed securities with average maturities and durations in the intermediate range. This index represents a sector of the Bloomberg Barclays US Aggregate Bond Index.
Bloomberg Barclays Mortgage Backed Securities Index is a market value-weighted index which covers the mortgage-backed securities component of the Bloomberg Barclays US Aggregate Bond Index. The index is composed of agency mortgage-backed passthrough securities of the Government National Mortgage Association (Ginnie Mae), the Federal National Mortgage Association (Fannie Mae), and the Federal Home Loan Mortgage Corporation (Freddie Mac) with a minimum $150 million par amount outstanding and a weighted-average maturity of at least 1 year. The index includes reinvestment of income.
Bloomberg Barclays US Aggregate Bond Index is a broad-based benchmark that measures the investment grade, US dollar-denominated, fixed-rate taxable bond market. The index includes Treasuries, government-related and corporate securities, MBS, ABS and CMBS.
Bloomberg Barclays US Corporate High Yield Index measures the US Dollar denominated, high-yield, fixed-rate corporate bond market.
Basis point(s) (bps) is a unit that is equal to 1/100th of 1%, and is used to denote the change in a financial instrument. The basis point is commonly used for calculating changes in interest rates, equity indexes and the yield of a fixed-income security. 1% is equal to 100 basis points.
Beta is a measure of the volatility, or systematic risk, of a security or a portfolio in comparison to the market as a whole.
Book value is the net asset value of a company, calculated by total assets minus intangible assets (patents, goodwill) and liabilities.
CAPEX, or capital expenditures, are funds used by a company to acquire or upgrade physical assets such as property, industrial buildings or equipment. It is often used to undertake new projects or investments by the firm. This type of outlay is also made by companies to maintain or increase the scope of their operations.
Cash flow measures the cash generating capability of a company by adding non-cash charges (e.g. depreciation) and interest expense to pretax income.
Correlation is a statistical measurement of how two securities move in relation to each other.
Dividend Yield is a financial ratio that shows how much a company pays out in dividends each year relative to its share price. In the absence of any capital gains, the dividend yield is the return on investment for a stock.
Downside Capture is a statistical measure of a fund’s performance in down markets. For example, a fund with downside capture of 90% would only have declined 90% as much as the related index during the same down market period.
Duration is a measure of the sensitivity of the price of a fixed-income investment to a change in interest rates. Duration is expressed as a number of years.
Earnings growth is a measure of growth in a company’s net income over a specific period, often one year. The term can apply to actual data from previous periods or estimated data for future periods.
Earnings per share (EPS) is calculated by taking the total earnings divided by the number of shares outstanding.
Earnings Yield is the earnings per share for the most recent 12-month period divided by the current market price per share. The earnings yield shows the percentage of each dollar invested in the stock that was earned by the company.
EBITDA is the Earnings Before Interest, Taxes, Depreciation and Amortization. An approximate measure of a company’s operating cash flow based on data from the company’s income statement.
Enterprise Value (EV) is a measure of a company’s value, often used as an alternative to straightforward market capitalization. Enterprise Value is calculated as market capitalization plus debt, minority interest and preferred shares, minus total cash and cash equivalents.
Forward price to earnings ratio uses forecasted earnings, rather than current earnings, to calculate the price to earnings ratio.
Free Cash Flow is the operating cash flows (net income plus amortization and depreciation) minus capital expenditures and dividends. Free cash flow is the amount of cash that a company has left over after it has paid all of its expenses, including investments.
Gross Domestic Product (GDP) is the monetary value of all the goods and services produced by an economy over a specified period. It includes consumption, government purchases, investments, and exports minus imports.
MSCI AC Asia ex Japan SMID Cap Index captures mid and small-cap representation across 2 of 3 Developed Markets (DM) countries (excluding Japan) and 8 Emerging Markets (EM) countries in Asia. With 2,001 constituents, the index covers approximately 28% of the free float-adjusted market capitalization in each country. DM countries in the index include: Hong Kong and Singapore. EM countries include: China, India, Indonesia, Korea, Malaysia, the Philippines, Taiwan and Thailand.
GLOSSARY OF TERMS
MSCI Emerging Markets Index is a free float-adjusted market capitalization index that is designed to measure equity market performance in the global emerging markets.
MSCI Emerging Markets Small Cap Index is a free float-adjusted market capitalization index that is designed to measure small cap equity market performance in the global emerging markets.
MSCI Europe Index is an index that captures large and mid cap representation across 15 developed market countries in Europe.
Price to Book Value Ratio (P/B) is ratio used to compare a stock’s market value to its book value. It is calculated by dividing the current closing price of the stock by the latest quarter’s book value per share.
Price to earnings ratio (P/E) is a common tool for comparing the prices of different common stocks and is calculated by dividing the current market price of a stock by the earnings per share.
Return of Capital (ROC) is a return from an investment that is not considered income. The return of capital is when some or all of the money an investor has in an investment is paid back to him or her, thus decreasing the value of the investment.
Return on Capital Employed (ROCE) is a financial ratio that measures a company’s profitability and the efficiency with which its capital is employed. Return on Capital Employed (ROCE) is calculated as: ROCE = Earnings Before Interest and Tax (EBIT) / Capital Employed.
Return on Equity (ROE) is the amount of net income returned as a percentage of shareholders equity. Return on equity measures a corporation’s profitability by revealing how much profit a company generates with the money shareholders have invested.
Return on Invested Capital (ROIC) is a calculation used to assess a company’s efficiency at allocating the capital under its control to profitable investments. ROIC is typically calculated by taking a company’s net income, subtracting dividends the company paid out and dividing that amount by the company’s total capital.
Russell Global Large Cap Index measures the performance of the largest securities in the Russell Global Index, based on market capitalization.
Russell 1000® Growth Index measures the performance of the large-cap growth segment of the of the U.S. equity universe. It includes those Russell 1000® companies with higher price to book value ratios and higher forecasted growth values.
Russell 1000® Value Index measures the performance of the large-cap value segment of the U.S. equity universe. It includes those Russell 1000® companies with lower price to book value ratios and lower expected growth values.
Russell 2000® Growth Index measures the performance of the small-cap growth segment of the U.S. equity universe. It includes those Russell 2000® companies with higher price to book value ratios and higher forecasted growth values.
Russell 2000® Index measures the performance of the 2,000 smallest companies in the Russell 3000® Index.
Russell 2000® Value Index measures the performance of the small-cap value segment of the U.S. equity universe. It includes those Russell 2000® companies with lower price to book value ratios and lower forecasted growth values.
Russell 3000® Index measures the performance of the 3,000 largest U.S. companies representing approximately 98% of the investable U.S. equity market.
S&P 500 Index (“S&P 500”) is a market-value weighted index representing the performance of 500 widely held, publicly traded large capitalization stocks.
Tier 1 Capital Ratio is a comparison between a banking firm’s core equity capital and total risk-weighted assets. A firm’s core equity capital is known as its Tier 1 capital and is the measure of a bank’s financial strength based on the sum of its equity capital and disclosed reserves, and sometimes non-redeemable, non-cumulative preferred stock. A firm’s risk-weighted assets include all assets that the firm holds that are systematically weighted for credit risk. Central banks typically develop the weighting scale for different asset classes, such as cash and coins, which have zero risk, versus a letter or credit, which carries more risk.
TOPIX Total Return U.S. Dollar Hedged Index is a market capitalization-weighted index of all companies listed on the First Section of the Tokyo Stock Exchange, hedged to eliminate the impact of the change in value between the US Dollar and Japanese Yen. The unhedged version of this index, known as the TOPIX Total Return Index, does not eliminate the change in value between the US Dollar and Japanese Yen.
Turnover refers to a fund buying or selling securities. (The fund “turns over” its portfolio.) A fund pays transaction costs, such as commissions, when it buys and sells securities. Additionally, a higher turnover rate may result in higher taxes when the fund shares are held in a taxable account.
Yield Curve is a line that plots the yields of securities having equal credit quality but different maturity dates.
Yield Spread is the difference between yields on differing securities, calculated by deducting the yield of one security from another.
The broad based market indexes referenced in the following management commentaries are considered representative of their indicated market, the indexes are unmanaged and do not reflect the deduction of fees, such as, investment management and fund accounting fees, or taxes associated with a mutual fund. Investors cannot invest directly in an index.
Brown Advisory Growth Equity Fund
A Message to Our Shareholders
June 30, 2017
Dear Shareholder:
During the year ended June 30, 2017, the Brown Advisory Growth Equity Fund Investor Shares (the “Fund”) increased 13.77% in value. During the same period, the Russell 1000® Growth Index, the Fund’s benchmark, increased 20.42%.
While we feel the year was strong from an absolute return perspective, it has been one of the more challenging periods for the Fund relative to its benchmark. The Fund, which we believe is well-positioned for long-term growth, struggled with the market dislocation caused first by the Brexit vote and then the surprise results of the U.S. presidential election. As investors favored yield and value over growth the consequent sector rotation contributed to considerable volatility in both absolute and relative returns for the portfolio throughout the second half of 2016. Many of these headwinds have shifted, however, and to some extent, relative performance has started to improve over the last six months.
The consumer discretionary sector has been the biggest drag on performance over this time period. Weakness in TripAdvisor, the online travel company, was the primary detractor. The company has faced near-term growth headwinds from the slower-than-expected transition to its Instant Booking (“IB”) platform. The IB platform, launched in the fourth quarter of 2015, represents the company’s evolution into an end-to-end platform for users to begin their travel research, book their trip, use features at the destination and submit feedback when they return. We believe that with this platform, TripAdvisor stands to capture substantially more of the economics in the online travel value chain and will close the monetization gap compared with its peers. In doing so, we believe that the company has the potential to more than double revenue over the medium term as the IB platform offering achieves greater adoption from online consumers. In short, the market has become too pessimistic and focused on the company’s near-term results in our view. Athletic apparel company Under Armour has also been disappointing, and when the company unexpectedly announced that the new CFO would be leaving, we eliminated our position in the company. Despite the lag from TripAdvisor and Under Armour, we benefitted from owning Amazon who continues to be a top performer in the portfolio. The company has had a profound effect on the consumer landscape over the last several years and the recent acquisition of Whole Foods puts it in position to disrupt the nearly one trillion dollar U.S. grocery market.
Technology has been one of the best performing sectors during the year. For the most part, the portfolio’s technology holdings have performed quite well, but did not keep up with the torrid pace of the benchmark sector average in total. All but one of our technology positions delivered a positive return for the period; Akamai was down on continued weakness from its media delivery segment. This segment is a smaller percentage of revenue then it was a few years ago as the company’s other segments have grown and are doing well. Some of the large customers have started to create their own content delivery networks and the overall lack of visibility, for what is still a very important part of the business, caused us to sell our position in Akamai.
Health care has been dominated by the much-publicized legislative reform efforts. This has injected a new level of volatility into stock prices in the sector. As we have done in the past we have attempted to use this volatility to our advantage and have added four new business models to the portfolio. DexCom and Edwards Lifesciences are companies that have delivered what we believe are leading-edge technologies that have been revolutionizing their respective specialties. DexCom has had a market-leading glucose monitoring device for treating diabetes, and Edwards has offered a minimally invasive heart valve replacement procedure. We sold several health care holdings, such as kidney dialysis operator DaVita. We believed DaVita’s business model had matured and expectations for growth diminished. We also eliminated Express Scripts, another longtime holding, as we saw their business becoming more challenging both from a competitive and regulatory standpoint.
In light of our performance compared to the benchmark, the last year has been challenging. When we take a big-picture view and assess the plight of the classic growth stock, we conclude that many of these stocks have been out of favor in this market – much as they were during the late 1990s. The portfolio recovered quickly in the subsequent quarters and during the years following the burst of the tech bubble. We maintained our investment discipline through those markets and continue to do so today which gives us confidence that the strategy has the same potential to outperform today as it did back then.
Sincerely,
Kenneth M. Stuzin, CFA
Portfolio Manager
1
Brown Advisory Growth Equity Fund
A Message to Our Shareholders
June 30, 2017
Past performance is not a guarantee of future results.
Mutual fund investing involves risk. Principal loss is possible. Investments in medium capitalization companies generally carry greater risk than is customarily associated with larger companies for various reasons such as narrower markets, limited financial resources and less liquid stock. The value of the Fund’s investments in REITs may change in response to changes in the real estate market such as declines in the value of real estate, lack of available capital or financing opportunities, and increases in property taxes or operating costs. Investments in foreign securities entail certain risks not associated with investments in domestic securities, such as volatility of currency exchange rates, and in some cases, political and economic instability and relatively illiquid markets. These risks are greater for investments in emerging markets. The Fund may invest in ETFs, which may trade at a discount to the aggregate value of the underlying securities and although expense ratios for ETFs are generally low, frequent trading of ETFs by the Fund can generate brokerage expenses.
Fund holdings and sector allocations are subject to change and should not be considered a recommendation to buy or sell any security. For a complete list of fund holdings, please refer to the Schedule of Investments provided in this report.
Definitions for terms and indices are provided in the Glossary of Terms.
2
Brown Advisory Growth Equity Fund
Performance Information & Portfolio Holdings Summary
June 30, 2017
| PORTFOLIO HOLDINGS | % of Net Assets |
| Information Technology | 35.9% |
| Consumer Discretionary | 18.4% |
| Health Care | 17.9% |
| Industrials | 11.2% |
| Consumer Staples | 6.0% |
| Money Market Funds | 3.8% |
| Materials | 3.6% |
| Real Estate Investment Trusts | 3.2% |
| Other Assets and Liabilities | 0.0% |
100.0% |
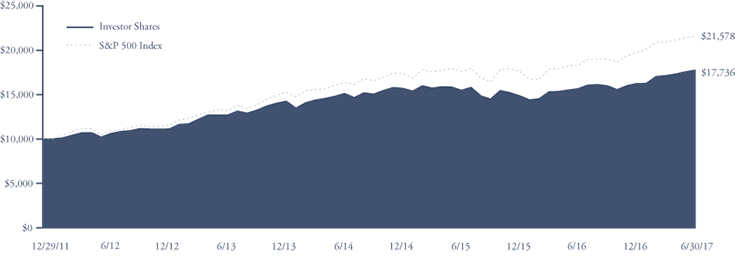
GROWTH OF A $10,000 INVESTMENT
The following chart reflects the change in value of a hypothetical $10,000 investment, including reinvested dividends and distributions, in the Fund as measured against broad-based securities market indices. The Russell 1000® Growth Index measures the performance of the large-cap growth segment of the U.S. equity universe. It includes those Russell 1000® companies with higher price to book and higher forecasted growth values. The S&P 500 Index is a market-value weighted index representing the performance of 500 widely held, publicly traded large capitalization stocks. The indexes are unmanaged and do not reflect the deduction of fees, such as investment management fees. Investors cannot invest directly in an index.

Average Annual Total Return as of 6/30/17 | One Year | Five Year | Ten Year |
Institutional Shares1 | 13.91% | 11.89% | 8.47% |
| Investor Shares | 13.77% | 11.73% | 8.31% |
| Advisor Shares | 13.53% | 11.47% | 7.96% |
Russell 1000® Growth Index | 20.42% | 15.30% | 8.91% |
| S&P 500 Index | 17.90% | 14.63% | 7.18% |
Institutional Shares | Investor Shares | Advisor Shares | |
Gross Expense Ratio2 | 0.72% | 0.87% | 1.12% |
Net Expense Ratio2 | 0.72% | 0.87% | 1.12% |
Past performance does not guarantee future results. The performance data quoted represents past performance and current returns may be lower or higher. The investment return and net asset value will fluctuate so that an investor’s shares, when redeemed, may be worth more or less than the original cost. To obtain performance information current to the most recent month end, please visit our website at brownadvisoryfunds.com/performance.html. The performance table and graph above do not reflect the deduction of taxes that a shareholder would pay on Fund distributions or the redemption of Fund shares. Investment performance reflects periods during which fee waivers were in effect. In the absence of such waivers, total return would have been reduced. Performance data does not reflect the imposition of the redemption fee of 1.00% on shares redeemed within 14 days, and if it did, performance would have been lower.
1 | Performance information for the Institutional Shares, prior to commencement of operations on October 19, 2012, is based on the performance of Investor Shares, and adjusted for the lower expenses applicable to Institutional Shares. |
2 | Per the Fund’s prospectus dated October 31, 2016. Refer to the financial highlights for the gross and net expense ratios for the year ended as of the date of this report. Please note that the expense ratios per the prospectus include acquired fund fees and expenses (as applicable) and the expense ratios in the financial highlights do not. |
3
Brown Advisory Growth Equity Fund
Schedule of Investments
June 30, 2017
| Shares | Security Description | Value $ | ||||||
| Common Stocks — 93.0% | ||||||||
| Consumer Discretionary — 18.4% | ||||||||
| 187,252 | Alibaba Group Holding, Ltd. ADR* | 26,383,807 | ||||||
| 76,798 | Amazon.com, Inc.* | 74,340,464 | ||||||
| 293,173 | FleetCor Technologies, Inc.* | 42,278,478 | ||||||
| 1,443,541 | Genpact, Ltd. | 40,173,746 | ||||||
| 14,501 | Priceline Group, Inc.* | 27,124,411 | ||||||
| 688,083 | Starbucks Corp. | 40,122,120 | ||||||
| 559,676 | TJX Companies, Inc. | 40,391,817 | ||||||
| 882,216 | TripAdvisor, Inc.* | 33,700,651 | ||||||
| 324,515,494 | ||||||||
| Consumer Staples — 6.0% | ||||||||
| 317,088 | Costco Wholesale Corp. | 50,711,884 | ||||||
| 571,463 | Estee Lauder Companies, Inc. | 54,849,019 | ||||||
| 105,560,903 | ||||||||
| Health Care — 17.9% | ||||||||
| 806,760 | Danaher Corp. | 68,082,476 | ||||||
| 379,777 | DexCom, Inc.* | 27,780,688 | ||||||
| 322,590 | Edwards Lifesciences Corp.* | 38,143,042 | ||||||
| 68,574 | Intuitive Surgical, Inc.* | 64,142,062 | ||||||
| 290,127 | Thermo Fisher Scientific, Inc. | 50,618,458 | ||||||
| 1,071,867 | Zoetis, Inc. | 66,863,063 | ||||||
| 315,629,789 | ||||||||
| Industrials — 11.2% | ||||||||
| 705,513 | A.O. Smith Corp. | 39,741,547 | ||||||
| 835,069 | Fortive Corp. | 52,901,621 | ||||||
| 271,647 | Roper Technologies, Inc. | 62,894,430 | ||||||
| 467,729 | Wabtec Corp. | 42,797,204 | ||||||
| 198,334,802 | ||||||||
| Information Technology — 35.9% | ||||||||
| 493,150 | Adobe Systems, Inc.* | 69,751,136 | ||||||
| 19,522 | Alphabet, Inc. — Class A* | 18,149,213 | ||||||
| 66,526 | Alphabet, Inc. — Class C* | 60,454,172 | ||||||
| 864,936 | Amphenol Corp. | 63,849,575 | ||||||
| 296,669 | ANSYS, Inc.* | 36,098,684 | ||||||
| 523,217 | Facebook, Inc.* | 78,995,303 | ||||||
| 373,484 | Intuit, Inc. | 49,602,410 | ||||||
| 537,701 | NXP Semiconductors NV* | 58,851,374 | ||||||
| 1,231,028 | PayPal Holdings, Inc.* | 66,069,273 | ||||||
| 622,706 | salesforce.com, Inc.* | 53,926,340 | ||||||
| 845,807 | Visa, Inc. | 79,319,780 | ||||||
| 635,067,260 | ||||||||
| Materials — 3.6% | ||||||||
| 482,212 | Ecolab, Inc. | 64,013,643 | ||||||
| Total Common Stocks (Cost $1,047,362,861) | 1,643,121,891 | |||||||
| Real Estate Investment Trusts — 3.2% | ||||||||
| 419,882 | SBA Communications Corp.* | 56,642,082 | ||||||
| Total Real Estate Investment Trusts (Cost $39,173,525) | 56,642,082 | |||||||
| Short-Term Investments — 3.8% | ||||||||
| Money Market Funds — 3.8% | ||||||||
| 66,595,850 | Cash Account Trust — Government | |||||||
| & Agency Securities Portfolio — | ||||||||
| Institutional Shares, 0.88%# | 66,595,850 | |||||||
| Total Short-Term Investments (Cost $66,595,850) | 66,595,850 | |||||||
| Total Investments — 100.0% (Cost $1,153,132,236) | 1,766,359,823 | |||||||
| Other Assets in Excess of Liabilities — 0.0% | 93,963 | |||||||
| NET ASSETS — 100.0% | $ | 1,766,453,786 | ||||||
ADR — American Depositary Receipt
| * | Non-Income Producing | |
| # | Annualized seven-day yield as of June 30, 2017. |
The accompanying notes are an integral part of these financial statements.
4
Brown Advisory Flexible Equity Fund
A Message to Our Shareholders
June 30, 2017
Dear Shareholder:
During the year ended June 30, 2017, the Brown Advisory Flexible Equity Fund Investor Shares (the “Fund”) increased 22.90% in value, exceeding the returns of the S&P 500 Index, the Fund’s benchmark, which rose 17.90%.
The market results were, in our view, great and they reflect what we believe to be a very favorable environment for equity returns – low interest rates, general economic expansion, post-election expectations of a pro-business administration lessening taxes and regulation, and business, investor and consumer confidence that is rising or already high. We see no immediate reason why the current environment should change; but, neither “great” nor its opposite are one-way streets in investment markets or human affairs. Whatever the current market sentiment or recent results, they should always be tempered by some expectation for change. We believe that owning stocks of quality companies purchased at sensible prices is a wise investment over time; however, owning them without the disposition and financial capacity to keep or add to them in less favorable environments can present problems if you are not prepared for market shifts when they occur.
Fund results in the last year benefited from rising interest rates and a shift in investor preferences from income-oriented investments like those found in the utilities and consumer staples sectors of the economy toward more growth-sensitive sectors like financials, information technology and industrials. We had relatively more of the latter and less of the former as we believed interest rates would eventually rise from historic lows and relative valuations were stretched in the income-driven sectors. We believe this shift has further to go, so we have not materially altered our exposures.
With a low-turnover approach, short-term actions rarely have a major impact on investment results relative to the market. Price movements tend to dominate any changes we make in the portfolio in the short term; but in the long term, aligning with what we believe to be good businesses that are priced attractively should dominate erratic short-term price movements. For taxable shareholders, low turnover has a further advantage of potentially greater tax efficiency through delayed timing of tax and reduced rates for individuals.
Charles Schwab, a financial services company, was the largest contributor to results rising on the expectation of higher interest rates, reduced regulation and lower corporate taxes which we believe are all positive for U.S. financial companies.
Additional large contributors to the Fund’s results include Priceline Group Inc., a provider of online travel and related services; Apple, Inc., a manufacturer of various personal digital, computing and communications devices; and Visa Inc. and MasterCard Inc., both global payments processors. These companies reported what we saw as good business results during the period and we continue to like their long-term prospects. Apple Inc. shares also benefitted from the news that Berkshire Hathaway (Warren Buffett’s company) had meaningfully increased its investment.
The biggest detractor to returns was Teva Pharmaceutical, a pharmaceuticals manufacturer. Several issues impacted the share price of Teva including concerns that patent protection will end earlier than anticipated for a key product. At the beginning of the year, Teva lowered its outlook for 2017 and announced the resignation of its CEO. Following a very challenging period, we expect improvement in their results based on better execution, efficiencies to be gained in its merger with Actavis, further diversification in its product line, the potential for its drugs under development, and its low valuation.
Occidental Petroleum Corp., an integrated energy company, fell with the decline in the price of oil. Pharmacy benefits manager Express Scripts, declined due to heightened scrutiny of drug pricing and the uncertainty regarding the potential future loss of a large contract.
Two retailers, both long-term holdings in the Fund, were among the biggest detractors. Lowe’s, a leading home improvement retailer, more recently has fallen short of investor’s earnings growth expectations. We consider Lowe’s a solid long-term investment, especially given the recovery in housing investment and home improvement. TJX Companies, an off-price retailer, has declined along with other retailers who have posted weaker results. Investors have continued to be concerned about the competitive threat from online retailers, but we believe that TJX has been operating with a defensible business model and a strong management team.
There was one new investment, one elimination and one name change since our December 31, 2016 semi-annual report to shareholders. The newest addition, Hanesbrands Inc., is an industry leader in mass-market undergarments and sports apparel under brand names including Hanes and Champion, among others. In our view, Hanes has a relatively stable business with recurring demand that produces good profits and cash flows. We favorably view management’s applying surplus cash to acquisitions of similar businesses that offer synergies, as well as returning capital to shareholders through dividends and share repurchase. Two years ago, investors became excited about Hanes’ acquisitions and bid the stock into the mid-$30s. Some recent disappointments and investor worries, which we believe are temporary, presented us with a bargain opportunity.
5
Brown Advisory Flexible Equity Fund
A Message to Our Shareholders
June 30, 2017
We sold our investment in Best Buy Co., Inc. selling the last of the shares that we first purchased four years ago. At the time of purchase, Best Buy was widely viewed as a company doomed to fail given intense competition from Amazon; but, a management change at Best Buy led us to take a closer look. Bringing new ideas, cost discipline, and improving its own internet offering, Best Buy management stabilized sales, improved profit margins, returned capital to shareholders, and produced a large gain for shareholders. Despite the great improvements, Best Buy still operates in a highly competitive arena and we exited the holding based on price.
Existing holding Yahoo! completed the sale of its namesake internet business to Verizon and renamed the company as Altaba, Inc. Altaba’s assets include a meaningful cash allocation, China’s leading e-commerce company Alibaba (referred to as the “Amazon of China”) and Yahoo! Japan Corp. Altaba has registered with the SEC as a publicly traded, non-diversified, closed-end investment company. Yahoo! CEO Marissa Mayer has resigned and Yahoo! director Thomas J. McInerney leads Altaba as its CEO. Today, we are attracted to the discount at which Altaba has traded compared to the pre-tax value of its holdings due to the potential tax consequences from its likely divestment of these holdings. We expect this discount to narrow in time as Altaba management determines the best strategies to realize the value of its assets for shareholders. We plan to maintain our ownership of Altaba for its future return potential driven by a favorable long-term view of Alibaba and prospects for narrowing the tax discount imbedded in the market price.
We search for investment bargains, particularly among what we believe are long-term attractive businesses with shareholder-oriented management. These businesses have typically had competitive advantages that have produced good economic results, managers who have allocated capital well, the capacity to adjust to changes in the world, and the ability to grow in value over time. Bargains in these types of stocks arise for many reasons, but are often due to short-term investor perceptions, temporary business challenges that have the potential to improve, as-yet-undiscovered or unrecognized opportunities, and company or industry changes for the better. Despite the occasional investment that will go awry, we are optimistic about the long-term outlook for equities of good companies purchased at reasonable prices and our ability to find them.
Sincerely,
R. Hutchings Vernon, CFA
Portfolio Manager
Past performance is not a guarantee of future results.
Mutual fund investing involves risk. Principal loss is possible. The Flexible Equity Fund may invest in securities of foreign issuers. Investments in such securities entail certain risks not associated with investments in domestic securities, such as volatility of currency exchange rates, and in some cases, political and economic instability and relatively illiquid markets. These risks are greater for investments in emerging markets. The value of the Fund’s investments in REITs may change in response to changes in the real estate market such as declines in the value of real estate, lack of available capital or financing opportunities, and increases in property taxes or operating costs. The Fund may invest in ETFs, which may trade at a discount to the aggregate value of the underlying securities and although expense ratios for ETFs are generally low, frequent trading of ETFs by the Fund can generate brokerage expenses. Investments in smaller and medium-sized companies generally carry greater risk than is customarily associated with larger companies for various reasons such as narrower markets, limited financial resources and less liquid stock. Investments in debt securities typically decrease in value when interest rates rise. This risk is usually greater for longer term debt securities. Investments in lower-rated and non-rated securities present a greater risk of loss to principal and interest than higher-rated securities.
Fund holdings and sector allocations are subject to change and should not be considered a recommendation to buy or sell any security. For a complete list of fund holdings, please refer to the Schedule of Investments provided in this report.
Definitions for terms and indices are provided in the Glossary of Terms.
6
Brown Advisory Flexible Equity Fund
Performance Information & Portfolio Holdings Summary
June 30, 2017
| PORTFOLIO HOLDINGS | % of Net Assets |
| Information Technology | 29.4% |
| Financials | 23.9% |
| Consumer Discretionary | 17.6% |
| Health Care | 9.8% |
| Industrials | 6.3% |
| Energy | 3.9% |
| Money Market Funds | 3.5% |
| Closed-End Funds | 2.4% |
| Real Estate Investment Trusts | 1.8% |
| Consumer Staples | 1.3% |
| Warrants | 0.1% |
| Other Assets and Liabilities | 0.0% |
100.0% |
GROWTH OF A $10,000 INVESTMENT
The following chart reflects the change in value of a hypothetical $10,000 investment, including reinvested dividends and distributions, in the Fund as measured against the broad-based securities market index. The S&P 500 Index (“Index”) is a market-value weighted index representing the performance of 500 widely held, publicly traded large capitalization stocks. The Index is unmanaged and does not reflect the deduction of fees, such as investment management fees. Investors cannot invest directly in an index.

Average Annual Total Return as of 6/30/17 | One Year | Five Year | Ten Year |
Institutional Shares1 | 23.05% | 14.52% | 6.08% |
| Investor Shares | 22.90% | 14.34% | 5.92% |
| Advisor Shares | 22.56% | 14.07% | 5.64% |
| S&P 500 Index | 17.90% | 14.63% | 7.18% |
Institutional Shares | Investor Shares | Advisor Shares | |
Gross Expense Ratio2 | 0.74% | 0.89% | 1.14% |
Net Expense Ratio2 | 0.74% | 0.89% | 1.14% |
Past performance does not guarantee future results. The performance data quoted represents past performance and current returns may be lower or higher. The investment return and net asset value will fluctuate so that an investor’s shares, when redeemed, may be worth more or less than the original cost. To obtain performance information current to the most recent month end, please visit our website at brownadvisoryfunds.com/performance.html. The performance table and graph above do not reflect the deduction of taxes that a shareholder would pay on Fund distributions or the redemption of Fund shares. Investment performance reflects periods during which fee waivers were in effect. In the absence of such waivers, total return would have been reduced. Performance data does not reflect the imposition of the redemption fee of 1.00% on shares redeemed within 14 days, and if it did, performance would have been lower.
1 | Performance information for the Institutional Shares, prior to commencement of operations on October 19, 2012, is based on the performance of Investor Shares, and adjusted for the lower expenses applicable to Institutional Shares. |
2 | Per the Fund’s prospectus dated October 31, 2016. Refer to the financial highlights for the gross and net expense ratios for the year ended as of the date of this report. Please note that the expense ratios per the prospectus include acquired fund fees and expenses (as applicable) and the expense ratios in the financial highlights do not. |
7
Brown Advisory Flexible Equity Fund
Schedule of Investments
June 30, 2017
| Shares | Security Description | Value $ | ||||||
| Common Stocks — 92.2% | ||||||||
| Consumer Discretionary — 17.6% | ||||||||
| 218,624 | CarMax, Inc.* | 13,786,429 | ||||||
| 16,804 | Chipotle Mexican Grill, Inc.* | 6,992,144 | ||||||
| 450,297 | Hanesbrands, Inc. | 10,428,879 | ||||||
| 162,462 | Lowe’s Companies, Inc. | 12,595,679 | ||||||
| 7,764 | Priceline Group, Inc.* | 14,522,717 | ||||||
| 77,422 | TJX Companies, Inc. | 5,587,546 | ||||||
| 91,774 | Walt Disney Co. | 9,750,988 | ||||||
| 73,664,382 | ||||||||
| Consumer Staples — 1.3% | ||||||||
| 47,851 | PepsiCo, Inc. | 5,526,312 | ||||||
| Energy — 3.9% | ||||||||
| 534,399 | Kinder Morgan, Inc. | 10,239,085 | ||||||
| 98,071 | Occidental Petroleum Corp. | 5,871,511 | ||||||
| 16,110,596 | ||||||||
| Financials — 23.9% | ||||||||
| 83,371 | Ameriprise Financial, Inc. | 10,612,294 | ||||||
| 366,295 | Bank of America Corp. | 8,886,317 | ||||||
| 124,702 | Berkshire Hathaway, Inc.* | 21,120,778 | ||||||
| 328,857 | Charles Schwab Corp. | 14,127,697 | ||||||
| 148,029 | JPMorgan Chase & Co. | 13,529,850 | ||||||
| 658,520 | Regions Financial Corp. | 9,640,733 | ||||||
| 65,565 | T. Rowe Price Group, Inc. | 4,865,579 | ||||||
| 308,038 | Wells Fargo & Co. | 17,068,385 | ||||||
| 99,851,633 | ||||||||
| Health Care — 9.8% | ||||||||
| 59,388 | Aetna, Inc. | 9,016,880 | ||||||
| 23,875 | Anthem, Inc. | 4,491,604 | ||||||
| 105,106 | Edwards Lifesciences Corp.* | 12,427,733 | ||||||
| 85,550 | Express Scripts Holding Co.* | 5,461,512 | ||||||
| 57,565 | Merck & Co., Inc. | 3,689,341 | ||||||
| 178,388 | Teva Pharmaceutical Industries, Ltd. ADR | 5,926,049 | ||||||
| 41,013,119 | ||||||||
| Industrials — 6.3% | ||||||||
| 103,910 | Canadian National Railway Co. | 8,421,905 | ||||||
| 32,396 | General Dynamics Corp. | 6,417,648 | ||||||
| 37,417 | United Rentals, Inc.* | 4,217,270 | ||||||
| 57,948 | United Technologies Corp. | 7,076,030 | ||||||
| 26,132,853 | ||||||||
| Information Technology — 29.4% | ||||||||
| 64,054 | Accenture PLC | 7,922,199 | ||||||
| 5,631 | Alphabet, Inc. — Class A* | 5,235,028 | ||||||
| 16,332 | Alphabet, Inc. — Class C* | 14,841,378 | ||||||
| 92,604 | Apple, Inc. | 13,336,828 | ||||||
| 160,375 | eBay, Inc.* | 5,600,295 | ||||||
| 76,963 | Facebook, Inc.* | 11,619,874 | ||||||
| 132,782 | MasterCard, Inc. | 16,126,374 | ||||||
| 168,641 | Microsoft Corp. | 11,624,424 | ||||||
| 134,604 | PayPal Holdings, Inc.* | 7,224,197 | ||||||
| 132,117 | QUALCOMM, Inc. | 7,295,501 | ||||||
| 235,009 | Visa, Inc. | 22,039,144 | ||||||
| 122,865,242 | ||||||||
| Total Common Stocks (Cost $265,653,558) | 385,164,137 | |||||||
| Real Estate Investment Trusts — 1.8% | ||||||||
| 74,059 | Crown Castle International Corp. | 7,419,230 | ||||||
| Total Real Estate Investment Trusts (Cost $5,441,826) | 7,419,230 | |||||||
| Closed-End Funds — 2.4% | ||||||||
| 182,510 | Altaba, Inc.* | 9,943,145 | ||||||
| Total Closed-End Funds (Cost $5,450,411) | 9,943,145 | |||||||
| Warrants — 0.1% | ||||||||
| 20,000 | Wells Fargo & Co.*, Exercise price | |||||||
| $33.79 expires 10/28/2018 | 444,000 | |||||||
| Total Warrants (Cost $221,299) | 444,000 | |||||||
| Short-Term Investments — 3.5% | ||||||||
| Money Market Funds — 3.5% | ||||||||
| 14,556,267 | Cash Account Trust — Government | |||||||
| & Agency Securities Portfolio — | ||||||||
| Institutional Shares, 0.88%# | 14,556,267 | |||||||
| Total Short-Term Investments (Cost $14,556,267) | 14,556,267 | |||||||
| Total Investments — 100.0% (Cost $291,323,361) | 417,526,779 | |||||||
| Other Assets in Excess of Liabilities — 0.0% | 106,635 | |||||||
| NET ASSETS — 100.0% | $ | 417,633,414 | ||||||
ADR — American Depositary Receipt
| * | Non-Income Producing | |
| # | Annualized seven-day yield as of June 30, 2017. |
The accompanying notes are an integral part of these financial statements.
8
Brown Advisory Equity Income Fund
A Message to Our Shareholders
June 30, 2017
Dear Shareholder:
During the year ended June 30, 2017, the Brown Advisory Equity Income Fund Investor Shares (the “Fund”) increased 13.28% in value. During the same period, the S&P 500 Index, the Fund’s benchmark, increased 17.90%.
Like a series of celebrity “before and after” snapshots displayed in a magazine or posted online, US stocks looked very different during the periods before and after the November U.S. presidential election. Stocks were relatively flat heading into the election, but prices rose fairly consistently on a monthly basis in the following months. Investor sentiment shifted to a decidedly more positive tone after the election as the prospects of a political and regulatory environment more favorable to economic growth and corporate profits became the dominant theme for the US stock market.
Within the benchmark, financials, information technology, and materials were the best performing sectors, while more traditionally defensive areas such as telecommunication services, utilities, and consumer staples trailed considerably. The energy sector also performed poorly as commodity prices trended downward during the period. The Fund benefitted from its lack of exposure to the telecommunication services and utilities sectors and its underweight position in energy. The outlook for future earnings and dividend growth are more muted in the current economic environment in these areas, and valuations generally are not overly compelling given the low growth outlook for the sectors.
The Fund’s consumer staples holdings outperformed the benchmark and ended up contributing to relative performance, despite an overweight positioning. This was largely due to an orientation towards relatively stronger growing areas within the sector such as tobacco and international-focused companies. Holdings such as Philip Morris International and Unilever performed better during the period than growth-challenged areas within the staples sector, such as domestic-oriented food producers.
During the period, what an investor didn’t own was just as important to performance as what was owned, whether particular sectors or smaller areas within the sectors. The performance of the Fund’s holdings in financials and information technology illustrated this “haves versus have-nots” aspect of the market, but from a less beneficial perspective. While the absolute performance figures of the Fund’s holdings in these sectors were impressive, the relative figures were not as both sectors trailed the benchmark’s performance.
JPMorgan Chase and Ameriprise Financial in financials and Apple and Microsoft in information technology were strong contributors to performance during the period. But their performance was not enough to offset weaker performance by other holdings elsewhere in these sectors. Additionally, a lack of exposure to the particularly strong internet-related software and services sub-sector detracted from performance within the information technology sector. Recent market standout performers such as Alphabet and Facebook do not pay dividends to their investors, and thus would generally not be owned by the Fund.
The Fund’s industrial and health care holdings also performed below the benchmark during the period, primarily because of idiosyncratic stock-specific issues. In industrials, General Electric dropped as the financial results from the conglomerate’s multi-year operational restructuring initiatives failed to meet investor expectations. Data measurement company Nielsen struggled to grow its profits amid a lack of volume growth and product innovation from its key customers in the consumer packaged goods area. And among the Fund’s health care names, Teva Pharmaceutical Industries declined from multiple setbacks ranging from a lost patent case involving a generic challenger to its key drug Copaxone to the departure of multiple executives during the period, including the CEO.
In general, the outlook for earnings and dividend growth remains bright for the majority of the Fund’s holdings. Over the past 12 months, over a dozen holdings have announced annual dividend increases of 10% or more. Included on this list of rapid divided growers are the three new additions to the Fund over the period: home improvement retailers Home Depot and Lowe’s Cos. and cell phone tower owner American Tower. These new names replaced general merchandise retailer Target, commercial truck maker Paccar, and specialty insurer OneBeacon Insurance, all of which were eliminated from the Fund. A comparatively lower outlook for future dividend growth played a meaningful role in the decision to exit these holdings in favor of the new additions, where we see the potential for a brighter future for dividend growth.
9
Brown Advisory Equity Income Fund
A Message to Our Shareholders
June 30, 2017
The Fund has a moderate amount of cash available for investment, which it will seek to deploy in a thoughtful manner as compelling investment opportunities present themselves. A focus on what we believe to be attractive valuations has been a hallmark of the Fund’s investment process since inception, and remains so, even amid the current environment of broad-based gains for U.S. stocks. Patience and discipline has the potential to pay off as the Fund seeks to add to its current stable of investments that offer competitive dividend yields with a strong potential for future growth at what we believe are reasonable valuations.
Sincerely,
Brian Graney, CFA
Portfolio Manager
Past performance does not guarantee future results.
Mutual fund investing involves risk. Principal loss is possible. Investments in debt securities typically decrease in value when interest rates rise. This risk is usually greater for longer-term debt securities. Investments in lower-rated and non-rated securities present a greater risk of loss to principal and interest than higher-rated securities. Investments in smaller and medium capitalization companies generally carry greater risk than is customarily associated with larger companies for various reasons such as narrower markets, limited financial resources and less liquid stock. The value of the Fund’s investments in REITs and Real Estate may change in response to changes in the real estate market such as declines in the value of real estate, lack of available capital or financing opportunities, and increases in property taxes or operating costs. The Fund may invest in ETFs, which may trade at a discount to the aggregate value of the underlying securities and although expense ratios for ETFs are generally low, frequent trading of ETFs by the Fund can generate brokerage expenses. Investments in foreign securities entail certain risks not associated with investments in domestic securities, such as volatility of currency exchange rates, and in some cases, political and economic instability and relatively illiquid markets. Investing in Master Limited Partnerships (“MLPs”) entails risk related to fluctuations in energy prices, decreases in supply of or demand for energy commodities, unique tax consequences due to the partnership structure and various other risks. Private Placement issued securities are restricted securities that are not publicly traded. Delay or difficulty in selling such securities may result in a loss to the Fund.
Fund holdings and sector allocations are subject to change and should not be considered a recommendation to buy or sell any security. For a complete list of fund holdings, please refer to the Schedule of Investments provided in this report.
Definitions for terms and indices are provided in the Glossary of Terms.
10
Brown Advisory Equity Income Fund
Performance Information & Portfolio Holdings Summary
June 30, 2017
| PORTFOLIO HOLDINGS | % of Net Assets |
| Information Technology | 18.9% |
| Consumer Staples | 15.1% |
| Financials | 14.9% |
| Industrials | 11.8% |
| Health Care | 11.7% |
| Consumer Discretionary | 9.5% |
| Real Estate Investment Trusts | 6.5% |
| Energy | 4.6% |
| Money Market Funds | 3.4% |
| Preferred Stocks | 2.0% |
| Materials | 1.7% |
| Other Assets and Liabilities | (0.1)% |
100.0% |
GROWTH OF A $10,000 INVESTMENT
The following chart reflects the change in value of a hypothetical $10,000 investment, including reinvested dividends and distributions, in the Fund as measured against a broad-based securities market index. The S&P 500 Index (“Index”) is a market-value weighted index representing the performance of 500 widely held, publicly traded large capitalization stocks. The Index is unmanaged and does not reflect the deduction of fees, such as investment management fees. Investors cannot invest directly in an index.
| Since Inception | |||
Average Annual Total Return as of 6/30/17 | One Year | Five Year | (12/29/11) |
Institutional Shares1 | 13.36% | 10.99% | 11.14% |
| Investor Shares | 13.28% | 10.82% | 10.97% |
| Advisor Shares | 13.02% | 10.56% | 10.71% |
| S&P 500 Index | 17.90% | 14.63% | 15.00% |
Institutional Shares | Investor Shares | Advisor Shares | |
Gross Expense Ratio2 | 0.76% | 0.91% | 1.16% |
Net Expense Ratio2 | 0.76% | 0.91% | 1.16% |
Past performance does not guarantee future results. The performance data quoted represents past performance and current returns may be lower or higher. The investment return and net asset value will fluctuate so that an investor’s shares, when redeemed, may be worth more or less than the original cost. To obtain performance information current to the most recent month end, please visit our website at brownadvisoryfunds.com/performance.html. The performance table and graph above do not reflect the deduction of taxes that a shareholder would pay on Fund distributions or the redemption of Fund shares. Performance data does not reflect the imposition of the redemption fee of 1.00% on shares redeemed within 14 days, and if it did, performance would have been lower.
1 | Performance information for the Institutional Shares, prior to commencement of operations on October 19, 2012, is based on the performance of Investor Shares, and adjusted for the lower expenses applicable to Institutional Shares. |
2 | Per the Fund’s prospectus dated October 31, 2016. Refer to the financial highlights for the gross and net expense ratios for the year ended as of the date of this report. Please note that the expense ratios per the prospectus include acquired fund fees and expenses (as applicable) and the expense ratios in the financial highlights do not. |
11
Brown Advisory Equity Income Fund
Schedule of Investments
June 30, 2017
| Shares | Security Description | Value $ | ||||||
| Common Stocks — 88.2% | ||||||||
| Consumer Discretionary — 9.5% | ||||||||
| 30,199 | Best Buy Co., Inc. | 1,731,309 | ||||||
| 8,399 | Home Depot, Inc. | 1,288,407 | ||||||
| 15,193 | Lowe’s Companies, Inc. | 1,177,913 | ||||||
| 26,615 | McDonald’s Corp. | 4,076,353 | ||||||
| 45,045 | V.F. Corp. | 2,594,592 | ||||||
| 10,868,574 | ||||||||
| Consumer Staples — 15.1% | ||||||||
| 80,327 | Altria Group, Inc. | 5,981,952 | ||||||
| 65,508 | Coca-Cola Co. | 2,938,034 | ||||||
| 40,391 | Philip Morris International, Inc. | 4,743,923 | ||||||
| 63,849 | Unilever NV ADR | 3,528,934 | ||||||
| 17,192,843 | ||||||||
| Energy — 4.6% | ||||||||
| 55,557 | Kinder Morgan, Inc. | 1,064,472 | ||||||
| 34,863 | Occidental Petroleum Corp. | 2,087,248 | ||||||
| 72,936 | Suncor Energy, Inc. | 2,129,731 | ||||||
| 5,281,451 | ||||||||
| Financials — 14.9% | ||||||||
| 22,576 | Ameriprise Financial, Inc. | 2,873,699 | ||||||
| 32,313 | Cincinnati Financial Corp. | 2,341,077 | ||||||
| 19,339 | Erie Indemnity Co. | 2,418,729 | ||||||
| 39,909 | JPMorgan Chase & Co. | 3,647,682 | ||||||
| 59,703 | Wells Fargo & Co. | 3,308,143 | ||||||
| 16,076 | Willis Towers Watson PLC | 2,338,415 | ||||||
| 16,927,745 | ||||||||
| Health Care — 11.7% | ||||||||
| 46,971 | AbbVie, Inc. | 3,405,867 | ||||||
| 24,422 | Johnson & Johnson | 3,230,786 | ||||||
| 36,405 | Merck & Co., Inc. | 2,333,197 | ||||||
| 37,208 | Novartis AG ADR | 3,105,752 | ||||||
| 36,806 | Teva Pharmaceutical Industries, Ltd. ADR | 1,222,695 | ||||||
| 13,298,297 | ||||||||
| Industrials — 11.8% | ||||||||
| 10,298 | General Dynamics Corp. | 2,040,034 | ||||||
| 99,831 | General Electric Co. | 2,696,435 | ||||||
| 62,111 | Healthcare Services Group, Inc. | 2,908,658 | ||||||
| 67,081 | Nielsen Holdings PLC | 2,593,351 | ||||||
| 26,615 | United Technologies Corp. | 3,249,958 | ||||||
| 13,488,436 | ||||||||
| Information Technology — 18.9% | ||||||||
| 20,864 | Accenture PLC | 2,580,459 | ||||||
| 29,638 | Apple, Inc. | 4,268,465 | ||||||
| 33,730 | Automatic Data Processing, Inc. | 3,455,976 | ||||||
| 107,851 | Cisco Systems, Inc. | 3,375,736 | ||||||
| 74,228 | Microsoft Corp. | 5,116,536 | ||||||
| 48,362 | QUALCOMM, Inc. | 2,670,550 | ||||||
| 21,467,722 | ||||||||
| Materials — 1.7% | ||||||||
| 14,525 | Praxair, Inc. | 1,925,289 | ||||||
| Total Common Stocks (Cost $64,958,715) | 100,450,357 | |||||||
| Preferred Stocks — 2.0% | ||||||||
| 88,244 | Public Storage, Inc. — Series S, 5.90% | 2,214,042 | ||||||
| Total Preferred Stocks (Cost $2,104,068) | 2,214,042 | |||||||
| Real Estate Investment Trusts — 6.5% | ||||||||
| 9,442 | American Tower Corp. | 1,249,365 | ||||||
| 49,057 | W.P. Carey, Inc. | 3,238,253 | ||||||
| 88,191 | Weyerhaeuser Co. | 2,954,399 | ||||||
| Total Real Estate Investment Trusts (Cost $6,034,994) | 7,442,017 | |||||||
| Short-Term Investments — 3.4% | ||||||||
| Money Market Funds — 3.4% | ||||||||
| 3,875,764 | Cash Account Trust — Government | |||||||
| & Agency Securities Portfolio — | ||||||||
| Institutional Shares, 0.88%# | 3,875,764 | |||||||
| Total Short-Term Investments (Cost $3,875,764) | 3,875,764 | |||||||
| Total Investments — 100.1% (Cost $76,973,541) | 113,982,180 | |||||||
| Liabilities in Excess of Other Assets — (0.1)% | (83,096 | ) | ||||||
| NET ASSETS — 100.0% | $ | 113,899,084 | ||||||
ADR — American Depositary Receipt
| # | Annualized seven-day yield as of June 30, 2017. |
The accompanying notes are an integral part of these financial statements.
12
Brown Advisory Sustainable Growth Fund
A Message to Our Shareholders
June 30, 2017
Dear Shareholder:
During the year ended June 30, 2017, the Brown Advisory Sustainable Growth Fund Institutional Shares (the “Fund”) increased 18.83% in value. During the same period, the Russell 1000® Growth Index (the “Index”), the Fund’s benchmark, increased 20.42%.
The Fund benefitted from strong stock selection across a number of economic sectors including consumer staples, health care and real estate. Amazon.com was the leading contributor. Adobe Systems, IDEXX Laboratories, Alphabet Class A and UnitedHealth Group also contributed to the strong performance. Finally, a large part of the performance resulted from positive sector allocation.
The Fund benefitted from being underweight lagging sectors including energy and telecommunication services and overweight stronger ones including information technology and industrials; this was unintentional. We do not manage the Fund by sector, but rather from a bottom-up, stock-by-stock basis. While there will be periods of time when sector allocation will be the primary driver of performance, over the long term we expect stock selection to account for the bulk of the difference between the Fund and the Index.
Unfortunately, we incurred disappointing results from a number of companies including Bristol-Myers Squibb, Acuity Brands, TreeHouse Foods, Cerner and Stericycle which partially offset the positive outperformance mentioned above. Among this group, we fully eliminated our positions in all of those but TreeHouse Foods. We remain confident that TreeHouse’s acquisition of ConAgra’s Private Brands will result in substantial synergies going forward.
Over the past year, we were pleased to see that three of our companies were acquired including ARM Holdings, NXP Semiconductor and WhiteWave Foods. Seeing large corporate buyers pay significant premiums to acquire companies that fit our investment criteria has been encouraging. For instance, WhiteWave is the owner of nine consumer food brands that have each held the number one or number two market share position in their respective categories. Therefore, from a fundamental perspective, the company has been the industry leader with well-known, growing brands. The company has been using sustainability to get even better by positioning its offerings to align with the most powerful trends in the food and beverage industry: products that are made with simple and clean ingredients, healthier foods, and those that are made with less environmental impact. On July 7, 2016, Danone announced its intention to acquire WhiteWave in an all-cash deal for $12.5 billion, a nearly 20% premium to the previous day’s closing price. In September 2016, Softbank acquired ARM Holdings for nearly a 44% premium and in October 2016 Qualcomm agreed to pay a 12% premium to acquire NXP Semiconductor.
In terms of new additions to the portfolio, we have added a few companies that we believe are less susceptible to macro-related downside risks including Unilever, Ball Corp and Healthcare Services Group. Unilever is one of the world’s best-known consumer goods companies and its products are used by 2.5 billion people every day. We like the company because of the substantial investments it has made over the past few years in building out its presence in emerging markets. We believe these investments position the company for multiple sources of value creation, including top line growth and margin improvements. Ball Corp is the world’s leading beverage can manufacturer with an enviable track record in sustainability in its internal operations. We believe Ball’s acquisition of Rexam puts it squarely on the path to potentially grow earnings at an above-average rate over the next few years. Healthcare Services Corp is a leading domestic provider of management, administrative and operating services to the non-acute health care industry. Given the company’s tighter management discipline, we believe Healthcare Services has been improving the quality of the facility it serves relative to the in-house labor force across multiple categories including: sanitation, environmental services, infection control, food quality etc. To make room for Unilever, Ball and Healthcare Services, we sold Canadian National, Acuity Brands and Nike, companies that we believe have greater exposure to macro-economic, cyclical risks.
As an ongoing practice, we continually look to strengthen the portfolio by identifying companies that we believe have superior business models and the potential for greater long term growth prospects than those that we already own. This past year was no different. We added Cavium, Edwards Lifesciences, Microsoft, Monolithic Power Systems, TreeHouse Foods, and Tyler Technologies to the portfolio given that we believe the business fundamentals are stronger than a number of our existing holdings. These additions replaced Akamai Technologies, Alexion, Bristol-Myers Squibb, Cerner, and Stericycle – holdings whose growth prospects deteriorated due to increased competition and/or worsening macro factors. We also sold ARM Holdings, NXP Semiconductor and WhiteWave after they were acquired.
13
Brown Advisory Sustainable Growth Fund
A Message to Our Shareholders
June 30, 2017
To conclude, we made a number of changes to the portfolio over the past year- many of which were incrementally additive to performance. We believe that our investment philosophy – seeking companies with strong fundamentals, the potential for sustainable competitive advantages, and compelling valuation – has helped identify a group of high-quality companies that has the potential to continue to perform well over time.
Sincerely,
Karina Funk, CFA
Portfolio Manager
David Powell, CFA
Portfolio Manager
Past performance is not a guarantee of future results.
Mutual fund investing involves risk. Principal loss is possible. The Fund’s investment focus on environmental factors could cause it to make or avoid investments that could result in the Fund underperforming similar funds that do not have an environmental focus. Investments in smaller and medium-sized capitalization companies generally carry greater risk than is customarily associated with larger companies for various reasons such as narrower markets, limited financial resources and less liquid stock. Investments in foreign securities entail certain risks not associated with investments in domestic securities, such as volatility of currency exchange rates, and in some cases, political and economic instability and relatively illiquid markets. These risks are greater for investments in emerging markets. The value of the Fund’s investments in REITS may change in response to changes in the real estate market such as declines in the value of real estate, lack of available capital or financing opportunities, and increases in property taxes or operating costs.
Fund holdings and sector allocations are subject to change and should not be considered a recommendation to buy or sell any security. For a complete list of fund holdings, please refer to the Schedule of Investments provided in this report.
Definitions for terms and indices are provided in the Glossary of Terms.
14
Brown Advisory Sustainable Growth Fund
Performance Information & Portfolio Holdings Summary
June 30, 2017
| PORTFOLIO HOLDINGS | % of Net Assets |
| Information Technology | 35.6% |
| Industrials | 19.1% |
| Health Care | 18.3% |
| Consumer Discretionary | 8.1% |
| Materials | 5.8% |
| Money Market Funds | 4.4% |
| Real Estate Investment Trusts | 4.3% |
| Consumer Staples | 4.3% |
| Other Assets and Liabilities | 0.1% |
100.0% |
GROWTH OF A $1,000,000 INVESTMENT
The following chart reflects the change in value of a hypothetical $1,000,000 investment, including reinvested dividends and distributions, in the Fund as measured against a broad-based securities market index. The Russell 1000® Growth Index (“Index”) measures the performance of the large-cap growth segment of the U.S. equity universe. It includes those Russell 1000® companies with higher price to book and higher forecasted growth values. The Index is unmanaged and does not reflect the deduction of fees, such as investment management fees. Investors cannot invest directly in an index.

| Since Inception | |||
Average Annual Total Return as of 6/30/17 | One Year | Five Year | (6/29/12) |
| Institutional Shares | 18.83% | 15.58% | 15.57% |
| Investor Shares | 18.65% | 15.39% | 15.38% |
| Advisor Shares | 18.33% | 15.11% | 15.10% |
Russell 1000® Growth Index | 20.42% | 15.30% | 15.29% |
Institutional Shares | Investor Shares | Advisor Shares | |
Gross Expense Ratio1 | 0.75% | 0.90% | 1.15% |
Net Expense Ratio1 | 0.75% | 0.90% | 1.15% |
Past performance does not guarantee future results. The performance data quoted represents past performance and current returns may be lower or higher. The investment return and net asset value will fluctuate so that an investor’s shares, when redeemed, may be worth more or less than the original cost. To obtain performance information current to the most recent month end, please visit our website at brownadvisoryfunds.com/performance.html. The performance table and graph above do not reflect the deduction of taxes that a shareholder would pay on Fund distributions or the redemption of Fund shares. Performance data does not reflect the imposition of the redemption fee of 1.00% on shares redeemed within 14 days, and if it did, performance would have been lower.
1 | Per the Fund’s prospectus dated October 31, 2016. Refer to the financial highlights for the gross and net expense ratios for the year ended as of the date of this report. Please note that the expense ratios per the prospectus include acquired fund fees and expenses (as applicable) and the expense ratios in the financial highlights do not. |
15
Brown Advisory Sustainable Growth Fund
Schedule of Investments
June 30, 2017
| Shares | Security Description | Value $ | ||||||
| Common Stocks — 91.2% | ||||||||
| Consumer Discretionary — 8.1% | ||||||||
| 19,598 | Amazon.com, Inc.* | 18,970,864 | ||||||
| 129,481 | Starbucks Corp. | 7,550,037 | ||||||
| 113,140 | TJX Companies, Inc. | 8,165,314 | ||||||
| 34,686,215 | ||||||||
| Consumer Staples — 4.3% | ||||||||
| 87,318 | TreeHouse Foods, Inc.* | 7,133,008 | ||||||
| 206,445 | Unilever NV ADR | 11,410,215 | ||||||
| 18,543,223 | ||||||||
| Health Care — 18.3% | ||||||||
| 188,607 | Danaher Corp. | 15,916,545 | ||||||
| 101,913 | Edwards Lifesciences Corp.* | 12,050,193 | ||||||
| 30,811 | IDEXX Laboratories, Inc.* | 4,973,512 | ||||||
| 15,343 | Mettler-Toledo International, Inc.* | 9,029,969 | ||||||
| 105,566 | Thermo Fisher Scientific, Inc. | 18,418,100 | ||||||
| 98,919 | UnitedHealth Group, Inc. | 18,341,561 | ||||||
| 78,729,880 | ||||||||
| Industrials — 19.1% | ||||||||
| 227,651 | A.O. Smith Corp. | 12,823,581 | ||||||
| 169,532 | Fortive Corp. | 10,739,852 | ||||||
| 243,493 | Healthcare Services Group, Inc. | 11,402,777 | ||||||
| 185,489 | Hexcel Corp. | 9,791,964 | ||||||
| 84,075 | J.B. Hunt Transport Services, Inc. | 7,682,774 | ||||||
| 82,681 | Middleby Corp.* | 10,046,568 | ||||||
| 90,936 | Verisk Analytics, Inc.* | 7,672,270 | ||||||
| 129,631 | Wabtec Corp. | 11,861,237 | ||||||
| 82,021,023 | ||||||||
| Information Technology — 35.6% | ||||||||
| 134,969 | Adobe Systems, Inc.* | 19,090,015 | ||||||
| 19,791 | Alphabet, Inc. — Class A* | 18,399,297 | ||||||
| 2,260 | Alphabet, Inc. — Class C* | 2,053,730 | ||||||
| 97,796 | Cavium, Inc.* | 6,076,065 | ||||||
| 120,749 | Facebook, Inc.* | 18,230,684 | ||||||
| 91,185 | Intuit, Inc. | 12,110,280 | ||||||
| 281,414 | Microsoft Corp. | 19,397,867 | ||||||
| 72,100 | Monolithic Power Systems, Inc. | 6,950,440 | ||||||
| 136,591 | Red Hat, Inc.* | 13,078,588 | ||||||
| 102,420 | salesforce.com, Inc.* | 8,869,572 | ||||||
| 51,733 | Tyler Technologies, Inc.* | 9,087,936 | ||||||
| 211,934 | Visa, Inc. | 19,875,171 | ||||||
| 153,219,645 | ||||||||
| Materials — 5.8% | ||||||||
| 311,659 | Ball Corp. | 13,155,126 | ||||||
| 89,938 | Ecolab, Inc. | 11,939,270 | ||||||
| 25,094,396 | ||||||||
| Total Common Stocks (Cost $269,317,188) | 392,294,382 | |||||||
| Real Estate Investment Trusts — 4.3% | ||||||||
| 140,423 | American Tower Corp. | 18,580,771 | ||||||
| Total Real Estate Investment Trusts (Cost $13,983,825) | 18,580,771 | |||||||
| Short-Term Investments — 4.4% | ||||||||
| Money Market Funds — 4.4% | ||||||||
| 18,710,074 | Cash Account Trust — Government | |||||||
| & Agency Securities Portfolio — | ||||||||
| Institutional Shares, 0.88%# | 18,710,074 | |||||||
| Total Short-Term Investments (Cost $18,710,074) | 18,710,074 | |||||||
| Total Investments — 99.9% (Cost $302,011,087) | 429,585,227 | |||||||
| Other Assets in Excess of Liabilities — 0.1% | 557,959 | |||||||
| NET ASSETS — 100.0% | $ | 430,143,186 | ||||||
ADR — American Depositary Receipt
| * | Non-Income Producing | |
| # | Annualized seven-day yield as of June 30, 2017. |
The accompanying notes are an integral part of these financial statements.
16
Brown Advisory Small-Cap Growth Fund
A Message to Our Shareholders
June 30, 2017
Dear Shareholder:
During the year ended June 30, 2017, the Brown Advisory Small-Cap Growth Fund Investor Shares (the “Fund”) increased 16.40% in value. During the same period, the Russell 2000® Growth Index, the Fund’s benchmark, increased 24.40%.
For most of 2016, we felt the Fund’s performance was solid; however, the period following the U.S. Presidential election was a very challenging relative period for the Fund. In fact, it was the most difficult stretch since the second quarter of 2009. We found this fact strange, so we dug into the underlying drivers of relative results in a detailed fashion. What we found was quite interesting.
Philosophically, we tend to invest in what we believe to be better businesses with an opportunity to create their own destiny due to attractive end market dynamics, strong leadership and compelling business models. The result tends to be a bias against commodity-oriented enterprises or those with intense cyclicality. This was an understandable drag in the second quarter of 2009 when the U.S. economy was emerging from the worst recession since the Great Depression. Nearly the exact same dynamics were at play post-election, however, which is strange considering the overall economic backdrop is starkly different – solid growth, low unemployment, etc. What prompted the sizeable rally in more cyclical shares was the expansionary and potentially inflationary policies being proposed by the incoming administration. It was a shot in the arm to numerous sub-segments that had been mired in a deflationary funk. We will indeed have to wait and see whether hope turns into reality or disappointment over time. In the trailing twelve months, this market regime change to companies away from our philosophical leanings was the dominant factor impacting relative returns. Unfortunately, the disappointing November/December run in 2016 wiped out the large relative lead the strategy had achieved earlier in the year largely due to security selection.
Since the Trump euphoria peaked in early 2017, other areas of the market have experienced more solid footing. As this occurred, the portfolio managed to keep pace with the solid gains in the first half of calendar year 2017. We believe we have done so with a lower risk profile than our benchmark, as we attempt to preserve our historical downside capture.
As bottom-up, fundamental investors, we would posit that thinking and acting differently against a universe of ideas where one possesses a unique or non-consensus view has the potential to best produce attractive risk-adjusted returns. We are ardent believers, however, that to fully understand the micro, one must appreciate the macro. We visualize the world of smaller company investment as being composed of a periodic table of small-cap elements. Each of these building blocks has the potential to create either a more or less favorable environment for small-cap equities in the future. Although a comprehensive, quantitative list is outside the bounds of these pages, the following provides a brief, qualitative summary:
| Favorable Environment: | Unfavorable Environment: | ||
| + | Improving US economy | - | Historically high valuations |
| + | Recovering earnings growth | - | Lower systemic liquidity (i.e. Fed policy) |
| + | Less regulation | - | Increasing leverage |
| + | Lower (pending) corporate taxes | - | Improved sentiment |
| + | Improved confidence | - | Low volatility |
Despite the present environment for small-caps appearing fairly balanced, our team is spending most of its time thinking and preparing for greater volatility ahead. The combination of market calm and high valuations usually breeds short- to intermediate-term dislocations that can rapidly change the prevailing opportunity set. Successfully navigating these periods is a critical factor in enabling long-term outperformance. In fact, many of the top contributors for the period were initially acquired or sized up during brief periods of distress.
Our top contributors for the fiscal year were spread across many sectors, providing balance in our returns. Waste Connections has demonstrated solid momentum thanks to its financially attractive acquisition of Progressive Waste and a solid economic backdrop. MACOM Technology has highlighted a data center opportunity over the next couple of years that was larger in magnitude than consensus expectations during a non-deal road show. IDEXX Laboratories gained after the company released positive second quarter results and favorable guidance on its financial outlook for the year and longer term vision. Cavium’s shares recovered from weakness after the firm reported commendable Q2 results and a positive pipeline view. In early September, Genesys announced a definitive agreement to acquire Interactive Intelligence (“ININ”) in an all-cash deal for $60.50 per share. The deal represented a 36% premium to ININ’s stock price on July 28, 2016, the trading day prior to media reports that ININ had hired an advisor to explore strategic alternatives.
17
Brown Advisory Small-Cap Growth Fund
A Message to Our Shareholders
June 30, 2017
Detractors for the trailing 12 months included Liberty TripAdvisor; Diplomat Pharmacy; and Global Eagle Entertainment. Liberty TripAdvisor’s fundamentals have continued to be hampered by the introduction of its Instant Book product. We believe the company occupies a strategic place in the online travel ecosystem, and that fundamentals will begin to show improvement as the Instant Book rollout concludes. Diplomat Pharmacy declined on the surprising news that a once insignificant – and thus undisclosed – fee charged by pharmacy benefit managers had suddenly ballooned into a massive short-term and intermediate-term hit to cash flow. Absent this dramatic fee change, we believe the financial results were largely in line with embedded expectations. We eliminated Diplomat due to a lack of intermediate-term fundamental visibility. Global Eagle’s shares fell after the board replaced the company’s CEO and CFO at the end of February due to deficiencies in execution. In all of these cases, we have taken the time to learn any lessons that may improve our investment process and team, allowing for the potential to drive improved shareholder returns in the future.
Finally, we are privileged to have such a knowledgeable, well-educated, and long-term thinking client base. This is an invaluable asset when striving for investment excellence and we continue to focus on the breadth, diversity and quality of the new assets we acquire.
As mentioned previously, we continue to believe volatility will emerge over the next 12 months as the calm associated with the market’s recent ascent has a low probability of continuing. We have many high quality companies that we are eager to invest against … at the right price. By maintaining a strong team, sound process and deep list of researched smaller companies, we strive to generate solid risk-adjusted returns over the long-term.
Sincerely,
Christopher A. Berrier
Portfolio Manager
Past performance is not a guarantee of future results.
Mutual fund investing involves risk. Principal loss is possible. Investments in smaller companies generally carry greater risk than is customarily associated with larger companies for various reasons such as narrower markets, limited financial resources and less liquid stock. The value of the Fund’s investments in REITs may change in response to changes in the real estate market such as declines in the value of real estate, lack of available capital or financing opportunities, and increases in property taxes or operating costs. The Fund may invest in ETFs, which may trade at a discount to the aggregate value of the underlying securities and although expense ratios for ETFs are generally low, frequent trading of ETFs by the Fund can generate brokerage expenses. Earnings growth is not representative of the fund’s future performance. Diversification does not assure a profit, nor does it protect against a loss in a declining market. Investments in foreign securities entail certain risks not associated with investments in domestic securities, such as volatility of currency exchange rates, and in some cases, political and economic instability and relatively illiquid markets. These risks are greater for investments in emerging markets. Privately Placement issued securities are restricted securities that are not publicly traded. Delay or difficulty in selling such securities may result in a loss to the Fund.
Fund holdings and sector allocations are subject to change and should not be considered a recommendation to buy or sell any security. For a complete list of fund holdings, please refer to the Schedule of Investments provided in this report.
Definitions for terms and indices are provided in the Glossary of Terms.
18
Brown Advisory Small-Cap Growth Fund
Performance Information & Portfolio Holdings Summary
June 30, 2017
| PORTFOLIO HOLDINGS | % of Net Assets |
| Information Technology | 28.6% |
| Consumer Discretionary | 20.3% |
| Industrials | 19.1% |
| Health Care | 14.5% |
| Money Market Funds | 7.7% |
| Financials | 3.4% |
| Telecommunication Services | 3.3% |
| Consumer Staples | 2.5% |
| Private Placements | 0.5% |
| Contingent Value Rights | 0.0% |
| Other Assets and Liabilities | 0.1% |
100.0% |
GROWTH OF A $10,000 INVESTMENT
The following chart reflects the change in value of a hypothetical $10,000 investment, including reinvested dividends and distributions, in the Fund compared with the broad-based securities market index. The Russell 2000® Growth Index (“Index”) measures the performance of the small-cap growth segment of the U.S. equity universe. It includes those Russell 2000® companies with higher price to book value ratios and higher forecasted growth values. The Index is unmanaged and does not reflect the deduction of fees, such as investment management fees. Investors cannot invest directly in an index.

Average Annual Total Return as of 6/30/17 | One Year | Five Year | Ten Year |
| Institutional Shares | 16.57% | 14.30% | 8.69% |
| Investor Shares | 16.40% | 14.14% | 8.68% |
| Advisor Shares | 16.04% | 13.86% | 8.30% |
Russell 2000® Growth Index | 24.40% | 13.98% | 7.82% |
Institutional Shares | Investor Shares | Advisor Shares | |
Gross Expense Ratio1 | 0.99% | 1.14% | 1.39% |
Net Expense Ratio1 | 0.99% | 1.14% | 1.39% |
Past performance does not guarantee future results. The performance data quoted represents past performance and current returns may be lower or higher. The investment return and net asset value will fluctuate so that an investor’s shares, when redeemed, may be worth more or less than the original cost. To obtain performance information current to the most recent month end, please visit our website at brownadvisoryfunds.com/performance.html. The performance table and graph above do not reflect the deduction of taxes that a shareholder would pay on Fund distributions or the redemption of Fund shares. Investment performance reflects periods during which fee waivers were in effect. In the absence of such waivers, total return would have been reduced. Performance data does not reflect the imposition of the redemption fee of 1.00% on shares redeemed within 14 days, and if it did, performance would have been lower.
1 Per the Fund’s prospectus dated October 31, 2016. Refer to the financial highlights for the gross and net expense ratios for the year ended as of the date of this report. Please note that the expense ratios per the prospectus include acquired fund fees and expenses (as applicable) and the expense ratios in the financial highlights do not.
19
Brown Advisory Small-Cap Growth Fund
Schedule of Investments
June 30, 2017
| Shares | Security Description | Value $ | ||||||
| Common Stocks — 91.7% | ||||||||
| Consumer Discretionary — 20.3% | ||||||||
| 284,939 | Black Diamond, Inc.* | 1,894,844 | ||||||
| 200,201 | Bright Horizons Family Solutions, Inc.* | 15,457,519 | ||||||
| 359,229 | Carrols Restaurant Group, Inc.* | 4,400,555 | ||||||
| 109,248 | Carvana Co.* | 2,236,307 | ||||||
| 258,272 | Core-Mark Holding Co., Inc. | 8,538,472 | ||||||
| 175,143 | Cotiviti Holdings, Inc.* | 6,504,811 | ||||||
| 141,578 | DigitalGlobe, Inc.* | 4,714,548 | ||||||
| 24,159 | Expedia, Inc. | 3,598,483 | ||||||
| 392,802 | Genpact, Ltd. | 10,931,680 | ||||||
| 35,487 | Habit Restaurants, Inc.* | 560,695 | ||||||
| 190,934 | Liberty Formula One* | 6,688,418 | ||||||
| 1,128,412 | Liberty TripAdvisor Holdings, Inc.* | 13,089,579 | ||||||
| 112,383 | Liberty Ventures* | 5,876,507 | ||||||
| 299,785 | Lindblad Expeditions Holdings, Inc.* | 3,147,743 | ||||||
| 100,364 | MakeMyTrip, Ltd.* | 3,367,212 | ||||||
| 93,575 | Papa John’s International, Inc. | 6,714,942 | ||||||
| 42,720 | PriceSmart, Inc. | 3,742,272 | ||||||
| 133,340 | SiteOne Landscape Supply, Inc.* | 6,941,680 | ||||||
| 108,406,267 | ||||||||
| Consumer Staples — 2.5% | ||||||||
| 37,508 | Casey’s General Stores, Inc. | 4,017,482 | ||||||
| 113,858 | TreeHouse Foods, Inc.* | 9,301,060 | ||||||
| 13,318,542 | ||||||||
| Financials — 3.4% | ||||||||
| 244,856 | ConnectOne Bancorp, Inc. | 5,521,503 | ||||||
| 163,242 | Envestnet, Inc.* | 6,464,383 | ||||||
| 97,647 | Prosperity Bancshares, Inc. | 6,272,843 | ||||||
| 18,258,729 | ||||||||
| Health Care — 14.5% | ||||||||
| 93,053 | Acceleron Pharma, Inc.* | 2,827,881 | ||||||
| 54,632 | Agios Pharmaceuticals, Inc.* | 2,810,816 | ||||||
| 114,476 | Alder Biopharmaceuticals, Inc.* | 1,310,750 | ||||||
| 97,830 | BeiGene, Ltd. ADR* | 4,402,350 | ||||||
| 385,835 | Catalent, Inc.* | 13,542,809 | ||||||
| 163,477 | Charles River Laboratories International, Inc.* | 16,535,699 | ||||||
| 121,362 | Coherus BioSciences, Inc.* | 1,741,545 | ||||||
| 50,304 | Henry Schein, Inc.* | 9,206,638 | ||||||
| 31,501 | IDEXX Laboratories, Inc.* | 5,084,891 | ||||||
| 58,514 | Jounce Therapeutics, Inc.* | 820,951 | ||||||
| 115,737 | Medidata Solutions, Inc.* | 9,050,633 | ||||||
| 50,429 | Neurocrine Biosciences, Inc.* | 2,319,734 | ||||||
| 277,236 | Novadaq Technologies, Inc.* | 3,249,206 | ||||||
| 68,760 | Ultragenyx Pharmaceutical, Inc.* | 4,270,684 | ||||||
| 77,174,587 | ||||||||
| Industrials — 19.1% | ||||||||
| 9,214 | BWX Technologies, Inc. | 449,183 | ||||||
| 166,930 | ESCO Technologies, Inc. | 9,957,375 | ||||||
| 213,117 | Healthcare Services Group, Inc. | 9,980,269 | ||||||
| 171,247 | HEICO Corp. | 12,302,384 | ||||||
| 224,459 | Hexcel Corp. | 11,849,191 | ||||||
| 78,408 | IDEX Corp. | 8,860,888 | ||||||
| 278,221 | KeyW Holding Corp.* | 2,601,366 | ||||||
| 242,886 | Knight Transportation, Inc. | 8,998,926 | ||||||
| 27,386 | WageWorks, Inc.* | 1,840,339 | ||||||
| 382,682 | Waste Connections, Inc. | 24,652,342 | ||||||
| 156,988 | Woodward, Inc. | 10,609,249 | ||||||
| 102,101,512 | ||||||||
| Information Technology — 28.6% | ||||||||
| 134,411 | 2U, Inc.* | 6,306,564 | ||||||
| 305,142 | Acxiom Corp.* | 7,927,589 | ||||||
| 22,207 | Appian Corp.* | 403,057 | ||||||
| 140,364 | Aspen Technology, Inc.* | 7,756,515 | ||||||
| 135,177 | Blackbaud, Inc. | 11,591,428 | ||||||
| 168,040 | Broadridge Financial Solutions, Inc. | 12,697,102 | ||||||
| 344,090 | BroadSoft, Inc.* | 14,813,074 | ||||||
| 189,710 | Cavium, Inc.* | 11,786,682 | ||||||
| 94,305 | CoreLogic, Inc.* | 4,090,951 | ||||||
| 4,035 | CoStar Group, Inc.* | 1,063,626 | ||||||
| 64,705 | Electronics For Imaging, Inc.* | 3,065,723 | ||||||
| 60,921 | Fair Isaac Corp. | 8,492,997 | ||||||
| 36,472 | Global Payments, Inc. | 3,294,151 | ||||||
| 96,320 | Guidewire Software, Inc.* | 6,618,147 | ||||||
| 227,985 | MACOM Technology Solutions Holdings, Inc.* | 12,714,723 | ||||||
| 139,448 | MAXIMUS, Inc. | 8,733,628 | ||||||
| 289,406 | Mimecast, Ltd.* | 7,750,293 | ||||||
| 105,880 | Monotype Imaging Holdings, Inc. | 1,937,604 | ||||||
| 15,790 | Nutanix, Inc.* | 318,169 | ||||||
| 45,189 | Paylocity Holding Corp.* | 2,041,639 | ||||||
| 38,936 | Proofpoint, Inc.* | 3,380,813 | ||||||
| 57,938 | SPS Commerce, Inc.* | 3,694,127 | ||||||
| 36,481 | Ultimate Software Group, Inc.* | 7,663,199 | ||||||
| 45,958 | WEX, Inc.* | 4,792,041 | ||||||
| 152,933,842 | ||||||||
| Telecommunication Services — 3.3% | ||||||||
| 364,930 | Cogent Communications Holdings, Inc. | 14,633,693 | ||||||
| 791,075 | Global Eagle Entertainment, Inc.* | 2,816,227 | ||||||
| 17,449,920 | ||||||||
| Total Common Stocks (Cost $362,181,455) | 489,643,399 | |||||||
| Private Placements — 0.5% | ||||||||
| 18,800 | Greenspring Global Partners IV-B, L.P.*^† | 2,302,960 | ||||||
| 85,769 | Greenspring Global Partners V-B, L.P.*~† | 112,500 | ||||||
| Total Private Placements (Cost $32,019) | 2,415,460 | |||||||
| Contingent Value Rights — 0.0% | ||||||||
| 118,191 | Dyax Corp.*† (Acquired in January 2016) | 131,192 | ||||||
| Total Contingent Value Rights (Cost $131,192) | 131,192 | |||||||
The accompanying notes are an integral part of these financial statements.
20
Brown Advisory Small-Cap Growth Fund
Schedule of Investments
June 30, 2017
| Shares | Security Description | Value $ | ||||||
| Short-Term Investments — 7.7% | ||||||||
| Money Market Funds — 7.7% | ||||||||
| 40,862,590 | Cash Account Trust — Government | |||||||
| & Agency Securities Portfolio — | ||||||||
| Institutional Shares, 0.88%# | 40,862,590 | |||||||
| Total Short-Term Investments (Cost $40,862,590) | 40,862,590 | |||||||
| Total Investments — 99.9% (Cost $403,207,256) | 533,052,641 | |||||||
| Other Assets in Excess of Liabilities — 0.1% | 599,456 | |||||||
| NET ASSETS — 100.0% | $ | 533,652,097 | ||||||
ADR — American Depositary Receipt
| * | Non-Income Producing |
| ^ | Security is exempt from registration under Regulation D of the Securities Act of 1933. Security was acquired from February 2008 to August 2016 as part of a $2,000,000 capital commitment. At June 30, 2017, $1,880,000 of the capital commitment has been fulfilled by the Fund. |
| ~ | Security is exempt from registration under Regulation D of the Securities Act of 1933. Security was acquired from October 2012 to February 2017 as part of a $100,000 capital commitment. At June 30, 2017, $85,000 of the capital commitment has been fulfilled by the Fund. |
| † | These securities are being fair valued under the supervision of the Board of Trustees. Further, they may not be sold by the Fund and are considered illiquid. At June 30, 2017 the total market value of securities considered illiquid was $2,546,652 or 0.5% of net assets. |
| # | Annualized seven-day yield as of June 30, 2017. |
The accompanying notes are an integral part of these financial statements.
21
Brown Advisory Small-Cap Fundamental Value Fund
A Message to Our Shareholders
June 30, 2017
Dear Shareholder:
During the year ended June 30, 2017, the Brown Advisory Small-Cap Fundamental Value Fund Investor Shares (the “Fund”) increased 19.54% in value. During the same period, the Russell 2000® Value Index, the Fund’s benchmark, increased 24.86%.
During the year, the Fund’s positive performance resulted from a combination of strong absolute performance in industrials, real estate and health care, as well as meaningful stock selection and sector allocation in energy and utilities. Our drag in the consumer discretionary, information technology, and material sectors was the cause for the Fund to underperform relative to the benchmark.
Synovus was the Fund’s largest individual contributor to performance during the year. During April, the company saw its share price rise following a strong first-quarter earnings release. Earnings came in ahead of expectations and the company raised full-year guidance. Additionally, the company announced the acquisition of the financial arm of Cabela’s, which has the potential to be immediately accretive to earnings and to capital.
Core-Mark, a long-term holding in the Fund and in the past a top contributor, was our largest detractor during the period. The stock was down during the period on the announcement that a major customer will be terminating its supply agreement with Core-Mark’s operation in its Southeast region effective January 2017.
The Fund added 18 new companies during the course of the year. Sizeable additions included Nexstar Media Group, Continental Building Products, and Altisource Residential. On January 3, 2017, Ares Capital Corporation completed the previously announced acquisition of American Capital.
Nexstar is one of the largest local broadcasting companies in the U.S. With its acquisition of Media General, Nexstar will own over 150 TV stations in 100 markets and related digital properties. The company has been diversifying away from local advertising revenues with almost half of EBITDA having been generated from other sources, largely carriage fees and digital advertising. With high free cash flow conversion and declining leverage, we believe Nexstar has the potential to generate excess cash flow following the Media General transaction. With the stock having traded at 7x EBITDA, we believe this is an attractive valuation.
Continental Building Products is a leading producer of gypsum wallboard and complementary finishing products in the United States and Canada. The company is the fifth largest player nationally (10% share), but given wallboard’s high “weight to value” ratio the industry operates more at the local level. Continental Building Products is a market leader east of the Mississippi with an estimated 30-35% in some key major metropolitan markets. Former parent company Lafarge built the business through acquisitions and greenfield expansion; spending over $575m in CAPEX over its 17 years of ownership, before selling it to private equity in 2013. That capital spend has left them with some of the newest and most cost-efficient capacity in the industry that has required very little in terms of sustaining CAPEX. With EBITDA margins having been near 30%, we expect free cash flow conversion to remain attractive in the near term. The stock has recently traded at a discount to the rest of the building products group and has had a 10% free cash flow yield. We believe that with attractive leverage to EBITDA levels, few CAPEX needs in the near term, and very little appetite for mergers and acquisitions, the vast majority of free cash flow has the potential to be returned to shareholders through buybacks going forward.
Altisource Residential Corporation owns a portfolio of over 10,000 single family rental properties. We believe we made an investment into this emerging single-family-rental operator at a 35% discount to undepreciated book value and a 27% discount to our estimate of NAV. The company has been in the midst of a transition from a non-performing loan purchaser to pure-play single-family rental Real Estate Investment Trust. As this multi-quarter conversion takes place, earnings have the potential to become more stable and we believe investors may begin to value this company against peers who trade on multiples of undepreciated book value, NAV and funds from operations.
During the year, there were 12 deletions from the Fund’s portfolio, six of which were a result of corporate actions. Diamond Resorts was acquired by affiliates of private equity firm Apollo Global Management for $2.2 billion. ElectroRent agreed to be purchased by private equity firm Platinum Equity for $13.12/share. Subsequent to that announcement ElectroRent was approached by a third party with a counter bid causing Platinum to raise their offer to $15.50, setting the price for which the company was ultimately sold in August. Patriot National announced that they had received an enhanced offer from Ebix following a $9.50/share offer announced in June. We took advantage of strength to finish exiting the position. On January 3rd, Ares Capital Corporation completed the previously announced acquisition of American Capital. Also in January, NorthStar Realty Finance completed its merger-of-equals transaction with NorthStar Asset Management Group and Colony Capital, Inc. The new entity is listed under the ticker CLNS (Colony NorthStar, Inc.). Finally, in April, Air Methods completed its announced sale to private equity firm American Securities.
22
Brown Advisory Small-Cap Fundamental Value Fund
A Message to Our Shareholders
June 30, 2017
While we believe we have a robust pipeline, it is heavily weighted towards investments that need to see some price decline in order to meet our return objectives. We are keenly interested in the upcoming earnings season to give us a better indication of economic activity. Given the continued high valuation of the markets, we are approaching the rest of 2017 with caution.
Sincerely,
J. David Schuster
Portfolio Manager
Past performance is not a guarantee of future results.
Investments in smaller companies generally carry greater risk than is customarily associated with larger companies for various reasons such as narrower markets, limited financial resources and less liquid stock. The value of the Fund’s investments in REITs may change in response to changes in the real estate market such as declines in the value of real estate, lack of available capital or financing opportunities, and increases in property taxes or operating costs. The Fund may invest in ETFs, which may trade at a discount to the aggregate value of the underlying securities and although expense ratios for ETFs are generally low, frequent trading of ETFs by the Fund can generate brokerage expenses. Investments in debt securities typically decrease in value when interest rates rise. This risk is usually greater for longer-term debt securities. Investments in foreign securities entail certain risks not associated with investments in domestic securities, such as volatility of currency exchange rates, and in some cases, political and economic instability and relatively illiquid markets. These risks are greater for investments in emerging markets. The risks of investments in derivatives, including options, futures contracts and options on futures contracts include imperfect correlation between the value of these instruments and the underlying assets; risks of default by the other party to the derivative transactions; risks that the transactions may result in losses that partially or completely offset gains in portfolio positions; and risks that the derivative transactions may not be liquid. Private Placement issued securities are restricted securities that are not publicly traded. Delay or difficulty in selling such securities may result in a loss to the Fund. Earnings growth is not a measure of the Fund’s future performance.
Fund holdings and sector allocations are subject to change and should not be considered a recommendation to buy or sell any security. For a complete list of fund holdings, please refer to the Schedule of Investments provided in this report.
Definitions for terms and indices are provided in the Glossary of Terms.
23
Brown Advisory Small-Cap Fundamental Value Fund
Performance Information & Portfolio Holdings Summary
June 30, 2017
| PORTFOLIO HOLDINGS | % of Net Assets |
| Financials | 28.8% |
| Consumer Discretionary | 14.9% |
| Industrials | 14.2% |
| Real Estate Investment Trusts | 11.9% |
| Information Technology | 11.4% |
| Materials | 5.6% |
| Money Market Funds | 4.6% |
| Energy | 2.8% |
| Telecommunication Services | 2.6% |
| Health Care | 1.8% |
| Consumer Staples | 1.1% |
| Utilities | 0.5% |
| Other Assets and Liabilities | (0.2)% |
100.0% |
GROWTH OF A $10,000 INVESTMENT
The following chart reflects the change in value of a hypothetical $10,000 investment, including reinvested dividends and distributions, in the Fund as measured against a broad-based securities market index. The Russell 2000® Value Index (“Index”) measures the performance of small-cap value segment of the U.S. equity universe. It includes those Russell 2000® companies with lower price to book ratios and lower forecasted growth values. The Index is unmanaged and does not reflect the deduction of fees, such as investment management fees. Investors cannot invest directly in an index.

| Since Inception | |||
Average Annual Total Return as of 6/30/17 | One Year | Five Year | (12/31/08) |
Institutional Shares1 | 19.73% | 14.73% | 16.01% |
| Investor Shares | 19.54% | 14.56% | 15.83% |
Advisor Shares2 | 19.29% | 14.26% | 15.55% |
Russell 2000® Value Index | 24.86% | 13.39% | 13.25% |
Institutional Shares | Investor Shares | Advisor Shares | |
Gross Expense Ratio3 | 1.23% | 1.38% | 1.63% |
Net Expense Ratio3 | 1.23% | 1.38% | 1.63% |
Past performance does not guarantee future results. The performance data quoted represents past performance and current returns may be lower or higher. The investment return and net asset value will fluctuate so that an investor’s shares, when redeemed, may be worth more or less than the original cost. To obtain performance information current to the most recent month end, please visit our website at brownadvisoryfunds.com/performance.html. The performance table and graph above do not reflect the deduction of taxes that a shareholder would pay on Fund distributions or the redemption of Fund shares. Investment performance reflects periods during which fee waivers were in effect. In the absence of such waivers, total return would have been reduced. Performance data does not reflect the imposition of the redemption fee of 1.00% on shares redeemed within 14 days, and if it did, performance would have been lower.
1 | Performance information for the Institutional Shares, prior to commencement of operations on October 19, 2012, is based on the performance of Investor Shares, and adjusted for the lower expenses applicable to Institutional Shares. |
2 | Performance information for Advisor Shares, prior to commencement on July 28, 2011, is based on the performance of Investor Shares, and adjusted for the higher expenses applicable to Advisor Shares. |
3 | Per the Fund’s prospectus dated October 31, 2016. Refer to the financial highlights for the gross and net expense ratios for the year ended as of the date of this report. Please note that the expense ratios per the prospectus include acquired fund fees and expenses (as applicable) and the expense ratios in the financial highlights do not. |
24
Brown Advisory Small-Cap Fundamental Value Fund
Schedule of Investments
June 30, 2017
| Shares | Security Description | Value $ | ||||||
| Common Stocks — 83.7% | ||||||||
| Consumer Discretionary — 14.9% | ||||||||
| 115,430 | Carriage Services, Inc. | 3,111,993 | ||||||
| 238,499 | Cato Corp. | 4,195,197 | ||||||
| 649,915 | Core-Mark Holding Co., Inc. | 21,486,190 | ||||||
| 108,193 | Culp, Inc. | 3,516,273 | ||||||
| 1,945,907 | Denny’s Corp.* | 22,903,325 | ||||||
| 405,427 | DigitalGlobe, Inc.* | 13,500,719 | ||||||
| 152,300 | Liberty Ventures* | 7,963,767 | ||||||
| 386,588 | Loral Space & Communications, Inc.*† | 16,062,731 | ||||||
| 468,065 | Murphy USA, Inc.* | 34,688,297 | ||||||
| 381,852 | Nexstar Broadcasting Group, Inc. | 22,834,750 | ||||||
| 1,478,481 | Regis Corp.* | 15,184,000 | ||||||
| 874,034 | TEGNA, Inc. | 12,594,830 | ||||||
| 178,042,072 | ||||||||
| Consumer Staples — 1.1% | ||||||||
| 120,634 | Casey’s General Stores, Inc. | 12,921,108 | ||||||
| Energy — 2.8% | ||||||||
| 182,186 | Linn Energy, Inc.* | 5,563,960 | ||||||
| 112,400 | Natural Gas Services Group, Inc.* | 2,793,140 | ||||||
| 1,398,624 | Par Pacific Holdings, Inc.*† | 25,231,177 | ||||||
| 33,588,277 | ||||||||
| Financials — 28.8% | ||||||||
| 1,411,416 | Ares Capital Corp. | 23,118,994 | ||||||
| 330,180 | Assurant, Inc. | 34,236,364 | ||||||
| 381,372 | Capital Bank Financial Corp. | 14,530,273 | ||||||
| 145,885 | Farmers Capital Bank Corp. | 5,623,867 | ||||||
| 220,304 | Howard Bancorp, Inc.*† | 4,240,852 | ||||||
| 908,957 | McGrath RentCorp† | 31,477,181 | ||||||
| 359,198 | Medley Management, Inc.† | 2,334,787 | ||||||
| 590,733 | National Bank Holdings Corp. | 19,559,170 | ||||||
| 967,610 | National General Holdings Corp. | 20,416,571 | ||||||
| 583,567 | OceanFirst Financial Corp. | 15,826,337 | ||||||
| 124,878 | Oritani Financial Corp. | 2,129,170 | ||||||
| 289,028 | Pacific Premier Bancorp, Inc.* | 10,665,133 | ||||||
| 408,279 | Primerica, Inc. | 30,927,134 | ||||||
| 338,171 | Renasant Corp. | 14,791,600 | ||||||
| 272,794 | State National Cos, Inc. | 5,013,954 | ||||||
| 1,091,985 | Synovus Financial Corp. | 48,309,416 | ||||||
| 1,158,086 | TFS Financial Corp. | 17,915,590 | ||||||
| 197,491 | TriState Capital Holdings, Inc.* | 4,976,773 | ||||||
| 264,311 | Triumph Bancorp, Inc.* | 6,488,835 | ||||||
| 298,717 | Virtus Investment Partners, Inc. | 33,142,651 | ||||||
| 345,724,652 | ||||||||
| Health Care — 1.8% | ||||||||
| 95,971 | Addus HomeCare Corp.* | 3,570,121 | ||||||
| 364,437 | Providence Service Corp.* | 18,444,157 | ||||||
| 22,014,278 | ||||||||
| Industrials — 14.2% | ||||||||
| 1,094,753 | Albany International Corp.† | 58,459,810 | ||||||
| 926,313 | Continental Building Products, Inc.* | 21,583,093 | ||||||
| 405,777 | EnPro Industries, Inc. | 28,960,305 | ||||||
| 732,981 | Federal Signal Corp. | 12,724,550 | ||||||
| 335,604 | Kadant, Inc. | 25,237,421 | ||||||
| 75,355 | KMG Chemicals, Inc. | 3,667,528 | ||||||
| 459,706 | Simpson Manufacturing Co., Inc. | 20,093,749 | ||||||
| 170,726,456 | ||||||||
| Information Technology — 11.4% | ||||||||
| 271,934 | Broadridge Financial Solutions, Inc. | 20,547,333 | ||||||
| 226,771 | Cars.com, Inc.* | 6,038,912 | ||||||
| 966,579 | CTS Corp.† | 20,878,106 | ||||||
| 223,172 | DST Systems, Inc. | 13,769,712 | ||||||
| 922,597 | EchoStar Corp.* | 56,001,638 | ||||||
| 306,877 | MAXIMUS, Inc. | 19,219,707 | ||||||
| 136,455,408 | ||||||||
| Materials — 5.6% | ||||||||
| 294,315 | Clearwater Paper Corp.* | 13,759,226 | ||||||
| 396,170 | Deltic Timber Corp.† | 29,578,052 | ||||||
| 301,303 | Neenah Paper, Inc. | 24,179,566 | ||||||
| 67,516,844 | ||||||||
| Telecommunication Services — 2.6% | ||||||||
| 405,538 | ATN International, Inc. | 27,755,021 | ||||||
| 126,666 | Hawaiian Telcom, Inc.* | 3,165,383 | ||||||
| 30,920,404 | ||||||||
| Utilities — 0.5% | ||||||||
| 551,882 | Star Gas Partners L.P. | 5,982,401 | ||||||
| Total Common Stocks (Cost $744,210,134) | 1,003,891,900 | |||||||
| Real Estate Investment Trusts — 11.9% | ||||||||
| 1,640,003 | Altisource Residential Corp. | 21,221,639 | ||||||
| 2,278,473 | Colony NorthStar, Inc. | 32,103,685 | ||||||
| 1,761,255 | Forest City Realty Trust, Inc. | 42,569,533 | ||||||
| 3,290,290 | MFA Financial, Inc. | 27,605,533 | ||||||
| 1,019,729 | Xenia Hotels & Resorts, Inc. | 19,752,151 | ||||||
| Total Real Estate Investment Trusts (Cost $123,757,331) | 143,252,541 | |||||||
| Short-Term Investments — 4.6% | ||||||||
| Money Market Funds — 4.6% | ||||||||
| 55,425,717 | Cash Account Trust — Government | |||||||
| & Agency Securities Portfolio — | ||||||||
| Institutional Shares, 0.88%# | 55,425,717 | |||||||
| Total Short-Term Investments (Cost $55,425,717) | 55,425,717 | |||||||
| Total Investments — 100.2% (Cost $923,393,182) | 1,202,570,158 | |||||||
| Liabilities in Excess of Other Assets — (0.2)% | (2,241,647 | ) | ||||||
| NET ASSETS — 100.0% | $ | 1,200,328, 511 | ||||||
| * | Non-Income Producing |
| † | All or a portion of this security is considered illiquid. At June 30, 2017 the total market value of securities considered illiquid was $36,635,854 or 3.1% of net assets. |
| # | Annualized seven-day yield as of June 30, 2017. |
The accompanying notes are an integral part of these financial statements.
25
Brown Advisory Global Leaders Fund
A Message to Our Shareholders
June 30, 2017
Dear Shareholder:
During the year ended June 30, 2017, the Brown Advisory Global Leaders Fund (the “Fund”) increased by 19.39% in value. During the same period, the Russell Global Large Cap Index, the Fund’s benchmark, increased by 18.85%.
Political change, both real and perceived, was undoubtedly the driving force in the period. The year started in the aftermath of the UK electorate’s decision to leave the European Union on June 23rd and markets rallied on hopes of an amicable solution. The biggest political event of the period was Donald Trump’s victory in the U.S. presidential election on November 9th. Investors initially embraced the new U.S. administration’s economic policies and developed world equity markets rallied in the final two months of 2016 with economically sensitive sectors such as financials leading the rotation. Concerns over the prospects of an ever strengthening dollar contributed to relative underperformance of emerging markets in the weeks following the election. Elsewhere, the penchant for cyclical rather than structural growth resulted in relative underperformance for our technology holdings in the final quarter of 2016. As the new year of 2017 matured, the equity market rally became more broad-based with investors taking comfort from diminishing political risk and improving economic data in Europe. The final quarter of the period was characterized by encouraging first quarter results from corporates, including the majority of the strategy’s holdings, and global indices continued to make new highs in the final moments of the period.
Despite investors having something of a love/hate relationship with technology companies, technology was the biggest contributor to performance during the year. Sector-based pigeon-holing can create an overly simplified view of the investment landscape. We view our technology franchises as having largely heterogeneous business models and their ability to keep uniquely satisfying their customers contributed to strong operational and share price performances in the year. With this in mind MasterCard, Google owner Alphabet, and Priceline were meaningful positive contributors to performance during the period. Elsewhere the election of Donald Trump in November 2016 resulted in share price gains for U.S. financials as investors priced in expectations of deregulation and rising interest rate. Accordingly, Charles Schwab and JPMorgan were the strategy’s two biggest positive contributors to performance during the period. Rotation and fears about the impact of dollar strength and domestic economic mismanagement resulted in underperformance for our Asian financials Bank Rakyat, AIA and HDFC Bank in the final quarter of 2016. We took the opportunity to selectively increase our exposure to our Asian financials on weakness and were rewarded with strong performances in the second half of the period on the back of robust results.
On the negative front health care was the main area of underperformance in the period largely due to stock-specific issues. Novo Nordisk shares were weak on the back of increased competition in the U.S. insulin market. Sun Pharmaceutical suffered a similar fate with rising competitive intensity in the U.S. putting pressure on the growth and profitability of their generic drug franchise. Elsewhere Danish enzyme manufacturer Novozymes also contributed negatively to performance after the company revised its 2016 growth outlook. We followed our drawdown process for Novo Nordisk, Sun Pharmaceuticals and Novozymes where we automatically review each individual investment thesis after a company’s shares drop 20% below where we initiated with the aim of the review being to either add to the position or exit. This part of our process is designed to combat the damaging impact of loss aversion which can create significant damage to client’s capital if left unchecked. In the case of Novo Nordisk, Sun Pharmaceutical and Novozymes we decided that increasing competition was undermining each company’s economic moat and that franchise quality was in danger of being corrupted so we exited our positions.
We continued to scour the four corners of the globe looking for special customer-focused franchises that trade at discounts to intrinsic value. Our research efforts bore multiple new fruits with a number of additions to the strategy during the period. Our work in Europe coincided with signs of an improvement in the economic and political environment in the region and as a result, we added Safran, Schindler and Hiscox to the strategy. Elsewhere following extensive research, including a trip to Japan, we added Hoshizaki to the portfolio. Hoshizaki has been the market leader in ice machines for the hospitality industry and we believe it has significant opportunities to expand internationally and into other product areas. Finally in the U.S., we added Microsoft and Fleetcor to the portfolio with both franchises having offered significant productivity improvements to their customers, in cloud computing and fuel cards, respectively.
We continue to look for the optimal blend of risk and reward for our client’s capital and with the exception of Novo Nordisk, Sun Pharmaceutical and Novozymes, the majority of the deletions from the portfolio were due to opportunity cost; we exited Apple, Subaru, Alexion and NXP Semiconductors for this reason. The only exception to this was United Internet which we sold on the back of concerns about the competitive environment in the German telecom market.
26
Brown Advisory Global Leaders Fund
A Message to Our Shareholders
June 30, 2017
The Fund invests in market-leading companies from across the globe that we believe deliver exceptional customer outcomes. We believe that companies that combine a superior outcome for their customers with strong leadership have the potential to generate high and sustainable returns on invested capital (“ROIC”) and can lead to attractive shareholder returns. Although we saw a significant amount of political change this year, we remain encouraged that the operational performance of our companies remains robust and that the aggregate valuations for the portfolio are at what we believe to be attractive levels. Given these qualities we were rewarded with outperformance during the period and, whilst gratifying, we would encourage our investors to focus on the long-term as the Fund seeks to compound excess economic returns at above market growth rates for many years to come. We believe that regardless of short-term political and economic vicissitudes, a concentrated low-turnover portfolio of global leaders has the potential to produce attractive long-term risk-adjusted returns for our clients.
Sincerely,
Michael Dillon
Lead Portfolio Manager
Bertie Thomson
Portfolio Manager
Past performance is not a guarantee of future results.
Mutual fund investing involves risk. Principal loss is possible. The Fund invests in small and medium capitalization companies which carry greater risk than is associated with larger companies for various reasons, such as narrower markets, limited financial resources and less liquid stock. The value of the Fund’s investments in REITs may change in response to changes in the real estate market such as declines in the value of real estate, lack of available capital or financing opportunities, and increases in property taxes or operating costs. The Fund may invest in ETFs, which may trade at a discount to the aggregate value of the underlying securities and although expense ratios for ETFs are generally low, frequent trading of ETFs by the Fund can generate brokerage expenses. Investments in foreign securities entail certain risks not associated with investments in domestic securities, such as volatility of currency exchange rates, and in some cases, political and economic instability and relatively illiquid markets. These risks are greater for investments in emerging markets. Private Placement issued securities are restricted securities that are not publicly traded. Delay or difficulty in selling such securities may result in a loss to the Fund.
Diversification does not assure a profit or protect against loss in a declining market.
Fund holdings and sector allocations are subject to change and should not be considered a recommendation to buy or sell any security. For a complete list of fund holdings, please refer to the Schedule of Investments provided in this report.
Definitions for terms and indices are provided in the Glossary of Terms.
27
Brown Advisory Global Leaders Fund
Performance Information & Portfolio Holdings Summary
June 30, 2017
| PORTFOLIO HOLDINGS | % of Net Assets |
| Information Technology | 27.4% |
| Financials | 18.8% |
| Industrials | 14.2% |
| Consumer Staples | 13.0% |
| Consumer Discretionary | 12.3% |
| Health Care | 6.1% |
| Materials | 6.0% |
| Money Market Funds | 1.8% |
| Other Assets and Liabilities | 0.4% |
100.0% |
GROWTH OF A $10,000 INVESTMENT
The following chart reflects the change in value of a hypothetical $10,000 investment, including reinvested dividends and distributions, in the Fund as measured against a broad-based securities market index. The Russell Global Large Cap Index (“Index”) measures the performance of the largest securities in the Russell Global Index, based on market capitalization. The Index is unmanaged and does not reflect the deduction of fees, such as investment management fees. Investors cannot invest directly in an index.

| Since Inception | ||
Average Annual Total Return as of 6/30/17 | One Year | (7/1/15) |
| Investor Shares | 19.39% | 7.34% |
| Russell Global Large Cap Index | 18.85% | 6.71% |
Investor Shares | |
Gross Expense Ratio1 | 1.42% |
Net Expense Ratio1 | 0.86% |
Past performance does not guarantee future results. The performance data quoted represents past performance and current returns may be lower or higher. The investment return and net asset value will fluctuate so that an investor’s shares, when redeemed, may be worth more or less than the original cost. To obtain performance information current to the most recent month end, please visit our website at brownadvisoryfunds.com/performance.html. The performance table and graph above do not reflect the deduction of taxes that a shareholder would pay on Fund distributions or the redemption of Fund shares. Investment performance reflects periods during which fee waivers were in effect. In the absence of such waivers, total return would have been reduced. Performance data does not reflect the imposition of the redemption fee of 1.00% on shares redeemed within 14 days, and if it did, performance would have been lower. Short-term performance, in particular, is not a good indication of the Fund’s future performance, and an investment should not be made based solely on returns.
1 | Per the Fund’s prospectus dated October 31, 2016. Refer to the financial highlights for the gross and net expense ratios for the year ended as of the date of this report. Please note that the expense ratios per the prospectus include acquired fund fees and expenses (as applicable) and the expense ratios in the financial highlights do not. |
28
Brown Advisory Global Leaders Fund
Schedule of Investments
June 30, 2017
| Shares | Security Description | Value $ | ||||||
| Common Stocks — 97.8% | ||||||||
| China — 3.2% | ||||||||
| 173,783 | AIA Group, Ltd. | 1,271,459 | ||||||
| France — 3.5% | ||||||||
| 14,982 | Safran SA | 1,373,947 | ||||||
| Germany — 3.4% | ||||||||
| 11,177 | Henkel AG & Co. KGaA | 1,353,921 | ||||||
| India — 3.0% | ||||||||
| 46,450 | HDFC Bank, Ltd. | 1,195,286 | ||||||
| Indonesia — 2.2% | ||||||||
| 765,800 | Bank Rakyat Indonesia Persero | 873,804 | ||||||
| Japan — 1.6% | ||||||||
| 6,728 | Hoshizaki Corp. | 610,437 | ||||||
| Sweden — 2.8% | ||||||||
| 31,749 | Atlas Copco AB | 1,097,396 | ||||||
| Switzerland — 3.5% | ||||||||
| 6,539 | Schindler Holding AG | 1,359,192 | ||||||
| Taiwan — 3.4% | ||||||||
| 38,849 | Taiwan Semiconductor | |||||||
| Manufacturing Co., Ltd. ADR | 1,358,161 | |||||||
| United Kingdom — 5.9% | ||||||||
| 42,318 | Hiscox Ltd | 698,739 | ||||||
| 30,008 | Unilever PLC | 1,623,977 | ||||||
| 2,322,716 | ||||||||
| United States — 65.3% | ||||||||
| Consumer Discretionary — 10.8% | ||||||||
| 5,184 | FleetCor Technologies, Inc.* | 747,585 | ||||||
| 11,355 | NIKE, Inc. | 669,945 | ||||||
| 535 | Priceline Group, Inc.* | 1,000,728 | ||||||
| 11,352 | Starbucks Corp. | 661,935 | ||||||
| 16,158 | TJX Companies, Inc. | 1,166,123 | ||||||
| 4,246,316 | ||||||||
| Consumer Staples — 5.4% | ||||||||
| 10,996 | Brown-Forman Corp. | 534,406 | ||||||
| 16,709 | Estee Lauder Companies, Inc. | 1,603,730 | ||||||
| 2,138,136 | ||||||||
| Financials — 8.6% | ||||||||
| 24,852 | Charles Schwab Corp. | 1,067,642 | ||||||
| 17,926 | JPMorgan Chase & Co. | 1,638,436 | ||||||
| 5,376 | Moody’s Corp. | 654,152 | ||||||
| 3,360,230 | ||||||||
| Health Care — 6.1% | ||||||||
| 7,091 | Cigna Corp. | 1,186,962 | ||||||
| 10,132 | Edwards Lifesciences Corp.* | 1,198,008 | ||||||
| 2,384,970 | ||||||||
| Industrials — 4.5% | ||||||||
| 5,642 | 3M Co. | 1,174,608 | ||||||
| 7,000 | Verisk Analytics, Inc.* | 590,590 | ||||||
| 1,765,198 | ||||||||
| Information Technology — 23.9% | ||||||||
| 2,076 | Alphabet, Inc. — Class C* | 1,886,523 | ||||||
| 15,095 | Cognizant Technology Solutions Corp. | 1,002,308 | ||||||
| 7,725 | Facebook, Inc.* | 1,166,321 | ||||||
| 10,885 | MasterCard, Inc. | 1,321,983 | ||||||
| 26,224 | Microsoft Corp. | 1,807,620 | ||||||
| 12,853 | PayPal Holdings, Inc.* | 689,821 | ||||||
| 16,494 | Visa, Inc. | 1,546,807 | ||||||
| 9,421,383 | ||||||||
| Materials — 6.0% | ||||||||
| 8,447 | Ecolab, Inc. | 1,121,339 | ||||||
| 3,541 | Sherwin-Williams Co. | 1,242,750 | ||||||
| 2,364,089 | ||||||||
| Total United States | 25,680,322 | |||||||
| Total Common Stocks (Cost $31,246,830) | 38,496,641 | |||||||
| Short-Term Investments — 1.8% | ||||||||
| Money Market Funds — 1.8% | ||||||||
| 694,025 | Cash Account Trust — Government | |||||||
| & Agency Securities Portfolio — | ||||||||
| Institutional Shares, 0.88%# | 694,025 | |||||||
| Total Short-Term Investments (Cost $694,025) | 694,025 | |||||||
| Total Investments — 99.6% (Cost $31,940,855) | 39,190,666 | |||||||
| Other Assets in Excess of Liabilities — 0.4% | 163,107 | |||||||
| NET ASSETS — 100.0% | $ | 39,353,773 | ||||||
ADR — American Depositary Receipt
| * | Non-Income Producing |
| # | Annualized seven-day yield as of June 30, 2017. |
The accompanying notes are an integral part of these financial statements.
29
Brown Advisory Intermediate Income Fund
A Message to Our Shareholders
June 30, 2017
Dear Shareholder:
During the year ended June 30, 2017, the Brown Advisory Intermediate Income Fund Investor Shares (the “Fund”) increased 0.40% in value. During the same period, the Bloomberg Barclays Intermediate US Aggregate Bond Index, the Fund’s benchmark, declined by 0.16%.
The Fund aims to generate performance primarily through individual security analysis, supported by a detailed and disciplined credit process and focused on downside protection. Duration and sector weightings are set mainly by an analysis of the intermediate-term risk/reward as opposed to any particular macro forecast.
The last year has been a period of high interest rate volatility, but persistently tighter credit spreads. The Fund was overweight credit generally, and corporate bonds were the largest contributors to performance. Among our best performers were: Micron Technology (+9.37%) HollyFrontier Corp. (+ 8.24%), Mylan Inc. (+7.95%) and FMC Technologies (+7.00%).
Mortgage Backed Securities (“MBS”) selection was a mild negative, with all the underperformance coming in the fourth quarter of 2016. In MBS, we focus on bonds that will repay principal slower and therefore return more in interest over the life of the bond. The sudden jump in rates caused some of these bonds to look less attractive. Over time, even at higher rate levels, investors are better off with bonds that repay at a slower pace and hence we are happy to wait out this period of high volatility.
Looking forward, there are plenty of threats to the bond market: the economy could improve and interest rates could rise or the economy could weaken and credit would perform poorly. Finding the right balance of risk and reward at this point in the cycle requires a disciplined process, an open mind, and discerning analysis. We believe that if we can maintain attractive yields within the Fund while avoiding poor risk/reward situations, we have the potential to deliver strong investment performance wherever the economy moves next.
We remain focused on our core philosophy of seeking sectors and bonds that we believe are underpriced on a fundamental basis while maintaining the core stability that our investors expect from the Fund.
Sincerely,
Paul D. Corbin
Portfolio Manager
Thomas D.D. Graff, CFA
Portfolio Manager
Past performance is not a guarantee of future results.
Mutual fund investing involves risk. Principal loss is possible. The Fund is subject to interest rate risk which is the risk that debt securities in the Fund’s portfolio will decline in value because of increases in market interest rates. Investments in Asset Backed and Mortgage Backed Securities include additional risks that investors should be aware of such as credit risk, prepayment risk, possible illiquidity and default, as well as increased susceptibility to adverse economic developments. Investments in debt securities typically decrease in value when interest rates rise. The risk is usually greater for longer-term debt securities. Inflation-indexed bonds see the principal value of the security increased as the Consumer Price Index increases. Should the Consumer Price Index decline, those securities should be adversely impacted. Diversification does not assure a profit, nor does it protect against a loss in a declining market.
Fund holdings and sector allocations are subject to change and should not be considered a recommendation to buy or sell any security. For a complete list of fund holdings, please refer to the Schedule of Investments provided in this report.
Definitions for terms and indices are provided in the Glossary of Terms.
30
Brown Advisory Intermediate Income Fund
Performance Information & Portfolio Holdings Summary
June 30, 2017
| PORTFOLIO HOLDINGS | % of Net Assets |
| Corporate Bonds & Notes | 28.8% |
| Affiliated Mutual Funds | 21.7% |
| Mortgage Backed Securities | 15.8% |
| U.S. Treasury Notes | 12.4% |
| Asset Backed Securities | 9.9% |
| Municipal Bonds | 7.6% |
| Money Market Funds | 2.4% |
| Other Assets and Liabilities | 1.4% |
100.0% |
GROWTH OF A $10,000 INVESTMENT
The following chart reflects the change in value of a hypothetical $10,000 investment, including reinvested dividends and distributions, in the Fund as measured against a broad-based bond index. The Bloomberg Barclays Intermediate US Aggregate Bond Index (“Index”) represents domestic taxable investment grade bonds, with index components for government and corporate securities, mortgage pass-through securities, and asset-backed securities with average maturities and durations in the intermediate range. The Index is unmanaged and does not reflect the deduction of fees, such as investment management fees. Investors cannot invest directly in an index.
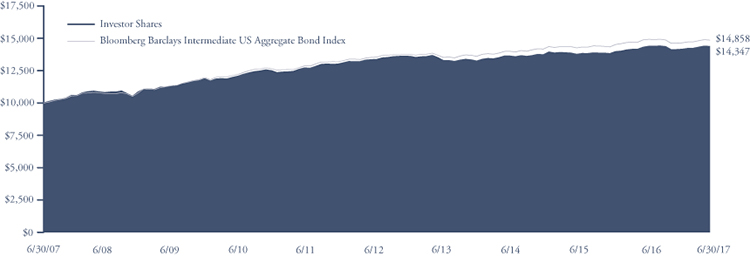
Average Annual Total Return as of 6/30/17 | One Year | Five Year | Ten Year |
| Investor Shares | 0.40% | 1.46% | 3.68% |
| Advisor Shares | 0.16% | 1.21% | 3.43% |
| Bloomberg Barclays Intermediate US Aggregate Bond Index | -0.16% | 1.87% | 4.04% |
Investor Shares | Advisor Shares | |
Gross Expense Ratio1 | 0.61% | 0.86% |
Net Expense Ratio1 | 0.54% | 0.79% |
Past performance does not guarantee future results. The performance data quoted represents past performance and current returns may be lower or higher. The investment return and net asset value will fluctuate so that an investor’s shares, when redeemed, may be worth more or less than the original cost. To obtain performance information current to the most recent month end, please visit our website at brownadvisoryfunds.com/performance.html. The performance table and graph above do not reflect the deduction of taxes that a shareholder would pay on Fund distributions or the redemption of Fund shares. Investment performance reflects periods during which fee waivers were in effect. In the absence of such waivers, total return would have been reduced. Performance data does not reflect the imposition of the redemption fee of 1.00% on shares redeemed within 14 days, and if it did, performance would have been lower.
1 | Per the Fund’s prospectus dated October 31, 2016. Refer to the financial highlights for the gross and net expense ratios for the year ended as of the date of this report. Please note that the expense ratios per the prospectus include acquired fund fees and expenses (as applicable) and the expense ratios in the financial highlights do not. |
31
Brown Advisory Intermediate Income Fund
Schedule of Investments
June 30, 2017
| Par Value | Security Description | Rate | Maturity | Value $ | ||||||||||
| Corporate Bonds & Notes — 28.8% | ||||||||||||||
| 1,365,000 | 21st Century Fox America, Inc. | 3.00 | % | 09/15/2022 | 1,386,541 | |||||||||
| 1,200,000 | Activision Blizzard, Inc.^ | 6.13 | % | 09/15/2023 | 1,295,296 | |||||||||
| 1,405,000 | American Express Credit Corp.# | 1.92 | % | 03/03/2022 | 1,415,467 | |||||||||
| 1,420,000 | American Tower Corp. | 2.25 | % | 01/15/2022 | 1,386,079 | |||||||||
| 1,355,000 | Analog Devices, Inc. | 3.13 | % | 12/05/2023 | 1,371,389 | |||||||||
| 1,410,000 | AstraZeneca PLC | 1.95 | % | 09/18/2019 | 1,414,109 | |||||||||
| 1,380,000 | AutoZone, Inc. | 2.50 | % | 04/15/2021 | 1,377,631 | |||||||||
| 1,380,000 | BB&T Corp. | 2.75 | % | 04/01/2022 | 1,401,317 | |||||||||
| 1,310,000 | Boston Properties L.P. | 3.85 | % | 02/01/2023 | 1,379,871 | |||||||||
| 1,400,000 | Broadcom Corp.^ | 3.88 | % | 01/15/2027 | 1,440,453 | |||||||||
| 1,385,000 | Campbell Soup Co. | 2.50 | % | 08/02/2022 | 1,386,011 | |||||||||
| 1,355,000 | Canadian Natural Resources, Ltd. | 3.80 | % | 04/15/2024 | 1,373,282 | |||||||||
| 1,306,000 | CC Holdings GS V LLC | 3.85 | % | 04/15/2023 | 1,374,748 | |||||||||
| 1,375,000 | Clorox Co. | 3.05 | % | 09/15/2022 | 1,411,579 | |||||||||
| 1,335,000 | Dollar General Corp. | 4.15 | % | 11/01/2025 | 1,411,477 | |||||||||
| 1,410,000 | Education Realty Operating Partnership L.P. | 4.60 | % | 12/01/2024 | 1,435,577 | |||||||||
| 1,370,000 | Energy Transfer L.P. | 4.05 | % | 03/15/2025 | 1,377,695 | |||||||||
| 1,245,000 | Fidelity National Information Services, Inc. | 5.00 | % | 10/15/2025 | 1,392,596 | |||||||||
| 1,395,000 | Healthcare Trust of America Holdings L.P. | 3.75 | % | 07/01/2027 | 1,381,743 | |||||||||
| 1,375,000 | JB Hunt Transport Services, Inc. | 2.40 | % | 03/15/2019 | 1,383,024 | |||||||||
| 1,275,000 | Micron Technology, Inc. | 7.50 | % | 09/15/2023 | 1,428,637 | |||||||||
| 1,295,000 | MPLX L.P. | 4.50 | % | 07/15/2023 | 1,376,487 | |||||||||
| 685,000 | Mylan NV | 3.95 | % | 06/15/2026 | 695,339 | |||||||||
| 1,565,000 | Providence Health & Services Obligated Group# | 2.10 | % | 10/01/2017 | 1,567,836 | |||||||||
| 1,365,000 | Rockwell Collins, Inc. | 2.80 | % | 03/15/2022 | 1,379,084 | |||||||||
| 2,115,000 | Royal Bank of Canada# | 1.74 | % | 03/06/2020 | 2,122,853 | |||||||||
| 1,240,000 | Sabine Pass Liquefaction LLC | 5.88 | % | 06/30/2026 | 1,388,222 | |||||||||
| 1,405,000 | Verizon Communications, Inc.# | 2.25 | % | 03/16/2022 | 1,422,444 | |||||||||
| Total Corporate Bonds & Notes (Cost $38,783,678) | 39,176,787 | |||||||||||||
| Mortgage Backed Securities — 15.8% | ||||||||||||||
| 2,740 | FHLMC PC, Pool# C0-0210 | 8.00 | % | 01/01/2023 | 2,996 | |||||||||
| 347,111 | FHLMC PC, Pool# 1B-0889# | 3.39 | % | 05/01/2033 | 365,998 | |||||||||
| 2,009,743 | FHLMC PC, Pool# Q2-5749 | 4.00 | % | 04/01/2044 | 2,116,211 | |||||||||
| 1,321,391 | FHLMC PC, Pool# Q4-2019 | 3.00 | % | 07/01/2046 | 1,319,802 | |||||||||
| 76,260 | FHLMC REMIC, Series 2782 | 4.00 | % | 11/15/2033 | 77,430 | |||||||||
| 1,600,000 | FHMS, Series K-042 | 2.67 | % | 12/25/2024 | 1,610,751 | |||||||||
| 1,525,000 | FHMS, Series K-046 | 3.21 | % | 03/25/2025 | 1,586,692 | |||||||||
| 700,000 | FHMS, Series K-047# | 3.33 | % | 05/25/2025 | 733,923 | |||||||||
| 1,550,000 | FHMS, Series K-048# | 3.28 | % | 06/25/2025 | 1,620,278 | |||||||||
| 16,629 | FNMA, Pool# 539082 | 7.00 | % | 08/01/2028 | 16,743 | |||||||||
| 8,531 | FNMA, Pool# 625536 | 6.00 | % | 01/01/2032 | 9,598 | |||||||||
| 38,865 | FNMA, Pool# 628837 | 6.50 | % | 03/01/2032 | 43,315 | |||||||||
| 105,977 | FNMA, Pool# 663238 | 5.50 | % | 09/01/2032 | 117,363 | |||||||||
| 12,824 | FNMA, Pool# 741373# | 2.78 | % | 12/01/2033 | 13,303 | |||||||||
| 35,402 | FNMA, Pool# 744805# | 2.89 | % | 11/01/2033 | 35,991 | |||||||||
| 65,438 | FNMA, Pool# 764342# | 2.90 | % | 02/01/2034 | 67,674 | |||||||||
| 36,932 | FNMA, Pool# 848817 | 5.00 | % | 01/01/2036 | 40,537 | |||||||||
| 2,184,303 | FNMA, Pool# AB9339 | 3.00 | % | 05/01/2043 | 2,197,580 | |||||||||
| 1,298,223 | FNMA, Pool# AL8256 | 3.00 | % | 03/01/2046 | 1,309,463 | |||||||||
| 645,055 | FNMA, Pool# AS1474 | 4.50 | % | 01/01/2044 | 692,615 | |||||||||
| 721,767 | FNMA, Pool# AV7911 | 4.50 | % | 01/01/2044 | 775,963 | |||||||||
| 4,328,009 | FNMA, Pool# AY3879 | 3.50 | % | 11/01/2045 | 4,449,243 | |||||||||
| 1,962,623 | FNMA, Pool# AY3880 | 4.00 | % | 11/01/2045 | 2,065,428 | |||||||||
| 1,800,204 | FNMA REMIC Trust, Series 2013-115 A1~ | 3.00 | % | 04/25/2031 | 227,195 | |||||||||
| 16,797 | GNMA, Pool# 487110 | 6.50 | % | 04/15/2029 | 19,457 | |||||||||
The accompanying notes are an integral part of these financial statements.
32
Brown Advisory Intermediate Income Fund
Schedule of Investments
June 30, 2017
| Par | ||||||||||||||
| Value/Shares | Security Description | Rate | Maturity | Value $ | ||||||||||
| Mortgage Backed Securities — 15.8% (Continued) | ||||||||||||||
| 6,213 | GNMA, Pool# 571166 | 7.00 | % | 08/15/2031 | 6,377 | |||||||||
| 27,050 | GNMA, Pool# 781186 | 9.00 | % | 06/15/2030 | 30,026 | |||||||||
| Total Mortgage Backed Securities (Cost $21,558,860) | 21,551,952 | |||||||||||||
| Asset Backed Securities — 9.9% | ||||||||||||||
| 376,428 | AmeriCredit Automobile Receivables Trust, Series 2017-2 A1 | 1.20 | % | 05/18/2018 | 376,423 | |||||||||
| 196,358 | AmeriCredit Automobile Receivables Trust, Series 2016-1 A2A | 1.52 | % | 06/10/2019 | 196,374 | |||||||||
| 700,000 | AmeriCredit Automobile Receivables Trust, Series 2015-4 A3 | 1.70 | % | 07/08/2020 | 700,176 | |||||||||
| 875,000 | AmeriCredit Automobile Receivables Trust, Series 2015-3 B | 2.08 | % | 09/08/2020 | 877,987 | |||||||||
| 1,000,000 | BlueMountain CLO, Ltd., Series 2015-3A B#^ | 4.26 | % | 10/20/2027 | 1,005,673 | |||||||||
| 2,500,000 | Capital Auto Receivables Asset Trust, Series 2014-3 B^ | 2.35 | % | 07/22/2019 | 2,509,509 | |||||||||
| 855,395 | Continental Airlines Trust, Series 1999-1 A | 6.55 | % | 08/02/2020 | 893,888 | |||||||||
| 794,390 | Federal Express Corp., Series 1998-1 | 6.72 | % | 07/15/2023 | 871,327 | |||||||||
| 1,500,000 | Octagon Investment Partners 24, Ltd., Series 2015-1A A2#^ | 3.12 | % | 05/21/2027 | 1,500,358 | |||||||||
| 1,000,000 | Octagon Investment Partners 30, Ltd., Series 2017-1A B#^ | 3.38 | % | 03/17/2030 | 1,001,760 | |||||||||
| 135,173 | OSCAR U.S. Funding Trust IV, Series 2016-1A A2B#^ | 2.69 | % | 07/15/2020 | 135,980 | |||||||||
| 105,799 | OSCAR U.S. Funding Trust V, Series 2016-2A A2B#^ | 2.39 | % | 11/15/2019 | 106,302 | |||||||||
| 1,500,000 | OZLM XIII, Ltd., Series 2015-13A A2#^ | 3.27 | % | 07/30/2027 | 1,506,324 | |||||||||
| 216,078 | Santander Drive Auto Receivables Trust, Series 2015-4 A3 | 1.58 | % | 09/16/2019 | 216,109 | |||||||||
| 1,500,000 | Stewart Park CLO, Ltd., Series 2015-1A B#^ | 3.16 | % | 04/15/2026 | 1,501,887 | |||||||||
| Total Asset Backed Securities (Cost $13,380,510) | 13,400,077 | |||||||||||||
| Municipal Bonds — 7.6% | ||||||||||||||
| 670,000 | District of Columbia, Series 2010F | 4.71 | % | 12/01/2022 | 751,177 | |||||||||
| 1,395,000 | Florida Hurricane Catastrophe Fund | 2.11 | % | 07/01/2018 | 1,403,537 | |||||||||
| 1,000,000 | Illinois, State of | 2.30 | % | 06/15/2019 | 999,790 | |||||||||
| 1,390,000 | Maryland Health & Higher Educational Facilities Authority | 3.43 | % | 07/01/2023 | 1,424,500 | |||||||||
| 2,000,000 | Miami-Dade County Florida Aviation | 2.37 | % | 10/01/2023 | 1,941,460 | |||||||||
| 1,315,000 | New York State Dormitory Authority | 4.00 | % | 07/01/2039 | 1,341,944 | |||||||||
| 1,250,000 | North Texas Tollway Authority | 8.91 | % | 02/01/2030 | 1,434,938 | |||||||||
| 1,000,000 | Texas A&M University | 3.23 | % | 05/15/2027 | 1,022,660 | |||||||||
| Total Municipal Bonds (Cost $10,342,454) | 10,320,006 | |||||||||||||
| U.S. Treasury Notes — 12.4% | ||||||||||||||
| 1,470,000 | United States Treasury Note | 0.75 | % | 10/31/2017 | 1,468,368 | |||||||||
| 3,645,000 | United States Treasury Note | 1.38 | % | 02/29/2020 | 3,632,757 | |||||||||
| 7,960,000 | United States Treasury Note | 1.88 | % | 08/31/2022 | 7,945,696 | |||||||||
| 4,000,000 | United States Treasury Note | 1.63 | % | 05/15/2026 | 3,792,892 | |||||||||
| Total U.S. Treasury Notes (Cost $16,949,911) | 16,839,713 | |||||||||||||
| Affiliated Mutual Funds (Note 3) — 21.7% | ||||||||||||||
| 2,995,189 | Brown Advisory Mortgage Securities Fund — Institutional Shares | 29,562,515 | ||||||||||||
| Total Affiliated Mutual Funds (Cost $30,238,441) | 29,562,515 | |||||||||||||
| Short-Term Investments — 2.4% | ||||||||||||||
| Money Market Funds — 2.4% | ||||||||||||||
| 3,321,580 | First American Treasury Obligations Fund — Class Z, 0.85%* | 3,321,580 | ||||||||||||
| Total Short-Term Investments (Cost $3,321,580) | 3,321,580 | |||||||||||||
| Total Investments — 98.6% (Cost $134,575,434) | 134,172,630 | |||||||||||||
| Other Assets in Excess of Liabilities — 1.4% | 1,865,826 | |||||||||||||
| NET ASSETS — 100.0% | $ | 136,038,456 | ||||||||||||
| * | Annualized seven-day yield as of June 30, 2017. |
| ^ | Security exempt from registration under Rule 144A of the Securities Act of 1933. These securities may be resold in transactions exempt from registration, normally to qualified institutional buyers. At June 30, 2017, the value of these securities amounted to $12,003,542 or 8.8% of net assets. |
| ~ | Interest Only Security |
| # | Variable rate security. Rate disclosed is as of June 30, 2017. |
The accompanying notes are an integral part of these financial statements.
33
Brown Advisory Total Return Fund
A Message to Our Shareholders
June 30, 2017
Dear Shareholder:
During the year ended June 30, 2017, the Brown Advisory Total Return Fund Institutional Shares (the “Fund”) was up 0.80%, modestly ahead of the -0.31% return for the Bloomberg Barclays US Aggregate Bond Index, the Fund’s benchmark.
The Fund aims to generate performance primarily through individual security analysis, supported by a detailed and disciplined credit process. Duration and sector weightings are set mainly by an analysis of the intermediate-term risk/reward as opposed to any particular macro forecast.
The last year has been a period of high interest rate volatility but persistently tighter credit spreads. While the Fund was generally overweight to credit, the Fund’s corporate bonds’ maturities were, on average, intentionally shorter than those in the benchmark. This positioning allows us to capitalize on our bottom-up selection while not courting unnecessary volatility at the portfolio level.
The attribution for this period validates this approach. For corporate bonds, the “allocation” effect, which measures the impact of your weightings to a class of bonds, was negative 0.25%. But the “selection” effect was +1.30%, which means our selections performed far better than the average bond in the benchmark. This is exactly what we were trying to achieve, focusing our efforts where we have the biggest edge.
Among our stronger performing individual selections were Cornerstone Chemicals (+16.69%), Brookfield Residential (+14.03%), Micron Technology (+13.83%), Capital One (+12.24%) and Interface Security (+13.28%).
Mortgage Backed Securities (“MBS”) selection was a mild negative, with all the underperformance coming in the fourth quarter of 2016. Within MBS, we focus on bonds that will repay principal more slowly and, therefore, return more in interest over the life of the bond. The sudden jump in rates caused some of these bonds to look less attractive. Over time, even at higher rate levels, we believe that investors are better off with bonds that repay at a slower pace and we are happy to wait out this period of increased volatility.
The Fund utilized Treasury futures during the year to manage duration. This allowed the Fund to focus its security selection on whichever bond it found to be the most attractive anywhere on the maturity spectrum and then adjust overall Fund duration as needed. In general during the year, the futures position was net long, meaning it added to the duration of the Fund. The isolated performance effect of this was -1.20%, but this merely reflects the fact that interest rates generally rose during the year.
Looking forward, there are plenty of threats to the bond market: the economy could improve and interest rates could rise or the economy could weaken and credit could perform poorly. Finding the right balance of risk and reward at this point in the credit cycle requires a disciplined process, an open mind, and discerning analysis. We believe that if we can maintain attractive yields within our portfolios while avoiding poor risk/reward situations, we have the potential to deliver strong investment performance wherever the economy moves next.
Sincerely,
Thomas D.D. Graff, CFA
Portfolio Manager
Past performance is not a guarantee of future results.
Mutual fund investing involves risk. Principal loss is possible. Investments in debt securities typically decrease in value when interest rates rise. This risk is usually greater for longer-term debt securities. Investments in Asset-Backed and Mortgage-Backed securities include additional risks that investor should be aware of including credit risk, prepayment risk, possible illiquidity and default, as well as increased susceptibility to adverse economic developments. Investments in lower rated and non-rated securities present a great risk of loss to principal and interest than higher rated securities. In addition, the fund is susceptible to risks from investments in derivatives, U.S. Government securities, and changes in interest rates. Income from tax-exempt funds may be subject to state and local taxes and a portion of income may be subject to the Federal Alternative minimum tax for certain investors.
Fund holdings and sector allocations are subject to change and should not be considered a recommendation to buy or sell any security. For a complete list of fund holdings, please refer to the Schedule of Investments provided in this report.
Definitions for terms and indices are provided in the Glossary of Terms.
34
Brown Advisory Total Return Fund
Performance Information & Portfolio Holdings Summary
June 30, 2017
| PORTFOLIO HOLDINGS | % of Net Assets |
| Corporate Bonds & Notes | 34.1% |
| Mortgage Backed Securities | 34.0% |
| Asset Backed Securities | 26.9% |
| Money Market Funds | 6.3% |
| U.S. Treasury Notes | 6.1% |
| Municipal Bonds | 2.3% |
| U.S. Treasury Bills | 0.5% |
| Other Assets and Liabilities | (10.2)% |
100.0% |
GROWTH OF A $1,000,000 INVESTMENT
The following chart reflects the change in value of a hypothetical $1,000,000 investment, including reinvested dividends and distributions, in the Fund as measured against a broad-based securities market index. The Bloomberg Barclays US Aggregate Bond Index (“Index”) is a broad-based benchmark that measures the investment grade US dollar-denominated, fixed rate taxable bond market. The Index includes Treasuries, government-related and corporate securities, MBS, ABS and CMBS. The Index is unmanaged and does not reflect the deduction of fees, such as investment management fees. Investors cannot invest directly in an index.
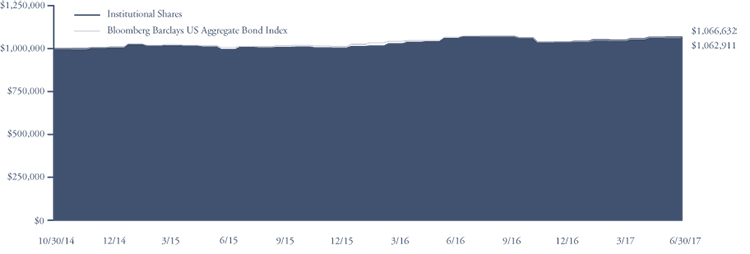
| Since Inception | ||
Average Annual Total Return as of 6/30/17 | One Year | (10/30/14) |
| Institutional Shares | 0.80% | 2.45% |
| Investor Shares | 0.75% | 2.40% |
| Bloomberg Barclays US Aggregate Bond Index | -0.31% | 2.32% |
Institutional Shares | Investor Shares | |
Gross Expense Ratio1 | 0.51% | 0.56% |
Net Expense Ratio1 | 0.51% | 0.56% |
Past performance does not guarantee future results. The performance data quoted represents past performance and current returns may be lower or higher. The investment return and net asset value will fluctuate so that an investor’s shares, when redeemed, may be worth more or less than the original cost. To obtain performance information current to the most recent month end, please visit our website at brownadvisoryfunds.com/performance.html. The performance table and graph above do not reflect the deduction of taxes that a shareholder would pay on Fund distributions or the redemption of Fund shares. Performance data does not reflect the imposition of the redemption fee of 1.00% on shares redeemed within 14 days, and if it did, performance would have been lower. Short-term performance, in particular, is not a good indication of the Fund’s future performance, and an investment should not be made based solely on returns.
1 | Per the Fund’s prospectus dated October 31, 2016. Refer to the financial highlights for the gross and net expense ratios for the year ended as of the date of this report. Please note that the expense ratios per the prospectus include acquired fund fees and expenses (as applicable) and the expense ratios in the financial highlights do not. |
35
Brown Advisory Total Return Fund
Schedule of Investments
June 30, 2017
| Par Value | Security Description | Rate | Maturity | Value $ | |||||||||
| Corporate Bonds & Notes — 34.1% | |||||||||||||
| 725,000 | Activision Blizzard, Inc.^ | 6.13 | % | 09/15/2023 | 782,574 | ||||||||
| 950,000 | AerCap Ireland Capital DAC | 3.50 | % | 05/26/2022 | 976,004 | ||||||||
| 1,100,000 | American Tower Corp. | 3.13 | % | 01/15/2027 | 1,057,958 | ||||||||
| 1,015,000 | Analog Devices, Inc. | 3.90 | % | 12/15/2025 | 1,056,875 | ||||||||
| 505,000 | Asbury Automotive Group, Inc. | 6.00 | % | 12/15/2024 | 516,363 | ||||||||
| 1,020,000 | AstraZeneca PLC | 3.38 | % | 11/16/2025 | 1,042,953 | ||||||||
| 1,080,000 | AutoZone, Inc. | 3.13 | % | 04/21/2026 | 1,041,220 | ||||||||
| 500,000 | Ball Corp. | 5.00 | % | 03/15/2022 | 535,625 | ||||||||
| 1,000,000 | Becton Dickinson and Co. | 3.73 | % | 12/15/2024 | 1,017,981 | ||||||||
| 1,005,000 | Boston Properties L.P. | 3.80 | % | 02/01/2024 | 1,044,064 | ||||||||
| 1,000,000 | Broadcom Corp.^ | 3.88 | % | 01/15/2027 | 1,028,895 | ||||||||
| 1,035,000 | Campbell Soup Co. | 2.50 | % | 08/02/2022 | 1,035,756 | ||||||||
| 1,025,000 | Canadian Natural Resources, Ltd. | 3.80 | % | 04/15/2024 | 1,038,829 | ||||||||
| 1,000,000 | Capital One Financial Corp.# | 5.55 | % | 12/29/2049 | 1,052,500 | ||||||||
| 990,000 | CC Holdings GS V LLC | 3.85 | % | 04/15/2023 | 1,042,114 | ||||||||
| 1,010,000 | Clorox Co. | 3.05 | % | 09/15/2022 | 1,036,869 | ||||||||
| 870,000 | CommScope Technologies LLC^ | 6.00 | % | 06/15/2025 | 933,075 | ||||||||
| 500,000 | Cornerstone Chemical Co.^ | 9.38 | % | 03/15/2018 | 501,250 | ||||||||
| 1,000,000 | Dollar General Corp. | 4.15 | % | 11/01/2025 | 1,057,286 | ||||||||
| 934,000 | Education Realty Operating Partnership L.P. | 4.60 | % | 12/01/2024 | 950,943 | ||||||||
| 1,045,000 | Energy Transfer L.P. | 4.05 | % | 03/15/2025 | 1,050,870 | ||||||||
| 970,000 | Equinix, Inc. | 5.88 | % | 01/15/2026 | 1,060,026 | ||||||||
| 65,000 | Equinix, Inc. | 5.38 | % | 05/15/2027 | 69,469 | ||||||||
| 930,000 | Fidelity National Information Services, Inc. | 5.00 | % | 10/15/2025 | 1,040,252 | ||||||||
| 500,000 | First Quality Finance Co., Inc.^ | 5.00 | % | 07/01/2025 | 511,250 | ||||||||
| 1,055,000 | Healthcare Trust of America Holdings L.P. | 3.75 | % | 07/01/2027 | 1,044,974 | ||||||||
| 475,000 | Interface Security Systems Holdings, Inc. | 9.25 | % | 01/15/2018 | 474,406 | ||||||||
| 1,055,000 | JB Hunt Transport Services, Inc. | 2.40 | % | 03/15/2019 | 1,061,157 | ||||||||
| 1,000,000 | Keysight Technologies, Inc. | 4.55 | % | 10/30/2024 | 1,051,279 | ||||||||
| 440,000 | Lamar Media Corp. | 5.75 | % | 02/01/2026 | 475,750 | ||||||||
| 445,000 | Mercer International, Inc. | 7.75 | % | 12/01/2022 | 478,931 | ||||||||
| 465,000 | Meritor, Inc. | 6.25 | % | 02/15/2024 | 487,088 | ||||||||
| 945,000 | Micron Technology, Inc. | 7.50 | % | 09/15/2023 | 1,058,873 | ||||||||
| 990,000 | MPLX L.P. | 4.88 | % | 12/01/2024 | 1,057,101 | ||||||||
| 500,000 | Mylan NV | 3.95 | % | 06/15/2026 | 507,547 | ||||||||
| 950,000 | Sabine Pass Liquefaction LLC | 5.88 | % | 06/30/2026 | 1,063,557 | ||||||||
| 338,000 | ServiceMaster Co. LLC | 7.45 | % | 08/15/2027 | 370,955 | ||||||||
| 440,000 | SESI LLC | 6.38 | % | 05/01/2019 | 436,700 | ||||||||
| 845,000 | Springs Industries, Inc. | 6.25 | % | 06/01/2021 | 875,631 | ||||||||
| 1,000,000 | TechnipFMC PLC^ | 3.45 | % | 10/01/2022 | 997,439 | ||||||||
| 450,000 | Teck Resources, Ltd.^ | 8.50 | % | 06/01/2024 | 520,875 | ||||||||
| 598,000 | Tenneco, Inc. | 5.00 | % | 07/15/2026 | 606,223 | ||||||||
| 940,000 | Verisk Analytics, Inc. | 4.00 | % | 06/15/2025 | 972,894 | ||||||||
| 950,000 | Verizon Communications, Inc. | 5.15 | % | 09/15/2023 | 1,056,658 | ||||||||
| 25,000 | Viking Cruises, Ltd^ | 8.50 | % | 10/15/2022 | 26,344 | ||||||||
| 500,000 | Viking Cruises, Ltd.^ | 6.25 | % | 05/15/2025 | 506,250 | ||||||||
| Total Corporate Bonds & Notes (Cost $37,406,518) | 37,611,633 | ||||||||||||
| Mortgage Backed Securities — 34.0% | |||||||||||||
| 400,000 | BAMLL Commercial Mortgage Securities Trust, Series 2013-DSNY#^ | 2.21 | % | 09/15/2026 | 401,164 | ||||||||
| 400,000 | BAMLL Commercial Mortgage Securities Trust, Series 2017-BNK3 | 3.75 | % | 02/17/2050 | 414,043 | ||||||||
| 600,000 | BANK, Series 2017-BNK4 | 3.78 | % | 05/17/2050 | 619,442 | ||||||||
| 120,385 | Bayview Opportunity Master Fund IIIb Trust, Series 2017-CRT2 M#^ | 3.22 | % | 11/25/2027 | 120,595 | ||||||||
| 250,000 | Chicago Skyscraper Trust, Series 2017-SKY B#^ | 2.26 | % | 02/15/2030 | 250,760 | ||||||||
| 250,000 | Chicago Skyscraper Trust, Series 2017-SKY C#^ | 2.41 | % | 02/15/2030 | 250,882 | ||||||||
| 150,000 | Cosmopolitan Hotel Trust, Series 2016-COSMO C#^ | 3.81 | % | 11/15/2033 | 151,629 | ||||||||
| 250,000 | CSMC, Series 2017-HD B#^ | 2.51 | % | 02/18/2031 | 251,007 | ||||||||
The accompanying notes are an integral part of these financial statements.
36
Brown Advisory Total Return Fund
Schedule of Investments
June 30, 2017
| Par Value | Security Description | Rate | Maturity | Value $ | |||||||||
| Mortgage Backed Securities — 34.0% (Continued) | |||||||||||||
| 250,000 | CSMC, Series 2017-HD C#^ | 2.86 | % | 02/18/2031 | 251,331 | ||||||||
| 200,000 | CSMC, Series 2017-LSTK A^ | 2.76 | % | 04/07/2033 | 202,568 | ||||||||
| 200,000 | CSMC, Series 2014-TIKI A#^ | 2.11 | % | 09/15/2038 | 200,298 | ||||||||
| 800,000 | FHLMC Gold, 2.5%, Due TBA July | 2.50 | % | 07/15/2032 | 804,625 | ||||||||
| 800,000 | FHLMC Gold, 3.0%, Due TBA July | 3.00 | % | 07/15/2032 | 821,563 | ||||||||
| 1,000,000 | FHLMC Gold, 3.0%, Due TBA July | 3.00 | % | 07/15/2047 | 997,891 | ||||||||
| 4,000,000 | FHLMC Gold, 3.5%, Due TBA July | 3.50 | % | 07/15/2047 | 4,109,581 | ||||||||
| 618,425 | FHLMC PC, Pool# J3-2596 | 3.50 | % | 08/01/2030 | 645,468 | ||||||||
| 725,942 | FHLMC PC, Pool# G0-7289 | 3.00 | % | 11/01/2042 | 730,282 | ||||||||
| 398,503 | FHLMC PC, Pool# Q4-6676 | 4.50 | % | 03/01/2047 | 427,128 | ||||||||
| 698,232 | FHLMC PC, Pool# Q4-7280 | 4.50 | % | 04/01/2047 | 748,403 | ||||||||
| 349,533 | FHLMC PC, Pool# Q4-7871 | 4.00 | % | 05/01/2047 | 368,844 | ||||||||
| 649,188 | FHLMC PC, Pool# Q4-7885 | 4.50 | % | 05/01/2047 | 695,818 | ||||||||
| 3,153,911 | FHLMC REMIC, Series 4094~ | 2.50 | % | 03/15/2027 | 223,664 | ||||||||
| 804,124 | FHLMC REMIC, Series 4107~ | 3.00 | % | 08/15/2027 | 178,852 | ||||||||
| 2,087,890 | FHLMC REMIC, Series 4143~ | 3.50 | % | 09/15/2042 | 251,992 | ||||||||
| 998,018 | FHLMC REMIC, Series 4495~ | 3.50 | % | 07/15/2045 | 184,570 | ||||||||
| 275,000 | FHLMC SCRTT, Series 2016-1 M1#^ | 3.00 | % | 09/25/2055 | 267,432 | ||||||||
| 569,171 | FHLMC STACR Debt Notes, Series 2014-DN2# | 2.87 | % | 04/25/2024 | 578,368 | ||||||||
| 682,667 | FHLMC STACR Debt Notes, Series 2015-DNA3# | 4.07 | % | 04/25/2028 | 707,257 | ||||||||
| 560,000 | FHLMC STACR Debt Notes, Series 2016-DNA2# | 3.42 | % | 10/25/2028 | 571,661 | ||||||||
| 2,037,197 | FHMS, Series K-721#~ | 0.46 | % | 08/25/2022 | 30,195 | ||||||||
| 610,235 | FHMS, Series K-J07 | 1.53 | % | 09/25/2022 | 594,084 | ||||||||
| 2,219,170 | FHMS, Series K-722#~ | 1.44 | % | 03/25/2023 | 135,681 | ||||||||
| 1,748,410 | FHMS, Series K-723#~ | 0.96 | % | 08/25/2023 | 85,115 | ||||||||
| 3,248,759 | FHMS, Series K-725#~ | 0.84 | % | 01/25/2024 | 132,054 | ||||||||
| 3,482,302 | FHMS, Series K-046#~ | 0.50 | % | 03/25/2025 | 89,026 | ||||||||
| 1,571,073 | FHMS, Series K-055#~ | 1.50 | % | 03/25/2026 | 152,598 | ||||||||
| 823,507 | FHMS, Series K-056#~ | 1.40 | % | 05/25/2026 | 74,276 | ||||||||
| 699,230 | FHMS, Series K-057#~ | 1.33 | % | 07/25/2026 | 60,768 | ||||||||
| 681,017 | FHMS, Series K-058#~ | 1.06 | % | 08/25/2026 | 47,073 | ||||||||
| 2,249,375 | FHMS, Series K-064#~ | 0.75 | % | 03/25/2027 | 111,409 | ||||||||
| 675,000 | FHMS, Series K-724#~ | 1.93 | % | 12/25/2044 | 67,630 | ||||||||
| 1,225,000 | FHMS, Series K-725#~ | 2.15 | % | 02/25/2045 | 142,907 | ||||||||
| 1,842,839 | FNMA, Pool# AS2249 | 4.00 | % | 04/01/2039 | 1,947,446 | ||||||||
| 950,893 | FNMA, Pool# AB9349 | 3.00 | % | 05/01/2043 | 955,065 | ||||||||
| 612,105 | FNMA, Pool# AU6230 | 5.00 | % | 09/01/2043 | 669,927 | ||||||||
| 869,921 | FNMA, Pool# AY0677 | 3.50 | % | 03/01/2045 | 898,608 | ||||||||
| 610,160 | FNMA, Pool# AZ8218 | 4.00 | % | 08/01/2045 | 642,000 | ||||||||
| 787,894 | FNMA, Pool# BD2775 | 4.00 | % | 07/01/2046 | 832,793 | ||||||||
| 997,346 | FNMA, Pool# BD3994 | 4.00 | % | 04/01/2047 | 1,049,745 | ||||||||
| 249,671 | FNMA, Pool# BH3057 | 4.00 | % | 05/01/2047 | 263,364 | ||||||||
| 2,000,000 | FNMA, 3.0%, Due TBA July | 3.00 | % | 07/15/2047 | 1,997,460 | ||||||||
| 3,500,000 | FNMA, 3.5%, Due TBA July | 3.50 | % | 07/15/2047 | 3,595,020 | ||||||||
| 1,000,000 | FNMA, 4.0%, Due TBA July | 4.00 | % | 07/01/2047 | 1,051,289 | ||||||||
| 850,000 | FREMF Mortgage Trust, Series 2017-K725#^ | 4.01 | % | 02/25/2024 | 851,384 | ||||||||
| 300,000 | FREMF Mortgage Trust, Series 2016-K723#^ | 3.70 | % | 10/25/2039 | 296,402 | ||||||||
| 250,000 | FREMF Mortgage Trust, Series 2017-K726#^ | 3.97 | % | 07/25/2049 | 251,902 | ||||||||
| 250,000 | FREMF Mortgage Trust, Series 2017-K724#^ | 3.60 | % | 12/25/2049 | 245,773 | ||||||||
| 1,247,070 | GNMA REMIC Trust, Series 2014-45#~ | 0.77 | % | 07/16/2054 | 57,440 | ||||||||
| 1,019,422 | GNMA REMIC Trust, Series 2014-135#~ | 0.84 | % | 01/16/2056 | 53,789 | ||||||||
| 1,066,112 | GNMA REMIC Trust, Series 2015-172#~ | 0.94 | % | 03/16/2057 | 69,523 | ||||||||
| 1,419,744 | GNMA REMIC Trust, Series 2016-40#~ | 0.81 | % | 07/16/2057 | 88,597 | ||||||||
| 1,131,319 | GNMA REMIC Trust, Series 2016-56#~ | 1.00 | % | 11/16/2057 | 86,155 | ||||||||
| 1,300,858 | GNMA REMIC Trust, Series 2016-98#~ | 0.98 | % | 05/16/2058 | 97,242 | ||||||||
| 1,191,771 | GNMA REMIC Trust, Series 2016-110#~ | 1.05 | % | 05/16/2058 | 92,328 | ||||||||
The accompanying notes are an integral part of these financial statements.
37
Brown Advisory Total Return Fund
Schedule of Investments
June 30, 2017
| Par Value | Security Description | Rate | Maturity | Value $ | |||||||||
| Mortgage Backed Securities — 34.0% (Continued) | |||||||||||||
| 612,680 | GNMA REMIC Trust, Series 2016-127#~ | 0.96 | % | 05/16/2058 | 47,420 | ||||||||
| 1,500,000 | GNMA, 3.0%, Due TBA July | 3.00 | % | 07/15/2047 | 1,515,234 | ||||||||
| 300,000 | GSMS Trust, Series 2017-GS6 | 3.64 | % | 05/12/2050 | 307,870 | ||||||||
| 200,000 | JPMCC, Series 2016-ASH A#^ | 2.66 | % | 10/15/2034 | 201,000 | ||||||||
| 200,000 | MSC, Series 2017-PRME B#^ | 2.51 | % | 02/15/2034 | 200,936 | ||||||||
| 500,000 | WFCM, Series A-3 | 2.65 | % | 08/17/2049 | 483,060 | ||||||||
| 555,000 | WFCM, Series 2017-RB1 AS | 3.76 | % | 03/17/2050 | 578,567 | ||||||||
| Total Mortgage Backed Securities (Cost $37,677,795) | 37,577,273 | ||||||||||||
| Asset Backed Securities — 26.9% | |||||||||||||
| 248,415 | Aircraft Certificate Owner Trust, Series 2003-1A E^ | 7.00 | % | 09/20/2022 | 266,736 | ||||||||
| 175,000 | American Credit Acceptance Receivables Trust, Series 2014-1 D^ | 5.20 | % | 04/12/2021 | 175,161 | ||||||||
| 150,000 | American Credit Acceptance Receivables Trust, Series 2015-1 C^ | 4.29 | % | 04/12/2021 | 152,393 | ||||||||
| 300,000 | American Credit Acceptance Receivables Trust, Series 2017-2 B^ | 2.46 | % | 04/12/2021 | 299,987 | ||||||||
| 752,856 | AmeriCredit Auto Receivables Trust, Series A-1 | 1.20 | % | 05/18/2018 | 752,846 | ||||||||
| 400,000 | Babson CLO, Ltd., Series 2013-IA D#^ | 4.66 | % | 04/20/2025 | 400,609 | ||||||||
| 193,961 | Bayview Opportunity Master Fund IVb Trust, Series 2017-CRT1 M#^ | 3.37 | % | 10/25/2028 | 194,585 | ||||||||
| 162,131 | Bayview Opportunity Master Fund IVb Trust, Series 2017-NPL1 A1#^ | 3.60 | % | 01/28/2032 | 162,200 | ||||||||
| 244,914 | Bayview Opportunity Master Fund IVb Trust, Series 2017-SPL4 A#^ | 3.50 | % | 01/28/2055 | 251,174 | ||||||||
| 165,253 | BRE Grand Islander Timeshare Issuer LLC, Series 2017-1A A^ | 2.94 | % | 05/25/2029 | 165,868 | ||||||||
| 164,783 | Capital Auto Receivables Asset Trust, Series 2014-1 B | 2.22 | % | 01/22/2019 | 164,888 | ||||||||
| 571,391 | Continental Airlines Trust, Series 1999-1 A | 6.55 | % | 08/02/2020 | 597,104 | ||||||||
| 86,072 | Continental Airlines Trust, Series 2000-1 A-1 | 8.05 | % | 05/01/2022 | 95,540 | ||||||||
| 86,935 | CPS Auto Receivables Trust, Series 2016-D A^ | 1.50 | % | 06/15/2020 | 86,777 | ||||||||
| 200,000 | CPS Auto Receivables Trust, Series 2017-A B^ | 2.68 | % | 05/17/2021 | 201,337 | ||||||||
| 175,000 | CPS Auto Receivables Trust, Series 2017-B B^ | 2.33 | % | 05/17/2021 | 175,145 | ||||||||
| 500,000 | Dell Equipment Finance Trust, Series 2015-2 B^ | 2.21 | % | 09/22/2020 | 501,209 | ||||||||
| 150,000 | Drive Auto Receivables Trust, Series 2017-BA B^ | 2.20 | % | 05/15/2020 | 150,248 | ||||||||
| 84,898 | DT Auto Owner Trust, Series 2016-1A B^ | 2.79 | % | 05/15/2020 | 85,087 | ||||||||
| 159,340 | Exeter Automobile Receivables Trust, Series 2016-3A A^ | 1.84 | % | 11/16/2020 | 158,997 | ||||||||
| 714,951 | Federal Express Corp., Series 1998-1 | 6.72 | % | 07/15/2023 | 784,194 | ||||||||
| 500,000 | Finn Square CLO, Ltd., Series 2012-1A C#^ | 4.90 | % | 12/24/2023 | 500,139 | ||||||||
| 300,000 | Flagship Credit Auto Trust, Series 2014-2 B^ | 2.84 | % | 11/16/2020 | 301,989 | ||||||||
| 500,000 | Grippen Park CLO, Ltd., Series 2017-1A C#^ | 3.55 | % | 01/20/2030 | 501,265 | ||||||||
| 1,500,000 | Highbridge Loan Management, Ltd., Series 4A-2014 A2A#^ | 3.22 | % | 07/28/2025 | 1,500,303 | ||||||||
| 1,500,000 | Highbridge Loan Management, Ltd., Series 4A-2014 B#^ | 4.17 | % | 07/28/2025 | 1,501,484 | ||||||||
| 800,000 | Highbridge Loan Management, Ltd., Series 7A-2015 C#^ | 4.56 | % | 11/15/2026 | 802,967 | ||||||||
| 1,000,000 | Highbridge Loan Management, Ltd., Series 6A-2015 C#^ | 4.24 | % | 05/05/2027 | 1,000,605 | ||||||||
| 60,876 | Hilton Grand Vacations Trust, Series 2013-A A^ | 2.28 | % | 01/25/2026 | 60,709 | ||||||||
| 137,243 | Hilton Grand Vacations Trust, Series 2017-AA A^ | 2.66 | % | 12/26/2028 | 137,400 | ||||||||
| 625,000 | Madison Park Funding XVII, Ltd.#^ | 3.56 | % | 07/21/2030 | 625,664 | ||||||||
| 750,000 | Madison Park Funding XVII, Ltd.#^ | 2.91 | % | 07/21/2030 | 750,806 | ||||||||
| 72,776 | MVW Owner Trust, Series 2013-1A A^ | 2.15 | % | 04/22/2030 | 72,569 | ||||||||
| 185,991 | MVW Owner Trust, Series 2015-1A A^ | 2.52 | % | 12/20/2032 | 185,190 | ||||||||
| 83,465 | MVW Owner Trust, Series 2016-1A A^ | 2.25 | % | 12/20/2033 | 82,514 | ||||||||
| 1,000,000 | Octagon Investment Partners XXII, Ltd., Series 2014-1A B2R#^ | 2.72 | % | 11/25/2025 | 1,001,678 | ||||||||
| 750,000 | Octagon Investment Partners 24, Ltd., Series 2015-1A A2#^ | 3.12 | % | 05/21/2027 | 750,179 | ||||||||
| 1,000,000 | Octagon Investment Partners 30, Ltd., Series 2017-1A A2B#^ | 3.38 | % | 03/17/2030 | 1,001,760 | ||||||||
| 168,268 | Orange Lake Timeshare Trust, Series 2016-A A^ | 2.61 | % | 03/08/2029 | 168,159 | ||||||||
| 42,320 | OSCAR U.S. Funding Trust V, Series 2016-2A A2B#^ | 2.39 | % | 11/15/2019 | 42,521 | ||||||||
| 170,000 | OSCAR U.S. Funding Trust VI LLC, Series 2017-1A A2B#^ | 1.92 | % | 05/11/2020 | 170,092 | ||||||||
| 270,345 | OSCAR U.S. Funding Trust IV, Series 2016-1A A2B#^ | 2.69 | % | 07/15/2020 | 271,959 | ||||||||
| 1,000,000 | OZLM Funding IV, Ltd., Series 2013-4A A2#^ | 2.90 | % | 07/22/2025 | 1,000,142 | ||||||||
| 1,000,000 | OZLM XIII, Ltd., Series 2015-13A A2#^ | 3.27 | % | 07/30/2027 | 1,004,216 | ||||||||
| 600,000 | Prestige Auto Receivables Trust, Series 2014-1A B^ | 1.91 | % | 04/15/2020 | 600,581 | ||||||||
| 750,000 | Regatta III Funding, Ltd.#^ | 4.60 | % | 04/15/2026 | 753,750 | ||||||||
| 608,661 | Santander Drive Auto Receivables Trust, Series 2013-A^ | 3.12 | % | 10/15/2019 | 610,474 | ||||||||
The accompanying notes are an integral part of these financial statements.
38
Brown Advisory Total Return Fund
Schedule of Investments
June 30, 2017
| Par Value | Security Description | Rate | Maturity | Value $ | |||||||||
| Asset Backed Securities — 26.9% (Continued) | |||||||||||||
| 321,709 | Santander Drive Auto Receivables Trust, Series 2015-1 B | 1.97 | % | 11/15/2019 | 321,912 | ||||||||
| 530,000 | Santander Drive Auto Receivables Trust, Series 2016-1 B | 2.47 | % | 12/15/2020 | 533,249 | ||||||||
| 400,000 | Santander Drive Auto Receivables Trust, Series 2017-2 | 2.79 | % | 08/15/2022 | 399,782 | ||||||||
| 53,401 | Sierra Timeshare Receivables Funding LLC, Series 2014-1A A^ | 2.07 | % | 03/20/2030 | 53,342 | ||||||||
| 69,487 | Sierra Timeshare Receivables Funding LLC, Series 2014-3A A^ | 2.30 | % | 10/20/2031 | 69,497 | ||||||||
| 68,511 | Sierra Timeshare Receivables Funding LLC, Series 2015-2A A^ | 2.43 | % | 06/20/2032 | 68,456 | ||||||||
| 69,574 | Sierra Timeshare Receivables Funding LLC, Series 2015-3A A^ | 2.58 | % | 09/20/2032 | 69,802 | ||||||||
| 134,761 | Sierra Timeshare Receivables Funding LLC, Series 2016-2A A^ | 2.33 | % | 07/20/2033 | 134,738 | ||||||||
| 100,959 | Sierra Timeshare Receivables Funding LLC, Series 2016-3A A^ | 2.43 | % | 10/20/2033 | 100,206 | ||||||||
| 127,697 | Sierra Timeshare Receivables Funding LLC, Series 2017-1A A^ | 2.91 | % | 03/20/2034 | 128,912 | ||||||||
| 202,492 | Southwest Airlines Co., Series 2007-1 | 6.15 | % | 02/01/2024 | 224,260 | ||||||||
| 1,000,000 | Stewart Park CLO, Ltd., Series 2015-1A B#^ | 3.16 | % | 04/15/2026 | 1,001,258 | ||||||||
| 1,000,000 | Stewart Park CLO, Ltd., Series 2015-1A C#^ | 4.06 | % | 04/15/2026 | 1,001,316 | ||||||||
| 94,326 | SVO VOI Mortgage LLC, Series 2012-AA A^ | 2.00 | % | 09/20/2029 | 93,483 | ||||||||
| 283,325 | TCF Auto Receivables Owner Trust, Series 2016-PT1A A^ | 1.93 | % | 06/15/2022 | 283,157 | ||||||||
| 37,428 | US Airways Pass Through Trust, Series 1999-1 A | 8.36 | % | 07/20/2020 | 37,802 | ||||||||
| 375,000 | Verizon Owner Trust, Series 2016-1A A^ | 1.42 | % | 01/20/2021 | 373,614 | ||||||||
| 132,543 | VOLT XXXVIII LLC, Series 2015-NP12 A1#^ | 3.88 | % | 09/25/2045 | 133,436 | ||||||||
| 304,914 | VOLT LI LLC, Series 2016-NPL11 A1#^ | 3.50 | % | 10/25/2046 | 305,933 | ||||||||
| 93,652 | VOLT LIV LLC, Series 2017-NPL1 A1#^ | 3.50 | % | 02/25/2047 | 93,947 | ||||||||
| 140,391 | VOLT LV LLC, Series 2017-NPL2 A1#^ | 3.50 | % | 03/25/2047 | 140,974 | ||||||||
| 229,278 | VOLT LVI LLC, Series 2017-NPL3 A1#^ | 3.50 | % | 03/25/2047 | 230,577 | ||||||||
| 152,011 | VOLT LVII LLC, Series 2017-NPL4 A1#^ | 3.38 | % | 04/25/2047 | 152,278 | ||||||||
| 217,570 | VOLT LVIII LLC, Series 2017-NPL5 A1#^ | 3.38 | % | 05/28/2047 | 218,032 | ||||||||
| 218,749 | VOLT LIX LLC, Series 2017-NPL6 A1#^ | 3.25 | % | 05/28/2047 | 219,565 | ||||||||
| 125,000 | VOLT LXI LLC, Series 2017-NPL8 A1#^ | 3.13 | % | 06/25/2047 | 125,112 | ||||||||
| 129,343 | VOLT XXXIII LLC, Series 2015-NPL5 A1#^ | 3.50 | % | 03/25/2055 | 130,140 | ||||||||
| 750,000 | Voya CLO, Ltd., Series 2013-1A C#^ | 4.66 | % | 04/15/2024 | 750,145 | ||||||||
| 89,762 | VSE VOI Mortgage LLC, Series 2016-A A^ | 2.54 | % | 07/20/2033 | 89,523 | ||||||||
| 100,000 | Westlake Automobile Receivables Trust, Series 2016-2A B^ | 2.30 | % | 11/15/2019 | 100,177 | ||||||||
| 69,018 | Westlake Automobile Receivables Trust, Series 2015-1A C^ | 2.29 | % | 11/16/2020 | 69,102 | ||||||||
| 175,000 | Westlake Automobile Receivables Trust, Series 2016-1A C^ | 3.29 | % | 09/15/2021 | 176,784 | ||||||||
| 175,000 | Westlake Automobile Receivables Trust, Series 2016-3A B^ | 2.07 | % | 12/15/2021 | 174,679 | ||||||||
| 175,000 | Westlake Automobile Receivables Trust, Series 2016-3A C^ | 2.46 | % | 01/18/2022 | 174,624 | ||||||||
| 305,000 | Westlake Automobile Receivables Trust, Series 2017-1A C^ | 2.70 | % | 10/17/2022 | 306,094 | ||||||||
| Total Asset Backed Securities (Cost $29,611,229) | 29,707,108 | ||||||||||||
| Municipal Bonds — 2.3% | |||||||||||||
| 230,000 | American Municipal Power, Inc. | 6.05 | % | 02/15/2043 | 283,919 | ||||||||
| 1,200,000 | Health Care Authority for Baptist Health | 5.50 | % | 11/15/2043 | 1,339,488 | ||||||||
| 800,000 | North Texas Tollway Authority | 8.91 | % | 02/01/2030 | 917,544 | ||||||||
| Total Municipal Bonds (Cost $2,492,136) | 2,540,951 | ||||||||||||
| U.S. Treasury Notes — 6.1% | |||||||||||||
| 6,720,000 | United States Treasury Note† | 0.75 | % | 10/31/2017 | 6,712,540 | ||||||||
| Total U.S. Treasury Notes (Cost $6,718,367) | 6,712,540 | ||||||||||||
The accompanying notes are an integral part of these financial statements.
39
Brown Advisory Total Return Fund
Schedule of Investments
June 30, 2017
| Par | ||||||||
| Value/Shares | Security Description | Value $ | ||||||
| Short-Term Investments — 6.8% | ||||||||
| Money Market Funds — 6.3% | ||||||||
| 6,923,309 | First American Treasury Obligations Fund — Class Z, 0.85%* | 6,923,309 | ||||||
| U.S. Treasury Bills — 0.5% | ||||||||
| 550,000 | United States Treasury Bill† | 549,047 | ||||||
| Total Short-Term Investments (Cost $7,472,440) | 7,472,356 | |||||||
| Total Investments — 110.2% (Cost $121,378,485) | 121,621,861 | |||||||
| Liabilities in Excess of Other Assets — (10.2)% | (11,268,377 | ) | ||||||
| NET ASSETS — 100.0% | $ | 110,353,484 | ||||||
| * | Annualized seven-day yield as of June 30, 2017. |
| ^ | Security exempt from registration under Rule 144A of the Securities Act of 1933. These securities may be resold in transactions exempt from registration, normally to qualified institutional buyers. At June 30, 2017, the value of these securities amounted to $35,998,546 or 32.6% of net assets. |
| ~ | Interest Only Security |
| † | All or a portion of this security is pledged as collateral in connection with open futures contracts. |
| # | Variable rate security. Rate disclosed is as of June 30, 2017. |
| Futures Contracts — Long (Note 7) | |||||||||||||||||
| Notional | Notional | Unrealized Appreciation | |||||||||||||||
Issue | Contracts | Expiration Date | Amount | Value | (Depreciation) | ||||||||||||
| U.S. Treasury 5-Year Note Futures September 2017 | 20 | 09/29/2017 | $ | 2,362,437 | $ | 2,356,719 | $ | (5,718 | ) | ||||||||
| U.S. Treasury Long Bond Futures September 2017 | 18 | 09/20/2017 | 2,746,915 | 2,766,375 | 19,460 | ||||||||||||
| U.S. Treasury Ultra Bond Futures September 2017 | 62 | 09/20/2017 | 10,169,864 | 10,284,250 | 114,386 | ||||||||||||
| $ | 15,279,216 | $ | 15,407,344 | $ | 128,128 | ||||||||||||
| Futures Contracts — Short (Note 7) | |||||||||||||||||
| Notional | Notional | Unrealized Appreciation | |||||||||||||||
Issue | Contracts | Expiration Date | Amount | Value | (Depreciation) | ||||||||||||
| U.S. Treasury 10-Year Note Futures September 2017 | (30) | 09/20/2017 | $ | (3,771,420 | ) | $ | (3,765,938 | ) | $ | 5,482 | |||||||
| $ | (3,771,420 | ) | $ | (3,765,938 | ) | $ | 5,482 | ||||||||||
There is no variation margin due to or from the Fund as of June 30, 2017.
The accompanying notes are an integral part of these financial statements.
40
Brown Advisory Strategic Bond Fund
A Message to Our Shareholders
June 30, 2017
Dear Shareholder:
The Brown Advisory Strategic Bond Fund Advisor Shares (the “Fund”) gained 3.65% in the year ended June 30, 2017, beating the -0.16% return for the Bloomberg Barclays Intermediate US Aggregate Bond Index, the Fund’s benchmark.
The Fund’s strategy is founded upon deep credit research that, in turn, feeds our proprietary risk pricing models; we believe this process helps us to consistently identify individual securities offering the best risk-adjusted return. We analyze investment ideas using rigorous underwriting standards and fundamental analysis to identify, assess, and price a bond’s risks. Our methodology allows us to compare the expected return of bonds across multiple sectors, using our due diligence process to adjust for both the impairment risk and interest rate risk, thereby driving our capital allocation decisions from the bottom-up. The consistent application of a sizing model focused on a bond’s estimated downside mitigates idiosyncratic risks.
The Fund attempts to mitigate duration risk and has been operating with a duration less than half that of our stated benchmark. As such, the Fund has been managed with a duration of roughly 1.0-2.0 over the course of the past year. As we have previously stated, we are not attempting to generate meaningful alpha by making a bet on the direction of interest rates. Instead, we aim to keep our sensitivity to interest rates low by buying shorter-dated bonds, using hedges such as Treasury futures and by purchasing floating rate instruments; floating rate debt comprised 45% of Fund assets at year-end.
The Fund’s annual gain came despite a negative return for the benchmark. The price of a 10-year U.S. Treasury fell roughly 6% due to its yield increasing 80 basis points for the year ended June 30, 2017. The fund’s relatively shorter duration and its relatively higher yield, combined with the strong performance of its corporate and corporate-backed bonds contributed to the Fund’s benchmark outperformance. In stark contrast to the volatility in credit markets experienced last year, the 12 months ended June 30, 2017 were marked by persistent spread compression across multiple fixed income sectors as volatility subsided, oil markets improved and corporate default rates steadily fell.
Over the past year, we have maintained our allocation to structured products including commercial mortgage-backed securities (CMBS), collateralized loan obligations (CLOs), government-sponsored enterprise (GSE) risk-sharing instruments, subprime auto asset-backed securities (ABS), and agency-backed specified mortgage pools. In the past year, we have expanded this universe to include other asset-backed instruments including, among others, timeshare ABS and mortgages on commercial aircraft – known as EETCs. We continue to believe that structured products are instrumental in helping us to improve the overall credit quality of the portfolio, enhance returns, reduce duration, and provide diversification. Despite the continued use of structured products, we expect that the bulk of our alpha will be driven by investments in corporate bonds, as it was over the last 12 months. Our high yield exposure ended the year at approximately 15%.
Looking ahead, we are continuously focused on seeking to maximize risk-adjusted return by consistently applying our deep due diligence process and proprietary risk pricing models to ensure optimal allocation on a risk-reward basis. As such, our focus remains on lending against stable or improving cash flows that we expect to perform through an entire business cycle. To reiterate, we are focused on credits that are capable of generating free cash flow through the cycle, offer good structures that protect recoveries in a downside scenario and have strong enterprise value coverage. By design, these criteria tend to cull our investment universe, guiding us toward what we believe are solid, defensible business models with good industry fundamentals and strong management teams. We believe that our disciplined credit process has the potential to continue to add value whether credit is widening or tightening and that this can be a key driver of performance going forward.
Sincerely,
Robert H. Snyder
Portfolio Manager
Thomas D.D. Graff, CFA
Portfolio Manager
41
Brown Advisory Strategic Bond Fund
A Message to Our Shareholders
June 30, 2017
Past performance is not a guarantee of future results.
Mutual fund investing involves risk. Principal loss is possible. Investments in debt securities typically decrease in value when interest rates rise. This risk is usually greater for longer-term debt securities. Investments in lower-rated and non-rated securities present a greater risk of loss to principal and interest than higher-rated securities. Municipal securities are subject to adverse political or economic factors, including changes in the tax law. Inflation-indexed bonds see the principal value of the security increased as the Consumer Price Index increases. Should the Consumer Price Index decline, those securities should be adversely impacted. A non-diversified fund may concentrate its assets in fewer individual holdings than a diversified fund. Therefore, a non-diversified fund is more exposed to individual stock volatility than a diversified fund. The fund may make short sales of securities, which involve the risk that losses in a security may exceed the original amount invested in that security. The risks of investments in derivatives, including options on futures contracts and options on futures contracts include imperfect correlation between the value of these instruments and the underlying assets; risks of default by the other party to the derivative transactions; risks that the transactions may result in losses that partially or completely offset gains in portfolio positions; and risks that the derivative transactions may not be liquid. Income from tax-exempt securities may be subject to state and local taxes and a portion of income may be subject to the federal alternative minimum tax for certain investors. Bond ratings are grades given to bonds that indicate their credit quality as determined by a private independent rating service such as Standard & Poor’s. The firm evaluates a bond issuer’s financial strength, or its ability to pay a bond’s principal and interest in a timely fashion. Ratings are expressed as letters ranging from ‘AAA’, which is the highest grade, to ‘D’, which is the lowest grade. In limited situations when the rating agency has not issued a formal rating, the Adviser will classify the security as non-rated.
Diversification does not assure a profit or protect against loss in a declining market.
Fund holdings and sector allocations are subject to change and should not be considered a recommendation to buy or sell any security. For a complete list of fund holdings, please refer to the Schedule of Investments provided in this report.
Definitions for terms and indices are provided in the Glossary of Terms.
42
Brown Advisory Strategic Bond Fund
Performance Information & Portfolio Holdings Summary
June 30, 2017
| PORTFOLIO HOLDINGS | % of Net Assets |
| Asset Backed Securities | 50.0% |
| Mortgage Backed Securities | 29.6% |
| Corporate Bonds & Notes | 22.2% |
| Exchange Traded Funds | 3.9% |
| Municipal Bonds | 3.0% |
| Money Market Funds | 2.4% |
| Closed-End Funds | 0.8% |
| Preferred Stocks | 0.1% |
| Other Assets and Liabilities | (12.0)% |
100.0% |
GROWTH OF A $10,000 INVESTMENT
The following chart reflects the change in value of a hypothetical $10,000 investment, including reinvested dividends and distributions, in the Fund as measured against a broad-based bond index. The Bloomberg Barclays Intermediate US Aggregate Bond Index (“Index”) represents domestic taxable investment grade bonds, with index components for government and corporate securities, mortgage pass-through securities, and asset-backed securities with average maturities and durations in the intermediate range. The Index is unmanaged and does not reflect the deduction of fees, such as investment management fees. Investors cannot invest directly in an index.
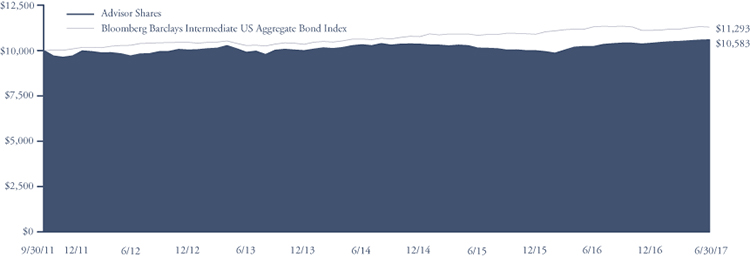
| Since Inception | |||
Average Annual Total Return as of 6/30/17 | One Year | Five Year | (9/30/11) |
Investor Shares1 | 3.92% | 2.07% | 1.28% |
| Advisor Shares | 3.65% | 1.78% | 0.99% |
| Bloomberg Barclays Intermediate US Aggregate Bond Index | -0.16% | 1.87% | 2.14% |
Investor Shares | Advisor Shares | |
Gross Expense Ratio2 | 0.76% | 1.01% |
Net Expense Ratio2 | 0.73% | 0.98% |
Past performance does not guarantee future results. The performance data quoted represents past performance and current returns may be lower or higher. The investment return and net asset value will fluctuate so that an investor’s shares, when redeemed, may be worth more or less than the original cost. To obtain performance information current to the most recent month end, please visit our website at brownadvisoryfunds.com/performance.html. The performance table and graph above do not reflect the deduction of taxes that a shareholder would pay on Fund distributions or the redemption of Fund shares. Investment performance reflects periods during which fee waivers were in effect. In the absence of such waivers, total return would have been reduced. Performance data does not reflect the imposition of the redemption fee of 1.00% on shares redeemed within 14 days, and if it did, performance would have been lower.
1 | Performance information for the Investor Shares, prior to commencement of operations on October 31, 2014, is based on the performance of Advisor Shares, and adjusted for the lower expenses applicable to Investor Shares. |
2 | Per the Fund’s prospectus dated October 31, 2016. Refer to the financial highlights for the gross and net expense ratios for the year ended as of the date of this report. Please note that the expense ratios per the prospectus include acquired fund fees and expenses (as applicable) and the expense ratios in the financial highlights do not. |
43
Brown Advisory Strategic Bond Fund
Schedule of Investments
June 30, 2017
| Par Value | Security Description | Rate | Maturity | Value $ | |||||||||
| Asset Backed Securities — 50.0% | |||||||||||||
| 207,241 | Aircraft Certificate Owner Trust, Series 2003-1A E^ | 7.00 | % | 09/20/2022 | 222,525 | ||||||||
| 429,353 | Ally Auto Receivables Trust, Series 2015-1 A3 | 1.39 | % | 09/16/2019 | 429,256 | ||||||||
| 58,789 | American Credit Acceptance Receivables Trust, Series 2014-2 C^ | 3.59 | % | 03/10/2020 | 58,883 | ||||||||
| 175,000 | American Credit Acceptance Receivables Trust, Series 2014-1 D^ | 5.20 | % | 04/12/2021 | 175,161 | ||||||||
| 150,000 | American Credit Acceptance Receivables Trust, Series 2015-1 C^ | 4.29 | % | 04/12/2021 | 152,393 | ||||||||
| 300,000 | American Credit Acceptance Receivables Trust, Series 2017-2 B^ | 2.46 | % | 04/12/2021 | 299,987 | ||||||||
| 11,387 | AmeriCredit Automobile Receivables Trust, Series 2013-3 C | 2.38 | % | 06/10/2019 | 11,403 | ||||||||
| 88,420 | AmeriCredit Automobile Receivables Trust, Series 2014-2 B | 1.60 | % | 07/08/2019 | 88,428 | ||||||||
| 67,267 | AmeriCredit Automobile Receivables Trust, Series 2013-4 C | 2.72 | % | 09/09/2019 | 67,425 | ||||||||
| 1,780,000 | AmeriCredit Automobile Receivables Trust, Series 2014-3 B | 1.92 | % | 11/08/2019 | 1,782,227 | ||||||||
| 205,000 | AmeriCredit Automobile Receivables Trust, Series 2014-2 C | 2.18 | % | 06/08/2020 | 205,777 | ||||||||
| 280,000 | AmeriCredit Automobile Receivables Trust, Series 2013-2 E^ | 3.41 | % | 10/08/2020 | 280,912 | ||||||||
| 555,000 | AmeriCredit Automobile Receivables Trust, Series 2015-2 C | 2.40 | % | 01/08/2021 | 559,495 | ||||||||
| 1,000,000 | Atlas Senior Loan Fund IV, Ltd., Series 2013-2A A3L#^ | 3.88 | % | 02/17/2026 | 1,000,274 | ||||||||
| 500,000 | Babson CLO, Ltd., Series 2013-IA D#^ | 4.66 | % | 04/20/2025 | 500,761 | ||||||||
| 193,961 | Bayview Opportunity Master Fund IVb Trust, Series 2017-CRT1 M#^ | 3.37 | % | 10/25/2028 | 194,585 | ||||||||
| 117,631 | Bayview Opportunity Master Fund IVb Trust, Series 2016-RN4 A1#^ | 3.47 | % | 10/28/2031 | 118,701 | ||||||||
| 162,131 | Bayview Opportunity Master Fund IVb Trust, Series 2017-NPL1 A1#^ | 3.60 | % | 01/28/2032 | 162,200 | ||||||||
| 244,914 | Bayview Opportunity Master Fund IVb Trust, Series 2017-SPL4 A#^ | 3.50 | % | 01/28/2055 | 251,174 | ||||||||
| 1,000,000 | BlueMountain CLO, Ltd, Series 2014-1A D#^ | 4.62 | % | 04/30/2026 | 1,009,231 | ||||||||
| 750,000 | BlueMountain CLO, Ltd, Series 2015-2A D#^ | 4.71 | % | 07/19/2027 | 753,649 | ||||||||
| 1,500,000 | BlueMountain CLO, Ltd., Series 2015-3A B#^ | 4.26 | % | 10/20/2027 | 1,508,509 | ||||||||
| 165,253 | BRE Grand Islander Timeshare Issuer LLC, Series 2017-1A A^ | 2.94 | % | 05/25/2029 | 165,868 | ||||||||
| 299,605 | Capital Auto Receivables Asset Trust, Series 2014-1 B | 2.22 | % | 01/22/2019 | 299,797 | ||||||||
| 750,000 | Capital Auto Receivables Asset Trust, Series 2014-3 B^ | 2.35 | % | 07/22/2019 | 752,853 | ||||||||
| 1,000,000 | Carlyle Global Market Strategies CLO, Ltd., Series 2014-1A BR#^ | 2.96 | % | 04/17/2025 | 1,001,597 | ||||||||
| 1,000,000 | CBAM, Ltd., Series 2017-1A B#^ | 3.13 | % | 07/20/2030 | 1,000,000 | ||||||||
| 206,156 | Continental Airlines Trust, Series 1999-1 A | 6.55 | % | 08/02/2020 | 215,433 | ||||||||
| 86,072 | Continental Airlines Trust, Series 2000-1 A-1 | 8.05 | % | 05/01/2022 | 95,540 | ||||||||
| 14,695 | CPS Auto Receivables Trust, Series 2014-C A^ | 1.31 | % | 02/15/2019 | 14,693 | ||||||||
| 69,548 | CPS Auto Receivables Trust, Series 2016-D A^ | 1.50 | % | 06/15/2020 | 69,422 | ||||||||
| 200,000 | CPS Auto Receivables Trust, Series 2017-A B^ | 2.68 | % | 05/17/2021 | 201,337 | ||||||||
| 175,000 | CPS Auto Receivables Trust, Series 2017-B B^ | 2.33 | % | 05/17/2021 | 175,145 | ||||||||
| 6,151 | Dell Equipment Finance Trust, Series 2015-1 A3^ | 1.30 | % | 03/23/2020 | 6,151 | ||||||||
| 1,000,000 | Dell Equipment Finance Trust, Series 2015-2 B^ | 2.21 | % | 09/22/2020 | 1,002,418 | ||||||||
| 128,043 | Drive Auto Receivables Trust, Series 2017-AA A2^ | 1.48 | % | 03/15/2019 | 128,017 | ||||||||
| 345,000 | Drive Auto Receivables Trust, Series 2017-BA B^ | 2.20 | % | 05/15/2020 | 345,571 | ||||||||
| 150,000 | Drive Auto Receivables Trust, Series 2017-AA B^ | 2.51 | % | 01/15/2021 | 150,605 | ||||||||
| 600,000 | Drive Auto Receivables Trust, Series 2016-AA C^ | 3.91 | % | 05/17/2021 | 609,385 | ||||||||
| 400,000 | Drive Auto Receivables Trust, Series 2017-1 C | 2.84 | % | 04/15/2022 | 399,888 | ||||||||
| 82,517 | DT Auto Owner Trust, Series 2015-3A B^ | 2.46 | % | 11/15/2019 | 82,643 | ||||||||
| 84,898 | DT Auto Owner Trust, Series 2016-1A B^ | 2.79 | % | 05/15/2020 | 85,087 | ||||||||
| 79,670 | Exeter Automobile Receivables Trust, Series 2016-3A A^ | 1.84 | % | 11/16/2020 | 79,499 | ||||||||
| 476,634 | Federal Express Corp., Series 1998-1 | 6.72 | % | 07/15/2023 | 522,796 | ||||||||
| 500,000 | Finn Square CLO, Ltd., Series 2012-1A C#^ | 4.90 | % | 12/24/2023 | 500,139 | ||||||||
| 269,001 | Flagship Credit Auto Trust, Series 2013-2 B^ | 3.21 | % | 08/15/2019 | 269,314 | ||||||||
| 49,696 | Flagship Credit Auto Trust, Series 2016-3 A1^ | 1.61 | % | 12/16/2019 | 49,676 | ||||||||
| 300,000 | Flagship Credit Auto Trust, Series 2014-2 B^ | 2.84 | % | 11/16/2020 | 301,989 | ||||||||
| 1,000,000 | GoldenTree Loan Management CLO, Ltd., Series 2017-1A C#^ | 3.38 | % | 04/20/2029 | 1,001,296 | ||||||||
| 1,000,000 | Grippen Park CLO, Ltd., Series 2017-1A C#^ | 3.55 | % | 01/20/2030 | 1,002,530 | ||||||||
| 1,500,000 | Highbridge Loan Management, Ltd., Series 4A-2014 A2A#^ | 3.22 | % | 07/28/2025 | 1,500,303 | ||||||||
| 1,500,000 | Highbridge Loan Management, Ltd., Series 4A-2014 B#^ | 4.17 | % | 07/28/2025 | 1,501,484 | ||||||||
| 1,000,000 | Highbridge Loan Management, Ltd., Series 7A-2015 D#^ | 4.93 | % | 11/15/2026 | 1,001,238 | ||||||||
| 2,000,000 | Highbridge Loan Management, Ltd., Series 6A-2015 C#^ | 4.24 | % | 05/05/2027 | 2,001,209 | ||||||||
| 48,701 | Hilton Grand Vacations Trust, Series 2013-A A^ | 2.28 | % | 01/25/2026 | 48,568 | ||||||||
| 137,243 | Hilton Grand Vacations Trust, Series 2017-AA A^ | 2.66 | % | 12/26/2028 | 137,400 | ||||||||
The accompanying notes are an integral part of these financial statements.
44
Brown Advisory Strategic Bond Fund
Schedule of Investments
June 30, 2017
| Par Value | Security Description | Rate | Maturity | Value $ | |||||||||
| Asset Backed Securities — 50.0% (Continued) | |||||||||||||
| 1,000,000 | Madison Park Funding XXV, Ltd.#^ | 3.75 | % | 04/25/2029 | 1,000,808 | ||||||||
| 750,000 | Madison Park Funding XVII, Ltd.#^ | 2.91 | % | 07/21/2030 | 750,806 | ||||||||
| 700,000 | Madison Park Funding XVII, Ltd.#^ | 3.56 | % | 07/21/2030 | 700,744 | ||||||||
| 750,000 | Magnetite IX, Ltd.#^ | 4.35 | % | 07/25/2026 | 750,044 | ||||||||
| 1,000,000 | Magnetite IX, Ltd.#^ | 3.16 | % | 07/25/2026 | 1,000,022 | ||||||||
| 168,841 | MVW Owner Trust, Series 2013-1A A^ | 2.15 | % | 04/22/2030 | 168,360 | ||||||||
| 385,268 | MVW Owner Trust, Series 2015-1A A^ | 2.52 | % | 12/20/2032 | 383,607 | ||||||||
| 292,129 | MVW Owner Trust, Series 2016-1A A^ | 2.25 | % | 12/20/2033 | 288,797 | ||||||||
| 163,858 | Nissan Auto Receivables Owner Trust, Series 2013-C | 1.30 | % | 06/15/2020 | 163,784 | ||||||||
| 1,000,000 | Octagon Investment Partners XVI, Ltd., Series 2013-1A D#^ | 4.51 | % | 07/17/2025 | 993,760 | ||||||||
| 2,000,000 | Octagon Investment Partners XXII, Ltd., Series 2014-1A D1R#^ | 4.42 | % | 11/25/2025 | 2,010,000 | ||||||||
| 500,000 | Octagon Investment Partners XIX, Ltd., Series 2014-1A CR#^ | 3.26 | % | 04/15/2026 | 506,341 | ||||||||
| 750,000 | Octagon Investment Partners 24, Ltd., Series 2015-1A A2#^ | 3.12 | % | 05/21/2027 | 750,179 | ||||||||
| 1,000,000 | Octagon Investment Partners XIV, Ltd., Series 2012-1A CR#^ | 5.16 | % | 07/15/2029 | 1,002,347 | ||||||||
| 1,000,000 | Octagon Investment Partners 30, Ltd., Series 2017-1A B#^ | 3.38 | % | 03/17/2030 | 1,001,760 | ||||||||
| 168,268 | Orange Lake Timeshare Trust, Series 2016-A A^ | 2.61 | % | 03/08/2029 | 168,159 | ||||||||
| 42,320 | OSCAR U.S. Funding Trust V, Series 2016-2A A2B#^ | 2.39 | % | 11/15/2019 | 42,521 | ||||||||
| 170,000 | OSCAR U.S. Funding Trust VI LLC, Series 2017-1A A2B#^ | 1.92 | % | 05/11/2020 | 170,092 | ||||||||
| 150,000 | OSCAR U.S. Funding Trust, Series 2014-1A A4^ | 2.55 | % | 12/15/2021 | 149,515 | ||||||||
| 1,000,000 | OZLM Funding IV, Ltd., Series 2013-4A A2#^ | 2.90 | % | 07/22/2025 | 1,000,142 | ||||||||
| 500,000 | OZLM XII, Ltd., Series 2015-12A C#^ | 4.87 | % | 04/30/2027 | 501,732 | ||||||||
| 1,000,000 | OZLM XIII, Ltd., Series 2015-13A A2#^ | 3.27 | % | 07/30/2027 | 1,004,216 | ||||||||
| 200,000 | Prestige Auto Receivables Trust, Series 2014-1A B^ | 1.91 | % | 04/15/2020 | 200,194 | ||||||||
| 101,143 | Prestige Auto Receivables Trust, Series 2015-1 A3^ | 1.53 | % | 02/15/2021 | 101,107 | ||||||||
| 1,500,000 | Regatta III Funding, Ltd., Series 2014-1A A2R#^ | 2.80 | % | 04/15/2026 | 1,500,000 | ||||||||
| 750,000 | Regatta III Funding, Ltd., Series 2014-1A CR#^ | 4.60 | % | 04/15/2026 | 753,750 | ||||||||
| 1,000,000 | Regatta Funding L.P., Series 2013-2A BR#^ | 4.06 | % | 01/15/2029 | 1,002,214 | ||||||||
| 104,383 | Santander Drive Auto Receivables Trust, Series 2013-5 C | 2.25 | % | 06/17/2019 | 104,553 | ||||||||
| 8,694 | Santander Drive Auto Receivables Trust, Series 2014-5 B | 1.76 | % | 09/16/2019 | 8,695 | ||||||||
| 100,534 | Santander Drive Auto Receivables Trust, Series 2015-1 B | 1.97 | % | 11/15/2019 | 100,597 | ||||||||
| 79,440 | Santander Drive Auto Receivables Trust, Series 2013-4 C | 3.25 | % | 01/15/2020 | 79,647 | ||||||||
| 103,461 | Santander Drive Auto Receivables Trust, Series 2014-1 C | 2.36 | % | 04/15/2020 | 103,692 | ||||||||
| 261,000 | Santander Drive Auto Receivables Trust, Series 2015-4 B | 2.26 | % | 06/15/2020 | 261,597 | ||||||||
| 400,000 | Santander Drive Auto Receivables Trust, Series 2016-1 B | 2.47 | % | 12/15/2020 | 402,452 | ||||||||
| 400,000 | Santander Drive Auto Receivables Trust, Series 2017-2 C | 2.79 | % | 08/15/2022 | 399,782 | ||||||||
| 173,085 | Sierra Timeshare Receivables Funding LLC, Series 2014-3A A^ | 2.30 | % | 10/20/2031 | 173,110 | ||||||||
| 68,511 | Sierra Timeshare Receivables Funding LLC, Series 2015-2A A^ | 2.43 | % | 06/20/2032 | 68,456 | ||||||||
| 69,574 | Sierra Timeshare Receivables Funding LLC, Series 2015-3A A^ | 2.58 | % | 09/20/2032 | 69,802 | ||||||||
| 67,381 | Sierra Timeshare Receivables Funding LLC, Series 2016-2A A^ | 2.33 | % | 07/20/2033 | 67,369 | ||||||||
| 100,959 | Sierra Timeshare Receivables Funding LLC, Series 2016-3A A^ | 2.43 | % | 10/20/2033 | 100,206 | ||||||||
| 170,263 | Sierra Timeshare Receivables Funding LLC, Series 2017-1A A^ | 2.91 | % | 03/20/2034 | 171,883 | ||||||||
| 286,545 | Southwest Airlines Co., Series 2007-1 | 6.15 | % | 02/01/2024 | 317,349 | ||||||||
| 1,000,000 | Stewart Park CLO, Ltd., Series 2015-1A B#^ | 3.16 | % | 04/15/2026 | 1,001,258 | ||||||||
| 1,000,000 | Stewart Park CLO, Ltd., Series 2015-1A C#^ | 4.06 | % | 04/15/2026 | 1,001,316 | ||||||||
| 94,326 | SVO VOI Mortgage LLC, Series 2012-AA A^ | 2.00 | % | 09/20/2029 | 93,483 | ||||||||
| 50,979 | TCF Auto Receivables Owner Trust, Series 2016-1A A2^ | 1.39 | % | 11/15/2019 | 50,931 | ||||||||
| 283,325 | TCF Auto Receivables Owner Trust, Series 2016-PT1A A^ | 1.93 | % | 06/15/2022 | 283,157 | ||||||||
| 37,428 | US Airways Pass Through Trust, Series 1999-1 A | 8.36 | % | 07/20/2020 | 37,802 | ||||||||
| 375,000 | Verizon Owner Trust, Series 2016-1A A^ | 1.42 | % | 01/20/2021 | 373,614 | ||||||||
| 132,543 | VOLT XXXVIII LLC, Series 2015-NPL12 A1#^ | 3.88 | % | 09/25/2045 | 133,436 | ||||||||
| 304,914 | VOLT LI LLC, Series 2016-NP11 A1#^ | 3.50 | % | 10/25/2046 | 305,933 | ||||||||
| 93,652 | VOLT LIV LLC, Series 2017-NPL1 A1#^ | 3.50 | % | 02/25/2047 | 93,947 | ||||||||
| 140,391 | VOLT LV LLC, Series 2017-NPL2 A1#^ | 3.50 | % | 03/25/2047 | 140,974 | ||||||||
| 229,278 | VOLT LVI LLC, Series 2017-NPL3 A1#^ | 3.50 | % | 03/25/2047 | 230,577 | ||||||||
| 152,011 | VOLT LVII LLC, Series 2017-NPL4 A1#^ | 3.38 | % | 04/25/2047 | 152,278 | ||||||||
| 217,570 | VOLT LVIII LLC, Series 2017-NPL5 A1#^ | 3.38 | % | 05/28/2047 | 218,032 | ||||||||
The accompanying notes are an integral part of these financial statements.
45
Brown Advisory Strategic Bond Fund
Schedule of Investments
June 30, 2017
| Par Value | Security Description | Rate | Maturity | Value $ | ||||||||||
| Asset Backed Securities — 50.0% (Continued) | ||||||||||||||
| 218,749 | VOLT LIX LLC, Series 2017-NPL6 A1#^ | 3.25 | % | 05/28/2047 | 219,565 | |||||||||
| 125,000 | VOLT LXI LLC, Series 2017-NPL8 A1#^ | 3.13 | % | 06/25/2047 | 125,113 | |||||||||
| 129,343 | VOLT XXXIII LLC, Series 2015-NPL5 A1#^ | 3.50 | % | 03/25/2055 | 130,140 | |||||||||
| 500,000 | Voya CLO, Ltd., Series 2013-1A C#^ | 4.66 | % | 04/15/2024 | 500,097 | |||||||||
| 1,000,000 | Voya CLO, Ltd., Series 2015-1A A2#^ | 3.26 | % | 04/18/2027 | 1,000,587 | |||||||||
| 1,000,000 | Voya CLO, Ltd., Series 2015-1A B#^ | 4.16 | % | 04/18/2027 | 1,000,238 | |||||||||
| 1,000,000 | Voya CLO, Ltd., Series 2016-3A C#^ | 5.01 | % | 10/18/2027 | 1,008,061 | |||||||||
| 89,762 | VSE VOI Mortgage LLC, Series 2016-A A^ | 2.54 | % | 07/20/2033 | 89,523 | |||||||||
| 1,202,735 | Westlake Automobile Receivables Trust, Series 2016-3A A2^ | 1.42 | % | 10/15/2019 | 1,201,617 | |||||||||
| 100,000 | Westlake Automobile Receivables Trust, Series 2016-2A B^ | 2.30 | % | 11/15/2019 | 100,177 | |||||||||
| 69,018 | Westlake Automobile Receivables Trust, Series 2015-1A C^ | 2.29 | % | 11/16/2020 | 69,102 | |||||||||
| 148,000 | Westlake Automobile Receivables Trust, Series 2015-3A B^ | 2.21 | % | 05/17/2021 | 148,070 | |||||||||
| 175,000 | Westlake Automobile Receivables Trust, Series 2016-1A C^ | 3.29 | % | 09/15/2021 | 176,784 | |||||||||
| 75,000 | Westlake Automobile Receivables Trust, Series 2016-3A B^ | 2.07 | % | 12/15/2021 | 74,863 | |||||||||
| 75,000 | Westlake Automobile Receivables Trust, Series 2016-3A C^ | 2.46 | % | 01/18/2022 | 74,839 | |||||||||
| 305,000 | Westlake Automobile Receivables Trust, Series 2017-1A C^ | 2.70 | % | 10/17/2022 | 306,094 | |||||||||
| Total Asset Backed Securities (Cost $57,216,138) | 57,387,646 | |||||||||||||
| Mortgage Backed Securities — 29.6% | ||||||||||||||
| 200,000 | BAMLL Commercial Mortgage Securities Trust, Series 2013-DSNY#^ | 2.21 | % | 09/15/2026 | 200,582 | |||||||||
| 120,385 | Bayview Opportunity Master Fund IIIb Trust, Series 2017-CRT2 M#^ | 3.22 | % | 11/25/2027 | 120,595 | |||||||||
| 250,000 | Chicago Skyscraper Trust, Series 2017-SKY B#^ | 2.26 | % | 02/15/2030 | 250,760 | |||||||||
| 250,000 | Chicago Skyscraper Trust, Series 2017-SKY C#^ | 2.41 | % | 02/15/2030 | 250,882 | |||||||||
| 100,000 | Cosmopolitan Hotel Trust, Series 2016-COSMO C#^ | 3.81 | % | 11/15/2033 | 101,086 | |||||||||
| 250,000 | CSMC, Series 2017-HD B#^ | 2.51 | % | 02/18/2031 | 251,007 | |||||||||
| 250,000 | CSMC Trust, Series 2017-HD C#^ | 2.86 | % | 02/18/2031 | 251,331 | |||||||||
| 200,000 | CSMC, Series 2014-TIKI A#^ | 2.11 | % | 09/15/2038 | 200,297 | |||||||||
| 116,564 | FHLMC PC, Pool# E0-1654 | 5.00 | % | 06/01/2019 | 119,619 | |||||||||
| 61,756 | FHLMC PC, Pool# N3-1000 | 4.50 | % | 08/01/2033 | 65,462 | |||||||||
| 804,123 | FHLMC REMIC, Series 4107† | 3.00 | % | 08/15/2027 | 178,852 | |||||||||
| 82,368 | FHLMC REMIC, Series 3878 | 3.00 | % | 04/15/2041 | 83,910 | |||||||||
| 2,087,889 | FHLMC REMIC, Series 4143† | 3.50 | % | 09/15/2042 | 251,992 | |||||||||
| 1,138,091 | FHLMC REMIC, Series 4495† | 3.50 | % | 07/15/2045 | 210,475 | |||||||||
| 275,000 | FHLMC SCRTT, Series 2016-1 M1#^ | 3.00 | % | 09/25/2055 | 267,432 | |||||||||
| 398,961 | FHLMC STACR Debt Notes, Series 2013-DN2# | 2.67 | % | 11/27/2023 | 400,752 | |||||||||
| 104,685 | FHLMC STACR Debt Notes, Series 2014-HQ2# | 2.67 | % | 09/25/2024 | 104,978 | |||||||||
| 700,000 | FHLMC STACR Debt Notes, Series 2014-HQ2# | 3.42 | % | 09/25/2024 | 719,336 | |||||||||
| 144,359 | FHLMC STACR Debt Notes, Series 2015-HQ2# | 2.32 | % | 05/27/2025 | 144,701 | |||||||||
| 695,000 | FHLMC STACR Debt Notes, Series 2015-HQ2# | 3.17 | % | 05/27/2025 | 708,400 | |||||||||
| 145,727 | FHLMC STACR Debt Notes, Series 2015-DNA1# | 2.12 | % | 10/25/2027 | 145,930 | |||||||||
| 700,000 | FHLMC STACR Debt Notes, Series 2015-DNA1# | 3.07 | % | 10/25/2027 | 718,162 | |||||||||
| 910,223 | FHLMC STACR Debt Notes, Series 2015-DNA3# | 4.07 | % | 04/25/2028 | 943,009 | |||||||||
| 500,000 | FHLMC STACR Debt Notes, Series 2016-DNA1# | 4.12 | % | 07/25/2028 | 520,661 | |||||||||
| 225,736 | FHLMC STACR Debt Notes, Series 2016-HQA1# | 2.97 | % | 09/25/2028 | 226,989 | |||||||||
| 280,000 | FHLMC STACR Debt Notes, Series 2016-DNA2# | 3.42 | % | 10/25/2028 | 285,831 | |||||||||
| 2,647,905 | FHMS, Series K-023#† | 1.41 | % | 08/25/2022 | 144,188 | |||||||||
| 2,037,197 | FHMS, Series K-721#† | 0.46 | % | 08/25/2022 | 30,195 | |||||||||
| 610,235 | FHMS, Series K-J07 | 1.53 | % | 09/25/2022 | 594,084 | |||||||||
| 1,109,585 | FHMS, Series K-722#† | 1.44 | % | 03/25/2023 | 67,840 | |||||||||
| 1,748,410 | FHMS, Series K-723#† | 0.96 | % | 08/25/2023 | 85,115 | |||||||||
| 3,248,759 | FHMS, Series K-725#† | 0.84 | % | 01/25/2024 | 132,010 | |||||||||
| 3,482,302 | FHMS, Series K-046#† | 0.50 | % | 03/25/2025 | 89,026 | |||||||||
| 809,341 | FHMS, Series K-055#† | 1.50 | % | 03/25/2026 | 78,611 | |||||||||
| 1,637,091 | FHMS, Series K-056#† | 1.40 | % | 05/25/2026 | 147,658 | |||||||||
| 1,348,516 | FHMS, Series K-057#† | 1.33 | % | 07/25/2026 | 117,196 | |||||||||
| 681,017 | FHMS, Series K-058#† | 1.06 | % | 08/25/2026 | 47,073 | |||||||||
| 2,249,375 | FHMS, Series K-064#† | 0.75 | % | 03/25/2027 | 111,409 | |||||||||
The accompanying notes are an integral part of these financial statements.
46
Brown Advisory Strategic Bond Fund
Schedule of Investments
June 30, 2017
| Par Value | Security Description | Rate | Maturity | Value $ | |||||||||
| Mortgage Backed Securities — 29.6% (Continued) | |||||||||||||
| 675,000 | FHMS, Series K-724#† | 1.93 | % | 12/25/2044 | 67,630 | ||||||||
| 1,225,000 | FHMS, Series K-725#† | 2.15 | % | 02/25/2045 | 142,907 | ||||||||
| 21,594 | FNMA, Pool# 673194 | 5.50 | % | 02/01/2018 | 21,698 | ||||||||
| 5,513 | FNMA, Pool# 722057 | 5.50 | % | 07/01/2018 | 5,536 | ||||||||
| 7,009 | FNMA, Pool# 931676 | 5.50 | % | 01/01/2019 | 7,131 | ||||||||
| 14,251 | FNMA, Pool# 774887 | 5.50 | % | 05/01/2019 | 14,500 | ||||||||
| 28,513 | FNMA, Pool# 794149 | 5.50 | % | 08/01/2019 | 29,128 | ||||||||
| 47,257 | FNMA, Pool# 255359 | 5.50 | % | 09/01/2019 | 48,708 | ||||||||
| 9,285 | FNMA, Pool# 778775 | 5.50 | % | 09/01/2019 | 9,465 | ||||||||
| 68,788 | FNMA, Pool# MA0208 | 5.00 | % | 09/01/2019 | 70,479 | ||||||||
| 38,649 | FNMA, Pool# 785732 | 5.50 | % | 11/01/2019 | 39,442 | ||||||||
| 55,500 | FNMA, Pool# 255645 | 4.00 | % | 01/01/2020 | 57,481 | ||||||||
| 57,760 | FNMA, Pool# AC0884 | 5.00 | % | 07/01/2020 | 59,180 | ||||||||
| 13,151 | FNMA, Pool# 826868 | 5.50 | % | 08/01/2020 | 13,480 | ||||||||
| 127,497 | FNMA, Pool# MA0620 | 4.50 | % | 11/01/2020 | 130,621 | ||||||||
| 58,690 | FNMA, Pool# 879409 | 5.50 | % | 02/01/2021 | 61,418 | ||||||||
| 30,675 | FNMA, Pool# 745562 | 5.50 | % | 04/01/2021 | 31,912 | ||||||||
| 9,961 | FNMA, Pool# 745525 | 5.50 | % | 05/01/2021 | 10,460 | ||||||||
| 56,268 | FNMA, Pool# AD0230 | 5.50 | % | 05/01/2021 | 59,012 | ||||||||
| 11,680 | FNMA, Pool# 936481 | 5.50 | % | 07/01/2021 | 12,217 | ||||||||
| 14,594 | FNMA, Pool# 888555 | 5.50 | % | 09/01/2021 | 15,199 | ||||||||
| 6,827 | FNMA, Pool# 889849 | 5.50 | % | 09/01/2021 | 6,977 | ||||||||
| 14,866 | FNMA, Pool# 908560 | 5.50 | % | 01/01/2022 | 15,440 | ||||||||
| 9,353 | FNMA, Pool# 889716 | 5.50 | % | 10/01/2022 | 9,903 | ||||||||
| 8,045 | FNMA, Pool# 889198 | 5.50 | % | 11/01/2022 | 8,369 | ||||||||
| 65,896 | FNMA, Pool# 911073 | 5.50 | % | 12/01/2022 | 69,576 | ||||||||
| 20,327 | FNMA, Pool# 972932 | 5.50 | % | 02/01/2023 | 21,341 | ||||||||
| 100,209 | FNMA, Pool# 975076 | 6.00 | % | 09/01/2023 | 106,613 | ||||||||
| 10,407 | FNMA, Pool# 995217 | 5.50 | % | 12/01/2023 | 11,037 | ||||||||
| 32,895 | FNMA, Pool# 995460 | 5.50 | % | 12/01/2023 | 34,923 | ||||||||
| 19,622 | FNMA, Pool# 930334 | 5.50 | % | 01/01/2024 | 21,078 | ||||||||
| 12,435 | FNMA, Pool# AE0467 | 5.50 | % | 03/01/2024 | 13,232 | ||||||||
| 11,664 | FNMA, Pool# AD0365 | 5.50 | % | 09/01/2024 | 12,308 | ||||||||
| 461,204 | FNMA, Pool# BC4577 | 4.50 | % | 09/01/2024 | 484,120 | ||||||||
| 93,015 | FNMA, Pool# AL1081 | 5.00 | % | 07/01/2025 | 97,012 | ||||||||
| 57,690 | FNMA, Pool# AL0517 | 5.50 | % | 08/01/2025 | 60,983 | ||||||||
| 326,956 | FNMA, Pool# 813714# | 2.60 | % | 01/01/2035 | 341,949 | ||||||||
| 393,688 | FNMA, Pool# 815323# | 2.87 | % | 01/01/2035 | 409,162 | ||||||||
| 162,702 | FNMA, Pool# 910181# | 3.45 | % | 03/01/2037 | 170,427 | ||||||||
| 607,561 | FNMA, Pool# 915191# | 3.45 | % | 04/01/2037 | 638,544 | ||||||||
| 459,147 | FNMA, Pool# AL6262# | 4.40 | % | 04/01/2038 | 481,226 | ||||||||
| 284,985 | FNMA, Pool# 965184# | 2.83 | % | 09/01/2038 | 305,902 | ||||||||
| 612,105 | FNMA, Pool# AU6230 | 5.00 | % | 09/01/2043 | 669,927 | ||||||||
| 266,272 | FNMA, Pool# 947512# | 3.00 | % | 09/01/2047 | 278,613 | ||||||||
| 77,047 | FNMA CAS, Series 2013-C01# | 3.22 | % | 10/25/2023 | 77,945 | ||||||||
| 820,968 | FNMA CAS, Series 2014-C02# | 2.17 | % | 05/28/2024 | 824,562 | ||||||||
| 412,665 | FNMA CAS, Series 2014-C03# | 2.42 | % | 07/25/2024 | 413,442 | ||||||||
| 58,825 | FNMA CAS, Series 2015-C03# | 2.72 | % | 07/25/2025 | 58,893 | ||||||||
| 222,033 | FNMA CAS, Series 2016-C02# | 3.37 | % | 09/25/2028 | 225,238 | ||||||||
| 139,884 | FNMA REMIC Trust, Series 2002-16 | 6.00 | % | 04/25/2022 | 148,536 | ||||||||
| 7,500,000 | FNMA, 2.5%, Due TBA July | 2.50 | % | 07/15/2032 | 7,539,551 | ||||||||
| 7,500,000 | FNMA, 3.0%, Due TBA July | 3.00 | % | 07/15/2032 | 7,698,047 | ||||||||
| 500,000 | FREMF Mortgage Trust, Series 2017-K725#^ | 4.01 | % | 02/25/2024 | 499,921 | ||||||||
| 200,000 | FREMF Mortgage Trust, Series 2016-K723#^ | 3.70 | % | 10/25/2039 | 197,602 | ||||||||
| 90,000 | FREMF Mortgage Trust, Series 2011-K10#^ | 4.79 | % | 11/25/2049 | 95,438 | ||||||||
| 250,000 | FREMF Mortgage Trust, Series 2017-K724#^ | 3.60 | % | 12/25/2049 | 245,773 | ||||||||
The accompanying notes are an integral part of these financial statements.
47
Brown Advisory Strategic Bond Fund
Schedule of Investments
June 30, 2017
| Par Value | Security Description | Rate | Maturity | Value $ | |||||||||
| Mortgage Backed Securities — 29.6% (Continued) | |||||||||||||
| 60,951 | GNMA, Pool# 595733X | 5.50 | % | 06/15/2020 | 62,757 | ||||||||
| 133,010 | GNMA, Pool# 676872X | 4.50 | % | 03/15/2023 | 137,600 | ||||||||
| 86,487 | GNMA, Pool# 689452X | 5.50 | % | 07/15/2023 | 88,733 | ||||||||
| 311,494 | GNMA, Pool# 004527M | 5.00 | % | 09/20/2024 | 335,526 | ||||||||
| 88,827 | GNMA, Pool# 005244M | 4.50 | % | 11/20/2026 | 94,300 | ||||||||
| 635,900 | GNMA REMIC Trust, Series 2014-45#† | 0.77 | % | 07/16/2054 | 29,289 | ||||||||
| 509,711 | GNMA REMIC Trust, Series 2014-135#† | 0.84 | % | 01/16/2056 | 26,895 | ||||||||
| 533,056 | GNMA REMIC Trust, Series 2015-172#† | 0.94 | % | 03/16/2057 | 34,762 | ||||||||
| 709,872 | GNMA REMIC Trust, Series 2016-40#† | 0.81 | % | 07/16/2057 | 44,299 | ||||||||
| 563,406 | GNMA REMIC Trust, Series 2016-56#† | 1.00 | % | 11/16/2057 | 42,906 | ||||||||
| 650,429 | GNMA REMIC Trust, Series 2016-98#† | 0.98 | % | 05/16/2058 | 48,621 | ||||||||
| 619,721 | GNMA REMIC Trust, Series 2016-110#† | 1.05 | % | 05/16/2058 | 48,011 | ||||||||
| 612,680 | GNMA REMIC Trust, Series 2016-127#† | 0.96 | % | 05/16/2058 | 47,420 | ||||||||
| 200,000 | JPMCC, Series 2016-ASH A#^ | 2.66 | % | 10/15/2034 | 201,000 | ||||||||
| 200,000 | MSC, Series 2017-PRME B#^ | 2.51 | % | 02/15/2034 | 200,936 | ||||||||
| Total Mortgage Backed Securities (Cost $33,932,160) | 34,011,705 | ||||||||||||
| Corporate Bonds & Notes — 22.2% | |||||||||||||
| 250,000 | Activision Blizzard, Inc.^ | 6.13 | % | 09/15/2023 | 269,853 | ||||||||
| 400,000 | AerCap Ireland Capital DAC | 3.50 | % | 05/26/2022 | 410,949 | ||||||||
| 300,000 | American Tower Corp. | 3.40 | % | 02/15/2019 | 306,388 | ||||||||
| 310,000 | Analog Devices, Inc. | 3.90 | % | 12/15/2025 | 322,789 | ||||||||
| 300,000 | Asbury Automotive Group, Inc. | 6.00 | % | 12/15/2024 | 306,750 | ||||||||
| 600,000 | Ball Corp. | 5.00 | % | 03/15/2022 | 642,750 | ||||||||
| 300,000 | Broadcom Corp.^ | 3.88 | % | 01/15/2027 | 308,668 | ||||||||
| 500,000 | Canadian Natural Resources, Ltd. | 3.85 | % | 06/01/2027 | 496,962 | ||||||||
| 300,000 | Capital One Financial Corp.# | 5.55 | % | 12/29/2049 | 315,750 | ||||||||
| 350,000 | Carrizo Oil & Gas, Inc. | 7.50 | % | 09/15/2020 | 357,437 | ||||||||
| 350,000 | Carrizo Oil & Gas, Inc. | 6.25 | % | 04/15/2023 | 338,625 | ||||||||
| 500,000 | Caterpillar Financial Services Corp.# | 1.81 | % | 06/06/2022 | 501,508 | ||||||||
| 200,000 | Clorox Co. | 3.05 | % | 09/15/2022 | 205,321 | ||||||||
| 200,000 | CommScope Technologies LLC^ | 6.00 | % | 06/15/2025 | 214,500 | ||||||||
| 100,000 | CommScope Technologies LLC^ | 5.00 | % | 03/15/2027 | 100,000 | ||||||||
| 500,000 | Cornerstone Chemical Co.^ | 9.38 | % | 03/15/2018 | 501,250 | ||||||||
| 220,000 | Crown Castle International Corp. | 4.88 | % | 04/15/2022 | 240,591 | ||||||||
| 300,000 | Dana, Inc. | 6.00 | % | 09/15/2023 | 314,250 | ||||||||
| 400,000 | Dollar General Corp. | 4.15 | % | 11/01/2025 | 422,914 | ||||||||
| 650,000 | Dollar Tree, Inc. | 5.75 | % | 03/01/2023 | 689,195 | ||||||||
| 500,000 | Ecolab, Inc. | 2.00 | % | 01/14/2019 | 502,365 | ||||||||
| 300,000 | Education Realty Operating Partnership L.P. | 4.60 | % | 12/01/2024 | 305,442 | ||||||||
| 600,000 | Energy Transfer L.P. | 4.05 | % | 03/15/2025 | 603,370 | ||||||||
| 250,000 | Equinix, Inc. | 5.88 | % | 01/15/2026 | 273,202 | ||||||||
| 380,000 | Equinix, Inc. | 5.38 | % | 05/15/2027 | 406,125 | ||||||||
| 100,000 | Fidelity National Information Services, Inc. | 5.00 | % | 10/15/2025 | 111,855 | ||||||||
| 400,000 | First Quality Finance Co., Inc.^ | 5.00 | % | 07/01/2025 | 409,000 | ||||||||
| 550,000 | Fresh Market, Inc.^ | 9.75 | % | 05/01/2023 | 462,688 | ||||||||
| 650,000 | Goodyear Tire & Rubber Co. | 4.88 | % | 03/15/2027 | 661,375 | ||||||||
| 500,000 | Harris Corp. | 3.83 | % | 04/27/2025 | 516,866 | ||||||||
| 200,000 | Healthcare Trust of America Holdings L.P. | 3.75 | % | 07/01/2027 | 198,099 | ||||||||
| 250,000 | High Ridge Brands Co.^ | 8.88 | % | 03/15/2025 | 250,313 | ||||||||
| 100,000 | Interface Master Holdings, Inc.^ | 12.50 | % | 08/01/2018 | 93,750 | ||||||||
| 500,000 | Interface Security Systems Holdings, Inc. | 9.25 | % | 01/15/2018 | 499,375 | ||||||||
| 300,000 | JB Hunt Transport Services, Inc. | 2.40 | % | 03/15/2019 | 301,751 | ||||||||
| 300,000 | Keysight Technologies, Inc. | 4.55 | % | 10/30/2024 | 315,384 | ||||||||
| 325,000 | Koppers, Inc.^ | 6.00 | % | 02/15/2025 | 346,125 | ||||||||
| 710,000 | Lamar Media Corp. | 5.75 | % | 02/01/2026 | 767,688 | ||||||||
| 105,000 | Lear Corp. | 5.38 | % | 03/15/2024 | 111,575 | ||||||||
The accompanying notes are an integral part of these financial statements.
48
Brown Advisory Strategic Bond Fund
Schedule of Investments
June 30, 2017
| Par | ||||||||||||||
| Value/Shares | Security Description | Rate | Maturity | Value $ | ||||||||||
| Corporate Bonds & Notes — 22.2% (Continued) | ||||||||||||||
| 1,000,000 | Martin Marietta Materials, Inc.# | 1.82 | % | 05/22/2020 | 1,003,207 | |||||||||
| 400,000 | Martin Marietta Materials, Inc. | 4.25 | % | 07/02/2024 | 420,391 | |||||||||
| 125,000 | Mercer International, Inc. | 7.75 | % | 12/01/2022 | 134,531 | |||||||||
| 200,000 | Mercer International, Inc.^ | 6.50 | % | 02/01/2024 | 209,338 | |||||||||
| 450,000 | Meritor, Inc. | 6.25 | % | 02/15/2024 | 471,375 | |||||||||
| 500,000 | Micron Technology, Inc. | 7.50 | % | 09/15/2023 | 560,250 | |||||||||
| 300,000 | MPLX L.P. | 5.50 | % | 02/15/2023 | 308,781 | |||||||||
| 350,000 | MPLX L.P. | 4.88 | % | 12/01/2024 | 373,723 | |||||||||
| 350,000 | Mylan NV | 3.15 | % | 06/15/2021 | 356,392 | |||||||||
| 400,000 | Mylan NV | 3.95 | % | 06/15/2026 | 406,037 | |||||||||
| 300,000 | Mylan, Inc. | 2.60 | % | 06/24/2018 | 302,227 | |||||||||
| 200,000 | NOVA Chemicals Corp.^ | 5.25 | % | 08/01/2023 | 206,250 | |||||||||
| 165,000 | Outfront Media Capital LLC | 5.88 | % | 03/15/2025 | 173,456 | |||||||||
| 900,000 | Sabine Pass Liquefaction LLC | 5.88 | % | 06/30/2026 | 1,007,581 | |||||||||
| 232,000 | ServiceMaster Co. LLC | 7.45 | % | 08/15/2027 | 254,620 | |||||||||
| 500,000 | SESI LLC | 6.38 | % | 05/01/2019 | 496,250 | |||||||||
| 150,000 | Springs Industries, Inc. | 6.25 | % | 06/01/2021 | 155,438 | |||||||||
| 370,000 | TechnipFMC PLC^ | 3.45 | % | 10/01/2022 | 369,052 | |||||||||
| 125,000 | Teck Resources, Ltd. | 3.75 | % | 02/01/2023 | 122,188 | |||||||||
| 530,000 | Teck Resources, Ltd.^ | 8.50 | % | 06/01/2024 | 613,475 | |||||||||
| 250,000 | Tenneco, Inc. | 5.00 | % | 07/15/2026 | 253,438 | |||||||||
| 100,000 | United Rentals North America, Inc. | 4.63 | % | 07/15/2023 | 104,200 | |||||||||
| 210,000 | Verisk Analytics, Inc. | 4.00 | % | 06/15/2025 | 217,349 | |||||||||
| 350,000 | Verizon Communications, Inc.# | 2.25 | % | 03/16/2022 | 354,346 | |||||||||
| 350,000 | Versum Materials, Inc.^ | 5.50 | % | 09/30/2024 | 368,813 | |||||||||
| 375,000 | Viking Cruises, Ltd.^ | 8.50 | % | 10/15/2022 | 395,156 | |||||||||
| 400,000 | Viking Cruises, Ltd.^ | 6.25 | % | 05/15/2025 | 405,000 | |||||||||
| 1,000,000 | Vulcan Materials Co.# | 1.85 | % | 06/15/2020 | 1,000,363 | |||||||||
| Total Corporate Bonds & Notes (Cost $25,248,899) | 25,446,025 | |||||||||||||
| Municipal Bonds — 3.0% | ||||||||||||||
| 500,000 | Houston Texas Airport System | 5.00 | % | 07/15/2020 | 539,130 | |||||||||
| 640,000 | New York Transportation Development Corp. | 5.00 | % | 08/01/2026 | 687,968 | |||||||||
| 225,000 | North Texas Tollway Authority | 8.91 | % | 02/01/2030 | 258,289 | |||||||||
| 500,000 | Public Finance Authority^ | 5.00 | % | 09/01/2030 | 521,785 | |||||||||
| 400,000 | Utah Charter School Finance Authority | 5.80 | % | 06/15/2038 | 404,300 | |||||||||
| 650,000 | Washington State Housing Finance Commission^ | 4.00 | % | 01/01/2024 | 639,801 | |||||||||
| 370,000 | Yamhill County Oregon Hospital Authority | 3.50 | % | 11/15/2020 | 366,803 | |||||||||
| Total Municipal Bonds (Cost $3,409,071) | 3,418,076 | |||||||||||||
| Preferred Stocks — 0.1% | ||||||||||||||
| 2,400 | AGNC Investment Corp., Series B, 7.75% | 62,448 | ||||||||||||
| Total Preferred Stocks (Cost $61,102) | 62,448 | |||||||||||||
| Closed-End Funds — 0.8% | ||||||||||||||
| 17,204 | BlackRock MuniYield Michigan Quality Fund | 241,372 | ||||||||||||
| 9,600 | Nuveen Massachusetts Quality Municipal Income Fund | 132,000 | ||||||||||||
| 9,184 | Nuveen Michigan Quality Municipal Income Fund | 125,821 | ||||||||||||
| 6,063 | Nuveen Pennsylvania Quality Municipal Income Fund | 81,123 | ||||||||||||
| 11,341 | PIMCO California Municipal Income Fund III | 142,669 | ||||||||||||
| 11,168 | PIMCO New York Municipal Income Fund II | 130,554 | ||||||||||||
| 11,801 | PIMCO New York Municipal Income Fund III | 115,768 | ||||||||||||
| Total Closed-End Funds (Cost $993,240) | 969,307 | |||||||||||||
| Exchange Traded Funds — 3.9% | ||||||||||||||
| 51,268 | iShares iBoxx $ High Yield Corporate Bond ETF | 4,531,579 | ||||||||||||
| Total Exchange Traded Funds (Cost $4,421,401) | 4,531,579 | |||||||||||||
The accompanying notes are an integral part of these financial statements.
49
Brown Advisory Strategic Bond Fund
Schedule of Investments
June 30, 2017
| Shares | Security Description | Value $ | ||||||
| Short-Term Investments — 2.4% | ||||||||
| Money Market Funds — 2.4% | ||||||||
| 2,814,897 | First American Treasury Obligations Fund — Class Z, 0.85%* | 2,814,897 | ||||||
| Total Short-Term Investments (Cost $2,814,897) | 2,814,897 | |||||||
| Total Investments — 112.0% (Cost $128,096,908) | 128,641,683 | |||||||
| Liabilities in Excess of Other Assets — (12.0)% | (13,741,917 | ) | ||||||
| NET ASSETS — 100.0% | $ | 114,899,766 | ||||||
| * | Annualized seven-day yield as of June 30, 2017. |
| ^ | Security exempt from registration under Rule 144A of the Securities Act of 1933. These securities may be resold in transactions exempt from registration, normally to qualified institutional buyers. At June 30, 2017, the value of these securities amounted to $60,749,690, or 52.9% of net assets. |
| † | Interest Only Security |
| # | Variable rate security. Rate disclosed is as of June 30, 2017. |
| Futures Contracts — Short (Note 7) | |||||||||||||||||
| Notional | Notional | Unrealized Appreciation | |||||||||||||||
Issue | Contracts | Expiration Date | Amount | Value | (Depreciation) | ||||||||||||
| U.S. Treasury 5-Year Note Futures September 2017 | (97) | 09/29/2017 | $ | (11,456,158 | ) | $ | (11,430,086 | ) | $ | 26,072 | |||||||
| $ | (11,456,158 | ) | $ | (11,430,086 | ) | $ | 26,072 | ||||||||||
There is no variation margin due to or from the Fund as of June 30, 2017.
The accompanying notes are an integral part of these financial statements.
50
Brown Advisory Maryland Bond Fund
A Message to Our Shareholders
June 30, 2017
Dear Shareholder:
During the year ended June 30, 2017, the Brown Advisory Maryland Bond Fund (the “Fund”) was down 0.27%. During the same period, the Fund’s benchmark, the Bloomberg Barclays 1-10 Year Blended Municipal Bond Index was up 0.16%.
The past year in the municipal bond market can be best characterized as a tale of two halves.
Municipal bond yields moved sharply higher during the second half of 2016. The rise only accelerated as Donald Trump’s election victory and the Republican sweep in Congress fueled optimism about economic growth, causing broad U.S. interest rates to spike. Municipal bonds were particularly hard-hit as a confluence of public policy uncertainty and negative technical factors weighed on the market. Expectations about the new administration’s ambitious fiscal agenda, the specter of U.S. federal tax reform and a temporary supply/demand imbalance in the municipal bond market created a period where both interest rates and credit spreads moved against investors. As a result, 10-year BBB-rated municipal revenue bond yields moved from roughly 2.00% in August to over 4.00% at year-end, levels not seen since 2013.
After a tumultuous end to 2016, the municipal bond market began to find its footing early in 2017. Yet unlike previous market dislocations in recent years, the market did not experience an immediate snapback. Continued policy uncertainty seemed to hang like a cloud over the market, causing many investors to seek refuge in short maturity municipal bonds. The demand for short duration overwhelmed supply causing short maturity bonds to strongly outperform the broad municipal bond market early in the year. This was in direct contrast to the movements of short Treasuries during the first quarter, which moved higher as the Federal Reserve continued to ratchet up the Fed Funds Target Rate. It was not until the second quarter that investor demand for Municipal bonds truly began to recover from the post-election hangover.
Municipal credit spreads began moving tighter in the second quarter. This tightening benefitted our portfolio’s relative performance for the period and we believe this should continue benefitting our revenue-backed sector overweight for the remainder of the year. The post-election selloff in municipal credit was largely driven by market technical pressures, rather than credit fundamentals, as investors seemed to indiscriminately shed risk. This led to a relatively high degree of volatility in several of our revenue backed sectors in late 2016, followed by a strong rebound in the second quarter of 2017. Our health care holdings, for example, were down roughly 5.00% for the second half of 2016, but returned 4.00% in total return for the first half of 2017; we believe they still have significant room for spread appreciation. The Fund saw similar rebounds in other revenue-backed sectors like toll roads, higher education, housing and corporate-backed entities.
Our long-term approach to credit selection that is grounded in bottom-up fundamental research provides us with the confidence to view market volatility as an opportunity rather than a distraction. Looking forward, we cannot know where interest rates may go; however, we believe that a disciplined and consistent process can lead to attractive income generation over time. We believe our bottom-up fundamental selection process will serve our investors well.
Sincerely,
Stephen M. Shutz, CFA
Portfolio Manager
Past performance is not a guarantee of future results.
Mutual fund investing involves risk. Principal loss is possible. The Fund is non-diversified which means it may invest a large percentage of its assets in the securities of fewer issuers. Investment in a limited number of issuers exposes the Fund to greater market risk than if its assets were diversified among a greater number of issuers. The Fund is also subject to interest rate risk which is the risk that debt securities in the Fund’s portfolio will decline in value because of an increase in market interest rates. Municipal securities are subject to adverse political or economic factors, including changes in the tax law. Income from tax-exempt funds may be subject to state and local taxes and a portion of income may be subject to the federal alternative minimum tax for certain investors.
Fund holdings and sector allocations are subject to change and should not be considered a recommendation to buy or sell any security. For a complete list of fund holdings, please refer to the Schedule of Investments provided in this report. Credit Quality weights by rating are derived from the highest bond rating as determined by Standard & Poor’s (“S&P”), Moody’s or Fitch. Bond ratings are grades given to bonds that indicate their credit quality as determined by private independent rating services such as S&P, Moody’s and Fitch. These firms evaluate a bond issuer’s financial strength, or its ability to pay a bond’s principal and interest in a timely fashion. Ratings are expressed as letters ranging from ‘AAA’, which is the highest grade, to ‘D’, which is the lowest grade. In limited situations when none of the three rating agencies have issued a formal rating, the Advisor will classify the security as nonrated.
Definitions for terms and indices are provided in the Glossary of Terms.
51
Brown Advisory Maryland Bond Fund
Performance Information & Portfolio Holdings Summary
June 30, 2017
| PORTFOLIO HOLDINGS | % of Net Assets |
| Revenue Bonds | 69.1% |
| General Obligation Bonds | 28.0% |
| Money Market Funds | 1.7% |
| Other Assets and Liabilities | 1.2% |
100.0% |
GROWTH OF A $10,000 INVESTMENT
The following chart reflects the change in value of a hypothetical $10,000 investment, including reinvested dividends and distributions, in the Fund as measured against the broad-based municipal bond index. The Bloomberg Barclays 1-10 Year Blended Municipal Bond Index (“Index”) is a market index of high quality, domestic fixed income securities with maturities of less than 10 years. The Index is unmanaged and does not reflect the deduction of fees, such as investment management fees. Investors cannot invest directly in an index.
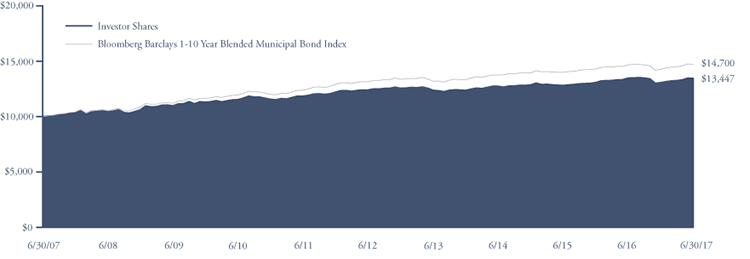
Average Annual Total Return as of 6/30/17 | One Year | Five Year | Ten Year |
| Investor Shares | -0.27% | 1.63% | 3.01% |
| Bloomberg Barclays 1-10 Year Blended Municipal Bond Index | 0.16% | 2.26% | 3.93% |
Investor Shares | |
Gross Expense Ratio1 | 0.49% |
Net Expense Ratio1 | 0.49% |
Past performance does not guarantee future results. The performance data quoted represents past performance and current returns may be lower or higher. The investment return and net asset value will fluctuate so that an investor’s shares, when redeemed, may be worth more or less than the original cost. To obtain performance information current to the most recent month end, please visit our website at brownadvisoryfunds.com/performance.html. The performance table and graph above do not reflect the deduction of taxes that a shareholder would pay on Fund distributions or the redemption of Fund shares. Investment performance reflects periods during which fee waivers were in effect. In the absence of such waivers, total return would have been reduced. Performance data does not reflect the imposition of the redemption fee of 1.00% on shares redeemed within 14 days, and if it did, performance would have been lower.
1 | Per the Fund’s prospectus dated October 31, 2016. Refer to the financial highlights for the gross and net expense ratios for the year ended as of the date of this report. Please note that the expense ratios per the prospectus include acquired fund fees and expenses (as applicable) and the expense ratios in the financial highlights do not. |
52
Brown Advisory Maryland Bond Fund
Schedule of Investments
June 30, 2017
| Par Value | Security Description | Rate | Maturity | Value $ | ||||||||||
| Municipal Bonds — 97.1% | ||||||||||||||
| General Obligation Bonds — 28.0% | ||||||||||||||
| 2,225,000 | Anne Arundel County Maryland | 5.00 | % | 04/01/2022 | 2,599,868 | |||||||||
| 575,000 | Baltimore County Maryland | 5.00 | % | 11/01/2017 | 583,159 | |||||||||
| 3,000,000 | Baltimore County Maryland | 4.50 | % | 09/01/2020 | 3,312,510 | |||||||||
| 1,305,000 | Baltimore, Maryland | 5.00 | % | 10/15/2018 | 1,373,003 | |||||||||
| 775,000 | Cecil County Maryland | 4.00 | % | 02/01/2018 | 789,113 | |||||||||
| 1,360,000 | Cecil County Maryland | 4.00 | % | 12/01/2021 | 1,514,605 | |||||||||
| 1,390,000 | Charles County Maryland | 5.00 | % | 11/01/2019 | 1,517,922 | |||||||||
| 1,970,000 | Charles County Maryland | 5.00 | % | 11/01/2021 | 2,284,727 | |||||||||
| 1,145,000 | Easton, Town of Maryland | 4.00 | % | 02/01/2020 | 1,229,112 | |||||||||
| 1,145,000 | Easton, Town of Maryland | 4.00 | % | 02/01/2021 | 1,255,630 | |||||||||
| 1,000,000 | Frederick, Maryland | 5.00 | % | 09/01/2017 | 1,007,240 | |||||||||
| 1,120,000 | Maryland National Capital Park & Planning Commission | 5.00 | % | 01/15/2019 | 1,188,477 | |||||||||
| 1,085,000 | Maryland National Capital Park & Planning Commission | 5.00 | % | 01/15/2020 | 1,190,972 | |||||||||
| 835,000 | Maryland State | 5.25 | % | 08/15/2017 | 839,709 | |||||||||
| 1,000,000 | Maryland State | 5.00 | % | 11/01/2019 | 1,090,490 | |||||||||
| 3,145,000 | Maryland State | 5.00 | % | 08/01/2023 | 3,787,366 | |||||||||
| 1,945,000 | Maryland State | 5.00 | % | 08/01/2023 | 2,292,202 | |||||||||
| 1,145,000 | Montgomery County Maryland | 5.00 | % | 12/01/2018 | 1,210,242 | |||||||||
| 5,000,000 | Montgomery County Maryland | 5.00 | % | 11/01/2023 | 6,042,650 | |||||||||
| 3,320,000 | Prince George’s County Maryland | 5.00 | % | 09/15/2026 | 3,816,904 | |||||||||
| 1,380,000 | Talbot County Maryland | 5.00 | % | 12/15/2018 | 1,460,454 | |||||||||
| 1,270,000 | Talbot County Maryland | 5.00 | % | 12/15/2019 | 1,390,269 | |||||||||
| 1,940,000 | Wicomico County Maryland | 4.00 | % | 11/01/2019 | 2,070,601 | |||||||||
| 1,985,000 | Wicomico County Maryland | 4.00 | % | 11/01/2020 | 2,166,171 | |||||||||
| 2,040,000 | Wicomico County Maryland | 4.00 | % | 11/01/2021 | 2,270,520 | |||||||||
| 2,225,000 | Worcester County Maryland | 5.00 | % | 03/01/2023 | 2,645,859 | |||||||||
| 50,929,775 | ||||||||||||||
| Revenue Bonds — 69.1% | ||||||||||||||
| 3,480,000 | Austin, Texas | 7.88 | % | 09/01/2026 | 3,884,341 | |||||||||
| 1,320,000 | Baltimore, Maryland | 5.00 | % | 07/01/2028 | 1,613,225 | |||||||||
| 1,000,000 | Baltimore, Maryland | 5.00 | % | 07/01/2028 | 1,222,140 | |||||||||
| 520,000 | Baltimore, Maryland | 5.00 | % | 06/15/2030 | 577,845 | |||||||||
| 1,250,000 | Baltimore, Maryland | 5.00 | % | 09/01/2031 | 1,434,587 | |||||||||
| 1,000,000 | Baltimore, Maryland | 5.00 | % | 07/01/2032 | 1,154,380 | |||||||||
| 1,365,000 | Baltimore, Maryland | 5.00 | % | 09/01/2032 | 1,558,953 | |||||||||
| 670,000 | Baltimore, Maryland | 5.00 | % | 06/15/2033 | 735,921 | |||||||||
| 1,150,000 | Baltimore, Maryland | 5.00 | % | 09/01/2033 | 1,307,033 | |||||||||
| 1,250,000 | Baltimore, Maryland | 5.00 | % | 09/01/2034 | 1,412,650 | |||||||||
| 1,550,000 | Franklin County Ohio | 5.00 | % | 11/15/2034 | 1,696,754 | |||||||||
| 2,375,000 | Frederick County Maryland | 5.50 | % | 07/01/2040 | 2,458,244 | |||||||||
| 1,000,000 | Harris County Cultural Education Facilities Finance Corp. | 5.00 | % | 01/01/2037 | 1,052,860 | |||||||||
| 4,800,000 | Houston Texas Airport System | 5.00 | % | 07/15/2020 | 5,175,648 | |||||||||
| 2,000,000 | Lancaster County Pennsylvania Hospital Authority | 5.00 | % | 07/01/2035 | 2,155,700 | |||||||||
| 1,000,000 | Maryland Community Development Administration | 3.25 | % | 03/01/2036 | 1,008,260 | |||||||||
| 1,185,000 | Maryland Economic Development Corp. | 5.25 | % | 07/01/2024 | 1,185,154 | |||||||||
| 1,025,000 | Maryland Economic Development Corp.# | 2.55 | % | 12/01/2025 | 1,020,849 | |||||||||
| 700,000 | Maryland Economic Development Corp. | 5.00 | % | 06/01/2027 | 765,156 | |||||||||
| 400,000 | Maryland Economic Development Corp. | 5.00 | % | 07/01/2027 | 440,228 | |||||||||
| 850,000 | Maryland Economic Development Corp. | 5.00 | % | 07/01/2031 | 933,717 | |||||||||
| 2,300,000 | Maryland Economic Development Corp. | 5.75 | % | 06/01/2035 | 2,473,811 | |||||||||
| 5,000,000 | Maryland Economic Development Corp.# | 0.90 | % | 02/15/2043 | 5,000,000 | |||||||||
| 4,500,000 | Maryland Economic Development Corp. | 4.50 | % | 07/01/2044 | 4,514,310 | |||||||||
| 2,500,000 | Maryland Industrial Development Financing Authority Series B# | 0.95 | % | 09/01/2040 | 2,500,000 | |||||||||
| 1,000,000 | Maryland State Department of Transportation | 5.00 | % | 12/15/2020 | 1,128,830 | |||||||||
The accompanying notes are an integral part of these financial statements.
53
Brown Advisory Maryland Bond Fund
Schedule of Investments
June 30, 2017
| Par Value | Security Description | Rate | Maturity | Value $ | |||||||||
| Municipal Bonds — 97.1% (Continued) | |||||||||||||
| Revenue Bonds — 69.1% (Continued) | |||||||||||||
| 1,055,000 | Maryland State Department of Transportation | 4.00 | % | 05/15/2022 | 1,183,921 | ||||||||
| 2,400,000 | Maryland State Department of Transportation | 4.00 | % | 05/15/2024 | 2,530,176 | ||||||||
| 260,000 | Maryland State Health & Higher Educational Facilities | 5.00 | % | 07/01/2018 | 270,163 | ||||||||
| 215,000 | Maryland State Health & Higher Educational Facilities | 5.00 | % | 07/01/2018 | 215,707 | ||||||||
| 35,000 | Maryland State Health & Higher Educational Facilities | 5.00 | % | 07/01/2018 | 35,004 | ||||||||
| 515,000 | Maryland State Health & Higher Educational Facilities | 5.00 | % | 07/01/2023 | 591,040 | ||||||||
| 485,000 | Maryland State Health & Higher Educational Facilities | 5.00 | % | 07/01/2023 | 549,500 | ||||||||
| 500,000 | Maryland State Health & Higher Educational Facilities | 5.00 | % | 08/15/2023 | 596,160 | ||||||||
| 500,000 | Maryland State Health & Higher Educational Facilities | 5.00 | % | 07/01/2024 | 569,545 | ||||||||
| 465,000 | Maryland State Health & Higher Educational Facilities | 5.50 | % | 07/01/2024 | 486,018 | ||||||||
| 1,000,000 | Maryland State Health & Higher Educational Facilities | 6.00 | % | 07/01/2025 | 1,151,490 | ||||||||
| 1,250,000 | Maryland State Health & Higher Educational Facilities | 5.00 | % | 07/01/2025 | 1,488,550 | ||||||||
| 1,500,000 | Maryland State Health & Higher Educational Facilities | 5.00 | % | 07/01/2025 | 1,782,480 | ||||||||
| 420,000 | Maryland State Health & Higher Educational Facilities | 5.00 | % | 07/01/2026 | 504,336 | ||||||||
| 2,500,000 | Maryland State Health & Higher Educational Facilities | 5.25 | % | 07/01/2026 | 2,950,625 | ||||||||
| 1,605,000 | Maryland State Health & Higher Educational Facilities | 5.00 | % | 07/01/2028 | 1,867,466 | ||||||||
| 3,500,000 | Maryland State Health & Higher Educational Facilities | 5.00 | % | 07/01/2029 | 4,162,725 | ||||||||
| 100,000 | Maryland State Health & Higher Educational Facilities | 4.00 | % | 10/01/2030 | 107,467 | ||||||||
| 1,130,000 | Maryland State Health & Higher Educational Facilities | 6.25 | % | 07/01/2031 | 1,281,691 | ||||||||
| 300,000 | Maryland State Health & Higher Educational Facilities | 4.00 | % | 10/01/2031 | 321,030 | ||||||||
| 1,070,000 | Maryland State Health & Higher Educational Facilities | 5.00 | % | 07/01/2032 | 1,207,142 | ||||||||
| 250,000 | Maryland State Health & Higher Educational Facilities | 5.00 | % | 06/01/2033 | 285,505 | ||||||||
| 1,250,000 | Maryland State Health & Higher Educational Facilities | 5.00 | % | 08/15/2033 | 1,425,625 | ||||||||
| 15,000 | Maryland State Health & Higher Educational Facilities | 5.00 | % | 07/01/2034 | 15,716 | ||||||||
| 235,000 | Maryland State Health & Higher Educational Facilities | 5.00 | % | 07/01/2034 | 253,299 | ||||||||
| 200,000 | Maryland State Health & Higher Educational Facilities | 4.50 | % | 07/01/2035 | 200,150 | ||||||||
| 430,000 | Maryland State Health & Higher Educational Facilities | 5.00 | % | 06/01/2036 | 487,138 | ||||||||
| 3,400,000 | Maryland State Health & Higher Educational Facilities | 5.00 | % | 05/15/2040 | 3,763,256 | ||||||||
| 1,015,000 | Maryland State Health & Higher Educational Facilities | 4.75 | % | 07/01/2047 | 1,017,010 | ||||||||
| 4,255,000 | Maryland State Transportation Authority | 5.00 | % | 03/01/2022 | 4,870,401 | ||||||||
| 1,000,000 | Maryland State Transportation Authority | 5.00 | % | 06/01/2022 | 1,144,890 | ||||||||
| 9,000,000 | Maryland State Transportation Authority | 5.00 | % | 07/01/2036 | 9,354,150 | ||||||||
| 2,525,000 | Maryland Water Quality Financing Administration | 5.00 | % | 03/01/2020 | 2,784,040 | ||||||||
| 1,200,000 | Montgomery County Maryland Housing Opportunities Commission | 2.95 | % | 01/01/2034 | 1,200,168 | ||||||||
| 1,750,000 | New Hope Texas Cultural Education Facilities Finance Corp. | 5.00 | % | 07/01/2025 | 1,978,235 | ||||||||
| 1,185,000 | New Hope Texas Cultural Education Facilities Finance Corp. | 5.75 | % | 07/01/2051 | 1,262,049 | ||||||||
| 4,000,000 | New York Transportation Development Corp. | 5.00 | % | 08/01/2026 | 4,299,800 | ||||||||
| 2,000,000 | Newport News Virginia Economic Development Authority | 5.00 | % | 12/01/2031 | 2,113,880 | ||||||||
| 2,000,000 | North Carolina Medical Care Commission | 5.00 | % | 10/01/2031 | 2,114,900 | ||||||||
| 1,005,000 | Prince William County Virginia Industrial Development Authority | 5.00 | % | 01/01/2023 | 1,099,329 | ||||||||
| 4,000,000 | University System of Maryland | 5.00 | % | 04/01/2018 | 4,123,000 | ||||||||
| 1,000,000 | University System of Maryland | 5.00 | % | 04/01/2018 | 1,030,750 | ||||||||
| 4,335,000 | University System of Maryland | 5.00 | % | 04/01/2022 | 5,058,295 | ||||||||
| 3,280,000 | Washington State Housing Finance Commission^ | 4.00 | % | 01/01/2026 | 3,294,104 | ||||||||
| 125,438,522 | |||||||||||||
| Total Municipal Bonds (Cost $175,033,839) | 176,368,297 | ||||||||||||
The accompanying notes are an integral part of these financial statements.
54
Brown Advisory Maryland Bond Fund
Schedule of Investments
June 30, 2017
| Shares | Security Description | Value $ | ||||||
| Short-Term Investments — 1.7% | ||||||||
| Money Market Funds — 1.7% | ||||||||
| 3,035,035 | First American Treasury Obligations Fund — Class Z, 0.85%* | 3,035,035 | ||||||
| Total Short-Term Investments (Cost $3,035,035) | 3,035,035 | |||||||
| Total Investments — 98.8% (Cost $178,068,874) | 179,403,332 | |||||||
| Other Assets in Excess of Liabilities — 1.2% | 2,115,035 | |||||||
| NET ASSETS — 100.0% | $ | 181,518,367 | ||||||
| * | Annualized seven-day yield as of June 30, 2017. |
| ^ | Security exempt from registration under Rule 144A of the Securities Act of 1933. These securities may be resold in transactions exempt from registration, normally to qualified institutional buyers. At June 30, 2017, the value of these securities amounted to $3,294,104 or 1.8% of net assets. |
| # | Variable rate security. Rate disclosed is as of June 30, 2017. |
The accompanying notes are an integral part of these financial statements.
55
Brown Advisory Tax Exempt Bond Fund
A Message to Our Shareholders
June 30, 2017
Dear Shareholder:
During the year ended June 30, 2017, the Brown Advisory Tax Exempt Bond Fund (the “Fund”) was down 0.29%. During the same period, the Bloomberg Barclays 1-10 Year Blended Municipal Bond Index, the Fund’s benchmark, was up 0.16%.
The past year in the municipal bond market can be best characterized as a tale of two halves.
Municipal bond yields moved sharply higher during the second half of 2016. The rise only accelerated as Donald Trump’s election victory and the Republican sweep in Congress fueled optimism about economic growth, causing broad U.S. interest rates to spike. Municipal bonds were particularly hard-hit as a confluence of public policy uncertainty and negative technical factors weighed on the market. Expectations about the new administration’s ambitious fiscal agenda, the specter of U.S. federal tax reform and a temporary supply/demand imbalance in the Muni market created a period where both interest rates and credit spreads moved against investors. As a result, 10-year BBB-rated municipal revenue bond yields moved from roughly 2.00% in August to over 4.00% at year-end, levels not seen since 2013.
After a tumultuous end to 2016, the municipal bond market began to find its footing early in 2017. Yet unlike previous market dislocations in recent years, the market did not experience an immediate snapback. Continued policy uncertainty seemed to hang like a cloud over the market, causing many investors to seek refuge in short maturity municipal bonds. The demand for short duration overwhelmed supply causing short maturity bonds to strongly outperform the broad municipal bond market early in the year. This was in direct contrast to the movements of short Treasuries during the first quarter, which moved higher as the Federal Reserve continued to ratchet up the Fed Funds Target Rate. It was not until the second quarter that investor demand for municipal bonds truly began to recover from the post-election hangover.
Municipal credit spreads began moving tighter in the second quarter. This tightening benefitted our portfolio’s relative performance for the period and we believe this should continue benefitting our revenue-backed sector overweight for the remainder of the year. The post-election selloff in municipal credit was largely driven by market technical pressures, rather than credit fundamentals, as investors seemed to indiscriminately shed risk. This led to a relatively high degree of volatility in several of our revenue backed sectors in late 2016, followed by a strong rebound in the second quarter of 2017. Our health care holdings, for example, were down roughly 5.00% for the second half of 2016, but returned 4.00% in total return for the first half of 2017; we believe they still have significant room for spread appreciation. The Fund saw similar rebounds in other revenue-backed sectors like toll roads, higher education, housing and corporate-backed entities.
Our long-term approach to credit selection that is grounded in bottom-up fundamental research provides us with the confidence to view market volatility as an opportunity rather than a distraction. Looking forward, we cannot know where interest rates may go; however, we believe that a disciplined and consistent process can lead to attractive income generation over time. We believe our bottom-up fundamental selection process will serve our investors well.
Sincerely,
Stephen M. Shutz, CFA
Portfolio Manager
Past performance is not a guarantee of future results.
Mutual fund investing involves risk. Principal loss is possible. The Fund is non-diversified which means it may invest a large percentage of its assets in the securities of fewer issuers. Concentration in a limited number of issuers exposes the Fund to greater market risk than if its assets were diversified among a greater number of issuers. The Fund is also subject to interest rate risk which is the risk that debt securities in the Fund’s portfolio will decline in value because of an increase in market interest rates. This risk is usually greater for longer-term debt securities. Income from tax-exempt funds may be subject to state and local taxes and a portion of income may be subject to the Federal Alternative minimum tax for certain investors.
Fund holdings and sector allocations are subject to change and should not be considered a recommendation to buy or sell any security. For a complete list of fund holdings, please refer to the Schedule of Investments provided in this report.
Definitions for terms and indices are provided in the Glossary of Terms.
56
Brown Advisory Tax Exempt Bond Fund
Performance Information & Portfolio Holdings Summary
June 30, 2017
| PORTFOLIO HOLDINGS | % of Net Assets |
| Revenue Bonds | 88.1% |
| General Obligation Bonds | 9.4% |
| Money Market Funds | 1.5% |
| Other Assets and Liabilities | 1.0% |
100.0% |
GROWTH OF A $10,000 INVESTMENT
The following chart reflects the change in value of a hypothetical $10,000 investment, including reinvested dividends and distributions, in the Fund as measured against the broad-based municipal bond index. The Bloomberg Barclays 1-10 Year Blended Municipal Bond Index (“Index”) is a market index of high quality, domestic fixed income securities with maturities of less than 10 years. The Index is unmanaged and does not reflect the deduction of fees, such as investment management fees. Investors cannot invest directly in an index.

| Since Inception | |||
Average Annual Total Return as of 6/30/17 | One Year | Five Year | (6/29/12) |
| Investor Shares | -0.29% | 2.05% | 2.05% |
| Bloomberg Barclays 1-10 Year Blended Municipal Bond Index | 0.16% | 2.26% | 2.26% |
Investor Shares | |
Gross Expense Ratio1 | 0.49% |
Net Expense Ratio1 | 0.49% |
Past performance does not guarantee future results. The performance data quoted represents past performance and current returns may be lower or higher. The investment return and net asset value will fluctuate so that an investor’s shares, when redeemed, may be worth more or less than the original cost. To obtain performance information current to the most recent month end, please visit our website at brownadvisoryfunds.com/performance.html. The performance table and graph above do not reflect the deduction of taxes that a shareholder would pay on Fund distributions or the redemption of Fund shares. Performance data does not reflect the imposition of the redemption fee of 1.00% on shares redeemed within 14 days, and if it did, performance would have been lower.
1 | Per the Fund’s prospectus dated October 31, 2016. Refer to the financial highlights for the gross and net expense ratios for the year ended as of the date of this report. Please note that the expense ratios per the prospectus include acquired fund fees and expenses (as applicable) and the expense ratios in the financial highlights do not. |
57
Brown Advisory Tax Exempt Bond Fund
Schedule of Investments
June 30, 2017
| Par Value | Security Description | Rate | Maturity | Value $ | |||||||||
| Municipal Bonds — 97.5% | |||||||||||||
| General Obligation Bonds — 9.4% | |||||||||||||
| 2,000,000 | Avondale School District | 5.00 | % | 05/01/2019 | 2,139,720 | ||||||||
| 600,000 | Bellwood, Village of Illinois | 3.00 | % | 12/01/2018 | 611,436 | ||||||||
| 1,150,000 | Clark County Nevada School District | 5.00 | % | 06/15/2025 | 1,185,857 | ||||||||
| 1,320,000 | Connecticut, State of | 5.00 | % | 10/15/2022 | 1,513,248 | ||||||||
| 1,025,000 | District of Columbia | 5.00 | % | 06/01/2029 | 1,227,663 | ||||||||
| 1,020,000 | Honolulu, City & County of Hawaii | 5.00 | % | 10/01/2029 | 1,227,386 | ||||||||
| 2,000,000 | Illinois, State of | 5.00 | % | 11/01/2017 | 2,019,420 | ||||||||
| 2,500,000 | Illinois, State of | 5.00 | % | 04/01/2022 | 2,528,975 | ||||||||
| 1,500,000 | New York, New York | 5.00 | % | 08/01/2027 | 1,823,070 | ||||||||
| 3,705,000 | Northside Texas Independent School District# | 1.75 | % | 06/01/2032 | 3,706,667 | ||||||||
| 6,000,000 | Texas, State of | 5.00 | % | 08/01/2031 | 6,019,380 | ||||||||
| 24,002,822 | |||||||||||||
| Revenue Bonds — 88.1% | |||||||||||||
| 550,000 | AltaPointe Health Systems, Inc. | 3.00 | % | 05/01/2019 | 558,332 | ||||||||
| 565,000 | AltaPointe Health Systems, Inc. | 3.00 | % | 05/01/2020 | 575,373 | ||||||||
| 1,125,000 | Arlington Texas Higher Education Finance Corp. | 5.00 | % | 02/15/2025 | 1,359,911 | ||||||||
| 4,500,000 | Austin, Texas | 7.88 | % | 09/01/2026 | 5,022,855 | ||||||||
| 2,970,000 | Central Texas Turnpike System | 5.00 | % | 08/15/2027 | 3,408,758 | ||||||||
| 2,615,000 | Chattanooga Tennessee Health Educational & Housing Facility Board | 5.25 | % | 01/01/2040 | 2,773,704 | ||||||||
| 3,000,000 | Chicago Illinois Midway International Airport | 5.00 | % | 01/01/2028 | 3,467,040 | ||||||||
| 660,000 | Chula Vista California Municipal Financing Authority | 4.00 | % | 09/01/2018 | 678,810 | ||||||||
| 855,000 | Chula Vista California Municipal Financing Authority | 4.00 | % | 09/01/2019 | 896,809 | ||||||||
| 300,000 | Colorado Health Facilities Authority | 5.00 | % | 12/01/2020 | 328,953 | ||||||||
| 1,000,000 | Colorado Health Facilities Authority | 5.00 | % | 06/01/2027 | 1,126,270 | ||||||||
| 1,300,000 | Colorado Health Facilities Authority | 5.00 | % | 12/01/2027 | 1,424,176 | ||||||||
| 1,500,000 | Colorado Health Facilities Authority | 5.00 | % | 12/01/2035 | 1,631,685 | ||||||||
| 4,390,000 | Cumberland County Pennsylvania Municipal Authority | 4.00 | % | 01/01/2033 | 4,438,246 | ||||||||
| 720,000 | Dallas Love Field | 5.00 | % | 11/01/2022 | 831,996 | ||||||||
| 1,100,000 | Denver Colorado Convention Center Hotel Authority | 5.00 | % | 12/01/2028 | 1,284,657 | ||||||||
| 2,750,000 | Denver, City & County of Colorado | 5.25 | % | 10/01/2032 | 2,771,450 | ||||||||
| 2,000,000 | Denver, City & County of Colorado Airport System | 5.00 | % | 11/15/2024 | 2,028,580 | ||||||||
| 5,000,000 | Denver, City & County of Colorado Airport System | 5.00 | % | 11/15/2030 | 5,068,450 | ||||||||
| 1,700,000 | Educational Enhancement Funding Corp. South Dakota | 5.00 | % | 06/01/2023 | 1,946,823 | ||||||||
| 500,000 | Florida Municipal Power Agency | 5.25 | % | 10/01/2023 | 526,025 | ||||||||
| 3,355,000 | Florida Municipal Power Agency | 5.00 | % | 10/01/2025 | 3,864,356 | ||||||||
| 1,000,000 | Harris County Texas Cultural Education Facilities Finance Corp. | 5.00 | % | 12/01/2035 | 1,108,300 | ||||||||
| 1,000,000 | Harris County-Houston Texas Sports Authority | 5.00 | % | 11/15/2028 | 1,168,040 | ||||||||
| 1,760,000 | Hawaii Department of Budget & Finance | 4.60 | % | 05/01/2026 | 1,763,678 | ||||||||
| 2,100,000 | Houston Texas Airport System | 5.00 | % | 07/15/2020 | 2,264,346 | ||||||||
| 4,000,000 | Houston Texas Airport System | 5.00 | % | 07/15/2020 | 4,313,040 | ||||||||
| 5,000,000 | Houston Texas Airport System | 5.00 | % | 07/01/2026 | 5,017,150 | ||||||||
| 3,850,000 | Houston Texas Airport System | 5.00 | % | 07/01/2029 | 4,145,218 | ||||||||
| 1,000,000 | Indiana Finance Authority | 5.00 | % | 09/15/2025 | 1,156,160 | ||||||||
| 1,750,000 | Indiana Finance Authority | 5.00 | % | 09/15/2028 | 1,972,933 | ||||||||
| 500,000 | Indiana Finance Authority | 5.13 | % | 03/01/2030 | 551,915 | ||||||||
| 1,250,000 | Kentucky Economic Development Finance Authority | 5.00 | % | 05/01/2024 | 1,310,000 | ||||||||
| 1,640,000 | Kentucky State Property & Building Commission | 5.00 | % | 02/01/2021 | 1,839,736 | ||||||||
| 205,000 | Kentucky State Property & Building Commission | 5.50 | % | 11/01/2028 | 216,570 | ||||||||
| 3,000,000 | Lancaster County Pennsylvania Hospital Authority | 5.00 | % | 07/01/2035 | 3,233,550 | ||||||||
| 2,280,000 | Las Vegas Nevada Redevelopment Agency | 5.00 | % | 06/15/2028 | 2,652,848 | ||||||||
| 4,750,000 | Lees Summit Missouri Industrial Development Authority | 5.13 | % | 08/15/2032 | 4,760,070 | ||||||||
| 2,000,000 | Louisiana Public Facilities Authority | 3.50 | % | 06/01/2030 | 2,014,960 | ||||||||
| 1,000,000 | Louisiana Public Facilities Authority | 5.00 | % | 06/01/2036 | 1,112,440 | ||||||||
| 1,500,000 | Louisiana State Citizens Property Insurance Corp. | 5.00 | % | 06/01/2020 | 1,644,420 | ||||||||
The accompanying notes are an integral part of these financial statements.
58
Brown Advisory Tax Exempt Bond Fund
Schedule of Investments
June 30, 2017
| Par Value | Security Description | Rate | Maturity | Value $ | |||||||||
| Municipal Bonds — 97.5% (Continued) | |||||||||||||
| Revenue Bonds — 88.1% (Continued) | |||||||||||||
| 985,000 | Lower Colorado River Texas Authority | 5.50 | % | 05/15/2036 | 1,058,481 | ||||||||
| 5,030,000 | Maryland Health & Higher Educational Facilities Authority | 5.50 | % | 01/01/2036 | 5,784,651 | ||||||||
| 150,000 | Massachusetts Health & Educational Facilities Authority | 5.00 | % | 10/01/2024 | 151,535 | ||||||||
| 1,015,000 | Massachusetts Health & Educational Facilities Authority | 5.50 | % | 06/01/2034 | 1,055,955 | ||||||||
| 1,895,000 | Miami Beach Florida Health Facilities | 5.00 | % | 11/15/2029 | 2,083,647 | ||||||||
| 1,165,000 | Mississippi Development Bank | 5.50 | % | 10/01/2021 | 1,316,427 | ||||||||
| 1,010,000 | Mississippi Development Bank | 6.25 | % | 10/01/2026 | 1,148,087 | ||||||||
| 1,505,000 | Mississippi Development Bank | 6.50 | % | 10/01/2031 | 1,695,804 | ||||||||
| 1,000,000 | Mobile Alabama Industrial Development Board# | 1.63 | % | 07/15/2034 | 1,002,590 | ||||||||
| 1,500,000 | Montgomery County Pennsylvania Industrial Development Authority# | 2.55 | % | 06/01/2029 | 1,493,925 | ||||||||
| 1,600,000 | Mountain House California Public Financing Authority | 5.00 | % | 12/01/2027 | 1,623,344 | ||||||||
| 2,565,000 | Mountain House California Public Financing Authority | 5.00 | % | 12/01/2032 | 2,598,755 | ||||||||
| 1,000,000 | New Hampshire Health & Education Facilities Authority | 5.25 | % | 10/01/2023 | 1,010,670 | ||||||||
| 1,045,000 | New Hampshire State Turnpike System | 5.00 | % | 04/01/2021 | 1,146,072 | ||||||||
| 2,000,000 | New Hope Texas Cultural Education Facilities Corp. | 5.00 | % | 07/01/2024 | 2,257,560 | ||||||||
| 1,000,000 | New Hope Texas Cultural Education Facilities Corp. | 5.00 | % | 04/01/2029 | 1,083,190 | ||||||||
| 930,000 | New Hope Texas Cultural Education Facilities Corp. | 5.00 | % | 07/01/2031 | 953,036 | ||||||||
| 1,000,000 | New Hope Texas Cultural Education Facilities Corp. | 5.25 | % | 07/01/2036 | 1,040,740 | ||||||||
| 2,400,000 | New Hope Texas Cultural Education Facilities Corp. | 5.00 | % | 08/01/2039 | 2,510,304 | ||||||||
| 1,250,000 | New Hope Texas Cultural Education Facilities Corp. | 5.50 | % | 07/01/2046 | 1,310,563 | ||||||||
| 1,000,000 | New Hope Texas Cultural Education Facilities Corp. | 5.75 | % | 07/01/2051 | 1,065,020 | ||||||||
| 3,955,000 | New Jersey Educational Facilities Authority | 5.00 | % | 07/01/2023 | 4,662,273 | ||||||||
| 2,375,000 | New York City Industrial Development Agency | 5.00 | % | 01/01/2039 | 2,380,629 | ||||||||
| 3,000,000 | New York City Industrial Development Agency | 5.00 | % | 01/01/2046 | 3,007,080 | ||||||||
| 3,500,000 | New York Transportation Development Corp. | 5.00 | % | 08/01/2020 | 3,775,555 | ||||||||
| 4,000,000 | New York Transportation Development Corp. | 5.00 | % | 08/01/2026 | 4,299,800 | ||||||||
| 3,375,000 | Newport News Virginia Economic Development Authority | 5.00 | % | 12/01/2031 | 3,567,173 | ||||||||
| 1,760,000 | Niagara County New York Tobacco Asset Securitization Corp. | 5.00 | % | 05/15/2024 | 2,061,805 | ||||||||
| 2,000,000 | North Carolina Medical Care Commission | 5.00 | % | 10/01/2031 | 2,114,900 | ||||||||
| 2,640,000 | Oregon State Facilities Authority | 5.00 | % | 10/01/2031 | 3,006,511 | ||||||||
| 1,250,000 | Palm Beach County Florida Health Facilities Authority | 5.00 | % | 12/01/2031 | 1,381,875 | ||||||||
| 1,000,000 | Park Creek Metropolitan District | 5.00 | % | 12/01/2022 | 1,138,500 | ||||||||
| 1,000,000 | Park Creek Metropolitan District | 5.00 | % | 12/01/2034 | 1,102,020 | ||||||||
| 1,535,000 | Pennsylvania Economic Development Financing Authority | 5.00 | % | 11/01/2027 | 1,724,849 | ||||||||
| 1,900,000 | Pennsylvania Turnpike Commission | 5.00 | % | 12/01/2030 | 2,077,403 | ||||||||
| 1,110,000 | Prince William County Virginia Industrial Development Authority | 5.00 | % | 01/01/2025 | 1,231,390 | ||||||||
| 1,420,000 | Prince William County Virginia Industrial Development Authority | 5.00 | % | 01/01/2031 | 1,530,178 | ||||||||
| 1,500,000 | Public Finance Authority | 2.63 | % | 11/01/2025 | 1,498,305 | ||||||||
| 1,300,000 | Public Finance Authority^ | 5.00 | % | 09/01/2030 | 1,356,641 | ||||||||
| 2,510,000 | Railsplitter Tobacco Settlement Authority | 5.00 | % | 06/01/2018 | 2,598,101 | ||||||||
| 1,000,000 | South Carolina Ports Authority | 5.00 | % | 07/01/2026 | 1,181,130 | ||||||||
| 250,000 | South Carolina Ports Authority | 5.00 | % | 07/01/2028 | 290,748 | ||||||||
| 400,000 | South Carolina Ports Authority | 5.00 | % | 07/01/2029 | 461,620 | ||||||||
| 5,000,000 | South Miami Florida Health Facilities Authority | 5.00 | % | 08/15/2032 | 5,022,050 | ||||||||
| 1,000,000 | St. Louis County Missouri Industrial Development Authority | 5.00 | % | 11/15/2041 | 1,006,750 | ||||||||
| 1,000,000 | St. Louis Missouri Parking Revenue | 5.00 | % | 12/15/2021 | 1,137,160 | ||||||||
| 1,900,000 | Tarrant County Texas Cultural Education Facilities Finance Corp. | 2.50 | % | 12/01/2018 | 1,900,969 | ||||||||
| 1,125,000 | Tarrant County Texas Cultural Education Facilities Finance Corp. | 5.00 | % | 11/15/2021 | 1,272,364 | ||||||||
| 1,185,000 | Tarrant County Texas Cultural Education Facilities Finance Corp. | 5.00 | % | 11/15/2022 | 1,373,486 | ||||||||
| 1,115,000 | Tobacco Settlement Authority | 5.25 | % | 06/01/2032 | 1,230,536 | ||||||||
| 3,735,000 | Tobacco Settlement Financing Corp. | 5.00 | % | 05/15/2019 | 3,942,666 | ||||||||
| 2,790,000 | TSASC, Inc. | 5.00 | % | 06/01/2022 | 3,169,747 | ||||||||
| 1,000,000 | Tulare California Public Financing Authority | 5.38 | % | 04/01/2035 | 1,031,160 | ||||||||
| 5,000,000 | University of Houston Texas | 5.00 | % | 02/15/2027 | 6,111,900 | ||||||||
| 2,600,000 | University of Houston Texas | 5.00 | % | 02/15/2028 | 3,151,148 | ||||||||
The accompanying notes are an integral part of these financial statements.
59
Brown Advisory Tax Exempt Bond Fund
Schedule of Investments
June 30, 2017
| Par | ||||||||||||||
| Value/Shares | Security Description | Rate | Maturity | Value $ | ||||||||||
| Municipal Bonds — 97.5% (Continued) | ||||||||||||||
| Revenue Bonds — 88.1% (Continued) | ||||||||||||||
| 830,000 | Vigo, County of Indiana | 2.00 | % | 07/15/2017 | 830,340 | |||||||||
| 2,000,000 | Waco Texas Educational Finance Corp. | 5.00 | % | 03/01/2028 | 2,051,820 | |||||||||
| 5,000,000 | Washington D.C. Convention & Sports Authority | 5.00 | % | 10/01/2025 | 5,017,000 | |||||||||
| 1,000,000 | Washington State Housing Finance Commission^ | 4.00 | % | 01/01/2026 | 1,004,300 | |||||||||
| 2,655,000 | Washington State Housing Finance Commission^ | 5.00 | % | 01/01/2031 | 2,815,734 | |||||||||
| 1,505,000 | Washoe, County of Nevada | 5.00 | % | 02/01/2043 | 1,584,750 | |||||||||
| 1,500,000 | Wayne County Michigan Airport Authority | 5.00 | % | 12/01/2022 | 1,524,570 | |||||||||
| 970,000 | Wayne County Michigan Airport Authority | 5.75 | % | 12/01/2024 | 1,029,248 | |||||||||
| 2,500,000 | Wayne County Michigan Airport Authority | 4.50 | % | 12/01/2024 | 2,536,250 | |||||||||
| 2,110,000 | Western Riverside Water & Wastewater Financing Authority | 5.00 | % | 09/01/2029 | 2,450,301 | |||||||||
| 1,610,000 | Wisconsin Health & Educational Facilities Authority | 5.00 | % | 05/01/2027 | 1,798,515 | |||||||||
| 1,730,000 | Wisconsin Health & Educational Facilities Authority | 5.00 | % | 08/15/2028 | 1,933,154 | |||||||||
| 650,000 | Wisconsin Health & Educational Facilities Authority | 5.00 | % | 09/15/2037 | 685,880 | |||||||||
| 200,000 | Wisconsin, State of | 5.75 | % | 05/01/2033 | 217,162 | |||||||||
| 910,000 | Yamhill County Oregon Hospital Authority | 4.00 | % | 11/15/2026 | 925,206 | |||||||||
| 480,000 | Yamhill County Oregon Hospital Authority | 5.00 | % | 11/15/2031 | 513,322 | |||||||||
| 460,000 | Yamhill County Oregon Hospital Authority | 5.00 | % | 11/15/2036 | 486,790 | |||||||||
| 1,085,000 | Yamhill County Oregon Hospital Authority | 5.00 | % | 11/15/2046 | 1,129,442 | |||||||||
| 226,981,195 | ||||||||||||||
| Total Municipal Bonds (Cost $251,200,260) | 250,984,017 | |||||||||||||
| Short-Term Investments — 1.5% | ||||||||||||||
| Money Market Funds — 1.5% | ||||||||||||||
| 3,945,333 | First American Treasury Obligations Fund — Class Z, 0.85%* | 3,945,333 | ||||||||||||
| Total Short-Term Investments (Cost $3,945,333) | 3,945,333 | |||||||||||||
| Total Investments — 99.0% (Cost $255,145,593) | 254,929,350 | |||||||||||||
| Other Assets in Excess of Liabilities — 1.0% | 2,672,791 | |||||||||||||
| NET ASSETS — 100.0% | $ | 257,602,141 | ||||||||||||
| * | Annualized seven-day yield as of June 30, 2017. |
| ^ | Security exempt from registration under Rule 144A of the Securities Act of 1933. These securities may be resold in transactions exempt from registration, normally to qualified institutional buyers. At June 30, 2017 the value of these securities amounted to $5,176,675 or 2.0% of net assets. |
| # | Variable rate security. Rate disclosed is as of June 30, 2017. |
The accompanying notes are an integral part of these financial statements.
60
Brown Advisory Mortgage Securities Fund
A Message to Our Shareholders
June 30, 2017
Dear Shareholder:
During the year ended June 30, 2017, the Brown Advisory Mortgage Securities Fund Investor Shares (the “Fund”) was down 0.68%, slightly behind the Bloomberg Barclays Mortgage Backed Securities Index which was down 0.06%.
The Fund’s investment process incorporates prepayment analysis to help find mortgage-related bonds where borrowers repay their balance more slowly than average. As slower repayments result in more interest earned by investors, we believe this strategy has the potential to result in outperformance over time.
In this analysis, we look for pools where the borrower has a lesser incentive and/or ability to refinance – from a smaller loan balance to lower upfront equity to a buyer incentive that would not be available upon refinance. Often we use an amalgamation of attractive features about a set of loans to determine their value.
This strategy is designed to work over time through income generation that exceeds our peers; however in the short-term, price fluctuations can overwhelm our income advantage. This was most evident in the fourth quarter of 2016. The sudden spike higher in rates caused the mortgage market to devalue features like smaller loan balance. In effect, the market was saying that the prepayment characteristics on these bonds were not as interesting in a higher rate environment as when rates are low. The Fund underperformed by 0.63% during that quarter, which accounts for nearly all of the underperformance for the year.
This is not to say the Fund is merely a victim of interest rate fluctuations. Historically there has been no pattern about whether the Fund outperforms or underperforms with any given rate direction. We believe that our process, which seeks better income generation and convexity, has the potential to ultimately lead to outperformance. We plan on sticking to our core process, analyzing each loan, and assessing the borrower’s incentives. We believe strongly in the advantages this can bring over time.
Sincerely,
Thomas D.D. Graff, CFA
Portfolio Manager
Past performance is not a guarantee of future results.
Mutual fund investing involves risk. Principal loss is possible. Investments in debt securities typically decrease in value when interest rates rise. This risk is usually greater for longer-term debt securities. Investments in Asset-Backed and Mortgage-Backed securities include additional risks that investor should be aware of including credit risk, prepayment risk, possible illiquidity and default, as well as increased susceptibility to adverse economic developments. Certain fixed income securities held by the Fund may be difficult (or impossible) to sell at the time and at the price the Adviser would like. As a result, the Fund may have to hold these securities longer than it would like and may forego other investment opportunities. Issuers may experience an acceleration in prepayments of mortgage loans or other receivables backing the issuers’ fixed income securities when interest rates decline, which can shorten the maturity of the security, force the Fund to invest in securities with lower interest rates, and reduce the Fund’s return. Issuers may decrease prepayments of principal when interest rates increase, extending the maturity of a fixed income security and causing the value of the security to decline. Investing involves risk. Principal loss is possible. Investors should consult a tax professional for advice and information concerning the tax features of mortgage backed securities and fixed coupon bonds. Mortgage-backed securities (MBS) are bonds secured by a mortgage or collection of mortgages. Diversification does not assure a profit nor protect against loss in a declining market.
Fund holdings and sector allocations are subject to change and should not be considered a recommendation to buy or sell any security. For a complete list of fund holdings, please refer to the Schedule of Investments provided in this report.
Definitions for terms and indices are provided in the Glossary of Terms.
61
Brown Advisory Mortgage Securities Fund
Performance Information & Portfolio Holdings Summary
June 30, 2017
| PORTFOLIO HOLDINGS | % of Net Assets |
| Mortgage Backed Securities | 109.4% |
| Asset Backed Securities | 18.8% |
| Money Market Funds | 6.5% |
| Local Government | |
| Housing Agency Bonds | 1.2% |
| Preferred Stocks | 0.1% |
| U.S. Treasury Bills | 0.1% |
| Other Assets and Liabilities | (36.1)% |
100.0% |
GROWTH OF A $10,000 INVESTMENT
The following chart reflects the change in value of a hypothetical $10,000 investment, including reinvested dividends and distributions, in the Fund as measured against a broad-based bond index. The Bloomberg Barclays Mortgage Backed Securities Index (“Index”) is a market value-weighted index which covers the mortgage-backed securities component of the Barclays US Aggregate Bond Index. The Index is composed of agency mortgage-backed passthrough securities of the Government National Mortgage Association (Ginnie Mae), the Federal National Mortgage Association (Fannie Mae), and the Federal Home Loan Mortgage Corporation (Freddie Mac) with a minimum $150 million par amount outstanding and a weighted-average maturity of at least 1 year. The Index includes reinvestment of income. The Index is unmanaged and does not reflect the deduction of fees, such as investment management fees. Investors cannot invest directly in an index.

| Since Inception | ||
Average Annual Total Return as of 6/30/17 | One Year | (12/26/13) |
Institutional Shares1 | -0.52% | 2.60% |
| Investor Shares | -0.68% | 2.53% |
| Bloomberg Barclays Mortgage Backed Securities Index | -0.06% | 3.07% |
Institutional Shares | Investor Shares | |
Gross Expense Ratio2 | 0.46% | 0.51% |
Net Expense Ratio2 | 0.46% | 0.51% |
Past performance does not guarantee future results. The performance data quoted represents past performance and current returns may be lower or higher. The investment return and net asset value will fluctuate so that an investor’s shares, when redeemed, may be worth more or less than the original cost. To obtain performance information current to the most recent month end, please visit our website at brownadvisoryfunds.com/performance.html. The performance table and graph above do not reflect the deduction of taxes that a shareholder would pay on Fund distributions or the redemption of Fund shares. Performance data does not reflect the imposition of the redemption fee of 1.00% on shares redeemed within 14 days, and if it did, performance would have been lower. Short-term performance, in particular, is not a good indication of the Fund’s future performance, and an investment should not be made based solely on returns.
1 | Performance information for the Institutional Shares, prior to commencement of operations on May 13, 2014, is based on the performance of the Investor Shares, and adjusted for the lower expenses applicable to the Institutional Shares. |
2 | Per the Fund’s prospectus dated October 31, 2016. Refer to the financial highlights for the gross and net expense ratios for the year ended as of the date of this report. Please note that the expense ratios per the prospectus include acquired fund fees and expenses (as applicable) and the expense ratios in the financial highlights do not. |
62
Brown Advisory Mortgage Securities Fund
Schedule of Investments
June 30, 2017
| Par Value | Security Description | Rate | Maturity | Value $ | |||||||||
| Mortgage Backed Securities — 109.4% | |||||||||||||
| 1,900,000 | BAMLL Commercial Mortgage Securities Trust, Series 2013-DSNY#^ | 2.21 | % | 09/15/2026 | 1,905,528 | ||||||||
| 1,600,000 | BAMLL Commercial Mortgage Securities Trust, Series 2017-BNK3 | 3.75 | % | 02/17/2050 | 1,656,172 | ||||||||
| 1,400,000 | BANK, Series 2017-BNK4 | 3.78 | % | 05/17/2050 | 1,445,365 | ||||||||
| 481,540 | Bayview Opportunity Master Fund IIIb Trust, Series 2017-CRT2 M#^ | 3.22 | % | 11/25/2027 | 482,379 | ||||||||
| 1,000,000 | Chicago Skyscraper Trust, Series 2017-SKY A#^ | 1.96 | % | 02/15/2030 | 1,003,032 | ||||||||
| 1,000,000 | Cosmopolitan Hotel Trust, Series 2016-COSMO A#^ | 2.56 | % | 11/15/2033 | 1,008,611 | ||||||||
| 250,000 | Cosmopolitan Hotel Trust, Series 2016-COSMO B#^ | 3.26 | % | 11/15/2033 | 252,181 | ||||||||
| 250,000 | Cosmopolitan Hotel Trust, Series 2016-COSMO C#^ | 3.81 | % | 11/15/2033 | 252,716 | ||||||||
| 1,000,000 | CSMC, Series 2017-HD A#^ | 2.11 | % | 02/18/2031 | 1,003,679 | ||||||||
| 500,000 | CSMC, Series 2017-HD B#^ | 2.51 | % | 02/18/2031 | 502,014 | ||||||||
| 500,000 | CSMC, Series 2017-HD C#^ | 2.86 | % | 02/18/2031 | 502,663 | ||||||||
| 800,000 | CSMC, Series 2017-LSTK A^ | 2.76 | % | 04/07/2033 | 810,273 | ||||||||
| 1,600,000 | CSMC, Series 2014-TIKI A#^ | 2.11 | % | 09/15/2038 | 1,602,380 | ||||||||
| 10,000,000 | FHLMC Gold, 2.5%, Due TBA July | 2.50 | % | 07/15/2032 | 10,057,810 | ||||||||
| 7,000,000 | FHLMC Gold, 3.0%, Due TBA July | 3.00 | % | 07/15/2032 | 7,188,672 | ||||||||
| 8,945,409 | FHLMC Gold, 3.0%, Due TBA July | 3.00 | % | 07/15/2047 | 8,926,539 | ||||||||
| 7,500,000 | FHLMC Gold, 3.5%, Due TBA July | 3.50 | % | 07/15/2047 | 7,705,463 | ||||||||
| 60,107 | FHLMC PC, Pool# E9-9067 | 4.50 | % | 09/01/2018 | 61,476 | ||||||||
| 63,998 | FHLMC PC, Pool# E0-1446 | 4.50 | % | 09/01/2018 | 65,451 | ||||||||
| 51,299 | FHLMC PC, Pool# E9-9078 | 4.50 | % | 09/01/2018 | 52,464 | ||||||||
| 38,769 | FHLMC PC, Pool# E9-9081 | 4.50 | % | 09/01/2018 | 39,649 | ||||||||
| 167,388 | FHLMC PC, Pool# B1-0554 | 4.50 | % | 11/01/2018 | 171,189 | ||||||||
| 115,195 | FHLMC PC, Pool# B1-2048 | 4.50 | % | 02/01/2019 | 117,811 | ||||||||
| 98,102 | FHLMC PC, Pool# B1-2124 | 4.50 | % | 02/01/2019 | 100,329 | ||||||||
| 35,886 | FHLMC PC, Pool# B1-2315 | 5.00 | % | 02/01/2019 | 36,900 | ||||||||
| 84,544 | FHLMC PC, Pool# B1-2954 | 4.50 | % | 03/01/2019 | 86,464 | ||||||||
| 38,368 | FHLMC PC, Pool# B1-5004 | 5.00 | % | 06/01/2019 | 39,366 | ||||||||
| 41,685 | FHLMC PC, Pool# B1-7160 | 5.00 | % | 11/01/2019 | 42,769 | ||||||||
| 187,687 | FHLMC PC, Pool# J1-1925 | 4.00 | % | 04/01/2020 | 194,437 | ||||||||
| 49,095 | FHLMC PC, Pool# G1-3598 | 5.00 | % | 04/01/2020 | 50,372 | ||||||||
| 30,506 | FHLMC PC, Pool# B1-9221 | 5.00 | % | 04/01/2020 | 31,522 | ||||||||
| 146,389 | FHLMC PC, Pool# J1-2792 | 4.00 | % | 08/01/2020 | 151,653 | ||||||||
| 60,491 | FHLMC PC, Pool# M3-0034 | 4.00 | % | 12/01/2020 | 61,653 | ||||||||
| 28,061 | FHLMC PC, Pool# J1-4794 | 4.00 | % | 03/01/2021 | 29,070 | ||||||||
| 37,111 | FHLMC PC, Pool# G1-8105 | 5.00 | % | 03/01/2021 | 38,398 | ||||||||
| 81,372 | FHLMC PC, Pool# G1-1980 | 5.00 | % | 04/01/2021 | 84,622 | ||||||||
| 31,757 | FHLMC PC, Pool# C9-0438 | 6.50 | % | 04/01/2021 | 34,525 | ||||||||
| 12,865 | FHLMC PC, Pool# G1-3055 | 5.00 | % | 05/01/2021 | 13,209 | ||||||||
| 341,638 | FHLMC PC, Pool# G1-2335 | 5.00 | % | 05/01/2021 | 354,850 | ||||||||
| 33,652 | FHLMC PC, Pool# D9-4634 | 6.50 | % | 05/01/2021 | 35,477 | ||||||||
| 84,652 | FHLMC PC, Pool# C9-0449 | 6.50 | % | 06/01/2021 | 92,114 | ||||||||
| 45,112 | FHLMC PC, Pool# C9-0457 | 6.50 | % | 07/01/2021 | 48,988 | ||||||||
| 27,378 | FHLMC PC, Pool# D9-4802 | 6.00 | % | 08/01/2021 | 30,782 | ||||||||
| 27,817 | FHLMC PC, Pool# C9-0473 | 6.50 | % | 08/01/2021 | 29,369 | ||||||||
| 29,669 | FHLMC PC, Pool# C9-0482 | 6.50 | % | 09/01/2021 | 32,228 | ||||||||
| 97,836 | FHLMC PC, Pool# G1-2419 | 5.00 | % | 10/01/2021 | 102,333 | ||||||||
| 71,202 | FHLMC PC, Pool# G1-2521 | 5.00 | % | 12/01/2021 | 74,356 | ||||||||
| 72,999 | FHLMC PC, Pool# G8-0074 | 7.75 | % | 12/17/2021 | 75,829 | ||||||||
| 161,606 | FHLMC PC, Pool# G1-2729 | 6.50 | % | 01/01/2022 | 170,226 | ||||||||
| 15,564 | FHLMC PC, Pool# C9-0523 | 6.00 | % | 02/01/2022 | 17,499 | ||||||||
| 66,976 | FHLMC PC, Pool# D9-5272 | 6.00 | % | 04/01/2022 | 75,306 | ||||||||
| 57,647 | FHLMC PC, Pool# G1-2944 | 5.00 | % | 05/01/2022 | 60,686 | ||||||||
| 135,577 | FHLMC PC, Pool# C9-0552 | 6.00 | % | 06/01/2022 | 152,438 | ||||||||
| 162,370 | FHLMC PC, Pool# Z6-0016 | 5.50 | % | 04/01/2023 | 178,989 | ||||||||
| 1,549,106 | FHLMC PC, Pool# G1-6224 | 6.00 | % | 09/01/2023 | 1,662,869 | ||||||||
| 48,622 | FHLMC PC, Pool# J2-7466 | 4.00 | % | 02/01/2024 | 50,688 | ||||||||
| 12,091 | FHLMC PC, Pool# G1-3584 | 4.50 | % | 06/01/2024 | 12,849 | ||||||||
| 26,600 | FHLMC PC, Pool# J1-1196 | 4.50 | % | 11/01/2024 | 28,297 | ||||||||
The accompanying notes are an integral part of these financial statements.
63
Brown Advisory Mortgage Securities Fund
Schedule of Investments
June 30, 2017
| Par Value | Security Description | Rate | Maturity | Value $ | |||||||||
| Mortgage Backed Securities — 109.4% (Continued) | |||||||||||||
| 46,323 | FHLMC PC, Pool# G1-3900 | 5.00 | % | 12/01/2024 | 47,758 | ||||||||
| 1,201,800 | FHLMC PC, Pool# G1-6223 | 5.50 | % | 12/01/2024 | 1,269,776 | ||||||||
| 46,667 | FHLMC PC, Pool# G1-5035 | 4.50 | % | 07/01/2025 | 49,627 | ||||||||
| 251,691 | FHLMC PC, Pool# G1-4153 | 5.00 | % | 04/01/2026 | 269,382 | ||||||||
| 53,271 | FHLMC PC, Pool# G1-4375 | 4.00 | % | 07/01/2026 | 55,938 | ||||||||
| 30,489 | FHLMC PC, Pool# G8-0294 | 6.20 | % | 10/20/2027 | 32,839 | ||||||||
| 151,215 | FHLMC PC, Pool# N3-0530 | 5.50 | % | 01/01/2029 | 155,926 | ||||||||
| 1,506,455 | FHLMC PC, Pool# J3-2596 | 3.50 | % | 08/01/2030 | 1,572,330 | ||||||||
| 1,075,447 | FHLMC PC, Pool# J3-2643 | 3.50 | % | 09/01/2030 | 1,122,540 | ||||||||
| 88,209 | FHLMC PC, Pool# N5-0056 | 6.50 | % | 02/01/2031 | 92,949 | ||||||||
| 25,286 | FHLMC PC, Pool# G8-0285 | 9.00 | % | 04/17/2031 | 28,471 | ||||||||
| 74,720 | FHLMC PC, Pool# C6-6421 | 6.50 | % | 02/01/2032 | 82,618 | ||||||||
| 48,336 | FHLMC PC, Pool# P0-0023 | 6.50 | % | 11/01/2032 | 52,908 | ||||||||
| 298,850 | FHLMC PC, Pool# N7-0078 | 5.50 | % | 01/01/2033 | 321,210 | ||||||||
| 162,173 | FHLMC PC, Pool# 1B-0889# | 3.39 | % | 05/01/2033 | 170,997 | ||||||||
| 12,540 | FHLMC PC, Pool# 1B-1275# | 3.17 | % | 10/01/2033 | 13,312 | ||||||||
| 111,570 | FHLMC PC, Pool# 1J-0204# | 3.53 | % | 05/01/2035 | 118,261 | ||||||||
| 272,352 | FHLMC PC, Pool# N7-0071 | 6.00 | % | 06/01/2035 | 296,993 | ||||||||
| 1,784,614 | FHLMC PC, Pool# K9-3365 | 3.50 | % | 11/01/2035 | 1,861,651 | ||||||||
| 1,079,353 | FHLMC PC, Pool# K9-3349 | 4.00 | % | 11/01/2035 | 1,149,827 | ||||||||
| 61,049 | FHLMC PC, Pool# 1L-1263# | 3.12 | % | 03/01/2036 | 64,422 | ||||||||
| 79,046 | FHLMC PC, Pool# 1H-1348# | 2.68 | % | 10/01/2036 | 83,496 | ||||||||
| 116,754 | FHLMC PC, Pool# B3-1891 | 5.38 | % | 01/01/2037 | 128,150 | ||||||||
| 432,178 | FHLMC PC, Pool# 84-7727# | 3.16 | % | 02/01/2037 | 456,317 | ||||||||
| 219,480 | FHLMC PC, Pool# B3-1900 | 5.38 | % | 02/01/2037 | 240,971 | ||||||||
| 242,220 | FHLMC PC, Pool# B3-1917 | 5.10 | % | 04/01/2037 | 263,716 | ||||||||
| 129,741 | FHLMC PC, Pool# B3-1934 | 5.38 | % | 04/01/2037 | 142,393 | ||||||||
| 34,018 | FHLMC PC, Pool# A5-9109 | 7.50 | % | 04/01/2037 | 38,666 | ||||||||
| 91,940 | FHLMC PC, Pool# B3-1950 | 5.10 | % | 05/01/2037 | 100,128 | ||||||||
| 252,653 | FHLMC PC, Pool# B3-1976 | 5.10 | % | 05/01/2037 | 275,012 | ||||||||
| 240,021 | FHLMC PC, Pool# A6-7884 | 5.38 | % | 05/01/2037 | 263,412 | ||||||||
| 215,896 | FHLMC PC, Pool# 1J-1681# | 3.82 | % | 06/01/2037 | 231,053 | ||||||||
| 185,457 | FHLMC PC, Pool# B3-2000 | 5.10 | % | 06/01/2037 | 201,819 | ||||||||
| 104,848 | FHLMC PC, Pool# B3-2032 | 5.10 | % | 07/01/2037 | 114,095 | ||||||||
| 104,794 | FHLMC PC, Pool# U3-0471 | 5.10 | % | 07/01/2037 | 114,055 | ||||||||
| 60,317 | FHLMC PC, Pool# U3-0653 | 5.13 | % | 07/01/2037 | 66,142 | ||||||||
| 83,670 | FHLMC PC, Pool# U3-0606 | 5.10 | % | 09/01/2037 | 91,105 | ||||||||
| 328,515 | FHLMC PC, Pool# U3-0681 | 5.10 | % | 09/01/2037 | 357,407 | ||||||||
| 56,989 | FHLMC PC, Pool# 1G-2249# | 3.28 | % | 10/01/2037 | 59,892 | ||||||||
| 289,094 | FHLMC PC, Pool# T3-0346 | 5.38 | % | 10/01/2037 | 317,381 | ||||||||
| 92,139 | FHLMC PC, Pool# U3-0800 | 5.10 | % | 11/01/2037 | 100,272 | ||||||||
| 157,221 | FHLMC PC, Pool# U3-1874 | 5.38 | % | 04/01/2038 | 172,692 | ||||||||
| 445,679 | FHLMC PC, Pool# N7-0082 | 6.00 | % | 07/01/2038 | 478,697 | ||||||||
| 123,862 | FHLMC PC, Pool# U3-2470 | 5.10 | % | 11/01/2038 | 134,865 | ||||||||
| 130,193 | FHLMC PC, Pool# A8-9112 | 4.50 | % | 10/01/2039 | 139,825 | ||||||||
| 257,542 | FHLMC PC, Pool# Q0-3759 | 3.50 | % | 10/01/2041 | 265,711 | ||||||||
| 3,226,409 | FHLMC PC, Pool# G0-7289 | 3.00 | % | 11/01/2042 | 3,245,696 | ||||||||
| 709,130 | FHLMC PC, Pool# Q3-8585 | 4.00 | % | 10/01/2043 | 747,286 | ||||||||
| 906,125 | FHLMC PC, Pool# Q2-6108 | 5.00 | % | 05/01/2044 | 986,958 | ||||||||
| 1,101,161 | FHLMC PC, Pool# Q4-3432 | 4.00 | % | 07/01/2046 | 1,159,496 | ||||||||
| 1,902,239 | FHLMC PC, Pool# Q4-6591 | 4.00 | % | 03/01/2047 | 2,007,331 | ||||||||
| 1,627,012 | FHLMC PC, Pool# Q4-6628 | 4.50 | % | 03/01/2047 | 1,743,879 | ||||||||
| 1,719,864 | FHLMC PC, Pool# Q4-6965 | 4.50 | % | 03/01/2047 | 1,843,407 | ||||||||
| 3,076,048 | FHLMC PC, Pool# Q4-6676 | 4.50 | % | 03/01/2047 | 3,297,007 | ||||||||
| 2,178,756 | FHLMC PC, Pool# Q4-7280 | 4.50 | % | 04/01/2047 | 2,335,310 | ||||||||
| 1,095,555 | FHLMC PC, Pool# Q4-7377 | 4.50 | % | 04/01/2047 | 1,174,249 | ||||||||
| 1,827,446 | FHLMC PC, Pool# Q4-7871 | 4.00 | % | 05/01/2047 | 1,928,407 | ||||||||
| 2,348,322 | FHLMC PC, Pool# Q4-7885 | 4.50 | % | 05/01/2047 | 2,516,997 | ||||||||
The accompanying notes are an integral part of these financial statements.
64
Brown Advisory Mortgage Securities Fund
Schedule of Investments
June 30, 2017
| Par Value | Security Description | Rate | Maturity | Value $ | |||||||||
| Mortgage Backed Securities — 109.4% (Continued) | |||||||||||||
| 6,962,326 | FHLMC REMIC, Series 4318~ | 2.50 | % | 08/15/2022 | 349,574 | ||||||||
| 23,737 | FHLMC REMIC, Series 2516 | 5.50 | % | 10/15/2022 | 25,650 | ||||||||
| 5,790,821 | FHLMC REMIC, Series 4329~ | 2.50 | % | 01/15/2023 | 324,758 | ||||||||
| 103,966 | FHLMC REMIC, Series 3571 | 4.00 | % | 09/15/2024 | 108,813 | ||||||||
| 1,588,745 | FHLMC REMIC, Series 4092~ | 3.00 | % | 09/15/2031 | 164,960 | ||||||||
| 221,472 | FHLMC REMIC, Series 2517 | 5.50 | % | 10/15/2032 | 235,791 | ||||||||
| 2,334,085 | FHLMC REMIC, Series 4309~ | 3.00 | % | 08/15/2039 | 297,681 | ||||||||
| 2,314,945 | FHLMC REMIC, Series 4015~ | 4.00 | % | 11/15/2039 | 331,419 | ||||||||
| 281,926 | FHLMC REMIC, Series 3878 | 3.00 | % | 04/15/2041 | 287,205 | ||||||||
| 1,549,095 | FHLMC REMIC, Series 4126~ | 3.50 | % | 05/15/2041 | 192,557 | ||||||||
| 4,778,293 | FHLMC REMIC, Series 4495~ | 3.50 | % | 07/15/2045 | 883,682 | ||||||||
| 85,905 | FHLMC REMIC, Series 1843 | 7.00 | % | 04/15/2026 | 95,272 | ||||||||
| 1,450,000 | FHLMC SCRTT, Series 2016-1 M1#^ | 3.00 | % | 09/25/2055 | 1,410,096 | ||||||||
| 1,137,075 | FHLMC SCRTT, Series 2017-1 HA# | 2.00 | % | 01/25/2056 | 1,139,104 | ||||||||
| 4,804,692 | FHLMC STACR Debt Notes, Series 2014-DN2 M2# | 2.87 | % | 04/25/2024 | 4,882,330 | ||||||||
| 1,258,535 | FHLMC STACR Debt Notes, Series 2015-HQ2 M1# | 2.32 | % | 05/27/2025 | 1,261,518 | ||||||||
| 1,307,811 | FHLMC STACR Debt Notes, Series 2015-DNA1 M1# | 2.12 | % | 10/25/2027 | 1,309,631 | ||||||||
| 16,257,823 | FHMS, Series K-721#~ | 0.46 | % | 08/25/2022 | 240,973 | ||||||||
| 2,191,034 | FHMS, Series K-J07 | 1.53 | % | 09/25/2022 | 2,133,046 | ||||||||
| 10,541,060 | FHMS, Series K-722#~ | 1.44 | % | 03/25/2023 | 644,484 | ||||||||
| 129,136 | FHMS, Series K-J12 | 2.38 | % | 04/25/2023 | 130,384 | ||||||||
| 16,485,004 | FHMS, Series K-723#~ | 0.96 | % | 08/25/2023 | 802,511 | ||||||||
| 3,000,000 | FHMS, Series K-J14 | 2.20 | % | 11/25/2023 | 3,010,428 | ||||||||
| 11,380,475 | FHMS, Series K-725#~ | 0.84 | % | 01/25/2024 | 462,435 | ||||||||
| 6,110,000 | FHMS, Series K-725 | 3.00 | % | 01/25/2024 | 6,297,259 | ||||||||
| 27,858,420 | FHMS, Series K-046#~ | 0.50 | % | 03/25/2025 | 712,212 | ||||||||
| 7,141,241 | FHMS, Series K-055#~ | 1.50 | % | 03/25/2026 | 693,628 | ||||||||
| 7,622,600 | FHMS, Series K-056#~ | 1.40 | % | 05/25/2026 | 687,521 | ||||||||
| 6,742,578 | FHMS, Series K-057#~ | 1.33 | % | 07/25/2026 | 585,981 | ||||||||
| 5,448,137 | FHMS, Series K-058#~ | 1.06 | % | 08/25/2026 | 376,585 | ||||||||
| 7,933,797 | FHMS, Series K-064#~ | 0.75 | % | 03/25/2027 | 392,953 | ||||||||
| 5,400,000 | FHMS, Series K-724#~ | 1.93 | % | 12/25/2044 | 541,037 | ||||||||
| 4,312,624 | FHMS, Series K-725#~ | 2.15 | % | 02/25/2045 | 503,105 | ||||||||
| 16,744 | FNMA, Pool# 683378 | 5.00 | % | 02/01/2018 | 17,154 | ||||||||
| 24,677 | FNMA, Pool# 254720 | 4.50 | % | 05/01/2018 | 25,282 | ||||||||
| 122,599 | FNMA, Pool# 709829 | 4.50 | % | 06/01/2018 | 125,603 | ||||||||
| 29,646 | FNMA, Pool# 254759 | 4.50 | % | 06/01/2018 | 30,373 | ||||||||
| 52,054 | FNMA, Pool# 709918 | 4.50 | % | 06/01/2018 | 53,329 | ||||||||
| 22,509 | FNMA, Pool# 722053 | 4.50 | % | 07/01/2018 | 23,061 | ||||||||
| 36,246 | FNMA, Pool# 254802 | 4.50 | % | 07/01/2018 | 37,134 | ||||||||
| 8,763 | FNMA, Pool# 730721 | 4.50 | % | 08/01/2018 | 8,977 | ||||||||
| 8,309 | FNMA, Pool# 746842 | 4.50 | % | 09/01/2018 | 8,513 | ||||||||
| 7,852 | FNMA, Pool# 746359 | 4.50 | % | 10/01/2018 | 8,045 | ||||||||
| 7,259 | FNMA, Pool# 746378 | 4.50 | % | 10/01/2018 | 7,437 | ||||||||
| 13,404 | FNMA, Pool# 744697 | 4.50 | % | 10/01/2018 | 13,732 | ||||||||
| 4,187 | FNMA, Pool# 738673 | 4.50 | % | 10/01/2018 | 4,290 | ||||||||
| 63,853 | FNMA, Pool# 254953 | 5.00 | % | 11/01/2018 | 65,422 | ||||||||
| 65,695 | FNMA, Pool# 725048 | 5.00 | % | 11/01/2018 | 67,310 | ||||||||
| 174,133 | FNMA, Pool# 747846 | 4.50 | % | 12/01/2018 | 178,401 | ||||||||
| 84,035 | FNMA, Pool# 255076 | 4.50 | % | 01/01/2019 | 86,094 | ||||||||
| 29,316 | FNMA, Pool# 735057 | 4.50 | % | 01/01/2019 | 30,034 | ||||||||
| 25,868 | FNMA, Pool# 763911 | 4.50 | % | 01/01/2019 | 26,502 | ||||||||
| 58,818 | FNMA, Pool# 765178 | 5.00 | % | 01/01/2019 | 60,318 | ||||||||
| 125,288 | FNMA, Pool# AL0472 | 5.50 | % | 01/01/2019 | 127,040 | ||||||||
| 2,100 | FNMA, Pool# 756846 | 4.50 | % | 02/01/2019 | 2,151 | ||||||||
| 8,693 | FNMA, Pool# 485352 | 6.00 | % | 02/01/2019 | 9,780 | ||||||||
The accompanying notes are an integral part of these financial statements.
65
Brown Advisory Mortgage Securities Fund
Schedule of Investments
June 30, 2017
| Par Value | Security Description | Rate | Maturity | Value $ | |||||||||
| Mortgage Backed Securities — 109.4% (Continued) | |||||||||||||
| 73,857 | FNMA, Pool# 747032 | 4.50 | % | 03/01/2019 | 75,667 | ||||||||
| 2,582 | FNMA, Pool# 766729 | 4.50 | % | 03/01/2019 | 2,646 | ||||||||
| 62,593 | FNMA, Pool# 255108 | 4.50 | % | 03/01/2019 | 64,127 | ||||||||
| 26,279 | FNMA, Pool# AA8642 | 4.50 | % | 03/01/2019 | 26,923 | ||||||||
| 67,042 | FNMA, Pool# 357566 | 4.50 | % | 04/01/2019 | 68,685 | ||||||||
| 12,028 | FNMA, Pool# 658653 | 4.50 | % | 04/01/2019 | 12,323 | ||||||||
| 78,481 | FNMA, Pool# 255176 | 4.50 | % | 04/01/2019 | 80,404 | ||||||||
| 10,113 | FNMA, Pool# 252386 | 6.50 | % | 04/01/2019 | 11,188 | ||||||||
| 2,194 | FNMA, Pool# 725445 | 4.50 | % | 05/01/2019 | 2,248 | ||||||||
| 46,860 | FNMA, Pool# 725414 | 4.50 | % | 05/01/2019 | 48,008 | ||||||||
| 193,756 | FNMA, Pool# 761405 | 4.50 | % | 05/01/2019 | 198,504 | ||||||||
| 17,346 | FNMA, Pool# 931245 | 4.50 | % | 05/01/2019 | 17,771 | ||||||||
| 7,136 | FNMA, Pool# 775227 | 4.50 | % | 05/01/2019 | 7,311 | ||||||||
| 20,374 | FNMA, Pool# 780962 | 4.50 | % | 05/01/2019 | 20,873 | ||||||||
| 43,758 | FNMA, Pool# 761477 | 4.50 | % | 06/01/2019 | 44,830 | ||||||||
| 131,408 | FNMA, Pool# 785427 | 4.50 | % | 06/01/2019 | 134,628 | ||||||||
| 53,199 | FNMA, Pool# 725602 | 4.50 | % | 06/01/2019 | 54,503 | ||||||||
| 262,700 | FNMA, Pool# 785246 | 4.50 | % | 06/01/2019 | 269,138 | ||||||||
| 96,803 | FNMA, Pool# 255273 | 4.50 | % | 06/01/2019 | 99,175 | ||||||||
| 3,119 | FNMA, Pool# 793178 | 4.50 | % | 06/01/2019 | 3,196 | ||||||||
| 62,807 | FNMA, Pool# 932309 | 5.00 | % | 06/01/2019 | 63,064 | ||||||||
| 54,691 | FNMA, Pool# MA0137 | 5.00 | % | 06/01/2019 | 56,035 | ||||||||
| 83,529 | FNMA, Pool# 779356 | 6.50 | % | 06/01/2019 | 85,282 | ||||||||
| 201,684 | FNMA, Pool# 776388 | 5.50 | % | 07/01/2019 | 205,831 | ||||||||
| 107,487 | FNMA, Pool# 773482 | 4.50 | % | 08/01/2019 | 109,377 | ||||||||
| 40,427 | FNMA, Pool# 786729 | 5.50 | % | 08/01/2019 | 41,345 | ||||||||
| 29,951 | FNMA, Pool# AB3436 | 4.50 | % | 10/01/2019 | 30,685 | ||||||||
| 7,059 | FNMA, Pool# 803941# | 3.44 | % | 11/01/2019 | 7,130 | ||||||||
| 7,212 | FNMA, Pool# 803632 | 4.50 | % | 11/01/2019 | 7,388 | ||||||||
| 191,676 | FNMA, Pool# 735095 | 4.50 | % | 12/01/2019 | 196,373 | ||||||||
| 73,649 | FNMA, Pool# 797410 | 4.50 | % | 12/01/2019 | 75,454 | ||||||||
| 4,458 | FNMA, Pool# 357697 | 4.50 | % | 12/01/2019 | 4,567 | ||||||||
| 95,612 | FNMA, Pool# 803899 | 5.00 | % | 12/01/2019 | 98,773 | ||||||||
| 16,141 | FNMA, Pool# AD0672 | 4.50 | % | 01/01/2020 | 16,536 | ||||||||
| 10,245 | FNMA, Pool# 810457 | 4.50 | % | 01/01/2020 | 10,496 | ||||||||
| 70,051 | FNMA, Pool# 807710 | 4.50 | % | 01/01/2020 | 72,020 | ||||||||
| 24,930 | FNMA, Pool# MA0300 | 4.50 | % | 01/01/2020 | 25,541 | ||||||||
| 24,673 | FNMA, Pool# 808905 | 5.00 | % | 01/01/2020 | 25,280 | ||||||||
| 33,802 | FNMA, Pool# 809861 | 4.50 | % | 02/01/2020 | 34,631 | ||||||||
| 27,352 | FNMA, Pool# MA0323 | 4.50 | % | 02/01/2020 | 28,022 | ||||||||
| 8,299 | FNMA, Pool# 735255 | 4.50 | % | 02/01/2020 | 8,520 | ||||||||
| 45,150 | FNMA, Pool# 798042 | 5.00 | % | 02/01/2020 | 46,554 | ||||||||
| 98,930 | FNMA, Pool# 801577 | 5.00 | % | 02/01/2020 | 101,362 | ||||||||
| 26,879 | FNMA, Pool# MA0408 | 5.00 | % | 03/01/2020 | 27,539 | ||||||||
| 10,560 | FNMA, Pool# MA0419 | 4.50 | % | 05/01/2020 | 10,819 | ||||||||
| 372,638 | FNMA, Pool# 923279 | 4.50 | % | 06/01/2020 | 381,861 | ||||||||
| 85,237 | FNMA, Pool# 255736 | 5.50 | % | 06/01/2020 | 88,438 | ||||||||
| 58,504 | FNMA, Pool# 809099 | 5.50 | % | 06/01/2020 | 60,126 | ||||||||
| 61,902 | FNMA, Pool# 745017 | 4.50 | % | 07/01/2020 | 63,419 | ||||||||
| 228,330 | FNMA, Pool# AC0884 | 5.00 | % | 07/01/2020 | 233,944 | ||||||||
| 125,313 | FNMA, Pool# 828696 | 5.50 | % | 07/01/2020 | 129,698 | ||||||||
| 15,509 | FNMA, Pool# AL0560 | 4.50 | % | 08/01/2020 | 15,889 | ||||||||
| 30,666 | FNMA, Pool# 837220 | 4.50 | % | 08/01/2020 | 31,643 | ||||||||
| 82,026 | FNMA, Pool# MA0517 | 4.00 | % | 09/01/2020 | 84,954 | ||||||||
| 57,643 | FNMA, Pool# 357985 | 4.50 | % | 09/01/2020 | 59,413 | ||||||||
| 10,254 | FNMA, Pool# 745393 | 4.50 | % | 09/01/2020 | 10,505 | ||||||||
The accompanying notes are an integral part of these financial statements.
66
Brown Advisory Mortgage Securities Fund
Schedule of Investments
June 30, 2017
| Par Value | Security Description | Rate | Maturity | Value $ | |||||||||
| Mortgage Backed Securities — 109.4% (Continued) | |||||||||||||
| 21,280 | FNMA, Pool# 735920 | 4.50 | % | 10/01/2020 | 21,874 | ||||||||
| 57,062 | FNMA, Pool# 255891 | 5.00 | % | 10/01/2020 | 59,261 | ||||||||
| 14,313 | FNMA, Pool# MA0613 | 4.00 | % | 11/01/2020 | 14,824 | ||||||||
| 87,943 | FNMA, Pool# 843510 | 4.50 | % | 11/01/2020 | 90,413 | ||||||||
| 161,123 | FNMA, Pool# 255937 | 5.00 | % | 11/01/2020 | 169,139 | ||||||||
| 161,561 | FNMA, Pool# 898044 | 4.50 | % | 12/01/2020 | 166,266 | ||||||||
| 105,534 | FNMA, Pool# 995158 | 4.50 | % | 12/01/2020 | 108,500 | ||||||||
| 40,214 | FNMA, Pool# 813939 | 5.00 | % | 12/01/2020 | 41,650 | ||||||||
| 50,953 | FNMA, Pool# 837189 | 5.00 | % | 12/01/2020 | 52,664 | ||||||||
| 26,399 | FNMA, Pool# 112132# | 6.15 | % | 12/01/2020 | 26,350 | ||||||||
| 92,011 | FNMA, Pool# 745285 | 4.50 | % | 01/01/2021 | 94,622 | ||||||||
| 11,874 | FNMA, Pool# MA0660 | 4.00 | % | 02/01/2021 | 12,298 | ||||||||
| 100,535 | FNMA, Pool# 850791 | 5.00 | % | 02/01/2021 | 103,455 | ||||||||
| 87,716 | FNMA, Pool# 889196 | 4.50 | % | 03/01/2021 | 90,174 | ||||||||
| 37,410 | FNMA, Pool# 831360 | 5.50 | % | 03/01/2021 | 39,060 | ||||||||
| 68,333 | FNMA, Pool# 831430 | 5.50 | % | 03/01/2021 | 71,123 | ||||||||
| 43,319 | FNMA, Pool# 256246 | 6.00 | % | 05/01/2021 | 45,091 | ||||||||
| 57,481 | FNMA, Pool# 256277 | 5.50 | % | 06/01/2021 | 60,326 | ||||||||
| 13,561 | FNMA, Pool# MA0805 | 4.00 | % | 07/01/2021 | 14,149 | ||||||||
| 169,960 | FNMA, Pool# 883002 | 6.00 | % | 07/01/2021 | 179,556 | ||||||||
| 117,766 | FNMA, Pool# 253945 | 6.50 | % | 08/01/2021 | 130,304 | ||||||||
| 184,774 | FNMA, Pool# AD0167 | 5.50 | % | 09/01/2021 | 192,943 | ||||||||
| 68,531 | FNMA, Pool# 254000 | 6.50 | % | 09/01/2021 | 75,828 | ||||||||
| 29,722 | FNMA, Pool# 254044 | 6.50 | % | 10/01/2021 | 32,888 | ||||||||
| 39,094 | FNMA, Pool# 889197 | 4.50 | % | 11/01/2021 | 40,217 | ||||||||
| 188,336 | FNMA, Pool# 254085 | 6.00 | % | 11/01/2021 | 211,883 | ||||||||
| 41,420 | FNMA, Pool# 889212 | 5.00 | % | 12/01/2021 | 42,500 | ||||||||
| 122,881 | FNMA, Pool# 254138 | 6.00 | % | 12/01/2021 | 138,244 | ||||||||
| 65,604 | FNMA, Pool# 911870 | 6.00 | % | 12/01/2021 | 69,463 | ||||||||
| 113,978 | FNMA, Pool# 922791 | 6.50 | % | 12/01/2021 | 117,740 | ||||||||
| 115,680 | FNMA, Pool# 254179 | 6.00 | % | 01/01/2022 | 130,143 | ||||||||
| 28,227 | FNMA, Pool# 906152 | 6.00 | % | 01/01/2022 | 29,789 | ||||||||
| 86,856 | FNMA, Pool# 254295 | 6.00 | % | 04/01/2022 | 97,715 | ||||||||
| 40,932 | FNMA, Pool# 888410 | 6.50 | % | 04/01/2022 | 43,283 | ||||||||
| 86,506 | FNMA, Pool# 889143 | 4.50 | % | 05/01/2022 | 88,906 | ||||||||
| 32,479 | FNMA, Pool# 254420 | 6.00 | % | 07/01/2022 | 36,540 | ||||||||
| 34,780 | FNMA, Pool# 907059 | 6.00 | % | 08/01/2022 | 36,785 | ||||||||
| 183,985 | FNMA, Pool# 254440 | 6.00 | % | 08/01/2022 | 206,988 | ||||||||
| 185,953 | FNMA, Pool# 888899 | 4.50 | % | 11/01/2022 | 191,941 | ||||||||
| 16,246 | FNMA, Pool# 888815 | 4.50 | % | 11/01/2022 | 16,809 | ||||||||
| 44,011 | FNMA, Pool# 947936 | 5.50 | % | 11/01/2022 | 46,977 | ||||||||
| 29,286 | FNMA, Pool# 967007 | 6.00 | % | 12/01/2022 | 31,116 | ||||||||
| 18,068 | FNMA, Pool# 196455# | 2.70 | % | 01/01/2023 | 18,295 | ||||||||
| 58,086 | FNMA, Pool# 965546 | 5.50 | % | 01/01/2023 | 60,622 | ||||||||
| 41,841 | FNMA, Pool# 970382 | 4.50 | % | 03/01/2023 | 43,535 | ||||||||
| 494,970 | FNMA, Pool# 933884 | 4.50 | % | 04/01/2023 | 521,847 | ||||||||
| 50,276 | FNMA, Pool# 962717 | 5.50 | % | 04/01/2023 | 53,780 | ||||||||
| 23,990 | FNMA, Pool# 205601# | 2.80 | % | 05/01/2023 | 24,128 | ||||||||
| 223,458 | FNMA, Pool# 963625 | 6.00 | % | 05/01/2023 | 235,601 | ||||||||
| 73,817 | FNMA, Pool# 257233 | 4.50 | % | 06/01/2023 | 77,399 | ||||||||
| 215,765 | FNMA, Pool# 987208 | 5.00 | % | 07/01/2023 | 228,557 | ||||||||
| 102,888 | FNMA, Pool# 933992 | 6.00 | % | 08/01/2023 | 109,747 | ||||||||
| 200,630 | FNMA, Pool# 988940 | 5.50 | % | 09/01/2023 | 215,524 | ||||||||
| 321,407 | FNMA, Pool# 889986 | 6.00 | % | 11/01/2023 | 341,707 | ||||||||
| 502,315 | FNMA, Pool# 995460 | 5.50 | % | 12/01/2023 | 533,273 | ||||||||
| 247,069 | FNMA, Pool# MA1937 | 4.00 | % | 03/01/2024 | 256,091 | ||||||||
The accompanying notes are an integral part of these financial statements.
67
Brown Advisory Mortgage Securities Fund
Schedule of Investments
June 30, 2017
| Par Value | Security Description | Rate | Maturity | Value $ | |||||||||
| Mortgage Backed Securities — 109.4% (Continued) | |||||||||||||
| 109,094 | FNMA, Pool# AL3941 | 6.00 | % | 03/01/2024 | 115,299 | ||||||||
| 51,187 | FNMA, Pool# AA2946 | 4.50 | % | 04/01/2024 | 54,018 | ||||||||
| 39,666 | FNMA, Pool# 934900 | 5.50 | % | 07/01/2024 | 41,974 | ||||||||
| 167,741 | FNMA, Pool# 931724 | 4.50 | % | 08/01/2024 | 178,178 | ||||||||
| 2,437,431 | FNMA, Pool# BC4577 | 4.50 | % | 09/01/2024 | 2,558,538 | ||||||||
| 170,024 | FNMA, Pool# AD0354 | 4.50 | % | 10/01/2024 | 180,885 | ||||||||
| 56,953 | FNMA, Pool# AC4010 | 4.50 | % | 10/01/2024 | 60,017 | ||||||||
| 48,314 | FNMA, Pool# 935764 | 4.50 | % | 11/01/2024 | 51,408 | ||||||||
| 38,517 | FNMA, Pool# AC5129 | 4.50 | % | 11/01/2024 | 40,987 | ||||||||
| 124,926 | FNMA, Pool# AC8537 | 4.50 | % | 12/01/2024 | 132,704 | ||||||||
| 98,886 | FNMA, Pool# AC8868 | 4.50 | % | 12/01/2024 | 104,208 | ||||||||
| 97,665 | FNMA, Pool# AC9692 | 4.50 | % | 02/01/2025 | 102,135 | ||||||||
| 45,929 | FNMA, Pool# AX5299 | 4.50 | % | 02/01/2025 | 48,271 | ||||||||
| 81,983 | FNMA, Pool# AD2872 | 4.50 | % | 03/01/2025 | 86,577 | ||||||||
| 40,015 | FNMA, Pool# AD7155 | 4.50 | % | 07/01/2025 | 42,245 | ||||||||
| 114,110 | FNMA, Pool# AE0284 | 5.00 | % | 07/01/2025 | 121,223 | ||||||||
| 18,282 | FNMA, Pool# 318779# | 2.86 | % | 10/01/2025 | 18,632 | ||||||||
| 75,083 | FNMA, Pool# 336422# | 3.46 | % | 10/01/2025 | 75,583 | ||||||||
| 15,986 | FNMA, Pool# 345313# | 3.03 | % | 01/01/2026 | 16,139 | ||||||||
| 162,189 | FNMA, Pool# 356232 | 6.50 | % | 01/01/2026 | 179,487 | ||||||||
| 26,192 | FNMA, Pool# 373145# | 2.87 | % | 02/01/2026 | 27,214 | ||||||||
| 296,406 | FNMA, Pool# AE0989 | 4.50 | % | 02/01/2026 | 314,918 | ||||||||
| 56,700 | FNMA, Pool# 406521# | 3.15 | % | 05/01/2026 | 57,366 | ||||||||
| 15,921 | FNMA, Pool# 393302# | 2.67 | % | 07/01/2026 | 16,377 | ||||||||
| 28,985 | FNMA, Pool# 341523# | 3.52 | % | 07/01/2026 | 29,231 | ||||||||
| 116,660 | FNMA, Pool# 890336 | 4.50 | % | 08/01/2026 | 123,366 | ||||||||
| 81,445 | FNMA, Pool# 356329# | 3.26 | % | 01/01/2027 | 83,461 | ||||||||
| 47,903 | FNMA, Pool# 890611 | 4.50 | % | 01/01/2027 | 50,538 | ||||||||
| 53,759 | FNMA, Pool# AL1953 | 4.50 | % | 01/01/2027 | 56,656 | ||||||||
| 28,108 | FNMA, Pool# 347559# | 2.75 | % | 02/01/2027 | 28,363 | ||||||||
| 20,325 | FNMA, Pool# 313377# | 2.82 | % | 02/01/2027 | 20,439 | ||||||||
| 54,666 | FNMA, Pool# 363850# | 2.90 | % | 04/01/2027 | 56,195 | ||||||||
| 39,559 | FNMA, Pool# 374711# | 3.11 | % | 07/01/2027 | 39,825 | ||||||||
| 26,657 | FNMA, Pool# 428177# | 2.90 | % | 10/01/2027 | 27,219 | ||||||||
| 59,446 | FNMA, Pool# 406380# | 2.88 | % | 11/01/2027 | 60,478 | ||||||||
| 25,596 | FNMA, Pool# 403245# | 2.63 | % | 12/01/2027 | 26,298 | ||||||||
| 13,600 | FNMA, Pool# 323083# | 2.81 | % | 12/01/2027 | 13,871 | ||||||||
| 19,852 | FNMA, Pool# 422279# | 2.91 | % | 12/01/2027 | 20,406 | ||||||||
| 21,245 | FNMA, Pool# 423294# | 3.04 | % | 01/01/2028 | 22,044 | ||||||||
| 23,804 | FNMA, Pool# 534740# | 3.06 | % | 03/01/2028 | 24,186 | ||||||||
| 30,454 | FNMA, Pool# 593950# | 3.27 | % | 05/01/2028 | 30,890 | ||||||||
| 10,943 | FNMA, Pool# 539082 | 7.00 | % | 08/01/2028 | 11,018 | ||||||||
| 11,527 | FNMA, Pool# 457274# | 2.92 | % | 10/01/2028 | 11,567 | ||||||||
| 39,656 | FNMA, Pool# 576596# | 3.15 | % | 12/01/2028 | 41,160 | ||||||||
| 38,387 | FNMA, Pool# 532580# | 2.85 | % | 02/01/2029 | 38,914 | ||||||||
| 26,314 | FNMA, Pool# 508399# | 2.67 | % | 06/01/2029 | 26,876 | ||||||||
| 967,257 | FNMA, Pool# 957502 | 3.98 | % | 07/01/2029 | 1,022,216 | ||||||||
| 56,978 | FNMA, Pool# 520478# | 2.60 | % | 11/01/2029 | 57,682 | ||||||||
| 13,132 | FNMA, Pool# 524669# | 2.60 | % | 11/01/2029 | 13,233 | ||||||||
| 12,226 | FNMA, Pool# 556998# | 2.83 | % | 02/01/2030 | 12,507 | ||||||||
| 17,481 | FNMA, Pool# 608435# | 2.97 | % | 06/01/2030 | 17,888 | ||||||||
| 12,938 | FNMA, Pool# 582342# | 2.97 | % | 08/01/2030 | 13,375 | ||||||||
| 48,015 | FNMA, Pool# 559439# | 2.90 | % | 09/01/2030 | 49,001 | ||||||||
| 19,345 | FNMA, Pool# 594243# | 3.06 | % | 12/01/2030 | 19,718 | ||||||||
| 63,280 | FNMA, Pool# 573097# | 2.71 | % | 02/01/2031 | 63,891 | ||||||||
| 21,737 | FNMA, Pool# 503648# | 3.15 | % | 02/01/2031 | 21,826 | ||||||||
The accompanying notes are an integral part of these financial statements.
68
Brown Advisory Mortgage Securities Fund
Schedule of Investments
June 30, 2017
| Par Value | Security Description | Rate | Maturity | Value $ | |||||||||
| Mortgage Backed Securities — 109.4% (Continued) | |||||||||||||
| 19,613 | FNMA, Pool# 581028# | 3.13 | % | 05/01/2031 | 19,942 | ||||||||
| 47,151 | FNMA, Pool# 590852# | 2.61 | % | 07/01/2031 | 47,581 | ||||||||
| 17,560 | FNMA, Pool# 594916# | 2.78 | % | 07/01/2031 | 17,821 | ||||||||
| 74,101 | FNMA, Pool# 656181# | 2.91 | % | 08/01/2031 | 76,877 | ||||||||
| 28,211 | FNMA, Pool# 602954# | 2.92 | % | 08/01/2031 | 28,427 | ||||||||
| 46,673 | FNMA, Pool# 723313# | 3.17 | % | 09/01/2031 | 46,957 | ||||||||
| 39,999 | FNMA, Pool# 598961# | 2.90 | % | 10/01/2031 | 40,741 | ||||||||
| 21,465 | FNMA, Pool# 618180# | 3.00 | % | 01/01/2032 | 21,860 | ||||||||
| 7,678 | FNMA, Pool# 625536 | 6.00 | % | 01/01/2032 | 8,638 | ||||||||
| 57,875 | FNMA, Pool# 642122# | 3.15 | % | 03/01/2032 | 60,364 | ||||||||
| 36,436 | FNMA, Pool# 628837 | 6.50 | % | 03/01/2032 | 40,608 | ||||||||
| 48,222 | FNMA, Pool# 640225# | 3.15 | % | 04/01/2032 | 50,467 | ||||||||
| 25,284 | FNMA, Pool# 629132# | 2.97 | % | 05/01/2032 | 25,579 | ||||||||
| 11,322 | FNMA, Pool# 642367# | 3.27 | % | 05/01/2032 | 11,354 | ||||||||
| 39,807 | FNMA, Pool# 651149# | 2.03 | % | 07/01/2032 | 40,338 | ||||||||
| 38,232 | FNMA, Pool# 652339# | 2.75 | % | 09/01/2032 | 38,671 | ||||||||
| 48,438 | FNMA, Pool# 662138# | 2.93 | % | 09/01/2032 | 49,348 | ||||||||
| 18,204 | FNMA, Pool# 675591# | 2.62 | % | 11/01/2032 | 18,653 | ||||||||
| 63,050 | FNMA, Pool# 668309# | 2.64 | % | 11/01/2032 | 63,412 | ||||||||
| 28,130 | FNMA, Pool# 665551# | 2.75 | % | 11/01/2032 | 28,274 | ||||||||
| 59,873 | FNMA, Pool# 675634# | 2.50 | % | 12/01/2032 | 61,083 | ||||||||
| 21,833 | FNMA, Pool# 675633# | 2.60 | % | 12/01/2032 | 22,881 | ||||||||
| 25,736 | FNMA, Pool# 713329# | 2.93 | % | 12/01/2032 | 26,199 | ||||||||
| 18,844 | FNMA, Pool# 669939# | 2.25 | % | 01/01/2033 | 19,448 | ||||||||
| 33,264 | FNMA, Pool# 677531# | 2.83 | % | 01/01/2033 | 34,364 | ||||||||
| 18,646 | FNMA, Pool# 658901# | 2.92 | % | 01/01/2033 | 19,610 | ||||||||
| 22,692 | FNMA, Pool# 688559# | 2.64 | % | 03/01/2033 | 23,153 | ||||||||
| 26,324 | FNMA, Pool# 688561# | 2.88 | % | 03/01/2033 | 26,276 | ||||||||
| 63,724 | FNMA, Pool# 696546# | 3.63 | % | 03/01/2033 | 64,060 | ||||||||
| 98,571 | FNMA, Pool# 696219# | 2.76 | % | 04/01/2033 | 101,000 | ||||||||
| 15,783 | FNMA, Pool# 711968# | 3.03 | % | 05/01/2033 | 16,505 | ||||||||
| 121,990 | FNMA, Pool# 702901 | 6.00 | % | 05/01/2033 | 140,664 | ||||||||
| 39,770 | FNMA, Pool# 732275# | 2.75 | % | 06/01/2033 | 40,816 | ||||||||
| 74,328 | FNMA, Pool# 721381# | 3.25 | % | 06/01/2033 | 75,208 | ||||||||
| 44,815 | FNMA, Pool# 555819# | 2.90 | % | 07/01/2033 | 46,473 | ||||||||
| 35,876 | FNMA, Pool# 732001# | 2.66 | % | 09/01/2033 | 37,538 | ||||||||
| 16,289 | FNMA, Pool# 748084# | 2.72 | % | 09/01/2033 | 17,093 | ||||||||
| 31,914 | FNMA, Pool# 748643# | 2.90 | % | 09/01/2033 | 33,091 | ||||||||
| 19,331 | FNMA, Pool# 705689# | 2.78 | % | 10/01/2033 | 19,791 | ||||||||
| 11,334 | FNMA, Pool# 753488# | 2.40 | % | 11/01/2033 | 11,567 | ||||||||
| 19,731 | FNMA, Pool# 725090# | 2.79 | % | 11/01/2033 | 20,403 | ||||||||
| 81,058 | FNMA, Pool# 751498# | 2.84 | % | 11/01/2033 | 85,954 | ||||||||
| 52,736 | FNMA, Pool# 744805# | 2.89 | % | 11/01/2033 | 53,614 | ||||||||
| 36,747 | FNMA, Pool# 725008# | 2.78 | % | 12/01/2033 | 38,328 | ||||||||
| 32,647 | FNMA, Pool# 741373# | 2.78 | % | 12/01/2033 | 33,866 | ||||||||
| 32,881 | FNMA, Pool# 754767 | 6.50 | % | 12/01/2033 | 36,375 | ||||||||
| 12,021 | FNMA, Pool# 725093# | 2.78 | % | 01/01/2034 | 12,466 | ||||||||
| 12,103 | FNMA, Pool# 762267# | 2.35 | % | 02/01/2034 | 12,395 | ||||||||
| 78,286 | FNMA, Pool# 764342# | 2.90 | % | 02/01/2034 | 80,961 | ||||||||
| 18,199 | FNMA, Pool# 788972# | 2.82 | % | 04/01/2034 | 18,604 | ||||||||
| 191,422 | FNMA, Pool# 774969# | 2.95 | % | 04/01/2034 | 199,802 | ||||||||
| 27,366 | FNMA, Pool# 779077# | 3.36 | % | 06/01/2034 | 29,077 | ||||||||
| 138,555 | FNMA, Pool# 783554# | 2.71 | % | 07/01/2034 | 141,657 | ||||||||
| 68,776 | FNMA, Pool# 789060# | 3.10 | % | 07/01/2034 | 72,599 | ||||||||
| 12,658 | FNMA, Pool# 725803# | 3.12 | % | 08/01/2034 | 13,280 | ||||||||
| 13,301 | FNMA, Pool# 784118# | 3.30 | % | 09/01/2034 | 13,763 | ||||||||
The accompanying notes are an integral part of these financial statements.
69
Brown Advisory Mortgage Securities Fund
Schedule of Investments
June 30, 2017
| Par Value | Security Description | Rate | Maturity | Value $ | |||||||||
| Mortgage Backed Securities — 109.4% (Continued) | |||||||||||||
| 12,947 | FNMA, Pool# 796884# | 2.56 | % | 10/01/2034 | 13,205 | ||||||||
| 28,923 | FNMA, Pool# 797313# | 2.52 | % | 11/01/2034 | 30,406 | ||||||||
| 29,371 | FNMA, Pool# 796283 | 5.50 | % | 12/01/2034 | 32,874 | ||||||||
| 10,735 | FNMA, Pool# 809345# | 3.14 | % | 02/01/2035 | 10,832 | ||||||||
| 66,360 | FNMA, Pool# 819649# | 3.23 | % | 03/01/2035 | 69,969 | ||||||||
| 37,532 | FNMA, Pool# 822036# | 3.16 | % | 07/01/2035 | 38,814 | ||||||||
| 55,493 | FNMA, Pool# 830970# | 3.13 | % | 08/01/2035 | 58,615 | ||||||||
| 178,337 | FNMA, Pool# 837329# | 2.63 | % | 09/01/2035 | 187,713 | ||||||||
| 10,205 | FNMA, Pool# 843021# | 2.90 | % | 09/01/2035 | 10,656 | ||||||||
| 84,139 | FNMA, Pool# 836335# | 2.73 | % | 10/01/2035 | 84,285 | ||||||||
| 117,705 | FNMA, Pool# 836715# | 3.18 | % | 10/01/2035 | 118,109 | ||||||||
| 240,338 | FNMA, Pool# 842006 | 4.25 | % | 10/01/2035 | 255,309 | ||||||||
| 113,275 | FNMA, Pool# 922680# | 3.54 | % | 11/01/2035 | 120,453 | ||||||||
| 17,877 | FNMA, Pool# 863741# | 2.67 | % | 12/01/2035 | 18,817 | ||||||||
| 302,725 | FNMA, Pool# 850232 | 4.25 | % | 12/01/2035 | 321,666 | ||||||||
| 44,676 | FNMA, Pool# 849273# | 2.87 | % | 01/01/2036 | 46,582 | ||||||||
| 12,492 | FNMA, Pool# 848817 | 5.00 | % | 01/01/2036 | 13,711 | ||||||||
| 12,349 | FNMA, Pool# 880366# | 2.79 | % | 02/01/2036 | 12,839 | ||||||||
| 17,728 | FNMA, Pool# 866923# | 3.01 | % | 02/01/2036 | 18,725 | ||||||||
| 14,538 | FNMA, Pool# 880373# | 3.11 | % | 02/01/2036 | 15,272 | ||||||||
| 48,797 | FNMA, Pool# 865849# | 3.22 | % | 03/01/2036 | 50,501 | ||||||||
| 94,094 | FNMA, Pool# 877009# | 4.05 | % | 03/01/2036 | 99,636 | ||||||||
| 119,380 | FNMA, Pool# 868568# | 3.54 | % | 04/01/2036 | 126,804 | ||||||||
| 71,214 | FNMA, Pool# 745626# | 2.88 | % | 05/01/2036 | 74,981 | ||||||||
| 83,476 | FNMA, Pool# 882017# | 2.93 | % | 05/01/2036 | 86,755 | ||||||||
| 53,605 | FNMA, Pool# 872895# | 3.51 | % | 06/01/2036 | 56,202 | ||||||||
| 54,901 | FNMA, Pool# 886163# | 3.25 | % | 07/01/2036 | 58,232 | ||||||||
| 16,749 | FNMA, Pool# 886344# | 3.46 | % | 07/01/2036 | 17,668 | ||||||||
| 12,822 | FNMA, Pool# 345858# | 2.82 | % | 08/01/2036 | 13,222 | ||||||||
| 14,896 | FNMA, Pool# 886530# | 3.03 | % | 08/01/2036 | 15,838 | ||||||||
| 11,159 | FNMA, Pool# 745762# | 3.05 | % | 08/01/2036 | 11,636 | ||||||||
| 159,401 | FNMA, Pool# AD0766 | 7.00 | % | 08/01/2036 | 188,603 | ||||||||
| 35,208 | FNMA, Pool# 745925# | 3.01 | % | 09/01/2036 | 37,328 | ||||||||
| 17,936 | FNMA, Pool# 900190# | 3.42 | % | 09/01/2036 | 18,058 | ||||||||
| 245,947 | FNMA, Pool# 745818 | 6.50 | % | 09/01/2036 | 276,070 | ||||||||
| 223,959 | FNMA, Pool# 894270# | 2.95 | % | 10/01/2036 | 224,522 | ||||||||
| 54,848 | FNMA, Pool# 905193# | 3.49 | % | 11/01/2036 | 56,384 | ||||||||
| 90,326 | FNMA, Pool# 902770 | 5.38 | % | 11/01/2036 | 99,624 | ||||||||
| 31,593 | FNMA, Pool# 870904# | 2.75 | % | 12/01/2036 | 31,625 | ||||||||
| 36,560 | FNMA, Pool# 905857# | 3.23 | % | 12/01/2036 | 38,795 | ||||||||
| 96,051 | FNMA, Pool# 906289 | 5.38 | % | 12/01/2036 | 105,886 | ||||||||
| 26,360 | FNMA, Pool# 920954# | 2.79 | % | 01/01/2037 | 27,355 | ||||||||
| 31,696 | FNMA, Pool# 906184# | 2.96 | % | 01/01/2037 | 31,916 | ||||||||
| 139,426 | FNMA, Pool# 940309# | 3.00 | % | 01/01/2037 | 142,614 | ||||||||
| 10,292 | FNMA, Pool# 909469# | 3.39 | % | 02/01/2037 | 10,831 | ||||||||
| 27,811 | FNMA, Pool# 909576# | 3.50 | % | 02/01/2037 | 28,469 | ||||||||
| 31,092 | FNMA, Pool# 912243# | 3.53 | % | 02/01/2037 | 31,216 | ||||||||
| 20,018 | FNMA, Pool# 881326# | 2.99 | % | 03/01/2037 | 21,082 | ||||||||
| 17,358 | FNMA, Pool# 913253# | 3.00 | % | 03/01/2037 | 18,078 | ||||||||
| 85,247 | FNMA, Pool# 910181# | 3.45 | % | 03/01/2037 | 89,294 | ||||||||
| 10,515 | FNMA, Pool# 888583# | 3.61 | % | 03/01/2037 | 10,923 | ||||||||
| 86,387 | FNMA, Pool# 888445# | 3.29 | % | 04/01/2037 | 92,597 | ||||||||
| 183,103 | FNMA, Pool#888366 | 7.00 | % | 04/01/2037 | 213,809 | ||||||||
| 76,003 | FNMA, Pool# 995521# | 3.61 | % | 05/01/2037 | 79,779 | ||||||||
| 117,809 | FNMA, Pool# 950382# | 2.43 | % | 08/01/2037 | 121,492 | ||||||||
| 66,864 | FNMA, Pool# 953988 | 5.38 | % | 08/01/2037 | 69,285 | ||||||||
The accompanying notes are an integral part of these financial statements.
70
Brown Advisory Mortgage Securities Fund
Schedule of Investments
June 30, 2017
| Par Value | Security Description | Rate | Maturity | Value $ | |||||||||
| Mortgage Backed Securities — 109.4% (Continued) | |||||||||||||
| 173,214 | FNMA, Pool# 941050# | 5.92 | % | 08/01/2037 | 172,973 | ||||||||
| 67,425 | FNMA, Pool# 946403# | 3.32 | % | 09/01/2037 | 67,482 | ||||||||
| 87,743 | FNMA, Pool# 952835# | 4.66 | % | 09/01/2037 | 91,315 | ||||||||
| 326,949 | FNMA, Pool# 955233 | 6.50 | % | 12/01/2037 | 379,146 | ||||||||
| 225,422 | FNMA, Pool# 962656# | 2.92 | % | 04/01/2038 | 233,245 | ||||||||
| 53,314 | FNMA, Pool# 982237# | 3.67 | % | 05/01/2038 | 56,909 | ||||||||
| 227,472 | FNMA, Pool# 988684 | 6.00 | % | 09/01/2038 | 257,408 | ||||||||
| 227,328 | FNMA, Pool# 930507 | 6.50 | % | 02/01/2039 | 264,098 | ||||||||
| 4,299,957 | FNMA, Pool# AS2249 | 4.00 | % | 04/01/2039 | 4,544,041 | ||||||||
| 10,111 | FNMA, Pool# AC4824# | 3.09 | % | 10/01/2039 | 10,661 | ||||||||
| 16,913 | FNMA, Pool# AI1170 | 5.00 | % | 04/01/2041 | 18,509 | ||||||||
| 448,519 | FNMA, Pool# MA1065 | 4.00 | % | 05/01/2042 | 473,404 | ||||||||
| 13,405 | FNMA, Pool# AR1150 | 3.00 | % | 01/01/2043 | 13,466 | ||||||||
| 2,924,766 | FNMA, Pool# AR6379 | 3.00 | % | 02/01/2043 | 2,942,607 | ||||||||
| 1,305,778 | FNMA, Pool# AB8711 | 3.00 | % | 03/01/2043 | 1,315,504 | ||||||||
| 1,028,560 | FNMA, Pool# BC1738 | 4.50 | % | 09/01/2043 | 1,109,164 | ||||||||
| 2,041,393 | FNMA, Pool# AU6230 | 5.00 | % | 09/01/2043 | 2,234,231 | ||||||||
| 799,405 | FNMA, Pool# AS1429 | 4.00 | % | 12/01/2043 | 842,929 | ||||||||
| 627,306 | FNMA, Pool# AV7739 | 4.00 | % | 01/01/2044 | 667,478 | ||||||||
| 2,598,995 | FNMA, Pool# BC1737 | 4.00 | % | 01/01/2044 | 2,746,213 | ||||||||
| 977,405 | FNMA, Pool# AW6485 | 4.00 | % | 06/01/2044 | 1,030,747 | ||||||||
| 1,312,390 | FNMA, Pool# AS2985 | 4.00 | % | 08/01/2044 | 1,390,235 | ||||||||
| 989,798 | FNMA, Pool# AY0382 | 4.00 | % | 11/01/2044 | 1,032,763 | ||||||||
| 203,707 | FNMA, Pool# AY1007 | 4.00 | % | 02/01/2045 | 214,337 | ||||||||
| 1,466,315 | FNMA, Pool# AY0677 | 3.50 | % | 03/01/2045 | 1,514,668 | ||||||||
| 1,039,152 | FNMA, Pool# AW9534 | 4.00 | % | 03/01/2045 | 1,098,415 | ||||||||
| 1,703,607 | FNMA, Pool# AZ2000 | 3.50 | % | 05/01/2045 | 1,759,818 | ||||||||
| 962,685 | FNMA, Pool# AZ4154 | 4.00 | % | 06/01/2045 | 1,019,849 | ||||||||
| 3,443,351 | FNMA, Pool# AZ7828 | 4.00 | % | 08/01/2045 | 3,623,037 | ||||||||
| 444,528 | FNMA, Pool# AZ8061 | 4.00 | % | 08/01/2045 | 467,725 | ||||||||
| 2,364,347 | FNMA, Pool# AZ8218 | 4.00 | % | 08/01/2045 | 2,487,726 | ||||||||
| 1,719,050 | FNMA, Pool# AZ7073 | 4.00 | % | 09/01/2045 | 1,813,024 | ||||||||
| 238,791 | FNMA, Pool# AZ1494 | 4.00 | % | 09/01/2045 | 252,011 | ||||||||
| 307,259 | FNMA, Pool# BA2936 | 4.00 | % | 10/01/2045 | 324,019 | ||||||||
| 1,734,287 | FNMA, Pool# BA3674 | 4.50 | % | 10/01/2045 | 1,869,904 | ||||||||
| 2,569,242 | FNMA, Pool# AZ7081 | 3.50 | % | 11/01/2045 | 2,654,401 | ||||||||
| 551,137 | FNMA, Pool# BA5579 | 3.50 | % | 12/01/2045 | 566,576 | ||||||||
| 1,309,118 | FNMA, Pool# BA5469 | 3.50 | % | 12/01/2045 | 1,351,425 | ||||||||
| 1,390,225 | FNMA, Pool# BA5582 | 3.50 | % | 12/01/2045 | 1,429,167 | ||||||||
| 1,425,481 | FNMA, Pool# BA5584 | 3.50 | % | 01/01/2046 | 1,472,814 | ||||||||
| 1,698,780 | FNMA, Pool# BA5583 | 3.50 | % | 01/01/2046 | 1,757,337 | ||||||||
| 1,581,780 | FNMA, Pool# BA5587 | 4.00 | % | 01/01/2046 | 1,675,744 | ||||||||
| 2,785,528 | FNMA, Pool# BC1230 | 3.50 | % | 02/01/2046 | 2,869,148 | ||||||||
| 1,188,359 | FNMA, Pool# BC1231 | 4.00 | % | 02/01/2046 | 1,258,955 | ||||||||
| 1,074,211 | FNMA, Pool# BC6366 | 4.50 | % | 02/01/2046 | 1,155,021 | ||||||||
| 4,768,804 | FNMA, Pool# AL8256 | 3.00 | % | 03/01/2046 | 4,810,096 | ||||||||
| 2,380,205 | FNMA, Pool# BC1236 | 3.50 | % | 03/01/2046 | 2,446,879 | ||||||||
| 676,642 | FNMA, Pool# BC3387 | 3.50 | % | 03/01/2046 | 695,793 | ||||||||
| 1,069,376 | FNMA, Pool# BC1240 | 3.50 | % | 04/01/2046 | 1,103,937 | ||||||||
| 2,291,773 | FNMA, Pool# BC1241 | 3.50 | % | 04/01/2046 | 2,355,969 | ||||||||
| 1,159,304 | FNMA, Pool# BC9463 | 4.00 | % | 05/01/2046 | 1,222,735 | ||||||||
| 1,104,550 | FNMA, Pool# BD1241 | 4.50 | % | 05/01/2046 | 1,194,315 | ||||||||
| 1,503,383 | FNMA, Pool# BD1026 | 4.00 | % | 06/01/2046 | 1,581,834 | ||||||||
| 1,028,897 | FNMA, Pool# BD2775 | 4.00 | % | 07/01/2046 | 1,087,528 | ||||||||
| 1,690,972 | FNMA, Pool# BD5189 | 4.50 | % | 07/01/2046 | 1,829,331 | ||||||||
| 1,076,010 | FNMA, Pool# BD7779 | 4.00 | % | 08/01/2046 | 1,140,948 | ||||||||
The accompanying notes are an integral part of these financial statements.
71
Brown Advisory Mortgage Securities Fund
Schedule of Investments
June 30, 2017
| Par Value | Security Description | Rate | Maturity | Value $ | |||||||||
| Mortgage Backed Securities — 109.4% (Continued) | |||||||||||||
| 1,161,224 | FNMA, Pool# BD3965 | 3.50 | % | 09/01/2046 | 1,196,123 | ||||||||
| 1,436,168 | FNMA, Pool# BE0297 | 3.50 | % | 09/01/2046 | 1,480,708 | ||||||||
| 1,501,324 | FNMA, Pool# BE0909 | 4.50 | % | 10/01/2046 | 1,642,878 | ||||||||
| 1,133,607 | FNMA, Pool# BD8599 | 4.50 | % | 11/01/2046 | 1,240,488 | ||||||||
| 1,815,638 | FNMA, Pool# BE4515 | 4.50 | % | 12/01/2046 | 1,948,598 | ||||||||
| 1,381,441 | FNMA, Pool# BE8112 | 4.00 | % | 02/01/2047 | 1,453,529 | ||||||||
| 3,068,469 | FNMA, Pool# BE7470 | 4.00 | % | 02/01/2047 | 3,228,591 | ||||||||
| 1,191,874 | FNMA, Pool# BE8875 | 4.00 | % | 03/01/2047 | 1,254,070 | ||||||||
| 2,779,981 | FNMA, Pool# BE2368 | 4.50 | % | 03/01/2047 | 2,984,433 | ||||||||
| 1,521,534 | FNMA, Pool# BD3994 | 4.00 | % | 04/01/2047 | 1,601,473 | ||||||||
| 1,633,830 | FNMA, Pool# BH1407 | 4.00 | % | 04/01/2047 | 1,723,438 | ||||||||
| 1,105,339 | FNMA, Pool# BH0073 | 4.00 | % | 04/01/2047 | 1,165,963 | ||||||||
| 1,157,826 | FNMA, Pool# BD3998 | 4.00 | % | 05/01/2047 | 1,221,335 | ||||||||
| 1,556,810 | FNMA, Pool# BH3057 | 4.00 | % | 05/01/2047 | 1,642,193 | ||||||||
| 1,080,412 | FNMA, Pool# BD3999 | 4.50 | % | 05/01/2047 | 1,159,544 | ||||||||
| 1,169,083 | FNMA, Pool# BD4003 | 4.00 | % | 06/01/2047 | 1,236,094 | ||||||||
| 1,851,030 | FNMA, Pool# BD4004 | 4.00 | % | 06/01/2047 | 1,948,282 | ||||||||
| 3,751,430 | FNMA, Pool# BH4618 | 4.00 | % | 06/01/2047 | 3,957,176 | ||||||||
| 66,238 | FNMA REMIC Trust, Series 2003-122 | 4.00 | % | 12/25/2018 | 66,874 | ||||||||
| 49 | FNMA REMIC Trust, Series 1990-105 | 6.50 | % | 09/25/2020 | 51 | ||||||||
| 113,578 | FNMA REMIC Trust, Series 1990-116 | 9.00 | % | 10/25/2020 | 122,766 | ||||||||
| 84,300 | FNMA REMIC Trust, Series 1991-136 | 7.50 | % | 10/25/2021 | 91,536 | ||||||||
| 6,079 | FNMA REMIC Trust, Series 2012-1 | 1.75 | % | 12/25/2021 | 6,079 | ||||||||
| 197,420 | FNMA REMIC Trust, Series 1996-23 | 6.50 | % | 07/25/2026 | 218,316 | ||||||||
| 1,500,000 | FNMA REMIC Trust, Series 2017-T1 | 2.90 | % | 06/25/2027 | 1,493,103 | ||||||||
| 3,446,291 | FNMA REMIC Trust, Series 2012-139~ | 2.50 | % | 12/25/2027 | 300,873 | ||||||||
| 243,868 | FNMA REMIC Trust, Series 2013-15~ | 3.00 | % | 03/25/2028 | 23,203 | ||||||||
| 166,381 | FNMA REMIC Trust, Series 2009-60 | 5.00 | % | 08/25/2029 | 181,229 | ||||||||
| 3,392,613 | FNMA REMIC Trust, Series 2013-115~ | 3.00 | % | 04/25/2031 | 428,165 | ||||||||
| 10,024,894 | FNMA REMIC Trust, Series 2014-14~ | 3.00 | % | 04/25/2031 | 775,980 | ||||||||
| 437,021 | FNMA REMIC Trust, Series 2001-80 | 6.00 | % | 01/25/2032 | 476,466 | ||||||||
| 7,917,362 | FNMA REMIC Trust, Series 2013-104~ | 3.00 | % | 08/25/2032 | 662,911 | ||||||||
| 534,018 | FNMA REMIC Trust, Series 2010-39 | 4.50 | % | 03/25/2036 | 534,857 | ||||||||
| 135,282 | FNMA REMIC Trust, Series 2012-30 | 3.00 | % | 08/25/2036 | 137,548 | ||||||||
| 121,355 | FNMA REMIC Trust, Series 2009-103# | 3.32 | % | 12/25/2039 | 129,459 | ||||||||
| 349,503 | FNMA REMIC Trust, Series 2012-10# | 1.77 | % | 02/25/2042 | 350,297 | ||||||||
| 1,720,749 | FNMA REMIC Trust, Series 2013-34~ | 3.00 | % | 05/25/2042 | 261,986 | ||||||||
| 1,397,865 | FNMA REMIC Trust, Series 2012-99~ | 4.50 | % | 05/25/2042 | 232,015 | ||||||||
| 14,515 | FNMA REMIC Trust, Series 2003-W10 | 4.30 | % | 06/25/2043 | 15,325 | ||||||||
| 4,919 | FNMA REMIC Trust, Series 2003-W12 | 4.48 | % | 06/25/2043 | 5,199 | ||||||||
| 29,512 | FNMA REMIC Trust, Series 2003-W12 | 4.55 | % | 06/25/2043 | 31,723 | ||||||||
| 16,365 | FNMA REMIC Trust, Series 2003-W12 | 4.68 | % | 06/25/2043 | 17,411 | ||||||||
| 19,093 | FNMA REMIC Trust, Series 2003-W12 | 5.00 | % | 06/25/2043 | 20,472 | ||||||||
| 1,360,030 | FNMA REMIC Trust, Series 2015-40~ | 4.50 | % | 03/25/2045 | 300,607 | ||||||||
| 14,500,000 | FNMA, 2.5%, Due TBA July | 2.50 | % | 07/15/2032 | 14,576,465 | ||||||||
| 11,000,000 | FNMA, 3.0%, Due TBA July | 3.00 | % | 07/15/2032 | 11,290,468 | ||||||||
| 11,500,000 | FNMA, 3.0%, Due TBA July | 3.00 | % | 07/15/2047 | 11,485,394 | ||||||||
| 3,150,000 | FREMF Mortgage Trust, Series 2017-K725#^ | 4.01 | % | 02/25/2024 | 3,149,504 | ||||||||
| 1,400,000 | FREMF Mortgage Trust, Series 2016-K723#^ | 3.70 | % | 10/25/2039 | 1,383,210 | ||||||||
| 750,000 | FREMF Mortgage Trust, Series 2017-K726#^ | 3.97 | % | 07/25/2049 | 755,706 | ||||||||
| 1,000,000 | FREMF Mortgage Trust, Series 2017-K724#^ | 3.60 | % | 12/25/2049 | 983,091 | ||||||||
| 41,059 | GNMA, Pool# 003577M | 5.50 | % | 07/20/2019 | 41,958 | ||||||||
| 25,033 | GNMA, Pool# 003644M | 4.00 | % | 09/20/2019 | 25,799 | ||||||||
| 43,235 | GNMA, Pool# MA3644M | 5.50 | % | 04/20/2022 | 43,611 | ||||||||
| 182,233 | GNMA, Pool# 782602X | 5.00 | % | 09/15/2022 | 190,713 | ||||||||
| 47,661 | GNMA, Pool# 672304X | 6.00 | % | 10/15/2022 | 49,919 | ||||||||
The accompanying notes are an integral part of these financial statements.
72
Brown Advisory Mortgage Securities Fund
Schedule of Investments
June 30, 2017
| Par Value | Security Description | Rate | Maturity | Value $ | |||||||||
| Mortgage Backed Securities — 109.4% (Continued) | |||||||||||||
| 6,718 | GNMA, Pool# 780576X | 7.00 | % | 12/15/2022 | 7,387 | ||||||||
| 82,870 | GNMA, Pool# 672701X | 4.00 | % | 05/15/2023 | 86,013 | ||||||||
| 206,159 | GNMA, Pool# 615782X | 5.00 | % | 09/15/2023 | 224,585 | ||||||||
| 72,620 | GNMA, Pool# 782396X | 6.00 | % | 09/15/2023 | 78,907 | ||||||||
| 62,539 | GNMA, Pool# 004295M | 6.00 | % | 10/20/2023 | 64,745 | ||||||||
| 30,520 | GNMA, Pool# 710732X | 4.50 | % | 08/15/2024 | 32,295 | ||||||||
| 29,653 | GNMA, Pool# 723460X | 4.00 | % | 12/15/2024 | 31,098 | ||||||||
| 204,322 | GNMA, Pool# 643800X | 6.00 | % | 06/15/2025 | 231,047 | ||||||||
| 390,143 | GNMA, Pool# 005247M | 3.50 | % | 11/20/2026 | 398,009 | ||||||||
| 11,338 | GNMA, Pool# 487110 | 6.50 | % | 04/15/2029 | 13,133 | ||||||||
| 567,879 | GNMA, Pool# 589694X | 4.50 | % | 08/15/2029 | 614,132 | ||||||||
| 4,920 | GNMA, Pool# 571166 | 7.00 | % | 08/15/2031 | 5,051 | ||||||||
| 1,861,939 | GNMA, Pool# 752099X | 3.50 | % | 12/15/2032 | 1,952,842 | ||||||||
| 2,208,821 | GNMA, Pool# 711773C | 3.50 | % | 06/20/2033 | 2,289,918 | ||||||||
| 1,311,035 | GNMA, Pool# 711788C | 3.50 | % | 07/20/2033 | 1,359,377 | ||||||||
| 9,154 | GNMA, Pool# 646058X | 6.00 | % | 11/15/2037 | 10,325 | ||||||||
| 460,761 | GNMA, Pool# 767055X | 3.00 | % | 05/15/2038 | 469,442 | ||||||||
| 573,708 | GNMA, Pool# 763853X | 3.00 | % | 07/15/2038 | 584,509 | ||||||||
| 103,337 | GNMA, Pool# 706295C | 5.10 | % | 12/20/2038 | 111,346 | ||||||||
| 107,693 | GNMA, Pool# 706155C | 5.10 | % | 03/20/2039 | 116,027 | ||||||||
| 9,466 | GNMA REMIC Trust, Series 2012-03 AK | 3.00 | % | 01/16/2027 | 9,735 | ||||||||
| 1,133,992 | GNMA REMIC Trust, Series 2013-168 IA~ | 2.50 | % | 11/16/2028 | 95,317 | ||||||||
| 611 | GNMA REMIC Trust, Series 2003-97 MA | 4.50 | % | 03/20/2033 | 627 | ||||||||
| 162,723 | GNMA REMIC Trust, Series 2003-94 AB | 4.00 | % | 04/16/2033 | 172,550 | ||||||||
| 219,591 | GNMA REMIC Trust, Series 2006-40 B | 6.00 | % | 08/20/2036 | 245,706 | ||||||||
| 1,069,139 | GNMA REMIC Trust, Series 2012-52 WA# | 6.15 | % | 04/20/2038 | 1,228,559 | ||||||||
| 682,000 | GNMA REMIC Trust, Series 2011-156 PM | 2.00 | % | 04/20/2040 | 567,651 | ||||||||
| 831,612 | GNMA REMIC Trust, Series 2012-97 GB | 2.00 | % | 08/16/2042 | 717,786 | ||||||||
| 592,517 | GNMA REMIC Trust, Series 2011-121 FA# | 1.57 | % | 03/16/2043 | 587,521 | ||||||||
| 725,000 | GNMA REMIC Trust, Series 2012-44 B | 2.95 | % | 08/16/2043 | 729,777 | ||||||||
| 4,842,253 | GNMA REMIC Trust, Series 2014-135 IO#~ | 0.84 | % | 01/16/2056 | 255,500 | ||||||||
| 5,064,034 | GNMA REMIC Trust, Series 2015-172 IO#~ | 0.94 | % | 03/16/2057 | 330,235 | ||||||||
| 6,913,339 | GNMA REMIC Trust, Series 2016-40 IO#~ | 0.81 | % | 07/16/2057 | 431,417 | ||||||||
| 5,516,872 | GNMA REMIC Trust, Series 2016-56 IO#~ | 1.00 | % | 11/16/2057 | 420,135 | ||||||||
| 6,371,870 | GNMA REMIC Trust, Series 2016-127 IO#~ | 0.96 | % | 05/16/2058 | 493,169 | ||||||||
| 6,179,077 | GNMA REMIC Trust, Series 2016-98 IO#~ | 0.98 | % | 05/16/2058 | 461,900 | ||||||||
| 5,815,841 | GNMA REMIC Trust, Series 2016-110 IO#~ | 1.05 | % | 05/16/2058 | 450,561 | ||||||||
| 23,000,000 | GNMA, 3.0%, Due TBA July | 3.00 | % | 07/15/2047 | 23,233,593 | ||||||||
| 28,000,000 | GNMA, 3.5%, Due TBA July | 3.50 | % | 07/15/2047 | 29,004,061 | ||||||||
| 470,000 | GSMS, Series 2013-GC10 | 2.61 | % | 02/12/2046 | 474,098 | ||||||||
| 847,000 | GSMS, Series 2017-GS6 AS | 3.64 | % | 05/12/2050 | 869,218 | ||||||||
| 1,100,000 | JPMCC, Series 2016-ASH A#^ | 2.66 | % | 10/15/2034 | 1,105,500 | ||||||||
| 1,000,000 | MSBAM, Series 2015-C26 A3 | 3.21 | % | 10/19/2048 | 1,016,285 | ||||||||
| 1,100,000 | MSC, Series 2017-PRME B#^ | 2.51 | % | 02/15/2034 | 1,105,150 | ||||||||
| 1,050,000 | WFCM, Series 2016-BNK1 A3 | 2.65 | % | 08/17/2049 | 1,014,425 | ||||||||
| 1,300,000 | WFCM, Series 2017-RB1 AS | 3.76 | % | 03/17/2050 | 1,355,203 | ||||||||
| Total Mortgage Backed Securities (Cost $377,594,152) | 375,609,784 | ||||||||||||
| Asset Backed Securities — 18.8% | |||||||||||||
| 1,273,642 | Aircraft Certificate Owner Trust, Series 2003-A E^ | 7.00 | % | 09/20/2022 | 1,367,574 | ||||||||
| 900,000 | American Credit Acceptance Receivables Trust, Series 2017-2 B^ | 2.46 | % | 04/12/2021 | 899,961 | ||||||||
| 338,000 | American Credit Acceptance Receivables Trust, Series 2015-1 C^ | 4.29 | % | 04/12/2021 | 343,391 | ||||||||
| 650,000 | American Credit Acceptance Receivables Trust, Series 2014-1 D^ | 5.20 | % | 04/12/2021 | 650,599 | ||||||||
| 377,415 | AmeriCredit Automobile Receivables Trust, Series 2016-1 A-2-A | 1.52 | % | 06/10/2019 | 377,446 | ||||||||
| 538,137 | AmeriCredit Automobile Receivables Trust, Series 2013-4 C | 2.72 | % | 09/09/2019 | 539,403 | ||||||||
| 1,551,685 | Bayview Opportunity Master Fund IVb Trust, Series 2017-CRT1 M#^ | 3.37 | % | 10/25/2028 | 1,556,680 | ||||||||
| 1,297,052 | Bayview Opportunity Master Fund IVb Trust, Series 2017-NPL1 A1#^ | 3.60 | % | 01/28/2032 | 1,297,597 | ||||||||
The accompanying notes are an integral part of these financial statements.
73
Brown Advisory Mortgage Securities Fund
Schedule of Investments
June 30, 2017
| Par Value | Security Description | Rate | Maturity | Value $ | |||||||||
| Asset Backed Securities — 18.8% (Continued) | |||||||||||||
| 613,795 | BRE Grand Islander Timeshare Issuer LLC, Series A^ | 2.94 | % | 05/25/2029 | 616,081 | ||||||||
| 1,500,000 | Capital Auto Receivables Asset Trust, Series 2014-3 B^ | 2.35 | % | 07/22/2019 | 1,505,705 | ||||||||
| 3,000,000 | Carlyle Global Market Strategies CLO, Ltd., Series 2014-1A BR#^ | 2.96 | % | 04/17/2025 | 3,004,792 | ||||||||
| 835,497 | Continental Airlines Trust, Series 1999-1 A | 6.55 | % | 08/02/2020 | 873,094 | ||||||||
| 679,286 | Continental Airlines Trust, Series 2000-1 A-1 | 8.05 | % | 05/01/2022 | 754,008 | ||||||||
| 538,999 | CPS Auto Receivables Trust, Series 2016-D A^ | 1.50 | % | 06/15/2020 | 538,020 | ||||||||
| 635,000 | CPS Auto Receivables Trust, Series 2017-B^ | 2.33 | % | 05/17/2021 | 635,528 | ||||||||
| 1,100,000 | CPS Auto Receivables Trust, Series 2017-A B^ | 2.68 | % | 05/17/2021 | 1,107,354 | ||||||||
| 1,500,000 | Dell Equipment Finance Trust, Series 2015-2 B^ | 2.21 | % | 09/22/2020 | 1,503,627 | ||||||||
| 895,000 | Drive Auto Receivables Trust, Series 2017-BA B^ | 2.20 | % | 05/15/2020 | 896,482 | ||||||||
| 663,000 | Drive Auto Receivables Trust, Series 2016-AA C^ | 3.91 | % | 05/17/2021 | 673,370 | ||||||||
| 600,000 | Drive Auto Receivables Trust, Series 2017-1 C | 2.84 | % | 04/15/2022 | 599,832 | ||||||||
| 230,000 | Dryden Senior Loan Fund, Series 2015-37A A#^ | 2.66 | % | 04/15/2027 | 230,453 | ||||||||
| 758,090 | DT Auto Owner Trust, Series 2016-1A B^ | 2.79 | % | 05/15/2020 | 759,780 | ||||||||
| 174,259 | Exeter Automobile Receivables Trust, Series 2015-2A A^ | 1.54 | % | 11/15/2019 | 174,196 | ||||||||
| 793,751 | Exeter Automobile Receivables Trust, Series 2016-3A A^ | 1.84 | % | 11/16/2020 | 792,042 | ||||||||
| 172,383 | Federal Express Corp., Series 1998-1 | 6.72 | % | 07/15/2023 | 189,078 | ||||||||
| 1,500,000 | Finn Square CLO, Ltd., Series 2012-1A C#^ | 4.90 | % | 12/24/2023 | 1,500,418 | ||||||||
| 269,001 | Flagship Credit Auto Trust, Series 2013-2 B^ | 3.21 | % | 08/15/2019 | 269,314 | ||||||||
| 2,400,000 | Flagship Credit Auto Trust, Series 2014-2 B^ | 2.84 | % | 11/16/2020 | 2,415,909 | ||||||||
| 1,750,000 | Highbridge Loan Management, Ltd., Series 4A-2014 B#^ | 4.17 | % | 07/28/2025 | 1,751,731 | ||||||||
| 3,000,000 | Highbridge Loan Management, Ltd., Series 6A-2015 C#^ | 4.24 | % | 05/05/2027 | 3,001,814 | ||||||||
| 175,865 | Hilton Grand Vacations Trust, Series 2013-A A^ | 2.28 | % | 01/25/2026 | 175,383 | ||||||||
| 343,446 | Hilton Grand Vacations Trust, Series 2014-AA A^ | 1.77 | % | 11/25/2026 | 338,214 | ||||||||
| 908,548 | Hilton Grand Vacations Trust, Series 2017-AA A^ | 2.66 | % | 12/26/2028 | 909,586 | ||||||||
| 750,000 | Magnetite IX, Ltd.#^ | 4.35 | % | 07/25/2026 | 750,044 | ||||||||
| 226,843 | MMAF Equipment Finance LLC, Series 2015-AA A3^ | 1.39 | % | 10/16/2019 | 226,615 | ||||||||
| 57,467 | MMAF Equipment Finance LLC, Series 2013-AA A4^ | 1.68 | % | 05/11/2020 | 57,500 | ||||||||
| 503,611 | MVW Owner Trust, Series 2013-1A A^ | 2.15 | % | 04/22/2030 | 502,178 | ||||||||
| 171,616 | MVW Owner Trust, Series 2014-1A A^ | 2.25 | % | 09/22/2031 | 170,544 | ||||||||
| 973,532 | MVW Owner Trust, Series 2015-1A A^ | 2.52 | % | 12/20/2032 | 969,336 | ||||||||
| 667,722 | MVW Owner Trust, Series 2016-1A A^ | 2.25 | % | 12/20/2033 | 660,108 | ||||||||
| 729,160 | Orange Lake Timeshare Trust, Series 2016-A A^ | 2.61 | % | 03/08/2029 | 728,687 | ||||||||
| 513,656 | OSCAR U.S. Funding Trust IV, Series 2016-1A A2B#^ | 2.69 | % | 07/15/2020 | 516,722 | ||||||||
| 275,077 | OSCAR U.S. Funding Trust V, Series 2016-2A A2B#^ | 2.39 | % | 11/15/2019 | 276,386 | ||||||||
| 419,900 | OSCAR U.S. Funding Trust VI LLC, Series 2017-1A A1^ | 1.18 | % | 04/10/2018 | 419,562 | ||||||||
| 810,000 | OSCAR U.S. Funding Trust VI LLC, Series 2017-1A A2B#^ | 1.92 | % | 05/11/2020 | 810,437 | ||||||||
| 177,681 | Prestige Auto Receivables Trust, Series 2016-1A A2^ | 1.78 | % | 04/15/2019 | 177,792 | ||||||||
| 2,200,000 | Prestige Auto Receivables Trust, Series 2014-1A B^ | 1.91 | % | 04/15/2020 | 2,202,130 | ||||||||
| 760,000 | Prestige Auto Receivables Trust, Series 2016-1A A3^ | 1.99 | % | 06/15/2020 | 762,161 | ||||||||
| 254,000 | Prestige Auto Receivables Trust, Series 2016-1A B^ | 2.98 | % | 11/16/2020 | 256,969 | ||||||||
| 285,000 | Prestige Auto Receivables Trust, Series 2015-1 B^ | 2.04 | % | 04/15/2021 | 285,468 | ||||||||
| 2,000,000 | Regatta III Funding, Ltd.#^ | 2.80 | % | 04/15/2026 | 2,000,000 | ||||||||
| 1,200,000 | Santander Drive Auto Receivables Trust, Series 2017-2 C | 2.79 | % | 08/15/2022 | 1,199,347 | ||||||||
| 70,312 | Sierra Timeshare Receivables Funding LLC, Series 2014-1A A^ | 2.07 | % | 03/20/2030 | 70,234 | ||||||||
| 770,670 | Sierra Timeshare Receivables Funding LLC, Series 2014-3A A^ | 2.30 | % | 10/20/2031 | 770,784 | ||||||||
| 491,933 | Sierra Timeshare Receivables Funding LLC, Series 2015-1A A^ | 2.40 | % | 03/20/2032 | 492,316 | ||||||||
| 841,706 | Sierra Timeshare Receivables Funding LLC, Series 2015-2A A^ | 2.43 | % | 06/20/2032 | 841,033 | ||||||||
| 715,618 | Sierra Timeshare Receivables Funding LLC, Series 2015-3A A^ | 2.58 | % | 09/20/2032 | 717,961 | ||||||||
| 640,117 | Sierra Timeshare Receivables Funding LLC, Series 2016-2A A^ | 2.33 | % | 07/20/2033 | 640,008 | ||||||||
| 975,936 | Sierra Timeshare Receivables Funding LLC, Series 2016-3A A^ | 2.43 | % | 10/20/2033 | 968,655 | ||||||||
| 979,013 | Sierra Timeshare Receivables Funding LLC, Series 2017-1A A^ | 2.91 | % | 03/20/2034 | 988,328 | ||||||||
| 118,952 | TCF Auto Receivables Owner Trust, Series 2016-1A A2^ | 1.39 | % | 11/15/2019 | 118,840 | ||||||||
| 1,052,350 | TCF Auto Receivables Owner Trust, Series 2016-PT1A A^ | 1.93 | % | 06/15/2022 | 1,051,727 | ||||||||
| 367,553 | US Airways Pass Through Trust, Series 1999-1A | 8.36 | % | 07/20/2020 | 371,228 | ||||||||
| 1,016,381 | VOLT LI LLC, Series 2016-NPL11 A1#^ | 3.50 | % | 10/25/2046 | 1,019,775 | ||||||||
The accompanying notes are an integral part of these financial statements.
74
Brown Advisory Mortgage Securities Fund
Schedule of Investments
June 30, 2017
| Par | ||||||||||||||
| Value/Shares | Security Description | Rate | Maturity | Value $ | ||||||||||
| Asset Backed Securities — 18.8% (Continued) | ||||||||||||||
| 749,213 | VOLT LIV LLC, Series 2017-NPL1 A1#^ | 3.50 | % | 02/25/2047 | 751,579 | |||||||||
| 777,776 | VOLT LIX LLC, Series 2017-NPL6 A1#^ | 3.25 | % | 05/28/2047 | 780,675 | |||||||||
| 655,157 | VOLT LV LLC, Series 2017-NPL2 A1#^ | 3.50 | % | 03/25/2047 | 657,877 | |||||||||
| 917,113 | VOLT LVI LLC, Series 2017-NPL3 A1#^ | 3.50 | % | 03/25/2047 | 922,307 | |||||||||
| 564,614 | VOLT LVII LLC, Series 2017-NPL4 A1#^ | 3.38 | % | 04/25/2047 | 565,603 | |||||||||
| 773,583 | VOLT LVIII LLC, Series 2017-NPL5 A1#^ | 3.38 | % | 05/28/2047 | 775,227 | |||||||||
| 500,000 | VOLT LXI LLC, Series 2017-NPL8 A1#^ | 3.13 | % | 06/25/2047 | 500,450 | |||||||||
| 603,599 | VOLT XXXIII LLC, Series 2015-NPL5 A1#^ | 3.50 | % | 03/25/2055 | 607,318 | |||||||||
| 618,536 | VOLT XXXVIII LLC, Series 2015-NPL12 A1#^ | 3.88 | % | 09/25/2045 | 622,700 | |||||||||
| 480,000 | Volvo Financial Equipment LLC, Series 2014-1A C#^ | 1.94 | % | 11/15/2021 | 480,458 | |||||||||
| 874,202 | VSE VOI Mortgage LLC, Series 2016-A A^ | 2.54 | % | 07/20/2033 | 871,872 | |||||||||
| 126,352 | Welk Resorts LLC, Series 2015-AA A^ | 2.79 | % | 06/15/2031 | 126,065 | |||||||||
| 416,000 | Westlake Automobile Receivables Trust, Series 2016-2A B^ | 2.30 | % | 11/15/2019 | 416,734 | |||||||||
| 666,022 | Westlake Automobile Receivables Trust, Series 2015-1A C^ | 2.29 | % | 11/16/2020 | 666,834 | |||||||||
| 335,000 | Westlake Automobile Receivables Trust, Series 2016-1A C^ | 3.29 | % | 09/15/2021 | 338,416 | |||||||||
| 750,000 | Westlake Automobile Receivables Trust, Series 2016-3A B^ | 2.07 | % | 12/15/2021 | 748,626 | |||||||||
| 750,000 | Westlake Automobile Receivables Trust, Series 2016-3A C^ | 2.46 | % | 01/18/2022 | 748,388 | |||||||||
| 600,000 | Westlake Automobile Receivables Trust, Series 2017-1A C^ | 2.70 | % | 10/17/2022 | 602,152 | |||||||||
| Total Asset Backed Securities (Cost $64,312,951) | 64,454,618 | |||||||||||||
| Municipal Bonds — 1.2% | ||||||||||||||
| Local Government Housing Agency Bonds — 1.2% | ||||||||||||||
| 1,595,000 | Delaware State Housing Authority | 2.75 | % | 12/01/2041 | 1,559,463 | |||||||||
| 2,000,000 | Maryland Community Development Administration | 3.24 | % | 09/01/2048 | 2,029,920 | |||||||||
| 680,000 | Missouri Housing Development Commission | 2.65 | % | 11/01/2040 | 666,278 | |||||||||
| Total Municipal Bonds (Cost $4,140,191) | 4,255,661 | |||||||||||||
| Preferred Stocks — 0.1% | ||||||||||||||
| 15,000 | AGNC Investment Corp., Series B, 7.75% | 390,300 | ||||||||||||
| Total Preferred Stocks (Cost $383,294) | 390,300 | |||||||||||||
| Short-Term Investments — 6.6% | ||||||||||||||
| Money Market Funds — 6.5% | ||||||||||||||
| 22,284,523 | First American Treasury Obligations Fund — Class Z, 0.85%* | 22,284,523 | ||||||||||||
| U.S. Treasury Bills — 0.1% | ||||||||||||||
| 300,000 | United States Treasury Bill† | 299,480 | ||||||||||||
| Total Short-Term Investments (Cost $22,584,004) | 22,584,003 | |||||||||||||
| Total Investments — 136.1% (Cost $469,014,592) | 467,294,366 | |||||||||||||
| Liabilities in Excess of Other Assets — (36.1)% | (123,851,181 | ) | ||||||||||||
| NET ASSETS — 100.0% | $ | 343,443,185 | ||||||||||||
| * | Annualized seven-day yield as of June 30, 2017. |
| ^ | Security exempt from registration under Rule 144A of the Securities Act of 1933. These securities may be resold in transactions exempt from registration, normally to qualified institutional buyers. At June 30, 2017, the value of these securities amounted to $78,768,895 or 22.9% of net assets. |
| ~ | Interest Only Security |
| † | This security is pledged as collateral in connection with open futures contracts. |
| # | Variable rate security. Rate disclosed is as of June 30, 2017. |
| Futures Contracts — Long (Note 7) | |||||||||||||||||
| Notional | Notional | Unrealized Appreciation | |||||||||||||||
Issue | Contracts | Expiration Date | Amount | Value | (Depreciation) | ||||||||||||
| U.S. Treasury 5-Year Note Futures September 2017 | 80 | 09/29/2017 | $ | 9,463,498 | $ | 9,426,875 | $ | (36,623 | ) | ||||||||
| U.S. Treasury 10-Year Ultra Bond Futures September 2017 | 40 | 09/20/2017 | 5,434,096 | 5,392,500 | (41,596 | ) | |||||||||||
| $ | 14,897,594 | $ | 14,819,375 | $ | (78,219 | ) | |||||||||||
There is no variation margin due to or from the Fund as of June 30, 2017.
The accompanying notes are an integral part of these financial statements.
75
Brown Advisory – WMC Strategic European Equity Fund
A Message to Our Shareholders
June 30, 2017
Dear Shareholder:
During the year ended June 30, 2017, the Brown Advisory – WMC Strategic European Equity Fund Institutional Shares (the “Fund”) increased 23.32%. During the same period, the MSCI Europe Index, the Fund’s benchmark, increased 21.11%.
Using a bottom-up approach, we build a portfolio of companies that we believe benefit from a structural growth advantage, are competitively positioned and attractively valued. This fundamental process leads us to certain sector over and underweights.
Allocation, a residual of the bottom-up stock selection process, was additive to relative performance with the Fund’s overweight to industrials and underweight to energy and telecommunication services contributing most to relative returns. Positive allocation was partially offset by the Fund’s underweight allocation to financials and materials. Stock selection also added to performance with consumer staples, information technology and industrials as the strongest sectors.
Top contributors to relative returns during the period included DSV, Atlas Copco, and Sandvik. DSV is a Denmark-based freight logistics company with a large road network across Europe. The company has had both a profitable position within European freight and contract logistics as well as exposure to sea and air. The company released what we felt were solid returns during the period and has seen incremental synergies surrounding the acquisition of U.S. shipping company, UTi. DSV has been a well-managed company with a strong focus on cost control and across all its divisions, it has benefitted from an asset light business. Additionally, given its position as a freight broker of considerable size, it has benefitted from pricing economies of scale. We continue to hold our position.
Atlas Copco is a Sweden-based global industrials group producing compressors, construction and mining equipment. The company has benefitted from leading market positions across most of its segments and we are attracted to what we see as an exceptionally strong balance sheet. In particular, its strength in the aftermarket is a strong driver of returns – a combination of what has been an increasing installed base, higher penetration of that base and improved pricing are strong positives for the stock. The company reported positive results during the period and better-than-expected order intake in its Compressor Technique, Industrial Technique and Mining segments. We trimmed our position into strength during the period.
Sandvik is a high-technology engineering group in tools and tooling systems for metal cutting, mining and the construction business. They are a global leader in the industry, and we like the new management team and believe the company will achieve improved synergies over the next few years as it focuses on refining its business mix. The company profited from an upswing in oil prices last year and also from an increase in order intake across its regional businesses (Europe, North America, Asia, and China). We purchased this stock at the beginning of 2016 and have recently been trimming it on strength.
Top detractors from relative returns included Hikma Pharmaceuticals, UCB, Reckitt Benckiser Group, and not owning HSBC Holdings. UK pharmaceuticals company Hikma fell on news of the U.S. Food and Drug Administration (FDA) rejection of its generic asthma medication (Advair) and accelerating price erosion in its U.S. business due to a tough continued environment in U.S. generics. We have based our thesis on the longer term prospects of the company and the potential value in the stock driven by fast-growing emerging markets exposure, as well as an enhanced pipeline after its acquisitions. This thesis is contingent on Hikma’s ability to accelerate new product approvals in the U.S. We continue to hold our position.
Belgian pharmaceuticals company UCB combines traditional synthetic chemistry and biotechnology approaches in targeting the central nervous system. The stock price faltered during the period as a result of a setback on their osteoporosis drug romozumbab (which they have co-developed with Amgen). While the drug met all of its clinical end points of effectiveness, the tests revealed some cardiovascular side effects which could cause delays and restrictions to the product’s use. We believe the stock remains attractive over the long term, offering both top-line growth and margin expansion opportunities and we continue to hold and monitor the stock.
Reckitt Benckiser is a UK-based, leading consumer healthcare and personal care provider. The company reported accelerated like-for-like sales growth, but reported sales were flat due to foreign exchange impact. We maintain a positive view on the security given its strong competitive position, execution capability, and recently announced cost optimization program. In addition, they have demonstrated a good track record in finding and extracting value from sound acquisition targets and obtaining financial synergies from these acquisitions. We continue to hold the stock.
While there are indications of a strengthening economy, we continue to think that we remain in an environment characterized by lower growth and low interest rates. Central banks will likely remain accommodative, with tapering or, in the case of the U.S.,
76
Brown Advisory – WMC Strategic European Equity Fund
A Message to Our Shareholders
June 30, 2017
gradual rate hikes – translating into large amounts of money chasing returns. This backdrop, in combination with political uncertainty, will, in our view, result in continued volatility in the equity markets during the year. While this may create unease among market participants, we as stock pickers welcome volatility as it translates into investment opportunity at attractive valuations.
As we have done over time, we seek to identify and invest in what we believe are companies that are exposed to structural growth drivers and have built strong competitive advantages. These intrinsic qualities have the potential to drive margins and returns, as well as high free-cash-flow generation, which we believe will create long term value.
Sincerely,
C. Dirk Enderlein, CFA
Portfolio Manager
Past performance is not a guarantee of future results.
Mutual fund investing involves risk. Principal loss is possible. Investments focused in a single geographic region may be exposed to greater risk than investments diversified among various geographies. Investments in foreign securities entail certain risks not associated with investments in domestic securities, such as volatility of currency exchange rates, and in some cases, political and economic instability and relatively illiquid markets. These risks are greater in emerging markets. Investments in smaller and medium capitalization companies generally carry greater risk than is customarily associated with larger companies for various reasons such as narrower markets, limited financial resources and less liquid stock. The Fund may invest in ETFs, which may trade at a discount to the aggregate value of the underlying securities and although expense ratios for ETFs are generally low, frequent trading of ETFs by the Fund can generate brokerage expenses. The value of investments in REITs may change in response to changes in the real estate market such as declines in the value of real estate, lack of available capital or financing opportunities, and increases in property taxes or operating costs. Derivatives involve risks different from, and in certain cases, greater than the risks presented by more traditional investments. Investors will indirectly bear the principal risks and its share of the fees and expenses of the Fund’s investment in other Investment Companies.
Fund holdings and sector allocations are subject to change and should not be considered a recommendation to buy or sell any security. For a complete list of fund holdings, please refer to the Schedule of Investments provided in this report.
Definitions for terms and indices are provided in the Glossary of Terms.
77
Brown Advisory – WMC Strategic European Equity Fund
Performance Information & Portfolio Holdings Summary
June 30, 2017
| PORTFOLIO HOLDINGS | % of Net Assets |
| United Kingdom | 27.9% |
| Switzerland | 16.9% |
| France | 13.3% |
| Sweden | 9.9% |
| Germany | 8.8% |
| Netherlands | 7.1% |
| Finland | 5.1% |
| Denmark | 4.3% |
| Belgium | 2.4% |
| Italy | 1.6% |
| Spain | 0.9% |
| Money Market Funds | 0.9% |
| Austria | 0.5% |
| Other Assets and Liabilities | 0.4% |
100.0% |
GROWTH OF A $1,000,000 INVESTMENT
The following chart reflects the change in value of a hypothetical $1,000,000 investment, including reinvested dividends and distributions, in the Fund as measured against a broad-based securities market index. The MSCI Europe Index (“Index”) is an index that captures large and mid cap representation across 15 developed market countries in Europe. The Index is unmanaged and does not reflect the deduction of fees, such as investment management fees. Investors cannot invest directly in an index.

| Since Inception | ||
Average Annual Total Return as of 6/30/17 | One Year | (10/21/13) |
| Institutional Shares | 23.32% | 5.94% |
| Investor Shares | 23.18% | 5.80% |
| Advisor Shares | 22.91% | 5.55% |
| MSCI Europe Index | 21.11% | 2.29% |
Institutional Shares | Investor Shares | Advisor Shares | |
Gross Expense Ratio1 | 1.11% | 1.26% | 1.51% |
Net Expense Ratio1 | 1.11% | 1.26% | 1.51% |
Past performance does not guarantee future results. The performance data quoted represents past performance and current returns may be lower or higher. The investment return and net asset value will fluctuate so that an investor’s shares, when redeemed, may be worth more or less than the original cost. To obtain performance information current to the most recent month end, please visit our website at brownadvisoryfunds.com/performance.html. The performance table and graph above do not reflect the deduction of taxes that a shareholder would pay on Fund distributions or the redemption of Fund shares. Performance data does not reflect the imposition of the redemption fee of 1.00% on shares redeemed within 14 days, and if it did, performance would have been lower. Short-term performance, in particular, is not a good indication of the Fund’s future performance, and an investment should not be made based solely on returns.
1 | Per the Fund’s prospectus dated October 31, 2016. Refer to the financial highlights for the gross and net expense ratios for the year ended as of the date of this report. Please note that the expense ratios per the prospectus include acquired fund fees and expenses (as applicable) and the expense ratios in the financial highlights do not. |
78
Brown Advisory – WMC Strategic European Equity Fund
Schedule of Investments
June 30, 2017
| Shares | Security Description | Value $ | ||||||
| Common Stocks — 98.3% | ||||||||
| Austria — 0.5% | ||||||||
| 194,798 | PORR AG | 6,154,300 | ||||||
| Belgium — 2.4% | ||||||||
| 427,141 | UCB S.A. | 29,377,256 | ||||||
| Denmark — 4.3% | ||||||||
| 18,508 | ALK-Abello A/S | 2,761,836 | ||||||
| 586,622 | DSV A/S | 36,032,754 | ||||||
| 142,999 | H. Lundbeck A/S | 8,027,563 | ||||||
| 310,544 | Spar Nord Bank A/S | 4,072,710 | ||||||
| 50,894,863 | ||||||||
| Finland — 5.1% | ||||||||
| 708,368 | Kone OYJ | 36,038,376 | ||||||
| 287,908 | Nokian Renkaat OYJ | 11,917,549 | ||||||
| 248,231 | Sampo OYJ | 12,735,671 | ||||||
| 60,691,596 | ||||||||
| France — 13.3% | ||||||||
| 706,528 | Altran Technologies S.A. | 11,509,956 | ||||||
| 47,216 | BioMerieux S.A. | 10,224,504 | ||||||
| 584,914 | Elior Group S.A. | 17,000,380 | ||||||
| 826,666 | Elis S.A. | 18,941,172 | ||||||
| 601,941 | Legrand S.A. | 42,064,593 | ||||||
| 106,409 | L’Oreal S.A. | 22,187,867 | ||||||
| 219,755 | Pernod Ricard S.A. | 29,426,831 | ||||||
| 222,676 | Worldline S.A.* | 7,637,157 | ||||||
| 158,992,460 | ||||||||
| Germany — 8.4% | ||||||||
| 217,006 | Beiersdorf AG | 22,825,086 | ||||||
| 158,919 | Brenntag AG | 9,216,389 | ||||||
| 924,556 | Infineon Technologies AG | 19,638,140 | ||||||
| 220,486 | Merck KGaA | 26,678,580 | ||||||
| 402,128 | United Internet AG | 22,130,777 | ||||||
| 100,488,972 | ||||||||
| Italy — 1.6% | ||||||||
| 112,798 | DiaSorin S.p.A. | 8,670,924 | ||||||
| 1,412,648 | OVS S.p.A. | 10,057,890 | ||||||
| 18,728,814 | ||||||||
| Netherlands — 7.1% | ||||||||
| 442,605 | Heineken NV | 43,036,638 | ||||||
| 749,728 | Unilever NV | 41,386,418 | ||||||
| 84,423,056 | ||||||||
| Spain — 0.9% | ||||||||
| 181,769 | Viscofan S.A. | 10,770,681 | ||||||
| Sweden — 9.9% | ||||||||
| 1,581,820 | Assa Abloy AB | 34,865,647 | ||||||
| 799,631 | Atlas Copco AB | 30,747,238 | ||||||
| 2,160,249 | Cloetta AB | 8,897,722 | ||||||
| 1,335,911 | Sandvik AB | 21,032,900 | ||||||
| 1,001,221 | Trelleborg AB | 22,861,247 | ||||||
| 118,404,754 | ||||||||
| Switzerland — 16.9% | ||||||||
| 1,522 | BELIMO Holding AG | 6,558,457 | ||||||
| 244,447 | Cie Financiere Richemont S.A. | 20,227,707 | ||||||
| 26,727 | Daetwyler Holding AG | 4,552,185 | ||||||
| 53,886 | Geberit AG | 25,162,624 | ||||||
| 11,555 | INFICON Holding AG | 5,710,470 | ||||||
| 751,866 | Julius Baer Group, Ltd.* | 39,725,768 | ||||||
| 112,471 | Kuehne & Nagel International AG | 18,803,297 | ||||||
| 3,433 | LEM Holding S.A. | 4,439,378 | ||||||
| 46,045 | Schindler Holding AG | 9,762,136 | ||||||
| 59,470 | Tecan Group AG | 11,198,595 | ||||||
| 69,833 | Temenos Group AG* | 6,247,474 | ||||||
| 2,896,398 | UBS Group | 49,255,817 | ||||||
| 201,643,908 | ||||||||
| United Kingdom — 27.9% | ||||||||
| 1,275,505 | Berendsen PLC | 20,448,715 | ||||||
| 390,491 | British American Tobacco PLC | 26,609,333 | ||||||
| 1,581,123 | Compass Group PLC | 33,373,812 | ||||||
| 354,629 | Diploma PLC | 5,094,875 | ||||||
| 1,848,852 | Electrocomponents PLC | 13,906,845 | ||||||
| 849,474 | Halma PLC | 12,173,327 | ||||||
| 800,037 | Hikma Pharmaceuticals PLC | 15,322,000 | ||||||
| 950,260 | Jardine Lloyd Thompson Group PLC | 14,852,067 | ||||||
| 1,283,143 | Prudential PLC | 29,453,125 | ||||||
| 402,390 | Reckitt Benckiser Group PLC | 40,791,738 | ||||||
| 3,085,508 | Rentokil Initial PLC | 10,980,021 | ||||||
| 2,109,434 | Smith & Nephew PLC | 36,426,948 | ||||||
| 436,089 | Spectris PLC | 14,337,113 | ||||||
| 236,431 | Spirax-Sarco Engineering PLC | 16,489,434 | ||||||
| 1,403,031 | SSP Group PLC | 8,694,706 | ||||||
| 572,814 | SuperGroup PLC | 11,153,676 | ||||||
| 1,425,156 | UBM PLC | 12,807,629 | ||||||
| 457,440 | WH Smith PLC | 10,210,792 | ||||||
| 333,126,156 | ||||||||
| Total Common Stocks (Cost $967,116,189) | 1,173,696,816 | |||||||
| Preferred Stocks — 0.4% | ||||||||
| Germany — 0.4% | ||||||||
| 94,745 | FUCHS PETROLUB SE | 5,163,895 | ||||||
| Total Preferred Stocks (Cost $3,994,433) | 5,163,895 | |||||||
| Short-Term Investments — 0.9% | ||||||||
| Money Market Funds — 0.9% | ||||||||
| 10,565,414 | Cash Account Trust — Government | |||||||
| & Agency Securities Portfolio — | ||||||||
| Institutional Shares, 0.88%# | 10,565,414 | |||||||
| Total Short-Term Investments (Cost $10,565,414) | 10,565,414 | |||||||
| Total Investments — 99.6% (Cost $981,676,036) | 1,189,426,125 | |||||||
| Other Assets in Excess of Liabilities — 0.4% | 5,172,462 | |||||||
| NET ASSETS — 100.0% | $ | 1,194,598,587 | ||||||
| * | Non-Income Producing |
| # | Annualized seven-day yield as of June 30, 2017. |
The accompanying notes are an integral part of these financial statements.
79
Brown Advisory – WMC Japan Alpha Opportunities Fund
A Message to Our Shareholders
June 30, 2017
Dear Shareholder:
During the year ended June 30, 2017, the Brown Advisory – WMC Japan Alpha Opportunities Fund Institutional Shares (the “Fund”) increased 23.33% in value. During the same period, the TOPIX Total Return Index, the Fund’s benchmark, increased 21.11%.
During the year, stock selection was the main driver of positive alpha. In particular, positive selection in the information technology (IT) and consumer discretionary sectors more than offset weaker selection in the materials and telecommunication services sectors. Sector allocation, a residual of our bottom-up stock selection process, also was additive. An overweight to information technology and an underweight to telecommunication services aided results. An underweight to financials and an overweight to consumer discretionary posed a headwind.
From an individual stock perspective, the top relative contributor during the period was Fujitsu, the largest IT service company in Japan. Fujitsu is going through an internal restructuring to focus on their higher-margin IT services business line by selling non-core divisions. We maintain an overweight position as the stock continues to outperform given the market’s acknowledgement of this turnaround. Our decision not to hold benchmark constituent Toyota Motor also was additive. The stock price of the Japan-based automobile manufacturer has declined due to declining auto sales. They retain high fixed costs from earlier investments and no clear catalyst to unlock value. We continue not to hold the stock.
The top detractor from relative performance was our decision not to hold benchmark constituent SoftBank, a Japan-based telecommunication and Internet business provider. Stock prices rose amid deal talks with Deutsche Telekom to merge Sprint and T-Mobile, two leading mobile phone companies controlled respectively by SoftBank and Deutsche Telekom. We continue not to hold the stock. Our position in Nippon Television also detracted; however, we remain confident in the name as it is the number one TV broadcaster in Japan and we see it as a late-cycle levered play on domestic macro. Despite poor market perception, fundamentals have been solid and are improving. Rapid growth in its subsidiary, Hulu Japan, is also promising. Additionally, we see Nippon as a potential beneficiary of the trend toward improving corporate governance in Japan. We maintain our overweight position in the stock.
Our largest new position during the period was Alps Electric, which manufactures and distributes electronic components and devices. We also initiated a position in Sumitomo Mitsui Trust Holdings, which engages in the management of its group companies with trust banking as its core business. Our largest sell during the period was Fujitsu. We eliminated our position in Sumitomo Heavy Industry, which manufactures and sells heavy equipment and industrial machineries.
Positive economic data in Japan (and its trading partners) combined with stable monetary policy has continued to support growth. Key risks to the Japanese economy include a slowdown in China, increased global protectionism and risks that the Bank of Japan exits too early. We have continued to see the positive impact of corporate reforms in Japan, as improving capital discipline (measured by return on equity and net margin) has supported equity market returns. The current cycle is increasingly becoming a domestically driven cycle that feeds into rising wages, inflation and stronger capex growth, leaving Japanese equities less dependent on the direction of the Yen.
We remain constructive on the value factor. From a valuation perspective, the value factor in Japan is in the bottom decile of its historical range going back to 2002, while fundamentals for the factor look strong with positive earnings revisions. We expect growth and value to outperform safety and low volatility factors as we continue to see late cycle economic growth. Low volatility looks expensive, but without a clear catalyst for reversion we believe that it remains a good way to reduce risk when overweight mean-reverting and trend-following strategies.
Sincerely,
Kent M. Stahl, CFA
Portfolio Manager
Gregg R. Thomas, CFA
Portfolio Manager
80
Brown Advisory – WMC Japan Alpha Opportunities Fund
A Message to Our Shareholders
June 30, 2017
Past performance is not a guarantee of future results.
Mutual fund investing involves risk. Principal loss is possible. Investments focused in a single geographic region may be exposed to greater risk than investments diversified among various geographies. Investments in foreign securities entail certain risks not associated with investments in domestic securities, such as volatility of currency exchange rates, and in some cases, political and economic instability and relatively illiquid markets. These risks are greater in emerging markets. Investments in smaller and medium capitalization companies generally carry greater risk than is customarily associated with larger companies for various reasons such as narrower markets, limited financial resources and less liquid stock. The Fund may invest in ETFs, which may trade at a discount to the aggregate value of the underlying securities and although expense ratios for ETFs are generally low, frequent trading of ETFs by the Fund can generate brokerage expenses. The value of investments in REITs may change in response to changes in the real estate market such as declines in the value of real estate, lack of available capital or financing opportunities, and increases in property taxes or operating costs. Derivatives involve risks different from, and in certain cases, greater than the risks presented by more traditional investments. Investors will indirectly bear the principal risks and its share of the fees and expenses of the Fund’s investment in other Investment Companies. Earnings growth is not representative of the fund’s future performance.
Fund holdings and sector allocations are subject to change and should not be considered a recommendation to buy or sell any security. For a complete list of fund holdings, please refer to the Schedule of Investments provided in this report.
Definitions for terms and indices are provided in the Glossary of Terms.
81
Brown Advisory – WMC Japan Alpha Opportunities Fund
Performance Information & Portfolio Holdings Summary
June 30, 2017
| PORTFOLIO HOLDINGS | % of Net Assets |
| Consumer Discretionary | 29.0% |
| Information Technology | 14.9% |
| Financials | 12.5% |
| Industrials | 11.6% |
| Materials | 11.0% |
| Money Market Funds | 7.6% |
| Health Care | 5.8% |
| Consumer Staples | 3.7% |
| Telecommunication Services | 1.4% |
| Energy | 1.4% |
| Real Estate | 1.0% |
| Utilities | 0.2% |
| Real Estate Investment Trusts | 0.1% |
| Other Assets and Liabilities | (0.2)% |
100.0% |
GROWTH OF A $1,000,000 INVESTMENT
The following chart reflects the change in value of a hypothetical $1,000,000 investment, including reinvested dividends and distributions, in the Fund as measured against broad-based securities market indices. TOPIX Total Return Index is a market capitalization-weighted index of all companies listed on the First Section of the Tokyo Stock Exchange. The index is unmanaged and does not reflect the deduction of fees, such as investment management fees. Investors cannot invest directly in an index.
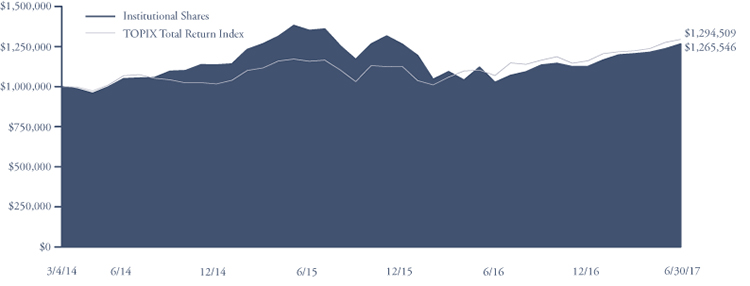
Since Inception | ||
Average Annual Total Return as of 6/30/17 | One Year | (3/4/14) |
| Institutional Shares | 23.33% | 7.34% |
| Investor Shares | 23.16% | 7.18% |
| Advisor Shares | 22.89% | 6.91% |
| TOPIX Total Return Index | 21.11% | 8.08% |
Institutional Shares | Investor Shares | Advisor Shares | |
Gross Expense Ratio1 | 1.15% | 1.30% | 1.55% |
Net Expense Ratio1 | 1.15% | 1.30% | 1.55% |
Past performance does not guarantee future results. The performance data quoted represents past performance and current returns may be lower or higher. The investment return and net asset value will fluctuate so that an investor’s shares, when redeemed, may be worth more or less than the original cost. To obtain performance information current to the most recent month end, please visit our website at brownadvisoryfunds.com/performance.html. The performance table and graph above do not reflect the deduction of taxes that a shareholder would pay on Fund distributions or the redemption of Fund shares. Performance data does not reflect the imposition of the redemption fee of 1.00% on shares redeemed within 14 days, and if it did, performance would have been lower. Short-term performance, in particular, is not a good indication of the Fund’s future performance, and an investment should not be made based solely on returns.
1 | Per the Fund’s prospectus dated October 31, 2016. Refer to the financial highlights for the gross and net expense ratios for the year ended as of the date of this report. Please note that the expense ratios per the prospectus include acquired fund fees and expenses (as applicable) and the expense ratios in the financial highlights do not. |
82
Brown Advisory – WMC Japan Alpha Opportunities Fund
Schedule of Investments
June 30, 2017
| Shares | Security Description | Value $ | ||||||
| Common Stocks — 92.5% | ||||||||
| Japan — 92.5% | ||||||||
| Consumer Discretionary — 29.0% | ||||||||
| 104,600 | Adastria Co., Ltd. | 2,915,203 | ||||||
| 327,100 | Aisan Industry Co., Ltd. | 2,593,856 | ||||||
| 914,000 | Alpine Electronics, Inc. | 13,712,866 | ||||||
| 18,200 | Amuse, Inc. | 496,231 | ||||||
| 234,300 | Avex Group Holdings, Inc. | 3,144,132 | ||||||
| 43,700 | BELC Co., Ltd. | 2,179,248 | ||||||
| 147,800 | Benesse Holdings, Inc. | 5,587,455 | ||||||
| 234,900 | Capcom Co., Ltd. | 5,575,383 | ||||||
| 440,900 | DaikyoNishikawa Corp. | 5,903,864 | ||||||
| 84,400 | Daiwa House Industry Co., Ltd. | 2,888,639 | ||||||
| 149,400 | Descente, Ltd. | 2,023,033 | ||||||
| 371,000 | DIP Corp. | 7,547,180 | ||||||
| 177,800 | Exedy Corp. | 5,026,767 | ||||||
| 146,217 | FUJIFILM Holdings Corp. | 5,272,214 | ||||||
| 355,600 | Funai Electric Co., Ltd. | 2,849,939 | ||||||
| 78,300 | Gendai Agency, Inc. | 392,804 | ||||||
| 208,000 | H2O Retailing Corp. | 3,794,995 | ||||||
| 576,500 | Honda Motor Co., Ltd. | 15,794,994 | ||||||
| 129,420 | Honeys Holdings Co., Ltd. | 1,399,897 | ||||||
| 189,100 | IDOM, Inc. | 1,306,607 | ||||||
| 279,600 | ITOCHU Corp. | 4,162,944 | ||||||
| 36,000 | Itokuro, Inc.* | 1,421,439 | ||||||
| 373,000 | Keihin Corp. | 5,110,305 | ||||||
| 80,900 | K’s Holdings Corp. | 1,581,758 | ||||||
| 158,300 | Kuroda Electric Co., Ltd. | 3,108,245 | ||||||
| 272,440 | Kyoritsu Maintenance Co., Ltd. | 7,934,918 | ||||||
| 177,300 | LIFULL Co., Ltd. | 1,558,062 | ||||||
| 227,700 | Mazda Motor Corp. | 3,198,933 | ||||||
| 1,484,610 | Mitsubishi Motors Corp. | 9,817,961 | ||||||
| 39,000 | MonotaRO Co., Ltd. | 1,260,377 | ||||||
| 668,667 | NGK Spark Plug Co., Ltd. | 14,323,191 | ||||||
| 396,500 | Nikon Corp. | 6,355,557 | ||||||
| 7,460 | Nintendo Co., Ltd. | 2,497,546 | ||||||
| 795,180 | Nippon Television Holdings, Inc. | 13,406,683 | ||||||
| 26,100 | Nishimatsuya Chain Co., Ltd. | 267,429 | ||||||
| 296,900 | Nissin Kogyo Co., Ltd. | 4,730,739 | ||||||
| 96,000 | PAL Group Holdings Co., Ltd. | 2,499,665 | ||||||
| 217,918 | Panasonic Corp. | 2,969,190 | ||||||
| 183,200 | Persol Holdings Co., Ltd. | 3,441,997 | ||||||
| 3,658,500 | Pioneer Corp.* | 7,347,801 | ||||||
| 111,900 | Prestige International, Inc. | 1,209,008 | ||||||
| 55,100 | Proto Corp. | 857,539 | ||||||
| 448,800 | Rakuten, Inc. | 5,296,251 | ||||||
| 231,200 | Relia, Inc. | 2,518,039 | ||||||
| 178,220 | Sankyo Co., Ltd. | 6,054,189 | ||||||
| 144,000 | Sanyo Shokai, Ltd. | 2,294,259 | ||||||
| 240,300 | Sekisui House, Ltd. | 4,246,966 | ||||||
| 415,020 | Showa Corp. | 4,028,848 | ||||||
| 49,600 | Sohgo Security Services Co., Ltd. | 2,238,949 | ||||||
| 170,200 | TechnoPro Holdings, Inc. | 6,850,850 | ||||||
| 109,900 | Tenma Corp. | 2,027,615 | ||||||
| 371,600 | Tokai Rika Co., Ltd. | 6,874,763 | ||||||
| 258,100 | Toppan Forms Co Ltd | 2,671,577 | ||||||
| 701,900 | Toray Industries, Inc. | 5,888,710 | ||||||
| 1,104,795 | Toyo Tire & Rubber Co., Ltd. | 22,633,468 | ||||||
| 268,500 | Toyoda Gosei Co., Ltd. | 6,433,649 | ||||||
| 50,210 | Toyota Industries Corp. | 2,655,622 | ||||||
| 212,300 | Trusco Nakayama Corp. | 5,073,927 | ||||||
| 115,300 | United Arrows, Ltd. | 3,745,554 | ||||||
| 238,200 | XEBIO Holdings Co., Ltd. | 4,211,337 | ||||||
| 50,900 | Yondoshi Holdings, Inc. | 1,269,742 | ||||||
| 286,480,909 | ||||||||
| Consumer Staples — 3.7% | ||||||||
| 46,700 | Ain Holdings, Inc. | 3,379,647 | ||||||
| 111,600 | Cawachi, Ltd. | 2,702,486 | ||||||
| 48,500 | Ci:z Holdings Co., Ltd. | 1,833,241 | ||||||
| 55,600 | Cocokara Fine, Inc. | 2,750,489 | ||||||
| 242,353 | Ezaki Glico Co., Ltd. | 13,049,084 | ||||||
| 508,200 | Itoham Yonekyu Holdings, Inc. | 4,611,827 | ||||||
| 77,860 | Matsumotokiyoshi Holdings Co., Ltd. | 4,435,239 | ||||||
| 42,800 | Morinaga & Co., Ltd. | 2,426,727 | ||||||
| 58,200 | Warabeya Nichiyo Holdings Co., Ltd. | 1,606,600 | ||||||
| 36,795,340 | ||||||||
| Energy — 1.4% | ||||||||
| 893,900 | Inpex Corp. | 8,631,019 | ||||||
| 241,800 | Japan Petroleum Exploration Co., Ltd. | 5,051,682 | ||||||
| 13,682,701 | ||||||||
| Financials — 12.5% | ||||||||
| 137,600 | AEON Financial Service Co., Ltd. | 2,920,163 | ||||||
| 138,000 | Bank of Kyoto Ltd/The | 1,307,697 | ||||||
| 508,500 | Dai-ichi Life Holdings Co., Inc. | 9,229,995 | ||||||
| 1,429,600 | Ichigo, Inc. | 4,274,507 | ||||||
| 423,600 | Ichiyoshi Securities Co., Ltd. | 3,569,464 | ||||||
| 41,400 | JAFCO Co., Ltd. | 1,674,059 | ||||||
| 4,472,533 | Mitsubishi UFJ Financial Group, Inc. | 30,167,451 | ||||||
| 7,842,100 | Mizuho Financial Group, Inc. | 14,378,284 | ||||||
| 232,000 | Oita Bank, Ltd. | 894,968 | ||||||
| 632,000 | Shinsei Bank, Ltd. | 1,107,114 | ||||||
| 433,400 | Sumitomo Mitsui Financial Group, Inc. | 16,921,871 | ||||||
| 249,260 | Sumitomo Mitsui Trust Holdings, Inc. | 8,953,242 | ||||||
| 769,900 | T&D Holdings, Inc. | 11,773,418 | ||||||
| 328,900 | Tochigi Bank, Ltd. | 1,398,152 | ||||||
| 175,365 | Tokio Marine Holdings, Inc. | 7,297,512 | ||||||
| 56,930 | Tokyo TY Financial Group, Inc. | 1,575,843 | ||||||
| 135,200 | Zenkoku Hosho Co., Ltd. | 5,535,616 | ||||||
| 122,979,356 | ||||||||
| Health Care — 5.8% | ||||||||
| 102,800 | Asahi Intecc Co., Ltd. | 4,677,825 | ||||||
| 122,700 | CMIC Holdings Co., Ltd. | 1,689,432 | ||||||
| 111,900 | Eisai Co., Ltd. | 6,191,155 | ||||||
| 150,800 | EPS Holdings, Inc. | 2,365,241 | ||||||
| 124,300 | Nihon Kohden Corp. | 2,877,251 | ||||||
| 96,200 | Nippon Shinyaku Co., Ltd. | 6,158,172 | ||||||
| 423,200 | Nipro Corp. | 5,523,614 | ||||||
| 149,000 | ONO Pharmaceutical Co., Ltd. | 3,249,897 | ||||||
| 49,400 | PeptiDream, Inc.* | 1,563,905 | ||||||
| 98,100 | SMS Co., Ltd. | 2,981,918 | ||||||
| 145,340 | Suzuken Co., Ltd. | 4,838,094 | ||||||
| 305,800 | Takeda Pharmaceutical Co., Ltd. | 15,525,153 | ||||||
| 57,641,657 | ||||||||
The accompanying notes are an integral part of these financial statements.
83
Brown Advisory – WMC Japan Alpha Opportunities Fund
Schedule of Investments
June 30, 2017
| Shares | Security Description | Value $ | ||||||
| Common Stocks — 92.5% (Continued) | ||||||||
| Japan — 92.5% (Continued) | ||||||||
| Industrials — 11.6% | ||||||||
| 725,000 | Chiyoda Corp. | 4,282,476 | ||||||
| 124,200 | Daifuku Co., Ltd. | 3,725,579 | ||||||
| 78,400 | Daiseki Co., Ltd. | 1,744,370 | ||||||
| 334,700 | DMG Mori Co., Ltd. | 5,540,383 | ||||||
| 776,995 | Hino Motors, Ltd. | 8,675,599 | ||||||
| 172,100 | Hisaka Works, Ltd. | 1,496,810 | ||||||
| 267,600 | Hitachi Metals, Ltd. | 3,733,657 | ||||||
| 248,500 | Hosiden Corp. | 2,856,436 | ||||||
| 1,477,000 | IHI Corp. | 5,047,476 | ||||||
| 145,400 | Jamco Corp. | 3,206,734 | ||||||
| 392,725 | Japan Aviation Electronics Industry, Ltd. | 5,449,518 | ||||||
| 333,100 | Japan Steel Works, Ltd. | 5,235,462 | ||||||
| 327,900 | JGC Corp. | 5,341,270 | ||||||
| 345,100 | Kyudenko Corp. | 12,370,118 | ||||||
| 25,900 | METAWATER Co., Ltd. | 710,283 | ||||||
| 621,000 | Mitsubishi Heavy Industries Ltd | 2,556,755 | ||||||
| 442,550 | NGK Insulators, Ltd. | 8,872,305 | ||||||
| 61,500 | Nippon Densetsu Kogyo Co., Ltd. | 1,266,869 | ||||||
| 4,123,933 | Nippon Yusen K.K. | 7,709,643 | ||||||
| 36,600 | Nittoku Engineering Co., Ltd. | 1,016,969 | ||||||
| 443,400 | Sanwa Holdings Corp. | 4,682,709 | ||||||
| 55,700 | SHO-BOND Holdings Co., Ltd. | 2,814,934 | ||||||
| 102,800 | Tadano, Ltd. | 1,245,525 | ||||||
| 1,014,000 | Toshiba Machine Co., Ltd. | 4,562,976 | ||||||
| 1,387,000 | Toyo Engineering Corp. | 3,424,654 | ||||||
| 117,000 | Tsubaki Nakashima Co., Ltd. | 2,269,506 | ||||||
| 368,100 | Ushio, Inc. | 4,646,093 | ||||||
| 114,485,109 | ||||||||
| Information Technology — 14.9% | ||||||||
| 30,206 | Alpha Systems, Inc. | 617,194 | ||||||
| 415,332 | Alps Electric Co., Ltd. | 12,064,704 | ||||||
| 309,400 | Canon, Inc. | 10,524,339 | ||||||
| 736,100 | Citizen Watch Co., Ltd. | 5,179,464 | ||||||
| 232,700 | DeNA Co., Ltd. | 5,230,036 | ||||||
| 11,600 | Disco Corp. | 1,860,540 | ||||||
| 329,747 | Ferrotec Corp. | 4,276,802 | ||||||
| 3,205,425 | Fujitsu, Ltd. | 23,708,179 | ||||||
| 994,500 | GREE, Inc. | 8,692,355 | ||||||
| 127,507 | Hitachi Maxell, Ltd. | 2,614,178 | ||||||
| 9,000 | Horiba, Ltd. | 548,996 | ||||||
| 159,400 | LAC Co., Ltd. | 2,096,768 | ||||||
| 76,420 | Melco Holdings, Inc. | 2,178,204 | ||||||
| 204,600 | Micronics Japan Co., Ltd. | 2,024,617 | ||||||
| 117,300 | Miraial Co., Ltd. | 1,139,949 | ||||||
| 201,300 | Mitsubishi Electric Corp. | 2,911,322 | ||||||
| 28,700 | Murata Manufacturing Co., Ltd. | 4,381,515 | ||||||
| 110,300 | NET One Systems Co., Ltd. | 1,047,134 | ||||||
| 452,700 | Nichicon Corp. | 4,875,384 | ||||||
| 156,000 | Nippon Ceramic Co., Ltd. | 3,644,496 | ||||||
| 427,000 | Nippon Chemi-Con Corp. | 1,549,724 | ||||||
| 33,065 | Otsuka Corp. | 2,056,777 | ||||||
| 36,000 | Outsourcing, Inc. | 1,757,316 | ||||||
| 16,200 | Rohm Co., Ltd. | 1,249,043 | ||||||
| 169,575 | SCSK Corp. | 7,619,387 | ||||||
| 732,500 | Shinko Electric Industries Co., Ltd. | 6,225,458 | ||||||
| 93,000 | SIIX Corp. | 3,692,663 | ||||||
| 200,800 | SUMCO Corp. | 2,918,618 | ||||||
| 125,020 | Taiyo Yuden Co., Ltd. | 1,975,243 | ||||||
| 42,800 | TDK Corp. | 2,829,162 | ||||||
| 126,600 | Tokyo Seimitsu Co., Ltd. | 4,084,138 | ||||||
| 186,700 | W-Scope Corp. | 3,279,576 | ||||||
| 1,732,900 | Yahoo! Japan Corp. | 7,533,308 | ||||||
| 100,400 | Yume No Machi Souzou Iinkai Co., Ltd. | 1,182,099 | ||||||
| 147,568,688 | ||||||||
| Materials — 11.0% | ||||||||
| 154,700 | Chubu Steel Plate Co., Ltd. | 952,374 | ||||||
| 715,680 | Daicel Corp. | 8,945,121 | ||||||
| 646,000 | Denka Co., Ltd. | 3,342,932 | ||||||
| 167,660 | DIC Corp. | 6,057,806 | ||||||
| 355,440 | JFE Holdings, Inc. | 6,188,775 | ||||||
| 501,380 | JSR Corp. | 8,679,512 | ||||||
| 73,600 | Kanto Denka Kogyo Co Ltd | 649,603 | ||||||
| 17,700 | KH Neochem Co., Ltd.* | 338,499 | ||||||
| 279,400 | Kobe Steel, Ltd.* | 2,880,959 | ||||||
| 236,400 | Kyoei Steel, Ltd. | 3,923,537 | ||||||
| 466,400 | MINEBEA MITSUMI, Inc. | 7,542,598 | ||||||
| 84,800 | Mitsubishi Materials Corp. | 2,573,376 | ||||||
| 235,300 | Nakayama Steel Works, Ltd. | 1,361,334 | ||||||
| 220,400 | Neturen Co., Ltd. | 2,092,880 | ||||||
| 63,900 | Nippon Shokubai Co., Ltd. | 4,127,508 | ||||||
| 307,600 | NOK Corp. | 6,530,243 | ||||||
| 1,285,000 | Pacific Metals Co., Ltd.* | 3,380,887 | ||||||
| 1,588,415 | Sumitomo Chemical Co., Ltd. | 9,180,717 | ||||||
| 296,900 | Sumitomo Riko Co., Ltd. | 3,064,968 | ||||||
| 725,000 | Taiheiyo Cement Corp. | 2,651,350 | ||||||
| 50,400 | Tocalo Co., Ltd. | 1,662,069 | ||||||
| 192,300 | Tokyo Ohka Kogyo Co., Ltd. | 6,426,067 | ||||||
| 1,139,500 | Tokyo Steel Manufacturing Co., Ltd. | 9,657,420 | ||||||
| 237,510 | Yamato Kogyo Co., Ltd. | 6,101,086 | ||||||
| 108,311,621 | ||||||||
| Real Estate — 1.0% | ||||||||
| 283,900 | Hulic Co., Ltd. | 2,907,366 | ||||||
| 535,900 | Kenedix, Inc. | 2,535,002 | ||||||
| 1,010,600 | Takara Leben Co., Ltd. | 4,540,474 | ||||||
| 9,982,842 | ||||||||
| Telecommunication Services — 1.4% | �� | |||||||
| 300,092 | Nippon Telegraph & Telephone Corp. | 14,165,574 | ||||||
| Utilities — 0.2% | ||||||||
| 67,500 | Nippon Gas Co., Ltd. | 2,190,168 | ||||||
| Total Common Stocks (Cost $728,537,470) | 914,283,965 | |||||||
| Real Estate Investment Trusts — 0.1% | ||||||||
| Japan — 0.1% | ||||||||
| 236 | Hoshino Resorts, Inc. | 1,211,095 | ||||||
| Total Real Estate Investment Trusts (Cost $1,252,837) | 1,211,095 | |||||||
The accompanying notes are an integral part of these financial statements.
84
Brown Advisory – WMC Japan Alpha Opportunities Fund
Schedule of Investments
June 30, 2017
| Shares | Security Description | Value $ | ||||||
| Short-Term Investments — 7.6% | ||||||||
| Money Market Funds — 7.6% | ||||||||
| 75,338,358 | Cash Account Trust — Government | |||||||
| & Agency Securities Portfolio — | ||||||||
| Institutional Shares, 0.88%# | 75,338,358 | |||||||
| Total Short-Term Investments (Cost $75,338,358) | 75,338,358 | |||||||
| Total Investments — 100.2% (Cost $805,128,665) | 990,833,418 | |||||||
| Liabilities in Excess of Other Assets — (0.2)% | (1,977,805 | ) | ||||||
| NET ASSETS — 100.0% | $ | 988,855,613 | ||||||
| * | Non-Income Producing |
| # | Annualized seven-day yield as of June 30, 2017. |
| Futures Contracts — Long (Note 7) | |||||||||||||||||
| Notional | Notional | Unrealized Appreciation | |||||||||||||||
Issue | Contracts | Expiration Date | Amount | Value | (Depreciation) | ||||||||||||
| TOPIX Index Futures Contracts^ | 315 | 09/07/2017 | $ | 44,894,873 | $ | 45,132,029 | $ | 237,156 | |||||||||
| ^ | Contracts are denominated in Japanese Yen. Notional amount, notional value and unrealized appreciation (depreciation) have been translated into U.S. Dollars as of June 30, 2017. |
There is $330,773 of variation margin due from the Fund to the broker as of June 30, 2017.
The accompanying notes are an integral part of these financial statements.
85
Brown Advisory – Somerset Emerging Markets Fund
A Message to Our Shareholders
June 30, 2017
Dear Shareholder:
During the year ended June 30, 2017, the Brown Advisory – Somerset Emerging Markets Fund Institutional Shares (the “Fund”) returned 18.04% in value. During the same period, the MSCI Emerging Markets Index, the Fund’s benchmark, returned 23.75%, resulting in relative underperformance by the Fund of 5.71% during the year. The first half of the year contributed most to this underperformance. The Fund has subsequently performed strongly over the last six months.
On a country level, the Fund’s exposure to South Korea positively affected performance during the year. SK Hynix and Samsung Electronics in Korea were two of the strongest performers. This supports our investment thesis around the strength of the semiconductor business at both companies and the improving pricing dynamics in the DRAM semiconductor space. The Philippines was our worst performing country exposure, principally due to the performance of Metro Bank and telecommunications company PLDT. We sold out of PLDT during the year following a change to our investment thesis.
At a sector level, information technology and financials contributed most to absolute performance over the period. In the top five stock contributors to performance, three financial stocks – OTP Bank in Hungary, PZU in Poland and HSBC (diversified) – were alongside our top two Korean names. OTP Bank has passed through its ‘turnaround’ stage and is now benefitting from a benign macroeconomic environment in Hungary. PZU is benefitting from the stabilization of market sentiment and strong fundamentals.
We made 6 buys and 8 sells during the year. Turnover on an NAV basis, including trims and additions, was 23% during the year, which is in line with historical averages. Stocks purchased included 3 consumer staples names, Coca-Cola HBC, Eurocash and X5 Retail. This increase in consumer names is partly related to valuations in the consumer space eight to nine months ago, back when we made some of these purchases. We were able to buy Eurocash at 20x P/E compared to a previous valuation of 35x P/E. This valuation was largely due to negative sentiment towards Poland and a potential retail tax, which may benefit Eurocash as a consolidator in the market.
Over the period, our sells were largely informed by stock-specifics but risk reduction was the overriding theme, if there was one. We sold Turk Sise Ve Cam in Turkey prior to the attempted coup there, in part on fundamentals but also as a way to reduce our exposure to Turkey. We sold First Gulf Bank prior to the merger with Union National Bank. We still retain our stake in the newly formed First Abu Dhabi Bank, but we cut our exposure in First Gulf partly because we felt the merger would be more positive for the Union National Bank side.
Looking to one of the biggest political events of the period, the election of U.S. President Donald Trump does not change our positive long-term outlook for emerging markets. We believe the oil price collapse, earnings recessions, and bear markets in most emerging markets have run their courses. We have growing confidence that January/February 2016 will be recognized as the low point or floor of a structural bear market started in 2007 (excluding the GFC). The key risk to this view will be the Chinese financial system. The Fund has continued to carry significant, but narrowing, opportunity cost risk in commodities and China, which, in our view, remains a short-term relative risk.
We are looking to accumulate more of what we believe to be best-of-breed companies in areas that have the potential for long-term sustainable growth alongside better value turnaround stocks in ways that reflect these structural growth opportunities.
Sincerely,
Edward Lam
Portfolio Manager
86
Brown Advisory – Somerset Emerging Markets Fund
A Message to Our Shareholders
June 30, 2017
Past performance is not a guarantee of future results.
Mutual fund investing involves risk. Principal loss is possible. The Fund may invest in ETFs, which may trade at a discount to the aggregate value of the underlying securities and although expense ratios for ETFs are generally low, frequent trading of ETFs by the Fund can generate brokerage expenses. The Fund may invest in foreign securities which involve greater volatility and political, economic and currency risks and differences in accounting methods. These risks are greater in emerging markets. Derivatives may involve certain costs and risks such as liquidity, interest rate, market, credit, management, and the risk that a position could not be closed when most advantageous. Investing in derivatives could lose more than the amount invested. The Fund invests in smaller and medium-sized companies which carry greater risk than is associated with larger companies for various reasons, such as narrower markets, limited financial resources and less liquid stock.
Fund holdings and sector allocations are subject to change and should not be considered a recommendation to buy or sell any security. For a complete list of fund holdings, please refer to the Schedule of Investments provided in this report.
Definitions for terms and indices are provided in the Glossary of Terms.
87
Brown Advisory – Somerset Emerging Markets Fund
Performance Information & Portfolio Holdings Summary
June 30, 2017
| PORTFOLIO HOLDINGS | % of Net Assets |
| South Korea | 21.2% |
| Taiwan | 10.1% |
| India | 9.5% |
| United Kingdom | 9.0% |
| Hungary | 8.3% |
| Turkey | 5.3% |
| Brazil | 5.0% |
| South Africa | 4.9% |
| Chile | 4.7% |
| Poland | 4.4% |
| China | 3.3% |
| Indonesia | 3.2% |
| United Arab Emirates | 3.0% |
| Philippines | 3.0% |
| Money Market Funds | 2.8% |
| Portugal | 1.3% |
| Nigeria | 0.8% |
| Thailand | 0.0% |
| Other Assets and Liabilities | 0.2% |
100.0% |
GROWTH OF A $1,000,000 INVESTMENT
The following chart reflects the change in value of a hypothetical $1,000,000 investment, including reinvested dividends and distributions, in the Fund as measured against a broad-based securities market index. The MSCI Emerging Markets Index (“Index”) is a free float-adjusted market capitalization index that is designed to measure equity market performance in the global emerging markets. The Index is unmanaged and does not reflect the deduction of fees, such as investment management fees. Investors cannot invest directly in an index.
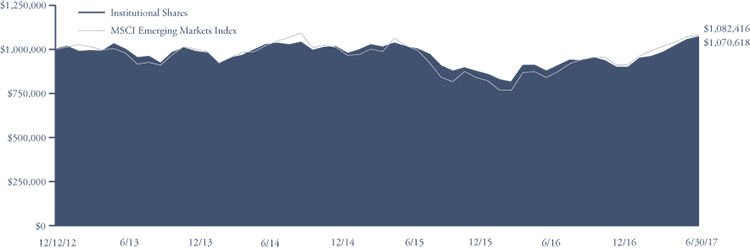
Since Inception | ||
Average Annual Total Return as of 6/30/17 | One Year | (12/12/12) |
| Institutional Shares | 18.04% | 1.51% |
| Investor Shares | 17.90% | 1.36% |
| Advisor Shares | 17.65% | 1.09% |
| MSCI Emerging Markets Index | 23.75% | 1.76% |
Institutional Shares | Investor Shares | Advisor Shares | |
Gross Expense Ratio1 | 1.18% | 1.33% | 1.58% |
Net Expense Ratio1 | 1.18% | 1.33% | 1.58% |
Past performance does not guarantee future results. The performance data quoted represents past performance and current returns may be lower or higher. The investment return and net asset value will fluctuate so that an investor’s shares, when redeemed, may be worth more or less than the original cost. To obtain performance information current to the most recent month end, please visit our website at brownadvisoryfunds.com/performance.html. The performance table and graph above do not reflect the deduction of taxes that a shareholder would pay on Fund distributions or the redemption of Fund shares. Performance data does not reflect the imposition of the redemption fee of 1.00% on shares redeemed within 14 days, and if it did, performance would have been lower. Short-term performance, in particular, is not a good indication of the Fund’s future performance, and an investment should not be made based solely on returns.
1 | Per the Fund’s prospectus dated October 31, 2016. Refer to the financial highlights for the gross and net expense ratios for the year ended as of the date of this report. Please note that the expense ratios per the prospectus include acquired fund fees and expenses (as applicable) and the expense ratios in the financial highlights do not. |
88
Brown Advisory – Somerset Emerging Markets Fund
Schedule of Investments
June 30, 2017
| Shares | Security Description | Value $ | ||||||
| Common Stocks — 97.0% | ||||||||
| Brazil — 5.0% | ||||||||
| 1,890,571 | Ambev S.A. | 10,494,612 | ||||||
| 2,060,856 | Porto Seguro S.A.† | 19,047,786 | ||||||
| 29,542,398 | ||||||||
| Chile — 4.7% | ||||||||
| 3,221,349 | AFP Habitat S.A.† | 3,882,166 | ||||||
| 8,604,446 | Aguas Andinas S.A. | 5,047,242 | ||||||
| 1,247,316 | Cia Cervecerias Unidas S.A.† | 16,408,033 | ||||||
| 1,399,468 | Inversiones Aguas Metropolitanas S.A.† | 2,346,413 | ||||||
| 27,683,854 | ||||||||
| China — 3.3% | ||||||||
| 242,500 | China Mobile, Ltd. | 2,570,937 | ||||||
| 5,581,216 | CNOOC, Ltd. | 6,123,934 | ||||||
| 195,500 | Henderson Land Development Co., Ltd. | 1,090,092 | ||||||
| 1,324,500 | Hengan International Group Co., Ltd. | 9,771,004 | ||||||
| 19,555,967 | ||||||||
| Hungary — 8.3% | ||||||||
| 243,561 | MOL Hungarian Oil & Gas PLC† | 19,129,844 | ||||||
| 898,948 | OTP Bank PLC | 30,087,300 | ||||||
| 49,217,144 | ||||||||
| India — 9.5% | ||||||||
| 412,194 | Axis Bank, Ltd. | 3,296,235 | ||||||
| 1,636,798 | HCL Technologies, Ltd. | 21,545,032 | ||||||
| 138,895 | Hero MotoCorp, Ltd. | 7,947,457 | ||||||
| 2,642,281 | Power Grid Corp. of India, Ltd. | 8,603,770 | ||||||
| 211,978 | Shriram Transport Finance Co., Ltd. | 3,274,983 | ||||||
| 513,036 | Yes Bank, Ltd. | 11,606,222 | ||||||
| 56,273,699 | ||||||||
| Indonesia — 3.2% | ||||||||
| 3,501,600 | AKR Corporindo | 1,711,712 | ||||||
| 49,751,983 | Telekomunikasi Indonesia | 16,895,352 | ||||||
| 18,607,064 | ||||||||
| Nigeria — 0.8% | ||||||||
| 160,191,125 | Access Bank PLC† | 4,740,045 | ||||||
| Philippines — 3.0% | ||||||||
| 14,964,680 | Aboitiz Power Corp.† | 11,536,875 | ||||||
| 3,479,337 | Metropolitan Bank & Trust Co. | 6,028,163 | ||||||
| 17,565,038 | ||||||||
| Poland — 4.4% | ||||||||
| 780,262 | Eurocash S.A. | 6,527,363 | ||||||
| 1,599,712 | Powszechny Zaklad Ubezpieczen S.A. | 19,247,168 | ||||||
| 25,774,531 | ||||||||
| Portugal — 1.3% | ||||||||
| 403,599 | Jeronimo Martins SGPS S.A. | 7,879,793 | ||||||
| South Africa — 4.9% | ||||||||
| 3,036,292 | Sanlam, Ltd. | 15,038,353 | ||||||
| 915,204 | Shoprite Holdings, Ltd. | 13,955,404 | ||||||
| 28,993,757 | ||||||||
| South Korea — 21.2% | ||||||||
| 121,230 | KT&G Corp. | 12,400,822 | ||||||
| 10,193 | NCSoft Corp. | 3,380,939 | ||||||
| 839,940 | Nexen Tire Corp.† | 9,801,128 | ||||||
| 51,279 | NongShim Co., Ltd.† | 15,131,662 | ||||||
| 12,801 | Samsung Electronics Co., Ltd. | 26,662,203 | ||||||
| 84,235 | Samsung Fire & Marine Insurance Co., Ltd. | 20,734,394 | ||||||
| 634,572 | SK Hynix, Inc. | 37,363,421 | ||||||
| 125,474,569 | ||||||||
| Taiwan — 10.1% | ||||||||
| 708,000 | eMemory Technology, Inc.† | 9,255,916 | ||||||
| 872,401 | Formosa International Hotels Corp.† | 4,746,297 | ||||||
| 10,149,300 | Pou Chen Corp. | 14,034,958 | ||||||
| 1,223,000 | President Chain Store Corp. | 10,988,955 | ||||||
| 897,750 | Taiwan Semiconductor Manufacturing Co., Ltd. | 6,133,619 | ||||||
| 2,699,584 | Win Semiconductors Corp. | 14,812,959 | ||||||
| 59,972,704 | ||||||||
| Turkey — 5.3% | ||||||||
| 2,031,441 | Aksa Akrilik Kimya Sanayii A/S | 7,726,399 | ||||||
| 2,639,776 | Anadolu Hayat Emeklilik A/S† | 4,157,126 | ||||||
| 196,051 | AvivaSA Emeklilik ve Hayat A/S† | 1,137,820 | ||||||
| 10,425,279 | Turk Telekomunikasyon A/S*† | 18,482,494 | ||||||
| 31,503,839 | ||||||||
| United Arab Emirates — 3.0% | ||||||||
| 4,384,282 | FirstAbu Dhabi Bank | 12,533,341 | ||||||
| 3,988,700 | Union National Bank† | 5,110,383 | ||||||
| 17,643,724 | ||||||||
| United Kingdom — 9.0% | ||||||||
| 492,170 | Coca-Cola HBC AG | 14,474,306 | ||||||
| 2,555,650 | HSBC Holdings PLC | 23,742,987 | ||||||
| 428,284 | X5 Retail Group NV GDR* | 14,840,041 | ||||||
| 53,057,334 | ||||||||
| Total Common Stocks (Cost $485,434,110) | 573,485,460 | |||||||
| Warrants — 0.0% | ||||||||
| Thailand — 0.0% | ||||||||
| 400,760 | SAMART Corp. PCL, Exercise price | |||||||
| THB 45 expires 02/19/2018* | 5,781 | |||||||
| Total Warrants (Cost $36,190) | 5,781 | |||||||
| Short-Term Investments — 2.8% | ||||||||
| Money Market Funds — 2.8% | ||||||||
| 16,806,386 | Cash Account Trust — Government | |||||||
| & Agency Securities Portfolio — | ||||||||
| Institutional Shares, 0.88%# | 16,806,386 | |||||||
| Total Short-Term Investments (Cost $16,806,386) | 16,806,386 | |||||||
| Total Investments — 99.8% (Cost $502,276,686) | 590,297,627 | |||||||
| Other Assets in Excess of Liabilities — 0.2% | 948,751 | |||||||
| NET ASSETS — 100.0% | $ | 591,246,378 | ||||||
GDR — Global Depository Receipt
| * | Non-Income Producing |
| † | All or a portion of this security is considered illiquid. At June 30, 2017, the total market value of securities considered illiquid was $63,335,834 or 10.7% of net assets. |
| # | Annualized seven-day yield as of June 30, 2017. |
The accompanying notes are an integral part of these financial statements.
89
Brown Advisory – Macquarie Asia New Stars Fund
A Message to Our Shareholders
June 30, 2017
Dear Shareholder:
During the year ended June 30, 2017, the Brown Advisory – Macquarie Asia New Stars Fund Institutional Shares (the “Fund”) increased 7.52% in value. During the same period, the MSCI AC Asia ex Japan SMID Cap Index, the Fund’s benchmark, increased 18.05%.
The year ended June 30, 2017 was characterized by two distinctive halves as the Fund underperformed a falling market for the first six months ended December 31, 2016 and subsequently outperformed a strongly rising market for the second six months ended June 30, 2017.
Unexpected political events in both India and South Korea impacted the Fund’s holdings in these countries. In South Korea, consumer stocks continue to be impacted by China’s deliberate efforts to reduce tourism to the country. The country also experienced elevated political uncertainty with the impeachment of their president which was positively resolved with the election of Moon Jae-in in the May 2017 election. In India, the country’s government implemented a surprise plan to demonetize its currency in a bid to tackle corruption in the country and weed out tax evasion. The risk of a “cash crunch” was initially negative for sentiment, however stock performance within India has since rebounded strongly.
At the sector level, the largest detractors from performance were financials and industrials as the Fund’s positioning could not keep pace with the strong rallies in both sectors.
China positioning has contributed the most to the Fund’s performance during the year with strong stock selection driving this outperformance. The Chinese market has led much of the rally which Asian markets have experienced since the start of the calendar year and the Fund’s positioning, particularly in Chinese internet company exposures has helped it outperform during this market strength.
From an individual stock perspective, the following names were key contributors:
| • | Baozun, Inc. (a Chinese end-to-end e-commerce solutions provider) rose 241.60% and rallied significantly since May after the release of its first quarter 2017 results indicated its growth plans are progressing on schedule. Investor sentiment also improved after the Baozun, Inc. annual conference in May which provided investors with further insights into the management team’s current and future growth plans. |
| • | General Interface Solution Holding, Ltd. (a Taiwanese touchscreen producer) rose 209.68% as sentiment continued to improve as the company delivered results perceived as strong and an increasingly positive outlook. The stock has enjoyed a sustained rally and has continued to receive positive ratings from numerous research houses; despite the stock’s rally we continue to see further upside in the company’s valuation. |
| • | Autohome, Inc. (a Chinese online auto classifieds company) rose 125.56% with the majority of these gains achieved since the start of 2017. The rally began as numerous brokers upgraded their recommendations for the company ahead of its results announcement in March; when the results were released the company’s reported profit was materially higher than consensus expectations. Our thesis that their transition to a capital light model would be a strong positive for margins and future profitability was recognized by the market and the stock has produced a strong rally as a result. |
The following names were key detractors: | |
| • | Korea Kolmar Co., Ltd. (a Korean cosmetics manufacturer) (“Kolmar”) was down 26.99% due to continuing concerns over the political situation in Korea both domestically and in its relations with China impacting Kolmar’s sales revenue. Although the company delivered a strong earnings beat during February, highlighting the strength of their domestic business, investors remain concerned that second quarter 2017 earnings will miss expectations due to the reducing arrivals of Chinese tourists to Korea. Although our valuation discipline saw us reduce our holding at higher prices earlier in 2017, we retain our long-term conviction. |
| • | Shriram Transport Finance Co., Ltd. (an Indian commercial vehicle finance provider) fell 11.93% during the year, despite recovering from the share price fall experienced after India’s demonetization event. Investors have been concerned that the poor outlook for India’s rural economy will limit growth in loans and the company’s net interest margins. We believe this is a temporary period of tough operating conditions for the lender and are looking through this short-term volatility by maintaining conviction in the company’s long-term prospects. |
90
Brown Advisory – Macquarie Asia New Stars Fund
A Message to Our Shareholders
June 30, 2017
| • | St. Shine Optical Co., Ltd. (a Taiwanese contact lens manufacturer) fell 3.95% as concerns emerged over increasing industry competition, coupled with rising wage costs from new regulations. Investors worried that the company’s high profit margins might contract as a result. |
We are optimistic that Asia has the potential to continue its path of stable growth, supported by more stimulatory fiscal policies as global monetary policy has taken on a more hawkish bias. Potential risks could emerge from external macro factors such as U.S. policies; however, the base case is for domestic growth to remain the key driver for Asian markets.
Sincerely,
John Bugg
Portfolio Manager
Sam Le Cornu
Portfolio Manager
Past performance is not a guarantee of future results.
Mutual fund investing involves risk. Principal loss is possible. The Fund may invest in foreign securities which involve political, economic and currency risks, greater volatility and differences in accounting methods. These risks are greater for investments in emerging markets. Derivatives may involve certain costs and risks such as liquidity, interest rate, market, credit, management, and the risk that a position could not be closed when most advantageous. Investing in derivatives could lose more than the amount invested. Investments in small and medium capitalization companies generally carry greater risk than is customarily associated with larger companies for various reasons such as narrower markets, limited financial resources and less liquid stock. The Fund may invest in ETFs, which may trade at a discount to the aggregate value of the underlying securities and although expense ratios for ETFs are generally low, frequent trading of ETFs by the Fund can generate brokerage expenses. In addition, the fund is susceptible to risks from investments in derivatives, private placements, REITs, and its investments in other investment companies.
Fund holdings and sector allocations are subject to change and should not be considered a recommendation to buy or sell any security. For a complete list of fund holdings, please refer to the Schedule of Investments provided in this report.
Definitions for terms and indices are provided in the Glossary of Terms.
91
Brown Advisory – Macquarie Asia New Stars Fund
Performance Information & Portfolio Holdings Summary
June 30, 2017
| PORTFOLIO HOLDINGS | % of Net Assets |
| China | 32.0% |
| South Korea | 16.4% |
| India | 15.5% |
| Taiwan | 13.7% |
| Singapore | 7.2% |
| Money Market Funds | 5.7% |
| Philippines | 3.6% |
| Thailand | 2.4% |
| Indonesia | 2.3% |
| Malaysia | 2.2% |
| Other Assets and Liabilities | (1.0)% |
100.0% |
GROWTH OF A $1,000,000 INVESTMENT
The following chart reflects the change in value of a hypothetical $1,000,000 investment, including reinvested dividends and distributions, in the Fund as measured against a broad-based securities market index. The MSCI Emerging Markets Small Cap Indexis a free float-adjusted market capitalization index that is designed to measure small cap equity market performance in the global emerging markets. The MSCI AC Asia ex Japan SMID Cap Index captures mid and small-cap representation across 2 of 3 Developed Markets (DM) countries (excluding Japan) and 8 Emerging Markets (EM) countries in Asia. With 2,001 constituents, the index covers approximately 28% of the free float-adjusted market capitalization in each country. The indexes are unmanaged and do not reflect the deduction of fees, such as investment management fees. Investors cannot invest directly in an index.
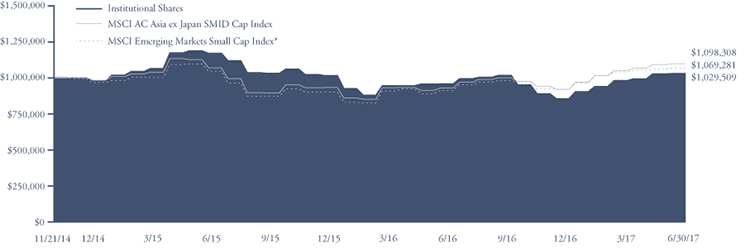
| Since Inception | ||
Average Annual Total Return as of 6/30/17 | One Year | (11/21/14) |
| Institutional Shares | 7.52% | 1.12% |
| Investor Shares | 7.43% | 0.97% |
| MSCI AC Asia ex Japan SMID Cap Index | 18.05% | 3.66% |
| MSCI Emerging Markets Small Cap Index* | 17.03% | 2.60% |
Institutional Shares | Investor Shares | |
Gross Expense Ratio1 | 1.54% | 1.69% |
Net Expense Ratio1 | 1.54% | 1.69% |
Past performance does not guarantee future results. The performance data quoted represents past performance and current returns may be lower or higher. The investment return and net asset value will fluctuate so that an investor’s shares, when redeemed, may be worth more or less than the original cost. To obtain performance information current to the most recent month end, please visit our website at brownadvisoryfunds.com/performance.html. The performance table and graph above do not reflect the deduction of taxes that a shareholder would pay on Fund distributions or the redemption of Fund shares. Performance data does not reflect the imposition of the redemption fee of 1.00% on shares redeemed within 14 days, and if it did, performance would have been lower. Short-term performance, in particular, is not a good indication of the Fund’s future performance, and an investment should not be made based solely on returns.
| * | Effective May 1, 2017, the Fund discontinued the use of the MSCI Emerging Markets Small Cap Index and replaced it with the MSCI AC Asia ex Japan SMID Cap Index. The Fund believes that use of the MSCI AC Asia ex Japan SMID Cap Index provides a better comparative benchmark since it more appropriately reflects the securities in which the Fund may invest. |
1 | Per the Fund’s prospectus dated May 1, 2017. Refer to the financial highlights for the gross and net expense ratios for the year ended as of the date of this report. Please note that the expense ratios per the prospectus include acquired fund fees and expenses (as applicable) and the expense ratios in the financial highlights do not. |
92
Brown Advisory – Macquarie Asia New Stars Fund
Schedule of Investments
June 30, 2017
| Shares | Security Description | Value $ | ||||||
| Common Stocks — 93.8% | ||||||||
| China — 32.0% | ||||||||
| 217,000 | ASM Pacific Technology, Ltd. | 2,927,923 | ||||||
| 106,902 | Autohome, Inc. ADR* | 4,849,075 | ||||||
| 70,000 | China Biologic Products, Inc.* | 7,917,000 | ||||||
| 36,934 | China Lodging Group, Ltd. ADR* | 2,979,835 | ||||||
| 2,421,000 | China Medical System Holdings, Ltd. | 4,186,068 | ||||||
| 4,576,000 | China State Construction | |||||||
| International Holdings, Ltd. | 7,829,943 | |||||||
| 19,339,000 | Guotai Junan International Holdings, Ltd. | 5,995,564 | ||||||
| 1,330,000 | Haier Electronics Group Co., Ltd. | 3,457,873 | ||||||
| 1,228,000 | Kingsoft Corp., Ltd. | 3,196,669 | ||||||
| 5,938,000 | Lee & Man Paper Manufacturing, Ltd. | 5,509,279 | ||||||
| 6,960,500 | Luye Pharma Group, Ltd. | 3,815,899 | ||||||
| 2,116,000 | Melco International Development Ltd. | 5,661,080 | ||||||
| 3,350,000 | Nine Dragons Paper Holdings, Ltd. | 4,461,158 | ||||||
| 188,200 | Tarena International, Inc. ADR | 3,370,662 | ||||||
| 4,688,000 | Zhejiang Expressway Co., Ltd. | 6,123,700 | ||||||
| 1,177,300 | Zhuzhou CSR Times Electric Co., Ltd. | 5,774,409 | ||||||
| 78,056,137 | ||||||||
| India — 15.5% | ||||||||
| 173,122 | Apollo Hospitals Enterprise Ltd. | 3,411,549 | ||||||
| 570,135 | Aurobindo Pharma Ltd. | 6,034,239 | ||||||
| 599,033 | Castrol India Ltd. | 3,748,065 | ||||||
| 1,879,001 | Power Grid Corp. of India, Ltd. | 6,118,385 | ||||||
| 475,508 | Shriram Transport Finance Co., Ltd. | 7,346,426 | ||||||
| 416,900 | Tata Chemicals Ltd. | 3,913,482 | ||||||
| 322,655 | Yes Bank, Ltd. | 7,299,304 | ||||||
| 37,871,450 | ||||||||
| Indonesia — 2.3% | ||||||||
| 5,306,600 | PT Matahari Department Store Tbk | 5,643,419 | ||||||
| Malaysia — 2.2% | ||||||||
| 3,417,400 | CIMB Group Holdings Bhd | 5,238,091 | ||||||
| Philippines — 3.6% | ||||||||
| 4,109,820 | Metropolitan Bank & Trust Co.† | 7,120,513 | ||||||
| 912,030 | Robinsons Retail Holdings, Inc. | 1,570,893 | ||||||
| 8,691,406 | ||||||||
| Singapore — 5.7% | ||||||||
| 2,839,800 | ComfortDelGro Corp., Ltd. | 4,743,334 | ||||||
| 1,329,500 | Singapore Exchange, Ltd. | 7,085,545 | ||||||
| 349,100 | UOL Group Ltd. | 1,936,952 | ||||||
| 13,765,831 | ||||||||
| South Korea — 16.4% | ||||||||
| 13,672 | CJ Korea Express Corp.* | 2,157,416 | ||||||
| 19,741 | Com2uS Corp. | 2,033,407 | ||||||
| 289,621 | Hanon Systems | 2,608,365 | ||||||
| 2,563 | Hugel, Inc.* | 1,253,170 | ||||||
| 41,741 | Hyundai Department Store Co., Ltd. | 4,031,738 | ||||||
| 102,779 | Hyundai Engineering & Construction Co., Ltd. | 4,140,575 | ||||||
| 123,492 | KB Financial Group, Inc. | 6,235,141 | ||||||
| 66,958 | Korea Kolmar Co., Ltd. | 4,224,005 | ||||||
| 37,661 | LG Innotek Co., Ltd. | 5,433,182 | ||||||
| 8,192 | Loen Entertainment, Inc. | 625,775 | ||||||
| 57,000 | Samsung Card Co., Ltd. | 1,947,547 | ||||||
| 3,730 | Samsung SDI Co., Ltd. | 559,961 | ||||||
| 22,134 | Yuhan Corp. | 4,758,507 | ||||||
| 40,008,789 | ||||||||
| Taiwan — 13.7% | ||||||||
| 677,000 | General Interface Solution Holding, Ltd. | 5,006,900 | ||||||
| 377,300 | Gourmet Master Co., Ltd. | 4,066,930 | ||||||
| 2,289,000 | Lite-On Technology Corp. | 3,757,221 | ||||||
| 545,000 | PChome Online, Inc. | 4,213,679 | ||||||
| 2,626,000 | Pou Chen Corp. | 3,631,364 | ||||||
| 161,000 | St. Shine Optical Co., Ltd. | 3,368,413 | ||||||
| 881,000 | Vanguard International Semiconductor Corp. | 1,736,980 | ||||||
| 7,777,000 | Winbond Electronics Corp. | 4,659,391 | ||||||
| 1,236,000 | Zhen Ding Technology Holding Ltd. | 2,926,497 | ||||||
| 33,367,375 | ||||||||
| Thailand — 2.4% | ||||||||
| 2,115,200 | Bangkok Airways PCL | 1,145,263 | ||||||
| 1,008,000 | Central Plaza Hotel PCL | 1,126,878 | ||||||
| 1,315,121 | Major Cineplex Group PCL | 1,306,087 | ||||||
| 3,519,300 | Tipco Asphalt PCL | 2,340,323 | ||||||
| 5,918,551 | ||||||||
| Total Common Stocks (Cost $217,611,700) | 228,561,049 | |||||||
| Real Estate Investment Trusts — 1.5% | ||||||||
| Singapore — 1.5% | ||||||||
| 4,452,100 | Mapletree Greater China Commercial Trust | 3,491,510 | ||||||
| Total Real Estate Investment Trusts (Cost $3,000,507) | 3,491,510 | |||||||
| Short-Term Investments — 5.7% | ||||||||
| Money Market Funds — 5.7% | ||||||||
| 13,984,799 | Cash Account Trust — Government | |||||||
| & Agency Securities Portfolio — | ||||||||
| Institutional Shares, 0.88%# | 13,984,799 | |||||||
| Total Short-Term Investments (Cost $13,984,799) | 13,984,799 | |||||||
| Total Investments — 101.0% (Cost $234,597,006) | 246,037,358 | |||||||
| Liabilities in Excess of Other Assets — (1.0)% | (2,390,273 | ) | ||||||
| NET ASSETS — 100.0% | $ | 243,647,085 | ||||||
ADR — American Depositary Receipt
| * | Non-Income Producing |
| † | All or a portion of this security is considered illiquid. At June 30, 2017, the total market value of securities considered illiquid was $2,589,277 or 1.1% of net assets. |
| # | Annualized seven-day yield as of June 30, 2017. |
The accompanying notes are an integral part of these financial statements.
93
Statements of Assets and Liabilities
June 30, 2017
| BROWN | BROWN | BROWN | BROWN | |||||||||||||
| ADVISORY | ADVISORY | ADVISORY | ADVISORY | |||||||||||||
| GROWTH | FLEXIBLE | EQUITY | SUSTAINABLE | |||||||||||||
| EQUITY | EQUITY | INCOME | GROWTH | |||||||||||||
| FUND | FUND | FUND | FUND | |||||||||||||
| ASSETS | ||||||||||||||||
| Investments: | ||||||||||||||||
| Total investments, at cost | $ | 1,153,132,236 | $ | 291,323,361 | $ | 76,973,541 | $ | 302,011,087 | ||||||||
| Net unrealized appreciation (depreciation) | 613,227,587 | 126,203,418 | 37,008,639 | 127,574,140 | ||||||||||||
| Total investments, at market value | 1,766,359,823 | 417,526,779 | 113,982,180 | 429,585,227 | ||||||||||||
| Receivables: | ||||||||||||||||
| Investments sold | 8,800,126 | — | — | — | ||||||||||||
| Fund shares sold | 1,427,810 | 308,124 | 51,429 | 744,585 | ||||||||||||
| Interest and dividends | 625,363 | 133,331 | 341,615 | 214,320 | ||||||||||||
| Prepaid expenses and other assets | 93,150 | 37,393 | 39,614 | 63,661 | ||||||||||||
| Total Assets | 1,777,306,272 | 418,005,627 | 114,414,838 | 430,607,793 | ||||||||||||
| LIABILITIES | ||||||||||||||||
| Payables: | ||||||||||||||||
| Investments purchased | 8,728,858 | — | — | — | ||||||||||||
| Fund shares redeemed | 838,442 | 57,308 | 40,360 | 51,946 | ||||||||||||
| Distribution to shareholders | — | — | 373,687 | — | ||||||||||||
| Due to custodian | — | 5,435 | — | — | ||||||||||||
| Accrued Liabilities: | ||||||||||||||||
| Investment advisory fees | 881,975 | 205,912 | 56,550 | 212,716 | ||||||||||||
| Service fees | 185,938 | 39,044 | 10,490 | 25,889 | ||||||||||||
| Administration, accounting and transfer agent fees | 54,088 | 11,679 | 3,603 | 12,065 | ||||||||||||
| Business management fees | 73,498 | 17,159 | 4,712 | 17,726 | ||||||||||||
| Trustee fees | 11,307 | 2,656 | 727 | 2,721 | ||||||||||||
| Distribution fees | 7,095 | 3,774 | 1,510 | 105,197 | ||||||||||||
| Professional fees | 26,554 | 21,429 | 20,079 | 21,367 | ||||||||||||
| Custody fees | 9,700 | 2,310 | 684 | 2,280 | ||||||||||||
| Other liabilities | 35,031 | 5,507 | 3,352 | 12,700 | ||||||||||||
| Total Liabilities | 10,852,486 | 372,213 | 515,754 | 464,607 | ||||||||||||
| NET ASSETS | $ | 1,766,453,786 | $ | 417,633,414 | $ | 113,899,084 | $ | 430,143,186 | ||||||||
| COMPONENTS OF NET ASSETS | ||||||||||||||||
| Paid-in capital | $ | 1,043,545,603 | $ | 291,682,608 | $ | 72,800,862 | $ | 294,816,360 | ||||||||
| Undistributed (Accumulated) net investment income (loss) | (848,321 | ) | 1,031,757 | 67,756 | (468,926 | ) | ||||||||||
| Accumulated net realized gain (loss) | 110,528,917 | (1,284,458 | ) | 4,021,827 | 8,221,612 | |||||||||||
| Unrealized appreciation (depreciation) on investments | 613,227,587 | 126,203,418 | 37,008,639 | 127,574,140 | ||||||||||||
| Unrealized appreciation (depreciation) on foreign receivables | — | 89 | — | — | ||||||||||||
| NET ASSETS | $ | 1,766,453,786 | $ | 417,633,414 | $ | 113,899,084 | $ | 430,143,186 | ||||||||
| COMPUTATION OF NET ASSET VALUE | ||||||||||||||||
| Institutional Shares: | ||||||||||||||||
| Net assets | $ | 276,592,201 | $ | 101,430,908 | $ | 29,586,828 | $ | 221,176,877 | ||||||||
| Shares outstanding (unlimited shares authorized) | 13,805,798 | 5,473,202 | 2,143,880 | 11,679,129 | ||||||||||||
| Net asset value per share | $ | 20.03 | $ | 18.53 | $ | 13.80 | $ | 18.94 | ||||||||
| Investor Shares: | ||||||||||||||||
| Net assets | $ | 1,484,382,957 | $ | 310,360,116 | $ | 81,890,445 | $ | 36,954,378 | ||||||||
| Shares outstanding (unlimited shares authorized) | 74,630,788 | 16,778,774 | 5,935,273 | 1,967,980 | ||||||||||||
| Net asset value per share | $ | 19.89 | $ | 18.50 | $ | 13.80 | $ | 18.78 | ||||||||
| Advisor Shares: | ||||||||||||||||
| Net assets | $ | 5,478,628 | $ | 5,842,390 | $ | 2,421,811 | $ | 172,011,931 | ||||||||
| Shares outstanding (unlimited shares authorized) | 287,799 | 315,770 | 175,806 | 9,276,805 | ||||||||||||
| Net asset value per share | $ | 19.04 | $ | 18.50 | $ | 13.78 | $ | 18.54 | ||||||||
The accompanying notes are an integral part of these financial statements.
94
Statements of Assets and Liabilities
June 30, 2017
| BROWN | BROWN | BROWN | BROWN | |||||||||||||
| ADVISORY | ADVISORY | ADVISORY | ADVISORY | |||||||||||||
| SMALL-CAP | SMALL-CAP | GLOBAL | INTERMEDIATE | |||||||||||||
| GROWTH | FUNDAMENTAL | LEADERS | INCOME | |||||||||||||
| FUND | VALUE FUND | FUND | FUND | |||||||||||||
| ASSETS | ||||||||||||||||
| Investments: | ||||||||||||||||
| Total investments – unaffiliated, at cost | $ | 403,207,256 | $ | 923,393,182 | $ | 31,940,855 | $ | 104,336,993 | ||||||||
| Total investments – affiliated, at cost (Note 3) | — | — | — | 30,238,441 | ||||||||||||
| Total cost of investments | 403,207,256 | 923,393,182 | 31,940,855 | 134,575,434 | ||||||||||||
| Net unrealized appreciation (depreciation) – unaffiliated | 129,845,385 | 279,176,976 | 7,249,811 | 273,122 | ||||||||||||
| Net unrealized appreciation (depreciation) – affiliated (Note 3) | — | — | — | (675,926 | ) | |||||||||||
| Total unrealized appreciation (depreciation) | 129,845,385 | 279,176,976 | 7,249,811 | (402,804 | ) | |||||||||||
| Total investments – unaffiliated, at market value | 533,052,641 | 1,202,570,158 | 39,190,666 | 104,610,115 | ||||||||||||
| Total investments – affiliated, at market value (Note 3) | — | — | — | 29,562,515 | ||||||||||||
| Total investments, at market value | 533,052,641 | 1,202,570,158 | 39,190,666 | 134,172,630 | ||||||||||||
| Foreign currency (Cost of $—, $—, $766,567 and $—, respectively) | — | — | 769,505 | — | ||||||||||||
| Receivables: | ||||||||||||||||
| Investments sold | — | — | — | 1,390,207 | ||||||||||||
| Fund shares sold | 5,327,980 | 2,698,620 | — | 52,521 | ||||||||||||
| Interest and dividends | 154,686 | 2,609,172 | 67,772 | 701,985 | ||||||||||||
| Prepaid expenses and other assets | 65,907 | 62,285 | 26,230 | 34,331 | ||||||||||||
| Total Assets | 538,601,214 | 1,207,940,235 | 40,054,173 | 136,351,674 | ||||||||||||
| LIABILITIES | ||||||||||||||||
| Payables: | ||||||||||||||||
| Investments purchased | 4,261,167 | 6,140,278 | 656,860 | — | ||||||||||||
| Fund shares redeemed | 160,427 | 369,322 | — | 64,964 | ||||||||||||
| Distribution to shareholders | — | — | — | 177,703 | ||||||||||||
| Accrued Liabilities: | ||||||||||||||||
| Investment advisory fees, net | 367,867 | 828,252 | 10,823 | 26,846 | ||||||||||||
| Distribution fees | 20,701 | 16,167 | — | 2,690 | ||||||||||||
| Service fees | 44,873 | 104,831 | 4,819 | 5,696 | ||||||||||||
| Administration, accounting and transfer agent fees | 14,800 | 38,021 | 1,482 | 5,401 | ||||||||||||
| Professional fees | 21,688 | 24,611 | 19,701 | 20,160 | ||||||||||||
| Business management fees | 21,639 | 48,721 | 1,606 | 5,696 | ||||||||||||
| Trustee fees | 3,329 | 7,589 | 247 | 893 | ||||||||||||
| Custodian fees | 3,600 | 6,700 | 2,400 | 1,168 | ||||||||||||
| Other liabilities | 29,026 | 27,232 | 2,462 | 2,001 | ||||||||||||
| Total Liabilities | 4,949,117 | 7,611,724 | 700,400 | 313,218 | ||||||||||||
| NET ASSETS | $ | 533,652,097 | $ | 1,200,328,511 | $ | 39,353,773 | $ | 136,038,456 | ||||||||
| COMPONENTS OF NET ASSETS | ||||||||||||||||
| Paid-in capital | $ | 401,967,770 | $ | 889,280,956 | $ | 33,752,284 | $ | 136,718,138 | ||||||||
| Undistributed (Accumulated) net investment income (loss) | (1,466,067 | ) | 4,459,274 | 36,421 | (169,025 | ) | ||||||||||
| Accumulated net realized gain (loss) | 3,305,009 | 27,411,305 | (1,687,868 | ) | (107,853 | ) | ||||||||||
| Unrealized appreciation (depreciation) on investments | 129,845,385 | 279,176,976 | 7,249,811 | (402,804 | ) | |||||||||||
| Unrealized appreciation (depreciation) on foreign currency/receivables | — | — | 3,125 | — | ||||||||||||
| NET ASSETS | $ | 533,652,097 | $ | 1,200,328,511 | $ | 39,353,773 | $ | 136,038,456 | ||||||||
| COMPUTATION OF NET ASSET VALUE | ||||||||||||||||
| Institutional Shares: | ||||||||||||||||
| Net assets | $ | 165,614,921 | $ | 341,037,756 | $ | — | $ | — | ||||||||
| Shares outstanding (unlimited shares authorized) | 4,711,644 | 12,579,446 | — | — | ||||||||||||
| Net asset value per share | $ | 35.15 | $ | 27.11 | $ | — | $ | — | ||||||||
| Investor Shares: | ||||||||||||||||
| Net assets | $ | 335,184,941 | $ | 834,316,594 | $ | 39,353,773 | $ | 131,940,619 | ||||||||
| Shares outstanding (unlimited shares authorized) | 19,032,765 | 30,809,471 | 3,423,260 | 12,450,095 | ||||||||||||
| Net asset value per share | $ | 17.61 | $ | 27.08 | $ | 11.50 | $ | 10.60 | ||||||||
| Advisor Shares: | ||||||||||||||||
| Net assets | $ | 32,852,235 | $ | 24,974,161 | $ | — | $ | 4,097,837 | ||||||||
| Shares outstanding (unlimited shares authorized) | 1,949,262 | 926,736 | — | 394,783 | ||||||||||||
| Net asset value per share | $ | 16.85 | $ | 26.95 | $ | — | $ | 10.38 | ||||||||
The accompanying notes are an integral part of these financial statements.
95
Statements of Assets and Liabilities
June 30, 2017
| BROWN | BROWN | |||||||
| ADVISORY | ADVISORY | |||||||
| TOTAL | STRATEGIC | |||||||
| RETURN | BOND | |||||||
| FUND | FUND | |||||||
| ASSETS | ||||||||
| Investments: | ||||||||
| Total investments, at cost | $ | 121,378,485 | $ | 128,096,908 | ||||
| Net unrealized appreciation (depreciation) | 243,376 | 544,775 | ||||||
| Total investments, at market value | 121,621,861 | 128,641,683 | ||||||
| Deposit at broker | 1,097,058 | 246,016 | ||||||
| Gross unrealized appreciation – futures contracts (Note 7) | 139,328 | 26,072 | ||||||
| Receivables: | ||||||||
| Investments sold | 1,213,975 | 530,834 | ||||||
| Fund shares sold | 895,003 | 317,427 | ||||||
| Interest and dividends | 676,393 | 706,378 | ||||||
| Prepaid expenses and other assets | 27,791 | 28,041 | ||||||
| Total Assets | 125,671,409 | 130,496,451 | ||||||
| LIABILITIES | ||||||||
| Gross unrealized depreciation – futures contracts (Note 7) | 5,718 | — | ||||||
| Payables: | ||||||||
| Investments purchased | 15,063,800 | 15,289,596 | ||||||
| Fund shares redeemed | 13,676 | 19,451 | ||||||
| Distribution to shareholders | 168,922 | 203,726 | ||||||
| Accrued Liabilities: | ||||||||
| Investment advisory fees, net | 26,773 | 36,347 | ||||||
| Administration, accounting and transfer agent fees | 6,474 | 7,145 | ||||||
| Service fees | 117 | 4,638 | ||||||
| Business management fees | 4,462 | 4,638 | ||||||
| Custodian fees | 1,256 | 1,800 | ||||||
| Trustee fees | 691 | 722 | ||||||
| Professional fees | 20,059 | 19,913 | ||||||
| Distribution fees | — | 177 | ||||||
| Other liabilities | 5,977 | 8,532 | ||||||
| Total Liabilities | 15,317,925 | 15,596,685 | ||||||
| NET ASSETS | $ | 110,353,484 | $ | 114,899,766 | ||||
| COMPONENTS OF NET ASSETS | ||||||||
| Paid-in capital | $ | 110,601,461 | $ | 117,475,238 | ||||
| Undistributed (Accumulated) net investment income (loss) | 4,229 | (67,975 | ) | |||||
| Accumulated net realized gain (loss) | (629,192 | ) | (3,078,344 | ) | ||||
| Unrealized appreciation (depreciation) on investments | 243,376 | 544,775 | ||||||
| Unrealized appreciation (depreciation) on futures contracts (Note 7) | 133,610 | 26,072 | ||||||
| NET ASSETS | $ | 110,353,484 | $ | 114,899,766 | ||||
| COMPUTATION OF NET ASSET VALUE | ||||||||
| Institutional Shares: | ||||||||
| Net assets | $ | 107,685,545 | $ | — | ||||
| Shares outstanding (unlimited shares authorized) | 10,772,007 | — | ||||||
| Net asset value per share | $ | 10.00 | $ | — | ||||
| Investor Shares: | ||||||||
| Net assets | $ | 2,667,939 | $ | 114,651,301 | ||||
| Shares outstanding (unlimited shares authorized) | 266,863 | 11,935,64 | ||||||
| Net asset value per share | $ | 10.00 | $ | 9.61 | ||||
| Advisor Shares: | ||||||||
| Net assets | $ | — | $ | 248,465 | ||||
| Shares outstanding (unlimited shares authorized) | — | 25,852 | ||||||
| Net asset value per share | $ | — | $ | 9.61 | ||||
The accompanying notes are an integral part of these financial statements.
96
Statements of Assets and Liabilities
June 30, 2017
| BROWN | BROWN | BROWN | ||||||||||
| ADVISORY | ADVISORY | ADVISORY | ||||||||||
| MARYLAND | TAX EXEMPT | MORTGAGE | ||||||||||
| BOND | BOND | SECURITIES | ||||||||||
| FUND | FUND | FUND | ||||||||||
| ASSETS | ||||||||||||
| Investments: | ||||||||||||
| Total investments, at cost | $ | 178,068,874 | $ | 255,145,593 | $ | 469,014,592 | ||||||
| Net unrealized appreciation (depreciation) | 1,334,458 | (216,243 | ) | (1,720,226 | ) | |||||||
| Total investments, at market value | 179,403,332 | 254,929,350 | 467,294,366 | |||||||||
| Deposit at broker | — | — | 3,200,305 | |||||||||
| Gross unrealized appreciation – futures contracts (Note 7) | — | — | — | |||||||||
| Receivables: | ||||||||||||
| Investments sold | — | — | 16,746,002 | |||||||||
| Fund shares sold | 89,549 | 379,220 | — | |||||||||
| Interest and dividends | 2,435,278 | 3,391,955 | 1,361,001 | |||||||||
| Prepaid expenses and other assets | 7,886 | 29,944 | 40,516 | |||||||||
| Total Assets | 181,936,045 | 258,730,469 | 488,642,190 | |||||||||
| LIABILITIES | ||||||||||||
| Gross unrealized depreciation – futures contracts (Note 7) | — | — | 78,219 | |||||||||
| Payables: | ||||||||||||
| Investments purchased | — | — | 144,407,172 | |||||||||
| Fund shares redeemed | 65,626 | 485,671 | 34,056 | |||||||||
| Distribution to shareholders | 258,950 | 518,323 | 519,867 | |||||||||
| Accrued Liabilities: | ||||||||||||
| Investment advisory fees | 44,846 | 63,490 | 86,205 | |||||||||
| Administration, accounting and transfer agent fees | 6,762 | 10,023 | 25,481 | |||||||||
| Service fees | 7,474 | 10,582 | 29 | |||||||||
| Business management fees | 7,474 | 10,582 | 14,368 | |||||||||
| Custodian fees | 950 | 1,500 | 7,602 | |||||||||
| Trustee fees | 1,154 | 1,637 | 2,233 | |||||||||
| Professional fees | 20,342 | 20,556 | 20,853 | |||||||||
| Other liabilities | 4,100 | 5,964 | 2,920 | |||||||||
| Total Liabilities | 417,678 | 1,128,328 | 145,199,005 | |||||||||
| NET ASSETS | $ | 181,518,367 | $ | 257,602,141 | $ | 343,443,185 | ||||||
| COMPONENTS OF NET ASSETS | ||||||||||||
| Paid-in capital | $ | 180,591,681 | $ | 260,230,551 | $ | 351,850,995 | ||||||
| Undistributed (Accumulated) net investment income (loss) | 60 | (116 | ) | 18,945 | ||||||||
| Accumulated net realized gain (loss) | (407,832 | ) | (2,412,051 | ) | (6,628,310 | ) | ||||||
| Unrealized appreciation (depreciation) on investments | 1,334,458 | (216,243 | ) | (1,720,226 | ) | |||||||
| Unrealized appreciation (depreciation) on futures contracts (Note 7) | — | — | (78,219 | ) | ||||||||
| NET ASSETS | $ | 181,518,367 | $ | 257,602,141 | $ | 343,443,185 | ||||||
| COMPUTATION OF NET ASSET VALUE | ||||||||||||
| Institutional Shares: | ||||||||||||
| Net assets | $ | — | $ | — | $ | 342,705,176 | ||||||
| Shares outstanding (unlimited shares authorized) | — | — | 34,721,588 | |||||||||
| Net asset value per share | $ | — | $ | — | $ | 9.87 | ||||||
| Investor Shares: | ||||||||||||
| Net assets | $ | 181,518,367 | $ | 257,602,141 | $ | 738,009 | ||||||
| Shares outstanding (unlimited shares authorized) | 17,087,761 | 25,921,279 | 74,738 | |||||||||
| Net asset value per share | $ | 10.62 | $ | 9.94 | $ | 9.87 | ||||||
| Advisor Shares: | ||||||||||||
| Net assets | $ | — | $ | — | $ | — | ||||||
| Shares outstanding (unlimited shares authorized) | — | — | — | |||||||||
| Net asset value per share | $ | — | $ | — | $ | — | ||||||
The accompanying notes are an integral part of these financial statements.
97
Statements of Assets and Liabilities
June 30, 2017
| BROWN | BROWN | BROWN | BROWN | |||||||||||||
| ADVISORY – | ADVISORY – | ADVISORY – | ADVISORY – | |||||||||||||
| WMC | WMC | SOMERSET | MACQUARIE | |||||||||||||
| STRATEGIC | JAPAN ALPHA | EMERGING | ASIA | |||||||||||||
| EUROPEAN | OPPORTUNITIES | MARKETS | NEW STARS | |||||||||||||
| EQUITY FUND | FUND | FUND | FUND | |||||||||||||
| ASSETS | ||||||||||||||||
| Investments: | ||||||||||||||||
| Total investments, at cost | $ | 981,676,036 | $ | 805,128,665 | $ | 502,276,686 | $ | 234,597,006 | ||||||||
| Net unrealized appreciation (depreciation) | 207,750,089 | 185,704,753 | 88,020,941 | 11,440,352 | ||||||||||||
| Total investments, at market value | 1,189,426,125 | 990,833,418 | 590,297,627 | 246,037,358 | ||||||||||||
| Foreign currency (Cost of $618,619, $19, $70,252 and $—, respectively) | 617,768 | 19 | 70,279 | — | ||||||||||||
| Deposit at broker | — | 1,229,174 | — | — | ||||||||||||
| Gross unrealized appreciation on futures contracts (Note 7) | — | 237,156 | — | — | ||||||||||||
| Receivables: | ||||||||||||||||
| Investments sold | 3,158,065 | 6,796,335 | 248,357 | 56,755 | ||||||||||||
| Fund shares sold | 1,744,902 | 1,223,779 | 844,658 | 476,846 | ||||||||||||
| Interest and dividends | 3,691,542 | 1,810,291 | 1,190,041 | 439,859 | ||||||||||||
| Prepaid expenses and other assets | 87,305 | 76,045 | 62,193 | 34,685 | ||||||||||||
| Total Assets | 1,198,725,707 | 1,002,206,217 | 592,713,155 | 247,045,503 | ||||||||||||
| LIABILITIES | ||||||||||||||||
| Gross unrealized depreciation on futures contracts (Note 7) | — | — | — | — | ||||||||||||
| Payables: | ||||||||||||||||
| Investments purchased | 2,072,974 | 11,296,342 | 214,807 | 2,745,781 | ||||||||||||
| Fund shares redeemed | 754,942 | 685,960 | 597,920 | 309,600 | ||||||||||||
| Variation margin due to broker (Note 7) | — | 330,773 | — | — | ||||||||||||
| Accrued Liabilities: | ||||||||||||||||
| Investment advisory fees | 885,399 | 808,927 | 433,523 | 248,443 | ||||||||||||
| Administration, accounting and transfer agent fees | 33,804 | 18,841 | 17,281 | 9,779 | ||||||||||||
| Custodian fees | 60,400 | 95,000 | 126,370 | 48,000 | ||||||||||||
| Business management fees | 49,189 | 40,446 | 24,085 | 9,938 | ||||||||||||
| Distribution fees | 3,851 | 245 | 152 | — | ||||||||||||
| Professional fees | 24,409 | 23,438 | 22,307 | 20,499 | ||||||||||||
| Trustee fees | 7,561 | 9,264 | 3,729 | 1,532 | ||||||||||||
| Service fees | 1,990 | 392 | 22,655 | 447 | ||||||||||||
| Other liabilities | 232,601 | 40,976 | 3,948 | 4,399 | ||||||||||||
| Total Liabilities | 4,127,120 | 13,350,604 | 1,466,777 | 3,398,418 | ||||||||||||
| NET ASSETS | $ | 1,194,598,587 | $ | 988,855,613 | $ | 591,246,378 | $ | 243,647,085 | ||||||||
| COMPONENTS OF NET ASSETS | ||||||||||||||||
| Paid-in capital | $ | 1,025,954,695 | $ | 763,293,575 | $ | 550,713,008 | $ | 255,648,358 | ||||||||
| Undistributed (Accumulated) net investment income (loss) | 11,692,431 | (16,075,640 | ) | 4,336,702 | 393,440 | |||||||||||
| Accumulated net realized gain (loss) | (50,868,927 | ) | 55,722,454 | (51,828,112 | ) | (23,834,919 | ) | |||||||||
| Unrealized appreciation (depreciation) on investments | 207,750,089 | 185,704,753 | 88,020,941 | 11,440,352 | ||||||||||||
| Unrealized appreciation (depreciation) on futures contracts (Note 7) | — | 237,156 | — | — | ||||||||||||
| Unrealized appreciation (depreciation) on foreign currency/receivables | 70,299 | (26,685 | ) | 3,839 | (146 | ) | ||||||||||
| NET ASSETS | $ | 1,194,598,587 | $ | 988,855,613 | $ | 591,246,378 | $ | 243,647,085 | ||||||||
| COMPUTATION OF NET ASSET VALUE | ||||||||||||||||
| Institutional Shares: | ||||||||||||||||
| Net assets | $ | 1,176,491,946 | $ | 985,653,855 | $ | 407,616,318 | $ | 239,812,053 | ||||||||
| Shares outstanding (unlimited shares authorized) | 97,621,435 | 90,489,032 | 40,070,827 | 24,295,215 | ||||||||||||
| Net asset value per share | $ | 12.05 | $ | 10.89 | $ | 10.17 | $ | 9.87 | ||||||||
| Investor Shares: | ||||||||||||||||
| Net assets | $ | 7,366,665 | $ | 2,813,926 | $ | 183,377,537 | $ | 3,835,032 | ||||||||
| Shares outstanding (unlimited shares authorized) | 611,373 | 259,292 | 18,067,846 | 390,060 | ||||||||||||
| Net asset value per share | $ | 12.05 | $ | 10.85 | $ | 10.15 | $ | 9.83 | ||||||||
| Advisor Shares: | ||||||||||||||||
| Net assets | $ | 10,739,976 | $ | 387,832 | $ | 252,523 | $ | — | ||||||||
| Shares outstanding (unlimited shares authorized) | 896,477 | 35,930 | 24,787 | — | ||||||||||||
| Net asset value per share | $ | 11.98 | $ | 10.79 | $ | 10.19 | $ | — | ||||||||
The accompanying notes are an integral part of these financial statements.
98
Statements of Operations
For the Year Ended June 30, 2017
| BROWN | BROWN | BROWN | BROWN | |||||||||||||
| ADVISORY | ADVISORY | ADVISORY | ADVISORY | |||||||||||||
| GROWTH | FLEXIBLE | EQUITY | SUSTAINABLE | |||||||||||||
| EQUITY | EQUITY | INCOME | GROWTH | |||||||||||||
| FUND | FUND | FUND | FUND | |||||||||||||
| INVESTMENT INCOME | ||||||||||||||||
| Dividend income | $ | 10,466,875 | $ | 5,075,036 | $ | 3,223,590 | $ | 2,354,705 | ||||||||
| Less: foreign income taxes withheld | — | (63,553 | ) | (48,575 | ) | (3,830 | ) | |||||||||
| Interest Income | 263,230 | 67,909 | 22,575 | 69,787 | ||||||||||||
| Total investment income | 10,730,105 | 5,079,392 | 3,197,590 | 2,420,662 | ||||||||||||
| EXPENSES | ||||||||||||||||
| Investment advisory fees (Note 3) | 11,500,341 | 2,270,403 | 709,776 | 2,283,572 | ||||||||||||
| Service fees – Investor Shares (Note 3) | 2,439,741 | 477,401 | 148,469 | 46,926 | ||||||||||||
| Service fees – Advisor Shares (Note 3) | 39,272 | 10,636 | 4,359 | 278,169 | ||||||||||||
| Business management fees | 958,362 | 189,200 | 59,148 | 190,298 | ||||||||||||
| Administration, accounting and transfer agent fees | 679,188 | 133,899 | 43,289 | 139,387 | ||||||||||||
| Miscellaneous expenses | 207,582 | 34,768 | 15,984 | 49,961 | ||||||||||||
| Professional fees | 132,057 | 41,851 | 27,063 | 41,987 | ||||||||||||
| Trustee fees | 77,252 | 15,781 | 4,838 | 16,591 | ||||||||||||
| Distribution fees – Advisor Shares (Note 3) | 65,454 | 17,727 | 7,265 | 463,616 | ||||||||||||
| Custodian fees | 61,245 | 13,239 | 4,371 | 13,420 | ||||||||||||
| Registration fees | 83,827 | 70,559 | 39,248 | 54,292 | ||||||||||||
| Insurance fees | 44,441 | 7,436 | 2,533 | 6,670 | ||||||||||||
| Interest expense on line of credit (Note 8) | — | — | 1,042 | 31 | ||||||||||||
| Total Expenses | 16,288,762 | 3,282,900 | 1,067,385 | 3,584,920 | ||||||||||||
| NET INVESTMENT INCOME (LOSS) | (5,558,657 | ) | 1,796,492 | 2,130,205 | (1,164,258 | ) | ||||||||||
| NET REALIZED AND UNREALIZED GAIN (LOSS) | ||||||||||||||||
| Net realized gain (loss) on investments | 237,349,413 | 9,225,463 | 7,663,911 | 19,653,792 | ||||||||||||
| Net change in unrealized appreciation (depreciation) on: | ||||||||||||||||
| Investments | 2,508,322 | 65,792,441 | 4,432,257 | 45,736,422 | ||||||||||||
| Foreign receivables | — | 452 | — | — | ||||||||||||
| Net change in unrealized appreciation (depreciation) | 2,508,322 | 65,792,893 | 4,432,257 | 45,736,422 | ||||||||||||
| NET REALIZED AND UNREALIZED GAIN (LOSS) | 239,857,735 | 75,018,356 | 12,096,168 | 65,390,214 | ||||||||||||
| INCREASE (DECREASE) IN NET ASSETS FROM OPERATIONS | $ | 234,299,078 | $ | 76,814,848 | $ | 14,226,373 | $ | 64,225,956 | ||||||||
The accompanying notes are an integral part of these financial statements.
99
Statements of Operations
For the Year Ended June 30, 2017
| BROWN | BROWN | BROWN | BROWN | |||||||||||||
| ADVISORY | ADVISORY | ADVISORY | ADVISORY | |||||||||||||
| SMALL-CAP | SMALL-CAP | GLOBAL | INTERMEDIATE | |||||||||||||
| GROWTH | FUNDAMENTAL | LEADERS | INCOME | |||||||||||||
| FUND | VALUE FUND | FUND | FUND | |||||||||||||
| INVESTMENT INCOME | ||||||||||||||||
| Dividend income – unaffiliated | $ | 1,938,642 | $ | 18,257,976 | $ | 413,390 | $ | — | ||||||||
| Dividend income – affiliated (Note 3) | — | — | — | 577,759 | ||||||||||||
| Less: foreign income taxes withheld | (24,894 | ) | — | (25,047 | ) | — | ||||||||||
| Interest Income | 176,144 | 265,585 | 6,134 | 2,768,364 | ||||||||||||
| Total investment income | 2,089,892 | 18,523,561 | 394,477 | 3,346,123 | ||||||||||||
| EXPENSES | ||||||||||||||||
| Investment advisory fees (Note 3) | 3,590,288 | 9,536,618 | 207,528 | 431,655 | ||||||||||||
| Distribution fees – Advisor Shares (Note 3) | 68,154 | 107,066 | — | 18,942 | ||||||||||||
| Service fees – Investor Shares (Note 3) | 455,275 | 1,223,817 | 47,891 | 68,154 | ||||||||||||
| Service fees – Advisor Shares (Note 3) | 40,892 | 64,240 | — | 3,788 | ||||||||||||
| Business management fees | 211,193 | 560,978 | 15,964 | 71,942 | ||||||||||||
| Administration, accounting and transfer agent fees | 152,852 | 406,087 | 14,808 | 68,720 | ||||||||||||
| Registration fees | 64,040 | 73,979 | 23,266 | 30,199 | ||||||||||||
| Miscellaneous expenses | 42,207 | 127,963 | 16,449 | 14,896 | ||||||||||||
| Professional fees | 43,992 | 84,383 | 21,455 | 28,002 | ||||||||||||
| Trustee fees | 19,744 | 47,743 | 1,452 | 6,027 | ||||||||||||
| Custodian fees | 20,727 | 38,459 | 21,123 | 7,071 | ||||||||||||
| Insurance fees | 5,785 | 19,405 | 464 | 2,960 | ||||||||||||
| Total Expenses | 4,715,149 | 12,290,738 | 370,400 | 752,356 | ||||||||||||
| Expenses waived by adviser – expense cap (Note 3) | — | — | (99,017 | ) | — | |||||||||||
| Expenses waived by adviser – investments in affiliates (Note 3) | — | — | — | (85,190 | ) | |||||||||||
| Net Expenses | 4,715,149 | 12,290,738 | 271,383 | 667,166 | ||||||||||||
| NET INVESTMENT INCOME (LOSS) | (2,625,257 | ) | 6,232,823 | 123,094 | 2,678,957 | |||||||||||
| NET REALIZED AND UNREALIZED GAIN (LOSS) | ||||||||||||||||
| Net realized gain (loss) on: | ||||||||||||||||
| Investments – unaffiliated | 12,097,018 | 33,184,360 | (697,183 | ) | 950,349 | |||||||||||
| Investments – affiliated (Note 3) | — | — | — | 28,260 | ||||||||||||
| Capital gain distribution from other RIC – affiliated (Note 3) | — | — | — | 179,865 | ||||||||||||
| Capital gain distribution from other RIC – unaffiliated | — | — | — | 27 | ||||||||||||
| Net realized gain (loss) | 12,097,018 | 33,184,360 | (697,183 | ) | 1,158,501 | |||||||||||
| Net change in unrealized appreciation (depreciation) on: | ||||||||||||||||
| Investments – unaffiliated | 51,670,727 | 158,498,930 | 6,294,578 | (2,525,186 | ) | |||||||||||
| Investments – affiliated (Note 3) | — | — | — | (862,429 | ) | |||||||||||
| Foreign currency and / or receivables | — | — | 4,147 | — | ||||||||||||
| Net change in unrealized appreciation (depreciation) | 51,670,727 | 158,498,930 | 6,298,725 | (3,387,615 | ) | |||||||||||
| NET REALIZED AND UNREALIZED GAIN (LOSS) | 63,767,745 | 191,683,290 | 5,601,542 | (2,229,114 | ) | |||||||||||
| INCREASE (DECREASE) IN NET ASSETS FROM OPERATIONS | $ | 61,142,488 | $ | 197,916,113 | $ | 5,724,636 | $ | 449,843 | ||||||||
The accompanying notes are an integral part of these financial statements.
100
Statements of Operations
For the Year Ended June 30, 2017
| BROWN | BROWN | |||||||
| ADVISORY | ADVISORY | |||||||
| TOTAL | STRATEGIC | |||||||
| RETURN | BOND | |||||||
| FUND | FUND | |||||||
| INVESTMENT INCOME | ||||||||
| Dividend income | $ | 19,515 | $ | 161,378 | ||||
| Interest Income | 2,778,184 | 1,908,655 | ||||||
| Total investment income | 2,797,699 | 2,070,033 | ||||||
| EXPENSES | ||||||||
| Investment advisory fees (Note 3) | 292,678 | 267,852 | ||||||
| Service fees – Investor Shares (Note 3) | 1,640 | 33,148 | ||||||
| Service fees – Advisor Shares (Note 3) | — | 334 | ||||||
| Business management fees | 48,780 | 33,481 | ||||||
| Administration, accounting and transfer agent fees | 72,841 | 71,673 | ||||||
| Professional fees | 25,343 | 23,388 | ||||||
| Miscellaneous expenses | 11,441 | 8,288 | ||||||
| Trustee fees | 4,376 | 3,131 | ||||||
| Registration fees | 31,644 | 34,556 | ||||||
| Custody fees | 7,297 | 7,244 | ||||||
| Insurance fees | 1,626 | 796 | ||||||
| Distribution fees – Advisor Shares (Note 3) | — | 1,678 | ||||||
| Total Expenses | 497,666 | 485,569 | ||||||
| Expenses waived by adviser – expense cap (Note 3) | — | (15,150 | ) | |||||
| Net Expenses | 497,666 | 470,419 | ||||||
| NET INVESTMENT INCOME (LOSS) | 2,300,033 | 1,599,614 | ||||||
| NET REALIZED AND UNREALIZED GAIN (LOSS) | ||||||||
| Net realized gain (loss) on: | ||||||||
| Investments | 802,167 | 260,509 | ||||||
| Capital gain distribution from other RIC | 28 | 885 | ||||||
| Futures contracts (Note 7) | (568,625 | ) | (50,681 | ) | ||||
| Net realized gain (loss) | 233,570 | 210,713 | ||||||
| Net change in unrealized appreciation (depreciation) on: | ||||||||
| Investments | (859,441 | ) | 519,342 | |||||
| Futures contracts (Note 7) | (600,333 | ) | 204,382 | |||||
| Net change in unrealized appreciation (depreciation) | (1,459,774 | ) | 723,724 | |||||
| NET REALIZED AND UNREALIZED GAIN (LOSS) | (1,226,204 | ) | 934,437 | |||||
| INCREASE (DECREASE) IN NET ASSETS FROM OPERATIONS | $ | 1,073,829 | $ | 2,534,051 | ||||
The accompanying notes are an integral part of these financial statements.
101
Statements of Operations
For the Year Ended June 30, 2017
| BROWN | BROWN | BROWN | ||||||||||
| ADVISORY | ADVISORY | ADVISORY | ||||||||||
| MARYLAND | TAX EXEMPT | MORTGAGE | ||||||||||
| BOND | BOND | SECURITIES | ||||||||||
| FUND | FUND | FUND | ||||||||||
| INVESTMENT INCOME | ||||||||||||
| Dividend income | $ | — | $ | — | $ | 21,797 | ||||||
| Interest Income | 4,654,072 | 8,319,270 | 7,427,049 | |||||||||
| Total investment income | 4,654,072 | 8,319,270 | 7,448,846 | |||||||||
| EXPENSES | ||||||||||||
| Investment advisory fees (Note 3) | 531,897 | 741,501 | 1,124,190 | |||||||||
| Service fees – Investor Shares (Note 3) | 88,649 | 123,584 | 474 | |||||||||
| Business management fees | 88,649 | 123,584 | 187,365 | |||||||||
| Administration, accounting and transfer agent fees | 81,950 | 115,358 | 257,673 | |||||||||
| Professional fees | 30,001 | 33,947 | 41,442 | |||||||||
| Miscellaneous expenses | 17,726 | 19,522 | 29,996 | |||||||||
| Trustee fees | 7,703 | 10,791 | 16,196 | |||||||||
| Registration fees | 4,437 | 26,085 | 31,097 | |||||||||
| Custody fees | 5,399 | 8,204 | 36,187 | |||||||||
| Insurance fees | 3,539 | 4,487 | 7,410 | |||||||||
| Total Expenses | 859,950 | 1,207,063 | 1,732,030 | |||||||||
| NET INVESTMENT INCOME (LOSS) | 3,794,122 | 7,112,207 | 5,716,816 | |||||||||
| NET REALIZED AND UNREALIZED GAIN (LOSS) | ||||||||||||
| Net realized gain (loss) on: | ||||||||||||
| Investments | (80,267 | ) | (1,333,785 | ) | (2,948,862 | ) | ||||||
| Capital gain distribution from other RIC | 49 | 4 | 182 | |||||||||
| Securities sold short | — | — | (37,031 | ) | ||||||||
| Net realized gain (loss) | (80,218 | ) | (1,333,781 | ) | (2,985,711 | ) | ||||||
| Net change in unrealized appreciation (depreciation) on: | ||||||||||||
| Investments | (4,730,549 | ) | (6,441,873 | ) | (5,439,462 | ) | ||||||
| Securities sold short | — | — | 58,307 | |||||||||
| Futures contracts (Note 7) | — | — | (78,219 | ) | ||||||||
| Net change in unrealized appreciation (depreciation) | (4,730,549 | ) | (6,441,873 | ) | (5,459,374 | ) | ||||||
| NET REALIZED AND UNREALIZED GAIN (LOSS) | (4,810,767 | ) | (7,775,654 | ) | (8,445,085 | ) | ||||||
| INCREASE (DECREASE) IN NET ASSETS FROM OPERATIONS | $ | (1,016,645 | ) | $ | (663,447 | ) | $ | (2,728,269 | ) | |||
The accompanying notes are an integral part of these financial statements.
102
Statements of Operations
For the Year Ended June 30, 2017
| BROWN | BROWN | BROWN | BROWN | |||||||||||||
| ADVISORY – | ADVISORY – | ADVISORY – | ADVISORY – | |||||||||||||
| WMC | WMC | SOMERSET | MACQUARIE | |||||||||||||
| STRATEGIC | JAPAN ALPHA | EMERGING | ASIA | |||||||||||||
| EUROPEAN | OPPORTUNITIES | MARKETS | NEW STARS | |||||||||||||
| EQUITY FUND | FUND | FUND | FUND | |||||||||||||
| INVESTMENT INCOME | ||||||||||||||||
| Dividend income | $ | 25,429,357 | $ | 32,510,641 | $ | 15,288,384 | $ | 4,151,859 | ||||||||
| Less: foreign income taxes withheld | (2,081,428 | ) | (3,250,621 | ) | (1,756,570 | ) | (399,474 | ) | ||||||||
| Interest Income | 55,863 | 385,363 | 79,347 | 48,732 | ||||||||||||
| Total investment income | 23,403,792 | 29,645,383 | 13,611,161 | 3,801,117 | ||||||||||||
| EXPENSES | ||||||||||||||||
| Investment advisory fees (Note 3) | 9,618,453 | 15,211,692 | 4,942,290 | 2,629,308 | ||||||||||||
| Business management fees | 534,358 | 760,585 | 274,572 | 105,172 | ||||||||||||
| Administration, accounting and transfer agent fees | 385,950 | 562,587 | 203,044 | 86,309 | ||||||||||||
| Custodian fees | 334,340 | 462,468 | 765,104 | 285,896 | ||||||||||||
| Miscellaneous expenses | 558,455 | 178,791 | 59,529 | 49,949 | ||||||||||||
| Registration fees | 101,161 | 63,259 | 84,628 | 33,558 | ||||||||||||
| Professional fees | 82,405 | 104,706 | 52,042 | 61,759 | ||||||||||||
| Trustee fees | 45,398 | 67,381 | 24,218 | 9,139 | ||||||||||||
| Service fees — Investor Shares (Note 3) | 13,939 | 2,708 | 289,441 | 6,842 | ||||||||||||
| Service fees — Advisor Shares (Note 3) | 3,377 | 813 | 375 | — | ||||||||||||
| Insurance fees | 22,008 | 2,729 | 9,728 | 4,306 | ||||||||||||
| Distribution fees — Advisor Shares (Note 3) | 5,628 | 1,355 | 625 | — | ||||||||||||
| Interest expense on line of credit (Note 8) | 80 | 22,173 | — | 1,200 | ||||||||||||
| Total Expenses | 11,705,552 | 17,441,247 | 6,705,596 | 3,273,438 | ||||||||||||
| NET INVESTMENT INCOME (LOSS) | 11,698,240 | 12,204,136 | 6,905,565 | 527,679 | ||||||||||||
| NET REALIZED AND UNREALIZED GAIN (LOSS) | ||||||||||||||||
| Net realized gain (loss) on: | ||||||||||||||||
| Investments | 273,046 | 204,677,895 | (22,275,180 | ) | 15,821,651 | |||||||||||
| Less: foreign capital gains taxes paid | — | — | — | (1,058,074 | ) | |||||||||||
| Forward foreign currency contracts (Note 6) | — | (11,565,713 | ) | — | — | |||||||||||
| Futures contracts (Note 7) | — | 9,432,515 | — | — | ||||||||||||
| Net realized gain (loss) | 273,046 | 202,544,697 | (22,275,180 | ) | 14,763,577 | |||||||||||
| Net change in unrealized appreciation (depreciation) on: | ||||||||||||||||
| Investments | 212,967,325 | 129,822,252 | 107,801,812 | (719,213 | ) | |||||||||||
| Forward foreign currency contracts (Note 6) | — | (10,962,063 | ) | — | — | |||||||||||
| Futures contracts (Note 7) | — | 237,156 | — | — | ||||||||||||
| Foreign currency and / or receivables | 164,300 | (497,508 | ) | 45,326 | (1,300 | ) | ||||||||||
| Net change in unrealized appreciation (depreciation) | 213,131,625 | 118,599,837 | 107,847,138 | (720,513 | ) | |||||||||||
| NET REALIZED AND UNREALIZED GAIN (LOSS) | 213,404,671 | 321,144,534 | 85,571,958 | 14,043,064 | ||||||||||||
| INCREASE (DECREASE) IN NET ASSETS FROM OPERATIONS | $ | 225,102,911 | $ | 333,348,670 | $ | 92,477,523 | $ | 14,570,743 | ||||||||
The accompanying notes are an integral part of these financial statements.
103
Statements of Changes in Net Assets
| BROWN ADVISORY | BROWN ADVISORY | |||||||||||||||
| GROWTH EQUITY FUND | FLEXIBLE EQUITY FUND | |||||||||||||||
| Fiscal | Fiscal | Fiscal | Fiscal | |||||||||||||
| Year Ended | Year Ended | Year Ended | Year Ended | |||||||||||||
| June 30, | June 30, | June 30, | June 30, | |||||||||||||
| 2017 | 2016 | 2017 | 2016 | |||||||||||||
| OPERATIONS | ||||||||||||||||
| Net investment income (loss) | $ | (5,558,657 | ) | $ | (5,874,397 | ) | $ | 1,796,492 | $ | 1,712,215 | ||||||
| Net realized gain (loss) | 237,349,413 | 124,211,432 | 9,225,463 | (9,574,851 | ) | |||||||||||
| Net change in unrealized appreciation (depreciation) | 2,508,322 | (111,591,843 | ) | 65,792,893 | (2,732,202 | ) | ||||||||||
| Increase (Decrease) in Net Assets from Operations | 234,299,078 | 6,745,192 | 76,814,848 | (10,594,838 | ) | |||||||||||
| DISTRIBUTIONS TO SHAREHOLDERS FROM | ||||||||||||||||
| Net investment income: | ||||||||||||||||
| Institutional Shares | — | — | (296,958 | ) | (118,078 | ) | ||||||||||
| Investor Shares | — | — | (1,264,674 | ) | (1,585,339 | ) | ||||||||||
| Advisor Shares | — | — | (11,536 | ) | (24,797 | ) | ||||||||||
| Net realized gain: | ||||||||||||||||
| Institutional Shares | (21,177,151 | ) | (16,080,264 | ) | — | — | ||||||||||
| Investor Shares | (123,877,317 | ) | (130,457,394 | ) | — | — | ||||||||||
| Advisor Shares | (2,370,151 | ) | (2,441,644 | ) | — | — | ||||||||||
| Total Distributions to Shareholders | (147,424,619 | ) | (148,979,302 | ) | (1,573,168 | ) | (1,728,214 | ) | ||||||||
| CAPITAL SHARE TRANSACTIONS | ||||||||||||||||
| Sale of shares: | ||||||||||||||||
| Institutional Shares | 119,319,112 | 44,809,830 | 81,914,255 | 23,904,540 | ||||||||||||
| Investor Shares | 211,845,143 | 276,195,465 | 32,256,785 | 124,130,337 | ||||||||||||
| Advisor Shares | 2,984,886 | 3,660,338 | 541,315 | 995,241 | ||||||||||||
| Reinvestment of distributions: | ||||||||||||||||
| Institutional Shares | 17,528,304 | 13,324,395 | 116,213 | 7 | ||||||||||||
| Investor Shares | 116,018,940 | 117,886,614 | 330,267 | 528,062 | ||||||||||||
| Advisor Shares | 2,309,631 | 2,377,708 | 10,376 | 22,944 | ||||||||||||
| Redemption of shares: | ||||||||||||||||
| Institutional Shares | (126,100,789 | ) | (49,170,983 | ) | (16,178,545 | ) | (3,463,636 | ) | ||||||||
| Investor Shares | (834,155,207 | ) | (495,565,323 | ) | (133,656,620 | ) | (75,680,003 | ) | ||||||||
| Advisor Shares | (33,588,840 | ) | (14,878,919 | ) | (4,314,983 | ) | (4,826,465 | ) | ||||||||
| Redemption fees: | ||||||||||||||||
| Institutional Shares | 8 | — | 456 | — | ||||||||||||
| Investor Shares | 522 | 2,208 | 904 | 64 | ||||||||||||
| Advisor Shares | 671 | 7 | 6 | 198 | ||||||||||||
| Shares issued in connection with the acquisition of | ||||||||||||||||
| the Brown Advisory Value Equity Fund (Note 9): | ||||||||||||||||
| Institutional Shares | N/A | N/A | 1,202,936 | N/A | ||||||||||||
| Investor Shares | N/A | N/A | 41,538,801 | N/A | ||||||||||||
| Advisor Shares | N/A | N/A | 992,710 | N/A | ||||||||||||
| Increase (Decrease) from Capital Share Transactions | (523,837,619 | ) | (101,358,660 | ) | 4,754,876 | 65,611,289 | ||||||||||
| Increase (Decrease) in Net Assets | (436,963,160 | ) | (243,592,770 | ) | 79,996,556 | 53,288,237 | ||||||||||
| NET ASSETS | ||||||||||||||||
| Beginning of period | 2,203,416,946 | 2,447,009,716 | 337,636,858 | 284,348,621 | ||||||||||||
| End of period | $ | 1,766,453,786 | $ | 2,203,416,946 | $ | 417,633,414 | $ | 337,636,858 | ||||||||
| Undistributed (Accumulated) net investment income (loss) | $ | (848,321 | ) | $ | (2,889,959 | ) | $ | 1,031,757 | $ | 808,933 | ||||||
| SHARE TRANSACTIONS | ||||||||||||||||
| Sale of shares: | ||||||||||||||||
| Institutional Shares | 6,213,516 | 2,313,362 | 4,821,892 | 1,546,649 | ||||||||||||
| Investor Shares | 11,129,360 | 14,288,981 | 1,894,148 | 8,303,092 | ||||||||||||
| Advisor Shares | 166,276 | 193,783 | 31,755 | 65,238 | ||||||||||||
| Reinvestment of distributions: | ||||||||||||||||
| Institutional Shares | 998,195 | 691,458 | 7,005 | — | ||||||||||||
| Investor Shares | 6,652,462 | 6,143,127 | 19,920 | 33,720 | ||||||||||||
| Advisor Shares | 138,218 | 128,525 | 625 | 1,464 | ||||||||||||
| Redemption of shares: | ||||||||||||||||
| Institutional Shares | (6,642,253 | ) | (2,512,389 | ) | (1,013,033 | ) | (228,251 | ) | ||||||||
| Investor Shares | (43,687,505 | ) | (25,683,769 | ) | (7,908,695 | ) | (4,974,758 | ) | ||||||||
| Advisor Shares | (1,831,432 | ) | (782,405 | ) | (250,475 | ) | (319,551 | ) | ||||||||
| Shares issued in connection with the acquisition of | ||||||||||||||||
| the Brown Advisory Value Equity Fund (Note 9): | ||||||||||||||||
| Institutional Shares | N/A | N/A | 72,612 | N/A | ||||||||||||
| Investor Shares | N/A | N/A | 2,509,981 | N/A | ||||||||||||
| Advisor Shares | N/A | N/A | 59,882 | N/A | ||||||||||||
| Increase (Decrease) in shares outstanding | (26,863,163 | ) | (5,219,327 | ) | 245,617 | 4,427,603 | ||||||||||
The accompanying notes are an integral part of these financial statements.
104
Statements of Changes in Net Assets
| BROWN ADVISORY | BROWN ADVISORY | |||||||||||||||
| EQUITY INCOME FUND | SUSTAINABLE GROWTH FUND | |||||||||||||||
| Fiscal | Fiscal | Fiscal | Fiscal | |||||||||||||
| Year Ended | Year Ended | Year Ended | Year Ended | |||||||||||||
| June 30, | June 30, | June 30, | June 30, | |||||||||||||
| 2017 | 2016 | 2017 | 2016 | |||||||||||||
| OPERATIONS | ||||||||||||||||
| Net investment income (loss) | $ | 2,130,205 | $ | 3,368,205 | $ | (1,164,258 | ) | $ | (1,102,504 | ) | ||||||
| Net realized gain (loss) | 7,663,911 | 1,228,571 | 19,653,792 | 3,885,315 | ||||||||||||
| Net change in unrealized appreciation (depreciation) | 4,432,257 | (6,886,953 | ) | 45,736,422 | 15,334,723 | |||||||||||
| Increase (Decrease) in Net Assets from Operations | 14,226,373 | (2,290,177 | ) | 64,225,956 | 18,117,534 | |||||||||||
| DISTRIBUTIONS TO SHAREHOLDERS FROM | ||||||||||||||||
| Net investment income: | ||||||||||||||||
| Institutional Shares | (300,565 | ) | (365,732 | ) | — | — | ||||||||||
| Investor Shares | (1,754,976 | ) | (2,950,606 | ) | — | — | ||||||||||
| Advisor Shares | (45,555 | ) | (53,866 | ) | — | — | ||||||||||
| Net realized gain: | ||||||||||||||||
| Institutional Shares | (408,109 | ) | (188,209 | ) | (1,045,872 | ) | (3,716,752 | ) | ||||||||
| Investor Shares | (3,601,920 | ) | (1,567,845 | ) | (198,697 | ) | (732,739 | ) | ||||||||
| Advisor Shares | (110,477 | ) | (29,616 | ) | (1,263,054 | ) | (9,527,402 | ) | ||||||||
| Total Distributions to Shareholders | (6,221,602 | ) | (5,155,874 | ) | (2,507,623 | ) | (13,976,893 | ) | ||||||||
| CAPITAL SHARE TRANSACTIONS | ||||||||||||||||
| Sale of shares: | ||||||||||||||||
| Institutional Shares | 30,529,529 | 1,263,000 | 100,732,392 | 65,254,532 | ||||||||||||
| Investor Shares | 5,936,447 | 10,269,026 | 28,660,628 | 20,556,459 | ||||||||||||
| Advisor Shares | 4,735 | 77,650 | 31,487,091 | 103,143,267 | ||||||||||||
| Reinvestment of distributions: | ||||||||||||||||
| Institutional Shares | 533,195 | 436,376 | 743,538 | 2,354,247 | ||||||||||||
| Investor Shares | 2,223,909 | 1,429,730 | 175,109 | 538,649 | ||||||||||||
| Advisor Shares | 145,768 | 72,240 | 1,188,453 | 8,931,717 | ||||||||||||
| Redemption of shares: | ||||||||||||||||
| Institutional Shares | (16,718,684 | ) | (5,375,406 | ) | (29,877,900 | ) | (16,564,900 | ) | ||||||||
| Investor Shares | (44,793,123 | ) | (75,816,836 | ) | (22,743,144 | ) | (7,069,856 | ) | ||||||||
| Advisor Shares | (903,287 | ) | (257,266 | ) | (91,353,897 | ) | (48,279,652 | ) | ||||||||
| Redemption fees: | ||||||||||||||||
| Institutional Shares | — | — | 201 | 1 | ||||||||||||
| Investor Shares | — | — | 1,047 | 341 | ||||||||||||
| Advisor Shares | 1 | — | 370 | 885 | ||||||||||||
| Increase (Decrease) from Capital Share Transactions | (23,041,510 | ) | (67,901,486 | ) | 19,013,888 | 128,865,690 | ||||||||||
| Increase (Decrease) in Net Assets | (15,036,739 | ) | (75,347,537 | ) | 80,732,221 | 133,006,331 | ||||||||||
| NET ASSETS | ||||||||||||||||
| Beginning of period | 128,935,823 | 204,283,360 | 349,410,965 | 216,404,634 | ||||||||||||
| End of period | $ | 113,899,084 | $ | 128,935,823 | $ | 430,143,186 | $ | 349,410,965 | ||||||||
| Undistributed (Accumulated) net investment income (loss) | $ | 67,756 | $ | 38,600 | $ | (468,926 | ) | $ | (577,943 | ) | ||||||
| SHARE TRANSACTIONS | ||||||||||||||||
| Sale of shares: | ||||||||||||||||
| Institutional Shares | 2,320,504 | 102,693 | 5,731,486 | 4,184,096 | ||||||||||||
| Investor Shares | 453,386 | 828,449 | 1,664,640 | 1,304,030 | ||||||||||||
| Advisor Shares | 354 | 6,691 | 1,881,748 | 6,520,698 | ||||||||||||
| Reinvestment of distributions: | ||||||||||||||||
| Institutional Shares | 40,657 | 35,362 | 44,075 | 150,527 | ||||||||||||
| Investor Shares | 171,641 | 116,203 | 10,461 | 34,640 | ||||||||||||
| Advisor Shares | 11,225 | 5,856 | 71,766 | 579,605 | ||||||||||||
| Redemption of shares: | ||||||||||||||||
| Institutional Shares | (1,292,954 | ) | (442,768 | ) | (1,697,204 | ) | (1,054,388 | ) | ||||||||
| Investor Shares | (3,407,417 | ) | (6,165,587 | ) | (1,317,790 | ) | (445,762 | ) | ||||||||
| Advisor Shares | (67,821 | ) | (20,572 | ) | (5,459,074 | ) | (3,184,241 | ) | ||||||||
| Increase (Decrease) in shares outstanding | (1,770,425 | ) | (5,533,673 | ) | 930,108 | 8,089,205 | ||||||||||
The accompanying notes are an integral part of these financial statements.
105
Statements of Changes in Net Assets
| BROWN ADVISORY | BROWN ADVISORY SMALL-CAP | |||||||||||||||
| SMALL-CAP GROWTH FUND | FUNDAMENTAL VALUE FUND | |||||||||||||||
| Fiscal | Fiscal | Fiscal | Fiscal | |||||||||||||
| Year Ended | Year Ended | Year Ended | Year Ended | |||||||||||||
| June 30, | June 30, | June 30, | June 30, | |||||||||||||
| 2017 | 2016 | 2017 | 2016 | |||||||||||||
| OPERATIONS | ||||||||||||||||
| Net investment income (loss) | $ | (2,625,257 | ) | $ | (1,621,898 | ) | $ | 6,232,823 | $ | 3,844,002 | ||||||
| Net realized gain (loss) | 12,097,018 | 24,884,563 | 33,184,360 | 5,583,924 | ||||||||||||
| Net change in unrealized appreciation (depreciation) | 51,670,727 | (17,671,772 | ) | 158,498,930 | (13,233,109 | ) | ||||||||||
| Increase (Decrease) in Net Assets from Operations | 61,142,488 | 5,590,893 | 197,916,113 | (3,805,183 | ) | |||||||||||
| DISTRIBUTIONS TO SHAREHOLDERS FROM | ||||||||||||||||
| Net investment income: | ||||||||||||||||
| Institutional Shares | — | — | (988,540 | ) | (484,047 | ) | ||||||||||
| Investor Shares | — | — | (1,873,774 | ) | (2,277,048 | ) | ||||||||||
| Advisor Shares | — | — | — | (35,541 | ) | |||||||||||
| Net realized gain: | ||||||||||||||||
| Institutional Shares | (3,125,896 | ) | (1,946,062 | ) | (334,931 | ) | (2,038,801 | ) | ||||||||
| Investor Shares | (9,911,936 | ) | (37,656,440 | ) | (1,026,309 | ) | (14,082,090 | ) | ||||||||
| Advisor Shares | (1,153,765 | ) | (819,956 | ) | (71,853 | ) | (1,069,503 | ) | ||||||||
| Total Distributions to Shareholders | (14,191,597 | ) | (40,422,458 | ) | (4,295,407 | ) | (19,987,030 | ) | ||||||||
| CAPITAL SHARE TRANSACTIONS | ||||||||||||||||
| Sale of shares: | ||||||||||||||||
| Institutional Shares | 153,338,783 | 5,588,177 | 179,876,139 | 89,252,983 | ||||||||||||
| Investor Shares | 87,942,206 | 44,867,427 | 150,643,608 | 221,245,590 | ||||||||||||
| Advisor Shares | 34,620,167 | 6,143,111 | 4,622,183 | 11,524,532 | ||||||||||||
| Reinvestment of distributions: | ||||||||||||||||
| Institutional Shares | 2,803,928 | 1,258,905 | 1,028,123 | 1,826,895 | ||||||||||||
| Investor Shares | 6,192,098 | 22,013,906 | 1,463,959 | 9,736,248 | ||||||||||||
| Advisor Shares | 804,864 | 565,945 | 70,862 | 1,084,680 | ||||||||||||
| Redemption of shares: | ||||||||||||||||
| Institutional Shares | (16,925,963 | ) | (1,279,143 | ) | (39,625,716 | ) | (13,343,881 | ) | ||||||||
| Investor Shares | (62,439,748 | ) | (27,986,757 | ) | (233,263,118 | ) | (180,251,556 | ) | ||||||||
| Advisor Shares | (14,767,401 | ) | (2,823,963 | ) | (41,744,149 | ) | (16,232,721 | ) | ||||||||
| Redemption fees: | ||||||||||||||||
| Institutional Shares | 239 | — | 596 | 1,477 | ||||||||||||
| Investor Shares | 38 | 292 | 293 | 1,354 | ||||||||||||
| Advisor Shares | 912 | 292 | 17 | 1,252 | ||||||||||||
| Increase (Decrease) from Capital Share Transactions | 191,570,123 | 48,348,192 | 23,072,797 | 124,846,853 | ||||||||||||
| Increase (Decrease) in Net Assets | 238,521,014 | 13,516,627 | 216,693,503 | 101,054,640 | ||||||||||||
| NET ASSETS | ||||||||||||||||
| Beginning of period | 295,131,083 | 281,614,456 | 983,635,008 | 882,580,368 | ||||||||||||
| End of period | $ | 533,652,097 | $ | 295,131,083 | $ | 1,200,328,511 | $ | 983,635,008 | ||||||||
| Undistributed (Accumulated) net investment income (loss) | $ | (1,466,067 | ) | $ | (442,829 | ) | $ | 4,459,274 | $ | 1,044,450 | ||||||
| SHARE TRANSACTIONS | ||||||||||||||||
| Sale of shares: | ||||||||||||||||
| Institutional Shares | 4,584,294 | 188,309 | 7,218,027 | 4,171,224 | ||||||||||||
| Investor Shares | 5,239,278 | 2,937,441 | 5,983,204 | 10,130,767 | ||||||||||||
| Advisor Shares | 2,170,147 | 431,751 | 186,049 | 533,241 | ||||||||||||
| Reinvestment of distributions: | ||||||||||||||||
| Institutional Shares | 85,694 | 41,977 | 38,734 | 83,739 | ||||||||||||
| Investor Shares | 377,337 | 1,461,747 | 55,176 | 447,800 | ||||||||||||
| Advisor Shares | 51,200 | 39,112 | 2,683 | 50,227 | ||||||||||||
| Redemption of shares: | ||||||||||||||||
| Institutional Shares | (504,564 | ) | (41,639 | ) | (1,544,437 | ) | (606,792 | ) | ||||||||
| Investor Shares | (3,732,469 | ) | (1,792,684 | ) | (9,311,268 | ) | (8,207,223 | ) | ||||||||
| Advisor Shares | (918,376 | ) | (190,374 | ) | (1,599,518 | ) | (740,720 | ) | ||||||||
| Increase (Decrease) in shares outstanding | 7,352,541 | 3,075,640 | 1,028,650 | 5,862,263 | ||||||||||||
The accompanying notes are an integral part of these financial statements.
106
Statements of Changes in Net Assets
| BROWN ADVISORY | BROWN ADVISORY | |||||||||||||||
| GLOBAL LEADERS FUND | INTERMEDIATE INCOME FUND | |||||||||||||||
| Fiscal | Fiscal | Fiscal | Fiscal | |||||||||||||
| Year Ended | Year Ended | Year Ended | Year Ended | |||||||||||||
| June 30, | June 30, | June 30, | June 30, | |||||||||||||
| 2017 | 2016 | 2017 | 2016 | |||||||||||||
| OPERATIONS | ||||||||||||||||
| Net investment income (loss) | $ | 123,094 | $ | 82,066 | $ | 2,678,957 | $ | 2,896,397 | ||||||||
| Net realized gain (loss) | (697,183 | ) | (1,102,079 | ) | 1,158,501 | (699,518 | ) | |||||||||
| Net change in unrealized appreciation (depreciation) | 6,298,725 | 699,600 | (3,387,615 | ) | 3,708,589 | |||||||||||
| Increase (Decrease) in Net Assets from Operations | 5,724,636 | (320,413 | ) | 449,843 | 5,905,468 | |||||||||||
| DISTRIBUTIONS TO SHAREHOLDERS FROM | ||||||||||||||||
| Net investment income: | ||||||||||||||||
| Investor Shares | (53,915 | ) | — | (2,831,381 | ) | (2,820,398 | ) | |||||||||
| Advisor Shares | — | — | (140,836 | ) | (160,893 | ) | ||||||||||
| Net realized gain: | ||||||||||||||||
| Investor Shares | — | — | — | (773,069 | ) | |||||||||||
| Advisor Shares | — | — | — | (49,905 | ) | |||||||||||
| Total Distributions to Shareholders | (53,915 | ) | — | (2,972,217 | ) | (3,804,265 | ) | |||||||||
| CAPITAL SHARE TRANSACTIONS | ||||||||||||||||
| Sale of shares: | ||||||||||||||||
| Investor Shares | 10,428,188 | 17,814,152 | 25,077,370 | 29,525,581 | ||||||||||||
| Advisor Shares | — | — | 38,794 | 44,413 | ||||||||||||
| Reinvestment of distributions: | ||||||||||||||||
| Investor Shares | 27,050 | — | 724,852 | 1,248,100 | ||||||||||||
| Advisor Shares | — | — | 86,263 | 130,783 | ||||||||||||
| Redemption of shares: | ||||||||||||||||
| Investor Shares | (3,139,577 | ) | (1,161,378 | ) | (29,404,931 | ) | (34,857,866 | ) | ||||||||
| Advisor Shares | — | — | (4,833,940 | ) | (933,155 | ) | ||||||||||
| Redemption fees: | ||||||||||||||||
| Investor Shares | — | — | — | 3 | ||||||||||||
| Advisor Shares | — | — | — | — | ||||||||||||
| Shares issued in connection with the acquisition of | ||||||||||||||||
| the Brown Advisory Opportunity Fund: | ||||||||||||||||
| Investor Shares | N/A | 10,035,030 | N/A | N/A | ||||||||||||
| Increase (Decrease) from Capital Share Transactions | 7,315,661 | 26,687,804 | (8,311,592 | ) | (4,842,141 | ) | ||||||||||
| Increase (Decrease) in Net Assets | 12,986,382 | 26,367,391 | (10,833,966 | ) | (2,740,938 | ) | ||||||||||
| NET ASSETS | ||||||||||||||||
| Beginning of period | 26,367,391 | — | 146,872,422 | 149,613,360 | ||||||||||||
| End of period | $ | 39,353,773 | $ | 26,367,391 | $ | 136,038,456 | $ | 146,872,422 | ||||||||
| Undistributed (Accumulated) net investment income (loss) | $ | 36,421 | $ | 53,912 | $ | (169,025 | ) | $ | (173,885 | ) | ||||||
| SHARE TRANSACTIONS | ||||||||||||||||
| Sale of shares: | ||||||||||||||||
| Investor Shares | 997,773 | 1,856,363 | 2,357,775 | 2,775,238 | ||||||||||||
| Advisor Shares | — | — | 3,759 | 4,256 | ||||||||||||
| Reinvestment of distributions: | ||||||||||||||||
| Investor Shares | 2,772 | — | 68,181 | 117,748 | ||||||||||||
| Advisor Shares | — | — | 8,282 | 12,566 | ||||||||||||
| Redemption of shares: | ||||||||||||||||
| Investor Shares | (308,305 | ) | (119,736 | ) | (2,768,529 | ) | (3,273,682 | ) | ||||||||
| Advisor Shares | — | — | (466,686 | ) | (89,510 | ) | ||||||||||
| Shares issued in connection with the acquisition of | ||||||||||||||||
| the Brown Advisory Opportunity Fund: | ||||||||||||||||
| Investor Shares | N/A | 994,393 | N/A | N/A | ||||||||||||
| Increase (Decrease) in shares outstanding | 692,240 | 2,731,020 | (797,218 | ) | (453,384 | ) | ||||||||||
The accompanying notes are an integral part of these financial statements.
107
Statements of Changes in Net Assets
| BROWN ADVISORY | BROWN ADVISORY | |||||||||||||||
| TOTAL RETURN FUND | STRATEGIC BOND FUND | |||||||||||||||
| Fiscal | Fiscal | Fiscal | Fiscal | |||||||||||||
| Year Ended | Year Ended | Year Ended | Year Ended | |||||||||||||
| June 30, | June 30, | June 30, | June 30, | |||||||||||||
| 2017 | 2016 | 2017 | 2016 | |||||||||||||
| OPERATIONS | ||||||||||||||||
| Net investment income (loss) | $ | 2,300,033 | $ | 2,053,474 | $ | 1,599,614 | $ | 1,521,593 | ||||||||
| Net realized gain (loss) | 233,570 | 516,458 | 210,713 | (1,923,589 | ) | |||||||||||
| Net change in unrealized appreciation (depreciation) | (1,459,774 | ) | 2,495,983 | 723,724 | 683,014 | |||||||||||
| Increase (Decrease) in Net Assets from Operations | 1,073,829 | 5,065,915 | 2,534,051 | 281,018 | ||||||||||||
| DISTRIBUTIONS TO SHAREHOLDERS FROM | ||||||||||||||||
| Net investment income: | ||||||||||||||||
| Institutional Shares | (2,343,658 | ) | (2,128,088 | ) | — | — | ||||||||||
| Investor Shares | (80,256 | ) | (94,064 | ) | (1,644,060 | ) | (2,420,788 | ) | ||||||||
| Advisor Shares | — | — | (14,139 | ) | (55,995 | ) | ||||||||||
| Net realized gain: | ||||||||||||||||
| Institutional Shares | (98,534 | ) | — | — | — | |||||||||||
| Investor Shares | (3,277 | ) | — | — | — | |||||||||||
| Advisor Shares | — | — | — | — | ||||||||||||
| Total Distributions to Shareholders | (2,525,725 | ) | (2,222,152 | ) | (1,658,199 | ) | (2,476,783 | ) | ||||||||
| CAPITAL SHARE TRANSACTIONS | ||||||||||||||||
| Sale of shares: | ||||||||||||||||
| Institutional Shares | 49,027,136 | 20,855,744 | — | — | ||||||||||||
| Investor Shares | 3,462,904 | 1,343,005 | 90,428,155 | 3,826,957 | ||||||||||||
| Advisor Shares | — | — | 222,462 | — | ||||||||||||
| Reinvestment of distributions: | ||||||||||||||||
| Institutional Shares | 612,556 | 135,297 | — | — | ||||||||||||
| Investor Shares | 60,281 | 79,685 | 288,868 | 317,063 | ||||||||||||
| Advisor Shares | — | — | 13,108 | 42,801 | ||||||||||||
| Redemption of shares: | ||||||||||||||||
| Institutional Shares | (24,464,517 | ) | (13,649,303 | ) | — | — | ||||||||||
| Investor Shares | (2,704,739 | ) | (8,612,071 | ) | (16,143,207 | ) | (22,475,247 | ) | ||||||||
| Advisor Shares | — | — | (861,525 | ) | (811,615 | ) | ||||||||||
| Redemption fees: | ||||||||||||||||
| Institutional Shares | 99 | — | — | — | ||||||||||||
| Investor Shares | — | — | 25 | — | ||||||||||||
| Advisor Shares | — | — | — | — | ||||||||||||
| Increase (Decrease) from Capital Share Transactions | 25,993,720 | 152,357 | 73,947,886 | (19,100,041 | ) | |||||||||||
| Increase (Decrease) in Net Assets | 24,541,824 | 2,996,120 | 74,823,738 | (21,295,806 | ) | |||||||||||
| NET ASSETS | ||||||||||||||||
| Beginning of period | 85,811,660 | 82,815,540 | 40,076,028 | 61,371,834 | ||||||||||||
| End of period | $ | 110,353,484 | $ | 85,811,660 | $ | 114,899,766 | $ | 40,076,028 | ||||||||
| Undistributed (Accumulated) net investment income (loss) | $ | 4,229 | $ | (623 | ) | $ | (67,975 | ) | $ | (73,959 | ) | |||||
| SHARE TRANSACTIONS | ||||||||||||||||
| Sale of shares: | ||||||||||||||||
| Institutional Shares | 4,910,349 | 2,109,393 | — | — | ||||||||||||
| Investor Shares | 341,146 | 135,649 | 9,446,682 | 403,394 | ||||||||||||
| Advisor Shares | — | — | 23,202 | — | ||||||||||||
| Reinvestment of distributions: | ||||||||||||||||
| Institutional Shares | 61,510 | 13,657 | — | — | ||||||||||||
| Investor Shares | 6,013 | 8,049 | 30,161 | 33,319 | ||||||||||||
| Advisor Shares | — | — | 1,370 | 4,491 | ||||||||||||
| Redemption of shares: | ||||||||||||||||
| Institutional Shares | (2,439,943 | ) | (1,380,268 | ) | — | — | ||||||||||
| Investor Shares | (272,638 | ) | (874,785 | ) | (1,682,618 | ) | (2,367,203 | ) | ||||||||
| Advisor Shares | — | — | (89,988 | ) | (85,611 | ) | ||||||||||
| Increase (Decrease) in shares outstanding | 2,606,437 | 11,695 | 7,728,809 | (2,011,610 | ) | |||||||||||
The accompanying notes are an integral part of these financial statements.
108
Statements of Changes in Net Assets
| BROWN ADVISORY | BROWN ADVISORY | |||||||||||||||
| MARYLAND BOND FUND | TAX EXEMPT BOND FUND | |||||||||||||||
| Fiscal | Fiscal | Fiscal | Fiscal | |||||||||||||
| Year Ended | Year Ended | Year Ended | Year Ended | |||||||||||||
| June 30, | June 30, | June 30, | June 30, | |||||||||||||
| 2017 | 2016 | 2017 | 2016 | |||||||||||||
| OPERATIONS | ||||||||||||||||
| Net investment income (loss) | $ | 3,794,122 | $ | 4,035,203 | $ | 7,112,207 | $ | 5,642,298 | ||||||||
| Net realized gain (loss) | (80,218 | ) | 1,347,240 | (1,333,781 | ) | 331,921 | ||||||||||
| Net change in unrealized appreciation (depreciation) | (4,730,549 | ) | 4,359,306 | (6,441,873 | ) | 7,199,311 | ||||||||||
| Increase (Decrease) in Net Assets from Operations | (1,016,645 | ) | 9,741,749 | (663,447 | ) | 13,173,530 | ||||||||||
| DISTRIBUTIONS TO SHAREHOLDERS FROM | ||||||||||||||||
| Net investment income: | ||||||||||||||||
| Investor Shares | (3,794,168 | ) | (4,035,074 | ) | (7,112,373 | ) | (5,642,129 | ) | ||||||||
| Net realized gain: | ||||||||||||||||
| Investor Shares | (627,717 | ) | (906,772 | ) | — | — | ||||||||||
| Total Distributions to Shareholders | (4,421,885 | ) | (4,941,846 | ) | (7,112,373 | ) | (5,642,129 | ) | ||||||||
| CAPITAL SHARE TRANSACTIONS | ||||||||||||||||
| Sale of shares: | ||||||||||||||||
| Investor Shares | 99,282,076 | 27,494,531 | 141,861,579 | 59,630,595 | ||||||||||||
| Reinvestment of distributions: | ||||||||||||||||
| Investor Shares | 1,035,598 | 1,233,816 | 1,288,963 | 1,187,875 | ||||||||||||
| Redemption of shares: | ||||||||||||||||
| Investor Shares | (97,065,553 | ) | (49,292,605 | ) | (111,448,107 | ) | (58,829,020 | ) | ||||||||
| Redemption fees: | ||||||||||||||||
| Investor Shares | — | — | 200 | — | ||||||||||||
| Increase (Decrease) from Capital Share Transactions | 3,252,121 | (20,564,258 | ) | 31,702,635 | 1,989,450 | |||||||||||
| Increase (Decrease) in Net Assets | (2,186,409 | ) | (15,764,355 | ) | 23,926,815 | 9,520,851 | ||||||||||
| NET ASSETS | ||||||||||||||||
| Beginning of period | 183,704,776 | 199,469,131 | 233,675,326 | 224,154,475 | ||||||||||||
| End of period | $ | 181,518,367 | $ | 183,704,776 | $ | 257,602,141 | $ | 233,675,326 | ||||||||
| Undistributed (Accumulated) net investment income (loss) | $ | 60 | $ | 157 | $ | (116 | ) | $ | 46 | |||||||
| SHARE TRANSACTIONS | ||||||||||||||||
| Sale of shares: | ||||||||||||||||
| Investor Shares | 9,426,718 | 2,553,474 | 14,282,097 | 5,916,196 | ||||||||||||
| Reinvestment of distributions: | ||||||||||||||||
| Investor Shares | 97,920 | 114,852 | 129,259 | 117,959 | ||||||||||||
| Redemption of shares: | ||||||||||||||||
| Investor Shares | (9,255,940 | ) | (4,580,145 | ) | (11,259,154 | ) | (5,841,862 | ) | ||||||||
| Increase (Decrease) in shares outstanding | 268,698 | (1,911,819 | ) | 3,152,202 | 192,293 | |||||||||||
The accompanying notes are an integral part of these financial statements.
109
Statements of Changes in Net Assets
| BROWN ADVISORY – | ||||||||||||||||
| BROWN ADVISORY | WMC STRATEGIC | |||||||||||||||
| MORTGAGE SECURITIES FUND | EUROPEAN EQUITY FUND | |||||||||||||||
| Fiscal | Fiscal | Fiscal | Fiscal | |||||||||||||
| Year Ended | Year Ended | Year Ended | Year Ended | |||||||||||||
| June 30, | June 30, | June 30, | June 30, | |||||||||||||
| 2017 | 2016 | 2017 | 2016 | |||||||||||||
| OPERATIONS | ||||||||||||||||
| Net investment income (loss) | $ | 5,716,816 | $ | 6,730,528 | $ | 11,698,240 | $ | 12,716,179 | ||||||||
| Net realized gain (loss) | (2,985,711 | ) | 2,435,203 | 273,046 | (38,401,054 | ) | ||||||||||
| Net change in unrealized appreciation (depreciation) | (5,459,374 | ) | 4,611,749 | 213,131,625 | (16,316,729 | ) | ||||||||||
| Increase (Decrease) in Net Assets from Operations | (2,728,269 | ) | 13,777,480 | 225,102,911 | (42,001,604 | ) | ||||||||||
| DISTRIBUTIONS TO SHAREHOLDERS FROM | ||||||||||||||||
| Net investment income: | ||||||||||||||||
| Institutional Shares | (7,650,400 | ) | (7,634,638 | ) | (12,504,477 | ) | (2,992,321 | ) | ||||||||
| Investor Shares | (17,169 | ) | (272,364 | ) | (101,420 | ) | — | |||||||||
| Advisor Shares | — | — | (6,394 | ) | — | |||||||||||
| Net realized gain: | ||||||||||||||||
| Institutional Shares | (2,569,582 | ) | (1,251,294 | ) | — | — | ||||||||||
| Investor Shares | (5,800 | ) | (6,444 | ) | — | — | ||||||||||
| Advisor Shares | — | — | — | — | ||||||||||||
| Total Distributions to Shareholders | (10,242,951 | ) | (9,164,740 | ) | (12,612,291 | ) | (2,992,321 | ) | ||||||||
| CAPITAL SHARE TRANSACTIONS | ||||||||||||||||
| Sale of shares: | ||||||||||||||||
| Institutional Shares | 88,368,686 | 190,657,531 | 180,461,066 | 1,071,009,646 | ||||||||||||
| Investor Shares | 921,398 | 4,298,461 | 5,963,037 | 16,339,283 | ||||||||||||
| Advisor Shares | — | — | 10,062,207 | 407,912 | ||||||||||||
| Reinvestment of distributions: | ||||||||||||||||
| Institutional Shares | 3,217,466 | 1,978,340 | 10,024,075 | 2,334,075 | ||||||||||||
| Investor Shares | 21,133 | 164,060 | 97,787 | — | ||||||||||||
| Advisor Shares | — | — | 6,394 | — | ||||||||||||
| Redemption of shares: | ||||||||||||||||
| Institutional Shares | (113,841,299 | ) | (25,603,200 | ) | (284,509,328 | ) | (209,118,819 | ) | ||||||||
| Investor Shares | (1,974,570 | ) | (31,354,854 | ) | (12,990,457 | ) | (28,730,256 | ) | ||||||||
| Advisor Shares | — | — | (654,097 | ) | (699,362 | ) | ||||||||||
| Redemption fees: | ||||||||||||||||
| Institutional Shares | 47 | — | 1,001 | 1 | ||||||||||||
| Investor Shares | — | — | — | — | ||||||||||||
| Advisor Shares | — | — | — | — | ||||||||||||
| Increase (Decrease) from Capital Share Transactions | (23,287,139 | ) | 140,140,338 | (91,538,315 | ) | 851,542,480 | ||||||||||
| Increase (Decrease) in Net Assets | (36,258,359 | ) | 144,753,078 | 120,952,305 | 806,548,555 | |||||||||||
| NET ASSETS | ||||||||||||||||
| Beginning of period | 379,701,544 | 234,948,466 | 1,073,646,282 | 267,097,727 | ||||||||||||
| End of period | $ | 343,443,185 | $ | 379,701,544 | $ | 1,194,598,587 | $ | 1,073,646,282 | ||||||||
| Undistributed (Accumulated) net investment income (loss) | $ | 18,945 | $ | (2,848 | ) | $ | 11,692,431 | $ | 12,611,576 | |||||||
| SHARE TRANSACTIONS | ||||||||||||||||
| Sale of shares: | ||||||||||||||||
| Institutional Shares | 8,791,904 | 18,863,416 | 16,985,955 | 104,321,742 | ||||||||||||
| Investor Shares | 92,228 | 423,537 | 546,811 | 1,657,066 | ||||||||||||
| Advisor Shares | — | — | 881,239 | 40,534 | ||||||||||||
| Reinvestment of distributions: | ||||||||||||||||
| Institutional Shares | 327,155 | 196,274 | 1,032,346 | 225,951 | ||||||||||||
| Investor Shares | 2,133 | 16,201 | 10,071 | — | ||||||||||||
| Advisor Shares | — | — | 661 | — | ||||||||||||
| Redemption of shares: | ||||||||||||||||
| Institutional Shares | (11,431,849 | ) | (2,524,958 | ) | (27,468,737 | ) | (21,019,706 | ) | ||||||||
| Investor Shares | (195,291 | ) | (3,110,533 | ) | (1,261,668 | ) | (2,876,056 | ) | ||||||||
| Advisor Shares | — | — | (61,070 | ) | (70,670 | ) | ||||||||||
| Increase (Decrease) in shares outstanding | (2,413,720 | ) | 13,863,937 | (9,334,392 | ) | 82,278,861 | ||||||||||
The accompanying notes are an integral part of these financial statements.
110
Statements of Changes in Net Assets
| BROWN ADVISORY – | BROWN ADVISORY – | |||||||||||||||
| WMC JAPAN ALPHA | SOMERSET EMERGING | |||||||||||||||
| OPPORTUNITIES FUND | MARKETS FUND | |||||||||||||||
| Fiscal | Fiscal | Fiscal | Fiscal | |||||||||||||
| Year Ended | Year Ended | Year Ended | Year Ended | |||||||||||||
| June 30, | June 30, | June 30, | June 30, | |||||||||||||
| 2017 | 2016 | 2017 | 2016 | |||||||||||||
| OPERATIONS | ||||||||||||||||
| Net investment income (loss) | $ | 12,204,136 | $ | 11,295,045 | $ | 6,905,565 | $ | 6,259,315 | ||||||||
| Net realized gain (loss) | 202,544,697 | (510,551,726 | ) | (22,275,180 | ) | (22,999,699 | ) | |||||||||
| Net change in unrealized appreciation (depreciation) | 118,599,837 | (72,848,302 | ) | 107,847,138 | (17,139,970 | ) | ||||||||||
| Increase (Decrease) in Net Assets from Operations | 333,348,670 | (572,104,983 | ) | 92,477,523 | (33,880,354 | ) | ||||||||||
| DISTRIBUTIONS TO SHAREHOLDERS FROM | ||||||||||||||||
| Net investment income: | ||||||||||||||||
| Institutional Shares | — | (188,806,891 | ) | (4,318,101 | ) | (2,214,836 | ) | |||||||||
| Investor Shares | — | (2,854,668 | ) | (2,188,677 | ) | (1,712,443 | ) | |||||||||
| Advisor Shares | — | (139,380 | ) | (1,624 | ) | (742 | ) | |||||||||
| Net realized gain: | ||||||||||||||||
| Institutional Shares | — | (39,006,684 | ) | — | — | |||||||||||
| Investor Shares | — | (593,987 | ) | — | — | |||||||||||
| Advisor Shares | — | (29,833 | ) | — | — | |||||||||||
| Total Distributions to Shareholders | — | (231,431,443 | ) | (6,508,402 | ) | (3,928,021 | ) | |||||||||
| CAPITAL SHARE TRANSACTIONS | ||||||||||||||||
| Sale of shares: | ||||||||||||||||
| Institutional Shares | 1,045,283,865 | 1,472,565,101 | 95,997,254 | 224,157,581 | ||||||||||||
| Investor Shares | 2,155,914 | 18,627,215 | 20,716,006 | 186,372,395 | ||||||||||||
| Advisor Shares | 56,165 | 1,410,394 | 16,703 | 224,436 | ||||||||||||
| Reinvestment of distributions: | ||||||||||||||||
| Institutional Shares | — | 13,872,815 | 1,750,302 | 455,104 | ||||||||||||
| Investor Shares | — | 3,431,115 | 2,152,636 | 1,685,181 | ||||||||||||
| Advisor Shares | — | 165,236 | 1,624 | 726 | ||||||||||||
| Redemption of shares: | ||||||||||||||||
| Institutional Shares | (2,221,364,487 | ) | (448,721,260 | ) | (67,106,538 | ) | (153,243,842 | ) | ||||||||
| Investor Shares | (1,290,024 | ) | (34,159,583 | ) | (65,282,879 | ) | (129,370,609 | ) | ||||||||
| Advisor Shares | (467,014 | ) | (2,045,925 | ) | (83,388 | ) | (749,289 | ) | ||||||||
| Redemption fees: | ||||||||||||||||
| Institutional Shares | 10,627 | 1,200 | 94 | — | ||||||||||||
| Investor Shares | — | 970 | — | 325 | ||||||||||||
| Advisor Shares | — | 2 | — | — | ||||||||||||
| Increase (Decrease) from Capital Share Transactions | (1,175,614,954 | ) | 1,025,147,280 | (11,838,186 | ) | 129,532,008 | ||||||||||
| Increase (Decrease) in Net Assets | (842,266,284 | ) | 221,610,854 | 74,130,935 | 91,723,633 | |||||||||||
| NET ASSETS | ||||||||||||||||
| Beginning of period | 1,831,121,897 | 1,609,511,043 | 517,115,443 | 425,391,810 | ||||||||||||
| End of period | $ | 988,855,613 | $ | 1,831,121,897 | $ | 591,246,378 | $ | 517,115,443 | ||||||||
| Undistributed (Accumulated) net investment income (loss) | $ | (16,075,640 | ) | $ | (357,952,163 | ) | $ | 4,336,702 | $ | 4,342,604 | ||||||
| SHARE TRANSACTIONS | ||||||||||||||||
| Sale of shares: | ||||||||||||||||
| Institutional Shares | 106,706,685 | 126,755,340 | 10,479,269 | 27,019,470 | ||||||||||||
| Investor Shares | 212,688 | 1,596,337 | 2,316,631 | 21,728,904 | ||||||||||||
| Advisor Shares | 6,003 | 119,056 | 1,899 | 26,550 | ||||||||||||
| Reinvestment of distributions: | ||||||||||||||||
| Institutional Shares | — | 1,236,172 | 207,136 | 54,569 | ||||||||||||
| Investor Shares | — | 307,350 | 255,052 | 202,302 | ||||||||||||
| Advisor Shares | — | 14,836 | 191 | 87 | ||||||||||||
| Redemption of shares: | ||||||||||||||||
| Institutional Shares | (223,388,247 | ) | (44,100,589 | ) | (7,274,648 | ) | (17,973,135 | ) | ||||||||
| Investor Shares | (134,436 | ) | (3,721,563 | ) | (7,106,002 | ) | (15,355,320 | ) | ||||||||
| Advisor Shares | (48,232 | ) | (186,243 | ) | (9,519 | ) | (91,522 | ) | ||||||||
| Increase (Decrease) in shares outstanding | (116,645,539 | ) | 82,020,696 | (1,129,991 | ) | 15,611,905 | ||||||||||
The accompanying notes are an integral part of these financial statements.
111
Statements of Changes in Net Assets
| BROWN ADVISORY – | ||||||||
| MACQUARIE ASIA | ||||||||
| NEW STARS FUND | ||||||||
| Fiscal | Fiscal | |||||||
| Year Ended | Year Ended | |||||||
| June 30, | June 30, | |||||||
| 2017 | 2016 | |||||||
| OPERATIONS | ||||||||
| Net investment income (loss) | $ | 527,679 | $ | (85,965 | ) | |||
| Net realized gain (loss) | 14,763,577 | (38,258,677 | ) | |||||
| Net change in unrealized appreciation (depreciation) | (720,513 | ) | (1,666,992 | ) | ||||
| Increase (Decrease) in Net Assets from Operations | 14,570,743 | (40,011,634 | ) | |||||
| DISTRIBUTIONS TO SHAREHOLDERS FROM | ||||||||
| Net realized gain: | ||||||||
| Institutional Shares | — | (8,236,160 | ) | |||||
| Investor Shares | — | (267,081 | ) | |||||
| Total Distributions to Shareholders | — | (8,503,241 | ) | |||||
| CAPITAL SHARE TRANSACTIONS | ||||||||
| Sale of shares: | ||||||||
| Institutional Shares | 94,155,195 | 125,620,842 | ||||||
| Investor Shares | 2,866,009 | 7,501,704 | ||||||
| Reinvestment of distributions: | ||||||||
| Institutional Shares | — | 4,501,118 | ||||||
| Investor Shares | — | 244,075 | ||||||
| Redemption of shares: | ||||||||
| Institutional Shares | (80,949,002 | ) | (60,180,293 | ) | ||||
| Investor Shares | (4,974,688 | ) | (18,088,567 | ) | ||||
| Redemption fees: | ||||||||
| Institutional Shares | 1,853 | — | ||||||
| Investor Shares | 50 | 1 | ||||||
| Increase (Decrease) from Capital Share Transactions | 11,099,417 | 59,598,880 | ||||||
| Increase (Decrease) in Net Assets | 25,670,160 | 11,084,005 | ||||||
| NET ASSETS | ||||||||
| Beginning of period | 217,976,925 | 206,892,920 | ||||||
| End of period | $ | 243,647,085 | $ | 217,976,925 | ||||
| Undistributed (Accumulated) net investment income (loss) | $ | 393,440 | $ | (501,587 | ) | |||
| SHARE TRANSACTIONS | ||||||||
| Sale of shares: | ||||||||
| Institutional Shares | 10,353,255 | 12,939,592 | ||||||
| Investor Shares | 310,586 | 729,171 | ||||||
| Reinvestment of distributions: | ||||||||
| Institutional Shares | — | 463,679 | ||||||
| Investor Shares | — | 25,187 | ||||||
| Redemption of shares: | ||||||||
| Institutional Shares | (9,199,650 | ) | (6,319,193 | ) | ||||
| Investor Shares | (535,893 | ) | (1,763,461 | ) | ||||
| Increase (Decrease) in shares outstanding | 928,298 | 6,074,975 | ||||||
The accompanying notes are an integral part of these financial statements.
112
Financial Highlights
| From Investment | Distributions to | Ratios to Average | ||||||||||||||||||||||||||||||||||||||
| Operations(a) | Shareholders From | Net Assets(b) | ||||||||||||||||||||||||||||||||||||||
| Net | ||||||||||||||||||||||||||||||||||||||||
| For a Share | Realized | Net | Net | |||||||||||||||||||||||||||||||||||||
| Outstanding | Net Asset | Net | & | Asset | Assets at | Net | ||||||||||||||||||||||||||||||||||
| Throughout Each | Value, | Investment | Unrealized | Net | Net | Value, | Total | End of | Investment | Gross | Portfolio | |||||||||||||||||||||||||||||
| Fiscal Period: | Beginning | Income | Gains | Investment | Realized | End of | Return | Period | Income | Net | Expenses | Turnover | ||||||||||||||||||||||||||||
| Beginning | Ending | of Period | (Loss) | (Losses) | Total | Income | Gains | Total | Period | (c) | (000’s | ) | (Loss) | Expenses | (d) | Rate(c) | ||||||||||||||||||||||||
| BROWN ADVISORY GROWTH EQUITY FUND: | ||||||||||||||||||||||||||||||||||||||||
| Institutional Shares* | ||||||||||||||||||||||||||||||||||||||||
| 07/01/16 | 06/30/17 | $19.16 | (0.03 | ) | 2.47 | 2.44 | — | (1.57 | ) | (1.57 | ) | $20.03 | 13.91 | % | $276,592 | (0.16 | )% | 0.72 | % | 0.72 | % | 40 | % | |||||||||||||||||
| 07/01/15 | 06/30/16 | 20.33 | (0.02 | ) | 0.13 | 0.11 | — | (1.28 | ) | (1.28 | ) | 19.16 | 0.49 | 253,640 | (0.12 | ) | 0.72 | 0.72 | 24 | |||||||||||||||||||||
| 07/01/14 | 06/30/15 | 19.10 | 0.02 | 1.82 | 1.84 | — | (0.61 | ) | (0.61 | ) | 20.33 | 9.73 | 259,098 | 0.09 | 0.72 | 0.72 | 24 | |||||||||||||||||||||||
| 07/01/13 | 06/30/14 | 16.22 | — | 2.99 | 2.99 | — | (0.11 | ) | (0.11 | ) | 19.10 | 18.46 | 233,627 | 0.03 | 0.74 | 0.74 | 25 | |||||||||||||||||||||||
| 10/19/12^ | 06/30/13 | 14.58 | 0.01 | 1.66 | 1.67 | (0.03 | ) | — | (0.03 | ) | 16.22 | 11.49 | 116,575 | 0.30 | 0.78 | 0.78 | 40 | |||||||||||||||||||||||
| Investor Shares* | ||||||||||||||||||||||||||||||||||||||||
| 07/01/16 | 06/30/17 | 19.06 | (0.06 | ) | 2.46 | 2.40 | — | (1.57 | ) | (1.57 | ) | 19.89 | 13.77 | 1,484,383 | (0.31 | ) | 0.87 | 0.87 | 40 | |||||||||||||||||||||
| 07/01/15 | 06/30/16 | 20.26 | (0.05 | ) | 0.13 | 0.08 | — | (1.28 | ) | (1.28 | ) | 19.06 | 0.34 | 1,916,472 | (0.27 | ) | 0.87 | 0.87 | 24 | |||||||||||||||||||||
| 07/01/14 | 06/30/15 | 19.07 | (0.01 | ) | 1.81 | 1.80 | — | (0.61 | ) | (0.61 | ) | 20.26 | 9.54 | 2,143,325 | (0.06 | ) | 0.87 | 0.87 | 24 | |||||||||||||||||||||
| 07/01/13 | 06/30/14 | 16.21 | (0.02 | ) | 2.99 | 2.97 | — | (0.11 | ) | (0.11 | ) | 19.07 | 18.35 | 2,497,036 | (0.12 | ) | 0.89 | 0.89 | 25 | |||||||||||||||||||||
| 07/01/12 | 06/30/13 | 13.80 | 0.03 | 2.41 | 2.44 | (0.03 | ) | — | (0.03 | ) | 16.21 | 17.67 | 1,653,389 | 0.17 | 0.91 | 0.91 | 40 | |||||||||||||||||||||||
| Advisor Shares* | ||||||||||||||||||||||||||||||||||||||||
| 07/01/16 | 06/30/17 | 18.35 | (0.10 | ) | 2.36 | 2.26 | — | (1.57 | ) | (1.57 | ) | 19.04 | 13.53 | 5,479 | (0.56 | ) | 1.12 | 1.12 | 40 | |||||||||||||||||||||
| 07/01/15 | 06/30/16 | 19.60 | (0.10 | ) | 0.13 | 0.03 | — | (1.28 | ) | (1.28 | ) | 18.35 | 0.09 | 33,304 | (0.52 | ) | 1.12 | 1.12 | 24 | |||||||||||||||||||||
| 07/01/14 | 06/30/15 | 18.51 | (0.06 | ) | 1.76 | 1.70 | — | (0.61 | ) | (0.61 | ) | 19.60 | 9.28 | 44,587 | (0.31 | ) | 1.12 | 1.12 | 24 | |||||||||||||||||||||
| 07/01/13 | 06/30/14 | 15.78 | (0.07 | ) | 2.91 | 2.84 | — | (0.11 | ) | (0.11 | ) | 18.51 | 18.02 | 48,632 | (0.37 | ) | 1.14 | 1.14 | 25 | |||||||||||||||||||||
| 07/01/12 | 06/30/13 | 13.45 | (0.01 | ) | 2.35 | 2.34 | (0.01 | ) | — | (0.01 | ) | 15.78 | 17.43 | 21,478 | (0.07 | ) | 1.15 | 1.15 | 40 | |||||||||||||||||||||
| BROWN ADVISORY FLEXIBLE EQUITY FUND: | ||||||||||||||||||||||||||||||||||||||||
| Institutional Shares* | ||||||||||||||||||||||||||||||||||||||||
| 07/01/16 | 06/30/17 | 15.15 | 0.11 | 3.37 | 3.48 | (0.10 | ) | — | (0.10 | ) | 18.53 | 23.05 | 101,431 | 0.61 | 0.73 | 0.73 | 15 | |||||||||||||||||||||||
| 07/01/15 | 06/30/16 | 15.92 | 0.11 | (0.77 | ) | (0.66 | ) | (0.11 | ) | — | (0.11 | ) | 15.15 | (4.16 | ) | 24,012 | 0.71 | 0.73 | 0.73 | 15 | ||||||||||||||||||||
| 07/01/14 | 06/30/15 | 14.81 | 0.12 | 1.08 | 1.20 | (0.09 | ) | — | (0.09 | ) | 15.92 | 8.09 | 4,240 | 0.76 | 0.76 | 0.76 | 7 | |||||||||||||||||||||||
| 07/01/13 | 06/30/14 | 12.28 | 0.09 | 2.49 | 2.58 | (0.05 | ) | — | (0.05 | ) | 14.81 | 21.06 | 3,126 | 0.66 | 0.82 | 0.81 | 15 | |||||||||||||||||||||||
| 10/19/12^ | 06/30/13 | 10.46 | 0.06 | 1.82 | 1.88 | (0.06 | ) | — | (0.06 | ) | 12.28 | 18.07 | 12 | 0.65 | 1.00 | 0.88 | 12 | |||||||||||||||||||||||
| Investor Shares* | ||||||||||||||||||||||||||||||||||||||||
| 07/01/16 | 06/30/17 | 15.12 | 0.08 | 3.37 | 3.45 | (0.07 | ) | — | (0.07 | ) | 18.50 | 22.90 | 310,360 | 0.46 | 0.88 | 0.88 | 15 | |||||||||||||||||||||||
| 07/01/15 | 06/30/16 | 15.89 | 0.08 | (0.76 | ) | (0.68 | ) | (0.09 | ) | — | (0.09 | ) | 15.12 | (4.30 | ) | 306,456 | 0.56 | 0.88 | 0.88 | 15 | ||||||||||||||||||||
| 07/01/14 | 06/30/15 | 14.79 | 0.10 | 1.07 | 1.17 | (0.07 | ) | — | (0.07 | ) | 15.89 | 7.92 | 268,569 | 0.61 | 0.91 | 0.91 | 7 | |||||||||||||||||||||||
| 07/01/13 | 06/30/14 | 12.28 | 0.07 | 2.48 | 2.55 | (0.04 | ) | — | (0.04 | ) | 14.79 | 20.78 | 162,615 | 0.51 | 0.97 | 0.96 | 15 | |||||||||||||||||||||||
| 07/01/12 | 06/30/13 | 9.68 | 0.05 | 2.60 | 2.65 | (0.05 | ) | — | (0.05 | ) | 12.28 | 27.51 | 82,783 | 0.50 | 1.15 | 1.05 | 12 | |||||||||||||||||||||||
| Advisor Shares* | ||||||||||||||||||||||||||||||||||||||||
| 07/01/16 | 06/30/17 | 15.12 | 0.04 | 3.37 | 3.41 | (0.03 | ) | — | (0.03 | ) | 18.50 | 22.56 | 5,842 | 0.21 | 1.13 | 1.13 | 15 | |||||||||||||||||||||||
| 07/01/15 | 06/30/16 | 15.88 | 0.05 | (0.77 | ) | (0.72 | ) | (0.04 | ) | — | (0.04 | ) | 15.12 | (4.56 | ) | 7,168 | 0.31 | 1.13 | 1.13 | 15 | ||||||||||||||||||||
| 07/01/14 | 06/30/15 | 14.77 | 0.06 | 1.07 | 1.13 | (0.02 | ) | — | (0.02 | ) | 15.88 | 7.68 | 11,540 | 0.36 | 1.16 | 1.16 | 7 | |||||||||||||||||||||||
| 07/01/13 | 06/30/14 | 12.28 | 0.04 | 2.48 | 2.52 | (0.03 | ) | — | (0.03 | ) | 14.77 | 20.52 | 14,831 | 0.26 | 1.22 | 1.21 | 15 | |||||||||||||||||||||||
| 07/01/12 | 06/30/13 | 9.68 | 0.02 | 2.61 | 2.63 | (0.03 | ) | — | (0.03 | ) | 12.28 | 27.25 | 6,115 | 0.30 | 1.35 | 1.30 | 12 | |||||||||||||||||||||||
The accompanying notes are an integral part of these financial statements.
113
Financial Highlights
| From Investment | Distributions to | Ratios to Average | ||||||||||||||||||||||||||||||||||||||||||
| Operations(a) | Shareholders From | Net Assets(b) | ||||||||||||||||||||||||||||||||||||||||||
| Net | ||||||||||||||||||||||||||||||||||||||||||||
| For a Share | Realized | Net | Net | |||||||||||||||||||||||||||||||||||||||||
| Outstanding | Net Asset | Net | & | Asset | Assets at | Net | ||||||||||||||||||||||||||||||||||||||
| Throughout Each | Value, | Investment | Unrealized | Net | Net | Value, | Total | End of | Investment | Gross | Portfolio | |||||||||||||||||||||||||||||||||
| Fiscal Period: | Beginning | Income | Gains | Investment | Realized | End of | Return | Period | Income | Net | Expenses | Turnover | ||||||||||||||||||||||||||||||||
| Beginning | Ending | of Period | (Loss) | (Losses) | Total | Income | Gains | Total | Period | (c) | (000’s | ) | (Loss) | Expenses | (d) | Rate(c) | ||||||||||||||||||||||||||||
| BROWN ADVISORY EQUITY INCOME FUND: | ||||||||||||||||||||||||||||||||||||||||||||
| Institutional Shares* | ||||||||||||||||||||||||||||||||||||||||||||
| 07/01/16 | 06/30/17 | $12.87 | 0.26 | 1.41 | 1.67 | (0.26 | ) | (0.48 | ) | (0.74 | ) | $13.80 | 13.36 | % | $ | $29,587 | 1.94 | % | 0.77 | % | 0.77 | % | 7 | % | ||||||||||||||||||||
| 07/01/15 | 06/30/16 | 13.14 | 0.28 | (0.13 | ) | 0.15 | (0.29 | ) | (0.13 | ) | (0.42 | ) | 12.87 | 1.31 | 13,840 | 2.24 | 0.75 | 0.75 | 17 | |||||||||||||||||||||||||
| 07/01/14 | 06/30/15 | 13.70 | 0.29 | 0.08 | 0.37 | (0.30 | ) | (0.63 | ) | (0.93 | ) | 13.14 | 2.60 | 18,134 | 2.16 | 0.75 | 0.75 | 18 | ||||||||||||||||||||||||||
| 07/01/13 | 06/30/14 | 12.16 | 0.29 | 1.99 | 2.28 | (0.29 | ) | (0.45 | ) | (0.74 | ) | 13.70 | 19.30 | 17,663 | 2.23 | 0.77 | 0.77 | 32 | ||||||||||||||||||||||||||
| 10/19/12^ | 06/30/13 | 11.07 | 0.21 | 1.19 | 1.40 | (0.23 | ) | (0.08 | ) | (0.31 | ) | 12.16 | 12.88 | 11 | 2.53 | 0.80 | 0.80 | 21 | ||||||||||||||||||||||||||
| Investor Shares* | ||||||||||||||||||||||||||||||||||||||||||||
| 07/01/16 | 06/30/17 | 12.86 | 0.24 | 1.42 | 1.66 | (0.24 | ) | (0.48 | ) | (0.72 | ) | 13.80 | 13.28 | 81,890 | 1.79 | 0.92 | 0.92 | 7 | ||||||||||||||||||||||||||
| 07/01/15 | 06/30/16 | 13.13 | 0.26 | (0.13 | ) | 0.13 | (0.27 | ) | (0.13 | ) | (0.40 | ) | 12.86 | 1.15 | 112,116 | 2.09 | 0.90 | 0.90 | 17 | |||||||||||||||||||||||||
| 07/01/14 | 06/30/15 | 13.69 | 0.27 | 0.08 | 0.35 | (0.28 | ) | (0.63 | ) | (0.91 | ) | 13.13 | 2.45 | 183,001 | 2.01 | 0.90 | 0.90 | 18 | ||||||||||||||||||||||||||
| 07/01/13 | 06/30/14 | 12.16 | 0.27 | 1.98 | 2.25 | (0.27 | ) | (0.45 | ) | (0.72 | ) | 13.69 | 19.04 | 180,372 | 2.08 | 0.92 | 0.92 | 32 | ||||||||||||||||||||||||||
| 07/01/12 | 06/30/13 | 10.49 | 0.27 | 1.76 | 2.03 | (0.28 | ) | (0.08 | ) | (0.36 | ) | 12.16 | 19.62 | 173,599 | 2.37 | 0.96 | 0.96 | 21 | ||||||||||||||||||||||||||
| Advisor Shares* | ||||||||||||||||||||||||||||||||||||||||||||
| 07/01/16 | 06/30/17 | 12.84 | 0.20 | 1.43 | 1.63 | (0.21 | ) | (0.48 | ) | (0.69 | ) | 13.78 | 13.02 | 2,422 | 1.54 | 1.17 | 1.17 | 7 | ||||||||||||||||||||||||||
| 07/01/15 | 06/30/16 | 13.11 | 0.23 | (0.13 | ) | 0.10 | (0.24 | ) | (0.13 | ) | (0.37 | ) | 12.84 | 0.90 | 2,980 | 1.84 | 1.15 | 1.15 | 17 | |||||||||||||||||||||||||
| 07/01/14 | 06/30/15 | 13.67 | 0.24 | 0.07 | 0.31 | (0.24 | ) | (0.63 | ) | (0.87 | ) | 13.11 | 2.19 | 3,148 | 1.76 | 1.15 | 1.15 | 18 | ||||||||||||||||||||||||||
| 07/01/13 | 06/30/14 | 12.14 | 0.24 | 1.98 | 2.22 | (0.24 | ) | (0.45 | ) | (0.69 | ) | 13.67 | 18.79 | 3,298 | 1.83 | 1.17 | 1.17 | 32 | ||||||||||||||||||||||||||
| 07/01/12 | 06/30/13 | 10.48 | 0.25 | 1.75 | 2.00 | (0.26 | ) | (0.08 | ) | (0.34 | ) | 12.14 | 19.33 | 2,346 | 2.13 | 1.20 | 1.20 | 21 | ||||||||||||||||||||||||||
| BROWN ADVISORY SUSTAINABLE GROWTH FUND: | ||||||||||||||||||||||||||||||||||||||||||||
| Institutional Shares* | ||||||||||||||||||||||||||||||||||||||||||||
| 07/01/16 | 06/30/17 | 16.05 | (0.02 | ) | 3.03 | 3.01 | — | (0.12 | ) | (0.12 | ) | 18.94 | 18.83 | 221,177 | (0.10 | ) | 0.73 | 0.73 | 41 | |||||||||||||||||||||||||
| 07/01/15 | 06/30/16 | 15.69 | (0.02 | ) | 1.13 | 1.11 | — | (0.75 | ) | (0.75 | ) | 16.05 | 7.17 | 122,008 | (0.11 | ) | 0.74 | 0.74 | 30 | |||||||||||||||||||||||||
| 07/01/14 | 06/30/15 | 14.11 | (0.02 | ) | 1.91 | 1.89 | — | (0.31 | ) | (0.31 | ) | 15.69 | 13.50 | 67,789 | (0.11 | ) | 0.75 | 0.75 | 37 | |||||||||||||||||||||||||
| 07/01/13 | 06/30/14 | 11.64 | — | 2.61 | 2.61 | — | (0.14 | ) | (0.14 | ) | 14.11 | 22.51 | 30,374 | (0.01 | ) | 0.77 | 0.77 | 30 | ||||||||||||||||||||||||||
| 07/01/12 | 06/30/13 | 10.00 | — | 1.65 | 1.65 | — | (0.01 | ) | (0.01 | ) | 11.64 | 16.47 | 32,045 | 0.03 | 0.86 | 0.86 | 30 | |||||||||||||||||||||||||||
| Investor Shares* | ||||||||||||||||||||||||||||||||||||||||||||
| 07/01/16 | 06/30/17 | 15.94 | (0.04 | ) | 3.00 | 2.96 | — | (0.12 | ) | (0.12 | ) | 18.78 | 18.65 | 36,954 | (0.25 | ) | 0.88 | 0.88 | 41 | |||||||||||||||||||||||||
| 07/01/15 | 06/30/16 | 15.61 | (0.04 | ) | 1.12 | 1.08 | — | (0.75 | ) | (0.75 | ) | 15.94 | 7.01 | 25,676 | (0.26 | ) | 0.89 | 0.89 | 30 | |||||||||||||||||||||||||
| 07/01/14 | 06/30/15 | 14.06 | (0.04 | ) | 1.90 | 1.86 | — | (0.31 | ) | (0.31 | ) | 15.61 | 13.34 | 11,206 | (0.26 | ) | 0.90 | 0.90 | 37 | |||||||||||||||||||||||||
| 07/01/13 | 06/30/14 | 11.62 | (0.02 | ) | 2.60 | 2.58 | — | (0.14 | ) | (0.14 | ) | 14.06 | 22.29 | 46,823 | (0.16 | ) | 0.92 | 0.92 | 30 | |||||||||||||||||||||||||
| 07/01/12 | 06/30/13 | 10.00 | (0.01 | ) | 1.64 | 1.63 | — | (0.01 | ) | (0.01 | ) | 11.62 | 16.27 | 24,028 | (0.12 | ) | 1.01 | 1.01 | 30 | |||||||||||||||||||||||||
| Advisor Shares* | ||||||||||||||||||||||||||||||||||||||||||||
| 07/01/16 | 06/30/17 | 15.78 | (0.08 | ) | 2.96 | 2.88 | — | (0.12 | ) | (0.12 | ) | 18.54 | 18.33 | 172,012 | (0.50 | ) | 1.13 | 1.13 | 41 | |||||||||||||||||||||||||
| 07/01/15 | 06/30/16 | 15.50 | (0.08 | ) | 1.11 | 1.03 | — | (0.75 | ) | (0.75 | ) | 15.78 | 6.73 | 201,727 | (0.51 | ) | 1.14 | 1.14 | 30 | |||||||||||||||||||||||||
| 07/01/14 | 06/30/15 | 14.00 | (0.07 | ) | 1.88 | 1.81 | — | (0.31 | ) | (0.31 | ) | 15.50 | 13.03 | 137,410 | (0.51 | ) | 1.15 | 1.15 | 37 | |||||||||||||||||||||||||
| 07/01/13 | 06/30/14 | 11.60 | (0.05 | ) | 2.59 | 2.54 | — | (0.14 | ) | (0.14 | ) | 14.00 | 21.99 | 132,846 | (0.41 | ) | 1.17 | 1.17 | 30 | |||||||||||||||||||||||||
| 07/01/12 | 06/30/13 | 10.00 | (0.04 | ) | 1.65 | 1.61 | — | (0.01 | ) | (0.01 | ) | 11.60 | 16.07 | 124,256 | (0.37 | ) | 1.26 | 1.26 | 30 | |||||||||||||||||||||||||
The accompanying notes are an integral part of these financial statements.
114
Financial Highlights
| From Investment | Distributions to | Ratios to Average | |||||||||||||||||||||||||||||||||||||||||
| Operations(a) | Shareholders From | Net Assets(b) | |||||||||||||||||||||||||||||||||||||||||
| Net | |||||||||||||||||||||||||||||||||||||||||||
| For a Share | Realized | Net | Net | ||||||||||||||||||||||||||||||||||||||||
| Outstanding | Net Asset | Net | & | Asset | Assets at | Net | |||||||||||||||||||||||||||||||||||||
| Throughout Each | Value, | Investment | Unrealized | Net | Net | Value, | Total | End of | Investment | Gross | Portfolio | ||||||||||||||||||||||||||||||||
| Fiscal Period: | Beginning | Income | Gains | Investment | Realized | End of | Return | Period | Income | Net | Expenses | Turnover | |||||||||||||||||||||||||||||||
| Beginning | Ending | of Period | (Loss) | (Losses) | Total | Income | Gains | Total | Period | (c) | (000’s | ) | (Loss) | Expenses | (d) | Rate(c) | |||||||||||||||||||||||||||
| BROWN ADVISORY SMALL-CAP GROWTH FUND: | |||||||||||||||||||||||||||||||||||||||||||
| Institutional Shares* | |||||||||||||||||||||||||||||||||||||||||||
| 07/01/16 | 06/30/17 | $31.19 | (0.16 | ) | 5.25 | 5.09 | — | (1.13 | ) | (1.13 | ) | $35.15 | 16.57 | % | $165,615 | (0.49 | )% | 0.98 | % | 0.98 | % | 22 | % | ||||||||||||||||||||
| 07/01/15 | 06/30/16 | 35.91 | (0.14 | ) | 0.51 | 0.37 | — | (5.09 | ) | (5.09 | ) | 31.19 | 1.61 | 17,037 | (0.45 | ) | 0.98 | 0.98 | 32 | ||||||||||||||||||||||||
| 07/01/14 | 06/30/15 | 35.85 | (0.18 | ) | 4.45 | 4.27 | — | (4.21 | ) | (4.21 | ) | 35.91 | 12.98 | 12,841 | (0.51 | ) | 0.99 | 0.99 | 28 | ||||||||||||||||||||||||
| 07/01/13 | 06/30/14 | 31.67 | (0.22 | ) | 6.08 | 5.86 | — | (1.68 | ) | (1.68 | ) | 35.85 | 18.59 | 8,497 | (0.63 | ) | 1.01 | 1.01 | 19 | ||||||||||||||||||||||||
| 07/01/12 | 06/30/13 | 28.36 | (0.07 | ) | 6.07 | 6.00 | — | (2.69 | ) | (2.69 | ) | 31.67 | 22.84 | 7,347 | (0.24 | ) | 1.05 | 1.05 | 48 | ||||||||||||||||||||||||
| Investor Shares* | |||||||||||||||||||||||||||||||||||||||||||
| 07/01/16 | 06/30/17 | 15.65 | (0.11 | ) | 2.63 | 2.52 | — | (0.56 | ) | (0.56 | ) | 17.61 | 16.40 | 335,185 | (0.64 | ) | 1.13 | 1.13 | 22 | ||||||||||||||||||||||||
| 07/01/15 | 06/30/16 | 18.05 | (0.10 | ) | 0.26 | 0.16 | — | (2.56 | ) | (2.56 | ) | 15.65 | 1.43 | 268,390 | (0.60 | ) | 1.13 | 1.13 | 32 | ||||||||||||||||||||||||
| 07/01/14 | 06/30/15 | 18.04 | (0.11 | ) | 2.24 | 2.13 | — | (2.12 | ) | (2.12 | ) | 18.05 | 12.86 | 262,426 | (0.66 | ) | 1.14 | 1.14 | 28 | ||||||||||||||||||||||||
| 07/01/13 | 06/30/14 | 15.96 | (0.14 | ) | 3.07 | 2.93 | — | (0.85 | ) | (0.85 | ) | 18.04 | 18.42 | 285,287 | (0.78 | ) | 1.16 | 1.16 | 19 | ||||||||||||||||||||||||
| 07/01/12 | 06/30/13 | 14.31 | (0.05 | ) | 3.06 | 3.01 | — | (1.36 | ) | (1.36 | ) | 15.96 | 22.68 | 281,027 | (0.36 | ) | 1.17 | 1.17 | 48 | ||||||||||||||||||||||||
| Advisor Shares* | |||||||||||||||||||||||||||||||||||||||||||
| 07/01/16 | 06/30/17 | 15.02 | (0.14 | ) | 2.51 | 2.37 | — | (0.54 | ) | (0.54 | ) | 16.85 | 16.04 | 32,852 | (0.89 | ) | 1.38 | 1.38 | 22 | ||||||||||||||||||||||||
| 07/01/15 | 06/30/16 | 17.35 | (0.13 | ) | 0.26 | 0.13 | — | (2.46 | ) | (2.46 | ) | 15.02 | 1.27 | 9,704 | (0.85 | ) | 1.38 | 1.38 | 32 | ||||||||||||||||||||||||
| 07/01/14 | 06/30/15 | 17.39 | (0.15 | ) | 2.15 | 2.00 | — | (2.04 | ) | (2.04 | ) | 17.35 | 12.54 | 6,348 | (0.91 | ) | 1.39 | 1.39 | 28 | ||||||||||||||||||||||||
| 07/01/13 | 06/30/14 | 15.43 | (0.18 | ) | 2.96 | 2.78 | — | (0.82 | ) | (0.82 | ) | 17.39 | 18.07 | 7,300 | (1.03 | ) | 1.41 | 1.41 | 19 | ||||||||||||||||||||||||
| 07/01/12 | 06/30/13 | 13.86 | (0.09 | ) | 2.97 | 2.88 | — | (1.31 | ) | (1.31 | ) | 15.43 | 22.45 | 5,493 | (0.60 | ) | 1.41 | 1.41 | 48 | ||||||||||||||||||||||||
| BROWN ADVISORY SMALL-CAP FUNDAMENTAL VALUE FUND: | |||||||||||||||||||||||||||||||||||||||||||
| Institutional Shares* | |||||||||||||||||||||||||||||||||||||||||||
| 07/01/16 | 06/30/17 | 22.75 | 0.17 | 4.31 | 4.48 | (0.09 | ) | (0.03 | ) | (0.12 | ) | 27.11 | 19.73 | 341,038 | 0.68 | 0.97 | 0.97 | 30 | |||||||||||||||||||||||||
| 07/01/15 | 06/30/16 | 23.61 | 0.13 | (0.44 | ) | (0.31 | ) | (0.10 | ) | (0.45 | ) | (0.55 | ) | 22.75 | (1.17 | ) | 156,205 | 0.59 | 0.98 | 0.98 | 30 | ||||||||||||||||||||||
| 07/01/14 | 06/30/15 | 23.96 | 0.10 | 0.86 | 0.96 | (0.14 | ) | (1.17 | ) | (1.31 | ) | 23.61 | 4.04 | 75,994 | 0.43 | 0.98 | 0.98 | 26 | |||||||||||||||||||||||||
| 07/01/13 | 06/30/14 | 20.06 | 0.12 | 4.91 | 5.03 | (0.19 | ) | (0.94 | ) | (1.13 | ) | 23.96 | 25.37 | 19,515 | 0.51 | 1.00 | 1.00 | 30 | |||||||||||||||||||||||||
| 10/19/12^ | 06/30/13 | 16.77 | 0.06 | 3.30 | 3.36 | (0.07 | ) | — | (0.07 | ) | 20.06 | 20.13 | 1,061 | 1.14 | 1.05 | 1.05 | 34 | ||||||||||||||||||||||||||
| Investor Shares* | |||||||||||||||||||||||||||||||||||||||||||
| 07/01/16 | 06/30/17 | 22.73 | 0.13 | 4.31 | 4.44 | (0.06 | ) | (0.03 | ) | (0.09 | ) | 27.08 | 19.54 | 834,317 | 0.53 | 1.12 | 1.12 | 30 | |||||||||||||||||||||||||
| 07/01/15 | 06/30/16 | 23.59 | 0.10 | (0.44 | ) | (0.34 | ) | (0.07 | ) | (0.45 | ) | (0.52 | ) | 22.73 | (1.32 | ) | 774,547 | 0.44 | 1.13 | 1.13 | 30 | ||||||||||||||||||||||
| 07/01/14 | 06/30/15 | 23.94 | 0.07 | 0.86 | 0.93 | (0.11 | ) | (1.17 | ) | (1.28 | ) | 23.59 | 3.90 | 748,003 | 0.28 | 1.13 | 1.13 | 26 | |||||||||||||||||||||||||
| 07/01/13 | 06/30/14 | 20.06 | 0.08 | 4.90 | 4.98 | (0.16 | ) | (0.94 | ) | (1.10 | ) | 23.94 | 25.13 | 567,799 | 0.36 | 1.15 | 1.15 | 30 | |||||||||||||||||||||||||
| 07/01/12 | 06/30/13 | 15.65 | 0.18 | 4.29 | 4.47 | (0.06 | ) | — | (0.06 | ) | 20.06 | 28.64 | 371,018 | 1.01 | 1.18 | 1.18 | 34 | ||||||||||||||||||||||||||
| Advisor Shares* | |||||||||||||||||||||||||||||||||||||||||||
| 07/01/16 | 06/30/17 | 22.62 | 0.07 | 4.29 | 4.36 | — | (0.03 | ) | (0.03 | ) | 26.95 | 19.29 | 24,974 | 0.28 | 1.37 | 1.37 | 30 | ||||||||||||||||||||||||||
| 07/01/15 | 06/30/16 | 23.48 | 0.04 | (0.44 | ) | (0.40 | ) | (0.01 | ) | (0.45 | ) | (0.46 | ) | 22.62 | (1.58 | ) | 52,883 | 0.19 | 1.38 | 1.38 | 30 | ||||||||||||||||||||||
| 07/01/14 | 06/30/15 | 23.87 | 0.01 | 0.85 | 0.86 | (0.08 | ) | (1.17 | ) | (1.25 | ) | 23.48 | 3.61 | 58,583 | 0.03 | 1.38 | 1.38 | 26 | |||||||||||||||||||||||||
| 07/01/13 | 06/30/14 | 20.01 | 0.02 | 4.89 | 4.91 | (0.11 | ) | (0.94 | ) | (1.05 | ) | 23.87 | 24.83 | 21,416 | 0.11 | 1.40 | 1.40 | 30 | |||||||||||||||||||||||||
| 07/01/12 | 06/30/13 | 15.63 | 0.03 | 4.38 | 4.41 | (0.03 | ) | — | (0.03 | ) | 20.01 | 28.28 | 15,764 | 0.75 | 1.44 | 1.44 | 34 | ||||||||||||||||||||||||||
The accompanying notes are an integral part of these financial statements.
115
Financial Highlights
| From Investment | Distributions to | Ratios to Average | |||||||||||||||||||||||||||||||||||||||||||||
| Operations(a) | Shareholders From | Net Assets(b) | |||||||||||||||||||||||||||||||||||||||||||||
| Net | |||||||||||||||||||||||||||||||||||||||||||||||
| For a Share | Realized | Net | Net | ||||||||||||||||||||||||||||||||||||||||||||
| Outstanding | Net Asset | Net | & | Asset | Assets at | Net | |||||||||||||||||||||||||||||||||||||||||
| Throughout | Value, | Investment | Unrealized | Net | Net | Value, | End of | Investment | Gross | Portfolio | |||||||||||||||||||||||||||||||||||||
| Fiscal Period: | Beginning | Income | Gains | Investment | Realized | End of | Total | Period | Income | Net | Expenses | Turnover | |||||||||||||||||||||||||||||||||||
| Beginning | Ending | of Period | (Loss) | (Losses) | Total | Income | Gains | Total | Period | Return(c) | (000’s | ) | (Loss) | Expenses | (d) | Rate(c) | |||||||||||||||||||||||||||||||
| BROWN ADVISORY GLOBAL LEADERS FUND: | |||||||||||||||||||||||||||||||||||||||||||||||
| Investor Shares* | |||||||||||||||||||||||||||||||||||||||||||||||
| 07/01/16 | 06/30/17 | $ | $ 9.65 | 0.04 | 1.83 | 1.87 | (0.02 | ) | — | (0.02 | ) | $11.50 | 19.39 | % | $ | $39,354 | 0.39 | % | 0.85 | % | 1.16 | % | 35 | % | |||||||||||||||||||||||
| 07/01/15^ | 06/30/16 | 10.00 | 0.05 | (0.40 | ) | (0.35 | ) | — | — | — | 9.65 | (3.50 | ) | 26,367 | 0.55 | 0.85 | 1.41 | 53 | |||||||||||||||||||||||||||||
| BROWN ADVISORY INTERMEDIATE INCOME FUND: | |||||||||||||||||||||||||||||||||||||||||||||||
| Investor Shares* | |||||||||||||||||||||||||||||||||||||||||||||||
| 07/01/16 | 06/30/17 | 10.78 | 0.20 | (0.16 | ) | 0.04 | (0.22 | ) | — | (0.22 | ) | 10.60 | 0.40 | 131,941 | 1.88 | 0.45 | 0.51 | 62 | |||||||||||||||||||||||||||||
| 07/01/15 | 06/30/16 | 10.63 | 0.20 | 0.22 | 0.42 | (0.21 | ) | (0.06 | ) | (0.27 | ) | 10.78 | 3.99 | 137,900 | 1.92 | 0.43 | 0.50 | 68 | |||||||||||||||||||||||||||||
| 07/01/14 | 06/30/15 | 10.74 | 0.19 | (0.08 | ) | 0.11 | (0.22 | ) | — | (0.22 | ) | 10.63 | 1.01 | 140,006 | 1.78 | 0.45 | 0.50 | 130 | |||||||||||||||||||||||||||||
| 07/01/13 | 06/30/14 | 10.85 | 0.17 | 0.12 | 0.29 | (0.18 | ) | (0.22 | ) | (0.40 | ) | 10.74 | 2.66 | 207,371 | 1.54 | 0.52 | 0.52 | 162 | |||||||||||||||||||||||||||||
| 07/01/12 | 06/30/13 | 11.37 | 0.19 | (0.26 | ) | (0.07 | ) | (0.25 | ) | (0.20 | ) | (0.45 | ) | 10.85 | (0.72 | ) | 241,543 | 1.66 | 0.52 | 0.52 | 111 | ||||||||||||||||||||||||||
| Advisor Shares* | |||||||||||||||||||||||||||||||||||||||||||||||
| 07/01/16 | 06/30/17 | 10.56 | 0.17 | (0.15 | ) | 0.02 | (0.20 | ) | — | (0.20 | ) | 10.38 | 0.16 | 4,098 | 1.63 | 0.70 | 0.76 | 62 | |||||||||||||||||||||||||||||
| 07/01/15 | 06/30/16 | 10.42 | 0.17 | 0.21 | 0.38 | (0.18 | ) | (0.06 | ) | (0.24 | ) | 10.56 | 3.71 | 8,972 | 1.67 | 0.68 | 0.75 | 68 | |||||||||||||||||||||||||||||
| 07/01/14 | 06/30/15 | 10.53 | 0.16 | (0.08 | ) | 0.08 | (0.19 | ) | — | (0.19 | ) | 10.42 | 0.78 | 9,608 | 1.53 | 0.70 | 0.75 | 130 | |||||||||||||||||||||||||||||
| 07/01/13 | 06/30/14 | 10.65 | 0.14 | 0.11 | 0.25 | (0.15 | ) | (0.22 | ) | (0.37 | ) | 10.53 | 2.36 | 12,613 | 1.29 | 0.77 | 0.77 | 162 | |||||||||||||||||||||||||||||
| 07/01/12 | 06/30/13 | 11.16 | 0.16 | (0.25 | ) | (0.09 | ) | (0.22 | ) | (0.20 | ) | (0.42 | ) | 10.65 | (0.87 | ) | 16,149 | 1.43 | 0.75 | 0.75 | 111 | ||||||||||||||||||||||||||
| BROWN ADVISORY TOTAL RETURN FUND: | |||||||||||||||||||||||||||||||||||||||||||||||
| Institutional Shares* | |||||||||||||||||||||||||||||||||||||||||||||||
| 07/01/16 | 06/30/17 | 10.18 | 0.24 | (0.16 | ) | 0.08 | (0.25 | ) | (0.01 | ) | (0.26 | ) | 10.00 | 0.80 | 107,686 | 2.36 | 0.51 | 0.51 | 216 | ||||||||||||||||||||||||||||
| 07/01/15 | 06/30/16 | 9.83 | 0.25 | 0.37 | 0.62 | (0.27 | ) | — | (0.27 | ) | 10.18 | 6.46 | 83,854 | 2.55 | 0.51 | 0.51 | 218 | ||||||||||||||||||||||||||||||
| 10/30/14^ | 06/30/15 | 10.00 | 0.13 | (0.19 | ) | (0.06 | ) | (0.11 | ) | — | (0.11 | ) | 9.83 | (0.60 | ) | 73,735 | 1.89 | 0.54 | 0.54 | 235 | |||||||||||||||||||||||||||
| Investor Shares* | |||||||||||||||||||||||||||||||||||||||||||||||
| 07/01/16 | 06/30/17 | 10.18 | 0.23 | (0.16 | ) | 0.07 | (0.24 | ) | (0.01 | ) | (0.25 | ) | 10.00 | 0.75 | 2,668 | 2.31 | 0.56 | 0.56 | 216 | ||||||||||||||||||||||||||||
| 07/01/15 | 06/30/16 | 9.83 | 0.25 | 0.37 | 0.62 | (0.27 | ) | — | (0.27 | ) | 10.18 | 6.40 | 1,957 | 2.50 | 0.56 | 0.56 | 218 | ||||||||||||||||||||||||||||||
| 10/30/14^ | 06/30/15 | 10.00 | 0.12 | (0.18 | ) | (0.06 | ) | (0.11 | ) | — | (0.11 | ) | 9.83 | (0.63 | ) | 9,081 | 1.84 | 0.59 | 0.59 | 235 | |||||||||||||||||||||||||||
| BROWN ADVISORY STRATEGIC BOND FUND: | |||||||||||||||||||||||||||||||||||||||||||||||
| Investor Shares* | |||||||||||||||||||||||||||||||||||||||||||||||
| 07/01/16 | 06/30/17 | 9.47 | 0.23 | 0.14 | 0.37 | (0.23 | ) | — | (0.23 | ) | 9.61 | 3.92 | 114,651 | 2.39 | 0.70 | 0.72 | 259 | ||||||||||||||||||||||||||||||
| 07/01/15 | 06/30/16 | 9.83 | 0.30 | (0.19 | ) | 0.11 | (0.47 | ) | — | (0.47 | ) | 9.47 | 1.18 | 39,211 | 3.21 | 0.70 | 0.73 | 288 | |||||||||||||||||||||||||||||
| 10/31/14^ | 06/30/15 | 10.07 | 0.16 | (0.35 | ) | (0.19 | ) | (0.05 | ) | — | (0.05 | ) | 9.83 | (1.85 | ) | 59,680 | 2.42 | 0.70 | 0.72 | 317 | |||||||||||||||||||||||||||
| Advisor Shares* | |||||||||||||||||||||||||||||||||||||||||||||||
| 07/01/16 | 06/30/17 | 9.47 | 0.20 | 0.14 | 0.34 | (0.20 | ) | — | (0.20 | ) | 9.61 | 3.65 | 248 | 2.14 | 0.95 | 0.97 | 259 | ||||||||||||||||||||||||||||||
| 07/01/15 | 06/30/16 | 9.82 | 0.28 | (0.20 | ) | 0.08 | (0.43 | ) | — | (0.43 | ) | 9.47 | 0.84 | 865 | 2.96 | 0.95 | 0.98 | 288 | |||||||||||||||||||||||||||||
| 07/01/14 | 06/30/15 | 10.04 | 0.19 | (0.37 | ) | (0.18 | ) | (0.04 | ) | — | (0.04 | ) | 9.82 | (1.80 | ) | 1,692 | 1.91 | 1.21 | 1.22 | 317 | |||||||||||||||||||||||||||
| 07/01/13 | 06/30/14 | 9.68 | (0.01 | ) | 0.42 | 0.41 | (0.05 | ) | — | (0.05 | ) | 10.04 | 4.22 | 24,399 | (0.07 | ) | 1.33 | 1.33 | 1,010 | ||||||||||||||||||||||||||||
| 07/01/12 | 06/30/13 | 9.68 | (0.09 | ) | 0.29 | 0.20 | (0.20 | ) | — | (0.20 | ) | 9.68 | 2.09 | 25,570 | (0.87 | ) | 1.40 | 1.40 | 992 | ||||||||||||||||||||||||||||
The accompanying notes are an integral part of these financial statements.
116
Financial Highlights
| From Investment | Distributions to | Ratios to Average | |||||||||||||||||||||||||||||||||||||||||||||
| Operations(a) | Shareholders From | Net Assets(b) | |||||||||||||||||||||||||||||||||||||||||||||
| Net | |||||||||||||||||||||||||||||||||||||||||||||||
| For a Share | Realized | Net | Net | ||||||||||||||||||||||||||||||||||||||||||||
| Outstanding | Net Asset | Net | & | Asset | Assets at | Net | |||||||||||||||||||||||||||||||||||||||||
| Throughout Each | Value, | Investment | Unrealized | Net | Net | Value, | Total | End of | Investment | Gross | Portfolio | ||||||||||||||||||||||||||||||||||||
| Fiscal Period: | Beginning | Income | Gains | Investment | Realized | End of | Return | Period | Income | Net | Expenses | Turnover | |||||||||||||||||||||||||||||||||||
| Beginning | Ending | of Period | (Loss) | (Losses) | Total | Income | Gains | Total | Period | (c) | (000’s | ) | (Loss) | Expenses | (d) | Rate(c) | |||||||||||||||||||||||||||||||
| BROWN ADVISORY MARYLAND BOND FUND: | |||||||||||||||||||||||||||||||||||||||||||||||
| Investor Shares* | |||||||||||||||||||||||||||||||||||||||||||||||
| 07/01/16 | 06/30/17 | $10.92 | 0.23 | (0.26 | ) | (0.03 | ) | (0.23 | ) | (0.04 | ) | (0.27 | ) | $ | $10.62 | (0.27 | )% | $181,518 | 2.14 | % | 0.49 | % | 0.49 | % | 53 | % | |||||||||||||||||||||
| 07/01/15 | 06/30/16 | 10.65 | 0.23 | 0.32 | 0.55 | (0.23 | ) | (0.05 | ) | (0.28 | ) | 10.92 | 5.24 | 183,705 | 2.12 | 0.48 | 0.48 | 80 | |||||||||||||||||||||||||||||
| 07/01/14 | 06/30/15 | 10.82 | 0.18 | (0.12 | ) | 0.06 | (0.18 | ) | (0.05 | ) | (0.23 | ) | 10.65 | 0.58 | 199,469 | 1.66 | 0.49 | 0.49 | 61 | ||||||||||||||||||||||||||||
| 07/01/13 | 06/30/14 | 10.81 | 0.21 | 0.10 | 0.31 | (0.21 | ) | (0.09 | ) | (0.30 | ) | 10.82 | 2.94 | 205,717 | 1.99 | 0.52 | 0.52 | 56 | |||||||||||||||||||||||||||||
| 07/01/12 | 06/30/13 | 11.06 | 0.21 | (0.23 | ) | (0.02 | ) | (0.21 | ) | (0.02 | ) | (0.23 | ) | 10.81 | (0.25 | ) | 252,166 | 1.86 | 0.52 | 0.52 | 30 | ||||||||||||||||||||||||||
| BROWN ADVISORY TAX EXEMPT BOND FUND: | |||||||||||||||||||||||||||||||||||||||||||||||
| Investor Shares* | |||||||||||||||||||||||||||||||||||||||||||||||
| 07/01/16 | 06/30/17 | 10.26 | 0.29 | (0.32 | ) | (0.03 | ) | (0.29 | ) | — | (0.29 | ) | 9.94 | (0.29 | ) | 257,602 | 2.88 | 0.49 | 0.49 | 55 | |||||||||||||||||||||||||||
| 07/01/15 | 06/30/16 | 9.93 | 0.25 | 0.33 | 0.58 | (0.25 | ) | — | (0.25 | ) | 10.26 | 5.94 | 233,675 | 2.51 | 0.49 | 0.49 | 119 | ||||||||||||||||||||||||||||||
| 07/01/14 | 06/30/15 | 10.03 | 0.18 | (0.10 | ) | 0.08 | (0.18 | ) | — | (0.18 | ) | 9.93 | 0.78 | 224,154 | 1.78 | 0.50 | 0.50 | 109 | |||||||||||||||||||||||||||||
| 07/01/13 | 06/30/14 | 9.84 | 0.19 | 0.19 | 0.38 | (0.19 | ) | — | (e) | (0.19 | ) | 10.03 | 3.94 | 205,177 | 1.96 | 0.52 | 0.52 | 157 | |||||||||||||||||||||||||||||
| 07/01/12 | 06/30/13 | 10.00 | 0.13 | (0.12 | ) | 0.01 | (0.13 | ) | (0.04 | ) | (0.17 | ) | 9.84 | 0.03 | 161,891 | 1.35 | 0.55 | 0.55 | 87 | ||||||||||||||||||||||||||||
| BROWN ADVISORY MORTGAGE SECURITIES FUND: | |||||||||||||||||||||||||||||||||||||||||||||||
| Institutional Shares* | |||||||||||||||||||||||||||||||||||||||||||||||
| 07/01/16 | 06/30/17 | 10.20 | 0.15 | (0.21 | ) | (0.06 | ) | (0.20 | ) | (0.07 | ) | (0.27 | ) | 9.87 | (0.52 | ) | 342,705 | 1.53 | 0.46 | 0.46 | 414 | ||||||||||||||||||||||||||
| 07/01/15 | 06/30/16 | 10.06 | 0.22 | 0.21 | 0.43 | (0.25 | ) | (0.04 | ) | (0.29 | ) | 10.20 | 4.32 | 377,908 | 2.12 | 0.45 | 0.45 | 244 | |||||||||||||||||||||||||||||
| 07/01/14 | 06/30/15 | 10.16 | 0.27 | 0.01 | 0.28 | (0.30 | ) | (0.08 | ) | (0.38 | ) | 10.06 | 2.74 | 206,299 | 2.68 | 0.47 | 0.47 | 147 | |||||||||||||||||||||||||||||
| 05/13/14^ | 06/30/14 | 10.15 | 0.03 | 0.02 | 0.05 | (0.04 | ) | — | (0.04 | ) | 10.16 | 0.49 | 131,415 | 1.98 | 0.52 | 0.52 | 88 | ||||||||||||||||||||||||||||||
| Investor Shares* | |||||||||||||||||||||||||||||||||||||||||||||||
| 07/01/16 | 06/30/17 | 10.21 | 0.15 | (0.22 | ) | (0.07 | ) | (0.20 | ) | (0.07 | ) | (0.27 | ) | 9.87 | (0.68 | ) | 738 | 1.48 | 0.51 | 0.51 | 414 | ||||||||||||||||||||||||||
| 07/01/15 | 06/30/16 | 10.06 | 0.21 | 0.22 | 0.43 | (0.24 | ) | (0.04 | ) | (0.28 | ) | 10.21 | 4.33 | 1,793 | 2.07 | 0.50 | 0.50 | 244 | |||||||||||||||||||||||||||||
| 07/01/14 | 06/30/15 | 10.16 | 0.27 | — | 0.27 | (0.29 | ) | (0.08 | ) | (0.37 | ) | 10.06 | 2.68 | 28,649 | 2.63 | 0.52 | 0.52 | 147 | |||||||||||||||||||||||||||||
| 12/26/13^ | 06/30/14 | 10.00 | 0.10 | 0.16 | 0.26 | (0.10 | ) | — | (0.10 | ) | 10.16 | 2.62 | 67,776 | 1.93 | 0.57 | 0.57 | 88 | ||||||||||||||||||||||||||||||
| BROWN ADVISORY – WMC STRATEGIC EUROPEAN EQUITY FUND: | |||||||||||||||||||||||||||||||||||||||||||||||
| Institutional Shares* | |||||||||||||||||||||||||||||||||||||||||||||||
| 07/01/16 | 06/30/17 | 9.90 | 0.12 | 2.16 | 2.28 | (0.13 | ) | — | (0.13 | ) | 12.05 | 23.32 | 1,176,492 | 1.10 | 1.09 | 1.09 | 27 | ||||||||||||||||||||||||||||||
| 07/01/15 | 06/30/16 | 10.20 | 0.13 | (0.40 | ) | (0.27 | ) | (0.03 | ) | — | (0.03 | ) | 9.90 | (2.68 | ) | 1,059,870 | 1.30 | 1.11 | 1.11 | 31 | |||||||||||||||||||||||||||
| 07/01/14 | 06/30/15 | 10.46 | 0.14 | (0.29 | ) | (0.15 | ) | (0.11 | ) | — | (0.11 | ) | 10.20 | (1.42 | ) | 240,182 | 1.35 | 1.13 | 1.13 | 48 | |||||||||||||||||||||||||||
| 10/21/13^ | 06/30/14 | 10.00 | 0.14 | 0.32 | 0.46 | — | — | — | 10.46 | 4.60 | 202,616 | 2.01 | 1.23 | 1.23 | 25 | ||||||||||||||||||||||||||||||||
| Investor Shares* | |||||||||||||||||||||||||||||||||||||||||||||||
| 07/01/16 | 06/30/17 | 9.90 | 0.10 | 2.17 | 2.27 | (0.12 | ) | — | (0.12 | ) | 12.05 | 23.18 | 7,367 | 0.95 | 1.24 | 1.24 | 27 | ||||||||||||||||||||||||||||||
| 07/01/15 | 06/30/16 | 10.19 | 0.12 | (0.41 | ) | (0.29 | ) | — | — | — | 9.90 | (2.85 | ) | 13,031 | 1.15 | 1.26 | 1.26 | 31 | |||||||||||||||||||||||||||||
| 07/01/14 | 06/30/15 | 10.45 | 0.12 | (0.29 | ) | (0.17 | ) | (0.09 | ) | — | (0.09 | ) | 10.19 | (1.56 | ) | 25,840 | 1.20 | 1.28 | 1.28 | 48 | |||||||||||||||||||||||||||
| 10/21/13^ | 06/30/14 | 10.00 | 0.13 | 0.32 | 0.45 | — | — | — | 10.45 | 4.50 | 18,011 | 1.86 | 1.38 | 1.38 | 25 | ||||||||||||||||||||||||||||||||
| Advisor Shares* | |||||||||||||||||||||||||||||||||||||||||||||||
| 07/01/16 | 06/30/17 | 9.85 | 0.08 | 2.15 | 2.23 | (0.10 | ) | — | (0.10 | ) | 11.98 | 22.91 | 10,740 | 0.70 | 1.49 | 1.49 | 27 | ||||||||||||||||||||||||||||||
| 07/01/15 | 06/30/16 | 10.17 | 0.09 | (0.41 | ) | (0.32 | ) | — | — | — | 9.85 | (3.15 | ) | 745 | 0.90 | 1.51 | 1.51 | 31 | |||||||||||||||||||||||||||||
| 07/01/14 | 06/30/15 | 10.44 | 0.10 | (0.29 | ) | (0.19 | ) | (0.08 | ) | — | (0.08 | ) | 10.17 | (1.78 | ) | 1,076 | 0.95 | 1.53 | 1.53 | 48 | |||||||||||||||||||||||||||
| 10/21/13^ | 06/30/14 | 10.00 | 0.11 | 0.33 | 0.44 | — | — | — | 10.44 | 4.40 | 240 | 1.61 | 1.63 | 1.63 | 25 | ||||||||||||||||||||||||||||||||
The accompanying notes are an integral part of these financial statements.
117
Financial Highlights
| From Investment | Distributions to | Ratios to Average | |||||||||||||||||||||||||||||||||||||||||
| Operations(a) | Shareholders From | Net Assets(b) | |||||||||||||||||||||||||||||||||||||||||
| Net | |||||||||||||||||||||||||||||||||||||||||||
| For a Share | Realized | Net | Net | ||||||||||||||||||||||||||||||||||||||||
| Outstanding | Net Asset | Net | & | Asset | Assets at | Net | |||||||||||||||||||||||||||||||||||||
| Throughout Each | Value, | Investment | Unrealized | Net | Net | Value, | Total | End of | Investment | Gross | Portfolio | ||||||||||||||||||||||||||||||||
| Fiscal Period: | Beginning | Income | Gains | Investment | Realized | End of | Return | Period | Income | Net | Expenses | Turnover | |||||||||||||||||||||||||||||||
| Beginning | Ending | of Period | (Loss) | (Losses) | Total | Income | Gains | Total | Period | (c) | (000’s | ) | (Loss) | Expenses | (d) | Rate(c) | |||||||||||||||||||||||||||
| BROWN ADVISORY – WMC JAPAN ALPHA OPPORTUNITIES FUND: | |||||||||||||||||||||||||||||||||||||||||||
| Institutional Shares* | |||||||||||||||||||||||||||||||||||||||||||
| 07/01/16 | 06/30/17 | $ 8.83 | 0.08 | 1.98 | 2.06 | — | — | — | $10.89 | 23.33 | % | $ 985,654 | 0.80 | % | 1.15 | % | 1.15 | % | 100 | % | |||||||||||||||||||||||
| 07/01/15 | 06/30/16 | 12.83 | 0.06 | (2.91 | ) | (2.85 | ) | (0.95 | ) | (0.20 | ) | (1.15 | ) | 8.83 | (24.02 | ) | 1,828,840 | 0.53 | 1.14 | 1.14 | 105 | ||||||||||||||||||||||
| 07/01/14 | 06/30/15 | 10.50 | 0.05 | 2.86 | 2.91 | (0.51 | ) | (0.07 | ) | (0.58 | ) | 12.83 | 28.62 | 1,582,214 | 0.41 | 1.15 | 1.15 | 70 | |||||||||||||||||||||||||
| 03/04/14^ | 06/30/14 | 10.00 | 0.05 | 0.45 | 0.50 | — | — | — | 10.50 | 5.00 | 1,080,717 | 1.59 | 1.21 | 1.21 | 26 | ||||||||||||||||||||||||||||
| Investor Shares* | |||||||||||||||||||||||||||||||||||||||||||
| 07/01/16 | 06/30/17 | 8.81 | 0.07 | 1.97 | 2.04 | — | — | — | 10.85 | 23.16 | 2,814 | 0.65 | 1.30 | 1.30 | 100 | ||||||||||||||||||||||||||||
| 07/01/15 | 06/30/16 | 12.82 | 0.04 | (2.91 | ) | (2.87 | ) | (0.94 | ) | (0.20 | ) | (1.14 | ) | 8.81 | (24.20 | ) | 1,595 | 0.38 | 1.29 | 1.29 | 105 | ||||||||||||||||||||||
| 07/01/14 | 06/30/15 | 10.49 | 0.03 | 2.87 | 2.90 | (0.50 | ) | (0.07 | ) | (0.57 | ) | 12.82 | 28.57 | 25,628 | 0.26 | 1.30 | 1.30 | 70 | |||||||||||||||||||||||||
| 03/04/14^ | 06/30/14 | 10.00 | 0.05 | 0.44 | 0.49 | — | — | — | 10.49 | 4.90 | 4,522 | 1.44 | 1.36 | 1.36 | 26 | ||||||||||||||||||||||||||||
| Advisor Shares* | |||||||||||||||||||||||||||||||||||||||||||
| 07/01/16 | 06/30/17 | 8.78 | 0.04 | 1.97 | 2.01 | — | — | — | 10.79 | 22.89 | 388 | 0.40 | 1.55 | 1.55 | 100 | ||||||||||||||||||||||||||||
| 07/01/15 | 06/30/16 | 12.79 | 0.01 | (2.90 | ) | (2.89 | ) | (0.92 | ) | (0.20 | ) | (1.12 | ) | 8.78 | (24.39 | ) | 687 | 0.13 | 1.54 | 1.54 | 105 | ||||||||||||||||||||||
| 07/01/14 | 06/30/15 | 10.48 | — | 2.87 | 2.87 | (0.49 | ) | (0.07 | ) | (0.56 | ) | 12.79 | 28.22 | 1,670 | 0.01 | 1.55 | 1.55 | 70 | |||||||||||||||||||||||||
| 03/04/14^ | 06/30/14 | 10.00 | 0.04 | 0.44 | 0.48 | — | — | — | 10.48 | 4.80 | 59 | 1.19 | 1.61 | 1.61 | 26 | ||||||||||||||||||||||||||||
| BROWN ADVISORY – SOMERSET EMERGING MARKETS FUND: | |||||||||||||||||||||||||||||||||||||||||||
| Institutional Shares* | |||||||||||||||||||||||||||||||||||||||||||
| 07/01/16 | 06/30/17 | 8.73 | 0.12 | 1.43 | 1.55 | (0.11 | ) | — | (0.11 | ) | 10.17 | 18.04 | 407,616 | 1.31 | 1.17 | 1.17 | 23 | ||||||||||||||||||||||||||
| 07/01/15 | 06/30/16 | 9.74 | 0.13 | (1.05 | ) | (0.92 | ) | (0.09 | ) | — | (0.09 | ) | 8.73 | (9.40 | ) | 319,993 | 1.56 | 1.17 | 1.17 | 19 | |||||||||||||||||||||||
| 07/01/14 | 06/30/15 | 10.22 | 0.13 | (0.46 | ) | (0.33 | ) | (0.15 | ) | — | (0.15 | ) | 9.74 | (3.22 | ) | 268,530 | 1.31 | 1.22 | 1.22 | 22 | |||||||||||||||||||||||
| 07/01/13 | 06/30/14 | 9.52 | 0.20 | 0.61 | 0.81 | (0.11 | ) | — | (0.11 | ) | 10.22 | 8.62 | 193,676 | 2.08 | 1.25 | 1.25 | 19 | ||||||||||||||||||||||||||
| 12/12/12^ | 06/30/13 | 10.00 | 0.12 | (0.60 | ) | (0.48 | ) | — | (e) | — | — | (e) | 9.52 | (4.77 | ) | 122,515 | 2.17 | 1.41 | 1.41 | 19 | |||||||||||||||||||||||
| Investor Shares* | |||||||||||||||||||||||||||||||||||||||||||
| 07/01/16 | 06/30/17 | 8.71 | 0.11 | 1.43 | 1.54 | (0.10 | ) | — | (0.10 | ) | 10.15 | 17.90 | 183,378 | 1.16 | 1.32 | 1.32 | 23 | ||||||||||||||||||||||||||
| 07/01/15 | 06/30/16 | 9.73 | 0.12 | (1.06 | ) | (0.94 | ) | (0.08 | ) | — | (0.08 | ) | 8.71 | (9.60 | ) | 196,841 | 1.41 | 1.32 | 1.32 | 19 | |||||||||||||||||||||||
| 07/01/14 | 06/30/15 | 10.21 | 0.11 | (0.45 | ) | (0.34 | ) | (0.14 | ) | — | (0.14 | ) | 9.73 | (3.33 | ) | 155,919 | 1.16 | 1.37 | 1.37 | 22 | |||||||||||||||||||||||
| 07/01/13 | 06/30/14 | 9.51 | 0.19 | 0.61 | 0.80 | (0.10 | ) | — | (0.10 | ) | 10.21 | 8.51 | 24,291 | 1.93 | 1.40 | 1.40 | 19 | ||||||||||||||||||||||||||
| 12/12/12^ | 06/30/13 | 10.00 | 0.11 | (0.60 | ) | (0.49 | ) | — | (e) | — | — | (e) | 9.51 | (4.87 | ) | 11,695 | 2.02 | 1.56 | 1.56 | 19 | |||||||||||||||||||||||
| Advisor Shares* | |||||||||||||||||||||||||||||||||||||||||||
| 07/01/16 | 06/30/17 | 8.73 | 0.08 | 1.45 | 1.53 | (0.07 | ) | — | (0.07 | ) | 10.19 | 17.65 | 253 | 0.91 | 1.57 | 1.57 | 23 | ||||||||||||||||||||||||||
| 07/01/15 | 06/30/16 | 9.70 | 0.10 | (1.05 | ) | (0.95 | ) | (0.02 | ) | — | (0.02 | ) | 8.73 | (9.82 | ) | 281 | 1.16 | 1.57 | 1.57 | 19 | |||||||||||||||||||||||
| 07/01/14 | 06/30/15 | 10.18 | 0.09 | (0.46 | ) | (0.37 | ) | (0.11 | ) | — | (0.11 | ) | 9.70 | (3.60 | ) | 942 | 0.91 | 1.62 | 1.62 | 22 | |||||||||||||||||||||||
| 07/01/13 | 06/30/14 | 9.49 | 0.16 | 0.61 | 0.77 | (0.08 | ) | — | (0.08 | ) | 10.18 | 8.19 | 533 | 1.68 | 1.65 | 1.65 | 19 | ||||||||||||||||||||||||||
| 12/12/12^ | 06/30/13 | 10.00 | 0.10 | (0.61 | ) | (0.51 | ) | — | (e) | — | — | (e) | 9.49 | (5.07 | ) | 990 | 1.77 | 1.81 | 1.81 | 19 | |||||||||||||||||||||||
The accompanying notes are an integral part of these financial statements.
118
Financial Highlights
| From Investment | Distributions to | Ratios to Average | ||||||||||||||||||||||||||||||||||||||||||
| Operations(a) | Shareholders From | Net Assets(b) | ||||||||||||||||||||||||||||||||||||||||||
| Net | ||||||||||||||||||||||||||||||||||||||||||||
| For a Share | Realized | Net | Net | |||||||||||||||||||||||||||||||||||||||||
| Outstanding | Net Asset | Net | & | Asset | Assets at | Net | ||||||||||||||||||||||||||||||||||||||
| Throughout Each | Value, | Investment | Unrealized | Net | Net | Value, | Total | End of | Investment | Gross | Portfolio | |||||||||||||||||||||||||||||||||
| Fiscal Period: | Beginning | Income | Gains | Investment | Realized | End of | Return | Period | Income | Net | Expenses | Turnover | ||||||||||||||||||||||||||||||||
| Beginning | Ending | of Period | (Loss) | (Losses) | Total | Income | Gains | Total | Period | (c) | (000’s | ) | (Loss) | Expenses | (d) | Rate(c) | ||||||||||||||||||||||||||||
| BROWN ADVISORY – MACQUARIE ASIA NEW STARS FUND: | ||||||||||||||||||||||||||||||||||||||||||||
| Institutional Shares* | ||||||||||||||||||||||||||||||||||||||||||||
| 07/01/16 | 06/30/17 | $ 9.18 | 0.02 | 0.67 | 0.69 | — | — | — | $ 9.87 | 7.52 | % | $239,812 | 0.25 | % | 1.55 | % | 1.55 | % | 169 | % | ||||||||||||||||||||||||
| 07/01/15 | 06/30/16 | 11.70 | — | (2.10 | ) | (2.10 | ) | — | (0.42 | ) | (0.42 | ) | 9.18 | (18.16 | ) | 212,344 | (0.03 | ) | 1.51 | 1.51 | 126 | |||||||||||||||||||||||
| 11/21/14^ | 06/30/15 | 10.00 | 0.02 | 1.68 | 1.70 | — | — | — | 11.70 | 17.00 | 187,901 | 0.27 | 1.83 | 1.83 | 89 | |||||||||||||||||||||||||||||
| Investor Shares* | ||||||||||||||||||||||||||||||||||||||||||||
| 07/01/16 | 06/30/17 | 9.15 | 0.01 | 0.67 | 0.68 | — | — | — | 9.83 | 7.43 | 3,835 | 0.10 | 1.70 | 1.70 | 169 | |||||||||||||||||||||||||||||
| 07/01/15 | 06/30/16 | 11.69 | (0.02 | ) | (2.10 | ) | (2.12 | ) | — | (0.42 | ) | (0.42 | ) | 9.15 | (18.35 | ) | 5,633 | (0.18 | ) | 1.66 | 1.66 | 126 | ||||||||||||||||||||||
| 11/21/14^ | 06/30/15 | 10.00 | 0.01 | 1.68 | 1.69 | — | — | — | 11.69 | 16.90 | 18,992 | 0.12 | 1.98 | 1.98 | 89 | |||||||||||||||||||||||||||||
| * | Redemption fees of less than $0.005/share are not presented and are included in net realized & unrealized gains (losses) from investment operations. Prior to October 19, 2012, Investor Shares of the Brown Advisory Growth Equity Fund, Flexible Equity Fund, Equity Income Fund, Small-Cap Growth Fund, Small-Cap Fundamental Value Fund, Intermediate Income Fund and Maryland Bond Fund were known as Institutional Shares. Prior to October 19, 2012, Institutional Shares of the Brown Advisory Small-Cap Growth Fund were known as D Shares. |
| ^ | Commencement of operations. |
| (a) | Calculated based on average shares outstanding during the fiscal period. |
| (b) | Annualized for periods less than one year. Ratios include only income and expenses of the funds themselves, as presented in the Statements of Operations, and do not include any additional or pro rata amounts of income or expenses from the ownership of any other investment companies (as applicable). |
| (c) | Not annualized for periods less than one year. Portfolio turnover rates are calculated at the fund level (not by individual share class). |
| (d) | Reflects the expense ratio excluding any expense waivers or expense recoupments. |
| (e) | Less than $0.005/share. |
The accompanying notes are an integral part of these financial statements.
119
Notes to Financial Statements
June 30, 2017
Note 1. Organization
The Brown Advisory Growth Equity Fund (“Growth Equity Fund”), Brown Advisory Flexible Equity Fund (“Flexible Equity Fund”), Brown Advisory Equity Income Fund (“Equity Income Fund”), Brown Advisory Sustainable Growth Fund (“Sustainable Growth Fund”), Brown Advisory Small-Cap Growth Fund (“Small-Cap Growth Fund”), Brown Advisory Small-Cap Fundamental Value Fund (“Small-Cap Fundamental Value Fund”), Brown Advisory Global Leaders Fund (“Global Leaders Fund”), Brown Advisory Intermediate Income Fund (“Intermediate Income Fund”), Brown Advisory Total Return Fund (“Total Return Fund”), Brown Advisory Strategic Bond Fund (“Strategic Bond Fund”), Brown Advisory Maryland Bond Fund (“Maryland Bond Fund”), Brown Advisory Tax Exempt Bond Fund (“Tax Exempt Bond Fund”), Brown Advisory Mortgage Securities Fund (“Mortgage Securities Fund”), Brown Advisory – WMC Strategic European Equity Fund (“WMC Strategic European Equity Fund”), Brown Advisory –WMC Japan Alpha Opportunities Fund (“WMC Japan Alpha Opportunities Fund”), Brown Advisory – Somerset Emerging Markets Fund (“Somerset Emerging Markets Fund”) and Brown Advisory – Macquarie Asia New Stars Fund (“Macquarie Asia New Stars Fund”) (individually a “Fund,” and collectively, the “Funds”) are each a series of shares of beneficial interest of Brown Advisory Funds (the “Trust”), which is registered under the Investment Company Act of 1940 as an open-ended management investment company. Prior to October 19, 2012, the Funds, except for the Sustainable Growth Fund, Global Leaders Fund, Total Return Fund, Tax Exempt Bond Fund, Mortgage Securities Fund, WMC Strategic European Equity Fund, WMC Japan Alpha Opportunities Fund, Somerset Emerging Markets Fund, and Macquarie Asia New Stars Fund, were series of Professionally Managed Portfolios Trust. Prior to April 12, 2010, the Funds, except for the Equity Income Fund, Sustainable Growth Fund, Global Leaders Fund, Total Return Fund, Strategic Bond Fund, Tax Exempt Bond Fund, Mortgage Securities Fund, WMC Strategic European Equity Fund, WMC Japan Alpha Opportunities Fund, Somerset Emerging Markets Fund, and Macquarie Asia New Stars Fund, each of which had yet to commence operations, were part of the Forum Funds Trust.
The Funds commenced operations as follows:
| Institutional | Investor | Advisor | |
Shares | Shares | Shares | |
| Growth Equity Fund | 10/19/2012 | $ 6/28/1999* | 5/18/2006** |
| Flexible Equity Fund | 10/19/2012 | 11/30/2006* | 1/24/2007** |
| Equity Income Fund | 10/19/2012 | 12/29/2011* | 12/29/2011 |
| Sustainable Growth Fund | 6/29/2012 | 6/29/2012 | 6/29/2012 |
| Small-Cap Growth Fund | 9/20/2002*** | 6/28/1999* | 4/25/2006** |
| Small-Cap Fundamental Value Fund | 10/19/2012 | 12/31/2008* | 7/28/2011 |
| Global Leaders Fund | — | 7/1/2015 | — |
| Intermediate Income Fund | — | 11/2/1995* | 5/13/1991** |
| Total Return Fund | 10/30/2014 | 10/30/2014 | — |
| Strategic Bond Fund | — | 10/31/2014 | 9/30/2011 |
| Maryland Bond Fund | — | 12/21/2000* | — |
| Tax Exempt Bond Fund | — | 6/29/2012 | — |
| Mortgage Securities Fund | 5/13/2014 | 12/26/2013 | — |
| WMC Strategic European Equity Fund | 10/21/2013 | 10/21/2013 | 10/21/2013 |
| WMC Japan Alpha Opportunities Fund | 3/4/2014 | 3/4/2014 | 3/4/2014 |
| Somerset Emerging Markets Fund | 12/12/2012 | 12/12/2012 | 12/12/2012 |
| Macquarie Asia New Stars Fund^ | 11/21/2014 | 11/21/2014 | — |
_________________________
| ^ | Known as the Brown Advisory Emerging Markets Small-Cap Fund prior to May 1, 2017. | |
| * | Prior to October 19, 2012, Investor Shares were known as Institutional Shares. | |
| ** | Prior to July 1, 2011, Advisor Shares were known as A Shares. | |
| *** | Prior to October 19, 2012, Small-Cap Growth Fund Institutional Shares were known as D Shares. |
Each share class has equal rights as to earnings and assets except that each class bears different shareholder servicing and distribution expenses. Each share class has exclusive voting rights with respect to matters that affect just that class. Income, expenses (other than expenses attributable to a specific class), and realized and unrealized gains or losses on investments are allocated to each share class on its relative net assets.
120
Notes to Financial Statements
June 30, 2017
The investment objective of Growth Equity Fund and Small-Cap Growth Fund is to achieve capital appreciation by primarily investing in equity securities. The investment objective of Small-Cap Fundamental Value Fund is to achieve long-term capital appreciation. Flexible Equity Fund’s investment objective is to achieve long-term growth of capital. Maryland Bond Fund’s investment objective is to provide a high level of current income exempt from both Federal and Maryland State income taxes without undue risk. Intermediate Income Fund’s investment objective is to provide a high level of current income consistent with preservation of principal within an intermediate-term maturity structure. Equity Income Fund’s investment objective is to provide current dividend yield and dividend growth. Sustainable Growth Fund’s investment objective is to seek capital appreciation by investing at least 80% of its net assets in equity securities of environmentally sustainable domestic companies. The investment objective of the Strategic Bond Fund is to achieve capital appreciation and income with a low correlation to interest rate movements. Tax Exempt Bond Fund’s investment objective is to seek to provide a high level of current income exempt from Federal income tax by investing primarily in intermediate-term investment grade municipal bonds. The investment objective of the Somerset Emerging Markets Fund is to seek to achieve total return by investing principally in equity securities issued by companies established or operating in emerging markets. The investment objective of the WMC Strategic European Equity Fund seeks to achieve total return by investing principally in equity securities issued by companies established or operating in Europe. The investment objective of the Mortgage Securities Fund seeks to maximize total return consistent with preservation of capital. The investment objective of the WMC Japan Alpha Opportunities Fund seeks to achieve total return by investing principally in equity securities of companies which are domiciled in or exercise the predominant part of their economic activity in Japan. Global Leaders Fund seeks to achieve capital appreciation by investing primarily in global equities. The investment objective of the Total Return Fund is to provide a competitive total return consistent with preservation of principal. The Macquarie Asia New Stars Fund’s investment objective is to achieve total return by investing principally in equity securities issued by small and medium capitalization companies which are domiciled in or exercise the predominant part of their economic activity in Asia (excluding Japan).
Note 2. Significant Accounting Policies
The following is a summary of significant accounting policies consistently followed by the Funds. These policies are in conformity with accounting principles generally accepted in the United States of America.
A. Security Valuation – The Funds have adopted fair valuation accounting standards which establish an authoritative definition of fair value and set out a hierarchy for measuring fair value. These standards require additional disclosures about the various inputs and valuation techniques used to develop the measurements of fair value and a discussion of changes in valuation techniques and related inputs, if any, during the period. These inputs are summarized in the three broad levels listed below:
| Level 1 – | Quoted prices in active markets for identical securities. |
| Level 2 – | Evaluated price based on other significant observable inputs (including quoted prices for similar securities, interest rates, prepayment spreads, credit risk, etc). |
| Level 3 – | Significant unobservable inputs (including the Fund’s own assumptions in determining the fair value of investments). |
The inputs or methodology used for valuing securities are not necessarily an indication of the risk associated with investing in those securities.
Equity securities that are traded on a national securities exchange, except those listed on the NASDAQ Global Market® (“NASDAQ”), are valued at the last reported sale price on the exchange on which the security is principally traded. Securities traded on NASDAQ will be valued at the NASDAQ Official Closing Price (“NOCP”). If, on a particular day, an exchange-traded or NASDAQ security does not trade, then the mean between the most recent quoted bid and asked prices will be used. All equity securities that are not traded on a listed exchange are valued at the last sale price in the over-the counter market. If a non-exchange traded security does not trade on a particular day, then the mean between the last quoted closing bid and asked price will be used. Such domestic equity securities are typically categorized as Level 1 securities. Investments in other domestic investment companies (open-ended mutual funds) are valued at their reported Net Asset Value (“NAV”) and are typically categorized as Level 1 securities. Investments in Exchange Traded Funds (“ETFs”) and Closed-End Funds are valued at their last reported sale price and are typically categorized as Level 1 securities.
For foreign securities that are traded on foreign exchanges, the Funds have selected ICE Data Services (“ICE”) to provide pricing data for those such securities that are held by the Funds. The use of ICE’s pricing services with respect to these foreign exchange traded securities is designed to capture events occurring after a foreign exchange closes that may affect the value of certain holdings of the Funds that are traded on those foreign exchanges. The Funds utilize a confidence interval when determining whether or not
121
Notes to Financial Statements
June 30, 2017
to utilize these prices provided by ICE. The confidence interval is a measure of the relationship that each foreign exchange traded security has to movements in various indices and the price of the foreign exchange traded security’s corresponding American Depositary Receipt, if one exists. ICE provides a confidence interval for each foreign exchange traded security for which it provides a price. If the confidence interval provided by ICE is equal to or greater than a predefined level utilized by the Funds, the Funds will value that foreign exchange traded security at that price. If the confidence interval provided by ICE is less than the predefined level utilized by the Funds, the Funds will value that foreign exchange traded security at the preceding closing price on its respective foreign exchange, or, if there were no transactions on the preceding day, at the mean between the bid and the asked prices. Such foreign securities are typically categorized as Level 2 securities. Foreign securities for which the local market closing prices are utilized are typically categorized as Level 1 securities.
Debt securities are valued by using the mean between the closing bid and asked prices provided by an independent pricing service. If the closing bid and asked prices are not readily available, the independent pricing service may provide a price determined by a matrix pricing method. These techniques generally consider such factors as yields or prices of bonds of comparable quality, type of issue, coupon, maturity, ratings and general market conditions. Fixed income debt instruments, such as commercial paper, banker’s acceptances and U.S. Treasury Bills, having a maturity of less than 60 days are valued at amortized cost when the amortized cost value is determined to approximate fair value established using market-based and issuer-specific factors. Such debt securities are typically categorized as Level 2.
Exchange traded options are valued at the composite price, using the National Best Bid and Offer quotes (NBBO). NBBO consists of the highest bid price and lowest ask price across any of the exchanges on which an option is quoted, thus providing a view across the entire U.S. options marketplace. Specifically, composite pricing calculates the mean of the highest bid price and lowest ask price across the exchanges where the option is traded. Such options are typically categorized as Level 2.
Futures contracts are generally valued at the settlement prices established each day on the exchange on which they are traded and are categorized as Level 1 securities.
Forward foreign currency contracts are valued at the prevailing forward exchange rate of the underlying currencies and are categorized as Level 2 securities.
Securities for which quotations are not readily available are valued at their respective fair values as determined in good faith under guidelines and procedures adopted by the Board of Trustees. These are generally considered Level 3 securities when significant unobservable inputs are utilized in the determination of the fair value. When a security is “fair valued,” consideration is given to the facts and circumstances relevant to the particular situation, including a review of various factors set forth in the guidelines and procedures adopted by the Board of Trustees. Fair value pricing is an inherently subjective process, and no single standard exists for determining fair value. Different funds could reasonably arrive at different values for the same security. The use of fair value pricing by a fund may cause the net asset value of its shares to differ significantly from the net asset value that would be calculated without regard to such considerations. As of June 30, 2017, the Small-Cap Growth Fund was the only fund that held any fair valued securities. As of June 30, 2017, the Small-Cap Growth Fund held fair valued securities with a total market value of $2,546,652 or 0.5% of net assets.
The following is a summary of inputs used to value the Funds’ investments as of June 30, 2017:
| Level 1 | Level 2 | Level 3 | ||||||||||
| Growth Equity Fund | ||||||||||||
| Common Stocks | $ | 1,643,121,891 | $ | — | $ | — | ||||||
| REIT^ | 56,642,082 | — | — | |||||||||
| Short-Term Investments | 66,595,850 | — | — | |||||||||
| Total Investments | $ | 1,766,359,823 | $ | — | $ | — | ||||||
| Flexible Equity Fund | ||||||||||||
| Common Stocks | $ | 385,164,137 | $ | — | $ | — | ||||||
| REIT^ | 7,419,230 | — | — | |||||||||
| Closed-End Funds | 9,943,145 | — | — | |||||||||
| Warrants | 444,000 | — | — | |||||||||
| Short-Term Investments | 14,556,267 | — | — | |||||||||
| Total Investments | $ | 417,526,779 | $ | — | $ | — | ||||||
122
Notes to Financial Statements
June 30, 2017
| Level 1 | Level 2 | Level 3 | ||||||||||
| Equity Income Fund | ||||||||||||
| Common Stocks | $ | 100,450,357 | $ | — | $ | — | ||||||
| Preferred Stocks | 2,214,042 | — | — | |||||||||
| REIT^ | 7,442,017 | — | — | |||||||||
| Short-Term Investments | 3,875,764 | — | — | |||||||||
| Total Investments | $ | 113,982,180 | $ | — | $ | — | ||||||
| Sustainable Growth Fund | ||||||||||||
| Common Stocks | $ | 392,294,382 | $ | — | $ | — | ||||||
| REIT^ | 18,580,771 | — | — | |||||||||
| Short-Term Investments | 18,710,074 | — | — | |||||||||
| Total Investments | $ | 429,585,227 | $ | — | $ | — | ||||||
| Small-Cap Growth Fund | ||||||||||||
| Common Stocks | $ | 489,643,399 | $ | — | $ | — | ||||||
| Private Placements | — | — | 2,415,460 | |||||||||
| Contingent Value Rights | — | — | 131,192 | |||||||||
| Short-Term Investments | 40,862,590 | — | — | |||||||||
| Total Investments | $ | 530,505,989 | $ | — | $ | 2,546,652 | ||||||
| Small-Cap Fundamental Value Fund | ||||||||||||
| Common Stocks | $ | 1,003,891,900 | $ | — | $ | — | ||||||
| REIT^ | 143,252,541 | — | — | |||||||||
| Short-Term Investments | 55,425,717 | — | — | |||||||||
| Total Investments | $ | 1,202,570,158 | $ | — | $ | — | ||||||
| Global Leaders Fund | ||||||||||||
| Common Stocks: | ||||||||||||
| China | $ | — | $ | 1,271,459 | $ | — | ||||||
| France | — | 1,373,947 | — | |||||||||
| Germany | — | 1,353,921 | — | |||||||||
| India | 1,195,286 | — | — | |||||||||
| Indonesia | — | 873,804 | — | |||||||||
| Japan | — | 610,437 | — | |||||||||
| Sweden | — | 1,097,396 | — | |||||||||
| Switzerland | — | 1,359,192 | — | |||||||||
| Taiwan | 1,358,161 | — | — | |||||||||
| United Kingdom | — | 2,322,716 | — | |||||||||
| United States | 25,680,322 | — | — | |||||||||
| Short-Term Investments | 694,025 | — | — | |||||||||
| Total Investments | $ | 28,927,794 | $ | 10,262,872 | $ | — | ||||||
| Intermediate Income Fund | ||||||||||||
| Corporate Bonds & Notes | $ | — | $ | 39,176,787 | $ | — | ||||||
| Mortgage Backed Securities | — | 21,551,952 | — | |||||||||
| Asset Backed Securities | — | 13,400,077 | — | |||||||||
| Municipal Bonds | — | 10,320,006 | — | |||||||||
| U.S. Treasury Notes | — | 16,839,713 | — | |||||||||
| Affiliated Mutual Funds | 29,562,515 | — | — | |||||||||
| Short-Term Investments | 3,321,580 | — | — | |||||||||
| Total Investments | $ | 32,884,095 | $ | 101,288,535 | $ | — | ||||||
| Total Return Fund | ||||||||||||
| Corporate Bonds & Notes | $ | — | $ | 37,611,633 | $ | — | ||||||
| Mortgage Backed Securities | — | 37,577,273 | — | |||||||||
| Asset Backed Securities | — | 29,707,108 | — | |||||||||
| Municipal Bonds | — | 2,540,951 | — | |||||||||
| U.S. Treasury Notes | — | 6,712,540 | — | |||||||||
| Short-Term Investments | 6,923,309 | 549,047 | — | |||||||||
| Total Investments | $ | 6,923,309 | $ | 114,698,552 | $ | — | ||||||
| Futures Contracts – Long* | $ | 128,128 | $ | — | $ | — | ||||||
| Futures Contracts – Short* | $ | 5,482 | $ | — | $ | — | ||||||
| Strategic Bond Fund | ||||||||||||
| Asset Backed Securities | $ | — | $ | 57,387,646 | $ | — | ||||||
| Mortgage Backed Securities | — | 34,011,705 | — | |||||||||
| Corporate Bonds & Notes | — | 25,446,025 | — | |||||||||
| Municipal Bonds | — | 3,418,076 | — | |||||||||
| Preferred Stocks | 62,448 | — | — | |||||||||
| Closed-End Funds | 969,307 | — | — | |||||||||
| Exchange Traded Funds | 4,531,579 | — | — | |||||||||
| Short-Term Investments | 2,814,897 | — | — | |||||||||
| Total Investments | $ | 8,378,231 | $ | 120,263,452 | $ | — | ||||||
| Futures Contracts – Short* | $ | 26,072 | $ | — | $ | — | ||||||
| Maryland Bond Fund | ||||||||||||
| Municipal Bonds | $ | — | $ | 176,368,297 | $ | — | ||||||
| Short-Term Investments | 3,035,035 | — | — | |||||||||
| Total Investments | $ | 3,035,035 | $ | 176,368,297 | $ | — | ||||||
| Tax Exempt Bond Fund | ||||||||||||
| Municipal Bonds | $ | — | $ | 250,984,017 | $ | — | ||||||
| Short-Term Investments | 3,945,333 | — | — | |||||||||
| Total Investments | $ | 3,945,333 | $ | 250,984,017 | $ | — | ||||||
| Mortgage Securities Fund | ||||||||||||
| Mortgage Backed Securities | $ | — | $ | 375,609,784 | $ | — | ||||||
| Asset Backed Securities | — | 64,454,618 | — | |||||||||
| Municipal Bonds | — | 4,255,661 | — | |||||||||
| Preferred Stocks | 390,300 | — | — | |||||||||
| Short-Term Investments | 22,284,523 | 299,480 | — | |||||||||
| Total Investments | $ | 22,674,823 | $ | 444,619,543 | $ | — | ||||||
| Futures Contracts – Long* | $ | (78,219 | ) | $ | — | $ | — | |||||
| WMC Strategic European Equity Fund | ||||||||||||
| Common Stocks: | ||||||||||||
| Austria | $ | — | $ | 6,154,300 | $ | — | ||||||
| Belgium | — | 29,377,256 | — | |||||||||
| Denmark | 2,761,836 | 48,133,027 | — | |||||||||
| Finland | — | 60,691,596 | — | |||||||||
| France | — | 158,992,460 | — | |||||||||
| Germany | — | 100,488,972 | — | |||||||||
| Italy | — | 18,728,814 | — | |||||||||
| Netherlands | — | 84,423,056 | — | |||||||||
| Spain | — | 10,770,681 | — | |||||||||
| Sweden | 8,897,722 | 109,507,032 | — | |||||||||
| Switzerland | 10,997,835 | 190,646,073 | — | |||||||||
| United Kingdom | 34,700,449 | 298,425,707 | — | |||||||||
| Preferred Stocks | — | 5,163,895 | — | |||||||||
| Short-Term Investments | 10,565,414 | — | — | |||||||||
| Total Investments | $ | 67,923,256 | $ | 1,121,502,869 | $ | — | ||||||
123
Notes to Financial Statements
June 30, 2017
| Level 1 | Level 2 | Level 3 | ||||||||||
| WMC Japan Alpha Opportunities Fund | ||||||||||||
| Common Stocks | $ | 338,499 | $ | 913,945,466 | $ | — | ||||||
| REIT^ | — | 1,211,095 | — | |||||||||
| Short-Term Investments | 75,338,358 | — | — | |||||||||
| Total Investments | $ | 75,676,857 | $ | 915,156,561 | $ | — | ||||||
| Futures Contracts – Long* | $ | 237,156 | $ | — | $ | — | ||||||
| Somerset Emerging Markets Fund | ||||||||||||
| Common Stocks: | ||||||||||||
| Brazil | $ | 29,542,398 | $ | — | $ | — | ||||||
| Chile | 27,683,854 | — | — | |||||||||
| China | — | 19,555,967 | — | |||||||||
| Hungary | — | 49,217,144 | — | |||||||||
| India | — | 56,273,699 | — | |||||||||
| Indonesia | — | 18,607,064 | — | |||||||||
| Nigeria | — | 4,740,045 | — | |||||||||
| Philippines | — | 17,565,038 | — | |||||||||
| Poland | 6,527,363 | 19,247,168 | — | |||||||||
| Portugal | — | 7,879,793 | — | |||||||||
| South Africa | — | 28,993,757 | — | |||||||||
| South Korea | — | 125,474,569 | — | |||||||||
| Taiwan | 4,746,297 | 55,226,407 | — | |||||||||
| Turkey | 1,137,820 | 30,366,019 | — | |||||||||
| United Arab Emirates | 12,533,341 | 5,110,383 | — | |||||||||
| United Kingdom | 14,840,041 | 38,217,293 | — | |||||||||
| Warrants | 5,781 | — | — | |||||||||
| Short-Term Investments | 16,806,386 | — | — | |||||||||
| Total Investments | $ | 113,823,281 | $ | 476,474,346 | $ | — | ||||||
| Macquarie Asia New Stars Fund | ||||||||||||
| Common Stocks: | ||||||||||||
| China | $ | 19,116,572 | $ | 58,939,565 | $ | — | ||||||
| India | — | 37,871,450 | — | |||||||||
| Indonesia | — | 5,643,419 | — | |||||||||
| Malaysia | — | 5,238,091 | — | |||||||||
| Philippines | — | 8,691,406 | — | |||||||||
| Singapore | — | 13,765,831 | — | |||||||||
| South Korea | 625,775 | 39,383,014 | — | |||||||||
| Taiwan | — | 33,367,375 | — | |||||||||
| Thailand | — | 5,918,551 | — | |||||||||
| REIT^ | — | 3,491,510 | — | |||||||||
| Short-Term Investments | 13,984,799 | — | — | |||||||||
| Total Investments | $ | 33,727,146 | $ | 212,310,212 | $ | — | ||||||
| ^ | Real Estate Investment Trusts |
| * | Amounts presented for Futures Contracts represent total unrealized appreciation (depreciation) as of June 30, 2017. |
The Funds recognize transfers between levels as of the end of the fiscal year. There were no transfers into or out of Level 1 or Level 2 securities as of June 30, 2017.
The following is a reconciliation of Level 3 securities for which significant unobservable inputs were used to determine fair value.
Small-Cap Growth Fund | Contingent Value Rights | Private Placements | ||||||
| Balance as of June 30, 2016 | $ | 131,192 | $ | 2,559,816 | ||||
| Acquisitions/Purchases | — | 47,000 | ||||||
| Returns of Capital | — | (511,899 | ) | |||||
| Realized Gains | — | 7,306 | ||||||
| Change in Unrealized Appreciation | — | 313,237 | ||||||
| Balance as of June 30, 2017 | $ | 131,192 | $ | 2,415,460 | ||||
The Contingent Value Rights (“CVR”) were acquired as a result of Dyax Corp. (which was a portfolio holding of the Fund) being acquired by Shire PLC. In exchange for the Fund’s shares in Dyax Corp., the Fund received cash considerations from Shire PLC as well as the CVR. The CVR are valued at the difference between the cash price at which Dyax Corp. was acquired by Shire PLC and the closing price of Dyax Corp. on its last day of trading prior to the acquisition.
The inputs utilized in valuing the Private Placements consist of annual audited financial statements and quarterly capital statements which are provided by the issuer. These valuations are adjusted periodically for certain events (additional contributions of capital or purchases made by the Fund, distributions to the Fund made by the issuer, etc) that may occur prior to receipt of the next quarterly capital statement or Annual Report.
B. Securities Transactions and Investment Income – Investment securities transactions are accounted for on the trade date. Discounts/premiums on debt securities purchased are accreted/amortized over the life of the respective securities. Dividend income is recorded on the ex-dividend date. Interest income is recorded on an accrual basis. Income and capital gains on some foreign securities may be subject to foreign withholding or capital gains taxes. Identified cost of investments sold is used to
124
Notes to Financial Statements
June 30, 2017
determine the gain and loss for both financial statement and Federal income tax purposes. Distributions deemed to be a return of capital are recorded as a reduction of the cost of the related investments.
C. Foreign Currency – Investment securities and other assets and liabilities denominated in foreign currencies are translated into U.S. Dollar amounts at the date of valuation. Purchases and sales of investment securities and income and expense items denominated in foreign currencies are translated into U.S. Dollar amounts on the respective dates of such transactions.
The Funds do not isolate the portion of the results of operations resulting from changes in foreign exchange rates on investments from the fluctuations arising from changes in market prices of securities held. Such fluctuations are included with the net realized and unrealized gain or loss from investments.
The Funds report net realized foreign exchange gains and losses that arise from sales of foreign currencies, currency gains or losses realized between the trade and settlement dates on securities transactions, and the difference between the amounts of dividends, interest, and foreign withholding taxes recorded on the Fund’s books and the U.S. Dollar equivalent of the amounts actually received or paid. Net unrealized foreign exchange gains and losses arise from changes in the fair values of the assets and liabilities, other than investments in securities at fiscal year end, resulting from changes in exchange rates.
Some of the Funds may invest in forward foreign currency contracts. These amounts are presented separately from realized and unrealized gains and losses from investments in the financial statements.
D. Options – The Funds may invest in options. When a Fund writes an option, an amount equal to the premium received by a Fund is recorded as a liability and is subsequently adjusted to the current value of the option written. Premiums received from writing options that expire unexercised are treated by a Fund on the expiration date as realized gain from investments. The difference between the premium and the amount paid on effecting a closing purchase transaction, including brokerage commissions, is also treated as a realized gain, or if the premium is less than the amount paid for closing purchase transaction, as a realized loss. If a call option is exercised, the premium is added to the proceeds from the sale of the underlying security or currency determining whether a Fund has a realized gain or loss. If a put option is exercised, the premium reduces the cost basis of the securities purchase by a Fund. A Fund, as a writer of an option, bears the market risk of an unfavorable change in the price of the security underlying the written option.
When a Fund purchases an option, an amount equal to the premium paid by a Fund is recorded as an investment and is subsequently adjusted to the current value of the option purchased. If an option expires on the stipulated expiration date or if a Fund enters into a closing sale transaction, a gain or loss is realized. If a call option is exercised, the cost of the security acquired is increased by the premium paid for the call. If a put option is exercised, a gain or loss is realized from the sale of the underlying security, and the proceeds from such sale are decreased by the premium originally paid. Written and purchased options are non- income producing securities.
None of the Funds purchased, sold or wrote any options during the year ended June 30, 2017.
E. Distributions to Shareholders – For the Maryland Bond Fund and Tax Exempt Bond Fund distributions of net investment income, if any, are declared daily and paid monthly. Distributions to shareholders of net investment income, if any, are declared and paid monthly for the Intermediate Income Fund, Total Return Fund, Strategic Bond Fund and Mortgage Securities Fund and quarterly for the Equity Income Fund. The remaining Funds declare and pay net investment income, if any, at least annually. Distributions to shareholders of net capital gains, if any, are declared and paid at least annually. Distributions are recorded on the ex-dividend date.
F. Use of Estimates – The preparation of financial statements in conformity with accounting principles generally accepted in the United States of America requires management to make estimates and assumptions that affect the reported amounts of assets and liabilities at the date of the financial statements and the reported amount of revenue and expenses during the reporting period. Actual results could differ from those estimates.
G. Federal Taxes – Each Fund has elected to be taxed as a “regulated investment company” and intends to distribute substantially all taxable income to its shareholders and otherwise comply with the provisions of the Internal Revenue Code applicable to regulated investment companies. Therefore, no provision for federal income taxes or excise taxes has been made.
The Funds recognize tax benefits of uncertain tax positions only where the position is “more likely than not” to be sustained assuming examination by tax authorities.
125
Notes to Financial Statements
June 30, 2017
The Funds have analyzed their tax positions and have concluded that no liability for unrecognized tax benefits should be recorded related to uncertain income tax positions taken on returns filed for open tax years (2014-2016) as of June 30, 2017 or are expected to be taken in the Funds’ 2017 tax returns. The Funds identify their major tax jurisdictions as U.S. Federal and Delaware State; however the Funds are not aware of any tax position for which it is reasonably possible that the total amounts of unrecognized tax benefits will change materially in the next year.
H. Redemption Fees – A shareholder who redeems or exchanges shares of the Funds within fourteen days of purchase will incur a redemption fee of 1.00% of the current net asset value of shares redeemed or exchanged, subject to certain exceptions. The fee is charged for the benefit of the remaining shareholders and will be paid to the Fund to help offset transaction costs. The fee is accounted for as an addition to paid-in capital. Each Fund reserves the right to modify the terms of or terminate the fee at any time. There are limited exceptions to the imposition of the redemption fee.
I. Guarantees and Indemnifications – In the normal course of business, the Funds enter into contracts with service providers that contain general indemnification clauses. The Funds’ maximum exposure under these arrangements is unknown as this would involve future claims that may be made against the Funds that have not yet occurred. However, based on experience, the Funds expect the risk of loss to be remote.
J. New Accounting Pronouncements – In March 2017, the Financial Accounting Standards Board (FASB) issued Accounting Standards Update (ASU) No. 2017-08, Receivables—Nonrefundable Fees and Other Costs (Subtopic 310-20): Premium Amortization on Purchased Callable Debt Securities. The amendments in the ASU shorten the amortization period for certain callable debt securities, held at a premium, to be amortized to the earliest call date. The ASU does not require an accounting change for securities held at a discount; which continues to be amortized to maturity. The ASU is effective for fiscal years and interim periods within those fiscal years beginning after December 15, 2018. Management is currently evaluating the impact of applying this provision.
K. Subsequent Events – In preparing these financial statements, the Funds have evaluated events and transactions for potential recognition through the date the financial statements were issued. No material events or transactions occurred subsequent to June 30, 2017 that would require recognition or disclosure in these financial statements.
Note 3. Commitments and Other Affiliated Party Transactions
Investment Adviser – Brown Advisory LLC serves as Investment Adviser (“the Adviser”) to the Funds. Pursuant to investment advisory agreements, the Adviser receives an advisory fee, accrued daily and payable monthly, from each Fund at an annual rate of the Fund’s average daily net assets as follows:
Annual Advisory Fee | Annual Advisory Fee | ||
| Growth Equity Fund | 0.60% | Strategic Bond Fund | 0.40% |
| Flexible Equity Fund | 0.60% | Maryland Bond Fund | 0.30% |
| Equity Income Fund | 0.60% | Tax Exempt Bond Fund | 0.30% |
| Sustainable Growth Fund | 0.60% | Mortgage Securities Fund | 0.30% |
| Small-Cap Growth Fund | 0.85% | WMC Strategic European Equity Fund** | 0.90% |
| Small-Cap Fundamental Value Fund | 0.85% | WMC Japan Alpha Opportunities Fund** | 1.00% |
| Global Leaders Fund* | 0.65% | Somerset Emerging Markets Fund*** | 0.90% |
| Intermediate Income Fund | 0.30% | Macquarie Asia New Stars Fund**** | 1.25% |
| Total Return Fund | 0.30% |
| * | Subject to the general oversight of the Adviser and Board of Trustees for the year ended June 30, 2017, Brown Advisory Limited (“BAL”) served as sub- adviser to the Global Leaders Fund and made investment decisions on its behalf. BAL is compensated for its services by the Adviser. | |
| ** | Subject to the general oversight of the Adviser and Board of Trustees for the year ended June 30, 2017, Wellington Management Company LLP (“Wellington”) served as sub-adviser to the WMC Strategic European Equity Fund and the WMC Japan Alpha Opportunities Fund and made investment decisions on their behalf. Wellington is compensated for its services by the Adviser. | |
| *** | Subject to the general oversight of the Adviser and Board of Trustees for the year ended June 30, 2017, Somerset Capital Management, LLP (“Somerset”) served as sub-adviser to the Somerset Emerging Markets Fund and made investment decisions on its behalf. Somerset is compensated for its services by the Adviser. | |
| **** | Subject to the general oversight of the Adviser and Board of Trustees for the year ended June 30, 2017, Macquarie Funds Management Hong Kong Limited (“MFMHKL”) served as sub-adviser to the Macquarie Asia New Stars Fund and made investment decisions on its behalf. MFMHKL is compensated for its services by the Adviser. |
The Adviser is also entitled to receive an annual business management fee of 0.05%, accrued daily and payable monthly, of the Funds’ average daily net assets in exchange for its management and oversight of the non-investment advisory services provided to the Funds and the Trust. The Funds’ advisory fees and business management fees are reported in the Statements of Operations.
126
Notes to Financial Statements
June 30, 2017
Fee Waivers and Expense Reimbursements (Operating Expense Caps) – The Adviser has contractually agreed to waive a portion of its fees and reimburse certain expenses to limit total annual operating expenses for each or the class’ average daily net assets for the Funds noted below:
Institutional Shares | Investor Shares | Advisor Shares | |
| Growth Equity Fund | 1.00% | 1.15% | 1.35% |
| Flexible Equity Fund | 1.00% | 1.15% | 1.35% |
| Equity Income Fund | 1.00% | 1.15% | 1.35% |
| Sustainable Growth Fund | 1.00% | 1.15% | 1.35% |
| Small-Cap Growth Fund | 1.25% | 1.40% | 1.60% |
| Small-Cap Fundamental Value Fund | 1.25% | 1.40% | 1.60% |
| Global Leaders Fund | 0.70% | 0.85% | 1.10% |
| Intermediate Income Fund | 0.55% | 0.60% | 0.80% |
| Total Return Fund | 0.55% | 0.60% | 0.80% |
| Strategic Bond Fund | 0.65% | 0.70% | 0.95% |
| Maryland Bond Fund | 0.55% | 0.60% | 0.80% |
| Tax Exempt Bond Fund | 0.55% | 0.60% | 0.80% |
| Mortgage Securities Fund | 0.55% | 0.60% | 0.80% |
| WMC Strategic European Equity Fund | 1.60% | 1.75% | 2.00% |
| WMC Japan Alpha Opportunities Fund | 1.70% | 1.85% | 2.10% |
| Somerset Emerging Markets Fund | 1.60% | 1.75% | 2.00% |
| Macquarie Asia New Stars Fund | 1.95% | 2.10% | 2.35% |
For the year ended June 30, 2017, the Adviser waived $99,017 in expenses for the Global Leaders Fund and $15,150 in expenses for the Strategic Bond Fund. The Adviser is permitted to seek reimbursement from the Funds for fees waived and/or Fund expenses it pays over the following three years after such payment. The Funds must pay their current ordinary operating expenses before the Adviser is entitled to any reimbursement of fees and/or expenses. At June 30, 2017, the cumulative amounts of previously waived fees that the Adviser may recoup from the Funds are shown below:
| June 30, | ||||||||||||||||
| 2018 | 2019 | 2020 | Total | |||||||||||||
| Global Leaders Fund | $ | — | $ | 84,282 | $ | 99,017 | $ | 183,299 | ||||||||
| Strategic Bond Fund | 7,500 | 14,033 | 15,150 | 36,683 | ||||||||||||
Distribution – Quasar Distributors, LLC (“the Distributor”) serves as principal underwriter for shares of the Funds, and acts as each Fund’s Distributor in a continuous public offering of each Fund’s shares. The Distributor is an affiliate of the Administrator.
Under a Distribution Plan adopted pursuant to Rule 12b-1 under the Act (“Distribution Plan”), each Fund pays the Distributor or any other entity as authorized by the Board, as compensation for the distribution-related and/or shareholder services provided by such entities an aggregate fee equal to 0.25% of the average daily net assets of Advisor Shares for each Fund. The Distributor may pay any or all amounts received under the Rule 12b-1 Plan to other persons, including the Adviser, for any distribution or service activity. These distribution fees are reported in the Funds’ Statements of Operations.
The Trust has also adopted a Shareholder Service Plan under which each Fund may pay a fee of up to 0.15% of the average daily net assets of each Fund’s Investor and Advisor Shares (except for the Maryland Bond Fund, Intermediate Income Fund, Tax Exempt Bond Fund, Mortgage Securities Fund, Total Return Fund and Strategic Bond Fund, which may pay a fee of up to 0.05%) for shareholder services provided to the Funds by financial institutions, including the Adviser. These service fees are reported in the Funds’ Statements of Operations.
Investments in Affiliates – Intermediate Income Fund
The Intermediate Income Fund and Mortgage Securities Fund are considered affiliates since Brown Advisory LLC is the Adviser to both of the Funds. In seeking to achieve its investment objective, the Intermediate Income Fund invests a portion of its assets into the Mortgage Securities Fund. As of June 30, 2017, the Intermediate Income Fund owned shares of the Mortgage Securities Fund with a total market value of $29,562,515, or 21.7% of the Intermediate Income Fund’s net assets.
The Intermediate Income Fund has entered into a Fee Waiver Agreement (“the Agreement”) with the Adviser. Per the Agreement, the Intermediate Income Fund will waive Advisory Fees in an amount equal to the Advisory Fees earned by the Mortgage
127
Notes to Financial Statements
June 30, 2017
Securities Fund on the assets invested into it by the Intermediate Income Fund. For example, if the Intermediate Income Fund owned $10,000,000 worth of the Mortgage Securities Fund for an entire year, it would waive, on an annual basis, $30,000 in Advisory Fees ($10,000,000 multiplied by 0.30%, the annual Advisory Fee ratio for the Mortgage Securities Fund). For the year ended June 30, 2017, the Intermediate Income Fund waived $85,190 in Advisory Fees per the terms of the Agreement. This is a permanent waiver of fees and these waived fees may not be recouped by the Adviser at any time in the future.
See the table below for details of the Intermediate Income Fund’s investment in the Mortgage Securities Fund Institutional Shares for the year ended June 30, 2017:
| Beginning | Unrealized | Net | Change In | Ending Market | ||||
| Market Value | Proceeds | Appreciation | Realized | Unrealized | Value | Capital | ||
| [# of shares held] | Purchases at Cost | from Sales | (Depreciation) | Gains | Appreciation | [# of shares held] | Dividend | Gain |
7/01/2016 | [# of shares purchased] | [# of shares sold] | 6/30/2017 | (Losses) | (Depreciation) | 6/30/2017 | Income | Distributions |
| $30,526,684 | $4,000,000 | $4,130,000 | $(675,926) | 28,260 | (862,429) | $29,562,515 | $577,759 | $179,865 |
| [2,992,812] | [406,091] | [403,714] | [2,995,189] |
Other Service Providers – U.S. Bancorp Fund Services, LLC (“USBFS”), an indirect wholly-owned subsidiary of U.S. Bancorp, serves as the Funds’ Administrator (“Administrator”), and in that capacity, performs various administrative and accounting services for the Funds. USBFS also serves as the Funds’ fund accountant and transfer agent. Certain officers of the Trust are employees of USBFS and the Funds’ custodian, U.S. Bank, N.A., is an affiliate of the Administrator. Fees paid to USBFS and U.S. Bank, N.A. for its services can be found in the Statements of Operations as “Administration, accounting and transfer agent fees” and “Custodian fees”, respectively. Additional amounts for miscellaneous expenses may be paid by the Funds to USBFS and included in “Miscellaneous expenses” in the Statements of Operations.
Rule 17a-7 Transactions – Each Fund is permitted to purchase and sell securities to certain affiliated parties under specified conditions outlined in procedures adopted by the Board of Trustees pursuant to Rule 17a-7 under the 1940 Act. Pursuant to these procedures, for the year ended June 30, 2017, the Tax Exempt Bond Fund, WMC Strategic European Equity Fund and WMC Japan Alpha Opportunities Fund engaged in securities purchases of $3,094,815, $342,591, and $251,915,respectively, and the Maryland Bond Fund and WMC Japan Alpha Opportunities Fund engaged in securities sales of $3,094,815 and $11,150,609, respectively. These transactions are included in the purchases and sales table in Note 4.
Note 4. Purchases and Sales of Securities
The cost of purchases and the proceeds from sales of investments (including maturities), other than short-term investments, for the year ended June 30, 2017 were as follows:
| Fund | Purchases | Sales | Fund | Purchases | Sales | ||||||||||||
| Growth Equity | $ | 739,808,691 | $ | 1,375,750,268 | Strategic Bond | $ | 272,601,095 | $ | 198,059,188 | ||||||||
| Flexible Equity | 56,012,787 | 96,470,330 | Maryland Bond | 93,181,831 | 90,434,185 | ||||||||||||
| Equity Income | 7,465,079 | 32,352,524 | Tax Exempt Bond | 159,922,914 | 131,958,391 | ||||||||||||
| Sustainable Growth | 165,836,474 | 151,729,256 | Mortgage Securities | 1,950,957,393 | 1,965,762,439 | ||||||||||||
| Small-Cap Growth | 241,088,067 | 84,698,074 | WMC Strategic European Equity | 290,356,868 | 380,740,931 | ||||||||||||
| Small-Cap Fundamental Value | 338,497,718 | 322,434,638 | WMC Japan Alpha Opportunities | 1,429,102,272 | 2,609,682,590 | ||||||||||||
| Global Leaders | 18,503,556 | 10,743,147 | Somerset Emerging Markets | 119,976,564 | 128,276,222 | ||||||||||||
| Intermediate Income | 86,146,476 | 93,810,710 | Macquarie Asia New Stars | 356,440,051 | 336,318,406 | ||||||||||||
| Total Return | 246,204,785 | 215,308,593 | |||||||||||||||
The Intermediate Income Fund purchased $20,967,802 and sold $30,423,892 in U.S. Government securities for the year ended June 30, 2017. The Total Return Fund purchased $2,468,602 and sold $3,273,352 in U.S. Government Securities for the year ended June 30, 2017. The Mortgage Securities Fund purchased $30,460,391 and sold $48,145,566 in U.S. Government securities for the year ended June 30, 2017. Purchases and sales of U.S. Government securities are included in the totals above and include U.S. Treasury Bonds and Notes.
128
Notes to Financial Statements
June 30, 2017
Note 5. Federal Income Tax and Distribution Information
At June 30, 2017, the components of distributable earnings (accumulated losses) on a tax basis were as follows:
| Growth | Flexible | Equity | Sustainable | Small-Cap | Small-Cap | |||||||||||||||||||
| Equity | Equity | Income | Growth | Growth | Fundamental | |||||||||||||||||||
| Fund | Fund | Fund | Fund | Fund | Value Fund | |||||||||||||||||||
| Cost of investments | $ | 1,161,976,593 | $ | 292,435,618 | $ | 76,519,598 | $ | 302,155,740 | $ | 406,021,601 | $ | 926,083,997 | ||||||||||||
| Unrealized appreciation | 640,322,375 | 135,718,008 | 39,015,924 | 130,139,654 | 149,644,373 | 297,340,703 | ||||||||||||||||||
| Unrealized depreciation | (35,939,145 | ) | (10,626,847 | ) | (1,553,342 | ) | (2,710,167 | ) | (22,613,333 | ) | (20,854,542 | ) | ||||||||||||
| Net unrealized app (dep) | 604,383,230 | 125,091,161 | 37,462,582 | 127,429,487 | 127,031,040 | 276,486,161 | ||||||||||||||||||
| Undistributed income | — | 1,031,757 | 306,381 | — | — | 16,074,525 | ||||||||||||||||||
| Undistributed capital gains | 119,373,274 | — | 3,329,259 | 8,366,265 | 6,763,267 | 18,486,869 | ||||||||||||||||||
| Total distributable earnings | 119,373,274 | 1,031,757 | 3,635,640 | 8,366,265 | 6,763,267 | 34,561,394 | ||||||||||||||||||
| Other accumulated losses | (848,321 | ) | (172,112 | ) | — | (468,926 | ) | (2,109,980 | ) | — | ||||||||||||||
| Total earnings (losses) | $ | 722,908,183 | $ | 125,950,806 | $ | 41,098,222 | $ | 135,326,826 | $ | 131,684,327 | $ | 311,047,555 | ||||||||||||
| Global | Intermediate | Total | Strategic | Maryland | Tax Exempt | |||||||||||||||||||
| Leaders | Income | Return | Bond | Bond | Bond | |||||||||||||||||||
| Fund | Fund | Fund | Fund | Fund | Fund | |||||||||||||||||||
| Cost of investments | $ | 32,074,707 | $ | 134,641,063 | $ | 121,378,996 | $ | 128,096,908 | $ | 178,068,874 | $ | 255,274,195 | ||||||||||||
| Unrealized appreciation | 7,337,822 | 876,020 | 1,013,686 | 1,031,593 | 2,772,802 | 2,655,988 | ||||||||||||||||||
| Unrealized depreciation | (221,863 | ) | (1,344,453 | ) | (770,821 | ) | (486,818 | ) | (1,438,344 | ) | (3,000,833 | ) | ||||||||||||
| Net unrealized app (dep) | 7,115,959 | (468,433 | ) | 242,865 | 544,775 | 1,334,458 | (344,845 | ) | ||||||||||||||||
| Undistributed income | 36,421 | 8,678 | 173,151 | 135,751 | 259,010^ | 518,207^ | ||||||||||||||||||
| Undistributed capital gains | — | — | — | — | — | — | ||||||||||||||||||
| Total distributable earnings | 36,421 | 8,678 | 173,151 | 135,751 | 259,010^ | 518,207^ | ||||||||||||||||||
| Other accumulated losses | (1,550,891 | ) | (219,927 | ) | (663,993 | ) | (3,255,998 | ) | (666,782 | ) | (2,801,772 | ) | ||||||||||||
| Total earnings (losses) | $ | 5,601,489 | $ | (679,682 | ) | $ | (247,977 | ) | $ | (2,575,472 | ) | $ | 926,686 | $ | (2,628,410 | ) | ||||||||
| WMC Japan | ||||||||||||||||||||||||
| Mortgage | WMC Strategic | Alpha | Somerset | Macquarie | ||||||||||||||||||||
| Securities | European | Opportunities | Emerging | Asia New | ||||||||||||||||||||
| Fund | Equity Fund | Fund | Markets Fund | Stars Fund | ||||||||||||||||||||
| Cost of investments | $ | 469,014,592 | $ | 993,679,562 | $ | 855,440,710 | $ | 502,586,929 | $ | 235,817,781 | ||||||||||||||
| Unrealized appreciation | 2,244,691 | 226,446,953 | 193,370,626 | 114,261,311 | 18,866,068 | |||||||||||||||||||
| Unrealized depreciation | (3,964,917 | ) | (30,700,390 | ) | (57,977,918 | ) | (26,550,613 | ) | (8,646,491 | ) | ||||||||||||||
| Net unrealized app (dep) | (1,720,226 | ) | 195,746,563 | 135,392,708 | 87,710,698 | 10,219,577 | ||||||||||||||||||
| Undistributed income | 538,812 | 11,692,431 | — | 4,336,702 | 884,945 | |||||||||||||||||||
| Undistributed capital gains | — | — | 89,958,859 | — | — | |||||||||||||||||||
| Total distributable earnings | 538,812 | 11,692,431 | 89,958,859 | 4,336,702 | 884,945 | |||||||||||||||||||
| Other accumulated losses | (7,226,396 | ) | (38,795,102 | ) | 210,471 | (51,514,030 | ) | (23,105,795 | ) | |||||||||||||||
| Total earnings (losses) | $ | (8,407,810 | ) | $ | 168,643,892 | $ | 225,562,038 | $ | 40,533,370 | $ | (12,001,273 | ) | ||||||||||||
^ Represents tax exempt income.
The differences between components of distributable earnings on a tax basis and the amounts reflected in the Statements of Assets and Liabilities are primarily due to wash sales, post-October losses, post-December ordinary losses and distributions payable.
129
Notes to Financial Statements
June 30, 2017
At June 30, 2017, the following capital loss carryforwards and tax deferrals were available and outstanding, respectively:
| Capital Loss Carryforwards | Tax Deferrals | |||||||||||||||||||
| Post-October | Post-December | |||||||||||||||||||
| Fund | Short-Term | Long-Term | Total | Capital Losses | Ordinary Losses | |||||||||||||||
| Growth Equity | $ | — | $ | — | $ | — | $ | — | $ | 848,321 | ||||||||||
| Flexible Equity | 172,201 | — | 172,201 | — | — | |||||||||||||||
| Equity Income | — | — | — | — | — | |||||||||||||||
| Sustainable Growth | — | — | — | — | 468,926 | |||||||||||||||
| Small-Cap Growth | — | — | — | 1,805,041 | 304,939 | |||||||||||||||
| Small-Cap Fundamental Value | — | — | — | — | — | |||||||||||||||
| Global Leaders | 1,249,995 | 304,021 | 1,554,016 | — | — | |||||||||||||||
| Intermediate Income | — | — | — | 42,224 | — | |||||||||||||||
| Total Return | — | 495,071 | 495,071 | — | — | |||||||||||||||
| Strategic Bond | 2,497,205 | 555,068 | 3,052,273 | — | — | |||||||||||||||
| Maryland Bond | — | — | — | 407,832 | — | |||||||||||||||
| Tax Exempt Bond | 750,093 | 1,533,356 | 2,283,449 | — | — | |||||||||||||||
| Mortgage Securities | — | — | — | 6,706,529 | — | |||||||||||||||
| WMC Strategic European Equity | 32,605,428 | 6,259,973 | 38,865,401 | — | — | |||||||||||||||
| WMC Japan Alpha Opportunities | — | — | — | — | — | |||||||||||||||
| Somerset Emerging Markets | 19,463,996 | 32,053,873 | 51,517,869 | — | — | |||||||||||||||
| Macquarie Asia New Stars | 19,498,869 | 3,606,780 | 23,105,649 | — | — | |||||||||||||||
Distributions during the fiscal periods ended as noted were characterized for tax purposes as follows:
| Tax Exempt Income | Ordinary Income | Long-Term Capital Gain^ | ||||||||||||||||||||||
| Fund | June 30, 2017 | June 30, 2016 | June 30, 2017 | June 30, 2016 | June 30, 2017 | June 30, 2016 | ||||||||||||||||||
| Growth Equity | $ | — | $ | — | $ | — | $ | 7,902,803 | $ | 147,424,619 | $ | 141,076,499 | ||||||||||||
| Flexible Equity | — | — | 1,573,168 | 1,728,214 | — | — | ||||||||||||||||||
| Equity Income | — | — | 2,223,795 | 3,370,204 | 3,997,807 | 1,785,670 | ||||||||||||||||||
| Sustainable Growth | — | — | — | 2,679,763 | 2,507,623 | 11,297,130 | ||||||||||||||||||
| Small-Cap Growth | — | — | 2,227,897 | 763,358 | 11,963,700 | 39,659,100 | ||||||||||||||||||
| Small-Cap Fundamental Value | — | — | 3,609,251 | 2,796,635 | 686,156 | 17,190,395 | ||||||||||||||||||
| Global Leaders | — | — | 53,915 | — | — | — | ||||||||||||||||||
| Intermediate Income | — | — | 2,972,217 | 3,434,796 | — | 369,469 | ||||||||||||||||||
| Total Return | — | — | 2,424,000 | 2,222,152 | 101,725 | — | ||||||||||||||||||
| Strategic Bond | — | — | 1,658,199 | 2,476,783 | — | — | ||||||||||||||||||
| Maryland Bond | 3,777,617 | 4,031,803 | 262,963 | 3,271 | 381,305 | 906,772 | ||||||||||||||||||
| Tax Exempt Bond | 7,094,476 | 5,642,129 | 17,897 | — | — | — | ||||||||||||||||||
| Mortgage Securities | — | — | 10,242,951 | 7,907,002 | — | 1,257,738 | ||||||||||||||||||
| WMC Strategic European Equity | — | — | 12,612,291 | 2,992,321 | — | — | ||||||||||||||||||
| WMC Japan Alpha Opportunities | — | — | — | 227,528,772 | — | 3,902,671 | ||||||||||||||||||
| Somerset Emerging Markets | — | — | 6,508,402 | 3,928,021 | — | — | ||||||||||||||||||
| Macquarie Asia New Stars | — | — | — | 8,503,241 | — | — | ||||||||||||||||||
^ Designated as a long-term capital gain dividend, pursuant to Internal Revenue Code Section 852(b)(3).
130
Notes to Financial Statements
June 30, 2017
In the Statements of Assets and Liabilities, as a result of net operating losses incurred, adjustments to holdings of Real Estate Investment Trusts, currency gains and losses, distribution reclassifications and income adjustments to asset-backed security transactions, certain amounts of income, realized gains, and paid-in capital have been reclassified for the year ended June 30, 2017. These reclassifications have no impact on the net assets of the Funds:
| Undistributed | ||||||||||||
| (Accumulated) | Accumulated | |||||||||||
| Paid-in | Net Investment | Net Realized | ||||||||||
| Fund | Capital | Income (Loss) | Gain (Loss) | |||||||||
| Growth Equity | $ | 37,848,482 | $ | 7,600,295 | $ | (45,448,777 | ) | |||||
| Flexible Equity | 157,390 | (500 | ) | (156,890 | ) | |||||||
| Equity Income | 1,797,828 | 47 | (1,797,875 | ) | ||||||||
| Sustainable Growth | (1,236,600 | ) | 1,273,275 | (36,675 | ) | |||||||
| Small-Cap Growth | 1,651,167 | 1,602,019 | (3,253,186 | ) | ||||||||
| Small-Cap Fundamental Value | 2,397,801 | 44,315 | (2,442,116 | ) | ||||||||
| Global Leaders | (282,988 | ) | (86,670 | ) | 369,658 | |||||||
| Intermediate Income | — | 298,120 | (298,120 | ) | ||||||||
| Total Return | — | 128,733 | (128,733 | ) | ||||||||
| Strategic Bond | — | 64,569 | (64,569 | ) | ||||||||
| Maryland Bond | 26,174 | (51 | ) | (26,123 | ) | |||||||
| Tax Exempt Bond | — | 4 | (4 | ) | ||||||||
| Mortgage Securities | 151,950 | 1,972,546 | (2,124,496 | ) | ||||||||
| WMC Strategic European Equity | — | (5,094 | ) | 5,094 | ||||||||
| WMC Japan Alpha Opportunities | (295,874,001 | ) | 329,672,387 | (33,798,386 | ) | |||||||
| Somerset Emerging Markets | — | (403,065 | ) | 403,065 | ||||||||
| Macquarie Asia New Stars | — | 367,348 | (367,348 | ) | ||||||||
Note 6. Forward Foreign Currency Contracts
The WMC Japan Alpha Opportunities Fund held forward foreign currency contracts during the year ended June 30, 2017.
The majority of the WMC Japan Alpha Opportunities Fund’s assets are denominated in Japanese Yen. The WMC Japan Alpha Opportunities Fund may seek to offset or hedge its exposure to the Japanese Yen by entering into forward foreign currency contracts. A forward foreign currency contract is a commitment to purchase or sell a foreign currency at a future date at an agreed upon price. These contracts are traded over-the-counter and not on an organized exchange. The contracts are marked-to-market daily and the change in market value is recorded as unrealized appreciation or depreciation. When the contract is closed, a realized gain or loss equal to the difference between the value at the time it was opened and the value at the time it was closed is recorded. The realized gains or losses are reported in the Statement of Operations as net realized gains or losses from forward foreign currency contracts. Unrealized appreciation on forward foreign currency contracts and unrealized depreciation on forward foreign currency contracts is reported in the Statement of Assets and Liabilities for those contracts that remain open as of year end (there are no forward foreign currency contracts open as of June 30, 2017). Risks may arise from the potential inability of a counterparty to meet the terms of the contract. There is generally no collateral exchanged by the Fund or counterparty to the contract in connection with these contracts. The Fund’s risk of loss from counterparty credit risk on these contracts is generally limited to the aggregate unrealized appreciation (depreciation) on open contracts on a counterparty by counterparty basis. The Fund attempts to mitigate counterparty credit risk by only entering into agreements with counterparties that it believes have the financial resources to honor their obligations and by monitoring the financial stability of those counterparties.
131
Notes to Financial Statements
June 30, 2017
The effect of forward foreign currency contracts, not accounted for as hedging instruments, on the Statements of Operations for the year ended June 30, 2017 is as follows:
| Net Realized | Net Change In Unrealized | |
| Gain (Loss) – | Appreciation (Depreciation) – | |
| Forward Foreign | Forward Foreign | |
Currency Contracts | Currency Contracts | |
| WMC Japan Alpha Opportunities Fund | $(11,565,713) | $(10,962,063) |
For the year ended June 30, 2017, the average net exposure, in U.S. Dollars, of forward foreign currency contracts held by the WMC Japan Alpha Opportunities Fund was $16,415,635. The WMC Japan Alpha Opportunities Fund is not invested in any forward foreign currency contracts as of June 30, 2017.
Note 7. Futures Contracts
The Total Return Fund, Strategic Bond Fund, Mortgage Securities Fund and WMC Japan Alpha Opportunities Fund invested in futures contracts during the year ended June 30, 2017. At the time a Fund purchases or enters into a futures contract, the Fund deposits and maintains as collateral an initial margin with the broker, as required by the terms of the contract. Pursuant to the contract, the Fund agrees to receive from or pay to the broker an amount of cash equal to the fluctuation in the value of the contract. These daily fluctuations are known as variation margin and are recorded by the Fund as unrealized gains or losses on futures contracts. When these futures contracts are closed, realized gains or losses on futures contracts are recorded by the Fund. The realized gains or losses are reported in the Statement of Operations as net realized gains or losses from futures contracts. Depending upon the agreement with the broker, the Funds may or may not settle variation margin daily. The Funds attempt to mitigate counterparty credit risk by only entering into futures contracts with brokers that the Funds believe have the financial resources to honor their obligations and by monitoring the financial stability of these brokers. The use of long futures contracts by the Funds subjects them to a risk of loss in excess of the notional amounts shown on the Statements of Assets and Liabilities and up to the total notional amount of the futures contract as shown in the Schedule of Investments. The use of short futures contracts by the Funds subjects them to a risk of loss in excess of the notional amounts shown on the Statements of Assets and Liabilities and, hypothetically, up to an unlimited amount of loss that could exceed the notional amounts of the futures contracts as shown in the Schedules of Investments.
The effect of futures contracts, not accounted for as hedging instruments, on the Statements of Assets and Liabilities as of June 30, 2017 is as follows:
| Gross Unrealized | Gross Unrealized | |
| Appreciation – | Depreciation – | |
Futures Contracts | Futures Contracts | |
| Total Return Fund | $139,328 | $ 5,718 |
| Strategic Bond Fund | 26,072 | — |
| Mortgage Securities Fund | — | 78,219 |
| WMC Japan Alpha Opportunities Fund | 237,156 | — |
The effect of futures contracts, not accounted for as hedging instruments, on the Statements of Operations for the year ended June 30, 2017 is as follows:
| Net Realized | Net Change in Unrealized | |
| Gain (Loss) – | Appreciation (Depreciation) – | |
Futures Contracts | Futures Contracts | |
| Total Return Fund | $ (568,625) | $(600,033) |
| Strategic Bond Fund | (50,681) | 204,382 |
| Mortgage Securities Fund | — | (78,219) |
| WMC Japan Alpha Opportunities Fund | 9,432,515 | 237,156 |
During the year ended June 30, 2017, the average notional value of long futures contracts held by the Total Return Fund, Mortgage Securities Fund and WMC Japan Alpha Opportunities Fund were $16,345,857, $1,049,718 and $49,352,692, respectively. The Total Return Fund and Mortgage Securities Fund were invested in long U.S. Treasury futures contracts, which gave the funds exposure to interest rate risk. The WMC Japan Alpha Opportunities Fund was invested in long stock index futures contracts, denominated in Japanese Yen, which gave the Fund exposure to foreign currency risk and Japanese equity risk.
132
Notes to Financial Statements
June 30, 2017
During the year ended June 30, 2017, the average notional value of the short futures contracts held by the Total Return Fund and the Strategic Bond Fund were $20,635 and $10,170,317, respectively. The Total Return Fund and the Strategic Bond Fund were invested in short U.S. Treasury futures contracts, which served to hedge or reduce the funds exposure to interest rate risk.
Offsetting Assets & Liabilities – Futures Contracts
To facilitate the Funds investment in futures contracts, the Funds have entered into agreements with counterparties that dictate the terms under which the Funds and the counterparty will enter into such agreements. Under these agreements, both the Funds and the counterparty may be allowed to combine amounts owed to or receivable from the other and settle all outstanding obligations on a “net basis.” In order to facilitate comparability amongst different funds, the table below shows what the Funds’ Statement of Assets and Liabilities accounts related to futures contracts would look like if they choose to offset, or present on a net basis, assets and liabilities related to futures contracts.
Assets:
| Gross Amounts | Net Amounts | Gross Amounts Not Offset | ||||||||||||||||||||||
| Gross | Offset in the | Presented in | in the Statement of | |||||||||||||||||||||
| Amounts of | Statement | the Statement | Assets & Liabilities | |||||||||||||||||||||
| Recognized | of Assets | of Assets | Financial | Collateral | ||||||||||||||||||||
Unrealized Appreciation on Futures Contracts | Assets | & Liabilities | & Liabilities | Instruments | Received | Net Amount | ||||||||||||||||||
| Total Return Fund | $ | 139,328 | $ | (5,718 | ) | $ | 133,610 | $ | — | $ | — | $ | 133,610 | |||||||||||
| Strategic Bond Fund | 26,072 | — | 26,072 | — | — | 26,072 | ||||||||||||||||||
| Mortgage Securities Fund | — | — | — | — | — | — | ||||||||||||||||||
| WMC Japan Alpha Opportunities Fund | 237,156 | — | 237,156 | — | — | 237,156 | ||||||||||||||||||
Liabilities:
| Gross Amounts | Net Amounts | Gross Amounts Not Offset | ||||||||||||||||||||||
| Gross | Offset in the | Presented in | in the Statement of | |||||||||||||||||||||
| Amounts of | Statement | the Statement | Assets & Liabilities | |||||||||||||||||||||
| Recognized | of Assets | of Assets | Financial | Collateral | ||||||||||||||||||||
Unrealized Depreciation on Futures Contracts | Liabilities | & Liabilities | & Liabilities | Instruments | Pledged | Net Amount | ||||||||||||||||||
| Total Return Fund | $ | 5,718 | $ | (5,718 | ) | $ | — | $ | — | $ | — | $ | — | |||||||||||
| Strategic Bond Fund | — | — | — | — | — | — | ||||||||||||||||||
| Mortgage Securities Fund | 78,219 | — | 78,219 | 78,219 | — | — | ||||||||||||||||||
| WMC Japan Alpha Opportunities Fund | — | — | — | — | — | — | ||||||||||||||||||
Note 8. Line of Credit
As of June 30, 2017, Brown Advisory Funds has an unsecured line of credit of up to $100,000,000 with U.S. Bank, N.A. The interest rate on the line of credit as of June 30, 2017 was 4.25% (prime rate). The following table shows the details of the Funds’ borrowing activity for the year ended June 30, 2017. Funds that are not listed did not utilize the line of credit during the period.
| Maximum | ||||
| Outstanding | Average Daily | Total Interest | Average | |
Balance | Balance | Incurred | Interest Rate | |
| Equity Income Fund | $ 1,810,000 | $ 29,351 | $ 1,042 | 3.50% |
| Sustainable Growth Fund | 321,000 | 879 | 31 | 3.50% |
| WMC Strategic European Equity Fund | 680,000 | 2,266 | 80 | 3.50% |
| WMC Japan Alpha Opportunities Fund | 52,121,000 | 624,844 | 22,173 | 3.50% |
| Macquarie Asia New Stars Fund | 2,448,000 | 31,795 | 1,200 | 3.72% |
As of June 30, 2017, none of the Funds had any amounts outstanding under the line of credit.
133
Notes to Financial Statements
June 30, 2017
Note 9. Merger of Funds
As of the close of business on December 2, 2016, pursuant to an Agreement and Plan of Reorganization approved by the Funds’ Board of Trustees, all of the assets, subject to the liabilities, of the Brown Advisory Value Equity Fund (“Value Equity Fund”) were transferred to the Flexible Equity Fund in exchange for shares of the Flexible Equity Fund of equal value. The purpose of the transaction was to combine two funds with similar investment strategies and investments into a single fund having a larger asset base that has the potential to produce economies of scale. The exchange ratio was 0.868 for Institutional Shares, 0.870 for Investor Shares and 0.875 for Advisor Shares. The net asset values of the Flexible Equity Fund Institutional, Investor, and Advisor Shares on the close of business December 2, 2016, both before and after the reorganization, were $16.57, $16.55 and $16.58, respectively. A total of 72,612 Institutional Shares, 2,509,981 Investor Shares and 59,882 Advisor Shares were issued to shareholders of the Value Equity Fund in the exchange. The Value Equity Fund’s net assets at the reorganization date of $43,734,447, including $10,536,322 of unrealized appreciation, were combined with those of the Flexible Equity Fund. Assuming the acquisition had been completed on July 1, 2016, the beginning of the annual reporting period of the Flexible Equity Fund, proforma results of operations for the year ended June 30, 2017 would include net investment income of $1,974,048 and net realized and change in unrealized gain of $79,609,640, resulting in an increase in net assets of $81,583,688. Prior to the reorganization, the Flexible Equity Fund net assets totaled $339,791,609. Immediately after the reorganization, the net assets of the Flexible Equity Fund totaled $383,526,056. The exchange was a tax-free event to the Value Equity Fund shareholders. For financial reporting purposes, assets received and shares issued by the Flexible Equity Fund were recorded at fair value; however, the cost basis of investments received from the Value Equity Fund was carried forward to align ongoing reporting of the Flexible Equity Fund’s realized and unrealized gains and losses with amounts distributable to shareholders for tax purposes.
134
Report of Independent Registered Public Accounting Firm
To the Board of Trustees and Shareholders
Brown Advisory Funds
We have audited the accompanying statements of assets and liabilities of Brown Advisory Growth Equity Fund, Brown Advisory Flexible Equity Fund, Brown Advisory Equity Income Fund, Brown Advisory Sustainable Growth Fund, Brown Advisory Small-Cap Growth Fund, Brown Advisory Small-Cap Fundamental Value Fund, Brown Advisory Global Leaders Fund, Brown Advisory Intermediate Income Fund, Brown Advisory Total Return Fund, Brown Advisory Strategic Bond Fund, Brown Advisory Maryland Bond Fund, Brown Advisory Tax Exempt Bond Fund, Brown Advisory Mortgage Securities Fund, Brown Advisory – WMC Strategic European Equity Fund, Brown Advisory – WMC Japan Alpha Opportunities Fund, Brown Advisory – Somerset Emerging Markets Fund, and Brown Advisory – Macquarie Asia New Stars Fund (formerly, Brown Advisory Emerging Markets Small-Cap Fund) (collectively the “Funds”), each a series of Brown Advisory Funds (the “Trust”), including the schedules of investments as of June 30, 2017, and the related statements of operations, the statements of changes in net assets and the financial highlights for the periods indicated thereon. These financial statements and financial highlights are the responsibility of the Trust’s management. Our responsibility is to express an opinion on these financial statements and financial highlights based on our audits.
We conducted our audits in accordance with the standards of the Public Company Accounting Oversight Board (United States). Those standards require that we plan and perform the audits to obtain reasonable assurance about whether the financial statements and financial highlights are free of material misstatement. The Funds are not required to have, nor were we engaged to perform an audit of its internal control over financial reporting. Our audits included consideration of internal control over financial reporting as a basis for designing audit procedures that are appropriate in the circumstances, but not for the purpose of expressing an opinion on the effectiveness of the Funds’ internal control over financial reporting. Accordingly, we express no such opinion. An audit includes examining, on a test basis, evidence supporting the amounts and disclosures in the financial statements. Our procedures included confirmation of securities owned as of June 30, 2017, by correspondence with the custodian and brokers or by other appropriate auditing procedures when replies from brokers were not received. An audit also includes assessing the accounting principles used and significant estimates made by management, as well as evaluating the overall financial statement presentation. We believe that our audits provide a reasonable basis for our opinion.
In our opinion, the financial statements and financial highlights referred to above present fairly, in all material respects, the financial position of Brown Advisory Growth Equity Fund, Brown Advisory Flexible Equity Fund, Brown Advisory Equity Income Fund, Brown Advisory Sustainable Growth Fund, Brown Advisory Small-Cap Growth Fund, Brown Advisory Small-Cap Fundamental Value Fund, Brown Advisory Global Leaders Fund, Brown Advisory Intermediate Income Fund, Brown Advisory Total Return Fund, Brown Advisory Strategic Bond Fund, Brown Advisory Maryland Bond Fund, Brown Advisory Tax Exempt Bond Fund, Brown Advisory Mortgage Securities Fund, Brown Advisory – WMC Strategic European Equity Fund, Brown Advisory – WMC Japan Alpha Opportunities Fund, Brown Advisory – Somerset Emerging Markets Fund, and Brown Advisory – Macquarie Asia New Stars Fund (formerly, Brown Advisory Emerging Markets Small-Cap Fund) as of June 30, 2017, the results of their operations, the changes in their net assets and the financial highlights for the periods indicated thereon, in conformity with accounting principles generally accepted in the United States of America.
| TAIT, WELLER & BAKER LLP |
Philadelphia, Pennsylvania
August 29, 2017
135
Expense Example For the Six Months Ended June 30, 2017 (Unaudited)
As a shareholder of a Fund you incur two types of costs: (1) transaction costs, including redemption fees and exchange fees; and (2) ongoing costs, including investment advisory fees; distribution and/or service fees; and other Fund expenses. This example is intended to help you understand your ongoing costs (in dollars) of investing in a Fund and to compare these costs with the ongoing costs of investing in other mutual funds. The example is based on an investment of $1,000 invested at the beginning of the six month period and held for the entire period (January 1, 2017 – June 30, 2017).
Actual Expenses
The Actual Expenses columns in the following table provides information about actual account values based on actual returns and actual expenses. As a shareholder you will be assessed fees for outgoing wire transfers, returned checks and stop payment orders at prevailing rates charged by U.S. Bancorp Fund Services, LLC, the Funds’ transfer agent. If you request that a redemption be made by wire transfer, currently, the Funds’ transfer agent charges a $15.00 fee. You will be charged a redemption fee equal to 1.00% of the net amount of the redemption if you redeem your shares less than 14 days after you purchase, with certain limited exceptions. Individual Retirement Accounts (“IRA”) that are held directly at the Funds will be charged a $15.00 annual maintenance fee. IRAs held by broker-dealers or through other means, may or may not incur an annual maintenance fee. Yet, if IRAs maintenance fees are charged to accounts held elsewhere, the fees charged may be more or may be less than $15.00. To the extent the Funds invest in shares of other investment companies as part of their investment strategy, you will indirectly bear your proportionate share of any fees and expenses charged by the underlying funds in which the Funds invest in addition to the expenses of the Funds. Actual expenses of the underlying funds may vary. These expenses are not included in the example below. The example below includes, but is not limited to, investment advisory, shareholder servicing, fund accounting, custody and transfer agent fees. However, the example below does not include portfolio trading commissions and related expenses. You may use the information in this line, together with the amount you invested, to estimate the expenses that you paid over the period. Simply divide your account value by $1,000 (for example, an $8,600 account value divided by $1,000 = 8.6). Then, multiply the result by the number in the first line under the heading entitled “Expenses Paid During the Period” to estimate the expenses you paid on your account during this period.
Hypothetical Example for Comparison Purposes
The Hypothetical Expenses columns in the following table provides information about hypothetical account values based on a hypothetical return and hypothetical expenses based on the Funds’ actual expense ratio and an assumed rate of return of 5% per year before expenses, which is not the Funds’ actual return. The hypothetical account values and expenses may not be used to estimate the actual ending account balance or expenses you paid for the period. You may use this information to compare the ongoing costs of investing in the Funds and other funds. To do so, compare this 5% hypothetical example with the 5% hypothetical examples that appear in the shareholder reports of the other funds. Please note that the expenses shown in the table are meant to highlight your ongoing costs only and do not reflect any transactional costs, such as sales charges (loads), redemption fees or exchange fees. Therefore, the hypothetical information in the table is useful in comparing ongoing costs only and will not help you determine the relative total costs of owning different funds. In addition, if these transactional costs were included, your costs would have been higher.
Actual Expenses | Hypothetical Expenses | |||||
| Beginning | Ending | Ending | Annualized | |||
| Account Value | Account Value | Expenses Paid | Account Value | Expenses Paid | Net Expense | |
January 1, 2017 | June 30, 2017 | During the Period* | June 30, 2017 | During the Period* | Ratio* | |
Growth Equity Fund | ||||||
| Institutional Shares | $1,000.00 | $1,154.50 | $3.79 | $1,021.27 | $3.56 | 0.71% |
| Investor Shares | $1,000.00 | $1,154.40 | $4.59 | $1,020.53 | $4.31 | 0.86% |
| Advisor Shares | $1,000.00 | $1,153.20 | $5.93 | $1,019.29 | $5.56 | 1.11% |
| Flexible Equity Fund | ||||||
| Institutional Shares | $1,000.00 | $1,103.00 | $3.81 | $1,021.17 | $3.66 | 0.73% |
| Investor Shares | $1,000.00 | $1,102.50 | $4.59 | $1,020.43 | $4.41 | 0.88% |
| Advisor Shares | $1,000.00 | $1,100.50 | $5.89 | $1,019.19 | $5.66 | 1.13% |
| Equity Income Fund | ||||||
| Institutional Shares | $1,000.00 | $1,093.10 | $4.00 | $1,020.98 | $3.86 | 0.77% |
| Investor Shares | $1,000.00 | $1,092.30 | $4.77 | $1,020.23 | $4.61 | 0.92% |
| Advisor Shares | $1,000.00 | $1,091.20 | $6.07 | $1,018.99 | $5.86 | 1.17% |
136
Expense Example For the Six Months Ended June 30, 2017 (Unaudited)
Actual Expenses | Hypothetical Expenses | |||||
| Beginning | Ending | Ending | Annualized | |||
| Account Value | Account Value | Expenses Paid | Account Value | Expenses Paid | Net Expense | |
January 1, 2017 | June 30, 2017 | During the Period* | June 30, 2017 | During the Period* | Ratio* | |
| Sustainable Growth Fund | ||||||
| Institutional Shares | $1,000.00 | $1,144.40 | $3.88 | $1,021.17 | $3.66 | 0.73% |
| Investor Shares | $1,000.00 | $1,143.70 | $4.68 | $1,020.43 | $4.41 | 0.88% |
| Advisor Shares | $1,000.00 | $1,142.30 | $6.00 | $1,019.19 | $5.66 | 1.13% |
| Small-Cap Growth Fund | ||||||
| Institutional Shares | $1,000.00 | $1,091.30 | $5.08 | $1,019.93 | $4.91 | 0.98% |
| Investor Shares | $1,000.00 | $1,090.40 | $5.86 | $1,019.19 | $5.66 | 1.13% |
| Advisor Shares | $1,000.00 | $1,088.50 | $7.15 | $1,017.95 | $6.90 | 1.38% |
| Small-Cap Fundamental Value Fund | ||||||
| Institutional Shares | $1,000.00 | $1,026.90 | $4.87 | $1,019.98 | $4.86 | 0.97% |
| Investor Shares | $1,000.00 | $1,026.10 | $5.63 | $1,019.24 | $5.61 | 1.12% |
| Advisor Shares | $1,000.00 | $1,024.70 | $6.88 | $1,018.00 | $6.85 | 1.37% |
| Global Leaders Fund | ||||||
| Investor Shares | $1,000.00 | $1,180.70 | $4.60 | $1,020.58 | $4.26 | 0.85% |
| Intermediate Income Fund | ||||||
| Investor Shares | $1,000.00 | $1,017.10 | $2.25 | $1,022.56 | $2.26 | 0.45% |
| Advisor Shares | $1,000.00 | $1,016.10 | $3.50 | $1,021.32 | $3.51 | 0.70% |
| Total Return Fund | ||||||
| Institutional Shares | $1,000.00 | $1,027.10 | $2.56 | $1,022.27 | $2.56 | 0.51% |
| Investor Shares | $1,000.00 | $1,026.90 | $2.81 | $1,022.02 | $2.81 | 0.56% |
| Strategic Bond Fund | ||||||
| Investor Shares | $1,000.00 | $1,020.00 | $3.51 | $1,021.32 | $3.51 | 0.70% |
| Advisor Shares | $1,000.00 | $1,018.60 | $4.75 | $1,020.08 | $4.76 | 0.95% |
| Maryland Bond Fund | ||||||
| Investor Shares | $1,000.00 | $1,029.00 | $2.41 | $1,022.41 | $2.41 | 0.48% |
| Tax Exempt Bond Fund | ||||||
| Investor Shares | $1,000.00 | $1,027.70 | $2.46 | $1,022.36 | $2.46 | 0.49% |
| Mortgage Securities Fund | ||||||
| Institutional Shares | $1,000.00 | $1,013.80 | $2.40 | $1,022.41 | $2.41 | 0.48% |
| Investor Shares | $1,000.00 | $1,013.50 | $2.65 | $1,022.17 | $2.66 | 0.53% |
| WMC Strategic European Equity Fund | ||||||
| Institutional Shares | $1,000.00 | $1,228.30 | $6.08 | $1,019.34 | $5.51 | 1.10% |
| Investor Shares | $1,000.00 | $1,227.10 | $6.90 | $1,018.60 | $6.26 | 1.25% |
| Advisor Shares | $1,000.00 | $1,226.20 | $8.28 | $1,017.36 | $7.50 | 1.50% |
| WMC Japan Alpha Opportunities Fund | ||||||
| Institutional Shares | $1,000.00 | $1,125.00 | $6.06 | $1,019.09 | $5.76 | 1.15% |
| Investor Shares | $1,000.00 | $1,124.40 | $6.85 | $1,018.35 | $6.51 | 1.30% |
| Advisor Shares | $1,000.00 | $1,122.80 | $8.16 | $1,017.11 | $7.75 | 1.55% |
| Somerset Emerging Markets Fund | ||||||
| Institutional Shares | $1,000.00 | $1,192.30 | $6.41 | $1,018.94 | $5.91 | 1.18% |
| Investor Shares | $1,000.00 | $1,191.30 | $7.23 | $1,018.20 | $6.66 | 1.33% |
| Advisor Shares | $1,000.00 | $1,190.40 | $8.58 | $1,016.96 | $7.90 | 1.58% |
| Macquarie Asia New Stars Fund | ||||||
| Institutional Shares | $1,000.00 | $1,203.70 | $8.63 | $1,016.96 | $7.90 | 1.58% |
| Investor Shares | $1,000.00 | $1,203.20 | $9.45 | $1,016.22 | $8.65 | 1.73% |
| * | The calculations are based on expenses incurred during the most recent six-month period ended as of the date of this report. The dollar amounts shown as expenses paid during the period are equal to the annualized six-month net expense ratio multiplied by the average account value during the period, multiplied by the number of days (181) in the most recent six-month period divided by the number of days in the Funds’ fiscal year (365). |
137
Trustees and Executive Officers
The Board is responsible for the overall management of the Trust, including general supervision and review of the investment activities of the Funds. The Board, in turn, elects the Officers of the Trust, who are responsible for administering the day-to-day operations of the Trust and each of the Funds. The current Trustees and Officers of the Trust, their ages and positions with the Trust, term of office with the Trust and length of time served, their principal occupations for the past five years and other directorships held during the past five years are set forth in the table below.
Additional information about the Trustees of the Trust can be found in the Statement of Additional Information, which is available, without charge, upon request, by calling Brown Advisory Funds toll free at 1-800-540-6807 or by accessing our website at www.brownadvisoryfunds.com.
| Number of | Other | ||||
| Term of | Portfolios in | Directorships | |||
| Office and | Fund Complex | Held During | |||
| Name, Age | Position with | Length of | Principal Occupation(s) | Overseen by | the Past |
| and Address | the Trust | Time Served | During Past 5 Years | Trustees | 5 Years(2) |
Independent Trustees of the Trust(1) | |||||
| Henry H. Hopkins | Trustee | Indefinite Term; | Retired; Formerly, Vice President and Chief | 17 | None. |
| Age: 74 | Since May 2012 | Legal Counsel, T. Rowe Price Associates, Inc. | |||
| c/o Brown Advisory LLC | Lead | Indefinite Term; | (investment management firm) (1998 to 2008). | ||
| 901 South Bond Street | Independent | Since May 2015 | |||
| Suite 400 | Trustee | ||||
| Baltimore, MD 21231 | |||||
| Kyle Prechtl Legg | Trustee | Indefinite Term; | Retired; Formerly President and Chief Executive | 17 | Director, SunTrust |
| Age: 65 | Since May 2012 | Officer, Legg Mason Capital Management, LLC | Banks, Inc. (bank | ||
| c/o Brown Advisory LLC | (investment management firm) (2006 to 2009). | holding company) | |||
| 901 South Bond Street | (since 2011); Director, | ||||
| Suite 400 | OM Asset Management | ||||
| Baltimore, MD 21231 | plc (asset management | ||||
| holding company) | |||||
| (since 2014); Director, | |||||
| Eastman Kodak Co. | |||||
| (printing equipment | |||||
| and supplies company) | |||||
| (2010 to 2013). | |||||
| Thomas F. O’Neil III | Trustee | Indefinite Term; | Global Compliance Officer, Cigna Corporation | 17 | None. |
| Age: 60 | Since May 2012 | (health services company) (since February 2017), | |||
| c/o Brown Advisory LLC | Formerly, President, The Saranac Group LLC | ||||
| 901 South Bond Street | (strategic consulting firm) (since 2010); Formerly, | ||||
| Suite 400 | Executive Vice Chairman (previously, Senior | ||||
| Baltimore, MD 21231 | Vice President, General Counsel and Secretary) | ||||
| WellCare Health Plans, Inc.(managed healthcare | |||||
| organization) (2008 to 2009); Formerly, Partner | |||||
| and Joint Global Practice Group Leader, DLA | |||||
| Piper US LLP (law firm) (2002 to 2008). | |||||
| Neal F. Triplett, CFA | Trustee | Indefinite Term; | President, DUMAC, Inc. (university endowment | 17 | None. |
| Age: 46 | Since May 2012 | investment organization) (since 1999). | |||
| c/o Brown Advisory LLC | |||||
| 901 South Bond Street | |||||
| Suite 400 | |||||
| Baltimore, MD 21231 | |||||
| Interested Trustees and Officers of the Trust | |||||
Michael D. Hankin(3) | Trustee | Indefinite Term | President and Chief Executive Officer, Brown | 17 | None. |
| Age: 59 | Since May 2012 | Advisory Incorporated and affiliates (investment | |||
| c/o Brown Advisory | management firm) (since 1993). | ||||
| Incorporated | |||||
| 901 South Bond Street | |||||
| Suite 400 | |||||
| Baltimore, MD 21231 | |||||
138
Trustees and Executive Officers
| Number of | Other | ||||
| Term of | Portfolios in | Directorships | |||
| Office and | Fund Complex | Held During | |||
| Name, Age | Position with | Length of | Principal Occupation(s) | Overseen by | the Past |
| and Address | the Trust | Time Served | During Past 5 Years | Trustees | 5 Years(2) |
| Interested Trustees and Officers of the Trust | |||||
Joseph R. Hardiman(3) | Chairman | Indefinite Term; | Business Consultant (financial services industry | 17 | Director of Franklin |
| Age: 80 | and Trustee | Since May 2012 | consulting) (since 1997); Formerly; Director of | Resources, Inc. | |
| c/o Brown Advisory LLC | Brown Advisory Incorporated (investment | (investment | |||
| 901 South Bond Street | management firm) (2001 to 2012). | management firm) | |||
| Suite 400 | (2005 to 2013). | ||||
| Baltimore, MD 21231 | |||||
| David M. Churchill | President/ | Indefinite Term; | Chief Operating Officer and Chief Financial | Not | Not |
| Age: 52 | Principal | Since May 2012 | Officer, Brown Advisory Incorporated and | Applicable. | Applicable. |
| c/o Brown Advisory | Executive | affiliates (investment management firm) | |||
| Incorporated | Officer | (since 1993). | |||
| 901 South Bond Street | |||||
| Suite 400 | |||||
| Baltimore, MD 21231 | |||||
| Paul J. Chew | Senior Vice | Indefinite Term; | Head of Investments, Brown Advisory | Not | Not |
| Age: 51 | President | Since May 2016 | Incorporated and affiliates (investment | Applicable. | Applicable. |
| c/o Brown Advisory | management firm) (since 1995). | ||||
| Incorporated | |||||
| 901 South Bond Street | |||||
| Suite 400 | |||||
| Baltimore, MD 21231 | |||||
| Carey E. Taylor | Vice | Indefinite Term; | Product Manager, Brown Advisory | Not | Not |
| Age: 29 | President | Since November | Incorporated and affiliates (investment | Applicable. | Applicable. |
| c/o Brown Advisory | 2015 | management firm) (since 2013); Formerly, | |||
| Incorporated | Senior Associate, Intermediary Risk | ||||
| 901 South Bond Street | Management, T. Rowe Price (investment | ||||
| Suite 400 | management firm) (2010 to 2013). | ||||
| Baltimore, MD 21231 | |||||
| Jason T. Meix | Treasurer/ | Indefinite Term; | Vice President, U.S. Bancorp Fund | Not | Not |
| Age: 38 | Principal | Since May 2012 | Services, LLC (fund administrative services firm) | Applicable. | Applicable. |
| c/o Brown Advisory LLC | Financial | (since 2008). | |||
| 901 South Bond Street | Officer | ||||
| Suite 400 | |||||
| Baltimore, MD 21231 | |||||
| Edward L. Paz | Secretary | Indefinite Term; | Vice President and Counsel, U.S. Bancorp Fund | Not | Not |
| Age: 46 | Since May 2012 | Services, LLC (fund administrative services firm) | Applicable. | Applicable. | |
| c/o Brown Advisory LLC | (since 2007). | ||||
| 901 South Bond Street | |||||
| Suite 400 | |||||
| Baltimore, MD 21231 | |||||
| Brett D. Rogers | Chief | Indefinite Term; | General Counsel and Chief Compliance | Not | Not |
| Age: 41 | Compliance | Since May 2012 | Officer, Brown Advisory Incorporated and | Applicable. | Applicable. |
| c/o Brown Advisory | Officer | affiliates (investment management firm) | |||
| Incorporated | (since 2009); Formerly, Director, Compliance | ||||
| 901 South Bond Street | Anti-Money | Indefinite Term: | and Risk, Deutsche Asset Management | ||
| Suite 400 | Laundering | Since May 2012 | (investment management firm) (2003 to 2009). | ||
| Baltimore, MD 21231 | Officer | ||||
(1) | The Trustees of the Trust who are not “interested persons” of the Trust as defined in the 1940 Act (“Independent Trustees”). |
(2) | The directorships disclosed in this column include only the directorships of those companies that a Trustee serves on that are required to report to the SEC under applicable Federal securities laws including publicly traded corporations that are registered with the SEC under the 1934 Act and investment companies that are registered with the SEC under the 1940 Act, and it therefore excludes various other types of directorships that the Trustees of the Trust may currently hold in other types of organizations, including private companies and not-for-profit organizations, which are expressly excluded from the disclosure requirements for mutual fund board members. |
(3) | Mr. Hankin is considered an “interested person” of the Trust, as defined in the 1940 Act, because of his current position with Brown Advisory Incorporated, the parent company of the Adviser, and Mr. Hardiman is considered an “interested person” of the Trust, as defined in the 1940 Act, because of his previous position with Brown Advisory Incorporated and his ownership interest in Brown Advisory Incorporated. |
139
Information About Proxy Voting (Unaudited)
A description of the policies and procedures that the Funds use to determine how to vote proxies relating to portfolio securities is available without charge upon request by calling toll-free at 800-540-6807 and by accessing the Funds’ website at www.brownadvisoryfunds.com. Furthermore, you can obtain the description on the SEC’s website at www.sec.gov.
Information regarding how the Funds voted proxies relating to portfolio securities during the 12-month period ended June 30 is available without charge, by calling toll-free at 800-540-6807. In addition, you can obtain the Funds’ proxy voting records on the SEC’s website at www.sec.gov.
Information About the Portfolio Holdings (Unaudited)
The Funds file their complete schedule of portfolio holdings for their first and third fiscal quarters with the SEC on Form N-Q. The Funds’ Form N-Q is available without charge, upon request, by calling toll-free at 800-540-6807. Furthermore, you can obtain the Form N-Q on the SEC’s website at www.sec.gov. The Funds’ schedules of portfolio holdings are posted on their website at www.brownadvisoryfunds.com within ten business days after calendar quarter end.
Householding (Unaudited)
In an effort to decrease costs, the Funds will reduce the number of duplicate Prospectuses and annual and semi-annual reports that you receive by sending only one copy of each to those addresses shown by two or more accounts. Please call the Transfer Agent toll free at 1-800-540-6807 to request individual copies of these documents. The Funds will begin sending individual copies 30 days after receiving your request. This policy does not apply to account statements.
Federal Tax Status of Dividends Declared during the Tax Year (Unaudited)
For Federal Income Tax purposes, distributions from short-term capital gains are classified as ordinary income. The percentage of ordinary income distributions designated as qualifying for the corporate dividend received deduction (“DRD”), the individual qualified dividend rate (“QDI”), the qualifying interest income exempt from U.S. tax for foreign shareholders (“QII”) and the qualifying short-term capital gain distributions exempt from U.S. tax for foreign shareholders (“QSTCG”) is presented below:
| Income Distributions | |||||
Exempt from Federal Tax | QDI | DRD | QII | QSTCG | |
| Growth Equity Fund | 0.00% | 0.00% | 0.00% | 0.00% | 0.00% |
| Flexible Equity Fund | 0.00% | 100.00% | 100.00% | 0.00% | 0.00% |
| Equity Income Fund | 0.00% | 100.00% | 98.62% | 0.00% | 5.52% |
| Sustainable Growth Fund | 0.00% | 0.00% | 0.00% | 0.00% | 0.00% |
| Small-Cap Growth Fund | 0.00% | 84.86% | 78.08% | 2.54% | 100.00% |
| Small-Cap Fundamental Value Fund | 0.00% | 73.34% | 72.60% | 0.00% | 20.70% |
| Global Leaders Fund | 0.00% | 100.00% | 100.00% | 1.41% | 0.00% |
| Intermediate Income Fund | 0.00% | 0.00% | 0.00% | 89.32% | 0.00% |
| Total Return Fund | 0.00% | 0.00% | 0.00% | 100.00% | 0.00% |
| Strategic Bond Fund | 0.00% | 0.00% | 0.00% | 90.57% | 0.00% |
| Maryland Bond Fund | 93.49% | 0.00% | 0.00% | 7.63% | 6.10% |
| Tax Exempt Bond Fund | 99.75% | 0.00% | 0.00% | 100.00% | 0.00% |
| Mortgage Securities Fund | 0.00% | 0.00% | 0.00% | 100.00% | 25.14% |
| WMC Strategic European Equity Fund | 0.00% | 100.00% | 0.00% | 0.00% | 0.00% |
| WMC Japan Alpha Opportunities Fund | 0.00% | 0.00% | 0.00% | 0.00% | 0.00% |
| Somerset Emerging Markets Fund | 0.00% | 100.00% | 0.00% | 0.00% | 0.00% |
| Macquarie Asia New Stars Fund | 0.00% | 0.00% | 0.00% | 0.00% | 0.00% |
The Funds, as applicable, intend to elect to pass through to shareholders the credit for taxes paid to foreign countries. Such credits for taxes paid to foreign countries will be included in shareholders' Form 1099-DIV.
140
BROWN ADVISORY FUNDS
At Brown Advisory, we believe that you deserve frank and open communication on all aspects of our relationship. In this spirit, we provide this annual summary of our policies relating to confidentiality and privacy of client information, mutual funds, conflicts of interest, trading commissions, proxy voting and Form ADV annual notice.
CONFIDENTIALITY AND PRIVACY POLICY
Brown Advisory takes the confidentiality of your personal information and the privacy of your account very seriously. Our commitment to safeguard your personal information goes beyond our legal obligation to process your transactions accurately and securely. Whether we serve you online, in person, on the telephone or by mail, the principles that guide the way in which we conduct business are built upon the core values of trust and integrity.
We limit access to your personal information to only those employees with a business reason to know such information. We train and consistently remind all employees to respect client privacy and to recognize the importance of the confidentiality of such information. Those who violate our privacy policy are subject to disciplinary action. This commitment also applies to the sharing of information among Brown Advisory and its affiliates.
We maintain physical, electronic and procedural safeguards that comply with applicable laws and regulations to protect your personal information, including various measures to protect your personal information while it is stored electronically.
Federal law requires us to inform you that we have on record personal information about you and that we obtain such information from you directly (e.g., information you provide to us on account applications and other forms, such as your name, address, social security number, occupation, assets and income) and indirectly (e.g., information on our computer systems about your transactions with us, such as your account balance and account holdings). Any personal information you choose to provide is kept confidential and allows us to: (i) provide better and more complete investment and strategic advice; (ii) develop new services that meet additional needs you may have; and, (iii) comply with legal and regulatory requirements.
In addition, in the normal conduct of our business, it may become necessary for us to share information relating to our clients that we have on record, as described above, with companies not affiliated with us who are under contract to perform services on our behalf. For example, we have contracted with companies to assist us in complying with anti-terrorist and anti-money laundering statutory requirements (including the identification and reporting of activities that may involve terrorist acts or money laundering activities), companies that provide clearing services, and other vendors that provide services directly related to your account relationship with us. Our agreements with these companies require that they keep your information confidential and not use such information for any unrelated purpose.
We do not sell information about you to third parties, and we do not otherwise disclose information to third parties without your permission or unless required by law.
141
(This Page Intentionally Left Blank.)
INVESTMENT ADVISER
Brown Advisory LLC
901 South Bond Street, Suite 400
Baltimore, MD 21231
www.brownadvisory.com
DISTRIBUTOR
Quasar Distributors, LLC
777 East Wisconsin Avenue
Milwaukee, WI 53202
CUSTODIAN
U.S. Bank, N.A.
Custody Operations
1555 North Rivercenter Drive, Suite 302
Milwaukee, WI 53212
TRANSFER AGENT
U.S. Bancorp Fund Services, LLC
P.O. Box 701
Milwaukee, WI 53201
(800) 540-6807
INDEPENDENT REGISTERED PUBLIC ACCOUNTING FIRM
Tait, Weller & Baker LLP
1818 Market Street, Suite 2400
Philadelphia, PA 19103
LEGAL COUNSEL
Dechert LLP
1900 K Street, NW
Washington, DC 20006
Institutional Shares | Investor Shares | Advisor Shares | ||||
Symbol | CUSIP | Symbol | CUSIP | Symbol | CUSIP | |
| Growth Equity Fund | BAFGX | 115233702 | BIAGX | 115233504 | BAGAX | 115233603 |
| Flexible Equity Fund | BAFFX | 115233843 | BIAFX | 115233868 | BAFAX | 115233850 |
| Equity Income Fund | BAFDX | 115233660 | BIADX | 115233686 | BADAX | 115233678 |
| Sustainable Growth Fund | BAFWX | 115233207 | BIAWX | 115233306 | BAWAX | 115233405 |
| Small-Cap Growth Fund | BAFSX | 115233819 | BIASX | 115233835 | BASAX | 115233827 |
| Small-Cap Fundamental Value Fund | BAUUX | 115233777 | BIAUX | 115233793 | BAUAX | 115233785 |
| Global Leaders Fund | — | — | BIALX | 115233462 | — | — |
| Intermediate Income Fund | — | — | BIAIX | 115233744 | BAIAX | 115233736 |
| Total Return Fund | BAFTX | 115233538 | BIATX | 115233520 | — | — |
| Strategic Bond Fund | — | — | BIABX | 115233470 | BATBX | 115233710 |
| Maryland Bond Fund | — | — | BIAMX | 115233751 | — | — |
| Tax Exempt Bond Fund | — | — | BIAEX | 115233108 | — | — |
| Mortgage Securities Fund | BAFZX | 115233546 | BIAZX | 115233587 | — | — |
| WMC Strategic European Equity Fund | BAFHX | 115233629 | BIAHX | 115233611 | BAHAX | 115233595 |
| WMC Japan Alpha Opportunities Fund | BAFJX | 115233579 | BIAJX | 115233561 | BAJAX | 115233553 |
| Somerset Emerging Markets Fund | BAFQX | 115233652 | BIAQX | 115233645 | BAQAX | 115233637 |
| Macquarie Asia New Stars Fund | BAFNX | 115233512 | BIANX | 115233496 | — | — |
This report is submitted for the general information of the shareholders of each Fund. It is not authorized for distribution to prospective investors unless preceded or accompanied by an effective prospectus, which includes information regarding the Funds’ risks, objectives, fees and expenses, experience of their management, and other information.
BX-ANNUAL
Item 2. Code of Ethics.
The registrant has adopted a code of ethics that applies to the registrant’s principal executive officer and principal financial officer. The registrant has not made any amendments to its code of ethics during the period covered by this report. The registrant has not granted any waivers from any provisions of the code of ethics during the period covered by this report.
A copy of the registrant’s Code of Ethics is filed herewith.
Item 3. Audit Committee Financial Expert.
The Registrant’s Board of Trustees has not designated an audit committee financial expert. The Registrant has determined that it will retain the services of an independent third party to assist it if circumstances arise that require specific investment company auditing expertise.
Item 4. Principal Accountant Fees and Services.
The Registrant has engaged its principal accountant to perform audit services, audit-related services, tax services and other services during the past two fiscal years. “Audit services” refer to performing an audit of the Registrant's annual financial statements or services that are normally provided by the accountant in connection with statutory and regulatory filings or engagements for those fiscal years. “Audit-related services” refer to the assurance and related services by the principal accountant that are reasonably related to the performance of the audit. “Tax services” refer to professional services rendered by the principal accountant for tax compliance, tax advice, and tax planning. There were no “Other services” provided by the principal accountant. The following table details the aggregate fees billed or expected to be billed for each of the last two fiscal years for audit fees, audit-related fees, tax fees and other fees by the principal accountant.
Brown Advisory Growth Equity Fund
| FYE 6/30/2017 | FYE 6/30/2016 | |
| Audit Fees | $16,800 | $16,400 |
| Audit-Related Fees | N/A | N/A |
| Tax Fees | $2,800 | $2,700 |
| All Other Fees | N/A | N/A |
Brown Advisory Flexible Equity Fund
| FYE 6/30/2017 | FYE 6/30/2016 | |
| Audit Fees | $16,800 | $16,400 |
| Audit-Related Fees | N/A | N/A |
| Tax Fees | $2,800 | $2,700 |
| All Other Fees | N/A | N/A |
Brown Advisory Equity Income Fund
| FYE 6/30/2017 | FYE 6/30/2016 | |
| Audit Fees | $16,800 | $16,400 |
| Audit-Related Fees | N/A | N/A |
| Tax Fees | $2,800 | $2,700 |
| All Other Fees | N/A | N/A |
Brown Advisory Sustainable Growth Fund
| FYE 6/30/2017 | FYE 6/30/2016 | |
| Audit Fees | $16,800 | $16,400 |
| Audit-Related Fees | N/A | N/A |
| Tax Fees | $2,800 | $2,700 |
| All Other Fees | N/A | N/A |
Brown Advisory Small-Cap Growth Fund
| FYE 6/30/2017 | FYE 6/30/2016 | |
| Audit Fees | $16,800 | $16,400 |
| Audit-Related Fees | N/A | N/A |
| Tax Fees | $2,800 | $2,700 |
| All Other Fees | N/A | N/A |
Brown Advisory Small-Cap Fundamental Value Fund
| FYE 6/30/2017 | FYE 6/30/2016 | |
| Audit Fees | $16,800 | $16,400 |
| Audit-Related Fees | N/A | N/A |
| Tax Fees | $2,800 | $2,700 |
| All Other Fees | N/A | N/A |
Brown Advisory Global Leaders Fund
| FYE 6/30/2017 | FYE 6/30/2016 | |
| Audit Fees | $16,800 | $10,000 |
| Audit-Related Fees | N/A | N/A |
| Tax Fees | $2,800 | $2,500 |
| All Other Fees | N/A | N/A |
Brown Advisory Intermediate Income Fund
| FYE 6/30/2017 | FYE 6/30/2016 | |
| Audit Fees | $16,800 | $16,400 |
| Audit-Related Fees | N/A | N/A |
| Tax Fees | $2,800 | $2,700 |
| All Other Fees | N/A | N/A |
Brown Advisory Total Return Fund
| FYE 6/30/2017 | FYE 6/30/2016 | |
| Audit Fees | $16,800 | $16,400 |
| Audit-Related Fees | N/A | N/A |
| Tax Fees | $2,800 | $2,700 |
| All Other Fees | N/A | N/A |
Brown Advisory Strategic Bond Fund
| FYE 6/30/2017 | FYE 6/30/2016 | |
| Audit Fees | $16,800 | $16,400 |
| Audit-Related Fees | N/A | N/A |
| Tax Fees | $2,800 | $2,700 |
| All Other Fees | N/A | N/A |
Brown Advisory Maryland Bond Fund
| FYE 6/30/2017 | FYE 6/30/2016 | |
| Audit Fees | $16,800 | $16,400 |
| Audit-Related Fees | N/A | N/A |
| Tax Fees | $2,800 | $2,700 |
| All Other Fees | N/A | N/A |
Brown Advisory Tax Exempt Bond Fund
| FYE 6/30/2017 | FYE 6/30/2016 | |
| Audit Fees | $16,800 | $16,400 |
| Audit-Related Fees | N/A | N/A |
| Tax Fees | $2,800 | $2,700 |
| All Other Fees | N/A | N/A |
Brown Advisory Mortgage Securities Fund
| FYE 6/30/2017 | FYE 6/30/2016 | |
| Audit Fees | $16,800 | $16,400 |
| Audit-Related Fees | N/A | N/A |
| Tax Fees | $2,800 | $2,700 |
| All Other Fees | N/A | N/A |
Brown Advisory – WMC Strategic European Equity Fund
| FYE 6/30/2017 | FYE 6/30/2016 | |
| Audit Fees | $16,800 | $16,400 |
| Audit-Related Fees | N/A | N/A |
| Tax Fees | $2,800 | $2,700 |
| All Other Fees | N/A | N/A |
Brown Advisor – WMC Japan Alpha Opportunities Fund
| FYE 6/30/2017 | FYE 6/30/2016 | |
| Audit Fees | $16,800 | $16,400 |
| Audit-Related Fees | N/A | N/A |
| Tax Fees | $2,800 | $2,700 |
| All Other Fees | N/A | N/A |
Brown Advisory – Somerset Emerging Markets Fund
| FYE 6/30/2017 | FYE 6/30/2016 | |
| Audit Fees | $16,800 | $16,400 |
| Audit-Related Fees | N/A | N/A |
| Tax Fees | $2,800 | $2,700 |
| All Other Fees | N/A | N/A |
Brown Advisory – Macquarie Asia New Stars Fund
| FYE 6/30/2017 | FYE 6/30/2016 | |
| Audit Fees | $16,800 | $16,400 |
| Audit-Related Fees | N/A | N/A |
| Tax Fees | $2,800 | $2,700 |
| All Other Fees | N/A | N/A |
The audit committee has adopted pre-approval policies and procedures that require the audit committee to pre‑approve all audit and non‑audit services of the Registrant, including services provided to any entity affiliated with the Registrant.
The percentages of fees billed by Tait, Weller & Baker LLP applicable to non-audit services pursuant to waiver of pre-approval requirement were as follows:
| FYE 6/30/2017 | FYE 6/30/2016 | |
| Audit-Related Fees | 0% | 0% |
| Tax Fees | 0% | 0% |
| All Other Fees | 0% | 0% |
All of the principal accountant’s hours spent on auditing the Registrant’s financial statements were attributed to work performed by full‑time permanent employees of the principal accountant.
The following table indicates the non-audit fees billed or expected to be billed by the Registrant’s accountant for services to the Registrant and to the Registrant’s investment adviser (and any other controlling entity, etc.—not sub-adviser) for the last two fiscal years. The audit committee of the board of trustees has considered whether the provision of non-audit services that were rendered to the Registrant's investment adviser is compatible with maintaining the principal accountant's independence and has concluded that the provision of such non-audit services by the accountant has not compromised the accountant’s independence.
| Non-Audit Related Fees | FYE 6/30/2017 | FYE 6/30/2016 |
| Registrant | N/A | N/A |
| Registrant’s Investment Adviser | N/A | N/A |
Item 5. Audit Committee of Listed Registrants.
| (a) | Not applicable to registrants who are not listed issuers (as defined in Rule 10A-3 under the Securities Exchange Act of 1934). |
| (b) | Not applicable. |
Item 6. Schedule of Investments.
| (a) | Schedule of Investments is included as part of the report to shareholders filed under Item 1 of this Form. |
| (b) | Not applicable. |
Item 7. Disclosure of Proxy Voting Policies and Procedures for Closed-End Management Investment Companies.
Not applicable to open-end investment companies.
Item 8. Portfolio Managers of Closed-End Management Investment Companies.
Not applicable to open-end investment companies.
Item 9. Purchases of Equity Securities by Closed‑End Management Investment Company and Affiliated Purchasers.
Not applicable to open-end investment companies.
Item 10. Submission of Matters to a Vote of Security Holders.
There have been no material changes to the procedures by which shareholders may recommend nominees to the registrant’s board of trustees.
Item 11. Controls and Procedures.
| (a) | The Registrant’s Principal Executive Officer and Principal Financial Officer have reviewed the Registrant's disclosure controls and procedures (as defined in Rule 30a-3(c) under the Investment Company Act of 1940 (the “Act”)) as of a date within 90 days of the filing of this report, as required by Rule 30a-3(b) under the Act and Rules 13a-15(b) or 15d‑15(b) under the Securities Exchange Act of 1934. Based on their review, such officers have concluded that the disclosure controls and procedures are effective in ensuring that information required to be disclosed in this report is appropriately recorded, processed, summarized and reported and made known to them by others within the Registrant and by the Registrant’s service provider. |
| (b) | There were no changes in the Registrant's internal control over financial reporting (as defined in Rule 30a-3(d) under the Act) that occurred during the fourth fiscal quarter of the period covered by this report that have materially affected, or are reasonably likely to materially affect, the Registrant's internal control over financial reporting. |
Item 12. Exhibits.
| (a) | (1) Any code of ethics or amendment thereto, that is subject of the disclosure required by Item 2, to the extent that the registrant intends to satisfy Item 2 requirements through filing an exhibit. Filed herewith. |
(2) A separate certification for each principal executive officer and principal financial officer pursuant to Section 302 of the Sarbanes-Oxley Act of 2002. Filed herewith.
(3) Any written solicitation to purchase securities under Rule 23c‑1 under the Act sent or given during the period covered by the report by or on behalf of the registrant to 10 or more persons. Not applicable to open-end investment companies.
| (b) | Certifications pursuant to Section 906 of the Sarbanes‑Oxley Act of 2002. Furnished herewith. |
SIGNATURES
Pursuant to the requirements of the Securities Exchange Act of 1934 and the Investment Company Act of 1940, the Registrant has duly caused this report to be signed on its behalf by the undersigned, thereunto duly authorized.
(Registrant) Brown Advisory Funds
By (Signature and Title)* /s/David M. Churchill
David M. Churchill, Principal Executive Officer
Date September 6, 2017
Pursuant to the requirements of the Securities Exchange Act of 1934 and the Investment Company Act of 1940, this report has been signed below by the following persons on behalf of the Registrant and in the capacities and on the dates indicated.
By (Signature and Title)* /s/David M. Churchill
David M. Churchill, Principal Executive Officer
Date September 6, 2017
By (Signature and Title)* /s/Jason T. Meix
Jason T. Meix, Principal Financial Officer
Date September 6, 2017
* Print the name and title of each signing officer under his or her signature.