UNITED STATES
SECURITIES AND EXCHANGE COMMISSION
Washington, D.C. 20549
SECURITIES AND EXCHANGE COMMISSION
Washington, D.C. 20549
FORM N-CSR
CERTIFIED SHAREHOLDER REPORT OF REGISTERED
MANAGEMENT INVESTMENT COMPANIES
Investment Company Act file number: (811-22708)
Brown Advisory Funds
(Exact name of Registrant as specified in charter)
(Exact name of Registrant as specified in charter)
901 South Bond Street Suite 400
Baltimore, MD 21231
(Address of principal executive offices) (Zip code)
(Address of principal executive offices) (Zip code)
David M. Churchill
Principal Executive Officer
Brown Advisory Funds
901 South Bond Street Suite 400
Baltimore, MD 21231
(Name and address of agent for service)
(Name and address of agent for service)
(410) 537-5400
Registrant's telephone number, including area code
Date of fiscal year end: June 30
Date of reporting period: June 30, 2016
Item 1. Reports to Stockholders.
ANNUAL REPORT
June 30, 2016
Brown Advisory Growth Equity Fund
Brown Advisory Value Equity Fund
Brown Advisory Flexible Equity Fund
Brown Advisory Equity Income Fund
Brown Advisory Sustainable Growth Fund
Brown Advisory Small-Cap Growth Fund
Brown Advisory Small-Cap Fundamental Value Fund
Brown Advisory Multi-Strategy Fund
Brown Advisory Global Leaders Fund
Brown Advisory Intermediate Income Fund
Brown Advisory Total Return Fund
Brown Advisory Strategic Bond Fund
Brown Advisory Maryland Bond Fund
Brown Advisory Tax Exempt Bond Fund
Brown Advisory Mortgage Securities Fund
Brown Advisory – WMC Strategic European Equity Fund
Brown Advisory – WMC Japan Alpha Opportunities Fund
Brown Advisory – Somerset Emerging Markets Fund
Brown Advisory Emerging Markets Small-Cap Fund
The views in the report contained herein were those of the Funds’ investment adviser, Brown Advisory LLC, or, for the sub-advised funds, of the respective sub-adviser, as of June 30, 2016 and may not reflect their views on the date this report is first published or anytime thereafter. This report may contain discussions about certain investments both held and not held in the portfolio as of June 30, 2016. All current and future holdings are subject to risk and are subject to change. While these views are intended to assist shareholders in understanding their investment in each Fund, they do not constitute investment advice, are not a guarantee of future performance and are not intended as an offer or solicitation with respect to the purchase or sale of any security. Performance figures include the reinvestment of dividend and capital gain distributions.
The Global Industry Classification Standard (GICS®) was developed by and is the exclusive property of MSCI, Inc. and Standard & Poor’s Financial Services LLC (“S&P”). GICS® is a service mark of MSCI, Inc. and S&P and has been licensed for use by the Administrator, U.S. Bancorp Fund Services, LLC.
TOPIX Index Values and TOPIX Marks are subject to the proprietary rights owned by the Tokyo Stock Exchange, Inc.
TABLE OF CONTENTS
| Brown Advisory Growth Equity Fund | ||
| A Message to our Shareholders, June 30, 2016 | 1 | |
| Performance Chart and Analysis | 3 | |
| Schedule of Investments, June 30, 2016 | 4 | |
| Brown Advisory Value Equity Fund | ||
| A Message to our Shareholders, June 30, 2016 | 5 | |
| Performance Chart and Analysis | 7 | |
| Schedule of Investments, June 30, 2016 | 8 | |
| Brown Advisory Flexible Equity Fund | ||
| A Message to our Shareholders, June 30, 2016 | 9 | |
| Performance Chart and Analysis | 11 | |
| Schedule of Investments, June 30, 2016 | 12 | |
| Brown Advisory Equity Income Fund | ||
| A Message to our Shareholders, June 30, 2016 | 13 | |
| Performance Chart and Analysis | 15 | |
| Schedule of Investments, June 30, 2016 | 16 | |
| Brown Advisory Sustainable Growth Fund | ||
| A Message to our Shareholders, June 30, 2016 | 17 | |
| Performance Chart and Analysis | 19 | |
| Schedule of Investments, June 30, 2016 | 20 | |
| Brown Advisory Small-Cap Growth Fund | ||
| A Message to our Shareholders, June 30, 2016 | 21 | |
| Performance Chart and Analysis | 23 | |
| Schedule of Investments, June 30, 2016 | 24 | |
| Brown Advisory Small-Cap Fundamental Value Fund | ||
| A Message to our Shareholders, June 30, 2016 | 26 | |
| Performance Chart and Analysis | 28 | |
| Schedule of Investments, June 30, 2016 | 29 | |
| Brown Advisory Multi-Strategy Fund | ||
| A Message to our Shareholders, June 30, 2016 | 30 | |
| Performance Chart and Analysis | 32 | |
| Schedule of Investments, June 30, 2016 | 33 | |
| Brown Advisory Global Leaders Fund | ||
| A Message to our Shareholders, June 30, 2016 | 34 | |
| Performance Chart and Analysis | 36 | |
| Schedule of Investments, June 30, 2016 | 37 | |
| Brown Advisory Intermediate Income Fund | ||
| A Message to our Shareholders, June 30, 2016 | 38 | |
| Performance Chart and Analysis | 39 | |
| Schedule of Investments, June 30, 2016 | 40 | |
| Brown Advisory Total Return Fund | ||
| A Message to our Shareholders, June 30, 2016 | 43 | |
| Performance Chart and Analysis | 44 | |
| Schedule of Investments, June 30, 2016 | 45 | |
| Brown Advisory Strategic Bond Fund | ||
| A Message to our Shareholders, June 30, 2016 | 48 | |
| Performance Chart and Analysis | 50 | |
| Schedule of Investments, June 30, 2016 | 51 | |
| Brown Advisory Maryland Bond Fund | ||
| A Message to our Shareholders, June 30, 2016 | 54 | |
| Performance Chart and Analysis | 55 | |
| Schedule of Investments, June 30, 2016 | 56 | |
| Brown Advisory Tax Exempt Bond Fund | ||
| A Message to our Shareholders, June 30, 2016 | 59 | |
| Performance Chart and Analysis | 60 | |
| Schedule of Investments, June 30, 2016 | 61 |
| Brown Advisory Mortgage Securities Fund | ||
| A Message to our Shareholders, June 30, 2016 | 64 | |
| Performance Chart and Analysis | 65 | |
| Schedule of Investments, June 30, 2016 | 66 | |
| Schedule of Securities Sold Short, June 30, 2016 | 73 | |
| Brown Advisory – WMC Strategic European Equity Fund | ||
| A Message to our Shareholders, June 30, 2016 | 74 | |
| Performance Chart and Analysis | 76 | |
| Schedule of Investments, June 30, 2016 | 77 | |
| Brown Advisory – WMC Japan Alpha Opportunities Fund | ||
| A Message to our Shareholders, June 30, 2016 | 79 | |
| Performance Chart and Analysis | 81 | |
| Schedule of Investments, June 30, 2016 | 82 | |
| Brown Advisory – Somerset Emerging Markets Fund | ||
| A Message to our Shareholders, June 30, 2016 | 85 | |
| Performance Chart and Analysis | 87 | |
| Schedule of Investments, June 30, 2016 | 88 | |
| Brown Advisory Emerging Markets Small-Cap Fund | ||
| A Message to our Shareholders, June 30, 2016 | 90 | |
| Performance Chart and Analysis | 91 | |
| Schedule of Investments, June 30, 2016 | 92 | |
| Statements of Assets and Liabilities | 94 | |
| Statements of Operations | 99 | |
| Statements of Changes in Net Assets | 104 | |
| Financial Highlights | 114 | |
| Notes to Financial Statements | 158 | |
| Report of Independent Registered Public Accounting Firm | 179 | |
| Additional Information | 180 |
GLOSSARY OF TERMS
Alpha refers to the abnormal rate of return on a security or portfolio in excess of what would be predicted by an equilibrium model like the capital asset pricing model (CAPM).
Barclays 1-10 Year Blended Municipal Bond Index is a market index of high quality, domestic fixed income securities with maturities of less than 10 years.
Barclays Intermediate US Aggregate Bond Index represents domestic taxable investment-grade bonds with index components for government and corporate securities, mortgage pass-through securities and asset-backed securities with average maturities and durations in the intermediate range. This index represents a sector of the Barclays US Aggregate Bond Index.
Barclays Mortgage Backed Securities Index is a market value-weighted index which covers the mortgage-backed securities component of the Barclays US Aggregate Bond Index. The index is composed of agency mortgage-backed passthrough securities of the Government National Mortgage Association (Ginnie Mae), the Federal National Mortgage Association (Fannie Mae), and the Federal Home Loan Mortgage Corporation (Freddie Mac) with a minimum $150 million par amount outstanding and a weighted-average maturity of at least 1 year. The index includes reinvestment of income.
Barclays US Aggregate Bond Index is a broad-based benchmark that measures the investment grade, US dollar-denominated, fixed-rate taxable bond market. The index includes Treasuries, government-related and corporate securities, MBS, ABS and CMBS.
Barclays US Corporate High Yield Index measures the US Dollar denominated, high-yield, fixed-rate corporate bond market.
Basis point(s) (bps) is a unit that is equal to 1/100th of 1%, and is used to denote the change in a financial instrument. The basis point is commonly used for calculating changes in interest rates, equity indexes and the yield of a fixed-income security. 1% is equal to 100 basis points.
Beta is a measure of the volatility, or systematic risk, of a security or a portfolio in comparison to the market as a whole.
Book value is the net asset value of a company, calculated by total assets minus intangible assets (patents, goodwill) and liabilities.
CAPEX, or capital expenditures, are funds used by a company to acquire or upgrade physical assets such as property, industrial buildings or equipment. It is often used to undertake new projects or investments by the firm. This type of outlay is also made by companies to maintain or increase the scope of their operations.
Cash flow measures the cash generating capability of a company by adding non-cash charges (e.g. depreciation) and interest expense to pretax income.
Correlation is a statistical measurement of how two securities move in relation to each other.
Dividend Yield is a financial ratio that shows how much a company pays out in dividends each year relative to its share price. In the absence of any capital gains, the dividend yield is the return on investment for a stock.
Downside Capture is a statistical measure of a fund’s performance in down markets. For example, a fund with downside capture of 90% would only have declined 90% as much as the related index during the same down market period.
Duration is a measure of the sensitivity of the price of a fixed-income investment to a change in interest rates. Duration is expressed as a number of years. Rising interest rates mean falling bond prices, while declining interest rates mean rising bond prices.
Earnings growth is a measure of growth in a company’s net income over a specific period, often one year. The term can apply to actual data from previous periods or estimated data for future periods.
Earnings per share (EPS) is calculated by taking the total earnings divided by the number of shares outstanding.
Earnings Yield is the earnings per share for the most recent 12-month period divided by the current market price per share. The earnings yield shows the percentage of each dollar invested in the stock that was earned by the company.
EBITDA is the Earnings Before Interest, Taxes, Depreciation and Amortization. An approximate measure of a company’s operating cash flow based on data from the company’s income statement.
Enterprise Value (EV) is a measure of a company’s value, often used as an alternative to straightforward market capitalization. Enterprise Value is calculated as market capitalization plus debt, minority interest and preferred shares, minus total cash and cash equivalents.
Forward price to earnings ratio uses forecasted earnings, rather than current earnings, to calculate the price to earnings ratio.
Free Cash Flow is the operating cash flows (net income plus amortization and depreciation) minus capital expenditures and dividends. Free cash flow is the amount of cash that a company has left over after it has paid all of its expenses, including investments.
Gross Domestic Product (GDP) is the monetary value of all the goods and services produced by an economy over a specified period. It includes consumption, government purchases, investments, and exports minus imports.
MSCI All Country World Index ex-U.S. is a market capitalization weighted index designed to provide a broad measure of stock performance throughout the world, with the exception of U.S.-based companies.
MSCI Emerging Markets Asia Small-Cap Index captures small-cap representation across 8 Emerging Markets countries.
MSCI Emerging Markets Index is a free float-adjusted market capitalization index that is designed to measure equity market performance in the global emerging markets.
GLOSSARY OF TERMS
MSCI Emerging Markets Small-Cap Index is a free float-adjusted market capitalization index that is designed to measure small cap equity market performance in the global emerging markets.
MSCI Europe Index is an index that captures large and mid cap representation across 15 developed market countries in Europe.
Price to Book Value Ratio (P/B) is ratio used to compare a stock’s market value to its book value. It is calculated by dividing the current closing price of the stock by the latest quarter’s book value per share.
Price to earnings ratio (P/E) is a common tool for comparing the prices of different common stocks and is calculated by dividing the current market price of a stock by the earnings per share.
Return of Capital (ROC) is a return from an investment that is not considered income. The return of capital is when some or all of the money an investor has in an investment is paid back to him or her, thus decreasing the value of the investment.
Return on Capital Employed (ROCE) is a financial ratio that measures a company’s profitability and the efficiency with which its capital is employed. Return on Capital Employed (ROCE) is calculated as: ROCE = Earnings Before Interest and Tax (EBIT) / Capital Employed.
Return on Equity (ROE) is the amount of net income returned as a percentage of shareholders equity. Return on equity measures a corporation’s profitability by revealing how much profit a company generates with the money shareholders have invested.
Return on Invested Capital (ROIC) is a calculation used to assess a company’s efficiency at allocating the capital under its control to profitable investments. ROIC is typically calculated by taking a company’s net income, subtracting dividends the company paid out and dividing that amount by the company’s total capital.
Russell Global Large Cap Index measures the performance of the largest securities in the Russell Global Index, based on market capitalization.
Russell 1000® Growth Index measures the performance of the large-cap growth segment of the of the U.S. equity universe. It includes those Russell 1000® companies with higher price to book value ratios and higher forecasted growth values.
Russell 1000® Value Index measures the performance of the large-cap value segment of the U.S. equity universe. It includes those Russell 1000® companies with lower price to book value ratios and lower expected growth values.
Russell 2000® Growth Index measures the performance of the small-cap growth segment of the U.S. equity universe. It includes those Russell 2000® companies with higher price to book value ratios and higher forecasted growth values.
Russell 2000® Index measures the performance of the 2,000 smallest companies in the Russell 3000® Index.
Russell 2000® Value Index measures the performance of the small-cap value segment of the U.S. equity universe. It includes those Russell 2000® companies with lower price to book value ratios and lower forecasted growth values.
Russell 3000® Index measures the performance of the 3,000 largest U.S. companies representing approximately 98% of the investable U.S. equity market.
S&P Balanced Equity and Bond – Moderate Index is the moderate profile of the S&P Balanced Equity and Bond Series which combines investable S&P indices for core equity and fixed income to provide a regulary rebalanced multi-asset measure for conservative, moderate and growth risk-reward profiles.
S&P 500 Index (“S&P 500”) is a market-value weighted index representing the performance of 500 widely held, publicly traded large capitalization stocks.
Tier 1 Capital Ratio is a comparison between a banking firm’s core equity capital and total risk-weighted assets. A firm’s core equity capital is known as its Tier 1 capital and is the measure of a bank’s financial strength based on the sum of its equity capital and disclosed reserves, and sometimes non-redeemable, non-cumulative preferred stock. A firm’s risk-weighted assets include all assets that the firm holds that are systematically weighted for credit risk. Central banks typically develop the weighting scale for different asset classes, such as cash and coins, which have zero risk, versus a letter or credit, which carries more risk.
TOPIX Total Return U.S. Dollar Hedged Index is a market capitalization-weighted index of all companies listed on the First Section of the Tokyo Stock Exchange, hedged to eliminate the impact of the change in value between the US Dollar and Japanese Yen. The unhedged version of this index, known as the TOPIX Total Return Index, does not eliminate the change in value between the US Dollar and Japanese Yen.
Turnover refers to a fund buying or selling securities. (The fund “turns over” its portfolio.) A fund pays transaction costs, such as commissions, when it buys and sells securities. Additionally, a higher turnover rate may result in higher taxes when the fund shares are held in a taxable account.
Yield Curve is a line that plots the yields of securities having equal credit quality but different maturity dates.
Yield Spread is the difference between yields on differing securities, calculated by deducting the yield of one security from another.
The broad based market indexes referenced in the following management commentaries are considered representative of their indicated market, the indexes are unmanaged and do not reflect the deduction of fees, such as, investment management and fund accounting fees, or taxes associated with a mutual fund. Investors cannot invest directly in an index.
Brown Advisory Growth Equity Fund
A Message to Our Shareholders
June 30, 2016
Dear Shareholder:
During the year ended June 30, 2016, the Brown Advisory Growth Equity Fund Investor Shares (the “Fund”) increased 0.34% in value. During the same period, the Russell 1000 Growth Index (the “Index”), the Fund’s benchmark, increased 3.02%.
Terrorist attacks and political uncertainty are just some of the issues investors wrestled with that sent equity markets on a roller coaster ride during the past 12 months. Despite the turbulence, the Fund and the Index both ended the period with a positive return.
The U.K. vote to leave the European Union roiled worldwide financial markets, partly due to concerns about Europe’s fragile growth trajectory. Amid the setback for broader markets, the Fund gave back the gains made in the prior months. Interest rate-sensitive stocks—especially those in financial services—were hit especially hard by the Brexit vote. The referendum threw yet another wrench into the Federal Reserve’s projections for an increase in the main interest rate. The yield on 10-year Treasuries dipped toward a historic low, pushing up shares with above-average dividend yields, such as those in consumer staples, utilities, and telecommunications sectors. We tend to be very underweight utilities and other high-dividend-paying stocks because they rarely meet our growth criteria.
Health care was the best performing sector compared with its counterpart in the benchmark during this time period. As a group, our health care positions held up better than the Index, due in part to the underweight to biotechnology, which fell 22%, and several individual holdings that outperformed, including long-time holding Intuitive Surgical. It was not that long ago that short-sighted investors left the stock for dead while the company worked through a sluggish cycle in hospital spending and rolled out a new version of its robotic surgical system. Procedure growth for the new system is performing better than many analysts expected, and international procedure growth is accelerating. On the negative side of health care, Alexion has been one of our biggest detractors. While the competitive environment has improved for Alexion, its results have been impaired by the strengthening U.S. dollar. Most biotech companies don’t have to deal with foreign currency issues as their revenues are predominantly domestic. Rather than avoid companies with overseas exposure, we look for those with unique products or services that are not easily replicated by competitors that benefit from the advantage of residing in a country with a weakening currency. For some of our companies, currency fluctuations will be a temporary headwind to near-term earnings. Over the long run, companies such as Alexion—which produces lifesaving drugs for the global market—have the potential to ultimately benefit from geographical diversification and the generation of revenues worldwide.
The recent volatility continues to provide opportunities to initiate new positions in what we believe to be exceptional business models and in some cases add to those that we already own. One example of this activity is our swap from Colfax to Westinghouse Air Brake Technologies (Wabtec). Wabtec is a leading manufacturer of electronic control and braking technology for the global rail industry. The recent declines in North America rail volume caused by the dislocation across the industrial landscape has created, in our belief, an excellent opportunity to invest in a best-in-breed industrial company trading at a very compelling valuation. There are several factors that make Wabtec an attractive long-term investment opportunity. Its electronic control system has become the industry standard, and new regulations will require that it be installed on new and existing trains over the next few years. The company recently announced the acquisition of a European company, gaining exposure to the commuter rail market and reducing the cyclicality of the business. We sold our position in Colfax, which is also a high quality industrial company. However, Colfax’s end markets are much more cyclical and we have much less confidence in its ability to grow through the global downturn. Although Colfax and Wabtec have both traded lower, we believe Wabtec possesses a superior business model.
We eliminated the last remaining pure energy stock in the portfolio during this period. As the price of oil declined and subsequently bottomed in February, energy stock valuations in our view signaled that investment in oilfield service stocks was predicated on the notion that the price of oil would quickly rebound. Our skill set is not predicting the short term direction of commodity prices. As such, we continued to reduce our exposure to energy and have now eliminated all of the pure energy stocks in the portfolio. We used the proceeds from the sale of FMC Technologies which is an oilfield service company, to purchase SBA Communications. SBA owns and operates cellular communication towers primarily in North America and Brazil. We have been watching SBA for several years, but it had never traded at a valuation we were willing to pay. Concerns about the deprecation of Brazil’s currency and general market weakness created an excellent opportunity in which to build our position. The business model has been stable with long term predictable lease terms. Also, the company has several new drivers for potential growth, including increasing mobile usage and reoccurring upgrades in communication hardware which has led to higher revenue per unit.
www.brownadvisoryfunds.com
1
Brown Advisory Growth Equity Fund
A Message to Our Shareholders
June 30, 2016
Despite the specter of slowing global growth we continue to find high quality growth companies. We have tried to use the recent market volatility to our advantage by capturing them at attractive valuations. At times, the market becomes preoccupied with short-term noise created by such things as foreign currency fluctuations or interest rates. Our focus has always been on business models that, in our belief, provide a truly differentiated product or customer experience. We believe this has the potential to translate into a sustainable long term growth rate.
Sincerely,
Kenneth M. Stuzin, CFA
Portfolio Manager
Past performance is not a guarantee of future results.
Mutual fund investing involves risk. Principal loss is possible. Investments in medium capitalization companies generally carry greater risk than is customarily associated with larger companies for various reasons such as narrower markets, limited financial resources and less liquid stock. The value of the Fund’s investments in REITs may change in response to changes in the real estate market such as declines in the value of real estate, lack of available capital or financing opportunities, and increases in property taxes or operating costs. Investments in foreign securities entail certain risks not associated with investments in domestic securities, such as volatility of currency exchange rates, and in some cases, political and economic instability and relatively illiquid markets. These risks are greater for investments in emerging markets. The Fund may invest in ETFs, which may trade at a discount to the aggregate value of the underlying securities and although expense ratios for ETFs are generally low, frequent trading of ETFs by the Fund can generate brokerage expenses.
Fund holdings and sector allocations are subject to change and should not be considered a recommendation to buy or sell any security. For a complete list of fund holdings, please refer to the Schedule of Investments provided in this report.
Definitions for terms and indices are provided in the Glossary of Terms.
www.brownadvisoryfunds.com
2
Brown Advisory Growth Equity Fund
Performance Chart and Analysis
June 30, 2016
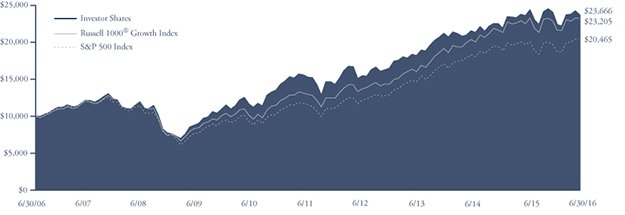
COMPARISON OF CHANGE IN VALUE OF A $10,000 INVESTMENT
The following chart reflects the change in value of a hypothetical $10,000 investment, including reinvested dividends and distributions, in the Fund as measured against broad-based securities market indices. The Russell 1000® Growth Index measures the performance of the large-cap growth segment of the U.S. equity universe. It includes those Russell 1000® companies with higher price to book and higher forecasted growth values. The S&P 500 Index is a market-value weighted index representing the performance of 500 widely held, publicly traded large capitalization stocks. The indexes are unmanaged and do not reflect the deduction of fees, such as investment management fees. Investors cannot invest directly in an index.
| Average Annual Total Return | One | Five | Ten | |
as of 6/30/16 | Year | Year | Year | |
Institutional Shares1 | 0.49% | 9.32% | 9.16% | |
| Investor Shares | 0.34% | 9.16% | 9.00% | |
| Advisor Shares | 0.09% | 8.90% | 8.61% | |
Russell 1000® Growth Index | 3.02% | 12.35% | 8.78% | |
| S&P 500 Index | 3.99% | 12.10% | 7.42% |
Institutional Shares | Investor Shares | Advisor Shares | ||
Gross Expense Ratio2 | 0.72% | 0.87% | 1.12% | |
Net Expense Ratio2 | 0.72% | 0.87% | 1.12% |
Past performance does not guarantee future results. The performance data quoted represents past performance and current returns may be lower or higher. The investment return and net asset value will fluctuate so that an investor’s shares, when redeemed, may be worth more or less than the original cost. To obtain performance information current to the most recent month end, please visit our website at brownadvisoryfunds.com/performance.html. The performance table and graph above do not reflect the deduction of taxes that a shareholder would pay on Fund distributions or the redemption of Fund shares. Investment performance reflects periods during which fee waivers were in effect. In the absence of such waivers, total return would have been reduced. Performance data does not reflect the imposition of the redemption fee of 1.00% on shares redeemed within 14 days, and if it did, performance would have been lower.
1 | Performance information for the Institutional Shares, prior to commencement of operations on October 19, 2012, is based on the performance of Investor Shares, and adjusted for the lower expenses applicable to Institutional Shares. |
2 | Per the Fund’s prospectus dated October 30, 2015. |
www.brownadvisoryfunds.com
3
Brown Advisory Growth Equity Fund
Schedule of Investments
June 30, 2016
Shares | Security Description | Value $ | ||||||
| Common Stocks — 95.1% | ||||||||
| Consumer Discretionary — 14.5% | ||||||||
| 147,410 | Amazon.com, Inc.* | 105,489,544 | ||||||
| 1,577,207 | Starbucks Corp. | 90,090,064 | ||||||
| 1,048,990 | TripAdvisor, Inc.* | 67,450,057 | ||||||
| 590,398 | Under Armour, Inc. — Class A* | 23,692,672 | ||||||
| 910,296 | Under Armour, Inc. — Class C* | 33,134,784 | ||||||
| 319,857,121 | ||||||||
| Consumer Staples — 10.6% | ||||||||
| 534,173 | Costco Wholesale Corp. | 83,886,528 | ||||||
| 864,858 | Estee Lauder Companies, Inc. | 78,719,375 | ||||||
| 779,564 | Mead Johnson Nutrition Co. | 70,745,433 | ||||||
| 233,351,336 | ||||||||
| Financials — 1.0% | ||||||||
| 858,735 | Charles Schwab Corp. | 21,734,583 | ||||||
| Health Care — 14.9% | ||||||||
| 429,598 | Alexion Pharmaceuticals, Inc.* | 50,159,862 | ||||||
| 1,110,603 | Bristol-Myers Squibb Co. | 81,684,851 | ||||||
| 661,938 | DaVita HealthCare Partners, Inc.* | 51,181,046 | ||||||
| 878,471 | Express Scripts Holding Co.* | 66,588,102 | ||||||
| 119,327 | Intuitive Surgical, Inc.* | 78,924,071 | ||||||
| 328,537,932 | ||||||||
| Industrials — 8.3% | ||||||||
| 888,752 | Danaher Corp. | 89,763,952 | ||||||
| 1,032,895 | Fastenal Co. | 45,850,209 | ||||||
| 666,950 | Wabtec Corp. | 46,839,899 | ||||||
| 182,454,060 | ||||||||
| Information Technology — 39.9% | ||||||||
| 532,631 | Adobe Systems, Inc.* | 51,020,723 | ||||||
| 882,158 | Akamai Technologies, Inc.* | 49,339,097 | ||||||
| 62,606 | Alphabet, Inc. — Class A* | 44,045,199 | ||||||
| 88,060 | Alphabet, Inc. — Class C* | 60,946,326 | ||||||
| 1,227,875 | Amphenol Corp. | 70,394,074 | ||||||
| 456,039 | ANSYS, Inc.* | 41,385,539 | ||||||
| 872,090 | Cognizant Technology Solutions Corp.* | 49,918,432 | ||||||
| 842,808 | Facebook, Inc.* | 96,316,098 | ||||||
| 347,489 | FleetCor Technologies, Inc.* | 49,736,101 | ||||||
| 2,187,741 | Genpact, Ltd.* | 58,718,968 | ||||||
| 553,138 | National Instruments Corp. | 15,155,981 | ||||||
| 602,146 | NetSuite, Inc.* | 43,836,229 | ||||||
| 724,855 | NXP Semiconductors NV* | 56,785,141 | ||||||
| 495,942 | PayPal Holdings, Inc.* | 18,106,842 | ||||||
| 952,132 | salesforce.com, Inc.* | 75,608,802 | ||||||
| 1,316,005 | Visa, Inc. | 97,608,091 | ||||||
| 878,921,643 | ||||||||
| Materials — 3.5% | ||||||||
| 645,843 | Ecolab, Inc. | 76,596,980 | ||||||
| Telecommunication Services — 2.4% | ||||||||
| 504,081 | SBA Communications Corp.* | 54,410,503 | ||||||
| Total Common Stocks (Cost $1,485,144,893) | 2,095,864,158 | |||||||
| Short-Term Investments — 4.0% | ||||||||
| Money Market Funds — 4.0% | ||||||||
| 88,142,557 | Cash Account Trust — Government | |||||||
| & Agency Securities Portfolio — | ||||||||
| Institutional Shares, 0.34%# | 88,142,557 | |||||||
| Total Short-Term Investments (Cost $88,142,557) | 88,142,557 | |||||||
| Total Investments — 99.1% (Cost $1,573,287,450) | 2,184,006,715 | |||||||
| Other Assets in Excess of Liabilities — 0.9% | 19,410,231 | |||||||
| NET ASSETS — 100.0% | $ | 2,203,416,946 | ||||||
| PORTFOLIO HOLDINGS | |
| % of Net Assets | |
| Information Technology | 39.9% |
| Health Care | 14.9% |
| Consumer Discretionary | 14.5% |
| Consumer Staples | 10.6% |
| Industrials | 8.3% |
| Money Market Funds | 4.0% |
| Materials | 3.5% |
| Telecommunication Services | 2.4% |
| Financials | 1.0% |
| Other Assets and Liabilities | 0.9% |
| 100.0% |
| * | Non-Income Producing |
| # | Annualized seven-day yield as of June 30, 2016. |
The accompanying notes are an integral part of these financial statements.
www.brownadvisoryfunds.com
4
Brown Advisory Value Equity Fund
A Message to Our Shareholders
June 30, 2016
Dear Shareholder:
During the year ended June 30, 2016, the Brown Advisory Value Equity Fund Investor Shares (the “Fund”) declined 8.74%, while the Russell 1000 Value Index, the Fund’s benchmark, increased 2.86%.
During the year, the U.S. equity market took investors on a wild ride but was unable to break out of a trading range. Our underperformance was a tale of two halves: Stock selection was the biggest factor in the first six months while sector allocation dominated the final six months.
In the final six months of 2015, a variety of factors impaired Fund results. Fears of a global slowdown resulting from China’s currency devaluation impacted our energy, material, and industrial holdings, especially Plains GP Holdings, Potash and Joy Global. Company-specific weakness in Micron and Apple—a strong performer last year—weighed on the strategy. Poor company outlooks affected the performance of Viacom and Ameriprise.
In the first six months of 2016 (the second half of this reporting period), the sharp decline in interest rates to record lows inverted the age-old adage of “buy bonds for income and stocks for capital gains.” As of now, equities yield more than bonds and it will be difficult to eke out much of a return on bonds without a capital gain component. Of course, to generate capital gains, rates would need to go even lower.
Several events along the way exacerbated the sharp decline in rates, but the two large forces were, 1) the move by Japan and European central banks to drive interest rates into negative yields and 2) the Brexit decision in the U.K. These events caused equity investors to move away from risk assets and instead chase yield in perceived safe havens such as utilities and telecom services. Both sectors had benchmark-leading returns exceeding 20%, and we were hurt by not having exposure to these traditionally defensive areas. Worth noting, during the period between these two events, the Fund’s performance was quite strong and kept pace with the benchmark.
During the year, consumer staples was our top performing sector—a bright spot for us among the traditionally defined defensive sectors. Philip Morris and Unilever, our two consumer staples holdings, gained 32% and 15% respectively.
In health care, political headlines focused on aggressive industry pricing practices undermined investor sentiment and weighed on our pharmaceutical names. Despite the overhang, drug price inflation has very little impact on the revenues of our pharmaceutical holdings. We remain confident in the long-term fundamentals of our health care holdings and believe they represent great value at current prices.
We believe the low and negative rate environment is distorting saving, consumption and investment. We see sizable misallocations of capital: stable businesses such as utilities and staples have traded at record high valuations, Merger & Acquisitions valuations have increased every month and corporations have been hesitant to increase capital expenditures because of the uncertainty of growth and a proper rate to discount the cash flows. Importantly, our portfolio investment allocations are based on bottom up value seeking—improving fundamentals and solid cash flows not recognized by the market—rather than on a macro call on the movement of interest rates.
Our overweight sectors (consumer discretionary, technology and financials) are currently valued at 13x forward earnings, while our underweights (utilities, telecom, energy, materials, staples) are currently valued at 22x forward earnings.
During the year we eliminated 16 holdings and added 10 to the portfolio, not including several corporate actions. Our portfolio turnover was driven by selling companies heavily dependent on macro factors in favor of companies with promising valuations.
We took advantage of market dislocations to add a number of quality companies across sectors at what we believe to be attractive prices. Centene, Target, CarMax, Liberty Media and Wells Fargo are U.S.-centric companies featuring historically steady growth, high returns on capital and low earnings variability. We believe they are undervalued. In addition to Wells Fargo, we diversified our financial holdings by adding Towers Watson and Comerica, while swapping out Northern Trust. We believe that General Dynamics is a much more defensive industrial company than the ones we sold, with good visibility for potential growth in its defense business and an underappreciated outlook for its competitively positioned Gulfsteam business jets.
We eliminated some of our weakest performers, including Viacom, Plains GP Holdings, Joy Global, Copa Airlines and Oceaneering among others. We sold these companies because of pricing pressures and structural challenges in their end markets. Their exposure to external factors outside of management control overwhelmed the business attributes that originally attracted us to these companies.
www.brownadvisoryfunds.com
5
Brown Advisory Value Equity Fund
A Message to Our Shareholders
June 30, 2016
The investor bias toward safety appears unsustainable to us. Our overweight sectors combine modest valuation with supportive business fundamentals. For example, key characteristics of our consumer discretionary holdings include companies with what we believe to be durable competitive advantage, innovation, strong consumer value propositions and attractive financial metrics. Our technology holdings maintain strong cash flow and profitability metrics with what we believe are good growth prospects. Our financial holdings have continued to take market share and cut costs even as Federal Reserve policymakers signal a postponement of their next increase in the main interest rate. For the defensive sectors, we believe the high current valuation, low growth prospects, and poor business models, along with the inevitable rise in rates, will likely provide sub-par returns for investors over the intermediate to long term.
Sincerely,
Doron S. Eisenberg, CFA
Portfolio Manager
Michael L. Foss, CFA
Portfolio Manager
Past performance is not a guarantee of future results.
Mutual fund investing involves risk. Principal loss is possible. Investments in medium capitalization companies generally carry greater risk than is customarily associated with larger companies for various reasons such as narrower markets, limited financial resources and less liquid stock. The value of the Fund’s investments in REITs may change in response to changes in the real estate market such as declines in the value of real estate, lack of available capital or financing opportunities, and increases in property taxes or operating costs. The Fund may invest in ETFs, which may trade at a discount to the aggregate value of the underlying securities and although expense ratios for ETFs are generally low, frequent trading of ETFs by the Fund can generate brokerage expenses. Investments in foreign securities entail certain risks not associated with investments in domestic securities, such as volatility of currency exchange rates, and in some cases, political and economic instability and relatively illiquid markets. These risks are greater for investments in emerging markets. Diversification does not guarantee a profit or protect from loss in a declining market. Earnings growth is not a measure of the Fund’s future performance.
Fund holdings and sector allocations are subject to change and should not be considered a recommendation to buy or sell any security. For a complete list of fund holdings, please refer to the Schedule of Investments provided in this report.
Definitions for terms and indices are provided in the Glossary of Terms.
www.brownadvisoryfunds.com
6
Brown Advisory Value Equity Fund
Performance Chart and Analysis
June 30, 2016
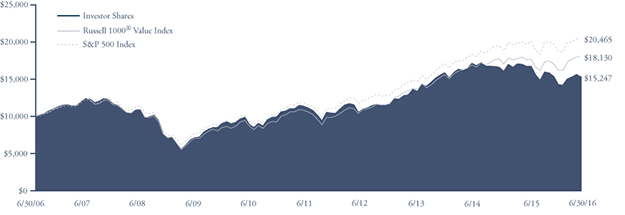
COMPARISON OF CHANGE IN VALUE OF A $10,000 INVESTMENT
The following chart reflects the change in value of a hypothetical $10,000 investment, including reinvested dividends and distributions, in the Fund as measured against broad-based securities market indices. The Russell 1000® Value Index measures the performance of the large-cap value segment of the U.S. equity universe. It includes those Russell 1000® companies with lower price to book ratios and lower expected growth values. The S&P 500 Index is a market-value weighted index representing the performance of 500 widely held, publicly traded large capitalization stocks. The indexes are unmanaged and do not reflect the deduction of fees, such as investment management fees. Investors cannot invest directly in an index.
| Average Annual Total Return | One | Five | Ten | |
as of 6/30/16 | Year | Year | Year | |
Institutional Shares1 | -8.57% | 6.73% | 4.46% | |
| Investor Shares | -8.74% | 6.57% | 4.31% | |
| Advisor Shares | -8.97% | 6.33% | 3.93% | |
Russell 1000® Value Index | 2.86% | 11.35% | 6.13% | |
| S&P 500 Index | 3.99% | 12.10% | 7.42% |
Institutional Shares | Investor Shares | Advisor Shares | ||
Gross Expense Ratio2 | 0.75% | 0.90% | 1.15% | |
Net Expense Ratio2 | 0.75% | 0.90% | 1.15% |
Past performance does not guarantee future results. The performance data quoted represents past performance and current returns may be lower or higher. The investment return and net asset value will fluctuate so that an investor’s shares, when redeemed, may be worth more or less than the original cost. To obtain performance information current to the most recent month end, please visit our website at brownadvisoryfunds.com/performance.html. The performance table and graph above do not reflect the deduction of taxes that a shareholder would pay on Fund distributions or the redemption of Fund shares. Investment performance reflects periods during which fee waivers were in effect. In the absence of such waivers, total return would have been reduced. Performance data does not reflect the imposition of the redemption fee of 1.00% on shares redeemed within 14 days, and if it did, performance would have been lower.
1 | Performance information for the Institutional Shares, prior to commencement of operations on October 19, 2012, is based on the performance of Investor Shares, and adjusted for the lower expenses applicable to Institutional Shares. |
2 | Per the Fund’s prospectus dated October 30, 2015. |
www.brownadvisoryfunds.com
7
Brown Advisory Value Equity Fund
Schedule of Investments
June 30, 2016
Shares | Security Description | Value $ | ||||||
| Common Stocks — 89.2% | ||||||||
| Consumer Discretionary — 12.7% | ||||||||
| 21,167 | BorgWarner, Inc. | 624,850 | ||||||
| 25,796 | CarMax, Inc.* | 1,264,778 | ||||||
| 30,064 | Garmin, Ltd. | 1,275,315 | ||||||
| 29,361 | Liberty Media Group* | 556,978 | ||||||
| 28,529 | Liberty Media SiriusXM Group* | 880,690 | ||||||
| 20,432 | Michael Kors Holdings, Ltd.* | 1,010,975 | ||||||
| 14,756 | Target Corp. | 1,030,264 | ||||||
| 6,643,850 | ||||||||
| Consumer Staples — 6.4% | ||||||||
| 16,459 | Philip Morris International, Inc. | 1,674,210 | ||||||
| 35,780 | Unilever NV ADR | 1,679,513 | ||||||
| 3,353,723 | ||||||||
| Energy — 5.4% | ||||||||
| 16,195 | Occidental Petroleum Corp. | 1,223,694 | ||||||
| 58,913 | Suncor Energy, Inc. | 1,633,658 | ||||||
| 2,857,352 | ||||||||
| Financials — 21.4% | ||||||||
| 15,811 | Ameriprise Financial, Inc. | 1,420,618 | ||||||
| 40,056 | Charles Schwab Corp. | 1,013,817 | ||||||
| 12,694 | Comerica, Inc. | 522,104 | ||||||
| 31,815 | JPMorgan Chase & Co. | 1,976,984 | ||||||
| 169,026 | Regions Financial Corp. | 1,438,411 | ||||||
| 40,784 | SunTrust Banks, Inc. | 1,675,407 | ||||||
| 18,721 | Synovus Financial Corp. | 542,722 | ||||||
| 8,777 | T. Rowe Price Group, Inc. | 640,458 | ||||||
| 20,016 | Wells Fargo Co. | 947,357 | ||||||
| 8,154 | Willis Towers Watson PLC | 1,013,624 | ||||||
| 11,191,502 | ||||||||
| Health Care — 14.6% | ||||||||
| 33,613 | AbbVie, Inc. | 2,080,981 | ||||||
| 9,664 | Centene Corp.* | 689,720 | ||||||
| 38,881 | Hologic, Inc.* | 1,345,282 | ||||||
| 21,191 | Merck & Co., Inc. | 1,220,813 | ||||||
| 11,863 | Novartis AG ADR | 978,816 | ||||||
| 27,051 | Teva Pharmaceutical Industries, Ltd. ADR | 1,358,772 | ||||||
| 7,674,384 | ||||||||
| Industrials — 6.1% | ||||||||
| 7,594 | General Dynamics Corp. | 1,057,389 | ||||||
| 51,271 | General Electric Co. | 1,614,011 | ||||||
| 10,016 | PACCAR, Inc. | 519,530 | ||||||
| 3,190,930 | ||||||||
| Information Technology — 22.6% | ||||||||
| 16,043 | Apple, Inc. | 1,533,711 | ||||||
| 11,967 | Check Point Software Technologies, Ltd.* | 953,531 | ||||||
| 65,036 | Cisco Systems, Inc. | 1,865,883 | ||||||
| 40,464 | CommScope Holding Co, Inc.* | 1,255,598 | ||||||
| 47,346 | eBay, Inc.* | 1,108,370 | ||||||
| 19,409 | Microchip Technology, Inc. | 985,201 | ||||||
| 22,055 | Micron Technology, Inc.* | 303,477 | ||||||
| 24,053 | Microsoft Corp. | 1,230,792 | ||||||
| 18,349 | PayPal Holdings, Inc.* | 669,922 | ||||||
| 18,441 | QUALCOMM, Inc. | 987,884 | ||||||
| 25,076 | Yahoo, Inc.* | 941,854 | ||||||
| 11,836,223 | ||||||||
| Total Common Stocks (Cost $37,311,741) | 46,747,964 | |||||||
| Real Estate Investment Trusts — 5.0% | ||||||||
| 42,063 | Forest City Realty Trust, Inc. | 938,425 | ||||||
| 24,085 | W.P. Carey, Inc. | 1,671,981 | ||||||
| Total Real Estate Investment Trusts (Cost $2,224,322) | 2,610,406 | |||||||
| Short-Term Investments — 2.9% | ||||||||
| Money Market Funds — 2.9% | ||||||||
| 1,516,074 | Cash Account Trust — Government | |||||||
| & Agency Securities Portfolio — | ||||||||
| Institutional Shares, 0.34%# | 1,516,074 | |||||||
| Total Short-Term Investments (Cost $1,516,074) | 1,516,074 | |||||||
| Total Investments — 97.1% (Cost $41,052,137) | 50,874,444 | |||||||
| Other Assets in Excess of Liabilities — 2.9% | 1,522,506 | |||||||
| NET ASSETS — 100.0% | $ | 52,396,950 | ||||||
| PORTFOLIO HOLDINGS | |
| % of Net Assets | |
| Information Technology | 22.6% |
| Financials | 21.4% |
| Health Care | 14.6% |
| Consumer Discretionary | 12.7% |
| Consumer Staples | 6.4% |
| Industrials | 6.1% |
| Energy | 5.4% |
| Real Estate Investment Trusts | 5.0% |
| Money Market Funds | 2.9% |
| Other Assets and Liabilities | 2.9% |
| 100.0% |
ADR — American Depositary Receipt
| * | Non-Income Producing |
| # | Annualized seven-day yield as of June 30, 2016. |
The accompanying notes are an integral part of these financial statements.
www.brownadvisoryfunds.com
8
Brown Advisory Flexible Equity Fund
A Message to Our Shareholders
June 30, 2016
Dear Shareholder:
During the year ended June 30, 2016, the Brown Advisory Flexible Equity Fund Investor Shares (the “Fund”) decreased 4.30%. The S&P 500 Index, the Fund’s benchmark, increased 3.99% during the same period.
Our investment results over time and relative to the S&P 500 Index benchmark have been good, despite recently lagging the market. In the past, periods of underperformance for our strategy have usually coincided with a narrowness in the focus of the markets, when just a few stocks or a particular economic sector do extremely well and the broader market lags behind. However, stocks that have recently performed well are not where we first look for new ideas—though we don’t rule them out. This approach differs from that of many investors but has served us well in the long run.
Narrowness in market focus has been a factor recently in our performance, but any manager with a portfolio that differs from the market is likely going to have periods of underperformance from time to time. There isn’t an investment Superman, Superwoman or Superteam that always out-performs the market averages. Our performance has rebounded strongly after previous lagging periods, and that is again our goal. As with the prior cases of underperformance, we are sticking with our investment disciplines rather than chasing what has been hot lately. Anything can happen in markets in short periods of time, but in the long term the market has tended to find its way back to rewarding good business performance purchased on a reasonable valuation basis. We have a strong investment team with great continuity and the same disciplines and approach as always.
The top contributor to return during the year was Edwards Lifesciences Corp., a manufacturer of devices to treat cardiovascular disease. Edwards Lifesciences rose because of strong revenue and earnings results and increased earnings guidance for the future. Additional large contributors to the Fund’s results in the period include Alphabet, Inc. Class A & C (formerly known as Google), a leader in on-line search; Lowe’s Companies, Inc., a leading home improvements retailer; Visa, Inc., a global payments processor; and Yahoo! Inc., an internet company. With the exception of Yahoo!, these have each been prominent companies and leaders in their fields. Each was purchased at times when we believe they offered exceptional value for the money from a long-term perspective, which has become better appreciated in the last year. Yahoo!, or at least its namesake business, is not exceptional but the sum of its various parts, the largest being Alibaba, the Chinese Internet retailer, showed that the shares were trading at a meaningful discount to the sum of its parts. Yahoo! shares have risen given the actions the company has taken to better realize the value of these parts for shareholders.
The biggest detractor to returns was Kinder Morgan, Inc., a pipeline transportation company, as its stock fell 49% during the year. As we discussed in our semi-annual report, we viewed Kinder Morgan’s fuel transport business as having low sensitivity to energy prices. But its reliance on capital markets to fund construction of new pipelines and expand capacity at existing lines was costly when investors’ appetite waned for funding new energy investments. Kinder was forced to either cut its investment projects or its dividend, and it chose to reduce its dividend by 75%, from $2 to 50 cents per share. The cash flows supporting the previous $2 dividend and debt service were largely intact, so we kept our stock and added to the holding as the company made good progress in improving its financial position.
Other meaningful detractors to the Fund’s performance were Charles Schwab Corp., a financial services company; Express Scripts, a pharmacy benefits manager; Copa Holdings, a Latin American airline; and Teva Pharmaceutical, a branded and proprietary pharmaceuticals manufacturer. We exited Copa during the year and continue to hold the others. We added to Teva, given the better value at the lower prices.
We added two new holdings and eliminated five since our December 31, 2015, Semi-Annual Report to shareholders. We purchased what we believe are good companies whose stocks sold off too much in our view and trimmed other holdings that held up well. We also eliminated holdings where our views of their long-term business opportunities had changed and invested in companies at good valuations with stronger near-term business trends and future prospects.
A weak earnings report and an increasingly competitive environment for credit cards prompted us to eliminate American Express. We sold Franklin Resources while maintaining our weighting in asset management companies with our investments in Ameriprise Financial and T. Rowe Price. Franklin Resources has been hit hard by recent investor withdrawals, especially involving international investments. We sold International Business Machines, an information technology company, as its various business initiatives have not sufficiently increased revenues and earnings. We exited Oceaneering International, a provider of offshore oil and services, because low oil prices have dimmed the outlook for offshore oil drilling relative to onshore drilling in shale formations in the U.S. The technology gains in onshore oil production from U.S. shale make offshore development less competitive, even with a rebound in oil prices. We eliminated California Resources shares that were distributed as part of a spinoff from Occidental Petroleum, an integrated energy company.
www.brownadvisoryfunds.com
9
Brown Advisory Flexible Equity Fund
A Message to Our Shareholders
June 30, 2016
We eliminated Owens Corning, a producer of building materials. The investment had done well since it was purchased in late 2011 as a play on a future pick up in housing activity. Housing activity has recovered and probably will continue to do so, but we believe Owens Corning shares no longer offer as much potential for future return.
We initiated new investments in Aetna, a leading health care insurance provider, and General Dynamics, an aerospace and defense company.
Aetna has had a strong competitive position and its pending acquisition of Humana has the potential to provide even greater scale in the commercial, Medicaid and Medicare Advantage markets and a more balanced mix of businesses across its portfolio. The company has invested in health care management businesses for future growth potential. Management has a proven track record of executing on strategic initiatives and good capital allocation. Valuation is attractive relative to peers, and may have the potential for above-average profit growth from the combination of Aetna and Humana.
General Dynamics is notably less expensive than other defense companies. This discounted valuation is mostly due to near-term concerns over the company’s Gulfstream commercial jets business, which we expect will be resolved over time. Defense spending worldwide has the potential to increase in the near future. General Dynamics has delivered attractive business results. It has had a strong management team, a good balance sheet, rising free cash flow and a history of increasing shareholder returns through dividends and repurchases.
We look for what we believe are bargains among long-term attractive businesses with shareholder-oriented managers. These bargains can arise due to short-term investor perceptions, temporary business difficulties that should improve, or as-yet-undiscovered opportunities and unrecognized changes for the better. We remain optimistic about the long-term outlook for equities of good companies purchased at reasonable prices and our ability to find them.
Sincerely,
R. Hutchings Vernon, CFA
Portfolio Manager
Michael L. Foss, CFA
Portfolio Manager
Past performance is not a guarantee of future results.
Mutual fund investing involves risk. Principal loss is possible. The Flexible Equity Fund may invest in securities of foreign issuers. Investments in such securities entail certain risks not associated with investments in domestic securities, such as volatility of currency exchange rates, and in some cases, political and economic instability and relatively illiquid markets. These risks are greater for investments in emerging markets. The value of the Fund’s investments in REITs may change in response to changes in the real estate market such as declines in the value of real estate, lack of available capital or financing opportunities, and increases in property taxes or operating costs. The Fund may invest in ETFs, which may trade at a discount to the aggregate value of the underlying securities and although expense ratios for ETFs are generally low, frequent trading of ETFs by the Fund can generate brokerage expenses. Investments in smaller and medium-sized companies generally carry greater risk than is customarily associated with larger companies for various reasons such as narrower markets, limited financial resources and less liquid stock. Investments in debt securities typically decrease in value when interest rates rise. This risk is usually greater for longer term debt securities. Investments in lower-rated and non-rated securities present a greater risk of loss to principal and interest than higher-rated securities.
Fund holdings and sector allocations are subject to change and should not be considered a recommendation to buy or sell any security. For a complete list of fund holdings, please refer to the Schedule of Investments provided in this report.
Definitions for terms and indices are provided in the Glossary of Terms.
www.brownadvisoryfunds.com
10
Brown Advisory Flexible Equity Fund
Performance Chart and Analysis
June 30, 2016
COMPARISON OF CHANGE IN VALUE OF A $10,000 INVESTMENT
The following chart reflects the change in value of a hypothetical $10,000 investment, including reinvested dividends and distributions, in the Fund as measured against the broad-based securities market index. The S&P 500 Index (“Index”) is a market-value weighted index representing the performance of 500 widely held, publicly traded large capitalization stocks. The Index is unmanaged and does not reflect the deduction of fees, such as investment management fees. Investors cannot invest directly in an index.

| Since | ||||
| Average Annual Total Return | One | Five | Inception | |
as of 6/30/16 | Year | Year | (11/30/06) | |
Institutional Shares1 | -4.16% | 11.19% | 5.06% | |
| Investor Shares | -4.30% | 11.01% | 4.90% | |
Advisor Shares2 | -4.56% | 10.75% | 4.62% | |
| S&P 500 Index | 3.99% | 12.10% | 6.58% |
| Institutional Shares | Investor Shares | Advisor Shares | ||
Gross Expense Ratio3 | 0.76% | 0.91% | 1.16% | |
Net Expense Ratio3 | 0.76% | 0.91% | 1.16% |
Past performance does not guarantee future results. The performance data quoted represents past performance and current returns may be lower or higher. The investment return and net asset value will fluctuate so that an investor’s shares, when redeemed, may be worth more or less than the original cost. To obtain performance information current to the most recent month end, please visit our website at brownadvisoryfunds.com/performance.html. The performance table and graph above do not reflect the deduction of taxes that a shareholder would pay on Fund distributions or the redemption of Fund shares. Investment performance reflects periods during which fee waivers were in effect. In the absence of such waivers, total return would have been reduced. Performance data does not reflect the imposition of the redemption fee of 1.00% on shares redeemed within 14 days, and if it did, performance would have been lower.
1 | Performance information for the Institutional Shares, prior to commencement of operations on October 19, 2012, is based on the performance of Investor Shares, and adjusted for the lower expenses applicable to Institutional Shares. |
2 | Performance information for Advisor Shares, prior to commencement of operations on January 24, 2007, is based on the performance of Investor Shares, and adjusted for the higher expenses applicable to Advisor Shares. |
3 | Per the Fund’s prospectus dated October 30, 2015. |
www.brownadvisoryfunds.com
11
Brown Advisory Flexible Equity Fund
Schedule of Investments
June 30, 2016
Shares | Security Description | Value $ | ||||||
| Common Stocks — 96.6% | ||||||||
| Consumer Discretionary — 17.4% | ||||||||
| 173,055 | Best Buy Co., Inc. | 5,295,483 | ||||||
| 249,534 | CarMax, Inc.* | 12,234,652 | ||||||
| 163,235 | Lowe’s Companies, Inc. | 12,923,315 | ||||||
| 9,648 | Priceline Group, Inc.* | 12,044,660 | ||||||
| 90,273 | TJX Companies, Inc. | 6,971,784 | ||||||
| 95,822 | Walt Disney Co. | 9,373,308 | ||||||
| 58,843,202 | ||||||||
| Consumer Staples — 1.5% | ||||||||
| 47,838 | PepsiCo, Inc. | 5,067,958 | ||||||
| Energy — 5.2% | ||||||||
| 541,946 | Kinder Morgan, Inc. | 10,145,229 | ||||||
| 98,419 | Occidental Petroleum Corp. | 7,436,540 | ||||||
| 17,581,769 | ||||||||
| Financials — 19.7% | ||||||||
| 77,136 | Ameriprise Financial, Inc. | 6,930,670 | ||||||
| 227,689 | Bank of America Corp. | 3,021,433 | ||||||
| 124,003 | Berkshire Hathaway, Inc.* | 17,954,395 | ||||||
| 336,875 | Charles Schwab Corp. | 8,526,306 | ||||||
| 123,881 | JPMorgan Chase & Co. | 7,697,965 | ||||||
| 413,539 | Regions Financial Corp. | 3,519,217 | ||||||
| 73,593 | T. Rowe Price Group, Inc. | 5,370,081 | ||||||
| 284,898 | Wells Fargo & Co. | 13,484,222 | ||||||
| 66,504,289 | ||||||||
| Health Care — 13.6% | ||||||||
| 49,062 | Aetna, Inc. | 5,991,942 | ||||||
| 31,994 | Anthem, Inc. | 4,202,092 | ||||||
| 100,217 | Edwards Lifesciences Corp.* | 9,994,641 | ||||||
| 141,975 | Express Scripts Holding Co.* | 10,761,705 | ||||||
| 57,539 | Merck & Co., Inc. | 3,314,822 | ||||||
| 233,913 | Teva Pharmaceutical Industries, Ltd. ADR | 11,749,450 | ||||||
| 46,014,652 | ||||||||
| Industrials — 9.1% | ||||||||
| 190,695 | Canadian National Railway Co. | 11,262,447 | ||||||
| 18,142 | Canadian Pacific Railway, Ltd. | 2,336,508 | ||||||
| 27,122 | General Dynamics Corp. | 3,776,467 | ||||||
| 106,608 | United Rentals, Inc.* | 7,153,397 | ||||||
| 58,412 | United Technologies Corp. | 5,990,151 | ||||||
| 30,518,970 | ||||||||
| Information Technology — 28.2% | ||||||||
| 62,039 | Accenture PLC | 7,028,398 | ||||||
| 7,155 | Alphabet, Inc. — Class A* | 5,033,757 | ||||||
| 14,792 | Alphabet, Inc. — Class C* | 10,237,543 | ||||||
| 102,161 | Apple, Inc. | 9,766,592 | ||||||
| 134,545 | eBay, Inc.* | 3,149,698 | ||||||
| 136,481 | MasterCard, Inc. | 12,018,517 | ||||||
| 168,505 | Microsoft Corp. | 8,622,401 | ||||||
| 135,645 | PayPal Holdings, Inc.* | 4,952,399 | ||||||
| 132,138 | QUALCOMM, Inc. | 7,078,633 | ||||||
| 244,107 | Visa, Inc. | 18,105,416 | ||||||
| 242,432 | Yahoo, Inc.* | 9,105,746 | ||||||
| 95,099,100 | ||||||||
| Telecommunication Services — 1.9% | ||||||||
| 63,773 | Crown Castle International Corp. | 6,468,495 | ||||||
| Total Common Stocks (Cost $276,274,880) | 326,098,435 | |||||||
| Warrants — 0.1% | ||||||||
| 20,000 | Wells Fargo & Co.*, Exercise price | |||||||
| $33.90 expires 10/28/2018 | 272,400 | |||||||
| Total Warrants (Cost $221,300) | 272,400 | |||||||
| Short-Term Investments — 3.5% | ||||||||
| Money Market Funds — 3.5% | ||||||||
| 11,833,570 | Cash Account Trust — Government | |||||||
| & Agency Securities Portfolio — | ||||||||
| Institutional Shares, 0.34%# | 11,833,570 | |||||||
| Total Short-Term Investments (Cost $11,833,570) | 11,833,570 | |||||||
| Total Investments — 100.2% (Cost $288,329,750) | 338,204,405 | |||||||
| Liabilities in Excess of Other Assets — (0.2)% | (567,547 | ) | ||||||
| NET ASSETS — 100.0% | $ | 337,636,858 | ||||||
| PORTFOLIO HOLDINGS | |
| % of Net Assets | |
| Information Technology | 28.2% |
| Financials | 19.7% |
| Consumer Discretionary | 17.4% |
| Health Care | 13.6% |
| Industrials | 9.1% |
| Energy | 5.2% |
| Money Market Funds | 3.5% |
| Telecommunication Services | 1.9% |
| Consumer Staples | 1.5% |
| Warrants | 0.1% |
| Other Assets and Liabilities | (0.2)% |
| 100.0% |
ADR — American Depositary Receipt
| * | Non-Income Producing |
| # | Annualized seven-day yield as of June 30, 2016. |
The accompanying notes are an integral part of these financial statements.
www.brownadvisoryfunds.com
12
Brown Advisory Equity Income Fund
A Message to Our Shareholders
June 30, 2016
Dear Shareholder:
During the year ended June 30, 2016, the Brown Advisory Equity Income Fund Investor Shares (the “Fund”) rose 1.15%. The S&P 500 Index, the Fund’s benchmark, increased 3.99% during the same period.
U.S. large-cap equity investors realized lower returns over the past year than in the prior several years as a variety of events drove rapid shifts up and down in investor sentiment and created increased volatility in stock prices. Worries over the impact of lower oil and commodity prices in the fall accelerated into concerns about slowing economic growth in China and elsewhere during the winter, when the market hit its low point. Those fears dissipated during the spring and the market subsequently rallied, but then it fell sharply in the early summer when the U.K. vote to leave the European Union surprised many investors.
For the Fund’s benchmark, the volatile sequence of events during the year corresponded with strong performance from the traditionally defensive sectors of the market such as consumer staples, telecommunications and utilities. The Fund’s consumer staples holdings, in particular, stood out in terms of performance, led by large jumps in the stock prices of tobacco companies Altria (MO) and Philip Morris International (PM). A combination of product price increases, market share gains and new product innovation propelled both stocks higher. The Fund is currently overweight the consumer staples sector. Strong performance of the holdings in that sector more than made up for the drag produced by not having any exposure to telecommunications and utilities, which also rose sharply during the period.
The Fund’s financial sector holdings also performed well, thanks to a diversity of holdings within the sector. Commercial insurer Cincinnati Financial rose on steady earnings improvement. Timber Real Estate Investment Trust (“REIT”) Weyerhaeuser (WY) gained following the completion of its merger with timber REIT counterpart Plum Creek Timber. Currently, REITs like Weyerhaeuser are included in the financial sector of the S&P 500 Index for reporting purposes, but a new stand-alone, REIT-specific sector is expected to be created by the end of 2016.
As for the other areas within financials, the outlook of lower interest rates for a longer period of time will likely hamper the near-term earnings growth of the Fund’s bank holdings JPMorgan Chase (JPM) and Wells Fargo (WFC). Asset manager T. Rowe Price (TROW) and jumbo mortgage financing REIT Redwood Trust (RWT) were eliminated on the expectation that the rates of future earnings and dividend growth at both companies will be reduced in the current environment. We believe that two new additions in the sector, diversified financial services provider Ameriprise Financial and insurance brokerage and consulting firm Willis Towers Watson (WLTW), have the potential to buck the trend within the sector and increase their rates of cash returned to shareholders within the foreseeable future.
The Fund’s worst performing stocks during the year were both in the energy sector, where continued weakness in commodity prices took their toll on pipeline operators Kinder Morgan (KMI) and Plains GP Holdings (PAGP). Reduced activity by oil and natural gas producers led to lower utilization of the transportation and storage assets of both companies, as well as a dramatic scaling-back of their previously ambitious growth plans. As a result of the more difficult multi-year outlooks for the companies, the Fund reduced its position in Kinder Morgan and eliminated Plains GP. Other holdings within energy, namely Black Stone Minerals (BSM) and Total (TOT), were also eliminated and the Fund is currently underweight the sector.
Consumer discretionary is another sector where the Fund is underweight following the eliminations of GameStop (GME) and Garmin (GRMN) during the period. In short, the prospective earnings growth of both companies does not look as favorable as it once did. GameStop’s core business of selling console video gaming software is entering into decline, and the company diversified into less attractive areas such as sales of mobile devices. At Garmin, the results at several of its business units are either in decline (such as portable navigation devices) or have been disappointing (wearable fitness devices).
Among other sectors, the Fund’s industrials sector weighting increased with the addition of defense and commercial aerospace manufacturer General Dynamics (GD). Also, the information technology sector weighting increased with the purchase of Cisco Systems (CSCO). General Dynamics is expected to benefit as the U.S. and its international allies increase their defense spending to confront rising global threats and terrorism. Cisco Systems has been a stable cash generator in the networking equipment space where the dividend yield is expected to rise over the next several years. While operating in different business sectors, both companies have been industry leaders that have produced strong predictable cash flows and have management teams that have been committed to returning capital to shareholders through increased dividends.
Investing in stocks with high dividend yields is currently popular, but the Fund is not oriented toward simply investing in any individual stock for the sake of its yield alone. We believe a more important factor for long-term performance is the underlying
www.brownadvisoryfunds.com
13
Brown Advisory Equity Income Fund
A Message to Our Shareholders
June 30, 2016
business model. The Fund’s preference remains to allocate capital toward companies with defensible business characteristics, where we believe the business models have proven to be resilient and adaptable to changing market and economic conditions. In a period of heightened economic uncertainty and increased volatility in global markets, this business-model-centric orientation strives to provide downside protection combined with the potential for a meaningful level of income generation for you, its investors.
Sincerely,
Mike L. Foss, CFA
Portfolio Manager
Brian E. Graney, CFA
Portfolio Manager
Past performance does not guarantee future results.
Mutual fund investing involves risk. Principal loss is possible. Investments in debt securities typically decrease in value when interest rates rise. This risk is usually greater for longer-term debt securities. Investments in lower-rated and non-rated securities present a greater risk of loss to principal and interest than higher-rated securities. Investments in smaller and medium capitalization companies generally carry greater risk than is customarily associated with larger companies for various reasons such as narrower markets, limited financial resources and less liquid stock. The value of the Fund’s investments in REITs and Real Estate may change in response to changes in the real estate market such as declines in the value of real estate, lack of available capital or financing opportunities, and increases in property taxes or operating costs. The Fund may invest in ETFs, which may trade at a discount to the aggregate value of the underlying securities and although expense ratios for ETFs are generally low, frequent trading of ETFs by the Fund can generate brokerage expenses. Investments in foreign securities entail certain risks not associated with investments in domestic securities, such as volatility of currency exchange rates, and in some cases, political and economic instability and relatively illiquid markets. Investing in Master Limited Partnerships (“MLPs”) entails risk related to fluctuations in energy prices, decreases in supply of or demand for energy commodities, unique tax consequences due to the partnership structure and various other risks. Privately Placement issued securities are restricted securities that are not publicly traded. Delay or difficulty in selling such securities may result in a loss to the Fund.
Fund holdings and sector allocations are subject to change and should not be considered a recommendation to buy or sell any security. For a complete list of fund holdings, please refer to the Schedule of Investments provided in this report.
Definitions for terms and indices are provided in the Glossary of Terms.
www.brownadvisoryfunds.com
14
Brown Advisory Equity Income Fund
Performance Chart and Analysis
June 30, 2016
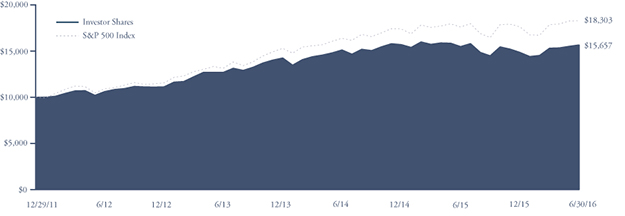
COMPARISON OF CHANGE IN VALUE OF A $10,000 INVESTMENT
The following chart reflects the change in value of a hypothetical $10,000 investment, including reinvested dividends and distributions, in the Fund as measured against a broad-based securities market index. The S&P 500 Index (“Index”) is a market-value weighted index representing the performance of 500 widely held, publicly traded large capitalization stocks. The Index is unmanaged and does not reflect the deduction of fees, such as investment management fees. Investors cannot invest directly in an index.
| Since | ||||
| Average Annual Total Return | One | Inception | ||
as of 6/30/16 | Year | (12/29/11) | ||
Institutional Shares1 | 1.31% | 10.65% | ||
| Investor Shares | 1.15% | 10.47% | ||
| Advisor Shares | 0.90% | 10.20% | ||
| S&P 500 Index | 3.99% | 14.36% |
Institutional Shares | Investor Shares | Advisor Shares | ||
Gross Expense Ratio2 | 0.75% | 0.90% | 1.15% | |
Net Expense Ratio2 | 0.75% | 0.90% | 1.15% |
Past performance does not guarantee future results. The performance data quoted represents past performance and current returns may be lower or higher. The investment return and net asset value will fluctuate so that an investor’s shares, when redeemed, may be worth more or less than the original cost. To obtain performance information current to the most recent month end, please visit our website at brownadvisoryfunds.com/performance.html. The performance table and graph above do not reflect the deduction of taxes that a shareholder would pay on Fund distributions or the redemption of Fund shares. Performance data does not reflect the imposition of the redemption fee of 1.00% on shares redeemed within 14 days, and if it did, performance would have been lower.
1 | Performance information for the Institutional Shares, prior to commencement of operations on October 19, 2012, is based on the performance of Investor Shares, and adjusted for the lower expenses applicable to Institutional Shares. |
2 | Per the Fund’s prospectus dated October 30, 2015. |
www.brownadvisoryfunds.com
15
Brown Advisory Equity Income Fund
Schedule of Investments
June 30, 2016
Shares | Security Description | Value $ | ||||||
| Common Stocks — 87.3% | ||||||||
| Consumer Discretionary — 9.8% | ||||||||
| 59,258 | Best Buy Co., Inc. | 1,813,295 | ||||||
| 31,063 | McDonald’s Corp. | 3,738,121 | ||||||
| 50,247 | Target Corp. | 3,508,245 | ||||||
| 57,483 | V.F. Corp. | 3,534,630 | ||||||
| 12,594,291 | ||||||||
| Consumer Staples — 14.9% | ||||||||
| 102,507 | Altria Group, Inc. | 7,068,883 | ||||||
| 83,596 | Coca-Cola Co. | 3,789,406 | ||||||
| 45,058 | Philip Morris International, Inc. | 4,583,300 | ||||||
| 81,480 | Unilever NV ADR | 3,824,671 | ||||||
| 19,266,260 | ||||||||
| Energy — 4.5% | ||||||||
| 69,329 | Kinder Morgan, Inc. | 1,297,839 | ||||||
| 37,309 | Occidental Petroleum Corp. | 2,819,068 | ||||||
| 58,911 | Suncor Energy, Inc. | 1,633,602 | ||||||
| 5,750,509 | ||||||||
| Financials — 14.3% | ||||||||
| 28,810 | Ameriprise Financial, Inc. | 2,588,579 | ||||||
| 41,235 | Cincinnati Financial Corp. | 3,088,089 | ||||||
| 24,680 | Erie Indemnity Co. | 2,451,711 | ||||||
| 50,929 | JPMorgan Chase & Co. | 3,164,728 | ||||||
| 74,141 | OneBeacon Insurance Group, Ltd. | 1,023,146 | ||||||
| 76,189 | Wells Fargo & Co. | 3,606,025 | ||||||
| 20,515 | Willis Towers Watson PLC | 2,550,220 | ||||||
| 18,472,498 | ||||||||
| Health Care — 12.5% | ||||||||
| 59,941 | AbbVie, Inc. | 3,710,947 | ||||||
| 31,165 | Johnson & Johnson | 3,780,315 | ||||||
| 46,458 | Merck & Co., Inc. | 2,676,446 | ||||||
| 43,385 | Novartis AG ADR | 3,579,696 | ||||||
| 46,970 | Teva Pharmaceutical Industries, Ltd. ADR | 2,359,303 | ||||||
| 16,106,707 | ||||||||
| Industrials — 13.1% | ||||||||
| 12,853 | General Dynamics Corp. | 1,789,652 | ||||||
| 109,095 | General Electric Co. | 3,434,311 | ||||||
| 79,261 | Healthcare Services Group, Inc. | 3,279,820 | ||||||
| 76,053 | Nielsen Holdings PLC | 3,952,474 | ||||||
| 29,299 | PACCAR, Inc. | 1,519,739 | ||||||
| 27,820 | United Technologies Corp. | 2,852,941 | ||||||
| 16,828,937 | ||||||||
| Information Technology — 17.1% | ||||||||
| 26,625 | Accenture PLC | 3,016,346 | ||||||
| 37,821 | Apple, Inc. | 3,615,688 | ||||||
| 43,044 | Automatic Data Processing, Inc. | 3,954,452 | ||||||
| 137,632 | Cisco Systems, Inc. | 3,948,662 | ||||||
| 94,724 | Microsoft Corp. | 4,847,027 | ||||||
| 49,359 | QUALCOMM, Inc. | 2,644,162 | ||||||
| 22,026,337 | ||||||||
| Materials — 1.1% | ||||||||
| 13,176 | Praxair, Inc. | 1,480,851 | ||||||
| Total Common Stocks (Cost $81,275,314) | 112,526,390 | |||||||
| Preferred Stocks — 2.2% | ||||||||
| 112,611 | Public Storage — Series S | 2,925,634 | ||||||
| Total Preferred Stocks (Cost $2,713,471) | 2,925,634 | |||||||
| Real Estate Investment Trusts — 6.0% | ||||||||
| 62,603 | W.P. Carey, Inc. | 4,345,900 | ||||||
| 112,543 | Weyerhaeuser Co. | 3,350,405 | ||||||
| Total Real Estate Investment Trusts (Cost $6,583,162) | 7,696,305 | |||||||
| Short-Term Investments — 5.4% | ||||||||
| Money Market Funds — 5.4% | ||||||||
| 6,934,634 | Cash Account Trust — Government & | |||||||
| Agency Securities Portfolio — | ||||||||
| Institutional Shares, 0.34%# | 6,934,634 | |||||||
| Total Short-Term Investments (Cost $6,934,634) | 6,934,634 | |||||||
| Total Investments — 100.9% (Cost $97,506,581) | 130,082,963 | |||||||
| Liabilities in Excess of Other Assets — (0.9)% | (1,147,140 | ) | ||||||
| NET ASSETS — 100.0% | $ | 128,935,823 | ||||||
| PORTFOLIO HOLDINGS | |
| % of Net Assets | |
| Information Technology | 17.1% |
| Consumer Staples | 14.9% |
| Financials | 14.3% |
| Industrials | 13.1% |
| Health Care | 12.5% |
| Consumer Discretionary | 9.8% |
| Real Estate Investment Trusts | 6.0% |
| Money Market Funds | 5.4% |
| Energy | 4.5% |
| Preferred Stocks | 2.2% |
| Materials | 1.1% |
| Other Assets and Liabilities | (0.9)% |
| 100.0% |
ADR — American Depositary Receipt
| # | Annualized seven-day yield as of June 30, 2016. |
The accompanying notes are an integral part of these financial statements.
www.brownadvisoryfunds.com
16
Brown Advisory Sustainable Growth Fund
A Message to Our Shareholders
June 30, 2016
Dear Shareholder:
During the year ended June 30, 2016, the Brown Advisory Sustainable Growth Fund Advisor Shares (the “Fund”) rose 6.73%. During the same period, the Russell 1000 Growth Index, the Fund’s benchmark, increased 3.02%.
The Fund benefitted from strong stock selection across a number of economic sectors including consumer discretionary, health care and information technology. Amazon.com was the best performing stock for the period, returning 65%. Facebook, IDEXX Laboratories, Acuity Brands and American Tower also contributed to the strong performance. Finally, a small part of our relative outperformance was due to our underweight in energy, the worst performing sector over the past 12 months.
On July 2, 2016, Danaher completed its separation into two publically traded companies: Fortive Corporation, with businesses in professional instrumentation and industrial technologies, and the “new” Danaher, with businesses serving the life sciences, dental and environmental sectors. Danaher has been a long-term holding for our strategy; we first purchased the stock in 2011. It is a great example of the type of company we look for, not only within industrials but across the broader investment landscape. While growth investors may perceive industrials as being overly cyclical, we have continually found attractive franchises within the sector that meet our investment criteria, including strong fundamentals, compelling valuations and environmental strategies that cut costs, drive revenue growth or improve franchise value. For more than two decades, Danaher has transformed its business into a high-margin, strong free-cash-flow generating science and technology company. The management team’s tremendous leadership and the culture of continuous improvement has led to steady, predictable gains for investors. Recall that we have had an overweight to industrials since the beginning of the strategy largely due to the fact that we have been able to identify what we believe to be high-quality companies like Danaher.
As previously mentioned, we also benefitted from not having any direct exposure to energy, a sector that experienced significant pressure due to declining commodity prices. To date, we have found it very difficult to find companies within energy that meet our investment criteria, and we believe this is unlikely to change going forward.
In terms of new additions to the portfolio, we have been adding companies we believe are less susceptible to macro-related downside risks and eliminating those with greater cyclical exposure. Over the past year, our allocation to health care has risen to 21% of the portfolio from 14%. This is due in part to the double-digit returns over the past year of Bristol-Myers, Thermo Fischer Scientific and IDEXX Laboratories, and also to the addition of two new holdings: Mettler-Toledo and UnitedHealth Group. Mettler provides laboratory equipment to the industrial and health care sectors. The company has a long history of strong cash generation and margin expansion, and has consistently returned capital to shareholders in the form of share repurchases. The Environmental Business Advantage (EBA™) for Mettler is the company’s machine vision inspection business which helps improve quality control for food and beverage customers. Vision inspection has been one of Mettler’s fastest growing businesses over the last few years. UnitedHealth is the country’s largest health insurer and the owner of Optum, an info-tech services business serving stakeholders outside of United’s medical insurance network. The company has a unique business model, offering the only integrated medical and drug management platform and providing a broader, more holistic approach to health care delivery. Optum has offered strong EBA by providing analytical insights that increase quality and efficiency in health care, and has enabled customers to reduce costs and patient risks. To make room for Mettler and UnitedHealth, we sold Delphi and TE Connectivity, companies that we believe have greater exposure to macro-economic, cyclical risks.
As an ongoing practice, we continually look to strengthen the portfolio by identifying companies that we believe have superior business models and greater long-term growth prospects to those that we already own. This past year was no different. We added Adobe Systems, American Tower, Red Hat and Hexcel to the portfolio given that we believe the business fundamentals are stronger than a number of our existing holdings. These additions replaced Apple, Chipotle Mexican Grill, Novo Nordisk and Praxair. The growth prospects of these companies have deteriorated because of increased competition and/or worsening macro factors. We also sold Pall Corporation after it was acquired by Danaher.
Another new holding since our last shareholder letter is WhiteWave Foods. WhiteWave is the owner of nine consumer food brands that have held the number one or number two market share position in their respective categories. The company has positioned its offerings to align with the most powerful trends in the food and beverage industry. This includes products that are made with simple and clean ingredients, healthier foods and those that are made with less environmental impact. On July 7, 2016, Danone announced its intention to acquire WhiteWave in an all cash deal for $12.5 billion, a nearly 20% premium to the previous day’s closing price.
www.brownadvisoryfunds.com
17
Brown Advisory Sustainable Growth Fund
A Message to Our Shareholders
June 30, 2016
To conclude, we made a number of changes to the portfolio over the past year–many of which were incrementally additive to performance. We believe that our investment philosophy–seeking companies with what we believe are strong fundamentals, sustainable competitive advantages including EBATM, and compelling valuation–has helped identify a group of high-quality companies that have the potential to continue to perform well over time.
Sincerely,
Karina Funk, CFA
Portfolio Manager
David Powell, CFA
Portfolio Manager
Past performance is not a guarantee of future results.
Mutual fund investing involves risk. Principal loss is possible. The Fund’s investment focus on environmental factors could cause it to make or avoid investments that could result in the Fund underperforming similar funds that do not have an environmental focus. Investments in smaller and medium-sized capitalization companies generally carry greater risk than is customarily associated with larger companies for various reasons such as narrower markets, limited financial resources and less liquid stock. Investments in foreign securities entail certain risks not associated with investments in domestic securities, such as volatility of currency exchange rates, and in some cases, political and economic instability and relatively illiquid markets. These risks are greater for investments in emerging markets. The value of the Fund’s investments in REITS may change in response to changes in the real estate market such as declines in the value of real estate, lack of available capital or financing opportunities, and increases in property taxes or operating costs.
Fund holdings and sector allocations are subject to change and should not be considered a recommendation to buy or sell any security. For a complete list of fund holdings, please refer to the Schedule of Investments provided in this report.
Definitions for terms and indices are provided in the Glossary of Terms.
www.brownadvisoryfunds.com
18
Brown Advisory Sustainable Growth Fund
Performance Chart and Analysis
June 30, 2016
COMPARISON OF CHANGE IN VALUE OF A $10,000 INVESTMENT
The following chart reflects the change in value of a hypothetical $10,000 investment, including reinvested dividends and distributions, in the Fund as measured against a broad-based securities market index. The Russell 1000® Growth Index (“Index”) measures the performance of the large-cap growth segment of the U.S. equity universe. It includes those Russell 1000® companies with higher price to book and higher forecasted growth values. The Index is unmanaged and does not reflect the deduction of fees, such as investment management fees. Investors cannot invest directly in an index.
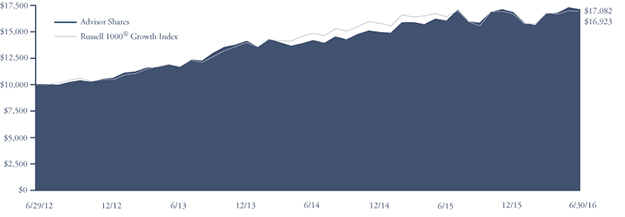
| Since | ||||
| Average Annual Total Return | One | Inception | ||
as of 6/30/16 | Year | (6/29/12) | ||
| Institutional Shares | 7.17% | 14.77% | ||
| Investor Shares | 7.01% | 14.58% | ||
| Advisor Shares | 6.73% | 14.31% | ||
Russell 1000® Growth Index | 3.02% | 14.05% |
Institutional Shares | Investor Shares | Advisor Shares | ||
Gross Expense Ratio1 | 0.75% | 0.90% | 1.15% | |
Net Expense Ratio1 | 0.75% | 0.90% | 1.15% |
Past performance does not guarantee future results. The performance data quoted represents past performance and current returns may be lower or higher. The investment return and net asset value will fluctuate so that an investor’s shares, when redeemed, may be worth more or less than the original cost. To obtain performance information current to the most recent month end, please visit our website at brownadvisoryfunds.com/performance.html. The performance table and graph above do not reflect the deduction of taxes that a shareholder would pay on Fund distributions or the redemption of Fund shares. Performance data does not reflect the imposition of the redemption fee of 1.00% on shares redeemed within 14 days, and if it did, performance would have been lower.
1 | Per the Fund’s prospectus dated October 30, 2015. |
www.brownadvisoryfunds.com
19
Brown Advisory Sustainable Growth Fund
Schedule of Investments
June 30, 2016
Shares | Security Description | Value $ | ||||||
| Common Stocks — 90.8% | ||||||||
| Consumer Discretionary — 11.8% | ||||||||
| 23,828 | Amazon.com, Inc.* | 17,051,793 | ||||||
| 126,588 | Nike, Inc. | 6,987,658 | ||||||
| 175,521 | Starbucks Corp. | 10,025,759 | ||||||
| 93,186 | TJX Companies, Inc. | 7,196,755 | ||||||
| 41,261,965 | ||||||||
| Consumer Staples — 2.4% | ||||||||
| 179,670 | WhiteWave Foods Co.* | 8,433,710 | ||||||
| Health Care — 20.7% | ||||||||
| 64,810 | Alexion Pharmaceuticals, Inc.* | 7,567,216 | ||||||
| 178,500 | Bristol-Myers Squibb Co. | 13,128,675 | ||||||
| 163,714 | Cerner Corp.* | 9,593,640 | ||||||
| 122,546 | IDEXX Laboratories, Inc.* | 11,379,621 | ||||||
| 20,105 | Mettler-Toledo International, Inc.* | 7,336,717 | ||||||
| 87,016 | Thermo Fisher Scientific, Inc. | 12,857,484 | ||||||
| 74,144 | UnitedHealth Group, Inc. | 10,469,133 | ||||||
| 72,332,486 | ||||||||
| Industrials — 25.4% | ||||||||
| 127,546 | A.O. Smith Corp. | 11,238,078 | ||||||
| 47,125 | Acuity Brands, Inc. | 11,685,115 | ||||||
| 84,676 | Canadian National Railway Co. | 5,000,965 | ||||||
| 154,033 | Danaher Corp. | 15,557,333 | ||||||
| 147,012 | Hexcel Corp. | 6,121,580 | ||||||
| 96,058 | J.B. Hunt Transport Services, Inc. | 7,773,974 | ||||||
| 59,677 | Middleby Corp.* | 6,877,774 | ||||||
| 80,416 | Stericycle, Inc.* | 8,372,914 | ||||||
| 119,142 | Verisk Analytics, Inc.* | 9,660,033 | ||||||
| 92,122 | Wabtec Corp. | 6,469,728 | ||||||
| 88,757,494 | ||||||||
| Information Technology — 28.2% | ||||||||
| 104,036 | Adobe Systems, Inc.* | 9,965,608 | ||||||
| 71,485 | Akamai Technologies, Inc.* | 3,998,156 | ||||||
| 16,627 | Alphabet, Inc. — Class A* | 11,697,593 | ||||||
| 3,267 | Alphabet, Inc. — Class C* | 2,261,091 | ||||||
| 115,631 | Arm Holdings PLC ADR | 5,262,367 | ||||||
| 135,417 | Facebook, Inc.* | 15,475,455 | ||||||
| 100,207 | Intuit, Inc. | 11,184,103 | ||||||
| 60,892 | NXP Semiconductors NV* | 4,770,279 | ||||||
| 135,311 | Red Hat, Inc.* | 9,823,579 | ||||||
| 113,929 | salesforce.com, Inc.* | 9,047,102 | ||||||
| 201,052 | Visa, Inc. | 14,912,027 | ||||||
| 98,397,360 | ||||||||
| Materials — 2.3% | ||||||||
| 69,145 | Ecolab, Inc. | 8,200,597 | ||||||
| Total Common Stocks (Cost $237,818,364) | 317,383,612 | |||||||
| Real Estate Investment Trusts — 4.0% | ||||||||
| 123,184 | American Tower Corp. | 13,994,935 | ||||||
| Total Real Estate Investment Trusts (Cost $11,722,465) | 13,994,935 | |||||||
| Short-Term Investments — 3.8% | ||||||||
| Money Market Funds — 3.8% | ||||||||
| 13,144,856 | Cash Account Trust — Government & | |||||||
| Agency Securities Portfolio — | ||||||||
| Institutional Shares, 0.34%# | 13,144,856 | |||||||
| Total Short-Term Investments (Cost $13,144,856) | 13,144,856 | |||||||
| Total Investments — 98.6% (Cost $262,685,685) | 344,523,403 | |||||||
| Other Assets in Excess of Liabilities — 1.4% | 4,887,562 | |||||||
| NET ASSETS — 100.0% | $ | 349,410,965 | ||||||
| PORTFOLIO HOLDINGS | |
| % of Net Assets | |
| Information Technology | 28.2% |
| Industrials | 25.4% |
| Health Care | 20.7% |
| Consumer Discretionary | 11.8% |
| Real Estate Investment Trusts | 4.0% |
| Money Market Funds | 3.8% |
| Consumer Staples | 2.4% |
| Materials | 2.3% |
| Other Assets and Liabilities | 1.4% |
| 100.0% |
ADR — American Depositary Receipt
| * | Non-Income Producing |
| # | Annualized seven-day yield as of June 30, 2016. |
The accompanying notes are an integral part of these financial statements.
www.brownadvisoryfunds.com
20
Brown Advisory Small-Cap Growth Fund
A Message to Our Shareholders
June 30, 2016
Dear Shareholder:
During the year ended June 30, 2016, the Brown Advisory Small-Cap Growth Fund Investor Shares (the “Fund”) rose 1.43%. During the same period, the Russell 2000 Growth Index, the Fund’s benchmark decreased 10.75%. The relative investment returns were overwhelmingly driven by individual stock selection.
“May you live in interesting times!” We certainly do. There are moments when the number of global cross-currents strains one’s cognitive capacity. Brexit? Negative sovereign interest rates? Weak global growth? Collapsed commodities? Record margins? Lofty valuations? The U.S. dollar? China? These investment topics are all cloudy at best, making today’s investment landscape one of the most perplexing we have ever encountered.
We counter this macro complexity with micro simplicity by remaining focused on our bottom-up approach to investing. While the current investment trade winds are important to consider, we have the benefit of looking at them through the narrow lens of their influence on each portfolio holding. For example, we do not know how low the British pound will fall. But, we can assess the translational exposure and shifting competitive dynamic for every company and determine whether a declining pound is appropriately discounted in the share price. Then, we can aggregate these specific exposures into a holistic view of the portfolio’s vulnerability (or opportunity).
As the market gyrated over the past year, we made important changes to individual stock weightings in the portfolio that, on balance, proved beneficial to our returns. However, the sum total of these individual moves did not alter the underlying structure of the portfolio meaningfully. We continue to maintain a very low relative exposure to traditional consumer holdings and our total cyclical weight (industrials + materials + energy) is comparatively low. And, although our technology weight as we define it, is not particularly high, we would define many of the businesses across the portfolio as “technology-enabled”–the companies are using technology as a competitive advantage.
Our top contributors for the year were spread across many sectors, providing balance in our returns. Waste Connections (WCN, +40%), our largest and longest-tenured holding, is an integrated municipal solid waste services company primarily focused on exclusive and secondary markets in the U.S. and Canada. The management team’s continued execution against its business model has produced solid volume and pricing growth, pushing both free cash flow generation and the stock higher. Moreover, the share price was catalyzed by its announced intention to merge with competitor Progressive Waste (BIN), a cash-flow-accretive combination with many potential long-term synergies. Broadridge (BR, +33%), a provider of investor communications and technology-driven solutions to banks, broker-dealers, mutual funds and corporate issuers, reported solid quarterly numbers and projected continued growth in fiscal year 2016. This prompted its valuation to expand. Demandware (DWRE), a leader in cloud-based digital commerce solutions, was acquired by Salesforce.com at approximately a 56% premium, which validated our long-held thesis that the company’s technology occupied a strategic part of the software ecosystem.
Detractors for the trailing 12 months included Advisory Board (ABCO), down 35%; Ascent Capital Group (ASCMA), down 73%; and Cavium (CAVM), down 44%. The Advisory Board is a leader in performance improvement software and solutions to the health care and higher education sectors. The company saw demand for its health care provider software solutions slow, causing its valuation to be rerated lower. Although we only held a remaining small position in Ascent Capital Group, a provider of home security systems and monitoring, it detracted from portfolio performance because of investor concerns regarding increasing competition in the market. Cavium, a provider of integrated semiconductor processors for networking, communications and storage, traded off meaningfully due to confusion regarding its acquisition of the slower growing Qlogic. It will take time to determine if management’s rationale for the deal was sound. Based upon solid historical execution, we believe the market is unduly pessimistic regarding the combined entity’s potential.
As previously mentioned, this is one of the most perplexing investment environments we have ever seen. There are days when it feels as though there is a high probability of a blow off top prior to this bull market’s end. Other days, it feels as though the end is nigh. Our solution to this macro complexity is to rely on bottom-up simplicity–let’s focus on finding the next Demandware, investing at the right time, right price and appropriate weight given the risk/reward. Patience has been a virtue over the years and should be of great value in the months ahead. Our goal is to prepare for volatility and then execute against it.
www.brownadvisoryfunds.com
21
Brown Advisory Small-Cap Growth Fund
A Message to Our Shareholders
June 30, 2016
It will be difficult to replicate the relative investment returns of the past year, but we will strive to continue to drive attractive risk-adjusted returns through the next full market cycle. We are extremely grateful for your continued support.
Sincerely,
Christopher A. Berrier
Portfolio Manager
Past performance is not a guarantee of future results.
Mutual fund investing involves risk. Principal loss is possible. Investments in smaller companies generally carry greater risk than is customarily associated with larger companies for various reasons such as narrower markets, limited financial resources and less liquid stock. The value of the Fund’s investments in REITs may change in response to changes in the real estate market such as declines in the value of real estate, lack of available capital or financing opportunities, and increases in property taxes or operating costs. The Fund may invest in ETFs, which may trade at a discount to the aggregate value of the underlying securities and although expense ratios for ETFs are generally low, frequent trading of ETFs by the Fund can generate brokerage expenses. Earnings growth is not representative of the fund’s future performance. Diversification does not assure a profit, nor does it protect against a loss in a declining market. Investments in foreign securities entail certain risks not associated with investments in domestic securities, such as volatility of currency exchange rates, and in some cases, political and economic instability and relatively illiquid markets. These risks are greater for investments in emerging markets. Privately Placement issued securities are restricted securities that are not publicly traded. Delay or difficulty in selling such securities may result in a loss to the Fund.
Fund holdings and sector allocations are subject to change and should not be considered a recommendation to buy or sell any security. For a complete list of fund holdings, please refer to the Schedule of Investments provided in this report.
Definitions for terms and indices are provided in the Glossary of Terms.
www.brownadvisoryfunds.com
22
Brown Advisory Small-Cap Growth Fund
Performance Chart and Analysis
June 30, 2016
COMPARISON OF CHANGE IN VALUE OF A $10,000 INVESTMENT
The following chart reflects the change in value of a hypothetical $10,000 investment, including reinvested dividends and distributions, in the Fund compared with the broad-based securities market index. The Russell 2000® Growth Index (“Index”) measures the performance of the small-cap growth segment of the U.S. equity universe. It includes those Russell 2000® companies with higher price to book value ratios and higher forecasted growth values. The Index is unmanaged and does not reflect the deduction of fees, such as investment management fees. Investors cannot invest directly in an index.

| Average Annual Total Return | One | Five | Ten | |
as of 6/30/16 | Year | Year | Year | |
| Institutional Shares | 1.61% | 10.14% | 9.14% | |
| Investor Shares | 1.43% | 10.01% | 9.19% | |
| Advisor Shares | 1.27% | 9.74% | 8.78% | |
Russell 2000® Growth Index | -10.75% | 8.51% | 7.14% |
Institutional Shares | Investor Shares | Advisor Shares | ||
Gross Expense Ratio1 | 0.99% | 1.14% | 1.39% | |
Net Expense Ratio1 | 0.99% | 1.14% | 1.39% |
Past performance does not guarantee future results. The performance data quoted represents past performance and current returns may be lower or higher. The investment return and net asset value will fluctuate so that an investor’s shares, when redeemed, may be worth more or less than the original cost. To obtain performance information current to the most recent month end, please visit our website at brownadvisoryfunds.com/performance.html. The performance table and graph above do not reflect the deduction of taxes that a shareholder would pay on Fund distributions or the redemption of Fund shares. Investment performance reflects periods during which fee waivers were in effect. In the absence of such waivers, total return would have been reduced. Performance data does not reflect the imposition of the redemption fee of 1.00% on shares redeemed within 14 days, and if it did, performance would have been lower.
1 | Per the Fund’s prospectus dated October 30, 2015. |
www.brownadvisoryfunds.com
23
Brown Advisory Small-Cap Growth Fund
Schedule of Investments
June 30, 2016
Shares | Security Description | Value $ | ||||||
| Common Stocks — 91.4% | ||||||||
| Consumer Discretionary — 10.1% | ||||||||
| 234,436 | Black Diamond, Inc.* | 970,565 | ||||||
| 115,927 | Bright Horizons Family Solutions, Inc.* | 7,687,119 | ||||||
| 6,912 | CoStar Group, Inc.* | 1,511,378 | ||||||
| 27,084 | Expedia, Inc. | 2,879,029 | ||||||
| 301,213 | Global Eagle Entertainment, Inc.* | 2,000,054 | ||||||
| 362,769 | Liberty TripAdvisor Holdings, Inc.* | 7,937,386 | ||||||
| 196,963 | Lindblad Expeditions Holdings, Inc.* | 1,896,754 | ||||||
| 70,904 | Papa Johns International, Inc. | 4,821,472 | ||||||
| 29,703,757 | ||||||||
| Consumer Staples — 2.4% | ||||||||
| 26,549 | PriceSmart, Inc. | 2,484,190 | ||||||
| 46,382 | Treehouse Foods, Inc.* | 4,761,112 | ||||||
| 7,245,302 | ||||||||
| Financials — 1.9% | ||||||||
| 158,564 | ConnectOne Bancorp, Inc. | 2,487,869 | ||||||
| 61,210 | Prosperity Bancshares, Inc. | 3,121,098 | ||||||
| 5,608,967 | ||||||||
| Health Care — 17.5% | ||||||||
| 50,013 | Acceleron Pharma, Inc.* | 1,699,442 | ||||||
| 74,398 | Alder Biopharmaceuticals, Inc.* | 1,857,718 | ||||||
| 17,629 | BeiGene, Ltd. ADR* | 525,344 | ||||||
| 87,875 | Charles River Laboratories International, Inc.* | 7,244,415 | ||||||
| 50,543 | Coherus BioSciences, Inc.* | 853,671 | ||||||
| 77,680 | Diplomat Pharmacy, Inc.* | 2,718,800 | ||||||
| 32,692 | Henry Schein, Inc.* | 5,779,946 | ||||||
| 49,898 | Heron Therapeutics, Inc.* | 900,659 | ||||||
| 71,248 | IDEXX Laboratories, Inc.* | 6,616,089 | ||||||
| 9,931 | Incyte Corp.* | 794,281 | ||||||
| 41,154 | Inovalon Holdings, Inc.* | 741,183 | ||||||
| 10,298 | Laboratory Corp. of America Holdings* | 1,341,520 | ||||||
| 117,477 | Medidata Solutions, Inc.* | 5,506,147 | ||||||
| 55,742 | Neurocrine Biosciences, Inc.* | 2,533,474 | ||||||
| 107,071 | Novadaq Technologies, Inc.* | 1,053,579 | ||||||
| 94,228 | Omeros Corp.* | 991,279 | ||||||
| 135,716 | Press Ganey Holdings, Inc.* | 5,340,425 | ||||||
| 176,686 | Teladoc, Inc.* | 2,830,510 | ||||||
| 44,853 | Ultragenyx Pharmaceutical, Inc.* | 2,193,760 | ||||||
| 51,522,242 | ||||||||
| Industrials — 20.2% | ||||||||
| 104,846 | Advisory Board Co.* | 3,710,500 | ||||||
| 42,097 | CEB, Inc. | 2,596,543 | ||||||
| 92,339 | DigitalGlobe, Inc.* | 1,975,131 | ||||||
| 110,619 | ESCO Technologies, Inc. | 4,418,123 | ||||||
| 119,781 | Healthcare Services Group, Inc. | 4,956,538 | ||||||
| 90,850 | HEICO Corp. | 6,069,689 | ||||||
| 128,680 | Hexcel Corp. | 5,358,235 | ||||||
| 52,349 | IDEX Corp. | 4,297,853 | ||||||
| 153,469 | Knight Transportation, Inc. | 4,079,206 | ||||||
| 35,669 | Team, Inc.* | 885,661 | ||||||
| 48,824 | WageWorks, Inc.* | 2,920,163 | ||||||
| 180,220 | Waste Connections, Inc. | 12,984,851 | ||||||
| 95,703 | Woodward, Inc. | 5,516,321 | ||||||
| 59,768,814 | ||||||||
| Information Technology — 36.2% | ||||||||
| 155,200 | 2U, Inc.* | 4,564,432 | ||||||
| 92,320 | Aspen Technology, Inc.* | 3,714,957 | ||||||
| 89,582 | Blackbaud, Inc. | 6,082,618 | ||||||
| 131,290 | Broadridge Financial Solutions, Inc. | 8,560,108 | ||||||
| 212,986 | BroadSoft, Inc.* | 8,738,816 | ||||||
| 126,374 | Cavium, Inc.* | 4,878,036 | ||||||
| 77,003 | CoreLogic, Inc.* | 2,963,075 | ||||||
| 108,709 | Demandware, Inc.* | 8,142,304 | ||||||
| 94,128 | Electronics For Imaging, Inc.* | 4,051,269 | ||||||
| 93,196 | Envestnet, Inc.* | 3,104,359 | ||||||
| 26,253 | Fair Isaac Corp. | 2,966,852 | ||||||
| 211,056 | Genpact, Ltd.* | 5,664,743 | ||||||
| 36,472 | Global Payments, Inc. | 2,603,371 | ||||||
| 43,802 | Guidewire Software, Inc.* | 2,705,212 | ||||||
| 151,222 | Interactive Intelligence Group, Inc.* | 6,198,590 | ||||||
| 157,837 | MACOM Technology Solutions Holdings, Inc.* | 5,205,464 | ||||||
| 91,194 | MAXIMUS, Inc. | 5,049,412 | ||||||
| 173,714 | Monotype Imaging Holdings, Inc. | 4,278,576 | ||||||
| 53,676 | Pegasystems, Inc. | 1,446,568 | ||||||
| 15,372 | Proofpoint, Inc.* | 969,819 | ||||||
| 64,275 | SPS Commerce, Inc.* | 3,895,065 | ||||||
| 82,986 | Synchronoss Technologies, Inc.* | 2,643,934 | ||||||
| 33,500 | Ultimate Software Group, Inc.* | 7,044,715 | ||||||
| 14,743 | WEX, Inc.* | 1,307,262 | ||||||
| 106,779,557 | ||||||||
| Telecommunication Services — 3.1% | ||||||||
| 230,479 | Cogent Communications Holdings, Inc. | 9,232,989 | ||||||
| Total Common Stocks (Cost $193,757,174) | 269,861,628 | |||||||
| Contingent Value Rights — 0.0% | ||||||||
| 118,191 | Dyax Corp.*†` | 131,192 | ||||||
| Total Contingent Value Rights (Cost $131,192) | 131,192 | |||||||
| Private Placements — 0.9% | ||||||||
| 18,400 | Greenspring Global Partners IV-B, L.P.*†^ | 2,434,009 | ||||||
| 78,769 | Greenspring Global Partners V-B, L.P.*†~ | 125,807 | ||||||
| Total Private Placements (Cost $489,612) | 2,559,816 | |||||||
The accompanying notes are an integral part of these financial statements.
www.brownadvisoryfunds.com
24
Brown Advisory Small-Cap Growth Fund
Schedule of Investments
June 30, 2016
Shares | Security Description | Value $ | ||||||
| Short-Term Investments — 7.7% | ||||||||
| Money Market Funds — 7.7% | ||||||||
| 22,697,340 | Cash Account Trust — Government | |||||||
| & Agency Securities Portfolio — | ||||||||
| Institutional Shares, 0.34%# | 22,697,340 | |||||||
| Total Short-Term Investments (Cost $22,697,340) | 22,697,340 | |||||||
| Total Investments — 100.0% (Cost $217,075,318) | 295,249,976 | |||||||
| Liabilities in Excess of Other Assets — (0.0)% | (118,893 | ) | ||||||
| NET ASSETS — 100.0% | $ | 295,131,083 | ||||||
| PORTFOLIO HOLDINGS | |
| % of Net Assets | |
| Information Technology | 36.2% |
| Industrials | 20.2% |
| Health Care | 17.5% |
| Consumer Discretionary | 10.1% |
| Money Market Funds | 7.7% |
| Telecommunication Services | 3.1% |
| Consumer Staples | 2.4% |
| Financials | 1.9% |
| Private Placements | 0.9% |
| Contingent Value Rights | 0.0% |
| Other Assets and Liabilities | (0.0)% |
| 100.0% |
| ^ | Security is exempt from registration under Regulation D of the Securities Act of 1933. Security is fair valued under the supervision of the Board of Trustees and was acquired from February 2008 to March 2016 as part of a $2,000,000 capital commitment. At June 30, 2016, 1,840,000 of the capital commitment has been fulfilled by the Fund. |
| ~ | Security is exempt from registration under Regulation D of the Securities Act of 1933. Security is fair valued under the supervision of the Board of Trustees and was acquired from October 2012 to March 2016 as part of a $100,000 capital commitment. At June 30, 2016, $78,000 of the capital commitment has been fulfilled by the Fund. |
| † | These securities may not be sold by the Fund and are considered illiquid. At June 30, 2016 the total market value of securities considered illiquid was $2,691,008 or 0.9% of net assets. |
| ` | Security is fair valued under supervision of the Board of Trustees |
| ADR — American Depositary Receipt | |
| * | Non-Income Producing |
| # | Annualized seven-day yield as of June 30, 2016. |
The accompanying notes are an integral part of these financial statements.
www.brownadvisoryfunds.com
25
Brown Advisory Small-Cap Fundamental Value Fund
A Message to Our Shareholders
June 30, 2016
Dear Shareholder:
During the year ended June 30, 2016, the Brown Advisory Small-Cap Fundamental Value Fund Investor Shares (the “Fund”) decreased 1.32% in value. During the same period, the Russell 2000 Value Index, the Fund’s benchmark, decreased 2.58%.
For the year ended June 30, 2016, the Fund’s relative outperformance resulted from a combination of strong absolute performance in consumer staples (up 44%) and telecommunication services (up 15%) as well as meaningful stock selection in consumer discretionary, financials, industrials and materials. Despite being underweight in the financials (38% vs. 43%) and consumer staples (1.6% vs. 3.4%) sectors, the Fund outperformed its benchmark.
Core-Mark was the Fund’s largest individual contributor to performance during the year. During the fourth quarter of 2014, Core-Mark announced an 800-store distribution agreement with Rite-Aid, opening up a significant new market opportunity for the company. Since this announcement, Core-Mark has continued to see its share price rise based on the growth from Rite-Aid.
The largest detractor from performance was NorthStar Asset Management Corp. The company in May confirmed it was in discussions with NorthStar Realty and Colony Capital for a tri-party all-stock business combination. In June, the deal was formally announced. The stock has since seen considerable weakness as we believe investors are skeptical of the deal’s ability to reduce the large discount to NAV. We await more details in the to-be-filed proxy statement.
The fund added 13 new companies during the course of the year. Sizeable additions included Murphy USA, Primerica and Regis Corp. Murphy USA is one of the largest independent retailers of motor fuel and convenience merchandise in the U.S. The company sells retail and motor fuel products and convenience merchandise through a chain of more than 1,200 retail locations that are all less than three miles from a Walmart store. Murphy is positioned as a low cost, high volume fuel retailer, able has been able to leverage its below-average breakeven profit margin. Murphy has had a strong balance sheet and a management team that has been dedicated to the disciplined use of capital. The company initiated a $250 million share repurchase program and, during the third quarter of 2015, bought back $150 million in stock.
Primerica (PRI), is a unique provider of term life insurance and a distributor of basic savings and investment products to middle-income consumers across the U.S. and Canada. With close to 105,000 sales representatives and almost $700 billion of face amount in-force, PRI is the largest provider of term life insurance in the U.S. PRI’s philosophy is to “Buy Term and Invest the Difference,” which essentially encourages middle-income consumers to buy term life insurance in place of more expensive cash value life insurance and then invest the savings across a variety of third party investment products distributed and sold by PRI representatives in order to save for retirement or other financial goals. The company was wholly owned by Citi until its IPO in 2010, and in the time it has been a stand-alone company, it has repurchased nearly one-third of shares outstanding and has returned over 125% of cumulative operating net income to shareholders. Even if term life sales remain at current levels, PRI has the potential to see meaningful earnings growth over the next several years because of a favorable reinsurance transaction that it entered into with Citi at the time of the IPO. This is a characteristic unique to PRI that we believe is largely overlooked by investors. Furthermore, a minimally capital intensive investment distribution business provides a cash-rich and highly recurring earnings stream that has diversified PRI’s earnings and has helped boost PRI’s Return on Equity (“ROE”) to well above peer average.
Regis Corp owns, franchises and operates over 9,500 beauty salons in North America and the U.K. Each of the company’s 30+ salon concepts generally offer similar salon products and services, and serve both the premium and mass marketplace for both genders. We believe Regis is under-earning, but has been a cash-flow-generative business model supported by stable industry fundamentals. CEO Dan Hanrahan and CFO Steve Speigel were brought in to initiate a turnaround focused on a stronger organizational structure, improved salon-level economics and incentives to realign the mindset of the company around profitability before growth. We have monitored Regis over the last two years and believe management has continued to make operational improvements with a focus on profitability and cash flow generation, and has also become more disciplined in capital allocation through increased share buybacks.
During the year, there were 14 deletions from the Fund’s portfolio, three of which were a result of corporate actions. Campus Crest was acquired by Harrison Street Real Estate Capital LLC, a private equity firm. StanCorp’s acquisition by Meiji Yasuda was finalized during the first quarter of 2016, eliminating our position. In April, Cash America (CSH) and First Cash Financial Services (FCFS) announced they would enter into a merger-of-equals transaction. We decided to sell our entire position in CSH because we believe transaction economics favored FCFS shareholders over CSH shareholders. Furthermore, prior knowledge of the FCFS management team and their focus on Latin American expansion was at odds with our initial thesis on Cash America, which highlighted CSH’s internal focus and emphasis on capital return.
www.brownadvisoryfunds.com
26
Brown Advisory Small-Cap Fundamental Value Fund
A Message to Our Shareholders
June 30, 2016
Given the broader environment for small-caps, and factoring in overall valuations and debt levels, we remain cautious. While we have a robust pipeline of opportunities that we are pursuing, we have seen an increasing number of investments that are inexpensive on traditional valuation metrics, but whose prospects or debt levels do not meet our criteria.
Sincerely,
J. David Schuster
Portfolio Manager
Past performance is not a guarantee of future results.
Investments in smaller companies generally carry greater risk than is customarily associated with larger companies for various reasons such as narrower markets, limited financial resources and less liquid stock. The value of the Fund’s investments in REITs may change in response to changes in the real estate market such as declines in the value of real estate, lack of available capital or financing opportunities, and increases in property taxes or operating costs. The Fund may invest in ETFs, which may trade at a discount to the aggregate value of the underlying securities and although expense ratios for ETFs are generally low, frequent trading of ETFs by the Fund can generate brokerage expenses. Investments in debt securities typically decrease in value when interest rates rise. This risk is usually greater for longer-term debt securities. Investments in foreign securities entail certain risks not associated with investments in domestic securities, such as volatility of currency exchange rates, and in some cases, political and economic instability and relatively illiquid markets. These risks are greater for investments in emerging markets. The risks of investments in derivatives, including options, futures contracts and options on futures contracts include imperfect correlation between the value of these instruments and the underlying assets; risks of default by the other party to the derivative transactions; risks that the transactions may result in losses that partially or completely offset gains in portfolio positions; and risks that the derivative transactions may not be liquid. Private Placement issued securities are restricted securities that are not publicly traded. Delay or difficulty in selling such securities may result in a loss to the Fund. Earnings growth is not a measure of the Fund’s future performance.
Fund holdings and sector allocations are subject to change and should not be considered a recommendation to buy or sell any security. For a complete list of fund holdings, please refer to the Schedule of Investments provided in this report.
Definitions for terms and indices are provided in the Glossary of Terms.
www.brownadvisoryfunds.com
27
Brown Advisory Small-Cap Fundamental Value Fund
Performance Chart and Analysis
June 30, 2016
COMPARISON OF CHANGE IN VALUE OF A $10,000 INVESTMENT
The following chart reflects the change in value of a hypothetical $10,000 investment, including reinvested dividends and distributions, in the Fund as measured against a broad-based securities market index. The Russell 2000® Value Index (“Index”) measures the performance of small-cap value segment of the U.S. equity universe. It includes those Russell 2000® companies with lower price to book ratios and lower forecasted growth values. The Index is unmanaged and does not reflect the deduction of fees, such as investment management fees. Investors cannot invest directly in an index.

| Since | ||||
| Average Annual Total Return | One | Five | Inception | |
as of 6/30/16 | Year | Year | (12/31/08) | |
Institutional Shares1 | -1.17% | 10.28% | 15.52% | |
| Investor Shares | -1.32% | 10.12% | 15.35% | |
Advisor Shares2 | -1.58% | 9.84% | 15.06% | |
Russell 2000® Value Index | -2.58% | 8.15% | 11.78% |
Institutional Shares | Investor Shares | Advisor Shares | ||
Gross Expense Ratio3 | 1.13% | 1.28% | 1.53% | |
Net Expense Ratio3 | 1.13% | 1.28% | 1.53% |
Past performance does not guarantee future results. The performance data quoted represents past performance and current returns may be lower or higher. The investment return and net asset value will fluctuate so that an investor’s shares, when redeemed, may be worth more or less than the original cost. To obtain performance information current to the most recent month end, please visit our website at brownadvisoryfunds.com/performance.html. The performance table and graph above do not reflect the deduction of taxes that a shareholder would pay on Fund distributions or the redemption of Fund shares. Investment performance reflects periods during which fee waivers were in effect. In the absence of such waivers, total return would have been reduced. Performance data does not reflect the imposition of the redemption fee of 1.00% on shares redeemed within 14 days, and if it did, performance would have been lower.
1 | Performance information for the Institutional Shares, prior to commencement of operations on October 19, 2012, is based on the performance of Investor Shares, and adjusted for the lower expenses applicable to Institutional Shares. | |
2 | Performance information for Advisor Shares, prior to commencement on July 28, 2011, is based on the performance of Investor Shares, and adjusted for the higher expenses applicable to Advisor Shares. | |
3 | Per the Fund’s prospectus dated October 30, 2015. |
www.brownadvisoryfunds.com
28
Brown Advisory Small-Cap Fundamental Value Fund
Schedule of Investments
June 30, 2016
Shares | Security Description | Value $ | ||||||
| Common Stocks — 88.0% | ||||||||
| Consumer Discretionary — 17.6% | ||||||||
| 399,829 | Cato Corp. | 15,081,550 | ||||||
| 610,876 | Core-Mark Holding Co., Inc. | 28,625,649 | ||||||
| 254,904 | Culp, Inc. | 7,042,997 | ||||||
| 1,912,805 | Denny’s Corp.* | 20,524,398 | ||||||
| 544,754 | Destination Maternity Corp. † | 3,203,153 | ||||||
| 1,106,980 | Diamond Resorts International, Inc.* | 33,165,121 | ||||||
| 335,191 | Liberty Global PLC LiLAC Group* | 10,890,356 | ||||||
| 463,554 | Murphy USA, Inc.* | 34,377,165 | ||||||
| 1,625,062 | Regis Corp.* | 20,232,022 | ||||||
| 173,142,411 | ||||||||
| Consumer Staples — 2.0% | ||||||||
| 118,201 | Casey’s General Stores, Inc. | 15,544,613 | ||||||
| 98,407 | MGP Ingredients, Inc. | 3,762,100 | ||||||
| 19,306,713 | ||||||||
| Energy — 2.7% | ||||||||
| 244,625 | Green Plains Partners L.P. | 3,803,919 | ||||||
| 1,212,245 | Par Pacific Holdings, Inc.* | 18,595,838 | ||||||
| 277,516 | RigNet, Inc.* | 3,715,939 | ||||||
| 26,115,696 | ||||||||
| Financials — 27.8% | ||||||||
| 2,831,691 | American Capital, Ltd.* | 44,825,669 | ||||||
| 337,131 | Assurant, Inc. | 29,097,777 | ||||||
| 322,195 | Capital Bank Financial Corp. | 9,279,216 | ||||||
| 159,315 | Farmers Capital Bank Corp. † | 4,357,265 | ||||||
| 571,477 | Maiden Holdings, Ltd. | 6,994,878 | ||||||
| 400,856 | Medley Management, Inc. † | 2,357,033 | ||||||
| 490,278 | National General Holdings Corp. | 10,501,755 | ||||||
| 1,534,561 | NorthStar Asset Management Group, Inc. | 15,667,868 | ||||||
| 511,863 | OceanFirst Financial Corp. | 9,300,551 | ||||||
| 246,128 | Oritani Financial Corp. | 3,935,587 | ||||||
| 342,270 | Pacific Premier Bancorp, Inc.* | 8,214,480 | ||||||
| 227,113 | Patriot National, Inc.* | 1,857,784 | ||||||
| 424,497 | Primerica, Inc. | 24,298,208 | ||||||
| 343,298 | Renasant Corp. | 11,098,824 | ||||||
| 1,148,094 | Synovus Financial Corp. | 33,283,245 | ||||||
| 2,194,432 | TFS Financial Corp. † | 37,788,119 | ||||||
| 291,906 | Triumph Bancorp, Inc.* | 4,670,496 | ||||||
| 222,999 | Virtus Investment Partners, Inc. | 15,873,069 | ||||||
| 273,401,824 | ||||||||
| Health Care — 3.6% | ||||||||
| 165,482 | Addus HomeCare Corp.* | 2,884,351 | ||||||
| 575,589 | Air Methods Corp.* | 20,623,354 | ||||||
| 275,460 | Providence Service Corp.* | 12,362,645 | ||||||
| 35,870,350 | ||||||||
| Industrials — 12.8% | ||||||||
| 1,011,392 | Albany International Corp. † | 40,384,883 | ||||||
| 744,154 | DigitalGlobe, Inc.* | 15,917,454 | ||||||
| 342,926 | EnPro Industries, Inc. | 15,222,485 | ||||||
| 810,963 | Federal Signal Corp. | 10,445,203 | ||||||
| 388,522 | Kadant, Inc. | 20,012,768 | ||||||
| 787,323 | McGrath RentCorp † | 24,084,211 | ||||||
| 126,067,004 | ||||||||
| Information Technology — 10.0% | ||||||||
| 363,319 | Broadridge Financial Solutions, Inc. | 23,688,399 | ||||||
| 945,610 | CTS Corp. † | 16,945,331 | ||||||
| 80,171 | DST Systems, Inc. | 9,334,310 | ||||||
| 750,321 | EchoStar Corp.* | 29,787,744 | ||||||
| 393,662 | Electro Rent Corp. | 6,066,331 | ||||||
| 229,208 | MAXIMUS, Inc. | 12,691,247 | ||||||
| 98,513,362 | ||||||||
| Materials — 8.6% | ||||||||
| 404,970 | Clearwater Paper Corp.* | 26,472,889 | ||||||
| 311,435 | Deltic Timber Corp. † | 20,906,632 | ||||||
| 208,651 | KMG Chemicals, Inc. | 5,422,839 | ||||||
| 437,591 | Neenah Paper, Inc. | 31,668,461 | ||||||
| 84,470,821 | ||||||||
| Telecommunication Services — 2.9% | ||||||||
| 338,158 | ATN International, Inc. | 26,312,074 | ||||||
| 123,790 | Hawaiian Telcom HoldCo, Inc.* | 2,623,110 | ||||||
| 28,935,184 | ||||||||
| Total Common Stocks (Cost $746,562,443) | 865,823,365 | |||||||
| Real Estate Investment Trusts — 7.8% | ||||||||
| 1,446,167 | Forest City Realty Trust, Inc. | 32,263,986 | ||||||
| 3,217,130 | MFA Financial, Inc. | 23,388,535 | ||||||
| 1,854,218 | Northstar Realty Finance Corp. | 21,193,711 | ||||||
| Total Real Estate Investment Trusts (Cost $75,429,108) | 76,846,232 | |||||||
| Short-Term Investments — 3.8% | ||||||||
| Money Market Funds — 3.8% | ||||||||
| 36,740,582 | Cash Account Trust — Government | |||||||
| & Agency Securities Portfolio — | ||||||||
| Institutional Shares, 0.34%# | 36,740,582 | |||||||
| Total Short-Term Investments (Cost $36,740,582) | 36,740,582 | |||||||
| Total Investments — 99.6% (Cost $858,732,133) | 979,410,179 | |||||||
| Other Assets in Excess of Liabilities — 0.4% | 4,224,829 | |||||||
| NET ASSETS — 100.0% | $ | 983,635,008 | ||||||
| PORTFOLIO HOLDINGS | |
| % of Net Assets | |
| Financials | 27.8% |
| Consumer Discretionary | 17.6% |
| Industrials | 12.8% |
| Information Technology | 10.0% |
| Materials | 8.6% |
| Real Estate Investment Trusts | 7.8% |
| Money Market Funds | 3.8% |
| Health Care | 3.6% |
| Telecommunication Services | 2.9% |
| Energy | 2.7% |
| Consumer Staples | 2.0% |
| Other Assets and Liabilities | 0.4% |
| 100.0% |
| † | All or a portion of this security is considered illiquid. At June 30, 2016 the total market value of securities considered illiquid was $35,098,296 or 3.6% of net assets. |
| * | Non-Income Producing |
| # | Annualized seven-day yield as of June 30, 2016. |
The accompanying notes are an integral part of these financial statements.
www.brownadvisoryfunds.com
29
Brown Advisory Multi-Strategy Fund
A Message to Our Shareholders
June 30, 2016
Dear Shareholder:
During the year ended June 30, 2016, the Brown Advisory Multi-Strategy Fund (the “Fund”) fell 1.93% in value. During the same period, the S&P Balanced Equity and Bond – Moderate Index, the Fund’s benchmark, increased 7.09%.
In June, the U.K. vote to leave the European Union jolted markets as investors flocked to safety assets such as sovereign bonds and U.S. dollars. However, markets rallied soon thereafter and reached near-all-time highs. Overall, emerging markets and commodities have been the best-performing asset classes, as the rebound in commodity prices has largely supported the rally in EM equities. Among developed market equities, European equities suffered from the Brexit vote, while Japanese equities have been challenged by lackluster economic growth and low inflation. U.S. equities and fixed income both produced positive returns for the first half of the year, highlighting the relative strength of the U.S. economy and its resilience amid global macro headwinds.
The largest contributor to performance on a relative basis was the Brown Advisory Total Return Fund, which rose 6.46%, compared with 6.00% for the Barclays US Aggregate Bond Index. Credit selection drove relative outperformance of the Brown Advisory Total Return Fund. While accommodative monetary policies and tepid growth should keep interest rates low, and with global yields continuing to fall toward historic lows, the Fund remains focused on seeking attractive, low-risk returns through fundamental, bottom-up research rather than on centering decisions on particular macroeconomic forecasts.
The largest detractor to performance on a relative basis was the Brown Advisory Flexible Equity Fund, which decreased 4.16%, compared with a 3.99% gain by the S&P 500 Index. The underperformance was mostly due to underweight exposures to high-yielding sectors (i.e. consumer staples, telecommunication services, and utilities) and stock selection within financials and industrials. In addition, the Brown Advisory Flexible Equity Fund is the largest underlying holding, constituting 30% of the Fund as of June 30, 2016.
Overall, the current macroeconomic environment is one of tremendous uncertainty emanating from many areas: central banks, Brexit, the U.S. election, China’s economic transition, etc. Despite all of this uncertainty, global equity and fixed income markets have continued to produce positive returns and valuations in both areas have exceeded historical norms. In an environment such as this, it is tempting to pull back from these asset classes entirely and raise cash. However, we do not believe that is prudent. Instead, we have maintained an asset allocation balance of stability and growth assets that is reflective of the challenging landscape. First, we have maintained allocations to traditional stability asset classes like high-grade U.S. bonds, believing that these are very likely to outperform cash and will likely provide ballast should the aforementioned risks produce an adverse outcome for the market. This defense allows us to make allocations designed to take advantage of opportunities created by excessive pessimism. This has included small-cap stocks in the U.S., where the valuation gap is growing despite the fact that small-cap stocks are not exposed to many of the headwinds faced by multi-national companies, such as the strong dollar and slowing growth in China. Additionally, Asian equities have not seen any increase in valuations over the past five years due to macroeconomic concerns, but we are finding tremendous bottom-up opportunities where earnings growth has remained strong and valuations have been quite reasonable. In this manner, we aim to balance select return opportunities and be prepared with ballast investments for an environment filled with significant uncertainty.
Sincerely,
Paul J. Chew, CFA
Portfolio Manager
www.brownadvisoryfunds.com
30
Brown Advisory Multi-Strategy Fund
A Message to Our Shareholders
June 30, 2016
Past performance is not a guarantee of future results.
Mutual fund investing involves risk. Principal loss is possible. The Fund invests in small and medium capitalization companies which carry greater risk than is associated with larger companies for various reasons, such as narrower markets, limited financial resources and less liquid stock. The value of the Fund’s investments in REITs may change in response to changes in the real estate market such as declines in the value of real estate, lack of available capital or financing opportunities, and increases in property taxes or operating costs. The Fund may invest in ETFs, which may trade at a discount to the aggregate value of the underlying securities and although expense ratios for ETFs are generally low, frequent trading of ETFs by the Fund can generate brokerage expenses. Investments in foreign securities entail certain risks not associated with investments in domestic securities, such as volatility of currency exchange rates, and in some cases, political and economic instability and relatively illiquid markets. These risks are greater for investments in emerging markets. Private Placement issued securities are restricted securities that are not publicly traded. Delay or difficulty in selling such securities may result in a loss to the Fund.
Diversification does not assure a profit or protect against loss in a declining market.
Fund holdings and sector allocations are subject to change and should not be considered a recommendation to buy or sell any security. For a complete list of fund holdings, please refer to the Schedule of Investments provided in this report.
Definitions for terms and indices are provided in the Glossary of Terms.
www.brownadvisoryfunds.com
31
Brown Advisory Multi-Strategy Fund
Performance Chart and Analysis
June 30, 2016
COMPARISON OF CHANGE IN VALUE OF A $1,000,000 INVESTMENT
The following chart reflects the change in value of a hypothetical $1,000,000 investment, including reinvested dividends and distributions, in the Fund as measured against a broad-based securities market index. The S&P Balanced Equity and Bond – Moderate Index (“Index”) is the moderate profile of the S&P Balanced Equity and Bond Series which combines investable S&P indices for core equity and fixed income to provide a regulary rebalanced multi-asset measure for conservative, moderate and growth risk-reward profiles. The Index is unmanaged and does not reflect the deduction of fees, such as investment management fees. Investors cannot invest directly in an index.
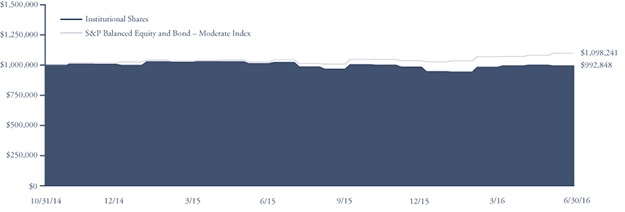
| Since | |||
| Average Annual Total Return | One | Inception | |
as of 6/30/16 | Year | (10/31/14) | |
| Institutional Shares | -1.93% | -0.43% | |
| S&P Balanced Equity and Bond – Moderate Index | 7.09% | 5.80% |
Institutional Shares | ||
Gross Expense Ratio1 | 3.84% | |
Net Expense Ratio1 | 1.89% |
Past performance does not guarantee future results. The performance data quoted represents past performance and current returns may be lower or higher. The investment return and net asset value will fluctuate so that an investor’s shares, when redeemed, may be worth more or less than the original cost. To obtain performance information current to the most recent month end, please visit our website at brownadvisoryfunds.com/performance.html. The performance table and graph above do not reflect the deduction of taxes that a shareholder would pay on Fund distributions or the redemption of Fund shares. Investment performance reflects periods during which fee waivers were in effect. In the absence of such waivers, total return would have been reduced. Performance data does not reflect the imposition of the redemption fee of 1.00% on shares redeemed within 14 days, and if it did, performance would have been lower. Short-term performance, in particular, is not a good indication of the Fund’s future performance, and an investment should not be made based solely on returns.
1 | Per the Fund’s prospectus dated October 30, 2015. |
www.brownadvisoryfunds.com
32
Brown Advisory Multi-Strategy Fund
Schedule of Investments
June 30, 2016
Shares | Security Description | Value $ | ||||||
| Affiliated Mutual Funds (Note 3) — 97.8% | ||||||||
| Domestic Equity Funds — 41.8% | ||||||||
| 59,096 | Brown Advisory Flexible Equity Fund — | |||||||
| Institutional Shares | 895,310 | |||||||
| 9,401 | Brown Advisory Small-Cap | |||||||
| Fundamental Value Fund — | ||||||||
| Institutional Shares | 213,867 | |||||||
| 3,938 | Brown Advisory Small-Cap Growth Fund — | |||||||
| Institutional Shares* | 122,823 | |||||||
| 1,232,000 | ||||||||
| Foreign Equity Funds — 18.1% | ||||||||
| 18,212 | Brown Advisory — Somerset Emerging | |||||||
| Markets Fund — Institutional Shares | 158,987 | |||||||
| 26,254 | Brown Advisory — WMC Strategic | |||||||
| European Equity Fund — Institutional Shares | 259,911 | |||||||
| 12,616 | Brown Advisory Emerging | |||||||
| Markets Small-Cap Fund — | ||||||||
| Institutional Shares* | 115,812 | |||||||
| 534,710 | ||||||||
| Bond Funds — 37.9% | ||||||||
| 31,024 | Brown Advisory Strategic Bond Fund — | |||||||
| Investor Shares | 293,797 | |||||||
| 80,666 | Brown Advisory Total Return Fund — | |||||||
| Institutional Shares | 821,175 | |||||||
| 1,114,972 | ||||||||
| Total Affiliated Mutual Funds (Cost $2,952,443) | 2,881,682 | |||||||
| Short-Term Investments — 2.3% | ||||||||
| Money Market Funds — 2.3% | ||||||||
| 68,483 | Cash Account Trust — Government | |||||||
| & Agency Securities Portfolio — | ||||||||
| Institutional Shares, 0.34%# | 68,483 | |||||||
| Total Short-Term Investments (Cost $68,483) | 68,483 | |||||||
| Total Investments — 100.1% (Cost $3,020,926) | 2,950,165 | |||||||
| Liabilities in Excess of Other Assets — (0.1)% | (3,264 | ) | ||||||
| NET ASSETS — 100.0% | $ | 2,946,901 | ||||||
| PORTFOLIO HOLDINGS | |
| % of Net Assets | |
| Domestic Equity Funds | 41.8% |
| Bond Funds | 37.9% |
| Foreign Equity Funds | 18.1% |
| Money Market Funds | 2.3% |
| Other Assets and Liabilities | (0.1)% |
| 100.0% |
| * | Non-Income Producing |
| # | Annualized seven-day yield as of June 30, 2016. |
The accompanying notes are an integral part of these financial statements.
www.brownadvisoryfunds.com
33
Brown Advisory Global Leaders Fund
A Message to Our Shareholders
June 30, 2016
Dear Shareholder:
The Brown Advisory Global Leaders Fund (the “Fund”) commenced operations as of the close of business on July 1, 2015. From the commencement of operations to June 30, 2016 (“the period”), the Fund decreased 3.50% in value. During the period, the Russell Global Large Cap Index, the Fund’s benchmark, fell 4.19%.
During the period, global equity markets were volatile—with three periods of significant weakness in the first, third and fourth quarters of the fiscal year—as a range of investor concerns prompted risk aversion. The primary cause of caution was the prospect of a slowing by China’s economy, one of the main engines of global growth. After several rounds of stimulus by Beijing, investor concerns abated, but we remain cautious because of the level of credit creation in the country. Elsewhere energy prices were particularly volatile, with the oil price dipping below $30 per barrel in January 2016 and bouncing to more than $50 per barrel toward the end of the period. We struggle to see the attraction of investing in energy companies because of questionable customer outcomes, capital intensity and a lack of pricing power. The fund’s underweight in energy was a positive contributor to performance during the first half but ended up being a modest detractor for the full year because of the recovery in the oil price. Finally, the U.K. vote on June 23 to leave the European Union provoked instability among equity markets. The political and economic ramifications of Brexit remain unclear, and we feel that the current period of uncertainty could persist in Europe.
Central bank activity and accommodative monetary policy created numerous equity market distortions throughout the fiscal year. The emergence of negative interest rates and additional monetary stimulus prompted the yields on a number of long-dated government bonds to turn negative. Accordingly, investor appetite increased for equities with bond-proxy qualities, and the premium for secure growth increased. Our investment process focuses on buying high-quality franchises with attractive return profiles. Crucially, though, we aim to invest at a discount to what we believe is the intrinsic value of a stock. This goal remains a sticking point for many of the bond-proxy equities. Despite the attractions of many consumer staples companies, we do not find their current valuations appealing. Our modest underweight in the sector detracted from performance during the period. Elsewhere, questionable customer outcomes, mediocre return profiles and valuation concerns contributed to our underweight positions in utilities and telecoms. These underweights also detracted from performance, as investors snapped up stocks with bond-like qualities in these sectors.
On a more positive note, good stock selection helped make materials stocks the main area of outperformance for the strategy during the period. Our three materials holdings—Ecolab (ECL), Sherwin-Williams (SHW) and Novozymes—have operated with what we believe to be differentiated business models and resilient return profiles that contributed to outperformance during the period. We are fundamental stockpickers and the sector allocation and associated performance is very much a result of our bottom-up stock selection.
Elsewhere, robust operating performances from Facebook (FB) and Taiwan Semiconductor (TSM) drove outperformance in information technology. Facebook’s continued monetization of its core platform resulted in impressive revenue growth in the period, and we remain encouraged by its ability to monetize complementary platforms, WhatsApp and Instagram. Taiwan Semiconductor continued to cement its dominant position in leading-edge semiconductor manufacturing technology. Despite strong share price performance during the year, TSM’s healthy prospects and an attractive risk-reward profile affirm the company’s position as a core holding.
Finally, a series of robust results and strong FDA data helped make Edwards Lifesciences (EW) the biggest contributor to outperformance during the year. Edwards has had a dominant position in the provision of TAVR heart valves. The company has been changing the lives of patients who suffer from severe symptomatic aortic stenosis (SSAS) by offering a superior alternative to open-heart surgery.
We have been particularly active on the research front during the period, having conducted multiple company visits and numerous research trips to the U.S., Europe and Asia. This activity and further in-depth analysis resulted in 8 additions to the portfolio, with 10 companies eliminated. Our efforts to find high-returning franchises that bring something different to the portfolio resulted in notable new positions in India-based HDFC Bank; Henkel, a German detergent, haircare and adhesives manufacturer; and U.S.-based Brown-Forman, a leading bourbon producer, among others. On the other side of the equation, concerns about the durability of individual competitive advantages resulted in the elimination of Burberry, Ameriprise, Next and Credit Suisse from the strategy.
www.brownadvisoryfunds.com
34
Brown Advisory Global Leaders Fund
A Message to Our Shareholders
June 30, 2016
The Global Leaders fund invests in market-leading companies from across the globe that deliver exceptional customer outcomes. We believe that companies that combine a superior outcome for their customers with strong leadership can generate high and sustainable returns on invested capital (ROIC), which can then lead to strong shareholder returns. We are long-term focused and look for franchises that can compound excess economic profit at above-market growth rates for extended periods of time. The current uncertain global economic outlook and increasing political risk—as evidenced by Brexit and the coming U.S. presidential election—serve as good reminders of the benefits of investing in exceptional franchises that provide special goods and services to their customers. Such high-quality companies tend to deliver high returns to investors. Although volatility currently seems inevitable, we believe that our companies have the potential to weather any impending storm and the portfolio has the potential to generate attractive long-term returns for our clients.
Sincerely,
Michael Dillon, CFA
Lead Portfolio Manager
Bertie Thomson, CFA
Portfolio Manager
Past performance is not a guarantee of future results.
Mutual fund investing involves risk. Principal loss is possible. The Fund invests in small and medium capitalization companies which carry greater risk than is associated with larger companies for various reasons, such as narrower markets, limited financial resources and less liquid stock. The value of the Fund’s investments in REITs may change in response to changes in the real estate market such as declines in the value of real estate, lack of available capital or financing opportunities, and increases in property taxes or operating costs. The Fund may invest in ETFs, which may trade at a discount to the aggregate value of the underlying securities and although expense ratios for ETFs are generally low, frequent trading of ETFs by the Fund can generate brokerage expenses. Investments in foreign securities entail certain risks not associated with investments in domestic securities, such as volatility of currency exchange rates, and in some cases, political and economic instability and relatively illiquid markets. These risks are greater for investments in emerging markets. Private Placement issued securities are restricted securities that are not publicly traded. Delay or difficulty in selling such securities may result in a loss to the Fund.
Diversification does not assure a profit or protect against loss in a declining market.
Fund holdings and sector allocations are subject to change and should not be considered a recommendation to buy or sell any security. For a complete list of fund holdings, please refer to the Schedule of Investments provided in this report.
Definitions for terms and indices are provided in the Glossary of Terms.
www.brownadvisoryfunds.com
35
Brown Advisory Global Leaders Fund
Performance Chart and Analysis
June 30, 2016
COMPARISON OF CHANGE IN VALUE OF A $10,000 INVESTMENT
The following chart reflects the change in value of a hypothetical $10,000 investment, including reinvested dividends and distributions, in the Fund as measured against a broad-based securities market index. The Russell Global Large Cap Index (“Index”) measures the performance of the largest securities in the Russell Global Index, based on market capitalization. The Index is unmanaged and does not reflect the deduction of fees, such as investment management fees. Investors cannot invest directly in an index.

| Since | ||
| Cumulative Total Return | Inception | |
as of 6/30/16 | (7/1/15) | |
| Investor Shares | -3.50% | |
| Russell Global Large Cap Index | -4.19% |
Investor Shares | ||
Gross Expense Ratio1 | 1.45% | |
Net Expense Ratio1 | 0.86% |
Past performance does not guarantee future results. The performance data quoted represents past performance and current returns may be lower or higher. The investment return and net asset value will fluctuate so that an investor’s shares, when redeemed, may be worth more or less than the original cost. To obtain performance information current to the most recent month end, please visit our website at brownadvisoryfunds.com/performance.html. The performance table and graph above do not reflect the deduction of taxes that a shareholder would pay on Fund distributions or the redemption of Fund shares. Investment performance reflects periods during which fee waivers were in effect. In the absence of such waivers, total return would have been reduced. Performance data does not reflect the imposition of the redemption fee of 1.00% on shares redeemed within 14 days, and if it did, performance would have been lower. Short-term performance, in particular, is not a good indication of the Fund’s future performance, and an investment should not be made based solely on returns.
1 | Per the Fund’s prospectus dated October 30, 2015. |
www.brownadvisoryfunds.com
36
Brown Advisory Global Leaders Fund
Schedule of Investments
June 30, 2016
Shares | Security Description | Value $ | ||||||
| Common Stocks — 95.0% | ||||||||
| China — 3.0% | ||||||||
| 131,934 | AIA Group, Ltd. | 793,415 | ||||||
| Denmark — 6.0% | ||||||||
| 3,317 | Novo Nordisk A/S ADR | 178,388 | ||||||
| 12,547 | Novo Nordisk A/S | 675,692 | ||||||
| 15,640 | Novozymes A/S | 751,047 | ||||||
| 1,605,127 | ||||||||
| Germany — 3.6% | ||||||||
| 4,108 | Henkel AG & Co KGaA | 444,356 | ||||||
| 11,906 | United Internet AG | 494,922 | ||||||
| 939,278 | ||||||||
| India — 3.5% | ||||||||
| 24,383 | HDFC Bank, Ltd. | 492,555 | ||||||
| 37,165 | Sun Pharmaceutical Industries, Ltd. | 421,391 | ||||||
| 913,946 | ||||||||
| Indonesia — 1.2% | ||||||||
| 370,559 | Bank Rakyat Indonesia Persero | 304,908 | ||||||
| Japan — 1.4% | ||||||||
| 10,700 | Fuji Heavy Industries, Ltd. | 367,795 | ||||||
| Sweden — 1.5% | ||||||||
| 16,423 | Atlas Copco AB | 389,263 | ||||||
| Taiwan — 3.3% | ||||||||
| 32,787 | Taiwan Semiconductor | |||||||
| Manufacturing Co., Ltd. ADR | 860,003 | |||||||
| United Kingdom — 4.4% | ||||||||
| 19,890 | Unilever PLC | 953,037 | ||||||
| 4,689 | Unilever PLC ADR | 224,650 | ||||||
| 1,177,687 | ||||||||
| United States — 67.1% | ||||||||
| Consumer Discretionary — 12.8% | ||||||||
| 14,230 | Nike, Inc. | 785,496 | ||||||
| 630 | Priceline Group, Inc. * | 786,498 | ||||||
| 15,782 | Starbucks Corp. | 901,469 | ||||||
| 11,480 | TJX Companies, Inc. | 886,600 | ||||||
| 3,360,063 | ||||||||
| Consumer Staples — 7.1% | ||||||||
| 9,666 | Brown Forman Corp. | 964,280 | ||||||
| 10,041 | Estee Lauder Companies, Inc. | 913,932 | ||||||
| 1,878,212 | ||||||||
| Financials — 6.8% | ||||||||
| 28,930 | Charles Schwab Corp. | 732,218 | ||||||
| 10,817 | JPMorgan Chase & Co. | 672,169 | ||||||
| 4,216 | Moody’s Corp. | 395,081 | ||||||
| 1,799,468 | ||||||||
| Health Care — 7.5% | ||||||||
| 3,049 | Alexion Pharmaceuticals, Inc. * | 356,001 | ||||||
| 6,115 | Cigna Corp. | 782,659 | ||||||
| 8,446 | Edwards Lifesciences Corp. * | 842,320 | ||||||
| 1,980,980 | ||||||||
| Industrials — 5.2% | ||||||||
| 4,662 | 3M Co. | 816,410 | ||||||
| 6,812 | Verisk Analytics, Inc. * | 552,317 | ||||||
| 1,368,727 | ||||||||
| Information Technology — 21.8% | ||||||||
| 1,366 | Alphabet, Inc. * | 945,409 | ||||||
| 5,063 | Apple, Inc. | 484,023 | ||||||
| 13,596 | Cognizant Technology Solutions Corp. * | 778,235 | ||||||
| 6,301 | Facebook, Inc. * | 720,078 | ||||||
| 9,761 | MasterCard, Inc. | 859,554 | ||||||
| 6,774 | NXP Semiconductors NV * | 530,675 | ||||||
| 13,002 | PayPal Holdings, Inc. * | 474,703 | ||||||
| 12,970 | Visa, Inc. | 961,984 | ||||||
| 5,754,661 | ||||||||
| Materials — 5.9% | ||||||||
| 6,130 | Ecolab, Inc. | 727,018 | ||||||
| 2,834 | Sherwin-Williams Co. | 832,260 | ||||||
| 1,559,278 | ||||||||
| Total United States | 17,701,389 | |||||||
| Total Common Stocks (Cost $24,097,578) | 25,052,811 | |||||||
| Short-Term Investments — 5.8% | ||||||||
| Money Market Funds — 5.8% | ||||||||
| 1,521,057 | Cash Account Trust — Government | |||||||
| & Agency Securities Portfolio — | ||||||||
| Institutional Shares, 0.34%# | 1,521,057 | |||||||
| Total Short-Term Investments (Cost $1,521,057) | 1,521,057 | |||||||
| Total Investments — 100.8% (Cost $25,618,635) | 26,573,868 | |||||||
| Liabilities in Excess of Other Assets — (0.8)% | (206,477 | ) | ||||||
| NET ASSETS — 100.0% | $ | 26,367,391 | ||||||
| PORTFOLIO HOLDINGS | |
| % of Net Assets | |
| Information Technology | 26.9% |
| Health Care | 15.2% |
| Consumer Discretionary | 14.1% |
| Consumer Staples | 13.3% |
| Financials | 12.9% |
| Industrials | 6.7% |
| Materials | 5.9% |
| Money Market Funds | 5.8% |
| Other Assets and Liabilities | (0.8)% |
| 100.0% |
| ADR — American Depositary Receipt | |
| * | Non-Income Producing |
| # | Annualized seven-day yield as of June 30, 2016. |
The accompanying notes are an integral part of these financial statements.
www.brownadvisoryfunds.com
37
Brown Advisory Intermediate Income Fund
A Message to Our Shareholders
June 30, 2016
Dear Shareholder:
For the year ended June 30, 2016, the Brown Advisory Intermediate Income Fund Investor Shares (the “Fund”) gained 3.99%, lagging the Fund’s benchmark, the Barclays Intermediate U.S. Aggregate Bond Index, which returned 4.36%.
The worldwide search for income-producing investments has brought money into the U.S. and helped push most domestic yields lower, even after the Federal Reserve raised short-term rates in December. The U.S. economy has performed relatively well despite the concerns about the rest of the world, including terrorism, slower growth in China and the impact on the European economy from the U.K. vote to leave the European Union. This has allowed our markets, both equities and bonds, to also perform relatively well, bolstered by a stronger dollar.
Throughout this period we have maintained a full allocation to corporate bonds, which remained attractive because of the higher yield and economic strength. Our analysts have been successful in separating “wheat from chaff,” and corporate credit has been our best performing sector. Though not predicting the dramatic fall in longer-term interest rates, we were acutely aware of foreign demand in a world rife with negative-yielding bonds, and have kept the Fund’s sensitivity to interest rates (duration) close to that of the benchmark.
Because of the complexities of the mortgage market, we have depended in large part on the Fund’s investment in the Brown Advisory Mortgage Securities Fund to navigate those waters. That has been another example of good, fundamental analysis carrying the day.
We continue to focus on the core stability that our investors expect from a high quality, intermediate bond fund.
Sincerely,
Paul D. Corbin
Portfolio Manager
Thomas D.D. Graff, CFA
Portfolio Manager
Past performance is not a guarantee of future results.
Mutual fund investing involves risk. Principal loss is possible. The Fund is subject to interest rate risk which is the risk that debt securities in the Fund’s portfolio will decline in value because of increases in market interest rates. Investments in Asset Backed and Mortgage Backed Securities include additional risks that investors should be aware of such as credit risk, prepayment risk, possible illiquidity and default, as well as increased susceptibility to adverse economic developments. Investments in debt securities typically decrease in value when interest rates rise. The risk is usually greater for longer-term debt securities. Inflation-indexed bonds see the principal value of the security increased as the Consumer Price Index increases. Should the Consumer Price Index decline, those securities should be adversely impacted. Diversification does not assure a profit, nor does it protect against a loss in a declining market.
Fund holdings and sector allocations are subject to change and should not be considered a recommendation to buy or sell any security. For a complete list of fund holdings, please refer to the Schedule of Investments provided in this report.
Definitions for terms and indices are provided in the Glossary of Terms.
www.brownadvisoryfunds.com
38
Brown Advisory Intermediate Income Fund
Performance Chart and Analysis
June 30, 2016
COMPARISON OF CHANGE IN VALUE OF A $10,000 INVESTMENT
The following chart reflects the change in value of a hypothetical $10,000 investment, including reinvested dividends and distributions, in the Fund as measured against a broad-based bond index. The Barclays Intermediate US Aggregate Bond Index (“Index”) represents domestic taxable investment grade bonds, with index components for government and corporate securities, mortgage pass-through securities, and asset-backed securities with average maturities and durations in the intermediate range. The Index is unmanaged and does not reflect the deduction of fees, such as investment management fees. Investors cannot invest directly in an index.

| Average Annual Total Return | One | Five | Ten | |
as of 6/30/16 | Year | Year | Year | |
| Investor Shares | 3.99% | 2.45% | 4.17% | |
| Advisor Shares | 3.71% | 2.21% | 3.92% | |
| Barclays Intermediate US Aggregate Bond Index | 4.36% | 2.96% | 4.66% |
Investor Shares | Advisor Shares | ||
Gross Expense Ratio1 | 0.59% | 0.84% | |
Net Expense Ratio1 | 0.54% | 0.79% |
Past performance does not guarantee future results. The performance data quoted represents past performance and current returns may be lower or higher. The investment return and net asset value will fluctuate so that an investor’s shares, when redeemed, may be worth more or less than the original cost. To obtain performance information current to the most recent month end, please visit our website at brownadvisoryfunds.com/performance.html. The performance table and graph above do not reflect the deduction of taxes that a shareholder would pay on Fund distributions or the redemption of Fund shares. Investment performance reflects periods during which fee waivers were in effect. In the absence of such waivers, total return would have been reduced. Performance data does not reflect the imposition of the redemption fee of 1.00% on shares redeemed within 14 days, and if it did, performance would have been lower.
1 | Per the Fund’s prospectus dated October 30, 2015. |
www.brownadvisoryfunds.com
39
Brown Advisory Intermediate Income Fund
Schedule of Investments
June 30, 2016
Par Value | Security Description | Rate | Maturity | Value $ | |||||||||
| Corporate Bonds & Notes — 28.3% | |||||||||||||
| 1,520,000 | 21st Century Fox America, Inc. | 3.00 | % | 09/15/2022 | 1,585,336 | ||||||||
| 1,525,000 | American Express Credit Corp.# | 1.12 | % | 08/15/2019 | 1,511,830 | ||||||||
| 1,465,000 | AutoZone, Inc. | 3.13 | % | 04/21/2026 | 1,504,499 | ||||||||
| 1,520,000 | AvalonBay Communities, Inc. | 2.95 | % | 05/11/2026 | 1,529,199 | ||||||||
| 1,330,000 | Barnabas Health, Inc. | 4.00 | % | 07/01/2028 | 1,377,996 | ||||||||
| 1,548,000 | BB&T Corp.# | 1.34 | % | 01/15/2020 | 1,536,718 | ||||||||
| 1,434,000 | Campbell Soup Co. | 2.50 | % | 08/02/2022 | 1,458,342 | ||||||||
| 1,425,000 | Canadian Natural Resources Ltd. | 5.90 | % | 02/01/2018 | 1,506,037 | ||||||||
| 1,521,000 | CC Holdings GS V LLC/Crown Castle GS III Corp. | 3.85 | % | 04/15/2023 | 1,624,825 | ||||||||
| 1,300,000 | Digital Realty Trust L.P. | 5.88 | % | 02/01/2020 | 1,459,201 | ||||||||
| 1,445,000 | E*TRADE Financial Corp. | 5.38 | % | 11/15/2022 | 1,531,700 | ||||||||
| 1,525,000 | Education Realty Operating Partnership L.P. | 4.60 | % | 12/01/2024 | 1,568,075 | ||||||||
| 1,350,000 | Fidelity National Information Services, Inc. | 5.00 | % | 10/15/2025 | 1,535,386 | ||||||||
| 1,650,000 | FMC Technologies, Inc. | 3.45 | % | 10/01/2022 | 1,575,645 | ||||||||
| 1,375,000 | Harris Corp. | 5.55 | % | 10/01/2021 | 1,561,659 | ||||||||
| 1,495,000 | Healthcare Trust of America Holdings L.P. | 3.38 | % | 07/15/2021 | 1,538,046 | ||||||||
| 1,435,000 | Janus Capital Group, Inc. | 4.88 | % | 08/01/2025 | 1,554,528 | ||||||||
| 1,490,000 | JB Hunt Transport Services, Inc. | 2.40 | % | 03/15/2019 | 1,506,547 | ||||||||
| 1,530,000 | Legg Mason, Inc. | 3.95 | % | 07/15/2024 | 1,549,298 | ||||||||
| 1,525,000 | Morgan Stanley | 3.95 | % | 04/23/2027 | 1,545,607 | ||||||||
| 1,700,000 | Noble Energy, Inc. | 4.15 | % | 12/15/2021 | 1,789,592 | ||||||||
| 1,565,000 | Providence Health & Services Obligated Group# | 1.58 | % | 10/01/2017 | 1,570,351 | ||||||||
| 1,610,000 | Regency Energy Partners L.P. | 4.50 | % | 11/01/2023 | 1,574,121 | ||||||||
| 2,275,000 | Royal Bank of Canada # | 1.20 | % | 03/06/2020 | 2,242,017 | ||||||||
| 2,250,000 | Sutter Health | 1.09 | % | 08/15/2053 | 2,245,844 | ||||||||
| 1,460,000 | Verizon Communications, Inc. | 3.65 | % | 09/14/2018 | 1,534,975 | ||||||||
| Total Corporate Bonds & Notes (Cost $40,424,076) | 41,517,374 | ||||||||||||
| Mortgage Backed Securities — 14.6% | |||||||||||||
| 3,374 | FHLMC PC, Pool# C00210 | 8.00 | % | 01/01/2023 | 3,891 | ||||||||
| 366,434 | FHLMC PC, Pool# 1B0889 # | 2.56 | % | 05/01/2033 | 387,106 | ||||||||
| 174,447 | FHLMC PC, Pool# 1J0203 # | 2.28 | % | 04/01/2035 | 185,222 | ||||||||
| 2,804,939 | FHLMC PC, Pool# Q2-5749 | 4.00 | % | 04/01/2044 | 3,002,378 | ||||||||
| 1,600,000 | FHLMC REMIC, Series K-042 | 2.67 | % | 12/25/2024 | 1,685,911 | ||||||||
| 1,525,000 | FHLMC REMIC, Series K-046 | 3.21 | % | 03/25/2025 | 1,669,215 | ||||||||
| 1,550,000 | FHLMC REMIC, Series K-048 | 3.28 | % | 06/25/2025 | 1,706,181 | ||||||||
| 122,836 | FHLMC REMIC, Series 2782 | 4.00 | % | 11/15/2033 | 126,772 | ||||||||
| 3,243 | FNMA, Pool# 254089 | 6.00 | % | 12/01/2016 | 3,258 | ||||||||
| 18,498 | FNMA, Pool# 539082 | 7.00 | % | 08/01/2028 | 18,713 | ||||||||
| 8,943 | FNMA, Pool# 625536 | 6.00 | % | 01/01/2032 | 10,219 | ||||||||
| 40,407 | FNMA, Pool# 628837 | 6.50 | % | 03/01/2032 | 46,538 | ||||||||
| 164,860 | FNMA, Pool# 663238 | 5.50 | % | 09/01/2032 | 186,653 | ||||||||
| 37,897 | FNMA, Pool# 744805 # | 2.39 | % | 11/01/2033 | 38,623 | ||||||||
| 19,055 | FNMA, Pool# 741373 # | 2.66 | % | 12/01/2033 | 19,901 | ||||||||
| 68,850 | FNMA, Pool# 764342 # | 2.40 | % | 02/01/2034 | 71,292 | ||||||||
| 67,172 | FNMA, Pool# 848817 | 5.00 | % | 01/01/2036 | 74,745 | ||||||||
| 849,442 | FNMA, Pool# AV7911 | 4.50 | % | 01/01/2044 | 927,479 | ||||||||
| 1,129,100 | FNMA, Pool# AS1474 | 4.50 | % | 01/01/2044 | 1,232,173 | ||||||||
| 4,845,193 | FNMA, Pool# AY3879 | 3.50 | % | 11/01/2045 | 5,125,643 | ||||||||
| 2,653,374 | FNMA, Pool# AY3880 | 4.00 | % | 11/01/2045 | 2,855,081 | ||||||||
| 1,461,480 | FNMA, Pool# AL8256 | 3.00 | % | 03/01/2046 | 1,539,924 | ||||||||
| 2,179,901 | FNMA REMIC Trust, Series 2013-115 † | 3.00 | % | 04/25/2031 | 244,171 | ||||||||
| 14,357 | GNMA, Pool# 781450 | 5.00 | % | 06/15/2017 | 14,617 | ||||||||
| 19,776 | GNMA, Pool# 487110 | 6.50 | % | 04/15/2029 | 22,624 | ||||||||
| 30,408 | GNMA, Pool# 781186 | 9.00 | % | 06/15/2030 | 35,042 | ||||||||
| 6,483 | GNMA, Pool# 571166 | 7.00 | % | 08/15/2031 | 6,695 | ||||||||
The accompanying notes are an integral part of these financial statements.
www.brownadvisoryfunds.com
40
Brown Advisory Intermediate Income Fund
Schedule of Investments
June 30, 2016
| Par | |||||||||||||
Value/Shares | Security Description | Rate | Maturity | Value $ | |||||||||
| Mortgage Backed Securities — (Continued) | |||||||||||||
| 2,463,981 | GNMA REMIC Trust, Series 2013-79 † | 3.00 | % | 01/20/2042 | 216,488 | ||||||||
| Total Mortgage Backed Securities (Cost $20,924,366) | 21,456,555 | ||||||||||||
| Asset Backed Securities — 8.8% | |||||||||||||
| 773,323 | AmeriCredit Automobile Receivables Trust, Series 2012-4 C | 1.93 | % | 08/08/2018 | 773,887 | ||||||||
| 924,000 | AmeriCredit Automobile Receivables Trust, Series 2016-1 # | 1.52 | % | 06/10/2019 | 925,650 | ||||||||
| 700,000 | AmeriCredit Automobile Receivables Trust, Series 2015-4 | 1.70 | % | 07/08/2020 | 704,789 | ||||||||
| 875,000 | AmeriCredit Automobile Receivables Trust, Series 2015-3 B | 2.08 | % | 09/08/2020 | 883,560 | ||||||||
| 519,388 | Capital Auto Receivables Asset Trust, Series 2014-1 | 1.32 | % | 06/20/2018 | 519,688 | ||||||||
| 1,500,000 | Madison Park Funding XVII, Ltd., Series 2015-17A #~ | 2.63 | % | 07/21/2027 | 1,494,951 | ||||||||
| 1,500,000 | Octagon Investment Partners 24, Ltd., Series A-2 #~ | 2.60 | % | 05/21/2027 | 1,464,645 | ||||||||
| 1,500,000 | Octagon Investment Partners XXII, Ltd., Series B-2 #~ | 2.94 | % | 11/25/2025 | 1,496,475 | ||||||||
| 121,168 | Oscar U.S. Funding Trust IV, Series 2016-4 ~ | 0.95 | % | 04/17/2017 | 121,469 | ||||||||
| 250,000 | Oscar U.S. Funding Trust IV, Series 2016-4 #~ | 2.14 | % | 07/15/2020 | 251,186 | ||||||||
| 1,500,000 | OZLM XIII, Ltd.#~ | 2.74 | % | 07/30/2027 | 1,474,192 | ||||||||
| 1,000,000 | Santander Drive Auto Receivables Trust, Series 2015-4 | 1.58 | % | 09/16/2019 | 1,003,590 | ||||||||
| 285,000 | Santander Drive Auto Receivables Trust, Series 2015-2 | 2.44 | % | 04/15/2021 | 287,705 | ||||||||
| 1,500,000 | Stewart Park CLO, Ltd., Series 2015-1 #~ | 2.63 | % | 04/15/2026 | 1,494,635 | ||||||||
| Total Asset Backed Securities (Cost $12,938,570) | 12,896,422 | ||||||||||||
| Municipal Bonds — 5.4% | |||||||||||||
| 670,000 | District of Columbia Income Tax Secured Revenue Bonds, Series 2010F | 4.71 | % | 12/01/2022 | 773,073 | ||||||||
| 1,495,000 | Florida Hurricane Catastrophe Revenue Bonds | 2.11 | % | 07/01/2018 | 1,519,369 | ||||||||
| 1,000,000 | Illinois State Sales Tax Revenue | 2.30 | % | 06/15/2019 | 1,033,610 | ||||||||
| 1,560,000 | Indiana State Bond Bank Revenue | 1.02 | % | 07/15/2016 | 1,560,374 | ||||||||
| 2,750,000 | Port Authority New York & New Jersey | 5.31 | % | 12/01/2019 | 3,120,975 | ||||||||
| Total Municipal Bonds (Cost $7,545,586) | 8,007,401 | ||||||||||||
| U.S. Treasury Notes — 20.5% | |||||||||||||
| 3,665,000 | United States Treasury Note | 0.63 | % | 10/15/2016 | 3,668,024 | ||||||||
| 3,000,000 | United States Treasury Note | 0.88 | % | 01/31/2017 | 3,007,734 | ||||||||
| 5,055,000 | United States Treasury Note | 1.38 | % | 02/29/2020 | 5,151,161 | ||||||||
| 7,635,000 | United States Treasury Note | 1.88 | % | 08/31/2022 | 7,936,674 | ||||||||
| 3,145,000 | United States Treasury Note | 2.00 | % | 02/15/2025 | 3,291,132 | ||||||||
| 1,445,000 | United States Treasury Note | 2.25 | % | 11/15/2025 | 1,541,691 | ||||||||
| 4,570,000 | United States Treasury Note | 0.75 | % | 10/31/2017 | 4,581,695 | ||||||||
| 870,000 | United States Treasury Note | 1.63 | % | 05/15/2026 | 880,671 | ||||||||
| Total U.S. Treasury Notes (Cost $29,305,628) | 30,058,782 | ||||||||||||
| Affiliated Mutual Funds (Note 3) — 20.8% | |||||||||||||
| 2,992,812 | Brown Advisory Mortgage Securities Fund — Institutional Shares | 30,526,684 | |||||||||||
| Total Affiliated Mutual Funds (Cost $30,340,181) | 30,526,684 | ||||||||||||
| Short-Term Investments — 1.3% | |||||||||||||
| Money Market Funds — 1.3% | |||||||||||||
| 1,968,162 | Cash Account Trust — Government & Agency Securities Portfolio — Institutional Shares, 0.34%* | 1,968,162 | |||||||||||
| Total Short-Term Investments (Cost $1,968,162) | 1,968,162 | ||||||||||||
| Total Investments — 99.7% (Cost $143,446,569) | 146,431,380 | ||||||||||||
| Other Assets in Excess of Liabilities — 0.3% | 441,042 | ||||||||||||
| NET ASSETS — 100.0% | $ | 146,872,422 | |||||||||||
The accompanying notes are an integral part of these financial statements.
www.brownadvisoryfunds.com
41
Brown Advisory Intermediate Income Fund
Schedule of Investments
June 30, 2016
| PORTFOLIO HOLDINGS | |
| % of Net Assets | |
| Corporate Bonds & Notes | 28.3% |
| Affiliated Mutual Funds | 20.8% |
| U.S. Treasury Notes | 20.5% |
| Mortgage Backed Securities | 14.6% |
| Asset Backed Securities | 8.8% |
| Municipal Bonds | 5.4% |
| Money Market Funds | 1.3% |
| Other Assets and Liabilities | 0.3% |
| 100.0% |
| # | Variable rate security. Rate disclosed is as of June 30, 2016. |
| † | Interest Only Security |
| ~ | Security exempt from registration under Rule 144A of the Securities Act of 1933. These securities may be resold in transactions exempt from registration, normally to qualified institutional buyers. At June 30, 2016, the value of these securities amounted to $7,797,553 or 5.3% of net assets. |
| * | Annualized seven-day yield as of June 30, 2016. |
The accompanying notes are an integral part of these financial statements.
www.brownadvisoryfunds.com
42
Brown Advisory Total Return Fund
A Message to Our Shareholders
June 30, 2016
Dear Shareholder:
During the year ended June 30, 2016, the Brown Advisory Total Return Fund Institutional Shares (the “Fund”) returned 6.46%, outperforming the 6.00% return for the Barclays US Aggregate Bond Index, the Fund’s benchmark.
The Fund aims to garner returns primarily through bottom-up analysis, supported by a detailed and disciplined credit process. Sector selection and other portfolio-level positioning is based more on the balance of risk and reward than either benchmark weightings or any sort of macro forecasting.
Credit selection was the biggest positive contributor to performance over this period. After adjusting for duration, our selections outperformed those in the benchmark by more than 130bps. Among our stronger performing individual selections were Enterprise Products, Noble Energy, Janus Capital, Morgan Stanley, Brookfield Residential and Carroll’s Restaurants.
Securitized credit, including asset-backed securities and commercial mortgage backed securities, was also a meaningful contributor. Most of the securities we hold in these sectors are high-quality, short-duration bonds, and so the absolute return is obviously not a big contributor. However, the yield available on some of these instruments is higher than similar duration bonds in governments or corporates. This made a material positive impact during the period.
Looking forward, interest rates have fallen materially and credit spreads have tightened since earlier in 2016 although U.S. rates are still high compared with other high-quality sovereign markets. We do not have a strong view about where interest rates are going next, but are respectful of the possibility that they could go lower. Regardless, our focus will remain on making individual bond selections.
Sincerely,
Thomas D.D. Graff, CFA
Portfolio Manager
Past performance is not a guarantee of future results.
Mutual fund investing involves risk. Principal loss is possible. Investments in debt securities typically decrease in value when interest rates rise. This risk is usually greater for longer-term debt securities. Investments in Asset-Backed and Mortgage-Backed securities include additional risks that investor should be aware of including credit risk, prepayment risk, possible illiquidity and default, as well as increased susceptibility to adverse economic developments. Investments in lower rated and non-rated securities present a great risk of loss to principal and interest than higher rated securities. In addition, the fund is susceptible to risks from investments in derivatives, U.S. Government securities, and changes in interest rates. Income from tax-exempt funds may be subject to state and local taxes and a portion of income may be subject to the Federal Alternative minimum tax for certain investors.
Fund holdings and sector allocations are subject to change and should not be considered a recommendation to buy or sell any security. For a complete list of fund holdings, please refer to the Schedule of Investments provided in this report.
Definitions for terms and indices are provided in the Glossary of Terms.
www.brownadvisoryfunds.com
43
Brown Advisory Total Return Fund
Performance Chart and Analysis
June 30, 2016
COMPARISON OF CHANGE IN VALUE OF A $1,000,000 INVESTMENT
The following chart reflects the change in value of a hypothetical $1,000,000 investment, including reinvested dividends and distributions, in the Fund as measured against a broad-based securities market index. The Barclays US Aggregate Bond Index (“Index”) is a broad-based benchmark that measures the investment grade US dollar-denominated, fixed rate taxable bond market. The Index includes Treasuries, government-related and corporate securities, MBS, ABS and CMBS. The Index is unmanaged and does not reflect the deduction of fees, such as investment management fees. Investors cannot invest directly in an index.

| Since | ||||
| Average Annual Total Return | One | Inception | ||
as of 6/30/16 | Year | (10/30/14) | ||
| Institutional Shares | 6.46% | 3.46% | ||
| Investor Shares | 6.40% | 3.40% | ||
| Barclays US Aggregate Bond Index | 6.00% | 3.93% |
Institutional Shares | Investor Shares | ||
Gross Expense Ratio1 | 0.56% | 0.61% | |
Net Expense Ratio1 | 0.56% | 0.61% |
Past performance does not guarantee future results. The performance data quoted represents past performance and current returns may be lower or higher. The investment return and net asset value will fluctuate so that an investor’s shares, when redeemed, may be worth more or less than the original cost. To obtain performance information current to the most recent month end, please visit our website at brownadvisoryfunds.com/performance.html. The performance table and graph above do not reflect the deduction of taxes that a shareholder would pay on Fund distributions or the redemption of Fund shares. Performance data does not reflect the imposition of the redemption fee of 1.00% on shares redeemed within 14 days, and if it did, performance would have been lower. Short-term performance, in particular, is not a good indication of the Fund’s future performance, and an investment should not be made based solely on returns.
1 | Per the Fund’s prospectus dated October 30, 2015. |
www.brownadvisoryfunds.com
44
Brown Advisory Total Return Fund
Schedule of Investments
June 30, 2016
Par Value | Security Description | Rate | Maturity | Value $ | |||||||||
| Mortgage Backed Securities — 37.9% | |||||||||||||
| 400,000 | BAMLL Commercial Mortgage Securities Trust, Series 2013-DSNY #^ | 1.48 | % | 09/15/2026 | 399,071 | ||||||||
| 800,000 | FHLMC Gold, 2.5%, Due TBA July | 2.50 | % | 07/15/2031 | 827,350 | ||||||||
| 800,000 | FHLMC Gold, 3.0%, Due TBA July | 3.00 | % | 07/15/2031 | 839,281 | ||||||||
| 1,000,000 | FHLMC Gold, 3.0%, Due TBA July | 3.00 | % | 07/15/2046 | 1,036,732 | ||||||||
| 5,000,000 | FHLMC Gold, 3.5%, Due TBA July | 3.50 | % | 07/15/2046 | 5,271,485 | ||||||||
| 684,267 | FHLMC PC, Pool# J3-2596 | 3.50 | % | 08/01/2030 | 725,943 | ||||||||
| 813,234 | FHLMC PC, Pool# G0-7289 | 3.00 | % | 11/01/2042 | 857,132 | ||||||||
| 2,228,000 | FHLMC REMIC, Series K-722 ~ | 1.31 | % | 03/25/2023 | 157,845 | ||||||||
| 1,577,895 | FHLMC REMIC, Series K-055 ~ | 1.37 | % | 03/25/2026 | 165,716 | ||||||||
| 4,125,254 | FHLMC REMIC, Series 4094 ~ | 2.50 | % | 03/15/2027 | 306,493 | ||||||||
| 804,124 | FHLMC REMIC, Series 4107 ~ | 3.00 | % | 08/15/2027 | 202,836 | ||||||||
| 2,447,477 | FHLMC REMIC, Series 4143 ~ | 3.50 | % | 09/15/2042 | 305,143 | ||||||||
| 3,000,000 | FHLMC REMIC, Series 4495 | 2.50 | % | 07/15/2045 | 3,057,967 | ||||||||
| 1,085,912 | FHLMC REMIC, Series 4495 ~ | 3.50 | % | 07/15/2045 | 167,493 | ||||||||
| 717,486 | FNMA, Pool# BA2725 | 3.50 | % | 10/01/2030 | 761,331 | ||||||||
| 568,513 | FNMA, Pool# MA2515 | 3.50 | % | 01/01/2031 | 604,504 | ||||||||
| 2,298,543 | FNMA, Pool# AS2249 | 4.00 | % | 04/01/2039 | 2,470,616 | ||||||||
| 737,842 | FNMA, Pool# AL6768 | 6.00 | % | 05/01/2041 | 845,414 | ||||||||
| 754,941 | FNMA, Pool# AU6230 | 5.00 | % | 09/01/2043 | 841,291 | ||||||||
| 933,878 | FNMA, Pool# AY0677 | 3.50 | % | 03/01/2045 | 998,992 | ||||||||
| 591,078 | FNMA, Pool# AZ7182 | 4.50 | % | 08/01/2045 | 647,232 | ||||||||
| 1,594,482 | FNMA REMIC, Series 2013-24 ~ | 3.00 | % | 11/25/2040 | 197,037 | ||||||||
| 4,000,000 | FNMA, 3.0%, Due TBA July | 3.00 | % | 07/15/2046 | 4,151,405 | ||||||||
| 1,500,000 | FNMA, 3.5%, Due TBA July | 3.50 | % | 07/15/2046 | 1,582,851 | ||||||||
| 750,000 | Freddie Mac STACR Debt Notes, Series 2014-DN1 # | 2.65 | % | 02/26/2024 | 760,535 | ||||||||
| 770,000 | Freddie Mac STACR Debt Notes, Series 2014-DN2 # | 2.10 | % | 04/25/2024 | 770,362 | ||||||||
| 700,000 | Freddie Mac STACR Debt Notes, Series 2015-DNA1 # | 2.30 | % | 10/25/2027 | 699,803 | ||||||||
| 750,000 | Freddie Mac STACR Debt Notes, Series 2015-DNA3 # | 3.30 | % | 04/25/2028 | 771,610 | ||||||||
| 560,000 | Freddie Mac STACR Debt Notes, Series 2016-DNA2 # | 2.65 | % | 10/25/2028 | 564,904 | ||||||||
| 800,000 | FREMF Mortgage, Series 2013-K712 #^ | 3.48 | % | 05/25/2045 | 819,366 | ||||||||
| 400,000 | FREMF Mortgage, Series 2012-K19 #^ | 4.17 | % | 05/25/2045 | 429,965 | ||||||||
| 274,377 | FREMF Mortgage, Series 2013-KF02 #^ | 3.45 | % | 12/25/2045 | 271,939 | ||||||||
| Total Mortgage Backed Securities (Cost $32,134,941) | 32,509,644 | ||||||||||||
| Corporate Bonds & Notes — 27.4% | |||||||||||||
| 820,000 | AutoZone, Inc. | 3.13 | % | 04/21/2026 | 842,109 | ||||||||
| 800,000 | AvalonBay Communities, Inc. | 2.95 | % | 05/11/2026 | 804,842 | ||||||||
| 316,000 | Brookfield Residential Properties, Inc. ^ | 6.13 | % | 07/01/2022 | 300,200 | ||||||||
| 752,000 | Campbell Soup Co. | 2.50 | % | 08/02/2022 | 764,765 | ||||||||
| 770,000 | Canadian Natural Resources Ltd. | 5.90 | % | 02/01/2018 | 813,788 | ||||||||
| 840,000 | Capital One Financial Corp. # | 5.55 | % | 12/29/2049 | 831,600 | ||||||||
| 750,000 | Carrols Restaurant Group, Inc. | 8.00 | % | 05/01/2022 | 811,875 | ||||||||
| 800,000 | CC Holdings GS V LLC/Crown Castle GS III Corp. | 3.85 | % | 04/15/2023 | 854,609 | ||||||||
| 500,000 | Cornerstone Chemical Co. ^ | 9.38 | % | 03/15/2018 | 492,500 | ||||||||
| 720,000 | Digital Realty Trust L.P. | 5.88 | % | 02/01/2020 | 808,173 | ||||||||
| 600,000 | Dollar Tree, Inc. ^ | 5.25 | % | 03/01/2020 | 621,000 | ||||||||
| 720,000 | E*TRADE Financial Corp. | 5.38 | % | 11/15/2022 | 763,200 | ||||||||
| 820,000 | Education Realty Operating Partnership L.P. | 4.60 | % | 12/01/2024 | 843,162 | ||||||||
| 835,000 | Enterprise Products Operating, LLC | 3.70 | % | 02/15/2026 | 870,668 | ||||||||
| 725,000 | Fidelity National Information Services, Inc. | 5.00 | % | 10/15/2025 | 824,559 | ||||||||
| 900,000 | FMC Technologies, Inc. | 3.45 | % | 10/01/2022 | 859,442 | ||||||||
| 700,000 | Harris Corp. | 5.55 | % | 10/01/2021 | 795,026 | ||||||||
| 795,000 | Healthcare Trust of America, Inc. | 3.38 | % | 07/15/2021 | 817,891 | ||||||||
| 300,000 | INEOS Group Holdings S.A. ^ | 5.88 | % | 02/15/2019 | 300,750 | ||||||||
| 250,000 | Interface Security Systems Holdings, Inc. | 9.25 | % | 01/15/2018 | 241,038 | ||||||||
| 750,000 | Janus Capital Group, Inc. | 4.88 | % | 08/01/2025 | 812,471 | ||||||||
| 790,000 | JB Hunt Transport Services, Inc. | 2.40 | % | 03/15/2019 | 798,773 | ||||||||
The accompanying notes are an integral part of these financial statements.
www.brownadvisoryfunds.com
45
Brown Advisory Total Return Fund
Schedule of Investments
June 30, 2016
Par Value | Security Description | Rate | Maturity | Value $ | |||||||||
| Corporate Bonds & Notes — (Continued) | |||||||||||||
| 810,000 | Legg Mason, Inc. | 5.63 | % | 01/15/2044 | 835,142 | ||||||||
| 780,000 | Micron Technology, Inc. | 5.88 | % | 02/15/2022 | 737,100 | ||||||||
| 240,000 | Mohegan Tribal Gaming Authority | 9.75 | % | 09/01/2021 | 256,800 | ||||||||
| 800,000 | Morgan Stanley | 3.95 | % | 04/23/2027 | 810,810 | ||||||||
| 855,000 | Noble Energy, Inc. | 4.15 | % | 12/15/2021 | 900,059 | ||||||||
| 142,000 | Novelis, Inc. | 8.75 | % | 12/15/2020 | 148,099 | ||||||||
| 230,000 | Outfront Media Capital LLC | 5.25 | % | 02/15/2022 | 234,313 | ||||||||
| 850,000 | Regency Energy Partners L.P. | 4.50 | % | 11/01/2023 | 831,058 | ||||||||
| 760,000 | Royal Caribbean Cruises, Ltd. | 5.25 | % | 11/15/2022 | 803,700 | ||||||||
| 400,000 | Serta Simmons Bedding, LLC ^ | 8.13 | % | 10/01/2020 | 411,000 | ||||||||
| 800,000 | Synovus Financial Corp. # | 5.75 | % | 12/15/2025 | 828,000 | ||||||||
| 705,000 | Verizon Communications, Inc. | 5.15 | % | 09/15/2023 | 822,318 | ||||||||
| Total Corporate Bonds & Notes (Cost $22,880,258) | 23,490,840 | ||||||||||||
| Asset Backed Securities — 22.0% | |||||||||||||
| 500,000 | AmeriCredit Automobile Receivables, Series 2015-4 | 2.11 | % | 01/08/2021 | 504,554 | ||||||||
| 800,000 | AmeriCredit Automobile Receivables, Series 2015-3 | 2.73 | % | 03/08/2021 | 814,681 | ||||||||
| 220,000 | Capital Auto Receivables Trust, Series 2014-1 B | 2.22 | % | 01/22/2019 | 221,641 | ||||||||
| 424,260 | Exeter Automobiles Receivables Trust, Series 2014-1 ^ | 2.42 | % | 01/15/2019 | 424,260 | ||||||||
| 1,500,000 | Highbridge Loan Management, Series 4a-2014 A2a #^ | 2.68 | % | 07/28/2025 | 1,478,932 | ||||||||
| 800,000 | Highbridge Loan Management, Series 7a-2015 C #^ | 4.01 | % | 11/15/2026 | 801,565 | ||||||||
| 1,000,000 | Highbridge Loan Management, Series 6a-2015 C #^ | 3.70 | % | 05/05/2027 | 982,899 | ||||||||
| 810,000 | Madison Park Funding XVII, Ltd., Series 2015-17A #^ | 2.63 | % | 07/21/2027 | 807,274 | ||||||||
| 500,000 | Madison Park Funding XVII, Ltd., Series 2015-17A #^ | 3.53 | % | 07/21/2027 | 496,878 | ||||||||
| 1,300,000 | Magnetite XII, Series 2015-12 #^ | 2.83 | % | 04/15/2027 | 1,300,139 | ||||||||
| 750,000 | Magnetite XII, Series 2015-12 #^ | 3.73 | % | 04/15/2027 | 750,204 | ||||||||
| 750,000 | Octagon Investment Partners 24, Ltd., Series A-2 #^ | 2.60 | % | 05/21/2027 | 732,322 | ||||||||
| 1,000,000 | Octagon Investment Partners XXII, Ltd., Series B-2 #^ | 2.94 | % | 11/25/2025 | 997,650 | ||||||||
| 1,000,000 | Octagon Investment Partners XXII, Ltd., Series C-1 #^ | 3.89 | % | 11/25/2025 | 998,181 | ||||||||
| 242,335 | Oscar U.S. Funding Trust IV, Series 2016-4 ^ | 0.95 | % | 04/17/2017 | 242,938 | ||||||||
| 500,000 | Oscar U.S. Funding Trust IV, Series 2016-4 #^ | 2.14 | % | 07/15/2020 | 502,371 | ||||||||
| 1,000,000 | OZLM Funding, Ltd., Series 2013-4 #^ | 2.37 | % | 07/22/2025 | 978,288 | ||||||||
| 750,000 | OZLM IX, Ltd. 2014-9A B #^ | 3.93 | % | 01/20/2027 | 750,536 | ||||||||
| 1,000,000 | OZLM XIII, Ltd. #^ | 2.74 | % | 07/30/2027 | 982,795 | ||||||||
| 59,792 | Santander Drive Automobile Receivables Trust, Series 2013-4 | 2.16 | % | 01/15/2020 | 59,818 | ||||||||
| 530,000 | Santander Drive Automobile Receivables Trust, Series 2016-1 | 2.47 | % | 12/15/2020 | 537,981 | ||||||||
| 475,000 | Santander Drive Automobile Receivables Trust, Series 2015-2 | 2.44 | % | 04/15/2021 | 479,508 | ||||||||
| 1,000,000 | Stewart Park CLO, Ltd., Series 2015-1 #^ | 2.63 | % | 04/15/2026 | 996,423 | ||||||||
| 1,000,000 | Stewart Park CLO, Ltd., Series 2015-1 #^ | 3.53 | % | 04/15/2026 | 993,426 | ||||||||
| 1,000,000 | Symphony CLO XIV, Ltd. #^ | 2.68 | % | 07/14/2026 | 992,735 | ||||||||
| Total Asset Backed Securities (Cost $18,840,583) | 18,827,999 | ||||||||||||
| Municipal Bonds — 1.9% | |||||||||||||
| 230,000 | American Municipal Power, Inc. | 6.05 | % | 02/15/2043 | 298,055 | ||||||||
| 1,200,000 | Health Care Authority for Baptist Health | 5.50 | % | 11/15/2043 | 1,362,156 | ||||||||
| Total Municipal Bonds (Cost $1,537,305) | 1,660,211 | ||||||||||||
| U.S. Treasury Notes — 7.2% | |||||||||||||
| 6,150,000 | United States Treasury Note † | 0.88 | % | 01/31/2017 | 6,165,855 | ||||||||
| Total U.S. Treasury Notes (Cost $6,158,645) | 6,165,855 | ||||||||||||
The accompanying notes are an integral part of these financial statements.
www.brownadvisoryfunds.com
46
Brown Advisory Total Return Fund
Schedule of Investments
June 30, 2016
| Shares | Security Description | Value $ | ||||||
| Short-Term Investments — 18.7% | ||||||||
| Money Market Funds — 18.7% | ||||||||
| 16,084,960 | Cash Account Trust — Government & Agency Securities Portfolio — Institutional Shares, 0.34%* | 16,084,960 | ||||||
| Total Short-Term Investments (Cost $16,084,960) | 16,084,960 | |||||||
| Total Investments — 115.1% (Cost $97,636,692) | 98,739,509 | |||||||
| Liabilities in Excess of Other Assets — (15.1)% | (12,927,849 | ) | ||||||
| NET ASSETS — 100.0% | $ | 85,811,660 | ||||||
| ^ | Security exempt from registration under Rule 144A of the Securities Act of 1933. These securities may be resold in transactions exempt from registration, normally to qualified institutional buyers. At June 30, 2016, the value of these securities amounted to $20,255,607 or 23.6% of net assets. |
| # | Variable rate security. Rate disclosed is as of June 30, 2016. |
| * | Annualized seven-day yield as of June 30, 2016. |
| ~ | Interest Only Security |
| † | All or a portion of this security is pledged as collateral in connection with open futures contracts. |
Futures Contracts — Long (Note 7)
| Unrealized Appreciation | |||||||||||||
Issue | Contracts | Expiration Date | Notional Amount | (Depreciation) | |||||||||
| U.S. Treasury 5 Year Note Futures September 2016 | 22 | 09/30/2016 | $ | 2,644,227 | $ | 43,382 | |||||||
| U.S. Treasury Long Bond Futures September 2016 | 10 | 09/21/2016 | 1,631,767 | 91,670 | |||||||||
| U.S. Treasury Ultra Bond Futures September 2016 | 53 | 09/21/2016 | 9,278,984 | 598,891 | |||||||||
| $ | 13,554,978 | $ | 733,943 | ||||||||||
| PORTFOLIO HOLDINGS | |
| % of Net Assets | |
| Mortgage Backed Securities | 37.9% |
| Corporate Bonds & Notes | 27.4% |
| Asset Backed Securities | 22.0% |
| Money Market Funds | 18.7% |
| U.S. Treasury Notes | 7.2% |
| Municipal Bonds | 1.9% |
| Other Assets and Liabilities | (15.1)% |
| 100.0% |
The accompanying notes are an integral part of these financial statements.
www.brownadvisoryfunds.com
47
Brown Advisory Strategic Bond Fund
A Message to Our Shareholders
June 30, 2016
Dear Shareholder:
The Brown Advisory Strategic Bond Fund Investor Shares (the “Fund”) gained 1.18% during the year ended June 30, 2016, trailing the 4.36% return for the Barclays Intermediate US Aggregate Bond Index.
The Fund’s strategy combines bottom-up credit selection with opportunistic sector allocation, both concentrated in our highest conviction ideas. We analyze investment ideas using rigorous underwriting standards and deep fundamental analysis to determine a bond’s appropriate risk-adjusted return. This process primarily guides our capital allocation decisions across sectors.
The Fund attempts to mitigate duration risk and has operated with a duration less than half that of our benchmark. As such, the Fund has been managed with a duration of roughly between one and two over the course of the past year. As we have previously stated, we are not attempting to generate meaningful alpha by making a bet on the direction of interest rates. Instead, we aim to keep our sensitivity to interest rates low by buying shorter-dated bonds, using hedges such as Treasury futures, and purchasing floating rate instruments. Compared to the year-ago period, we have increased our use of floating-rate debt. It now accounts for 57% of the portfolio compared with 45% a year ago.
The fixed income markets during the year ended June 30, 2016 witnessed volatility in credit markets coupled with strong overall performance in interest-rate-sensitive products. Over this time, the 10-year Treasury yield fell from 2.35% to 1.47%, while investment grade BBB-rated bonds traded in a band exceeding 100 basis points. High yield bonds ranged across almost 400 basis points of ground from peak to trough. Two factors contributed to the Fund’s underperformance versus our benchmark: 1) the outperformance of duration product and 2) the poor performance of an investment we have previously discussed, Peabody Energy, which we exited by the end of October 2015.
Over the past year, we have more than doubled our exposure to structured products, expanding into subsectors that offer what we believe are good risk-adjusted returns and meet our low-duration objective. Recently, we began adding exposure to commercial mortgage-backed securities (CMBS) in addition to our holdings of Collateralized Loan Obligations, Government Sponsored Entity risk-sharing instruments, auto Asset Backed Securities, and agency-backed specified mortgage pools positions. As always, our investment selection is driven by risk-adjusted return and is underpinned by our bottom-up research process. We continue to believe that structured products (all investment-grade rated) are instrumental in helping us to improve the overall credit quality of the portfolio, enhance yield, reduce duration and provide diversification. Despite the increased use of structured products, we still anticipate that the bulk of our alpha will be driven from investments in corporate debt instruments. At year-end, these made up roughly 60% of the Fund’s net exposure. Our high yield exposure ended the year at 7.6%.
Looking ahead, we are focused on maximizing risk-adjusted return, but are still cognizant of the fact that we do not know exactly how late we are in the economic cycle. As such we are concentrating our efforts on lending against stable or improving cash flows that we expect to perform through an entire business cycle. To reiterate, we are focused on credits that we believe can generate free cash flow through the cycle, feature good structures that should protect recoveries in a downside scenario and offer strong enterprise value coverage. By design, these criteria tend to cull our investment universe, guiding us toward solid, defensible business models with good industry fundamentals and strong management teams. We believe our disciplined credit process has the potential to add value whether credit is widening or tightening and can be a key driver of performance going forward.
Sincerely,
Robert H. Snyder
Portfolio Manager
Thomas D.D. Graff, CFA
Portfolio Manager
www.brownadvisoryfunds.com
48
Brown Advisory Strategic Bond Fund
A Message to Our Shareholders
June 30, 2016
Past performance is not a guarantee of future results.
Mutual fund investing involves risk. Principal loss is possible. Investments in debt securities typically decrease in value when interest rates rise. This risk is usually greater for longer-term debt securities. Investments in lower-rated and non-rated securities present a greater risk of loss to principal and interest than higher-rated securities. Municipal securities are subject to adverse political or economic factors, including changes in the tax law. Inflation-indexed bonds see the principal value of the security increased as the Consumer Price Index increases. Should the Consumer Price Index decline, those securities should be adversely impacted. A non-diversified fund may concentrate its assets in fewer individual holdings than a diversified fund. Therefore, non-diversified Fund is more exposed to individual stock volatility than a diversified fund. The fund may make short sales of securities, which involve the risk that losses in a security may exceed the original amount invested in that security. The risks of investments in derivatives, including options on futures contracts and options on futures contracts include imperfect correlation between the value of these instruments and the underlying assets; risks of default by the other party to the derivative transactions; risks that the transactions may result in losses that partially or completely offset gains in portfolio positions; and risks that the derivative transactions may not be liquid. Income from tax-exempt securities may be subject to state and local taxes and a portion of income may be subject to the federal alternative minimum tax for certain investors. Bond ratings are grades given to bonds that indicate their credit quality as determined by a private independent rating service such as Standard & Poor’s. The firm evaluates a bond issuer’s financial strength, or its ability to pay a bond’s principal and interest in a timely fashion. Ratings are expressed as letters ranging from ‘AAA’, which is the highest grade, to ‘D’, which is the lowest grade. In limited situations when the rating agency has not issued a formal rating, the Adviser will classify the security as non-rated.
Diversification does not assure a profit or protect against loss in a declining market.
Fund holdings and sector allocations are subject to change and should not be considered a recommendation to buy or sell any security. For a complete list of fund holdings, please refer to the Schedule of Investments provided in this report.
Definitions for terms and indices are provided in the Glossary of Terms.
www.brownadvisoryfunds.com
49
Brown Advisory Strategic Bond Fund
Performance Chart and Analysis
June 30, 2016
COMPARISON OF CHANGE IN VALUE OF A $10,000 INVESTMENT
The following chart reflects the change in value of a hypothetical $10,000 investment, including reinvested dividends and distributions, in the Fund as measured against a broad-based bond index. The Barclays Intermediate US Aggregate Bond Index (“Index”) represents domestic taxable investment grade bonds, with index components for government and corporate securities, mortgage pass-through securities, and asset-backed securities with average maturities and durations in the intermediate range. The Index is unmanaged and does not reflect the deduction of fees, such as investment management fees. Investors cannot invest directly in an index.

| Since | |||
| Average Annual Total Return | One | Inception | |
as of 6/30/16 | Year | (9/30/11) | |
Investor Shares1 | 1.18% | 0.73% | |
| Advisor Shares | 0.84% | 0.44% | |
| Barclays Intermediate US Aggregate Bond Index | 4.36% | 2.63% |
Investor Shares | Advisor Shares | ||
Gross Expense Ratio2 | 0.75% | 1.00% | |
Net Expense Ratio2 | 0.73% | 0.98% |
Past performance does not guarantee future results. The performance data quoted represents past performance and current returns may be lower or higher. The investment return and net asset value will fluctuate so that an investor’s shares, when redeemed, may be worth more or less than the original cost. To obtain performance information current to the most recent month end, please visit our website at brownadvisoryfunds.com/performance.html. The performance table and graph above do not reflect the deduction of taxes that a shareholder would pay on Fund distributions or the redemption of Fund shares. Investment performance reflects periods during which fee waivers were in effect. In the absence of such waivers, total return would have been reduced. Performance data does not reflect the imposition of the redemption fee of 1.00% on shares redeemed within 14 days, and if it did, performance would have been lower.
1 Performance information for the Investor Shares, prior to commencement of operations on October 31, 2014, is based on the performance of Advisor Shares, and adjusted for the lower expenses applicable to Investor Shares.
2 Per the Fund’s prospectus dated October 30, 2015.
www.brownadvisoryfunds.com
50
Brown Advisory Strategic Bond Fund
Schedule of Investments
June 30, 2016
Par Value | Security Description | Rate | Maturity | Value $ | |||||||||
| Asset Backed Securities — 55.7% | |||||||||||||
| 250,000 | AmeriCredit Automobile Receivables, Series 2015-4 | 2.11 | % | 01/08/2021 | 252,277 | ||||||||
| 600,000 | AmeriCredit Automobile Receivables, Series 2015-3 | 2.73 | % | 03/08/2021 | 611,011 | ||||||||
| 205,000 | AmeriCredit Automobile Receivables, Series 2014-2 | 2.18 | % | 06/08/2020 | 206,055 | ||||||||
| 555,000 | AmeriCredit Automobile Receivables, Series 2015-2 | 2.40 | % | 01/08/2021 | 563,081 | ||||||||
| 400,000 | Capital Auto Receivables Asset Trust 2014-1, Series B | 2.22 | % | 01/22/2019 | 402,983 | ||||||||
| 313,952 | Exeter Automobiles Receivables Trust, Series 2014-1^ | 2.42 | % | 01/15/2019 | 313,952 | ||||||||
| 1,500,000 | Highbridge Loan Management, Series 4a-2014 A2a #^ | 2.68 | % | 07/28/2025 | 1,478,932 | ||||||||
| 1,000,000 | Highbridge Loan Management, Series 7-2015 #^ | 4.38 | % | 11/15/2026 | 914,168 | ||||||||
| 2,000,000 | Highbridge Loan Management, Series 6a-2015 C #^ | 3.70 | % | 05/05/2027 | 1,965,798 | ||||||||
| 825,000 | Madison Park Funding XVII, Ltd., Series 2015-17A #^ | 2.63 | % | 07/21/2027 | 822,223 | ||||||||
| 500,000 | Madison Park Funding XVII, Ltd., Series 2015-17A #^ | 3.53 | % | 07/21/2027 | 496,878 | ||||||||
| 1,300,000 | Magnetite XII, Series 2015-12 #^ | 2.83 | % | 04/15/2027 | 1,300,139 | ||||||||
| 750,000 | Magnetite XII, Series 2015-12 #^ | 3.73 | % | 04/15/2027 | 750,204 | ||||||||
| 750,000 | Octagon Investment Partners 24, Ltd., Series A-2 #^ | 2.60 | % | 05/21/2027 | 732,322 | ||||||||
| 1,000,000 | Octagon Investment Partners XXII, Ltd., Series B-2 #^ | 2.94 | % | 11/25/2025 | 997,650 | ||||||||
| 1,000,000 | Octagon Investment Partners XXII, Ltd., Series C-1 #^ | 3.89 | % | 11/25/2025 | 998,181 | ||||||||
| 1,000,000 | OZLM Funding, Ltd., Series 2013-4 #^ | 2.37 | % | 07/22/2025 | 978,288 | ||||||||
| 750,000 | OZLM IX, Ltd. 2014-9A B #^ | 3.93 | % | 01/20/2027 | 750,536 | ||||||||
| 1,000,000 | OZLM XIII, Ltd. #^ | 2.74 | % | 07/30/2027 | 982,795 | ||||||||
| 500,000 | Santander Drive Auto Receivables Trust, Series 2015-2 | 2.44 | % | 04/15/2021 | 504,746 | ||||||||
| 200,000 | Santander Drive Auto Receivables Trust, Series 2014-1 | 2.36 | % | 04/15/2020 | 201,196 | ||||||||
| 185,505 | Santander Drive Automobile Receivables Trust, Series 2013-A^ | 1.89 | % | 10/15/2019 | 185,614 | ||||||||
| 54,855 | Santander Drive Automobile Receivables Trust, Series 2013-4 | 2.16 | % | 01/15/2020 | 54,879 | ||||||||
| 400,000 | Santander Drive Automobile Receivables Trust, Series 2016-1 | 2.47 | % | 12/15/2020 | 406,024 | ||||||||
| 1,000,000 | Stewart Park CLO, Ltd., Series 2015-1 #^ | 2.63 | % | 04/15/2026 | 996,423 | ||||||||
| 1,000,000 | Stewart Park CLO, Ltd., Series 2015-1 #^ | 3.53 | % | 04/15/2026 | 993,426 | ||||||||
| 1,500,000 | Symphony CLO XIV, Ltd. #^ | 2.68 | % | 07/14/2026 | 1,489,103 | ||||||||
| 1,000,000 | Voya CLO 2015-1, Ltd., Series 2015-1 #^ | 2.73 | % | 04/18/2027 | 976,934 | ||||||||
| 1,000,000 | Voya CLO 2015-1, Ltd., Series 2015-1 #^ | 3.63 | % | 04/18/2027 | 982,024 | ||||||||
| Total Asset Backed Securities (Cost $22,405,617) | 22,307,842 | ||||||||||||
| Mortgage Backed Securities — 55.9% | |||||||||||||
| 200,000 | BAMLL Commercial Mortgage Securities Trust, Series 2013-DSNY #^ | 1.48 | % | 09/15/2026 | 199,535 | ||||||||
| 1,114,000 | FHLMC REMIC, Series K-722 † | 1.31 | % | 03/25/2023 | 78,922 | ||||||||
| 812,855 | FHLMC REMIC, Series K-055 † | 1.37 | % | 03/25/2026 | 85,369 | ||||||||
| 804,123 | FHLMC REMIC, Series 4107 † | 3.00 | % | 08/15/2027 | 202,836 | ||||||||
| 2,447,477 | FHLMC REMIC, Series 4143 † | 3.50 | % | 09/15/2042 | 305,143 | ||||||||
| 1,238,321 | FHLMC REMIC, Series 4495 † | 3.50 | % | 07/15/2045 | 191,001 | ||||||||
| 754,941 | FNMA, Pool# AU6230 | 5.00 | % | 09/01/2043 | 841,291 | ||||||||
| 1,594,482 | FNMA REMIC Trust, Series 2013-24 † | 3.00 | % | 11/25/2040 | 197,037 | ||||||||
| 5,000,000 | FNMA, 3.5%, Due TBA July | 3.50 | % | 07/15/2031 | 5,298,514 | ||||||||
| 5,000,000 | FNMA, 2.5%, Due TBA July | 2.50 | % | 07/15/2031 | 5,173,336 | ||||||||
| 5,000,000 | FNMA, 3.0%, Due TBA July | 3.00 | % | 07/15/2031 | 5,242,188 | ||||||||
| 750,000 | FHLMC STACR, Series 2014-DN1 # | 2.65 | % | 02/26/2024 | 760,535 | ||||||||
| 700,000 | FHLMC STACR, Series 2015-DNA1 # | 2.30 | % | 10/25/2027 | 699,803 | ||||||||
| 1,000,000 | FHLMC STACR, Series 2015-DNA3 # | 3.30 | % | 04/25/2028 | 1,028,813 | ||||||||
| 500,000 | FHLMC STACR, Series 2016-DNA1 # | 3.35 | % | 07/25/2028 | 515,950 | ||||||||
| 171,940 | FHLMC STACR, Series 2014-DN1 # | 1.45 | % | 02/26/2024 | 172,070 | ||||||||
| 92,243 | FHLMC STACR, Series 2015-DN1 # | 1.70 | % | 01/25/2025 | 92,245 | ||||||||
| 147,561 | FHLMC STACR, Series 2015-DNA2 # | 1.60 | % | 12/25/2027 | 147,781 | ||||||||
| 288,136 | FHLMC STACR, Series 2015-DNA3 # | 1.80 | % | 04/25/2028 | 288,693 | ||||||||
| 280,000 | FHLMC STACR, Series 2016-DNA2 # | 2.65 | % | 10/25/2028 | 282,452 | ||||||||
| 400,000 | FREMF Mortgage Trust, Series 2013-K712 #^ | 3.48 | % | 05/25/2045 | 409,683 | ||||||||
| 182,918 | FREMF Mortgage Trust, Series 2013-KF02 #^ | 3.45 | % | 12/25/2045 | 181,292 | ||||||||
| Total Mortgage Backed Securities (Cost $22,477,171) | 22,394,489 | ||||||||||||
The accompanying notes are an integral part of these financial statements.
www.brownadvisoryfunds.com
51
Brown Advisory Strategic Bond Fund
Schedule of Investments
June 30, 2016
| Par Value/ | |||||||||||||
Shares | Security Description | Rate | Maturity | Value $ | |||||||||
| Corporate Bonds & Notes — 13.1% | |||||||||||||
| 300,000 | Boyd Gaming Corp. | 9.00 | % | 07/01/2020 | 315,240 | ||||||||
| 134,000 | Brookfield Residential Properties, Inc.^ | 6.13 | % | 07/01/2022 | 127,300 | ||||||||
| 50,000 | Canadian Natural Resources, Ltd. | 5.90 | % | 02/01/2018 | 52,843 | ||||||||
| 300,000 | Capital One Financial Corp.# | 5.55 | % | 12/29/2049 | 297,000 | ||||||||
| 300,000 | Carrols Restaurant Group, Inc. | 8.00 | % | 05/01/2022 | 324,750 | ||||||||
| 500,000 | Cornerstone Chemical Co.^ | 9.38 | % | 03/15/2018 | 492,500 | ||||||||
| 150,000 | E*TRADE Financial Corp. | 5.38 | % | 11/15/2022 | 159,000 | ||||||||
| 300,000 | Education Realty Operating Partnership L.P. | 4.60 | % | 12/01/2024 | 308,474 | ||||||||
| 100,000 | Enterprise Products Operating, LLC | 3.70 | % | 02/15/2026 | 104,272 | ||||||||
| 100,000 | Fidelity National Information Services, Inc. | 5.00 | % | 10/15/2025 | 113,732 | ||||||||
| 200,000 | FMC Technologies, Inc. | 3.45 | % | 10/01/2022 | 190,987 | ||||||||
| 300,000 | Harris Corp. | 5.55 | % | 10/01/2021 | 340,726 | ||||||||
| 200,000 | INEOS Group Holdings S.A.^ | 5.88 | % | 02/15/2019 | 200,500 | ||||||||
| 100,000 | Interface Master Holdings, Inc.^ | 12.50 | % | 08/01/2018 | 90,500 | ||||||||
| 250,000 | Interface Security Systems Holdings, Inc. | 9.25 | % | 01/15/2018 | 241,037 | ||||||||
| 150,000 | Lamar Media Corp.^ | 5.75 | % | 02/01/2026 | 156,469 | ||||||||
| 250,000 | Micron Technology, Inc. | 5.88 | % | 02/15/2022 | 236,250 | ||||||||
| 60,000 | Mohegan Tribal Gaming Authority | 9.75 | % | 09/01/2021 | 64,200 | ||||||||
| 50,000 | Noble Energy, Inc. | 4.15 | % | 12/15/2021 | 52,635 | ||||||||
| 8,000 | Novelis, Inc. | 8.75 | % | 12/15/2020 | 8,344 | ||||||||
| 40,000 | Outfront Media Capital LLC | 5.25 | % | 02/15/2022 | 40,750 | ||||||||
| 300,000 | Regency Energy Partners L.P. | 4.50 | % | 11/01/2023 | 293,315 | ||||||||
| 100,000 | Royal Caribbean Cruises, Ltd. | 5.25 | % | 11/15/2022 | 105,750 | ||||||||
| 100,000 | Serta Simmons Bedding LLC^ | 8.13 | % | 10/01/2020 | 102,750 | ||||||||
| 300,000 | Synovus Financial Corp.# | 5.75 | % | 12/15/2025 | 310,500 | ||||||||
| 140,000 | Verizon Communications, Inc. | 5.15 | % | 09/15/2023 | 163,297 | ||||||||
| 300,000 | Welltower, Inc. | 5.25 | % | 01/15/2022 | 337,414 | ||||||||
| Total Corporate Bonds & Notes (Cost $5,146,795) | 5,230,535 | ||||||||||||
| Mutual Funds — 2.2% | |||||||||||||
| 17,204 | Blackrock MuniYield Michigan Quality Fund | 266,490 | |||||||||||
| 3,000 | Blackrock Massachusetts Tax-Exempt Trust | 46,965 | |||||||||||
| 5,000 | Invesco Pennsylvania Value Municipal Income Trust | 72,450 | |||||||||||
| 4,600 | Nuveen Massachusetts Premium Income Municipal Fund | 72,220 | |||||||||||
| 14,476 | PIMCO California Municipal Income Fund II | 159,960 | |||||||||||
| 8,341 | PIMCO California Municipal Income Fund III | 102,594 | |||||||||||
| 11,168 | PIMCO New York Municipal Income Fund II | 160,708 | |||||||||||
| 1,030 | PIMCO New York Municipal Income Fund III | 11,907 | |||||||||||
| Total Mutual Funds (Cost $771,144) | 893,294 | ||||||||||||
| Short-Term Investments — 12.3% | |||||||||||||
| Money Market Funds — 12.1% | |||||||||||||
| 4,865,549 | Cash Account Trust — Government & Agency Securities Portfolio — Institutional Shares, 0.34%* | 4,865,549 | |||||||||||
| U.S. Treasury Bills — 0.2% | |||||||||||||
| 100,000 | United States Treasury Bill ~ | 99,970 | |||||||||||
| Total Short-Term Investments (Cost $4,965,519) | 4,965,519 | ||||||||||||
| Total Investments — 139.2% (Cost $55,766,246) | 55,791,679 | ||||||||||||
| Liabilities in Excess of Other Assets — (39.2)% | (15,715,651 | ) | |||||||||||
| NET ASSETS — 100.0% | $ | 40,076,028 | |||||||||||
| ^ | Security exempt from registration under Rule 144A of the Securities Act of 1933. These securities may be resold in transactions exempt from registration, normally to qualified institutional buyers. At June 30, 2016, the value of these securities amounted to $21,066,119, or 52.6% of net assets. |
| † | Interest Only Security |
| # | Variable rate security. Rate disclosed is as of June 30, 2016. |
| * | Annualized seven-day yield as of June 30, 2016. |
| ~ | All or a portion of this security is pledged as collateral in connection with open futures contracts. |
The accompanying notes are an integral part of these financial statements.
www.brownadvisoryfunds.com
52
Brown Advisory Strategic Bond Fund
Schedule of Investments
June 30, 2016
Futures Contracts — Short (Note 7)
| Unrealized Appreciation | |||||||||||||
Issue | Contracts | Expiration Date | Notional Amount | (Depreciation) | |||||||||
| U.S. Treasury 5-Year Note Futures September 2016 | (90 | ) | 09/30/16 | $ | (10,816,456 | ) | $ | (178,310 | ) | ||||
| $ | (10,816,456 | ) | $ | (178,310 | ) | ||||||||
| PORTFOLIO HOLDINGS | |
| % of Net Assets | |
| Mortgage Backed Securities | 55.9% |
| Asset Backed Securities | 55.7% |
| Corporate Bonds & Notes | 13.1% |
| Mutual Funds | 2.2% |
| Money Market Funds | 12.1% |
| U.S. Treasury Bills | 0.2% |
| Other Assets and Liabilities | (39.2)% |
| 100.0% |
The accompanying notes are an integral part of these financial statements.
www.brownadvisoryfunds.com
53
Brown Advisory Maryland Bond Fund
A Message to Our Shareholders
June 30, 2016
Dear Shareholder:
During the year ended June 30, 2016, the Brown Advisory Maryland Bond Fund (the “Fund”) rose 5.24%. During the same period, the Barclays 1-10 Year Blended Municipal Bond Index, the Fund’s benchmark, increased 4.88%.
Tax-exempt municipal bond yields reached record lows in late June as demand for yield continued to drive another strong quarter in market performance. While the Brexit vote was the proximate cause of U.S. interest rates dropping dramatically at the end of June, it was only the latest in a series of factors that have weighed on rates. The fear is that a more isolated U.K. could be a drag on growth both in the U.K. as well as in continental Europe. But assuming no other political fallout, we believe that the impact of Brexit will be incremental. The more vexing problem is that Brexit is another impediment to the weak growth among developed economies. All of this makes high-quality, yield-generating instruments scarce, and municipal bonds continued to benefit from very strong demand from investors both domestically and abroad.
The Fund was well positioned to benefit from these strong market dynamics. During a time when demand for yield has far outpaced supply, our focus on high-conviction credit ideas with long time horizons ensured that we were not caught flat footed. We rely on bottom-up credit selection to drive performance rather than the general direction of interest rates, and the Fund’s overweight to credit-sensitive sectors benefited relative performance as credit spreads compressed.
Within the portfolio, Maryland State and Local general obligation (“GO”) holdings provided the largest contribution to performance, returning roughly 5% during the year, and contributing 1.9% to the Fund’s total return. The state’s abundance of high quality GO issuers provide a level of stability to the Fund. The team then looks to drive performance upside through revenue-backed credit selection. Within those revenue sectors, non-profit hospitals provided the largest contribution to performance, returning almost 11% during the year, and contributing 1.2% to the Fund’s total return. Health care (senior living facilities) returned more than 11%, contributing 0.9%, and transportation holdings (airports/toll roads) returned close to 7%, contributing 0.6%. We are particularly encouraged by the breadth of relative performance contribution across our credit sectors, and the Fund’s overall sector diversification is more balanced now than at any time in the past several years.
We continue to expect credit selection and income generation to drive fixed income returns in the future. Roughly three-quarters of the Fund’s performance during the year has been derived from income generation, compared with only one quarter from capital appreciation. By focusing on credit instead of duration to provide returns, we believe that the Fund has the potential to provide solid relative performance regardless of the future direction of interest rates.
Sincerely,
Stephen M. Shutz, CFA
Portfolio Manager
Past performance is not a guarantee of future results.
Mutual fund investing involves risk. Principal loss is possible. The Fund is non-diversified which means it may invest a large percentage of its assets in the securities of fewer issuers. Investment in a limited number of issuers exposes the Fund to greater market risk than if its assets were diversified among a greater number of issuers. The Fund is also subject to interest rate risk which is the risk that debt securities in the Fund’s portfolio will decline in value because of an increase in market interest rates. Municipal securities are subject to adverse political or economic factors, including changes in the tax law. Income from tax-exempt funds may be subject to state and local taxes and a portion of income may be subject to the federal alternative minimum tax for certain investors.
Fund holdings and sector allocations are subject to change and should not be considered a recommendation to buy or sell any security. For a complete list of fund holdings, please refer to the Schedule of Investments provided in this report.
Definitions for terms and indices are provided in the Glossary of Terms.
www.brownadvisoryfunds.com
54
Brown Advisory Maryland Bond Fund
Performance Chart and Analysis
June 30, 2016
COMPARISON OF CHANGE IN VALUE OF A $10,000 INVESTMENT
The following chart reflects the change in value of a hypothetical $10,000 investment, including reinvested dividends and distributions, in the Fund as measured against the broad-based municipal bond index. The Barclays 1-10 Year Blended Municipal Bond Index (“Index”) is a market index of high quality, domestic fixed income securities with maturities of less than 10 years. The Index is unmanaged and does not reflect the deduction of fees, such as investment management fees. Investors cannot invest directly in an index.
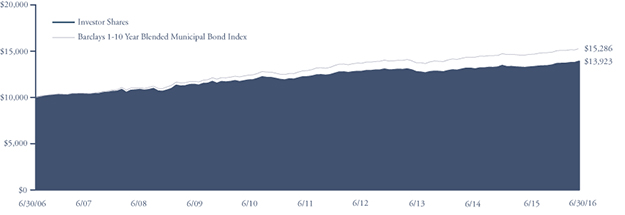
| Average Annual Total Return | One | Five | Ten | |
as of 6/30/16 | Year | Year | Year | |
| Investor Shares | 5.24% | 2.62% | 3.37% | |
| Barclays 1-10 Year Blended Municipal Bond Index | 4.88% | 3.45% | 4.33% |
Investor Shares | ||
Gross Expense Ratio1 | 0.50% | |
Net Expense Ratio1 | 0.50% |
Past performance does not guarantee future results. The performance data quoted represents past performance and current returns may be lower or higher. The investment return and net asset value will fluctuate so that an investor’s shares, when redeemed, may be worth more or less than the original cost. To obtain performance information current to the most recent month end, please visit our website at brownadvisoryfunds.com/performance.html. The performance table and graph above do not reflect the deduction of taxes that a shareholder would pay on Fund distributions or the redemption of Fund shares. Investment performance reflects periods during which fee waivers were in effect. In the absence of such waivers, total return would have been reduced. Performance data does not reflect the imposition of the redemption fee of 1.00% on shares redeemed within 14 days, and if it did, performance would have been lower.
1 | Per the Fund’s prospectus dated October 30, 2015. |
www.brownadvisoryfunds.com
55
Brown Advisory Maryland Bond Fund
Schedule of Investments
June 30, 2016
Par Value | Security Description | Rate | Maturity | Value $ | |||||||||
| Municipal Bonds — 98.5% | |||||||||||||
| General Obligation Bonds — 40.9% | |||||||||||||
| 2,225,000 | Anne Arundel County Maryland Consolidated General Improvements | 5.00 | % | 04/01/2022 | 2,722,399 | ||||||||
| 500,000 | Baltimore County Maryland Consolidated Public Improvement | 5.00 | % | 08/01/2016 | 501,985 | ||||||||
| 450,000 | Baltimore County Maryland Consolidated Public Improvement Series A | 3.00 | % | 10/15/2016 | 453,384 | ||||||||
| 575,000 | Baltimore County Maryland Consolidated Public Improvement Series A | 5.00 | % | 11/01/2017 | 609,115 | ||||||||
| 3,000,000 | Baltimore County Maryland Consolidated Public Improvement | 4.50 | % | 09/01/2020 | 3,458,220 | ||||||||
| 1,305,000 | Baltimore Maryland | 5.00 | % | 10/15/2018 | 1,433,712 | ||||||||
| 775,000 | Cecil County Maryland | 4.00 | % | 02/01/2018 | 816,951 | ||||||||
| 1,390,000 | Charles County Maryland | 5.00 | % | 11/01/2019 | 1,586,727 | ||||||||
| 1,970,000 | Charles County Maryland | 5.00 | % | 11/01/2021 | 2,381,848 | ||||||||
| 1,145,000 | Easton Maryland, Town of | 4.00 | % | 02/01/2020 | 1,274,614 | ||||||||
| 1,145,000 | Easton Maryland, Town of | 4.00 | % | 02/01/2021 | 1,302,151 | ||||||||
| 1,000,000 | Frederick, Maryland | 5.00 | % | 09/01/2017 | 1,052,110 | ||||||||
| 1,000,000 | Howard County Maryland | 4.00 | % | 04/15/2017 | 1,027,610 | ||||||||
| 1,120,000 | Maryland National Capital Park & Planning Commission | 5.00 | % | 01/15/2019 | 1,243,446 | ||||||||
| 1,085,000 | Maryland National Capital Park & Planning Commission | 5.00 | % | 01/15/2020 | 1,247,761 | ||||||||
| 500,000 | Maryland State | 5.00 | % | 08/01/2016 | 501,985 | ||||||||
| 715,000 | Maryland State 1st Series B | 5.25 | % | 03/01/2017 | 737,751 | ||||||||
| 835,000 | Maryland State 2nd Series B | 5.25 | % | 08/15/2017 | 879,121 | ||||||||
| 2,500,000 | Maryland State | 4.00 | % | 06/01/2028 | 2,953,425 | ||||||||
| 1,000,000 | Maryland State | 4.50 | % | 08/01/2019 | 1,117,220 | ||||||||
| 3,145,000 | Maryland State | 5.00 | % | 08/01/2023 | 3,978,708 | ||||||||
| 1,945,000 | Maryland State | 5.00 | % | 08/01/2023 | 2,392,817 | ||||||||
| 5,000,000 | Maryland State | 5.00 | % | 08/01/2024 | 6,470,350 | ||||||||
| 7,500,000 | Montgomery County Maryland | 5.00 | % | 11/01/2023 | 9,532,650 | ||||||||
| 5,000,000 | Montgomery County Maryland | 5.00 | % | 12/01/2024 | 6,411,900 | ||||||||
| 825,000 | Montgomery County Maryland Consolidated Public Improvement | 5.00 | % | 11/01/2016 | 837,697 | ||||||||
| 3,320,000 | Prince George’s County Maryland | 5.00 | % | 09/15/2026 | 3,991,901 | ||||||||
| 800,000 | Prince George’s County Maryland Public Improvement Series A | 5.00 | % | 09/01/2016 | 806,232 | ||||||||
| 1,380,000 | Talbot County Maryland | 5.00 | % | 12/15/2018 | 1,526,418 | ||||||||
| 1,270,000 | Talbot County Maryland | 5.00 | % | 12/15/2019 | 1,455,915 | ||||||||
| 1,215,000 | Washington Suburban Sanitary District | 5.00 | % | 06/01/2017 | 1,264,876 | ||||||||
| 1,645,000 | Washington Suburban Sanitary District | 5.00 | % | 06/01/2023 | 2,072,667 | ||||||||
| 1,940,000 | Wicomico County Maryland | 4.00 | % | 11/01/2019 | 2,148,007 | ||||||||
| 1,985,000 | Wicomico County Maryland | 4.00 | % | 11/01/2020 | 2,249,700 | ||||||||
| 2,225,000 | Worcester County | 5.00 | % | 03/01/2023 | 2,774,820 | ||||||||
| 75,216,193 | |||||||||||||
| Refunded Bonds — 5.7% | |||||||||||||
| 780,000 | Baltimore County Maryland | 5.00 | % | 09/01/2026 | 785,905 | ||||||||
| 35,000 | Maryland State Health & Higher Educational Facilities | 5.00 | % | 07/01/2018 | 36,546 | ||||||||
| 445,000 | Maryland State Health & Higher Educational Facilities | 5.00 | % | 07/01/2023 | 445,053 | ||||||||
| 240,000 | Maryland State Health & Higher Educational Facilities | 5.00 | % | 01/01/2025 | 240,029 | ||||||||
| 515,000 | Maryland State Health & Higher Educational Facilities | 5.00 | % | 01/01/2026 | 515,062 | ||||||||
| 365,000 | Maryland State Health & Higher Educational Facilities | 5.00 | % | 07/01/2026 | 365,044 | ||||||||
| 2,660,000 | Maryland State Health & Higher Educational Facilities | 5.75 | % | 01/01/2033 | 2,866,097 | ||||||||
| 5,005,000 | Maryland State Health & Higher Educational Facilities | 5.00 | % | 07/01/2037 | 5,203,999 | ||||||||
| 10,457,735 | |||||||||||||
| Revenue Bonds — 51.9% | |||||||||||||
| 500,000 | Alexandria Industrial Development Authority | 5.00 | % | 10/01/2030 | 606,580 | ||||||||
| 500,000 | Baltimore Maryland # | 3.00 | % | 10/01/2031 | 502,175 | ||||||||
| 520,000 | Baltimore Maryland | 5.00 | % | 06/15/2030 | 610,007 | ||||||||
| 670,000 | Baltimore Maryland | 5.00 | % | 06/15/2033 | 776,563 | ||||||||
| 405,000 | Baltimore Maryland | 3.40 | % | 07/01/2016 | 405,032 | ||||||||
| 255,000 | Chicago Illinois Midway International Airport | 5.00 | % | 01/01/2027 | 307,265 | ||||||||
| 1,500,000 | Chicago O’Hare International Airport | 5.00 | % | 01/01/2038 | 1,579,335 | ||||||||
The accompanying notes are an integral part of these financial statements.
www.brownadvisoryfunds.com’
56
Brown Advisory Maryland Bond Fund
Schedule of Investments
June 30, 2016
Par Value | Security Description | Rate | Maturity | Value $ | ||||||||
| Revenue Bonds — (Continued) | ||||||||||||
| 2,395,000 | Clark County Maryland Department of Aviation | 5.00 | % | 07/01/2025 | 2,484,477 | |||||||
| 1,550,000 | Franklin County Health Care Facilities Friendship Village | 5.00 | % | 11/15/2034 | 1,804,835 | |||||||
| 2,420,000 | Frederick County Maryland | 5.50 | % | 07/01/2040 | 2,595,886 | |||||||
| 4,800,000 | Houston Texas Airport System | 5.00 | % | 07/15/2020 | 5,357,376 | |||||||
| 1,100,000 | Houston Texas Airport System | 5.00 | % | 07/15/2020 | 1,227,732 | |||||||
| 750,000 | Indiana Finance Authority Series A | 5.00 | % | 09/15/2028 | 889,432 | |||||||
| 2,000,000 | Lancaster County Hospital Authority | 5.00 | % | 07/01/2035 | 2,292,300 | |||||||
| 2,250,000 | Lees Summit Industrial Development Authority | 5.13 | % | 08/15/2032 | 2,310,615 | |||||||
| 1,000,000 | Maryland Community Development Administration Housing Revenue | 3.25 | % | 03/01/2036 | 1,052,610 | |||||||
| 1,185,000 | Maryland Economic Development Corp. | 5.25 | % | 07/01/2024 | 1,233,668 | |||||||
| 1,025,000 | Maryland Economic Development Corp.# | 2.55 | % | 12/01/2025 | 1,052,778 | |||||||
| 700,000 | Maryland Economic Development Corp. | 5.00 | % | 06/01/2027 | 800,947 | |||||||
| 400,000 | Maryland Economic Development Corp. | 5.00 | % | 07/01/2027 | 467,812 | |||||||
| 850,000 | Maryland Economic Development Corp. | 5.00 | % | 07/01/2031 | 976,956 | |||||||
| 2,300,000 | Maryland Economic Development Corp. | 5.75 | % | 06/01/2035 | 2,558,727 | |||||||
| 2,500,000 | Maryland Industrial Development Financing Authority Series B # | 0.95 | % | 09/01/2040 | 2,503,500 | |||||||
| 250,000 | Maryland State Community Development Administration | 0.40 | % | 09/01/2016 | 249,967 | |||||||
| 1,500,000 | Maryland State Department of Transportation | 5.00 | % | 06/01/2017 | 1,561,575 | |||||||
| 500,000 | Maryland State Department of Transportation | 4.00 | % | 05/15/2020 | 514,980 | |||||||
| 1,000,000 | Maryland State Department of Transportation | 5.00 | % | 12/15/2020 | 1,183,360 | |||||||
| 1,055,000 | Maryland State Department of Transportation | 4.00 | % | 05/15/2022 | 1,227,967 | |||||||
| 1,395,000 | Maryland State Health & Higher Educational Facilities | 5.00 | % | 01/01/2018 | 1,481,588 | |||||||
| 215,000 | Maryland State Health & Higher Educational Facilities | 5.00 | % | 07/01/2018 | 224,277 | |||||||
| 260,000 | Maryland State Health & Higher Educational Facilities Series F | 5.00 | % | 07/01/2018 | 280,597 | |||||||
| 1,000,000 | Maryland State Health & Higher Educational Facilities | 5.00 | % | 07/01/2023 | 1,171,250 | |||||||
| 500,000 | Maryland State Health & Higher Educational Facilities | 5.00 | % | 08/15/2023 | 619,700 | |||||||
| 500,000 | Maryland State Health & Higher Educational Facilities | 5.00 | % | 07/01/2024 | 590,810 | |||||||
| 465,000 | Maryland State Health & Higher Educational Facilities | 5.50 | % | 07/01/2024 | 502,186 | |||||||
| 1,000,000 | Maryland State Health & Higher Educational Facilities | 6.00 | % | 07/01/2025 | 1,203,800 | |||||||
| 1,500,000 | Maryland State Health & Higher Educational Facilities | 5.00 | % | 07/01/2025 | 1,860,720 | |||||||
| 1,250,000 | Maryland State Health & Higher Educational Facilities | 5.00 | % | 07/01/2025 | 1,537,488 | |||||||
| 420,000 | Maryland State Health & Higher Educational Facilities | 5.00 | % | 07/01/2026 | 532,249 | |||||||
| 1,605,000 | Maryland State Health & Higher Educational Facilities | 5.00 | % | 07/01/2028 | 1,959,448 | |||||||
| 100,000 | Maryland State Health & Higher Educational Facilities | 4.00 | % | 10/01/2030 | 114,081 | |||||||
| 1,130,000 | Maryland State Health & Higher Educational Facilities | 6.25 | % | 07/01/2031 | 1,351,299 | |||||||
| 300,000 | Maryland State Health & Higher Educational Facilities | 4.00 | % | 10/01/2031 | 340,299 | |||||||
| 1,250,000 | Maryland State Health & Higher Educational Facilities | 5.00 | % | 08/15/2033 | 1,512,100 | |||||||
| 250,000 | Maryland State Health & Higher Educational Facilities | 5.00 | % | 07/01/2034 | 273,590 | |||||||
| 200,000 | Maryland State Health & Higher Educational Facilities | 4.50 | % | 07/01/2035 | 203,310 | |||||||
| 3,000,000 | Maryland State Health & Higher Educational Facilities | 5.25 | % | 01/01/2037 | 3,522,630 | |||||||
| 3,400,000 | Maryland State Health & Higher Educational Facilities | 5.00 | % | 05/15/2040 | 3,850,398 | |||||||
| 750,000 | Maryland State Transportation Authority Series A | 3.00 | % | 07/01/2016 | 750,053 | |||||||
| 4,255,000 | Maryland State Transportation Authority | 5.00 | % | 03/01/2022 | 5,084,980 | |||||||
| 9,000,000 | Maryland State Transportation Authority | 5.00 | % | 07/01/2036 | 9,711,180 | |||||||
| 2,525,000 | Maryland Water Quality Financing | 5.00 | % | 03/01/2020 | 2,910,366 | |||||||
| 4,000,000 | Miami-Dade County Florida Aviation | 5.25 | % | 10/01/2026 | 4,197,800 | |||||||
| 1,975,000 | Montgomery County Housing Opportunities Commission | 2.95 | % | 01/01/2034 | 2,001,584 | |||||||
| 630,000 | Nassau County Local Economic Assistance Corp. | 5.00 | % | 07/01/2026 | 765,242 | |||||||
| 1,750,000 | New Hope Cultural Education Facilities Corp. | 5.00 | % | 07/01/2025 | 2,077,933 | |||||||
| 2,275,000 | Pennsylvania Economic Development Financing Authority # | 2.25 | % | 07/01/2041 | 2,342,522 | |||||||
| 1,000,000 | Pompano Beach, Florida | 5.00 | % | 09/01/2044 | 1,131,910 | |||||||
| 780,000 | Railsplitter Tobacco Settlement Authority | 5.25 | % | 06/01/2020 | 899,558 | |||||||
| 925,000 | San Antonio Texas Airport System | 5.00 | % | 07/01/2024 | 1,141,987 | |||||||
| 95,281,392 | ||||||||||||
| Total Municipal Bonds (Cost $174,890,313) | 180,955,320 | |||||||||||
The accompanying notes are an integral part of these financial statements.
www.brownadvisoryfunds.com
57
Brown Advisory Maryland Bond Fund
Schedule of Investments
June 30, 2016
| Shares | Security Description | Value $ | ||||||
| Short-Term Investments — 0.3% | ||||||||
| Money Market Funds — 0.3% | ||||||||
| 497,875 | Cash Account Trust — Tax-Exempt Portfolio — Institutional Shares, 0.29%* | 497,875 | ||||||
| Total Short-Term Investments (Cost $497,875) | 497,875 | |||||||
| Total Investments — 98.8% (Cost $175,388,188) | 181,453,195 | |||||||
| Other Assets in Excess of Liabilities — 1.2% | 2,251,581 | |||||||
| NET ASSETS — 100.0% | $ | 183,704,776 | ||||||
| PORTFOLIO HOLDINGS | |
| % of Net Assets | |
| Revenue Bonds | 51.9% |
| General Obligation Bonds | 40.9% |
| Refunded Bonds | 5.7% |
| Money Market Funds | 0.3% |
| Other Assets and Liabilities | 1.2% |
| 100.0% |
| # | Variable rate security. Rate disclosed is as of June 30, 2016. |
| * | Annualized seven-day yield as of June 30, 2016. |
The accompanying notes are an integral part of these financial statements.
www.brownadvisoryfunds.com
58
Brown Advisory Tax Exempt Bond Fund
A Message to Our Shareholders
June 30, 2016
Dear Shareholder:
During the year ended June 30, 2016, the Brown Advisory Tax Exempt Bond Fund (the “Fund”) returned 5.94%. During the same period, the Barclays 1-10 Year Blended Municipal Bond Index, the Fund’s benchmark, increased 4.88%.
Tax-exempt municipal bond yields reached record lows in late June as demand for yield continued to drive another strong quarter in market performance. While the Brexit vote was the proximate cause of U.S. interest rates dropping dramatically at the end of June, it was only the latest in a series of factors that have weighed on rates. The fear is that a more isolated U.K. could be a drag on growth both in the U.K. as well as in continental Europe. But assuming no other political fallout, we believe the effect of Brexit will be incremental. The more vexing problem is that Brexit is another impediment to the weak growth among developed economies. All of this makes high-quality, yield-generating instruments scarce, and municipal bonds continued to benefit from very strong demand from investors both domestically and abroad.
The Fund was well positioned to benefit from these strong market dynamics. During a time when demand for yield has far outpaced supply, our focus on high-conviction credit ideas with long time horizons helped ensure that we were not caught flat footed. We rely on bottom-up credit selection to drive performance rather than the general direction of interest rates, and the Fund’s overweight to credit-sensitive sectors benefited relative performance as credit spreads compressed.
Within the portfolio, health care (senior living facilities) provided the largest contribution to performance, returning over 15% during the year, and contributing 1.4% to the Fund’s total return. We selectively added to our health care overweight throughout the year and continue to see value in the sector. The Fund’s non-profit hospital holdings returned just under 10%, contributing 1.1%, and transportation holdings (airports/toll roads) returned close to 7%, which contributed 0.9% to the Fund’s total return. We are particularly encouraged by the breadth of relative performance contribution across our credit sectors, and the Fund’s overall sector diversification is more balanced now than at any time in the past several years.
We continue to expect credit selection and income generation to drive fixed income returns in the future. Roughly two-thirds of the Fund’s performance during the year has been derived from income generation, compared with only one third from capital appreciation. By focusing on credit instead of duration to provide returns, we believe that the Fund has the potential to provide solid relative performance regardless of the future direction of interest rates.
Sincerely,
Stephen M. Shutz, CFA
Portfolio Manager
Past performance is not a guarantee of future results.
Mutual fund investing involves risk. Principal loss is possible. The Fund is non-diversified which means it may invest a large percentage of its assets in the securities of fewer issuers. Concentration in a limited number of issuers exposes the Fund to greater market risk than if its assets were diversified among a greater number of issuers. The Fund is also subject to interest rate risk which is the risk that debt securities in the Fund’s portfolio will decline in value because of an increase in market interest rates. This risk is usually greater for longer-term debt securities. Income from tax-exempt funds may be subject to state and local taxes and a portion of income may be subject to the Federal Alternative minimum tax for certain investors.
Fund holdings and sector allocations are subject to change and should not be considered a recommendation to buy or sell any security. For a complete list of fund holdings, please refer to the Schedule of Investments provided in this report.
Definitions for terms and indices are provided in the Glossary of Terms.
www.brownadvisoryfunds.com
59
Brown Advisory Tax Exempt Bond Fund
Performance Chart and Analysis
June 30, 2016
COMPARISON OF CHANGE IN VALUE OF A $10,000 INVESTMENT
The following chart reflects the change in value of a hypothetical $10,000 investment, including reinvested dividends and distributions, in the Fund as measured against the broad-based municipal bond index. The Barclays 1-10 Year Blended Municipal Bond Index (“Index”) is a market index of high quality, domestic fixed income securities with maturities of less than 10 years. The Index is unmanaged and does not reflect the deduction of fees, such as investment management fees. Investors cannot invest directly in an index.

| Since | |||
| Average Annual Total Return | One | Inception | |
as of 6/30/16 | Year | (6/29/12) | |
| Investor Shares | 5.94% | 2.64% | |
| Barclays 1-10 Year Blended Municipal Bond Index | 4.88% | 2.79% |
Investor Shares | ||
Gross Expense Ratio1 | 0.51% | |
Net Expense Ratio1 | 0.51% |
Past performance does not guarantee future results. The performance data quoted represents past performance and current returns may be lower or higher. The investment return and net asset value will fluctuate so that an investor’s shares, when redeemed, may be worth more or less than the original cost. To obtain performance information current to the most recent month end, please visit our website at brownadvisoryfunds.com/performance.html. The performance table and graph above do not reflect the deduction of taxes that a shareholder would pay on Fund distributions or the redemption of Fund shares. Performance data does not reflect the imposition of the redemption fee of 1.00% on shares redeemed within 14 days, and if it did, performance would have been lower.
1 Per the Fund’s prospectus dated October 30, 2015.
www.brownadvisoryfunds.com
60
Brown Advisory Tax Exempt Bond Fund
Schedule of Investments
June 30, 2016
Par Value | Security Description | Rate | Maturity | Value $ | ||||||||
| Municipal Bonds — 98.9% | ||||||||||||
| General Obligation Bonds — 11.9% | ||||||||||||
| 2,000,000 | Avondale School District | 5.00 | % | 05/01/2019 | 2,224,720 | |||||||
| 1,150,000 | Clark County School District | 5.00 | % | 06/15/2025 | 1,230,465 | |||||||
| 650,000 | Clark County School District | 5.00 | % | 06/15/2027 | 691,905 | |||||||
| 1,320,000 | Connecticut, State of | 5.00 | % | 10/15/2022 | 1,592,936 | |||||||
| 2,700,000 | District of Columbia | 5.00 | % | 06/01/2022 | 2,810,349 | |||||||
| 750,000 | Jefferson County Board of Education | 4.00 | % | 05/01/2017 | 770,363 | |||||||
| 1,325,000 | Kaufman, Texas | 3.00 | % | 02/15/2018 | 1,367,824 | |||||||
| 3,880,000 | Northside Independent School District | 1.75 | % | 06/01/2032 | 3,882,677 | |||||||
| 2,000,000 | Northside Independent School District # | 2.00 | % | 06/01/2046 | 2,081,880 | |||||||
| 5,000,000 | Pennsylvania, Commonwealth of | 5.00 | % | 08/15/2022 | 6,007,500 | |||||||
| 2,500,000 | Pennsylvania, Commonwealth of | 5.00 | % | 04/15/2022 | 2,781,925 | |||||||
| 2,065,000 | Pierce, County of Washington | 3.00 | % | 08/01/2017 | 2,114,890 | |||||||
| 27,557,434 | ||||||||||||
| Revenue Bonds — 87.0% | ||||||||||||
| 1,500,000 | Alabama 21st Century Authority | 5.00 | % | 06/01/2017 | 1,557,405 | |||||||
| 1,250,000 | Alameda Corridor Transportation Authority | 4.00 | % | 10/01/2035 | 1,394,650 | |||||||
| 550,000 | AltaPointe Health Systems, Inc. | 3.00 | % | 05/01/2019 | 565,774 | |||||||
| 565,000 | AltaPointe Health Systems, Inc. | 3.00 | % | 05/01/2020 | 584,029 | |||||||
| 1,125,000 | Arlington Higher Education Finance Corp. | 5.00 | % | 02/15/2025 | 1,434,465 | |||||||
| 1,000,000 | Carson Redevelopment Agency | 5.00 | % | 10/01/2026 | 1,254,170 | |||||||
| 2,970,000 | Central Texas Turnpike System | 5.00 | % | 08/15/2027 | 3,627,647 | |||||||
| 2,615,000 | Chattanooga Health Educational & Housing Facility Board | 5.25 | % | 01/01/2040 | 3,033,060 | |||||||
| 3,000,000 | Chicago Midway International Airport | 5.00 | % | 01/01/2028 | 3,591,810 | |||||||
| 700,000 | Chicago O’Hare International Airport | 5.00 | % | 01/01/2021 | 810,257 | |||||||
| 600,000 | Chicago O’Hare International Airport | 5.00 | % | 01/01/2022 | 708,432 | |||||||
| 820,000 | Chicago O’Hare International Airport | 5.00 | % | 01/01/2023 | 984,246 | |||||||
| 1,500,000 | Chicago O’Hare International Airport | 5.00 | % | 01/01/2038 | 1,579,335 | |||||||
| 660,000 | Chula Vista Municipal Financing Authority | 4.00 | % | 09/01/2018 | 704,979 | |||||||
| 855,000 | Chula Vista Municipal Financing Authority | 4.00 | % | 09/01/2019 | 936,678 | |||||||
| 5,000,000 | Clark County Maryland Department of Aviation | 5.00 | % | 07/01/2025 | 5,186,800 | |||||||
| 300,000 | Colorado Health Facilities Authority | 5.00 | % | 12/01/2020 | 340,329 | |||||||
| 1,000,000 | Colorado Health Facilities Authority | 5.00 | % | 06/01/2027 | 1,188,560 | |||||||
| 1,500,000 | Colorado Health Facilities Authority | 5.00 | % | 12/01/2035 | 1,744,050 | |||||||
| 1,300,000 | Colorado Health Facilities Authority | 5.00 | % | 12/01/2027 | 1,491,555 | |||||||
| 4,390,000 | Cumberland County Municipal Authority | 4.00 | % | 01/01/2033 | 4,801,782 | |||||||
| 1,000,000 | Dallas Love Field | 5.00 | % | 11/01/2020 | 1,157,000 | |||||||
| 720,000 | Dallas Love Field | 5.00 | % | 11/01/2022 | 865,238 | |||||||
| 750,000 | Denver, City & County of Colorado | 5.25 | % | 10/01/2032 | 781,057 | |||||||
| 2,000,000 | Denver, City & County of Colorado Airport System | 5.00 | % | 11/15/2024 | 2,106,420 | |||||||
| 1,700,000 | Educational Enhancement Funding Corp. | 5.00 | % | 06/01/2023 | 2,029,545 | |||||||
| 500,000 | Florida Municipal Power Agency | 5.25 | % | 10/01/2023 | 549,690 | |||||||
| 3,355,000 | Florida Municipal Power Agency | 5.00 | % | 10/01/2025 | 4,057,738 | |||||||
| 2,200,000 | Franklin Ohio Health Care, County of | 5.00 | % | 11/15/2044 | 2,547,468 | |||||||
| 955,000 | Harris County-Houston Sports Authority | 5.00 | % | 11/15/2028 | 1,174,593 | |||||||
| 1,760,000 | Hawaii Department of Budget & Finance | 4.60 | % | 05/01/2026 | 1,795,869 | |||||||
| 4,000,000 | Houston Texas Airport System | 5.00 | % | 07/15/2020 | 4,464,480 | |||||||
| 1,100,000 | Houston Texas Airport System | 5.00 | % | 07/15/2020 | 1,227,732 | |||||||
| 3,850,000 | Houston Texas Airport System | 5.00 | % | 07/01/2029 | 4,382,455 | |||||||
| 1,000,000 | Indiana Finance Authority | 5.00 | % | 09/15/2025 | 1,206,320 | |||||||
| 1,000,000 | Indiana Finance Authority | 5.00 | % | 09/15/2028 | 1,185,910 | |||||||
| 500,000 | Indiana Finance Authority | 5.13 | % | 03/01/2030 | 536,730 | |||||||
| 1,210,000 | Jacksonville Aviation Authority | 5.00 | % | 10/01/2021 | 1,224,459 | |||||||
| 1,640,000 | Kentucky State Property & Building Commission | 5.00 | % | 02/01/2021 | 1,909,928 | |||||||
| 205,000 | Kentucky State Property & Building Commission | 5.50 | % | 11/01/2028 | 225,660 | |||||||
The accompanying notes are an integral part of these financial statements.
www.brownadvisoryfunds.com
61
Brown Advisory Tax Exempt Bond Fund
Schedule of Investments
June 30, 2016
Par Value | Security Description | Rate | Maturity | Value $ | ||||||||
| Municipal Bonds — (Continued) | ||||||||||||
| Revenue Bonds — (Continued) | ||||||||||||
| 3,000,000 | Lancaster County Hospital Authority | 5.00 | % | 07/01/2035 | 3,438,450 | |||||||
| 2,280,000 | Las Vegas Redevelopment Agency | 5.00 | % | 06/15/2028 | 2,811,992 | |||||||
| 2,500,000 | Lees Summit Industrial Development Authority | 5.13 | % | 08/15/2032 | 2,567,350 | |||||||
| 2,000,000 | Louisiana Public Facilities Authority | 3.50 | % | 06/01/2030 | 2,101,840 | |||||||
| 1,000,000 | Louisiana Public Facilities Authority | 5.00 | % | 06/01/2036 | 1,184,690 | |||||||
| 1,500,000 | Louisiana State Citizens Property Insurance Corp. | 5.00 | % | 06/01/2020 | 1,716,540 | |||||||
| 2,155,000 | Massachusetts Health & Educational Facilities Authority | 5.00 | % | 10/01/2024 | 2,270,357 | |||||||
| 1,015,000 | Massachusetts Health & Educational Facilities Authority | 5.50 | % | 06/01/2034 | 1,105,670 | |||||||
| 1,750,000 | Miami Beach Florida Health Facilities | 5.00 | % | 11/15/2029 | 2,041,638 | |||||||
| 3,235,000 | Miami-Dade County Florida Aviation | 5.25 | % | 10/01/2026 | 3,394,971 | |||||||
| 1,000,000 | Miami-Dade County Health Facilities Authority | 6.00 | % | 08/01/2046 | 1,193,840 | |||||||
| 1,165,000 | Mississippi Development Bank | 5.50 | % | 10/01/2021 | 1,374,001 | |||||||
| 1,505,000 | Mississippi Development Bank | 6.50 | % | 10/01/2031 | 1,810,635 | |||||||
| 1,000,000 | Mobile, Alabama Industrial Development Board # | 1.63 | % | 07/15/2034 | 1,013,110 | |||||||
| 1,500,000 | Montgomery County Industrial Development Authority # | 2.55 | % | 06/01/2029 | 1,544,790 | |||||||
| 1,600,000 | Mountain House Public Financing Authority | 5.00 | % | 12/01/2027 | 1,679,280 | |||||||
| 2,565,000 | Mountain House Public Financing Authority | 5.00 | % | 12/01/2032 | 2,689,505 | |||||||
| 2,000,000 | New Hope Cultural Education Facilities Corp. | 5.00 | % | 07/01/2024 | 2,358,400 | |||||||
| 1,000,000 | New Hope Cultural Education Facilities Corp. | 5.00 | % | 04/01/2029 | 1,151,850 | |||||||
| 1,000,000 | New Hope Cultural Education Facilities Corp. | 5.75 | % | 07/01/2051 | 1,136,920 | |||||||
| 630,000 | New Hope Cultural Education Facilities Corp. | 5.00 | % | 07/01/2031 | 688,584 | |||||||
| 650,000 | New Hope Cultural Education Facilities Corp. | 5.25 | % | 07/01/2036 | 720,402 | |||||||
| 1,900,000 | New Hope Cultural Education Facilities Corp. | 5.00 | % | 08/01/2039 | 2,208,161 | |||||||
| 1,250,000 | New Hope Cultural Education Facilities Corp. | 5.50 | % | 07/01/2046 | 1,395,550 | |||||||
| 3,955,000 | New Jersey Education Facilities Authority | 5.00 | % | 07/01/2023 | 4,854,327 | |||||||
| 1,500,000 | New Jersey Health Care Facilities Financing Authority | 5.63 | % | 07/01/2032 | 1,790,355 | |||||||
| 2,150,000 | New Jersey Health Care Facilities Financing Authority | 6.63 | % | 07/01/2038 | 2,364,119 | |||||||
| 5,000,000 | New York City Industrial Development Agency # | 2.00 | % | 08/01/2028 | 4,995,050 | |||||||
| 1,760,000 | Niagara Tobacco Asset Securitization Corp. | 5.00 | % | 05/15/2024 | 2,159,854 | |||||||
| 3,320,000 | Norman Regional Hospital Authority | 5.38 | % | 09/01/2029 | 3,336,401 | |||||||
| 1,250,000 | Palm Beach County Florida Health Corp. | 5.00 | % | 12/01/2031 | 1,485,388 | |||||||
| 1,000,000 | Park Creek Metropolitan District | 5.00 | % | 12/01/2022 | 1,199,420 | |||||||
| 1,000,000 | Park Creek Metropolitan District | 5.00 | % | 12/01/2034 | 1,196,580 | |||||||
| 3,000,000 | Pennsylvania Economic Development Financing Authority # | 2.25 | % | 07/01/2041 | 3,089,040 | |||||||
| 1,900,000 | Pennsylvania Turnpike Commission | 5.00 | % | 12/01/2030 | 2,166,627 | |||||||
| 1,920,000 | Philadelphia Pennsylvania Airport | 5.00 | % | 06/15/2022 | 2,289,485 | |||||||
| 1,000,000 | Pompano Beach, Florida | 5.00 | % | 09/01/2039 | 1,130,380 | |||||||
| 3,120,000 | Pompano Beach, Florida | 5.00 | % | 09/01/2044 | 3,531,559 | |||||||
| 750,000 | Public Finance Authority | 2.63 | % | 11/01/2025 | 765,293 | |||||||
| 755,000 | Railsplitter Tobacco Settlement Authority | 5.00 | % | 06/01/2017 | 783,547 | |||||||
| 2,010,000 | Railsplitter Tobacco Settlement Authority | 5.00 | % | 06/01/2018 | 2,161,514 | |||||||
| 1,000,000 | Saint Louis Missouri Parking Revenue | 5.00 | % | 12/15/2021 | 1,185,370 | |||||||
| 510,000 | San Antonio Texas Airport System | 5.00 | % | 07/01/2020 | 585,735 | |||||||
| 795,000 | San Antonio Texas Airport System | 5.00 | % | 07/01/2021 | 932,607 | |||||||
| 835,000 | San Antonio Texas Airport System | 5.00 | % | 07/01/2022 | 998,209 | |||||||
| 500,000 | Seattle Washington, Port of | 5.00 | % | 04/01/2022 | 599,230 | |||||||
| 1,000,000 | South Carolina Ports Authority | 5.00 | % | 07/01/2026 | 1,241,870 | |||||||
| 250,000 | South Carolina Ports Authority | 5.00 | % | 07/01/2028 | 305,975 | |||||||
| 400,000 | South Carolina Ports Authority | 5.00 | % | 07/01/2029 | 488,104 | |||||||
| 1,125,000 | Tarrant County Cultural Education Facilities Finance Corp. | 5.00 | % | 11/15/2021 | 1,328,546 | |||||||
| 1,185,000 | Tarrant County Cultural Education Facilities Finance Corp. | 5.00 | % | 11/15/2022 | 1,424,666 | |||||||
| 5,000,000 | Tobacco Settlement Authority | 5.00 | % | 06/01/2017 | 5,187,100 | |||||||
| 1,115,000 | Tobacco Settlement Authority | 5.25 | % | 06/01/2032 | 1,299,310 | |||||||
| 2,000,000 | Tobacco Settlement Financing Corp. | 5.00 | % | 06/01/2017 | 2,082,180 | |||||||
| 3,735,000 | Tobacco Settlement Financing Corp. | 5.00 | % | 05/15/2019 | 4,131,508 | |||||||
The accompanying notes are an integral part of these financial statements.
www.brownadvisoryfunds.com
62
Brown Advisory Tax Exempt Bond Fund
Schedule of Investments
June 30, 2016
| Par | |||||||||||||
Value/Shares | Security Description | Rate | Maturity | Value $ | |||||||||
| Municipal Bonds — (Continued) | |||||||||||||
| Revenue Bonds — (Continued) | |||||||||||||
| 4,310,000 | University of North Florida Financing Corp. | 5.00 | % | 11/01/2026 | 4,541,318 | ||||||||
| 820,000 | Vigo, County of | 2.00 | % | 01/15/2017 | 825,584 | ||||||||
| 830,000 | Vigo, County of | 2.00 | % | 07/15/2017 | 840,500 | ||||||||
| 2,000,000 | Waco Educational Finance Corp. | 5.00 | % | 03/01/2028 | 2,136,020 | ||||||||
| 5,000,000 | Washington Convention & Sports Authority | 5.00 | % | 10/01/2025 | 5,059,550 | ||||||||
| 1,000,000 | Washington State Housing Finance Commission | 5.63 | % | 01/01/2027 | 1,010,750 | ||||||||
| 1,505,000 | Washoe, County of Nevada | 5.00 | % | 02/01/2043 | 1,648,622 | ||||||||
| 2,500,000 | Wayne County Michigan Airport | 4.50 | % | 12/01/2024 | 2,622,900 | ||||||||
| 970,000 | Wayne County Michigan Airport | 5.75 | % | 12/01/2024 | 1,072,801 | ||||||||
| 1,610,000 | Wisconsin Health & Educational Facilities Authority | 5.00 | % | 05/01/2027 | 1,880,850 | ||||||||
| 1,730,000 | Wisconsin Health & Educational Facilities Authority | 5.00 | % | 08/15/2028 | 2,020,311 | ||||||||
| 650,000 | Wisconsin Health & Educational Facilities Authority | 5.00 | % | 09/15/2037 | 721,747 | ||||||||
| 1,000,000 | Wisconsin Health & Educational Facilities Authority | 5.00 | % | 09/15/2045 | 1,112,180 | ||||||||
| 2,000,000 | Wisconsin, State of | 5.75 | % | 05/01/2033 | 2,267,200 | ||||||||
| 203,396,513 | |||||||||||||
| Total Municipal Bonds (Cost $224,728,317) | 230,953,947 | ||||||||||||
| Short-Term Investments — 0.5% | |||||||||||||
| Money Market Funds — 0.5% | |||||||||||||
| 1,272,606 | Cash Account Trust — Tax-Exempt Portfolio — Institutional Shares, 0.29%* | 1,272,606 | |||||||||||
| Total Short-Term Investments (Cost $1,272,606) | 1,272,606 | ||||||||||||
| Total Investments — 99.4% (Cost $226,000,923) | 232,226,553 | ||||||||||||
| Other Assets in Excess of Liabilities — 0.6% | 1,448,773 | ||||||||||||
| NET ASSETS — 100.0% | $ | 233,675,326 | |||||||||||
| PORTFOLIO HOLDINGS | |
| % of Net Assets | |
| Revenue Bonds | 87.0% |
| General Obligation Bonds | 11.9% |
| Money Market Funds | 0.5% |
| Other Assets and Liabilities | 0.6% |
| 100.0% |
| # | Variable rate security. Rate disclosed is as of June 30, 2016. |
| * | Annualized seven-day yield as of June 30, 2016. |
The accompanying notes are an integral part of these financial statements.
www.brownadvisoryfunds.com
63
Brown Advisory Mortgage Securities Fund
A Message to Our Shareholders
June 30, 2016
Dear Shareholder:
During the year ended June 30, 2016, the Brown Advisory Mortgage Securities Fund Institutional Shares (the “Fund”) rose 4.32%, almost exactly in line with the Barclays Mortgage Backed Securities Index, the Fund’s benchmark, which rose 4.34%.
The Fund’s investment process centers on finding mortgage-related bonds that we believe will enjoy superior principal payment speeds. This generally involves finding pools where the characteristic of the underlying borrowers mutes their incentive to refinance the loan. This includes loans with smaller loan balances, lower equity, recent purchases, etc. During the last year, the Fund’s holding in mortgage pass-throughs were slower than a coupon-matched average of generic mortgage-backed securities (MBS) every month. The Conditional Prepayment Rate (CPR) for our pools averaged 5.7 during the year vs. 13.9 for coupon-matched generics. This slower rate of repayment allows the Fund to collect more income, which we believe is the most consistent way to deliver performance in mortgage-backed bonds.
This resulted in meaningful outperformance in our 4.0% and 4.5% MBS. Our selections outperformed those same coupons in the benchmark by over 100bps for this period, entirely due to slower repayment. Indeed in every coupon cohort in which we had a meaningful holding, our selections outperformed those in the benchmark. Our bottom-up process worked well during this period.
Our coupon selection was a detractor from performance during the year. We were 7% overweight the 4.0% and 4.5% coupons while underweight coupons below 4.0% by 26%. As rates fell, lower coupons outperformed. Our strategy to mitigate this effect was to own certain refinance-protected positions, such as Commercial MBS that have prepayment penalties. While those produced strong results in isolation, our weighting was not large enough to quite make up for the coupon differential.
Looking now at a world where many high quality sovereign rates have fallen below zero, we need to be respectful that rates in the U.S. could keep falling as well. This has very specific implications for mortgage portfolios, where in theory the entire sector could get repaid at a moment’s notice. While we are loathe to make duration calls within our portfolios, we are putting positions in place that should protect the Mortgage Securities Fund should rates keep falling. That being said, our core process will remain to focus on individual bond selection, and that remains where we expect most of our value generation to reside.
Sincerely,
Thomas D.D. Graff, CFA
Portfolio Manager
Past performance is not a guarantee of future results.
Mutual fund investing involves risk. Principal loss is possible. Investments in debt securities typically decrease in value when interest rates rise. This risk is usually greater for longer-term debt securities. Investments in Asset-Backed and Mortgage-Backed securities include additional risks that investor should be aware of including credit risk, prepayment risk, possible illiquidity and default, as well as increased susceptibility to adverse economic developments. Certain fixed income securities held by the Fund may be difficult (or impossible) to sell at the time and at the price the Adviser would like. As a result, the Fund may have to hold these securities longer than it would like and may forego other investment opportunities. Issuers may experience an acceleration in prepayments of mortgage loans or other receivables backing the issuers’ fixed income securities when interest rates decline, which can shorten the maturity of the security, force the Fund to invest in securities with lower interest rates, and reduce the Fund’s return. Issuers may decrease prepayments of principal when interest rates increase, extending the maturity of a fixed income security and causing the value of the security to decline. Investing involves risk. Principal loss is possible. Investors should consult a tax professional for advice and information concerning the tax features of mortgage backed securities and fixed coupon bonds. Mortgage-backed securities (MBS) are bonds secured by a mortgage or collection of mortgages. Diversification does not assure a profit nor protect against loss in a declining market.
Fund holdings and sector allocations are subject to change and should not be considered a recommendation to buy or sell any security. For a complete list of fund holdings, please refer to the Schedule of Investments provided in this report.
Definitions for terms and indices are provided in the Glossary of Terms.
www.brownadvisoryfunds.com
64
Brown Advisory Mortgage Securities Fund
Performance Chart and Analysis
June 30, 2016
COMPARISON OF CHANGE IN VALUE OF A $10,000 INVESTMENT
The following chart reflects the change in value of a hypothetical $10,000 investment, including reinvested dividends and distributions, in the Fund as measured against a broad-based bond index. The Barclays Mortgage Backed Securities Index (“Index”) is a market value-weighted index which covers the mortgage-backed securities component of the Barclays US Aggregate Bond Index. The Index is composed of agency mortgage-backed passthrough securities of the Government National Mortgage Association (Ginnie Mae), the Federal National Mortgage Association (Fannie Mae), and the Federal Home Loan Mortgage Corporation (Freddie Mac) with a minimum $150 million par amount outstanding and a weighted-average maturity of at least 1 year. The Index includes reinvestment of income. Investors cannot invest directly in an index.

| Since | |||
| Average Annual Total Return | One | Inception | |
as of 6/30/16 | Year | (12/26/13) | |
Institutional Shares1 | 4.32% | 3.87% | |
| Investor Shares | 4.33% | 3.84% | |
| Barclays Mortgage Backed Securities Index | 4.34% | 4.34% |
Institutional Shares | Investor Shares | ||
Gross Expense Ratio2 | 0.47% | 0.52% | |
Net Expense Ratio2 | 0.47% | 0.52% |
Past performance does not guarantee future results. The performance data quoted represents past performance and current returns may be lower or higher. The investment return and net asset value will fluctuate so that an investor’s shares, when redeemed, may be worth more or less than the original cost. To obtain performance information current to the most recent month end, please visit our website at brownadvisoryfunds.com/performance.html. The performance table and graph above do not reflect the deduction of taxes that a shareholder would pay on Fund distributions or the redemption of Fund shares. Performance data does not reflect the imposition of the redemption fee of 1.00% on shares redeemed within 14 days, and if it did, performance would have been lower. Short-term performance, in particular, is not a good indication of the Fund’s future performance, and an investment should not be made based solely on returns.
1 | Performance information for the Institutional Shares, prior to commencement of operations on May 13, 2014, is based on the performance of the Investor Shares, and adjusted for the lower expenses applicable to the Institutional Shares. |
2 | Per the Fund’s prospectus dated October 30, 2015. |
www.brownadvisoryfunds.com
65
Brown Advisory Mortgage Securities Fund
Schedule of Investments
June 30, 2016
Par Value | Security Description | Rate | Maturity | Value $ | ||||||||
| Mortgage Backed Securities — 114.6% | ||||||||||||
| 250,000 | Anchorage Capital CLO, Ltd. #^ | 2.23 | % | 10/15/2026 | 248,967 | |||||||
| 1,900,000 | BAMLL Commercial Mortgage Securities, Series 2013-DSNY #^ | 1.48 | % | 09/15/2026 | 1,895,586 | |||||||
| 27,553 | Federal Home Loan Banks, Series SB-2016 | 4.89 | % | 12/23/2016 | 28,040 | |||||||
| 97,941 | Federal Home Loan Banks, Series MI-2017 | 4.78 | % | 01/25/2017 | 98,162 | |||||||
| 3,200,000 | FHLMC Gold, 2.5%, Due TBA July | 2.50 | % | 07/15/2031 | 3,309,399 | |||||||
| 3,200,000 | FHLMC Gold, 3.0%, Due TBA July | 3.00 | % | 07/15/2031 | 3,357,125 | |||||||
| 29,000,000 | FHLMC Gold, 3.0%, Due TBA July | 3.00 | % | 07/15/2046 | 30,065,235 | |||||||
| 11,500,000 | FHLMC Gold, 3.5%, Due TBA July | 3.50 | % | 07/15/2046 | 12,124,415 | |||||||
| 70 | FHLMC PC, Pool# G1-1357 | 5.50 | % | 01/01/2018 | 72 | |||||||
| 473 | FHLMC PC, Pool# E0-1488 | 5.00 | % | 10/01/2018 | 487 | |||||||
| 241 | FHLMC PC, Pool# C9-0242 | 6.00 | % | 12/01/2018 | 274 | |||||||
| 7,676 | FHLMC PC, Pool# G1-1778 | 5.50 | % | 10/01/2020 | 8,189 | |||||||
| 196 | FHLMC PC, Pool# G1-1924 | 5.50 | % | 03/01/2021 | 211 | |||||||
| 696 | FHLMC PC, Pool# C9-0428 | 6.00 | % | 03/01/2021 | 790 | |||||||
| 60 | FHLMC PC, Pool# J0-1540 | 5.00 | % | 04/01/2021 | 62 | |||||||
| 743 | FHLMC PC, Pool# G1-2110 | 5.50 | % | 06/01/2021 | 798 | |||||||
| 855 | FHLMC PC, Pool# G1-2522 | 5.00 | % | 02/01/2022 | 910 | |||||||
| 1,491 | FHLMC PC, Pool# G1-2600 | 5.50 | % | 03/01/2022 | 1,617 | |||||||
| 994 | FHLMC PC, Pool# G1-2710 | 5.50 | % | 07/01/2022 | 1,084 | |||||||
| 57 | FHLMC PC, Pool# 84-5640 # | 2.48 | % | 08/01/2023 | 59 | |||||||
| 15,852 | FHLMC PC, Pool# G1-3584 | 4.50 | % | 06/01/2024 | 16,942 | |||||||
| 36,817 | FHLMC PC, Pool# J1-1196 | 4.50 | % | 11/01/2024 | 39,621 | |||||||
| 1,666,843 | FHLMC PC, Pool# J3-2596 | 3.50 | % | 08/01/2030 | 1,768,364 | |||||||
| 1,143,971 | FHLMC PC, Pool# J3-2643 | 3.50 | % | 09/01/2030 | 1,214,251 | |||||||
| 60 | FHLMC PC, Pool# G0-1317 | 7.00 | % | 10/01/2031 | 68 | |||||||
| 9 | FHLMC PC, Pool# C5-8701 | 7.00 | % | 10/01/2031 | 9 | |||||||
| 38 | FHLMC PC, Pool# G0-1391 | 7.00 | % | 04/01/2032 | 44 | |||||||
| 171,201 | FHLMC PC, Pool# 1B0889 # | 2.56 | % | 05/01/2033 | 180,859 | |||||||
| 15,807 | FHLMC PC, Pool# 1B-1275 # | 2.60 | % | 10/01/2033 | 16,771 | |||||||
| 158,746 | FHLMC PC, Pool# 1J0203 # | 2.78 | % | 04/01/2035 | 168,552 | |||||||
| 979 | FHLMC PC, Pool# A4-6671 | 5.00 | % | 08/01/2035 | 1,084 | |||||||
| 1,250 | FHLMC PC, Pool# G0-8079 | 5.00 | % | 09/01/2035 | 1,388 | |||||||
| 13,244 | FHLMC PC, Pool# 1B-3950 # | 2.80 | % | 11/01/2035 | 13,265 | |||||||
| 2,117,486 | FHLMC PC, Pool# K9-3365 | 3.50 | % | 11/01/2035 | 2,260,700 | |||||||
| 1,117,472 | FHLMC PC, Pool# K9-3349 | 4.00 | % | 11/01/2035 | 1,209,522 | |||||||
| 77,941 | FHLMC PC, Pool# 1L-1263 # | 2.88 | % | 03/01/2036 | 82,934 | |||||||
| 8,972 | FHLMC PC, Pool# 1J-1317 # | 2.90 | % | 04/01/2036 | 9,522 | |||||||
| 4,616 | FHLMC PC, Pool# 1G-2408 # | 2.38 | % | 06/01/2036 | 4,892 | |||||||
| 10,445 | FHLMC PC, Pool# 84-7625 # | 2.35 | % | 07/01/2036 | 10,887 | |||||||
| 7,682 | FHLMC PC, Pool# G0-2274 | 5.00 | % | 07/01/2036 | 8,535 | |||||||
| 342 | FHLMC PC, Pool# A5-9220 | 5.00 | % | 04/01/2037 | 379 | |||||||
| 248,845 | FHLMC PC, Pool# B3-1917 | 5.10 | % | 04/01/2037 | 274,786 | |||||||
| 94,511 | FHLMC PC, Pool# B3-1950 | 5.10 | % | 05/01/2037 | 104,436 | |||||||
| 259,397 | FHLMC PC, Pool# B3-1976 | 5.10 | % | 05/01/2037 | 286,421 | |||||||
| 190,398 | FHLMC PC, Pool# B3-2000 | 5.10 | % | 06/01/2037 | 210,234 | |||||||
| 107,621 | FHLMC PC, Pool# B3-2032 | 5.10 | % | 07/01/2037 | 118,833 | |||||||
| 207,185 | FHLMC PC, Pool# U3-0471 | 5.10 | % | 07/01/2037 | 228,706 | |||||||
| 6,443 | FHLMC PC, Pool# 1J-0573 # | 2.72 | % | 08/01/2037 | 6,860 | |||||||
| 448,885 | FHLMC PC, Pool# U3-0681 | 5.10 | % | 09/01/2037 | 497,129 | |||||||
| 86,014 | FHLMC PC, Pool# U3-0606 | 5.10 | % | 09/01/2037 | 95,002 | |||||||
| 119,715 | FHLMC PC, Pool# U3-0929 | 5.10 | % | 10/01/2037 | 132,129 | |||||||
| 94,512 | FHLMC PC, Pool# U3-0800 | 5.10 | % | 11/01/2037 | 104,287 | |||||||
| 4,467 | FHLMC PC, Pool# 1B-4292 # | 2.66 | % | 09/01/2038 | 4,653 | |||||||
| 126,782 | FHLMC PC, Pool# U3-2470 | 5.10 | % | 11/01/2038 | 139,967 | |||||||
| 182,011 | FHLMC PC, Pool# A8-9112 | 4.50 | % | 10/01/2039 | 199,489 | |||||||
| 271,597 | FHLMC PC, Pool# Q0-3759 | 3.50 | % | 10/01/2041 | 288,626 | |||||||
The accompanying notes are an integral part of these financial statements.
www.brownadvisoryfunds.com
66
Brown Advisory Mortgage Securities Fund
Schedule of Investments
June 30, 2016
Par Value | Security Description | Rate | Maturity | Value $ | ||||||||
| Mortgage Backed Securities — (Continued) | ||||||||||||
| 3,614,373 | FHLMC PC, Pool# G0-7289 | 3.00 | % | 11/01/2042 | 3,809,477 | |||||||
| 891,698 | FHLMC PC, Pool# Q3-8585 | 4.00 | % | 10/01/2043 | 956,129 | |||||||
| 920,391 | FHLMC PC, Pool# Q2-6108 | 5.00 | % | 05/01/2044 | 1,017,307 | |||||||
| 1,014,920 | FHLMC PC, Pool# Q2-9637 | 4.50 | % | 11/01/2044 | 1,116,792 | |||||||
| 1,848,899 | FHLMC PC, Pool# Q3-6224 | 4.00 | % | 09/01/2045 | 1,980,975 | |||||||
| 1,108,696 | FHLMC PC, Pool# Q3-6806 | 4.00 | % | 10/01/2045 | 1,211,228 | |||||||
| 1,600,430 | FHLMC PC, Pool# Q3-7804 | 4.00 | % | 12/01/2045 | 1,713,780 | |||||||
| 2,262,977 | FHLMC PC, Pool# Q3-8701 | 4.00 | % | 02/01/2046 | 2,424,581 | |||||||
| 9,571,425 | FHLMC PC, Pool# Q3-8776 | 4.00 | % | 02/01/2046 | 10,269,636 | |||||||
| 2,209,179 | FHLMC PC, Pool# Q3-9216 | 4.00 | % | 03/01/2046 | 2,381,172 | |||||||
| 1,499,765 | FHLMC PC, Pool# Q3-9840 | 3.50 | % | 04/01/2046 | 1,589,430 | |||||||
| 2,499,561 | FHLMC PC, Pool# Q3-9868 | 4.00 | % | 04/01/2046 | 2,678,063 | |||||||
| 1,340,854 | FHLMC PC, Pool# Q4-1122 | 4.50 | % | 04/01/2046 | 1,468,724 | |||||||
| 1,297,925 | FHLMC PC, Pool# Q3-9870 | 4.50 | % | 04/01/2046 | 1,421,709 | |||||||
| 1,759,702 | FHLMC PC, Pool# Q4-0481 | 3.50 | % | 05/01/2046 | 1,860,234 | |||||||
| 2,527,078 | FHLMC PC, Pool# Q4-0444 | 4.00 | % | 05/01/2046 | 2,707,541 | |||||||
| 3,336,427 | FHLMC PC, Pool# Q4-1006 | 3.50 | % | 06/01/2046 | 3,526,771 | |||||||
| 10,226,867 | FHLMC REMIC, Series 4318 ~ | 2.50 | % | 08/15/2022 | 617,069 | |||||||
| 8,058,820 | FHLMC REMIC, Series 4329 ~ | 2.50 | % | 01/15/2023 | 526,799 | |||||||
| 10,583,000 | FHLMC REMIC, Series K-722 ~ | 1.31 | % | 03/25/2023 | 749,763 | |||||||
| 141,461 | FHLMC REMIC, Series 3571 | 4.00 | % | 09/15/2024 | 151,204 | |||||||
| 7,172,250 | FHLMC REMIC, Series K-055 ~ | 1.37 | % | 03/25/2026 | 753,257 | |||||||
| 1,983,171 | FHLMC REMIC, Series 4092 ~ | 3.00 | % | 09/15/2031 | 171,905 | |||||||
| 8,288,466 | FHLMC REMIC, Series 4186 ~ | 3.00 | % | 03/15/2033 | 1,068,784 | |||||||
| 2,911,159 | FHLMC REMIC, Series 4309 ~ | 3.00 | % | 08/15/2039 | 321,625 | |||||||
| 2,777,279 | FHLMC REMIC, Series 4015 ~ | 4.00 | % | 11/15/2039 | 329,230 | |||||||
| 406,943 | FHLMC REMIC, Series 3878 | 3.00 | % | 04/15/2041 | 424,510 | |||||||
| 1,808,442 | FHLMC REMIC, Series 4126 ~ | 3.50 | % | 05/15/2041 | 225,928 | |||||||
| 5,514,837 | FHLMC REMIC, Series 4144 | 2.50 | % | 12/15/2042 | 5,474,905 | |||||||
| 1,943,640 | FHLMC REMIC, Series 4144 | 2.50 | % | 12/15/2042 | 1,915,710 | |||||||
| 2,292,400 | FHLMC REMIC, Series 4153 | 2.50 | % | 01/15/2043 | 2,249,190 | |||||||
| 13,912,248 | FHLMC REMIC, Series 4495 | 2.50 | % | 07/15/2045 | 14,181,065 | |||||||
| 5,199,109 | FHLMC REMIC, Series 4495 ~ | 3.50 | % | 07/15/2045 | 801,922 | |||||||
| 4,040 | FNMA, Pool# 254089 | 6.00 | % | 12/01/2016 | 4,058 | |||||||
| 72 | FNMA, Pool# 555013 | 5.50 | % | 11/01/2017 | 74 | |||||||
| 352 | FNMA, Pool# 725544 | 5.50 | % | 12/01/2017 | 357 | |||||||
| 7,215 | FNMA, Pool# 763020 | 3.50 | % | 08/01/2018 | 7,652 | |||||||
| 26,110 | FNMA, Pool# 744697 | 4.50 | % | 10/01/2018 | 26,793 | |||||||
| 6,769 | FNMA, Pool# 725185 | 5.00 | % | 02/01/2019 | 7,001 | |||||||
| 35,638 | FNMA, Pool# 803941 # | 2.69 | % | 11/01/2019 | 36,136 | |||||||
| 8,156 | FNMA, Pool# 255626 | 5.00 | % | 03/01/2020 | 8,610 | |||||||
| 53,634 | FNMA, Pool# 970382 | 4.50 | % | 03/01/2023 | 56,094 | |||||||
| 730 | FNMA, Pool# 303585 | 7.00 | % | 10/01/2025 | 827 | |||||||
| 982 | FNMA, Pool# 303713 | 6.50 | % | 02/01/2026 | 1,131 | |||||||
| 1,787,414 | FNMA, Pool# AS6915 | 3.50 | % | 09/01/2026 | 1,912,409 | |||||||
| 12,173 | FNMA, Pool# 539082 | 7.00 | % | 08/01/2028 | 12,315 | |||||||
| 1,291,463 | FNMA, Pool# AS5354 | 3.50 | % | 01/01/2030 | 1,369,815 | |||||||
| 914,019 | FNMA, Pool# AY2366 | 3.50 | % | 07/01/2030 | 972,925 | |||||||
| 1,660,226 | FNMA, Pool# AY9794 | 3.50 | % | 07/01/2030 | 1,766,118 | |||||||
| 1,040,679 | FNMA, Pool# AZ3260 | 3.50 | % | 09/01/2030 | 1,106,830 | |||||||
| 1,415,180 | FNMA, Pool# BA2725 | 3.50 | % | 10/01/2030 | 1,501,661 | |||||||
| 1,521,736 | FNMA, Pool# AZ8668 | 3.50 | % | 11/01/2030 | 1,614,977 | |||||||
| 1,715,829 | FNMA, Pool# BA4230 | 3.50 | % | 11/01/2030 | 1,824,493 | |||||||
| 1,338,675 | FNMA, Pool# BA6294 | 3.50 | % | 12/01/2030 | 1,419,891 | |||||||
| 999,637 | FNMA, Pool# BC1118 | 3.50 | % | 12/01/2030 | 1,064,716 | |||||||
| 1,040,576 | FNMA, Pool# AZ8691 | 3.50 | % | 01/01/2031 | 1,114,768 | |||||||
The accompanying notes are an integral part of these financial statements.
www.brownadvisoryfunds.com
67
Brown Advisory Mortgage Securities Fund
Schedule of Investments
June 30, 2016
Par Value | Security Description | Rate | Maturity | Value $ | ||||||||
| Mortgage Backed Securities — (Continued) | ||||||||||||
| 966,742 | FNMA, Pool# BC2878 | 3.50 | % | 02/01/2031 | 1,028,146 | |||||||
| 2,732 | FNMA, Pool# 592751 | 7.00 | % | 06/01/2031 | 2,888 | |||||||
| 8,049 | FNMA, Pool# 625536 | 6.00 | % | 01/01/2032 | 9,197 | |||||||
| 37,882 | FNMA, Pool# 628837 | 6.50 | % | 03/01/2032 | 43,629 | |||||||
| 657 | FNMA, Pool# 555531 | 5.50 | % | 06/01/2033 | 745 | |||||||
| 793 | FNMA, Pool# 555591 | 5.50 | % | 07/01/2033 | 900 | |||||||
| 41,130 | FNMA, Pool# 748643 # | 2.37 | % | 09/01/2033 | 42,790 | |||||||
| 845 | FNMA, Pool# 555876 | 5.50 | % | 10/01/2033 | 965 | |||||||
| 56,452 | FNMA, Pool# 744805 # | 2.39 | % | 11/01/2033 | 57,535 | |||||||
| 48,508 | FNMA, Pool# 741373 # | 2.66 | % | 12/01/2033 | 50,661 | |||||||
| 82,369 | FNMA, Pool# 764342 # | 2.40 | % | 02/01/2034 | 85,289 | |||||||
| 2,556 | FNMA, Pool# 725424 | 5.50 | % | 04/01/2034 | 2,901 | |||||||
| 34,233 | FNMA, Pool# 796283 | 5.50 | % | 12/01/2034 | 38,847 | |||||||
| 1,165 | FNMA, Pool# 735022 | 5.50 | % | 12/01/2034 | 1,323 | |||||||
| 9,872 | FNMA, Pool# 735263 # | 2.43 | % | 01/01/2035 | 10,345 | |||||||
| 2,716 | FNMA, Pool# 821252 # | 2.61 | % | 05/01/2035 | 2,836 | |||||||
| 944 | FNMA, Pool# 255706 | 5.50 | % | 05/01/2035 | 1,069 | |||||||
| 69 | FNMA, Pool# 735580 | 5.00 | % | 06/01/2035 | 77 | |||||||
| 163,588 | FNMA, Pool# 836335 # | 2.30 | % | 10/01/2035 | 164,173 | |||||||
| 122,257 | FNMA, Pool# 836715 # | 2.61 | % | 10/01/2035 | 122,983 | |||||||
| 8,388 | FNMA, Pool# 851372 # | 2.63 | % | 12/01/2035 | 8,894 | |||||||
| 112 | FNMA, Pool# 849496 | 5.50 | % | 12/01/2035 | 126 | |||||||
| 1,269 | FNMA, Pool# 256022 | 5.50 | % | 12/01/2035 | 1,436 | |||||||
| 22,720 | FNMA, Pool# 848817 | 5.00 | % | 01/01/2036 | 25,281 | |||||||
| 907 | FNMA, Pool# 845341 | 5.50 | % | 01/01/2036 | 1,026 | |||||||
| 1,532 | FNMA, Pool# 256059 | 5.50 | % | 01/01/2036 | 1,735 | |||||||
| 2,606 | FNMA, Pool# 880371 # | 2.62 | % | 02/01/2036 | 2,753 | |||||||
| 57,982 | FNMA, Pool# 865849 # | 2.58 | % | 03/01/2036 | 60,265 | |||||||
| 4,715 | FNMA, Pool# 891332 # | 2.50 | % | 04/01/2036 | 4,948 | |||||||
| 2,976 | FNMA, Pool# 745480 # | 2.81 | % | 04/01/2036 | 3,127 | |||||||
| 101,172 | FNMA, Pool# 882017 # | 2.43 | % | 05/01/2036 | 105,413 | |||||||
| 3,094 | FNMA, Pool# 901006 # | 2.38 | % | 09/01/2036 | 3,289 | |||||||
| 10,318 | FNMA, Pool# 902188 # | 2.66 | % | 11/01/2036 | 10,884 | |||||||
| 201 | FNMA, Pool# 905690 | 5.50 | % | 12/01/2036 | 227 | |||||||
| 89,216 | FNMA, Pool# 888445 # | 2.62 | % | 04/01/2037 | 96,041 | |||||||
| 11,034 | FNMA, Pool# 888463 # | 5.22 | % | 05/01/2037 | 11,403 | |||||||
| 374 | FNMA, Pool# 960392 | 5.50 | % | 12/01/2037 | 421 | |||||||
| 5,195 | FNMA, Pool# 933628 # | 2.38 | % | 07/01/2038 | 5,397 | |||||||
| 3,790 | FNMA, Pool# 965185 # | 1.96 | % | 09/01/2038 | 3,984 | |||||||
| 5,363,268 | FNMA, Pool# AS2249 | 4.00 | % | 04/01/2039 | 5,764,771 | |||||||
| 15,579 | FNMA, Pool# AC4824 # | 2.54 | % | 10/01/2039 | 16,524 | |||||||
| 9,059 | FNMA, Pool# AH4794 | 5.00 | % | 02/01/2041 | 10,115 | |||||||
| 22,519 | FNMA, Pool# AI1170 | 5.00 | % | 04/01/2041 | 24,998 | |||||||
| 4,011,490 | FNMA, Pool# AL6768 | 6.00 | % | 05/01/2041 | 4,596,336 | |||||||
| 1,839,966 | FNMA, Pool# AW7425 | 5.00 | % | 01/01/2042 | 2,049,239 | |||||||
| 609,858 | FNMA, Pool# MA1065 | 4.00 | % | 05/01/2042 | 655,733 | |||||||
| 900,389 | FNMA, Pool# AO7724 | 4.50 | % | 06/01/2042 | 986,023 | |||||||
| 15,234 | FNMA, Pool# AR1150 | 3.00 | % | 01/01/2043 | 15,886 | |||||||
| 3,227,271 | FNMA, Pool# AR6379 | 3.00 | % | 02/01/2043 | 3,386,027 | |||||||
| 1,084,296 | FNMA, Pool# BC1738 | 4.50 | % | 09/01/2043 | 1,189,495 | |||||||
| 2,517,754 | FNMA, Pool# AU6230 | 5.00 | % | 09/01/2043 | 2,805,735 | |||||||
| 1,161,031 | FNMA, Pool# AV5309 | 4.00 | % | 12/01/2043 | 1,246,682 | |||||||
| 817,268 | FNMA, Pool# AS1429 | 4.00 | % | 12/01/2043 | 879,237 | |||||||
| 1,091,611 | FNMA, Pool# AV7739 | 4.00 | % | 01/01/2044 | 1,178,263 | |||||||
| 2,778,731 | FNMA, Pool# BC1737 | 4.00 | % | 01/01/2044 | 2,983,857 | |||||||
| 1,593,312 | FNMA, Pool# AS2985 | 4.00 | % | 08/01/2044 | 1,727,547 | |||||||
The accompanying notes are an integral part of these financial statements.
www.brownadvisoryfunds.com
68
Brown Advisory Mortgage Securities Fund
Schedule of Investments
June 30, 2016
Par Value | Security Description | Rate | Maturity | Value $ | ||||||||
| Mortgage Backed Securities — (Continued) | ||||||||||||
| 1,860,806 | FNMA, Pool# AZ6807 | 3.50 | % | 11/01/2044 | 1,967,406 | |||||||
| 1,127,755 | FNMA, Pool# AY0382 | 4.00 | % | 11/01/2044 | 1,220,687 | |||||||
| 1,543,742 | FNMA, Pool# AX3968 | 4.50 | % | 01/01/2045 | 1,690,417 | |||||||
| 207,491 | FNMA, Pool# AY1007 | 4.00 | % | 02/01/2045 | 222,560 | |||||||
| 388,757 | FNMA, Pool# AY3851 | 4.50 | % | 02/01/2045 | 424,944 | |||||||
| 1,574,119 | FNMA, Pool# AY0677 | 3.50 | % | 03/01/2045 | 1,683,874 | |||||||
| 1,059,812 | FNMA, Pool# AW9534 | 4.00 | % | 03/01/2045 | 1,144,274 | |||||||
| 1,181,714 | FNMA, Pool# AY8675 | 4.50 | % | 04/01/2045 | 1,293,990 | |||||||
| 1,849,294 | FNMA, Pool# AZ2000 | 3.50 | % | 05/01/2045 | 1,977,885 | |||||||
| 984,314 | FNMA, Pool# AZ4154 | 4.00 | % | 06/01/2045 | 1,068,073 | |||||||
| 3,303,291 | FNMA, Pool# AZ2719 | 4.00 | % | 06/01/2045 | 3,567,047 | |||||||
| 984,482 | FNMA, Pool# AZ5811 | 4.00 | % | 07/01/2045 | 1,060,821 | |||||||
| 692,067 | FNMA, Pool# AZ8061 | 4.00 | % | 08/01/2045 | 745,736 | |||||||
| 1,652,552 | FNMA, Pool# AY8184 | 4.00 | % | 08/01/2045 | 1,784,761 | |||||||
| 2,451,742 | FNMA, Pool# AZ8218 | 4.00 | % | 08/01/2045 | 2,631,114 | |||||||
| 3,603,127 | FNMA, Pool# AZ7828 | 4.00 | % | 08/01/2045 | 3,882,508 | |||||||
| 2,647,225 | FNMA, Pool# AZ7182 | 4.50 | % | 08/01/2045 | 2,898,716 | |||||||
| 2,540,289 | FNMA, Pool# AY8481 | 4.50 | % | 08/01/2045 | 2,781,649 | |||||||
| 1,746,549 | FNMA, Pool# AZ7073 | 4.00 | % | 09/01/2045 | 1,880,854 | |||||||
| 394,292 | FNMA, Pool# AZ1494 | 4.00 | % | 09/01/2045 | 424,149 | |||||||
| 1,601,196 | FNMA, Pool# AZ9834 | 4.50 | % | 09/01/2045 | 1,752,834 | |||||||
| 315,565 | FNMA, Pool# BA2936 | 4.00 | % | 10/01/2045 | 340,035 | |||||||
| 1,279,936 | FNMA, Pool# BA2526 | 4.00 | % | 10/01/2045 | 1,379,159 | |||||||
| 1,934,215 | FNMA, Pool# BA6225 | 4.00 | % | 10/01/2045 | 2,081,231 | |||||||
| 2,037,477 | FNMA, Pool# BA3674 | 4.50 | % | 10/01/2045 | 2,230,699 | |||||||
| 1,140,266 | FNMA, Pool# BA2509 | 4.50 | % | 10/01/2045 | 1,248,545 | |||||||
| 1,411,769 | FNMA, Pool# AZ9543 | 4.50 | % | 10/01/2045 | 1,545,830 | |||||||
| 2,617,909 | FNMA, Pool# AZ7081 | 3.50 | % | 11/01/2045 | 2,799,716 | |||||||
| 2,205,043 | FNMA, Pool# BA5436 | 3.50 | % | 11/01/2045 | 2,337,676 | |||||||
| 1,267,825 | FNMA, Pool# BC3849 | 4.00 | % | 11/01/2045 | 1,364,158 | |||||||
| 1,417,412 | FNMA, Pool# BA5582 | 3.50 | % | 12/01/2045 | 1,499,451 | |||||||
| 1,333,472 | FNMA, Pool# BA5469 | 3.50 | % | 12/01/2045 | 1,418,530 | |||||||
| 560,534 | FNMA, Pool# BA5579 | 3.50 | % | 12/01/2045 | 592,287 | |||||||
| 1,559,159 | FNMA, Pool# AZ5003 | 4.00 | % | 12/01/2045 | 1,674,643 | |||||||
| 2,127,199 | FNMA, Pool# BA4395 | 4.00 | % | 12/01/2045 | 2,292,159 | |||||||
| 1,012,845 | FNMA, Pool# BA6309 | 4.50 | % | 12/01/2045 | 1,115,916 | |||||||
| 3,912,566 | FNMA, Pool# BA6310 | 4.50 | % | 12/01/2045 | 4,284,580 | |||||||
| 1,731,670 | FNMA, Pool# BA5583 | 3.50 | % | 01/01/2046 | 1,855,476 | |||||||
| 1,449,418 | FNMA, Pool# BA5584 | 3.50 | % | 01/01/2046 | 1,550,592 | |||||||
| 2,061,225 | FNMA, Pool# BA7237 | 4.00 | % | 01/01/2046 | 2,221,732 | �� | ||||||
| 1,355,776 | FNMA, Pool# BC2159 | 4.00 | % | 01/01/2046 | 1,460,871 | |||||||
| 1,609,472 | FNMA, Pool# BA5587 | 4.00 | % | 01/01/2046 | 1,747,093 | |||||||
| 2,379,231 | FNMA, Pool# BC3871 | 3.50 | % | 02/01/2046 | 2,515,603 | |||||||
| 3,181,701 | FNMA, Pool# BC1230 | 3.50 | % | 02/01/2046 | 3,373,891 | |||||||
| 1,926,060 | FNMA, Pool# BC3867 | 3.50 | % | 02/01/2046 | 2,035,266 | |||||||
| 1,581,546 | FNMA, Pool# BC3491 | 4.00 | % | 02/01/2046 | 1,697,836 | |||||||
| 1,239,752 | FNMA, Pool# BC7884 | 4.00 | % | 02/01/2046 | 1,333,954 | |||||||
| 1,092,542 | FNMA, Pool# BA5510 | 4.00 | % | 02/01/2046 | 1,180,090 | |||||||
| 1,357,023 | FNMA, Pool# BC1231 | 4.00 | % | 02/01/2046 | 1,473,060 | |||||||
| 1,034,185 | FNMA, Pool# BC2890 | 4.50 | % | 02/01/2046 | 1,131,165 | |||||||
| 1,093,361 | FNMA, Pool# BC6366 | 4.50 | % | 02/01/2046 | 1,197,228 | |||||||
| 3,410,120 | FNMA, Pool# AL8256 | 3.00 | % | 03/01/2046 | 3,593,157 | |||||||
| 689,136 | FNMA, Pool# BC3387 | 3.50 | % | 03/01/2046 | 727,998 | |||||||
| 2,258,994 | FNMA, Pool# BC5311 | 3.50 | % | 03/01/2046 | 2,386,384 | |||||||
| 2,420,127 | FNMA, Pool# BC1236 | 3.50 | % | 03/01/2046 | 2,560,353 | |||||||
| 2,448,935 | FNMA, Pool# BC5066 | 3.50 | % | 03/01/2046 | 2,587,034 | |||||||
The accompanying notes are an integral part of these financial statements.
www.brownadvisoryfunds.com
69
Brown Advisory Mortgage Securities Fund
Schedule of Investments
June 30, 2016
Par Value | Security Description | Rate | Maturity | Value $ | ||||||||
| Mortgage Backed Securities — (Continued) | ||||||||||||
| 1,067,605 | FNMA, Pool# BC2913 | 4.00 | % | 03/01/2046 | 1,150,368 | |||||||
| 1,008,229 | FNMA, Pool# BC5323 | 4.00 | % | 03/01/2046 | 1,086,385 | |||||||
| 2,332,194 | FNMA, Pool# BC1241 | 3.50 | % | 04/01/2046 | 2,467,320 | |||||||
| 1,449,546 | FNMA, Pool# BC7881 | 3.50 | % | 04/01/2046 | 1,533,531 | |||||||
| 1,478,914 | FNMA, Pool# BC6557 | 3.50 | % | 04/01/2046 | 1,562,311 | |||||||
| 1,092,878 | FNMA, Pool# BC1240 | 3.50 | % | 04/01/2046 | 1,162,595 | |||||||
| 1,561,220 | FNMA, Pool# BC6771 | 4.50 | % | 04/01/2046 | 1,720,101 | |||||||
| 1,594,784 | FNMA, Pool# BC9451 | 3.50 | % | 05/01/2046 | 1,690,127 | |||||||
| 1,178,355 | FNMA, Pool# BC9463 | 4.00 | % | 05/01/2046 | 1,269,028 | |||||||
| 2,225,867 | FNMA, Pool# BC8680 | 4.50 | % | 05/01/2046 | 2,452,387 | |||||||
| 1,388,450 | FNMA, Pool# BD1370 | 3.50 | % | 06/01/2046 | 1,468,890 | |||||||
| 3,960,232 | FNMA, Pool# BD1382 | 4.00 | % | 06/01/2046 | 4,252,232 | |||||||
| 172,476 | FNMA REMIC Trust, Series 2003-122 | 4.00 | % | 12/25/2018 | 176,895 | |||||||
| 70 | FNMA REMIC Trust, Series 1990-105 | 6.50 | % | 09/25/2020 | 75 | |||||||
| 9,370 | FNMA REMIC Trust, Series 2012-1 | 1.75 | % | 12/25/2021 | 9,486 | |||||||
| 382,005 | FNMA REMIC Trust, Series 2011-18 | 4.00 | % | 10/25/2025 | 384,556 | |||||||
| 4,283,367 | FNMA REMIC Trust, Series 2012-139 ~ | 2.50 | % | 12/25/2027 | 391,428 | |||||||
| 294,911 | FNMA REMIC Trust, Series 2013-15 ~ | 3.00 | % | 03/25/2028 | 29,145 | |||||||
| 4,108,179 | FNMA REMIC Trust, Series 2013-115 ~ | 3.00 | % | 04/25/2031 | 460,157 | |||||||
| 13,113,971 | FNMA REMIC Trust, Series 2014-14 ~ | 3.00 | % | 04/25/2031 | 937,532 | |||||||
| 10,135,574 | FNMA REMIC Trust, Series 2013-104 ~ | 3.00 | % | 08/25/2032 | 716,992 | |||||||
| 10,536,239 | FNMA REMIC Trust, Series 2013-24 ~ | 3.00 | % | 11/25/2040 | 1,302,007 | |||||||
| 485,098 | FNMA REMIC Trust, Series 2012-10 # | 1.00 | % | 02/25/2042 | 488,675 | |||||||
| 1,985,334 | FNMA REMIC Trust, Series 2013-34 ~ | 3.00 | % | 05/25/2042 | 282,704 | |||||||
| 1,636,496 | FNMA REMIC Trust, Series 2012-99 ~ | 4.50 | % | 05/25/2042 | 277,089 | |||||||
| 8,402,889 | FNMA REMIC Trust, Series 2013-20 ~ | 3.50 | % | 11/25/2042 | 1,022,919 | |||||||
| 16,416 | FNMA REMIC Trust, Series 2003-W10 | 4.30 | % | 06/25/2043 | 17,762 | |||||||
| 5,653 | FNMA REMIC Trust, Series 2003-W12 | 4.48 | % | 06/25/2043 | 6,121 | |||||||
| 33,918 | FNMA REMIC Trust, Series 2003-W12 | 4.55 | % | 06/25/2043 | 37,291 | |||||||
| 18,581 | FNMA REMIC Trust, Series 2003-W12 | 4.68 | % | 06/25/2043 | 20,218 | |||||||
| 21,678 | FNMA REMIC Trust, Series 2003-W12 | 5.00 | % | 06/25/2043 | 23,671 | |||||||
| 1,535,419 | FNMA REMIC Trust, Series 2015-40 ~ | 4.50 | % | 03/25/2045 | 327,239 | |||||||
| 7,500,000 | FNMA, 2.5%, Due TBA July | 2.50 | % | 07/15/2031 | 7,760,005 | |||||||
| 7,000,000 | FNMA, 3.0%, Due TBA July | 3.00 | % | 07/15/2031 | 7,339,063 | |||||||
| 17,000,000 | FNMA, 3.0%, Due TBA July | 3.00 | % | 07/15/2046 | 17,643,472 | |||||||
| 11,000,000 | FNMA, 3.5%, Due TBA July | 3.50 | % | 07/15/2046 | 11,607,578 | |||||||
| 3,320,000 | Freddie Mac STACR Debt Notes, Series 2014-DN1 # | 2.65 | % | 02/26/2024 | 3,366,633 | |||||||
| 6,500,000 | Freddie Mac STACR Debt Notes, Series 2014-DN2 # | 2.10 | % | 04/25/2024 | 6,503,055 | |||||||
| 702,954 | Freddie Mac STACR Debt Notes, Series 2015-DN1 # | 1.70 | % | 01/25/2025 | 702,971 | |||||||
| 3,126,736 | Freddie Mac STACR Debt Notes, Series 2015-DNA1 # | 1.35 | % | 10/25/2027 | 3,126,320 | |||||||
| 3,600,000 | Freddie Mac STACR Debt Notes, Series 2015-DNA1 # | 2.30 | % | 10/25/2027 | 3,598,986 | |||||||
| 5,750,000 | Freddie Mac STACR Debt Notes, Series 2015-DNA3 # | 3.30 | % | 04/25/2028 | 5,915,675 | |||||||
| 2,660,000 | Freddie Mac STACR Debt Notes, Series 2016-DNA2 # | 2.65 | % | 10/25/2028 | 2,683,295 | |||||||
| 900,000 | FREMF Mortgage, Series 2011-K703 #^ | 5.05 | % | 07/25/2044 | 940,706 | |||||||
| 2,896,068 | FREMF Mortgage, Series 2013-K712 #^ | 3.48 | % | 05/25/2045 | 2,966,174 | |||||||
| 2,790,963 | FREMF Mortgage, Series 2012-K19 #^ | 4.17 | % | 05/25/2045 | 3,000,039 | |||||||
| 5,000,000 | FREMF Mortgage, Series 2012-K711 #^ | 3.68 | % | 08/25/2045 | 5,167,892 | |||||||
| 600,000 | FREMF Mortgage, Series 2013-K713 #^ | 3.27 | % | 04/25/2046 | 610,419 | |||||||
| 4 | GNMA, Pool# 180963X | 9.50 | % | 11/15/2016 | 4 | |||||||
| 127 | GNMA, Pool# 781403X | 6.00 | % | 02/15/2017 | 128 | |||||||
| 25 | GNMA, Pool# 198708X | 9.50 | % | 04/15/2017 | 25 | |||||||
| 6,829 | GNMA, Pool# 595167X | 5.50 | % | 11/15/2017 | 6,938 | |||||||
| 4,510 | GNMA, Pool# 552929X | 5.00 | % | 12/15/2017 | 4,557 | |||||||
| 1,243 | GNMA, Pool# 607669X | 5.00 | % | 02/15/2018 | 1,263 | |||||||
| 4,144 | GNMA, Pool# 594102X | 4.50 | % | 09/15/2018 | 4,222 | |||||||
| 105,753 | GNMA, Pool# 706295C | 5.10 | % | 12/20/2038 | 115,227 | |||||||
The accompanying notes are an integral part of these financial statements.
www.brownadvisoryfunds.com
70
Brown Advisory Mortgage Securities Fund
Schedule of Investments
June 30, 2016
Par Value | Security Description | Rate | Maturity | Value $ | |||||||||
| Mortgage Backed Securities — (Continued) | |||||||||||||
| 110,226 | GNMA, Pool# 706155C | 5.10 | % | 03/20/2039 | 120,089 | ||||||||
| 8,843 | GNMA, Pool# 780576X | 7.00 | % | 12/15/2022 | 10,022 | ||||||||
| 38,028 | GNMA, Pool# 723460X | 4.00 | % | 12/15/2024 | 40,616 | ||||||||
| 1,396 | GNMA, Pool# 780195X | 8.00 | % | 07/15/2025 | 1,627 | ||||||||
| 13,349 | GNMA, Pool# 487110 | 6.50 | % | 04/15/2029 | 15,271 | ||||||||
| 341 | GNMA, Pool# 536231X | 9.00 | % | 07/15/2030 | 343 | ||||||||
| 5,134 | GNMA, Pool# 571166 | 7.00 | % | 08/15/2031 | 5,302 | ||||||||
| 4,473 | GNMA, Pool# 004017M | 6.00 | % | 08/20/2037 | 5,134 | ||||||||
| 3,566 | GNMA, Pool# 565240X | 6.50 | % | 09/15/2037 | 4,206 | ||||||||
| 3,972 | GNMA, Pool# 676322X | 7.00 | % | 09/15/2037 | 4,356 | ||||||||
| 11,088 | GNMA, Pool# 646058X | 6.00 | % | 11/15/2037 | 12,694 | ||||||||
| 12,251 | GNMA REMIC Trust, Series 201-03 | 3.00 | % | 01/16/2027 | 12,877 | ||||||||
| 15,347,606 | GNMA REMIC Trust, Series 2013-170 ~ | 2.50 | % | 05/16/2028 | 1,097,920 | ||||||||
| 1,357,075 | GNMA REMIC Trust, Series 2013-168 ~ | 2.50 | % | 11/16/2028 | 125,584 | ||||||||
| 992 | GNMA REMIC Trust, Series 2003-97 | 4.50 | % | 03/20/2033 | 1,029 | ||||||||
| 682,000 | GNMA REMIC Trust, Series 2011-156 | 2.00 | % | 04/20/2040 | 620,101 | ||||||||
| 10,882,582 | GNMA REMIC Trust, Series 2013-79 ~ | 3.00 | % | 01/20/2042 | 956,156 | ||||||||
| 831,612 | GNMA REMIC Trust, Series 2012-97 | 2.00 | % | 08/16/2042 | 764,607 | ||||||||
| 616,376 | GNMA REMIC Trust, Series 2011-121 # | 0.84 | % | 03/16/2043 | 611,694 | ||||||||
| 725,000 | GNMA REMIC Trust, Series 2012-44 | 2.95 | % | 08/16/2043 | 751,286 | ||||||||
| 6,867,000 | GNMA REMIC Trust, Series 2013-85 # | 2.79 | % | 02/16/2049 | 6,894,364 | ||||||||
| 8,000,000 | GNMA REMIC Trust, Series 2013-73 # | 2.67 | % | 10/16/2052 | 8,019,720 | ||||||||
| 7,000,000 | GNMA, 3.0%, Due TBA July | 3.00 | % | 07/15/2046 | 7,319,512 | ||||||||
| 14,000,000 | GNMA, 3.5%, Due TBA July | 3.50 | % | 07/15/2046 | 14,860,235 | ||||||||
| Total Mortgage Backed Securities (Cost $431,971,275) | 435,282,438 | ||||||||||||
| Asset Backed Securities — 5.1% | |||||||||||||
| 434,146 | AmeriCredit Automobile Receivables Trust, Series 2012-4 C | 1.93 | % | 08/08/2018 | 434,463 | ||||||||
| 187,286 | AmeriCredit Automobile Receivables Trust, Series 2012-5 C | 1.69 | % | 11/08/2018 | 187,382 | ||||||||
| 477,905 | AmeriCredit Automobile Receivables Trust, Series 2014-2 A-3 | 0.94 | % | 02/08/2019 | 477,810 | ||||||||
| 1,776,000 | AmeriCredit Automobile Receivables Trust, Series 2016-1 A-2-A # | 1.52 | % | 06/10/2019 | 1,779,171 | ||||||||
| 1,750,000 | AmeriCredit Automobile Receivables Trust, Series 2015-4 | 2.11 | % | 01/08/2021 | 1,765,939 | ||||||||
| 1,500,000 | AmeriCredit Automobile Receivables Trust, Series 2015-3 | 2.73 | % | 03/08/2021 | 1,527,527 | ||||||||
| 250,000 | Ares XXXI CLO, Ltd. #^ | 2.11 | % | 08/28/2025 | 248,540 | ||||||||
| 250,000 | Atlas Senior Loan Fund VI, Ltd., Series A #^ | 2.17 | % | 10/15/2026 | 249,111 | ||||||||
| 128,845 | Capital Auto Receivables Asset Trust, Series 2013-4 A-3 | 1.09 | % | 03/20/2018 | 128,853 | ||||||||
| 538,925 | Capital Auto Receivables Asset Trust, Series 2014-2 A-3 | 1.26 | % | 05/21/2018 | 539,285 | ||||||||
| 317,917 | Capital Auto Receivables Asset Trust, Series 2013-2 A-4 | 1.56 | % | 07/20/2018 | 318,027 | ||||||||
| 250,000 | Carlyle Global Market Strategies CLO, Ltd., Series FLT #^ | 2.09 | % | 07/27/2026 | 249,654 | ||||||||
| 32,703 | Dell Equipment Finance Trust, Series 2015-2 ^ | 0.53 | % | 10/24/2016 | 32,703 | ||||||||
| 1,261,904 | Exeter Automobile Receivables, Series 2015-2 ^ | 1.54 | % | 11/15/2019 | 1,259,006 | ||||||||
| 3,000,000 | Highbridge Loan Management, Series 6a-2015 C #^ | 3.70 | % | 05/05/2027 | 2,948,697 | ||||||||
| 72,701 | Oscar U.S. Funding Trust IV, Series 2016-4 ^ | 0.95 | % | 04/17/2017 | 72,881 | ||||||||
| 950,000 | Oscar U.S. Funding Trust IV, Series 2016-4 #^ | 2.14 | % | 07/15/2020 | 954,506 | ||||||||
| 500,000 | Prestige Auto Receivables Trust, Series 2016-1 A-2 ^ | 1.78 | % | 04/15/2019 | 501,645 | ||||||||
| 760,000 | Prestige Auto Receivables Trust, Series 2016-1 A-3 ^ | 1.99 | % | 06/15/2020 | 763,893 | ||||||||
| 254,000 | Prestige Auto Receivables Trust, Series 2016-1 B ^ | 2.98 | % | 11/16/2020 | 255,768 | ||||||||
| 285,000 | Prestige Auto Receivables Trust, Series 2015-1 B ^ | 2.04 | % | 04/15/2021 | 282,591 | ||||||||
| 458,906 | Santander Drive Automobile Receivables Trust, Series 2014-1 | 1.59 | % | 10/15/2018 | 459,214 | ||||||||
| 2,499,026 | Santander Drive Automobile Receivables Trust, Series 2014-3 | 1.45 | % | 05/15/2019 | 2,501,313 | ||||||||
| 1,455,000 | Santander Drive Automobile Receivables Trust, Series 2015-2 | 2.44 | % | 04/15/2021 | 1,468,810 | ||||||||
| 113,628 | SLM Student Loan Trust, Series 2007-1 # | 0.70 | % | 01/25/2022 | 113,534 | ||||||||
| Total Asset Backed Securities (Cost $19,362,207) | 19,520,323 | ||||||||||||
The accompanying notes are an integral part of these financial statements.
www.brownadvisoryfunds.com
71
Brown Advisory Mortgage Securities Fund
Schedule of Investments
June 30, 2016
| Par | |||||||||||||
Value/Shares | Security Description | Rate | Maturity | Value $ | |||||||||
| U.S. Treasury Notes — 4.8% | |||||||||||||
| 6,000,000 | United States Treasury Note | 0.88 | % | 06/15/2017 | 6,021,444 | ||||||||
| 6,000,000 | United States Treasury Note | 1.13 | % | 06/15/2018 | 6,061,170 | ||||||||
| 6,000,000 | United States Treasury Note | 0.88 | % | 05/15/2019 | 6,029,064 | ||||||||
| Total U.S. Treasury Notes (Cost $18,045,103) | 18,111,678 | ||||||||||||
| Local Government Housing Agency Bonds — 0.7% | |||||||||||||
| 1,795,000 | Delaware State Housing Authority | 2.75 | % | 12/01/2041 | 1,827,938 | ||||||||
| 830,000 | Missouri Housing Development Commission | 2.65 | % | 11/01/2040 | 824,730 | ||||||||
| Total Local Government Housing Agency Bonds (Cost $2,469,286) | 2,652,668 | ||||||||||||
| Short-Term Investments — 3.9% | |||||||||||||
| Money Market Funds — 3.9% | |||||||||||||
| 14,810,076 | Cash Account Trust — Government & Agency Securities Portfolio — Institutional Shares, 0.34%* | 14,810,076 | |||||||||||
| Total Short-Term Investments (Cost $14,810,076) | 14,810,076 | ||||||||||||
| Total Investments — 129.1% (Cost $486,657,947) | 490,377,183 | ||||||||||||
| Liabilities in Excess of Other Assets — (29.1)% | (110,675,639 | ) | |||||||||||
| NET ASSETS — 100.0% | $ | 379,701,544 | |||||||||||
| ^ | Security exempt from registration under Rule 144A of the Securities Act of 1933. These securities may be resold in transactions exempt from registration, normally to qualified institutional buyers. At June 30, 2016, the value of these securities amounted to $22,648,778 or 6.0% of net assets. |
| # | Variable rate security. Rate disclosed is as of June 30, 2016. |
| * | Annualized seven-day yield as of June 30, 2016. |
| ~ | Interest Only Security |
| PORTFOLIO HOLDINGS | |
| % of Net Assets | |
| Mortgage Backed Securities | 114.6% |
| Asset Backed Securities | 5.1% |
| U.S. Treasury Notes | 4.8% |
| Money Market Funds | 3.9% |
| Local Government Housing Agency Bonds | 0.7% |
| Other Assets and Liabilities | (29.1)% |
| 100.0% |
The accompanying notes are an integral part of these financial statements.
www.brownadvisoryfunds.com
72
Brown Advisory Mortgage Securities Fund
Schedule of Securities Sold Short
June 30, 2016
Par Value | Security Description | Rate | Maturity | Value $ | |||||||||
| Mortgage Backed Securities — (2.8)% | |||||||||||||
| 10,000,000 | FNMA, 4.0%, Due TBA July | 4.00 | % | 07/15/2046 | (10,722,369 | ) | |||||||
| Total Mortgage Backed Securities (Proceeds $10,664,062) | $ | (10,722,369 | ) | ||||||||||
Percentages are stated as a percent of net assets.
The accompanying notes are an integral part of these financial statements.
www.brownadvisoryfunds.com
73
Brown Advisory – WMC Strategic European Equity Fund
A Message to Our Shareholders
June 30, 2016
Dear Shareholder:
During the year ended June 30, 2016, the Brown Advisory — WMC Strategic European Equity Fund Institutional Shares (the “Fund”) returned -2.68%. During the same period, the MSCI Europe Index (the “Index”), the Fund’s benchmark, returned -11.22%.
We take a bottom up approach to building the portfolio where we aim to identify companies that we believe benefit from a structural growth advantage, are competitively positioned, and attractively valued. This fundamental process leads us to hold certain sector over- and under-weights.
Despite negative absolute performance during the period, the Fund outperformed the Index by 8.54%, with outperformance driven by strong stock selection. Selection within the industrials, health care, and consumer discretionary sectors contributed most to relative performance. Positive selection was partially offset by weaker selection in materials. Sector allocation, a fall-out of the bottom-up stock selection process, was also a strong contributor to relative returns. Our underweight to financials, the worst performing sector in the Index, along with an overweight to consumer staples and industrials were additive to returns. In contrast, our underweight to energy and utilities weighed on relative performance.
Top contributors to relative returns during the period included DSV, British-American Tobacco, and Heineken. Denmark-based freight and logistics company DSV was a top contributor for the period. The company has both a profitable position within European freight and contract logistics as well as exposure to sea and air freight. Across all of its divisions, the company has benefitted from an asset-light business and, given its position as a freight broker of considerable size, it has been able to benefit from pricing economies of scale. In addition, DSV has had a solid management team along with a strong focus on shareholder returns. During the period, the company reported consensus-beating results and raised its full-year guidance, due to a combination of better than expected volume performance and a positive currency translation impact. British American Tobacco is a UK-based tobacco goods manufacturer with strong market share across a number of developed and emerging market countries. The company reported solid 2015 results during the period. As a more defensive name with broad revenue exposure outside the UK, British American Tobacco held up well both preceding and post the Brexit vote. We trimmed some of our position given the strong price performance, but continue to view British American Tobacco’s strong industry positioning, attractive valuation, cash flow, and earnings growth profile positively. Heineken was also a large contributor to relative returns. We view the structural growth profile of Heineken as attractive with not only what has been a strong geographical mix of revenues, across both emerging and developed markets, but also a brand that has been well positioned across most price segments. The company’s recent acquisition of a competitor has the potential to allow it to increase its exposure across less penetrated markets, with commensurately higher growth potential.
Top detractors from relative returns included UBS, not owning Nestle, and our positions in Julius Baer and Essentra. Financials, in particular banks, experienced a tumultuous start to 2016. Factors including low bank return on equity, negative interest rate policy, a more rigid bank resolution structure, and regulatory uncertainty weighed heavily on the sector. This volatility impacted two of our top detractors, UBS and Julius Baer, which were further impacted by a more challenging 2015 in the Swiss wealth management business. We remain positive on Julius Baer’s strong brand cachet and depth of knowledge within the private banking segment, and its valuation remains attractive. We continue to hold UBS and favor wealth management companies given their high barriers to entry. Essentra is a UK-based supplier of plastic and fibre products. The stock fell in early June after Essentra announced that profits would be well below consensus for the year despite recent acquisitions. The profit warning was attributed to a combination of factors including the loss of a major contract opportunity and deterioration in trading conditions in China and India as well as operational issues in the integration of a producer of packaging products. We exited our position due to concerns over revenue pressure and integration of acquisitions.
We sold our position in Nordea, a Swedish bank, as a result of perceived higher operational risk and potential future capital concerns and sold Sanofi over concerns surrounding their diabetes franchise, Lantus which is facing pricing pressure in the US. During the period we also added to our position in UBS, given our positive outlook for the company and what we believe are attractive risk/reward characteristics.
During the period the Fund utilized futures and forward contracts for the purposes of reducing risk and/or obtaining efficient investment or currency exposure. These did not have a material impact on performance.
www.brownadvisoryfunds.com
74
Brown Advisory – WMC Strategic European Equity Fund
A Message to Our Shareholders
June 30, 2016
Over the period, volatility increased; driven by concerns on low-growth, lower oil prices and Brexit implications. With the Brexit referendum results, as well as upcoming elections in Europe, we anticipate volatility to persist through 2016. In this environment, investors continue to seek quality and growth attributes in stocks. We remain encouraged that the portfolio’s relative valuation premium versus the broad market remains at historically low levels. Our portfolio positioning continues to be driven by bottom-up stock selection, as illustrated by our sector weights where we remain underweight Energy and Financials, given a lack of securities that meet our criteria, and overweight Industrials given the breadth of opportunities in the sector. While our positioning is the result of bottom-up stock selection we are cognizant of the cyclical/defensive balance of the portfolio in terms of its overall resilience in various market environments.
In the longer term, given the complexities of the potential form of Brexit, we believe there will be time to analyze and adapt the portfolio and individual holdings, within the context of our philosophy and process. We will continue to seek to identify and invest in companies that we believe are exposed to structural growth drivers and that have built strong competitive advantages. These intrinsic qualities drive margins and returns, as well as high free cash flow generation.
Sincerely,
C. Dirk Enderlein, CFA
Portfolio Manager
Past performance is not a guarantee of future results.
Mutual fund investing involves risk. Principal loss is possible. Investments focused in a single geographic region may be exposed to greater risk than investments diversified among various geographies. Investments in foreign securities entail certain risks not associated with investments in domestic securities, such as volatility of currency exchange rates, and in some cases, political and economic instability and relatively illiquid markets. These risks are greater in emerging markets. Investments in smaller and medium capitalization companies generally carry greater risk than is customarily associated with larger companies for various reasons such as narrower markets, limited financial resources and less liquid stock. The Fund may invest in ETFs, which may trade at a discount to the aggregate value of the underlying securities and although expense ratios for ETFs are generally low, frequent trading of ETFs by the Fund can generate brokerage expenses. The value of investments in REITs may change in response to changes in the real estate market such as declines in the value of real estate, lack of available capital or financing opportunities, and increases in property taxes or operating costs. Derivatives involve risks different from, and in certain cases, greater than the risks presented by more traditional investments. Investors will indirectly bear the principal risks and its share of the fees and expenses of the Fund’s investment in other Investment Companies.
Fund holdings and sector allocations are subject to change and should not be considered a recommendation to buy or sell any security. For a complete list of fund holdings, please refer to the Schedule of Investments provided in this report.
Definitions for terms and indices are provided in the Glossary of Terms.
www.brownadvisoryfunds.com
75
Brown Advisory – WMC Strategic European Equity Fund
Performance Chart and Analysis
June 30, 2016
COMPARISON OF CHANGE IN VALUE OF A $1,000,000 INVESTMENT
The following chart reflects the change in value of a hypothetical $1,000,000 investment, including reinvested dividends and distributions, in the Fund as measured against a broad-based securities market index. The MSCI Europe Index (“Index”) is an index that captures large and mid cap representation across 15 developed market countries in Europe. The Index is unmanaged and does not reflect the deduction of fees, such as investment management fees. Investors cannot invest directly in an index.
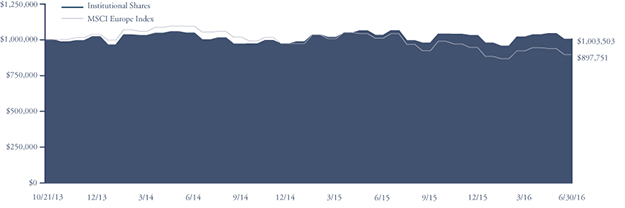
| Since | |||
| Average Annual Total Return | One | Inception | |
as of 6/30/16 | Year | (10/21/13) | |
| Institutional Shares | -2.68% | 0.13% | |
| Investor Shares | -2.85% | -0.02% | |
| Advisor Shares | -3.15% | -0.25% | |
| MSCI Europe Index | -11.22% | -3.93% |
Institutional Shares | Investor Shares | Advisor Shares | ||
Gross Expense Ratio1 | 1.13% | 1.28% | 1.53% | |
Net Expense Ratio1 | 1.13% | 1.28% | 1.53% |
Past performance does not guarantee future results. The performance data quoted represents past performance and current returns may be lower or higher. The investment return and net asset value will fluctuate so that an investor’s shares, when redeemed, may be worth more or less than the original cost. To obtain performance information current to the most recent month end, please visit our website at brownadvisoryfunds.com/performance.html. The performance table and graph above do not reflect the deduction of taxes that a shareholder would pay on Fund distributions or the redemption of Fund shares. Performance data does not reflect the imposition of the redemption fee of 1.00% on shares redeemed within 14 days, and if it did, performance would have been lower. Short-term performance, in particular, is not a good indication of the Fund’s future performance, and an investment should not be made based solely on returns.
1 Per the Fund’s prospectus dated October 30, 2015.
www.brownadvisoryfunds.com
76
Brown Advisory – WMC Strategic European Equity Fund
Schedule of Investments
June 30, 2016
Shares | Security Description | Value $ | ||||||
| Common Stocks — 98.4% | ||||||||
| Belgium — 2.6% | ||||||||
| 371,118 | UCB S.A. | 27,866,398 | ||||||
| Denmark — 4.6% | ||||||||
| 835,809 | DSV A/S | 35,144,211 | ||||||
| 307,776 | H. Lundbeck A/S | 11,537,707 | ||||||
| 310,544 | Spar Nord Bank A/S | 2,490,494 | ||||||
| 49,172,412 | ||||||||
| Finland — 4.2% | ||||||||
| 719,486 | Kone OYJ | 33,204,673 | ||||||
| 284,255 | Sampo OYJ | 11,625,032 | ||||||
| 44,829,705 | ||||||||
| France — 12.1% | ||||||||
| 756,256 | Altran Technologies S.A. | 10,018,453 | ||||||
| 73,045 | BioMerieux S.A. | 9,897,610 | ||||||
| 658,476 | Elior S.A. | 14,288,432 | ||||||
| 520,261 | Elis S.A.* | 9,128,614 | ||||||
| 624,333 | Legrand S.A. | 31,960,580 | ||||||
| 119,154 | L’Oreal S.A. | 22,812,537 | ||||||
| 243,094 | Pernod Ricard S.A. | 26,914,603 | ||||||
| 155,439 | Worldline S.A.* | 4,521,183 | ||||||
| 129,542,012 | ||||||||
| Germany — 8.9% | ||||||||
| 193,533 | Beiersdorf AG | 18,322,729 | ||||||
| 1,428,771 | Infineon Technologies AG | 20,683,567 | ||||||
| 259,959 | Merck KGaA | 26,423,131 | ||||||
| 114,549 | NORMA Group SE | 5,427,423 | ||||||
| 287,530 | ProSiebenSat.1 Media AG | 12,577,213 | ||||||
| 289,034 | United Internet AG | 12,014,891 | ||||||
| 95,448,954 | ||||||||
| Italy — 3.0% | ||||||||
| 192,460 | DiaSorin S.p.A. | 11,769,555 | ||||||
| 1,761,940 | OVS S.p.A. | 10,260,527 | ||||||
| 491,503 | Salvatore Ferragam S.p.A. | 10,018,782 | ||||||
| 32,048,864 | ||||||||
| Netherlands — 4.6% | ||||||||
| 159,657 | ASML Holding NV | 15,716,420 | ||||||
| 364,535 | Heineken NV | 33,435,960 | ||||||
| 49,152,380 | ||||||||
| Spain — 0.5% | ||||||||
| 106,351 | Viscofan S.A. | 5,902,579 | ||||||
| Sweden — 9.4% | ||||||||
| 1,368,012 | Assa Abloy AB | 28,143,881 | ||||||
| 1,405,315 | Atlas Copco AB | 36,499,047 | ||||||
| 2,002,091 | Cloetta AB | 6,884,023 | ||||||
| 1,217,341 | Sandvik AB | 12,187,935 | ||||||
| 994,373 | Trelleborg AB | 17,645,615 | ||||||
| 101,360,501 | ||||||||
| Switzerland — 18.9% | ||||||||
| 2,535 | BELIMO Holding AG | 7,525,822 | ||||||
| 781 | Chocoladefabriken Lindt & Spruengli AG | 4,657,979 | ||||||
| 562,135 | Cie Financiere Richemont S.A. | 32,904,406 | ||||||
| 30,690 | Daetwyler Holding AG | 4,098,266 | ||||||
| 70,178 | Geberit AG | 26,580,791 | ||||||
| 3,608 | Givaudan S.A. | 7,264,796 | ||||||
| 15,497 | INFICON Holding AG | 5,245,388 | ||||||
| 775,755 | Julius Baer Gruppe AG | 31,222,834 | ||||||
| 125,963 | Kuehne & Nagel International AG | 17,648,635 | ||||||
| 4,485 | LEM Holding S.A. | 4,032,596 | ||||||
| 90,462 | Schindler Holding, Ltd. | 16,377,962 | ||||||
| 65,828 | Tecan Trading AG | 10,268,325 | ||||||
| 77,338 | Temenos Group AG* | 3,860,074 | ||||||
| 2,405,188 | UBS Group | 31,208,742 | ||||||
| 202,896,616 | ||||||||
| United Kingdom — 29.6% | ||||||||
| 568,642 | Berendsen PLC | 9,238,903 | ||||||
| 8,904,610 | Booker Group PLC | 20,621,278 | ||||||
| 718,184 | British American Tobacco PLC | 46,559,415 | ||||||
| 1,597,953 | Compass Group | 30,401,836 | ||||||
| 365,565 | Diploma PLC | 4,071,415 | ||||||
| 333,351 | Dunelm Group PLC | 3,499,172 | ||||||
| 662,813 | Halma PLC | 9,014,975 | ||||||
| 408,997 | Hikma Pharmaceuticals PLC | 13,468,748 | ||||||
| 1,031,335 | Jardine Lloyd Thompson Group PLC | 12,921,449 | ||||||
| 1,566,924 | Prudential PLC | 26,589,121 | ||||||
| 396,733 | Reckitt Benckiser Group PLC | 39,781,276 | ||||||
| 3,243,369 | Saga PLC | 8,342,488 | ||||||
| 1,702,183 | Smith & Nephew PLC | 28,905,212 | ||||||
| 772,053 | Spectris PLC | 18,793,166 | ||||||
| 320,841 | Spirax-Sarco Engineering PLC | 16,066,035 | ||||||
| 1,485,602 | SSP Group PLC | 5,575,061 | ||||||
| 475,909 | SuperGroup PLC | 8,053,335 | ||||||
| 324,556 | Ultra Electronics PLC | 7,552,095 | ||||||
| 430,009 | WH Smith PLC | 9,033,895 | ||||||
| 318,488,875 | ||||||||
| Total Common Stocks (Cost $1,061,926,532) | 1,056,709,296 | |||||||
| Short-Term Investments — 1.4% | ||||||||
| Money Market Funds — 1.4% | ||||||||
| 14,983,547 | Cash Account Trust — Government | |||||||
| & Agency Securities Portfolio — | ||||||||
| Institutional Shares, 0.34%# | 14,983,547 | |||||||
| Total Short-Term Investments (Cost $14,983,547) | 14,983,547 | |||||||
| Total Investments — 99.8% (Cost $1,076,910,079) | 1,071,692,843 | |||||||
| Other Assets in Excess of Liabilities — 0.2% | 1,953,439 | |||||||
| NET ASSETS — 100.0% | $ | 1,073,646,282 | ||||||
The accompanying notes are an integral part of these financial statements.
www.brownadvisoryfunds.com
77
Brown Advisory – WMC Strategic European Equity Fund
Schedule of Investments
June 30, 2016
| PORTFOLIO HOLDINGS | |
| % of Net Assets | |
| United Kingdom | 29.6% |
| Switzerland | 18.9% |
| France | 12.1% |
| Sweden | 9.4% |
| Germany | 8.9% |
| Denmark | 4.6% |
| Netherlands | 4.6% |
| Finland | 4.2% |
| Italy | 3.0% |
| Belgium | 2.6% |
| Money Market Funds | 1.4% |
| Spain | 0.5% |
| Other Assets and Liabilities | 0.2% |
| 100.0% |
| * | Non-Income Producing |
| # | Annualized seven-day yield as of June 30, 2016. |
The accompanying notes are an integral part of these financial statements.
www.brownadvisoryfunds.com
78
Brown Advisory – WMC Japan Alpha Opportunities Fund
A Message to Our Shareholders
June 30, 2016
Dear Shareholder:
During the year ended June 30, 2016, the Brown Advisory — WMC Japan Alpha Opportunities Fund Institutional Shares (the “Fund”) returned -24.02%, while the TOPIX Total Return U.S. Dollar Hedged Index, the Fund’s benchmark, returned -22.52%. The TOPIX Total Return Index returned -7.73% during the same period.
While factors such as a domestic-led macro and favorable supply-demand remained supportive, concerns about slowing global growth (especially China), and uncertainty around US Federal Reserve policy weighed on equities. The market continued to decline as Japan’s fourth-quarter 2015 GDP contracted an annualized 1.1%, hurt by soft domestic consumption. In early 2016, the Bank of Japan (BOJ) followed the lead of central banks in Europe by cutting its benchmark lending rate into negative territory. The Japanese equity market continued its decline amid a backdrop of a strengthening yen and foreign selling. The BOJ’s new negative interest rate policy failed to mitigate concerns about slower global growth and lower natural resource prices. Japanese exports fell in May for the eighth consecutive month, due to slumping shipments to Europe and China. On the positive side, Japan’s economy grew 1.9% annualized during the first quarter, which was more than initially estimated.
From a factor perspective, momentum and growth were the best performing factors across Japan, while foreign sensitivity and value were among the worst performing factors. The portfolio’s bias toward higher volatility names and underweight to growth detracted from performance, and was only partially offset by the tailwind from a tilt to smaller cap names.
Sector allocation, a residual of bottom-up stock selection by the underlying managers, weighed on relative returns during the period. Our underweight allocations to the industrials, consumer staples, and telecommunication services sectors detracted from relative performance. Partially offsetting this allocation effect were overweights to the information technology, consumer discretionary, and materials sectors. Stock selection was mostly flat for the period with weaker selection in the health care, financials, and energy sectors being mostly offset by strong selection in the industrials, consumer staples, and consumer discretionary sectors.
Top relative detractors included our position in Toyo Tire & Rubber and our underweight positions in KDDI CORP and NTT DOCOMO. Not owning strong performing benchmark constituent Japan Tobacco also detracted from relative returns. Top relative contributors included our positions in Adastria, SCREEN Holdings, and SCSK.
During the period, the team eliminated the portfolio’s position in Rakuten. The Japanese electronic commerce and internet retailer struggled with slow growth while experiencing an increase in competition from Amazon and Yahoo. The team also added to their position in Toyo Tire & Rubber, the tire and rubber products company. We added to our position during the end of the period as valuations were attractive and our view that the negative share price action had reset expectations for the company and forward foreign exchange estimates to very low levels.
The Fund utilized currency forwards during the period to hedge against the fluctuation in the yen as it relates to the securities held in the portfolio. These positions detracted from the Fund’s absolute performance during the period given the yen’s appreciation against the dollar. The portfolio also utilized index futures during the period to equitize cash. These positions also detracted from absolute performance.
Japan’s economy and stock market have been facing headwinds caused by its strengthening currency and subdued growth and inflation numbers. We believe that although there has been a policy hiatus since the controversial introduction of negative interest rates, there is the potential for new stimulus initiatives from the BOJ later this year. Corporate Japan remains one of our favored regions given self-help opportunities to expand margins, improved governance, and better deployment of excess capital. Valuation disparities between sectors and factors, alongside market breadth and low sell side coverage, continue to provide fundamental stock pickers with a strong opportunity for alpha generation in Japan. Risks to this outlook may come from policy disappointment or a further material strengthening of the yen. With respect to the broad impact from Brexit, we would expect to see slower global economic growth and in a world of heightened risk, the yen may be seen as a safe haven currency.
Sincerely,
Kent M. Stahl, CFA
Portfolio Manager
Gregg R. Thomas, CFA
Portfolio Manager
www.brownadvisoryfunds.com
79
Brown Advisory – WMC Japan Alpha Opportunities Fund
A Message to Our Shareholders
June 30, 2016
Past performance is not a guarantee of future results.
Mutual fund investing involves risk. Principal loss is possible. Investments focused in a single geographic region may be exposed to greater risk than investments diversified among various geographies. Investments in foreign securities entail certain risks not associated with investments in domestic securities, such as volatility of currency exchange rates, and in some cases, political and economic instability and relatively illiquid markets. These risks are greater in emerging markets. Investments in smaller and medium capitalization companies generally carry greater risk than is customarily associated with larger companies for various reasons such as narrower markets, limited financial resources and less liquid stock. The Fund may invest in ETFs, which may trade at a discount to the aggregate value of the underlying securities and although expense ratios for ETFs are generally low, frequent trading of ETFs by the Fund can generate brokerage expenses. The value of investments in REITs may change in response to changes in the real estate market such as declines in the value of real estate, lack of available capital or financing opportunities, and increases in property taxes or operating costs. Derivatives involve risks different from, and in certain cases, greater than the risks presented by more traditional investments. Investors will indirectly bear the principal risks and its share of the fees and expenses of the Fund’s investment in other Investment Companies. Earnings growth is not representative of the fund’s future performance.
Fund holdings and sector allocations are subject to change and should not be considered a recommendation to buy or sell any security. For a complete list of fund holdings, please refer to the Schedule of Investments provided in this report.
Definitions for terms and indices are provided in the Glossary of Terms.
www.brownadvisoryfunds.com
80
Brown Advisory – WMC Japan Alpha Opportunities Fund
Performance Chart and Analysis
June 30, 2016
COMPARISON OF CHANGE IN VALUE OF A $1,000,000 INVESTMENT
The following chart reflects the change in value of a hypothetical $1,000,000 investment, including reinvested dividends and distributions, in the Fund as measured against broad-based securities market indices. TOPIX Total Return U.S. Dollar Hedged Index is a market capitalization-weighted index of all companies listed on the First Section of the Tokyo Stock Exchange, hedged to eliminate the impact of the change in value between the US Dollar and Japanese Yen. The unhedged version of this index, known as the TOPIX Total Return Index, does not eliminate the change in value between the US Dollar and Japanese Yen. The indexes are unmanaged and do not reflect the deduction of fees, such as investment management fees. Investors cannot invest directly in an index.
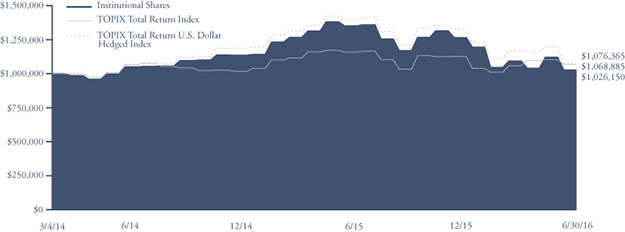
| Since | |||
| Average Annual Total Return | One | Inception | |
as of 6/30/16 | Year | (3/4/14) | |
| Institutional Shares | -24.02% | 1.12% | |
| Investor Shares | -24.20% | 0.96% | |
| Advisor Shares | -24.39% | 0.69% | |
| TOPIX Total Return U.S. Dollar Hedged Index | -22.52% | 3.22% | |
| TOPIX Total Return Index | -7.73% | 2.91% |
Institutional Shares | Investor Shares | Advisor Shares | ||
Gross Expense Ratio1 | 1.15% | 1.30% | 1.55% | |
Net Expense Ratio1 | 1.15% | 1.30% | 1.55% |
Past performance does not guarantee future results. The performance data quoted represents past performance and current returns may be lower or higher. The investment return and net asset value will fluctuate so that an investor’s shares, when redeemed, may be worth more or less than the original cost. To obtain performance information current to the most recent month end, please visit our website at brownadvisoryfunds.com/performance.html. The performance table and graph above do not reflect the deduction of taxes that a shareholder would pay on Fund distributions or the redemption of Fund shares. Performance data does not reflect the imposition of the redemption fee of 1.00% on shares redeemed within 14 days, and if it did, performance would have been lower. Short-term performance, in particular, is not a good indication of the Fund’s future performance, and an investment should not be made based solely on returns.
1 | Per the Fund’s prospectus dated October 30, 2015. |
www.brownadvisoryfunds.com
81
Brown Advisory – WMC Japan Alpha Opportunities Fund
Schedule of Investments
June 30, 2016
Shares | Security Description | Value $ | ||||||
| Common Stocks — 95.7% | ||||||||
| Japan — 95.7% | ||||||||
| Consumer Discretionary — 26.5% | ||||||||
| 78,152 | Adastria Holdings Co., Ltd. | 3,096,906 | ||||||
| 575,300 | Aisan Industry Co., Ltd. | 3,722,472 | ||||||
| 1,361,900 | Alpine Electronics, Inc. | 13,346,945 | ||||||
| 377,500 | Avex Group Holdings, Inc. | 4,272,811 | ||||||
| 343,390 | Bandai Namco Holdings, Inc. | 8,861,699 | ||||||
| 93,060 | BELC Co, Ltd. | 3,879,701 | ||||||
| 316,100 | Bellsystem24 Holdings, Inc. | 2,525,983 | ||||||
| 224,000 | Benesse Holdings, Inc. | 5,258,570 | ||||||
| 103,300 | Cyber Agent, Inc. | 6,252,872 | ||||||
| 613,200 | DaikyoNishikawa Co. | 7,766,941 | ||||||
| 155,378 | DIP Corp. | 4,192,047 | ||||||
| 365,100 | En-Japan, Inc. | 6,782,519 | ||||||
| 423,200 | Exedy Corp. | 9,060,547 | ||||||
| 510,730 | FUJIFILM Holdings Corp. | 19,816,541 | ||||||
| 846,300 | Funai Electric Co., Ltd. | 7,458,120 | ||||||
| 195,000 | Gendai Agency, Inc. | 939,105 | ||||||
| 643,723 | Gulliver International Co., Ltd. | 5,283,666 | ||||||
| 170,800 | H.I.S. Co., Ltd. | 5,516,019 | ||||||
| 311,700 | H2O Retailing Co. | 4,208,692 | ||||||
| 1,124,300 | Honda Motor Co., Ltd. | 28,203,363 | ||||||
| 458,020 | Honeys Co., Ltd. | 5,014,539 | ||||||
| 31,100 | Hoshizaki Electric Co., Ltd. | 3,044,509 | ||||||
| 362,900 | Iida Group Holdings Co., Ltd. | 7,431,856 | ||||||
| 1,192,100 | Isuzu Motors, Ltd. | 14,683,074 | ||||||
| 68,500 | Itokuro, Inc.* | 2,223,116 | ||||||
| 792,400 | Keihin Corp. | 12,226,619 | ||||||
| 96,175 | Konami Holdings Co. | 3,669,061 | ||||||
| 487,500 | Kuroda Electric Co., Ltd. | 8,373,300 | ||||||
| 4,800 | Kyoritsu Maintenance Co., Ltd. | 321,446 | ||||||
| 55,214 | M3, Inc. | 1,926,968 | ||||||
| 2,078,500 | Mitsubishi Motors Corp. | 9,595,051 | ||||||
| 1,040,940 | NGK Spark Plug Co., Ltd. | 15,712,762 | ||||||
| 1,087,000 | Nikon Corp. | 14,717,773 | ||||||
| 104,800 | Nintendo Co., Ltd. | 15,059,677 | ||||||
| 1,457,080 | Nippon Television Holdings, Inc. | 24,057,079 | ||||||
| 220,100 | Nishimatsuya Chain Co., Ltd. | 3,121,334 | ||||||
| 707,400 | Nissin Kogyo Co., Ltd. | 9,060,379 | ||||||
| 228,200 | Pal Co., Ltd. | 5,380,191 | ||||||
| 1,337,900 | Panasonic Corp. | 11,510,677 | ||||||
| 3,931,000 | Pioneer Corp. | 6,901,508 | ||||||
| 130,700 | Proto Corp. | 1,520,510 | ||||||
| 1,311,000 | Rakuten, Inc. | 14,228,725 | ||||||
| 334,000 | Relia, Inc. | 3,492,842 | ||||||
| 23,487 | Relo Holdings, Inc. | 4,157,024 | ||||||
| 1,736,000 | Sanyo Shokai Co., Ltd. | 3,265,853 | ||||||
| 24,345 | Seria Co., Ltd. | 2,014,937 | ||||||
| 110,075 | Start Today Co., Ltd. | 5,818,419 | ||||||
| 604,400 | Suzuki Motor Corp. | 16,365,900 | ||||||
| 405,846 | TechnoPro Holdings, Inc. | 12,637,385 | ||||||
| 650,000 | Teijin, Ltd. | 2,153,807 | ||||||
| 276,800 | Temp Holdings Co., Ltd. | 4,795,925 | ||||||
| 170,800 | Tenma Corp. | 2,543,394 | ||||||
| 744,000 | Tokai Rika Co., Ltd. | 10,989,915 | ||||||
| 2,889,690 | Toyo Tire & Rubber Co., Ltd. | 31,501,425 | ||||||
| 638,900 | Toyoda Gosei Co., Ltd. | 11,378,385 | ||||||
| 95,210 | Toyota Industries Corp. | 3,785,539 | ||||||
| 176,200 | Trusco Nakayama Corp. | 8,884,924 | ||||||
| 180,500 | TV Asahi Holdings Corp. | 2,939,077 | ||||||
| 166,000 | USS Co., Ltd. | 2,743,414 | ||||||
| 468,800 | XEBIO Holdings Co., Ltd. | 6,627,705 | ||||||
| 432,641 | Yamada Denki Co. | 2,283,835 | ||||||
| 52,140 | Yamaha Corp. | 1,405,351 | ||||||
| 221,200 | Yondoshi Holdings, Inc. | 4,471,249 | ||||||
| 66,200 | Zojirushi Corp. | 1,257,905 | ||||||
| 485,739,883 | ||||||||
| Consumer Staples — 7.0% | ||||||||
| 122,300 | Ain Holdings, Inc. | 9,486,438 | ||||||
| 55,363 | Ariake Japan Co., Ltd. | 3,296,086 | ||||||
| 232,300 | Cawachi, Ltd. | 5,546,645 | ||||||
| 166,632 | Cocokara Fine, Inc. | 8,635,983 | ||||||
| 89,230 | Create SD Holdings Co., Ltd. | 2,531,218 | ||||||
| 87,100 | Ezaki Glico Co., Ltd. | 5,095,332 | ||||||
| 830,200 | Itoham Yonekyu Holdings, Inc. | 8,449,525 | ||||||
| 28,932 | Kao Corp. | 1,685,062 | ||||||
| 71,626 | Kikkoman Corp. | 2,642,999 | ||||||
| 70,821 | Kose Corp. | 6,001,357 | ||||||
| 247,594 | Lion Corp. | 4,085,178 | ||||||
| 66,690 | MEIJI Holdings Co., Ltd. | 6,852,754 | ||||||
| 297,878 | Morinaga & Co., Ltd. | 1,878,135 | ||||||
| 198,119 | Nippon Flour Mills Co., Ltd. | 1,548,202 | ||||||
| 75,960 | Nisshin Seifun Group, Inc. | 1,221,048 | ||||||
| 22,515 | Pola Orbis Holdings, Inc. | 2,118,890 | ||||||
| 135,700 | Rohto Pharmaceutical Co., Ltd. | 2,068,089 | ||||||
| 127,796 | Sapporo Holdings, Ltd. | 3,692,885 | ||||||
| 453,900 | Seven & I Holdings Co., Ltd. | 19,031,171 | ||||||
| 93,977 | Sundrug Co., Ltd. | 8,823,970 | ||||||
| 98,558 | Tsuruha Holdings, Inc. | 11,934,250 | ||||||
| 308,800 | United Super Markets Holdings, Inc. | 3,152,448 | ||||||
| 91,700 | Welcia Holdings Co., Ltd. | 5,797,488 | ||||||
| 67,227 | Yamazaki Baking Co., Ltd. | 1,876,821 | ||||||
| 127,451,974 | ||||||||
| Energy — 1.6% | ||||||||
| 2,698,000 | Inpex Corp. | 21,099,982 | ||||||
| 422,600 | Japan Petroleum Exploration Co. | 8,518,367 | ||||||
| 29,618,349 | ||||||||
| Financials — 11.9% | ||||||||
| 1,209,400 | Dai-ichi Life Insurance Co., Ltd. | 13,538,501 | ||||||
| 477,000 | Eighteenth Bank, Ltd. | 1,165,241 | ||||||
| 557,500 | Hulic Co., Ltd. | 5,874,704 | ||||||
| 630,700 | Ichigo, Inc. | 2,491,754 | ||||||
| 942,100 | Kenedix, Inc. | 3,540,288 | ||||||
| 2,369,160 | Leopalace 21 Corp. | 16,641,154 | ||||||
| 11,371,440 | Mitsubishi UFJ Financial Group, Inc. | 50,976,498 | ||||||
| 441,200 | Mitsubishi UFJ Lease & Finance Co., Ltd. | 1,695,343 | ||||||
| 14,211,600 | Mizuho Financial Group, Inc. | 20,451,329 | ||||||
| 720,600 | Oita Bank, Ltd. | 2,078,373 | ||||||
| 3,206,000 | Shinsei Bank, Ltd. | 4,671,085 | ||||||
| 887,800 | Sumitomo Mitsui Financial Group, Inc. | 25,635,278 | ||||||
| 267,600 | Sumitomo Real Estate Sales Co., Ltd. | 5,260,958 | ||||||
| 2,306,700 | T&D Holdings, Inc. | 19,588,562 | ||||||
The accompanying notes are an integral part of these financial statements.
www.brownadvisoryfunds.com
82
Brown Advisory – WMC Japan Alpha Opportunities Fund
Schedule of Investments
June 30, 2016
Shares | Security Description | Value $ | ||||||
| Common Stocks — (Continued) | ||||||||
| Japan — (Continued) | ||||||||
| Financials — (Continued) | ||||||||
| 1,450,400 | Takara Leben Co., Ltd. | 11,115,774 | ||||||
| 748,000 | Tochigi Bank, Ltd. | 2,584,730 | ||||||
| 466,420 | Tokio Marine Holdings, Inc. | 15,527,628 | ||||||
| 172,130 | Tokyo TY Financial Group, Inc. | 3,997,917 | ||||||
| 615,000 | Yamanashi Chuo Bank, Ltd. | 2,166,550 | ||||||
| 253,300 | Zenkoku Hosho Co., Ltd. | 9,251,664 | ||||||
| 218,253,331 | ||||||||
| Health Care — 7.1% | ||||||||
| 171,179 | Asahi Intecc Co., Ltd. | 8,364,906 | ||||||
| 278,000 | CMIC Holdings Co., Ltd. | 4,302,572 | ||||||
| 433,400 | Eisai Co., Ltd. | 24,199,363 | ||||||
| 218,100 | EPS Holdings, Inc. | 2,740,136 | ||||||
| 272,900 | Nippon Shinyaku Co., Ltd. | 14,309,886 | ||||||
| 382,060 | Olympus Corp. | 14,266,732 | ||||||
| 179,481 | ONO Pharmaceutical Co., Ltd. | 7,818,385 | ||||||
| 36,725 | Otsuka Holdings Co., Ltd. | 1,692,394 | ||||||
| 24,408 | Peptidream, Inc.* | 1,459,836 | ||||||
| 224,238 | Shionogi & Co., Ltd. | 12,258,210 | ||||||
| 152,300 | SMS Co., Ltd. | 3,345,832 | ||||||
| 14,537 | Sosei Group Corp.* | 2,707,408 | ||||||
| 49,814 | Sysmex Corp. | 3,430,116 | ||||||
| 611,900 | Takeda Pharmaceutical Co., Ltd. | 26,390,139 | ||||||
| 84,651 | Terumo Corp. | 3,612,512 | ||||||
| 130,898,427 | ||||||||
| Industrials — 11.7% | ||||||||
| 233,300 | Bunka Shutter Co., Ltd. | 1,871,318 | ||||||
| 212,600 | Daifuku Co., Ltd. | 3,807,625 | ||||||
| 78,800 | Daiseki Co., Ltd. | 1,523,935 | ||||||
| 56,700 | Denyo Co., Ltd. | 586,761 | ||||||
| 186,500 | DMG Mori Co., Ltd. | 1,799,392 | ||||||
| 199,250 | East Japan Railway Co. | 18,465,161 | ||||||
| 169,811 | Fuji Kyuko Co., Ltd. | 2,374,345 | ||||||
| 1,706,210 | Hino Motors, Ltd. | 16,993,782 | ||||||
| 414,900 | Hisaka Works, Ltd. | 3,423,313 | ||||||
| 481,300 | Hitachi Chemical Co., Ltd. | 8,988,952 | ||||||
| 1,290,300 | Hosiden Corp. | 8,022,019 | ||||||
| 4,733,710 | IHI Corp. | 12,759,677 | ||||||
| 90,200 | Jamco Corp. | 1,652,069 | ||||||
| 429,820 | Japan Aviation Electronics Industry, Ltd. | 5,928,841 | ||||||
| 3,008,000 | Japan Steel Works, Ltd. | 13,749,130 | ||||||
| 593,808 | Kyudenko Corp. | 17,576,193 | ||||||
| 72,000 | METAWATER Co., Ltd. | 1,956,273 | ||||||
| 587,840 | NGK Insulators, Ltd. | 11,884,514 | ||||||
| 166,200 | Nippon Densetsu Kogyo Co., Ltd. | 2,796,703 | ||||||
| 189,371 | Nissin Electric Co., Ltd. | 2,802,936 | ||||||
| 244,907 | Obayashi Corp. | 2,607,502 | ||||||
| 583,100 | Sanwa Holdings Corp. | 5,300,400 | ||||||
| 821,720 | Sumitomo Electric Industries, Ltd. | 10,875,829 | ||||||
| 2,551,000 | Sumitomo Heavy Industries, Ltd. | 11,206,282 | ||||||
| 212,628 | Taisei Corp. | 1,747,100 | ||||||
| 418,900 | Tokyu Construction Co., Ltd. | 3,823,618 | ||||||
| 2,406,000 | Toshiba Machine Co., Ltd. | 7,277,914 | ||||||
| 356,700 | Toshiba Plant System & Services Corp. | 5,836,149 | ||||||
| 3,298,000 | Toyo Engineering Corp. | 10,949,265 | ||||||
| 404,300 | Tsubaki Nakashima Co., Ltd. | 4,613,703 | ||||||
| 684,500 | Ushio, Inc. | 8,041,906 | ||||||
| 60,200 | Zuiko Corp. | 2,571,626 | ||||||
| 213,814,233 | ||||||||
| Information Technology — 19.4% | ||||||||
| 72,606 | Alpha Systems, Inc. | 1,160,247 | ||||||
| 120,800 | Alps Electric Co., Ltd. | 2,294,996 | ||||||
| 734,300 | Canon, Inc. | 20,964,418 | ||||||
| 877,400 | DeNA Co., Ltd. | 20,525,467 | ||||||
| 122,100 | Digital Garage, Inc. | 2,849,123 | ||||||
| 44,200 | Disco Corp. | 3,997,440 | ||||||
| 567,966 | Ferrotec Corp. | 8,050,279 | ||||||
| 29,900 | FreakOut, Inc.* | 1,949,829 | ||||||
| 14,274,320 | Fujitsu, Ltd. | 52,491,214 | ||||||
| 1,723,800 | GREE, Inc. | 9,769,894 | ||||||
| 502,510 | Hitachi High-Technologies Corp. | 13,752,586 | ||||||
| 58,200 | Horiba, Ltd. | 2,560,730 | ||||||
| 342,300 | Itochu Techno-Solutions Corp. | 7,374,256 | ||||||
| 307,020 | Japan Digital Laboratory Co., Ltd. | 4,174,980 | ||||||
| 138,500 | Kyocera Corp. | 6,590,220 | ||||||
| 307,000 | Melco Holdings, Inc. | 6,291,916 | ||||||
| 325,700 | Mimasu Semiconductor Industry Co., Ltd. | 3,059,503 | ||||||
| 288,300 | Miraial Co., Ltd. | 2,014,444 | ||||||
| 1,100,860 | Mitsubishi Electric Corp. | 13,142,458 | ||||||
| 404,500 | Mitsumi Electric Co., Ltd. | 1,631,619 | ||||||
| 115,160 | Mixi, Inc. | 4,761,332 | ||||||
| 1,391,900 | NET One Systems Co., Ltd. | 8,017,578 | ||||||
| 1,265,400 | Nichicon Corp. | 8,222,438 | ||||||
| 236,800 | Nippon Ceramic Co., Ltd. | 4,454,796 | ||||||
| 110,507 | OBIC Co., Ltd. | 6,083,004 | ||||||
| 309,470 | Otsuka Corp. | 14,471,232 | ||||||
| 140,700 | Outsourcing, Inc. | 6,480,440 | ||||||
| 496,350 | Recruit Holdings Co., Ltd | 18,133,711 | ||||||
| 363,500 | Rohm Co., Ltd. | 14,347,383 | ||||||
| 235,000 | SCREEN Holdings Co., Ltd. | 2,557,789 | ||||||
| 654,220 | SCSK Corp. | 24,506,830 | ||||||
| 92,000 | Shimadzu Corp. | 1,383,062 | ||||||
| 699,042 | Shinkawa, Ltd. | 3,129,895 | ||||||
| 1,742,500 | Shinko Electric Industries Co., Ltd. | 8,534,900 | ||||||
| 538,590 | SoftBank Corp. | 30,458,382 | ||||||
| 539,300 | Tokyo Seimitsu Co., Ltd. | 12,558,730 | ||||||
| 98,600 | W-Scope Corp. | 2,332,500 | ||||||
| 355,079,621 | ||||||||
| Materials — 8.1% | ||||||||
| 519,000 | Aichi Steel Corp. | 2,303,613 | ||||||
| 369,200 | Chubu Steel Plate Co., Ltd. | 1,782,756 | ||||||
| 465,000 | Denka Co., Ltd. | 1,880,493 | ||||||
| 180,400 | Fujimi, Inc. | 2,649,736 | ||||||
| 1,321,380 | JSR Corp. | 17,499,204 | ||||||
| 564,200 | Kyoei Steel, Ltd. | 8,583,199 | ||||||
| 683,400 | Minebea Co. | 4,642,957 | ||||||
| 1,797,000 | Mitsui Chemicals, Inc. | 6,603,549 | ||||||
| 139,154 | Miura Co., Ltd. | 3,110,546 | ||||||
| 543,500 | Neturen Co., Ltd. | 3,825,782 | ||||||
| 86,300 | Nippon Shokubai Co., Ltd. | 4,963,661 | ||||||
The accompanying notes are an integral part of these financial statements.
www.brownadvisoryfunds.com
83
Brown Advisory – WMC Japan Alpha Opportunities Fund
Schedule of Investments
June 30, 2016
Shares | Security Description | Value $ | ||||||
| Common Stocks — (Continued) | ||||||||
| Japan — (Continued) | ||||||||
| Materials — (Continued) | ||||||||
| 155,600 | Nitto Denko Corp. | 9,870,362 | ||||||
| 730,600 | NOK Corp. | 12,424,316 | ||||||
| 2,240,000 | Pacific Metals Co. | 6,107,847 | ||||||
| 309,430 | Shin-etsu Chemical Co., Ltd. | 18,129,037 | ||||||
| 1,716,000 | Sumitomo Bakelite Co., Ltd. | 7,959,073 | ||||||
| 709,400 | Sumitomo Riko Co., Ltd. | 5,684,014 | ||||||
| 1,484,000 | Taiheiyo Cement Corp. | 3,514,954 | ||||||
| 98,900 | Tokyo Ohka Kogyo Co., Ltd. | 2,440,216 | ||||||
| 1,726,100 | Tokyo Steel Manufacturing Co., Ltd. | 9,461,534 | ||||||
| 412,800 | Yamato Kogyo Co., Ltd. | 9,369,973 | ||||||
| 189,168 | Yodogawa Steel Works, Ltd. | 4,613,367 | ||||||
| 147,420,189 | ||||||||
| Telecommunication Services — 2.3% | ||||||||
| 717,990 | Nippon Telegraph & Telephone Corp. | 33,670,080 | ||||||
| 317,919 | NTT DoCoMo, Inc. | 8,573,814 | ||||||
| 42,243,894 | ||||||||
| Utilities — 0.1% | ||||||||
| 163,981 | Toho Gas Co., Ltd. | 1,341,811 | ||||||
| Total Common Stocks (Cost $1,696,372,434) | 1,751,861,712 | |||||||
| Real Estate Investment Trusts — 0.1% | ||||||||
| Japan — 0.1% | ||||||||
| 192 | Hoshino Resorts, Inc. | 2,417,891 | ||||||
| Total Real Estate Investment Trusts (Cost $2,057,964) | 2,417,891 | |||||||
| Exchange Traded Funds — 0.4% | ||||||||
| Japan — 0.4% | ||||||||
| 545,330 | Nomura AM TOPIX ETF | 6,948,975 | ||||||
| Total Exchange Traded Funds (Cost $6,915,679) | 6,948,975 | |||||||
| Short-Term Investments — 2.9% | ||||||||
| Money Market Funds — 2.9% | ||||||||
| 53,537,464 | Cash Account Trust — Government | |||||||
| & Agency Securities Portfolio — | ||||||||
| Institutional Shares, 0.34%# | 53,537,464 | |||||||
| Total Short-Term Investments (Cost $53,537,464) | 53,537,464 | |||||||
| Total Investments — 99.1% (Cost $1,758,883,541) | 1,814,766,042 | |||||||
| Other Assets in Excess of Liabilities — 0.9% | 16,355,855 | |||||||
| NET ASSETS — 100.0% | $ | 1,831,121,897 | ||||||
| PORTFOLIO HOLDINGS | |
| % of Net Assets | |
| Consumer Discretionary | 26.5% |
| Information Technology | 19.4% |
| Financials | 11.9% |
| Industrials | 11.7% |
| Materials | 8.1% |
| Health Care | 7.1% |
| Consumer Staples | 7.0% |
| Money Market Funds | 2.9% |
| Telecommunication Services | 2.3% |
| Energy | 1.6% |
| Exchange Traded Funds | 0.4% |
| Real Estate Investment Trusts | 0.1% |
| Utilities | 0.1% |
| Other Assets and Liabilities | 0.9% |
| 100.0% |
| * | Non-Income Producing |
| # | Annualized seven-day yield as of June 30, 2016. |
Forward Foreign Currency Exchange Contracts (Note 6)
The Brown Advisory — WMC Japan Alpha Opportunities Fund had the following outstanding contracts as of June 30, 2016:
| Unrealized | |||||||||||||||
| Settlement | Appreciation | ||||||||||||||
Currency to be Delivered | Currency to be Received | Date | Counterparty | (Depreciation) | |||||||||||
| U.S. Dollars | 114,184,787 | Japanese Yen | 11,584,903,000 | 07/29/16 | BNP-Paribas | $ | (1,896,596 | ) | |||||||
| U.S. Dollars | 151,372,956 | Japanese Yen | 15,477,476,000 | 07/29/16 | Standard Chartered Bank | (1,355,490 | ) | ||||||||
| U.S. Dollars | 120,403,251 | Japanese Yen | 12,350,986,000 | 07/29/16 | Standard Chartered Bank | (689,701 | ) | ||||||||
| Japanese Yen | 70,696,746,000 | U.S. Dollars | 692,646,984 | 07/29/16 | Commonwealth Bank of Australia | 7,409,506 | |||||||||
| Japanese Yen | 70,696,745,000 | U.S. Dollars | 692,731,811 | 07/29/16 | State Street Capital Markets | 7,494,344 | |||||||||
| $ | 10,962,063 | ||||||||||||||
The accompanying notes are an integral part of these financial statements.
www.brownadvisoryfunds.com
84
Brown Advisory – Somerset Emerging Markets Fund
A Message to Our Shareholders
June 30, 2016
Dear Shareholder:
During the year ended June 30, 2016, the Brown Advisory - Somerset Emerging Markets Fund Institutional Shares (the “Fund”) returned -9.40%. During the same period, the MSCI Emerging Markets Index, the Fund’s benchmark, returned -12.06%, resulting in relative outperformance by the Fund of 2.66%.
On a country level, the Fund’s exposure to China, Hungary and Korea positively affected performance during the year. CNOOC in China was a new purchase for the Fund and one of the strongest performers over the period, which, along with Hengan International, increased the Fund’s Chinese exposure to 3 names. Korea is the largest country weighting in the Fund and a number of our stocks there were strong performers over the 12 month period. Utilities was the strongest performing sector but Power Grid in India was the principal contributor to this performance.
From an individual stock perspective, the most significant contributors to the Fund’s performance were KT&G Corp, OTP Bank in Hungary and Telekomunikasi Indonesia. OTP Bank has followed its strong 2015 performance with strong YTD 2016 performance, which suggests that the market may have priced in our original investment thesis and that this performance does reflect signal rather than noise. We bought OTP at an attractive P/B and were able to add to the position following market uncertainty related to the Russian incursion into the Crimea (OTP has Russian and Ukrainian operations). OTP Bank has benefited from the improving outlook for the Hungarian banking sector and economy, with loan growth restarting. KT&G has benefitted from some stabilization in the decline in tobacco volumes and strong fundamentals. Telekomunikasi Indonesia is the largest telecommunications company in Indonesia, which has a dominant market position. The most significant detractors were PZU in Poland and HCL Tech in India. PZU suffered from political instability and HCL Tech was weaker due to concerns about headwinds facing the industry.
We made 9 buys and 5 sells during the year. Turnover was 19% during the year, which is in line with historical averages. Notable purchases included 2 oil stocks, CNOOC and MOL, and HSBC. We have not owned any oil stocks since the Fund’s inception for a number of reasons, not least because we have not been able to get comfortable with CAPEX across the industry. Following the oil price collapse in the later part of 2015 our meetings with oil company managements markedly changed. The tone, the assumptions being made by managements and CAPEX plans were all noticeable different. We have been following HSBC for a number of years and met with management recently on a trip to China. We feel that it is well positioned for the Chinese lending crisis and much further along in adjusting to the new global regulations than peers. We judge around 51% revenues to be from EMs (including Hong Kong) and believe because of its emphasis on growth in Asia this portion may increase in the long run. However, because of its international presence, and rigorous international standards, its recording of things like non-performing loans gives it a substantial advantage over local Chinese banks on comparable valuations.
Over the period, 3 of the 5 sells we made were in Brazil. However, these were only in part informed by macro, much was stock-specific. Cielo is a credit card merchant acquirer company. There were three main factors that prompted us to sell the stock: it is a stock which is relatively highly related to the slowing Brazilian credit environment, the valuation had been high for some time and it had raised a lot of debt to make an acquisition. Another sell for the Fund was Merry Electronics in Taiwan. This was a rump position which we finished selling out of in Q1 2016. We think there will be more issues ahead for the technology and components subsector in Taiwan.
We remain discriminately bullish in the long term (beyond 5 years) whilst negative on a short term view. The increased activity over Q2 2016 in part reflects this along with the attractive entry points we have found over this period, many of which were in names that we have been following for some time. We have begun the process of addressing what was one of the Fund’s significant relative risks last year: the low exposure to China and commodities, adding 2 Chinese names and 2 oil stocks (1 of which is in China) over the period.
Sincerely,
Edward Lam
Portfolio Manager
www.brownadvisoryfunds.com
85
Brown Advisory – Somerset Emerging Markets Fund
A Message to Our Shareholders
June 30, 2016
Past performance is not a guarantee of future results.
Mutual fund investing involves risk. Principal loss is possible. The Fund may invest in ETFs, which may trade at a discount to the aggregate value of the underlying securities and although expense ratios for ETFs are generally low, frequent trading of ETFs by the Fund can generate brokerage expenses. The Fund may invest in foreign securities which involve greater volatility and political, economic and currency risks and differences in accounting methods. These risks are greater in emerging markets. Derivatives may involve certain costs and risks such as liquidity, interest rate, market, credit, management, and the risk that a position could not be closed when most advantageous. Investing in derivatives could lose more than the amount invested. The Fund invests in smaller and medium-sized companies which carry greater risk than is associated with larger companies for various reasons, such as narrower markets, limited financial resources and less liquid stock.
Fund holdings and sector allocations are subject to change and should not be considered a recommendation to buy or sell any security. For a complete list of fund holdings, please refer to the Schedule of Investments provided in this report.
Definitions for terms and indices are provided in the Glossary of Terms.
www.brownadvisoryfunds.com
86
Brown Advisory – Somerset Emerging Markets Fund
Performance Chart and Analysis
June 30, 2016
COMPARISON OF CHANGE IN VALUE OF A $1,000,000 INVESTMENT
The following chart reflects the change in value of a hypothetical $1,000,000 investment, including reinvested dividends and distributions, in the Fund as measured against a broad-based securities market index. The MSCI Emerging Markets Index (“Index”) is a free float-adjusted market capitalization index that is designed to measure equity market performance in the global emerging markets. The Index is unmanaged and does not reflect the deduction of fees, such as investment management fees. Investors cannot invest directly in an index.
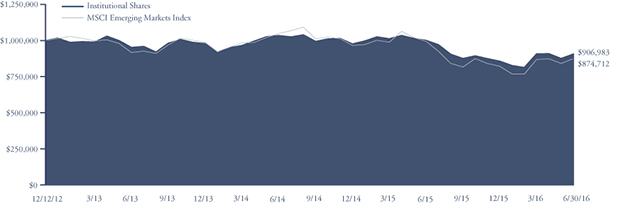
| Since | |||
| Average Annual Total Return | One | Inception | |
as of 6/30/16 | Year | (12/12/12) | |
| Institutional Shares | -9.40% | -2.71% | |
| Investor Shares | -9.60% | -2.86% | |
| Advisor Shares | -9.82% | -3.15% | |
| MSCI Emerging Markets Index | -12.06% | -3.70% |
Institutional Shares | Investor Shares | Advisor Shares | ||
Gross Expense Ratio1 | 1.27% | 1.42% | 1.67% | |
Net Expense Ratio1 | 1.27% | 1.42% | 1.67% |
Past performance does not guarantee future results. The performance data quoted represents past performance and current returns may be lower or higher. The investment return and net asset value will fluctuate so that an investor’s shares, when redeemed, may be worth more or less than the original cost. To obtain performance information current to the most recent month end, please visit our website at brownadvisoryfunds.com/performance.html. The performance table and graph above do not reflect the deduction of taxes that a shareholder would pay on Fund distributions or the redemption of Fund shares. Performance data does not reflect the imposition of the redemption fee of 1.00% on shares redeemed within 14 days, and if it did, performance would have been lower. Short-term performance, in particular, is not a good indication of the Fund’s future performance, and an investment should not be made based solely on returns.
1 Per the Fund’s prospectus dated October 30, 2015.
www.brownadvisoryfunds.com
87
Brown Advisory – Somerset Emerging Markets Fund
Schedule of Investments
June 30, 2016
Shares | Security Description | Value $ | ||||||
| Common Stocks — 95.9% | ||||||||
| Brazil — 4.1% | ||||||||
| 714,700 | Ambev S.A. | 4,238,407 | ||||||
| 2,060,856 | Porto Seguro S.A.† | 17,013,947 | ||||||
| 21,252,354 | ||||||||
| Chile — 3.8% | ||||||||
| 3,221,349 | AFP Habitat S.A. † | 4,234,294 | ||||||
| 8,604,446 | Aguas Andinas S.A. † | 4,940,041 | ||||||
| 715,595 | Cia Cervecerias Unidas S.A. † | 8,384,422 | ||||||
| 1,399,468 | Inversiones Aguas Metropolitanas S.A. † | 2,228,577 | ||||||
| 19,787,334 | ||||||||
| China — 6.8% | ||||||||
| 1,684,500 | China Mobile, Ltd. | 19,463,076 | ||||||
| 9,410,000 | CNOOC, Ltd. | 11,745,747 | ||||||
| 474,500 | Hengan International Group Co., Ltd. | 3,974,287 | ||||||
| 69,100 | Qinqin Foodstuffs Group Co., Ltd.* | 97,975 | ||||||
| 35,281,085 | ||||||||
| Hungary — 6.4% | ||||||||
| 164,962 | MOL Hungarian Oil & Gas PLC | 9,549,814 | ||||||
| 1,058,955 | OTP Bank PLC | 23,696,638 | ||||||
| 33,246,452 | ||||||||
| India — 11.8% | ||||||||
| 1,932,085 | Axis Bank, Ltd. | 15,352,723 | ||||||
| 1,672,973 | HCL Technologies, Ltd. | 18,159,405 | ||||||
| 96,815 | Hero MotoCorp, Ltd. | 4,572,409 | ||||||
| 2,088,925 | Power Grid Corp. of India, Ltd. | 5,057,724 | ||||||
| 211,978 | Shriram Transport Finance Co., Ltd. | 3,790,645 | ||||||
| 1,687,142 | Wipro, Ltd. | 13,983,846 | ||||||
| 60,916,752 | ||||||||
| Indonesia — 2.4% | ||||||||
| 40,552,800 | Telekomunikasi Indonesia | 12,338,018 | ||||||
| Nigeria — 0.1% | ||||||||
| 37,846,491 | Access Bank PLC | 771,009 | ||||||
| Philippines — 8.0% | ||||||||
| 14,964,680 | Aboitiz Power Corp. † | 14,689,662 | ||||||
| 10,097,591 | Metropolitan Bank & Trust Co. † | 19,448,075 | ||||||
| 155,695 | Philippine Long Distance Corp. | 7,116,337 | ||||||
| 41,254,074 | ||||||||
| Poland — 3.6% | ||||||||
| 203,453 | Bank Pekao S.A. | 7,103,419 | ||||||
| 1,592,713 | Powszechny Zaklad Ubezpieczen S.A. | 11,606,482 | ||||||
| 18,709,901 | ||||||||
| Portugal — 0.8% | ||||||||
| 276,323 | Jeronimo Martins SGPS S.A. | 4,358,117 | ||||||
| South Africa — 5.9% | ||||||||
| 2,944,476 | Nampak, Ltd. | 3,820,662 | ||||||
| 3,729,459 | Sanlam, Ltd. | 15,407,171 | ||||||
| 988,102 | Shoprite Holdings, Ltd. | 11,191,155 | ||||||
| 30,418,988 | ||||||||
| South Korea — 21.3% | ||||||||
| 109,905 | KT&G Corp. | 13,016,604 | ||||||
| 33,110 | NCSoft Corp. | 6,817,795 | ||||||
| 729,908 | Nexen Tire Corp. † | 8,393,905 | ||||||
| 51,279 | NongShim Co., Ltd. † | 16,661,338 | ||||||
| 16,240 | Samsung Electronics Co., Ltd | 20,224,505 | ||||||
| 92,062 | Samsung Fire & Marine Insurance Co., Ltd. | 21,144,797 | ||||||
| 836,926 | SK Hynix, Inc. | 23,816,392 | ||||||
| 110,075,336 | ||||||||
| Sweden — 0.7% | ||||||||
| 58,878 | Millicom International Cellular S.A. | 3,611,538 | ||||||
| Taiwan — 9.4% | ||||||||
| 708,000 | eMemory Technology, Inc. † | 7,038,192 | ||||||
| 674,401 | Formosa International Hotels Corp. | 3,853,737 | ||||||
| 12,631,000 | Pou Chen Corp. † | 17,001,473 | ||||||
| 1,190,000 | President Chain Store Corp. | 9,297,894 | ||||||
| 1,624,000 | Taiwan Semiconductor | |||||||
| Manufacturing Co., Ltd. | 8,184,468 | |||||||
| 1,504,000 | Win Semiconductors Corp. | 3,078,163 | ||||||
| 48,453,927 | ||||||||
| Thailand — 0.2% | ||||||||
| 1,780,500 | SAMART Corp. PCL | 860,303 | ||||||
| Turkey — 5.6% | ||||||||
| 2,031,441 | Aksa Akrilik Kimya Sanayii † | 5,433,963 | ||||||
| 2,301,176 | Anadolu Hayat Emeklilik A/S † | 4,044,136 | ||||||
| 196,051 | AvivaSA Emeklilik ve Hayat S.A. † | 1,300,418 | ||||||
| 8,444,076 | Turk Telekomunikasyon A/S † | 17,798,668 | ||||||
| 490,197 | Turkiye Sise ve Cam Fabrikalari A/S | 606,098 | ||||||
| 29,183,283 | ||||||||
| United Arab Emirates — 3.1% | ||||||||
| 855,491 | First Gulf Bank | 2,941,007 | ||||||
| 4,005,714 | National Bank Abu Dhabi † | 10,558,936 | ||||||
| 2,032,773 | Union National Bank | 2,272,875 | ||||||
| 15,772,818 | ||||||||
| United Kingdom — 1.9% | ||||||||
| 1,604,500 | HSBC Holdings PLC | 9,826,471 | ||||||
| Total Common Stocks (Cost $515,873,162) | 496,117,760 | |||||||
| Warrants — 0.0% | ||||||||
| Thailand — 0.0% | ||||||||
| 400,760 | SAMART Corp. PCL, Excerise price | |||||||
| THB 45 expires 02/19/2018 | 10,721 | |||||||
| Total Warrants (Cost $36,190) | 10,721 | |||||||
| Short-Term Investments — 4.1% | ||||||||
| Money Market Funds — 4.1% | ||||||||
| 21,071,793 | Cash Account Trust — Government | |||||||
| & Agency Securities Portfolio — | ||||||||
| Institutional Shares, 0.34%# | 21,071,793 | |||||||
| Total Short-Term Investments (Cost $21,071,793) | 21,070,793 | |||||||
| Total Investments — 100.0% (Cost $536,981,145) | 517,200,274 | |||||||
| Liabilities in Excess of Other Assets — (0.0)% | (84,831 | ) | ||||||
| NET ASSETS — 100.0% | $ | 517,115,443 | ||||||
The accompanying notes are an integral part of these financial statements.
www.brownadvisoryfunds.com
88
Brown Advisory – Somerset Emerging Markets Fund
Schedule of Investments
June 30, 2016
| PORTFOLIO HOLDINGS | |
| % of Net Assets | |
| South Korea | 21.3% |
| India | 11.8% |
| Taiwan | 9.4% |
| Philippines | 8.0% |
| China | 6.8% |
| Hungary | 6.4% |
| South Africa | 5.9% |
| Turkey | 5.6% |
| Brazil | 4.1% |
| Money Market Funds | 4.1% |
| Chile | 3.8% |
| Poland | 3.6% |
| United Arab Emirates | 3.1% |
| Indonesia | 2.4% |
| United Kingdom | 1.9% |
| Portugal | 0.8% |
| Sweden | 0.7% |
| Thailand | 0.2% |
| Nigeria | 0.1% |
| Other Assets and Liabilities | (0.0)% |
| 100.0% |
| † | All or a portion of this security is considered illiquid. At June 30, 2016, the total market value of securities considered illiquid was $49,560,047 or 9.6% of net assets. |
| # | Annualized seven-day yield as of June 30, 2016. |
| * | Security is fair valued under supervision of the Board of Trustees |
The accompanying notes are an integral part of these financial statements.
www.brownadvisoryfunds.com
89
Brown Advisory Emerging Markets Small-Cap Fund
A Message to Our Shareholders
June 30, 2016
Dear Shareholder:
During the year ended June 30, 2016, the Brown Advisory Emerging Markets Small-Cap Fund Institutional Shares (the “Fund”) returned -18.16%. During the same period, the Fund’s benchmark, the MSCI Emerging Markets Small-Cap Index returned -12.76%.
The key drivers of underperformance were stock selection in Korea and financial holdings in Greater China. Towards the back end of 2015, Korean tourism-related stocks saw mean reversion, following a very strong first half of 2015. This was mainly around the event of Middle East Respiratory Syndrome, whereby travel warnings for travel to Korea prevailed for a short period around September 2015. We hold conviction in these names and indeed their structural growth has proved to be enduring following this event with a rapid recovery in tourism numbers noted in early 2016. We remain overweight these holdings. Chinese financials were impacted by outflows from the region associated with depreciation in the Chinese Yuan. They were also impacted by general equity market weakness and adverse impacts of the loosening of monetary conditions witnessed in that market. For the Chinese financials, we see enduring risk and have therefore reduced the exposure.
From an individual stock perspective, the following names were key contributors.
• Techtronic Industries Co (a Chinese power tool manufacturer), rose 28.6%. Techtronic has benefitted from strong demand for tools in the US, rising market share in Europe and falling costs of production due to favorable raw material pricing and a depreciating value of the Chinese Yuan over the past twelve months.
• Yes Bank (an Indian bank), was up 24.8% on optimism towards the Indian economy and delivery of strong profit results and loan growth. With what has been sound credit management and good exposure to increasing credit penetration in India, Yes Bank remains our top long-term core holding in India.
• Charoen Pokphand Foods (a Thai agro-industrials and food company) rose 19.3%. Earnings in the first quarter of 2016 strongly beat the market’s expectation, with core profit up 897% year-on-year. The business experienced a strong improvement in gross profit margins, largely due to the recovery in its shrimp and livestock businesses.
The following names were key detractors.
• Kepco Plant Service and Engineering (a Korean power plant maintenance company) fell 54.3%. Lingering concerns of weak overseas orders and lower earnings in Q4 2015 weighed on investor sentiment. We have subsequently exited this position.
• China Power International (a Chinese power company) fell 52.3%. China power generation companies were sold off as concerns about the implications of potential power tariff cuts across the coal-fired, wind and solar sectors dampened sentiment. We have subsequently exited this position.
• China Taiping Insurance (a Chinese life insurer) fell 51.8% on weaker market sentiment. The correction in the market raised concerns over falling domestic bond yields and weak equity markets. These factors typically impact an insurer’s asset yield and capital positioning. We have subsequently exited this position.
Overall, Asia ex-Japan continues to trade at what we believe are attractive valuations and we believe the region’s growth profile remains robust. The Fund retains its strong quality bias, aversion to risk and a preference for companies focused on domestic demand, favoring companies that we feel are conservatively capitalized with a solid long-term track record.
Sincerely,
Paul Chew, CFA
Portfolio Manager
Past performance is not a guarantee of future results.
Mutual fund investing involves risk. Principal loss is possible. The Fund may invest in foreign securities which involve political, economic and currency risks, greater volatility and differences in accounting methods. These risks are greater for investments in emerging markets. Derivatives may involve certain costs and risks such as liquidity, interest rate, market, credit, management, and the risk that a position could not be closed when most advantageous. Investing in derivatives could lose more than the amount invested. Investments in small and medium capitalization companies generally carry greater risk than is customarily associated with larger companies for various reasons such as narrower markets, limited financial resources and less liquid stock. The Fund may invest in ETFs, which may trade at a discount to the aggregate value of the underlying securities and although expense ratios for ETFs are generally low, frequent trading of ETFs by the Fund can generate brokerage expenses. In addition, the fund is susceptible to risks from investments in derivatives, private placements, REITs, and its investments in other investment companies.
Fund holdings and sector allocations are subject to change and should not be considered a recommendation to buy or sell any security. For a complete list of fund holdings, please refer to the Schedule of Investments provided in this report.
Definitions for terms and indices are provided in the Glossary of Terms.
www.brownadvisoryfunds.com
90
Brown Advisory Emerging Markets Small-Cap Fund
Performance Chart and Analysis
June 30, 2016
COMPARISON OF CHANGE IN VALUE OF A $1,000,000 INVESTMENT
The following chart reflects the change in value of a hypothetical $1,000,000 investment, including reinvested dividends and distributions, in the Fund as measured against a broad-based securities market index. The MSCI Emerging Markets Small-Cap Index (“Index”) is a free float-adjusted market capitalization index that is designed to measure small cap equity market performance in the global emerging markets. The Index is unmanaged and does not reflect the deduction of fees, such as investment management fees. Investors cannot invest directly in an index.
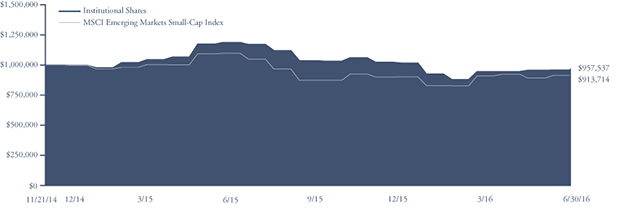
| Since | |||
| Average Annual Total Return | One | Inception | |
as of 6/30/16 | Year | (11/21/14) | |
| Institutional Shares | -18.16% | -2.67% | |
| Investor Shares | -18.35% | -2.86% | |
| MSCI Emerging Markets Small-Cap Index | -12.76% | -5.47% |
Institutional Shares | Investor Shares | ||
Gross Expense Ratio1 | 1.84% | 1.99% | |
Net Expense Ratio1 | 1.84% | 1.99% |
Past performance does not guarantee future results. The performance data quoted represents past performance and current returns may be lower or higher. The investment return and net asset value will fluctuate so that an investor’s shares, when redeemed, may be worth more or less than the original cost. To obtain performance information current to the most recent month end, please visit our website at brownadvisoryfunds.com/performance.html. The performance table and graph above do not reflect the deduction of taxes that a shareholder would pay on Fund distributions or the redemption of Fund shares. Performance data does not reflect the imposition of the redemption fee of 1.00% on shares redeemed within 14 days, and if it did, performance would have been lower. Short-term performance, in particular, is not a good indication of the Fund’s future performance, and an investment should not be made based solely on returns.
1 | Per the Fund’s prospectus dated October 30, 2015. |
www.brownadvisoryfunds.com
91
Brown Advisory Emerging Markets Small-Cap Fund
Schedule of Investments
June 30, 2016
Shares | Security Description | Value $ | ||||||
| Common Stocks — 87.8% | ||||||||
| China — 14.6% | ||||||||
| 3,962,000 | Beijing Capital International Airport Co., Ltd. | 4,315,058 | ||||||
| 412,500 | Bloomage Biotechno Corp., Ltd. | 642,274 | ||||||
| 1,073,000 | China Medical System Holdings, Ltd. | 1,644,509 | ||||||
| 3,196,000 | China Travel International | |||||||
| Investment Hong Kong, Ltd. | 929,825 | |||||||
| 4,406,000 | CITIC Telecom International Holdings, Ltd. † | 1,665,912 | ||||||
| 1,990,000 | Dongfeng Motor Group Co., Ltd. | 2,097,564 | ||||||
| 4,871,000 | Lee & Man Paper Manufacturing, Ltd. | 3,639,005 | ||||||
| 742,000 | Minth Group, Ltd. | 2,403,335 | ||||||
| 2,159,000 | Nexteer Automotive Group, Ltd. | 1,975,812 | ||||||
| 1,896,000 | Shandong Weigao Group | |||||||
| Medical Polymer Co., Ltd. | 1,086,445 | |||||||
| 558,500 | Techtronic Industries Co., Ltd. | 2,332,296 | ||||||
| 1,370,000 | Tong Ren Tang Technologies Co., Ltd. † | 2,275,053 | ||||||
| 2,755,000 | Uni-President China Holdings, Ltd. | 2,328,261 | ||||||
| 2,211,000 | Value Partners Group, Ltd. | 2,047,374 | ||||||
| 3,164,000 | Want Want China Holdings, Ltd. | 2,239,861 | ||||||
| 31,622,584 | ||||||||
| India — 12.8% | ||||||||
| 493,659 | Aurobindo Pharma, Ltd. | 5,445,910 | ||||||
| 1,661,912 | Dish TV India, Ltd. * | 2,417,405 | ||||||
| 604,307 | Exide Industries, Ltd. | 1,519,810 | ||||||
| 306,398 | Indiabulls Housing Finance, Ltd. | 3,058,454 | ||||||
| 60,540 | LIC Housing Finance, Ltd. | 445,539 | ||||||
| 189,995 | Shriram Transport Finance Co., Ltd. | 3,397,539 | ||||||
| 104,042 | Strides Arcolab, Ltd. | 1,746,320 | ||||||
| 849,026 | UPL, Ltd. | 6,943,833 | ||||||
| 173,002 | Yes Bank, Ltd. | 2,850,447 | ||||||
| 27,825,257 | ||||||||
| Indonesia — 2.3% | ||||||||
| 3,354,200 | Matahari Department Store TBK | 5,112,165 | ||||||
| Malaysia — 0.9% | ||||||||
| 1,941,700 | Westports Holdings Bhd. | 2,026,814 | ||||||
| Philippines — 4.4% | ||||||||
| 1,715,900 | Puregold Price Club, Inc. | 1,537,280 | ||||||
| 1,679,150 | Robinsons Retail Holdings, Inc. † | 3,086,086 | ||||||
| 1,191,540 | Security Bank Corp. | 4,874,550 | ||||||
| 9,497,916 | ||||||||
| Singapore — 2.7% | ||||||||
| 2,879,500 | Comfortdelgro Corp., Ltd. | 5,913,430 | ||||||
| South Korea — 26.3% | ||||||||
| 34,701 | CJ Korea Express Corp. * | 6,561,133 | ||||||
| 8,719 | Cuckoo Electronics Co., Ltd. | 1,108,379 | ||||||
| 890,135 | Hanon Systems Corp. | 8,146,458 | ||||||
| 46,069 | Hansae Co., Ltd. | 1,520,166 | ||||||
| 57,286 | Hyundai Department Store Co., Ltd. | 6,444,745 | ||||||
| 80,830 | InBody Co., Ltd. | 2,881,047 | ||||||
| 99,602 | Korea Kolmar Co., Ltd. | 8,708,979 | ||||||
| 583,066 | LG Uplus Corp. | 5,537,769 | ||||||
| 34,893 | Loen Entertainment, Inc. | 2,227,525 | ||||||
| 10,116 | Medy-Tox, Inc. | 3,826,033 | ||||||
| 61,590 | Modetour Network, Inc. | 1,486,608 | ||||||
| 64,393 | S-1 Corporation | 6,037,203 | ||||||
| 81,322 | Samsung Card Co., Ltd. | 2,946,945 | ||||||
| 57,432,990 | ||||||||
| Taiwan — 16.6% | ||||||||
| 224,000 | Cleanaway Co., Ltd. | 1,206,918 | ||||||
| 363,000 | CUB Elecparts, Inc. | 4,090,334 | ||||||
| 400,000 | Gourmet Master Co., Ltd. † | 3,540,834 | ||||||
| 1,125,000 | Hota Industrial Manufacturing Co., Ltd. | 5,278,940 | ||||||
| 5,680,000 | King Yuan Electronics Co., Ltd. | 5,058,845 | ||||||
| 3,387,000 | Pou Chen Corp. | 4,558,941 | ||||||
| 312,000 | St. Shine Optical Co., Ltd. | 7,050,615 | ||||||
| 3,211,000 | Vanguard International Semiconductor Corp. | 5,307,630 | ||||||
| 36,093,057 | ||||||||
| Thailand — 7.2% | ||||||||
| 963,400 | Bangkok Bank PCL | 4,361,328 | ||||||
| 1,574,000 | Central Plaza Hotel | 1,675,144 | ||||||
| 7,607,500 | Charoen Pokphand Foods PCL | 6,236,387 | ||||||
| 1,216,021 | Major Cineplex Group Public Co., Ltd. | 1,145,438 | ||||||
| 1,973,400 | Minor International Public Co., Ltd. | 2,268,252 | ||||||
| 15,686,549 | ||||||||
| Total Common Stocks (Cost $179,550,520) | 191,210,762 | |||||||
| Real Estate Investment Trusts — 1.4% | ||||||||
| Singapore — 1.4% | ||||||||
| 4,065,500 | Mapletree Greater China Commercial Trust | 3,058,436 | ||||||
| Total Real Estate Investment Trusts (Cost $2,833,296) | 3,058,436 | |||||||
| Mutual Funds — 1.1% | ||||||||
| Thailand — 1.1% | ||||||||
| 5,794,200 | Digital Telecommunications | |||||||
| Infrastructure Fund | 2,393,073 | |||||||
| Total Mutual Funds (Cost $2,119,112) | 2,393,073 | |||||||
| Warrants — 0.0% | ||||||||
| China — 0.0% | ||||||||
| 86,250 | Ju Teng International Holdings, Ltd., | |||||||
| Exercise price HKD 4.60 | ||||||||
| expires 10/14/2016 | 222 | |||||||
| Total Warrants (Cost $–) | 222 | |||||||
| Short-Term Investments — 9.0% | ||||||||
| Money Market Funds — 9.0% | ||||||||
| 19,686,070 | Cash Account Trust — Government | |||||||
| & Agency Securities Portfolio — | ||||||||
| Institutional Shares, 0.34%# | 19,686,070 | |||||||
| Total Short-Term Investments (Cost $19,686,070) | 19,686,070 | |||||||
| Total Investments — 99.3% (Cost $204,188,998) | 216,348,563 | |||||||
| Other Assets in Excess of Liabilities — 0.7% | 1,628,362 | |||||||
| NET ASSETS — 100.0% | $ | 217,976,925 | ||||||
The accompanying notes are an integral part of these financial statements.
www.brownadvisoryfunds.com
92
Brown Advisory Emerging Markets Small-Cap Fund
Schedule of Investments
June 30, 2016
| PORTFOLIO HOLDINGS | |
| % of Net Assets | |
| South Korea | 26.3% |
| Taiwan | 16.6% |
| China | 14.6% |
| India | 12.8% |
| Money Market Funds | 9.0% |
| Thailand | 8.3% |
| Philippines | 4.4% |
| Singapore | 4.1% |
| Indonesia | 2.3% |
| Malaysia | 0.9% |
| Other Assets and Liabilities | 0.7% |
| 100.0% |
| † | All or a portion of this security is considered illiquid. At June 30, 2016, the total market value of securities considered illiquid was $2,859,243 or 1.3% of net assets. |
| * | Non-Income Producing |
| # | Annualized seven-day yield as of June 30, 2016. |
The accompanying notes are an integral part of these financial statements.
www.brownadvisoryfunds.com
93
Statements of Assets and Liabilities
June 30, 2016
| BROWN | BROWN | BROWN | BROWN | |||||||||||||
| ADVISORY | ADVISORY | ADVISORY | ADVISORY | |||||||||||||
| GROWTH | VALUE | FLEXIBLE | EQUITY | |||||||||||||
| EQUITY | EQUITY | EQUITY | INCOME | |||||||||||||
| FUND | FUND | FUND | FUND | |||||||||||||
| ASSETS | ||||||||||||||||
| Investments: | ||||||||||||||||
| Total investments, at cost | $ | 1,573,287,450 | $ | 41,052,137 | $ | 288,329,750 | $ | 97,506,581 | ||||||||
| Net unrealized appreciation (depreciation) | 610,719,265 | 9,822,307 | 49,874,655 | 32,576,382 | ||||||||||||
| Total investments, at market value | 2,184,006,715 | 50,874,444 | 338,204,405 | 130,082,963 | ||||||||||||
| Cash | — | — | 46,764 | — | ||||||||||||
| Receivables: | ||||||||||||||||
| Investment securities sold | 36,161,667 | 1,680,319 | — | — | ||||||||||||
| Fund shares sold | 3,155,380 | — | 262,667 | 50,971 | ||||||||||||
| Interest and dividends | 1,308,997 | 126,397 | 207,890 | 396,651 | ||||||||||||
| Prepaid expenses and other assets | 98,682 | 24,938 | 39,233 | 30,028 | ||||||||||||
| Total Assets | 2,224,731,441 | 52,706,098 | 338,760,959 | 130,560,613 | ||||||||||||
| LIABILITIES | ||||||||||||||||
| Payables: | ||||||||||||||||
| Investment securities purchased | 18,441,969 | 67,335 | — | 1,247,250 | ||||||||||||
| Fund shares redeemed | 1,153,243 | 179,323 | 836,846 | 35,508 | ||||||||||||
| Distributions | — | — | — | 224,272 | ||||||||||||
| Accrued Liabilities: | ||||||||||||||||
| Investment advisory fees | 1,095,627 | 26,443 | 168,610 | 63,071 | ||||||||||||
| Service fees | 242,350 | 6,609 | 39,162 | 14,090 | ||||||||||||
| Administration, accounting and transfer agent fees | 136,474 | 3,783 | 21,511 | 8,234 | ||||||||||||
| Business management fees | 91,302 | 2,204 | 14,051 | 5,256 | ||||||||||||
| Trustee fees | 25,563 | 611 | 3,908 | 1,460 | ||||||||||||
| Distribution fees | 22,345 | 580 | 4,970 | 1,821 | ||||||||||||
| Professional fees | 36,899 | 19,662 | 21,835 | 19,609 | ||||||||||||
| Custody fees | 6,025 | 667 | 1,537 | 736 | ||||||||||||
| Other liabilities | 62,698 | 1,931 | 11,671 | 3,483 | ||||||||||||
| Total Liabilities | 21,314,495 | 309,148 | 1,124,101 | 1,624,790 | ||||||||||||
| NET ASSETS | $ | 2,203,416,946 | $ | 52,396,950 | $ | 337,636,858 | $ | 128,935,823 | ||||||||
| COMPONENTS OF NET ASSETS | ||||||||||||||||
| Paid-in capital | $ | 1,529,534,740 | $ | 45,004,894 | $ | 297,306,664 | $ | 94,044,544 | ||||||||
| Undistributed (Accumulated) net investment income (loss) | (2,889,959 | ) | 1,400,042 | 808,933 | 38,600 | |||||||||||
| Accumulated net realized gain (loss) | 66,052,900 | (3,830,293 | ) | (10,353,031 | ) | 2,276,297 | ||||||||||
| Unrealized appreciation (depreciation) on investments | 610,719,265 | 9,822,307 | 49,874,655 | 32,576,382 | ||||||||||||
| Unrealized appreciation (depreciation) – foreign receivables | — | — | (363 | ) | — | |||||||||||
| NET ASSETS | $ | 2,203,416,946 | $ | 52,396,950 | $ | 337,636,858 | $ | 128,935,823 | ||||||||
| COMPUTATION OF NET ASSET VALUE | ||||||||||||||||
| Institutional Shares: | ||||||||||||||||
| Net assets | $ | 253,639,992 | $ | 12,671 | $ | 24,012,417 | $ | 13,840,007 | ||||||||
| Shares outstanding (unlimited shares authorized) | 13,236,340 | 917 | 1,584,726 | 1,075,673 | ||||||||||||
| Net asset value per share | $ | 19.16 | $ | 13.82 | $ | 15.15 | $ | 12.87 | ||||||||
| Investor Shares: | ||||||||||||||||
| Net assets | $ | 1,916,472,495 | $ | 51,467,346 | $ | 306,456,170 | $ | 112,115,821 | ||||||||
| Shares outstanding (unlimited shares authorized) | 100,536,471 | 3,724,872 | 20,263,420 | 8,717,663 | ||||||||||||
| Net asset value per share | $ | 19.06 | $ | 13.82 | $ | 15.12 | $ | 12.86 | ||||||||
| Advisor Shares: | ||||||||||||||||
| Net assets | $ | 33,304,459 | $ | 916,933 | $ | 7,168,271 | $ | 2,979,995 | ||||||||
| Shares outstanding (unlimited shares authorized) | 1,814,737 | 65,922 | 473,983 | 232,048 | ||||||||||||
| Net asset value per share | $ | 18.35 | $ | 13.91 | $ | 15.12 | $ | 12.84 | ||||||||
The accompanying notes are an integral part of these financial statements.
www.brownadvisoryfunds.com
94
Statements of Assets and Liabilities
June 30, 2016
| BROWN | BROWN | BROWN | BROWN | |||||||||||||
| ADVISORY | ADVISORY | ADVISORY | ADVISORY | |||||||||||||
| SUSTAINABLE | SMALL-CAP | SMALL-CAP | MULTI- | |||||||||||||
| GROWTH | GROWTH | FUNDAMENTAL | STRATEGY | |||||||||||||
| FUND | FUND | VALUE FUND | FUND | |||||||||||||
| ASSETS | ||||||||||||||||
| Investments: | ||||||||||||||||
| Total investments – unaffiliated, at cost | $ | 262,685,685 | $ | 217,075,318 | $ | 858,732,133 | $ | 68,483 | ||||||||
| Total investments – affiliated, at cost (Note 3) | — | — | — | 2,952,443 | ||||||||||||
| Total cost of investments | 262,685,685 | 217,075,318 | 858,732,133 | 3,020,926 | ||||||||||||
| Net unrealized appreciation (depreciation) – unaffiliated | 81,837,718 | 78,174,658 | 120,678,046 | — | ||||||||||||
| Net unrealized appreciation (depreciation) – affiliated (Note 3) | — | — | — | (70,761 | ) | |||||||||||
| Total unrealized appreciation (depreciation) | 81,837,718 | 78,174,658 | 120,678,046 | (70,761 | ) | |||||||||||
| Total investments – unaffiliated, at market value | 344,523,403 | 295,249,976 | 979,410,179 | 68,483 | ||||||||||||
| Total investments – affiliated, at market value (Note 3) | — | — | — | 2,881,682 | ||||||||||||
| Total investments, at market value | 344,523,403 | 295,249,976 | 979,410,179 | 2,950,165 | ||||||||||||
| Cash | 20,265 | — | — | — | �� | |||||||||||
| Receivables: | ||||||||||||||||
| Investment securities sold | — | — | 3,651,447 | — | ||||||||||||
| Fund shares sold | 5,099,423 | 309,556 | 568,634 | — | ||||||||||||
| Interest and dividends | 226,707 | 100,603 | 1,408,651 | 2,250 | ||||||||||||
| Expense Reimbursement due from Adviser, net | — | — | — | 1,202 | ||||||||||||
| Prepaid expenses and other assets | 55,302 | 38,049 | 71,900 | 13,606 | ||||||||||||
| Total Assets | 349,925,100 | 295,698,184 | 985,110,811 | 2,967,223 | ||||||||||||
| LIABILITIES | ||||||||||||||||
| Payables: | ||||||||||||||||
| Investment securities purchased | — | 191,709 | — | — | ||||||||||||
| Fund shares redeemed | 117,844 | 71,739 | 487,415 | — | ||||||||||||
| Accrued Liabilities: | ||||||||||||||||
| Investment advisory fees, net | 166,930 | 203,928 | 683,915 | — | ||||||||||||
| Distribution fees | 124,611 | 5,488 | 32,866 | — | ||||||||||||
| Service fees | 27,791 | 33,910 | 101,652 | — | ||||||||||||
| Administration, accounting and transfer agent fees | 20,263 | 17,593 | 55,919 | 189 | ||||||||||||
| Professional fees | 21,750 | 21,377 | 26,823 | 19,114 | ||||||||||||
| Business management fees | 13,911 | 11,996 | 40,230 | 121 | ||||||||||||
| Trustee fees | 3,779 | 3,309 | 11,178 | 33 | ||||||||||||
| Custodian fees | 936 | 944 | 3,179 | 63 | ||||||||||||
| Other liabilities | 16,320 | 5,108 | 32,626 | 802 | ||||||||||||
| Total Liabilities | 514,135 | 567,101 | 1,475,803 | 20,322 | ||||||||||||
| NET ASSETS | $ | 349,410,965 | $ | 295,131,083 | $ | 983,635,008 | $ | 2,946,901 | ||||||||
| COMPONENTS OF NET ASSETS | ||||||||||||||||
| Paid-in capital | $ | 277,039,072 | $ | 208,746,480 | $ | 863,810,358 | $ | 3,017,238 | ||||||||
| Undistributed (Accumulated) net investment income (loss) | (577,943 | ) | (442,829 | ) | 1,044,450 | (1,057 | ) | |||||||||
| Accumulated net realized gain (loss) | (8,887,882 | ) | 8,652,774 | (1,897,846 | ) | 1,481 | ||||||||||
| Unrealized appreciation (depreciation) on investments | 81,837,718 | 78,174,658 | 120,678,046 | (70,761 | ) | |||||||||||
| NET ASSETS | $ | 349,410,965 | $ | 295,131,083 | $ | 983,635,008 | $ | 2,946,901 | ||||||||
| COMPUTATION OF NET ASSET VALUE | ||||||||||||||||
| Institutional Shares: | ||||||||||||||||
| Net assets | $ | 122,008,311 | $ | 17,037,053 | $ | 156,204,619 | $ | 2,946,901 | ||||||||
| Shares outstanding (unlimited shares authorized) | 7,600,772 | 546,220 | 6,867,122 | 301,620 | ||||||||||||
| Net asset value per share | $ | 16.05 | $ | 31.19 | $ | 22.75 | $ | 9.77 | ||||||||
| Investor Shares: | ||||||||||||||||
| Net assets | $ | 25,675,982 | $ | 268,389,952 | $ | 774,547,383 | $ | — | ||||||||
| Shares outstanding (unlimited shares authorized) | 1,610,669 | 17,148,619 | 34,082,359 | — | ||||||||||||
| Net asset value per share | $ | 15.94 | $ | 15.65 | $ | 22.73 | $ | — | ||||||||
| Advisor Shares: | ||||||||||||||||
| Net assets | $ | 201,726,672 | $ | 9,704,078 | $ | 52,883,006 | $ | — | ||||||||
| Shares outstanding (unlimited shares authorized) | 12,782,365 | 646,291 | 2,337,522 | — | ||||||||||||
| Net asset value per share | $ | 15.78 | $ | 15.02 | $ | 22.62 | $ | — | ||||||||
The accompanying notes are an integral part of these financial statements.
www.brownadvisoryfunds.com
95
Statements of Assets and Liabilities
June 30, 2016
| BROWN | BROWN | BROWN | BROWN | |||||||||||||
| ADVISORY | ADVISORY | ADVISORY | ADVISORY | |||||||||||||
| GLOBAL | INTERMEDIATE | TOTAL | STRATEGIC | |||||||||||||
| LEADERS | INCOME | RETURN | BOND | |||||||||||||
| FUND | FUND | FUND | FUND | |||||||||||||
| ASSETS | ||||||||||||||||
| Investments: | ||||||||||||||||
| Total investments – unaffiliated, at cost | $ | 25,618,635 | $ | 113,106,388 | $ | 97,636,692 | $ | 55,766,246 | ||||||||
| Total investments – affiliated, at cost (Note 3) | — | 30,340,181 | — | — | ||||||||||||
| Total cost of investments | 25,618,635 | 143,446,569 | 97,636,692 | 55,766,246 | ||||||||||||
| Net unrealized appreciation (depreciation) – unaffiliated | 955,233 | 2,798,308 | 1,102,817 | 25,433 | ||||||||||||
| Net unrealized appreciation (depreciation) – affiliated (Note 3) | — | 186,503 | — | — | ||||||||||||
| Total unrealized appreciation (depreciation) | 955,233 | 2,984,811 | 1,102,817 | 25,433 | ||||||||||||
| Total investments – unaffiliated, at market value | 26,573,868 | 115,904,696 | 98,739,509 | 55,791,679 | ||||||||||||
| Total investments – affiliated, at market value (Note 3) | — | 30,526,684 | — | — | ||||||||||||
| Total investments, at market value | 26,573,868 | 146,431,380 | 98,739,509 | 55,791,679 | ||||||||||||
| Deposit at broker – futures contracts (Note 7) | — | — | 261,155 | 193,060 | ||||||||||||
| Gross unrealized appreciation – futures contracts (Note 7) | — | — | 733,943 | — | ||||||||||||
| Receivables: | ||||||||||||||||
| Investment securities sold | 239,068 | 53,696 | 3,270,911 | 76,703 | ||||||||||||
| Fund shares sold | 50,000 | 100 | 20,300 | 5,800 | ||||||||||||
| Interest and dividends | 43,261 | 708,045 | 509,340 | 263,618 | ||||||||||||
| Prepaid expenses and other assets | 24,314 | 29,105 | 21,885 | 20,620 | ||||||||||||
| Total Assets | 26,930,511 | 147,222,326 | 103,557,043 | 56,351,480 | ||||||||||||
| LIABILITIES | ||||||||||||||||
| Gross unrealized depreciation – futures contracts (Note 7) | — | — | — | 178,310 | ||||||||||||
| Payables: | ||||||||||||||||
| Investment securities purchased | 493,047 | — | 17,477,866 | 15,979,460 | ||||||||||||
| Fund shares redeemed | 40,000 | 92,827 | 58,810 | 3,164 | ||||||||||||
| Distributions | — | 173,885 | 152,656 | 73,959 | ||||||||||||
| Accrued Liabilities: | ||||||||||||||||
| Investment advisory fees, net | 5,904 | 28,809 | 20,679 | 9,318 | ||||||||||||
| Professional fees | 12,673 | 20,274 | 19,751 | 19,403 | ||||||||||||
| Custodian fees | 1,076 | 521 | 334 | 271 | ||||||||||||
| Service fees | 3,191 | 6,093 | 80 | 1,663 | ||||||||||||
| Administration, accounting and transfer agent fees | 2,562 | 11,376 | 7,787 | 4,466 | ||||||||||||
| Business management fees | 1,064 | 6,093 | 3,447 | 1,663 | ||||||||||||
| Trustee fees | 286 | 1,709 | 936 | 447 | ||||||||||||
| Distribution fees | — | 5,576 | — | 535 | ||||||||||||
| Other liabilities | 3,317 | 2,741 | 3,037 | 2,793 | ||||||||||||
| Total Liabilities | 563,120 | 349,904 | 17,745,383 | 16,275,452 | ||||||||||||
| NET ASSETS | $ | 26,367,391 | $ | 146,872,422 | $ | 85,811,660 | $ | 40,076,028 | ||||||||
| COMPONENTS OF NET ASSETS | ||||||||||||||||
| Paid-in capital | $ | 26,719,611 | $ | 145,029,730 | $ | 84,607,741 | $ | 43,527,352 | ||||||||
| Undistributed (Accumulated) net investment income (loss) | 53,912 | (173,885 | ) | (623 | ) | (73,959 | ) | |||||||||
| Accumulated net realized gain (loss) | (1,360,343 | ) | (968,234 | ) | (632,218 | ) | (3,224,488 | ) | ||||||||
| Unrealized appreciation (depreciation) on investments | 955,233 | 2,984,811 | 1,102,817 | 25,433 | ||||||||||||
| Unrealized appreciation (depreciation) on futures contracts (Note 7) | — | — | 733,943 | (178,310 | ) | |||||||||||
| Unrealized appreciation (depreciation) – foreign receivables | (1,022 | ) | — | — | — | |||||||||||
| NET ASSETS | $ | 26,367,391 | $ | 146,872,422 | $ | 85,811,660 | $ | 40,076,028 | ||||||||
| COMPUTATION OF NET ASSET VALUE | ||||||||||||||||
| Institutional Shares: | ||||||||||||||||
| Net assets | $ | — | $ | — | $ | 83,854,497 | $ | — | ||||||||
| Shares outstanding (unlimited shares authorized) | — | — | 8,240,091 | — | ||||||||||||
| Net asset value per share | $ | — | $ | — | $ | 10.18 | $ | — | ||||||||
| Investor Shares: | ||||||||||||||||
| Net assets | $ | 26,367,391 | $ | 137,900,369 | $ | 1,957,163 | $ | 39,211,362 | ||||||||
| Shares outstanding (unlimited shares authorized) | 2,731,020 | 12,792,668 | 192,342 | 4,141,420 | ||||||||||||
| Net asset value per share | $ | 9.65 | $ | 10.78 | $ | 10.18 | $ | 9.47 | ||||||||
| Advisor Shares: | ||||||||||||||||
| Net assets | $ | — | $ | 8,972,053 | $ | ��� | $ | 864,666 | ||||||||
| Shares outstanding (unlimited shares authorized) | — | 849,428 | — | 91,268 | ||||||||||||
| Net asset value per share | $ | — | $ | 10.56 | $ | — | $ | 9.47 | ||||||||
The accompanying notes are an integral part of these financial statements.
www.brownadvisoryfunds.com
96
Statements of Assets and Liabilities
June 30, 2016
| BROWN | ||||||||||||||||
| BROWN | BROWN | BROWN | ADVISORY – | |||||||||||||
| ADVISORY | ADVISORY | ADVISORY | WMC | |||||||||||||
| MARYLAND | TAX EXEMPT | MORTGAGE | STRATEGIC | |||||||||||||
| BOND | BOND | SECURITIES | EUROPEAN | |||||||||||||
| FUND | FUND | FUND | EQUITY FUND | |||||||||||||
| ASSETS | ||||||||||||||||
| Investments: | ||||||||||||||||
| Total investments, at cost | $ | 175,388,188 | $ | 226,000,923 | $ | 486,657,947 | $ | 1,076,910,079 | ||||||||
| Net unrealized appreciation (depreciation) | 6,065,007 | 6,225,630 | 3,719,236 | (5,217,236 | ) | |||||||||||
| Total investments, at market value | 181,453,195 | 232,226,553 | 490,377,183 | 1,071,692,843 | ||||||||||||
| Cash | — | — | — | 217,692 | ||||||||||||
| Receivables: | ||||||||||||||||
| Investment securities sold | — | — | 57,413,752 | — | ||||||||||||
| Fund shares sold | 101,569 | — | 375,000 | 2,017,307 | ||||||||||||
| Interest and dividends | 2,577,124 | 2,635,634 | 1,434,518 | 1,973,653 | ||||||||||||
| Prepaid expenses and other assets | 7,351 | 26,054 | 34,172 | 129,379 | ||||||||||||
| Total Assets | 184,139,239 | 234,888,241 | 549,634,625 | 1,076,030,874 | ||||||||||||
| LIABILITIES | ||||||||||||||||
| Securities sold short, at market value | ||||||||||||||||
| (Proceeds of $—, $—, $10,664,062 and $—, respectively) | — | — | 10,722,369 | — | ||||||||||||
| Payables: | ||||||||||||||||
| Investment securities purchased | — | 139,993 | 158,297,116 | — | ||||||||||||
| Fund shares redeemed | 57,649 | 524,966 | 54,232 | 1,197,385 | ||||||||||||
| Distributions | 275,162 | 426,608 | 669,608 | — | ||||||||||||
| Accrued Liabilities: | ||||||||||||||||
| Investment advisory fees | 44,918 | 57,160 | 93,595 | 809,088 | ||||||||||||
| Professional fees | 20,641 | 20,858 | 22,059 | 27,952 | ||||||||||||
| Administration, accounting and transfer agent fees | 15,126 | 17,589 | 32,561 | 67,152 | ||||||||||||
| Service fees | 7,486 | 9,527 | 73 | 1,744 | ||||||||||||
| Business management fees | 7,486 | 9,527 | 15,599 | 44,949 | ||||||||||||
| Trustee fees | 2,041 | 2,538 | 4,156 | 12,376 | ||||||||||||
| Custodian fees | 768 | 557 | 2,009 | 33,704 | ||||||||||||
| Distribution fees | — | — | — | 472 | ||||||||||||
| Other liabilities | 3,186 | 3,592 | 19,704 | 189,770 | ||||||||||||
| Total Liabilities | 434,463 | 1,212,915 | 169,933,081 | 2,384,592 | ||||||||||||
| NET ASSETS | $ | 183,704,776 | $ | 233,675,326 | $ | 379,701,544 | $ | 1,073,646,282 | ||||||||
| COMPONENTS OF NET ASSETS | ||||||||||||||||
| Paid-in capital | $ | 177,313,386 | $ | 228,527,916 | $ | 374,986,184 | $ | 1,117,493,010 | ||||||||
| Undistributed (Accumulated) net investment income (loss) | 157 | 46 | (2,848 | ) | 12,611,576 | |||||||||||
| Accumulated net realized gain (loss) | 326,226 | (1,078,266 | ) | 1,057,279 | (51,147,067 | ) | ||||||||||
| Unrealized appreciation (depreciation) on investments | 6,065,007 | 6,225,630 | 3,719,236 | (5,217,236 | ) | |||||||||||
| Unrealized appreciation (depreciation) on securities sold short | — | — | (58,307 | ) | — | |||||||||||
| Unrealized appreciation (depreciation) – foreign receivables | — | — | — | (94,001 | ) | |||||||||||
| NET ASSETS | $ | 183,704,776 | $ | 233,675,326 | $ | 379,701,544 | $ | 1,073,646,282 | ||||||||
| COMPUTATION OF NET ASSET VALUE | ||||||||||||||||
| Institutional Shares: | ||||||||||||||||
| Net assets | $ | — | $ | — | $ | 377,908,477 | $ | 1,059,869,610 | ||||||||
| Shares outstanding (unlimited shares authorized) | — | — | 37,034,378 | 107,071,871 | ||||||||||||
| Net asset value per share | $ | — | $ | — | $ | 10.20 | $ | 9.90 | ||||||||
| Investor Shares: | ||||||||||||||||
| Net assets | $ | 183,704,776 | $ | 233,675,326 | $ | 1,793,067 | $ | 13,031,434 | ||||||||
| Shares outstanding (unlimited shares authorized) | 16,819,063 | 22,769,077 | 175,668 | 1,316,159 | ||||||||||||
| Net asset value per share | $ | 10.92 | $ | 10.26 | $ | 10.21 | $ | 9.90 | ||||||||
| Advisor Shares: | ||||||||||||||||
| Net assets | $ | — | $ | — | $ | — | $ | 745,238 | ||||||||
| Shares outstanding (unlimited shares authorized) | — | — | — | 75,647 | ||||||||||||
| Net asset value per share | $ | — | $ | — | $ | — | $ | 9.85 | ||||||||
The accompanying notes are an integral part of these financial statements.
www.brownadvisoryfunds.com
97
Statements of Assets and Liabilities
June 30, 2016
| BROWN ADVISORY – | ||||||||||||
| WMC JAPAN ALPHA | BROWN ADVISORY – | BROWN ADVISORY | ||||||||||
| OPPORTUNITIES | SOMERSET EMERGING | EMERGING MARKETS | ||||||||||
| FUND | MARKETS FUND | SMALL-CAP FUND | ||||||||||
| ASSETS | ||||||||||||
| Investments: | ||||||||||||
| Total investments, at cost | $ | 1,758,883,541 | $ | 536,981,145 | $ | 204,188,998 | ||||||
| Net unrealized appreciation (depreciation) | 55,882,501 | (19,780,871 | ) | 12,159,565 | ||||||||
| Total investments, at market value | 1,814,766,042 | 517,200,274 | 216,348,563 | |||||||||
| Cash | 2,530,575 | — | — | |||||||||
| Foreign currency | ||||||||||||
| (Cost of $54,039, $2,722,535, and $594,505, respectively) | 54,039 | 2,722,569 | 595,598 | |||||||||
| Gross unrealized appreciation – | ||||||||||||
| forward foreign currency contracts (Note 6) | 14,903,850 | — | — | |||||||||
| Receivables: | ||||||||||||
| Investment securities sold | 35,302,660 | 444,622 | 1,367,286 | |||||||||
| Fund shares sold | 2,643,227 | 282,175 | 150,876 | |||||||||
| Interest and dividends | 3,052,763 | 1,085,164 | 513,035 | |||||||||
| Prepaid expenses and other assets | 69,664 | 76,477 | 26,186 | |||||||||
| Total Assets | 1,873,322,820 | 521,811,281 | 219,001,544 | |||||||||
| LIABILITIES | ||||||||||||
| Gross unrealized depreciation – | ||||||||||||
| forward foreign currency contracts (Note 6) | 3,941,787 | — | — | |||||||||
| Payables: | ||||||||||||
| Investment securities purchased | 31,948,981 | 4,107,853 | 407,584 | |||||||||
| Fund shares redeemed | 4,254,667 | 50,379 | 313,770 | |||||||||
| Accrued Liabilities: | ||||||||||||
| Investment advisory fees | 1,570,001 | 372,705 | 224,603 | |||||||||
| Administration, accounting and transfer agent fees | 123,172 | 31,727 | 14,289 | |||||||||
| Custodian fees | 60,120 | 40,462 | 21,893 | |||||||||
| Business management fees | 78,500 | 20,706 | 8,984 | |||||||||
| Trustee fees | 22,989 | 5,438 | 2,417 | |||||||||
| Professional fees | 35,299 | 22,981 | 20,817 | |||||||||
| Distribution fees | 512 | 172 | — | |||||||||
| Service fees | 299 | 23,752 | 695 | |||||||||
| Other liabilities | 164,596 | 19,663 | 9,567 | |||||||||
| Total Liabilities | 42,200,923 | 4,695,838 | 1,024,619 | |||||||||
| NET ASSETS | $ | 1,831,121,897 | $ | 517,115,443 | $ | 217,976,925 | ||||||
| COMPONENTS OF NET ASSETS | ||||||||||||
| Paid-in capital | $ | 2,234,782,530 | $ | 562,551,194 | $ | 244,548,941 | ||||||
| Undistributed (Accumulated) net investment income (loss) | (357,952,163 | ) | 4,342,604 | (501,587 | ) | |||||||
| Accumulated net realized gain (loss) | (113,023,857 | ) | (29,955,997 | ) | (38,231,148 | ) | ||||||
| Unrealized appreciation (depreciation) on investments | 55,882,501 | (19,780,871 | ) | 12,159,565 | ||||||||
| Unrealized appreciation (depreciation) – | ||||||||||||
| forward foreign currency contracts (Note 6) | 10,962,063 | — | — | |||||||||
| Unrealized appreciation (depreciation) – foreign receivables | 470,823 | (41,487 | ) | 1,154 | ||||||||
| NET ASSETS | $ | 1,831,121,897 | $ | 517,115,443 | $ | 217,976,925 | ||||||
| COMPUTATION OF NET ASSET VALUE | ||||||||||||
| Institutional Shares: | ||||||||||||
| Net assets | $ | 1,828,840,380 | $ | 319,993,118 | $ | 212,344,161 | ||||||
| Shares outstanding (unlimited shares authorized) | 207,170,594 | 36,659,070 | 23,141,610 | |||||||||
| Net asset value per share | $ | 8.83 | $ | 8.73 | $ | 9.18 | ||||||
| Investor Shares: | ||||||||||||
| Net assets | $ | 1,594,972 | $ | 196,841,020 | $ | 5,632,764 | ||||||
| Shares outstanding (unlimited shares authorized) | 181,040 | 22,602,165 | 615,367 | |||||||||
| Net asset value per share | $ | 8.81 | $ | 8.71 | $ | 9.15 | ||||||
| Advisor Shares: | ||||||||||||
| Net assets | $ | 686,545 | $ | 281,305 | $ | — | ||||||
| Shares outstanding (unlimited shares authorized) | 78,159 | 32,216 | — | |||||||||
| Net asset value per share | $ | 8.78 | $ | 8.73 | $ | — | ||||||
The accompanying notes are an integral part of these financial statements.
www.brownadvisoryfunds.com
98
Statements of Operations
For the Year Ended June 30, 2016
| BROWN | BROWN | BROWN | BROWN | |||||||||||||
| ADVISORY | ADVISORY | ADVISORY | ADVISORY | |||||||||||||
| GROWTH | VALUE | FLEXIBLE | EQUITY | |||||||||||||
| EQUITY | EQUITY | EQUITY | INCOME | |||||||||||||
| FUND | FUND | FUND | FUND | |||||||||||||
| INVESTMENT INCOME | ||||||||||||||||
| Dividend income | $ | 13,831,383 | $ | 2,452,529 | $ | 4,483,909 | $ | 4,852,547 | ||||||||
| Less: foreign taxes withheld | — | (57,059 | ) | (66,408 | ) | (62,637 | ) | |||||||||
| Interest Income | 115,349 | 4,515 | 24,546 | 11,912 | ||||||||||||
| Total investment income | 13,946,732 | 2,399,985 | 4,442,047 | 4,801,822 | ||||||||||||
| EXPENSES | ||||||||||||||||
| Investment advisory fees (Note 3) | 13,917,933 | 646,993 | 1,853,035 | 963,369 | ||||||||||||
| Service fees – Investor Shares (Note 3) | 3,037,910 | 160,196 | 427,819 | 212,160 | ||||||||||||
| Service fees – Advisor Shares (Note 3) | 56,987 | 1,533 | 14,279 | 4,368 | ||||||||||||
| Business management fees | 1,159,828 | 53,916 | 154,420 | 80,281 | ||||||||||||
| Administration, accounting and transfer agent fees | 811,824 | 39,031 | 110,175 | 58,110 | ||||||||||||
| Miscellaneous expenses | 310,349 | 10,586 | 24,619 | 16,202 | ||||||||||||
| Professional fees | 131,724 | 24,539 | 33,530 | 27,629 | ||||||||||||
| Trustee fees | 121,084 | 5,565 | 16,230 | 8,375 | ||||||||||||
| Distribution fees – Advisor Shares (Note 3) | 94,979 | 2,556 | 23,799 | 7,281 | ||||||||||||
| Custodian fees | 72,580 | 6,944 | 12,127 | 6,759 | ||||||||||||
| Registration fees | 60,829 | 43,677 | 54,571 | 45,322 | ||||||||||||
| Insurance fees | 45,102 | 3,094 | 5,228 | 3,761 | ||||||||||||
| Interest expense on line of credit (Note 8) | — | 232 | — | — | ||||||||||||
| Total Expenses | 19,821,129 | 998,862 | 2,729,832 | 1,433,617 | ||||||||||||
| NET INVESTMENT INCOME (LOSS) | (5,874,397 | ) | 1,401,123 | 1,712,215 | 3,368,205 | |||||||||||
| NET REALIZED AND UNREALIZED GAIN (LOSS) | ||||||||||||||||
| Net realized gain (loss) on investments | 124,211,432 | (2,405,776 | ) | (9,574,851 | ) | 1,228,571 | ||||||||||
| Net change in unrealized appreciation (depreciation) on: | ||||||||||||||||
| Investments | (111,591,843 | ) | (17,471,770 | ) | (2,732,150 | ) | (6,886,953 | ) | ||||||||
| Foreign receivables | — | — | (52 | ) | — | |||||||||||
| Net change in unrealized appreciation (depreciation) | (111,591,843 | ) | (17,471,770 | ) | (2,732,202 | ) | (6,886,953 | ) | ||||||||
| NET REALIZED AND UNREALIZED GAIN (LOSS) | 12,619,589 | (19,877,546 | ) | (12,307,053 | ) | (5,658,382 | ) | |||||||||
| INCREASE (DECREASE) IN NET ASSETS FROM OPERATIONS | $ | 6,745,192 | $ | (18,476,423 | ) | $ | (10,594,838 | ) | $ | (2,290,177 | ) | |||||
The accompanying notes are an integral part of these financial statements.
www.brownadvisoryfunds.com
99
Statements of Operations
For the Year Ended June 30, 2016
| BROWN | BROWN | BROWN | BROWN | |||||||||||||
| ADVISORY | ADVISORY | ADVISORY | ADVISORY | |||||||||||||
| SUSTAINABLE | SMALL-CAP | SMALL-CAP | MULTI- | |||||||||||||
| GROWTH | GROWTH | FUNDAMENTAL | STRATEGY | |||||||||||||
| FUND | FUND | VALUE FUND | FUND | |||||||||||||
| INVESTMENT INCOME | ||||||||||||||||
| Dividend income | $ | 1,832,338 | $ | 1,419,995 | $ | 13,588,376 | $ | — | ||||||||
| Dividend income – affiliated (Note 3) | — | — | — | 45,559 | ||||||||||||
| Less: foreign taxes withheld | (33,718 | ) | (6,691 | ) | — | — | ||||||||||
| Interest Income | 18,448 | 31,067 | 67,546 | 143 | ||||||||||||
| Total investment income | 1,817,068 | 1,444,371 | 13,655,922 | 45,702 | ||||||||||||
| EXPENSES | ||||||||||||||||
| Investment advisory fees (Note 3) | 1,736,123 | 2,299,765 | 7,418,755 | 8,549 | ||||||||||||
| Distribution fees – Advisor Shares (Note 3) | 467,054 | 16,754 | 133,640 | — | ||||||||||||
| Service fees – Investor Shares (Note 3) | 25,493 | 375,741 | 1,064,187 | — | ||||||||||||
| Service fees – Advisor Shares (Note 3) | 280,233 | 10,052 | 80,183 | — | ||||||||||||
| Business management fees | 144,677 | 135,280 | 436,397 | 1,425 | ||||||||||||
| Administration, accounting and transfer agent fees | 106,246 | 97,944 | 307,549 | 1,110 | ||||||||||||
| Registration fees | 58,181 | 44,453 | 98,252 | 20,548 | ||||||||||||
| Miscellaneous expenses | 36,771 | 23,905 | 114,913 | 3,998 | ||||||||||||
| Professional fees | 33,230 | 32,243 | 61,358 | 19,176 | ||||||||||||
| Trustee fees | 15,018 | 14,418 | 47,119 | 147 | ||||||||||||
| Custodian fees | 12,560 | 10,532 | 33,325 | 887 | ||||||||||||
| Insurance fees | 3,986 | 5,182 | 16,242 | 22 | ||||||||||||
| Total Expenses | 2,919,572 | 3,066,269 | 9,811,920 | 55,862 | ||||||||||||
| Expenses waived by adviser – expense cap (Note 3) | — | — | — | (24,516 | ) | |||||||||||
| Net Expenses | 2,919,572 | 3,066,269 | 9,811,920 | 31,346 | ||||||||||||
| NET INVESTMENT INCOME (LOSS) | (1,102,504 | ) | (1,621,898 | ) | 3,844,002 | 14,356 | ||||||||||
| NET REALIZED AND UNREALIZED GAIN (LOSS) | ||||||||||||||||
| Net realized gain (loss) on: | ||||||||||||||||
| Investments – unaffiliated | 3,885,315 | 24,884,563 | 5,583,924 | — | ||||||||||||
| Investments – affiliated (Note 3) | — | — | — | — | ||||||||||||
| Capital gain distribution from other RIC – affiliated (Note 3) | — | — | — | 26,365 | ||||||||||||
| Net realized gain (loss) | 3,885,315 | 24,884,563 | 5,583,924 | 26,365 | ||||||||||||
| Net change in unrealized appreciation (depreciation) on: | ||||||||||||||||
| Investments – unaffiliated | 15,334,599 | (17,671,772 | ) | (13,233,109 | ) | — | ||||||||||
| Investments – affiliated (Note 3) | — | — | — | (102,524 | ) | |||||||||||
| Foreign receivables | 124 | — | — | — | ||||||||||||
| Net change in unrealized appreciation (depreciation) | 15,334,723 | (17,671,772 | ) | (13,233,109 | ) | (102,524 | ) | |||||||||
| NET REALIZED AND UNREALIZED GAIN (LOSS) | 19,220,038 | 7,212,791 | (7,649,185 | ) | (76,159 | ) | ||||||||||
| INCREASE (DECREASE) IN NET ASSETS FROM OPERATIONS | $ | 18,117,534 | $ | 5,590,893 | $ | (3,805,183 | ) | $ | (61,803 | ) | ||||||
The accompanying notes are an integral part of these financial statements.
www.brownadvisoryfunds.com
100
Statements of Operations
For the Year Ended June 30, 2016
| BROWN | BROWN | BROWN | BROWN | |||||||||||||
| ADVISORY | ADVISORY | ADVISORY | ADVISORY | |||||||||||||
| GLOBAL | INTERMEDIATE | TOTAL | STRATEGIC | |||||||||||||
| LEADERS | INCOME | RETURN | BOND | |||||||||||||
| FUND* | FUND | FUND | FUND | |||||||||||||
| INVESTMENT INCOME | ||||||||||||||||
| Dividend income – unaffiliated | $ | 223,588 | $ | — | $ | 7,445 | $ | 61,638 | ||||||||
| Dividend income – affiliated (Note 3) | — | 857,876 | — | — | ||||||||||||
| Less: foreign taxes withheld | (16,467 | ) | — | — | — | |||||||||||
| Interest Income | 2,561 | 2,721,441 | 2,456,117 | 1,795,235 | ||||||||||||
| Total investment income | 209,682 | 3,579,317 | 2,463,562 | 1,856,873 | ||||||||||||
| EXPENSES | ||||||||||||||||
| Investment advisory fees (Note 3) | 97,589 | 455,457 | 242,212 | 189,926 | ||||||||||||
| Registration fees | 33,061 | 33,770 | 31,591 | 34,323 | ||||||||||||
| Custodian fees | 24,456 | 6,362 | 4,321 | 2,155 | ||||||||||||
| Service fees – Investor Shares (Note 3) | 22,521 | 71,330 | 1,899 | 23,159 | ||||||||||||
| Service fees – Advisor Shares (Note 3) | — | 4,580 | — | 582 | ||||||||||||
| Professional fees | 9,410 | 26,471 | 22,975 | 21,328 | ||||||||||||
| Administration, accounting and transfer agent fees | 9,352 | 66,517 | 44,808 | 29,516 | ||||||||||||
| Business management fees | 7,507 | 75,910 | 40,369 | 23,741 | ||||||||||||
| Miscellaneous expenses | 6,994 | 13,393 | 16,238 | 17,712 | ||||||||||||
| Trustee fees | 817 | 7,997 | 4,231 | 2,482 | ||||||||||||
| Insurance fees | 191 | 2,756 | 1,444 | 1,130 | ||||||||||||
| Distribution fees – Advisor Shares (Note 3) | — | 22,897 | — | 2,909 | ||||||||||||
| Interest expense on line of credit (Note 8) | — | — | — | 350 | ||||||||||||
| Total Expenses | 211,898 | 787,440 | 410,088 | 349,313 | ||||||||||||
| Expenses waived by adviser – expense cap (Note 3) | (84,282 | ) | — | — | (14,033 | ) | ||||||||||
| Expenses waived by adviser – investments in affiliates (Note 3) | — | (104,520 | ) | — | — | |||||||||||
| Net Expenses | 127,616 | 682,920 | 410,088 | 335,280 | ||||||||||||
| NET INVESTMENT INCOME (LOSS) | 82,066 | 2,896,397 | 2,053,474 | 1,521,593 | ||||||||||||
| NET REALIZED AND UNREALIZED GAIN (LOSS) | ||||||||||||||||
| Net realized gain (loss) on: | ||||||||||||||||
| Investments – unaffiliated | (1,102,079 | ) | (794,007 | ) | (373,296 | ) | (1,779,690 | ) | ||||||||
| Investments – affiliated (Note 3) | — | (44,580 | ) | — | — | |||||||||||
| Securities sold short | — | — | (21,864 | ) | 156 | |||||||||||
| Futures contracts (Note 7) | — | — | 911,618 | (144,055 | ) | |||||||||||
| Capital gain distribution from other RIC – affiliated (Note 3) | — | 139,069 | — | — | ||||||||||||
| Net realized gain (loss) | (1,102,079 | ) | (699,518 | ) | 516,458 | (1,923,589 | ) | |||||||||
| Net change in unrealized appreciation (depreciation) on: | ||||||||||||||||
| Investments – unaffiliated | 700,622 | 3,218,967 | 1,622,342 | 834,918 | ||||||||||||
| Investments – affiliated (Note 3) | — | 489,622 | — | — | ||||||||||||
| Futures contracts (Note 7) | — | — | 873,641 | (151,904 | ) | |||||||||||
| Foreign receivables | (1,022 | ) | — | — | — | |||||||||||
| Net change in unrealized appreciation (depreciation) | 699,600 | 3,708,589 | 2,495,983 | 683,014 | ||||||||||||
| NET REALIZED AND UNREALIZED GAIN (LOSS) | (402,479 | ) | 3,009,071 | 3,012,441 | (1,240,575 | ) | ||||||||||
| INCREASE (DECREASE) IN NET ASSETS FROM OPERATIONS | $ | (320,413 | ) | $ | 5,905,468 | $ | 5,065,915 | $ | 281,018 | |||||||
| * | Commenced operations on July 1, 2015. Information presented is for the period from July 1, 2015 (end of day) to June 30, 2016. |
The accompanying notes are an integral part of these financial statements.
www.brownadvisoryfunds.com
101
Statements of Operations
For the Year Ended June 30, 2016
| BROWN | BROWN | BROWN | BROWN | |||||||||||||
| ADVISORY | ADVISORY | ADVISORY | ADVISORY – | |||||||||||||
| MARYLAND | TAX EXEMPT | MORTGAGE | WMC STRATEGIC | |||||||||||||
| BOND | BOND | SECURITIES | EUROPEAN | |||||||||||||
| FUND | FUND | FUND | EQUITY FUND | |||||||||||||
| INVESTMENT INCOME | ||||||||||||||||
| Dividend income | $ | — | $ | — | $ | — | $ | 25,912,986 | ||||||||
| Less: foreign taxes withheld | — | — | — | (2,332,663 | ) | |||||||||||
| Interest Income | 4,955,398 | 6,741,859 | 8,161,907 | 19,479 | ||||||||||||
| Total investment income | 4,955,398 | 6,741,859 | 8,161,907 | 23,599,802 | ||||||||||||
| EXPENSES | ||||||||||||||||
| Investment advisory fees (Note 3) | 569,973 | 674,998 | 951,696 | 8,817,590 | ||||||||||||
| Service fees – Investor Shares (Note 3) | 94,995 | 112,500 | 6,179 | 26,915 | ||||||||||||
| Service fees – Advisor Shares (Note 3) | — | — | — | 1,324 | ||||||||||||
| Business management fees | 94,995 | 112,500 | 158,616 | 489,866 | ||||||||||||
| Administration, accounting and transfer agent fees | 90,265 | 102,589 | 166,490 | 352,514 | ||||||||||||
| Professional fees | 28,411 | 29,924 | 34,183 | 69,287 | ||||||||||||
| Miscellaneous expenses | 13,059 | 17,169 | 24,162 | 485,229 | ||||||||||||
| Trustee fees | 9,940 | 11,754 | 16,332 | 49,604 | ||||||||||||
| Registration fees | 8,108 | 26,141 | 48,357 | 226,900 | ||||||||||||
| Custodian fees | 6,568 | 7,857 | 21,038 | 357,266 | ||||||||||||
| Insurance fees | 3,677 | 4,129 | 4,326 | 4,918 | ||||||||||||
| Interest expense on line of credit (Note 8) | 204 | — | — | 3 | ||||||||||||
| Distribution fees – Advisor Shares (Note 3) | — | — | — | 2,207 | ||||||||||||
| Total Expenses | 920,195 | 1,099,561 | 1,431,379 | 10,883,623 | ||||||||||||
| NET INVESTMENT INCOME (LOSS) | 4,035,203 | 5,642,298 | 6,730,528 | 12,716,179 | ||||||||||||
| NET REALIZED AND UNREALIZED GAIN (LOSS) | ||||||||||||||||
| Net realized gain (loss) on: | ||||||||||||||||
| Investments | 1,347,240 | 331,921 | 2,735,125 | (36,606,968 | ) | |||||||||||
| Securities sold short | — | — | (299,922 | ) | — | |||||||||||
| Forward foreign currency contracts (Note 6) | — | — | — | (82,499 | ) | |||||||||||
| Futures contracts (Note 7) | — | — | — | (1,711,587 | ) | |||||||||||
| Net realized gain (loss) | 1,347,240 | 331,921 | 2,435,203 | (38,401,054 | ) | |||||||||||
| Net change in unrealized appreciation (depreciation) on: | ||||||||||||||||
| Investments | 4,359,306 | 7,199,311 | 4,670,056 | (16,245,921 | ) | |||||||||||
| Securities sold short | — | — | (58,307 | ) | — | |||||||||||
| Foreign receivables | — | — | — | (70,808 | ) | |||||||||||
| Net change in unrealized appreciation (depreciation) | 4,359,306 | 7,199,311 | 4,611,749 | (16,316,729 | ) | |||||||||||
| NET REALIZED AND UNREALIZED GAIN (LOSS) | 5,706,546 | 7,531,232 | 7,046,952 | (54,717,783 | ) | |||||||||||
| INCREASE (DECREASE) IN NET ASSETS FROM OPERATIONS | $ | 9,741,749 | $ | 13,173,530 | $ | 13,777,480 | $ | (42,001,604 | ) | |||||||
The accompanying notes are an integral part of these financial statements.
www.brownadvisoryfunds.com
102
Statements of Operations
For the Year Ended June 30, 2016
| BROWN ADVISORY – | ||||||||||||
| WMC JAPAN ALPHA | BROWN ADVISORY – | BROWN ADVISORY | ||||||||||
| OPPORTUNITIES | SOMERSET EMERGING | EMERGING MARKETS | ||||||||||
| FUND | MARKETS FUND | SMALL-CAP FUND | ||||||||||
| INVESTMENT INCOME | ||||||||||||
| Dividend income | $ | 39,179,732 | $ | 13,043,652 | $ | 3,330,224 | ||||||
| Less: foreign taxes withheld | (3,917,992 | ) | (1,706,605 | ) | (302,539 | ) | ||||||
| Interest Income | 235,970 | 54,292 | 34,981 | |||||||||
| Total investment income | 35,497,710 | 11,391,339 | 3,062,666 | |||||||||
| EXPENSES | ||||||||||||
| Investment advisory fees (Note 3) | 21,220,448 | 3,754,801 | 2,587,569 | |||||||||
| Business management fees | 1,061,022 | 208,600 | 103,503 | |||||||||
| Administration, accounting and transfer agent fees | 773,542 | 152,945 | 79,142 | |||||||||
| Custodian fees | 522,422 | 545,013 | 248,553 | |||||||||
| Miscellaneous expenses | 182,239 | 45,350 | 28,800 | |||||||||
| Registration fees | 144,047 | 103,364 | 41,336 | |||||||||
| Professional fees | 125,374 | 39,041 | 28,865 | |||||||||
| Trustee fees | 107,637 | 21,412 | 10,763 | |||||||||
| Service fees – Investor Shares (Note 3) | 30,402 | 251,341 | 16,501 | |||||||||
| Service fees – Advisor Shares (Note 3) | 2,069 | 887 | — | |||||||||
| Insurance fees | 30,015 | 7,793 | 3,599 | |||||||||
| Distribution fees – Advisor Shares (Note 3) | 3,448 | 1,477 | — | |||||||||
| Total Expenses | 24,202,665 | 5,132,024 | 3,148,631 | |||||||||
| NET INVESTMENT INCOME (LOSS) | 11,295,045 | 6,259,315 | (85,965 | ) | ||||||||
| NET REALIZED AND UNREALIZED GAIN (LOSS) | ||||||||||||
| Net realized gain (loss) on: | ||||||||||||
| Investments | (98,654,489 | ) | (22,999,699 | ) | (38,258,677 | ) | ||||||
| Forward foreign currency contracts (Note 6) | (365,382,827 | ) | — | — | ||||||||
| Futures contracts (Note 7) | (46,514,410 | ) | — | — | ||||||||
| Net realized gain (loss) | (510,551,726 | ) | (22,999,699 | ) | (38,258,677 | ) | ||||||
| Net change in unrealized appreciation (depreciation) on: | ||||||||||||
| Investments | (104,696,789 | ) | (17,123,751 | ) | (1,667,003 | ) | ||||||
| Forward foreign currency contracts (Note 6) | 30,021,230 | — | — | |||||||||
| Futures contracts (Note 7) | 1,281,897 | — | — | |||||||||
| Foreign receivables | 545,360 | (16,219 | ) | 11 | ||||||||
| Net change in unrealized appreciation (depreciation) | (72,848,302 | ) | (17,139,970 | ) | (1,666,992 | ) | ||||||
| NET REALIZED AND UNREALIZED GAIN (LOSS) | (583,400,028 | ) | (40,139,669 | ) | (39,925,669 | ) | ||||||
| INCREASE (DECREASE) IN NET ASSETS FROM OPERATIONS | $ | (572,104,983 | ) | $ | (33,880,354 | ) | $ | (40,011,634 | ) | |||
The accompanying notes are an integral part of these financial statements.
www.brownadvisoryfunds.com
103
Statements of Changes in Net Assets
BROWN ADVISORY GROWTH EQUITY FUND | BROWN ADVISORY VALUE EQUITY FUND | |||||||||||||||
| Year Ended | Year Ended | Year Ended | Year Ended | |||||||||||||
| June 30, | June 30, | June 30, | June 30, | |||||||||||||
| 2016 | 2015 | 2016 | 2015 | |||||||||||||
| OPERATIONS | ||||||||||||||||
| Net investment income (loss) | $ | (5,874,397 | ) | $ | (1,287,032 | ) | $ | 1,401,123 | $ | 2,873,324 | ||||||
| Net realized gain (loss) | 124,211,432 | 142,498,453 | (2,405,776 | ) | 20,505,998 | |||||||||||
| Net change in unrealized appreciation (depreciation) | (111,591,843 | ) | 95,329,685 | (17,471,770 | ) | (28,872,930 | ) | |||||||||
| Increase (Decrease) in Net Assets from Operations | 6,745,192 | 236,541,106 | (18,476,423 | ) | (5,493,608 | ) | ||||||||||
| DISTRIBUTIONS TO SHAREHOLDERS FROM | ||||||||||||||||
| Net investment income: | ||||||||||||||||
| Institutional Shares | — | — | (212 | ) | (835 | ) | ||||||||||
| Investor Shares | — | — | (1,748,361 | ) | (3,161,833 | ) | ||||||||||
| Advisor Shares | — | — | (12,194 | ) | (16,853 | ) | ||||||||||
| Net realized gain: | ||||||||||||||||
| Institutional Shares | (16,080,264 | ) | (7,762,347 | ) | (1,575 | ) | (1,614 | ) | ||||||||
| Investor Shares | (130,457,394 | ) | (69,561,007 | ) | (15,946,009 | ) | (6,779,611 | ) | ||||||||
| Advisor Shares | (2,441,644 | ) | (1,508,212 | ) | (129,102 | ) | (45,355 | ) | ||||||||
| Total Distributions to Shareholders | (148,979,302 | ) | (78,831,566 | ) | (17,837,453 | ) | (10,006,101 | ) | ||||||||
| CAPITAL SHARE TRANSACTIONS | ||||||||||||||||
| Sale of shares: | ||||||||||||||||
| Institutional Shares | 44,809,830 | 67,603,650 | — | 43,422 | ||||||||||||
| Investor Shares | 276,195,465 | 259,807,081 | 1,714,189 | 13,675,935 | ||||||||||||
| Advisor Shares | 3,660,338 | 3,854,264 | — | 58,887 | ||||||||||||
| Reinvestment of distributions: | ||||||||||||||||
| Institutional Shares | 13,324,395 | 7,222,086 | 1,575 | 1,614 | ||||||||||||
| Investor Shares | 117,886,614 | 62,066,866 | 8,194,017 | 4,242,468 | ||||||||||||
| Advisor Shares | 2,377,708 | 1,473,353 | 109,569 | 51,115 | ||||||||||||
| Redemption of shares: | ||||||||||||||||
| Institutional Shares | (49,170,983 | ) | (65,507,889 | ) | — | (40,675 | ) | |||||||||
| Investor Shares | (495,565,323 | ) | (814,445,647 | ) | (89,191,167 | ) | (77,385,552 | ) | ||||||||
| Advisor Shares | (14,878,919 | ) | (12,071,342 | ) | (122,853 | ) | (457,798 | ) | ||||||||
| Redemption fees: | ||||||||||||||||
| Institutional Shares | — | 139 | — | — | ||||||||||||
| Investor Shares | 2,208 | 2,014 | — | — | ||||||||||||
| Advisor Shares | 7 | 47 | — | 106 | ||||||||||||
| Increase (Decrease) from Capital Share Transactions | (101,358,660 | ) | (489,995,378 | ) | (79,294,670 | ) | (59,810,478 | ) | ||||||||
| Increase (Decrease) in Net Assets | (243,592,770 | ) | (332,285,838 | ) | (115,608,546 | ) | (75,310,187 | ) | ||||||||
| NET ASSETS | ||||||||||||||||
| Beginning of year | 2,447,009,716 | 2,779,295,554 | 168,005,496 | 243,315,683 | ||||||||||||
| End of year | $ | 2,203,416,946 | $ | 2,447,009,716 | $ | 52,396,950 | $ | 168,005,496 | ||||||||
| Undistributed (Accumulated) net investment income (loss) | $ | (2,889,959 | ) | $ | — | $ | 1,400,042 | $ | 1,760,722 | |||||||
| SHARE TRANSACTIONS | ||||||||||||||||
| Sale of shares: | ||||||||||||||||
| Institutional Shares | 2,313,362 | 3,477,138 | — | 2,358 | ||||||||||||
| Investor Shares | 14,288,981 | 13,244,976 | 108,811 | 751,004 | ||||||||||||
| Advisor Shares | 193,783 | 204,051 | — | 3,309 | ||||||||||||
| Reinvestment of distributions: | ||||||||||||||||
| Institutional Shares | 691,458 | 369,039 | 113 | 91 | ||||||||||||
| Investor Shares | 6,143,127 | 3,179,655 | 587,890 | 240,913 | ||||||||||||
| Advisor Shares | 128,525 | 77,914 | 7,810 | 2,883 | ||||||||||||
| Redemption of shares: | ||||||||||||||||
| Institutional Shares | (2,512,389 | ) | (3,331,028 | ) | — | (2,425 | ) | |||||||||
| Investor Shares | (25,683,769 | ) | (41,587,352 | ) | (6,494,305 | ) | (4,361,257 | ) | ||||||||
| Advisor Shares | (782,405 | ) | (634,323 | ) | (9,014 | ) | (25,841 | ) | ||||||||
| Increase (Decrease) in Shares Outstanding | (5,219,327 | ) | (24,999,930 | ) | (5,798,695 | ) | (3,388,965 | ) | ||||||||
The accompanying notes are an integral part of these financial statements.
www.brownadvisoryfunds.com
104
Statements of Changes in Net Assets
| BROWN ADVISORY | BROWN ADVISORY | |||||||||||||||
| FLEXIBLE EQUITY FUND | EQUITY INCOME FUND | |||||||||||||||
| Year Ended | Year Ended | Year Ended | Year Ended | |||||||||||||
| June 30, | June 30, | June 30, | June 30, | |||||||||||||
| 2016 | 2015 | 2016 | 2015 | |||||||||||||
| OPERATIONS | ||||||||||||||||
| Net investment income (loss) | $ | 1,712,215 | $ | 1,422,084 | $ | 3,368,205 | $ | 4,175,538 | ||||||||
| Net realized gain (loss) | (9,574,851 | ) | 2,577,056 | 1,228,571 | 4,209,370 | |||||||||||
| Net change in unrealized appreciation (depreciation) | (2,732,202 | ) | 11,769,398 | (6,886,953 | ) | (3,425,774 | ) | |||||||||
| Increase (Decrease) in Net Assets from Operations | (10,594,838 | ) | 15,768,538 | (2,290,177 | ) | 4,959,134 | ||||||||||
| DISTRIBUTIONS TO SHAREHOLDERS FROM | ||||||||||||||||
| Net investment income: | ||||||||||||||||
| Institutional Shares | (118,078 | ) | (672 | ) | (365,732 | ) | (393,937 | ) | ||||||||
| Investor Shares | (1,585,339 | ) | (980,117 | ) | (2,950,606 | ) | (3,734,830 | ) | ||||||||
| Advisor Shares | (24,797 | ) | (20,673 | ) | (53,866 | ) | (56,365 | ) | ||||||||
| Net realized gain: | ||||||||||||||||
| Institutional Shares | — | — | (188,209 | ) | (823,551 | ) | ||||||||||
| Investor Shares | — | — | (1,567,845 | ) | (8,462,343 | ) | ||||||||||
| Advisor Shares | — | — | (29,616 | ) | (144,101 | ) | ||||||||||
| Total Distributions to Shareholders | (1,728,214 | ) | (1,001,462 | ) | (5,155,874 | ) | (13,615,127 | ) | ||||||||
| CAPITAL SHARE TRANSACTIONS | ||||||||||||||||
| Sale of shares: | ||||||||||||||||
| Institutional Shares | 23,904,540 | 4,491,198 | 1,263,000 | 425,083 | ||||||||||||
| Investor Shares | 124,130,337 | 126,514,218 | 10,269,026 | 24,779,203 | ||||||||||||
| Advisor Shares | 995,241 | 4,346,413 | 77,650 | 232,804 | ||||||||||||
| Reinvestment of distributions: | ||||||||||||||||
| Institutional Shares | 7 | — | 436,376 | 1,111,862 | ||||||||||||
| Investor Shares | 528,062 | 371,990 | 1,429,730 | 5,450,611 | ||||||||||||
| Advisor Shares | 22,944 | 19,373 | 72,240 | 184,935 | ||||||||||||
| Redemption of shares: | ||||||||||||||||
| Institutional Shares | (3,463,636 | ) | (3,560,985 | ) | (5,375,406 | ) | (307,761 | ) | ||||||||
| Investor Shares | (75,680,003 | ) | (34,603,086 | ) | (75,816,836 | ) | (19,832,624 | ) | ||||||||
| Advisor Shares | (4,826,465 | ) | (8,570,686 | ) | (257,266 | ) | (437,250 | ) | ||||||||
| Redemption fees: | ||||||||||||||||
| Institutional Shares | — | — | — | — | ||||||||||||
| Investor Shares | 64 | 852 | — | — | ||||||||||||
| Advisor Shares | 198 | — | — | — | ||||||||||||
| Increase (Decrease) from Capital Share Transactions | 65,611,289 | 89,009,287 | (67,901,486 | ) | 11,606,863 | |||||||||||
| Increase (Decrease) in Net Assets | 53,288,237 | 103,776,363 | (75,347,537 | ) | 2,950,870 | |||||||||||
| NET ASSETS | ||||||||||||||||
| Beginning of year | 284,348,621 | 180,572,258 | 204,283,360 | 201,332,490 | ||||||||||||
| End of year | $ | 337,636,858 | $ | 284,348,621 | $ | 128,935,823 | $ | 204,283,360 | ||||||||
| Undistributed (Accumulated) net investment income (loss) | $ | 808,933 | $ | 826,205 | $ | 38,600 | $ | — | ||||||||
| SHARE TRANSACTIONS | ||||||||||||||||
| Sale of shares: | ||||||||||||||||
| Institutional Shares | 1,546,649 | 286,808 | 102,693 | 31,623 | ||||||||||||
| Investor Shares | 8,303,092 | 8,056,850 | 828,449 | 1,827,033 | ||||||||||||
| Advisor Shares | 65,238 | 276,507 | 6,691 | 17,249 | ||||||||||||
| Reinvestment of distributions: | ||||||||||||||||
| Institutional Shares | — | — | 35,362 | 82,255 | ||||||||||||
| Investor Shares | 33,720 | 23,062 | 116,203 | 403,046 | ||||||||||||
| Advisor Shares | 1,464 | 1,201 | 5,856 | 13,700 | ||||||||||||
| Redemption of shares: | ||||||||||||||||
| Institutional Shares | (228,251 | ) | (231,546 | ) | (442,768 | ) | (22,576 | ) | ||||||||
| Investor Shares | (4,974,758 | ) | (2,175,833 | ) | (6,165,587 | ) | (1,463,547 | ) | ||||||||
| Advisor Shares | (319,551 | ) | (555,109 | ) | (20,572 | ) | (32,018 | ) | ||||||||
| Increase (Decrease) in Shares Outstanding | 4,427,603 | 5,681,940 | (5,533,673 | ) | 856,765 | |||||||||||
The accompanying notes are an integral part of these financial statements.
www.brownadvisoryfunds.com
105
Statements of Changes in Net Assets
| BROWN ADVISORY | BROWN ADVISORY | |||||||||||||||
| SUSTAINABLE GROWTH FUND | SMALL-CAP GROWTH FUND | |||||||||||||||
| Year Ended | Year Ended | Year Ended | Year Ended | |||||||||||||
| June 30, | June 30, | June 30, | June 30, | |||||||||||||
| 2016 | 2015 | 2016 | 2015 | |||||||||||||
| OPERATIONS | ||||||||||||||||
| Net investment income (loss) | $ | (1,102,504 | ) | $ | (817,352 | ) | $ | (1,621,898 | ) | $ | (1,823,234 | ) | ||||
| Net realized gain (loss) | 3,885,315 | 17,678,513 | 24,884,563 | 38,675,691 | ||||||||||||
| Net change in unrealized appreciation (depreciation) | 15,334,723 | 9,157,231 | (17,671,772 | ) | (4,311,804 | ) | ||||||||||
| Increase (Decrease) in Net Assets from Operations | 18,117,534 | 26,018,392 | 5,590,893 | 32,540,653 | ||||||||||||
| DISTRIBUTIONS TO SHAREHOLDERS FROM | ||||||||||||||||
| Net realized gain: | ||||||||||||||||
| Institutional Shares | (3,716,752 | ) | (655,994 | ) | (1,946,062 | ) | (978,695 | ) | ||||||||
| Investor Shares | (732,739 | ) | (998,289 | ) | (37,656,440 | ) | (30,219,392 | ) | ||||||||
| Advisor Shares | (9,527,402 | ) | (2,685,927 | ) | (819,956 | ) | (686,814 | ) | ||||||||
| Total Distributions to Shareholders | (13,976,893 | ) | (4,340,210 | ) | (40,422,458 | ) | (31,884,901 | ) | ||||||||
| CAPITAL SHARE TRANSACTIONS | ||||||||||||||||
| Sale of shares: | ||||||||||||||||
| Institutional Shares | 65,254,532 | 43,518,158 | 5,588,177 | 5,495,343 | ||||||||||||
| Investor Shares | 20,556,459 | 6,918,710 | 44,867,427 | 18,679,499 | ||||||||||||
| Advisor Shares | 103,143,267 | 10,366,384 | 6,143,111 | 1,729,263 | ||||||||||||
| Reinvestment of distributions: | ||||||||||||||||
| Institutional Shares | 2,354,247 | 523,469 | 1,258,905 | 867,109 | ||||||||||||
| Investor Shares | 538,649 | 577,035 | 22,013,906 | 17,079,397 | ||||||||||||
| Advisor Shares | 8,931,717 | 2,496,115 | 565,945 | 522,789 | ||||||||||||
| Redemption of shares: | ||||||||||||||||
| Institutional Shares | (16,564,900 | ) | (9,300,080 | ) | (1,279,143 | ) | (2,442,148 | ) | ||||||||
| Investor Shares | (7,069,856 | ) | (48,880,467 | ) | (27,986,757 | ) | (58,853,998 | ) | ||||||||
| Advisor Shares | (48,279,652 | ) | (21,536,336 | ) | (2,823,963 | ) | (3,203,139 | ) | ||||||||
| Redemption fees: | ||||||||||||||||
| Institutional Shares | 1 | — | — | — | ||||||||||||
| Investor Shares | 341 | 59 | 292 | 233 | ||||||||||||
| Advisor Shares | 885 | 463 | 292 | — | ||||||||||||
| Increase (Decrease) from Capital Share Transactions | 128,865,690 | (15,316,490 | ) | 48,348,192 | (20,125,652 | ) | ||||||||||
| Increase (Decrease) in Net Assets | 133,006,331 | 6,361,692 | 13,516,627 | (19,469,900 | ) | |||||||||||
| NET ASSETS | ||||||||||||||||
| Beginning of year | 216,404,634 | 210,042,942 | 281,614,456 | 301,084,356 | ||||||||||||
| End of year | $ | 349,410,965 | $ | 216,404,634 | $ | 295,131,083 | $ | 281,614,456 | ||||||||
| Undistributed (Accumulated) net investment income (loss) | $ | (577,943 | ) | $ | (429,774 | ) | $ | (442,829 | ) | $ | (536,612 | ) | ||||
| SHARE TRANSACTIONS | ||||||||||||||||
| Sale of shares: | ||||||||||||||||
| Institutional Shares | 4,184,096 | 2,737,848 | 188,309 | 164,079 | ||||||||||||
| Investor Shares | 1,304,030 | 469,873 | 2,937,441 | 1,066,313 | ||||||||||||
| Advisor Shares | 6,520,698 | 675,203 | 431,751 | 102,159 | ||||||||||||
| Reinvestment of distributions: | ||||||||||||||||
| Institutional Shares | 150,527 | 35,538 | 41,977 | 26,324 | ||||||||||||
| Investor Shares | 34,640 | 39,334 | 1,461,747 | 1,031,365 | ||||||||||||
| Advisor Shares | 579,605 | 171,201 | 39,112 | 32,776 | ||||||||||||
| Redemption of shares: | ||||||||||||||||
| Institutional Shares | (1,054,388 | ) | (605,631 | ) | (41,639 | ) | (69,833 | ) | ||||||||
| Investor Shares | (445,762 | ) | (3,121,284 | ) | (1,792,684 | ) | (3,366,097 | ) | ||||||||
| Advisor Shares | (3,184,241 | ) | (1,472,472 | ) | (190,374 | ) | (188,820 | ) | ||||||||
| Increase (Decrease) in Shares Outstanding | 8,089,205 | (1,070,390 | ) | 3,075,640 | (1,201,734 | ) | ||||||||||
The accompanying notes are an integral part of these financial statements.
www.brownadvisoryfunds.com
106
Statements of Changes in Net Assets
| BROWN ADVISORY SMALL-CAP | BROWN ADVISORY | |||||||||||||||
| FUNDAMENTAL VALUE FUND | MULTI-STRATEGY FUND | |||||||||||||||
| Year Ended | Year Ended | Year Ended | Period Ended | |||||||||||||
| June 30, | June 30, | June 30, | June 30, | |||||||||||||
| 2016 | 2015 | 2016 | 2015 | * | ||||||||||||
| OPERATIONS | ||||||||||||||||
| Net investment income (loss) | $ | 3,844,002 | $ | 1,918,449 | $ | 14,356 | $ | (8,431 | ) | |||||||
| Net realized gain (loss) | 5,583,924 | 32,140,185 | 26,365 | 2,407 | ||||||||||||
| Net change in unrealized appreciation (depreciation) | (13,233,109 | ) | (8,864,807 | ) | (102,524 | ) | 31,763 | |||||||||
| Increase (Decrease) in Net Assets from Operations | (3,805,183 | ) | 25,193,827 | (61,803 | ) | 25,739 | ||||||||||
| DISTRIBUTIONS TO SHAREHOLDERS FROM | ||||||||||||||||
| Net investment income: | ||||||||||||||||
| Institutional Shares | (484,047 | ) | (194,841 | ) | (10,556 | ) | (2,394 | ) | ||||||||
| Investor Shares | (2,277,048 | ) | (2,670,756 | ) | — | — | ||||||||||
| Advisor Shares | (35,541 | ) | (125,977 | ) | — | — | ||||||||||
| Net realized gain: | ||||||||||||||||
| Institutional Shares | (2,038,801 | ) | (1,600,207 | ) | (21,323 | ) | — | |||||||||
| Investor Shares | (14,082,090 | ) | (28,747,296 | ) | — | — | ||||||||||
| Advisor Shares | (1,069,503 | ) | (1,814,795 | ) | — | — | ||||||||||
| Total Distributions to Shareholders | (19,987,030 | ) | (35,153,872 | ) | (31,879 | ) | (2,394 | ) | ||||||||
| CAPITAL SHARE TRANSACTIONS | ||||||||||||||||
| Sale of shares: | ||||||||||||||||
| Institutional Shares | 89,252,983 | 59,718,016 | 855,349 | 3,213,113 | ||||||||||||
| Investor Shares | 221,245,590 | 268,908,004 | — | — | ||||||||||||
| Advisor Shares | 11,524,532 | 45,406,706 | — | — | ||||||||||||
| Reinvestment of distributions: | ||||||||||||||||
| Institutional Shares | 1,826,895 | 1,724,030 | 15,316 | 1,862 | ||||||||||||
| Investor Shares | 9,736,248 | 17,869,434 | — | — | ||||||||||||
| Advisor Shares | 1,084,680 | 1,911,251 | — | — | ||||||||||||
| Redemption of shares: | ||||||||||||||||
| Institutional Shares | (13,343,881 | ) | (4,249,966 | ) | (149,304 | ) | (919,098 | ) | ||||||||
| Investor Shares | (180,251,556 | ) | (97,894,196 | ) | — | — | ||||||||||
| Advisor Shares | (16,232,721 | ) | (9,586,430 | ) | — | — | ||||||||||
| Redemption fees: | ||||||||||||||||
| Institutional Shares | 1,477 | 15 | — | — | ||||||||||||
| Investor Shares | 1,354 | 1,692 | — | — | ||||||||||||
| Advisor Shares | 1,252 | 1,622 | — | — | ||||||||||||
| Increase (Decrease) from Capital Share Transactions | 124,846,853 | 283,810,178 | 721,361 | 2,295,877 | ||||||||||||
| Increase (Decrease) in Net Assets | 101,054,640 | 273,850,133 | 627,679 | 2,319,222 | ||||||||||||
| NET ASSETS | ||||||||||||||||
| Beginning of year | 882,580,368 | 608,730,235 | 2,319,222 | — | ||||||||||||
| End of year | $ | 983,635,008 | $ | 882,580,368 | $ | 2,946,901 | $ | 2,319,222 | ||||||||
| Undistributed (Accumulated) net investment income (loss) | $ | 1,044,450 | $ | — | $ | (1,057 | ) | $ | (10,237 | ) | ||||||
| SHARE TRANSACTIONS | ||||||||||||||||
| Sale of shares: | ||||||||||||||||
| Institutional Shares | 4,171,224 | 2,510,304 | 85,535 | 320,283 | ||||||||||||
| Investor Shares | 10,130,767 | 11,368,688 | — | — | ||||||||||||
| Advisor Shares | 533,241 | 1,923,210 | — | — | ||||||||||||
| Reinvestment of distributions: | ||||||||||||||||
| Institutional Shares | 83,739 | 73,145 | 1,579 | 185 | ||||||||||||
| Investor Shares | 447,800 | 758,465 | — | — | ||||||||||||
| Advisor Shares | 50,227 | 81,364 | — | — | ||||||||||||
| Redemption of shares: | ||||||||||||||||
| Institutional Shares | (606,792 | ) | (179,005 | ) | (15,766 | ) | (90,196 | ) | ||||||||
| Investor Shares | (8,207,223 | ) | (4,131,656 | ) | — | — | ||||||||||
| Advisor Shares | (740,720 | ) | (406,882 | ) | — | — | ||||||||||
| Increase (Decrease) in Shares Outstanding | 5,862,263 | 11,997,633 | 71,348 | 230,272 | ||||||||||||
| * | Commenced operations on October 31, 2014. The information presented is for the period from October 31, 2014 to June 30, 2015. |
The accompanying notes are an integral part of these financial statements.
www.brownadvisoryfunds.com
107
Statements of Changes in Net Assets
| BROWN ADVISORY | BROWN ADVISORY | |||||||||||
| GLOBAL LEADERS FUND | INTERMEDIATE INCOME FUND | |||||||||||
| Period Ended | Year Ended | Year Ended | ||||||||||
| June 30, | June 30, | June 30, | ||||||||||
| 2016* | 2016 | 2015 | ||||||||||
| OPERATIONS | ||||||||||||
| Net investment income (loss) | $ | 82,066 | $ | 2,896,397 | $ | 3,167,470 | ||||||
| Net realized gain (loss) | (1,102,079 | ) | (699,518 | ) | 1,131,585 | |||||||
| Net change in unrealized appreciation (depreciation) | 699,600 | 3,708,589 | (2,404,862 | ) | ||||||||
| Increase (Decrease) in Net Assets from Operations | (320,413 | ) | 5,905,468 | 1,894,193 | ||||||||
| DISTRIBUTIONS TO SHAREHOLDERS FROM | ||||||||||||
| Net investment income: | ||||||||||||
| Investor Shares | — | (2,820,398 | ) | (3,342,529 | ) | |||||||
| Advisor Shares | — | (160,893 | ) | (190,222 | ) | |||||||
| Net realized gain: | ||||||||||||
| Investor Shares | — | (773,069 | ) | — | ||||||||
| Advisor Shares | — | (49,905 | ) | — | ||||||||
| Total Distributions to Shareholders | — | (3,804,265 | ) | (3,532,751 | ) | |||||||
| CAPITAL SHARE TRANSACTIONS | ||||||||||||
| Sale of shares: | ||||||||||||
| Investor Shares | 17,814,152 | 29,525,581 | 29,017,096 | |||||||||
| Advisor Shares | — | 44,413 | 29,024 | |||||||||
| Reinvestment of distributions: | ||||||||||||
| Investor Shares | — | 1,248,100 | 742,197 | |||||||||
| Advisor Shares | — | 130,783 | 117,261 | |||||||||
| Redemption of shares: | ||||||||||||
| Investor Shares | (1,161,378 | ) | (34,857,866 | ) | (95,596,082 | ) | ||||||
| Advisor Shares | — | (933,155 | ) | (3,041,900 | ) | |||||||
| Redemption fees: | ||||||||||||
| Investor Shares | — | 3 | 66 | |||||||||
| Advisor Shares | — | — | — | |||||||||
| Shares issued in connection with the acquisition of | ||||||||||||
| the Brown Advisory Opportunity Fund (Note 9): | ||||||||||||
| Investor Shares | 10,035,030 | N/A | N/A | |||||||||
| Increase (Decrease) from Capital Share Transactions | 26,687,804 | (4,842,141 | ) | (68,732,338 | ) | |||||||
| Increase (Decrease) in Net Assets | 26,367,391 | (2,740,938 | ) | (70,370,896 | ) | |||||||
| NET ASSETS | ||||||||||||
| Beginning of period / year | — | 149,613,360 | 219,984,256 | |||||||||
| End of period / year | $ | 26,367,391 | $ | 146,872,422 | $ | 149,613,360 | ||||||
| Undistributed (Accumulated) net investment income (loss) | $ | 53,912 | $ | (173,885 | ) | $ | (190,234 | ) | ||||
| SHARE TRANSACTIONS | ||||||||||||
| Sale of shares: | ||||||||||||
| Investor Shares | 1,856,363 | 2,775,238 | 2,702,238 | |||||||||
| Advisor Shares | — | 4,256 | 2,759 | |||||||||
| Reinvestment of distributions: | ||||||||||||
| Investor Shares | — | 117,748 | 69,244 | |||||||||
| Advisor Shares | — | 12,566 | 11,158 | |||||||||
| Redemption of shares: | ||||||||||||
| Investor Shares | (119,736 | ) | (3,273,682 | ) | (8,904,829 | ) | ||||||
| Advisor Shares | — | (89,510 | ) | (289,204 | ) | |||||||
| Shares issued in connection with the acquisition of | ||||||||||||
| the Brown Advisory Opportunity Fund (Note 9): | ||||||||||||
| Investor Shares | 994,393 | N/A | N/A | |||||||||
| Increase (Decrease) in Shares Outstanding | 2,731,020 | (453,384 | ) | (6,408,634 | ) | |||||||
| * | Commenced operations on July 1, 2015. The information presented is for the period from July 1, 2015 (end of day) to June 30, 2016. |
The accompanying notes are an integral part of these financial statements.
www.brownadvisoryfunds.com
108
Statements of Changes in Net Assets
| BROWN ADVISORY | BROWN ADVISORY | |||||||||||||||
| TOTAL RETURN FUND | STRATEGIC BOND FUND | |||||||||||||||
| Year Ended | Period Ended | Year Ended | Year Ended | |||||||||||||
| June 30, | June 30, | June 30, | June 30, | |||||||||||||
| 2016 | 2015* | 2016 | 2015 | |||||||||||||
| OPERATIONS | ||||||||||||||||
| Net investment income (loss) | $ | 2,053,474 | $ | 828,180 | $ | 1,521,593 | $ | 947,449 | ||||||||
| Net realized gain (loss) | 516,458 | (971,999 | ) | (1,923,589 | ) | (827,486 | ) | |||||||||
| Net change in unrealized appreciation (depreciation) | 2,495,983 | (659,223 | ) | 683,014 | (1,128,037 | ) | ||||||||||
| Increase (Decrease) in Net Assets from Operations | 5,065,915 | (803,042 | ) | 281,018 | (1,008,074 | ) | ||||||||||
| DISTRIBUTIONS TO SHAREHOLDERS FROM | ||||||||||||||||
| Net investment income: | ||||||||||||||||
| Institutional Shares | (2,128,088 | ) | (682,226 | ) | — | — | ||||||||||
| Investor Shares | (94,064 | ) | (154,576 | ) | (2,420,788 | ) | (184,113 | ) | ||||||||
| Advisor Shares | — | — | (55,995 | ) | (16,546 | ) | ||||||||||
| Total Distributions to Shareholders | (2,222,152 | ) | (836,802 | ) | (2,476,783 | ) | (200,659 | ) | ||||||||
| CAPITAL SHARE TRANSACTIONS | ||||||||||||||||
| Sale of shares: | ||||||||||||||||
| Institutional Shares | 20,855,744 | 77,851,406 | — | — | ||||||||||||
| Investor Shares | 1,343,005 | 65,246,223 | 3,826,957 | 63,812,872 | ||||||||||||
| Advisor Shares | — | — | — | 660,164 | ||||||||||||
| Reinvestment of distributions: | ||||||||||||||||
| Institutional Shares | 135,297 | 14,220 | — | — | ||||||||||||
| Investor Shares | 79,685 | 79,537 | 317,063 | 10,665 | ||||||||||||
| Advisor Shares | — | — | 42,801 | 12,621 | ||||||||||||
| Redemption of shares: | ||||||||||||||||
| Institutional Shares | (13,649,303 | ) | (1,951,607 | ) | — | — | ||||||||||
| Investor Shares | (8,612,071 | ) | (56,784,565 | ) | (22,475,247 | ) | (2,931,241 | ) | ||||||||
| Advisor Shares | — | — | (811,615 | ) | (23,383,633 | ) | ||||||||||
| Redemption fees: | ||||||||||||||||
| Institutional Shares | — | — | — | — | ||||||||||||
| Investor Shares | — | 170 | — | — | ||||||||||||
| Advisor Shares | — | — | — | — | ||||||||||||
| Increase (Decrease) from Capital Share Transactions | 152,357 | 84,455,384 | (19,100,041 | ) | 38,181,448 | |||||||||||
| Increase (Decrease) in Net Assets | 2,996,120 | 82,815,540 | (21,295,806 | ) | 36,972,715 | |||||||||||
| NET ASSETS | ||||||||||||||||
| Beginning of year / period | 82,815,540 | — | 61,371,834 | 24,399,119 | ||||||||||||
| End of year / period | $ | 85,811,660 | $ | 82,815,540 | $ | 40,076,028 | $ | 61,371,834 | ||||||||
| Undistributed (Accumulated) net investment income (loss) | $ | (623 | ) | $ | 5,632 | $ | (73,959 | ) | $ | 772,240 | ||||||
| SHARE TRANSACTIONS | ||||||||||||||||
| Sale of shares: | ||||||||||||||||
| Institutional Shares | 2,109,393 | 7,692,250 | — | — | ||||||||||||
| Investor Shares | 135,649 | 6,514,215 | 403,394 | 6,365,336 | ||||||||||||
| Advisor Shares | — | — | — | 65,803 | ||||||||||||
| Reinvestment of distributions: | ||||||||||||||||
| Institutional Shares | 13,657 | 1,421 | — | — | ||||||||||||
| Investor Shares | 8,049 | 7,947 | 33,319 | 1,063 | ||||||||||||
| Advisor Shares | — | — | 4,491 | 1,257 | ||||||||||||
| Redemption of shares: | ||||||||||||||||
| Institutional Shares | (1,380,268 | ) | (196,362 | ) | — | — | ||||||||||
| Investor Shares | (874,785 | ) | (5,598,733 | ) | (2,367,203 | ) | (294,489 | ) | ||||||||
| Advisor Shares | — | — | (85,611 | ) | (2,326,028 | ) | ||||||||||
| Increase (Decrease) in Shares Outstanding | 11,695 | 8,420,738 | (2,011,610 | ) | 3,812,942 | |||||||||||
| * | Commenced operations on October 30, 2014. The information presented is for the period from October 30, 2014 to June 30, 2015. |
The accompanying notes are an integral part of these financial statements.
www.brownadvisoryfunds.com
109
Statements of Changes in Net Assets
| BROWN ADVISORY | BROWN ADVISORY | |||||||||||||||
| MARYLAND BOND FUND | TAX EXEMPT BOND FUND | |||||||||||||||
| Year Ended | Year Ended | Year Ended | Year Ended | |||||||||||||
| June 30, | June 30, | June 30, | June 30, | |||||||||||||
| 2016 | 2015 | 2016 | 2015 | |||||||||||||
| OPERATIONS | ||||||||||||||||
| Net investment income (loss) | $ | 4,035,203 | $ | 3,476,302 | $ | 5,642,298 | $ | 3,903,365 | ||||||||
| Net realized gain (loss) | 1,347,240 | 585,355 | 331,921 | (946,691 | ) | |||||||||||
| Net change in unrealized appreciation (depreciation) | 4,359,306 | (2,821,647 | ) | 7,199,311 | (1,400,710 | ) | ||||||||||
| Increase (Decrease) in Net Assets from Operations | 9,741,749 | 1,240,010 | 13,173,530 | 1,555,964 | ||||||||||||
| DISTRIBUTIONS TO SHAREHOLDERS FROM | ||||||||||||||||
| Net investment income: | ||||||||||||||||
| Investor Shares | (4,035,074 | ) | (3,476,302 | ) | (5,642,129 | ) | (3,903,365 | ) | ||||||||
| Net realized gain: | ||||||||||||||||
| Investor Shares | (906,772 | ) | (1,040,851 | ) | — | — | ||||||||||
| Total Distributions to Shareholders | (4,941,846 | ) | (4,517,153 | ) | (5,642,129 | ) | (3,903,365 | ) | ||||||||
| CAPITAL SHARE TRANSACTIONS | ||||||||||||||||
| Sale of shares: | ||||||||||||||||
| Investor Shares | 27,494,531 | 53,347,422 | 59,630,595 | 97,415,938 | ||||||||||||
| Reinvestment of distributions: | ||||||||||||||||
| Investor Shares | 1,233,816 | 1,121,200 | 1,187,875 | 850,588 | ||||||||||||
| Redemption of shares: | ||||||||||||||||
| Investor Shares | (49,292,605 | ) | (57,440,183 | ) | (58,829,020 | ) | (76,942,910 | ) | ||||||||
| Redemption fees: | ||||||||||||||||
| Investor Shares | — | 442 | — | 787 | ||||||||||||
| Increase (Decrease) from Capital Share Transactions | (20,564,258 | ) | (2,971,119 | ) | 1,989,450 | 21,324,403 | ||||||||||
| Increase (Decrease) in Net Assets | (15,764,355 | ) | (6,248,262 | ) | 9,520,851 | 18,977,002 | ||||||||||
| NET ASSETS | ||||||||||||||||
| Beginning of year | 199,469,131 | 205,717,393 | 224,154,475 | 205,177,473 | ||||||||||||
| End of year | $ | 183,704,776 | $ | 199,469,131 | $ | 233,675,326 | $ | 224,154,475 | ||||||||
| Undistributed (Accumulated) net investment income (loss) | $ | 157 | $ | 28 | $ | 46 | $ | (123 | ) | |||||||
| SHARE TRANSACTIONS | ||||||||||||||||
| Sale of shares: | ||||||||||||||||
| Investor Shares | 2,553,474 | 4,947,707 | 5,916,196 | 9,696,551 | ||||||||||||
| Reinvestment of distributions: | ||||||||||||||||
| Investor Shares | 114,852 | 104,124 | 117,959 | 84,697 | ||||||||||||
| Redemption of shares: | ||||||||||||||||
| Investor Shares | (4,580,145 | ) | (5,332,469 | ) | (5,841,862 | ) | (7,659,517 | ) | ||||||||
| Increase (Decrease) in Shares Outstanding | (1,911,819 | ) | (280,638 | ) | 192,293 | 2,121,731 | ||||||||||
The accompanying notes are an integral part of these financial statements.
www.brownadvisoryfunds.com
110
Statements of Changes in Net Assets
| BROWN ADVISORY – | ||||||||||||||||
| BROWN ADVISORY | WMC STRATEGIC | |||||||||||||||
| MORTGAGE SECURITIES FUND | EUROPEAN EQUITY FUND | |||||||||||||||
| Year Ended | Year Ended | Year Ended | Year Ended | |||||||||||||
| June 30, | June 30, | June 30, | June 30, | |||||||||||||
| 2016 | 2015 | 2016 | 2015 | |||||||||||||
| OPERATIONS | ||||||||||||||||
| Net investment income (loss) | $ | 6,730,528 | $ | 5,722,383 | $ | 12,716,179 | $ | 3,017,569 | ||||||||
| Net realized gain (loss) | 2,435,203 | 2,379,466 | (38,401,054 | ) | (12,510,798 | ) | ||||||||||
| Net change in unrealized appreciation (depreciation) | 4,611,749 | (2,496,970 | ) | (16,316,729 | ) | 3,959,200 | ||||||||||
| Increase (Decrease) in Net Assets from Operations | 13,777,480 | 5,604,879 | (42,001,604 | ) | (5,534,029 | ) | ||||||||||
| DISTRIBUTIONS TO SHAREHOLDERS FROM | ||||||||||||||||
| Net investment income: | ||||||||||||||||
| Institutional Shares | (7,634,638 | ) | (5,220,946 | ) | (2,992,321 | ) | (2,028,155 | ) | ||||||||
| Investor Shares | (272,364 | ) | (1,048,373 | ) | — | (161,265 | ) | |||||||||
| Advisor Shares | — | — | — | (3,195 | ) | |||||||||||
| Net realized gain: | ||||||||||||||||
| Institutional Shares | (1,251,294 | ) | (1,220,433 | ) | — | — | ||||||||||
| Investor Shares | (6,444 | ) | (354,459 | ) | — | — | ||||||||||
| Advisor Shares | — | — | — | — | ||||||||||||
| Total Distributions to Shareholders | (9,164,740 | ) | (7,844,211 | ) | (2,992,321 | ) | (2,192,615 | ) | ||||||||
| CAPITAL SHARE TRANSACTIONS | ||||||||||||||||
| Sale of shares: | ||||||||||||||||
| Institutional Shares | 190,657,531 | 120,438,550 | 1,071,009,646 | 128,250,563 | ||||||||||||
| Investor Shares | 4,298,461 | 15,997,743 | 16,339,283 | 14,088,732 | ||||||||||||
| Advisor Shares | — | — | 407,912 | 1,072,184 | ||||||||||||
| Reinvestment of distributions: | ||||||||||||||||
| Institutional Shares | 1,978,340 | 1,264,476 | 2,334,075 | 136,737 | ||||||||||||
| Investor Shares | 164,060 | 752,471 | — | 131,427 | ||||||||||||
| Advisor Shares | — | — | — | 2,681 | ||||||||||||
| Redemption of shares: | ||||||||||||||||
| Institutional Shares | (25,603,200 | ) | (44,771,378 | ) | (209,118,819 | ) | (83,625,059 | ) | ||||||||
| Investor Shares | (31,354,854 | ) | (55,685,240 | ) | (28,730,256 | ) | (5,873,578 | ) | ||||||||
| Advisor Shares | — | — | (699,362 | ) | (230,575 | ) | ||||||||||
| Redemption fees: | ||||||||||||||||
| Institutional Shares | — | — | 1 | — | ||||||||||||
| Investor Shares | — | — | — | 5,075 | ||||||||||||
| Advisor Shares | — | — | — | 49 | ||||||||||||
| Increase (Decrease) from Capital Share Transactions | 140,140,338 | 37,996,622 | 851,542,480 | 53,958,236 | ||||||||||||
| Increase (Decrease) in Net Assets | 144,753,078 | 35,757,290 | 806,548,555 | 46,231,592 | ||||||||||||
| NET ASSETS | ||||||||||||||||
| Beginning of year / period | 234,948,466 | 199,191,176 | 267,097,727 | 220,866,135 | ||||||||||||
| End of year / period | $ | 379,701,544 | $ | 234,948,466 | $ | 1,073,646,282 | $ | 267,097,727 | ||||||||
| Undistributed (Accumulated) net investment income (loss) | $ | (2,848 | ) | $ | 16,572 | $ | 12,611,576 | $ | 2,991,719 | |||||||
| SHARE TRANSACTIONS | ||||||||||||||||
| Sale of shares: | ||||||||||||||||
| Institutional Shares | 18,863,416 | 11,840,919 | 104,321,742 | 12,789,191 | ||||||||||||
| Investor Shares | 423,537 | 1,573,302 | 1,657,066 | 1,385,487 | ||||||||||||
| Advisor Shares | — | — | 40,534 | 105,099 | ||||||||||||
| Reinvestment of distributions: | ||||||||||||||||
| Institutional Shares | 196,274 | 125,482 | 225,951 | 14,053 | ||||||||||||
| Investor Shares | 16,201 | 74,490 | — | 13,521 | ||||||||||||
| Advisor Shares | — | — | — | 276 | ||||||||||||
| Redemption of shares: | ||||||||||||||||
| Institutional Shares | (2,524,958 | ) | (4,401,492 | ) | (21,019,706 | ) | (8,631,771 | ) | ||||||||
| Investor Shares | (3,110,533 | ) | (5,472,951 | ) | (2,876,056 | ) | (587,647 | ) | ||||||||
| Advisor Shares | — | — | (70,670 | ) | (22,565 | ) | ||||||||||
| Increase (Decrease) in Shares Outstanding | 13,863,937 | 3,739,750 | 82,278,861 | 5,065,644 | ||||||||||||
The accompanying notes are an integral part of these financial statements.
www.brownadvisoryfunds.com
111
Statements of Changes in Net Assets
| BROWN ADVISORY – | BROWN ADVISORY – | |||||||||||||||
| WMC JAPAN ALPHA | SOMERSET EMERGING | |||||||||||||||
| OPPORTUNITIES FUND | MARKETS FUND | |||||||||||||||
| Year Ended | Year Ended | Year Ended | Year Ended | |||||||||||||
| June 30, | June 30, | June 30, | June 30, | |||||||||||||
| 2016 | 2015 | 2016 | 2015 | |||||||||||||
| OPERATIONS | ||||||||||||||||
| Net investment income (loss) | $ | 11,295,045 | $ | 5,364,284 | $ | 6,259,315 | $ | 3,540,051 | ||||||||
| Net realized gain (loss) | (510,551,726 | ) | 268,242,436 | (22,999,699 | ) | 2,204,829 | ||||||||||
| Net change in unrealized appreciation (depreciation) | (72,848,302 | ) | 75,794,530 | (17,139,970 | ) | (16,502,944 | ) | |||||||||
| Increase (Decrease) in Net Assets from Operations | (572,104,983 | ) | 349,401,250 | (33,880,354 | ) | (10,758,064 | ) | |||||||||
| DISTRIBUTIONS TO SHAREHOLDERS FROM | ||||||||||||||||
| Net investment income: | ||||||||||||||||
| Institutional Shares | (188,806,891 | ) | (56,510,560 | ) | (2,214,836 | ) | (3,242,870 | ) | ||||||||
| Investor Shares | (2,854,668 | ) | (515,706 | ) | (1,712,443 | ) | (540,676 | ) | ||||||||
| Advisor Shares | (139,380 | ) | (5,171 | ) | (742 | ) | (6,119 | ) | ||||||||
| Net realized gain: | ||||||||||||||||
| Institutional Shares | (39,006,684 | ) | (7,825,633 | ) | — | — | ||||||||||
| Investor Shares | (593,987 | ) | (72,262 | ) | — | — | ||||||||||
| Advisor Shares | (29,833 | ) | (749 | ) | — | — | ||||||||||
| Total Distributions to Shareholders | (231,431,443 | ) | (64,930,081 | ) | (3,928,021 | ) | (3,789,665 | ) | ||||||||
| CAPITAL SHARE TRANSACTIONS | ||||||||||||||||
| Sale of shares: | ||||||||||||||||
| Institutional Shares | 1,472,565,101 | 429,017,811 | 224,157,581 | 122,818,655 | ||||||||||||
| Investor Shares | 18,627,215 | 19,702,437 | 186,372,395 | 146,036,626 | ||||||||||||
| Advisor Shares | 1,410,394 | 1,666,578 | 224,436 | 558,959 | ||||||||||||
| Reinvestment of distributions: | ||||||||||||||||
| Institutional Shares | 13,872,815 | 2,070,113 | 455,104 | 490,258 | ||||||||||||
| Investor Shares | 3,431,115 | 586,590 | 1,685,181 | 429,370 | ||||||||||||
| Advisor Shares | 165,236 | 5,920 | 726 | 6,119 | ||||||||||||
| Redemption of shares: | ||||||||||||||||
| Institutional Shares | (448,721,260 | ) | (210,662,995 | ) | (153,243,842 | ) | (37,255,938 | ) | ||||||||
| Investor Shares | (34,159,583 | ) | (2,531,378 | ) | (129,370,609 | ) | (11,527,368 | ) | ||||||||
| Advisor Shares | (2,045,925 | ) | (115,120 | ) | (749,289 | ) | (116,905 | ) | ||||||||
| Redemption fees: | ||||||||||||||||
| Institutional Shares | 1,200 | 443 | — | — | ||||||||||||
| Investor Shares | 970 | 1,272 | 325 | — | ||||||||||||
| Advisor Shares | 2 | — | — | — | ||||||||||||
| Increase (Decrease) from Capital Share Transactions | 1,025,147,280 | 239,741,671 | 129,532,008 | 221,439,776 | ||||||||||||
| Increase (Decrease) in Net Assets | 221,610,854 | 524,212,840 | 91,723,633 | 206,892,047 | ||||||||||||
| NET ASSETS | ||||||||||||||||
| Beginning of year / period | 1,609,511,043 | 1,085,298,203 | 425,391,810 | 218,499,763 | ||||||||||||
| End of year / period | $ | 1,831,121,897 | $ | 1,609,511,043 | $ | 517,115,443 | $ | 425,391,810 | ||||||||
| Undistributed (Accumulated) net investment income (loss) | $ | (357,952,163 | ) | $ | 173,902,253 | $ | 4,342,604 | $ | 2,706,260 | |||||||
| SHARE TRANSACTIONS | ||||||||||||||||
| Sale of shares: | ||||||||||||||||
| Institutional Shares | 126,755,340 | 37,938,780 | 27,019,470 | 12,355,851 | ||||||||||||
| Investor Shares | 1,596,337 | 1,726,060 | 21,728,904 | 14,781,054 | ||||||||||||
| Advisor Shares | 119,056 | 133,674 | 26,550 | 56,038 | ||||||||||||
| Reinvestment of distributions: | ||||||||||||||||
| Institutional Shares | 1,236,172 | 188,021 | 54,569 | 51,770 | ||||||||||||
| Investor Shares | 307,350 | 53,278 | 202,302 | 45,388 | ||||||||||||
| Advisor Shares | 14,836 | 538 | 87 | 647 | ||||||||||||
| Redemption of shares: | ||||||||||||||||
| Institutional Shares | (44,100,589 | ) | (17,819,683 | ) | (17,973,135 | ) | (3,801,894 | ) | ||||||||
| Investor Shares | (3,721,563 | ) | (211,427 | ) | (15,355,320 | ) | (1,179,864 | ) | ||||||||
| Advisor Shares | (186,243 | ) | (9,321 | ) | (91,522 | ) | (11,945 | ) | ||||||||
| Increase (Decrease) in Shares Outstanding | 82,020,696 | 21,999,920 | 15,611,905 | 22,297,045 | ||||||||||||
The accompanying notes are an integral part of these financial statements.
www.brownadvisoryfunds.com
112
Statements of Changes in Net Assets
| BROWN ADVISORY | ||||||||
| EMERGING MARKETS | ||||||||
| SMALL-CAP FUND | ||||||||
| Year Ended | Period Ended | |||||||
| June 30, | June 30, | |||||||
| 2016 | 2015* | |||||||
| OPERATIONS | ||||||||
| Net investment income (loss) | $ | (85,965 | ) | $ | 199,181 | |||
| Net realized gain (loss) | (38,258,677 | ) | 7,874,779 | |||||
| Net change in unrealized appreciation (depreciation) | (1,666,992 | ) | 13,827,711 | |||||
| Increase (Decrease) in Net Assets from Operations | (40,011,634 | ) | 21,901,671 | |||||
| DISTRIBUTIONS TO SHAREHOLDERS FROM | ||||||||
| Net realized gain: | ||||||||
| Institutional Shares | (8,236,160 | ) | — | |||||
| Investor Shares | (267,081 | ) | — | |||||
| Total Distributions to Shareholders | (8,503,241 | ) | — | |||||
| CAPITAL SHARE TRANSACTIONS | ||||||||
| Sale of shares: | ||||||||
| Institutional Shares | 125,620,842 | 172,179,444 | ||||||
| Investor Shares | 7,501,704 | 19,556,483 | ||||||
| Reinvestment of distributions: | ||||||||
| Institutional Shares | 4,501,118 | — | ||||||
| Investor Shares | 244,075 | — | ||||||
| Redemption of shares: | ||||||||
| Institutional Shares | (60,180,293 | ) | (4,525,254 | ) | ||||
| Investor Shares | (18,088,567 | ) | (2,219,470 | ) | ||||
| Redemption fees: | ||||||||
| Institutional Shares | — | 46 | ||||||
| Investor Shares | 1 | — | ||||||
| Increase (Decrease) from Capital Share Transactions | 59,598,880 | 184,991,249 | ||||||
| Increase (Decrease) in Net Assets | 11,084,005 | 206,892,920 | ||||||
| NET ASSETS | ||||||||
| Beginning of year / period | 206,892,920 | — | ||||||
| End of year / period | $ | 217,976,925 | $ | 206,892,920 | ||||
| Undistributed (Accumulated) net investment income (loss) | $ | (501,587 | ) | $ | — | |||
| SHARE TRANSACTIONS | ||||||||
| Sale of shares: | ||||||||
| Institutional Shares | 12,939,592 | 16,476,173 | ||||||
| Investor Shares | 729,171 | 1,814,477 | ||||||
| Reinvestment of distributions: | ||||||||
| Institutional Shares | 463,679 | — | ||||||
| Investor Shares | 25,187 | — | ||||||
| Redemption of shares: | ||||||||
| Institutional Shares | (6,319,193 | ) | (418,641 | ) | ||||
| Investor Shares | (1,763,461 | ) | (190,007 | ) | ||||
| Increase (Decrease) in Shares Outstanding | 6,074,975 | 17,682,002 | ||||||
| * | Commenced operations on November 21, 2014. The information presented is for the period from November 21, 2014 to June 30, 2015. |
The accompanying notes are an integral part of these financial statements.
www.brownadvisoryfunds.com
113
Financial Highlights
These financial highlights reflect selected per share data and ratios for a share outstanding of the Fund throughout each year / period.
BROWN ADVISORY GROWTH EQUITY FUND
INSTITUTIONAL SHARES
| Year / Period Ended: | ||||||||||||||||
| June 30, | June 30, | June 30, | June 30, | |||||||||||||
| 2016 | 2015 | 2014 | 2013(g) | |||||||||||||
| Net Asset Value, Beginning of Year / Period | $ | 20.33 | $ | 19.10 | $ | 16.22 | $ | 14.58 | ||||||||
| Net Investment Income (Loss)(a) | (0.02 | ) | 0.02 | — | 0.01 | |||||||||||
| Net Realized And Unrealized Gains (Losses) | 0.13 | 1.82 | 2.99 | 1.66 | ||||||||||||
| Total from Investment Operations | $ | 0.11 | $ | 1.84 | $ | 2.99 | $ | 1.67 | ||||||||
| Distributions from: | ||||||||||||||||
| Net Investment Income | — | — | — | (0.03 | ) | |||||||||||
| Net Realized Gains | (1.28 | ) | (0.61 | ) | (0.11 | ) | — | |||||||||
| Total Distributions to Shareholders | $ | (1.28 | ) | $ | (0.61 | ) | $ | (0.11 | ) | $ | (0.03 | ) | ||||
| Redemption fees(a) | — | —(e | ) | —(e | ) | —(e | ) | |||||||||
| Net Asset Value, End of Year / Period | $ | 19.16 | $ | 20.33 | $ | 19.10 | $ | 16.22 | ||||||||
| Total Return | 0.49 | % | 9.73 | % | 18.46 | % | 11.49 | %(b) | ||||||||
| Net Assets at End of Year / Period (000’s Omitted) | $ | 253,640 | $ | 259,098 | $ | 233,627 | $ | 116,575 | ||||||||
| Ratios to Average Net Assets: | ||||||||||||||||
| Net Investment Income (Loss) | (0.12 | )% | 0.09 | % | 0.03 | % | 0.30 | %(c) | ||||||||
| Net Expenses | 0.72 | % | 0.72 | % | 0.74 | % | 0.78 | %(c) | ||||||||
| Gross Expenses(d) | 0.72 | % | 0.72 | % | 0.74 | % | 0.78 | %(c) | ||||||||
| Portfolio Turnover Rate | 24 | % | 24 | % | 25 | % | 40 | %(f) | ||||||||
| (a) | Calculated based on average shares outstanding during the year / period. |
| (b) | Not annualized. |
| (c) | Annualized. |
| (d) | Reflects the expense ratio excluding any waivers and/or expense reimbursements. |
| (e) | Less than $0.01 per share. |
| (f) | Reflects portfolio turnover at the Fund level for the year ended June 30, 2013. |
| (g) | Commenced operations on October 19, 2012. The information presented is for the period from October 19, 2012 to June 30, 2013. |
The accompanying notes are an integral part of these financial statements.
www.brownadvisoryfunds.com
114
Financial Highlights
These financial highlights reflect selected per share data and ratios for a share outstanding of the Fund throughout each year.
BROWN ADVISORY GROWTH EQUITY FUND
INVESTOR SHARES*
| Year Ended: | ||||||||||||||||||||
| June 30, | June 30, | June 30, | June 30, | June 30, | ||||||||||||||||
| 2016 | 2015 | 2014 | 2013 | 2012 | ||||||||||||||||
| Net Asset Value, Beginning of Year | $ | 20.26 | $ | 19.07 | $ | 16.21 | $ | 13.80 | $ | 13.63 | ||||||||||
| Net Investment Income (Loss)(a) | (0.05 | ) | (0.01 | ) | (0.02 | ) | 0.03 | (0.05 | ) | |||||||||||
| Net Realized And Unrealized Gains (Losses) | 0.13 | 1.81 | 2.99 | 2.41 | 0.22 | |||||||||||||||
| Total from Investment Operations | $ | 0.08 | $ | 1.80 | $ | 2.97 | $ | 2.44 | $ | 0.17 | ||||||||||
| Distributions from: | ||||||||||||||||||||
| Net Investment Income | — | — | — | (0.03 | ) | — | ||||||||||||||
| Net Realized Gains | (1.28 | ) | (0.61 | ) | (0.11 | ) | — | — | ||||||||||||
| Total Distributions to Shareholders | $ | (1.28 | ) | $ | (0.61 | ) | $ | (0.11 | ) | $ | (0.03 | ) | $ | — | ||||||
| Redemption fees(a) | —(c | ) | —(c | ) | —(c | ) | —(c | ) | —(c | ) | ||||||||||
| Net Asset Value, End of Year | $ | 19.06 | $ | 20.26 | $ | 19.07 | $ | 16.21 | $ | 13.80 | ||||||||||
| Total Return | 0.34 | % | 9.54 | % | 18.35 | % | 17.67 | % | 1.25 | % | ||||||||||
| Net Assets at End of Year (000’s Omitted) | $ | 1,916,472 | $ | 2,143,325 | $ | 2,497,036 | $ | 1,653,389 | $ | 954,560 | ||||||||||
| Ratios to Average Net Assets: | ||||||||||||||||||||
| Net Investment Income (Loss) | (0.27 | )% | (0.06 | )% | (0.12 | )% | 0.17 | % | (0.35 | )% | ||||||||||
| Net Expenses | 0.87 | % | 0.87 | % | 0.89 | % | 0.91 | % | 0.90 | % | ||||||||||
| Gross Expenses(b) | 0.87 | % | 0.87 | % | 0.89 | % | 0.91 | % | 0.90 | % | ||||||||||
| Portfolio Turnover Rate | 24 | % | 24 | % | 25 | % | 40 | % | 58 | % | ||||||||||
| (a) | Calculated based on average shares outstanding during the year. |
| (b) | Reflects the expense ratio excluding any waivers and/or expense reimbursements. |
| (c) | Less than $0.01 per share. |
| * | Prior to October 19, 2012, Investor Shares were known as Institutional Shares. |
The accompanying notes are an integral part of these financial statements.
www.brownadvisoryfunds.com
115
Financial Highlights
These financial highlights reflect selected per share data and ratios for a share outstanding of the Fund throughout each year.
BROWN ADVISORY GROWTH EQUITY FUND
ADVISOR SHARES
| Year Ended: | ||||||||||||||||||||
| June 30, | June 30, | June 30, | June 30, | June 30, | ||||||||||||||||
| 2016 | 2015 | 2014 | 2013 | 2012 | ||||||||||||||||
| Net Asset Value, Beginning of Year | $ | 19.60 | $ | 18.51 | $ | 15.78 | $ | 13.45 | $ | 13.31 | ||||||||||
| Net Investment Income (Loss)(a) | (0.10 | ) | (0.06 | ) | (0.07 | ) | (0.01 | ) | (0.07 | ) | ||||||||||
| Net Realized And Unrealized Gains (Losses) | 0.13 | 1.76 | 2.91 | 2.35 | 0.21 | |||||||||||||||
| Total from Investment Operations | $ | 0.03 | $ | 1.70 | $ | 2.84 | $ | 2.34 | $ | 0.14 | ||||||||||
| Distributions from: | ||||||||||||||||||||
| Net Investment Income | — | — | — | (0.01 | ) | — | ||||||||||||||
| Net Realized Gains | (1.28 | ) | (0.61 | ) | (0.11 | ) | — | — | ||||||||||||
| Total Distributions to Shareholders | $ | (1.28 | ) | $ | (0.61 | ) | $ | (0.11 | ) | $ | (0.01 | ) | $ | — | ||||||
| Redemption fees(a) | —(c | ) | —(c | ) | —(c | ) | —(c | ) | —(c | ) | ||||||||||
| Net Asset Value, End of Year | $ | 18.35 | $ | 19.60 | $ | 18.51 | $ | 15.78 | $ | 13.45 | ||||||||||
| Total Return | 0.09 | % | 9.28 | % | 18.02 | % | 17.43 | % | 1.05 | % | ||||||||||
| Net Assets at End of Year (000’s Omitted) | $ | 33,304 | $ | 44,587 | $ | 48,632 | $ | 21,478 | $ | 11,593 | ||||||||||
| Ratios to Average Net Assets: | ||||||||||||||||||||
| Net Investment Income (Loss) | (0.52 | )% | (0.31 | )% | (0.37 | )% | (0.07 | )% | (0.55 | )% | ||||||||||
| Net Expenses | 1.12 | % | 1.12 | % | 1.14 | % | 1.15 | % | 1.10 | % | ||||||||||
| Gross Expenses(b) | 1.12 | % | 1.12 | % | 1.14 | % | 1.15 | % | 1.10 | % | ||||||||||
| Portfolio Turnover Rate | 24 | % | 24 | % | 25 | % | 40 | % | 58 | % | ||||||||||
| (a) | Calculated based on average shares outstanding during the year. |
| (b) | Reflects the expense ratio excluding any waivers and/or expense reimbursements. |
| (c) | Less than $0.01 per share. |
The accompanying notes are an integral part of these financial statements.
www.brownadvisoryfunds.com
116
Financial Highlights
These financial highlights reflect selected per share data and ratios for a share outstanding of the Fund throughout each year / period.
BROWN ADVISORY VALUE EQUITY FUND
INSTITUTIONAL SHARES
| Year / Period Ended: | ||||||||||||||||
| June 30, | June 30, | June 30, | June 30, | |||||||||||||
| 2016 | 2015 | 2014 | 2013(f) | |||||||||||||
| Net Asset Value, Beginning of Year / Period | $ | 17.52 | $ | 18.75 | $ | 14.74 | $ | 13.05 | ||||||||
| Net Investment Income (Loss)(a) | 0.22 | 0.27 | 0.22 | 0.18 | ||||||||||||
| Net Realized And Unrealized Gains (Losses) | (1.73 | ) | (0.68 | ) | 3.95 | 1.74 | ||||||||||
| Total from Investment Operations | $ | (1.51 | ) | $ | (0.41 | ) | $ | 4.17 | $ | 1.92 | ||||||
| Distributions from: | ||||||||||||||||
| Net Investment Income | (0.23 | ) | (0.28 | ) | (0.16 | ) | (0.23 | ) | ||||||||
| Net Realized Gains | (1.96 | ) | (0.54 | ) | — | — | ||||||||||
| Total Distributions to Shareholders | $ | (2.19 | ) | $ | (0.82 | ) | $ | (0.16 | ) | $ | (0.23 | ) | ||||
| Redemption fees(a) | — | — | — | — | ||||||||||||
| Net Asset Value, End of Year / Period | $ | 13.82 | $ | 17.52 | $ | 18.75 | $ | 14.74 | ||||||||
| Total Return | (8.57 | )% | (2.20 | )% | 28.41 | % | 14.99 | %(b) | ||||||||
| Net Assets at End of Year / Period (000’s Omitted) | $ | 13 | $ | 14 | $ | 15 | $ | 12 | ||||||||
| Ratios to Average Net Assets: | ||||||||||||||||
| Net Investment Income (Loss) | 1.45 | % | 1.49 | % | 1.31 | % | 1.67 | %(c) | ||||||||
| Net Expenses | 0.77 | % | 0.75 | % | 0.77 | % | 0.81 | %(c) | ||||||||
| Gross Expenses(d) | 0.77 | % | 0.75 | % | 0.77 | % | 0.81 | %(c) | ||||||||
| Portfolio Turnover Rate | 38 | % | 45 | % | 37 | % | 57 | %(e) | ||||||||
| (a) | Calculated based on average shares outstanding during the year / period. |
| (b) | Not annualized. |
| (c) | Annualized. |
| (d) | Reflects the expense ratio excluding any waivers and/or expense reimbursements. |
| (e) | Reflects portfolio turnover at the Fund level for the year ended June 30, 2013. |
| (f) | Commenced operations on October 19, 2012. The information presented is for the period from October 19, 2012 to June 30, 2013. |
The accompanying notes are an integral part of these financial statements.
www.brownadvisoryfunds.com
117
Financial Highlights
These financial highlights reflect selected per share data and ratios for a share outstanding of the Fund throughout each year.
BROWN ADVISORY VALUE EQUITY FUND
INVESTOR SHARES*
| Year Ended: | ||||||||||||||||||||
| June 30, | June 30, | June 30, | June 30, | June 30, | ||||||||||||||||
| 2016 | 2015 | 2014 | 2013 | 2012 | ||||||||||||||||
| Net Asset Value, Beginning of Year | $ | 17.52 | $ | 18.75 | $ | 14.74 | $ | 12.30 | $ | 12.56 | ||||||||||
| Net Investment Income (Loss)(a) | 0.20 | 0.24 | 0.20 | 0.21 | 0.15 | |||||||||||||||
| Net Realized And Unrealized Gains (Losses) | (1.74 | ) | (0.68 | ) | 3.95 | 2.45 | (0.33 | ) | ||||||||||||
| Total from Investment Operations | $ | (1.54 | ) | $ | (0.44 | ) | $ | 4.15 | $ | 2.66 | $ | (0.18 | ) | |||||||
| Distributions from: | ||||||||||||||||||||
| Net Investment Income | (0.20 | ) | (0.25 | ) | (0.14 | ) | (0.22 | ) | (0.08 | ) | ||||||||||
| Net Realized Gains | (1.96 | ) | (0.54 | ) | — | — | — | |||||||||||||
| Total Distributions to Shareholders | $ | (2.16 | ) | $ | (0.79 | ) | $ | (0.14 | ) | $ | (0.22 | ) | $ | (0.08 | ) | |||||
| Redemption fees(a) | — | — | —(c | ) | —(c | ) | — | |||||||||||||
| Net Asset Value, End of Year | $ | 13.82 | $ | 17.52 | $ | 18.75 | $ | 14.74 | $ | 12.30 | ||||||||||
| Total Return | (8.74 | )% | (2.35 | )% | 28.26 | % | 21.91 | % | (1.35 | )% | ||||||||||
| Net Assets at End of Year (000’s Omitted) | $ | 51,467 | $ | 166,808 | $ | 241,666 | $ | 160,800 | $ | 156,226 | ||||||||||
| Ratios to Average Net Assets: | ||||||||||||||||||||
| Net Investment Income (Loss) | 1.30 | % | 1.34 | % | 1.16 | % | 1.54 | % | 1.27 | % | ||||||||||
| Net Expenses | 0.92 | % | 0.90 | % | 0.92 | % | 0.94 | % | 0.91 | % | ||||||||||
| Gross Expenses(b) | 0.92 | % | 0.90 | % | 0.92 | % | 0.94 | % | 0.91 | % | ||||||||||
| Portfolio Turnover Rate | 38 | % | 45 | % | 37 | % | 57 | % | 72 | % | ||||||||||
| (a) | Calculated based on average shares outstanding during the year. |
| (b) | Reflects the expense ratio excluding any waivers and/or expense reimbursements. |
| (c) | Less than $0.01 per share. |
| * | Prior to October 19, 2012, Investor Shares were known as Institutional Shares. |
The accompanying notes are an integral part of these financial statements.
www.brownadvisoryfunds.com
118
Financial Highlights
These financial highlights reflect selected per share data and ratios for a share outstanding of the Fund throughout each year.
BROWN ADVISORY VALUE EQUITY FUND
ADVISOR SHARES
| Year Ended: | ||||||||||||||||||||
| June 30, | June 30, | June 30, | June 30, | June 30, | ||||||||||||||||
| 2016 | 2015 | 2014 | 2013 | 2012 | ||||||||||||||||
| Net Asset Value, Beginning of Year | $ | 17.62 | $ | 18.85 | $ | 14.82 | $ | 12.36 | $ | 12.62 | ||||||||||
| Net Investment Income (Loss)(a) | 0.16 | 0.20 | 0.15 | 0.16 | 0.13 | |||||||||||||||
| Net Realized And Unrealized Gains (Losses) | (1.74 | ) | (0.69 | ) | 3.98 | 2.49 | (0.32 | ) | ||||||||||||
| Total from Investment Operations | $ | (1.58 | ) | $ | (0.49 | ) | $ | 4.13 | $ | 2.65 | $ | (0.19 | ) | |||||||
| Distributions from: | ||||||||||||||||||||
| Net Investment Income | (0.17 | ) | (0.20 | ) | (0.10 | ) | (0.19 | ) | (0.07 | ) | ||||||||||
| Net Realized Gains | (1.96 | ) | (0.54 | ) | — | — | — | |||||||||||||
| Total Distributions to Shareholders | $ | (2.13 | ) | $ | (0.74 | ) | $ | (0.10 | ) | $ | (0.19 | ) | $ | (0.07 | ) | |||||
| Redemption fees(a) | — | —(c | ) | — | — | — | ||||||||||||||
| Net Asset Value, End of Year | $ | 13.91 | $ | 17.62 | $ | 18.85 | $ | 14.82 | $ | 12.36 | ||||||||||
| Total Return | (8.97 | )% | (2.61 | )% | 27.90 | % | 21.63 | % | (1.45 | )% | ||||||||||
| Net Assets at End of Year (000’s Omitted) | $ | 917 | $ | 1,183 | $ | 1,635 | $ | 1,615 | $ | 2,201 | ||||||||||
| Ratios to Average Net Assets: | ||||||||||||||||||||
| Net Investment Income (Loss) | 1.05 | % | 1.09 | % | 0.91 | % | 1.31 | % | 1.07 | % | ||||||||||
| Net Expenses | 1.17 | % | 1.15 | % | 1.17 | % | 1.17 | % | 1.11 | % | ||||||||||
| Gross Expenses(b) | 1.17 | % | 1.15 | % | 1.17 | % | 1.17 | % | 1.11 | % | ||||||||||
| Portfolio Turnover Rate | 38 | % | 45 | % | 37 | % | 57 | % | 72 | % | ||||||||||
| (a) | Calculated based on average shares outstanding during the year. |
| (b) | Reflects the expense ratio excluding any waivers and/or expense reimbursements. |
| (c) | Less than $0.01 per share. |
The accompanying notes are an integral part of these financial statements.
www.brownadvisoryfunds.com
119
Financial Highlights
These financial highlights reflect selected per share data and ratios for a share outstanding of the Fund throughout each year / period.
BROWN ADVISORY FLEXIBLE EQUITY FUND
INSTITUTIONAL SHARES
| Year / Period Ended: | ||||||||||||||||
| June 30, | June 30, | June 30, | June 30, | |||||||||||||
| 2016 | 2015 | 2014 | 2013(f) | |||||||||||||
| Net Asset Value, Beginning of Year / Period | $ | 15.92 | $ | 14.81 | $ | 12.28 | $ | 10.46 | ||||||||
| Net Investment Income (Loss)(a) | 0.11 | 0.12 | 0.09 | 0.06 | ||||||||||||
| Net Realized And Unrealized Gains (Losses) | (0.77 | ) | 1.08 | 2.49 | 1.82 | |||||||||||
| Total from Investment Operations | $ | (0.66 | ) | $ | 1.20 | $ | 2.58 | $ | 1.88 | |||||||
| Distributions from: | ||||||||||||||||
| Net Investment Income | (0.11 | ) | (0.09 | ) | (0.05 | ) | (0.06 | ) | ||||||||
| Total Distributions to Shareholders | $ | (0.11 | ) | $ | (0.09 | ) | $ | (0.05 | ) | $ | (0.06 | ) | ||||
| Redemption fees(a) | — | — | — | — | ||||||||||||
| Net Asset Value, End of Year / Period | $ | 15.15 | $ | 15.92 | $ | 14.81 | $ | 12.28 | ||||||||
| Total Return | (4.16 | )% | 8.09 | % | 21.06 | % | 18.07 | %(b) | ||||||||
| Net Assets at End of Year / Period (000’s Omitted) | $ | 24,012 | $ | 4,240 | $ | 3,126 | $ | 12 | ||||||||
| Ratios to Average Net Assets: | ||||||||||||||||
| Net Investment Income (Loss) | 0.71 | % | 0.76 | % | 0.66 | % | 0.65 | %(c) | ||||||||
| Net Expenses | 0.73 | % | 0.76 | % | 0.82 | % | 1.00 | %(c) | ||||||||
| Gross Expenses(d) | 0.73 | % | 0.76 | % | 0.81 | % | 0.88 | %(c) | ||||||||
| Portfolio Turnover Rate | 15 | % | 7 | % | 15 | % | 12 | %(e) | ||||||||
| (a) | Calculated based on average shares outstanding during the year / period. |
| (b) | Not annualized. |
| (c) | Annualized. |
| (d) | Reflects the expense ratio excluding any waivers or recoupments. |
| (e) | Reflects portfolio turnover at the Fund level for the year ended June 30, 2013. |
| (f) | Commenced operations on October 19, 2012. The information presented is for the period from October 19, 2012 to June 30, 2013. |
The accompanying notes are an integral part of these financial statements.
www.brownadvisoryfunds.com
120
Financial Highlights
These financial highlights reflect selected per share data and ratios for a share outstanding of the Fund throughout each year.
BROWN ADVISORY FLEXIBLE EQUITY FUND
INVESTOR SHARES*
| Year Ended: | ||||||||||||||||||||
| June 30, | June 30, | June 30, | June 30, | June 30, | ||||||||||||||||
| 2016 | 2015 | 2014 | 2013 | 2012 | ||||||||||||||||
| Net Asset Value, Beginning of Year | $ | 15.89 | $ | 14.79 | $ | 12.28 | $ | 9.68 | $ | 9.16 | ||||||||||
| Net Investment Income (Loss)(a) | 0.08 | 0.10 | 0.07 | 0.05 | 0.05 | |||||||||||||||
| Net Realized And Unrealized Gains (Losses) | (0.76 | ) | 1.07 | 2.48 | 2.60 | 0.50 | ||||||||||||||
| Total from Investment Operations | $ | (0.68 | ) | $ | 1.17 | $ | 2.55 | $ | 2.65 | $ | 0.55 | |||||||||
| Distributions from: | ||||||||||||||||||||
| Net Investment Income | (0.09 | ) | (0.07 | ) | (0.04 | ) | (0.05 | ) | (0.03 | ) | ||||||||||
| Total Distributions to Shareholders | $ | (0.09 | ) | $ | (0.07 | ) | $ | (0.04 | ) | $ | (0.05 | ) | $ | (0.03 | ) | |||||
| Redemption fees(a) | —(c | ) | —(c | ) | —(c | ) | — | — | ||||||||||||
| Net Asset Value, End of Year | $ | 15.12 | $ | 15.89 | $ | 14.79 | $ | 12.28 | $ | 9.68 | ||||||||||
| Total Return | (4.30 | )% | 7.92 | % | 20.78 | % | 27.51 | % | 5.98 | % | ||||||||||
| Net Assets at End of Year (000’s Omitted) | $ | 306,456 | $ | 268,569 | $ | 162,615 | $ | 82,783 | $ | 37,477 | ||||||||||
| Ratios to Average Net Assets: | ||||||||||||||||||||
| Net Investment Income (Loss) | 0.56 | % | 0.61 | % | 0.51 | % | 0.50 | % | 0.52 | % | ||||||||||
| Net Expenses | 0.88 | % | 0.91 | % | 0.97 | % | 1.15 | % | 1.15 | % | ||||||||||
| Gross Expenses(b) | 0.88 | % | 0.91 | % | 0.96 | % | 1.05 | % | 1.18 | % | ||||||||||
| Portfolio Turnover Rate | 15 | % | 7 | % | 15 | % | 12 | % | 19 | % | ||||||||||
| (a) | Calculated based on average shares outstanding during the year. |
| (b) | Reflects the expense ratio excluding any waivers or recoupments. |
| (c) | Less than $0.01 per share. |
| * | Prior to October 19, 2012, Investor Shares were known as Institutional Shares. |
The accompanying notes are an integral part of these financial statements.
www.brownadvisoryfunds.com
121
Financial Highlights
These financial highlights reflect selected per share data and ratios for a share outstanding of the Fund throughout each year.
BROWN ADVISORY FLEXIBLE EQUITY FUND
ADVISOR SHARES
| Year Ended: | ||||||||||||||||||||
| June 30, | June 30, | June 30, | June 30, | June 30, | ||||||||||||||||
| 2016 | 2015 | 2014 | 2013 | 2012 | ||||||||||||||||
| Net Asset Value, Beginning of Year | $ | 15.88 | $ | 14.77 | $ | 12.28 | $ | 9.68 | $ | 9.17 | ||||||||||
| Net Investment Income (Loss)(a) | 0.05 | 0.06 | 0.04 | 0.02 | 0.03 | |||||||||||||||
| Net Realized And Unrealized Gains (Losses) | (0.77 | ) | 1.07 | 2.48 | 2.61 | 0.49 | ||||||||||||||
| Total from Investment Operations | $ | (0.72 | ) | $ | 1.13 | $ | 2.52 | $ | 2.63 | $ | 0.52 | |||||||||
| Distributions from: | ||||||||||||||||||||
| Net Investment Income | (0.04 | ) | (0.02 | ) | (0.03 | ) | (0.03 | ) | (0.01 | ) | ||||||||||
| Total Distributions to Shareholders | $ | (0.04 | ) | $ | (0.02 | ) | $ | (0.03 | ) | $ | (0.03 | ) | $ | (0.01 | ) | |||||
| Redemption fees(a) | —(c | ) | — | — | — | — | ||||||||||||||
| Net Asset Value, End of Year | $ | 15.12 | $ | 15.88 | $ | 14.77 | $ | 12.28 | $ | 9.68 | ||||||||||
| Total Return | (4.56 | )% | 7.68 | % | 20.52 | % | 27.25 | % | 5.73 | % | ||||||||||
| Net Assets at End of Year (000’s Omitted) | $ | 7,168 | $ | 11,540 | $ | 14,831 | $ | 6,115 | $ | 1,079 | ||||||||||
| Ratios to Average Net Assets: | ||||||||||||||||||||
| Net Investment Income (Loss) | 0.31 | % | 0.36 | % | 0.26 | % | 0.30 | % | 0.32 | % | ||||||||||
| Net Expenses | 1.13 | % | 1.16 | % | 1.22 | % | 1.35 | % | 1.35 | % | ||||||||||
| Gross Expenses(b) | 1.13 | % | 1.16 | % | 1.21 | % | 1.30 | % | 1.38 | % | ||||||||||
| Portfolio Turnover Rate | 15 | % | 7 | % | 15 | % | 12 | % | 19 | % | ||||||||||
| (a) | Calculated based on average shares outstanding during the year. |
| (b) | Reflects the expense ratio excluding any waivers or recoupments. |
| (c) | Less than $0.01 per share. |
The accompanying notes are an integral part of these financial statements.
www.brownadvisoryfunds.com
122
Financial Highlights
These financial highlights reflect selected per share data and ratios for a share outstanding of the Fund throughout each year / period.
BROWN ADVISORY EQUITY INCOME FUND
INSTITUTIONAL SHARES
| Year / Period Ended: | ||||||||||||||||
| June 30, | June 30, | June 30, | June 30, | |||||||||||||
| 2016 | 2015 | 2014 | 2013(f) | |||||||||||||
| Net Asset Value, Beginning of Year / Period | $ | 13.14 | $ | 13.70 | $ | 12.16 | $ | 11.07 | ||||||||
| Net Investment Income (Loss)(a) | 0.28 | 0.29 | 0.29 | 0.21 | ||||||||||||
| Net Realized And Unrealized Gains (Losses) | (0.13 | ) | 0.08 | 1.99 | 1.19 | |||||||||||
| Total from Investment Operations | $ | 0.15 | $ | 0.37 | $ | 2.28 | $ | 1.40 | ||||||||
| Distributions from: | ||||||||||||||||
| Net Investment Income | (0.29 | ) | (0.30 | ) | (0.29 | ) | (0.23 | ) | ||||||||
| Net Realized Gains | (0.13 | ) | (0.63 | ) | (0.45 | ) | (0.08 | ) | ||||||||
| Total Distributions to Shareholders | $ | (0.42 | ) | $ | (0.93 | ) | $ | (0.74 | ) | $ | (0.31 | ) | ||||
| Redemption fees(a) | — | — | — | — | ||||||||||||
| Net Asset Value, End of Year / Period | $ | 12.87 | $ | 13.14 | $ | 13.70 | $ | 12.16 | ||||||||
| Total Return | 1.31 | % | 2.60 | % | 19.30 | % | 12.88 | %(b) | ||||||||
| Net Assets at End of Year / Period (000’s Omitted) | $ | 13,840 | $ | 18,134 | $ | 17,663 | $ | 11 | ||||||||
| Ratios to Average Net Assets: | ||||||||||||||||
| Net Investment Income (Loss) | 2.24 | % | 2.16 | % | 2.23 | % | 2.53 | %(c) | ||||||||
| Net Expenses | 0.75 | % | 0.75 | % | 0.77 | % | 0.80 | %(c) | ||||||||
| Gross Expenses(d) | 0.75 | % | 0.75 | % | 0.77 | % | 0.80 | %(c) | ||||||||
| Portfolio Turnover Rate | 17 | % | 18 | % | 32 | % | 21 | %(e) | ||||||||
| (a) | Calculated based on average shares outstanding during the year / period. |
| (b) | Not annualized. |
| (c) | Annualized. |
| (d) | Reflects the expense ratio excluding any waivers and/or expense reimbursements. |
| (e) | Reflects portfolio turnover at the Fund level for the year ended June 30, 2013. |
| (f) | Commenced operations on October 19, 2012. The information presented is for the period from October 19, 2012 to June 30, 2013. |
The accompanying notes are an integral part of these financial statements.
www.brownadvisoryfunds.com
123
Financial Highlights
These financial highlights reflect selected per share data and ratios for a share outstanding of the Fund throughout each year / period.
BROWN ADVISORY EQUITY INCOME FUND
INVESTOR SHARES*
| Year / Period Ended: | ||||||||||||||||||||
| June 30, | June 30, | June 30, | June 30, | June 30, | ||||||||||||||||
| 2016 | 2015 | 2014 | 2013 | 2012(f) | ||||||||||||||||
| Net Asset Value, Beginning of Year / Period | $ | 13.13 | $ | 13.69 | $ | 12.16 | $ | 10.49 | $ | 10.00 | ||||||||||
| Net Investment Income (Loss)(a) | 0.26 | 0.27 | 0.27 | 0.27 | 0.15 | |||||||||||||||
| Net Realized And Unrealized Gains (Losses) | (0.13 | ) | 0.08 | 1.98 | 1.76 | 0.46 | ||||||||||||||
| Total from Investment Operations | $ | 0.13 | $ | 0.35 | $ | 2.25 | $ | 2.03 | $ | 0.61 | ||||||||||
| Distributions from: | ||||||||||||||||||||
| Net Investment Income | (0.27 | ) | (0.28 | ) | (0.27 | ) | (0.28 | ) | (0.12 | ) | ||||||||||
| Net Realized Gains | (0.13 | ) | (0.63 | ) | (0.45 | ) | (0.08 | ) | — | |||||||||||
| Total Distributions to Shareholders | $ | (0.40 | ) | $ | (0.91 | ) | $ | (0.72 | ) | $ | (0.36 | ) | $ | (0.12 | ) | |||||
| Redemption fees(a) | — | — | — | —(e | ) | —(e | ) | |||||||||||||
| Net Asset Value, End of Year / Period | $ | 12.86 | $ | 13.13 | $ | 13.69 | $ | 12.16 | $ | 10.49 | ||||||||||
| Total Return | 1.15 | % | 2.45 | % | 19.04 | % | 19.62 | % | 6.11 | %(b) | ||||||||||
| Net Assets at End of Year / Period (000’s Omitted) | $ | 112,116 | $ | 183,001 | $ | 180,372 | $ | 173,599 | $ | 106,075 | ||||||||||
| Ratios to Average Net Assets: | ||||||||||||||||||||
| Net Investment Income (Loss) | 2.09 | % | 2.01 | % | 2.08 | % | 2.37 | % | 2.82 | %(c) | ||||||||||
| Net Expenses | 0.90 | % | 0.90 | % | 0.92 | % | 0.96 | % | 0.99 | %(c) | ||||||||||
| Gross Expenses(d) | 0.90 | % | 0.90 | % | 0.92 | % | 0.96 | % | 0.99 | %(c) | ||||||||||
| Portfolio Turnover Rate | 17 | % | 18 | % | 32 | % | 21 | % | 14 | %(b) | ||||||||||
| (a) | Calculated based on average shares outstanding during the year / period. |
| (b) | Not annualized. |
| (c) | Annualized. |
| (d) | Reflects the expense ratio excluding any waivers and/or expense reimbursements. |
| (e) | Less than $0.01 per share. |
| (f) | Commenced operations on December 29, 2011. The information presented is for the period from December 29, 2011 to June 30, 2012. |
| * | Prior to October 19, 2012, Investor Shares were known as Institutional Shares. |
The accompanying notes are an integral part of these financial statements.
www.brownadvisoryfunds.com
124
Financial Highlights
These financial highlights reflect selected per share data and ratios for a share outstanding of the Fund throughout each year / period.
BROWN ADVISORY EQUITY INCOME FUND
ADVISOR SHARES
| Year / Period Ended: | ||||||||||||||||||||
| June 30, | June 30, | June 30, | June 30, | June 30, | ||||||||||||||||
| 2016 | 2015 | 2014 | 2013 | 2012(f) | ||||||||||||||||
| Net Asset Value, Beginning of Year / Period | $ | 13.11 | $ | 13.67 | $ | 12.14 | $ | 10.48 | $ | 10.00 | ||||||||||
| Net Investment Income (Loss)(a) | 0.23 | 0.24 | 0.24 | 0.25 | 0.14 | |||||||||||||||
| Net Realized And Unrealized Gains (Losses) | (0.13 | ) | 0.07 | 1.98 | 1.75 | 0.46 | ||||||||||||||
| Total from Investment Operations | $ | 0.10 | $ | 0.31 | $ | 2.22 | $ | 2.00 | $ | 0.60 | ||||||||||
| Distributions from: | ||||||||||||||||||||
| Net Investment Income | (0.24 | ) | (0.24 | ) | (0.24 | ) | (0.26 | ) | (0.12 | ) | ||||||||||
| Net Realized Gains | (0.13 | ) | (0.63 | ) | (0.45 | ) | (0.08 | ) | — | |||||||||||
| Total Distributions to Shareholders | $ | (0.37 | ) | $ | (0.87 | ) | $ | (0.69 | ) | $ | (0.34 | ) | $ | (0.12 | ) | |||||
| Redemption fees(a) | — | — | — | — | —(e | ) | ||||||||||||||
| Net Asset Value, End of Year / Period | $ | 12.84 | $ | 13.11 | $ | 13.67 | $ | 12.14 | $ | 10.48 | ||||||||||
| Total Return | 0.90 | % | 2.19 | % | 18.79 | % | 19.33 | % | 5.95 | %(b) | ||||||||||
| Net Assets at End of Year / Period (000’s Omitted) | $ | 2,980 | $ | 3,148 | $ | 3,298 | $ | 2,346 | $ | 636 | ||||||||||
| Ratios to Average Net Assets: | ||||||||||||||||||||
| Net Investment Income (Loss) | 1.84 | % | 1.76 | % | 1.83 | % | 2.13 | % | 2.60 | %(c) | ||||||||||
| Net Expenses | 1.15 | % | 1.15 | % | 1.17 | % | 1.20 | % | 1.19 | %(c) | ||||||||||
| Gross Expenses (d) | 1.15 | % | 1.15 | % | 1.17 | % | 1.20 | % | 1.19 | %(c) | ||||||||||
| Portfolio Turnover Rate | 17 | % | 18 | % | 32 | % | 21 | % | 14 | %(b) | ||||||||||
| (a) | Calculated based on average shares outstanding during the year / period. |
| (b) | Not annualized. |
| (c) | Annualized. |
| (d) | Reflects the expense ratio excluding any waivers and/or expense reimbursements. |
| (e) | Less than $0.01 per share. |
| (f) | Commenced operations on December 29, 2011. The information presented is for the period from December 29, 2011 to June 30, 2012. |
The accompanying notes are an integral part of these financial statements.
www.brownadvisoryfunds.com
125
Financial Highlights
These financial highlights reflect selected per share data and ratios for a share outstanding of the Fund throughout each year.
BROWN ADVISORY SUSTAINABLE GROWTH FUND*
INSTITUTIONAL SHARES
| Year Ended: | ||||||||||||||||
| June 30, | June 30, | June 30, | June 30, | |||||||||||||
| 2016 | 2015 | 2014 | 2013 | |||||||||||||
| Net Asset Value, Beginning of Year | $ | 15.69 | $ | 14.11 | $ | 11.64 | $ | 10.00 | ||||||||
| Net Investment Income (Loss)(a) | (0.02 | ) | (0.02 | ) | — | — | ||||||||||
| Net Realized And Unrealized Gains (Losses) | 1.13 | 1.91 | 2.61 | 1.65 | ||||||||||||
| Total from Investment Operations | $ | 1.11 | $ | 1.89 | $ | 2.61 | $ | 1.65 | ||||||||
| Distributions from: | ||||||||||||||||
| Net Realized Gains | (0.75 | ) | (0.31 | ) | (0.14 | ) | (0.01 | ) | ||||||||
| Total Distributions to Shareholders | $ | (0.75 | ) | $ | (0.31 | ) | $ | (0.14 | ) | $ | (0.01 | ) | ||||
| Redemption fees(a) | —(c | ) | —(c | ) | — | — | ||||||||||
| Net Asset Value, End of Year | $ | 16.05 | $ | 15.69 | $ | 14.11 | $ | 11.64 | ||||||||
| Total Return | 7.17 | % | 13.50 | % | 22.51 | % | 16.47 | % | ||||||||
| Net Assets at End of Year (000’s Omitted) | $ | 122,008 | $ | 67,789 | $ | 30,374 | $ | 32,045 | ||||||||
| Ratios to Average Net Assets: | ||||||||||||||||
| Net Investment Income (Loss) | (0.11 | )% | (0.11 | )% | (0.01 | )% | 0.03 | % | ||||||||
| Net Expenses | 0.74 | % | 0.75 | % | 0.77 | % | 0.86 | % | ||||||||
| Gross Expenses(b) | 0.74 | % | 0.75 | % | 0.77 | % | 0.86 | % | ||||||||
| Portfolio Turnover Rate | 30 | % | 37 | % | 30 | % | 30 | % | ||||||||
| (a) | Calculated based on average shares outstanding during the year. |
| (b) | Reflects the expense ratio excluding any waivers and/or expense reimbursements. |
| (c) | Less than $0.01 per share. |
| * | Commenced operations on June 29, 2012. No financial highlights are presented for the period from June 29, 2012 to June 30, 2012, as the Fund did not make any investments, earn any income or incur any expenses during the Year. |
The accompanying notes are an integral part of these financial statements.
www.brownadvisoryfunds.com
126
Financial Highlights
These financial highlights reflect selected per share data and ratios for a share outstanding of the Fund throughout each year.
BROWN ADVISORY SUSTAINABLE GROWTH FUND*
INVESTOR SHARES
| Year Ended: | ||||||||||||||||
| June 30, | June 30, | June 30, | June 30, | |||||||||||||
| 2016 | 2015 | 2014 | 2013 | |||||||||||||
| Net Asset Value, Beginning of Year | $ | 15.61 | $ | 14.06 | $ | 11.62 | $ | 10.00 | ||||||||
| Net Investment Income (Loss)(a) | (0.04 | ) | (0.04 | ) | (0.02 | ) | (0.01 | ) | ||||||||
| Net Realized And Unrealized Gains (Losses) | 1.12 | 1.90 | 2.60 | 1.64 | ||||||||||||
| Total from Investment Operations | $ | 1.08 | $ | 1.86 | $ | 2.58 | $ | 1.63 | ||||||||
| Distributions from: | ||||||||||||||||
| Net Realized Gains | (0.75 | ) | (0.31 | ) | (0.14 | ) | (0.01 | ) | ||||||||
| Total Distributions to Shareholders | $ | (0.75 | ) | $ | (0.31 | ) | $ | (0.14 | ) | $ | (0.01 | ) | ||||
| Redemption fees(a) | —(c | ) | —(c | ) | — | — | ||||||||||
| Net Asset Value, End of Year | $ | 15.94 | $ | 15.61 | $ | 14.06 | $ | 11.62 | ||||||||
| Total Return | 7.01 | % | 13.34 | % | 22.29 | % | 16.27 | % | ||||||||
| Net Assets at End of Year (000’s Omitted) | $ | 25,676 | $ | 11,206 | $ | 46,823 | $ | 24,028 | ||||||||
| Ratios to Average Net Assets: | ||||||||||||||||
| Net Investment Income (Loss) | (0.26 | )% | (0.26 | )% | (0.16 | )% | (0.12 | )% | ||||||||
| Net Expenses | 0.89 | % | 0.90 | % | 0.92 | % | 1.01 | % | ||||||||
| Gross Expenses(b) | 0.89 | % | 0.90 | % | 0.92 | % | 1.01 | % | ||||||||
| Portfolio Turnover Rate | 30 | % | 37 | % | 30 | % | 30 | % | ||||||||
| (a) | Calculated based on average shares outstanding during the year. |
| (b) | Reflects the expense ratio excluding any waivers and/or expense reimbursements. |
| (c) | Less than $0.01 per share. |
| * | Commenced operations on June 29, 2012. No financial highlights are presented for the period from June 29, 2012 to June 30, 2012, as the Fund did not make any investments, earn any income or incur any expenses during the Year. |
The accompanying notes are an integral part of these financial statements.
www.brownadvisoryfunds.com
127
Financial Highlights
These financial highlights reflect selected per share data and ratios for a share outstanding of the Fund throughout each year.
BROWN ADVISORY SUSTAINABLE GROWTH FUND*
ADVISOR SHARES
| Year Ended: | ||||||||||||||||
| June 30, | June 30, | June 30, | June 30, | |||||||||||||
| 2016 | 2015 | 2014 | 2013 | |||||||||||||
| Net Asset Value, Beginning of Year | $ | 15.50 | $ | 14.00 | $ | 11.60 | $ | 10.00 | ||||||||
| Net Investment Income (Loss)(a) | (0.08 | ) | (0.07 | ) | (0.05 | ) | (0.04 | ) | ||||||||
| Net Realized And Unrealized Gains (Losses) | 1.11 | 1.88 | 2.59 | 1.65 | ||||||||||||
| Total from Investment Operations | $ | 1.03 | $ | 1.81 | $ | 2.54 | $ | 1.61 | ||||||||
| Distributions from: | ||||||||||||||||
| Net Realized Gains | (0.75 | ) | (0.31 | ) | (0.14 | ) | (0.01 | ) | ||||||||
| Total Distributions to Shareholders | $ | (0.75 | ) | $ | (0.31 | ) | $ | (0.14 | ) | $ | (0.01 | ) | ||||
| Redemption fees(a) | —(c | ) | —(c | ) | —(c | ) | —(c | ) | ||||||||
| Net Asset Value, End of Year | $ | 15.78 | $ | 15.50 | $ | 14.00 | $ | 11.60 | ||||||||
| Total Return | 6.73 | % | 13.03 | % | 21.99 | % | 16.07 | % | ||||||||
| Net Assets at End of Year (000’s Omitted) | $ | 201,727 | $ | 137,410 | $ | 132,846 | $ | 124,256 | ||||||||
| Ratios to Average Net Assets: | ||||||||||||||||
| Net Investment Income (Loss) | (0.51 | )% | (0.51 | )% | (0.41 | )% | (0.37 | )% | ||||||||
| Net Expenses | 1.14 | % | 1.15 | % | 1.17 | % | 1.26 | % | ||||||||
| Gross Expenses (b) | 1.14 | % | 1.15 | % | 1.17 | % | 1.26 | % | ||||||||
| Portfolio Turnover Rate | 30 | % | 37 | % | 30 | % | 30 | % | ||||||||
| (a) | Calculated based on average shares outstanding during the year. |
| (b) | Reflects the expense ratio excluding any waivers and/or expense reimbursements. |
| (c) | Less than $0.01 per share. |
| * | Commenced operations on June 29, 2012. No financial highlights are presented for the period from June 29, 2012 to June 30, 2012, as the Fund did not make any investments, earn any income or incur any expenses during the period. |
The accompanying notes are an integral part of these financial statements.
www.brownadvisoryfunds.com
128
Financial Highlights
These financial highlights reflect selected per share data and ratios for a share outstanding of the Fund throughout each year.
BROWN ADVISORY SMALL-CAP GROWTH FUND
INSTITUTIONAL SHARES*
| Year Ended: | ||||||||||||||||||||
| June 30, | June 30, | June 30, | June 30, | June 30, | ||||||||||||||||
| 2016 | 2015 | 2014 | 2013 | 2012 | ||||||||||||||||
| Net Asset Value, Beginning of Year | $ | 35.91 | $ | 35.85 | $ | 31.67 | $ | 28.36 | $ | 29.56 | ||||||||||
| Net Investment Income Loss(a) | (0.14 | ) | (0.18 | ) | (0.22 | ) | (0.07 | ) | (0.21 | ) | ||||||||||
| Net Realized And Unrealized Gains (Losses) | 0.51 | 4.45 | 6.08 | 6.07 | (0.72 | ) | ||||||||||||||
| Total from Investment Operations | $ | 0.37 | $ | 4.27 | $ | 5.86 | $ | 6.00 | $ | (0.93 | ) | |||||||||
| Distributions from: | ||||||||||||||||||||
| Net Realized Gains | (5.09 | ) | (4.21 | ) | (1.68 | ) | (2.69 | ) | (0.27 | ) | ||||||||||
| Total Distributions to Shareholders | $ | (5.09 | ) | $ | (4.21 | ) | $ | (1.68 | ) | $ | (2.69 | ) | $ | (0.27 | ) | |||||
| Redemption fees(a) | — | — | — | — | — | |||||||||||||||
| Net Asset Value, End of Year | $ | 31.19 | $ | 35.91 | $ | 35.85 | $ | 31.67 | $ | 28.36 | ||||||||||
| Total Return | 1.61 | % | 12.98 | % | 18.59 | % | 22.84 | % | (3.08 | )% | ||||||||||
| Net Assets at End of Year (000’s Omitted) | $ | 17,037 | $ | 12,841 | $ | 8,497 | $ | 7,347 | $ | 6,944 | ||||||||||
| Ratios to Average Net Assets: | ||||||||||||||||||||
| Net Investment Income (Loss) | (0.45 | )% | (0.51 | )% | (0.63 | )% | (0.24 | )% | (0.77 | )% | ||||||||||
| Net Expenses | 0.98 | % | 0.99 | % | 1.01 | % | 1.05 | % | 1.11 | % | ||||||||||
| Gross Expenses(b) | 0.98 | % | 0.99 | % | 1.01 | % | 1.05 | % | 1.11 | % | ||||||||||
| Portfolio Turnover Rate | 32 | % | 28 | % | 19 | % | 48 | % | 66 | % | ||||||||||
| (a) | Calculated based on average shares outstanding during the year. |
| (b) | Reflects the expense ratio excluding any waivers and/or expense reimbursements. |
| * | Prior to October 19, 2012, Institutional Shares were known as D Shares. |
The accompanying notes are an integral part of these financial statements.
www.brownadvisoryfunds.com
129
Financial Highlights
These financial highlights reflect selected per share data and ratios for a share outstanding of the Fund throughout each year.
BROWN ADVISORY SMALL-CAP GROWTH FUND
INVESTOR SHARES*
| Year Ended: | ||||||||||||||||||||
| June 30, | June 30, | June 30, | June 30, | June 30, | ||||||||||||||||
| 2016 | 2015 | 2014 | 2013 | 2012 | ||||||||||||||||
| Net Asset Value, Beginning of Year | $ | 18.05 | $ | 18.04 | $ | 15.96 | $ | 14.31 | $ | 15.07 | ||||||||||
| Net Investment Income Loss(a) | (0.10 | ) | (0.11 | ) | (0.14 | ) | (0.05 | ) | (0.11 | ) | ||||||||||
| Net Realized And Unrealized Gains (Losses) | 0.26 | 2.24 | 3.07 | 3.06 | (0.38 | ) | ||||||||||||||
| Total from Investment Operations | $ | 0.16 | $ | 2.13 | $ | 2.93 | $ | 3.01 | $ | (0.49 | ) | |||||||||
| Distributions from: | ||||||||||||||||||||
| Net Realized Gains | (2.56 | ) | (2.12 | ) | (0.85 | ) | (1.36 | ) | (0.27 | ) | ||||||||||
| Total Distributions to Shareholders | $ | (2.56 | ) | $ | (2.12 | ) | $ | (0.85 | ) | $ | (1.36 | ) | $ | (0.27 | ) | |||||
| Redemption fees(a) | —(c | ) | —(c | ) | —(c | ) | —(c | ) | —(c | ) | ||||||||||
| Net Asset Value, End of Year | $ | 15.65 | $ | 18.05 | $ | 18.04 | $ | 15.96 | $ | 14.31 | ||||||||||
| Total Return | 1.43 | % | 12.86 | % | 18.42 | % | 22.68 | % | (3.12 | )% | ||||||||||
| Net Assets at End of Year (000’s Omitted) | $ | 268,390 | $ | 262,426 | $ | 285,287 | $ | 281,027 | $ | 215,311 | ||||||||||
| Ratios to Average Net Assets: | ||||||||||||||||||||
| Net Investment Income (Loss) | (0.60 | )% | (0.66 | )% | (0.78 | )% | (0.36 | )% | (0.82 | )% | ||||||||||
| Net Expenses | 1.13 | % | 1.14 | % | 1.16 | % | 1.17 | % | 1.16 | % | ||||||||||
| Gross Expenses(b) | 1.13 | % | 1.14 | % | 1.16 | % | 1.17 | % | 1.16 | % | ||||||||||
| Portfolio Turnover Rate | 32 | % | 28 | % | 19 | % | 48 | % | 66 | % | ||||||||||
| (a) | Calculated based on average shares outstanding during the year. |
| (b) | Reflects the expense ratio excluding any waivers and/or expense reimbursements. |
| (c) | Less than $0.01 per share. |
| * | Prior to October 19, 2012, Investor Shares were known as Institutional Shares. |
The accompanying notes are an integral part of these financial statements.
www.brownadvisoryfunds.com
130
Financial Highlights
These financial highlights reflect selected per share data and ratios for a share outstanding of the Fund throughout each year.
BROWN ADVISORY SMALL-CAP GROWTH FUND
ADVISOR SHARES
| Year Ended: | ||||||||||||||||||||
| June 30, | June 30, | June 30, | June 30, | June 30, | ||||||||||||||||
| 2016 | 2015 | 2014 | 2013 | 2012 | ||||||||||||||||
| Net Asset Value, Beginning of Year | $ | 17.35 | $ | 17.39 | $ | 15.43 | $ | 13.86 | $ | 14.65 | ||||||||||
| Net Investment Income Loss(a) | (0.13 | ) | (0.15 | ) | (0.18 | ) | (0.09 | ) | (0.14 | ) | ||||||||||
| Net Realized And Unrealized Gains (Losses) | 0.26 | 2.15 | 2.96 | 2.97 | (0.38 | ) | ||||||||||||||
| Total from Investment Operations | $ | 0.13 | $ | 2.00 | $ | 2.78 | $ | 2.88 | $ | (0.52 | ) | |||||||||
| Distributions from: | ||||||||||||||||||||
| Net Realized Gains | (2.46 | ) | (2.04 | ) | (0.82 | ) | (1.31 | ) | (0.27 | ) | ||||||||||
| Total Distributions to Shareholders | $ | (2.46 | ) | $ | (2.04 | ) | $ | (0.82 | ) | $ | (1.31 | ) | $ | (0.27 | ) | |||||
| Redemption fees(a) | —(c | ) | — | — | — | —(c | ) | |||||||||||||
| Net Asset Value, End of Year | $ | 15.02 | $ | 17.35 | $ | 17.39 | $ | 15.43 | $ | 13.86 | ||||||||||
| Total Return | 1.27 | % | 12.54 | % | 18.07 | % | 22.45 | % | (3.41 | )% | ||||||||||
| Net Assets at End of Year (000’s Omitted) | $ | 9,704 | $ | 6,348 | $ | 7,300 | $ | 5,493 | $ | 2,875 | ||||||||||
| Ratios to Average Net Assets: | ||||||||||||||||||||
| Net Investment Income (Loss) | (0.85 | )% | (0.91 | )% | (1.03 | )% | (0.60 | )% | (1.07 | )% | ||||||||||
| Net Expenses | 1.38 | % | 1.39 | % | 1.41 | % | 1.41 | % | 1.41 | % | ||||||||||
| Gross Expenses(b) | 1.38 | % | 1.39 | % | 1.41 | % | 1.41 | % | 1.41 | % | ||||||||||
| Portfolio Turnover Rate | 32 | % | 28 | % | 19 | % | 48 | % | 66 | % | ||||||||||
| (a) | Calculated based on average shares outstanding during the year. |
| (b) | Reflects the expense ratio excluding any waivers and/or expense reimbursements. |
| (c) | Less than $0.01 per share. |
The accompanying notes are an integral part of these financial statements.
www.brownadvisoryfunds.com
131
Financial Highlights
These financial highlights reflect selected per share data and ratios for a share outstanding of the Fund throughout each year / period.
BROWN ADVISORY SMALL-CAP FUNDAMENTAL VALUE FUND
INSTITUTIONAL SHARES
| Year / Period Ended: | ||||||||||||||||
| June 30, | June 30, | June 30, | June 30, | |||||||||||||
| 2016 | 2015 | 2014 | 2013(g) | |||||||||||||
| Net Asset Value, Beginning of Year / Period | $ | 23.61 | $ | 23.96 | $ | 20.06 | $ | 16.77 | ||||||||
| Net Investment Income (Loss)(a) | 0.13 | 0.10 | 0.12 | 0.06 | ||||||||||||
| Net Realized And Unrealized Gains (Losses) | (0.44 | ) | 0.86 | 4.91 | 3.30 | |||||||||||
| Total from Investment Operations | $ | (0.31 | ) | $ | 0.96 | $ | 5.03 | $ | 3.36 | |||||||
| Distributions from: | ||||||||||||||||
| Net Investment Income | (0.10 | ) | (0.14 | ) | (0.19 | ) | (0.07 | ) | ||||||||
| Net Realized Gains | (0.45 | ) | (1.17 | ) | (0.94 | ) | — | |||||||||
| Total Distributions to Shareholders | $ | (0.55 | ) | $ | (1.31 | ) | $ | (1.13 | ) | $ | (0.07 | ) | ||||
| Redemption fees(a) | —(e | ) | —(e | ) | — | — | ||||||||||
| Net Asset Value, End of Year / Period | $ | 22.75 | $ | 23.61 | $ | 23.96 | $ | 20.06 | ||||||||
| Total Return | (1.17 | )% | 4.04 | % | 25.37 | % | 20.13 | %(b) | ||||||||
| Net Assets at End of Year / Period (000’s Omitted) | $ | 156,205 | $ | 75,994 | $ | 19,515 | $ | 1,061 | ||||||||
| Ratios to Average Net Assets: | ||||||||||||||||
| Net Investment Income (Loss) | 0.59 | % | 0.43 | % | 0.51 | % | 1.14 | %(c) | ||||||||
| Net Expenses | 0.98 | % | 0.98 | % | 1.00 | % | 1.05 | %(c) | ||||||||
| Gross Expenses (d) | 0.98 | % | 0.98 | % | 1.00 | % | 1.05 | %(c) | ||||||||
| Portfolio Turnover Rate | 30 | % | 26 | % | 30 | % | 34 | %(f) | ||||||||
| (a) | Calculated based on average shares outstanding during the year / period. |
| (b) | Not annualized. |
| (c) | Annualized. |
| (d) | Reflects the expense ratio excluding any waivers and/or expense reimbursements. |
| (e) | Less than $0.01 per share. |
| (f) | Reflects portfolio turnover at the Fund level for the year ended June 30, 2013. |
| (g) | Commenced operations on October 19, 2012. The information presented is for the period from October 19, 2012 to June 30, 2013. |
The accompanying notes are an integral part of these financial statements.
www.brownadvisoryfunds.com
132
Financial Highlights
These financial highlights reflect selected per share data and ratios for a share outstanding of the Fund throughout each year.
BROWN ADVISORY SMALL-CAP FUNDAMENTAL VALUE FUND
INVESTOR SHARES*
| Year Ended: | ||||||||||||||||||||
| June 30, | June 30, | June 30, | June 30, | June 30, | ||||||||||||||||
| 2016 | 2015 | 2014 | 2013 | 2012 | ||||||||||||||||
| Net Asset Value, Beginning of Year | $ | 23.59 | $ | 23.94 | $ | 20.06 | $ | 15.65 | $ | 16.89 | ||||||||||
| Net Investment Income (Loss)(a) | 0.10 | 0.07 | 0.08 | 0.18 | 0.10 | |||||||||||||||
| Net Realized And Unrealized Gains (Losses) | (0.44 | ) | 0.86 | 4.90 | 4.29 | (0.51 | ) | |||||||||||||
| Total from Investment Operations | $ | (0.34 | ) | $ | 0.93 | $ | 4.98 | $ | 4.47 | $ | (0.41 | ) | ||||||||
| Distributions from: | ||||||||||||||||||||
| Net Investment Income | (0.07 | ) | (0.11 | ) | (0.16 | ) | (0.06 | ) | (0.12 | ) | ||||||||||
| Net Realized Gains | (0.45 | ) | (1.17 | ) | (0.94 | ) | — | (0.71 | ) | |||||||||||
| Total Distributions to Shareholders | $ | (0.52 | ) | $ | (1.28 | ) | $ | (1.10 | ) | $ | (0.06 | ) | $ | (0.83 | ) | |||||
| Redemption fees(a) | —(c | ) | —(c | ) | —(c | ) | —(c | ) | —(c | ) | ||||||||||
| Net Asset Value, End of Year | $ | 22.73 | $ | 23.59 | $ | 23.94 | $ | 20.06 | $ | 15.65 | ||||||||||
| Total Return | (1.32 | )% | 3.90 | % | 25.13 | % | 28.64 | % | (1.90 | )% | ||||||||||
| Net Assets at End of Year (000’s Omitted) | $ | 774,547 | $ | 748,003 | $ | 567,799 | $ | 371,018 | $ | 194,719 | ||||||||||
| Ratios to Average Net Assets: | ||||||||||||||||||||
| Net Investment Income (Loss) | 0.44 | % | 0.28 | % | 0.36 | % | 1.01 | % | 0.64 | % | ||||||||||
| Net Expenses | 1.13 | % | 1.13 | % | 1.15 | % | 1.18 | % | 1.19 | % | ||||||||||
| Gross Expenses(b) | 1.13 | % | 1.13 | % | 1.15 | % | 1.18 | % | 1.19 | % | ||||||||||
| Portfolio Turnover Rate | 30 | % | 26 | % | 30 | % | 34 | % | 36 | % | ||||||||||
| (a) | Calculated based on average shares outstanding during the year. |
| (b) | Reflects the expense ratio excluding any waivers and/or expense reimbursements. |
| (c) | Less than $0.01 per share. |
| * | Prior to October 19, 2012, Investor Shares were known as Institutional Shares. |
The accompanying notes are an integral part of these financial statements.
www.brownadvisoryfunds.com
133
Financial Highlights
These financial highlights reflect selected per share data and ratios for a share outstanding of the Fund throughout each year / period.
BROWN ADVISORY SMALL-CAP FUNDAMENTAL VALUE FUND
ADVISOR SHARES
| Year / Period Ended: | ||||||||||||||||||||
| June 30, | June 30, | June 30, | June 30, | June 30, | ||||||||||||||||
| 2016 | 2015 | 2014 | 2013 | 2012(g) | ||||||||||||||||
| Net Asset Value, Beginning of Year / Period | $ | 23.48 | $ | 23.87 | $ | 20.01 | $ | 15.63 | $ | 16.39 | ||||||||||
| Net Investment Income (Loss)(a) | 0.04 | 0.01 | 0.02 | 0.03 | 0.07 | |||||||||||||||
| Net Realized And Unrealized Gains (Losses) | (0.44 | ) | 0.85 | 4.89 | 4.38 | (0.01 | ) | |||||||||||||
| Total from Investment Operations | $ | (0.40 | ) | $ | 0.86 | $ | 4.91 | $ | 4.41 | $ | 0.06 | |||||||||
| Distributions from: | ||||||||||||||||||||
| Net Investment Income | (0.01 | ) | (0.08 | ) | (0.11 | ) | (0.03 | ) | (0.11 | ) | ||||||||||
| Net Realized Gains | (0.45 | ) | (1.17 | ) | (0.94 | ) | — | (0.71 | ) | |||||||||||
| Total Distributions to Shareholders | $ | (0.46 | ) | $ | (1.25 | ) | $ | (1.05 | ) | $ | (0.03 | ) | $ | (0.82 | ) | |||||
| Redemption fees(a) | —(e | ) | — | —(e | ) | — | —(e | ) | ||||||||||||
| Net Asset Value, End of Year / Period | $ | 22.62 | $ | 23.48 | $ | 23.87 | $ | 20.01 | $ | 15.63 | ||||||||||
| Total Return | (1.58 | )% | 3.61 | % | 24.83 | % | 28.28 | % | 0.90 | %(b) | ||||||||||
| Net Assets at End of Year / Period (000’s Omitted) | $ | 52,883 | $ | 58,583 | $ | 21,416 | $ | 15,764 | $ | 418 | ||||||||||
| Ratios to Average Net Assets: | ||||||||||||||||||||
| Net Investment Income (Loss) | 0.19 | % | 0.03 | % | 0.11 | % | 0.75 | % | 0.44 | %(c) | ||||||||||
| Net Expenses | 1.38 | % | 1.38 | % | 1.40 | % | 1.44 | % | 1.39 | %(c) | ||||||||||
| Gross Expenses (d) | 1.38 | % | 1.38 | % | 1.40 | % | 1.44 | % | 1.39 | %(c) | ||||||||||
| Portfolio Turnover Rate | 30 | % | 26 | % | 30 | % | 34 | % | 36 | %(f) | ||||||||||
| (a) | Calculated based on average shares outstanding during the year / period. |
| (b) | Not annualized. |
| (c) | Annualized. |
| (d) | Reflects the expense ratio excluding any waivers and/or expense reimbursements. |
| (e) | Less than $0.01 per share. |
| (f) | Reflects portfolio turnover at the Fund level for the year ended June 30, 2012. |
| (g) | Advisor Shares commenced operations July 28, 2011. The information presented is for the period from July 28, 2011 to June 30, 2012. |
The accompanying notes are an integral part of these financial statements.
www.brownadvisoryfunds.com
134
Financial Highlights
These financial highlights reflect selected per share data and ratios for a share outstanding of the Fund throughout each year / period.
BROWN ADVISORY MULTI-STRATEGY FUND
INSTITUTIONAL SHARES
| Year / Period Ended: | ||||||||
| June 30, | June 30, | |||||||
| 2016 | 2015(f) | |||||||
| Net Asset Value, Beginning of Year / Period | $ | 10.07 | $ | 10.00 | ||||
| Net Investment Income (Loss)(a) | 0.05 | (0.05 | ) | |||||
| Net Realized And Unrealized Gains (Losses) | (0.25 | ) | 0.17 | |||||
| Total from Investment Operations | $ | (0.20 | ) | $ | 0.12 | |||
| Distributions from: | ||||||||
| Net Investment Income | (0.03 | ) | (0.05 | ) | ||||
| Net Realized Gains | (0.07 | ) | — | |||||
| Total Distributions to Shareholders | $ | (0.10 | ) | $ | (0.05 | ) | ||
| Redemption fees(a) | — | — | ||||||
| Net Asset Value, End of Year / Period | $ | 9.77 | $ | 10.07 | ||||
| Total Return | (1.93 | )% | 1.23 | %(b) | ||||
| Net Assets at End of Year / Period (000’s Omitted) | $ | 2,947 | $ | 2,319 | ||||
| Ratios to Average Net Assets: | ||||||||
| Net Investment Income (Loss)(g) | 0.50 | % | (0.67 | )%(c) | ||||
| Net Expenses(h) | 1.10 | % | 1.44 | %(c)(e) | ||||
| Gross Expenses(d)(h) | 1.96 | % | 3.05 | %(c) | ||||
| Portfolio Turnover Rate | 0 | % | 53 | %(b) | ||||
| (a) | Calculated based on average shares outstanding during the year / period. |
| (b) | Not annualized. |
| (c) | Annualized. |
| (d) | Reflects the expense ratio excluding any waivers and/or expense reimbursements. |
| (e) | Effective May 7, 2015, the Fund lowered its expense cap from 1.60% to 1.10%. For the period from May 7, 2015 to June 30, 2015, the net expense ratio was 1.10% |
| (f) | Commenced operations on October 31, 2014. The information presented is for the period from October 31, 2014 to June 30, 2015. |
| (g) | The Net Investment Income (Loss) ratio includes income actually earned and received by the Fund from the dividend distributions made to it by the underlying investment companies in which it invests, as disclosed on the Statement of Operations and in further detail within the “Investments in Affiliates – Multi-Strategy Fund” section of Note 3. The Net Investment Income (Loss) ratio does not include any other pro-rata amounts of the net investment income of the underlying investment companies in which it invests. |
| (h) | The Gross and Net Expense ratios include the actual gross and net expenses incurred by the Fund as disclosed on the Statement of Operations. The Gross and Net Expense ratios do not include any other pro-rata amounts of expenses incurred by the underlying investment companies in which the Fund invests (known as Acquired Fund Fees and Expenses). |
The accompanying notes are an integral part of these financial statements.
www.brownadvisoryfunds.com
135
Financial Highlights
These financial highlights reflect selected per share data and ratios for a share outstanding of the Fund throughout the period.
BROWN ADVISORY GLOBAL LEADERS FUND
INVESTOR SHARES
| Period Ended | ||||
| June 30, | ||||
| 2016(e) | ||||
| Net Asset Value, Beginning of Period | $ | 10.00 | ||
| Net Investment Income (Loss)(a) | 0.05 | |||
| Net Realized And Unrealized Gains (Losses) | (0.40 | ) | ||
| Total from Investment Operations | $ | (0.35 | ) | |
| Redemption fees(a) | — | |||
| Net Asset Value, End of Period | $ | 9.65 | ||
| Total Return | (3.50 | )%(b) | ||
| Net Assets at End of Period (000’s Omitted) | $ | 26,367 | ||
| Ratios to Average Net Assets: | ||||
| Net Investment Income (Loss) | 0.55 | %(c) | ||
| Net Expenses | 0.85 | %(c) | ||
| Gross Expenses(d) | 1.41 | %(c) | ||
| Portfolio Turnover Rate | 53 | %(b) | ||
| (a) | Calculated based on average shares outstanding during the period. |
| (b) | Not annualized. |
| (c) | Annualized. |
| (d) | Reflects the expense ratio excluding any waivers and/or expense reimbursements. |
| (e) | Commenced operations on July 1, 2015. The information presented is for the period from July 1, 2015 (end of day) to June 30, 2016. |
The accompanying notes are an integral part of these financial statements.
www.brownadvisoryfunds.com
136
Financial Highlights
These financial highlights reflect selected per share data and ratios for a share outstanding of the Fund throughout each year.
BROWN ADVISORY INTERMEDIATE INCOME FUND
INVESTOR SHARES*
| Year Ended: | ||||||||||||||||||||
| June 30, | June 30, | June 30, | June 30, | June 30, | ||||||||||||||||
| 2016 | 2015 | 2014 | 2013 | 2012 | ||||||||||||||||
| Net Asset Value, Beginning of Year | $ | 10.63 | $ | 10.74 | $ | 10.85 | $ | 11.37 | $ | 11.28 | ||||||||||
| Net Investment Income (Loss)(a) | 0.20 | 0.19 | 0.17 | 0.19 | 0.24 | |||||||||||||||
| Net Realized And Unrealized Gains (Losses) | 0.22 | (0.08 | ) | 0.12 | (0.26 | ) | 0.36 | |||||||||||||
| Total from Investment Operations | $ | 0.42 | $ | 0.11 | $ | 0.29 | $ | (0.07 | ) | $ | 0.60 | |||||||||
| Distributions from: | ||||||||||||||||||||
| Net Investment Income | (0.21 | ) | (0.22 | ) | (0.18 | ) | (0.25 | ) | (0.25 | ) | ||||||||||
| Net Realized Gains | (0.06 | ) | — | (0.22 | ) | (0.20 | ) | (0.26 | ) | |||||||||||
| Total Distributions to Shareholders | $ | (0.27 | ) | $ | (0.22 | ) | $ | (0.40 | ) | $ | (0.45 | ) | $ | (0.51 | ) | |||||
| Redemption fees(a) | —(c | ) | —(c | ) | —(c | ) | —(c | ) | —(c | ) | ||||||||||
| Net Asset Value, End of Year | $ | 10.78 | $ | 10.63 | $ | 10.74 | $ | 10.85 | $ | 11.37 | ||||||||||
| Total Return | 3.99 | % | 1.01 | % | 2.66 | % | (0.72 | )% | 5.42 | % | ||||||||||
| Net Assets at End of Year (000’s Omitted) | $ | 137,900 | $ | 140,006 | $ | 207,371 | $ | 241,543 | $ | 292,556 | ||||||||||
| Ratios to Average Net Assets: | ||||||||||||||||||||
| Net Investment Income Loss(d) | 1.92 | % | 1.78 | % | 1.54 | % | 1.66 | % | 2.15 | % | ||||||||||
| Net Expenses(e) | 0.43 | % | 0.45 | % | 0.52 | % | 0.52 | % | 0.50 | % | ||||||||||
| Gross Expenses(b)(e) | 0.50 | % | 0.50 | % | 0.52 | % | 0.52 | % | 0.50 | % | ||||||||||
| Portfolio Turnover Rate | 68 | % | 130 | % | 162 | % | 111 | % | 75 | % | ||||||||||
| (a) | Calculated based on average shares outstanding during the year. |
| (b) | Reflects the expense ratio excluding any waivers and/or expense reimbursements. |
| (c) | Less than $0.01 per share. |
| (d) | The Net Investment Income (Loss) ratio includes income actually earned by the Fund from its investments in fixed income securities as well as from dividend distributions made to it by the underlying investment companies in which it invests, as disclosed on the Statement of Operations and in further detail within the “Investments in Affiliates – Intermediate Income Fund” section of Note 3. The Net Investment Income ratio does not include any other pro-rata amounts of the net investment income of the underlying investment companies in which it invests. |
| (e) | The Gross and Net Expense ratios include the actual gross and net expenses incurred by the Fund as disclosed on the Statement of Operations. The Gross and Net Expense ratios do not include any other pro-rata amounts of expenses ’incurred by the underlying investment companies in which the Fund invests (known as Acquired Fund Fees and Expenses). For further details regarding the expenses waived in this fund, refer to the “investments in Affiliates – Intermediate Income Fund” section of Note 3. |
| * | Prior to October 19, 2012, Investor Shares were known as Institutional Shares. |
The accompanying notes are an integral part of these financial statements.
www.brownadvisoryfunds.com
137
Financial Highlights
These financial highlights reflect selected per share data and ratios for a share outstanding of the Fund throughout each year.
BROWN ADVISORY INTERMEDIATE INCOME FUND
ADVISOR SHARES
| Year Ended: | ||||||||||||||||||||
| June 30, | June 30, | June 30, | June 30, | June 30, | ||||||||||||||||
| 2016 | 2015 | 2014 | 2013 | 2012 | ||||||||||||||||
| Net Asset Value, Beginning of Year | $ | 10.42 | $ | 10.53 | $ | 10.65 | $ | 11.16 | $ | 11.08 | ||||||||||
| Net Investment Income (Loss)(a) | 0.17 | 0.16 | 0.14 | 0.16 | 0.22 | |||||||||||||||
| Net Realized And Unrealized Gains (Losses) | 0.21 | (0.08 | ) | 0.11 | (0.25 | ) | 0.35 | |||||||||||||
| Total from Investment Operations | $ | 0.38 | $ | 0.08 | $ | 0.25 | $ | (0.09 | ) | $ | 0.57 | |||||||||
| Distributions from: | ||||||||||||||||||||
| Net Investment Income | (0.18 | ) | (0.19 | ) | (0.15 | ) | (0.22 | ) | (0.23 | ) | ||||||||||
| Net Realized Gains | (0.06 | ) | — | (0.22 | ) | (0.20 | ) | (0.26 | ) | |||||||||||
| Total Distributions to Shareholders | $ | (0.24 | ) | $ | (0.19 | ) | $ | (0.37 | ) | $ | (0.42 | ) | $ | (0.49 | ) | |||||
| Redemption fees(a) | — | — | — | — | —(c | ) | ||||||||||||||
| Net Asset Value, End of Year | $ | 10.56 | $ | 10.42 | $ | 10.53 | $ | 10.65 | $ | 11.16 | ||||||||||
| Total Return | 3.71 | % | 0.78 | % | 2.36 | % | (0.87 | )% | 5.21 | % | ||||||||||
| Net Assets at End of Year (000’s Omitted) | $ | 8,972 | $ | 9,608 | $ | 12,613 | $ | 16,149 | $ | 19,540 | ||||||||||
| Ratios to Average Net Assets: | ||||||||||||||||||||
| Net Investment Income Loss(d) | 1.67 | % | 1.53 | % | 1.29 | % | 1.43 | % | 1.94 | % | ||||||||||
| Net Expenses(e) | 0.68 | % | 0.70 | % | 0.77 | % | 0.75 | % | 0.71 | % | ||||||||||
| Gross Expenses(b)(e) | 0.75 | % | 0.75 | % | 0.77 | % | 0.75 | % | 0.71 | % | ||||||||||
| Portfolio Turnover Rate | 68 | % | 130 | % | 162 | % | 111 | % | 75 | % | ||||||||||
| (a) | Calculated based on average shares outstanding during the year. |
| (b) | Reflects the expense ratio excluding any waivers and/or expense reimbursements. |
| (c) | Less than $0.01 per share. |
| (d) | The Net Investment Income (Loss) ratio includes income actually earned by the Fund from its investments in fixed income securities as well as from dividend distributions made to it by the underlying investment companies in which it invests, as disclosed on the Statement of Operations and in further detail within the “Investments in Affiliates – Intermediate Income Fund” section of Note 3. The Net Investment Income ratio does not include any other pro-rata amounts of the net investment income of the underlying investment companies in which it invests. |
| (e) | The Gross and Net Expense ratios include the actual gross and net expenses incurred by the Fund as disclosed on the Statement of Operations. The Gross and Net Expense ratios do not include any other pro-rata amounts of expenses ’incurred by the underlying investment companies in which the Fund invests (known as Acquired Fund Fees and Expenses). For further details regarding the expenses waived in this fund, refer to the “investments in Affiliates – Intermediate Income Fund” section of Note 3. |
The accompanying notes are an integral part of these financial statements.
www.brownadvisoryfunds.com
138
Financial Highlights
These financial highlights reflect selected per share data and ratios for a share outstanding of the Fund throughout each year / period.
BROWN ADVISORY TOTAL RETURN FUND
INSTITUTIONAL SHARES
| Year / Period Ended: | ||||||||
| June 30, | June 30, | |||||||
| 2016 | 2015(e) | |||||||
| Net Asset Value, Beginning of Year / Period | $ | 9.83 | $ | 10.00 | ||||
| Net Investment Income (Loss)(a) | 0.25 | 0.13 | ||||||
| Net Realized And Unrealized Gains (Losses) | 0.37 | (0.19 | ) | |||||
| Total from Investment Operations | $ | 0.62 | $ | (0.06 | ) | |||
| Distributions from: | ||||||||
| Net Investment Income | (0.27 | ) | (0.11 | ) | ||||
| Total Distributions to Shareholders | $ | (0.27 | ) | $ | (0.11 | ) | ||
| Redemption fees(a) | — | — | ||||||
| Net Asset Value, End of Year / Period | $ | 10.18 | $ | 9.83 | ||||
| Total Return | 6.46 | % | (0.60 | )%(b) | ||||
| Net Assets at End of Year / Period (000’s Omitted) | $ | 83,854 | $ | 73,735 | ||||
| Ratios to Average Net Assets: | ||||||||
| Net Investment Income (Loss) | 2.55 | % | 1.89 | %(c) | ||||
| Net Expenses | 0.51 | % | 0.54 | %(c) | ||||
| Gross Expenses(d) | 0.51 | % | 0.54 | %(c) | ||||
| Portfolio Turnover Rate | 218 | % | 235 | %(b) | ||||
| (a) | Calculated based on average shares outstanding during the year / period. |
| (b) | Not annualized. |
| (c) | Annualized. |
| (d) | Reflects the expense ratio excluding any waivers and/or expense reimbursements. |
| (e) | Commenced operations on October 30, 2014. The information presented is for the period from October 30, 2014 to June 30, 2015. |
The accompanying notes are an integral part of these financial statements.
www.brownadvisoryfunds.com
139
Financial Highlights
These financial highlights reflect selected per share data and ratios for a share outstanding of the Fund throughout each year / period.
BROWN ADVISORY TOTAL RETURN FUND
INVESTOR SHARES
| Year / Period Ended: | ||||||||
| June 30, | June 30, | |||||||
| 2016 | 2015(e) | |||||||
| Net Asset Value, Beginning of Year / Period | $ | 9.83 | $ | 10.00 | ||||
| Net Investment Income (Loss)(a) | 0.25 | 0.12 | ||||||
| Net Realized And Unrealized Gains (Losses) | 0.37 | (0.18 | ) | |||||
| Total from Investment Operations | $ | 0.62 | $ | (0.06 | ) | |||
| Distributions from: | ||||||||
| Net Investment Income | (0.27 | ) | (0.11 | ) | ||||
| Total Distributions to Shareholders | $ | (0.27 | ) | $ | (0.11 | ) | ||
| Redemption fees(a) | — | — | ||||||
| Net Asset Value, End of Year / Period | $ | 10.18 | $ | 9.83 | ||||
| Total Return | 6.40 | % | (0.63 | )%(b) | ||||
| Net Assets at End of Year / Period (000’s Omitted) | $ | 1,957 | $ | 9,081 | ||||
| Ratios to Average Net Assets: | ||||||||
| Net Investment Income (Loss) | 2.50 | % | 1.84 | %(c) | ||||
| Net Expenses | 0.56 | % | 0.59 | %(c) | ||||
| Gross Expenses(d) | 0.56 | % | 0.59 | %(c) | ||||
| Portfolio Turnover Rate | 218 | % | 235 | %(b) | ||||
| (a) | Calculated based on average shares outstanding during the year / period. |
| (b) | Not annualized. |
| (c) | Annualized. |
| (d) | Reflects the expense ratio excluding any waivers and/or expense reimbursements. |
| (e) | Commenced operations on October 30, 2014. The information presented is for the period from October 30, 2014 to June 30, 2015. |
The accompanying notes are an integral part of these financial statements.
www.brownadvisoryfunds.com
140
Financial Highlights
These financial highlights reflect selected per share data and ratios for a share outstanding of the Fund throughout each year / period.
BROWN ADVISORY STRATEGIC BOND FUND
INVESTOR SHARES
| Year / Period Ended: | ||||||||
| June 30, | June 30, | |||||||
| 2016 | 2015(f) | |||||||
| Net Asset Value, Beginning of Year / Period | $ | 9.83 | $ | 10.07 | ||||
| Net Investment Income (Loss)(a) | 0.30 | 0.16 | ||||||
| Net Realized And Unrealized Gains (Losses) | (0.19 | ) | (0.35 | ) | ||||
| Total from Investment Operations | $ | 0.11 | $ | (0.19 | ) | |||
| Distributions from: | ||||||||
| Net Investment Income | (0.47 | ) | (0.05 | ) | ||||
| Total Distributions to Shareholders | $ | (0.47 | ) | $ | (0.05 | ) | ||
| Redemption fees(a) | — | — | ||||||
| Net Asset Value, End of Year / Period | $ | 9.47 | $ | 9.83 | ||||
| Total Return | 1.18 | % | (1.85 | )%(b) | ||||
| Net Assets at End of Year / Period (000’s Omitted) | $ | 39,211 | $ | 59,680 | ||||
| Ratios to Average Net Assets: | ||||||||
| Net Investment Income (Loss) | 3.21 | % | 2.42 | %(c) | ||||
| Net Expenses | 0.70 | % | 0.70 | %(c) | ||||
| Gross Expenses(d) | 0.73 | % | 0.72 | %(c) | ||||
| Portfolio Turnover Rate | 288 | % | 317 | %(e) | ||||
| (a) | Calculated based on average shares outstanding during the year / period. |
| (b) | Not annualized |
| (c) | Annualized |
| (d) | Reflects the expense ratio excluding any waivers and/or expense reimbursements. |
| (e) | Reflects portfolio turnover at the Fund level for the year ended June 30, 2015. |
| (f) | Commenced operations on October 31, 2014. The information presented is for the period from October 31, 2014 to June 30, 2015. |
The accompanying notes are an integral part of these financial statements.
www.brownadvisoryfunds.com
141
Financial Highlights
These financial highlights reflect selected per share data and ratios for a share outstanding of the Fund throughout each year / period.
BROWN ADVISORY STRATEGIC BOND FUND
ADVISOR SHARES
| Year / Period Ended: | ||||||||||||||||||||
| June 30, | June 30, | June 30, | June 30, | June 30, | ||||||||||||||||
| 2016 | 2015 | 2014 | 2013 | 2012(g) | ||||||||||||||||
| Net Asset Value, Beginning of Year / Period | $ | 9.82 | $ | 10.04 | $ | 9.68 | $ | 9.68 | $ | 10.00 | ||||||||||
| Net Investment Income (Loss)(a) | 0.28 | 0.19 | (0.01 | ) | (0.09 | ) | (0.04 | ) | ||||||||||||
| Net Realized And Unrealized Gains (Losses) | (0.20 | ) | (0.37 | ) | 0.42 | 0.29 | (0.27 | ) | ||||||||||||
| Total from Investment Operations | $ | 0.08 | $ | (0.18 | ) | $ | 0.41 | $ | 0.20 | $ | (0.31 | ) | ||||||||
| Distributions from: | ||||||||||||||||||||
| Net Investment Income | (0.43 | ) | (0.04 | ) | (0.05 | ) | (0.20 | ) | (0.01 | ) | ||||||||||
| Total Distributions to Shareholders | $ | (0.43 | ) | $ | (0.04 | ) | $ | (0.05 | ) | $ | (0.20 | ) | $ | (0.01 | ) | |||||
| Redemption fees(a) | — | — | — | —(e | ) | —(e | ) | |||||||||||||
| Net Asset Value, End of Year / Period | $ | 9.47 | $ | 9.82 | $ | 10.04 | $ | 9.68 | $ | 9.68 | ||||||||||
| Total Return | 0.84 | % | (1.80 | )% | 4.22 | % | 2.09 | % | (3.09 | )%(b) | ||||||||||
| Net Assets at End of Year / Period (000’s Omitted) | $ | 865 | $ | 1,692 | $ | 24,399 | $ | 25,570 | $ | 29,541 | ||||||||||
| Ratios to Average Net Assets: | ||||||||||||||||||||
| Net Investment Income (Loss) | 2.96 | % | 1.91 | % | (0.07 | )% | (0.87 | )% | (0.56 | )%(c) | ||||||||||
| Net Expenses | 0.95 | % | 1.21 | %(f) | 1.33 | % | 1.40 | % | 1.40 | %(c) | ||||||||||
| Gross Expenses(d) | 0.98 | % | 1.22 | %(f) | 1.33 | % | 1.40 | % | 1.40 | %(c) | ||||||||||
| Portfolio Turnover Rate | 288 | % | 317 | % | 1010 | % | 992 | % | 1290 | %(b) | ||||||||||
| (a) | Calculated based on average shares outstanding during the year / period. |
| (b) | Not annualized |
| (c) | Annualized |
| (d) | Reflects the expense ratio excluding any waivers and/or expense reimbursements. |
| (e) | Less than $0.01 per share. |
| (f) | On October 31, 2015, the expense cap for this share class was lowered to 0.95%. For the period from October 31, 2014 to June 30, 2015, the net and gross expense ratios were 0.95% and 0.97%, respectively. |
| (g) | Commenced operations on September 30, 2011. The information presented is for the period from September 30, 2011 to June 30, 2012. |
The accompanying notes are an integral part of these financial statements.
www.brownadvisoryfunds.com
142
Financial Highlights
These financial highlights reflect selected per share data and ratios for a share outstanding of the Fund throughout each year.
BROWN ADVISORY MARYLAND BOND FUND
INVESTOR SHARES*
| Year Ended: | ||||||||||||||||||||
| June 30, | June 30, | June 30, | June 30, | June 30, | ||||||||||||||||
| 2016 | 2015 | 2014 | 2013 | 2012 | ||||||||||||||||
| Net Asset Value, Beginning of Year | $ | 10.65 | $ | 10.82 | $ | 10.81 | $ | 11.06 | $ | 10.85 | ||||||||||
| Net Investment Income (Loss)(a) | 0.23 | 0.18 | 0.21 | 0.21 | 0.25 | |||||||||||||||
| Net Realized And Unrealized Gains (Losses) | 0.32 | (0.12 | ) | 0.10 | (0.23 | ) | 0.26 | |||||||||||||
| Total from Investment Operations | $ | 0.55 | $ | 0.06 | $ | 0.31 | $ | (0.02 | ) | $ | 0.51 | |||||||||
| Distributions from: | ||||||||||||||||||||
| Net Investment Income | (0.23 | ) | (0.18 | ) | (0.21 | ) | (0.21 | ) | (0.25 | ) | ||||||||||
| Net Realized Gains | (0.05 | ) | (0.05 | ) | (0.09 | ) | (0.02 | ) | (0.05 | ) | ||||||||||
| Total Distributions to Shareholders | $ | (0.28 | ) | $ | (0.23 | ) | $ | (0.30 | ) | $ | (0.23 | ) | $ | (0.30 | ) | |||||
| Redemption fees(a) | — | —(c | ) | — | —(c | ) | —(c | ) | ||||||||||||
| Net Asset Value, End of Year | $ | 10.92 | $ | 10.65 | $ | 10.82 | $ | 10.81 | $ | 11.06 | ||||||||||
| Total Return | 5.24 | % | 0.58 | % | 2.94 | % | (0.25 | )% | 4.69 | % | ||||||||||
| Net Assets at End of Year (000’s Omitted) | $ | 183,705 | $ | 199,469 | $ | 205,717 | $ | 252,166 | $ | 250,087 | ||||||||||
| Ratios to Average Net Assets: | ||||||||||||||||||||
| Net Investment Income (Loss) | 2.12 | % | 1.66 | % | 1.99 | % | 1.86 | % | 2.23 | % | ||||||||||
| Net Expenses | 0.48 | % | 0.49 | % | 0.52 | % | 0.52 | % | 0.51 | % | ||||||||||
| Gross Expenses(b) | 0.48 | % | 0.49 | % | 0.52 | % | 0.52 | % | 0.51 | % | ||||||||||
| Portfolio Turnover Rate | 80 | % | 61 | % | 56 | % | 30 | % | 16 | % | ||||||||||
| (a) | Calculated based on average shares outstanding during the year. |
| (b) | Reflects the expense ratio excluding any waivers and/or expense reimbursements. |
| (c) | Less than $0.01 per share. |
| * | Prior to October 19, 2012, Investor Shares were known as Institutional Shares. |
The accompanying notes are an integral part of these financial statements.
www.brownadvisoryfunds.com
143
Financial Highlights
These financial highlights reflect selected per share data and ratios for a share outstanding of each Fund throughout each year.
BROWN ADVISORY TAX EXEMPT BOND FUND*
INVESTOR SHARES
| Year Ended: | ||||||||||||||||
| June 30, | June 30, | June 30, | June 30, | |||||||||||||
| 2016 | 2015 | 2014 | 2013 | |||||||||||||
| Net Asset Value, Beginning of Year | $ | 9.93 | $ | 10.03 | $ | 9.84 | $ | 10.00 | ||||||||
| Net Investment Income (Loss)(a) | 0.25 | 0.18 | 0.19 | 0.13 | ||||||||||||
| Net Realized And Unrealized Gains (Losses) | 0.33 | (0.10 | ) | 0.19 | (0.12 | ) | ||||||||||
| Total from Investment Operations | $ | 0.58 | $ | 0.08 | $ | 0.38 | $ | 0.01 | ||||||||
| Distributions from: | ||||||||||||||||
| Net Investment Income | (0.25 | ) | (0.18 | ) | (0.19 | ) | (0.13 | ) | ||||||||
| Net Realized Gains | — | — | —(c | ) | (0.04 | ) | ||||||||||
| Total Distributions to Shareholders | $ | (0.25 | ) | $ | (0.18 | ) | $ | (0.19 | ) | $ | (0.17 | ) | ||||
| Redemption fees(a) | — | —(c | ) | — | —(c | ) | ||||||||||
| Net Asset Value, End of Year | $ | 10.26 | $ | 9.93 | $ | 10.03 | $ | 9.84 | ||||||||
| Total Return | 5.94 | % | 0.78 | % | 3.94 | % | 0.03 | % | ||||||||
| Net Assets at End of Year (000’s Omitted) | $ | 233,675 | $ | 224,154 | $ | 205,177 | $ | 161,891 | ||||||||
| Ratios to Average Net Assets: | ||||||||||||||||
| Net Investment Income (Loss) | 2.51 | % | 1.78 | % | 1.96 | % | 1.35 | % | ||||||||
| Net Expenses | 0.49 | % | 0.50 | % | 0.52 | % | 0.55 | % | ||||||||
| Gross Expenses(b) | 0.49 | % | 0.50 | % | 0.52 | % | 0.55 | % | ||||||||
| Portfolio Turnover Rate | 119 | % | 109 | % | 157 | % | 87 | % | ||||||||
| (a) | Calculated based on average shares outstanding during the year. |
| (b) | Reflects the expense ratio excluding any waivers and/or expense reimbursements. |
| (c) | Less than $0.01 per share. |
| * | Commenced operations on June 29, 2012. No financial highlights are presented for the period from June 29, 2012 to June 30, 2012, as the Fund did not make any investments, earn any income or incur any expenses during the period. |
The accompanying notes are an integral part of these financial statements.
www.brownadvisoryfunds.com
144
Financial Highlights
These financial highlights reflect selected per share data and ratios for a share outstanding of the Fund throughout each year / period.
BROWN ADVISORY MORTGAGE SECURITIES FUND
INSTITUTIONAL SHARES
| Year / Period Ended: | ||||||||||||
| June 30, | June 30, | June 30, | ||||||||||
| 2016 | 2015 | 2014(e) | ||||||||||
| Net Asset Value, Beginning of Year / Period | $ | 10.06 | $ | 10.16 | $ | 10.15 | ||||||
| Net Investment Income (Loss)(a) | 0.22 | 0.27 | 0.03 | |||||||||
| Net Realized And Unrealized Gains (Losses) | 0.21 | 0.01 | 0.02 | |||||||||
| Total from Investment Operations | $ | 0.43 | $ | 0.28 | $ | 0.05 | ||||||
| Distributions from: | ||||||||||||
| Net Investment Income | (0.25 | ) | (0.30 | ) | (0.04 | ) | ||||||
| Net Realized Gains | (0.04 | ) | (0.08 | ) | — | |||||||
| Total Distributions to Shareholders | $ | (0.29 | ) | $ | (0.38 | ) | $ | (0.04 | ) | |||
| Redemption fees(a) | — | — | — | |||||||||
| Net Asset Value, End of Year / Period | $ | 10.20 | $ | 10.06 | $ | 10.16 | ||||||
| Total Return | 4.32 | % | 2.74 | % | 0.49 | %(b) | ||||||
| Net Assets at End of Year / Period (000’s Omitted) | $ | 377,908 | $ | 206,299 | $ | 131,415 | ||||||
| Ratios to Average Net Assets: | ||||||||||||
| Net Investment Income (Loss) | 2.12 | % | 2.68 | % | 1.98 | %(c) | ||||||
| Net Expenses | 0.45 | % | 0.47 | % | 0.52 | %(c) | ||||||
| Gross Expenses(d) | 0.45 | % | 0.47 | % | 0.52 | %(c) | ||||||
| Portfolio Turnover Rate | 244 | % | 147 | % | 88 | %(b) | ||||||
| (a) | Calculated based on average shares outstanding during the year / period. |
| (b) | Not annualized. |
| (c) | Annualized. |
| (d) | Reflects the expense ratio excluding any waivers and/or expense reimbursements. |
| (e) | Commenced operations on May 13, 2014. The information presented is for the period from May 13, 2014 to June 30, 2014. |
The accompanying notes are an integral part of these financial statements.
www.brownadvisoryfunds.com
145
Financial Highlights
These financial highlights reflect selected per share data and ratios for a share outstanding of the Fund throughout each year / period.
BROWN ADVISORY MORTGAGE SECURITIES FUND
INVESTOR SHARES
| Year / Period Ended: | ||||||||||||
| June 30, | June 30, | June 30, | ||||||||||
| 2016 | 2015 | 2014(e) | ||||||||||
| Net Asset Value, Beginning of Year / Period | $ | 10.06 | $ | 10.16 | $ | 10.00 | ||||||
| Net Investment Income (Loss)(a) | 0.21 | 0.27 | 0.10 | |||||||||
| Net Realized And Unrealized Gains (Losses) | 0.22 | — | 0.16 | |||||||||
| Total from Investment Operations | $ | 0.43 | $ | 0.27 | $ | 0.26 | ||||||
| Distributions from: | ||||||||||||
| Net Investment Income | (0.24 | ) | (0.29 | ) | (0.10 | ) | ||||||
| Net Realized Gains | (0.04 | ) | (0.08 | ) | — | |||||||
| Total Distributions to Shareholders | $ | (0.28 | ) | $ | (0.37 | ) | $ | (0.10 | ) | |||
| Redemption fees(a) | — | — | — | |||||||||
| Net Asset Value, End of Year / Period | $ | 10.21 | $ | 10.06 | $ | 10.16 | ||||||
| Total Return | 4.33 | % | 2.68 | % | 2.62 | %(b) | ||||||
| Net Assets at End of Year / Period (000’s Omitted) | $ | 1,793 | $ | 28,649 | $ | 67,776 | ||||||
| Ratios to Average Net Assets: | ||||||||||||
| Net Investment Income (Loss) | 2.07 | % | 2.63 | % | 1.93 | %(c) | ||||||
| Net Expenses | 0.50 | % | 0.52 | % | 0.57 | %(c) | ||||||
| Gross Expenses(d) | 0.50 | % | 0.52 | % | 0.57 | %(c) | ||||||
| Portfolio Turnover Rate | 244 | % | 147 | % | 88 | %(b) | ||||||
| (a) | Calculated based on average shares outstanding during the year / period. |
| (b) | Not annualized. |
| (c) | Annualized. |
| (d) | Reflects the expense ratio excluding any waivers and/or expense reimbursements. |
| (e) | Commenced operations on December 26, 2013. The information presented is for the period from December 26, 2013 to June 30, 2014. |
The accompanying notes are an integral part of these financial statements.
www.brownadvisoryfunds.com
146
Financial Highlights
These financial highlights reflect selected per share data and ratios for a share outstanding of the Fund throughout each year / period.
BROWN ADVISORY – WMC STRATEGIC EUROPEAN EQUITY FUND
INSTITUTIONAL SHARES
| Year / Period Ended: | ||||||||||||
| June 30, | June 30, | June 30, | ||||||||||
| 2016 | 2015 | 2014(f) | ||||||||||
| Net Asset Value, Beginning of Year / Period | $ | 10.20 | $ | 10.46 | $ | 10.00 | ||||||
| Net Investment Income (Loss)(a) | 0.13 | 0.14 | 0.14 | |||||||||
| Net Realized And Unrealized Gains (Losses) | (0.40 | ) | (0.29 | ) | 0.32 | |||||||
| Total from Investment Operations | $ | (0.27 | ) | $ | (0.15 | ) | $ | 0.46 | ||||
| Distributions from: | ||||||||||||
| Net Investment Income | (0.03 | ) | (0.11 | ) | — | |||||||
| Total Distributions to Shareholders | $ | (0.03 | ) | $ | (0.11 | ) | $ | — | ||||
| Redemption fees(a) | —(e | ) | — | — | ||||||||
| Net Asset Value, End of Year / Period | $ | 9.90 | $ | 10.20 | $ | 10.46 | ||||||
| Total Return | (2.68 | )% | (1.42 | )% | 4.60 | %(b) | ||||||
| Net Assets at End of Year / Period (000’s Omitted) | $ | 1,059,870 | $ | 240,182 | $ | 202,616 | ||||||
| Ratios to Average Net Assets: | ||||||||||||
| Net Investment Income (Loss) | 1.30 | % | 1.35 | % | 2.01 | %(c) | ||||||
| Net Expenses | 1.11 | % | 1.13 | % | 1.23 | %(c) | ||||||
| Gross Expenses(d) | 1.11 | % | 1.13 | % | 1.23 | %(c) | ||||||
| Portfolio Turnover Rate | 31 | % | 48 | % | 25 | %(b) | ||||||
| (a) | Calculated based on average shares outstanding during the year / period. |
| (b) | Not annualized. |
| (c) | Annualized. |
| (d) | Reflects the expense ratio excluding any waivers and/or expense reimbursements. |
| (e) | Less than $0.01 per share. |
| (f) | Commenced operations on October 21, 2013. The information presented is for the period from October 21, 2013 to June 30, 2014. |
The accompanying notes are an integral part of these financial statements.
www.brownadvisoryfunds.com
147
Financial Highlights
These financial highlights reflect selected per share data and ratios for a share outstanding of the Fund throughout each year / period.
BROWN ADVISORY – WMC STRATEGIC EUROPEAN EQUITY FUND
INVESTOR SHARES
| Year / Period Ended: | ||||||||||||
| June 30, | June 30, | June 30, | ||||||||||
| 2016 | 2015 | 2014(f) | ||||||||||
| Net Asset Value, Beginning of Year / Period | $ | 10.19 | $ | 10.45 | $ | 10.00 | ||||||
| Net Investment Income (Loss)(a) | 0.12 | 0.12 | 0.13 | |||||||||
| Net Realized And Unrealized Gains (Losses) | (0.41 | ) | (0.29 | ) | 0.32 | |||||||
| Total from Investment Operations | $ | (0.29 | ) | $ | (0.17 | ) | $ | 0.45 | ||||
| Distributions from: | ||||||||||||
| Net Investment Income | — | (0.09 | ) | — | ||||||||
| Total Distributions to Shareholders | $ | — | $ | (0.09 | ) | $ | — | |||||
| Redemption fees(a) | — | —(e | ) | — | ||||||||
| Net Asset Value, End of Year / Period | $ | 9.90 | $ | 10.19 | $ | 10.45 | ||||||
| Total Return | (2.85 | )% | (1.56 | )% | 4.50 | %(b) | ||||||
| Net Assets at End of Year / Period (000’s Omitted) | $ | 13,031 | $ | 25,840 | $ | 18,011 | ||||||
| Ratios to Average Net Assets: | ||||||||||||
| Net Investment Income (Loss) | 1.15 | % | 1.20 | % | 1.86 | %(c) | ||||||
| Net Expenses | 1.26 | % | 1.28 | % | 1.38 | %(c) | ||||||
| Gross Expenses(d) | 1.26 | % | 1.28 | % | 1.38 | %(c) | ||||||
| Portfolio Turnover Rate | 31 | % | 48 | % | 25 | %(b) | ||||||
| (a) | Calculated based on average shares outstanding during the year / period. |
| (b) | Not annualized. |
| (c) | Annualized. |
| (d) | Reflects the expense ratio excluding any waivers and/or expense reimbursements. |
| (e) | Less than $0.01 per share. |
| (f) | Commenced operations on October 21, 2013. The information presented is for the period from October 21, 2013 to June 30, 2014. |
The accompanying notes are an integral part of these financial statements.
www.brownadvisoryfunds.com
148
Financial Highlights
These financial highlights reflect selected per share data and ratios for a share outstanding of the Fund throughout each year / period.
BROWN ADVISORY – WMC STRATEGIC EUROPEAN EQUITY FUND
ADVISOR SHARES
| Year / Period Ended: | ||||||||||||
| June 30, | June 30, | June 30, | ||||||||||
| 2016 | 2015 | 2014(f) | ||||||||||
| Net Asset Value, Beginning of Year / Period | $ | 10.17 | $ | 10.44 | $ | 10.00 | ||||||
| Net Investment Income (Loss)(a) | 0.09 | 0.10 | 0.11 | |||||||||
| Net Realized And Unrealized Gains (Losses) | (0.41 | ) | (0.29 | ) | 0.33 | |||||||
| Total from Investment Operations | $ | (0.32 | ) | $ | (0.19 | ) | $ | 0.44 | ||||
| Distributions from: | ||||||||||||
| Net Investment Income | — | (0.08 | ) | — | ||||||||
| Total Distributions to Shareholders | $ | — | $ | (0.08 | ) | $ | — | |||||
| Redemption fees(a) | — | —(e | ) | — | ||||||||
| Net Asset Value, End of Year / Period | $ | 9.85 | $ | 10.17 | $ | 10.44 | ||||||
| Total Return | (3.15 | )% | (1.78 | )% | 4.40 | %(b) | ||||||
| Net Assets at End of Year / Period (000’s Omitted) | $ | 745 | $ | 1,076 | $ | 240 | ||||||
| Ratios to Average Net Assets: | ||||||||||||
| Net Investment Income (Loss) | 0.90 | % | 0.95 | % | 1.61 | %(c) | ||||||
| Net Expenses | 1.51 | % | 1.53 | % | 1.63 | %(c) | ||||||
| Gross Expenses (d) | 1.51 | % | 1.53 | % | 1.63 | %(c) | ||||||
| Portfolio Turnover Rate | 31 | % | 48 | % | 25 | %(b) | ||||||
| (a) | Calculated based on average shares outstanding during the year / period. |
| (b) | Not annualized. |
| (c) | Annualized. |
| (d) | Reflects the expense ratio excluding any waivers and/or expense reimbursements. |
| (e) | Less than $0.01 per share. |
| (f) | Commenced operations on October 21, 2013. The information presented is for the period from October 21, 2013 to June 30, 2014. |
The accompanying notes are an integral part of these financial statements.
www.brownadvisoryfunds.com
149
Financial Highlights
These financial highlights reflect selected per share data and ratios for a share outstanding of the Fund throughout each year / period.
BROWN ADVISORY – WMC JAPAN ALPHA OPPORTUNITIES FUND
INSTITUTIONAL SHARES
| Year / Period Ended: | ||||||||||||
| June 30, | June 30, | June 30, | ||||||||||
| 2016 | 2015 | 2014(f) | ||||||||||
| Net Asset Value, Beginning of Year / Period | $ | 12.83 | $ | 10.50 | $ | 10.00 | ||||||
| Net Investment Income (Loss)(a) | 0.06 | 0.05 | 0.05 | |||||||||
| Net Realized And Unrealized Gains (Losses) | (2.91 | ) | 2.86 | 0.45 | ||||||||
| Total from Investment Operations | $ | (2.85 | ) | $ | 2.91 | $ | 0.50 | |||||
| Distributions from: | ||||||||||||
| Net Investment Income | (0.95 | ) | (0.51 | ) | — | |||||||
| Net Realized Gains | (0.20 | ) | (0.07 | ) | — | |||||||
| Total Distributions to Shareholders | $ | (1.15 | ) | $ | (0.58 | ) | $ | — | ||||
| Redemption fees(a) | —(e | ) | —(e | ) | — | |||||||
| Net Asset Value, End of Year / Period | $ | 8.83 | $ | 12.83 | $ | 10.50 | ||||||
| Total Return | (24.02 | )% | 28.62 | % | 5.00 | %(b) | ||||||
| Net Assets at End of Year / Period (000’s Omitted) | $ | 1,828,840 | $ | 1,582,214 | $ | 1,080,717 | ||||||
| Ratios to Average Net Assets: | ||||||||||||
| Net Investment Income (Loss) | 0.53 | % | 0.41 | % | 1.59 | %(c) | ||||||
| Net Expenses | 1.14 | % | 1.15 | % | 1.21 | %(c) | ||||||
| Gross Expenses(d) | 1.14 | % | 1.15 | % | 1.21 | %(c) | ||||||
| Portfolio Turnover Rate | 105 | % | 70 | % | 26 | %(b) | ||||||
| (a) | Calculated based on average shares outstanding during the year / period. |
| (b) | Not annualized. |
| (c) | Annualized. |
| (d) | Reflects the expense ratio excluding any waivers and/or expense reimbursements. |
| (e) | Less than $0.01 per share. |
| (f) | Commenced operations on March 4, 2014. The information presented is for the period from March 4, 2014 to June 30, 2014. |
The accompanying notes are an integral part of these financial statements.
www.brownadvisoryfunds.com
150
Financial Highlights
These financial highlights reflect selected per share data and ratios for a share outstanding of the Fund throughout each year / period.
BROWN ADVISORY – WMC JAPAN ALPHA OPPORTUNITIES FUND
INVESTOR SHARES
| Year / Period Ended: | ||||||||||||
| June 30, | June 30, | June 30, | ||||||||||
| 2016 | 2015 | 2014(f) | ||||||||||
| Net Asset Value, Beginning of Year / Period | $ | 12.82 | $ | 10.49 | $ | 10.00 | ||||||
| Net Investment Income (Loss)(a) | 0.04 | 0.03 | 0.05 | |||||||||
| Net Realized And Unrealized Gains (Losses) | (2.91 | ) | 2.87 | 0.44 | ||||||||
| Total from Investment Operations | $ | (2.87 | ) | $ | 2.90 | $ | 0.49 | |||||
| Distributions from: | ||||||||||||
| Net Investment Income | (0.94 | ) | (0.50 | ) | — | |||||||
| Net Realized Gains | (0.20 | ) | (0.07 | ) | — | |||||||
| Total Distributions to Shareholders | $ | (1.14 | ) | $ | (0.57 | ) | $ | — | ||||
| Redemption fees(a) | —(e | ) | —(e | ) | — | |||||||
| Net Asset Value, End of Year / Period | $ | 8.81 | $ | 12.82 | $ | 10.49 | ||||||
| Total Return | (24.20 | )% | 28.57 | % | 4.90 | %(b) | ||||||
| Net Assets at End of Year / Period (000’s Omitted) | $ | 1,595 | $ | 25,628 | $ | 4,522 | ||||||
| Ratios to Average Net Assets: | ||||||||||||
| Net Investment Income (Loss) | 0.38 | % | 0.26 | % | 1.44 | %(c) | ||||||
| Net Expenses | 1.29 | % | 1.30 | % | 1.36 | %(c) | ||||||
| Gross Expenses(d) | 1.29 | % | 1.30 | % | 1.36 | %(c) | ||||||
| Portfolio Turnover Rate | 105 | % | 70 | % | 26 | %(b) | ||||||
| (a) | Calculated based on average shares outstanding during the year / period. |
| (b) | Not annualized. |
| (c) | Annualized. |
| (d) | Reflects the expense ratio excluding any waivers and/or expense reimbursements. |
| (e) | Less than $0.01 per share. |
| (f) | Commenced operations on March 4, 2014. The information presented is for the period from March 4, 2014 to June 30, 2014. |
The accompanying notes are an integral part of these financial statements.
www.brownadvisoryfunds.com
151
Financial Highlights
These financial highlights reflect selected per share data and ratios for a share outstanding of the Fund throughout each year / period.
BROWN ADVISORY – WMC JAPAN ALPHA OPPORTUNITIES FUND
ADVISOR SHARES
| Year / Period Ended: | ||||||||||||
| June 30, | June 30, | June 30, | ||||||||||
| 2016 | 2015 | 2014(f) | ||||||||||
| Net Asset Value, Beginning of Year / Period | $ | 12.79 | $ | 10.48 | $ | 10.00 | ||||||
| Net Investment Income (Loss)(a) | 0.01 | — | 0.04 | |||||||||
| Net Realized And Unrealized Gains (Losses) | (2.90 | ) | 2.87 | 0.44 | ||||||||
| Total from Investment Operations | $ | (2.89 | ) | $ | 2.87 | $ | 0.48 | |||||
| Distributions from: | ||||||||||||
| Net Investment Income | (0.92 | ) | (0.49 | ) | — | |||||||
| Net Realized Gains | (0.20 | ) | (0.07 | ) | — | |||||||
| Total Distributions to Shareholders | $ | (1.12 | ) | $ | (0.56 | ) | $ | — | ||||
| Redemption fees(a) | —(e | ) | — | — | ||||||||
| Net Asset Value, End of Year / Period | $ | 8.78 | $ | 12.79 | $ | 10.48 | ||||||
| Total Return | (24.39 | )% | 28.22 | % | 4.80 | %(b) | ||||||
| Net Assets at End of Year / Period (000’s Omitted) | $ | 687 | $ | 1,670 | $ | 59 | ||||||
| Ratios to Average Net Assets: | ||||||||||||
| Net Investment Income (Loss) | 0.13 | % | 0.01 | % | 1.19 | %(c) | ||||||
| Net Expenses | 1.54 | % | 1.55 | % | 1.61 | %(c) | ||||||
| Gross Expenses (d) | 1.54 | % | 1.55 | % | 1.61 | %(c) | ||||||
| Portfolio Turnover Rate | 105 | % | 70 | % | 26 | %(b) | ||||||
| (a) | Calculated based on average shares outstanding during the year / period. |
| (b) | Not annualized. |
| (c) | Annualized. |
| (d) | Reflects the expense ratio excluding any waivers and/or expense reimbursements. |
| (e) | Less than $0.01 per share. |
| (f) | Commenced operations on March 4, 2014. The information presented is for the period from March 4, 2014 to June 30, 2014. |
The accompanying notes are an integral part of these financial statements.
www.brownadvisoryfunds.com
152
Financial Highlights
These financial highlights reflect selected per share data and ratios for a share outstanding of the Fund throughout each year / period.
BROWN ADVISORY – SOMERSET EMERGING MARKETS FUND
INSTITUTIONAL SHARES
| Year / Period Ended: | ||||||||||||||||
| June 30, | June 30, | June 30, | June 30, | |||||||||||||
| 2016 | 2015 | 2014 | 2013(f) | |||||||||||||
| Net Asset Value, Beginning of Year / Period | $ | 9.74 | $ | 10.22 | $ | 9.52 | $ | 10.00 | ||||||||
| Net Investment Income (Loss)(a) | 0.13 | 0.13 | 0.20 | 0.12 | ||||||||||||
| Net Realized And Unrealized Gains (Losses) | (1.05 | ) | (0.46 | ) | 0.61 | (0.60 | ) | |||||||||
| Total from Investment Operations | $ | (0.92 | ) | $ | (0.33 | ) | $ | 0.81 | $ | (0.48 | ) | |||||
| Distributions from: | ||||||||||||||||
| Net Investment Income | (0.09 | ) | (0.15 | ) | (0.11 | ) | —(e | ) | ||||||||
| Total Distributions to Shareholders | $ | (0.09 | ) | $ | (0.15 | ) | $ | (0.11 | ) | $ | —(e | ) | ||||
| Redemption fees(a) | — | — | — | —(e | ) | |||||||||||
| Net Asset Value, End of Year / Period | $ | 8.73 | $ | 9.74 | $ | 10.22 | $ | 9.52 | ||||||||
| Total Return | (9.40 | )% | (3.22 | )% | 8.62 | % | (4.77 | )%(b) | ||||||||
| Net Assets at End of Year / Period (000’s Omitted) | $ | 319,993 | $ | 268,530 | $ | 193,676 | $ | 122,515 | ||||||||
| Ratios to Average Net Assets: | ||||||||||||||||
| Net Investment Income (Loss) | 1.56 | % | 1.31 | % | 2.08 | % | 2.17 | %(c) | ||||||||
| Net Expenses | 1.17 | % | 1.22 | % | 1.25 | % | 1.41 | %(c) | ||||||||
| Gross Expenses(d) | 1.17 | % | 1.22 | % | 1.25 | % | 1.41 | %(c) | ||||||||
| Portfolio Turnover Rate | 19 | % | 22 | % | 19 | % | 19 | %(b) | ||||||||
| (a) | Calculated based on average shares outstanding during the year / period. |
| (b) | Not annualized. |
| (c) | Annualized. |
| (d) | Reflects the expense ratio excluding any waivers and/or expense reimbursements. |
| (e) | Less than $0.01 per share. |
| (f) | Commenced operations on December 12, 2012. The information presented is for the period from December 12, 2012 to June 30, 2013. |
The accompanying notes are an integral part of these financial statements.
www.brownadvisoryfunds.com
153
Financial Highlights
These financial highlights reflect selected per share data and ratios for a share outstanding of the Fund throughout each year / period.
BROWN ADVISORY – SOMERSET EMERGING MARKETS FUND
INVESTOR SHARES
| Year / Period Ended: | ||||||||||||||||
| June 30, | June 30, | June 30, | June 30, | |||||||||||||
| 2016 | 2015 | 2014 | 2013(f) | |||||||||||||
| Net Asset Value, Beginning of Year / Period | $ | 9.73 | $ | 10.21 | $ | 9.51 | $ | 10.00 | ||||||||
| Net Investment Income (Loss)(a) | 0.12 | 0.11 | 0.19 | 0.11 | ||||||||||||
| Net Realized And Unrealized Gains (Losses) | (1.06 | ) | (0.45 | ) | 0.61 | (0.60 | ) | |||||||||
| Total from Investment Operations | $ | (0.94 | ) | $ | (0.34 | ) | $ | 0.80 | $ | (0.49 | ) | |||||
| Distributions from: | ||||||||||||||||
| Net Investment Income | (0.08 | ) | (0.14 | ) | (0.10 | ) | —(e | ) | ||||||||
| Total Distributions to Shareholders | $ | (0.08 | ) | $ | (0.14 | ) | $ | (0.10 | ) | $ | —(e | ) | ||||
| Redemption fees(a) | —(e | ) | — | — | — | |||||||||||
| Net Asset Value, End of Year / Period | $ | 8.71 | $ | 9.73 | $ | 10.21 | $ | 9.51 | ||||||||
| Total Return | (9.60 | )% | (3.33 | )% | 8.51 | % | (4.87 | )%(b) | ||||||||
| Net Assets at End of Year / Period (000’s Omitted) | $ | 196,841 | $ | 155,919 | $ | 24,291 | $ | 11,695 | ||||||||
| Ratios to Average Net Assets: | ||||||||||||||||
| Net Investment Income (Loss) | 1.41 | % | 1.16 | % | 1.93 | % | 2.02 | %(c) | ||||||||
| Net Expenses | 1.32 | % | 1.37 | % | 1.40 | % | 1.56 | %(c) | ||||||||
| Gross Expenses(d) | 1.32 | % | 1.37 | % | 1.40 | % | 1.56 | %(c) | ||||||||
| Portfolio Turnover Rate | 19 | % | 22 | % | 19 | % | 19 | %(b) | ||||||||
| (a) | Calculated based on average shares outstanding during the year / period. |
| (b) | Not annualized. |
| (c) | Annualized. |
| (d) | Reflects the expense ratio excluding any waivers and/or expense reimbursements. |
| (e) | Less than $0.01 per share. |
| (f) | Commenced operations on December 12, 2012. The information presented is for the period from December 12, 2012 to June 30, 2013. |
The accompanying notes are an integral part of these financial statements.
www.brownadvisoryfunds.com
154
Financial Highlights
These financial highlights reflect selected per share data and ratios for a share outstanding of the Fund throughout each year / period.
BROWN ADVISORY – SOMERSET EMERGING MARKETS FUND
ADVISOR SHARES
| Year / Period Ended: | ||||||||||||||||
| June 30, | June 30, | June 30, | June 30, | |||||||||||||
| 2016 | 2015 | 2014 | 2013(f) | |||||||||||||
| Net Asset Value, Beginning of Year / Period | $ | 9.70 | $ | 10.18 | $ | 9.49 | $ | 10.00 | ||||||||
| Net Investment Income (Loss)(a) | 0.10 | 0.09 | 0.16 | 0.10 | ||||||||||||
| Net Realized And Unrealized Gains (Losses) | (1.05 | ) | (0.46 | ) | 0.61 | (0.61 | ) | |||||||||
| Total from Investment Operations | $ | (0.95 | ) | $ | (0.37 | ) | $ | 0.77 | $ | (0.51 | ) | |||||
| Distributions from: | ||||||||||||||||
| Net Investment Income | (0.02 | ) | (0.11 | ) | (0.08 | ) | —(e | ) | ||||||||
| Total Distributions to Shareholders | $ | (0.02 | ) | $ | (0.11 | ) | $ | (0.08 | ) | $ | —(e | ) | ||||
| Redemption fees(a) | — | — | — | — | ||||||||||||
| Net Asset Value, End of Year / Period | $ | 8.73 | $ | 9.70 | $ | 10.18 | $ | 9.49 | ||||||||
| Total Return | (9.82 | )% | (3.60 | )% | 8.19 | % | (5.07 | )%(b) | ||||||||
| Net Assets at End of Year / Period (000’s Omitted) | $ | 281 | $ | 942 | $ | 533 | $ | 990 | ||||||||
| Ratios to Average Net Assets: | ||||||||||||||||
| Net Investment Income (Loss) | 1.16 | % | 0.91 | % | 1.68 | % | 1.77 | %(c) | ||||||||
| Net Expenses | 1.57 | % | 1.62 | % | 1.65 | % | 1.81 | %(c) | ||||||||
| Gross Expenses (d) | 1.57 | % | 1.62 | % | 1.65 | % | 1.81 | %(c) | ||||||||
| Portfolio Turnover Rate | 19 | % | 22 | % | 19 | % | 19 | %(b) | ||||||||
| (a) | Calculated based on average shares outstanding during the year / period. |
| (b) | Not annualized. |
| (c) | Annualized. |
| (d) | Reflects the expense ratio excluding any waivers and/or expense reimbursements. |
| (e) | Less than $0.01 per share. |
| (f) | Commenced operations on December 12, 2012. The information presented is for the period from December 12, 2012 to June 30, 2013. |
The accompanying notes are an integral part of these financial statements.
www.brownadvisoryfunds.com
155
Financial Highlights
These financial highlights reflect selected per share data and ratios for a share outstanding of the Fund throughout each year / period.
BROWN ADVISORY EMERGING MARKETS SMALL-CAP FUND
INSTITUTIONAL SHARES
| Year / Period Ended: | ||||||||
| June 30, | June 30, | |||||||
| 2016 | 2015(e) | |||||||
| Net Asset Value, Beginning of Year / Period | $ | 11.70 | $ | 10.00 | ||||
| Net Investment Income (Loss)(a) | — | 0.02 | ||||||
| Net Realized And Unrealized Gains (Losses) | (2.10 | ) | 1.68 | |||||
| Total from Investment Operations | $ | (2.10 | ) | $ | 1.70 | |||
| Distributions from: | ||||||||
| Net Realized Gains | (0.42 | ) | — | |||||
| Total Distributions to Shareholders | $ | (0.42 | ) | $ | — | |||
| Redemption fees(a) | — | — | ||||||
| Net Asset Value, End of Year / Period | $ | 9.18 | $ | 11.70 | ||||
| Total Return | (18.16 | )% | 17.00 | %(b) | ||||
| Net Assets at End of Year / Period (000’s Omitted) | $ | 212,344 | $ | 187,901 | ||||
| Ratios to Average Net Assets: | ||||||||
| Net Investment Income (Loss) | (0.03 | )% | 0.27 | %(c) | ||||
| Net Expenses | 1.51 | % | 1.83 | %(c) | ||||
| Gross Expenses(d) | 1.51 | % | 1.83 | %(c) | ||||
| Portfolio Turnover Rate | 126 | % | 89 | %(b) | ||||
| (a) | Calculated based on average shares outstanding during the year / period. |
| (b) | Not annualized. |
| (c) | Annualized. |
| (d) | Reflects the expense ratio excluding any waivers and/or expense reimbursements. |
| (e) | Commenced operations on November 21, 2014. The information presented is for the period from November 21, 2014 to June 30, 2015. |
The accompanying notes are an integral part of these financial statements.
www.brownadvisoryfunds.com
156
Financial Highlights
These financial highlights reflect selected per share data and ratios for a share outstanding of the Fund throughout each year / period.
BROWN ADVISORY EMERGING MARKETS SMALL-CAP FUND
INVESTOR SHARES
| Year / Period Ended: | ||||||||
| June 30, | June 30, | |||||||
| 2016 | 2015(f) | |||||||
| Net Asset Value, Beginning of Year / Period | $ | 11.69 | $ | 10.00 | ||||
| Net Investment Income (Loss)(a) | (0.02 | ) | 0.01 | |||||
| Net Realized And Unrealized Gains (Losses) | (2.10 | ) | 1.68 | |||||
| Total from Investment Operations | $ | (2.12 | ) | $ | 1.69 | |||
| Distributions from: | ||||||||
| Net Realized Gains | (0.42 | ) | — | |||||
| Total Distributions to Shareholders | $ | (0.42 | ) | $ | — | |||
| Redemption fees(a) | —(e | ) | — | |||||
| Net Asset Value, End of Year / Period | $ | 9.15 | $ | 11.69 | ||||
| Total Return | (18.35 | )% | 16.90 | %(b) | ||||
| Net Assets at End of Year / Period (000’s Omitted) | $ | 5,633 | $ | 18,992 | ||||
| Ratios to Average Net Assets: | ||||||||
| Net Investment Income (Loss) | (0.18 | )% | 0.12 | %(c) | ||||
| Net Expenses | 1.66 | % | 1.98 | %(c) | ||||
| Gross Expenses(d) | 1.66 | % | 1.98 | %(c) | ||||
| Portfolio Turnover Rate | 126 | % | 89 | %(b) | ||||
| (a) | Calculated based on average shares outstanding during the year / period. |
| (b) | Not annualized. |
| (c) | Annualized. |
| (d) | Reflects the expense ratio excluding any waivers and/or expense reimbursements. |
| (e) | Less than $0.01 per share. |
| (f) | Commenced operations on November 21, 2014. The information presented is for the period from November 21, 2014 to June 30, 2015. |
The accompanying notes are an integral part of these financial statements.
www.brownadvisoryfunds.com
157
Notes to Financial Statements
June 30, 2016
Note 1. Organization
The Brown Advisory Growth Equity Fund (“Growth Equity Fund”), Brown Advisory Value Equity Fund (“Value Equity Fund”), Brown Advisory Flexible Equity Fund (“Flexible Equity Fund”), Brown Advisory Equity Income Fund (“Equity Income Fund”), Brown Advisory Sustainable Growth Fund (“Sustainable Growth Fund”), Brown Advisory Small-Cap Growth Fund (“Small-Cap Growth Fund”), Brown Advisory Small-Cap Fundamental Value Fund (“Small-Cap Fundamental Value Fund”), Brown Advisory Multi-Strategy Fund (“Multi-Strategy Fund”), Brown Advisory Global Leaders Fund (“Global Leaders Fund”), Brown Advisory Intermediate Income Fund (“Intermediate Income Fund”), Brown Advisory Total Return Fund (“Total Return Fund”), Brown Advisory Strategic Bond Fund (“Strategic Bond Fund”), Brown Advisory Maryland Bond Fund (“Maryland Bond Fund”), Brown Advisory Tax Exempt Bond Fund (“Tax Exempt Bond Fund”), Brown Advisory Mortgage Securities Fund (“Mortgage Securities Fund”), Brown Advisory – WMC Strategic European Equity Fund (“Strategic European Equity Fund”), Brown Advisory – WMC Japan Alpha Opportunities Fund (“Japan Alpha Opportunities Fund”), Brown Advisory – Somerset Emerging Markets Fund (“Emerging Markets Fund”) and Brown Advisory Emerging Markets Small-Cap Fund (“Emerging Markets Small-Cap Fund”) (individually a “Fund,” and collectively, the “Funds”) are each a series of shares of beneficial interest of Brown Advisory Funds (the “Trust”), which is registered under the Investment Company Act of 1940 as an open-ended management investment company. Prior to October 19, 2012, the Funds, except for the Sustainable Growth Fund, Multi-Strategy Fund, Global Leaders Fund, Total Return Fund, Tax Exempt Bond Fund, Mortgage Securities Fund, Strategic European Equity Fund, Japan Alpha Opportunities Fund, Emerging Markets Fund, and Emerging Markets Small-Cap Fund, were series of Professionally Managed Portfolios Trust. Prior to April 12, 2010, the Funds, except for the Equity Income Fund, Sustainable Growth Fund, Multi-Strategy Fund, Global Leaders Fund, Total Return Fund, Strategic Bond Fund, Tax Exempt Bond Fund, Mortgage Securities Fund, Strategic European Equity Fund, Japan Alpha Opportunities Fund, Emerging Markets Fund, and Emerging Markets Small-Cap Fund, each of which had yet to commence operations, were part of the Forum Funds Trust.
The Funds commenced operations as follows:
| Institutional | Investor | Advisor | |
Shares | Shares | Shares | |
| Growth Equity Fund | 10/19/2012 | 6/28/1999* | 5/18/2006** |
| Value Equity Fund | 10/19/2012 | 1/28/2003* | 4/25/2006** |
| Flexible Equity Fund | 10/19/2012 | 11/30/2006* | 1/24/2007** |
| Equity Income Fund | 10/19/2012 | 12/29/2011* | 12/29/2011 |
| Sustainable Growth Fund | 6/29/2012 | 6/29/2012 | 6/29/2012 |
| Small-Cap Growth Fund | 9/20/2002*** | 6/28/1999* | 4/25/2006** |
| Small-Cap Fundamental Value Fund | 10/19/2012 | 12/31/2008* | 7/28/2011 |
| Multi-Strategy Fund | 10/31/2014 | — | — |
| Global Leaders Fund | — | 7/1/2015 | — |
| Intermediate Income Fund | — | 11/2/1995* | 5/13/1991** |
| Total Return Fund | 10/30/2014 | 10/30/2014 | — |
| Strategic Bond Fund | — | 10/31/2014 | 9/30/2011 |
| Maryland Bond Fund | — | 12/21/2000* | — |
| Tax Exempt Bond Fund | — | 6/29/2012 | — |
| Mortgage Securities Fund | 5/13/2014 | 12/26/2013 | — |
| Strategic European Equity Fund | 10/21/2013 | 10/21/2013 | 10/21/2013 |
| Japan Alpha Opportunities Fund | 3/4/2014 | 3/4/2014 | 3/4/2014 |
| Emerging Markets Fund | 12/12/2012 | 12/12/2012 | 12/12/2012 |
| Emerging Markets Small-Cap Fund | 11/21/2014 | 11/21/2014 | — |
_________________________
| * | Prior to October 19, 2012, Investor Shares were known as Institutional Shares. |
| ** | Prior to July 1, 2011, Advisor Shares were known as A Shares. |
| *** | Prior to October 19, 2012, Small-Cap Growth Fund Institutional Shares were known as D Shares. |
Each share class has equal rights as to earnings and assets except that each class bears different shareholder servicing and distribution expenses. Each share class has exclusive voting rights with respect to matters that affect just that class. Income, expenses (other than expenses attributable to a specific class), and realized and unrealized gains or losses on investments are allocated to each share class on its relative net assets.
www.brownadvisoryfunds.com
158
Notes to Financial Statements
June 30, 2016
The investment objective of Growth Equity Fund and Small-Cap Growth Fund is to achieve capital appreciation by primarily investing in equity securities. The investment objective of Value Equity Fund is to achieve capital appreciation. The investment objective of Small-Cap Fundamental Value Fund is to achieve long-term capital appreciation. Flexible Equity Fund’s investment objective is to achieve long-term growth of capital. Maryland Bond Fund’s investment objective is to provide a high level of current income exempt from both Federal and Maryland State income taxes without undue risk. Intermediate Income Fund’s investment objective is to provide a high level of current income consistent with preservation of principal within an intermediate-term maturity structure. Equity Income Fund’s investment objective is to provide current dividend yield and dividend growth. Sustainable Growth Fund’s investment objective is to seek capital appreciation by investing at least 80% of its net assets in equity securities of environmentally sustainable domestic companies. The investment objective of the Strategic Bond Fund is to achieve capital appreciation and income with a low correlation to interest rate movements. Tax Exempt Bond Fund’s investment objective is to seek to provide a high level of current income exempt from Federal income tax by investing primarily in intermediate-term investment grade municipal bonds. The investment objective of the Emerging Markets Fund is to seek to achieve total return by investing principally in equity securities issued by companies established or operating in emerging markets. The investment objective of the Strategic European Equity Fund seeks to achieve total return by investing principally in equity securities issued by companies established or operating in Europe. The investment objective of the Mortgage Securities Fund seeks to maximize total return consistent with preservation of capital. The current investment objective of the Japan Alpha Opportunities Fund (effective as of July 7, 2016) seeks to achieve total return by investing principally in equity securities of companies which are domiciled in or exercise the predominant part of their economic activity in Japan (and prior to July 7, 2016 the investment objective of the Japan Alpha Opportunities Fund had been to seek to achieve total return by investing principally in equity securities of companies which are domiciled in or exercise the predominant part of their economic activity in Japan, while also limiting exposure to fluctuations between the value of the Japanese yen and the U.S. dollar). Multi-Strategy Fund’s investment objective is to achieve long-term capital appreciation and current income. Global Leaders Fund seeks to achieve capital appreciation by investing primarily in global equities. The investment objective of the Total Return fund is to provide a competitive total return consistent with preservation of principal. The Emerging Markets Small-Cap Fund’s investment objective is to achieve total return by investing principally in equity securities issued by small-capitalization companies established or operating in emerging markets.
Note 2. Significant Accounting Policies
The following is a summary of significant accounting policies consistently followed by the Funds. These policies are in conformity with accounting principles generally accepted in the United States of America.
A. Security Valuation – The Funds have adopted fair valuation accounting standards which establish an authoritative definition of fair value and set out a hierarchy for measuring fair value. These standards require additional disclosures about the various inputs and valuation techniques used to develop the measurements of fair value and a discussion of changes in valuation techniques and related inputs, if any, during the period. These inputs are summarized in the three broad levels listed below:
| Level 1 – | Quoted prices in active markets for identical securities. |
| Level 2 – | Evaluated price based on other significant observable inputs (including quoted prices for similar securities, interest rates, prepayment spreads, credit risk, etc). |
| Level 3 – | Significant unobservable inputs (including the Fund’s own assumptions in determining the fair value of investments). |
The inputs or methodology used for valuing securities are not necessarily an indication of the risk associated with investing in those securities.
Equity securities that are traded on a national securities exchange, except those listed on the NASDAQ Global Market® (“NASDAQ”), are valued at the last reported sale price on the exchange on which the security is principally traded. Securities traded on NASDAQ will be valued at the NASDAQ Official Closing Price (“NOCP”). If, on a particular day, an exchange-traded or NASDAQ security does not trade, then the mean between the most recent quoted bid and asked prices will be used. All equity securities that are not traded on a listed exchange are valued at the last sale price in the over-the counter market. If a non-exchange traded security does not trade on a particular day, then the mean between the last quoted closing bid and asked price will be used. Such domestic equity securities are typically categorized as Level 1 securities. Investments in other domestic investment companies are valued at their reported Net Asset Value (“NAV”) and are typically categorized as Level 1 securities. Investments in Exchange Traded Funds (“ETFs”) are valued at their last reported sale price and are typically categorized as Level 1 securities.
For foreign securities that are traded on foreign exchanges, the Funds have selected Interactive Data Corporation (“IDC”) to provide pricing data for those such securities that are held by the Funds. The use of IDC’s pricing services with respect to these foreign exchange traded securities is designed to capture events occurring after a foreign exchange closes that may affect the value
www.brownadvisoryfunds.com
159
Notes to Financial Statements
June 30, 2016
of certain holdings of the Funds that are traded on those foreign exchanges. The Funds utilize a confidence interval when determining whether or not to utilize these prices provided by IDC. The confidence interval is a measure of the relationship that each foreign exchange traded security has to movements in various indices and the price of the foreign exchange traded security’s corresponding American Depositary Receipt, if one exists. IDC provides a confidence interval for each foreign exchange traded security for which it provides a price. If the confidence interval provided by IDC is equal to or greater than a predefined level utilized by the Funds, the Funds will value that foreign exchange traded security at that price. If the confidence interval provided by IDC is less than the predefined level utilized by the Funds, the Funds will value that foreign exchange traded security at the preceding closing price on its respective foreign exchange, or, if there were no transactions on the preceding day, at the mean between the bid and the asked prices. Such foreign securities are typically categorized as Level 2 securities. Foreign securities for which the local market closing prices are utilized are typically categorized as Level 1 securities.
Debt securities are valued by using the mean between the closing bid and asked prices provided by an independent pricing service. If the closing bid and asked prices are not readily available, the independent pricing service may provide a price determined by a matrix pricing method. These techniques generally consider such factors as yields or prices of bonds of comparable quality, type of issue, coupon, maturity, ratings and general market conditions. Fixed income debt instruments, such as commercial paper, banker’s acceptances and U.S. Treasury Bills, having a maturity of less than 60 days are valued at amortized cost when the amortized cost value is determined to approximate fair value established using market-based and issuer-specific factors. Such debt securities are typically categorized as Level 2.
Exchange traded options are valued at the composite price, using the National Best Bid and Offer quotes (NBBO). NBBO consists of the highest bid price and lowest ask price across any of the exchanges on which an option is quoted, thus providing a view across the entire U.S. options marketplace. Specifically, composite pricing calculates the mean of the highest bid price and lowest ask price across the exchanges where the option is traded. Such options are typically categorized as Level 2.
Futures contracts are generally valued at the settlement prices established each day on the exchange on which they are traded and are categorized as Level 1 securities.
Forward foreign currency contracts are valued at the prevailing forward exchange rate of the underlying currencies and are categorized as Level 2 securities.
Credit default swaps are valued based upon the daily closing price of the underlying index or reference entity and are categorized as Level 2 securities.
Securities for which quotations are not readily available are valued at their respective fair values as determined in good faith under guidelines and procedures adopted by the Board of Trustees. These are generally considered Level 3 securities when significant unobservable inputs are utilized in the determination of the fair value. When a security is “fair valued,” consideration is given to the facts and circumstances relevant to the particular situation, including a review of various factors set forth in the guidelines and procedures adopted by the Board of Trustees. Fair value pricing is an inherently subjective process, and no single standard exists for determining fair value. Different funds could reasonably arrive at different values for the same security. The use of fair value pricing by a fund may cause the net asset value of its shares to differ significantly from the net asset value that would be calculated without regard to such considerations. As of June 30, 2016, the Small-Cap Growth Fund and the Emerging Markets Fund held fair valued securities. As of June 30, 2016, the Small-Cap Growth Fund held fair valued securities with a total market value of $2,691,008 or 0.9% of total net assets. As of June 30, 2016, the Emerging Markets Fund held fair valued securities with a total market value of 97,975 or 0.0% of total net assets.
The following is a summary of inputs used to value the Funds’ investments as of June 30, 2016:
| Level 1 | Level 2 | Level 3 | ||||||||||
| Growth Equity Fund | ||||||||||||
| Common Stocks | $ | 2,095,864,158 | $ | — | $ | — | ||||||
| Short-Term Investments | 88,142,557 | — | — | |||||||||
| Total Investments in Securities | $ | 2,184,006,715 | $ | — | $ | — | ||||||
| Level 1 | Level 2 | Level 3 | ||||||||||
| Value Equity Fund | ||||||||||||
| Common Stocks | $ | 46,747,964 | $ | — | $ | — | ||||||
| Real Estate Investment Trusts | 2,610,406 | — | ||||||||||
| Short-Term Investments | 1,516,074 | — | — | |||||||||
| Total Investments in Securities | $ | 50,874,444 | $ | — | $ | — | ||||||
www.brownadvisoryfunds.com
160
Notes to Financial Statements
June 30, 2016
| Level 1 | Level 2 | Level 3 | ||||||||||
| Flexible Equity Fund | ||||||||||||
| Common Stocks | $ | 326,098,435 | $ | — | $ | — | ||||||
| Warrants | 272,400 | — | — | |||||||||
| Short-Term Investments | 11,833,570 | — | — | |||||||||
| Total Investments in Securities | $ | 338,204,405 | $ | — | $ | — | ||||||
| Level 1 | Level 2 | Level 3 | ||||||||||
| Equity Income Fund | ||||||||||||
| Common Stocks | $ | 112,526,390 | $ | — | $ | — | ||||||
| Preferred Stocks | 2,925,634 | — | — | |||||||||
| Real Estate Investment Trusts | 7,696,305 | — | — | |||||||||
| Short-Term Investments | 6,934,634 | — | — | |||||||||
| Total Investments in Securities | $ | 130,082,963 | $ | — | $ | — | ||||||
| Level 1 | Level 2 | Level 3 | ||||||||||
| Sustainable Growth Fund | ||||||||||||
| Common Stocks | $ | 317,383,612 | $ | — | $ | — | ||||||
| Real Estate Investment Trusts | 13,994,935 | — | — | |||||||||
| Short-Term Investments | 13,144,856 | — | — | |||||||||
| Total Investments in Securities | $ | 344,523,403 | $ | — | $ | — | ||||||
| Level 1 | Level 2 | Level 3 | ||||||||||
| Small-Cap Growth Fund | ||||||||||||
| Common Stocks | $ | 269,861,628 | $ | — | $ | — | ||||||
| Contingent Value Rights | — | — | 131,192 | |||||||||
| Private Placements | — | — | 2,559,816 | |||||||||
| Short-Term Investments | 22,697,340 | — | — | |||||||||
| Total Investments in Securities | $ | 292,558,968 | $ | — | $ | 2,691,008 | ||||||
| Level 1 | Level 2 | Level 3 | ||||||||||
| Small-Cap Fundamental Value Fund | ||||||||||||
| Common Stocks | $ | 865,823,365 | $ | — | $ | — | ||||||
| Real Estate Investment Trusts | 76,846,232 | — | — | |||||||||
| Short-Term Investments | 36,740,582 | — | — | |||||||||
| Total Investments in Securities | $ | 979,410,179 | $ | — | $ | — | ||||||
| Level 1 | Level 2 | Level 3 | ||||||||||
| Multi-Strategy Fund | ||||||||||||
| Affiliated Mutual Funds | $ | 2,881,682 | $ | — | $ | — | ||||||
| Short-Term Investments | 68,483 | — | — | |||||||||
| Total Investments in Securities | $ | 2,950,165 | $ | — | $ | — | ||||||
| Level 1 | Level 2 | Level 3 | ||||||||||
| Global Leaders Fund | ||||||||||||
| Common Stocks: | ||||||||||||
| China | $ | — | $ | 793,415 | $ | — | ||||||
| Denmark | 178,388 | 1,426,739 | — | |||||||||
| Germany | — | 939,278 | — | |||||||||
| India | — | 913,946 | — | |||||||||
| Indonesia | — | 304,908 | — | |||||||||
| Japan | — | 367,795 | — | |||||||||
| Sweden | — | 389,263 | — | |||||||||
| Taiwan | 860,003 | — | — | |||||||||
| United Kingdom | 224,650 | 953,037 | — | |||||||||
| United States | 17,701,389 | — | — | |||||||||
| Short-Term Investments | 1,521,057 | — | — | |||||||||
| Total Investments in Securities | $ | 20,485,487 | $ | 6,088,381 | $ | — | ||||||
www.brownadvisoryfunds.com
161
Notes to Financial Statements
June 30, 2016
| Level 1 | Level 2 | Level 3 | ||||||||||
| Intermediate Income Fund | ||||||||||||
| Corporate Bonds & Notes | $ | — | $ | 41,517,374 | $ | — | ||||||
| Mortgage Backed Securities | — | 21,456,555 | — | |||||||||
| Asset Backed Securities | — | 12,896,422 | — | |||||||||
| Municipal Bonds | — | 8,007,401 | — | |||||||||
| U.S. Treasury Notes | — | 30,058,782 | — | |||||||||
| Affiliated Mutual Funds | 30,526,684 | — | — | |||||||||
| Short-Term Investments | 1,968,162 | — | — | |||||||||
| Total Investments in Securities | $ | 32,494,846 | $ | 113,936,534 | $ | — | ||||||
| Level 1 | Level 2 | Level 3 | ||||||||||
| Total Return Fund | ||||||||||||
| Mortgage Backed Securities | $ | — | $ | 32,509,644 | $ | — | ||||||
| Corporate Bonds & Notes | — | 23,490,840 | — | |||||||||
| Asset Backed Securities | — | 18,827,999 | — | |||||||||
| Municipal Bonds | — | 1,660,211 | — | |||||||||
| U.S. Treasury Notes | — | 6,165,855 | — | |||||||||
| Short-Term Investments | 16,084,960 | — | — | |||||||||
| Total Investments in Securities | $ | 16,084,960 | $ | 82,654,549$— | ||||||||
| Future Contracts – Long* | $ | 733,943 | $ | — | $ | — | ||||||
| * Unrealized Appreciation (Depreciation) | ||||||||||||
| Level 1 | Level 2 | Level 3 | ||||||||||
| Strategic Bond Fund | ||||||||||||
| Asset Backed Securities | $ | — | $ | 22,307,842 | $ | — | ||||||
| Mortgage Backed Securities | — | 22,394,489 | — | |||||||||
| Corporate Bonds & Notes | — | 5,230,535 | — | |||||||||
| Mutual Funds | 893,294 | — | — | |||||||||
| Short-Term Investments | 4,865,549 | 99,970 | — | |||||||||
| Total Investments in Securities | $ | 5,758,843 | $ | 50,032,836$— | ||||||||
| Future Contracts – Short* | $ | (178,310 | ) | $ | — | $ | — | |||||
| * Unrealized Appreciation (Depreciation) | ||||||||||||
| Level 1 | Level 2 | Level 3 | ||||||||||
| Maryland Bond Fund | ||||||||||||
| Municipal Bonds | $ | — | $ | 180,955,320 | $ | — | ||||||
| Short-Term Investments | 497,875 | — | — | |||||||||
| Total Investments in Securities | $ | 497,875 | $ | 180,955,320 | $ | — | ||||||
| Level 1 | Level 2 | Level 3 | ||||||||||
| Tax Exempt Bond Fund | ||||||||||||
| Municipal Bonds | $ | — | $ | 230,953,947 | $ | — | ||||||
| Short-Term Investments | 1,272,606 | — | — | |||||||||
| Total Investments in Securities | $ | 1,272,606 | $ | 230,953,947 | $ | — | ||||||
| Level 1 | Level 2 | Level 3 | ||||||||||
| Mortgage Securities Fund | ||||||||||||
| Mortgage Backed Securities | $ | — | $ | 435,282,438 | $ | — | ||||||
| Asset Backed Securities | — | 19,520,323 | — | |||||||||
| U.S. Treasury Notes | — | 18,111,678 | — | |||||||||
| Local Government Housing Agency Bonds | — | 2,652,668 | — | |||||||||
| Short-Term Investments | 14,810,076 | — | — | |||||||||
| Total Investments in Securities | $ | 14,810,076 | $ | 475,567,107 | $ | — | ||||||
| Mortgage Backed Securities – Short | $ | — | $ | (10,722,369 | ) | $ | — | |||||
www.brownadvisoryfunds.com
162
Notes to Financial Statements
June 30, 2016
| Level 1 | Level 2 | Level 3 | ||||||||||
| Strategic European Equity Fund | ||||||||||||
| Common Stocks: | ||||||||||||
| Belgium | $ | — | $ | 27,866,398 | $ | — | ||||||
| Denmark | — | 49,172,412 | — | |||||||||
| Finland | — | 44,829,705 | — | |||||||||
| France | — | 129,542,012 | — | |||||||||
| Germany | — | 95,448,954 | — | |||||||||
| Italy | — | 32,048,864 | — | |||||||||
| Netherlands | — | 49,152,380 | — | |||||||||
| Spain | — | 5,902,579 | — | |||||||||
| Sweden | — | 101,360,501 | — | |||||||||
| Switzerland | 11,558,418 | 191,338,198 | — | |||||||||
| United Kingdom | 3,499,172 | 314,989,703 | — | |||||||||
| Short-Term Investments | 14,983,547 | — | — | |||||||||
| Total Investments in Securities | $ | 30,041,137 | $ | 1,041,651,706 | $ | — | ||||||
| Level 1 | Level 2 | Level 3 | ||||||||||
| Japan Alpha Opportunities Fund | ||||||||||||
| Common Stocks | $ | 8,449,525 | $ | 1,743,412,187 | $ | — | ||||||
| Real Estate Investment Trusts | — | 2,417,891 | — | |||||||||
| Exchange Traded Funds | — | 6,948,975 | — | |||||||||
| Short-Term Investments | 53,537,464 | — | — | |||||||||
| Total Investments in Securities | $ | 61,986,989 | $ | 1,752,779,053 | $ | — | ||||||
| Forward Currency Exchange Contracts* | $ | — | $ | 10,962,063 | $ | — | ||||||
| * Unrealized Appreciation (Depreciation) | ||||||||||||
| Level 1 | Level 2 | Level 3 | ||||||||||
| Emerging Markets Fund | ||||||||||||
| Common Stocks: | ||||||||||||
| Brazil | $ | 21,252,354 | $ | — | $ | — | ||||||
| Chile | 19,787,334 | — | — | |||||||||
| China | — | 35,281,085 | — | |||||||||
| Hungary | — | 33,246,452 | — | |||||||||
| India | — | 60,916,752 | — | |||||||||
| Indonesia | — | 12,338,018 | — | |||||||||
| Nigeria | 771,009 | — | — | |||||||||
| Philippines | — | 41,254,074 | — | |||||||||
| Poland | — | 18,709,901 | — | |||||||||
| Portugal | — | 4,358,117 | — | |||||||||
| South Africa | — | 30,418,988 | — | |||||||||
| South Korea | — | 110,075,336 | — | |||||||||
| Sweden | — | 3,611,538 | — | |||||||||
| Taiwan | — | 48,453,927 | — | |||||||||
| Thailand | — | 860,303 | — | |||||||||
| Turkey | 1,300,418 | 27,882,865 | — | |||||||||
| United Arab Emirates | — | 15,772,818 | — | |||||||||
| United Kingdom | — | 9,826,471 | — | |||||||||
| Warrants | 10,721 | — | — | |||||||||
| Short-Term Investments | 21,071,793 | — | — | |||||||||
| Total Investments in Securities | $ | 64,193,629 | $ | 453,006,645 | $ | — | ||||||
www.brownadvisoryfunds.com
163
Notes to Financial Statements
June 30, 2016
| Level 1 | Level 2 | Level 3 | ||||||||||
| Emerging Markets Small-Cap Fund | ||||||||||||
| Common Stocks: | ||||||||||||
| China | $ | — | $ | 31,622,584 | $ | — | ||||||
| India | — | 27,825,257 | — | |||||||||
| Indonesia | — | 5,112,165 | — | |||||||||
| Malaysia | — | 2,026,814 | — | |||||||||
| Philippines | 1,537,280 | 7,960,636 | — | |||||||||
| Singapore | — | 5,913,430 | — | |||||||||
| South Korea | — | 57,432,990 | — | |||||||||
| Taiwan | — | 36,093,057 | — | |||||||||
| Thailand | — | 15,686,549 | — | |||||||||
| Real Estate Investment Trusts | — | 3,058,436 | — | |||||||||
| Mutual Funds | — | 2,393,073 | — | |||||||||
| Warrants | 222 | — | — | |||||||||
| Short-Term Investments | 19,686,070 | — | — | |||||||||
| Total Investments in Securities | $ | 21,223,572 | $ | 195,124,991 | $ | — | ||||||
The Funds recognize transfers between levels as of the end of the fiscal year. There were no transfers into or out of Level 1 or Level 2 securities as of June, 30, 2016.
The following is a reconciliation of Level 3 securities for which significant unobservable inputs were used to determine fair value.
Small-Cap Growth Fund | Contingent Value Rights | Private Placements | ||||||
| Balance as of June 30, 2015 | $ | — | $ | 2,665,607 | ||||
| Acquisitions/Purchases | 131,192 | 44,000 | ||||||
| Returns of Capital | — | (319,295 | ) | |||||
| Change in Unrealized Appreciation | — | 169,504 | ||||||
| Balance as of June 30, 2016 | $ | 131,192 | $ | 2,559,816 | ||||
The Contingent Value Rights (“CVR”) were acquired as a result of Dyax Corp. (which was a portfolio holding of the Fund) being acquired by Shire PLC. In exchange for the Fund’s shares in Dyax Corp., the Fund received cash considerations from Shire PLC as well as the CVR. The CVR are valued at the difference between the cash price at which Dyax Corp. was acquired by Shire PLC and the closing price of Dyax Corp. on its last day of trading prior to the acquisition.
The inputs utilized in valuing the Private Placements consist of annual audited financial statements and quarterly capital statements which are provided by the issuer. These valuations are adjusted periodically for certain events (additional contributions of capital or purchases made by the Fund, distributions to the Fund made by the issuer, etc) that may occur prior to receipt of the next quarterly capital statement or Annual Report.
B. Securities Transactions and Investment Income – Investment securities transactions are accounted for on the trade date. Discounts/premiums on debt securities purchased are accreted/amortized over the life of the respective securities using the effective interest method. Dividend income is recorded on the ex-dividend date. Interest income is recorded on an accrual basis. Foreign dividend income is recorded on the ex-dividend date or as soon as practical after a Fund determines the existence of a dividend declaration after exercising reasonable due diligence. Income and capital gains on some foreign securities may be subject to foreign withholding taxes, which are accrued as applicable. Identified cost of investments sold is used to determine the gain and loss for both financial statement and Federal income tax purposes. Distributions deemed to be a return of capital are recorded as a reduction of the cost of the related investments.
C. Foreign Currency – Investment securities and other assets and liabilities denominated in foreign currencies are translated into U.S. Dollar amounts at the date of valuation. Purchases and sales of investment securities and income and expense items denominated in foreign currencies are translated into U.S. Dollar amounts on the respective dates of such transactions.
The Funds do not isolate the portion of the results of operations resulting from changes in foreign exchange rates on investments from the fluctuations arising from changes in market prices of securities held. Such fluctuations are included with the net realized and unrealized gain or loss from investments.
www.brownadvisoryfunds.com
164
Notes to Financial Statements
June 30, 2016
The Funds report net realized foreign exchange gains and losses that arise from sales of foreign currencies, currency gains or losses realized between the trade and settlement dates on securities transactions, and the difference between the amounts of dividends, interest, and foreign withholding taxes recorded on the Fund’s books and the U.S. Dollar equivalent of the amounts actually received or paid. Net unrealized foreign exchange gains and losses arise from changes in the fair values of the assets and liabilities, other than investments in securities at fiscal year end, resulting from changes in exchange rates.
Some of the Funds may invest in forward foreign currency contracts. These amounts are presented separately from realized and unrealized gains and losses from investments in the financial statements.
D. Options – The Funds may invest in options. When a Fund writes an option, an amount equal to the premium received by a Fund is recorded as a liability and is subsequently adjusted to the current value of the option written. Premiums received from writing options that expire unexercised are treated by a Fund on the expiration date as realized gain from investments. The difference between the premium and the amount paid on effecting a closing purchase transaction, including brokerage commissions, is also treated as a realized gain, or if the premium is less than the amount paid for closing purchase transaction, as a realized loss. If a call option is exercised, the premium is added to the proceeds from the sale of the underlying security or currency determining whether a Fund has a realized gain or loss. If a put option is exercised, the premium reduces the cost basis of the securities purchase by a Fund. A Fund, as a writer of an option, bears the market risk of an unfavorable change in the price of the security underlying the written option.
When a Fund purchases an option, an amount equal to the premium paid by a Fund is recorded as an investment and is subsequently adjusted to the current value of the option purchased. If an option expires on the stipulated expiration date or if a Fund enters into a closing sale transaction, a gain or loss is realized. If a call option is exercised, the cost of the security acquired is increased by the premium paid for the call. If a put option is exercised, a gain or loss is realized from the sale of the underlying security, and the proceeds from such sale are decreased by the premium originally paid. Written and purchased options are non-income producing securities.
None of the Funds purchased, sold or wrote any options during the year ended June 30, 2016. The Strategic Bond Fund held purchased options which expired without being exercised, resulting in a realized loss of $92,291. This amount is included in the Statement of Operations as a net realized loss on investments – unaffiliated.
E. Distributions to Shareholders – For the Maryland Bond Fund and Tax Exempt Bond Fund distributions of net investment income, if any, are declared daily and paid monthly. Distributions to shareholders of net investment income, if any, are declared and paid monthly for the Intermediate Income Fund, Total Return Fund, Strategic Bond Fund and Mortgage Securities Fund and quarterly for the Equity Income Fund. The remaining Funds declare and pay net investment income, if any, at least annually. Distributions to shareholders of net capital gains, if any, are declared and paid at least annually. Distributions are recorded on the ex-dividend date.
F. Use of Estimates – The preparation of financial statements in conformity with accounting principles generally accepted in the United States of America requires management to make estimates and assumptions that affect the reported amounts of assets and liabilities at the date of the financial statements and the reported amount of revenue and expenses during the reporting period. Actual results could differ from those estimates.
G. Federal Taxes – Each Fund has elected to be taxed as a “regulated investment company” and intends to distribute substantially all taxable income to its shareholders and otherwise comply with the provisions of the Internal Revenue Code applicable to regulated investment companies. Therefore, no provision for federal income taxes or excise taxes has been made.
The Funds recognize tax benefits of uncertain tax positions only where the position is “more likely than not” to be sustained assuming examination by tax authorities.
The Funds have analyzed their tax positions and have concluded that no liability for unrecognized tax benefits should be recorded related to uncertain income tax positions taken on returns filed for open tax years (2013-2015) as of June 30, 2016 or are expected to be taken in the Funds’ 2016 tax returns. The Funds identify their major tax jurisdictions as U.S. Federal and Delaware State; however the Funds are not aware of any tax position for which it is reasonably possible that the total amounts of unrecognized tax benefits will change materially in the next year.
H. Redemption Fees – A shareholder who redeems or exchanges shares of the Funds within fourteen days of purchase will incur a redemption fee of 1.00% of the current net asset value of shares redeemed or exchanged, subject to certain exceptions. The fee is
www.brownadvisoryfunds.com
165
Notes to Financial Statements
June 30, 2016
charged for the benefit of the remaining shareholders and will be paid to the Fund to help offset transaction costs. The fee is accounted for as an addition to paid-in capital. Each Fund reserves the right to modify the terms of or terminate the fee at any time. There are limited exceptions to the imposition of the redemption fee.
I. Guarantees and Indemnifications – In the normal course of business, the Funds enter into contracts with service providers that contain general indemnification clauses. The Funds’ maximum exposure under these arrangements is unknown as this would involve future claims that may be made against the Funds that have not yet occurred. However, based on experience, the Funds expect the risk of loss to be remote.
J. Subsequent Events – In preparing these financial statements, the Funds have evaluated events and transactions for potential recognition through the date the financial statements were issued. Refer to Note 10 for details regarding the liquidation of the Multi-Strategy Fund.
Note 3. Commitments and Other Affiliated Party Transactions
Investment Adviser – Brown Advisory LLC serves as Investment Adviser (“the Adviser”) to the Funds. Pursuant to investment advisory agreements, the Adviser receives an advisory fee, accrued daily and payable monthly, from each Fund at an annual rate of the Fund’s average daily net assets as follows:
Annual Advisory Fee | |
| Growth Equity Fund | 0.60% |
| Value Equity Fund | 0.60% |
| Flexible Equity Fund | 0.60% |
| Equity Income Fund | 0.60% |
| Sustainable Growth Fund | 0.60% |
| Small-Cap Growth Fund | 0.85% |
| Small-Cap Fundamental Value Fund | 0.85% |
| Multi-Strategy Fund | 0.30% |
| Global Leaders Fund* | 0.65% |
| Intermediate Income Fund | 0.30% |
| Total Return Fund | 0.30% |
| Strategic Bond Fund | 0.40% |
| Maryland Bond Fund | 0.30% |
| Tax Exempt Bond Fund | 0.30% |
| Mortgage Securities Fund | 0.30% |
| Strategic European Equity Fund** | 0.90% |
| Japan Alpha Opportunities Fund** | 1.00% |
| Emerging Markets Fund*** | 0.90% |
| Emerging Markets Small-Cap Fund**** | 1.25% |
| * | Subject to the general oversight of the Adviser and Board of Trustees during the period ended June 30, 2016, Brown Advisory Limited (“BAL”) served as sub-adviser to the Global Leaders Fund and made investment decisions on its behalf. BAL is compensated for its services by the Adviser. |
| ** | Subject to the general oversight of the Adviser and Board of Trustees for the year ended June 30, 2016, Wellington Management Company LLP (“Wellington”) served as sub-adviser to the Strategic European Equity Fund and the Japan Alpha Opportunities Fund and made investment decisions on their behalf. Wellington is compensated for its services by the Adviser. |
| *** | Subject to the general oversight of the Adviser and Board of Trustees for the year ended June 30, 2016, Somerset Capital Management, LLP (“Somerset”) served as sub-adviser to the Emerging Markets Fund and made investment decisions on its behalf. Somerset is compensated for its services by the Adviser. |
| **** | Subject to the general oversight of the Adviser and Board of Trustees for the year ended June 30, 2016, Macquarie Funds Management Hong Kong Limited (“MFMHKL”) served as sub-adviser to the Emerging Markets Small-Cap Fund and made investment decisions on its behalf. MFMHKL is compensated for its services by the Adviser. |
The Adviser is also entitled to receive an annual business management fee of 0.05%, accrued daily and payable monthly, of the Funds’ average daily net assets in exchange for its management and oversight of the non-investment advisory services provided to the Funds and the Trust. The Funds’ advisory fees and business management fees are reported in the Statements of Operations.
www.brownadvisoryfunds.com
166
Notes to Financial Statements
June 30, 2016
Fee Waivers and Expense Reimbursements (Operating Expense Caps) – The Adviser has contractually agreed to waive a portion of its fees and reimburse certain expenses to limit total annual operating expenses for each or the class’ average daily net assets for the Funds noted below:
Institutional Shares | Investor Shares | Advisor Shares | |
| Growth Equity Fund | 1.00% | 1.15% | 1.35% |
| Value Equity Fund | 1.00% | 1.15% | 1.35% |
| Flexible Equity Fund | 1.00% | 1.15% | 1.35% |
| Equity Income Fund | 1.00% | 1.15% | 1.35% |
| Sustainable Growth Fund | 1.00% | 1.15% | 1.35% |
| Small-Cap Growth Fund | 1.25% | 1.40% | 1.60% |
| Small-Cap Fundamental Value Fund | 1.25% | 1.40% | 1.60% |
| Multi-Strategy Fund | 1.10% | 1.25% | 1.50% |
| Global Leaders Fund | 0.70% | 0.85% | 1.10% |
| Intermediate Income Fund | 0.55% | 0.60% | 0.80% |
| Total Return Fund | 0.55% | 0.60% | 0.80% |
| Strategic Bond Fund | 0.65% | 0.70% | 0.95% |
| Maryland Bond Fund | 0.55% | 0.60% | 0.80% |
| Tax Exempt Bond Fund | 0.55% | 0.60% | 0.80% |
| Mortgage Securities Fund | 0.55% | 0.60% | 0.80% |
| Strategic European Equity Fund | 1.60% | 1.75% | 2.00% |
| Japan Alpha Opportunities Fund | 1.70% | 1.85% | 2.10% |
| Emerging Markets Fund | 1.60% | 1.75% | 2.00% |
| Emerging Markets Small-Cap Fund | 1.95% | 2.10% | 2.35% |
For the year ended June 30, 2016, the Adviser waived $24,516 in expenses for the Multi-Strategy Fund, $84,282 in expenses for the Global Leaders Fund, and $14,033 in expenses for the Strategic Bond Fund. The Adviser is permitted to seek reimbursement from the Funds for fees waived and/or Fund expenses it pays over the following three years after such payment. The Funds must pay their current ordinary operating expenses before the Adviser is entitled to any reimbursement of fees and/or expenses. At June 30, 2016, the cumulative amounts of previously waived fees that the Adviser may recoup from the Funds are shown below:
| June 30, | ||||||||||||||||
| 2017 | 2018 | 2019 | Total | |||||||||||||
| Multi-Strategy Fund | $ | — | $ | 20,377 | $ | 24,516 | $ | 44,893 | ||||||||
| Global Leaders Fund | — | — | 84,282 | 84,282 | ||||||||||||
| Strategic Bond Fund | — | 7,500 | 14,033 | 21,533 | ||||||||||||
Distribution – Quasar Distributors, LLC (“the Distributor”) serves as principal underwriter for shares of the Funds, and acts as each Fund’s Distributor in a continuous public offering of each Fund’s shares. The Distributor is an affiliate of the Administrator.
Under a Distribution Plan adopted pursuant to Rule 12b-1 under the Act (“Distribution Plan”), each Fund pays the Distributor or any other entity as authorized by the Board, as compensation for the distribution-related and/or shareholder services provided by such entities an aggregate fee equal to 0.25% of the average daily net assets of Advisor Shares for each Fund. The Distributor may pay any or all amounts received under the Rule 12b-1 Plan to other persons, including the Adviser, for any distribution or service activity. These distribution fees are reported in the Funds’ Statements of Operations.
The Trust has also adopted a Shareholder Service Plan under which each Fund may pay a fee of up to 0.15% of the average daily net assets of each Fund’s Investor and Advisor Shares (except for the Maryland Bond Fund, Intermediate Income Fund, Tax Exempt Bond Fund, Mortgage Securities Fund, Total Return Fund and Strategic Bond Fund, which may pay a fee of up to 0.05%) for shareholder services provided to the Funds by financial institutions, including the Adviser. These service fees are reported in the Funds’ Statements of Operations.
Investments in Affiliates – Intermediate Income Fund
The Intermediate Income Fund and Mortgage Securities Fund are considered affiliates since Brown Advisory LLC is the Adviser to both of the Funds. In seeking to achieve its investment objective, the Intermediate Income Fund invests a portion of its assets
www.brownadvisoryfunds.com
167
Notes to Financial Statements
June 30, 2016
into the Mortgage Securities Fund. As of June 30, 2016, the Intermediate Income Fund owned shares of the Mortgage Securities Fund with a total market value of $30,526,684, or 20.8% of the Intermediate Income Fund’s net assets.
The Intermediate Income Fund has entered into a Fee Waiver Agreement (“the Agreement”) with the Adviser. Per the Agreement, the Intermediate Income Fund will waive Advisory Fees in an amount equal to the Advisory Fees earned by the Mortgage Securities Fund on the assets invested into it by the Intermediate Income Fund. For example, if the Intermediate Income Fund owned $10,000,000 worth of the Mortgage Securities Fund for an entire year, it would waive, on an annual basis, $30,000 in Advisory Fees ($10,000,000 multiplied by 0.30%, the annual Advisory Fee ratio for the Mortgage Securities Fund). For the year ended June 30, 2016, the Intermediate Income Fund waived $104,520 in Advisory Fees per the terms of the Agreement. This is a permanent waiver of fees and these waived fees may not be recouped by the Adviser at any time in the future.
See the table below for details of the Intermediate Income Fund’s investment in the Mortgage Securities Fund for the year ended June 30, 2016:
| Beginning | Purchases | Proceeds | Unrealized | Net | Ending | |||||||||||||||||||||||||||
| Market Value; | at Cost; | from Sales; | Appreciation | Realized | Market Value; | Capital | ||||||||||||||||||||||||||
| Affiliated | [# of shares held] | [# of shares | [# of | (Depreciation) | Gains | [# of shares held} | Dividend | Gains | ||||||||||||||||||||||||
Investment | 7/1/2015 | purchased] | shares sold] | 6/30/2016 | (Losses) | 6/30/2016 | Income | Distributions | ||||||||||||||||||||||||
| Mortgage Securities Fund | $ | 33,931,642 | $ | 3,150,000 | $ | 7,000,000 | $ | 186,503 | $ | (44,580 | ) | $ | 30,526,684 | $ | 857,876 | $ | 139,069 | |||||||||||||||
| [3,372,927 | ] | [310,039 | ] | [690,154 | ] | [2,992,812 | ] | |||||||||||||||||||||||||
Investments in Affiliates – Multi-Strategy Fund
The Multi-Strategy Fund invests in affiliated Brown Advisory Funds. As of June 30, 2016, the Multi-Strategy Fund owned shares of affiliated Brown Advisory Funds with a total market value of $2,881,682, or 97.8% of the Multi-Strategy Fund’s net assets.
See the table below for details of the Multi-Strategy Fund investment in affiliated Brown Advisory Funds for the year ended June 30, 2016:
| Beginning | Purchases | Proceeds | Unrealized | Net | Ending | |||||||||||||||||||||||||||
| Market Value; | at Cost; | from Sales; | Appreciation | Realized | Market Value; | Capital | ||||||||||||||||||||||||||
| Affiliated | [# of shares held] | [# of shares | [# of | (Depreciation) | Gains | [# of shares held] | Dividend | Gains | ||||||||||||||||||||||||
Investment | 7/1/2015 | purchased] | shares sold] | 6/30/2016 | (Losses) | 6/30/2016 | Income | Distributions | ||||||||||||||||||||||||
| Flexible Equity Fund | $ | 709,389 | $ | 233,992 | $ | — | $ | (26,210 | ) | $ | — | $ | 895,310 | $ | 6,622 | $ | — | |||||||||||||||
| [44,560 | ] | [14,536 | ] | [— | ] | [59,096 | ] | |||||||||||||||||||||||||
| Small-Cap Growth Fund | $ | 92,664 | $ | 45,334 | $ | — | $ | (6,485 | ) | $ | — | $ | 122,823 | $ | — | $ | 17,143 | |||||||||||||||
| [2,580 | ] | [1,358 | ] | [— | ] | [3,938 | ] | |||||||||||||||||||||||||
| Small-Cap | $ | 162,521 | $ | 58,107 | $ | — | $ | (2,759 | ) | $ | — | $ | 213,867 | $ | 987 | $ | 4,164 | |||||||||||||||
| Fundamental | ||||||||||||||||||||||||||||||||
| Value Fund | ||||||||||||||||||||||||||||||||
| [6,884 | ] | [2,517 | ] | [— | ] | [9,401 | ] | |||||||||||||||||||||||||
| Strategic Bond Fund | $ | 232,283 | $ | 71,752 | $ | — | $ | (13,637 | ) | $ | — | $ | 293,797 | $ | 13,934 | $ | — | |||||||||||||||
| [23,630 | ] | [7,394 | ] | [— | ] | [31,024 | ] | |||||||||||||||||||||||||
| Total Return Fund | $ | 626,562 | $ | 166,626 | $ | — | $ | 11,352 | $ | — | $ | 821,175 | $ | 21,660 | $ | — | ||||||||||||||||
| [63,740 | ] | [16,926 | ] | [— | ] | [80,666 | ] | |||||||||||||||||||||||||
| Strategic | $ | 206,191 | $ | 62,878 | $ | — | $ | (1,415 | ) | $ | — | $ | 259,911 | $ | 721 | $ | — | |||||||||||||||
| European | ||||||||||||||||||||||||||||||||
| Equity Fund | [20,215 | ] | [6,039 | ] | [— | ] | [26,254 | ] | ||||||||||||||||||||||||
| Emerging | $ | 117,555 | $ | 55,288 | $ | — | $ | (15,013 | ) | $ | — | $ | 158,987 | $ | 1,635 | $ | — | |||||||||||||||
| Markets Fund | ||||||||||||||||||||||||||||||||
| [12,069 | ] | [6,143 | ] | [— | ] | [18,212 | ] | |||||||||||||||||||||||||
| Emerging Markets | $ | 94,042 | $ | 49,022 | $ | — | $ | (16,594 | ) | $ | — | $ | 115,812 | $ | — | $ | 5,058 | |||||||||||||||
| Small-Cap Fund | ||||||||||||||||||||||||||||||||
| [8,038 | ] | [4,578 | ] | [— | ] | [12,616 | ] | |||||||||||||||||||||||||
| Totals: | $ | (70,761 | ) | $ | — | $ | 2,881,682 | $ | 45,559 | $ | 26,365 | |||||||||||||||||||||
www.brownadvisoryfunds.com
168
Notes to Financial Statements
June 30, 2016
Other Service Providers – U.S. Bancorp Fund Services, LLC (“USBFS”), an indirect wholly-owned subsidiary of U.S. Bancorp, serves as the Funds’ Administrator (“Administrator”), and in that capacity, performs various administrative and accounting services for the Funds. USBFS also serves as the Funds’ fund accountant and transfer agent. Certain officers of the Trust are employees of USBFS and the Funds’ custodian, U.S. Bank, N.A., is an affiliate of the Administrator. Fees paid to USBFS and U.S. Bank, N.A. for its services can be found in the Statements of Operations as “Administration, transfer agent and accounting fees” and “Custodian fees”, respectively. Additional amounts for miscellaneous expenses may be paid by the Funds to USBFS and included in “Miscellaneous expenses” in the Statements of Operations.
Note 4. Purchases and Sales of Securities
The cost of purchases and the proceeds from sales of investment securities (including maturities), other than short-term investments, for the year ended June 30, 2016 were as follows:
| Investment Securities | ||||||||
| Purchases | Sales | |||||||
| Growth Equity Fund | $ | 539,333,029 | $ | 842,120,331 | ||||
| Value Equity Fund | 39,463,563 | 133,227,050 | ||||||
| Flexible Equity Fund | 115,544,031 | 44,092,641 | ||||||
| Equity Income Fund | 26,586,288 | 89,418,505 | ||||||
| Sustainable Growth Fund | 186,569,213 | 82,499,644 | ||||||
| Small-Cap Growth Fund | 80,875,182 | 85,085,060 | ||||||
| Small-Cap Fundamental Value Fund | 361,902,677 | 257,041,505 | ||||||
| Multi-Strategy Fund | 742,999 | — | ||||||
| Global Leaders Fund | 23,558,540 | 7,522,415 | ||||||
| Intermediate Income Fund | 101,167,179 | 99,146,884 | ||||||
| Total Return Fund | 184,122,048 | 191,086,677 | ||||||
| Strategic Bond Fund | 159,477,554 | 168,221,241 | ||||||
| Maryland Bond Fund | 148,845,404 | 162,942,745 | ||||||
| Tax Exempt Bond Fund | 275,701,217 | 262,620,817 | ||||||
| Mortgage Securities Fund | 1,101,527,505 | 867,472,259 | ||||||
| Strategic European Equity Fund | 1,139,623,943 | 292,907,852 | ||||||
| Japan Alpha Opportunities Fund | 2,487,941,023 | 2,010,747,816 | ||||||
| Emerging Markets Fund | 235,144,733 | 74,957,445 | ||||||
| Emerging Markets Small-Cap Fund | 282,212,257 | 237,754,039 | ||||||
The Intermediate Income Fund purchased $35,828,335 and sold $22,769,897 in U.S. Government securities for the year ended June 30, 2016. The Total Return Fund purchased $17,581,905 and sold $21,506,115 in U.S. Government securities for the year ended June 30, 2016. The Mortgage Securities Fund purchased $18,047,109 and sold $0 in U.S. Government securities for the year ended June 30, 2016. Purchases and sales of U.S. Government securities are included in the totals above and include U.S. Treasury Bonds and Notes.
www.brownadvisoryfunds.com
169
Notes to Financial Statements
June 30, 2016
Note 5. Federal Income Tax and Distribution Information
At June 30, 2016, the components of distributable earnings (accumulated losses) on a tax basis were as follows:
| Growth Equity | Value Equity | Flexible Equity | Equity Income | |||||||||||||
| Fund | Fund | Fund | Fund | |||||||||||||
| Tax Cost of Investments | $ | 1,577,174,964 | $ | 42,153,010 | $ | 288,975,929 | $ | 96,930,742 | ||||||||
| Gross tax unrealized appreciation | 658,467,321 | 10,271,185 | 64,085,944 | 34,230,543 | ||||||||||||
| Gross tax unrealized depreciation | (51,635,570 | ) | (1,549,751 | ) | (14,857,468 | ) | (1,078,322 | ) | ||||||||
| Net tax unrealized appreciation (depreciation) | 606,831,751 | 8,721,434 | 49,228,476 | 33,152,221 | ||||||||||||
| Net unrealized appreciation (depreciation) on foreign receivables | — | — | (363 | ) | — | |||||||||||
| Undistributed ordinary income | — | 1,400,042 | 808,933 | 38,600 | ||||||||||||
| Undistributed long-term capital gain | 84,659,198 | — | — | 1,700,458 | ||||||||||||
| Total distributable earnings | 84,659,198 | 1,400,042 | 808,933 | 1,739,058 | ||||||||||||
| Other accumulated losses | (17,608,743 | ) | (2,729,420 | ) | (9,706,852 | ) | — | |||||||||
| Total accumulated earnings (losses) | $ | 673,882,206 | $ | 7,392,056 | $ | 40,330,194 | $ | 34,891,279 | ||||||||
| Sustainable | Small-Cap | |||||||||||||||
| Growth | Small-Cap | Fundamental | Multi-Strategy | |||||||||||||
| Fund | Growth Fund | Value Fund | Fund | |||||||||||||
| Tax Cost of Investments | $ | 262,983,024 | $ | 218,192,448 | $ | 861,341,880 | $ | 3,027,586 | ||||||||
| Gross tax unrealized appreciation | 86,837,288 | 89,951,020 | 181,585,320 | 16,434 | ||||||||||||
| Gross tax unrealized depreciation | (5,296,909 | ) | (12,893,492 | ) | (63,517,021 | ) | (93,855 | ) | ||||||||
| Net tax unrealized appreciation (depreciation) | 81,540,379 | 77,057,528 | 118,068,299 | (77,421 | ) | |||||||||||
| Undistributed ordinary income | — | — | 1,070,636 | — | ||||||||||||
| Undistributed long-term capital gain | — | 10,003,131 | 685,715 | 8,141 | ||||||||||||
| Total distributable earnings | — | 10,003,131 | 1,756,351 | 8,141 | ||||||||||||
| Other accumulated losses | (9,168,486 | ) | (676,056 | ) | — | (1,057 | ) | |||||||||
| Total accumulated earnings (losses) | $ | 72,371,893 | $ | 86,384,603 | $ | 119,824,650 | $ | (70,337 | ) | |||||||
| Global Leaders | Intermediate | Total Return | Strategic | |||||||||||||
| Fund | Income Fund | Fund | Bond Fund | |||||||||||||
| Tax Cost of Investments | $ | 25,746,668 | $ | 143,446,571 | $ | 97,636,692 | $ | 55,766,246 | ||||||||
| Gross tax unrealized appreciation | 1,769,571 | 3,276,145 | 1,620,422 | 512,894 | ||||||||||||
| Gross tax unrealized depreciation | (942,371 | ) | (291,336 | ) | (517,605 | ) | (487,461 | ) | ||||||||
| Net tax unrealized appreciation (depreciation) | 827,200 | 2,984,809 | 1,102,817 | 25,433 | ||||||||||||
| Net unrealized appreciation (depreciation) on foreign receivables | (1,022 | ) | — | — | — | |||||||||||
| Undistributed ordinary income | 53,912 | — | 152,033 | — | ||||||||||||
| Undistributed long-term capital gain | — | — | 101,725 | — | ||||||||||||
| Total distributable earnings | 53,912 | — | 253,758 | — | ||||||||||||
| Other accumulated losses | (1,232,310 | ) | (1,142,117 | ) | (152,656 | ) | (3,476,757 | ) | ||||||||
| Total accumulated earnings (losses) | $ | (352,220 | ) | $ | 1,842,692 | $ | 1,203,919 | $ | (3,451,324 | ) | ||||||
www.brownadvisoryfunds.com
170
Notes to Financial Statements
June 30, 2016
| Strategic | ||||||||||||||||
| Maryland | Tax Exempt | Mortgage | European | |||||||||||||
| Bond Fund | Bond Fund | Securities Fund | Equity Fund | |||||||||||||
| Tax Cost of Investments | $ | 175,388,188 | $ | 226,000,923 | $ | 486,677,635 | $ | 1,082,614,986 | ||||||||
| Gross tax unrealized appreciation | 6,439,626 | 7,030,141 | 8,502,824 | 77,448,176 | ||||||||||||
| Gross tax unrealized depreciation | (374,619 | ) | (804,511 | ) | (4,803,276 | ) | (88,370,319 | ) | ||||||||
| Net tax unrealized appreciation (depreciation) | 6,065,007 | 6,225,630 | 3,699,548 | (10,922,143 | ) | |||||||||||
| Net unrealized appreciation (depreciation) on foreign receivables | — | — | — | (94,001 | ) | |||||||||||
| Undistributed ordinary income | 275,319 | ^ | 426,654 | ^ | 2,221,131 | 12,611,576 | ||||||||||
| Undistributed long-term capital gain | 326,226 | — | — | — | ||||||||||||
| Total distributable earnings | 601,545 | 426,654 | 2,221,131 | 12,611,576 | ||||||||||||
| Other accumulated losses | (275,162 | ) | (1,504,874 | ) | (1,205,319 | ) | (45,442,160 | ) | ||||||||
| Total accumulated earnings (losses) | $ | 6,391,390 | $ | 5,147,410 | $ | 4,715,360 | $ | (43,846,728 | ) | |||||||
| Japan Alpha | Emerging | Emerging | ||||||||||||||
| Opportunities | Markets | Markets | ||||||||||||||
| Fund | Fund | Small-Cap Fund | ||||||||||||||
| Tax Cost of Investments | $ | 1,804,575,524 | $ | 537,927,826 | $ | 205,413,445 | ||||||||||
| Gross tax unrealized appreciation | 223,706,732 | 35,712,524 | 19,065,482 | |||||||||||||
| Gross tax unrealized depreciation | (213,516,214 | ) | (56,440,076 | ) | (8,130,364 | ) | ||||||||||
| Net tax unrealized appreciation (depreciation) | 10,190,518 | (20,727,552 | ) | 10,935,118 | ||||||||||||
| Net unrealized appreciation (depreciation) on foreign receivables | 470,823 | (41,487 | ) | 1,154 | ||||||||||||
| Undistributed ordinary income | — | 4,342,604 | — | |||||||||||||
| Undistributed long-term capital gain | — | — | — | |||||||||||||
| Total distributable earnings | — | 4,342,604 | — | |||||||||||||
| Other accumulated losses | (414,321,974 | ) | (29,009,316 | ) | (37,508,288 | ) | ||||||||||
| Total accumulated earnings (losses) | $ | (403,660,633 | ) | $ | (45,435,751 | ) | $ | (26,572,016 | ) | |||||||
^ Represents tax exempt income
The differences between components of distributable earnings on a tax basis and the amounts reflected in the Statements of Assets and Liabilities are primarily due to wash sales, post-October losses, post-December ordinary losses, investments in passive foreign investment companies, investments in partnerships, investments in futures and distributions payable.
www.brownadvisoryfunds.com
171
Notes to Financial Statements
June 30, 2016
At June 30, 2016, the following capital loss carryforwards were available:
| Expiring | Infinite | Infinite | ||||||||||||||
| 2017 | Short-Term | Long-Term | Total | |||||||||||||
| Growth Equity Fund | $ | — | $ | — | $ | — | $ | — | ||||||||
| Value Equity Fund | — | — | — | — | ||||||||||||
| Flexible Equity Fund | 563,381 | 1,978,582 | 4,177,693 | 6,719,656 | ||||||||||||
| Equity Income Fund | — | — | — | — | ||||||||||||
| Sustainable Growth Fund | 8,590,543 | — | — | 8,590,543 | ||||||||||||
| Small-Cap Growth Fund | — | — | — | — | ||||||||||||
| Small-Cap Fundamental Value Fund | — | — | — | — | ||||||||||||
| Multi-Strategy Fund | — | — | — | — | ||||||||||||
| Global Leaders Fund | 282,988 | 695,990 | 253,332 | 1,232,310 | ||||||||||||
| Intermediate Income Fund | — | 884,315 | 83,917 | 968,232 | ||||||||||||
| Total Return Fund | — | — | — | — | ||||||||||||
| Strategic Bond Fund | — | 2,747,125 | 655,673 | 3,402,798 | ||||||||||||
| Maryland Bond Fund | — | — | — | — | ||||||||||||
| Tax Exempt Bond Fund | — | — | 1,078,266 | 1,078,266 | ||||||||||||
| Mortgage Securities Fund | — | — | — | — | ||||||||||||
| Strategic European Equity Fund | — | 9,293,797 | 4,421,027 | 13,714,824 | ||||||||||||
| Japan Alpha Opportunities Fund | — | 77,775,051 | — | 77,775,051 | ||||||||||||
| Emerging Markets Fund | — | 18,305,246 | 10,704,070 | 29,009,316 | ||||||||||||
| Emerging Markets Small-Cap Fund | — | 4,599,632 | — | 4,599,632 | ||||||||||||
Distributions during the fiscal periods ended as noted were characterized for tax purposes as follows:
| Tax Exempt Income | Ordinary Income | |||||||||||||||
| June 30, 2016 | June 30, 2015 | June 30, 2016 | June 30, 2015 | |||||||||||||
| Growth Equity Fund | $ | — | $ | — | $ | 7,902,803 | $ | 10,853,820 | ||||||||
| Value Equity Fund | — | — | 3,831,033 | 4,810,520 | ||||||||||||
| Flexible Equity Fund | — | — | 1,728,214 | 1,001,462 | ||||||||||||
| Equity Income Fund | — | — | 3,370,204 | 5,266,833 | ||||||||||||
| Sustainable Growth Fund | — | — | 2,679,763 | — | ||||||||||||
| Small-Cap Growth Fund | — | — | 763,358 | — | ||||||||||||
| Small-Cap Fundamental Value Fund | — | — | 2,796,635 | 8,008,331 | ||||||||||||
| Multi-Strategy Fund | — | — | 14,413 | 2,394 | ||||||||||||
| Global Leaders Fund | — | N/A | — | N/A | ||||||||||||
| Intermediate Income Fund | — | — | 3,434,796 | 3,532,751 | ||||||||||||
| Total Return Fund | — | — | 2,222,152 | 836,802 | ||||||||||||
| Strategic Bond Fund | — | — | 2,476,783 | 200,659 | ||||||||||||
| Maryland Bond Fund | 4,031,803 | 3,466,082 | 3,271 | 10,220 | ||||||||||||
| Tax Exempt Bond Fund | 5,642,129 | 3,896,216 | — | 7,149 | ||||||||||||
| Mortgage Securities Fund | — | — | 7,907,002 | 7,844,211 | ||||||||||||
| Strategic European Equity Fund | — | — | 2,992,321 | 2,192,615 | ||||||||||||
| Japan Alpha Opportunities Fund | — | — | 227,528,772 | 64,930,081 | ||||||||||||
| Emerging Markets Fund | — | — | 3,928,021 | 3,789,665 | ||||||||||||
| Emerging Markets Small-Cap Fund | — | — | 8,503,241 | — | ||||||||||||
www.brownadvisoryfunds.com
172
Notes to Financial Statements
June 30, 2016
| Long-Term Capital Gain^ | ||||||||
| June 30, 2016 | June 30, 2015 | |||||||
| Growth Equity Fund | $ | 141,076,499 | $ | 67,977,746 | ||||
| Value Equity Fund | 14,006,420 | 5,195,581 | ||||||
| Flexible Equity Fund | — | — | ||||||
| Equity Income Fund | 1,785,670 | 8,348,294 | ||||||
| Sustainable Growth Fund | 11,297,130 | 4,340,210 | ||||||
| Small-Cap Growth Fund | 39,659,100 | 31,884,901 | ||||||
| Small-Cap Fundamental Value Fund | 17,190,395 | 27,145,541 | ||||||
| Multi-Strategy Fund | 17,466 | — | ||||||
| Global Leaders Fund | — | N/A | ||||||
| Intermediate Income Fund | 369,469 | — | ||||||
| Total Return Fund | — | — | ||||||
| Strategic Bond Fund | — | — | ||||||
| Maryland Bond Fund | 906,772 | 1,040,851 | ||||||
| Tax Exempt Bond Fund | — | — | ||||||
| Mortgage Securities Fund | 1,257,738 | — | ||||||
| Strategic European Equity Fund | — | — | ||||||
| Japan Alpha Opportunities Fund | 3,902,671 | — | ||||||
| Emerging Markets Fund | — | — | ||||||
| Emerging Markets Small-Cap Fund | — | — | ||||||
^ Designated as a long-term capital gain dividend, pursuant to Internal Revenue Code Section 852(b)(3).
In the Statements of Assets and Liabilities, as a result of net operating losses incurred, adjustments to holdings of Real Estate Investment Trusts, currency gains and losses, distribution reclassifications and income adjustments to asset-backed security transactions, certain amounts of income, realized gains, and paid-in capital have been reclassified for the year ended June 30, 2016. These reclassifications have no impact on the net assets of the Funds:
| Undistributed | ||||||||||||
| (Accumulated) | Accumulated | |||||||||||
| Net Investment | Net Realized | Paid-in | ||||||||||
| Income (Loss) | Gain (Loss) | Capital | ||||||||||
| Growth Equity Fund | $ | 2,984,438 | $ | (2,984,438 | ) | $ | — | |||||
| Value Equity Fund | (1,036 | ) | 1,036 | — | ||||||||
| Flexible Equity Fund | (1,273 | ) | 1,273 | — | ||||||||
| Equity Income Fund | 40,599 | (40,599 | ) | — | ||||||||
| Sustainable Growth Fund | 954,335 | 656 | (954,991 | ) | ||||||||
| Small-Cap Growth Fund | 1,715,681 | (356,321 | ) | (1,359,360 | ) | |||||||
| Small-Cap Fundamental Value Fund | (2,916 | ) | 2,916 | — | ||||||||
| Multi-Strategy Fund | 5,380 | (5,380 | ) | — | ||||||||
| Global Leaders Fund | (28,154 | ) | (258,264 | ) | 286,418 | |||||||
| Intermediate Income Fund | 101,243 | (99,614 | ) | (1,629 | ) | |||||||
| Total Return Fund | 162,423 | (162,423 | ) | — | ||||||||
| Strategic Bond Fund | 108,991 | (25,112 | ) | (83,879 | ) | |||||||
| Maryland Bond Fund | — | — | — | |||||||||
| Tax Exempt Bond Fund | — | — | — | |||||||||
| Mortgage Securities Fund | 1,157,054 | (1,157,054 | ) | — | ||||||||
| Strategic European Equity Fund | (104,001 | ) | 104,001 | — | ||||||||
| Japan Alpha Opportunities Fund | (351,348,522 | ) | 405,452,352 | (54,103,830 | ) | |||||||
| Emerging Markets Fund | (694,950 | ) | 694,950 | — | ||||||||
| Emerging Markets Small-Cap Fund | (415,622 | ) | 456,810 | (41,188 | ) | |||||||
www.brownadvisoryfunds.com
173
Notes to Financial Statements
June 30, 2016
At June 30, 2016, the Funds deferred, on a tax basis:
| Post-October | Post-October | Post-December | ||||||||||
| Capital Losses | Currency Losses | Ordinary Losses | ||||||||||
| Growth Equity Fund | $ | 14,718,784 | $ | — | $ | 2,889,959 | ||||||
| Value Equity Fund | 2,729,420 | — | — | |||||||||
| Flexible Equity Fund | 2,987,196 | — | — | |||||||||
| Equity Income Fund | — | — | — | |||||||||
| Sustainable Growth Fund | — | — | 577,943 | |||||||||
| Small-Cap Growth Fund | — | — | 676,056 | |||||||||
| Small-Cap Fundamental Value Fund | — | — | — | |||||||||
| Multi-Strategy Fund | — | — | 1,057 | |||||||||
| Global Leaders Fund | — | — | — | |||||||||
| Intermediate Income Fund | — | — | — | |||||||||
| Total Return Fund | — | — | — | |||||||||
| Strategic Bond Fund | — | — | — | |||||||||
| Maryland Bond Fund | — | — | — | |||||||||
| Tax Exempt Bond Fund | — | — | — | |||||||||
| Mortgage Securities Fund | 424,435 | — | — | |||||||||
| Strategic European Equity Fund | 31,727,336 | — | — | |||||||||
| Japan Alpha Opportunities Fund | — | — | 347,508,986 | |||||||||
| Emerging Markets Fund | — | — | — | |||||||||
| Emerging Markets Small-Cap Fund | 32,908,656 | — | — | |||||||||
Note 6. Forward Foreign Currency Contracts
The Strategic European Equity Fund and the Japan Alpha Opportunities Fund invested in forward foreign currency contracts during the year ended June 30, 2016.
The majority of the Japan Alpha Opportunities Fund’s assets are denominated in Japanese Yen. The Japan Alpha Opportunities Fund may seek to offset or hedge its exposure to the Japanese Yen by entering into forward foreign currency contracts. A forward foreign currency contract is a commitment to purchase or sell a foreign currency at a future date at an agreed upon price. These contracts are traded over-the-counter and not on an organized exchange. The contracts are marked-to-market daily and the change in market value is recorded as unrealized appreciation or depreciation. When the contract is closed, a realized gain or loss equal to the difference between the value at the time it was opened and the value at the time it was closed is recorded. The realized gains or losses are reported in the Statement of Operations as net realized gains or losses from forward foreign currency contracts. Unrealized appreciation on forward foreign currency contracts and unrealized depreciation on forward foreign currency contracts is reported in the Statement of Assets and Liabilities for those contracts that remain open as of year end. Risks may arise from the potential inability of a counterparty to meet the terms of the contract. There is generally no collateral exchanged by the Fund or counterparty to the contract in connection with these contracts. The Fund’s risk of loss from counterparty credit risk on these contracts is generally limited to the aggregate unrealized appreciation (depreciation) on open contracts on a counterparty by counterparty basis. The Fund attempts to mitigate counterparty credit risk by only entering into agreements with counterparties that it believes have the financial resources to honor their obligations and by monitoring the financial stability of those counterparties.
www.brownadvisoryfunds.com
174
Notes to Financial Statements
June 30, 2016
The effect of forward foreign currency contracts on the Statements of Assets and Liabilities as of June 30, 2016 is as follows:
| Derivatives not accounted | Statement of Assets | ||
Fund | for as hedging instruments | and Liabilities Location | Amount |
| Japan Alpha Opportunities Fund | Forward Foreign Currency Contracts | Assets: Gross Unrealized | |
| Appreciation – Forward Foreign | |||
| Currency Contracts | $ 14,903,850 | ||
| Japan Alpha Opportunities Fund | Forward Foreign Currency Contracts | Liabilities: Gross Unrealized | |
| Depreciation – Forward Foreign | |||
| Currency Contracts | $ 3,941,787 |
The effect of forward foreign currency contracts on the Statements of Operations for the year ended June 30, 2016 is as follows:
| Derivatives not accounted | Statement of | ||
Fund | for as hedging instruments | Operations Location | Amount |
| Strategic European Equity Fund | Forward Foreign Currency Contracts | Net Realized Gain (Loss) – | |
| Forward Foreign Currency Contracts | $ (82,499) | ||
| Japan Alpha Opportunities Fund | Forward Foreign Currency Contracts | Net Realized Gain (Loss) – | |
| Forward Foreign Currency Contracts | $(365,382,827) | ||
| Japan Alpha Opportunities Fund | Forward Foreign Currency Contracts | Net Change in Unrealized | |
| Appreciation (Depreciation) – | |||
| Forward Foreign Currency Contract | $ 30,021,230 |
For the year ended June 30, 2016, the average net exposure, in U.S. Dollars, of forward foreign currency contracts held by the Japan Alpha Opportunities Fund was $1,878,562,888.
For the year ended June 30, 2016, the average net exposure, in U.S. Dollars, of forward foreign currency contracts held by Strategic European Equity Fund was $119,094.
Offsetting Assets & Liabilities – Forward Foreign Currency Contracts
To facilitate the Japan Alpha Opportunities Fund’s investment in forward foreign currency contracts, the Fund has entered into agreements with counterparties that dictate the terms under which the Fund and the counterparty will enter into such agreements. Under these agreements, both the Fund and the counterparty may be allowed to combine amounts owed to or receivable from the other and settle all outstanding obligations on a “net basis”.
Consequently, some funds may choose to present such assets or liabilities related to forward foreign currency contracts or other derivatives on a net basis in their Statements of Assets and Liabilities. The Japan Alpha Opportunities Fund does not present any assets or liabilities related to forward foreign currency contracts in such a manner; rather, the Fund presents the gross amounts of assets and the gross amounts of liabilities related to forward foreign currency contracts in the Statements of Assets and Liabilities. In order to facilitate comparability amongst different funds, the table below shows what the Japan Alpha Opportunities Fund’s Statement of Assets and Liabilities accounts related to forward foreign currency contracts would look like if it did choose to offset, or present on a net basis, assets and liabilities related to forward foreign currency contracts.
Assets:
| Gross Amounts | Net Amounts | Gross Amounts Not Offset | ||||||||||||||||||||||
| Gross | Offset in the | Presented in | in the Statement of | |||||||||||||||||||||
| Amounts of | Statement | the Statement | Assets & Liabilities | |||||||||||||||||||||
| Unrealized Appreciation on | Recognized | of Assets | of Assets | Financial | Collateral | |||||||||||||||||||
Forward Foreign Currency Contracts | Assets | & Liabilities | & Liabilities | Instruments | Received | Net Amount | ||||||||||||||||||
| Counterparty: | ||||||||||||||||||||||||
| BNP-Paribas | $ | — | $ | — | $ | — | $ | — | $ | — | $ | — | ||||||||||||
| Standard Chartered Bank | — | — | — | — | — | — | ||||||||||||||||||
| Standard Chartered Bank | — | — | — | — | — | — | ||||||||||||||||||
| Commonwealth Bank of Australia | 7,409,506 | — | 7,409,506 | — | — | 7,409,506 | ||||||||||||||||||
| State Street Capital Markets | 7,494,344 | — | 7,494,344 | — | — | 7,494,344 | ||||||||||||||||||
| Total | $ | 14,903,850 | $ | — | $ | 14,903,850 | $ | — | $ | — | $ | 14,903,850 | ||||||||||||
www.brownadvisoryfunds.com
175
Notes to Financial Statements
June 30, 2016
Liabilities:
| Gross Amounts | Net Amounts | Gross Amounts Not Offset | ||||||||||||||||||||||
| Gross | Offset in the | Presented in | in the Statement of | |||||||||||||||||||||
| Amounts of | Statement | the Statement | Assets & Liabilities | |||||||||||||||||||||
| Unrealized Depreciation on | Recognized | of Assets | of Assets | Financial | Collateral | |||||||||||||||||||
Forward Foreign Currency Contracts | Liabilities | & Liabilities | & Liabilities | Instruments | Pledged | Net Amount | ||||||||||||||||||
| Counterparty: | ||||||||||||||||||||||||
| BNP-Paribas | $ | 1,896,596 | $ | — | $ | 1,896,596 | $ | — | $ | — | $ | 1,896,596 | ||||||||||||
| Standard Chartered Bank | 1,355,490 | — | 1,355,490 | — | — | 1,355,490 | ||||||||||||||||||
| Standard Chartered Bank | 689,701 | — | 689,701 | — | — | 689,701 | ||||||||||||||||||
| Commonwealth Bank of Australia | — | — | — | — | — | — | ||||||||||||||||||
| State Street Capital Markets | — | — | — | — | — | — | ||||||||||||||||||
| Total | $ | 3,941,787 | $ | — | $ | 3,941,787 | $ | — | $ | — | $ | 3,941,787 | ||||||||||||
Note 7. Futures Contracts
The Total Return Fund, Strategic Bond Fund, Strategic European Equity Fund and Japan Alpha Opportunities Fund invested in futures contracts during the year ended June 30, 2016. At the time a Fund purchases or enters into a futures contract, the Fund deposits and maintains as collateral an initial margin with the broker, as required by the terms of the contract. Pursuant to the contract, the Fund agrees to receive from or pay to the broker an amount of cash equal to the daily fluctuation in the value of the contract. Such receipts or payments are known as variation margin and are recorded by the Fund as unrealized gains or losses on futures contracts. The daily settlement of variation margin between the Fund and the broker serves to reduce counterparty risk to the Fund. The use of long futures contracts by the Funds subjects them to a risk of loss in excess of the amounts shown on the Statements of Assets and Liabilities and up to the total notional amount of the futures contract as shown in the Schedule of Investments. The use of short futures contracts by the Funds subjects them to a risk of loss in excess of the amounts shown on the Statements of Assets and Liabilities and, hypothetically, up to an unlimited amount of loss that could exceed the notional amount of the futures contract as shown in the Schedule of Investments.
The effect of futures contracts on the Statements of Assets and Liabilities as of June 30, 2016 is as follows:
| Derivatives not accounted | Statement of Assets | ||
Fund | for as hedging instruments | and Liabilities Location | Amount |
| Total Return Fund | Futures Contracts | Gross Unrealized Appreciation – | |
| Futures Contracts | $ 733,943 | ||
| Total Return Fund | Futures Contracts | Gross Unrealized Depreciation – | |
| Futures Contracts | $ — | ||
| Strategic Bond Fund | Futures Contracts | Gross Unrealized Appreciation – | |
| Futures Contracts | $ — | ||
| Strategic Bond Fund | Futures Contracts | Gross Unrealized Depreciation – | |
| Futures Contracts | $ 178,310 |
www.brownadvisoryfunds.com
176
Notes to Financial Statements
June 30, 2016
The effect of futures contracts on the Statements of Operations for the year ended June 30, 2016 is as follows:
| Derivatives not accounted | Statement of | ||
Fund | for as hedging instruments | Operations Location | Amount |
| Total Return Fund | Futures Contracts | Net Realized Gain (Loss) – | |
| Futures Contracts | $ 911,618 | ||
| Total Return Fund | Futures Contracts | Net Change in Unrealized | |
| Appreciation (Depreciation) – | |||
| Futures Contracts | $ 873,641 | ||
| Strategic Bond Fund | Futures Contracts | Net Realized Gain (Loss) – | |
| Futures Contracts | $ (144,055) | ||
| Strategic Bond Fund | Futures Contracts | Net Change in Unrealized | |
| Appreciation (Depreciation) – | |||
| Futures Contracts | $ (151,904) | ||
| Strategic European Equity Fund | Futures Contracts | Net Realized Gain (Loss) – | |
| Futures Contracts | $ (1,711,587) | ||
| Japan Alpha Opportunities Fund | Futures Contracts | Net Realized Gain (Loss) – | |
| Futures Contracts | $(46,514,410) | ||
| Japan Alpha Opportunities Fund | Futures Contracts | Net Change in Unrealized | |
| Appreciation (Depreciation) – | |||
| Futures Contracts | $ 1,281,897 |
During the year ended June 30, 2016, the average notional market value of long futures contracts held by the Total Return Fund, Strategic European Equity Fund and Japan Alpha Opportunities Fund were $12,145,677, $95,853 and $121,830,102, respectively. The Total Return Fund was invested in long U.S. Treasury futures contracts. The Strategic European Equity Fund and Japan Alpha Opportunities Fund were invested in long stock index futures contracts.
During the year ended June 30, 2016, the average notional market value of the short futures contracts held by the Total Return Fund, Strategic Bond Fund, and Japan Alpha Opportunities Fund were $4,180,156, $7,928,674 and $22,631,466, respectively. The Total Return Fund and Strategic Bond Fund were invested in short U.S. Treasury futures contracts and the Japan Alpha Opportunities Fund was invested in short currency futures contracts.
Offsetting Assets & Liabilities – Futures Contracts
To facilitate the Funds investment in futures contracts, the Funds have entered into agreements with counterparties that dictate the terms under which the Funds and the counterparty will enter into such agreements. Under these agreements, both the Funds and the counterparty may be allowed to combine amounts owed to or receivable from the other and settle all outstanding obligations on a “net basis.” In order to facilitate comparability amongst different funds, the table below shows what the Funds’ Statement of Assets and Liabilities accounts related to futures contracts would look like if they choose to offset, or present on a net basis, assets and liabilities related to futures contracts.
Assets:
| Gross Amounts | Net Amounts | Gross Amounts Not Offset | ||||||||||||||||||||||
| Gross | Offset in the | Presented in | in the Statement of | |||||||||||||||||||||
| Amounts of | Statement | the Statement | Assets & Liabilities | |||||||||||||||||||||
| Recognized | of Assets | of Assets | Financial | Collateral | ||||||||||||||||||||
Description | Assets | & Liabilities | & Liabilities | Instruments | Received | Net Amount | ||||||||||||||||||
| Total Return Fund | ||||||||||||||||||||||||
| Futures Contracts | $ | 733,943 | $ | — | $ | 733,943 | $ | — | $ | — | $ | 733,943 | ||||||||||||
| Strategic Bond Fund | ||||||||||||||||||||||||
| Futures Contracts | — | — | — | — | — | — | ||||||||||||||||||
www.brownadvisoryfunds.com
177
Notes to Financial Statements
June 30, 2016
Liabilities:
| Gross Amounts | Net Amounts | Gross Amounts Not Offset | ||||||||||||||||||||||
| Gross | Offset in the | Presented in | in the Statement of | |||||||||||||||||||||
| Amounts of | Statement | the Statement | Assets & Liabilities | |||||||||||||||||||||
| Recognized | of Assets | of Assets | Financial | Collateral | ||||||||||||||||||||
Description | Liabilities | & Liabilities | & Liabilities | Instruments | Pledged | Net Amount | ||||||||||||||||||
| Total Return Fund | ||||||||||||||||||||||||
| Futures Contracts | $ | — | $ | — | $ | — | $ | — | $ | — | $ | — | ||||||||||||
| Strategic Bond Fund | ||||||||||||||||||||||||
| Futures Contracts | 178,310 | — | 178,310 | 99,970 | 78,340 | — | ||||||||||||||||||
Note 8. Line of Credit
As of June 30, 2016, Brown Advisory Funds has an unsecured line of credit of up to $100,000,000 with U.S. Bank, N.A. The interest rate on the line of credit as of June 30, 2016 was 3.50% (prime rate). For the year ended June 30, 2016, the only Funds to utilize the line of credit were the Value Equity Fund, Strategic Bond Fund, Maryland Bond Fund, and Strategic European Equity Fund. The Value Equity Fund had a maximum outstanding balance of $521,000 and an average daily balance outstanding of $6,689. The Strategic Bond Fund had a maximum outstanding balance of $580,000 and an average daily balance outstanding of $9,945. The Maryland Bond Fund had a maximum outstanding balance of $2,097,000 and an average daily balance outstanding of $5,730. The Strategic European Equity Fund had a maximum outstanding balance of $26,000 and an average daily balance outstanding of $71. The total interest expense incurred by the Value Equity Fund, Strategic Bond Fund, Maryland Bond Fund, and Strategic European Equity Fund under the terms of the line of credit were $232, $350, $204, and $3, respectively. As of June 30, 2016, none of the Funds had any amounts outstanding under the line of credit. For the year ended June 30, 2016, the average interest rate on outstanding borrowings for the Value Equity Fund, Strategic Bond Fund, Maryland Bond Fund, and Strategic European Equity Fund was 3.41%, 3.46%, 3.50%, and 3.50%, respectively.
Note 9. Merger of Funds
As of the close of business on October 23, 2015, pursuant to an Agreement and Plan of Reorganization approved by the Funds’ Board of Trustees, all of the assets, subject to the liabilities, of the Brown Advisory Opportunity Fund (“Opportunity Fund”) were transferred to the Global Leaders Fund in exchange for shares of the Global Leaders Fund of equal value. The purpose of the transaction was to combine two funds with similar investment strategies into a single fund where the Fund and its shareholders have the potential to benefit from economies of scale. Investor Shares of the Opportunity Fund were exchanged for Investor Shares of the Global Leaders Fund. The exchange ratio was 2.446. The net asset value of the Global Leaders Fund’s Investor Shares on the close of business October 23, 2015 both before and after the reorganization was $10.09. A total of 994,393 Investor Shares were issued to the shareholders of the Opportunity Fund in the exchange. The Opportunity Fund’s net assets at the reorganization date of $10,035,030, including $254,611 of unrealized appreciation, were combined with those of the Global Leaders Fund. Assuming the acquisition had been completed on July 1, 2015, the beginning of the annual reporting period of the Global Leaders Fund, proforma results of operations for the year ended June 30, 2016 would include net investment income of $61,946, and net realized and change in unrealized loss of $394,907, resulting in a decrease in net assets of $332,961. Prior to the reorganization, the Global Leaders Fund net assets totaled $4,178,793. Immediately after the reorganization, the net assets of the Global Leaders Fund totaled $14,213,823. The exchange was a tax-free event to the Opportunity Fund shareholders. For financial reporting purposes, assets received and shares issued by the Global Leaders Fund were recorded at fair value; however, the cost basis of investments received from the Opportunity Fund was carried forward to align ongoing reporting of the Global Leaders Fund’s realized and unrealized gains and losses with amounts distributable to shareholders for tax purposes.
Note 10. Liquidation of Multi-Strategy Fund
On July 15, 2016, the Board of Trustees of Brown Advisory Funds approved a Plan of Liquidation and Termination relating to the Multi-Strategy Fund (“the Fund”) pursuant to which the Fund would cease operations and be liquidated on or about August 12, 2016. The Board considered the recommendation of Brown Advisory LLC (“Brown Advisory”), the investment adviser to the Fund, to liquidate the Fund based upon the Fund’s current small asset size and small shareholder base. After careful consideration of the proposal of Brown Advisory to liquidate the Fund, the Board concluded that it is in the best interests of the Fund and its shareholders to liquidate the Fund and cease its operations. The Fund was then liquidated on August 12, 2016.
www.brownadvisoryfunds.com
178
Report of Independent Registered Public Accounting Firm
To the Board of Trustees and Shareholders
Brown Advisory Funds
We have audited the accompanying statements of assets and liabilities of Brown Advisory Growth Equity Fund, Brown Advisory Value Equity Fund, Brown Advisory Flexible Equity Fund, Brown Advisory Equity Income Fund, Brown Advisory Sustainable Growth Fund, Brown Advisory Small-Cap Growth Fund, Brown Advisory Small-Cap Fundamental Value Fund, Brown Advisory Multi-Strategy Fund, Brown Advisory Global Leaders Fund, Brown Advisory Intermediate Income Fund, Brown Advisory Total Return Fund, Brown Advisory Strategic Bond Fund, Brown Advisory Maryland Bond Fund, Brown Advisory Tax Exempt Bond Fund, Brown Advisory Mortgage Securities Fund, Brown Advisory – WMC Strategic European Equity Fund, Brown Advisory – WMC Japan Alpha Opportunities Fund, Brown Advisory – Somerset Emerging Markets Fund, and Brown Advisory Emerging Markets Small-Cap Fund (collectively the “Funds”), each a series of Brown Advisory Funds (the “Trust”), including the schedules of investments as of June 30, 2016, and the related statements of operations, the statements of changes in net assets and the financial highlights for the periods indicated thereon. These financial statements and financial highlights are the responsibility of the Trust’s management. Our responsibility is to express an opinion on these financial statements and financial highlights based on our audits.
We conducted our audits in accordance with the standards of the Public Company Accounting Oversight Board (United States). Those standards require that we plan and perform the audits to obtain reasonable assurance about whether the financial statements and financial highlights are free of material misstatement. The Funds are not required to have, nor were we engaged to perform an audit of its internal control over financial reporting. Our audits included consideration of internal control over financial reporting as a basis for designing audit procedures that are appropriate in the circumstances, but not for the purpose of expressing an opinion on the effectiveness of the Funds’ internal control over financial reporting. Accordingly, we express no such opinion. An audit includes examining, on a test basis, evidence supporting the amounts and disclosures in the financial statements. Our procedures included confirmation of securities owned as of June 30, 2016, by correspondence with the custodian and brokers or by other appropriate auditing procedures when replies from brokers were not received. An audit also includes assessing the accounting principles used and significant estimates made by management, as well as evaluating the overall financial statement presentation. We believe that our audits provide a reasonable basis for our opinion.
In our opinion, the financial statements and financial highlights referred to above present fairly, in all material respects, the financial position of Brown Advisory Growth Equity Fund, Brown Advisory Value Equity Fund, Brown Advisory Flexible Equity Fund, Brown Advisory Equity Income Fund, Brown Advisory Sustainable Growth Fund, Brown Advisory Small-Cap Growth Fund, Brown Advisory Small-Cap Fundamental Value Fund, Brown Advisory Multi-Strategy Fund, Brown Advisory Global Leaders Fund, Brown Advisory Intermediate Income Fund, Brown Advisory Total Return Fund, Brown Advisory Strategic Bond Fund (formerly the Brown Advisory Tactical Bond Fund), Brown Advisory Maryland Bond Fund, Brown Advisory Tax Exempt Bond Fund, Brown Advisory Mortgage Securities Fund, Brown Advisory – WMC Strategic European Equity Fund, Brown Advisory – WMC Japan Alpha Opportunities Fund, Brown Advisory – Somerset Emerging Markets Fund, and Brown Advisory Emerging Markets Small-Cap Fund as of June 30, 2016, the results of their operations, the changes in their net assets and the financial highlights for the periods indicated thereon, in conformity with accounting principles generally accepted in the United States of America.
| TAIT, WELLER & BAKER LLP |
Philadelphia, Pennsylvania
August 26, 2016
www.brownadvisoryfunds.com
179
Expense Example For the Six Months Ended June 30, 2016 (Unaudited)
As a shareholder of a Fund you incur two types of costs: (1) transaction costs, including redemption fees and exchange fees; and (2) ongoing costs, including investment advisory fees; distribution and/or service fees; and other Fund expenses. This example is intended to help you understand your ongoing costs (in dollars) of investing in a Fund and to compare these costs with the ongoing costs of investing in other mutual funds. The example is based on an investment of $1,000 invested at the beginning of the six month period and held for the entire period (January 1, 2016 – June 30, 2016).
Actual Expenses
The “Actual Return” row in the following table provides information about actual account values based on actual returns and actual expenses. As a shareholder you will be assessed fees for outgoing wire transfers, returned checks and stop payment orders at prevailing rates charged by U.S. Bancorp Fund Services, LLC, the Funds’ transfer agent. If you request that a redemption be made by wire transfer, currently, the Funds’ transfer agent charges a $15.00 fee. You will be charged a redemption fee equal to 1.00% of the net amount of the redemption if you redeem your shares less than 14 days after you purchase, with certain limited exceptions. Individual Retirement Accounts (“IRA”) that are held directly at the Funds will be charged a $15.00 annual maintenance fee. IRAs held by broker-dealers or through other means, may or may not incur an annual maintenance fee. Yet, if IRAs maintenance fees are charged to accounts held elsewhere, the fees charged may be more or may be less than $15.00. To the extent the Funds invest in shares of other investment companies as part of their investment strategy, you will indirectly bear your proportionate share of any fees and expenses charged by the underlying funds in which the Funds invest in addition to the expenses of the Funds. Actual expenses of the underlying funds may vary. These expenses are not included in the example below. The example below includes, but is not limited to, investment advisory, shareholder servicing, fund accounting, custody and transfer agent fees. However, the example below does not include portfolio trading commissions and related expenses. You may use the information in this line, together with the amount you invested, to estimate the expenses that you paid over the period. Simply divide your account value by $1,000 (for example, an $8,600 account value divided by $1,000 = 8.6). Then, multiply the result by the number in the first line under the heading entitled “Expenses Paid During the Period” to estimate the expenses you paid on your account during this period.
Hypothetical Example for Comparison Purposes
The “Hypothetical Return” row in the following table provides information about hypothetical account values based on a hypothetical return and hypothetical expenses based on the Funds’ actual expense ratio and an assumed rate of return of 5% per year before expenses, which is not the Funds’ actual return. The hypothetical account values and expenses may not be used to estimate the actual ending account balance or expenses you paid for the period. You may use this information to compare the ongoing costs of investing in the Funds and other funds. To do so, compare this 5% hypothetical example with the 5% hypothetical examples that appear in the shareholder reports of the other funds. Please note that the expenses shown in the table are meant to highlight your ongoing costs only and do not reflect any transactional costs, such as sales charges (loads), redemption fees or exchange fees. Therefore, the Hypothetical information in the table is useful in comparing ongoing costs only and will not help you determine the relative total costs of owning different funds. In addition, if these transactional costs were included, your costs would have been higher.
| Beginning | Ending | Annualized | ||
| Account Value | Account Value | Expenses Paid | Net Expense | |
January 1, 2016 | June 30, 2016 | During the Period* | Ratio* | |
Growth Equity Fund: | ||||
| Institutional Shares | ||||
| Actual Return | $1,000 | $ 985 | $3.55 | 0.72% |
| Hypothetical Return | $1,000 | $1,021 | $3.62 | 0.72% |
| Investor Shares | ||||
| Actual Return | $1,000 | $ 984 | $4.29 | 0.87% |
| Hypothetical Return | $1,000 | $1,021 | $4.37 | 0.87% |
| Advisor Shares | ||||
| Actual Return | $1,000 | $ 982 | $5.52 | 1.12% |
| Hypothetical Return | $1,000 | $1,019 | $5.62 | 1.12% |
www.brownadvisoryfunds.com
180
Expense Example For the Six Months Ended June 30, 2016 (Unaudited)
| Beginning | Ending | Annualized | ||
| Account Value | Account Value | Expenses Paid | Net Expense | |
January 1, 2016 | June 30, 2016 | During the Period* | Ratio* | |
Value Equity Fund: | ||||
| Institutional Shares | ||||
| Actual Return | $1,000 | $ 995 | $3.97 | 0.80% |
| Hypothetical Return | $1,000 | $1,021 | $4.02 | 0.80% |
| Investor Shares | ||||
| Actual Return | $1,000 | $ 994 | $4.71 | 0.95% |
| Hypothetical Return | $1,000 | $1,020 | $4.77 | 0.95% |
| Advisor Shares | ||||
| Actual Return | $1,000 | $993 | $5.95 | 1.20% |
| Hypothetical Return | $1,000 | $1,019 | $6.02 | 1.20% |
Flexible Equity Fund: | ||||
| Institutional Shares | ||||
| Actual Return | $1,000 | $ 982 | $3.60 | 0.73% |
| Hypothetical Return | $1,000 | $1,021 | $3.67 | 0.73% |
| Investor Shares | ||||
| Actual Return | $1,000 | $ 981 | $4.33 | 0.88% |
| Hypothetical Return | $1,000 | $1,020 | $4.42 | 0.88% |
| Advisor Shares | ||||
| Actual Return | $1,000 | $ 980 | $5.56 | 1.13% |
| Hypothetical Return | $1,000 | $1,019 | $5.67 | 1.13% |
Equity Income Fund: | ||||
| Institutional Shares | ||||
| Actual Return | $1,000 | $1,055 | $3.88 | 0.76% |
| Hypothetical Return | $1,000 | $1,021 | $3.82 | 0.76% |
| Investor Shares | ||||
| Actual Return | $1,000 | $1,054 | $4.65 | 0.91% |
| Hypothetical Return | $1,000 | $1,020 | $4.57 | 0.91% |
| Advisor Shares | ||||
| Actual Return | $1,000 | $1,053 | $5.92 | 1.16% |
| Hypothetical Return | $1,000 | $1,019 | $5.82 | 1.16% |
Sustainable Growth Fund: | ||||
| Institutional Shares | ||||
| Actual Return | $1,000 | $1,018 | $3.76 | 0.75% |
| Hypothetical Return | $1,000 | $1,021 | $3.77 | 0.75% |
| Investor Shares | ||||
| Actual Return | $1,000 | $1,018 | $4.52 | 0.90% |
| Hypothetical Return | $1,000 | $1,020 | $4.52 | 0.90% |
| Advisor Shares | ||||
| Actual Return | $1,000 | $1,017 | $5.77 | 1.15% |
| Hypothetical Return | $1,000 | $1,019 | $5.77 | 1.15% |
www.brownadvisoryfunds.com
181
Expense Example For the Six Months Ended June 30, 2016 (Unaudited)
| Beginning | Ending | Annualized | ||
| Account Value | Account Value | Expenses Paid | Net Expense | |
January 1, 2016 | June 30, 2016 | During the Period* | Ratio* | |
Small-Cap Growth Fund: | ||||
| Institutional Shares | ||||
| Actual Return | $1,000 | $1,027 | $4.94 | 0.98% |
| Hypothetical Return | $1,000 | $1,020 | $4.92 | 0.98% |
| Investor Shares | ||||
| Actual Return | $1,000 | $1,026 | $5.69 | 1.13% |
| Hypothetical Return | $1,000 | $1,019 | $5.67 | 1.13% |
| Advisor Shares | ||||
| Actual Return | $1,000 | $1,025 | $6.95 | 1.38% |
| Hypothetical Return | $1,000 | $1,018 | $6.92 | 1.38% |
Small-Cap Fundamental Value Fund: | ||||
| Institutional Shares | ||||
| Actual Return | $1,000 | $1,047 | $4.99 | 0.98% |
| Hypothetical Return | $1,000 | $1,020 | $4.92 | 0.98% |
| Investor Shares | ||||
| Actual Return | $1,000 | $1,046 | $5.75 | 1.13% |
| Hypothetical Return | $1,000 | $1,019 | $5.67 | 1.13% |
| Advisor Shares | ||||
| Actual Return | $1,000 | $1,044 | $7.01 | 1.38% |
| Hypothetical Return | $1,000 | $1,018 | $6.92 | 1.38% |
Multi-Strategy Fund: | ||||
| Institutional Shares | ||||
| Actual Return | $1,000 | $1,009 | $5.50 | 1.10% |
| Hypothetical Return | $1,000 | $1,019 | $5.52 | 1.10% |
Global Leaders Fund: | ||||
| Investor Shares | ||||
| Actual Return | $1,000 | $976 | $4.18 | 0.85% |
| Hypothetical Return | $1,000 | $1,021 | $4.27 | 0.85% |
Intermediate Income Fund: | ||||
| Investor Shares | ||||
| Actual Return | $1,000 | $1,036 | $2.18 | 0.43% |
| Hypothetical Return | $1,000 | $1,023 | $2.16 | 0.43% |
| Advisor Shares | ||||
| Actual Return | $1,000 | $1,033 | $3.44 | 0.68% |
| Hypothetical Return | $1,000 | $1,021 | $3.42 | 0.68% |
Total Return Fund: | ||||
| Institutional Shares | ||||
| Actual Return | $1,000 | $1,056 | $2.56 | 0.50% |
| Hypothetical Return | $1,000 | $1,022 | $2.51 | 0.50% |
| Investor Shares | ||||
| Actual Return | $1,000 | $1,055 | $2.81 | 0.55% |
| Hypothetical Return | $1,000 | $1,022 | $2.77 | 0.55% |
www.brownadvisoryfunds.com
182
Expense Example For the Six Months Ended June 30, 2016 (Unaudited)
| Beginning | Ending | Annualized | ||
| Account Value | Account Value | Expenses Paid | Net Expense | |
January 1, 2016 | June 30, 2016 | During the Period* | Ratio* | |
Strategic Bond Fund: | ||||
| Investor Shares | ||||
| Actual Return | $1,000 | $1,024 | $3.52 | 0.70% |
| Hypothetical Return | $1,000 | $1,021 | $3.52 | 0.70% |
| Advisor Shares | ||||
| Actual Return | $1,000 | $1,023 | $4.78 | 0.95% |
| Hypothetical Return | $1,000 | $1,020 | $4.77 | 0.95% |
Maryland Bond Fund: | ||||
| Investor Shares | ||||
| Actual Return | $1,000 | $1,031 | $2.42 | 0.48% |
| Hypothetical Return | $1,000 | $1,022 | $2.41 | 0.48% |
Tax Exempt Bond Fund: | ||||
| Investor Shares | ||||
| Actual Return | $1,000 | $1,037 | $2.43 | 0.48% |
| Hypothetical Return | $1,000 | $1,022 | $2.41 | 0.48% |
Mortgage Securities Fund: | ||||
| Institutional Shares | ||||
| Actual Return | $1,000 | $1,032 | $2.27 | 0.45% |
| Hypothetical Return | $1,000 | $1,023 | $2.26 | 0.45% |
| Investor Shares | ||||
| Actual Return | $1,000 | $1,033 | $2.53 | 0.50% |
| Hypothetical Return | $1,000 | $1,022 | $2.51 | 0.50% |
Strategic European Equity Fund: | ||||
| Institutional Shares | ||||
| Actual Return | $1,000 | $ 974 | $5.60 | 1.14% |
| Hypothetical Return | $1,000 | $1,019 | $5.72 | 1.14% |
| Investor Shares | ||||
| Actual Return | $1,000 | $974 | $6.33 | 1.29% |
| Hypothetical Return | $1,000 | $1,018 | $6.47 | 1.29% |
| Advisor Shares | ||||
| Actual Return | $1,000 | $ 972 | $7.55 | 1.54% |
| Hypothetical Return | $1,000 | $1,017 | $7.72 | 1.54% |
Japan Alpha Opportunities Fund: | ||||
| Institutional Shares | ||||
| Actual Return | $1,000 | $ 812 | $5.13 | 1.14% |
| Hypothetical Return | $1,000 | $1,019 | $5.72 | 1.14% |
| Investor Shares | ||||
| Actual Return | $1,000 | $ 811 | $5.81 | 1.29% |
| Hypothetical Return | $1,000 | $1,018 | $6.47 | 1.29% |
| Advisor Shares | ||||
| Actual Return | $1,000 | $ 810 | $6.93 | 1.54% |
| Hypothetical Return | $1,000 | $1,017 | $7.72 | 1.54% |
www.brownadvisoryfunds.com
183
Expense Example For the Six Months Ended June 30, 2016 (Unaudited)
| Beginning | Ending | Annualized | ||
| Account Value | Account Value | Expenses Paid | Net Expense | |
January 1, 2016 | June 30, 2016 | During the Period* | Ratio* | |
Emerging Markets Fund: | ||||
| Institutional Shares | ||||
| Actual Return | $1,000 | $1,058 | $5.88 | 1.15% |
| Hypothetical Return | $1,000 | $1,019 | $5.77 | 1.15% |
| Investor Shares | ||||
| Actual Return | $1,000 | $1,057 | $6.65 | 1.30% |
| Hypothetical Return | $1,000 | $1,018 | $6.52 | 1.30% |
| Advisor Shares | ||||
| Actual Return | $1,000 | $1,056 | $7.92 | 1.55% |
| Hypothetical Return | $1,000 | $1,017 | $7.77 | 1.55% |
Emerging Markets Small-Cap Fund: | ||||
| Institutional Shares | ||||
| Actual Return | $1,000 | $ 943 | $7.24 | 1.50% |
| Hypothetical Return | $1,000 | $1,017 | $7.52 | 1.50% |
| Investor Shares | ||||
| Actual Return | $1,000 | $ 941 | $7.96 | 1.65% |
| Hypothetical Return | $1,000 | $1,017 | $8.27 | 1.65% |
_________________________
| * | The calculations are based on expenses incurred during the most recent six-month period ended as of the date of this report. The dollar amounts shown as expenses paid during the period are equal to the annualized six-month net expense ratio multiplied by the average account value during the period, multiplied by the number of days (182) in the most recent six-month period divided by the number of days in the Funds’ fiscal year ended (366) as of the date of this report. |
www.brownadvisoryfunds.com
184
Trustees and Executive Officers
The Board is responsible for the overall management of the Trust, including general supervision and review of the investment activities of the Funds. The Board, in turn, elects the Officers of the Trust, who are responsible for administering the day-to-day operations of the Trust and each of the Funds. The current Trustees and Officers of the Trust, their ages and positions with the Trust, term of office with the Trust and length of time served, their principal occupations for the past five years and other directorships held during the past five years are set forth in the table below.
Additional information about the Trustees of the Trust can be found in the Statement of Additional Information, which is available, without charge, upon request, by calling Brown Advisory Funds toll free at 1-800-540-6807 or by accessing our website at www.brownadvisoryfunds.com.
| Number of | Other | ||||
| Term of | Portfolios in | Directorships | |||
| Office and | Fund Complex | Held During | |||
| Name, Age | Position with | Length of | Principal Occupation(s) | Overseen by | the Past |
| and Address | the Trust | Time Served | During Past 5 Years | Trustees | 5 Years(2) |
Independent Trustees of the Trust(1) | |||||
| Henry H. Hopkins | Trustee | Indefinite Term; | Retired; Formerly, Vice President and Chief | 19 | None. |
| Age: 73 | Since May 2012 | Legal Counsel, T. Rowe Price Associates, Inc. | |||
| c/o Brown Advisory LLC | Lead | Indefinite Term; | (investment management firm) (1998 to 2008). | ||
| 901 South Bond Street | Independent | Since May 2015 | |||
| Suite 400 | Trustee | ||||
| Baltimore, MD 21231 | |||||
| Kyle P. Legg | Trustee | Indefinite Term; | Retired; Formerly President and Chief Executive | 19 | Director, SunTrust |
| Age: 64 | Since May 2012 | Officer, Legg Mason Capital Management, LLC | Banks, Inc. (bank | ||
| c/o Brown Advisory LLC | (investment management firm) (2006 to 2009). | holding company) | |||
| 901 South Bond Street | (since 2011); Director, | ||||
| Suite 400 | OM Asset Management | ||||
| Baltimore, MD 21231 | plc (asset management | ||||
| holding company) | |||||
| (since 2014); Director, | |||||
| Eastman Kodak Co. | |||||
| (printing equipment | |||||
| and supplies company) | |||||
| (2010 to 2013). | |||||
| Thomas F. O’Neil III | Trustee | Indefinite Term; | President, The Saranac Group LLC (strategic | 19 | None. |
| Age: 59 | Since May 2012 | consulting firm) (since 2010); Formerly, Executive | |||
| c/o Brown Advisory LLC | Vice Chairman (previously, Senior Vice President, | ||||
| 901 South Bond Street | General Counsel and Secretary) WellCare Health | ||||
| Suite 400 | Plans, Inc. (managed healthcare organization) | ||||
| Baltimore, MD 21231 | (2008 to 2009); Formerly, Partner and Joint | ||||
| Global Practice Group Leader, DLA Piper US LLP | |||||
| (law firm) (2002 to 2008). | |||||
| Neal F. Triplett, CFA | Trustee | Indefinite Term; | President, DUMAC, Inc. (university endowment | 19 | None. |
| Age: 45 | Since May 2012 | investment organization) (since 1999). | |||
| c/o Brown Advisory LLC | |||||
| 901 South Bond Street | |||||
| Suite 400 | |||||
| Baltimore, MD 21231 | |||||
| Interested Trustees and Officers of the Trust | |||||
Michael D. Hankin(3) | Trustee | Indefinite Term | President and Chief Executive Officer, Brown | 19 | None. |
| Age: 58 | Since May 2012 | Advisory Incorporated and affiliates (investment | |||
| c/o Brown Advisory | management firm) (since 1993). | ||||
| Incorporated | |||||
| 901 South Bond Street | |||||
| Suite 400 | |||||
| Baltimore, MD 21231 | |||||
www.brownadvisoryfunds.com
185
Trustees and Executive Officers
| Number of | Other | ||||
| Term of | Portfolios in | Directorships | |||
| Office and | Fund Complex | Held During | |||
| Name, Age | Position with | Length of | Principal Occupation(s) | Overseen by | the Past |
| and Address | the Trust | Time Served | During Past 5 Years | Trustees | 5 Years(2) |
| Interested Trustees and Officers of the Trust | |||||
Joseph R. Hardiman(3) | Chairman | Indefinite Term; | Business Consultant (financial services industry | 19 | Director of Franklin |
| Age: 79 | and Trustee | Since May 2012 | consulting) (since 1997); Formerly; Director of | Resources, Inc. | |
| c/o Brown Advisory LLC | Brown Advisory Incorporated (investment | (investment | |||
| 901 South Bond Street | management firm) (2001 to 2012). | management firm) | |||
| Suite 400 | (2005 to 2013). | ||||
| Baltimore, MD 21231 | |||||
| David M. Churchill | President/ | Indefinite Term; | Chief Operating Officer and Chief Financial | Not | Not |
| Age: 51 | Principal | Since May 2012 | Officer, Brown Advisory Incorporated and | Applicable. | Applicable. |
| c/o Brown Advisory | Executive | affiliates (investment management firm) | |||
| Incorporated | Officer | (since 1993). | |||
| 901 South Bond Street | |||||
| Suite 400 | |||||
| Baltimore, MD 21231 | |||||
| Paul J. Chew | Senior Vice | Indefinite Term; | Head of Investments, Brown Advisory | Not | Not |
| Age: 50 | President | Since May 2016 | Incorporated and affiliates (investment | Applicable. | Applicable. |
| c/o Brown Advisory | management firm) (since 1995). | ||||
| Incorporated | |||||
| 901 South Bond Street | |||||
| Suite 400 | |||||
| Baltimore, MD 21231 | |||||
| Carey E. Taylor | Vice | Indefinite Term; | Product Manager, Brown Advisory | Not | Not |
| Age: 28 | President | Since November | Incorporated and affiliates (investment | Applicable. | Applicable. |
| c/o Brown Advisory | 2015 | management firm) (since 2013); Formerly, | |||
| Incorporated | Senior Associate, Intermediary Risk | ||||
| 901 South Bond Street | Management, T. Rowe Price (investment | ||||
| Suite 400 | management firm) (2010 to 2013). | ||||
| Baltimore, MD 21231 | |||||
| Jason T. Meix | Treasurer/ | Indefinite Term; | Vice President, U.S. Bancorp Fund | Not | Not |
| Age: 37 | Principal | Since May 2012 | Services, LLC (fund administrative services firm) | Applicable. | Applicable. |
| c/o Brown Advisory LLC | Financial | (since 2008). | |||
| 901 South Bond Street | Officer | ||||
| Suite 400 | |||||
| Baltimore, MD 21231 | |||||
| Edward L. Paz | Secretary | Indefinite Term; | Vice President and Counsel, U.S. Bancorp Fund | Not | Not |
| Age: 45 | Since May 2012 | Services, LLC (fund administrative services firm) | Applicable. | Applicable. | |
| c/o Brown Advisory LLC | (since 2007). | ||||
| 901 South Bond Street | |||||
| Suite 400 | |||||
| Baltimore, MD 21231 | |||||
| Brett D. Rogers | Chief | Indefinite Term; | General Counsel and Chief Compliance | Not | Not |
| Age: 40 | Compliance | Since May 2012 | Officer, Brown Advisory Incorporated and | Applicable. | Applicable. |
| c/o Brown Advisory | Officer | affiliates (investment management firm) | |||
| Incorporated | (since 2009); Formerly, Director, Compliance | ||||
| 901 South Bond Street | Anti-Money | Indefinite Term: | and Risk, Deutsche Asset Management | ||
| Suite 400 | Laundering | Since May 2012 | (investment management firm) (2003 to 2009). | ||
| Baltimore, MD 21231 | Officer | ||||
(1) | The Trustees of the Trust who are not “interested persons” of the Trust as defined in the 1940 Act (“Independent Trustees”). |
(2) | The directorships disclosed in this column include only the directorships of those companies that a Trustee serves on that are required to report to the SEC under applicable Federal securities laws including publicly traded corporations that are registered with the SEC under the 1934 Act and investment companies that are registered with the SEC under the 1940 Act, and it therefore excludes various other types of directorships that the Trustees of the Trust may currently hold in other types of organizations, including private companies and not-for-profit organizations, which are expressly excluded from the disclosure requirements for mutual fund board members. |
(3) | Mr. Hankin is considered an “interested person” of the Trust, as defined in the 1940 Act, because of his current position with Brown Advisory Incorporated, the parent company of the Adviser, and Mr. Hardiman is considered an “interested person” of the Trust, as defined in the 1940 Act, because of his previous position with Brown Advisory Incorporated and his ownership interest in Brown Advisory Incorporated. |
www.brownadvisoryfunds.com
186
Information About Proxy Voting (Unaudited)
A description of the policies and procedures that the Funds use to determine how to vote proxies relating to portfolio securities is available without charge upon request by calling toll-free at 800-540-6807 and by accessing the Funds’ website at www.brownadvisoryfunds.com. Furthermore, you can obtain the description on the SEC’s website at www.sec.gov.
Information regarding how the Funds voted proxies relating to portfolio securities during the 12-month period ended June 30 is available without charge, by calling toll-free at 800-540-6807. In addition, you can obtain the Funds’ proxy voting records on the SEC’s website at www.sec.gov.
Information About the Portfolio Holdings (Unaudited)
The Funds file their complete schedule of portfolio holdings for their first and third fiscal quarters with the SEC on Form N-Q. The Funds’ Form N-Q is available without charge, upon request, by calling toll-free at 800-540-6807. Furthermore, you can obtain the Form N-Q on the SEC’s website at www.sec.gov. The Funds’ schedules of portfolio holdings are posted on their website at www.brownadvisoryfunds.com within ten business days after calendar quarter end.
Householding (Unaudited)
In an effort to decrease costs, the Funds will reduce the number of duplicate Prospectuses and annual and semi-annual reports that you receive by sending only one copy of each to those addresses shown by two or more accounts. Please call the Transfer Agent toll free at 1-800-540-6807 to request individual copies of these documents. The Funds will begin sending individual copies 30 days after receiving your request. This policy does not apply to account statements.
Federal Tax Status of Dividends Declared during the Tax Year (Unaudited)
For Federal Income Tax purposes, distributions from short-term capital gains are classified as ordinary income. The percentage of ordinary income distributions designated as qualifying for the corporate dividend received deduction (“DRD”), the individual qualified dividend rate (“QDI”), the qualifying interest income exempt from U.S. tax for foreign shareholders (“QII”) and the qualifying short-term capital gain distributions exempt from U.S. tax for foreign shareholders (“QSTCG”) is presented below:
| Income Distributions | |||||
Exempt from Federal Tax | QDI | DRD | QII | QSTCG | |
| Growth Equity Fund | 0.00% | 100.00% | 100.00% | 0.42% | 100.00% |
| Value Equity Fund | 0.00% | 74.75% | 52.21% | 0.02% | 54.04% |
| Flexible Equity Fund | 0.00% | 100.00% | 100.00% | 0.36% | 0.00% |
| Equity Income Fund | 0.00% | 100.00% | 100.00% | 0.25% | 0.00% |
| Sustainable Growth Fund | 0.00% | 62.16% | 47.32% | 0.33% | 0.00% |
| Small-Cap Growth Fund | 0.00% | 100.00% | 100.00% | 0.09% | 100.00% |
| Small-Cap Fundamental Value Fund | 0.00% | 100.00% | 100.00% | 0.49% | 0.00% |
| Multi-Strategy Fund | 0.00% | 77.88% | 55.76% | 0.27% | 26.76% |
| Global Leaders Fund | 0.00% | 0.00% | 0.00% | 0.00% | 0.00% |
| Intermediate Income Fund | 0.00% | 0.00% | 0.00% | 83.48% | 13.20% |
| Total Return Fund | 0.00% | 30.00% | 0.30% | 100.00% | 0.00% |
| Strategic Bond Fund | 0.00% | 20.00% | 0.20% | 91.66% | 0.00% |
| Maryland Bond Fund | 99.92% | 0.00% | 0.00% | 100.00% | 0.00% |
| Tax Exempt Bond Fund | 100.00% | 0.00% | 0.00% | 0.00% | 0.00% |
| Mortgage Securities Fund | 0.00% | 0.00% | 0.00% | 96.74% | 0.00% |
| Strategic European Equity Fund | 0.00% | 100.00% | 0.00% | 0.02% | 0.00% |
| Japan Alpha Opportunities Fund | 0.00% | 7.49% | 0.00% | 0.01% | 15.70% |
| Emerging Markets Fund | 0.00% | 93.05% | 0.71% | 0.24% | 0.00% |
| Emerging Markets Small-Cap Fund | 0.00% | 6.65% | 0.00% | 0.02% | 100.00% |
The Funds, as applicable, intend to elect to pass through to shareholders the credit for taxes paid to foreign countries. Such credits for taxes paid to foreign countries will be included in shareholders' Form 1099-DIV.
www.brownadvisoryfunds.com
187
BROWN ADVISORY FUNDS
At Brown Advisory, we believe that you deserve frank and open communication on all aspects of our relationship. In this spirit, we provide this annual summary of our policies relating to confidentiality and privacy of client information, mutual funds, conflicts of interest, trading commissions, proxy voting and Form ADV annual notice.
CONFIDENTIALITY AND PRIVACY POLICY
Brown Advisory takes the confidentiality of your personal information and the privacy of your account very seriously. Our commitment to safeguard your personal information goes beyond our legal obligation to process your transactions accurately and securely. Whether we serve you online, in person, on the telephone or by mail, the principles that guide the way in which we conduct business are built upon the core values of trust and integrity.
We limit access to your personal information to only those employees with a business reason to know such information. We train and consistently remind all employees to respect client privacy and to recognize the importance of the confidentiality of such information. Those who violate our privacy policy are subject to disciplinary action. This commitment also applies to the sharing of information among Brown Advisory and its affiliates.
We maintain physical, electronic and procedural safeguards that comply with applicable laws and regulations to protect your personal information, including various measures to protect your personal information while it is stored electronically.
Federal law requires us to inform you that we have on record personal information about you and that we obtain such information from you directly (e.g., information you provide to us on account applications and other forms, such as your name, address, social security number, occupation, assets and income) and indirectly (e.g., information on our computer systems about your transactions with us, such as your account balance and account holdings). Any personal information you choose to provide is kept confidential and allows us to: (i) provide better and more complete investment and strategic advice; (ii) develop new services that meet additional needs you may have; and, (iii) comply with legal and regulatory requirements.
In addition, in the normal conduct of our business, it may become necessary for us to share information relating to our clients that we have on record, as described above, with companies not affiliated with us who are under contract to perform services on our behalf. For example, we have contracted with companies to assist us in complying with anti-terrorist and anti-money laundering statutory requirements (including the identification and reporting of activities that may involve terrorist acts or money laundering activities), companies that provide clearing services, and other vendors that provide services directly related to your account relationship with us. Our agreements with these companies require that they keep your information confidential and not use such information for any unrelated purpose.
We do not sell information about you to third parties, and we do not otherwise disclose information to third parties without your permission or unless required by law.
www.brownadvisoryfunds.com
188
(This Page Intentionally Left Blank.)
INVESTMENT ADVISER
Brown Advisory LLC
901 South Bond Street, Suite 400
Baltimore, MD 21231
www.brownadvisory.com
DISTRIBUTOR
Quasar Distributors, LLC
615 East Michigan Street
Milwaukee, WI 53202
CUSTODIAN
U.S. Bank, N.A.
Custody Operations
1555 North Rivercenter Drive, Suite 302
Milwaukee, WI 53212
TRANSFER AGENT
U.S. Bancorp Fund Services, LLC
P.O. Box 701
Milwaukee, WI 53201
(800) 540-6807
INDEPENDENT REGISTERED PUBLIC ACCOUNTING FIRM
Tait, Weller & Baker LLP
1818 Market Street, Suite 2400
Philadelphia, PA 19103
LEGAL COUNSEL
Dechert LLP
1900 K Street, NW
Washington, DC 20006
Institutional Shares | Investor Shares | Advisor Shares | ||||
Symbol | CUSIP | Symbol | CUSIP | Symbol | CUSIP | |
| Growth Equity Fund | BAFGX | 115233702 | BIAGX | 115233504 | BAGAX | 115233603 |
| Value Equity Fund | BAFVX | 115233876 | BIAVX | 115233801 | BAVAX | 115233884 |
| Flexible Equity Fund | BAFFX | 115233843 | BIAFX | 115233868 | BAFAX | 115233850 |
| Equity Income Fund | BAFDX | 115233660 | BIADX | 115233686 | BADAX | 115233678 |
| Sustainable Growth Fund | BAFWX | 115233207 | BIAWX | 115233306 | BAWAX | 115233405 |
| Small-Cap Growth Fund | BAFSX | 115233819 | BIASX | 115233835 | BASAX | 115233827 |
| Small-Cap Fundamental Value Fund | BAUUX | 115233777 | BIAUX | 115233793 | BAUAX | 115233785 |
| Global Leaders Fund | — | — | BIALX | 115233462 | — | — |
| Intermediate Income Fund | — | — | BIAIX | 115233744 | BAIAX | 115233736 |
| Total Return Fund | BAFTX | 115233538 | BIATX | 115233520 | — | — |
| Strategic Bond Fund | — | — | BIABX | 115233470 | BATBX | 115233710 |
| Maryland Bond Fund | — | — | BIAMX | 115233751 | — | — |
| Tax Exempt Bond Fund | — | — | BIAEX | 115233108 | — | — |
| Mortgage Securities Fund | BAFZX | 115233546 | BIAZX | 115233587 | — | — |
| WMC Strategic European Equity Fund | BAFHX | 115233629 | BIAHX | 115233611 | BAHAX | 115233595 |
| WMC Japan Alpha Opportunities Fund | BAFJX | 115233579 | BIAJX | 115233561 | BAJAX | 115233553 |
| Somerset Emerging Markets Fund | BAFQX | 115233652 | BIAQX | 115233645 | BAQAX | 115233637 |
| Emerging Markets Small-Cap Fund | BAFNX | 115233512 | BIANX | 115233496 | — | — |
This report is submitted for the general information of the shareholders of each Fund. It is not authorized for distribution to prospective investors unless preceded or accompanied by an effective prospectus, which includes information regarding the Funds’ risks, objectives, fees and expenses, experience of their management, and other information.
BX-ANNUAL
Item 2. Code of Ethics.
The registrant has adopted a code of ethics that applies to the registrant’s principal executive officer and principal financial officer. The registrant has not made any amendments to its code of ethics during the period covered by this report. The registrant has not granted any waivers from any provisions of the code of ethics during the period covered by this report.
A copy of the registrant’s Code of Ethics is filed herewith.
Item 3. Audit Committee Financial Expert.
The Registrant’s Board of Trustees has not designated an audit committee financial expert. The Registrant has determined that it will retain the services of an independent third party to assist it if circumstances arise that require specific investment company auditing expertise.
Item 4. Principal Accountant Fees and Services.
The Registrant has engaged its principal accountant to perform audit services, audit-related services, tax services and other services during the past two fiscal years. “Audit services” refer to performing an audit of the Registrant's annual financial statements or services that are normally provided by the accountant in connection with statutory and regulatory filings or engagements for those fiscal years. “Audit-related services” refer to the assurance and related services by the principal accountant that are reasonably related to the performance of the audit. “Tax services” refer to professional services rendered by the principal accountant for tax compliance, tax advice, and tax planning. There were no “Other services” provided by the principal accountant. The following table details the aggregate fees billed or expected to be billed for each of the last two fiscal years for audit fees, audit-related fees, tax fees and other fees by the principal accountant.
Brown Advisory Growth Equity Fund
| FYE 6/30/2016 | FYE 6/30/2015 | |
| Audit Fees | $16,400 | $16,000 |
| Audit-Related Fees | N/A | N/A |
| Tax Fees | $2,700 | $2,600 |
| All Other Fees | N/A | N/A |
Brown Advisory Value Equity Fund
| FYE 6/30/2016 | FYE 6/30/2015 | |
| Audit Fees | $16,400 | $16,000 |
| Audit-Related Fees | N/A | N/A |
| Tax Fees | $2,700 | $2,600 |
| All Other Fees | N/A | N/A |
Brown Advisory Flexible Equity Fund
| FYE 6/30/2016 | FYE 6/30/2015 | |
| Audit Fees | $16,400 | $16,000 |
| Audit-Related Fees | N/A | N/A |
| Tax Fees | $2,700 | $2,600 |
| All Other Fees | N/A | N/A |
Brown Advisory Equity Income Fund
| FYE 6/30/2016 | FYE 6/30/2015 | |
| Audit Fees | $16,400 | $16,000 |
| Audit-Related Fees | N/A | N/A |
| Tax Fees | $2,700 | $2,600 |
| All Other Fees | N/A | N/A |
Brown Advisory Sustainable Growth Fund
| FYE 6/30/2016 | FYE 6/30/2015 | |
| Audit Fees | $16,400 | $16,000 |
| Audit-Related Fees | N/A | N/A |
| Tax Fees | $2,700 | $2,600 |
| All Other Fees | N/A | N/A |
Brown Advisory Small-Cap Growth Fund
| FYE 6/30/2016 | FYE 6/30/2015 | |
| Audit Fees | $16,400 | $16,000 |
| Audit-Related Fees | N/A | N/A |
| Tax Fees | $2,700 | $2,600 |
| All Other Fees | N/A | N/A |
Brown Advisory Small-Cap Fundamental Value Fund
| FYE 6/30/2016 | FYE 6/30/2015 | |
| Audit Fees | $16,400 | $16,000 |
| Audit-Related Fees | N/A | N/A |
| Tax Fees | $2,700 | $2,600 |
| All Other Fees | N/A | N/A |
Brown Advisory Multi-Strategy Fund
| FYE 6/30/2016 | FYE 6/30/2015 | |
| Audit Fees | $16,400 | $10,000 |
| Audit-Related Fees | N/A | N/A |
| Tax Fees | $2,700 | $2,500 |
| All Other Fees | N/A | N/A |
Brown Advisory Global Leaders Fund
| FYE 6/30/2016 | FYE 6/30/2015 | |
| Audit Fees | $10,000 | N/A |
| Audit-Related Fees | N/A | N/A |
| Tax Fees | $2,500 | N/A |
| All Other Fees | N/A | N/A |
Brown Advisory Intermediate Income Fund
| FYE 6/30/2016 | FYE 6/30/2015 | |
| Audit Fees | $16,400 | $16,000 |
| Audit-Related Fees | N/A | N/A |
| Tax Fees | $2,700 | $2,600 |
| All Other Fees | N/A | N/A |
Brown Advisory Total Return Fund
| FYE 6/30/2016 | FYE 6/30/2015 | |
| Audit Fees | $16,400 | $10,000 |
| Audit-Related Fees | N/A | N/A |
| Tax Fees | $2,700 | $2,500 |
| All Other Fees | N/A | N/A |
Brown Advisory Strategic Bond Fund
| FYE 6/30/2016 | FYE 6/30/2015 | |
| Audit Fees | $16,400 | $16,000 |
| Audit-Related Fees | N/A | N/A |
| Tax Fees | $2,700 | $2,600 |
| All Other Fees | N/A | N/A |
Brown Advisory Maryland Bond Fund
| FYE 6/30/2016 | FYE 6/30/2015 | |
| Audit Fees | $16,400 | $16,000 |
| Audit-Related Fees | N/A | N/A |
| Tax Fees | $2,700 | $2,600 |
| All Other Fees | N/A | N/A |
Brown Advisory Tax Exempt Bond Fund
| FYE 6/30/2016 | FYE 6/30/2015 | |
| Audit Fees | $16,400 | $16,000 |
| Audit-Related Fees | N/A | N/A |
| Tax Fees | $2,700 | $2,600 |
| All Other Fees | N/A | N/A |
Brown Advisory Mortgage Securities Fund
| FYE 6/30/2016 | FYE 6/30/2015 | |
| Audit Fees | $16,400 | $16,000 |
| Audit-Related Fees | N/A | N/A |
| Tax Fees | $2,700 | $2,600 |
| All Other Fees | N/A | N/A |
Brown Advisory – WMC Strategic European Equity Fund
| FYE 6/30/2016 | FYE 6/30/2015 | |
| Audit Fees | $16,400 | $16,000 |
| Audit-Related Fees | N/A | N/A |
| Tax Fees | $2,700 | $2,600 |
| All Other Fees | N/A | N/A |
Brown Advisor – WMC Japan Alpha Opportunities Fund
| FYE 6/30/2016 | FYE 6/30/2015 | |
| Audit Fees | $16,400 | $16,000 |
| Audit-Related Fees | N/A | N/A |
| Tax Fees | $2,700 | $2,600 |
| All Other Fees | N/A | N/A |
Brown Advisory – Somerset Emerging Markets Fund
| FYE 6/30/2016 | FYE 6/30/2015 | |
| Audit Fees | $16,400 | $16,000 |
| Audit-Related Fees | N/A | N/A |
| Tax Fees | $2,700 | $2,600 |
| All Other Fees | N/A | N/A |
Brown Advisory Emerging Markets Small-Cap Fund
| FYE 6/30/2016 | FYE 6/30/2015 | |
| Audit Fees | $16,400 | $10,000 |
| Audit-Related Fees | N/A | N/A |
| Tax Fees | $2,700 | $2,500 |
| All Other Fees | N/A | N/A |
The audit committee has adopted pre-approval policies and procedures that require the audit committee to pre‑approve all audit and non‑audit services of the Registrant, including services provided to any entity affiliated with the Registrant.
The percentages of fees billed by Tait, Weller & Baker LLP applicable to non-audit services pursuant to waiver of pre-approval requirement were as follows:
| FYE 6/30/2016 | FYE 6/30/2015 | |
| Audit-Related Fees | 0% | 0% |
| Tax Fees | 0% | 0% |
| All Other Fees | 0% | 0% |
All of the principal accountant’s hours spent on auditing the Registrant’s financial statements were attributed to work performed by full‑time permanent employees of the principal accountant.
The following table indicates the non-audit fees billed or expected to be billed by the Registrant’s accountant for services to the Registrant and to the Registrant’s investment adviser (and any other controlling entity, etc.—not sub-adviser) for the last two fiscal years. The audit committee of the board of trustees has considered whether the provision of non-audit services that were rendered to the Registrant's investment adviser is compatible with maintaining the principal accountant's independence and has concluded that the provision of such non-audit services by the accountant has not compromised the accountant’s independence.
| Non-Audit Related Fees | FYE 6/30/2016 | FYE 6/30/2015 |
| Registrant | N/A | N/A |
| Registrant’s Investment Adviser | N/A | N/A |
Item 5. Audit Committee of Listed Registrants.
Not applicable to registrants who are not listed issuers (as defined in Rule 10A-3 under the Securities Exchange Act of 1934).
Item 6. Schedule of Investments.
Schedule of Investments is included as part of the report to shareholders filed under Item 1 of this Form.
Item 7. Disclosure of Proxy Voting Policies and Procedures for Closed-End Management Investment Companies.
Not applicable to open-end investment companies.
Item 8. Portfolio Managers of Closed-End Management Investment Companies.
Not applicable to open-end investment companies.
Item 9. Purchases of Equity Securities by Closed‑End Management Investment Company and Affiliated Purchasers.
Not applicable to open-end investment companies.
Item 10. Submission of Matters to a Vote of Security Holders.
There have been no material changes to the procedures by which shareholders may recommend nominees to the registrant’s board of trustees.
Item 11. Controls and Procedures.
| (a) | The Registrant’s Principal Executive Officer and Principal Financial Officer have reviewed the Registrant's disclosure controls and procedures (as defined in Rule 30a-3(c) under the Investment Company Act of 1940 (the “Act”)) as of a date within 90 days of the filing of this report, as required by Rule 30a-3(b) under the Act and Rules 13a-15(b) or 15d‑15(b) under the Securities Exchange Act of 1934. Based on their review, such officers have concluded that the disclosure controls and procedures are effective in ensuring that information required to be disclosed in this report is appropriately recorded, processed, summarized and reported and made known to them by others within the Registrant and by the Registrant’s service provider. |
| (b) | There were no changes in the Registrant's internal control over financial reporting (as defined in Rule 30a-3(d) under the Act) that occurred during the fourth fiscal quarter of the period covered by this report that has materially affected, or is reasonably likely to materially affect, the Registrant's internal control over financial reporting. |
Item 12. Exhibits.
| (a) | (1) Any code of ethics or amendment thereto, that is subject of the disclosure required by Item 2, to the extent that the registrant intends to satisfy Item 2 requirements through filing an exhibit. Furnished herewith. |
(2) Certifications pursuant to Section 302 of the Sarbanes-Oxley Act of 2002. Furnished herewith.
(3) Any written solicitation to purchase securities under Rule 23c‑1 under the Act sent or given during the period covered by the report by or on behalf of the registrant to 10 or more persons. Not applicable to open-end investment companies.
| (b) | Certification pursuant to Section 906 of the Sarbanes‑Oxley Act of 2002. Furnished herewith. |
SIGNATURES
Pursuant to the requirements of the Securities Exchange Act of 1934 and the Investment Company Act of 1940, the Registrant has duly caused this report to be signed on its behalf by the undersigned, thereunto duly authorized.
(Registrant) Brown Advisory Funds
By (Signature and Title)* /s/David M. Churchill
David M. Churchill, Principal Executive Officer
Date September 3, 2016
Pursuant to the requirements of the Securities Exchange Act of 1934 and the Investment Company Act of 1940, this report has been signed below by the following persons on behalf of the Registrant and in the capacities and on the dates indicated.
By (Signature and Title)* /s/David M. Churchill
David M. Churchill, Principal Executive Officer
Date September 3, 2016
By (Signature and Title)* /s/Jason T. Meix
Jason T. Meix, Principal Financial Officer
Date September 2, 2016
* Print the name and title of each signing officer under his or her signature.