UNITED STATES
SECURITIES AND EXCHANGE COMMISSION
Washington, D.C. 20549
FORM N-CSR
CERTIFIED SHAREHOLDER REPORT OF REGISTERED
MANAGEMENT INVESTMENT COMPANIES
Investment Company Act file number: (811-22708)
Brown Advisory Funds
(Exact name of Registrant as specified in charter)
901 South Bond Street Suite 400
Baltimore, MD 21231
(Address of principal executive offices) (Zip code)
David M. Churchill
President
Brown Advisory Funds
901 South Bond Street Suite 400
Baltimore, MD 21231
(Name and address of agent for service)
(410) 537-5400
Registrant's telephone number, including area code
Date of fiscal year end: June 30
Date of reporting period: June 30, 2014
Item 1. Reports to Stockholders.
ANNUAL REPORT
June 30, 2014
Brown Advisory Growth Equity Fund
Brown Advisory Value Equity Fund
Brown Advisory Flexible Equity Fund
Brown Advisory Small-Cap Growth Fund
Brown Advisory Small-Cap Fundamental Value Fund
Brown Advisory Opportunity Fund
Brown Advisory Maryland Bond Fund
Brown Advisory Intermediate Income Fund
Brown Advisory Tactical Bond Fund
Brown Advisory Equity Income Fund
Brown Advisory Sustainable Growth Fund
Brown Advisory Tax Exempt Bond Fund
Brown Advisory – Somerset Emerging Markets Fund
Brown Advisory – WMC Strategic European Equity Fund
Brown Advisory Mortgage Securities Fund
Brown Advisory – WMC Japan Alpha Opportunities Fund
The views in the report contained herein were those of the Funds’ investment adviser, Brown Advisory, LLC, or, for the sub-advised funds, of the respective sub-adviser, as of June 30, 2014 and may not reflect their views on the date this report is first published or anytime thereafter. This report may contain discussions about certain investments both held and not held in the portfolio as of June 30, 2014. All current and future holdings are subject to risk and are subject to change. While these views are intended to assist shareholders in understanding their investment in each Fund, they do not constitute investment advice, are not a guarantee of future performance and are not intended as an offer or solicitation with respect to the purchase or sale of any security. Performance figures include the reinvestment of dividend and capital gain distributions.
The Global Industry Classification Standard (GICS®) was developed by and is the exclusive property of MSCI, Inc. and Standard & Poor’s Financial Services LLC (“S&P”). GICS® is a service mark of MSCI, Inc. and S&P and has been licensed for use by the Administrator, U.S. Bancorp Fund Services, LLC.
TOPIX Index Values and TOPIX Marks are subject to the proprietary rights owned by the Tokyo Stock Exchange, Inc.
TABLE OF CONTENTS
| Brown Advisory Growth Equity Fund | |||
| A Message to our Shareholders, June 30, 2014 | 1 | ||
| Performance Chart and Analysis | 3 | ||
| Schedule of Investments, June 30, 2014 | 4 | ||
| Brown Advisory Value Equity Fund | |||
| A Message to our Shareholders, June 30, 2014 | 5 | ||
| Performance Chart and Analysis | 7 | ||
| Schedule of Investments, June 30, 2014 | 8 | ||
| Brown Advisory Flexible Equity Fund | |||
| A Message to our Shareholders, June 30, 2014 | 9 | ||
| Performance Chart and Analysis | 11 | ||
| Schedule of Investments, June 30, 2014 | 12 | ||
| Brown Advisory Small-Cap Growth Fund | |||
| A Message to our Shareholders, June 30, 2014 | 13 | ||
| Performance Chart and Analysis | 15 | ||
| Schedule of Investments, June 30, 2014 | 16 | ||
| Brown Advisory Small-Cap Fundamental Value Fund | |||
| A Message to our Shareholders, June 30, 2014 | 18 | ||
| Performance Chart and Analysis | 20 | ||
| Schedule of Investments, June 30, 2014 | 21 | ||
| Brown Advisory Opportunity Fund | |||
| A Message to our Shareholders, June 30, 2014 | 22 | ||
| Performance Chart and Analysis | 24 | ||
| Schedule of Investments, June 30, 2014 | 25 | ||
| Brown Advisory Maryland Bond Fund | |||
| A Message to our Shareholders, June 30, 2014 | 27 | ||
| Performance Chart and Analysis | 28 | ||
| Schedule of Investments, June 30, 2014 | 29 | ||
| Brown Advisory Intermediate Income Fund | |||
| A Message to our Shareholders, June 30, 2014 | 34 | ||
| Performance Chart and Analysis | 35 | ||
| Schedule of Investments, June 30, 2014 | 36 | ||
| Brown Advisory Tactical Bond Fund | |||
| A Message to our Shareholders, June 30, 2014 | 38 | ||
| Performance Chart and Analysis | 39 | ||
| Schedule of Investments, June 30, 2014 | 40 | ||
| Brown Advisory Equity Income Fund | |||
| A Message to our Shareholders, June 30, 2014 | 41 | ||
| Performance Chart and Analysis | 43 | ||
| Schedule of Investments, June 30, 2014 | 44 | ||
| Brown Advisory Sustainable Growth Fund | |||
| A Message to our Shareholders, June 30, 2014 | 45 | ||
| Performance Chart and Analysis | 47 | ||
| Schedule of Investments, June 30, 2014 | 48 | ||
| Brown Advisory Tax Exempt Bond Fund | |||
| A Message to our Shareholders, June 30, 2014 | 49 | ||
| Performance Chart and Analysis | 50 | ||
| Schedule of Investments, June 30, 2014 | 51 | ||
| Brown Advisory – Somerset Emerging Markets Fund | |||
| A Message to our Shareholders, June 30, 2014 | 54 | ||
| Performance Chart and Analysis | 56 | ||
| Schedule of Investments, June 30, 2014 | 57 | ||
| Brown Advisory – WMC Strategic European Equity Fund | |||
| A Message to our Shareholders, June 30, 2014 | 59 | ||
| Performance Chart and Analysis | 61 | ||
| Schedule of Investments, June 30, 2014 | 62 | ||
| Brown Advisory Mortgage Securities Fund | |||
| A Message to our Shareholders, June 30, 2014 | 64 | ||
| Performance Chart and Analysis | 65 | ||
| Schedule of Investments, June 30, 2014 | 66 | ||
| Brown Advisory – WMC Japan Alpha Opportunities Fund | |||
| A Message to our Shareholders, June 30, 2014 | 70 | ||
| Performance Chart and Analysis | 72 | ||
| Schedule of Investments, June 30, 2014 | 73 | ||
| Statements of Assets and Liabilities | 77 | ||
| Statements of Operations | 81 | ||
| Statements of Changes in Net Assets | 85 | ||
| Financial Highlights | 93 | ||
| Notes to Financial Statements | 131 | ||
| Report of Independent Registered Public Accounting Firm | 150 | ||
| Additional Information | 151 | ||
GLOSSARY OF TERMS
Alpha refers to the abnormal rate of return on a security or portfolio in excess of what would be predicted by an equilibrium model like the capital asset pricing model (CAPM).
Barclays 1-10 Year Blended Municipal Bond Index is a market index of high quality, domestic fixed income securities with maturities of less than 10 years.
Barclays Intermediate U.S. Aggregate Bond Index represents domestic taxable investment-grade bonds with index components for government and corporate securities, mortgage pass-through securities and asset-backed securities with average maturities and durations in the intermediate range. This index represents a sector of the Barclays Capital U.S. Aggregate Index.
Barclays Mortgage Backed Securities Index is a market value-weighted index which covers the mortgage-backed securities component of the Barclays U.S. Aggregate Bond Index. The index is composed of agency mortgage-backed passthrough securities of the Government National Mortgage Association (Ginnie Mae), the Federal National Mortgage Association (Fannie Mae), and the Federal Home Loan Mortgage Corporation (Freddie Mac) with a minimum $150 million par amount outstanding and a weighted-average maturity of at least 1 year. The index includes reinvestment of income.
Basis point is a unit that is equal to 1/100th of 1%, and is used to denote the change in a financial instrument. The basis point is commonly used for calculating changes in interest rates, equity indexes and the yield of a fixed-income security. 1% is equal to 100 basis points.
Beta is a measure of the volatility, or systematic risk, of a security or a portfolio in comparison to the market as a whole.
Book value is the net asset value of a company, calculated by total assets minus intangible assets (patents, goodwill) and liabilities.
Cash flow measures the cash generating capability of a company by adding non-cash charges (e.g. depreciation) and interest expense to pretax income.
Correlation is a statistical measurement of how two securities move in relation to each other.
Dividend Yield is a financial ratio that shows how much a company pays out in dividends each year relative to its share price. In the absence of any capital gains, the dividend yield is the return on investment for a stock.
Downside Capture is a statistical measure of a fund’s performance in down markets. For example, a fund with downside capture of 90% would only have declined 90% as much as the related index during the same down market period.
Duration is a measure of the sensitivity of the price of a fixed-income investment to a change in interest rates. Duration is expressed as a number of years. Rising interest rates mean falling bond prices, while declining interest rates mean rising bond prices.
Earnings growth is a measure of growth in a company’s net income over a specific period, often one year. The term can apply to actual data from previous periods or estimated data for future periods.
Earnings per share (EPS) is calculated by taking the total earnings divided by the number of shares outstanding.
Earnings Yield is the earnings per share for the most recent 12-month period divided by the current market price per share. The earnings yield shows the percentage of each dollar invested in the stock that was earned by the company.
EBITDA is the Earnings Before Interest, Taxes, Depreciation and Amortization. An approximate measure of a company’s operating cash flow based on data from the company’s income statement.
Enterprise Value (EV) is a measure of a company’s value, often used as an alternative to straightforward market capitalization. Enterprise Value is calculated as market capitalization plus debt, minority interest and preferred shares, minus total cash and cash equivalents.
Forward price to earnings ratio uses forecasted earnings, rather than current earnings, to calculate the price to earnings ratio.
Free Cash Flow is the operating cash flows (net income plus amortization and depreciation) minus capital expenditures and dividends. Free cash flow is the amount of cash that a company has left over after it has paid all of its expenses, including investments.
Gross Domestic Product (GDP) is the monetary value of all the goods and services produced by an economy over a specified period. It includes consumption, government purchases, investments, and exports minus imports.
GLOSSARY OF TERMS
MSCI Emerging Markets Index is a free float-adjusted market capitalization index that is designed to measure equity market performance in the global emerging markets.
MSCI Europe Index is an index that captures large and mid cap representation across 15 developed market countries in Europe.
Price to Book Value Ratio is ratio used to compare a stock’s market value to its book value. It is calculated by dividing the current closing price of the stock by the latest quarter’s book value per share.
Price to earnings ratio (P/E) is a common tool for comparing the prices of different common stocks and is calculated by dividing the current market price of a stock by the earnings per share.
Return of Capital (ROC) is a return from an investment that is not considered income. The return of capital is when some or all of the money an investor has in an investment is paid back to him or her, thus decreasing the value of the investment.
Return on Capital Employed (ROCE) is a financial ratio that measures a company’s profitability and the efficiency with which its capital is employed. Return on Capital Employed (ROCE) is calculated as: ROCE = Earnings Before Interest and Tax (EBIT) / Capital Employed
Return on Equity (ROE) is the amount of net income returned as a percentage of shareholders equity. Return on equity measures a corporation’s profitability by revealing how much profit a company generates with the money shareholders have invested.
Return on Invested Capital (ROIC) is a calculation used to assess a company’s efficiency at allocating the capital under its control to profitable investments. ROIC is typically calculated by taking a company’s net income, subtracting dividends the company paid out and dividing that amount by the company’s total capital.
Russell 1000® Growth Index measures the performance of the large-cap growth segment of the of the U.S. equity universe. It includes those Russell 1000® companies with higher price to book value ratios and higher forecasted growth values.
Russell 1000® Value Index measures the performance of the large-cap value segment of the U.S. equity universe. It includes those Russell 1000® companies with lower price to book value ratios and lower expected growth values.
Russell 2000® Growth Index measures the performance of the small-cap growth segment of the U.S. equity universe. It includes those Russell 2000® companies with higher price to book value ratios and higher forecasted growth values.
Russell 2000® Index measures the performance of the 2,000 smallest companies in the Russell 3000® Index.
Russell 2000® Value Index measures the performance of the small-cap value segment of the U.S. equity universe. It includes those Russell 2000® companies with lower price to book value ratios and lower forecasted growth values.
Russell 3000® Index measures the performance of the 3,000 largest U.S. companies representing approximately 98% of the investable U.S. equity market.
S&P 500 Index (“S&P 500”) is a market-value weighted index representing the performance of 500 widely held, publicly traded large capitalization stocks.
Tier 1 Capital Ratio is a comparison between a banking firm’s core equity capital and total risk-weighted assets. A firm’s core equity capital is known as its Tier 1 capital and is the measure of a bank’s financial strength based on the sum of its equity capital and disclosed reserves, and sometimes non-redeemable, non-cumulative preferred stock. A firm’s risk-weighted assets include all assets that the firm holds that are systematically weighted for credit risk. Central banks typically develop the weighting scale for different asset classes, such as cash and coins, which have zero risk, versus a letter or credit, which carries more risk.
TOPIX Total Return U.S. Dollar Hedged Index is a market capitalization-weighted index of all companies listed on the First Section of the Tokyo Stock Exchange.
Turnover refers to a fund buying or selling securities. (The fund “turns over” its portfolio.) A fund pays transaction costs, such as commissions, when it buys and sells securities. Additionally, a higher turnover rate may result in higher taxes when the fund shares are held in a taxable account.
Yield Curve is a line that plots the yields of securities having equal credit quality but different maturity dates.
The broad based market indexes referenced in the following management commentaries are considered representative of their indicated market, the indexes are unmanaged and do not reflect the deduction of fees, such as, investment management and fund accounting fees, or taxes associated with a mutual fund. Investors cannot invest directly in an index.
A Message to Our Shareholders
June 30, 2014
Dear Shareholder:
Dear Shareholder:
During the year ended June 30, 2014, the Brown Advisory Growth Equity Fund Investor Shares (the “Fund”) returned 18.35%. During the same period, the Fund’s benchmark, the Russell 1000® Growth Index (the “Index”) returned 26.92%.
U.S. stocks marched steadily upward during the year ended June 30, 2014, and many domestic stock indexes were trading at or near all-time highs at the end of the second quarter. We posted strong absolute returns during this period but trailed our benchmark during what was clearly a challenging period for the Fund. A confluence of unrelated factors impacted performance over the course of the fiscal year. Momentum buyers drove sharp returns in several segments of the market such as biotechnology and social media, while many investors were attracted to the slower-growing defensive names at the other end of the risk spectrum. The companies that have exhibited a history of high-quality fast-growing business models that we favor in our strategy were unloved by the market during this period. Additionally, several of our portfolio companies struggled with specific short-term issues during the year, which gave us opportunities to add to our position at what we believe to be attractive prices but nonetheless hampered our 12-month performance.
We try to remind our shareholders of how our long-term investment approach is likely to perform in various market conditions over time. Given our valuation-sensitive, quality-focused approach, these sorts of runaway markets have been a headwind to our strategy in the past, and historically we have generated the bulk of our alpha during more rational periods over the course of full market cycles.
Specifically, our underperformance for the period was the result of two main factors: underexposure to the booming biotech sector, and several short-term issues with Intuitive Surgical and Whole Foods.
We have held Intuitive Surgical for over seven years. Our thesis for the stock is the same today as when we bought it: The company manufactures a minimally invasive robotic surgery system for which there is virtually no competition. In our opinion, the business model offers an extremely attractive long-term growth trajectory in terms of the number of surgical procedures performed using the system. The stock endured several controversies during the year, ranging from false claims about safety to interim sales comparables that did not satisfy analysts’ expectations. In our opinion, much of this controversy was a distraction and narrowly focused on short-term metrics. After a considerable amount of additional due diligence, we concluded that our investment thesis for the company’s business model remains solidly intact. Whole Foods also fell far out of favor with growth investors after reporting several consecutive quarters of disappointing same-store-sales growth. We spent a great deal of time with the company’s management team in an effort to sort through these interim difficulties, and the exercise confirmed our belief that the team is still very much on track in seeking to successfully execute its long-term growth strategy.
Biotechnology stocks turned in blistering performance during the past 12 months, but our investment approach steers us toward sustainable growth business models, and we are inherently wary of stocks whose fates are so closely tied to the binary outcome of clinical trials. Thus, our exposure to this market segment has been through stocks that, in our view, offer a return profile with more limited downside relative to their upside potential. One such name that we added to the portfolio during the year is Gilead Sciences (a biotechnology company that recently received approval for Sovaldi, a new highly effective hepatitis C treatment).
One strong positive contributor was energy-service company Schlumberger, one of our longest-held positions. Over the last several years, the company has endeavored to create a step change in technology within the oil and gas industry, and its progress with this effort along with more recent efficiency initiatives caught the attention of investors. Despite Schlumberger’s size, we believe that it can grow its earnings at a healthy double-digit clip for the foreseeable future.
Although we seek to own companies for the long term, we added several new names to the portfolio and exited several others over the course of the past year. Fastenal is an industrial distribution company we have followed for a number of years while waiting for an attractive entry point. Our patience paid off, as the stock recently traded down from its typical premium valuation on non-fundamental concerns. We funded the purchase of Fastenal by exiting Roper, another industrial company. We also purchased Discovery Communications, a leading provider of cable TV content that reaches its global subscriber base through nearly 200 networks spearheaded by the Discovery Channel, TLC and Animal Planet. The business has historically offered attractive profit margins and has steadily gained market share. In order to fund the purchase of Discovery, we sold our position in NetApp, a data-storage company, as we grew concerned about its long-term growth outlook in the face of the market’s shift toward cloud-based data solutions.
www.brownadvisoryfunds.com
1
Brown Advisory Growth Equity Fund
A Message to Our Shareholders
June 30, 2014
While interim underperformance is unwelcome, it is an inevitable result for a long-term investment program that applies a rigorous investment process consistently. We have strict criteria for the types of business models we include in the portfolio. We haven’t chased returns by buying slower-growing defensive companies that pay high dividends, and we haven’t exposed the portfolio to momentum-driven stocks to chase after short-term market excitement. We are committed to owning a portfolio of high-quality business models that we believe are capable of sustaining above-average growth rates for an extended period. These companies may or may not be in favor in a given year, but we believe that their results over time will speak for themselves.
While interim underperformance is unwelcome, it is an inevitable result for a long-term investment program that applies a rigorous investment process consistently. We have strict criteria for the types of business models we include in the portfolio. We haven’t chased returns by buying slower-growing defensive companies that pay high dividends, and we haven’t exposed the portfolio to momentum-driven stocks to chase after short-term market excitement. We are committed to owning a portfolio of high-quality business models that we believe are capable of sustaining above-average growth rates for an extended period. These companies may or may not be in favor in a given year, but we believe that their results over time will speak for themselves.
Sincerely,
Kenneth M. Stuzin, CFA
Portfolio Manager
Past performance is not a guarantee of future results.
Mutual fund investing involves risk. Principal loss is possible. Investments in smaller and medium capitalization companies generally carry greater risk than is customarily associated with larger companies for various reasons such as narrower markets, limited financial resources and less liquid stock. The value of the Fund’s investments in REITs may change in response to changes in the real estate market such as declines in the value of real estate, lack of available capital or financing opportunities, and increases in property taxes or operating costs. Investments in foreign securities entail certain risks not associated with investments in domestic securities, such as volatility of currency exchange rates, and in some cases, political and economic instability and relatively illiquid markets. The Fund may invest in ETFs, which may trade at a discount to the aggregate value of the underlying securities and although expense ratios for ETFs are generally low, frequent trading of ETFs by the Fund can generate brokerage expenses. Earnings growth is not a measure of the Fund’s future performance.
Fund holdings and sector allocations are subject to change and should not be considered a recommendation to buy or sell any security. For a complete list of fund holdings, please refer to the Schedule of Investments provided in this report.
Definitions for terms and indices are provided in the Glossary of Terms.
www.brownadvisoryfunds.com
2
Brown Advisory Growth Equity Fund
Performance Chart and Analysis
June 30, 2014
COMPARISON OF CHANGE IN VALUE OF A $10,000 INVESTMENT
COMPARISON OF CHANGE IN VALUE OF A $10,000 INVESTMENT
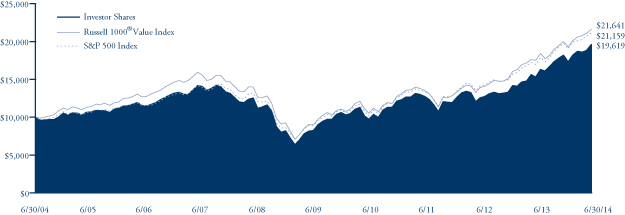
The following chart reflects the change in value of a hypothetical $10,000 investment, including reinvested dividends and distributions, in the Fund as measured against broad-based securities market indices. The Russell 1000® Growth Index measures the performance of the large-cap growth segment of the U.S. equity universe. It includes those Russell 1000® companies with higher price to book and higher forecasted growth values. The S&P 500 Index is a market-value weighted index representing the performance of 500 widely held, publicly traded large capitalization stocks. The indexes are unmanaged and do not reflect the deduction of fees, such as investment management fees. Investors cannot invest directly in an index.

| Average Annual Total Return | One | Five | Ten |
| as of 6/30/14 | Year | Year | Year |
Institutional Shares1 | 18.46% | 19.12% | 8.90% |
| Investor Shares | 18.35% | 18.95% | 8.74% |
Advisor Shares2 | 18.02% | 18.58% | 8.36% |
Russell 1000® Growth Index | 26.92% | 19.24% | 8.20% |
| S&P 500 Index | 24.61% | 18.83% | 7.78% |
| Institutional Shares | Investor Shares | Advisor Shares | |
Gross Expense Ratio3 | 0.78% | 0.93% | 1.18% |
Net Expense Ratio3 | 0.78% | 0.93% | 1.18% |
Past performance does not guarantee future results. The performance data quoted represents past performance and current returns may be lower or higher. The investment return and net asset value will fluctuate so that an investor’s shares, when redeemed, may be worth more or less than the original cost. To obtain performance information current to the most recent month end, please visit our website at brownadvisoryfunds.com/performance.html. The performance table and graph above do not reflect the deduction of taxes that a shareholder would pay on Fund distributions or the redemption of Fund shares. Investment performance reflects periods during which fee waivers were in effect. In the absence of such waivers, total return would have been reduced. Performance data does not reflect the imposition of the redemption fee of 1.00% on shares redeemed within 14 days, and if it did, performance would have been lower.
| 1 | Performance information for the Institutional Shares, prior to commencement of operations on October 19, 2012, is based on the performance of Investor Shares, and adjusted for the lower expenses applicable to Institutional Shares. |
| 2 | Performance information for Advisor Shares, prior to commencement of operations on May 18, 2006, is based on the performance of Investor Shares, and adjusted for the higher expenses applicable to Advisor Shares. |
| 3 | Per the Fund’s prospectus dated October 31, 2013. |
www.brownadvisoryfunds.com
3
Brown Advisory Growth Equity Fund
Schedule of Investments
June 30, 2014
| Shares | Security Description | Value $ | |||||
| Common Stocks — 97.5% | |||||||
| Consumer Discretionary — 7.4% | |||||||
| 791,577 | Discovery Communications, Inc.* | 58,798,339 | |||||
| 431,903 | Fossil Group, Inc.* | 45,142,502 | |||||
| 1,327,989 | Starbucks Corp. | 102,759,789 | |||||
| 206,700,630 | |||||||
| Consumer Staples — 12.1% | |||||||
| 520,845 | Costco Wholesale Corp. | 59,980,510 | |||||
| 1,218,278 | Estee Lauder Companies, Inc. | 90,469,324 | |||||
| 1,106,613 | Mead Johnson Nutrition Co. | 103,103,133 | |||||
| 2,146,838 | Whole Foods Market, Inc. | 82,932,352 | |||||
| 336,485,319 | |||||||
| Energy — 11.3% | |||||||
| 534,512 | Core Laboratories NV | 89,295,575 | |||||
| 1,623,559 | FMC Technologies, Inc.* | 99,150,748 | |||||
| 1,066,703 | Schlumberger NV | 125,817,619 | |||||
| 314,263,942 | |||||||
| Financials — 4.3% | |||||||
| 4,382,691 | Charles Schwab Corp. | 118,025,869 | |||||
| Health Care — 16.1% | |||||||
| 704,931 | Covance, Inc.* | 60,327,995 | |||||
| 1,129,801 | DaVita HealthCare Partners, Inc.* | 81,707,208 | |||||
| 1,648,806 | Express Scripts Holding Co.* | 114,311,720 | |||||
| 1,208,427 | Gilead Sciences, Inc.* | 100,190,683 | |||||
| 223,120 | Intuitive Surgical, Inc.* | 91,880,816 | |||||
| 448,418,422 | |||||||
| Industrials — 11.4% | |||||||
| 1,238,543 | Danaher Corp. | 97,510,491 | |||||
| 1,190,574 | Fastenal Co. | 58,921,507 | |||||
| 1,009,779 | Fluor Corp. | 77,652,005 | |||||
| 687,077 | Stericycle, Inc.* | 81,363,658 | |||||
| 315,447,661 | |||||||
| Information Technology — 31.6% | |||||||
| 821,427 | Accenture PLC | 66,404,159 | |||||
| 913,038 | Amphenol Corp. | 87,962,081 | |||||
| 542,990 | ANSYS, Inc.* | 41,169,502 | |||||
| 1,080,653 | Apple, Inc. | 100,425,083 | |||||
| 1,037,289 | Cognizant Technology Solutions Corp.* | 50,733,805 | |||||
| 3,296,529 | Genpact, Ltd.* | 57,788,153 | |||||
| 106,217 | Google, Inc. — Class A* | 62,101,893 | |||||
| 106,217 | Google, Inc. — Class C* | 61,104,516 | |||||
| 1,469,552 | National Instruments Corp. | 47,598,789 | |||||
| 1,452,962 | QUALCOMM, Inc. | 115,074,590 | |||||
| 1,402,134 | Salesforce.com, Inc.* | 81,435,943 | |||||
| 505,133 | Visa, Inc. | 106,436,575 | |||||
| 878,235,089 | |||||||
| Materials — 3.3% | |||||||
| 825,936 | Ecolab, Inc. | 91,959,714 | % | ||||
| Total Common Stocks (Cost $2,082,555,223) | 2,709,536,646 | ||||||
| Short-Term Investments — 2.8% | |||||||
| Money Market Funds — 2.8% | |||||||
| 78,492,937 | DWS Cash Account Trust — Government | ||||||
| & Agency Securities Portfolio, 0.03%# | 78,492,937 | ||||||
| Total Short-Term Investments (Cost $78,492,937) | 78,492,937 | ||||||
| Total Investments — 100.3% (Cost $2,161,048,160) | 2,788,029,583 | ||||||
| Liabilities in Excess of Other Assets — (0.3)% | (8,734,029 | ) | |||||
| NET ASSETS — 100.0% | $ | 2,779,295,554 | |||||
| PORTFOLIO HOLDINGS | |||||||
| % of Net Assets | |||||||
| Information Technology | 31.6 | % | |||||
| Health Care | 16.1 | % | |||||
| Consumer Staples | 12.1 | % | |||||
| Industrials | 11.4 | % | |||||
| Energy | 11.3 | % | |||||
| Consumer Discretionary | 7.4 | % | |||||
| Financials | 4.3 | % | |||||
| Materials | 3.3 | % | |||||
| Money Market Funds | 2.8 | % | |||||
| Other Assets and Liabilities | (0.3 | )% | |||||
| 100.0 | % | ||||||
| * | Non-Income Producing |
| # | Annualized seven-day yield as of June 30, 2014. |
The accompanying notes are an integral part of these financial statements.
www.brownadvisoryfunds.com
4
Brown Advisory Value Equity Fund
A Message to Our Shareholders
June 30, 2014
Dear Shareholder:
During the year ended June 30, 2014, the Brown Advisory Value Equity Fund Investor Shares (the “Fund”) increased 28.26 % in value. During the same period, the Russell 1000® Value Index (the “Index”), the Fund’s benchmark, increased 23.81%.
For the year ended June 30, 2014, the portfolio gained ground, in varying degrees, in all sectors vs. its benchmark. Several factors supported our performance over the past year. First, investors paid a huge premium for perceived safety in utilities and other purely defensive names in the past few years, but more recently we believe that they began to see that economic conditions were relatively healthy, especially in the U.S. Our pro-cyclical orientation has benefited from this, as we have little to no exposure in defensive areas such as consumer staples, telecom and utilities. Second, we have benefited from favorable stock selection within most sectors, and in particular within the energy space; and while our technology selections lagged those of the benchmark, we still earned strong absolute returns from technology that helped our overall performance.
Leading contributors to performance during the period included Schlumberger, Apple, Canadian Natural Resources, Best Buy and Garmin. The new CEO at Schlumberger is committed to innovation, productivity, returns on capital and better capital deployment, and his initiatives have produced very encouraging early results. Apple’s stock has recovered considerably from recent lows thanks to solid financial returns, a focus on shareholder value, and investor optimism regarding its product pipeline.
Performance detractors included Abercrombie and Fitch, Guess?, Coach, Ensco and JP Morgan. Retailing conditions remain difficult, and teen retail has been particularly challenging; we elected to sell Abercrombie upon concluding that its recovery plan would fall short of what we initially expected. In contrast, we still hold Guess?, and we added Coach to the portfolio after a string of disappointing quarters have greatly lowered investors’ expectations for this leading luxury goods maker.
Our new idea pipeline has been consistently strong throughout the trailing 12 months, with new portfolio names coming from a variety of market segments. New investments included Baxter International, a leading healthcare company; City National, a high-quality regional bank; Coach, a global luxury goods franchise; Ensco plc, a high-quality offshore rig company; Gamestop, the world’s leading video game retailer; Garmin Ltd, a GPS-focused technology products firm; Joy Global, a leading mining equipment provider; JP Morgan, a well-known global bank; Potash Corp, a key producer of nitrogen, phosphate and potash for agricultural markets; and Teva Pharmaceutical, a global leader in generic drugs.
Most of our sales over the past year were from investments that reached our price targets or offered us less appealing prospects than the new ideas listed above. Positions sold during the period included Carbo Ceramics, Cimarex Energy, Deckers Outdoors, DuPont, Eaton, Fluor, Metlife, PNC Financial and Terex. In the cases of Abercrombie & Fitch and FirstMerit, we sold our positions due to a breakdown in our investment thesis.
We believe that the Fund is well positioned for the year ahead. Notably, a large portion of our portfolio companies, in our view, are “under-earning” right now compared to their historic potential; in other words, we believe that they have plenty of room to expand their margins, during a period when many companies appear to be at peak margin levels. Another meaningful portion of the portfolio includes companies whose business franchise strength supports reliable high free cash flows. Collectively, we believe that our companies compare favorably to those of the benchmark. Our portfolio, in our view, is more global, has higher financial quality, is more Research and Development (R&D) focused, generates higher free cash flows and consists of companies that offer a competitive dividend yield, yet overall our portfolio trades at a meaningful discount to the benchmark. We have relied on this approach for many years and believe that it has the potential to produce attractive returns going forward.
Sincerely,
Richard Bernstein, CFA
Portfolio Manager
www.brownadvisoryfunds.com
5
Brown Advisory Value Equity Fund
A Message to Our Shareholders
June 30, 2014
Past performance is not a guarantee of future results.
Mutual fund investing involves risk. Principal loss is possible. Investments in medium capitalization companies generally carry greater risk than is customarily associated with larger companies for various reasons such as narrower markets, limited financial resources and less liquid stock. The value of the Fund’s investments in REITs may change in response to changes in the real estate market such as declines in the value of real estate, lack of available capital or financing opportunities, and increases in property taxes or operating costs. The Fund may invest in ETFs, which may trade at a discount to the aggregate value of the underlying securities and although expense ratios for ETFs are generally low, frequent trading of ETFs by the Fund can generate brokerage expenses. Investments in foreign securities entail certain risks not associated with investments in domestic securities, such as volatility of currency exchange rates, and in some cases, political and economic instability and relatively illiquid markets. These risks are greater for investments in emerging markets. Diversification does not guarantee a profit or protect from loss in a declining market.
Fund holdings and sector allocations are subject to change and should not be considered a recommendation to buy or sell any security. For a complete list of fund holdings, please refer to the Schedule of Investments provided in this report.
Definitions for terms and indices are provided in the Glossary on Terms.
www.brownadvisoryfunds.com
6
Brown Advisory Value Equity Fund
Performance Chart and Analysis
June 30, 2014
COMPARISON OF CHANGE IN VALUE OF A $10,000 INVESTMENT
The following chart reflects the change in value of a hypothetical $10,000 investment, including reinvested dividends and distributions, in the Fund as measured against broad-based securities market indices. The Russell 1000® Value Index measures the performance of the large-cap value segment of the U.S. equity universe. It includes those Russell 1000® companies with lower price to book ratios and lower expected growth values. The S&P 500 Index is a market-value weighted index representing the performance of 500 widely held, publicly traded large capitalization stocks. The indexes are unmanaged and do not reflect the deduction of fees, such as investment management fees. Investors cannot invest directly in an index.
| Average Annual Total Return | One | Five | Ten |
| as of 6/30/14 | Year | Year | Year |
Institutional Shares1 | 28.41% | 19.14% | 7.13% |
| Investor Shares | 28.26% | 18.98% | 6.97% |
Advisor Shares2 | 27.90% | 18.62% | 6.57% |
Russell 1000® Value Index | 23.81% | 19.23% | 8.03% |
| S&P 500 Index | 24.61% | 18.83% | 7.78% |
| Institutional Shares | Investor Shares | Advisor Shares | |
Gross Expense Ratio3 | 0.82% | 0.97% | 1.22% |
Net Expense Ratio3 | 0.82% | 0.97% | 1.22% |
Past performance does not guarantee future results. The performance data quoted represents past performance and current returns may be lower or higher. The investment return and net asset value will fluctuate so that an investor’s shares, when redeemed, may be worth more or less than the original cost. To obtain performance information current to the most recent month end, please visit our website at brownadvisoryfunds.com/performance.html. The performance table and graph above do not reflect the deduction of taxes that a shareholder would pay on Fund distributions or the redemption of Fund shares. Investment performance reflects periods during which fee waivers were in effect. In the absence of such waivers, total return would have been reduced. Performance data does not reflect the imposition of the redemption fee of 1.00% on shares redeemed within 14 days, and if it did, performance would have been lower.
| 1 | Performance information for the Institutional Shares, prior to commencement of operations on October 19, 2012, is based on the performance of Investor Shares, and adjusted for the lower expenses applicable to Institutional Shares. |
| 2 | Performance information for Advisor Shares, prior to commencement of operations on April 25, 2006, is based on the performance of Investor Shares, and adjusted for the higher expenses applicable to Advisor Shares. |
| 3 | Per the Fund’s prospectus dated October 31, 2013. |
www.brownadvisoryfunds.com
7
Brown Advisory Value Equity Fund
Schedule of Investments
June 30, 2014
| Shares | Security Description | Value $ | |||||
| Common Stocks — 96.0% | |||||||
| Consumer Discretionary — 11.5% | |||||||
| 239,895 | Best Buy, Inc. | 7,439,144 | |||||
| 102,175 | Coach, Inc. | 3,493,363 | |||||
| 129,079 | GameStop Corp. | 5,223,827 | |||||
| 106,785 | Garmin, Ltd. | 6,503,207 | |||||
| 193,088 | Guess?, Inc. | 5,213,376 | |||||
| 27,872,917 | |||||||
| Energy — 16.1% | |||||||
| 168,546 | Canadian Natural Resources, Ltd. | 7,737,947 | |||||
| 129,020 | ENSCO PLC | 7,169,641 | |||||
| 80,806 | National Oilwell Varco, Inc. | 6,654,374 | |||||
| 68,341 | Occidental Petroleum Corp. | 7,013,837 | |||||
| 90,760 | Schlumberger NV | 10,705,142 | |||||
| 39,280,941 | |||||||
| Financials — 22.6% | |||||||
| 283,078 | Charles Schwab Corp. | 7,623,290 | |||||
| 89,010 | City National Corp. | 6,743,398 | |||||
| 143,745 | Hartford Financial Services Group, Inc. | 5,147,508 | |||||
| 116,105 | JPMorgan Chase & Co. | 6,689,970 | |||||
| 45,273 | M&T Bank Corp. | 5,616,116 | |||||
| 113,825 | Northern Trust Corp. | 7,308,703 | |||||
| 695,701 | Regions Financial Corp. | 7,388,345 | |||||
| 208,301 | SunTrust Banks, Inc. | 8,344,538 | |||||
| 54,861,868 | |||||||
| Health Care — 11.9% | |||||||
| 80,910 | Baxter International, Inc. | 5,849,793 | |||||
| 234,340 | Hologic, Inc.* | 5,940,519 | |||||
| 84,550 | Merck & Co., Inc. | 4,891,218 | |||||
| 59,680 | Novartis AG ADR | 5,402,830 | |||||
| 130,420 | Teva Pharmaceutical Industries, Ltd. ADR | 6,836,616 | |||||
| 28,920,976 | |||||||
| Industrials — 7.2% | |||||||
| 102,460 | Joy Global, Inc. | 6,309,487 | |||||
| 135,983 | Kennametal, Inc. | 6,293,293 | |||||
| 78,757 | PACCAR, Inc. | 4,948,302 | |||||
| 17,551,082 | |||||||
| Information Technology — 20.5% | |||||||
| 112,210 | Apple, Inc. | 10,427,675 | |||||
| 56,465 | Check Point Software Technologies, Ltd.* | 3,784,849 | |||||
| 340,535 | Cisco Systems, Inc. | 8,462,295 | |||||
| 71,970 | Microchip Technology, Inc. | 3,512,856 | |||||
| 108,245 | Microsoft Corp. | 4,513,817 | |||||
| 173,275 | NetApp, Inc. | 6,328,003 | |||||
| 117,197 | Oracle Corp. | 4,749,994 | |||||
| 102,395 | QUALCOMM, Inc. | 8,109,684 | |||||
| 49,889,173 | |||||||
| Materials — 6.2% | |||||||
| 202,155 | Freeport-McMoRan Copper & Gold, Inc. | 7,378,658 | |||||
| 205,670 | Potash Corp. of Saskatchewan, Inc. | 7,807,233 | |||||
| 15,185,891 | |||||||
| Total Common Stocks (Cost $177,395,841) | 233,562,848 | ||||||
| Short-Term Investments — 3.9% | |||||||
| Money Market Funds — 3.9% | |||||||
| 9,433,414 | DWS Cash Account Trust — Government | ||||||
| & Agency Securities Portfolio, 0.03%# | 9,433,414 | ||||||
| Total Short-Term Investments (Cost $9,433,414) | 9,433,414 | ||||||
| Total Investments — 99.9% (Cost $186,829,255) | 242,996,262 | ||||||
| Other Assets in Excess of Liabilities — 0.1% | 319,421 | ||||||
| NET ASSETS — 100.0% | $ | 243,315,683 | |||||
| PORTFOLIO HOLDINGS | |||||||
| % of Net Assets | |||||||
| Financials | 22.6 | % | |||||
| Information Technology | 20.5 | % | |||||
| Energy | 16.1 | % | |||||
| Health Care | 11.9 | % | |||||
| Consumer Discretionary | 11.5 | % | |||||
| Industrials | 7.2 | % | |||||
| Materials | 6.2 | % | |||||
| Money Market Funds | 3.9 | % | |||||
| Other Assets and Liabilities | 0.1 | % | |||||
| 100.0 | % | ||||||
ADR — American Depositary Receipt
| * | Non-Income Producing |
| # | Annualized seven-day yield as of June 30, 2014. |
The accompanying notes are an integral part of these financial statements.
www.brownadvisoryfunds.com
8
Brown Advisory Flexible Equity Fund
A Message to Our Shareholders
June 30, 2014
Dear Shareholder:
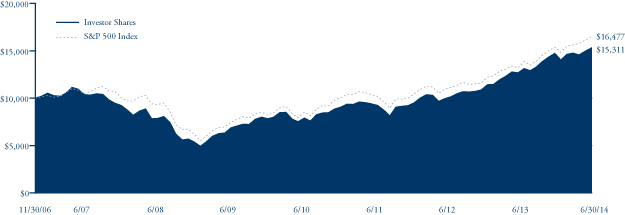
During the year ended June 30, 2014, the Brown Advisory Flexible Equity Fund Investor Shares (the “Fund”) returned 20.78%. The S&P 500 Index (the “Index”), the Fund’s benchmark, returned 24.61% during the same period. The Fund outperformed the Index for the trailing three- and five-year periods ending June 30, 2014 with annualized returns of 17.74% and 19.37% compared to the benchmark returns of 16.58% and 18.83% for the same periods, respectively. Since inception on November 30, 2006, the Fund returned 5.78% vs. the Index’s return of 6.81%. The Fund’s gross expense ratio, per the prospectus dated October 31, 2013, is 1.04%.
Performance data quoted represents past performance and is no guarantee of future results. Performance for periods greater than one year is annualized. Current performance may be lower or higher than the performance data quoted. Investment return and principal value will fluctuate so that an investor’s shares, when redeemed, may be worth more or less than original cost. Shares redeemed or exchanged within 14 days of purchase will be charged a 1.00% fee. Performance data quoted does not reflect the redemption or exchange fee. If reflected, total returns would be reduced. For the most recent month- end performance, please call 1-800-540-6807.
Five-year annualized returns of 18% to 19% are well out of the ordinary; the trailing five-year period began during a post-financial-crisis historical low point for equity markets. The long-term average earnings growth for S&P 500 Index companies is about 7%; when factoring in current dividend yields of approximately 2% for those companies, we might more reasonably expect lower annualized returns going forward. Of course, the concept of annualizing returns suggests a steadiness in returns from year to year, when in fact the opposite is closer to the truth. Economic and business progress is uneven, and investor sentiment is even more uneven, so stock index prices tend to vary widely from one period to the next.
Additionally, active investment strategies have inherent biases based on the types of stocks they favor. For example, we favor businesses with differentiated offerings or with a history of more dependable recurring revenues vs. revenues that fluctuate with commodity prices or economic cycles. We try to avoid areas of the market that are overheating thanks to a boom mentality and instead focus on what we consider to be outstanding businesses that we can own over a long period of time. Obviously, this approach might excel in certain short-term periods but lag the market during periods when performance is dominated by a hot market trend. If you really get to know your manager’s approach and tendencies, you can better prepare yourself for the inevitable periods of short-term underperformance that can occur on the way to potentially good long-term results.
The biggest contributors to the Fund’s results during the year were Google, Apple, MasterCard, United Rentals and Canadian National Railway. With the exception of United Rentals, all of the top performers are multiyear holdings in the fund. The most significant detractors to the Fund’s performance were Kinder Morgan, Kraft Foods and eBay. We added to Kinder Morgan, another long-term holding in the Fund, on short-term price weakness, while we eliminated Kraft after it separated from Mondelez and subsequently advanced to what we viewed as an expensive valuation relative to its likely future growth. eBay’s share price dipped a bit with the disclosure of a security breach in its systems, but we do not anticipate that the event will have a long-term impact on its healthy, growing e-commerce and PayPal businesses.
Recent new holdings include Copa Holdings, National Oilwell Varco, Now Inc. and Teva Pharmaceutical. The airline industry is notorious for intense price competition, high capital intensity, and unpredictable costs and passenger demand, but Copa has distinguished itself despite these obstacles to produce good results for shareholders. Similarly to eBay, oil-and-gas equipment firm National Oilwell Varco’s stock price has lagged the company’s earnings progress. We believe that the stock has the potential to be better appreciated by the market in time. Management appears focused on building value for shareholders with good capital allocation decisions, such as the spinoff of its distribution business, Now Inc. Teva is facing generic competition for Copaxone, a key multiple sclerosis drug whose patent is set to expire. The stock is trading at what we view as a low multiple, and we believe that the company and its new CEO are focused on the right things to potentially minimize the profit impact of the loss of Copaxone sales.
We sold Aaron’s, Bed, Bath & Beyond, Rogers Communications and Southwestern Energy during the period covered in this report, all based on revised assessments of their long-term business prospects.
In early May, we attended the Berkshire Hathaway Annual Meeting, as we have for many years, to hear the comments of Warren Buffett and Charlie Munger. Berkshire Hathaway is a sizable long-term holding in the fund. Our notes from this year’s meeting will be available for a time at brownadvisory.com, and afterward upon request. We encourage you to read them for the business and investment wisdom shared by Mr. Buffett and Mr. Munger.
www.brownadvisoryfunds.com
9
Brown Advisory Flexible Equity Fund
A Message to Our Shareholders
June 30, 2014
As a reminder of our approach, we look for bargains among long-term attractive businesses with shareholder-oriented managers. These bargains can arise due to short-term investor perceptions, temporary business difficulties that should improve, or as-yet undiscovered opportunities and unrecognized changes for the better. We remain optimistic about the long-term outlook for equities of good companies purchased at reasonable prices and our ability to find them.
Sincerely,
R. Hutchings Vernon
Portfolio Manager
Michael L. Foss
Portfolio Manager
Past performance is not a guarantee of future results.
Mutual fund investing involves risk. Principal loss is possible. The Flexible Equity Fund may invest in securities of foreign issuers. Investments in such securities entail certain risks not associated with investments in domestic securities, such as volatility of currency exchange rates, and in some cases, political and economic instability and relatively illiquid markets. These risks are greater for investments in emerging markets. The value of the Fund’s investments in REITs may change in response to changes in the real estate market such as declines in the value of real estate, lack of available capital or financing opportunities, and increases in property taxes or operating costs. The Fund may invest in ETFs, which may trade at a discount to the aggregate value of the underlying securities and although expense ratios for ETFs are generally low, frequent trading of ETFs by the Fund can generate brokerage expenses. Investments in smaller companies generally carry greater risk than is customarily associated with larger companies for various reasons such as narrower markets, limited financial resources and less liquid stock. Investments in debt securities typically decrease in value when interest rates rise. This risk is usually greater for longer term debt securities. Investments in lower-rated and non-rated securities present a greater risk of loss to principal and interest than higher-rated securities.
Stocks are generally perceived to have more financial risk than bonds in that bond holders have a claim on firm operations or assets that is senior to that of equity holders. In addition, stock prices are generally more volatile than bond prices. Investments in debt securities typically decrease in value when interest rates rise. This risk is usually greater for longer-term debt securities. A stock may trade with more or less liquidity than a bond depending on the number of shares and bonds outstanding, the size of the company, and the demand for the securities. Similarly, the transaction costs involved in trading a stock may be more or less than a particular bond depending on the factors mentioned above and whether the stock or bond trades upon an exchange. Depending on the entity issuing the bond, it may or may or may not afford additional protections to the investor, such as a guarantee of return of principal by a government or bond insurance company. There is typically no guarantee of any kind associated with the purchase of an individual stock. Bonds are often owned by individuals interested in current income while stocks are generally owned by individuals seeking price appreciation with income a secondary concern. The tax treatment of returns of bonds and stocks also differs given differential tax treatment of income versus capital gain.
Fund holdings and sector allocations are subject to change and should not be considered a recommendation to buy or sell any security. For a complete list of fund holdings, please refer to the Schedule of Investments provided in this report.
Definitions for terms and indices are provided in the Glossary of Terms.
www.brownadvisoryfunds.com
10
Brown Advisory Flexible Equity Fund
Performance Chart and Analysis
June 30, 2014
COMPARISON OF CHANGE IN VALUE OF A $10,000 INVESTMENT
The following chart reflects the change in value of a hypothetical $10,000 investment, including reinvested dividends and distributions, in the Fund as measured against the broad-based securities market index. The S&P 500 (“Index”) is a market-value weighted index representing the performance of 500 widely held, publicly traded large capitalization stocks. The Index is unmanaged and does not reflect the deduction of fees, such as investment management fees. Investors cannot invest directly in an index.
| Since | |||
| Average Annual Total Return | One | Five | Inception |
| as of 6/30/14 | Year | Year | (11/30/06) |
Institutional Shares1 | 21.06% | 19.56% | 5.94% |
| Investor Shares | 20.78% | 19.37% | 5.78% |
Advisor Shares2 | 20.52% | 19.10% | 5.49% |
| S&P 500 Index | 24.61% | 18.83% | 6.81% |
| Institutional Shares | Investor Shares | Advisor Shares | |
Gross Expense Ratio3 | 0.89% | 1.04% | 1.29% |
Net Expense Ratio3 | 0.89% | 1.04% | 1.29% |
Past performance does not guarantee future results. The performance data quoted represents past performance and current returns may be lower or higher. The investment return and net asset value will fluctuate so that an investor’s shares, when redeemed, may be worth more or less than the original cost. To obtain performance information current to the most recent month end, please visit our website at brownadvisoryfunds.com/performance.html. The performance table and graph above do not reflect the deduction of taxes that a shareholder would pay on Fund distributions or the redemption of Fund shares. Investment performance reflects periods during which fee waivers were in effect. In the absence of such waivers, total return would have been reduced. Performance data does not reflect the imposition of the redemption fee of 1.00% on shares redeemed within 14 days, and if it did, performance would have been lower.
| 1 | Performance information for the Institutional Shares, prior to commencement of operations on October 19, 2012, is based on the performance of Investor Shares, and adjusted for the lower expenses applicable to Institutional Shares. |
| 2 | Performance information for Advisor Shares, prior to commencement of operations on January 24, 2007, is based on the performance of Investor Shares, and adjusted for the higher expenses applicable to Advisor Shares. |
| 3 | Per the Fund’s prospectus dated October 31, 2013. |
www.brownadvisoryfunds.com
11
Brown Advisory Flexible Equity Fund
Schedule of Investments
June 30, 2014
| Shares | Security Description | Value $ | |||||
| Common Stocks — 93.0% | |||||||
| Consumer Discretionary — 14.4% | |||||||
| 194,936 | Best Buy, Inc. | 6,044,965 | |||||
| 73,715 | CarMax, Inc.* | 3,833,917 | |||||
| 54,641 | General Motors Co. | 1,983,468 | |||||
| 77,961 | Lowe’s Companies, Inc. | 3,741,349 | |||||
| 16,445 | Time Warner Cable, Inc. | 2,422,349 | |||||
| 55,101 | TJX Companies, Inc. | 2,928,618 | |||||
| 59,557 | Walt Disney Co. | 5,106,417 | |||||
| 26,061,083 | |||||||
| Consumer Staples — 2.2% | |||||||
| 45,842 | Mondelez International, Inc. | 1,724,118 | |||||
| 25,197 | PepsiCo, Inc. | 2,251,100 | |||||
| 3,975,218 | |||||||
| Energy — 8.6% | |||||||
| 154,643 | Kinder Morgan, Inc. | 5,607,355 | |||||
| 52,112 | National Oilwell Varco, Inc. | 4,291,423 | |||||
| 54,263 | Occidental Petroleum Corp. | 5,569,012 | |||||
| 15,467,790 | |||||||
| Financials — 20.0% | |||||||
| 31,215 | American Express Co. | 2,961,367 | |||||
| 103,815 | Bank of America Corp. | 1,595,636 | |||||
| 58,884 | Berkshire Hathaway, Inc.* | 7,452,359 | |||||
| 156,602 | Charles Schwab Corp. | 4,217,292 | |||||
| 18,377 | CME Group, Inc. | 1,303,848 | |||||
| 54,606 | Franklin Resources, Inc. | 3,158,411 | |||||
| 72,977 | JPMorgan Chase & Co. | 4,204,935 | |||||
| 230,019 | Regions Financial Corp. | 2,442,802 | |||||
| 14,521 | T. Rowe Price Group, Inc. | 1,225,717 | |||||
| 143,069 | Wells Fargo Co. | 7,519,707 | |||||
| 36,082,074 | |||||||
| Health Care — 11.2% | |||||||
| 45,242 | Edwards Lifesciences Corp.* | 3,883,573 | |||||
| 88,354 | Express Scripts Holding Co.* | 6,125,583 | |||||
| 31,545 | Merck & Co., Inc. | 1,824,878 | |||||
| 76,735 | Teva Pharmaceutical Industries, Ltd. ADR | 4,022,449 | |||||
| 40,443 | Wellpoint, Inc. | 4,352,071 | |||||
| 20,208,554 | |||||||
| Industrials — 11.7% | |||||||
| 96,384 | Canadian National Railway Co. | 6,266,888 | |||||
| 10,636 | Canadian Pacific Railway, Ltd. | 1,926,605 | |||||
| 21,328 | Copa Holdings S.A. | 3,040,733 | |||||
| 12,940 | NOW, Inc.* | 468,557 | |||||
| 73,556 | Owens Corning | 2,845,146 | |||||
| 30,038 | United Rentals, Inc.* | 3,145,880 | |||||
| 30,669 | United Technologies Corp. | 3,540,736 | |||||
| 21,234,545 | |||||||
| Information Technology — 23.6% | |||||||
| 45,969 | Accenture PLC | 3,716,134 | |||||
| 51,170 | Apple, Inc. | 4,755,228 | |||||
| 54,083 | eBay, Inc.* | 2,707,395 | |||||
| 6,554 | Google, Inc. Class A* | 3,831,927 | % | ||||
| 7,199 | Google, Inc. Class C* | 4,141,441 | |||||
| 12,504 | International Business Machines Corp. | 2,266,600 | |||||
| 78,110 | Mastercard, Inc. | 5,738,742 | |||||
| 100,319 | Microsoft Corp. | 4,183,302 | |||||
| 49,324 | QUALCOMM, Inc. | 3,906,461 | |||||
| 34,818 | Visa, Inc. | 7,336,501 | |||||
| 42,583,731 | |||||||
| Telecommunication Services — 1.3% | |||||||
| 31,030 | Crown Castle International Corp. | 2,304,288 | |||||
| Total Common Stocks (Cost $127,290,186) | 167,917,283 | ||||||
| Warrants — 0.3% | |||||||
| 40,000 | Kinder Morgan, Inc.* | 111,200 | |||||
| 20,000 | Wells Fargo Co.* | 428,800 | |||||
| Total Warrants (Cost $330,001) | 540,000 | ||||||
| Short-Term Investments — 5.6% | |||||||
| Money Market Funds — 5.6% | |||||||
| 10,090,890 | DWS Cash Account Trust — Government | ||||||
| & Agency Securities Portfolio, 0.03%# | 10,090,890 | ||||||
| Total Short-Term Investments (Cost $10,090,890) | 10,090,890 | ||||||
| Total Investments — 98.9% (Cost $137,711,077) | 178,548,173 | ||||||
| Other Assets in Excess of Liabilities — 1.1% | 2,024,085 | ||||||
| NET ASSETS — 100.0% | $ | 180,572,258 | |||||
| PORTFOLIO HOLDINGS | |||||||
| % of Net Assets | |||||||
| Information Technology | 23.6 | % | |||||
| Financials | 20.0 | % | |||||
| Consumer Discretionary | 14.4 | % | |||||
| Industrials | 11.7 | % | |||||
| Health Care | 11.2 | % | |||||
| Energy | 8.6 | % | |||||
| Money Market Funds | 5.6 | % | |||||
| Consumer Staples | 2.2 | % | |||||
| Telecommunication Services | 1.3 | % | |||||
| Warrants | 0.3 | % | |||||
| Other Assets and Liabilities | 1.1 | % | |||||
| 100.0 | % | ||||||
ADR — American Depositary Receipt
| * | Non-Income Producing |
| # | Annualized seven-day yield as of June 30, 2014. |
The accompanying notes are an integral part of these financial statements.
www.brownadvisoryfunds.com
12
Brown Advisory Small-Cap Growth Fund
A Message to Our Shareholders
June 30, 2014
Dear Shareholder:
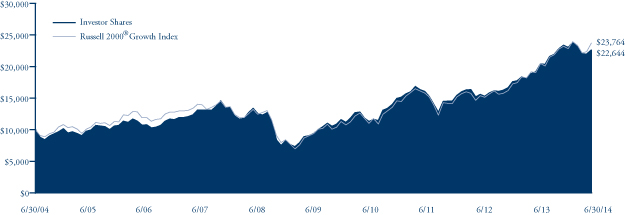
During the year ended June 30, 2014, the Brown Advisory Small-Cap Growth Fund Investor Shares (the “Fund”) increased 18.42% in value. During the same period, the Russell 2000® Growth Index (the “Index”), the Fund’s benchmark, increased 24.73%.
The year can be divided into two distinct periods. For most of the past year, the Fund performed largely in line with its benchmark. Sound stock selection helped to mitigate the fact that we were underweight in some of the best-performing areas of the market (i.e., biotechnology & pharmaceuticals, etc.). However, the period from mid-May 2014 through the end of the second quarter proved quite challenging for our portfolio, during which we generated the bulk of the underperformance for the full year. A stock-specific event impacted results negatively, along with a vigorous benchmark rally in lower-quality stocks that, due to our focus on higher-quality names, worked to our detriment.
Heading into 2014, we were prepared for increased volatility following a near linear ascent in small-cap issues in 2013. As part of this preparation, we positioned the portfolio generally in what we viewed as higher-quality stocks, at reasonable relative valuations, and within the upper end of the small-market-capitalization spectrum. Unfortunately, our results were disappointing; to use a baseball analogy, we had a decent batting average, but our slugging percentage was weak—in other words, we saw a handful of our largest positions pull back meaningfully from recent highs.
While we are disappointed with recent performance, we are certainly not discouraged about our investment approach. We have maintained a consistent philosophy and executed a consistent process and strategy over the last eight years.
Overall sector allocation did not change dramatically over the past year. We were overweight in industrials and information technology, and underweight in consumer discretionary, energy, financials, health care and materials. At times, the Global Industry Classification Standard (GICS) methodology does not necessarily align with our internal view of the appropriate sector designations for our holdings. When making our internal adjustments, our weighting in consumer discretionary, health care and financials increases, while our weighting in information technology and industrials decreases.
Our top and bottom contributors for the year were spread across many sectors, with no particular sector driving performance on either side of the ledger. Incyte Corporation was the largest contributor. This relatively mature biotechnology company more than doubled on the strength of the launch of its drug for myelofibrosis, Jakafi, and a preliminary data release on that drug’s potential effectiveness in treating pancreatic cancer. United Rentals was the second largest contributor, benefiting from the recovery in the commercial real estate sector. Broadridge Financial Solutions, Harman International and Idex Corporation rounded out the Fund’s top-five contributors for the trailing 12 months.
The largest detractors during the period came from the consumer discretionary, health care and industrial sectors. Quiksilver reported extremely disappointing sales results, a result of a large number of small, wholesale-account closures. The new management team’s efforts to drive greater cost efficiency simply could not offset the shortfall in anticipated revenue. Ariad Pharmaceuticals was a small position, but it declined materially due to troubling safety data emanating from its FDA-approved drug, Iclusig. UTI Worldwide, a global freight forwarding company, experienced difficulties in rolling out key systems in the U.S. and also produced lackluster international results. As a result of these difficulties, the company unexpectedly moved to raise capital. In each of these cases, we viewed our original investment thesis as being violated and moved to exit the positions.
During the period, we added a number of new holdings while eliminating those that reached our price targets or that weren’t progressing as we had hoped. The period turnover was relatively low, consistent with our history and in line with our desire to be business owners and not stock traders.
We were heavily engaged in due diligence over the past year, conducting face-to-face meetings with the management teams of the majority of our portfolio companies along with dozens of other companies that we are considering as potential new ideas for the portfolio. We seek companies that offer us the potential for growth (through large and/or growing end markets and a differentiated product, service or business model), the potential for sustainable results (through favorable competitive positioning and/or strong
www.brownadvisoryfunds.com
13
Brown Advisory Small-Cap Growth Fund
A Message to Our Shareholders
June 30, 2014
management), and the potential for value creation (through high or improving margins and capital efficiency). We look to purchase these businesses at attractive prices when we have a non-consensus view. We will maintain this discipline going forward as we strive for stronger relative results going forward.
management), and the potential for value creation (through high or improving margins and capital efficiency). We look to purchase these businesses at attractive prices when we have a non-consensus view. We will maintain this discipline going forward as we strive for stronger relative results going forward.
Sincerely,
Christopher A. Berrier
Portfolio Manager
Past performance is not a guarantee of future results.
Mutual fund investing involves risk. Principal loss is possible. Investments in smaller companies generally carry greater risk than is customarily associated with larger companies for various reasons such as narrower markets, limited financial resources and less liquid stock. The value of the Fund’s investments in REITs may change in response to changes in the real estate market such as declines in the value of real estate, lack of available capital or financing opportunities, and increases in property taxes or operating costs. The Fund may invest in ETFs, which may trade at a discount to the aggregate value of the underlying securities and although expense ratios for ETFs are generally low, frequent trading of ETFs by the Fund can generate brokerage expenses. Investments in foreign securities entail certain risks not associated with investments in domestic securities, such as volatility of currency exchange rates, and in some cases, political and economic instability and relatively illiquid markets. These risks are greater for investments in emerging markets. Privately Placement issued securities are restricted securities that are not publicly traded. Delay or difficulty in selling such securities may result in a loss to the Fund.
Fund holdings and sector allocations are subject to change and should not be considered a recommendation to buy or sell any security. For a complete list of fund holdings, please refer to the Schedule of Investments provided in this report.
Definitions for terms and indices are provided in the Glossary of Terms.
www.brownadvisoryfunds.com
14
Brown Advisory Small-Cap Growth Fund
Performance Chart and Analysis
June 30, 2014
COMPARISON OF CHANGE IN VALUE OF A $10,000 INVESTMENT
The following chart reflects the change in value of a hypothetical $10,000 investment, including reinvested dividends and distributions, in the Fund compared with the broad-based securities market index. The Russell 2000® Growth Index (“Index”) measures the performance of the small-cap growth segment of the U.S. equity universe. It includes those Russell 2000® companies with higher price to book value ratios and higher forecasted growth values. The Index is unmanaged and does not reflect the deduction of fees, such as investment management fees. Investors cannot invest directly in an index.
| Average Annual Total Return | One | Five | Ten |
| as of 6/30/14 | Year | Year | Year |
| Institutional Shares | 18.59% | 19.36% | 8.33% |
| Investor Shares | 18.42% | 19.29% | 8.52% |
Advisor Shares1 | 18.07% | 18.90% | 8.09% |
Russell 2000® Growth Index | 24.73% | 20.50% | 9.04% |
| Institutional Shares | Investor Shares | Advisor Shares | |
Gross Expense Ratio2 | 1.04% | 1.19% | 1.44% |
Net Expense Ratio2 | 1.04% | 1.19% | 1.44% |
Past performance does not guarantee future results. The performance data quoted represents past performance and current returns may be lower or higher. The investment return and net asset value will fluctuate so that an investor’s shares, when redeemed, may be worth more or less than the original cost. To obtain performance information current to the most recent month end, please visit our website at brownadvisoryfunds.com/performance.html. The performance table and graph above do not reflect the deduction of taxes that a shareholder would pay on Fund distributions or the redemption of Fund shares. Investment performance reflects periods during which fee waivers were in effect. In the absence of such waivers, total return would have been reduced. Performance data does not reflect the imposition of the redemption fee of 1.00% on shares redeemed within 14 days, and if it did, performance would have been lower.
| 1 | Performance information for Advisor Shares, prior to commencement of operations on April 25, 2006, is based on the performance of Investor Shares, and adjusted for the higher expenses applicable to Advisor Shares. |
| 2 | Per the Fund’s prospectus dated October 31, 2013. |
www.brownadvisoryfunds.com
15
Brown Advisory Small-Cap Growth Fund
Schedule of Investments
June 30, 2014
| Shares | Security Description | Value $ | |||||
| Common Stocks — 96.2% | |||||||
| Consumer Discretionary — 11.9% | |||||||
| 88,442 | ANN, Inc.* | 3,638,504 | |||||
| 81,315 | Ascent Capital Group, Inc.* | 5,367,603 | |||||
| 122,199 | Bright Horizons Family Solutions, Inc.* | 5,247,225 | |||||
| 26,723 | CoStar Group, Inc.* | 4,226,777 | |||||
| 28,496 | Harman International Industries, Inc. | 3,061,325 | |||||
| 276,210 | HomeAway, Inc.* | 9,617,632 | |||||
| 109,866 | Krispy Kreme Doughnuts, Inc.* | 1,755,659 | |||||
| 358,519 | Quiksilver, Inc.* | 1,283,498 | |||||
| 93,609 | Stage Stores, Inc. | 1,749,552 | |||||
| 35,947,775 | |||||||
| Consumer Staples — 3.1% | |||||||
| 41,100 | PriceSmart, Inc. | 3,577,344 | |||||
| 70,811 | Susser Holdings Corp.* | 5,715,864 | |||||
| 9,293,208 | |||||||
| Energy — 2.3% | |||||||
| 259,025 | Helix Energy Solutions Group, Inc.* | 6,814,948 | |||||
| Financials — 4.3% | |||||||
| 62,090 | City National Corp. | 4,703,938 | |||||
| 130,461 | Prosperity Bancshares, Inc. | 8,166,859 | |||||
| 12,870,797 | |||||||
| Health Care — 12.0% | |||||||
| 95,606 | Charles River Laboratories International, Inc.* | 5,116,833 | |||||
| 80,733 | Covance, Inc.* | 6,909,130 | |||||
| 85,652 | Dyax Corp.* | 822,259 | |||||
| 198,223 | Endologix, Inc.* | 3,014,972 | |||||
| 50,461 | Henry Schein, Inc.* | 5,988,207 | |||||
| 40,041 | IDEXX Laboratories, Inc.* | 5,348,276 | |||||
| 43,205 | Incyte Corp.* | 2,438,490 | |||||
| 12,733 | Receptos, Inc.* | 542,426 | |||||
| 69,756 | Seattle Genetics, Inc.* | 2,668,167 | |||||
| 4,101 | Ultragenyx Pharmaceutical, Inc.* | 184,094 | |||||
| 127,623 | Volcano Corporation* | 2,247,441 | |||||
| 23,132 | WuXi PharmaTech (Cayman), Inc. ADR* | 760,118 | |||||
| 36,040,413 | |||||||
| Industrials — 24.9% | |||||||
| 14,332 | Acuity Brands, Inc. | 1,981,399 | |||||
| 91,473 | Advisory Board Company* | 4,738,301 | |||||
| 46,999 | Colfax Corp.* | 3,503,305 | |||||
| 89,266 | Corporate Executive Board Co. | 6,089,726 | |||||
| 199,392 | DigitalGlobe, Inc.* | 5,543,098 | |||||
| 122,908 | HEICO Corp. | 6,383,842 | |||||
| 104,544 | Hexcel Corp.* | 4,275,850 | |||||
| 95,960 | IDEX Corp. | 7,747,810 | |||||
| 317,169 | Knight Transportation, Inc. | 7,539,107 | |||||
| 86,999 | Landstar System, Inc. | 5,567,936 | |||||
| 142,951 | Roadrunner Transportation | ||||||
| Services Holdings, Inc.* | 4,016,923 | ||||||
| 67,791 | Team, Inc.* | 2,780,787 | |||||
| 28,549 | United Rentals, Inc.* | 2,989,937 | |||||
| 213,291 | Waste Connections, Inc. | 10,355,278 | |||||
| 30,316 | Woodward, Inc. | 1,521,257 | |||||
| 75,034,556 | |||||||
| Information Technology — 35.8% | |||||||
| 245,610 | Applied Micro Circuits Corp.* | 2,655,044 | |||||
| 183,588 | Aruba Networks, Inc.* | 3,216,462 | |||||
| 240,940 | Broadridge Financial Solutions, Inc. | 10,032,742 | |||||
| 165,559 | BroadSoft, Inc.* | 4,369,102 | |||||
| 71,862 | Cavium, Inc.* | 3,568,667 | |||||
| 25,809 | CommVault Systems, Inc.* | 1,269,028 | |||||
| 28,374 | Concur Technologies, Inc.* | 2,648,429 | |||||
| 275,303 | CoreLogic, Inc.* | 8,358,199 | |||||
| 20,587 | Cvent, Inc.* | 598,876 | |||||
| 110,171 | E2open, Inc.* | 2,277,235 | |||||
| 305,247 | EXFO, Inc.*† | 1,465,186 | |||||
| 95,965 | Fair Isaac Corp. | 6,118,728 | |||||
| 323,970 | Genpact, Ltd.* | 5,679,194 | |||||
| 79,283 | Global Payments, Inc. | 5,775,766 | |||||
| 211,743 | Informatica Corp.* | 7,548,638 | |||||
| 167,724 | Interactive Intelligence Group, Inc.* | 9,414,348 | |||||
| 170,505 | MAXIMUS, Inc. | 7,335,125 | |||||
| 384,530 | Pegasystems, Inc. | 8,121,274 | |||||
| 29,848 | PROS Holdings, Inc.* | 789,181 | |||||
| 164,284 | Riverbed Technology, Inc.* | 3,389,179 | |||||
| 196,463 | Sapient Corp.* | 3,192,524 | |||||
| 69,865 | Synchronoss Technologies, Inc.* | 2,442,480 | |||||
| 39,045 | Ultimate Software Group, Inc.* | 5,394,848 | |||||
| 85,768 | Xoom Corp.* | 2,260,844 | |||||
| 107,921,099 | |||||||
| Materials — 1.9% | |||||||
| 76,651 | Rockwood Holdings, Inc. | 5,824,710 | |||||
| Total Common Stocks (Cost $190,947,113) | 289,747,506 | ||||||
| Private Placements — 0.8% | |||||||
| 16,600 | Greenspring Global Partners IV-B, L.P.*^† | 2,235,793 | |||||
| 54,769 | Greenspring Global Partners V-B, L.P.*~† | 69,705 | |||||
| Total Private Placements (Cost $947,657) | 2,305,498 | ||||||
The accompanying notes are an integral part of these financial statements.
www.brownadvisoryfunds.com
16
Brown Advisory Small-Cap Growth Fund
Schedule of Investments
June 30, 2014
| Shares | Security Description | Value $ | |||||
| Short-Term Investments — 3.5% | |||||||
| Money Market Funds — 3.5% | |||||||
| 10,572,132 | DWS Cash Account Trust — Government | ||||||
| & Agency Securities Portfolio, 0.03%# | 10,572,132 | ||||||
| Total Short-Term Investments (Cost $10,572,132) | 10,572,132 | ||||||
| Total Investments — 100.5% (Cost $202,466,902) | 302,625,136 | ||||||
| Liabilities in Excess of Other Assets — (0.5)% | (1,540,780 | ) | |||||
| NET ASSETS — 100.0% | $ | 301,084,356 | |||||
| PORTFOLIO HOLDINGS | |||||||
| % of Net Assets | |||||||
| Information Technology | 35.8 | % | |||||
| Industrials | 24.9 | % | |||||
| Health Care | 12.0 | % | |||||
| Consumer Discretionary | 11.9 | % | |||||
| Financials | 4.3 | % | |||||
| Money Market Funds | 3.5 | % | |||||
| Consumer Staples | 3.1 | % | |||||
| Energy | 2.3 | % | |||||
| Materials | 1.9 | % | |||||
| Private Placements | 0.8 | % | |||||
| Other Assets and Liabilities | (0.5 | )% | |||||
| 100.0 | % | ||||||
ADR — American Depositary Receipt
| * | Non-Income Producing |
| ^ | Security is exempt from registration under Rule 144A of the Securities Act of 1933. Security is fair valued under the supervision of the Board of Trustees and was acquired from February 2008 to April 2014 as part of a $2,000,000 capital commitment. At June 30, 2014, $1,660,000 of the capital commitment has been fulfilled by the Fund. |
| ~ | Security is exempt from registration under Rule 144A of the Securities Act of 1933. Security is fair valued under the supervision of the Board of Trustees and was acquired from October 2012 to May 2014 as part of a $100,000 capital commitment. At June 30, 2014, $54,769 of the capital commitment has been fulfilled by the Fund. |
| † | All or a portion of this security is considered illiquid. At June 30, 2014, the total market value of securities considered illiquid was $2,455,773 or 0.8% of net assets. |
| # | Annualized seven-day yield as of June 30, 2014. |
The accompanying notes are an integral part of these financial statements.
www.brownadvisoryfunds.com
17
Brown Advisory Small-Cap Fundamental Value Fund
A Message to Our Shareholders
June 30, 2014
Dear Shareholder:
During the year ended June 30, 2014, the Brown Advisory Small-Cap Fundamental Value Fund Investor Shares (the “Fund”) increased 25.13% in value. During the same period, the Russell 2000® Value (the Index), the Fund’s benchmark, increased 22.54%.
During the period, the Fund’s relative outperformance resulted from a combination of strong absolute performance in the consumer staples sector as well as favorable stock selection in financials, energy and information technology. Despite being underweight in the financials and energy sectors, the Fund’s investments in those sectors outperformed those of the benchmark, particularly within energy.
Susser Holdings was the largest individual contributor to performance during the period thanks to its announced sale to Energy Transfer Partners. The announced transaction price was 42% higher than its closing price prior to the announcement, and that price represented an 11x EBITDA multiple and nearly 2.3x our initial investment price during the second quarter of 2012. The transaction consideration is a combination of stock and cash. Due to a persistent and wide merger spread—meaning that the stock is trading well below the announced transaction price—we have opted to hold our position pending its expected close in the third quarter. Incidentally, the transaction did not include the acquisition of Susser Petroleum Partners, but there have been discussions of a second set of transactions between the newly combined entity and Susser Petroleum. Susser Petroleum subsequently rose in recognition of this potential future activity, and we sold our position at the elevated valuation. As indicated from the activity above, Susser Holdings’ initial public offering (IPO) of Susser Petroleum in 2012 served as the mechanism to create a tremendous amount of shareholder value. RigNet and Broadridge also contributed significantly to performance.
The largest detractor from performance was Ascent Capital Group, a holding company that through its subsidiary provides alarm-monitoring services. Ascent Capital was under pressure as investors continue to worry about new competitors entering the home-security market. Ascent’s results and comments from its management team indicate that the company has seen little or no impact from competition to date, and we used the near-term price weakness to add to our existing position. We sold another of our detractors, Destination Maternity, in the second quarter of 2014. Like many other retailers, the company pre-announced disappointing first-quarter 2014 same-store-sales and earnings.
During the period, the Fund added 12 investments and exited eight. Six of the new holdings were in the financial sector, two were in industrials, and the rest were in telecommunication services, consumer discretionary, information technology and materials.
Sold positions were across a variety of sectors; five were in financials, three in consumer discretionary, and one of each in telecommunication services, consumer discretionary, information technology, materials and energy.
Since inception, the Fund has been consistent in its investment approach. We believe that companies that can generate substantial levels of free cash flow should be able to weather challenging economic periods and should enable us to generate attractive risk-adjusted returns for our investors over the long term.
Sincerely,
J. David Schuster
Portfolio Manager
www.brownadvisoryfunds.com
18
Brown Advisory Small-Cap Fundamental Value Fund
A Message to Our Shareholders
June 30, 2014
Past performance is not a guarantee of future results.
Investments in smaller companies generally carry greater risk than is customarily associated with larger companies for various reasons such as narrower markets, limited financial resources and less liquid stock. The value of the Fund’s investments in REITs may change in response to changes in the real estate market such as declines in the value of real estate, lack of available capital or financing opportunities, and increases in property taxes or operating costs. The Fund may invest in ETFs, which may trade at a discount to the aggregate value of the underlying securities and although expense ratios for ETFs are generally low, frequent trading of ETFs by the Fund can generate brokerage expenses. Investments in debt securities typically decrease in value when interest rates rise. This risk is usually greater for longer-term debt securities. Investments in foreign securities entail certain risks not associated with investments in domestic securities, such as volatility of currency exchange rates, and in some cases, political and economic instability and relatively illiquid markets. The risks of investments in derivatives, including options, futures contracts and options on futures contracts include imperfect correlation between the value of these instruments and the underlying assets; risks of default by the other party to the derivative transactions; risks that the transactions may result in losses that partially or completely offset gains in portfolio positions; and risks that the derivative transactions may not be liquid.
Fund holdings and sector allocations are subject to change and should not be considered a recommendation to buy or sell any security. For a complete list of fund holdings, please refer to the Schedule of Investments provided in this report.
Definitions for terms and indices are provided in the Glossary of Terms.
www.brownadvisoryfunds.com
19
Brown Advisory Small-Cap Fundamental Value Fund
Performance Chart and Analysis
June 30, 2014
COMPARISON OF CHANGE IN VALUE OF A $10,000 INVESTMENT
The following chart reflects the change in value of a hypothetical $10,000 investment, including reinvested dividends and distributions, in the Fund as measured against a broad-based securities market index. The Russell 2000® Value Index (“Index”) measures the performance of small-cap value segment of the U.S. equity universe. It includes those Russell 2000® companies with lower price to book ratios and lower forecasted growth values. The Index is unmanaged and does not reflect the deduction of fees, such as investment management fees. Investors cannot invest directly in an index.
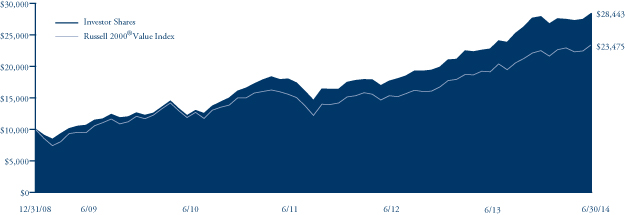
| Since | |||
| Average Annual Total Return | One | Five | Inception |
| as of 6/30/14 | Year | Year | (12/31/08) |
Institutional Shares1 | 25.37% | 21.95% | 21.31% |
| Investor Shares | 25.13% | 21.77% | 20.95% |
Advisor Shares2 | 24.83% | 21.47% | 20.65% |
Russell 2000® Value Index | 22.54% | 19.88% | 16.80% |
| Institutional Shares | Investor Shares | Advisor Shares | |
Gross Expense Ratio3 | 1.05% | 1.20% | 1.45% |
Net Expense Ratio3 | 1.05% | 1.20% | 1.45% |
Past performance does not guarantee future results. The performance data quoted represents past performance and current returns may be lower or higher. The investment return and net asset value will fluctuate so that an investor’s shares, when redeemed, may be worth more or less than the original cost. To obtain performance information current to the most recent month end, please visit our website at brownadvisoryfunds.com/performance.html. The performance table and graph above do not reflect the deduction of taxes that a shareholder would pay on Fund distributions or the redemption of Fund shares. Investment performance reflects periods during which fee waivers were in effect. In the absence of such waivers, total return would have been reduced. Performance data does not reflect the imposition of the redemption fee of 1.00% on shares redeemed within 14 days, and if it did, performance would have been lower.
| 1 | Performance information for the Institutional Shares, prior to commencement of operations on October 19, 2012, is based on the performance of Investor Shares, and adjusted for the lower expenses applicable to Institutional Shares. |
| 2 | Performance information for Advisor Shares, prior to commencement on July 28, 2011, is based on the performance of Investor Shares, and adjusted for the higher expenses applicable to Advisor Shares. |
| 3 | Per the Fund’s prospectus dated October 31, 2013. |
www.brownadvisoryfunds.com
20
Brown Advisory Small-Cap Fundamental Value Fund
Schedule of Investments
June 30, 2014
| Shares | Security Description | Value $ | |||||
| Common Stocks — 91.3% | |||||||
| Consumer Discretionary — 16.3% | |||||||
| 241,130 | Ascent Capital Group, Inc.* | 15,916,991 | |||||
| 216,561 | Cato Corp. | 6,691,735 | |||||
| 650,823 | Core-Mark Holding Co., Inc. | 29,697,054 | |||||
| 322,396 | Culp, Inc.† | 5,612,914 | |||||
| 2,726,821 | Denny’s Corp.* | 17,778,873 | |||||
| 592,586 | Destination Maternity Corp.† | 13,493,183 | |||||
| 328,423 | Starz, Inc.* | 9,783,721 | |||||
| 98,974,471 | |||||||
| Consumer Staples — 4.9% | |||||||
| 83,243 | Casey’s General Stores, Inc. | 5,851,150 | |||||
| 300,816 | Susser Holdings Corp.* | 24,281,868 | |||||
| 30,133,018 | |||||||
| Energy — 6.4% | |||||||
| 253,600 | Bristow Group, Inc. | 20,445,232 | |||||
| 343,528 | RigNet, Inc.* | 18,488,677 | |||||
| 38,933,909 | |||||||
| Financials — 23.2% | |||||||
| 1,064,616 | American Capital, Ltd.* | 16,277,979 | |||||
| 356,543 | American Equity Investment Life Holding Co. | 8,770,958 | |||||
| 202,378 | Assurant, Inc. | 13,265,878 | |||||
| 406,763 | Capitol Federal Financial, Inc. | 4,946,238 | |||||
| 34,604 | Farmers Capital Bank Corp.* | 781,704 | |||||
| 242,294 | Fly Leasing, Ltd. ADR | 3,510,840 | |||||
| 735,783 | Forest City Enterprises, Inc.* | 14,620,008 | |||||
| 1,368,973 | GFI Group, Inc. | 4,544,990 | |||||
| 163,708 | Kemper Corp. | 6,034,277 | |||||
| 808,507 | Maiden Holdings, Ltd. | 9,774,850 | |||||
| 198,360 | National General Holdings Corp. | 3,451,464 | |||||
| 336,520 | OceanFirst Financial Corp. | 5,572,771 | |||||
| 379,141 | Oritani Financial Corp. | 5,834,980 | |||||
| 220,957 | Pacific Premier Bancorp, Inc.* | 3,113,284 | |||||
| 191,328 | Renasant Corp. | 5,561,905 | |||||
| 44,193 | Springleaf Holdings, Inc.* | 1,146,808 | |||||
| 572,983 | Synovus Financial Corp. | 13,969,326 | |||||
| 1,391,530 | TFS Financial Corp.* | 19,843,218 | |||||
| 141,021,478 | |||||||
| Health Care — 2.3% | |||||||
| 273,687 | Air Methods Corp.* | 14,135,934 | |||||
| Industrials — 16.1% | |||||||
| 592,570 | Albany International Corp. | 22,493,957 | |||||
| 377,133 | DigitalGlobe, Inc.* | 10,484,297 | |||||
| 374,123 | EnPro Industries, Inc.* | 27,370,839 | |||||
| 408,284 | Kadant, Inc.† | 15,698,520 | |||||
| 41,989 | McGrath RentCorp | 1,543,096 | |||||
| 200,206 | Thermon Group Holdings, Inc. | 5,269,422 | |||||
| 393,707 | TriMas Corp.* | 15,012,048 | |||||
| 97,872,179 | |||||||
| Information Technology — 16.0% | |||||||
| 590,060 | Broadridge Financial Solutions, Inc. | 24,570,098 | |||||
| 489,622 | CoreLogic, Inc.* | 14,864,924 | |||||
| 8,159 | CTS Corp. | 152,573 | |||||
| 47,708 | DST Systems, Inc. | 4,397,246 | |||||
| 446,935 | Echostar Corp.* | 23,660,739 | |||||
| 200,873 | MAXIMUS, Inc. | 8,641,557 | |||||
| 527,285 | MoneyGram International, Inc.* | 7,766,908 | |||||
| 123,034 | MTS Systems Corp. | 8,336,784 | |||||
| 286,121 | Vishay Precision Group, Inc.*† | 4,709,552 | |||||
| 97,100,381 | |||||||
| Materials — 4.0% | |||||||
| 186,839 | Innophos Holdings, Inc. | 10,756,321 | |||||
| 181,196 | KMG Chemicals, Inc.† | 3,257,904 | |||||
| 190,829 | Neenah Paper, Inc. | 10,142,562 | |||||
| 24,156,787 | |||||||
| Telecommunication Services — 2.1% | |||||||
| 176,013 | Atlantic Tele-Network, Inc. | 10,208,754 | |||||
| 430,085 | ORBCOMM, Inc.* | 2,834,260 | |||||
| 13,043,014 | |||||||
| Total Common Stocks (Cost $416,644,599) | 555,371,171 | ||||||
| Real Estate Investment Trusts — 5.3% | |||||||
| 1,544,192 | MFA Financial, Inc. | 12,677,816 | |||||
| 1,133,914 | NorthStar Realty Finance Corp. | 19,707,425 | |||||
| Total Real Estate Investment Trusts (Cost $28,335,851) | 32,385,241 | ||||||
| Short-Term Investments — 4.1% | |||||||
| Money Market Funds — 4.1% | |||||||
| 25,059,989 | DWS Cash Account Trust — Government | ||||||
| & Agency Securities Portfolio, 0.03%# | 25,059,989 | ||||||
| Total Short-Term Investments (Cost $25,059,989) | 25,059,989 | ||||||
| Total Investments — 100.7% (Cost $470,040,439) | 612,816,401 | ||||||
| Liabilities in Excess of Other Assets — (0.7)% | (4,086,166 | ) | |||||
| NET ASSETS — 100.0% | $ | 608,730,235 | |||||
| PORTFOLIO HOLDINGS | ||||
| % of Net Assets | ||||
| Financials | 23.2 | % | ||
| Consumer Discretionary | 16.3 | % | ||
| Industrials | 16.1 | % | ||
| Information Technology | 16.0 | % | ||
| Energy | 6.4 | % | ||
| Real Estate Investment Trusts | 5.3 | % | ||
| Consumer Staples | 4.9 | % | ||
| Money Market Funds | 4.1 | % | ||
| Materials | 4.0 | % | ||
| Health Care | 2.3 | % | ||
| Telecommunication Services | 2.1 | % | ||
| Other Assets and Liabilities | (0.7 | )% | ||
| 100.0 | % | |||
ADR — American Depositary Receipt
| * | Non-Income Producing |
| † | All or a portion of this security is considered illiquid. At June 30, 2014, the total market value of securities considered illiquid was $6,874,861 or 1.1% of net assets. |
| # | Annualized seven-day yield as of June 30, 2014. |
The accompanying notes are an integral part of these financial statements.
www.brownadvisoryfunds.com
21
Brown Advisory Opportunity Fund
A Message to Our Shareholders
June 30, 2014
Dear Shareholder:
During the year ended June 30, 2014, the Brown Advisory Opportunity Fund (the “Fund”) increased 24.20% in value. During the same period, the Russell 3000® Index (the “Index”), the Fund’s benchmark, increased 25.22%.
Equity markets got off to a slow start in 2014 as investors moved to take profits after exceptionally strong performance in 2013. However, this proved to be just a short breather as the bull market resumed in full force by February, and many U.S. equity indexes ended the period at all-time highs.
The Fund produced strong absolute returns over the past year, outperforming the benchmark in the back half of 2014. But we gave back some of that relative outperformance in the first half of 2014, a disappointing period when our losers hurt us much more than our winners helped us. Our consumer discretionary holdings offer an example of the outsized impact of some of our laggards: Under Armour and Chipotle were solid positive contributors, but Quiksilver violated our investment thesis in striking fashion as it reported the loss of a meaningful proportion of its wholesale accounts; we subsequently eliminated the position from the portfolio. Whole Foods also disappointed, but we continue to hold to the position and have added on weakness, after spending time with the company’s management team and reconfirming our belief that Whole Foods can manage through this period and successfully execute its long-term growth strategy.
The past year has been a challenge for us; the market has favored momentum stocks and purely defensive stocks while shunning the quality growth companies that we favor. Despite this, we have found opportunities to invest in what we believe to be great companies offering attractive upside potential. For instance, our patience paid off in the technology sector, where a fairly broad-based correction in March and April gave us the opportunity to invest in several names such as Xoom, Criteo and Stratasys at attractive prices. The stocks had all been trading at what we considered to be full valuations prior to the spring technology pullback. We have no control over the timing of these events, but our process is such that we continually scour the investment landscape in seeking to take advantage of opportunities such as this. We believe that this approach has the potential to generate attractive returns over full market cycles.
Sincerely,
Maneesh Bajaj, CFA
Portfolio Manager
Eric Gordon, CFA
Portfolio Manager
Paul Li, Ph.D., CFA
Portfolio Manager
www.brownadvisoryfunds.com
22
Brown Advisory Opportunity Fund
A Message to Our Shareholders
June 30, 2014
Past performance is not a guarantee of future results.
Mutual fund investing involves risk. Principal loss is possible. The Fund invests in small and medium capitalization companies which carry greater risk than is associated with larger companies for various reasons, such as narrower markets, limited financial resources and less liquid stock. The value of the Fund’s investments in REITs may change in response to changes in the real estate market such as declines in the value of real estate, lack of available capital or financing opportunities, and increases in property taxes or operating costs. The Fund may invest in ETFs, which may trade at a discount to the aggregate value of the underlying securities and although expense ratios for ETFs are generally low, frequent trading of ETFs by the Fund can generate brokerage expenses. Investments in foreign securities entail certain risks not associated with investments in domestic securities, such as volatility of currency exchange rates, and in some cases, political and economic instability and relatively illiquid markets. These risks are greater for investments in emerging markets.
Diversification does not assure a profit or protect against loss in a declining market.
Fund holdings and sector allocations are subject to change and should not be considered a recommendation to buy or sell any security. For a complete list of fund holdings, please refer to the Schedule of Investments provided in this report.
Definitions for terms and indices are provided in the Glossary of Terms.
www.brownadvisoryfunds.com
23
Brown Advisory Opportunity Fund
Performance Chart and Analysis
June 30, 2014
COMPARISON OF CHANGE IN VALUE OF A $10,000 INVESTMENT
The following chart reflects the change in value of a hypothetical $10,000 investment, including reinvested dividends and distributions, in the Fund as measured against the broad-based securities market index. The Russell 3000® Index (“Index”) measures the performance of the 3,000 largest U.S. companies representing approximately 98% of the investable U.S. equity market. The Index is unmanaged and does not reflect the deduction of fees, such as investment management fees. Investors cannot invest directly in an index.
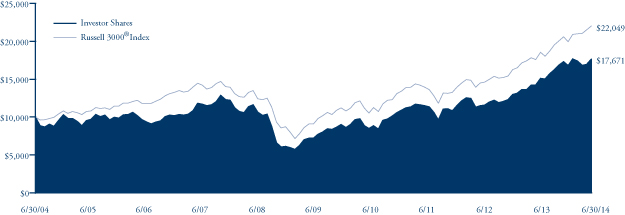
| Average Annual Total Return | One | Five | Ten |
| as of 6/30/14 | Year | Year | Year |
| Investor Shares | 24.20% | 19.69% | 5.86% |
Russell 3000® Index | 25.22% | 19.33% | 8.23% |
| Investor Shares | |
Gross Expense Ratio1 | 1.67% |
Net Expense Ratio1 | 1.50% |
Past performance does not guarantee future results. The performance data quoted represents past performance and current returns may be lower or higher. The investment return and net asset value will fluctuate so that an investor’s shares, when redeemed, may be worth more or less than the original cost. To obtain performance information current to the most recent month end, please visit our website at brownadvisoryfunds.com/performance.html. The performance table and graph above do not reflect the deduction of taxes that a shareholder would pay on Fund distributions or the redemption of Fund shares. Investment performance reflects periods during which fee waivers were in effect. In the absence of such waivers, total return would have been reduced. Performance data does not reflect the imposition of the redemption fee of 1.00% on shares redeemed within 14 days, and if it did, performance would have been lower.
| 1 | Per the Fund’s prospectus dated October 31, 2013. |
www.brownadvisoryfunds.com
24
Brown Advisory Opportunity Fund
Schedule of Investments
June 30, 2014
| Shares | Security Description | Value $ | |||||
| Common Stocks — 98.3% | |||||||
| Consumer Discretionary — 16.0% | |||||||
| 5,627 | Best Buy, Inc. | 174,493 | |||||
| 3,028 | Bright Horizons Family Solutions, Inc.* | 130,022 | |||||
| 222 | Chipotle Mexican Grill, Inc.* | 131,537 | |||||
| 3,388 | Destination Maternity Corp. | 77,145 | |||||
| 1,896 | Discovery Communications, Inc.* | 137,631 | |||||
| 2,482 | Garmin, Ltd. | 151,154 | |||||
| 3,828 | Guess?, Inc. | 103,356 | |||||
| 5,765 | HomeAway, Inc.* | 200,737 | |||||
| 6,382 | Krispy Kreme Doughnuts, Inc.* | 101,984 | |||||
| 4,129 | LKQ Corp.* | 110,203 | |||||
| 3,422 | Lowe’s Companies, Inc. | 164,222 | |||||
| 2,270 | Starbucks Corp. | 175,653 | |||||
| 3,548 | Under Armour, Inc.* | 211,071 | |||||
| 1,869,208 | |||||||
| Consumer Staples — 7.4% | |||||||
| 1,584 | Estee Lauder Companies, Inc. | 117,628 | |||||
| 1,932 | Mead Johnson Nutrition Co. | 180,005 | |||||
| 1,702 | PriceSmart, Inc. | 148,142 | |||||
| 3,565 | Susser Holdings Corp.* | 287,767 | |||||
| 3,388 | Whole Foods Market, Inc. | 130,878 | |||||
| 864,420 | |||||||
| Energy — 10.2% | |||||||
| 3,052 | Canadian Natural Resources, Ltd. | 140,117 | |||||
| 1,418 | Core Laboratories NV | 236,891 | |||||
| 1,314 | Dril-Quip, Inc.* | 143,541 | |||||
| 3,250 | FMC Technologies, Inc.* | 198,477 | |||||
| 3,716 | Helix Energy Solutions Group, Inc.* | 97,768 | |||||
| 1,310 | National Oilwell Varco, Inc. | 107,879 | |||||
| 2,250 | Schlumberger NV | 265,388 | |||||
| 1,190,061 | |||||||
| Financials — 14.4% | |||||||
| 7,430 | American Capital, Ltd.* | 113,605 | |||||
| 8,657 | Charles Schwab Corp. | 233,133 | |||||
| 2,693 | City National Corp. | 204,022 | |||||
| 3,468 | JPMorgan Chase & Co. | 199,826 | |||||
| 726 | M&T Bank Corp. | 90,060 | |||||
| 2,702 | Prosperity Bancshares, Inc. | 169,145 | |||||
| 3,882 | Realogy Holdings Corp.* | 146,390 | |||||
| 11,009 | Regions Financial Corp. | 116,915 | |||||
| 3,595 | SunTrust Banks, Inc. | 144,016 | |||||
| 4,660 | Synovus Financial Corp. | 113,611 | |||||
| 10,708 | TFS Financial Corp.* | 152,696 | |||||
| 1,683,419 | |||||||
| Health Care — 11.4% | |||||||
| 1,007 | athenahealth, Inc.* | 126,006 | |||||
| 1,734 | Bristol-Myers Squibb Co. | 84,116 | |||||
| 1,498 | Covance, Inc.* | 128,199 | |||||
| 2,269 | DaVita HealthCare Partners, Inc.* | 164,094 | |||||
| 2,702 | Express Scripts Holding Co.* | 187,330 | |||||
| 1,534 | Gilead Sciences, Inc.* | 127,184 | |||||
| 2,905 | HMS Holdings Corp.* | 59,291 | |||||
| 3,418 | Incyte Corp.* | 192,912 | |||||
| 413 | Intuitive Surgical, Inc.* | 170,073 | |||||
| 2,396 | Seattle Genetics, Inc.* | 91,647 | |||||
| 1,330,852 | |||||||
| Industrials — 10.2% | |||||||
| 3,013 | Canadian National Railway Co. | 195,905 | |||||
| 1,868 | Colfax Corp.* | 139,241 | |||||
| 1,560 | Copa Holdings S.A. | 222,409 | |||||
| 4,395 | Fastenal Co. | 217,508 | |||||
| 2,453 | HEICO Corp. | 127,409 | |||||
| 327 | NOW, Inc.* | 11,841 | |||||
| 1,227 | Stericycle, Inc.* | 145,301 | |||||
| 1,216 | United Rentals, Inc.* | 127,352 | |||||
| 1,186,966 | |||||||
| Information Technology — 24.6% | |||||||
| 4,305 | Apple, Inc. | 400,064 | |||||
| 9,215 | Applied Micro Circuits Corp.* | 99,614 | |||||
| 2,998 | BroadSoft, Inc.* | 79,117 | |||||
| 1,934 | Check Point Software Technologies, Ltd.* | 129,636 | |||||
| 1,393 | CommVault Systems, Inc.* | 68,494 | |||||
| 4,057 | CoreLogic, Inc.* | 123,171 | |||||
| 1,539 | Criteo S.A. ADR* | 51,972 | |||||
| 2,554 | E2open, Inc.* | 52,791 | |||||
| 2,293 | Fair Isaac Corp. | 146,202 | |||||
| 5,588 | Genpact, Ltd.* | 97,958 | |||||
| 143 | Google, Inc. — Class C* | 82,265 | |||||
| 143 | Google, Inc. — Class A* | 83,608 | |||||
| 3,541 | Microsemi Corp.* | 94,757 | |||||
| 2,696 | MTS Systems Corp. | 182,681 | |||||
| 2,991 | National Instruments Corp. | 96,878 | |||||
| 2,123 | NetApp, Inc. | 77,532 | |||||
| 7,876 | Pegasystems, Inc. | 166,341 | |||||
| 3,876 | QUALCOMM, Inc. | 306,979 | |||||
| 2,793 | Salesforce.com, Inc.* | 162,217 | |||||
| 1,256 | Stratasys Ltd.* | 142,719 | |||||
| 740 | Visa, Inc. | 155,925 | |||||
| 2,910 | Xoom Corp.* | 76,708 | |||||
| 2,877,629 | |||||||
| Materials — 4.1% | |||||||
| 1,711 | Ecolab, Inc. | 190,503 | |||||
| 4,110 | Marrone Bio Innovations, Inc.* | 47,758 | |||||
| 892 | Praxair, Inc. | 118,493 | |||||
| 1,640 | Rockwood Holdings, Inc. | 124,624 | |||||
| 481,378 | |||||||
| Total Common Stocks (Cost $8,294,472) | 11,483,933 | ||||||
The accompanying notes are an integral part of these financial statements.
www.brownadvisoryfunds.com
25
Brown Advisory Opportunity Fund
Schedule of Investments
June 30, 2014
| Shares | Security Description | Value $ | |||||
| Short-Term Investments — 1.5% | |||||||
| Money Market Funds — 1.5% | |||||||
| 179,902 | DWS Cash Account Trust — Government | ||||||
| & Agency Securities Portfolio, 0.03%# | 179,902 | ||||||
| Total Short-Term Investments (Cost $179,902) | 179,902 | ||||||
| Total Investments — 99.8% (Cost $8,474,374) | 11,663,835 | ||||||
| Other Assets in Excess of Liabilities — 0.2% | 17,134 | ||||||
| NET ASSETS — 100.0% | $ | 11,680,969 | |||||
PORTFOLIO HOLDINGS
% of Net Assets
| Information Technology | 24.6 | % | ||
| Consumer Discretionary | 16.0 | % | ||
| Financials | 14.4 | % | ||
| Health Care | 11.4 | % | ||
| Energy | 10.2 | % | ||
| Industrials | 10.2 | % | ||
| Consumer Staples | 7.4 | % | ||
| Materials | 4.1 | % | ||
| Money Market Funds | 1.5 | % | ||
| Other Assets and Liabilities | 0.2 | % | ||
| 100.0 | % |
| * | Non-Income Producing |
| # | Annualized seven-day yield as of June 30, 2014. |
The accompanying notes are an integral part of these financial statements.
www.brownadvisoryfunds.com
26
Brown Advisory Maryland Bond Fund
A Message to Our Shareholders
June 30, 2014
Dear Shareholder:
For the year ended June 30, 2014, the Brown Advisory Maryland Bond Fund (the “Fund”) returned 2.94%, versus the Fund’s benchmark, the Barclays 1-10 Year Blended Municipal Bond Index, which returned 4.27%.
The second half of 2013 proved to be a difficult period for the tax-exempt market. Negative sentiment fueled by concerns about Puerto Rico’s troubled economy, Detroit’s bankruptcy and the Federal Reserve’s impending taper of its quantitative-easing program led to a flood of redemptions from municipal bond funds. The resulting pressure on bond prices produced negative returns in the tax-exempt market for that six-month period.
However, demand for municipal bonds picked up considerably during the first half of 2014, and cash flows into investment-grade mutual funds turned positive as nontraditional tax-exempt entities moved in to buy bonds at what they perceived as discounted price levels, particularly for longer-maturity issues. Higher yields also enticed retail investors to follow suit. During the six months ended June 30, the tax-exempt market experienced strong returns, generally reversing most of the negative performance of 2013. Credit spreads tightened around the country, but the Maryland market lagged the broader muni market due to the generally higher-quality characteristics of bonds issued by the state.
We have been positioning the Fund to potentially benefit from a yield-curve “flattening” scenario, meaning a scenario in which short-term rates rise more than long-term rates. While the Fed is likely to begin hiking short-term rates in the near term, we believe that long-term rates are likely to stay somewhat anchored by the fears that rate hikes could choke off an already-tepid economic recovery. Specifically, we have focused the portfolio on the shorter (inside of three years) and longer (beyond 10 years) parts of the yield curve. The shorter maturities are being held as dry powder to purchase bonds at higher yields when the Fed begins to move. The longer maturities are being held for the yield opportunity and the stability that we believe they offer. Overall, the duration of the Fund has been neutral to slightly shorter than the benchmark, a positioning that contributed to above-benchmark performance in the first half of 2014.
We are overweight credit sectors, even after taking advantage of the strength in the hospital sector to sell some holdings at healthy valuations. Longer-maturity credit issues were the underperformers for the second half of 2013 but have proven to be among the strongest performers in 2014. Given the high-quality composition of the Maryland market, there are a limited number of credits available to optimize the Fund’s spread sector exposure. The Fund has the capacity to invest up to 20% in non-Maryland issues, and we have been able to mitigate the lack of spread sector credits in the Maryland market by investing in select non-Maryland issues.
The fund seeks to provide a high level of current income consistent with preservation of principal within an intermediate-term maturity structure.
Sincerely,
Monica M. Hausner
Portfolio Manager
Past performance is not a guarantee of future results.
Mutual fund investing involves risk. Principal loss is possible. The Fund is non-diversified which means it may invest a large percentage of its assets in the securities of fewer issuers. Investment in a limited number of issuers exposes the Fund to greater market risk than if its assets were diversified among a greater number of issuers. The Fund is also subject to interest rate risk which is the risk that debt securities in the Fund’s portfolio will decline in value because of an increase in market interest rates. Municipal securities are subject to adverse political or economic factors, including changes in the tax law. Income from tax-exempt funds may be subject to state and local taxes and a portion of income may be subject to the federal alternative minimum tax for certain investors.
Fund holdings and sector allocations are subject to change and should not be considered a recommendation to buy or sell any security. For a complete list of fund holdings, please refer to the Schedule of Investments provided in this report.
Definitions for terms and indices are provided in the Glossary of Terms.
www.brownadvisoryfunds.com
27
Brown Advisory Maryland Bond Fund
Performance Chart and Analysis
June 30, 2014
COMPARISON OF CHANGE IN VALUE OF A $10,000 INVESTMENT
The following chart reflects the change in value of a hypothetical $10,000 investment, including reinvested dividends and distributions, in the Fund as measured against the broad-based municipal bond index. The Barclays 1-10 Year Blended Municipal Bond Index (“Index”) is a market index of high quality, domestic fixed income securities with maturities of less than 10 years. The Index is unmanaged and does not reflect the deduction of fees, such as investment management fees. Investors cannot invest directly in an index.
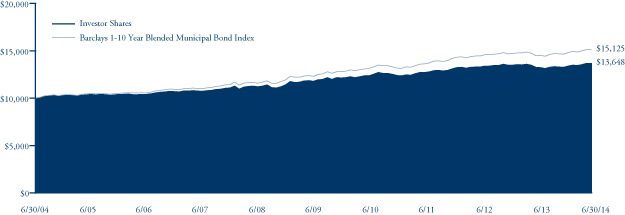
| Average Annual Total Return | One | Five | Ten |
| as of 6/30/14 | Year | Year | Year |
| Investor Shares | 2.94% | 3.03% | 3.16% |
| Barclays 1-10 Year Blended Municipal Bond Index | 4.27% | 4.19% | 4.22% |
| Investor Shares | |
Gross Expense Ratio1 | 0.55% |
Net Expense Ratio1 | 0.55% |
Past performance does not guarantee future results. The performance data quoted represents past performance and current returns may be lower or higher. The investment return and net asset value will fluctuate so that an investor’s shares, when redeemed, may be worth more or less than the original cost. To obtain performance information current to the most recent month end, please visit our website at brownadvisoryfunds.com/performance.html. The performance table and graph above do not reflect the deduction of taxes that a shareholder would pay on Fund distributions or the redemption of Fund shares. Investment performance reflects periods during which fee waivers were in effect. In the absence of such waivers, total return would have been reduced. Performance data does not reflect the imposition of the redemption fee of 1.00% on shares redeemed within 14 days, and if it did, performance would have been lower.
| 1 | Per the Fund’s prospectus dated October 31, 2013. |
www.brownadvisoryfunds.com
28
Brown Advisory Maryland Bond Fund
Schedule of Investments
June 30, 2014
| Par Value | Security Description | Rate | Maturity | Value $ | |||||||||
| Municipal Bonds — 96.5% | |||||||||||||
| General Obligation Bonds — 38.4% | |||||||||||||
| 565,000 | Anne Arundel County Maryland Consolidated General Improvements | 5.00 | % | 03/01/2015 | 583,453 | ||||||||
| 500,000 | Anne Arundel County Maryland Consolidated General Improvements | 4.00 | % | 04/01/2015 | 514,590 | ||||||||
| 5,075,000 | Anne Arundel County Maryland Consolidated General Improvements Callable 04/01/2024 @ 100^ | 5.00 | % | 04/01/2030 | 6,029,049 | ||||||||
| 900,000 | Baltimore County Maryland Consolidated Public Improvement | 5.00 | % | 09/01/2015 | 951,210 | ||||||||
| 315,000 | Baltimore County Maryland Consolidated Public Improvement | 5.00 | % | 11/01/2015 | 335,374 | ||||||||
| 350,000 | Baltimore County Maryland Consolidated Public Improvement | 5.00 | % | 08/01/2022 | 429,597 | ||||||||
| 1,280,000 | Baltimore County Maryland Consolidated Public Improvement | 5.00 | % | 10/15/2015 | 1,359,974 | ||||||||
| 250,000 | Baltimore County Maryland Consolidated Public Improvement | 5.00 | % | 10/15/2015 | 265,620 | ||||||||
| 440,000 | Baltimore County Maryland Consolidated Public Improvement | 5.00 | % | 10/15/2014 | 446,323 | ||||||||
| 575,000 | Baltimore County Maryland Pension Funding | 5.00 | % | 08/01/2015 | 605,469 | ||||||||
| 1,000,000 | Carroll County Maryland County Commissioners Consolidated Public Improvement | 5.00 | % | 11/01/2015 | 1,064,680 | ||||||||
| 500,000 | Carroll County Maryland County Commissioners Consolidated Public Improvement | 4.00 | % | 12/01/2015 | 527,185 | ||||||||
| 200,000 | Cecil County Maryland | 5.00 | % | 05/01/2024 | 246,596 | ||||||||
| 1,930,000 | Charles County Maryland County Commissioners Consolidated Public Improvement | 5.00 | % | 02/01/2015 | 1,985,545 | ||||||||
| 660,000 | Charles County Maryland County Commissioners Consolidated Public Improvement | ||||||||||||
| Callable 3/1/2015 @ 100^ | 4.25 | % | 03/01/2016 | 678,018 | |||||||||
| 3,000,000 | Frederick City Maryland Consolidated Public Improvement | 5.00 | % | 09/01/2016 | 3,305,880 | ||||||||
| 2,000,000 | Frederick County Maryland Consolidated Public Improvement Series A | 4.00 | % | 02/01/2016 | 2,118,140 | ||||||||
| 200,000 | Frederick County Maryland Public Facilities | 5.00 | % | 08/01/2014 | 200,850 | ||||||||
| 500,000 | Frederick County Maryland Public Facilities | 5.25 | % | 11/01/2021 | 613,975 | ||||||||
| 1,000,000 | Harford County Maryland | 5.00 | % | 03/15/2016 | 1,080,750 | ||||||||
| 330,000 | Harford County Maryland Consolidated Public Improvement | 5.00 | % | 07/01/2015 | 346,186 | ||||||||
| 200,000 | Harford County Maryland Consolidated Public Improvement | 5.00 | % | 12/01/2015 | 213,708 | ||||||||
| 685,000 | Howard County Maryland Consolidated Public Improvement Project Series A | 5.00 | % | 08/15/2014 | 689,220 | ||||||||
| 1,000,000 | Howard County Maryland Consolidated Public Improvement Project Series A | 5.00 | % | 02/15/2016 | 1,077,320 | ||||||||
| 2,000,000 | Howard County Maryland Consolidated Public Improvement Project Series A | 4.00 | % | 04/15/2015 | 2,061,700 | ||||||||
| 300,000 | Howard County Maryland Consolidated Public Improvement Project Series A | 5.00 | % | 08/15/2015 | 316,446 | ||||||||
| 2,020,000 | Howard County Maryland Metropolitan District Project Series B | 5.00 | % | 08/15/2016 | 2,220,970 | ||||||||
| 1,095,000 | Maryland National Capital Park & Planning Commission | 3.00 | % | 01/15/2015 | 1,112,213 | ||||||||
| 945,000 | Maryland National Capital Park & Planning Commission | 3.00 | % | 01/15/2016 | 985,418 | ||||||||
| 6,335,000 | Maryland State | 5.00 | % | 08/01/2016 | 6,954,816 | ||||||||
| 550,000 | Maryland State & Local Facilities Loan | 5.00 | % | 08/01/2015 | 579,145 | ||||||||
| 500,000 | Maryland State & Local Facilities Loan 2nd Series A | 5.00 | % | 08/01/2015 | 526,495 | ||||||||
| 5,000,000 | Maryland State & Local Facilities Loan | 5.00 | % | 08/01/2015 | 5,264,950 | ||||||||
| 500,000 | Maryland State & Local Facilities Loan | 5.00 | % | 08/01/2016 | 548,920 | ||||||||
| 2,950,000 | Maryland State & Local Facilities Loan Callable 3/1/2021 @ 100^ | 5.00 | % | 03/01/2023 | 3,516,312 | ||||||||
| 2,500,000 | Maryland State Local Facilities First Series C, Callable 3/1/2019 @ 100^ | 4.00 | % | 03/01/2022 | 2,783,775 | ||||||||
| 565,000 | Montgomery County Maryland Consolidated Public Improvement Series A | 5.00 | % | 08/01/2014 | 567,401 | ||||||||
| 1,000,000 | Montgomery County Maryland Consolidated Public Improvement Series A | 5.00 | % | 11/01/2014 | 1,016,560 | ||||||||
| 2,175,000 | Montgomery County Maryland Consolidated Public Improvement Series A | 5.00 | % | 05/01/2015 | 2,264,023 | ||||||||
| 565,000 | Montgomery County Maryland Consolidated Public Improvement Series A | 5.00 | % | 08/01/2015 | 594,939 | ||||||||
| 500,000 | Montgomery County Maryland Consolidated Public Improvement Series A, | ||||||||||||
| Callable 9/1/2014 @ 100^ | 5.00 | % | 09/01/2015 | 504,175 | |||||||||
| 1,745,000 | Montgomery County Maryland Consolidated Public Improvement Series A | 5.00 | % | 05/01/2016 | 1,896,571 | ||||||||
| 2,000,000 | Montgomery County Maryland Consolidated Public Improvement Series A | 5.00 | % | 08/01/2016 | 2,195,680 | ||||||||
| 2,955,000 | Montgomery County Maryland Consolidated Public Improvement | 5.00 | % | 07/01/2021 | 3,590,886 | ||||||||
| 1,790,000 | Prince Georges County Maryland Consolidated Public Improvement | 5.00 | % | 09/15/2014 | 1,808,383 | ||||||||
| 750,000 | Prince Georges County Maryland Consolidated Public Improvement Series A | 5.00 | % | 07/15/2015 | 788,168 | ||||||||
| 1,275,000 | Prince Georges County Maryland Consolidated Public Improvement | 5.00 | % | 09/15/2015 | 1,349,881 | ||||||||
| 2,400,000 | Prince Georges County Maryland Consolidated Public Improvement | 5.00 | % | 08/01/2016 | 2,634,816 | ||||||||
| 565,000 | Washington County Maryland — Public Improvement | 4.50 | % | 01/01/2015 | 577,481 | ||||||||
| 1,600,000 | Washington Suburban Sanitary District | 4.00 | % | 06/01/2015 | 1,657,280 | ||||||||
| 250,000 | Washington Suburban Sanitary District Maryland Consolidated Public Improvement Series A | 4.00 | % | 06/01/2015 | 258,950 | ||||||||
| 200,000 | Washington Suburban Sanitary District Maryland Sewage Disposal | 5.00 | % | 06/01/2016 | 218,118 | ||||||||
| 1,500,000 | Washington Suburban Sanitation District Consolidated Public Improvement | 5.00 | % | 06/01/2015 | 1,567,485 | ||||||||
The accompanying notes are an integral part of these financial statemen
www.brownadvisoryfunds.com
29
Brown Advisory Maryland Bond Fund
Schedule of Investments
June 30, 2014
| Par Value | Security Description | Rate | Maturity | Value $ | |||||||||
| Municipal Bonds — (Continued) | |||||||||||||
| General Obligation Bonds — (Continued) | |||||||||||||
| 1,500,000 | Washington Suburban Sanitation District Consolidated Public Improvement | 5.00 | % | 06/01/2016 | 1,635,885 | ||||||||
| 1,330,000 | Wicomico County Maryland | 3.00 | % | 12/01/2014 | 1,346,213 | ||||||||
| 79,012,767 | |||||||||||||
| Refunded Bonds — 1.1% | |||||||||||||
| 250,000 | Frederick County Maryland Public Facilities Callable 8/1/2015 @ 100^ | 5.00 | % | 08/01/2016 | 263,120 | ||||||||
| 500,000 | Maryland State & Local Facilities Loan 1st Series, Callable 8/1/2014 @ 100^ | 5.00 | % | 08/01/2015 | 502,110 | ||||||||
| 665,000 | Maryland State & Local Facilities Loan 2nd Series A, Callable 8/1/2015 @ 100^ | 5.00 | % | 08/01/2017 | 699,899 | ||||||||
| 250,000 | Maryland State Health & Higher Educational Facilities — Goucher College Callable 7/1/2014 @ 100^ | 4.50 | % | 07/01/2019 | 250,030 | ||||||||
| 500,000 | Maryland State Health & Higher Educational Facilities — Lifebridge Health Series A, | ||||||||||||
| Prerefunded 7/1/2014 @ 100^ | 4.00 | % | 07/01/2017 | 500,055 | |||||||||
| 2,215,214 | |||||||||||||
| Revenue Bonds — 57.0% | |||||||||||||
| 500,000 | Baltimore County Maryland Economic Development Various Garrison Forest School Incorporate# | 3.00 | % | 10/01/2031 | 518,350 | ||||||||
| 405,000 | Baltimore Maryland Wastewater Project Series A | 3.40 | % | 07/01/2016 | 429,588 | ||||||||
| 360,000 | Baltimore Maryland Wastewater Project Series A, Callable 7/1/2018 @ 100 AGM Insured^ | 5.00 | % | 07/01/2020 | 412,920 | ||||||||
| 500,000 | Chicago Illinois Motor Fuel Tax Revenue Callable 01/01/2024 @ 100^ | 5.00 | % | 01/01/2027 | 546,855 | ||||||||
| 1,000,000 | Chicago Illinois O’Hare International Airport Refunding General Airport Third Lien Series B | 5.25 | % | 01/01/2018 | 1,141,660 | ||||||||
| 255,000 | Chicago Midway International Airport Callable 01/01/2024 @ 100^ | 5.00 | % | 01/01/2027 | 290,226 | ||||||||
| 5,000,000 | City of Baltimore Callable 01/01/2024 @ 100^ | 5.00 | % | 07/01/2038 | 5,621,250 | ||||||||
| 2,855,000 | Colorado Health Facilities Authority Revenue Covenant Retirement | 5.00 | % | 12/01/2022 | 3,155,717 | ||||||||
| 2,500,000 | Frederick County Maryland Special Obligation Subordinated Urbana | ||||||||||||
| Community Development Authority Series B, Callable 7/1/2020 @ 100^ | 5.50 | % | 07/01/2040 | 2,524,775 | |||||||||
| 375,000 | Frederick County Maryland Special Obligation Urbana Community Development Authority Series A | 4.00 | % | 07/01/2017 | 406,627 | ||||||||
| 500,000 | Maryland Environmental Service Revenue Mid Shore III Regional Landfill Callable 11/1/2020 @ 100^ | 5.00 | % | 11/01/2022 | 573,750 | ||||||||
| 500,000 | Maryland State Community Development Administration — Residential Program Series G | 4.10 | % | 09/01/2014 | 503,150 | ||||||||
| 1,000,000 | Maryland State Community Development Administration — Residential Program Series C | 3.85 | % | 09/01/2015 | 1,040,150 | ||||||||
| 1,498,286 | Maryland State Community Development Administration — Single Family Housing Series A, | ||||||||||||
| Callable 10/1/2023 @ 100^ | 4.00 | % | 07/01/2043 | 1,528,476 | |||||||||
| 500,000 | Maryland State Community Development Administration Local Government Infrastructure — A-1 | ||||||||||||
| Callable 6/1/2020 @ 100^ | 3.50 | % | 06/01/2022 | 534,815 | |||||||||
| 1,000,000 | Maryland State Department of Transportation | 5.25 | % | 12/15/2014 | 1,023,710 | ||||||||
| 200,000 | Maryland State Department of Transportation | 5.00 | % | 03/01/2015 | 206,558 | ||||||||
| 100,000 | Maryland State Department of Transportation | 5.00 | % | 06/01/2015 | 104,499 | ||||||||
| 3,200,000 | Maryland State Department of Transportation | 4.00 | % | 02/15/2016 | 3,395,552 | ||||||||
| 500,000 | Maryland State Department of Transportation Callable 5/15/2017 @ 100^ | 4.00 | % | 05/15/2020 | 539,100 | ||||||||
| 700,000 | Maryland State Department of Transportation 2nd Issue, Callable 9/1/2018 @ 100^ | 4.00 | % | 09/01/2021 | 774,662 | ||||||||
| 100,000 | Maryland State Economic Development Corporation — Salisbury University Project | 5.00 | % | 06/01/2022 | 111,364 | ||||||||
| 100,000 | Maryland State Economic Development Corporation — Salisbury University Project | 4.00 | % | 06/01/2023 | 102,974 | ||||||||
| 200,000 | Maryland State Economic Development Corporation — Salisbury University Project | ||||||||||||
| Callable 6/1/2023 @ 100^ | 5.00 | % | 06/01/2027 | 215,390 | |||||||||
| 400,000 | Maryland State Economic Development Corporation — Senior Student Housing | ||||||||||||
| Towson University Project Callable 7/1/2022 @ 100^ | 5.00 | % | 07/01/2027 | 431,000 | |||||||||
| 500,000 | Maryland State Economic Development Corporation — University of Maryland | ||||||||||||
| College Park Project Callable 6/1/2016 @ 100^ | 5.00 | % | 06/01/2022 | 532,090 | |||||||||
| 10,000,000 | Maryland State Health & Higher Educational Facilities — Adjusted Rate — | ||||||||||||
| Pooled Loan Program Series B# | 0.07 | % | 04/01/2035 | 10,000,000 | |||||||||
| 455,000 | Maryland State Health & Higher Educational Facilities — Adventist Health Care Series A | 5.00 | % | 01/01/2022 | 519,342 | ||||||||
| 2,110,000 | Maryland State Health & Higher Educational Facilities — Adventist Health Care Series A, | ||||||||||||
| Callable 1/1/2022 @ 100^ | 5.50 | % | 01/01/2023 | 2,454,352 | |||||||||
| 1,395,000 | Maryland State Health & Higher Educational Facilities — Charlestown Community Project | 5.00 | % | 01/01/2018 | 1,522,531 | ||||||||
| 650,000 | Maryland State Health & Higher Educational Facilities — Edenwald Series A, | ||||||||||||
| Callable 7/1/2016 @ 100^ | 5.20 | % | 01/01/2024 | 673,231 | |||||||||
The accompanying notes are an integral part of these financial statements.
www.brownadvisoryfunds.com
30
Brown Advisory Maryland Bond Fund
Schedule of Investments
June 30, 2014
| Par Value | Security Description | Rate | Maturity | Value $ | |||||||||
| Municipal Bonds — (Continued) | |||||||||||||
| Revenue Bonds — (Continued) | |||||||||||||
| 1,000,000 | Maryland State Health & Higher Educational Facilities — Edenwald Series A, | ||||||||||||
| Callable 7/1/2016 @ 100^ | 5.40 | % | 01/01/2037 | 1,024,170 | |||||||||
| 390,000 | Maryland State Health & Higher Educational Facilities — Greater Baltimore Medical Center Series A, | ||||||||||||
| Callable 7/1/2022 @ 100^ | 5.00 | % | 07/01/2023 | 452,205 | |||||||||
| 1,995,000 | Maryland State Health & Higher Educational Facilities — Greater Baltimore Medical Center | 5.00 | % | 07/01/2021 | 2,277,173 | ||||||||
| 1,000,000 | Maryland State Health & Higher Educational Facilities — Greater Baltimore Medical Center | ||||||||||||
| Callable 7/1/2021 @ 100^ | 5.00 | % | 07/01/2023 | 1,115,800 | |||||||||
| 575,000 | Maryland State Health & Higher Educational Facilities — Greater Baltimore Medical Center | ||||||||||||
| Callable 7/1/2021 @ 100^ | 5.25 | % | 07/01/2024 | 646,892 | |||||||||
| 250,000 | Maryland State Health & Higher Educational Facilities — Greater Baltimore Medical Center | ||||||||||||
| Callable 7/1/2021 @ 100^ | 5.25 | % | 07/01/2025 | 279,598 | |||||||||
| 1,500,000 | Maryland State Health & Higher Educational Facilities — Johns Hopkins Health System | ||||||||||||
| Callable 7/1/2022 @ 100^ | 5.00 | % | 07/01/2023 | 1,780,050 | |||||||||
| 3,400,000 | Maryland State Health & Higher Educational Facilities — Johns Hopkins Health System | ||||||||||||
| Callable 5/15/2020 @ 100^ | 5.00 | % | 05/15/2040 | 3,630,418 | |||||||||
| 350,000 | Maryland State Health & Higher Educational Facilities — Johns Hopkins Health System Series B# | 4.30 | % | 05/15/2048 | 362,768 | ||||||||
| 115,000 | Maryland State Health & Higher Educational Facilities — Johns Hopkins Hospital | 5.00 | % | 05/15/2021 | 136,895 | ||||||||
| 500,000 | Maryland State Health & Higher Educational Facilities — Johns Hopkins University Series A | 5.00 | % | 07/01/2018 | 581,385 | ||||||||
| 500,000 | Maryland State Health & Higher Educational Facilities — Lifebridge Health | 5.00 | % | 07/01/2017 | 551,815 | ||||||||
| 250,000 | Maryland State Health & Higher Educational Facilities — Lifebridge Health | ||||||||||||
| Callable 7/1/2017 @ 100^ | 5.00 | % | 07/01/2018 | 276,297 | |||||||||
| 250,000 | Maryland State Health & Higher Educational Facilities — Lifebridge Health | 5.00 | % | 07/01/2019 | 282,990 | ||||||||
| 100,000 | Maryland State Health & Higher Educational Facilities — Lifebridge Health | ||||||||||||
| Callable 7/1/2021 @ 100^ | 6.00 | % | 07/01/2022 | 118,893 | |||||||||
| 520,000 | Maryland State Health & Higher Educational Facilities — Lifebridge Health | ||||||||||||
| Callable 7/1/2021 @ 100^ | 5.25 | % | 07/01/2024 | 585,016 | |||||||||
| 355,000 | Maryland State Health & Higher Educational Facilities — Medstar Health | 5.00 | % | 08/15/2021 | 413,259 | ||||||||
| 500,000 | Maryland State Health & Higher Educational Facilities — Medstar Health | 5.00 | % | 08/15/2023 | 581,970 | ||||||||
| 3,290,000 | Maryland State Health & Higher Educational Facilities — Medstar Health | ||||||||||||
| Callable 08/15/2023 @ 100^ | 5.00 | % | 08/15/2038 | 3,541,915 | |||||||||
| 500,000 | Maryland State Health & Higher Educational Facilities — Mercy Medical Center | ||||||||||||
| Callable 7/1/2022 @ 100^ | 5.00 | % | 07/01/2024 | 554,720 | |||||||||
| 1,000,000 | Maryland State Health & Higher Educational Facilities — Mercy Medical Center | ||||||||||||
| Callable 7/1/2021 @ 100^ | 6.00 | % | 07/01/2025 | 1,155,420 | |||||||||
| 1,130,000 | Maryland State Health & Higher Educational Facilities — Mercy Medical Center | ||||||||||||
| Callable 7/1/2021 @ 100^ | 6.25 | % | 07/01/2031 | 1,282,471 | |||||||||
| 200,000 | Maryland State Health & Higher Educational Facilities — Mercy Ridge Series A, | ||||||||||||
| Callable 7/1/2017 @ 100^ | 5.00 | % | 07/01/2026 | 207,672 | |||||||||
| 135,000 | Maryland State Health & Higher Educational Facilities — Mercy Ridge Series A, | ||||||||||||
| Callable 7/1/2017 @ 100^ | 5.00 | % | 07/01/2027 | 139,751 | |||||||||
| 200,000 | Maryland State Health & Higher Educational Facilities — Mercy Ridge Callable 7/1/2017 @ 100^ | 4.50 | % | 07/01/2035 | 202,238 | ||||||||
| 1,000,000 | Maryland State Health & Higher Educational Facilities — Peninsula Regional Medical Center | ||||||||||||
| Callable 7/1/2016 @ 100^ | 5.00 | % | 07/01/2026 | 1,068,630 | |||||||||
| 260,000 | Maryland State Health & Higher Educational Facilities — University of Maryland | ||||||||||||
| Medical System Series F | 5.00 | % | 07/01/2018 | 296,202 | |||||||||
| 250,000 | Maryland State Health & Higher Educational Facilities — University of Maryland Medical System | 5.00 | % | 07/01/2020 | 291,383 | ||||||||
| 400,000 | Maryland State Health & Higher Educational Facilities — University of Maryland Medical System | 5.00 | % | 07/01/2022 | 468,652 | ||||||||
| 500,000 | Maryland State Health & Higher Educational Facilities — University of Maryland Medical System | ||||||||||||
| Callable 7/1/2018 @ 100^ | 5.50 | % | 07/01/2024 | 566,060 | |||||||||
| 250,000 | Maryland State Health & Higher Educational Facilities — University of Maryland Medical System | ||||||||||||
| Callable 7/1/2019 @ 100^ | 5.00 | % | 07/01/2034 | 263,317 | |||||||||
| 1,640,000 | Maryland State Health & Higher Educational Facilities — Upper Chesapeake Hospitals | 5.50 | % | 01/01/2018 | 1,740,302 | ||||||||
| 240,000 | Maryland State Health & Higher Educational Facilities — Western Medical Health Series A, | ||||||||||||
| Callable 7/1/2016 @ 100^ | 5.00 | % | 01/01/2025 | 257,954 | |||||||||
| 1,750,000 | Maryland State Industrial Development Financing Authority Multi-Modal# | 2.00 | % | 09/01/2040 | 1,780,590 | ||||||||
The accompanying notes are an integral part of these financial statements.
www.brownadvisoryfunds.com
31
Brown Advisory Maryland Bond Fund
Schedule of Investments
June 30, 2014
| Par Value | Security Description | Rate | Maturity | Value $ | |||||||||
| Municipal Bonds — (Continued) | |||||||||||||
| Revenue Bonds — (Continued) | |||||||||||||
| 1,250,000 | Maryland State Industrial Development Financing Authority Multi-Modal — | ||||||||||||
| McDonogh School Series B# | 1.10 | % | 09/01/2040 | 1,259,825 | |||||||||
| 750,000 | Maryland State Transportation Authority Series A | 3.00 | % | 07/01/2016 | 790,170 | ||||||||
| 570,000 | Maryland State Transportation Authority Callable 7/1/2018 @ 100^ | 5.00 | % | 07/01/2021 | 651,390 | ||||||||
| 4,255,000 | Maryland State Transportation Authority Airport Baltimore/Washington | 5.00 | % | 03/01/2022 | 5,012,773 | ||||||||
| 970,000 | Maryland State Transportation Authority Transportation Facilities Project Series 2009A, | ||||||||||||
| Callable 7/1/2019 @ 100^ | 5.00 | % | 07/01/2022 | 1,129,895 | |||||||||
| 1,815,000 | Maryland State Transportation Authority Transportation | 5.00 | % | 07/01/2020 | 2,159,451 | ||||||||
| 1,715,000 | Maryland State Water Quality Financing | 5.00 | % | 03/01/2015 | 1,771,235 | ||||||||
| 500,000 | Maryland State Water Quality Financing Series A | 5.00 | % | 09/01/2015 | 528,390 | ||||||||
| 265,000 | Maryland State Water Quality Financing — Administrative Revolving Loan Fund Series A, | ||||||||||||
| Callable 3/1/2018 @ 100^ | 5.00 | % | 03/01/2019 | 303,735 | |||||||||
| 300,000 | Maryland State Water Quality Financing — Administrative Revolving Loan Fund | ||||||||||||
| Callable 3/1/2018 @ 100^ | 4.00 | % | 03/01/2019 | 330,468 | |||||||||
| 2,820,000 | Maryland Water Quality Financing Administration Revolving Loan Fund | 5.00 | % | 03/01/2017 | 3,154,678 | ||||||||
| 785,000 | Montgomery County Maryland Housing Opportunities Revenue Bonds | 1.60 | % | 07/01/2018 | 794,640 | ||||||||
| 950,000 | Montgomery County Maryland Parking Revenue System Project Bethesda Parking Lot District | 4.00 | % | 06/01/2015 | 983,117 | ||||||||
| 1,385,000 | Montgomery County Maryland Parking Revenue System Project Bethesda Parking Lot District | 4.00 | % | 06/01/2015 | 1,433,281 | ||||||||
| 1,000,000 | Nebraska Investment Finance Authority Housing Single Revenue Bonds | 2.50 | % | 09/01/2022 | 988,410 | ||||||||
| 1,000,000 | New Jersey State Transportation Trust Fund Authority Transportation Program Bonds Series AA | 5.00 | % | 06/15/2020 | 1,153,710 | ||||||||
| 1,381,037 | New Mexico State Mortgage Finance Authority Callable 6/1/2023 @ 100^ | 2.85 | % | 07/01/2043 | 1,395,344 | ||||||||
| 700,000 | New York State Mortgage Agency Revenue | 0.85 | % | 04/01/2016 | 704,760 | ||||||||
| 500,000 | Oklahoma State Municipal Power Authority Callable 1/1/2023 @ 100^ | 4.00 | % | 01/01/2043 | 503,770 | ||||||||
| 450,000 | Oregon Health & Science University Series E, Callable 7/1/2022 @ 100^ | 5.00 | % | 07/01/2025 | 519,327 | ||||||||
| 1,250,000 | Puerto Rico Sales Tax Financing Corp Callable 08/01/2019 @ 100^ | 5.38 | % | 08/01/2020 | 1,230,550 | ||||||||
| 3,500,000 | Puerto Rico Sales Tax Financing Corp. Revenue Bonds | 5.25 | % | 08/01/2019 | 3,495,205 | ||||||||
| 3,500,000 | Puerto Rico Sales Tax Financing Corp. Revenue Bonds Series A, Callable 8/1/2019 @ 100^ | 5.50 | % | 08/01/2023 | 3,331,300 | ||||||||
| 1,810,000 | Puerto Rico Sales Tax Financing Corp. Revenue Bonds First Subseries A-1 | 8.14 | %~ | 08/01/2024 | 822,084 | ||||||||
| 250,000 | Railsplitter Tobacco Settlement Authority | 5.00 | % | 06/01/2016 | 269,750 | ||||||||
| 3,000,000 | Tobacco Settlement Financing Corp. | 5.00 | % | 06/01/2017 | 3,269,100 | ||||||||
| 2,540,000 | Tobacco Settlement Financing Corp. Callable 6/1/2017 @ 100^ | 5.00 | % | 06/01/2018 | 2,738,501 | ||||||||
| 2,300,000 | University of Maryland System Auxiliary | 5.00 | % | 10/01/2020 | 2,766,509 | ||||||||
| 350,000 | University of Maryland System Auxiliary Facility & Tuition Revenue | 5.00 | % | 04/01/2015 | 362,901 | ||||||||
| 1,000,000 | University of Maryland System Auxiliary Facility & Tuition Revenue Series D | 3.00 | % | 04/01/2015 | 1,021,820 | ||||||||
| 500,000 | University of Maryland System Auxiliary Facility & Tuition Revenue Series B | 3.75 | % | 10/01/2015 | 522,585 | ||||||||
| 1,100,000 | University of Maryland University Revenues Various Revolving — A-RMKT# | 1.25 | % | 07/01/2023 | 1,103,773 | ||||||||
| 117,251,982 | |||||||||||||
| Total Municipal Bonds (Cost $193,952,615) | 198,479,963 | ||||||||||||
The accompanying notes are an integral part of these financial statements.
www.brownadvisoryfunds.com
32
Brown Advisory Maryland Bond Fund
Schedule of Investments
June 30, 2014
| Shares | Security Description | Value $ | |||||
| Short-Term Investments — 1.7% | |||||||
| Money Market Funds — 1.7% | |||||||
| 3,434,566 | DWS Cash Account Trust — Tax-Exempt Portfolio, 0.01%* | 3,434,566 | |||||
| Total Short-Term Investments (Cost $3,434,566) | 3,434,566 | ||||||
| Total Investments — 98.2% (Cost $197,387,181) | 201,914,529 | ||||||
| Other Assets in Excess of Liabilities — 1.8% | 3,802,864 | ||||||
| TOTAL NET ASSETS — 100.0% | $ | 205,717,393 | |||||
| PORTFOLIO HOLDINGS | ||||
| % of Net Assets | ||||
| Revenue Bonds | 57.0 | % | ||
| General Obligation Bonds | 38.4 | % | ||
| Money Market Funds | 1.7 | % | ||
| Refunded Bond | 1.1 | % | ||
| Other Assets and Liabilities | 1.8 | % | ||
| 100.0 | % | |||
| ^ | Continuously callable with 30 days notice. |
| ~ | Zero coupon bond. Rate disclosed is yield to maturity as of June 30, 2014. |
| # | Variable rate security. Rate disclosed is as of June 30, 2014. |
| * | Annualized seven-day yield as of June 30, 2014. |
The accompanying notes are an integral part of these financial statements.
www.brownadvisoryfunds.com
33
Brown Advisory Intermediate Income Fund
A Message to Our Shareholders
June 30, 2014
Dear Shareholder:
For the year ended June 30, 2014, the Brown Advisory Intermediate Income Fund Investor Shares (the “Fund”) returned 2.66%, lagging the Fund’s benchmark, the Barclays Intermediate U.S. Aggregate Bond Index, which returned 3.48%.
In mortgage-backed securities, we were positioned defensively during the past year, emphasizing higher-coupon bonds. However, it was the lower-coupon, higher-duration bonds that performed best in an environment of generally falling rates. Mortgage spreads also tightened, as fresh bank demand overwhelmed diminishing Fed purchases from its quantitative easing program. While our positions benefited from this trend, it was not to the same degree as lower-coupon bonds.
Our corporate positions performed well, and we began to add floating-rate exposure starting in late 2013 as it became more likely that the Fed might begin to raise short-term rates earlier than previously expected. We believe that these positions will help to mitigate principal losses if and when rates begin to rise.
Municipal positions also contributed notably to returns. Municipals suffered a difficult period in the back half of 2013 due to persistent fund outflows that put substantial pressure on the whole sector. Particularly challenged were longer-term bonds, which tend to be largely held by tax-free mutual funds. We took positions in high-quality long-term bonds at different points during the period, and these positions performed quite well during the first quarter when mutual fund flows normalized and longer-term rates declined moderately. We have largely exited these positions on favorable terms as of the end of the reporting period.
Treasury Inflation-Protected Securities (TIPS) and traditional Treasuries were both mild detractors. TIPS dragged on our returns in the second half of 2013, but rallied substantially in 2014 as the market began to anticipate inflationary influences. Overall, TIPS produced positive but tepid returns over the course of the year. We typically use Treasuries as a store of liquidity as we wait for appealing opportunities in other sectors.
As we approach the end of the Federal Reserve’s quantitative-easing program and potentially the beginning of a cycle of interest-rate hikes, we believe that a conservative, yet opportunistic approach should serve investors well.
Sincerely,
Paul D. Corbin
Portfolio Manager
Past performance is not a guarantee of future results.
Mutual fund investing involves risk. Principal loss is possible. The Fund is subject to interest rate risk which is the risk that debt securities in the Fund’s portfolio will decline in value because of increases in market interest rates. Investments in Asset Backed and Mortgage Backed Securities include additional risks that investors should be aware of such as credit risk, prepayment risk, possible illiquidity and default, as well as increased susceptibility to adverse economic developments. Inflation-indexed bonds see the principal value of the security increased as the Consumer Price Index increases. Should the Consumer Price Index decline, those securities should be adversely impacted.
Fund holdings and sector allocations are subject to change and should not be considered a recommendation to buy or sell any security. For a complete list of fund holdings, please refer to the Schedule of Investments provided in this report.
Definitions for terms and indices are provided in the Glossary of Terms.
www.brownadvisoryfunds.com
34
Brown Advisory Intermediate Income Fund
Performance Chart and Analysis
June 30, 2014
COMPARISON OF CHANGE IN VALUE OF A $10,000 INVESTMENT
The following chart reflects the change in value of a hypothetical $10,000 investment, including reinvested dividends and distributions, in the Fund as measured against a broad-based bond index. The Barclays Intermediate U.S. Aggregate Bond Index (“Index”) represents domestic taxable investment grade bonds, with index components for government and corporate securities, mortgage pass-through securities, and asset-backed securities with average maturities and durations in the intermediate range. The Index is unmanaged and does not reflect the deduction of fees, such as investment management fees. Investors cannot invest directly in an index.

| Average Annual Total Return | One | Five | Ten |
| as of 6/30/14 | Year | Year | Year |
| Investor Shares | 2.66% | 3.76% | 4.15% |
| Advisor Shares | 2.36% | 3.52% | 3.88% |
| Barclays Intermediate U.S. Aggregate Bond Index | 3.48% | 4.23% | 4.57% |
| Investor Shares | Advisor Shares | |
Gross Expense Ratio1 | 0.54% | 0.79% |
Net Expense Ratio1 | 0.54% | 0.79% |
Past performance does not guarantee future results. The performance data quoted represents past performance and current returns may be lower or higher. The investment return and net asset value will fluctuate so that an investor’s shares, when redeemed, may be worth more or less than the original cost. To obtain performance information current to the most recent month end, please visit our website at brownadvisoryfunds.com/performance.html. The performance table and graph above do not reflect the deduction of taxes that a shareholder would pay on Fund distributions or the redemption of Fund shares. Investment performance reflects periods during which fee waivers were in effect. In the absence of such waivers, total return would have been reduced. Performance data does not reflect the imposition of the redemption fee of 1.00% on shares redeemed within 14 days, and if it did, performance would have been lower.
| 1 | Per the Fund’s prospectus dated October 31, 2013. |
www.brownadvisoryfunds.com
35
Brown Advisory Intermediate Income Fund
Schedule of Investments
June 30, 2014
| Par Value | Security Description | Rate | Maturity | Value $ | |||||||||
| U.S. Treasury Securities — 35.4% | |||||||||||||
| 5,310,375 | United States Treasury Inflation Indexed Bond | 1.13 | % | 01/15/2021 | 5,756,569 | ||||||||
| 15,998,892 | United States Treasury Inflation Indexed Bond | 0.13 | % | 04/15/2018 | 16,535,111 | ||||||||
| 18,060,000 | United States Treasury Note | 0.25 | % | 07/15/2015 | 18,079,396 | ||||||||
| 6,000,000 | United States Treasury Note | 0.38 | % | 02/15/2016 | 6,007,620 | ||||||||
| 9,000,000 | United States Treasury Note | 0.63 | % | 10/15/2016 | 9,010,197 | ||||||||
| 11,700,000 | United States Treasury Note | 0.75 | % | 02/28/2018 | 11,517,644 | ||||||||
| 11,050,000 | United States Treasury Note | 2.50 | % | 05/15/2024 | 11,035,325 | ||||||||
| Total U.S. Treasury Securities (Cost $77,543,650) | 77,941,862 | ||||||||||||
| Corporate Bonds & Notes — 24.9% | |||||||||||||
| 3,160,000 | Apple, Inc.# | 0.52 | % | 05/06/2019 | 3,166,788 | ||||||||
| 2,165,000 | Celgene Corp. | 2.30 | % | 08/15/2018 | 2,202,184 | ||||||||
| 2,235,000 | Citigroup, Inc.# | 1.92 | % | 05/15/2018 | 2,323,694 | ||||||||
| 2,300,000 | Eastman Chemical Co. | 2.40 | % | 06/01/2017 | 2,369,593 | ||||||||
| 2,060,000 | Energy Transfer Partners LP Callable 11/01/2021 @ 100^ | 5.20 | % | 02/01/2022 | 2,283,117 | ||||||||
| 2,350,000 | FMC Technologies, Inc. | 2.00 | % | 10/01/2017 | 2,382,075 | ||||||||
| 2,350,000 | Goldman Sachs Group, Inc.# | 1.42 | % | 04/30/2018 | 2,390,166 | ||||||||
| 2,135,000 | Healthcare Trust of America, Inc. Callable 05/15/2021 @ 100^ | 3.38 | % | 07/15/2021 | 2,139,471 | ||||||||
| 2,170,000 | JB Hunt Transport Services Inc. | 2.40 | % | 03/15/2019 | 2,182,024 | ||||||||
| 2,300,000 | JPMorgan Chase & Co# | 0.86 | % | 01/28/2019 | 2,312,915 | ||||||||
| 2,250,000 | Medco Health Solutions, Inc. | 4.13 | % | 09/15/2020 | 2,417,976 | ||||||||
| 2,185,000 | Nasdaq Omx Group, Inc. Callable 03/01/2024 @ 100^# | 4.25 | % | 06/01/2024 | 2,219,479 | ||||||||
| 926,000 | Oracle Corp.# | 0.74 | % | 10/08/2019 | 926,000 | ||||||||
| 2,290,000 | Providence Health & Services Floating Note# | 1.18 | % | 10/01/2017 | 2,279,798 | ||||||||
| 3,500,000 | Provident Bank of Maryland Callable 12/16/2013 @ 100^ | 9.50 | % | 05/01/2018 | 3,526,334 | ||||||||
| 2,245,000 | Realty Income Corp. Callable 05/01/2023 @ 100^ | 4.65 | % | 08/01/2023 | 2,414,731 | ||||||||
| 1,828,000 | Regency Centers LP | 6.00 | % | 06/15/2020 | 2,137,416 | ||||||||
| 3,395,000 | Royal Bank of Canada# | 0.76 | % | 03/15/2019 | 3,419,339 | ||||||||
| 1,610,000 | Saint Barnabas Health System | 4.00 | % | 07/01/2028 | 1,459,763 | ||||||||
| 2,250,000 | Sutter Health | 1.09 | % | 08/15/2053 | 2,232,380 | ||||||||
| 1,760,000 | Time Warner Entertainment Co. LP | 8.38 | % | 03/15/2023 | 2,384,221 | ||||||||
| 2,270,000 | Verizon Communications, Inc. | 3.65 | % | 09/14/2018 | 2,430,092 | ||||||||
| 2,742,000 | W.R. Berkley Corp. | 6.15 | % | 08/15/2019 | 3,102,433 | ||||||||
| Total Corporate Bonds & Notes (Cost $53,940,049) | 54,701,989 | ||||||||||||
| Municipal Bonds — 11.1% | |||||||||||||
| 670,000 | District of Columbia Income Tax Secured Revenue Bonds, Series 2010F | 4.71 | % | 12/01/2022 | 741,744 | ||||||||
| 5,770,257 | Illinois Housing Development Authority Revenue Bonds Callable 1/1/2023 @ 100^ | 2.75 | % | 06/01/2043 | 5,499,459 | ||||||||
| 1,000,000 | Illinois State Sales Tax Revenue Taxable Building | 2.30 | % | 06/15/2019 | 1,007,570 | ||||||||
| 1,560,000 | Indiana State Bond Bank Revenue | 1.02 | % | 07/15/2016 | 1,571,419 | ||||||||
| 3,200,000 | Maryland State Health & Higher Education Revenue Bonds | 3.99 | % | 07/01/2028 | 3,097,440 | ||||||||
| 290,000 | Metropolitan Washington District of Columbia Airports Taxable Series C Callable 10/1/2015 @ 100^ | 5.69 | % | 10/01/2030 | 300,034 | ||||||||
| 2,750,000 | Port Authority New York & New Jersey | 5.31 | % | 12/01/2019 | 3,207,930 | ||||||||
| 3,260,000 | Puerto Rico Sales Tax Financing Corporate Sales Revenue Bonds Callable 8/1/2019 @ 100^ | 5.25 | % | 08/01/2027 | 2,831,571 | ||||||||
| 845,000 | Puerto Rico Sales Tax Financing Corp. Revenue Bonds, Series A Callable 8/1/2019 @ 100^ | 5.00 | % | 08/01/2024 | 756,283 | ||||||||
| 5,791,314 | Virginia State Housing Development Authority Homeownership Tax Mortgage Bonds | 3.25 | % | 08/25/2042 | 5,536,323 | ||||||||
| Total Municipal Bonds (Cost $24,808,538) | 24,549,773 | ||||||||||||
| Mortgage Backed Securities — 9.8% | |||||||||||||
| 5,339 | FHLMC, Pool# C00210 | 8.00 | % | 01/01/2023 | 6,116 | ||||||||
| 473,289 | FHLMC, Pool# 1B0889# | 2.28 | % | 05/01/2033 | 500,654 | ||||||||
| 374,389 | FHLMC, Pool# 1J0203# | 2.35 | % | 04/01/2035 | 395,469 | ||||||||
| 3,975,220 | FHLMC PC, Pool# Q2-5749 | 4.00 | % | 04/01/2044 | 4,218,249 | ||||||||
| 266,680 | FHLMC REMIC, Series 2782 | 4.00 | % | 11/15/2033 | 280,074 | ||||||||
| 3,090 | FNMA, Pool# 409589 | 9.50 | % | 11/01/2015 | 3,099 | ||||||||
| 39,339 | FNMA, Pool# 254089 | 6.00 | % | 12/01/2016 | 40,939 | ||||||||
| 284,758 | FNMA, Pool# 842239 | 5.00 | % | 09/01/2020 | 307,266 | ||||||||
The accompanying notes are an integral part of these financial statements.
www.brownadvisoryfunds.com
36
Brown Advisory Intermediate Income Fund
Schedule of Investments
June 30, 2014
| Par | |||||||||||||
| Value/Shares | Security Description | Rate | Maturity | Value $ | |||||||||
| Mortgage Backed Securities — (Continued) | |||||||||||||
| 21,839 | FNMA, Pool# 539082 | 7.00 | % | 08/01/2028 | 22,242 | ||||||||
| 29,474 | FNMA, Pool# 625536 | 6.00 | % | 01/01/2032 | 33,170 | ||||||||
| 43,218 | FNMA, Pool# 628837 | 6.50 | % | 03/01/2032 | 48,887 | ||||||||
| 234,556 | FNMA, Pool# 663238 | 5.50 | % | 09/01/2032 | 263,495 | ||||||||
| 73,063 | FNMA, Pool# 744805# | 1.89 | % | 11/01/2033 | 76,100 | ||||||||
| 70,525 | FNMA, Pool# 741373# | 2.41 | % | 12/01/2033 | 71,481 | ||||||||
| 75,476 | FNMA, Pool# 764342# | 1.90 | % | 02/01/2034 | 79,203 | ||||||||
| 141,149 | FNMA, Pool# 848817 | 5.00 | % | 01/01/2036 | 156,867 | ||||||||
| 4,141,540 | FNMA, Pool# AA7686 | 4.50 | % | 06/01/2039 | 4,524,956 | ||||||||
| 1,490,806 | FNMA, Pool# AV7911 | 4.50 | % | 01/01/2044 | 1,615,954 | ||||||||
| 2,479,213 | FNMA, Pool# AS1474 | 4.50 | % | 01/01/2044 | 2,690,069 | ||||||||
| 2,826,248 | FNMA REMIC Trust, Series 2013-115~ | 3.00 | % | 04/25/2031 | 382,526 | ||||||||
| 113,357 | GNMA, Pool# 781450 | 5.00 | % | 06/15/2017 | 118,105 | ||||||||
| 28,311 | GNMA, Pool# 487110 | 6.50 | % | 04/15/2029 | 33,084 | ||||||||
| 36,161 | GNMA, Pool# 781186 | 9.00 | % | 06/15/2030 | 38,275 | ||||||||
| 6,961 | GNMA, Pool# 571166 | 7.00 | % | 08/15/2031 | 7,229 | ||||||||
| 143,839 | GNMA, Series 2008-1-PA | 4.50 | % | 12/20/2036 | 144,830 | ||||||||
| 3,000,000 | GNMA REMIC Trust, Series 2010-124 | 2.72 | % | 05/16/2037 | 3,052,371 | ||||||||
| 3,248,249 | GNMA REMIC Trust, Series 2013-79~ | 3.00 | % | 01/20/2042 | 446,040 | ||||||||
| 2,000,000 | GNMA REMIC Trust, Series 2014-01 | 3.29 | % | 03/16/2054 | 1,997,114 | ||||||||
| Total Mortgage Backed Securities (Cost $20,852,019) | 21,553,864 | ||||||||||||
| Asset Backed Securities — 0.9% | |||||||||||||
| 2,000,000 | STACR, Series 2014-DN1# | 2.35 | % | 02/25/2024 | 2,068,985 | ||||||||
| Total Asset Backed Securities (Cost $2,000,000) | 2,068,985 | ||||||||||||
| Affiliated Mutual Funds (Note 3) — 11.4% | |||||||||||||
| 2,461,503 | Brown Advisory Mortgage Securities Fund | 25,008,867 | |||||||||||
| Total Affiliated Mutual Funds (Cost $25,000,000) | 25,008,867 | ||||||||||||
| Short-Term Investments — 5.4% | |||||||||||||
| Money Market Funds — 5.4% | |||||||||||||
| 11,823,379 | DWS Cash Account Trust — Government & Agency Securities Portfolio, 0.03%* | 11,823,379 | |||||||||||
| Total Short-Term Investments (Cost $11,823,379) | 11,823,379 | ||||||||||||
| Total Investments — 98.9% (Cost $215,967,635) | 217,648,719 | ||||||||||||
| Other Assets in Excess of Liabilities — 1.1% | 2,335,537 | ||||||||||||
| NET ASSETS — 100.0% | $ | 219,984,256 | |||||||||||
| PORTFOLIO HOLDINGS | ||||
| % of Net Assets | ||||
| U.S. Treasury Securities | 35.4 | % | ||
| Corporate Bonds & Notes | 24.9 | % | ||
| Affiliated Mutual Funds | 11.4 | % | ||
| Municipal Bonds | 11.1 | % | ||
| Mortgage Backed Securities | 9.8 | % | ||
| Money Market Funds | 5.4 | % | ||
| Asset Backed Securities | 0.9 | % | ||
| Other Assets and Liabilities | 1.1 | % | ||
| 100.0 | % | |||
| ^ | Continuously callable with 30 days notice. |
| # | Variable rate security. Rate disclosed is as of June 30, 2014. |
| ~ | Interest Only Security |
| * | Annualized seven-day yield as of June 30, 2014. |
The accompanying notes are an integral part of these financial statements.
www.brownadvisoryfunds.com
37
Brown Advisory Tactical Bond Fund
A Message to Our Shareholders
June 30, 2014
Dear Shareholder:
During the 12-month period ending June 30, 2014, the Brown Advisory Tactical Bond Fund (the “Fund”) was up 4.22%. During the same period, the Barclays Intermediate U.S. Aggregate Bond Index, the Fund’s benchmark, rose 3.48%.
The Fund’s strategy is to invest tactically in four fixed income sectors: high-yield corporate bonds, municipal bonds, U.S. Treasury bonds, and Treasury Inflation-Protected Securities (TIPS). The Fund had a healthy weighting in the high-yield sector for almost the entire period, and this was a major driver of performance. While high-yield bond yields are now quite low, our models indicate that default rates for these issues are likely to remain well below historical averages. Thus, we believe that the strong valuations in the high-yield market are likely to continue, if not strengthen further.
Municipals were also a major contributor to returns. The muni market suffered from persistent mutual fund outflows during the second half of 2013, which put substantial pressure on the whole sector. Particularly challenged were longer-term bonds, which tend to be the province of municipal mutual funds. We added positions in high-quality long-term bonds throughout 2013’s second half and were rewarded during the first quarter of 2014 when municipals recovered thanks to normalized fund flows as well as a flattening yield curve, which resulted in long-term bonds outperforming intermediate bonds.
TIPS and Treasuries were both mild detractors. TIPS were a significant detractor in the second half of 2013 but rallied substantially in 2014, effectively producing a net contribution near zero for the full 12-month period. The impact of Treasuries on returns was minimal; we typically use Treasuries as a store of liquidity as we wait for opportunities in the other sectors.
This period was a successful one in terms of one of the Fund’s core mandates—namely, to produce returns that are not directly related to the direction of interest rates. We know we will get some positions right and some positions wrong, but we believe that our balanced approach has the potential to produce results that have higher upside without materially more downside than the bond market as a whole. Thus, we believe that this strategy offers attractive return potential and reasonable diversification when paired with traditional bond strategies.
Sincerely,
Thomas D.D. Graff, CFA
Portfolio Manager
Past performance is not a guarantee of future results.
Mutual fund investing involves risk. Principal loss is possible. Investments in debt securities typically decrease in value when interest rates rise. This risk is usually greater for longer-term debt securities. Investments in lower-rated and non-rated securities present a greater risk of loss to principal and interest than higher-rated securities. Municipal securities are subject to adverse political or economic factors, including changes in the tax law. Inflation-indexed bonds see the principal value of the security increased as the Consumer Price Index increases. Should the Consumer Price Index decline, those securities should be adversely impacted. A non-diversified fund may concentrate its assets in fewer individual holdings than a diversified fund. Therefore, non-diversified Fund is more exposed to individual stock volatility than a diversified fund. The fund may make short sales of securities, which involve the risk that losses in a security may exceed the original amount invested in that security. The risks of investments in derivatives, including options on futures contracts and options on futures contracts include imperfect correlation between the value of these instruments and the underlying assets; risks of default by the other party to the derivative transactions; risks that the transactions may result in losses that partially or completely offset gains in portfolio positions; and risks that the derivative transactions may not be liquid. Income from tax-exempt securities may be subject to state and local taxes and a portion of income may be subject to the federal alternative minimum tax for certain investors.
Diversification does not assure a profit or protect against loss in a declining market.
Fund holdings and sector allocations are subject to change and should not be considered a recommendation to buy or sell any security. For a complete list of fund holdings, please refer to the Schedule of Investments provided in this report.
Definitions for terms and indices are provided in the Glossary of Terms.
www.brownadvisoryfunds.com
38
Brown Advisory Tactical Bond Fund
Performance Chart and Analysis
June 30, 2014
COMPARISON OF CHANGE IN VALUE OF A $10,000 INVESTMENT
The following chart reflects the change in value of a hypothetical $10,000 investment, including reinvested dividends and distributions, in the Fund as measured against a broad-based bond index. The Barclays Intermediate U.S. Aggregate Bond Index (“Index”) represents domestic taxable investment grade bonds, with index components for government and corporate securities, mortgage pass-through securities, and asset-backed securities with average maturities and durations in the intermediate range. The Index is unmanaged and does not reflect the deduction of fees, such as investment management fees. Investors cannot invest directly in an index.
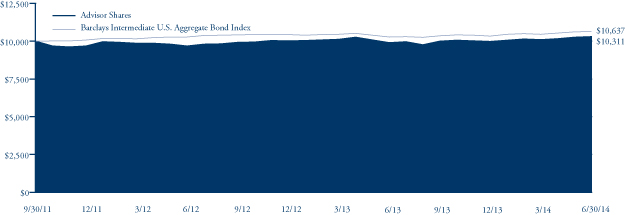
| Since | ||
| Average Annual Total Return | One | Inception |
| as of 6/30/14 | Year | (9/30/11) |
| Advisor Shares | 4.22% | 1.12% |
| Barclays Intermediate U.S. Aggregate Bond Index | 3.48% | 2.27% |
| Advisor Shares | ||
Gross Expense Ratio1 | 1.31% | |
Net Expense Ratio1 | 1.31% | |
Past performance does not guarantee future results. The performance data quoted represents past performance and current returns may be lower or higher. The investment return and net asset value will fluctuate so that an investor’s shares, when redeemed, may be worth more or less than the original cost. To obtain performance information current to the most recent month end, please visit our website at brownadvisoryfunds.com/performance.html. The performance table and graph above do not reflect the deduction of taxes that a shareholder would pay on Fund distributions or the redemption of Fund shares. Performance data does not reflect the imposition of the redemption fee of 1.00% on shares redeemed within 14 days, and if it did, performance would have been lower.
| 1 | Per the Fund’s prospectus dated October 31, 2013. |
www.brownadvisoryfunds.com
39
Brown Advisory Tactical Bond Fund
Schedule of Investments
June 30, 2014
| Par | |||||||||||||
| Value/Shares | Security Description | Rate | Maturity | Value $ | |||||||||
| U.S. Treasury Securities — 41.0% | |||||||||||||
| 7,061,409 | United States Treasury Inflation Indexed Bonds | 0.63 | % | 01/15/2024 | 7,321,798 | ||||||||
| 1,600,000 | United States Treasury Note | 0.25 | % | 05/15/2016 | 1,595,625 | ||||||||
| 1,035,000 | United States Treasury Note | 3.00 | % | 09/30/2016 | 1,092,006 | ||||||||
| Total U.S. Treasury Securities (Cost $9,917,764) | 10,009,429 | ||||||||||||
| Municipal Bonds — 23.2% | |||||||||||||
| 1,000,000 | Chicago Midway International Airport Callable 01/01/2024 @ 100^ | 5.00 | % | 01/01/2035 | 1,085,410 | ||||||||
| 1,000,000 | City of Chicago IL Motor Fuel Tax Revenue Callable 01/01/2024 @ 100^ | 5.00 | % | 01/01/2027 | 1,093,710 | ||||||||
| 1,000,000 | City Public Service Board of San Antonio TX Callable 02/01/2024 @100^ | 5.00 | % | 02/01/2026 | 1,191,910 | ||||||||
| 1,000,000 | Iowa Finance Authority Callable 07/01/2023 @100^ | 5.00 | % | 07/01/2033 | 1,089,970 | ||||||||
| 1,000,000 | New York City Transitional Finance Authority Future Tax Secured Revenue | ||||||||||||
| Callable 11/01/2022 @100^ | 5.00 | % | 11/01/2023 | 1,197,840 | |||||||||
| Total Municipal Bonds (Cost $5,639,607) | 5,658,840 | ||||||||||||
| Mutual Funds — 2.4% | |||||||||||||
| 7,966 | Blackrock Massachusetts Tax-Exempt Trust | 110,966 | |||||||||||
| 8,326 | Eaton Vance Massachusetts Municipal Bond Fund | 117,896 | |||||||||||
| 10,000 | Invesco Pennsylvania Value Municipal Income Trust | 134,600 | |||||||||||
| 9,000 | Pimco California Municipal Income Fund III | 95,220 | |||||||||||
| 11,168 | PIMCO New York Municipal Income Fund II | 128,991 | |||||||||||
| Total Mutual Funds (Cost $557,975) | 587,673 | ||||||||||||
| Short-Term Investments — 36.9% | |||||||||||||
| U.S. Treasury Bills — 28.3% | |||||||||||||
| 6,900,000 | United States Treasury Bill | 6,898,729 | |||||||||||
| Money Market Funds — 8.6% | |||||||||||||
| 2,088,016 | DWS Cash Account Trust — Government & Agency Securities Portfolio, 0.03%* | 2,088,016 | |||||||||||
| Total Short-Term Investments (Cost $8,986,745) | 8,986,745 | ||||||||||||
| Total Investments — 103.5% (Cost $25,102,091) | 25,242,687 | ||||||||||||
| Liabilities in Excess of Other Assets — (3.5)% | (843,568 | ) | |||||||||||
| NET ASSETS — 100.0% | $ | 24,399,119 | |||||||||||
| ^ | Continuously callable with 30 days notice. |
| * | Annualized seven-day yield as of June 30, 2014. |
Credit Default Swap Contracts (Note 6) — Sell Protection#
| Termination | Notional | Unrealized | ||||||||||||
| Counterparty | Reference Entity | Rate | Date | Amount† | Appreciation | |||||||||
| Credit Suisse | Markit CDX North American High Yield Index Series 22 | 5.00 | % | 6/20/19 | $ | 7,425,000 | $ | 151,550 | ||||||
| # | If the Fund is a seller of protection and a credit event occurs, i.e. bankruptcy or failure to pay, as defined under the terms of that particular swap agreement, the Fund will either (i) pay to the buyer of the protection an amount up to or equal to the notional amount of the swap and take delivery of the reference obligations or underlying securities comprising the reference index or (ii) pay a net settlement amount in the form of cash or securities up to or equal to the notional amount of the swap less the recovery value of the reference obligation or underlying securities comprising the reference index. |
| † | The maximum potential amount (if, after a credit event the value of the related obligation or obligations were determined to have a value of zero) the Fund could be required to pay as seller of credit protection or entitled to as a buyer of credit protection if a credit event occurs as defined under the terms of that particular swap agreement. |
| PORTFOLIO HOLDINGS | ||||
| % of Net Assets | ||||
| U.S. Treasury Securities | 41.0 | % | ||
| U.S. Treasury Bills | 28.3 | % | ||
| Municipal Bonds | 23.2 | % | ||
| Money Market Funds | 8.6 | % | ||
| Mutual Funds | 2.4 | % | ||
| Other Assets and Liabilities | (3.5 | )% | ||
| 100.0 | % | |||
The accompanying notes are an integral part of these financial statements.
www.brownadvisoryfunds.com
40
Brown Advisory Equity Income Fund
A Message to Our Shareholders
June 30, 2014
Dear Shareholder:
During the year ended June 30, 2014, the Brown Advisory Equity Income Fund Investor Shares (the “Fund”) increased 19.04% in value. The S&P 500 Index, the Fund’s benchmark, increased 24.61% in value during the same period.
U.S. stocks continued their long-running rally and reached new highs despite a growing list of investor concerns, including inconsistent U.S. GDP growth readings, rising geopolitical tensions and more volatile energy prices. The Fund is oriented toward conservative, higher-quality companies. As such, these historically lower-beta stocks may tend to prevent the Fund from outperforming a strongly rising stock market. Such was the case over the recent 12-month period.
The Fund’s best-performing sector was consumer discretionary, led by a large gain in holding Garmin Ltd. Garmin was purchased during the year at a time when it was largely unwanted by investors, primarily because of declining sales of the company’s best-known product, the personal navigation device or PND. However, new products in the aviation, fitness and outdoor segments have more than made up for the drag from the declining PND business. As a result, the company’s sales and earnings have grown faster than previously expected, and the stock’s earnings multiple has increased.
The Fund’s worst-performing sector relative to the Index was financials. Within this sector, the Fund’s holdings of real estate investment trusts, preferred stocks, and property and casualty insurers performed relatively poorly. Among the latter group, personal lines insurer Erie Indemnity Co. saw its shares decline despite showing fundamental improvements in its margins and earnings growth.
Portfolio turnover for the Fund was 32%, slightly elevated from previous periods. Ten new names were added and 11 positions were eliminated over the past year. Among the additions were Wells Fargo;, W.P. Carey, an American Tower convertible-preferred security in the financials sector; and two holdings in the energy sector, Ensco and Plains GP Holdings. The Wells Fargo purchase is worth highlighting. Wells Fargo has consistently exhibited attractive investment attributes such as a proven, high-quality management team, a favorable business mix, a reasonable valuation compared to other banks and a recent record of strong dividend growth.
Among the eliminations were Mondelez, PepsiCo and Wal-Mart Stores in consumer staples. The Fund’s lone utilities investment, Dominion Resources, was also eliminated.
Portfolio turnover is the most direct measure of the Fund’s commitment to a patient, long-term decision-making process. Producing low turnover is quite easy—the manager simply needs to walk away from the trading terminal. However, maintaining consistently low turnover within a successful investment strategy is more challenging. We try to focus on finding high-quality companies at the right price, utilizing conservative forecasts over a reasonable two- to three-year investment horizon, and we place a substantial emphasis on patience. Patience is always a challenge for investors. This is due to the far greater supply of day-to-day noise in the market vs. the amount of truly important fundamental information that can alter our assessment of a given investment. Continuous monitoring of the fundamentals to ensure that our investment thesis is on track helps us filter out the noise.
After an impressive multiyear run, we believe that stocks have broadly reached fair valuations. The Fund’s cash level has risen moderately as a consequence of a market where fewer stocks appear attractive on a relative-value basis. Recent additions to the Fund, such as Target, Ensco, Wells Fargo and Plains, offer us more in the way of dividend growth potential than they do absolute yield. In fact, for many of our holdings, we believe that dividends per share may potentially grow at a faster rate than earnings per share, as their payout ratios have continued to rise. Looking ahead, we hope that this tilt toward dividend growth can serve as a buffer against the potential impact of rising interest rates.
www.brownadvisoryfunds.com
41
Brown Advisory Equity Income Fund
A Message to Our Shareholders
June 30, 2014
Our investment approach seeks high-quality businesses that have a history of paying above-average dividends and offer a compelling total return prospects. If we succeed in building a portfolio offering potentially higher income and lower risk than the benchmark, we believe that the Fund’s shareholders should be well served in an environment in which market returns may be more muted than they have been in recent years.
Sincerely,
Mike Foss
Portfolio Manager
Brian Graney
Portfolio Manager
Past performance does not guarantee future results.
Mutual fund investing involves risk. Principal loss is possible. Investments in debt securities typically decrease in value when interest rates rise. This risk is usually greater for longer-term debt securities. Investments in lower-rated and non-rated securities present a greater risk of loss to principal and interest than higher-rated securities. Investments in smaller and medium capitalization companies generally carry greater risk than is customarily associated with larger companies for various reasons such as narrower markets, limited financial resources and less liquid stock. The value of the Fund’s investments in REITs and Real Estate may change in response to changes in the real estate market such as declines in the value of real estate, lack of available capital or financing opportunities, and increases in property taxes or operating costs. The Fund may invest in ETFs, which may trade at a discount to the aggregate value of the underlying securities and although expense ratios for ETFs are generally low, frequent trading of ETFs by the Fund can generate brokerage expenses. Investments in foreign securities entail certain risks not associated with investments in domestic securities, such as volatility of currency exchange rates, and in some cases, political and economic instability and relatively illiquid markets. Investing in Master Limited Partnerships (“MLPs”) entails risk related to fluctuations in energy prices, decreases in supply of or demand for energy commodities, unique tax consequences due to the partnership structure and various other risks. Privately Placement issued securities are restricted securities that are not publicly traded. Delay or difficulty in selling such securities may result in a loss to the Fund.
Fund holdings and sector allocations are subject to change and should not be considered a recommendation to buy or sell any security. For a complete list of fund holdings, please refer to the Schedule of Investments provided in this report.
Definitions for terms and indices are provided in the Glossary of Terms.
www.brownadvisoryfunds.com
42
Brown Advisory Equity Income Fund
Performance Chart and Analysis
June 30, 2014
COMPARISON OF CHANGE IN VALUE OF A $10,000 INVESTMENT
The following chart reflects the change in value of a hypothetical $10,000 investment, including reinvested dividends and distributions, in the Fund as measured against a broad-based securities market index. The S&P 500 (“Index”) is a market-value weighted index representing the performance of 500 widely held, publicly traded large capitalization stocks. The Index is unmanaged and does not reflect the deduction of fees, such as investment management fees. Investors cannot invest directly in an index.
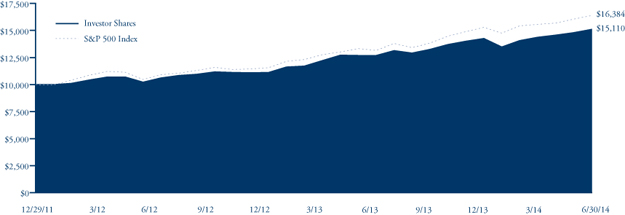
| Since | ||
| Average Annual Total Return | One | Inception |
| as of 6/30/14 | Year | (12/29/11) |
Institutional Shares1 | 19.30% | 18.13% |
| Investor Shares | 19.04% | 17.92% |
| Advisor Shares | 18.79% | 17.64% |
| S&P 500 Index | 24.61% | 21.79% |
| Institutional Shares | Investor Shares | Advisor Shares | |
Gross Expense Ratio2 | 0.81% | 0.96% | 1.21% |
Net Expense Ratio2 | 0.81% | 0.96% | 1.21% |
Past performance does not guarantee future results. The performance data quoted represents past performance and current returns may be lower or higher. The investment return and net asset value will fluctuate so that an investor’s shares, when redeemed, may be worth more or less than the original cost. To obtain performance information current to the most recent month end, please visit our website at brownadvisoryfunds.com/performance.html. The performance table and graph above do not reflect the deduction of taxes that a shareholder would pay on Fund distributions or the redemption of Fund shares. Performance data does not reflect the imposition of the redemption fee of 1.00% on shares redeemed within 14 days, and if it did, performance would have been lower.
| 1 | Performance information for the Institutional Shares, prior to commencement of operations on October 19, 2012, is based on the performance of Investor Shares, and adjusted for the lower expenses applicable to Institutional Shares. |
| 2 | Per the Fund’s prospectus dated October 31, 2013. |
www.brownadvisoryfunds.com
43
Brown Advisory Equity Income Fund
Schedule of Investments
June 30, 2014
| Shares | Security Description | Value $ | |||||
| Common Stocks — 85.1% | |||||||
| Consumer Discretionary — 14.7% | |||||||
| 160,678 | Best Buy, Inc. | 4,982,625 | |||||
| 114,833 | GameStop Corp. | 4,647,291 | |||||
| 81,889 | Garmin, Ltd. | 4,987,040 | |||||
| 37,650 | McDonald’s Corp. | 3,792,861 | |||||
| 55,961 | Target Corp. | 3,242,940 | |||||
| 14,506 | Time Warner Cable, Inc. | 2,136,734 | |||||
| 92,354 | V.F. Corp. | 5,818,302 | |||||
| 29,607,793 | |||||||
| Consumer Staples — 12.0% | |||||||
| 193,400 | Altria Group, Inc. | 8,111,196 | |||||
| 73,307 | Coca-Cola Co. | 3,105,285 | |||||
| 48,059 | Kraft Foods Group, Inc. | 2,881,137 | |||||
| 57,140 | Philip Morris International, Inc. | 4,817,473 | |||||
| 119,927 | Unilever NV | 5,248,006 | |||||
| 24,163,097 | |||||||
| Energy — 11.7% | |||||||
| 51,326 | ENSCO PLC | 2,852,186 | |||||
| 213,333 | Kinder Morgan, Inc. | 7,735,455 | |||||
| 47,783 | Occidental Petroleum Corp. | 4,903,969 | |||||
| 140,524 | Plains GP Holdings LP | 4,495,363 | |||||
| 48,115 | Total S.A. ADR | 3,473,903 | |||||
| 23,460,876 | |||||||
| Financials — 11.3% | |||||||
| 66,885 | Cincinnati Financial Corp. | 3,213,155 | |||||
| 46,620 | Erie Indemnity Co. | 3,508,621 | |||||
| 82,609 | JPMorgan Chase & Co. | 4,759,931 | |||||
| 37,706 | M&T Bank Corp. | 4,677,429 | |||||
| 166,325 | OneBeacon Insurance Group, Ltd. | 2,584,690 | |||||
| 23,033 | T. Rowe Price Group, Inc. | 1,944,216 | |||||
| 39,810 | Wells Fargo Co. | 2,092,414 | |||||
| 22,780,456 | |||||||
| Health Care — 12.7% | |||||||
| 83,218 | AbbVie, Inc. | 4,696,824 | |||||
| 48,447 | Johnson & Johnson | 5,068,525 | |||||
| 83,550 | Merck & Co., Inc. | 4,833,367 | |||||
| 70,373 | Novartis AG ADR | 6,370,868 | |||||
| 86,540 | Teva Pharmaceutical Industries, Ltd. ADR | 4,536,427 | |||||
| 25,506,011 | |||||||
| Industrials — 6.3% | |||||||
| 128,564 | Healthcare Services Group, Inc. | 3,784,924 | |||||
| 66,718 | PACCAR, Inc. | 4,191,892 | |||||
| 40,972 | United Technologies Corp. | 4,730,218 | |||||
| 12,707,034 | |||||||
| Information Technology — 13.7% | |||||||
| 49,222 | Accenture PLC | 3,979,106 | |||||
| 61,237 | Apple, Inc. | 5,690,754 | |||||
| 76,297 | Automatic Data Processing, Inc. | 6,048,826 | |||||
| 172,305 | Microsoft Corp. | 7,185,119 | |||||
| 59,188 | QUALCOMM, Inc. | 4,687,690 | |||||
| 27,591,495 | |||||||
| Materials — 1.2% | |||||||
| 18,105 | Praxair, Inc. | 2,405,068 | |||||
| Telecommunication Services — 1.5% | |||||||
| 76,629 | Rogers Communications, Inc. | 3,084,317 | |||||
| Total Common Stocks (Cost $129,145,248) | 171,306,147 | ||||||
| Preferred Stocks — 3.5% | |||||||
| 3,109 | American Tower Corp.~ | 330,798 | |||||
| 182,659 | Public Storage, Inc. — Series S | 4,449,573 | |||||
| 88,478 | Public Storage, Inc. — Series O | 2,324,317 | |||||
| Total Preferred Stocks (Cost $6,962,488) | 7,104,688 | ||||||
| Real Estate Investment Trusts — 6.4% | |||||||
| 114,113 | Plum Creek Timber Co., Inc. | 5,146,496 | |||||
| 190,650 | Redwood Trust, Inc. | 3,711,956 | |||||
| 61,458 | W.P. Carey, Inc. | 3,957,895 | |||||
| Total Real Estate Investment Trusts (Cost $12,230,156) | 12,816,347 | ||||||
| Short-Term Investments — 5.9% | |||||||
| Money Market Funds — 5.9% | |||||||
| 11,861,755 | DWS Cash Account Trust — Government | ||||||
| & Agency Securities Portfolio, 0.03%# | 11,861,755 | ||||||
| Total Short-Term Investments (Cost $11,861,755) | 11,861,755 | ||||||
| Total Investments — 100.9% (Cost $160,199,647) | 203,088,937 | ||||||
| Liabilities in Excess of Other Assets — (0.9)% | (1,756,447 | ) | |||||
| NET ASSETS — 100.0% | $ | 201,332,490 | |||||
| PORTFOLIO HOLDINGS | ||||
| % of Net Assets | ||||
| Consumer Discretionary | 14.7 | % | ||
| Information Technology | 13.7 | % | ||
| Health Care | 12.7 | % | ||
| Consumer Staples | 12.0 | % | ||
| Energy | 11.7 | % | ||
| Financials | 11.3 | % | ||
| Real Estate Investment Trusts | 6.4 | % | ||
| Industrials | 6.3 | % | ||
| Money Market Funds | 5.9 | % | ||
| Preferred Stocks | 3.5 | % | ||
| Telecommunication Services | 1.5 | % | ||
| Materials | 1.2 | % | ||
| Other Assets and Liabilities | (0.9 | )% | ||
| 100.0 | % | |||
ADR — American Depositary Receipt
| ~ | Convertible Security |
| # | Annualized seven-day yield as of June 30, 2014. |
The accompanying notes are an integral part of these financial statements.
www.brownadvisoryfunds.com
44
Brown Advisory Sustainable Growth Fund
A Message to Our Shareholders
June 30, 2014
Dear Shareholder:
During the year ended June 30, 2014, the Brown Advisory Sustainable Growth Fund Advisor Shares (the “Fund”) increased 21.99% in value. During the same period, the Russell 1000® Growth Index (the “Index”), the Fund’s benchmark, increased 26.92%.
In contrast to the six months ended December 31, 2013, our results in the first half of 2014 were disappointing. We were hurt by the market’s broad rotation out of higher-growth names over the past several quarters, but there were also several more nuanced factors that caused us to underperform over the past year and in particular the last six months.
First, the portfolio has minimal exposure to several areas of the market that have performed well of late. For example, we have no direct exposure to the energy sector, and traditional energy stocks rallied in the past few quarters on the back of a spike in oil prices. Additionally, we were underweight in health care throughout the period covered in this report, and in particular we did not have exposure to the booming biotech sector or to the wave of merger activity in the specialty pharmaceutical segment. It is worth noting that our exposure in energy, health care or other sectors has nothing to do with a view on those sectors and everything to do with fundamental analysis of individual companies. These market segments have gathered a lot of momentum recently, but we have not found companies in them that offer the mix of fundamental strength, environmental business advantages (EBA) and compelling valuation that we look for.
Second, a number of our holdings performed poorly during the period, but in our view, only one of these holdings—Whole Foods—suffered due to an actual deterioration in its business. We have owned Whole Foods since the inception of the strategy, believing the company would reap the benefits of its differentiated grocery offerings alongside a strong tailwind of secular demand for fresh, natural and organic foods. The company beat consensus expectations for twenty straight quarters between Q4 2008 and Q3 2013, but by the end of last year we grew concerned about its ability to attract a broader demographic and fend off heavier competition. These fears were realized, and the stock fell more than 40% from its October 2013 high. Fortunately, we trimmed the stock considerably late last year—it was the portfolio’s smallest position through 2014. We recently exited our small position, subsequent to the period covered in this report.
For the most part, we believe that despite the recent underperformance of many of our names, their businesses still appear to be well positioned for growth and may offer investors a favorable mix of risk and return potential. In some cases, these stocks fell during the period due to a temporary slowdown in top-line growth, or due to a conscious choice by management to increase investment spending that temporarily depressed operating margins, but as long as we are confident in our investment thesis in a name, price corrections for these reasons are less a cause for concern and more of an opportunity to add to our positions at attractive prices.
We also used price weakness to initiate new positions in Akamai Technologies, eBay and Stratasys. Akamai’s extensive server network helps speed up Internet traffic, reduces network bottlenecks, and provides a security offering that mitigates large-scale attacks on websites (a particularly valuable benefit for those streaming high-profile events over the Web). Stratasys is a market leader in 3D-printing technology, and its technology has the potential to nearly eliminate waste during certain manufacturing processes, thus providing the potential for high returns on investment for its customers. eBay is a global leader in e-commerce and pioneered the Internet auction market, and it also offers a robust payment solution via PayPal. Innovations such as measuring “carbon per transaction” make eBay a leader in its industry for environmentally driven cost-mitigation strategies.
Another new holding since our last shareholder letter is Thermo Fisher Scientific. Thermo is the global leader in analytical instruments, consumables and diagnostic tests for the health care industry. The company enjoys high levels of recurring revenue and steady pricing power. Thermo Fisher is also an industry leader in environmental instruments such as air- emission-monitoring equipment, radiation-detection equipment and water-quality testing systems. This business accounts for 15% to 20% of its total revenue with historically faster growth than the corporate average.
We exited our positions in Accenture, Ansys, EMC and Chart Industries to make room for these new positions that we believe offer more favorable prospects.
To conclude, we have a high degree of confidence in the companies in our portfolio. As long-term, low-turnover investors, we are keenly aware that there will be times when we are out of step with the market. There will also be times when our stocks experience growth slowdowns and disappoint investors in the near term. Keeping a long-term focus and staying true to the three tenets of our
www.brownadvisoryfunds.com
45
Brown Advisory Sustainable Growth Fund
A Message to Our Shareholders
June 30, 2014
investment philosophy—seeking strong fundamentals, seeking sustainable competitive advantages including EBA, and valuation discipline—is critical during these periods. Despite disappointing performance so far this year, we remain committed to our approach of building material positions in companies that we believe are making the right investments and the right management decisions that are geared toward positioning them to potentially thrive over a long-term investment horizon.
Sincerely,
Karina Funk
Portfolio Manager
David Powell
Portfolio Manager
Past performance is not a guarantee of future results.
Mutual fund investing involves risk. Principal loss is possible. The Fund’s investment focus on environmental factors could cause it to make or avoid investments that could result in the Fund underperforming similar funds that do not have an environmental focus. Investments in smaller capitalization companies generally carry greater risk than is customarily associated with larger companies for various reasons such as narrower markets, limited financial resources and less liquid stock. Investments in foreign securities entail certain risks not associated with investments in domestic securities, such as volatility of currency exchange rates, and in some cases, political and economic instability and relatively illiquid markets. These risks are greater for investments in emerging markets.
Fund holdings and sector allocations are subject to change and should not be considered a recommendation to buy or sell any security. For a complete list of fund holdings, please refer to the Schedule of Investments provided in this report.
Definitions for terms and indices are provided in the Glossary of Terms.
www.brownadvisoryfunds.com
46
Brown Advisory Sustainable Growth Fund
Performance Chart and Analysis
June 30, 2014
COMPARISON OF CHANGE IN VALUE OF A $10,000 INVESTMENT
The following chart reflects the change in value of a hypothetical $10,000 investment, including reinvested dividends and distributions, in the Fund as measured against a broad-based securities market index. The Russell 1000® Growth Index measures the performance of the large-cap growth segment of the U.S. equity universe. It includes those Russell 1000® companies with higher price to book and higher forecasted growth values. The index is unmanaged and does not reflect the deduction of fees, such as investment management fees. Investors cannot invest directly in an index.

| Since | ||
| Average Annual Total Return | One | Inception |
| as of 6/30/14 | Year | (6/29/12) |
| Institutional Shares | 22.51% | 19.42% |
| Investor Shares | 22.29% | 19.21% |
| Advisor Shares | 21.99% | 18.96% |
Russell 1000® Growth Index | 26.92% | 21.86% |
| Institutional Shares | Investor Shares | Advisor Shares | |
Gross Expense Ratio1 | 0.86% | 1.01% | 1.26% |
Net Expense Ratio1 | 0.86% | 1.01% | 1.26% |
Past performance does not guarantee future results. The performance data quoted represents past performance and current returns may be lower or higher. The investment return and net asset value will fluctuate so that an investor’s shares, when redeemed, may be worth more or less than the original cost. To obtain performance information current to the most recent month end, please visit our website at brownadvisoryfunds.com/performance.html. The performance table and graph above do not reflect the deduction of taxes that a shareholder would pay on Fund distributions or the redemption of Fund shares. Performance data does not reflect the imposition of the redemption fee of 1.00% on shares redeemed within 14 days, and if it did, performance would have been lower.
| 1 | Per the Fund’s prospectus dated October 31, 2013. |
www.brownadvisoryfunds.com
47
Brown Advisory Sustainable Growth Fund
Schedule of Investments
June 30, 2014
| Shares | Security Description | Value $ | |||||
| Common Stocks — 97.2% | |||||||
| Consumer Discretionary — 17.7% | |||||||
| 90,067 | BorgWarner, Inc. | 5,871,468 | |||||
| 9,888 | Chipotle Mexican Grill, Inc.* | 5,858,739 | |||||
| 245,956 | LKQ Corp.* | 6,564,566 | |||||
| 93,050 | Nike, Inc | 7,216,027 | |||||
| 83,282 | Starbucks Corp. | 6,444,361 | |||||
| 97,575 | TJX Companies, Inc. | 5,186,111 | |||||
| 37,141,272 | |||||||
| Consumer Staples — 1.4% | |||||||
| 74,386 | Whole Foods Market, Inc. | 2,873,531 | |||||
| Health Care — 6.6% | |||||||
| 93,378 | Cerner Corp.* | 4,816,437 | |||||
| 60,447 | Thermo Fisher Scientific, Inc. | 7,132,746 | |||||
| 17,880 | Waters Corp.* | 1,867,387 | |||||
| 13,816,570 | |||||||
| Industrials — 33.1% | |||||||
| 96,467 | A. O. Smith Corp. | 4,782,834 | |||||
| 108,648 | Canadian National Railway Co. | 7,064,293 | |||||
| 26,459 | Cummins, Inc. | 4,082,359 | |||||
| 111,989 | Danaher Corp. | 8,816,894 | |||||
| 45,140 | IHS, Inc.* | 6,124,144 | |||||
| 70,113 | J.B. Hunt Transport Services, Inc. | 5,172,937 | |||||
| 51,126 | Middleby Corp.* | 4,229,143 | |||||
| 52,693 | Pall Corp. | 4,499,455 | |||||
| 71,249 | Stericycle, Inc.* | 8,437,307 | |||||
| 135,877 | Verisk Analytics, Inc.* | 8,155,337 | |||||
| 100,115 | Westinghouse Air Brake Technologies Corp. | 8,268,498 | |||||
| 69,633,201 | |||||||
| Information Technology — 29.1% | |||||||
| 57,816 | Akamai Technologies, Inc.* | 3,530,245 | |||||
| 43,624 | Apple, Inc. | 4,053,978 | |||||
| 105,224 | Arm Holdings PLC ADR | 4,760,334 | |||||
| 89,188 | eBay, Inc.* | 4,464,751 | |||||
| 7,491 | Google, Inc. — Class C* | 4,309,423 | |||||
| 7,491 | Google, Inc. — Class A* | 4,379,763 | |||||
| 78,680 | Intuit, Inc. | 6,336,101 | |||||
| 88,684 | QUALCOMM, Inc. | 7,023,773 | |||||
| 101,678 | Salesforce.com, Inc.* | 5,905,458 | |||||
| 35,174 | Stratasys Ltd.* | 3,996,822 | |||||
| 132,173 | Trimble Navigation, Ltd.* | 4,883,792 | |||||
| 35,585 | Visa, Inc. | 7,498,115 | |||||
| 61,142,555 | |||||||
| Materials — 9.3% | |||||||
| 73,930 | Ecolab, Inc. | 8,231,366 | |||||
| 47,390 | Praxair, Inc. | 6,295,288 | |||||
| 64,681 | Rockwood Holdings, Inc. | 4,915,109 | |||||
| 19,441,763 | |||||||
| Total Common Stocks (Cost $146,703,128) | 204,048,892 | ||||||
| Short-Term Investments — 2.9% | |||||||
| Money Market Funds — 2.9% | |||||||
| 6,116,641 | DWS Cash Account Trust — Government | ||||||
| & Agency Securities Portfolio, 0.03%# | 6,116,641 | ||||||
| Total Short-Term Investments (Cost $6,116,641) | 6,116,641 | ||||||
| Total Investments — 100.1% (Cost $152,819,769) | 210,165,533 | ||||||
| Liabilities in Excess of Other Assets — (0.1)% | (122,591 | ) | |||||
| NET ASSETS — 100.0% | $ | 210,042,942 | |||||
| PORTFOLIO HOLDINGS | ||||
| % of Net Assets | ||||
| Industrials | 33.1 | % | ||
| Information Technology | 29.1 | % | ||
| Consumer Discretionary | 17.7 | % | ||
| Materials | 9.3 | % | ||
| Health Care | 6.6 | % | ||
| Money Market Funds | 2.9 | % | ||
| Consumer Staples | 1.4 | % | ||
| Other Assets and Liabilities | (0.1 | )% | ||
| 100.0 | % | |||
ADR — American Depositary Receipt
| * | Non-Income Producing |
| # | Annualized seven-day yield as of June 30, 2014. |
The accompanying notes are an integral part of these financial statements.
www.brownadvisoryfunds.com
48
Brown Advisory Tax Exempt Bond Fund
A Message to Our Shareholders
June 30, 2014
Dear Shareholder:
During the year ended June 30, 2014, the Brown Advisory Tax Exempt Bond Fund (the “Fund”) increased 3.94% in value. During the same period, the Barclays 1-10 Year Blended Municipal Bond Index (the “Index”), the Fund’s benchmark, increased 4.27%.
We would characterize the past year in the municipal bond market as a tale of two halves. The market was hit particularly hard during the second half of 2013 as investor fears of higher rates, negative credit headlines and record municipal mutual fund outflows created a period where both interest rates and credit spreads moved against investors. The Fund underperformed the Index during the second half of 2013 when our overweight in revenue-backed sectors dragged on performance as broad municipal credit spreads moved wider.
During this period, we positioned the Fund to capture what we believed to be a mispricing of risk along the yield curve. We dramatically reduced holdings in the five-year maturity range, where valuations had become unreasonably stretched, and redistributed proceeds in a blend of longer maturities (greater than 10 years) and shorter maturities (less than three years). We believed that this “barbell” approach would perform well once demand recovered in the market.
The first half of 2014 proved to be a very different experience for the Fund’s shareholders as broader demand for municipals did in fact recover. Institutions began buying municipals based on attractive relative valuations vs. corporate bonds, and traditional buyers also reentered the market. Demand continued to build throughout the first half of 2014, with long-maturity bonds (and credit-sensitive issues) providing the strongest returns.
Curve positioning became the largest contributor to the Fund’s strong relative performance for the first half of 2014. We believe that improving economics and nascent inflation may cause the Fed to begin hiking interest rates earlier than the market expects. Based on past rate cycles, we believe that this may cause the yield curve to flatten further over time.
Sector selection was also a major contributor to the Fund’s performance in the first half of the year. Our overweights in credit-sensitive segments such as hospitals, airports, toll roads and special-tax revenues provided the largest positive contributions to sector performance. While we believe that these sectors have upside potential, we began to trim some security-specific exposure when we felt valuations for those issues had approached their full potential.
We believe that our core philosophy of seeking bonds that are undervalued on a fundamental basis has the potential to produce a portfolio with upside potential and lower volatility, especially during periods of high volatility similar to what we experienced over the past year.
Sincerely,
Stephen M. Shutz, CFA
Portfolio Manager
Past performance is not a guarantee of future results.
Mutual fund investing involves risk. Principal loss is possible. The Fund is non-diversified, meaning it may invest in fewer individual holdings than a diversified fund. Therefore, the Fund is more exposed to individual stock volatility than a diversified fund. Investments in debt securities typically decrease in value when interest rates rise. This risk is usually greater for longer-term debt securities. Investments in lower-rated and non-rated securities present a greater risk of loss to principal and interest than higher-rated securities. Municipal securities are subject to adverse political or economic factors, including changes in the tax law. Income from tax-exempt funds may be subject to state and local taxes and a portion of income may be subject to the federal and/or state alternative minimum tax for certain investors. Federal income tax rules will apply to any capital gains distribution.
Fund holdings and sector allocations are subject to change and should not be considered a recommendation to buy or sell any security. For a complete list of fund holdings, please refer to the Schedule of Investments provided in this report.
Definitions for terms and indices are provided in the Glossary of Terms.
www.brownadvisoryfunds.com
49
Brown Advisory Tax Exempt Bond Fund
Performance Chart and Analysis
June 30, 2014
COMPARISON OF CHANGE IN VALUE OF A $10,000 INVESTMENT
The following chart reflects the change in value of a hypothetical $10,000 investment, including reinvested dividends and distributions, in the Fund as measured against the broad-based municipal bond index. The Barclays 1-10 Year Blended Municipal Bond Index (“Index”) is a market index of high quality, domestic fixed income securities with maturities of less than 10 years. The Index is unmanaged and does not reflect the deduction of fees, such as investment management fees. Investors cannot invest directly in an index.

| Since | ||
| Average Annual Total Return | One | Inception |
| as of 6/30/14 | Year | (6/29/12) |
| Investor Shares | 3.94% | 1.96% |
| Barclays 1-10 Year Blended Municipal Bond Index | 4.27% | 2.28% |
| Investor Shares | ||
Gross Expense Ratio1 | 0.57% | |
Net Expense Ratio1 | 0.57% |
Past performance does not guarantee future results. The performance data quoted represents past performance and current returns may be lower or higher. The investment return and net asset value will fluctuate so that an investor’s shares, when redeemed, may be worth more or less than the original cost. To obtain performance information current to the most recent month end, please visit our website at brownadvisoryfunds.com/performance.html. The performance table and graph above do not reflect the deduction of taxes that a shareholder would pay on Fund distributions or the redemption of Fund shares. Performance data does not reflect the imposition of the redemption fee of 1.00% on shares redeemed within 14 days, and if it did, performance would have been lower.
| 1 | Per the Fund’s prospectus dated October 31, 2013. |
www.brownadvisoryfunds.com
50
Brown Advisory Tax Exempt Bond Fund
Schedule of Investments
June 30, 2014
| Par Value | Security Description | Rate | Maturity | Value $ | ||||||||||
| Municipal Bonds — 95.3% | ||||||||||||||
| General Obligation Bonds — 24.6% | ||||||||||||||
| 1,500,000 | Alamo Community College District | 3.50 | % | 02/15/2015 | 1,531,875 | |||||||||
| 1,695,000 | Charleston County South Carolina | 5.00 | % | 06/01/2016 | 1,848,889 | |||||||||
| 1,500,000 | Cheshire Connecticut | 4.00 | % | 08/01/2015 | 1,562,190 | |||||||||
| 1,000,000 | Chicago Callable 01/01/2024 @ 100^ | 5.00 | % | 01/01/2025 | 1,091,210 | |||||||||
| 1,080,000 | Cook County Community High School District | 5.00 | % | 12/01/2018 | 1,241,687 | |||||||||
| 1,750,000 | Fort Bend Independent School District | 3.00 | % | 08/15/2016 | 1,849,540 | |||||||||
| 1,000,000 | Georgia, State of | 5.00 | % | 07/01/2015 | 1,049,050 | |||||||||
| 1,320,000 | Gwinnett County School District | 5.00 | % | 02/01/2016 | 1,419,726 | |||||||||
| 1,000,000 | Henry County Georgia | 5.00 | % | 07/01/2014 | 1,000,140 | |||||||||
| 845,000 | Hudson County New Jersey | 2.00 | % | 03/15/2015 | 855,343 | |||||||||
| 1,500,000 | Illinois, State of | 5.00 | % | 02/01/2020 | 1,690,560 | |||||||||
| 1,885,000 | Johnson County Unified School District | 4.00 | % | 10/01/2014 | 1,903,718 | |||||||||
| 1,000,000 | King & Snohomish Counties School District | 5.00 | % | 12/01/2014 | 1,020,570 | |||||||||
| 1,000,000 | Lake Travis Independent School District | 2.00 | % | 02/15/2015 | 1,011,980 | |||||||||
| 650,000 | Leawood Kansas Improvement Series A | 2.00 | % | 09/01/2014 | 652,125 | |||||||||
| 1,255,000 | Louisville & Jefferson County Kentucky | 4.00 | % | 04/01/2015 | 1,291,822 | |||||||||
| 2,310,000 | Lower Merion School District | 3.00 | % | 05/15/2015 | 2,368,120 | |||||||||
| 1,400,000 | Lubbock Texas | 2.00 | % | 02/15/2015 | 1,416,464 | |||||||||
| 1,250,000 | Lufkin Independent School District | 2.00 | % | 08/15/2015 | 1,276,237 | |||||||||
| 1,000,000 | Maryland, State of | 5.00 | % | 08/01/2015 | 1,052,990 | |||||||||
| 3,000,000 | Mecklenburg County North Carolina | 3.00 | % | 12/01/2015 | 3,120,600 | |||||||||
| 1,000,000 | Midland Texas Independent School District | 2.00 | % | 02/15/2015 | 1,011,980 | |||||||||
| 1,400,000 | Murfreesboro Tennessee | 1.00 | % | 04/01/2015 | 1,409,156 | |||||||||
| 1,315,000 | Nashville & Davidson County — District Energy System | 3.00 | % | 10/01/2015 | 1,362,143 | |||||||||
| 1,000,000 | New York New York | 5.00 | % | 08/01/2015 | 1,052,970 | |||||||||
| 1,310,000 | North Central Wisconsin Technical College District | 2.00 | % | 09/01/2014 | 1,314,035 | |||||||||
| 2,750,000 | Northside Independent School District | 2.00 | % | 06/15/2015 | 2,799,665 | |||||||||
| 1,500,000 | Ohio State Third Frontier | 3.13 | % | 11/01/2014 | 1,515,285 | |||||||||
| 1,200,000 | Oxford Alabama Series B | 2.00 | % | 09/01/2014 | 1,203,372 | |||||||||
| 1,000,000 | Pennsylvania, Commonwealth of | 5.50 | % | 02/01/2015 | 1,031,650 | |||||||||
| 2,565,000 | Rhode Island, State of | 2.00 | % | 11/01/2014 | 2,581,467 | |||||||||
| 1,000,000 | Richardson Texas Independent School District | 3.00 | % | 02/15/2015 | 1,017,560 | |||||||||
| 1,655,000 | South Carolina, State of | 5.00 | % | 04/01/2015 | 1,715,937 | |||||||||
| 1,100,000 | South Windsor Connecticut | 5.00 | % | 08/15/2015 | 1,159,268 | |||||||||
| 1,010,000 | Wisconsin, State of — Series A | 5.00 | % | 05/01/2015 | 1,051,339 | |||||||||
| 50,480,663 | ||||||||||||||
| Refunded Bonds — 17.7% | ||||||||||||||
| 1,800,000 | Arizona State University Callable 03/01/2015 @ 100^ | 5.00 | % | 09/01/2023 | 1,858,032 | |||||||||
| 1,090,000 | Arizona State University Callable 9/1/2014 @ 100^ | 5.25 | % | 09/01/2024 | 1,099,407 | |||||||||
| 750,000 | Blue Mountain School District Callable 10/01/2014 @ 100^ | 4.45 | % | 10/01/2026 | 758,197 | |||||||||
| 2,000,000 | Charleston South Carolina Educational Excellence Financing Corp. Callable 12/1/2014 @ 100^ | 5.00 | % | 12/01/2016 | 2,041,140 | |||||||||
| 2,000,000 | Delaware River Joint Toll Bridge Commission Callable 07/01/2015 @ 100^ | 4.50 | % | 07/01/2030 | 2,087,460 | |||||||||
| 3,000,000 | Easton Area School District Callable 04/01/2016 @ 100^ | 7.50 | % | 04/01/2021 | 3,377,310 | |||||||||
| 2,835,000 | Easton Area School District Callable 4/01/2016 @ 100^ | 7.50 | % | 04/01/2022 | 3,191,558 | |||||||||
| 1,000,000 | Hammond School Building Corp. Callable 1/15/2015 @ 100^ | 5.00 | % | 07/15/2020 | 1,026,270 | |||||||||
| 650,000 | Honolulu Hawaii City & County Series B, Callable 7/01/2014 @ 100^ | 5.00 | % | 07/01/2016 | 650,091 | |||||||||
| 1,375,000 | Indiana State Office Building Commission | 5.25 | % | 07/01/2015 | 1,444,740 | |||||||||
| 6,000,000 | Mississippi Development Bank Callable 09/01/2014 @ 100^ | 5.00 | % | 09/01/2034 | 6,049,680 | |||||||||
| 2,105,000 | Municipality of Anchorage, Alaska 2005 (Schools) Series A, Callable 03/01/2015 @ 100^ | 5.00 | % | 03/01/2020 | 2,173,602 | |||||||||
| 2,500,000 | Nevada System of Higher Education Callable 01/01/2016 @ 100^ | 5.00 | % | 07/01/2026 | 2,680,175 | |||||||||
| 1,425,000 | New Jersey Economic Development Authority Callable 09/01/2015 @ 100^ | 5.25 | % | 09/01/2019 | 1,509,446 | |||||||||
| 3,895,000 | North Carolina Infrastructure Finance Corp. Callable 02/01/2015 @ 100^ | 5.00 | % | 02/01/2020 | 4,005,696 | |||||||||
| 1,000,000 | Pierce County School District Callable 06/01/2016 @ 100^ | 5.00 | % | 12/01/2024 | 1,090,420 | |||||||||
The accompanying notes are an integral part of these financial statements.
www.brownadvisoryfunds.com
51
Brown Advisory Tax Exempt Bond Fund
Schedule of Investments
June 30, 2014
| Par Value | Security Description | Rate | Maturity | Value $ | |||||||||
| Municipal Bonds — (Continued) | |||||||||||||
| Refunded Bonds — (Continued) | |||||||||||||
| 1,150,000 | Snohomish County School District Callable 12/01/2014 @ 100^ | 5.00 | % | 12/01/2021 | 1,173,518 | ||||||||
| 36,216,742 | |||||||||||||
| Revenue Bonds — 53.0% | |||||||||||||
| 1,500,000 | Alabama 21st Century Authority — Tobacco Settlement | 5.00 | % | 06/01/2017 | 1,677,495 | ||||||||
| 2,100,000 | Alabama 21st Century Authority — Tobacco Settlement Series A | 4.00 | % | 06/01/2015 | 2,171,211 | ||||||||
| 1,500,000 | Atlanta Department of Aviation Callable 1/01/2024 @ 100^ | 5.00 | % | 01/01/2032 | 1,695,450 | ||||||||
| 3,000,000 | Chicago Motor Fuel Tax Revenue Callable 01/01/2024 @ 100^ | 5.00 | % | 01/01/2027 | 3,281,130 | ||||||||
| 3,000,000 | Chicago Midway International Airport Callable 1/01/2024 @ 100^ | 5.00 | % | 01/01/2028 | 3,380,520 | ||||||||
| 5,000,000 | Chicago Transit Authority Callable 12/01/2024 @ 100^ | 5.25 | % | 12/01/2049 | 5,463,750 | ||||||||
| 300,000 | Colorado Health Facilities Authority — Covenant Retirement Communities | 5.00 | % | 12/01/2020 | 333,909 | ||||||||
| 2,190,000 | Colorado Health Facilities Authority Callable 6/01/2022 @ 100^ | 5.00 | % | 12/01/2025 | 2,414,103 | ||||||||
| 1,800,000 | Colorado Health Facilities Authority Revenue — Covenant Retirement Communities, Inc. Series A, | ||||||||||||
| Callable 12/01/2022 @ 100^ | 5.00 | % | 12/01/2027 | 1,920,906 | |||||||||
| 335,000 | Cook County Sales Tax Revenue | 4.00 | % | 11/15/2015 | 352,316 | ||||||||
| 2,455,000 | Dallas/Fort Worth International Airport Callable 11/01/2023 @ 100^ | 5.25 | % | 11/01/2030 | 2,829,387 | ||||||||
| 1,600,000 | Delaware Transportation Authority | 5.00 | % | 07/01/2015 | 1,678,816 | ||||||||
| 3,235,000 | Denver Health & Hospital Authority Callable 12/01/2023 @ 100^ | 5.00 | % | 12/01/2039 | 3,385,783 | ||||||||
| 1,000,000 | Florida Water Pollution Control Financing Corp. | 2.75 | % | 01/15/2015 | 1,014,370 | ||||||||
| 1,350,000 | Harris County Cultural Education Facilities Finance Corp. Callable 12/01/2024 @ 100^ | 5.00 | % | 12/01/2026 | 1,583,982 | ||||||||
| 1,000,000 | Indiana Finance Authority | 4.00 | % | 02/01/2015 | 1,022,860 | ||||||||
| 1,000,000 | Iowa Finance Authority Health Facilities — Mercy Medical Center Project | ||||||||||||
| Callable 08/15/2022 @ 100^ | 5.00 | % | 08/15/2026 | 1,112,180 | |||||||||
| 1,050,000 | Kentucky Economic Development Finance Authority Callable 08/15/2021 @ 100^ | 5.25 | % | 08/15/2046 | 1,126,482 | ||||||||
| 4,500,000 | Kentucky State Property & Building Commission | 2.00 | % | 08/01/2014 | 4,507,380 | ||||||||
| 1,500,000 | Lincoln Nebraska — Lincoln Electric System | 4.00 | % | 09/01/2015 | 1,567,470 | ||||||||
| 2,070,000 | Louisville & Jefferson County Kentucky Callable 10/01/2023 @ 100^ | 5.75 | % | 10/01/2038 | 2,313,742 | ||||||||
| 2,000,000 | Massachusetts Bay Transportation Authority | 5.00 | % | 07/01/2031 | 2,438,260 | ||||||||
| 3,000,000 | Massachusetts Bay Transportation Authority | 5.25 | % | 07/01/2032 | 3,758,940 | ||||||||
| 2,000,000 | Massachusetts Water Pollution Abatement Trust | 5.25 | % | 08/01/2015 | 2,111,400 | ||||||||
| 1,898,332 | New Mexico State Mortgage Finance Authority Callable 6/1/2023 @ 100^ | 2.85 | % | 07/01/2043 | 1,917,999 | ||||||||
| 1,465,000 | New York City Transitional Finance Authority Future Tax Secured Revenue | 5.00 | % | 11/01/2015 | 1,560,313 | ||||||||
| 1,000,000 | New York City Transitional Finance Authority Future Tax Secured Revenue | 5.00 | % | 11/01/2015 | 1,065,060 | ||||||||
| 2,545,000 | New York Metropolitan Transportation Authority Callable 05/15/2023 @ 100^ | 5.00 | % | 11/15/2038 | 2,772,141 | ||||||||
| 2,000,000 | New York Metropolitan Transportation Authority Callable 05/15/2023 @ 100^ | 5.00 | % | 11/15/2042 | 2,164,400 | ||||||||
| 1,000,000 | New York State Dormitory Authority | 5.00 | % | 02/15/2015 | 1,030,570 | ||||||||
| 1,000,000 | New York State Dormitory Authority | 4.00 | % | 10/01/2015 | 1,047,780 | ||||||||
| 2,780,000 | New York State Dormitory Authority | 5.00 | % | 02/15/2016 | 2,993,198 | ||||||||
| 1,000,000 | New York State Environmental Facilities Corp. | 5.00 | % | 06/15/2015 | 1,046,970 | ||||||||
| 1,730,000 | New York State Environmental Facilities Corp. | 2.00 | % | 11/15/2015 | 1,773,890 | ||||||||
| 4,000,000 | New York State Urban Development Corp. Callable 03/15/2023 @ 100^ | 5.00 | % | 03/15/2043 | 4,423,120 | ||||||||
| 1,700,000 | North Carolina Medical Care Commission Callable 10/01/2022 @ 100^ | 5.00 | % | 10/01/2038 | 1,834,504 | ||||||||
| 2,000,000 | Pennsylvania Economic Development Financing Revenue Bonds | 5.00 | % | 07/01/2015 | 2,098,100 | ||||||||
| 3,000,000 | Pennsylvania Turnpike Commission Callable 12/01/2024 @ 100^ | 5.00 | % | 12/01/2038 | 3,246,840 | ||||||||
| 3,000,000 | Pennsylvania Turnpike Commission Callable 12/01/2024 @ 100^ | 5.00 | % | 12/01/2044 | 3,303,210 | ||||||||
| 1,025,000 | Philadelphia — Water & Wastewater | 5.25 | % | 12/15/2014 | 1,045,572 | ||||||||
| 1,000,000 | Puerto Rico Sales Tax Financing Corp Callable 08/01/2019 @ 100^ | 5.38 | % | 08/01/2020 | 984,440 | ||||||||
| 1,000,000 | Puerto Rico Sales Tax Financing Corp. Revenue Bonds | 4.63 | % | 08/01/2019 | 971,070 | ||||||||
| 2,765,000 | Puerto Rico Sales Tax Financing Corp. Revenue Bonds | 5.25 | % | 08/01/2019 | 2,761,212 | ||||||||
| 1,810,000 | Puerto Rico Sales Tax Financing Corp. Revenue Bonds First Subseries A-1 | 8.14 | %~ | 08/01/2024 | 822,084 | ||||||||
| 1,000,000 | Puerto Rico Sales Tax Financing Corp. Revenue Bonds Series A, Callable 8/1/2019 @ 100^ | 5.50 | % | 08/01/2023 | 951,800 | ||||||||
| 750,000 | Purdue University Student Fee Series AA | 4.00 | % | 07/01/2014 | 750,083 | ||||||||
| 1,340,000 | Rhode Island Clean Water Finance Agency — Water Pollution Control Series B | 3.00 | % | 10/01/2015 | 1,387,610 | ||||||||
| 1,305,000 | Sedgwick County Public Building Commission | 5.00 | % | 02/01/2015 | 1,342,480 | ||||||||
| 2,000,000 | Tobacco Settlement Financing Corp. | 5.00 | % | 06/01/2017 | 2,179,400 | ||||||||
The accompanying notes are an integral part of these financial statements.
www.brownadvisoryfunds.com
52
Brown Advisory Tax Exempt Bond Fund
Schedule of Investments
June 30, 2014
| Par | |||||||||||||
| Value/Shares | Security Description | Rate | Maturity | Value $ | |||||||||
| Municipal Bonds — (Continued) | |||||||||||||
| Revenue Bonds — (Continued) | |||||||||||||
| 1,600,000 | Tobacco Settlement Financing Corp. Callable 6/1/2017 @ 100^ | 5.00 | % | 06/01/2018 | 1,725,040 | ||||||||
| 2,550,000 | Tobacco Settlement Financing Corp. Louisiana Revenue Bonds | 5.00 | % | 05/15/2019 | 2,917,634 | ||||||||
| 1,000,000 | Tucson Arizona Water System Revenue Bonds | 3.00 | % | 07/01/2015 | 1,029,210 | ||||||||
| 2,845,000 | Wisconsin Health & Educational Facilities Authority | 5.00 | % | 06/01/2022 | 3,275,505 | ||||||||
| 1,090,000 | Wisconsin Health & Educational Facilities Authority Callable 08/15/2023 @ 100^ | 5.00 | % | 08/15/2043 | 1,125,414 | ||||||||
| 108,688,491 | |||||||||||||
| Total Municipal Bonds (Cost $194,958,867) | 195,385,896 | ||||||||||||
| Short-Term Investments — 6.6% | |||||||||||||
| Money Market Fund — 6.6% | |||||||||||||
| 13,597,430 | DWS Cash Account Trust — Tax-Exempt Portfolio, 0.01%* | 13,597,430 | |||||||||||
| Total Short-Term Investments (Cost $13,597,430) | 13,597,430 | ||||||||||||
| Total Investments — 101.9% (Cost $208,556,297) | 208,983,326 | ||||||||||||
| Liabilities in Excess of Other Assets — (1.9)% | (3,805,853 | ) | |||||||||||
| TOTAL NET ASSETS — 100.0% | $ | 205,177,473 | |||||||||||
| PORTFOLIO HOLDINGS | ||||
| % of Net Assets | ||||
| Revenue Bonds | 53.0 | % | ||
| General Obligation Bonds | 24.6 | % | ||
| Refunded Bonds | 17.7 | % | ||
| Money Market Funds | 6.6 | % | ||
| Other Assets and Liabilities | (1.9 | )% | ||
| 100.0 | % | |||
| ^ | Continuously callable with 30 days notice. |
| # | Variable rate security. Rate disclosed is as of June 30, 2014. |
| ~ | Zero coupon bond. Rate disclosed is yield to maturity as of June 30, 2014. |
| * | Annualized seven-day yield as of June 30, 2014. |
The accompanying notes are an integral part of these financial statements.
www.brownadvisoryfunds.com
53
Brown Advisory – Somerset Emerging Markets Fund
A Message to Our Shareholders
June 30, 2014
Dear Shareholder:
The year ended June 30, 2014 saw continued volatility in emerging markets, as fears of diminishing liquidity from U.S. Federal Reserve tapering and the potential for a hard economic landing in China weighed on investor sentiment. There were capital outflows from emerging-markets currencies, bonds and equities, particularly in 2013’s third quarter and the first quarter of this year—leading to some large moves in stock markets, initially downward, followed by a rally across our asset class in Q214. For the year ended June 30, 2014, the Brown Advisory – Somerset Emerging Markets Fund Institutional Shares (the “Fund”) increased by 8.62% against a return of 14.31% for the MSCI Emerging Markets Index, the Fund’s benchmark.
On the surface, emerging-market stocks appear broadly inexpensive, but in reality there remain both expensive and cheap segments of the market. We see attractive opportunities in the more overlooked areas of the market, where good stock picking is especially important, as these sectors (examples include textiles, long-term insurance, industrials and information-technology hardware) are often complicated or under-researched. The Fund held a mixture of what we view as solid value companies as well as more perennial positions as of the end of the period, and we work as always to reduce exposure to expensive stocks.
From an individual stock perspective, our holdings in Indonesia declined during the period. Semen Gresik and PT Bukit Asam (PTBA) fell owing to a combination of poor market sentiment, currency weakness and, in the case of PTBA, weak fundamental performance. The Fund’s relative overweight in these names was an additional drag on performance, especially in the second half of 2013. At a country level, our underweight in China combined with our more defensive holdings in that country (China Mobile and AAC Technologies) detracted from returns; our attribution analysis shows that more than one-third of our underperformance in the second half of 2013 was related to China. Due to our continued concerns about currency issues and the health of the banking sector, we have stayed away from Chinese banks, construction companies and other cyclicals. Finally, the Chilean market was weak, and the Fund’s returns were hampered by our relative overweight in Chile vs. the benchmark.
However, there were a number of bright spots during what was a difficult period for the Fund. NCSOFT, a Korean online gaming company, added considerably to performance, while our financials holdings also benefited our relative return. Our strongest performers in the financial sector included Polish firms Bank Pekao and PZU, National Bank of Abu Dhabi and Public Bank in Malaysia.
In the first half of 2014, our stocks in South Africa and Russia were a drag on performance. The continued weakness of the South African rand combined with poor sentiment toward consumer-related sectors led to declines in South African holdings Shoprite and Nampak. Elsewhere, Russian-related geopolitical issues have dominated headlines, and our Russian holding Nokian Renkaat, which is listed in Finland, declined materially during the period. The Fund was not affected by the military coup in Thailand, as we sold our only Thai holding, Siam Commercial Bank, in the third quarter of 2013.
There was limited activity during the period covered in this report, in keeping with our long-term investment approach. We sold Siam Commercial Bank due to concerns over its growing book of nonperforming loans and debt concerns, disposed of residual positions in Tiger Brands and Foschini Group, and sold Semen Gresik due to demand concerns as well as its expensive valuation. In addition, we sold Far Eastone Telecomm on valuation, Natura Cosmeticos and Souza Cruz on high valuations in Brazilian consumer staples, and PTBA on concerns over management issues. We added six positions over the last 12 months, including three financials (OTP Bank in Hungary, Brazilian insurance company Porto Seguro and Axis Bank of India), as well as Pou Chen (a Taiwanese shoe manufacturer), SK Hynix (a Korean technology hardware company) and Nexen Tire (a Korean tire manufacturer). We plan to continue seeking to invest in quality stocks with historically growing dividend streams in an effort to position the Fund toward value and away from some of the more expensive names.
Sincerely,
Edward Lam
Portfolio Manager
www.brownadvisoryfunds.com
54
Brown Advisory – Somerset Emerging Markets Fund
A Message to Our Shareholders
June 30, 2014
Past performance is not a guarantee of future results.
Mutual fund investing involves risk. Principal loss is possible. Investments in foreign securities entail certain risks not associated with investments in domestic securities, such as volatility of currency exchange rates, and in some cases, political and economic instability and relatively illiquid markets. These risks are greater for investments in emerging markets. Derivatives may involve certain costs and risks such as liquidity, interest rate, market, credit, management, and the risk that a position could not be closed when most advantageous. Investing in derivatives could lose more than the amount invested. The Fund invests in smaller companies which carry greater risk than is associated with larger companies for various reasons, such as narrower markets, limited financial resources and less liquid stock. The Fund may invest in ETFs, which may trade at a discount to the aggregate value of the underlying securities and although expense ratios for ETFs are generally low, frequent trading of ETFs by the Fund can generate brokerage expenses. Multi-investment management styles may lead to higher transaction expenses compared to single investment management styles. Outcomes depend on the skill of the sub-advisor and the advisor and the allocation of assets among them.
Fund holdings and sector allocations are subject to change and should not be considered a recommendation to buy or sell any security. For a complete list of fund holdings, please refer to the Schedule of Investments provided in this report.
Definitions for terms and indices are provided in the Glossary of Terms.
www.brownadvisoryfunds.com
55
Brown Advisory – Somerset Emerging Markets Fund
Performance Chart and Analysis
June 30, 2014
COMPARISON OF CHANGE IN VALUE OF A $1,000,000 INVESTMENT
The following chart reflects the change in value of a hypothetical $1,000,000 investment, including reinvested dividends and distributions, in the Fund as measured against a broad-based securities market index. The MSCI Emerging Markets Index is a free float-adjusted market capitalization index that is designed to measure equity market performance in the global emerging markets. The index is unmanaged and does not reflect the deduction of fees, such as investment management fees. Investors cannot invest directly in an index.

| Since | ||
| Average Annual Total Return | One | Inception |
| as of 6/30/14 | Year | (12/12/12) |
| Institutional Shares | 8.62% | 2.21% |
| Investor Shares | 8.51% | 2.07% |
| Advisor Shares | 8.19% | 1.74% |
| MSCI Emerging Markets Index | 14.31% | 3.10% |
| Institutional Shares | Investor Shares | Advisor Shares | |
Gross Expense Ratio1 | 1.45% | 1.60% | 1.85% |
Net Expense Ratio1 | 1.45% | 1.60% | 1.85% |
Past performance does not guarantee future results. The performance data quoted represents past performance and current returns may be lower or higher. The investment return and net asset value will fluctuate so that an investor’s shares, when redeemed, may be worth more or less than the original cost. To obtain performance information current to the most recent month end, please visit our website at brownadvisoryfunds.com/performance.html. The performance table and graph above do not reflect the deduction of taxes that a shareholder would pay on Fund distributions or the redemption of Fund shares. Performance data does not reflect the imposition of the redemption fee of 1.00% on shares redeemed within 14 days, and if it did, performance would have been lower. Short-term performance, in particular, is not a good indication of the Fund’s future performance, and an investment should not be made based solely on returns.
| 1 | Per the Fund’s prospectus dated October 31, 2013. |
www.brownadvisoryfunds.com
56
Brown Advisory – Somerset Emerging Markets Fund
Schedule of Investments
June 30, 2014
| Shares | Security Description | Value $ | |||||
| Common Stocks — 78.6% | |||||||
| Brazil — 4.7% | |||||||
| 271,440 | Cielo S.A. | 5,595,878 | |||||
| 333,700 | Porto Seguro S.A. | 4,766,495 | |||||
| 10,362,373 | |||||||
| Chile — 5.4% | |||||||
| 2,979,170 | AFP Habitat S.A.† | 3,983,360 | |||||
| 4,047,719 | Aguas Andinas S.A. | 2,552,921 | |||||
| 273,240 | Cia Cervecerias Unidas S.A. | 3,205,221 | |||||
| 1,220,368 | Inversiones Aguas Metropolitan | 1,975,045 | |||||
| 11,716,547 | |||||||
| China — 6.8% | |||||||
| 1,323,424 | AAC Technologies Holdings, Inc. | 8,612,910 | |||||
| 651,000 | China Mobile, Ltd. | 6,322,994 | |||||
| 14,935,904 | |||||||
| Finland — 2.5% | |||||||
| 137,176 | Nokian Renkaat | 5,348,081 | |||||
| Hungary — 2.8% | |||||||
| 314,655 | OTP Bank PLC | 6,045,498 | |||||
| Indonesia — 1.6% | |||||||
| 17,135,000 | Telekomunikasi Indonesia | 3,564,124 | |||||
| Luxembourg — 1.5% | |||||||
| 36,148 | Millicom International Cellular | 3,308,923 | |||||
| Malaysia — 2.9% | |||||||
| 108,109 | British American Tobacco Malayasia Berhad | 2,206,826 | |||||
| 577,900 | Public Bank Berhad | 3,524,083 | |||||
| 430,900 | Top Glove Corp. | 613,275 | |||||
| 6,344,184 | |||||||
| Morocco — 1.0% | |||||||
| 190,909 | Maroc Telecom S.A. | 2,212,800 | |||||
| Philippines — 6.3% | |||||||
| 4,589,161 | Aboitiz Power Corp. | 3,856,504 | |||||
| 3,005,492 | Metropolitan Bank & Trust | 6,017,176 | |||||
| 58,475 | Philippine Long Distance Corp. | 3,978,999 | |||||
| 13,852,679 | |||||||
| Poland — 4.2% | |||||||
| 37,153 | Bank Pekao S.A. | 2,128,039 | |||||
| 48,171 | Powszechny Zaklad Ubezpieczen S.A. | 7,038,190 | |||||
| 9,166,229 | |||||||
| South Africa — 5.9% | |||||||
| 1,534,976 | Nampak, Ltd. | 5,308,696 | |||||
| 1,217,084 | Sanlam, Ltd. | 7,066,514 | |||||
| 28,781 | Shoprite Holding, Ltd. | 417,019 | |||||
| 12,792,229 | |||||||
| South Korea — 14.0% | |||||||
| 78,712 | KT&G Corp. | 6,965,080 | |||||
| 24,867 | NCSoft Corp. | 4,485,155 | |||||
| 342,080 | Nexen Tire Corp. | 5,222,287 | |||||
| 6,227 | Samsung Electronics Co., Ltd. | 8,132,148 | |||||
| 117,969 | SK Hynix, Inc.* | 5,664,619 | |||||
| 30,469,289 | |||||||
| Taiwan — 9.1% | |||||||
| 146,100 | Formosa International Hotels | 1,775,604 | |||||
| 5,217,000 | Pou Chen Corp. | 6,285,401 | |||||
| 463,000 | President Chain Store Corp. | 3,710,529 | |||||
| 1,924,000 | Taiwan Semiconductor Manufacturing Co. | 8,141,494 | |||||
| 19,913,028 | |||||||
| Turkey — 5.9% | |||||||
| 1,483,050 | Aksa Akrilik Kimya Sanayii† | 5,368,557 | |||||
| 2,033,598 | Anadolu Hayat Emeklilik AS† | 4,577,673 | |||||
| 2,147,872 | Turkiye Sise Ve Cam Fabrikalari | 3,024,467 | |||||
| 12,970,697 | |||||||
| United Arab Emirates — 4.0% | |||||||
| 756,566 | First Gulf Bank | 3,277,048 | |||||
| 1,410,520 | National Bank Abu Dhabi | 5,453,437 | |||||
| 8,730,485 | |||||||
| Total Common Stocks (Cost $158,529,541) | 171,733,070 | ||||||
| Preferred Stocks — 1.4% | |||||||
| Brazil — 1.4% | |||||||
| 351,900 | AES Tiete S.A. | 3,105,703 | |||||
| Total Preferred Stocks (Cost $3,662,285) | 3,105,703 | ||||||
| Exchange Traded Funds — 3.7% | |||||||
| India — 3.7% | |||||||
| 424,700 | iShares MSCI India Index ETF* | 3,070,581 | |||||
| 175,421 | iShares India 50 ETF | 5,081,946 | |||||
| Total Exchange Traded Funds (Cost $6,984,633) | 8,152,527 | ||||||
| Rights — 0.1% | |||||||
| Malaysia — 0.1% | |||||||
| 57,790 | Public Bank Berhad-Rights | 98,986 | |||||
| Total Rights (Cost $93,649) | 98,986 | ||||||
| Short-Term Investments — 15.9% | |||||||
| Money Market Funds — 15.9% | |||||||
| 34,843,506 | DWS Cash Account Trust — Government | ||||||
| & Agency Securities Portfolio, 0.03%# | 34,843,506 | ||||||
| Total Short-Term Investments (Cost $34,843,506) | 34,843,506 | ||||||
| Total Investments — 99.7% (Cost $204,113,614) | 217,933,792 | ||||||
| Other Assets in Excess of Liabilities — 0.3% | 565,971 | ||||||
| NET ASSETS — 100.0% | $ | 218,499,763 | |||||
The accompanying notes are an integral part of these financial statements.
www.brownadvisoryfunds.com
57
Brown Advisory – Somerset Emerging Markets Fund
Schedule of Investments
June 30, 2014
| PORTFOLIO HOLDINGS | ||||
| % of Net Assets | ||||
| Money Market Funds | 15.9 | % | ||
| South Korea | 14.0 | % | ||
| Taiwan | 9.1 | % | ||
| China | 6.8 | % | ||
| Philippines | 6.3 | % | ||
| Brazil | 6.1 | % | ||
| Turkey | 5.9 | % | ||
| South Africa | 5.9 | % | ||
| Chile | 5.4 | % | ||
| Poland | 4.2 | % | ||
| United Arab Emirates | 4.0 | % | ||
| India | 3.7 | % | ||
| Malaysia | 3.0 | % | ||
| Hungary | 2.8 | % | ||
| Finland | 2.5 | % | ||
| Indonesia | 1.6 | % | ||
| Luxembourg | 1.5 | % | ||
| Morocco | 1.0 | % | ||
| Other Assets and Liabilities | 0.3 | % | ||
| 100.0 | % | |||
| * | Non-Income Producing |
| † | All or a portion of this security is considered illiquid. At June 30, 2014, the total market value of securities considered illiquid was $10,177,186 or 4.7% of net assets. |
| # | Annualized seven-day yield as of June 30, 2014. |
www.brownadvisoryfunds.com
58
Brown Advisory – WMC Strategic European Equity Fund
A Message to Our Shareholders
June 30, 2014
Dear Shareholder:
The Brown Advisory – WMC Strategic European Equity Fund Institutional Shares (the “Fund”) launched on October 21, 2013. From the Fund’s inception through June 30, 2014, the Fund increased 4.60% in value. During the same period, the MSCI Europe Index (the “Index”), the Fund’s benchmark, increased 9.50%.
We take a bottom-up approach to building the Fund’s portfolio, in which we aim to identify companies that can benefit from a structural growth advantage, appear to be competitively well positioned and are attractively valued. This fundamental process leads us to hold certain sector over- and underweights. During the period, our underweight positions in energy and utilities hurt relative results, as these sectors rallied considerably during the period. Energy stocks specifically performed well, as expectations seem to encapsulate a moderation of capital expenditure with potentially positive implications for free cash flow growth. However, we continue to see a dearth of opportunities within the energy and utilities sectors and instead see more structural growth opportunities within the industrials and information technology sectors, though our overweights to these sectors also weighed on relative performance. Partially offsetting negative results was our underweight allocation to the financials sector. Overall, security selection detracted from relative performance driven by weak selection in consumer staples, health care and industrials. Positive selection in information technology added to relative results.
Top detractors from relative returns included Julius Baer, SKF and Swatch. Shares of Switzerland-based private bank Julius Baer suffered when the company released quarterly earnings that disappointed the market, in part due to question marks around assets under management (AUM) progression and the potential knock-on impact on margins. However, we remain positive regarding the company’s strong competitive position and attractive valuation. Shares of SKF fell on earnings numbers that fell short of the market’s expectations, although more recently, the company’s commentary has been positive, and we remain in favor of the company’s underlying fundamentals. Shares of Switzerland-based watch-maker Swatch also fell during the period, and we eliminated the name from the portfolio, as our outlook for the company’s free-cash-flow generation ability became less compelling, especially in light of recent margin pressures.
On the positive side, top contributors to relative returns during the period included Infineon, Geberit and UCB. Infineon has continued to produce good numbers. Its semiconductor content per car in Europe is higher than the global average, and our outlook for the stock remains positive based on its relatively new positioning within this semiconductor industry. Shares of Geberit, a Switzerland-based leader of sanitary technology, performed well over the period. The company released positive earnings, showcasing its strong organic top-line growth. It remains a high return-on-capital-employed (ROCE) company with a strong balance sheet. Finally, shares of Belgium-based pharmaceuticals company UCB also rose. The company has been executing well over the period, and its key pipeline drugs have performed ahead of expectations.
We reviewed our holdings during the period and initiated new positions in Bayer, ING and Nordea. Bayer, in our view, has a strong lineup of recently launched drugs and solid exposure to biologics and cancer drugs, both of which should support steady long-term growth. We believe ING has been a turnaround stock in the wake of the financial crisis, with management focused on bolstering the bank’s balance sheet. In our view, the upshot of its efforts has led to a more sustainable and attractive return-on-equity (ROE) profile. In Nordea’s case, we view the company as a high-quality franchise with a very strong core Tier 1 capital ratio; it has continued to steadily attract deposits within the region, and it has been aligning its lending focus away from transaction to more relationship-based lending. We eliminated Capita based on our expectations of a more routine ROCE profile and a much less compelling valuation profile. Lastly, we eliminated Adidas as we no longer believed the risk-reward profile is attractive.
We continue to expect 2014 to be an important year of reckoning. Companies will have to deliver on the hopes for a broad earnings recovery, and we believe stock picking will be extremely important. We believe stocks that disappoint will be hit hard, while those companies that can deliver should do well.
We see quite a significant disconnect between valuations in the peripheral (e.g., Italy and Spain) vs. core (e.g., Germany and Sweden) areas of Europe. In the peripheral areas, investor demand and expectations have driven stock prices higher despite a lack of notable improvements in earnings revisions. This is in contrast to the core area of Europe, where valuations do not seem to fully price in the level of expected earnings.
Sincerely,
C. Dirk Enderlein, CFA
Portfolio Manager
www.brownadvisoryfunds.com
59
Brown Advisory – WMC Strategic European Equity Fund
A Message to Our Shareholders
June 30, 2014
Past performance is not a guarantee of future results.
Mutual fund investing involves risk. Principal loss is possible. Investments focused in a single geographic region may be exposed to greater risk than investments diversified among various geographies. Investments in foreign securities entail certain risks not associated with investments in domestic securities, such as volatility of currency exchange rates, and in some cases, political and economic instability and relatively illiquid markets. These risks are greater in emerging markets. Investments in smaller and medium capitalization companies generally carry greater risk than is customarily associated with larger companies for various reasons such as narrower markets, limited financial resources and less liquid stock. The Fund may invest in ETFs, which may trade at a discount to the aggregate value of the underlying securities and although expense ratios for ETFs are generally low, frequent trading of ETFs by the Fund can generate brokerage expenses. The value of investments in REITs may change in response to changes in the real estate market such as declines in the value of real estate, lack of available capital or financing opportunities, and increases in property taxes or operating costs. Derivatives involve risks different from, and in certain cases, greater than the risks presented by more traditional investments. Investors will indirectly bear the principal risks and its share of the fees and expenses of the Fund’s investment in other Investment Companies.
Fund holdings and sector allocations are subject to change and should not be considered a recommendation to buy or sell any security. For a complete list of fund holdings, please refer to the Schedule of Investments provided in this report.
Definitions for terms and indices are provided in the Glossary of Terms.
www.brownadvisoryfunds.com
60
Brown Advisory – WMC Strategic European Equity Fund
Performance Chart and Analysis
June 30, 2014
COMPARISON OF CHANGE IN VALUE OF A $1,000,000 INVESTMENT
The following chart reflects the change in value of a hypothetical $1,000,000 investment, including reinvested dividends and distributions, in the Fund as measured against a broad-based securities market index. The MSCI Europe Index is an index that captures large and mid cap representation across 15 developed market countries in Europe. The index is unmanaged and does not reflect the deduction of fees, such as investment management fees. Investors cannot invest directly in an index.

| Since | |||
| Cumulative Total Return | Inception | ||
| as of 6/30/14 | (10/21/13) | ||
| Institutional Shares | 4.60% | ||
| Investor Shares | 4.50% | ||
| Advisor Shares | 4.40% | ||
| MSCI Europe Index | 9.50% | ||
| Institutional Shares | Investor Shares | Advisor Shares | |
Gross Expense Ratio1 | 1.20% | 1.35% | 1.60% |
Net Expense Ratio1 | 1.20% | 1.35% | 1.60% |
Past performance does not guarantee future results. The performance data quoted represents past performance and current returns may be lower or higher. The investment return and net asset value will fluctuate so that an investor’s shares, when redeemed, may be worth more or less than the original cost. To obtain performance information current to the most recent month end, please visit our website at brownadvisoryfunds.com/performance.html. The performance table and graph above do not reflect the deduction of taxes that a shareholder would pay on Fund distributions or the redemption of Fund shares. Performance data does not reflect the imposition of the redemption fee of 1.00% on shares redeemed within 14 days, and if it did, performance would have been lower. Short-term performance, in particular, is not a good indication of the Fund’s future performance, and an investment should not be made based solely on returns.
| 1 | Per the Fund’s prospectus dated October 31, 2013. |
www.brownadvisoryfunds.com
61
Brown Advisory – WMC Strategic European Equity Fund
Schedule of Investments
June 30, 2014
| Shares | Security Description | Value $ | |||||
| Common Stocks — 98.6% | |||||||
| Belgium — 4.7% | |||||||
| 59,623 | Anheuser-Busch InBev SA | 6,850,705 | |||||
| 42,550 | UCB SA | 3,599,822 | |||||
| 10,450,527 | |||||||
| Denmark — 2.8% | |||||||
| 186,891 | DSV A/S | 6,094,214 | |||||
| Finland — 3.4% | |||||||
| 98,459 | Kone OYJ | 4,105,353 | |||||
| 67,822 | Sampo OYJ | 3,428,566 | |||||
| 7,533,919 | |||||||
| France — 12.4% | |||||||
| 91,370 | Bureau Veritas SA | 2,537,661 | |||||
| 108,953 | Edenred SA | 3,303,887 | |||||
| 99,498 | Legrand SA | 6,093,318 | |||||
| 46,974 | Pernod Ricard SA | 5,642,544 | |||||
| 68,785 | Sanofi | 7,311,128 | |||||
| 76,255 | Zodiac Aerospace SA | 2,581,797 | |||||
| 27,470,335 | |||||||
| Germany — 10.5% | |||||||
| 27,845 | Bayer AG | 3,928,184 | |||||
| 8,123 | Bertrandt AG | 1,290,855 | |||||
| 24,716 | Gerry Weber International AG | 1,205,964 | |||||
| 31,919 | Hugo Boss AG | 4,766,126 | |||||
| 478,050 | Infineon Technologies AG | 5,967,570 | |||||
| 20,993 | NORMA Group SE | 1,158,205 | |||||
| 95,302 | ProSiebenSat.1 Media AG | 4,241,799 | |||||
| 14,892 | United Internet AG | 654,238 | |||||
| 23,212,941 | |||||||
| Italy — 0.7% | |||||||
| 38,063 | DiaSorin SpA | 1,593,951 | |||||
| Luxembourg — 0.3% | |||||||
| 4,913 | RTL Group SA | 545,322 | |||||
| Netherlands — 5.3% | |||||||
| 25,764 | ASML Holding NV | 2,402,786 | |||||
| 87,085 | Heineken NV | 6,250,883 | |||||
| 219,045 | ING Groep NV* | 3,073,747 | |||||
| 11,727,416 | |||||||
| Portugal — 1.8% | |||||||
| 244,723 | Jeronimo Martins SGPS SA | 4,023,623 | |||||
| Sweden — 14.4% | |||||||
| 162,834 | Alfa Laval AB | 4,192,983 | |||||
| 99,489 | ASSA ABLOY AB | 5,060,599 | |||||
| 244,336 | Atlas Copco AB | 7,054,265 | |||||
| 40,967 | Axis Communications AB | 1,194,504 | |||||
| 158,203 | Nordea Bank AB | 2,230,338 | |||||
| 293,317 | SKF AB | 7,478,893 | |||||
| 214,014 | Trelleborg AB | 4,551,464 | |||||
| 31,763,046 | |||||||
| Switzerland — 15.6% | |||||||
| 463 | BELIMO Holding AG | 1,249,203 | |||||
| 44,291 | Cie Financiere Richemont SA | 4,641,222 | |||||
| 524 | Daetwyler Holding AG | 79,552 | |||||
| 13,901 | Geberit AG | 4,876,384 | |||||
| 1,013 | Givaudan SA | 1,687,583 | |||||
| 2,349 | INFICON Holding AG | 765,518 | |||||
| 84,806 | Julius Baer Gruppe AG | 3,493,950 | |||||
| 8,939 | Kuehne & Nagel International AG | 1,188,618 | |||||
| 725 | LEM Holding SA | 628,693 | |||||
| 195 | Lindt & Spruengli AG | 992,591 | |||||
| 12,249 | Roche Holding, Ltd. | 3,649,674 | |||||
| 1,004 | SGS SA | 2,402,497 | |||||
| 15,864 | Tecan Trading AG | 1,813,708 | |||||
| 374,100 | UBS AG | 6,858,943 | |||||
| 34,328,136 | |||||||
| United Kingdom — 26.7% | |||||||
| 196,290 | British American Tobacco PLC | 11,679,641 | |||||
| 279,681 | Compass Group PLC | 4,862,631 | |||||
| 39,103 | Croda International PLC | 1,472,656 | |||||
| 140,442 | Diageo PLC | 4,472,928 | |||||
| 179,729 | Halma PLC | 1,812,985 | |||||
| 64,509 | Intertek Group PLC | 3,033,038 | |||||
| 97,547 | Jardine Lloyd Thompson Group PLC | 1,736,120 | |||||
| 267,560 | Prudential PLC | 6,130,157 | |||||
| 77,441 | Reckitt Benckiser Group PLC | 6,752,445 | |||||
| 282,427 | Smith & Nephew PLC | 4,998,362 | |||||
| 82,188 | Spectris PLC | 3,123,039 | |||||
| 61,895 | Spirax-Sarco Engineering PLC | 2,893,111 | |||||
| 83,646 | SuperGroup PLC* | 1,510,491 | |||||
| 27,258 | Victrex PLC | 793,566 | |||||
| 93,767 | WH Smith PLC | 1,715,817 | |||||
| 27,233 | Whitbread PLC | 2,054,462 | |||||
| 59,041,449 | |||||||
| Total Common Stocks (Cost $210,736,496) | 217,784,879 | ||||||
The accompanying notes are an integral part of these financial statements.
www.brownadvisoryfunds.com
62
Brown Advisory – WMC Strategic European Equity Fund
Schedule of Investments
June 30, 2014
| Shares | Security Description | Value $ | |||||
| Short Term Investments — 1.7% | |||||||
| Money Market Funds- 1.7% | |||||||
| 3,726,461 | DWS Cash Account Trust — Government | ||||||
| & Agency Securities Portfolio, 0.03%# | 3,726,461 | ||||||
| Total Short-Term Investments (Cost $3,726,461) | 3,726,461 | ||||||
| Total Investments — 100.3% (Cost $214,462,957) | 221,511,340 | ||||||
| Liabilities in Excess of Other Assets — (0.3)% | (645,205 | ) | |||||
| NET ASSETS — 100.0% | $ | 220,866,135 | |||||
| PORTFOLIO HOLDINGS | ||||
| % of Net Assets | ||||
| United Kingdom | 26.7 | % | ||
| Switzerland | 15.6 | % | ||
| Sweden | 14.4 | % | ||
| France | 12.4 | % | ||
| Germany | 10.5 | % | ||
| Netherlands | 5.3 | % | ||
| Belgium | 4.7 | % | ||
| Finland | 3.4 | % | ||
| Denmark | 2.8 | % | ||
| Portugal | 1.8 | % | ||
| Money Market Funds | 1.7 | % | ||
| Italy | 0.7 | % | ||
| Luxembourg | 0.3 | % | ||
| Other Assets and Liabilities | (0.3 | )% | ||
| 100.0 | % | |||
| * | Non-Income Producing |
| # | Annualized seven-day yield as of June 30, 2014. |
The accompanying notes are an integral part of these financial statements.
www.brownadvisoryfunds.com
63
Brown Advisory Mortgage Securities Fund
A Message to Our Shareholders
June 30, 2014
Dear Shareholder:
The Brown Advisory Mortgage Securities Fund (the “Fund”) was launched on December 26, 2013. From the Fund’s inception through June 30, 2014, the Investor Shares of the Fund increased 2.62% in value. During the same period, the Barclays Mortgage-Backed Securities Index, the Fund’s benchmark, increased 4.25%.
The Fund seeks to invest in mortgage-related bonds that have a favorable mix of upside potential and potential downside risk. We concentrate our portfolio investments in our best ideas, and this approach may lead to portfolio weightings that are diverged materially from the Fund’s benchmark, the Barclays Mortgage-Backed Securities Index.
For example, at the end of the period covered in this report, we were overweight 4.0% and 4.5% coupons in the 30-year space and had no weighting in 30-year bonds with coupons of 3.5% or less. This represents what we believe to be favorable prepayment positioning; in our view, housing turnover and high costs of refinancing have slowed the pace of mortgage prepayments for some time to come. (Slower prepayment may be better for holders of an mortgage backed security (MBS)—the more cash flow you can expect in the future from a portfolio of mortgages, the more that portfolio is typically worth.) With this positioning, however, we do miss out on some of the capital appreciation that lower-coupon bonds would provide in a falling-rate environment such as the one we experienced in the first half of 2014, when our low-coupon underweight dragged on total return. Mortgage spreads also tightened, as fresh bank demand overwhelmed diminishing Fed purchases from its quantitative easing program. While our positions benefited from this trend, it was not to the same degree as lower coupon bonds.
We remain comfortable with this trade-off between interest-rate risk and the potential to generate alpha from prepayment analysis. This positioning is less about interest rates and more about our assessment of risk vs. reward. Bank demand for MBS can be fickle, and if rates start rising and banks choose to sell, both rates and MBS spreads could move rapidly wider, as we witnessed in the summer of 2013. Meanwhile, with Fed rate hikes moving closer and MBS spreads at their tightest level this cycle, we see limited room for continued improvement.
Hence, we are much more comfortable owning high-quality MBS with favorable prepayment characteristics. While this might lead to some short-term tracking error, we believe that this approach has the potential to deliver favorable results for investors over time.
Sincerely,
Thomas D.D. Graff, CFA
Portfolio Manager
Past performance is not a guarantee of future results.
Mutual fund investing involves risk. Principal loss is possible. Investments in debt securities typically decrease in value when interest rates rise. This risk is usually greater for longer-term debt securities. Investments in Asset-Backed and Mortgage-Backed securities include additional risks that investor should be aware of including credit risk, prepayment risk, possible illiquidity and default, as well as increased susceptibility to adverse economic developments. Certain fixed income securities held by the Fund may be difficult (or impossible) to sell at the time and at the price the Adviser would like. As a result, the Fund may have to hold these securities longer than it would like and may forego other investment opportunities. Issuers may experience an acceleration in prepayments of mortgage loans or other receivables backing the issuers’ fixed income securities when interest rates decline, which can shorten the maturity of the security, force the Fund to invest in securities with lower interest rates, and reduce the Fund’s return. Issuers may decrease prepayments of principal when interest rates increase, extending the maturity of a fixed income security and causing the value of the security to decline.
Fund holdings and sector allocations are subject to change and should not be considered a recommendation to buy or sell any security. For a complete list of fund holdings, please refer to the Schedule of Investments provided in this report.
Definitions for terms and indices are provided in the Glossary of Terms.
www.brownadvisoryfunds.com
64
Brown Advisory Mortgage Securities Fund
Performance Chart and Analysis
June 30, 2014
COMPARISON OF CHANGE IN VALUE OF A $10,000 INVESTMENT
The following chart reflects the change in value of a hypothetical $10,000 investment, including reinvested dividends and distributions, in the Fund as measured against a broad-based bond index. The Barclays Mortgage Backed Securities Index is a market value-weighted index which covers the mortgage-backed securities component of the Barclays U.S. Aggregate Bond Index. The index is composed of agency mortgage-backed passthrough securities of the Government National Mortgage Association (Ginnie Mae), the Federal National Mortgage Association (Fannie Mae), and the Federal Home Loan Mortgage Corporation (Freddie Mac) with a minimum $150 million par amount outstanding and a weighted-average maturity of at least 1 year. The index includes reinvestment of income. Investors cannot invest directly in an index.
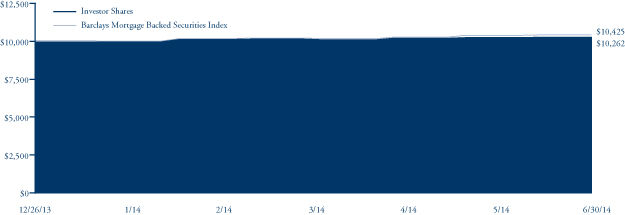
| Since | ||
| Cumulative Total Return | Inception | |
| as of 6/30/14 | (12/26/13) | |
Institutional Shares1 | 2.63% | |
| Investor Shares | 2.62% | |
| Barclays Mortgage Backed Securities Index | 4.25% | |
| Institutional Shares | Investor Shares | |
Gross Expense Ratio2 | 0.49% | 0.54% |
Net Expense Ratio2 | 0.49% | 0.54% |
Past performance does not guarantee future results. The performance data quoted represents past performance and current returns may be lower or higher. The investment return and net asset value will fluctuate so that an investor’s shares, when redeemed, may be worth more or less than the original cost. To obtain performance information current to the most recent month end, please visit our website at brownadvisoryfunds.com/performance.html. The performance table and graph above do not reflect the deduction of taxes that a shareholder would pay on Fund distributions or the redemption of Fund shares. Performance data does not reflect the imposition of the redemption fee of 1.00% on shares redeemed within 14 days, and if it did, performance would have been lower. Short-term performance, in particular, is not a good indication of the Fund’s future performance, and an investment should not be made based solely on returns.
| 1 | Performance information for the Institutional Shares, prior to commencement of operations on May 13, 2014, is based on the performance of the Investor Shares, and adjusted for the lower expenses applicable to the Institutional Shares. |
| 2 | Per the Fund’s prospectus dated December 26, 2013. |
www.brownadvisoryfunds.com
65
Brown Advisory Mortgage Securities Fund
Schedule of Investments
June 30, 2014
| Par Value | Security Description | Rate | Maturity | Value $ | |||||||||
| Mortgage Backed Securities — 81.6% | |||||||||||||
| 43,640 | Federal Home Loan Banks, Series SB-2016 Callable 12/25/2013 @ 100^ | 4.89 | % | 12/23/2016 | 45,772 | ||||||||
| 149,257 | Federal Home Loan Banks, Series MI-2017^ | 4.78 | % | 01/25/2017 | 157,917 | ||||||||
| 366 | FHLMC PC, Pool# G1-1357 | 5.50 | % | 01/01/2018 | 389 | ||||||||
| 1,341 | FHLMC PC, Pool# E0-1488 | 5.00 | % | 10/01/2018 | 1,424 | ||||||||
| 653 | FHLMC PC, Pool# C9-0242 | 6.00 | % | 12/01/2018 | 733 | ||||||||
| 15,185 | FHLMC PC, Pool# G1-1778 | 5.50 | % | 10/01/2020 | 16,456 | ||||||||
| 398 | FHLMC PC, Pool# G1-1924 | 5.50 | % | 03/01/2021 | 434 | ||||||||
| 1,274 | FHLMC PC, Pool# C9-0428 | 6.00 | % | 03/01/2021 | 1,430 | ||||||||
| 237 | FHLMC PC, Pool# J0-1540 | 5.00 | % | 04/01/2021 | 253 | ||||||||
| 1,508 | FHLMC PC, Pool# G1-2110 | 5.50 | % | 06/01/2021 | 1,647 | ||||||||
| 1,633 | FHLMC PC, Pool# G1-2522 | 5.00 | % | 02/01/2022 | 1,765 | ||||||||
| 2,858 | FHLMC PC, Pool# G1-2600 | 5.50 | % | 03/01/2022 | 3,121 | ||||||||
| 1,855 | FHLMC PC, Pool# G1-2710 | 5.50 | % | 07/01/2022 | 2,034 | ||||||||
| 136 | FHLMC PC, Pool# 84-5640# | 2.23 | % | 08/01/2023 | 145 | ||||||||
| 28,348 | FHLMC PC, Pool# G1-3584 | 4.50 | % | 06/01/2024 | 30,542 | ||||||||
| 60,733 | FHLMC PC, Pool# J1-1196 | 4.50 | % | 11/01/2024 | 65,476 | ||||||||
| 11 | FHLMC PC, Pool# C3-6309 | 7.00 | % | 02/01/2030 | 12 | ||||||||
| 98 | FHLMC PC, Pool# G0-1317 | 7.00 | % | 10/01/2031 | 114 | ||||||||
| 21 | FHLMC PC, Pool# C5-8701 | 7.00 | % | 10/01/2031 | 22 | ||||||||
| 59 | FHLMC PC, Pool# G0-1391 | 7.00 | % | 04/01/2032 | 68 | ||||||||
| 221,124 | FHLMC PC, Pool# 1B0889# | 2.28 | % | 05/01/2033 | 233,909 | ||||||||
| 23,878 | FHLMC PC, Pool# 1B-1275# | 2.41 | % | 10/01/2033 | 25,396 | ||||||||
| 340,694 | FHLMC PC, Pool# 1J0203# | 2.35 | % | 04/01/2035 | 359,877 | ||||||||
| 2,120 | FHLMC PC, Pool# A4-6671 | 5.00 | % | 08/01/2035 | 2,351 | ||||||||
| 2,389 | FHLMC PC, Pool# G0-8079 | 5.00 | % | 09/01/2035 | 2,650 | ||||||||
| 14,072 | FHLMC PC, Pool# 1B-3950# | 5.42 | % | 11/01/2035 | 14,698 | ||||||||
| 103,298 | FHLMC PC, Pool# 1L-1263# | 2.38 | % | 03/01/2036 | 110,119 | ||||||||
| 13,076 | FHLMC PC, Pool# 1J-1317# | 2.45 | % | 04/01/2036 | 13,926 | ||||||||
| 5,967 | FHLMC PC, Pool# 1G-2408# | 2.24 | % | 06/01/2036 | 6,275 | ||||||||
| 15,577 | FHLMC PC, Pool# 84-7625# | 1.95 | % | 07/01/2036 | 16,429 | ||||||||
| 13,509 | FHLMC PC, Pool# G0-2274 | 5.00 | % | 07/01/2036 | 14,986 | ||||||||
| 532 | FHLMC PC, Pool# A5-9220 | 5.00 | % | 04/01/2037 | 589 | ||||||||
| 7,636 | FHLMC PC, Pool# 1J-0573# | 2.65 | % | 08/01/2037 | 8,196 | ||||||||
| 4,969 | FHLMC PC, Pool# 1B-4292# | 2.53 | % | 09/01/2038 | 5,016 | ||||||||
| 5,498,562 | FHLMC PC, Pool# Q2-5034 | 4.00 | % | 03/01/2044 | 5,834,722 | ||||||||
| 4,969,025 | FHLMC PC, Pool# Q2-5749 | 4.00 | % | 04/01/2044 | 5,272,812 | ||||||||
| 2,680,535 | FHLMC PC, Pool# Q2-5713 | 4.00 | % | 04/01/2044 | 2,845,825 | ||||||||
| 11,671,486 | FHLMC PC, Pool# G0-8583 | 4.50 | % | 04/01/2044 | 12,649,718 | ||||||||
| 1,016,298 | FHLMC PC, Pool# Q2-5943 | 4.50 | % | 05/01/2044 | 1,105,505 | ||||||||
| 5,938,451 | FHLMC PC, Pool# G0-8587 | 4.50 | % | 05/01/2044 | 6,435,191 | ||||||||
| 17,860,742 | FHLMC REMIC, Series 4318~ | 2.50 | % | 08/15/2022 | 1,254,547 | ||||||||
| 72,166 | FHLMC REMIC, Series 2692 | 5.00 | % | 12/15/2022 | 73,294 | ||||||||
| 12,892,536 | FHLMC REMIC, Series 4329~ | 2.50 | % | 01/15/2023 | 952,927 | ||||||||
| 220,000 | FHLMC REMIC, Series 3571 | 4.00 | % | 09/15/2024 | 236,024 | ||||||||
| 92,120 | FHLMC REMIC, Series 3636 | 4.00 | % | 08/15/2027 | 93,795 | ||||||||
| 2,726,226 | FHLMC REMIC, Series 4092~ | 3.00 | % | 09/15/2031 | 378,269 | ||||||||
| 10,861,759 | FHLMC REMIC, Series 4186~ | 3.00 | % | 03/15/2033 | 1,821,702 | ||||||||
| 4,054,387 | FHLMC REMIC, Series 4309~ | 3.00 | % | 08/15/2039 | 559,885 | ||||||||
| 764,326 | FHLMC REMIC, Series 3878 | 3.00 | % | 04/15/2041 | 778,274 | ||||||||
| 1,595,386 | FHLMC REMIC, Series 4105# | 0.55 | % | 09/15/2042 | 1,582,195 | ||||||||
| 127,871 | FNMA, Pool# 745504# | 5.13 | % | 02/01/2016 | 134,246 | ||||||||
| 3,595 | FNMA, Pool# 576086 | 6.00 | % | 03/01/2016 | 3,659 | ||||||||
| 49,010 | FNMA, Pool# 254089 | 6.00 | % | 12/01/2016 | 51,004 | ||||||||
| 337 | FNMA, Pool# 555013 | 5.50 | % | 11/01/2017 | 358 | ||||||||
| 2,714 | FNMA, Pool# 725544 | 5.50 | % | 12/01/2017 | 2,883 | ||||||||
| 14,522 | FNMA, Pool# 763020 | 3.50 | % | 08/01/2018 | 15,414 | ||||||||
The accompanying notes are an integral part of these financial statements.
www.brownadvisoryfunds.com
66
Brown Advisory Mortgage Securities Fund
Schedule of Investments
June 30, 2014
| Par Value | Security Description | Rate | Maturity | Value $ | |||||||||
| Mortgage Backed Securities — (Continued) | |||||||||||||
| 67,420 | FNMA, Pool# 744697 | 4.50 | % | 10/01/2018 | 71,838 | ||||||||
| 18,684 | FNMA, Pool# 725185 | 5.00 | % | 02/01/2019 | 19,888 | ||||||||
| 56,986 | FNMA, Pool# 803941# | 2.56 | % | 11/01/2019 | 57,053 | ||||||||
| 303,889 | FNMA, Pool# 801904 | 4.50 | % | 11/01/2019 | 328,331 | ||||||||
| 18,008 | FNMA, Pool# 255626 | 5.00 | % | 03/01/2020 | 19,449 | ||||||||
| 126 | FNMA, Series 1990-105 | 6.50 | % | 09/25/2020 | 136 | ||||||||
| 85,245 | FNMA, Pool# 970382 | 4.50 | % | 03/01/2023 | 90,893 | ||||||||
| 1,050 | FNMA, Pool# 303585 | 7.00 | % | 10/01/2025 | 1,193 | ||||||||
| 119,773 | FNMA, Pool# 256030 | 4.50 | % | 11/01/2025 | 129,805 | ||||||||
| 1,371 | FNMA, Pool# 303713 | 6.50 | % | 02/01/2026 | 1,547 | ||||||||
| 14,372 | FNMA, Pool# 539082 | 7.00 | % | 08/01/2028 | 14,637 | ||||||||
| 2,916 | FNMA, Pool# 592751 | 7.00 | % | 06/01/2031 | 3,118 | ||||||||
| 26,526 | FNMA, Pool# 625536 | 6.00 | % | 01/01/2032 | 29,853 | ||||||||
| 40,517 | FNMA, Pool# 628837 | 6.50 | % | 03/01/2032 | 45,831 | ||||||||
| 1,088 | FNMA, Pool# 555531 | 5.50 | % | 06/01/2033 | 1,230 | ||||||||
| 1,270 | FNMA, Pool# 555591 | 5.50 | % | 07/01/2033 | 1,429 | ||||||||
| 55,794 | FNMA, Pool# 748643# | 1.93 | % | 09/01/2033 | 58,844 | ||||||||
| 1,391 | FNMA, Pool# 555876 | 5.50 | % | 10/01/2033 | 1,576 | ||||||||
| 108,838 | FNMA, Pool# 744805# | 1.89 | % | 11/01/2033 | 113,362 | ||||||||
| 179,536 | FNMA, Pool# 741373# | 2.41 | % | 12/01/2033 | 181,971 | ||||||||
| 90,295 | FNMA, Pool# 764342# | 1.90 | % | 02/01/2034 | 94,753 | ||||||||
| 4,242 | FNMA, Pool# 725424 | 5.50 | % | 04/01/2034 | 4,770 | ||||||||
| 143,931 | FNMA, Pool# 780488# | 4.98 | % | 07/01/2034 | 145,251 | ||||||||
| 45,440 | FNMA, Pool# 796283 | 5.50 | % | 12/01/2034 | 50,957 | ||||||||
| 1,854 | FNMA, Pool# 735022 | 5.50 | % | 12/01/2034 | 2,084 | ||||||||
| 14,826 | FNMA, Pool# 735263# | 2.20 | % | 01/01/2035 | 15,851 | ||||||||
| 6,409 | FNMA, Pool# 821252# | 2.18 | % | 05/01/2035 | 6,764 | ||||||||
| 1,497 | FNMA, Pool# 255706 | 5.50 | % | 05/01/2035 | 1,682 | ||||||||
| 114 | FNMA, Pool# 735580 | 5.00 | % | 06/01/2035 | 127 | ||||||||
| 133,235 | FNMA, Pool# 836715# | 2.36 | % | 10/01/2035 | 133,755 | ||||||||
| 173,319 | FNMA, Pool# 836335# | 5.34 | % | 10/01/2035 | 174,904 | ||||||||
| 11,195 | FNMA, Pool# 851372# | 2.38 | % | 12/01/2035 | 11,844 | ||||||||
| 2,220 | FNMA, Pool# 256022 | 5.50 | % | 12/01/2035 | 2,493 | ||||||||
| 222 | FNMA, Pool# 849496 | 5.50 | % | 12/01/2035 | 249 | ||||||||
| 47,741 | FNMA, Pool# 848817 | 5.00 | % | 01/01/2036 | 53,058 | ||||||||
| 2,644 | FNMA, Pool# 256059 | 5.50 | % | 01/01/2036 | 2,963 | ||||||||
| 1,711 | FNMA, Pool# 845341 | 5.50 | % | 01/01/2036 | 1,919 | ||||||||
| 3,253 | FNMA, Pool# 880371# | 2.39 | % | 02/01/2036 | 3,467 | ||||||||
| 102,205 | FNMA, Pool# 865849# | 2.14 | % | 03/01/2036 | 110,546 | ||||||||
| 2,743 | FNMA, Pool# 895860# | 1.80 | % | 04/01/2036 | 2,850 | ||||||||
| 5,900 | FNMA, Pool# 891332# | 2.03 | % | 04/01/2036 | 6,262 | ||||||||
| 7,629 | FNMA, Pool# 745480# | 5.77 | % | 04/01/2036 | 7,975 | ||||||||
| 126,592 | FNMA, Pool# 882017# | 1.93 | % | 05/01/2036 | 136,916 | ||||||||
| 3,339 | FNMA, Pool# 901006# | 2.25 | % | 09/01/2036 | 3,570 | ||||||||
| 11,422 | FNMA, Pool# 902188# | 2.42 | % | 11/01/2036 | 12,300 | ||||||||
| 337 | FNMA, Pool# 905690 | 5.50 | % | 12/01/2036 | 377 | ||||||||
| 108,759 | FNMA, Pool# 888445# | 3.30 | % | 04/01/2037 | 117,038 | ||||||||
| 33,108 | FNMA, Pool# 888463# | 5.84 | % | 05/01/2037 | 35,571 | ||||||||
| 669 | FNMA, Pool# 960392 | 5.50 | % | 12/01/2037 | 749 | ||||||||
| 9,026 | FNMA, Pool# 933628# | 5.04 | % | 07/01/2038 | 9,713 | ||||||||
| 7,343 | FNMA, Pool# 965185# | 1.88 | % | 09/01/2038 | 7,760 | ||||||||
| 199,373 | FNMA, Pool# AA7686 | 4.50 | % | 06/01/2039 | 217,831 | ||||||||
| 26,103 | FNMA, Pool# AC4824# | 3.60 | % | 10/01/2039 | 27,809 | ||||||||
| 1,934,334 | FNMA, Pool# AE0881# | 3.16 | % | 02/01/2041 | 2,063,289 | ||||||||
| 13,583 | FNMA, Pool# AH4794 | 5.00 | % | 02/01/2041 | 15,160 | ||||||||
| 38,099 | FNMA, Pool# AI1170 | 5.00 | % | 04/01/2041 | 42,379 | ||||||||
The accompanying notes are an integral part of these financial statements.
www.brownadvisoryfunds.com
67
Brown Advisory Mortgage Securities Fund
Schedule of Investments
June 30, 2014
| Par Value | Security Description | Rate | Maturity | Value $ | |||||||||
| Mortgage Backed Securities — (Continued) | |||||||||||||
| 18,588 | FNMA, Pool# AR1150 | 3.00 | % | 01/01/2043 | 18,407 | ||||||||
| 7,909,216 | FNMA, Pool# AS1320 | 4.00 | % | 12/01/2043 | 8,421,277 | ||||||||
| 7,757,001 | FNMA, Pool# AS1459 | 4.00 | % | 01/01/2044 | 8,246,303 | ||||||||
| 8,570,499 | FNMA, Pool# AS1465 | 4.50 | % | 01/01/2044 | 9,352,291 | ||||||||
| 4,406,696 | FNMA, Pool# AV7911 | 4.50 | % | 01/01/2044 | 4,776,623 | ||||||||
| 7,176,986 | FNMA, Pool# AS1474 | 4.50 | % | 01/01/2044 | 7,787,385 | ||||||||
| 9,469,061 | FMNA Pass-thru Long 30 Year, Pool# AV2385 | 4.00 | % | 01/01/2044 | 10,066,358 | ||||||||
| 3,831,782 | FMNA Pass-thru Long 30 Year, Pool# AW2120 | 4.50 | % | 03/01/2044 | 4,156,871 | ||||||||
| 7,433,668 | FMNA Pass-thru Long 30 Year, Pool# AS2385 | 4.00 | % | 05/01/2044 | 7,903,651 | ||||||||
| 6,647,541 | FMNA Pass-thru Long 30 Year, Pool# AW1237 | 4.00 | % | 05/01/2044 | 7,067,846 | ||||||||
| 1,926,705 | FMNA Pass-thru Long 30 Year, Pool# AW0619 | 4.50 | % | 05/01/2044 | 2,091,334 | ||||||||
| 5,050,686 | FMNA Pass-thru Long 30 Year, Pool# AV2159 | 4.00 | % | 06/01/2044 | 5,369,277 | ||||||||
| 539,192 | FNMA REMIC Trust, Series 2003-122 | 4.00 | % | 12/25/2018 | 565,977 | ||||||||
| 18,497 | FNMA REMIC Trust, Series 2012-1 | 1.75 | % | 12/25/2021 | 18,781 | ||||||||
| 1,225,000 | FNMA REMIC Trust, Series 2011-18 | 4.00 | % | 10/25/2025 | 1,259,553 | ||||||||
| 414,193 | FNMA REMIC Trust, Series 2013-15~ | 3.00 | % | 03/25/2028 | 53,272 | ||||||||
| 18,762,968 | FNMA REMIC Trust, Series 2014-14~ | 3.00 | % | 04/25/2031 | 2,279,834 | ||||||||
| 5,326,265 | FNMA REMIC Trust, Series 2013-115~ | 3.00 | % | 04/25/2031 | 720,898 | ||||||||
| 2,552,833 | FNMA REMIC Trust, Series 2012-96# | 0.45 | % | 07/25/2041 | 2,532,411 | ||||||||
| 791,223 | FNMA REMIC Trust, Series 2012-10# | 0.70 | % | 02/25/2042 | 796,326 | ||||||||
| 4,062,200 | FNMA REMIC Trust, Series 2012-15# | 0.70 | % | 03/25/2042 | 4,075,837 | ||||||||
| 2,552,735 | FNMA REMIC Trust, Series 2013-34~ | 3.00 | % | 05/25/2042 | 358,693 | ||||||||
| 12,580,975 | FNMA REMIC Trust, Series 2013-20~ | 3.50 | % | 11/25/2042 | 1,920,905 | ||||||||
| 21,786 | FNMA REMIC Trust, Series 2003-W10 | 4.30 | % | 06/25/2043 | 23,315 | ||||||||
| 7,289 | FNMA REMIC Trust, Series 2003-W12 | 4.48 | % | 06/25/2043 | 7,809 | ||||||||
| 43,736 | FNMA REMIC Trust, Series 2003-W12 | 4.55 | % | 06/25/2043 | 47,608 | ||||||||
| 23,967 | FNMA REMIC Trust, Series 2003-W12 | 4.68 | % | 06/25/2043 | 25,840 | ||||||||
| 27,961 | FNMA REMIC Trust, Series 2003-W12 | 5.00 | % | 06/25/2043 | 30,257 | ||||||||
| 5,000,000 | Freddie Mac Structured Agency Credit Risk Debt Notes, Series 2014-DN2# | 1.80 | % | 04/25/2024 | 5,038,147 | ||||||||
| 37 | GNMA, Pool# 180963X | 9.50 | % | 11/15/2016 | 37 | ||||||||
| 1,160 | GNMA, Pool# 781403X | 6.00 | % | 02/15/2017 | 1,210 | ||||||||
| 222 | GNMA, Pool# 198708X | 9.50 | % | 04/15/2017 | �� | 225 | |||||||
| 1,025 | GNMA, Pool# 250287X | 8.00 | % | 09/15/2017 | 1,038 | ||||||||
| 41,662 | GNMA, Pool# 595167X | 5.50 | % | 11/15/2017 | 44,184 | ||||||||
| 18,615 | GNMA, Pool# 552929X | 5.00 | % | 12/15/2017 | 19,701 | ||||||||
| 3,633 | GNMA, Pool# 607669X | 5.00 | % | 02/15/2018 | 3,867 | ||||||||
| 11,898 | GNMA, Pool# 594102X | 4.50 | % | 09/15/2018 | 12,525 | ||||||||
| 14,281 | GNMA, Pool# 780576X | 7.00 | % | 12/15/2022 | 16,343 | ||||||||
| 61,886 | GNMA, Pool# 723460X | 4.00 | % | 12/15/2024 | 65,857 | ||||||||
| 2,017 | GNMA, Pool# 780195X | 8.00 | % | 07/15/2025 | 2,372 | ||||||||
| 19,110 | GNMA, Pool# 487110 | 6.50 | % | 04/15/2029 | 22,332 | ||||||||
| 368 | GNMA, Pool# 536231X | 9.00 | % | 07/15/2030 | 370 | ||||||||
| 5,513 | GNMA, Pool# 571166 | 7.00 | % | 08/15/2031 | 5,725 | ||||||||
| 7,524 | GNMA, Pool# 004017M | 6.00 | % | 08/20/2037 | 8,553 | ||||||||
| 6,482 | GNMA, Pool# 565240X | 6.50 | % | 09/15/2037 | 7,712 | ||||||||
| 6,495 | GNMA, Pool# 676322X | 7.00 | % | 09/15/2037 | 7,374 | ||||||||
| 18,613 | GNMA, Pool# 646058X | 6.00 | % | 11/15/2037 | 20,929 | ||||||||
| 694,797 | GNMA, Pool# 082512M# | 2.00 | % | 04/20/2040 | 722,543 | ||||||||
| 20,129 | GNMA REMIC Trust, Series 201-03 | 3.00 | % | 01/16/2027 | 21,047 | ||||||||
| 22,313,873 | GNMA REMIC Trust, Series 2013-170~ | 2.50 | % | 05/16/2028 | 2,003,837 | ||||||||
| 1,878,308 | GNMA REMIC Trust, Series 2013-168~ | 2.50 | % | 11/16/2028 | 196,043 | ||||||||
| 19,531 | GNMA REMIC Trust, Series 2010-159 | 2.16 | % | 01/16/2033 | 19,610 | ||||||||
| 2,005 | GNMA REMIC Trust, Series 2003-97 | 4.50 | % | 03/20/2033 | 2,116 | ||||||||
| 86,672 | GNMA REMIC Trust, Series 2011-6 | 2.20 | % | 01/16/2035 | 86,947 | ||||||||
| 308,726 | GNMA REMIC Trust, Series 2010-32 | 3.00 | % | 03/20/2036 | 313,878 | ||||||||
| 1,230,000 | GNMA REMIC Trust, Series 2010-124 | 2.72 | % | 05/16/2037 | 1,251,472 | ||||||||
The accompanying notes are an integral part of these financial statements.
www.brownadvisoryfunds.com
68
Brown Advisory Mortgage Securities Fund
Schedule of Investments
June 30, 2014
| Par | |||||||||||||
| Value/Shares | Security Description | Rate | Maturity | Value $ | |||||||||
| Mortgage Backed Securities — (Continued) | |||||||||||||
| 24,651 | GNMA REMIC Trust, Series 2010-2 | 4.00 | % | 01/20/2038 | 25,986 | ||||||||
| 647,626 | GNMA REMIC Trust, Series 2006-63 | 5.01 | % | 03/16/2038 | 681,886 | ||||||||
| 10,402,859 | GNMA REMIC Trust, Series 2012-65~ | 3.00 | % | 07/20/2039 | 1,298,988 | ||||||||
| 14,346,433 | GNMA REMIC Trust, Series 2013-79 | 3.00 | % | 01/20/2042 | 1,970,009 | ||||||||
| 1,409,693 | GNMA REMIC Trust, Series 2011-121# | 0.55 | % | 03/16/2043 | 1,397,929 | ||||||||
| 725,000 | GNMA REMIC Trust, Series 2012-44 | 2.95 | % | 08/16/2043 | 704,800 | ||||||||
| 715,000 | GNMA REMIC Trust, Series 2011-126 | 2.65 | % | 01/16/2045 | 726,257 | ||||||||
| 8,000,000 | GNMA REMIC Trust, Series 2014-01 | 3.29 | % | 03/16/2054 | 7,988,456 | ||||||||
| Total Mortgage Backed Securities (Cost $162,031,072) | 162,588,634 | ||||||||||||
| Local Government Housing Agency Bonds — 14.3% | |||||||||||||
| 2,265,000 | Delaware State Housing Authority Callable 1/1/2021 @ 100^ | 2.75 | % | 12/01/2041 | 2,155,963 | ||||||||
| 8,059,441 | Illinois Housing Development Authority Callable 1/1/2023 @ 100^ | 2.75 | % | 06/01/2043 | 7,681,212 | ||||||||
| 7,308,503 | Minnesota Housing Finance Agency Callable 1/1/2023 @ 100^ | 2.70 | % | 09/01/2041 | 7,170,153 | ||||||||
| 1,250,000 | Missouri Housing Development Commission Callable 11/1/2019 @ 100^ | 2.65 | % | 11/01/2040 | 1,198,550 | ||||||||
| 2,605,461 | New Mexico State Mortgage Finance Authority Callable 6/1/2023 @ 100^ | 2.85 | % | 07/01/2043 | 2,632,454 | ||||||||
| 7,955,937 | Virginia State Housing Development Authority Homeownership Tax Mortgage Bonds | 3.25 | % | 08/25/2042 | 7,605,637 | ||||||||
| Total Local Government Housing Agency Bonds (Cost $27,457,015) | 28,443,969 | ||||||||||||
| Asset Backed Securities — 0.6% | |||||||||||||
| 1,251,164 | SLM Student Loan Trust 2007-1, Series 2007-1# | 0.29 | % | 01/25/2022 | 1,246,670 | ||||||||
| Total Asset Backed Securities (Cost $1,245,036) | 1,246,670 | ||||||||||||
| Short-Term Investments — 3.3% | |||||||||||||
| Money Market Funds — 3.3% | |||||||||||||
| 6,485,585 | DWS Cash Account Trust — Government & Agency Securities Portfolio, 0.03%* | 6,485,585 | |||||||||||
| Total Short-Term Investments (Cost $6,485,585) | 6,485,585 | ||||||||||||
| Total Investments — 99.8% (Cost $197,218,708) | 198,764,858 | ||||||||||||
| Other Assets in Excess of Liabilities — 0.2% | 426,318 | ||||||||||||
| NET ASSETS — 100.0% | $ | 199,191,176 | |||||||||||
| PORTFOLIO HOLDINGS | ||||
| % of Net Assets | ||||
| Mortgage Backed Securities | 81.6 | % | ||
| Local Government Housing Agency Bonds | 14.3 | % | ||
| Money Market Funds | 3.3 | % | ||
| Asset Backed Securities | 0.6 | % | ||
| Other Assets and Liabilities | 0.2 | % | ||
| 100.0 | % | |||
| ^ | Continuously callable with 30 days notice. |
| # | Variable rate security. Rate disclosed is as of June 30, 2014. |
| ~ | Interest Only Security |
| * | Annualized seven-day yield as of June 30, 2014. |
The accompanying notes are an integral part of these financial statements.
www.brownadvisoryfunds.com
69
Brown Advisory – WMC Japan Alpha Opportunities Fund
A Message to Our Shareholders
June 30, 2014
Dear Shareholder:
The Brown Advisory – WMC Japan Alpha Opportunities Fund Institutional Shares (the “Fund”) launched on March 4, 2014. From the Fund’s inception through June 30, 2014, the Fund increased 5.00% in value. During the same period, the TOPIX Total Return U.S. Dollar Hedged Index (the “Index”), the Fund’s benchmark, increased 6.09%. The unhedged TOPIX Total Return Index returned 6.94% in U.S. Dollar terms for the same period, as the Japanese Yen appreciated relative to the U.S. Dollar.
Japanese stocks fell in March as the economy grew at a slower pace than initially estimated in the fourth quarter, dragged down by weaker capital spending and private consumption. Other disconcerting data points released during the month included a larger-than-forecasted trade deficit and the lowest consumer confidence reading since September 2011. However, the Japanese equity market bounced back in the second quarter. Japan’s first-quarter GDP grew at its fastest pace since 2011, as stronger capital spending helped offset the weaker consumer confidence associated with the April 1 sales-tax increase. Investor sentiment was also boosted after Prime Minister Shinzo Abe unveiled a package of reform measures aimed at bolstering Japan’s long-term economic growth, including lowering the corporate tax rate and increasing the risk posture of the world’s largest pension fund (Japan’s Government Pension Investment Fund).
Stock selection was weakest within materials and financials, while selection within the consumer discretionary, health care and information technology sectors helped relative results. Sector allocation, a residual of bottom-up stock selection by the underlying managers, also had an impact on performance. Our underweight allocation to industrials and consumer staples weighed on relative results, while our overweight in energy and underweight in utilities aided relative performance.
Top relative detractors included social media and Internet marketing service company DeNa, developer of computer network systems and software Itochu Techno-Solutions, and steel manufacturer Yamato Kogyo. Top relative contributors included manufacturer of semiconductor, computer and communication equipment Fujitsu, oil and natural gas exploration and production company Inpex, and pharmaceutical company Nippon Shinyaku.
During the period, the team reduced the portfolio’s position in Nippon Coke & Engineering. Continuing weakness in coking coal prices and a delay in the timing of bringing back export capacity to the very strong domestic market reduced our earnings outlook for the stock. The team also initiated a new position in machine tool maker DMG Mori Seiki after a share price decline following a recent capital raise that seemed excessive given the company’s improving fundamentals and its now-strengthened balance sheet. The firm’s relationship with Gildemeister in Germany continues to develop, and the team believes that operational synergies will be unlocked as the relationship deepens.
Despite a slow start to the year, we are still optimistic about the Japanese economy and, in turn, Japanese equities. We are starting to see signs that the post-value added tax-hike downturn is fading. Structural reforms are broadening, and inflation expectations continue to rise. As expected, labor markets have been tightening, and wages have been rising in accordance. We are also seeing an improvement in corporate capital management. Companies have been starting to increase capital spending and looking for opportunities to return value to shareholders through increased dividends and share repurchases. We believe that these factors could be a catalyst to lift Japanese equities, with opportunities coming from a wide array of economic and market-cap segments.
Sincerely,
C. Dirk Enderlein, CFA
Kent M. Stahl, CFA
Portfolio Manager
Gregg R. Thomas, CFA
Portfolio Manager
www.brownadvisoryfunds.com
70
Brown Advisory – WMC Japan Alpha Opportunities Fund
A Message to Our Shareholders
June 30, 2014
Past performance is not a guarantee of future results.
Mutual fund investing involves risk. Principal loss is possible. Investments focused in a single geographic region may be exposed to greater risk than investments diversified among various geographies. Investments in foreign securities entail certain risks not associated with investments in domestic securities, such as volatility of currency exchange rates, and in some cases, political and economic instability and relatively illiquid markets. These risks are greater in emerging markets. Investments in smaller and medium capitalization companies generally carry greater risk than is customarily associated with larger companies for various reasons such as narrower markets, limited financial resources and less liquid stock. The Fund may invest in ETFs, which may trade at a discount to the aggregate value of the underlying securities and although expense ratios for ETFs are generally low, frequent trading of ETFs by the Fund can generate brokerage expenses. The value of investments in REITs may change in response to changes in the real estate market such as declines in the value of real estate, lack of available capital or financing opportunities, and increases in property taxes or operating costs. Derivatives involve risks different from, and in certain cases, greater than the risks presented by more traditional investments. Investors will indirectly bear the principal risks and its share of the fees and expenses of the Fund’s investment in other Investment Companies.
Fund holdings and sector allocations are subject to change and should not be considered a recommendation to buy or sell any security. For a complete list of fund holdings, please refer to the Schedule of Investments provided in this report.
Definitions for terms and indices are provided in the Glossary of Terms.
www.brownadvisoryfunds.com
71
Brown Advisory – WMC Japan Alpha Opportunities Fund
Performance Chart and Analysis
June 30, 2014
COMPARISON OF CHANGE IN VALUE OF A $1,000,000 INVESTMENT
The following chart reflects the change in value of a hypothetical $1,000,000 investment, including reinvested dividends and distributions, in the Fund as measured against a broad-based securities market index. The TOPIX Total Return U.S. Dollar Hedged Index is a market capitalization-weighted index of all companies listed on the First Section of the Tokyo Stock Exchange. The index is unmanaged and does not reflect the deduction of fees, such as investment management fees. Investors cannot invest directly in an index.
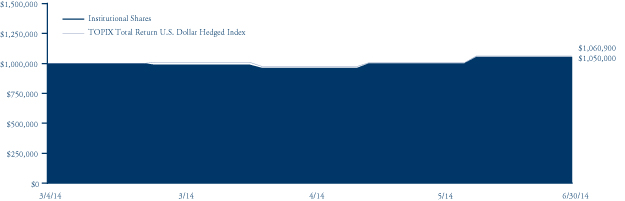
| Since | |||
| Cumulative Total Return | Inception | ||
| as of 6/30/14 | (3/4/14) | ||
| Institutional Shares | 5.00% | ||
| Investor Shares | 4.90% | ||
| Advisor Shares | 4.80% | ||
| TOPIX Total Return U.S. Dollar Hedged Index | 6.09% | ||
| Institutional Shares | Investor Shares | Advisor Shares | |
Gross Expense Ratio1 | 1.21% | 1.36% | 1.61% |
Net Expense Ratio1 | 1.21% | 1.36% | 1.61% |
Past performance does not guarantee future results. The performance data quoted represents past performance and current returns may be lower or higher. The investment return and net asset value will fluctuate so that an investor’s shares, when redeemed, may be worth more or less than the original cost. To obtain performance information current to the most recent month end, please visit our website at brownadvisoryfunds.com/performance.html. The performance table and graph above do not reflect the deduction of taxes that a shareholder would pay on Fund distributions or the redemption of Fund shares. Performance data does not reflect the imposition of the redemption fee of 1.00% on shares redeemed within 14 days, and if it did, performance would have been lower. Short-term performance, in particular, is not a good indication of the Fund’s future performance, and an investment should not be made based solely on returns.
| 1 | Per the Fund’s prospectus dated February 26, 2014. |
www.brownadvisoryfunds.com
72
Brown Advisory – WMC Japan Alpha Opportunities Fund
Schedule of Investments
June 30, 2014
| Shares | Security Description | Value $ | |||||
| Common Stocks — 92.3% | |||||||
| Japan — 92.3% | |||||||
| Consumer Discretionary — 24.4% | |||||||
| 209,300 | Adastria Holdings Co., Ltd. | 4,912,975 | |||||
| 107,400 | Aeon Delight Co., Ltd. | 2,595,618 | |||||
| 180,856 | Aisin Seiki Co., Ltd. | 7,199,149 | |||||
| 281,000 | Alpine Electronics, Inc. | 3,962,975 | |||||
| 129,100 | Artnature, Inc. | 3,841,242 | |||||
| 161,400 | Avex Group Holdings, Inc. | 2,843,820 | |||||
| 112,300 | Cyber Agent, Inc. | 4,546,004 | |||||
| 121,250 | Daihatsu Motor Co., Ltd. | 2,157,802 | |||||
| 91,600 | DaikyoNishikawa Co. | 1,795,185 | |||||
| 141,200 | Denso Corp. | 6,745,208 | |||||
| 115,200 | Doshisha Co., Ltd. | 2,030,877 | |||||
| 196,500 | Doutor Nichires Holdings Co., Ltd. | 3,481,588 | |||||
| 134,700 | En-Japan, Inc. | 2,875,752 | |||||
| 228,200 | Exedy Corp. | 6,791,967 | |||||
| 178,300 | Fuji Heavy Industries, Ltd. | 4,944,039 | |||||
| 149,990 | FUJIFILM Holdings Corp. | 4,186,311 | |||||
| 364,700 | Funai Electric Co., Ltd. | 3,678,762 | |||||
| 96,400 | Gendai Agency, Inc. | 651,977 | |||||
| 145,100 | H.I.S. Co., Ltd. | 4,686,503 | |||||
| 262,600 | Honda Motor Co., Ltd. | 9,163,366 | |||||
| 284,620 | Honeys Co., Ltd. | 2,726,479 | |||||
| 65,000 | Hoshizaki Electric Co., Ltd. | 3,244,349 | |||||
| 233,000 | Iida Group Holdings Co., Ltd. | 3,541,258 | |||||
| 1,177,680 | Isuzu Motors, Ltd. | 7,798,569 | |||||
| 67,900 | Jin Co., Ltd. | 2,167,145 | |||||
| 73,000 | Joyful Honda Co., Ltd. | 3,145,403 | |||||
| 140,300 | Kakaku.com., Inc. | 2,460,299 | |||||
| 1,653,000 | Kayaba Industry Co. | 7,787,893 | |||||
| 697,330 | Keihin Corp. | 11,088,456 | |||||
| 64,600 | Musashi Seimitsu Industry Co., Ltd. | 1,620,741 | |||||
| 55,100 | Nintendo Co., Ltd. | 6,616,808 | |||||
| 620,580 | Nippon Television Holdings, Inc. | 10,761,517 | |||||
| 391,700 | Nishimatsuya Chain Co., Ltd. | 3,461,275 | |||||
| 391,350 | Nissan Motor Co., Ltd. | 3,705,873 | |||||
| 284,200 | Pal Co., Ltd. | 6,752,844 | |||||
| 106,700 | Proto Corp. | 1,574,536 | |||||
| 908,410 | Rakuten, Inc. | 11,744,921 | |||||
| 36,530 | Ryohin Keikaku Co., Ltd. | 4,147,896 | |||||
| 56,300 | Shimamura Co. | 5,541,812 | |||||
| 455,243 | Tachi-S Co., Ltd. | 7,875,274 | |||||
| 223,300 | Tenma Corp. | 3,484,250 | |||||
| 288,700 | Tokai Rika Co., Ltd. | 5,799,655 | |||||
| 88,700 | Topre Corporation | 1,206,022 | |||||
| 2,157,380 | Toshiba Corp. | 10,084,529 | |||||
| 366,900 | Toyoda Gosei Co., Ltd. | 7,626,770 | |||||
| 534,900 | Toyota Boshoku Corp. | 5,661,298 | |||||
| 187,080 | Toyota Industries Corp. | 9,666,486 | |||||
| 82,800 | Tri-Stage, Inc. | 1,003,973 | |||||
| 268,980 | TS Tech Co., Ltd. | 7,836,990 | |||||
| 596,100 | TV Asahi Holdings Corp. | 10,904,719 | |||||
| 102,000 | West Holdings Corp. | 1,535,338 | |||||
| 230,000 | Xebio Co., Ltd. | 4,511,540 | |||||
| 169,500 | Yamazen Corp. | 1,284,654 | |||||
| 134,700 | Yondoshi Holdings, Inc. | 2,777,995 | |||||
| 264,238,687 | |||||||
| Consumer Staples — 3.1% | |||||||
| 148,680 | Asahi Group Holdings, Ltd. | 4,668,986 | |||||
| 153,700 | Cawachi, Ltd. | 2,936,660 | |||||
| 518,500 | Kirin Holdings Co. | 7,486,535 | |||||
| 127,300 | Pigeon Corp. | 6,715,041 | |||||
| 71,200 | Pola Orbis Holdings, Inc. | 2,875,445 | |||||
| 171,700 | Tsuruha Holdings, Inc. | 9,474,995 | |||||
| 34,157,662 | |||||||
| Energy — 2.8% | |||||||
| 1,022,640 | Inpex Corp. | 15,556,604 | |||||
| 177,200 | Japan Petroleum Exploration Co. | 7,392,374 | |||||
| 1,026,280 | JX Holdings, Inc. | 5,491,856 | |||||
| 1,418,800 | Nippon Coke & Engineering Co., Ltd. | 1,639,425 | |||||
| 30,080,259 | |||||||
| Financials — 16.8% | |||||||
| 105,200 | Aeon Mall Co., Ltd. | 2,773,799 | |||||
| 302,416 | Credit Saison Co., Ltd. | 6,296,410 | |||||
| 510,000 | Dai-ichi Life Insurance Co., Ltd. | 7,600,343 | |||||
| 804,000 | Eighteenth Bank, Ltd. | 2,087,261 | |||||
| 547,000 | Higashi-Nippon Bank, Ltd. | 1,393,958 | |||||
| 417,320 | IBJ Leasing Co., Ltd. | 11,005,200 | |||||
| 181,000 | Ichiyoshi Securities Co., Ltd. | 2,556,142 | |||||
| 421,000 | Jaccs Co., Ltd. | 2,171,335 | |||||
| 719,200 | Kenedix, Inc. | 3,589,944 | |||||
| 74,800 | Kyokuto Securities Co., Ltd. | 1,296,416 | |||||
| 758,800 | Leopalace 21 Corp. | 3,913,807 | |||||
| 432,730 | Mitsubishi Estate Co., Ltd. | 10,690,816 | |||||
| 5,619,840 | Mitsubishi UFJ Financial Group, Inc. | 34,498,608 | |||||
| 979,500 | Mitsubishi UFJ Lease & Finance Co., Ltd. | 5,630,458 | |||||
| 429,000 | Oita Bank, Ltd. | 1,550,610 | |||||
| 390,100 | Pocket Card Co., Ltd. | 3,240,429 | |||||
| 1,838,000 | Shinsei Bank, Ltd. | 4,139,840 | |||||
| 570,610 | Sony Financial Holdings, Inc. | 9,741,516 | |||||
| 514,330 | Sumitomo Mitsui Financial Group, Inc. | 21,579,704 | |||||
| 1,728,330 | T&D Holdings, Inc. | 23,507,980 | |||||
| 487,000 | Tochigi Bank, Ltd. | 2,086,740 | |||||
| 280,160 | Tokio Marine Holdings, Inc. | 9,221,117 | |||||
| 298,900 | Tokyo Tomin Bank, Ltd. | 3,664,126 | |||||
| 384,000 | Yamanashi Chuo Bank, Ltd. | 1,819,889 | |||||
| 242,800 | Zenkoku Hosho Co., Ltd. | 6,609,163 | |||||
| 182,665,611 | |||||||
| Health Care — 6.8% | |||||||
| 192,900 | Acucela, Inc.* | 1,966,988 | |||||
| 116,500 | Asahi Intecc Co., Ltd. | 4,785,571 | |||||
| 147,500 | CMIC Holdings Co., Ltd. | 2,413,760 | |||||
| 650,100 | Daiichi Sankyo Co., Ltd. | 12,151,507 | |||||
| 188,600 | Eisai Co., Ltd. | 7,914,658 | |||||
| 98,200 | Message Co., Ltd. | 3,740,702 | |||||
| 74,920 | Nihon Kohden Corp. | 3,761,522 | |||||
| 201,000 | Nippon Shinyaku Co., Ltd. | 5,861,272 | |||||
| 169,060 | Paramount Bed Holdings Co., Ltd. | 5,339,443 | |||||
| 551,632 | Shionogi & Co., Ltd. | 11,521,724 | |||||
| 302,900 | Takeda Pharmaceutical Co., Ltd. | 14,058,421 | |||||
| 73,515,568 | |||||||
The accompanying notes are an integral part of these financial statements.
www.brownadvisoryfunds.com
73
Brown Advisory – WMC Japan Alpha Opportunities Fund
Schedule of Investments
June 30, 2014
| Shares | Security Description | Value $ | |||||
| Common Stocks — (Continued) | |||||||
| Industrials — 12.0% | |||||||
| 124,000 | Amada Co., Ltd. | 1,263,052 | |||||
| 65,400 | Asahi Diamond Industrial Co., Ltd. | 1,038,920 | |||||
| 220,300 | Daifuku Co., Ltd. | 3,089,748 | |||||
| 258,200 | Denyo Co., Ltd. | 4,017,485 | |||||
| 449,800 | DMG Mori Seiki Co. | 6,539,988 | |||||
| 81,600 | Eagle Industry Co., Ltd. | 1,460,419 | |||||
| 377,300 | Fuji Machine Manufacturing Co., Ltd. | 3,297,177 | |||||
| 117,700 | Futaba Corp. | 2,016,799 | |||||
| 140,300 | Glory, Ltd. | 4,575,972 | |||||
| 428,400 | Hino Motors | 5,910,353 | |||||
| 185,000 | Hisaka Works, Ltd. | 1,715,162 | |||||
| 433,500 | Hitachi Chemical Co., Ltd. | 7,177,158 | |||||
| 761,010 | Hitachi Metals, Ltd. | 11,602,844 | |||||
| 575,700 | Hosiden Corp. | 3,592,780 | |||||
| 828,000 | IHI Corp. | 3,859,657 | |||||
| 171,200 | Jamco Corp. | 3,180,082 | |||||
| 512,000 | Japan Steel Works | 2,247,501 | |||||
| 1,533,550 | Makino Milling Machine Co., Ltd. | 13,214,095 | |||||
| 1,581,659 | Mitsui O.S.K. Lines, Ltd. | 5,892,434 | |||||
| 275,100 | Nikkiso Co., Ltd. | 3,266,939 | |||||
| 617,000 | Sanwa Holdings Corp. | 4,343,075 | |||||
| 429,400 | Sodick Co., Ltd. | 1,921,289 | |||||
| 190,600 | Star Micronics Co., Ltd. | 2,719,011 | |||||
| 549,910 | Sumitomo Electric Industries, Ltd. | 7,741,343 | |||||
| 96,800 | THK Co., Ltd. | 2,282,110 | |||||
| 211,900 | Tomoe Engineering Co., Ltd. | 3,529,461 | |||||
| 830,000 | Toshiba Machine Co., Ltd. | 3,862,492 | |||||
| 163,000 | Tsubakimoto Chain Co. | 1,345,120 | |||||
| 431,000 | Ushio, Inc. | 5,554,119 | |||||
| 387,300 | Yumeshin Holdings Co., Ltd. | 3,669,863 | |||||
| 82,800 | Zuiko Corp. | 4,690,609 | |||||
| 130,617,057 | |||||||
| Information Technology — 15.8% | |||||||
| 39,500 | Alpha Systems, Inc. | 607,242 | |||||
| 531,410 | Anritsu Corp. | 5,971,167 | |||||
| 373,800 | Canon, Inc. | 12,216,531 | |||||
| 186,400 | Dai-ichi Seiko Co., Ltd. | 3,197,179 | |||||
| 2,018,000 | Dainippon Screen Manufacturing Co., Ltd. | 9,441,650 | |||||
| 348,600 | DeNA Co., Ltd. | 4,716,859 | |||||
| 147,300 | Digital Garage, Inc. | 2,414,715 | |||||
| 122,000 | DTS Corp. | 2,266,902 | |||||
| 545,966 | Ferrotec Corp. | 3,834,292 | |||||
| 1,932,000 | Fujitsu, Ltd. | 14,476,181 | |||||
| 204,100 | Infomart Corp. | 4,720,918 | |||||
| 98,200 | Internet Initiative Japan, Inc. | 2,413,407 | |||||
| 250,760 | Itochu Techno-Solutions Corp. | 10,900,343 | |||||
| 149,800 | Japan Digital Laboratory Co., Ltd. | 2,648,325 | |||||
| 494,800 | Japan Display, Inc. | 3,041,152 | |||||
| 112,300 | Kyocera Corp. | 5,332,431 | |||||
| 209,300 | Melco Holdings, Inc. | 4,248,118 | |||||
| 259,600 | Mimasu Semiconductor Industry Co., Ltd. | 2,405,624 | |||||
| 160,600 | Miraial Co., Ltd. | 2,916,762 | |||||
| 302,800 | Mitsubishi Electric Corp. | 3,740,410 | |||||
| 367,600 | Mitsumi Electric Co., Ltd. | 2,662,277 | |||||
| 27,200 | Mobile Create Co., Ltd. | 970,434 | |||||
| 533,700 | NET One Systems Co., Ltd. | 3,705,340 | |||||
| 474,400 | Nichicon Corp. | 3,871,415 | |||||
| 162,800 | Nippon Ceramic Co., Ltd. | 2,747,135 | |||||
| 125,000 | NSD Co., Ltd. | 1,645,357 | |||||
| 190,700 | OBIC Co., Ltd. | 6,289,294 | |||||
| 100,600 | Outsourcing, Inc. | 1,447,756 | |||||
| 144,500 | Rohm Co., Ltd. | 8,287,786 | |||||
| 383,330 | SCSK Corp. | 10,803,090 | |||||
| 316,200 | Shinkawa, Ltd. | 1,529,742 | |||||
| 836,300 | Shinko Electric Industries Co., Ltd. | 7,617,518 | |||||
| 276,600 | Tokyo Seimitsu Co., Ltd. | 4,978,227 | |||||
| 1,625,300 | Yahoo Japan Corp. | 7,505,569 | |||||
| 202,100 | Yaskawa Electric Corp. | 2,449,952 | |||||
| 168,400 | Yokogawa Electric Corp. | 2,132,923 | |||||
| 115,100 | Zuken, Inc. | 1,150,902 | |||||
| 171,304,925 | |||||||
| Materials — 8.8% | |||||||
| 114,000 | Aichi Steel Corp. | 454,981 | |||||
| 130,600 | Chubu Steel Plate Co., Ltd. | 579,326 | |||||
| 215,100 | Fujimi, Inc. | 3,019,326 | |||||
| 378,180 | JSR Corp. | 6,492,604 | |||||
| 159,100 | Maruichi Steel Tube, Ltd. | 4,273,083 | |||||
| 1,851,000 | Mitsubishi Gas Chemical Co., Inc. | 11,853,179 | |||||
| 2,475,000 | Mitsui Chemicals, Inc. | 6,771,877 | |||||
| 88,300 | Neturen Co., Ltd. | 674,335 | |||||
| 175,400 | Nihon Nohyaku Co., Ltd. | 2,130,675 | |||||
| 239,000 | Nippon Shokubai Co., Ltd. | 3,212,505 | |||||
| 155,900 | Nitto Denko Corp. | 7,302,578 | |||||
| 523,400 | NOK Corp. | 10,524,124 | |||||
| 37,400 | Osaka Titanium Technologies Co., Ltd. | 774,544 | |||||
| 486,800 | Shin-Etsu Polymer Co., Ltd. | 2,394,017 | |||||
| 1,302,000 | Sumitomo Bakelite Co., Ltd. | 5,169,028 | |||||
| 300,800 | Tokai Rubber Industries, Ltd. | 3,410,464 | |||||
| 248,750 | Tokyo Ohka Kogyo Co., Ltd. | 5,934,828 | |||||
| 741,400 | Tokyo Steel Manufacturing Co., Ltd. | 3,881,503 | |||||
| 295,000 | Toyo Kohan Co., Ltd. | 1,735,536 | |||||
| 968,000 | Ube Industries, Ltd. | 1,683,787 | |||||
| 413,300 | Yamato Kogyo Co., Ltd. | 12,132,729 | |||||
| 204,000 | Yodogawa Steel Works, Ltd. | 905,729 | |||||
| 95,310,758 | |||||||
| Telecommunication Services — 1.7% | |||||||
| 122,220 | KDDI Corp. | 7,457,080 | |||||
| 180,320 | Nippon Telegraph & Telephone Corp. | 11,238,962 | |||||
| 18,696,042 | |||||||
| Utilities — 0.1% | |||||||
| 191,800 | Shizuoka Gas Co., Ltd. | 1,314,668 | |||||
| Total Common Stocks (Cost $932,475,831) | 1,001,901,237 | ||||||
| Real Estate Investment Trusts — 0.5% | |||||||
| Japan — 0.5% | |||||||
| 589 | Daiwa Office Investment Corp. | 2,803,986 | |||||
| 2,975 | GLP J-REIT | 3,334,668 | |||||
| Total Real Estate Investment Trusts (Cost $5,978,230) | 6,138,654 | ||||||
The accompanying notes are an integral part of these financial statements.
www.brownadvisoryfunds.com
74
Brown Advisory – WMC Japan Alpha Opportunities Fund
Schedule of Investments
June 30, 2014
| Shares | Security Description | Value $ | |||||
| Mutual Funds — 0.6% | |||||||
| Japan — 0.6% | |||||||
| 486,160 | Nomura TOPIX ETF | 6,248,263 | |||||
| Total Mutual Funds (Cost $6,188,661) | 6,248,263 | ||||||
| Short-Term Investments — 7.1% | |||||||
| Money Market Funds — 7.1% | |||||||
| 76,886,727 | DWS Cash Account Trust — Government | ||||||
| & Agency Securities Portfolio, 0.03%# | 76,886,727 | ||||||
| Total Short-Term Investments (Cost $76,886,727) | 76,886,727 | ||||||
| Total Investments — 100.5% (Cost $1,021,529,449) | 1,091,174,881 | ||||||
| Liabilities in Excess of Other Assets — (0.5)% | (5,876,678 | ) | |||||
| NET ASSETS — 100.0% | $ | 1,085,298,203 | |||||
| * | Non-Income Producing |
| # | Annualized seven-day yield as of June 30, 2014. |
| PORTFOLIO HOLDINGS | ||||
| % of Net Assets | ||||
| Consumer Discretionary | 24.4 | % | ||
| Financials | 16.8 | % | ||
| Information Technology | 15.8 | % | ||
| Industrials | 12.0 | % | ||
| Materials | 8.8 | % | ||
| Money Market Funds | 7.1 | % | ||
| Health Care | 6.8 | % | ||
| Consumer Staples | 3.1 | % | ||
| Energy | 2.8 | % | ||
| Telecommunication Services | 1.7 | % | ||
| Mutual Funds | 0.6 | % | ||
| Real Estate Investment Trusts | 0.5 | % | ||
| Utilities | 0.1 | % | ||
| Other Assets and Liabilities | (0.5 | )% | ||
| 100.0 | % | |||
Forward Foreign Currency Exchange Contracts (Note 7)
The Brown Advisory — WMC Japan Alpha Opportunities Fund had the following outstanding contracts as of June 30, 2014:
| Settlement | Unrealized | |||||||||||||||
| Currency to be Delivered | Currency to be Received | Date | Counterparty | Depreciation | ||||||||||||
| Japanese Yen | 46,836,251,000 | U.S. Dollars | 459,620,527 | 9/17/14 | BNP-Paribas | $ | (2,991,429 | ) | ||||||||
| Japanese Yen | 46,836,251,000 | U.S. Dollars | 459,609,703 | 9/17/14 | Bank of America, N.A. | (2,991,359 | ) | |||||||||
| Japanese Yen | 5,406,637,000 | U.S. Dollars | 53,035,779 | 9/17/14 | Goldman Sachs & Co. | (345,182 | ) | |||||||||
| Japanese Yen | 1,993,531,000 | U.S. Dollars | 19,565,138 | 9/17/14 | Morgan Stanley & Co., LLC | (127,339 | ) | |||||||||
| $ | (6,455,309 | ) | ||||||||||||||
Futures Contracts — Long (Note 7)
The Brown Advisory — WMC Japan Alpha Opportunities Fund had the following open long futures contracts as of June 30, 2014:
| Issue | Contracts | Expiration Date | Notional Value | Unrealized Appreciation | ||||||||
| TOPIX Index Futures Contracts | 460 | September 16, 2014 | $ | 57,326,884 | $ | 1,169,594 | ||||||
The accompanying notes are an integral part of these financial statements.
www.brownadvisoryfunds.com
75
(This Page Intentionally Left Blank.)
76
Statements of Assets and Liabilities
June 30, 2014
| BROWN | BROWN | BROWN | BROWN | |||||||||||||
| ADVISORY | ADVISORY | ADVISORY | ADVISORY | |||||||||||||
| GROWTH | VALUE | FLEXIBLE | SMALL-CAP | |||||||||||||
| EQUITY | EQUITY | EQUITY | GROWTH | |||||||||||||
| FUND | FUND | FUND | FUND | |||||||||||||
| ASSETS | ||||||||||||||||
| Investments: | ||||||||||||||||
| Total investments, at cost | $ | 2,161,048,160 | $ | 186,829,255 | $ | 137,711,077 | $ | 202,466,902 | ||||||||
| Net unrealized appreciation | 626,981,423 | 56,167,007 | 40,837,096 | 100,158,234 | ||||||||||||
| Total investments, at market value | 2,788,029,583 | 242,996,262 | 178,548,173 | 302,625,136 | ||||||||||||
| Cash | — | 51,257 | 18,971 | — | ||||||||||||
| Receivables: | ||||||||||||||||
| Investment securities sold | — | 1,015,650 | 1,451,493 | 917,369 | ||||||||||||
| Fund shares sold | 2,361,241 | 99,500 | 1,448,876 | 244,499 | ||||||||||||
| Interest and dividends | 1,589,049 | 333,544 | 129,629 | 93,707 | ||||||||||||
| Prepaid expenses and other assets | 68,942 | 28,957 | 37,097 | 34,238 | ||||||||||||
| Total Assets | 2,792,048,815 | 244,525,170 | 181,634,239 | 303,914,949 | ||||||||||||
| LIABILITIES | ||||||||||||||||
| Payables: | ||||||||||||||||
| Investment securities purchased | — | 968,828 | 865,170 | 2,080,752 | ||||||||||||
| Fund shares redeemed | 10,495,950 | 33,000 | 25,188 | 431,633 | ||||||||||||
| Accrued Liabilities: | ||||||||||||||||
| Investment advisory fees | 1,365,326 | 118,005 | 86,789 | 207,846 | ||||||||||||
| Administration, accounting, and transfer agent fees | 210,589 | 18,230 | 12,841 | 23,605 | ||||||||||||
| Custodian fees | 15,067 | 1,501 | 1,972 | 2,025 | ||||||||||||
| Service fees | 312,880 | 29,499 | 21,316 | 35,646 | ||||||||||||
| Business management fees | 113,777 | 9,834 | 7,232 | 12,226 | ||||||||||||
| Distribution fees | 30,003 | 1,007 | 9,058 | 4,502 | ||||||||||||
| Other liabilities | 209,669 | 29,583 | 32,415 | 32,358 | ||||||||||||
| Total Liabilities | 12,753,261 | 1,209,487 | 1,061,981 | 2,830,593 | ||||||||||||
| NET ASSETS | $ | 2,779,295,554 | $ | 243,315,683 | $ | 180,572,258 | $ | 301,084,356 | ||||||||
| COMPONENTS OF NET ASSETS | ||||||||||||||||
| Paid-in capital | $ | 2,120,888,778 | $ | 184,110,042 | $ | 142,686,088 | $ | 181,883,355 | ||||||||
| Undistributed (Accumulated) net investment income (loss) | — | 2,067,371 | 406,100 | (425,777 | ) | |||||||||||
| Accumulated net realized gain (loss) | 31,425,353 | 971,263 | (3,357,026 | ) | 19,468,544 | |||||||||||
| Unrealized appreciation on investments | 626,981,423 | 56,167,007 | 40,837,096 | 100,158,234 | ||||||||||||
| NET ASSETS | $ | 2,779,295,554 | $ | 243,315,683 | $ | 180,572,258 | $ | 301,084,356 | ||||||||
| COMPUTATION OF NET ASSET VALUE | ||||||||||||||||
| Institutional Shares: | ||||||||||||||||
| Net assets | $ | 233,627,144 | $ | 14,628 | $ | 3,126,200 | $ | 8,497,411 | ||||||||
| Shares outstanding (unlimited shares authorized) | 12,228,760 | 780 | 211,066 | 237,003 | ||||||||||||
| Net asset value per share | $ | 19.10 | $ | 18.75 | $ | 14.81 | $ | 35.85 | ||||||||
| Investor Shares: | ||||||||||||||||
| Net assets | $ | 2,497,036,473 | $ | 241,665,669 | $ | 162,614,777 | $ | 285,286,848 | ||||||||
| Shares outstanding (unlimited shares authorized) | 130,950,853 | 12,891,816 | 10,997,287 | 15,810,534 | ||||||||||||
| Net asset value per share | $ | 19.07 | $ | 18.75 | $ | 14.79 | $ | 18.04 | ||||||||
| Advisor Shares: | ||||||||||||||||
| Net assets | $ | 48,631,937 | $ | 1,635,386 | $ | 14,831,281 | $ | 7,300,097 | ||||||||
| Shares outstanding (unlimited shares authorized) | 2,627,192 | 86,775 | 1,004,233 | 419,687 | ||||||||||||
| Net asset value per share | $ | 18.51 | $ | 18.85 | $ | 14.77 | $ | 17.39 | ||||||||
The accompanying notes are an integral part of these financial statements.
www.brownadvisoryfunds.com
77
Statements of Assets and Liabilities
June 30, 2014
| BROWN | BROWN | BROWN | ||||||||||||||
| ADVISORY | BROWN | ADVISORY | ADVISORY | |||||||||||||
| SMALL-CAP | ADVISORY | MARYLAND | INTERMEDIATE | |||||||||||||
| FUNDAMENTAL | OPPORTUNITY | BOND | INCOME | |||||||||||||
| VALUE FUND | FUND | FUND | FUND | |||||||||||||
| ASSETS | ||||||||||||||||
| Investments: | ||||||||||||||||
| Total investments – unaffiliated, at cost | $ | 470,040,439 | $ | 8,474,374 | $ | 197,387,181 | $ | 190,967,635 | ||||||||
| Total investments – affiliated, at cost (Note 3) | — | — | — | 25,000,000 | ||||||||||||
| Total cost of investments | 470,040,439 | 8,474,374 | 197,387,181 | 215,967,635 | ||||||||||||
| Net unrealized appreciation – unaffiliated | 142,775,962 | 3,189,461 | 4,527,348 | 1,672,217 | ||||||||||||
| Net unrealized appreciation – affiliated (Note 3) | — | — | — | 8,867 | ||||||||||||
| Total unrealized appreciation | 142,775,962 | 3,189,461 | 4,527,348 | 1,681,084 | ||||||||||||
| Total investments, at market value | 612,816,401 | 11,663,835 | 201,914,529 | 217,648,719 | ||||||||||||
| Cash | — | 1,791 | — | — | ||||||||||||
| Receivables: | ||||||||||||||||
| Investment securities sold | 1,950,236 | — | 3,635,370 | 96,959 | ||||||||||||
| Fund shares sold | 515,252 | 35,833 | 281,933 | 3,336,500 | ||||||||||||
| Interest and dividends | 1,000,598 | 5,338 | 2,802,389 | 914,564 | ||||||||||||
| Prepaid expenses and other assets | 44,466 | 19,440 | 6,567 | 29,720 | ||||||||||||
| Total Assets | 616,326,953 | 11,726,237 | 208,640,788 | 222,026,462 | ||||||||||||
| LIABILITIES | ||||||||||||||||
| Payables: | ||||||||||||||||
| Investment securities purchased | 6,460,416 | — | — | 926,000 | ||||||||||||
| Fund shares redeemed | 437,594 | 14,877 | 2,529,602 | 730,065 | ||||||||||||
| Distributions | — | — | 268,673 | 263,151 | ||||||||||||
| Accrued Liabilities: | ||||||||||||||||
| Investment advisory fees, net | 416,427 | 8,227 | 51,826 | 47,922 | ||||||||||||
| Administration, accounting, and transfer agent fees | 45,959 | 964 | 24,448 | 19,109 | ||||||||||||
| Cash overdraft – due to custodian | 61,351 | — | — | — | ||||||||||||
| Custodian fees | 4,711 | 286 | 1,349 | 1,551 | ||||||||||||
| Service fees | 71,137 | 1,408 | 8,638 | 8,981 | ||||||||||||
| Business management fees | 24,496 | 469 | 8,638 | 8,981 | ||||||||||||
| Distribution fees | 11,995 | — | — | 7,910 | ||||||||||||
| Other liabilities | 62,632 | 19,037 | 30,221 | 28,536 | ||||||||||||
| Total Liabilities | 7,596,718 | 45,268 | 2,923,395 | 2,042,206 | ||||||||||||
| NET ASSETS | $ | 608,730,235 | $ | 11,680,969 | $ | 205,717,393 | $ | 219,984,256 | ||||||||
| COMPONENTS OF NET ASSETS | ||||||||||||||||
| Paid-in capital | $ | 455,386,681 | $ | 14,926,208 | $ | 200,848,763 | 218,605,838 | |||||||||
| Undistributed (Accumulated) net investment income (loss) | 58,682 | (34,133 | ) | 28 | (219,785 | ) | ||||||||||
| Accumulated net realized gain (loss) | 10,508,910 | (6,400,567 | ) | 341,254 | (82,881 | ) | ||||||||||
| Unrealized appreciation on investments | 142,775,962 | 3,189,461 | 4,527,348 | 1,681,084 | ||||||||||||
| NET ASSETS | $ | 608,730,235 | $ | 11,680,969 | $ | 205,717,393 | $ | 219,984,256 | ||||||||
| COMPUTATION OF NET ASSET VALUE | ||||||||||||||||
| Institutional Shares: | ||||||||||||||||
| Net assets | $ | 19,515,271 | $ | — | $ | — | $ | — | ||||||||
| Shares outstanding (unlimited shares authorized) | 814,507 | — | — | — | ||||||||||||
| Net asset value per share | $ | 23.96 | $ | — | $ | — | $ | — | ||||||||
| Investor Shares: | ||||||||||||||||
| Net assets | $ | 567,798,950 | $ | 11,680,969 | $ | 205,717,393 | $ | 207,370,977 | ||||||||
| Shares outstanding (unlimited shares authorized) | 23,715,518 | 508,130 | 19,011,520 | 19,306,711 | ||||||||||||
| Net asset value per share | $ | 23.94 | $ | 22.99 | $ | 10.82 | $ | 10.74 | ||||||||
| Advisor Shares: | ||||||||||||||||
| Net assets | $ | 21,416,014 | $ | — | $ | — | $ | 12,613,279 | ||||||||
| Shares outstanding (unlimited shares authorized) | 897,082 | — | — | 1,197,403 | ||||||||||||
| Net asset value per share | $ | 23.87 | $ | — | $ | — | $ | 10.53 | ||||||||
The accompanying notes are an integral part of these financial statements.
www.brownadvisoryfunds.com
78
Statements of Assets and Liabilities
June 30, 2014
| BROWN | BROWN | BROWN | ||||||||||||||
| BROWN | ADVISORY | ADVISORY | ADVISORY | |||||||||||||
| ADVISORY | EQUITY | SUSTAINABLE | TAX EXEMPT | |||||||||||||
| TACTICAL | INCOME | GROWTH | BOND | |||||||||||||
| BOND FUND | FUND | FUND | FUND | |||||||||||||
| ASSETS | ||||||||||||||||
| Investments: | ||||||||||||||||
| Total investments, at cost | $ | 25,102,091 | $ | 160,199,647 | $ | 152,819,769 | $ | 208,556,297 | ||||||||
| Net unrealized appreciation | 140,596 | 42,889,290 | 57,345,764 | 427,029 | ||||||||||||
| Total investments, at market value | 25,242,687 | 203,088,937 | 210,165,533 | 208,983,326 | ||||||||||||
| Cash | — | 38,315 | 21,610 | — | ||||||||||||
| Deposit at broker – credit default swaps (Note 6) | 155,328 | — | — | — | ||||||||||||
| Gross unrealized appreciation – credit default swaps (Note 6) | 151,550 | — | — | — | ||||||||||||
| Receivables: | ||||||||||||||||
| Investment securities sold | — | — | — | 1,329,175 | ||||||||||||
| Fund shares sold | — | 144,198 | 295,697 | 1,827,500 | ||||||||||||
| Interest and dividends | 72,567 | 450,570 | 62,567 | 2,088,193 | ||||||||||||
| Prepaid expenses and other assets | 17,831 | 30,104 | 39,234 | 25,394 | ||||||||||||
| Total Assets | 25,639,963 | 203,752,124 | 210,584,641 | 214,253,588 | ||||||||||||
| LIABILITIES | ||||||||||||||||
| Gross unrealized depreciation – credit default swaps (Note 6) | — | — | — | — | ||||||||||||
| Payables: | ||||||||||||||||
| Investment securities purchased | 1,187,370 | 716,240 | — | 8,510,208 | ||||||||||||
| Fund shares redeemed | — | 812,118 | 281,406 | 200,140 | ||||||||||||
| Distributions | — | 715,661 | — | 249,354 | ||||||||||||
| Accrued Liabilities: | ||||||||||||||||
| Investment advisory fees | 11,894 | 97,534 | 102,799 | 49,980 | ||||||||||||
| Administration, accounting, and transfer agent fees | 2,178 | 15,087 | 16,651 | 19,199 | ||||||||||||
| Custodian fees | 244 | 1,428 | 1,260 | 1,164 | ||||||||||||
| Service fees | 2,974 | 22,673 | 21,967 | 8,330 | ||||||||||||
| Business management fees | 991 | 8,128 | 8,567 | 8,330 | ||||||||||||
| Distribution fees | 15,108 | 1,986 | 81,800 | — | ||||||||||||
| Other liabilities | 20,085 | 28,779 | 27,249 | 29,410 | ||||||||||||
| Total Liabilities | 1,240,844 | 2,419,634 | 541,699 | 9,076,115 | ||||||||||||
| NET ASSETS | $ | 24,399,119 | $ | 201,332,490 | $ | 210,042,942 | $ | 205,177,473 | ||||||||
| COMPONENTS OF NET ASSETS | ||||||||||||||||
| Paid-in capital | $ | 24,529,824 | $ | 150,339,167 | $ | 165,130,671 | $ | 205,214,062 | ||||||||
| Undistributed (Accumulated) net investment income (loss) | (138,070 | ) | — | (297,381 | ) | (123 | ) | |||||||||
| Accumulated net realized gain (loss) | (284,781 | ) | 8,104,214 | (12,136,112 | ) | (463,495 | ) | |||||||||
| Unrealized appreciation on investments | 140,596 | 42,889,290 | 57,345,764 | 427,029 | ||||||||||||
| Unrealized appreciation – credit default swaps (Note 6) | 151,550 | — | — | — | ||||||||||||
| Unrealized depreciation – foreign receivables | — | (181 | ) | — | — | |||||||||||
| NET ASSETS | $ | 24,399,119 | $ | 201,332,490 | $ | 210,042,942 | $ | 205,177,473 | ||||||||
| COMPUTATION OF NET ASSET VALUE | ||||||||||||||||
| Institutional Shares: | ||||||||||||||||
| Net assets | $ | — | $ | 17,662,624 | $ | 30,373,827 | $ | — | ||||||||
| Shares outstanding (unlimited shares authorized) | — | 1,289,084 | 2,152,782 | — | ||||||||||||
| Net asset value per share | $ | — | $ | 13.70 | $ | 14.11 | $ | — | ||||||||
| Investor Shares: | ||||||||||||||||
| Net assets | $ | — | $ | 180,372,266 | $ | 46,822,709 | $ | 205,177,473 | ||||||||
| Shares outstanding (unlimited shares authorized) | — | 13,172,066 | 3,329,838 | 20,455,053 | ||||||||||||
| Net asset value per share | $ | — | $ | 13.69 | $ | 14.06 | $ | 10.03 | ||||||||
| Advisor Shares: | ||||||||||||||||
| Net assets | $ | 24,399,119 | $ | 3,297,600 | $ | 132,846,406 | $ | — | ||||||||
| Shares outstanding (unlimited shares authorized) | 2,431,356 | 241,142 | 9,492,371 | — | ||||||||||||
| Net asset value per share | $ | 10.04 | $ | 13.67 | $ | 14.00 | $ | — | ||||||||
The accompanying notes are an integral part of these financial statements.
www.brownadvisoryfunds.com
79
Statements of Assets and Liabilities
June 30, 2014
| BROWN | BROWN | BROWN | BROWN | |||||||||||||
| ADVISORY – | ADVISORY – | ADVISORY | ADVISORY – WMC | |||||||||||||
| SOMERSET | WMC STRATEGIC | MORTGAGE | JAPAN ALPHA | |||||||||||||
| EMERGING | EUROPEAN | SECURITIES | OPPORTUNITIES | |||||||||||||
| MARKETS FUND | EQUITY FUND | FUND | FUND | |||||||||||||
| ASSETS | ||||||||||||||||
| Investments: | ||||||||||||||||
| Total investments, at cost | $ | 204,113,614 | $ | 214,462,957 | $ | 197,218,708 | $ | 1,021,529,449 | ||||||||
| Net unrealized appreciation | 13,820,178 | 7,048,383 | 1,546,150 | 69,645,432 | ||||||||||||
| Total investments, at market value | 217,933,792 | 221,511,340 | 198,764,858 | 1,091,174,881 | ||||||||||||
| Cash | — | — | — | 1,569,122 | ||||||||||||
| Foreign currency | 109,866 | — | — | — | ||||||||||||
| Deposit at broker – futures contracts (Note 7) | — | — | — | 1,402,003 | ||||||||||||
| Variation margin – futures contracts (Note 7) | — | — | — | 337,417 | ||||||||||||
| Gross unrealized appreciation – forward | ||||||||||||||||
| foreign currency contracts (Note 7) | — | — | — | — | ||||||||||||
| Receivables: | ||||||||||||||||
| Investment securities sold | — | 1,330,413 | 91,131 | 5,905,256 | ||||||||||||
| Fund shares sold | 530,387 | 692,799 | — | 1,351,008 | ||||||||||||
| Interest and dividends | 181,341 | 209,329 | 819,249 | 1,345,540 | ||||||||||||
| Prepaid expenses and other assets | 39,604 | 43,851 | 32,280 | 49,372 | ||||||||||||
| Total Assets | 218,794,990 | 223,787,732 | 199,707,518 | 1,103,134,599 | ||||||||||||
| LIABILITIES | ||||||||||||||||
| Gross unrealized depreciation – forward | ||||||||||||||||
| foreign currency contracts (Note 7) | — | — | — | 6,455,309 | ||||||||||||
| Payables: | ||||||||||||||||
| Investment securities purchased | 10,962 | 2,651,727 | — | 8,420,321 | ||||||||||||
| Fund shares redeemed | 15,000 | — | 24,931 | 1,781,788 | ||||||||||||
| Distributions | — | — | 361,046 | — | ||||||||||||
| Accrued Liabilities: | ||||||||||||||||
| Investment advisory fees | 157,225 | 159,275 | 48,433 | 862,166 | ||||||||||||
| Administration, accounting, and transfer agent fees | 17,774 | 17,806 | 18,258 | 78,152 | ||||||||||||
| Custodian fees | 46,445 | 30,036 | 2,175 | 35,492 | ||||||||||||
| Service fees | 2,978 | 2,195 | 4,593 | 344 | ||||||||||||
| Business management fees | 8,735 | 8,849 | 8,072 | 43,108 | ||||||||||||
| Distribution fees | 313 | 133 | — | 27 | ||||||||||||
| Other liabilities | 35,795 | 51,576 | 48,834 | 159,689 | ||||||||||||
| Total Liabilities | 295,227 | 2,921,597 | 516,342 | 17,836,396 | ||||||||||||
| NET ASSETS | $ | 218,499,763 | $ | 220,866,135 | $ | 199,191,176 | $ | 1,085,298,203 | ||||||||
| COMPONENTS OF NET ASSETS | ||||||||||||||||
| Paid-in capital | $ | 211,579,410 | $ | 211,992,294 | $ | 196,849,224 | $ | 1,023,997,409 | ||||||||
| Undistributed (Accumulated) net investment income (loss) | 2,310,343 | 2,146,536 | 48,689 | (813,416 | ) | |||||||||||
| Accumulated net realized gain (loss) | (9,210,546 | ) | (318,987 | ) | 747,113 | (2,254,949 | ) | |||||||||
| Unrealized appreciation on investments | 13,820,178 | 7,048,383 | 1,546,150 | 69,645,432 | ||||||||||||
| Unrealized appreciation – futures contracts (Note 7) | — | — | — | 1,169,594 | ||||||||||||
| Unrealized depreciation – forward | ||||||||||||||||
| foreign currency contracts (Note 7) | — | — | — | (6,455,309 | ) | |||||||||||
| Unrealized appreciation (depreciation) – foreign receivables | 378 | (2,091 | ) | — | 9,442 | |||||||||||
| NET ASSETS | $ | 218,499,763 | $ | 220,866,135 | $ | 199,191,176 | $ | 1,085,298,203 | ||||||||
| COMPUTATION OF NET ASSET VALUE | ||||||||||||||||
| Institutional Shares: | ||||||||||||||||
| Net assets | $ | 193,675,771 | $ | 202,615,704 | $ | 131,415,185 | $ | 1,080,716,912 | ||||||||
| Shares outstanding (unlimited shares authorized) | 18,952,439 | 19,372,411 | 12,934,737 | 102,972,553 | ||||||||||||
| Net asset value per share | $ | 10.22 | $ | 10.46 | $ | 10.16 | $ | 10.50 | ||||||||
| Investor Shares: | ||||||||||||||||
| Net assets | $ | 24,290,927 | $ | 18,010,700 | $ | 67,775,991 | $ | 4,522,385 | ||||||||
| Shares outstanding (unlimited shares authorized) | 2,379,701 | 1,723,788 | 6,671,622 | 431,005 | ||||||||||||
| Net asset value per share | $ | 10.21 | $ | 10.45 | $ | 10.16 | $ | 10.49 | ||||||||
| Advisor Shares: | ||||||||||||||||
| Net assets | $ | 533,065 | $ | 239,731 | $ | — | $ | 58,906 | ||||||||
| Shares outstanding (unlimited shares authorized) | 52,361 | 22,973 | — | 5,619 | ||||||||||||
| Net asset value per share | $ | 10.18 | $ | 10.44 | $ | — | $ | 10.48 | ||||||||
The accompanying notes are an integral part of these financial statements.
www.brownadvisoryfunds.com
80
Statements of Operations
For the Year Ended June 30, 2014
| BROWN | BROWN | BROWN | BROWN | |||||||||||||
| ADVISORY | ADVISORY | ADVISORY | ADVISORY | |||||||||||||
| GROWTH | VALUE | FLEXIBLE | SMALL-CAP | |||||||||||||
| EQUITY | EQUITY | EQUITY | GROWTH | |||||||||||||
| FUND | FUND | FUND | FUND | |||||||||||||
| INVESTMENT INCOME | ||||||||||||||||
| Dividend income | $ | 19,744,446 | $ | 4,468,579 | $ | 2,130,468 | $ | 1,187,754 | ||||||||
| Less: foreign taxes withheld | (105,178 | ) | (86,005 | ) | (35,520 | ) | — | |||||||||
| Interest Income | 23,396 | 3,037 | 2,590 | 4,930 | ||||||||||||
| Total investment income | 19,662,664 | 4,385,611 | 2,097,538 | 1,192,684 | ||||||||||||
| EXPENSES | ||||||||||||||||
| Investment advisory fees | 15,472,211 | 1,267,071 | 851,025 | 2,686,655 | ||||||||||||
| Service fees | 3,600,209 | 316,748 | 209,728 | 460,788 | ||||||||||||
| Business management fees | 1,289,351 | 105,589 | 70,919 | 158,039 | ||||||||||||
| Administration, accounting, and transfer agent fees | 1,156,466 | 93,819 | 64,788 | 142,654 | ||||||||||||
| Miscellaneous expenses | 282,480 | 26,378 | 21,857 | 38,105 | ||||||||||||
| Registration fees | 265,253 | 60,759 | 62,906 | 67,096 | ||||||||||||
| Professional fees | 241,171 | 37,798 | 31,347 | 46,839 | ||||||||||||
| Trustee fees and expenses | 143,756 | 11,902 | 8,061 | 17,566 | ||||||||||||
| Distribution fees | 98,506 | 4,344 | 32,360 | 17,055 | ||||||||||||
| Custodian fees | 82,223 | 8,345 | 12,752 | 11,395 | ||||||||||||
| Insurance fees | 57,744 | 5,076 | 2,702 | 9,508 | ||||||||||||
| Total Expenses | 22,689,370 | 1,937,829 | 1,368,445 | 3,655,700 | ||||||||||||
| Expenses recouped by adviser (Note 3) | — | — | 18,551 | — | ||||||||||||
| Net Expenses | 22,689,370 | 1,937,829 | 1,386,996 | 3,655,700 | ||||||||||||
| NET INVESTMENT INCOME (LOSS) | (3,026,706 | ) | 2,447,782 | 710,542 | (2,463,016 | ) | ||||||||||
| NET REALIZED AND UNREALIZED GAIN (LOSS) | ||||||||||||||||
| Net realized gain on investments | 68,484,570 | 16,997,084 | 1,912,542 | 31,585,276 | ||||||||||||
| Net change in unrealized appreciation (depreciation) | 338,915,369 | 31,519,020 | 22,754,176 | 24,366,462 | ||||||||||||
| NET REALIZED AND UNREALIZED GAIN | 407,399,939 | 48,516,104 | 24,666,718 | 55,951,738 | ||||||||||||
| INCREASE IN NET ASSETS FROM OPERATIONS | $ | 404,373,233 | $ | 50,963,886 | $ | 25,377,260 | $ | 53,488,722 | ||||||||
The accompanying notes are an integral part of these financial statements.
www.brownadvisoryfunds.com
81
Statements of Operations
For the Year Ended June 30, 2014
| BROWN | BROWN | BROWN | ||||||||||||||
| ADVISORY | BROWN | ADVISORY | ADVISORY | |||||||||||||
| SMALL-CAP | ADVISORY | MARYLAND | INTERMEDIATE | |||||||||||||
| FUNDAMENTAL | OPPORTUNITY | BOND | INCOME | |||||||||||||
| VALUE FUND | FUND | FUND | FUND | |||||||||||||
| INVESTMENT INCOME | ||||||||||||||||
| Dividend income – unaffiliated | $ | 7,858,468 | $ | 96,024 | $ | — | $ | — | ||||||||
| Dividend income – affiliated (Note 3) | — | — | — | 88,534 | ||||||||||||
| Less: foreign taxes withheld | (4,201 | ) | (1,036 | ) | — | — | ||||||||||
| Interest Income | 6,039 | 81 | 5,586,642 | 4,760,676 | ||||||||||||
| Total investment income | 7,860,306 | 95,069 | 5,586,642 | 4,849,210 | ||||||||||||
| EXPENSES | ||||||||||||||||
| Investment advisory fees | 4,429,963 | 92,406 | 668,820 | 706,999 | ||||||||||||
| Service fees | 763,073 | 16,307 | 111,470 | 117,833 | ||||||||||||
| Business management fees | 260,586 | 5,436 | 111,470 | 117,833 | ||||||||||||
| Administration, accounting, and transfer agent fees | 233,907 | 6,898 | 144,583 | 122,954 | ||||||||||||
| Registration fees | 90,233 | 21,173 | 15,303 | 60,597 | ||||||||||||
| Miscellaneous expenses | 66,324 | 2,321 | 28,624 | 25,986 | ||||||||||||
| Professional fees | 64,279 | 19,155 | 40,004 | 40,402 | ||||||||||||
| Distribution fees | 46,022 | — | — | 34,856 | ||||||||||||
| Trustee fees and expenses | 29,865 | 514 | 12,514 | 13,303 | ||||||||||||
| Custodian fees | 23,603 | 1,092 | 7,599 | 9,685 | ||||||||||||
| Insurance fees | 12,206 | 295 | 8,394 | 8,577 | ||||||||||||
| Total Expenses | 6,020,061 | 165,597 | 1,148,781 | 1,259,025 | ||||||||||||
| Expenses waived by adviser – expense cap (Note 3) | — | (2,527 | ) | — | — | |||||||||||
| Expenses waived by adviser – investments in affiliates (Note 3) | — | — | — | (8,309 | ) | |||||||||||
| Net Expenses | 6,020,061 | 163,070 | 1,148,781 | 1,250,716 | ||||||||||||
| NET INVESTMENT INCOME (LOSS) | 1,840,245 | (68,001 | ) | 4,437,861 | 3,598,494 | |||||||||||
| NET REALIZED AND UNREALIZED GAIN (LOSS) | ||||||||||||||||
| Net realized gain on investments – unaffiliated | 29,407,001 | 996,471 | 341,254 | 41,616 | ||||||||||||
| Net realized gain (loss) on investments – affiliated (Note 3) | — | — | — | — | ||||||||||||
| Net realized gain (loss) | 29,407,001 | 996,471 | 341,254 | 41,616 | ||||||||||||
| Net change in unrealized appreciation (depreciation) – unaffiliated | 76,764,405 | 1,311,409 | 1,397,876 | 2,180,683 | ||||||||||||
| Net change in unrealized appreciation (depreciation) – affiliated (Note 3) | — | — | — | 8,867 | ||||||||||||
| Net change in unrealized appreciation (depreciation) | 76,764,405 | 1,311,409 | 1,397,876 | 2,189,550 | ||||||||||||
| NET REALIZED AND UNREALIZED GAIN | 106,171,406 | 2,307,880 | 1,739,130 | 2,231,166 | ||||||||||||
| INCREASE IN NET ASSETS FROM OPERATIONS | $ | 108,011,651 | $ | 2,239,879 | $ | 6,176,991 | $ | 5,829,660 | ||||||||
The accompanying notes are an integral part of these financial statements.
www.brownadvisoryfunds.com
82
Statements of Operations
For the Year Ended June 30, 2014
| BROWN | BROWN | BROWN | ||||||||||||||
| BROWN | ADVISORY | ADVISORY | ADVISORY | |||||||||||||
| ADVISORY | EQUITY | SUSTAINABLE | TAX EXEMPT | |||||||||||||
| TACTICAL | INCOME | GROWTH | BOND | |||||||||||||
| BOND FUND | FUND | FUND | FUND | |||||||||||||
| INVESTMENT INCOME | ||||||||||||||||
| Dividend income | $ | 12,361 | $ | 5,788,395 | $ | 1,549,437 | $ | — | ||||||||
| Less: foreign taxes withheld | — | (165,266 | ) | (16,592 | ) | — | ||||||||||
| Interest Income | 286,026 | 2,654 | 1,776 | 4,189,599 | ||||||||||||
| Total investment income | 298,387 | 5,625,783 | 1,534,621 | 4,189,599 | ||||||||||||
| EXPENSES | ||||||||||||||||
| Investment advisory fees | 142,677 | 1,124,647 | 1,207,768 | 506,671 | ||||||||||||
| Distribution fees | 59,449 | 7,261 | 335,478 | — | ||||||||||||
| Service fees | 35,669 | 276,126 | 256,959 | 84,445 | ||||||||||||
| Registration fees | 25,516 | 62,968 | 62,439 | 39,494 | ||||||||||||
| Professional fees | 20,038 | 35,716 | 34,750 | 32,571 | ||||||||||||
| Business management fees | 11,890 | 93,721 | 100,647 | 84,445 | ||||||||||||
| Administration, accounting, and transfer agent fees | 11,611 | 84,056 | 93,810 | 93,094 | ||||||||||||
| Miscellaneous expenses | 5,575 | 25,175 | 30,958 | 22,107 | ||||||||||||
| Custodian fees | 1,470 | 6,577 | 7,170 | 6,442 | ||||||||||||
| Trustee fees and expenses | 1,307 | 10,517 | 10,677 | 9,557 | ||||||||||||
| Insurance fees | 853 | 5,740 | 5,873 | 5,329 | ||||||||||||
| Total Expenses | 316,055 | 1,732,504 | 2,146,529 | 884,155 | ||||||||||||
| NET INVESTMENT INCOME (LOSS) | (17,668 | ) | 3,893,279 | (611,908 | ) | 3,305,444 | ||||||||||
| NET REALIZED AND UNREALIZED GAIN (LOSS) | ||||||||||||||||
| Net realized gain (loss) on: | ||||||||||||||||
| Investments | (351,741 | ) | 11,151,487 | 10,473,938 | (463,496 | ) | ||||||||||
| Credit default swaps (Note 6) | 1,013,815 | — | — | — | ||||||||||||
| Net realized gain (loss) | 662,074 | 11,151,487 | 10,473,938 | (463,496 | ) | |||||||||||
| Net change in unrealized appreciation (depreciation) on: | ||||||||||||||||
| Investments | 568,091 | 18,099,447 | 28,972,172 | 4,078,241 | ||||||||||||
| Credit default swaps (Note 6) | (253,599 | ) | — | — | — | |||||||||||
| Foreign receivables | — | (181 | ) | 97 | — | |||||||||||
| Net change in unrealized appreciation (depreciation) | 314,492 | 18,099,266 | 28,972,269 | 4,078,241 | ||||||||||||
| NET REALIZED AND UNREALIZED GAIN | 976,566 | 29,250,753 | 39,446,207 | 3,614,745 | ||||||||||||
| INCREASE IN NET ASSETS FROM OPERATIONS | $ | 958,898 | $ | 33,144,032 | $ | 38,834,299 | $ | 6,920,189 | ||||||||
The accompanying notes are an integral part of these financial statements.
www.brownadvisoryfunds.com
83
Statements of Operations
For the Year/Period Ended June 30, 2014
| BROWN | BROWN | BROWN | BROWN | |||||||||||||
| ADVISORY – | ADVISORY – | ADVISORY | ADVISORY – WMC | |||||||||||||
| SOMERSET | WMC STRATEGIC | MORTGAGE | JAPAN ALPHA | |||||||||||||
| EMERGING | EUROPEAN | SECURITIES | OPPORTUNITIES | |||||||||||||
| MARKETS FUND | EQUITY FUND* | FUND** | FUND*** | |||||||||||||
| INVESTMENT INCOME | ||||||||||||||||
| Dividend income | $ | 6,224,368 | $ | 4,004,961 | $ | — | $ | 9,043,653 | ||||||||
| Less: foreign taxes withheld | (829,914 | ) | (521,602 | ) | — | (1,208,215 | ) | |||||||||
| Interest Income | 4,180 | 947 | 2,041,224 | 10,267 | ||||||||||||
| Total investment income | 5,398,634 | 3,484,306 | 2,041,224 | 7,845,705 | ||||||||||||
| EXPENSES | ||||||||||||||||
| Investment advisory fees | 1,456,197 | 967,095 | 244,582 | 2,803,056 | ||||||||||||
| Custodian fees | 275,611 | 144,121 | 6,728 | 92,973 | ||||||||||||
| Administration, accounting, and transfer agent fees | 83,105 | 55,252 | 51,535 | 133,817 | ||||||||||||
| Business management fees | 80,900 | 53,727 | 40,764 | 140,153 | ||||||||||||
| Registration fees | 56,053 | 51,198 | 36,738 | 121,086 | ||||||||||||
| Professional fees | 36,065 | 24,996 | 24,330 | 32,024 | ||||||||||||
| Miscellaneous expenses | 28,586 | 20,677 | 15,454 | 38,565 | ||||||||||||
| Service fees | 25,657 | 14,211 | 36,805 | 436 | ||||||||||||
| Trustee fees and expenses | 8,867 | 5,944 | 5,663 | 17,079 | ||||||||||||
| Insurance fees | 4,186 | 315 | 186 | 234 | ||||||||||||
| Distribution fees | 1,853 | 257 | — | 29 | ||||||||||||
| Total Expenses | 2,057,080 | 1,337,793 | 462,785 | 3,379,452 | ||||||||||||
| NET INVESTMENT INCOME | 3,341,554 | 2,146,513 | 1,578,439 | 4,466,253 | ||||||||||||
| NET REALIZED AND UNREALIZED GAIN (LOSS) | ||||||||||||||||
| Net realized gain (loss) on: | ||||||||||||||||
| Investments | (7,237,279 | ) | (347,221 | ) | 920,861 | 2,416,022 | ||||||||||
| Futures contracts (Note 7) | — | — | — | (4,094,834 | ) | |||||||||||
| Forward foreign currency contracts (Note 7) | — | — | — | (5,855,806 | ) | |||||||||||
| Net realized gain (loss) | (7,237,279 | ) | (347,221 | ) | 920,861 | (7,534,618 | ) | |||||||||
| Net change in unrealized appreciation (depreciation) on: | ||||||||||||||||
| Investments | 19,121,207 | 7,048,383 | 1,546,150 | 69,645,432 | ||||||||||||
| Futures contracts (Note 7) | — | — | — | 1,169,594 | ||||||||||||
| Forward foreign currency contracts (Note 7) | — | — | — | (6,455,309 | ) | |||||||||||
| Foreign receivables | 7,183 | (2,091 | ) | — | 9,442 | |||||||||||
| Net change in unrealized appreciation (depreciation) | 19,128,390 | 7,046,292 | 1,546,150 | 64,369,159 | ||||||||||||
| NET REALIZED AND UNREALIZED GAIN | 11,891,111 | 6,699,071 | 2,467,011 | 56,834,541 | ||||||||||||
| INCREASE IN NET ASSETS FROM OPERATIONS | $ | 15,232,665 | $ | 8,845,584 | $ | 4,045,450 | $ | 61,300,794 | ||||||||
| * | Commenced operations on October 21, 2013. The information presented is for the period from October 21, 2013 to June 30, 2014. |
| ** | Commenced operations on December 26, 2013. The information presented is for the period from December 26, 2013 to June 30, 2014. |
| *** | Commenced operations on March 4, 2014. The information presented is for the period from March 4, 2014 to June 30, 2014. |
The accompanying notes are an integral part of these financial statements.
www.brownadvisoryfunds.com
84
Statements of Changes in Net Assets
| BROWN ADVISORY | BROWN ADVISORY | |||||||||||||||
| GROWTH EQUITY FUND | VALUE EQUITY FUND | |||||||||||||||
| Year Ended | Year Ended | Year Ended | Year Ended | |||||||||||||
| June 30, | June 30, | June 30, | June 30, | |||||||||||||
| 2014 | 2013 | 2014 | 2013 | |||||||||||||
| OPERATIONS | ||||||||||||||||
| Net investment income (loss) | $ | (3,026,706 | ) | $ | 2,080,980 | $ | 2,447,782 | $ | 2,324,972 | |||||||
| Net realized gains (losses) | 68,484,570 | (5,648,207 | ) | 16,997,084 | 13,481,067 | |||||||||||
| Net change in unrealized appreciation (depreciation) | 338,915,369 | 202,184,736 | 31,519,020 | 13,485,570 | ||||||||||||
| Increase in Net Assets from Operations | 404,373,233 | 198,617,509 | 50,963,886 | 29,291,609 | ||||||||||||
| DISTRIBUTIONS TO SHAREHOLDERS FROM | ||||||||||||||||
| Net investment income: | ||||||||||||||||
| Institutional Shares | — | (65,974 | ) | (128 | ) | (178 | ) | |||||||||
| Investor Shares | — | (1,975,839 | ) | (1,812,794 | ) | (2,400,157 | ) | |||||||||
| Advisor Shares | — | (13,229 | ) | (10,159 | ) | (25,371 | ) | |||||||||
| Net realized gain: | ||||||||||||||||
| Institutional Shares | (946,386 | ) | — | — | — | |||||||||||
| Investor Shares | (14,286,774 | ) | — | — | — | |||||||||||
| Advisor Shares | (297,701 | ) | — | — | — | |||||||||||
| Total Distributions to Shareholders | (15,530,861 | ) | (2,055,042 | ) | (1,823,081 | ) | (2,425,706 | ) | ||||||||
| CAPITAL SHARE TRANSACTIONS | ||||||||||||||||
| Sale of shares: | ||||||||||||||||
| Institutional Shares | 114,398,361 | 113,544,951 | — | 10,000 | ||||||||||||
| Investor Shares | 1,019,160,535 | 820,532,267 | 43,671,979 | 27,858,672 | ||||||||||||
| Advisor Shares | 32,019,095 | 9,830,221 | 500 | 3,075 | ||||||||||||
| Reinvestment of distributions: | ||||||||||||||||
| Institutional Shares | 912,323 | 65,974 | — | 178 | ||||||||||||
| Investor Shares | 13,350,521 | 1,709,853 | 322,261 | 441,858 | ||||||||||||
| Advisor Shares | 290,801 | 12,373 | 8,720 | 22,592 | ||||||||||||
| Redemption of shares: | ||||||||||||||||
| Institutional Shares | (23,531,450 | ) | (2,895,661 | ) | — | — | ||||||||||
| Investor Shares | (547,273,104 | ) | (311,681,632 | ) | (11,853,550 | ) | (50,239,650 | ) | ||||||||
| Advisor Shares | (10,321,727 | ) | (2,403,058 | ) | (401,578 | ) | (963,619 | ) | ||||||||
| Redemption fees: | ||||||||||||||||
| Institutional Shares | 154 | 428 | — | — | ||||||||||||
| Investor Shares | 4,850 | 11,002 | 193 | 13 | ||||||||||||
| Advisor Shares | 2 | 6 | — | — | ||||||||||||
| Increase (Decrease) from Capital Share Transactions | 599,010,361 | 628,726,724 | 31,748,525 | (22,866,881 | ) | |||||||||||
| Increase in Net Assets | 987,852,733 | 825,289,191 | 80,889,330 | 3,999,022 | ||||||||||||
| NET ASSETS | ||||||||||||||||
| Beginning of year | 1,791,442,821 | 966,153,630 | 162,426,353 | 158,427,331 | ||||||||||||
| End of year | $ | 2,779,295,554 | $ | 1,791,442,821 | $ | 243,315,683 | $ | 162,426,353 | ||||||||
| Undistributed (Accumulated) net investment income (loss) | $ | — | $ | (1,374,373 | ) | $ | 2,067,371 | $ | 1,442,921 | |||||||
| SHARE TRANSACTIONS | ||||||||||||||||
| Sale of shares: | ||||||||||||||||
| Institutional Shares | 6,267,064 | 7,369,370 | — | 766 | ||||||||||||
| Investor Shares | 58,154,868 | 53,330,610 | 2,658,481 | 2,000,983 | ||||||||||||
| Advisor Shares | 1,829,286 | 659,189 | 31 | 203 | ||||||||||||
| Reinvestment of distributions: | ||||||||||||||||
| Institutional Shares | 49,444 | 4,494 | — | 14 | ||||||||||||
| Investor Shares | 739,231 | 116,475 | 18,628 | 34,466 | ||||||||||||
| Advisor Shares | 16,570 | 865 | 500 | 1,752 | ||||||||||||
| Redemption of shares: | ||||||||||||||||
| Institutional Shares | (1,275,736 | ) | (185,876 | ) | — | — | ||||||||||
| Investor Shares | (29,939,374 | ) | (20,618,203 | ) | (692,354 | ) | (3,829,558 | ) | ||||||||
| Advisor Shares | (579,987 | ) | (160,608 | ) | (22,764 | ) | (71,094 | ) | ||||||||
| Increase (Decrease) from Capital Share Transactions | 35,261,366 | 40,516,316 | 1,962,522 | (1,862,468 | ) | |||||||||||
The accompanying notes are an integral part of these financial statements.
www.brownadvisoryfunds.com
85
Statements of Changes in Net Assets
| BROWN ADVISORY | BROWN ADVISORY | |||||||||||||||
| FLEXIBLE EQUITY FUND | SMALL-CAP GROWTH FUND | |||||||||||||||
| Year Ended | Year Ended | Year Ended | Year Ended | |||||||||||||
| June 30, | June 30, | June 30, | June 30, | |||||||||||||
| 2014 | 2013 | 2014 | 2013 | |||||||||||||
| OPERATIONS | ||||||||||||||||
| Net investment income (loss) | $ | 710,542 | $ | 255,458 | $ | (2,463,016 | ) | $ | (913,379 | ) | ||||||
| Net realized gains | 1,912,542 | 381,342 | 31,585,276 | 19,273,284 | ||||||||||||
| Net change in unrealized appreciation (depreciation) | 22,754,176 | 11,667,334 | 24,366,462 | 34,372,117 | ||||||||||||
| Increase in Net Assets from Operations | 25,377,260 | 12,304,134 | 53,488,722 | 52,732,022 | ||||||||||||
| DISTRIBUTIONS TO SHAREHOLDERS FROM | ||||||||||||||||
| Net investment income: | ||||||||||||||||
| Institutional Shares | (7,405 | ) | (58 | ) | — | — | ||||||||||
| Investor Shares | (368,373 | ) | (230,035 | ) | — | — | ||||||||||
| Advisor Shares | (28,875 | ) | (3,699 | ) | — | — | ||||||||||
| Net realized gain: | ||||||||||||||||
| Institutional Shares | — | — | (369,008 | ) | (633,269 | ) | ||||||||||
| Investor Shares | — | — | (13,816,372 | ) | (21,015,379 | ) | ||||||||||
| Advisor Shares | — | — | (304,670 | ) | (286,575 | ) | ||||||||||
| Total Distributions to Shareholders | (404,653 | ) | (233,792 | ) | (14,490,050 | ) | (21,935,223 | ) | ||||||||
| CAPITAL SHARE TRANSACTIONS | ||||||||||||||||
| Sale of shares: | ||||||||||||||||
| Institutional Shares | 2,923,927 | 10,000 | 2,951,287 | 15,705 | ||||||||||||
| Investor Shares | 69,789,625 | 37,446,111 | 26,226,777 | 56,559,441 | ||||||||||||
| Advisor Shares | 11,380,969 | 5,167,925 | 2,139,136 | 2,148,049 | ||||||||||||
| Reinvestment of distributions: | ||||||||||||||||
| Institutional Shares | — | 58 | 336,338 | 572,119 | ||||||||||||
| Investor Shares | 180,778 | 81,645 | 7,763,483 | 16,467,524 | ||||||||||||
| Advisor Shares | 27,104 | 2,102 | 185,410 | 256,880 | ||||||||||||
| Redemption of shares: | ||||||||||||||||
| Institutional Shares | (134,923 | ) | — | (2,934,502 | ) | (1,017,846 | ) | |||||||||
| Investor Shares | (12,584,573 | ) | (4,044,749 | ) | (67,246,745 | ) | (36,724,238 | ) | ||||||||
| Advisor Shares | (4,893,918 | ) | (379,541 | ) | (1,202,041 | ) | (338,790 | ) | ||||||||
| Redemption fees: | ||||||||||||||||
| Institutional Shares | — | — | — | — | ||||||||||||
| Investor Shares | 322 | 137 | 72 | 515 | ||||||||||||
| Advisor Shares | 191 | — | — | — | ||||||||||||
| Increase (Decrease) from Capital Share Transactions | 66,689,502 | 38,283,688 | (31,780,785 | ) | 37,939,359 | |||||||||||
| Increase in Net Assets | 91,662,109 | 50,354,030 | 7,217,887 | 68,736,158 | ||||||||||||
| NET ASSETS | ||||||||||||||||
| Beginning of year | 88,910,149 | 38,556,119 | 293,866,469 | 225,130,311 | ||||||||||||
| End of year | $ | 180,572,258 | $ | 88,910,149 | $ | 301,084,356 | $ | 293,866,469 | ||||||||
| Undistributed (Accumulated) net investment income (loss) | $ | 406,100 | $ | 100,229 | $ | (425,777 | ) | $ | 205,885 | |||||||
| SHARE TRANSACTIONS | ||||||||||||||||
| Sale of shares: | ||||||||||||||||
| Institutional Shares | 220,376 | 956 | 78,822 | 585 | ||||||||||||
| Investor Shares | 5,170,097 | 3,227,028 | 1,462,019 | 3,844,440 | ||||||||||||
| Advisor Shares | 867,329 | 419,254 | 121,903 | 152,517 | ||||||||||||
| Reinvestment of distributions: | ||||||||||||||||
| Institutional Shares | — | 6 | 9,512 | 21,292 | ||||||||||||
| Investor Shares | 12,758 | 7,754 | 435,906 | 1,214,419 | ||||||||||||
| Advisor Shares | 1,913 | 200 | 10,786 | 19,579 | ||||||||||||
| Redemption of shares: | ||||||||||||||||
| Institutional Shares | (10,272 | ) | — | (83,303 | ) | (34,801 | ) | |||||||||
| Investor Shares | (928,933 | ) | (364,307 | ) | (3,692,883 | ) | (2,500,764 | ) | ||||||||
| Advisor Shares | (362,982 | ) | (32,988 | ) | (69,091 | ) | (23,431 | ) | ||||||||
| Increase (Decrease) from Capital Share Transactions | 4,970,286 | 3,257,903 | (1,726,329 | ) | 2,693,836 | |||||||||||
The accompanying notes are an integral part of these financial statements.
www.brownadvisoryfunds.com
86
Statements of Changes in Net Assets
| BROWN ADVISORY SMALL-CAP | BROWN ADVISORY | |||||||||||||||
| FUNDAMENTAL VALUE FUND | OPPORTUNITY FUND | |||||||||||||||
| Year Ended | Year Ended | Year Ended | Year Ended | |||||||||||||
| June 30, | June 30, | June 30, | June 30, | |||||||||||||
| 2014 | 2013 | 2014 | 2013 | |||||||||||||
| OPERATIONS | ||||||||||||||||
| Net investment income (loss) | $ | 1,840,245 | $ | 2,631,366 | $ | (68,001 | ) | $ | (24,640 | ) | ||||||
| Net realized gains | 29,407,001 | 15,854,801 | 996,471 | 644,942 | ||||||||||||
| Net change in unrealized appreciation (depreciation) | 76,764,405 | 45,698,631 | 1,311,409 | 1,222,400 | ||||||||||||
| Increase in Net Assets from Operations | 108,011,651 | 64,184,798 | 2,239,879 | 1,842,702 | ||||||||||||
| DISTRIBUTIONS TO SHAREHOLDERS FROM | ||||||||||||||||
| Net investment income: | ||||||||||||||||
| Institutional Shares | (140,496 | ) | (44 | ) | — | — | ||||||||||
| Investor Shares | (3,540,086 | ) | (862,851 | ) | — | — | ||||||||||
| Advisor Shares | (95,529 | ) | (1,100 | ) | — | — | ||||||||||
| Net realized gain: | ||||||||||||||||
| Institutional Shares | (670,124 | ) | — | — | — | |||||||||||
| Investor Shares | (19,658,734 | ) | — | — | — | |||||||||||
| Advisor Shares | (760,942 | ) | — | — | — | |||||||||||
| Total Distributions to Shareholders | (24,865,911 | ) | (863,995 | ) | — | — | ||||||||||
| CAPITAL SHARE TRANSACTIONS | ||||||||||||||||
| Sale of shares: | ||||||||||||||||
| Institutional Shares | 17,839,759 | 1,048,500 | — | — | ||||||||||||
| Investor Shares | 172,880,303 | 134,389,272 | 1,317,533 | 383,175 | ||||||||||||
| Advisor Shares | 5,013,486 | 13,977,201 | — | — | ||||||||||||
| Reinvestment of distributions: | ||||||||||||||||
| Institutional Shares | 801,537 | 44 | — | — | ||||||||||||
| Investor Shares | 12,588,210 | 163,746 | — | — | ||||||||||||
| Advisor Shares | 851,303 | 988 | — | — | ||||||||||||
| Redemption of shares: | ||||||||||||||||
| Institutional Shares | (1,162,598 | ) | (11,977 | ) | — | — | ||||||||||
| Investor Shares | (67,733,638 | ) | (19,906,645 | ) | (1,049,564 | ) | (1,539,347 | ) | ||||||||
| Advisor Shares | (3,337,506 | ) | (276,993 | ) | — | — | ||||||||||
| Redemption fees: | ||||||||||||||||
| Institutional Shares | — | — | — | — | ||||||||||||
| Investor Shares | 635 | 1,147 | — | — | ||||||||||||
| Advisor Shares | 32 | — | — | — | ||||||||||||
| Increase (Decrease) from Capital Share Transactions | 137,741,523 | 129,385,283 | 267,969 | (1,156,172 | ) | |||||||||||
| Increase in Net Assets | 220,887,263 | 192,706,086 | 2,507,848 | 686,530 | ||||||||||||
| NET ASSETS | ||||||||||||||||
| Beginning of year | 387,842,972 | 195,136,886 | 9,173,121 | 8,486,591 | ||||||||||||
| End of year | $ | 608,730,235 | $ | 387,842,972 | $ | 11,680,969 | $ | 9,173,121 | ||||||||
| Undistributed (Accumulated) net investment income (loss) | $ | 58,682 | $ | 2,053,423 | $ | (34,133 | ) | $ | (24,827 | ) | ||||||
| SHARE TRANSACTIONS | ||||||||||||||||
| Sale of shares: | ||||||||||||||||
| Institutional Shares | 777,261 | 53,495 | — | — | ||||||||||||
| Investor Shares | 7,643,580 | 7,167,523 | 60,945 | 22,201 | ||||||||||||
| Advisor Shares | 217,599 | 775,604 | — | — | ||||||||||||
| Reinvestment of distributions: | ||||||||||||||||
| Institutional Shares | 34,883 | 3 | — | — | ||||||||||||
| Investor Shares | 549,691 | 9,335 | — | — | ||||||||||||
| Advisor Shares | 37,268 | 57 | — | — | ||||||||||||
| Redemption of shares: | ||||||||||||||||
| Institutional Shares | (50,536 | ) | (599 | ) | — | — | ||||||||||
| Investor Shares | (2,974,633 | ) | (1,120,225 | ) | (48,362 | ) | (93,623 | ) | ||||||||
| Advisor Shares | (145,557 | ) | (14,632 | ) | — | — | ||||||||||
| Increase (Decrease) from Capital Share Transactions | 6,089,556 | 6,870,561 | 12,583 | (71,422 | ) | |||||||||||
The accompanying notes are an integral part of these financial statements.
www.brownadvisoryfunds.com
87
Statements of Changes in Net Assets
| BROWN ADVISORY | BROWN ADVISORY | |||||||||||||||
| MARYLAND BOND FUND | INTERMEDIATE INCOME FUND | |||||||||||||||
| Year Ended | Year Ended | Year Ended | Year Ended | |||||||||||||
| June 30, | June 30, | June 30, | June 30, | |||||||||||||
| 2014 | 2013 | 2014 | 2013 | |||||||||||||
| OPERATIONS | ||||||||||||||||
| Net investment income | $ | 4,437,861 | $ | 4,884,891 | $ | 3,598,494 | $ | 4,885,718 | ||||||||
| Net realized gains | 341,254 | 1,708,121 | 41,616 | 5,538,948 | ||||||||||||
| Net change in unrealized appreciation (depreciation) | 1,397,876 | (7,327,698 | ) | 2,189,550 | (11,603,288 | ) | ||||||||||
| Increase (Decrease) in Net Assets from Operations | 6,176,991 | (734,686 | ) | 5,829,660 | (1,178,622 | ) | ||||||||||
| DISTRIBUTIONS TO SHAREHOLDERS FROM | ||||||||||||||||
| Net investment income: | ||||||||||||||||
| Investor Shares | (4,437,861 | ) | (4,884,891 | ) | (3,569,560 | ) | (6,094,190 | ) | ||||||||
| Advisor Shares | — | — | (193,169 | ) | (369,069 | ) | ||||||||||
| Net realized gain: | ||||||||||||||||
| Investor Shares | (1,707,914 | ) | (455,702 | ) | (4,271,648 | ) | (5,050,407 | ) | ||||||||
| Advisor Shares | — | — | (275,860 | ) | (344,796 | ) | ||||||||||
| Total Distributions to Shareholders | (6,145,775 | ) | (5,340,593 | ) | (8,310,237 | ) | (11,858,462 | ) | ||||||||
| CAPITAL SHARE TRANSACTIONS | ||||||||||||||||
| Sale of shares: | ||||||||||||||||
| Investor Shares | 134,290,934 | 85,262,666 | 78,227,331 | 86,127,669 | ||||||||||||
| Advisor Shares | — | — | 448,258 | 283,788 | ||||||||||||
| Reinvestment of distributions: | ||||||||||||||||
| Investor Shares | 1,556,130 | 821,746 | 3,631,333 | 5,190,762 | ||||||||||||
| Advisor Shares | — | — | 314,913 | 460,726 | ||||||||||||
| Redemption of shares: | ||||||||||||||||
| Investor Shares | (182,327,223 | ) | (77,931,410 | ) | (113,719,031 | ) | (130,115,548 | ) | ||||||||
| Advisor Shares | — | — | (4,129,873 | ) | (3,315,606 | ) | ||||||||||
| Redemption fees: | ||||||||||||||||
| Investor Shares | — | 1,520 | 50 | 1,372 | ||||||||||||
| Advisor Shares | — | — | — | — | ||||||||||||
| Increase (Decrease) from Capital Share Transactions | (46,480,159 | ) | 8,154,522 | (35,227,019 | ) | (41,366,837 | ) | |||||||||
| Increase (Decrease) in Net Assets | (46,448,943 | ) | 2,079,243 | (37,707,596 | ) | (54,403,921 | ) | |||||||||
| NET ASSETS | ||||||||||||||||
| Beginning of year | 252,166,336 | 250,087,093 | 257,691,852 | 312,095,773 | ||||||||||||
| End of year | $ | 205,717,393 | $ | 252,166,336 | $ | 219,984,256 | $ | 257,691,852 | ||||||||
| Undistributed (Accumulated) net investment income (loss) | $ | 28 | $ | — | $ | (219,785 | ) | $ | (180,031 | ) | ||||||
| SHARE TRANSACTIONS | ||||||||||||||||
| Sale of shares: | ||||||||||||||||
| Investor Shares | 12,545,458 | 7,681,767 | 7,311,163 | 7,632,294 | ||||||||||||
| Advisor Shares | — | — | 42,887 | 25,311 | ||||||||||||
| Reinvestment of distributions: | ||||||||||||||||
| Investor Shares | 145,627 | 74,031 | 342,553 | 460,203 | ||||||||||||
| Advisor Shares | — | — | 30,195 | 41,621 | ||||||||||||
| Redemption of shares: | ||||||||||||||||
| Investor Shares | (17,015,043 | ) | (7,036,820 | ) | (10,601,394 | ) | (11,577,396 | ) | ||||||||
| Advisor Shares | — | — | (391,768 | ) | (301,177 | ) | ||||||||||
| Increase (Decrease) from Capital Share Transactions | (4,323,958 | ) | 718,978 | (3,266,364 | ) | (3,719,144 | ) | |||||||||
The accompanying notes are an integral part of these financial statements.
www.brownadvisoryfunds.com
88
Statements of Changes in Net Assets
| BROWN ADVISORY | BROWN ADVISORY | |||||||||||||||
| TACTICAL BOND FUND | EQUITY INCOME FUND | |||||||||||||||
| Year Ended | Year Ended | Year Ended | Year Ended | |||||||||||||
| June 30, | June 30, | June 30, | June 30, | |||||||||||||
| 2014 | 2013 | 2014 | 2013 | |||||||||||||
| OPERATIONS | ||||||||||||||||
| Net investment income (loss) | $ | (17,668 | ) | $ | (218,723 | ) | $ | 3,893,279 | $ | 3,569,695 | ||||||
| Net realized gains | 662,074 | 916,317 | 11,151,487 | 1,842,110 | ||||||||||||
| Net change in unrealized appreciation (depreciation) | 314,492 | (226,884 | ) | 18,099,266 | 21,873,753 | |||||||||||
| Increase in Net Assets from Operations | 958,898 | 470,710 | 33,144,032 | 27,285,558 | ||||||||||||
| DISTRIBUTIONS TO SHAREHOLDERS FROM | ||||||||||||||||
| Net investment income: | ||||||||||||||||
| Institutional Shares | — | — | (132,683 | ) | (214 | ) | ||||||||||
| Investor Shares | — | — | (3,811,080 | ) | (3,830,549 | ) | ||||||||||
| Advisor Shares | (110,929 | ) | (492,870 | ) | (56,126 | ) | (33,737 | ) | ||||||||
| Net realized gain: | ||||||||||||||||
| Institutional Shares | — | — | (411 | ) | (68 | ) | ||||||||||
| Investor Shares | — | — | (6,248,858 | ) | (1,030,451 | ) | ||||||||||
| Advisor Shares | — | — | (98,052 | ) | (6,589 | ) | ||||||||||
| Total Distributions to Shareholders | (110,929 | ) | (492,870 | ) | (10,347,210 | ) | (4,901,608 | ) | ||||||||
| CAPITAL SHARE TRANSACTIONS | ||||||||||||||||
| Sale of shares: | ||||||||||||||||
| Institutional Shares | — | — | 16,604,412 | 10,000 | ||||||||||||
| Investor Shares | — | — | 20,766,881 | 74,267,932 | ||||||||||||
| Advisor Shares | 4,168,994 | 6,133,204 | 702,263 | 1,557,286 | ||||||||||||
| Reinvestment of distributions: | ||||||||||||||||
| Institutional Shares | — | — | 108,931 | 148 | ||||||||||||
| Investor Shares | — | — | 4,310,334 | 1,582,535 | ||||||||||||
| Advisor Shares | 15,079 | 87,886 | 144,327 | 31,524 | ||||||||||||
| Redemption of shares: | ||||||||||||||||
| Institutional Shares | — | — | — | — | ||||||||||||
| Investor Shares | — | — | (39,823,968 | ) | (30,534,656 | ) | ||||||||||
| Advisor Shares | (6,203,314 | ) | (10,169,608 | ) | (234,450 | ) | (53,111 | ) | ||||||||
| Redemption fees: | ||||||||||||||||
| Institutional Shares | — | — | — | — | ||||||||||||
| Investor Shares | — | — | — | 395 | ||||||||||||
| Advisor Shares | — | 48 | — | — | ||||||||||||
| Increase (Decrease) from Capital Share Transactions | (2,019,241 | ) | (3,948,470 | ) | 2,578,730 | 46,862,053 | ||||||||||
| Increase (Decrease) in Net Assets | (1,171,272 | ) | (3,970,630 | ) | 25,375,552 | 69,246,003 | ||||||||||
| NET ASSETS | ||||||||||||||||
| Beginning of year | 25,570,391 | 29,541,021 | 175,956,938 | 106,710,935 | ||||||||||||
| End of year | $ | 24,399,119 | $ | 25,570,391 | $ | 201,332,490 | $ | 175,956,938 | ||||||||
| Undistributed (Accumulated) net investment income (loss) | $ | (138,070 | ) | $ | (294,236 | ) | $ | — | $ | — | ||||||
| SHARE TRANSACTIONS | ||||||||||||||||
| Sale of shares: | ||||||||||||||||
| Institutional Shares | — | — | 1,280,070 | 903 | ||||||||||||
| Investor Shares | — | — | 1,621,159 | 6,703,721 | ||||||||||||
| Advisor Shares | 426,035 | 614,124 | 54,858 | 134,623 | ||||||||||||
| Reinvestment of distributions: | ||||||||||||||||
| Institutional Shares | — | — | 8,097 | 14 | ||||||||||||
| Investor Shares | — | — | 339,005 | 142,013 | ||||||||||||
| Advisor Shares | 1,553 | 8,968 | 11,304 | 2,752 | ||||||||||||
| Redemption of shares: | ||||||||||||||||
| Institutional Shares | — | — | — | — | ||||||||||||
| Investor Shares | — | — | (3,069,500 | ) | (2,679,756 | ) | ||||||||||
| Advisor Shares | (638,450 | ) | (1,033,345 | ) | (18,262 | ) | (4,810 | ) | ||||||||
| Increase (Decrease) from Capital Share Transactions | (210,862 | ) | (410,253 | ) | 226,731 | 4,299,460 | ||||||||||
The accompanying notes are an integral part of these financial statements.
www.brownadvisoryfunds.com
89
Statements of Changes in Net Assets
| BROWN ADVISORY | BROWN ADVISORY | |||||||||||||||
| SUSTAINABLE GROWTH FUND | TAX EXEMPT BOND FUND | |||||||||||||||
| Year Ended | Year Ended | Year Ended | Year Ended | |||||||||||||
| June 30, | June 30, | June 30, | June 30, | |||||||||||||
| 2014 | 2013 | 2014 | 2013 | |||||||||||||
| OPERATIONS | ||||||||||||||||
| Net investment income (loss) | $ | (611,908 | ) | $ | (340,164 | ) | $ | 3,305,444 | $ | 2,083,108 | ||||||
| Net realized gains (losses) | 10,473,938 | 1,276,044 | (463,496 | ) | 607,053 | |||||||||||
| Net change in unrealized appreciation (depreciation) | 28,972,269 | 22,091,899 | 4,078,241 | (3,651,212 | ) | |||||||||||
| Increase (Decrease) in Net Assets from Operations | 38,834,299 | 23,027,779 | 6,920,189 | (961,051 | ) | |||||||||||
| DISTRIBUTIONS TO SHAREHOLDERS FROM | ||||||||||||||||
| Net investment income: | ||||||||||||||||
| Institutional Shares | — | — | — | — | ||||||||||||
| Investor Shares | — | — | (3,305,444 | ) | (2,083,108 | ) | ||||||||||
| Advisor Shares | — | — | — | — | ||||||||||||
| Net realized gain: | ||||||||||||||||
| Institutional Shares | (303,352 | ) | (15,485 | ) | — | — | ||||||||||
| Investor Shares | (384,995 | ) | (6,011 | ) | (27,107 | ) | (580,068 | ) | ||||||||
| Advisor Shares | (1,452,293 | ) | (74,045 | ) | — | — | ||||||||||
| Total Distributions to Shareholders | (2,140,640 | ) | (95,541 | ) | (3,332,551 | ) | (2,663,176 | ) | ||||||||
| CAPITAL SHARE TRANSACTIONS | ||||||||||||||||
| Sale of shares: | ||||||||||||||||
| Institutional Shares | 5,077,590 | 9,555,134 | — | — | ||||||||||||
| Investor Shares | 19,256,931 | 22,800,938 | 225,415,569 | 231,803,244 | ||||||||||||
| Advisor Shares | 6,421,891 | 3,880,586 | — | — | ||||||||||||
| Reinvestment of distributions: | ||||||||||||||||
| Institutional Shares | 240,303 | 12,794 | — | — | ||||||||||||
| Investor Shares | 218,672 | 5,078 | 557,364 | 805,800 | ||||||||||||
| Advisor Shares | 1,353,148 | 69,128 | — | — | ||||||||||||
| Redemption of shares: | ||||||||||||||||
| Institutional Shares | (12,964,879 | ) | (7,809,453 | ) | — | — | ||||||||||
| Investor Shares | (2,502,788 | ) | (732,413 | ) | (186,274,382 | ) | (67,119,557 | ) | ||||||||
| Advisor Shares | (24,082,304 | ) | (23,490,114 | ) | — | — | ||||||||||
| Redemption fees: | ||||||||||||||||
| Institutional Shares | — | — | — | — | ||||||||||||
| Investor Shares | — | — | — | 1,024 | ||||||||||||
| Advisor Shares | 1,025 | 195 | — | — | ||||||||||||
| Shares issued in connection with the acquisition | ||||||||||||||||
| of Winslow Green Growth Fund: | ||||||||||||||||
| Institutional Shares | — | 26,493,967 | — | — | ||||||||||||
| Investor Shares | — | — | — | — | ||||||||||||
| Advisor Shares | — | 126,536,616 | — | — | ||||||||||||
| Increase (Decrease) from Capital Share Transactions | (6,980,411 | ) | 157,322,456 | 39,698,551 | 165,490,511 | |||||||||||
| Increase in Net Assets | 29,713,248 | 180,254,694 | 43,286,189 | 161,866,284 | ||||||||||||
| NET ASSETS | ||||||||||||||||
| Beginning of year | 180,329,694 | 75,000 | 161,891,284 | 25,000 | ||||||||||||
| End of year | $ | 210,042,942 | $ | 180,329,694 | $ | 205,177,473 | $ | 161,891,284 | ||||||||
| Undistributed (Accumulated) net investment income (loss) | $ | (297,381 | ) | $ | (268,549 | ) | $ | (123 | ) | $ | — | |||||
The accompanying notes are an integral part of these financial statements.
www.brownadvisoryfunds.com
90
Statements of Changes in Net Assets
| BROWN ADVISORY | BROWN ADVISORY | |||||||||||||||
| SUSTAINABLE GROWTH FUND | TAX EXEMPT BOND FUND | |||||||||||||||
| Year Ended | Year Ended | Year Ended | Year Ended | |||||||||||||
| June 30, | June 30, | June 30, | June 30, | |||||||||||||
| 2014 | 2013 | 2014 | 2013 | |||||||||||||
| SHARE TRANSACTIONS | ||||||||||||||||
| Sale of shares: | ||||||||||||||||
| Institutional Shares | 376,843 | 840,318 | — | — | ||||||||||||
| Investor Shares | 1,428,380 | 2,129,178 | 22,962,219 | 23,009,054 | ||||||||||||
| Advisor Shares | 481,546 | 348,027 | — | — | ||||||||||||
| Reinvestment of distributions: | ||||||||||||||||
| Institutional Shares | 17,853 | 1,213 | — | — | ||||||||||||
| Investor Shares | 16,295 | 482 | 56,344 | 79,465 | ||||||||||||
| Advisor Shares | 101,132 | 6,565 | — | — | ||||||||||||
| Redemption of shares: | ||||||||||||||||
| Institutional Shares | (994,246 | ) | (703,890 | ) | — | — | ||||||||||
| Investor Shares | (182,207 | ) | (64,790 | ) | (19,017,976 | ) | (6,636,553 | ) | ||||||||
| Advisor Shares | (1,804,877 | ) | (2,134,017 | ) | — | — | ||||||||||
| Shares issued in connection with the acquisition | ||||||||||||||||
| of Winslow Green Growth Fund: | ||||||||||||||||
| Institutional Shares | — | 2,612,191 | — | — | ||||||||||||
| Investor Shares | — | — | — | — | ||||||||||||
| Advisor Shares | — | 12,491,495 | — | — | ||||||||||||
| Increase (Decrease) from Capital Share Transactions | (559,281 | ) | 15,526,772 | 4,000,587 | 16,451,966 | |||||||||||
The accompanying notes are an integral part of these financial statements.
www.brownadvisoryfunds.com
91
Statements of Changes in Net Assets
| BROWN | BROWN | |||||||||||||||||||
| ADVISORY – | BROWN | ADVISORY – | ||||||||||||||||||
| WMC | ADVISORY | WMC | ||||||||||||||||||
| BROWN ADVISORY – | STRATEGIC | MORTGAGE | JAPAN ALPHA | |||||||||||||||||
| SOMERSET EMERGING | EUROPEAN | SECURITIES | OPPORTUNITIES | |||||||||||||||||
| MARKETS FUND | EQUITY FUND | FUND | FUND | |||||||||||||||||
| Year Ended | Period Ended | Period Ended | Period Ended | Period Ended | ||||||||||||||||
| June 30, | June 30, | June 30, | June 30, | June 30, | ||||||||||||||||
| 2014 | 2013* | 2014** | 2014*** | 2014**** | ||||||||||||||||
| OPERATIONS | ||||||||||||||||||||
| Net investment income | $ | 3,341,554 | $ | 1,234,805 | $ | 2,146,513 | $ | 1,578,439 | $ | 4,466,253 | ||||||||||
| Net realized gains (losses) | (7,237,279 | ) | (2,474,598 | ) | (347,221 | ) | 920,861 | (7,534,618 | ) | |||||||||||
| Net change in unrealized appreciation (depreciation) | 19,128,390 | (5,307,834 | ) | 7,046,292 | 1,546,150 | 64,369,159 | ||||||||||||||
| Increase (Decrease) in Net Assets from Operations | 15,232,665 | (6,547,627 | ) | 8,845,584 | 4,045,450 | 61,300,794 | ||||||||||||||
| DISTRIBUTIONS TO SHAREHOLDERS FROM | ||||||||||||||||||||
| Net investment income: | ||||||||||||||||||||
| Institutional Shares | (1,597,073 | ) | (25,072 | ) | — | (322,103 | ) | — | ||||||||||||
| Investor Shares | (155,756 | ) | (1,228 | ) | — | (1,381,608 | ) | — | ||||||||||||
| Advisor Shares | (8,284 | ) | (46 | ) | — | — | — | |||||||||||||
| Total Distributions to Shareholders | (1,761,113 | ) | (26,346 | ) | — | (1,703,711 | ) | — | ||||||||||||
| CAPITAL SHARE TRANSACTIONS | ||||||||||||||||||||
| Sale of shares: | ||||||||||||||||||||
| Institutional Shares | 87,865,122 | 129,847,886 | 199,664,123 | 133,244,915 | 1,031,575,751 | |||||||||||||||
| Investor Shares | 12,800,049 | 14,723,368 | 17,731,422 | 200,853,490 | 4,455,791 | |||||||||||||||
| Advisor Shares | 92,326 | 1,047,755 | 286,619 | — | 54,786 | |||||||||||||||
| Reinvestment of distributions: | ||||||||||||||||||||
| Institutional Shares | 117,284 | 1,716 | — | 15,168 | — | |||||||||||||||
| Investor Shares | 111,069 | 737 | — | 362,917 | — | |||||||||||||||
| Advisor Shares | 8,284 | 46 | — | — | — | |||||||||||||||
| Redemption of shares: | ||||||||||||||||||||
| Institutional Shares | (28,796,591 | ) | (1,480,131 | ) | (5,104,407 | ) | (1,880,000 | ) | (12,008,108 | ) | ||||||||||
| Investor Shares | (1,766,244 | ) | (2,359,346 | ) | (501,971 | ) | (135,747,053 | ) | (80,811 | ) | ||||||||||
| Advisor Shares | (601,984 | ) | (10,103 | ) | (55,235 | ) | — | — | ||||||||||||
| Redemption fees: | ||||||||||||||||||||
| Institutional Shares | — | 941 | — | — | — | |||||||||||||||
| Investor Shares | — | — | — | — | — | |||||||||||||||
| Advisor Shares | — | — | — | — | — | |||||||||||||||
| Increase from Capital Share Transactions | 69,829,315 | 141,772,869 | 212,020,551 | 196,849,437 | 1,023,997,409 | |||||||||||||||
| Increase in Net Assets | 83,300,867 | 135,198,896 | 220,866,135 | 199,191,176 | 1,085,298,203 | |||||||||||||||
| NET ASSETS | ||||||||||||||||||||
| Beginning of year/period | 135,198,896 | — | — | — | — | |||||||||||||||
| End of year/period | $ | 218,499,763 | $ | 135,198,896 | $ | 220,866,135 | $ | 199,191,176 | $ | 1,085,298,203 | ||||||||||
| Undistributed (Accumulated) net investment income (loss) | $ | 2,310,343 | $ | 919,023 | $ | 2,146,536 | $ | 48,689 | $ | (813,416 | ) | |||||||||
| SHARE TRANSACTIONS | ||||||||||||||||||||
| Sale of shares: | ||||||||||||||||||||
| Institutional Shares | 9,071,496 | 13,026,064 | 19,876,042 | 13,118,411 | 104,178,148 | |||||||||||||||
| Investor Shares | 1,323,455 | 1,467,686 | 1,773,327 | 20,017,629 | 438,918 | |||||||||||||||
| Advisor Shares | 9,530 | 105,235 | 28,371 | — | 5,619 | |||||||||||||||
| Reinvestment of distributions: | ||||||||||||||||||||
| Institutional Shares | 12,230 | 169 | — | 1,493 | — | |||||||||||||||
| Investor Shares | 11,594 | 73 | — | 35,819 | — | |||||||||||||||
| Advisor Shares | 865 | 4 | — | — | — | |||||||||||||||
| Redemption of shares: | ||||||||||||||||||||
| Institutional Shares | (3,005,651 | ) | (151,869 | ) | (503,631 | ) | (185,167 | ) | (1,205,595 | ) | ||||||||||
| Investor Shares | (185,281 | ) | (237,826 | ) | (49,539 | ) | (13,381,826 | ) | (7,913 | ) | ||||||||||
| Advisor Shares | (62,273 | ) | (1,000 | ) | (5,398 | ) | — | — | ||||||||||||
| Increase from Capital Share Transactions | 7,175,965 | 14,208,536 | 21,119,172 | 19,606,359 | 103,409,177 | |||||||||||||||
| * | Commenced operations on December 12, 2012. The information presented is for the period from December 12, 2012 to June 30, 2013. |
| ** | Commenced operations on October 21, 2013. The information presented is for the period from October 21, 2013 to June 30, 2014. |
| *** | Commenced operations on December 26, 2013. The information presented is for the period from December 26, 2013 to June 30, 2014. |
| **** | Commenced operations on March 4, 2014. The information presented is for the period from March 4, 2014 to June 30, 2014. |
The accompanying notes are an integral part of these financial statements.
www.brownadvisoryfunds.com
92
Financial Highlights
These financial highlights reflect selected per share data and ratios for a share outstanding of the Fund throughout each year / period.
BROWN ADVISORY GROWTH EQUITY FUND
INSTITUTIONAL SHARES
| Year / Period Ended: | ||||||||
| June 30, | June 30, | |||||||
| 2014 | 2013(f) | |||||||
| Net Asset Value, Beginning of Year / Period | $ | 16.22 | $ | 14.58 | ||||
| Net Investment Income(a) | — | 0.01 | ||||||
| Net Realized And Unrealized Gains | 2.99 | 1.66 | ||||||
| Total from Investment Operations | $ | 2.99 | $ | 1.67 | ||||
| Distributions: | ||||||||
| from Net Investment Income | — | (0.03 | ) | |||||
| from Net Realized Gains | (0.11 | ) | — | |||||
| Total Distributions to Shareholders | $ | (0.11 | ) | $ | (0.03 | ) | ||
| Redemption fees(a) | — | (e) | — | (e) | ||||
| Net Asset Value, End of Year / Period | $ | 19.10 | $ | 16.22 | ||||
| Total Return | 18.46 | % | 11.49 | %(b) | ||||
| Net Assets at End of Year / Period (000’s Omitted) | $ | 233,627 | $ | 116,575 | ||||
| Ratios to Average Net Assets: | ||||||||
| Net Investment Income | 0.03 | % | 0.30 | %(c) | ||||
| Net Expenses | 0.74 | % | 0.78 | %(c) | ||||
| Gross Expenses(d) | 0.74 | % | 0.78 | %(c) | ||||
| Portfolio Turnover Rate | 25 | % | 40 | % | ||||
| (a) | Calculated based on average shares outstanding during the year / period. |
| (b) | Not annualized. |
| (c) | Annualized. |
| (d) | Reflects the expense ratio excluding any waivers and/or expense reimbursements. |
| (e) | Less than $0.01 per share. |
| (f) | Commenced operations on October 19, 2012. The information presented is for the period from October 19, 2012 to June 30, 2013. |
The accompanying notes are an integral part of these financial statements.
www.brownadvisoryfunds.com
93
Financial Highlights
These financial highlights reflect selected per share data and ratios for a share outstanding of the Fund throughout each year / period.
BROWN ADVISORY GROWTH EQUITY FUND
INVESTOR SHARES*
| Year / Period Ended: | ||||||||||||||||||||||||
| June 30, | June 30, | June 30, | June 30, | June 30, | May 31, | |||||||||||||||||||
| 2014 | 2013 | 2012 | 2011 | 2010(f) | 2010 | |||||||||||||||||||
| Net Asset Value, Beginning of Year / Period | $ | 16.21 | $ | 13.80 | $ | 13.63 | $ | 9.99 | $ | 10.39 | $ | 7.83 | ||||||||||||
| Net Investment Income (Loss)(a) | (0.02 | ) | 0.03 | (0.05 | ) | (0.04 | ) | (0.01 | ) | (0.06 | ) | |||||||||||||
| Net Realized And Unrealized Gains (Losses) | 2.99 | 2.41 | 0.22 | 3.68 | (0.39 | ) | 2.62 | |||||||||||||||||
| Total from Investment Operations | $ | 2.97 | $ | 2.44 | $ | 0.17 | $ | 3.64 | $ | (0.40 | ) | $ | 2.56 | |||||||||||
| Distributions: | ||||||||||||||||||||||||
| from Net Investment Income | — | (0.03 | ) | — | — | — | — | |||||||||||||||||
| from Net Realized Gains | (0.11 | ) | — | — | — | — | — | |||||||||||||||||
| Total Distributions to Shareholders | $ | (0.11 | ) | $ | (0.03 | ) | $ | — | $ | — | $ | — | $ | — | ||||||||||
| Redemption fees(a) | — | (e) | — | (e) | — | (e) | — | (e) | — | (e) | — | (e) | ||||||||||||
| Net Asset Value, End of Year / Period | $ | 19.07 | $ | 16.21 | $ | 13.80 | $ | 13.63 | $ | 9.99 | $ | 10.39 | ||||||||||||
| Total Return | 18.35 | % | 17.67 | % | 1.25 | % | 36.44 | % | (3.85 | )%(b) | 32.69 | % | ||||||||||||
| Net Assets at End of Year / Period (000’s Omitted) | $ | 2,497,036 | $ | 1,653,389 | $ | 954,560 | $ | 463,228 | $ | 96,889 | $ | 97,136 | ||||||||||||
| Ratios to Average Net Assets: | ||||||||||||||||||||||||
| Net Investment Income (Loss) | (0.12 | )% | 0.17 | % | (0.35 | )% | (0.29 | )% | (0.76 | )%(c) | (0.56 | )% | ||||||||||||
| Net Expenses | 0.89 | % | 0.91 | % | 0.90 | % | 0.94 | % | 1.00 | %(c) | 1.10 | % | ||||||||||||
| Gross Expenses(d) | 0.89 | % | 0.91 | % | 0.90 | % | 0.94 | % | 1.00 | %(c) | 1.10 | % | ||||||||||||
| Portfolio Turnover Rate | 25 | % | 40 | % | 58 | % | 30 | % | 1 | %(b) | 34 | % | ||||||||||||
| (a) | Calculated based on average shares outstanding during the year / period. |
| (b) | Not annualized. |
| (c) | Annualized. |
| (d) | Reflects the expense ratio excluding any waivers and/or expense reimbursements. |
| (e) | Less than $0.01 per share. |
| (f) | Effective June 1, 2010, the Fund changed its fiscal year end from May 31 to June 30. The information presented is for the period from June 1, 2010 to June 30, 2010. |
| * | Prior to October 19, 2012, Investor Shares were known as Institutional Shares. |
The accompanying notes are an integral part of these financial statements.
www.brownadvisoryfunds.com
94
Financial Highlights
These financial highlights reflect selected per share data and ratios for a share outstanding of the Fund throughout each year / period.
BROWN ADVISORY GROWTH EQUITY FUND
ADVISOR SHARES*
| Year / Period Ended: | ||||||||||||||||||||||||
| June 30, | June 30, | June 30, | June 30, | June 30, | May 31, | |||||||||||||||||||
| 2014 | 2013 | 2012 | 2011 | 2010(g) | 2010 | |||||||||||||||||||
| Net Asset Value, Beginning of Year / Period | $ | 15.78 | $ | 13.45 | $ | 13.31 | $ | 9.80 | $ | 10.20 | $ | 7.72 | ||||||||||||
| Net Investment Loss(a) | (0.07 | ) | (0.01 | ) | (0.07 | ) | (0.09 | ) | (0.01 | ) | (0.10 | ) | ||||||||||||
| Net Realized And Unrealized Gains (Losses) | 2.91 | 2.35 | 0.21 | 3.60 | (0.39 | ) | 2.58 | |||||||||||||||||
| Total from Investment Operations | $ | 2.84 | $ | 2.34 | $ | 0.14 | $ | 3.51 | $ | (0.40 | ) | $ | 2.48 | |||||||||||
| Distributions: | ||||||||||||||||||||||||
| from Net Investment Income | — | (0.01 | ) | — | — | — | — | |||||||||||||||||
| from Net Realized Gains | (0.11 | ) | — | — | — | — | — | |||||||||||||||||
| Total Distributions to Shareholders | $ | (0.11 | ) | $ | (0.01 | ) | $ | — | $ | — | $ | — | $ | — | ||||||||||
| Redemption fees(a) | — | (f) | — | (f) | — | (f) | — | — | — | |||||||||||||||
| Net Asset Value, End of Year / Period | $ | 18.51 | $ | 15.78 | $ | 13.45 | $ | 13.31 | $ | 9.80 | $ | 10.20 | ||||||||||||
| Total Return(b) | 18.02 | % | 17.43 | % | 1.05 | % | 35.82 | % | (3.92 | )%(c) | 32.12 | % | ||||||||||||
| Net Assets at End of Year / Period (000’s Omitted) | $ | 48,632 | $ | 21,478 | $ | 11,593 | $ | 5,698 | $ | 6,027 | $ | 6,287 | ||||||||||||
| Ratios to Average Net Assets: | ||||||||||||||||||||||||
| Net Investment Loss | (0.37 | )% | (0.07 | )% | (0.55 | )% | (0.74 | )% | (1.21 | )%(d) | (1.02 | )% | ||||||||||||
| Net Expenses | 1.14 | % | 1.15 | % | 1.10 | % | 1.39 | % | 1.45 | %(d) | 1.56 | % | ||||||||||||
| Gross Expenses(e) | 1.14 | % | 1.15 | % | 1.10 | % | 1.39 | % | 1.45 | %(d) | 1.56 | % | ||||||||||||
| Portfolio Turnover Rate | 25 | % | 40 | % | 58 | % | 30 | % | 1 | %(c) | 34 | % | ||||||||||||
| (a) | Calculated based on average shares outstanding during the year / period. |
| (b) | Total return does not include the effects of sales charges which existed for Advisor Shares (then known as A Shares) for years / periods ended June 30, 2011 and earlier. |
| (c) | Not annualized. |
| (d) | Annualized. |
| (e) | Reflects the expense ratio excluding any waivers and/or expense reimbursements. |
| (f) | Less than $0.01 per share. |
| (g) | Effective June 1, 2010, the Fund changed its fiscal year end from May 31 to June 30. The information presented is for the period from June 1, 2010 to June 30, 2010. |
| * | Prior to July 1, 2011, Advisor Shares were known as A Shares. |
The accompanying notes are an integral part of these financial statements.
www.brownadvisoryfunds.com
95
Financial Highlights
These financial highlights reflect selected per share data and ratios for a share outstanding of the Fund throughout each year / period.
BROWN ADVISORY VALUE EQUITY FUND
INSTITUTIONAL SHARES
| Year / Period Ended: | ||||||||
| June 30, | June 30, | |||||||
| 2014 | 2013(e) | |||||||
| Net Asset Value, Beginning of Year / Period | $ | 14.74 | $ | 13.05 | ||||
| Net Investment Income(a) | 0.22 | 0.18 | ||||||
| Net Realized And Unrealized Gains | 3.95 | 1.74 | ||||||
| Total from Investment Operations | $ | 4.17 | $ | 1.92 | ||||
| Distributions: | ||||||||
| from Net Investment Income | (0.16 | ) | (0.23 | ) | ||||
| Total Distributions to Shareholders | $ | (0.16 | ) | $ | (0.23 | ) | ||
| Redemption fees(a) | — | — | ||||||
| Net Asset Value, End of Year / Period | $ | 18.75 | $ | 14.74 | ||||
| Total Return | 28.41 | % | 14.99 | %(b) | ||||
| Net Assets at End of Year / Period (000’s Omitted) | $ | 15 | $ | 12 | ||||
| Ratios to Average Net Assets: | ||||||||
| Net Investment Income | 1.31 | % | 1.67 | %(c) | ||||
| Net Expenses | 0.77 | % | 0.81 | %(c) | ||||
| Gross Expenses(d) | 0.77 | % | 0.81 | %(c) | ||||
| Portfolio Turnover Rate | 37 | % | 57 | % | ||||
| (a) | Calculated based on average shares outstanding during the year / period. |
| (b) | Not annualized. |
| (c) | Annualized. |
| (d) | Reflects the expense ratio excluding any waivers and/or expense reimbursements. |
| (e) | Commenced operations on October 19, 2012. The information presented is for the period from October 19, 2012 to June 30, 2013. |
The accompanying notes are an integral part of these financial statements.
www.brownadvisoryfunds.com
96
Financial Highlights
These financial highlights reflect selected per share data and ratios for a share outstanding of the Fund throughout each year / period.
BROWN ADVISORY VALUE EQUITY FUND
INVESTOR SHARES*
| Year / Period Ended: | ||||||||||||||||||||||||
| June 30, | June 30, | June 30, | June 30, | June 30, | May 31, | |||||||||||||||||||
| 2014 | 2013 | 2012 | 2011 | 2010(f) | 2010 | |||||||||||||||||||
| Net Asset Value, Beginning of Year / Period | $ | 14.74 | $ | 12.30 | $ | 12.56 | $ | 9.69 | $ | 10.18 | $ | 8.34 | ||||||||||||
| Net Investment Income(a) | 0.20 | 0.21 | 0.15 | 0.16 | 0.01 | 0.15 | ||||||||||||||||||
| Net Realized And Unrealized Gains (Losses) | 3.95 | 2.45 | (0.33 | ) | 2.83 | (0.47 | ) | 1.89 | ||||||||||||||||
| Total from Investment Operations | $ | 4.15 | $ | 2.66 | $ | (0.18 | ) | $ | 2.99 | $ | (0.46 | ) | $ | 2.04 | ||||||||||
| Distributions: | ||||||||||||||||||||||||
| from Net Investment Income | (0.14 | ) | (0.22 | ) | (0.08 | ) | (0.12 | ) | (0.03 | ) | (0.20 | ) | ||||||||||||
| from Net Realized Gains | — | — | — | — | — | — | ||||||||||||||||||
| Total Distributions to Shareholders | $ | (0.14 | ) | $ | (0.22 | ) | $ | (0.08 | ) | $ | (0.12 | ) | $ | (0.03 | ) | $ | (0.20 | ) | ||||||
| Payments by affiliates | — | — | — | — | — | (e) | — | |||||||||||||||||
| Redemption fees(a) | — | (e) | — | (e) | — | — | (e) | — | — | (e) | ||||||||||||||
| Net Asset Value, End of Year / Period | $ | 18.75 | $ | 14.74 | $ | 12.30 | $ | 12.56 | $ | 9.69 | $ | 10.18 | ||||||||||||
| Total Return | 28.26 | % | 21.91 | % | (1.35 | )% | 30.90 | % | (4.47 | )%(b) | 24.52 | % | ||||||||||||
| Net Assets at End of Year / Period (000’s Omitted) | $ | 241,666 | $ | 160,800 | $ | 156,226 | $ | 177,918 | $ | 135,709 | $ | 147,337 | ||||||||||||
| Ratios to Average Net Assets: | ||||||||||||||||||||||||
| Net Investment Income | 1.16 | % | 1.54 | % | 1.27 | % | 1.34 | % | 0.79 | %(c) | 1.51 | % | ||||||||||||
| Net Expenses | 0.92 | % | 0.94 | % | 0.91 | % | 0.93 | % | 0.97 | %(c) | 1.03 | % | ||||||||||||
| Gross Expenses(d) | 0.92 | % | 0.94 | % | 0.91 | % | 0.93 | % | 0.97 | %(c) | 1.03 | % | ||||||||||||
| Portfolio Turnover Rate | 37 | % | 57 | % | 72 | % | 64 | % | 7 | %(b) | 62 | % | ||||||||||||
| (a) | Calculated based on average shares outstanding during the year / period. |
| (b) | Not annualized. |
| (c) | Annualized. |
| (d) | Reflects the expense ratio excluding any waivers and/or expense reimbursements. |
| (e) | Less than $0.01 per share. |
| (f) | Effective June 1, 2010, the Fund changed its fiscal year end from May 31 to June 30. The information presented is for the period from June 1, 2010 to June 30, 2010. |
| * | Prior to October 19, 2012, Investor Shares were known as Institutional Shares. |
The accompanying notes are an integral part of these financial statements.
www.brownadvisoryfunds.com
97
Financial Highlights
These financial highlights reflect selected per share data and ratios for a share outstanding of the Fund throughout each year / period.
BROWN ADVISORY VALUE EQUITY FUND
ADVISOR SHARES*
| Year / Period Ended: | ||||||||||||||||||||||||
| June 30, | June 30, | June 30, | June 30, | June 30, | May 31, | |||||||||||||||||||
| 2014 | 2013 | 2012 | 2011 | 2010(g) | 2010 | |||||||||||||||||||
| Net Asset Value, Beginning of Year / Period | $ | 14.82 | $ | 12.36 | $ | 12.62 | $ | 9.74 | $ | 10.23 | $ | 8.37 | ||||||||||||
| Net Investment Income(a) | 0.15 | 0.16 | 0.13 | 0.10 | — | 0.11 | ||||||||||||||||||
| Net Realized And Unrealized Gains (Losses) | 3.98 | 2.49 | (0.32 | ) | 2.84 | (0.47 | ) | 1.90 | ||||||||||||||||
| Total from Investment Operations | $ | 4.13 | $ | 2.65 | $ | (0.19 | ) | $ | 2.94 | $ | (0.47 | ) | $ | 2.01 | ||||||||||
| Distributions: | ||||||||||||||||||||||||
| from Net Investment Income | (0.10 | ) | (0.19 | ) | (0.07 | ) | (0.06 | ) | (0.02 | ) | (0.15 | ) | ||||||||||||
| Total Distributions to Shareholders | $ | (0.10 | ) | $ | (0.19 | ) | $ | (0.07 | ) | $ | (0.06 | ) | $ | (0.02 | ) | $ | (0.15 | ) | ||||||
| Payments by affiliates | — | — | — | — | — | (f) | — | |||||||||||||||||
| Redemption fees(a) | — | — | — | — | — | — | ||||||||||||||||||
| Net Asset Value, End of Year / Period | $ | 18.85 | $ | 14.82 | $ | 12.36 | $ | 12.62 | $ | 9.74 | $ | 10.23 | ||||||||||||
| Total Return(b) | 27.90 | % | 21.63 | % | (1.45 | )% | 30.28 | % | (4.57 | )%(c) | 24.08 | % | ||||||||||||
| Net Assets at End of Year / Period (000’s Omitted) | $ | 1,635 | $ | 1,615 | $ | 2,201 | $ | 2,996 | $ | 4,868 | $ | 5,196 | ||||||||||||
| Ratios to Average Net Assets: | ||||||||||||||||||||||||
| Net Investment Income | 0.91 | % | 1.31 | % | 1.07 | % | 0.89 | % | 0.34 | %(d) | 1.05 | % | ||||||||||||
| Net Expenses | 1.17 | % | 1.17 | % | 1.11 | % | 1.38 | % | 1.42 | %(d) | 1.49 | % | ||||||||||||
| Gross Expenses(e) | 1.17 | % | 1.17 | % | 1.11 | % | 1.38 | % | 1.42 | %(d) | 1.49 | % | ||||||||||||
| Portfolio Turnover Rate | 37 | % | 57 | % | 72 | % | 64 | % | 7 | %(c) | 62 | % | ||||||||||||
| (a) | Calculated based on average shares outstanding during the year / period. |
| (b) | Total return does not include the effects of sales charges which existed for Advisor Shares (then known as A Shares) for years / periods ended June 30, 2011 and earlier. |
| (c) | Not annualized. |
| (d) | Annualized. |
| (e) | Reflects the expense ratio excluding any waivers and/or expense reimbursements. |
| (f) | Less than $0.01 per share. |
| (g) | Effective June 1, 2010, the Fund changed its fiscal year end from May 31 to June 30. The information presented is for the period from June 1, 2010 to June 30, 2010. |
| * | Prior to July 1, 2011, Advisor Shares were known as A Shares. |
The accompanying notes are an integral part of these financial statements.
www.brownadvisoryfunds.com
98
Financial Highlights
These financial highlights reflect selected per share data and ratios for a share outstanding of the Fund throughout each year / period.
BROWN ADVISORY FLEXIBLE EQUITY FUND
INSTITUTIONAL SHARES
| Year / Period Ended: | ||||||||
| June 30, | June 30, | |||||||
| 2014 | 2013(e) | |||||||
| Net Asset Value, Beginning of Year / Period | $ | 12.28 | $ | 10.46 | ||||
| Net Investment Income(a) | 0.09 | 0.06 | ||||||
| Net Realized And Unrealized Gains | 2.49 | 1.82 | ||||||
| Total from Investment Operations | $ | 2.58 | $ | 1.88 | ||||
| Distributions: | ||||||||
| from Net Investment Income | (0.05 | ) | (0.06 | ) | ||||
| Total Distributions to Shareholders | $ | (0.05 | ) | $ | (0.06 | ) | ||
| Redemption fees(a) | — | — | ||||||
| Net Asset Value, End of Year / Period | $ | 14.81 | $ | 12.28 | ||||
| Total Return | 21.06 | % | 18.07 | %(b) | ||||
| Net Assets at End of Year / Period (000’s Omitted) | $ | 3,126 | $ | 12 | ||||
| Ratios to Average Net Assets: | ||||||||
| Net Investment Income | 0.66 | % | 0.65 | %(c) | ||||
| Net Expenses | 0.82 | % | 1.00 | %(c) | ||||
| Gross Expenses(d) | 0.81 | % | 0.88 | %(c) | ||||
| Portfolio Turnover Rate | 15 | % | 12 | % | ||||
| (a) | Calculated based on average shares outstanding during the year / period. | |
| (b) | Not annualized. | |
| (c) | Annualized. | |
| (d) | Reflects the expense ratio excluding any waivers or recoupments. | |
| (e) | Commenced operations on October 19, 2012. The information presented is for the period from October 19, 2012 to June 30, 2013. |
The accompanying notes are an integral part of these financial statements.
www.brownadvisoryfunds.com
99
Financial Highlights
These financial highlights reflect selected per share data and ratios for a share outstanding of the Fund throughout each year / period.
BROWN ADVISORY FLEXIBLE EQUITY FUND
INVESTOR SHARES*
| Year / Period Ended: | ||||||||||||||||||||||||
| June 30, | June 30, | June 30, | June 30, | June 30, | May 31, | |||||||||||||||||||
| 2014 | 2013 | 2012 | 2011 | 2010(f) | 2010 | |||||||||||||||||||
| Net Asset Value, Beginning of Year / Period | $ | 12.28 | $ | 9.68 | $ | 9.16 | $ | 7.33 | $ | 7.62 | $ | 6.16 | ||||||||||||
| Net Investment Income(a) | 0.07 | 0.05 | 0.05 | 0.02 | — | 0.05 | ||||||||||||||||||
| Net Realized And Unrealized Gains (Losses) | 2.48 | 2.60 | 0.50 | 1.83 | (0.28 | ) | 1.45 | |||||||||||||||||
| Total from Investment Operations | $ | 2.55 | $ | 2.65 | $ | 0.55 | $ | 1.85 | $ | (0.28 | ) | $ | 1.50 | |||||||||||
| Distributions: | ||||||||||||||||||||||||
| from Net Investment Income | (0.04 | ) | (0.05 | ) | (0.03 | ) | (0.02 | ) | (0.01 | ) | (0.04 | ) | ||||||||||||
| from Return of Capital | — | — | — | — | (e) | — | — | |||||||||||||||||
| Total Distributions to Shareholders | $ | (0.04 | ) | $ | (0.05 | ) | $ | (0.03 | ) | $ | (0.02 | ) | $ | (0.01 | ) | $ | (0.04 | ) | ||||||
| Redemption fees(a) | — | (e) | — | — | — | (e) | — | — | ||||||||||||||||
| Net Asset Value, End of Year / Period | $ | 14.79 | $ | 12.28 | $ | 9.68 | $ | 9.16 | $ | 7.33 | $ | 7.62 | ||||||||||||
| Total Return(b) | 20.78 | % | 27.51 | % | 5.98 | % | 25.27 | % | (3.69 | )%(b) | 24.39 | % | ||||||||||||
| Net Assets at End of Year / Period (000’s Omitted) | $ | 162,615 | $ | 82,783 | $ | 37,477 | $ | 26,827 | $ | 18,108 | $ | 17,777 | ||||||||||||
| Ratios to Average Net Assets: | ||||||||||||||||||||||||
| Net Investment Income | 0.51 | % | 0.50 | % | 0.52 | % | 0.28 | % | 0.38 | %(c) | 0.61 | % | ||||||||||||
| Net Expenses | 0.97 | % | 1.15 | % | 1.15 | % | 1.15 | % | 1.15 | %(c) | 1.11 | % | ||||||||||||
| Gross Expenses(d) | 0.96 | % | 1.05 | % | 1.18 | % | 1.32 | % | 1.48 | %(c) | 1.61 | % | ||||||||||||
| Portfolio Turnover Rate | 15 | % | 12 | % | 19 | % | 33 | % | 1 | %(b) | 22 | % | ||||||||||||
| (a) | Calculated based on average shares outstanding during the year / period. |
| (b) | Not annualized. |
| (c) | Annualized. |
| (d) | Reflects the expense ratio excluding any waivers or recoupments. |
| (e) | Less than $0.01 per share. |
| (f) | Effective June 1, 2010, the Fund changed its fiscal year end from May 31 to June 30. The information presented is for the period from June 1, 2010 to June 30, 2010. |
| * | Prior to October 19, 2012, Investor Shares were known as Institutional Shares. |
The accompanying notes are an integral part of these financial statements.
www.brownadvisoryfunds.com
100
Financial Highlights
These financial highlights reflect selected per share data and ratios for a share outstanding of the Fund throughout each year / period.
BROWN ADVISORY FLEXIBLE EQUITY FUND
ADVISOR SHARES*
| Year / Period Ended: | ||||||||||||||||||||||||
| June 30, | June 30, | June 30, | June 30, | June 30, | May 31, | |||||||||||||||||||
| 2014 | 2013 | 2012 | 2011 | 2010(g) | 2010 | |||||||||||||||||||
| Net Asset Value, Beginning of Year / Period | $ | 12.28 | $ | 9.68 | $ | 9.17 | $ | 7.33 | $ | 7.62 | $ | 6.17 | ||||||||||||
| Net Investment Income(a) | 0.04 | 0.02 | 0.03 | 0.01 | — | 0.02 | ||||||||||||||||||
| Net Realized And Unrealized Gains (Losses) | 2.48 | 2.61 | 0.49 | 1.84 | (0.29 | ) | 1.45 | |||||||||||||||||
| Total from Investment Operations | $ | 2.52 | $ | 2.63 | $ | 0.52 | $ | 1.85 | $ | (0.29 | ) | $ | 1.47 | |||||||||||
| Distributions: | ||||||||||||||||||||||||
| from Net Investment Income | (0.03 | ) | (0.03 | ) | (0.01 | ) | (0.01 | ) | — | (f) | (0.02 | ) | ||||||||||||
| from Return of Capital | — | — | — | — | (f) | — | — | |||||||||||||||||
| Total Distributions to Shareholders | $ | (0.03 | ) | $ | (0.03 | ) | $ | (0.01 | ) | $ | (0.01 | ) | $ | — | (f) | $ | (0.02 | ) | ||||||
| Redemption fees(a) | — | — | — | — | (f) | — | — | |||||||||||||||||
| Net Asset Value, End of Year / Period | $ | 14.77 | $ | 12.28 | $ | 9.68 | $ | 9.17 | $ | 7.33 | $ | 7.62 | ||||||||||||
| Total Return(b) | 20.52 | % | 27.25 | % | 5.73 | % | 25.18 | % | (3.75 | )%(c) | 23.88 | % | ||||||||||||
| Net Assets at End of Year / Period (000’s Omitted) | $ | 14,831 | $ | 6,115 | $ | 1,079 | $ | 1,259 | $ | 955 | $ | 992 | ||||||||||||
| Ratios to Average Net Assets: | ||||||||||||||||||||||||
| Net Investment Income | 0.26 | % | 0.30 | % | 0.32 | % | 0.08 | % | 0.18 | %(d) | 0.37 | % | ||||||||||||
| Net Expenses | 1.22 | % | 1.35 | % | 1.35 | % | 1.35 | % | 1.35 | %(d) | 1.35 | % | ||||||||||||
| Gross Expenses(e) | 1.21 | % | 1.30 | % | 1.38 | % | 1.53 | % | 1.68 | %(d) | 1.85 | % | ||||||||||||
| Portfolio Turnover Rate | 15 | % | 12 | % | 19 | % | 33 | % | 1 | %(c) | 22 | % | ||||||||||||
| (a) | Calculated based on average shares outstanding during the year / period. |
| (b) | Total return does not include the effects of sales charges which existed for Advisor Shares (then known as A Shares) for years / periods ended June 30, 2011 and earlier. |
| (c) | Not annualized. |
| (d) | Annualized. |
| (e) | Reflects the expense ratio excluding any waivers or recoupments. |
| (f) | Less than $0.01 per share. |
| (g) | Effective June 1, 2010, the Fund changed its fiscal year end from May 31 to June 30. The information presented is for the period from June 1, 2010 to June 30, 2010. |
| * | Prior to July 1, 2011, Advisor Shares were known as A Shares. |
The accompanying notes are an integral part of these financial statements.
www.brownadvisoryfunds.com
101
Financial Highlights
These financial highlights reflect selected per share data and ratios for a share outstanding of the Fund throughout each year / period.
BROWN ADVISORY SMALL-CAP GROWTH FUND
INSTITUTIONAL SHARES*
| Year / Period Ended: | ||||||||||||||||||||||||
| June 30, | June 30, | June 30, | June 30, | June 30, | May 31, | |||||||||||||||||||
| 2014 | 2013 | 2012 | 2011 | 2010(e) | 2010 | |||||||||||||||||||
| Net Asset Value, Beginning of Year / Period | $ | 31.67 | $ | 28.36 | $ | 29.56 | $ | 20.75 | $ | 21.67 | $ | 16.64 | ||||||||||||
| Net Investment Loss(a) | (0.22 | ) | (0.07 | ) | (0.21 | ) | (0.21 | ) | (0.02 | ) | (0.23 | ) | ||||||||||||
| Net Realized And Unrealized Gains (Losses) | 6.08 | 6.07 | (0.72 | ) | 9.02 | (0.90 | ) | 5.26 | ||||||||||||||||
| Total from Investment Operations | $ | 5.86 | $ | 6.00 | $ | (0.93 | ) | $ | 8.81 | $ | (0.92 | ) | $ | 5.03 | ||||||||||
| Distributions: | ||||||||||||||||||||||||
| from Net Realized Gains | (1.68 | ) | (2.69 | ) | (0.27 | ) | — | — | — | |||||||||||||||
| Total Distributions to Shareholders | $ | (1.68 | ) | $ | (2.69 | ) | $ | (0.27 | ) | $ | — | $ | — | $ | — | |||||||||
| Redemption fees(a) | — | — | — | — | — | — | ||||||||||||||||||
| Net Asset Value, End of Year / Period | $ | 35.85 | $ | 31.67 | $ | 28.36 | $ | 29.56 | $ | 20.75 | $ | 21.67 | ||||||||||||
| Total Return | 18.59 | % | 22.84 | % | (3.08 | )% | 42.46 | % | (4.25 | )%(b) | 30.23 | % | ||||||||||||
| Net Assets at End of Year / Period (000’s Omitted) | $ | 8,497 | $ | 7,347 | $ | 6,944 | $ | 8,732 | $ | 7,065 | $ | 7,400 | ||||||||||||
| Ratios to Average Net Assets: | ||||||||||||||||||||||||
| Net Investment Loss | (0.63 | )% | (0.24 | )% | (0.77 | )% | (0.80 | )% | (0.92 | )%(c) | (1.12 | )% | ||||||||||||
| Net Expenses | 1.01 | % | 1.05 | % | 1.11 | % | 1.13 | % | 1.17 | %(c) | 1.49 | % | ||||||||||||
| Gross Expenses(d) | 1.01 | % | 1.05 | % | 1.11 | % | 1.13 | % | 1.17 | %(c) | 1.49 | % | ||||||||||||
| Portfolio Turnover Rate | 19 | % | 48 | % | 66 | % | 61 | % | 7 | %(b) | 71 | % | ||||||||||||
| (a) | Calculated based on average shares outstanding during the year / period. |
| (b) | Not annualized. |
| (c) | Annualized. |
| (d) | Reflects the expense ratio excluding any waivers and/or expense reimbursements. |
| (e) | Effective June 1, 2010, the Fund changed its fiscal year end from May 31 to June 30. The information presented is for the period from June 1, 2010 to June 30, 2010. |
| * | Prior to October 19, 2012, Institutional Shares were known as D Shares. |
The accompanying notes are an integral part of these financial statements.
www.brownadvisoryfunds.com
102
Financial Highlights
These financial highlights reflect selected per share data and ratios for a share outstanding of the Fund throughout each year / period.
BROWN ADVISORY SMALL-CAP GROWTH FUND
INVESTOR SHARES*
| Year / Period Ended: | ||||||||||||||||||||||||
| June 30, | June 30, | June 30, | June 30, | June 30, | May 31, | |||||||||||||||||||
| 2014 | 2013 | 2012 | 2011 | 2010(f) | 2010 | |||||||||||||||||||
| Net Asset Value, Beginning of Year / Period | $ | 15.96 | $ | 14.31 | $ | 15.07 | $ | 10.58 | $ | 11.06 | $ | 8.47 | ||||||||||||
| Net Investment Loss(a) | (0.14 | ) | (0.05 | ) | (0.11 | ) | (0.11 | ) | (0.01 | ) | (0.10 | ) | ||||||||||||
| Net Realized And Unrealized Gains (Losses) | 3.07 | 3.06 | (0.38 | ) | 4.60 | (0.47 | ) | 2.69 | ||||||||||||||||
| Total from Investment Operations | $ | 2.93 | $ | 3.01 | $ | (0.49 | ) | $ | 4.49 | $ | (0.48 | ) | $ | 2.59 | ||||||||||
| Distributions: | ||||||||||||||||||||||||
| from Net Realized Gains | (0.85 | ) | (1.36 | ) | (0.27 | ) | — | — | — | |||||||||||||||
| Total Distributions to Shareholders | $ | (0.85 | ) | $ | (1.36 | ) | $ | (0.27 | ) | $ | — | $ | — | $ | — | |||||||||
| Redemption fees(a) | — | (e) | — | (e) | — | (e) | — | — | (e) | — | (e) | |||||||||||||
| Net Asset Value, End of Year / Period | $ | 18.04 | $ | 15.96 | $ | 14.31 | $ | 15.07 | $ | 10.58 | $ | 11.06 | ||||||||||||
| Total Return | 18.42 | % | 22.68 | % | (3.12 | )% | 42.44 | % | (4.34 | )%(b) | 30.58 | % | ||||||||||||
| Net Assets at End of Year / Period (000’s Omitted) | $ | 285,287 | $ | 281,027 | $ | 215,311 | $ | 208,222 | $ | 139,647 | $ | 145,293 | ||||||||||||
| Ratios to Average Net Assets: | ||||||||||||||||||||||||
| Net Investment Loss | (0.78 | )% | (0.36 | )% | (0.82 | )% | (0.85 | )% | (0.97 | )%(c) | (0.95 | )% | ||||||||||||
| Net Expenses | 1.16 | % | 1.17 | % | 1.16 | % | 1.18 | % | 1.22 | %(c) | 1.32 | % | ||||||||||||
| Gross Expenses(d) | 1.16 | % | 1.17 | % | 1.16 | % | 1.18 | % | 1.22 | %(c) | 1.32 | % | ||||||||||||
| Portfolio Turnover Rate | 19 | % | 48 | % | 66 | % | 61 | % | 7 | %(b) | 71 | % | ||||||||||||
| (a) | Calculated based on average shares outstanding during the year / period. |
| (b) | Not annualized. |
| (c) | Annualized. |
| (d) | Reflects the expense ratio excluding any waivers and/or expense reimbursements. |
| (e) | Less than $0.01 per share. |
| (f) | Effective June 1, 2010, the Fund changed its fiscal year end from May 31 to June 30. The information presented is for the period from June 1, 2010 to June 30, 2010. |
| * | Prior to October 19, 2012, Investor Shares were known as Institutional Shares. |
The accompanying notes are an integral part of these financial statements.
www.brownadvisoryfunds.com
103
Financial Highlights
These financial highlights reflect selected per share data and ratios for a share outstanding of the Fund throughout each year / period.
BROWN ADVISORY SMALL-CAP GROWTH FUND
ADVISOR SHARES*
| Year / Period Ended: | ||||||||||||||||||||||||
| June 30, | June 30, | June 30, | June 30, | June 30, | May 31, | |||||||||||||||||||
| 2014 | 2013 | 2012 | 2011 | 2010(g) | 2010 | |||||||||||||||||||
| Net Asset Value, Beginning of Year / Period | $ | 15.43 | $ | 13.86 | $ | 14.65 | $ | 10.34 | $ | 10.80 | $ | 8.32 | ||||||||||||
| Net Investment Loss(a) | (0.18 | ) | (0.09 | ) | (0.14 | ) | (0.18 | ) | (0.01 | ) | (0.14 | ) | ||||||||||||
| Net Realized And Unrealized Gains (Losses) | 2.96 | 2.97 | (0.38 | ) | 4.49 | (0.45 | ) | 2.62 | ||||||||||||||||
| Total from Investment Operations | $ | 2.78 | $ | 2.88 | $ | (0.52 | ) | $ | 4.31 | $ | (0.46 | ) | $ | 2.48 | ||||||||||
| Distributions: | ||||||||||||||||||||||||
| from Net Realized Gains | (0.82 | ) | (1.31 | ) | (0.27 | ) | — | — | — | |||||||||||||||
| Total Distributions to Shareholders | $ | (0.82 | ) | $ | (1.31 | ) | $ | (0.27 | ) | $ | — | $ | — | $ | — | |||||||||
| Redemption fees(a) | — | — | — | (f) | — | — | — | |||||||||||||||||
| Net Asset Value, End of Year / Period | $ | 17.39 | $ | 15.43 | $ | 13.86 | $ | 14.65 | $ | 10.34 | $ | 10.80 | ||||||||||||
| Total Return(b) | 18.07 | % | 22.45 | % | (3.41 | )% | 41.68 | % | (4.26 | )%(c) | 29.81 | % | ||||||||||||
| Net Assets at End of Year / Period (000’s Omitted) | $ | 7,300 | $ | 5,493 | $ | 2,875 | $ | 3,110 | $ | 4,075 | $ | 4,254 | ||||||||||||
| Ratios to Average Net Assets: | ||||||||||||||||||||||||
| Net Investment Loss | (1.03 | )% | (0.60 | )% | (1.07 | )% | (1.36 | )% | (1.42 | )%(d) | (1.41 | )% | ||||||||||||
| Net Expenses | 1.41 | % | 1.41 | % | 1.41 | % | 1.69 | % | 1.67 | %(d) | 1.78 | % | ||||||||||||
| Gross Expenses(e) | 1.41 | % | 1.41 | % | 1.41 | % | 1.69 | % | 1.67 | %(d) | 1.78 | % | ||||||||||||
| Portfolio Turnover Rate | 19 | % | 48 | % | 66 | % | 61 | % | 7 | %(c) | 71 | % | ||||||||||||
| (a) | Calculated based on average shares outstanding during the year / period. |
| (b) | Total return does not include the effects of sales charges which existed for Advisor Shares (then known as A Shares) for years / periods ended June 30, 2011 and earlier. |
| (c) | Not annualized. |
| (d) | Annualized. |
| (e) | Reflects the expense ratio excluding any waivers and/or expense reimbursements. |
| (f) | Less than $0.01 per share. |
| (g) | Effective June 1, 2010, the Fund changed its fiscal year end from May 31 to June 30. The information presented is for the period from June 1, 2010 to June 30, 2010. |
| * | Prior to July 1, 2011, Advisor Shares were known as A Shares. |
The accompanying notes are an integral part of these financial statements.
www.brownadvisoryfunds.com
104
Financial Highlights
These financial highlights reflect selected per share data and ratios for a share outstanding of the Fund throughout each year / period.
BROWN ADVISORY SMALL-CAP FUNDAMENTAL VALUE FUND
INSTITUTIONAL SHARES
| Year / Period Ended: | ||||||||
| June 30, | June 30, | |||||||
| 2014 | 2013(e) | |||||||
| Net Asset Value, Beginning of Year / Period | $ | 20.06 | $ | 16.77 | ||||
| Net Investment Income(a) | 0.12 | 0.06 | ||||||
| Net Realized And Unrealized Gains | 4.91 | 3.30 | ||||||
| Total from Investment Operations | $ | 5.03 | $ | 3.36 | ||||
| Distributions: | ||||||||
| from Net Investment Income | (0.19 | ) | (0.07 | ) | ||||
| from Net Realized Gains | (0.94 | ) | — | |||||
| Total Distributions to Shareholders | $ | (1.13 | ) | $ | (0.07 | ) | ||
| Redemption fees(a) | — | — | ||||||
| Net Asset Value, End of Year / Period | $ | 23.96 | $ | 20.06 | ||||
| Total Return | 25.37 | % | 20.13 | %(b) | ||||
| Net Assets at End of Year / Period (000’s Omitted) | $ | 19,515 | $ | 1,061 | ||||
| Ratios to Average Net Assets: | ||||||||
| Net Investment Income | 0.51 | % | 1.14 | %(c) | ||||
| Net Expenses | 1.00 | % | 1.05 | %(c) | ||||
| Gross Expenses(d) | 1.00 | % | 1.05 | %(c) | ||||
| Portfolio Turnover Rate | 30 | % | 34 | % | ||||
| (a) | Calculated based on average shares outstanding during the year / period. |
| (b) | Not annualized. |
| (c) | Annualized. |
| (d) | Reflects the expense ratio excluding any waivers and/or expense reimbursements. |
| (e) | Commenced operations on October 19, 2012. The information presented is for the period from October 19, 2012 to June 30, 2013. |
The accompanying notes are an integral part of these financial statements.
www.brownadvisoryfunds.com
105
Financial Highlights
These financial highlights reflect selected per share data and ratios for a share outstanding of the Fund throughout each year / period.
BROWN ADVISORY SMALL-CAP FUNDAMENTAL VALUE FUND
INVESTOR SHARES*
| Year / Period Ended: | ||||||||||||||||||||||||
| June 30, | June 30, | June 30, | June 30, | June 30, | May 31, | |||||||||||||||||||
| 2014 | 2013 | 2012 | 2011 | 2010(f) | 2010 | |||||||||||||||||||
| Net Asset Value, Beginning of Year / Period | $ | 20.06 | $ | 15.65 | $ | 16.89 | $ | 11.92 | $ | 13.03 | $ | 10.48 | ||||||||||||
| Net Investment Income (Loss)(a) | 0.08 | 0.18 | 0.10 | 0.11 | 0.01 | (0.02 | ) | |||||||||||||||||
| Net Realized And Unrealized Gains (Losses) | 4.90 | 4.29 | (0.51 | ) | 5.54 | (1.12 | ) | 2.80 | ||||||||||||||||
| Total from Investment Operations | $ | 4.98 | $ | 4.47 | $ | (0.41 | ) | $ | 5.65 | $ | (1.11 | ) | $ | 2.78 | ||||||||||
| Distributions: | ||||||||||||||||||||||||
| from Net Investment Income | (0.16 | ) | (0.06 | ) | (0.12 | ) | (0.08 | ) | — | (0.05 | ) | |||||||||||||
| from Net Realized Gains | (0.94 | ) | — | (0.71 | ) | (0.60 | ) | — | (0.18 | ) | ||||||||||||||
| Total Distributions to Shareholders | $ | (1.10 | ) | $ | (0.06 | ) | $ | (0.83 | ) | $ | (0.68 | ) | $ | — | $ | (0.23 | ) | |||||||
| Redemption fees(a) | — | (e) | — | (e) | — | (e) | — | (e) | — | — | ||||||||||||||
| Net Asset Value, End of Year / Period | $ | 23.94 | $ | 20.06 | $ | 15.65 | $ | 16.89 | $ | 11.92 | $ | 13.03 | ||||||||||||
| Total Return | 25.13 | % | 28.64 | % | (1.90 | )% | 48.20 | % | (8.52 | )%(b) | 26.70 | % | ||||||||||||
| Net Assets at End of Year / Period (000’s Omitted) | $ | 567,799 | $ | 371,018 | $ | 194,719 | $ | 107,537 | $ | 37,207 | $ | 37,629 | ||||||||||||
| Ratios to Average Net Assets: | ||||||||||||||||||||||||
| Net Investment Income (Loss) | 0.36 | % | 1.01 | % | 0.64 | % | 0.70 | % | 0.91 | %(c) | (0.14 | )% | ||||||||||||
| Net Expenses | 1.15 | % | 1.18 | % | 1.19 | % | 1.24 | % | 1.36 | %(c) | 1.47 | % | ||||||||||||
| Gross Expenses(d) | 1.15 | % | 1.18 | % | 1.19 | % | 1.24 | % | 1.36 | %(c) | 1.62 | % | ||||||||||||
| Portfolio Turnover Rate | 30 | % | 34 | % | 36 | % | 67 | % | 2 | %(b) | 82 | % | ||||||||||||
| (a) | Calculated based on average shares outstanding during the year / period. |
| (b) | Not annualized. |
| (c) | Annualized. |
| (d) | Reflects the expense ratio excluding any waivers and/or expense reimbursements. |
| (e) | Less than $0.01 per share. |
| (f) | Effective June 1, 2010, the Fund changed its fiscal year end from May 31 to June 30. The information presented is for the period from June 1, 2010 to June 30, 2010. |
| * | Prior to October 19, 2012, Investor Shares were known as Institutional Shares. |
The accompanying notes are an integral part of these financial statements.
www.brownadvisoryfunds.com
106
Financial Highlights
These financial highlights reflect selected per share data and ratios for a share outstanding of the Fund throughout each year / period.
BROWN ADVISORY SMALL-CAP FUNDAMENTAL VALUE FUND
ADVISOR SHARES
| Year / Period Ended: | ||||||||||||
| June 30, | June 30, | June 30, | ||||||||||
| 2014 | 2013 | 2012(f) | ||||||||||
| Net Asset Value, Beginning of Year / Period | $ | 20.01 | $ | 15.63 | $ | 16.39 | ||||||
| Net Investment Income(a) | 0.02 | 0.03 | 0.07 | |||||||||
| Net Realized And Unrealized Gains (Losses) | 4.89 | 4.38 | (0.01 | ) | ||||||||
| Total from Investment Operations | $ | 4.91 | $ | 4.41 | $ | 0.06 | ||||||
| Distributions: | ||||||||||||
| from Net Investment Income | (0.11 | ) | (0.03 | ) | (0.11 | ) | ||||||
| from Net Realized Gains | (0.94 | ) | — | (0.71 | ) | |||||||
| Total Distributions to Shareholders | $ | (1.05 | ) | $ | (0.03 | ) | $ | (0.82 | ) | |||
| Redemption fees(a) | — | (e) | — | — | (e) | |||||||
| Net Asset Value, End of Year / Period | $ | 23.87 | $ | 20.01 | $ | 15.63 | ||||||
| Total Return | 24.83 | % | 28.28 | % | 0.90 | %(b) | ||||||
| Net Assets at End of Year / Period (000’s Omitted) | $ | 21,416 | $ | 15,764 | $ | 418 | ||||||
| Ratios to Average Net Assets: | ||||||||||||
| Net Investment Income | 0.11 | % | 0.75 | % | 0.44 | %(c) | ||||||
| Net Expenses | 1.40 | % | 1.44 | % | 1.39 | %(c) | ||||||
| Gross Expenses(d) | 1.40 | % | 1.44 | % | 1.39 | %(c) | ||||||
| Portfolio Turnover Rate | 30 | % | 34 | % | 36 | % | ||||||
| (a) | Calculated based on average shares outstanding during the year / period. |
| (b) | Not annualized. |
| (c) | Annualized. |
| (d) | Reflects the expense ratio excluding any waivers and/or expense reimbursements. |
| (e) | Less than $0.01 per share. |
| (f) | Commenced operations July 28, 2011. The information presented is for the period from July 28, 2011 to June 30, 2012. |
The accompanying notes are an integral part of these financial statements.
www.brownadvisoryfunds.com
107
Financial Highlights
These financial highlights reflect selected per share data and ratios for a share outstanding of the Fund throughout each year / period.
BROWN ADVISORY OPPORTUNITY FUND
INVESTOR SHARES*
| Year / Period Ended: | ||||||||||||||||||||||||
| June 30, | June 30, | June 30, | June 30, | June 30, | May 31, | |||||||||||||||||||
| 2014 | 2013 | 2012 | 2011 | 2010(e) | 2010 | |||||||||||||||||||
| Net Asset Value, Beginning of Year / Period | $ | 18.51 | $ | 14.97 | $ | 14.94 | $ | 11.03 | $ | 11.51 | $ | 9.40 | ||||||||||||
| Net Investment Loss(a) | (0.13 | ) | (0.05 | ) | (0.09 | ) | (0.10 | ) | (0.01 | ) | (0.03 | ) | ||||||||||||
| Net Realized And Unrealized Gains (Losses) | 4.61 | 3.59 | 0.12 | 4.01 | (0.47 | ) | 2.14 | |||||||||||||||||
| Total from Investment Operations | $ | 4.48 | $ | 3.54 | $ | 0.03 | $ | 3.91 | $ | (0.48 | ) | $ | 2.11 | |||||||||||
| Redemption fees(a) | — | — | — | — | — | — | ||||||||||||||||||
| Net Asset Value, End of Year / Period | $ | 22.99 | $ | 18.51 | $ | 14.97 | $ | 14.94 | $ | 11.03 | $ | 11.51 | ||||||||||||
| Total Return | 24.20 | % | 23.65 | % | 0.20 | % | 35.45 | % | (4.17 | )%(b) | 22.45 | % | ||||||||||||
| Net Assets at End of Year / Period (000’s Omitted) | $ | 11,681 | $ | 9,173 | $ | 8,487 | $ | 11,692 | $ | 13,498 | $ | 14,863 | ||||||||||||
| Ratios to Average Net Assets: | ||||||||||||||||||||||||
| Net Investment Loss | (0.63 | )% | (0.29 | )% | (0.59 | )% | (0.75 | )% | (0.84 | )%(c) | (0.29 | )% | ||||||||||||
| Net Expenses | 1.50 | % | 1.50 | % | 1.50 | % | 1.50 | % | 1.50 | %(c) | 1.50 | % | ||||||||||||
| Gross Expenses(d) | 1.52 | % | 1.72 | % | 1.74 | % | 1.78 | % | 1.68 | %(c) | 1.75 | % | ||||||||||||
| Portfolio Turnover Rate | 41 | % | 54 | % | 76 | % | 65 | % | 3 | %(b) | 97 | % | ||||||||||||
| (a) | Calculated based on average shares outstanding during the year / period. |
| (b) | Not annualized. |
| (c) | Annualized. |
| (d) | Reflects the expense ratio excluding any waivers and/or expense reimbursements. |
| (e) | Effective June 1, 2010, the Fund changed its fiscal year end from May 31 to June 30. The information presented is for the period from June 1, 2010 to June 30, 2010. |
| * | Prior to October 19, 2012, Investor Shares were known as Institutional Shares. |
The accompanying notes are an integral part of these financial statements.
www.brownadvisoryfunds.com
108
Financial Highlights
These financial highlights reflect selected per share data and ratios for a share outstanding of the Fund throughout each year / period.
BROWN ADVISORY MARYLAND BOND FUND
INVESTOR SHARES*
| Year / Period Ended: | ||||||||||||||||||||||||
| June 30, | June 30, | June 30, | June 30, | June 30, | May 31, | |||||||||||||||||||
| 2014 | 2013 | 2012 | 2011 | 2010(f) | 2010 | |||||||||||||||||||
| Net Asset Value, Beginning of Year / Period | $ | 10.81 | $ | 11.06 | $ | 10.85 | $ | 10.81 | $ | 10.81 | $ | 10.62 | ||||||||||||
| Net Investment Income(a) | 0.21 | 0.21 | 0.25 | 0.25 | 0.02 | 0.25 | ||||||||||||||||||
| Net Realized And Unrealized Gains (Losses) | 0.10 | (0.23 | ) | 0.26 | 0.04 | — | 0.19 | |||||||||||||||||
| Total from Investment Operations | $ | 0.31 | $ | (0.02 | ) | $ | 0.51 | $ | 0.29 | $ | 0.02 | $ | 0.44 | |||||||||||
| Distributions: | ||||||||||||||||||||||||
| from Net Investment Income | (0.21 | ) | (0.21 | ) | (0.25 | ) | (0.25 | ) | (0.02 | ) | (0.25 | ) | ||||||||||||
| from Net Realized Gains | (0.09 | ) | (0.02 | ) | (0.05 | ) | — | — | — | |||||||||||||||
| Total Distributions to Shareholders | $ | (0.30 | ) | $ | (0.23 | ) | $ | (0.30 | ) | $ | (0.25 | ) | $ | (0.02 | ) | $ | (0.25 | ) | ||||||
| Redemption fees(a) | — | — | (e) | — | (e) | — | — | (e) | — | (e) | ||||||||||||||
| Net Asset Value, End of Year / Period | $ | 10.82 | $ | 10.81 | $ | 11.06 | $ | 10.85 | $ | 10.81 | $ | 10.81 | ||||||||||||
| Total Return | 2.94 | % | (0.25 | )% | 4.69 | % | 2.74 | % | 0.19 | %(b) | 4.21 | % | ||||||||||||
| Net Assets at End of Year / Period (000’s Omitted) | $ | 205,717 | $ | 252,166 | $ | 250,087 | $ | 188,180 | $ | 192,077 | $ | 187,288 | ||||||||||||
| Ratios to Average Net Assets: | ||||||||||||||||||||||||
| Net Investment Income | 1.99 | % | 1.86 | % | 2.23 | % | 2.33 | % | 2.36 | %(c) | 2.32 | % | ||||||||||||
| Net Expenses | 0.52 | % | 0.52 | % | 0.51 | % | 0.51 | % | 0.54 | %(c) | 0.62 | % | ||||||||||||
| Gross Expenses(d) | 0.52 | % | 0.52 | % | 0.51 | % | 0.51 | % | 0.54 | %(c) | 0.62 | % | ||||||||||||
| Portfolio Turnover Rate | 56 | % | 30 | % | 16 | % | 29 | % | 1 | %(b) | 8 | % | ||||||||||||
| (a) | Calculated based on average shares outstanding during the year / period. |
| (b) | Not annualized. |
| (c) | Annualized. |
| (d) | Reflects the expense ratio excluding any waivers and/or expense reimbursements. |
| (e) | Less than $0.01 per share. |
| (f) | Effective June 1, 2010, the Fund changed its fiscal year end from May 31 to June 30. The information presented is for the period from June 1, 2010 to June 30, 2010. |
| * | Prior to October 19, 2012, Investor Shares were known as Institutional Shares. |
The accompanying notes are an integral part of these financial statements.
www.brownadvisoryfunds.com
109
Financial Highlights
These financial highlights reflect selected per share data and ratios for a share outstanding of the Fund throughout each year / period.
BROWN ADVISORY INTERMEDIATE INCOME FUND
INVESTOR SHARES*
| Year / Period Ended: | ||||||||||||||||||||||||
| June 30, | June 30, | June 30, | June 30, | June 30, | May 31, | |||||||||||||||||||
| 2014 | 2013 | 2012 | 2011 | 2010(f) | 2010 | |||||||||||||||||||
| Net Asset Value, Beginning of Year / Period | $ | 10.85 | $ | 11.37 | $ | 11.28 | $ | 11.23 | $ | 11.13 | $ | 10.76 | ||||||||||||
| Net Investment Income (a) | 0.17 | 0.19 | 0.24 | 0.31 | 0.03 | 0.38 | ||||||||||||||||||
| Net Realized And Unrealized Gains (Losses) | 0.12 | (0.26 | ) | 0.36 | 0.11 | 0.10 | 0.38 | |||||||||||||||||
| Total from Investment Operations | $ | 0.29 | $ | (0.07 | ) | $ | 0.60 | $ | 0.42 | $ | 0.13 | $ | 0.76 | |||||||||||
| Distributions: | ||||||||||||||||||||||||
| from Net Investment Income | (0.18 | ) | (0.25 | ) | (0.25 | ) | (0.33 | ) | (0.03 | ) | (0.39 | ) | ||||||||||||
| from Net Realized Gains | (0.22 | ) | (0.20 | ) | (0.26 | ) | (0.04 | ) | — | — | ||||||||||||||
| Total Distributions to Shareholders | $ | (0.40 | ) | $ | (0.45 | ) | $ | (0.51 | ) | $ | (0.37 | ) | $ | (0.03 | ) | $ | (0.39 | ) | ||||||
| Redemption fees(a) | — | (e) | — | (e) | — | (e) | — | (e) | — | (e) | — | (e) | ||||||||||||
| Net Asset Value, End of Year / Period | $ | 10.74 | $ | 10.85 | $ | 11.37 | $ | 11.28 | $ | 11.23 | $ | 11.13 | ||||||||||||
| Total Return | 2.66 | % | (0.72 | )% | 5.42 | % | 3.84 | % | 1.20 | %(b) | 7.17 | % | ||||||||||||
| Net Assets at End of Year / Period (000’s Omitted) | $ | 207,371 | $ | 241,543 | $ | 292,556 | $ | 255,847 | $ | 280,537 | $ | 270,658 | ||||||||||||
| Ratios to Average Net Assets: | ||||||||||||||||||||||||
| Net Investment Income | 1.54 | % | 1.66 | % | 2.15 | % | 2.75 | % | 3.23 | %(c) | 3.45 | % | ||||||||||||
| Net Expenses | 0.52 | % | 0.52 | % | 0.50 | % | 0.52 | % | 0.53 | %(c) | 0.61 | % | ||||||||||||
| Gross Expenses(d) | 0.52 | % | 0.52 | % | 0.50 | % | 0.52 | % | 0.53 | %(c) | 0.61 | % | ||||||||||||
| Portfolio Turnover Rate | 162 | % | 111 | % | 75 | % | 84 | % | 6 | %(b) | 25 | % | ||||||||||||
| (a) | Calculated based on average shares outstanding during the year / period. |
| (b) | Not annualized. |
| (c) | Annualized. |
| (d) | Reflects the expense ratio excluding any waivers and/or expense reimbursements. |
| (e) | Less than $0.01 per share. |
| (f) | Effective June 1, 2010, the Fund changed its fiscal year end from May 31 to June 30. The information presented is for the period from June 1, 2010 to June 30, 2010. |
| * | Prior to October 19, 2012, Investor Shares were known as Institutional Shares. |
The accompanying notes are an integral part of these financial statements.
www.brownadvisoryfunds.com
110
Financial Highlights
These financial highlights reflect selected per share data and ratios for a share outstanding of the Fund throughout each year / period.
BROWN ADVISORY INTERMEDIATE INCOME FUND
ADVISOR SHARES*
| Year / Period Ended: | ||||||||||||||||||||||||
| June 30, | June 30, | June 30, | June 30, | June 30, | May 31, | |||||||||||||||||||
| 2014 | 2013 | 2012 | 2011 | 2010(g) | 2010 | |||||||||||||||||||
| Net Asset Value, Beginning of Year / Period | $ | 10.65 | $ | 11.16 | $ | 11.08 | $ | 11.04 | $ | 10.95 | $ | 10.59 | ||||||||||||
| Net Investment Income(a) | 0.14 | 0.16 | 0.22 | 0.28 | 0.03 | 0.35 | ||||||||||||||||||
| Net Realized And Unrealized Gains (Losses) | 0.11 | (0.25 | ) | 0.35 | 0.11 | 0.09 | 0.38 | |||||||||||||||||
| Total from Investment Operations | $ | 0.25 | $ | (0.09 | ) | $ | 0.57 | $ | 0.39 | $ | 0.12 | $ | 0.73 | |||||||||||
| Distributions: | ||||||||||||||||||||||||
| from Net Investment Income | (0.15 | ) | (0.22 | ) | (0.23 | ) | (0.31 | ) | (0.03 | ) | (0.37 | ) | ||||||||||||
| from Net Realized Gains | (0.22 | ) | (0.20 | ) | (0.26 | ) | (0.04 | ) | — | — | ||||||||||||||
| Total Distributions to Shareholders | $ | (0.37 | ) | $ | (0.42 | ) | $ | (0.49 | ) | $ | (0.35 | ) | $ | (0.03 | ) | $ | (0.37 | ) | ||||||
| Redemption fees(a) | — | — | — | (f) | — | — | — | |||||||||||||||||
| Net Asset Value, End of Year / Period | $ | 10.53 | $ | 10.65 | $ | 11.16 | $ | 11.08 | $ | 11.04 | $ | 10.95 | ||||||||||||
| Total Return(b) | 2.36 | % | (0.87 | )% | 5.21 | % | 3.60 | % | 1.11 | %(c) | 6.98 | % | ||||||||||||
| Net Assets at End of Year / Period (000’s Omitted) | $ | 12,613 | $ | 16,149 | $ | 19,540 | $ | 22,647 | $ | 31,607 | $ | 31,415 | ||||||||||||
| Ratios to Average Net Assets: | ||||||||||||||||||||||||
| Net Investment Income | 1.29 | % | 1.43 | % | 1.94 | % | 2.54 | % | 3.03 | %(d) | 3.24 | % | ||||||||||||
| Net Expenses | 0.77 | % | 0.75 | % | 0.71 | % | 0.72 | % | 0.73 | %(d) | 0.82 | % | ||||||||||||
| Gross Expenses(e) | 0.77 | % | 0.75 | % | 0.71 | % | 0.72 | % | 0.73 | %(d) | 0.82 | % | ||||||||||||
| Portfolio Turnover Rate | 162 | % | 111 | % | 75 | % | 84 | % | 6 | %(c) | 25 | % | ||||||||||||
| (a) | Calculated based on average shares outstanding during the year / period. |
| (b) | Total return does not include the effects of sales charges which existed for Advisor Shares (then known as A Shares) for years / periods ended June 30, 2011 and earlier. |
| (c) | Not annualized. |
| (d) | Annualized. |
| (e) | Reflects the expense ratio excluding any waivers and/or expense reimbursements. |
| (f) | Less than $0.01 per share. |
| (g) | Effective June 1, 2010, the Fund changed its fiscal year end from May 31 to June 30. The information presented is for the period from June 1, 2010 to June 30, 2010. |
| * | Prior to July 1, 2011, Advisor Shares were known as A Shares. |
The accompanying notes are an integral part of these financial statements.
www.brownadvisoryfunds.com
111
Financial Highlights
These financial highlights reflect selected per share data and ratios for a share outstanding of the Fund throughout each year / period.
BROWN ADVISORY TACTICAL BOND FUND
ADVISOR SHARES
| Year / Period Ended: | ||||||||||||
| June 30, | June 30, | June 30, | ||||||||||
| 2014 | 2013 | 2012(f) | ||||||||||
| Net Asset Value, Beginning of Year / Period | $ | 9.68 | $ | 9.68 | $ | 10.00 | ||||||
| Net Investment Loss(a) | (0.01 | ) | (0.09 | ) | (0.04 | ) | ||||||
| Net Realized And Unrealized Gains (Losses) | 0.42 | 0.29 | (0.27 | ) | ||||||||
| Total from Investment Operations | $ | 0.41 | $ | 0.20 | $ | (0.31 | ) | |||||
| Distributions: | ||||||||||||
| from Net Investment Income | (0.05 | ) | (0.20 | ) | (0.01 | ) | ||||||
| Total Distributions to Shareholders | $ | (0.05 | ) | $ | (0.20 | ) | $ | (0.01 | ) | |||
| Redemption fees(a) | — | — | (e) | — | (e) | |||||||
| Net Asset Value, End of Year / Period | $ | 10.04 | $ | 9.68 | $ | 9.68 | ||||||
| Total Return | 4.22 | % | 2.09 | % | (3.09 | )%(b) | ||||||
| Net Assets at End of Year / Period (000’s Omitted) | $ | 24,399 | $ | 25,570 | $ | 29,541 | ||||||
| Ratios to Average Net Assets: | ||||||||||||
| Net Investment Loss | (0.07 | )% | (0.87 | )% | (0.56 | )%(c) | ||||||
| Net Expenses | 1.33 | % | 1.40 | % | 1.40 | %(c) | ||||||
| Gross Expenses(d) | 1.33 | % | 1.40 | % | 1.40 | %(c) | ||||||
| Portfolio Turnover Rate | 1010 | % | 992 | % | 1290 | %(b) | ||||||
| (a) | Calculated based on average shares outstanding during the year / period. |
| (b) | Not annualized. |
| (c) | Annualized. |
| (d) | Reflects the expense ratio excluding any waivers and/or expense reimbursements. |
| (e) | Less than $0.01 per share. |
| (f) | Commenced operations on September 30, 2011. The information presented is for the period from September 30, 2011 to June 30, 2012. |
The accompanying notes are an integral part of these financial statements.
www.brownadvisoryfunds.com
112
Financial Highlights
These financial highlights reflect selected per share data and ratios for a share outstanding of the Fund throughout each year / period.
BROWN ADVISORY EQUITY INCOME FUND
INSTITUTIONAL SHARES
| Year / Period Ended: | ||||||||
| June 30, | June 30, | |||||||
| 2014 | 2013(e) | |||||||
| Net Asset Value, Beginning of Year / Period | $ | 12.16 | $ | 11.07 | ||||
| Net Investment Income(a) | 0.29 | 0.21 | ||||||
| Net Realized And Unrealized Gains | 1.99 | 1.19 | ||||||
| Total from Investment Operations | $ | 2.28 | $ | 1.40 | ||||
| Distributions: | ||||||||
| from Net Investment Income | (0.29 | ) | (0.23 | ) | ||||
| from Net Realized Gains | (0.45 | ) | (0.08 | ) | ||||
| Total Distributions to Shareholders | $ | (0.74 | ) | $ | (0.31 | ) | ||
| Redemption fees(a) | — | — | ||||||
| Net Asset Value, End of Year / Period | $ | 13.70 | $ | 12.16 | ||||
| Total Return | 19.30 | % | 12.88 | %(b) | ||||
| Net Assets at End of Year / Period (000’s Omitted) | $ | 17,663 | $ | 11 | ||||
| Ratios to Average Net Assets: | ||||||||
| Net Investment Income | 2.23 | % | 2.53 | %(c) | ||||
| Net Expenses | 0.77 | % | 0.80 | %(c) | ||||
| Gross Expenses(d) | 0.77 | % | 0.80 | %(c) | ||||
| Portfolio Turnover Rate | 32 | % | 21 | % | ||||
| (a) | Calculated based on average shares outstanding during the year / period. |
| (b) | Not annualized. |
| (c) | Annualized. |
| (d) | Reflects the expense ratio excluding any waivers and/or expense reimbursements. |
| (e) | Commenced operations on October 19, 2012. The information presented is for the period from October 19, 2012 to June 30, 2013. |
The accompanying notes are an integral part of these financial statements.
www.brownadvisoryfunds.com
113
Financial Highlights
These financial highlights reflect selected per share data and ratios for a share outstanding of the Fund throughout each year / period.
BROWN ADVISORY EQUITY INCOME FUND
INVESTOR SHARES*
| Year / Period Ended: | ||||||||||||
| June 30, | June 30, | June 30, | ||||||||||
| 2014 | 2013 | 2012(f) | ||||||||||
| Net Asset Value, Beginning of Year / Period | $ | 12.16 | $ | 10.49 | $ | 10.00 | ||||||
| Net Investment Income(a) | 0.27 | 0.27 | 0.15 | |||||||||
| Net Realized And Unrealized Gains | 1.98 | 1.76 | 0.46 | |||||||||
| Total from Investment Operations | $ | 2.25 | $ | 2.03 | $ | 0.61 | ||||||
| Distributions: | ||||||||||||
| from Net Investment Income | (0.27 | ) | (0.28 | ) | (0.12 | ) | ||||||
| from Net Realized Gains | (0.45 | ) | (0.08 | ) | — | |||||||
| Total Distributions to Shareholders | $ | (0.72 | ) | $ | (0.36 | ) | $ | (0.12 | ) | |||
| Redemption fees(a) | — | — | (e) | — | (e) | |||||||
| Net Asset Value, End of Year / Period | $ | 13.69 | $ | 12.16 | $ | 10.49 | ||||||
| Total Return | 19.04 | % | 19.62 | % | 6.11 | %(b) | ||||||
| Net Assets at End of Year / Period (000’s Omitted) | $ | 180,372 | $ | 173,599 | $ | 106,075 | ||||||
| Ratios to Average Net Assets: | ||||||||||||
| Net Investment Income | 2.08 | % | 2.37 | % | 2.82 | %(c) | ||||||
| Net Expenses | 0.92 | % | 0.96 | % | 0.99 | %(c) | ||||||
| Gross Expenses(d) | 0.92 | % | 0.96 | % | 0.99 | %(c) | ||||||
| Portfolio Turnover Rate | 32 | % | 21 | % | 14 | %(b) | ||||||
| (a) | Calculated based on average shares outstanding during the year / period. | ||
| (b) | Not annualized. | ||
| (c) | Annualized. | ||
| (d) | Reflects the expense ratio excluding any waivers and/or expense reimbursements. | ||
| (e) | Less than $0.01 per share. | ||
| (f) | Commenced operations on December 29, 2011. The information presented is for the period from December 29, 2011 to June 30, 2012. | ||
| * | Prior to October 19, 2012, Investor Shares were known as Institutional Shares. |
The accompanying notes are an integral part of these financial statements.
www.brownadvisoryfunds.com
114
Financial Highlights
These financial highlights reflect selected per share data and ratios for a share outstanding of the Fund throughout each year / period.
BROWN ADVISORY EQUITY INCOME FUND
ADVISOR SHARES
| Year / Period Ended: | ||||||||||||
| June 30, | June 30, | June 30, | ||||||||||
| 2014 | 2013 | 2012(f) | ||||||||||
| Net Asset Value, Beginning of Year / Period | $ | 12.14 | $ | 10.48 | $ | 10.00 | ||||||
| Net Investment Income(a) | 0.24 | 0.25 | 0.14 | |||||||||
| Net Realized And Unrealized Gains (Losses)(a) | 1.98 | 1.75 | 0.46 | |||||||||
| Total from Investment Operations | $ | 2.22 | $ | 2.00 | $ | 0.60 | ||||||
| Distributions: | ||||||||||||
| from Net Investment Income | (0.24 | ) | (0.26 | ) | (0.12 | ) | ||||||
| from Net Realized Gains | (0.45 | ) | (0.08 | ) | — | |||||||
| Total Distributions to Shareholders | $ | (0.69 | ) | $ | (0.34 | ) | $ | (0.12 | ) | |||
| Redemption fees(a) | — | — | — | (e) | ||||||||
| Net Asset Value, End of Year / Period | $ | 13.67 | $ | 12.14 | $ | 10.48 | ||||||
| Total Return | 18.79 | % | 19.33 | % | 5.95 | %(b) | ||||||
| Net Assets at End of Year / Period (000’s Omitted) | $ | 3,298 | $ | 2,346 | $ | 636 | ||||||
| Ratios to Average Net Assets: | ||||||||||||
| Net Investment Income | 1.83 | % | 2.13 | % | 2.60 | %(c) | ||||||
| Net Expenses | 1.17 | % | 1.20 | % | 1.19 | %(c) | ||||||
| Gross Expenses(d) | 1.17 | % | 1.20 | % | 1.19 | %(c) | ||||||
| Portfolio Turnover Rate | 32 | % | 21 | % | 14 | %(b) | ||||||
| (a) | Calculated based on average shares outstanding during the year / period. | ||
| (b) | Not annualized. | ||
| (c) | Annualized. | ||
| (d) | Reflects the expense ratio excluding any waivers and/or expense reimbursements. | ||
| (e) | Less than $0.01 per share. | ||
| (f) | Commenced operations on December 29, 2011. The information presented is for the period from December 29, 2011 to June 30, 2012. |
The accompanying notes are an integral part of these financial statements.
www.brownadvisoryfunds.com
115
Financial Highlights
These financial highlights reflect selected per share data and ratios for a share outstanding of the Fund throughout each year.
BROWN ADVISORY SUSTAINABLE GROWTH FUND*
INSTITUTIONAL SHARES
| Year Ended: | ||||||||
| June 30, | June 30, | |||||||
| 2014 | 2013 | |||||||
| Net Asset Value, Beginning of Year | $ | 11.64 | $ | 10.00 | ||||
| Net Investment Income (Loss)(a) | — | — | ||||||
| Net Realized And Unrealized Gains | 2.61 | 1.65 | ||||||
| Total from Investment Operations | $ | 2.61 | $ | 1.65 | ||||
| Distributions: | ||||||||
| from Net Realized Gains | (0.14 | ) | (0.01 | ) | ||||
| Total Distributions to Shareholders | $ | (0.14 | ) | $ | (0.01 | ) | ||
| Redemption fees(a) | — | — | ||||||
| Net Asset Value, End of Year | $ | 14.11 | $ | 11.64 | ||||
| Total Return | 22.51 | % | 16.47 | % | ||||
| Net Assets at End of Year (000’s Omitted) | $ | 30,374 | $ | 32,045 | ||||
| Ratios to Average Net Assets: | ||||||||
| Net Investment Income | (0.01 | )% | 0.03 | % | ||||
| Net Expenses | 0.77 | % | 0.86 | % | ||||
| Gross Expenses(b) | 0.77 | % | 0.86 | % | ||||
| Portfolio Turnover Rate | 30 | % | 30 | % | ||||
| (a) | Calculated based on average shares outstanding during the year. | |
| (b) | Reflects the expense ratio excluding any waivers and/or expense reimbursements. | |
| * | Commenced operations on June 29, 2012. No financial highlights are presented for the period from June 29, 2012 to June 30, 2012, as the Fund did not make any investments, earn any income or incur any expenses during the period. |
The accompanying notes are an integral part of these financial statements.
www.brownadvisoryfunds.com
116
Financial Highlights
These financial highlights reflect selected per share data and ratios for a share outstanding of the Fund throughout each year.
BROWN ADVISORY SUSTAINABLE GROWTH FUND*
INVESTOR SHARES
| Year Ended: | ||||||||
| June 30, | June 30, | |||||||
| 2014 | 2013 | |||||||
| Net Asset Value, Beginning of Year | $ | 11.62 | $ | 10.00 | ||||
| Net Investment Loss(a) | (0.02 | ) | (0.01 | ) | ||||
| Net Realized And Unrealized Gains | 2.60 | 1.64 | ||||||
| Total from Investment Operations | $ | 2.58 | $ | 1.63 | ||||
| Distributions: | ||||||||
| from Net Realized Gains | (0.14 | ) | (0.01 | ) | ||||
| Total Distributions to Shareholders | $ | (0.14 | ) | $ | (0.01 | ) | ||
| Redemption fees(a) | — | — | ||||||
| Net Asset Value, End of Year | $ | 14.06 | $ | 11.62 | ||||
| Total Return | 22.29 | % | 16.27 | % | ||||
| Net Assets at End of Year (000’s Omitted) | $ | 46,823 | $ | 24,028 | ||||
| Ratios to Average Net Assets: | ||||||||
| Net Investment Loss | (0.16 | )% | (0.12 | )% | ||||
| Net Expenses | 0.92 | % | 1.01 | % | ||||
| Gross Expenses(b) | 0.92 | % | 1.01 | % | ||||
| Portfolio Turnover Rate | 30 | % | 30 | % | ||||
| (a) | Calculated based on average shares outstanding during the year. |
| (b) | Reflects the expense ratio excluding any waivers and/or expense reimbursements. |
| * | Commenced operations on June 29, 2012. No financial highlights are presented for the period from June 29, 2012 to June 30, 2012, as the Fund did not make any investments, earn any income or incur any expenses during the period. |
The accompanying notes are an integral part of these financial statements.
www.brownadvisoryfunds.com
117
Financial Highlights
These financial highlights reflect selected per share data and ratios for a share outstanding of the Fund throughout each year.
BROWN ADVISORY SUSTAINABLE GROWTH FUND*
ADVISOR SHARES
| Year Ended: | ||||||||
| June 30, | June 30, | |||||||
| 2014 | 2013 | |||||||
| Net Asset Value, Beginning of Year | $ | 11.60 | $ | 10.00 | ||||
| Net Investment Loss(a) | (0.05 | ) | (0.04 | ) | ||||
| Net Realized And Unrealized Gains | 2.59 | 1.65 | ||||||
| Total from Investment Operations | $ | 2.54 | $ | 1.61 | ||||
| Distributions: | ||||||||
| from Net Realized Gains | (0.14 | ) | (0.01 | ) | ||||
| Total Distributions to Shareholders | $ | (0.14 | ) | $ | (0.01 | ) | ||
| Redemption fees(a) | — | (c) | — | (c) | ||||
| Net Asset Value, End of Year | $ | 14.00 | $ | 11.60 | ||||
| Total Return | 21.99 | % | 16.07 | % | ||||
| Net Assets at End of Year (000’s Omitted) | $ | 132,846 | $ | 124,256 | ||||
| Ratios to Average Net Assets: | ||||||||
| Net Investment Loss | (0.41 | )% | (0.37 | )% | ||||
| Net Expenses | 1.17 | % | 1.26 | % | ||||
| Gross Expenses(b) | 1.17 | % | 1.26 | % | ||||
| Portfolio Turnover Rate | 30 | % | 30 | % | ||||
| (a) | Calculated based on average shares outstanding during the year. |
| (b) | Reflects the expense ratio excluding any waivers and/or expense reimbursements. |
| (c) | Less than $0.01 per share. |
| * | Commenced operations on June 29, 2012. No financial highlights are presented for the period from June 29, 2012 to June 30, 2012, as the Fund did not make any investments, earn any income or incur any expenses during the period. |
The accompanying notes are an integral part of these financial statements.
www.brownadvisoryfunds.com
118
Financial Highlights
These financial highlights reflect selected per share data and ratios for a share outstanding of each Fund throughout each year.
BROWN ADVISORY TAX EXEMPT BOND FUND*
INVESTOR SHARES
| Year Ended: | ||||||||
| June 30, | June 30, | |||||||
| 2014 | 2013 | |||||||
| Net Asset Value, Beginning of Year | $ | 9.84 | $ | 10.00 | ||||
| Net Investment Income(a) | 0.19 | 0.13 | ||||||
| Net Realized And Unrealized Gains (Losses) | 0.19 | (0.12 | ) | |||||
| Total from Investment Operations | $ | 0.38 | $ | 0.01 | ||||
| Distributions: | ||||||||
| from Net Investment Income | (0.19 | ) | (0.13 | ) | ||||
| from Net Realized Gains | — | (c) | (0.04 | ) | ||||
| Total Distributions to Shareholders | $ | (0.19 | ) | $ | (0.17 | ) | ||
| Redemption fees(a) | — | — | (c) | |||||
| Net Asset Value, End of Year | $ | 10.03 | $ | 9.84 | ||||
| Total Return | 3.94 | % | 0.03 | % | ||||
| Net Assets at End of Year (000’s Omitted) | $ | 205,177 | $ | 161,891 | ||||
| Ratios to Average Net Assets: | ||||||||
| Net Investment Income | 1.96 | % | 1.35 | % | ||||
| Net Expenses | 0.52 | % | 0.55 | % | ||||
| Gross Expenses(b) | 0.52 | % | 0.55 | % | ||||
| Portfolio Turnover Rate | 157 | % | 87 | % | ||||
| (a) | Calculated based on average shares outstanding during the year. |
| (b) | Reflects the expense ratio excluding any waivers and/or expense reimbursements. |
| (c) | Less than $0.01 per share. |
| * | Commenced operations on June 29, 2012. No financial highlights are presented for the period from June 29, 2012 to June 30, 2012, as the Fund did not make any investments, earn any income or incur any expenses during the period. |
The accompanying notes are an integral part of these financial statements.
www.brownadvisoryfunds.com
119
Financial Highlights
These financial highlights reflect selected per share data and ratios for a share outstanding of the Fund throughout each year / period.
BROWN ADVISORY – SOMERSET EMERGING MARKETS FUND
INSTITUTIONAL SHARES
| Year / Period Ended: | ||||||||
| June 30, | June 30, | |||||||
| 2014 | 2013(f) | |||||||
| Net Asset Value, Beginning of Year / Period | $ | 9.52 | $ | 10.00 | ||||
| Net Investment Income(a) | 0.20 | 0.12 | ||||||
| Net Realized And Unrealized Gains (Losses) | 0.61 | (0.60 | ) | |||||
| Total from Investment Operations | $ | 0.81 | $ | (0.48 | ) | |||
| Distributions: | ||||||||
| from Net Investment Income | (0.11 | ) | — | (e) | ||||
| Total Distributions to Shareholders | $ | (0.11 | ) | $ | — | (e) | ||
| Redemption fees(a) | — | — | (e) | |||||
| Net Asset Value, End of Year / Period | $ | 10.22 | $ | 9.52 | ||||
| Total Return | 8.62 | % | (4.77 | )%(b) | ||||
| Net Assets at End of Year / Period (000’s Omitted) | $ | 193,676 | $ | 122,515 | ||||
| Ratios to Average Net Assets: | ||||||||
| Net Investment Income | 2.08 | % | 2.17 | %(c) | ||||
| Net Expenses | 1.25 | % | 1.41 | %(c) | ||||
| Gross Expenses(d) | 1.25 | % | 1.41 | %(c) | ||||
| Portfolio Turnover Rate | 19 | % | 19 | %(b) | ||||
| (a) | Calculated based on average shares outstanding during the year / period. |
| (b) | Not annualized. |
| (c) | Annualized. |
| (d) | Reflects the expense ratio excluding any waivers and/or expense reimbursements. |
| (e) | Less than $0.01 per share. |
| (f) | Commenced operations on December 12, 2012. The information presented is for the period from December 12, 2012 to June 30, 2013. |
The accompanying notes are an integral part of these financial statements.
www.brownadvisoryfunds.com
120
Financial Highlights
These financial highlights reflect selected per share data and ratios for a share outstanding of the Fund throughout each year / period.
BROWN ADVISORY – SOMERSET EMERGING MARKETS FUND
INVESTOR SHARES
| Year / Period Ended: | ||||||||
| June 30, | June 30, | |||||||
| 2014 | 2013(f) | |||||||
| Net Asset Value, Beginning of Year / Period | $ | 9.51 | $ | 10.00 | ||||
| Net Investment Income(a) | 0.19 | 0.11 | ||||||
| Net Realized And Unrealized Gains (Losses) | 0.61 | (0.60 | ) | |||||
| Total from Investment Operations | $ | 0.80 | $ | (0.49 | ) | |||
| Distributions: | ||||||||
| from Net Investment Income | (0.10 | ) | — | (e) | ||||
| Total Distributions to Shareholders | $ | (0.10 | ) | $ | — | (e) | ||
| Redemption fees(a) | — | — | ||||||
| Net Asset Value, End of Year / Period | $ | 10.21 | $ | 9.51 | ||||
| Total Return | 8.51 | % | (4.87 | )%(b) | ||||
| Net Assets at End of Year / Period (000’s Omitted) | $ | 24,291 | $ | 11,695 | ||||
| Ratios to Average Net Assets: | ||||||||
| Net Investment Income | 1.93 | % | 2.02 | %(c) | ||||
| Net Expenses | 1.40 | % | 1.56 | %(c) | ||||
| Gross Expenses(d) | 1.40 | % | 1.56 | %(c) | ||||
| Portfolio Turnover Rate | 19 | % | 19 | %(b) | ||||
| (a) | Calculated based on average shares outstanding during the year / period. |
| (b) | Not annualized. |
| (c) | Annualized. |
| (d) | Reflects the expense ratio excluding any waivers and/or expense reimbursements. |
| (e) | Less than $0.01 per share. |
| (f) | Commenced operations on December 12, 2012. The information presented is for the period from December 12, 2012 to June 30, 2013. |
The accompanying notes are an integral part of these financial statements.
www.brownadvisoryfunds.com
121
Financial Highlights
These financial highlights reflect selected per share data and ratios for a share outstanding of the Fund throughout each year / period.
BROWN ADVISORY – SOMERSET EMERGING MARKETS FUND
ADVISOR SHARES
| Year / Period Ended: | ||||||||
| June 30, | June 30, | |||||||
| 2014 | 2013(f) | |||||||
| Net Asset Value, Beginning of Year / Period | $ | 9.49 | $ | 10.00 | ||||
| Net Investment Income(a) | 0.16 | 0.10 | ||||||
| Net Realized And Unrealized Gains (Losses) | 0.61 | (0.61 | ) | |||||
| Total from Investment Operations | $ | 0.77 | $ | (0.51 | ) | |||
| Distributions: | ||||||||
| from Net Investment Income | (0.08 | ) | — | (e) | ||||
| Total Distributions to Shareholders | $ | (0.08 | ) | $ | — | (e) | ||
| Redemption fees(a) | — | — | ||||||
| Net Asset Value, End of Year / Period | $ | 10.18 | $ | 9.49 | ||||
| Total Return | 8.19 | % | (5.07 | )%(b) | ||||
| Net Assets at End of Year / Period (000’s Omitted) | $ | 533 | $ | 990 | ||||
| Ratios to Average Net Assets: | ||||||||
| Net Investment Income | 1.68 | % | 1.77 | %(c) | ||||
| Net Expenses | 1.65 | % | 1.81 | %(c) | ||||
| Gross Expenses(d) | 1.65 | % | 1.81 | %(c) | ||||
| Portfolio Turnover Rate | 19 | % | 19 | %(b) | ||||
| (a) | Calculated based on average shares outstanding during the year / period. |
| (b) | Not annualized. |
| (c) | Annualized. |
| (d) | Reflects the expense ratio excluding any waivers and/or expense reimbursements. |
| (e) | Less than $0.01 per share. |
| (f) | Commenced operations on December 12, 2012. The information presented is for the period from December 12, 2012 to June 30, 2013. |
The accompanying notes are an integral part of these financial statements.
www.brownadvisoryfunds.com
122
Financial Highlights
These financial highlights reflect selected per share data and ratios for a share outstanding of the Fund throughout the period.
BROWN ADVISORY – WMC STRATEGIC EUROPEAN EQUITY FUND
INSTITUTIONAL SHARES
| Period Ended | ||||
| June 30, | ||||
| 2014(e) | ||||
| Net Asset Value, Beginning of Period | $ | 10.00 | ||
| Net Investment Income(a) | 0.14 | |||
| Net Realized And Unrealized Gains | 0.32 | |||
| Total from Investment Operations | $ | 0.46 | ||
| Distributions: | ||||
| from Net Investment Income | — | |||
| Total Distributions to Shareholders | $ | — | ||
| Redemption fees(a) | — | |||
| Net Asset Value, End of Period | $ | 10.46 | ||
| Total Return | 4.60 | %(b) | ||
| Net Assets at End of Period (000’s Omitted) | $ | 202,616 | ||
| Ratios to Average Net Assets: | ||||
| Net Investment Income | 2.01 | %(c) | ||
| Net Expenses | 1.23 | %(c) | ||
| Gross Expenses(d) | 1.23 | %(c) | ||
| Portfolio Turnover Rate | 25 | %(b) | ||
| (a) | Calculated based on average shares outstanding during the period. |
| (b) | Not annualized. |
| (c) | Annualized. |
| (d) | Reflects the expense ratio excluding any waivers and/or expense reimbursements. |
| (e) | Commenced operations on October 21, 2013. The information presented is for the period from October 21, 2013 to June 30, 2014. |
The accompanying notes are an integral part of these financial statements.
www.brownadvisoryfunds.com
123
Financial Highlights
These financial highlights reflect selected per share data and ratios for a share outstanding of the Fund throughout the period.
BROWN ADVISORY – WMC STRATEGIC EUROPEAN EQUITY FUND
INVESTOR SHARES
| Period Ended | ||||
| June 30, | ||||
| 2014(e) | ||||
| Net Asset Value, Beginning of Period | $ | 10.00 | ||
| Net Investment Income(a) | 0.13 | |||
| Net Realized And Unrealized Gains | 0.32 | |||
| Total from Investment Operations | $ | 0.45 | ||
| Distributions: | ||||
| from Net Investment Income | — | |||
| Total Distributions to Shareholders | $ | — | ||
| Redemption fees(a) | — | |||
| Net Asset Value, End of Period | $ | 10.45 | ||
| Total Return | 4.50 | %(b) | ||
| Net Assets at End of Period (000’s Omitted) | $ | 18,011 | ||
| Ratios to Average Net Assets: | ||||
| Net Investment Income | 1.86 | %(c) | ||
| Net Expenses | 1.38 | %(c) | ||
| Gross Expenses(d) | 1.38 | %(c) | ||
| Portfolio Turnover Rate | 25 | %(b) | ||
| (a) | Calculated based on average shares outstanding during the period. |
| (b) | Not annualized. |
| (c) | Annualized. |
| (d) | Reflects the expense ratio excluding any waivers and/or expense reimbursements. |
| (e) | Commenced operations on October 21, 2013. The information presented is for the period from October 21, 2013 to June 30, 2014. |
The accompanying notes are an integral part of these financial statements.
www.brownadvisoryfunds.com
124
Financial Highlights
These financial highlights reflect selected per share data and ratios for a share outstanding of the Fund throughout the period.
BROWN ADVISORY – WMC STRATEGIC EUROPEAN EQUITY FUND
ADVISOR SHARES
| Period Ended | ||||
| June 30, | ||||
| 2014(e) | ||||
| Net Asset Value, Beginning of Period | $ | 10.00 | ||
| Net Investment Income(a) | 0.11 | |||
| Net Realized And Unrealized Gains | 0.33 | |||
| Total from Investment Operations | $ | 0.44 | ||
| Distributions: | ||||
| from Net Investment Income | — | |||
| Total Distributions to Shareholders | $ | — | ||
| Redemption fees(a) | — | |||
| Net Asset Value, End of Period | $ | 10.44 | ||
| Total Return | 4.40 | %(b) | ||
| Net Assets at End of Period (000’s Omitted) | $ | 240 | ||
| Ratios to Average Net Assets: | ||||
| Net Investment Income | 1.61 | %(c) | ||
| Net Expenses | 1.63 | %(c) | ||
| Gross Expenses(d) | 1.63 | %(c) | ||
| Portfolio Turnover Rate | 25 | %(b) | ||
| (a) | Calculated based on average shares outstanding during the period. |
| (b) | Not annualized. |
| (c) | Annualized. |
| (d) | Reflects the expense ratio excluding any waivers and/or expense reimbursements. |
| (e) | Commenced operations on October 21, 2013. The information presented is for the period from October 21, 2013 to June 30, 2014. |
The accompanying notes are an integral part of these financial statements.
www.brownadvisoryfunds.com
125
Financial Highlights
These financial highlights reflect selected per share data and ratios for a share outstanding of the Fund throughout the period.
BROWN ADVISORY MORTGAGE SECURITIES FUND
INSTITUTIONAL SHARES
| Period Ended | ||||
| June 30, | ||||
| 2014(e) | ||||
| Net Asset Value, Beginning of Period | $ | 10.15 | ||
| Net Investment Income(a) | 0.03 | |||
| Net Realized And Unrealized Gains | 0.02 | |||
| Total from Investment Operations | $ | 0.05 | ||
| Distributions: | ||||
| from Net Investment Income | (0.04 | ) | ||
| Total Distributions to Shareholders | $ | (0.04 | ) | |
| Redemption fees(a) | — | |||
| Net Asset Value, End of Period | $ | 10.16 | ||
| Total Return | 0.49 | %(b) | ||
| Net Assets at End of Period (000’s Omitted) | $ | 131,415 | ||
| Ratios to Average Net Assets: | ||||
| Net Investment Income | 1.98 | %(c) | ||
| Net Expenses | 0.52 | %(c) | ||
| Gross Expenses(d) | 0.52 | %(c) | ||
| Portfolio Turnover Rate | 88 | %(f) | ||
| (a) | Calculated based on average shares outstanding during the period. |
| (b) | Not annualized. |
| (c) | Annualized. |
| (d) | Reflects the expense ratio excluding any waivers and/or expense reimbursements. |
| (e) | Commenced operations on May 13, 2014. The information presented is for the period from May 13, 2014 to June 30, 2014. |
| (f) | Represents portfolio turnover, not annualized, from the inception of the Investor Shares of the Fund on December 26, 2013 to June 30, 2014. |
The accompanying notes are an integral part of these financial statements.
www.brownadvisoryfunds.com
126
Financial Highlights
These financial highlights reflect selected per share data and ratios for a share outstanding of the Fund throughout the period.
BROWN ADVISORY MORTGAGE SECURITIES FUND
INVESTOR SHARES
| Period Ended | ||||
| June 30, | ||||
| 2014(e) | ||||
| Net Asset Value, Beginning of Period | $ | 10.00 | ||
| Net Investment Income(a) | 0.10 | |||
| Net Realized And Unrealized Gains | 0.16 | |||
| Total from Investment Operations | $ | 0.26 | ||
| Distributions: | ||||
| from Net Investment Income | (0.10 | ) | ||
| Total Distributions to Shareholders | $ | (0.10 | ) | |
| Redemption fees(a) | — | |||
| Net Asset Value, End of Period | $ | 10.16 | ||
| Total Return | 2.62 | %(b) | ||
| Net Assets at End of Period (000’s Omitted) | $ | 67,776 | ||
| Ratios to Average Net Assets: | ||||
| Net Investment Income | 1.93 | %(c) | ||
| Net Expenses | 0.57 | %(c) | ||
| Gross Expenses(d) | 0.57 | %(c) | ||
| Portfolio Turnover Rate | 88 | %(b) | ||
| (a) | Calculated based on average shares outstanding during the period. |
| (b) | Not annualized. |
| (c) | Annualized. |
| (d) | Reflects the expense ratio excluding any waivers and/or expense reimbursements. |
| (e) | Commenced operations on December 26, 2013. The information presented is for the period from December 26, 2013 to June 30, 2014. |
The accompanying notes are an integral part of these financial statements.
www.brownadvisoryfunds.com
127
Financial Highlights
These financial highlights reflect selected per share data and ratios for a share outstanding of the Fund throughout the period.
BROWN ADVISORY – WMC JAPAN ALPHA OPPORTUNITIES FUND
INSTITUTIONAL SHARES
| Period Ended | ||||
| June 30, | ||||
| 2014(e) | ||||
| Net Asset Value, Beginning of Period | $ | 10.00 | ||
| Net Investment Income(a) | 0.05 | |||
| Net Realized And Unrealized Gains | 0.45 | |||
| Total from Investment Operations | $ | 0.50 | ||
| Redemption fees(a) | — | |||
| Net Asset Value, End of Period | $ | 10.50 | ||
| Total Return | 5.00 | %(b) | ||
| Net Assets at End of Period (000’s Omitted) | $ | 1,080,717 | ||
| Ratios to Average Net Assets: | ||||
| Net Investment Income | 1.59 | %(c) | ||
| Net Expenses | 1.21 | %(c) | ||
| Gross Expenses(d) | 1.21 | %(c) | ||
| Portfolio Turnover Rate | 26 | %(b) | ||
| (a) | Calculated based on average shares outstanding during the period. |
| (b) | Not annualized. |
| (c) | Annualized. |
| (d) | Reflects the expense ratio excluding any waivers and/or expense reimbursements. |
| (e) | Commenced operations on March 4, 2014. The information presented is for the period from March 4, 2014 to June 30, 2014. |
The accompanying notes are an integral part of these financial statements.
www.brownadvisoryfunds.com
128
Financial Highlights
These financial highlights reflect selected per share data and ratios for a share outstanding of the Fund throughout the period.
BROWN ADVISORY – WMC JAPAN ALPHA OPPORTUNITIES FUND
INVESTOR SHARES
| Period Ended | ||||
| June 30, | ||||
| 2014(e) | ||||
| Net Asset Value, Beginning of Period | $ | 10.00 | ||
| Net Investment Income(a) | 0.05 | |||
| Net Realized And Unrealized Gains | 0.44 | |||
| Total from Investment Operations | $ | 0.49 | ||
| Redemption fees(a) | — | |||
| Net Asset Value, End of Period | $ | 10.49 | ||
| Total Return | 4.90 | %(b) | ||
| Net Assets at End of Period (000’s Omitted) | $ | 4,522 | ||
| Ratios to Average Net Assets: | ||||
| Net Investment Income | 1.44 | %(c) | ||
| Net Expenses | 1.36 | %(c) | ||
| Gross Expenses(d) | 1.36 | %(c) | ||
| Portfolio Turnover Rate | 26 | %(b) | ||
| (a) | Calculated based on average shares outstanding during the period. |
| (b) | Not annualized. |
| (c) | Annualized. |
| (d) | Reflects the expense ratio excluding any waivers and/or expense reimbursements. |
| (e) | Commenced operations on March 4, 2014. The information presented is for the period from March 4, 2014 to June 30, 2014. |
The accompanying notes are an integral part of these financial statements.
www.brownadvisoryfunds.com
129
Financial Highlights
These financial highlights reflect selected per share data and ratios for a share outstanding of the Fund throughout the period.
BROWN ADVISORY – WMC JAPAN ALPHA OPPORTUNITIES FUND
ADVISOR SHARES
| Period Ended | ||||
| June 30, | ||||
| 2014(e) | ||||
| Net Asset Value, Beginning of Period | $ | 10.00 | ||
| Net Investment Income(a) | 0.04 | |||
| Net Realized And Unrealized Gains | 0.44 | |||
| Total from Investment Operations | $ | 0.48 | ||
| Redemption fees(a) | — | |||
| Net Asset Value, End of Period | $ | 10.48 | ||
| Total Return | 4.80 | %(b) | ||
| Net Assets at End of Period (000’s Omitted) | $ | 59 | ||
| Ratios to Average Net Assets: | ||||
| Net Investment Income | 1.19 | %(c) | ||
| Net Expenses | 1.61 | %(c) | ||
| Gross Expenses(d) | 1.61 | %(c) | ||
| Portfolio Turnover Rate | 26 | %(b) | ||
| (a) | Calculated based on average shares outstanding during the period. |
| (b) | Not annualized. |
| (c) | Annualized. |
| (d) | Reflects the expense ratio excluding any waivers and/or expense reimbursements. |
| (e) | Commenced operations on March 4, 2014. The information presented is for the period from March 4, 2014 to June 30, 2014. |
The accompanying notes are an integral part of these financial statements.
www.brownadvisoryfunds.com
130
Notes to Financial Statements
June 30, 2014
Note 1. Organization
The Brown Advisory Growth Equity Fund (“Growth Equity Fund”), Brown Advisory Value Equity Fund (“Value Equity Fund”), Brown Advisory Flexible Equity Fund (“Flexible Equity Fund”), Brown Advisory Small-Cap Growth Fund (“Small-Cap Growth Fund”), Brown Advisory Small-Cap Fundamental Value Fund (“Small-Cap Fundamental Value Fund”), Brown Advisory Opportunity Fund (“Opportunity Fund”), Brown Advisory Maryland Bond Fund (“Maryland Bond Fund”), Brown Advisory Intermediate Income Fund (“Intermediate Income Fund”), Brown Advisory Tactical Bond Fund (“Tactical Bond Fund”), Brown Advisory Equity Income Fund (“Equity Income Fund”), Brown Advisory Sustainable Growth Fund (“Sustainable Growth Fund”), Brown Advisory Tax Exempt Bond Fund (“Tax Exempt Bond Fund”), Brown Advisory – Somerset Emerging Markets Fund (“Emerging Markets Fund”), Brown Advisory – WMC Strategic European Equity Fund (“Strategic European Equity Fund”), Brown Advisory Mortgage Securities Fund (“Mortgage Securities Fund”) and Brown Advisory – WMC Japan Alpha Opportunities Fund (“Japan Alpha Opportunities Fund”) (individually a “Fund,” and collectively, the “Funds”) are each a series of shares of beneficial interest of Brown Advisory Funds (the “Trust”), which is registered under the Investment Company Act of 1940 as an open-ended management investment company. Prior to October 19, 2012, the Funds, except for the Sustainable Growth Fund, Tax Exempt Bond Fund, Emerging Markets Fund, Strategic European Equity Fund, Mortgage Securities Fund, and Japan Alpha Opportunities Fund, were series of Professionally Managed Portfolios Trust. Prior to April 12, 2010, the Funds, except for the Tactical Bond Fund, Equity Income Fund, Sustainable Growth Fund, Tax Exempt Bond Fund, Emerging Markets Fund, Strategic European Equity Fund, Mortgage Securities Fund, and Japan Alpha Opportunities Fund, each of which had yet to commence operations, were part of the Forum Funds Trust.
The Funds commenced operations as follows:
| Institutional | Investor | Advisor | ||||||||
| Shares | Shares | Shares | ||||||||
| Growth Equity Fund | 10/19/2012 | 6/28/1999 | * | 5/18/2006 | ** | |||||
| Value Equity Fund | 10/19/2012 | 1/28/2003 | * | 4/25/2006 | ** | |||||
| Flexible Equity Fund | 10/19/2012 | 11/30/2006 | * | 1/24/2007 | ** | |||||
| Small-Cap Growth Fund | 9/20/2002 | *** | 6/28/1999 | * | 4/25/2006 | ** | ||||
| Small-Cap Fundamental Value Fund | 10/19/2012 | 12/31/2008 | * | 7/28/2011 | ||||||
| Opportunity Fund | — | 6/29/1998 | * | — | ||||||
| Maryland Bond Fund | — | 12/21/2000 | * | — | ||||||
| Intermediate Income Fund | — | 11/2/1995 | * | 5/13/1991 | ** | |||||
| Tactical Bond Fund | — | — | 9/30/2011 | |||||||
| Equity Income Fund | 10/19/2012 | 12/29/2011 | * | 12/29/2011 | ||||||
| Sustainable Growth Fund | 6/29/2012 | 6/29/2012 | 6/29/2012 | |||||||
| Tax Exempt Bond Fund | — | 6/29/2012 | — | |||||||
| Emerging Markets Fund | 12/12/2012 | 12/12/2012 | 12/12/2012 | |||||||
| Strategic European Equity Fund | 10/21/2013 | 10/21/2013 | 10/21/2013 | |||||||
| Mortgage Securities Fund | 5/13/2014 | 12/26/2013 | — | |||||||
| Japan Alpha Opportunities Fund | 3/4/2014 | 3/4/2014 | 3/4/2014 |
| * | Prior to October 19, 2012, Investor Shares were known as Institutional Shares. | |
| ** | Prior to July 1, 2011, Advisor Shares were known as A Shares. | |
| *** | Prior to October 19, 2012, Small-Cap Growth Fund Institutional Shares were known as D Shares. |
Each share class has equal rights as to earnings and assets except that each class bears different shareholder servicing and distribution expenses. Each share class has exclusive voting rights with respect to matters that affect just that class. Income, expenses (other than expenses attributable to a specific class), and realized and unrealized gains or losses on investments are allocated to each share class on its relative net assets.
The investment objective of Growth Equity Fund and Small-Cap Growth Fund is to achieve capital appreciation by primarily investing in equity securities. The investment objective of Value Equity Fund and Tactical Bond Fund is to achieve capital appreciation. The investment objective of Small-Cap Fundamental Value Fund and Opportunity Fund is to achieve long-term capital appreciation. Flexible Equity Fund’s investment objective is to achieve long-term growth of capital. Maryland Bond Fund’s
www.brownadvisoryfunds.com
131
Notes to Financial Statements
June 30, 2014
investment objective is to provide a high level of current income exempt from both Federal and Maryland State income taxes without undue risk. Intermediate Income Fund’s investment objective is to provide a high level of current income consistent with preservation of principal within an intermediate-term maturity structure. Equity Income Fund’s investment objective is to provide current dividend yield and dividend growth. Sustainable Growth Fund’s investment objective is to seek capital appreciation by investing at least 80% of its net assets in equity securities of environmentally sustainable domestic companies. Tax Exempt Bond Fund’s investment objective is to seek to provide a high level of current income exempt from Federal income tax by investing primarily in intermediate-term investment grade municipal bonds. The investment objective of the Emerging Markets Fund is to seek to achieve total return by investing principally in equity securities issued by companies established or operating in emerging markets. The investment objective of the Strategic European Equity Fund seeks to achieve total return by investing principally in equity securities issued by companies established or operating in Europe. The investment objective of the Mortgage Securities Fund seeks to maximize total return consistent with preservation of capital. The investment objective of the Japan Alpha Opportunities Fund seeks to achieve total return by investing principally in equity securities of companies which are domiciled in or exercise the predominant part of their economic activity in Japan, while also limiting exposure to fluctuations between the value of the Japanese yen and the U.S. dollar.
Note 2. Significant Accounting Policies
The following is a summary of significant accounting policies consistently followed by the Funds. These policies are in conformity with accounting principles generally accepted in the United States of America.
A. Security Valuation – The Funds have adopted fair valuation accounting standards which establish and authoritative definition of fair value and set out a hierarchy for measuring fair value. These standards require additional disclosures about the various inputs and valuation techniques used to develop the measurements of fair value and a discussion of changes in valuation techniques and related inputs, if any, during the period. These inputs are summarized in the three broad levels listed below:
| Level 1 – | Quoted prices in active markets for identical securities. |
| Level 2 – | Evaluated price based on other significant observable inputs (including quoted prices for similar securities, interest rates, prepayment spreads, credit risk, etc). |
| Level 3 – | Significant unobservable inputs (including the Fund’s own assumptions in determining the fair value of investments). |
The inputs or methodology used for valuing securities are not necessarily an indication of the risk associated with investing in those securities.
Equity securities that are traded on a national securities exchange, except those listed on the NASDAQ Global Market® (“NASDAQ”), are valued at the last reported sale price on the exchange on which the security is principally traded. Securities traded on NASDAQ will be valued at the NASDAQ Official Closing Price (“NOCP”). If, on a particular day, an exchange-traded or NASDAQ security does not trade, then the mean between the most recent quoted bid and asked prices will be used. All equity securities that are not traded on a listed exchange are valued at the last sale price in the over-the counter market. If a non-exchange traded security does not trade on a particular day, then the mean between the last quoted closing bid and asked price will be used. Such domestic equity securities are typically categorized as Level 1 securities.
For foreign securities that are traded on foreign exchanges, the Funds have selected Interactive Data Corporation (“IDC”) to provide pricing data for those such securities that are held by the Funds. The use of IDC’s pricing services with respect to these foreign exchange traded securities is designed to capture events occurring after a foreign exchange closes that may affect the value of certain holdings of the Funds that are traded on those foreign exchanges. The Funds utilize a confidence interval when determining whether or not to utilize these prices provided by IDC. The confidence interval is a measure of the relationship that each foreign exchange traded security has to movements in various indices and the price of the foreign exchange traded security’s corresponding American Depositary Receipt, if one exists. IDC provides a confidence interval for each foreign exchange traded security for which it provides a price. If the confidence interval provided by IDC is equal to or greater than a predefined level utilized by the Funds, the Funds will value that foreign exchange traded security at that price. If the confidence interval provided by IDC is less than the predefined level utilized by the Funds, the Funds will value that foreign exchange traded security at the preceding closing price on its respective foreign exchange, or, if there were no transactions on the preceding day, at the mean between the bid and the asked prices. Such foreign securities are typically categorized as Level 2 securities. Foreign securities for which the local market closing prices are utilized are typically categorized as Level 1 securities.
www.brownadvisoryfunds.com
132
Notes to Financial Statements
June 30, 2014
Debt securities are valued by using the mean between the closing bid and asked prices provided by an independent pricing service. If the closing bid and asked prices are not readily available, the independent pricing service may provide a price determined by a matrix pricing method. These techniques generally consider such factors as yields or prices of bonds of comparable quality, type of issue, coupon, maturity, ratings and general market conditions. Fixed income debt instruments, such as commercial paper, banker’s acceptances and U.S. Treasury Bills, having a maturity of less than 60 days are valued at amortized cost. Any discount or premium is accreted or amortized on a straight-line basis until maturity. Such debt securities are typically categorized as Level 2.
Exchange traded options are valued at the composite price, using the National Best Bid and Offer quotes (NBBO). NBBO consists of the highest bid price and lowest ask price across any of the exchanges on which an option is quoted, thus providing a view across the entire U.S. options marketplace. Specifically, composite pricing calculates the mean of the highest bid price and lowest ask price across the exchanges where the option is traded. The Funds did not hold any options during the year ended June 30, 2014, but such options would typically be considered Level 2 securities.
Futures contracts are generally valued at the settlement prices established each day on the exchange on which they are traded and are categorized as Level 1 securities.
Forward foreign currency contracts are valued at the prevailing forward exchange rate of the underlying currencies and are categorized as Level 2 securities.
Credit default swaps are valued based upon the daily closing price of the underlying index or reference entity and are categorized as Level 2 securities.
Securities for which quotations are not readily available are valued at their respective fair values as determined in good faith under guidelines and procedures adopted by the Board of Trustees. These are generally considered Level 3 securities. When a security is “fair valued,” consideration is given to the facts and circumstances relevant to the particular situation, including a review of various factors set forth in the guidelines and procedures adopted by the Board of Trustees. Fair value pricing is an inherently subjective process, and no single standard exists for determining fair value. Different funds could reasonably arrive at different values for the same security. The use of fair value pricing by a fund may cause the net asset value of its shares to differ significantly from the net asset value that would be calculated without regard to such considerations. As of June 30, 2014, the Small-Cap Growth Fund was the only fund that held any fair valued securities. As of June 30, 2014, the Small-Cap Growth Fund held fair valued securities with a total market value of $2,305,498 or 0.8% of total net assets.
The following is a summary of inputs used to value the Funds’ investments as of June 30, 2014:
| Level 1 | Level 2 | Level 3 | ||||||||||
| Growth Equity Fund | ||||||||||||
| Common Stocks | $ | 2,709,536,646 | $ | — | $ | — | ||||||
| Short-Term Investments | 78,492,937 | — | — | |||||||||
| Total Investments in Securities | $ | 2,788,029,583 | $ | — | $ | — | ||||||
| Level 1 | Level 2 | Level 3 | ||||||||||
| Value Equity Fund | ||||||||||||
| Common Stocks | $ | 233,562,848 | $ | — | $ | — | ||||||
| Short-Term Investments | 9,433,414 | — | — | |||||||||
| Total Investments in Securities | $ | 242,996,262 | $ | — | $ | — | ||||||
| Level 1 | Level 2 | Level 3 | ||||||||||
| Flexible Equity Fund | ||||||||||||
| Common Stocks | $ | 167,917,283 | $ | — | $ | — | ||||||
| Warrants | 540,000 | — | — | |||||||||
| Short-Term Investments | 10,090,890 | — | — | |||||||||
| Total Investments in Securities | $ | 178,548,173 | $ | — | $ | — | ||||||
www.brownadvisoryfunds.com
133
Notes to Financial Statements
June 30, 2014
| Level 1 | Level 2 | Level 3 | ||||||||||
| Small-Cap Growth Fund | ||||||||||||
| Common Stocks | $ | 289,747,506 | $ | — | $ | — | ||||||
| Private Placements | — | — | 2,305,498 | |||||||||
| Short-Term Investments | 10,572,132 | — | — | |||||||||
| Total Investments in Securities | $ | 300,319,638 | $ | — | $ | 2,305,498 | ||||||
| Level 1 | Level 2 | Level 3 | ||||||||||
| Small-Cap Fundamental Value Fund | ||||||||||||
| Common Stocks | $ | 555,371,171 | $ | — | $ | — | ||||||
| Real Estate Investment Trusts | 32,385,241 | — | — | |||||||||
| Short-Term Investments | 25,059,989 | — | — | |||||||||
| Total Investments in Securities | $ | 612,816,401 | $ | — | $ | — | ||||||
| Level 1 | Level 2 | Level 3 | ||||||||||
| Opportunity Fund | ||||||||||||
| Common Stocks | $ | 11,483,933 | $ | — | $ | — | ||||||
| Short-Term Investments | 179,902 | — | — | |||||||||
| Total Investments in Securities | $ | 11,663,835 | $ | — | $ | — | ||||||
| Level 1 | Level 2 | Level 3 | ||||||||||
| Maryland Bond Fund | ||||||||||||
| Municipal Bonds | $ | — | $ | 198,479,963 | $ | — | ||||||
| Short-Term Investments | 3,434,566 | — | — | |||||||||
| Total Investments in Securities | $ | 3,434,566 | $ | 198,479,963 | $ | — | ||||||
| Level 1 | Level 2 | Level 3 | ||||||||||
| Intermediate Income Fund | ||||||||||||
| U.S. Treasury Securities | $ | — | $ | 77,941,862 | $ | — | ||||||
| Corporate Bonds & Notes | — | 54,701,989 | — | |||||||||
| Municipal Bonds | — | 24,549,773 | — | |||||||||
| Mortgage Backed Securities | — | 21,553,864 | — | |||||||||
| Asset Backed Securities | — | 2,068,985 | — | |||||||||
| Affiliated Mutual Funds (Note 3) | 25,008,867 | — | — | |||||||||
| Short-Term Investments | 11,823,379 | — | — | |||||||||
| Total Investments in Securities | $ | 36,832,246 | $ | 180,816,473 | $ | — | ||||||
| Level 1 | Level 2 | Level 3 | ||||||||||
| Tactical Bond Fund | ||||||||||||
| U.S. Treasury Securities | $ | — | $ | 10,009,429 | $ | — | ||||||
| Municipal Bonds | — | 5,658,840 | — | |||||||||
| Mutual Funds | 587,673 | — | — | |||||||||
| Short-Term Investments | 2,088,016 | 6,898,729 | — | |||||||||
| Total Investments in Securities | $ | 2,675,689 | $ | 22,566,998 | $ | — | ||||||
| Credit Default Swaps* | $ | — | $ | 151,550 | $ | — | ||||||
| Level 1 | Level 2 | Level 3 | ||||||||||
| Equity Income Fund | ||||||||||||
| Common Stocks | $ | 171,306,147 | $ | — | $ | — | ||||||
| Preferred Stocks | 7,104,688 | — | — | |||||||||
| Real Estate Investment Trusts | 12,816,347 | — | — | |||||||||
| Short-Term Investments | 11,861,755 | — | — | |||||||||
| Total Investments in Securities | $ | 203,088,937 | $ | — | $ | — | ||||||
www.brownadvisoryfunds.com
134
Notes to Financial Statements
June 30, 2014
| Level 1 | Level 2 | Level 3 | ||||||||||
| Sustainable Growth Fund | ||||||||||||
| Common Stocks | $ | 204,048,892 | $ | — | $ | — | ||||||
| Short-Term Investments | 6,116,641 | — | — | |||||||||
| Total Investments in Securities | $ | 210,165,533 | $ | — | $ | — | ||||||
| Level 1 | Level 2 | Level 3 | ||||||||||
| Tax Exempt Bond Fund | ||||||||||||
| Municipal Bonds | $ | — | $ | 195,385,896 | $ | — | ||||||
| Short-Term Investments | 13,597,430 | — | — | |||||||||
| Total Investments in Securities | $ | 13,597,430 | $ | 195,385,896 | $ | — | ||||||
| Level 1 | Level 2 | Level 3 | ||||||||||
| Emerging Markets Fund | ||||||||||||
| Common Stocks | $ | 27,532,357 | $ | 144,200,713 | $ | — | ||||||
| Preferred Stocks | 3,105,703 | — | — | |||||||||
| Exchange Traded Funds | 8,152,527 | — | — | |||||||||
| Rights | 98,986 | — | — | |||||||||
| Short-Term Investments | 34,843,506 | — | — | |||||||||
| Total Investments in Securities | $ | 73,733,079 | $ | 144,200,713 | $ | — | ||||||
| Level 1 | Level 2 | Level 3 | ||||||||||
| Strategic European Equity Fund | ||||||||||||
| Common Stocks | $ | 2,386,802 | $ | 215,398,077 | $ | — | ||||||
| Short-Term Investments | 3,726,461 | — | — | |||||||||
| Total Investments in Securities | $ | 6,113,263 | $ | 215,398,077 | $ | — | ||||||
| Level 1 | Level 2 | Level 3 | ||||||||||
| Mortgage Securities Fund | ||||||||||||
| Mortgage Backed Securities | $ | — | $ | 162,588,634 | $ | — | ||||||
| Local Government Housing Agency Bonds | — | 28,443,969 | — | |||||||||
| Asset Backed Securities | — | 1,246,670 | — | |||||||||
| Short-Term Investments | 6,485,585 | — | — | |||||||||
| Total Investments in Securities | $ | 6,485,585 | $ | 192,279,273 | $ | — | ||||||
| Level 1 | Level 2 | Level 3 | ||||||||||
| Japan Alpha Opportunities Fund | ||||||||||||
| Common Stocks | $ | 5,112,391 | $ | 996,788,846 | $ | — | ||||||
| Real Estate Investment Trusts | — | 6,138,654 | — | |||||||||
| Mutual Funds | 6,248,263 | — | — | |||||||||
| Short-Term Investments | 76,886,727 | — | ||||||||||
| Total Investments in Securities | $ | 88,247,381 | $ | 1,002,927,500 | $ | — | ||||||
| Forward Currency Exchange Contracts* | $ | — | $ | (6,455,309 | ) | $ | — | |||||
| Future Contracts* | $ | 1,169,594 | $ | — | $ | — | ||||||
* Unrealized Appreciation (Depreciation)
As of June 30, 2013, the Intermediate Income Fund had a Level 3 security with a market value of $1,485,888. This security has since become a Level 2 Security during the year ended June 30, 2014 and is now being priced by an outside pricing vendor.
www.brownadvisoryfunds.com
135
Notes to Financial Statements
June 30, 2014
The following is a reconciliation of Level 3 securities for which significant unobservable inputs were used to determine fair value.
| Small-Cap Growth Fund | ||||
| Balance as of June 30, 2013 | $ | 1,740,560 | ||
| Purchases | 80,000 | |||
| Returns of Capital | (371,000 | ) | ||
| Change in Unrealized Appreciation | 855,938 | |||
| Balance as of June 30, 2014 | $ | 2,305,498 | ||
The inputs utilized in valuing these securities consist of annual audited financial statements and quarterly capital statements which are provided by the issuer. These valuations are adjusted periodically for certain events (additional contributions of capital or purchases made by the Fund, distributions to the Fund made by the issuer, etc) that may occur prior to receipt of the next quarterly capital statement or Annual Report.
B. Securities Transactions and Investment Income – Investment securities transactions are accounted for on the trade date. Discounts/premiums on debt securities purchased are accreted/amortized over the life of the respective securities using the effective interest method. Dividend income is recorded on the ex-dividend date. Interest income is recorded on an accrual basis. Foreign dividend income is recorded on the ex-dividend date or as soon as practical after a Fund determines the existence of a dividend declaration after exercising reasonable due diligence. Income and capital gains on some foreign securities may be subject to foreign withholding taxes, which are accrued as applicable. Identified cost of investments sold is used to determine the gain and loss for both financial statement and Federal income tax purposes. Distributions deemed to be a return of capital are recorded as a reduction of the cost of the related investments.
C. Foreign Currency – Investment securities and other assets and liabilities denominated in foreign currencies are translated into U.S. Dollar amounts at the date of valuation. Purchases and sales of investment securities and income and expense items denominated in foreign currencies are translated into U.S. Dollar amounts on the respective dates of such transactions.
The Funds do not isolate the portion of the results of operations resulting from changes in foreign exchange rates on investments from the fluctuations arising from changes in market prices of securities held. Such fluctuations are included with the net realized and unrealized gain or loss from investments.
The Funds report net realized foreign exchange gains and losses that arise from sales of foreign currencies, currency gains or losses realized between the trade and settlement dates on securities transactions, and the difference between the amounts of dividends, interest, and foreign withholding taxes recorded on the Fund’s books and the U.S. Dollar equivalent of the amounts actually received or paid. Net unrealized foreign exchange gains and losses arise from changes in the fair values of the assets and liabilities, other than investments in securities at fiscal year end, resulting from changes in exchange rates.
The Japan Alpha Opportunities Fund invests in forward foreign currency contracts (see Note 7) in order to limit exposure to the fluctuations in value of the Japanese Yen. The Japan Alpha Opportunities Fund does isolate realized and unrealized gains and losses from forward foreign currency exchange contracts. These amounts are presented separately from realized and unrealized gains and losses from investments in the financial statements.
D. Options – The Funds may invest in options. When a Fund writes an option, an amount equal to the premium received by a Fund is recorded as a liability and is subsequently adjusted to the current value of the option written. Premiums received from writing options that expire unexercised are treated by a Fund on the expiration date as realized gain from investments. The difference between the premium and the amount paid on effecting a closing purchase transaction, including brokerage commissions, is also treated as a realized gain, or if the premium is less than the amount paid for closing purchase transaction, as a realized loss. If a call option is exercised, the premium is added to the proceeds from the sale of the underlying security or currency determining whether a Fund has a realized gain or loss. If a put option is exercised, the premium reduces the cost basis of the securities purchase by a Fund. A Fund, as a writer of an option, bears the market risk of an unfavorable change in the price of the security underlying the written option.
When a Fund purchases an option, an amount equal to the premium paid by a Fund is recorded as an investment and is subsequently adjusted to the current value of the option purchased. If an option expires on the stipulated expiration date or if a
www.brownadvisoryfunds.com
136
Notes to Financial Statements
June 30, 2014
Fund enters into a closing sale transaction, a gain or loss is realized. If a call option is exercised, the cost of the security acquired is increased by the premium paid for the call. If a put option is exercised, a gain or loss is realized from the sale of the underlying security, and the proceeds from such sale are decreased by the premium originally paid. Written and purchased options are non-income producing securities.
No options were held by the Funds during the year ended June 30, 2014.
E. Distributions to Shareholders – For the Maryland Bond Fund and Tax Exempt Bond Fund distributions of net investment income, if any, are declared daily and paid monthly. Distributions to shareholders of net investment income, if any, are declared and paid monthly for the Intermediate Income Fund and Mortgage Securities Fund and quarterly for the Equity Income Fund. The remaining Funds declare and pay net investment income, if any, at least annually. Distributions to shareholders of net capital gains, if any, are declared and paid at least annually. Distributions are recorded on the ex-dividend date.
F. Use of Estimates – The preparation of financial statements in conformity with accounting principles generally accepted in the United States of America requires management to make estimates and assumptions that affect the reported amounts of assets and liabilities at the date of the financial statements and the reported amount of revenue and expenses during the reporting period. Actual results could differ from those estimates.
G. Federal Taxes – Each Fund has elected to be taxed as a “regulated investment company” and intends to distribute substantially all taxable income to its shareholders and otherwise comply with the provisions of the Internal Revenue Code applicable to regulated investment companies. Therefore, no provision for federal income taxes or excise taxes has been made.
The Funds recognize tax benefits of uncertain tax positions only where the position is “more likely than not” to be sustained assuming examination by tax authorities.
The Funds have analyzed their tax positions and have concluded that no liability for unrecognized tax benefits should be recorded related to uncertain income tax positions taken on returns filed for open tax years as of June 30, 2014. The Funds identify their major tax jurisdictions as U.S. Federal and Delaware State; however the Funds are not aware of any tax position for which it is reasonably possible that the total amounts of unrecognized tax benefits will change materially in the next year.
H. Redemption Fees – A shareholder who redeems or exchanges shares of the Funds within fourteen days of purchase will incur a redemption fee of 1.00% of the current net asset value of shares redeemed or exchanged, subject to certain exceptions. The fee is charged for the benefit of the remaining shareholders and will be paid to the Fund to help offset transaction costs. The fee is accounted for as an addition to paid-in capital. Each Fund reserves the right to modify the terms of or terminate the fee at any time. There are limited exceptions to the imposition of the redemption fee.
I. Guarantees and Indemnifications – In the normal course of business, the Funds enter into contracts with service providers that contain general indemnification clauses. The Funds’ maximum exposure under these arrangements is unknown as this would involve future claims that may be made against the Funds that have not yet occurred. However, based on experience, the Funds expect the risk of loss to be remote.
J. Subsequent Events – In preparing these financial statements, the Funds have evaluated events and transactions for potential recognition through the date the financial statements were issued.
www.brownadvisoryfunds.com
137
Notes to Financial Statements
June 30, 2014
Note 3. Commitments and Other Affiliated Party Transactions
Investment Adviser – Brown Advisory, LLC serves as Investment Adviser (“the Adviser”) to the Funds. Pursuant to investment advisory agreements, the Adviser receives an advisory fee, accrued daily and payable monthly, from each Fund at an annual rate of the Fund’s average daily net assets as follows:
| Annual Advisory Fee | |
| Growth Equity Fund | 0.60% |
| Value Equity Fund | 0.60% |
| Flexible Equity Fund | 0.60% |
| Small-Cap Growth Fund | 0.85% |
| Small-Cap Fundamental Value Fund | 0.85% |
| Opportunity Fund | 0.85% |
| Maryland Bond Fund | 0.30% |
| Intermediate Income Fund | 0.30% |
| Tactical Bond Fund | 0.60% |
| Equity Income Fund | 0.60% |
| Sustainable Growth Fund | 0.60% |
| Tax Exempt Bond Fund | 0.30% |
| Emerging Markets Fund* | 0.90% |
| Strategic European Equity Fund** | 0.90% |
| Mortgage Securities Fund | 0.30% |
| Japan Alpha Opportunities Fund** | 1.00% |
| * | Subject to the general oversight of the Adviser and Board of Trustees during the period ended June 30, 2014, Somerset Capital Management, LLP (“Somerset”), served as sub-adviser to the Emerging Markets Fund and made investment decisions on its behalf. Somerset is compensated for its services by the Adviser. | |
| ** | Subject to the general oversight of the Adviser and Board of Trustees during the period ended June 30, 2014. Wellington Management Company, LLC (“Wellington”), served as sub-adviser to the Strategic European Equity Fund and the Japan Alpha Opportunities Fund and made investment decisions on their behalf. Wellington is compensated for its services by the Adviser. |
The Adviser is also entitled to receive an annual business management fee of 0.05%, accrued daily and payable monthly, of the Funds’ average daily net assets in exchange for its management and oversight of the non-investment advisory services provided to the Funds and the Trust.
Fee Waivers and Expense Reimbursements (Operating Expense Caps) – The Adviser has contractually agreed to waive a portion of its fees and reimburse certain expenses to limit total annual operating expenses for each or the class’ average daily net assets for the Funds noted below:
| Institutional Shares | Investor Shares | Advisor Shares | |
| Growth Equity Fund | 1.00% | 1.15% | 1.35% |
| Value Equity Fund | 1.00% | 1.15% | 1.35% |
| Flexible Equity Fund | 1.00% | 1.15% | 1.35% |
| Small-Cap Growth Fund | 1.25% | 1.40% | 1.60% |
| Small-Cap Fundamental Value Fund | 1.25% | 1.40% | 1.60% |
| Opportunity Fund | 1.35% | 1.50% | 1.70% |
| Maryland Bond Fund | 0.55% | 0.60% | 0.80% |
| Intermediate Income Fund | 0.55% | 0.60% | 0.80% |
| Tactical Bond Fund | 1.40% | 1.55% | 1.75% |
| Equity Income Fund | 1.00% | 1.15% | 1.35% |
| Sustainable Growth Fund | 1.00% | 1.15% | 1.35% |
| Tax Exempt Bond Fund | 0.55% | 0.60% | 0.80% |
| Emerging Markets Fund | 1.60% | 1.75% | 2.00% |
| Strategic European Equity Fund | 1.60% | 1.75% | 2.00% |
| Mortgage Securities Fund | 0.55% | 0.60% | 0.80% |
| Japan Alpha Opportunities Fund | 1.70% | 1.85% | 2.10% |
www.brownadvisoryfunds.com
138
Notes to Financial Statements
June 30, 2014
For the year ended June 30, 2014, the Adviser waived $2,527 in expenses for the Opportunity Fund and recouped $18,551 in previously waived fees from the Flexible Equity Fund. The Adviser is permitted to seek reimbursement from the Funds for fees waived and/or Fund expenses it pays over the following three years after such payment. The Funds must pay their current ordinary operating expenses before the Adviser is entitled to any reimbursement of fees and/or expenses. At June 30, 2014, the cumulative amounts of previously waived fees that the Adviser may recoup from the Opportunity Fund was $43,992. The Adviser may recoup portions of the above amount no later than the dates below:
| June 30, | ||||||||||||
| 2015 | 2016 | 2017 | ||||||||||
| Opportunity Fund | $ | 22,493 | $ | 18,972 | $ | 2,527 | ||||||
During the year ended June 30, 2014, $35,673 of fees previously waived by the Adviser in the Opportunity Fund expired without being recouped. These fees may no longer be recouped from the Fund by the Adviser.
Distribution – Quasar Distributors, LLC (“the Distributor”) serves as principal underwriter for shares of the Funds, and acts as each Fund’s Distributor in a continuous public offering of each Fund’s shares. The Distributor is an affiliate of the Administrator.
Under a Distribution Plan adopted pursuant to Rule 12b-1 under the Act (“Distribution Plan”), each Fund pays the Distributor or any other entity as authorized by the Board, as compensation for the distribution-related and/or shareholder services provided by such entities an aggregate fee equal to 0.25% of the average daily net assets of Advisor Shares for each Fund. The Distributor may pay any or all amounts received under the Rule 12b-1 Plan to other persons, including the Adviser, for any distribution or service activity.
The Trust has also adopted a Shareholder Service Plan under which each Fund may pay a fee of up to 0.15% of the average daily net assets of each Fund’s Investor and Advisor Shares (except for the Maryland Bond Fund, Intermediate Income Fund, Tax Exempt Bond Fund and Mortgage Securities Fund, which may pay a fee of up to 0.05%) for shareholder services provided to the Funds by financial institutions, including the Adviser.
Investments in Affiliates – The Intermediate Income Fund and Mortgage Securities Fund are considered affiliates since Brown Advisory, LLC is the Adviser to both of the Funds. In seeking to achieve its investment objective, the Intermediate Income Fund began investing a portion of its assets into the Institutional Shares of the Mortgage Securities Fund beginning in May of 2014. As of June 30, 2014, the Intermediate Income Fund owned Institutional Shares of the Mortgage Securities Fund with a total market value of $25,008,867, or 11.4% of the Intermediate Income Fund’s net assets.
The Intermediate Income Fund has entered into a Fee Waiver Agreement (“the Agreement”) with the Adviser. Per the Agreement, the Intermediate Income Fund will waive Advisory Fees in an amount equal to the Advisory Fees earned by the Mortgage Securities Fund on the assets invested into it by the Intermediate Income Fund. For example, if the Intermediate Income Fund owned $10,000,000 worth of the Mortgage Securities Fund for an entire year, it would waive, on an annual basis, $30,000 in Advisory Fees ($10,000,000 multiplied by 0.30%, the annual Advisory Fee ratio for the Mortgage Securities Fund). During the year ended June 30, 2014, the Intermediate Income Fund waived $8,309 in Advisory Fees per the terms of the Agreement. This is a permanent waiver of fees and these waived fees may not be recouped by the Adviser at any time in the future.
See the table below for details of the Intermediate Income Fund’s investment in the Mortgage Securities Fund for the year ended June 30, 2014:
| Beginning | Purchases | Proceeds | Ending | |||||||||||||||||||||||||
| Market Value; | at Cost; | from sales; | Realized | Market Value; | ||||||||||||||||||||||||
| Affiliated | [# of shares held] | [# of shares | [# of | Unrealized | Gains | [# of shares held] | Dividend | |||||||||||||||||||||
| Investment | 7/1/2013 | purchased] | shares sold] | Appreciation | (Losses) | 6/30/2014 | Income | |||||||||||||||||||||
| Mortgage Securities Fund – | ||||||||||||||||||||||||||||
| Institutional Shares | $ | — | $ | 25,000,000 | $ | — | $ | 8,867 | $ | — | $ | 25,008,867 | $ | 88,534 | ||||||||||||||
| [— | ] | [2,461,503 | ] | [— | ] | [2,461,503 | ] | |||||||||||||||||||||
Other Service Providers – U.S. Bancorp Fund Services, LLC (“USBFS”), an indirect wholly-owned subsidiary of U.S. Bancorp, serves as the Funds’ Administrator (“Administrator”), and in that capacity, performs various administrative and accounting services for the Funds. USBFS also serves as the Funds’ fund accountant and transfer agent. Certain officers of the Trust are employees of
www.brownadvisoryfunds.com
139
Notes to Financial Statements
June 30, 2014
USBFS and the Funds’ custodian, U.S. Bank, N.A., is an affiliate of the Administrator. Fees paid to USBFS and U.S. Bank, N.A. for its services can be found in the Statements of Operations as “Administration, transfer agent and accounting fees” and “Custodian fees”, respectively. Additional amounts for miscellaneous expenses may be paid by the Funds to USBFS and included in “Miscellaneous expenses” in the Statements of Operations.
Note 4. Purchases and Sales of Securities
The cost of purchases and the proceeds from sales of investment securities (including maturities), other than short-term investments, for the year ended June 30, 2014 were as follows:
| Investment Securities | ||||||||
| Purchases | Sales | |||||||
| Growth Equity Fund | $ | 1,183,760,193 | $ | 623,466,225 | ||||
| Value Equity Fund | 106,424,299 | 73,611,966 | ||||||
| Flexible Equity Fund | 80,656,529 | 20,394,848 | ||||||
| Small-Cap Growth Fund | 57,855,069 | 102,437,309 | ||||||
| Small-Cap Fundamental Value Fund | 256,607,000 | 148,034,465 | ||||||
| Opportunity Fund | 4,679,211 | 4,392,831 | ||||||
| Maryland Bond Fund | 118,113,985 | 161,126,950 | ||||||
| Intermediate Income Fund | 342,232,938 | 384,765,647 | ||||||
| Tactical Bond Fund | 159,550,909 | 159,107,883 | ||||||
| Equity Income Fund | 56,885,662 | 62,713,394 | ||||||
| Sustainable Growth Fund | 58,751,815 | 67,751,224 | ||||||
| Tax Exempt Bond Fund | 272,385,749 | 250,000,828 | ||||||
| Emerging Markets Fund | 79,427,987 | 27,894,496 | ||||||
| Strategic European Equity Fund | 246,514,117 | 35,458,633 | ||||||
| Mortgage Securities Fund | 307,549,755 | 116,773,720 | ||||||
| Japan Alpha Opportunities Fund | 1,124,120,249 | 182,131,639 | ||||||
The Intermediate Income Fund purchased $232,626,643 and sold $198,646,081in U.S. Government securities for the year ended June 30, 2014. $25,000,000 of the purchases by the Intermediate Income Fund were in affiliated issuers (see Investments in Affiliates in Note 3 for further details). The Tactical Bond Fund purchased $74,456,283 and sold $79,177,892 in U.S. Government securities for the year ended June 30, 2014. Purchases and sales of U.S. Government securities are included in the totals above and include U.S. Treasury Bonds and Notes.
Note 5. Federal Income Tax and Distribution Information
At June 30, 2014, the components of distributable earnings (accumulated losses) on a tax basis were as follows:
| Growth Equity | Value Equity | Flexible Equity | Small-Cap | |||||||||||||
| Fund | Fund | Fund | Growth Fund | |||||||||||||
| Tax Cost of Investments | $ | 2,167,378,589 | $ | 188,030,228 | $ | 137,762,078 | $ | 204,178,592 | ||||||||
| Gross tax unrealized appreciation | 665,297,737 | 57,807,804 | 41,678,478 | 104,343,611 | ||||||||||||
| Gross tax unrealized depreciation | (44,646,743 | ) | (2,841,770 | ) | (892,383 | ) | (5,897,067 | ) | ||||||||
| Net tax unrealized appreciation | 620,650,994 | 54,966,034 | 40,786,095 | 98,446,544 | ||||||||||||
| Undistributed ordinary income | 4,968,744 | 2,067,371 | 406,100 | — | ||||||||||||
| Undistributed long-term capital gain | 32,787,038 | 2,172,236 | — | 21,430,923 | ||||||||||||
| Total distributable earnings | 37,755,782 | 4,239,607 | 406,100 | 21,430,923 | ||||||||||||
| Other accumulated loss | — | — | (3,306,025 | ) | (676,466 | ) | ||||||||||
| Total accumulated earnings | $ | 658,406,776 | $ | 59,205,641 | $ | 37,886,170 | $ | 119,201,001 | ||||||||
www.brownadvisoryfunds.com
140
Notes to Financial Statements
June 30, 2014
| Small-Cap | Intermediate | |||||||||||||||
| Fundamental | Opportunity | Maryland Bond | Income | |||||||||||||
| Value Fund | Fund | Fund | Fund | |||||||||||||
| Tax Cost of Investments | $ | 471,204,145 | $ | 8,524,133 | $ | 197,387,181 | $ | 215,967,643 | ||||||||
| Gross tax unrealized appreciation | 151,603,759 | 3,368,462 | 5,153,491 | 2,697,235 | ||||||||||||
| Gross tax unrealized depreciation | (9,991,503 | ) | (228,760 | ) | (626,143 | ) | (1,016,159 | ) | ||||||||
| Net tax unrealized appreciation | 141,612,256 | 3,139,702 | 4,527,348 | 1,681,076 | ||||||||||||
| Undistributed ordinary income | 5,273,709 | — | 268,701^ | 43,366 | ||||||||||||
| Undistributed long-term capital gain | 10,563,232 | — | 341,254 | — | ||||||||||||
| Total distributable earnings | 15,836,941 | — | 609,955 | 43,366 | ||||||||||||
| Other accumulated loss | (4,105,643 | ) | (6,384,941 | ) | (268,673 | ) | (346,024 | ) | ||||||||
| Total accumulated earnings (losses) | $ | 153,343,554 | $ | (3,245,239 | ) | $ | 4,868,630 | $ | 1,378,418 | |||||||
| Tactical Bond | Equity Income | Sustainable | Tax Exempt | |||||||||||||
| Fund | Fund | Growth Fund | Bond Fund | |||||||||||||
| Tax Cost of Investments | $ | 25,102,114 | $ | 159,048,299 | $ | 152,872,047 | $ | 208,556,297 | ||||||||
| Gross tax unrealized appreciation | 283,042 | 44,551,276 | 58,664,106 | 1,461,148 | ||||||||||||
| Gross tax unrealized depreciation | (142,469 | ) | (510,638 | ) | (1,370,620 | ) | (1,034,119 | ) | ||||||||
| Net tax unrealized appreciation | 140,573 | 44,040,638 | 57,293,486 | 427,029 | ||||||||||||
| Net unrealized depreciation on foreign receivables | — | (181 | ) | — | — | |||||||||||
| Undistributed ordinary income | 13,480 | 693,223 | — | 249,231^ | ||||||||||||
| Undistributed long-term capital gain | — | 6,259,643 | 1,754,640 | — | ||||||||||||
| Total distributable earnings | 13,480 | 6,952,866 | 1,754,640 | 249,231^ | ||||||||||||
| Other accumulated loss | (284,758 | ) | — | (14,135,855 | ) | (712,849 | ) | |||||||||
| Total accumulated earnings | $ | (130,705 | ) | $ | 50,993,323 | $ | 44,912,271 | $ | (36,589 | ) | ||||||
| Strategic | Japan Alpha | |||||||||||||||
| Emerging | European | Mortgage | Opportunities | |||||||||||||
| Markets Fund | Equity Fund | Securities Fund | Fund | |||||||||||||
| Tax Cost of Investments | $ | 204,299,736 | $ | 214,745,737 | $ | 197,218,708 | $ | 1,035,756,856 | ||||||||
| Gross tax unrealized appreciation | 21,357,162 | 11,689,713 | 2,576,050 | 85,342,805 | ||||||||||||
| Gross tax unrealized depreciation | (7,723,106 | ) | (4,924,110 | ) | (1,029,900 | ) | (29,924,780 | ) | ||||||||
| Net tax unrealized appreciation | 13,634,056 | 6,765,603 | 1,546,150 | 55,418,025 | ||||||||||||
| Net unrealized appreciation (depreciation) on foreign receivables | 378 | (2,091 | ) | — | 9,442 | |||||||||||
| Undistributed ordinary income | 2,310,343 | 2,146,536 | 795,802 | 5,873,327 | ||||||||||||
| Undistributed long-term capital gain | — | — | — | — | ||||||||||||
| Total distributable earnings | 2,310,343 | 2,146,536 | 795,802 | 5,873,327 | ||||||||||||
| Other accumulated loss | (9,024,424 | ) | (36,207 | ) | — | — | ||||||||||
| Total accumulated earnings | $ | 6,920,353 | $ | 8,873,841 | $ | 2,341,952 | $ | 61,300,794 | ||||||||
^ Represents tax exempt income. | ||||||||||||||||
The differences between components of distributable earnings on a tax basis and the amounts reflected in the Statements of Assets and Liabilities are primarily due to wash sales, post-October losses and distributions payable.
www.brownadvisoryfunds.com
141
Notes to Financial Statements
June 30, 2014
At June 30, 2014, the following capital loss carryforwards were available:
| Expiring | Expiring | Expiring | Expiring | Infinite | Infinite | |||||||||||||||||||||||
| 2015 | 2016 | 2017 | 2018 | Short-Term | Long-Term | Total | ||||||||||||||||||||||
| Growth Equity Fund | $ | — | $ | — | $ | — | $ | — | $ | — | $ | — | $ | — | ||||||||||||||
| Value Equity Fund | — | — | — | — | — | — | — | |||||||||||||||||||||
| Flexible Equity Fund | 24,652 | — | 3,281,373 | — | — | — | 3,306,025 | |||||||||||||||||||||
| Small-Cap Growth Fund | — | — | — | — | — | — | — | |||||||||||||||||||||
| Small-Cap Fundamental Value Fund | — | 4,105,643 | * | — | — | — | — | 4,105,643 | * | |||||||||||||||||||
| Opportunity Fund | — | 5,615,872 | 734,936 | — | — | — | 6,350,808 | |||||||||||||||||||||
| Maryland Bond Fund | — | — | — | — | — | — | — | |||||||||||||||||||||
| Intermediate Income Fund | — | — | — | — | 82,873 | — | 82,873 | |||||||||||||||||||||
| Tactical Bond Fund | — | — | — | — | — | — | — | |||||||||||||||||||||
| Equity Income Fund | — | — | — | — | — | — | — | |||||||||||||||||||||
| Sustainable Growth Fund | — | — | — | — | 13,838,474 | ** | — | 13,838,474 | ** | |||||||||||||||||||
| Tax Exempt Bond Fund | — | — | — | — | — | — | — | |||||||||||||||||||||
| Emerging Markets Fund | — | — | — | — | 3,851,415 | — | 3,851,415 | |||||||||||||||||||||
| Strategic European Equity Fund | — | — | — | — | 36,207 | — | 36,207 | |||||||||||||||||||||
| Mortgage Securities Fund | — | — | — | — | — | — | — | |||||||||||||||||||||
| Japan Alpha Opportunities Fund | — | — | — | — | — | — | — | |||||||||||||||||||||
| * | Acquired in connection with the merger of the Brown Advisory Small Companies Fund. The amount vests ratably and becomes available to use over the next two fiscal years ending on June 30, 2016. | |
| ** | Acquired in connection with the merger of the Winslow Green Growth Fund. The amount vests ratably and becomes available to use over the next three fiscal years ending on June 30, 2017. |
Distributions during the fiscal years ended as noted were characterized for tax purposes as follows:
| Tax Exempt Income | Ordinary Income | |||||||||||||||
| June 30, | June 30, | June 30, | June 30, | |||||||||||||
| 2014 | 2013 | 2014 | 2013 | |||||||||||||
| Growth Equity Fund | $ | — | $ | — | $ | — | $ | 2,055,042 | ||||||||
| Value Equity Fund | — | — | 1,823,081 | 2,425,706 | ||||||||||||
| Flexible Equity Fund | — | — | 404,653 | 233,792 | ||||||||||||
| Small-Cap Growth Fund | — | — | 1,881,236 | — | ||||||||||||
| Small-Cap Fundamental Value Fund | — | — | 9,553,188 | 863,995 | ||||||||||||
| Opportunity Fund | — | — | — | — | ||||||||||||
| Maryland Bond Fund | 4,420,903 | 4,878,494 | 16,958 | 51,425 | ||||||||||||
| Intermediate Income Fund | — | — | 4,135,996 | 10,441,954 | ||||||||||||
| Tactical Bond Fund | — | — | 110,929 | 492,870 | ||||||||||||
| Equity Income Fund | — | — | 5,646,162 | 4,522,065 | ||||||||||||
| Sustainable Growth Fund | — | — | — | 95,541 | ||||||||||||
| Tax Exempt Bond Fund | 3,290,873 | 2,082,988 | 41,678 | 580,188 | ||||||||||||
| Emerging Markets Fund | — | — | 1,761,113 | 26,346 | ||||||||||||
| Strategic European Equity Fund | — | N/A | — | N/A | ||||||||||||
| Mortgage Securities Fund | — | N/A | 1,703,711 | N/A | ||||||||||||
| Japan Alpha Opportunities Fund | — | N/A | — | N/A | ||||||||||||
www.brownadvisoryfunds.com
142
Notes to Financial Statements
June 30, 2014
| Long-Term Capital Gain^ | ||||||||
| June 30, | June 30, | |||||||
| 2014 | 2013 | |||||||
| Growth Equity Fund | $ | 15,530,861 | $ | — | ||||
| Value Equity Fund | — | — | ||||||
| Flexible Equity Fund | — | — | ||||||
| Small-Cap Growth Fund | 12,608,814 | 21,935,223 | ||||||
| Small-Cap Fundamental Value Fund | 15,312,723 | — | ||||||
| Opportunity Fund | — | — | ||||||
| Maryland Bond Fund | 1,707,914 | 410,674 | ||||||
| Intermediate Income Fund | 4,174,241 | 1,416,508 | ||||||
| Tactical Bond Fund | — | — | ||||||
| Equity Income Fund | 4,701,048 | 379,543 | ||||||
| Sustainable Growth Fund | 2,140,640 | — | ||||||
| Tax Exempt Bond Fund | — | — | ||||||
| Emerging Markets Fund | — | — | ||||||
| Strategic European Equity Fund | — | N/A | ||||||
| Mortgage Securities Fund | — | N/A | ||||||
| Japan Alpha Opportunities Fund | — | N/A | ||||||
| ^ | Designated as a long-term capital gain dividend, pursuant to Internal Revenue Code Section 852(b)(3). |
On the Statements of Assets and Liabilities, as a result of net operating losses incurred, adjustments to holdings of Real Estate Investment Trusts, currency gains and losses, distribution reclassifications and income adjustments to asset-backed security transactions, certain amounts of income, realized gains, and paid-in capital have been reclassified for the year ended June 30, 2014. These reclassifications have no impact on the net assets of the Funds:
| Undistributed | Accumulated | |||||||||||
| Net Investment | Net Realized | Paid-in | ||||||||||
| Income (Loss) | Gain (Loss) | Capital | ||||||||||
| Growth Equity Fund | $ | 4,401,079 | $ | (4,401,079 | ) | $ | — | |||||
| Value Equity Fund | (251 | ) | 251 | — | ||||||||
| Flexible Equity Fund | (18 | ) | 18 | — | ||||||||
| Small-Cap Growth Fund | 1,831,354 | (1,831,354 | ) | — | ||||||||
| Small-Cap Fundamental Value Fund | (58,875 | ) | 73,841 | (14,966 | ) | |||||||
| Opportunity Fund | 58,695 | 14 | (58,709 | ) | ||||||||
| Maryland Bond Fund | 28 | (28 | ) | — | ||||||||
| Intermediate Income Fund | 124,481 | (124,481 | ) | — | ||||||||
| Tactical Bond Fund | 284,763 | (284,763 | ) | — | ||||||||
| Equity Income Fund | 106,610 | (106,610 | ) | — | ||||||||
| Sustainable Growth Fund | 583,076 | 98 | (583,174 | ) | ||||||||
| Tax Exempt Bond Fund | (123 | ) | 123 | — | ||||||||
| Emerging Markets Fund | (189,121 | ) | 189,121 | — | ||||||||
| Strategic European Equity Fund | 23 | 28,234 | (28,257 | ) | ||||||||
| Mortgage Securities Fund | 173,961 | (173,748 | ) | (213 | ) | |||||||
| Japan Alpha Opportunities Fund | (5,279,669 | ) | 5,279,669 | — | ||||||||
www.brownadvisoryfunds.com
143
Notes to Financial Statements
June 30, 2014
At June 30, 2014, the Funds deferred, on a tax basis:
| Post-October | Post-October | Post-December | ||||||||||
| Capital Losses | Currency Losses | Ordinary Losses | ||||||||||
| Growth Equity Fund | $ | — | $ | — | $ | — | ||||||
| Value Equity Fund | — | — | — | |||||||||
| Flexible Equity Fund | — | — | — | |||||||||
| Small-Cap Growth Fund | — | — | 676,466 | |||||||||
| Small-Cap Fundamental Value Fund | — | — | — | |||||||||
| Opportunity Fund | — | — | 34,133 | |||||||||
| Maryland Bond Fund | — | — | — | |||||||||
| Intermediate Income Fund | — | — | — | |||||||||
| Tactical Bond Fund | 284,758 | — | — | |||||||||
| Equity Income Fund | — | — | — | |||||||||
| Sustainable Growth Fund | — | — | 297,381 | |||||||||
| Tax Exempt Bond Fund | 463,496 | — | — | |||||||||
| Emerging Markets Fund | 5,173,009 | — | — | |||||||||
| Strategic European Equity Fund | — | — | — | |||||||||
| Mortgage Securities Fund | — | — | — | |||||||||
| Japan Alpha Opportunities Fund | — | — | — | |||||||||
Note 6. Tactical Bond Fund - Credit Default Swap Agreements
The Tactical Bond Fund may invest in credit default swap agreements. Credit default swap agreements involve one party making a stream of payments (generally referred to as the buyer of protection) to another party (the seller of protection) in exchange for the right to receive a specified return in the event of a default or other credit event in respect of a referenced entity, obligation or index. As a seller of protection on credit default swap agreements, a Fund will generally receive from the buyer of protection a fixed rate of income throughout the term of the swap. As the seller, a Fund would effectively add leverage to its portfolio because, in addition to its total net assets, the Fund would be subject to investment exposure on the notional amount of the swap.
If a Fund is a seller of protection and a credit event occurs, as defined under the terms of that particular swap agreement, the Fund will either (i) pay to the buyer of protection an amount equal to the notional amount of the swap and take delivery of the referenced obligation, other deliverable obligations or underlying securities comprising the referenced index or (ii) pay a net settlement amount in the form of cash or securities equal to the notional amount of the swap less the recovery value of the referenced obligation or underlying securities comprising the referenced index. If a Fund is a buyer of protection and a credit event occurs, as defined under the terms of that particular swap agreement, the Fund will either (i) receive from the seller of protection an amount equal to the notional amount of the swap and deliver the referenced obligation, other deliverable obligations or underlying securities comprising the referenced index or (ii) receive a net settlement amount in the form of cash or securities equal to the notional amount of the swap less the recovery value of the referenced obligation or underlying securities comprising the referenced index. Recovery values are typically estimated by market makers considering either industry standard recovery rates or entity specific factors and considerations until a credit event occurs.
Credit default swap agreements on credit indices involve one party making a stream of payments to another party in exchange for the right to receive a specified return in the event of a write-down, principal shortfall, interest shortfall or default some or all of the referenced entities comprising the credit index. A credit index is a basket of credit instruments or exposures typically designed to be representative of some part of the credit market as a whole. Components of the indices may include, but are not limited to, investment grade securities, high yield securities, asset-backed securities, emerging markets, and/or various credit ratings within each sector. Credit indices are typically traded using credit default swaps with standardized terms including a fixed spread and standard maturity dates. An index credit default swap references all the names in the index, and if there is a default, the credit event is settled based on that name’s weight in the index.
www.brownadvisoryfunds.com
144
Notes to Financial Statements
June 30, 2014
The effect of derivative instruments (credit default swap contracts) on the Statements of Assets and Liabilities as of June 30, 2014 is as follows:
| Derivatives not accounted | Statement of Assets | ||
| Fund | for as hedging instruments | and Liabilities Location | Amount |
| Tactical Bond Fund | Credit Default Swap Contracts | Gross Unrealized Appreciation – | |
| Credit Default Swaps | $151,550 | ||
| Tactical Bond Fund | Credit Default Swap Contracts | Gross Unrealized Depreciation – | |
| Credit Default Swaps | $ — |
The effect of derivative instruments (credit default swap contracts) on the Statements of Operations for the year ended June 30, 2014 is as follows:
| Derivatives not accounted | Statement of | ||
| Fund | for as hedging instruments | Operations Location | Amount |
| Tactical Bond Fund | Credit Default Swap Contracts | Net Realized Gain (Loss) – | |
| Credit Default Swap Contracts | $1,013,815 | ||
| Tactical Bond Fund | Credit Default Swap Contracts | Net Change in Unrealized | |
| Appreciation (Depreciation) – | |||
| Credit Default Swap Contracts | $ (253,599) |
As of June 30, 2014, the Tactical Bond Fund had open credit default swap contracts with a notional value of $7,425,000. During the year ended June 30, 2014, the average notional value of credit default swaps outstanding was $7,493,125.
Offsetting Assets & Liabilities
To facilitate the Tactical Bond Fund’s investment in credit default swaps, the Fund has entered into agreements with counterparties that dictate the terms under which the Fund may purchase or sell protection using credit default swaps, or engage in other derivatives transactions (with the exception of credit default swaps, the Fund did not engage in any other derivatives activity during the year ended June 30, 2014). Under these agreements, both the Fund and the counterparty may be allowed to combine amounts owed to or receivable from the other and settle all outstanding obligations on a “net basis”.
Consequently, some funds may choose to present such assets or liabilities arising from credit default swaps or other derivatives on a net basis in their Statements of Assets and Liabilities. The Tactical Bond Fund does not present any assets or liabilities related to credit default swaps in such a manner; rather, the Fund presents the gross amounts of assets and the gross amounts of liabilities related to credit default swaps in the Statements of Assets and Liabilities. In order to facilitate comparability amongst different funds, the table below shows what the Tactical Bond Fund’s Statement of Assets and Liabilities accounts related to credit default swaps would look like if it did choose to offset, or present on a net basis, assets and liabilities related to credit default swaps. As the Tactical Bond Fund only has a single swap open as of June 30, 2014, with a single counterparty, there are no amounts that could be offset, as the table below indicates:
Assets:
| Gross Amounts | Net Amounts | Gross Amounts not offset | ||||
| Gross | Offset in the | Presented in | in the Statement of | |||
| Amounts of | Statement | the Statement | Assets & Liabilities | |||
| Recognized | of Assets | of Assets | Financial | Collateral | ||
| Description / Counterparty | Assets | & Liabilities | & Liabilities | Instruments | Received | Net Amount |
| Credit Default Swap – sell protection / | ||||||
| Credit Suisse Securities (USA) LLC | $151,550 | $ — | $151,550 | $ — | $ — | $151,550 |
www.brownadvisoryfunds.com
145
Notes to Financial Statements
June 30, 2014
Liabilities:
| Gross Amounts | Net Amounts | Gross Amounts not offset | ||||
| Gross | Offset in the | Presented in | in the Statement of | |||
| Amounts of | Statement | the Statement | Assets & Liabilities | |||
| Recognized | of Assets | of Assets | Financial | Collateral | ||
| Description / Counterparty | Liabilities | & Liabilities | & Liabilities | Instruments | Pledged | Net Amount |
| Credit Default Swap – sell protection / | ||||||
| Credit Suisse Securities (USA) LLC | $ — | $ — | $ — | $ — | $ — | $ — |
Note 7 – Japan Alpha Opportunities Fund – Forward Foreign Currency Contracts and Futures Contracts
The Japan Alpha Opportunities Fund invests in both forward foreign currency contracts and futures contracts.
Forward Foreign Currency Contracts
The majority of the Japan Alpha Opportunities Fund’s assets are denominated in Japanese Yen. The Japan Alpha Opportunities Fund seeks to offset or hedge its exposure to the Japanese Yen by entering into forward foreign currency contracts. A forward foreign currency contract is a commitment to purchase or sell a foreign currency at a future date at an agreed upon price. Typically, the Japan Alpha Opportunities Fund will have a net position in forward foreign currency contracts that commits the Fund to sell Japanese Yen in return for U.S. Dollars. These contracts are traded over-the-counter and not on an organized exchange. The contracts are marked-to-market daily and the change in market value is recorded as unrealized appreciation or depreciation. When the contract is closed, a realized gain or loss equal to the difference between the value at the time it was opened and the value at the time it was closed is recorded. The realized gains or losses are reported in the Statement of Operations as net realized gains or losses from forward foreign currency contracts. Unrealized appreciation on forward foreign currency contracts and unrealized depreciation on forward foreign currency contracts is reported in the Statement of Assets and Liabilities for those contracts that remain open as of year end. Risks may arise from the potential inability of a counterparty to meet the terms of the contract. There is generally no collateral exchanged by the Fund or counterparty to the contract in connection with these contracts. The Fund’s risk of loss from counterparty credit risk on these contracts is generally limited to the aggregate unrealized appreciation on open contracts on a counterparty by counterparty basis. The Fund attempts to mitigate counterparty credit risk by only entering into agreements with counterparties that it believes have the financial resources to honor their obligations and by monitoring the financial stability of those counterparties.
The effect of forward foreign currency contracts on the Statements of Assets and Liabilities as of June 30, 2014 is as follows:
| Derivatives not accounted | Statement of Assets | ||
| Fund | for as hedging instruments | and Liabilities Location | Amount |
| Japan Alpha Opportunities Fund | Forward Foreign Currency Contracts | Assets: Gross Unrealized | |
| Appreciation – Forward | |||
| Foreign Currency Contracts | $ — | ||
| Japan Alpha Opportunities Fund | Forward Foreign Currency Contracts | Liabilities: Gross Unrealized | |
| Depreciation – Forward | |||
| Foreign Currency Contracts | $6,455,309 |
The effect of forward foreign currency contracts on the Statements of Operations for the period ended June 30, 2014 is as follows:
| Derivatives not accounted | Statement of | ||
| Fund | for as hedging instruments | Operations Location | Amount |
| Japan Alpha Opportunities Fund | Forward Foreign Currency Contracts | Net Realized Gain (Loss) – | |
| Forward Foreign Currency Contracts | $(5,855,806) | ||
| Japan Alpha Opportunities Fund | Forward Foreign Currency Contracts | Net Change in Unrealized | |
| Appreciation (Depreciation) – | |||
| Forward Foreign Currency Contracts | $(6,455,309) |
www.brownadvisoryfunds.com
146
Notes to Financial Statements
June 30, 2014
As of June 30, 2014, the Japan Alpha Opportunities Fund had open forward foreign currency contracts with an original market value, in U.S. Dollars, of $991,831,147. During the period ended June 30, 2014, the average original market value, in U.S. Dollars, of forward foreign currency contracts held by the Fund was $487,459,154. Typically, the Fund will seek to offset all or nearly all of its exposure to the Japanese Yen through the use of forward foreign currency contracts. Therefore, the amount of open forward foreign currency contracts outstanding at any given time is likely to be similar to the total net assets of the Fund at that time.
Offsetting Assets & Liabilities – Forward Foreign Currency Contracts
To facilitate the Japan Alpha Opportunities Fund’s investment in forward foreign currency contracts, the Fund has entered into agreements with counterparties that dictate the terms under which the Fund and the counterparty will enter into such agreements. Under these agreements, both the Fund and the counterparty may be allowed to combine amounts owed to or receivable from the other and settle all outstanding obligations on a “net basis”.
Consequently, some funds may choose to present such assets or liabilities related to forward foreign currency contracts or other derivatives on a net basis in their Statements of Assets and Liabilities. The Japan Alpha Opportunities Fund does not present any assets or liabilities related to forward foreign currency contracts in such a manner; rather, the Fund presents the gross amounts of assets and the gross amounts of liabilities related to forward foreign currency contracts in the Statements of Assets and Liabilities. In order to facilitate comparability amongst different funds, the table below shows what the Japan Alpha Opportunities Fund’s Statement of Assets and Liabilities accounts related to forward foreign currency contracts would look like if it did choose to offset, or present on a net basis, assets and liabilities related to forward foreign currency contracts. At June 30, 2014, the Japan Alpha Opportunities Fund had four open forward foreign currency contracts open with four distinct counterparties, and each contract was in a position of having unrealized depreciation. Therefore, there are no amounts that may be offset by the Fund in the Statement of Assets and Liabilities, as shown in the table below:
Assets:
| Gross Amounts | Net Amounts | Gross Amounts not offset | ||||||||||||||||||||||
| Gross | Offset in the | Presented in | in the Statement of | |||||||||||||||||||||
| Amounts of | Statement | the Statement | Assets & Liabilities | |||||||||||||||||||||
| Unrealized Appreciation on | Recognized | of Assets | of Assets | Financial | Collateral | |||||||||||||||||||
| Forward Foreign Currency Contracts | Assets | & Liabilities | & Liabilities | Instruments | Received | Net Amount | ||||||||||||||||||
| Counterparty: | ||||||||||||||||||||||||
| BNP Paribas | $ | — | $ | — | $ | — | $ | — | $ | — | $ | — | ||||||||||||
| Bank of America | — | — | — | — | — | — | ||||||||||||||||||
| Goldman Sachs | — | — | — | — | — | — | ||||||||||||||||||
| Morgan Stanley | — | — | — | — | — | — | ||||||||||||||||||
| Total | $ | — | $ | — | $ | — | $ | — | $ | — | $ | — | ||||||||||||
| Liabilities: | ||||||||||||||||||||||||
| Gross Amounts | Net Amounts | Gross Amounts not offset | ||||||||||||||||||||||
| Gross | Offset in the | Presented in | in the Statement of | |||||||||||||||||||||
| Amounts of | Statement | the Statement | Assets & Liabilities | |||||||||||||||||||||
| Unrealized Depreciation on | Recognized | of Assets | of Assets | Financial | Collateral | |||||||||||||||||||
| Forward Foreign Currency Contracts | Liabilities | & Liabilities | & Liabilities | Instruments | Pledged | Net Amount | ||||||||||||||||||
| Counterparty: | ||||||||||||||||||||||||
| BNP Paribas | $ | 2,991,429 | $ | — | $ | 2,991,429 | $ | — | $ | — | $ | 2,991,429 | ||||||||||||
| Bank of America | 2,991,359 | — | 2,991,359 | — | — | 2,991,359 | ||||||||||||||||||
| Goldman Sachs | 345,182 | — | 345,182 | — | — | 345,182 | ||||||||||||||||||
| Morgan Stanley | 127,339 | — | 127,339 | — | — | 127,339 | ||||||||||||||||||
| Total | $ | 6,455,309 | $ | — | $ | 6,455,309 | $ | — | $ | — | $ | 6,455,309 | ||||||||||||
www.brownadvisoryfunds.com
147
Notes to Financial Statements
June 30, 2014
Futures Contracts
The Japan Alpha Opportunities Fund invests in futures contracts as a means to simulate investment in an underlying index that is consistent with the investment objective of the Fund. At the time the Fund purchases or enters into a futures contract, the Fund deposits and maintains as collateral an initial margin with the broker, as required by the terms of the contract. Pursuant to the contract the Fund agrees to receive from or pay o the broker an amount of cash equal to the daily fluctuation in the value of the contract. Such receipts or payments are known as variation margin and are recorded by the Fund as unrealized gains or losses on futures contracts. This amount can be found on the Statement of Assets and Liabilities as Variation margin – futures contracts. The daily settlement of variation margin between the Fund and the broker serves to reduce counterparty risk to the Fund. The use of long futures contracts by the Fund subjects it to a risk of loss in excess of the amounts shown on the Statements of Assets and Liabilities and up to the total notional amount of the futures contract as shown in the Schedule of Investments.
The effect of futures contracts on the Statements of Assets and Liabilities as of June 30, 2014 is as follows:
| Derivatives not accounted | Statement of Assets | ||
| Fund | for as hedging instruments | and Liabilities Location | Amount |
| Japan Alpha Opportunities Fund | Futures Contracts | Unrealized Appreciation – | |
| Futures Contracts | $1,169,594 |
The effect of futures contracts on the Statements of Operations for the period ended June 30, 2014 is as follows:
| Derivatives not accounted | Statement of | ||
| Fund | for as hedging instruments | Operations Location | Amount |
| Japan Alpha Opportunities Fund | Futures Contracts | Net Realized Gain (Loss) – | |
| Futures Contracts | $(4,094,834) | ||
| Japan Alpha Opportunities Fund | Futures Contracts | Net Change in Unrealized | |
| Appreciation (Depreciation) – | |||
| Futures Contracts | $ 1,169,594 |
As of June 30, 2014, the Japan Alpha Opportunities Fund had long open futures contracts with a notional value of $57,326,884. During the period ended June 30, 2014, the average notional value of long open futures contracts held by the Fund was $54,119,013.
Offsetting Assets & Liabilities – Futures Contracts
To facilitate the Japan Alpha Opportunities Fund’s investment in futures contracts, the Fund has entered into agreements with counterparties that dictate the terms under which the Fund and the counterparty will enter into such agreements. Under these agreements, both the Fund and the counterparty may be allowed to combine amounts owed to or receivable from the other and settle all outstanding obligations on a “net basis”.
Consequently, some funds may choose to present such assets or liabilities related to futures contracts or other derivatives on a net basis in their Statements of Assets and Liabilities. The Japan Alpha Opportunities Fund does not present any assets or liabilities related to futures contracts in such a manner; rather, the Fund presents the gross amounts of assets and the gross amounts of liabilities related to futures contracts in the Statements of Assets and Liabilities. In order to facilitate comparability amongst different funds, the table below shows what the Japan Alpha Opportunities Fund’s Statement of Assets and Liabilities accounts related to futures contracts would look like if it did choose to offset, or present on a net basis, assets and liabilities related to futures contracts. At June 30, 2014, the Japan Alpha Opportunities Fund had one long futures contract open with a single broker. Therefore, there are no amounts that may be offset by the Fund in the Statement of Assets and Liabilities, as shown in the table below:
www.brownadvisoryfunds.com
148
Notes to Financial Statements
June 30, 2014
Assets:
| Gross Amounts | Net Amounts | Gross Amounts not offset | ||||||||||||||||||||||
| Gross | Offset in the | Presented in | in the Statement of | |||||||||||||||||||||
| Amounts of | Statement | the Statement | Assets & Liabilities | |||||||||||||||||||||
| Recognized | of Assets | of Assets | Financial | Collateral | ||||||||||||||||||||
| Description | Assets | & Liabilities | & Liabilities | Instruments | Received | Net Amount | ||||||||||||||||||
| Futures contracts | $ | 1,169,594 | $ | — | $ | 1,169,594 | $ | — | $ | — | $ | 1,169,594 | ||||||||||||
| Liabilities: | ||||||||||||||||||||||||
| Gross Amounts | Net Amounts | Gross Amounts not offset | ||||||||||||||||||||||
| Gross | Offset in the | Presented in | in the Statement of | |||||||||||||||||||||
| Amounts of | Statement | the Statement | Assets & Liabilities | |||||||||||||||||||||
| Recognized | of Assets | of Assets | Financial | Collateral | ||||||||||||||||||||
| Description | Liabilities | & Liabilities | & Liabilities | Instruments | Pledged | Net Amount | ||||||||||||||||||
| Futures Contracts | $ | — | $ | — | $ | — | $ | — | $ | — | $ | — | ||||||||||||
www.brownadvisoryfunds.com
149
Report of Independent Registered Public Accounting Firm
To the Board of Trustees and Shareholders
Brown Advisory Funds
We have audited the accompanying statements of assets and liabilities of Brown Advisory Growth Equity Fund, Brown Advisory Value Equity Fund, Brown Advisory Flexible Equity Fund, Brown Advisory Small-Cap Growth Fund, Brown Advisory Small-Cap Fundamental Value Fund, Brown Advisory Opportunity Fund, Brown Advisory Maryland Bond Fund, Brown Advisory Intermediate Income Fund, Brown Advisory Tactical Bond Fund, Brown Advisory Equity Income Fund, Brown Advisory Sustainable Growth Fund, Brown Advisory Tax Exempt Bond Fund, Brown Advisory – Somerset Emerging Markets Fund (formerly the Brown Advisory Emerging Markets Fund), Brown Advisory – WMC Strategic European Equity Fund, Brown Advisory Mortgage Securities Fund, and Brown Advisory – WMC Japan Alpha Opportunities Fund (collectively the “Funds”), each a series of Brown Advisory Funds (the “Trust”), including the schedules of investments as of June 30, 2014, and the related statements of operations, the statements of changes in net assets and the financial highlights for the periods indicated thereon. These financial statements and financial highlights are the responsibility of the Trust’s management. Our responsibility is to express an opinion on these financial statements and financial highlights based on our audits.
We conducted our audits in accordance with the standards of the Public Company Accounting Oversight Board (United States). Those standards require that we plan and perform the audits to obtain reasonable assurance about whether the financial statements and financial highlights are free of material misstatement. The Funds are not required to have, nor were we engaged to perform an audit of its internal control over financial reporting. Our audits included consideration of internal control over financial reporting as a basis for designing audit procedures that are appropriate in the circumstances, but not for the purpose of expressing an opinion on the effectiveness of the Funds’ internal control over financial reporting. Accordingly, we express no such opinion. An audit includes examining, on a test basis, evidence supporting the amounts and disclosures in the financial statements. Our procedures included confirmation of securities owned as of June 30, 2014, by correspondence with the custodian and brokers or by other appropriate auditing procedures when replies from brokers were not received. An audit also includes assessing the accounting principles used and significant estimates made by management, as well as evaluating the overall financial statement presentation. We believe that our audits provide a reasonable basis for our opinion.
In our opinion, the financial statements and financial highlights referred to above present fairly, in all material respects, the financial position of Brown Advisory Growth Equity Fund, Brown Advisory Value Equity Fund, Brown Advisory Flexible Equity Fund, Brown Advisory Small-Cap Growth Fund, Brown Advisory Small-Cap Fundamental Value Fund, Brown Advisory Opportunity Fund, Brown Advisory Maryland Bond Fund, Brown Advisory Intermediate Income Fund, Brown Advisory Tactical Bond Fund, Brown Advisory Equity Income Fund, Brown Advisory Sustainable Growth Fund, Brown Advisory Tax Exempt Bond Fund, Brown Advisory – Somerset Emerging Markets Fund, Brown Advisory – WMC Strategic European Equity Fund, Brown Advisory Mortgage Securities Fund, and Brown Advisory – WMC Japan Alpha Opportunities Fund as of June 30, 2014, the results of their operations, the changes in their net assets and the financial highlights for the periods indicated thereon, in conformity with accounting principles generally accepted in the United States of America.
| TAIT, WELLER & BAKER LLP |
Philadelphia, Pennsylvania
August 25, 2014
www.brownadvisoryfunds.com
150
Expense Example For the Six Months Ended June 30, 2014 (Unaudited)
As a shareholder of a Fund you incur two types of costs: (1) transaction costs, including redemption fees and exchange fees; and (2) ongoing costs, including investment advisory fees; distribution and/or service fees; and other Fund expenses. This example is intended to help you understand your ongoing costs (in dollars) of investing in a Fund and to compare these costs with the ongoing costs of investing in other mutual funds. The example is based on an investment of $1,000 invested at the beginning of the period and held for the entire period* (January 1, 2014 – June 30, 2014).
Actual Expenses
The “Actual Return” row in the following table provides information about actual account values based on actual returns and actual expenses. As a shareholder you will be assessed fees for outgoing wire transfers, returned checks and stop payment orders at prevailing rates charged by U.S. Bancorp Fund Services, LLC, the Funds’ transfer agent. If you request that a redemption be made by wire transfer, currently, the Funds’ transfer agent charges a $15.00 fee. You will be charged a redemption fee equal to 1.00% of the net amount of the redemption if you redeem your shares less than 14 days after you purchase, with certain limited exceptions. Individual Retirement Accounts (“IRA”) that are held directly at the Funds will be charged a $15.00 annual maintenance fee. IRAs held by broker-dealers or through other means, may or may not incur an annual maintenance fee. Yet, if IRAs maintenance fees are charged to accounts held elsewhere, the fees charged may be more or may be less than $15.00. To the extent the Funds invest in shares of other investment companies as part of their investment strategy, you will indirectly bear your proportionate share of any fees and expenses charged by the underlying funds in which the Funds invest in addition to the expenses of the Funds. Actual expenses of the underlying funds may vary. These expenses are not included in the example below. The example below includes, but is not limited to, investment advisory, shareholder servicing, fund accounting, custody and transfer agent fees. However, the example below does not include portfolio trading commissions and related expenses and other extraordinary expenses as determined under generally accepted accounting principles. You may use the information in this line, together with the amount you invested, to estimate the expenses that you paid over the period. Simply divide your account value by $1,000 (for example, an $8,600 account value divided by $1,000 = 8.6). Then, multiply the result by the number in the first line under the heading entitled “Expenses Paid During the Period” to estimate the expenses you paid on your account during this period.
Hypothetical Example for Comparison Purposes
The “Hypothetical Return” row in the following table provides information about hypothetical account values based on a hypothetical return and hypothetical expenses based on the Funds’ actual expense ratio and an assumed rate of return of 5% per year before expenses, which is not the Funds’ actual return. The hypothetical account values and expenses may not be used to estimate the actual ending account balance or expenses you paid for the period. You may use this information to compare the ongoing costs of investing in the Funds and other funds. To do so, compare this 5% hypothetical example with the 5% hypothetical examples that appear in the shareholder reports of the other funds. Please note that the expenses shown in the table are meant to highlight your ongoing costs only and do not reflect any transactional costs, such as sales charges (loads), redemption fees or exchange fees. Therefore, the Hypothetical information in the table is useful in comparing ongoing costs only and will not help you determine the relative total costs of owning different funds. In addition, if these transactional costs were included, your costs would have been higher.
| Beginning | Ending | Annualized | ||
| Account Value | Account Value | Expenses Paid | Net Expense | |
| January 1, 2014 | June 30, 2014 | During the Period* | Ratio* | |
| Growth Equity Fund | ||||
| Institutional Shares | ||||
| Actual Return | $1,000 | $1,017 | $3.65 | 0.73% |
| Hypothetical (5% annual return before expenses) | $1,000 | $1,021 | $3.66 | 0.73% |
| Investor Shares | ||||
| Actual Return | $1,000 | $1,016 | $4.40 | 0.88% |
| Hypothetical (5% annual return before expenses) | $1,000 | $1,020 | $4.41 | 0.88% |
| Advisor Shares | ||||
| Actual Return | $1,000 | $1,015 | $5.65 | 1.13% |
| Hypothetical (5% annual return before expenses) | $1,000 | $1,019 | $5.66 | 1.13% |
www.brownadvisoryfunds.com
151
Expense Example For the Six Months Ended June 30, 2014 (Unaudited)
| Beginning | Ending | Annualized | ||
| Account Value | Account Value | Expenses Paid | Net Expense | |
| January 1, 2014 | June 30, 2014 | During the Period* | Ratio* | |
| Value Equity Fund | ||||
| Institutional Shares | ||||
| Actual Return | $1,000 | $1,080 | $3.92 | 0.76% |
| Hypothetical (5% annual return before expenses) | $1,000 | $1,021 | $3.81 | 0.76% |
| Investor Shares | ||||
| Actual Return | $1,000 | $1,080 | $4.69 | 0.91% |
| Hypothetical (5% annual return before expenses) | $1,000 | $1,020 | $4.56 | 0.91% |
| Advisor Shares | ||||
| Actual Return | $1,000 | $1,078 | $5.98 | 1.16% |
| Hypothetical (5% annual return before expenses) | $1,000 | $1,019 | $5.81 | 1.16% |
| Flexible Equity Fund | ||||
| Institutional Shares | ||||
| Actual Return | $1,000 | $1,040 | $3.95 | 0.78% |
| Hypothetical (5% annual return before expenses) | $1,000 | $1,021 | $3.91 | 0.78% |
| Investor Shares | ||||
| Actual Return | $1,000 | $1,039 | $4.70 | 0.93% |
| Hypothetical (5% annual return before expenses) | $1,000 | $1,020 | $4.66 | 0.93% |
| Advisor Shares | ||||
| Actual Return | $1,000 | $1,038 | $5.96 | 1.18% |
| Hypothetical (5% annual return before expenses) | $1,000 | $1,019 | $5.91 | 1.18% |
| Small-Cap Growth Fund | ||||
| Institutional Shares | ||||
| Actual Return | $1,000 | $970 | $4.88 | 1.00% |
| Hypothetical (5% annual return before expenses) | $1,000 | $1,020 | $5.01 | 1.00% |
| Investor Shares | ||||
| Actual Return | $1,000 | $969 | $5.61 | 1.15% |
| Hypothetical (5% annual return before expenses) | $1,000 | $1,019 | $5.76 | 1.15% |
| Advisor Shares | ||||
| Actual Return | $1,000 | $968 | $6.83 | 1.40% |
| Hypothetical (5% annual return before expenses) | $1,000 | $1,018 | $7.00 | 1.40% |
| Small-Cap Fundamental Value Fund | ||||
| Institutional Shares | ||||
| Actual Return | $1,000 | $1,020 | $4.96 | 0.99% |
| Hypothetical (5% annual return before expenses) | $1,000 | $1,020 | $4.96 | 0.99% |
| Investor Shares | ||||
| Actual Return | $1,000 | $1,020 | $5.71 | 1.14% |
| Hypothetical (5% annual return before expenses) | $1,000 | $1,019 | $5.71 | 1.14% |
| Advisor Shares | ||||
| Actual Return | $1,000 | $1,018 | $6.96 | 1.39% |
| Hypothetical (5% annual return before expenses) | $1,000 | $1,018 | $6.95 | 1.39% |
| Opportunity Fund | ||||
| Investor Shares | ||||
| Actual Return | $1,000 | $1,020 | $7.51 | 1.50% |
| Hypothetical (5% annual return before expenses) | $1,000 | $1,017 | $7.50 | 1.50% |
www.brownadvisoryfunds.com
152
Expense Example For the Six Months Ended June 30, 2014 (Unaudited)
| Beginning | Ending | Annualized | ||
| Account Value | Account Value | Expenses Paid | Net Expense | |
| January 1, 2014 | June 30, 2014 | During the Period* | Ratio* | |
| Maryland Bond Fund | ||||
| Investor Shares | ||||
| Actual Return | $1,000 | $1,030 | $2.52 | 0.50% |
| Hypothetical (5% annual return before expenses) | $1,000 | $1,022 | $2.51 | 0.50% |
| Intermediate Income Fund | ||||
| Investor Shares | ||||
| Actual Return | $1,000 | $1,029 | $2.57 | 0.51% |
| Hypothetical (5% annual return before expenses) | $1,000 | $1,022 | $2.56 | 0.51% |
| Advisor Shares | ||||
| Actual Return | $1,000 | $1,027 | $3.82 | 0.76% |
| Hypothetical (5% annual return before expenses) | $1,000 | $1,021 | $3.81 | 0.76% |
| Tactical Bond Fund | ||||
| Advisor Shares | ||||
| Actual Return | $1,000 | $1,033 | $6.60 | 1.31% |
| Hypothetical (5% annual return before expenses) | $1,000 | $1,018 | $6.56 | 1.31% |
| Equity Income Fund | ||||
| Institutional Shares | ||||
| Actual Return | $1,000 | $1,062 | $3.88 | 0.76% |
| Hypothetical (5% annual return before expenses) | $1,000 | $1,021 | $3.81 | 0.76% |
| Investor Shares | ||||
| Actual Return | $1,000 | $1,061 | $4.65 | 0.91% |
| Hypothetical (5% annual return before expenses) | $1,000 | $1,020 | $4.56 | 0.91% |
| Advisor Shares | ||||
| Actual Return | $1,000 | $1,059 | $5.92 | 1.16% |
| Hypothetical (5% annual return before expenses) | $1,000 | $1,019 | $5.81 | 1.16% |
| Sustainable Growth Fund | ||||
| Institutional Shares | ||||
| Actual Return | $1,000 | $1,006 | $3.78 | 0.76% |
| Hypothetical (5% annual return before expenses) | $1,000 | $1,021 | $3.81 | 0.76% |
| Investor Shares | ||||
| Actual Return | $1,000 | $1,006 | $4.53 | 0.91% |
| Hypothetical (5% annual return before expenses) | $1,000 | $1,020 | $4.56 | 0.91% |
| Advisor Shares | ||||
| Actual Return | $1,000 | $1,005 | $5.77 | 1.16% |
| Hypothetical (5% annual return before expenses) | $1,000 | $1,019 | $5.81 | 1.16% |
| Tax Exempt Bond Fund | ||||
| Investor Shares | ||||
| Actual Return | $1,000 | $1,040 | $2.58 | 0.51% |
| Hypothetical (5% annual return before expenses) | $1,000 | $1,022 | $2.56 | 0.51% |
www.brownadvisoryfunds.com
153
Expense Example For the Six Months Ended June 30, 2014 (Unaudited)
| Beginning | Ending | Annualized | ||
| Account Value | Account Value | Expenses Paid | Net Expense | |
| January 1, 2014 | June 30, 2014 | During the Period* | Ratio* | |
| Emerging Markets Fund | ||||
| Institutional Shares | ||||
| Actual Return | $1,000 | $1,057 | $6.43 | 1.26% |
| Hypothetical (5% annual return before expenses) | $1,000 | $1,019 | $6.31 | 1.26% |
| Investor Shares | ||||
| Actual Return | $1,000 | $1,057 | $7.19 | 1.41% |
| Hypothetical (5% annual return before expenses) | $1,000 | $1,018 | $7.05 | 1.41% |
| Advisor Shares | ||||
| Actual Return | $1,000 | $1,055 | $8.46 | 1.66% |
| Hypothetical (5% annual return before expenses) | $1,000 | $1,017 | $8.30 | 1.66% |
| Strategic European Equity Fund | ||||
| Institutional Shares | ||||
| Actual Return | $1,000 | $1,025 | $6.12 | 1.22% |
| Hypothetical (5% annual return before expenses) | $1,000 | $1,019 | $6.11 | 1.22% |
| Investor Shares | ||||
| Actual Return | $1,000 | $1,025 | $6.88 | 1.37% |
| Hypothetical (5% annual return before expenses) | $1,000 | $1,018 | $6.85 | 1.37% |
| Advisor Shares | ||||
| Actual Return | $1,000 | $1,024 | $8.13 | 1.62% |
| Hypothetical (5% annual return before expenses) | $1,000 | $1,017 | $8.10 | 1.62% |
| Mortgage Securities Fund | ||||
| Institutional Shares | ||||
| Actual Return | $1,000 | $1,005 | $0.69 | 0.52% |
| Hypothetical (5% annual return before expenses) | $1,000 | $1,022 | $2.61 | 0.52% |
| Investor Shares | ||||
| Actual Return | $1,000 | $1,026 | $2.86 | 0.57% |
| Hypothetical (5% annual return before expenses) | $1,000 | $1,022 | $2.86 | 0.57% |
| Japan Alpha Opportunities Fund | ||||
| Institutional Shares | ||||
| Actual Return | $1,000 | $1,050 | $4.01 | 1.21% |
| Hypothetical (5% annual return before expenses) | $1,000 | $1,019 | $6.06 | 1.21% |
| Investor Shares | ||||
| Actual Return | $1,000 | $1,049 | $4.50 | 1.36% |
| Hypothetical (5% annual return before expenses) | $1,000 | $1,018 | $6.80 | 1.36% |
| Advisor Shares | ||||
| Actual Return | $1,000 | $1,048 | $5.33 | 1.61% |
| Hypothetical (5% annual return before expenses) | $1,000 | $1,017 | $8.05 | 1.61% |
| * | The calculations are based on expenses incurred during the most recent six-month period ended as of the date of this report. The dollar amounts shown as expenses paid during the period are equal to the annualized six-month net expense ratio multiplied by the average account value during the period, multiplied by the number of days in the most recent six-month period divided by the number of days in the Funds’ fiscal year ended as of the date of this report, with the exception of the Actual Return calculations for the Japan Alpha Opportunities Fund, which commenced operations on March 4, 2014 and the Institutional Share Class of the Mortgage Securities Fund, which commenced operations on May 13, 2014. For these Funds / Share Classes, the Actual Return calculations are for the period during which the Funds / Share Classes were open. |
www.brownadvisoryfunds.com
154
Approval of the Investment Advisory Agreement and
Sub-Investment Advisory Agreement for the
Brown Advisory – WMC Japan Alpha Opportunities Fund (Unaudited)
| 1. | Board of Trustees Approval of the Investment Advisory Agreement and Sub-Investment Advisory Agreement for the Brown Advisory – WMC Japan Alpha Opportunities Fund |
The Investment Advisory Agreement between the Trust, on behalf of the Brown Advisory – WMC Japan Alpha Opportunities Fund (the “Fund”), and Brown Advisory, LLC (“Brown Advisory” or the “Adviser”), was approved by the Board of Trustees at a meeting of the Board held on February 13, 2014. At the same meeting, the Board of Trustees also approved the Sub-Investment Advisory Agreement with respect to the Fund between Brown Advisory and Wellington Management Company, LLP (“Wellington” or the “Sub-Adviser”), the sub-investment adviser to the Fund.
In accordance with the Investment Company Act of 1940, the Board of Trustees was required to consider the approval of both the Investment Advisory Agreement and the Sub-Investment Advisory Agreement, and this was required to take place at an in-person meeting of the Board. The relevant provisions of the Investment Company Act of 1940 specifically provide that it is the duty of the Board to request and evaluate such information as the Board determines is necessary to allow them to properly consider the approval of each of the Agreements, and it is the duty of the Adviser and the Sub-Adviser, as applicable, to furnish the Trustees with such information that is responsive to their request.
Accordingly, in determining whether to approve: (1) the Investment Advisory Agreement between the Adviser and the Trust with respect to the Fund, and (2) the Sub-Investment Advisory Agreement between Brown Advisory and Wellington, the Board of Trustees requested, and the Adviser and the Sub-Adviser provided, information and data relevant to the Board’s consideration.
This included materials prepared by the Adviser, the Sub-Adviser and by the Fund’s administrator that provided the Board with information regarding the investment performance of the Sub-Adviser’s separate accounts having similar investment objectives and strategies as the Fund, and information regarding the estimated fees and expenses of the Fund, as compared to other similar mutual funds.
The Board initially met by means of a telephonic meeting held on December 12, 2013 in order to consider various matters with respect to the proposed approval of each of the Agreements. At this meeting, the Board reviewed with representatives of the Adviser various matters with respect to the proposed establishment and organization of the Fund, the proposed sub-advisory services to be provided to the Fund by the Sub-Adviser, the nature and extent of the duties and responsibilities of the Adviser and the Sub-Adviser with respect to the Fund, the compliance oversight process involving the Fund and its operations, and the proposed fees and expenses of the Fund, including the proposed sub-advisory fees applicable to the Fund. During this meeting representatives of the Adviser made a presentation to the Board regarding their recommendation to retain the Sub-Adviser to provide sub-advisory services to the Fund and they reviewed the process that they had followed in determining to select Wellington to serve as Sub-Adviser. Representatives of Wellington also made a presentation to the Board at this meeting during which they reviewed their plans for providing sub-advisory services to the Fund.
The Board then met again at in-person meeting of the Board of Trustees held on February 13, 2014 to consider matters with respect to the Fund and the members of the Board reviewed and considered the approval of the Investment Advisory Agreement and the Sub-Investment Advisory Agreement. In addition, the Board also considered the adoption of an Expense Limitation Agreement with respect to the Fund which would limit the total operating expenses of the Fund through October 31, 2016, as well as a Business Management Agreement with Brown Advisory pursuant to which Brown Advisory would provide certain business management services to the Fund. At this meeting, representatives of the Sub-Adviser, including one of the proposed portfolio managers of the Fund, reviewed for the members of the Board Wellington’s experience and background in managing Japanese equity securities, and they also reviewed information regarding the investment advisory process followed by the Sub-Adviser and the compliance program of the Sub-Adviser. In addition, the members of the Board reviewed with the proposed co-portfolio manager of the Fund various matters with respect to the proposed sub-advisory services to be provided to the Fund by Wellington and the investment strategies that would be employed by the firm in managing the Fund.
Following their review and consideration of these matters, the Trustees determined that the Investment Advisory Agreement with the Adviser with respect to the Fund would enable shareholders of the Fund to obtain high quality services at a cost that is appropriate, reasonable, and in the best interests of the Fund and its shareholders. Accordingly, the Board, including those Trustees who are not considered to be “interested persons” of the Trust, as that term is defined in the Investment Company Act of 1940 (the “Independent Trustees”), unanimously approved the Investment Advisory Agreement for the Fund. In reaching their decision, the Trustees requested and obtained from the Adviser such information as they deemed reasonably necessary to evaluate the
www.brownadvisoryfunds.com
155
Approval of the Investment Advisory Agreement and
Sub-Investment Advisory Agreement for the
Brown Advisory – WMC Japan Alpha Opportunities Fund (Unaudited)
Investment Advisory Agreement. The Trustees also carefully considered the projected profitability data and comparative fee, expense and performance information prepared by Trust management. In considering the Investment Advisory Agreement with respect to the Fund, the Trustees evaluated a number of factors that they believed, in light of their reasonable business judgment, to be relevant. They based their decision on the following considerations, among others, although they did not identify any one specific consideration or any particular information that was controlling of their decision:
The nature, extent and quality of the advisory services to be provided. The Trustees concluded that Brown Advisory is capable of providing high quality services to the Fund, as indicated by the nature, extent and quality of services provided in the past to the other Funds in the Trust, Brown Advisory’s management capabilities demonstrated with respect to the other Funds in the Trust, the professional qualifications and experience of the members of Brown Advisory’s investment management oversight team who will be responsible for the ongoing supervision and oversight of Wellington’s investment activities with respect to the Fund, Brown Advisory’s investment and compliance oversight processes, and the competitive investment performance of the other Funds in the Trust. The Trustees also determined that Brown Advisory proposed to provide investment advisory services that were of the same quality as services provided to the other Funds in the Trust, and that these services are appropriate in scope and extent in light of the Fund’s proposed operations, the competitive landscape of the investment company business and investor needs. On the basis of the Trustees’ assessment of the nature, extent and quality of the advisory services to be provided by Brown Advisory, the Trustees concluded that Brown Advisory is capable of generating a level of long-term investment performance that is appropriate in light of the Fund’s investment objectives, policies and strategies and competitive with many other comparable investment companies.
The cost of advisory services to be provided and the expected level of profitability. On the basis of comparative information derived from the data that was provided to the Board, the Trustees determined that the overall projected expense ratios for each respective class of shares of the Fund were competitive with industry averages. The Trustees also noted that Brown Advisory had proposed a contractual commitment for the benefit of shareholders of the Fund to limit the Fund’s operating expenses through October 31, 2016. The Board also focused on Brown Advisory’s projected level of profitability with respect to the Fund, and noted that Brown Advisory’s expected level of profitability was acceptable and not unreasonable. Accordingly, on the basis of the Board’s review of the fees to be charged by Brown Advisory for investment advisory services, the investment advisory services and sub-advisory oversight services to be provided to the Fund by Brown Advisory, and the estimated level of profitability from Brown Advisory’s relationship with the Fund, the Board concluded that the level of investment advisory fees, the level of the sub-investment advisory fees and Brown Advisory’s projected profitability are appropriate in light of the management fees, overall expense ratios and investment performance of comparable investment companies.
The extent to which economies of scale may be realized as the Fund grows and whether the advisory fees reflect possible economies of scale. While it was noted that the Fund’s investment advisory fees will not decrease as the Fund’s assets grow because they will not be subject to investment advisory fee breakpoints, the Trustees concluded that the Fund’s investment advisory fees are appropriate in light of the projected size of the Fund, and appropriately reflect the current economic environment for Brown Advisory and the competitive nature of the mutual fund market. The Trustees then noted that they will have the opportunity to periodically re-examine whether the Fund has achieved economies of scale, and the appropriateness of the investment advisory fees payable to Brown Advisory with respect to the Fund, in the future at which time the implementation of fee breakpoints on the Fund could further be considered.
Benefits to Brown Advisory from its relationship with the Fund (and any corresponding benefits to the Fund). The Trustees concluded that other benefits that may be derived by Brown Advisory from its relationship with the Fund, including any potential “soft dollar” benefits in connection with the Fund’s brokerage transactions and use of the Fund’s performance track record in advertising materials, are reasonable and fair, and consistent with industry practice and the best interests of the Fund and its shareholders. In addition, the Trustees determined that the Fund will benefit from its relationship with Brown Advisory by virtue of Brown Advisory’s provision of business management and shareholder services, in addition to investment advisory services, at a cost to the Fund that is generally comparable to the costs of an outside service provider, which the Trustees determined to be reasonable, fair and in the best interests of the shareholders of the Fund in light of the nature and quality of the services to be provided and the necessity of the services for the Fund’s operations.
Other Considerations. In approving the Investment Advisory Agreement, the Trustees determined that Brown Advisory has made a substantial commitment to the recruitment and retention of high quality personnel, and maintains the financial, compliance and operational resources reasonably necessary to manage the Fund in a professional manner that is consistent with the best interests of
www.brownadvisoryfunds.com
156
Approval of the Investment Advisory Agreement and
Sub-Investment Advisory Agreement for the
Brown Advisory – WMC Japan Alpha Opportunities Fund (Unaudited)
the Fund and its shareholders. The Board also considered the nature of the oversight duties to be performed by Brown Advisory which include extensive investment management and compliance due diligence with respect to the operations of the Sub-Adviser, and the Board determined that the investment advisory fee fairly compensated Brown Advisory for the services that it is to perform pursuant to the Investment Advisory Agreement. The Trustees also concluded that Brown Advisory has made a significant entrepreneurial commitment to the management and success of the Fund, which entails a substantial financial and professional commitment, including the Expense Limitation Agreement under which Brown Advisory has undertaken to waive a portion of its fees to the benefit of the Fund’s shareholders to the extent necessary in accordance with the terms of the Expense Limitation Agreement. The Board also considered matters with respect to the brokerage practices of Brown Advisory, including its soft dollar arrangements and its best-execution procedures, and noted that these were reasonable and consistent with standard industry practice.
In considering information regarding the investment management fees payable by the Fund to the Adviser under the Investment Advisory Agreement, the Board also took note of the business management fees that are payable by the Fund to Brown Advisory under the terms of the Business Management Agreement. In considering the approval of the Business Management Agreement with respect to the Fund, the Board members considered various factors with respect to the business management fees, including the level and amount of these fees and the services to be provided by Brown Advisory in connection with the Business Management Agreement, in determining the reasonableness of the total fees to be paid by the Fund to Brown Advisory for the overall level of services that Brown Advisory is to provide to the Fund and its shareholders. In considering the nature and extent of the non-advisory business management services to be provided to the Fund by the Adviser, the Board took into consideration: (1) whether the Business Management Agreement is in the best interest of the Fund and its shareholders; (2) whether the services to be performed under the Business Management Agreement are required for the operation of the Fund; (3) whether the services to be provided are of a nature and quality at least equal to the same or similar services provided by independent third parties; and (4) whether the fees for the services are fair and reasonable in light of the usual and customary charges made by others for services of the same nature and quality. After reviewing these factors with respect to the Business Management Agreement, the Board of Trustees determined that approval of the Business Management Agreement was advisable and in the best interest of the Fund and its shareholders and that the fees payable to Brown Advisory under the terms of the Business Management Agreement were fair and reasonable in light of the services to be provided.
The Board also considered various matters with respect to the proposed distribution and shareholder servicing arrangements applicable to the Fund and they considered the distribution fees and the non-distribution shareholder servicing fees payable with respect to certain of the share classes of the Fund, including certain of such fees which may be payable to the Adviser for the shareholder administrative services that it provides to shareholders of the Fund. The Board took note of the fact that the non-distribution related shareholder administrative fees payable to the Adviser are intended to compensate the Adviser for providing certain administrative services to those Fund shareholders covered by the applicable servicing arrangements in the relevant share classes.
It was noted that in making their determinations, the Trustees had considered and relied upon the materials provided to them with respect to the proposed contracts and the presentation of the representatives of Brown Advisory and Wellington, as well as the information and materials that they had been provided with in connection with their December 12, 2013 and February 13, 2014 meetings at which they had considered various matters with respect to the proposed establishment and operation of the Fund, and during which meetings they had reviewed matters with respect to the Fund with representatives of the Adviser and Wellington. In reaching their conclusion with respect to the approval of the Investment Advisory Agreement and the level of fees to be paid under the Agreement, the Trustees did not identify any one single factor as being controlling, rather, the Trustees took note of a combination of factors that had influenced their decision making process. They noted the level and quality of investment advisory services provided by Brown Advisory to each of the other Funds in the Trust, and they found that these services will benefit the Fund and its shareholders and also reflected management’s overall commitment to the growth and development of the Fund.
The Board then undertook the consideration of various matters with respect to the proposed approval of the Sub-Advisory Agreement between Brown Advisory and Wellington. They considered various matters involving the respective services to be provided by each of the Adviser and the Sub-Adviser in connection with the management and operation of the Fund and they took note of the extensive oversight duties to be performed by the Adviser including investment management and compliance oversight of the operations of the Sub-Adviser.
www.brownadvisoryfunds.com
157
Approval of the Investment Advisory Agreement and
Sub-Investment Advisory Agreement for the
Brown Advisory – WMC Japan Alpha Opportunities Fund (Unaudited)
The Board reviewed and evaluated the information that the Adviser and the Sub-Adviser had presented for the Board’s review. The Board particularly noted, among other considerations, that the Fund’s proposed investment advisory fees and overall operating expenses were competitive with comparable mutual funds, and that Wellington has successfully managed other accounts with similar investment objectives and strategies. Based on its review of all of the information, the Board determined that the Sub-Investment Advisory Agreement was consistent with the best interests of the Fund and its shareholders and would enable the Fund to receive high quality sub-advisory services at a cost that is appropriate, reasonable, and in the best interests of the Fund and its shareholders. In reaching these conclusions, the Board considered the following:
The nature, extent and quality of the sub-investment advisory services to be provided. The Trustees concluded that Wellington is capable of providing high quality sub-advisory services to the Fund, as indicated by the nature and quality of services provided to its other managed accounts having a similar investment objective and strategy as the Fund, the professional qualifications and experience of the proposed portfolio managers of the Fund, and Wellington’s investment management processes. On the basis of the Trustees’ assessment of the nature, extent and quality of the sub-advisory services to be provided by Wellington, the Trustees concluded that Wellington is capable of generating a level of long-term investment performance that is appropriate in light of the Fund’s investment objectives, policies and strategies and competitive with many other comparable investment companies.
The cost of advisory services to be provided and the expected level of profitability. On the basis of comparative information derived from the data that had been provided to the Board members, the Trustees determined that the overall projected expense ratios for each respective class of shares of the Fund are competitive with industry averages. The Trustees also noted that the Fund will be subject to a contractual expense limitation agreement for the benefit of shareholders of the Fund to limit the Fund’s operating expenses through October 31, 2016. The Board took note of the fact that the sub-advisory fee had been separately negotiated by Brown Advisory and Wellington and was consistent with fee arrangements for sub-advisory services in connection with other sub-advised mutual funds. Accordingly, on the basis of the Board’s review of the fees to be charged by Wellington for sub-investment advisory services to be provided to the Fund, the Board concluded that the level of sub-investment advisory fees are appropriate in light of the management fees, overall expense ratios and investment performance of comparable investment companies, and that the sub-advisory fee had been separately negotiated at arms-length by independent third parties.
The extent to which economies of scale may be realized as the Fund grows and whether the advisory fees reflect possible economies of scale. While it was noted that the Fund’s investment advisory fees will not decrease as the Fund’s assets grow because they will not be subject to investment advisory fee breakpoints, the Trustees concluded that the Fund’s investment advisory fees are appropriate in light of the projected size of the Fund, and appropriately reflect the current economic environment for Brown Advisory and Wellington and the competitive nature of the mutual fund market. The Trustees then noted that they will have the opportunity to periodically re-examine whether the Fund has achieved economies of scale, and the appropriateness of the investment advisory fees and sub-investment advisory fees with respect to the Fund, in the future at which time the implementation of fee breakpoints on the Fund could be further considered.
Benefits to Wellington from its relationship with the Fund (and any corresponding benefits to the Fund). The Trustees concluded that other benefits that may be derived by Wellington from its relationship with the Fund, including any potential “soft dollar” benefits in connection with the Fund’s brokerage transactions and use of the Fund’s performance track record in advertising materials, are reasonable and fair, and consistent with industry practice and the best interests of the Fund and its shareholders.
Other Considerations. In approving the Sub-Investment Advisory Agreement, the Trustees determined that Wellington has made a substantial commitment to the recruitment and retention of high quality personnel, and maintains the financial, compliance and operational resources reasonably necessary to provide sub-advisory services to the Fund in a professional manner that is consistent with the best interests of the Fund and its shareholders. The Board also considered matters with respect to the brokerage practices of Wellington, including its soft dollar arrangements and its best-execution procedures, and noted that these were reasonable and consistent with standard industry practice.
It was noted that in making their determinations, the Trustees had considered and relied upon the materials provided to them with respect to the proposed contracts and the presentation of the representatives of Brown Advisory and Wellington, as well as the information and materials that they had been provided with in connection with their December 12, 2013 and February 13, 2014 meetings at which they had considered various matters with respect to the proposed establishment and operation of the Fund, and
www.brownadvisoryfunds.com
158
Approval of the Investment Advisory Agreement and
Sub-Investment Advisory Agreement for the
Brown Advisory – WMC Japan Alpha Opportunities Fund (Unaudited)
at which meeting representatives of the Adviser and Wellington and one of the proposed portfolio managers for the Fund had made presentations to the Board. In reaching their conclusion with respect to the approval of the Sub-Investment Advisory Agreement and the level of fees to be paid under the Agreement, the Trustees did not identify any one single factor as being controlling, rather, the Trustees took note of a combination of factors that had influenced their decision making process. They noted the level and quality of investment advisory services provided by Wellington to its other investment advisory clients and they found that these services will benefit the Fund and its shareholders. They also considered the nature of the allocation of the duties and responsibilities for the management and operation of the Fund between Brown Advisory and Wellington and they determined that the sub-advisory fee, as negotiated by Brown Advisory and Wellington, reasonably reflected the nature and extent of the services to be provided by Wellington with respect to the Fund.
www.brownadvisoryfunds.com
159
Trustees and Executive Officers
The Board is responsible for the overall management of the Trust, including general supervision and review of the investment activities of the Funds. The Board, in turn, elects the Officers of the Trust, who are responsible for administering the day-to-day operations of the Trust and each of the Funds. The current Trustees and Officers of the Trust, their ages and positions with the Trust, term of office with the Trust and length of time served, their principal occupations for the past five years and other directorships held during the past five years are set forth in the table below.
| Number of | ||||||||||
| Portfolios | Other | |||||||||
| Term of | in Fund | Directorships | ||||||||
| Office and | Complex | Held During | ||||||||
| Name, Age | Position with | Length of | Principal Occupation(s) | Overseen by | the Past | |||||
| and Address | the Trust | Time Served | During Past 5 Years | Trustees | 5 Years |
Independent Trustees of the Trust(1) | ||||||||||
| Henry H. Hopkins | Trustee | Indefinite Term; | Retired; Formerly, Vice President and Chief | 16 | None. | |||||
| Age: 71 | Since May 2012 | Legal Counsel, T. Rowe Price Associates, Inc. | ||||||||
| c/o Brown Advisory, LLC | (investment management firm) (1998 to 2008). | |||||||||
| 901 South Bond Street | ||||||||||
| Suite 400 | ||||||||||
| Baltimore, MD 21231 | ||||||||||
| Kyle P. Legg | Trustee | Indefinite Term; | Retired; Formerly President and Chief Executive | 16 | Director, SunTrust | |||||
| Age: 62 | Since May 2012 | Officer, Legg Mason Capital Management, LLC | Banks, Inc. (bank | |||||||
| c/o Brown Advisory, LLC | (investment management firm) (2006 to 2009). | holding company) | ||||||||
| 901 South Bond Street | (since 2011); | |||||||||
| Suite 400 | Director, Eastman | |||||||||
| Baltimore, MD 21231 | Kodak Co. (printing | |||||||||
| equipment and supplies | ||||||||||
| company) (2010 to | ||||||||||
| 2013). | ||||||||||
| Thomas F. O’Neil III | Trustee | Indefinite Term; | President, The Saranac Group LLC (strategic | 16 | None. | |||||
| Age: 57 | Since May 2012 | consulting firm) (since 2010); Formerly, Executive | ||||||||
| c/o Brown Advisory, LLC | Vice Chairman (previously, Senior Vice President, | |||||||||
| 901 South Bond Street | General Counsel and Secretary) WellCare Health | |||||||||
| Suite 400 | Plans, Inc. (managed healthcare organization) | |||||||||
| Baltimore, MD 21231 | (2008 to 2009); Formerly, Partner and Joint | |||||||||
| Global Practice Group Leader, DLA Piper US LLP | ||||||||||
| (law firm) (2002 to 2008). | ||||||||||
| Neal F. Triplett, CFA | Trustee | Indefinite Term; | President, DUMAC, Inc. (university endowment | 16 | None. | |||||
| Age: 43 | Since May 2012 | investment organization) (since 1999). | ||||||||
| c/o Brown Advisory, LLC | ||||||||||
| 901 South Bond Street | ||||||||||
| Suite 400 | ||||||||||
| Baltimore, MD 21231 | ||||||||||
www.brownadvisoryfunds.com
160
Trustees and Executive Officers
| Number of | ||||||||||
| Portfolios | Other | |||||||||
| Term of | in Fund | Directorships | ||||||||
| Office and | Complex | Held During | ||||||||
| Name, Age | Position with | Length of | Principal Occupation(s) | Overseen by | the Past | |||||
| and Address | the Trust | Time Served | During Past 5 Years | Trustees | 5 Years |
| Interested Trustees and Officers of the Trust | ||||||||||
Michael D. Hankin(2) | Trustee | Indefinite Term | President and Chief Executive Officer, Brown | 16 | None. | |||||
| Age: 56 | Since May 2012 | Advisory Incorporated and affiliates (investment | ||||||||
| c/o Brown Advisory | management firm) (since 1993). | |||||||||
| Incorporated | ||||||||||
| 901 South Bond Street | ||||||||||
| Suite 400 | ||||||||||
| Baltimore, MD 21231 | ||||||||||
Joseph R. Hardiman(2) | Chairman | Indefinite Term; | Business Consultant (financial services industry | 16 | Director of Franklin | |||||
| Age: 77 | and Trustee | Since May 2012 | consulting) (since 1997); Formerly; Director of | Resources, Inc. | ||||||
| c/o Brown Advisory, LLC | Brown Advisory Incorporated (investment | (investment | ||||||||
| 901 South Bond Street | management firm) (2001 to 2012). | management firm) | ||||||||
| Suite 400 | (2005 to 2013). | |||||||||
| Baltimore, MD 21231 | ||||||||||
| David M. Churchill | President/ | Indefinite Term; | Chief Financial Officer and Chief Operations | Not | Not | |||||
| Age: 48 | Principal | Since May 2012 | Officer, Brown Advisory Incorporated and | Applicable. | Applicable. | |||||
| c/o Brown Advisory | Executive | affiliates (investment management firm) | ||||||||
| Incorporated | Officer | (since 1993). | ||||||||
| 901 South Bond Street | ||||||||||
| Suite 400 | ||||||||||
| Baltimore, MD 21231 | ||||||||||
| Jason T. Meix | Treasurer/ | Indefinite Term; | Vice President, U.S. Bancorp Fund | Not | Not | |||||
| Age: 35 | Principal | Since May 2012 | Services, LLC (fund administrative services firm) | Applicable. | Applicable. | |||||
| c/o Brown Advisory, LLC | Financial | (since 2008). | ||||||||
| 901 South Bond Street | Officer | |||||||||
| Suite 400 | ||||||||||
| Baltimore, MD 21231 | ||||||||||
| Tyler J. Mills | Vice President | Indefinite Term; | Head of Commingled Funds, Brown Advisory, | Not | Not | |||||
| Age: 34 | Since May 2012 | LLC (investment management firm) (since 2009); | Applicable. | Applicable. | ||||||
| c/o Brown Advisory | Senior Consultant, Accenture LLP (management | |||||||||
| Incorporated | consulting firm) (2008 to 2009). | |||||||||
| 901 South Bond Street | ||||||||||
| Suite 400 | ||||||||||
| Baltimore, MD 21231 | ||||||||||
| Edward L. Paz | Secretary | Indefinite Term; | Vice President and Counsel, U.S. Bancorp Fund | Not | Not | |||||
| Age: 43 | Since May 2012 | Services, LLC (fund administrative services firm) | Applicable. | Applicable. | ||||||
| c/o Brown Advisory, LLC | (since 2007). | |||||||||
| 901 South Bond Street | ||||||||||
| Suite 400 | ||||||||||
| Baltimore, MD 21231 | ||||||||||
| Brett D. Rogers | Chief | Indefinite Term; | Chief Compliance Officer, Brown Advisory | Not | Not | |||||
| Age: 38 | Compliance | Since May 2012 | Incorporated and affiliates (investment | Applicable. | Applicable. | |||||
| c/o Brown Advisory | Officer | management firm) (since 2009); Formerly, | ||||||||
| Incorporated | Director, Compliance and Risk, Deutsche Asset | |||||||||
| 901 South Bond Street | Anti-Money | Indefinite Term: | Management (investment management firm) | |||||||
| Suite 400 | Laundering | Since May 2012 | (2003 to 2009). | |||||||
| Baltimore, MD 21231 | Officer | |||||||||
| (1) | The Trustees of the Trust who are not “interested persons” of the Trust as defined in the 1940 Act (“Independent Trustees”). |
| (2) | Mr. Hankin is considered an “interested person” of the Trust, as defined in the 1940 Act, because of his current position with Brown Advisory Incorporated, the parent company of the Adviser, and Mr. Hardiman is considered an “interested person” of the Trust, as defined in the 1940 Act, because of his previous position with Brown Advisory Incorporated and his ownership interest in Brown Advisory Incorporated. |
www.brownadvisoryfunds.com
161
Information About Proxy Voting (Unaudited)
A description of the policies and procedures that the Funds use to determine how to vote proxies relating to portfolio securities is available without charge upon request by calling toll-free at 800-540-6807 and by accessing the Funds’ website at www.brownadvisoryfunds.com. Furthermore, you can obtain the description on the SEC’s website at www.sec.gov.
Information regarding how the Funds voted proxies relating to portfolio securities during the 12-month period ended June 30 is available without charge, by calling toll-free at 800-540-6807. In addition, you can obtain the Funds’ proxy voting records on the SEC’s website at www.sec.gov.
Information About the Portfolio Holdings (Unaudited)
The Funds file their complete schedule of portfolio holdings for their first and third fiscal quarters with the SEC on Form N-Q. The Funds’ Form N-Q is available without charge, upon request, by calling toll-free at 800-540-6807. Furthermore, you can obtain the Form N-Q on the SEC’s website at www.sec.gov. The Funds’ schedules of portfolio holdings are posted on their website at www.brownadvisoryfunds.com within ten business days after calendar quarter end.
Householding (Unaudited)
In an effort to decrease costs, the Funds will reduce the number of duplicate Prospectuses and annual and semi-annual reports that you receive by sending only one copy of each to those addresses shown by two or more accounts. Please call the Transfer Agent toll free at 1-800-540-6807 to request individual copies of these documents. The Funds will begin sending individual copies 30 days after receiving your request. This policy does not apply to account statements.
Federal Tax Status of Dividends Declared during the Tax Year (Unaudited)
For Federal Income Tax purposes, distributions from short-term capital gains are classified as ordinary income. The percentage of ordinary income distributions designated as qualifying for the corporate dividend received deduction (“DRD”), the individual qualified dividend rate (“QDI”), the qualifying interest income exempt from U.S. tax for foreign shareholders (“QII”) and the qualifying short-term capital gain distributions exempt from U.S. tax for foreign shareholders (“QSTCG”) is presented below:
| Income Distributions | |||||||||||||||
| Exempt from | |||||||||||||||
| Federal Tax | QDI | DRD | QII | QSTCG | |||||||||||
| Growth Equity Fund | 0.00 | % | 0.00 | % | 0.00 | % | 0.00 | % | 0.00 | % | |||||
| Value Equity Fund | 0.00 | % | 100.00 | % | 100.00 | % | 0.04 | % | 0.00 | % | |||||
| Flexible Equity Fund | 0.00 | % | 100.00 | % | 100.00 | % | 0.12 | % | 0.00 | % | |||||
| Small-Cap Growth Fund | 0.00 | % | 100.00 | % | 100.00 | % | 0.11 | % | 100.00 | % | |||||
| Small-Cap Fundamental Value Fund | 0.00 | % | 66.36 | % | 63.37 | % | 0.04 | % | 60.47 | % | |||||
| Opportunity Fund | 0.00 | % | 0.00 | % | 0.00 | % | 0.00 | % | 0.00 | % | |||||
| Maryland Bond Fund | 99.62 | % | 0.00 | % | 0.00 | % | 100.00 | % | 0.00 | % | |||||
| Intermediate Income Fund | 0.00 | % | 0.00 | % | 0.00 | % | 100.00 | % | 9.02 | % | |||||
| Tactical Bond Fund | 0.00 | % | 0.00 | % | 0.00 | % | 31.04 | % | 0.00 | % | |||||
| Equity Income Fund | 0.00 | % | 84.64 | % | 71.35 | % | 0.04 | % | 29.16 | % | |||||
| Sustainable Growth Fund | 0.00 | % | 0.00 | % | 0.00 | % | 0.00 | % | 0.00 | % | |||||
| Tax Exempt Bond Fund | 98.75 | % | 0.00 | % | 0.00 | % | 100.00 | % | 81.34 | % | |||||
| Emerging Markets Fund | 0.00 | % | 94.15 | % | 2.08 | % | 0.07 | % | 0.00 | % | |||||
| Strategic European Equity Fund | 0.00 | % | 0.00 | % | 0.00 | % | 0.00 | % | 0.00 | % | |||||
| Mortgage Securities Fund | 0.00 | % | 0.00 | % | 0.00 | % | 100.00 | % | 0.00 | % | |||||
| Japan Alpha Opportunities Fund | 0.00 | % | 0.00 | % | 0.00 | % | 0.00 | % | 0.00 | % | |||||
The Funds, as applicable, intend to elect to pass through to shareholders the credit for taxes paid to foreign countries. For the fiscal year ended June 30, 2014, the Emerging Markets Fund had gross foreign income of $6,209,671 and foreign taxes paid of $829,914. The Strategic European Equity Fund had gross foreign income of $4,004,961 and foreign taxes paid of $432,685. The Japan Alpha Opportunities Fund had gross foreign income of $10,445,656 and foreign taxes of $1,208,215.
www.brownadvisoryfunds.com
162
BROWN ADVISORY FUNDS
At Brown Advisory Funds, we believe that you deserve sincere and open communication on all issues relating to our relationship.
In this spirit, we wish to provide to you a summary of certain of our policies relating to confidentiality and privacy of shareholder information.
CONFIDENTIALITY AND PRIVACY POLICY
Brown Advisory Funds takes confidentiality of your personal information and privacy of your account very seriously.
Our commitment to safeguard your personal information goes beyond our legal obligations, and the principles that guide the way in which we conduct business are built upon the core values of trust, confidence and integrity. By adhering to the practices described in this policy, we affirm our continuing commitment to protecting your privacy.
Brown Advisory Funds collects only relevant information from shareholders that the law allows or requires us to have in order to conduct our business and properly service you. We obtain non-public financial and other personal information (“Personal Information”) about you directly (e.g., information on account applications and other forms, such as your name, address, and social security number, and information provided to access account information or conduct account transactions online, such as password, account number, e-mail address, and alternate telephone number), and indirectly (e.g., information about your transactions with us, such as transaction amounts, account balance and account holdings).
We maintain physical, electronic and procedural safeguards that comply with applicable laws and regulations to protect your Personal Information, and we continually assess new technology with the aim of adding new safeguards to those we have in place. For example, we take many measures to protect your Personal Information while it is stored electronically.
In the normal conduct of our business, it may become necessary for us to share your Personal Information with companies who are under contract to perform services on behalf of Brown Advisory Funds. For example, those who may receive this information include the companies that provide Brown Advisory Funds with transfer agent, technology and administrative services, as well as the investment adviser, Brown Investment Advisory Incorporated, who is an affiliate of Brown Advisory Funds. If you maintain a retirement/educational custodial account directly with Brown Advisory Funds, we may also disclose your Personal Information to the custodian for that account for shareholder servicing purposes. We limit access to your Personal Information to only those employees of Brown Advisory Funds’ service providers with a business reason to know such information.
We do not sell Personal Information about current or former shareholders or their accounts to any third parties, and we have policies and procedures intended to prevent the disclosure of such Personal Information to third parties unless necessary to support the operations and administration of the Brown Advisory Funds, the Brown Advisory Funds’ compliance with applicable laws and regulations, or as otherwise permitted by law.
We strive to keep our records of your information accurate, and we take immediate steps to correct errors. If there are any inaccuracies in your statements or in any other communications from us, please contact us or contact your investment professional.
This privacy policy applies to individuals, and we reserve the right to change any or all of the principles, along with related provisions, at any time.
www.brownadvisoryfunds.com
163
(This Page Intentionally Left Blank.)
INVESTMENT ADVISER
Brown Advisory, LLC
901 South Bond Street, Suite 400
Baltimore, MD 21231
www.brownadvisory.com
DISTRIBUTOR
Quasar Distributors, LLC
615 East Michigan Street
Milwaukee, WI 53202
CUSTODIAN
U.S. Bank, N.A.
Custody Operations
1555 North RiverCenter Drive, Suite 302
Milwaukee, WI 53212
TRANSFER AGENT
U.S. Bancorp Fund Services, LLC
P.O. Box 701
Milwaukee, WI 53201-0701
(800) 540-6807
INDEPENDENT REGISTERED PUBLIC ACCOUNTING FIRM
Tait, Weller & Baker LLP
1818 Market Street, Suite 2400
Philadelphia, PA 19103
LEGAL COUNSEL
Dechert, LLP
1900 K Street, NW
Washington, DC 20006
| Institutional Shares | Investor Shares | Advisor Shares | ||||||||||
| Symbol | CUSIP | Symbol | CUSIP | Symbol | CUSIP | |||||||
| Growth Equity Fund | BAFGX | 115233702 | BIAGX | 115233504 | BAGAX | 115233603 | ||||||
| Value Equity Fund | BAFVX | 115233876 | BIAVX | 115233801 | BAVAX | 115233884 | ||||||
| Flexible Equity Fund | BAFFX | 115233843 | BIAFX | 115233868 | BAFAX | 115233850 | ||||||
| Small-Cap Growth Fund | BAFSX | 115233819 | BIASX | 115233835 | BASAX | 115233827 | ||||||
| Small-Cap Fundamental Value Fund | BAUUX | 115233777 | BIAUX | 115233793 | BAUAX | 115233785 | ||||||
| Opportunity Fund | — | — | BIAOX | 115233769 | — | — | ||||||
| Maryland Bond Fund | — | — | BIAMX | 115233751 | — | — | ||||||
| Intermediate Income Fund | — | — | BIAIX | 115233744 | BAIAX | 115233736 | ||||||
| Tactical Bond Fund | — | — | — | — | BATBX | 115233710 | ||||||
| Equity Income Fund | BAFDX | 115233660 | BIADX | 115233686 | BADAX | 115233678 | ||||||
| Sustainable Growth Fund | BAFWX | 115233207 | BIAWX | 115233306 | BAWAX | 115233405 | ||||||
| Tax Exempt Bond Fund | — | — | BIAEX | 115233108 | — | — | ||||||
| Somerset Emerging Markets Fund | BAFQX | 115233652 | BIAQX | 115233645 | BAQAX | 115233637 | ||||||
| WMC Strategic European Equity Fund | BAFHX | 115233629 | BIAHX | 115233611 | BAHAX | 115233595 | ||||||
| Mortgage Securities Fund | BAFZX | 115233546 | BIAZX | 115233587 | — | — | ||||||
| WMC Japan Alpha Opportunities Fund | BAFJX | 115233579 | BIAJX | 115233561 | BAJAX | 115233553 | ||||||
This report is submitted for the general information of the shareholders of each Fund. It is not authorized for distribution to prospective investors unless preceded or accompanied by an effective prospectus, which includes information regarding the Funds’ risks, objectives, fees and expenses, experience of their management, and other information.
BX-ANNUAL
Item 2. Code of Ethics.
The registrant has adopted a code of ethics that applies to the registrant’s principal executive officer and principal financial officer. The registrant has not made any amendments to its code of ethics during the period covered by this report. The registrant has not granted any waivers from any provisions of the code of ethics during the period covered by this report.
A copy of the registrant’s Code of Ethics is filed herewith.
Item 3. Audit Committee Financial Expert.
The Registrant’s Board of Trustees has not designated an audit committee financial expert. The Registrant has determined that it will retain the services of an independent third party to assist it if circumstances arise that require specific investment company auditing expertise.
Item 4. Principal Accountant Fees and Services.
The Registrant has engaged its principal accountant to perform audit services, audit-related services, tax services and other services during the past two fiscal years. “Audit services” refer to performing an audit of the Registrant's annual financial statements or services that are normally provided by the accountant in connection with statutory and regulatory filings or engagements for those fiscal years. “Audit-related services” refer to the assurance and related services by the principal accountant that are reasonably related to the performance of the audit. “Tax services” refer to professional services rendered by the principal accountant for tax compliance, tax advice, and tax planning. There were no “Other services” provided by the principal accountant. The following table details the aggregate fees billed or expected to be billed for each of the last two fiscal years for audit fees, audit-related fees, tax fees and other fees by the principal accountant.
Brown Advisory Growth Equity Fund
| FYE 6/30/2014 | FYE 6/30/2013 | |
| Audit Fees | $15,700 | 16,700 |
| Audit-Related Fees | N/A | N/A |
| Tax Fees | $4,500 | $2,400 |
| All Other Fees | N/A | N/A |
Brown Advisory Value Equity Fund
| FYE 6/30/2014 | FYE 6/30/2013 | |
| Audit Fees | $15,700 | $16,700 |
| Audit-Related Fees | N/A | N/A |
| Tax Fees | $4,500 | $2,400 |
| All Other Fees | N/A | N/A |
Brown Advisory Flexible Equity Fund
| FYE 6/30/2014 | FYE 6/30/2013 | |
| Audit Fees | $15,700 | $16,700 |
| Audit-Related Fees | N/A | N/A |
| Tax Fees | $4,500 | $2,400 |
| All Other Fees | N/A | N/A |
Brown Advisory Small-Cap Growth Fund
| FYE 6/30/2014 | FYE 6/30/2013 | |
| Audit Fees | $15,700 | $15,200 |
| Audit-Related Fees | N/A | N/A |
| Tax Fees | $4,500 | $2,400 |
| All Other Fees | N/A | N/A |
Brown Advisory Small-Cap Fundamental Value Fund
| FYE 6/30/2014 | FYE 6/30/2013 | |
| Audit Fees | $15,700 | $16,700 |
| Audit-Related Fees | N/A | N/A |
| Tax Fees | $4,500 | $2,400 |
| All Other Fees | N/A | N/A |
Brown Advisory Opportunity Fund
| FYE 6/30/2014 | FYE 6/30/2013 | |
| Audit Fees | $15,700 | $15,200 |
| Audit-Related Fees | N/A | N/A |
| Tax Fees | $2,500 | $2,400 |
| All Other Fees | N/A | N/A |
Brown Advisory Maryland Bond Fund
| FYE 6/30/2014 | FYE 6/30/2013 | |
| Audit Fees | $15,700 | $15,200 |
| Audit-Related Fees | N/A | N/A |
| Tax Fees | $2,500 | $2,400 |
| All Other Fees | N/A | N/A |
Brown Advisory Intermediate Income Fund
| FYE 6/30/2014 | FYE 6/30/2013 | |
| Audit Fees | $15,700 | $15,200 |
| Audit-Related Fees | N/A | N/A |
| Tax Fees | $2,500 | $2,400 |
| All Other Fees | N/A | N/A |
Brown Advisory Tactical Bond Fund
| FYE 6/30/2014 | FYE 6/30/2013 | |
| Audit Fees | $15,700 | $15,200 |
| Audit-Related Fees | N/A | N/A |
| Tax Fees | $2,500 | $2,400 |
| All Other Fees | N/A | N/A |
Brown Advisory Equity Income Fund
| FYE 6/30/2014 | FYE 6/30/2013 | |
| Audit Fees | $15,700 | $16,700 |
| Audit-Related Fees | N/A | N/A |
| Tax Fees | $4,500 | $2,400 |
| All Other Fees | N/A | N/A |
Brown Advisory Sustainable Growth Fund
| FYE 6/30/2014 | FYE 6/30/2013 | |
| Audit Fees | $15,700 | $15,200 |
| Audit-Related Fees | N/A | N/A |
| Tax Fees | $4,500 | $2,400 |
| All Other Fees | N/A | N/A |
Brown Advisory Tax Exempt Bond Fund
| FYE 6/30/2014 | FYE 6/30/2013 | |
| Audit Fees | $15,700 | $15,200 |
| Audit-Related Fees | N/A | N/A |
| Tax Fees | $2,500 | $2,400 |
| All Other Fees | N/A | N/A |
Brown Advisory Emerging Markets Fund
| FYE 6/30/2014 | FYE 6/30/2013 | |
| Audit Fees | $15,700 | $15,200 |
| Audit-Related Fees | N/A | N/A |
| Tax Fees | $4,500 | $2,400 |
| All Other Fees | N/A | N/A |
Brown Advisory – WMC Strategic European Equity Fund
| FYE 6/30/2014 | FYE 6/30/2013 | |
| Audit Fees | $15,700 | N/A |
| Audit-Related Fees | N/A | N/A |
| Tax Fees | $4,500 | N/A |
| All Other Fees | N/A | N/A |
Brown Advisory Mortgage Securities Fund
| FYE 6/30/2014 | FYE 6/30/2013 | |
| Audit Fees | $17,200 | N/A |
| Audit-Related Fees | N/A | N/A |
| Tax Fees | $2,500 | N/A |
| All Other Fees | N/A | N/A |
Brown Advisor – WMC Japan Alpha Opportunities Fund
| FYE 6/30/2014 | FYE 6/30/2013 | |
| Audit Fees | $10,000 | N/A |
| Audit-Related Fees | N/A | N/A |
| Tax Fees | $4,400 | N/A |
| All Other Fees | N/A | N/A |
The audit committee has adopted pre-approval policies and procedures that require the audit committee to pre-approve all audit and non-audit services of the Registrant, including services provided to any entity affiliated with the Registrant. All of the principal accountant’s hours spent on auditing the Registrant’s financial statements were attributed to work performed by full-time permanent employees of the principal accountant. (If more than 50 percent of the accountant’s hours were spent to audit the Registrant's financial statements for the most recent fiscal year, state how many hours were attributed to work performed by persons other than the principal accountant's full-time, permanent employees.)
The following table indicates the non-audit fees billed or expected to be billed by the Registrant’s accountant for services to the Registrant and to the Registrant’s investment adviser (and any other controlling entity, etc.—not sub-adviser) for the last two fiscal years. The audit committee of the board of trustees has considered whether the provision of non-audit services that were rendered to the Registrant's investment adviser is compatible with maintaining the principal accountant's independence and has concluded that the provision of such non-audit services by the accountant has not compromised the accountant’s independence.
Brown Advisory Growth Equity Fund
| Non-Audit Related Fees | FYE 6/30/2014 | FYE 6/30/2013 |
| Registrant | N/A | N/A |
| Registrant’s Investment Adviser | N/A | N/A |
Brown Advisory Value Equity Fund
| Non-Audit Related Fees | FYE 6/30/2014 | FYE 6/30/2013 |
| Registrant | N/A | N/A |
| Registrant’s Investment Adviser | N/A | N/A |
Brown Advisory Flexible Equity Fund
| Non-Audit Related Fees | FYE 6/30/2014 | FYE 6/30/2013 |
| Registrant | N/A | N/A |
| Registrant’s Investment Adviser | N/A | N/A |
Brown Advisory Small-Cap Growth Fund
| Non-Audit Related Fees | FYE 6/30/2014 | FYE 6/30/2013 |
| Registrant | N/A | N/A |
| Registrant’s Investment Adviser | N/A | N/A |
Brown Advisory Small-Cap Fundamental Value Fund
| Non-Audit Related Fees | FYE 6/30/2014 | FYE 6/30/2013 |
| Registrant | N/A | N/A |
| Registrant’s Investment Adviser | N/A | N/A |
Brown Advisory Opportunity Fund
| Non-Audit Related Fees | FYE 6/30/2014 | FYE 6/30/2013 |
| Registrant | N/A | N/A |
| Registrant’s Investment Adviser | N/A | N/A |
Brown Advisory Maryland Bond Fund
| Non-Audit Related Fees | FYE 6/30/2014 | FYE 6/30/2013 |
| Registrant | N/A | N/A |
| Registrant’s Investment Adviser | N/A | N/A |
Brown Advisory Intermediate Income Fund
| Non-Audit Related Fees | FYE 6/30/2014 | FYE 6/30/2013 |
| Registrant | N/A | N/A |
| Registrant’s Investment Adviser | N/A | N/A |
Brown Advisory Tactical Bond Fund
| Non-Audit Related Fees | FYE 6/30/2014 | FYE 6/30/2013 |
| Registrant | N/A | N/A |
| Registrant’s Investment Adviser | N/A | N/A |
Brown Advisory Equity Income Fund
| Non-Audit Related Fees | FYE 6/30/2014 | FYE 6/30/2013 |
| Registrant | N/A | N/A |
| Registrant’s Investment Adviser | N/A | N/A |
Brown Advisory Sustainable Growth Fund
| Non-Audit Related Fees | FYE 6/30/2014 | FYE 6/30/2013 |
| Registrant | N/A | N/A |
| Registrant’s Investment Adviser | N/A | N/A |
Brown Advisory Tax Exempt Bond Fund
| Non-Audit Related Fees | FYE 6/30/2014 | FYE 6/30/2013 |
| Registrant | N/A | N/A |
| Registrant’s Investment Adviser | N/A | N/A |
Brown Advisory Emerging Markets Fund
| Non-Audit Related Fees | FYE 6/30/2014 | FYE 6/30/2013 |
| Registrant | N/A | N/A |
| Registrant’s Investment Adviser | N/A | N/A |
Brown Advisory – WMC Strategic European Equity Fund
| Non-Audit Related Fees | FYE 6/30/2014 | FYE 6/30/2013 |
| Registrant | N/A | N/A |
| Registrant’s Investment Adviser | N/A | N/A |
Brown Advisory Mortgage Securities Fund
| Non-Audit Related Fees | FYE 6/30/2014 | FYE 6/30/2013 |
| Registrant | N/A | N/A |
| Registrant’s Investment Adviser | N/A | N/A |
Brown Advisor – WMC Japan Alpha Opportunities Fund
| Non-Audit Related Fees | FYE 6/30/2014 | FYE 6/30/2013 |
| Registrant | N/A | N/A |
| Registrant’s Investment Adviser | N/A | N/A |
Item 5. Audit Committee of Listed Registrants.
Not applicable to registrants who are not listed issuers (as defined in Rule 10A-3 under the Securities Exchange Act of 1934).
Item 6. Schedule of Investments.
Schedule of Investments is included as part of the report to shareholders filed under Item 1 of this Form.
Item 7. Disclosure of Proxy Voting Policies and Procedures for Closed-End Management Investment Companies.
Not applicable to open-end investment companies.
Item 8. Portfolio Managers of Closed-End Management Investment Companies.
Not applicable to open-end investment companies.
Item 9. Purchases of Equity Securities by Closed-End Management Investment Company and Affiliated Purchasers.
Not applicable to open-end investment companies.
Item 10. Submission of Matters to a Vote of Security Holders.
There have been no material changes to the procedures by which shareholders may recommend nominees to the registrant’s board of trustees.
Item 11. Controls and Procedures.
| (a) | The Registrant’s President and Treasurer have reviewed the Registrant's disclosure controls and procedures (as defined in Rule 30a-3(c) under the Investment Company Act of 1940 (the “Act”)) as of a date within 90 days of the filing of this report, as required by Rule 30a-3(b) under the Act and Rules 13a-15(b) or 15d-15(b) under the Securities Exchange Act of 1934. Based on their review, such officers have concluded that the disclosure controls and procedures are effective in ensuring that information required to be disclosed in this report is appropriately recorded, processed, summarized and reported and made known to them by others within the Registrant and by the Registrant’s service provider. |
| (b) | There were no changes in the Registrant's internal control over financial reporting (as defined in Rule 30a-3(d) under the Act) that occurred during the second fiscal quarter of the period covered by this report that has materially affected, or is reasonably likely to materially affect, the Registrant's internal control over financial reporting. |
Item 12. Exhibits.
| (a) | (1) Any code of ethics or amendment thereto, that is subject of the disclosure required by Item 2, to the extent that the registrant intends to satisfy Item 2 requirements through filing an exhibit. Furnished herewith. |
(2) Certifications pursuant to Section 302 of the Sarbanes-Oxley Act of 2002. Furnished herewith.
(3) Any written solicitation to purchase securities under Rule 23c-1 under the Act sent or given during the period covered by the report by or on behalf of the registrant to 10 or more persons. Not applicable to open-end investment companies.
| (b) | Certification pursuant to Section 906 of the Sarbanes-Oxley Act of 2002. Furnished herewith. |
SIGNATURES
Pursuant to the requirements of the Securities Exchange Act of 1934 and the Investment Company Act of 1940, the Registrant has duly caused this report to be signed on its behalf by the undersigned, thereunto duly authorized.
(Registrant)
By (Signature and Title)* /s/David M. Churchill
David M. Churchill, President
Date September 4, 2014
Pursuant to the requirements of the Securities Exchange Act of 1934 and the Investment Company Act of 1940, this report has been signed below by the following persons on behalf of the Registrant and in the capacities and on the dates indicated.
By (Signature and Title)* /s/David M. Churchill
David M. Churchill, President
Date September 4, 2014
By (Signature and Title)* /s/Jason T. Meix
Jason T. Meix, Treasurer
Date September 5, 2014
* Print the name and title of each signing officer under his or her signature.