ANNUAL REPORT
June 30, 2019
Brown Advisory Growth Equity Fund
Brown Advisory Flexible Equity Fund
Brown Advisory Equity Income Fund
Brown Advisory Sustainable Growth Fund
Brown Advisory Mid-Cap Growth Fund
Brown Advisory Small-Cap Growth Fund
Brown Advisory Small-Cap Fundamental Value Fund
Brown Advisory Global Leaders Fund
Brown Advisory Intermediate Income Fund
Brown Advisory Total Return Fund
Brown Advisory Strategic Bond Fund
Brown Advisory Sustainable Bond Fund
Brown Advisory Maryland Bond Fund
Brown Advisory Tax-Exempt Bond Fund
Brown Advisory Mortgage Securities Fund
Brown Advisory – WMC Strategic European Equity Fund
Brown Advisory Emerging Markets Select Fund
Brown Advisory – Beutel Goodman Large-Cap Value Fund
Beginning on January 1, 2021, as permitted by regulations adopted by the U.S. Securities and Exchange Commission, paper copies of the Fund's annual and semi-annual shareholder reports will no longer be sent by mail, unless you specifically request paper copies of the reports. Instead, the reports will be made available on the Fund’s website (www.brownadvisory.com/mf/how-to-invest), and you will be notified by mail each time a report is posted and provided with a website link to access the report.
If you already elected to receive shareholder reports electronically, you will not be affected by this change and you need not take any action. You may elect to receive shareholder reports and other communications from the Fund electronically anytime by contacting your financial intermediary (such as a broker-dealer or a bank) or, if you are a direct investor, by calling (800) 540-6807 or by enrolling at www.brownadvisory.com/mf.
You may elect to receive all future reports in paper free of charge. If you invest through a financial intermediary, you can contact your financial intermediary to request that you continue to receive paper copies of your shareholder reports. If you invest directly with the Fund, you can call (800) 540-6807 to let the Fund know you wish to continue receiving paper copies of your shareholder reports. Your election to receive reports in paper will apply to all Funds held in your account if you invest through your financial intermediary or all Funds held with the fund complex if you invest directly with the Funds.
TABLE OF CONTENTS
Brown Advisory Growth Equity Fund | 1 |
Brown Advisory Flexible Equity Fund | 5 |
Brown Advisory Equity Income Fund | 9 |
Brown Advisory Sustainable Growth Fund | 13 |
Brown Advisory Mid-Cap Growth Fund | 17 |
Brown Advisory Small-Cap Growth Fund | 22 |
Brown Advisory Small-Cap Fundamental Value Fund | 28 |
Brown Advisory Global Leaders Fund | 33 |
Brown Advisory Intermediate Income Fund | 38 |
Brown Advisory Total Return Fund | 43 |
Brown Advisory Strategic Bond Fund | 50 |
Brown Advisory Sustainable Bond Fund | 58 |
Brown Advisory Maryland Bond Fund | 64 |
Brown Advisory Tax-Exempt Bond Fund | 69 |
Brown Advisory Mortgage Securities Fund | 76 |
Brown Advisory – WMC Strategic European Equity Fund | 86 |
Brown Advisory Emerging Markets Select Fund | 90 |
Brown Advisory – Beutel Goodman Large-Cap Value Fund | 94 |
Statements of Assets and Liabilities | 98 |
Statements of Operations | 103 |
Statements of Changes in Net Assets | 108 |
Financial Highlights | 117 |
Notes to Financial Statements | 124 |
Report of Independent Registered Public Accounting Firm | 138 |
Additional Information | 139 |
The views in the report contained herein were those of the Funds’ investment adviser, Brown Advisory LLC, or, for the sub-advised funds, of the respective sub-adviser, as of June 30, 2019 and may not reflect their views on the date this report is first published or anytime thereafter. This report may contain discussions about certain investments both held and not held in the portfolio as of June 30, 2019. All current and future holdings are subject to risk and are subject to change. While these views are intended to assist shareholders in understanding their investment in each Fund, they do not constitute investment advice, are not a guarantee of future performance and are not intended as an offer or solicitation with respect to the purchase or sale of any security. Performance figures include the reinvestment of dividend and capital gain distributions.
The Global Industry Classification Standard (GICS®) was developed by and is the exclusive property of MSCI, Inc. and Standard & Poor’s Financial Services LLC (“S&P”). GICS® is a service mark of MSCI, Inc. and S&P and has been licensed for use by the Administrator, U.S. Bancorp Fund Services, LLC.
GLOSSARY OF TERMS
Alpha refers to the abnormal rate of return on a security or portfolio in excess of what would be predicted by an equilibrium model like the capital asset pricing model (CAPM).
Bloomberg Barclays 1-10 Year Blended Municipal Bond Index is a market index of high quality, domestic fixed income securities with maturities of less than 10 years.
Bloomberg Barclays Intermediate US Aggregate Bond Index represents domestic taxable investment-grade bonds with index components for government and corporate securities, mortgage pass-through securities and asset-backed securities with average maturities and durations in the intermediate range. This index represents a sector of the Bloomberg Barclays US Aggregate Bond Index.
Bloomberg Barclays Mortgage Backed Securities Index is a market value-weighted index which covers the mortgage-backed securities component of the Bloomberg Barclays US Aggregate Bond Index. The index is composed of agency mortgage-backed passthrough securities of the Government National Mortgage Association (Ginnie Mae), the Federal National Mortgage Association (Fannie Mae), and the Federal Home Loan Mortgage Corporation (Freddie Mac) with a minimum $150 million par amount outstanding and a weighted-average maturity of at least 1 year. The index includes reinvestment of income.
Bloomberg Barclays US Aggregate Bond Index is a broad-based benchmark that measures the investment grade, US dollar-denominated, fixed-rate taxable bond market. The index includes Treasuries, government-related and corporate securities, MBS, ABS and CMBS.
Bloomberg Barclays US Corporate High Yield Index measures the US Dollar denominated, high-yield, fixed-rate corporate bond market.
Basis point(s) (bps) is a unit that is equal to 1/100th of 1%, and is used to denote the change in a financial instrument. The basis point is commonly used for calculating changes in interest rates, equity indexes and the yield of a fixed-income security. 1% is equal to 100 basis points.
Beta is a measure of the volatility, or systematic risk, of a security or a portfolio in comparison to the market as a whole.
Book value is the net asset value of a company, calculated by total assets minus intangible assets (patents, goodwill) and liabilities.
CAPEX, or capital expenditures, are funds used by a company to acquire or upgrade physical assets such as property, industrial buildings or equipment. It is often used to undertake new projects or investments by the firm. This type of outlay is also made by companies to maintain or increase the scope of their operations.
Cash flow measures the cash generating capability of a company by adding non-cash charges (e.g. depreciation) and interest expense to pretax income.
Correlation is a statistical measurement of how two securities move in relation to each other.
Dividend Yield is a financial ratio that shows how much a company pays out in dividends each year relative to its share price. In the absence of any capital gains, the dividend yield is the return on investment for a stock.
Downside Capture is a statistical measure of a fund’s performance in down markets. For example, a fund with downside capture of 90% would only have declined 90% as much as the related index during the same down market period.
Duration is a measure of the sensitivity of the price of a fixed-income investment to a change in interest rates. Duration is expressed as a number of years.
Earnings growth is a measure of growth in a company’s net income over a specific period, often one year. The term can apply to actual data from previous periods or estimated data for future periods.
Earnings per share (EPS) is calculated by taking the total earnings divided by the number of shares outstanding.
Earnings Yield is the earnings per share for the most recent 12-month period divided by the current market price per share. The earnings yield shows the percentage of each dollar invested in the stock that was earned by the company.
EBITDA is the Earnings Before Interest, Taxes, Depreciation and Amortization. An approximate measure of a company’s operating cash flow based on data from the company’s income statement.
Enterprise Value (EV) is a measure of a company’s value, often used as an alternative to straightforward market capitalization. Enterprise Value is calculated as market capitalization plus debt, minority interest and preferred shares, minus total cash and cash equivalents.
FTSE All-World Index is a market capitalization weighted index representing the performance of large and mid-capitalization stocks from the FTSE Global Equity Index Series.
FTSE Emerging Index is a market capitalization weighted index representing the performance of over 790 large and mid-capitalization companies in 22 emerging markets.
Forward price to earnings ratio uses forecasted earnings, rather than current earnings, to calculate the price to earnings ratio.
Free Cash Flow is the operating cash flows (net income plus amortization and depreciation) minus capital expenditures and dividends. Free cash flow is the amount of cash that a company has left over after it has paid all of its expenses, including investments.
Gross Domestic Product (GDP) is the monetary value of all the goods and services produced by an economy over a specified period. It includes consumption, government purchases, investments, and exports minus imports.
GLOSSARY OF TERMS
ICE BofAML 0-3 Month US Treasury Bill Index is a subset of the ICE BofAML US Treasury Bill Index and includes all securities with a remaining term to final maturity less than 3 months.
MSCI Emerging Markets Index is a free float-adjusted market capitalization index that is designed to measure equity market performance in the global emerging markets.
MSCI Emerging Markets Small Cap Index is a free float-adjusted market capitalization index that is designed to measure small cap equity market performance in the global emerging markets.
MSCI Europe Index is an index that captures large and mid cap representation across 15 developed market countries in Europe.
Price to Book Value Ratio (P/B) is ratio used to compare a stock’s market value to its book value. It is calculated by dividing the current closing price of the stock by the latest quarter’s book value per share.
Price to earnings ratio (P/E) is a common tool for comparing the prices of different common stocks and is calculated by dividing the current market price of a stock by the earnings per share.
Return of Capital (ROC) is a return from an investment that is not considered income. The return of capital is when some or all of the money an investor has in an investment is paid back to him or her, thus decreasing the value of the investment.
Return on Capital Employed (ROCE) is a financial ratio that measures a company’s profitability and the efficiency with which its capital is employed. Return on Capital Employed (ROCE) is calculated as: ROCE = Earnings Before Interest and Tax (EBIT) / Capital Employed.
Return on Equity (ROE) is the amount of net income returned as a percentage of shareholders equity. Return on equity measures a corporation’s profitability by revealing how much profit a company generates with the money shareholders have invested.
Return on Invested Capital (ROIC) is a calculation used to assess a company’s efficiency at allocating the capital under its control to profitable investments. ROIC is typically calculated by taking a company’s net income, subtracting dividends the company paid out and dividing that amount by the company’s total capital.
Russell Midcap Growth Index measures the performance of the mid-capitalization growth sector of the U.S. equity market.
Russell 1000® Growth Index measures the performance of the large-cap growth segment of the of the U.S. equity universe. It includes those Russell 1000® companies with higher price to book value ratios and higher forecasted growth values.
Russell 1000® Value Index measures the performance of the large-cap value segment of the U.S. equity universe. It includes those Russell 1000® companies with lower price to book value ratios and lower expected growth values.
Russell 2000® Growth Index measures the performance of the small-cap growth segment of the U.S. equity universe. It includes those Russell 2000® companies with higher price to book value ratios and higher forecasted growth values.
Russell 2000® Index measures the performance of the 2,000 smallest companies in the Russell 3000® Index.
Russell 2000® Value Index measures the performance of the small-cap value segment of the U.S. equity universe. It includes those Russell 2000® companies with lower price to book value ratios and lower forecasted growth values.
Russell 3000® Index measures the performance of the 3,000 largest U.S. companies representing approximately 98% of the investable U.S. equity market.
S&P 500 Index (“S&P 500”) is a market-value weighted index representing the performance of 500 widely held, publicly traded large capitalization stocks.
Tangible Book Value (“TBV”) is a valuation ratio expressing the price of a security compared to its hard, or tangible, book value as reported in the company’s balance sheet. The tangible book value number is equal to the company’s total book value less the value of any intangible assets.
Tier 1 Capital Ratio is a comparison between a banking firm’s core equity capital and total risk-weighted assets. A firm’s core equity capital is known as its Tier 1 capital and is the measure of a bank’s financial strength based on the sum of its equity capital and disclosed reserves, and sometimes non-redeemable, non-cumulative preferred stock. A firm’s risk-weighted assets include all assets that the firm holds that are systematically weighted for credit risk. Central banks typically develop the weighting scale for different asset classes, such as cash and coins, which have zero risk, versus a letter or credit, which carries more risk.
Turnover refers to a fund buying or selling securities. (The fund “turns over” its portfolio.) A fund pays transaction costs, such as commissions, when it buys and sells securities. Additionally, a higher turnover rate may result in higher taxes when the fund shares are held in a taxable account.
Yield Curve is a line that plots the yields of securities having equal credit quality but different maturity dates.
Yield Spread is the difference between yields on differing securities, calculated by deducting the yield of one security from another.
The broad based market indexes referenced in the following management commentaries are considered representative of their indicated market, the indexes are unmanaged and do not reflect the deduction of fees, such as, investment management and fund accounting fees, or taxes associated with a mutual fund. Investors cannot invest directly in an index.
Brown Advisory Growth Equity Fund
A Message to Our Shareholders
June 30, 2019
Dear Shareholders:
During the year ended June 30, 2019, the Brown Advisory Growth Equity Fund – Investor Shares (the “Fund”) increased 16.50% in value. During the same period, the Fund’s benchmark, the Russell 1000® Growth Index (the “Index”), increased 11.56%.
The Fund delivered strong results, in both absolute and relative terms over the course the fiscal year. Falling interest rates coupled with a resilient labor market has translated to robust stock market appreciation, but this by no means is considered a “Goldilocks” scenario. While the U.S. does have a relatively stronger footing than most global economies, international trade remains a wildcard and many economies have started to experience some weakness. However equity markets seem to be discounting the probability of a deep global recession.
Health care continues to be a meaningful contributor to the Fund’s performance. Yet the backdrop for the health care sector broadly remains cloudy and the sector has been an underperformer for the benchmark. Concerns over drug pricing and increasing regulation continue to weigh on biopharma stocks. The portfolio remains overweight to the sector, although this is not due to a top-down view. From a bottom-up perspective, we are quite sanguine about the underlying strength of the individual business models that we own. For example, Danaher, which has been a longtime portfolio holding, announced the acquisition of GE’s health care business, sending the stock higher. This was not necessarily considered a transformative acquisition. We believe that the company has done an extraordinary job over the last several years transforming the business by increasing both the recurring nature of its revenues and the profitability of the business, thus improving the overall quality of its multi-industry business model.
On an absolute basis, technology was a leading sector for the market and the portfolio. Fundamentals across much of the software and services segment continue to be quite robust. As companies in all areas of the economy look to invest in technology to modernize their operations and stave off disruption, “digital transformation” partners, such as Salesforce.com, Adobe, Autodesk and Microsoft are experiencing robust, secular demand. This investment cycle remains early in the large enterprise segment, with today’s investments often focusing on front-office applications before moving to back-office applications and IT infrastructure in the future. In addition to these industrywide tailwinds, the portfolio benefited from several stock-specific drivers in companies like Intuit, Autodesk and Genpact.
While our industrials stocks were additive to performance, one holding BWX Technologies, has pulled back after missing expectations due to a quality control issue in a non-core business segment. The market initially overreacted to the news, however, the core naval power-plant business which underpins our investment case remains on track, and the stock has begun to recover.
We initiated a new position in consumer staples company, Brown-Forman. Brown-Forman owns a leading portfolio of super-premium spirits brands and maintains an exceptional position in the key growth categories of American whiskey and tequila. The stock underperformed its peer group and the broader market over last year, creating an opportunity to build our position at a compelling valuation. We eliminated our position in Facebook as the company remains in the crosshairs of regulatory and consumer backlash as a result of its missteps with respect to data governance practices, and management turnover. Given these challenges, we are reallocating the capital to Microsoft which is a business we believe has greater visibility and offers a more compelling ratio of upside potential versus downside risk. Microsoft is an enterprise software company offering both cloud computing and productivity applications. The company has successfully reinvented itself over the last several years, and we have a high degree of confidence in its ability to grow revenues and expand operating margins going forward.
We are pleased that the portfolio continues to outperform, especially in light of the volatile markets we are experiencing. We believe it is impossible, nor do we even try, to predict the short-term market response or the precise quarterly cadence of companies’ results. Our focus is geared toward finding companies with unique business models that we believe have the potential to grow at above-average rates over a full cycle. We have always been confident that the market will reward these types of companies over the long term.
Sincerely,
Kenneth M. Stuzin, CFA
Portfolio Manager
www.brownadvisory.com/mf
Brown Advisory Growth Equity FundA Message to Our Shareholders
June 30, 2019
Past performance is not a guarantee of future results.
Mutual fund investing involves risk. Principal loss is possible. Investments in medium capitalization companies generally carry greater risk than is customarily associated with larger companies for various reasons such as narrower markets, limited financial resources and less liquid stock. The value of the Fund’s investments in REITs may change in response to changes in the real estate market such as declines in the value of real estate, lack of available capital or financing opportunities, and increases in property taxes or operating costs. Investments in foreign securities entail certain risks not associated with investments in domestic securities, such as volatility of currency exchange rates, and in some cases, political and economic instability and relatively illiquid markets. These risks are greater for investments in emerging markets. The Fund may invest in ETFs, which may trade at a discount to the aggregate value of the underlying securities and although expense ratios for ETFs are generally low, frequent trading of ETFs by the Fund can generate brokerage expenses.
Fund holdings and sector allocations are subject to change and should not be considered a recommendation to buy or sell any security. For a complete list of fund holdings, please refer to the Schedule of Investments provided in this report.
Definitions for terms and indices are provided in the Glossary of Terms.
www.brownadvisory.com/mf
Brown Advisory Growth Equity FundPerformance Information & Portfolio Holdings Summary
June 30, 2019
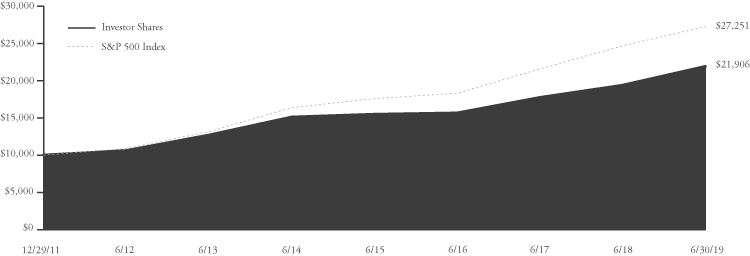
GROWTH OF A $10,000 INVESTMENT
The following chart reflects the change in value of a hypothetical $10,000 investment, including reinvested dividends and distributions, in the Fund as measured against broad-based securities market indices. The Russell 1000® Growth Index measures the performance of the large-cap growth segment of the U.S. equity universe. It includes those Russell 1000® companies with higher price to book ratios and higher forecasted growth values. The S&P 500 Index is a market-value weighted index representing the performance of 500 widely held, publicly traded large capitalization stocks. The indexes are unmanaged and do not reflect the deduction of fees, such as investment management fees. Investors cannot invest directly in an index.

| PORTFOLIO HOLDINGS | % of Net Assets |
Information Technology | | | 33.6 | % | |
Health Care | | | 20.3 | % | |
Industrials | | | 11.6 | % | |
Consumer Discretionary | | | 11.4 | % | |
Consumer Staples | | | 7.4 | % | |
Communication Services | | | 5.9 | % | |
Real Estate Investment Trusts | | | 3.9 | % | |
Materials | | | 3.1 | % | |
Money Market Funds | | | 2.8 | % | |
Other Assets and Liabilities | | | 0.0 | % | |
| | | | 100.0 | % | |
Average Annual Total Return | One Year | Five Year | Ten Year |
Institutional Shares1 | 16.69% | 13.57% | 16.31% |
| Investor Shares | 16.50% | 13.39% | 16.14% |
| Advisor Shares | 16.22% | 13.11% | 15.82% |
Russell 1000® Growth Index | 11.56% | 13.39% | 16.28% |
| S&P 500 Index | 10.42% | 10.71% | 14.70% |
| | Institutional Shares | Investor Shares | Advisor Shares |
Gross Expense Ratio2 | 0.71% | 0.86% | 1.11% |
Net Expense Ratio2 | 0.71% | 0.86% | 1.11% |
Past performance does not guarantee future results. The performance data quoted represents past performance and current returns may be lower or higher. The investment return and net asset value will fluctuate so that an investor’s shares, when redeemed, may be worth more or less than the original cost. To obtain performance information current to the most recent month end, please visit our website at brownadvisory.com/mf/growth-equity-fund. The performance table and graph above do not reflect the deduction of taxes that a shareholder would pay on Fund distributions or the redemption of Fund shares. Investment performance reflects periods during which fee waivers were in effect. In the absence of such waivers, total return would have been reduced. Performance data does not reflect the imposition of the redemption fee of 1.00% on shares redeemed within 14 days, and if it did, performance would have been lower. Returns shown are calculated using the net asset values (“NAV”) that were used for shareholder transactions as of the respective period ends. These NAV, and the returns calculated from them, may differ from the NAV and returns shown elsewhere in this report.
1 | Performance information for the Institutional Shares, prior to commencement of operations on October 19, 2012, is based on the performance of Investor Shares, and adjusted for the lower expenses applicable to Institutional Shares. |
2 | Per the Fund’s prospectus dated October 31, 2018. Refer to the financial highlights for the gross and net expense ratios for the year ended as of the date of this report. Please note that the expense ratios per the prospectus include acquired fund fees and expenses (as applicable) and the expense ratios in the financial highlights do not. |
www.brownadvisory.com/mf
Brown Advisory Growth Equity FundSchedule of Investments
June 30, 2019
| Shares | | Security Description | | Value $ | |
| Common Stocks — 93.3% | | | |
| | | | |
| Communication Services — 5.9% | | | |
| | 64,945 | | Alphabet, Inc. — Class C* | | | 70,199,700 | |
| | 673,995 | | Electronic Arts, Inc.* | | | 68,248,734 | |
| | | | | | | 138,448,434 | |
| Consumer Discretionary — 11.4% | | | | |
| | 272,690 | | Alibaba Group Holding, Ltd. ADR* | | | 46,207,320 | |
| | 54,825 | | Amazon.com, Inc.* | | | 103,818,265 | |
| | 32,114 | | Booking Holdings, Inc.* | | | 60,204,437 | |
| | 1,099,685 | | TJX Companies, Inc. | | | 58,151,343 | |
| | | | | | | 268,381,365 | |
| Consumer Staples — 7.4% | | | | |
| | 979,915 | | Brown-Forman Corp. | | | 54,316,688 | |
| | 189,018 | | Costco Wholesale Corp. | | | 49,949,897 | |
| | 386,962 | | Estee Lauder Companies, Inc. | | | 70,856,612 | |
| | | | | | | 175,123,197 | |
| Health Care — 20.3% | | | | |
| | 573,908 | | Danaher Corp. | | | 82,022,931 | |
| | 449,197 | | DexCom, Inc.* | | | 67,307,679 | |
| | 305,202 | | Edwards Lifesciences Corp.* | | | 56,383,017 | |
| | 154,434 | | Intuitive Surgical, Inc.* | | | 81,008,355 | |
| | 307,991 | | Thermo Fisher Scientific, Inc. | | | 90,450,797 | |
| | 893,135 | | Zoetis, Inc. | | | 101,361,891 | |
| | | | | | | 478,534,670 | |
| Industrials — 11.6% | | | | |
| | 800,300 | | BWX Technologies, Inc. | | | 41,695,630 | |
| | 304,645 | | Cintas Corp. | | | 72,289,212 | |
| | 863,492 | | Fortive Corp. | | | 70,391,868 | |
| | 247,668 | | Roper Technologies, Inc. | | | 90,710,881 | |
| | | | | | | 275,087,591 | |
| Information Technology — 33.6% | | | | |
| | 200,095 | | Adobe, Inc.* | | | 58,957,992 | |
| | 646,105 | | Amphenol Corp. | | | 61,987,314 | |
| | 443,699 | | Autodesk, Inc.* | | | 72,278,567 | |
| | 126,464 | | FleetCor Technologies, Inc.* | | | 35,517,414 | |
| | 1,651,121 | | Genpact, Ltd. | | | 62,891,199 | |
| | 307,991 | | Intuit, Inc. | | | 80,487,288 | |
| | 792,490 | | Microsoft Corp. | | | 106,161,960 | |
| | 478,841 | | NXP Semiconductors NV | | | 46,739,670 | |
| | 830,581 | | PayPal Holdings, Inc.* | | | 95,068,301 | |
| | 446,249 | | salesforce.com, Inc.* | | | 67,709,361 | |
| | 600,285 | | Visa, Inc. | | | 104,179,462 | |
| | | | | | | 791,978,528 | |
| Materials — 3.1% | | | | |
| | 158,259 | | Sherwin-Williams Co. | | | 72,528,517 | |
Total Common Stocks (Cost $1,181,225,033) | | | 2,200,082,302 | |
| | | | | |
| Real Estate Investment Trusts — 3.9% | | | | |
| | 409,513 | | SBA Communications Corp.* | | | 92,074,903 | |
Total Real Estate Investment Trusts (Cost $41,070,486) | | | 92,074,903 | |
| | | | | | | | |
| Short-Term Investments — 2.8% | | | | |
| | | | | |
| Money Market Funds — 2.8% | | | | |
| | 65,816,903 | | First American Government | | | | |
| | | | Obligations Fund — Class Z, 2.26%# | | | 65,816,903 | |
Total Short-Term Investments (Cost $65,816,903) | | | 65,816,903 | |
Total Investments — 100.0% (Cost $1,288,112,422) | | | 2,357,974,108 | |
Other Assets in Excess of Liabilities — 0.0% | | | 729,657 | |
| NET ASSETS — 100.0% | | $ | 2,358,703,765 | |
ADR — American Depositary Receipt
* | Non-Income Producing |
# | Annualized seven-day yield as of June 30, 2019. |
| | |
The accompanying notes are an integral part of these financial statements.
www.brownadvisory.com/mf
Brown Advisory Flexible Equity FundA Message to Our Shareholders
June 30, 2019
Dear Shareholders:
During the year ended June 30, 2019, the Brown Advisory Flexible Equity Fund – Investor Shares (the “Fund”) increased 8.77% in value. During the same period, the Fund’s benchmark, the S&P 500® Index (the “Index”), increased 10.42%.
The U.S. stock market and the Fund rose sharply in the first half of 2019, recovering from the fourth quarter’s sharp decline. The catalyst for the equity market reversing the dour mood of late 2018 was a signal from the Federal Reserve that it was no longer as set on increasing interest rates. This caused bonds to rally, and equities followed. The gains in the equity market were against a backdrop of an escalation in the U.S. trade dispute with China and heightened concerns related to a slowing global economy. Fears related to a potential economic slowdown were reflected by a surge in demand for Treasuries and the associated meaningful decline in the bond yields. The ten year yield fell to 2%, a level which was last seen in 2016.
We continue to view equities as more attractive than bonds. With interest on U.S. Treasuries capitalized at 2% and stocks capitalized at 5.6% with price-to-earnings ratios (P/E) of 17.7x on forward-year earnings, the advantage of stocks is strong, in our view. With this spread in favor of stocks, one would have to either be very negative on the future of sustainable earnings of stocks or, given stocks’ greater sensitivity to increases in interest rates, very negative on the outlook for inflation and thus interest rates. In the 12-month period, information technology was our best performing sector compared to the S&P 500 Index and the financial sector was the laggard. The Fund’s information technology holdings had a larger weighting and a higher return than the Index sector. Our financials’ sector holdings declined very slightly relative to the sector’s increase in the Index.
The biggest contributors, all long-term holdings, to returns in the twelve-month period were global payments networks MasterCard and Visa. Microsoft, a software and services provider, Edwards Lifesciences, a manufacturer and marketer of medical devices to treat late-stage cardiovascular disease, and PayPal Holdings, a digital payments company, were also strong contributors. These companies achieved strong business results and we continue to like their long-term prospects.
The largest detractors to returns were Charles Schwab Corp, a financial services provider, Conagra Brands, a packaged food business, Cimarex Energy Co., an oil and gas exploration and production company, Suncor Energy Inc, a Canadian integrated energy company and Wells Fargo & Co., a banking and diversified financial services company. Energy and financial stocks were generally lower for the period. Energy stocks fell with the decline in the price of oil while financials were impacted by lower interest rates. Conagra Brands disappointed investors with its results which included its recent acquisition of Pinnacle Foods. Despite the setback, we continue to hold the shares.
We added one new investment and eliminated three since our December 31, 2018 Semi-Annual Report to shareholders. New holdings include Stericycle, Inc., a medical waste removal and document destruction business, as well as spin-offs Corteva, Inc. (agricultural products) and Dow, Inc. (materials science) from our original investment in DowDuPont. We believe that value will be realized from these and future business portfolio changes within the various DowDuPont companies.
We view Stericycle’s business as a tollbooth on medical and business activity with a highly recurring revenue base. The business had faced challenges due to poor management. A new management team is in place to revive the business prospects.
We purchased Stericycle with the proceeds from the sale of T. Rowe Price. T. Rowe Price is a good business but the asset management industry is facing challenges such as fee compression as low fee passive investing continues to gain share.
We sold Altaba and invested the proceeds in existing holding Alibaba Group Holding due to a narrowing spread in valuation between the two. Since Altaba’s value was largely tied to its investment in Alibaba, our exposure to the underlying business did not change. We now own Alibaba directly rather than through an intermediary. Alibaba is the largest e-commerce company in China. We believe that Alibaba will continue to achieve above-average growth in China and other regions in Asia.
We eliminated eBay due to its lagging overall e-commerce growth rates. We made our investment in eBay in 2014 and saw an opportunity for improvement in its namesake business and potential for its PayPal business. PayPal was spun out of eBay in 2016 and is currently held in the Fund. eBay was moderately successful as an investment and PayPal, to date, has been very successful, making the combination quite attractive overall in our view.
We search for investment bargains among long-term attractive businesses with shareholder-oriented managers. These businesses should have or develop competitive advantages that result in good business economics, managers who allocate capital well, capacity to adjust to changes in the world and the ability to grow business value over time. Bargains in these types of stocks can arise for various reasons, but are often due to short-term investor perceptions, temporary business challenges that will improve,
www.brownadvisory.com/mf
Brown Advisory Flexible Equity FundA Message to Our Shareholders
June 30, 2019
company or industry changes for the better or as-yet-unrecognized potential for long-term growth and development. Despite the occasional investment that will go awry, we are optimistic about the long-term outlook for equities of good businesses purchased at reasonable prices and our ability to find them. To that end, our equity research team is experienced, enterprising, and motivated in this search.
Sincerely,
Maneesh Bajaj, CFA
Portfolio Manager
Past performance is not a guarantee of future results.
Mutual fund investing involves risk. Principal loss is possible. The Fund may invest in securities of foreign issuers. Investments in such securities entail certain risks not associated with investments in domestic securities, such as volatility of currency exchange rates, and in some cases, political and economic instability and relatively illiquid markets. These risks are greater for investments in emerging markets. The value of the Fund’s investments in REITs may change in response to changes in the real estate market such as declines in the value of real estate, lack of available capital or financing opportunities, and increases in property taxes or operating costs. The Fund may invest in ETFs, which may trade at a discount to the aggregate value of the underlying securities and although expense ratios for ETFs are generally low, frequent trading of ETFs by the Fund can generate brokerage expenses. Investments in smaller and medium-sized companies generally carry greater risk than is customarily associated with larger companies for various reasons such as narrower markets, limited financial resources and less liquid stock. Investments in debt securities typically decrease in value when interest rates rise. This risk is usually greater for longer term debt securities. Investments in lower-rated and non-rated securities present a greater risk of loss to principal and interest than higher-rated securities.
Fund holdings and sector allocations are subject to change and should not be considered a recommendation to buy or sell any security. For a complete list of fund holdings, please refer to the Schedule of Investments provided in this report.
Definitions for terms and indices are provided in the Glossary of Terms.
www.brownadvisory.com/mf
Brown Advisory Flexible Equity FundPerformance Information & Portfolio Holdings Summary
June 30, 2019
GROWTH OF A $10,000 INVESTMENT
The following chart reflects the change in value of a hypothetical $10,000 investment, including reinvested dividends and distributions, in the Fund as measured against the broad-based securities market index. The S&P 500 Index (“Index”) is a market-value weighted index representing the performance of 500 widely held, publicly traded large capitalization stocks. The Index is unmanaged and does not reflect the deduction of fees, such as investment management fees. Investors cannot invest directly in an index.
| PORTFOLIO HOLDINGS | % of Net Assets |
Information Technology | | | 26.0 | % | |
Financials | | | 19.9 | % | |
Consumer Discretionary | | | 14.9 | % | |
Communication Services | | | 10.0 | % | |
Health Care | | | 8.9 | % | |
Industrials | | | 7.4 | % | |
Energy | | | 4.4 | % | |
Consumer Staples | | | 3.2 | % | |
Real Estate Investment Trusts | | | 2.6 | % | |
Money Market Funds | | | 1.4 | % | |
Materials | | | 1.2 | % | |
Other Assets and Liabilities | | | 0.1 | % | |
| | | | 100.0 | % | |
Average Annual Total Return | One Year | Five Year | Ten Year |
Institutional Shares1 | 8.94% | 10.58% | 14.98% |
| Investor Shares | 8.77% | 10.42% | 14.81% |
| Advisor Shares | 8.52% | 10.15% | 14.54% |
| S&P 500 Index | 10.42% | 10.71% | 14.70% |
| | Institutional Shares | Investor Shares | Advisor Shares |
Gross Expense Ratio2 | 0.58% | 0.73% | 0.98% |
Net Expense Ratio2 | 0.58% | 0.73% | 0.98% |
Past performance does not guarantee future results. The performance data quoted represents past performance and current returns may be lower or higher. The investment return and net asset value will fluctuate so that an investor’s shares, when redeemed, may be worth more or less than the original cost. To obtain performance information current to the most recent month end, please visit our website at brownadvisory.com/mf/flexible-equity-fund. The performance table and graph above do not reflect the deduction of taxes that a shareholder would pay on Fund distributions or the redemption of Fund shares. Investment performance reflects periods during which fee waivers were in effect. In the absence of such waivers, total return would have been reduced. Performance data does not reflect the imposition of the redemption fee of 1.00% on shares redeemed within 14 days, and if it did, performance would have been lower. Returns shown are calculated using the net asset values (“NAV”) that were used for shareholder transactions as of the respective period ends. These NAV, and the returns calculated from them, may differ from the NAV and returns shown elsewhere in this report.
1 | Performance information for the Institutional Shares, prior to commencement of operations on October 19, 2012, is based on the performance of Investor Shares, and adjusted for the lower expenses applicable to Institutional Shares. |
2 | Per the Fund’s prospectus dated October 31, 2018. Refer to the financial highlights for the gross and net expense ratios for the year ended as of the date of this report. Please note that the expense ratios per the prospectus include acquired fund fees and expenses (as applicable) and the expense ratios in the financial highlights do not. |
www.brownadvisory.com/mf
Brown Advisory Flexible Equity FundSchedule of Investments
June 30, 2019
| Shares | | Security Description | | Value $ | |
| Common Stocks — 95.9% | | | |
| | | | |
| Communication Services — 10.0% | | | |
| | 5,631 | | Alphabet, Inc. — Class A* | | | 6,097,247 | |
| | 13,724 | | Alphabet, Inc. — Class C* | | | 14,834,409 | |
| | 100,082 | | Facebook, Inc.* | | | 19,315,826 | |
| | 57,561 | | Walt Disney Co. | | | 8,037,818 | |
| | | | | | | 48,285,300 | |
| Consumer Discretionary — 14.9% | | | | |
| | 72,972 | | Alibaba Group Holding, Ltd. ADR* | | | 12,365,105 | |
| | 2,831 | | Amazon.com, Inc.* | | | 5,360,866 | |
| | 7,958 | | Booking Holdings, Inc.* | | | 14,918,942 | |
| | 214,901 | | CarMax, Inc.* | | | 18,659,854 | |
| | 164,470 | | Lowe’s Companies, Inc. | | | 16,596,668 | |
| | 80,351 | | TJX Companies, Inc. | | | 4,248,961 | |
| | | | | | | 72,150,396 | |
| Consumer Staples — 3.2% | | | | |
| | 230,720 | | Conagra Brands, Inc. | | | 6,118,695 | |
| | 437,740 | | Nomad Foods, Ltd.* | | | 9,350,126 | |
| | | | | | | 15,468,821 | |
| Energy — 4.4% | | | | |
| | 79,859 | | Cimarex Energy Co. | | | 4,738,035 | |
| | 467,633 | | Kinder Morgan, Inc. | | | 9,764,177 | |
| | 221,345 | | Suncor Energy, Inc. | | | 6,897,110 | |
| | | | | | | 21,399,322 | |
| Financials — 19.9% | | | | |
| | 78,002 | | Ameriprise Financial, Inc. | | | 11,322,770 | |
| | 474,204 | | Bank of America Corp. | | | 13,751,916 | |
| | 97,712 | | Berkshire Hathaway, Inc.* | | | 20,829,267 | |
| | 287,594 | | Charles Schwab Corp. | | | 11,558,403 | |
| | 137,660 | | JPMorgan Chase & Co. | | | 15,390,388 | |
| | 272,692 | | KKR & Co., Inc. | | | 6,890,927 | |
| | 328,682 | | Regions Financial Corp. | | | 4,910,509 | |
| | 247,514 | | Wells Fargo & Co. | | | 11,712,362 | |
| | | | | | | 96,366,542 | |
| Health Care — 8.9% | | | | |
| | 31,906 | | Anthem, Inc. | | | 9,004,192 | |
| | 86,474 | | Edwards Lifesciences Corp.* | | | 15,975,207 | |
| | 50,819 | | Merck & Co., Inc. | | | 4,261,173 | |
| | 55,207 | | UnitedHealth Group, Inc. | | | 13,471,060 | |
| | | | | | | 42,711,632 | |
| Industrials — 7.4% | | | | |
| | 67,898 | | Canadian National Railway Co. | | | 6,279,207 | |
| | 121,999 | | Delta Air Lines, Inc. | | | 6,923,443 | |
| | 28,599 | | General Dynamics Corp. | | | 5,199,870 | |
| | 119,175 | | Stericycle, Inc.* | | | 5,690,606 | |
| | 38,504 | | United Rentals, Inc.* | | | 5,106,786 | |
| | 51,157 | | United Technologies Corp. | | | 6,660,642 | |
| | | | | | | 35,860,554 | |
| Information Technology — 26.0% | | | | |
| | 56,547 | | Accenture PLC | | | 10,448,189 | |
| | 66,203 | | Apple, Inc. | | | 13,102,898 | |
| | 27,014 | | Broadcom, Inc. | | | 7,776,250 | |
| | 98,637 | | MasterCard, Inc. | | | 26,092,446 | |
| | 158,249 | | Microsoft Corp. | | | 21,199,036 | |
| | 98,171 | | PayPal Holdings, Inc.* | | | 11,236,653 | |
| | 116,078 | | Taiwan Semiconductor | | | | |
| | | | Manufacturing Co., Ltd. ADR | | | 4,546,775 | |
| | 179,808 | | Visa, Inc. | | | 31,205,678 | |
| | | | | | | 125,607,925 | |
| Materials — 1.2% | | | | |
| | 38,550 | | Corteva, Inc. | | | 1,139,923 | |
| | 38,550 | | Dow, Inc. | | | 1,900,900 | |
| | 38,550 | | DuPont de Nemours, Inc. | | | 2,893,949 | |
| | | | | | | 5,934,772 | |
Total Common Stocks (Cost $262,848,453) | | | 463,785,264 | |
| | | | | |
| Real Estate Investment Trusts — 2.6% | | | | |
| | 39,605 | | Crown Castle International Corp. | | | 5,162,512 | |
| | 34,038 | | SBA Communications Corp.* | | | 7,653,104 | |
Total Real Estate Investment Trusts (Cost $8,139,080) | | | 12,815,616 | |
| | | | | |
| Short-Term Investments — 1.4% | | | | |
| | | | | |
| Money Market Funds — 1.4% | | | | |
| | 6,831,305 | | First American Government | | | | |
| | | | Obligations Fund — Class Z, 2.26%# | | | 6,831,305 | |
Total Short-Term Investments (Cost $6,831,305) | | | 6,831,305 | |
Total Investments — 99.9% (Cost $277,818,838) | | | 483,432,185 | |
Other Assets in Excess of Liabilities — 0.1% | | | 326,452 | |
| NET ASSETS — 100.0% | | $ | 483,758,637 | |
| | | | | | | | |
ADR — American Depositary Receipt
* | Non-Income Producing |
# | Annualized seven-day yield as of June 30, 2019. |
The accompanying notes are an integral part of these financial statements.
www.brownadvisory.com/mf
Brown Advisory Equity Income FundA Message to Our Shareholders
June 30, 2019
Dear Shareholders:
During the year ended June 30, 2019, the Brown Advisory Equity Income Fund – Investor Shares (the “Fund”) increased 13.03% in value. During the same period, the Fund’s benchmark, the S&P 500® Index (the “Index”), increased 10.42%.
The past year was far from a smooth upward ride for U.S. investors. Stocks jumped during the first three months, declined sharply in October and December, and then reversed course and recouped more than all of their lost ground during the final six months of the period. Worries over the direction of interest rates and trade tensions between the U.S. and China preoccupied investors’ minds throughout the year. However, by the end of the period a sense of relief on both issues emerged and helped to push stock prices higher and the Index to a new all-time high.
The best performing sectors for the Fund during the period were financials, information technology, and health care. Most notably among financials, property and casualty insurers Erie Indemnity and Cincinnati Financial were strong performers. Recently, both companies have posted steady business growth attributable to a beneficial pricing environment and market share gains for their various insurance products. Moreover, the changing interest rate environment is not expected to greatly impact Erie and Cincinnati’s future financial results. In contrast, lower interest rates are expected to create a bit of a near-term growth headwind for the Fund’s bank stocks such as Bank of America, JPMorgan Chase, and Wells Fargo.
Information technology holdings Microsoft and Cisco Systems also rose in price during the period. Both companies continued to report strong financial results because of a persistent spending tailwind for cloud computing and systems digitalization by corporate customers around the globe. Other information technology sector holdings such as Automatic Data Processing and Broadcom have seen strong demand for their products as well. Higher margins and impressive free cash flow growth during the year propelled both of those stocks higher.
The Fund’s health care stocks performed well in the face of growing political scrutiny in the U.S. around the issue of drug prices. Pharmaceutical companies Merck, Novartis, and Johnson & Johnson all gained because of a brighter general sales outlook for their current drugs and investor enthusiasm for future drugs in their development pipelines. The Fund added fellow pharmaceutical maker Gilead Sciences during the market selloff in December. Along with a historical commitment to dividend growth, Gilead has a strong franchise in HIV drugs where it continues to innovate to maintain its leading position with patients.
Industrials and consumer staples were the worst performing sectors for the Fund during the period. In industrials, nursing home outsourced services provider Healthcare Services Group declined because of an ongoing Securities and Exchange Commission examination of its financial reporting practices. The company, which has also struggled with stagnating margins in its core business, delayed but eventually filed its annual report without any changes to its previous financial statements. Also in the sector, data measurement company Nielsen was eliminated during the period because of deteriorating cash flows that led to a reduction in its full-year financial guidance.
In consumer staples, tobacco holdings Altria and Philip Morris International dropped amid ongoing investor concerns over how the rapid adoption of new e-cigarette technologies and tighter regulatory oversight could negatively impact the sales volumes of traditional cigarettes. The declines from Altria and Philip Morris International offset solid stock performance during the period from the Fund’s other consumer staples holdings, Coca-Cola and Unilever.
The December stock market sell-off created new investment opportunities as price/earnings multiples fell across many industry sectors. Besides adding Gilead Sciences in health care, the Fund also added cable and broadband provider Comcast in communications services and luxury retailer Tiffany & Co. in consumer discretionary. Along with reasonable valuations, both Comcast and Tiffany offered above-average dividend yields, strong balance sheets and cash flows, and attractive future growth potential.
There were several corporate actions that impacted existing holdings during the final months of the period. Chemical maker Dow Inc. and agricultural products company Corteva separated from specialty products maker DuPont de Nemours, and jeans producer Kontoor Brands was spun-off from former parent VF Corp. While the Fund continues to hold these new positions, it eliminated eye care company Alcon following the company’s spin-off from Novartis. While the Alcon business has many attractive attributes, the expected dividend yield from the new company was well below the Index’s average.
www.brownadvisory.com/mf
Brown Advisory Equity Income FundA Message to Our Shareholders
June 30, 2019
Remaining patient and disciplined early in the period paid off for investors in December, as market volatility increased. This created a better environment to buy high quality companies with durable, defensible business models at attractive prices. Through ups and downs in the stock market, the Fund’s long-term strategy has remained the same. The ultimate goal is to build a portfolio of investments that should generate a reliable stream of growing income over time, while also offering capital conservation during those periods when it is needed.
Sincerely,
Brian Graney, CFA
Portfolio Manager
Past performance is not a guarantee of future results.
Mutual fund investing involves risk. Principal loss is possible. Investments in debt securities typically decrease in value when interest rates rise. This risk is usually greater for longer-term debt securities. Investments in lower-rated and nonrated securities present a greater risk of loss to principal and interest than higher-rated securities. Investments in smaller and medium capitalization companies generally carry greater risk than is customarily associated with larger companies for various reasons such as narrower markets, limited financial resources and less liquid stock. The value of the Fund’s investments in REITs and Real Estate may change in response to changes in the real estate market such as declines in the value of real estate, lack of available capital or financing opportunities, and increases in property taxes or operating costs. The Fund may invest in ETFs, which may trade at a discount to the aggregate value of the underlying securities and although expense ratios for ETFs are generally low, frequent trading of ETFs by the Fund can generate brokerage expenses. Investments in foreign securities entail certain risks not associated with investments in domestic securities, such as volatility of currency exchange rates, and in some cases, political and economic instability and relatively illiquid markets. Investing in Master Limited Partnerships (“MLPs”) entails risk related to fluctuations in energy prices, decreases in supply of or demand for energy commodities, unique tax consequences due to the partnership structure and various other risks. Private Placement issued securities are restricted securities that are not publicly traded. Delay or difficulty in selling such securities may result in a loss to the Fund.
Fund holdings and sector allocations are subject to change and should not be considered a recommendation to buy or sell any security. For a complete list of fund holdings, please refer to the Schedule of Investments provided in this report.
Definitions for terms and indices are provided in the Glossary of Terms.
www.brownadvisory.com/mf
Brown Advisory Equity Income FundPerformance Information & Portfolio Holdings Summary
June 30, 2019
GROWTH OF A $10,000 INVESTMENT
The following chart reflects the change in value of a hypothetical $10,000 investment, including reinvested dividends and distributions, in the Fund as measured against a broad-based securities market index. The S&P 500 Index (“Index”) is a market-value weighted index representing the performance of 500 widely held, publicly traded large capitalization stocks. The Index is unmanaged and does not reflect the deduction of fees, such as investment management fees. Investors cannot invest directly in an index.
| PORTFOLIO HOLDINGS | % of Net Assets |
Information Technology | | | 23.4 | % | |
Financials | | | 15.6 | % | |
Health Care | | | 14.2 | % | |
Consumer Discretionary | | | 11.8 | % | |
Consumer Staples | | | 7.7 | % | |
Real Estate Investment Trusts | | | 7.3 | % | |
Energy | | | 5.5 | % | |
Industrials | | | 5.1 | % | |
Materials | | | 4.2 | % | |
Money Market Funds | | | 3.2 | % | |
Communication Services | | | 2.1 | % | |
Other Assets and Liabilities | | | (0.1 | )% | |
| | | | 100.0 | % | |
| | | | Since Inception |
Average Annual Total Return | One Year | Five Year | (12/29/11) |
Institutional Shares1 | 13.12% | 7.86% | 11.18% |
| Investor Shares | 13.03% | 7.71% | 11.02% |
| Advisor Shares | 12.67% | 7.44% | 10.74% |
| S&P 500 Index | 10.42% | 10.71% | 14.29% |
| | Institutional Shares | Investor Shares | Advisor Shares |
Gross Expense Ratio2 | 0.77% | 0.92% | 1.17% |
Net Expense Ratio2 | 0.77% | 0.92% | 1.17% |
Past performance does not guarantee future results. The performance data quoted represents past performance and current returns may be lower or higher. The investment return and net asset value will fluctuate so that an investor’s shares, when redeemed, may be worth more or less than the original cost. To obtain performance information current to the most recent month end, please visit our website at brownadvisory.com/mf/equity-income-fund. The performance table and graph above do not reflect the deduction of taxes that a shareholder would pay on Fund distributions or the redemption of Fund shares. Performance data does not reflect the imposition of the redemption fee of 1.00% on shares redeemed within 14 days, and if it did, performance would have been lower. Returns shown are calculated using the net asset values (“NAV”) that were used for shareholder transactions as of the respective period ends. These NAV, and the returns calculated from them, may differ from the NAV and returns shown elsewhere in this report.
1 | Performance information for the Institutional Shares, prior to commencement of operations on October 19, 2012, is based on the performance of Investor Shares, and adjusted for the lower expenses applicable to Institutional Shares. |
2 | Per the Fund’s prospectus dated October 31, 2018. Refer to the financial highlights for the gross and net expense ratios for the year ended as of the date of this report. Please note that the expense ratios per the prospectus include acquired fund fees and expenses (as applicable) and the expense ratios in the financial highlights do not. |
www.brownadvisory.com/mf
Brown Advisory Equity Income FundSchedule of Investments
June 30, 2019
| Shares | | Security Description | | Value $ | |
| Common Stocks — 89.6% | | | |
| | | | |
| Communication Services — 2.1% | | | |
| | 44,662 | | Comcast Corp. | | | 1,888,309 | |
| | | | | |
| Consumer Discretionary — 11.8% | | | | |
| | 19,172 | | Best Buy Co., Inc. | | | 1,336,863 | |
| | 16,863 | | Hasbro, Inc. | | | 1,782,082 | |
| | 6,708 | | Home Depot, Inc. | | | 1,395,063 | |
| | 1,686 | | Kontoor Brands, Inc. | | | 47,242 | |
| | 12,950 | | Lowe’s Companies, Inc. | | | 1,306,784 | |
| | 13,263 | | McDonald’s Corp. | | | 2,754,195 | |
| | 10,053 | | Tiffany & Co. | | | 941,363 | |
| | 11,802 | | V.F. Corp. | | | 1,030,905 | |
| | | | | | | 10,594,497 | |
| Consumer Staples — 7.7% | | | | |
| | 23,299 | | Altria Group, Inc. | | | 1,103,208 | |
| | 45,630 | | Coca-Cola Co. | | | 2,323,480 | |
| | 16,761 | | Philip Morris International, Inc. | | | 1,316,241 | |
| | 36,239 | | Unilever NV ADR | | | 2,200,432 | |
| | | | | | | 6,943,361 | |
| Energy — 5.5% | | | | |
| | 106,373 | | Kinder Morgan, Inc. | | | 2,221,068 | |
| | 15,316 | | Occidental Petroleum Corp. | | | 770,088 | |
| | 62,329 | | Suncor Energy, Inc. | | | 1,942,172 | |
| | | | | | | 4,933,328 | |
| Financials — 15.6% | | | | |
| | 14,333 | | Ameriprise Financial, Inc. | | | 2,080,578 | |
| | 72,748 | | Bank of America Corp. | | | 2,109,692 | |
| | 22,857 | | Cincinnati Financial Corp. | | | 2,369,585 | |
| | 10,948 | | Erie Indemnity Co. | | | 2,783,857 | |
| | 25,337 | | JPMorgan Chase & Co. | | | 2,832,677 | |
| | 37,903 | | Wells Fargo & Co. | | | 1,793,570 | |
| | | | | | | 13,969,959 | |
| Health Care — 14.2% | | | | |
| | 13,025 | | AbbVie, Inc. | | | 947,178 | |
| | 12,159 | | Gilead Sciences, Inc. | | | 821,462 | |
| | 17,763 | | Johnson & Johnson | | | 2,474,031 | |
| | 21,822 | | Medtronic PLC | | | 2,125,245 | |
| | 44,102 | | Merck & Co., Inc. | | | 3,697,953 | |
| | 29,192 | | Novartis AG ADR | | | 2,665,521 | |
| | | | | | | 12,731,390 | |
| Industrials — 5.1% | | | | |
| | 7,472 | | General Dynamics Corp. | | | 1,358,559 | |
| | 29,047 | | Healthcare Services Group, Inc. | | | 880,705 | |
| | 18,272 | | United Technologies Corp. | | | 2,379,014 | |
| | | | | | | 4,618,278 | |
| Information Technology — 23.4% | | | | |
| | 13,246 | | Accenture PLC | | | 2,447,463 | |
| | 18,816 | | Apple, Inc. | | | 3,724,063 | |
| | 19,138 | | Automatic Data Processing, Inc. | | | 3,164,085 | |
| | 6,623 | | Broadcom, Inc. | | | 1,906,497 | |
| | 74,601 | | Cisco Systems, Inc. | | | 4,082,913 | |
| | 42,556 | | Microsoft Corp. | | | 5,700,802 | |
| | | | | | | 21,025,823 | |
| Materials — 4.2% | | | | |
| | 9,492 | | Corteva, Inc. | | | 280,679 | |
| | 14,276 | | Dow, Inc. | | | 703,950 | |
| | 9,492 | | DuPont de Nemours, Inc. | | | 712,564 | |
| | 10,308 | | Linde PLC | | | 2,069,846 | |
| | | | | | | 3,767,039 | |
Total Common Stocks (Cost $45,392,630) | | | 80,471,984 | |
| | | | | |
| Real Estate Investment Trusts — 7.3% | | | | |
| | 10,834 | | American Tower Corp. | | | 2,215,011 | |
| | 32,554 | | W.P. Carey, Inc. | | | 2,642,734 | |
| | 64,072 | | Weyerhaeuser Co. | | | 1,687,657 | |
Total Real Estate Investment Trusts (Cost $4,610,933) | | | 6,545,402 | |
| | | | | |
| Short-Term Investments — 3.2% | | | | |
| | | | | |
| Money Market Funds — 3.2% | | | | |
| | 2,873,953 | | First American Government | | | | |
| | | | Obligations Fund — Class Z, 2.26%# | | | 2,873,953 | |
Total Short-Term Investments (Cost $2,873,953) | | | 2,873,953 | |
Total Investments — 100.1% (Cost $52,877,516) | | | 89,891,339 | |
Liabilities in Excess of Other Assets — (0.1)% | | | (115,615 | ) |
| NET ASSETS — 100.0% | | $ | 89,775,724 | |
ADR — American Depositary Receipt
| # | Annualized seven-day yield as of June 30, 2019. |
The accompanying notes are an integral part of these financial statements.
www.brownadvisory.com/mf
Brown Advisory Sustainable Growth FundA Message to Our Shareholders
June 30, 2019
Dear Shareholders:
During the year ended June 30, 2019, the Brown Advisory Sustainable Growth Fund – Institutional Shares (the “Fund”) increased 18.89% in value. During the same period, the Fund’s benchmark, the Russell 1000® Growth Index (the “Index”), increased 11.56%.
We are pleased with the outperformance generated over the period. We added value in six of the ten economic sectors and added the most value in the areas of the market in which we have the largest weights (i.e. technology and health care). The Fund’s relative outperformance was also due to strong stock selection in materials and real estate. Our underweight in communication services also contributed to the positive performance relative to the benchmark. These positive factors more than offset weak performance from some of our industrial holdings.
As of the date of this writing, uncertainty surrounding trade talks between the U.S. and China dominate short-term sentiment. Increased antitrust scrutiny of big technology companies, slowing global growth, and the hope of a dovish Federal Reserve in the back half of the year round out the major, near-term caveats to an otherwise healthy domestic market. While the macroeconomic environment remains fluid and is always uncertain, our focus remains unchanged. We seek to identify fundamentally superior companies that are using sustainability strategies to drive strong financial performance. We are in the tenth year of a bull market and are careful to avoid chasing momentum-led stories.
Taking a closer look at the last twelve months, performance was broad-based with a number of stocks from different sectors contributing positively to performance, including Ball Corporation, American Tower and Danaher. Ball Corporation posted strong revenue growth in its most recent quarter. The majority of new beverage offerings are being packaged in cans which is a dramatic shift from just a few years ago when most were packaged in plastic bottles. American Tower posted strong growth in the U.S. as carrier spending remains robust. Going forward, we expect domestic carrier spending to remain elevated given the move to 5G. During the first quarter in 2019, Danaher announced its intentions to acquire the biopharma business from General Electric for roughly $21b. The deal should expand Danaher’s presence in multiple fast-growing areas of life sciences including research, discovery, process development, and manufacturing workflows of biopharmaceuticals.
In terms of our largest detractors, Facebook, Welbilt and J.B. Hunt were our worst performers during the period. Facebook came under significant pressure after the company reduced its near-term profitability goals. Welbilt encountered lower-than-expected demand for its cooking equipment and J.B. Hunt’s intermodal business suffered reduced volume as a result of the trade war with China.
We added three new names to the portfolio during the last twelve months including Analog Devices, Illumina, Aspen Technologies.
Analog Devices is a leading, high-performance analog technology company. The company translates real-world phenomena to accurately sense, measure, connect, interpret and power various applications. Energy efficiency has increased the adoption of analog chips which has helped make numerous applications smarter, safer, more accurate and more efficient.
Illumina is a leading developer of life science tools and integrated systems for the analysis of genetic variation and function. Illumina’s sustainable business advantage is its ability to drive the efficiency and productivity of diagnostics and therapeutics within the health system.
Aspen Technology is a provider of process optimization and asset performance management software to the process industries. Its solutions help improve the competitiveness and profitability of its customers by increasing throughput, energy efficiency, and production yields and by reducing unplanned downtime.
As for deletions during the period, we eliminated A.O. Smith, Facebook, and Welbilt. We sold A.O. Smith because the Chinese market has become increasingly competitive which is extremely concerning given that part of our investment thesis had been centered on the company’s strong market position in the region. We exited the stock and swapped the position into Analog Devices with confidence that this is an upgrade to the portfolio.
We also exited our position in Facebook during the period given the elevated risks around privacy, data security, governance, and regulation. Soon after our initiation of Welbilt, the company’s CEO surprisingly resigned. This prompted us to exit the position, having lost confidence in the management team and their ability to execute in a highly competitive industry. We swapped our position into Aspen Technologies in the fourth quarter. We also sold our position in Red Hat after IBM announced its intention to acquire the company in the fourth quarter of 2018. Finally, we consolidated our ownership in Alphabet by selling our Class C shares and retaining our ownership in the Class A shares.
www.brownadvisory.com/mf
Brown Advisory Sustainable Growth FundA Message to Our Shareholders
June 30, 2019
We maintain a disciplined process of discerning what we believe to be are high-quality names poised for steady success–even in uncertain operating environments. Sustainable growth requires management teams to be resilient against many challenges, including constraints on the natural environment and resources. Our deep sustainability research helps us identify the companies that have been making the right long-term investments, for many years now, toward their own long-term sustainability and growth.
While we enter the second half of calendar year 2019 with considerable macroeconomic and political uncertainty, we will maintain focus on our disciplined, repeatable formula for stock selection which we believe will enable us to provide attractive long-term returns.
Sincerely,
David Powell and Karina Funk
Portfolio Managers
Past performance is not a guarantee of future results.
Mutual fund investing involves risk. Principal loss is possible. The Fund’s investment focus on environmental factors could cause it to make or avoid investments that could result in the Fund underperforming similar funds that do not have an environmental focus. Investments in smaller and medium-sized capitalization companies generally carry greater risk than is customarily associated with larger companies for various reasons such as narrower markets, limited financial resources and less liquid stock. Investments in foreign securities entail certain risks not associated with investments in domestic securities, such as volatility of currency exchange rates, and in some cases, political and economic instability and relatively illiquid markets. These risks are greater for investments in emerging markets. The value of the Fund’s investments in REITS may change in response to changes in the real estate market such as declines in the value of real estate, lack of available capital or financing opportunities, and increases in property taxes or operating costs.
Fund holdings and sector allocations are subject to change and should not be considered a recommendation to buy or sell any security. For a complete list of fund holdings, please refer to the Schedule of Investments provided in this report.
Definitions for terms and indices are provided in the Glossary of Terms.
www.brownadvisory.com/mf
Brown Advisory Sustainable Growth FundPerformance Information & Portfolio Holdings Summary
June 30, 2019
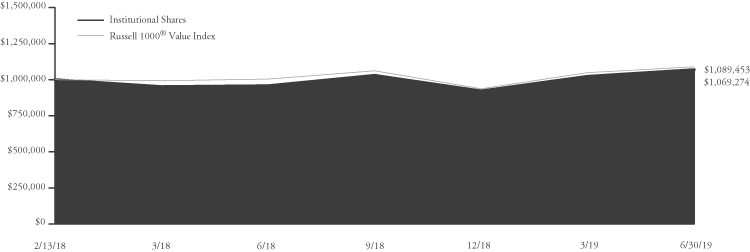
GROWTH OF A $1,000,000 INVESTMENT
The following chart reflects the change in value of a hypothetical $1,000,000 investment, including reinvested dividends and distributions, in the Fund as measured against a broad-based securities market index. The Russell 1000® Growth Index (“Index”) measures the performance of the large-cap growth segment of the U.S. equity universe. It includes those Russell 1000® companies with higher price to book ratios and higher forecasted growth values. The Index is unmanaged and does not reflect the deduction of fees, such as investment management fees. Investors cannot invest directly in an index.
| PORTFOLIO HOLDINGS | % of Net Assets |
Information Technology | | | 31.8 | % | |
Health Care | | | 24.8 | % | |
Consumer Discretionary | | | 13.2 | % | |
Industrials | | | 10.3 | % | |
Materials | | | 6.4 | % | |
Real Estate Investment Trusts | | | 4.5 | % | |
Communication Services | | | 3.4 | % | |
Money Market Funds | | | 3.0 | % | |
Consumer Staples | | | 2.1 | % | |
Other Assets and Liabilities | | | 0.5 | % | |
| | | | 100.0 | % | |
| | | | Since Inception |
Average Annual Total Return | One Year | Five Year | (6/29/12) |
| Institutional Shares | 18.89% | 16.26% | 17.16% |
| Investor Shares | 18.68% | 16.08% | 16.97% |
| Advisor Shares | 18.39% | 15.78% | 16.68% |
Russell 1000® Growth Index | 11.56% | 13.39% | 15.75% |
| | Institutional Shares | Investor Shares | Advisor Shares |
Gross Expense Ratio1 | 0.73% | 0.88% | 1.13% |
Net Expense Ratio1 | 0.73% | 0.88% | 1.13% |
Past performance does not guarantee future results. The performance data quoted represents past performance and current returns may be lower or higher. The investment return and net asset value will fluctuate so that an investor’s shares, when redeemed, may be worth more or less than the original cost. To obtain performance information current to the most recent month end, please visit our website at brownadvisory.com/mf/sustainable-growth-fund. The performance table and graph above do not reflect the deduction of taxes that a shareholder would pay on Fund distributions or the redemption of Fund shares. Performance data does not reflect the imposition of the redemption fee of 1.00% on shares redeemed within 14 days, and if it did, performance would have been lower. Returns shown are calculated using the net asset values (“NAV”) that were used for shareholder transactions as of the respective period ends. These NAV, and the returns calculated from them, may differ from the NAV and returns shown elsewhere in this report.
1 | Per the Fund’s prospectus dated October 31, 2018. Refer to the financial highlights for the gross and net expense ratios for the year ended as of the date of this report. Please note that the expense ratios per the prospectus include acquired fund fees and expenses (as applicable) and the expense ratios in the financial highlights do not. |
www.brownadvisory.com/mf
Brown Advisory Sustainable Growth FundSchedule of Investments
June 30, 2019
| Shares | | Security Description | | Value $ | |
| Common Stocks — 92.0% | | | |
| | | | |
| Communication Services — 3.4% | | | |
| | 43,228 | | Alphabet, Inc. — Class A* | | | 46,807,278 | |
| | | | | |
| Consumer Discretionary — 13.2% | | | | |
| | 31,655 | | Amazon.com, Inc.* | | | 59,942,858 | |
| | 369,988 | | Aptiv PLC | | | 29,906,130 | |
| | 123,897 | | Home Depot, Inc. | | | 25,766,859 | |
| | 233,157 | | Marriott International, Inc. | | | 32,709,595 | |
| | 638,544 | | TJX Companies, Inc. | | | 33,766,207 | |
| | | | | | | 182,091,649 | |
| Consumer Staples — 2.1% | | | | |
| | 484,354 | | Unilever NV ADR | | | 29,409,975 | |
| | | | | |
| Health Care — 24.8% | | | | |
| | 461,889 | | Danaher Corp. | | | 66,013,176 | |
| | 175,293 | | Edwards Lifesciences Corp.* | | | 32,383,629 | |
| | 126,279 | | IDEXX Laboratories, Inc.* | | | 34,768,397 | |
| | 104,495 | | Illumina, Inc.* | | | 38,469,834 | |
| | 41,866 | | Mettler-Toledo International, Inc.* | | | 35,167,440 | |
| | 186,526 | | Thermo Fisher Scientific, Inc. | | | 54,778,956 | |
| | 210,011 | | UnitedHealth Group, Inc. | | | 51,244,784 | |
| | 219,882 | | West Pharmaceutical Services, Inc. | | | 27,518,232 | |
| | | | | | | 340,344,448 | |
| Industrials — 10.3% | | | | |
| | 432,617 | | Fortive Corp. | | | 35,266,938 | |
| | 293,744 | | J.B. Hunt Transport Services, Inc. | | | 26,851,139 | |
| | 218,521 | | Nordson Corp. | | | 30,879,202 | |
| | 329,824 | | Verisk Analytics, Inc. | | | 48,306,023 | |
| | | | | | | 141,303,302 | |
| Information Technology — 31.8% | | | | |
| | 135,129 | | Adobe, Inc.* | | | 39,815,760 | |
| | 175,705 | | Analog Devices, Inc. | | | 19,831,823 | |
| | 272,640 | | Aspen Technology, Inc.* | | | 33,883,699 | |
| | 234,518 | | Autodesk, Inc.* | | | 38,202,982 | |
| | 216,138 | | Intuit, Inc. | | | 56,483,344 | |
| | 1,148,426 | | Marvell Technology Group, Ltd. | | | 27,412,929 | |
| | 512,605 | | Microsoft Corp. | | | 68,668,566 | |
| | 232,817 | | Monolithic Power Systems, Inc. | | | 31,611,892 | |
| | 207,969 | | salesforce.com, Inc.* | | | 31,555,136 | |
| | 136,831 | | Tyler Technologies, Inc.* | | | 29,558,233 | |
| | 347,863 | | Visa, Inc. | | | 60,371,624 | |
| | | | | | | 437,395,988 | |
| Materials — 6.4% | | | | |
| | 577,276 | | Ball Corp. | | | 40,403,547 | |
| | 244,049 | | Ecolab, Inc. | | | 48,185,035 | |
| | | | | | | 88,588,582 | |
Total Common Stocks (Cost $912,548,668) | | | 1,265,941,222 | |
| | | | | |
| Real Estate Investment Trusts — 4.5% | | | | |
| | 300,551 | | American Tower Corp. | | | 61,447,652 | |
Total Real Esate Investment Trusts (Cost $40,176,397) | | | 61,447,652 | |
| | | | | | | | |
| Short-Term Investments — 3.0% | | | | |
| | | | | |
| Money Market Funds — 3.0% | | | | |
| | 41,319,174 | | First American Government | | | | |
| | | | Obligations Fund — Class Z, 2.26%# | | | 41,319,174 | |
Total Short-Term Investments (Cost $41,319,174) | | | 41,319,174 | |
Total Investments — 99.5% (Cost $994,044,239) | | | 1,368,708,048 | |
Other Assets in Excess of Liabilities — 0.5% | | | 6,880,026 | |
| NET ASSETS — 100.0% | | $ | 1,375,588,074 | |
ADR — American Depositary Receipt
* | Non-Income Producing |
# | Annualized seven-day yield as of June 30, 2019. |
The accompanying notes are an integral part of these financial statements.
www.brownadvisory.com/mf
Brown Advisory Mid-Cap Growth FundA Message to Our Shareholders
June 30, 2019
Dear Shareholders:
During the year ended June 30, 2019, the Brown Advisory Mid-Cap Growth Fund – Investor Shares (the “Fund”) increased 16.80% in value. During the same period, the Fund’s benchmark, the Russell Midcap Growth Index (the “Index”), increased 13.94%.
Solid returns since last June might seem benevolent, but that masks a jarring December-quarter drawdown and ebullient 2019 recovery. Specifically, the Fund’s benchmark retrenched 22.46% between September 14th and Christmas Eve of 2018, then surged 35.18% into the end of June. Given our quality-bent, our Fund benefited from that volatility in terms of relative results. Also, many fourth-quarter “losers” turned into recent “winners,” helping the Fund outpace its benchmark in the first half of 2019. As detailed below, we took advantage of several pops and drops. We added to numerous existing positions such as Catalent (CTLT), SiteOne (SITE), National Vision (EYE), and GoDaddy (GDDY) and built new ones in companies that we think will compound at above-average rates for many years to come.
While we welcome volatility, the Fund’s subtle small-cap bias likely counteracted any tailwind it may have provided. Aside from the frenetic swing captioned above, small-caps’ lag may be the most notable market dynamic in the last 12 months. Measured by the Russell Midcap Growth Index and the Russell 2000® Growth Index, mid-caps have outpaced small-caps by a staggering 14% over the last twelve months. Why? We suspect a number of reasons play a role. Tech has outperformed, and the mid- and large-cap growth benchmarks boast heavier weights in that sector. Specifically, the Russell Midcap Growth Information Technology sector was the best performing vertical June to June, rising more than 23%, beating the Index average by more than 9%. Outside of what we have dubbed “the tech phenomenon,” small-cap valuations seemed mildly stretched to us twelve months ago. So, the starting point of this analysis matters. Finally, Wall Street analysts now expect mid- and large-caps to post faster growth rates this year.
Despite the portfolio’s minor small-cap tilt and technology sector underweight, the team’s solid stock selection helped the Fund outpace its benchmark over the last twelve months, with particular success in materials and health care. Strong gains from portfolio holdings Ball Corp (BLL) and Ecolab (ECL) lifted returns in the materials sector during the period. The portfolio’s tilt away from the building materials industry (an underperforming category) also aided the index-relative comparison. Broad positive stock selection, boosted by M&A in the biotech industry, lifted the Fund’s returns in the health care sector. The portfolio’s tilt away from high-multiple technology stocks (an outperforming category) drove underperformance in the information technology sector. A pullback in Electronic Arts’ (EA) share price dampened returns in the commercial services industry while a number of detractors muted the Fund’s performance in the consumer discretionary sector over the last twelve months.
Top contributors during the period included Ball Corporation (BALL), Waste Connections (WCN) and HEICO (HEI). Ball Corp’s share-price nearly doubled as accelerating can demand in North America and continued strength in Europe washed away investors’ doubts following the firm’s extended integration of Rexam. As the market-share leader in specialty aluminum cans, Ball also benefited from a growing popular movement away from plastic bottles. Waste Connections, a long-term holding and also the largest position in the portfolio, outperformed largely attributable to stable trends in waste volumes and strong pricing. HEICO continued to deliver double-digit organic growth driven by strong aerospace aftermarket and defense demand, along with margin improvement. Strong free cash flow conversion has also enabled the company to deploy capital into niche, accretive M&A opportunities.
The biggest detractors during the period included Welbilt Inc. (WBT), Electronic Arts (EA), and Covetrus (CVET). As a result of input cost inflation and a host of other reasons, Welbilt’s margins compressed and the company reported lower-than expected earnings during the second half of 2018. Shares felt additional pressure due to management changes and fears surrounding tariffs. We sold the position after shares partially recovered in Q1 to fund higher-conviction ideas. Electronic Arts’ closely-watched Live Services revenue growth decelerated in late 2018 for several reasons, including unfavorable currency movements and the World Cup’s negative effect on FIFA Ultimate Team. To make matters worse, sales of Battlefront and Battlefield—two main game franchises—missed expectations. We still hold the position. EA’s full-game sales continue to transition from packaged to digital (which boosts gross profit) and we believe Live Services revenue growth will recover this year. Covetrus has suffered due to weak results from Henry Schein’s vet distribution business. We believe the integration of Vets First Choice (patient engagement/prescription management software) and Schein’s distribution business could be rocky for a few quarters but ultimately quite successful. VFC’s contingency revenue model boasts low start-up costs and can lift profits for veterinarians as it increases pet-owner prescription compliance and ultimately grows pharmaceutical sales. We added to the position on weakness.
During the period, the Fund added twenty-three investments and exited twenty positions. Dollar turnover remains within historical norms but was mildly elevated when compared to the previous year due to heightened market volatility. Given our three-
www.brownadvisory.com/mf
Brown Advisory Mid-Cap Growth FundA Message to Our Shareholders
June 30, 2019
to five-year investment time-horizon, we expect turnover to range between 20% and 50% annually, depending on market conditions, portfolio needs, and investment opportunities.
Eight of the new positions were in health care, five in information technology, four in communication services, three in consumer discretionary, two in industrials, and one in financials. We took advantage of the late 2018 drawdown to build new positions in companies that we think will be much larger in three to five years, including Teleflex (TFX), Aspen Technology (AZPN), NXP Semiconductor (NXPI), Integra Lifesciences (IART), and ServiceNow (NOW). Despite lower volatility and higher prices, we also found several opportunities to build new positions during the first half of 2019. Match.com (MTCH) and KAR Auction Services (KAR), for instance, are highlighted below. However, we also bought DollarTree (DLTR), Farfetch (FTCH), and Littlefuse (LFUS).
In the last twelve months, we shuffled a few small positions in the Fund’s “biotech basket.” We sold Alder (ALDR) to purchase Biohaven (BHVN), we ditched Agios (AGIO) to buy Blueprint Medicines (BPMC), we bought Global Blood Therapeutics (GBT), and we built new positions in Loxo Oncology (LOXO) and Array BioPharma (ARRY). Eli Lilly bought Loxo and Pfizer announced its intention to buy ARRY in 1H19. Finally, we participated in three IPOs—Lyft (LYFT), Pinterest (PINS), and Tradeweb (TW). We sold our small position in Lyft immediately following its public-market debut when it breached our target price. We added to Pinterest in the open market. We held a small position in Tradeweb at the end of June.
Match.com (MTCH) owns over 40 online dating sites, including Tinder, which is driving the firm’s double-digit percentage revenue and EBITDA growth. The online dating market is large, underpenetrated and growing. Match estimates that there are over 600 million singles globally (ex. China), with a small portion currently using an app. In fact, while usage has grown rapidly in the U.S., still only 39% of singles try to pair over the internet, up from 29% in 2012. Usage outside the U.S. varies, but generally remains about five years behind that in the U.S.; less than one-third of international singles have ever even tried a dating app. That is changing and Tinder is the only online dating site to truly gain global scale. While the addressable opportunity is smaller, the dynamics of the online dating market remind us of online travel ten years ago, shortly after Priceline bought Booking.com and ActiveHotels.com. Priceline (now Booking Holdings) went on to drive surprisingly durable growth for years thanks to that market construct. We think Match, which commands over 50% market share, could drive the same over the next several years. In addition to increasing subscribers, we think Match can further monetize its Tinder users by adding features that ease the path to a match and by pushing price. We took advantage of investor concerns regarding a temporary lull in growth following the introduction of a higher-priced subscription tier (“Tinder Gold”) one year ago to accumulate shares in the first quarter.
KAR Auction Services (KAR) and its recent spin-off Insurance Auto Auctions (IAA) compete in two different domestic oligopolies—whole-car and salvage auctions, respectively. Both businesses enjoy secular growth drivers, and KAR (the previously-combined entity) has been a compounder since 2011. We took advantage of weakness in the first quarter of 2019 following the firm’s earnings report to build a position. At the time, we believe investors feared fading growth in off-lease vehicles, heavy investments in a new online platform, and a delayed spin-off of its salvage auction business. The last concern was deep-sixed in June when KAR spun out Insurance Auto Auctions (IAA). Based on our primary research, we think the other two concerns could prove transient for the remaining company (KAR). Moreover, we believe investors will warm up to IAA’s secular growth prospects, its noncyclical profile, and its potential for margin improvement, helping to close the valuation gap from its main competitor.
We sold positions across a variety of sectors: six in information technology, six in health care, three in industrials, two in communication services, one in consumer discretionary, one in consumer staples, and one in financials. Typically, we sell for three reasons: valuation, structural (an acquisition, for instance), or fundamentals. We exited HealthEquity (HQY), Gartner (IT), and Global Payments (GPN) due to heightened valuations. We sold Cotiviti (COTV), Loxo Oncology (LOXO), and Worldpay (WP) for structural reasons after announced take outs. We sold A. O. Smith (AOS), Agios (AGIO), Alder (ALDR), BankUnited (BKU), Blackbaud (BLKB), CoreLogic (CLGX), Estee Lauder (EL), Liberty Media Liberty Sirius (LSXMA), Microchip (MCHP), Sensata (ST), Ultragenyx (RARE), and Welbilt (WBT) in favour of more promising ideas.
We build the portfolio’s holdings through bottom-up fundamental research, eschewing “macro overlays.” However, our team speaks to hundreds of small- and mid-cap company management teams each year and we use this primary research to build a broader view of the domestic economy and its sub-sectors. Management teams have generally noted stability/strength from a macro perspective the past two months, only citing swings in industries highlighted in the second half of last year—semiconductors, transportation, and U.S. residential housing. We have also seen deterioration in some industries exposed to China—autos, for instance—while others, such as luxury consumer goods, have shown surprising strength. Given comments indicating stability, we are cautiously optimistic on the remainder of the year.
www.brownadvisory.com/mf
Brown Advisory Mid-Cap Growth FundA Message to Our Shareholders
June 30, 2019
As always, we remain committed to achieving attractive risk-adjusted returns over a full market cycle by owning a diversified portfolio of companies that we believe could one day grow much larger. We are grateful for your support and look forward to updating you again.
Sincerely,
George Sakellaris
Portfolio Manager
Past performance is not a guarantee of future results.
Mutual fund investing involves risk. Principal loss is possible. The Fund may invest in securities of foreign issuers. Investments in such securities entail certain risks not associated with investments in domestic securities, such as volatility of currency exchange rates, and in some cases, political and economic instability and relatively illiquid markets. These risks are greater for investments in emerging markets. The value of the Fund’s investments in REITs may change in response to changes in the real estate market such as declines in the value of real estate, lack of available capital or financing opportunities, and increases in property taxes or operating costs. The Fund may invest in ETFs, which may trade at a discount to the aggregate value of the underlying securities and although expense ratios for ETFs are generally low, frequent trading of ETFs by the Fund can generate brokerage expenses. Investments in smaller and medium-sized companies generally carry greater risk than is customarily associated with larger companies for various reasons such as narrower markets, limited financial resources and less liquid stock. Investments in debt securities typically decrease in value when interest rates rise. This risk is usually greater for longer term debt securities. Investments in lower-rated and non-rated securities present a greater risk of loss to principal and interest than higher-rated securities.
Fund holdings and sector allocations are subject to change and should not be considered a recommendation to buy or sell any security. For a complete list of fund holdings, please refer to the Schedule of Investments provided in this report.
Definitions for terms and indices are provided in the Glossary of Terms.
www.brownadvisory.com/mf
Brown Advisory Mid-Cap Growth FundPerformance Information & Portfolio Holdings Summary
June 30, 2019
GROWTH OF A $10,000 INVESTMENT
The following chart reflects the change in value of a hypothetical $10,000 investment, including reinvested dividends and distributions, in the Fund compared with the broad-based securities market index. The Russell Midcap Growth Index (“Index”) measures the performance of the mid-capitalization growth sector of the U.S. equity market. The Index is unmanaged and does not reflect the deduction of fees, such as investment management fees. Investors cannot invest directly in an index.
| PORTFOLIO HOLDINGS | % of Net Assets |
Information Technology | | | 26.5 | % | |
Industrials | | | 18.0 | % | |
Health Care | | | 16.9 | % | |
Consumer Discretionary | | | 15.6 | % | |
Communication Services | | | 5.9 | % | |
Materials | | | 5.1 | % | |
Money Market Funds | | | 4.1 | % | |
Consumer Staples | | | 2.9 | % | |
Real Estate Investment Trusts | | | 2.2 | % | |
Financials | | | 2.1 | % | |
Other Assets and Liabilities | | | 0.7 | % | |
| | | | 100.0 | % | |
| | | Since Inception |
Average Annual Total Return | One Year | (10/2/17) |
Institutional Shares1 | 16.98% | 17.80% |
| Investor Shares | 16.80% | 17.62% |
| Russell Midcap Growth Index | 13.94% | 15.02% |
| | Institutional Shares | Investor Shares |
Gross Expense Ratio2 | 1.44% | 1.59% |
Net Expense Ratio2 | 0.71% | 0.86% |
Past performance does not guarantee future results. The performance data quoted represents past performance and current returns may be lower or higher. The investment return and net asset value will fluctuate so that an investor’s shares, when redeemed, may be worth more or less than the original cost. To obtain performance information current to the most recent month end, please visit our website at brownadvisory.com/mf/mid-cap-growth-fund. The performance table and graph above do not reflect the deduction of taxes that a shareholder would pay on Fund distributions or the redemption of Fund shares. Performance data does not reflect the imposition of the redemption fee of 1.00% on shares redeemed within 14 days, and if it did, performance would have been lower. Returns shown are calculated using the net asset values (“NAV”) that were used for shareholder transactions as of the respective period ends. These NAV, and the returns calculated from them, may differ from the NAV and returns shown elsewhere in this report.
1 | Performance information for the Institutional Shares, prior to commencement of operations on July 2, 2018, is based on the performance of Investor Shares, and adjusted for the lower expenses applicable to Institutional Shares. |
2 | Per the Fund’s prospectus dated October 31, 2018. Refer to the financial highlights for the gross and net expense ratios for the year ended as of the date of this report. Please note that the expense ratios per the prospectus include acquired fund fees and expenses (as applicable) and the expense ratios in the financial highlights do not. |
www.brownadvisory.com/mf
Brown Advisory Mid-Cap Growth FundSchedule of Investments
June 30, 2019
| Shares | | Security Description | | Value $ | |
| Common Stocks — 93.0% | | | |
| | | | |
| Communication Services — 5.9% | | | |
| | 10,265 | | Electronic Arts, Inc.* | | | 1,039,434 | |
| | 10,965 | | Farfetch, Ltd.* | | | 228,072 | |
| | 5,444 | | Liberty Broadband Corp.* | | | 559,861 | |
| | 7,466 | | Match Group, Inc. | | | 502,237 | |
| | 9,566 | | Pinterest, Inc.* | | | 260,387 | |
| | 1,962 | | Tradeweb Markets, Inc. | | | 85,955 | |
| | | | | | | 2,675,946 | |
| Consumer Discretionary — 15.6% | | | | |
| | 10,615 | | Aptiv PLC | | | 858,010 | |
| | 5,230 | | Bright Horizons Family Solutions, Inc.* | | | 789,050 | |
| | 4,277 | | CarMax, Inc.* | | | 371,372 | |
| | 11,976 | | Ctrip.com International, Ltd. ADR* | | | 442,034 | |
| | 6,144 | | Dollar Tree, Inc.* | | | 659,804 | |
| | 7,155 | | Etsy, Inc.* | | | 439,102 | |
| | 13,512 | | IAA, Inc.* | | | 523,995 | |
| | 7,388 | | Marriott International, Inc. | | | 1,036,463 | |
| | 27,763 | | National Vision Holdings, Inc.* | | | 853,158 | |
| | 7,641 | | Ross Stores, Inc. | | | 757,376 | |
| | 7,116 | | Six Flags Entertainment Corp. | | | 353,523 | |
| | | | | | | 7,083,887 | |
| Consumer Staples — 2.9% | | | | |
| | 5,502 | | Brown-Forman Corp. | | | 304,976 | |
| | 8,321 | | Calavo Growers, Inc. | | | 804,973 | |
| | 2,625 | | Church & Dwight Co., Inc. | | | 191,783 | |
| | | | | | | 1,301,732 | |
| Financials — 2.1% | | | | |
| | 19,151 | | KKR & Co., Inc. | | | 483,945 | |
| | 9,410 | | Webster Financial Corp. | | | 449,516 | |
| | | | | | | 933,461 | |
| Health Care — 16.9% | | | | |
| | 7,991 | | Array BioPharma, Inc.* | | | 370,222 | |
| | 5,517 | | Biohaven Pharmaceutical Holding Co., Ltd.* | | | 241,589 | |
| | 2,041 | | Blueprint Medicines Corp.* | | | 192,528 | |
| | 25,033 | | Catalent, Inc.* | | | 1,357,039 | |
| | 4,413 | | Charles River Laboratories International, Inc.* | | | 626,205 | |
| | 1,439 | | Cooper Companies, Inc. | | | 484,785 | |
| | 25,061 | | Covetrus, Inc.* | | | 612,992 | |
| | 3,189 | | DexCom, Inc.* | | | 477,840 | |
| | 4,880 | | Edwards Lifesciences Corp.* | | | 901,531 | |
| | 2,353 | | Global Blood Therapeutics, Inc.* | | | 123,768 | |
| | 4,724 | | Henry Schein, Inc.* | | | 330,208 | |
| | 11,801 | | Integra LifeSciences Holdings Corp.* | | | 659,086 | |
| | 2,664 | | Neurocrine Biosciences, Inc.* | | | 224,922 | |
| | 3,247 | | Teleflex, Inc. | | | 1,075,243 | |
| | | | | | | 7,677,958 | |
| Industrials — 18.0% | | | | |
| | 5,172 | | Allegion PLC | | | 571,765 | |
| | 9,099 | | BWX Technologies, Inc. | | | 474,058 | |
| | 2,994 | | Cintas Corp. | | | 710,446 | |
| | 4,997 | | HEICO Corp. | | | 668,649 | |
| | 5,249 | | Hexcel Corp. | | | 424,539 | |
| | 3,208 | | IDEX Corp. | | | 552,225 | |
| | 3,519 | | J.B. Hunt Transport Services, Inc. | | | 321,672 | |
| | 13,512 | | KAR Auction Services, Inc. | | | 337,800 | |
| | 12,132 | | SiteOne Landscape Supply, Inc.* | | | 840,748 | |
| | 9,721 | | TransUnion | | | 714,591 | |
| | 17,517 | | Waste Connections, Inc. | | | 1,674,274 | |
| | 7,544 | | Woodward, Inc. | | | 853,679 | |
| | | | | | | 8,144,446 | |
| Information Technology — 26.5% | | | | |
| | 5,191 | | Amphenol Corp. | | | 498,025 | |
| | 4,200 | | Aspen Technology, Inc.* | | | 521,976 | |
| | 5,638 | | Autodesk, Inc.* | | | 918,430 | |
| | 13,648 | | Black Knight, Inc.* | | | 820,927 | |
| | 9,274 | | Booz Allen Hamilton Holding Corp. | | | 614,032 | |
| | 4,783 | | Broadridge Financial Solutions, Inc. | | | 610,693 | |
| | 1,691 | | Fair Isaac Corp.* | | | 531,008 | |
| | 30,660 | | Genpact, Ltd. | | | 1,167,839 | |
| | 11,121 | | GoDaddy, Inc.* | | | 780,138 | |
| | 5,522 | | Guidewire Software, Inc.* | | | 559,820 | |
| | 3,325 | | Intuit, Inc. | | | 868,922 | |
| | 2,975 | | Jack Henry & Associates, Inc. | | | 398,412 | |
| | 2,100 | | Littelfuse, Inc. | | | 371,511 | |
| | 34,568 | | Marvell Technology Group, Ltd. | | | 825,138 | |
| | 23,408 | | Mimecast, Ltd.* | | | 1,093,389 | |
| | 6,241 | | NXP Semiconductors NV | | | 609,184 | |
| | 1,575 | | ServiceNow, Inc.* | | | 432,448 | |
| | 1,866 | | WEX, Inc.* | | | 388,315 | |
| | | | | | | 12,010,207 | |
| Materials — 5.1% | | | | |
| | 22,417 | | Ball Corp. | | | 1,568,966 | |
| | 3,830 | | Ecolab, Inc. | | | 756,195 | |
| | | | | | | 2,325,161 | |
Total Common Stocks (Cost $34,946,766) | | | 42,152,798 | |
| | | | | |
| Real Estate Investment Trusts — 2.2% | | | | |
| | 4,472 | | SBA Communications Corp.* | | | 1,005,484 | |
Total Real Estate Investment Trusts (Cost $753,280) | | | 1,005,484 | |
| | | | | |
| Short-Term Investments — 4.1% | | | | |
| | | | | |
| Money Market Funds — 4.1% | | | | |
| | 1,871,751 | | First American Government | | | | |
| | | | Obligations Fund — Class Z, 2.26%# | | | 1,871,751 | |
Total Short-Term Investments (Cost $1,871,751) | | | 1,871,751 | |
Total Investments — 99.3% (Cost $37,571,797) | | | 45,030,033 | |
Other Assets in Excess of Liabilities — 0.7% | | | 306,702 | |
| NET ASSETS — 100.0% | | $ | 45,336,735 | |
ADR — American Depositary Receipt
* | Non-Income Producing |
# | Annualized seven-day yield as of June 30, 2019. |
The accompanying notes are an integral part of these financial statements.
www.brownadvisory.com/mf
Brown Advisory Small-Cap Growth FundA Message to Our Shareholders
June 30, 2019
Dear Shareholders:
During the year ended June 30, 2019, the Brown Advisory Small-Cap Growth Fund – Institutional Shares (the “Fund”) increased 14.56% in value. During the same period, the Fund’s benchmark, the Russell 2000® Growth Index (the “Index”), decreased 0.49%. This solid result was catalyzed by strong security selection across sectors in addition to prudent portfolio positioning that flowed from a mostly cautious stance in mid-2018 to a more aggressive one by the beginning of 2019.
The investment landscape changed quite dramatically over the past 12 months. The end of 2018, particularly the 13% December swoon in smaller cap growth stocks, presented us with a rare opportunity to take advantage of the burgeoning “on-deck” circle our analytical team has been building over the last couple years. In short, a number of stocks finally hit price points where we believed the risk/reward dynamic actually favored our shareholders. This was a buying moment that we were able to take advantage of because of the portfolio’s solid downside protection that is driven by a focus on quality, diversification and valuation discipline. Our conservatism simply allows us to lean against the wind during times of market stress. In our opinion, there is no doubt that the actions taken late last year have helped to produce a solid start in the first half of 2019.
What drove the equity market from its lows in December of 2018 to the vigorous rally in 2019? As a starting point, while valuations were not “cheap” at the low, they were at least reasonable – a rarity over the past few years. This provided a solid foundation for the market to move higher. Thus, as concerns over the Chinese economy waned, generally solid U.S. company earnings were announced, and the Federal Reserve pivoted 180 degrees from its reluctantly hawkish position to a decidedly dovish one, investor sentiment turned markedly. From a more academic point of view, small-cap growth equities tend to have more of their market capitalization housed in the terminal value versus the explicit forecast period in a discounted cash flow analysis, making them more susceptible to changes in discount rates. As long-term interest rate expectations declined, our primary benchmark rose.
Looking at high level portfolio exposures, the strategy’s architecture has not changed meaningfully. We hope to preserve our historical capital conservation through diversification, asset quality and attention to valuation. In this pursuit, we have accelerated our reduction in our technology weight due to strong performance (and excessive valuations) and added diversity to our end market exposures. We believe balance sheets, profits and price will matter once again at some point over the intermediate term.
We are ardent believers that new idea generation is the lifeblood of superior, long-term small-cap investing. To that end, we are pleased to report that team productivity as measured by management interviews, pipeline build and our “on deck” circle is at all-time highs. Thus, even though valuations are now inching back toward prior peaks, the team has still been able to generate new investment opportunities. This is vital as it allows for us to sell when any of our investment theses appear to be faltering or we conclude that we can upgrade the portfolio’s risk-adjusted return potential via capital allocation changes. We know it is rare that we are exactly right with our adjustments, so our primary goal is always to be generally moving in the right direction based on our probabilistic assessment of the investment backdrop (even if we acknowledge our timing is likely to be imperfect). As John Maynard Keynes said, “It is better to be roughly right than precisely wrong.”
During the period, we eliminated several positions and replaced them with a similar number of new names. Here is a sampling of the sell-side activity that occurred. We sold technology holding Proofpoint (PFPT), Alarm.com (ALRM), Everbridge (EVBG), Medidata Solutions (MDSO) and Cogent Communications (CCOI) mostly due to elevated price points and a desire to control our weight in the area as stated above. Alternatively, sales of Ultragenyx Pharmaceutical (RARE), Alder Biopharmaceuticals (ALDR), PriceSmart (PSMT) and Welbuilt (WBT) were prompted by concerns that our thesis was adrift in one manner or another. Last, but certainly not least, Loxo Oncology (LOXO) was purchased by Eli Lilly at a 68% premium, which represented a good outcome, in our view.
We look forward to updating you on the contributions from the additions to the portfolio as they mature in coming quarters.
Since stock selection has driven the portfolio performance over the long-term and, given the relatively concentrated nature of the portfolio, it is always instructive and illustrative to examine the top and bottom contributors during the last twelve months as a window into the nature of the broader, diversified portfolio.
Our top contributors were large, long tenured portfolio holdings, reminding us why we have the philosophy of striving to invest in “compounders” to generate superior risk-adjusted returns. Bright Horizons (BFAM), a provider of employer-based child care services, was the top contributor to performance during the period. The company reported strong financial results and generally
www.brownadvisory.com/mf
Brown Advisory Small-Cap Growth FundA Message to Our Shareholders
June 30, 2019
raised guidance on better than expected growth across all segments. Waste Connections (WCN) a provider of waste disposal services, the longest held name in the portfolio, continued to expand its free cash flow generation markedly on better than anticipated pricing power and continued execution against its incredibly thoughtful M&A strategy. Genpact (G), a business process management, outsourcing, shared services and information outsourcing company, reported strong fourth quarter 2018 results in its core Global Client BPO business and reiterated its guidance for growth in its GE business for the first time in nearly five years. As a result, financial year 2019 guidance came in ahead of expectations, and Genpact’s multiple began to re-rate, closing some of its discount to peers. In total, these holdings represented over 10% of the portfolio and rose an average of 36%.
On the other side of the ledger, the largest detractors were collectively much smaller portfolio weights and were not tied together by any theme or industry dynamic. Welbilt (WBT), a commercial food service equipment company, was a disappointment as North American revenue growth was solid and consistent with our due diligence, but the company’s margins were negatively impacted by a collection of surprising issues. This result ran counter to the last several quarters, which were highlighted by inconsistent revenue growth, but strong margins. Shares felt additional pressure due to a recent management change and tariff fears. Covetrus (CVET), an operator of animal-health technology and services, experienced growing pains post its spin-off from Henry Schein. The complexity of the transaction proved more challenging than expected and resulted in the company having to postpone its first quarterly report as a public company. While results were not overly negative, an early stumble by what was considered a solid management team was not well received by investors. 2U Inc. (TWOU), a provider of online educational services, is a business we have owned for many years. In the middle of 2018, we cut our position size materially due to excessive valuation. Following the material pull-back in the stock, we have slowly increased our position, but it still remains relatively small. Unfortunately, the company recently disclosed a slowdown in the growth rate of its Graduate Programs due to the stagnation/decline of enrollments in a couple large programs for a variety of different reasons. While we do not believe 2U’s long-term growth algorithm is impaired, it is unlikely that the market will afford it the premium multiple it once garnered anytime soon, thus our more measured weighting in the name may remain.
It is difficult to review all our thoughts and portfolio changes in the scope of this letter. However, we hope that by mentioning a few positions you are better able to understand the varied nature of the companies we hold on your behalf and demonstrate actions that are in-line with the investment philosophy, process and ethos that we espouse.
In sum, execution of the strategy remains steadfast and our thinking simple. We are committed to generating attractive risk-adjusted returns over a full market cycle. Since we do not control outcomes, we work hard to strengthen our foundation (i.e. team), adhere to our philosophy, and continuously improve our investment process. At present, research productivity is generally high and improving, providing ample flexibility in portfolio positioning should it be required. We continue to keep one eye on absolute returns and one eye on relative returns with the goal of improving both over time. Our tendencies will likely cause us to lean against the market trade winds with the goal of continuously balancing our offensive exposures with adequate defense as an insurance policy against the unknown.
We look forward to updating you as time progresses and thank you for your interest and support.
Sincerely,
Christopher A. Berrier
Portfolio Manager
www.brownadvisory.com/mf
Brown Advisory Small-Cap Growth FundA Message to Our Shareholders
June 30, 2019
Past performance is not a guarantee of future results.
Mutual fund investing involves risk. Principal loss is possible. Investments in smaller companies generally carry greater risk than is customarily associated with larger companies for various reasons such as narrower markets, limited financial resources and less liquid stock. The value of the Fund’s investments in REITs may change in response to changes in the real estate market such as declines in the value of real estate, lack of available capital or financing opportunities, and increases in property taxes or operating costs. The Fund may invest in ETFs, which may trade at a discount to the aggregate value of the underlying securities and although expense ratios for ETFs are generally low, frequent trading of ETFs by the Fund can generate brokerage expenses. Earnings growth is not representative of the fund’s future performance. Diversification does not assure a profit, nor does it protect against a loss in a declining market. Investments in foreign securities entail certain risks not associated with investments in domestic securities, such as volatility of currency exchange rates, and in some cases, political and economic instability and relatively illiquid markets. These risks are greater for investments in emerging markets. Privately Placement issued securities are restricted securities that are not publicly traded. Delay or difficulty in selling such securities may result in a loss to the Fund.
Fund holdings and sector allocations are subject to change and should not be considered a recommendation to buy or sell any security. For a complete list of fund holdings, please refer to the Schedule of Investments provided in this report.
Definitions for terms and indices are provided in the Glossary of Terms.
www.brownadvisory.com/mf
Brown Advisory Small-Cap Growth FundPerformance Information & Portfolio Holdings Summary
June 30, 2019
GROWTH OF A $1,000,000 INVESTMENT
The following chart reflects the change in value of a hypothetical $1,000,000 investment, including reinvested dividends and distributions, in the Fund compared with the broad-based securities market index. The Russell 2000® Growth Index (“Index”) measures the performance of the small-cap growth segment of the U.S. equity universe. It includes those Russell 2000® companies with higher price to book ratios and higher forecasted growth values. The Index is unmanaged and does not reflect the deduction of fees, such as investment management fees. Investors cannot invest directly in an index.
| PORTFOLIO HOLDINGS | % of Net Assets |
Information Technology | | | 24.5 | % | |
Consumer Discretionary | | | 19.6 | % | |
Health Care | | | 18.1 | % | |
Industrials | | | 18.0 | % | |
Money Market Funds | | | 7.8 | % | |
Financials | | | 5.5 | % | |
Consumer Staples | | | 3.8 | % | |
Communication Services | | | 3.5 | % | |
Energy | | | 0.7 | % | |
Private Placements | | | 0.2 | % | |
Other Assets and Liabilities | | | (1.7 | )% | |
| | | | 100.0 | % | |
Average Annual Total Return | One Year | Five Year | Ten Year |
| Institutional Shares | 14.56% | 12.52% | 15.89% |
| Investor Shares | 14.40% | 12.35% | 15.77% |
| Advisor Shares | 14.08% | 12.08% | 15.44% |
Russell 2000® Growth Index | -0.49% | 8.63% | 14.41% |
| | Institutional Shares | Investor Shares | Advisor Shares |
Gross Expense Ratio1 | 0.99% | 1.14% | 1.39% |
Net Expense Ratio1 | 0.99% | 1.14% | 1.39% |
Past performance does not guarantee future results. The performance data quoted represents past performance and current returns may be lower or higher. The investment return and net asset value will fluctuate so that an investor’s shares, when redeemed, may be worth more or less than the original cost. To obtain performance information current to the most recent month end, please visit our website at brownadvisory.com/mf/small-cap-growth-fund. The performance table and graph above do not reflect the deduction of taxes that a shareholder would pay on Fund distributions or the redemption of Fund shares. Investment performance reflects periods during which fee waivers were in effect. In the absence of such waivers, total return would have been reduced. Performance data does not reflect the imposition of the redemption fee of 1.00% on shares redeemed within 14 days, and if it did, performance would have been lower. Returns shown are calculated using the net asset values (“NAV”) that were used for shareholder transactions as of the respective period ends. These NAV, and the returns calculated from them, may differ from the NAV and returns shown elsewhere in this report.
1 | Per the Fund’s prospectus dated October 31, 2018. Refer to the financial highlights for the gross and net expense ratios for the year ended as of the date of this report. Please note that the expense ratios per the prospectus include acquired fund fees and expenses (as applicable) and the expense ratios in the financial highlights do not. |
www.brownadvisory.com/mf
Brown Advisory Small-Cap Growth FundSchedule of Investments
June 30, 2019
| Shares | | Security Description | | Value $ | |
| Common Stocks — 93.7% | | | |
| | | | |
| Communication Services — 3.5% | | | |
| | 512,903 | | GCI Liberty, Inc.* | | | 31,523,018 | |
| | 2,578,463 | | Zynga, Inc.* | | | 15,805,978 | |
| | | | | | | 47,328,996 | |
| Consumer Discretionary — 19.6% | | | | |
| | 374,806 | | Bright Horizons Family Solutions, Inc.* | | | 56,546,981 | |
| | 501,924 | | Carrols Restaurant Group, Inc.* | | | 4,532,374 | |
| | 547,383 | | Chegg, Inc.* | | | 21,123,510 | |
| | 335,234 | | Choice Hotels International, Inc. | | | 29,168,710 | |
| | 545,630 | | Clarus Corp. | | | 7,878,897 | |
| | 623,938 | | Despegar.com Corp.* | | | 8,666,499 | |
| | 327,646 | | Etsy, Inc.* | | | 20,107,635 | |
| | 295,167 | | Habit Restaurants, Inc.* | | | 3,096,302 | |
| | 627,003 | | Hudson, Ltd.* | | | 8,646,371 | |
| | 348,865 | | IAA, Inc.* | | | 13,528,985 | |
| | 533,607 | | Lindblad Expeditions Holdings, Inc.* | | | 9,578,246 | |
| | 869,393 | | MakeMyTrip, Ltd.* | | | 21,560,946 | |
| | 757,227 | | National Vision Holdings, Inc.* | | | 23,269,586 | |
| | 303,400 | | Stitch Fix, Inc.* | | | 9,705,766 | |
| | 321,481 | | TopBuild Corp.* | | | 26,605,767 | |
| | | | | | | 264,016,575 | |
| Consumer Staples — 3.8% | | | | |
| | 238,799 | | Calavo Growers, Inc. | | | 23,101,415 | |
| | 108,201 | | Casey’s General Stores, Inc. | | | 16,878,274 | |
| | 477,192 | | Hain Celestial Group, Inc.* | | | 10,450,505 | |
| | | | | | | 50,430,194 | |
| Energy — 0.7% | | | | |
| | 299,658 | | Cactus, Inc.* | | | 9,924,673 | |
| | | | | |
| Financials — 5.5% | | | | |
| | 572,215 | | Ares Management Corp. | | | 14,974,867 | |
| | 160,679 | | BankUnited, Inc. | | | 5,421,310 | |
| | 965,767 | | Capitol Investment Corp. IV* | | | 9,879,796 | |
| | 217,951 | | Hamilton Lane, Inc. | | | 12,436,284 | |
| | 236,881 | | Prosperity Bancshares, Inc. | | | 15,645,990 | |
| | 318,830 | | Webster Financial Corp. | | | 15,230,509 | |
| | | | | | | 73,588,756 | |
| Health Care — 18.1% | | | | |
| | 129,475 | | Acceleron Pharma, Inc.* | | | 5,318,833 | |
| | 114,572 | | Agios Pharmaceuticals, Inc.* | | | 5,714,851 | |
| | 43,216 | | AnaptysBio, Inc.* | | | 2,438,247 | |
| | 440,839 | | Array BioPharma, Inc.* | | | 20,424,071 | |
| | 318,321 | | Biohaven Pharmaceutical Holding Co., Ltd.* | | | 13,939,277 | |
| | 87,007 | | Blueprint Medicines Corp.* | | | 8,207,370 | |
| | 771,124 | | Catalent, Inc.* | | | 41,802,632 | |
| | 268,135 | | Charles River Laboratories International, Inc.* | | | 38,048,356 | |
| | 191,779 | | Coherus BioSciences, Inc.* | | | 4,238,316 | |
| | 788,155 | | Covetrus, Inc.* | | | 19,278,271 | |
| | 129,221 | | Global Blood Therapeutics, Inc.* | | | 6,797,025 | |
| | 89,572 | | HealthEquity, Inc.* | | | 5,858,009 | |
| | 122,343 | | Henry Schein, Inc.* | | | 8,551,776 | |
| | 439,306 | | Integra LifeSciences Holdings Corp.* | | | 24,535,240 | |
| | 196,706 | | Kura Oncology, Inc.* | | | 3,873,141 | |
| | 761,406 | | NeoGenomics, Inc.* | | | 16,705,248 | |
| | 167,875 | | Neurocrine Biosciences, Inc.* | | | 14,173,686 | |
| | 72,854 | | Tabula Rasa HealthCare, Inc.* | | | 3,637,600 | |
| | | | | | | 243,541,949 | |
| Industrials — 18.0% | | | | |
| | 422,558 | | BWX Technologies, Inc. | | | 22,015,272 | |
| | 156,295 | | ESCO Technologies, Inc. | | | 12,913,093 | |
| | 161,736 | | HEICO Corp. | | | 21,641,894 | |
| | 290,714 | | Hexcel Corp. | | | 23,512,948 | |
| | 85,319 | | IDEX Corp. | | | 14,686,813 | |
| | 132,484 | | John Bean Technologies Corp. | | | 16,047,787 | |
| | 466,072 | | Knight-Swift Transportation Holdings, Inc. | | | 15,305,804 | |
| | 94,521 | | Mercury Systems, Inc.* | | | 6,649,552 | |
| | 351,172 | | SiteOne Landscape Supply, Inc.* | | | 24,336,220 | |
| | 236,967 | | WageWorks, Inc.* | | | 12,035,554 | |
| | 564,858 | | Waste Connections, Inc. | | | 53,989,128 | |
| | 170,643 | | Woodward, Inc. | | | 19,309,962 | |
| | | | | | | 242,444,027 | |
| Information Technology — 24.5% | | | | |
| | 236,342 | | 2U, Inc.* | | | 8,895,913 | |
| | 57,520 | | AppFolio, Inc.* | | | 5,882,570 | |
| | 225,386 | | Aspen Technology, Inc.* | | | 28,010,972 | |
| | 91,758 | | Blackbaud, Inc. | | | 7,661,793 | |
| | 280,419 | | BlackLine, Inc.* | | | 15,005,221 | |
| | 61,304 | | Broadridge Financial Solutions, Inc. | | | 7,827,295 | |
| | 898,633 | | EVO Payments, Inc.* | | | 28,333,898 | |
| | 54,065 | | Fair Isaac Corp.* | | | 16,977,491 | |
| | 1,167,789 | | Genpact, Ltd. | | | 44,481,083 | |
| | 171,681 | | Guidewire Software, Inc.* | | | 17,405,020 | |
| | 89,405 | | Littelfuse, Inc. | | | 15,816,639 | |
| | 290,691 | | Marvell Technology Group, Ltd. | | | 6,938,794 | |
| | 74,892 | | MAXIMUS, Inc. | | | 5,432,666 | |
| | 844,111 | | Mimecast, Ltd.* | | | 39,428,425 | |
| | 13,729 | | Pagerduty, Inc.* | | | 645,949 | |
| | 65,860 | | Paylocity Holding Corp.* | | | 6,178,985 | |
| | 205,272 | | PROS Holdings, Inc.* | | | 12,985,507 | |
| | 106,125 | | WEX, Inc.* | | | 22,084,612 | |
| | 407,678 | | Workiva, Inc.* | | | 23,682,015 | |
| | 1,097,983 | | Zuora, Inc.* | | | 16,821,100 | |
| | | | | | | 330,495,948 | |
Total Common Stocks (Cost $938,743,526) | | | 1,261,771,118 | |
| | | | | |
| Private Placements — 0.2% | | | | |
| | 19,200 | | Greenspring Global Partners IV-B, L.P.*^† | | | 2,280,597 | |
| | 91,769 | | Greenspring Global Partners V-B, L.P.*~† | | | 122,737 | |
Total Private Placements (Cost $—) | | | 2,403,334 | |
The accompanying notes are an integral part of these financial statements.
www.brownadvisory.com/mf
Brown Advisory Small-Cap Growth FundSchedule of Investments
June 30, 2019
| Shares | | Security Description | | Value $ | |
| Short-Term Investments — 7.8% | | | |
| | | | |
| Money Market Funds — 7.8% | | | |
| | 104,924,940 | | First American Government | | | |
| | | | Obligations Fund — Class Z, 2.26%# | | | 104,924,940 | |
Total Short-Term Investments (Cost $104,924,940) | | | 104,924,940 | |
Total Investments — 101.7% (Cost $1,043,668,466) | | | 1,369,099,392 | |
Liabilities in Excess of Other Assets — (1.7)% | | | (22,491,261 | ) |
| NET ASSETS — 100.0% | | $ | 1,346,608,131 | |
| * | Non-Income Producing |
| ^ | Security is exempt from registration under Regulation D of the Securities Act of 1933. Security was acquired from February 2008 to April 2018 as part of a $2,000,000 capital commitment. At June 30, 2019 $1,920,000 of the capital commitment has been fulfilled by the Fund. |
| ~ | Security is exempt from registration under Regulation D of the Securities Act of 1933. Security was acquired from October 2012 to August 2018 as part of a $100,000 capital commitment. At June 30, 2019 $91,000 of the capital commitment has been fulfilled by the Fund. |
| † | These securities are being fair valued, using significant unobservable inputs (Level 3), under the supervision of the Board of Trustees. Further, they may not be sold by the Fund. Total unfunded capital commitments related to these holdings are immaterial and total $89,000, or 0.0% of the Fund’s net assets as of the date of this report. |
| # | Annualized seven-day yield as of June 30, 2019. |
The accompanying notes are an integral part of these financial statements.
www.brownadvisory.com/mf
Brown Advisory Small-Cap Fundamental Value FundA Message to Our Shareholders
June 30, 2019
Dear Shareholders:
During the year ended June 30, 2019, the Brown Advisory Small-Cap Fundamental Value Fund – Investor Shares (the “Fund”) decreased 3.05% in value. During the same period, the Fund’s benchmark, the Russell 2000® Value Index (the “Index”), decreased 6.24%.
The beginning of 2019 saw a sharp rebound in small-cap company share prices. This snap back followed a particularly challenging fourth quarter in which fears of a rapidly slowing economy weighed on share prices. As you may recall, small cap shares were down meaningfully during the back half of 2018 with the Russell 2000 Value Index down 12.9% for the 2018 calendar year. Sales growth has generally remained comparable, but earnings growth lagged for the group during the first quarter of 2019 and was expected to be weak during the second quarter due to margin pressures. Among small-cap companies, growth company shares, led by technology, generally performed better than value. This only served to expand the material difference in year-to-date performance and relative valuation gap between growth and value. From a macro perspective, small-cap investors are focused on the potential relief from a trade deal with China benefiting cyclicals as well as the potential impact from an interest rate cut for financials. This heightened volatility demonstrates the ongoing debate surrounding the macro environment and questions about a potential second half earnings rebound.
For the twelve months ended June 30, 2019, the Fund outpaced its benchmark from strong performance in communication services (+37%), materials (+13%), real estate (+13%), and utilities (+7%). Our drag to performance was in the energy (-52%), consumer staples (-32%), and health care (-24%) sectors.
There were several notable corporate actions during the period. Nexstar (NXST) announced its planned divestitures in connection with its anticipated close of Tribune later in 2019. The sales prices on the divestitures were much higher than the market’s assumption, which, along with solid operating performance, drove Nexstar’s share price higher. Denny’s (DENN) announced that it was accelerating its re-franchising strategy and reducing the number of company owned restaurants from 10% of its total to approximately 4%. Through a combination of increased franchise fees and share repurchases (using proceeds from restaurant sales), Denny’s believes that the transaction will be accretive and should garner a higher multiple in the market. Not all the transactions were value creating or received well by the markets. One of the portfolio’s most sizable losses during the period came from our recent investment in Spectrum Brands (SPB) which was undergoing a significant corporate simplification and reorganization. Unfortunately, during November, it announced that it had to renegotiate the terms of its battery business sale to Energizer due to regulatory challenges. Unfortunately, during November, the company announced that it had to renegotiate the terms of its battery business sale to Energizer Holdings due to regulatory concerns. This renegotiation coupled with reported weakness in its consumer products division during the third quarter reduced the overall expected value from the corporate simplification plan, and was quickly reflected in the share price. Eagle Materials (EXP) completed its strategic review with an announcement that it would spin off its wallboard division and sell its oil and gas proppant business. This breakup, combined with a sizable buyback (20% of the outstanding shares), was well received by the market. Magellan Health (MGHC) continues its strategic review and was rumored to be in exclusive discussions with a private equity company. Extended Stay’s (STAY) strategic review also continues, but our expectation is that a final announcement will not end in a sale but a division between the property company and the management company. This should free the company to restart its buyback program. Finally, Roan (ROAN) announced that it had hired advisors to respond to potential interest; however, we decided to proceed with the sale of our investment.
Albany International was the Fund’s largest individual contributor to performance during the year. The company reported strong first-quarter results and was able to leverage improving sales trends in each of its two business segments to drive over 200 basis points of earnings before interest taxes, depreciation and amortization (EBITDA) margin expansion year over year. Management also reiterated its full-year 2019 guidance as well as its long-term guidance for its Engineered Composites segment. Another top contributor during the period was Nextstar Media Group. Nextstar rose on strong earnings results and an encouraging outlook.
The Fund added seventeen new companies during the course of the year. Sizable additions included; Eagle Materials, Essential Properties Realty Trust, Deluxe Corporation, and Cabot Microelectronics.
Eagle Materials, Inc. (EXP) is a leading supplier of heavy construction materials, light building materials, and materials used in oil & gas extraction. The company sells commodity products and its relentless focus on being the low-cost provider in each of its markets has led to higher margins, returns, and free cash flow versus its competitors over time. EXP’s stock came under significant pressure throughout the year as a multitude of weather-related issues weighed on the company’s cement segment results. We think that street expectations for the cement business have finally corrected to a more reasonable level and the set up going forward looks
www.brownadvisory.com/mf
Brown Advisory Small-Cap Fundamental Value FundA Message to Our Shareholders
June 30, 2019
favorable as the market continues to tighten. Eagle is also coming off a record amount of capex spend over a trailing four-quarter period, and we think free cash flow is set to materially improve during the second half of FY19 and into FY20. With low leverage on the balance sheet, and few potential acquisition opportunities in the market today, we expect the majority of excess free cash flow to be returned to shareholders through share repurchases in the near term.
Essential Properties (EPRT) is a net lease REIT that was founded in 2016 and came public in June 2018. The company’s portfolio consists of retail and service-oriented properties that we believe are well-positioned for the ecommerce era and which are generally middle market in size and tenant profile, allowing EPRT to provide attractive financing options otherwise unavailable to such tenants. The stock traded poorly at the time of the IPO due to a temporary spike in interest rates in the late summer of 2018, giving us an opportunity to own this attractive portfolio at a discount to intrinsic value and capture an upfront yield of over 6%. With an under-levered balance sheet, we believe EPRT has a nice runway to grow its portfolio and prove itself as a differentiated player in the net lease industry.
Deluxe Corporation’s legacy business—manufacturing and selling checks—generates good cash flow and is declining at a predictable rate. The company is diversifying away from checks, and marketing solutions which now makes up more than 40% of the company’s revenue and 25 to 30% of cash flow. A new CEO is taking a fresh look at the company’s markets and competitive positioning, which may lead to the exit of less attractive businesses and greater focus on the strongest ones. The company returns cash to shareholders through both repurchases and a regular dividend, and we think valuation is attractive today at 5.5x EBITDA and a mid-teens free cash flow yield.
We received shares of Cabot Microelectronics (CCMP) as a result of the closure of its KMG Chemicals acquisition during the fourth quarter. The Fund had a previous position in KMG and received cash and shares of CCMP as a result of the deal.
During the year, there were twelve deletions from the Fund’s portfolio, four of which were a result of corporate action (Forest City, KMG Chemicals, TCF Financial Corp, and Farmer’s Capital Bank Corp). We sold our positions in ATN International, Broadridge, and Culp due to valuation. The remaining deletions from the portfolio were due to either a thesis violation or to fund new ideas.
The market continues to consider the operating performance and the challenges that companies face from a potential recession, as well as the positive impacts that are hoped for in a rate cut and possible tariff relief. The diversion between the broader fixed income markets and the equity markets seem to be giving investors contradictory indications, and the rapid changes in high-yield spreads just further the confusion for market participants. Given such an environment, we remain steadfast that an opportunistic approach focused on cash flows, valuation and capital allocation should continue to produce attractive risk-adjusted returns for our investors.
Sincerely,
J. David Schuster
Portfolio Manager
www.brownadvisory.com/mf
Brown Advisory Small-Cap Fundamental Value FundA Message to Our Shareholders
June 30, 2019
Past performance is not a guarantee of future results.
Investments in smaller companies generally carry greater risk than is customarily associated with larger companies for various reasons such as narrower markets, limited financial resources and less liquid stock. The value of the Fund’s investments in REITs may change in response to changes in the real estate market such as declines in the value of real estate, lack of available capital or financing opportunities, and increases in property taxes or operating costs. The Fund may invest in ETFs, which may trade at a discount to the aggregate value of the underlying securities and although expense ratios for ETFs are generally low, frequent trading of ETFs by the Fund can generate brokerage expenses. Investments in debt securities typically decrease in value when interest rates rise. This risk is usually greater for longer-term debt securities. Investments in foreign securities entail certain risks not associated with investments in domestic securities, such as volatility of currency exchange rates, and in some cases, political and economic instability and relatively illiquid markets. These risks are greater for investments in emerging markets. The risks of investments in derivatives, including options, futures contracts and options on futures contracts include imperfect correlation between the value of these instruments and the underlying assets; risks of default by the other party to the derivative transactions; risks that the transactions may result in losses that partially or completely offset gains in portfolio positions; and risks that the derivative transactions may not be liquid. Private Placement issued securities are restricted securities that are not publicly traded. Delay or difficulty in selling such securities may result in a loss to the Fund. Earnings growth is not a measure of the Fund’s future performance.
Fund holdings and sector allocations are subject to change and should not be considered a recommendation to buy or sell any security. For a complete list of fund holdings, please refer to the Schedule of Investments provided in this report.
Definitions for terms and indices are provided in the Glossary of Terms.
www.brownadvisory.com/mf
Brown Advisory Small-Cap Fundamental Value FundPerformance Information & Portfolio Holdings Summary
June 30, 2019
GROWTH OF A $10,000 INVESTMENT
The following chart reflects the change in value of a hypothetical $10,000 investment, including reinvested dividends and distributions, in the Fund as measured against a broad-based securities market index. The Russell 2000® Value Index (“Index”) measures the performance of small-cap value segment of the U.S. equity universe. It includes those Russell 2000® companies with lower price to book ratios and lower forecasted growth values. The Index is unmanaged and does not reflect the deduction of fees, such as investment management fees. Investors cannot invest directly in an index.
| PORTFOLIO HOLDINGS | % of Net Assets |
Financials | | | 25.8 | % | |
Industrials | | | 19.8 | % | |
Consumer Discretionary | | | 14.2 | % | |
Information Technology | | | 7.9 | % | |
Communication Services | | | 6.4 | % | |
Real Estate Investment Trusts | | | 5.9 | % | |
Money Market Funds | | | 4.1 | % | |
Materials | | | 3.6 | % | |
Health Care | | | 3.3 | % | |
Investment Companies | | | 3.0 | % | |
Energy | | | 2.6 | % | |
Consumer Staples | | | 1.7 | % | |
Utilities | | | 0.8 | % | |
Real Estate | | | 0.7 | % | |
Other Assets and Liabilities | | | 0.2 | % | |
| | | | 100.0 | % | |
Average Annual Total Return | One Year | Five Year | Ten Year |
Institutional Shares1 | -2.91% | 6.03% | 13.71% |
| Investor Shares | -3.05% | 5.87% | 13.54% |
Advisor Shares2 | -3.27% | 5.61% | 13.26% |
Russell 2000® Value Index | -6.24% | 5.39% | 12.40% |
| | Institutional Shares | Investor Shares | Advisor Shares |
Gross Expense Ratio3 | 1.15% | 1.30% | 1.55% |
Net Expense Ratio3 | 1.15% | 1.30% | 1.55% |
Past performance does not guarantee future results. The performance data quoted represents past performance and current returns may be lower or higher. The investment return and net asset value will fluctuate so that an investor’s shares, when redeemed, may be worth more or less than the original cost. To obtain performance information current to the most recent month end, please visit our website at brownadvisory.com/mf/small-cap-fundamental-value-fund. The performance table and graph above do not reflect the deduction of taxes that a shareholder would pay on Fund distributions or the redemption of Fund shares. Investment performance reflects periods during which fee waivers were in effect. In the absence of such waivers, total return would have been reduced. Performance data does not reflect the imposition of the redemption fee of 1.00% on shares redeemed within 14 days, and if it did, performance would have been lower. Returns shown are calculated using the net asset values (“NAV”) that were used for shareholder transactions as of the respective period ends. These NAV, and the returns calculated from them, may differ from the NAV and returns shown elsewhere in this report.
1 | Performance information for the Institutional Shares, prior to commencement of operations on October 19, 2012, is based on the performance of Investor Shares, and adjusted for the lower expenses applicable to Institutional Shares. |
2 | Performance information for Advisor Shares, prior to commencement on July 28, 2011, is based on the performance of Investor Shares, and adjusted for the higher expenses applicable to Advisor Shares. |
3 | Per the Fund’s prospectus dated October 31, 2018. Refer to the financial highlights for the gross and net expense ratios for the year ended as of the date of this report. Please note that the expense ratios per the prospectus include acquired fund fees and expenses (as applicable) and the expense ratios in the financial highlights do not. |
www.brownadvisory.com/mf
Brown Advisory Small-Cap Fundamental Value FundSchedule of Investments
June 30, 2019
| Shares | | Security Description | | Value $ | |
| Common Stocks — 86.8% | | | |
| | | | |
| Communication Services — 6.4% | | | |
| | 392,783 | | GCI Liberty, Inc.* | | | 24,140,443 | |
| | 331,484 | | Loral Space & Communications, Inc.* | | | 11,439,513 | |
| | 296,972 | | Nexstar Broadcasting Group, Inc. | | | 29,994,172 | |
| | | | | | | 65,574,128 | |
| Consumer Discretionary — 14.2% | | | | |
| | 481,022 | | Century Casinos, Inc.* | | | 4,665,913 | |
| | 265,890 | | Core-Mark Holding Co., Inc. | | | 10,561,151 | |
| | 120,656 | | Culp, Inc. | | | 2,292,464 | |
| | 1,128,762 | | Denny’s Corp.* | | | 23,173,484 | |
| | 630,170 | | Designer Brands, Inc. | | | 12,080,359 | |
| | 350,370 | | Dick’s Sporting Goods, Inc. | | | 12,133,313 | |
| | 2,031,850 | | Extended Stay America, Inc. | | | 34,317,947 | |
| | 994,451 | | Hudson, Ltd.* | | | 13,713,479 | |
| | 183,507 | | Murphy USA, Inc.* | | | 15,420,093 | |
| | 929,908 | | Regis Corp.* | | | 15,436,473 | |
| | 829,685 | | Tile Shop Holdings, Inc. | | | 3,318,740 | |
| | | | | | | 147,113,416 | |
| Consumer Staples — 1.7% | | | | |
| | 320,664 | | Spectrum Brands Holdings, Inc. | | | 17,242,103 | |
| | | | | |
| Energy — 2.6% | | | | |
| | 130,017 | | Natural Gas Services Group, Inc.* | | | 2,145,280 | |
| | 134,702 | | REX American Resources Corp.* | | | 9,819,776 | |
| | 1,181,081 | | Riviera Resources, Inc.* | | | 14,999,729 | |
| | | | | | | 26,964,785 | |
| Financials — 25.8% | | | | |
| | 249,101 | | Assurant, Inc. | | | 26,499,364 | |
| | 261,595 | | Capitol Investment Corp. IV* | | | 2,676,117 | |
| | 358,424 | | Central Pacific Financial Corp. | | | 10,738,383 | |
| | 265,109 | | Howard Bancorp, Inc.* | | | 4,021,703 | |
| | 479,460 | | National Bank Holdings Corp. | | | 17,404,398 | |
| | 804,307 | | National General Holdings Corp. | | | 18,450,803 | |
| | 698,888 | | OceanFirst Financial Corp. | | | 17,367,367 | |
| | 659,453 | | Pacific Premier Bancorp, Inc. | | | 20,363,909 | |
| | 284,773 | | Peapack Gladstone Financial Corp. | | | 8,007,817 | |
| | 189,914 | | Primerica, Inc. | | | 22,780,184 | |
| | 420,114 | | Renasant Corp. | | | 15,098,897 | |
| | 734,808 | | TFS Financial Corp. | | | 13,277,981 | |
| | 756,484 | | TriState Capital Holdings, Inc.* | | | 16,143,369 | |
| | 408,010 | | Triumph Bancorp, Inc.* | | | 11,852,690 | |
| | 234,654 | | Virtus Investment Partners, Inc. | | | 25,201,840 | |
| | 525,142 | | Waddell & Reed Financial, Inc. | | | 8,754,117 | |
| | 673,509 | | Washington Federal, Inc. | | | 23,525,669 | |
| | 119,084 | | WesBanco, Inc. | | | 4,590,688 | |
| | | | | | | 266,755,296 | |
| Health Care — 3.3% | | | | |
| | 234,225 | | Magellan Health, Inc.* | | | 17,386,522 | |
| | 288,926 | | Providence Service Corp.* | | | 16,567,017 | |
| | | | | | | 33,953,539 | |
| Industrials — 19.8% | | | | |
| | 494,688 | | Albany International Corp. | | | 41,014,582 | |
| | 323,783 | | Continental Building Products, Inc.* | | | 8,602,914 | |
| | 216,857 | | CRA International, Inc. | | | 8,312,129 | |
| | 414,647 | | Deluxe Corp. | | | 16,859,547 | |
| | 462,281 | | Federal Signal Corp. | | | 12,366,017 | |
| | 228,798 | | Kadant, Inc. | | | 20,777,146 | |
| | 235,435 | | Lydall, Inc.* | | | 4,755,787 | |
| | 394,344 | | McGrath RentCorp | | | 24,508,480 | |
| | 1,368,883 | | MRC Global, Inc.* | | | 23,435,277 | |
| | 1,949,858 | | Mueller Water Products, Inc. | | | 19,147,605 | |
| | 289,707 | | Simpson Manufacturing Co., Inc. | | | 19,253,927 | |
| | 78,091 | | VIAD Corp. | | | 5,172,748 | |
| | | | | | | 204,206,159 | |
| Information Technology — 7.9% | | | | |
| | 147,832 | | Cabot Microelectronics Corp. | | | 16,273,347 | |
| | 220,599 | | CTS Corp. | | | 6,084,120 | |
| | 473,994 | | EchoStar Corp.* | | | 21,007,414 | |
| | 296,344 | | MAXIMUS, Inc. | | | 21,496,794 | |
| | 436,589 | | SMART Global Holdings, Inc.* | | | 10,037,181 | |
| | 703,674 | | South Mountain Merger Corp. Units*^ | | | 7,036,740 | |
| | | | | | | 81,935,596 | |
| Materials — 3.6% | | | | |
| | 356,081 | | Eagle Materials, Inc. | | | 33,008,709 | |
| | 65,984 | | Neenah, Inc. | | | 4,457,219 | |
| | | | | | | 37,465,928 | |
| Real Estate — 0.7% | | | | |
| | 41,387 | | Consolidated-Tomoka Land Co. | | | 2,470,804 | |
| | 277,603 | | Landmark Infrastructure Partners L.P. | | | 4,677,610 | |
| | | | | | | 7,148,414 | |
| Utilities — 0.8% | | | | |
| | 836,323 | | Star Group L.P. | | | 8,354,867 | |
Total Common Stocks (Cost $730,489,198) | | | 896,714,231 | |
| | | | | |
| Real Estate Investment Trusts — 5.9% | | | | |
| | 1,117,439 | | Essential Properties Realty Trust, Inc. | | | 22,393,478 | |
| | 2,613,996 | | MFA Financial, Inc. | | | 18,768,491 | |
| | 945,255 | | Xenia Hotels & Resorts, Inc. | | | 19,708,567 | |
Total Real Estate Investment Trusts (Cost $50,317,106) | | | 60,870,536 | |
| | | | | |
| Investment Companies — 3.0% | | | | |
| | 878,881 | | Ares Capital Corp. | | | 15,767,125 | |
| | 1,594,167 | | Barings BDC, Inc. | | | 15,686,603 | |
Total Investment Companies (Cost $31,800,859) | | | 31,453,728 | |
| | | | | |
| Short-Term Investments — 4.1% | | | | |
| | | | | |
| Money Market Funds — 4.1% | | | | |
| | 42,562,829 | | First American Government | | | | |
| | | | Obligations Fund — Class Z, 2.26%# | | | 42,562,829 | |
Total Short-Term Investments (Cost $42,562,829) | | | 42,562,829 | |
Total Investments — 99.8% (Cost $855,169,992) | | | 1,031,601,324 | |
Other Assets in Excess of Liabilities — 0.2% | | | 1,848,654 | |
| NET ASSETS — 100.0% | | $ | 1,033,449,978 | |
| * | Non-Income Producing |
| # | Annualized seven-day yield as of June 30, 2019. |
| ^ | Each unit consists of one share of Class A common stock and one-half of one warrant. Each whole warrant is exercisable to purchase one share of Class A common stock at a price of $11.50 per share. The warrants became exercisable on July 24, 2019 and expire on June 20, 2024. Refer to the company’s filings at sec.gov for additional information. |
The accompanying notes are an integral part of these financial statements.
www.brownadvisory.com/mf
Brown Advisory Global Leaders FundA Message to Our Shareholders
June 30, 2019
Dear Shareholders:
During the year ended June 30, 2019, the Brown Advisory Global Leaders Fund – Investor Shares (the “Fund”) increased 10.49% in value. During the same period, the Fund’s benchmark, the FTSE All-World Index (the “Index”), increased 5.54%.
For the 12-month period ended June 30, 2019 global equity markets were volatile with a sharp reversal of fortunes during the year. In the first half of the period investor sentiment shifted from the end of 2018 as the prevailing narrative coalesced towards concerns of a slowing global economy resulting in market weakness. This evolution was followed by positive U.S. economic data and corporate results which, combined with accommodative rhetoric from the Federal Reserve, served to undermine pessimism at the start of 2019. Accordingly, equity markets rebounded from their New Year lows and ended the period close to all-time highs.
The strategy is focused on delivering long-term performance by buying a concentrated portfolio of industry-leading companies that we believe uniquely satisfy their customers and generate what we view as favourable economics for shareholders. Although we are acutely aware of the economic environment, we are stock pickers and our primary focus is on the operational performances of the franchises in which we invest and their ability to generate cash flow. As a result, our sector attribution is primarily an output of our stock-picking. For the covered period, our holdings in information technology and financials were the main areas of outperformance. It is gratifying to see continued outperformance from our financials holdings as financial business models are not always obvious candidates for a quality-biased investment strategy. We believe that each of our holdings in this sector provide unique services to their customers and our exposure is a major differentiator from other quality-focused global equity strategies. On the negative front, communication services and consumer discretionary were the two main areas that detracted from performance with company specific issues serving as the primary driver of the weakness. We will touch on the main individual detractors from these two sectors in due course.
We believe capital allocation is equally important as stock selection and we were pleased to see our two biggest positions contribute some of the largest amounts of alpha for the period. Core holdings Microsoft Corporation and Visa Inc. materially outperformed during the period. Microsoft reported positive results throughout the year. The company continues to effectively migrate its customers towards cloud-based solutions that provide significant productivity and cost benefits. Visa outperformed following a string of results that demonstrate that the company is benefitting from the ongoing structural shift to the cashless global economy. The payment network’s outperformance was mirrored by its only significant competitor MasterCard which was another positive contributor during the period. The company is benefitting from similar trends to Visa and continues to exhibit strong growth in emerging markets.
Elsewhere, Indonesia’s PT Bank Rakyat was another meaningful contributor to performance during the period. The company continues to benefit from prudent underwriting in an underpenetrated banking market that has fostered healthy loan growth. Indeed Bank Rakyat benefited from business fundamentals combined with receding currency concerns and increasing positive investor sentiment towards emerging markets to drive share price gains. The final major positive contributor to performance during the period was Estee Lauder. The cosmetics company’s shares were propelled after it released a string of encouraging results underpinned by its growing position in Asia. As we mentioned in the last annual letter Estee Lauder’s improving fortunes serve as a good reminder of the importance of maintaining a long-term vision in investment. The company had a torrid time in 2016 as myopic investors fixated on the seemingly endless malaise of bricks and mortar retail and overlooked the group’s brand power and opportunities for self-help.
On the negative front Electronic Arts (“EA”) detracted from performance during the period after the company revised its outlook for its 2019 financial year. We still see significant value in EA’s sports franchise and see further benefits as EA’s business model continues shifting towards digital with downloading, and eventually streaming, which has the potential to improve the economics for shareholders over time. Elsewhere, Charles Schwab was another detractor from performance as the asset manager’s shares suffered on the back of expectations of a return to expansionary monetary policy in the U.S. The company generates the majority of its revenue from net interest income and investors remain preoccupied with the prospect of U.S. interest rate changes and frequently overlook Schwab’s impressive history of asset gathering.
The Fund has a strict drawdown review process where we automatically review a holding if it falls either 20% since initiation or underperforms the strategy’s benchmark by 20% over a rolling 12-month basis. We believe that this facet of our process enables us to nip loss aversion – one of the most damaging behavioural traits in investing – in the bud as we have to either add to or exit significant losing positions that we review. We sold one of our largest detractors from performance, eBay, during the period following a drawdown review. In the case of eBay, we believe that the investment thesis had shifted due to structural, competitive
www.brownadvisory.com/mf
Brown Advisory Global Leaders FundA Message to Our Shareholders
June 30, 2019
challenges on the supply side. We similarly disposed of Japanese catering equipment manufacturer Hoshizaki after a period of weakness. Hoshizaki’s shares were weak in the period due to an internal investigation on the conduct at one of its sales subsidiaries at the end of October. The lengthiness of the investigation caused us to lose confidence in management’s control of the company and we decided to exit our investment.
Late in the period we conducted two additional drawdown reviews which resulted in us exiting two other companies, 3M and Cognizant Technology Solutions. 3M has been reinvesting capital at an incrementally lower return on capital. Additionally, we worry about capital allocation through M&A as the recent health care acquisition was both large and expensive. Our meetings with Cognizant management confirmed it has seen a worsening of its competitive position with supply-side disruption leading to declining growth in the traditional business. Our biggest fear is always a company that is no longer uniquely serving its customer. Cognizant has been internally focused and it is not clear how long a turnaround by the new CEO will take, and therefore, we decided to allocate elsewhere.
We sold the last major detractor from performance, Facebook, in order to fully build the position in Tencent Holdings that we initiated early in the period. We were particularly concerned when the founders of Instagram, WhatsApp and Oculus (all companies Facebook has acquired) all left within the last year. We viewed this exodus as being a by-product of Facebook trying to drive more advertising onto its platforms, which risks further user disengagement. Additionally, from a capital allocation perspective, we did not want 10% of our clients’ capital exposed to advertising-driven business models and favored our investments in Google and Tencent over Facebook.
There were two meaningful additions during the period, Tencent Holdings and Marvell Technology Group. After extensive work and monitoring we patiently built our Tencent position during the first half of the fiscal year. We see significant optionality in the company’s technology platforms and we used a temporary hiatus over gaming approvals to invest in China’s premier digital ecosystem at an attractive valuation. Elsewhere, we initiated a new position in semi-conductor specialist Marvell. The company has had leading positions in storage and communications niches and significant self-help potential following its acquisition of competitor Cavium.
The Fund invests in what we view as market-leading companies from across the globe that attempt to deliver exceptional customer outcomes. We believe that companies that combine a superior outcome for their customers with strong leadership have the potential to generate high and sustainable returns on invested capital (“ROIC”), which can lead to outstanding shareholder returns. We focus on the long-term and look for franchises that have the potential to compound excess economic profit at above-market growth rates for extended periods of time. Although we do not try and second guess the ebbs and flows of the world economy, many investors are preoccupied with the potential outcome of the current U.S.-China trade war and how central banks will respond to any deterioration in global growth. Although such a scenario is by no means certain, we take comfort from the strategy’s quality bias, aggregate ROIC profile and what we believe to be attractive absolute and relative valuations at which our underlying securities trade. Although there are no certainties in investing, we view these characteristics as standing the portfolio in good stead to have the potential to continue creating value for our clients in a variety of scenarios – which may include an economic slowdown.
Despite macro-economic uncertainty, the Global Leaders team remains focused on executing on the investment process and scouring the globe for high quality companies. We remain very active on the research front and maintain extensive ready to review and ready to buy lists. Patience is an underrated virtue in investing and we remain disciplined on entry points for attractive assets. We feel that overpaying for good businesses is an ever present risk for quality focused investors. We subscribe to Warren Buffett’s idea that investors can be busy fools – sometimes investing can feel like watching paint dry!
Sincerely,
Michael Dillon
Portfolio Manager
Bertie Thomson
Portfolio Manager
www.brownadvisory.com/mf
Brown Advisory Global Leaders FundA Message to Our Shareholders
June 30, 2019
Past performance is not a guarantee of future results.
Mutual fund investing involves risk. Principal loss is possible. The Fund invests in small and medium capitalization companies which carry greater risk than is associated with larger companies for various reasons, such as narrower markets, limited financial resources and less liquid stock. The value of the Fund’s investments in REITs may change in response to changes in the real estate market such as declines in the value of real estate, lack of available capital or financing opportunities, and increases in property taxes or operating costs. The Fund may invest in ETFs, which may trade at a discount to the aggregate value of the underlying securities and although expense ratios for ETFs are generally low, frequent trading of ETFs by the Fund can generate brokerage expenses. Investments in foreign securities entail certain risks not associated with investments in domestic securities, such as volatility of currency exchange rates, and in some cases, political and economic instability and relatively illiquid markets. These risks are greater for investments in emerging markets. Private Placement issued securities are restricted securities that are not publicly traded. Delay or difficulty in selling such securities may result in a loss to the Fund.
Fund holdings and sector allocations are subject to change and should not be considered a recommendation to buy or sell any security. For a complete list of fund holdings, please refer to the Schedule of Investments provided in this report.
Definitions for terms and indices are provided in the Glossary of Terms.
www.brownadvisory.com/mf
Brown Advisory Global Leaders FundPerformance Information & Portfolio Holdings Summary
June 30, 2019
GROWTH OF A $10,000 INVESTMENT
The following chart reflects the change in value of a hypothetical $10,000 investment, including reinvested dividends and distributions, in the Fund as measured against a broad-based securities market index. The FTSE All-World Index (“Index”) is a market capitalization weighted index representing the performance of large and mid-capitalization stocks from the FTSE Global Equity Index Series. The Index is unmanaged and does not reflect the deduction of fees, such as investment management fees. Investors cannot invest directly in an index.
| PORTFOLIO HOLDINGS | % of Net Assets |
Information Technology | | | 23.4 | % | |
Financials | | | 19.1 | % | |
Industrials | | | 14.4 | % | |
Communication Services | | | 13.0 | % | |
Consumer Staples | | | 10.8 | % | |
Consumer Discretionary | | | 7.9 | % | |
Materials | | | 4.9 | % | |
Money Market Funds | | | 3.8 | % | |
Health Care | | | 2.7 | % | |
Other Assets and Liabilities | | | (0.0 | )% | |
| | | | 100.0 | % | |
| | | Since Inception |
Average Annual Total Return | One Year | (7/1/15) |
Institutional Shares1 | 10.62% | 11.39% |
| Investor Shares | 10.49% | 11.24% |
FTSE All-World Index2 | 5.54% | 7.36% |
| | Institutional Shares | Investor Shares |
Gross Expense Ratio3 | 0.95% | 1.10% |
Net Expense Ratio3 | 0.75% | 0.90% |
Past performance does not guarantee future results. The performance data quoted represents past performance and current returns may be lower or higher. The investment return and net asset value will fluctuate so that an investor’s shares, when redeemed, may be worth more or less than the original cost. To obtain performance information current to the most recent month end, please visit our website at brownadvisory.com/mf/global-leaders-fund. The performance table and graph above do not reflect the deduction of taxes that a shareholder would pay on Fund distributions or the redemption of Fund shares. Investment performance reflects periods during which fee waivers were in effect. In the absence of such waivers, total return would have been reduced. Performance data does not reflect the imposition of the redemption fee of 1.00% on shares redeemed within 14 days, and if it did, performance would have been lower. Short-term performance, in particular, is not a good indication of the Fund’s future performance, and an investment should not be made based solely on returns. Returns shown are calculated using the net asset values (“NAV”) that were used for shareholder transactions as of the respective period ends. These NAV, and the returns calculated from them, may differ from the NAV and returns shown elsewhere in this report.
1 | Performance information for the Institutional Shares, prior to commencement of operations on October 31, 2018, is based on the performance of Investor Shares, and adjusted for the lower expenses applicable to Institutional Shares. |
2 | The Fund’s previous benchmark, the Russell Global Large Cap Index, has been decommissioned by its sponsor. |
3 | Per the Fund’s prospectus dated October 31, 2018. Refer to the financial highlights for the gross and net expense ratios for the year ended as of the date of this report. Please note that the expense ratios per the prospectus include acquired fund fees and expenses (as applicable) and the expense ratios in the financial highlights do not. |
www.brownadvisory.com/mf
Brown Advisory Global Leaders FundSchedule of Investments
June 30, 2019
| Shares | | Security Description | | Value $ | |
| Common Stocks — 96.2% | | | |
| | | | |
| China — 8.8% | | | |
| | 815,283 | | AIA Group, Ltd. | | | 8,804,162 | |
| | 135,159 | | Ctrip.com International, Ltd. ADR* | | | 4,988,719 | |
| | 149,358 | | Tencent Holdings Ltd. | | | 6,756,869 | |
| | | | | | | 20,549,750 | |
| France — 2.9% | | | | |
| | 45,551 | | Safran SA | | | 6,663,739 | |
| | | | | |
| Germany — 5.2% | | | | |
| | 146,849 | | CTS Eventim AG & Co. KGaA | | | 6,827,982 | |
| | 36,664 | | Deutsche Boerse AG | | | 5,175,856 | |
| | | | | | | 12,003,838 | |
| India — 2.9% | | | | |
| | 193,750 | | HDFC Bank, Ltd. | | | 6,862,866 | |
| | | | | |
| Indonesia — 2.7% | | | | |
| | 20,040,600 | | Bank Rakyat Indonesia Persero | | | 6,187,036 | |
| | | | | |
| Netherlands — 3.1% | | | | |
| | 98,834 | | Wolters Kluwer NV | | | 7,190,303 | |
| | | | | |
| Sweden — 3.3% | | | | |
| | 270,942 | | Atlas Copco AB | | | 7,789,698 | |
| | | | | |
| Switzerland — 2.8% | | | | |
| | 29,988 | | Schindler Holding AG | | | 6,555,779 | |
| | | | | |
| Taiwan — 2.9% | | | | |
| | 173,728 | | Taiwan Semiconductor | | | | |
| | | | Manufacturing Co., Ltd. ADR | | | 6,804,926 | |
| | | | | |
| United Kingdom — 7.1% | | | | |
| | 271,875 | | Hiscox, Ltd. | | | 5,841,295 | |
| | 172,896 | | Unilever PLC | | | 10,732,605 | |
| | | | | | | 16,573,900 | |
| United States — 54.5% | | | | |
| | | | | |
| Communication Services — 7.1% | | | | |
| | 10,186 | | Alphabet, Inc. — Class C* | | | 11,010,150 | |
| | 55,148 | | Electronic Arts, Inc.* | | | 5,584,286 | |
| | | | | | | 16,594,436 | |
| Consumer Discretionary — 5.8% | | | | |
| | 4,518 | | Booking Holdings, Inc.* | | | 8,469,940 | |
| | 92,108 | | TJX Companies, Inc. | | | 4,870,671 | |
| | | | | | | 13,340,611 | |
| Consumer Staples — 6.2% | | | | |
| | 102,493 | | Brown-Forman Corp. | | | 5,681,187 | |
| | 48,389 | | Estee Lauder Companies, Inc. | | | 8,860,510 | |
| | | | | | | 14,541,697 | |
| Financials — 5.0% | | | | |
| | 97,429 | | Charles Schwab Corp. | | | 3,915,672 | |
| | 69,874 | | JPMorgan Chase & Co. | | | 7,811,913 | |
| | | | | | | 11,727,585 | |
| Health Care — 2.7% | | | | |
| | 34,128 | | Edwards Lifesciences Corp.* | | | 6,304,807 | |
| | | | | |
| Industrials — 2.3% | | | | |
| | 101,719 | | Flowserve Corp. | | | 5,359,574 | |
| | | | | |
| Information Technology — 20.5% | | | | |
| | 241,753 | | Marvell Technology Group, Ltd. | | | 5,770,644 | |
| | 36,720 | | MasterCard, Inc. | | | 9,713,542 | |
| | 131,882 | | Microsoft Corp. | | | 17,666,912 | |
| | 84,319 | | Visa, Inc. | | | 14,633,562 | |
| | | | | | | 47,784,660 | |
| Materials — 4.9% | | | | |
| | 31,438 | | Ecolab, Inc. | | | 6,207,119 | |
| | 11,503 | | Sherwin-Williams Co. | | | 5,271,710 | |
| | | | | | | 11,478,829 | |
Total United States | | | 127,132,199 | |
Total Common Stocks (Cost $188,135,436) | | | 224,314,034 | |
| | | | | |
| Short-Term Investments — 3.8% | | | | |
| | | | | |
| Money Market Funds — 3.8% | | | | |
| | 8,922,477 | | First American Government | | | | |
| | | | Obligations Fund — Class Z, 2.26%# | | | 8,922,477 | |
Total Short-Term Investments (Cost $8,922,477) | | | 8,922,477 | |
Total Investments — 100.0% (Cost $197,057,913) | | | 233,236,511 | |
Liabilities in Excess of Other Assets — (0.0)% | | | (30,557 | ) |
| NET ASSETS — 100.0% | | $ | 233,205,954 | |
ADR — American Depositary Receipt
* | Non-Income Producing |
# | Annualized seven-day yield as of June 30, 2019. |
The accompanying notes are an integral part of these financial statements.
www.brownadvisory.com/mf
Brown Advisory Intermediate Income FundA Message to Our Shareholders
June 30, 2019
Dear Shareholders:
During the year ended June 30, 2019, the Brown Advisory Intermediate Income Fund – Investor Shares (the “Fund”) was up 6.24%, trailing the 6.73% return for the Bloomberg Barclays Intermediate US Aggregate Bond Index (the “Index”).
The Fund aims to generate performance primarily through individual security analysis, supported by a detailed and disciplined research process and focus on capital preservation. Duration and sector weightings are set mainly by an analysis of the intermediate-term risk/reward as opposed to any particular macro forecast.
The second half of 2018 was a tumultuous period for the fixed income markets. Spreads of all types widened meaningfully, especially during the 4th quarter, where investment-grade corporate bonds had their worst quarter since 2011. Our investment philosophy of seeking alpha through individual bond selection naturally leads us to owning more spread bonds and fewer Treasury bonds. While this was detrimental to performance in the 4th quarter, this has been a major driver of the Fund’s strong long-term track record.
Specifically, the weakness in credit and equity markets was broad based as investors questioned the durability of economic growth with a Federal Reserve intent on removing excess policy stimulus. Moreover, as concerns continued to grow regarding the pace of growth and flagging inflation, the Federal Reverse abruptly shifted course and adopted a more dovish tone.
In the first half of 2019, investors encouraged by a less hawkish Federal Reserve and continued low inflation became comfortable again investing in credit-sensitive sectors and also owning longer duration securities. Given that we had conviction in our analysis, we have maintained our positions. We benefited greatly from the spread tightening and outperformance of longer duration assets as the market continued to reprice the future path of monetary policy.
Our exposure to the high quality mortgage market added considerable value to the portfolio. Our view that interest rates could decline rapidly if the economy slowed combined with the fact that the mortgage market did not seem to have this risk priced in led us to meaningfully underweight traditional mortgages in favor of commercial mortgage bonds, which generally perform better during periods of falling rates. We believe that over time our focus on prepayment analysis will enable us to identify bonds that will repay principal more slowly and generate more interest over the life of the bond.
While we are always disappointed about periods of relative underperformance, we are pleased with the portfolio’s absolute performance as well as its forward looking potential. Though difficult to call a turn in the business cycle, we believe the risk of an economic slowdown has certainly increased. We believe that the Fund has the potential to perform well regardless of what the macro economy does due to our bottom-up fundamental research process that leads us to bonds that we believe have attractive risk/return profiles.
Sincerely,
Paul D. Corbin
Portfolio Manager
Jason T. Vlosich
Associate Portfolio Manager
Past performance is not a guarantee of future results.
Mutual fund investing involves risk. Principal loss is possible. The Fund is subject to interest rate risk which is the risk that debt securities in the Fund’s portfolio will decline in value because of increases in market interest rates. Investments in Asset Backed and Mortgage Backed Securities include additional risks that investors should be aware of such as credit risk, prepayment risk, possible illiquidity and default, as well as increased susceptibility to adverse economic developments. Investments in debt securities typically decrease in value when interest rates rise. The risk is usually greater for longer-term debt securities. Inflation-indexed bonds see the principal value of the security increased as the Consumer Price Index increases. Should the Consumer Price Index decline, those securities should be adversely impacted. Diversification does not assure a profit, nor does it protect against a loss in a declining market.
Fund holdings and sector allocations are subject to change and should not be considered a recommendation to buy or sell any security. For a complete list of fund holdings, please refer to the Schedule of Investments provided in this report.
Definitions for terms and indices are provided in the Glossary of Terms.
www.brownadvisory.com/mf
Brown Advisory Intermediate Income FundPerformance Information & Portfolio Holdings Summary
June 30, 2019
GROWTH OF A $10,000 INVESTMENT
The following chart reflects the change in value of a hypothetical $10,000 investment, including reinvested dividends and distributions, in the Fund as measured against a broad-based bond index. The Bloomberg Barclays Intermediate US Aggregate Bond Index (“Index”) represents domestic taxable investment grade bonds, with index components for government and corporate securities, mortgage pass-through securities, and asset-backed securities with average maturities and durations in the intermediate range. The Index is unmanaged and does not reflect the deduction of fees, such as investment management fees. Investors cannot invest directly in an index.
| PORTFOLIO HOLDINGS | % of Net Assets |
Corporate Bonds & Notes | | | 27.8 | % | |
Affiliated Mutual Funds | | | 19.7 | % | |
Asset Backed Securities | | | 18.8 | % | |
U.S. Treasury Notes | | | 15.9 | % | |
Mortgage Backed Securities | | | 11.0 | % | |
Municipal Bonds | | | 5.5 | % | |
Money Market Funds | | | 1.0 | % | |
Other Assets and Liabilities | | | 0.3 | % | |
| | | | 100.0 | % | |
Average Annual Total Return | One Year | Five Year | Ten Year |
| Investor Shares | 6.24% | 2.27% | 3.01% |
| Advisor Shares | 6.01% | 2.03% | 2.77% |
| Bloomberg Barclays Intermediate US Aggregate Bond Index | 6.73% | 2.46% | 3.34% |
| | | |
| | Investor Shares | Advisor Shares |
Gross Expense Ratio1 | 0.62% | 0.87% |
Net Expense Ratio1 | 0.56% | 0.81% |
Past performance does not guarantee future results. The performance data quoted represents past performance and current returns may be lower or higher. The investment return and net asset value will fluctuate so that an investor’s shares, when redeemed, may be worth more or less than the original cost. To obtain performance information current to the most recent month end, please visit our website at brownadvisory.com/mf/intermediate-income-fund. The performance table and graph above do not reflect the deduction of taxes that a shareholder would pay on Fund distributions or the redemption of Fund shares. Investment performance reflects periods during which fee waivers were in effect. In the absence of such waivers, total return would have been reduced. Performance data does not reflect the imposition of the redemption fee of 1.00% on shares redeemed within 14 days, and if it did, performance would have been lower. Returns shown are calculated using the net asset values (“NAV”) that were used for shareholder transactions as of the respective period ends. These NAV, and the returns calculated from them, may differ from the NAV and returns shown elsewhere in this report.
1 | Per the Fund’s prospectus dated October 31, 2018. Refer to the financial highlights for the gross and net expense ratios for the year ended as of the date of this report. Please note that the expense ratios per the prospectus include acquired fund fees and expenses (as applicable) and the expense ratios in the financial highlights do not. |
www.brownadvisory.com/mf
Brown Advisory Intermediate Income FundSchedule of Investments
June 30, 2019
| Par Value | | Security Description | | Rate | | Maturity | | Value $ | |
| Corporate Bonds & Notes — 27.8% | |
| | 1,345,000 | | AerCap Ireland Capital DAC | | | 3.30 | % | | 01/23/2023 | | | 1,357,862 | |
| | 1,280,000 | | American Express Co. (3 Month LIBOR USD + 0.75%) | | | 3.33 | % | | 08/03/2023 | | | 1,287,546 | |
| | 1,325,000 | | American Tower Corp. | | | 5.00 | % | | 02/15/2024 | | | 1,459,680 | |
| | 1,330,000 | | Amphenol Corp. | | | 3.20 | % | | 04/01/2024 | | | 1,363,886 | |
| | 665,000 | | Analog Devices, Inc. | | | 3.13 | % | | 12/05/2023 | | | 680,843 | |
| | 675,000 | | Apache Corp. | | | 4.38 | % | | 10/15/2028 | | | 705,991 | |
| | 1,365,000 | | AstraZeneca PLC | | | 1.95 | % | | 09/18/2019 | | | 1,363,781 | |
| | 630,000 | | AutoZone, Inc. | | | 2.50 | % | | 04/15/2021 | | | 631,654 | |
| | 1,205,000 | | Bank of America Corp. (3 Month LIBOR USD + 1.16%) | | | 3.75 | % | | 01/20/2023 | | | 1,219,143 | |
| | 1,330,000 | | BB&T Corp. | | | 2.75 | % | | 04/01/2022 | | | 1,346,614 | |
| | 680,000 | | Boston Properties L.P. | | | 3.65 | % | | 02/01/2026 | | | 707,086 | |
| | 625,000 | | BP Capital Markets America, Inc. | | | 3.80 | % | | 09/21/2025 | | | 667,508 | |
| | 1,306,000 | | CC Holdings GS V LLC | | | 3.85 | % | | 04/15/2023 | | | 1,365,392 | |
| | 1,355,000 | | Citigroup, Inc. (3 Month LIBOR USD + 0.69%) | | | 3.27 | % | | 10/27/2022 | | | 1,357,137 | |
| | 745,000 | | Clorox Co. | | | 3.05 | % | | 09/15/2022 | | | 761,387 | |
| | 1,325,000 | | CVS Health Corp. | | | 4.30 | % | | 03/25/2028 | | | 1,398,376 | |
| | 970,000 | | Digital Realty Trust L.P. | | | 3.95 | % | | 07/01/2022 | | | 1,011,283 | |
| | 650,000 | | Dollar General Corp. | | | 4.15 | % | | 11/01/2025 | | | 695,568 | |
| | 1,340,000 | | Dollar Tree, Inc. | | | 4.00 | % | | 05/15/2025 | | | 1,397,949 | |
| | 1,335,000 | | Duke Energy Progress LLC | | | 3.45 | % | | 03/15/2029 | | | 1,408,711 | |
| | 1,290,000 | | Energy Transfer Operating L.P. | | | 4.50 | % | | 04/15/2024 | | | 1,373,620 | |
| | 1,025,000 | | Enterprise Products Operating LLC (Fixed until 08/16/2027, then 3 Month LIBOR USD + 3.03%) | | | 5.25 | % | | 08/16/2077 | | | 980,997 | |
| | 665,000 | | Exelon Corp. | | | 2.45 | % | | 04/15/2021 | | | 665,038 | |
| | 1,275,000 | | Express Scripts Holding Co. | | | 4.50 | % | | 02/25/2026 | | | 1,376,975 | |
| | 645,000 | | Ferguson Finance PLC^ | | | 4.50 | % | | 10/24/2028 | | | 674,407 | |
| | 620,000 | | Fidelity National Information Services, Inc. | | | 5.00 | % | | 10/15/2025 | | | 696,540 | |
| | 645,000 | | General Dynamics Corp. | | | 3.50 | % | | 05/15/2025 | | | 687,789 | |
| | 1,295,000 | | Goldman Sachs Group, Inc. (3 Month LIBOR USD + 0.75%) | | | 3.27 | % | | 02/23/2023 | | | 1,291,739 | |
| | 1,181,000 | | Hasbro, Inc. | | | 3.50 | % | | 09/15/2027 | | | 1,199,535 | |
| | 675,000 | | Healthcare Trust of America Holdings L.P. | | | 3.75 | % | | 07/01/2027 | | | 696,323 | |
| | 650,000 | | JB Hunt Transport Services, Inc. | | | 3.88 | % | | 03/01/2026 | | | 681,266 | |
| | 685,000 | | Kroger Co. | | | 3.70 | % | | 08/01/2027 | | | 706,599 | |
| | 1,210,000 | | Land O’ Lakes, Inc.^ | | | 6.00 | % | | 11/15/2022 | | | 1,268,228 | |
| | 710,000 | | Lear Corp. | | | 3.80 | % | | 09/15/2027 | | | 703,467 | |
| | 645,000 | | Morgan Stanley | | | 3.75 | % | | 02/25/2023 | | | 674,238 | |
| | 1,355,000 | | NXP BV^ | | | 3.88 | % | | 06/18/2026 | | | 1,393,844 | |
| | 640,000 | | Verizon Communications, Inc. (3 Month LIBOR USD + 1.00%) | | | 3.41 | % | | 03/16/2022 | | | 649,908 | |
| | 650,000 | | West Fraser Timber Co., Ltd.^ | | | 4.35 | % | | 10/15/2024 | | | 674,999 | |
Total Corporate Bonds & Notes (Cost $37,738,642) | | | | | | | | | 38,582,909 | |
| | |
| Asset Backed Securities — 18.8% | |
| | 510,000 | | American Homes 4 Rent Trust, Series 2015-SFR2 C^ | | | 4.69 | % | | 10/18/2052 | | | 553,053 | |
| | 706,000 | | Dell Equipment Finance Trust, Series 2018-1 C^ | | | 3.53 | % | | 06/22/2023 | | | 716,592 | |
| | 500,000 | | Dell Equipment Finance Trust, Series 2018-2 D^ | | | 3.97 | % | | 10/22/2024 | | | 516,537 | |
| | 500,000 | | Dell Equipment Finance Trust, Series 2019-1 D^ | | | 3.45 | % | | 03/24/2025 | | | 508,315 | |
| | 460,224 | | Drive Auto Receivables Trust, Series 2018-1 B | | | 2.88 | % | | 02/15/2022 | | | 460,297 | |
| | 800,000 | | Drive Auto Receivables Trust, Series 2018-1 C | | | 3.22 | % | | 03/15/2023 | | | 803,161 | |
| | 1,000,000 | | Drive Auto Receivables Trust, Series 2017-3 D^ | | | 3.53 | % | | 12/15/2023 | | | 1,011,015 | |
| | 670,000 | | Drive Auto Receivables Trust, Series 2018-4 | | | 3.66 | % | | 11/15/2024 | | | 679,436 | |
| | 500,000 | | Drive Auto Receivables Trust, Series 2018-2 | | | 3.63 | % | | 08/15/2024 | | | 504,239 | |
| | 1,000,000 | | Drive Auto Receivables Trust, Series 2019-3 | | | 2.90 | % | | 08/15/2025 | | | 1,005,439 | |
| | 500,000 | | DT Auto Owner Trust, Series 2019-2^ | | | 3.18 | % | | 02/18/2025 | | | 505,677 | |
| | 1,000,000 | | DT Auto Owner Trust, Series 2018-3^ | | | 3.56 | % | | 09/15/2022 | | | 1,012,825 | |
| | 443,481 | | Federal Express Corp., Series 1998-1 | | | 6.72 | % | | 07/15/2023 | | | 463,816 | |
| | 734,000 | | Invitation Homes Trust, Series 2018-SFR1 C (1 Month LIBOR USD + 1.25%)^ | | | 3.64 | % | | 03/19/2037 | | | 731,298 | |
| | 750,000 | | Madison Park Funding XII, Ltd., Series 2014-12A CR (3 Month LIBOR USD + 2.35%)^ | | | 4.94 | % | | 07/20/2026 | | | 751,495 | |
| | 500,000 | | Madison Park Funding XV, Ltd., Series 2014-15A A2R (3 Month LIBOR USD + 1.50%)^ | | | 4.08 | % | | 01/27/2026 | | | 500,527 | |
The accompanying notes are an integral part of these financial statements.
www.brownadvisory.com/mf
Brown Advisory Intermediate Income FundSchedule of Investments
June 30, 2019
| Par Value | | Security Description | | Rate | | Maturity | | Value $ | |
| Asset Backed Securities — 18.8% (Continued) | |
| | 700,000 | | Madison Park Funding XVI, Ltd., Series 2015-16A A2R (3 Month LIBOR USD + 1.90%)^ | | | 4.49 | % | | 04/20/2026 | | | 700,428 | |
| | 750,000 | | Magnetite IX, Ltd., Series 2014-9A A2R (3 Month LIBOR USD + 1.50%)^ | | | 4.08 | % | | 07/27/2026 | | | 750,369 | |
| | 500,000 | | Magnetite IX, Ltd., Series 2014-9A BR (3 Month LIBOR USD + 2.00%)^ | | | 4.58 | % | | 07/27/2026 | | | 500,046 | |
| | 1,000,000 | | Neuberger Berman Loan Advisers CLO, Ltd., Series 2017-26A A (3 Month LIBOR USD + 1.17%)^ | | | 3.77 | % | | 10/18/2030 | | | 998,775 | |
| | 750,000 | | Octagon Investment Partners XIX, Ltd., Series 2014-1A CR (3 Month LIBOR USD + 2.10%)^ | | | 4.70 | % | | 04/15/2026 | | | 751,500 | |
| | 800,000 | | OHA Credit Partners IX, Ltd., Series 2013-9A B1R (3 Month LIBOR USD + 1.46%)^ | | | 4.05 | % | | 10/20/2025 | | | 801,945 | |
| | 400,000 | | Oportun Funding X LLC, Series 2018-C A^ | | | 4.10 | % | | 10/08/2024 | | | 410,460 | |
| | 1,500,000 | | OZLM XIII, Ltd., Series 2015-13A A2R (3 Month LIBOR USD + 1.65%)^ | | | 4.23 | % | | 07/30/2027 | | | 1,489,727 | |
| | 410,000 | | Prestige Auto Receivables Trust, Series 2017-1A D^ | | | 3.61 | % | | 10/16/2023 | | | 416,681 | |
| | 1,230,677 | | Progress Residential Trust, Series 2015-SFR2 A^ | | | 2.74 | % | | 06/14/2032 | | | 1,229,913 | |
| | 752,457 | | Progress Residential Trust, Series 2015-SFR3 A^ | | | 3.07 | % | | 11/15/2032 | | | 753,115 | |
| | 700,000 | | Progress Residential Trust, Series 2017-SFR2 C^ | | | 3.40 | % | | 12/19/2034 | | | 708,696 | |
| | 243,359 | | Santander Drive Auto Receivables Trust 2017-2, Series 2017-2 | | | 2.21 | % | | 10/15/2021 | | | 243,304 | |
| | 328,248 | | Seneca Park CLO, Ltd., Series 2014-1A AR (3 Month LIBOR USD + 1.12%)^ | | | 3.71 | % | | 07/17/2026 | | | 328,546 | |
| | 750,000 | | Tesla Auto Lease Trust, Series 2018-B^ | | | 4.12 | % | | 10/20/2021 | | | 769,813 | |
| | 750,000 | | Treman Park CLO, Ltd., Series 2015-1A ARR (3 Month LIBOR USD + 1.07%)^ | | | 3.66 | % | | 10/20/2028 | | | 751,041 | |
| | 500,000 | | United Auto Credit Securitization Trust, Series B^ | | | 3.03 | % | | 04/10/2024 | | | 502,993 | |
| | 592,000 | | Verizon Owner Trust, Series 2016-2A B^ | | | 2.15 | % | | 05/20/2021 | | | 591,247 | |
| | 424,000 | | Verizon Owner Trust, Series 2017-1A B^ | | | 2.45 | % | | 09/20/2021 | | | 424,184 | |
| | 300,000 | | Verizon Owner Trust, Series 2018-1A C^ | | | 3.20 | % | | 09/20/2022 | | | 304,731 | |
| | 500,000 | | Verizon Owner Trust, Series 2018-A C | | | 3.55 | % | | 04/20/2023 | | | 514,943 | |
| | 500,000 | | Verizon Owner Trust, Series 2019-A | | | 3.22 | % | | 09/20/2023 | | | 512,577 | |
| | 500,000 | | Volvo Financial Equipment LLC, Series 2019-1A B^ | | | 3.26 | % | | 01/16/2024 | | | 514,969 | |
| | 415,000 | | Westlake Automobile Receivables Trust, Series 2019-2A C^ | | | 2.84 | % | | 07/15/2024 | | | 416,416 | |
Total Asset Backed Securities (Cost $25,924,987) | | | | | | | | | 26,110,141 | |
| | |
| Mortgage Backed Securities — 11.0% | |
| | 700,000 | | BAMLL Commercial Mortgage Securities Trust, Series 2018-DSNY C | | | | | | | | | | |
| | | | (1 Month LIBOR USD + 1.35%)^ | | | 3.74 | % | | 09/15/2034 | | | 694,457 | |
| | 750,000 | | BAMLL Commercial Mortgage Securities Trust, Series 2019-RLJ C | | | | | | | | | | |
| | | | (1 Month LIBOR USD + 1.60%)^ | | | 3.99 | % | | 04/15/2036 | | | 752,581 | |
| | 812,124 | | BX Commercial Mortgage Trust, Series 2018-IND B (1 Month LIBOR USD + 0.90%)^ | | | 3.29 | % | | 11/15/2035 | | | 812,699 | |
| | 500,000 | | CGDBB Commercial Mortgage Trust, Series 2017-BIOC D (1 Month LIBOR USD + 1.60%)^ | | | 3.99 | % | | 07/15/2032 | | | 501,342 | |
| | 750,000 | | CSMC, Series 2019-ICE4 C (1 Month LIBOR USD + 1.43%)^ | | | 3.82 | % | | 05/15/2036 | | | 752,607 | |
| | 500,000 | | DBGS Mortgage Trust, Series 2018-C1 7EA^ | | | 4.64 | % | | 10/17/2051 | | | 520,489 | |
| | 1,356 | | FHLMC PC, Pool# C0-0210 | | | 8.00 | % | | 01/01/2023 | | | 1,431 | |
| | 174,845 | | FHLMC PC, Pool# 1B-0889 (12 Month LIBOR USD + 1.59%) | | | 4.50 | % | | 05/01/2033 | | | 183,324 | |
| | 12,203 | | FHLMC REMIC, Series 2782 PA | | | 4.00 | % | | 11/15/2033 | | | 12,196 | |
| | 425,010 | | FHLMC STACR, Series 2014-DN1 M2 (1 Month LIBOR USD + 2.20%) | | | 4.60 | % | | 02/26/2024 | | | 432,395 | |
| | 491,803 | | FHLMC STACR, Series 2015-DNA1 (1 Month LIBOR USD + 1.85%) | | | 4.25 | % | | 10/25/2027 | | | 497,116 | |
| | 863,433 | | FHLMC STACR, Series 2016-DNA2 M2 (1 Month LIBOR USD + 2.20%) | | | 4.60 | % | | 10/25/2028 | | | 866,122 | |
| | 856,242 | | FHMS, Series Q-006 APT1# | | | 2.62 | % | | 04/25/2028 | | | 910,376 | |
| | 35,466 | | FNMA, Pool# 628837 | | | 6.50 | % | | 03/01/2032 | | | 39,420 | |
| | 74,196 | | FNMA, Pool# 663238 | | | 5.50 | % | | 09/01/2032 | | | 79,428 | |
| | 30,111 | | FNMA, Pool# 744805 (6 Month LIBOR USD + 1.52%) | | | 4.14 | % | | 11/01/2033 | | | 30,445 | |
| | 11,691 | | FNMA, Pool# 741373 (1 Year CMT Rate + 2.28%) | | | 4.78 | % | | 12/01/2033 | | | 12,162 | |
| | 27,626 | | FNMA, Pool# 764342 (6 Month LIBOR USD + 1.52%) | | | 4.40 | % | | 02/01/2034 | | | 28,464 | |
| | 385,544 | | FNMA, Pool# BJ4072 | | | 4.50 | % | | 09/01/2048 | | | 412,700 | |
| | 425,353 | | FNMA, Pool# BJ4073 | | | 4.50 | % | | 09/01/2048 | | | 451,812 | |
| | 356,824 | | FNMA, Pool# BJ4075 | | | 5.00 | % | | 09/01/2048 | | | 389,326 | |
| | 197,590 | | FNMA, Pool# BN0202 | | | 5.50 | % | | 09/01/2048 | | | 215,288 | |
| | 512,702 | | FNMA, Pool# BJ4078 | | | 4.50 | % | | 10/01/2048 | | | 544,435 | |
| | 637,593 | | FNMA, Pool# BJ4079 | | | 5.00 | % | | 10/01/2048 | | | 686,825 | |
| | 233,822 | | FNMA REMIC Trust, Series 2016-M5 FA (1 Month LIBOR USD + 0.72%) | | | 3.16 | % | | 04/25/2023 | | | 233,949 | |
| | 497,792 | | FNMA REMIC Trust, Series 2018-M13 A1# | | | 3.82 | % | | 09/25/2030 | | | 543,555 | |
| | 1,115,757 | | FNMA REMIC Trust, Series 2013-115 AI~ | | | 3.00 | % | | 04/25/2031 | | | 96,989 | |
| | 1,150,000 | | FREMF Mortgage Trust, Series 2016-K723 B#^ | | | 3.58 | % | | 10/25/2039 | | | 1,188,374 | |
| | | | | | | | | | | | | | |
The accompanying notes are an integral part of these financial statements.
www.brownadvisory.com/mf
Brown Advisory Intermediate Income FundSchedule of Investments
June 30, 2019
| Par | | | | | | | | | | | |
| Value/Shares | | Security Description | | Rate | | | Maturity | | Value $ | |
| Mortgage Backed Securities — 11.0% (Continued) | |
| | 22,917 | | GNMA, Pool# 781186X | | | 9.00 | % | | | 06/15/2030 | | | 24,799 | |
| | 500,000 | | Great Wolf Trust, Series 2017-WOLF D (1 Month LIBOR USD + 2.10%)^ | | | 4.49 | % | | | 09/15/2034 | | | 500,700 | |
| | 1,000,000 | | GSMS, Series 2018-FBLU C (1 Month LIBOR USD + 1.60%)^ | | | 3.99 | % | | | 11/15/2035 | | | 999,898 | |
| | 500,000 | | JPMCC, Series 2019-MFP C (1 Month LIBOR USD + 1.36%)^ | | | 3.74 | % | | | 07/15/2036 | | | 500,000 | |
| | 500,000 | | KNDL Mortgage Trust, Series 2019-KNSQ C (1 Month LIBOR USD + 1.05%)^ | | | 3.44 | % | | | 05/15/2036 | | | 501,880 | |
| | 900,000 | | MSC, Series 2017-CLS A (1 Month LIBOR USD + 0.70%)^ | | | 3.09 | % | | | 11/15/2034 | | | 899,885 | |
Total Mortgage Backed Securities (Cost $15,124,884) | | | | | | | | | | 15,317,469 | |
| | |
| Municipal Bonds — 5.5% | |
| | 670,000 | | District of Columbia | | | 4.71 | % | | | 12/01/2022 | | | 726,943 | |
| | 1,600,000 | | District of Columbia# | | | 6.50 | % | | | 08/01/2038 | | | 1,600,000 | |
| | 1,390,000 | | Maryland Health & Higher Educational Facilities Authority | | | 3.43 | % | | | 07/01/2023 | | | 1,439,776 | |
| | 2,000,000 | | Miami-Dade County Florida Aviation | | | 2.37 | % | | | 10/01/2023 | | | 2,013,100 | |
| | 1,250,000 | | North Texas Tollway Authority | | | 8.91 | % | | | 02/01/2030 | | | 1,296,488 | |
| | 470,000 | | Regional Transportation Authority | | | 3.01 | % | | | 05/29/2020 | | | 473,102 | |
Total Municipal Bonds (Cost $7,482,709) | | | | | | | |
| | | 7,549,409 | |
| | |
| U.S. Treasury Notes — 15.9% | |
| | 100,000 | | United States Treasury Note | | | 1.38 | % | | | 02/29/2020 | | | 99,561 | |
| | 8,000,000 | | United States Treasury Note | | | 1.63 | % | | | 08/15/2022 | | | 7,976,719 | |
| | 485,000 | | United States Treasury Note | | | 1.88 | % | | | 08/31/2022 | | | 487,245 | |
| | 6,500,000 | | United States Treasury Note | | | 2.25 | % | | | 03/31/2026 | | | 6,661,357 | |
| | 6,410,000 | | United States Treasury Note | | | 2.88 | % | | | 05/15/2028 | | | 6,883,989 | |
Total U.S. Treasury Notes (Cost $21,344,172) | | | | | | | | | | | 22,108,871 | |
| | | | | | | | | | | | | | | | |
| Affiliated Mutual Funds (Note 3) — 19.7% | |
| | 2,728,260 | | Brown Advisory Mortgage Securities Fund — Institutional Shares | | | | | | | | | | | 27,337,169 | |
Total Affiliated Mutual Funds (Cost $27,356,612) | | | | | | | | | | | 27,337,169 | |
| | |
| Short-Term Investments — 1.0% | |
| | |
| Money Market Funds — 1.0% | |
| | 1,344,585 | | First American Government Obligations Fund — Class Z, 2.26%* | | | | | | | | | | | 1,344,585 | |
Total Short-Term Investments (Cost $1,344,585) | | | | | | | | | | | 1,344,585 | |
Total Investments — 99.7% (Cost $136,316,591) | | | | | | | | | | | 138,350,553 | |
Other Assets in Excess of Liabilities — 0.3% | | | | | | | | | | | 439,275 | |
| NET ASSETS — 100.0% | | | $
| 138,789,828 |
| # | Variable rate security. Rate disclosed is as of June 30, 2019. |
| ^ | Security exempt from registration under Rule 144A of the Securities Act of 1933. These securities may be resold in transactions exempt from registration, normally to qualified institutional buyers. |
| ~ | Interest Only Security |
| * | Annualized seven-day yield as of June 30, 2019. |
Futures Contracts — Long (Note 6)
| | | | | | | Notional | | | Notional | | | Unrealized Appreciation | |
| Issue | | Contracts | | Expiration Date | | Amount | | | Value | | | (Depreciation) | |
U.S. Treasury 2-Year Note Futures | | | 70 | | 09/30/2019 | | $ | 14,955,167 | | | $ | 15,062,578 | | | $ | 107,411 | |
U.S. Treasury 5-Year Note Futures | | | 120 | | 09/30/2019 | | | 13,943,998 | | | | 14,178,750 | | | | 234,752 | |
| | | | | | | | $ | 28,899,165 | | | $ | 29,241,328 | | | $ | 342,163 | |
There is no variation margin due to or from the Fund as of June 30, 2019.
The accompanying notes are an integral part of these financial statements.
www.brownadvisory.com/mf
Brown Advisory Total Return FundA Message to Our Shareholders
June 30, 2019
Dear Shareholders:
During the year ended June 30, 2019, the Brown Advisory Total Return Fund – Institutional Shares (the “Fund”) returned 7.90%, roughly in line with its benchmark, the Bloomberg Barclays US Aggregate Bond Index (the “Index”), which was up 7.87%.
The Fund aims to generate performance primarily through individual security analysis, supported by a detailed and disciplined credit process and focused on downside protection. Interest rate and sector weightings are set mainly by an analysis of the intermediate-term risk/reward as opposed to any particular macroeconomic forecast.
In the most recent year, bond-specific results within the portfolio contributed to outperformance in several bond sectors, notably in corporate bonds. Corporates are the sector where we find the most differentiation between individual bonds, and therefore this sector is a major focus of our bottom-up credit research effort.
Among our largest positive contributing individual selections were MPLX (+14.3% return for the 12-month period ended 6/30/19), American Tower (+13.3%), Verisk Analytics (+12.7%) and Dollar General (+12.3%).
Sector weightings had minimal effect on relative performance, except for the fact that our overweight of non-government sectors allowed the portfolio to achieve higher yield than the benchmark (+71 basis point differential).
Interest rates fell materially over the course of the past 12 months; 10-year Treasury yields hit a peak of 3.24% in November 2018 and ended the period at 2.00%. While interest rate positioning is not a major focus of our investment approach, we did take steps to add to duration at the start of 2019 as a hedge against the possibility of the economy weakening. This set of actions added approximately 11 basis points to relative returns.
Looking forward, there are nascent signs of global economic weakness, but how it plays out from here is hard to guess. The economy has too many variables, many of which interact with each other in unpredictable ways, to forecast definitively. However, we do think there are more downside risks today than there have been in recent years, and this is influencing how we think about both individual bond selection and broader portfolio construction. We are focused on building portfolios that can generate strong income generation but also perform reasonably well in various economic scenarios.
Sincerely,
Thomas D.D. Graff, CFA
Portfolio Manager
Past performance is not a guarantee of future results.
Mutual fund investing involves risk. Principal loss is possible. Investments in debt securities typically decrease in value when interest rates rise. This risk is usually greater for longer-term debt securities. Investments in Asset-Backed and Mortgage-Backed securities include additional risks that investor should be aware of including credit risk, prepayment risk, possible illiquidity and default, as well as increased susceptibility to adverse economic developments. Investments in lower rated and non-rated securities present a great risk of loss to principal and interest than higher rated securities. In addition, the fund is susceptible to risks from investments in derivatives, U.S. Government securities, and changes in interest rates. Income from tax-exempt funds may be subject to state and local taxes and a portion of income may be subject to the Federal Alternative minimum tax for certain investors.
Fund holdings and sector allocations are subject to change and should not be considered a recommendation to buy or sell any security. For a complete list of fund holdings, please refer to the Schedule of Investments provided in this report.
Definitions for terms and indices are provided in the Glossary of Terms.
www.brownadvisory.com/mf
Brown Advisory Total Return FundPerformance Information & Portfolio Holdings Summary
June 30, 2019
GROWTH OF A $1,000,000 INVESTMENT
The following chart reflects the change in value of a hypothetical $1,000,000 investment, including reinvested dividends and distributions, in the Fund as measured against a broad-based securities market index. The Bloomberg Barclays US Aggregate Bond Index (“Index”) is a broad-based benchmark that measures the investment grade US dollar-denominated, fixed rate taxable bond market. The Index includes Treasuries, government-related and corporate securities, MBS, ABS and CMBS. The Index is unmanaged and does not reflect the deduction of fees, such as investment management fees. Investors cannot invest directly in an index.
| PORTFOLIO HOLDINGS | % of Net Assets |
Asset Backed Securities | | | 32.1 | % | |
Corporate Bonds & Notes | | | 29.3 | % | |
Mortgage Backed Securities | | | 24.8 | % | |
U.S. Treasury Notes | | | 7.4 | % | |
Municipal Bonds | | | 3.1 | % | |
Money Market Funds | | | 1.8 | % | |
Preferred Stocks | | | 0.5 | % | |
Other Assets and Liabilities | | | 1.0 | % | |
| | | | 100.0 | % | |
| | | Since Inception |
Average Annual Total Return | One Year | (10/30/14) |
| Institutional Shares | 7.90% | 3.19% |
| Investor Shares | 7.85% | 3.14% |
| Bloomberg Barclays US Aggregate Bond Index | 7.87% | 2.89% |
| | Institutional Shares | Investor Shares |
Gross Expense Ratio1 | 0.51% | 0.56% |
Net Expense Ratio1 | 0.51% | 0.56% |
Past performance does not guarantee future results. The performance data quoted represents past performance and current returns may be lower or higher. The investment return and net asset value will fluctuate so that an investor’s shares, when redeemed, may be worth more or less than the original cost. To obtain performance information current to the most recent month end, please visit our website at brownadvisory.com/mf/total-return-fund. The performance table and graph above do not reflect the deduction of taxes that a shareholder would pay on Fund distributions or the redemption of Fund shares. Performance data does not reflect the imposition of the redemption fee of 1.00% on shares redeemed within 14 days, and if it did, performance would have been lower. Short-term performance, in particular, is not a good indication of the Fund’s future performance, and an investment should not be made based solely on returns. Returns shown are calculated using the net asset values (“NAV”) that were used for shareholder transactions as of the respective period ends. These NAV, and the returns calculated from them, may differ from the NAV and returns shown elsewhere in this report.
1 | Per the Fund’s prospectus dated October 31, 2018. Refer to the financial highlights for the gross and net expense ratios for the year ended as of the date of this report. Please note that the expense ratios per the prospectus include acquired fund fees and expenses (as applicable) and the expense ratios in the financial highlights do not. |
www.brownadvisory.com/mf
Brown Advisory Total Return FundSchedule of Investments
June 30, 2019
| Par Value | | Security Description | | Rate | | Maturity | | Value $ | |
| Asset Backed Securities — 32.1% | |
| | 320,000 | | American Homes 4 Rent, Series 2015-SFR1 D^ | | | 4.41 | % | | 04/18/2052 | | | 335,950 | |
| | 93,610 | | BRE Grand Islander Timeshare Issuer LLC, Series 2017-1A A^ | | | 2.94 | % | | 05/25/2029 | | | 94,089 | |
| | 1,375,000 | | Carlyle Global Market Strategies CLO, Ltd., Series 2015-1A CR (3 Month LIBOR USD + 2.00%)^ | | | 4.59 | % | | 04/20/2027 | | | 1,375,936 | |
| | 600,000 | | CCG Receivables Trust, Series 2019-1 B^ | | | 3.22 | % | | 09/14/2026 | | | 612,519 | |
| | 1,375,000 | | CIFC Funding, Ltd., Series 2012-2RA B (3 Month LIBOR USD + 1.55%)^ | | | 4.14 | % | | 01/20/2028 | | | 1,338,347 | |
| | 1,000,000 | | Dell Equipment Finance Trust, Series 2018-1 C^ | | | 3.53 | % | | 06/22/2023 | | | 1,015,003 | |
| | 750,000 | | Dell Equipment Finance Trust, Series 2018-2 D^ | | | 3.97 | % | | 10/22/2024 | | | 774,805 | |
| | 1,250,000 | | Dell Equipment Finance Trust, Series 2019-1 D^ | | | 3.45 | % | | 03/24/2025 | | | 1,270,788 | |
| | 1,250,000 | | DLL LLC, Series 2019-DA1 A2^ | | | 2.79 | % | | 11/22/2021 | | | 1,255,526 | |
| | 1,615,000 | | Drive Auto Receivables Trust, Series 2017-3 D^ | | | 3.53 | % | | 12/15/2023 | | | 1,632,789 | |
| | 1,500,000 | | Drive Auto Receivables Trust, Series 2018-1 D | | | 3.81 | % | | 05/15/2024 | | | 1,527,098 | |
| | 1,100,000 | | Drive Auto Receivables Trust, Series 2018-2 D | | | 4.14 | % | | 08/15/2024 | | | 1,127,140 | |
| | 700,000 | | Drive Auto Receivables Trust, Series 2018-3 D | | | 4.30 | % | | 09/16/2024 | | | 721,944 | |
| | 1,000,000 | | Drive Auto Receivables Trust, Series 2019-3 D | | | 3.18 | % | | 10/15/2026 | | | 1,006,124 | |
| | 500,000 | | DT Auto Owner Trust, Series 2018-2A C^ | | | 3.67 | % | | 03/15/2024 | | | 507,871 | |
| | 1,000,000 | | DT Auto Owner Trust, Series 2018-3A D^ | | | 4.19 | % | | 07/15/2024 | | | 1,031,256 | |
| | 1,000,000 | | DT Auto Owner Trust, Series 2019-2A C^ | | | 3.18 | % | | 02/18/2025 | | | 1,011,354 | |
| | 500,000 | | DT Auto Owner Trust, Series 2019-2A D^ | | | 3.48 | % | | 02/18/2025 | | | 509,754 | |
| | 1,500,000 | | DT Auto Owner Trust, Series 2018-2A E^ | | | 5.54 | % | | 06/16/2025 | | | 1,571,181 | |
| | 1,250,000 | | Emerson Park CLO, Ltd., Series 2013-1A C1R (3 Month LIBOR USD + 2.15%)^ | | | 4.75 | % | | 07/15/2025 | | | 1,252,295 | |
| | 1,000,000 | | Exeter Automobile Receivables Trust, Series 2018-2A E^ | | | 5.33 | % | | 05/15/2025 | | | 1,039,350 | |
| | 399,133 | | Federal Express Corp., Series 1998-1 | | | 6.72 | % | | 07/15/2023 | | | 417,435 | |
| | 2,000,000 | | GoldenTree Loan Opportunities XI, Ltd., Series 2015-11A AR2 (3 Month LIBOR USD + 1.07%)^ | | | 3.67 | % | | 01/21/2031 | | | 1,990,028 | |
| | 500,000 | | Great American Auto Leasing, Inc., Series 2019-1 B^ | | | 3.37 | % | | 02/18/2025 | | | 515,067 | |
| | 500,000 | | Great American Auto Leasing, Inc., Series 2019-1 C^ | | | 3.54 | % | | 02/17/2026 | | | 514,898 | |
| | 300,000 | | GreatAmerica Leasing Receivables Funding LLC, Series 2018-1 C^ | | | 3.14 | % | | 06/16/2025 | | | 304,673 | |
| | 500,000 | | Grippen Park CLO, Ltd., Series 2017-1A C (3 Month LIBOR USD + 2.30%)^ | | | 4.89 | % | | 01/20/2030 | | | 499,987 | |
| | 800,000 | | Highbridge Loan Management, Ltd., Series 7A-2015 CR (3 Month LIBOR USD + 1.70%)^ | | | 4.22 | % | | 03/15/2027 | | | 780,765 | |
| | 1,380,000 | | Invitation Homes Trust, Series 2017-SFR2 B (1 Month LIBOR USD + 1.15%)^ | | | 3.54 | % | | 12/19/2036 | | | 1,380,650 | |
| | 200,000 | | Invitation Homes Trust, Series 2017-SFR2 C (1 Month LIBOR USD + 1.45%)^ | | | 3.84 | % | | 12/19/2036 | | | 200,545 | |
| | 2,200,000 | | Invitation Homes Trust, Series 2018-SFR1 C (1 Month LIBOR USD + 1.25%)^ | | | 3.64 | % | | 03/19/2037 | | | 2,191,901 | |
| | 999,863 | | Invitation Homes Trust, Series 2018-SFR1 E (1 Month LIBOR USD + 2.00%)^ | | | 4.39 | % | | 03/19/2037 | | | 1,003,100 | |
| | 1,000,000 | | Invitation Homes Trust, Series 2018-SFR2 B (1 Month LIBOR USD + 1.08%)^ | | | 3.47 | % | | 06/18/2037 | | | 995,067 | |
| | 2,750,000 | | Madison Park Funding XII, Ltd., Series 2014-12A CR (3 Month LIBOR USD + 2.35%)^ | | | 4.94 | % | | 07/20/2026 | | | 2,755,482 | |
| | 750,000 | | Madison Park Funding XV, Ltd., Series 2014-15A A2R (3 Month LIBOR USD + 1.50%)^ | | | 4.08 | % | | 01/27/2026 | | | 750,790 | |
| | 2,100,000 | | Madison Park Funding XVI, Ltd., Series 2015-16A A2R (3 Month LIBOR USD + 1.90%)^ | | | 4.49 | % | | 04/20/2026 | | | 2,101,283 | |
| | 750,000 | | Madison Park Funding XVII, Ltd., Series 2015-17A B1R (3 Month LIBOR USD + 1.75%)^ | | | 4.34 | % | | 07/21/2030 | | | 749,963 | |
| | 625,000 | | Madison Park Funding XVII, Ltd., Series 2015-17A CR (3 Month LIBOR USD + 2.40%)^ | | | 4.99 | % | | 07/22/2030 | | | 625,215 | |
| | 500,000 | | Madison Park Funding XXI, Ltd., Series 2016-21A B (3 Month LIBOR USD + 2.75%)^ | | | 5.33 | % | | 07/25/2029 | | | 501,200 | |
| | 1,000,000 | | Magnetite IX, Ltd., Series 2014-9A A2R (3 Month LIBOR USD + 1.50%)^ | | | 4.08 | % | | 07/27/2026 | | | 1,000,492 | |
| | 750,000 | | Magnetite IX, Ltd., Series 2014-9A BR (3 Month LIBOR USD + 2.00%)^ | | | 4.58 | % | | 07/27/2026 | | | 750,069 | |
| | 750,000 | | Magnetite XVI, Ltd., Series 2015-16A C2R (3 Month LIBOR USD + 1.60%)^ | | | 4.20 | % | | 01/18/2028 | | | 743,092 | |
| | 2,000,000 | | Neuberger Berman Loan Advisers CLO, Ltd., Series 2017-26A A (3 Month LIBOR USD + 1.17%)^ | | | 3.77 | % | | 10/18/2030 | | | 1,997,550 | |
| | 454,750 | | Newtek Small Business Loan Trust, Series 2018-1 A (1 Month LIBOR USD + 1.70%)^ | | | 4.10 | % | | 02/25/2044 | | | 455,045 | |
| | 750,000 | | Octagon Investment Partners 25, Ltd., Series 2015-1A AR (3 Month LIBOR USD + 0.80%)^ | | | 3.39 | % | | 10/20/2026 | | | 748,274 | |
| | 750,000 | | Octagon Investment Partners 25, Ltd., Series 2015-1A BR (3 Month LIBOR USD + 1.20%)^ | | | 3.79 | % | | 10/20/2026 | | | 741,666 | |
| | 2,000,000 | | Octagon Investment Partners 36, Ltd., Series 2018-1A A1 (3 Month LIBOR USD + 0.97%)^ | | | 3.57 | % | | 04/15/2031 | | | 1,977,984 | |
| | 1,000,000 | | Octagon Investment Partners XIX, Ltd., Series 2014-1A CR (3 Month LIBOR USD + 2.10%)^ | | | 4.70 | % | | 04/15/2026 | | | 1,002,000 | |
| | 1,500,000 | | Octagon Investment Partners XXIII, Ltd., Series 2015-1A CR (3 Month LIBOR USD + 1.85%)^ | | | 4.45 | % | | 07/15/2027 | | | 1,487,077 | |
| | 1,125,000 | | OHA Credit Partners IX, Ltd., Series 2013-9A B1R (3 Month LIBOR USD + 1.46%)^ | | | 4.05 | % | | 10/20/2025 | | | 1,127,735 | |
| | 250,000 | | Oportun Funding IX LLC, Series 2018-B B^ | | | 4.50 | % | | 07/08/2024 | | | 253,563 | |
| | 325,000 | | Oportun Funding VII LLC, Series 2017-B B^ | | | 4.26 | % | | 10/10/2023 | | | 327,647 | |
| | 250,000 | | Oportun Funding VII LLC, Series 2017-B C^ | | | 5.29 | % | | 10/10/2023 | | | 252,027 | |
| | 500,000 | | Oportun Funding VIII LLC, Series 2018-A C^ | | | 5.09 | % | | 03/08/2024 | | | 506,491 | |
| | 1,100,000 | | Oportun Funding X LLC, Series 2018-C A^ | | | 4.10 | % | | 10/08/2024 | | | 1,128,766 | |
| | 400,000 | | Oportun Funding X LLC, Series 2018-C B^ | | | 4.59 | % | | 10/08/2024 | | | 410,195 | |
| | 34,116 | | OSCAR U.S. Funding Trust VII LLC, Series 2017-2A A2B (1 Month LIBOR USD + 0.65%)^ | | | 3.06 | % | | 11/10/2020 | | | 34,129 | |
| | 1,000,000 | | OZLM XIII, Ltd., Series 2015-13A A2R (3 Month LIBOR USD + 1.65%)^ | | | 4.23 | % | | 07/30/2027 | | | 993,151 | |
| | 500,000 | | OZLM XV, Ltd., Series 2016-15A A2A (3 Month LIBOR USD + 2.10%)^ | | | 4.69 | % | | 01/22/2029 | | | 500,054 | |
The accompanying notes are an integral part of these financial statements.
www.brownadvisory.com/mf
Brown Advisory Total Return FundSchedule of Investments
June 30, 2019
| Par Value | | Security Description | | Rate | | Maturity | | Value $ | |
| Asset Backed Securities — 32.1% (Continued) | |
| | 500,000 | | Prestige Auto Receivables Trust, Series 2017-1A D^ | | | 3.61 | % | | 10/16/2023 | | | 508,147 | |
| | 651,650 | | Progress Residential Trust, Series 2015-SFR2 A^ | | | 2.74 | % | | 06/14/2032 | | | 651,246 | |
| | 529,983 | | Progress Residential Trust, Series 2015-SFR3 A^ | | | 3.07 | % | | 11/15/2032 | | | 530,446 | |
| | 931,009 | | Progress Residential Trust, Series 2017-SFR1 A^ | | | 2.77 | % | | 08/17/2034 | | | 937,613 | |
| | 750,000 | | Progress Residential Trust, Series 2017-SFR2 C^ | | | 3.40 | % | | 12/19/2034 | | | 759,317 | |
| | 850,000 | | Progress Residential Trust, Series 2018-SFR1 B^ | | | 3.48 | % | | 03/17/2035 | | | 863,172 | |
| | 500,000 | | Progress Residential Trust, Series 2018-SFR1 A^ | | | 3.26 | % | | 03/19/2035 | | | 506,211 | |
| | 500,000 | | Santander Drive Auto Receivables Trust, Series 2017-1 D | | | 3.17 | % | | 04/17/2023 | | | 504,139 | |
| | 1,310,000 | | Santander Drive Auto Receivables Trust, Series 2018-3 D | | | 4.07 | % | | 08/15/2024 | | | 1,352,328 | |
| | 550,000 | | Santander Drive Auto Receivables Trust, Series 2019-2 D | | | 3.22 | % | | 07/15/2025 | | | 558,342 | |
| | 1,247,342 | | Seneca Park CLO, Ltd., Series 2014-1A AR (3 Month LIBOR USD + 1.12%)^ | | | 3.71 | % | | 07/17/2026 | | | 1,248,477 | |
| | 28,120 | | Sierra Timeshare Receivables Funding LLC, Series 2015-3A A^ | | | 2.58 | % | | 09/20/2032 | | | 28,114 | |
| | 750,000 | | Sound Point CLO XIV, Ltd., Series 2016-3A C (3 Month LIBOR USD + 2.65%)^ | | | 5.24 | % | | 01/23/2029 | | | 750,335 | |
| | 145,625 | | Southwest Airlines Co., Series 2007-1 | | | 6.15 | % | | 02/01/2024 | | | 154,176 | |
| | 1,018,543 | | Symphony CLO XII, Ltd., Series 2013-12A AR (3 Month LIBOR USD + 1.03%)^ | | | 3.63 | % | | 10/15/2025 | | | 1,018,573 | |
| | 1,329,116 | | Symphony CLO XIV, Ltd., Series 2014-14A A1R (3 Month LIBOR USD + 1.28%)^ | | | 3.88 | % | | 07/14/2026 | | | 1,329,444 | |
| | 429,183 | | Tesla Auto Lease Trust, Series 2018-B A^ | | | 3.71 | % | | 08/20/2021 | | | 435,724 | |
| | 1,000,000 | | Tesla Auto Lease Trust, Series 2018-B B^ | | | 4.12 | % | | 10/20/2021 | | | 1,026,417 | |
| | 1,250,000 | | Treman Park CLO, Ltd., Series 2015-1A ARR (3 Month LIBOR USD + 1.07%)^ | | | 3.66 | % | | 10/20/2028 | | | 1,251,735 | |
| | 500,000 | | United Auto Credit Securitization Trust, Series 2019-1 B^ | | | 3.03 | % | | 04/10/2024 | | | 502,993 | |
| | 1,125,000 | | United Auto Credit Securitization Trust, Series 2019-1 D^ | | | 3.47 | % | | 08/12/2024 | | | 1,135,012 | |
| | 30,802 | | Verizon Owner Trust, Series 2016-1A A^ | | | 1.42 | % | | 01/20/2021 | | | 30,814 | |
| | 600,000 | | Verizon Owner Trust, Series 2016-2A B^ | | | 2.15 | % | | 05/20/2021 | | | 599,237 | |
| | 424,000 | | Verizon Owner Trust, Series 2017-1A B^ | | | 2.45 | % | | 09/20/2021 | | | 424,184 | |
| | 300,000 | | Verizon Owner Trust, Series 2018-1A C^ | | | 3.20 | % | | 09/20/2022 | | | 304,731 | |
| | 750,000 | | Verizon Owner Trust, Series 2018-A C | | | 3.55 | % | | 04/20/2023 | | | 772,415 | |
| | 500,000 | | Volvo Financial Equipment LLC, Series 2019-1A B^ | | | 3.26 | % | | 01/16/2024 | | | 514,969 | |
| | 1,000,000 | | Voya CLO, Ltd., Series 2019 1A C (3 Month LIBOR USD + 2.35%)^ | | | 4.99 | % | | 04/16/2029 | | | 1,000,092 | |
| | 826,154 | | Westgate Resorts LLC, Series 2018-1A C^ | | | 4.10 | % | | 12/20/2031 | | | 834,606 | |
| | 375,000 | | Westlake Automobile Receivables Trust, Series 2017-2A D^ | | | 3.28 | % | | 12/15/2022 | | | 378,608 | |
| | 900,000 | | Westlake Automobile Receivables Trust, Series 2018-1A D^ | | | 3.41 | % | | 05/15/2023 | | | 906,968 | |
| | 1,260,000 | | Westlake Automobile Receivables Trust, Series 2018-2A D^ | | | 4.00 | % | | 01/16/2024 | | | 1,288,541 | |
| | 835,000 | | Westlake Automobile Receivables Trust, Series 2019-2A C^ | | | 2.84 | % | | 07/15/2024 | | | 837,850 | |
| | 1,000,000 | | Westlake Automobile Receivables Trust, Series 2019-2A D^ | | | 3.20 | % | | 11/15/2024 | | | 1,004,120 | |
Total Asset Backed Securities (Cost $80,207,486) | | | | | | | | | 80,675,271 | |
| | |
| Corporate Bonds & Notes — 29.3% | |
| | 2,200,000 | | AerCap Ireland Capital DAC | | | 3.30 | % | | 01/23/2023 | | | 2,221,039 | |
| | 1,130,000 | | Allison Transmission, Inc.^ | | | 4.75 | % | | 10/01/2027 | | | 1,127,175 | |
| | 2,265,000 | | American Tower Corp. | | | 3.13 | % | | 01/15/2027 | | | 2,249,098 | |
| | 2,115,000 | | Analog Devices, Inc. | | | 3.90 | % | | 12/15/2025 | | | 2,235,781 | |
| | 2,150,000 | | Apache Corp. | | | 4.38 | % | | 10/15/2028 | | | 2,248,712 | |
| | 2,205,000 | | AstraZeneca PLC | | | 2.38 | % | | 06/12/2022 | | | 2,212,260 | |
| | 1,115,000 | | AutoZone, Inc. | | | 3.13 | % | | 04/21/2026 | | | 1,126,603 | |
| | 1,070,000 | | Ball Corp. | | | 4.38 | % | | 12/15/2020 | | | 1,096,215 | |
| | 1,150,000 | | BWAY Holding Co.^ | | | 7.25 | % | | 04/15/2025 | | | 1,114,063 | |
| | 1,070,000 | | BWX Technologies, Inc.^ | | | 5.38 | % | | 07/15/2026 | | | 1,110,072 | |
| | 1,130,000 | | Core & Main L.P.^ | | | 6.13 | % | | 08/15/2025 | | | 1,146,950 | |
| | 2,155,000 | | Crown Castle International Corp. | | | 4.88 | % | | 04/15/2022 | | | 2,291,959 | |
| | 2,315,000 | | CVS Health Corp. | | | 4.30 | % | | 03/25/2028 | | | 2,443,200 | |
| | 2,085,000 | | Dollar General Corp. | | | 4.15 | % | | 11/01/2025 | | | 2,231,168 | |
| | 2,145,000 | | Dollar Tree, Inc. | | | 4.00 | % | | 05/15/2025 | | | 2,237,762 | |
| | 2,570,000 | | Energy Transfer Operating L.P. (Fixed until 02/15/2023, then 3 Month LIBOR USD + 4.03%) | | | 6.25 | % | | 05/15/2023 | | | 2,394,006 | |
| | 2,325,000 | | Enterprise Products Operating LLC (Fixed until 08/16/2027, then 3 Month LIBOR USD + 3.03%) | | | 5.25 | % | | 08/16/2077 | | | 2,225,188 | |
| | 2,095,000 | | Express Scripts Holding Co. | | | 4.50 | % | | 02/25/2026 | | | 2,262,559 | |
| | 2,200,000 | | Ferguson Finance PLC^ | | | 4.50 | % | | 10/24/2028 | | | 2,300,302 | |
| | 2,005,000 | | Fidelity National Information Services, Inc. | | | 5.00 | % | | 10/15/2025 | | | 2,252,520 | |
| | 1,115,000 | | First Quality Finance Co., Inc.^ | | | 5.00 | % | | 07/01/2025 | | | 1,126,150 | |
| | 1,050,000 | | frontdoor, Inc.^ | | | 6.75 | % | | 08/15/2026 | | | 1,120,875 | |
| | | | | | | | | | | | | | |
The accompanying notes are an integral part of these financial statements.
www.brownadvisory.com/mf
Brown Advisory Total Return FundSchedule of Investments
June 30, 2019
| Par Value | | Security Description | | Rate | | | Maturity | | | Value $ | |
| Corporate Bonds & Notes — 29.3% (Continued) | |
| | 1,175,000 | | Graphic Packaging International LLC^ | | | 4.75 | % | | | 07/15/2027 | | | | 1,208,781 | |
| | 1,709,000 | | Hasbro, Inc. | | | 3.50 | % | | | 09/15/2027 | | | | 1,735,821 | |
| | 1,650,000 | | Healthcare Trust of America Holdings L.P. | | | 3.75 | % | | | 07/01/2027 | | | | 1,702,123 | |
| | 2,155,000 | | Keysight Technologies, Inc. | | | 4.55 | % | | | 10/30/2024 | | | | 2,307,784 | |
| | 1,655,000 | | Kroger Co. | | | 3.70 | % | | | 08/01/2027 | | | | 1,707,185 | |
| | 2,255,000 | | Lear Corp. | | | 3.80 | % | | | 09/15/2027 | | | | 2,234,251 | |
| | 1,065,000 | | Mercer International, Inc. | | | 6.50 | % | | | 02/01/2024 | | | | 1,106,269 | |
| | 1,575,000 | | MPLX LP | | | 4.80 | % | | | 02/15/2029 | | | | 1,736,161 | |
| | 1,210,000 | | NextEra Energy Capital Holdings, Inc. (Fixed until 12/01/2027, then 3 Month LIBOR USD + 2.41%) | 4.80 | % | | | 12/01/2077 | | | | 1,139,319 | |
| | 2,370,000 | | NXP BV^ | | | 3.88 | % | | | 06/18/2026 | | | | 2,437,941 | |
| | 1,150,000 | | Oasis Petroleum, Inc. | | | 6.88 | % | | | 03/15/2022 | | | | 1,150,000 | |
| | 1,037,000 | | ServiceMaster Co. LLC | | | 7.45 | % | | | 08/15/2027 | | | | 1,116,071 | |
| | 1,075,000 | | Steel Dynamics, Inc. | | | 5.25 | % | | | 04/15/2023 | | | | 1,095,156 | |
| | 2,130,000 | | TechnipFMC PLC | | | 3.45 | % | | | 10/01/2022 | | | | 2,174,628 | |
| | 2,120,000 | | Trimble, Inc. | | | 4.90 | % | | | 06/15/2028 | | | | 2,273,317 | |
| | 2,090,000 | | Verisk Analytics, Inc. | | | 4.00 | % | | | 06/15/2025 | | | | 2,233,500 | |
| | 1,140,000 | | Viking Cruises, Ltd.^ | | | 5.88 | % | | | 09/15/2027 | | | | 1,157,100 | |
| | 510,000 | | Vulcan Materials Co. | | | 3.90 | % | | | 04/01/2027 | | | | 523,790 | |
| | 2,415,000 | | West Fraser Timber Co., Ltd.^ | | | 4.35 | % | | | 10/15/2024 | | | | 2,507,882 | |
| | 1,275,000 | | Western Digital Corp. | | | 4.75 | % | | | 02/15/2026 | | | | 1,254,026 | |
Total Corporate Bonds & Notes (Cost $71,210,673) | | | | | | | |
| | | | 73,574,762 | |
| | |
| Mortgage Backed Securities — 24.8% | |
| | 400,000 | | BAMLL Commercial Mortgage Securities Trust, Series 2018-DSNY C | | | | | | | | | | | | | |
| | | | (1 Month LIBOR USD + 1.35%)^ | | | 3.74 | % | | | 09/15/2034 | | | | 396,833 | |
| | 750,000 | | BAMLL Commercial Mortgage Securities Trust, Series 2018-DSNY D | | | | | | | | | | | | | |
| | | | (1 Month LIBOR USD + 1.70%)^ | | | 4.09 | % | | | 09/15/2034 | | | | 753,784 | |
| | 1,250,000 | | BAMLL Commercial Mortgage Securities Trust, Series 2019-RLJ C (1 Month LIBOR USD + 1.60%)^ | 3.99 | % | | | 04/15/2036 | | | | 1,254,301 | |
| | 1,000,000 | | BAMLL Commercial Mortgage Securities Trust, Series 2019-RLJ D (1 Month LIBOR USD + 1.95%)^ | 4.34 | % | | | 04/15/2036 | | | | 1,001,337 | |
| | 400,000 | | BBCMS Mortgage Trust, Series 2018-TALL C (1 Month LIBOR USD + 1.12%)^ | | | 3.52 | % | | | 03/16/2037 | | | | 400,008 | |
| | 406,062 | | BX Commercial Mortgage Trust, Series 2018-IND B (1 Month LIBOR USD + 0.90%)^ | | | 3.29 | % | | | 11/15/2035 | | | | 406,349 | |
| | 406,062 | | BX Commercial Mortgage Trust, Series 2018-IND D (1 Month LIBOR USD + 1.30%)^ | | | 3.69 | % | | | 11/15/2035 | | | | 406,369 | |
| | 500,000 | | CAMB Commercial Mortgage Trust, Series 2019-LIFE B (1 Month LIBOR USD + 1.25%)^ | | | 3.64 | % | | | 12/15/2037 | | | | 502,203 | |
| | 500,000 | | CAMB Commercial Mortgage Trust, Series 2019-LIFE C (1 Month LIBOR USD + 1.45%)^ | | | 3.84 | % | | | 12/15/2037 | | | | 502,840 | |
| | 1,500,000 | | CGDBB Commercial Mortgage Trust, Series 2017-BIOC E (1 Month LIBOR USD + 2.15%)^ | | | 4.54 | % | | | 07/15/2032 | | | | 1,501,486 | |
| | 750,000 | | CORE Mortgage Trust, Series 2019-CORE C (1 Month LIBOR USD + 1.30%)^ | | | 3.69 | % | | | 12/15/2031 | | | | 751,311 | |
| | 1,250,000 | | CSMC, Series 2019-ICE4 C (1 Month LIBOR USD + 1.43%)^ | | | 3.82 | % | | | 05/15/2036 | | | | 1,254,346 | |
| | 1,250,000 | | CSMC, Series 2019-ICE4 D (1 Month LIBOR USD + 1.60%)^ | | | 3.99 | % | | | 05/15/2036 | | | | 1,255,160 | |
| | 2,000,000 | | DBGS Mortgage Trust, Series 2018-C1 7EA^ | | | 4.64 | % | | | 10/17/2051 | | | | 2,081,954 | |
| | 185,934 | | FHLMC PC, Pool# G6-1330 | | | 6.00 | % | | | 07/01/2040 | | | | 211,075 | |
| | 1,124,028 | | FHLMC PC, Pool# V8-2155 | | | 4.00 | % | | | 12/01/2045 | | | | 1,178,673 | |
| | 1,951,162 | | FHLMC REMIC, Series 4094 NI~ | | | 2.50 | % | | | 03/15/2027 | | | | 104,923 | |
| | 804,124 | | FHLMC REMIC, Series 4107 LI~ | | | 3.00 | % | | | 08/15/2027 | | | | 131,421 | |
| | 1,445,111 | | FHLMC REMIC, Series 4143 IA~ | | | 3.50 | % | | | 09/15/2042 | | | | 158,383 | |
| | 275,000 | | FHLMC SCRTT, Series 2016-1 M1#^ | | | 3.00 | % | | | 09/25/2055 | | | | 268,494 | |
| | 531,262 | | FHLMC STACR, Series 2014-DN1 M2 (1 Month LIBOR USD + 2.20%) | | | 4.60 | % | | | 02/26/2024 | | | | 540,493 | |
| | 1,383,605 | | FHLMC STACR, Series 2015-DNA1 M2 (1 Month LIBOR USD + 1.85%) | | | 4.25 | % | | | 10/25/2027 | | | | 1,398,552 | |
| | 1,472,914 | | FHLMC STACR, Series 2016-DNA2 M2 (1 Month LIBOR USD + 2.20%) | | | 4.60 | % | | | 10/25/2028 | | | | 1,477,503 | |
| | 4,126,753 | | FHMS, Series K-021 X1#~ | | | 1.44 | % | | | 06/25/2022 | | | | 151,128 | |
| | 1,983,998 | | FHMS, Series K-721 X1#~ | | | 0.33 | % | | | 08/25/2022 | | | | 19,161 | |
| | 10,305,032 | | FHMS, Series K-C02 X1#~ | | | 0.37 | % | | | 03/25/2024 | | | | 170,585 | |
| | 1,700,000 | | FHMS, Series K-728 A2# | | | 3.06 | % | | | 08/25/2024 | | | | 1,770,497 | |
| | 10,398,525 | | FHMS, Series K-734 X1#~ | | | 0.79 | % | | | 02/25/2026 | | | | 392,327 | |
| | 674,959 | | FHMS, Series K-058 X1#~ | | | 0.93 | % | | | 08/25/2026 | | | | 38,308 | |
| | 3,000,000 | | FHMS, Series K-C04 X1#~ | | | 1.25 | % | | | 12/25/2026 | | | | 209,978 | |
| | 1,386,640 | | FHMS, Series K-W03 X1#~ | | | 0.84 | % | | | 06/25/2027 | | | | 71,739 | |
| | 9,962,106 | | FHMS, Series K-070 X1#~ | | | 0.33 | % | | | 11/25/2027 | | | | 254,293 | |
| | 761,104 | | FHMS, Series Q-006 APT1# | | | 2.62 | % | | | 04/25/2028 | | | | 809,223 | |
| | 4,996,027 | | FHMS, Series K-087 X1#~ | | | 0.36 | % | | | 12/25/2028 | | | | 160,145 | |
| | | | | | | | | | | | | | | | | |
The accompanying notes are an integral part of these financial statements.
www.brownadvisory.com/mf
Brown Advisory Total Return FundSchedule of Investments
June 30, 2019
| Par Value | | Security Description | | Rate | | Maturity | | Value $ | |
| Mortgage Backed Securities — 24.8% (Continued) | |
| | 3,999,700 | | FHMS, Series K-092 X1#~ | | | 0.85 | % | | 04/25/2029 | | | 242,829 | |
| | 5,500,000 | | FHMS, Series K-G01 X1#~ | | | 0.97 | % | | 04/25/2029 | | | 392,304 | |
| | 721,712 | | FHMS, Series Q-004 A2H# | | | 3.05 | % | | 01/25/2046 | | | 725,339 | |
| | 739,199 | | FNMA, Pool# BM3352 | | | 2.55 | % | | 12/01/2026 | | | 749,298 | |
| | 500,000 | | FNMA, Pool# AN6558 | | | 2.91 | % | | 09/01/2027 | | | 518,803 | |
| | 538,632 | | FNMA, Pool# AM3724 | | | 3.08 | % | | 06/01/2028 | | | 563,733 | |
| | 485,000 | | FNMA, Pool# AN2738 | | | 2.39 | % | | 09/01/2028 | | | 486,031 | |
| | 708,477 | | FNMA, Pool# AL3596 | | | 5.00 | % | | 10/01/2035 | | | 777,874 | |
| | 1,429,851 | | FNMA, Pool# AS2249 | | | 4.00 | % | | 04/01/2039 | | | 1,508,462 | |
| | 269,158 | | FNMA, Pool# 467095 | | | 5.90 | % | | 01/01/2041 | | | 319,208 | |
| | 178,399 | | FNMA, Pool# 469130 | | | 4.87 | % | | 10/01/2041 | | | 205,037 | |
| | 817,887 | | FNMA, Pool# AB9349 | | | 3.00 | % | | 05/01/2043 | | | 832,235 | |
| | 1,068,923 | | FNMA, Pool# BD4016 | | | 4.00 | % | | 07/01/2047 | | | 1,133,245 | |
| | 390,410 | | FNMA, Pool# BD4041 | | | 4.00 | % | | 11/01/2047 | | | 411,384 | |
| | 390,862 | | FNMA, Pool# BH7686 | | | 4.50 | % | | 12/01/2047 | | | 411,689 | |
| | 1,119,000 | | FNMA, Pool# BJ4049 | | | 4.00 | % | | 05/01/2048 | | | 1,169,944 | |
| | 294,849 | | FNMA, Pool# BJ4051 | | | 4.50 | % | | 05/01/2048 | | | 315,707 | |
| | 196,849 | | FNMA, Pool# BJ4050 | | | 4.50 | % | | 05/01/2048 | | | 212,387 | |
| | 197,016 | | FNMA, Pool# BJ4052 | | | 4.50 | % | | 05/01/2048 | | | 209,737 | |
| | 197,336 | | FNMA, Pool# BK5105 | | | 5.50 | % | | 05/01/2048 | | | 215,010 | |
| | 295,551 | | FNMA, Pool# BJ4057 | | | 4.50 | % | | 06/01/2048 | | | 312,130 | |
| | 177,613 | | FNMA, Pool# BK8032 | | | 5.50 | % | | 06/01/2048 | | | 193,520 | |
| | 245,619 | | FNMA, Pool# BJ4062 | | | 4.50 | % | | 07/01/2048 | | | 259,785 | |
| | 246,794 | | FNMA, Pool# BJ4061 | | | 4.50 | % | | 07/01/2048 | | | 264,175 | |
| | 246,636 | | FNMA, Pool# BJ4060 | | | 4.50 | % | | 07/01/2048 | | | 266,168 | |
| | 741,631 | | FNMA, Pool# BJ4067 | | | 4.50 | % | | 08/01/2048 | | | 784,706 | |
| | 890,242 | | FNMA, Pool# BJ4070 | | | 4.00 | % | | 09/01/2048 | | | 929,792 | |
| | 504,489 | | FNMA, Pool# BJ4073 | | | 4.50 | % | | 09/01/2048 | | | 535,871 | |
| | 464,629 | | FNMA, Pool# BJ4072 | | | 4.50 | % | | 09/01/2048 | | | 497,357 | |
| | 426,207 | | FNMA, Pool# BJ4075 | | | 5.00 | % | | 09/01/2048 | | | 465,029 | |
| | 197,590 | | FNMA, Pool# BN0202 | | | 5.50 | % | | 09/01/2048 | | | 215,288 | |
| | 584,475 | | FNMA, Pool# BJ4082 | | | 5.00 | % | | 11/01/2048 | | | 635,574 | |
| | 298,269 | | FNMA, Pool# BN4936 | | | 5.50 | % | | 12/01/2048 | | | 322,783 | |
| | 298,495 | | FNMA, Pool# BN4921 | | | 5.50 | % | | 01/01/2049 | | | 323,028 | |
| | 518,087 | | FNMA, Pool# BJ4085 | | | 4.50 | % | | 02/01/2049 | | | 554,063 | |
| | 499,253 | | FNMA, Pool# BJ4086 | | | 5.00 | % | | 02/01/2049 | | | 540,080 | |
| | 923,000 | | FNMA REMIC Trust, Series 2017-M13 A2# | | | 3.04 | % | | 09/25/2027 | | | 954,517 | |
| | 750,000 | | FNMA REMIC Trust, Series 2018-M8 A2# | | | 3.44 | % | | 06/25/2028 | | | 799,931 | |
| | 491,342 | | FNMA REMIC Trust, Series 2018-M3 A1# | | | 3.09 | % | | 02/25/2030 | | | 510,544 | |
| | 746,687 | | FNMA REMIC Trust, Series 2018-M13 A1# | | | 3.82 | % | | 09/25/2030 | | | 815,332 | |
| | 582,276 | | FNMA REMIC Trust, Series 2012-65 HJ | | | 5.00 | % | | 07/25/2040 | | | 646,390 | |
| | 1,750,000 | | FREMF Mortgage Trust, Series 2016-K723 B#^ | | | 3.58 | % | | 10/25/2039 | | | 1,808,395 | |
| | 780,000 | | FREMF Mortgage Trust, Series 2017-K729 B#^ | | | 3.80 | % | | 11/25/2049 | | | 800,386 | |
| | 1,500,000 | | FREMF Mortgage Trust, Series 2019-K89 B#^ | | | 4.43 | % | | 01/25/2051 | | | 1,586,960 | |
| | 1,500,000 | | FREMF Mortgage Trust, Series 2019-K734 B#^ | | | 4.19 | % | | 02/25/2051 | | | 1,582,966 | |
| | 622,851 | | GNMA, Pool# 723334X | | | 5.00 | % | | 09/15/2039 | | | 685,806 | |
| | 649,533 | | GNMA REMIC Trust, Series 2006-47 ZA | | | 5.00 | % | | 08/16/2036 | | | 710,016 | |
| | 1,074,984 | | GNMA REMIC Trust, Series 2014-45 B1#~ | | | 0.74 | % | | 07/16/2054 | | | 43,627 | |
| | 922,205 | | GNMA REMIC Trust, Series 2014-135 I0#~ | | | 0.81 | % | | 01/16/2056 | | | 45,816 | |
| | 882,534 | | GNMA REMIC Trust, Series 2015-172 I0#~ | | | 0.87 | % | | 03/16/2057 | | | 50,941 | |
| | 1,182,353 | | GNMA REMIC Trust, Series 2016-40 I0#~ | | | 0.73 | % | | 07/16/2057 | | | 62,699 | |
| | 968,241 | | GNMA REMIC Trust, Series 2016-56 I0#~ | | | 0.92 | % | | 11/16/2057 | | | 65,424 | |
| | 1,260,513 | | GNMA REMIC Trust, Series 2016-98 I0#~ | | | 0.95 | % | | 05/16/2058 | | | 88,775 | |
| | 2,000,000 | | Great Wolf Trust, Series 2017-WOLF D (1 Month LIBOR USD + 2.10%)^ | | | 4.49 | % | | 09/15/2034 | | | 2,002,799 | |
| | 500,000 | | GSMS, Series 2018-FBLU C (1 Month LIBOR USD + 1.60%)^ | | | 3.99 | % | | 11/15/2035 | | | 499,949 | |
| | 1,250,000 | | GSMS, Series 2018-FBLU D (1 Month LIBOR USD + 2.00%)^ | | | 4.39 | % | | 11/15/2035 | | | 1,248,997 | |
| | 750,000 | | HPLY Trust, Series 2019-HIT D (1 Month LIBOR USD + 2.00%)^ | | | 4.39 | % | | 11/17/2036 | | | 753,038 | |
| | 1,500,000 | | JPMCC, Series 2019-MFP C (1 Month LIBOR USD + 1.36%)^ | | | 3.74 | % | | 07/15/2036 | | | 1,500,000 | |
| | 500,000 | | JPMCC, Series 2019-MFP E (1 Month LIBOR USD + 2.16%)^ | | | 4.54 | % | | 07/15/2036 | | | 500,000 | |
The accompanying notes are an integral part of these financial statements.
www.brownadvisory.com/mf
Brown Advisory Total Return FundSchedule of Investments
June 30, 2019
| | Security Description | | Rate | | Maturity | | Value $ | |
| Mortgage Backed Securities — 24.8% (Continued) | |
| | 500,000 | | KNDL Mortgage Trust, Series 2019-KNSQ D (1 Month LIBOR USD + 1.35%)^ | | | 3.74 | % | | 05/15/2036 | | | 501,871 | |
| | 385,000 | | MAD Mortgage Trust, Series 2017-330M B#^ | | | 3.48 | % | | 08/17/2034 | | | 393,253 | |
| | 275,000 | | MSC, Series 2017-CLS C (1 Month LIBOR USD + 1.00%)^ | | | 3.39 | % | | 11/15/2034 | | | 274,280 | |
| | 925,000 | | MSC, Series 2017-CLS D (1 Month LIBOR USD + 1.40%)^ | | | 3.79 | % | | 11/15/2034 | | | 925,224 | |
| | 1,000,000 | | Velocity Commercial Capital Loan Trust, Series 2016-2 M1# | | | 3.66 | % | | 10/25/2046 | | | 1,032,805 | |
| | 500,000 | | Velocity Commercial Capital Loan Trust, Series 2017-1 M1#^ | | | 3.55 | % | | 05/25/2047 | | | 500,255 | |
| | 434,419 | | Velocity Commercial Capital Loan Trust, Series 2018-2 A#^ | | | 4.05 | % | | 10/25/2048 | | | 444,871 | |
Total Mortgage Backed Securities (Cost $61,131,266) | | |
| 62,320,654 |
| | |
| Municipal Bonds — 3.1% | |
| | 230,000 | | American Municipal Power, Inc. | | | 6.05 | % | | 02/15/2043 | | | 315,889 | |
| | 3,500,000 | | District of Columbia# | | | 6.50 | % | | 08/01/2038 | | | 3,500,000 | |
| | 350,000 | | District of Columbia# | | | 6.60 | % | | 08/01/2038 | | | 350,000 | |
| | 1,200,000 | | Health Care Authority for Baptist Health | | | 5.50 | % | | 11/15/2043 | | | 1,417,848 | |
| | 1,275,000 | | Mosaic District Community Development Authority | | | 7.25 | % | | 03/01/2036 | | | 1,338,010 | |
| | 800,000 | | North Texas Tollway Authority | | | 8.91 | % | | 02/01/2030 | | | 829,752 | |
| Total Municipal Bonds (Cost $7,503,040) | | |
| 7,751,499 |
| | |
| U.S. Treasury Notes — 7.4% | |
| | 18,500,000 | | United States Treasury Note | | | 1.88 | % | | 08/31/2022 | | | 18,585,635 | |
Total U.S. Treasury Notes (Cost $18,296,314) | | |
| 18,585,635 |
| | | | | | | | | | | | | |
| Preferred Stocks — 0.5% | | | | | | | | | | |
| | 14,625 | | AGNC Investment Corp., Series B, 7.75% | | | | | | | | | 374,108 | |
| | 19,576 | | AGNC Investment Corp., Series C, 7.00% | | | | | | | | | | |
| | | | (Fixed until 10/15/2022, then 3 Month LIBOR USD + 5.11%) | | | | | | | | | 508,976 | |
| | 10,000 | | Annaly Capital Management, Inc., Series G, 6.50% | | | | | | | | | | |
| | | | (Fixed until 03/31/2023, then 3 Month LIBOR USD + 4.17%) | | | | | | | | | 242,000 | |
Total Preferred Stocks (Cost $1,113,864) | | | | | | 1,125,084 | |
| | |
| Short-Term Investments — 1.8% | |
| | |
| Money Market Funds — 1.8% | |
| | 4,462,814 | | First American Government Obligations Fund — Class Z, 2.26%* | | | | | | | | | 4,462,814 | |
Total Short-Term Investments (Cost $4,462,814) | | | | | | 4,462,814 | |
Total Investments — 99.0% (Cost $243,925,457) | | | | | | 248,495,719 | |
Other Assets in Excess of Liabilities — 1.0% | | | | | | 2,493,663 | |
| NET ASSETS — 100.0% | | | | | $ | 250,989,382 | |
| # | Variable rate security. Rate disclosed is as of June 30, 2019. |
| ^ | Security exempt from registration under Rule 144A of the Securities Act of 1933. These securities may be resold in transactions exempt from registration, normally to qualified institutional buyers. |
| ~ | Interest Only Security |
| * | Annualized seven-day yield as of June 30, 2019. |
Futures Contracts — Long (Note 6)
| | | | | | | Notional | | | Notional | | | Unrealized Appreciation | |
| Issue | | Contracts | | Expiration Date | | Amount | | | Value | | | (Depreciation) | |
U.S. Treasury 2-Year Note Futures | | | 55 | | 09/30/2019 | | $ | 11,843,730 | | | $ | 11,834,883 | | | $ | (8,847 | ) |
U.S. Treasury 5-Year Note Futures | | | 382 | | 09/30/2019 | | | 44,388,392 | | | | 45,135,687 | | | | 747,295 | |
U.S. Treasury 10-Year Note Futures | | | 48 | | 09/19/2019 | | | 5,988,979 | | | | 6,142,500 | | | | 153,521 | |
U.S. Treasury 10-Year Ultra Futures | | | 185 | | 09/19/2019 | | | 24,732,905 | | | | 25,553,125 | | | | 820,220 | |
U.S. Treasury Long Bond Futures | | | 57 | | 09/19/2019 | | | 8,496,837 | | | | 8,868,844 | | | | 372,007 | |
U.S. Treasury Ultra Bond Futures | | | 80 | | 09/19/2019 | | | 13,477,890 | | | | 14,205,000 | | | | 727,110 | |
| | | | | | | | $ | 108,928,733 | | | $ | 111,740,039 | | | $ | 2,811,306 | |
There is no variation margin due to or from the Fund as of June 30, 2019.
The accompanying notes are an integral part of these financial statements.
www.brownadvisory.com/mf
Brown Advisory Strategic Bond FundA Message to Our Shareholders
June 30, 2019
Dear Shareholders:
The Brown Advisory Strategic Bond Fund – Investor Shares (the “Fund”) returned 4.18% during the year ended June 30, 2019, outperforming its primary benchmark, the ICE BofAML 0-3 Month US Treasury Bill Index, which returned 2.28%. The Fund underperformed the 7.87% return of its secondary benchmark, the Bloomberg Barclays US Aggregate Bond Index. A strong 2019 rally in credit drove nearly all of our return for the twelve-month period, following a largely technical-driven market sell-off during Q4 2018.
We focus on deep credit research that feeds our proprietary, factor-based risk pricing models. We believe that this process helps us to consistently identify individual securities that offer compelling risk-adjusted return potential. We analyze investment ideas using rigorous underwriting standards and fundamental analysis to identify, assess, and price a bond’s risks. Our methodology allows us to compare the expected return of bonds across multiple sectors, using our diligence process to adjust for both the impairment risk and interest rate risk, thereby driving our capital allocation decisions from the bottom-up. Idiosyncratic risks are mitigated by the strict application of a sizing model focused on a bond’s estimated downside.
The Fund attempts to mitigate duration risk, in an effort to reduce correlation to general interest-rate movements. The Fund has been managed with a duration of under 2.0 over the past year, and we do not seek to generate meaningful alpha by betting on interest-rate directionality. Instead, we aim to reduce sensitivity to rates by buying shorter-dated bonds, using hedges such as Treasury futures, and by purchasing floating-rate instruments (floating-rate debt comprised 42.5% of Fund assets at period’s end).
The Fund’s gain came despite a market sell-off in corporate credit in December 2018. The Fund was conservatively positioned headed into the sell-off, which helped dampen volatility relative to other risk assets. We added selectively to corporate bonds at the very end of December and maintained our high-yield corporate bond exposure through the end of June. Overall, however, we maintained a low weighting to high-yield bonds; our allocation hovered in the 15-20% range—roughly half of what we consider to be the Fund’s neutral weighting and well below our self-imposed maximum allocation of 50%. The Fund’s allocation to investment-grade corporates averaged in the high single digits, and did not change materially throughout the year. While corporate bonds put in a modestly negative return in the first half of the fiscal year, they were our best-performing sector in the six months ending June 30, returning roughly 7% over that period.
Structured products make up the majority of our holdings; our composition within the structured segment is based on relative value. Beginning in January, we began increasing our exposure to collateralized loan obligations (CLOs) based on relative value compared to other asset-backed securities (ABS). CLOs sold off more during the December quarter than other ABS, offering better relative value for similar duration and rating. We focused on CLOs with shorter tenors, in an effort to dampen volatility in a tight credit-spread environment. Similarly, we added to single-asset, single-borrower commercial mortgage-backed securities (SASB CMBS), which are backed by prized real estate assets. Both these and CLOs pay floating-rate interest, thereby offering us protection from rising rates. While these securities tend to be callable given our focus on shorter tenors, we are finding inefficiencies in the market; while these bonds remain uncalled, we are collecting incremental income. All of our structured finance allocations generated positive returns of between 3.3% and 6.6% over the past twelve months. We continue to believe that structured products are instrumental in helping us improve the overall credit quality of the portfolio, enhance returns, reduce duration, and provide diversification.
Lastly, the Fund took advantage of pockets of value in certain municipal bond securities in mid-2018, although many were called away over the past twelve months and our exposure at period’s end was not meaningful. While the average allocation to this sector over the year was less than 4% of assets, the strong returns we achieved in municipals contributed almost 30 basis points to overall performance. The flexible nature of the strategy allows us to take advantage of these types of value opportunities wherever they may appear.
Our investment process is focused on maximizing risk-adjusted return through the disciplined application of a deep due diligence process and proprietary risk pricing models designed to optimize capital allocation decisions. Our process is designed to facilitate consistently better decision-making, grounded in our thorough understanding of each investment’s cash flow profile, liquidity, structural terms, and enterprise value coverage. We believe that adhering to this process can continue to add value whether credit is widening or tightening and may be a key driver of outperformance through market and business cycles.
Sincerely,
Robert H. Snyder
Co-Portfolio Manager
Thomas D.D. Graff, CFA
Co-Portfolio Manager
www.brownadvisory.com/mf
Brown Advisory Strategic Bond FundA Message to Our Shareholders
June 30, 2019
Past performance is not a guarantee of future results. Mutual fund investing involves risk. Principal loss is possible. Investments in debt securities typically decrease in value when interest rates rise. This risk is usually greater for longer-term debt securities. Investments in lower-rated and nonrated securities present a greater risk of loss to principal and interest than higher-rated securities. Municipal securities are subject to adverse political or economic factors, including changes in the tax law. Inflation-indexed bonds see the principal value of the security increased as the Consumer Price Index increases. Should the Consumer Price Index decline, those securities should be adversely impacted. A non-diversified fund may concentrate its assets in fewer individual holdings than a diversified fund. Therefore, a non-diversified fund is more exposed to individual stock volatility than a diversified fund. The fund may make short sales of securities, which involve the risk that losses in a security may exceed the original amount invested in that security. The risks of investments in derivatives, including options on futures contracts and options on futures contracts include imperfect correlation between the value of these instruments and the underlying assets; risks of default by the other party to the derivative transactions; risks that the transactions may result in losses that partially or completely offset gains in portfolio positions; and risks that the derivative transactions may not be liquid. Income from tax-exempt securities may be subject to state and local taxes and a portion of income may be subject to the federal alternative minimum tax for certain investors. Bond ratings are grades given to bonds that indicate their credit quality as determined by a private independent rating service such as Standard & Poor’s. The firm evaluates a bond issuer’s financial strength, or its ability to pay a bond’s principal and interest in a timely fashion. Ratings are expressed as letters ranging from ‘AAA’, which is the highest grade, to ‘D’, which is the lowest grade. In limited situations when the rating agency has not issued a formal rating, the Adviser will classify the security as non-rated.
Diversification does not assure a profit or protect against loss in a declining market.
Fund holdings and sector allocations are subject to change and should not be considered a recommendation to buy or sell any security. For a complete list of fund holdings, please refer to the Schedule of Investments provided in this report.
Definitions for terms and indices are provided in the Glossary of Terms.
www.brownadvisory.com/mf
Brown Advisory Strategic Bond FundPerformance Information & Portfolio Holdings Summary
June 30, 2019
GROWTH OF A $10,000 INVESTMENT
The following chart reflects the change in value of a hypothetical $10,000 investment, including reinvested dividends and distributions, in the Fund as measured against a broad-based bond index. The ICE BofAML 0-3 Month US Treasury Bill Index is a subset of the ICE BofAML US Treasury Bill Index and includes all securities with a remaining term to final maturity less than 3 months. The Bloomberg Barclays US Aggregate Bond Index is a broad-based benchmark that measures the investment grade US dollar-denominated, fixed rate taxable bond market and includes Treasuries, government-related and corporate securities, MBS, ABS and CMBS. The indexes are unmanaged and do not reflect the deduction of fees, such as investment management fees. Investors cannot invest directly in an index.

| PORTFOLIO HOLDINGS | % of Net Assets |
Asset Backed Securities | | | 48.5 | % | |
Corporate Bonds & Notes | | | 28.7 | % | |
Mortgage Backed Securities | | | 15.8 | % | |
Money Market Funds | | | 3.5 | % | |
Municipal Bonds | | | 2.6 | % | |
Preferred Stocks | | | 0.7 | % | |
Other Assets and Liabilities | | | 0.2 | % | |
| | | | 100.0 | % | |
| | | | Since Inception |
Average Annual Total Return | One Year | Five Year | (9/30/11) |
Institutional Shares1 | 4.23% | 1.91% | 1.74% |
| Investor Shares | 4.18% | 1.66% | 1.47% |
| ICE BofAML 0-3 Month US Treasury Bill Index | 2.28% | 0.83% | 0.55% |
| Bloomberg Barclays US Aggregate Bond Index | 7.87% | 2.95% | 2.82% |
Bloomberg Barclays Intermediate US Aggregate Bond Index2 | 6.73% | 2.46% | 2.39% |
| | Institutional Shares | Investor Shares |
Gross Expense Ratio3 | 0.65% | 0.70% |
Net Expense Ratio3 | 0.65% | 0.70% |
Past performance does not guarantee future results. The performance data quoted represents past performance and current returns may be lower or higher. The investment return and net asset value will fluctuate so that an investor’s shares, when redeemed, may be worth more or less than the original cost. To obtain performance information current to the most recent month end, please visit our website at brownadvisory.com/mf/strategic-bond-fund. The performance table and graph above do not reflect the deduction of taxes that a shareholder would pay on Fund distributions or the redemption of Fund shares. Investment performance reflects periods during which fee waivers were in effect. In the absence of such waivers, total return would have been reduced. Performance data does not reflect the imposition of the redemption fee of 1.00% on shares redeemed within 14 days, and if it did, performance would have been lower. Returns shown are calculated using the net asset values (“NAV”) that were used for shareholder transactions as of the respective period ends. These NAV, and the returns calculated from them, may differ from the NAV and returns shown elsewhere in this report.
1 | Performance information for the Institutional Shares, prior to commencement of operations on October 31, 2014, is based on the performance of Investor Shares, and adjusted for the lower expenses applicable to Institutional Shares. |
2 | Effective February 28, 2019, the Fund discontinued the use of the Bloomberg Barclays Intermediate US Aggregate Bond Index and replaced it with the ICE BofAML 0-3 Month Treasury Bill Index. Also effective as of the same date, the Fund has adopted the Bloomberg Barclays US Aggregate Bond Index as its secondary benchmark. The Adviser has determined that the ICE BofAML 0-3 Month US Treasury Bill Index better reflects the Fund’s investment strategy. |
3 | Per the Fund’s prospectus dated October 31, 2018. Refer to the financial highlights for the gross and net expense ratios for the year ended as of the date of this report. Please note that the expense ratios per the prospectus include acquired fund fees and expenses (as applicable) and the expense ratios in the financial highlights do not. |
www.brownadvisory.com/mf
Brown Advisory Strategic Bond FundSchedule of Investments
June 30, 2019
| Par Value | | Security Description | | Rate | | Maturity | | Value $ | |
| Asset Backed Securities — 48.5% | |
| | 1,000,000 | | AmeriCredit Automobile Receivables Trust, Series 2016-2 D | | | 3.65 | % | | 05/09/2022 | | | 1,015,727 | |
| | 200,000 | | AmeriCredit Automobile Receivables Trust, Series 2016-3 D | | | 2.71 | % | | 09/08/2022 | | | 200,731 | |
| | 225,000 | | AmeriCredit Automobile Receivables Trust, Series 2017-3 D | | | 3.18 | % | | 07/18/2023 | | | 227,623 | |
| | 275,000 | | AmeriCredit Automobile Receivables Trust, Series 2017-4 D | | | 3.08 | % | | 12/18/2023 | | | 279,102 | |
| | 1,000,000 | | Apidos CLO XVI, Series 2013-16A CR (3 Month LIBOR USD + 3.00%)^ | | | 5.59 | % | | 01/21/2025 | | | 1,000,037 | |
| | 189,894 | | BRE Grand Islander Timeshare Issuer LLC, Series 2017-1A A^ | | | 2.94 | % | | 05/25/2029 | | | 190,867 | |
| | 1,375,000 | | Carlyle Global Market Strategies CLO, Ltd., Series 2015-1A CR (3 Month LIBOR USD + 2.00%)^ | | | 4.59 | % | | 04/20/2027 | | | 1,375,936 | |
| | 2,000,000 | | Carlyle Global Market Strategies CLO, Ltd., Series 2013-4A A1RR (3 Month LIBOR USD + 1.00%)^ | | | 3.60 | % | | 01/15/2031 | | | 1,981,256 | |
| | 2,000,000 | | Carlyle US CLO, Ltd., Series 2017-2A A1B (3 Month LIBOR USD + 1.22%)^ | | | 3.81 | % | | 07/21/2031 | | | 1,998,008 | |
| | 1,000,000 | | CBAM, Ltd., Series 2017-1A B (3 Month LIBOR USD + 1.80%)^ | | | 4.39 | % | | 07/20/2030 | | | 998,846 | |
| | 636,000 | | CCG Receivables Trust, Series 2019-1 B^ | | | 3.22 | % | | 09/14/2026 | | | 649,270 | |
| | 1,375,000 | | CIFC Funding, Ltd., Series 2012-2RA B (3 Month LIBOR USD + 1.55%)^ | | | 4.14 | % | | 01/20/2028 | | | 1,338,347 | |
| | 1,250,000 | | Dell Equipment Finance Trust, Series 2017-2 B^ | | | 2.47 | % | | 10/24/2022 | | | 1,247,775 | |
| | 1,000,000 | | Dell Equipment Finance Trust, Series 2018-1 C^ | | | 3.53 | % | | 06/22/2023 | | | 1,015,003 | |
| | 750,000 | | Dell Equipment Finance Trust, Series 2018-2 D^ | | | 3.97 | % | | 10/22/2024 | | | 774,805 | |
| | 1,250,000 | | Dell Equipment Finance Trust, Series 2019-1 D^ | | | 3.45 | % | | 03/24/2025 | | | 1,270,788 | |
| | 1,000,000 | | Drive Auto Receivables Trust, Series 2017-1 D | | | 3.84 | % | | 03/15/2023 | | | 1,012,323 | |
| | 1,000,000 | | Drive Auto Receivables Trust, Series 2017-3 D^ | | | 3.53 | % | | 12/15/2023 | | | 1,011,015 | |
| | 1,500,000 | | Drive Auto Receivables Trust, Series 2018-1 D | | | 3.81 | % | | 05/15/2024 | | | 1,527,098 | |
| | 2,025,000 | | Drive Auto Receivables Trust, Series 2018-2 D | | | 4.14 | % | | 08/15/2024 | | | 2,074,962 | |
| | 700,000 | | Drive Auto Receivables Trust, Series 2018-3 D | | | 4.30 | % | | 09/16/2024 | | | 721,944 | |
| | 1,000,000 | | Drive Auto Receivables Trust, Series 2019-3 D | | | 3.18 | % | | 10/15/2026 | | | 1,006,124 | |
| | 1,650,000 | | Dryden XXV Senior Loan Fund, Series 2012-25A CRR (3 Month LIBOR USD + 1.85%)^ | | | 4.45 | % | | 10/15/2027 | | | 1,645,884 | |
| | 1,900,000 | | DT Auto Owner Trust, Series 2017-4A D^ | | | 3.47 | % | | 07/17/2023 | | | 1,914,572 | |
| | 500,000 | | DT Auto Owner Trust, Series 2018-2A C^ | | | 3.67 | % | | 03/15/2024 | | | 507,871 | |
| | 1,000,000 | | DT Auto Owner Trust, Series 2018-3A D^ | | | 4.19 | % | | 07/15/2024 | | | 1,031,256 | |
| | 500,000 | | DT Auto Owner Trust, Series 2019-2A D^ | | | 3.48 | % | | 02/18/2025 | | | 509,754 | |
| | 1,500,000 | | DT Auto Owner Trust, Series 2018-2A E^ | | | 5.54 | % | | 06/16/2025 | | | 1,571,181 | |
| | 1,000,000 | | DT Auto Owner Trust, Series 2019-2A E^ | | | 4.46 | % | | 05/15/2026 | | | 1,021,111 | |
| | 1,550,000 | | Emerson Park CLO, Ltd., Series 2013-1A C1R (3 Month LIBOR USD + 2.15%)^ | | | 4.75 | % | | 07/15/2025 | | | 1,552,846 | |
| | 1,062,000 | | Exeter Automobile Receivables Trust, Series 2018-2A E^ | | | 5.33 | % | | 05/15/2025 | | | 1,103,790 | |
| | 266,088 | | Federal Express Corp., Series 1998-1 | | | 6.72 | % | | 07/15/2023 | | | 278,290 | |
| | 1,220,000 | | Flatiron CLO, Ltd., Series 2013-1A BR (3 Month LIBOR USD + 2.35%)^ | | | 4.94 | % | | 01/20/2026 | | | 1,220,031 | |
| | 1,000,000 | | GoldenTree Loan Management CLO, Ltd., Series 2017-1A C (3 Month LIBOR USD + 2.20%)^ | | | 4.79 | % | | 04/20/2029 | | | 995,502 | |
| | 2,000,000 | | GoldenTree Loan Opportunities XI, Ltd., Series 2015-11A AR2 (3 Month LIBOR USD + 1.07%)^ | | | 3.67 | % | | 01/21/2031 | | | 1,990,028 | |
| | 300,000 | | GreatAmerica Leasing Receivables Funding LLC, Series 2018-1 C^ | | | 3.14 | % | | 06/16/2025 | | | 304,673 | |
| | 1,000,000 | | Grippen Park CLO, Ltd., Series 2017-1A C (3 Month LIBOR USD + 2.30%)^ | | | 4.89 | % | | 01/20/2030 | | | 999,974 | |
| | 1,975,000 | | Highbridge Loan Management, Ltd., Series 2013-2A A2R (3 Month LIBOR USD + 1.63%)^ | | | 4.22 | % | | 10/20/2029 | | | 1,958,151 | |
| | 300,000 | | Invitation Homes Trust, Series 2017-SFR2 B (1 Month LIBOR USD + 1.15%)^ | | | 3.54 | % | | 12/19/2036 | | | 300,141 | |
| | 200,000 | | Invitation Homes Trust, Series 2017-SFR2 C (1 Month LIBOR USD + 1.45%)^ | | | 3.84 | % | | 12/19/2036 | | | 200,545 | |
| | 500,000 | | Invitation Homes Trust, Series 2017-SFR2 D (1 Month LIBOR USD + 1.80%)^ | | | 4.19 | % | | 12/19/2036 | | | 501,248 | |
| | 1,200,000 | | Invitation Homes Trust, Series 2018-SFR1 C (1 Month LIBOR USD + 1.25%)^ | | | 3.64 | % | | 03/19/2037 | | | 1,195,582 | |
| | 999,863 | | Invitation Homes Trust, Series 2018-SFR1 E (1 Month LIBOR USD + 2.00%)^ | | | 4.39 | % | | 03/19/2037 | | | 1,003,100 | |
| | 500,000 | | Invitation Homes Trust, Series 2018-SFR2 B (1 Month LIBOR USD + 1.08%)^ | | | 3.47 | % | | 06/18/2037 | | | 497,533 | |
| | 930,000 | | LCM XXV, Ltd., Series 2017-25A C2 (3 Month LIBOR USD + 2.30%)^ | | | 4.89 | % | | 07/22/2030 | | | 930,547 | |
| | 2,750,000 | | Madison Park Funding XII, Ltd., Series 2014-12A CR (3 Month LIBOR USD + 2.35%)^ | | | 4.94 | % | | 07/20/2026 | | | 2,755,482 | |
| | 750,000 | | Madison Park Funding XV, Ltd., Series 2014-15A A2R (3 Month LIBOR USD + 1.50%)^ | | | 4.08 | % | | 01/27/2026 | | | 750,790 | |
| | 2,200,000 | | Madison Park Funding XVI, Ltd., Series 2015-16A A2R (3 Month LIBOR USD + 1.90%)^ | | | 4.49 | % | | 04/20/2026 | | | 2,201,344 | |
| | 1,000,000 | | Madison Park Funding XVI, Ltd., Series 2015-16A C (3 Month LIBOR USD + 3.70%)^ | | | 6.29 | % | | 04/20/2026 | | | 1,002,398 | |
| | 750,000 | | Madison Park Funding XVII, Ltd., Series 2015-17A B1R (3 Month LIBOR USD + 1.75%)^ | | | 4.34 | % | | 07/21/2030 | | | 749,963 | |
| | 700,000 | | Madison Park Funding XVII, Ltd., Series 2015-17A CR (3 Month LIBOR USD + 2.40%)^ | | | 4.99 | % | | 07/22/2030 | | | 700,241 | |
| | 500,000 | | Madison Park Funding XXI, Ltd., Series 2016-21A B (3 Month LIBOR USD + 2.75%)^ | | | 5.33 | % | | 07/25/2029 | | | 501,200 | |
| | 1,000,000 | | Madison Park Funding XXV, Ltd., Series 2017-25A B (3 Month LIBOR USD + 2.35%)^ | | | 4.93 | % | | 04/25/2029 | | | 1,000,679 | |
| | 1,400,000 | | Magnetite IX, Ltd., Series 2014-9A A2R (3 Month LIBOR USD + 1.50%)^ | | | 4.08 | % | | 07/27/2026 | | | 1,400,688 | |
| | 1,500,000 | | Magnetite IX, Ltd., Series 2014-9A BR (3 Month LIBOR USD + 2.00%)^ | | | 4.58 | % | | 07/27/2026 | | | 1,500,137 | |
| | 750,000 | | Magnetite IX, Ltd., Series 2014-9A CR (3 Month LIBOR USD + 3.10%)^ | | | 5.68 | % | | 07/27/2026 | | | 750,099 | |
| | | | | | | | | | | | | | |
The accompanying notes are an integral part of these financial statements.
www.brownadvisory.com/mf
Brown Advisory Strategic Bond FundSchedule of Investments
June 30, 2019
| Par Value | | Security Description | | Rate | | Maturity | | Value $ | |
| Asset Backed Securities — 48.5% (Continued) | |
| | 750,000 | | Magnetite XVI, Ltd., Series 2015-16A C2R (3 Month LIBOR USD + 1.60%)^ | | | 4.20 | % | | 01/18/2028 | | | 743,092 | |
| | 2,000,000 | | Neuberger Berman Loan Advisers CLO, Ltd., Series 2017-26A A (3 Month LIBOR USD + 1.17%)^ | | | 3.77 | % | | 10/18/2030 | | | 1,997,550 | |
| | 454,750 | | Newtek Small Business Loan Trust, Series 2018-1 A (1 Month LIBOR USD + 1.70%)^ | | | 4.10 | % | | 02/25/2044 | | | 455,045 | |
| | 750,000 | | Octagon Investment Partners 25, Ltd., Series 2015-1A AR (3 Month LIBOR USD + 0.80%)^ | | | 3.39 | % | | 10/20/2026 | | | 748,274 | |
| | 750,000 | | Octagon Investment Partners 25, Ltd., Series 2015-1A BR (3 Month LIBOR USD + 1.20%)^ | | | 3.79 | % | | 10/20/2026 | | | 741,666 | |
| | 2,000,000 | | Octagon Investment Partners 36, Ltd., Series 2018-1A A1 (3 Month LIBOR USD + 0.97%)^ | | | 3.57 | % | | 04/15/2031 | | | 1,977,984 | |
| | 2,000,000 | | Octagon Investment Partners XIX, Ltd., Series 2014-1A CR (3 Month LIBOR USD + 2.10%)^ | | | 4.70 | % | | 04/15/2026 | | | 2,004,000 | |
| | 1,500,000 | | Octagon Investment Partners XXIII, Ltd., Series 2015-1A CR (3 Month LIBOR USD + 1.85%)^ | | | 4.45 | % | | 07/15/2027 | | | 1,487,077 | |
| | 1,125,000 | | OHA Credit Partners IX, Ltd., Series 2013-9A B1R (3 Month LIBOR USD + 1.46%)^ | | | 4.05 | % | | 10/20/2025 | | | 1,127,735 | |
| | 750,000 | | OHA Credit Partners IX, Ltd., Series 2013-9A DR (3 Month LIBOR USD + 3.30%)^ | | | 5.89 | % | | 10/20/2025 | | | 751,199 | |
| | 250,000 | | Oportun Funding IX LLC, Series 2018-B B^ | | | 4.50 | % | | 07/08/2024 | | | 253,563 | |
| | 325,000 | | Oportun Funding VII LLC, Series 2017-B B^ | | | 4.26 | % | | 10/10/2023 | | | 327,647 | |
| | 250,000 | | Oportun Funding VII LLC, Series 2017-B C^ | | | 5.29 | % | | 10/10/2023 | | | 252,027 | |
| | 500,000 | | Oportun Funding VIII LLC, Series 2018-A C^ | | | 5.09 | % | | 03/08/2024 | | | 506,491 | |
| | 1,500,000 | | Oportun Funding X LLC, Series 2018-C A^ | | | 4.10 | % | | 10/08/2024 | | | 1,539,227 | |
| | 400,000 | | Oportun Funding X LLC, Series 2018-C B^ | | | 4.59 | % | | 10/08/2024 | | | 410,195 | |
| | 34,116 | | OSCAR U.S. Funding Trust VII LLC, Series 2017-2A A2B (1 Month LIBOR USD + 0.65%)^ | | | 3.06 | % | | 11/10/2020 | | | 34,129 | |
| | 260,000 | | OSCAR U.S. Funding Trust VII LLC, Series 2017-2A A3^ | | | 2.45 | % | | 12/10/2021 | | | 260,039 | |
| | 333,458 | | OSCAR U.S. Funding Trust VIII LLC, Series 2018-1A A2B (1 Month LIBOR USD + 0.49%)^ | | | 2.90 | % | | 04/12/2021 | | | 333,683 | |
| | 1,000,000 | | OZLM XIII, Ltd., Series 2015-13A A2R (3 Month LIBOR USD + 1.65%)^ | | | 4.23 | % | | 07/30/2027 | | | 993,151 | |
| | 500,000 | | OZLM XV, Ltd., Series 2016-15A A2A (3 Month LIBOR USD + 2.10%)^ | | | 4.69 | % | | 01/22/2029 | | | 500,054 | |
| | 500,000 | | Prestige Auto Receivables Trust, Series 2017-1A D^ | | | 3.61 | % | | 10/16/2023 | | | 508,147 | |
| | 652,632 | | Progress Residential Trust, Series 2015-SFR2 A^ | | | 2.74 | % | | 06/14/2032 | | | 652,227 | |
| | 401,442 | | Progress Residential Trust, Series 2015-SFR3 A^ | | | 3.07 | % | | 11/15/2032 | | | 401,793 | |
| | 850,000 | | Progress Residential Trust, Series 2018-SFR1 B^ | | | 3.48 | % | | 03/17/2035 | | | 863,172 | |
| | 500,000 | | Progress Residential Trust, Series 2018-SFR1 A^ | | | 3.26 | % | | 03/19/2035 | | | 506,211 | |
| | 500,000 | | Santander Drive Auto Receivables Trust, Series 2017-1 D | | | 3.17 | % | | 04/17/2023 | | | 504,139 | |
| | 150,000 | | Santander Drive Auto Receivables Trust, Series 2017-2 D | | | 3.49 | % | | 07/17/2023 | | | 151,703 | |
| | 325,000 | | Santander Drive Auto Receivables Trust, Series 2017-3 D | | | 3.20 | % | | 11/15/2023 | | | 328,565 | |
| | 550,000 | | Santander Drive Auto Receivables Trust, Series 2019-2 D | | | 3.22 | % | | 07/15/2025 | | | 558,342 | |
| | 1,283,450 | | Seneca Park CLO, Ltd., Series 2014-1A AR (3 Month LIBOR USD + 1.12%)^ | | | 3.71 | % | | 07/17/2026 | | | 1,284,617 | |
| | 28,120 | | Sierra Timeshare Receivables Funding LLC, Series 2015-3A A^ | | | 2.58 | % | | 09/20/2032 | | | 28,114 | |
| | 750,000 | | Sound Point CLO XIV, Ltd., Series 2016-3A C (3 Month LIBOR USD + 2.65%)^ | | | 5.24 | % | | 01/23/2029 | | | 750,335 | |
| | 206,073 | | Southwest Airlines Co., Series 2007-1 | | | 6.15 | % | | 02/01/2024 | | | 218,173 | |
| | 1,329,116 | | Symphony CLO XIV, Ltd., Series 2014-14A A1R (3 Month LIBOR USD + 1.28%)^ | | | 3.88 | % | | 07/14/2026 | | | 1,329,444 | |
| | 429,183 | | Tesla Auto Lease Trust, Series 2018-B A^ | | | 3.71 | % | | 08/20/2021 | | | 435,724 | |
| | 2,000,000 | | Treman Park CLO, Ltd., Series 2015-1A ARR (3 Month LIBOR USD + 1.07%)^ | | | 3.66 | % | | 10/20/2028 | | | 2,002,776 | |
| | 1,125,000 | | United Auto Credit Securitization Trust, Series 2019-1 D^ | | | 3.47 | % | | 08/12/2024 | | | 1,135,012 | |
| | 30,802 | | Verizon Owner Trust, Series 2016-1A A^ | | | 1.42 | % | | 01/20/2021 | | | 30,814 | |
| | 750,000 | | Verizon Owner Trust, Series 2016-2A B^ | | | 2.15 | % | | 05/20/2021 | | | 749,046 | |
| | 707,053 | | Verizon Owner Trust, Series 2017-1A A^ | | | 2.06 | % | | 09/20/2021 | | | 706,134 | |
| | 400,000 | | Verizon Owner Trust, Series 2017-1A B^ | | | 2.45 | % | | 09/20/2021 | | | 400,174 | |
| | 700,000 | | Verizon Owner Trust, Series 2017-2A A^ | | | 1.92 | % | | 12/20/2021 | | | 698,675 | |
| | 400,000 | | Verizon Owner Trust, Series 2018-1A C^ | | | 3.20 | % | | 09/20/2022 | | | 406,308 | |
| | 750,000 | | Verizon Owner Trust, Series 2018-A C | | | 3.55 | % | | 04/20/2023 | | | 772,415 | |
| | 1,000,000 | | Voya CLO, Ltd., Series 2019 1A C (3 Month LIBOR USD + 2.35%)^ | | | 4.99 | % | | 04/16/2029 | | | 1,000,092 | |
| | 1,500,000 | | Voya CLO, Ltd., Series 2013-1A A2R (3 Month LIBOR USD + 1.55%)^ | | | 4.15 | % | | 10/15/2030 | | | 1,479,932 | |
| | 826,154 | | Westgate Resorts LLC, Series 2018-1A C^ | | | 4.10 | % | | 12/20/2031 | | | 834,606 | |
| | 300,000 | | Westlake Automobile Receivables Trust, Series 2017-2A D^ | | | 3.28 | % | | 12/15/2022 | | | 302,886 | |
| | 900,000 | | Westlake Automobile Receivables Trust, Series 2018-1A D^ | | | 3.41 | % | | 05/15/2023 | | | 906,968 | |
| | 1,000,000 | | Westlake Automobile Receivables Trust, Series 2018-2A D^ | | | 4.00 | % | | 01/16/2024 | | | 1,022,652 | |
| | 630,000 | | Westlake Automobile Receivables Trust, Series 2018-2A E^ | | | 4.86 | % | | 01/16/2024 | | | 646,212 | |
| | 1,300,000 | | Westlake Automobile Receivables Trust, Series 2019-2A E^ | | | 4.02 | % | | 04/15/2025 | | | 1,305,595 | |
| Total Asset Backed Securities (Cost $99,422,328) | | | | | | 99,829,049 | |
| | | | | | | | | | | | | | |
The accompanying notes are an integral part of these financial statements.
www.brownadvisory.com/mf
Brown Advisory Strategic Bond FundSchedule of Investments
June 30, 2019
| Par Value | | Security Description | | Rate | | Maturity | | Value $ | |
| Corporate Bonds & Notes — 28.7% | | | | | | | | |
| | 800,000 | | Allison Transmission, Inc.^ | | | 5.00 | % | | 10/01/2024 | | | 819,000 | |
| | 1,000,000 | | American Tower Corp. | | | 2.80 | % | | 06/01/2020 | | | 1,002,437 | |
| | 1,000,000 | | Apache Corp. | | | 4.25 | % | | 01/15/2030 | | | 1,033,331 | |
| | 650,000 | | Asbury Automotive Group, Inc. | | | 6.00 | % | | 12/15/2024 | | | 676,000 | |
| | 1,000,000 | | Ball Corp. | | | 5.00 | % | | 03/15/2022 | | | 1,053,750 | |
| | 2,000,000 | | Bank of America Corp. (Fixed until 01/23/2021, then 3 Month LIBOR USD + 0.37%) | | | 2.74 | % | | 01/23/2022 | | | 2,009,447 | |
| | 250,000 | | BWAY Holding Co.^ | | | 7.25 | % | | 04/15/2025 | | | 242,187 | |
| | 3,000,000 | | BWX Technologies, Inc.^ | | | 5.38 | % | | 07/15/2026 | | | 3,112,350 | |
| | 1,000,000 | | Citigroup, Inc. | | | 2.65 | % | | 10/26/2020 | | | 1,003,733 | |
| | 1,220,000 | | Crown Castle International Corp. | | | 4.88 | % | | 04/15/2022 | | | 1,297,536 | |
| | 300,000 | | Dana, Inc. | | | 6.00 | % | | 09/15/2023 | | | 307,875 | |
| | 1,000,000 | | Energy Transfer Operating L.P. (Fixed until 02/15/2023, then 3 Month LIBOR USD + 4.03%) | | | 6.25 | % | | 05/15/2023 | | | 931,520 | |
| | 1,000,000 | | Enterprise Products Operating LLC (Fixed until 08/16/2027, then 3 Month LIBOR USD + 3.03%) | | | 5.25 | % | | 08/16/2077 | | | 957,070 | |
| | 3,000,000 | | Equinix, Inc. | | | 5.88 | % | | 01/15/2026 | | | 3,183,750 | |
| | 1,900,000 | | Exelon Corp. | | | 2.85 | % | | 06/15/2020 | | | 1,906,319 | |
| | 700,000 | | First Quality Finance Co., Inc.^ | | | 5.00 | % | | 07/01/2025 | | | 707,000 | |
| | 3,000,000 | | frontdoor, Inc.^ | | | 6.75 | % | | 08/15/2026 | | | 3,202,500 | |
| | 750,000 | | Goldman Sachs Group, Inc. (3 Month LIBOR USD + 0.75%) | | | 3.27 | % | | 02/23/2023 | | | 748,112 | |
| | 1,000,000 | | Hasbro, Inc. | | | 3.15 | % | | 05/15/2021 | | | 1,009,080 | |
| | 1,700,000 | | HCA, Inc. | | | 6.50 | % | | 02/15/2020 | | | 1,739,233 | |
| | 1,000,000 | | HCA, Inc. | | | 5.38 | % | | 02/01/2025 | | | 1,081,875 | |
| | 500,000 | | JC Penney Corp, Inc. | | | 8.13 | % | | 10/01/2019 | | | 501,250 | |
| | 1,100,000 | | JC Penney Corp, Inc.^ | | | 5.88 | % | | 07/01/2023 | | | 926,750 | |
| | 1,650,000 | | KeHE Distributors LLC^ | | | 7.63 | % | | 08/15/2021 | | | 1,645,875 | |
| | 1,610,000 | | Lamar Media Corp. | | | 5.75 | % | | 02/01/2026 | | | 1,698,550 | |
| | 460,000 | | Land O’ Lakes, Inc.^ | | | 7.25 | % | | 07/14/2027 | | | 450,800 | |
| | 1,000,000 | | Martin Marietta Materials, Inc. (3 Month LIBOR USD + 0.50%) | | | 2.89 | % | | 12/20/2019 | | | 1,000,055 | |
| | 650,000 | | Matterhorn Merger Sub LLC^ | | | 8.50 | % | | 06/01/2026 | | | 580,125 | |
| | 68,000 | | Mercer International, Inc. | | | 7.75 | % | | 12/01/2022 | | | 70,635 | |
| | 1,500,000 | | Mercer International, Inc. | | | 6.50 | % | | 02/01/2024 | | | 1,558,125 | |
| | 1,500,000 | | Morgan Stanley | | | 2.63 | % | | 11/17/2021 | | | 1,509,647 | |
| | 1,000,000 | | Nathan’s Famous, Inc.^ | | | 6.63 | % | | 11/01/2025 | | | 990,000 | |
| | 1,026,000 | | Neenah, Inc.^ | | | 5.25 | % | | 05/15/2021 | | | 1,027,283 | |
| | 1,500,000 | | NextEra Energy Capital Holdings, Inc. (Fixed until 12/01/2027, then 3 Month LIBOR USD + 2.41%) | | | 4.80 | % | | 12/01/2077 | | | 1,412,379 | |
| | 3,000,000 | | NXP BV^ | | | 4.13 | % | | 06/01/2021 | | | 3,076,800 | |
| | 574,000 | | NXP BV^ | | | 3.88 | % | | 06/18/2026 | | | 590,455 | |
| | 500,000 | | Oasis Petroleum, Inc. | | | 6.88 | % | | 03/15/2022 | | | 500,000 | |
| | 1,715,000 | | Outfront Media Capital LLC | | | 5.88 | % | | 03/15/2025 | | | 1,779,312 | |
| | 250,000 | | Rivers Pittsburgh Borrower L.P.^ | | | 6.13 | % | | 08/15/2021 | | | 254,375 | |
| | 2,280,000 | | ServiceMaster Co. LLC | | | 7.45 | % | | 08/15/2027 | | | 2,453,850 | |
| | 1,000,000 | | Steel Dynamics, Inc. | | | 5.25 | % | | 04/15/2023 | | | 1,018,750 | |
| | 370,000 | | TechnipFMC PLC | | | 3.45 | % | | 10/01/2022 | | | 377,752 | |
| | 1,000,000 | | TransDigm, Inc.^ | | | 6.25 | % | | 03/15/2026 | | | 1,055,000 | |
| | 550,000 | | USA Compression Partners L.P. | | | 6.88 | % | | 04/01/2026 | | | 584,320 | |
| | 2,575,000 | | Viking Cruises, Ltd.^ | | | 5.88 | % | | 09/15/2027 | | | 2,613,625 | |
| | 1,000,000 | | Vulcan Materials Co. (3 Month LIBOR USD + 0.60%) | | | 3.01 | % | | 06/15/2020 | | | 1,000,261 | |
| | 1,300,000 | | West Fraser Timber Co., Ltd.^ | | | 4.35 | % | | 10/15/2024 | | | 1,349,999 | |
| | 1,100,000 | | Zimmer Biomet Holdings, Inc. (3 Month LIBOR USD + 0.75%) | | | 3.17 | % | | 03/19/2021 | | | 1,099,194 | |
Total Corporate Bonds & Notes (Cost $58,235,617) | | | | | | | | | 59,149,272 | |
| | | | | | | | | | | |
| Mortgage Backed Securities — 15.8% | | | | | | | | | | |
| | 400,000 | | BAMLL Commercial Mortgage Securities Trust, Series 2018-DSNY C | | | | | | | | | | |
| | | | (1 Month LIBOR USD + 1.35%)^ | | | 3.74 | % | | 09/15/2034 | | | 396,833 | |
| | 1,300,000 | | BAMLL Commercial Mortgage Securities Trust, Series 2018-DSNY D | | | | | | | | | | |
| | | | (1 Month LIBOR USD + 1.70%)^ | | | 4.09 | % | | 09/15/2034 | | | 1,306,560 | |
| | 2,000,000 | | BAMLL Commercial Mortgage Securities Trust, Series 2019-RLJ D (1 Month LIBOR USD + 1.95%)^ | | | 4.34 | % | | 04/15/2036 | | | 2,002,673 | |
| | 400,000 | | BBCMS Mortgage Trust, Series 2018-TALL C (1 Month LIBOR USD + 1.12%)^ | | | 3.52 | % | | 03/16/2037 | | | 400,008 | |
The accompanying notes are an integral part of these financial statements.
www.brownadvisory.com/mf
Brown Advisory Strategic Bond FundSchedule of Investments
June 30, 2019
| Par Value | | Security Description | | Rate | | Maturity | | Value $ | |
| Mortgage Backed Securities — 15.8% (Continued) | |
| | 406,062 | | BX Commercial Mortgage Trust, Series 2018-IND B (1 Month LIBOR USD + 0.90%)^ | | | 3.29 | % | | 11/15/2035 | | | 406,349 | |
| | 812,124 | | BX Commercial Mortgage Trust, Series 2018-IND D (1 Month LIBOR USD + 1.30%)^ | | | 3.69 | % | | 11/15/2035 | | | 812,737 | |
| | 2,500,000 | | CGDBB Commercial Mortgage Trust, Series 2017-BIOC E (1 Month LIBOR USD + 2.15%)^ | | | 4.54 | % | | 07/15/2032 | | | 2,502,476 | |
| | 1,000,000 | | CORE Mortgage Trust, Series 2019-CORE D (1 Month LIBOR USD + 1.65%)^ | | | 4.04 | % | | 12/15/2031 | | | 1,002,430 | |
| | 2,000,000 | | CSMC, Series 2019-ICE4 E (1 Month LIBOR USD + 2.15%)^ | | | 4.54 | % | | 05/15/2036 | | | 2,009,849 | |
| | 2,000,000 | | DBGS Mortgage Trust, Series 2018-C1 7EA^ | | | 4.64 | % | | 10/17/2051 | | | 2,081,954 | |
| | 804,123 | | FHLMC REMIC, Series 4107 LI~ | | | 3.00 | % | | 08/15/2027 | | | 131,420 | |
| | 1,445,111 | | FHLMC REMIC, Series 4143 IA~ | | | 3.50 | % | | 09/15/2042 | | | 158,383 | |
| | 335,000 | | FHLMC SCRTT, Series 2016-1 M1#^ | | | 3.00 | % | | 09/25/2055 | | | 327,074 | |
| | 531,262 | | FHLMC STACR, Series 2014-DN1 M2 (1 Month LIBOR USD + 2.20%) | | | 4.60 | % | | 02/26/2024 | | | 540,493 | |
| | 1,726,865 | | FHLMC STACR, Series 2016-DNA2 M2 (1 Month LIBOR USD + 2.20%) | | | 4.60 | % | | 10/25/2028 | | | 1,732,245 | |
| | 757,934 | | FHLMC STACR, Series 2016-HQA3 M2 (1 Month LIBOR USD + 1.35%) | | | 3.75 | % | | 03/26/2029 | | | 763,124 | |
| | 4,126,753 | | FHMS, Series K-021 X1#~ | | | 1.44 | % | | 06/25/2022 | | | 151,127 | |
| | 1,983,998 | | FHMS, Series K-721 X1#~ | | | 0.33 | % | | 08/25/2022 | | | 19,161 | |
| | 2,514,779 | | FHMS, Series K-023 X1#~ | | | 1.25 | % | | 08/25/2022 | | | 83,910 | |
| | 10,305,032 | | FHMS, Series K-C02 X1#~ | | | 0.37 | % | | 03/25/2024 | | | 170,585 | |
| | 10,398,525 | | FHMS, Series K-734 X1#~ | | | 0.79 | % | | 02/25/2026 | | | 392,327 | |
| | 674,959 | | FHMS, Series K-058 X1#~ | | | 0.93 | % | | 08/25/2026 | | | 38,308 | |
| | 3,000,000 | | FHMS, Series K-C04 X1#~ | | | 1.25 | % | | 12/25/2026 | | | 209,978 | |
| | 1,386,640 | | FHMS, Series K-W03 X1#~ | | | 0.84 | % | | 06/25/2027 | | | 71,739 | |
| | 9,962,106 | | FHMS, Series K-070 X1#~ | | | 0.33 | % | | 11/25/2027 | | | 254,293 | |
| | 761,104 | | FHMS, Series Q-006 APT1# | | | 2.62 | % | | 04/25/2028 | | | 809,223 | |
| | 4,996,027 | | FHMS, Series K-087 X1#~ | | | 0.36 | % | | 12/25/2028 | | | 160,145 | |
| | 918,542 | | FHMS, Series Q-004 A2H# | | | 3.05 | % | | 01/25/2046 | | | 923,159 | |
| | 265,223 | | FNMA, Pool# AB9392 | | | 2.50 | % | | 05/01/2023 | | | 267,957 | |
| | 190,862 | | FNMA, Pool# 815323 (6 Month LIBOR USD + 1.53%) | | | 4.24 | % | | 01/01/2035 | | | 197,511 | |
| | 176,519 | | FNMA, Pool# 813714 (1 Year CMT Rate + 1.94%) | | | 4.57 | % | | 01/01/2035 | | | 184,439 | |
| | 55,735 | | FNMA, Pool# 910181 (12 Month LIBOR USD + 1.71%) | | | 4.79 | % | | 03/01/2037 | | | 58,793 | |
| | 168,630 | | FNMA, Pool# 915191 (12 Month LIBOR USD + 1.70%) | | | 4.58 | % | | 04/01/2037 | | | 178,081 | |
| | 401,394 | | FNMA, Pool# AL6262 (1 Year CMT Rate + 2.38%) | | | 4.80 | % | | 04/01/2038 | | | 419,536 | |
| | 128,537 | | FNMA, Pool# 965184 (12 Month LIBOR USD + 1.59%) | | | 4.34 | % | | 09/01/2038 | | | 133,266 | |
| | 256,652 | | FNMA, Pool# 947512 (12 Month LIBOR USD + 1.75%) | | | 4.50 | % | | 09/01/2047 | | | 269,884 | |
| | 582,276 | | FNMA REMIC Trust, Series 2012-65 HJ | | | 5.00 | % | | 07/25/2040 | | | 646,390 | |
| | 780,000 | | FREMF Mortgage Trust, Series 2017-K729 B#^ | | | 3.80 | % | | 11/25/2049 | | | 800,386 | |
| | 90,000 | | FREMF Mortgage Trust, Series 2011-K10 B#^ | | | 4.62 | % | | 11/25/2049 | | | 92,163 | |
| | 207,790 | | GNMA, Pool# 004527M | | | 5.00 | % | | 09/20/2024 | | | 226,163 | |
| | 548,151 | | GNMA REMIC Trust, Series 2014-45 B1#~ | | | 0.74 | % | | 07/16/2054 | | | 22,246 | |
| | 461,103 | | GNMA REMIC Trust, Series 2014-135 I0#~ | | | 0.81 | % | | 01/16/2056 | | | 22,908 | |
| | 441,267 | | GNMA REMIC Trust, Series 2015-172 I0#~ | | | 0.87 | % | | 03/16/2057 | | | 25,471 | |
| | 591,177 | | GNMA REMIC Trust, Series 2016-40 I0#~ | | | 0.73 | % | | 07/16/2057 | | | 31,349 | |
| | 482,192 | | GNMA REMIC Trust, Series 2016-56 I0#~ | | | 0.92 | % | | 11/16/2057 | | | 32,582 | |
| | 630,257 | | GNMA REMIC Trust, Series 2016-98 I0#~ | | | 0.95 | % | | 05/16/2058 | | | 44,388 | |
| | 2,000,000 | | Great Wolf Trust, Series 2017-WOLF D (1 Month LIBOR USD + 2.10%)^ | | | 4.49 | % | | 09/15/2034 | | | 2,002,799 | |
| | 500,000 | | GSMS, Series 2018-FBLU C (1 Month LIBOR USD + 1.60%)^ | | | 3.99 | % | | 11/15/2035 | | | 499,949 | |
| | 1,250,000 | | GSMS, Series 2018-FBLU D (1 Month LIBOR USD + 2.00%)^ | | | 4.39 | % | | 11/15/2035 | | | 1,248,997 | |
| | 750,000 | | HPLY Trust, Series 2019-HIT D (1 Month LIBOR USD + 2.00%)^ | | | 4.39 | % | | 11/17/2036 | | | 753,038 | |
| | 1,000,000 | | JPMCC, Series 2019-MFP E (1 Month LIBOR USD + 2.16%)^ | | | 4.54 | % | | 07/15/2036 | | | 1,000,000 | |
| | 385,000 | | MAD Mortgage Trust, Series 2017-330M B#^ | | | 3.48 | % | | 08/17/2034 | | | 393,253 | |
| | 275,000 | | MSC, Series 2017-CLS C (1 Month LIBOR USD + 1.00%)^ | | | 3.39 | % | | 11/15/2034 | | | 274,280 | |
| | 925,000 | | MSC, Series 2017-CLS D (1 Month LIBOR USD + 1.40%)^ | | | 3.79 | % | | 11/15/2034 | | | 925,224 | |
| | 1,000,000 | | Velocity Commercial Capital Loan Trust, Series 2016-2 M1# | | | 3.66 | % | | 10/25/2046 | | | 1,032,805 | |
| | 500,000 | | Velocity Commercial Capital Loan Trust, Series 2017-1 M1#^ | | | 3.55 | % | | 05/25/2047 | | | 500,255 | |
| | 434,419 | | Velocity Commercial Capital Loan Trust, Series 2018-2 A#^ | | | 4.05 | % | | 10/25/2048 | | | 444,871 | |
| Total Mortgage Backed Securities (Cost $32,187,177) | | |
| 32,587,547 |
The accompanying notes are an integral part of these financial statements.
www.brownadvisory.com/mf
Brown Advisory Strategic Bond FundSchedule of Investments
June 30, 2019
| Par | | | | | | | | | | |
| Value/Shares | | Security Description | | Rate | | Maturity | | Value $ | |
| Municipal Bonds — 2.6% | |
| | 2,500,000 | | District of Columbia# | | | 6.50 | % | | 08/01/2038 | | 2,500,000 | |
| | 400,000 | | District of Columbia# | | | 6.60 | % | | 08/01/2038 | | 400,000 | |
| | 685,000 | | Mosaic District Community Development Authority | | | 7.25 | % | | 03/01/2036 | | 718,853 | |
| | 225,000 | | North Texas Tollway Authority | | | 8.91 | % | | 02/01/2030 | | 233,368 | |
| | 500,000 | | Public Finance Authority^ | | | 5.00 | % | | 09/01/2030 | | 536,350 | |
| | 370,000 | | Utah Charter School Finance Authority | | | 5.80 | % | | 06/15/2038 | | 370,751 | |
| | 450,000 | | Washington State Housing Finance Commission^ | | | 4.00 | % | | 01/01/2024 | | 454,266 | |
| | 130,000 | | Yamhill County Oregon Hospital Authority | | | 3.50 | % | | 11/15/2020 | | 130,054 | |
Total Municipal Bonds (Cost $5,219,315) | | | | | | | | 5,343,642 | |
| | |
| Preferred Stocks — 0.7% | |
| | 16,475 | | AGNC Investment Corp., Series B, 7.75% | | | | | | | | 421,431 | |
| | 29,576 | | AGNC Investment Corp., Series C, 7.00% | | | | | | | | | |
| | | | (Fixed until 10/15/2022, then 3 Month LIBOR USD + 5.11%) | | | | | | | | 768,976 | |
| | 10,000 | | Annaly Capital Management, Inc., Series G, 6.50% | | | | | | | | | |
| | | | (Fixed until 03/31/2023, then 3 Month LIBOR USD + 4.17%) | | | | | | | | 242,000 | |
Total Preferred Stocks (Cost $1,418,105) | | | | | | | | 1,432,407 | |
| | |
| Short-Term Investments — 3.5% | |
| | |
| Money Market Funds — 3.5% | |
| | 7,256,947 | | First American Government Obligations Fund — Class Z, 2.26%* | | | | | | | | 7,256,947 | |
Total Short-Term Investments (Cost $7,256,947) | | | 7,256,947 |
Total Investments — 99.8% (Cost $203,739,489) | | | 205,598,864 |
Other Assets in Excess of Liabilities — 0.2% | | | 491,520 |
| NET ASSETS — 100.0% | | $ | 206,090,384 |
| # | Variable rate security. Rate disclosed is as of June 30, 2019. |
| ^ | Security exempt from registration under Rule 144A of the Securities Act of 1933. These securities may be resold in transactions exempt from registration, normally to qualified institutional buyers. |
| ~ | Interest Only Security |
| * | Annualized seven-day yield as of June 30, 2019. |
The accompanying notes are an integral part of these financial statements.
www.brownadvisory.com/mf
Brown Advisory Sustainable Bond FundA Message to Our Shareholders
June 30, 2019
Dear Shareholders:
During the year ended June 30, 2019, the Brown Advisory Sustainable Bond Fund – Investor Shares (the “Fund”) was up 7.54% trailing the 7.87% return for the Bloomberg Barclays US Aggregate Bond Index (the “Index”), the Fund’s benchmark.
The Fund aims to generate performance primarily through individual security selection that augments fundamental credit analysis with integrated ESG research. The Fund seeks to identify and invest in issuers whose ESG characteristics strengthen their credit profiles, as well as issuers whose use of proceeds create positive environmental and social impacts. Duration and sector weightings are set mainly by an analysis of the intermediate-term risk/reward, as opposed to any particular macro forecast.
The second half of 2018 was a tumultuous period for credit markets. Spreads of all types widened significantly, especially during the 4th quarter, where both high-yield and investment-grade corporate bonds had their worst quarters since 2011. Our investment philosophy of seeking alpha through individual bond selection naturally leads us to owning more spread bonds and fewer Treasury bonds. While this was detrimental to performance the second half of 2018, this has been a major driver of the Fund’s strong longer-term track record.
The first half of 2019 was strong, and the Fund outperformed the Index. Credit had weakened substantially. We did not want to lose alpha opportunities so we kept our corporate overweight by percentage, but underweighted by duration. This left us underweight beta but overweight alpha. If we continue to see weakness we should be less exposed with our position in shorter-term bonds. This is one way we hope to maintain strong relative performance even if credit markets underperform.
Our biggest performance drivers have been strong credit selection, credit overweight generally, mortgage-backed securities (MBS) underweight and yield curve positioning. We added some duration outright as well as overweighted the 5-10 year part of the curve. Both of these were meant to add performance in a situation where the Fed was cutting rates. This position was less about a call on interest rates and more of a hedge against the economy weakening. Interest rates have fallen this year, and the fact that the 5-10 year area has been the best performing segment has helped relative performance.
While we are always disappointed about periods of underperformance, we are pleased with the portfolio’s potential looking forward. We come in with a strong idea of how a bond should perform in an adverse market, and this allows us to weather periods of volatility from a position of strength. In the long run, we believe this focus on downside plus a strong level of income generation should result in outperformance.
Sincerely,
Thomas D.D. Graff, CFA
Portfolio Manager
Amy Hauter, CFA
Portfolio Manager
Past performance is not a guarantee of future results.
Mutual fund investing involves risk. Principal loss is possible. Investments in debt securities typically decrease in value when interest rates rise. This risk is usually greater for longer-term debt securities. Investments in Asset-Backed and Mortgage-Backed securities include additional risks that investor should be aware of including credit risk, prepayment risk, possible illiquidity and default, as well as increased susceptibility to adverse economic developments. Investments in lower rated and non-rated securities present a great risk of loss to principal and interest than higher rated securities. In addition, the fund is susceptible to risks from investments in derivatives, U.S. Government securities, and changes in interest rates. Income from tax-exempt funds may be subject to state and local taxes and a portion of income may be subject to the Federal Alternative minimum tax for certain investors.
Fund holdings and sector allocations are subject to change and should not be considered a recommendation to buy or sell any security. For a complete list of fund holdings, please refer to the Schedule of Investments provided in this report.
Definitions for terms and indices are provided in the Glossary of Terms.
www.brownadvisory.com/mf
Brown Advisory Sustainable Bond FundPerformance Information & Portfolio Holdings Summary
June 30, 2019
GROWTH OF A $10,000 INVESTMENT
The following chart reflects the change in value of a hypothetical $10,000 investment, including reinvested dividends and distributions, in the Fund as measured against a broad-based securities market index. The Bloomberg Barclays US Aggregate Bond Index (“Index”) is a broad-based benchmark that measures the investment grade US dollar-denominated, fixed rate taxable bond market. The Index includes Treasuries, government-related and corporate securities, MBS, ABS and CMBS. The Index is unmanaged and does not reflect the deduction of fees, such as investment management fees. Investors cannot invest directly in an index.
| PORTFOLIO HOLDINGS | % of Net Assets |
Corporate Bonds & Notes | | | 39.8 | % | |
Mortgage Backed Securities | | | 32.0 | % | |
Municipal Bonds | | | 13.0 | % | |
Asset Backed Securities | | | 7.9 | % | |
Foreign Government Bonds | | | 2.7 | % | |
U.S. Treasury Notes | | | 1.2 | % | |
Money Market Funds | | | 0.0 | % | |
Other Assets and Liabilities | | | 3.4 | % | |
| | | | 100.0 | % | |
| | | Since Inception |
Average Annual Total Return | One Year | (8/7/17) |
Institutional Shares1 | 7.60% | 3.27% |
| Investor Shares | 7.54% | 3.21% |
| Bloomberg Barclays US Aggregate Bond Index | 7.87% | 3.50% |
| | Institutional Shares | Investor Shares |
Gross Expense Ratio2 | 0.67% | 0.72% |
Net Expense Ratio2 | 0.56% | 0.61% |
Past performance does not guarantee future results. The performance data quoted represents past performance and current returns may be lower or higher. The investment return and net asset value will fluctuate so that an investor’s shares, when redeemed, may be worth more or less than the original cost. To obtain performance information current to the most recent month end, please visit our website at brownadvisory.com/mf/sustainable-bond-fund. The performance table and graph above do not reflect the deduction of taxes that a shareholder would pay on Fund distributions or the redemption of Fund shares. Investment performance reflects periods during which fee waivers were in effect. In the absence of such waivers, total return would have been reduced. Performance data does not reflect the imposition of the redemption fee of 1.00% on shares redeemed within 14 days, and if it did, performance would have been lower. Short-term performance, in particular, is not a good indication of the Fund’s future performance, and an investment should not be made based solely on returns. Returns shown are calculated using the net asset values (“NAV”) that were used for shareholder transactions as of the respective period ends. These NAV, and the returns calculated from them, may differ from the NAV and returns shown elsewhere in this report.
1 | Performance information for the Institutional Shares, prior to commencement of operations on July 2, 2018, is based on the performance of Investor Shares, and adjusted for the lower expenses applicable to Institutional Shares. |
2 | Per the Fund’s prospectus dated October 31, 2018. Refer to the financial highlights for the gross and net expense ratios for the year ended as of the date of this report. Please note that the expense ratios per the prospectus include acquired fund fees and expenses (as applicable) and the expense ratios in the financial highlights do not. |
www.brownadvisory.com/mf
Brown Advisory Sustainable Bond FundSchedule of Investments
June 30, 2019
| Par Value | | Security Description | | Rate | | Maturity | | Value $ | |
| Corporate Bonds & Notes — 39.8% | |
| | 1,630,000 | | Albemarle Corp. | | | 4.15 | % | | 12/01/2024 | | | 1,723,697 | |
| | 1,150,000 | | Alexandria Real Estate Equities, Inc. | | | 3.80 | % | | 04/15/2026 | | | 1,209,875 | |
| | 1,730,000 | | Allison Transmission, Inc.^ | | | 4.75 | % | | 10/01/2027 | | | 1,725,675 | |
| | 1,750,000 | | American Tower Corp. | | | 3.13 | % | | 01/15/2027 | | | 1,737,713 | |
| | 1,635,000 | | Analog Devices, Inc. | | | 3.90 | % | | 12/15/2025 | | | 1,728,370 | |
| | 1,100,000 | | AstraZeneca PLC | | | 3.38 | % | | 11/16/2025 | | | 1,151,940 | |
| | 1,080,000 | | AvalonBay Communities, Inc. | | | 4.20 | % | | 12/15/2023 | | | 1,158,240 | |
| | 1,890,000 | | Ball Corp. | | | 4.88 | % | | 03/15/2026 | | | 2,012,850 | |
| | 1,390,000 | | Bank of America Corp. (Fixed until 05/17/2021, then 3 Month LIBOR USD + 0.63%) | | | 3.50 | % | | 05/17/2022 | | | 1,417,147 | |
| | 1,400,000 | | Boston Properties L.P. | | | 3.65 | % | | 02/01/2026 | | | 1,455,765 | |
| | 560,000 | | BWAY Holding Co.^ | | | 7.25 | % | | 04/15/2025 | | | 542,500 | |
| | 790,000 | | Children’s Hospital Corp. | | | 4.12 | % | | 01/01/2047 | | | 874,923 | |
| | 1,155,000 | | Clorox Co. | | | 3.10 | % | | 10/01/2027 | | | 1,183,530 | |
| | 585,000 | | Core & Main L.P.^ | | | 6.13 | % | | 08/15/2025 | | | 593,775 | |
| | 1,205,000 | | CVS Health Corp. | | | 4.30 | % | | 03/25/2028 | | | 1,271,730 | |
| | 1,425,000 | | Digital Realty Trust L.P. | | | 3.95 | % | | 07/01/2022 | | | 1,485,648 | |
| | 2,205,000 | | Duke Energy Progress LLC | | | 3.45 | % | | 03/15/2029 | | | 2,326,747 | |
| | 1,885,000 | | Ecolab, Inc. | | | 4.35 | % | | 12/08/2021 | | | 1,980,293 | |
| | 1,135,000 | | Equinix, Inc. | | | 5.38 | % | | 01/01/2022 | | | 1,167,631 | |
| | 1,090,000 | | Express Scripts Holding Co. | | | 4.50 | % | | 02/25/2026 | | | 1,177,179 | |
| | 610,000 | | Graphic Packaging International LLC^ | | | 4.75 | % | | 07/15/2027 | | | 627,538 | |
| | 1,740,000 | | Hasbro, Inc. | | | 3.50 | % | | 09/15/2027 | | | 1,767,308 | |
| | 1,108,000 | | JB Hunt Transport Services, Inc. | | | 3.88 | % | | 03/01/2026 | | | 1,161,297 | |
| | 20,000 | | Kaiser Foundation Hospitals | | | 3.15 | % | | 05/01/2027 | | | 20,639 | |
| | 1,670,000 | | Keysight Technologies, Inc. | | | 4.55 | % | | 10/30/2024 | | | 1,788,397 | |
| | 1,435,000 | | Kroger Co. | | | 3.70 | % | | 08/01/2027 | | | 1,480,248 | |
| | 1,715,000 | | Land O’ Lakes, Inc.^ | | | 7.25 | % | | 07/14/2027 | | | 1,680,700 | |
| | 1,135,000 | | MidAmerican Energy Co. | | | 3.10 | % | | 05/01/2027 | | | 1,166,924 | |
| | 595,000 | | NextEra Energy Capital Holdings, Inc. (Fixed until 12/01/2027, then 3 Month LIBOR USD + 2.41%) | | | 4.80 | % | | 12/01/2077 | | | 560,244 | |
| | 2,245,000 | �� | Northwell Healthcare, Inc. | | | 4.26 | % | | 11/01/2047 | | | 2,400,661 | |
| | 1,245,000 | | NXP BV^ | | | 3.88 | % | | 06/18/2026 | | | 1,280,690 | |
| | 1,200,000 | | Regency Centers L.P. | | | 3.75 | % | | 06/15/2024 | | | 1,250,778 | |
| | 1,110,000 | | Trimble, Inc. | | | 4.90 | % | | 06/15/2028 | | | 1,190,275 | |
| | 900,000 | | Trustees of the University of Pennsylvania | | | 4.01 | % | | 08/15/2047 | | | 906,661 | |
| | 1,620,000 | | Verisk Analytics, Inc. | | | 4.00 | % | | 06/15/2025 | | | 1,731,230 | |
| | 1,640,000 | | Verizon Communications, Inc. | | | 3.88 | % | | 02/08/2029 | | | 1,760,626 | |
| | 1,835,000 | | West Fraser Timber Co., Ltd.^ | | | 4.35 | % | | 10/15/2024 | | | 1,905,575 | |
Total Corporate Bonds & Notes (Cost $48,605,513) | | |
| 50,605,019 |
| | |
| Mortgage Backed Securities — 32.0% | |
| | 500,000 | | CAMB Commercial Mortgage Trust, Series 2019-LIFE B (1 Month LIBOR USD + 1.25%)^ | | | 3.64 | % | | 12/15/2037 | | | 502,203 | |
| | 500,000 | | CAMB Commercial Mortgage Trust, Series 2019-LIFE C (1 Month LIBOR USD + 1.45%)^ | | | 3.84 | % | | 12/15/2037 | | | 502,840 | |
| | 1,500,000 | | CGDBB Commercial Mortgage Trust, Series 2017-BIOC D (1 Month LIBOR USD + 1.60%)^ | | | 3.99 | % | | 07/15/2032 | | | 1,504,027 | |
| | 500,000 | | CGDBB Commercial Mortgage Trust, Series 2017-BIOC E (1 Month LIBOR USD + 2.15%)^ | | | 4.54 | % | | 07/15/2032 | | | 500,495 | |
| | 750,000 | | CORE Mortgage Trust, Series 2019-CORE C (1 Month LIBOR USD + 1.30%)^ | | | 3.69 | % | | 12/15/2031 | | | 751,310 | |
| | 500,000 | | CSMC, Series 2019-ICE4 C (1 Month LIBOR USD + 1.43%)^ | | | 3.82 | % | | 05/15/2036 | | | 501,738 | |
| | 750,000 | | CSMC, Series 2019-ICE4 D (1 Month LIBOR USD + 1.60%)^ | | | 3.99 | % | | 05/15/2036 | | | 753,096 | |
| | 142,942 | | FHLMC STACR, Series 2014-HQ2 M2 (1 Month LIBOR USD + 2.20%) | | | 4.60 | % | | 09/25/2024 | | | 145,253 | |
| | 344,609 | | FHLMC STACR, Series 2015-HQA2 M2 (1 Month LIBOR USD + 2.80%) | | | 5.20 | % | | 05/25/2028 | | | 349,558 | |
| | 689,867 | | FHLMC STACR, Series 2016-HQA3 M2 (1 Month LIBOR USD + 1.35%) | | | 3.75 | % | | 03/26/2029 | | | 694,591 | |
| | 207,984 | | FHMS, Series K-W01 A1 | | | 2.59 | % | | 05/25/2025 | | | 211,929 | |
| | 600,000 | | FHMS, Series K-G01 A7 | | | 2.88 | % | | 04/25/2026 | | | 621,098 | |
| | 594,274 | | FHMS, Series K-W03 X1#~ | | | 0.84 | % | | 06/25/2027 | | | 30,745 | |
| | 300,000 | | FHMS, Series K-W03 A2 | | | 3.02 | % | | 06/25/2027 | | | 309,678 | |
| | 856,242 | | FHMS, Series Q-006 APT1# | | | 2.62 | % | | 04/25/2028 | | | 910,376 | |
| | 1,333,965 | | FHMS, Series K-W07 A1 | | | 3.60 | % | | 07/25/2028 | | | 1,419,835 | |
| | 641,917 | | FHMS, Series K-W04 A (1 Month LIBOR USD + 0.24%) | | | 2.67 | % | | 09/25/2028 | | | 639,872 | |
| | | | | | | | | | | | | | |
The accompanying notes are an integral part of these financial statements.
www.brownadvisory.com/mf
Brown Advisory Sustainable Bond FundSchedule of Investments
June 30, 2019
| Par Value | | Security Description | | Rate | | Maturity | | Value $ | |
| Mortgage Backed Securities — 32.0% (Continued) | |
| | 5,500,000 | | FHMS, Series K-G01 X1#~ | | | 0.97 | % | | 04/25/2029 | | | 392,304 | |
| | 886,483 | | FHMS, Series Q-008 A (1 Month LIBOR USD + 0.39%) | | | 2.82 | % | | 10/25/2045 | | | 877,639 | |
| | 429,746 | | FHMS, Series Q-004 A2H# | | | 3.05 | % | | 01/25/2046 | | | 431,906 | |
| | 1,103,271 | | FHMS, Series Q-007 APT1# | | | 2.99 | % | | 10/25/2047 | | | 1,123,115 | |
| | 659,104 | | FNMA, Pool# AN6116 | | | 2.85 | % | | 07/01/2027 | | | 680,415 | |
| | 500,000 | | FNMA, Pool# AN6558 | | | 2.91 | % | | 09/01/2027 | | | 518,803 | |
| | 275,536 | | FNMA, Pool# AS2826 | | | 4.00 | % | | 07/01/2044 | | | 289,452 | |
| | 275,631 | | FNMA, Pool# AS3724 | | | 3.50 | % | | 11/01/2044 | | | 285,146 | |
| | 255,895 | | FNMA, Pool# AS5917 | | | 3.50 | % | | 10/01/2045 | | | 264,009 | |
| | 361,368 | | FNMA, Pool# AS6127 | | | 3.50 | % | | 11/01/2045 | | | 372,826 | |
| | 289,149 | | FNMA, Pool# AS8808 | | | 3.50 | % | | 02/01/2047 | | | 297,864 | |
| | 982,873 | | FNMA, Pool# BJ4049 | | | 4.00 | % | | 05/01/2048 | | | 1,027,619 | |
| | 294,849 | | FNMA, Pool# BJ4051 | | | 4.50 | % | | 05/01/2048 | | | 315,707 | |
| | 196,849 | | FNMA, Pool# BJ4050 | | | 4.50 | % | | 05/01/2048 | | | 212,387 | |
| | 197,016 | | FNMA, Pool# BJ4052 | | | 4.50 | % | | 05/01/2048 | | | 209,737 | |
| | 197,336 | | FNMA, Pool# BK5105 | | | 5.50 | % | | 05/01/2048 | | | 215,010 | |
| | 197,034 | | FNMA, Pool# BJ4057 | | | 4.50 | % | | 06/01/2048 | | | 208,087 | |
| | 177,613 | | FNMA, Pool# BK8032 | | | 5.50 | % | | 06/01/2048 | | | 193,520 | |
| | 246,794 | | FNMA, Pool# BJ4061 | | | 4.50 | % | | 07/01/2048 | | | 264,175 | |
| | 246,636 | | FNMA, Pool# BJ4060 | | | 4.50 | % | | 07/01/2048 | | | 266,168 | |
| | 245,619 | | FNMA, Pool# BJ4062 | | | 4.50 | % | | 07/01/2048 | | | 259,785 | |
| | 988,842 | | FNMA, Pool# BJ4067 | | | 4.50 | % | | 08/01/2048 | | | 1,046,275 | |
| | 1,200,076 | | FNMA, Pool# BJ4070 | | | 4.00 | % | | 09/01/2048 | | | 1,253,392 | |
| | 247,127 | | FNMA, Pool# BJ4072 | | | 4.50 | % | | 09/01/2048 | | | 264,534 | |
| | 259,074 | | FNMA, Pool# BJ4073 | | | 4.50 | % | | 09/01/2048 | | | 275,189 | |
| | 236,111 | | FNMA, Pool# BJ4075 | | | 5.00 | % | | 09/01/2048 | | | 257,617 | |
| | 197,590 | | FNMA, Pool# BN0202 | | | 5.50 | % | | 09/01/2048 | | | 215,288 | |
| | 494,639 | | FNMA, Pool# BJ4078 | | | 4.50 | % | | 10/01/2048 | | | 525,254 | |
| | 495,901 | | FNMA, Pool# BJ4079 | | | 5.00 | % | | 10/01/2048 | | | 534,193 | |
| | 495,840 | | FNMA, Pool# BJ4082 | | | 5.00 | % | | 11/01/2048 | | | 539,190 | |
| | 298,269 | | FNMA, Pool# BN4936 | | | 5.50 | % | | 12/01/2048 | | | 322,783 | |
| | 298,495 | | FNMA, Pool# BN4921 | | | 5.50 | % | | 01/01/2049 | | | 323,028 | |
| | 497,863 | | FNMA, Pool# BJ4085 | | | 4.50 | % | | 02/01/2049 | | | 532,434 | |
| | 498,049 | | FNMA, Pool# BJ4086 | | | 5.00 | % | | 02/01/2049 | | | 538,777 | |
| | 300,000 | | FNMA REMIC Trust, Series 2017-M10 AV2# | | | 2.65 | % | | 07/25/2024 | | | 305,243 | |
| | 80,000 | | FNMA REMIC Trust, Series 2017-M2 A2# | | | 2.88 | % | | 02/25/2027 | | | 82,385 | |
| | 831,000 | | FNMA REMIC Trust, Series 2017-M13 A2# | | | 3.04 | % | | 09/25/2027 | | | 859,376 | |
| | 865,000 | | FNMA REMIC Trust, Series 2017-M15 A2# | | | 3.06 | % | | 09/25/2027 | | | 902,853 | |
| | 1,358,809 | | FNMA REMIC Trust, Series 2018-M2 A1# | | | 2.90 | % | | 01/25/2028 | | | 1,410,274 | |
| | 1,900,000 | | FNMA REMIC Trust, Series 2018-M2 A2# | | | 3.00 | % | | 01/25/2028 | | | 1,963,251 | |
| | 1,600,000 | | FNMA REMIC Trust, Series 2018-M8 A2# | | | 3.44 | % | | 06/25/2028 | | | 1,706,521 | |
| | 930,000 | | FNMA REMIC Trust, Series 2019-M1 A2# | | | 3.67 | % | | 09/25/2028 | | | 1,010,271 | |
| | 1,070,252 | | FNMA REMIC Trust, Series 2018-M13 A1# | | | 3.82 | % | | 09/25/2030 | | | 1,168,644 | |
| | 1,000,000 | | FREMF Mortgage Trust, Series 2019-K89 B#^ | | | 4.43 | % | | 01/25/2051 | | | 1,057,973 | |
| | 1,000,000 | | FREMF Mortgage Trust, Series 2019-K734 B#^ | | | 4.19 | % | | 02/25/2051 | | | 1,055,310 | |
| | 500,000 | | JPMCC, Series 2019-MFP C (1 Month LIBOR USD + 1.36%)^ | | | 3.74 | % | | 07/15/2036 | | | 500,000 | |
| | 500,000 | | JPMCC, Series 2019-MFP E (1 Month LIBOR USD + 2.16%)^ | | | 4.54 | % | | 07/15/2036 | | | 500,000 | |
| | 645,000 | | KNDL Mortgage Trust, Series 2019-KNSQ C (1 Month LIBOR USD + 1.05%)^ | | | 3.44 | % | | 05/15/2036 | | | 647,425 | |
| | 500,000 | | KNDL Mortgage Trust, Series 2019-KNSQ D (1 Month LIBOR USD + 1.35%)^ | | | 3.74 | % | | 05/15/2036 | | | 501,871 | |
| | 200,000 | | MSC, Series 2017-CLS A (1 Month LIBOR USD + 0.70%)^ | | | 3.09 | % | | 11/15/2034 | | | 199,974 | |
| | 100,000 | | MSC, Series 2017-CLS C (1 Month LIBOR USD + 1.00%)^ | | | 3.39 | % | | 11/15/2034 | | | 99,738 | |
| | 1,110,000 | | MSC, Series 2017-CLS D (1 Month LIBOR USD + 1.40%)^ | | | 3.79 | % | | 11/15/2034 | | | 1,110,269 | |
Total Mortgage Backed Securities (Cost $39,582,824) | | |
| 40,763,650 |
The accompanying notes are an integral part of these financial statements.
www.brownadvisory.com/mf
Brown Advisory Sustainable Bond FundSchedule of Investments
June 30, 2019
| Par Value | | Security Description | | Rate | | Maturity | | Value $ | |
| Municipal Bonds — 13.0% | |
| | 300,000 | | Atlanta Development Authority | | | 3.57 | % | | 12/01/2036 | | | 311,142 | |
| | 1,800,000 | | District of Columbia# | | | 6.50 | % | | 08/01/2038 | | | 1,800,000 | |
| | 75,000 | | District of Columbia# | | | 6.60 | % | | 08/01/2038 | | | 75,000 | |
| | 1,060,000 | | Grant County Washington Public Utility District No. 2 | | | 5.63 | % | | 01/01/2027 | | | 1,284,211 | |
| | 565,000 | | Honolulu, City & County Hawaii | | | 3.12 | % | | 09/01/2023 | | | 591,521 | |
| | 100,000 | | Honolulu, City & County Hawaii | | | 3.00 | % | | 09/01/2027 | | | 104,138 | |
| | 850,000 | | Honolulu, City & County Hawaii | | | 4.00 | % | | 09/01/2036 | | | 896,699 | |
| | 30,000 | | Los Angeles California Community College District | | | 6.60 | % | | 08/01/2042 | | | 44,885 | |
| | 430,000 | | Los Angeles California Wastewater System Revenue | | | 3.49 | % | | 06/01/2029 | | | 459,597 | |
| | 30,000 | | Maryland Community Development Administration | | | 3.24 | % | | 09/01/2048 | | | 30,296 | |
| | 110,000 | | Massachusetts, Commonwealth of | | | 3.28 | % | | 06/01/2046 | | | 109,306 | |
| | 530,000 | | Miami-Dade County Florida Aviation | | | 3.98 | % | | 10/01/2041 | | | 543,822 | |
| | 675,000 | | Miami-Dade County Florida Educational Facilities Authority | | | 4.47 | % | | 04/01/2051 | | | 713,880 | |
| | 650,000 | | Montgomery County Virginia Economic Development Authority | | | 3.95 | % | | 06/01/2039 | | | 675,929 | |
| | 340,000 | | New York State Dormitory Authority | | | 4.00 | % | | 07/01/2039 | | | 356,357 | |
| | 780,000 | | New York State Environmental Facilities Corp. | | | 2.77 | % | | 07/15/2031 | | | 784,352 | |
| | 100,000 | | Ohio Air Quality Development Authority^ | | | 3.75 | % | | 01/15/2028 | | | 106,854 | |
| | 475,000 | | Oregon State University | | | 3.75 | % | | 04/01/2049 | | | 485,122 | |
| | 250,000 | | Pennsylvania Economic Development | | | 3.20 | % | | 11/15/2027 | | | 258,813 | |
| | 20,000 | | San Diego California Redevelopment Agency Successor Agency | | | 4.00 | % | | 09/01/2040 | | | 20,734 | |
| | 500,000 | | San Francisco, City & County of California Community Facilities District No. 2014-1 | | | 3.75 | % | | 09/01/2037 | | | 516,295 | |
| | 595,000 | | San Francisco, City & County of California Community Facilities District No. 2014-1 | | | 4.37 | % | | 09/01/2049 | | | 628,861 | |
| | 60,000 | | San Francisco, City & County of California Public Utilities Commission Water Revenue | | | 3.55 | % | | 11/01/2031 | | | 62,778 | |
| | 2,735,000 | | Santa Clara California Valley Water District | | | 3.82 | % | | 06/01/2039 | | | 2,926,697 | |
| | 480,000 | | Southern California Public Power Authority | | | 4.31 | % | | 07/01/2029 | | | 516,048 | |
| | 790,000 | | Texas A&M University | | | 3.82 | % | | 05/15/2047 | | | 811,354 | |
| | 355,000 | | University of California | | | 2.99 | % | | 05/15/2026 | | | 369,214 | |
| | 850,000 | | University of Massachusetts Building Authority | | | 5.45 | % | | 11/01/2040 | | | 1,084,660 | |
| | 25,000 | | University of North Texas System | | | 3.69 | % | | 04/15/2030 | | | 26,629 | |
Total Municipal Bonds (Cost $15,857,462) | | | | | | | | | 16,595,194 | |
| | |
| Asset Backed Securities — 7.9% | |
| | 750,000 | | DLL LLC, Series 2019-DA1 A2^ | | | 2.79 | % | | 11/22/2021 | | | 753,316 | |
| | 500,000 | | Great American Auto Leasing, Inc., Series 2019-1 B^ | | | 3.37 | % | | 02/18/2025 | | | 515,067 | |
| | 500,000 | | Great American Auto Leasing, Inc., Series 2019-1 C^ | | | 3.54 | % | | 02/17/2026 | | | 514,898 | |
| | 909,500 | | Newtek Small Business Loan Trust, Series 2018-1 A (1 Month LIBOR USD + 1.70%)^ | | | 4.10 | % | | 02/25/2044 | | | 910,090 | |
| | 250,000 | | Oportun Funding VII LLC, Series 2017-B B^ | | | 4.26 | % | | 10/10/2023 | | | 252,036 | |
| | 500,000 | | Oportun Funding VIII LLC, Series 2018-A C^ | | | 5.09 | % | | 03/08/2024 | | | 506,491 | |
| | 900,000 | | Oportun Funding X LLC, Series 2018-C A^ | | | 4.10 | % | | 10/08/2024 | | | 923,536 | |
| | 250,000 | | Oportun Funding X LLC, Series 2018-C B^ | | | 4.59 | % | | 10/08/2024 | | | 256,372 | |
| | 150,028 | | Tesla Auto Lease Trust, Series 2018-A A^ | | | 2.32 | % | | 12/20/2019 | | | 149,969 | |
| | 429,183 | | Tesla Auto Lease Trust, Series 2018-B A^ | | | 3.71 | % | | 08/20/2021 | | | 435,724 | |
| | 1,250,000 | | Tesla Auto Lease Trust, Series 2018-B B^ | | | 4.12 | % | | 10/20/2021 | | | 1,283,021 | |
| | 825,000 | | Verizon Owner Trust, Series 2017-1A C^ | | | 2.65 | % | | 09/20/2021 | | | 826,880 | |
| | 1,000,000 | | Verizon Owner Trust, Series 2017-2A C^ | | | 2.38 | % | | 12/20/2021 | | | 1,000,355 | |
| | 750,000 | | Verizon Owner Trust, Series 2019-A C | | | 3.22 | % | | 09/20/2023 | | | 768,865 | |
| | 1,000,000 | | Verizon Owner Trust, Series 2019-B C | | | 2.60 | % | | 12/20/2023 | | | 1,004,800 | |
Total Asset Backed Securities (Cost $9,982,075) | | | | | | | | | 10,101,420 | |
| | |
| Foreign Government Bonds — 2.7% | |
| | 1,000,000 | | Industrial Bank of Korea (3 Month LIBOR USD + 0.60%)^ | | | 3.18 | % | | 08/02/2021 | | | 1,004,219 | |
| | 2,425,000 | | Korea Development Bank (3 Month LIBOR USD + 0.73%) | | | 3.31 | % | | 07/06/2022 | | | 2,438,516 | |
Total Foreign Government Bonds (Cost $3,433,243) | | |
| 3,442,735 |
| | |
| U.S. Treasury Notes — 1.2% | |
| | 1,525,000 | | United States Treasury Note | | | 1.88 | % | | 08/31/2022 | | | 1,532,059 | |
Total U.S. Treasury Notes (Cost $1,531,462) | | |
| 1,532,059 |
The accompanying notes are an integral part of these financial statements.
www.brownadvisory.com/mf
Brown Advisory Sustainable Bond FundSchedule of Investments
June 30, 2019
| Shares | | Security Description | | Value $ | |
| Short-Term Investments — 0.0% | |
| | | | |
Money Market Funds — 0.0% | | | |
| | 12,444 | | First American Government Obligations Fund — Class Z, 2.26%* | | | 12,444 | |
Total Short-Term Investments (Cost $12,444) | | | 12,444 | |
Total Investments — 96.6% (Cost $119,005,023) | | | 123,052,521 | |
Other Assets in Excess of Liabilities — 3.4% | | | 4,297,394 | |
| NET ASSETS — 100.0% | | $ | 127,349,915 | |
| | | | | | | | |
| # | Variable rate security. Rate disclosed is as of June 30, 2019. |
| * | Annualized seven-day yield as of June 30, 2019. |
| ^ | Security exempt from registration under Rule 144A of the Securities Act of 1933. These securities may be resold in transactions exempt from registration, normally to qualified institutional buyers. |
| ~ | Interest Only Security |
| Futures Contracts — Long (Note 6) | | | | | | | | | | | | | |
| | | | | | | Notional | | | Notional | | | Unrealized Appreciation | |
| Issue | | Contracts | | Expiration Date | | Amount | | | Value | | | (Depreciation) | |
U.S. Treasury 2-Year Note Futures | | | 120 | | 09/30/2019 | | $ | 25,821,178 | | | $ | 25,821,563 | | | $ | 385 | |
U.S. Treasury 5-Year Note Futures | | | 115 | | 09/30/2019 | | | 13,362,998 | | | | 13,587,969 | | | | 224,971 | |
U.S. Treasury Long Bond Futures | | | 10 | | 09/19/2019 | | | 1,490,673 | | | | 1,555,938 | | | | 65,265 | |
U.S. Treasury Ultra Bond Futures | | | 23 | | 09/19/2019 | | | 3,874,893 | | | | 4,083,937 | | | | 209,044 | |
| | | | | | | | $ | 44,549,742 | | | $ | 45,049,407 | | | $ | 499,665 | |
| | | | | | | | | | | | | | | | | | |
| Futures Contracts — Short (Note 6) | | | | | | | | | | | | | | | | | |
| | | | | | | | Notional | | | Notional | | | Unrealized Appreciation | |
| Issue | | Contracts | | Expiration Date | | Amount | | | Value | | | (Depreciation) | |
U.S. Treasury 10-Year Ultra Bond Futures | | | (20) |
| 09/19/2019 | | $ | (2,673,398 | ) | | $ | (2,762,500 | ) | | $ | (89,102 | ) |
| | | | | | | | $ | (2,673,398 | ) | | $ | (2,762,500 | ) | | $ | (89,102 | ) |
| | | | | | | | | | | | | | | | | | |
There is no variation margin due to or from the Fund as of June 30, 2019.
The accompanying notes are an integral part of these financial statements.
www.brownadvisory.com/mf
Brown Advisory Maryland Bond FundA Message to Our Shareholders
June 30, 2019
Dear Shareholders:
During the year ended June 30, 2019, the Brown Advisory Maryland Bond Fund – Investor Shares (the “Fund”) increased 5.65% in value. During the same period, the Fund’s benchmark, the Bloomberg Barclays 1-10 Year Blended Municipal Bond Index (the “Index”), increased 5.49%.
The Fund posted solid relative performance for the 12-months ended June 30, 2019 – a period where broad intermediate municipal bond yields moved lower. The Fund benefited from a combination of curve positioning, bottom-up security selection, and yield advantage.
Strong supply/demand technicals continue to benefit the municipal bond market as the desire for tax-free income has bolstered a demand that has outpaced the supply of new bonds. The U.S. Federal Reserve has done a complete about-face from the policy guidance from a year ago. The Fed has indicated an inclination to eschew rate hikes for the rest of the year, and are now signaling that rate cuts are coming, if necessary. This dovish shift by the Fed has had an especially profound impact on the municipal bond market. Intermediate and longer maturity municipal bond yields have fallen 120 basis points from their recent highs in November. Given this backdrop, investor sentiment has swung from a seemingly omnipresent fear of rising interest rates to a more pragmatic approach – find some yield.
In many ways, this dynamic has caused certain portions of the municipal universe to become fully valued. The most obvious example is 1-5 year fixed-rate bonds. The level of yields on this part of the curve continues to mystify us, earning 1.30% or even lower for AAA-rated bonds. Almost 70% of the benchmark’s holdings are in this maturity range, which explains the anemic yield levels offered by our benchmark (1.61%) and many peer managers. By comparison, the Fund’s net indicated yield ended the period at 2.67%, which is near the top of our Morningstar peer group.
We are able to achieve this yield advantage by taking a flexible approach to capital allocation. We are benchmark-aware, but not benchmark beholden. Our goal is to deliver a portfolio that provides principal stability and upside potential. To achieve our goal we have been utilizing non-benchmark securities, like floating-rate bonds, along with somewhat “off-the-run” structures, like lower-coupon bonds and short-call bonds that have more attractive relative valuations. These holdings have helped create a durable yield advantage that we believe can continue to deliver solid performance in a variety of interest rate environments.
Finding the right balance of risk and reward at this point in the market cycle requires a disciplined process, an open mind and discerning analysis. In the current environment, we believe our use of outside-of-benchmark securities, like municipal floating-rate bonds, can offer a better return profile and more extensive diversification from the various risks of the market than the Index. We believe our approach to fundamental research and holistic risk management can continue to provide opportunities for both principal stability and upside potential in a wide variety of economic scenarios.
Sincerely,
Stephen M. Shutz, CFA
Portfolio Manager
www.brownadvisory.com/mf
Brown Advisory Maryland Bond FundA Message to Our Shareholders
June 30, 2019
Past performance is not a guarantee of future results.
Mutual fund investing involves risk. Principal loss is possible. The Fund is non-diversified which means it may invest a large percentage of its assets in the securities of fewer issuers. Investment in a limited number of issuers exposes the Fund to greater market risk than if its assets were diversified among a greater number of issuers. The Fund is also subject to interest rate risk which is the risk that debt securities in the Fund’s portfolio will decline in value because of an increase in market interest rates. Municipal securities are subject to adverse political or economic factors, including changes in the tax law. Income from tax-exempt funds may be subject to state and local taxes and a portion of income may be subject to the federal alternative minimum tax for certain investors.
Fund holdings and sector allocations are subject to change and should not be considered a recommendation to buy or sell any security. For a complete list of fund holdings, please refer to the Schedule of Investments provided in this report. Credit Quality weights by rating are derived from the highest bond rating as determined by Standard & Poor’s (“S&P”), Moody’s or Fitch. Bond ratings are grades given to bonds that indicate their credit quality as determined by private independent rating services such as S&P, Moody’s and Fitch. These firms evaluate a bond issuer’s financial strength, or its ability to pay a bond’s principal and interest in a timely fashion. Ratings are expressed as letters ranging from ‘AAA’, which is the highest grade, to ‘D’, which is the lowest grade. In limited situations when none of the three rating agencies have issued a formal rating, the Advisor will classify the security as nonrated.
Definitions for terms and indices are provided in the Glossary of Terms.
www.brownadvisory.com/mf
Brown Advisory Maryland Bond FundPerformance Information & Portfolio Holdings Summary
June 30, 2019
GROWTH OF A $10,000 INVESTMENT
The following chart reflects the change in value of a hypothetical $10,000 investment, including reinvested dividends and distributions, in the Fund as measured against the broad-based municipal bond index. The Bloomberg Barclays 1-10 Year Blended Municipal Bond Index (“Index”) is a market index of high quality, domestic fixed income securities with maturities of less than 10 years. The Index is unmanaged and does not reflect the deduction of fees, such as investment management fees. Investors cannot invest directly in an index.
| PORTFOLIO HOLDINGS | % of Net Assets |
Revenue Bonds | | | 76.4 | % | |
General Obligation Bonds | | | 21.9 | % | |
Money Market Funds | | | 1.2 | % | |
Other Assets and Liabilities | | | 0.5 | % | |
| | | | 100.0 | % | |
Average Annual Total Return | One Year | Five Year | Ten Year |
| Investor Shares | 5.65% | 2.47% | 2.75% |
| Bloomberg Barclays 1-10 Year Blended Municipal Bond Index | 5.49% | 2.55% | 3.37% |
| | Investor Shares |
Gross Expense Ratio1 | 0.49% |
Net Expense Ratio1 | 0.49% |
Past performance does not guarantee future results. The performance data quoted represents past performance and current returns may be lower or higher. The investment return and net asset value will fluctuate so that an investor’s shares, when redeemed, may be worth more or less than the original cost. To obtain performance information current to the most recent month end, please visit our website at brownadvisory.com/mf/maryland-bond-fund. The performance table and graph above do not reflect the deduction of taxes that a shareholder would pay on Fund distributions or the redemption of Fund shares. Investment performance reflects periods during which fee waivers were in effect. In the absence of such waivers, total return would have been reduced. Performance data does not reflect the imposition of the redemption fee of 1.00% on shares redeemed within 14 days, and if it did, performance would have been lower. Returns shown are calculated using the net asset values (“NAV”) that were used for shareholder transactions as of the respective period ends. These NAV, and the returns calculated from them, may differ from the NAV and returns shown elsewhere in this report.
1 | Per the Fund’s prospectus dated October 31, 2018. Refer to the financial highlights for the gross and net expense ratios for the year ended as of the date of this report. Please note that the expense ratios per the prospectus include acquired fund fees and expenses (as applicable) and the expense ratios in the financial highlights do not. |
| | |
www.brownadvisory.com/mf
Brown Advisory Maryland Bond FundSchedule of Investments
June 30, 2019
| Par Value | | Security Description | | Rate | | Maturity | | Value $ | |
| Municipal Bonds — 98.3% | |
| | |
| General Obligation Bonds — 21.9% | |
| | 2,225,000 | | Anne Arundel County Maryland | | | 5.00 | % | | 04/01/2022 | | | 2,447,433 | |
| | 1,265,000 | | Anne Arundel County Maryland | | | 5.00 | % | | 10/01/2026 | | | 1,530,663 | |
| | 1,000,000 | | Baltimore County Maryland | | | 5.00 | % | | 08/01/2030 | | | 1,163,640 | |
| | 5,000,000 | | Baltimore County Maryland | | | 4.00 | % | | 03/01/2036 | | | 5,684,550 | |
| | 3,145,000 | | Maryland State | | | 5.00 | % | | 08/01/2023 | | | 3,603,321 | |
| | 1,945,000 | | Maryland State | | | 5.00 | % | | 08/01/2023 | | | 2,164,104 | |
| | 2,400,000 | | Maryland State | | | 5.00 | % | | 08/01/2024 | | | 2,828,928 | |
| | 1,400,000 | | Maryland State | | | 5.00 | % | | 08/01/2031 | | | 1,764,350 | |
| | 3,000,000 | | Montgomery County Maryland | | | 5.00 | % | | 12/01/2019 | | | 3,046,500 | |
| | 5,000,000 | | Montgomery County Maryland | | | 5.00 | % | | 11/01/2023 | | | 5,770,500 | |
| | 5,000,000 | | Prince George’s County Maryland | | | 4.00 | % | | 07/15/2037 | | | 5,608,400 | |
| | 1,985,000 | | Wicomico County Maryland | | | 4.00 | % | | 11/01/2020 | | | 2,057,313 | |
| | 2,040,000 | | Wicomico County Maryland | | | 4.00 | % | | 11/01/2021 | | | 2,166,521 | |
| | | | | | | | | | | | | 39,836,223 | |
| Revenue Bonds — 76.4% | |
| | 3,300,000 | | Austin, Texas | | | 7.88 | % | | 09/01/2026 | | | 3,508,692 | |
| | 1,000,000 | | Baltimore, Maryland | | | 5.00 | % | | 07/01/2028 | | | 1,227,150 | |
| | 1,320,000 | | Baltimore, Maryland | | | 5.00 | % | | 07/01/2028 | | | 1,627,138 | |
| | 520,000 | | Baltimore, Maryland | | | 5.00 | % | | 06/15/2030 | | | 586,929 | |
| | 2,255,000 | | Baltimore, Maryland | | | 5.00 | % | | 09/01/2031 | | | 2,646,536 | |
| | 1,000,000 | | Baltimore, Maryland | | | 5.00 | % | | 07/01/2032 | | | 1,138,840 | |
| | 670,000 | | Baltimore, Maryland | | | 5.00 | % | | 06/15/2033 | | | 747,130 | |
| | 1,150,000 | | Baltimore, Maryland | | | 5.00 | % | | 09/01/2033 | | | 1,335,403 | |
| | 1,000,000 | | Baltimore, Maryland | | | 4.00 | % | | 07/01/2034 | | | 1,133,090 | |
| | 2,350,000 | | Baltimore, Maryland | | | 5.00 | % | | 09/01/2039 | | | 2,692,277 | |
| | 1,000,000 | | Denver County Colorado | | | 5.00 | % | | 10/01/2032 | | | 1,087,710 | |
| | 1,550,000 | | Franklin County Ohio | | | 5.00 | % | | 11/15/2034 | | | 1,724,096 | |
| | 1,000,000 | | Frederick County Maryland^ | | | 5.00 | % | | 09/01/2027 | | | 1,136,630 | |
| | 5,050,000 | | Frederick County Maryland^ | | | 5.00 | % | | 09/01/2032 | | | 5,744,981 | |
| | 1,110,000 | | Frederick County Maryland^ | | | 5.00 | % | | 09/01/2037 | | | 1,244,843 | |
| | 2,260,000 | | Frederick County Maryland | | | 5.50 | % | | 07/01/2040 | | | 2,320,726 | |
| | 1,000,000 | | Gaithersburg, City of Maryland | | | 5.00 | % | | 01/01/2028 | | | 1,151,370 | |
| | 2,000,000 | | Gaithersburg, City of Maryland | | | 5.00 | % | | 01/01/2033 | | | 2,269,600 | |
| | 2,500,000 | | Health & Educational Facilities Authority of the State of Missouri# | | | 3.20 | % | | 06/01/2020 | | | 2,500,000 | |
| | 2,000,000 | | Lancaster County Pennsylvania Hospital Authority | | | 5.00 | % | | 07/01/2035 | | | 2,170,040 | |
| | 1,000,000 | | Maryland Community Development Administration | | | 3.25 | % | | 03/01/2036 | | | 1,024,490 | |
| | 1,025,000 | | Maryland Economic Development Corp.# | | | 2.55 | % | | 12/01/2025 | | | 1,029,602 | |
| | 5,000,000 | | Maryland Economic Development Corp. | | | 5.00 | % | | 06/01/2026 | | | 5,337,200 | |
| | 700,000 | | Maryland Economic Development Corp. | | | 5.00 | % | | 06/01/2027 | | | 755,349 | |
| | 400,000 | | Maryland Economic Development Corp. | | | 5.00 | % | | 07/01/2027 | | | 433,848 | |
| | 850,000 | | Maryland Economic Development Corp. | | | 5.00 | % | | 07/01/2031 | | | 935,816 | |
| | 1,300,000 | | Maryland Economic Development Corp. | | | 5.75 | % | | 06/01/2035 | | | 1,351,883 | |
| | 4,500,000 | | Maryland Economic Development Corp. | | | 4.50 | % | | 07/01/2044 | | | 4,659,255 | |
| | 3,000,000 | | Maryland Stadium Authority | | | 5.00 | % | | 05/01/2030 | | | 3,593,340 | |
| | 1,000,000 | | Maryland State Department of Transportation | | | 5.00 | % | | 12/15/2020 | | | 1,053,810 | |
| | 1,055,000 | | Maryland State Department of Transportation | | | 4.00 | % | | 05/15/2022 | | | 1,135,718 | |
| | 1,715,000 | | Maryland State Department of Transportation | | | 5.00 | % | | 10/01/2027 | | | 2,118,282 | |
| | 1,015,000 | | Maryland State Health & Higher Educational Facilities | | | 4.00 | % | | 07/01/2019 | | | 1,015,000 | |
| | 485,000 | | Maryland State Health & Higher Educational Facilities | | | 5.00 | % | | 07/01/2023 | | | 518,717 | |
| | 500,000 | | Maryland State Health & Higher Educational Facilities | | | 5.00 | % | | 08/15/2023 | | | 568,775 | |
| | 500,000 | | Maryland State Health & Higher Educational Facilities | | | 5.00 | % | | 07/01/2024 | | | 544,430 | |
| | 1,450,000 | | Maryland State Health & Higher Educational Facilities | | | 5.00 | % | | 07/01/2025 | | | 1,676,461 | |
| | 1,500,000 | | Maryland State Health & Higher Educational Facilities | | | 5.00 | % | | 07/01/2025 | | | 1,762,890 | |
The accompanying notes are an integral part of these financial statements.
www.brownadvisory.com/mf
Brown Advisory Maryland Bond FundSchedule of Investments
June 30, 2019
| Par | | | | | | | | | | |
| Value/Shares | | Security Description | | Rate | | Maturity | | Value $ | |
| Municipal Bonds — 98.3% (Continued) | |
| | |
| Revenue Bonds — 76.4% (Continued) | |
| | 1,000,000 | | Maryland State Health & Higher Educational Facilities | | | 6.00 | % | | 07/01/2025 | | | 1,082,350 | |
| | 1,060,000 | | Maryland State Health & Higher Educational Facilities | | | 5.00 | % | | 07/01/2025 | | | 1,163,520 | |
| | 420,000 | | Maryland State Health & Higher Educational Facilities | | | 5.00 | % | | 07/01/2026 | | | 498,859 | |
| | 2,500,000 | | Maryland State Health & Higher Educational Facilities | | | 5.25 | % | | 07/01/2026 | | | 2,881,450 | |
| | 1,605,000 | | Maryland State Health & Higher Educational Facilities | | | 5.00 | % | | 07/01/2028 | | | 1,835,895 | |
| | 3,500,000 | | Maryland State Health & Higher Educational Facilities | | | 5.00 | % | | 07/01/2029 | | | 4,265,660 | |
| | 100,000 | | Maryland State Health & Higher Educational Facilities | | | 4.00 | % | | 10/01/2030 | | | 108,850 | |
| | 1,130,000 | | Maryland State Health & Higher Educational Facilities | | | 6.25 | % | | 07/01/2031 | | | 1,222,728 | |
| | 300,000 | | Maryland State Health & Higher Educational Facilities | | | 4.00 | % | | 10/01/2031 | | | 325,248 | |
| | 1,070,000 | | Maryland State Health & Higher Educational Facilities | | | 5.00 | % | | 07/01/2032 | | | 1,210,812 | |
| | 250,000 | | Maryland State Health & Higher Educational Facilities | | | 5.00 | % | | 06/01/2033 | | | 286,352 | |
| | 1,250,000 | | Maryland State Health & Higher Educational Facilities | | | 5.00 | % | | 08/15/2033 | | | 1,428,238 | |
| | 1,955,000 | | Maryland State Health & Higher Educational Facilities | | | 5.00 | % | | 07/01/2034 | | | 2,236,403 | |
| | 15,000 | | Maryland State Health & Higher Educational Facilities | | | 5.00 | % | | 07/01/2034 | | | 15,008 | |
| | 200,000 | | Maryland State Health & Higher Educational Facilities | | | 4.50 | % | | 07/01/2035 | | | 200,238 | |
| | 430,000 | | Maryland State Health & Higher Educational Facilities | | | 5.00 | % | | 06/01/2036 | | | 487,513 | |
| | 1,200,000 | | Maryland State Health & Higher Educational Facilities | | | 5.00 | % | | 07/01/2037 | | | 1,391,100 | |
| | 1,500,000 | | Maryland State Health & Higher Educational Facilities | | | 5.00 | % | | 07/01/2038 | | | 1,703,625 | |
| | 3,400,000 | | Maryland State Health & Higher Educational Facilities | | | 5.00 | % | | 05/15/2040 | | | 3,508,664 | |
| | 1,310,000 | | Maryland State Health & Higher Educational Facilities | | | 5.00 | % | | 07/01/2043 | | | 1,480,221 | |
| | 4,255,000 | | Maryland State Transportation Authority | | | 5.00 | % | | 03/01/2022 | | | 4,658,374 | |
| | 1,000,000 | | Maryland State Transportation Authority | | | 5.00 | % | | 06/01/2022 | | | 1,100,430 | |
| | 4,420,000 | | Maryland State Transportation Authority | | | 5.00 | % | | 07/01/2028 | | | 5,535,078 | |
| | 4,330,000 | | Maryland State Transportation Authority | | | 4.00 | % | | 06/01/2035 | | | 4,848,128 | |
| | 2,525,000 | | Maryland Water Quality Financing Administration | | | 5.00 | % | | 03/01/2020 | | | 2,587,368 | |
| | 1,500,000 | | Metropolitan Washington DC Airports Authority | | | 5.00 | % | | 10/01/2039 | | | 1,822,710 | |
| | 1,185,000 | | New Hope Texas Cultural Education Facilities Finance Corp. | | | 5.75 | % | | 07/01/2051 | | | 1,307,446 | |
| | 3,640,000 | | New York Transportation Development Corp. | | | 5.00 | % | | 08/01/2026 | | | 3,848,463 | |
| | 2,000,000 | | Newport News Virginia Economic Development Authority | | | 5.00 | % | | 12/01/2031 | | | 2,193,820 | |
| | 2,000,000 | | North Carolina Medical Care Commission | | | 5.00 | % | | 10/01/2031 | | | 2,207,420 | |
| | 1,005,000 | | Prince William County Virginia Industrial Development Authority | | | 5.00 | % | | 01/01/2023 | | | 1,099,581 | |
| | 5,896,000 | | Puerto Rico Sales Tax Financing Corp. Sales Tax Revenue+ | | | 4.86 | % | | 07/01/2031 | | | 3,696,379 | |
| | 1,000,000 | | St Mary’s College of Maryland | | | 4.00 | % | | 09/01/2024 | | | 1,120,980 | |
| | 4,335,000 | | University System of Maryland | | | 5.00 | % | | 04/01/2022 | | | 4,769,584 | |
| | 3,280,000 | | Washington State Housing Finance Commission^ | | | 4.00 | % | | 01/01/2026 | | | 3,500,383 | |
| | | | | | | | | | | | | 139,136,925 | |
Total Municipal Bonds (Cost $174,006,204) | | | | | | | | | 178,973,148 | |
| | |
| Short-Term Investments — 1.2% | |
| | |
| Money Market Fund — 1.2% | |
| | 2,158,984 | | First American Government Obligations Fund — Class Z, 2.26%* | | | | | | | | | 2,158,984 | |
Total Short-Term Investments (Cost $2,158,984) | | |
| 2,158,984 |
Total Investments — 99.5% (Cost $176,165,188) | | |
| 181,132,132 |
Other Assets in Excess of Liabilities — 0.5% | | |
| 939,512 |
| NET ASSETS — 100.0% | |
| $
| 182,071,644 |
| # | Variable rate security. Rate disclosed is as of June 30, 2019. |
| * | Annualized seven-day yield as of June 30, 2019. |
| ^ | Security exempt from registration under Rule 144A of the Securities Act of 1933. These securities may be resold in transactions exempt from registration, normally to qualified institutional buyers. |
+ | Zero coupon bond. Rate disclosed is calculated yield to maturity as of June 30, 2019. |
The accompanying notes are an integral part of these financial statements.
www.brownadvisory.com/mf
Brown Advisory Tax-Exempt Bond FundA Message to Our Shareholders
June 30, 2019
Dear Shareholders:
During the year ended June 30, 2019, the Brown Advisory Tax-Exempt Bond Fund – Investor Shares (the “Fund”) increased 6.49% in value. During the same period, the Fund’s benchmark, the Bloomberg Barclays 1-10 Year Blended Municipal Bond Index (the “Index”), increased 5.49%.
The Fund posted attractive relative performance for the 12-months ended June 30, 2019 – a period where broad intermediate municipal bond yields moved lower. The Fund benefited from a combination of curve positioning, bottom-up security selection, and yield advantage.
Strong supply/demand technicals continue to benefit the municipal bond market as the desire for tax-free income has bolstered a demand that has outpaced the supply of new bonds. The U.S. Federal Reserve has done a complete about-face from the policy guidance a year ago. The Fed has indicated an inclination to eschew rate hikes for the rest of the year, and are now signaling that rate cuts are coming, if necessary. This dovish shift by the Fed has had an especially profound impact on the municipal bond market. Intermediate and longer maturity municipal bond yields have fallen 120 basis points from their recent highs in November. Given this backdrop, investor sentiment has swung from a seemingly omnipresent fear of rising interest rates to a more pragmatic approach – find some yield.
In many ways, this dynamic has caused certain portions of the municipal universe to become fully valued. The most obvious example is 1-5 year fixed-rate bonds. The level of yields on this part of the curve continues to mystify us, earning 1.30% or even lower for AAA-rated bonds. Almost 70% of the benchmark’s holdings are in this maturity range, which explains the anemic yield levels offered by our benchmark (1.61%) and many peer managers. By comparison, the Fund’s net indicated yield ended the period at 3.09%, which is near the top of our Morningstar peer group.
We are able to achieve this yield advantage by taking a flexible approach to capital allocation. We are benchmark-aware, but not benchmark beholden. Our goal is to deliver a portfolio that provides principal stability and upside potential. To achieve our goal we have been utilizing non-benchmark securities, like floating-rate bonds, along with somewhat “off-the-run” structures, like lower-coupon bonds and short-call bonds that have more attractive relative valuations. These holdings have helped create a durable yield advantage that we believe can continue to deliver solid performance in a variety of interest rate environments.
Finding the right balance of risk and reward at this point in the market cycle requires a disciplined process, an open mind and discerning analysis. In the current environment, we believe our use of outside-of-benchmark securities, like municipal floating-rate bonds, can offer a better return profile and more extensive diversification from the various risks of the market than the Index. We believe our approach to fundamental research and holistic risk management can continue to provide opportunities for both principal stability and upside potential in a wide variety of economic scenarios.
Sincerely,
Stephen M. Shutz, CFA
Portfolio Manager
www.brownadvisory.com/mf
Brown Advisory Tax-Exempt Bond FundA Message to Our Shareholders
June 30, 2019
Past performance is not a guarantee of future results.
Mutual fund investing involves risk. Principal loss is possible. The Fund is non-diversified which means it may invest a large percentage of its assets in the securities of fewer issuers. Concentration in a limited number of issuers exposes the Fund to greater market risk than if its assets were diversified among a greater number of issuers. The Fund is also subject to interest rate risk which is the risk that debt securities in the Fund’s portfolio will decline in value because of an increase in market interest rates. This risk is usually greater for longer-term debt securities. Income from tax-exempt funds may be subject to state and local taxes and a portion of income may be subject to the Federal Alternative minimum tax for certain investors.
Diversification does not assure a profit nor protect against loss in a declining market.
Fund holdings and sector allocations are subject to change and should not be considered a recommendation to buy or sell any security. For a complete list of fund holdings, please refer to the Schedule of Investments provided in this report.
Credit Quality weights by rating are derived from the highest bond rating as determined by Standard & Poor’s (“S&P”), Moody’s or Fitch. Bond ratings are grades given to bonds that indicate their credit quality as determined by private independent rating services such as S&P, Moody’s and Fitch. These firms evaluate a bond issuer’s financial strength, or its ability to pay a bond’s principal and interest in a timely fashion. Ratings are expressed as letters ranging from ‘AAA’, which is the highest grade, to ‘D’, which is the lowest grade. In limited situations when none of the three rating agencies have issued a formal rating, the Advisor will classify the security as nonrated.
Definitions for terms and indices are provided in the Glossary of Terms.
www.brownadvisory.com/mf
Brown Advisory Tax-Exempt Bond FundPerformance Information & Portfolio Holdings Summary
June 30, 2019
GROWTH OF A $10,000 INVESTMENT
The following chart reflects the change in value of a hypothetical $10,000 investment, including reinvested dividends and distributions, in the Fund as measured against the broad-based municipal bond index. The Bloomberg Barclays 1-10 Year Blended Municipal Bond Index (“Index”) is a market index of high quality, domestic fixed income securities with maturities of less than 10 years. The Index is unmanaged and does not reflect the deduction of fees, such as investment management fees. Investors cannot invest directly in an index.
| PORTFOLIO HOLDINGS | % of Net Assets |
Revenue Bonds | | | 84.5 | % | |
General Obligation Bonds | | | 11.8 | % | |
Money Market Funds | | | 2.2 | % | |
Other Assets and Liabilities | | | 1.5 | % | |
| | | | 100.0 | % | |
| | | | Since Inception |
Average Annual Total Return | One Year | Five Year | (6/29/12) |
Institutional Shares1 | 6.53% | 3.15% | 2.82% |
| Investor Shares | 6.49% | 3.10% | 2.78% |
| Bloomberg Barclays 1-10 Year Blended Municipal Bond Index | 5.49% | 2.55% | 2.47% |
| | Institutional Shares | Investor Shares |
Gross Expense Ratio2 | 0.44% | 0.49% |
Net Expense Ratio2 | 0.44% | 0.49% |
Past performance does not guarantee future results. The performance data quoted represents past performance and current returns may be lower or higher. The investment return and net asset value will fluctuate so that an investor’s shares, when redeemed, may be worth more or less than the original cost. To obtain performance information current to the most recent month end, please visit our website at brownadvisory.com/mf/tax-exempt-bond-fund. The performance table and graph above do not reflect the deduction of taxes that a shareholder would pay on Fund distributions or the redemption of Fund shares. Performance data does not reflect the imposition of the redemption fee of 1.00% on shares redeemed within 14 days, and if it did, performance would have been lower. Returns shown are calculated using the net asset values (“NAV”) that were used for shareholder transactions as of the respective period ends. These NAV, and the returns calculated from them, may differ from the NAV and returns shown elsewhere in this report.
1 | Performance information for the Institutional Shares, prior to commencement of operations on July 2, 2018, is based on the performance of Investor Shares, and adjusted for the lower expenses applicable to Institutional Shares. |
2 | Per the Fund’s prospectus dated October 31, 2018. Refer to the financial highlights for the gross and net expense ratios for the year ended as of the date of this report. Please note that the expense ratios per the prospectus include acquired fund fees and expenses (as applicable) and the expense ratios in the financial highlights do not. |
www.brownadvisory.com/mf
Brown Advisory Tax-Exempt Bond FundSchedule of Investments
June 30, 2019
| Par Value | | Security Description | | Rate | | Maturity | | Value $ | |
| Municipal Bonds — 96.3% | |
| | |
| General Obligation Bonds — 11.8% | |
| | 11,425,000 | | Clark County Nevada | | | 4.00 | % | | 12/01/2035 | | | 12,861,579 | |
| | 11,000,000 | | Clark County Nevada | | | 4.00 | % | | 12/01/2036 | | | 12,338,810 | |
| | 4,775,000 | | Clark County Nevada School District | | | 5.00 | % | | 06/15/2032 | | | 5,837,437 | |
| | 1,750,000 | | Connecticut, State of | | | 4.00 | % | | 06/15/2036 | | | 1,946,612 | |
| | 1,700,000 | | Connecticut, State of | | | 4.00 | % | | 06/15/2037 | | | 1,884,042 | |
| | 2,210,000 | | Florida, State of | | | 4.00 | % | | 06/01/2031 | | | 2,544,285 | |
| | 6,760,000 | | Foothill-De Anza Community College District+ | | | 2.79 | % | | 08/01/2036 | | | 4,252,716 | |
| | 10,000,000 | | Illinois, State of | | | 5.00 | % | | 11/01/2021 | | | 10,698,600 | |
| | 18,300,000 | | Illinois, State of | | | 5.00 | % | | 11/01/2022 | | | 20,030,631 | |
| | 1,435,000 | | Lane County Oregon School District No 19 Springfield+ | | | 3.49 | % | | 06/15/2032 | | | 998,157 | |
| | 1,280,000 | | Madera California Unified School District+ | | | 3.13 | % | | 08/01/2029 | | | 1,015,360 | |
| | 2,310,000 | | Massachusetts, Commonwealth of (3 Month LIBOR USD + 0.57%) | | | 2.30 | % | | 05/01/2037 | | | 2,255,600 | |
| | 8,045,000 | | Massachusetts, Commonwealth of (3 Month LIBOR USD + 0.57%) | | | 2.30 | % | | 05/01/2037 | | | 7,855,540 | |
| | 6,235,000 | | Mississippi, State of | | | 4.00 | % | | 10/01/2035 | | | 7,029,027 | |
| | 1,615,000 | | Oak Grove California School District+ | | | 3.20 | % | | 08/01/2031 | | | 1,169,373 | |
| | 1,155,000 | | Oak Grove California School District+ | | | 3.02 | % | | 08/01/2032 | | | 830,734 | |
| | 1,190,000 | | Oak Grove California School District+ | | | 2.89 | % | | 08/01/2033 | | | 848,637 | |
| | 2,905,000 | | Oceanside Unified California School District+ | | | 4.11 | % | | 08/01/2042 | | | 1,421,329 | |
| | 1,675,000 | | Oceanside Unified California School District+ | | | 4.12 | % | | 08/01/2043 | | | 788,875 | |
| | 10,690,000 | | Palomar Health+ | | | 4.11 | % | | 08/01/2039 | | | 5,432,872 | |
| | 1,365,000 | | Rosemont, Village of Illinois | | | 5.00 | % | | 12/01/2025 | | | 1,598,579 | |
| | 5,315,000 | | Victor Valley California Union High School District+ | | | 3.73 | % | | 08/01/2035 | | | 3,372,527 | |
| | 3,340,000 | | West Contra Costa California Unified School District | | | 4.00 | % | | 08/01/2038 | | | 3,691,669 | |
| | 3,060,000 | | West Contra Costa California Unified School District | | | 4.00 | % | | 08/01/2038 | | | 3,382,187 | |
| | | | | | | | | | | | | 114,085,178 | |
| Revenue Bonds — 84.5% | |
| | 8,990,000 | | Anaheim California Public Financing Authority+ | | | 2.69 | % | | 09/01/2031 | | | 6,546,788 | |
| | 1,285,000 | | Arizona Sports & Tourism Authority | | | 5.00 | % | | 07/01/2028 | | | 1,381,555 | |
| | 1,500,000 | | Arlington, Texas | | | 5.00 | % | | 02/15/2037 | | | 1,800,900 | |
| | 4,275,000 | | Austin, Texas | | | 7.88 | % | | 09/01/2026 | | | 4,545,351 | |
| | 17,000,000 | | Black Belt Energy Gas District# | | | 4.00 | % | | 12/01/2048 | | | 18,380,060 | |
| | 8,450,000 | | California Health Facilities Financing Authority# | | | 3.22 | % | | 11/01/2033 | | | 8,450,000 | |
| | 25,835,000 | | Cedar Rapids, Iowa# | | | 3.40 | % | | 08/15/2029 | | | 25,835,000 | |
| | 8,300,000 | | Cedar Rapids, Iowa# | | | 3.00 | % | | 08/15/2032 | | | 8,300,000 | |
| | 2,970,000 | | Central Texas Turnpike System | | | 5.00 | % | | 08/15/2027 | | | 3,415,559 | |
| | 6,330,000 | | Chicago O’Hare International Airport | | | 5.00 | % | | 01/01/2033 | | | 7,244,938 | |
| | 1,000,000 | | Colorado Health Facilities Authority | | | 5.00 | % | | 06/01/2027 | | | 1,160,550 | |
| | 1,300,000 | | Colorado Health Facilities Authority | | | 5.00 | % | | 12/01/2027 | | | 1,424,709 | |
| | 6,600,000 | | Colorado Health Facilities Authority | | | 5.50 | % | | 07/01/2034 | | | 6,620,856 | |
| | 5,965,000 | | Colorado Health Facilities Authority | | | 5.00 | % | | 12/01/2035 | | | 6,674,477 | |
| | 5,000,000 | | Commonwealth Financing Authority | | | 5.00 | % | | 06/01/2025 | | | 5,865,950 | |
| | 2,095,000 | | Connecticut Special Tax Revenue | | | 5.00 | % | | 08/01/2031 | | | 2,434,851 | |
| | 4,390,000 | | Cumberland County Pennsylvania Municipal Authority | | | 4.00 | % | | 01/01/2033 | | | 4,546,811 | |
| | 2,500,000 | | Delaware State Health Facilities Authority | | | 5.00 | % | | 06/01/2034 | | | 2,946,950 | |
| | 15,250,000 | | Delaware Valley Pennsylvania Regional Finance Authority (3 Month LIBOR USD + 0.65%) | | | 2.34 | % | | 06/01/2027 | | | 15,065,170 | |
| | 15,000,000 | | Delaware Valley Pennsylvania Regional Finance Authority (3 Month LIBOR USD + 0.75%) | | | 2.44 | % | | 06/01/2037 | | | 13,998,600 | |
| | 5,500,000 | | Denver Colorado Airport System Revenue | | | 5.00 | % | | 12/01/2034 | | | 7,088,070 | |
| | 9,150,000 | | Denver Colorado Airport System Revenue | | | 5.00 | % | | 12/01/2036 | | | 11,897,104 | |
| | 1,100,000 | | Denver Colorado Convention Center Hotel Authority | | | 5.00 | % | | 12/01/2028 | | | 1,298,077 | |
| | 10,000,000 | | Denver Colorado Health & Hospital Authority (3 Month LIBOR USD + 1.10%) | | | 2.79 | % | | 12/01/2033 | | | 9,895,900 | |
| | 9,000,000 | | Detroit Michigan Sewage Disposal System (3 Month LIBOR USD + 0.60%) | | | 2.34 | % | | 07/01/2032 | | | 8,986,320 | |
| | 15,000,000 | | District of Columbia# | | | 6.60 | % | | 08/01/2037 | | | 15,000,000 | |
| | 5,000,000 | | District of Columbia# | | | 6.50 | % | | 08/01/2038 | | | 5,000,000 | |
| | 5,175,000 | | District of Columbia# | | | 6.60 | % | | 08/01/2038 | | | 5,175,000 | |
The accompanying notes are an integral part of these financial statements.
www.brownadvisory.com/mf
Brown Advisory Tax-Exempt Bond FundSchedule of Investments
June 30, 2019
| Par Value | | Security Description | | Rate | | Maturity | | Value $ | |
| Municipal Bonds — 96.3% (Continued) | |
| | |
| Revenue Bonds — 84.5% (Continued) | |
| | 1,700,000 | | Educational Enhancement Funding Corp. | | | 5.00 | % | | 06/01/2023 | | | 1,896,826 | |
| | 12,095,000 | | Florida’s Turnpike Enterprise | | | 4.00 | % | | 07/01/2039 | | | 13,542,046 | |
| | 15,000,000 | | Golden State Tobacco Securitization Corp. | | | 5.00 | % | | 06/01/2031 | | | 17,775,000 | |
| | 2,500,000 | | Golden State Tobacco Securitization Corp. | | | 5.00 | % | | 06/01/2032 | | | 2,949,725 | |
| | 6,500,000 | | Grand Forks County North Dakota^ | | | 5.00 | % | | 09/15/2028 | | | 6,503,055 | |
| | 1,000,000 | | Hamilton County Ohio Convention Facilities Authority | | | 5.00 | % | | 12/01/2033 | | | 1,124,390 | |
| | 11,150,000 | | Harris County Texas (3 Month LIBOR USD + 0.67%) | | | 2.36 | % | | 08/15/2035 | | | 10,676,683 | |
| | 8,500,000 | | Harris County Texas Cultural Education Facilities Finance Corp. | | | 5.50 | % | | 10/01/2039 | | | 8,587,805 | |
| | 3,865,000 | | Harris County Texas Sports Authority+ | | | 4.36 | % | | 11/15/2034 | | | 2,246,183 | |
| | 7,425,000 | | Hawaii Department of Budget & Finance | | | 6.50 | % | | 07/01/2039 | | | 7,455,962 | |
| | 1,400,000 | | Henrico County Virginia Economic Development Authority# | | | 4.25 | % | | 08/23/2027 | | | 1,400,000 | |
| | 6,070,000 | | Imperial California Irrigation District Electric System Revenue | | | 4.00 | % | | 11/01/2037 | | | 6,736,972 | |
| | 3,720,000 | | Kansas City Missouri Municipal Assistance Corp.+ | | | 2.99 | % | | 04/15/2026 | | | 3,192,578 | |
| | 10,000,000 | | Kentucky Asset Liability Commission (3 Month LIBOR USD + 0.55%) | | | 2.28 | % | | 11/01/2025 | | | 9,795,300 | |
| | 1,250,000 | | Kentucky Economic Development Finance Authority | | | 5.00 | % | | 05/01/2024 | | | 1,253,225 | |
| | 3,000,000 | | Lancaster County Pennsylvania Hospital Authority | | | 5.00 | % | | 07/01/2035 | | | 3,255,060 | |
| | 2,280,000 | | Las Vegas Nevada Redevelopment Agency | | | 5.00 | % | | 06/15/2028 | | | 2,692,498 | |
| | 5,235,000 | | Lees Summit Missouri Industrial Development Authority | | | 5.25 | % | | 08/15/2039 | | | 5,622,704 | |
| | 29,300,000 | | Louisiana Public Facilities Authority# | | | 3.31 | % | | 09/01/2025 | | | 29,300,000 | |
| | 55,000,000 | | Louisiana Public Facilities Authority# | | | 3.21 | % | | 09/01/2027 | | | 55,000,000 | |
| | 3,000,000 | | Louisiana Public Facilities Authority | | | 3.50 | % | | 06/01/2030 | | | 3,051,240 | |
| | 1,000,000 | | Louisiana Public Facilities Authority | | | 5.00 | % | | 06/01/2036 | | | 1,148,220 | |
| | 5,725,000 | | Love Field Texas Airport Modernization Corp. | | | 5.00 | % | | 11/01/2028 | | | 6,263,952 | |
| | 9,455,000 | | Maricopa County Arizona Pollution Control Corp. | | | 5.00 | % | | 06/01/2035 | | | 9,694,117 | |
| | 5,030,000 | | Maryland Health & Higher Educational Facilities Authority | | | 5.50 | % | | 01/01/2036 | | | 5,962,663 | |
| | 1,300,000 | | Massachusetts Health & Educational Facilities Authority# | | | 6.16 | % | | 07/01/2023 | | | 1,300,000 | |
| | 2,015,000 | | Massachusetts Health & Educational Facilities Authority# | | | 6.16 | % | | 07/01/2023 | | | 2,006,275 | |
| | 6,100,000 | | Massachusetts Health & Educational Facilities Authority# | | | 4.95 | % | | 07/01/2023 | | | 6,100,000 | |
| | 150,000 | | Massachusetts Health & Educational Facilities Authority | | | 5.00 | % | | 10/01/2024 | | | 150,441 | |
| | 1,495,000 | | Metropolitan Pier & Exposition Authority+ | | | 4.02 | % | | 12/15/2033 | | | 931,639 | |
| | 10,000,000 | | Metropolitan Pier & Exposition Authority+ | | | 4.07 | % | | 06/15/2035 | | | 5,800,600 | |
| | 10,165,000 | | Metropolitan Pier & Exposition Authority+ | | | 4.10 | % | | 06/15/2037 | | | 5,343,232 | |
| | 7,470,000 | | Metropolitan Pier & Exposition Authority+ | | | 4.06 | % | | 06/15/2038 | | | 3,741,798 | |
| | 1,705,000 | | Metropolitan Transportation Authority+ | | | 3.20 | % | | 11/15/2029 | | | 1,320,846 | |
| | 6,000,000 | | Metropolitan Transportation Authority+ | | | 3.62 | % | | 11/15/2033 | | | 4,026,660 | |
| | 1,895,000 | | Miami Beach Florida Health Facilities | | | 5.00 | % | | 11/15/2029 | | | 2,085,353 | |
| | 6,760,000 | | Miami-Dade County Florida Water & Sewer System Revenue | | | 4.00 | % | | 10/01/2035 | | | 7,545,512 | |
| | 4,700,000 | | Minneapolis & St. Paul, Minnesota Housing & Redevelopment Authority# | | | 3.51 | % | | 08/01/2027 | | | 4,700,000 | |
| | 1,450,000 | | Minneapolis & St. Paul, Minnesota Housing & Redevelopment Authority# | | | 3.57 | % | | 08/01/2028 | | | 1,450,000 | |
| | 5,000,000 | | Mission Texas Economic Development Corp.^ | | | 4.63 | % | | 10/01/2031 | | | 5,352,700 | |
| | 30,000,000 | | Missouri State Environmental Improvement & Energy Resources Authority# | | | 3.35 | % | | 09/01/2033 | | | 30,000,000 | |
| | 20,000,000 | | Missouri State Environmental Improvement & Energy Resources Authority# | | | 3.34 | % | | 09/01/2033 | | | 20,000,000 | |
| | 15,285,000 | | Montgomery County Ohio | | | 5.00 | % | | 05/01/2039 | | | 15,326,728 | |
| | 1,600,000 | | Mountain House California Public Financing Authority | | | 5.00 | % | | 12/01/2027 | | | 1,604,496 | |
| | 2,565,000 | | Mountain House California Public Financing Authority | | | 5.00 | % | | 12/01/2032 | | | 2,571,515 | |
| | 1,000,000 | | New Hope Texas Cultural Education Facilities Finance Corp. | | | 5.00 | % | | 04/01/2029 | | | 1,078,650 | |
| | 1,080,000 | | New Hope Texas Cultural Education Facilities Finance Corp. | | | 5.00 | % | | 07/01/2031 | | | 1,174,878 | |
| | 1,750,000 | | New Hope Texas Cultural Education Facilities Finance Corp. | | | 5.25 | % | | 07/01/2036 | | | 1,900,150 | |
| | 1,250,000 | | New Hope Texas Cultural Education Facilities Finance Corp. | | | 5.50 | % | | 07/01/2046 | | | 1,368,238 | |
| | 1,000,000 | | New Hope Texas Cultural Education Facilities Finance Corp. | | | 5.75 | % | | 07/01/2051 | | | 1,103,330 | |
| | 10,410,000 | | New Jersey Health Care Facilities Financing Authority | | | 5.50 | % | | 07/01/2038 | | | 10,410,000 | |
| | 10,000,000 | | New Jersey Turnpike Authority (1 Month LIBOR USD + 0.70%) | | | 2.41 | % | | 01/02/2024 | | | 10,069,400 | |
| | 10,390,000 | | New York City Industrial Development Agency# | | | 3.69 | % | | 10/01/2029 | | | 10,390,000 | |
| | 2,375,000 | | New York City Industrial Development Agency | | | 5.00 | % | | 01/01/2039 | | | 2,414,948 | |
| | 3,000,000 | | New York City Industrial Development Agency | | | 5.00 | % | | 01/01/2046 | | | 3,045,480 | |
The accompanying notes are an integral part of these financial statements.
www.brownadvisory.com/mf
Brown Advisory Tax-Exempt Bond FundSchedule of Investments
June 30, 2019
| Par Value | | Security Description | | Rate | | | Maturity | | Value $ | |
| Municipal Bonds — 96.3% (Continued) | |
| | |
| Revenue Bonds — 84.5% (Continued) | |
| | 5,000,000 | | New York Convention Center Development Corp.+ | | | 3.78 | % | | 11/15/2041 | | | 2,389,750 | |
| | 3,375,000 | | Newport News Virginia Economic Development Authority | | | 5.00 | % | | 12/01/2031 | | | 3,702,071 | |
| | 1,760,000 | | Niagara County New York Tobacco Asset Securitization Corp. | | | 5.00 | % | | 05/15/2024 | | | 1,949,429 | |
| | 2,000,000 | | North Carolina Medical Care Commission | | | 5.00 | % | | 10/01/2031 | | | 2,207,420 | |
| | 3,765,000 | | North Carolina Turnpike Authority+ | | | 3.85 | % | | 01/01/2034 | | | 2,430,609 | |
| | 4,165,000 | | North Texas Tollway Authority | | | 5.00 | % | | 01/01/2032 | | | 4,814,698 | |
| | 5,000,000 | | North Texas Tollway Authority | | | 5.25 | % | | 01/01/2044 | | | 5,013,300 | |
| | 5,950,000 | | Ohio Air Quality Development Authority^ | | | 3.75 | % | | 01/15/2028 | | | 6,357,813 | |
| | 4,575,000 | | Ohio, State of# | | | 3.27 | % | | 09/01/2041 | | | 4,507,610 | |
| | 5,790,000 | | Oregon State Facilities Authority | | | 5.00 | % | | 10/01/2031 | | | 6,694,745 | |
| | 1,250,000 | | Palm Beach County Florida Health Facilities Authority | | | 5.00 | % | | 12/01/2031 | | | 1,416,338 | |
| | 1,000,000 | | Park Creek Colorado Metropolitan District | | | 5.00 | % | | 12/01/2034 | | | 1,150,620 | |
| | 1,535,000 | | Pennsylvania Economic Development Financing Authority | | | 5.00 | % | | 11/01/2027 | | | 1,669,159 | |
| | 10,000,000 | | Pennsylvania Turnpike Commission | | | 5.00 | % | | 06/01/2029 | | | 11,788,900 | |
| | 6,360,000 | | Pennsylvania Turnpike Commission | | | 4.00 | % | | 12/01/2036 | | | 6,974,376 | |
| | 8,325,000 | | Pinellas County Florida Health Facilities Authority# | | | 3.58 | % | | 11/15/2023 | | | 8,325,000 | |
| | 1,110,000 | | Prince William County Virginia Industrial Development Authority | | | 5.00 | % | | 01/01/2025 | | | 1,263,935 | |
| | 3,120,000 | | Prince William County Virginia Industrial Development Authority | | | 5.00 | % | | 01/01/2031 | | | 3,533,026 | |
| | 1,500,000 | | Public Finance Authority | | | 2.63 | % | | 11/01/2025 | | | 1,549,335 | |
| | 1,500,000 | | Public Finance Authority^ | | | 5.00 | % | | 09/01/2030 | | | 1,609,050 | |
| | 15,000,000 | | Puerto Rico Sales Tax Financing Corp Sales Tax Revenue+ | | | 4.90 | % | | 07/01/2033 | | | 8,394,900 | |
| | 7,315,000 | | San Diego California Tobacco Settlement Revenue Funding Corp. | | | 4.00 | % | | 06/01/2032 | | | 7,713,302 | |
| | 6,840,000 | | Selma Alabama Industrial Development Board | | | 6.25 | % | | 11/01/2033 | | | 6,942,053 | |
| | 8,225,000 | | Syracuse New York Industrial Development Agency# | | | 3.51 | % | | 12/01/2029 | | | 8,225,000 | |
| | 19,100,000 | | Tennessee Energy Acquisition Corp.# | | | 4.00 | % | | 05/01/2048 | | | 20,481,694 | |
| | 5,805,000 | | Texas Municipal Gas Acquisition & Supply Corp II (3 Month LIBOR USD + 0.87%) | | | 2.49 | % | | 09/15/2027 | | | 5,811,966 | |
| | 6,995,000 | | Texas Municipal Gas Acquisition & Supply Corp. III | | | 5.00 | % | | 12/15/2023 | | | 7,736,190 | |
| | 2,055,000 | | Tobacco Settlement Authority | | | 5.25 | % | | 06/01/2032 | | | 2,165,847 | |
| | 11,105,000 | | Tobacco Settlement Financing Corp. | | | 5.00 | % | | 06/01/2031 | | | 13,304,678 | |
| | 20,500,000 | | Tobacco Settlement Financing Corp. | | | 5.00 | % | | 06/01/2035 | | | 22,601,045 | |
| | 1,045,000 | | Triborough Bridge & Tunnel Authority+ | | | 3.38 | % | | 11/15/2031 | | | 752,327 | |
| | 9,030,000 | | TSASC, Inc. | | | 5.00 | % | | 06/01/2031 | | | 10,515,164 | |
| | 2,405,000 | | University of Connecticut | | | 5.00 | % | | 03/15/2029 | | | 2,865,413 | |
| | 3,107,624 | | Vermont Student Assistance Corp. (3 Month LIBOR USD + 3.00%) | | | 5.48 | % | | 12/03/2035 | | | 3,246,566 | |
| | 5,755,000 | | Virginia Public Building Authority | | | 4.00 | % | | 08/01/2036 | | | 6,546,543 | |
| | 4,000,000 | | Virginia Small Business Financing Authority | | | 5.00 | % | | 07/01/2034 | | | 4,256,240 | |
| | 1,000,000 | | Washington State Housing Finance Commission^ | | | 4.00 | % | | 01/01/2026 | | | 1,067,190 | |
| | 2,655,000 | | Washington State Housing Finance Commission^ | | | 5.00 | % | | 01/01/2031 | | | 2,944,448 | |
| | 3,655,000 | | Wayne County Michigan Airport Authority | | | 5.00 | % | | 12/01/2038 | | | 4,203,433 | |
| | 1,610,000 | | Wisconsin Health & Educational Facilities Authority | | | 5.00 | % | | 05/01/2027 | | | 1,808,883 | |
| | 1,730,000 | | Wisconsin Health & Educational Facilities Authority | | | 5.00 | % | | 08/15/2028 | | | 1,926,718 | |
| | 650,000 | | Wisconsin Health & Educational Facilities Authority | | | 5.00 | % | | 09/15/2037 | | | 677,463 | |
| | 2,010,000 | | Yamhill County Oregon Hospital Authority | | | 4.00 | % | | 11/15/2026 | | | 2,138,881 | |
| | 480,000 | | Yamhill County Oregon Hospital Authority | | | 5.00 | % | | 11/15/2031 | | | 540,302 | |
| | 460,000 | | Yamhill County Oregon Hospital Authority | | | 5.00 | % | | 11/15/2036 | | | 511,920 | |
| | 1,085,000 | | Yamhill County Oregon Hospital Authority | | | 5.00 | % | | 11/15/2046 | | | 1,194,379 | |
| | | | | | | | | | | | | 820,338,348 | |
Total Municipal Bonds (Cost $908,441,423) | | |
| 934,423,526 |
The accompanying notes are an integral part of these financial statements.
www.brownadvisory.com/mf
Brown Advisory Tax-Exempt Bond FundSchedule of Investments
June 30, 2019
| Shares | | Security Description | | Value $ | |
| Short-Term Investments — 2.2% | |
| | |
| Money Market Fund — 2.2% | |
| | 21,256,533 | | First American Government Obligations Fund — Class Z, 2.26%* | | | 21,256,533 | |
Total Short-Term Investments (Cost $21,256,533) | | | 21,256,533 | |
Total Investments — 98.5% (Cost $929,697,956) | | | 955,680,059 | |
Other Assets in Excess of Liabilities — 1.5% | | | 14,547,687 | |
| NET ASSETS — 100.0% | | $ | 970,227,746 | |
| # | Variable rate security. Rate disclosed is as of June 30, 2019. |
| * | Annualized seven-day yield as of June 30, 2019. |
| ^ | Security exempt from registration under Rule 144A of the Securities Act of 1933. These securities may be resold in transactions exempt from registration, normally to qualified institutional buyers. |
| + | Zero coupon bond. Rate disclosed is calculated yield to maturity as of June 30, 2019. |
The accompanying notes are an integral part of these financial statements.
www.brownadvisory.com/mf
Brown Advisory Mortgage Securities FundA Message to Our Shareholders
June 30, 2019
Dear Shareholders:
During the year ended June 30, 2019, the Brown Advisory Mortgage Securities Fund – Investor Shares (the “Fund”) increased 6.55%. During the same period, the Fund’s benchmark, the Bloomberg Barclays Mortgage Backed Securities Index (the “Index”), increased 6.22%.
The Fund aims to generate performance through strong current income generation from high quality mortgage-related securities. The mortgage sector in particular is highly sensitive to interest rate volatility and assumptions around borrower refinancing behavior. Our disciplined process is supported by detailed individual security selection with a keen focus on capital conservation from these factors across all interest rate environments.
For the 12 months ended June 30, 2019, the Fund’s muted prepayment sensitivity helped to drive outperformance as falling rates led to market wide fears of increased rates of refinancing. During the course of the period, 10-year U.S. Treasury yields fell from 3.24% in November 2018, to 2.00% at period’s end. Mortgages typically underperform Treasuries during sharp rallies, particularly if it is the first opportunity for many borrowers to lock in lower rates. We remain underweight lower-coupon mortgages, as our team sees few opportunities to capitalize on individual security selection in that segment. Rather, we favor seasoned, higher-coupon passthroughs, as well as specific parts of the agency commercial mortgage market that offer more predictable cash flows.
Within our non-agency holdings, we maintain an allocation to low-duration asset-backed securities and floating-rate securitized products. While we believe that these sectors help to reduce our sensitivity to interest rates and offer compelling risk-adjusted return, we reduced our exposure to them during 2019 as part of an effort to take a more defensive stance in the face of weaker macroeconomic conditions.
Looking forward, we believe that mortgage investors will face a more difficult environment due to lower rates and more disparate prepayment profiles. Our objective for the Fund is to build a portfolio that is resilient in a wide variety of challenging markets. By balancing what we believe will be attractive income generation with stable prepayment profiles and fundamentally sound credits, we aim to deliver incremental return alongside the stability of a government-related mandate.
Sincerely,
Thomas D.D. Graff, CFA
Portfolio Manager
John Henry Iucker
Associate Portfolio Manager
Past performance is not a guarantee of future results.
Mutual fund investing involves risk. Principal loss is possible. Investments in debt securities typically decrease in value when interest rates rise. This risk is usually greater for longer-term debt securities. Investments in Asset-Backed and Mortgage-Backed securities include additional risks that investor should be aware of including credit risk, prepayment risk, possible illiquidity and default, as well as increased susceptibility to adverse economic developments. Certain fixed income securities held by the Fund may be difficult (or impossible) to sell at the time and at the price the Adviser would like. As a result, the Fund may have to hold these securities longer than it would like and may forego other investment opportunities. Issuers may experience an acceleration in prepayments of mortgage loans or other receivables backing the issuers’ fixed income securities when interest rates decline, which can shorten the maturity of the security, force the Fund to invest in securities with lower interest rates, and reduce the Fund’s return. Issuers may decrease prepayments of principal when interest rates increase, extending the maturity of a fixed income security and causing the value of the security to decline. Investing involves risk. Principal loss is possible. Investors should consult a tax professional for advice and information concerning the tax features of mortgage backed securities and fixed coupon bonds. Mortgage-backed securities (MBS) are bonds secured by a mortgage or collection of mortgages. Diversification does not assure a profit nor protect against loss in a declining market.
Fund holdings and sector allocations are subject to change and should not be considered a recommendation to buy or sell any security. For a complete list of fund holdings, please refer to the Schedule of Investments provided in this report.
Definitions for terms and indices are provided in the Glossary of Terms.
www.brownadvisory.com/mf
Brown Advisory Mortgage Securities FundPerformance Information & Portfolio Holdings Summary
June 30, 2019
GROWTH OF A $10,000 INVESTMENT
The following chart reflects the change in value of a hypothetical $10,000 investment, including reinvested dividends and distributions, in the Fund as measured against a broad-based bond index. The Bloomberg Barclays Mortgage Backed Securities Index (“Index”) is a market value-weighted index which covers the mortgage-backed securities component of the Barclays US Aggregate Bond Index. The Index is composed of agency mortgage-backed passthrough securities of the Government National Mortgage Association (Ginnie Mae), the Federal National Mortgage Association (Fannie Mae), and the Federal Home Loan Mortgage Corporation (Freddie Mac) with a minimum $150 million par amount outstanding and a weighted-average maturity of at least 1 year. The Index includes reinvestment of income. The Index is unmanaged and does not reflect the deduction of fees, such as investment management fees. Investors cannot invest directly in an index.
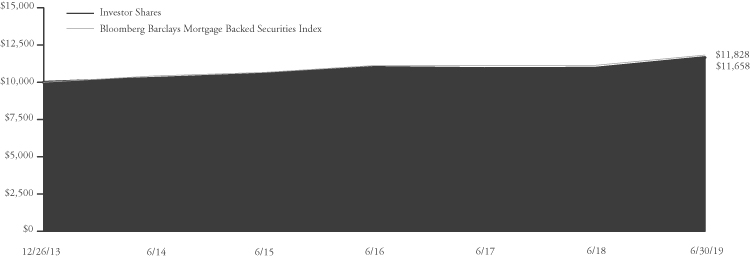
| PORTFOLIO HOLDINGS | % of Net Assets |
Mortgage Backed Securities | | | 87.8 | % | |
Asset Backed Securities | | | 5.7 | % | |
Municipal Bonds | | | 2.6 | % | |
Money Market Funds | | | 1.8 | % | |
U.S. Treasury Notes | | | 1.1 | % | |
Preferred Stocks | | | 0.8 | % | |
Purchased Options | | | 0.0 | % | |
Other Assets and Liabilities | | | 0.2 | % | |
| | | | 100.0 | % | |
| | | | Since Inception |
Average Annual Total Return | One Year | Five Year | (12/26/13) |
Institutional Shares1 | 6.72% | 2.65% | 2.89% |
| Investor Shares | 6.55% | 2.58% | 2.82% |
| Bloomberg Barclays Mortgage Backed Securities Index | 6.22% | 2.56% | 3.09% |
| | Institutional Shares | Investor Shares |
Gross Expense Ratio2 | 0.48% | 0.53% |
Net Expense Ratio2 | 0.48% | 0.53% |
Past performance does not guarantee future results. The performance data quoted represents past performance and current returns may be lower or higher. The investment return and net asset value will fluctuate so that an investor’s shares, when redeemed, may be worth more or less than the original cost. To obtain performance information current to the most recent month end, please visit our website at brownadvisory.com/mf/mortgage-securities-fund. The performance table and graph above do not reflect the deduction of taxes that a shareholder would pay on Fund distributions or the redemption of Fund shares. Performance data does not reflect the imposition of the redemption fee of 1.00% on shares redeemed within 14 days, and if it did, performance would have been lower. Short-term performance, in particular, is not a good indication of the Fund’s future performance, and an investment should not be made based solely on returns. Returns shown are calculated using the net asset values (“NAV”) that were used for shareholder transactions as of the respective period ends. These NAV, and the returns calculated from them, may differ from the NAV and returns shown elsewhere in this report.
1 | Performance information for the Institutional Shares, prior to commencement of operations on May 13, 2014, is based on the performance of the Investor Shares, and adjusted for the lower expenses applicable to the Institutional Shares. |
2 | Per the Fund’s prospectus dated October 31, 2018. Refer to the financial highlights for the gross and net expense ratios for the year ended as of the date of this report. Please note that the expense ratios per the prospectus include acquired fund fees and expenses (as applicable) and the expense ratios in the financial highlights do not. |
www.brownadvisory.com/mf
Brown Advisory Mortgage Securities FundSchedule of Investments
June 30, 2019
| Par Value | | Security Description | | Rate | | Maturity | | Value $ | |
| Mortgage Backed Securities — 87.8% | |
| | 986,000 | | DBGS Mortgage Trust, Series 2018-C1 7EA^ | | | 4.64 | % | | 10/17/2051 | | | 1,026,404 | |
| | 53,850 | | FHLMC PC, Pool# N3-0530 | | | 5.50 | % | | 01/01/2029 | | | 54,307 | |
| | 415,422 | | FHLMC PC, Pool# C4-6100 | | | 6.00 | % | | 08/01/2029 | | | 463,802 | |
| | 107,842 | | FHLMC PC, Pool# C5-3878 | | | 5.50 | % | | 12/01/2030 | | | 118,106 | |
| | 291,738 | | FHLMC PC, Pool# C9-1366 | | | 4.50 | % | | 04/01/2031 | | | 310,904 | |
| | 64,793 | | FHLMC PC, Pool# C6-6421 | | | 6.50 | % | | 02/01/2032 | | | 71,925 | |
| | 232,041 | | FHLMC PC, Pool# N7-0078 | | | 5.50 | % | | 01/01/2033 | | | 247,963 | |
| | 81,689 | | FHLMC PC, Pool# 1B-0889 (12 Month LIBOR USD + 1.59%) | | | 4.50 | % | | 05/01/2033 | | | 85,650 | |
| | 670,822 | | FHLMC PC, Pool# C7-9930 | | | 5.50 | % | | 06/01/2033 | | | 737,549 | |
| | 790,739 | | FHLMC PC, Pool# A1-2929 | | | 5.00 | % | | 08/01/2033 | | | 863,927 | |
| | 169,284 | | FHLMC PC, Pool# A1-4256 | | | 5.50 | % | | 10/01/2033 | | | 188,049 | |
| | 341,381 | | FHLMC PC, Pool# G3-0932 | | | 4.50 | % | | 03/01/2034 | | | 363,743 | |
| | 671,289 | | FHLMC PC, Pool# A3-0648 | | | 5.50 | % | | 12/01/2034 | | | 725,007 | |
| | 57,246 | | FHLMC PC, Pool# 1J-0204 (12 Month LIBOR USD + 1.75%) | | | 4.64 | % | | 05/01/2035 | | | 60,306 | |
| | 180,531 | | FHLMC PC, Pool# N7-0071 | | | 6.00 | % | | 06/01/2035 | | | 194,448 | |
| | 90,015 | | FHLMC PC, Pool# A4-6629 | | | 5.00 | % | | 08/01/2035 | | | 98,515 | |
| | 1,314,683 | | FHLMC PC, Pool# K9-3365 | | | 3.50 | % | | 11/01/2035 | | | 1,358,363 | |
| | 997,607 | | FHLMC PC, Pool# K9-3349 | | | 4.00 | % | | 11/01/2035 | | | 1,051,808 | |
| | 145,447 | | FHLMC PC, Pool# A3-9555 | | | 5.50 | % | | 11/01/2035 | | | 161,599 | |
| | 411,658 | | FHLMC PC, Pool# G0-1980 | | | 5.00 | % | | 12/01/2035 | | | 452,466 | |
| | 36,894 | | FHLMC PC, Pool# 1L-1263 (1 Year CMT Rate + 2.25%) | | | 4.90 | % | | 03/01/2036 | | | 39,041 | |
| | 587,071 | | FHLMC PC, Pool# G0-5935 | | | 6.00 | % | | 03/01/2036 | | | 666,550 | |
| | 41,066 | | FHLMC PC, Pool# 1H-1348 (1 Year CMT Rate + 2.14%) | | | 4.41 | % | | 10/01/2036 | | | 43,191 | |
| | 339,713 | | FHLMC PC, Pool# G2-0028 | | | 7.50 | % | | 12/01/2036 | | | 379,588 | |
| | 107,279 | | FHLMC PC, Pool# B3-1891 | | | 5.38 | % | | 01/01/2037 | | | 114,179 | |
| | 201,653 | | FHLMC PC, Pool# A5-6261 | | | 5.50 | % | | 01/01/2037 | | | 218,276 | |
| | 129,206 | | FHLMC PC, Pool# 84-7727 (12 Month LIBOR USD + 1.74%) | | | 4.57 | % | | 02/01/2037 | | | 135,139 | |
| | 206,421 | | FHLMC PC, Pool# B3-1900 | | | 5.38 | % | | 02/01/2037 | | | 219,820 | |
| | 121,492 | | FHLMC PC, Pool# B3-1934 | | | 5.38 | % | | 04/01/2037 | | | 129,283 | |
| | 97,956 | | FHLMC PC, Pool# B3-1976 | | | 5.10 | % | | 05/01/2037 | | | 103,804 | |
| | 82,025 | | FHLMC PC, Pool# B3-1950 | | | 5.10 | % | | 05/01/2037 | | | 86,796 | |
| | 180,155 | | FHLMC PC, Pool# A6-7884 | | | 5.38 | % | | 05/01/2037 | | | 192,325 | |
| | 58,291 | | FHLMC PC, Pool# 1J-1681 (12 Month LIBOR USD + 1.98%) | | | 4.86 | % | | 06/01/2037 | | | 61,642 | |
| | 174,714 | | FHLMC PC, Pool# B3-2000 | | | 5.10 | % | | 06/01/2037 | | | 185,023 | |
| | 98,814 | | FHLMC PC, Pool# U3-0471 | | | 5.10 | % | | 07/01/2037 | | | 104,674 | |
| | 56,842 | | FHLMC PC, Pool# U3-0653 | | | 5.13 | % | | 07/01/2037 | | | 60,632 | |
| | 77,474 | | FHLMC PC, Pool# U3-0606 | | | 5.10 | % | | 09/01/2037 | | | 82,085 | |
| | 234,276 | | FHLMC PC, Pool# U3-0681 | | | 5.10 | % | | 09/01/2037 | | | 248,017 | |
| | 53,334 | | FHLMC PC, Pool# 1G-2249 (12 Month LIBOR USD + 1.78%) | | | 4.65 | % | | 10/01/2037 | | | 56,036 | |
| | 272,997 | | FHLMC PC, Pool# T3-0346 | | | 5.38 | % | | 10/01/2037 | | | 290,648 | |
| | 86,976 | | FHLMC PC, Pool# U3-0800 | | | 5.10 | % | | 11/01/2037 | | | 92,113 | |
| | 149,160 | | FHLMC PC, Pool# U3-1874 | | | 5.38 | % | | 04/01/2038 | | | 158,819 | |
| | 361,466 | | FHLMC PC, Pool# N7-0082 | | | 6.00 | % | | 07/01/2038 | | | 392,460 | |
| | 272,257 | | FHLMC PC, Pool# G0-4540 | | | 6.00 | % | | 08/01/2038 | | | 313,495 | |
| | 235,202 | | FHLMC PC, Pool# G0-4655 | | | 6.00 | % | | 08/01/2038 | | | 270,954 | |
| | 116,386 | | FHLMC PC, Pool# U3-2470 | | | 5.10 | % | | 11/01/2038 | | | 123,280 | |
| | 158,816 | | FHLMC PC, Pool# G0-8348 | | | 5.00 | % | | 06/01/2039 | | | 172,764 | |
| | 923,400 | | FHLMC PC, Pool# A8-7915 | | | 5.00 | % | | 08/01/2039 | | | 1,020,110 | |
| | 3,191,656 | | FHLMC PC, Pool# G0-7058 | | | 6.00 | % | | 09/01/2039 | | | 3,670,442 | |
| | 169,512 | | FHLMC PC, Pool# G0-7053 | | | 5.00 | % | | 10/01/2039 | | | 186,256 | |
| | 526,354 | | FHLMC PC, Pool# A9-2630 | | | 5.00 | % | | 06/01/2040 | | | 581,615 | |
| | 775,708 | | FHLMC PC, Pool# G6-1330 | | | 6.00 | % | | 07/01/2040 | | | 880,597 | |
| | 1,251,707 | | FHLMC PC, Pool# G0-7054 | | | 5.00 | % | | 06/01/2041 | | | 1,368,997 | |
| | 636,013 | | FHLMC PC, Pool# Q3-8585 | | | 4.00 | % | | 10/01/2043 | | | 669,550 | |
| | 2,377,320 | | FHLMC PC, Pool# V8-2155 | | | 4.00 | % | | 12/01/2045 | | | 2,492,894 | |
| | 790,248 | | FHLMC PC, Pool# G0-8828 | | | 5.50 | % | | 04/01/2048 | | | 845,010 | |
The accompanying notes are an integral part of these financial statements.
www.brownadvisory.com/mf
Brown Advisory Mortgage Securities FundSchedule of Investments
June 30, 2019
| Par Value | | Security Description | | Rate | | Maturity | | Value $ | |
| Mortgage Backed Securities — 87.8% (Continued) | |
| | 2,332,492 | | FHLMC PC, Pool# Q5-7464 | | | 4.50 | % | | 07/01/2048 | | | 2,453,098 | |
| | 2,539,536 | | FHLMC REMIC, Series 4318 DI~ | | | 2.50 | % | | 08/15/2022 | | | 72,039 | |
| | 2,546,335 | | FHLMC REMIC, Series 4329 CI~ | | | 2.50 | % | | 01/15/2023 | | | 86,771 | |
| | 48,329 | | FHLMC REMIC, Series 1843 Z | | | 7.00 | % | | 04/15/2026 | | | 52,137 | |
| | 175,912 | | FHLMC REMIC, Series 2517 Z | | | 5.50 | % | | 10/15/2032 | | | 187,868 | |
| | 406,890 | | FHLMC REMIC, Series 2890 ZA | | | 5.00 | % | | 11/15/2034 | | | 451,788 | |
| | 619,394 | | FHLMC REMIC, Series 3150 DZ | | | 5.50 | % | | 05/15/2036 | | | 705,169 | |
| | 245,281 | | FHLMC REMIC, Series 3294 CB | | | 5.50 | % | | 03/15/2037 | | | 275,297 | |
| | 1,539,989 | | FHLMC REMIC, Series 4309 BI~ | | | 3.00 | % | | 08/15/2039 | | | 139,857 | |
| | 1,450,000 | | FHLMC SCRTT, Series 2016-1 M1#^ | | | 3.00 | % | | 09/25/2055 | | | 1,415,694 | |
| | 1,000,000 | | FHLMC SCRTT, Series 2017-1 M1#^ | | | 4.00 | % | | 01/25/2056 | | | 1,013,922 | |
| | 458,744 | | FHLMC WLST, Series 2017-SC02 2A1 | | | 3.50 | % | | 05/25/2047 | | | 463,981 | |
| | 13,667,826 | | FHMS, Series K-019 X1#~ | | | 1.62 | % | | 03/25/2022 | | | 512,899 | |
| | 12,380,260 | | FHMS, Series K-021 X1#~ | | | 1.44 | % | | 06/25/2022 | | | 453,382 | |
| | 15,833,272 | | FHMS, Series K-721 X1#~ | | | 0.33 | % | | 08/25/2022 | | | 152,916 | |
| | 25,070,972 | | FHMS, Series K-025 X1#~ | | | 0.83 | % | | 10/25/2022 | | | 599,266 | |
| | 13,374,684 | | FHMS, Series K-035 X1#~ | | | 0.39 | % | | 08/25/2023 | | | 189,011 | |
| | 30,915,095 | | FHMS, Series K-C02 X1#~ | | | 0.37 | % | | 03/25/2024 | | | 511,756 | |
| | 4,915,000 | | FHMS, Series K-726 A2 | | | 2.91 | % | | 04/25/2024 | | | 5,083,230 | |
| | 1,955,000 | | FHMS, Series K-728 A2# | | | 3.06 | % | | 08/25/2024 | | | 2,036,071 | |
| | 37,056,040 | | FHMS, Series K-040 X1#~ | | | 0.73 | % | | 09/25/2024 | | | 1,199,882 | |
| | 3,000,000 | | FHMS, Series K-729 A2 | | | 3.14 | % | | 10/25/2024 | | | 3,132,396 | |
| | 31,425,543 | | FHMS, Series K-734 X1#~ | | | 0.79 | % | | 02/25/2026 | | | 1,185,657 | |
| | 5,399,670 | | FHMS, Series K-058 X1#~ | | | 0.93 | % | | 08/25/2026 | | | 306,462 | |
| | 6,535,885 | | FHMS, Series K-059 X1#~ | | | 0.32 | % | | 09/25/2026 | | | 129,988 | |
| | 14,000,000 | | FHMS, Series K-C04 X1#~ | | | 1.25 | % | | 12/25/2026 | | | 979,896 | |
| | 55,521,261 | | FHMS, Series K-063 X1#~ | | | 0.29 | % | | 01/25/2027 | | | 1,114,456 | |
| | 4,057,680 | | FHMS, Series K-064 X1#~ | | | 0.61 | % | | 03/25/2027 | | | 166,915 | |
| | 4,378,812 | | FHMS, Series K-W03 X1#~ | | | 0.84 | % | | 06/25/2027 | | | 226,541 | |
| | 11,406,981 | | FHMS, Series K-068 X1#~ | | | 0.44 | % | | 08/25/2027 | | | 360,007 | |
| | 30,974,580 | | FHMS, Series K-069 X1#~ | | | 0.37 | % | | 09/25/2027 | | | 869,992 | |
| | 42,837,055 | | FHMS, Series K-070 X1#~ | | | 0.33 | % | | 11/25/2027 | | | 1,093,459 | |
| | 31,842,607 | | FHMS, Series K-072 X1#~ | | | 0.49 | % | | 12/25/2027 | | | 906,174 | |
| | 4,186,073 | | FHMS, Series Q-006 APT1# | | | 2.62 | % | | 04/25/2028 | | | 4,450,726 | |
| | 19,984,109 | | FHMS, Series K-087 X1#~ | | | 0.36 | % | | 12/25/2028 | | | 640,579 | |
| | 18,234,188 | | FHMS, Series K-091 X1#~ | | | 0.70 | % | | 03/25/2029 | | | 887,099 | |
| | 12,679,338 | | FHMS, Series K-092 X1#~ | | | 0.85 | % | | 04/25/2029 | | | 769,787 | |
| | 10,000,000 | | FHMS, Series K-G01 X1#~ | | | 0.97 | % | | 04/25/2029 | | | 713,280 | |
| | 6,300,000 | | FHMS, Series K-093 X1#~ | | | 0.95 | % | | 05/25/2029 | | | 501,454 | |
| | 3,136,165 | | FHMS, Series Q-004 A2H# | | | 3.05 | % | | 01/25/2046 | | | 3,151,928 | |
| | 4,780,978 | | FHMS, Series Q-007 APT1# | | | 2.99 | % | | 10/25/2047 | | | 4,866,971 | |
| | 3,800,533 | | FHMS, Series Q-007 APT2# | | | 3.33 | % | | 10/25/2047 | | | 3,934,555 | |
| | 43,981 | | FNMA, Pool# 922791 | | | 6.50 | % | | 12/01/2021 | | | 44,225 | |
| | 55,344 | | FNMA, Pool# 336422 (3 Year CMT Rate + 2.30%) | | | 4.66 | % | | 10/01/2025 | | | 55,622 | |
| | 200,463 | | FNMA, Pool# 344903 | | | 5.50 | % | | 10/01/2025 | | | 218,091 | |
| | 108,290 | | FNMA, Pool# 356232 | | | 6.50 | % | | 01/01/2026 | | | 120,172 | |
| | 44,245 | | FNMA, Pool# 406521 (1 Year CMT Rate + 2.52%) | | | 4.65 | % | | 05/01/2026 | | | 44,687 | |
| | 2,700,835 | | FNMA, Pool# AN3155 | | | 2.49 | % | | 11/01/2026 | | | 2,724,520 | |
| | 4,188,795 | | FNMA, Pool# BM3352 | | | 2.55 | % | | 12/01/2026 | | | 4,246,021 | |
| | 1,670,000 | | FNMA, Pool# AN3727 | | | 2.71 | % | | 12/01/2026 | | | 1,710,543 | |
| | 906,086 | | FNMA, Pool# AM6988 | | | 3.18 | % | | 12/01/2026 | | | 952,223 | |
| | 778,065 | | FNMA, Pool# AM7816 | | | 3.19 | % | | 01/01/2027 | | | 820,578 | |
| | 66,608 | | FNMA, Pool# 356329 (1 Year CMT Rate + 2.64%) | | | 5.26 | % | | 01/01/2027 | | | 68,088 | |
| | 1,735,000 | | FNMA, Pool# AM8035 | | | 2.66 | % | | 03/01/2027 | | | 1,768,834 | |
| | 21,660 | | FNMA, Pool# 363850 (1 Year CMT Rate + 2.13%) | | | 4.70 | % | | 04/01/2027 | | | 22,077 | |
| | 1,000,000 | | FNMA, Pool# AN5713 | | | 2.97 | % | | 06/01/2027 | | | 1,039,568 | |
The accompanying notes are an integral part of these financial statements.
www.brownadvisory.com/mf
Brown Advisory Mortgage Securities FundSchedule of Investments
June 30, 2019
| Par Value | | Security Description | | Rate | | Maturity | | Value $ | |
| Mortgage Backed Securities — 87.8% (Continued) | |
| | 2,870,000 | | FNMA, Pool# AN6558 | | | 2.91 | % | | 09/01/2027 | | | 2,977,932 | |
| | 46,270 | | FNMA, Pool# 406380 (1 Year CMT Rate + 2.17%) | | | 4.56 | % | | 11/01/2027 | | | 46,872 | |
| | 2,000,000 | | FNMA, Pool# AN7384 | | | 2.88 | % | | 12/01/2027 | | | 2,065,270 | |
| | 1,120,000 | | FNMA, Pool# AN1710 | | | 2.87 | % | | 05/01/2028 | | | 1,155,983 | |
| | 1,121,603 | | FNMA, Pool# 257203 | | | 5.00 | % | | 05/01/2028 | | | 1,186,089 | |
| | 2,423,845 | | FNMA, Pool# AM3724 | | | 3.08 | % | | 06/01/2028 | | | 2,536,801 | |
| | 2,000,000 | | FNMA, Pool# AN2738 | | | 2.39 | % | | 09/01/2028 | | | 2,004,250 | |
| | 833,148 | | FNMA, Pool# 957502 | | | 3.98 | % | | 07/01/2029 | | | 882,388 | |
| | 48,719 | | FNMA, Pool# 520478 (1 Year CMT Rate + 2.10%) | | | 4.60 | % | | 11/01/2029 | | | 49,534 | |
| | 42,324 | | FNMA, Pool# 559439 (1 Year CMT Rate + 2.27%) | | | 4.52 | % | | 09/01/2030 | | | 43,254 | |
| | 55,929 | | FNMA, Pool# 573097 (1 Year CMT Rate + 2.21%) | | | 4.71 | % | | 02/01/2031 | | | 56,758 | |
| | 195,319 | | FNMA, Pool# AL0898 | | | 5.00 | % | | 02/01/2031 | | | 206,600 | |
| | 42,081 | | FNMA, Pool# 590852 (1 Year CMT Rate + 2.11%) | | | 4.36 | % | | 07/01/2031 | | | 42,506 | |
| | 2,875,020 | | FNMA, Pool# AI4717 | | | 4.50 | % | | 07/01/2031 | | | 3,068,000 | |
| | 60,062 | | FNMA, Pool# 656181 (1 Year CMT Rate + 2.16%) | | | 4.85 | % | | 08/01/2031 | | | 62,163 | |
| | 40,940 | | FNMA, Pool# 723313 (1 Year CMT Rate + 2.54%) | | | 4.79 | % | | 09/01/2031 | | | 41,311 | |
| | 24,514 | | FNMA, Pool# 642122 (1 Year CMT Rate + 2.27%) | | | 4.77 | % | | 03/01/2032 | | | 25,007 | |
| | 33,249 | | FNMA, Pool# 628837 | | | 6.50 | % | | 03/01/2032 | | | 36,956 | |
| | 43,261 | | FNMA, Pool# 640225 (1 Year CMT Rate + 2.27%) | | | 4.77 | % | | 04/01/2032 | | | 44,735 | |
| | 43,703 | | FNMA, Pool# 662138 (1 Year CMT Rate + 2.30%) | | | 4.55 | % | | 09/01/2032 | | | 44,143 | |
| | 46,954 | | FNMA, Pool# 668309 (1 Year CMT Rate + 2.02%) | | | 4.27 | % | | 11/01/2032 | | | 47,321 | |
| | 31,989 | | FNMA, Pool# 696546 (6 Month LIBOR USD + 2.26%) | | | 5.01 | % | | 03/01/2033 | | | 32,049 | |
| | 518,858 | | FNMA, Pool# 687887 | | | 5.50 | % | | 03/01/2033 | | | 579,396 | |
| | 210,298 | | FNMA, Pool# 688002 | | | 5.50 | % | | 03/01/2033 | | | 234,851 | |
| | 487,480 | | FNMA, Pool# 702427 | | | 5.50 | % | | 04/01/2033 | | | 544,292 | |
| | 94,205 | | FNMA, Pool# 711206 | | | 5.50 | % | | 05/01/2033 | | | 100,503 | |
| | 302,656 | | FNMA, Pool# 711501 | | | 5.50 | % | | 05/01/2033 | | | 327,307 | |
| | 791,233 | | FNMA, Pool# 555458 | | | 5.50 | % | | 05/01/2033 | | | 883,715 | |
| | 35,153 | | FNMA, Pool# 555819 (6 Month LIBOR USD + 1.55%) | | | 4.20 | % | | 07/01/2033 | | | 36,335 | |
| | 44,856 | | FNMA, Pool# 744805 (6 Month LIBOR USD + 1.52%) | | | 4.14 | % | | 11/01/2033 | | | 45,352 | |
| | 39,820 | | FNMA, Pool# 751498 (1 Year CMT Rate + 2.22%) | | | 4.71 | % | | 11/01/2033 | | | 41,954 | |
| | 29,762 | | FNMA, Pool# 741373 (1 Year CMT Rate + 2.28%) | | | 4.78 | % | | 12/01/2033 | | | 30,962 | |
| | 387,265 | | FNMA, Pool# 725017 | | | 5.50 | % | | 12/01/2033 | | | 432,669 | |
| | 30,579 | | FNMA, Pool# 754767 | | | 6.50 | % | | 12/01/2033 | | | 33,926 | |
| | 365,153 | | FNMA, Pool# 725599 | | | 5.50 | % | | 01/01/2034 | | | 407,965 | |
| | 1,184,653 | | FNMA, Pool# 763673 | | | 5.50 | % | | 01/01/2034 | | | 1,322,858 | |
| | 667,415 | | FNMA, Pool# 759331 | | | 5.50 | % | | 01/01/2034 | | | 745,924 | |
| | 33,050 | | FNMA, Pool# 764342 (6 Month LIBOR USD + 1.52%) | | | 4.40 | % | | 02/01/2034 | | | 34,053 | |
| | 112,846 | | FNMA, Pool# 774969 (1 Year CMT Rate + 2.23%) | | | 4.73 | % | | 04/01/2034 | | | 116,527 | |
| | 605,355 | | FNMA, Pool# 763545 | | | 5.50 | % | | 04/01/2034 | | | 676,566 | |
| | 126,975 | | FNMA, Pool# 783554 (1 Year CMT Rate + 2.21%) | | | 4.46 | % | | 07/01/2034 | | | 129,674 | |
| | 31,175 | | FNMA, Pool# 789060 (12 Month LIBOR USD + 1.75%) | | | 4.50 | % | | 07/01/2034 | | | 32,739 | |
| | 462,984 | | FNMA, Pool# 725690 | | | 6.00 | % | | 08/01/2034 | | | 525,235 | |
| | 361,673 | | FNMA, Pool# 801034 | | | 5.50 | % | | 11/01/2034 | | | 401,504 | |
| | 377,045 | | FNMA, Pool# AD0163 | | | 6.00 | % | | 11/01/2034 | | | 427,721 | |
| | 510,240 | | FNMA, Pool# AM7615 | | | 3.63 | % | | 12/01/2034 | | | 552,696 | |
| | 36,950 | | FNMA, Pool# 819649 (12 Month LIBOR USD + 1.52%) | | | 4.61 | % | | 03/01/2035 | | | 38,633 | |
| | 85,297 | | FNMA, Pool# 889829 | | | 5.00 | % | | 07/01/2035 | | | 92,871 | |
| | 45,365 | | FNMA, Pool# 830970 (12 Month LIBOR USD + 1.83%) | | | 4.59 | % | | 08/01/2035 | | | 47,683 | |
| | 130,237 | | FNMA, Pool# 837329 (1 Year CMT Rate + 2.04%) | | | 4.29 | % | | 09/01/2035 | | | 137,019 | |
| | 142,325 | | FNMA, Pool# 842006 | | | 4.25 | % | | 10/01/2035 | | | 147,959 | |
| | 19,847 | | FNMA, Pool# 836335 (1 Year CMT Rate + 2.23%) | | | 4.60 | % | | 10/01/2035 | | | 20,019 | |
| | 58,327 | | FNMA, Pool# 836715 (12 Month LIBOR USD + 1.77%) | | | 4.64 | % | | 10/01/2035 | | | 58,754 | |
| | 1,592,696 | | FNMA, Pool# AL3596 | | | 5.00 | % | | 10/01/2035 | | | 1,748,705 | |
| | 40,838 | | FNMA, Pool# 922680 (12 Month LIBOR USD + 1.91%) | | | 4.75 | % | | 11/01/2035 | | | 43,187 | |
| | 280,553 | | FNMA, Pool# 850232 | | | 4.25 | % | | 12/01/2035 | | | 292,030 | |
| | | | | | | | | | | | | | |
The accompanying notes are an integral part of these financial statements.
www.brownadvisory.com/mf
Brown Advisory Mortgage Securities FundSchedule of Investments
June 30, 2019
| Par Value | | Security Description | | Rate | | Maturity | | Value $ | |
| Mortgage Backed Securities — 87.8% (Continued) | |
| | 14,344 | | FNMA, Pool# 865849 (12 Month LIBOR USD + 1.54%) | | | 4.66 | % | | 03/01/2036 | | | 14,802 | |
| | 54,688 | | FNMA, Pool# 877009 (12 Month LIBOR USD + 2.38%) | | | 5.29 | % | | 03/01/2036 | | | 58,576 | |
| | 56,359 | | FNMA, Pool# 868568 (12 Month LIBOR USD + 1.75%) | | | 4.69 | % | | 04/01/2036 | | | 59,519 | |
| | 68,881 | | FNMA, Pool# 882017 (6 Month LIBOR USD + 1.56%) | | | 4.19 | % | | 05/01/2036 | | | 71,347 | |
| | 41,402 | | FNMA, Pool# 745626 (1 Year CMT Rate + 2.12%) | | | 4.49 | % | | 05/01/2036 | | | 43,040 | |
| | 18,124 | | FNMA, Pool# 872895 (12 Month LIBOR USD + 1.68%) | | | 4.46 | % | | 06/01/2036 | | | 19,017 | |
| | 29,292 | | FNMA, Pool# 886163 (12 Month LIBOR USD + 1.80%) | | | 4.55 | % | | 07/01/2036 | | | 30,938 | |
| | 481,457 | | FNMA, Pool# 896838 | | | 5.45 | % | | 07/01/2036 | | | 519,996 | |
| | 529,706 | | FNMA, Pool# 995026 | | | 6.00 | % | | 09/01/2036 | | | 600,805 | |
| | 164,055 | | FNMA, Pool# 745818 | | | 6.50 | % | | 09/01/2036 | | | 188,692 | |
| | 169,250 | | FNMA, Pool# 894270 (1 Year CMT Rate + 2.50%) | | | 5.00 | % | | 10/01/2036 | | | 171,254 | |
| | 665,437 | | FNMA, Pool# 960606 | | | 5.50 | % | | 10/01/2036 | | | 738,844 | |
| | 481,045 | | FNMA, Pool# 903242 | | | 6.00 | % | | 10/01/2036 | | | 545,149 | |
| | 4,823 | | FNMA, Pool# 905193 (12 Month LIBOR USD + 1.99%) | | | 4.86 | % | | 11/01/2036 | | | 4,921 | |
| | 84,267 | | FNMA, Pool# 902770 | | | 5.38 | % | | 11/01/2036 | | | 89,707 | |
| | 120,771 | | FNMA, Pool# 940309 (12 Month LIBOR USD + 1.50%) | | | 4.37 | % | | 01/01/2037 | | | 123,482 | |
| | 246,203 | | FNMA, Pool# 900852 | | | 6.00 | % | | 01/01/2037 | | | 278,872 | |
| | 29,202 | | FNMA, Pool# 910181 (12 Month LIBOR USD + 1.71%) | | | 4.79 | % | | 03/01/2037 | | | 30,804 | |
| | 44,598 | | FNMA, Pool# 888445 (12 Month LIBOR USD + 1.55%) | | | 4.59 | % | | 04/01/2037 | | | 47,675 | |
| | 269,335 | | FNMA, Pool# 995148 | | | 5.50 | % | | 04/01/2037 | | | 299,346 | |
| | 69,394 | | FNMA, Pool# 995521 (12 Month LIBOR USD + 1.84%) | | | 4.71 | % | | 05/01/2037 | | | 72,700 | |
| | 123,846 | | FNMA, Pool# 888418 | | | 5.50 | % | | 05/01/2037 | | | 139,002 | |
| | 93,507 | | FNMA, Pool# 950382 (6 Month LIBOR USD + 1.09%) | | | 3.94 | % | | 08/01/2037 | | | 95,368 | |
| | 156,348 | | FNMA, Pool# 941050 (12 Month LIBOR USD + 1.70%) | | | 4.45 | % | | 08/01/2037 | | | 156,012 | |
| | 63,228 | | FNMA, Pool# 953988 | | | 5.38 | % | | 08/01/2037 | | | 64,932 | |
| | 60,244 | | FNMA, Pool# 952835 (1 Year CMT Rate + 2.32%) | | | 4.72 | % | | 09/01/2037 | | | 63,981 | |
| | 5,118,581 | | FNMA, Pool# MA3208 | | | 4.50 | % | | 10/01/2037 | | | 5,394,279 | |
| | 140,594 | | FNMA, Pool# 955233 | | | 6.50 | % | | 12/01/2037 | | | 162,298 | |
| | 64,410 | | FNMA, Pool# 962656 (12 Month LIBOR USD + 1.24%) | | | 4.21 | % | | 04/01/2038 | | | 66,302 | |
| | 16,310 | | FNMA, Pool# 982237 (12 Month LIBOR USD + 1.84%) | | | 4.72 | % | | 05/01/2038 | | | 17,308 | |
| | 450,616 | | FNMA, Pool# AD0100 | | | 7.00 | % | | 12/01/2038 | | | 538,855 | |
| | 112,760 | | FNMA, Pool# 930507 | | | 6.50 | % | | 02/01/2039 | | | 131,178 | |
| | 3,336,318 | | FNMA, Pool# AS2249 | | | 4.00 | % | | 04/01/2039 | | | 3,519,745 | |
| | 2,458,485 | | FNMA, Pool# AC3666 | | | 5.50 | % | | 10/01/2039 | | | 2,767,569 | |
| | 397,818 | | FNMA, Pool# AD0427 | | | 5.50 | % | | 10/01/2039 | | | 443,172 | |
| | 2,210,375 | | FNMA, Pool# AD3507 | | | 5.00 | % | | 04/01/2040 | | | 2,403,242 | |
| | 512,972 | | FNMA, Pool# AD0941 | | | 5.50 | % | | 04/01/2040 | | | 574,606 | |
| | 628,035 | | FNMA, Pool# 467095 | | | 5.90 | % | | 01/01/2041 | | | 744,818 | |
| | 648,375 | | FNMA, Pool# AH8447 | | | 5.50 | % | | 04/01/2041 | | | 698,175 | |
| | 4,544,323 | | FNMA, Pool# BM3797 | | | 6.00 | % | | 07/01/2041 | | | 5,154,971 | |
| | 268,349 | | FNMA, Pool# AL2903 | | | 5.50 | % | | 09/01/2041 | | | 301,253 | |
| | 713,596 | | FNMA, Pool# 469130 | | | 4.87 | % | | 10/01/2041 | | | 820,147 | |
| | 810,234 | | FNMA, Pool# BC1738 | | | 4.50 | % | | 09/01/2043 | | | 869,426 | |
| | 759,130 | | FNMA, Pool# AS1429 | | | 4.00 | % | | 12/01/2043 | | | 796,751 | |
| | 601,770 | | FNMA, Pool# AV7739 | | | 4.00 | % | | 01/01/2044 | | | 638,539 | |
| | 695,930 | | FNMA, Pool# AW6485 | | | 4.00 | % | | 06/01/2044 | | | 732,181 | |
| | 943,760 | | FNMA, Pool# AY0382 | | | 4.00 | % | | 11/01/2044 | | | 988,264 | |
| | 725,358 | | FNMA, Pool# AW9534 | | | 4.00 | % | | 03/01/2045 | | | 771,497 | |
| | 684,716 | | FNMA, Pool# AZ4154 | | | 4.00 | % | | 06/01/2045 | | | 710,961 | |
| | 3,124,202 | | FNMA, Pool# AZ7828 | | | 4.00 | % | | 08/01/2045 | | | 3,269,193 | |
| | 2,046,604 | | FNMA, Pool# AZ9229 | | | 4.00 | % | | 10/01/2045 | | | 2,166,791 | |
| | 1,367,104 | | FNMA, Pool# BA3674 | | | 4.50 | % | | 10/01/2045 | | | 1,454,804 | |
| | 1,358,026 | | FNMA, Pool# BA5587 | | | 4.00 | % | | 01/01/2046 | | | 1,431,083 | |
| | 1,040,235 | | FNMA, Pool# BC1231 | | | 4.00 | % | | 02/01/2046 | | | 1,096,199 | |
| | 643,816 | | FNMA, Pool# BC6366 | | | 4.50 | % | | 02/01/2046 | | | 680,594 | |
| | 635,768 | | FNMA, Pool# BD1241 | | | 4.50 | % | | 05/01/2046 | | | 671,707 | |
The accompanying notes are an integral part of these financial statements.
www.brownadvisory.com/mf
Brown Advisory Mortgage Securities FundSchedule of Investments
June 30, 2019
| Par Value | | Security Description | | Rate | | Maturity | | Value $ | |
| Mortgage Backed Securities — 87.8% (Continued) | |
| | 1,571,797 | | FNMA, Pool# BD5189 | | | 4.50 | % | | 07/01/2046 | | | 1,675,280 | |
| | 898,072 | | FNMA, Pool# BD8599 | | | 4.50 | % | | 11/01/2046 | | | 974,244 | |
| | 1,049,126 | | FNMA, Pool# BD3999 | | | 4.50 | % | | 05/01/2047 | | | 1,106,369 | |
| | 1,097,364 | | FNMA, Pool# BD4009 | | | 4.00 | % | | 07/01/2047 | | | 1,172,510 | |
| | 1,054,785 | | FNMA, Pool# BD4010 | | | 4.00 | % | | 07/01/2047 | | | 1,119,230 | |
| | 794,469 | | FNMA, Pool# BD4041 | | | 4.00 | % | | 11/01/2047 | | | 837,150 | |
| | 1,167,581 | | FNMA, Pool# BH7686 | | | 4.50 | % | | 12/01/2047 | | | 1,229,796 | |
| | 1,471,489 | | FNMA, Pool# BJ8287 | | | 4.50 | % | | 01/01/2048 | | | 1,558,547 | |
| | 913,165 | | FNMA, Pool# BJ4035 | | | 4.50 | % | | 02/01/2048 | | | 967,133 | |
| | 983,633 | | FNMA, Pool# AN8989 | | | 4.07 | % | | 04/01/2048 | | | 1,065,740 | |
| | 1,044,475 | | FNMA, Pool# BJ4051 | | | 4.50 | % | | 05/01/2048 | | | 1,118,363 | |
| | 680,405 | | FNMA, Pool# BJ4052 | | | 4.50 | % | | 05/01/2048 | | | 724,338 | |
| | 679,290 | | FNMA, Pool# BJ4050 | | | 4.50 | % | | 05/01/2048 | | | 732,911 | |
| | 967,733 | | FNMA, Pool# BK5105 | | | 5.50 | % | | 05/01/2048 | | | 1,054,406 | |
| | 1,261,419 | | FNMA, Pool# BJ4057 | | | 4.50 | % | | 06/01/2048 | | | 1,332,179 | |
| | 629,051 | | FNMA, Pool# BK8032 | | | 5.50 | % | | 06/01/2048 | | | 685,391 | |
| | 826,502 | | FNMA, Pool# BJ4062 | | | 4.50 | % | | 07/01/2048 | | | 874,169 | |
| | 740,904 | | FNMA, Pool# BJ4060 | | | 4.50 | % | | 07/01/2048 | | | 799,580 | |
| | 957,185 | | FNMA, Pool# BJ4061 | | | 4.50 | % | | 07/01/2048 | | | 1,024,598 | |
| | 1,587,483 | | FNMA, Pool# BJ4067 | | | 4.50 | % | | 08/01/2048 | | | 1,679,687 | |
| | 629,708 | | FNMA, Pool# BN0202 | | | 5.50 | % | | 09/01/2048 | | | 686,109 | |
| | 745,478 | | FNMA, Pool# BN4936 | | | 5.50 | % | | 12/01/2048 | | | 806,749 | |
| | 429,671 | | FNMA, Pool# BN4921 | | | 5.50 | % | | 01/01/2049 | | | 464,986 | |
| | 23,293 | | FNMA REMIC Trust, Series 1990-116 H | | | 9.00 | % | | 10/25/2020 | | | 23,957 | |
| | 74,023 | | FNMA REMIC Trust, Series 1991-136 J | | | 7.50 | % | | 10/25/2021 | | | 75,956 | |
| | 1,376,461 | | FNMA REMIC Trust, Series 2017-M5 FA1 (1 Month LIBOR USD + 0.67%) | | | 3.11 | % | | 04/25/2024 | | | 1,375,342 | |
| | 400,000 | | FNMA REMIC Trust, Series 2016-M4 A2 | | | 2.58 | % | | 03/25/2026 | | | 405,010 | |
| | 114,013 | | FNMA REMIC Trust, Series 1996-23 G | | | 6.50 | % | | 07/25/2026 | | | 126,092 | |
| | 1,705,000 | | FNMA REMIC Trust, Series 2017-M13 A2# | | | 3.04 | % | | 09/25/2027 | | | 1,763,220 | |
| | 2,236,792 | | FNMA REMIC Trust, Series 2012-139 HI~ | | | 2.50 | % | | 12/25/2027 | | | 160,145 | |
| | 160,486 | | FNMA REMIC Trust, Series 2013-15 QI~ | | | 3.00 | % | | 03/25/2028 | | | 12,410 | |
| | 1,625,000 | | FNMA REMIC Trust, Series 2018-M8 A2# | | | 3.44 | % | | 06/25/2028 | | | 1,733,184 | |
| | 808,614 | | FNMA REMIC Trust, Series 2016-M10 A1 | | | 2.10 | % | | 07/25/2028 | | | 802,797 | |
| | 3,981,900 | | FNMA REMIC Trust, Series 2017-M5 A1 | | | 2.74 | % | | 04/25/2029 | | | 4,061,522 | |
| | 2,706,291 | | FNMA REMIC Trust, Series 2018-M3 A1# | | | 3.09 | % | | 02/25/2030 | | | 2,812,056 | |
| | 2,929,105 | | FNMA REMIC Trust, Series 2018-M12 A1 | | | 3.55 | % | | 08/25/2030 | | | 3,149,342 | |
| | 3,902,685 | | FNMA REMIC Trust, Series 2018-M13 A1# | | | 3.82 | % | | 09/25/2030 | | | 4,261,471 | |
| | 2,102,724 | | FNMA REMIC Trust, Series 2013-115 AI~ | | | 3.00 | % | | 04/25/2031 | | | 182,783 | |
| | 6,013,907 | | FNMA REMIC Trust, Series 2014-14 LI~ | | | 3.00 | % | | 04/25/2031 | | | 295,221 | |
| | 273,731 | | FNMA REMIC Trust, Series 2001-80 Z | | | 6.00 | % | | 01/25/2032 | | | 296,309 | |
| | 864,424 | | FNMA REMIC Trust, Series 2006-M2 A2A# | | | 5.27 | % | | 10/25/2032 | | | 971,300 | |
| | 625,626 | | FNMA REMIC Trust, Series 2003-71 MB | | | 5.50 | % | | 08/25/2033 | | | 709,035 | |
| | 2,840,638 | | FNMA REMIC Trust, Series 2005-73 EZ | | | 5.50 | % | | 08/25/2035 | | | 3,247,139 | |
| | 1,030,562 | | FNMA REMIC Trust, Series 2005-110 GL | | | 5.50 | % | | 12/25/2035 | | | 1,163,533 | |
| | 873,000 | | FNMA REMIC Trust, Series 2005-104 UE | | | 5.50 | % | | 12/25/2035 | | | 1,004,405 | |
| | 69,710 | | FNMA REMIC Trust, Series 2012-30 DA | | | 3.00 | % | | 08/25/2036 | | | 70,114 | |
| | 1,079,245 | | FNMA REMIC Trust, Series 2006-112 QC | | | 5.50 | % | | 11/25/2036 | | | 1,219,052 | |
| | 585,050 | | FNMA REMIC Trust, Series 2010-43 HJ | | | 5.50 | % | | 05/25/2040 | | | 662,614 | |
| | 2,329,103 | | FNMA REMIC Trust, Series 2012-65 HJ | | | 5.00 | % | | 07/25/2040 | | | 2,585,561 | |
| | 353,719 | | FNMA REMIC Trust, Series 2012-10 UF (1 Month LIBOR USD + 0.55%) | | | 2.95 | % | | 02/25/2042 | | | 356,157 | |
| | 1,259,213 | | FNMA REMIC Trust, Series 2013-34 IG~ | | | 3.00 | % | | 05/25/2042 | | | 115,297 | |
| | 11,122 | | FNMA REMIC Trust, Series 2003-W10 3A5 | | | 4.30 | % | | 06/25/2043 | | | 11,759 | |
| | 3,172 | | FNMA REMIC Trust, Series 2003-W12 1A9 | | | 4.48 | % | | 06/25/2043 | | | 3,423 | |
| | 19,035 | | FNMA REMIC Trust, Series 2003-W12 1A8 | | | 4.55 | % | | 06/25/2043 | | | 20,425 | |
| | 11,001 | | FNMA REMIC Trust, Series 2003-W12 2A7 | | | 4.68 | % | | 06/25/2043 | | | 11,697 | |
| | 12,835 | | FNMA REMIC Trust, Series 2003-W12 2A6 | | | 5.00 | % | | 06/25/2043 | | | 13,867 | |
The accompanying notes are an integral part of these financial statements.
www.brownadvisory.com/mf
Brown Advisory Mortgage Securities FundSchedule of Investments
June 30, 2019
| Par Value | | Security Description | | Rate | | Maturity | | Value $ | |
| Mortgage Backed Securities — 87.8% (Continued) | |
| | 984,391 | | FNMA REMIC Trust, Series 2015-40 LI~ | | | 4.50 | % | | 03/25/2045 | | | 200,044 | |
| | 31,709 | | GNMA, Pool# 004295M | | | 6.00 | % | | 10/20/2023 | | | 32,184 | |
| | 271,229 | | GNMA, Pool# 783374X | | | 5.50 | % | | 04/15/2024 | | | 285,425 | |
| | 348,128 | | GNMA, Pool# 728160X | | | 5.25 | % | | 11/15/2024 | | | 365,355 | |
| | 387,330 | | GNMA, Pool# 623145X | | | 5.50 | % | | 10/15/2028 | | | 415,263 | |
| | 445,568 | | GNMA, Pool# 589694X | | | 4.50 | % | | 08/15/2029 | | | 473,434 | |
| | 87,671 | | GNMA, Pool# 728157X | | | 3.75 | % | | 11/15/2029 | | | 91,415 | |
| | 441,458 | | GNMA, Pool# 770225C | | | 4.25 | % | | 08/20/2031 | | | 464,636 | |
| | 576,781 | | GNMA, Pool# 003160M | | | 6.00 | % | | 11/20/2031 | | | 661,826 | |
| | 1,148,751 | | GNMA, Pool# 604389X | | | 5.00 | % | | 06/15/2033 | | | 1,237,104 | |
| | 983,407 | | GNMA, Pool# 615958X | | | 5.00 | % | | 09/15/2033 | | | 1,067,327 | |
| | 821,593 | | GNMA, Pool# 003489M | | | 6.00 | % | | 12/20/2033 | | | 942,849 | |
| | 512,462 | | GNMA, Pool# 781746X | | | 5.00 | % | | 05/15/2034 | | | 556,362 | |
| | 870,643 | | GNMA, Pool# 781815X | | | 5.00 | % | | 10/15/2034 | | | 944,967 | |
| | 441,345 | | GNMA, Pool# 782173M | | | 5.50 | % | | 05/20/2035 | | | 483,283 | |
| | 234,828 | | GNMA, Pool# 784315X | | | 6.00 | % | | 06/15/2036 | | | 257,030 | |
| | 396,302 | | GNMA, Pool# 770226C | | | 4.75 | % | | 09/20/2036 | | | 417,647 | |
| | 282,894 | | GNMA, Pool# 004194M | | | 5.50 | % | | 07/20/2038 | | | 309,770 | |
| | 98,042 | | GNMA, Pool# 706295C | | | 5.10 | % | | 12/20/2038 | | | 102,828 | |
| | 3,983,851 | | GNMA, Pool# 367090X | | | 4.50 | % | | 07/15/2041 | | | 4,297,534 | |
| | 1,309,566 | | GNMA, Pool# AC0521C | | | 5.50 | % | | 05/20/2042 | | | 1,407,653 | |
| | 738,663 | | GNMA REMIC Trust, Series 2013-168 IA~ | | | 2.50 | % | | 11/16/2028 | | | 49,901 | |
| | 112,884 | | GNMA REMIC Trust, Series 2003-94 AB | | | 4.00 | % | | 04/16/2033 | | | 114,042 | |
| | 933,465 | | GNMA REMIC Trust, Series 2004-93 PD | | | 5.00 | % | | 11/16/2034 | | | 1,012,187 | |
| | 1,725,160 | | GNMA REMIC Trust, Series 2006-47 ZA | | | 5.00 | % | | 08/16/2036 | | | 1,885,801 | |
| | 152,525 | | GNMA REMIC Trust, Series 2006-40 B | | | 6.00 | % | | 08/20/2036 | | | 170,177 | |
| | 800,164 | | GNMA REMIC Trust, Series 2012-52 WA# | | | 6.16 | % | | 04/20/2038 | | | 921,315 | |
| | 1,144,005 | | GNMA REMIC Trust, Series 2011-2 DP# | | | 5.46 | % | | 03/20/2039 | | | 1,285,781 | |
| | 682,000 | | GNMA REMIC Trust, Series 2011-156 PM | | | 2.00 | % | | 04/20/2040 | | | 607,019 | |
| | 535,686 | | GNMA REMIC Trust, Series 2016-112 AW# | | | 7.12 | % | | 12/20/2040 | | | 626,916 | |
| | 831,612 | | GNMA REMIC Trust, Series 2012-97 GB | | | 2.00 | % | | 08/16/2042 | | | 754,463 | |
| | 461,142 | | GNMA REMIC Trust, Series 2011-121 FA (1 Month LIBOR USD + 0.40%) | | | 2.79 | % | | 03/16/2043 | | | 459,687 | |
| | 1,425,830 | | GNMA REMIC Trust, Series 2013-86 IA~ | | | 5.00 | % | | 06/20/2043 | | | 244,639 | |
| | 725,000 | | GNMA REMIC Trust, Series 2012-44 B | | | 2.95 | % | | 08/16/2043 | | | 730,269 | |
| | 4,380,475 | | GNMA REMIC Trust, Series 2014-135 I0#~ | | | 0.81 | % | | 01/16/2056 | | | 217,625 | |
| | 4,192,036 | | GNMA REMIC Trust, Series 2015-172 I0#~ | | | 0.87 | % | | 03/16/2057 | | | 241,970 | |
| | 5,757,383 | | GNMA REMIC Trust, Series 2016-40 I0#~ | | | 0.73 | % | | 07/16/2057 | | | 305,306 | |
| | 4,721,622 | | GNMA REMIC Trust, Series 2016-56 I0#~ | | | 0.92 | % | | 11/16/2057 | | | 319,042 | |
| | 5,987,437 | | GNMA REMIC Trust, Series 2016-98 I0#~ | | | 0.95 | % | | 05/16/2058 | | | 421,681 | |
| | 2,500,000 | | GSMS, Series 2018-FBLU D (1 Month LIBOR USD + 2.00%)^ | | | 4.39 | % | | 11/15/2035 | | | 2,497,994 | |
| | 932,882 | | SBA, Pool# 522053 (PRIME + 0.58%) | | | 6.08 | % | | 05/25/2026 | | | 979,575 | |
| | 1,122,000 | | Velocity Commercial Capital Loan Trust, Series 2017-1 M1#^ | | | 3.55 | % | | 05/25/2047 | | | 1,122,573 | |
Total Mortgage Backed Securities (Cost $240,260,500) | | |
| 247,436,305 |
| | |
| Asset Backed Securities — 5.7% | |
| | 1,000,000 | | Apidos CLO XVI, Series 2013-16A CR (3 Month LIBOR USD + 3.00%)^ | | | 5.59 | % | | 01/21/2025 | | | 1,000,037 | |
| | 347,694 | | BRE Grand Islander Timeshare Issuer LLC, Series 2017-1A A^ | | | 2.94 | % | | 05/25/2029 | | | 349,475 | |
| | 1,500,000 | | Carlyle Global Market Strategies CLO, Ltd., Series 2015-1A CR (3 Month LIBOR USD + 2.00%)^ | | | 4.59 | % | | 04/20/2027 | | | 1,501,021 | |
| | 800,000 | | Emerson Park CLO, Ltd., Series 2013-1A C1R (3 Month LIBOR USD + 2.15%)^ | | | 4.75 | % | | 07/15/2025 | | | 801,469 | |
| | 1,220,000 | | Flatiron CLO, Ltd., Series 2013-1A BR (3 Month LIBOR USD + 2.35%)^ | | | 4.94 | % | | 01/20/2026 | | | 1,220,031 | |
| | 600,000 | | Invitation Homes Trust, Series 2017-SFR2 C (1 Month LIBOR USD + 1.45%)^ | | | 3.84 | % | | 12/19/2036 | | | 601,636 | |
| | 1,484,600 | | Madison Park Funding XII, Ltd., Series 2014-12A CR (3 Month LIBOR USD + 2.35%)^ | | | 4.94 | % | | 07/20/2026 | | | 1,487,559 | |
| | 750,000 | | Madison Park Funding XVI, Ltd., Series 2015-16A C (3 Month LIBOR USD + 3.70%)^ | | | 6.29 | % | | 04/20/2026 | | | 751,799 | |
| | 1,000,000 | | Madison Park Funding XXI, Ltd., Series 2016-21A B (3 Month LIBOR USD + 2.75%)^ | | | 5.33 | % | | 07/25/2029 | | | 1,002,400 | |
| | 750,000 | | Magnetite IX, Ltd., Series 2014-9A BR (3 Month LIBOR USD + 2.00%)^ | | | 4.58 | % | | 07/27/2026 | | | 750,069 | |
| | 750,000 | | Magnetite IX, Ltd., Series 2014-9A CR (3 Month LIBOR USD + 3.10%)^ | | | 5.68 | % | | 07/27/2026 | | | 750,099 | |
| | 750,000 | | OHA Credit Partners IX, Ltd., Series 2013-9A DR (3 Month LIBOR USD + 3.30%)^ | | | 5.89 | % | | 10/20/2025 | | | 751,199 | |
The accompanying notes are an integral part of these financial statements.
www.brownadvisory.com/mf
Brown Advisory Mortgage Securities FundSchedule of Investments
June 30, 2019
| Par Value/ | | | | | | | | | | | |
| Contracts/Shares | | Security Description | | Rate | | Maturity | | | Value $ | |
| Asset Backed Securities — 5.7% (Continued) | |
| | 500,000 | | Oportun Funding IX LLC, Series 2018-B B^ | | | 4.50 | % | | 07/08/2024 | | | | 507,127 | |
| | 650,000 | | Oportun Funding VII LLC, Series 2017-B B^ | | | 4.26 | % | | 10/10/2023 | | | | 655,293 | |
| | 500,000 | | Oportun Funding VII LLC, Series 2017-B C^ | | | 5.29 | % | | 10/10/2023 | | | | 504,055 | |
| | 725,000 | | Oportun Funding VIII LLC, Series 2018-A C^ | | | 5.09 | % | | 03/08/2024 | | | | 734,411 | |
| | 950,000 | | Oportun Funding X LLC, Series 2018-C B^ | | | 4.59 | % | | 10/08/2024 | | | | 974,213 | |
| | 102,348 | | OSCAR U.S. Funding Trust VII LLC, Series 2017-2A A2B (1 Month LIBOR USD + 0.65%)^ | 3.06 | % | | 11/10/2020 | | | | 102,387 | |
| | 289,232 | | Sierra Timeshare Receivables Funding LLC, Series 2015-3A A^ | | | 2.58 | % | | 09/20/2032 | | | | 289,176 | |
| | 500,000 | | Symphony CLO XIV, Ltd., Series 2014-14A D2 (3 Month LIBOR USD + 3.60%)^ | | | 6.20 | % | | 07/14/2026 | | | | 500,108 | |
| | 862,074 | | Westgate Resorts LLC, Series 2018-1A C^ | | | 4.10 | % | | 12/20/2031 | | | | 870,893 | |
Total Asset Backed Securities (Cost $17,036,684) | | | | | | | | | | 16,104,457 | |
| | |
| Municipal Bonds — 2.6% | |
| | 2,800,000 | | District of Columbia# | | | 6.50 | % | | 08/01/2038 | | | | 2,800,000 | |
| | 1,100,000 | | District of Columbia# | | | 6.60 | % | | 08/01/2038 | | | | 1,100,000 | |
| | 450,000 | | Landis Sewage Authority# | | | 5.06 | % | | 09/19/2019 | | | | 450,000 | |
| | 2,940,000 | | Mosaic District Community Development Authority | | | 7.25 | % | | 03/01/2036 | | | | 3,085,295 | |
Total Municipal Bonds (Cost $7,177,703) | | | | | | |
| | | | 7,435,295 | |
| | |
| U.S. Treasury Notes — 1.1% | |
| | 3,000,000 | | United States Treasury Note | | | 1.63 | % | | 08/15/2022 | | | | 2,991,269 | |
Total U.S. Treasury Notes (Cost $2,986,758) | | | | | | | | | | | 2,991,269 | |
| | |
| Purchased Options — 0.0% | |
| | |
| Put Options — 0.0% | |
| | 300 | | U.S. Treasury 5-Year Note Futures Option, Expiration 08/23/2019, Strike Price $117.00† | | | | | | | | | | | 44,531 | |
Total Purchased Options (Cost $116,292) | | | | | | | | | | | 44,531 | |
| | | | | | | | | | | | | | | |
| Preferred Stocks — 0.8% | | | | | | | | | | | | |
| | 28,655 | | AGNC Investment Corp., Series B, 7.75% | | | | | | | | | | | 732,995 | |
| | 32,768 | | AGNC Investment Corp., Series C, 7.00% | | | | | | | | | | | | |
| | | | (Fixed until 10/15/2022, then 3 Month LIBOR USD + 5.11%) | | | | | | | | | | | 851,968 | |
| | 25,000 | | Annaly Capital Management, Inc., Series G, 6.50% | | | | | | | | | | | | |
| | | | (Fixed until 03/31/2023, then 3 Month LIBOR USD + 4.17%) | | | | | | | | | | | 605,000 | |
Total Preferred Stocks (Cost $2,175,686) | | | | | | | | | | | 2,189,963 | |
| | |
| Short-Term Investments — 1.8% | |
| | |
| Money Market Funds — 1.8% | |
| | 5,171,116 | | First American Government Obligations Fund — Class Z, 2.26%* | | | | | | | | | | | 5,171,116 | |
Total Short-Term Investments (Cost $5,171,116) | | | | 5,171,116 | |
Total Investments — 99.8% (Cost $274,924,739) | | | | 281,372,936 | |
Other Assets in Excess of Liabilities — 0.2% | | | | 621,488 | |
| NET ASSETS — 100.0% | | | $ | 281,994,424 | |
| † | Non-Income Producing |
| # | Variable rate security. Rate disclosed is as of June 30, 2019. |
| ^ | Security exempt from registration under Rule 144A of the Securities Act of 1933. These securities may be resold in transactions exempt from registration, normally to qualified institutional buyers. |
| ~ | Interest Only Security |
| * | Annualized seven-day yield as of June 30, 2019. |
The accompanying notes are an integral part of these financial statements.
www.brownadvisory.com/mf
Brown Advisory Mortgage Securities FundSchedule of Investments
June 30, 2019
| Futures Contracts — Long (Note 6) | |
| | | | | | | Notional | | | Notional | | | Unrealized Appreciation | |
| Issue | | Contracts | | Expiration Date | | Amount | | | Value | | | (Depreciation) | |
U.S. Treasury 2-Year Note Futures | | | 200 | | 09/30/2019 | | $ | 42,888,229 | | | $ | 43,035,938 | | | $ | 147,709 | |
U.S. Treasury 5-Year Note Futures | | | 110 | | 09/30/2019 | | | 12,781,998 | | | | 12,997,188 | | | | 215,190 | |
U.S. Treasury Long Bond Futures | | | 110 | | 09/19/2019 | | | 16,397,405 | | | | 17,115,312 | | | | 717,907 | |
U.S. Treasury Ultra Bond Futures | | | 20 | | 09/19/2019 | | | 3,369,472 | | | | 3,551,250 | | | | 181,778 | |
| | | | | | | | $ | 75,437,104 | | | $ | 76,699,688 | | | $ | 1,262,584 | |
| | |
| Futures Contracts — Short (Note 6) | |
| | | | | | | | Notional | | | Notional | | | Unrealized Appreciation | |
| Issue | | Contracts | | Expiration Date | | Amount | | | Value | | | (Depreciation) | |
U.S. Treasury 10-Year Note Futures | | | (50) |
| 09/19/2019 | | $ | (6,237,652 | ) | | $ | (6,398,437 | ) | | $ | (160,785 | ) |
U.S. Treasury 10-Year Ultra Futures | | | (40) |
| 09/19/2019 | | | (5,502,309 | ) | | | (5,525,000 | ) | | | (22,691 | ) |
| | | | | | | | $ | (11,739,961 | ) | | $ | (11,923,437 | ) | | $ | (183,476 | ) |
There is no variation margin due to or from the Fund as of June 30, 2019.
The accompanying notes are an integral part of these financial statements.
www.brownadvisory.com/mf
Brown Advisory – WMC Strategic European Equity FundA Message to Our Shareholders
June 30, 2019
Dear Shareholders:
During the year ended June 30, 2019, the Brown Advisory – WMC Strategic European Equity Fund – Institutional Shares (the “Fund”) returned 0.84%, underperforming its benchmark, the MSCI Europe Index (the “Index”), which delivered a 1.88% gain.
Our bottom-up approach aims to identify companies that we believe benefit from a structural growth advantage, are competitively positioned, and attractively valued. This fundamental process leads us to hold certain sectors over- and underweight.
Stock selection was the primary driver of relative underperformance during the period. Selection within information technology, industrials, and communication services detracted most, while holdings in consumer discretionary and health care partially offset these results. Sector allocation, a residual of the bottom-up stock selection process, was positive during the period. The Fund’s underweight to energy and financials contributed the most to relative returns. This was partially offset by negative results from our underweight to utilities.
Top detractors from relative returns during the period included United Internet, UBS, and Julius Baer, along with not holding Nestle and Novartis.
United Internet is a German internet services company. Despite posting results broadly in-line with consensus, the stock continued to underperform amid market concerns over price competition in the German mobile market, as well as its bid on Germany’s 5G spectrum auctions which have potentially high licensing costs and conditions. We think the market is underestimating that United Internet already has a high mobile subscriber base, with roughly ten million subscribers, and is already a very viable player in the German market. It has one of the best brands in our view and is well known for excellent customer service. If the company can execute on the rollout of 5G, this could be a longer-term value driver for the shares and the company in our view. We continue to hold a position and believe the company has a good structural growth opportunity to create further value.
UBS offers global private banking services and advice on wealth management, financial planning, and investment banking. The stock has continued to underperform on the back of recent pressure on European financials due to the fine levied by French tax authorities. We continue to see UBS’ efforts to downsize its investment banking activities over the recent years as positive and believe this should result in a more profitable product mix over the long-term. We think private banking should continue to be one of the most attractive areas in banking. The industry is growing 2x GDP, and UBS is exposed to even higher growth areas (Asia, U.S., Ultra High Net Worth). Wealth Management is a scale business where UBS should benefit from higher investment in information technology. It is a well-established franchise relative to peers – the strength of its brand is a clear competitive advantage in an industry that is characterized by high barriers to entry in our view. We believe the valuation is more attractive now, and we continue to hold our position.
Julius Baer is a Swiss-based private banking and wealth management company. The stock underperformed primarily due to negative market sentiment in Europe and European financials, poor performance in Asia where transaction volumes were lower than expected, and a minor money-laundering scandal in Panama. Starting this year, the stock bounced back as net new money growth appears to be picking up in Asia, market sentiment recovered, and broad equity market performance continued to improve. We continue to have conviction in the company, its private banking franchise, and the wealth management industry, more broadly, and have added on weakness.
Top contributors to relative returns during the period included Jardine Lloyd Thompson, Smith & Nephew, and adidas.
British multinational insurance, reinsurance, and employee benefits service provider, Jardine Lloyd Thompson, outperformed as the share price rose sharply after U.S. insurance broker, Marsh & McLennan, confirmed that they would take over the company at a significant premium on the recent share price. We sold the remaining shares after the news and took the gain.
Smith & Nephew is a UK-based multinational medical equipment manufacturing company specializing in wound management and orthopaedic products. Shares outperformed as the company announced planned changes to the commercial structure and a cost-cutting exercise. Smith & Nephew has seen margin improvement and strong growth, particularly in the U.Ss and emerging markets. We continue to believe that the business has a strong competitive position, a good balance sheet, and is exposed to growing end markets with further potential for margin expansion. We have increased our position and believe in the growth potential of the company.
www.brownadvisory.com/mf
Brown Advisory – WMC Strategic European Equity FundA Message to Our Shareholders
June 30, 2019
Adidas is a German-based multinational sports manufacturer. The stock continued its strong start to the year by reporting a good set of first-quarter results. Despite sales growth slowing, margins continued to rise driven by sustained growth in China and higher volumes through its E-commerce platform. We have added to our position based on the continued growth in demand for sporting apparel and the company’s tighter focus on process and operations. Additionally, the company as seen improving margins and free cash flow generation over the longer-term, particularly in North America and China.
Despite the continued normalization of some macroeconomic indicators, we believe that the long-term growth story in Europe is still supported by positive longer-term data and modestly increasing inflation. However, political unease is expected to linger, and with the rising threat of protectionism, Brexit and the uncertain implications of European Parliamentary elections, the shorter-term outlook remains unclear, and a degree of volatility is likely to persist. Against this backdrop, we continue to think that the environment is one of slowly rising, albeit low, interest rates, steady longer-term growth, and Central banks likely to remain relatively accommodative. Some of 2017’s euro strength has reversed, but this does not fundamentally change our view on any existing holdings or any new positions. We think a relatively strong and likely more stable euro should not impact share prices over the longer term.
As we have done over time, we continue to seek to identify and invest in companies that are exposed to structural growth drivers and that have built strong competitive advantages. These intrinsic qualities drive margins and returns, as well as high free cash flow generation, which we believe will create long-term value.
Sincerely,
Carl Dirk Enderlein, CFA
Portfolio Manager
Past performance is not a guarantee of future results.
Mutual fund investing involves risk. Principal loss is possible. Investments focused in a single geographic region may be exposed to greater risk than investments diversified among various geographies. Investments in foreign securities entail certain risks not associated with investments in domestic securities, such as volatility of currency exchange rates, and in some cases, political and economic instability and relatively illiquid markets. These risks are greater in emerging markets. Investments in smaller and medium capitalization companies generally carry greater risk than is customarily associated with larger companies for various reasons such as narrower markets, limited financial resources and less liquid stock. The Fund may invest in ETFs, which may trade at a discount to the aggregate value of the underlying securities and although expense ratios for ETFs are generally low, frequent trading of ETFs by the Fund can generate brokerage expenses. The value of investments in REITs may change in response to changes in the real estate market such as declines in the value of real estate, lack of available capital or financing opportunities, and increases in property taxes or operating costs. Derivatives involve risks different from, and in certain cases, greater than the risks presented by more traditional investments. Investors will indirectly bear the principal risks and its share of the fees and expenses of the Fund’s investment in other Investment Companies.
Fund holdings and sector allocations are subject to change and should not be considered a recommendation to buy or sell any security. For a complete list of fund holdings, please refer to the Schedule of Investments provided in this report.
Definitions for terms and indices are provided in the Glossary of Terms.
www.brownadvisory.com/mf
Brown Advisory – WMC Strategic European Equity FundPerformance Information & Portfolio Holdings Summary
June 30, 2019
GROWTH OF A $1,000,000 INVESTMENT
The following chart reflects the change in value of a hypothetical $1,000,000 investment, including reinvested dividends and distributions, in the Fund as measured against a broad-based securities market index. The MSCI Europe Index (“Index”) is an index that captures large and mid cap representation across 15 developed market countries in Europe. The Index is unmanaged and does not reflect the deduction of fees, such as investment management fees. Investors cannot invest directly in an index.
| PORTFOLIO HOLDINGS | % of Net Assets |
United Kingdom | | | 22.1 | % | |
France | | �� | 15.5 | % | |
Switzerland | | | 13.5 | % | |
Germany | | | 12.9 | % | |
Sweden | | | 10.9 | % | |
Netherlands | | | 9.4 | % | |
Denmark | | | 2.8 | % | |
Money Market Funds | | | 2.7 | % | |
Belgium | | | 2.6 | % | |
Spain | | | 1.9 | % | |
Portugal | | | 1.6 | % | |
Finland | | | 1.6 | % | |
Ireland | | | 0.6 | % | |
Italy | | | 0.5 | % | |
Austria | | | 0.4 | % | |
Other Assets and Liabilities | | | 1.0 | % | |
| | | | 100.0 | % | |
| | | | Since Inception |
Average Annual Total Return | One Year | Five Year | (10/21/13) |
| Institutional Shares | 0.84% | 4.40% | 4.68% |
| Investor Shares | 0.58% | 4.24% | 4.52% |
| Advisor Shares | 0.42% | 3.98% | 4.28% |
| MSCI Europe Index | 1.88% | 1.27% | 2.74% |
| | | | |
| | Institutional Shares | Investor Shares | Advisor Shares |
Gross Expense Ratio1 | 1.07% | 1.22% | 1.47% |
Net Expense Ratio1 | 1.07% | 1.22% | 1.47% |
Past performance does not guarantee future results. The performance data quoted represents past performance and current returns may be lower or higher. The investment return and net asset value will fluctuate so that an investor’s shares, when redeemed, may be worth more or less than the original cost. To obtain performance information current to the most recent month end, please visit our website at brownadvisory.com/mf/wmc-strategic-european-equity-fund. The performance table and graph above do not reflect the deduction of taxes that a shareholder would pay on Fund distributions or the redemption of Fund shares. Performance data does not reflect the imposition of the redemption fee of 1.00% on shares redeemed within 14 days, and if it did, performance would have been lower. Short-term performance, in particular, is not a good indication of the Fund’s future performance, and an investment should not be made based solely on returns. Returns shown are calculated using the net asset values (“NAV”) that were used for shareholder transactions as of the respective period ends. These NAV, and the returns calculated from them, may differ from the NAV and returns shown elsewhere in this report.
1 | Per the Fund’s prospectus dated October 31, 2018. Refer to the financial highlights for the gross and net expense ratios for the year ended as of the date of this report. Please note that the expense ratios per the prospectus include acquired fund fees and expenses (as applicable) and the expense ratios in the financial highlights do not. |
www.brownadvisory.com/mf
Brown Advisory – WMC Strategic European Equity FundSchedule of Investments
June 30, 2019
| Shares | | Security Description | | Value $ | |
| Common Stocks — 95.7% | | | |
| | | | |
| Austria — 0.4% | | | |
| | 88,691 | | Porr AG | | | 1,956,049 | |
| | | | | |
| Belgium — 2.6% | | | | |
| | 157,883 | | UCB S.A. | | | 13,102,652 | |
| | | | | |
| Denmark — 2.8% | | | | |
| | 20,946 | | ALK-Abello A/S* | | | 4,890,664 | |
| | 68,466 | | DSV A/S | | | 6,741,847 | |
| | 18,895 | | Netcompany Group A/S* | | | 761,079 | |
| | 191,117 | | Spar Nord Bank A/S | | | 1,683,011 | |
| | | | | | | 14,076,601 | |
| Finland — 1.6% | | | | |
| | 131,007 | | Kone OYJ | | | 7,736,401 | |
| | | | | |
| France — 15.5% | | | | |
| | 99,912 | | Capgemini SE | | | 12,422,375 | |
| | 561,141 | | Elior Group S.A. | | | 7,717,853 | |
| | 699,065 | | Elis S.A. | | | 12,673,996 | |
| | 38,000 | | Ipsen S.A. | | | 5,183,039 | |
| | 225,233 | | Legrand S.A. | | | 16,466,521 | |
| | 19,994 | | LVMH Moet Hennessy Louis Vuitton SE | | | 8,499,961 | |
| | 61,264 | | Pernod Ricard S.A. | | | 11,283,388 | |
| | 13,973 | | Virbac S.A.* | | | 2,672,479 | |
| | | | | | | 76,919,612 | |
| Germany — 12.3% | | | | |
| | 31,972 | | Adidas AG | | | 9,891,183 | |
| | 78,259 | | Beiersdorf AG | | | 9,383,735 | |
| | 120,697 | | Brenntag AG | | | 5,922,298 | |
| | 34,210 | | Knorr-Bremse AG | | | 3,816,054 | |
| | 134,171 | | Merck KGaA | | | 14,014,339 | |
| | 152,175 | | Siemens Healthineers AG | | | 6,412,343 | |
| | 276,476 | | United Internet AG | | | 9,108,812 | |
| | 40,933 | | Washtec AG | | | 2,783,386 | |
| | | | | | | 61,332,150 | |
| Ireland — 0.6% | | | | |
| | 53,023 | | Kingspan Group PLC | | | 2,883,584 | |
| | | | | |
| Italy — 0.5% | | | | |
| | 20,445 | | DiaSorin S.p.A. | | | 2,375,153 | |
| | | | | |
| Netherlands — 9.4% | | | | |
| | 31,803 | | ASML Holding NV | | | 6,617,884 | |
| | 156,231 | | Heineken NV | | | 17,412,329 | |
| | 173,200 | | QIAGEN NV* | | | 7,047,816 | |
| | 210,027 | | Unilever NV | | | 12,760,860 | |
| | 38,170 | | Wolters Kluwer NV | | | 2,776,918 | |
| | | | | | | 46,615,807 | |
| Portugal — 1.6% | | | | |
| | 508,664 | | Jeronimo Martins SGPS S.A. | | | 8,199,240 | |
| | | | | |
| Spain — 1.9% | | | | |
| | 168,513 | | Almirall S.A. | | | 3,114,655 | |
| | 106,473 | | Laboratorios Farmaceuticos Rovi S.A. | | | 2,433,516 | |
| | 74,195 | | Viscofan S.A. | | | 3,889,178 | |
| | | | | | | 9,437,349 | |
| Sweden — 10.9% | | | | |
| | 635,050 | | Alfa Laval AB | | | 13,877,458 | |
| | 544,199 | | Assa Abloy AB | | | 12,278,596 | |
| | 187,209 | | Atlas Copco AB | | | 5,999,234 | |
| | 858,714 | | Cloetta AB | | | 2,796,225 | |
| | 1,342,977 | | Epiroc AB | | | 13,992,922 | |
| | 380,248 | | Trelleborg AB | | | 5,405,612 | |
| | | | | | | 54,350,047 | |
| Switzerland — 13.5% | | | | |
| | 117 | | BELIMO Holding AG | | | 719,456 | |
| | 148,725 | | Cie Financiere Richemont S.A. | | | 12,638,138 | |
| | 20,843 | | Geberit AG | | | 9,742,571 | |
| | 4,835 | | INFICON Holding AG | | | 2,950,861 | |
| | 373,006 | | Julius Baer Group, Ltd. | | | 16,618,940 | |
| | 45,987 | | Kuehne & Nagel International AG | | | 6,830,770 | |
| | 1,457,648 | | UBS Group AG | | | 17,324,505 | |
| | | | | | | 66,825,241 | |
| United Kingdom — 22.1% | | | | |
| | 421,232 | | Beazley PLC | | | 2,952,608 | |
| | 236,759 | | Bunzl PLC | | | 6,247,147 | |
| | 552,161 | | Compass Group PLC | | | 13,236,324 | |
| | 92,929 | | Diploma PLC | | | 1,807,061 | |
| | 1,498,412 | | Electrocomponents PLC | | | 12,037,908 | |
| | 502,935 | | IMI PLC | | | 6,635,506 | |
| | 795,153 | | Prudential PLC | | | 17,359,027 | |
| | 156,024 | | Reckitt Benckiser Group PLC | | | 12,318,873 | |
| | 1,630,044 | | Rentokil Initial PLC | | | 8,229,610 | |
| | 184,319 | | Rotork PLC | | | 741,002 | |
| | 942,207 | | Smith & Nephew PLC | | | 20,459,737 | |
| | 315,779 | | Smiths Group PLC | | | 6,282,798 | |
| | 34,496 | | Spectris PLC | | | 1,260,042 | |
| | | | | | | 109,567,643 | |
Total Common Stocks (Cost $394,701,032) | | | 475,377,529 | |
| | | | | |
| Preferred Stocks — 0.6% | | | | |
| | | | | |
| Germany — 0.6% | | | | |
| | 81,691 | | Fuchs Petrolub SE | | | 3,207,213 | |
Total Preferred Stocks (Cost $3,376,495) | | | 3,207,213 | |
| | | | | |
| Short-Term Investments — 2.7% | | | | |
| | | | | |
| Money Market Funds — 2.7% | | | | |
| | 13,222,566 | | First American Government | | | | |
| | | | Obligations Fund — Class Z, 2.26%# | | | 13,222,566 | |
Total Short-Term Investments (Cost $13,222,566) | | | 13,222,566 | |
Total Investments — 99.0% (Cost $411,300,093) | | | 491,807,308 | |
Other Assets in Excess of Liabilities — 1.0% | | | 4,759,037 | |
| NET ASSETS — 100.0% | | $ | 496,566,345 | |
* | Non-Income Producing |
# | Annualized seven-day yield as of June 30, 2019. |
The accompanying notes are an integral part of these financial statements.
www.brownadvisory.com/mf
Brown Advisory Emerging Markets Select FundA Message to Our Shareholders
June 30, 2019
Dear Shareholders:
During the year ended June 30, 2019, the Brown Advisory Emerging Markets Select Fund – Institutional Shares (the “Fund”) returned -3.35%. During the same period, the FTSE Emerging Index (the “Index”), the Fund’s benchmark, increased 4.02%.
During the year, the Fund’s underperformance can be attributed to both regional and sector specific allocations. First, the Fund’s notable overweight to South Korea was a detriment to performance. Since FTSE considers South Korea a “developed” region, the Index does not allocate to any companies domiciled in the country. Generally, performance in Korea was difficult specifically due to the strengthening U.S. Dollar and the general concerns over trade tensions between the United States and China.
From a sector perspective, information technology and financials proved challenging. Disappointing performance within the semiconductor sub-sector of information technology weighed on the Fund’s performance as both sales and earnings growth declined across the industry. Unlike information technology, the Fund’s overweight to the financials sector was helpful to performance over the last year, however specific stock selection across various emerging market banks dragged on returns as they underperformed peers for idiosyncratic or currency specific reasons.
From an individual stock perspective, Porto Seguro, Brazil’s third largest insurer, was the Fund’s largest contributor after attractive performance in the third quarter of 2018 driven by strong earnings results and reduced insurance claims. Two semiconductor companies, Win Semiconductors and SK Hynix, and two banks, Alpha Bank, the second largest Greek bank, and Yes Bank, the fourth largest private sector Indian bank, were the biggest detractors from performance over the trailing 12-month period.
Over the course of the year, the portfolio experienced heightened turnover due to a change in the underlying sub-advisors of the strategy.
Looking forward, we believe the shift in the Fund’s strategy should prove beneficial to performance. We believe a structural overweight to the Asia ex-Japan region, which has relatively low valuations compared to the rest of the global investment universe coupled with attractive long-term growth potential, may be accretive to future returns. Additionally, we believe underweights to more cyclical sectors, such as energy, industrials, and materials, can provide some level of protection from macroeconomic and commodity-focused concerns.
Overall, we believe the Fund is structurally well-positioned to take advantage of both growth opportunities in Asia and mispriced value opportunities across the emerging markets.
Sincerely,
Chris H. Bartlett
Portfolio Manager
Past performance is not a guarantee of future results.
Mutual fund investing involves risk. Principal loss is possible. The Fund may invest in ETFs, which may trade at a discount to the aggregate value of the underlying securities and although expense ratios for ETFs are generally low, frequent trading of ETFs by the Fund can generate brokerage expenses. The Fund may invest in foreign securities which involve greater volatility and political, economic and currency risks and differences in accounting methods. These risks are greater in emerging markets. Derivatives may involve certain costs and risks such as liquidity, interest rate, market, credit, management, and the risk that a position could not be closed when most advantageous. Investing in derivatives could lose more than the amount invested. The Fund invests in smaller and medium-sized companies which carry greater risk than is associated with larger companies for various reasons, such as narrower markets, limited financial resources and less liquid stock.
Fund holdings and sector allocations are subject to change and should not be considered a recommendation to buy or sell any security. For a complete list of fund holdings, please refer to the Schedule of Investments provided in this report.
Definitions for terms and indices are provided in the Glossary of Terms.
www.brownadvisory.com/mf
Brown Advisory Emerging Markets Select FundPerformance Information & Portfolio Holdings Summary
June 30, 2019
GROWTH OF A $1,000,000 INVESTMENT
The following chart reflects the change in value of a hypothetical $1,000,000 investment, including reinvested dividends and distributions, in the Fund as measured against a broad-based securities market index. The FTSE Emerging Index (“Index”) is a market capitalization weighted index representing the performance of over 790 large and mid-capitalization companies in 22 emerging markets. The Index is unmanaged and does not reflect the deduction of fees, such as investment management fees. Investors cannot invest directly in an index.
| PORTFOLIO HOLDINGS | % of Net Assets |
China | | | 32.9 | % | |
South Korea | | | 14.3 | % | |
India | | | 10.6 | % | |
Taiwan | | | 10.6 | % | |
Russia | | | 3.9 | % | |
Money Market Funds | | | 3.7 | % | |
Singapore | | | 3.6 | % | |
United States | | | 2.7 | % | |
Thailand | | | 2.6 | % | |
United Kingdom | | | 2.0 | % | |
Malaysia | | | 1.8 | % | |
Brazil | | | 1.6 | % | |
Indonesia | | | 1.6 | % | |
Turkey | | | 1.5 | % | |
South Africa | | | 1.4 | % | |
United Arab Emirates | | | 1.1 | % | |
Czech Republic | | | 1.0 | % | |
Philippines | | | 0.8 | % | |
Australia | | | 0.6 | % | |
Hungary | | | 0.4 | % | |
Other Assets and Liabilities | | | 1.3 | % | |
| | | | 100.0 | % | |
| | | | Since Inception |
Average Annual Total Return | One Year | Five Year | (12/12/12) |
| Institutional Shares | -3.35% | -0.02% | 0.50% |
| Investor Shares | -3.42% | -0.17% | 0.35% |
| Advisor Shares | -3.66% | -0.41% | 0.09% |
| FTSE Emerging Index | 4.02% | 2.87% | 2.96% |
MSCI Emerging Markets Index1 | 1.21% | 2.49% | 2.63% |
| | Institutional Shares | Investor Shares | Advisor Shares |
Gross Expense Ratio2 | 1.15% | 1.30% | 1.55% |
Net Expense Ratio2 | 1.15% | 1.30% | 1.55% |
Past performance does not guarantee future results. The performance data quoted represents past performance and current returns may be lower or higher. The investment return and net asset value will fluctuate so that an investor’s shares, when redeemed, may be worth more or less than the original cost. To obtain performance information current to the most recent month end, please visit our website at brownadvisory.com/mf/emerging-markets-select-fund. The performance table and graph above do not reflect the deduction of taxes that a shareholder would pay on Fund distributions or the redemption of Fund shares. Performance data does not reflect the imposition of the redemption fee of 1.00% on shares redeemed within 14 days, and if it did, performance would have been lower. Short-term performance, in particular, is not a good indication of the Fund’s future performance, and an investment should not be made based solely on returns.
1 | Effective February 28, 2019, the Fund discontinued the use of the MSCI Emerging Markets Index and replaced it with the FTSE Emerging Index. The Adviser has determined that the FTSE Emerging Index better reflects the securities in which the Fund invests. |
2 | Per the Fund’s prospectus dated October 31, 2018. Refer to the financial highlights for the gross and net expense ratios for the year ended as of the date of this report. Please note that the expense ratios per the prospectus include acquired fund fees and expenses (as applicable) and the expense ratios in the financial highlights do not. |
www.brownadvisory.com/mf
Brown Advisory Emerging Markets Select FundSchedule of Investments
June 30, 2019
| Shares | | Security Description | | Value $ | |
| Common Stocks — 91.8% | | | |
| | | | |
| Australia — 0.6% | | | |
| | 200,012 | | Treasury Wine Estates, Ltd. | | | 2,100,625 | |
| | | | | |
| China — 32.9% | | | | |
| | 26,853 | | 51job, Inc. ADR* | | | 2,027,401 | |
| | 807,064 | | AIA Group, Ltd. | | | 8,715,406 | |
| | 66,188 | | Alibaba Group Holding, Ltd. ADR* | | | 11,215,557 | |
| | 207,581 | | ASM Pacific Technology, Ltd. | | | 2,128,204 | |
| | 38,173 | | Baidu, Inc. ADR* | | | 4,479,983 | |
| | 13,931 | | BeiGene, Ltd. ADR* | | | 1,726,747 | |
| | 1,908,034 | | Brilliance China Automotive Holdings, Ltd. | | | 2,110,078 | |
| | 2,106,000 | | China Communications Services Corp., Ltd. | | | 1,633,258 | |
| | 8,169,582 | | China Construction Bank Corp. | | | 7,042,212 | |
| | 189,292 | | China International Travel Service Corp., Ltd. | | | 2,446,332 | |
| | 805,034 | | China Mengniu Dairy Co., Ltd.* | | | 3,121,218 | |
| | 493,926 | | China Merchants Bank Co., Ltd. | | | 2,451,068 | |
| | 274,000 | | China Mobile, Ltd. | | | 2,494,404 | |
| | 3,938,000 | | China Resources Power Holdings Co., Ltd. | | | 5,744,139 | |
| | 1,092,500 | | China Shenhua Energy Co., Ltd. | | | 2,288,314 | |
| | 4,253,811 | | Dongfeng Motor Group Co., Ltd. | | | 3,487,987 | |
| | 259,056 | | ENN Energy Holdings, Ltd. | | | 2,521,029 | |
| | 459,763 | | Henderson Land Development Co., Ltd | | | 2,534,825 | |
| | 7,902,955 | | Huadian Power International Corp., Ltd. | | | 3,130,499 | |
| | 2,202,000 | | Industrial & Commercial Bank of China, Ltd. | | | 1,607,287 | |
| | 265,650 | | Inner Mongolia Yili Industrial Group Co., Ltd. | | | 1,294,918 | |
| | 12,911 | | Kweichow Moutai Co., Ltd. | | | 1,854,324 | |
| | 4,454,000 | | Lenovo Group, Ltd. | | | 3,448,662 | |
| | 843,723 | | Longfor Group Holdings, Ltd. | | | 3,181,182 | |
| | 1,634,325 | | MGM China Holdings, Ltd. | | | 2,776,397 | |
| | 235,100 | | Midea Group Co., Ltd. | | | 1,781,814 | |
| | 21,148 | | New Oriental Education & | | | | |
| | | | Technology Group, Inc. ADR* | | | 2,042,474 | |
| | 392,012 | | Ping An Insurance Group Co. of China, Ltd. | | | 4,713,896 | |
| | 57,004 | | TAL Education Group ADR* | | | 2,171,852 | |
| | 250,996 | | Tencent Holdings, Ltd. | | | 11,354,913 | |
| | 62,600 | | WuXi AppTec Co., Ltd. — Class A* | | | 790,849 | |
| | 106,260 | | WuXi AppTec Co., Ltd. — Class H | | | 931,724 | |
| | | | | | | 109,248,953 | |
| Czech Republic — 1.0% | | | | |
| | 134,603 | | CEZ A/S | | | 3,252,867 | |
| | | | | |
| Hungary — 0.4% | | | | |
| | 34,081 | | OTP Bank | | | 1,357,153 | |
| | | | | |
| India — 10.6% | | | | |
| | 37,341 | | Bajaj Auto, Ltd. | | | 1,529,487 | |
| | 1,130,428 | | Bharat Electronics, Ltd.* | | | 1,842,680 | |
| | 140,977 | | Cyient, Ltd. | | | 1,107,295 | |
| | 231,113 | | Escorts, Ltd. | | | 1,795,192 | |
| | 207,076 | | Godrej Consumer Products, Ltd. | | | 1,990,968 | |
| | 169,118 | | Godrej Properties, Ltd.* | | | 2,456,486 | |
| | 88,179 | | HDFC Bank, Ltd. | | | 3,123,410 | |
| | 129,845 | | Housing Development Finance Corp., Ltd. | | | 4,122,987 | |
| | 419,922 | | ICICI Bank, Ltd. | | | 2,658,424 | |
| | 94,463 | | IndusInd Bank, Ltd. | | | 1,930,246 | |
| | 75,418 | | Kotak Mahindra Bank, Ltd. | | | 1,613,873 | |
| | 1,614,133 | | NTPC, Ltd. | | | 3,304,204 | |
| | 242,949 | | Oberoi Realty, Ltd.* | | | 2,138,874 | |
| | 2,602,576 | | Punjab National Bank* | | | 2,999,330 | |
| | 33,194 | | PVR, Ltd. | | | 805,327 | |
| | 366,047 | | State Bank of India* | | | 1,915,484 | |
| | | | | | | 35,334,267 | |
| Indonesia — 1.6% | | | | |
| | 1,544,868 | | Bank Central Asia Tbk PT | | | 3,278,328 | |
| | 6,116,300 | | Bank Rakyat Indonesia Persero Tbk PT | | | 1,888,255 | |
| | | | | | | 5,166,583 | |
| Malaysia — 1.8% | | | | |
| | 2,039,800 | | CIMB Group Holdings Bhd | | | 2,656,971 | |
| | 4,060,600 | | Genting Malaysia Bhd | | | 3,186,263 | |
| | | | | | | 5,843,234 | |
| Philippines — 0.8% | | | | |
| | 786,561 | | Universal Robina Corp. | | | 2,548,746 | |
| | | | | |
| Russia — 3.9% | | | | |
| | 54,389 | | LUKOIL PJSC ADR | | | 4,598,041 | |
| | 161,127 | | MMC Norilsk Nickel PJSC ADR | | | 3,659,194 | |
| | 726,746 | | Rosneft Oil Co. PJSC GDR | | | 4,768,556 | |
| | | | | | | 13,025,791 | |
| Singapore — 3.6% | | | | |
| | 187,389 | | DBS Group Holdings, Ltd. | | | 3,599,754 | |
| | 198,942 | | Venture Corp., Ltd. | | | 2,401,963 | |
| | 2,219,708 | | Wilmar International, Ltd. | | | 6,076,329 | |
| | | | | | | 12,078,046 | |
| South Africa — 1.4% | | | | |
| | 181,274 | | Sasol, Ltd. | | | 4,507,449 | |
| | | | | |
| South Korea — 13.1% | | | | |
| | 49,650 | | DB Insurance Co., Ltd. | | | 2,548,040 | |
| | 71,060 | | Hana Financial Group, Inc. | | | 2,303,220 | |
| | 4,740 | | Hugel, Inc.* | | | 1,722,973 | |
| | 54,770 | | KB Financial Group, Inc. | | | 2,171,039 | |
| | 49,593 | | Korea Shipbuilding & Offshore | | | | |
| | | | Engineering Co., Ltd.* | | | 5,094,689 | |
| | 11,039 | | LG Electronics, Inc. | | | 759,551 | |
| | 2,495 | | LG Household & Health Care, Ltd. | | | 2,841,719 | |
| | 27,222 | | POSCO | | | 5,778,823 | |
| | 346,925 | | Samsung Electronics Co., Ltd. | | | 14,126,905 | |
| | 81,210 | | Shinhan Financial Group Co., Ltd. | | | 3,158,589 | |
| | 51,630 | | SK Hynix, Inc. | | | 3,105,513 | |
| | | | | | | 43,611,061 | |
| Taiwan — 10.6% | | | | |
| | 397,000 | | Catcher Technology Co., Ltd. | | | 2,852,232 | |
| | 401,803 | | Chroma ATE, Inc. | | | 1,792,402 | |
| | 3,693,000 | | Compal Electronics, Inc. | | | 2,422,396 | |
| | 1,160,000 | | Hon Hai Precision Industry Co., Ltd. | | | 2,894,101 | |
| | 2,090,406 | | Lite-On Technology Corp. | | | 3,063,737 | |
| | 325,191 | | MediaTek, Inc. | | | 3,293,785 | |
| | 117,000 | | Realtek Semiconductor Corp. | | | 861,737 | |
| | 64,685 | | Silergy Corp. | | | 1,268,191 | |
| | 1,759,212 | | Taiwan Semiconductor Manufacturing Co., Ltd. | | | 13,455,129 | |
| | 1,187,179 | | Uni-President Enterprises Corp. | | | 3,162,267 | |
| | | | | | | 35,065,977 | |
| | | | | | | | |
The accompanying notes are an integral part of these financial statements.
www.brownadvisory.com/mf
Brown Advisory Emerging Markets Select FundSchedule of Investments
June 30, 2019
| Shares | | Security Description | | Value $ | |
| Thailand — 2.6% | | | |
| | 382,500 | | Bangkok Bank PCL NVDR | | | 2,458,355 | |
| | 798,315 | | CP ALL PCL | | | 2,240,705 | |
| | 884,700 | | Siam Commercial Bank PCL NVDR | | | 4,026,300 | |
| | | | | | | 8,725,360 | |
| Turkey — 1.5% | | | | |
| | 2,353,731 | | Akbank T.A.S.* | | | 2,785,680 | |
| | 210,690 | | Ford Otomotiv Sanayi A.S. | | | 2,272,707 | |
| | | | | | | 5,058,387 | |
| United Arab Emirates — 1.1% | | | | |
| | 1,551,174 | | Abu Dhabi Commercial Bank PJSC | | | 3,505,097 | |
| | | | | |
| United Kingdom — 2.0% | | | | |
| | 223,980 | | Antofagasta PLC | | | 2,645,689 | |
| | 455,871 | | Standard Chartered PLC | | | 4,135,615 | |
| | | | | | | 6,781,304 | |
| United States — 2.3% | | | | |
| | 71,754 | | Cognizant Technology Solutions Corp. | | | 4,548,486 | |
| | 322,369 | | Flex, Ltd.* | | | 3,085,071 | |
| | | | | | | 7,633,557 | |
Total Common Stocks (Cost $298,510,438) | | | 304,844,457 | |
| | | | | |
| Preferred Stocks — 2.8% | | | | |
| | | | | |
| Brazil — 1.6% | | | | |
| | 1,357,996 | | Cia Energetica de Minas Gerais | | | 5,255,230 | |
| | | | | |
| South Korea — 1.2% | | | | |
| | 59,034 | | Hyundai Motor Co. | | | 4,047,260 | |
Total Preferred Stocks (Cost $8,755,006) | | | 9,302,490 | |
| | | | | |
| Exchange Traded Funds — 0.4% | | | | |
| | | | | |
| United States — 0.4% | | | | |
| | 16,914 | | iShares MSCI All Country Asia | | | | |
| | | | ex Japan Exchange Traded Fund | | | 1,180,428 | |
Total Exchange Traded Funds (Cost $1,105,240) | | | 1,180,428 | |
| | | | | | | | |
| Short-Term Investments — 3.7% | | | | |
| | | | | |
| Money Market Funds — 3.7% | | | | |
| | 12,348,291 | | First American Government | | | | |
| | | | Obligations Fund — Class Z, 2.26%# | | | 12,348,291 | |
Total Short-Term Investments (Cost $12,348,291) | | | 12,348,291 | |
Total Investments — 98.7% (Cost $320,718,975) | | | 327,675,666 | |
Other Assets in Excess of Liabilities — 1.3% | | | 4,246,616 | |
| NET ASSETS — 100.0% | | $ | 331,922,282 | |
ADR — American Depositary Receipt
GDR — Global Depositary Receipt
NVDR — Non-Voting Depositary Receipt
| * | Non-Income Producing |
| # | Annualized seven-day yield as of June 30, 2019. |
The accompanying notes are an integral part of these financial statements.
www.brownadvisory.com/mf
Brown Advisory – Beutel Goodman Large-Cap Value FundA Message to Our Shareholders
June 30, 2019
Dear Shareholders:
During the year ended June 30, 2019, the Brown Advisory – Beutel Goodman Large-Cap Value Fund – Institutional Shares (the “Fund”) increased 11.62% in value. During the same period, the Fund’s benchmark, the Russell 1000® Value Index (the “Index”), increased 8.46%.
With the exception of a brief period during Q3 and Q4 of calendar year 2018, momentum has been the driving force behind much of the market’s performance, as investors have crowded into areas of the market viewed as “safe”; paying up for economically insensitive companies perceived as offering stable growth. However, we are starting to see signs that investors are looking for valuation ceilings. While a gap between growth and value persists, the margin is narrowing. Over a trailing five-year period, the Russell 1000® Value Index has underperformed the Russell 1000® Growth Index by 44%; however, over the past year, that gap has shrunk to 3.1%. We are hopeful that this is an early sign that fundamentals may become much more important in the months ahead.
Sector weighting effects provided a meaningful source of outperformance over the period, where the Fund’s underweight position in energy, as well as overweight positions in communication services, information technology and consumer staples all contributed positively to performance. Stock selection was also a driver over the one year period, with the most significant contributions coming from the Fund’s names in the industrials, financials, consumer discretionary and communication services sectors. Our sector weights are purely a function of our bottom-up fundamental view of stocks; accordingly, our discussion will focus on absolute contributions to performance.
From an individual stock perspective, automotive parts retailer AutoZone provided the most meaningful contribution as the company continued to operate well and exceeded expectations, while consistently allocating capital in a shareholder-friendly manner. Drug manufacturer, Eli Lilly also provided notable positive contribution as sales strength combined with impressive margin expansion generated strong free cash flow for the company to continue returning cash to shareholders. Oracle contributed positively to performance, having rebounded off December lows due in part to a return of positive momentum for technology stocks and, in June, a strong first-quarter earnings report. The stock’s strength resulted in it reaching our target price in the second quarter, and we consequently completed a process-driven one-third sale and a full valuation review. American Express was another notable contributor on an absolute-return basis. The stock rose on positive quarterly results and news that it had extended deals with existing partners Delta Air and Air Canada. With a record number of new card additions, greater card acceptance at merchants and a continued shift to online retail, we believe the future looks very good for American Express.
Halliburton and Kellogg were the most meaningful detractors over the period. Weakness in spending in the U.S. shale industry continued to weigh on Halliburton’s revenues. However, with a growing international market and improvement in the U.S. market, we continue to believe the company has great upside. Kellogg’s share price declined in the quarter due in part to lowered guidance and announcements of reorganization plans for its European and North American operations. However, the company continues to pay an attractive dividend while also repurchasing stock and we believe it will be rewarded for its efforts to reposition itself for sustainable growth.
New positions added over the period include flow control and compression equipment provider Gardner Denver, investment management firm BlackRock, engine manufacturer Cummins, hygiene product manufacturer Kimberly-Clark, and capital equipment provider KLA-Tencor.
Following a second process-driven one-third sale of Eli Lilly in the first quarter of 2019, the stock continued to rise in the second quarter and the Fund exited the position. Procter & Gamble, Johnson & Johnson and Allegion PLC were also sold in their entirety, as all three offered minimal upside with increasing downside risk from valuation. Other holdings which moved through their targets, triggering mandatory one-third sales but remain in the portfolio, include Merck, Ingersoll Rand, AutoZone, and Oracle.
The resulting proceeds were used to fund additions to a number of existing holdings, including Ameriprise, Amgen, Amdocs, Comcast, Halliburton, Kellogg, Omnicom, Symantec and Harley-Davidson. In the case of Ameriprise, the increased weight reflects continuing high conviction in this high-quality franchise, with valuations near all-time low levels. Additions to Amgen, a newer holding added to the portfolio in the first half of 2018, occurred after a pullback following strong performance shortly after our initiation. Symantec’s weight was increased to better reflect its attractive risk-adjusted return.
www.brownadvisory.com/mf
Brown Advisory – Beutel Goodman Large-Cap Value FundA Message to Our Shareholders
June 30, 2019
Our outlook for the Fund remains positive given the attractive valuations we are seeing in our high-quality portfolio (as measured by returns, balance sheet strength, and management alignment). Our portfolio of what we believe are gems continues to trade at deep discounts to the market, and more importantly, deep discounts to intrinsic value.
We are cognizant of the increasing levels of noise about economic weakness in U.S. and global markets, trade tensions and geopolitical uncertainty. However, we are ultimately bottom-up stock pickers and we will always remain focused on fundamentals. We believe the best form of risk control is to know what you own and what it is worth. All of the holdings in the portfolio continue to generate free cash flow, have strong balance sheets and capital allocation policies that we feel strike the right balance between corporate needs and shareholder returns. High-quality business models and company-specific catalysts factor into attractive risk/reward profiles and, importantly, capital conservation.
Sincerely,
Rui Cardoso, CFA
Portfolio Manager
Glenn Fortin, CFA
Portfolio Manager
Past performance is not a guarantee of future results.
Mutual fund investing involves risk. Principal loss is possible. The Fund may invest in ETFs, which may trade at a discount to the aggregate value of the underlying securities and although expense ratios for ETFs are generally low, frequent trading of ETFs by the Fund can generate brokerage expenses. In addition, the Fund is susceptible to risks from investments in derivatives, private placements, REITs, and its investments in other investment companies. The Fund is non-diversified, which means that it may invest a significant portion of its assets in the securities of a single issuer or small number of issuers. Investment by the Fund in securities of a limited number of issuers exposes it to greater risk and potential monetary losses than if its assets were diversified among the securities of a greater number of issuers. If a Fund is non-diversified, then its investments are not required to meet certain requirements under Federal law. A non-diversified fund is permitted to invest a greater percentage of its assets in the securities of a single issuer than a diversified fund. Thus, the Fund may have fewer holdings than other funds. As a result, a decline in the value of those investments would cause the Fund’s overall value to decline to a greater degree than if the Fund held a more diversified portfolio. The risks of derivatives include imperfect correlation between the value of the instruments and the underlying assets; risks of default by the other party to the derivative transactions; risks that the transactions may result in losses that partially or completely offset gains in portfolio positions ad risks that the derivative transactions may not be liquid.
Fund holdings and sector allocations are subject to change and should not be considered a recommendation to buy or sell any security. For a complete list of fund holdings, please refer to the Schedule of Investments provided in this report.
Definitions for terms and indices are provided in the Glossary of Terms.
www.brownadvisory.com/mf
Brown Advisory – Beutel Goodman Large-Cap Value FundPerformance Information & Portfolio Holdings Summary
June 30, 2019
GROWTH OF A $1,000,000 INVESTMENT
The following chart reflects the change in value of a hypothetical $1,000,000 investment, including reinvested dividends and distributions, in the Fund as measured against a broad-based securities market index. The Russell 1000® Value Index (“Index”) measures the performance of the large-cap value segment of the U.S. equity universe. It includes those Russell 1000® companies with lower price to book ratios and lower expected growth values. The Index is unmanaged and does not reflect the deduction of fees, such as investment management fees. Investors cannot invest directly in an index.
| PORTFOLIO HOLDINGS | % of Net Assets |
Industrials | | | 16.6 | % | |
Information Technology | | | 15.9 | % | |
Communication Services | | | 15.6 | % | |
Financials | | | 15.5 | % | |
Consumer Staples | | | 11.1 | % | |
Health Care | | | 10.6 | % | |
Consumer Discretionary | | | 6.0 | % | |
Money Market Funds | | | 3.3 | % | |
Energy | | | 2.4 | % | |
Materials | | | 2.4 | % | |
Other Assets and Liabilities | | | 0.6 | % | |
| | | | 100.0 | % | |
| | | Since Inception |
Average Annual Total Return | One Year | (2/13/18) |
| Institutional Shares | 11.62% | 4.99% |
Russell 1000® Value Index | 8.46% | 6.43% |
| | Institutional Shares | |
Gross Expense Ratio1 | 0.67% | |
Net Expense Ratio1 | 0.67% | |
Past performance does not guarantee future results. The performance data quoted represents past performance and current returns may be lower or higher. The investment return and net asset value will fluctuate so that an investor’s shares, when redeemed, may be worth more or less than the original cost. To obtain performance information current to the most recent month end, please visit our website at brownadvisory.com/mf/beutel-goodman-large-cap-value-fund. The performance table and graph above do not reflect the deduction of taxes that a shareholder would pay on Fund distributions or the redemption of Fund shares. Performance data does not reflect the imposition of the redemption fee of 1.00% on shares redeemed within 14 days, and if it did, performance would have been lower. Returns shown are calculated using the net asset values (“NAV”) that were used for shareholder transactions as of the respective period ends. These NAV, and the returns calculated from them, may differ from the NAV and returns shown elsewhere in this report.
1 | Per the Fund’s prospectus dated October 31, 2018. Refer to the financial highlights for the gross and net expense ratios for the year ended as of the date of this report. Please note that the expense ratios per the prospectus include acquired fund fees and expenses (as applicable) and the expense ratios in the financial highlights do not. |
www.brownadvisory.com/mf
Brown Advisory – Beutel Goodman Large-Cap Value FundSchedule of Investments
June 30, 2019
| Shares | | Security Description | | Value $ | |
| Common Stocks — 96.1% | | | |
| | | | |
| Communication Services — 15.6% | | | |
| | 312,680 | | Comcast Corp. | | | 13,220,110 | |
| | 191,127 | | Omnicom Group, Inc. | | | 15,662,858 | |
| | 302,460 | | Verizon Communications, Inc. | | | 17,279,540 | |
| | | | | | | 46,162,508 | |
| Consumer Discretionary — 6.0% | | | | |
| | 5,910 | | AutoZone, Inc.* | | | 6,497,868 | |
| | 314,554 | | Harley-Davidson, Inc. | | | 11,270,470 | |
| | | | | | | 17,768,338 | |
| Consumer Staples — 11.1% | | | | |
| | 195,680 | | Campbell Soup Co. | | | 7,840,898 | |
| | 220,746 | | Kellogg Co. | | | 11,825,363 | |
| | 98,740 | | Kimberly-Clark Corp. | | | 13,160,067 | |
| | | | | | | 32,826,328 | |
| Energy — 2.4% | | | | |
| | 314,940 | | Halliburton Co. | | | 7,161,736 | |
| | | | | |
| Financials — 15.5% | | | | |
| | 117,830 | | American Express Co. | | | 14,544,935 | |
| | 91,380 | | Ameriprise Financial, Inc. | | | 13,264,721 | |
| | 18,290 | | BlackRock, Inc. | | | 8,583,497 | |
| | 53,820 | | JPMorgan Chase & Co. | | | 6,017,076 | |
| | 77,420 | | Wells Fargo & Co. | | | 3,663,514 | |
| | | | | | | 46,073,743 | |
| Health Care — 10.6% | | | | |
| | 173,631 | | AmerisourceBergen Corp. | | | 14,803,779 | |
| | 69,680 | | Amgen, Inc. | | | 12,840,630 | |
| | 46,180 | | Merck & Co., Inc. | | | 3,872,193 | |
| | | | | | | 31,516,602 | |
| Industrials — 16.6% | | | | |
| | 68,820 | | Cummins, Inc. | | | 11,791,619 | |
| | 150,359 | | Flowserve Corp. | | | 7,922,416 | |
| | 224,070 | | Gardner Denver Holdings, Inc.* | | | 7,752,822 | |
| | 58,720 | | Ingersoll-Rand PLC | | | 7,438,062 | |
| | 84,710 | | Parker-Hannifin Corp. | | | 14,401,546 | |
| | | | | | | 49,306,465 | |
| Information Technology — 15.9% | | | | |
| | 218,397 | | Amdocs, Ltd. | | | 13,560,270 | |
| | 106,650 | | KLA-Tencor Corp. | | | 12,606,030 | |
| | 174,600 | | Oracle Corp. | | | 9,946,962 | |
| | 516,280 | | Symantec Corp. | | | 11,234,253 | |
| | | | | | | 47,347,515 | |
| Materials — 2.4% | | | | |
| | 82,930 | | LyondellBasell Industries NV | | | 7,142,761 | |
Total Common Stocks (Cost $267,660,143) | | | 285,305,996 | |
| | | | | | | | |
| Short-Term Investments — 3.3% | | | | |
| | | | | |
| Money Market Funds — 3.3% | | | | |
| | 9,842,138 | | First American Government | | | | |
| | | | Obligations Fund — Class Z, 2.26%# | | | 9,842,138 | |
Total Short-Term Investments (Cost $9,842,138) | | | 9,842,138 | |
Total Investments — 99.4% (Cost $277,502,281) | | | 295,148,134 | |
Other Assets in Excess of Liabilities — 0.6% | | | 1,814,461 | |
| NET ASSETS — 100.0% | | $ | 296,962,595 | |
| * | Non-Income Producing |
| # | Annualized seven-day yield as of June 30, 2019. |
The accompanying notes are an integral part of these financial statements.
www.brownadvisory.com/mf
Statements of Assets and Liabilities
June 30, 2019
| | | BROWN | | | BROWN | | | BROWN | | | BROWN | |
| | | ADVISORY | | | ADVISORY | | | ADVISORY | | | ADVISORY | |
| | | GROWTH | | | FLEXIBLE | | | EQUITY | | | SUSTAINABLE | |
| | | EQUITY | | | EQUITY | | | INCOME | | | GROWTH | |
| | | FUND | | | FUND | | | FUND | | | FUND | |
| ASSETS | | | | | | | | | | | | |
| Investments: | | | | | | | | | | | | |
| Total investments, at cost | | $ | 1,288,112,422 | | | $ | 277,818,838 | | | $ | 52,877,516 | | | $ | 994,044,239 | |
| Net unrealized appreciation (depreciation) | | | 1,069,861,686 | | | | 205,613,347 | | | | 37,013,823 | | | | 374,663,809 | |
| Total investments, at market value | | | 2,357,974,108 | | | | 483,432,185 | | | | 89,891,339 | | | | 1,368,708,048 | |
| Receivables: | | | | | | | | | | | | | | | | |
| Fund shares sold | | | 2,544,830 | | | | 378,057 | | | | 1,083 | | | | 7,903,430 | |
| Interest and dividends | | | 688,396 | | | | 311,303 | | | | 202,411 | | | | 667,371 | |
| Prepaid expenses and other assets | | | 126,216 | | | | 44,291 | | | | 37,105 | | | | 119,516 | |
| Total Assets | | | 2,361,333,550 | | | | 484,165,836 | | | | 90,131,938 | | | | 1,377,398,365 | |
| LIABILITIES | | | | | | | | | | | | | | | | |
| Payables: | | | | | | | | | | | | | | | | |
| Fund shares redeemed | | | 1,194,970 | | | | 121,129 | | | | 43,150 | | | | 825,147 | |
| Distribution to shareholders | | | — | | | | — | | | | 227,883 | | | | — | |
| Accrued Liabilities: | | | | | | | | | | | | | | | | |
| Investment advisory fees | | | 1,077,469 | | | | 172,484 | | | | 43,998 | | | | 644,890 | |
| Service fees | | | 100,961 | | | | 42,186 | | | | 7,750 | | | | 73,414 | |
| Administration, accounting and transfer agent fees | | | 75,718 | | | | 16,891 | | | | 2,955 | | | | 40,973 | |
| Business management fees | | | 92,348 | | | | 19,506 | | | | 3,666 | | | | 53,741 | |
| Trustee fees | | | 9,940 | | | | 2,237 | | | | 345 | | | | 8,114 | |
| Distribution fees | | | 1,337 | | | | 938 | | | | 207 | | | | 50,244 | |
| Professional fees | | | 31,526 | | | | 22,888 | | | | 20,841 | | | | 25,899 | |
| Custody fees | | | 11,784 | | | | 2,931 | | | | 574 | | | | 8,618 | |
| Other liabilities | | | 33,732 | | | | 6,009 | | | | 4,845 | | | | 79,251 | |
| Total Liabilities | | | 2,629,785 | | | | 407,199 | | | | 356,214 | | | | 1,810,291 | |
| NET ASSETS | | $ | 2,358,703,765 | | | $ | 483,758,637 | | | $ | 89,775,724 | | | $ | 1,375,588,074 | |
| | | | | | | | | | | | | | | | | |
| COMPONENTS OF NET ASSETS | | | | | | | | | | | | | | | | |
| Paid-in capital | | $ | 1,214,310,798 | | | $ | 263,112,871 | | | $ | 47,102,286 | | | $ | 988,933,253 | |
| Total distributable earnings (loss) | | | 1,144,392,967 | | | | 220,645,766 | | | | 42,673,438 | | | | 386,654,821 | |
| NET ASSETS | | $ | 2,358,703,765 | | | $ | 483,758,637 | | | $ | 89,775,724 | | | $ | 1,375,588,074 | |
| | | | | | | | | | | | | | | | | |
| COMPUTATION OF NET ASSET VALUE | | | | | | | | | | | | | | | | |
| Institutional Shares: | | | | | | | | | | | | | | | | |
| Net assets | | $ | 1,523,632,950 | | | $ | 135,189,832 | | | $ | 26,449,362 | | | $ | 749,948,514 | |
| Shares outstanding (unlimited shares authorized) | | | 61,440,665 | | | | 5,898,202 | | | | 1,869,321 | | | | 28,420,418 | |
| Net asset value per share | | $ | 24.80 | | | $ | 22.92 | | | $ | 14.15 | | | $ | 26.39 | |
| Investor Shares: | | | | | | | | | | | | | | | | |
| Net assets | | $ | 828,388,046 | | | $ | 343,917,030 | | | $ | 62,309,156 | | | $ | 374,768,897 | |
| Shares outstanding (unlimited shares authorized) | | | 33,808,647 | | | | 15,031,450 | | | | 4,404,902 | | | | 14,374,303 | |
| Net asset value per share | | $ | 24.50 | | | $ | 22.88 | | | $ | 14.15 | | | $ | 26.07 | |
| Advisor Shares: | | | | | | | | | | | | | | | | |
| Net assets | | $ | 6,682,769 | | | $ | 4,651,775 | | | $ | 1,017,206 | | | $ | 250,870,663 | |
| Shares outstanding (unlimited shares authorized) | | | 289,378 | | | | 203,159 | | | | 71,949 | | | | 9,801,882 | |
| Net asset value per share | | $ | 23.09 | | | $ | 22.90 | | | $ | 14.14 | | | $ | 25.59 | |
The accompanying notes are an integral part of these financial statements.
www.brownadvisory.com/mf
Statements of Assets and Liabilities
June 30, 2019
| | | BROWN | | | BROWN | | | BROWN | | | BROWN | |
| | | ADVISORY | | | ADVISORY | | | ADVISORY | | | ADVISORY | |
| | | MID-CAP | | | SMALL-CAP | | | SMALL-CAP | | | GLOBAL | |
| | | GROWTH | | | GROWTH | | | FUNDAMENTAL | | | LEADERS | |
| | | FUND | | | FUND | | | VALUE FUND | | | FUND | |
| ASSETS | | | | | | | | | | | | |
| Investments: | | | | | | | | | | | | |
| Total investments, at cost | | $ | 37,571,797 | | | $ | 1,043,668,466 | | | $ | 855,169,992 | | | $ | 197,057,913 | |
| Net unrealized appreciation (depreciation) | | | 7,458,236 | | | | 325,430,926 | | | | 176,431,332 | | | | 36,178,598 | |
| Total investments, at market value | | | 45,030,033 | | | | 1,369,099,392 | | | | 1,031,601,324 | | | | 233,236,511 | |
| Foreign currency (Cost of $—, $—, $— and $89,657, respectively.) | | | — | | | | — | | | | — | | | | 89,657 | |
| Receivables: | | | | | | | | | | | | | | | | |
| Fund shares sold | | | 362,000 | | | | 3,192,667 | | | | 1,756,432 | | | | 974,068 | |
| Interest and dividends | | | 11,276 | | | | 377,720 | | | | 1,550,180 | | | | 358,488 | |
| Prepaid expenses and other assets | | | 30,752 | | | | 111,322 | | | | 60,348 | | | | 49,303 | |
| Total Assets | | | 45,434,061 | | | | 1,372,781,101 | | | | 1,034,968,284 | | | | 234,708,027 | |
| LIABILITIES | | | | | | | | | | | | | | | | |
| Payables: | | | | | | | | | | | | | | | | |
| Investments purchased | | | — | | | | 23,267,773 | | | | — | | | | 1,082,396 | |
| Fund shares redeemed | | | 51,043 | | | | 1,714,103 | | | | 587,449 | | | | 241,056 | |
| Accrued Liabilities: | | | | | | | | | | | | | | | | |
| Investment advisory fees, net | | | 17,782 | | | | 908,870 | | | | 708,578 | | | | 100,963 | |
| Service fees | | | 351 | | | | 60,918 | | | | 70,853 | | | | 2,230 | |
| Administration, accounting and transfer agent fees | | | 1,618 | | | | 42,573 | | | | 34,788 | | | | 6,651 | |
| Business management fees | | | 1,774 | | | | 53,463 | | | | 41,681 | | | | 9,167 | |
| Trustee fees | | | 240 | | | | 8,112 | | | | 4,180 | | | | 1,288 | |
| Distribution fees | | | — | | | | 3,182 | | | | 1,719 | | | | — | |
| Professional fees | | | 17,536 | | | | 26,226 | | | | 26,301 | | | | 21,568 | |
| Custody fees | | | 3,087 | | | | 8,178 | | | | 8,576 | | | | 19,052 | |
| Other liabilities | | | 3,895 | | | | 79,572 | | | | 34,181 | | | | 17,702 | |
| Total Liabilities | | | 97,326 | | | | 26,172,970 | | | | 1,518,306 | | | | 1,502,073 | |
| NET ASSETS | | $ | 45,336,735 | | | $ | 1,346,608,131 | | | $ | 1,033,449,978 | | | $ | 233,205,954 | |
| | | | | | | | | | | | | | | | | |
| COMPONENTS OF NET ASSETS | | | | | | | | | | | | | | | | |
| Paid-in capital | | $ | 38,151,088 | | | $ | 997,413,523 | | | $ | 837,836,793 | | | $ | 200,024,212 | |
| Total distributable earnings (loss) | | | 7,185,647 | | | | 349,194,608 | | | | 195,613,185 | | | | 33,181,742 | |
| NET ASSETS | | $ | 45,336,735 | | | $ | 1,346,608,131 | | | $ | 1,033,449,978 | | | $ | 233,205,954 | |
| | | | | | | | | | | | | | | | | |
| COMPUTATION OF NET ASSET VALUE | | | | | | | | | | | | | | | | |
| Institutional Shares: | | | | | | | | | | | | | | | | |
| Net assets | | $ | 42,403,838 | | | $ | 838,698,348 | | | $ | 447,845,666 | | | $ | 214,263,228 | |
| Shares outstanding (unlimited shares authorized) | | | 3,225,881 | | | | 18,958,136 | | | | 18,080,914 | | | | 14,059,586 | |
| Net asset value per share | | $ | 13.14 | | | $ | 44.24 | | | $ | 24.77 | | | $ | 15.24 | |
| Investor Shares: | | | | | | | | | | | | | | | | |
| Net assets | | $ | 2,932,897 | | | $ | 493,421,232 | | | $ | 577,211,516 | | | $ | 18,942,726 | |
| Shares outstanding (unlimited shares authorized) | | | 223,472 | | | | 22,295,200 | | | | 23,321,490 | | | | 1,244,170 | |
| Net asset value per share | | $ | 13.12 | | | $ | 22.13 | | | $ | 24.75 | | | $ | 15.23 | |
| Advisor Shares: | | | | | | | | | | | | | | | | |
| Net assets | | $ | — | | | $ | 14,488,551 | | | $ | 8,392,796 | | | $ | — | |
| Shares outstanding (unlimited shares authorized) | | | — | | | | 685,036 | | | | 340,615 | | | | — | |
| Net asset value per share | | $ | — | | | $ | 21.15 | | | $ | 24.64 | | | $ | — | |
The accompanying notes are an integral part of these financial statements.
www.brownadvisory.com/mf
Statements of Assets and Liabilities
June 30, 2019
| | | BROWN | | | BROWN | | | BROWN | | | BROWN | |
| | | ADVISORY | | | ADVISORY | | | ADVISORY | | | ADVISORY | |
| | | INTERMEDIATE | | | TOTAL | | | STRATEGIC | | | SUSTAINABLE | |
| | | INCOME | | | RETURN | | | BOND | | | BOND | |
| | | FUND | | | FUND | | | FUND | | | FUND | |
| ASSETS | | | | | | | | | | | | |
| Investments: | | | | | | | | | | | | |
| Investments – unaffiliated, at cost | | $ | 108,959,979 | | | $ | 243,925,457 | | | $ | 203,739,489 | | | $ | 119,005,023 | |
| Investments – affiliated, at cost (Note 3) | | | 27,356,612 | | | | — | | | | — | | | | — | |
| Total investments, at cost | | | 136,316,591 | | | | 243,925,457 | | | | 203,739,489 | | | | 119,005,023 | |
| Net unrealized appreciation (depreciation) – unaffiliated | | | 2,053,405 | | | | 4,570,262 | | | | 1,859,375 | | | | 4,047,498 | |
| Net unrealized appreciation (depreciation) – affiliated (Note 3) | | | (19,443 | ) | | | — | | | | — | | | | — | |
| Total net unrealized appreciation (depreciation) | | | 2,033,962 | | | | 4,570,262 | | | | 1,859,375 | | | | 4,047,498 | |
| Investments – unaffiliated, at market value | | | 111,013,384 | | | | 248,495,719 | | | | 205,598,864 | | | | 123,052,521 | |
| Investments – affiliated, at market value (Note 3) | | | 27,337,169 | | | | — | | | | — | | | | — | |
| Total investments, at market value | | | 138,350,553 | | | | 248,495,719 | | | | 205,598,864 | | | | 123,052,521 | |
| Cash deposit at broker – futures contracts (Note 6) | | | — | | | | — | | | | 89,823 | | | | — | |
| Gross unrealized appreciation – futures contracts (Note 6) | | | 342,163 | | | | 2,820,153 | | | | — | | | | 499,665 | |
| Receivables: | | | | | | | | | | | | | | | | |
| Investments sold | | | 1,858 | | | | 888,400 | | | | 567,291 | | | | 3,030,168 | |
| Fund shares sold | | | 37,862 | | | | 1,161,543 | | | | 284,296 | | | | 2,888,500 | |
| Interest and dividends | | | 754,032 | | | | 1,673,273 | | | | 1,636,951 | | | | 758,975 | |
| Prepaid expenses and other assets | | | 37,805 | | | | 33,668 | | | | 32,782 | | | | 45,087 | |
| Total Assets | | | 139,524,273 | | | | 255,072,756 | | | | 208,210,007 | | | | 130,274,916 | |
| LIABILITIES | | | | | | | | | | | | | | | | |
| Cash collateral from broker – futures contracts (Note 6) | | | 2,712 | | | | 1,275,342 | | | | — | | | | 37,850 | |
| Gross unrealized depreciation – futures contracts (Note 6) | | | — | | | | 8,847 | | | | — | | | | 89,102 | |
| Payables: | | | | | | | | | | | | | | | | |
| Investments purchased | | | 550,886 | | | | 2,219,961 | | | | 1,000,000 | | | | 2,460,674 | |
| Fund shares redeemed | | | 13,205 | | | | 51,512 | | | | 557,186 | | | | 22,669 | |
| Distribution to shareholders | | | 94,286 | | | | 403,222 | | | | 437,522 | | | | 234,904 | |
| Accrued Liabilities: | | | | | | | | | | | | | | | | |
| Investment advisory fees, net | | | 27,271 | | | | 60,258 | | | | 67,168 | | | | 36,253 | |
| Service fees | | | 5,665 | | | | 169 | | | | 72 | | | | 34 | |
| Administration, accounting and transfer agent fees | | | 6,897 | | | | 11,709 | | | | 12,170 | | | | 6,278 | |
| Business management fees | | | 5,665 | | | | 10,043 | | | | 8,396 | | | | 5,173 | |
| Trustee fees | | | 501 | | | | 1,196 | | | | 793 | | | | 526 | |
| Distribution fees | | | 740 | | | | — | | | | — | | | | — | |
| Professional fees | | | 21,353 | | | | 22,132 | | | | 22,079 | | | | 17,926 | |
| Custodian fees | | | 1,415 | | | | 2,206 | | | | 2,704 | | | | 1,268 | |
| Other liabilities | | | 3,849 | | | | 16,777 | | | | 11,533 | | | | 12,344 | |
| Total Liabilities | | | 734,445 | | | | 4,083,374 | | | | 2,119,623 | | | | 2,925,001 | |
| NET ASSETS | | $ | 138,789,828 | | | $ | 250,989,382 | | | $ | 206,090,384 | | | $ | 127,349,915 | |
| COMPONENTS OF NET ASSETS | | | | | | | | | | | | | | | | |
| Paid-in capital | | $ | 137,852,351 | | | $ | 243,184,542 | | | $ | 208,761,859 | | | $ | 122,889,030 | |
| Total distributable earnings (loss) | | | 937,477 | | | | 7,804,840 | | | | (2,671,475 | ) | | | 4,460,885 | |
| NET ASSETS | | $ | 138,789,828 | | | $ | 250,989,382 | | | $ | 206,090,384 | | | $ | 127,349,915 | |
| | | | | | | | | | | | | | | | | |
| COMPUTATION OF NET ASSET VALUE | | | | | | | | | | | | | | | | |
| Institutional Shares: | | | | | | | | | | | | | | | | |
| Net assets | | $ | — | | | $ | 246,073,532 | | | $ | 204,326,473 | | | $ | 126,466,370 | |
| Shares outstanding (unlimited shares authorized) | | | — | | | | 24,069,807 | | | | 21,339,805 | | | | 12,479,211 | |
| Net asset value per share | | $ | — | | | $ | 10.22 | | | $ | 9.57 | | | $ | 10.13 | |
| Investor Shares: | | | | | | | | | | | | | | | | |
| Net assets | | $ | 135,174,919 | | | $ | 4,915,850 | | | $ | 1,763,911 | | | $ | 883,545 | |
| Shares outstanding (unlimited shares authorized) | | | 12,611,216 | | | | 480,841 | | | | 184,264 | | | | 87,180 | |
| Net asset value per share | | $ | 10.72 | | | $ | 10.22 | | | $ | 9.57 | | | $ | 10.13 | |
| Advisor Shares: | | | | | | | | | | | | | | | | |
| Net assets | | $ | 3,614,909 | | | $ | — | | | $ | — | | | $ | — | |
| Shares outstanding (unlimited shares authorized) | | | 344,701 | | | | — | | | | — | | | | — | |
| Net asset value per share | | $ | 10.49 | | | $ | — | | | $ | — | | | $ | — | |
The accompanying notes are an integral part of these financial statements.
www.brownadvisory.com/mf
Statements of Assets and Liabilities
June 30, 2019
| | | | | | | | | | | | BROWN | |
| | | | | | | | | | | | ADVISORY – | |
| | | BROWN | | | BROWN | | | BROWN | | | WMC | |
| | | ADVISORY | | | ADVISORY | | | ADVISORY | | | STRATEGIC | |
| | | MARYLAND | | | TAX-EXEMPT | | | MORTGAGE | | | EUROPEAN | |
| | | BOND | | | BOND | | | SECURITIES | | | EQUITY | |
| | | FUND | | | FUND | | | FUND | | | FUND | |
| ASSETS | | | | | | | | | | | | |
| Investments: | | | | | | | | | | | | |
| Total investments, at cost | | $ | 176,165,188 | | | $ | 929,697,956 | | | $ | 274,924,739 | | | $ | 411,300,093 | |
| Net unrealized appreciation (depreciation) | | | 4,966,944 | | | | 25,982,103 | | | | 6,448,197 | | | | 80,507,215 | |
| Total investments, at market value | | | 181,132,132 | | | | 955,680,059 | | | | 281,372,936 | | | | 491,807,308 | |
| Foreign currency (Cost of $—, $—, $— and $444,212, respectively.) | | | — | | | | — | | | | — | | | | 444,288 | |
| Gross unrealized appreciation – futures contracts (Note 6) | | | — | | | | — | | | | 1,262,584 | | | | — | |
| Receivables: | | | | | | | | | | | | | | | | |
| Investments sold | | | — | | | | — | | | | 33,161,735 | | | | 1,726,512 | |
| Fund shares sold | | | 799,801 | | | | 11,093,357 | | | | 45,000 | | | | 734,365 | |
| Interest and dividends | | | 2,536,477 | | | | 6,257,782 | | | | 1,328,957 | | | | 3,403,100 | |
| Prepaid expenses and other assets | | | 10,635 | | | | 91,454 | | | | 38,536 | | | | 43,626 | |
| Total Assets | | | 184,479,045 | | | | 973,122,652 | | | | 317,209,748 | | | | 498,159,199 | |
| LIABILITIES | | | | | | | | | | | | | | | | |
| Cash collateral from broker – futures contracts (Note 6) | | | — | | | | — | | | | 297,291 | | | | — | |
| Gross unrealized depreciation – futures contracts (Note 6) | | | — | | | | — | | | | 183,476 | | | | — | |
| Payables: | | | | | | | | | | | | | | | | |
| Investments purchased | | | 1,824,885 | | | | — | | | | 34,091,293 | | | | 458,283 | |
| Fund shares redeemed | | | 203,934 | | | | 717,117 | | | | 125,205 | | | | 647,083 | |
| Distribution to shareholders | | | 285,178 | | | | 1,794,006 | | | | 386,033 | | | | — | |
| Accrued Liabilities: | | | | | | | | | | | | | | | | |
| Investment advisory fees | | | 44,711 | | | | 230,078 | | | | 69,537 | | | | 358,648 | |
| Service fees | | | 7,452 | | | | 769 | | | | 10 | | | | 3,113 | |
| Administration, accounting and transfer agent fees | | | 7,144 | | | | 29,748 | | | | 16,920 | | | | 16,954 | |
| Business management fees | | | 7,452 | | | | 38,347 | | | | 11,589 | | | | 19,925 | |
| Trustee fees | | | 543 | | | | 4,773 | | | | 876 | | | | 406 | |
| Distribution fees | | | — | | | | — | | | | — | | | | 1,532 | |
| Professional fees | | | 21,369 | | | | 24,399 | | | | 22,632 | | | | 24,291 | |
| Custodian fees | | | 1,141 | | | | 5,436 | | | | 4,324 | | | | 34,750 | |
| Other liabilities | | | 3,592 | | | | 50,233 | | | | 6,138 | | | | 27,869 | |
| Total Liabilities | | | 2,407,401 | | | | 2,894,906 | | | | 35,215,324 | | | | 1,592,854 | |
| NET ASSETS | | $ | 182,071,644 | | | $ | 970,227,746 | | | $ | 281,994,424 | | | $ | 496,566,345 | |
| COMPONENTS OF NET ASSETS | | | | | | | | | | | | | | | | |
| Paid-in capital | | $ | 178,264,589 | | | $ | 949,507,098 | | | $ | 287,600,535 | | | $ | 418,565,098 | |
| Total distributable earnings (loss) | | | 3,807,055 | | | | 20,720,648 | | | | (5,606,111 | ) | | | 78,001,247 | |
| NET ASSETS | | $ | 182,071,644 | | | $ | 970,227,746 | | | $ | 281,994,424 | | | $ | 496,566,345 | |
| | | | | | | | | | | | | | | | | |
| COMPUTATION OF NET ASSET VALUE | | | | | | | | | | | | | | | | |
| Institutional Shares: | | | | | | | | | | | | | | | | |
| Net assets | | $ | — | | | $ | 950,832,371 | | | $ | 281,728,252 | | | $ | 470,902,810 | |
| Shares outstanding (unlimited shares authorized) | | | — | | | | 93,226,163 | | | | 28,125,432 | | | | 42,250,826 | |
| Net asset value per share | | $ | — | | | $ | 10.20 | | | $ | 10.02 | | | $ | 11.15 | |
| Investor Shares: | | | | | | | | | | | | | | | | |
| Net assets | | $ | 182,071,644 | | | $ | 19,395,375 | | | $ | 266,172 | | | $ | 18,100,175 | |
| Shares outstanding (unlimited shares authorized) | | | 16,860,003 | | | | 1,901,695 | | | | 26,552 | | | | 1,627,562 | |
| Net asset value per share | | $ | 10.80 | | | $ | 10.20 | | | $ | 10.02 | | | $ | 11.12 | |
| Advisor Shares: | | | | | | | | | | | | | | | | |
| Net assets | | $ | — | | | $ | — | | | $ | — | | | $ | 7,563,360 | |
| Shares outstanding (unlimited shares authorized) | | | — | | | | — | | | | — | | | | 685,814 | |
| Net asset value per share | | $ | — | | | $ | — | | | $ | — | | | $ | 11.03 | |
The accompanying notes are an integral part of these financial statements.
www.brownadvisory.com/mf
Statements of Assets and Liabilities
June 30, 2019
| | | | | | BROWN | |
| | | BROWN | | | ADVISORY – | |
| | | ADVISORY | | | BEUTEL | |
| | | EMERGING | | | GOODMAN | |
| | | MARKETS | | | LARGE-CAP | |
| | | SELECT FUND | | | VALUE FUND | |
| ASSETS | | | | | | |
| Investments: | | | | | | |
| Total investments, at cost | | $ | 320,718,975 | | | $ | 277,502,281 | |
| Net unrealized appreciation (depreciation) | | | 6,956,691 | | | | 17,645,853 | |
| Total investments, at market value | | | 327,675,666 | | | | 295,148,134 | |
| Foreign currency (Cost of $464,700 and $—, respectively.) | | | 464,799 | | | | — | |
| Receivables: | | | | | | | | |
| Investments sold | | | 762,665 | | | | — | |
| Fund shares sold | | | 2,046,703 | | | | 1,611,465 | |
| Interest and dividends | | | 1,717,034 | | | | 354,798 | |
| Prepaid expenses and other assets | | | 61,047 | | | | 30,886 | |
| Total Assets | | | 332,727,914 | | | | 297,145,283 | |
| LIABILITIES | | | | | | | | |
| Payables: | | | | | | | | |
| Investments purchased | | | 420,505 | | | | — | |
| Fund shares redeemed | | | 10,413 | | | | 16,000 | |
| Accrued Liabilities: | | | | | | | | |
| Investment advisory fees | | | 235,424 | | | | 105,500 | |
| Service fees | | | 647 | | | | — | |
| Administration, accounting and transfer agent fees | | | 10,725 | | | | 7,568 | |
| Business management fees | | | 13,079 | | | | 11,722 | |
| Trustee fees | | | 2,226 | | | | 1,448 | |
| Distribution fees | | | 33 | | | | — | |
| Professional fees | | | 29,973 | | | | 18,677 | |
| Custodian fees | | | 72,521 | | | | 3,224 | |
| Other liabilities | | | 10,086 | | | | 18,549 | |
| Total Liabilities | | | 805,632 | | | | 182,688 | |
| NET ASSETS | | $ | 331,922,282 | | | $ | 296,962,595 | |
| COMPONENTS OF NET ASSETS | | | | | | | | |
| Paid-in capital | | $ | 338,660,318 | | | $ | 281,773,075 | |
| Total distributable earnings (loss) | | | (6,738,036 | ) | | | 15,189,520 | |
| NET ASSETS | | $ | 331,922,282 | | | $ | 296,962,595 | |
| COMPUTATION OF NET ASSET VALUE | | | | | | | | |
| Institutional Shares: | | | | | | | | |
| Net assets | | $ | 326,692,596 | | | $ | 296,962,595 | |
| Shares outstanding (unlimited shares authorized) | | | 34,968,268 | | | | 28,354,879 | |
| Net asset value per share | | $ | 9.34 | | | $ | 10.47 | |
| Investor Shares: | | | | | | | | |
| Net assets | | $ | 5,062,730 | | | $ | — | |
| Shares outstanding (unlimited shares authorized) | | | 542,889 | | | | — | |
| Net asset value per share | | $ | 9.33 | | | $ | — | |
| Advisor Shares: | | | | | | | | |
| Net assets | | $ | 166,956 | | | $ | — | |
| Shares outstanding (unlimited shares authorized) | | | 17,827 | | | | — | |
| Net asset value per share | | $ | 9.37 | | | $ | — | |
The accompanying notes are an integral part of these financial statements.
www.brownadvisory.com/mf
Statements of Operations
For the Year Ended June 30, 2019
| | | BROWN | | | BROWN | | | BROWN | | | BROWN | |
| | | ADVISORY | | | ADVISORY | | | ADVISORY | | | ADVISORY | |
| | | GROWTH | | | FLEXIBLE | | | EQUITY | | | SUSTAINABLE | |
| | | EQUITY | | | EQUITY | | | INCOME | | | GROWTH | |
| | | FUND | | | FUND | | | FUND | | | FUND | |
| INVESTMENT INCOME | | | | | | | | | | | | |
| Dividend income | | $ | 9,387,975 | | | $ | 6,124,195 | | | $ | 2,404,363 | | | $ | 7,203,059 | |
| Less: foreign taxes withheld | | | (69,004 | ) | | | (87,298 | ) | | | (33,850 | ) | | | (91,609 | ) |
| Interest Income | | | 1,171,127 | | | | 145,124 | | | | 73,224 | | | | 523,722 | |
| Total investment income | | | 10,490,098 | | | | 6,182,021 | | | | 2,443,737 | | | | 7,635,172 | |
| EXPENSES | | | | | | | | | | | | | | | | |
| Investment advisory fees | | | 12,048,451 | | | | 2,037,313 | | | | 548,299 | | | | 5,497,756 | |
| Service fees – Investor Shares (Note 3) | | | 1,925,151 | | | | 484,284 | | | | 95,448 | | | | 286,889 | |
| Service fees – Advisor Shares (Note 3) | | | 9,226 | | | | 7,609 | | | | 1,522 | | | | 333,061 | |
| Business management fees | | | 1,027,132 | | | | 229,664 | | | | 45,692 | | | | 458,146 | |
| Administration, accounting and transfer agent fees | | | 726,301 | | | | 164,751 | | | | 34,149 | | | | 327,785 | |
| Miscellaneous expenses | | | 160,729 | | | | 46,059 | | | | 28,066 | | | | 113,422 | |
| Professional fees | | | 152,814 | | | | 50,409 | | | | 26,626 | | | | 79,264 | |
| Trustee fees | | | 104,825 | | | | 23,561 | | | | 4,662 | | | | 46,408 | |
| Distribution fees – Advisor Shares (Note 3) | | | 15,377 | | | | 12,682 | | | | 2,536 | | | | 555,101 | |
| Custody fees | | | 63,909 | | | | 14,924 | | | | 4,243 | | | | 36,148 | |
| Registration fees | | | 59,665 | | | | 38,906 | | | | 41,453 | | | | 113,743 | |
| Insurance fees | | | 27,568 | | | | 6,201 | | | | 1,374 | | | | 8,748 | |
| Total Expenses | | | 16,321,148 | | | | 3,116,363 | | | | 834,070 | | | | 7,856,471 | |
| NET INVESTMENT INCOME (LOSS) | | | (5,831,050 | ) | | | 3,065,658 | | | | 1,609,667 | | | | (221,299 | ) |
| NET REALIZED AND UNREALIZED GAIN (LOSS) | | | | | | | | | | | | | | | | |
| Net realized gain (loss) on investments | | | 169,374,545 | | | | 19,425,595 | | | | 7,006,550 | | | | 14,589,301 | |
| Net change in unrealized appreciation (depreciation) on investments | | | 154,675,163 | | | | 16,141,116 | | | | 2,049,045 | | | | 168,526,897 | |
| NET REALIZED AND UNREALIZED GAIN (LOSS) | | | 324,049,708 | | | | 35,566,711 | | | | 9,055,595 | | | | 183,116,198 | |
| INCREASE (DECREASE) IN NET ASSETS FROM OPERATIONS | | $ | 318,218,658 | | | $ | 38,632,369 | | | $ | 10,665,262 | | | $ | 182,894,899 | |
The accompanying notes are an integral part of these financial statements.
www.brownadvisory.com/mf
Statements of Operations
For the Year Ended June 30, 2019
| | | BROWN | | | BROWN | | | BROWN | | | BROWN | |
| | | ADVISORY | | | ADVISORY | | | ADVISORY | | | ADVISORY | |
| | | MID-CAP | | | SMALL-CAP | | | SMALL-CAP | | | GLOBAL | |
| | | GROWTH | | | GROWTH | | | FUNDAMENTAL | | | LEADERS | |
| | | FUND | | | FUND | | | VALUE FUND | | | FUND | |
| INVESTMENT INCOME | | | | | | | | | | | | |
| Dividend income | | $ | 199,091 | | | $ | 4,965,520 | | | $ | 22,798,532 | | | $ | 2,222,584 | |
| Less: foreign taxes withheld | | | (2,182 | ) | | | (47,514 | ) | | | — | | | | (169,144 | ) |
| Interest Income | | | 18,099 | | | | 1,553,360 | | | | 953,408 | | | | 161,078 | |
| Total investment income | | | 215,008 | | | | 6,471,366 | | | | 23,751,940 | | | | 2,214,518 | |
| EXPENSES | | | | | | | | | | | | | | | | |
| Investment advisory fees | | | 200,183 | | | | 8,774,829 | | | | 9,772,276 | | | | 987,183 | |
| Service fees – Investor Shares (Note 3) | | | 11,548 | | | | 709,119 | | | | 943,694 | | | | 70,556 | |
| Service fees – Advisor Shares (Note 3) | | | — | | | | 26,378 | | | | 27,809 | | | | — | |
| Business management fees | | | 15,399 | | | | 516,166 | | | | 574,840 | | | | 75,937 | |
| Administration, accounting and transfer agent fees | | | 14,324 | | | | 366,831 | | | | 399,533 | | | | 57,495 | |
| Miscellaneous expenses | | | 22,821 | | | | 203,694 | | | | 143,642 | | | | 42,474 | |
| Professional fees | | | 19,177 | | | | 85,436 | | | | 95,169 | | | | 30,585 | |
| Trustee fees | | | 1,513 | | | | 52,732 | | | | 59,591 | | | | 7,645 | |
| Distribution fees – Advisor Shares (Note 3) | | | — | | | | 43,963 | | | | 46,349 | | | | — | |
| Custody fees | | | 14,661 | | | | 38,485 | | | | 45,033 | | | | 103,516 | |
| Registration fees | | | 30,902 | | | | 111,292 | | | | 39,499 | | | | 46,181 | |
| Insurance fees | | | 120 | | | | 11,685 | | | | 17,568 | | | | 976 | |
| Interest expense on line of credit | | | 321 | | | | — | | | | — | | | | — | |
| Total Expenses | | | 330,969 | | | | 10,940,610 | | | | 12,165,003 | | | | 1,422,548 | |
| Expenses waived by adviser – expense cap (Note 3) | | | (103,738 | ) | | | — | | | | — | | | | (231,484 | ) |
| Net Expenses | | | 227,231 | | | | 10,940,610 | | | | 12,165,003 | | | | 1,191,064 | |
| NET INVESTMENT INCOME (LOSS) | | | (12,223 | ) | | | (4,469,244 | ) | | | 11,586,937 | | | | 1,023,454 | |
| NET REALIZED AND UNREALIZED GAIN (LOSS) | | | | | | | | | | | | | | | | |
| Net realized gain (loss) on investments | | | 9,412 | | | | 70,447,097 | | | | 87,538,333 | | | | (3,182,936 | ) |
| Net change in unrealized appreciation (depreciation) on investments | | | 6,000,860 | | | | 85,126,028 | | | | (151,351,080 | ) | | | 21,420,078 | |
| NET REALIZED AND UNREALIZED GAIN (LOSS) | | | 6,010,272 | | | | 155,573,125 | | | | (63,812,747 | ) | | | 18,237,142 | |
| INCREASE (DECREASE) IN NET ASSETS FROM OPERATIONS | | $ | 5,998,049 | | | $ | 151,103,881 | | | $ | (52,225,810 | ) | | $ | 19,260,596 | |
The accompanying notes are an integral part of these financial statements.
www.brownadvisory.com/mf
Statements of Operations
For the Year Ended June 30, 2019
| | | BROWN | | | BROWN | | | BROWN | | | BROWN | |
| | | ADVISORY | | | ADVISORY | | | ADVISORY | | | ADVISORY | |
| | | INTERMEDIATE | | | TOTAL | | | STRATEGIC | | | SUSTAINABLE | |
| | | INCOME | | | RETURN | | | BOND | | | BOND | |
| | | FUND | | | FUND | | | FUND | | | FUND | |
| INVESTMENT INCOME | | | | | | | | | | | | |
| Dividend income – unaffiliated | | $ | — | | | $ | 48,791 | | | $ | 94,756 | | | $ | — | |
| Dividend income – affiliated (Note 3) | | | 695,005 | | | | — | | | | — | | | | — | |
| Interest Income | | | 3,372,620 | | | | 6,759,973 | | | | 7,325,255 | | | | 3,324,579 | |
| Total investment income | | | 4,067,625 | | | | 6,808,764 | | | | 7,420,011 | | | | 3,324,579 | |
| EXPENSES | | | | | | | | | | | | | | | | |
| Investment advisory fees | | | 392,907 | | | | 544,939 | | | | 715,703 | | | | 275,018 | |
| Service fees – Investor Shares (Note 3) | | | 63,689 | | | | 1,660 | | | | 488 | | | | 7,942 | |
| Service fees – Advisor Shares (Note 3) | | | 1,795 | | | | — | | | | — | | | | — | |
| Business management fees | | | 65,485 | | | | 90,823 | | | | 89,463 | | | | 45,836 | |
| Administration, accounting and transfer agent fees | | | 67,795 | | | | 113,997 | | | | 136,528 | | | | 56,881 | |
| Miscellaneous expenses | | | 26,562 | | | | 28,453 | | | | 29,500 | | | | 26,528 | |
| Professional fees | | | 29,296 | | | | 32,807 | | | | 32,898 | | | | 23,186 | |
| Trustee fees | | | 7,001 | | | | 9,041 | | | | 8,972 | | | | 4,540 | |
| Distribution fees – Advisor Shares (Note 3) | | | 8,981 | | | | — | | | | — | | | | — | |
| Custodian fees | | | 7,188 | | | | 12,209 | | | | 11,787 | | | | 6,455 | |
| Registration fees | | | 31,128 | | | | 47,406 | | | | 41,948 | | | | 35,405 | |
| Insurance fees | | | 1,787 | | | | 1,612 | | | | 1,969 | | | | 527 | |
| Total Expenses | | | 703,614 | | | | 882,947 | | | | 1,069,256 | | | | 482,318 | |
| Expenses waived by adviser – investments in affiliates (Note 3) | | | (76,301 | ) | | | — | | | | — | | | | — | |
| Previously waived expenses recovered by adviser (Note 3) | | | — | | | | — | | | | — | | | | 28,558 | |
| Net Expenses | | | 627,313 | | | | 882,947 | | | | 1,069,256 | | | | 510,876 | |
| NET INVESTMENT INCOME (LOSS) | | | 3,440,312 | | | | 5,925,817 | | | | 6,350,755 | | | | 2,813,703 | |
| NET REALIZED AND UNREALIZED GAIN (LOSS) | |
| Net realized gain (loss) on: | | | | | | | | | | | | | | | | |
| Investments – unaffiliated | | | (720,949 | ) | | | (356,547 | ) | | | (1,413,117 | ) | | | 77,287 | |
| Investments – affiliated (Note 3) | | | (58,395 | ) | | | — | | | | — | | | | — | |
| Futures contracts (Note 6) | | | 89,951 | | | | 2,607,315 | | | | (38,160 | ) | | | 14,666 | |
| Net realized gain (loss) | | | (689,393 | ) | | | 2,250,768 | | | | (1,451,277 | ) | | | 91,953 | |
| Net change in unrealized appreciation (depreciation) on: | | | | | | | | | | | | | | | | |
| Investments – unaffiliated | | | 3,937,651 | | | | 6,249,050 | | | | 2,851,831 | | | | 4,796,699 | |
| Investments – affiliated (Note 3) | | | 1,077,219 | | | | — | | | | — | | | | — | |
| Futures contracts (Note 6) | | | 342,163 | | | | 2,320,423 | | | | 70,497 | | | | 420,347 | |
| Net change in unrealized appreciation (depreciation) | | | 5,357,033 | | | | 8,569,473 | | | | 2,922,328 | | | | 5,217,046 | |
| NET REALIZED AND UNREALIZED GAIN (LOSS) | | | 4,667,640 | | | | 10,820,241 | | | | 1,471,051 | | | | 5,308,999 | |
| INCREASE (DECREASE) IN NET ASSETS FROM OPERATIONS | | $ | 8,107,952 | | | $ | 16,746,058 | | | $ | 7,821,806 | | | $ | 8,122,702 | |
The accompanying notes are an integral part of these financial statements.
www.brownadvisory.com/mf
Statements of Operations
For the Year Ended June 30, 2019
| | | | | | | | | | | | BROWN | |
| | | | | | | | | | | | ADVISORY – | |
| | | BROWN | | | BROWN | | | BROWN | | | WMC | |
| | | ADVISORY | | | ADVISORY | | | ADVISORY | | | STRATEGIC | |
| | | MARYLAND | | | TAX-EXEMPT | | | MORTGAGE | | | EUROPEAN | |
| | | BOND | | | BOND | | | SECURITIES | | | EQUITY | |
| | | FUND | | | FUND | | | FUND | | | FUND | |
| INVESTMENT INCOME | | | | | | | | | | | | |
| Dividend income | | $ | — | | | $ | — | | | $ | 107,499 | | | $ | 12,572,853 | |
| Less: foreign taxes withheld | | | — | | | | — | | | | — | | | | (1,183,848 | ) |
| Interest Income | | | 5,733,675 | | | | 24,653,171 | | | | 7,912,543 | | | | 320,141 | |
| Total investment income | | | 5,733,675 | | | | 24,653,171 | | | | 8,020,042 | | | | 11,709,146 | |
| EXPENSES | | | | | | | | | | | | | | | | |
| Investment advisory fees | | | 541,202 | | | | 1,950,788 | | | | 872,147 | | | | 6,229,291 | |
| Service fees – Investor Shares (Note 3) | | | 90,200 | | | | 62,257 | | | | 136 | | | | 23,814 | |
| Service fees – Advisor Shares (Note 3) | | | — | | | | — | | | | — | | | | 14,030 | |
| Business management fees | | | 90,200 | | | | 325,131 | | | | 145,358 | | | | 346,072 | |
| Administration, accounting and transfer agent fees | | | 81,472 | | | | 257,857 | | | | 183,754 | | | | 250,220 | |
| Miscellaneous expenses | | | 28,507 | | | | 43,392 | | | | 34,813 | | | | 82,375 | |
| Professional fees | | | 31,662 | | | | 61,828 | | | | 39,300 | | | | 63,070 | |
| Trustee fees | | | 9,113 | | | | 32,557 | | | | 14,842 | | | | 33,897 | |
| Distribution fees – Advisor Shares (Note 3) | | | — | | | | — | | | | — | | | | 23,384 | |
| Custodian fees | | | 5,804 | | | | 22,020 | | | | 24,976 | | | | 305,523 | |
| Registration fees | | | 7,245 | | | | 97,028 | | | | 35,049 | | | | 49,488 | |
| Insurance fees | | | 2,511 | | | | 5,120 | | | | 4,166 | | | | 18,114 | |
| Interest expense on line of credit | | | 133 | | | | — | | | | — | | | | 17,549 | |
| Total Expenses | | | 888,049 | | | | 2,857,978 | | | | 1,354,541 | | | | 7,456,827 | |
| NET INVESTMENT INCOME (LOSS) | | | 4,845,626 | | | | 21,795,193 | | | | 6,665,501 | | | | 4,252,319 | |
| NET REALIZED AND UNREALIZED GAIN (LOSS) | | | | | | | | | | | | | | | | |
| Net realized gain (loss) on: | | | | | | | | | | | | | | | | |
| Investments | | | (543,793 | ) | | | (1,493,959 | ) | | | (239,517 | ) | | | 45,646,473 | |
| Securities sold short | | | — | | | | — | | | | (103,907 | ) | | | — | |
| Futures contracts (Note 6) | | | — | | | | — | | | | 1,265,488 | | | | — | |
| Net realized gain (loss) | | | (543,793 | ) | | | (1,493,959 | ) | | | 922,064 | | | | 45,646,473 | |
| Net change in unrealized appreciation (depreciation) on: | | | | | | | | | | | | | | | | |
| Investments | | | 5,517,531 | | | | 26,180,265 | | | | 10,346,945 | | | | (81,646,181 | ) |
| Futures contracts (Note 6) | | | — | | | | — | | | | 443,352 | | | | — | |
| Net change in unrealized appreciation (depreciation) | | | 5,517,531 | | | | 26,180,265 | | | | 10,790,297 | | | | (81,646,181 | ) |
| NET REALIZED AND UNREALIZED GAIN (LOSS) | | | 4,973,738 | | | | 24,686,306 | | | | 11,712,361 | | | | (35,999,708 | ) |
| INCREASE (DECREASE) IN NET ASSETS FROM OPERATIONS | | $ | 9,819,364 | | | $ | 46,481,499 | | | $ | 18,377,862 | | | $ | (31,747,389 | ) |
The accompanying notes are an integral part of these financial statements.
www.brownadvisory.com/mf
Statements of Operations
For the Year Ended June 30, 2019
| | | BROWN | | | | |
| | | BROWN | | | ADVISORY – | |
| | | ADVISORY | | | BEUTEL | |
| | | EMERGING | | | GOODMAN | |
| | | MARKETS | | | LARGE-CAP | |
| | | SELECT FUND | | | VALUE FUND | |
| INVESTMENT INCOME | | | | | | |
| Dividend income | | $ | 9,289,494 | | | $ | 5,425,666 | |
| Less: foreign taxes withheld | | | (1,275,368 | ) | | | (1,972 | ) |
| Interest Income | | | 244,361 | | | | 134,088 | |
Total investment income | | | 8,258,487 | | | | 5,557,782 | |
| EXPENSES | | | | | | | | |
| Investment advisory fees | | | 3,017,643 | | | | 971,420 | |
| Service fees – Investor Shares (Note 3) | | | 35,304 | | | | — | |
| Service fees – Advisor Shares (Note 3) | | | 244 | | | | — | |
| Business management fees | | | 167,647 | | | | 107,936 | |
| Administration, accounting and transfer agent fees | | | 128,238 | | | | 76,487 | |
| Miscellaneous expenses | | | 82,846 | | | | 29,164 | |
| Professional fees | | | 48,258 | | | | 31,530 | |
| Trustee fees | | | 17,813 | | | | 10,893 | |
| Distribution fees – Advisor Shares (Note 3) | | | 406 | | | | — | |
| Custodian fees | | | 647,296 | | | | 19,167 | |
| Registration fees | | | 67,866 | | | | 42,671 | |
| Insurance fees | | | 8,466 | | | | 1,610 | |
| Interest expense on line of credit | | | 54,906 | | | | 5,080 | |
Total Expenses | | | 4,276,933 | | | | 1,295,958 | |
| NET INVESTMENT INCOME (LOSS) | | | 3,981,554 | | | | 4,261,824 | |
| NET REALIZED AND UNREALIZED GAIN (LOSS) | | | | | | | | |
| Net realized gain (loss) on investments | | | 35,869,933 | | | | (1,911,535 | ) |
| Net change in unrealized appreciation (depreciation) on investments | | | (72,194,485 | ) | | | 21,553,306 | |
| NET REALIZED AND UNREALIZED GAIN (LOSS) | | | (36,324,552 | ) | | | 19,641,771 | |
| INCREASE (DECREASE) IN NET ASSETS FROM OPERATIONS | | $ | (32,342,998 | ) | | $ | 23,903,595 | |
The accompanying notes are an integral part of these financial statements.
www.brownadvisory.com/mf
Statements of Changes in Net Assets
| | | BROWN ADVISORY | | | BROWN ADVISORY | |
| | | GROWTH EQUITY FUND | | | FLEXIBLE EQUITY FUND | |
| | | Fiscal | | | Fiscal | | | Fiscal | | | Fiscal | |
| | | Year Ended | | | Year Ended | | | Year Ended | | | Year Ended | |
| | | June 30, | | | June 30, | | | June 30, | | | June 30, | |
| | | 2019 | | | 2018 | | | 2019 | | | 2018 | |
| OPERATIONS | | | | | | | | | | | | |
| Net investment income (loss) | | $ | (5,831,050 | ) | | $ | (7,980,352 | ) | | $ | 3,065,658 | | | $ | 1,623,165 | |
| Net realized gain (loss) | | | 169,374,545 | | | | 189,010,520 | | | | 19,425,595 | | | | 11,789,560 | |
| Net change in unrealized appreciation (depreciation) | | | 154,675,163 | | | | 301,958,936 | | | | 16,141,116 | | | | 63,268,737 | |
| Increase (Decrease) in Net Assets from Operations | | | 318,218,658 | | | | 482,989,104 | | | | 38,632,369 | | | | 76,681,462 | |
| DISTRIBUTIONS FROM EARNINGS | | | | | | | | | | | | | | | | |
| Institutional Shares | | | (31,938,112 | ) | | | (23,141,509 | ) | | | (4,982,976 | ) | | | (643,925 | ) |
| Investor Shares | | | (170,284,138 | ) | | | (120,503,157 | ) | | | (11,627,698 | ) | | | (1,422,429 | ) |
| Advisor Shares | | | (633,523 | ) | | | (469,496 | ) | | | (152,574 | ) | | | (9,268 | ) |
Total Distributions from Earnings (Note 9) | | | (202,855,773 | ) | | | (144,114,162 | ) | | | (16,763,248 | ) | | | (2,075,622 | ) |
| CAPITAL SHARE TRANSACTIONS | | | | | | | | | | | | | | | | |
| Sale of shares: | | | | | | | | | | | | | | | | |
| Institutional Shares | | | 1,214,065,021 | | | | 55,826,305 | | | | 15,209,667 | | | | 24,771,706 | |
| Investor Shares | | | 173,036,435 | | | | 242,524,550 | | | | 37,630,673 | | | | 24,311,427 | |
| Advisor Shares | | | 1,736,644 | | | | 1,099,275 | | | | 173,850 | | | | 746,297 | |
| Reinvestment of distributions: | | | | | | | | | | | | | | | | |
| Institutional Shares | | | 25,119,029 | | | | 18,263,760 | | | | 4,128,381 | | | | 294,182 | |
| Investor Shares | | | 158,805,779 | | | | 113,405,269 | | | | 6,006,030 | | | | 278,371 | |
| Advisor Shares | | | 570,681 | | | | 435,592 | | | | 131,607 | | | | 8,519 | |
| Redemption of shares: | | | | | | | | | | | | | | | | |
| Institutional Shares | | | (199,631,475 | ) | | | (112,225,735 | ) | | | (21,274,184 | ) | | | (14,207,288 | ) |
| Investor Shares | | | (1,199,080,020 | ) | | | (352,089,999 | ) | | | (31,566,261 | ) | | | (73,507,427 | ) |
| Advisor Shares | | | (2,115,835 | ) | | | (1,740,283 | ) | | | (2,321,621 | ) | | | (1,163,850 | ) |
| Redemption fees: | | | | | | | | | | | | | | | | |
| Institutional Shares | | | 3,234 | | | | 311 | | | | — | | | | 3 | |
| Investor Shares | | | 2,185 | | | | 1,329 | | | | — | | | | 82 | |
| Advisor Shares | | | 4 | | | | 96 | | | | 3 | | | | 95 | |
Increase (Decrease) from Capital Share Transactions | | | 172,511,682 | | | | (34,499,530 | ) | | | 8,118,145 | | | | (38,467,883 | ) |
Increase (Decrease) in Net Assets | | | 287,874,567 | | | | 304,375,412 | | | | 29,987,266 | | | | 36,137,957 | |
| NET ASSETS | | | | | | | | | | | | | | | | |
| Beginning of period | | | 2,070,829,198 | | | | 1,766,453,786 | | | | 453,771,371 | | | | 417,633,414 | |
| End of period | | $ | 2,358,703,765 | | | $ | 2,070,829,198 | | | $ | 483,758,637 | | | $ | 453,771,371 | |
| SHARE TRANSACTIONS | | | | | | | | | | | | | | | | |
| Sale of shares: | | | | | | | | | | | | | | | | |
| Institutional Shares | | | 56,772,050 | | | | 2,520,724 | | | | 695,341 | | | | 1,176,283 | |
| Investor Shares | | | 7,510,920 | | | | 11,032,342 | | | | 1,758,262 | | | | 1,192,054 | |
| Advisor Shares | | | 78,798 | | | | 50,292 | | | | 8,068 | | | | 34,532 | |
| Reinvestment of distributions: | | | | | | | | | | | | | | | | |
| Institutional Shares | | | 1,280,930 | | | | 865,991 | | | | 213,265 | | | | 14,123 | |
| Investor Shares | | | 8,190,086 | | | | 5,423,494 | | | | 309,491 | | | | 13,383 | |
| Advisor Shares | | | 31,185 | | | | 21,867 | | | | 6,780 | | | | 409 | |
| Redemption of shares: | | | | | | | | | | | | | | | | |
| Institutional Shares | | | (8,717,249 | ) | | | (5,087,579 | ) | | | (990,468 | ) | | | (683,544 | ) |
| Investor Shares | | | (56,836,557 | ) | | | (16,142,426 | ) | | | (1,470,632 | ) | | | (3,549,882 | ) |
| Advisor Shares | | | (96,472 | ) | | | (84,091 | ) | | | (105,832 | ) | | | (56,568 | ) |
Increase (Decrease) in shares outstanding | | | 8,213,691 | | | | (1,399,386 | ) | | | 424,275 | | | | (1,859,210 | ) |
The accompanying notes are an integral part of these financial statements.
www.brownadvisory.com/mf
Statements of Changes in Net Assets
| | | BROWN ADVISORY | | | BROWN ADVISORY | |
| | | EQUITY INCOME FUND | | | SUSTAINABLE GROWTH FUND | |
| | | Fiscal | | | Fiscal | | | Fiscal | | | Fiscal | |
| | | Year Ended | | | Year Ended | | | Year Ended | | | Year Ended | |
| | | June 30, | | | June 30, | | | June 30, | | | June 30, | |
| | | 2019 | | | 2018 | | | 2019 | | | 2018 | |
| OPERATIONS | | | | | | | | | | | | |
| Net investment income (loss) | | $ | 1,609,667 | | | $ | 1,770,507 | | | $ | (221,299 | ) | | $ | (605,520 | ) |
| Net realized gain (loss) | | | 7,006,550 | | | | 10,709,083 | | | | 14,589,301 | | | | 29,170,107 | |
| Net change in unrealized appreciation (depreciation) | | | 2,049,045 | | | | (2,043,861 | ) | | | 168,526,897 | | | | 78,562,772 | |
| Increase (Decrease) in Net Assets from Operations | | | 10,665,262 | | | | 10,435,729 | | | | 182,894,899 | | | | 107,127,359 | |
| DISTRIBUTIONS FROM EARNINGS | | | | | | | | | | | | | | | | |
| Institutional Shares | | | (3,458,904 | ) | | | (1,429,024 | ) | | | (14,400,593 | ) | | | (4,421,769 | ) |
| Investor Shares | | | (8,182,576 | ) | | | (3,809,361 | ) | | | (4,531,789 | ) | | | (802,354 | ) |
| Advisor Shares | | | (124,204 | ) | | | (102,967 | ) | | | (7,216,074 | ) | | | (3,143,772 | ) |
Total Distributions from Earnings (Note 9) | | | (11,765,684 | ) | | | (5,341,352 | ) | | | (26,148,456 | ) | | | (8,367,895 | ) |
| CAPITAL SHARE TRANSACTIONS | | | | | | | | | | | | | | | | |
| Sale of shares: | | | | | | | | | | | | | | | | |
| Institutional Shares | | | 1,204,412 | | | | 3,800,667 | | | | 341,962,244 | | | | 122,220,935 | |
| Investor Shares | | | 2,199,841 | | | | 3,156,796 | | | | 358,637,346 | | | | 79,916,263 | |
| Advisor Shares | | | 46,946 | | | | 11,604 | | | | 33,138,882 | | | | 32,423,797 | |
| Reinvestment of distributions: | | | | | | | | | | | | | | | | |
| Institutional Shares | | | 3,219,492 | | | | 1,168,517 | | | | 10,630,756 | | | | 3,046,077 | |
| Investor Shares | | | 3,472,257 | | | | 1,369,084 | | | | 4,159,852 | | | | 658,241 | |
| Advisor Shares | | | 112,078 | | | | 98,704 | | | | 6,736,941 | | | | 2,961,244 | |
| Redemption of shares: | | | | | | | | | | | | | | | | |
| Institutional Shares | | | (5,635,593 | ) | | | (7,864,535 | ) | | | (59,777,923 | ) | | | (29,645,324 | ) |
| Investor Shares | | | (9,087,646 | ) | | | (23,608,528 | ) | | | (128,921,185 | ) | | | (25,813,176 | ) |
| Advisor Shares | | | (220,207 | ) | | | (1,561,239 | ) | | | (32,840,757 | ) | | | (29,567,360 | ) |
| Redemption fees: | | | | | | | | | | | | | | | | |
| Institutional Shares | | | — | | | | — | | | | 2,125 | | | | 379 | |
| Investor Shares | | | — | | | | 20 | | | | 7,666 | | | | 848 | |
| Advisor Shares | | | 15 | | | | — | | | | 351 | | | | 759 | |
Increase (Decrease) from Capital Share Transactions | | | (4,688,405 | ) | | | (23,428,910 | ) | | | 533,736,298 | | | | 156,202,683 | |
Increase (Decrease) in Net Assets | | | (5,788,827 | ) | | | (18,334,533 | ) | | | 690,482,741 | | | | 254,962,147 | |
| NET ASSETS | | | | | | | | | | | | | | | | |
| Beginning of period | | | 95,564,551 | | | | 113,899,084 | | | | 685,105,333 | | | | 430,143,186 | |
| End of period | | $ | 89,775,724 | | | $ | 95,564,551 | | | $ | 1,375,588,074 | | | $ | 685,105,333 | |
| SHARE TRANSACTIONS | | | | | | | | | | | | | | | | |
| Sale of shares: | | | | | | | | | | | | | | | | |
| Institutional Shares | | | 89,966 | | | | 264,042 | | | | 14,360,645 | | | | 5,634,586 | |
| Investor Shares | | | 167,988 | | | | 218,695 | | | | 15,163,632 | | | | 3,662,250 | |
| Advisor Shares | | | 3,826 | | | | 800 | | | | 1,408,385 | | | | 1,527,066 | |
| Reinvestment of distributions: | | | | | | | | | | | | | | | | |
| Institutional Shares | | | 258,861 | | | | 80,076 | | | | 505,024 | | | | 144,982 | |
| Investor Shares | | | 282,353 | | | | 93,297 | | | | 199,801 | | | | 31,616 | |
| Advisor Shares | | | 9,047 | | | | 6,755 | | | | 329,274 | | | | 144,240 | |
| Redemption of shares: | | | | | | | | | | | | | | | | |
| Institutional Shares | | | (421,246 | ) | | | (546,258 | ) | | | (2,501,182 | ) | | | (1,402,766 | ) |
| Investor Shares | | | (662,890 | ) | | | (1,629,814 | ) | | | (5,473,465 | ) | | | (1,177,511 | ) |
| Advisor Shares | | | (15,743 | ) | | | (108,542 | ) | | | (1,438,394 | ) | | | (1,445,494 | ) |
| Increase (Decrease) in shares outstanding | | | (287,838 | ) | | | (1,620,949 | ) | | | 22,553,720 | | | | 7,118,969 | |
The accompanying notes are an integral part of these financial statements.
www.brownadvisory.com/mf
Statements of Changes in Net Assets
| | | BROWN ADVISORY | | | BROWN ADVISORY | |
| | | MID-CAP GROWTH FUND | | | SMALL-CAP GROWTH FUND | |
| | | Fiscal | | | Fiscal | | | Fiscal | | | Fiscal | |
| | | Year Ended | | | Year Ended | | | Year Ended | | | Year Ended | |
| | | June 30, | | | June 30, | | | June 30, | | | June 30, | |
| | | 2019 | | | 2018* |
| | 2019 | | | 2018 | |
| OPERATIONS | | | | | | | | | | | | | | | |
| Net investment income (loss) | | $ | (12,223 | ) | | $ | (12,997 | ) | | $ | (4,469,244 | ) | | $ | (3,827,917 | ) |
| Net realized gain (loss) | | | 9,412 | | | | 87,029 | | | | 70,447,097 | | | | 16,272,365 | |
| Net change in unrealized appreciation (depreciation) | | | 6,000,860 | | | | 1,457,376 | | | | 85,126,028 | | | | 110,459,513 | |
| Increase (Decrease) in Net Assets from Operations | | | 5,998,049 | | | | 1,531,408 | | | | 151,103,881 | | | | 122,903,961 | |
| DISTRIBUTIONS FROM EARNINGS | | | | | | | | | | | | | | | | |
| Institutional Shares | | | (251,515 | ) | | | — | | | | (18,857,505 | ) | | | (6,328,426 | ) |
| Investor Shares | | | (28,594 | ) | | | — | | | | (20,274,985 | ) | | | (6,317,788 | ) |
| Advisor Shares | | | — | | | | — | | | | (736,847 | ) | | | (287,248 | ) |
Total Distributions from Earnings (Note 9) | | | (280,109 | ) | | | — | | | | (39,869,337 | ) | | | (12,933,462 | ) |
| CAPITAL SHARE TRANSACTIONS | | | | | | | | | | | | | | | | |
| Sale of shares: | | | | | | | | | | | | | | | | |
| Institutional Shares | | | 45,446,576 | | | | — | | | | 453,596,629 | | | | 251,107,663 | |
| Investor Shares | | | 4,870,115 | | | | 20,644,989 | | | | 84,662,520 | | | | 141,526,587 | |
| Advisor Shares | | | — | | | | — | | | | 3,596,032 | | | | 3,086,119 | |
| Reinvestment of distributions: | | | | | | | | | | | | | | | | |
| Institutional Shares | | | 175,744 | | | | — | | | | 17,134,301 | | | | 5,632,861 | |
| Investor Shares | | | 6,330 | | | | — | | | | 13,467,349 | | | | 3,636,951 | |
| Advisor Shares | | | — | | | | — | | | | 472,665 | | | | 199,271 | |
| Redemption of shares: | | | | | | | | | | | | | | | | |
| Institutional Shares | | | (7,410,342 | ) | | | — | | | | (123,532,084 | ) | | | (48,046,237 | ) |
| Investor Shares | | | (24,847,122 | ) | | | (798,980 | ) | | | (124,299,139 | ) | | | (60,450,109 | ) |
| Advisor Shares | | | — | | | | — | | | | (9,409,409 | ) | | | (20,641,592 | ) |
| Redemption fees: | | | | | | | | | | | | | | | | |
| Institutional Shares | | | — | | | | — | | | | 332 | | | | 9,528 | |
| Investor Shares | | | — | | | | 77 | | | | 9 | | | | 316 | |
| Advisor Shares | | | — | | | | — | | | | 308 | | | | 120 | |
Increase (Decrease) from Capital Share Transactions | | | 18,241,301 | | | | 19,846,086 | | | | 315,689,513 | | | | 276,061,478 | |
Increase (Decrease) in Net Assets | | | 23,959,241 | | | | 21,377,494 | | | | 426,924,057 | | | | 386,031,977 | |
| NET ASSETS | | | | | | | | | | | | | | | | |
| Beginning of period | | | 21,377,494 | | | | — | | | | 919,684,074 | | | | 533,652,097 | |
| End of period | | $ | 45,336,735 | | | $ | 21,377,494 | | | $ | 1,346,608,131 | | | $ | 919,684,074 | |
| SHARE TRANSACTIONS | | | | | | | | | | | | | | | | |
| Sale of shares: | | | | | | | | | | | | | | | | |
| Institutional Shares | | | 3,888,574 | | | | — | | | | 11,137,950 | | | | 6,841,265 | |
| Investor Shares | | | 411,866 | | | | 1,955,128 | | | | 4,315,251 | | | | 7,365,046 | |
| Advisor Shares | | | — | | | | — | | | | 188,531 | | | | 171,520 | |
| Reinvestment of distributions: | | | | | | | | | | | | | | | | |
| Institutional Shares | | | 17,435 | | | | — | | | | 504,201 | | | | 150,581 | |
| Investor Shares | | | 628 | | | | — | | | | 789,396 | | | | 194,006 | |
| Advisor Shares | | | — | | | | — | | | | 29,009 | | | | 11,119 | |
| Redemption of shares: | | | | | | | | | | | | | | | | |
| Institutional Shares | | | (680,128 | ) | | | — | | | | (3,128,368 | ) | | | (1,259,137 | ) |
| Investor Shares | | | (2,071,357 | ) | | | (72,793 | ) | | | (6,245,404 | ) | | | (3,155,860 | ) |
| Advisor Shares | | | — | | | | — | | | | (480,780 | ) | | | (1,183,625 | ) |
| Increase (Decrease) in shares outstanding | | | 1,567,018 | | | | 1,882,335 | | | | 7,109,786 | | | | 9,134,915 | |
* | Commenced operations October 2, 2017. The information presented is for the period from October 2, 2017 to June 30, 2018. |
The accompanying notes are an integral part of these financial statements.
www.brownadvisory.com/mf
Statements of Changes in Net Assets
| | | BROWN ADVISORY SMALL-CAP | | | BROWN ADVISORY | |
| | | FUNDAMENTAL VALUE FUND | | | GLOBAL LEADERS FUND | |
| | | Fiscal | | | Fiscal | | | Fiscal | | | Fiscal | |
| | | Year Ended | | | Year Ended | | | Year Ended | | | Year Ended | |
| | | June 30, | | | June 30, | | | June 30, | | | June 30, | |
| | | 2019 | | | 2018 | | | 2019 | | | 2018 | |
| OPERATIONS | | | | | | | | | | | | |
| Net investment income (loss) | | $ | 11,586,937 | | | $ | 5,201,123 | | | $ | 1,023,454 | | | $ | 334,758 | |
| Net realized gain (loss) | | | 87,538,333 | | | | 90,515,972 | | | | (3,182,936 | ) | | | 870,610 | |
| Net change in unrealized appreciation (depreciation) | | | (151,351,080 | ) | | | 48,605,436 | | | | 21,420,078 | | | | 7,505,020 | |
| Increase (Decrease) in Net Assets from Operations | | | (52,225,810 | ) | | | 144,322,531 | | | | 19,260,596 | | | | 8,710,388 | |
| DISTRIBUTIONS FROM EARNINGS | | | | | | | | | | | | | | | | |
| Institutional Shares | | | (61,245,393 | ) | | | (16,278,424 | ) | | | (320,277 | ) | | | — | |
| Investor Shares | | | (69,753,987 | ) | | | (35,639,963 | ) | | | (26,825 | ) | | | (43,629 | ) |
| Advisor Shares | | | (2,165,335 | ) | | | (920,082 | ) | | | — | | | | — | |
Total Distributions from Earnings (Note 9) | | | (133,164,715 | ) | | | (52,838,469 | ) | | | (347,102 | ) | | | (43,629 | ) |
| CAPITAL SHARE TRANSACTIONS | | | | | | | | | | | | | | | | |
| Sale of shares: | | | | | | | | | | | | | | | | |
| Institutional Shares | | | 286,399,463 | | | | 91,821,131 | | | | 206,071,635 | | | | — | |
| Investor Shares | | | 64,699,564 | | | | 129,081,238 | | | | 59,641,568 | | | | 41,258,390 | |
| Advisor Shares | | | 1,897,188 | | | | 4,185,998 | | | | — | | | | — | |
| Reinvestment of distributions: | | | | | | | | | | | | | | | | |
| Institutional Shares | | | 41,165,697 | | | | 11,905,214 | | | | 87,785 | | | | — | |
| Investor Shares | | | 44,121,355 | | | | 21,281,919 | | | | 14,683 | | | | 19,205 | |
| Advisor Shares | | | 2,090,046 | | | | 890,719 | | | | — | | | | — | |
| Redemption of shares: | | | | | | | | | | | | | | | | |
| Institutional Shares | | | (202,513,956 | ) | | | (61,182,890 | ) | | | (14,648,283 | ) | | | — | |
| Investor Shares | | | (311,577,993 | ) | | | (172,896,660 | ) | | | (122,987,577 | ) | | | (3,185,671 | ) |
| Advisor Shares | | | (17,532,405 | ) | | | (6,814,344 | ) | | | — | | | | — | |
| Redemption fees: | | | | | | | | | | | | | | | | |
| Institutional Shares | | | 5,423 | | | | 83 | | | | 36 | | | | — | |
| Investor Shares | | | 9 | | | | 836 | | | | 157 | | | | — | |
| Advisor Shares | | | 261 | | | | 34 | | | | — | | | | — | |
Increase (Decrease) from Capital Share Transactions | | | (91,245,348 | ) | | | 18,273,278 | | | | 128,180,004 | | | | 38,091,924 | |
Increase (Decrease) in Net Assets | | | (276,635,873 | ) | | | 109,757,340 | | | | 147,093,498 | | | | 46,758,683 | |
| NET ASSETS | | | | | | | | | | | | | | | | |
| Beginning of period | | | 1,310,085,851 | | | | 1,200,328,511 | | | | 86,112,456 | | | | 39,353,773 | |
| End of period | | $ | 1,033,449,978 | | | $ | 1,310,085,851 | | | $ | 233,205,954 | | | $ | 86,112,456 | |
| SHARE TRANSACTIONS | | | | | | | | | | | | | | | | |
| Sale of shares: | | | | | | | | | | | | | | | | |
| Institutional Shares | | | 10,281,751 | | | | 3,252,145 | | | | 15,186,717 | | | | — | |
| Investor Shares | | | 2,606,432 | | | | 4,590,806 | | | | 4,223,089 | | | | 3,053,558 | |
| Advisor Shares | | | 71,572 | | | | 147,739 | | | | — | | | | — | |
| Reinvestment of distributions: | | | | | | | | | | | | | | | | |
| Institutional Shares | | | 1,856,445 | | | | 416,146 | | | | 7,172 | | | | — | |
| Investor Shares | | | 1,989,311 | | | | 744,919 | | | | 1,200 | | | | 1,474 | |
| Advisor Shares | | | 94,809 | | | | 31,366 | | | | — | | | | — | |
| Redemption of shares: | | | | | | | | | | | | | | | | |
| Institutional Shares | | | (8,146,724 | ) | | | (2,158,295 | ) | | | (1,134,303 | ) | | | — | |
| Investor Shares | | | (11,298,838 | ) | | | (6,120,611 | ) | | | (9,212,269 | ) | | | (246,142 | ) |
| Advisor Shares | | | (689,443 | ) | | | (242,164 | ) | | | — | | | | — | |
Increase (Decrease) in shares outstanding | | | (3,234,685 | ) | | | 662,051 | | | | 9,071,606 | | | | 2,808,890 | |
The accompanying notes are an integral part of these financial statements.
www.brownadvisory.com/mf
Statements of Changes in Net Assets
| | | BROWN ADVISORY | | | BROWN ADVISORY | |
| | | INTERMEDIATE INCOME FUND | | | TOTAL RETURN FUND | |
| | | Fiscal | | | Fiscal | | | Fiscal | | | Fiscal | |
| | | Year Ended | | | Year Ended | | | Year Ended | | | Year Ended | |
| | | June 30, | | | June 30, | | | June 30, | | | June 30, | |
| | | 2019 | | | 2018 | | | 2019 | | | 2018 | |
| OPERATIONS | | | | | | | | | | | | |
| Net investment income (loss) | | $ | 3,440,312 | | | $ | 2,931,790 | | | $ | 5,925,817 | | | $ | 3,248,105 | |
| Net realized gain (loss) | | | (689,393 | ) | | | (512,406 | ) | | | 2,250,768 | | | | (1,077,288 | ) |
| Net change in unrealized appreciation (depreciation) | | | 5,357,033 | | | | (2,578,104 | ) | | | 8,569,473 | | | | (1,564,891 | ) |
| Increase (Decrease) in Net Assets from Operations | | | 8,107,952 | | | | (158,720 | ) | | | 16,746,058 | | | | 605,926 | |
| DISTRIBUTIONS FROM EARNINGS | | | | | | | | | | | | | | | | |
| Institutional Shares | | | — | | | | — | | | | (5,843,105 | ) | | | (3,247,038 | ) |
| Investor Shares | | | (3,236,114 | ) | | | (2,930,957 | ) | | | (107,565 | ) | | | (80,086 | ) |
| Advisor Shares | | | (84,055 | ) | | | (80,947 | ) | | | — | | | | — | |
Total Distributions from Earnings (Note 9) | | | (3,320,169 | ) | | | (3,011,904 | ) | | | (5,950,670 | ) | | | (3,327,124 | ) |
| CAPITAL SHARE TRANSACTIONS | | | | | | | | | | | | | | | | |
| Sale of shares: | | | | | | | | | | | | | | | | |
| Institutional Shares | | | — | | | | — | | | | 134,263,932 | | | | 42,259,249 | |
| Investor Shares | | | 31,974,326 | | | | 27,591,617 | | | | 2,404,176 | | | | 865,839 | |
| Advisor Shares | | | 81,553 | | | | 42,334 | | | | — | | | | — | |
| Reinvestment of distributions: | | | | | | | | | | | | | | | | |
| Institutional Shares | | | — | | | | — | | | | 1,804,015 | | | | 914,158 | |
| Investor Shares | | | 928,274 | | | | 776,065 | | | | 72,245 | | | | 50,718 | |
| Advisor Shares | | | 57,663 | | | | 44,524 | | | | — | | | | — | |
| Redemption of shares: | | | | | | | | | | | | | | | | |
| Institutional Shares | | | — | | | | — | | | | (22,004,981 | ) | | | (26,826,272 | ) |
| Investor Shares | | | (27,451,535 | ) | | | (32,172,093 | ) | | | (345,153 | ) | | | (896,218 | ) |
| Advisor Shares | | | (430,919 | ) | | | (307,597 | ) | | | — | | | | — | |
| Redemption fees: | | | | | | | | | | | | | | | | |
| Institutional Shares | | | — | | | | — | | | | — | | | | — | |
| Investor Shares | | | 1 | | | | — | | | | — | | | | — | |
| Advisor Shares | | | — | | | | — | | | | — | | | | — | |
Increase (Decrease) from Capital Share Transactions | | | 5,159,363 | | | | (4,025,150 | ) | | | 116,194,234 | | | | 16,367,474 | |
Increase (Decrease) in Net Assets | | | 9,947,146 | | | | (7,195,774 | ) | | | 126,989,622 | | | | 13,646,276 | |
| NET ASSETS | | | | | | | | | | | | | | | | |
| Beginning of period | | | 128,842,682 | | | | 136,038,456 | | | | 123,999,760 | | | | 110,353,484 | |
| End of period | | $ | 138,789,828 | | | $ | 128,842,682 | | | $ | 250,989,382 | | | $ | 123,999,760 | |
| SHARE TRANSACTIONS | | | | | | | | | | | | | | | | |
| Sale of shares: | | | | | | | | | | | | | | | | |
| Institutional Shares | | | — | | | | — | | | | 13,690,421 | | | | 4,246,452 | |
| Investor Shares | | | 3,079,002 | | | | 2,634,707 | | | | 241,142 | | | | 86,723 | |
| Advisor Shares | | | 8,014 | | | | 4,147 | | | | — | | | | — | |
| Reinvestment of distributions: | | | | | | | | | | | | | | | | |
| Institutional Shares | | | — | | | | — | | | | 183,175 | | | | 92,154 | |
| Investor Shares | | | 89,217 | | | | 74,019 | | | | 7,349 | | | | 5,106 | |
| Advisor Shares | | | 5,649 | | | | 4,334 | | | | — | | | | — | |
| Redemption of shares: | | | | | | | | | | | | | | | | |
| Institutional Shares | | | — | | | | — | | | | (2,220,358 | ) | | | (2,694,044 | ) |
| Investor Shares | | | (2,642,447 | ) | | | (3,073,377 | ) | | | (35,530 | ) | | | (90,812 | ) |
| Advisor Shares | | | (42,328 | ) | | | (29,898 | ) | | | — | | | | — | |
Increase (Decrease) in shares outstanding | | | 497,107 | | | | (386,068 | ) | | | 11,866,199 | | | | 1,645,579 | |
The accompanying notes are an integral part of these financial statements.
www.brownadvisory.com/mf
Statements of Changes in Net Assets
| | | BROWN ADVISORY | | | BROWN ADVISORY | |
| | | STRATEGIC BOND FUND | | | SUSTAINABLE BOND FUND | |
| | | Fiscal | | | Fiscal | | | Fiscal | | | Fiscal | |
| | | Year Ended | | | Year Ended | | | Year Ended | | | Year Ended | |
| | | June 30, | | | June 30, | | | June 30, | | | June 30, | |
| | | 2019 | | | 2018 | | | 2019 | | | 2018* |
|
| OPERATIONS | | | | | | | | | | | | | |
| Net investment income (loss) | | $ | 6,350,755 | | | $ | 3,738,451 | | | $ | 2,813,703 | | | $ | 612,584 | |
| Net realized gain (loss) | | | (1,451,277 | ) | | | 126,593 | | | | 91,953 | | | | (95,567 | ) |
| Net change in unrealized appreciation (depreciation) | | | 2,922,328 | | | | (1,633,800 | ) | | | 5,217,046 | | | | (758,985 | ) |
| Increase (Decrease) in Net Assets from Operations | | | 7,821,806 | | | | 2,231,244 | | | | 8,122,702 | | | | (241,968 | ) |
| DISTRIBUTIONS FROM EARNINGS | | | | | | | | | | | | | | | | |
| Institutional Shares | | | (6,353,117 | ) | | | (3,754,542 | ) | | | (2,447,030 | ) | | | — | |
| Investor Shares | | | (35,886 | ) | | | (5,508 | ) | | | (359,798 | ) | | | (607,063 | ) |
Total Distributions from Earnings (Note 9) | | | (6,389,003 | ) | | | (3,760,050 | ) | | | (2,806,828 | ) | | | (607,063 | ) |
| CAPITAL SHARE TRANSACTIONS | | | | | | | | | | | | | | | | |
| Sale of shares: | | | | | | | | | | | | | | | | |
| Institutional Shares | | | 91,338,915 | | | | 75,949,692 | | | | 137,251,390 | | | | — | |
| Investor Shares | | | 1,984,929 | | | | 3,026 | | | | 13,050,813 | | | | 58,724,426 | |
| Reinvestment of distributions: | | | | | | | | | | | | | | | | |
| Institutional Shares | | | 1,270,091 | | | | 715,397 | | | | 389,456 | | | | — | |
| Investor Shares | | | 35,545 | | | | 5,481 | | | | 121,617 | | | | 87,382 | |
| Redemption of shares: | | | | | | | | | | | | | | | | |
| Institutional Shares | | | (30,848,146 | ) | | | (48,641,279 | ) | | | (16,988,816 | ) | | | — | |
| Investor Shares | | | (487,540 | ) | | | (40,830 | ) | | | (66,081,904 | ) | | | (3,671,592 | ) |
| Redemption fees: | | | | | | | | | | | | | | | | |
| Institutional Shares | | | 150 | | | | 1,150 | | | | — | | | | — | |
| Investor Shares | | | 40 | | | | — | | | | — | | | | 300 | |
Increase (Decrease) from Capital Share Transactions | | | 63,293,984 | | | | 27,992,637 | | | | 67,742,556 | | | | 55,140,516 | |
Increase (Decrease) in Net Assets | | | 64,726,787 | | | | 26,463,831 | | | | 73,058,430 | | | | 54,291,485 | |
| NET ASSETS | | | | | | | | | | | | | | | | |
| Beginning of period | | | 141,363,597 | | | | 114,899,766 | | | | 54,291,485 | | | | — | |
| End of period | | $ | 206,090,384 | | | $ | 141,363,597 | | | $ | 127,349,915 | | | $ | 54,291,485 | |
| SHARE TRANSACTIONS | | | | | | | | | | | | | | | | |
| Sale of shares: | | | | | | | | | | | | | | | | |
| Institutional Shares | | | 9,600,905 | | | | 7,918,222 | | | | 14,165,832 | | | | — | |
| Investor Shares | | | 209,165 | | | | 316 | | | | 1,348,441 | | | | 5,962,310 | |
| Reinvestment of distributions: | | | | | | | | | | | | | | | | |
| Institutional Shares | | | 133,702 | | | | 74,680 | | | | 39,625 | | | | — | |
| Investor Shares | | | 3,739 | | | | 572 | | | | 12,602 | | | | 8,943 | |
| Redemption of shares: | | | | | | | | | | | | | | | | |
| Institutional Shares | | | (3,241,949 | ) | | | (5,081,400 | ) | | | (1,726,246 | ) | | | — | |
| Investor Shares | | | (51,135 | ) | | | (4,245 | ) | | | (6,869,071 | ) | | | (376,045 | ) |
Increase (Decrease) in shares outstanding | | | 6,654,427 | | | | 2,908,145 | | | | 6,971,183 | | | | 5,595,208 | |
* | Commenced operations August 7, 2017. Information presented is for the period from August 7, 2017 to June 30, 2018. |
The accompanying notes are an integral part of these financial statements.
www.brownadvisory.com/mf
Statements of Changes in Net Assets
| | | BROWN ADVISORY | | | BROWN ADVISORY | |
| | | MARYLAND BOND FUND | | | TAX-EXEMPT BOND FUND | |
| | | Fiscal | | | Fiscal | | | Fiscal | | | Fiscal | |
| | | Year Ended | | | Year Ended | | | Year Ended | | | Year Ended | |
| | | June 30, | | | June 30, | | | June 30, | | | June 30, | |
| | | 2019 | | | 2018 | | | 2019 | | | 2018 | |
| OPERATIONS | | | | | | | | | | | | |
| Net investment income (loss) | | $ | 4,845,626 | | | $ | 4,460,151 | | | $ | 21,795,193 | | | $ | 10,089,671 | |
| Net realized gain (loss) | | | (543,793 | ) | | | (208,324 | ) | | | (1,493,959 | ) | | | (1,355,285 | ) |
| Net change in unrealized appreciation (depreciation) | | | 5,517,531 | | | | (1,885,045 | ) | | | 26,180,265 | | | | 18,081 | |
| Increase (Decrease) in Net Assets from Operations | | | 9,819,364 | | | | 2,366,782 | | | | 46,481,499 | | | | 8,752,467 | |
| DISTRIBUTIONS FROM EARNINGS | | | | | | | | | | | | | | | | |
| Institutional Shares | | | — | | | | — | | | | (17,854,169 | ) | | | — | |
| Investor Shares | | | (4,845,626 | ) | | | (4,460,151 | ) | | | (3,941,024 | ) | | | (10,089,715 | ) |
Total Distributions from Earnings (Note 9) | | | (4,845,626 | ) | | | (4,460,151 | ) | | | (21,795,193 | ) | | | (10,089,715 | ) |
| CAPITAL SHARE TRANSACTIONS | | | | | | | | | | | | | | | | |
| Sale of shares: | | | | | | | | | | | | | | | | |
| Institutional Shares | | | — | | | | — | | | | 1,049,625,643 | | | | — | |
| Investor Shares | | | 36,672,964 | | | | 35,879,457 | | | | 84,945,677 | | | | 246,120,438 | |
| Reinvestment of distributions: | | | | | | | | | | | | | | | | |
| Institutional Shares | | | — | | | | — | | | | 3,636,859 | | | | — | |
| Investor Shares | | | 1,358,666 | | | | 1,054,555 | | | | 957,286 | | | | 2,167,523 | |
| Redemption of shares: | | | | | | | | | | | | | | | | |
| Institutional Shares | | | — | | | | — | | | | (129,045,070 | ) | | | — | |
| Investor Shares | | | (42,164,096 | ) | | | (35,128,638 | ) | | | (504,486,079 | ) | | | (64,647,222 | ) |
| Redemption fees: | | | | | | | | | | | | | | | | |
| Institutional Shares | | | — | | | | — | | | | 782 | | | | — | |
| Investor Shares | | | — | | | | — | | | | 312 | | | | 398 | |
Increase (Decrease) from Capital Share Transactions | | | (4,132,466 | ) | | | 1,805,374 | | | | 505,635,410 | | | | 183,641,137 | |
Increase (Decrease) in Net Assets | | | 841,272 | | | | (287,995 | ) | | | 530,321,716 | | | | 182,303,889 | |
| NET ASSETS | | | | | | | | | | | | | | | | |
| Beginning of period | | | 181,230,372 | | | | 181,518,367 | | | | 439,906,030 | | | | 257,602,141 | |
| End of period | | $ | 182,071,644 | | | $ | 181,230,372 | | | $ | 970,227,746 | | | $ | 439,906,030 | |
| SHARE TRANSACTIONS | | | | | | | | | | | | | | | | |
| Sale of shares: | | | | | | | | | | | | | | | | |
| Institutional Shares | | | — | | | | — | | | | 105,870,655 | | | | — | |
| Investor Shares | | | 3,489,427 | | | | 3,393,000 | | | | 8,578,932 | | | | 24,817,937 | |
| Reinvestment of distributions: | | | | | | | | | | | | | | | | |
| Institutional Shares | | | — | | | | — | | | | 363,223 | | | | — | |
| Investor Shares | | | 128,831 | | | | 99,934 | | | | 96,722 | | | | 218,428 | |
| Redemption of shares: | | | | | | | | | | | | | | | | |
| Institutional Shares | | | — | | | | — | | | | (13,007,715 | ) | | | — | |
| Investor Shares | | | (4,011,799 | ) | | | (3,327,151 | ) | | | (51,214,148 | ) | | | (6,517,455 | ) |
Increase (Decrease) in shares outstanding | | | (393,541 | ) | | | 165,783 | | | | 50,687,669 | | | | 18,518,910 | |
| | | | | | | | | | | | | | | | | |
The accompanying notes are an integral part of these financial statements.
www.brownadvisory.com/mf
Statements of Changes in Net Assets
| | | | | | | | | BROWN ADVISORY – | |
| | | BROWN ADVISORY | | | WMC STRATEGIC | |
| | | MORTGAGE SECURITIES FUND | | | EUROPEAN EQUITY FUND | |
| | | Fiscal | | | Fiscal | | | Fiscal | | | Fiscal | |
| | | Year Ended | | | Year Ended | | | Year Ended | | | Year Ended | |
| | | June 30, | | | June 30, | | | June 30, | | | June 30, | |
| | | 2019 | | | 2018 | | | 2019 | | | 2018 | |
| OPERATIONS | | | | | | | | | | | | |
| Net investment income (loss) | | $ | 6,665,501 | | | $ | 6,217,564 | | | $ | 4,252,319 | | | $ | 13,288,431 | |
| Net realized gain (loss) | | | 922,064 | | | | (4,400,444 | ) | | | 45,646,473 | | | | 89,857,660 | |
| Net change in unrealized appreciation (depreciation) | | | 10,790,297 | | | | (1,464,547 | ) | | | (81,646,181 | ) | | | (45,676,197 | ) |
| Increase (Decrease) in Net Assets from Operations | | | 18,377,862 | | | | 352,573 | | | | (31,747,389 | ) | | | 57,469,894 | |
| DISTRIBUTIONS FROM EARNINGS | | | | | | | | | | | | | | | | |
| Institutional Shares | | | (7,953,449 | ) | | | (7,958,014 | ) | | | (74,718,358 | ) | | | (11,440,046 | ) |
| Investor Shares | | | (7,313 | ) | | | (9,960 | ) | | | (1,440,449 | ) | | | (101,939 | ) |
| Advisor Shares | | | — | | | | — | | | | (877,353 | ) | | | (150,711 | ) |
Total Distributions from Earnings (Note 9) | | | (7,960,762 | ) | | | (7,967,974 | ) | | | (77,036,160 | ) | | | (11,692,696 | ) |
| CAPITAL SHARE TRANSACTIONS | | | | | | | | | | | | | | | | |
| Sale of shares: | | | | | | | | | | | | | | | | |
| Institutional Shares | | | 42,679,230 | | | | 39,751,492 | | | | 153,465,228 | | | | 339,470,651 | |
| Investor Shares | | | 140,547 | | | | 216,903 | | | | 10,126,285 | | | | 11,622,830 | |
| Advisor Shares | | | — | | | | — | | | | 965,406 | | | | 16,766,170 | |
| Reinvestment of distributions: | | | | | | | | | | | | | | | | |
| Institutional Shares | | | 1,072,618 | | | | 1,241,725 | | | | 54,307,922 | | | | 7,878,218 | |
| Investor Shares | | | 7,312 | | | | 9,914 | | | | 1,336,888 | | | | 90,587 | |
| Advisor Shares | | | — | | | | — | | | | 832,723 | | | | 144,260 | |
| Redemption of shares: | | | | | | | | | | | | | | | | |
| Institutional Shares | | | (73,075,085 | ) | | | (75,445,993 | ) | | | (558,385,244 | ) | | | (641,379,961 | ) |
| Investor Shares | | | (210,771 | ) | | | (638,352 | ) | | | (6,787,813 | ) | | | (4,408,236 | ) |
| Advisor Shares | | | — | | | | — | | | | (6,409,594 | ) | | | (14,664,337 | ) |
| Redemption fees: | | | | | | | | | | | | | | | | |
| Institutional Shares | | | — | | | | — | | | | 172 | | | | 1,843 | |
| Investor Shares | | | — | | | | — | | | | — | | | | 55 | |
| Advisor Shares | | | — | | | | — | | | | 51 | | | | 5 | |
Increase (Decrease) from Capital Share Transactions | | | (29,386,149 | ) | | | (34,864,311 | ) | | | (350,547,976 | ) | | | (284,477,915 | ) |
Increase (Decrease) in Net Assets | | | (18,969,049 | ) | | | (42,479,712 | ) | | | (459,331,525 | ) | | | (238,700,717 | ) |
| NET ASSETS | | | | | | | | | | | | | | | | |
| Beginning of period | | | 300,963,473 | | | | 343,443,185 | | | | 955,897,870 | | | | 1,194,598,587 | |
| End of period | | $ | 281,994,424 | | | $ | 300,963,473 | | | $ | 496,566,345 | | | $ | 955,897,870 | |
| SHARE TRANSACTIONS | | | | | | | | | | | | | | | | |
| Sale of shares: | | | | | | | | | | | | | | | | |
| Institutional Shares | | | 4,411,309 | | | | 4,037,680 | | | | 14,506,240 | | | | 26,506,741 | |
| Investor Shares | | | 14,369 | | | | 22,023 | | | | 930,583 | | | | 908,527 | |
| Advisor Shares | | | — | | | | — | | | | 88,786 | | | | 1,340,426 | |
| Reinvestment of distributions: | | | | | | | | | | | | | | | | |
| Institutional Shares | | | 110,676 | | | | 126,980 | | | | 5,614,751 | | | | 614,047 | |
| Investor Shares | | | 755 | | | | 1,011 | | | | 138,631 | | | | 7,066 | |
| Advisor Shares | | | — | | | | — | | | | 87,135 | | | | 11,332 | |
| Redemption of shares: | | | | | | | | | | | | | | | | |
| Institutional Shares | | | (7,540,833 | ) | | | (7,741,968 | ) | | | (52,569,893 | ) | | | (50,042,495 | ) |
| Investor Shares | | | (21,775 | ) | | | (64,569 | ) | | | (624,135 | ) | | | (344,483 | ) |
| Advisor Shares | | | — | | | | — | | | | (572,179 | ) | | | (1,166,163 | ) |
Increase (Decrease) in shares outstanding | | | (3,025,499 | ) | | | (3,618,843 | ) | | | (32,400,081 | ) | | | (22,165,002 | ) |
The accompanying notes are an integral part of these financial statements.
www.brownadvisory.com/mf
Statements of Changes in Net Assets
| | | BROWN ADVISORY | | | BROWN ADVISORY – | |
| | | EMERGING MARKETS | | | BEUTEL GOODMAN | |
| | | SELECT FUND | | | LARGE-CAP VALUE FUND | |
| | | Fiscal | | | Fiscal | | | Fiscal | | | Fiscal | |
| | | Year Ended | | | Year Ended | | | Year Ended | | | Year Ended | |
| | | June 30, | | | June 30, | | | June 30, | | | June 30, | |
| | | 2019 | | | 2018 | | | 2019 | | | 2018* |
|
| OPERATIONS | | | | | | | | | | | | | |
| Net investment income (loss) | | $ | 3,981,554 | | | $ | 10,115,149 | | | $ | 4,261,824 | | | $ | 664,783 | |
| Net realized gain (loss) | | | 35,869,933 | | | | (780,021 | ) | | | (1,911,535 | ) | | | (418,544 | ) |
| Net change in unrealized appreciation (depreciation) | | | (72,194,485 | ) | | | (8,868,079 | ) | | | 21,553,306 | | | | (3,907,453 | ) |
| Increase (Decrease) in Net Assets from Operations | | | (32,342,998 | ) | | | 467,049 | | | | 23,903,595 | | | | (3,661,214 | ) |
| DISTRIBUTIONS FROM EARNINGS | | | | | | | | | | | | | | | | |
| Institutional Shares | | | (8,210,572 | ) | | | (4,634,486 | ) | | | (4,272,001 | ) | | | — | |
| Investor Shares | | | (1,023,238 | ) | | | (1,520,480 | ) | | | — | | | | — | |
| Advisor Shares | | | (5,109 | ) | | | (1,572 | ) | | | — | | | | — | |
Total Distributions from Earnings (Note 9) | | | (9,238,919 | ) | | | (6,156,538 | ) | | | (4,272,001 | ) | | | — | |
| CAPITAL SHARE TRANSACTIONS | | | | | | | | | | | | | | | | |
| Sale of shares: | | | | | | | | | | | | | | | | |
| Institutional Shares | | | 220,418,141 | | | | 268,323,043 | | | | 181,152,872 | | | | 158,358,440 | |
| Investor Shares | | | 6,679,100 | | | | 12,555,778 | | | | — | | | | — | |
| Advisor Shares | | | 10,724 | | | | 15,769 | | | | — | | | | — | |
| Reinvestment of distributions: | | | | | | | | | | | | | | | | |
| Institutional Shares | | | 2,455,975 | | | | 1,577,593 | | | | 1,717,764 | | | | — | |
| Investor Shares | | | 889,506 | | | | 1,425,207 | | | | — | | | | — | |
| Advisor Shares | | | 5,109 | | | | 1,571 | | | | — | | | | — | |
| Redemption of shares: | | | | | | | | | | | | | | | | |
| Institutional Shares | | | (371,214,620 | ) | | | (139,753,965 | ) | | | (56,543,596 | ) | | | (3,694,661 | ) |
| Investor Shares | | | (37,547,635 | ) | | | (177,784,349 | ) | | | — | | | | — | |
| Advisor Shares | | | (9,609 | ) | | | (104,083 | ) | | | — | | | | — | |
| Redemption fees: | | | | | | | | | | | | | | | | |
| Institutional Shares | | | 3,838 | | | | 87 | | | | — | | | | 1,396 | |
| Investor Shares | | | 130 | | | | — | | | | — | | | | — | |
| Advisor Shares | | | — | | | | — | | | | — | | | | — | |
Increase (Decrease) from Capital Share Transactions | | | (178,309,341 | ) | | | (33,743,349 | ) | | | 126,327,040 | | | | 154,665,175 | |
Increase (Decrease) in Net Assets | | | (219,891,258 | ) | | | (39,432,838 | ) | | | 145,958,634 | | | | 151,003,961 | |
| NET ASSETS | | | | | | | | | | | | | | | | |
| Beginning of period | | | 551,813,540 | | | | 591,246,378 | | | | 151,003,961 | | | | — | |
| End of period | | $ | 331,922,282 | | | $ | 551,813,540 | | | $ | 296,962,595 | | | $ | 151,003,961 | |
| SHARE TRANSACTIONS | | | | | | | | | | | | | | | | |
| Sale of shares: | | | | | | | | | | | | | | | | |
| Institutional Shares | | | 23,815,702 | | | | 23,671,478 | | | | 18,467,748 | | | | 16,152,897 | |
| Investor Shares | | | 717,214 | | | | 1,152,310 | | | | — | | | | — | |
| Advisor Shares | | | 1,139 | | | | 1,423 | | | | — | | | | — | |
| Reinvestment of distributions: | | | | | | | | | | | | | | | | |
| Institutional Shares | | | 291,337 | | | | 142,382 | | | | 185,951 | | | | — | |
| Investor Shares | | | 105,642 | | | | 128,745 | | | | — | | | | — | |
| Advisor Shares | | | 603 | | | | 141 | | | | — | | | | — | |
| Redemption of shares: | | | | | | | | | | | | | | | | |
| Institutional Shares | | | (40,192,817 | ) | | | (12,830,641 | ) | | | (6,065,208 | ) | | | (386,509 | ) |
| Investor Shares | | | (4,078,896 | ) | | | (15,549,972 | ) | | | — | | | | — | |
| Advisor Shares | | | (1,017 | ) | | | (9,249 | ) | | | — | | | | — | |
Increase (Decrease) in shares outstanding | | | (19,341,093 | ) | | | (3,293,383 | ) | | | 12,588,491 | | | | 15,766,388 | |
| * | Commenced operations February 13, 2018. Information presented is for the period from February 13, 2018 to June 30, 2018. |
The accompanying notes are an integral part of these financial statements.
www.brownadvisory.com/mf
Financial Highlights
| | | | | | From Investment | | Distributions to | | | | |
| | | | | Ratios to Average | | | | |
| | | | | | Operations(a) | | Shareholders From | | | | |
| | | | | Net Assets(b) | | | | |
| | | | | | | | | Net | | | | | | | | | | | | | | | | | | | | | | | | | | | | | | |
| For a Share | | | | | | | Realized | | | | | | | | | | | | Net | | | | | Net | | | | | | | | | | | | |
| Outstanding | | Net Asset | | Net
| | & | | | | | | | | | | | | Asset | | | | | Assets at | | Net | | | | | | | | | |
| Throughout | | Value, | | Investment | | Unrealized | | | | Net | | Net | | | | Value, | | | | | End of | | Investment | |
| | | Gross | | Portfolio |
| Each Fiscal Period: | | Beginning | | Income | | Gains | |
| | | Realized | |
| | | | Total | | Period | | Income | | Net | | Expenses | | Turnover
|
| Beginning | Ending | | of Period | | (Loss) | | (Losses) | | Total | | Income | | Gains | | Total | | Period | | Return(c) | | (000’s) |
| (Loss) | | Expenses | | (d) | | Rate(c) |
| | | | | | | | | | | | | | | | | | | | | | | | | | | | | | | | | | | | | | | | | |
| BROWN ADVISORY GROWTH EQUITY FUND: | | | | | | | | | | |
| | | | | | | | | | | | | | | | | | | | | | | | | | | | | | | | | | | | | | | | | |
| Institutional Shares* | | | | | | | | | | |
| 07/01/18 | 06/30/19 | | $ | 23.91 | | (0.04 | ) | | 3.38 | | | 3.34 | | — | | | (2.45 | ) | | (2.45 | ) | | $ | 24.80 | | 16.69 | % | | $ | 1,523,633 | | (0.19 | )% | | 0.70 | % | | 0.70 | % | | 22 | % |
| 07/01/17 | 06/30/18 | | | 20.03 | | (0.06 | ) | | 5.62 | | | 5.56 | | — | | | (1.68 | ) | | (1.68 | ) | | | 23.91 | | 28.89 | | | | 289,434 | | (0.29 | ) | | 0.71 | | | 0.71 | | | 25 | |
| 07/01/16 | 06/30/17 | | | 19.16 | | (0.03 | ) | | 2.47 | | | 2.44 | | — | | | (1.57 | ) | | (1.57 | ) | | | 20.03 | | 13.91 | | | | 276,592 | | (0.16 | ) | | 0.72 | | | 0.72 | | | 40 | |
| 07/01/15 | 06/30/16 | | | 20.33 | | (0.02 | ) | | 0.13 | | | 0.11 | | — | | | (1.28 | ) | | (1.28 | ) | | | 19.16 | | 0.49 | | | | 253,640 | | (0.12 | ) | | 0.72 | | | 0.72 | | | 24 | |
| 07/01/14 | 06/30/15 | | | 19.10 | | 0.02 | | | 1.82 | | | 1.84 | | — | | | (0.61 | ) | | (0.61 | ) | | | 20.33 | | 9.73 | | | | 259,098 | | 0.09 | | | 0.72 | | | 0.72 | | | 24 | |
| | | | | | | | | | | |
| Investor Shares* | | | | | | | | | | |
| 07/01/18 | 06/30/19 | | | 23.69 | | (0.08 | ) | | 3.34 | | | 3.26 | | — | | | (2.45 | ) | | (2.45 | ) | | | 24.50 | | 16.50 | | | | 828,388 | | (0.34 | ) | | 0.85 | | | 0.85 | | | 22 | |
| 07/01/17 | 06/30/18 | | | 19.89 | | (0.10 | ) | | 5.58 | | | 5.48 | | — | | | (1.68 | ) | | (1.68 | ) | | | 23.69 | | 28.69 | | | | 1,775,180 | | (0.44 | ) | | 0.86 | | | 0.86 | | | 25 | |
| 07/01/16 | 06/30/17 | | | 19.06 | | (0.06 | ) | | 2.46 | | | 2.40 | | — | | | (1.57 | ) | | (1.57 | ) | | | 19.89 | | 13.77 | | | | 1,484,383 | | (0.31 | ) | | 0.87 | | | 0.87 | | | 40 | |
| 07/01/15 | 06/30/16 | | | 20.26 | | (0.05 | ) | | 0.13 | | | 0.08 | | — | | | (1.28 | ) | | (1.28 | ) | | | 19.06 | | 0.34 | | | | 1,916,472 | | (0.27 | ) | | 0.87 | | | 0.87 | | | 24 | |
| 07/01/14 | 06/30/15 | | | 19.07 | | (0.01 | ) | | 1.81 | | | 1.80 | | — | | | (0.61 | ) | | (0.61 | ) | | | 20.26 | | 9.54 | | | | 2,143,325 | | (0.06 | ) | | 0.87 | | | 0.87 | | | 24 | |
| | | | | | | | | | | |
| Advisor Shares* | | | | | | | | | | |
| 07/01/18 | 06/30/19 | | | 22.53 | | (0.13 | ) | | 3.14 | | | 3.01 | | — | | | (2.45 | ) | | (2.45 | ) | | | 23.09 | | 16.22 | | | | 6,683 | | (0.59 | ) | | 1.10 | | | 1.10 | | | 22 | |
| 07/01/17 | 06/30/18 | | | 19.04 | | (0.14 | ) | | 5.31 | | | 5.17 | | — | | | (1.68 | ) | | (1.68 | ) | | | 22.53 | | 28.32 | | | | 6,215 | | (0.69 | ) | | 1.11 | | | 1.11 | | | 25 | |
| 07/01/16 | 06/30/17 | | | 18.35 | | (0.10 | ) | | 2.36 | | | 2.26 | | — | | | (1.57 | ) | | (1.57 | ) | | | 19.04 | | 13.53 | | | | 5,479 | | (0.56 | ) | | 1.12 | | | 1.12 | | | 40 | |
| 07/01/15 | 06/30/16 | | | 19.60 | | (0.10 | ) | | 0.13 | | | 0.03 | | — | | | (1.28 | ) | | (1.28 | ) | | | 18.35 | | 0.09 | | | | 33,304 | | (0.52 | ) | | 1.12 | | | 1.12 | | | 24 | |
| 07/01/14 | 06/30/15 | | | 18.51 | | (0.06 | ) | | 1.76 | | | 1.70 | | — | | | (0.61 | ) | | (0.61 | ) | | | 19.60 | | 9.28 | | | | 44,587 | | (0.31 | ) | | 1.12 | | | 1.12 | | | 24 | |
| | | | | | | | | | | | | | | | | | | | | | | | | | | | | | | | | | | | | | | | | | | |
| BROWN ADVISORY FLEXIBLE EQUITY FUND: | | | | | | | | | | | | |
| | | | | | | | | | | | | | | | | | | | | | | | | | | | | | | | | | | | | | | | | | | |
| Institutional Shares* | | | | | | | | | | |
| 07/01/18 | 06/30/19 | | | 21.94 | | 0.17 | | | 1.63 | | | 1.80 | | (0.08 | ) | | (0.74 | ) | | (0.82 | ) | | | 22.92 | | 8.94 | | | �� | 135,190 | | 0.78 | | | 0.57 | | | 0.57 | | | 14 | |
| 07/01/17 | 06/30/18 | | | 18.53 | | 0.10 | | | 3.43 | | | 3.53 | | (0.12 | ) | | — | | | (0.12 | ) | | | 21.94 | | 19.07 | | | | 131,218 | | 0.48 | | | 0.72 | | | 0.72 | | | 15 | |
| 07/01/16 | 06/30/17 | | | 15.15 | | 0.11 | | | 3.37 | | | 3.48 | | (0.10 | ) | | — | | | (0.10 | ) | | | 18.53 | | 23.05 | | | | 101,431 | | 0.61 | | | 0.73 | | | 0.73 | | | 15 | |
| 07/01/15 | 06/30/16 | | | 15.92 | | 0.11 | | | (0.77 | ) | | (0.66 | ) | (0.11 | ) | | — | | | (0.11 | ) | | | 15.15 | | (4.16 | ) | | | 24,012 | | 0.71 | | | 0.73 | | | 0.73 | | | 15 | |
| 07/01/14 | 06/30/15 | | | 14.81 | | 0.12 | | | 1.08 | | | 1.20 | | (0.09 | ) | | — | | | (0.09 | ) | | | 15.92 | | 8.09 | | | | 4,240 | | 0.76 | | | 0.76 | | | 0.76 | | | 7 | |
| | | | | | | | | | | | | |
| Investor Shares* | | | | | | | | | | | | |
| 07/01/18 | 06/30/19 | | | 21.90 | | 0.14 | | | 1.63 | | | 1.77 | | (0.05 | ) | | (0.74 | ) | | (0.79 | ) | | | 22.88 | | 8.77 | | | | 343,917 | | 0.63 | | | 0.72 | | | 0.72 | | | 14 | |
| 07/01/17 | 06/30/18 | | | 18.50 | | 0.07 | | | 3.42 | | | 3.49 | | (0.09 | ) | | — | | | (0.09 | ) | | | 21.90 | | 18.88 | | | | 316,109 | | 0.33 | | | 0.87 | | | 0.87 | | | 15 | |
| 07/01/16 | 06/30/17 | | | 15.12 | | 0.08 | | | 3.37 | | | 3.45 | | (0.07 | ) | | — | | | (0.07 | ) | | | 18.50 | | 22.90 | | | | 310,360 | | 0.46 | | | 0.88 | | | 0.88 | | | 15 | |
| 07/01/15 | 06/30/16 | | | 15.89 | | 0.08 | | | (0.76 | ) | | (0.68 | ) | (0.09 | ) | | — | | | (0.09 | ) | | | 15.12 | | (4.30 | ) | | | 306,456 | | 0.56 | | | 0.88 | | | 0.88 | | | 15 | |
| 07/01/14 | 06/30/15 | | | 14.79 | | 0.10 | | | 1.07 | | | 1.17 | | (0.07 | ) | | — | | | (0.07 | ) | | | 15.89 | | 7.92 | | | | 268,569 | | 0.61 | | | 0.91 | | | 0.91 | | | 7 | |
| | | | | | | | |
| Advisor Shares* | | | | | | | |
| 07/01/18 | 06/30/19 | | | 21.91 | | 0.08 | | | 1.65 | | | 1.73 | | — | | | (0.74 | ) | | (0.74 | ) | | | 22.90 | | 8.52 | | | | 4,652 | | 0.38 | | | 0.97 | | | 0.97 | | | 14 | |
| 07/01/17 | 06/30/18 | | | 18.50 | | 0.02 | | | 3.42 | | | 3.44 | | (0.03 | ) | | — | | | (0.03 | ) | | | 21.91 | | 18.61 | | | | 6,445 | | 0.08 | | | 1.12 | | | 1.12 | | | 15 | |
| 07/01/16 | 06/30/17 | | | 15.12 | | 0.04 | | | 3.37 | | | 3.41 | | (0.03 | ) | | — | | | (0.03 | ) | | | 18.50 | | 22.56 | | | | 5,842 | | 0.21 | | | 1.13 | | | 1.13 | | | 15 | |
| 07/01/15 | 06/30/16 | | | 15.88 | | 0.05 | | | (0.77 | ) | | (0.72 | ) | (0.04 | ) | | — | | | (0.04 | ) | | | 15.12 | | (4.56 | ) | | | 7,168 | | 0.31 | | | 1.13 | | | 1.13 | | | 15 | |
| 07/01/14 | 06/30/15 | | | 14.77 | | 0.06 | | | 1.07 | | | 1.13 | | (0.02 | ) | | — | | | (0.02 | ) | | | 15.88 | | 7.68 | | | | 11,540 | | 0.36 | | | 1.16 | | | 1.16 | | | 7 | |
The accompanying notes are an integral part of these financial statements.
www.brownadvisory.com/mf
Financial Highlights
| | | | | | From Investment | | Distributions to | | | | | | | | | Ratios to Average | | | | |
| | | | | | Operations(a) | | Shareholders From | | | | | | | | | Net Assets(b) | | | | |
| | | | | | | | Net | | | | | | | | | | | | | | | | | | | | | | | | | | | | | |
| For a Share | | | | | | Realized | | | | | | | | | | | | | Net | |
| | Net | | | | | | | | | | | | |
| Outstanding | | Net Asset | | Net | | & | | | | | | | | | | | | Asset | |
| Assets at | | Net | | | | | | | | | |
| Throughout | | Value, | | Investment | | Unrealized | |
| | Net | | | | |
| | | |
| | | | Investment | | | | | Gross | Portfolio |
| Each Fiscal Period: | Beginning | | Income | | Gains | |
| Investment | Realized | | |
| | | | | Period | | Income | | | Expenses | Turnover |
| Beginning | Ending | | of Period | | (Loss) | | (Losses) | | Total | | Income | | Gains | | Total | | | | | | | | | | | | |
| | | | | | | | | | | | | | | | | | | | | | | | | | | | | | | | | | | | | | |
| BROWN ADVISORY EQUITY INCOME FUND: | | | | | | | | | | | | |
| | | | | | | | | | | | | | | | | | | | | | | | | | | | | | | | | | | | | | |
| Institutional Shares* | | | | | | | | | | | | | | | |
07/01/18 | 06/30/19 | | $ | 14.41 | | 0.26 | | 1.33 | | | 1.59 | | (0.27 | ) | | (1.58 | ) | | (1.85 | ) | | $ | 14.15 | | 13.12 | % | $ | 26,449 | | 1.87 | % | | 0.80 | % | | 0.80 | % | | 11 | % |
07/01/17 | 06/30/18 | | | 13.80 | | 0.24 | | 1.07 | | | 1.31 | | (0.25 | ) | | (0.45 | ) | | (0.70 | ) | | | 14.41 | | 9.51 | | | 27,975 | | 1.70 | | | 0.77 | | | 0.77 | | | 14 | |
07/01/16 | 06/30/17 | | | 12.87 | | 0.26 | | 1.41 | | | 1.67 | | (0.26 | ) | | (0.48 | ) | | (0.74 | ) | | | 13.80 | | 13.36 | | | 29,587 | | 1.94 | | | 0.77 | | | 0.77 | | | 7 | |
07/01/15 | 06/30/16 | | | 13.14 | | 0.28 | | (0.13 | ) | | 0.15 | | (0.29 | ) | | (0.13 | ) | | (0.42 | ) | | | 12.87 | | 1.31 | | | 13,840 | | 2.24 | | | 0.75 | | | 0.75 | | | 17 | |
07/01/14 | 06/30/15 | | | 13.70 | | 0.29 | | 0.08 | | | 0.37 | | (0.30 | ) | | (0.63 | ) | | (0.93 | ) | | | 13.14 | | 2.60 | | | 18,134 | | 2.16 | | | 0.75 | | | 0.75 | | | 18 | |
| | | | | | | | | | | | | |
| Investor Shares* | | | | | | | | | | | | |
07/01/18 | 06/30/19 | | | 14.40 | | 0.24 | | 1.34 | | | 1.58 | | (0.25 | ) | | (1.58 | ) | | (1.83 | ) | | | 14.15 | | 13.03 | | | 62,309 | | 1.72 | | | 0.95 | | | 0.95 | | | 11 | |
07/01/17 | 06/30/18 | | | 13.80 | | 0.22 | | 1.06 | | | 1.28 | | (0.23 | ) | | (0.45 | ) | | (0.68 | ) | | | 14.40 | | 9.27 | | | 66,512 | | 1.55 | | | 0.92 | | | 0.92 | | | 14 | |
07/01/16 | 06/30/17 | | | 12.86 | | 0.24 | | 1.42 | | | 1.66 | | (0.24 | ) | | (0.48 | ) | | (0.72 | ) | | | 13.80 | | 13.28 | | | 81,890 | | 1.79 | | | 0.92 | | | 0.92 | | | 7 | |
07/01/15 | 06/30/16 | | | 13.13 | | 0.26 | | (0.13 | ) | | 0.13 | | (0.27 | ) | | (0.13 | ) | | (0.40 | ) | | | 12.86 | | 1.15 | | | 112,116 | | 2.09 | | | 0.90 | | | 0.90 | | | 17 | |
07/01/14 | 06/30/15 | | | 13.69 | | 0.27 | | 0.08 | | | 0.35 | | (0.28 | ) | | (0.63 | ) | | (0.91 | ) | | | 13.13 | | 2.45 | | | 183,001 | | 2.01 | | | 0.90 | | | 0.90 | | | 18 | |
| | | | | | | | | | | | | |
| Advisor Shares* | | | | | | | | | | | | |
07/01/18 | 06/30/19 | | | 14.40 | | 0.21 | | 1.33 | | | 1.54 | | (0.22 | ) | | (1.58 | ) | | (1.80 | ) | | | 14.14 | | 12.67 | | | 1,017 | | 1.47 | | | 1.20 | | | 1.20 | | | 11 | |
07/01/17 | 06/30/18 | | | 13.78 | | 0.19 | | 1.06 | | | 1.25 | | (0.18 | ) | | (0.45 | ) | | (0.63 | ) | | | 14.40 | | 9.04 | | | 1,077 | | 1.30 | | | 1.17 | | | 1.17 | | | 14 | |
07/01/16 | 06/30/17 | | | 12.84 | | 0.20 | | 1.43 | | | 1.63 | | (0.21 | ) | | (0.48 | ) | | (0.69 | ) | | | 13.78 | | 13.02 | | | 2,422 | | 1.54 | | | 1.17 | | | 1.17 | | | 7 | |
07/01/15 | 06/30/16 | | | 13.11 | | 0.23 | | (0.13 | ) | | 0.10 | | (0.24 | ) | | (0.13 | ) | | (0.37 | ) | | | 12.84 | | 0.90 | | | 2,980 | | 1.84 | | | 1.15 | | | 1.15 | | | 17 | |
07/01/14 | 06/30/15 | | | 13.67 | | 0.24 | | 0.07 | | | 0.31 | | (0.24 | ) | | (0.63 | ) | | (0.87 | ) | | | 13.11 | | 2.19 | | | 3,148 | | 1.76 | | | 1.15 | | | 1.15 | | | 18 | |
| | | | | | | | | | | | | | | | | | | | | | | | | | | | | | | | | | | | | | | | | |
| BROWN ADVISORY SUSTAINABLE GROWTH FUND: | | | | | | | | | | | | |
| | | | | | | | �� | | | | | | | | | | | | | | | | | | | | | | | | | | | | | | | | | |
| Institutional Shares* | | | | | | | | | | | | |
07/01/18 | 06/30/19 | | | 23.02 | | 0.03 | | 4.12 | | | 4.15 | | — | | | (0.78 | ) | | (0.78 | ) | | | 26.39 | | 18.89 | | | 749,949 | | 0.10 | | | 0.73 | | | 0.73 | | | 21 | |
07/01/17 | 06/30/18 | | | 18.94 | | 0.01 | | 4.42 | | | 4.43 | | — | | | (0.35 | ) | | (0.35 | ) | | | 23.02 | | 23.59 | | | 369,642 | | 0.05 | | | 0.73 | | | 0.73 | | | 29 | |
07/01/16 | 06/30/17 | | | 16.05 | | (0.02 | ) | 3.03 | | | 3.01 | | — | | | (0.12 | ) | | (0.12 | ) | | | 18.94 | | 18.83 | | | 221,177 | | (0.10 | ) | | 0.73 | | | 0.73 | | | 41 | |
07/01/15 | 06/30/16 | | | 15.69 | | (0.02 | ) | 1.13 | | | 1.11 | | — | | | (0.75 | ) | | (0.75 | ) | | | 16.05 | | 7.17 | | | 122,008 | | (0.11 | ) | | 0.74 | | | 0.74 | | | 30 | |
07/01/14 | 06/30/15 | | | 14.11 | | (0.02 | ) | 1.91 | | | 1.89 | | — | | | (0.31 | ) | | (0.31 | ) | | | 15.69 | | 13.50 | | | 67,789 | | (0.11 | ) | | 0.75 | | | 0.75 | | | 37 | |
| | | | | | | | | | | | | |
| Investor Shares* | | | | | | | | | | | | |
07/01/18 | 06/30/19 | | | 22.79 | | (0.01 | ) | 4.07 | | | 4.06 | | — | | | (0.78 | ) | | (0.78 | ) | | | 26.07 | | 18.68 | | | 374,769 | | (0.05 | ) | | 0.88 | | | 0.88 | | | 21 | |
07/01/17 | 06/30/18 | | | 18.78 | | (0.02 | ) | 4.38 | | | 4.36 | | — | | | (0.35 | ) | | (0.35 | ) | | | 22.79 | | 23.41 | | | 102,201 | | (0.10 | ) | | 0.88 | | | 0.88 | | | 29 | |
07/01/16 | 06/30/17 | | | 15.94 | | (0.04 | ) | 3.00 | | | 2.96 | | — | | | (0.12 | ) | | (0.12 | ) | | | 18.78 | | 18.65 | | | 36,954 | | (0.25 | ) | | 0.88 | | | 0.88 | | | 41 | |
07/01/15 | 06/30/16 | | | 15.61 | | (0.04 | ) | 1.12 | | | 1.08 | | — | | | (0.75 | ) | | (0.75 | ) | | | 15.94 | | 7.01 | | | 25,676 | | (0.26 | ) | | 0.89 | | | 0.89 | | | 30 | |
07/01/14 | 06/30/15 | | | 14.06 | | (0.04 | ) | 1.90 | | | 1.86 | | — | | | (0.31 | ) | | (0.31 | ) | | | 15.61 | | 13.34 | | | 11,206 | | (0.26 | ) | | 0.90 | | | 0.90 | | | 37 | |
| | | | | | | | | | | | | |
| Advisor Shares* | | | | | | | | | | | | |
07/01/18 | 06/30/19 | | | 22.44 | | (0.07 | ) | 4.00 | | | 3.93 | | — | | | (0.78 | ) | | (0.78 | ) | | | 25.59 | | 18.39 | | | 250,871 | | (0.30 | ) | | 1.13 | | | 1.13 | | | 21 | |
07/01/17 | 06/30/18 | | | 18.54 | | (0.07 | ) | 4.32 | | | 4.25 | | — | | | (0.35 | ) | | (0.35 | ) | | | 22.44 | | 23.12 | | | 213,262 | | (0.35 | ) | | 1.13 | | | 1.13 | | | 29 | |
07/01/16 | 06/30/17 | | | 15.78 | | (0.08 | ) | 2.96 | | | 2.88 | | — | | | (0.12 | ) | | (0.12 | ) | | | 18.54 | | 18.33 | | | 172,012 | | (0.50 | ) | | 1.13 | | | 1.13 | | | 41 | |
07/01/15 | 06/30/16 | | | 15.50 | | (0.08 | ) | 1.11 | | | 1.03 | | — | | | (0.75 | ) | | (0.75 | ) | | | 15.78 | | 6.73 | | | 201,727 | | (0.51 | ) | | 1.14 | | | 1.14 | | | 30 | |
07/01/14 | 06/30/15 | | | 14.00 | | (0.07 | ) | 1.88 | | | 1.81 | | — | | | (0.31 | ) | | (0.31 | ) | | | 15.50 | | 13.03 | | | 137,410 | | (0.51 | ) | | 1.15 | | | 1.15 | | | 37 | |
The accompanying notes are an integral part of these financial statements.
www.brownadvisory.com/mf
Financial Highlights
| | | | | | From Investment | | Distributions to | | | | |
| | | | | Ratios to Average | | | | |
| | | | | | Operations(a) | | Shareholders From | | |
| | | | | | | Net Assets(b) | | | | |
| | | | | | | | | Net | | | | | | | | | | | | | | | | | | | | | | | | | | | | | | | |
| For a Share | | | | | | | Realized | | | | | | | | | | | | | | Net | |
| | | Net | | | | | | | | | | | | |
| Outstanding | | Net Asset | | Net | | & | | | | | | | | | | | | | | Asset | | | | Assets at | | Net | | | | | | | | | |
| Throughout | | Value, | Investment | Unrealized | | |
| | Net | | | | | | | | |
| | | End of | Investment | |
| | | Gross | Portfolio |
| Each Fiscal Period: | | Beginning
| | Income | | | | |
| Investment | | Realized | |
| | | | Total | | Period | | Income | | Net | Expenses | Turnover |
| Beginning | Ending | | of Period | | (Loss) | | (Losses) | | Total | | Income | | | Gains | | Total | | Period | | Return(c) | | | (000’s | ) | (Loss) | | Expenses | | | | |
| | | | | | | | | | | | | | | | | | | | | | | | | | | | | | | | | | | | | | | | | |
| BROWN ADVISORY MID-CAP GROWTH FUND: | | | | | | | | | | | | | | | | |
| | | | | | | | | | | | | | | | | | | | | | | | | | | | | | | | | | | | | | | | | |
| Institutional Shares* | | | | | | | | | | | | | | | | |
07/02/18^ | 06/30/19 | | $ | 11.42 | | (0.00 | ) | | 1.83 | | | 1.83 | | — | | | (0.11 | ) | | (0.11 | ) | | $ | 13.14 | | 16.36 | % | | $ | 42,404 | | (0.00 | )% | | 0.70 | % | | 1.04 | % | | 46 | % |
| | | | | | | | | | | | | | | | | | | | | | | | | | | | | | | | | | | | | |
| Investor Shares* | | | | | | | | | | | | | | | | | | | | | | | | | | | | | | | | | | | | |
07/01/18 | 06/30/19 | | | 11.36 | | (0.02 | ) | | 1.89 | | | 1.87 | | — | | | (0.11 | ) | | (0.11 | ) | | | 13.12 | | 16.80 | | | | 2,933 | | (0.15 | ) | | 0.85 | | | 1.19 | | | 46 | |
10/02/17^ | 06/30/18 | | | 10.00 | | (0.01 | ) | | 1.37 | | | 1.36 | | — | | | — | | | — | | | | 11.36 | | 13.60 | | | | 21,377 | | (0.16 | ) | | 0.85 | | | 1.58 | | | 29 | |
| | | | | | | | | | | | | | | | | | | | | | | | | | | | | | | | | | | | | | | | | | | |
| BROWN ADVISORY SMALL-CAP GROWTH FUND: | | | | | | | | | | | | | | | | |
| | | | | | | | | | | | | | | | | | | | | | | | | | | | | | | | | | | | | | | | | | | |
| Institutional Shares* | | | | | | | | | | | | | | | | |
07/01/18 | 06/30/19 | | | 40.64 | | (0.15 | ) | | 5.52 | | | 5.37 | | (0.18 | ) | | (1.59 | ) | | (1.77 | ) | | | 44.24 | | 14.56 | | | | 838,698 | | (0.36 | ) | | 0.98 | | | 0.98 | | | 44 | |
07/01/17 | 06/30/18 | | | 35.15 | | (0.16 | ) | | 6.31 | | | 6.15 | | (0.15 | ) | | (0.51 | ) | | (0.66 | ) | | | 40.64 | | 17.64 | | | | 424,449 | | (0.42 | ) | | 0.98 | | | 0.98 | | | 30 | |
07/01/16 | 06/30/17 | | | 31.19 | | (0.16 | ) | | 5.25 | | | 5.09 | | — | | | (1.13 | ) | | (1.13 | ) | | | 35.15 | | 16.57 | | | | 165,615 | | (0.49 | ) | | 0.98 | | | 0.98 | | | 22 | |
07/01/15 | 06/30/16 | | | 35.91 | | (0.14 | ) | | 0.51 | | | 0.37 | | — | | | (5.09 | ) | | (5.09 | ) | | | 31.19 | | 1.61 | | | | 17,037 | | (0.45 | ) | | 0.98 | | | 0.98 | | | 32 | |
07/01/14 | 06/30/15 | | | 35.85 | | (0.18 | ) | | 4.45 | | | 4.27 | | — | | | (4.21 | ) | | (4.21 | ) | | | 35.91 | | 12.98 | | | | 12,841 | | (0.51 | ) | | 0.99 | | | 0.99 | | | 28 | |
| | | | | | | | | | | | | | | | | | | | | | | | | | | | | | | | | | | | | |
| Investor Shares* | | | | | | | | | | | | | | | | | | | | | | | | | | | | | | | | | | | | |
07/01/18 | 06/30/19 | | | 20.34 | | (0.10 | ) | | 2.77 | | | 2.67 | | (0.08 | ) | | (0.80 | ) | | (0.88 | ) | | | 22.13 | | 14.40 | | | | 493,421 | | (0.51 | ) | | 1.13 | | | 1.13 | | | 44 | |
07/01/17 | 06/30/18 | | | 17.61 | | (0.11 | ) | | 3.15 | | | 3.04 | | (0.06 | ) | | (0.25 | ) | | (0.31 | ) | | | 20.34 | | 17.44 | | | | 476,786 | | (0.57 | ) | | 1.13 | | | 1.13 | | | 30 | |
07/01/16 | 06/30/17 | | | 15.65 | | (0.11 | ) | | 2.63 | | | 2.52 | | — | | | (0.56 | ) | | (0.56 | ) | | | 17.61 | | 16.40 | | | | 335,185 | | (0.64 | ) | | 1.13 | | | 1.13 | | | 22 | |
07/01/15 | 06/30/16 | | | 18.05 | | (0.10 | ) | | 0.26 | | | 0.16 | | — | | | (2.56 | ) | | (2.56 | ) | | | 15.65 | | 1.43 | | | | 268,390 | | (0.60 | ) | | 1.13 | | | 1.13 | | | 32 | |
07/01/14 | 06/30/15 | | | 18.04 | | (0.11 | ) | | 2.24 | | | 2.13 | | — | | | (2.12 | ) | | (2.12 | ) | | | 18.05 | | 12.86 | | | | 262,426 | | (0.66 | ) | | 1.14 | | | 1.14 | | | 28 | |
| | | | | | | | | | | | | | | | | | | | | | | | | | | | | | | | | | | | | | | | | | | |
| Advisor Shares* | | | | | | | | | | | | | | | | | | | | | | | | | | | | | | | | | | | | |
07/01/18 | 06/30/19 | | | 19.46 | | (0.15 | ) | | 2.64 | | | 2.49 | | (0.04 | ) | | (0.76 | ) | | (0.80 | ) | | | 21.15 | | 14.08 | | | | 14,489 | | (0.76 | ) | | 1.38 | | | 1.38 | | | 44 | |
07/01/17 | 06/30/18 | | | 16.85 | | (0.15 | ) | | 3.02 | | | 2.87 | | (0.02 | ) | | (0.24 | ) | | (0.26 | ) | | | 19.46 | | 17.21 | | | | 18,449 | | (0.82 | ) | | 1.38 | | | 1.38 | | | 30 | |
07/01/16 | 06/30/17 | | | 15.02 | | (0.14 | ) | | 2.51 | | | 2.37 | | — | | | (0.54 | ) | | (0.54 | ) | | | 16.85 | | 16.04 | | | | 32,852 | | (0.89 | ) | | 1.38 | | | 1.38 | | | 22 | |
07/01/15 | 06/30/16 | | | 17.35 | | (0.13 | ) | | 0.26 | | | 0.13 | | — | | | (2.46 | ) | | (2.46 | ) | | | 15.02 | | 1.27 | | | | 9,704 | | (0.85 | ) | | 1.38 | | | 1.38 | | | 32 | |
07/01/14 | 06/30/15 | | | 17.39 | | (0.15 | ) | | 2.15 | | | 2.00 | | — | | | (2.04 | ) | | (2.04 | ) | | | 17.35 | | 12.54 | | | | 6,348 | | (0.91 | ) | | 1.39 | | | 1.39 | | | 28 | |
| | | | | | | | | | | | | | | | | | | | | | | | | | | | | | | | | | | | | | | | | | | |
| BROWN ADVISORY SMALL-CAP FUNDAMENTAL VALUE FUND: | | | | | | | | | | | | | | | | |
| | | | | | | | | | | | | | | | | | | | | | | | | | | | | | | | | | | | | | | | | | | |
| Institutional Shares* | | | | | | | | | | | | | | | | |
07/01/18 | 06/30/19 | | | 29.16 | | 0.29 | | | (1.54 | ) | | (1.25 | ) | (0.21 | ) | | (2.93 | ) | | (3.14 | ) | | | 24.77 | | (2.91 | ) | | | 447,846 | | 1.10 | | | 0.97 | | | 0.97 | | | 36 | |
07/01/17 | 06/30/18 | | | 27.11 | | 0.15 | | | 3.11 | | | 3.26 | | (0.20 | ) | | (1.01 | ) | | (1.21 | ) | | | 29.16 | | 12.13 | | | | 410,785 | | 0.52 | | | 0.97 | | | 0.97 | | | 32 | |
07/01/16 | 06/30/17 | | | 22.75 | | 0.17 | | | 4.31 | | | 4.48 | | (0.09 | ) | | (0.03 | ) | | (0.12 | ) | | | 27.11 | | 19.73 | | | | 341,038 | | 0.68 | | | 0.97 | | | 0.97 | | | 30 | |
07/01/15 | 06/30/16 | | | 23.61 | | 0.13 | | | (0.44 | ) | | (0.31 | ) | (0.10 | ) | | (0.45 | ) | | (0.55 | ) | | | 22.75 | | (1.17 | ) | | | 156,205 | | 0.59 | | | 0.98 | | | 0.98 | | | 30 | |
07/01/14 | 06/30/15 | | | 23.96 | | 0.10 | | | 0.86 | | | 0.96 | | (0.14 | ) | | (1.17 | ) | | (1.31 | ) | | | 23.61 | | 4.04 | | | | 75,994 | | 0.43 | | | 0.98 | | | 0.98 | | | 26 | |
| | | | | | | | | | | | | | | | | |
| Investor Shares* | | | | | | | | | | | | | | | | |
07/01/18 | 06/30/19 | | | 29.12 | | 0.25 | | | (1.53 | ) | | (1.28 | ) | (0.16 | ) | | (2.93 | ) | | (3.09 | ) | | | 24.75 | | (3.05 | ) | | | 577,212 | | 0.95 | | | 1.12 | | | 1.12 | | | 36 | |
07/01/17 | 06/30/18 | | | 27.08 | | 0.10 | | | 3.10 | | | 3.20 | | (0.15 | ) | | (1.01 | ) | | (1.16 | ) | | | 29.12 | | 11.95 | | | | 874,269 | | 0.37 | | | 1.12 | | | 1.12 | | | 32 | |
07/01/16 | 06/30/17 | | | 22.73 | | 0.13 | | | 4.31 | | | 4.44 | | (0.06 | ) | | (0.03 | ) | | (0.09 | ) | | | 27.08 | | 19.54 | | | | 834,317 | | 0.53 | | | 1.12 | | | 1.12 | | | 30 | |
07/01/15 | 06/30/16 | | | 23.59 | | 0.10 | | | (0.44 | ) | | (0.34 | ) | (0.07 | ) | | (0.45 | ) | | (0.52 | ) | | | 22.73 | | (1.32 | ) | | | 774,547 | | 0.44 | | | 1.13 | | | 1.13 | | | 30 | |
07/01/14 | 06/30/15 | | | 23.94 | | 0.07 | | | 0.86 | | | 0.93 | | (0.11 | ) | | (1.17 | ) | | (1.28 | ) | | | 23.59 | | 3.90 | | | | 748,003 | | 0.28 | | | 1.13 | | | 1.13 | | | 26 | |
| | | | | | | | | | | | | | | | | |
| Advisor Shares* | | | | | | | | | | | | | | | | |
07/01/18 | 06/30/19 | | | 28.98 | | 0.19 | | | (1.51 | ) | | (1.32 | ) | (0.09 | ) | | (2.93 | ) | | (3.02 | ) | | | 24.64 | | (3.27 | ) | | | 8,393 | | 0.70 | | | 1.37 | | | 1.37 | | | 36 | |
07/01/17 | 06/30/18 | | | 26.95 | | 0.03 | | | 3.08 | | | 3.11 | | (0.07 | ) | | (1.01 | ) | | (1.08 | ) | | | 28.98 | | 11.65 | | | | 25,032 | | 0.12 | | | 1.37 | | | 1.37 | | | 32 | |
07/01/16 | 06/30/17 | | | 22.62 | | 0.07 | | | 4.29 | | | 4.36 | | — | | | (0.03 | ) | | (0.03 | ) | | | 26.95 | | 19.29 | | | | 24,974 | | 0.28 | | | 1.37 | | | 1.37 | | | 30 | |
07/01/15 | 06/30/16 | | | 23.48 | | 0.04 | | | (0.44 | ) | | (0.40 | ) | (0.01 | ) | | (0.45 | ) | | (0.46 | ) | | | 22.62 | | (1.58 | ) | | | 52,883 | | 0.19 | | | 1.38 | | | 1.38 | | | 30 | |
07/01/14 | 06/30/15 | | | 23.87 | | 0.01 | | | 0.85 | | | 0.86 | | (0.08 | ) | | (1.17 | ) | | (1.25 | ) | | | 23.48 | | 3.61 | | | | 58,583 | | 0.03 | | | 1.38 | | | 1.38 | | | 26 | |
The accompanying notes are an integral part of these financial statements.
www.brownadvisory.com/mf
| | | | | | From Investment | | | Distributions to | | | | | | | | | | | Ratios to Average | | | | |
| | | | | | Operations(a) | | | Shareholders From | | | | | | | | | | | Net Assets(b) | | | | |
| | | | | | | | Net | | | | | | | | | | | | | | | | | | | | | | | | | | | | | | | | | |
| For a Share | | | | | | Realized | | | | | | | | | | | | | | | Net | | |
| | | Net | | | | | | | | | | | | |
| Outstanding | | Net Asset | | Net | | & | | | | | | | | | | | | | | | Asset | | | | | | Assets at
| | Net | | | | | | | | | | |
| Throughout | | Value, | | Investment | | Unrealized | | |
| | | Net | | | Net | | |
| | | Value, | | |
| | | | | | |
| | | Gross | | Portfolio |
| Each Fiscal Period: | | Beginning | | Income | | Gains | | | | | | Investment | | | Realized | | |
| | | | | | Total | | Period | | Income | | Net | | Expenses | | Turnover |
| Beginning | Ending | | of Period | | (Loss) | | (Losses) | | | Total | | | Income | | | Gains | | | Total | | | Period | | | Return(c) | | | (000’s | ) | (Loss) | | Expenses | | (d) | | Rate(c) |
| | | | | | | | | | | | | | | | | | | | | | | | | | | | | | | | | | | | | | | | | | |
| BROWN ADVISORY GLOBAL LEADERS FUND: | | | | | | | | | | | | |
| | | | | | | | | | | | | | | | | | | | | | | | | | | | | | | | | | | | | | | | | | |
| Institutional Shares* | | | | | | | | | | | | |
10/31/18^ | 06/30/19 | | $ | 13.13 | | 0.07 | | 2.07 | | | 2.14 | | | (0.03 | ) | | — | | | (0.03 | ) | | $ | 15.24 | | | 16.38 | % | | $ | 214,263 | | 0.71 | % | | 0.75 | % | | 0.88 | % | | 23 | % |
| | | | | | | | | | | | | | | | | | | | | | | | | | | | | | | | | | | | | | |
| Investor Shares* | | | | | | | | | | | | | | | | | | | | | | | | | | | | | | | | | | | | | |
07/01/18 | 06/30/19 | | | 13.82 | | 0.08 | | 1.36 | | | 1.44 | | | (0.03 | ) | | — | | | (0.03 | ) | | | 15.23 | | | 10.49 | | | | 18,943 | | 0.60 | | | 0.86 | | | 1.07 | | | 23 | |
07/01/17 | 06/30/18 | | | 11.50 | | 0.08 | | 2.25 | | | 2.33 | | | (0.01 | ) | | — | | | (0.01 | ) | | | 13.82 | | | 20.28 | | | | 86,112 | | 0.60 | | | 0.85 | | | 1.10 | | | 26 | |
07/01/16 | 06/30/17 | | | 9.65 | | 0.04 | | 1.83 | | | 1.87 | | | (0.02 | ) | | — | | | (0.02 | ) | | | 11.50 | | | 19.39 | | | | 39,354 | | 0.39 | | | 0.85 | | | 1.16 | | | 35 | |
07/01/15^ | 06/30/16 | | | 10.00 | | 0.05 | | (0.40 | ) | | (0.35 | ) | | — | | | — | | | — | | | | 9.65 | | | (3.50 | ) | | | 26,367 | | 0.55 | | | 0.85 | | | 1.41 | | | 53 | |
| | | | | | | | | | | | | | | | | | | | | | | | | | | | | | | | | | | | | | | | | | | | |
| BROWN ADVISORY INTERMEDIATE INCOME FUND: | | | | | | | | | | | | |
| | | | | | | | | | | | | | | | | | | | | | | | | | | | | | | | | | | | | | | | | | | | |
| Investor Shares* | | | | | | | | | | | | |
07/01/18 | 06/30/19 | | | 10.35 | | 0.27 | | 0.36 | | | 0.63 | | | (0.26 | ) | | — | | | (0.26 | ) | | | 10.72 | | | 6.24 | | | | 135,175 | | 2.63 | | | 0.47 | | | 0.53 | | | 82 | |
07/01/17 | 06/30/18 | | | 10.60 | | 0.23 | | (0.24 | ) | | (0.01 | ) | | (0.24 | ) | | — | | | (0.24 | ) | | | 10.35 | | | (0.12 | ) | | | 125,060 | | 2.20 | | | 0.45 | | | 0.51 | | | 35 | |
07/01/16 | 06/30/17 | | | 10.78 | | 0.20 | | (0.16 | ) | | 0.04 | | | (0.22 | ) | | — | | | (0.22 | ) | | | 10.60 | | | 0.40 | | | | 131,941 | | 1.88 | | | 0.45 | | | 0.51 | | | 62 | |
07/01/15 | 06/30/16 | | | 10.63 | | 0.20 | | 0.22 | | | 0.42 | | | (0.21 | ) | | (0.06 | ) | | (0.27 | ) | | | 10.78 | | | 3.99 | | | | 137,900 | | 1.92 | | | 0.43 | | | 0.50 | | | 68 | |
07/01/14 | 06/30/15 | | | 10.74 | | 0.19 | | (0.08 | ) | | 0.11 | | | (0.22 | ) | | — | | | (0.22 | ) | | | 10.63 | | | 1.01 | | | | 140,006 | | 1.78 | | | 0.45 | | | 0.50 | | | 130 | |
| | | | | | | | | | | | | | | | | | | | | | | | | | | | | | | | | | | | | | | | | | | | |
| Advisor Shares* | | | | | | | | | | | | | | | | | | | | | | | | | | | | | | | | | | | | | |
07/01/18 | 06/30/19 | | | 10.13 | | 0.24 | | 0.36 | | | 0.60 | | | (0.24 | ) | | — | | | (0.24 | ) | | | 10.49 | | | 6.01 | | | | 3,615 | | 2.38 | | | 0.72 | | | 0.78 | | | 82 | |
07/01/17 | 06/30/18 | | | 10.38 | | 0.20 | | (0.24 | ) | | (0.04 | ) | | (0.21 | ) | | — | | | (0.21 | ) | | | 10.13 | | | (0.38 | ) | | | 3,782 | | 1.95 | | | 0.70 | | | 0.76 | | | 35 | |
07/01/16 | 06/30/17 | | | 10.56 | | 0.17 | | (0.15 | ) | | 0.02 | | | (0.20 | ) | | — | | | (0.20 | ) | | | 10.38 | | | 0.16 | | | | 4,098 | | 1.63 | | | 0.70 | | | 0.76 | | | 62 | |
07/01/15 | 06/30/16 | | | 10.42 | | 0.17 | | 0.21 | | | 0.38 | | | (0.18 | ) | | (0.06 | ) | | (0.24 | ) | | | 10.56 | | | 3.71 | | | | 8,972 | | 1.67 | | | 0.68 | | | 0.75 | | | 68 | |
07/01/14 | 06/30/15 | | | 10.53 | | 0.16 | | (0.08 | ) | | 0.08 | | | (0.19 | ) | | — | | | (0.19 | ) | | | 10.42 | | | 0.78 | | | | 9,608 | | 1.53 | | | 0.70 | | | 0.75 | | | 130 | |
| | | | | | | | | | | | | | | | | | | | | | | | | | | | | | | | | | | | | | | | | | | | |
| BROWN ADVISORY TOTAL RETURN FUND: | | | | | | | | | | | | |
| | | | | | | | | | | | | | | | | | | | | | | | | | | | | | | | | | | | | | | | | | | | |
| Institutional Shares* | | | | | | | | | | | | |
07/01/18 | 06/30/19 | | | 9.78 | | 0.32 | | 0.44 | | | 0.76 | | | (0.32 | ) | | — | | | (0.32 | ) | | | 10.22 | | | 7.90 | | | | 246,074 | | 3.26 | | | 0.49 | | | 0.49 | | | 106 | |
07/01/17 | 06/30/18 | | | 10.00 | | 0.28 | | (0.22 | ) | | 0.06 | | | (0.28 | ) | | — | | | (0.28 | ) | | | 9.78 | | | 0.61 | | | | 121,381 | | 2.79 | | | 0.50 | | | 0.50 | | | 209 | |
07/01/16 | 06/30/17 | | | 10.18 | | 0.24 | | (0.16 | ) | | 0.08 | | | (0.25 | ) | | (0.01 | ) | | (0.26 | ) | | | 10.00 | | | 0.80 | | | | 107,686 | | 2.36 | | | 0.51 | | | 0.51 | | | 216 | |
07/01/15 | 06/30/16 | | | 9.83 | | 0.25 | | 0.37 | | | 0.62 | | | (0.27 | ) | | — | | | (0.27 | ) | | | 10.18 | | | 6.46 | | | | 83,854 | | 2.55 | | | 0.51 | | | 0.51 | | | 218 | |
10/30/14^ | 06/30/15 | | | 10.00 | | 0.13 | | (0.19 | ) | | (0.06 | ) | | (0.11 | ) | | — | | | (0.11 | ) | | | 9.83 | | | (0.60 | ) | | | 73,735 | | 1.89 | | | 0.54 | | | 0.54 | | | 235 | |
| | | | | | | | | | | | | |
| Investor Shares* | | | | | | | | | | | | |
07/01/18 | 06/30/19 | | | 9.78 | | 0.32 | | 0.43 | | | 0.75 | | | (0.31 | ) | | — | | | (0.31 | ) | | | 10.22 | | | 7.85 | | | | 4,916 | | 3.21 | | | 0.54 | | | 0.54 | | | 106 | |
07/01/17 | 06/30/18 | | | 10.00 | | 0.27 | | (0.21 | ) | | 0.06 | | | (0.28 | ) | | — | | | (0.28 | ) | | | 9.78 | | | 0.56 | | | | 2,619 | | 2.74 | | | 0.55 | | | 0.55 | | | 209 | |
07/01/16 | 06/30/17 | | | 10.18 | | 0.23 | | (0.16 | ) | | 0.07 | | | (0.24 | ) | | (0.01 | ) | | (0.25 | ) | | | 10.00 | | | 0.75 | | | | 2,668 | | 2.31 | | | 0.56 | | | 0.56 | | | 216 | |
07/01/15 | 06/30/16 | | | 9.83 | | 0.25 | | 0.37 | | | 0.62 | | | (0.27 | ) | | — | | | (0.27 | ) | | | 10.18 | | | 6.40 | | | | 1,957 | | 2.50 | | | 0.56 | | | 0.56 | | | 218 | |
10/30/14^ | 06/30/15 | | | 10.00 | | 0.12 | | (0.18 | ) | | (0.06 | ) | | (0.11 | ) | | — | | | (0.11 | ) | | | 9.83 | | | (0.63 | ) | | | 9,081 | | 1.84 | | | 0.59 | | | 0.59 | | | 235 | |
| | | | | | | | | | | | | | | | | | | | | | | | | | | | | | | | | | | | | | | | | | | | |
The accompanying notes are an integral part of these financial statements.
www.brownadvisory.com/mf
Financial Highlights
| | | | | | | From Investment | | | Distributions to | | | | | | | | | | | | Ratios to Average | | | | |
| | | | | | | Operations(a) | | | Shareholders From | | | | | | | | | | | | Net Assets(b) | | | | |
| | | | | | | | | | Net | | | | | | | | | | | | | | | | | | | | | | | | | | | | | | | | | | |
| For a Share | | | | | | | | Realized | | | | | | | | | | | | | | | Net | | | | | | Net | | | | | | | | | | | | | |
| Outstanding | | Net Asset | | | Net | | | & | | | | | | | | | | | | | | | Asset | | | | | | Assets at | | | Net | | | | | | | | | |
| Throughout | | Value, | | | Investment | | | Unrealized | | |
| | | | | | Net | | | | | | | | |
| | | | | | | | | | | Gross | | Portfolio |
| Each Fiscal Period: | | Beginning | | | Income | | | Gains | | |
| | | Investment | | | Realized | | |
| | | | | | Total | | | | | | | | Net | | Expenses | | Turnover |
| Beginning | Ending | | of Period | | | (Loss) | | | (Losses) | | | Total | | | Income | | | Gains | | | Total | | | Period | | | Return(c) | | | | (000’s | ) | | (Loss) | | Expenses | | (d) | | Rate(c) |
| | | | | | | | | | | | | | | | | | | | | | | | | | | | | | | | | | | | | | | | | | | | | |
| BROWN ADVISORY STRATEGIC BOND FUND: | | | | | | | | | | | | | |
| | | | | | | | | | | | | | | | | | | | | | | | | | | | | | | | | | | | | | | | | | | | | |
| Institutional Shares* | | | | | | | | | | | | | |
07/01/18 | 06/30/19 | | $ | 9.51 | | | 0.34 | | | 0.05 | | | | 0.39 | | | (0.33 | ) | | | — | | | | (0.33 | ) | | $ | 9.57 | | | 4.23 | % | | $ | 204,326 | | | | 3.55 | % | | 0.60 | % | | 0.60 | % | | 115 | % |
07/01/17 | 06/30/18 | | | 9.61 | | | 0.27 | | | (0.10 | ) | | | 0.17 | | | (0.27 | ) | | | — | | | | (0.27 | ) | | | 9.51 | | | 1.80 | | | | 141,150 | | | | 2.85 | | | 0.70 | | | 0.67 | | | 200 | |
07/01/16 | 06/30/17 | | | 9.47 | | | 0.23 | | | 0.14 | | | | 0.37 | | | (0.23 | ) | | | — | | | | (0.23 | ) | | | 9.61 | | | 3.92 | | | | 114,651 | | | | 2.39 | | | 0.70 | | | 0.72 | | | 259 | |
07/01/15 | 06/30/16 | | | 9.83 | | | 0.30 | | | (0.19 | ) | | | 0.11 | | | (0.47 | ) | | | — | | | | (0.47 | ) | | | 9.47 | | | 1.18 | | | | 39,211 | | | | 3.21 | | | 0.70 | | | 0.73 | | | 288 | |
10/31/14^ | 06/30/15 | | | 10.07 | | | 0.16 | | | (0.35 | ) | | | (0.19 | ) | | (0.05 | ) | | | — | | | | (0.05 | ) | | | 9.83 | | | (1.85 | ) | | | 59,680 | | | | 2.42 | | | 0.70 | | | 0.72 | | | 317 | |
| | | | | | | | | | | | | | | |
| Investor Shares* | | | | | | | | | | | | | | |
07/01/18 | 06/30/19 | | | 9.51 | | | 0.33 | | | 0.06 | | | | 0.39 | | | (0.33 | ) | | | — | | | | (0.33 | ) | | | 9.57 | | | 4.18 | | | | 1,764 | | | | 3.50 | | | 0.65 | | | 0.65 | | | 115 | |
07/01/17 | 06/30/18 | | | 9.61 | | | 0.25 | | | (0.10 | ) | | | 0.15 | | | (0.25 | ) | | | — | | | | (0.25 | ) | | | 9.51 | | | 1.54 | | | | 214 | | | | 2.60 | | | 0.95 | | | 0.92 | | | 200 | |
07/01/16 | 06/30/17 | | | 9.47 | | | 0.20 | | | 0.14 | | | | 0.34 | | | (0.20 | ) | | | — | | | | (0.20 | ) | | | 9.61 | | | 3.65 | | | | 248 | | | | 2.14 | | | 0.95 | | | 0.97 | | | 259 | |
07/01/15 | 06/30/16 | | | 9.82 | | | 0.28 | | | (0.20 | ) | | | 0.08 | | | (0.43 | ) | | | — | | | | (0.43 | ) | | | 9.47 | | | 0.84 | | | | 865 | | | | 2.96 | | | 0.95 | | | 0.98 | | | 288 | |
07/01/14 | 06/30/15 | | | 10.04 | | | 0.19 | | | (0.37 | ) | | | (0.18 | ) | | (0.04 | ) | | | — | | | | (0.04 | ) | | | 9.82 | | | (1.80 | ) | | | 1,692 | | | | 1.91 | | | 1.21 | | | 1.22 | | | 317 | |
| | | | | | | | | | | | | | | | | | | | | | | | | | | | | | | | | | | | | | | | | | | | | | | | | | | |
| BROWN ADVISORY SUSTAINABLE BOND FUND: | | | | | | | | | | | | | | |
| | | | | | | | | | | | | | | | | | | | | | | | | | | | | | | | | | | | | | | | | | | | | | | | | | | |
| Institutional Shares* | | | | | | | | | | | | | | |
07/02/18^ | 06/30/19 | | | 9.70 | | | 0.30 | | | 0.42 | | | | 0.72 | | | (0.29 | ) | | | — | | | | (0.29 | ) | | | 10.13 | | | 7.60 | | | | 126,466 | | | | 3.08 | | | 0.55 | | | 0.52 | | | 66 | |
| | | | | | | | | | | | | | | |
| Investor Shares* | | | | | | | | | | | | | | |
07/01/18 | 06/30/19 | | | 9.70 | | | 0.29 | | | 0.43 | | | | 0.72 | | | (0.29 | ) | | | — | | | | (0.29 | ) | | | 10.13 | | | 7.54 | | | | 884 | | | | 3.03 | | | 0.60 | | | 0.57 | | | 66 | |
08/07/17^ | 06/30/18 | | | 10.00 | | | 0.21 | | | (0.34 | ) | | | (0.13 | ) | | (0.17 | ) | | | — | | | | (0.17 | ) | | | 9.70 | | | (1.27 | ) | | | 54,291 | | | | 2.41 | | | 0.60 | | | 0.71 | | | 64 | |
| | | | | | | | | | | | | | | | | | | | | | | | | | | | | | | | | | | | | | | | | | | | | | | | | | | |
| BROWN ADVISORY MARYLAND BOND FUND: | | | | | | | | | | | | | | |
| | | | | | | | | | | | | | | | | | | | | | | | | | | | | | | | | | | | | | | | | | | | | | | | | | | |
| Investor Shares* | | | | | | | | | | | | | | |
07/01/18 | 06/30/19 | | | 10.50 | | | 0.28 | | | 0.30 | | | | 0.58 | | | (0.28 | ) | | | — | | | | (0.28 | ) | | | 10.80 | | | 5.65 | | | | 182,072 | | | | 2.69 | | | 0.49 | | | 0.49 | | | 33 | |
07/01/17 | 06/30/18 | | | 10.62 | | | 0.26 | | | (0.12 | ) | | | 0.14 | | | (0.26 | ) | | | — | | | | (0.26 | ) | | | 10.50 | | | 1.29 | | | | 181,230 | | | | 2.42 | | | 0.48 | | | 0.48 | | | 25 | |
07/01/16 | 06/30/17 | | | 10.92 | | | 0.23 | | | (0.26 | ) | | | (0.03 | ) | | (0.23 | ) | | | (0.04 | ) | | | (0.27 | ) | | | 10.62 | | | (0.27 | ) | | | 181,518 | | | | 2.14 | | | 0.49 | | | 0.49 | | | 53 | |
07/01/15 | 06/30/16 | | | 10.65 | | | 0.23 | | | 0.32 | | | | 0.55 | | | (0.23 | ) | | | (0.05 | ) | | | (0.28 | ) | | | 10.92 | | | 5.24 | | | | 183,705 | | | | 2.12 | | | 0.48 | | | 0.48 | | | 80 | |
07/01/14 | 06/30/15 | | | 10.82 | | | 0.18 | | | (0.12 | ) | | | 0.06 | | | (0.18 | ) | | | (0.05 | ) | | | (0.23 | ) | | | 10.65 | | | 0.58 | | | | 199,469 | | | | 1.66 | | | 0.49 | | | 0.49 | | | 61 | |
| | | | | | | | | | | | | | | | | | | | | | | | | | | | | | | | | | | | | | | | | | | | | | | | | | | |
| BROWN ADVISORY TAX-EXEMPT BOND FUND: | | | | | | | | | | | | | | |
| | | | | | | | | | | | | | | | | | | | | | | | | | | | | | | | | | | | | | | | | | | | | | | | | | | |
| Institutional Shares* | | | | | | | | | | | | | | |
07/02/18^ | 06/30/19 | | | 9.90 | | | 0.33 | | | 0.30 | | | | 0.63 | | | (0.33 | ) | | | — | | | | (0.33 | ) | | | 10.20 | | | 6.51 | | | | 950,832 | | | | 3.36 | | | 0.43 | | | 0.43 | | | 53 | |
| | | | | | | | | | | | | | | |
| Investor Shares* | | | | | | | | | | | | | | |
07/01/18 | 06/30/19 | | | 9.90 | | | 0.33 | | | 0.30 | | | | 0.63 | | | (0.33 | ) | | | — | | | | (0.33 | ) | | | 10.20 | | | 6.49 | | | | 19,395 | | | | 3.31 | | | 0.48 | | | 0.48 | | | 53 | |
07/01/17 | 06/30/18 | | | 9.94 | | | 0.31 | | | (0.04 | ) | | | 0.27 | | | (0.31 | ) | | | — | | | | (0.31 | ) | | | 9.90 | | | 2.78 | | | | 439,906 | | | | 3.16 | | | 0.48 | | | 0.48 | | | 55 | |
07/01/16 | 06/30/17 | | | 10.26 | | | 0.29 | | | (0.32 | ) | | | (0.03 | ) | | (0.29 | ) | | | — | | | | (0.29 | ) | | | 9.94 | | | (0.29 | ) | | | 257,602 | | | | 2.88 | | | 0.49 | | | 0.49 | | | 55 | |
07/01/15 | 06/30/16 | | | 9.93 | | | 0.25 | | | 0.33 | | | | 0.58 | | | (0.25 | ) | | | — | | | | (0.25 | ) | | | 10.26 | | | 5.94 | | | | 233,675 | | | | 2.51 | | | 0.49 | | | 0.49 | | | 119 | |
07/01/14 | 06/30/15 | | | 10.03 | | | 0.18 | | | (0.10 | ) | | | 0.08 | | | (0.18 | ) | | | — | | | | (0.18 | ) | | | 9.93 | | | 0.78 | | | | 224,154 | | | | 1.78 | | | 0.50 | | | 0.50 | | | 109 | |
The accompanying notes are an integral part of these financial statements.
www.brownadvisory.com/mf
Financial Highlights
| | | | | | | From Investment Operations(a) | | | Distributions to | | | | | | | | | | | | Ratios to Average Net Assets(b) | | | | |
|
| |
| | | | | | |
| | |
| | |
| | | | |
| |
| | | | | | | | | | Net | | | | | | | | | | | | | | | | | | | | | | | | | | | | | | | | | | |
| For a Share | | | | | | | | Realized | | | | | | | | | | | | | | | Net | | |
| | | Net | | | | | | | | | | | | | |
| Outstanding | | Net Asset | | | Net | | | & | | | | | | | | | | | | | | | Asset | | |
| | | | | | Net | | | | | | | | | |
| Throughout | | Value, | | | Investment
| | | Unrealized | | |
| | | Net | | | | | | | | | | | |
| | | | | | | | | | | Gross | | Portfolio |
| Each Fiscal Period: | | Beginning | | | Income | | | | | |
| | | Investment | | | Realized | | |
| | | | | | | | | Period | | | Income | | Net | | Expenses | | Turnover |
| Beginning | Ending | | of Period | | | (Loss) | | | | | | Total | | | | | | | | | | | | | | | | | | | (000’s | ) | | (Loss) | | Expenses | | (d) | | Rate(c) |
| | | | | | | | | | | | | | | | | | | | | | | | | | | | | | | | | | | | | | | | | | | | | |
| BROWN ADVISORY MORTGAGE SECURITIES FUND: | | | | | | | | | | | | | | | | | | | | |
| | | | | | | | | | | | | | | | | | | | | | | | | | | | | | | | | | | | | | | | | | | | | |
| Institutional Shares* | | | | | | | | | | | | | | | | | | | | |
07/01/18 | 06/30/19 | | $ | 9.65 | | | 0.22 | | | 0.42 | | | | 0.64 | | | (0.27 | ) | | | — | | | | (0.27 | ) | | $ | 10.02 | | | 6.72 | % | | $ | 281,728 | | | 2.29 | % | | 0.47 | % | | 0.47 | % | | 200 | % |
07/01/17 | 06/30/18 | | | 9.87 | | | 0.18 | | | (0.16 | ) | | | 0.02 | | | (0.24 | ) | | | — | | | | (0.24 | ) | | | 9.65 | | | 0.16 | | | | 300,643 | | | 1.86 | | | 0.47 | | | 0.47 | | | 336 | |
07/01/16 | 06/30/17 | | | 10.20 | | | 0.15 | | | (0.21 | ) | | | (0.06 | ) | | (0.20 | ) | | | (0.07 | ) | | | (0.27 | ) | | | 9.87 | | | (0.52 | ) | | | 342,705 | | | 1.53 | | | 0.46 | | | 0.46 | | | 414 | |
07/01/15 | 06/30/16 | | | 10.06 | | | 0.22 | | | 0.21 | | | | 0.43 | | | (0.25 | ) | | | (0.04 | ) | | | (0.29 | ) | | | 10.20 | | | 4.32 | | | | 377,908 | | | 2.12 | | | 0.45 | | | 0.45 | | | 244 | |
07/01/14 | 06/30/15 | | | 10.16 | | | 0.27 | | | 0.01 | | | | 0.28 | | | (0.30 | ) | | | (0.08 | ) | | | (0.38 | ) | | | 10.06 | | | 2.74 | | | | 206,299 | | | 2.68 | | | 0.47 | | | 0.47 | | | 147 | |
| | | | | | | | | | | | | | | | | | | | | | | | | | | | | | | | | | | | | | | | | | | | | | | | | | |
| Investor Shares* | | | | | | | | | | | | | | | | | | | | |
07/01/18 | 06/30/19 | | | 9.66 | | | 0.22 | | | 0.40 | | | | 0.62 | | | (0.26 | ) | | | — | | | | (0.26 | ) | | | 10.02 | | | 6.55 | | | | 266 | | | 2.24 | | | 0.52 | | | 0.52 | | | 200 | |
07/01/17 | 06/30/18 | | | 9.87 | | | 0.18 | | | (0.16 | ) | | | 0.02 | | | (0.23 | ) | | | — | | | | (0.23 | ) | | | 9.66 | | | 0.21 | | | | 321 | | | 1.81 | | | 0.52 | | | 0.52 | | | 336 | |
07/01/16 | 06/30/17 | | | 10.21 | | | 0.15 | | | (0.22 | ) | | | (0.07 | ) | | (0.20 | ) | | | (0.07 | ) | | | (0.27 | ) | | | 9.87 | | | (0.68 | ) | | | 738 | | | 1.48 | | | 0.51 | | | 0.51 | | | 414 | |
07/01/15 | 06/30/16 | | | 10.06 | | | 0.21 | | | 0.22 | | | | 0.43 | | | (0.24 | ) | | | (0.04 | ) | | | (0.28 | ) | | | 10.21 | | | 4.33 | | | | 1,793 | | | 2.07 | | | 0.50 | | | 0.50 | | | 244 | |
07/01/14 | 06/30/15 | | | 10.16 | | | 0.27 | | | — | | | | 0.27 | | | (0.29 | ) | | | (0.08 | ) | | | (0.37 | ) | | | 10.06 | | | 2.68 | | | | 28,649 | | | 2.63 | | | 0.52 | | | 0.52 | | | 147 | |
| | | | | | | | | | | | | | | | | | | | | | | | | | | | | | | | | | | | | | | | | | | | | | | | | | |
| BROWN ADVISORY – WMC STRATEGIC EUROPEAN EQUITY FUND: | | | | | | | | | | | | | | | | | | | | |
| | | | | | | | | | | | | | | | | | | | | | | | | | | | | | | | | | | | | | | | | | | | | | | | | | |
| Institutional Shares* | | | | | | | | | | | | | | | | | | | | |
07/01/18 | 06/30/19 | | | 12.42 | | | 0.07 | | | (0.16 | ) | | | (0.09 | ) | | (0.20 | ) | | | (0.98 | ) | | | (1.18 | ) | | | 11.15 | | | 0.84 | | | | 470,903 | | | 0.62 | | | 1.07 | | | 1.07 | | | 34 | |
07/01/17 | 06/30/18 | | | 12.05 | | | 0.13 | | | 0.35 | | | | 0.48 | | | (0.11 | ) | | | — | | | | (0.11 | ) | | | 12.42 | | | 3.97 | | | | 927,916 | | | 1.03 | | | 1.07 | | | 1.07 | | | 33 | |
07/01/16 | 06/30/17 | | | 9.90 | | | 0.12 | | | 2.16 | | | | 2.28 | | | (0.13 | ) | | | — | | | | (0.13 | ) | | | 12.05 | | | 23.32 | | | | 1,176,492 | | | 1.10 | | | 1.09 | | | 1.09 | | | 27 | |
07/01/15 | 06/30/16 | | | 10.20 | | | 0.13 | | | (0.40 | ) | | | (0.27 | ) | | (0.03 | ) | | | — | | | | (0.03 | ) | | | 9.90 | | | (2.68 | ) | | | 1,059,870 | | | 1.30 | | | 1.11 | | | 1.11 | | | 31 | |
07/01/14 | 06/30/15 | | | 10.46 | | | 0.14 | | | (0.29 | ) | | | (0.15 | ) | | (0.11 | ) | | | — | | | | (0.11 | ) | | | 10.20 | | | (1.42 | ) | | | 240,182 | | | 1.35 | | | 1.13 | | | 1.13 | | | 48 | |
| | | | | | | | | | | | | | | | | | | | | |
| Investor Shares* | | | | | | | | | | | | | | | | | | | | |
07/01/18 | 06/30/19 | | | 12.41 | | | 0.05 | | | (0.17 | ) | | | (0.12 | ) | | (0.19 | ) | | | (0.98 | ) | | | (1.17 | ) | | | 11.12 | | | 0.58 | | | | 18,100 | | | 0.47 | | | 1.22 | | | 1.22 | | | 34 | |
07/01/17 | 06/30/18 | | | 12.05 | | | 0.11 | | | 0.36 | | | | 0.47 | | | (0.11 | ) | | | — | | | | (0.11 | ) | | | 12.41 | | | 3.85 | | | | 14,669 | | | 0.88 | | | 1.22 | | | 1.22 | | | 33 | |
07/01/16 | 06/30/17 | | | 9.90 | | | 0.10 | | | 2.17 | | | | 2.27 | | | (0.12 | ) | | | — | | | | (0.12 | ) | | | 12.05 | | | 23.18 | | | | 7,367 | | | 0.95 | | | 1.24 | | | 1.24 | | | 27 | |
07/01/15 | 06/30/16 | | | 10.19 | | | 0.12 | | | (0.41 | ) | | | (0.29 | ) | | — | | | | — | | | | — | | | | 9.90 | | | (2.85 | ) | | | 13,031 | | | 1.15 | | | 1.26 | | | 1.26 | | | 31 | |
07/01/14 | 06/30/15 | | | 10.45 | | | 0.12 | | | (0.29 | ) | | | (0.17 | ) | | (0.09 | ) | | | — | | | | (0.09 | ) | | | 10.19 | | | (1.56 | ) | | | 25,840 | | | 1.20 | | | 1.28 | | | 1.28 | | | 48 | |
| | | | | | | | | | | | | | | | | | | | | |
| Advisor Shares* | | | | | | | | | | | | | | | | | | | | |
07/01/18 | 06/30/19 | | | 12.30 | | | 0.02 | | | (0.16 | ) | | | (0.14 | ) | | (0.15 | ) | | | (0.98 | ) | | | (1.13 | ) | | | 11.03 | | | 0.42 | | | | 7,563 | | | 0.22 | | | 1.47 | | | 1.47 | | | 34 | |
07/01/17 | 06/30/18 | | | 11.98 | | | 0.08 | | | 0.35 | | | | 0.43 | | | (0.11 | ) | | | — | | | | (0.11 | ) | | | 12.30 | | | 3.54 | | | | 13,313 | | | 0.63 | | | 1.47 | | | 1.47 | | | 33 | |
07/01/16 | 06/30/17 | | | 9.85 | | | 0.08 | | | 2.15 | | | | 2.23 | | | (0.10 | ) | | | — | | | | (0.10 | ) | | | 11.98 | | | 22.91 | | | | 10,740 | | | 0.70 | | | 1.49 | | | 1.49 | | | 27 | |
07/01/15 | 06/30/16 | | | 10.17 | | | 0.09 | | | (0.41 | ) | | | (0.32 | ) | | — | | | | — | | | | — | | | | 9.85 | | | (3.15 | ) | | | 745 | | | 0.90 | | | 1.51 | | | 1.51 | | | 31 | |
07/01/14 | 06/30/15 | | | 10.44 | | | 0.10 | | | (0.29 | ) | | | (0.19 | ) | | (0.08 | ) | | | — | | | | (0.08 | ) | | | 10.17 | | | (1.78 | ) | | | 1,076 | | | 0.95 | | | 1.53 | | | 1.53 | | | 48 | |
The accompanying notes are an integral part of these financial statements.
www.brownadvisory.com/mf
Financial Highlights
| | | | | | From Investment | | | Distributions to | | | | | | | | | | Ratios to Average | | | | |
| | | | | | Operations(a) | | | Shareholders From | | | | | | | | | | Net Assets(b) | | | | |
| | | | | | | | Net | | | | | | | | | | | | | | | | | | | | | | | | | | | | | | | | |
| For a Share | | | | | | Realized | | | | | | | | | | | | | | | Net | |
| | | Net | |
| | | | | | | | | | |
| Outstanding | | Net Asset | | Net | | & | | |
| | | | | | | | | | | | Asset | |
| | | | Net | |
| | | | | | | |
| Throughout | | Value, | | Investment | | | | |
| | | Net | | | | | |
| | | | | | | | | | | | | | | Gross | | |
| Each Fiscal Period: | | | | Income | | Gains | | | | | | Investment | | | | | |
| | | | | | | | | | | | | | | | |
| Beginning | Ending | | of Period | | (Loss) | | (Losses) | | | | | | | | | | | | | | | | | | | | | | | | | | | | | |
| | | | | | | | | | | | | | | | | | | | | | | | | | | | | | | | | | | | | | | | | |
| BROWN ADVISORY EMERGING MARKETS SELECT FUND: | | | | | | | |
| | | | | | | | | | | | | | | | | | | | | | | | | | | | | | | | | | | | | | | | | |
| Institutional Shares* | | | | | | | | | | | | | | | | | | | | | | | | | | | | | | | | | | | | | | | |
07/01/18 | 06/30/19 | | $ | 10.06 | | 0.11 | | (0.48 | ) | | (0.37 | ) | | (0.35 | ) | | — | | | (0.35 | ) | | $ | 9.34 | | (3.35 | )% | | $ | 326,693 | | 1.20 | % | | 1.26 | % | | 1.26 | % | | 131 | % |
07/01/17 | 06/30/18 | | | 10.17 | | 0.17 | | (0.17 | ) | | — | | | (0.11 | ) | | — | | | (0.11 | ) | | | 10.06 | | (0.12 | ) | | | 513,535 | | 1.57 | | | 1.15 | | | 1.15 | | | 13 | |
07/01/16 | 06/30/17 | | | 8.73 | | 0.12 | | 1.43 | | | 1.55 | | | (0.11 | ) | | — | | | (0.11 | ) | | | 10.17 | | 18.04 | | | | 407,616 | | 1.31 | | | 1.17 | | | 1.17 | | | 23 | |
07/01/15 | 06/30/16 | | | 9.74 | | 0.13 | | (1.05 | ) | | (0.92 | ) | | (0.09 | ) | | — | | | (0.09 | ) | | | 8.73 | | (9.40 | ) | | | 319,993 | | 1.56 | | | 1.17 | | | 1.17 | | | 19 | |
07/01/14 | 06/30/15 | | | 10.22 | | 0.13 | | (0.46 | ) | | (0.33 | ) | | (0.15 | ) | | — | | | (0.15 | ) | | | 9.74 | | (3.22 | ) | | | 268,530 | | 1.31 | | | 1.22 | | | 1.22 | | | 22 | |
| | | | | | | | | | | | | | | | | | | | | | | | | | | | | | | | | | | | | | | | | |
| Investor Shares* | | | | | | | | | | | | | | | | | | | | | | | | | | | | | | | | | | | | | | | | |
07/01/18 | 06/30/19 | | | 10.03 | | 0.10 | | (0.48 | ) | | (0.38 | ) | | (0.32 | ) | | — | | | (0.32 | ) | | | 9.33 | | (3.42 | ) | | | 5,063 | | 1.05 | | | 1.41 | | | 1.41 | | | 131 | |
07/01/17 | 06/30/18 | | | 10.15 | | 0.16 | | (0.19 | ) | | (0.03 | ) | | (0.09 | ) | | — | | | (0.09 | ) | | | 10.03 | | (0.37 | ) | | | 38,106 | | 1.42 | | | 1.30 | | | 1.30 | | | 13 | |
07/01/16 | 06/30/17 | | | 8.71 | | 0.11 | | 1.43 | | | 1.54 | | | (0.10 | ) | | — | | | (0.10 | ) | | | 10.15 | | 17.90 | | | | 183,378 | | 1.16 | | | 1.32 | | | 1.32 | | | 23 | |
07/01/15 | 06/30/16 | | | 9.73 | | 0.12 | | (1.06 | ) | | (0.94 | ) | | (0.08 | ) | | — | | | (0.08 | ) | | | 8.71 | | (9.60 | ) | | | 196,841 | | 1.41 | | | 1.32 | | | 1.32 | | | 19 | |
07/01/14 | 06/30/15 | | | 10.21 | | 0.11 | | (0.45 | ) | | (0.34 | ) | | (0.14 | ) | | — | | | (0.14 | ) | | | 9.73 | | (3.33 | ) | | | 155,919 | | 1.16 | | | 1.37 | | | 1.37 | | | 22 | |
| | | | | | | | | | | | | | | | | | | | | | | | | | | | | | | | | | | | | | | | | | |
| Advisor Shares* | | | | | | | | | | | | | | | | | | | | | | | | | | | | | | | | | | | | | | | | | |
07/01/18 | 06/30/19 | | | 10.07 | | 0.07 | | (0.47 | ) | | (0.40 | ) | | (0.30 | ) | | — | | | (0.30 | ) | | | 9.37 | | (3.66 | ) | | | 167 | | 0.80 | | | 1.66 | | | 1.66 | | | 131 | |
07/01/17 | 06/30/18 | | | 10.19 | | 0.13 | | (0.18 | ) | | (0.05 | ) | | (0.07 | ) | | — | | | (0.07 | ) | | | 10.07 | | (0.60 | ) | | | 172 | | 1.17 | | | 1.55 | | | 1.55 | | | 13 | |
07/01/16 | 06/30/17 | | | 8.73 | | 0.08 | | 1.45 | | | 1.53 | | | (0.07 | ) | | — | | | (0.07 | ) | | | 10.19 | | 17.65 | | | | 253 | | 0.91 | | | 1.57 | | | 1.57 | | | 23 | |
07/01/15 | 06/30/16 | | | 9.70 | | 0.10 | | (1.05 | ) | | (0.95 | ) | | (0.02 | ) | | — | | | (0.02 | ) | | | 8.73 | | (9.82 | ) | | | 281 | | 1.16 | | | 1.57 | | | 1.57 | | | 19 | |
07/01/14 | 06/30/15 | | | 10.18 | | 0.09 | | (0.46 | ) | | (0.37 | ) | | (0.11 | ) | | — | | | (0.11 | ) | | | 9.70 | | (3.60 | ) | | | 942 | | 0.91 | | | 1.62 | | | 1.62 | | | 22 | |
| | | | | | | | | | | | | | | | | | | | | | | | | | | | | | | | | | | | | | | | | | | |
| BROWN ADVISORY – BEUTEL GOODMAN LARGE-CAP VALUE FUND: | | | | | | | | | | |
| | | | | | | | | | | | | | | | | | | | | | | | | | | | | | | | | | | | | | | | | | | |
| Institutional Shares* | | | | | | | | | | | | | | | | | | | | | | | | | | | | | | | | | | | | | | |
07/01/18 | 06/30/19 | | | 9.58 | | 0.20 | | 0.89 | | | 1.09 | | | (0.11 | ) | | (0.09 | ) | | (0.20 | ) | | | 10.47 | | 11.62 | | | | 296,963 | | 1.97 | | | 0.60 | | | 0.60 | | | 45 | |
02/13/18^ | 06/30/18 | | | 10.00 | | 0.06 | | (0.48 | ) | | (0.42 | ) | | — | | | — | | | — | | | | 9.58 | | (4.20 | ) | | | 151,004 | | 1.61 | | | 0.67 | | | 0.67 | | | 11 | |
| * | Redemption fees of less than $0.005/share are not presented and are included in net realized & unrealized gains (losses) from investment operations. Prior to July 1, 2018, Brown Advisory Strategic Bond Fund Institutional Shares and Investor Shares were known as Investor Shares and Advisor Shares, respectively. The increase in the portfolio turnover rate for the Brown Advisory Emerging Markets Select Fund for the year ended June 30, 2019 was primarily the result of a change in sub-advisers during the year. |
| ^ | Commencement of operations. |
| (a) | Calculated based on average shares outstanding during the fiscal period. |
| (b) | Annualized for periods less than one year. Ratios include only income and expenses of the funds themselves, as presented in the Statements of Operations, and do not include any additional or pro rata amounts of income or expenses from the ownership of any other investment companies (as applicable). |
| (c) | Not annualized for periods less than one year. Portfolio turnover rates are calculated at the fund level (not by individual share class). |
| (d) | Reflects the expense ratio excluding any expense waivers or expense recoupments. |
| (e) | Less than $0.005/share. |
The accompanying notes are an integral part of these financial statements.
www.brownadvisory.com/mf
Notes to Financial Statements
June 30, 2019
Note 1. Organization
Brown Advisory Funds (the “Trust”) is registered under the Investment Company Act of 1940 as an open-ended management investment company. The Trust offers the following series of shares (each a “Fund,” and collectively, the “Funds”):
| • | Brown Advisory Growth Equity Fund (“Growth Equity Fund”) seeks to achieve capital appreciation by primarily investing in equity securities, |
| • | Brown Advisory Flexible Equity Fund (“Flexible Equity Fund”) seeks to achieve long-term growth of capital, |
| • | Brown Advisory Equity Income Fund (“Equity Income Fund”) seeks to provide current dividend yield and dividend growth, |
| • | Brown Advisory Sustainable Growth Fund (“Sustainable Growth Fund”) seeks to achieve capital appreciation, |
| • | Brown Advisory Mid-Cap Growth Fund (“Mid-Cap Growth Fund”) seeks to achieve long-term capital appreciation, |
| • | Brown Advisory Small-Cap Growth Fund (“Small-Cap Growth Fund”) seeks to achieve long-term capital appreciation by primarily investing in equity securities, |
| • | Brown Advisory Small-Cap Fundamental Value Fund (“Small-Cap Fundamental Value Fund”) seeks to achieve long-term capital appreciation, |
| • | Brown Advisory Global Leaders Fund (“Global Leaders Fund”) seeks to achieve long-term capital appreciation by investing primarily in global equities, |
| • | Brown Advisory Intermediate Income Fund (“Intermediate Income Fund”) seeks to provide a high level of current income consistent with the preservation of principal within an intermediate-term maturity structure, |
| • | Brown Advisory Total Return Fund (“Total Return Fund”) seeks to provide a competitive total return consistent with the preservation of principal, |
| • | Brown Advisory Strategic Bond Fund (“Strategic Bond Fund”) seeks to achieve capital appreciation and income with a low correlation to interest rate movements, |
| • | Brown Advisory Sustainable Bond Fund (“Sustainable Bond Fund”) seeks to provide a competitive total return consistent with the preservation of principal while giving special consideration to certain environmental, social and governance criteria, |
| • | Brown Advisory Maryland Bond Fund (“Maryland Bond Fund”) seeks to provide a high level of current income exempt from both Federal and Maryland State income taxes without undue risk, |
| • | Brown Advisory Tax-Exempt Bond Fund (“Tax-Exempt Bond Fund”) seeks to provide a high level of current income exempt from Federal income tax by investing primarily in intermediate-term investment grade municipal bonds, |
| • | Brown Advisory Mortgage Securities Fund (“Mortgage Securities Fund”) seeks to maximize total return consistent with preservation of capital, |
| • | Brown Advisory – WMC Strategic European Equity Fund (“WMC Strategic European Equity Fund”) seeks to achieve total return by investing principally in equity securities issued by companies established or operating in Europe, |
| • | Brown Advisory Emerging Markets Select Fund (“Emerging Markets Select Fund”) seeks to achieve total return by investing principally in equity securities issued by companies established or operating in emerging markets, and |
| • | Brown Advisory – Beutel Goodman Large-Cap Value Fund (“Beutel Goodman Large-Cap Value Fund”) seeks to achieve capital appreciation. |
The Funds commenced operations as follows:
| |
| Institutional | Investor | | Advisor | | | | Institutional | | Investor | | Advisor |
Fund | | Shares | Shares | | Shares | | Fund | | Shares | | Shares | | Shares |
| Growth Equity | | 10/19/2012 | 6/28/1999 | | 5/18/2006 | | Total Return | | 10/30/2014 | | 10/30/2014 | | — |
| Flexible Equity | | 10/19/2012 | 11/30/2006 | | 1/24/2007 | | Strategic Bond1 | | 10/31/2014 | | 9/30/2011 | | — |
| Equity Income | | 10/19/2012 | 12/29/2011 | | 12/29/2011 | | Sustainable Bond | | 7/2/2018 | | 8/7/2017 | | — |
| Sustainable Growth | | 6/29/2012 | 6/29/2012 | | 6/29/2012 | | Maryland Bond | | — | | 12/21/2000 | | — |
| Mid-Cap Growth | | 7/2/2018 | 10/2/2017 | | — | | Tax-Exempt Bond | | 7/2/2018 | | 6/29/2012 | | — |
| Small-Cap Growth | | 9/20/2002 | 6/28/1999 | | 4/25/2006 | | Mortgage Securities | | 5/13/2014 | | 12/26/2013 | | — |
| Small-Cap | | | | | | | WMC Strategic | | | | | | |
| Fundamental Value | | 10/19/2012 | 12/31/2008 | | 7/28/2011 | | European Equity | | 10/21/2013 | | 10/21/2013 | | 10/21/2013 |
| Global Leaders | | 10/31/2018 | 7/1/2015 | | — | | Emerging Markets Select2 | | 12/12/2012 | | 12/12/2012 | | 12/12/2012 |
| Intermediate Income | | — | 11/2/1995 | | 5/13/1991 | | Beutel Goodman | | | | | | |
| | | | | | | | Large-Cap Value | | 2/13/2018 | | — | | — |
1 | Prior to July 1, 2018, Institutional Shares and Investor Shares were known as Investor Shares and Advisor Shares, respectively. |
2 | Known as Brown Advisory – Somerset Emerging Markets Fund prior to February 25, 2019. |
www.brownadvisory.com/mf
Notes to Financial Statements
June 30, 2019
Note 2. Significant Accounting Policies
The following is a summary of significant accounting policies consistently followed by the Funds. These policies are in conformity with accounting principles generally accepted in the United States of America (“U.S. GAAP”). The Funds are investment companies and follow the investment company accounting and reporting guidance of the Financial Accounting Standards Board Accounting Standards Codification Topic 946 Financial Services – Investment Companies, which is part of U.S. GAAP.
A. Security Valuation – The Funds have adopted fair valuation accounting standards which establish an authoritative definition of fair value and set out a hierarchy for measuring fair value. These standards require additional disclosures about the various inputs and valuation techniques used to develop the measurements of fair value and a discussion of changes in valuation techniques and related inputs, if any, during the period. These inputs are summarized in the three broad levels listed below:
| Level 1 – | Quoted prices in active markets for identical securities. |
| Level 2 – | Evaluated price based on other significant observable inputs (including quoted prices for similar securities, interest rates, prepayment spreads, credit risk, etc). |
| Level 3 – | Significant unobservable inputs (including the Fund’s own assumptions in determining the fair value of investments). |
The inputs or methodology used for valuing securities are not necessarily an indication of the risk associated with investing in those securities.
Domestic Equity Securities – Domestic equity securities that are traded on a national securities exchange, except those listed on the NASDAQ Global Market® (“NASDAQ”), are valued at the last reported sale price on the exchange on which the security is principally traded. Securities traded on NASDAQ will be valued at the NASDAQ Official Closing Price (“NOCP”). If, on a particular day, an exchange-traded or NASDAQ security does not trade, then the mean between the most recent quoted bid and asked prices will be used. All equity securities that are not traded on a listed exchange are valued at the last sale price in the over-the counter market. If a non-exchange traded security does not trade on a particular day, then the mean between the last quoted closing bid and asked price will be used. Such domestic equity securities are typically categorized as Level 1 securities. Investments in other domestic investment companies (open-ended mutual funds) are valued at their reported Net Asset Value (“NAV”) and are typically categorized as Level 1 securities. Investments in Exchange Traded Funds (“ETFs”) and Closed-End Funds are valued at their last reported sale price and are typically categorized as Level 1 securities.
Foreign Equity Securities – For foreign equity securities that are traded on foreign exchanges, the Funds have selected ICE Data Services (“ICE”) to provide pricing data. The use of ICE’s pricing services with respect to these foreign exchange traded securities is designed to capture events occurring after a foreign exchange closes that may affect the value of certain holdings of the Funds that are traded on those foreign exchanges. The Funds utilize a confidence interval when determining whether or not to utilize these prices provided by ICE. The confidence interval is a measure of the relationship that each foreign exchange traded security has to movements in various indices and the price of the foreign exchange traded security’s corresponding American Depositary Receipt, if one exists. ICE provides a confidence interval for each foreign exchange traded security for which it provides a price. If the confidence interval provided by ICE is equal to or greater than a predefined level utilized by the Funds, the Funds will value that foreign exchange traded security at that price. If the confidence interval provided by ICE is less than the predefined level utilized by the Funds, the Funds will value that foreign exchange traded security at the preceding closing price on its respective foreign exchange, or, if there were no transactions on the preceding day, at the mean between the bid and the asked prices. Such foreign securities are typically categorized as Level 2 securities. Foreign securities for which the local market closing prices are utilized are typically categorized as Level 1 securities.
Debt Securities – Debt securities are valued by using the mean between the closing bid and asked prices provided by an independent pricing service. If the closing bid and asked prices are not readily available, the independent pricing service may provide a price determined by a matrix pricing method. These techniques generally consider such factors as yields or prices of bonds of comparable quality, type of issue, coupon, maturity, ratings and general market conditions. Fixed income debt instruments, such as commercial paper, banker’s acceptances and U.S. Treasury Bills, having a maturity of less than 60 days are valued at amortized cost when the amortized cost value is determined to approximate fair value established using market-based and issuer-specific factors. Such debt securities are typically categorized as Level 2.
Exchange Traded Options – Exchange traded options are valued at the composite price, using the National Best Bid and Offer quotes (NBBO). NBBO consists of the highest bid price and lowest ask price across any of the exchanges on which an option is quoted, thus
www.brownadvisory.com/mf
Notes to Financial Statements
June 30, 2019
providing a view across the entire U.S. options marketplace. Specifically, composite pricing calculates the mean of the highest bid price and lowest ask price across the exchanges where the option is traded. Such options are typically categorized as Level 2.
Futures Contracts – Futures contracts are generally valued at the settlement prices established each day on the exchange on which they are traded and are categorized as Level 1 securities.
Forward Foreign Currency Contracts – Forward foreign currency contracts are valued at the prevailing forward exchange rates of the underlying currencies and are categorized as Level 2 securities.
Securities for which quotations are not readily available, or for which quotations are deemed to be inaccurate or unreliable, are valued at their respective fair values as determined in good faith under guidelines and procedures adopted by the Board of Trustees. These are generally considered Level 3 securities when significant unobservable inputs are utilized in the determination of the fair value. When a security is “fair valued,” consideration is given to the facts and circumstances relevant to the particular situation, including a review of various factors set forth in the guidelines and procedures adopted by the Board of Trustees. Fair value pricing is an inherently subjective process, and no single standard exists for determining fair value. Different funds could reasonably arrive at different values for the same security. The use of fair value pricing by a fund may cause the net asset value of its shares to differ significantly from the net asset value that would be calculated without regard to such considerations. As of June 30, 2019, the Small-Cap Growth Fund held Level 3 securities for which significant and unobservable inputs or assumptions were used in the determination of fair value. The total market value of such securities held as of June 30, 2019, was $2,403,334 or 0.2% of Small-Cap Growth Fund’s net assets.
The following is a summary of inputs used to value the Funds’ investments as of June 30, 2019:
| | | Level 1 | | | Level 2 | | | Level 3 | |
| Growth Equity Fund | | | | | | | | | |
| Common Stocks | | $ | 2,200,082,302 | | | $ | — | | | $ | — | |
| REIT^ | | | 92,074,903 | | | | — | | | | — | |
| Short-Term Investments | | | 65,816,903 | | | | — | | | | — | |
| Total Investments | | $ | 2,357,974,108 | | | $ | — | | | $ | — | |
| | | | | | | | | | | | | |
| Flexible Equity Fund | | | | | | | | | | | | |
| Common Stocks | | $ | 463,785,264 | | | $ | — | | | $ | — | |
| REIT^ | | | 12,815,616 | | | | — | | | | — | |
| Short-Term Investments | | | 6,831,305 | | | | — | | | | — | |
| Total Investments | | $ | 483,432,185 | | | $ | — | | | $ | — | |
| | | | | | | | | | | | | |
| Equity Income Fund | | | | | | | | | | | | |
| Common Stocks | | $ | 80,471,984 | | | $ | — | | | $ | — | |
| REIT^ | | | 6,545,402 | | | | — | | | | — | |
| Short-Term Investments | | | 2,873,953 | | | | — | | | | — | |
| Total Investments | | $ | 89,891,339 | | | $ | — | | | $ | — | |
| | | | | | | | | | | | | |
| Sustainable Growth Fund | | | | | | | | | | | | |
| Common Stocks | | $ | 1,265,941,222 | | | $ | — | | | $ | — | |
| REIT^ | | | 61,447,652 | | | | — | | | | — | |
| Short-Term Investments | | | 41,319,174 | | | | — | | | | — | |
| Total Investments | | $ | 1,368,708,048 | | | $ | — | | | $ | — | |
| | | | | | | | | | | | | |
| Mid-Cap Growth Fund | | | | | | | | | | | | |
| Common Stocks | | $ | 42,152,798 | | | $ | — | | | $ | — | |
| REIT^ | | | 1,005,484 | | | | — | | | | — | |
| Short-Term Investments | | | 1,871,751 | | | | — | | | | — | |
| Total Investments | | $ | 45,030,033 | | | $ | — | | | $ | — | |
| | | | | | | | | | | | | |
| Small-Cap Growth Fund | | | | | | | | | | | | |
| Common Stocks | | $ | 1,261,771,118 | | | $ | — | | | $ | — | |
| Private Placements | | | — | | | | — | | | | 2,403,334 | |
| Short-Term Investments | | | 104,924,940 | | | | — | | | | — | |
| Total Investments | | $ | 1,366,696,058 | | | $ | — | | | $ | 2,403,334 | |
| | | | | | | | | | | | | |
| Small-Cap Fundamental Value Fund | | | | | | | | | | | | |
| Common Stocks | | $ | 896,714,231 | | | $ | — | | | $ | — | |
| REIT^ | | | 60,870,536 | | | | — | | | | — | |
| Investment Companies | | | 31,453,728 | | | | — | | | | — | |
| Short-Term Investments | | | 42,562,829 | | | | — | | | | — | |
| Total Investments | | $ | 1,031,601,324 | | | $ | — | | | $ | — | |
| | | | | | | | | | | | | |
| Global Leaders Fund | | | | | | | | | | | | |
| Common Stocks: | | | | | | | | | | | | |
| China | | $ | 4,988,719 | | | $ | 15,561,031 | | | $ | — | |
| France | | | — | | | | 6,663,739 | | | | — | |
| Germany | | | — | | | | 12,003,838 | | | | — | |
| India | | | — | | | | 6,862,866 | | | | — | |
| Indonesia | | | — | | | | 6,187,036 | | | | — | |
| Netherlands | | | — | | | | 7,190,303 | | | | — | |
| Sweden | | | — | | | | 7,789,698 | | | | — | |
| Switzerland | | | — | | | | 6,555,779 | | | | — | |
| Taiwan | | | 6,804,926 | | | | — | | | | — | |
| United Kingdom | | | — | | | | 16,573,900 | | | | — | |
| United States | | | 127,132,199 | | | | — | | | | — | |
| Short-Term Investments | | | 8,922,477 | | | | — | | | | — | |
| Total Investments | | $ | 147,848,321 | | | $ | 85,388,190 | | | $ | — | |
| | | | | | | | | | | | | |
| Intermediate Income Fund | | | | | | | | | | | | |
| Corporate Bonds & Notes | | $ | — | | | $ | 38,582,909 | | | $ | — | |
| Asset Backed Securities | | | — | | | | 26,110,141 | | | | — | |
| Mortgage Backed Securities | | | — | | | | 15,317,469 | | | | — | |
| Municipal Bonds | | | — | | | | 7,549,409 | | | | — | |
| U.S. Treasury Notes | | | — | | | | 22,108,871 | | | | — | |
| Affiliated Mutual Funds | | | 27,337,169 | | | | — | | | | — | |
| Short-Term Investments | | | 1,344,585 | | | | — | | | | — | |
| Total Investments | | $ | 28,681,754 | | | $ | 109,668,799 | | | $ | — | |
| Futures Contracts – Long* | | $ | 342,163 | | | $ | — | | | $ | — | |
www.brownadvisory.com/mf
Notes to Financial Statements
June 30, 2019
| | | | | | | | | | |
| | Level 1 | | | Level 2 | | | Level 3 | |
| Total Return Fund | | | | | | | | | |
| Asset Backed Securities | | $ | — | | | $ | 80,675,271 | | | $ | — | |
| Corporate Bonds & Notes | | | — | | | | 73,574,762 | | | | — | |
| Mortgage Backed Securities | | | — | | | | 62,320,654 | | | | — | |
| Municipal Bonds | | | — | | | | 7,751,499 | | | | — | |
| U.S. Treasury Notes | | | — | | | | 18,585,635 | | | | — | |
| Preferred Stocks | | | 1,125,084 | | | | — | | | | — | |
| Short-Term Investments | | | 4,462,814 | | | | — | | | | — | |
| Total Investments | | $ | 5,587,898 | | | $ | 242,907,821 | | | $ | — | |
| Futures Contracts – Long* | | $ | 2,811,306 | | | $ | — | | | $ | — | |
| | | | | | | | | | | | | |
| Strategic Bond Fund | | | | | | | | | | | | |
| Asset Backed Securities | | $ | — | | | $ | 99,829,049 | | | $ | — | |
| Corporate Bonds & Notes | | | — | | | | 59,149,272 | | | | — | |
| Mortgage Backed Securities | | | — | | | | 32,587,547 | | | | — | |
| Municipal Bonds | | | — | | | | 5,343,642 | | | | — | |
| Preferred Stocks | | | 1,432,407 | | | | — | | | | — | |
| Short-Term Investments | | | 7,256,947 | | | | — | | | | — | |
| Total Investments | | $ | 8,689,354 | | | $ | 196,909,510 | | | $ | — | |
| | | | | | | | | | | | | |
| Sustainable Bond Fund | | | | | | | | | | | | |
| Corporate Bonds & Notes | | $ | — | | | $ | 50,605,019 | | | $ | — | |
| Mortgage Backed Securities | | | — | | | | 40,763,650 | | | | — | |
| Municipal Bonds | | | — | | | | 16,595,194 | | | | — | |
| Asset Backed Securities | | | — | | | | 10,101,420 | | | | — | |
| Foreign Government Bonds | | | — | | | | 3,442,735 | | | | — | |
| U.S. Treasury Notes | | | — | | | | 1,532,059 | | | | — | |
| Short-Term Investments | | | 12,444 | | | | — | | | | — | |
| Total Investments | | $ | 12,444 | | | $ | 123,040,077 | | | $ | — | |
| Futures Contracts – Long* | | $ | 499,665 | | | $ | — | | | $ | — | |
| Futures Contracts – Short* | | $ | (89,102 | ) | | $ | — | | | $ | — | |
| | | | | | | | | | | | | |
| Maryland Bond Fund | | | | | | | | | | | | |
| Municipal Bonds | | $ | — | | | $ | 178,973,148 | | | $ | — | |
| Short-Term Investments | | | 2,158,984 | | | | — | | | | — | |
| Total Investments | | $ | 2,158,984 | | | $ | 178,973,148 | | | $ | — | |
| | | | | | | | | | | | | |
| Tax-Exempt Bond Fund | | | | | | | | | | | | |
| Municipal Bonds | | $ | — | | | $ | 934,423,526 | | | $ | — | |
| Short-Term Investments | | | 21,256,533 | | | | — | | | | — | |
| Total Investments | | $ | 21,256,533 | | | $ | 934,423,526 | | | $ | — | |
| | | | | | | | | | | | | |
| Mortgage Securities Fund | | | | | | | | | | | | |
| Mortgage Backed Securities | | $ | — | | | $ | 247,436,305 | | | $ | — | |
| Asset Backed Securities | | | — | | | | 16,104,457 | | | | — | |
| Municipal Bonds | | | — | | | | 7,435,295 | | | | — | |
| U.S. Treasury Notes | | | — | | | | 2,991,269 | | | | — | |
| Purchased Options | | | 44,531 | | | | — | | | | — | |
| Preferred Stocks | | | 2,189,963 | | | | — | | | | — | |
| Short-Term Investments | | | 5,171,116 | | | | — | | | | — | |
| Total Investments | | $ | 7,405,610 | | | $ | 273,967,326 | | | $ | — | |
| Futures Contracts – Long* | | $ | 1,262,584 | | | $ | — | | | $ | — | |
| Futures Contracts – Short* | | $ | (183,476 | ) | | $ | — | | | $ | — | |
| | | | | | | | | | | | | |
| WMC Strategic European Equity Fund | | | | | | | | | | | | |
| Common Stocks: | | | | | | | | | | | | |
| Austria | | $ | — | | | $ | 1,956,049 | | | $ | — | |
| Belgium | | | — | | | | 13,102,652 | | | | — | |
| Denmark | | | 761,079 | | | | 13,315,522 | | | | — | |
| Finland | | | — | | | | 7,736,401 | | | | — | |
| France | | | 2,672,479 | | | | 74,247,133 | | | | — | |
| Germany | | | 2,783,386 | | | | 58,548,764 | | | | — | |
| Ireland | | | — | | | | 2,883,584 | | | | — | |
| Italy | | | — | | | | 2,375,153 | | | | — | |
| Netherlands | | | — | | | | 46,615,807 | | | | — | |
| Portugal | | | — | | | | 8,199,240 | | | | — | |
| Spain | | | 2,433,516 | | | | 7,003,833 | | | | — | |
| Sweden | | | — | | | | 54,350,047 | | | | — | |
| Switzerland | | | — | | | | 66,825,241 | | | | — | |
| United Kingdom | | | — | | | | 109,567,643 | | | | — | |
| Preferred Stocks | | | — | | | | 3,207,213 | | | | — | |
| Short-Term Investments | | | 13,222,566 | | | | — | | | | — | |
| Total Investments | | $ | 21,873,026 | | | $ | 469,934,282 | | | $ | — | |
| | | | | | | | | | | | | |
| Emerging Markets Select Fund | | | | | | | | | | | | |
| Common Stocks: | | | | | | | | | | | | |
| Australia | | $ | — | | | $ | 2,100,625 | | | $ | — | |
| China | | | 23,664,014 | | | | 85,584,939 | | | | — | |
| Czech Republic | | | — | | | | 3,252,867 | | | | — | |
| Hungary | | | — | | | | 1,357,153 | | | | — | |
| India | | | — | | | | 35,334,267 | | | | — | |
| Indonesia | | | — | | | | 5,166,583 | | | | — | |
| Malaysia | | | — | | | | 5,843,234 | | | | — | |
| Philippines | | | — | | | | 2,548,746 | | | | — | |
| Russia | | | 3,659,194 | | | | 9,366,597 | | | | — | |
| Singapore | | | — | | | | 12,078,046 | | | | — | |
| South Africa | | | — | | | | 4,507,449 | | | | — | |
| South Korea | | | — | | | | 43,611,061 | | | | — | |
| Taiwan | | | — | | | | 35,065,977 | | | | — | |
| Thailand | | | — | | | | 8,725,360 | | | | — | |
| Turkey | | | — | | | | 5,058,387 | | | | — | |
| United Arab Emirates | | | — | | | | 3,505,097 | | | | — | |
| United Kingdom | | | — | | | | 6,781,304 | | | | — | |
| United States | | | 7,633,557 | | | | — | | | | — | |
| Preferred Stocks: | | | | | | | | | | | | |
| Brazil | | | 5,255,230 | | | | — | | | | — | |
| South Korea | | | — | | | | 4,047,260 | | | | — | |
| Exchange Traded Funds | | | 1,180,428 | | | | — | | | | — | |
| Short-Term Investments | | | 12,348,291 | | | | — | | | | — | |
| Total Investments | | $ | 53,740,714 | | | $ | 273,934,952 | | | $ | — | |
| | | | | | | | | | | | | |
| Beutel Goodman Large-Cap Value Fund | | | | | | | | | | | | |
| Common Stocks | | $ | 285,305,996 | | | $ | — | | | $ | — | |
| Short-Term Investments | | | 9,842,138 | | | | — | | | | — | |
| Total Investments | | $ | 295,148,134 | | | $ | — | | | $ | — | |
| ^ | Real Estate Investment Trusts |
| * | Amounts presented for Futures Contracts represent total unrealized appreciation (depreciation) as of June 30, 2019. |
www.brownadvisory.com/mf
Notes to Financial Statements
June 30, 2019
The following is a reconciliation of Level 3 securities for which significant unobservable inputs were used to determine fair value.
Small-Cap Growth Fund | | Contingent Value Rights | | | Private Placements | |
Balance as of June 30, 2018 | | $ | 131,192 | | | $ | 2,450,871 | |
Acquisitions / Purchases | | | — | | | | 3,000 | |
Distributions / Returns of Capital | | | — | | | | (378,000 | ) |
Realized Gains | | | 341,572 | | | | 366,331 | |
Change in Unrealized Appreciation | | | | | | | (38,868 | ) |
Dispositions/Sales | | | (472,764 | ) | | | — | |
Balance as June 30, 2019 | | $ | — | | | $ | 2,403,334 | |
Contingent Value Rights – The Contingent Value Rights (“CVR”) were acquired as a result of Dyax Corp. (which was a portfolio holding of the Fund) being acquired by Shire PLC. In exchange for the Fund’s shares in Dyax Corp., the Fund received cash considerations from Shire PLC as well as the CVR. On September 10, 2018, the Fund received $472,674 from Shire PLC in exchange for the CVR. The Fund recognized realized gains of $341,572 in connection with the disposition of the CVR.
Private Placements – The inputs utilized in valuing the Private Placements consist of annual audited financial statements and quarterly capital statements which are provided by the issuer. These valuations are adjusted periodically for certain events (additional contributions of capital or purchases made by the Fund, distributions to the Fund made by the issuer, etc) that may occur prior to receipt of the next quarterly capital statement or Annual Report.
| | Asset Backed Securities | |
| | | Intermediate | | | Total | | | Strategic | | | Mortgage | |
| | | Income Fund | | | Return Fund | | | Bond Fund | | | Securities Fund | |
Balance as of June 30, 2018 | | $ | 1,131,822 | | | $ | 1,153,813 | | | $ | 871,021 | | | $ | 2,119,829 | |
Accrued discounts/premiums | | | (11,782 | ) | | | (10,834 | ) | | | (6,745 | ) | | | (12,668 | ) |
Paydowns | | | — | | | | — | | | | (7,970 | ) | | | — | |
Realized gain (loss) | | | (25,480 | ) | | | (24,731 | ) | | | (15,943 | ) | | | (48,586 | ) |
Change in unrealized appreciation (depreciation) | | | 20,048 | | | | 18,697 | | | | 11,605 | | | | 38,251 | |
Sales | | | (650,792 | ) | | | (719,510 | ) | | | (573,678 | ) | | | (2,096,826 | ) |
Transfers out of Level 3 and into Level 2 | | | (463,816 | ) | | | (417,435 | ) | | | (278,290 | ) | | | — | |
Balance as of June 30, 2019 | | $ | — | | | $ | — | | | $ | — | | | $ | — | |
B. Securities Transactions and Investment Income – Investment securities transactions are accounted for on trade date. Discounts/premiums on debt securities purchased are accreted/amortized over the life of the respective securities. Dividend income is recorded on the ex-dividend date. Interest income is recorded on an accrual basis. Income and capital gains on some foreign securities may be subject to foreign withholding or capital gains taxes. Identified cost of investments sold is used to determine the gain and loss for both financial statement and Federal income tax purposes. Distributions deemed to be a return of capital are recorded as a reduction of the cost of the related investments or as realized capital gains when there is no remaining cost basis on the investments.
C. Expenses and Share Class Allocations – Expenses directly attributable to a Fund are charged to that Fund. Expenses attributable to more than one Fund are allocated to the respective Funds on the basis of relative net assets or other appropriate methods. In Funds with multiple share classes, each share class has equal rights to earnings and assets except that each share class bears different shareholder servicing and/or Rule 12b-1 distribution expenses. Each share class has exclusive voting rights with respect to matters that affect just that share class. Income, expenses (other than expenses attributable to a specific share class), and realized and unrealized capital gains or losses on investments are allocated to each share class on the basis of relative net assets.
D. Foreign Currency – Investment securities and other assets and liabilities denominated in foreign currencies are translated into U.S. Dollar amounts at the date of valuation. Purchases and sales of investment securities and income and expense items denominated in foreign currencies are translated into U.S. Dollar amounts on the respective dates of such transactions.
The Funds do not isolate the portion of the results of operations resulting from changes in foreign exchange rates on investments from the fluctuations arising from changes in market prices of securities held. Such fluctuations are included with the net realized and unrealized gain or loss from investments. Some of the Funds may invest in forward foreign currency contracts. These amounts are presented separately from realized and unrealized gains and losses from investments in the financial statements.
www.brownadvisory.com/mf
Notes to Financial Statements
June 30, 2019
E. Options – The Funds may invest in options. When a Fund writes an option, an amount equal to the premium received by a Fund is recorded as a liability and is subsequently adjusted to the current value of the option written. Premiums received from writing options that expire unexercised are treated by a Fund on the expiration date as realized gain from investments. The difference between the premium and the amount paid on effecting a closing purchase transaction, including brokerage commissions, is also treated as a realized gain, or if the premium is less than the amount paid for closing purchase transaction, as a realized loss. If a call option is exercised, the premium is added to the proceeds from the sale of the underlying security or currency determining whether a Fund has a realized gain or loss. If a put option is exercised, the premium reduces the cost basis of the securities purchase by a Fund. A Fund, as a writer of an option, bears the market risk of an unfavorable change in the price of the security underlying the written option.
When a Fund purchases an option, an amount equal to the premium paid by a Fund is recorded as an investment and is subsequently adjusted to the current value of the option purchased. If an option expires on the stipulated expiration date or if a Fund enters into a closing sale transaction, a gain or loss is realized. If a call option is exercised, the cost of the security acquired is increased by the premium paid for the call. If a put option is exercised, a gain or loss is realized from the sale of the underlying security, and the proceeds from such sale are decreased by the premium originally paid. Written and purchased options are non-income producing securities. None of the Funds, other than Mortgage Securities Fund, purchased, sold or wrote any options during the year ended June 30, 2019. Mortgage Securities Fund purchased options during the year and holds purchased options as of the date of this report.
F. To-Be-Announced Securities – Some of the Funds may invest in to-be-announced securities (“TBAs”). TBAs is a term that is generally used to describe forward-settling mortgage-backed securities. These TBAs are generally issued by U.S. Government Agencies or U.S. Government Sponsored Entities such as Freddie Mac, Fannie Mae and Ginnie Mae. The actual mortgage-backed security that will be delivered to the buyer at the time TBAs trades are entered into is not known, however, the terms of the acceptable pools of loans that will comprise the mortgage-backed security are determined at the time the trade is entered into (coupon rate, maturity, credit quality, etc.). Investment in TBAs will generally increase a Fund’s exposure to interest rate risk and could also expose a Fund to counterparty default risk. In order to mitigate counterparty default risk, the Funds only enter into TBAs with counterparties for which the risk of default is determined to be remote. As a purchaser or seller of TBAs, the Funds segregate cash or cash equivalents as collateral as required in accordance with applicable industry regulations.
G. Distributions to Shareholders – For the Maryland Bond Fund and Tax-Exempt Bond Fund, distributions of net investment income, if any, are declared daily and paid monthly. Distributions to shareholders of net investment income, if any, are declared and paid monthly for the Intermediate Income Fund, Total Return Fund, Strategic Bond Fund, Sustainable Bond Fund and Mortgage Securities Fund and quarterly for the Equity Income Fund. The remaining Funds declare and pay net investment income, if any, at least annually. Distributions to shareholders of net capital gains, if any, are declared and paid at least annually. Distributions are recorded on the ex-dividend date. If a Fund is involved in a reorganization in which it acquires, or is being acquired by another fund, an additional distribution of net investment income and/or capital gains may be made prior to such reorganization.
H. Use of Estimates – The preparation of financial statements in conformity with accounting principles generally accepted in the United States of America requires management to make estimates and assumptions that affect the reported amounts of assets and liabilities at the date of the financial statements and the reported amount of revenue and expenses during the reporting period. Actual results could differ from those estimates.
I. Federal Taxes – Each Fund has elected to be taxed as a “regulated investment company” and intends to distribute substantially all taxable income to its shareholders and otherwise comply with the provisions of the Internal Revenue Code applicable to regulated investment companies. Therefore, no provision for federal income taxes or excise taxes has been made.
The Funds recognize tax benefits of uncertain tax positions only where the position is “more likely than not” to be sustained assuming examination by tax authorities.
The Funds have analyzed their tax positions and have concluded that no liability for unrecognized tax benefits should be recorded related to uncertain income tax positions taken on returns filed for open tax years (2016-2018) as of June 30, 2019 or are expected to be taken in the Funds’ 2019 tax returns. The Funds identify their major tax jurisdictions as U.S. Federal and Delaware State; however, the Funds are not aware of any tax position for which it is reasonably possible that the total amounts of unrecognized tax benefits will change materially in the next year.
J. Redemption Fees – A shareholder who redeems or exchanges shares of the Funds within fourteen days of purchase will incur a redemption fee of 1.00% of the current net asset value of shares redeemed or exchanged, subject to certain exceptions. The fee is
Notes to Financial Statements
June 30, 2019
charged for the benefit of the remaining shareholders and will be paid to the Fund to help offset transaction costs. The fee is accounted for as an addition to paid-in capital. Each Fund reserves the right to modify the terms of or terminate the fee at any time.
K. Guarantees and Indemnifications – In the normal course of business, the Funds enter into contracts with service providers that contain general indemnification clauses. The Funds’ maximum exposure under these arrangements is unknown as this would involve future claims that may be made against the Funds that have not yet occurred. However, based on experience, the Funds expect the risk of loss to be remote.
L. New Accounting Pronouncements – In March 2017, the Financial Accounting Standards Board (FASB) issued Accounting Standards Update (ASU) No. 2017-08, Receivables—Nonrefundable Fees and Other Costs (Subtopic 310-20): Premium Amortization on Purchased Callable Debt Securities. The amendments in the ASU shorten the amortization period for certain callable debt securities, held at a premium, to be amortized to the earliest call date. The ASU does not require an accounting change for securities held at a discount; such securities will continue to be amortized to maturity. The ASU is effective for fiscal years and interim periods within those fiscal years beginning after December 15, 2018 and has been adopted by the Funds as of July 1, 2019. Additional information regarding the impact of this change in accounting principle will be included in the Funds’ December 31, 2019 Semi-Annual Report.
Note 3. Commitments and Other Affiliated Party Transactions
Investment Adviser – Brown Advisory LLC serves as Investment Adviser (the “Adviser”) to the Funds. Pursuant to investment advisory agreements, the Adviser receives a management fee, accrued daily and payable monthly, from each Fund at an annual rate of the Fund’s average daily net assets as follows:
Fund | Breakpoint | Annual Fee | Fund | Breakpoint | Annual Fee |
| | | | | | |
Growth Equity and | First $1.5 billion | 0.60% | Flexible Equity* | First $150 million | 0.50% |
Sustainable Growth* | $1.5 billion to $3 billion | 0.55% | | $150 million to $250 million | 0.45% |
| | $3 billion to $6 billion | 0.50% | | $250 million to $1 billion | 0.40% |
| | Over $6 billion | 0.45% | | Over $1 billion | 0.38% |
| * | From July 1, 2018 through September 11, 2018, the Adviser voluntarily lowered its management fee by implementing a new breakpoint structure (previously, the management fee was 0.60% of average daily net assets). Effective September 12, 2018, the Adviser contractually lowered its management fee under the same breakpoint structure. |
Fund | Annual Fee | Fund | Annual Fee |
Equity Income | 0.60% | Sustainable Bond | 0.30% |
Mid-Cap Growth | 0.65% | Maryland Bond | 0.30% |
Small-Cap Growth | 0.85% | Tax-Exempt Bond | 0.30% |
Small-Cap Fundamental Value | 0.85% | Mortgage Securities Fund | 0.30% |
Global Leaders1 | 0.65% | WMC Strategic European Equity2 | 0.90% |
Intermediate Income | 0.30% | Emerging Markets Select2,3,4 | 0.90% |
Total Return | 0.30% | Beutel Goodman Large-Cap Value5 | 0.45% |
Strategic Bond | 0.40% | | |
1 | Brown Advisory Limited (“BAL”) serves as sub-adviser to the Global Leaders Fund and makes investment decisions on its behalf. BAL is compensated for its services by the Adviser. |
2 | Wellington Management Company LLP (“Wellington”) serves as sub-adviser to the WMC Strategic European Equity Fund and the Emerging Markets Select Fund and makes investment decisions on their behalf. Wellington is compensated for its services by the Adviser. |
3 | Pzena Investment Management, LLC (“Pzena”) serves as sub-adviser to the Emerging Markets Select Fund and makes investment decisions on its behalf. Pzena is compensated for its services by the Adviser. |
4 | Prior to February 25, 2019, Somerset Capital Management LLP (“Somerset”) served as the sole sub-adviser to the Fund and made investment decisions on its behalf. Somerset was compensated for its services by the Adviser. |
5 | Beutel, Goodman & Company Ltd. (“Beutel Goodman”) serves as sub-adviser to the Beutel Goodman Large-Cap Value Fund and makes investment decisions on its behalf. Beutel Goodman is compensated for its services by the Adviser. |
These fees are reported on the Funds’ Statements of Operations as “Investment advisory fees”.
Business Management Fees – The Adviser is also entitled to receive an annual business management fee of 0.05%, accrued daily and payable monthly, of the Funds’ average daily net assets in exchange for its management and oversight of the non-investment advisory services provided to the Funds and the Trust. These fees are reported on the Funds’ Statements of Operations as “Business management fees”.
www.brownadvisory.com/mf
Notes to Financial Statements
June 30, 2019
Fee Waivers and Expense Reimbursements (Operating Expense Caps) – The Adviser has contractually agreed to waive a portion of its fees and reimburse certain expenses to limit total annual operating expenses as follows:
Fund(s): | Institutional Shares | Investor Shares | Advisor Shares |
Growth Equity, Flexible Equity, Equity Income and Sustainable Growth | 1.00% | 1.15% | 1.35% |
Mid-Cap Growth and Beutel Goodman Large-Cap Value | 0.70% | 0.85% | 1.10% |
Small-Cap Growth and Small-Cap Fundamental Value | 1.25% | 1.40% | 1.60% |
Global Leaders* | 0.75% | 0.90% | 1.15% |
Intermediate Income, Total Return, | | | |
Sustainable Bond, Maryland Bond, Tax-Exempt Bond and Mortgage Securities | 0.55% | 0.60% | 0.80% |
Strategic Bond | 0.65% | 0.70% | 0.95% |
WMC Strategic European Equity and Emerging Markets Select | 1.60% | 1.75% | 2.00% |
| * | Prior to November 1, 2018, the expense caps for the Institutional Shares, Investor Shares, and Advisor Shares of the Global Leaders Fund were 0.70%, 0.85%, and 1.10%, respectively. |
During the year ended June 30, 2019, the Adviser waived $103,738 in expenses for the Mid-Cap Growth Fund and $231,484 in expenses for Global Leaders Fund. The Adviser may recoup any waived amounts from the Funds if such reimbursement does not cause the Funds to exceed its existing expense limitations or the limitation in place at the time the reduction was originally made and the amount recouped is made within three years after the date on which the Adviser waived the expense. The Funds must pay their current ordinary operating expenses before the Adviser is entitled to any recoupment of previously waived fees and/or expenses. The cumulative amounts of previously waived fees that the Adviser may recoup from the Funds are shown below:
| | June 30, |
| | 2020 | 2021 | 2022 | Total |
Mid-Cap Growth Fund | N/A | $ 59,874 | $103,738 | $163,612 |
Global Leaders Fund | $99,017 | 138,801 | 231,484 | 469,302 |
During the year ended June 30, 2019, the Adviser recovered $28,558 of previously waived fees in the Sustainable Bond Fund.
Distribution – ALPS Distributors, Inc. (the “Distributor”) serves as principal underwriter for shares of the Funds, and acts as each Fund’s Distributor in a continuous public offering of each Fund’s shares.
Rule 12b-1 Distribution Fees – Under a Distribution Plan adopted pursuant to Rule 12b-1 under the Act (“Distribution Plan”), each Fund pays ALPS Distributors, Inc. (the “Distributor”), or any other entity as authorized by the Board, as compensation for the distribution-related and/or shareholder services provided by such entities an aggregate fee equal to 0.25% of the average daily net assets of Advisor Shares for each Fund. The Distributor may pay any or all amounts received under the Rule 12b-1 Plan to financial intermediaries or other persons, including the Adviser, for any distribution or service activity. These fees are reported in the Funds’ Statements of Operations as “Distribution Fees – Advisor Shares”. Prior to March 29, 2019, Quasar Distributors, LLC, an affiliate of the Administrator, served as principal underwriter and distributor of the Funds.
Shareholder Servicing Fees – The Trust has also adopted a Shareholder Service Plan under which each Fund may pay a fee of up to 0.15% of the average daily net assets of each Fund’s Investor and Advisor Shares (except for the Intermediate Income Fund, Total Return Fund, Strategic Bond Fund, Sustainable Bond Fund, Maryland Bond Fund, Tax-Exempt Bond Fund and Mortgage Securities Fund, which may pay a fee of up to 0.05%) for shareholder services provided to the Funds by financial institutions, including the Adviser. The Adviser serves as the shareholder servicing agent of the Funds. These fees are reported in the Funds’ Statements of Operations as “Service Fees – Investor Shares” and “Service Fees – Advisor Shares”.
Investments in Affiliates – Intermediate Income Fund
The Intermediate Income Fund and Mortgage Securities Fund are considered affiliates since Brown Advisory LLC is the Adviser to both of the Funds. In seeking to achieve its investment objective, the Intermediate Income Fund invests a portion of its assets into the Mortgage Securities Fund. As of June 30, 2019, the Intermediate Income Fund owned shares of the Mortgage Securities Fund with a total market value of $27,337,169, or 19.7% of the Intermediate Income Fund’s net assets.
www.brownadvisory.com/mf
Notes to Financial Statements
June 30, 2019
The Intermediate Income Fund has entered into a Fee Waiver Agreement (the “Agreement”) with the Adviser. Per the Agreement, the Intermediate Income Fund will waive Advisory Fees in an amount equal to the Advisory Fees earned by the Mortgage Securities Fund on the assets invested into it by the Intermediate Income Fund. For example, if the Intermediate Income Fund owned $10,000,000 worth of the Mortgage Securities Fund for an entire year, it would waive, on an annual basis, $30,000 in Advisory Fees ($10,000,000 multiplied by 0.30%, the annual Advisory Fee ratio for the Mortgage Securities Fund). For the year ended June 30, 2019, the Intermediate Income Fund waived $76,301 in Advisory Fees per the terms of the Agreement. This is a permanent waiver of fees and these waived fees may not be recouped by the Adviser at any time in the future.
See the table below for details of the Intermediate Income Fund’s investment in the Mortgage Securities Fund Institutional Shares for the year ended June 30, 2019:
| | | | Net | Change In | | Unrealized | | |
| Beginning | | | Realized | Unrealized | Ending | Appreciation | | |
| Market Value | Purchases | Proceeds | Gains | Appreciation | Market Value | (Depreciation) | Dividend | Capital Gain |
7/01/2018 | at Cost | from Sales | (Losses) | (Depreciation) | 6/30/2019 | 6/30/2019 | Income | Distributions |
| $24,318,345 | $3,000,000 | $(1,000,000) | $(58,395) | $1,077,219 | $27,337,169 | $(19,443) | $695,005 | $ — |
Other Service Providers – U.S. Bancorp Fund Services, LLC (“Fund Services”), doing business as U.S. Bank Global Fund Services, an indirect wholly-owned subsidiary of U.S. Bancorp, serves as the Funds’ Administrator (“Administrator”), and in that capacity, performs various administrative services for the Funds. Fund Services also serves as the Funds’ fund accountant and transfer agent. Certain officers of the Trust are employees of Fund Services and the Funds’ custodian, U.S. Bank, N.A., is an affiliate of the Administrator. Fees paid to Fund Services and U.S. Bank, N.A. for its service can be found in the Statements of Operations as “Administration, accounting and transfer agent fees” and “Custodian fees”, respectively. Additional amounts for miscellaneous expenses may be paid by the Funds to Fund Services and included in “Miscellaneous expenses” in the Statements of Operations.
Rule 17a-7 Transactions – Each Fund is permitted to purchase and sell securities to certain affiliated parties under specified conditions outlined in procedures adopted by the Board of Trustees pursuant to Rule 17a-7 under the 1940 Act. Pursuant to these procedures, during the year ended June 30, 2019, the Emerging Markets Select Fund engaged in securities purchases of $217,072. These transactions are included in the purchases and sales table in Note 4.
Note 4. Purchases and Sales of Securities
The cost of purchases and the proceeds from sales of investments (including maturities), other than short-term investments, for the year ended June 30, 2019 were as follows:
| Fund | | Purchases | | | Sales | | Fund | | Purchases | | | Sales | |
Growth Equity | | $ | 435,093,482 | | | $ | 482,028,843 | | Total Return | | $ | 307,458,955 | | | $ | 186,554,046 | |
Flexible Equity | | | 63,948,128 | | | | 70,567,878 | | Strategic Bond | | | 239,358,097 | | | | 199,332,342 | |
Equity Income | | | 9,826,756 | | | | 24,774,846 | | Sustainable Bond | | | 127,096,760 | | | | 58,621,116 | |
Sustainable Growth | | | 676,269,322 | | | | 194,667,334 | | Maryland Bond | | | 57,450,633 | | | | 58,619,756 | |
Mid-Cap Growth | | | 30,311,686 | | | | 13,968,784 | | Tax-Exempt Bond | | | 827,464,940 | | | | 337,242,219 | |
Small-Cap Growth | | | 676,028,188 | | | | 434,232,594 | | Mortgage Securities | | | 640,131,245 | | | | 741,539,294 | |
Small-Cap Fundamental Value | | | 395,940,669 | | | | 609,617,286 | | WMC Strategic European Equity | | | 230,291,620 | | | | 655,818,382 | |
Global Leaders | | | 154,931,374 | | | | 33,275,813 | | Emerging Markets Select | | | 432,232,139 | | | | 630,602,255 | |
Intermediate Income | | | 114,585,081 | | | | 104,330,705 | | Beutel Goodman Large-Cap Value | | | 213,987,367 | | | | 93,367,683 | |
The Intermediate Income Fund purchased $38,241,745 and sold $39,948,677 in U.S. Government securities for the year ended June 30, 2019. The Total Return Fund purchased $34,795,908 and sold $16,643,314 in U.S. Government securities for the year ended June 30, 2019. The Sustainable Bond Fund purchased $30,644,477 and sold $30,752,044 in U.S. Government securities for the year ended June 30, 2019. The Mortgage Securities Fund purchased $18,943,361 and sold $15,984,607 in U.S. Government securities for the year ended June 30, 2019. Purchases and sales of U.S. Government securities are included in the totals above and include U.S. Treasury Bonds and Notes.
www.brownadvisory.com/mf
Notes to Financial Statements
June 30, 2019
Note 5. Federal Income Tax and Distribution Information
At June 30, 2019, the components of distributable earnings (accumulated losses) on a tax basis were as follows:
| | | Growth | | | Flexible | | | Equity | | | Sustainable | | | Mid-Cap | | | Small-Cap | |
| | | Equity | | | Equity | | | Income | | | Growth | | | Growth | | | Growth | |
| | | Fund | | | Fund | | | Fund | | | Fund | | | Fund | | | Fund | |
Cost of investments | | $ | 1,293,328,783 | | | $ | 278,577,796 | | | $ | 52,772,839 | | | $ | 996,079,467 | | | $ | 37,994,739 | | | $ | 1,045,528,343 | |
Unrealized appreciation | | | 1,079,698,735 | | | | 214,224,179 | | | | 37,733,172 | | | | 381,426,166 | | | | 8,363,081 | | | | 366,419,978 | |
Unrealized depreciation | | | (15,053,410 | ) | | | (9,369,790 | ) | | | (614,672 | ) | | | (8,797,585 | ) | | | (1,327,787 | ) | | | (42,848,929 | ) |
Net unrealized app (dep) | | | 1,064,645,325 | | | | 204,854,389 | | | | 37,118,500 | | | | 372,628,581 | | | | 7,035,294 | | | | 323,571,049 | |
Undistributed income | | | — | | | | 2,368,648 | | | | 9,678 | | | | — | | | | 105,389 | | | | 964,545 | |
Undistributed capital gains | | | 82,104,473 | | | | 13,422,716 | | | | 5,545,260 | | | | 14,026,240 | | | | 44,964 | | | | 24,659,014 | |
Total undistributed earnings | | | 82,104,473 | | | | 15,791,364 | | | | 5,554,938 | | | | 14,026,240 | | | | 150,353 | | | | 25,623,559 | |
Other accumulated gains (losses) | | | (2,356,831 | ) | | | 13 | | | | — | | | | — | | | | — | | | | — | |
Total distributable earnings (losses) | | $ | 1,144,392,967 | | | $ | 220,645,766 | | | $ | 42,673,438 | | | $ | 386,654,821 | | | $ | 7,185,647 | | | $ | 349,194,608 | |
| | | | | | | | | | | | | | | | | | | | | | | | | |
| | | Small-Cap | | | Global | | | Intermediate | | | Total | | | Strategic | | | Sustainable | |
| | | Fundamental | | | Leaders | | | Income | | | Return | | | Bond | | | Bond | |
| | | Value Fund | | | Fund | | | Fund | | | Fund | | | Fund | | | Fund | |
Cost of investments | | $ | 863,217,659 | | | $ | 197,977,745 | | | $ | 136,316,591 | | | $ | 243,928,042 | | | $ | 203,742,201 | | | $ | 119,005,754 | |
Unrealized appreciation | | | 240,954,158 | | | | 38,580,203 | | | | 2,645,118 | | | | 5,304,074 | | | | 2,521,600 | | | | 4,188,751 | |
Unrealized depreciation | | | (72,570,493 | ) | | | (3,321,437 | ) | | | (611,156 | ) | | | (736,397 | ) | | | (664,937 | ) | | | (141,984 | ) |
Net unrealized app (dep) | | | 168,383,665 | | | | 35,258,766 | | | | 2,033,962 | | | | 4,567,677 | | | | 1,856,663 | | | | 4,046,767 | |
Undistributed income | | | — | | | | 936,191 | | | | 94,560 | | | | 2,226,186 | | | | 518,382 | | | | 519,147 | |
Undistributed capital gains | | | 27,229,520 | | | | — | | | | — | | | | 1,414,199 | | | | — | | | | 129,875 | |
Total undistributed earnings | | | 27,229,520 | | | | 936,191 | | | | 94,560 | | | | 3,640,385 | | | | 518,382 | | | | 649,022 | |
Other accumulated gains (losses) | | | — | | | | (3,013,215 | ) | | | (1,191,045 | ) | | | (403,222 | ) | | | (5,046,520 | ) | | | (234,904 | ) |
Total distributable earnings (losses) | | $ | 195,613,185 | | | $ | 33,181,742 | | | $ | 937,477 | | | $ | 7,804,840 | | | $ | (2,671,475 | ) | | $ | 4,460,885 | |
| | | | | | | | | | | | | | | | | | | | | | | | |
| | | | | | | | | | |
| | | | | | | | | | | Beutel | |
| | | Maryland | | | Tax- | | | Mortgage | | | WMC Strategic | | | Emerging | | | Goodman | |
| | | Bond | | | Exempt | | | Securities | | | European | | | Markets | | | Large-Cap | |
| | | Fund | | | Bond Fund | | | Fund | | | Equity Fund | | | Select Fund | | | Value Fund | |
Cost of investments | | $ | 176,165,188 | | | $ | 929,827,424 | | | $ | 275,075,130 | | | $ | 429,107,744 | | | $ | 320,989,938 | | | $ | 286,658,154 | |
Gross unrealized appreciation | | | 5,261,238 | | | | 27,655,436 | | | | 8,412,963 | | | | 92,701,543 | | | | 20,903,949 | | | | 28,711,321 | |
Gross unrealized depreciation | | | (294,294 | ) | | | (1,802,801 | ) | | | (2,115,157 | ) | | | (30,001,979 | ) | | | (14,218,221 | ) | | | (20,221,341 | ) |
Net unrealized app (dep) | | | 4,966,944 | | | | 25,852,635 | | | | 6,297,806 | | | | 62,699,564 | | | | 6,685,728 | | | | 8,489,980 | |
Undistributed income | | 285,238 | ^ | | 1,793,846 | ^ | | | 459,035 | | | | 4,318,580 | | | | 1,319,782 | | | | 5,267,009 | |
Undistributed capital gains | | | — | | | | — | | | | — | | | | 10,992,308 | | | | — | | | | 1,432,531 | |
Total undistributed earnings | | 285,238 | ^
| | 1,793,846 | ^ | | | 459,035 | | | | 15,310,888 | | | | 1,319,782 | | | | 6,699,540 | |
Other accumulated gains (losses) | | | (1,445,127 | ) | | | (6,925,833 | ) | | | (12,362,952 | ) | | | (9,205 | ) | | | (14,743,546 | ) | | | — | |
Total distributable earnings (losses) | | $ | 3,807,055 | | | $ | 20,720,648 | | | $ | (5,606,111 | ) | | $ | 78,001,247 | | | $ | (6,738,036 | ) | | $ | 15,189,520 | |
^ Represents income that is exempt from federal income taxes.
The differences between tax basis and book basis amounts are primarily due to wash sales, post-October losses, post-December ordinary losses and distributions payable.
www.brownadvisory.com/mf
Notes to Financial Statements
June 30, 2019
At June 30, 2019, the following capital loss carryforwards and tax deferrals were available and outstanding, respectively:
| | | Capital Loss Carryforwards | | | Tax Deferrals | |
| | | | | | | | | | | | Post-October | | | Post-December | |
| Fund | | Short-Term | | | Long-Term | | | Total | | | Capital Losses | | | Ordinary Losses | |
Growth Equity | | $ | — | | | $ | — | | | $ | — | | | $ | — | | | $ | 2,356,831 | |
Flexible Equity | | | — | | | | — | | | | — | | | | — | | | | — | |
Equity Income | | | — | | | | — | | | | — | | | | — | | | | — | |
Sustainable Growth | | | — | | | | — | | | | — | | | | — | | | | — | |
Mid-Cap Growth | | | — | | | | — | | | | — | | | | — | | | | — | |
Small-Cap Growth | | | — | | | | — | | | | — | | | | — | | | | — | |
Small-Cap Fundamental Value | | | — | | | | — | | | | — | | | | — | | | | — | |
Global Leaders | | | 3,012,651 | | | | — | | | | 3,012,651 | | | | — | | | | — | |
Intermediate Income | | | — | | | | 1,096,759 | | | | 1,096,759 | | | | — | | | | — | |
Total Return | | | — | | | | — | | | | — | | | | — | | | | — | |
Strategic Bond | | | 3,278,143 | | | | 1,330,855 | | | | 4,608,998 | | | | — | | | | — | |
Sustainable Bond | | | — | | | | — | | | | — | | | | — | | | | — | |
Maryland Bond | | | 178,094 | | | | 981,855 | | | | 1,159,949 | | | | — | | | | — | |
Tax-Exempt Bond | | | 1,700,045 | | | | 3,431,782 | | | | 5,131,827 | | | | — | | | | — | |
Mortgage Securities | | | 7,821,101 | | | | 4,155,817 | | | | 11,976,918 | | | | — | | | | — | |
WMC Strategic European Equity | | | — | | | | — | | | | — | | | | — | | | | — | |
Emerging Markets Select | | | 14,749,071 | | | | — | | | | 14,749,071 | | | | — | | | | — | |
Beutel Goodman Large-Cap Value | | | — | | | | — | | | | — | | | | — | | | | — | |
Distributions during the fiscal periods ended as noted were characterized for tax purposes as follows:
| | | Tax Exempt Income | | | Ordinary Income | | | Long-Term Capital Gain^ | |
| | | June 30, | | | June 30, | | | June 30, | | | June 30, | | | June 30, | | | June 30, | |
| Fund | | 2019 | | | 2018 | | | 2019 | | | 2018 | | | 2019 | | | 2018 | |
| Growth Equity | | $ | — | | | $ | — | | | $ | — | | | $ | — | | | $ | 202,855,773 | | | $ | 144,114,162 | |
| Flexible Equity | | | — | | | | — | | | | 2,104,882 | | | | 2,075,622 | | | | 14,658,366 | | | | — | |
| Equity Income | | | — | | | | — | | | | 1,928,181 | | | | 2,012,078 | | | | 9,837,503 | | | | 3,329,274 | |
| Sustainable Growth | | | — | | | | — | | | | 1,432,651 | | | | — | | | | 24,715,805 | | | | 8,367,895 | |
| Mid-Cap Growth | | | — | | | | — | | | | 280,109 | | | | — | | | | — | | | | — | |
| Small-Cap Growth | | | — | | | | — | | | | 11,630,630 | | | | 2,657,312 | | | | 28,238,707 | | | | 10,276,150 | |
| Small-Cap Fundamental Value | | | — | | | | — | | | | 20,916,108 | | | | 19,877,192 | | | | 112,248,607 | | | | 32,961,277 | |
| Global Leaders | | | — | | | | — | | | | 347,102 | | | | 43,629 | | | | — | | | | — | |
| Intermediate Income | | | — | | | | — | | | | 3,320,169 | | | | 3,011,904 | | | | — | | | | — | |
| Total Return | | | — | | | | — | | | | 5,950,670 | | | | 3,327,124 | | | | — | | | | — | |
| Strategic Bond | | | — | | | | — | | | | 6,389,003 | | | | 3,760,050 | | | | — | | | | — | |
| Sustainable Bond | | | — | | | | — | | | | 2,806,828 | | | | 607,063 | | | | — | | | | — | |
| Maryland Bond | | | 4,779,731 | | | | 4,411,293 | | | | 65,895 | | | | 48,858 | | | | — | | | | — | |
| Tax-Exempt Bond | | | 21,013,692 | | | | 9,857,181 | | | | 781,501 | | | | 232,534 | | | | — | | | | — | |
| Mortgage Securities | | | — | | | | — | | | | 7,960,762 | | | | 7,967,974 | | | | — | | | | — | |
| WMC Strategic European Equity | | | — | | | | — | | | | 13,352,788 | | | | 11,692,696 | | | | 63,683,372 | | | | — | |
| Emerging Markets Select | | | — | | | | — | | | | 9,238,919 | | | | 6,156,538 | | | | — | | | | — | |
| Beutel Goodman Large-Cap Value | | | — | | | | — | | | | 4,272,001 | | | | — | | | | — | | | | — | |
| ^ | Designated as a long-term capital gain dividend, pursuant to Internal Revenue Code Section 852(b)(3). The Funds, as applicable, have also designated earnings and profits distributed to shareholders on the redemption of shares as capital gains in order to reduce earnings and profits of the Fund related to net capital gains to zero for the year ended as of the date of this report. |
U.S GAAP requires that certain components of net assets (presented on the Statements of Assets and Liabilities) be reclassified for permanent differences between financial reporting and tax reporting. These reclassifications are primarily the result of net operating losses, investments in real estate investment trusts, foreign currency transactions, distribution reclassifications, and
www.brownadvisory.com/mf
Notes to Financial Statements
June 30, 2019
income adjustments to asset-backed security transactions. These reclassifications have no impact on the net assets of the Funds or the Funds’ NAV’s. For the year ended June 30, 2019, the following reclassifications were made:
| | | Paid-in | | | Distributable | | | | | Paid-in | | | Distributable | |
| Fund | | Capital | | | Earnings (Loss) | | | Fund | | Capital | | | Earnings (Loss) | |
Growth Equity | | $ | 16,578,132 | | | $ | (16,578,132 | ) | | Total Return | | $ | 21,373 | | | $ | (21,373 | ) |
Flexible Equity | | | 1,181,568 | | | | (1,181,568 | ) | | Strategic Bond | | | — | | | | — | |
Equity Income | | | 876,861 | | | | (876,861 | ) | | Sustainable Bond | | | 5,958 | | | | (5,958 | ) |
Sustainable Growth | | | 1,901,654 | | | | (1,901,654 | ) | | Maryland Bond | | | — | | | | — | |
Mid-Cap Growth | | | 63,701 | | | | (63,701 | ) | | Tax-Exempt Bond | | | — | | | | — | |
Small-Cap Growth | | | 3,694,762 | | | | (3,694,762 | ) | | Mortgage Securities | | | — | | | | — | |
Small-Cap Fundamental Value | | | 15,740,643 | | | | (15,740,643 | ) | | WMC Strategic European Equity | | | 13,086,016 | | | | (13,086,016 | ) |
Global Leaders | | | — | | | | — | | | Emerging Markets Select | | | — | | | | — | |
Intermediate Income | | | — | | | | — | | | Beutel Goodman Large-Cap Value | | | 780,860 | | | | (780,860 | ) |
Note 6. Futures Contracts
The Intermediate Income Fund, Total Return Fund, Strategic Bond Fund, Sustainable Bond Fund, and Mortgage Securities Fund invested in futures contracts during the year ended June 30, 2019. At the time a Fund purchases or enters into a futures contract, the Fund deposits and maintains as collateral an initial margin with the broker, as required by the terms of the contract. This collateral may consist of cash and / or securities (generally U.S. Treasury Bills). Thereafter, in connection with changes in the market value of the futures contracts, the Funds may send or receive collateral to or from the broker. Such amounts are included on the Statements of Assets and Liabilities as “Cash deposit at broker – futures contracts” or “Cash collateral from broker – futures contracts”. Securities pledged as collateral are included on the Statements of Assets and Liabilities as part of “Total investments, at market value”. These securities are tickmarked on the Schedules of Investments as being pledged in connection with open futures contracts. At June 30, 2019, the Funds did not have any securities pledged in connection with open futures contracts.
Pursuant to the contract, the Fund agrees to receive from or pay to the broker an amount of cash equal to the fluctuation in the value of the contract. These daily fluctuations are known as variation margin and are recorded by the Fund as unrealized gains or losses on futures contracts. When these futures contracts are closed, realized gains or losses on futures contracts are recorded by the Fund. The realized gains or losses are reported in the Statement of Operations as net realized gains or losses from futures contracts. Depending upon the agreement with the broker, the Funds may or may not settle variation margin daily. The Funds attempt to mitigate counterparty credit risk by only entering into futures contracts with brokers that the Funds believe have the financial resources to honor their obligations and by monitoring the financial stability of these brokers. The “Notional Amount” of futures contracts shown on the Schedule of Investments represents the notional market value of the futures contracts on the day they were opened. The “Notional Value” of futures contracts shown on the Schedule of Investments represents the notional market value of the futures contracts as of the date of this report. For long futures contracts, an excess of Notional Value over Notional Amount results in unrealized appreciation on the futures contract (and an excess of Notional Amount over Notional Value results in unrealized depreciation on the futures contract). The opposite is true for short futures contracts. These unrealized appreciation (depreciation) amounts represent the net impact on a Fund’s net assets as a result of open futures contracts as of the date of this report. The use of long futures contracts by the Funds subjects them to a risk of loss in excess of the gross unrealized appreciation and/or gross unrealized depreciation amounts shown on the Statements of Assets and Liabilities and up to the total Notional Amount of the futures contract as shown on the Schedule of Investments. The use of short futures contracts by the Funds subjects them to a risk of loss in excess of the gross unrealized appreciation and/or gross unrealized depreciation amounts shown on the Statements of Assets and Liabilities and, hypothetically, up to an unlimited amount of loss that could exceed the Notional Amount of the futures contracts as shown on the Schedules of Investments.
www.brownadvisory.com/mf
Notes to Financial Statements
June 30, 2019
During the year ended June 30, 2019, investments in futures contracts were as follows:
| | | | | Average Notional Value Outstanding | |
| Fund | | Risk Type | | Long Futures Contracts | | | Short Futures Contracts | |
Intermediate Income | | Interest Rate | | $ | 6,802,167 | | | $ | — | |
Total Return | | Interest Rate | | | 54,771,118 | | | | (4,081,565 | ) |
Strategic Bond | | Interest Rate | | | — | | | | (3,131,066 | ) |
Sustainable Bond | | Interest Rate | | | 10,672,840 | | | | (7,548,885 | ) |
Mortgage Securities | | Interest Rate | | | 42,727,746 | | | | (54,867,195 | ) |
Investment in long futures contracts increases a Fund’s exposure to interest rate risk, while investment in short futures contracts serves to reduce a Fund’s exposure to interest rate risk. Assets and/or liabilities related to futures contracts were not subject to an arrangement wherein those assets and/or liabilities were, or could have been, settled on a net basis with any other derivative related obligations.
Note 7. Line of Credit
As of June 30, 2019, Brown Advisory Funds has an unsecured line of credit of up to $100,000,000 with U.S. Bank, N.A. The interest rate on the line of credit as of June 30, 2019 was 5.50% (prime rate). The following table shows the details of the Funds’ borrowing activity during the year ended June 30, 2019. Funds that are not listed did not utilize the line of credit during the period.
| | | Maximum | | | | | | Total Interest | | | Average | |
| | | Outstanding | | | Average Daily | | | Expense | | | Annual | |
| Fund | | Balance | | | Balance | | | Incurred | | | Interest Rate | |
Mid-Cap Growth | | $ | 864,000 | | | $ | 6,066 | | | $ | 321 | | | | 5.23 | % |
Maryland Bond | | | 303,000 | | | | 2,490 | | | | 133 | | | | 5.25 | % |
WMC Strategic European Equity | | | 37,056,000 | | | | 344,268 | | | | 17,549 | | | | 5.03 | % |
Emerging Markets Select | | | 35,961,000 | | | | 1,008,203 | | | | 54,906 | | | | 5.37 | % |
Beutel Goodman Large-Cap Value | | | 11,083,000 | | | | 91,093 | | | | 5,080 | | | | 5.50 | % |
As of the date of this report, none of the Funds had any outstanding borrowings under the line of credit.
Note 8. Subsequent Events
In preparing these financial statements, the Funds have evaluated events and transactions for potential recognition through the date the financial statements were issued. No material events or transactions occurred subsequent to June 30, 2019 that would require recognition or disclosure in these financial statements.
www.brownadvisory.com/mf
Notes to Financial Statements
June 30, 2019
Note 9. SEC Disclosure Update and Simplification Release
The SEC Disclosure Update and Simplification Release has prescribed that distributions presented in the Statements of Changes in Net Assets will no longer be presented separately as from net investment income and net realized gain and will instead be shown only in total (except for distributions deemed to be a return of capital). For reference, prior year distributions which are no longer presented separately on the Statements of Changes in Net Assets as from net investment income and net realized gain were categorized as follows:
| | | Fiscal Year Ended June 30, 2018 | |
| | | Net Investment Income | | | Net Realized Gain | |
| | | Institutional | | | Investor | | | Advisor | | | Institutional | | | Investor | | | Advisor | |
| Fund | | Shares | | | Shares | | | Shares | | | Shares | | | Shares | | | Shares | |
| Growth Equity | | | — | | | | — | | | | — | | | | 23,141,509 | | | | 120,503,157 | | | | 469,496 | |
| Flexible Equity | | | 643,925 | | | | 1,422,429 | | | | 9,268 | | | | — | | | | — | | | | — | |
| Equity Income | | | 512,185 | | | | 1,236,776 | | | | 24,423 | | | | 916,839 | | | | 2,572,585 | | | | 78,544 | |
| Sustainable Growth | | | — | | | | — | | | | — | | | | 4,421,769 | | | | 802,354 | | | | 3,143,772 | |
| Mid-Cap Growth | | | — | | | | — | | | | — | | | | — | | | | — | | | | — | |
| Small-Cap Growth | | | 1,427,349 | | | | 1,204,104 | | | | 25,859 | | | | 4,901,077 | | | | 5,113,684 | | | | 261,389 | |
| Small-Cap Fundamental Value | | | 2,681,377 | | | | 4,805,086 | | | | 62,036 | | | | 13,597,047 | | | | 30,834,877 | | | | 858,046 | |
| Global Leaders | | | — | | | | 43,629 | | | | — | | | | — | | | | — | | | | — | |
| Intermediate Income | | | — | | | | 2,930,957 | | | | 80,947 | | | | — | | | | — | | | | — | |
| Total Return | | | 3,247,038 | | | | 80,086 | | | | — | | | | — | | | | — | | | | — | |
| Strategic Bond | | | 3,754,542 | | | | 5,508 | | | | — | | | | — | | | | — | | | | — | |
| Sustainable Bond | | | — | | | | 607,063 | | | | — | | | | — | | | | — | | | | — | |
| Maryland Bond | | | — | | | | 4,460,151 | | | | — | | | | — | | | | — | | | | — | |
| Tax-Exempt Bond | | | — | | | | 10,089,715 | | | | — | | | | — | | | | — | | | | — | |
| Mortgage Securities | | | 7,958,014 | | | | 9,960 | | | | — | | | | — | | | | — | | | | — | |
| WMC Strategic European Equity | | | 11,440,046 | | | | 101,939 | | | | 150,711 | | | | — | | | | — | | | | — | |
| Emerging Markets Select | | | 4,634,486 | | | | 1,520,480 | | | | 1,572 | | | | — | | | | — | | | | — | |
| Beutel Goodman Large-Cap Value | | | — | | | | — | | | | — | | | | — | | | | — | | | | — | |
www.brownadvisory.com/mf
Report of Independent Registered Public Accounting Firm
To the Shareholders and Board of Trustees
Brown Advisory Funds
Baltimore, MD
Opinion on the Financial Statements
We have audited the accompanying statements of assets and liabilities of Brown Advisory Growth Equity Fund, Brown Advisory Flexible Equity Fund, Brown Advisory Equity Income Fund, Brown Advisory Sustainable Growth Fund, Brown Advisory Mid-Cap Growth Fund, Brown Advisory Small-Cap Growth Fund, Brown Advisory Small-Cap Fundamental Value Fund, Brown Advisory Global Leaders Fund, Brown Advisory Intermediate Income Fund, Brown Advisory Total Return Fund, Brown Advisory Strategic Bond Fund, Brown Advisory Sustainable Bond Fund, Brown Advisory Maryland Bond Fund, Brown Advisory Tax-Exempt Bond Fund, Brown Advisory Mortgage Securities Fund, Brown Advisory – WMC Strategic European Equity Fund, Brown Advisory Emerging Markets Select Fund (formerly Brown Advisory – Somerset Emerging Markets Fund), and Brown Advisory – Beutel Goodman Large-Cap Value Fund (the “Funds”), each a series of Brown Advisory Funds (the “Trust”), including the schedules of investments, as of June 30, 2019, the related statements of operations, the statements of changes in net assets, financial highlights for the periods indicated thereon, and the related notes (collectively referred to as the “financial statements”). In our opinion, the financial statements present fairly, in all material respects, the financial position of the Funds as of June 30, 2019, the results of their operations, the changes in their net assets, and their financial highlights for the periods indicated thereon, in conformity with accounting principles generally accepted in the United States of America.
Basis for Opinion
These financial statements are the responsibility of the Funds’ management. Our responsibility is to express an opinion on the Funds’ financial statements based on our audits. We are a public accounting firm registered with the Public Company Accounting Oversight Board (United States) (“PCAOB”) and are required to be independent with respect to the Funds in accordance with the U.S. federal securities laws and the applicable rules and regulations of the Securities and Exchange Commission and the PCAOB. We have served as the auditor of one or more of the funds in the Trust since 2008.
We conducted our audits in accordance with the standards of the PCAOB. Those standards require that we plan and perform the audits to obtain reasonable assurance about whether the financial statements are free of material misstatement, whether due to error or fraud. The Funds are not required to have, nor were we engaged to perform, an audit of the Funds’ internal control over financial reporting. As part of our audits we are required to obtain an understanding of internal control over financial reporting, but not for the purpose of expressing an opinion on the effectiveness of the Funds’ internal control over financial reporting. Accordingly, we express no such opinion.
Our audits included performing procedures to assess the risks of material misstatement of the financial statements, whether due to error or fraud, and performing procedures that respond to those risks. Such procedures included examining, on a test basis, evidence regarding the amounts and disclosures in the financial statements. Our audits also included evaluating the accounting principles used and significant estimates made by management, as well as evaluating the overall presentation of the financial statements. Our procedures included confirmation of securities owned as of June 30, 2019 by correspondence with the custodian and brokers; when replies were not received from brokers, we performed other auditing procedures. We believe that our audits provide a reasonable basis for our opinion.
Philadelphia, Pennsylvania
August 28, 2019
www.brownadvisory.com/mf
Expense Example For the Six Months Ended June 30, 2019 (Unaudited)
As a shareholder of a Fund you incur two types of costs: (1) transaction costs, including redemption fees and exchange fees; and (2) ongoing costs, including investment advisory fees; distribution and/or service fees; and other Fund expenses. This example is intended to help you understand your ongoing costs (in dollars) of investing in a Fund and to compare these costs with the ongoing costs of investing in other mutual funds. The example is based on an investment of $1,000 invested at the beginning of the six month period and held for the entire period (January 1, 2019 – June 30, 2019).
Actual Expenses
The Actual Expenses columns in the following table provides information about actual account values based on actual returns and actual expenses. As a shareholder you will be assessed fees for outgoing wire transfers, returned checks and stop payment orders at prevailing rates charged by U.S. Bancorp Fund Services, LLC, the Funds’ transfer agent. If you request that a redemption be made by wire transfer, currently, the Funds’ transfer agent charges a $15.00 fee. You will be charged a redemption fee equal to 1.00% of the net amount of the redemption if you redeem your shares less than 14 days after you purchase, with certain limited exceptions. Individual Retirement Accounts (“IRA”) that are held directly at the Funds will be charged a $15.00 annual maintenance fee. IRAs held by broker-dealers or through other means, may or may not incur an annual maintenance fee. Yet, if IRAs maintenance fees are charged to accounts held elsewhere, the fees charged may be more or may be less than $15.00. To the extent the Funds invest in shares of other investment companies as part of their investment strategy, you will indirectly bear your proportionate share of any fees and expenses charged by the underlying funds in which the Funds invest in addition to the expenses of the Funds. Actual expenses of the underlying funds may vary. These expenses are not included in the example below. The example below includes, but is not limited to, investment advisory, shareholder servicing, fund accounting, custody and transfer agent fees. However, the example below does not include portfolio trading commissions and related expenses. You may use the information in this line, together with the amount you invested, to estimate the expenses that you paid over the period. Simply divide your account value by $1,000 (for example, an $8,600 account value divided by $1,000 = 8.6). Then, multiply the result by the number in the first line under the heading entitled “Expenses Paid During the Period” to estimate the expenses you paid on your account during this period.
Hypothetical Example for Comparison Purposes
The Hypothetical Expenses columns in the following table provides information about hypothetical account values based on a hypothetical return and hypothetical expenses based on the Funds’ actual expense ratio and an assumed rate of return of 5% per year before expenses, which is not the Funds’ actual return. The hypothetical account values and expenses may not be used to estimate the actual ending account balance or expenses you paid for the period. You may use this information to compare the ongoing costs of investing in the Funds and other funds. To do so, compare this 5% hypothetical example with the 5% hypothetical examples that appear in the shareholder reports of the other funds. Please note that the expenses shown in the table are meant to highlight your ongoing costs only and do not reflect any transactional costs, such as sales charges (loads), redemption fees or exchange fees. Therefore, the hypothetical information in the table is useful in comparing ongoing costs only and will not help you determine the relative total costs of owning different funds. In addition, if these transactional costs were included, your costs would have been higher.
| | | Actual Expenses | | Hypothetical Expenses | |
| | Beginning | Ending | | | Ending | | Annualized |
| | Account Value | Account Value | Expenses Paid | | Account Value | Expenses Paid | Net Expense |
| | January 1, 2019 | June 30, 2019 | During the Period* | | June 30, 2019 | During the Period* | Ratio* |
| Growth Equity Fund | | | | | | | |
| Institutional Shares | $1,000.00 | $1,264.00 | $3.93 | | $1,021.32 | $3.51 | 0.70% |
| Investor Shares | $1,000.00 | $1,263.50 | $4.77 | | $1,020.58 | $4.26 | 0.85% |
| Advisor Shares | $1,000.00 | $1,261.70 | $6.17 | | $1,019.34 | $5.51 | 1.10% |
| | | | | | | | |
| Flexible Equity Fund | | | | | | | |
| Institutional Shares | $1,000.00 | $1,198.10 | $3.11 | | $1,021.97 | $2.86 | 0.57% |
| Investor Shares | $1,000.00 | $1,197.30 | $3.92 | | $1,021.22 | $3.61 | 0.72% |
| Advisor Shares | $1,000.00 | $1,196.40 | $5.28 | | $1,019.98 | $4.86 | 0.97% |
www.brownadvisory.com/mf
Expense Example For the Six Months Ended June 30, 2019 (Unaudited)
| | | | | | |
| | | Actual Expenses | | Hypothetical Expenses | |
| | Beginning | Ending | | | Ending | | Annualized |
| | Account Value | Account Value | Expenses Paid | | Account Value | Expenses Paid | Net Expense |
| | January 1, 2019 | June 30, 2019 | During the Period* |
| June 30, 2019 | During the Period* | Ratio* |
| Equity Income Fund | | | | | | | |
| Institutional Shares | $1,000.00 | $1,194.10 | $4.46 | | $1,020.73 | $4.11 | 0.82% |
| Investor Shares | $1,000.00 | $1,193.20 | $5.27 | | $1,019.98 | $4.86 | 0.97% |
| Advisor Shares | $1,000.00 | $1,191.90 | $6.63 | | $1,018.74 | $6.11 | 1.22% |
| | | | | | | | |
| Sustainable Growth Fund | | | | | | | |
| Institutional Shares | $1,000.00 | $1,254.90 | $4.08 | | $1,021.17 | $3.66 | 0.73% |
| Investor Shares | $1,000.00 | $1,254.00 | $4.92 | | $1,020.43 | $4.41 | 0.88% |
| Advisor Shares | $1,000.00 | $1,252.00 | $6.31 | | $1,019.19 | $5.66 | 1.13% |
| | | | | | | | |
| Mid-Cap Growth Fund | | | | | | | |
| Institutional Shares | $1,000.00 | $1,314.00 | $4.02 | | $1,021.32 | $3.51 | 0.70% |
| Investor Shares | $1,000.00 | $1,313.30 | $4.88 | | $1,020.58 | $4.26 | 0.85% |
| | | | | | | | |
| Small-Cap Growth Fund | | | | | | | |
| Institutional Shares | $1,000.00 | $1,311.60 | $5.67 | | $1,019.89 | $4.96 | 0.99% |
| Investor Shares | $1,000.00 | $1,310.20 | $6.53 | | $1,019.14 | $5.71 | 1.14% |
| Advisor Shares | $1,000.00 | $1,308.80 | $7.96 | | $1,017.90 | $6.95 | 1.39% |
| | | | | | | | |
| Small-Cap Fundamental Value Fund | | | | | | |
| Institutional Shares | $1,000.00 | $1,145.70 | $5.21 | | $1,019.93 | $4.91 | 0.98% |
| Investor Shares | $1,000.00 | $1,144.80 | $6.01 | | $1,019.19 | $5.66 | 1.13% |
| Advisor Shares | $1,000.00 | $1,143.40 | $7.33 | | $1,017.95 | $6.90 | 1.38% |
| | | | | | | | |
| Global Leaders Fund | | | | | | | |
| Institutional Shares | $1,000.00 | $1,202.80 | $4.10 | | $1,021.08 | $3.76 | 0.75% |
| Investor Shares | $1,000.00 | $1,202.10 | $4.91 | | $1,020.33 | $4.51 | 0.90% |
| | | | | | | | |
| Intermediate Income Fund | | | | | | | |
| Investor Shares | $1,000.00 | $1,049.60 | $2.44 | | $1,022.41 | $2.41 | 0.48% |
| Advisor Shares | $1,000.00 | $1,048.40 | $3.71 | | $1,021.17 | $3.66 | 0.73% |
| | | | | | | | |
| Total Return Fund | | | | | | | |
| Institutional Shares | $1,000.00 | $1,070.40 | $2.52 | | $1,022.36 | $2.46 | 0.49% |
| Investor Shares | $1,000.00 | $1,070.20 | $2.77 | | $1,022.12 | $2.71 | 0.54% |
| | | | | | | | |
| Strategic Bond Fund | | | | | | | |
| Institutional Shares | $1,000.00 | $1,040.30 | $3.04 | | $1,021.82 | $3.01 | 0.60% |
| Investor Shares | $1,000.00 | $1,040.00 | $3.29 | | $1,021.57 | $3.26 | 0.65% |
| | | | | | | | |
| Sustainable Bond Fund | | | | | | | |
| Institutional Shares | $1,000.00 | $1,065.70 | $2.82 | | $1,022.07 | $2.76 | 0.55% |
| Investor Shares | $1,000.00 | $1,065.30 | $3.07 | | $1,021.82 | $3.01 | 0.60% |
| | | | | | | | |
| Maryland Bond Fund | | | | | | | |
| Investor Shares | $1,000.00 | $1,044.70 | $2.53 | | $1,022.32 | $2.51 | 0.50% |
| | | | | | | | |
| Tax-Exempt Bond Fund | | | | | | | |
| Institutional Shares | $1,000.00 | $1,049.80 | $2.19 | | $1,022.66 | $2.16 | 0.43% |
| Investor Shares | $1,000.00 | $1,049.50 | $2.44 | | $1,022.41 | $2.41 | 0.48% |
| | | | | | | | |
| Mortgage Securities Fund | | | | | | | |
| Institutional Shares | $1,000.00 | $1,050.00 | $2.34 | | $1,022.51 | $2.31 | 0.46% |
| Investor Shares | $1,000.00 | $1,049.80 | $2.59 | | $1,022.27 | $2.56 | 0.51% |
| | | | | | | | |
| WMC Strategic European Equity Fund | | | | | | |
| Institutional Shares | $1,000.00 | $1,161.50 | $5.52 | | $1,019.69 | $5.16 | 1.03% |
| Investor Shares | $1,000.00 | $1,159.50 | $6.32 | | $1,018.94 | $5.91 | 1.18% |
| Advisor Shares | $1,000.00 | $1,158.60 | $7.65 | | $1,017.70 | $7.15 | 1.43% |
www.brownadvisory.com/mf
Expense Example For the Six Months Ended June 30, 2019 (Unaudited)
| | | Actual Expenses | | Hypothetical Expenses | |
| | Beginning | Ending | | | Ending | | Annualized |
| | Account Value | Account Value | Expenses Paid | | Account Value | Expenses Paid | Net Expense |
| | January 1, 2019 | June 30, 2019 | During the Period* |
| June 30, 2019 | During the Period* | Ratio* |
| Emerging Markets Select Fund | | | | | | |
| Institutional Shares | $1,000.00 | $1,086.00 | $6.72 | | $1,018.35 | $6.51 | 1.30% |
| Investor Shares | $1,000.00 | $1,086.10 | $7.50 | | $1,017.60 | $7.25 | 1.45% |
| Advisor Shares | $1,000.00 | $1,084.50 | $8.79 | | $1,016.36 | $8.50 | 1.70% |
| | | | | | | |
| Beutel Goodman Large-Cap Value Fund | | | | | | |
| Institutional Shares | $1,000.00 | $1,159.50 | $3.21 | | $1,021.82 | $3.01 | 0.60% |
| * | The calculations are based on expenses incurred during the most recent six-month period ended as of the date of this report. The dollar amounts shown as expenses paid during the period are equal to the annualized six-month net expense ratio multiplied by the average account value during the period, multiplied by the number of days (181) in the most recent six-month period divided by the number of days in the Funds’ fiscal year (365). |
www.brownadvisory.com/mf
Board of Trustees Approval of New Sub-Investment Advisory Agreements for the
Brown Advisory Emerging Markets Select Fund
(Unaudited)
In connection with the replacement of the sub-adviser previously used by Brown Advisory in connection with the Brown Advisory Emerging Markets Select Fund (the “Fund”), at a Special Meeting of the Board of Trustees held on February 20, 2019, the Board of Trustees approved the adoption of two new Sub-Advisory Agreements for use with respect to the Fund. Specifically, the Board approved: (i) a new Sub-Advisory Agreement for use between Brown Advisory and Wellington Management Company LLC (“Wellington”) in connection with the assets of the Fund to be allocated by Brown Advisory to Wellington (the “Wellington Sub-Advisory Agreement”) and (ii) a new Sub-Advisory Agreement for use between Brown Advisory and Pzena Investment Management LLC (“Pzena”) in connection with the assets of the Fund to be allocated by Brown Advisory to Pzena (the “Pzena Sub-Advisory Agreement”). (Wellington and Pzena are referred to collectively herein as the “Sub-Advisers”). The shareholders of the Fund approved each of the Wellington Sub-Advisory Agreement and the Pzena Sub-Advisory Agreement at a Special Meeting of the Shareholders of the Fund that was held on April 29, 2019.
In accordance with the Investment Company Act of 1940, the Board of Trustees was required to consider the approval of both the Wellington Sub-Advisory Agreement and the Pzena Sub-Advisory Agreement, and this was required to take place at an in-person meeting of the Board. The relevant provisions of the Investment Company Act of 1940 specifically provide that it is the duty of the Board to request and evaluate such information as the Board determines is necessary to allow them to properly consider the approval of each of the Sub-Advisory Agreements, and it is the duty of the Brown Advisory and each of the Sub-Advisers, as applicable, to furnish the Trustees with such information that is responsive to their request.
Accordingly, in determining whether to approve each of the Wellington Sub-Advisory Agreement and the Pzena Sub-Advisory Agreement, the Board of Trustees requested, and Brown Advisory and each of the Sub-Advisers provided, information and data relevant to the Board’s consideration. This included materials prepared by Brown Advisory and by each of the Sub-Advisers and by the Fund’s administrator that provided the Board with information regarding the investment performance of each of the Sub-Advisers’ separate accounts having similar investment objectives and strategies as the Fund, and information regarding the proposed sub-advisory fees.
The Board of Trustees met at an in-person meeting of the Board held on February 20, 2019 to consider matters with respect to the proposed new Sub-Advisory Agreements and the members of the Board reviewed and considered the proposed approval of each of the Sub-Advisory Agreements. At this meeting, representatives of each of Wellington and Pzena reviewed for the members of the Board their firms’ respective experience and background in managing emerging markets securities, and they also reviewed information regarding the investment advisory process followed by their respective firms and the compliance programs of their firms. In addition, the members of the Board reviewed with each respective firm various matters with respect to the proposed sub-advisory services that they proposed to provide to the Fund with respect to their allocated assets.
The Board then undertook the consideration of various matters with respect to the proposed approval of each of the Sub-Advisory Agreements between Brown Advisory and the proposed new Sub-Advisers. They considered various matters involving the respective services to be provided by each of Brown Advisory and the Sub-Advisers in connection with the management and operation of the Fund and they took note of the extensive oversight duties to be performed by Brown Advisory including investment management and compliance oversight of the operations of the proposed new Sub-Advisers.
The Board reviewed and evaluated the information that Brown Advisory and each of the Sub-Advisers had presented for the Board’s review. Based on its review of all of the information, the Board determined that the proposed new Sub-Advisory Agreements were consistent with the best interests of the Fund and its shareholders and would enable the Fund to receive high quality sub-advisory services at a cost that is appropriate, reasonable, and in the best interests of the Fund and its shareholders.
1. Approval of the Wellington Sub-Advisory Agreement
The factors considered by the Board with respect to the approval of the Wellington Sub-Advisory Agreement is set forth below:
The nature, extent and quality of the sub-investment advisory services to be provided. The Trustees concluded that Wellington is capable of providing high quality sub-advisory services to the Fund, as indicated by the nature and quality of services provided to its other managed accounts having a similar investment objective and strategy as the Fund, the professional qualifications and experience of the proposed portfolio manager for Wellington’s allocated portion of the Fund, and Wellington’s investment management processes. On the basis of the Trustees’ assessment of the nature, extent and quality of the sub-advisory services to be provided by Wellington, the Trustees concluded that Wellington is capable of generating a level of long-term investment performance that is appropriate in light of the Fund’s investment objectives, policies and strategies and competitive with many other comparable investment companies.
www.brownadvisory.com/mfBoard of Trustees Approval of New Sub-Investment Advisory Agreements for the
Brown Advisory Emerging Markets Select Fund
(Unaudited)
The cost of sub-advisory services to be provided and the expected level of profitability. The Board took note of the fact that the sub-advisory fee had been separately negotiated by Brown Advisory and Wellington and was consistent with fee arrangements for sub-advisory services in connection with other sub-advised mutual funds.�� Accordingly, on the basis of the Board’s review of the fees to be charged by Wellington for sub-investment advisory services to be provided to the Fund, the Board concluded that the level of sub-investment advisory fees are appropriate in light of the management fees, overall expense ratios and investment performance of comparable investment companies, and that the sub-advisory fee had been separately negotiated at arms-length by independent third parties.
The extent to which economies of scale may be realized as the Fund grows and whether the advisory fees reflect possible economies of scale. While it was noted that the Fund’s investment advisory fees will not decrease as the Fund’s assets grow because they will not be subject to investment advisory fee breakpoints, the Trustees concluded that the Fund’s investment advisory fees are appropriate in light of the current size of the Fund, and appropriately reflect the current economic environment for Brown Advisory and Wellington and the competitive nature of the mutual fund market. The Trustees then noted that they will have the opportunity to periodically re-examine whether the Fund has achieved economies of scale, and the appropriateness of the investment advisory fees and sub-investment advisory fees with respect to the Fund, in the future at which time the implementation of fee breakpoints on the Fund could be further considered.
Benefits to Wellington from its relationship with the Fund (and any corresponding benefits to the Fund). The Trustees concluded that other benefits that may be derived by Wellington from its relationship with the Fund, including any potential “soft dollar” benefits in connection with the Fund’s brokerage transactions and use of the Fund’s performance track record in advertising materials, are reasonable and fair, and consistent with industry practice and the best interests of the Fund and its shareholders.
Other Considerations. In approving the Wellington Sub-Advisory Agreement, the Trustees determined that Wellington has made a substantial commitment to the recruitment and retention of high quality personnel, and maintains the financial, compliance and operational resources reasonably necessary to provide sub-advisory services to the Fund in a professional manner that is consistent with the best interests of the Fund and its shareholders. The Board also considered matters with respect to the brokerage practices of Wellington, including its soft dollar arrangements and its best-execution procedures, and noted that these were reasonable and consistent with standard industry practice.
Following their further discussion and consideration of questions raised by the Independent Trustees, the Trustees determined that they had received sufficient information relating to the Fund in order to consider the approval of the Wellington Sub-Advisory Agreement. It was noted that in making their determination, the Trustees had considered and relied upon the materials provided to them with respect to the proposed contract and the presentation of the representatives of Brown Advisory and Wellington. In reaching their conclusion with respect to the approval of the Wellington Sub-Advisory Agreement and the level of fees to be paid under the Agreement, the Trustees did not identify any one single factor as being controlling, rather, the Trustees took note of a combination of factors that had influenced their decision making process. They noted the level and quality of investment advisory services provided by Wellington to its other investment advisory clients and they found that these services will benefit the Fund and its shareholders. They also considered the nature of the allocation of the duties and responsibilities for the management and operation of the Fund between Brown Advisory and Wellington and they determined that the sub-advisory fee, as negotiated by Brown Advisory and Wellington, reasonably reflected the nature and extent of the services to be provided by Wellington with respect to the Fund. The Trustees also took into consideration the fact that Wellington currently sub-advises another Fund in the Trust and that Wellington had, until shortly before the Board meeting, also sub-advised another Fund in the Trust, and the Board took note of the fact that Wellington had managed these other Funds in a highly capable manner.
2. Approval of the Pzena Sub-Advisory Agreement
The factors considered by the Board with respect to the approval of the Pzena Sub-Advisory Agreement is set forth below:
The nature, extent and quality of the sub-investment advisory services to be provided. The Trustees concluded that Pzena is capable of providing high quality sub-advisory services to the Fund, as indicated by the nature and quality of services provided to its other managed accounts having a similar investment objective and strategy as the Fund, the professional qualifications and experience of the proposed portfolio managers for Pzena’s allocated portion of the Fund, and Pzena’s investment management processes. On the basis of the Trustees’ assessment of the nature, extent and quality of the sub-advisory services to be provided by Pzena, the Trustees concluded that Pzena is capable of generating a level of long-term investment performance that is appropriate in light of the Fund’s investment objectives, policies and strategies and competitive with many other comparable investment companies.
www.brownadvisory.com/mf
Board of Trustees Approval of New Sub-Investment Advisory Agreements for the
Brown Advisory Emerging Markets Select Fund
(Unaudited)
The cost of sub-advisory services to be provided and the expected level of profitability. The Board took note of the fact that the sub-advisory fee had been separately negotiated by Brown Advisory and Pzena and was consistent with fee arrangements for sub-advisory services in connection with other sub-advised mutual funds. Accordingly, on the basis of the Board’s review of the fees to be charged by Pzena for sub-investment advisory services to be provided to the Fund, the Board concluded that the level of sub-investment advisory fees are appropriate in light of the management fees, overall expense ratios and investment performance of comparable investment companies, and that the sub-advisory fee had been separately negotiated at arms-length by independent third parties.
The extent to which economies of scale may be realized as the Fund grows and whether the advisory fees reflect possible economies of scale. While it was noted that the Fund’s investment advisory fees will not decrease as the Fund’s assets grow because they will not be subject to investment advisory fee breakpoints, the Trustees concluded that the Fund’s investment advisory fees are appropriate in light of the current size of the Fund, and appropriately reflect the current economic environment for Brown Advisory and Pzena and the competitive nature of the mutual fund market. The Trustees then noted that they will have the opportunity to periodically re-examine whether the Fund has achieved economies of scale, and the appropriateness of the investment advisory fees and sub-investment advisory fees with respect to the Fund, in the future at which time the implementation of fee breakpoints on the Fund could be further considered.
Benefits to Pzena from its relationship with the Fund (and any corresponding benefits to the Fund). The Trustees concluded that other benefits that may be derived by Pzena from its relationship with the Fund, including any potential “soft dollar” benefits in connection with the Fund’s brokerage transactions and use of the Fund’s performance track record in advertising materials, are reasonable and fair, and consistent with industry practice and the best interests of the Fund and its shareholders.
Other Considerations. In approving the Pzena Sub-Advisory Agreement, the Trustees determined that Pzena has made a substantial commitment to the recruitment and retention of high quality personnel, and maintains the financial, compliance and operational resources reasonably necessary to provide sub-advisory services to the Fund in a professional manner that is consistent with the best interests of the Fund and its shareholders. The Board also considered matters with respect to the brokerage practices of Pzena, including its soft dollar arrangements and its best-execution procedures, and noted that these were reasonable and consistent with standard industry practice.
Following their further discussion and consideration of questions raised by the Independent Trustees, the Trustees determined that they had received sufficient information relating to the Fund in order to consider the approval of the Pzena Sub-Advisory Agreement. It was noted that in making their determination, the Trustees had considered and relied upon the materials provided to them with respect to the proposed contract and the presentation of the representatives of Brown Advisory and Pzena. In reaching their conclusion with respect to the approval of the Pzena Sub-Advisory Agreement and the level of fees to be paid under the Agreement, the Trustees did not identify any one single factor as being controlling, rather, the Trustees took note of a combination of factors that had influenced their decision making process. They noted the level and quality of investment advisory services provided by Pzena to its other investment advisory clients and they found that these services will benefit the Fund and its shareholders. They also considered the nature of the allocation of the duties and responsibilities for the management and operation of the Fund between Brown Advisory and Pzena and they determined that the sub-advisory fee, as negotiated by Brown Advisory and Pzena, reasonably reflected the nature and extent of the services to be provided by Pzena with respect to the Fund.
www.brownadvisory.com/mf
Trustees and Executive Officers
The Board is responsible for the overall management of the Trust, including general supervision and review of the investment activities of the Funds. The Board, in turn, elects the Officers of the Trust, who are responsible for administering the day-to-day operations of the Trust and each of the Funds. The current Trustees and Officers of the Trust, their ages and positions with the Trust, term of office with the Trust and length of time served, their principal occupations for the past five years and other directorships held during the past five years are set forth in the table below.
Additional information about the Trustees of the Trust can be found in the Statement of Additional Information, which is available, without charge, upon request, by calling Brown Advisory Funds toll free at 1-800-540-6807 or by accessing our website at www.brownadvisory.com/mf/how-to-invest.
| | | | | Number of | Other |
| | | Term of | | Portfolios in | Directorships |
| | | Office and | | Fund Complex | Held During |
| Name, Age | Position with | Length of | Principal Occupation(s) | Overseen by | the Past |
| and Address | the Trust | Time Served | During Past 5 Years | Trustees | 5 Years(2) |
Independent Trustees of the Trust(1) | | | | |
Henry H. Hopkins | Trustee | Indefinite Term; | Retired; Formerly, Vice President and Chief | 18 | None. |
Age: 76 | | Since 2012 | Legal Counsel, T. Rowe Price Associates, Inc. | | |
c/o Brown Advisory LLC | Lead | Indefinite Term; | (investment management firm) (1998 to 2008). | | |
901 South Bond Street | Independent | Since 2015 | | | |
Suite 400 | Trustee | | | | |
Baltimore, MD 21231 | | | | | |
Kyle Prechtl Legg | Trustee | Indefinite Term; | Retired; Formerly President and Chief Executive | 18 | Director, SunTrust |
Age: 67 | | Since 2012 | Officer, Legg Mason Capital Management, LLC | | Banks, Inc. (bank |
c/o Brown Advisory LLC | | | (investment management firm) (2006 to 2009). | | holding company) |
901 South Bond Street | | | | | (since 2011); Director, |
Suite 400 | | | | | BrightSphere |
Baltimore, MD 21231 | | | | | Investment Group |
| | | | | | plc (asset management |
| | | | | | holding company) |
| | | | | | (since 2014); Director, |
| | | | | | Eastman Kodak Co. |
| | | | | | (printing equipment |
| | | | | | and supplies company) |
| | | | | | (2010 to 2013). |
Thomas F. O’Neil III | Trustee | Indefinite Term; | Global Compliance Officer, Cigna Corporation | 18 | None. |
Age: 62 | | Since 2012 | (health services company) (since 2017), Formerly, | | |
c/o Brown Advisory LLC | | | President, The Saranac Group LLC (strategic | | |
901 South Bond Street | | | consulting firm) (2010 to 2016); Formerly, | | |
Suite 400 | | | Executive Vice Chairman (previously, Senior | | |
Baltimore, MD 21231 | | | Vice President, General Counsel and Secretary) | | |
| | | | WellCare Health Plans, Inc.(managed healthcare | | |
| | | | organization) (2008 to 2009); Formerly, Partner | | |
| | | | and Joint Global Practice Group Leader, DLA | | |
| | | | Piper US LLP (law firm) (2002 to 2008). | | |
Neal F. Triplett, CFA | Trustee | Indefinite Term; | President, DUMAC, Inc. (university endowment | 18 | None. |
Age: 48 | | Since 2012 | investment organization) (since 1999). | | |
c/o Brown Advisory LLC | | | | | |
901 South Bond Street | | | | | |
Suite 400 | | | | | |
Baltimore, MD 21231 | | | | | |
| Interested Trustees and Officers of the Trust | | | |
Michael D. Hankin(3) | Trustee | Indefinite Term | President and Chief Executive Officer, Brown | 18 | Stanley Black & |
Age: 61 | | Since 2012 | Advisory Incorporated and affiliates (investment | | Decker, Inc. (industrial |
c/o Brown Advisory | | | management firm) (since 1993). | | |
tools and hardware) | | | | | |
Incorporated | | | | | |
(since 2016). | | | | | |
901 South Bond Street | | | | | |
Suite 400 | | | | | |
Baltimore, MD 21231 | | | | | |
www.brownadvisory.com/mf
Trustees and Executive Officers
| | | | | | |
| | | | | Number of | Other |
| | | Term of | | Portfolios in | Directorships |
| | | Office and | | Fund Complex | Held During |
| Name, Age | Position with | Length of | Principal Occupation(s) | Overseen by | the Past |
| and Address | the Trust | Time Served | During Past 5 Years | Trustees | 5 Years(2) |
| Interested Trustees and Officers of the Trust | | | |
Joseph R. Hardiman(3) | Chairman | Indefinite Term; | Business Consultant (financial services industry | 18 | Director of Franklin |
Age: 82 | and Trustee | Since 2012 | consulting) (since 1997); Formerly; Director of | | Resources, Inc. |
c/o Brown Advisory LLC | | | Brown Advisory Incorporated (investment | | (investment |
901 South Bond Street | | | management firm) (2001 to 2012). | | management firm) |
Suite 400 | | | (2005 to 2013). | | |
Baltimore, MD 21231 | | | | | |
Paul J. Chew | President/ | Indefinite Term; | Chief Investment Officer, Brown Advisory | Not | Not |
Age: 53 | Principal | Since October 2018 | Incorporated and affiliates (investment | Applicable. | Applicable. |
c/o Brown Advisory | Executive | | management firm) (since 1995). | | |
Incorporated | Officer | | | | |
901 South Bond Street | | | | | |
Suite 400 | Senior Vice | 2016 to |
| | |
Baltimore, MD 21231 | President | October 2018 |
| | |
Carey E. Taylor | Vice | Indefinite Term; | Chief Operating Officer of | Not | Not |
Age: 31 | President | Since 2015 | Institutional Investing, Brown Advisory | Applicable. | Applicable. |
c/o Brown Advisory | | | Incorporated and affiliates (investment | | |
Incorporated | | | management firm) (since 2018); Formerly, | | |
901 South Bond Street | | | Product Manager, Brown Advisory | | |
Suite 400 | | | Incorporated and affiliates (investment | | |
Baltimore, MD 21231 | | | management firm) (2013 to 2018). | | |
Jason T. Meix | Treasurer/ | Indefinite Term; | Vice President, U.S. Bancorp Fund | Not | Not |
Age: 40 | Principal | Since 2012 | Services, LLC (fund administrative services firm) | Applicable. | Applicable. |
c/o Brown Advisory LLC | Financial | | (since 2008). | | |
901 South Bond Street | Officer | | | | |
Suite 400 | | | | | |
Baltimore, MD 21231 | | | | | |
Edward L. Paz | Secretary | Indefinite Term; | Vice President and Counsel, U.S. Bancorp Fund | Not | Not |
Age: 48 | | Since 2012 | Services, LLC (fund administrative services firm) | Applicable. | Applicable. |
c/o Brown Advisory LLC | | | (since 2007). | | |
901 South Bond Street | | | | | |
Suite 400 | | | | | |
Baltimore, MD 21231 | | | | | |
Brett D. Rogers | Chief | Indefinite Term; | General Counsel and Chief Compliance | Not | Not |
Age: 43 | Compliance | Since 2012 | Officer, Brown Advisory Incorporated and | Applicable. | Applicable. |
c/o Brown Advisory | Officer | | affiliates (investment management firm) | | |
Incorporated | | | (since 2009). | | |
901 South Bond Street | Anti-Money | Indefinite Term: |
| | |
Suite 400 | Laundering | Since 2012 |
| | |
Baltimore, MD 21231 | Officer | | | | |
(1) | The Trustees of the Trust who are not “interested persons” of the Trust as defined in the 1940 Act (“Independent Trustees”). |
(2) | The directorships disclosed in this column include only the directorships of those companies that a Trustee serves on that are required to report to the SEC under applicable Federal securities laws including publicly traded corporations that are registered with the SEC under the 1934 Act and investment companies that are registered with the SEC under the 1940 Act, and it therefore excludes various other types of directorships that the Trustees of the Trust may currently hold in other types of organizations, including private companies and not-for-profit organizations, which are expressly excluded from the disclosure requirements for mutual fund board members. |
(3) | Mr. Hankin is considered an “interested person” of the Trust, as defined in the 1940 Act, because of his current position with Brown Advisory Incorporated, the parent company of the Adviser, and Mr. Hardiman is considered an “interested person” of the Trust, as defined in the 1940 Act, because of his previous position with Brown Advisory Incorporated and his ownership interest in Brown Advisory Incorporated. |
www.brownadvisory.com/mf
Information About Proxy Voting (Unaudited)
A description of the policies and procedures that the Funds use to determine how to vote proxies relating to portfolio securities is available without charge upon request by calling toll-free at (800) 540-6807 and by accessing the Funds’ website at www.brownadvisory.com/mf/how-to-invest (refer to Appendix B in the Statement of Additional Information). Furthermore, you can obtain the description on the SEC’s website at www.sec.gov.
Information regarding how the Funds voted proxies relating to portfolio securities during the year ended June 30 is available without charge, by calling toll-free at (800) 540-6807. In addition, you can obtain the Funds’ proxy voting records on the SEC’s website at www.sec.gov.
Information About the Portfolio Holdings (Unaudited)
The Funds file their complete schedule of portfolio holdings for their first and third fiscal quarters with the SEC on Form N-PORT. The Funds’ Form N-PORT is available without charge, upon request, by calling toll-free at (800) 540-6807. Furthermore, you can obtain the Form N-PORT on the SEC’s website at www.sec.gov. The Funds’ schedules of portfolio holdings are posted on their website at www.brownadvisory.com/mf/how-to-invest within ten business days after calendar quarter end.
Householding (Unaudited)
In an effort to decrease costs, the Funds will reduce the number of duplicate Prospectuses and annual and semi-annual reports that you receive by sending only one copy of each to those addresses shown by two or more accounts. Please call the Transfer Agent toll free at (800) 540-6807 to request individual copies of these documents. The Funds will begin sending individual copies 30 days after receiving your request. This policy does not apply to account statements.
Federal Tax Status of Dividends Declared during the Tax Year (Unaudited)
For Federal Income Tax purposes, distributions from short-term capital gains are classified as ordinary income. The percentage of ordinary income distributions designated as qualifying for the corporate dividend received deduction (“DRD”), the individual qualified dividend rate (“QDI”), the qualifying interest income exempt from U.S. tax for foreign shareholders (“QII”) and the qualifying short-term capital gain distributions exempt from U.S. tax for foreign shareholders (“QSTCG”) is presented below:
| | | Income Distributions | | | | | | | | | | | | | | | | | | |
| Fund | | Exempt from Federal Tax | | | QDI | | | DRD | | | QII | | | QSTCG | |
| Growth Equity | | 0.00 | % | | | 0.00 | % | | | 0.00 | % | | | 0.00 | % | | | 0.00 | % | |
| Flexible Equity | | 0.00 | % | | | 100.00 | % | | | 100.00 | % | | | 2.20 | % | | | 39.35 | % | |
| Equity Income | | 0.00 | % | | | 100.00 | % | | | 100.00 | % | | | 2.76 | % | | | 12.61 | % | |
| Sustainable Growth | | 0.00 | % | | | 100.00 | % | | | 100.00 | % | | | 3.20 | % | | | 100.00 | % | |
| Mid-Cap Growth | | 0.00 | % | | | 56.98 | % | | | 52.41 | % | | | 3.31 | % | | | 100.00 | % | |
| Small-Cap Growth | | 0.00 | % | | | 51.48 | % | | | 47.80 | % | | | 6.77 | % | | | 67.52 | % | |
| Small-Cap Fundamental Value | | 0.00 | % | | | 100.00 | % | | | 100.00 | % | | | 3.58 | % | | | 28.49 | % | |
| Global Leaders | | 0.00 | % | | | 100.00 | % | | | 83.89 | % | | | 2.82 | % | | | 0.00 | % | |
| Intermediate Income | | 0.00 | % | | | 0.00 | % | | | 0.00 | % | | | 100.00 | % | | | 0.00 | % | |
| Total Return | | 0.00 | % | | | 0.00 | % | | | 0.00 | % | | | 99.64 | % | | | 0.00 | % | |
| Strategic Bond | | 0.00 | % | | | 0.00 | % | | | 0.00 | % | | | 100.00 | % | | | 0.00 | % | |
| Sustainable Bond | | 0.00 | % | | | 0.00 | % | | | 0.00 | % | | | 97.11 | % | | | 0.00 | % | |
| Maryland Bond | | 98.64 | % | | | 0.00 | % | | | 0.00 | % | | | 100.00 | % | | | 0.00 | % | |
| Tax-Exempt Bond | | 96.41 | % | | | 0.00 | % | | | 0.00 | % | | | 100.00 | % | | | 0.00 | % | |
| Mortgage Securities | | 0.00 | % | | | 0.00 | % | | | 0.00 | % | | | 100.00 | % | | | 0.00 | % | |
| WMC Strategic European Equity | | 0.00 | % | | | 100.00 | % | | | 0.00 | % | | | 0.62 | % | | | 0.00 | % | |
| Emerging Markets Select | | 0.00 | % | | | 100.00 | % | | | 11.00 | % | | | 1.76 | % | | | 0.00 | % | |
| Beutel Goodman Large-Cap Value | | 0.00 | % | | | 65.23 | % | | | 61.30 | % | | | 1.63 | % | | | 43.91 | % | |
The Funds, as applicable, intend to elect to pass through to shareholders the credit for taxes paid to foreign countries. Such credits for taxes paid to foreign countries will be included in shareholders' Form 1099-DIV.
Special Meeting of Shareholders (Unaudited)
A special meeting of shareholders of Brown Advisory Emerging Markets Select Fund (the “Fund”) was held on April 29, 2019. At the meeting, shareholders voted on two proposals: (1) to approve an investment sub-advisory agreement between Brown Advisory LLC and Wellington Management Company LLP on behalf of the Fund, and (2) to approve an investment sub-advisory agreement between Brown Advisory LLC and Pzena Investment Management LLC on behalf of the Fund. The proposals were approved as follows:
| | For | Against | Abstain | |
| Proposal 1 | 17,216,759 | 41,341 | 1,560 | |
| Proposal 2 | 17,216,759 | 41,341 | 1,560 | |
www.brownadvisory.com/mfBROWN ADVISORY FUNDS
At Brown Advisory, we believe that you deserve frank and open communication on all aspects of our relationship. In this spirit, we provide this annual summary of our policies relating to confidentiality and privacy of client information, mutual funds, conflicts of interest, trading commissions, proxy voting and Form ADV annual notice.
CONFIDENTIALITY AND PRIVACY POLICY
Brown Advisory takes the confidentiality of your personal information and the privacy of your account very seriously. Our commitment to safeguard your personal information goes beyond our legal obligation to process your transactions accurately and securely. Whether we serve you online, in person, on the telephone or by mail, the principles that guide the way in which we conduct business are built upon the core values of trust and integrity.
We limit access to your personal information to only those employees with a business reason to know such information. We train and consistently remind all employees to respect client privacy and to recognize the importance of the confidentiality of such information. Those who violate our privacy policy are subject to disciplinary action. This commitment also applies to the sharing of information among Brown Advisory and its affiliates.
We maintain physical, electronic and procedural safeguards that comply with applicable laws and regulations to protect your personal information, including various measures to protect your personal information while it is stored electronically.
Federal law requires us to inform you that we have on record personal information about you and that we obtain such information from you directly (e.g., information you provide to us on account applications and other forms, such as your name, address, social security number, occupation, assets and income) and indirectly (e.g., information on our computer systems about your transactions with us, such as your account balance and account holdings). Any personal information you choose to provide is kept confidential and allows us to: (i) provide better and more complete investment and strategic advice; (ii) develop new services that meet additional needs you may have; and, (iii) comply with legal and regulatory requirements.
In addition, in the normal conduct of our business, it may become necessary for us to share information relating to our clients that we have on record, as described above, with companies not affiliated with us who are under contract to perform services on our behalf. For example, we have contracted with companies to assist us in complying with anti-terrorist and anti-money laundering statutory requirements (including the identification and reporting of activities that may involve terrorist acts or money laundering activities), companies that provide clearing services, and other vendors that provide services directly related to your account relationship with us. Our agreements with these companies require that they keep your information confidential and not use such information for any unrelated purpose.
We do not sell information about you to third parties, and we do not otherwise disclose information to third parties without your permission or unless required by law.
www.brownadvisory.com/mf
(This Page Intentionally Left Blank.)
INVESTMENT ADVISER
Brown Advisory LLC
901 South Bond Street, Suite 400
Baltimore, MD 21231
www.brownadvisory.com
DISTRIBUTOR
ALPS Distributors, Inc.
1290 Broadway, Suite 1100
Denver, CO 80203
CUSTODIAN
U.S. Bank, N.A.
Custody Operations
1555 North Rivercenter Drive, Suite 302
Milwaukee, WI 53212
TRANSFER AGENT
U.S. Bancorp Fund Services, LLC
P.O. Box 701
Milwaukee, WI 53201
(800) 540-6807
INDEPENDENT REGISTERED PUBLIC
ACCOUNTING FIRM
Tait, Weller & Baker LLP
Two Liberty Place
50 South 16th Street, Suite 2900
Philadelphia, PA 19102
LEGAL COUNSEL
Dechert LLP
1900 K Street, NW
Washington, DC 20006
| | Institutional Shares | Investor Shares | Advisor Shares |
| | Symbol | CUSIP
| Symbol | CUSIP
| Symbol | CUSIP
|
Growth Equity Fund | BAFGX | 115233702 | BIAGX | 115233504 | BAGAX | 115233603 |
Flexible Equity Fund | BAFFX | 115233843 | BIAFX | 115233868 | BAFAX | 115233850 |
Equity Income Fund | BAFDX | 115233660 | BIADX | 115233686 | BADAX | 115233678 |
Sustainable Growth Fund | BAFWX | 115233207 | BIAWX | 115233306 | BAWAX | 115233405 |
Mid-Cap Growth Fund | BAFMX | 115233413 | BMIDX | 115233439 | — | — |
Small-Cap Growth Fund | BAFSX | 115233819 | BIASX | 115233835 | BASAX | 115233827 |
Small-Cap Fundamental Value Fund | BAUUX | 115233777 | BIAUX | 115233793 | BAUAX | 115233785 |
Global Leaders Fund | BAFLX | 115233355 | BIALX | 115233462 | — | — |
Intermediate Income Fund | — | — | BIAIX | 115233744 | BAIAX | 115233736 |
Total Return Fund | BAFTX | 115233538 | BIATX | 115233520 | — | — |
Strategic Bond Fund | BIABX | 115233470 | BATBX | 115233710 | — | — |
Sustainable Bond Fund | BAISX | 115233389 | BASBX | 115233447 | — | — |
Maryland Bond Fund | — | — | BIAMX | 115233751 | — | — |
Tax-Exempt Bond Fund | BTEIX | 115233371 | BIAEX | 115233108 | — | — |
Mortgage Securities Fund | BAFZX | 115233546 | BIAZX | 115233587 | — | — |
WMC Strategic European Equity Fund | BAFHX | 115233629 | BIAHX | 115233611 | BAHAX | 115233595 |
Emerging Markets Select Fund | BAFQX | 115233652 | BIAQX | 115233645 | BAQAX | 115233637 |
Beutel Goodman Large-Cap Value Fund | BVALX | 115233421 | — | — | — | — |
This report is submitted for the general information of the shareholders of each Fund. It is not authorized for distribution to prospective investors unless preceded or accompanied by an effective prospectus, which includes information regarding the Funds’ risks, objectives, fees and expenses, experience of their management, and other information.
BX-ANNUAL
Item 2. Code of Ethics.
The registrant has adopted a code of ethics that applies to the registrant’s principal executive officer and principal financial officer. The registrant has not made any amendments to its code of ethics during the period covered by this report. The registrant has not granted any waivers from any provisions of the code of ethics during the period covered by this report.
A copy of the registrant’s Code of Ethics is filed herewith.
Item 3. Audit Committee Financial Expert.
The Registrant’s Board of Trustees has not designated an audit committee financial expert. The Registrant has determined that it will retain the services of an independent third party to assist it if circumstances arise that require specific investment company auditing expertise.
Item 4. Principal Accountant Fees and Services.
The Registrant has engaged its principal accountant to perform audit services, audit-related services, tax services and other services during the past two fiscal years. “Audit services” refer to performing an audit of the Registrant's annual financial statements or services that are normally provided by the accountant in connection with statutory and regulatory filings or engagements for those fiscal years. “Audit-related services” refer to the assurance and related services by the principal accountant that are reasonably related to the performance of the audit. “Tax services” refer to professional services rendered by the principal accountant for tax compliance, tax advice, and tax planning. There were no “Other services” provided by the principal accountant. The following table details the aggregate fees billed or expected to be billed for each of the last two fiscal years for audit fees, audit-related fees, tax fees and other fees by the principal accountant.
| | FYE 6/30/2019 | FYE 6/30/2018 |
Audit Fees | $310,650 | $325,450 |
Audit-Related Fees | N/A | N/A |
Tax Fees | $50,400 | $55,100 |
All Other Fees | N/A | N/A |
The audit committee has adopted pre-approval policies and procedures that require the audit committee to pre‑approve all audit and non‑audit services of the Registrant, including services provided to any entity affiliated with the Registrant.
The percentages of fees billed by Tait, Weller & Baker LLP applicable to non-audit services pursuant to waiver of pre-approval requirement were as follows:
| | FYE 6/30/2019 | FYE 6/30/2018 |
Audit-Related Fees | 0% | 0% |
Tax Fees | 0% | 0% |
All Other Fees | 0% | 0% |
All of the principal accountant’s hours spent on auditing the Registrant’s financial statements were attributed to work performed by full‑time permanent employees of the principal accountant.
The following table indicates the non-audit fees billed or expected to be billed by the Registrant’s accountant for services to the Registrant and to the Registrant’s investment adviser (and any other controlling entity, etc.—not sub-adviser) for the last two fiscal years. The audit committee of the board of trustees has considered whether the provision of non-audit services that were rendered to the Registrant's investment adviser is compatible with maintaining the principal accountant's independence and has concluded that the provision of such non-audit services by the accountant has not compromised the accountant’s independence.
Non-Audit Related Fees | FYE 6/30/2019 | FYE 6/30/2018 |
Registrant | N/A | N/A |
Registrant’s Investment Adviser | N/A | N/A |
Item 5. Audit Committee of Listed Registrants.
| (a) | Not applicable to registrants who are not listed issuers (as defined in Rule 10A-3 under the Securities Exchange Act of 1934). |
Item 6. Schedule of Investments.
| (a) | Schedule of Investments is included as part of the report to shareholders filed under Item 1 of this Form. |
Item 7. Disclosure of Proxy Voting Policies and Procedures for Closed-End Management Investment Companies.
Not applicable to open-end investment companies.
Item 8. Portfolio Managers of Closed-End Management Investment Companies.
Not applicable to open-end investment companies.
Item 9. Purchases of Equity Securities by Closed‑End Management Investment Company and Affiliated Purchasers.
Not applicable to open-end investment companies.
Item 10. Submission of Matters to a Vote of Security Holders.
There have been no material changes to the procedures by which shareholders may recommend nominees to the registrant’s board of trustees.
Item 11. Controls and Procedures.
(a) | The Registrant’s Principal Executive Officer and Principal Financial Officer have reviewed the Registrant's disclosure controls and procedures (as defined in Rule 30a-3(c) under the Investment Company Act of 1940 (the “Act”)) as of a date within 90 days of the filing of this report, as required by Rule 30a-3(b) under the Act and Rules 13a-15(b) or 15d‑15(b) under the Securities Exchange Act of 1934. Based on their review, such officers have concluded that the disclosure controls and procedures are effective in ensuring that information required to be disclosed in this report is appropriately recorded, processed, summarized and reported and made known to them by others within the Registrant and by the Registrant’s service provider. |
(b) | There were no changes in the Registrant's internal control over financial reporting (as defined in Rule 30a-3(d) under the Act) that occurred during the period covered by this report that have materially affected, or are reasonably likely to materially affect, the Registrant's internal control over financial reporting. |
Item 12. Disclosure of Securities Lending Activities for Closed-End Management Investment Companies.
Not applicable to open-end investment companies.
Item 13. Exhibits.
| (a) | (1) Any code of ethics or amendment thereto, that is subject of the disclosure required by Item 2, to the extent that the registrant intends to satisfy Item 2 requirements through filing an exhibit. Filed herewith. |
(2) A separate certification for each principal executive officer and principal financial officer pursuant to Section 302 of the Sarbanes-Oxley Act of 2002. Filed herewith.
(3) Any written solicitation to purchase securities under Rule 23c‑1 under the Act sent or given during the period covered by the report by or on behalf of the registrant to 10 or more persons. Not applicable to open-end investment companies.
(4) Change in the registrant’s independent public accountant. There was no change in the registrant’s independent public accountant for the period covered by this report.
| (b) | Certifications pursuant to Section 906 of the Sarbanes‑Oxley Act of 2002. Furnished herewith. |
SIGNATURES
Pursuant to the requirements of the Securities Exchange Act of 1934 and the Investment Company Act of 1940, the Registrant has duly caused this report to be signed on its behalf by the undersigned, thereunto duly authorized.
(Registrant) Brown Advisory Funds
By (Signature and Title)*
/s/Paul J. ChewPaul J. Chew, Principal Executive Officer
Date August 30, 2019
Pursuant to the requirements of the Securities Exchange Act of 1934 and the Investment Company Act of 1940, this report has been signed below by the following persons on behalf of the Registrant and in the capacities and on the dates indicated.
By (Signature and Title)* /s/Paul J. Chew
Paul J. Chew, Principal Executive Officer
Date August 30, 2019
By (Signature and Title)* /s/Jason T. Meix
Jason T. Meix, Principal Financial Officer
Date August 30, 2019
* Print the name and title of each signing officer under his or her signature.