UNITED STATES
SECURITIES AND EXCHANGE COMMISSION
Washington, D.C. 20549
SECURITIES AND EXCHANGE COMMISSION
Washington, D.C. 20549
FORM N-CSR
CERTIFIED SHAREHOLDER REPORT OF REGISTERED
MANAGEMENT INVESTMENT COMPANIES
Investment Company Act file number: (811-22708)
Brown Advisory Funds
(Exact name of Registrant as specified in charter)
(Exact name of Registrant as specified in charter)
901 South Bond Street Suite 400
Baltimore, MD 21231
(Address of principal executive offices) (Zip code)
(Address of principal executive offices) (Zip code)
David M. Churchill
Principal Executive Officer
Brown Advisory Funds
901 South Bond Street Suite 400
Baltimore, MD 21231
(Name and address of agent for service)
(Name and address of agent for service)
(410) 537-5400
Registrant's telephone number, including area code
Date of fiscal year end: June 30
Date of reporting period: June 30, 2018
Item 1. Reports to Stockholders.
ANNUAL REPORT
June 30, 2018
Brown Advisory Growth Equity Fund
Brown Advisory Flexible Equity Fund
Brown Advisory Equity Income Fund
Brown Advisory Sustainable Growth Fund
Brown Advisory Mid-Cap Growth Fund
Brown Advisory Small-Cap Growth Fund
Brown Advisory Small-Cap Fundamental Value Fund
Brown Advisory Global Leaders Fund
Brown Advisory Intermediate Income Fund
Brown Advisory Total Return Fund
Brown Advisory Strategic Bond Fund
Brown Advisory Sustainable Bond Fund
Brown Advisory Maryland Bond Fund
Brown Advisory Tax Exempt Bond Fund
Brown Advisory Mortgage Securities Fund
Brown Advisory – WMC Strategic European Equity Fund
Brown Advisory – WMC Japan Alpha Opportunities Fund
Brown Advisory – Somerset Emerging Markets Fund
Brown Advisory – Macquarie Asia New Stars Fund
Brown Advisory – Beutel Goodman Large-Cap Value Fund
TABLE OF CONTENTS
| Brown Advisory Growth Equity Fund | 1 | |
| Brown Advisory Flexible Equity Fund | 5 | |
| Brown Advisory Equity Income Fund | 9 | |
| Brown Advisory Sustainable Growth Fund | 13 | |
| Brown Advisory Mid-Cap Growth Fund | 17 | |
| Brown Advisory Small-Cap Growth Fund | 21 | |
| Brown Advisory Small-Cap Fundamental Value Fund | 27 | |
| Brown Advisory Global Leaders Fund | 31 | |
| Brown Advisory Intermediate Income Fund | 35 | |
| Brown Advisory Total Return Fund | 40 | |
| Brown Advisory Strategic Bond Fund | 47 | |
| Brown Advisory Sustainable Bond Fund | 56 | |
| Brown Advisory Maryland Bond Fund | 61 | |
| Brown Advisory Tax Exempt Bond Fund | 67 | |
| Brown Advisory Mortgage Securities Fund | 73 | |
| Brown Advisory – WMC Strategic European Equity Fund | 84 | |
| Brown Advisory – WMC Japan Alpha Opportunities Fund | 88 | |
| Brown Advisory – Somerset Emerging Markets Fund | 94 | |
| Brown Advisory – Macquarie Asia New Stars Fund | 97 | |
| Brown Advisory – Beutel Goodman Large-Cap Value Fund | 101 | |
| Statements of Assets and Liabilities | 105 | |
| Statements of Operations | 110 | |
| Statements of Changes in Net Assets | 115 | |
| Financial Highlights | 125 | |
| Notes to Financial Statements | 132 | |
| Report of Independent Registered Public Accounting Firm | 148 | |
| Additional Information | 149 |
The views in the report contained herein were those of the Funds’ investment adviser, Brown Advisory LLC, or, for the sub-advised funds, of the respective sub-adviser, as of June 30, 2018 and may not reflect their views on the date this report is first published or anytime thereafter. This report may contain discussions about certain investments both held and not held in the portfolio as of June 30, 2018. All current and future holdings are subject to risk and are subject to change. While these views are intended to assist shareholders in understanding their investment in each Fund, they do not constitute investment advice, are not a guarantee of future performance and are not intended as an offer or solicitation with respect to the purchase or sale of any security. Performance figures include the reinvestment of dividend and capital gain distributions.
The Global Industry Classification Standard (GICS®) was developed by and is the exclusive property of MSCI, Inc. and Standard & Poor’s Financial Services LLC (“S&P”). GICS® is a service mark of MSCI, Inc. and S&P and has been licensed for use by the Administrator, U.S. Bancorp Fund Services, LLC.
TOPIX Index Values and TOPIX Marks are subject to the proprietary rights owned by the Tokyo Stock Exchange, Inc.
GLOSSARY OF TERMS
Alpha refers to the abnormal rate of return on a security or portfolio in excess of what would be predicted by an equilibrium model like the capital asset pricing model (CAPM).
Bloomberg Barclays 1-10 Year Blended Municipal Bond Index is a market index of high quality, domestic fixed income securities with maturities of less than 10 years.
Bloomberg Barclays Intermediate US Aggregate Bond Index represents domestic taxable investment-grade bonds with index components for government and corporate securities, mortgage pass-through securities and asset-backed securities with average maturities and durations in the intermediate range. This index represents a sector of the Bloomberg Barclays US Aggregate Bond Index.
Bloomberg Barclays Mortgage Backed Securities Index is a market value-weighted index which covers the mortgage-backed securities component of the Bloomberg Barclays US Aggregate Bond Index. The index is composed of agency mortgage-backed passthrough securities of the Government National Mortgage Association (Ginnie Mae), the Federal National Mortgage Association (Fannie Mae), and the Federal Home Loan Mortgage Corporation (Freddie Mac) with a minimum $150 million par amount outstanding and a weighted-average maturity of at least 1 year. The index includes reinvestment of income.
Bloomberg Barclays US Aggregate Bond Index is a broad-based benchmark that measures the investment grade, US dollar-denominated, fixed-rate taxable bond market. The index includes Treasuries, government-related and corporate securities, MBS, ABS and CMBS.
Bloomberg Barclays US Corporate High Yield Index measures the US Dollar denominated, high-yield, fixed-rate corporate bond market.
Basis point(s) (bps) is a unit that is equal to 1/100th of 1%, and is used to denote the change in a financial instrument. The basis point is commonly used for calculating changes in interest rates, equity indexes and the yield of a fixed-income security. 1% is equal to 100 basis points.
Beta is a measure of the volatility, or systematic risk, of a security or a portfolio in comparison to the market as a whole.
Book value is the net asset value of a company, calculated by total assets minus intangible assets (patents, goodwill) and liabilities.
CAPEX, or capital expenditures, are funds used by a company to acquire or upgrade physical assets such as property, industrial buildings or equipment. It is often used to undertake new projects or investments by the firm. This type of outlay is also made by companies to maintain or increase the scope of their operations.
Cash flow measures the cash generating capability of a company by adding non-cash charges (e.g. depreciation) and interest expense to pretax income.
Correlation is a statistical measurement of how two securities move in relation to each other.
Dividend Yield is a financial ratio that shows how much a company pays out in dividends each year relative to its share price. In the absence of any capital gains, the dividend yield is the return on investment for a stock.
Downside Capture is a statistical measure of a fund’s performance in down markets. For example, a fund with downside capture of 90% would only have declined 90% as much as the related index during the same down market period.
Duration is a measure of the sensitivity of the price of a fixed-income investment to a change in interest rates. Duration is expressed as a number of years.
Earnings growth is a measure of growth in a company’s net income over a specific period, often one year. The term can apply to actual data from previous periods or estimated data for future periods.
Earnings per share (EPS) is calculated by taking the total earnings divided by the number of shares outstanding.
Earnings Yield is the earnings per share for the most recent 12-month period divided by the current market price per share. The earnings yield shows the percentage of each dollar invested in the stock that was earned by the company.
EBITDA is the Earnings Before Interest, Taxes, Depreciation and Amortization. An approximate measure of a company’s operating cash flow based on data from the company’s income statement.
Enterprise Value (EV) is a measure of a company’s value, often used as an alternative to straightforward market capitalization. Enterprise Value is calculated as market capitalization plus debt, minority interest and preferred shares, minus total cash and cash equivalents.
Forward price to earnings ratio uses forecasted earnings, rather than current earnings, to calculate the price to earnings ratio.
Free Cash Flow is the operating cash flows (net income plus amortization and depreciation) minus capital expenditures and dividends. Free cash flow is the amount of cash that a company has left over after it has paid all of its expenses, including investments.
Gross Domestic Product (GDP) is the monetary value of all the goods and services produced by an economy over a specified period. It includes consumption, government purchases, investments, and exports minus imports.
MSCI AC Asia ex Japan SMID Cap Index captures mid and small-cap representation across 2 of 3 Developed Markets (DM) countries (excluding Japan) and 8 Emerging Markets (EM) countries in Asia. With 2,001 constituents, the index covers approximately 28% of the free float-adjusted market capitalization in each country. DM countries in the index include: Hong Kong and Singapore. EM countries include: China, India, Indonesia, Korea, Malaysia, the Philippines, Taiwan and Thailand.
MSCI Emerging Markets Index is a free float-adjusted market capitalization index that is designed to measure equity market performance in the global emerging markets.
GLOSSARY OF TERMS
MSCI Emerging Markets Small Cap Index is a free float-adjusted market capitalization index that is designed to measure small cap equity market performance in the global emerging markets.
MSCI Europe Index is an index that captures large and mid cap representation across 15 developed market countries in Europe.
Price to Book Value Ratio (P/B) is ratio used to compare a stock’s market value to its book value. It is calculated by dividing the current closing price of the stock by the latest quarter’s book value per share.
Price to earnings ratio (P/E) is a common tool for comparing the prices of different common stocks and is calculated by dividing the current market price of a stock by the earnings per share.
Return of Capital (ROC) is a return from an investment that is not considered income. The return of capital is when some or all of the money an investor has in an investment is paid back to him or her, thus decreasing the value of the investment.
Return on Capital Employed (ROCE) is a financial ratio that measures a company’s profitability and the efficiency with which its capital is employed. Return on Capital Employed (ROCE) is calculated as: ROCE = Earnings Before Interest and Tax (EBIT) / Capital Employed.
Return on Equity (ROE) is the amount of net income returned as a percentage of shareholders equity. Return on equity measures a corporation’s profitability by revealing how much profit a company generates with the money shareholders have invested.
Return on Invested Capital (ROIC) is a calculation used to assess a company’s efficiency at allocating the capital under its control to profitable investments. ROIC is typically calculated by taking a company’s net income, subtracting dividends the company paid out and dividing that amount by the company’s total capital.
Russell Global Large Cap Index measures the performance of the largest securities in the Russell Global Index, based on market capitalization.
Russell Midcap Growth Index measures the performance of the mid-capitalization growth sector of the U.S. equity market.
Russell 1000® Growth Index measures the performance of the large-cap growth segment of the of the U.S. equity universe. It includes those Russell 1000® companies with higher price to book value ratios and higher forecasted growth values.
Russell 1000® Value Index measures the performance of the large-cap value segment of the U.S. equity universe. It includes those Russell 1000® companies with lower price to book value ratios and lower expected growth values.
Russell 2000® Growth Index measures the performance of the small-cap growth segment of the U.S. equity universe. It includes those Russell 2000® companies with higher price to book value ratios and higher forecasted growth values.
Russell 2000® Index measures the performance of the 2,000 smallest companies in the Russell 3000® Index.
Russell 2000® Value Index measures the performance of the small-cap value segment of the U.S. equity universe. It includes those Russell 2000® companies with lower price to book value ratios and lower forecasted growth values.
Russell 3000® Index measures the performance of the 3,000 largest U.S. companies representing approximately 98% of the investable U.S. equity market.
S&P 500 Index (“S&P 500”) is a market-value weighted index representing the performance of 500 widely held, publicly traded large capitalization stocks.
Tangible Book Value (“TBV”) is a valuation ratio expressing the price of a security compared to its hard, or tangible, book value as reported in the company’s balance sheet. The tangible book value number is equal to the company’s total book value less the value of any intangible assets.
Tier 1 Capital Ratio is a comparison between a banking firm’s core equity capital and total risk-weighted assets. A firm’s core equity capital is known as its Tier 1 capital and is the measure of a bank’s financial strength based on the sum of its equity capital and disclosed reserves, and sometimes non-redeemable, non-cumulative preferred stock. A firm’s risk-weighted assets include all assets that the firm holds that are systematically weighted for credit risk. Central banks typically develop the weighting scale for different asset classes, such as cash and coins, which have zero risk, versus a letter or credit, which carries more risk.
TOPIX Total Return U.S. Dollar Hedged Index is a market capitalization-weighted index of all companies listed on the First Section of the Tokyo Stock Exchange, hedged to eliminate the impact of the change in value between the US Dollar and Japanese Yen. The unhedged version of this index, known as the TOPIX Total Return Index, does not eliminate the change in value between the US Dollar and Japanese Yen.
Turnover refers to a fund buying or selling securities. (The fund “turns over” its portfolio.) A fund pays transaction costs, such as commissions, when it buys and sells securities. Additionally, a higher turnover rate may result in higher taxes when the fund shares are held in a taxable account.
Yield Curve is a line that plots the yields of securities having equal credit quality but different maturity dates.
Yield Spread is the difference between yields on differing securities, calculated by deducting the yield of one security from another.
The broad based market indexes referenced in the following management commentaries are considered representative of their indicated market, the indexes are unmanaged and do not reflect the deduction of fees, such as, investment management and fund accounting fees, or taxes associated with a mutual fund. Investors cannot invest directly in an index.
Brown Advisory Growth Equity Fund
A Message to Our Shareholders
June 30, 2018
Dear Shareholders:
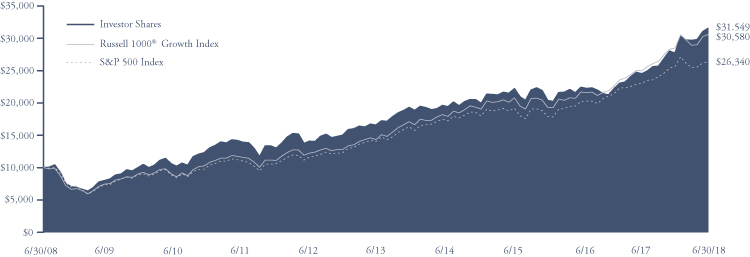
During the year ended June 30, 2018, the Brown Advisory Growth Equity Fund – Investor Shares (the “Fund”) increased 28.69% in value. During the same period, the Fund’s benchmark, the Russell 1000® Growth Index (the “Index”), increased 22.51%.
The market backdrop has remained favorable to our investment approach and we are quite pleased with both the absolute and relative returns for the fiscal year. Despite the global economy remaining on solid footing, cross-currents of rising interest rates and concern over global trade policy has led an increase in market volatility. Rising interest rates have, nonetheless, helped take the focus off dividends as a primary factor driving stock performance. With the preoccupation with yield waning, stocks of fundamentally strong companies with above-average growth prospects can no longer be ignored. The Fund’s outperformance this fiscal year was fairly broad-based across economic sectors. Technology, health care and consumer staples have delivered strong positive contributions on a relative basis. While our consumer discretionary stocks have performed well as group, the Index fared better; this led to a relative drag versus the Index for the year. Westinghouse Air Brake Technologies Corporation (“Wabtec”), an industrial company that manufactures and sells parts into the freight rail industry, was a meaningful detractor. While U.S. freight volumes have recovered, Wabtec’s fundamentals have not and the recent acquisition of a European transit business that was supposed to help reduce cyclicality has not helped either. We eliminated our position in the stock as we lost confidence in the management team to capitalize on the favorable environment.
As always, we seek to separate signals from noise in our research, and that can be challenging in a very noisy, unending 24-hour news cycle. For example, Facebook and several of our consumer-oriented technology companies came under fire for data privacy and security issues or, in the case of Amazon, the sheer dominance of its retail e-commerce business. The issues being discussed about the companies are highly complex; we continue doing our own research and using our external relationships to build our knowledge on the risks around data security, privacy and regulation. With respect to Facebook specifically, we trimmed our position notably in advance of recent events, based on the meaningful appreciation in 2017. This was a normal outcome of our capital reallocation process; we manage our positions in Amazon, Google and any other company the same way. Each of these investment opportunities has specific merits and specific risks that we incorporate into our upside and downside analysis. We incorporate the potential impact that future regulation may have on margins or how a lack of trust may affect consumer engagement. These issues – along with other issues that may not make news – are not new and have long been part of our investment discussions about these companies.
More recently, the U.S. began implementing tariffs designed to equalize trade imbalances which has financial markets preoccupied with the notion that it will lead to a global trade war. While it is impossible to predict how an actual trade war would play out, we believe that it is unlikely to have a favorable impact on the overall stock market. The objective of these policies is to create domestic employment opportunities, typically in lower-skilled positions most susceptible to offshore relocation. This makes certain labor-intensive industries more likely to be impacted. Industries involved in manufacturing, commodities and agricultural products will be caught squarely in the crosshairs of these policies. As it pertains to the Fund, these types of businesses rarely meet the growth or quality criteria for our investment process and, as such, the Fund has little exposure to these industries. Where we do have exposure, the goods have been primarily produced in-country and therefore should be less susceptible to tariffs or trade retaliation. Technology companies have also been in the spotlight, but it has been focused primarily on semiconductor and networking equipment due the security-sensitive nature of these industries. Here again, the portfolio has very little exposure to these industries; we sold our position in NXP Semiconductors in January as it was in the process of being acquired. The bulk of our technology holdings have been enterprise software and service companies or consumer- and network-oriented business models, such as Visa, Facebook and Electronic Arts. We are not suggesting that these companies would be immune to protectionist policies or a trade war, but they are clearly not the primary targets, in our view.
We are delighted that the stock market has delivered strong returns over the course of the fiscal year; however, we are always mindful of the future. Periods of volatility can be disconcerting, yet the Fund has historically been able to capitalize on these periods. Since our inception, three of our five best relative quarters coincided with double-digit negative returns for our benchmark. Volatility often opens up opportunities for us to execute our investment process—either to add a new long-term holding that we previously deemed too expensive or to add to an existing holding at an attractive level. We cannot pretend to enjoy periods of acute volatility, but our process is designed to take advantage of these periods that are an inevitable byproduct of long-term market cycles.
Sincerely,
Kenneth M. Stuzin, CFA
Portfolio Manager
1
Brown Advisory Growth Equity Fund
A Message to Our Shareholders
June 30, 2018
Past performance is not a guarantee of future results.
Mutual fund investing involves risk. Principal loss is possible. Investments in medium capitalization companies generally carry greater risk than is customarily associated with larger companies for various reasons such as narrower markets, limited financial resources and less liquid stock. The value of the Fund’s investments in REITs may change in response to changes in the real estate market such as declines in the value of real estate, lack of available capital or financing opportunities, and increases in property taxes or operating costs. Investments in foreign securities entail certain risks not associated with investments in domestic securities, such as volatility of currency exchange rates, and in some cases, political and economic instability and relatively illiquid markets. These risks are greater for investments in emerging markets. The Fund may invest in ETFs, which may trade at a discount to the aggregate value of the underlying securities and although expense ratios for ETFs are generally low, frequent trading of ETFs by the Fund can generate brokerage expenses.
Fund holdings and sector allocations are subject to change and should not be considered a recommendation to buy or sell any security. For a complete list of fund holdings, please refer to the Schedule of Investments provided in this report.
Definitions for terms and indices are provided in the Glossary of Terms.
2
Brown Advisory Growth Equity Fund
Performance Information & Portfolio Holdings Summary
June 30, 2018
| PORTFOLIO HOLDINGS | % of Net Assets |
| Information Technology | 40.6% |
| Health Care | 18.7% |
| Consumer Discretionary | 13.6% |
| Industrials | 12.5% |
| Consumer Staples | 5.4% |
| Real Estate Investment Trusts | 3.4% |
| Materials | 3.1% |
| Money Market Funds | 2.4% |
| Other Assets and Liabilities | 0.3% |
100.0% |
GROWTH OF A $10,000 INVESTMENT
The following chart reflects the change in value of a hypothetical $10,000 investment, including reinvested dividends and distributions, in the Fund as measured against broad-based securities market indices. The Russell 1000® Growth Index measures the performance of the large-cap growth segment of the U.S. equity universe. It includes those Russell 1000® companies with higher price to book ratios and higher forecasted growth values. The S&P 500 Index is a market-value weighted index representing the performance of 500 widely held, publicly traded large capitalization stocks. The indexes are unmanaged and do not reflect the deduction of fees, such as investment management fees. Investors cannot invest directly in an index.
Average Annual Total Return | One Year | Five Year | Ten Year |
Institutional Shares1 | 28.89% | 13.91% | 12.34% |
| Investor Shares | 28.69% | 13.75% | 12.18% |
| Advisor Shares | 28.32% | 13.46% | 11.84% |
Russell 1000® Growth Index | 22.51% | 16.36% | 11.83% |
| S&P 500 Index | 14.37% | 13.42% | 10.17% |
Institutional Shares | Investor Shares | Advisor Shares | |
Gross Expense Ratio2 | 0.72% | 0.87% | 1.12% |
Net Expense Ratio2 | 0.72% | 0.87% | 1.12% |
Past performance does not guarantee future results. The performance data quoted represents past performance and current returns may be lower or higher. The investment return and net asset value will fluctuate so that an investor’s shares, when redeemed, may be worth more or less than the original cost. To obtain performance information current to the most recent month end, please visit our website at brownadvisoryfunds.com/performance.html. The performance table and graph above do not reflect the deduction of taxes that a shareholder would pay on Fund distributions or the redemption of Fund shares. Investment performance reflects periods during which fee waivers were in effect. In the absence of such waivers, total return would have been reduced. Performance data does not reflect the imposition of the redemption fee of 1.00% on shares redeemed within 14 days, and if it did, performance would have been lower.
1 | Performance information for the Institutional Shares, prior to commencement of operations on October 19, 2012, is based on the performance of Investor Shares, and adjusted for the lower expenses applicable to Institutional Shares. |
2 | Per the Fund’s prospectus dated October 31, 2017. Refer to the financial highlights for the gross and net expense ratios for the year ended as of the date of this report. Please note that the expense ratios per the prospectus include acquired fund fees and expenses (as applicable) and the expense ratios in the financial highlights do not. |
3
Brown Advisory Growth Equity Fund
Schedule of Investments
June 30, 2018
| Shares | Security Description | Value $ | ||||||
| Common Stocks — 93.9% | ||||||||
| Consumer Discretionary — 13.6% | ||||||||
| 339,235 | Alibaba Group Holding, Ltd. ADR* | 62,938,270 | ||||||
| 59,034 | Amazon.com, Inc.* | 100,345,993 | ||||||
| 31,608 | Booking Holdings, Inc.* | 64,072,261 | ||||||
| 568,368 | TJX Companies, Inc. | 54,097,266 | ||||||
| 281,453,790 | ||||||||
| Consumer Staples — 5.4% | ||||||||
| 291,616 | Costco Wholesale Corp. | 60,941,912 | ||||||
| 362,338 | Estee Lauder Companies, Inc. | 51,702,009 | ||||||
| 112,643,921 | ||||||||
| Health Care — 18.7% | ||||||||
| 590,169 | Danaher Corp. | 58,237,877 | ||||||
| 515,588 | DexCom, Inc.* | 48,970,548 | ||||||
| 311,066 | Edwards Lifesciences Corp.* | 45,281,878 | ||||||
| 175,739 | Intuitive Surgical, Inc.* | 84,087,597 | ||||||
| 288,777 | Thermo Fisher Scientific, Inc. | 59,817,268 | ||||||
| 1,060,729 | Zoetis, Inc. | 90,363,503 | ||||||
| 386,758,671 | ||||||||
| Industrials — 12.5% | ||||||||
| 647,321 | A.O. Smith Corp. | 38,289,037 | ||||||
| 612,457 | BWX Technologies, Inc. | 38,168,320 | ||||||
| 258,359 | Cintas Corp. | 47,814,500 | ||||||
| 852,226 | Fortive Corp. | 65,715,147 | ||||||
| 251,472 | Roper Technologies, Inc. | 69,383,640 | ||||||
| 259,370,644 | ||||||||
| Information Technology — 40.6% | ||||||||
| 317,358 | Adobe Systems, Inc.* | 77,375,054 | ||||||
| 72,837 | Alphabet, Inc. — Class C* | 81,260,599 | ||||||
| 732,350 | Amphenol Corp. | 63,824,302 | ||||||
| 179,844 | ANSYS, Inc.* | 31,325,228 | ||||||
| 143,446 | Autodesk, Inc.* | 18,804,336 | ||||||
| 471,949 | Electronic Arts, Inc.* | 66,554,248 | ||||||
| 392,362 | Facebook, Inc.* | 76,243,784 | ||||||
| 217,104 | FleetCor Technologies, Inc.* | 45,732,958 | ||||||
| 1,763,817 | Genpact, Ltd. | 51,027,226 | ||||||
| 419,355 | Intuit, Inc. | 85,676,323 | ||||||
| 904,160 | PayPal Holdings, Inc.* | 75,289,403 | ||||||
| 594,950 | salesforce.com, Inc.* | 81,151,180 | ||||||
| 657,002 | Visa, Inc. | 87,019,915 | ||||||
| 841,284,556 | ||||||||
| Materials — 3.1% | ||||||||
| 156,029 | Sherwin-Williams Co. | 63,592,739 | ||||||
| Total Common Stocks (Cost $1,058,102,775) | 1,945,104,321 | |||||||
| Real Estate Investment Trusts — 3.4% | ||||||||
| 423,586 | SBA Communications Corp.* | 69,942,520 | ||||||
| Total Real Estate Investment Trusts (Cost $41,757,543) | 69,942,520 | |||||||
| Short-Term Investments — 2.4% | ||||||||
| Money Market Funds — 2.4% | ||||||||
| 48,745,022 | Deutsche Government & | |||||||
| Agency Securities Portfolio — | ||||||||
| Institutional Shares, 1.82%# | 48,745,022 | |||||||
| Total Short-Term Investments (Cost $48,745,022) | 48,745,022 | |||||||
| Total Investments — 99.7% (Cost $1,148,605,340) | 2,063,791,863 | |||||||
| Other Assets in Excess of Liabilities — 0.3% | 7,037,335 | |||||||
| NET ASSETS — 100.0% | $ | 2,070,829,198 | ||||||
ADR — American Depositary Receipt
| * | Non-Income Producing | |
| # | Annualized seven-day yield as of June 30, 2018. |
The accompanying notes are an integral part of these financial statements.
4
Brown Advisory Flexible Equity Fund
A Message to Our Shareholders
June 30, 2018
Dear Shareholders:
During the year ended June 30, 2018, the Brown Advisory Flexible Equity Fund – Investor Shares (the “Fund”) increased 18.88% in value, exceeding the returns of the Fund’s benchmark, the S&P 500 Index (the “Index”), which rose 14.37%.
The U.S. corporate tax cut passed in late December added to an already favorable environment for equity returns from broad economic expansion, low interest rates and high levels of business, investor and consumer confidence. By increasing after-tax earnings, the tax cut somewhat lowered already high valuations–compared to history–that reflected this favorable backdrop. Equity markets produced what we believe are very strong annualized results over the last five years; however, we expect that higher valuations may meaningfully lower the future rate in the coming five to ten years. By reducing the rate of return, it will lengthen the time required to double an investment. Doubling over time is the important concept here reflecting the generally positive-sum nature of equity investing, but the ebb and flow of investor sentiment and economic events may create a retreat in prices around the rising trend. When this happens, recall that lower prices generally equate to better return prospects.
Turning to what stocks one might buy to beat the market, there is a lot of discussion about “value” stocks vs. “growth” stocks and the indices that track them. We try to avoid this labeling in our search for investment bargains. In matters of return, we believe that both future prospects (growth, but other qualities as well) and valuation are important to the investment equation—the outlook of a business should not be separated from the price paid to obtain that outlook. In recent years, businesses that are innovating and growing quickly because they are offering something new or better have been rewarded in the marketplace in anticipation of the future profits of their innovations. Businesses that are more stable–perhaps less innovative and growing more slowly–have been rewarded less or penalized if they begin to shrink. There are more of the former in the growth indices and more of the latter in value indices. Consequently, “growth” has outperformed “value” in the last few years. Looking at historical patterns of growth vs. value performance, both categories get their days in the sun, but it is hard to identify a regular cycle between or the reasons to anticipate, on a pure timing basis, when to favor one vs. the other. One may expect that when the cycle does turn, there will be some lustrous growth companies whose highly valued stocks lose their “mojo” and some dull, lowly valued companies whose stocks regain some luster. This scenario happened in dramatic fashion in 1999–2000 and many times before. It is easy to see looking back, but not as easy looking forward.
We deal with the question of growth vs. value by picking stocks—mostly one at a time—with an emphasis on what (in terms of future cash flows) we are getting in exchange for our money today. This means our portfolios are open to many types of investments and if we believe that a particular area offers better opportunities than others, our portfolio will gravitate in that direction. We believe that it is important to note that better opportunity does not mean we expect the stock to move up immediately (though it is nice when that happens), but that the return potential over a two-to-three-year investment horizon looks attractive.
During the year, consumer staples, financials and information technology were our best-performing sectors compared to the Index, meaning our stock selections rose more than the Index holdings in the same sectors. Consumer discretionary was our worst with our selections rising less than the Index sector holdings.
The top individual stocks contributing to our returns were global payments processors Mastercard and Visa. Both companies have continued to achieve strong results and we believe they are well positioned for future growth. Technology holdings Microsoft, a software and services provider, Apple, Inc., a manufacturer of various personal digital, computing and communications devices, and PayPal Holdings, a digital payments company, were also strong contributors.
We eliminated three of the largest detractors to returns, including Teva Pharmaceutical, a branded and generics pharmaceuticals manufacturer and the biggest detractor to returns, after our original investment thesis did not materialize. Teva disappointed fundamentally with volume weakness and pricing erosion in the generics business, in addition to the lack of leadership at the time of our sale. We also eliminated Express Scripts, a pharmacy benefits manager, due to erosion of their competitive position and loss of a key customer. Despite its low valuation, we sold Hanesbrands, as its apparel business proved more challenging than our original assessment.
New investments since our December 31, 2017 semiannual report to shareholders include Broadcom Inc., a semiconductor company, KKR & Co. Inc., an investment and private equity asset manager, and SBA Communications Corp., a wireless communications tower company. Qualcomm, a wireless communications company was eliminated.
We sold Qualcomm to invest in Broadcom, who had their hostile bid to acquire Qualcomm blocked by the U.S. government for national security reasons in March. Broadcom has since re-domiciled from Singapore to the U.S. with its existing co-headquarters
5
Brown Advisory Flexible Equity Fund
A Message to Our Shareholders
June 30, 2018
in San Jose, CA becoming its sole headquarters. Between these two semiconductor companies, we prefer to own the shareholder-friendly Broadcom, which we believe will grow both organically and through M&A, and should expand margins through increased scale and cost reduction.
We believe that KKR’s valuation should improve with the company’s change from a master limited partnership on July 1 to a corporate structure which allows for fewer tax complications for investors.
Our thesis for SBA Communications is based on what we see as their being well-positioned to benefit from wireless technology’s secular growth. Management’s focus on both organic growth and tower acquisitions, as well as their use of free cash flow for share repurchase, has the potential to create shareholder value. We believe that the company is poised to benefit from an eventual increase in carrier spending during the next upgrade cycle. Their founder is still involved in the company and many believe that he may ultimately realize additional value for shareholders through a sale of the company.
We search for investment bargains among long-term attractive businesses with shareholder-oriented managers. These businesses should have or develop competitive advantages that result in good business economics, managers who allocate capital well, capacity to adjust to changes in the world and the ability to grow business value over time. Bargains in these types of stocks arise for various reasons, but are often due to short-term investor perceptions, temporary business challenges that may improve, company or industry changes for the better, or as-yet-unrecognized potential for long-term growth and development. Despite the occasional investment that will go awry, we are optimistic about the long-term outlook for equities of good businesses purchased at reasonable prices and our ability to find them. To that end, our equity research team is smart, enterprising, and motivated in this search.
Sincerely,
R. Hutchings Vernon, CFA
Portfolio Manager
Maneesh Bajaj, CFA
Portfolio Manager
Past performance is not a guarantee of future results.
Mutual fund investing involves risk. Principal loss is possible. The Fund may invest in securities of foreign issuers. Investments in such securities entail certain risks not associated with investments in domestic securities, such as volatility of currency exchange rates, and in some cases, political and economic instability and relatively illiquid markets. These risks are greater for investments in emerging markets. The value of the Fund’s investments in REITs may change in response to changes in the real estate market such as declines in the value of real estate, lack of available capital or financing opportunities, and increases in property taxes or operating costs. The Fund may invest in ETFs, which may trade at a discount to the aggregate value of the underlying securities and although expense ratios for ETFs are generally low, frequent trading of ETFs by the Fund can generate brokerage expenses. Investments in smaller and medium-sized companies generally carry greater risk than is customarily associated with larger companies for various reasons such as narrower markets, limited financial resources and less liquid stock. Investments in debt securities typically decrease in value when interest rates rise. This risk is usually greater for longer term debt securities. Investments in lower-rated and non-rated securities present a greater risk of loss to principal and interest than higher-rated securities.
Fund holdings and sector allocations are subject to change and should not be considered a recommendation to buy or sell any security. For a complete list of fund holdings, please refer to the Schedule of Investments provided in this report.
Definitions for terms and indices are provided in the Glossary of Terms.
6
Brown Advisory Flexible Equity Fund
Performance Information & Portfolio Holdings Summary
June 30, 2018
| PORTFOLIO HOLDINGS | % of Net Assets |
| Information Technology | 31.9% |
| Financials | 23.7% |
| Consumer Discretionary | 13.8% |
| Health Care | 8.8% |
| Industrials | 6.3% |
| Energy | 5.2% |
| Consumer Staples | 3.8% |
| Closed-End Funds | 2.6% |
| Real Estate Investment Trusts | 2.4% |
| Money Market Funds | 1.4% |
| Warrants | 0.1% |
| Other Assets and Liabilities | (0.0)% |
100.0% |
GROWTH OF A $10,000 INVESTMENT
The following chart reflects the change in value of a hypothetical $10,000 investment, including reinvested dividends and distributions, in the Fund as measured against the broad-based securities market index. The S&P 500 Index (“Index”) is a market-value weighted index representing the performance of 500 widely held, publicly traded large capitalization stocks. The Index is unmanaged and does not reflect the deduction of fees, such as investment management fees. Investors cannot invest directly in an index.

Average Annual Total Return | One Year | Five Year | Ten Year |
Institutional Shares1 | 19.07% | 12.94% | 11.62% |
| Investor Shares | 18.88% | 12.75% | 11.45% |
| Advisor Shares | 18.61% | 12.48% | 11.16% |
| S&P 500 Index | 14.37% | 13.42% | 10.17% |
Institutional Shares | Investor Shares | Advisor Shares | |
Gross Expense Ratio2 | 0.74% | 0.89% | 1.14% |
Net Expense Ratio2 | 0.74% | 0.89% | 1.14% |
Past performance does not guarantee future results. The performance data quoted represents past performance and current returns may be lower or higher. The investment return and net asset value will fluctuate so that an investor’s shares, when redeemed, may be worth more or less than the original cost. To obtain performance information current to the most recent month end, please visit our website at brownadvisoryfunds.com/performance.html. The performance table and graph above do not reflect the deduction of taxes that a shareholder would pay on Fund distributions or the redemption of Fund shares. Investment performance reflects periods during which fee waivers were in effect. In the absence of such waivers, total return would have been reduced. Performance data does not reflect the imposition of the redemption fee of 1.00% on shares redeemed within 14 days, and if it did, performance would have been lower.
1 | Performance information for the Institutional Shares, prior to commencement of operations on October 19, 2012, is based on the performance of Investor Shares, and adjusted for the lower expenses applicable to Institutional Shares. |
2 | Per the Fund’s prospectus dated October 31, 2017. Refer to the financial highlights for the gross and net expense ratios for the year ended as of the date of this report. Please note that the expense ratios per the prospectus include acquired fund fees and expenses (as applicable) and the expense ratios in the financial highlights do not. |
7
Brown Advisory Flexible Equity Fund
Schedule of Investments
June 30, 2018
| Shares | Security Description | Value $ | ||||||
| Common Stocks — 93.5% | ||||||||
| Consumer Discretionary — 13.8% | ||||||||
| 7,008 | Booking Holdings, Inc.* | 14,205,847 | ||||||
| 217,203 | CarMax, Inc.* | 15,827,583 | ||||||
| 12,988 | Chipotle Mexican Grill, Inc.* | 5,602,633 | ||||||
| 151,580 | Lowe’s Companies, Inc. | 14,486,501 | ||||||
| 54,617 | TJX Companies, Inc. | 5,198,446 | ||||||
| 70,641 | Walt Disney Co. | 7,403,883 | ||||||
| 62,724,893 | ||||||||
| Consumer Staples — 3.8% | ||||||||
| 152,353 | Conagra Brands, Inc. | 5,443,572 | ||||||
| 375,067 | Nomad Foods, Ltd.* | 7,197,536 | ||||||
| 43,192 | PepsiCo, Inc. | 4,702,313 | ||||||
| 17,343,421 | ||||||||
| Energy — 5.2% | ||||||||
| 482,369 | Kinder Morgan, Inc. | 8,523,460 | ||||||
| 88,523 | Occidental Petroleum Corp. | 7,407,605 | ||||||
| 188,956 | Suncor Energy, Inc. | 7,686,730 | ||||||
| 23,617,795 | ||||||||
| Financials — 23.7% | ||||||||
| 79,755 | Ameriprise Financial, Inc. | 11,156,130 | ||||||
| 359,907 | Bank of America Corp. | 10,145,778 | ||||||
| 111,505 | Berkshire Hathaway, Inc.* | 20,812,408 | ||||||
| 294,054 | Charles Schwab Corp. | 15,026,159 | ||||||
| 130,531 | JPMorgan Chase & Co. | 13,601,330 | ||||||
| 272,692 | KKR & Co., L.P. | 6,776,396 | ||||||
| 590,189 | Regions Financial Corp. | 10,493,561 | ||||||
| 35,378 | T. Rowe Price Group, Inc. | 4,107,032 | ||||||
| 275,792 | Wells Fargo & Co. | 15,289,909 | ||||||
| 107,408,703 | ||||||||
| Health Care — 8.8% | ||||||||
| 14,691 | Aetna, Inc. | 2,695,798 | ||||||
| 32,622 | Anthem, Inc. | 7,765,015 | ||||||
| 94,873 | Edwards Lifesciences Corp.* | 13,810,663 | ||||||
| 51,961 | Merck & Co., Inc. | 3,154,033 | ||||||
| 52,240 | UnitedHealth Group, Inc. | 12,816,561 | ||||||
| 40,242,070 | ||||||||
| Industrials — 6.3% | ||||||||
| 83,143 | Canadian National Railway Co. | 6,796,940 | ||||||
| 115,182 | Delta Air Lines, Inc. | 5,706,116 | ||||||
| 29,242 | General Dynamics Corp. | 5,451,001 | ||||||
| 26,930 | United Rentals, Inc.* | 3,975,407 | ||||||
| 52,306 | United Technologies Corp. | 6,539,819 | ||||||
| 28,469,283 | ||||||||
| Information Technology — 31.9% | ||||||||
| 57,817 | Accenture PLC | 9,458,283 | ||||||
| 5,631 | Alphabet, Inc. — Class A* | 6,358,469 | ||||||
| 14,135 | Alphabet, Inc. — Class C* | 15,769,713 | ||||||
| 83,588 | Apple, Inc. | 15,472,974 | ||||||
| 23,846 | Broadcom, Inc. | 5,785,993 | ||||||
| 144,761 | eBay, Inc.* | 5,249,034 | ||||||
| 69,415 | Facebook, Inc.* | 13,488,723 | ||||||
| 109,515 | MasterCard, Inc. | 21,521,888 | ||||||
| 161,804 | Microsoft Corp. | 15,955,492 | ||||||
| 113,899 | PayPal Holdings, Inc.* | 9,484,370 | ||||||
| 197,046 | Visa, Inc. | 26,098,743 | ||||||
| 144,643,682 | ||||||||
| Total Common Stocks (Cost $244,203,025) | 424,449,847 | |||||||
| Real Estate Investment Trusts — 2.4% | ||||||||
| 46,441 | Crown Castle International Corp. | 5,007,269 | ||||||
| 35,100 | SBA Communications Corp.* | 5,795,712 | ||||||
| Total Real Estate Investment Trusts (Cost $8,949,540) | 10,802,981 | |||||||
| Closed-End Funds — 2.6% | ||||||||
| 164,741 | Altaba, Inc.* | 12,060,688 | ||||||
| Total Closed-End Funds (Cost $4,908,030) | 12,060,688 | |||||||
| Warrants — 0.1% | ||||||||
| 20,000 | Wells Fargo & Co., Exercise price | |||||||
| $33.64 expires 10/28/2018* | 440,400 | |||||||
| Total Warrants (Cost $221,299) | 440,400 | |||||||
| Short-Term Investments — 1.4% | ||||||||
| Money Market Funds — 1.4% | ||||||||
| 6,126,082 | Deutsche Government & | |||||||
| Agency Securities Portfolio — | ||||||||
| Institutional Shares, 1.82%# | 6,126,082 | |||||||
| Total Short-Term Investments (Cost $6,126,082) | 6,126,082 | |||||||
| Total Investments — 100.0% (Cost $264,407,976) | 453,879,998 | |||||||
| Liabilities in Excess of Other Assets — (0.0)% | (108,627 | ) | ||||||
| NET ASSETS — 100.0% | $ | 453,771,371 | ||||||
| * | Non-Income Producing | |
| # | Annualized seven-day yield as of June 30, 2018. |
The accompanying notes are an integral part of these financial statements.
8
Brown Advisory Equity Income Fund
A Message to Our Shareholders
June 30, 2018
Dear Shareholders:
During the year ended June 30, 2018, the Brown Advisory Equity Income Fund – Investor Shares (the “Fund”) increased 9.27% in value. During the same period, the Fund’s benchmark, the S&P 500 Index (the “Index”), increased 14.37%.
During the first several months of the year, U.S. stocks performed strongly and the Index hit a new high in late January. After a sharp selloff in early February, the Index traded within a fairly narrow range over the subsequent months. The synchronized global economic growth theme that carried U.S. stocks higher in the beginning of the period gave way to worries about slowing international economies, foreign currency and commodity price volatility, and a tariff dispute between the U.S. and China by the end of the year.
The best-performing sectors of the Index during this span were information technology, consumer discretionary, and energy. Businesses worldwide are investing more resources into their IT systems. As a result, revenue growth is accelerating and margins are expanding at leading IT vendors, such as Fund holdings Microsoft and Cisco Systems. The two IT stalwarts were among the Fund’s top holdings and largest contributors to overall performance the past year.
Energy holdings Occidental Petroleum and Suncor Energy also rose in price, following the general rise in oil prices. Higher realized prices for their oil output drove earnings at both companies, as well as increased year-over-year production activity in their core geographical areas.
Consumer discretionary stocks generally performed well amid strong consumer spending trends, particularly in the U.S. Apparel manufacturer V.F. Corp. was a standout performer in this sector during the period due to strong results from its diverse lineup of brands, such as Vans and The North Face. The Fund added toymaker Hasbro during the year, which increased the overall weighting of the consumer discretionary sector close to the current Index weighting.
In contrast to the consumer discretionary sector’s rise, consumer staples was the worst-performing sector for both the Fund and the Index during the period. In particular, tobacco companies Altria and Philip Morris International were among the largest detractors from performance. The FDA’s announcement relating to nicotine levels in cigarettes hurt Altria’s stock price early in the period. Subsequently, investor sentiment for tobacco stocks deteriorated further due to disappointing earnings from Philip Morris International. Sales of a new generation of heated tobacco products unexpectedly slowed in Philip Morris International’s key Japanese market. As a result, what had been seen as a success story for the company turned into a point of concern for investors, who worried about early market maturity and increased competition from new technologies.
The Fund’s industrial holdings also detracted from relative performance during the year. Most notably, conglomerate General Electric declined considerably after the company reported earnings that were far below expectations and projected continued weakness in several of its major business units. The Fund eliminated the stock on concerns that the dividend was in jeopardy; indeed, GE’s new management team later slashed the dividend. Elsewhere in the sector, data measurement company Nielsen fell after projecting lower near-term revenues and margins, though they maintained their dividend.
The Fund does not have any holdings in either the utilities or the telecommunication services sector, which had a favorable relative impact on performance during the year. Just two stocks dominate the Index’s telecommunication services sector – Verizon and AT&T. In the coming months, that sector will be renamed and expanded with media companies and certain internet-related companies that will be added. These new constituents will significantly impact the overall dividend yield and historic defensive nature of this sector, in our view.
New additions to the Fund over the past year came from a variety of sectors, such as bank holding company Bank of America, specialty materials producer DowDuPont, medical devices maker Medtronic and semiconductor firm Broadcom. We believe that there is a bright outlook for sustained earnings and dividend growth among these new names, particularly in comparison to the holdings that were eliminated during the same period. Along with GE, the Fund eliminated Willis Towers Watson, Teva Pharmaceutical and Qualcomm. The Fund’s preferred shares of storage REIT Public Storage were called and redeemed by the company during the period.
The Fund has continued to favor investments with what we believe to be attractive dividend growth opportunities over those that have offered high absolute dividend yields but inferior growth potential. As long-term interest rates in the U.S. have risen over the past two years, it is notable that faster-growing stocks have generally outperformed slower-growing ones. Additionally, this year’s corporate tax reform has the potential to boost the cash available to companies to pay dividends. It is reasonable to expect that the dividend growth rates for many of the Fund’s holdings have the potential to accelerate over the coming year.
9
Brown Advisory Equity Income Fund
A Message to Our Shareholders
June 30, 2018
We believe that staying focused on industry leaders with durable business models–as well as emphasizing the potential for sustainable dividend growth over absolute dividend yield–remains a prudent strategy for an income-oriented investor in the current environment. As always, our objective is constructing a portfolio of investments offering what we believe to be above-average yields with strong potential for future growth at reasonable valuations.
Sincerely,
Brian Graney, CFA
Portfolio Manager
Past performance does not guarantee future results.
Mutual fund investing involves risk. Principal loss is possible. Investments in debt securities typically decrease in value when interest rates rise. This risk is usually greater for longer-term debt securities. Investments in lower-rated and non-rated securities present a greater risk of loss to principal and interest than higher-rated securities. Investments in smaller and medium capitalization companies generally carry greater risk than is customarily associated with larger companies for various reasons such as narrower markets, limited financial resources and less liquid stock. The value of the Fund’s investments in REITs and Real Estate may change in response to changes in the real estate market such as declines in the value of real estate, lack of available capital or financing opportunities, and increases in property taxes or operating costs. The Fund may invest in ETFs, which may trade at a discount to the aggregate value of the underlying securities and although expense ratios for ETFs are generally low, frequent trading of ETFs by the Fund can generate brokerage expenses. Investments in foreign securities entail certain risks not associated with investments in domestic securities, such as volatility of currency exchange rates, and in some cases, political and economic instability and relatively illiquid markets. Investing in Master Limited Partnerships (“MLPs”) entails risk related to fluctuations in energy prices, decreases in supply of or demand for energy commodities, unique tax consequences due to the partnership structure and various other risks. Private Placement issued securities are restricted securities that are not publicly traded. Delay or difficulty in selling such securities may result in a loss to the Fund.
Fund holdings and sector allocations are subject to change and should not be considered a recommendation to buy or sell any security. For a complete list of fund holdings, please refer to the Schedule of Investments provided in this report.
Definitions for terms and indices are provided in the Glossary of Terms.
10
Brown Advisory Equity Income Fund
Performance Information & Portfolio Holdings Summary
June 30, 2018
| PORTFOLIO HOLDINGS | % of Net Assets |
| Information Technology | 21.2% |
| Financials | 14.7% |
| Health Care | 12.5% |
| Consumer Discretionary | 12.5% |
| Consumer Staples | 11.6% |
| Industrials | 8.3% |
| Real Estate Investment Trusts | 7.4% |
| Energy | 5.6% |
| Materials | 3.6% |
| Money Market Funds | 3.1% |
| Other Assets and Liabilities | (0.5)% |
100.0% |
GROWTH OF A $10,000 INVESTMENT
The following chart reflects the change in value of a hypothetical $10,000 investment, including reinvested dividends and distributions, in the Fund as measured against a broad-based securities market index. The S&P 500 Index (“Index”) is a market-value weighted index representing the performance of 500 widely held, publicly traded large capitalization stocks. The Index is unmanaged and does not reflect the deduction of fees, such as investment management fees. Investors cannot invest directly in an index.

| Since Inception | |||
Average Annual Total Return | One Year | Five Year | (12/29/11) |
Institutional Shares1 | 9.51% | 9.01% | 10.89% |
| Investor Shares | 9.27% | 8.83% | 10.71% |
| Advisor Shares | 9.04% | 8.58% | 10.45% |
| S&P 500 Index | 14.37% | 13.42% | 14.90% |
Institutional Shares | Investor Shares | Advisor Shares | |
Gross Expense Ratio2 | 0.77% | 0.92% | 1.17% |
Net Expense Ratio2 | 0.77% | 0.92% | 1.17% |
Past performance does not guarantee future results. The performance data quoted represents past performance and current returns may be lower or higher. The investment return and net asset value will fluctuate so that an investor’s shares, when redeemed, may be worth more or less than the original cost. To obtain performance information current to the most recent month end, please visit our website at brownadvisoryfunds.com/performance.html. The performance table and graph above do not reflect the deduction of taxes that a shareholder would pay on Fund distributions or the redemption of Fund shares. Performance data does not reflect the imposition of the redemption fee of 1.00% on shares redeemed within 14 days, and if it did, performance would have been lower.
1 | Performance information for the Institutional Shares, prior to commencement of operations on October 19, 2012, is based on the performance of Investor Shares, and adjusted for the lower expenses applicable to Institutional Shares. |
2 | Per the Fund’s prospectus dated October 31, 2017. Refer to the financial highlights for the gross and net expense ratios for the year ended as of the date of this report. Please note that the expense ratios per the prospectus include acquired fund fees and expenses (as applicable) and the expense ratios in the financial highlights do not. |
11
Brown Advisory Equity Income Fund
Schedule of Investments
June 30, 2018
| Shares | Security Description | Value $ | ||||||
| Common Stocks — 90.0% | ||||||||
| Consumer Discretionary — 12.5% | ||||||||
| 23,060 | Best Buy Co., Inc. | 1,719,814 | ||||||
| 20,282 | Hasbro, Inc. | 1,872,231 | ||||||
| 8,068 | Home Depot, Inc. | 1,574,067 | ||||||
| 13,705 | Lowe’s Companies, Inc. | 1,309,787 | ||||||
| 20,323 | McDonald’s Corp. | 3,184,411 | ||||||
| 27,717 | V.F. Corp. | 2,259,490 | ||||||
| 11,919,800 | ||||||||
| Consumer Staples — 11.6% | ||||||||
| 65,933 | Altria Group, Inc. | 3,744,335 | ||||||
| 54,883 | Coca-Cola Co. | 2,407,169 | ||||||
| 30,842 | Philip Morris International, Inc. | 2,490,183 | ||||||
| 43,588 | Unilever NV ADR | 2,428,723 | ||||||
| 11,070,410 | ||||||||
| Energy — 5.6% | ||||||||
| 52,983 | Kinder Morgan, Inc. | 936,210 | ||||||
| 26,328 | Occidental Petroleum Corp. | 2,203,127 | ||||||
| 55,087 | Suncor Energy, Inc. | 2,240,939 | ||||||
| 5,380,276 | ||||||||
| Financials — 14.7% | ||||||||
| 17,239 | Ameriprise Financial, Inc. | 2,411,391 | ||||||
| 75,717 | Bank of America Corp. | 2,134,462 | ||||||
| 27,492 | Cincinnati Financial Corp. | 1,838,115 | ||||||
| 16,545 | Erie Indemnity Co. | 1,940,067 | ||||||
| 30,475 | JPMorgan Chase & Co. | 3,175,495 | ||||||
| 45,589 | Wells Fargo & Co. | 2,527,454 | ||||||
| 14,026,984 | ||||||||
| Health Care — 12.5% | ||||||||
| 21,692 | AbbVie, Inc. | 2,009,764 | ||||||
| 19,792 | Johnson & Johnson | 2,401,561 | ||||||
| 19,261 | Medtronic PLC | 1,648,934 | ||||||
| 53,045 | Merck & Co., Inc. | 3,219,832 | ||||||
| 35,111 | Novartis AG ADR | 2,652,285 | ||||||
| 11,932,376 | ||||||||
| Industrials — 8.3% | ||||||||
| 7,864 | General Dynamics Corp. | 1,465,928 | ||||||
| 47,428 | Healthcare Services Group, Inc. | 2,048,415 | ||||||
| 52,840 | Nielsen Holdings PLC | 1,634,341 | ||||||
| 21,978 | United Technologies Corp. | 2,747,910 | ||||||
| 7,896,594 | ||||||||
| Information Technology — 21.2% | ||||||||
| 15,932 | Accenture PLC | 2,606,316 | ||||||
| 22,631 | Apple, Inc. | 4,189,224 | ||||||
| 23,019 | Automatic Data Processing, Inc. | 3,087,769 | ||||||
| 6,128 | Broadcom, Inc. | 1,486,898 | ||||||
| 89,728 | Cisco Systems, Inc. | 3,860,996 | ||||||
| 51,186 | Microsoft Corp. | 5,047,451 | ||||||
| 20,278,654 | ||||||||
| Materials — 3.6% | ||||||||
| 22,836 | DowDuPont, Inc. | 1,505,349 | ||||||
| 12,398 | Praxair, Inc. | 1,960,744 | ||||||
| 3,466,093 | ||||||||
| Total Common Stocks (Cost $52,623,285) | 85,971,187 | |||||||
| Real Estate Investment Trusts — 7.4% | ||||||||
| 12,623 | American Tower Corp. | 1,819,858 | ||||||
| 37,460 | W.P. Carey, Inc. | 2,485,471 | ||||||
| 75,226 | Weyerhaeuser Co. | 2,742,740 | ||||||
| Total Real Estate Investment Trusts (Cost $5,431,193) | 7,048,069 | |||||||
| Short-Term Investments — 3.1% | ||||||||
| Money Market Funds — 3.1% | ||||||||
| 2,997,202 | Deutsche Government & | |||||||
| Agency Securities Portfolio — | ||||||||
| Institutional Shares, 1.82%# | 2,997,202 | |||||||
| Total Short-Term Investments (Cost $2,997,202) | 2,997,202 | |||||||
| Total Investments — 100.5% (Cost $61,051,680) | 96,016,458 | |||||||
| Liabilities in Excess of Other Assets — (0.5)% | (451,907 | ) | ||||||
| NET ASSETS — 100.0% | $ | 95,564,551 | ||||||
ADR — American Depositary Receipt
| # | Annualized seven-day yield as of June 30, 2018. |
The accompanying notes are an integral part of these financial statements.
12
Brown Advisory Sustainable Growth Fund
A Message to Our Shareholders
June 30, 2018
Dear Shareholders:
During the year ended June 30, 2018, the Brown Advisory Sustainable Growth Fund – Institutional Shares (the “Fund”) increased 23.59% in value. During the same period, the Russell 1000 Growth Index, the Fund’s benchmark, increased 22.51%.
We are pleased with the outperformance generated during the year. We added value in eight of the eleven economic sectors and added the most value in the areas of the market in which we have the largest weights (i.e. technology and health care). The Fund’s relative outperformance was also due to strong stock selection in consumer discretionary. Our underweight in consumer staples also contributed to the positive performance relative the benchmark. These positive factors more than offset weak performance from some of our industrials and materials holdings.
The equity markets have continued to advance despite clouds on the horizon such as trade wars, the strengthening U.S. dollar and commodity price inflation. While the macroeconomic environment has remained fluid and is uncertain, our focus remains unchanged. We seek to identify fundamentally superior companies that are using sustainability strategies that have the potential to drive strong financial performance. We are in the ninth year of a bull market and are careful to avoid chasing momentum-led stories.
Taking a closer look at the last year, a number of our technology holdings contributed most positively to performance, including Adobe Systems, Microsoft and Intuit. Adobe Systems’ Creative Cloud business delivered very impressive results as new users have continued to adopt the software. During the year, the company announced a price increase for its Creative Cloud suite which has the potential to help drive growth. Strong growth from Microsoft’s public cloud business, along with effective cost control execution, contributed to its robust results. We are hopeful that the company’s enhanced gaming platform will be a new driver of growth going forward. Intuit’s consumer tax business delivered robust growth during the latest tax season. The rollout of Turbo Tax Live helped attract new users into the software ecosystem and we are hopeful that it will be a positive harbinger for growth in the years to come.
In terms of our largest detractors, Ball Corporation (“Ball”), Westinghouse Air Brake Technologies (“Wabtec”) and Healthcare Services Group were our worst performers during the period. Despite Ball executing well on the integration of Rexam, investors have become concerned about weakness in North American volume. While Ball has been on track to meet its financial targets by the end of 2019, the stock has come under increasing pressure and its multiple has contracted. We are confident in management’s ability to navigate through the current environment and have used the weakness to add to our position. Wabtec’s freight aftermarket business performed much worse than expected and caused the company to reduce guidance multiple times. We are disappointed with Wabtec’s results during the trough of the railcar cycle and eliminated the stock during the period. Healthcare Services Group took an unusual write-down of its accounts receivable in the first quarter, reflecting the financial challenges of its end markets. We believe that the difficult industry backdrop will likely persist going forward and we exited the position.
Overall, we added eight new names to the portfolio during the year including Aptiv, Nordson, Welbilt, West Pharmaceutical Services, Home Depot, Autodesk and Marriott. We also added Marvell, which was in the process of acquiring one of our portfolio companies, Cavium.
Aptiv is a leading supplier of electrical architecture, safety products and electronics, and systems for light vehicles. Aptiv’s products have enabled auto manufacturers to meet increasingly stringent government regulations and consumer preferences for products that are safe, ‘green’ and connected. These trends have led to increased content per vehicle, greater profitability and higher margins.
Nordson manufactures precision technology solutions focused on material dispensing (adhesives and coatings), plastic/polymer processing, test and inspection, surface treatment, and fluid handling. The company’s products are used to precisely apply, dispense and cure adhesives, paints, sealants and coatings in a variety of consumer and industrial products. Nordson’s technology helps its customers reduce raw material usage in manufacturing applications.
Welbilt is a world-leading manufacturer of commercial food service equipment. Welbilt designs and manufactures cooking, holding, food preparation, beverage dispensing, refrigeration and ice-making technologies. The company helps its customers by designing products that reduce energy and water consumption. Welbilt’s mobile connectivity and monitoring capabilities help commercial kitchens reduce downtime, optimize energy use and improve service response time.
13
Brown Advisory Sustainable Growth Fund
A Message to Our Shareholders
June 30, 2018
West Pharmaceutical Services is a leading manufacturer of packaging components and delivery systems for injectable drugs and health care products. The company’s products promote the safety, purity and efficacy of the world’s pharmaceutical drug supply. They have had a dominant position in the market and supply components for many of the top biologics in the world.
Marriott is the world’s largest branded hotel network – a position solidified by its recent acquisition of Starwood Hotels. The company enjoys structurally high returns on invested capital given its asset-light franchise model, while franchisees have benefited from lower distribution, procurement and marketing costs via Marriott’s global scale. Marriott’s sustainable business advantage has been their attention to environmental and social performance, whereby their environmental management and track record makes them a preferred partner to large corporate customers and improves operating cost structures.
Autodesk is a provider of computer-aided design (CAD) software, with an entrenched position in the architecture, design and manufacturing industries. We believe that these end markets have growing needs for engineering software, and are also very sticky due to long-standing engineering education and training, lock-in with legacy designs, and high switching costs due to process automation and data formatting. The company helps address the imperatives of sustainable design and lifecycle/waste management.
As for deletions during the period, we eliminated Hexcel, Middleby, Starbucks and TreeHouse Foods along with previously mentioned names: Cavium, HealthCare Services and Wabtec. We sold Hexcel given we believe investors already discount much of the strong growth in its aerospace business. We exited Middelby due to our belief that Welbilt will grow faster in the commercial food service market. Welbilt has a full lineup up of both hot and cold offerings combined with an integrated solution offering called FitKitchen. In contrast, Middleby lacks a full-service offering and has a weaker lineup of cold equipment. We sold Starbucks due to a slowdown in growth and exited Treehouse after a number of missteps by management in the integration of ConAgra’s Private Brands business.
We maintain a disciplined process of discerning high-quality names poised for steady success–even in uncertain operating environments. Sustainable growth requires management teams to be resilient against many challenges, including constraints on the natural environment and resources. Our deep sustainability research helps us identify the companies that have been making the right long-term investments, for many years now, toward their own long-term sustainability and growth.
While we enter the second half of calendar year 2018 with considerable macroeconomic and political uncertainty, we will maintain focus on our disciplined, repeatable formula for stock selection which we believe has the potential to enable us to provide attractive long-term returns.
Sincerely,
Karina Funk, CFA
Portfolio Manager
David Powell, CFA
Portfolio Manager
Past performance is not a guarantee of future results.
Mutual fund investing involves risk. Principal loss is possible. The Fund’s investment focus on environmental factors could cause it to make or avoid investments that could result in the Fund underperforming similar funds that do not have an environmental focus. Investments in smaller and medium-sized capitalization companies generally carry greater risk than is customarily associated with larger companies for various reasons such as narrower markets, limited financial resources and less liquid stock. Investments in foreign securities entail certain risks not associated with investments in domestic securities, such as volatility of currency exchange rates, and in some cases, political and economic instability and relatively illiquid markets. These risks are greater for investments in emerging markets. The value of the Fund’s investments in REITS may change in response to changes in the real estate market such as declines in the value of real estate, lack of available capital or financing opportunities, and increases in property taxes or operating costs.
Fund holdings and sector allocations are subject to change and should not be considered a recommendation to buy or sell any security. For a complete list of fund holdings, please refer to the Schedule of Investments provided in this report.
Definitions for terms and indices are provided in the Glossary of Terms.
14
Brown Advisory Sustainable Growth Fund
Performance Information & Portfolio Holdings Summary
June 30, 2018
| PORTFOLIO HOLDINGS | % of Net Assets |
| Information Technology | 37.2% |
| Health Care | 20.6% |
| Industrials | 14.4% |
| Consumer Discretionary | 13.0% |
| Materials | 5.1% |
| Real Estate Investment Trusts | 4.3% |
| Money Market Funds | 3.2% |
| Consumer Staples | 2.1% |
| Other Assets and Liabilities | 0.1% |
100.0% |
GROWTH OF A $1,000,000 INVESTMENT
The following chart reflects the change in value of a hypothetical $1,000,000 investment, including reinvested dividends and distributions, in the Fund as measured against a broad-based securities market index. The Russell 1000® Growth Index (“Index”) measures the performance of the large-cap growth segment of the U.S. equity universe. It includes those Russell 1000® companies with higher price to book ratios and higher forecasted growth values. The Index is unmanaged and does not reflect the deduction of fees, such as investment management fees. Investors cannot invest directly in an index.

| Since Inception | |||
Average Annual Total Return | One Year | Five Year | (6/29/12) |
| Institutional Shares | 23.59% | 16.96% | 16.87% |
| Investor Shares | 23.41% | 16.78% | 16.69% |
| Advisor Shares | 23.12% | 16.48% | 16.40% |
Russell 1000® Growth Index | 22.51% | 16.36% | 16.47% |
Institutional Shares | Investor Shares | Advisor Shares | |
Gross Expense Ratio1 | 0.74% | 0.89% | 1.14% |
Net Expense Ratio1 | 0.74% | 0.89% | 1.14% |
Past performance does not guarantee future results. The performance data quoted represents past performance and current returns may be lower or higher. The investment return and net asset value will fluctuate so that an investor’s shares, when redeemed, may be worth more or less than the original cost. To obtain performance information current to the most recent month end, please visit our website at brownadvisoryfunds.com/performance.html. The performance table and graph above do not reflect the deduction of taxes that a shareholder would pay on Fund distributions or the redemption of Fund shares. Performance data does not reflect the imposition of the redemption fee of 1.00% on shares redeemed within 14 days, and if it did, performance would have been lower.
1 | Per the Fund’s prospectus dated October 31, 2017. Refer to the financial highlights for the gross and net expense ratios for the year ended as of the date of this report. Please note that the expense ratios per the prospectus include acquired fund fees and expenses (as applicable) and the expense ratios in the financial highlights do not. |
15
Brown Advisory Sustainable Growth Fund
Schedule of Investments
June 30, 2018
| Shares | Security Description | Value $ | ||||||
| Common Stocks — 92.4% | ||||||||
| Consumer Discretionary — 13.0% | ||||||||
| 17,820 | Amazon.com, Inc.* | 30,290,436 | ||||||
| 131,158 | Aptiv PLC | 12,018,008 | ||||||
| 100,335 | Home Depot, Inc. | 19,575,358 | ||||||
| 133,887 | Marriott International, Inc. | 16,950,094 | ||||||
| 105,633 | TJX Companies, Inc. | 10,054,149 | ||||||
| 88,888,045 | ||||||||
| Consumer Staples — 2.1% | ||||||||
| 261,995 | Unilever NV ADR | 14,598,362 | ||||||
| Health Care — 20.6% | ||||||||
| 249,794 | Danaher Corp. | 24,649,672 | ||||||
| 148,978 | Edwards Lifesciences Corp.* | 21,686,727 | ||||||
| 45,753 | IDEXX Laboratories, Inc.* | 9,971,409 | ||||||
| 18,943 | Mettler-Toledo International, Inc.* | 10,960,988 | ||||||
| 123,613 | Thermo Fisher Scientific, Inc. | 25,605,197 | ||||||
| 120,723 | UnitedHealth Group, Inc. | 29,618,181 | ||||||
| 188,470 | West Pharmaceutical Services, Inc. | 18,713,186 | ||||||
| 141,205,360 | ||||||||
| Industrials — 14.4% | ||||||||
| 268,417 | A.O. Smith Corp. | 15,876,865 | ||||||
| 236,952 | Fortive Corp. | 18,271,369 | ||||||
| 160,536 | J.B. Hunt Transport Services, Inc. | 19,513,151 | ||||||
| 94,235 | Nordson Corp. | 12,100,716 | ||||||
| 178,195 | Verisk Analytics, Inc.* | 19,180,910 | ||||||
| 616,941 | Welbilt, Inc.* | 13,763,954 | ||||||
| 98,706,965 | ||||||||
| Information Technology — 37.2% | ||||||||
| 103,960 | Adobe Systems, Inc.* | 25,346,488 | ||||||
| 23,759 | Alphabet, Inc. — Class A* | 26,828,425 | ||||||
| 3,371 | Alphabet, Inc. — Class C* | 3,760,856 | ||||||
| 74,007 | Autodesk, Inc.* | 9,701,578 | ||||||
| 78,823 | Facebook, Inc.* | 15,316,885 | ||||||
| 123,145 | Intuit, Inc. | 25,159,139 | ||||||
| 658,674 | Marvell Technology Group, Ltd. | 14,121,971 | ||||||
| 340,658 | Microsoft Corp. | 33,592,285 | ||||||
| 125,860 | Monolithic Power Systems, Inc. | 16,823,706 | ||||||
| 127,787 | Red Hat, Inc.* | 17,170,739 | ||||||
| 144,162 | salesforce.com, Inc.* | 19,663,697 | ||||||
| 69,512 | Tyler Technologies, Inc.* | 15,438,615 | ||||||
| 243,052 | Visa, Inc. | 32,192,238 | ||||||
| 255,116,622 | ||||||||
| Materials — 5.1% | ||||||||
| 375,815 | Ball Corp. | 13,360,223 | ||||||
| 152,509 | Ecolab, Inc. | 21,401,588 | ||||||
| 34,761,811 | ||||||||
| Total Common Stocks (Cost $433,688,470) | 633,277,165 | |||||||
| Real Estate Investment Trusts — 4.3% | ||||||||
| 203,881 | American Tower Corp. | 29,393,524 | ||||||
| Total Real Estate Investment Trusts (Cost $22,845,307) | 29,393,524 | |||||||
| Short-Term Investments — 3.2% | ||||||||
| Money Market Funds — 3.2% | ||||||||
| 21,937,525 | Deutsche Government & | |||||||
| Agency Securities Portfolio — | ||||||||
| Institutional Shares, 1.82%# | 21,937,525 | |||||||
| Total Short-Term Investments (Cost $21,937,525) | 21,937,525 | |||||||
| Total Investments — 99.9% (Cost $478,471,302) | 684,608,214 | |||||||
| Other Assets in Excess of Liabilities — 0.1% | 497,119 | |||||||
| NET ASSETS — 100.0% | $ | 685,105,333 | ||||||
ADR — American Depositary Receipt
| * | Non-Income Producing | |
| # | Annualized seven-day yield as of June 30, 2018. |
The accompanying notes are an integral part of these financial statements.
16
Brown Advisory Mid-Cap Growth Fund
A Message to Our Shareholders
June 30, 2018
Dear Shareholders:
For the period from October 2, 2017 (commencement of operations) to June 30, 2018, the Brown Advisory Mid-Cap Growth Fund – Investor Shares (the “Fund”) increased 13.60% in value. During the same period, the Fund’s benchmark, the Russell Midcap Growth Index, increased 12.00%.
We focus on generating competitive risk-adjusted returns through stock selection and a focus on limiting the downside risk of our investments over long periods of time. The investment strategy that governs this Fund has a six-year track record demonstrating this dynamic; we were happy to see it continue over this short nine-month stretch. In general, large-caps outpaced small-caps in the last nine months and traditional-growth sectors, such as health care and information technology, outperformed cyclical sectors. We believe that the market environment provided neither a tailwind nor a headwind to our relative results. As in previous periods, we found that positive stock selection across several sectors drove our relative gains, with particular success in information technology, health care, and industrials since last November.
Top performers during the period included TransUnion, Broadridge, Mimecast, and Edwards Lifesciences. TransUnion showed a surprising persistence that we believe drives long-term compounders. This credit bureau provides data and analytics to a diverse customer set. It has benefitted from secular trends in consumer payments worldwide, a limited competitive set (due to network effects and efficiency, most countries sport only two or three major credit bureaus), and the scale that most database businesses yield over time. Importantly, a shift in data profiling toward individual credit profile trends and “alternative” data has driven TransUnion’s revenue and gross profit per credit inquiry higher. This shift, while not perfectly quantified or publicized by management, has the potential to help TransUnion continue to grow margins and return on capital employed (i.e. scale)—we believe that this combination may keep growth durable for longer than most expect.
Broadridge continued posting solid results with particular strength in its proxy and securities processing businesses. Email security provider Mimecast benefited from the technology sector’s outperformance, as well as strong fundamentals thanks to trends that have favored cloud-based and advanced email security in the U.S. and abroad. Edwards Lifesciences displayed persistent double-digit growth as patients have switched from open-heart to minimally-invasive aortic valve surgery. Given that only 20% of procedures are performed via a catheter, we believe that this leaves a meaningful opportunity for growth as that proportion grows.
Top detractors during the period included TripAdvisor, Ball Corporation, Liberty Broadband, and Liberty Media Liberty Formula One. TripAdvisor struggled with a business-model transition in 2016 and 2017. Trip Advisor’s results were further hindered in the second half of 2017 after Priceline reduced its advertising spend on hotel metasearch auctions. Ball Corp suffered from a de-rating of low-growth consumer staples stocks. That was compounded by a slowdown in two of their major markets (“Big Beer” in the U.S., and beverage cans in Brazil after a trucking strike). The last two were likely weak from waning investor appetite for businesses with financial leverage. To be fair, Charter Communications (Liberty Broadband’s main asset) posted mildly disappointing first quarter 2018 results, but it would take another quarter to alarm us. We exited our position in Liberty Media Formula One to fund other opportunities.
During the period, the Fund added 14 investments and exited 17 positions. The Fund’s turnover, which measured 29% since operations commenced, was slightly higher than average for this strategy, but remains within historical norms. Given our three- to five-year investment time-horizon, we expect turnover to range between 20% and 50% annually, depending on market conditions, portfolio needs, and opportunities.
During the last nine months, we found investment opportunities in numerous sectors. Six of the new positions were in information technology, two in health care, two in industrials, two in consumer discretionary, one in financials and one in consumer staples.
We have followed HealthEquity, a leading administrator of health savings accounts (HSAs) for years. At one point or another, we have owned every one of its publicly traded competitors in our small-cap growth strategy. We believe that HSAs are only about 25% penetrated and that trends towards high-deductible health care plans in the U.S. have the potential to push double-digit account growth for years. Moreover, HealthEquity has gained share with what we see as a better offering and we think that can continue. We believe that HealthEquity is the best positioned competitor to benefit from rising rates. As that became a reality, we built a position on both market and stock-specific weakness following a misinterpreted industry report early in the year that erroneously showed slowing market-wide growth for HSAs.
17
Brown Advisory Mid-Cap Growth Fund
A Message to Our Shareholders
June 30, 2018
We constructed a meaningful position in Cintas, the leading domestic uniform-rental company, when the stock dipped with the market in early February. Cintas has gained share in a large, underpenetrated market for years by offering a needed service and a better product set. After completing our due diligence—which consisted of visiting management, speaking to customers, competitors and former employees—we concluded that the firm’s earnings growth could remain durable thanks to a steady shift to hygiene products, which have carried higher gross margins and lower incremental capital requirements when compared to its mainstay uniform rental operations. Moreover, Cintas bought competitor G&K and will soon offer its broader product portfolio to those customers. If Cintas can grow hygiene products from three percent of G&K’s sales closer to its current average in the teens, we think it could unlock even more value from the acquisition than many expect.
We sold positions across a variety of sectors as well – eight in information technology, three in consumer discretionary, two in industrials, two in consumer staples, one in financials and one in real estate. We sold shares of MACOM Technology Solutions, TreeHouse Foods, Equifax, TripAdvisor and Chipotle due to fundamental concerns. We exited our position in ANSYS due to valuation. Broadsoft, C. R. Bard and Cavium were acquired by other companies. We sold small positions in Acxiom, Crown Castle, ESCO, Maximus, Prosperity Bancshares, ESCO Technologies and PriceSmart to fund other opportunities.
We remain committed to seeking attractive risk-adjusted returns over a full market cycle by owning a diversified portfolio of companies that we believe could one day grow much larger. We thank you for your support and interest, and look forward to updating you in more detail in our next update.
Sincerely,
George Sakellaris
Portfolio Manager
Christopher A. Berrier
Portfolio Manager
Past performance is not a guarantee of future results.
Mutual fund investing involves risk. Principal loss is possible. The Fund may invest in securities of foreign issuers. Investments in such securities entail certain risks not associated with investments in domestic securities, such as volatility of currency exchange rates, and in some cases, political and economic instability and relatively illiquid markets. These risks are greater for investments in emerging markets. The value of the Fund’s investments in REITs may change in response to changes in the real estate market such as declines in the value of real estate, lack of available capital or financing opportunities, and increases in property taxes or operating costs. The Fund may invest in ETFs, which may trade at a discount to the aggregate value of the underlying securities and although expense ratios for ETFs are generally low, frequent trading of ETFs by the Fund can generate brokerage expenses. Investments in smaller and medium-sized companies generally carry greater risk than is customarily associated with larger companies for various reasons such as narrower markets, limited financial resources and less liquid stock. Investments in debt securities typically decrease in value when interest rates rise. This risk is usually greater for longer term debt securities. Investments in lower-rated and non-rated securities present a greater risk of loss to principal and interest than higher-rated securities.
Fund holdings and sector allocations are subject to change and should not be considered a recommendation to buy or sell any security. For a complete list of fund holdings, please refer to the Schedule of Investments provided in this report.
Definitions for terms and indices are provided in the Glossary of Terms.
18
Brown Advisory Mid-Cap Growth Fund
Performance Information & Portfolio Holdings Summary
June 30, 2018
| PORTFOLIO HOLDINGS | % of Net Assets |
| Information Technology | 29.3% |
| Industrials | 22.2% |
| Health Care | 16.8% |
| Consumer Discretionary | 11.6% |
| Materials | 4.4% |
| Consumer Staples | 4.3% |
| Telecommunication Services | 3.8% |
| Financials | 3.0% |
| Money Market Funds | 2.7% |
| Real Estate Investment Trusts | 1.9% |
| Other Assets and Liabilities | 0.0% |
100.0% |
GROWTH OF A $10,000 INVESTMENT
The following chart reflects the change in value of a hypothetical $10,000 investment, including reinvested dividends and distributions, in the Fund compared with the broad-based securities market index. The Russell Midcap Growth Index (“Index”) measures the performance of the mid-capitalization growth sector of the U.S. equity market. The Index is unmanaged and does not reflect the deduction of fees, such as investment management fees. Investors cannot invest directly in an index.
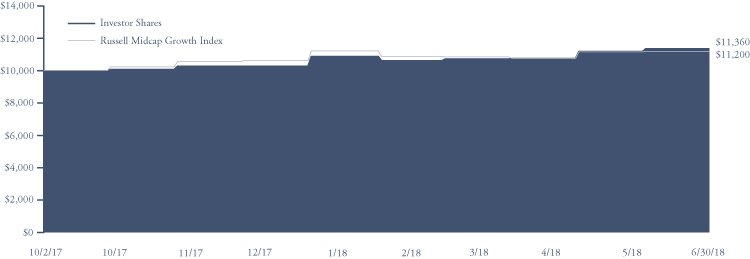
| Since Inception | |
Cumulative Total Return | (10/2/17) |
| Investor Shares | 13.60% |
| Russell Midcap Growth Index | 12.00% |
Investor Shares | |
Gross Expense Ratio1 | 1.39% |
Net Expense Ratio1 | 0.86% |
Past performance does not guarantee future results. The performance data quoted represents past performance and current returns may be lower or higher. The investment return and net asset value will fluctuate so that an investor’s shares, when redeemed, may be worth more or less than the original cost. To obtain performance information current to the most recent month end, please visit our website at brownadvisoryfunds.com/performance.html. The performance table and graph above do not reflect the deduction of taxes that a shareholder would pay on Fund distributions or the redemption of Fund shares. Performance data does not reflect the imposition of the redemption fee of 1.00% on shares redeemed within 14 days, and if it did, performance would have been lower.
1 | Per the Fund’s prospectus dated October 31, 2017. Refer to the financial highlights for the gross and net expense ratios for the year ended as of the date of this report. Please note that the expense ratios per the prospectus include acquired fund fees and expenses (as applicable) and the expense ratios in the financial highlights do not. |
19
Brown Advisory Mid-Cap Growth Fund
Schedule of Investments
June 30, 2018
| Shares | Security Description | Value $ | ||||||
| Common Stocks — 95.4% | ||||||||
| Consumer Discretionary — 11.6% | ||||||||
| 5,213 | Aptiv PLC | 477,667 | ||||||
| 2,937 | Bright Horizons Family Solutions, Inc.* | 301,102 | ||||||
| 3,667 | CarMax, Inc.* | 267,214 | ||||||
| 4,699 | Ctrip.com International, Ltd. ADR* | 223,813 | ||||||
| 5,342 | Liberty SiriusXM* | 240,657 | ||||||
| 3,818 | Marriott International, Inc. | 483,359 | ||||||
| 3,092 | National Vision Holdings, Inc.* | 113,074 | ||||||
| 4,285 | Ross Stores, Inc. | 363,154 | ||||||
| 2,470,040 | ||||||||
| Consumer Staples — 4.3% | ||||||||
| 3,678 | Brown-Forman Corp. | 180,259 | ||||||
| 2,805 | Calavo Growers, Inc. | 269,701 | ||||||
| 5,968 | Church & Dwight Co., Inc. | 317,258 | ||||||
| 1,114 | Estee Lauder Companies, Inc. | 158,957 | ||||||
| 926,175 | ||||||||
| Financials — 3.0% | ||||||||
| 7,578 | BankUnited, Inc. | 309,561 | ||||||
| 5,281 | Webster Financial Corp. | 336,400 | ||||||
| 645,961 | ||||||||
| Health Care — 16.8% | ||||||||
| 1,485 | Agios Pharmaceuticals, Inc.* | 125,082 | ||||||
| 5,889 | Alder Biopharmaceuticals, Inc.* | 93,046 | ||||||
| 3,947 | Cambrex Corp.* | 206,428 | ||||||
| 12,594 | Catalent, Inc.* | 527,563 | ||||||
| 2,937 | Charles River Laboratories International, Inc.* | 329,708 | ||||||
| 1,898 | Cooper Companies, Inc. | 446,884 | ||||||
| 9,789 | Cotiviti Holdings, Inc.* | 431,989 | ||||||
| 1,783 | DexCom, Inc.* | 169,349 | ||||||
| 3,728 | Edwards Lifesciences Corp.* | 542,684 | ||||||
| 1,388 | HealthEquity, Inc.* | 104,239 | ||||||
| 5,350 | Henry Schein, Inc.* | 388,624 | ||||||
| 1,485 | Neurocrine Biosciences, Inc.* | 145,887 | ||||||
| 1,043 | Ultragenyx Pharmaceutical, Inc.* | 80,175 | ||||||
| 3,591,658 | ||||||||
| Industrials — 22.2% | ||||||||
| 4,062 | Allegion PLC | 314,236 | ||||||
| 5,105 | BWX Technologies, Inc. | 318,144 | ||||||
| 1,895 | Cintas Corp. | 350,708 | ||||||
| 5,443 | HEICO Corp. | 396,921 | ||||||
| 4,835 | Hexcel Corp. | 320,947 | ||||||
| 1,866 | IDEX Corp. | 254,672 | ||||||
| 1,977 | J.B. Hunt Transport Services, Inc. | 240,304 | ||||||
| 4,422 | Sensata Technologies Holding PLC* | 210,399 | ||||||
| 2,078 | SiteOne Landscape Supply, Inc.* | 174,490 | ||||||
| 8,075 | TransUnion | 578,493 | ||||||
| 10,775 | Waste Connections, Inc. | 811,143 | ||||||
| 17,918 | Welbilt, Inc.* | 399,750 | ||||||
| 4,778 | Woodward, Inc. | 367,237 | ||||||
| 4,737,444 | ||||||||
| Information Technology — 29.3% | ||||||||
| 2,912 | Amphenol Corp. | 253,781 | ||||||
| 2,312 | Autodesk, Inc.* | 303,080 | ||||||
| 2,024 | Blackbaud, Inc. | 207,359 | ||||||
| 5,202 | Booz Allen Hamilton Holding Corp. | 227,483 | ||||||
| 3,678 | Broadridge Financial Solutions, Inc. | 423,338 | ||||||
| 3,160 | CoreLogic, Inc.* | 164,004 | ||||||
| 3,692 | Electronic Arts, Inc.* | 520,645 | ||||||
| 4,997 | Etsy, Inc.* | 210,823 | ||||||
| 949 | Fair Isaac Corp.* | 183,461 | ||||||
| 1,539 | Gartner, Inc.* | 204,533 | ||||||
| 17,195 | Genpact, Ltd. | 497,451 | ||||||
| 1,812 | Global Payments, Inc. | 202,020 | ||||||
| 4,868 | GoDaddy, Inc.* | 343,681 | ||||||
| 3,103 | Guidewire Software, Inc.* | 275,484 | ||||||
| 1,866 | Intuit, Inc. | 381,233 | ||||||
| 1,668 | Jack Henry & Associates, Inc. | 217,440 | ||||||
| 14,542 | Marvell Technology Group, Ltd. | 311,780 | ||||||
| 3,998 | Microchip Technology, Inc. | 363,619 | ||||||
| 10,393 | Mimecast, Ltd.* | 428,296 | ||||||
| 1,043 | WEX, Inc.* | 198,671 | ||||||
| 4,235 | Worldpay, Inc.* | 346,338 | ||||||
| 6,264,520 | ||||||||
| Materials — 4.4% | ||||||||
| 12,579 | Ball Corp. | 447,183 | ||||||
| 3,599 | Ecolab, Inc. | 505,048 | ||||||
| 952,231 | ||||||||
| Telecommunication Services — 3.8% | ||||||||
| 10,724 | Cogent Communications Holdings, Inc. | 572,662 | ||||||
| 3,049 | Liberty Broadband Corp.* | 230,626 | ||||||
| 803,288 | ||||||||
| Total Common Stocks (Cost $18,943,621) | 20,391,317 | |||||||
| Real Estate Investment Trusts — 1.9% | ||||||||
| 2,506 | SBA Communications Corp.* | 413,791 | ||||||
| Total Real Estate Investment Trusts (Cost $404,111) | 413,791 | |||||||
| Short-Term Investments — 2.7% | ||||||||
| Money Market Funds — 2.7% | ||||||||
| 563,521 | Deutsche Government & | |||||||
| Agency Securities Portfolio — | ||||||||
| Institutional Shares, 1.82%# | 563,521 | |||||||
| Total Short-Term Investments (Cost $563,521) | 563,521 | |||||||
| Total Investments — 100.0% (Cost $19,911,253) | 21,368,629 | |||||||
| Other Assets in Excess of Liabilities — 0.0% | 8,865 | |||||||
| NET ASSETS — 100.0% | $ | 21,377,494 | ||||||
ADR — American Depositary Receipt
| * | Non-Income Producing | |
| # | Annualized seven-day yield as of June 30, 2018. |
The accompanying notes are an integral part of these financial statements.
20
Brown Advisory Small-Cap Growth Fund
A Message to Our Shareholders
June 30, 2018
Dear Shareholders:
During the year ended June 30, 2018, the Brown Advisory Small-Cap Growth Fund – Investor Shares (the “Fund”) increased 17.44% in value. During the same period, the Fund’s benchmark, the Russell 2000 Growth Index increased 21.86%. These results are not surprising given the leadership in momentum, lower quality and loss-making issues.
Our investment strategy has been consistent over almost a dozen years. We strive to produce attractive risk-adjusted returns over a full market cycle through long-term security selection, while attempting to mitigate downside risk through portfolio diversification, quality and valuation sensitivity. This has led to positive long-term results.
Our investment philosophy generally leads to certain structural portfolio characteristics that, at times, can be a net tailwind or headwind to relative results. The following are the three consistent portfolio tilts: 1) modestly higher market capitalization; 2) lower weighting to commodity-oriented businesses; and 3) meaningfully lower exposure to businesses with no earnings/cash flow.
From where do these biases stem? As long-term investors, our express goal is to buy companies when they are small ($1bn-$2bn market capitalization, on average) and watch them compound into mid- or (with a little luck) large-cap status. Hence, the modestly higher market capitalization of the portfolio. The small-cap benchmarks reconstitute every year, while our portfolio decisions are based on fundamental execution against our thesis and risk/reward.
In seeking out these potential long-term “compounders,” we focus on particular business characteristics that generally lead to a higher probability of completing the journey from small- to large-cap. We refer to these traits internally as “3G” – durable growth, sound governance and scalable go-to-market strategies. Simply, commodity-driven enterprises do not map well to these descriptors. On occasion, our team uncovers a differentiated, technology-enabled business in a commoditized field (e.g. oil), but this is the exception, not the rule, thus the relative underweight.
Finally, we are willing to own companies that lack earnings/cash flow today, but there needs to be a clear path in the not-so-distant future to achieving those milestones. In these instances, the bar for the end-market opportunity, business model, management team and competitive position should be higher as there is more absolute downside risk should the franchise stumble, particularly when many of these companies trade at high multiples with high expectations. Thus, to the extent we as managers raise the bar, we lower the number of smaller cap companies that are going to clear it. The result is an underweight to unprofitable companies.
Generally, we have found our path to be effective. Small-cap market history would suggest that over the very long-term, our portfolio “skews” are additive to performance. At times, however, they are not. The recent period has been unkind to our structure as momentum has been the dominant market factor, loss-marking companies have performed exceptionally well and valuation has largely not mattered. This fact has magnified our errors of both commission and omission. It only takes one stock in both columns to meaningfully impact relative results.
At present, it is difficult to determine whether the small-cap investment climate is beginning to change. While we migrated from a strong “risk-on” environment in the later stages of calendar 2017 and early 2018 to a brief period of volatility in February, small-caps demonstrated surprising relative strength and recovered toward the end of the year. What is a clear change is the return dynamics have narrowed considerably. We are witnessing strength in only a couple of industry groups, including software, internet, biopharma and health care services. (Given the greater prevalence of loss-makers in these categories, it helps to explain their performance.) Typically, a narrowing of the market has not been a constructive sign for the future, so this is worth noting. With the recent push higher in prices, valuations remain at cycle highs, but that has not slowed appreciation in the most dearly valued entities, highlighting the historical fact that valuation simply does not matter…until it does.
Fortunately, the economic backdrop remains strong. U.S. GDP growth continues chugging along, unemployment and interest rates remain low, and general optimism has led to growth in business and consumer outlays. The business climate, coupled with the corporate tax cuts, has certainly buoyed small-cap companies in the opening months of 2018 when compared to large-caps. Thus, present fundamentals do support the higher stock prices that fund flows have driven. Similar to our bottom-up investments, the landscape has been dictated by changes at the margin and we will do our best to recognize when the second derivative turns negative.
We have been active in the portfolio. We have sold or trimmed a number of positions as prices migrated higher. To soak up this capital, we have been planting seeds for the future by recycling capital into a number of early-stage businesses. For example, we recently eliminated decade-long holdings Global Payments and Idexx Laboratories as our thesis had fully played out, expectations and valuations had become elevated, and the market capitalizations had swelled. We invested the proceeds from these sales into Everbridge, Littlefuse, Coupa Software, HealthEquity, Mercury Systems, TopBuild and more. This diverse collection of companies
21
Brown Advisory Small-Cap Growth Fund
A Message to Our Shareholders
June 30, 2018
across sectors and end markets will hopefully play a role in driving performance over the next couple years. For many of the new additions, we would welcome some market volatility in order to upsize our positions for the long-term.
There were other eliminations driven by our view that our original investment thesis was violated by the deterioration of certain key metrics. Companies in this category included Carvana, KeyW, Papa John’s, TreeHouse Foods, MACOM Technology Solutions and WageWorks. While names like Carvana and KeyW have migrated higher, the remainder of the sales proved timely as a few of the companies moved meaningfully lower. Improving our sell discipline remains a key area of focus for the team along with allowing our winners to run. We fully believe that small improvements in both of these categories have the potential to be very impactful to results in the future.
Given the relatively concentrated nature of the portfolio, it is always instructive and illustrative to examine the top and bottom contributors during the last year as a window into the nature of the broader, diversified portfolio. Let’s look at two positive drivers. BeiGene, a developer of biopharmaceutical products, was up 355% during the period. The company has continued to demonstrate substantive clinical and commercial progress over the course of the year. It has a strong position in its home market (China) and has expanded its opportunity overseas through its partnership with Celgene. Broadridge, a technology-enabled business process outsourcer to the financial services sector, has continued its multiyear ascent on solid financial results. We first purchased the business during the financial crisis and its strong management team has consistently invested to expand the company’s addressable market opportunity, while at the same time enhancing shareholder returns through margin expansion and disciplined capital deployment.
On the other side of the ledger, the largest detractor for the period was MACOM Technology Solutions, which operates as a holding company whose subsidiaries provide high-performance analog semiconductor solutions. MACOM’s share price fell on the release of the company’s 2017 third quarter earnings results and guidance which disappointed due to an abrupt and continued pause in Chinese demand. We finalized our sale of the company during the first quarter of 2018 prior to the company’s disappointing fourth quarter earnings results as we believed that our original thesis had been compromised. Another detractor, Core-Mark Holdings, a distributor to convenience stores, has been one of the only players of scale consolidating a highly fragmented end market. The other key player in the space is Berkshire Hathaway-controlled McLane Company. Unfortunately, the company pre-announced negative fourth quarter results due to cost overruns associated with the onboarding of a significant new account. This issue was compounded by the decline in cigarette volume experienced by its California convenience store customers due to a tax, which was further exacerbated by a shift to “vape” products. Although one of these issues is likely transient, management missteps and the potential challenge posed by secular change in nicotine consumption give us pause. For each holding, whether a winner or a loser, we ask ourselves whether the next change at the margin is poised to be positive or negative. At times, that may mean doubling down on a poorly performing holding or exiting the position all together. Every stock situation is unique and, as long-term investors, we are trying to probabilistically weigh whether a particular issue (positive or negative) is transient or secular in nature. The future is unknowable, so all we can do is assess probabilities and act according to what our risk/reward framework suggests.
Overall, we remain laser-focused on generating attractive risk-adjusted returns over a full market cycle. As always, since we do not control outcomes, we work hard to strengthen our foundation (i.e. team), adhere to our philosophy and continuously improve our investment process. Although we have been consistently pleased with our downside capture, market volatility has remained low, so this feature of the portfolio has not added a lot of value. Furthermore, certain areas of market strength are not aligned well with our overall investment philosophy and, thus, even a very small number of errors of commission or omission given our relatively concentrated portfolio are impactful. We continue to keep one eye on absolute and one eye on relative returns with the goal of improving both over time.
In sum, we have planted a number of seeds in the portfolio and have a growing list of eligible companies that we would love to scale up or purchase at the right price, respectively. We believe we are well positioned to take advantage of any future volatility to “reload for growth.” Small-cap fundamentals, sentiment and valuation are robust, so we will continue striving to find and weight appropriately attractive risk/reward opportunities in our investable universe.
We look forward to updating you as time progresses and thank you for your interest and support.
Sincerely,
Christopher A. Berrier
Portfolio Manager
22
Brown Advisory Small-Cap Growth Fund
A Message to Our Shareholders
June 30, 2018
Past performance is not a guarantee of future results.
Mutual fund investing involves risk. Principal loss is possible. Investments in smaller companies generally carry greater risk than is customarily associated with larger companies for various reasons such as narrower markets, limited financial resources and less liquid stock. The value of the Fund’s investments in REITs may change in response to changes in the real estate market such as declines in the value of real estate, lack of available capital or financing opportunities, and increases in property taxes or operating costs. The Fund may invest in ETFs, which may trade at a discount to the aggregate value of the underlying securities and although expense ratios for ETFs are generally low, frequent trading of ETFs by the Fund can generate brokerage expenses. Earnings growth is not representative of the fund’s future performance. Diversification does not assure a profit, nor does it protect against a loss in a declining market. Investments in foreign securities entail certain risks not associated with investments in domestic securities, such as volatility of currency exchange rates, and in some cases, political and economic instability and relatively illiquid markets. These risks are greater for investments in emerging markets. Privately Placement issued securities are restricted securities that are not publicly traded. Delay or difficulty in selling such securities may result in a loss to the Fund.
Fund holdings and sector allocations are subject to change and should not be considered a recommendation to buy or sell any security. For a complete list of fund holdings, please refer to the Schedule of Investments provided in this report.
Definitions for terms and indices are provided in the Glossary of Terms.
23
Brown Advisory Small-Cap Growth Fund
Performance Information & Portfolio Holdings Summary
June 30, 2018
| PORTFOLIO HOLDINGS | % of Net Assets |
| Information Technology | 30.0% |
| Industrials | 21.2% |
| Health Care | 16.6% |
| Consumer Discretionary | 13.6% |
| Financials | 5.9% |
| Money Market Funds | 5.7% |
| Telecommunication Services | 3.4% |
| Consumer Staples | 3.3% |
| Private Placements | 0.3% |
| Contingent Value Rights | 0.0% |
| Other Assets and Liabilities | (0.0)% |
100.0% |
GROWTH OF A $10,000 INVESTMENT
The following chart reflects the change in value of a hypothetical $10,000 investment, including reinvested dividends and distributions, in the Fund compared with the broad-based securities market index. The Russell 2000® Growth Index (“Index”) measures the performance of the small-cap growth segment of the U.S. equity universe. It includes those Russell 2000® companies with higher price to book ratios and higher forecasted growth values. The Index is unmanaged and does not reflect the deduction of fees, such as investment management fees. Investors cannot invest directly in an index.
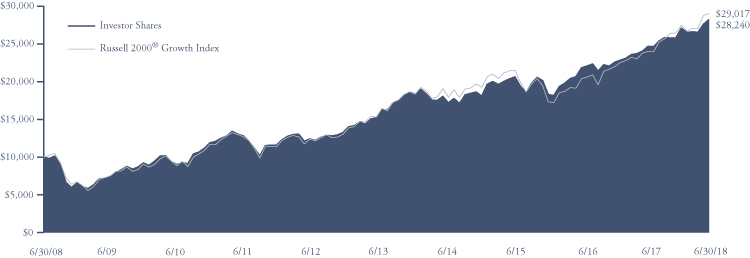
Average Annual Total Return | One Year | Five Year | Ten Year |
| Institutional Shares | 17.64% | 13.30% | 11.01% |
| Investor Shares | 17.44% | 13.13% | 10.94% |
| Advisor Shares | 17.21% | 12.85% | 10.60% |
Russell 2000® Growth Index | 21.86% | 13.65% | 11.24% |
Institutional Shares | Investor Shares | Advisor Shares | |
Gross Expense Ratio1 | 0.99% | 1.14% | 1.39% |
Net Expense Ratio1 | 0.99% | 1.14% | 1.39% |
Past performance does not guarantee future results. The performance data quoted represents past performance and current returns may be lower or higher. The investment return and net asset value will fluctuate so that an investor’s shares, when redeemed, may be worth more or less than the original cost. To obtain performance information current to the most recent month end, please visit our website at brownadvisoryfunds.com/performance.html. The performance table and graph above do not reflect the deduction of taxes that a shareholder would pay on Fund distributions or the redemption of Fund shares. Investment performance reflects periods during which fee waivers were in effect. In the absence of such waivers, total return would have been reduced. Performance data does not reflect the imposition of the redemption fee of 1.00% on shares redeemed within 14 days, and if it did, performance would have been lower.
1 | Per the Fund’s prospectus dated October 31, 2017. Refer to the financial highlights for the gross and net expense ratios for the year ended as of the date of this report. Please note that the expense ratios per the prospectus include acquired fund fees and expenses (as applicable) and the expense ratios in the financial highlights do not. |
24
Brown Advisory Small-Cap Growth Fund
Schedule of Investments
June 30, 2018
| Shares | Security Description | Value $ | ||||||
| Common Stocks — 94.0% | ||||||||
| Consumer Discretionary — 13.6% | ||||||||
| 287,574 | Bright Horizons Family Solutions, Inc.* | 29,482,087 | ||||||
| 611,219 | Carrols Restaurant Group, Inc.* | 9,076,602 | ||||||
| 181,704 | Choice Hotels International, Inc. | 13,736,823 | ||||||
| 431,064 | Clarus Corp.* | 3,556,278 | ||||||
| 187,913 | Core-Mark Holding Co., Inc. | 4,265,625 | ||||||
| 570,940 | EVO Payments, Inc.* | 11,749,945 | ||||||
| 315,407 | GCI Liberty, Inc.* | 14,218,548 | ||||||
| 286,982 | Habit Restaurants, Inc.* | 2,869,820 | ||||||
| 501,404 | Lindblad Expeditions Holdings, Inc.* | 6,643,603 | ||||||
| 320,654 | MakeMyTrip, Ltd.* | 11,591,642 | ||||||
| 133,097 | National Vision Holdings, Inc.* | 4,867,357 | ||||||
| 165,260 | TopBuild Corp.* | 12,946,468 | ||||||
| 125,004,798 | ||||||||
| Consumer Staples — 3.3% | ||||||||
| 92,653 | Calavo Growers, Inc. | 8,908,586 | ||||||
| 105,024 | Casey’s General Stores, Inc. | 11,035,922 | ||||||
| 119,955 | PriceSmart, Inc. | 10,855,927 | ||||||
| 30,800,435 | ||||||||
| Financials — 5.9% | ||||||||
| 495,918 | BankUnited, Inc. | 20,258,250 | ||||||
| 343,416 | ConnectOne Bancorp, Inc. | 8,551,059 | ||||||
| 135,062 | Prosperity Bancshares, Inc. | 9,232,838 | ||||||
| 256,590 | Webster Financial Corp. | 16,344,783 | ||||||
| 54,386,930 | ||||||||
| Health Care — 16.6% | ||||||||
| 147,260 | Acceleron Pharma, Inc.* | 7,145,055 | ||||||
| 83,294 | Agios Pharmaceuticals, Inc.* | 7,015,854 | ||||||
| 295,085 | Alder Biopharmaceuticals, Inc.* | 4,662,343 | ||||||
| 29,698 | AnaptysBio, Inc.* | 2,109,746 | ||||||
| 173,234 | Cambrex Corp.* | 9,060,138 | ||||||
| 617,032 | Catalent, Inc.* | 25,847,470 | ||||||
| 208,819 | Charles River Laboratories International, Inc.* | 23,442,021 | ||||||
| 191,156 | Coherus BioSciences, Inc.* | 2,676,184 | ||||||
| 576,236 | Cotiviti Holdings, Inc.* | 25,429,295 | ||||||
| 118,626 | HealthEquity, Inc.* | 8,908,813 | ||||||
| 142,732 | Henry Schein, Inc.* | 10,368,052 | ||||||
| 17,149 | Loxo Oncology, Inc.* | 2,975,009 | ||||||
| 84,341 | Medidata Solutions, Inc.* | 6,794,511 | ||||||
| 74,876 | Neurocrine Biosciences, Inc.* | 7,355,818 | ||||||
| 109,847 | Ultragenyx Pharmaceutical, Inc.* | 8,443,939 | ||||||
| 152,234,248 | ||||||||
| Industrials — 21.2% | ||||||||
| 192,281 | BWX Technologies, Inc. | 11,982,952 | ||||||
| 269,918 | ESCO Technologies, Inc. | 15,574,268 | ||||||
| 294,412 | Healthcare Services Group, Inc. | 12,715,654 | ||||||
| 215,493 | HEICO Corp. | 15,715,868 | ||||||
| 258,370 | Hexcel Corp. | 17,150,601 | ||||||
| 91,743 | IDEX Corp. | 12,521,085 | ||||||
| 344,123 | Knight-Swift Transportation Holdings, Inc. | 13,148,940 | ||||||
| 203,280 | Mercury Systems, Inc.* | 7,736,837 | ||||||
| 132,522 | SiteOne Landscape Supply, Inc.* | 11,127,872 | ||||||
| 504,411 | Waste Connections, Inc. | 37,972,060 | ||||||
| 762,245 | Welbilt, Inc.* | 17,005,686 | ||||||
| 289,838 | Woodward, Inc. | 22,276,949 | ||||||
| 194,928,772 | ||||||||
| Information Technology — 30.0% | ||||||||
| 47,493 | 2U, Inc.* | 3,968,515 | ||||||
| 227,651 | Alarm.com Holdings, Inc.* | 9,192,547 | ||||||
| 191,559 | Aspen Technology, Inc.* | 17,765,182 | ||||||
| 190,523 | Blackbaud, Inc. | 19,519,081 | ||||||
| 260,831 | Blackline, Inc.* | 11,327,890 | ||||||
| 205,186 | Broadridge Financial Solutions, Inc. | 23,616,909 | ||||||
| 286,587 | Cavium, Inc.* | 24,789,776 | ||||||
| 142,166 | CoreLogic, Inc.* | 7,378,416 | ||||||
| 33,964 | Coupa Software, Inc.* | 2,113,919 | ||||||
| 88,639 | Envestnet, Inc.* | 4,870,713 | ||||||
| 187,631 | Etsy, Inc.* | 7,916,152 | ||||||
| 151,815 | Everbridge, Inc.* | 7,199,067 | ||||||
| 87,907 | Fair Isaac Corp.* | 16,994,181 | ||||||
| 865,376 | Genpact, Ltd. | 25,035,328 | ||||||
| 123,995 | Guidewire Software, Inc.* | 11,008,276 | ||||||
| 53,799 | Littelfuse, Inc. | 12,275,856 | ||||||
| 133,248 | MAXIMUS, Inc. | 8,276,033 | ||||||
| 532,908 | Mimecast, Ltd.* | 21,961,139 | ||||||
| 144,119 | Paylocity Holding Corp.* | 8,482,844 | ||||||
| 75,491 | Proofpoint, Inc.* | 8,704,867 | ||||||
| 42,701 | Ultimate Software Group, Inc.* | 10,987,394 | ||||||
| 63,828 | WEX, Inc.* | 12,157,958 | ||||||
| 22,395 | Zuora, Inc.* | 609,144 | ||||||
| 276,151,187 | ||||||||
| Telecommunication Services — 3.4% | ||||||||
| 582,309 | Cogent Communications Holdings, Inc. | 31,095,300 | ||||||
| Total Common Stocks (Cost $626,738,974) | 864,601,670 | |||||||
| Private Placements — 0.3% | ||||||||
| 19,200 | Greenspring Global Partners IV-B, L.P.*^† | 2,345,139 | ||||||
| 88,769 | Greenspring Global Partners V-B, L.P.*~† | 105,732 | ||||||
| Total Private Placements (Cost $8,669) | 2,450,871 | |||||||
| Contingent Value Rights — 0.0% | ||||||||
| 118,191 | Dyax Corp.*† (Acquired in January 2016) | 131,192 | ||||||
| Total Contingent Value Rights (Cost $131,192) | 131,192 | |||||||
25
Brown Advisory Small-Cap Growth Fund
Schedule of Investments
June 30, 2018
| Shares | Security Description | Value $ | ||||||
| Short-Term Investments — 5.7% | ||||||||
| Money Market Funds — 5.7% | ||||||||
| 52,791,450 | Deutsche Government & | |||||||
| Agency Securities Portfolio — | ||||||||
| Institutional Shares, 1.82%# | 52,791,450 | |||||||
| Total Short-Term Investments (Cost $52,791,450) | 52,791,450 | |||||||
| Total Investments — 100.0% (Cost $679,670,285) | 919,975,183 | |||||||
| Liabilities in Excess of Other Assets — (0.0)% | (291,109 | ) | ||||||
| NET ASSETS — 100.0% | $ | 919,684,074 | ||||||
| * | Non-Income Producing | |
| ^ | Security is exempt from registration under Regulation D of the Securities Act of 1933. Security was acquired from February 2008 to April 2018 as part of a $2,000,000 capital commitment. At June 30, 2018, $1,920,000 of the capital commitment has been fulfilled by the Fund. | |
| ~ | Security is exempt from registration under Regulation D of the Securities Act of 1933. Security was acquired from October 2012 to November 2017 as part of a $100,000 capital commitment. At June 30, 2018, $88,000 of the capital commitment has been fulfilled by the Fund. | |
| † | These securities are being fair valued, using significant unobservable inputs (Level 3), under the supervision of the Board of Trustees. Further, they may not be sold by the Fund and are considered illiquid. At June 30, 2018 the total market value of securities considered illiquid was $2,582,063 or 0.3% of net assets. | |
| # | Annualized seven-day yield as of June 30, 2018. |
The accompanying notes are an integral part of these financial statements.
26
Brown Advisory Small-Cap Fundamental Value Fund
A Message to Our Shareholders
June 30, 2018
Dear Shareholders:
During the year ended June 30, 2018, the Brown Advisory Small-Cap Fundamental Value Fund – Investor Shares (the “Fund”) increased 11.95% in value. During the same period, the Russell 2000 Value Index (the “Index”), the Fund’s benchmark, increased 13.10%.
For the year ended June 30, 2018, the Fund’s positive performance resulted from a combination of strong absolute performance in health care, industrials and materials, as well as meaningful stock selection and in financials and information technology. The Fund primarily underperformed the Index due to our drag in the consumer discretionary, energy, and real estate sectors.
McGrath RentCorp was the Fund’s largest individual contributor to performance during the year. The company’s positive performance was primarily attributable to both internal and market-based drivers. Internally, the company has done an effective job improving their margins by focusing on higher returning markets and product lines. Externally, we saw an improvement in their lagging business (tank rentals) and continued strong performance from their main modular rentals business. Another top contributor during the period was CTS Corp, which rose during the year on the back of strong first quarter 2018 earnings that saw the highest organic revenue growth rate in years. We believe that management has done an excellent job restructuring the manufacturing footprint, as well as the sales force over the last few years and its efforts have begun to payoff.
The Fund added 17 new companies during the course of the year. Sizeable additions included Extended Stay America, HRG Group and Washington Federal.
Extended Stay America (“STAY”) is an owner and operator of economy, long-term stay hotels across the U.S. The company employs a “Paired Share” corporate structure, reflecting two different underlying businesses housed in one company: a PropCo (structured as a REIT) that owns its 625 Extended Stay America hotels and an OpCo that operates, manages and will soon develop those assets. We believe that the market is currently mispricing STAY based on improving fundamentals and free cash flow under the current structure, and that longer-term an opportunity exists to create significant shareholder value by splitting the PropCo and OpCo into two separate companies. Recent events that have led to an attractive set-up are: the renovation of the entire hotel base over five years for $600m; the completion of which has the potential to lead free cash flow to ramp by over $100m this year; the final exit of private equity owners Blackstone, Centerbridge and Paulson in June 2017; reconstitution of the Board with four new directors; and the commencement of the company’s refranchising efforts in early 2018.
HRG Group (“HRG”) is a holding company that owns a stake of approximately 45% of Spectrum Brands (“SPB”), a consumer products company. We purchased HRG ahead of its pending merger with SPB wherein HRG will essentially be collapsed into SPB, and after which we will own shares of SPB (allowing us to buy SPB at a slight discount). SPB is a $5bn revenue company with a broad portfolio of leading brands in household categories sold through major retailers globally. Its brands span across a range of categories including batteries, residential locksets, builders’ hardware, plumbing, shaving and grooming products, small appliances, insecticides and more; key brands are Rayovac, Baldwin, Kwikset, Stanley, Pfister, Remington, Black & Decker, Russell Hobbs and Cutter. SPB is under contract to sell its battery business to Energizer for $2bn, and is marketing for sale its Appliance business for roughly $1.5bn. Further, the HRG transaction brings meaningful net operating losses to SPB which SPB may use to shield these divestments from taxes. We believe that the complexity of these pending transactions masks an attractive valuation for the underlying SPB business. Furthermore, SPB has recently suffered substantial disruption to its business from its consolidation of multiple distribution centers across the U.S. into two large new facilities. We view this disruption as temporary, and believe that it has added another layer to an already complex situation that has afforded us the opportunity to buy the stock at what we believe is a meaningful discount. We expect the HRG transaction may close in early third quarter 2018, followed by the battery sale later in calendar 2018; we also believe that progress on the sale of the appliance business along with resolution of the warehouse disruption has the potential to serve as catalysts over the next few quarters.
Washington Federal is a conservatively run, over-capitalized bank. This bank serves as a nice compliment to the Fund’s portfolio of banks due to a combination of A) a balance sheet that we believe is effectively neutral to rising interest rates; B) strong credit quality; C) a long history of conservative operations; and D) significant over-capitalization that supports robust capital return and has the potential to provide a cushion to equity shareholders should macroeconomic conditions turn unfavorable. In effect, this is a self-described ‘sleepy’ bank that we believe is being overlooked by investors because it is not exciting, asset sensitive or “growthy.” This is a company that has quietly repurchased nearly a quarter of its shares outstanding since 2013, has returned nearly 100% of net income to shareholders over that same time period and has continued to grow organically with only one (pending) whole bank acquisition in the last five years that accounts for only three percent of private fund assets. Despite the laundry list of favorable characteristics, the bank trades at a discount to peers on earnings and on tangible book value.
27
Brown Advisory Small-Cap Fundamental Value Fund
A Message to Our Shareholders
June 30, 2018
During the year, there were 18 deletions from the Fund’s portfolio, five of which were a result of corporate action (Capital Bank Financial, Deltic Timber, Digital Globe, DST Systems and State National). We sold our investment in Addus at the end of the second quarter, as we felt the valuation had more than priced in any potential further operational improvement. We sold our position in Casey’s General Stores as convenience store industry trends remain pressured and they continued earning lower returns on new store openings. In response, the company has embarked on a costly digital initiative. We sold our position in Clearwater Paper based on a weakening tissue market in North America, as well concerns around the company’s leverage profile and cash flow.
While we believe that valuations are high for the market overall, we remain excited about our pipeline due to the wide dispersion of results throughout the year and the variation of valuations that this has created.
Sincerely,
J. David Schuster
Portfolio Manager
Past performance is not a guarantee of future results.
Investments in smaller companies generally carry greater risk than is customarily associated with larger companies for various reasons such as narrower markets, limited financial resources and less liquid stock. The value of the Fund’s investments in REITs may change in response to changes in the real estate market such as declines in the value of real estate, lack of available capital or financing opportunities, and increases in property taxes or operating costs. The Fund may invest in ETFs, which may trade at a discount to the aggregate value of the underlying securities and although expense ratios for ETFs are generally low, frequent trading of ETFs by the Fund can generate brokerage expenses. Investments in debt securities typically decrease in value when interest rates rise. This risk is usually greater for longer-term debt securities. Investments in foreign securities entail certain risks not associated with investments in domestic securities, such as volatility of currency exchange rates, and in some cases, political and economic instability and relatively illiquid markets. These risks are greater for investments in emerging markets. The risks of investments in derivatives, including options, futures contracts and options on futures contracts include imperfect correlation between the value of these instruments and the underlying assets; risks of default by the other party to the derivative transactions; risks that the transactions may result in losses that partially or completely offset gains in portfolio positions; and risks that the derivative transactions may not be liquid. Private Placement issued securities are restricted securities that are not publicly traded. Delay or difficulty in selling such securities may result in a loss to the Fund. Earnings growth is not a measure of the Fund’s future performance.
Fund holdings and sector allocations are subject to change and should not be considered a recommendation to buy or sell any security. For a complete list of fund holdings, please refer to the Schedule of Investments provided in this report.
Definitions for terms and indices are provided in the Glossary of Terms.
28
Brown Advisory Small-Cap Fundamental Value Fund
Performance Information & Portfolio Holdings Summary
June 30, 2018
| PORTFOLIO HOLDINGS | % of Net Assets |
| Financials | 24.9% |
| Industrials | 19.8% |
| Consumer Discretionary | 18.7% |
| Real Estate Investment Trusts | 9.4% |
| Information Technology | 6.9% |
| Energy | 5.9% |
| Money Market Funds | 3.3% |
| Health Care | 3.2% |
| Investment Companies | 2.5% |
| Consumer Staples | 2.0% |
| Materials | 1.4% |
| Telecommunication Services | 0.9% |
| Utilities | 0.7% |
| Real Estate | 0.6% |
| Other Assets and Liabilities | (0.2)% |
100.0% |
GROWTH OF A $10,000 INVESTMENT
The following chart reflects the change in value of a hypothetical $10,000 investment, including reinvested dividends and distributions, in the Fund as measured against a broad-based securities market index. The Russell 2000® Value Index (“Index”) measures the performance of small-cap value segment of the U.S. equity universe. It includes those Russell 2000® companies with lower price to book ratios and lower forecasted growth values. The Index is unmanaged and does not reflect the deduction of fees, such as investment management fees. Investors cannot invest directly in an index.
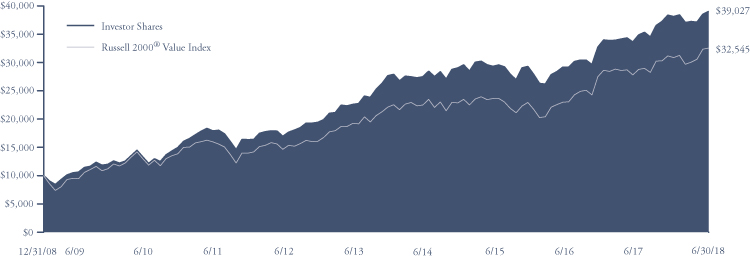
| Since Inception | |||
Average Annual Total Return | One Year | Five Year | (12/31/08) |
Institutional Shares1 | 12.13% | 11.59% | 15.59% |
| Investor Shares | 11.95% | 11.42% | 15.42% |
Advisor Shares2 | 11.65% | 11.14% | 15.13% |
Russell 2000® Value Index | 13.10% | 11.18% | 13.23% |
Institutional Shares | Investor Shares | Advisor Shares | |
Gross Expense Ratio3 | 1.16% | 1.31% | 1.56% |
Net Expense Ratio3 | 1.16% | 1.31% | 1.56% |
Past performance does not guarantee future results. The performance data quoted represents past performance and current returns may be lower or higher. The investment return and net asset value will fluctuate so that an investor’s shares, when redeemed, may be worth more or less than the original cost. To obtain performance information current to the most recent month end, please visit our website at brownadvisoryfunds.com/performance.html. The performance table and graph above do not reflect the deduction of taxes that a shareholder would pay on Fund distributions or the redemption of Fund shares. Investment performance reflects periods during which fee waivers were in effect. In the absence of such waivers, total return would have been reduced. Performance data does not reflect the imposition of the redemption fee of 1.00% on shares redeemed within 14 days, and if it did, performance would have been lower.
1 | Performance information for the Institutional Shares, prior to commencement of operations on October 19, 2012, is based on the performance of Investor Shares, and adjusted for the lower expenses applicable to Institutional Shares. |
2 | Performance information for Advisor Shares, prior to commencement on July 28, 2011, is based on the performance of Investor Shares, and adjusted for the higher expenses applicable to Advisor Shares. |
3 | Per the Fund’s prospectus dated October 31, 2017. Refer to the financial highlights for the gross and net expense ratios for the year ended as of the date of this report. Please note that the expense ratios per the prospectus include acquired fund fees and expenses (as applicable) and the expense ratios in the financial highlights do not. |
29
Brown Advisory Small-Cap Fundamental Value Fund
Schedule of Investments
June 30, 2018
| Shares | Security Description | Value $ | ||||||
| Common Stocks — 85.0% | ||||||||
| Consumer Discretionary — 18.7% | ||||||||
| 398,955 | Century Casinos, Inc.* | 3,490,856 | ||||||
| 778,523 | Core-Mark Holding Co., Inc. | 17,672,472 | ||||||
| 107,161 | Culp, Inc. | 2,630,803 | ||||||
| 1,455,313 | Denny’s Corp.* | 23,183,136 | ||||||
| 1,015,812 | DSW, Inc. | 26,228,266 | ||||||
| 1,659,304 | Extended Stay America, Inc. | 35,857,559 | ||||||
| 475,932 | GCI Liberty, Inc.* | 21,455,015 | ||||||
| 263,871 | Lifetime Brands, Inc. | 3,337,968 | ||||||
| 413,583 | Loral Space & Communications, Inc.* | 15,550,721 | ||||||
| 246,488 | Murphy USA, Inc.* | 18,311,593 | ||||||
| 684,449 | Nexstar Media Group, Inc. | 50,238,557 | ||||||
| 1,622,693 | Regis Corp.*† | 26,839,342 | ||||||
| 244,796,288 | ||||||||
| Consumer Staples — 2.0% | ||||||||
| 2,017,763 | HRG Group, Inc.* | 26,412,518 | ||||||
| Energy — 5.9% | ||||||||
| 1,423,365 | Linn Energy, Inc.* | 55,013,057 | ||||||
| 110,586 | Natural Gas Services Group, Inc.* | 2,609,830 | ||||||
| 363,266 | Par Pacific Holdings, Inc.* | 6,313,563 | ||||||
| 166,941 | REX American Resources Corp.* | 13,517,213 | ||||||
| 77,453,663 | ||||||||
| Financials — 24.9% | ||||||||
| 301,421 | Assurant, Inc. | 31,194,059 | ||||||
| 622,054 | BankUnited, Inc. | 25,410,906 | ||||||
| 444,935 | Central Pacific Financial Corp. | 12,747,388 | ||||||
| 141,903 | Farmers Capital Bank Corp. | 7,393,146 | ||||||
| 373,879 | Howard Bancorp, Inc.* | 6,729,822 | ||||||
| 712,450 | National Bank Holdings Corp. | 27,493,445 | ||||||
| 972,388 | National General Holdings Corp. | 25,602,976 | ||||||
| 649,911 | OceanFirst Financial Corp. | 19,471,334 | ||||||
| 283,806 | Pacific Premier Bancorp, Inc.* | 10,827,199 | ||||||
| 259,892 | Primerica, Inc. | 25,885,243 | ||||||
| 332,248 | Renasant Corp. | 15,123,929 | ||||||
| 465,663 | Synovus Financial Corp. | 24,600,976 | ||||||
| 1,135,712 | TFS Financial Corp. | 17,910,178 | ||||||
| 289,188 | TriState Capital Holdings, Inc.* | 7,547,807 | ||||||
| 223,230 | Triumph Bancorp, Inc.* | 9,096,623 | ||||||
| 285,763 | Virtus Investment Partners, Inc. | 36,563,376 | ||||||
| 703,547 | Washington Federal, Inc. | 23,005,987 | ||||||
| 326,604,394 | ||||||||
| Health Care — 3.2% | ||||||||
| 140,732 | Magellan Health, Inc.* | 13,503,235 | ||||||
| 356,714 | Providence Service Corp.* | 28,019,885 | ||||||
| 41,523,120 | ||||||||
| Industrials — 19.8% | ||||||||
| 962,548 | Albany International Corp.† | 57,897,262 | ||||||
| 1,081,887 | Continental Building Products, Inc.* | 34,133,535 | ||||||
| 939,006 | Federal Signal Corp. | 21,869,450 | ||||||
| 283,358 | Kadant, Inc. | 27,244,872 | ||||||
| 736,212 | McGrath RentCorp | 46,580,133 | ||||||
| 745,071 | MRC Global, Inc.* | 16,145,689 | ||||||
| 1,303,581 | Mueller Water Products, Inc. | 15,277,969 | ||||||
| 656,948 | Simpson Manufacturing Co., Inc. | 40,855,596 | ||||||
| 260,004,506 | ||||||||
| Information Technology — 6.9% | ||||||||
| 33,385 | Broadridge Financial Solutions, Inc. | 3,842,614 | ||||||
| 559,880 | CTS Corp. | 20,155,680 | ||||||
| 905,243 | EchoStar Corp.* | 40,192,789 | ||||||
| 422,467 | MAXIMUS, Inc. | 26,239,425 | ||||||
| 90,430,508 | ||||||||
| Materials — 1.4% | ||||||||
| 105,337 | KMG Chemicals, Inc. | 7,771,764 | ||||||
| 119,106 | Neenah, Inc. | 10,106,144 | ||||||
| 17,877,908 | ||||||||
| Real Estate — 0.6% | ||||||||
| 52,121 | Consolidated-Tomoka Land Co. | 3,205,963 | ||||||
| 344,363 | Landmark Infrastructure Partners L.P. | 4,769,427 | ||||||
| 7,975,390 | ||||||||
| Telecommunication Services — 0.9% | ||||||||
| 224,598 | ATN International, Inc. | 11,852,036 | ||||||
| Utilities — 0.7% | ||||||||
| 879,039 | Star Gas Partners L.P.† | 8,614,582 | ||||||
| Total Common Stocks (Cost $800,751,264) | 1,113,544,913 | |||||||
| Real Estate Investment Trusts — 9.4% | ||||||||
| 1,274,878 | Forest City Realty Trust, Inc. | 29,079,967 | ||||||
| 2,184,190 | Front Yard Residential Corp. | 22,759,260 | ||||||
| 3,228,046 | MFA Financial, Inc. | 24,468,589 | ||||||
| 552,627 | PotlatchDeltic Corp. | 28,101,083 | ||||||
| 784,190 | Xenia Hotels & Resorts, Inc. | 19,102,868 | ||||||
| Total Real Estate Investment Trusts (Cost $108,466,588) | 123,511,767 | |||||||
| Investment Companies — 2.5% | ||||||||
| 1,445,276 | Ares Capital Corp. | 23,774,790 | ||||||
| 764,579 | Triangle Capital Corp. | 8,792,659 | ||||||
| Total Investment Companies (Cost $32,623,865) | 32,567,449 | |||||||
| Short-Term Investments — 3.3% | ||||||||
| Money Market Funds — 3.3% | ||||||||
| 42,871,046 | Deutsche Government & | |||||||
| Agency Securities Portfolio — | ||||||||
| Institutional Shares, 1.82%# | 42,871,046 | |||||||
| Total Short-Term Investments (Cost $42,871,046) | 42,871,046 | |||||||
| Total Investments — 100.2% (Cost $984,712,763) | 1,312,495,175 | |||||||
| Liabilities in Excess of Other Assets — (0.2)% | (2,409,324 | ) | ||||||
| NET ASSETS — 100.0% | $ | 1,310,085,851 | ||||||
| * | Non-Income Producing | |
| † | All or a portion of this security is considered illiquid. At June 30, 2018 the total market value of securities considered illiquid was $18,352,109 or 1.4% of net assets. | |
| # | Annualized seven-day yield as of June 30, 2018. |
The accompanying notes are an integral part of these financial statements.
30
Brown Advisory Global Leaders Fund
A Message to Our Shareholders
June 30, 2018
Dear Shareholders:
During the year ended June 30, 2018, the Brown Advisory Global Leaders Fund (the “Fund”) increased 20.28% in value. During the same period, the Fund’s benchmark, the Russell Global Large Cap Index (the “Index”), increased 10.90%.
In the final six months of the year, investors embraced positive corporate news flow and mounting evidence of synchronized global growth to drive global equity indices to fresh highs. The Fund’s strategy focuses on attempting to deliver long-term performance by buying a concentrated portfolio of companies that we believe uniquely satisfy their customers and have the potential to generate outstanding economics for shareholders. Although we are acutely aware of the economic environment, we are stock pickers and our primary focus is on the operational performances of the franchises in which we invest and their ability to generate cash flow. Accordingly, our sectoral attribution is primarily an output of our stock picking and our holdings’ strong operational performances were mirrored by stock price gains in the information technology, financials and consumer staples sectors. What is perhaps most noteworthy is that these three areas were detractors from performance in the fourth quarter of 2016 when investor euphoria about Donald Trump’s seemingly messianic economic powers prompted a sharp rotation away from companies listed in these sectors. This episode has served as a reminder of the benefits of perspective as the market serves up opportunities for the long-sighted investor. On the negative front energy was the only significant area that detracted from performance with increasing concord and harmony between OPEC members driving rising oil prices during the period.
Core holding Microsoft was the largest single positive contributor to performance during the period. The company has continued to effectively migrate its customers toward its cloud products while remaining relevant in its legacy technologies. Microsoft management put their customer at the centre of their strategy – by breaking down traditional software silos, they have enabled greater freedom for the millions of consumers and businesses that use their products. Estee Lauder’s fortunes during the year were paradigmatic of the importance of maintaining a long-term vision in the face of the market’s irrational disposition and associated short-term share price volatility. Estee Lauder shares were propelled after it released a string of encouraging results underpinned by healthy sales growth and profitability improvements. Some of our followers may remember that the luxury cosmetics specialist had a torrid time in 2016 as myopic investors fixated on the seemingly endless malaise of bricks and mortar retail and overlooked the company’s brand power and opportunities for self-help.
Elsewhere our payments holdings MasterCard and Visa contributed positively to performance during the year. Both companies reported robust results that were underpinned by the ongoing global migration to a cashless world economy. The final positive contributor of note was aerospace specialist Safran, which has continued transitioning to its new LEAP engine. The French company posted encouraging results late in the year on the back of healthy aftermarket demand. We remain confident that the company has the potential to monetize its sizeable order book and generate significant free cash flow in the decades to come.
On the negative front there were few meaningful underperformers during the year; eBay, Bank Rakyat and Nike were some of the main detractors. eBay and Nike reported results that were badly received by investors. Elsewhere, U.S. dollar strength stoked investor concerns about the health of the Indonesian economy which contributed to marginal weakness in Bank Rakyat shares late in the year.
We were active in the year with seven new additions, one spin-off and seven deletions from the strategy. One notable addition was a new position in Electronic Arts (“EA”). The company has had the leading sports franchise in the industry and may be set to benefit from the ongoing consolidating of gameplay to a smaller number of blockbuster titles. In addition, EA’s business model has continued shifting towards digital with downloading and eventually streaming which has the potential to improve the economics for shareholders over time. Finally, we believe that EA’s shares are undervalued and we see the potential for meaningful three-year upside as the digital transition plays out.
After extensive due diligence we also added Deutsche Boerse to the Fund. The German company owns two valuable pieces of European financial infrastructure in derivative exchange Eurex and custody and settlement operation Clearstream. The franchise has the potential to benefit from financial market regulation and any increase in volatility from today’s low levels. We believe that Deutsche Boerse shares remain attractively valued, on an absolute and relative basis, as investors have priced in today’s market conditions as if they will persist forever – we view this as an opportunity for the far-sighted investor. Elsewhere we initiated a new position in another German company during the period – ticketing and live event specialist CTS Eventim. The company has had a dominant position in ticketing in Western Europe with market leading networks in Germany, Austria and Switzerland. CTS Eventim has multiple economic moats and significant optionality to monetize its extensive database of concertgoers and sports fans.
Further afield, we initiated a new position in another network franchise – China’s dominant travel platform Ctrip. The company has what we see as an enviable position and is set to potentially benefit from increased domestic and international travel as the Chinese consumer explores both their country and the world outside. In eBay, we added another platform business at what we perceived as attractive valuation. The online retailer has significant self-help potential as it tries to capture its share of e-commerce growth and monetize its network.
31
Brown Advisory Global Leaders Fund
A Message to Our Shareholders
June 30, 2018
Self-help was one of the attractions behind our new investments in Dutch publisher Wolters Kluwer and American industrial Flowserve. We view both businesses as having the ability to improve their margins over the long-term and each franchise brings a differentiated exposure to the strategy. Although classified as an industrial pump and valve maker, Flowserve increases the strategy’s exposure to the energy space which we have historically struggled with due to our focus on franchises that have delivered superior customer outcomes. During our research we learned that Flowserve’s customers have valued the reliability and breadth of their product suite and their extensive service network. The aforementioned self-help attributes coupled with the company’s shares trading at what we believe to be a discount to long-term value prompted an investment. Elsewhere in the commodity complex, we received shares in Atlas Copco’s mining spin-off Epiroc. We attended the company’s inaugural investor day and continue analyzing Epiroc’s prospects as a standalone enterprise.
On the other side of the equation, opportunity cost and increasingly full valuations were the driving forces for most of the deletions from the strategy. Our sales of Henkel, Moody’s, Nike, Starbucks, FleetCor and Verisk were very much in this vein. One notable exception was our disposal of Cigna after the company announced its acquisition of pharmacy benefit manager Express Scripts. We view this move as an expensive and defensive acquisition of a franchise that has a questionable customer outcome. Accordingly, we sold our Cigna position during the period.
The Fund invests in market-leading companies from across the globe that deliver what we believe to be exceptional customer outcomes. We believe that companies that combine a superior outcome for their customers with strong leadership have the potential to generate high and sustainable returns on invested capital (“ROIC”), which can lead to outstanding shareholder returns. We are long-term focused and look for franchises that can compound excess economic profit at above market growth rates for extended periods of time. Although the strategy produced healthy returns during the period, we remain laser-focused on value within the portfolio as we strive to expose our clients to what we perceive to be the best blend of risk and reward. We take significant comfort from the Fund’s attributes with the strategy having an average ROIC that is significantly higher than the Index (31.2% vs 11.7%) while trading at a discount to the market on our preferred shorthand valuation techniques of free cash flow yield (4.1% vs 3.7% for the Index) and EV/EBIT (18.1x vs 19.3x for the Index). We believe that paying less for assets that are more productive and durable than the benchmark is an incredibly attractive proposition for the rational investor. Although there are no certainties in investing, we feel that these characteristics stand the strategy in good stead to continue creating value for our clients in the future.
Sincerely,
Michael Dillon
Portfolio Manager
Bertie Thomson
Portfolio Manager
Past performance is not a guarantee of future results.
Mutual fund investing involves risk. Principal loss is possible. The Fund invests in small and medium capitalization companies which carry greater risk than is associated with larger companies for various reasons, such as narrower markets, limited financial resources and less liquid stock. The value of the Fund’s investments in REITs may change in response to changes in the real estate market such as declines in the value of real estate, lack of available capital or financing opportunities, and increases in property taxes or operating costs. The Fund may invest in ETFs, which may trade at a discount to the aggregate value of the underlying securities and although expense ratios for ETFs are generally low, frequent trading of ETFs by the Fund can generate brokerage expenses. Investments in foreign securities entail certain risks not associated with investments in domestic securities, such as volatility of currency exchange rates, and in some cases, political and economic instability and relatively illiquid markets. These risks are greater for investments in emerging markets. Private Placement issued securities are restricted securities that are not publicly traded. Delay or difficulty in selling such securities may result in a loss to the Fund.
Diversification does not assure a profit or protect against loss in a declining market.
Fund holdings and sector allocations are subject to change and should not be considered a recommendation to buy or sell any security. For a complete list of fund holdings, please refer to the Schedule of Investments provided in this report.
Definitions for terms and indices are provided in the Glossary of Terms.
32
Brown Advisory Global Leaders Fund
Performance Information & Portfolio Holdings Summary
June 30, 2018
| PORTFOLIO HOLDINGS | % of Net Assets |
| Information Technology | 34.8% |
| Financials | 18.7% |
| Industrials | 15.7% |
| Consumer Discretionary | 12.3% |
| Consumer Staples | 8.7% |
| Materials | 4.5% |
| Health Care | 3.2% |
| Money Market Funds | 2.8% |
| Other Assets and Liabilities | (0.7)% |
100.0% |
GROWTH OF A $10,000 INVESTMENT
The following chart reflects the change in value of a hypothetical $10,000 investment, including reinvested dividends and distributions, in the Fund as measured against a broad-based securities market index. The Russell Global Large Cap Index (“Index”) measures the performance of the largest securities in the Russell Global Index, based on market capitalization. The Index is unmanaged and does not reflect the deduction of fees, such as investment management fees. Investors cannot invest directly in an index.

| Since Inception | ||
Average Annual Total Return | One Year | (7/1/15) |
| Investor Shares | 20.28% | 11.49% |
| Russell Global Large Cap Index | 10.90% | 8.09% |
Investor Shares | ||
Gross Expense Ratio1 | 1.16% | |
Net Expense Ratio1 | 0.85% |
Past performance does not guarantee future results. The performance data quoted represents past performance and current returns may be lower or higher. The investment return and net asset value will fluctuate so that an investor’s shares, when redeemed, may be worth more or less than the original cost. To obtain performance information current to the most recent month end, please visit our website at brownadvisoryfunds.com/performance.html. The performance table and graph above do not reflect the deduction of taxes that a shareholder would pay on Fund distributions or the redemption of Fund shares. Investment performance reflects periods during which fee waivers were in effect. In the absence of such waivers, total return would have been reduced. Performance data does not reflect the imposition of the redemption fee of 1.00% on shares redeemed within 14 days, and if it did, performance would have been lower. Short-term performance, in particular, is not a good indication of the Fund’s future performance, and an investment should not be made based solely on returns.
1 | Per the Fund’s prospectus dated October 31, 2017. Refer to the financial highlights for the gross and net expense ratios for the year ended as of the date of this report. Please note that the expense ratios per the prospectus include acquired fund fees and expenses (as applicable) and the expense ratios in the financial highlights do not. |
33
Brown Advisory Global Leaders Fund
Schedule of Investments
June 30, 2018
| Shares | Security Description | Value $ | ||||||
| Common Stocks — 97.9% | ||||||||
| China — 5.4% | ||||||||
| 306,283 | AIA Group, Ltd. | 2,668,158 | ||||||
| 41,056 | Ctrip.com International, Ltd. ADR* | 1,955,497 | ||||||
| 4,623,655 | ||||||||
| France — 3.5% | ||||||||
| 24,887 | Safran SA | 3,013,941 | ||||||
| Germany — 4.6% | ||||||||
| 42,791 | CTS Eventim AG & Co. KGaA | 2,100,943 | ||||||
| 14,132 | Deutsche Boerse AG | 1,878,910 | ||||||
| 3,979,853 | ||||||||
| India — 2.2% | ||||||||
| 60,650 | HDFC Bank, Ltd. | 1,894,344 | ||||||
| Indonesia — 1.9% | ||||||||
| 8,116,200 | Bank Rakyat Indonesia Persero | 1,605,311 | ||||||
| Japan — 2.0% | ||||||||
| 17,098 | Hoshizaki Corp. | 1,727,966 | ||||||
| Netherlands — 3.3% | ||||||||
| 50,102 | Wolters Kluwer NV | 2,814,570 | ||||||
| Sweden — 2.3% | ||||||||
| 55,544 | Atlas Copco AB | 1,447,022 | ||||||
| 54,187 | Epiroc AB* | 496,088 | ||||||
| 1,943,110 | ||||||||
| Switzerland — 2.8% | ||||||||
| 11,620 | Schindler Holding AG | 2,440,966 | ||||||
| Taiwan — 3.1% | ||||||||
| 74,103 | Taiwan Semiconductor | |||||||
| Manufacturing Co., Ltd. ADR | 2,709,206 | |||||||
| United Kingdom — 6.8% | ||||||||
| 103,408 | Hiscox, Ltd. | 2,075,292 | ||||||
| 68,824 | Unilever PLC | 3,801,865 | ||||||
| 5,877,157 | ||||||||
| United States — 60.0% | ||||||||
| Consumer Discretionary — 5.7% | ||||||||
| 1,090 | Booking Holdings, Inc.* | 2,209,528 | ||||||
| 28,563 | TJX Companies, Inc. | 2,718,627 | ||||||
| 4,928,155 | ||||||||
| Consumer Staples — 4.2% | ||||||||
| 21,470 | Brown-Forman Corp. | 1,052,245 | ||||||
| 18,205 | Estee Lauder Companies, Inc. | 2,597,671 | ||||||
| 3,649,916 | ||||||||
| Financials — 7.0% | ||||||||
| 46,456 | Charles Schwab Corp. | 2,373,902 | ||||||
| 34,995 | JPMorgan Chase & Co. | 3,646,479 | ||||||
| 6,020,381 | ||||||||
| Health Care — 3.2% | ||||||||
| 19,160 | Edwards Lifesciences Corp.* | 2,789,121 | ||||||
| Industrials — 3.7% | ||||||||
| 8,369 | 3M Co. | 1,646,350 | ||||||
| 38,266 | Flowserve Corp. | 1,545,946 | ||||||
| 3,192,296 | ||||||||
| Information Technology — 31.7% | ||||||||
| 3,743 | Alphabet, Inc. — Class C* | 4,175,879 | ||||||
| 21,369 | Cognizant Technology Solutions Corp. | 1,687,937 | ||||||
| 67,319 | eBay, Inc.* | 2,440,987 | ||||||
| 15,578 | Electronic Arts, Inc.* | 2,196,810 | ||||||
| 13,335 | Facebook, Inc.* | 2,591,257 | ||||||
| 18,133 | MasterCard, Inc. | 3,563,497 | ||||||
| 51,909 | Microsoft Corp. | 5,118,746 | ||||||
| 18,663 | PayPal Holdings, Inc.* | 1,554,068 | ||||||
| 29,669 | Visa, Inc. | 3,929,659 | ||||||
| 27,258,840 | ||||||||
| Materials — 4.5% | ||||||||
| 9,042 | Ecolab, Inc. | 1,268,864 | ||||||
| 6,371 | Sherwin-Williams Co. | 2,596,628 | ||||||
| 3,865,492 | ||||||||
| Total United States | 51,704,201 | |||||||
| Total Common Stocks (Cost $69,575,626) | 84,334,280 | |||||||
| Short-Term Investments — 2.8% | ||||||||
| Money Market Funds — 2.8% | ||||||||
| 2,412,973 | Deutsche Government & | |||||||
| Agency Securities Portfolio — | ||||||||
| Institutional Shares, 1.82%# | 2,412,973 | |||||||
| Total Short-Term Investments (Cost $2,412,973) | 2,412,973 | |||||||
| Total Investments — 100.7% (Cost $71,988,599) | 86,747,253 | |||||||
| Liabilities in Excess of Other Assets — (0.7)% | (634,797 | ) | ||||||
| NET ASSETS — 100.0% | $ | 86,112,456 | ||||||
ADR — American Depositary Receipt
| * | Non-Income Producing | |
| # | Annualized seven-day yield as of June 30, 2018. |
The accompanying notes are an integral part of these financial statements.
34
Brown Advisory Intermediate Income Fund
A Message to Our Shareholders
June 30, 2018
Dear Shareholders:
During the year ended June 30, 2018, the Brown Advisory Intermediate Income Fund – Investor Shares (the “Fund”) returned -0.12%, ahead of the -0.32% return for the Fund’s benchmark, the Bloomberg Barclays Intermediate US Aggregate Bond Index (the “Index”).
Interest rates moved meaningfully higher during the year, resulting in an overall negative return for the Index. The Fund’s duration was mostly neutral during the period, leaving little relative effect from the direction of rates. However, the Fund was also positioned for longer-term rates to rise less than shorter-term rates, which did come to fruition. This effect benefitted the portfolio’s relative return. Some of our largest contributors were asset-backed securities with fairly short durations and floating-rate corporate and municipal debt.
The Fund aims to generate performance primarily through individual security analysis, supported by a detailed and disciplined credit process. Interest rate and sector weightings are set mainly by an analysis of the intermediate-term risk/reward as opposed to any particular macro forecast.
Sector weightings had very little effect on relative performance. During the year, corporate credit spreads moved tighter through January but have widened since, ending slightly weaker for the entire year. Our overweight of corporate bonds generally was somewhat of a detractor; however, security selection, and particularly our allocation to floating-rate debt, was strong enough to make corporate credit a net contributor to performance.
It is always hard to know when a cycle will turn. If the U.S. economy turns weaker a year from now, we will look back at the flattening yield curve and widening credit spreads as warning signs. Both of these indicators have produced false signals many times in the past, however. We believe that the Fund has the potential to perform well whatever the macro economy does by buying bonds with what we believe to be attractive yields and focusing our analysis on downside risks.
Sincerely,
Paul D. Corbin
Portfolio Manager
Thomas D.D. Graff, CFA
Portfolio Manager
Past performance is not a guarantee of future results.
Mutual fund investing involves risk. Principal loss is possible. The Fund is subject to interest rate risk which is the risk that debt securities in the Fund’s portfolio will decline in value because of increases in market interest rates. Investments in Asset Backed and Mortgage Backed Securities include additional risks that investors should be aware of such as credit risk, prepayment risk, possible illiquidity and default, as well as increased susceptibility to adverse economic developments. Investments in debt securities typically decrease in value when interest rates rise. The risk is usually greater for longer-term debt securities. Inflation-indexed bonds see the principal value of the security increased as the Consumer Price Index increases. Should the Consumer Price Index decline, those securities should be adversely impacted. Diversification does not assure a profit, nor does it protect against a loss in a declining market.
Fund holdings and sector allocations are subject to change and should not be considered a recommendation to buy or sell any security. For a complete list of fund holdings, please refer to the Schedule of Investments provided in this report.
Definitions for terms and indices are provided in the Glossary of Terms.
35
Brown Advisory Intermediate Income Fund
Performance Information & Portfolio Holdings Summary
June 30, 2018
| PORTFOLIO HOLDINGS | % of Net Assets |
| Corporate Bonds & Notes | 25.3% |
| U.S. Treasury Notes | 19.6% |
| Affiliated Mutual Funds | 18.9% |
| Mortgage Backed Securities | 14.6% |
| Municipal Bonds | 11.1% |
| Asset Backed Securities | 7.8% |
| Money Market Funds | 2.1% |
| Other Assets and Liabilities | 0.6% |
100.0% |
GROWTH OF A $10,000 INVESTMENT
The following chart reflects the change in value of a hypothetical $10,000 investment, including reinvested dividends and distributions, in the Fund as measured against a broad-based bond index. The Bloomberg Barclays Intermediate US Aggregate Bond Index (“Index”) represents domestic taxable investment grade bonds, with index components for government and corporate securities, mortgage pass-through securities, and asset-backed securities with average maturities and durations in the intermediate range. The Index is unmanaged and does not reflect the deduction of fees, such as investment management fees. Investors cannot invest directly in an index.
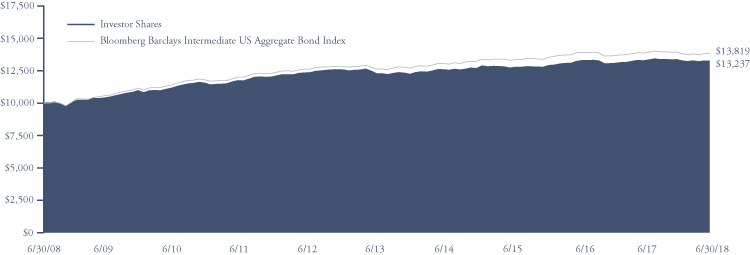
Average Annual Total Return | One Year | Five Year | Ten Year |
| Investor Shares | -0.12% | 1.58% | 2.84% |
| Advisor Shares | -0.38% | 1.31% | 2.61% |
| Bloomberg Barclays Intermediate US Aggregate Bond Index | -0.32% | 1.83% | 3.29% |
Investor Shares | Advisor Shares | ||
Gross Expense Ratio1 | 0.61% | 0.86% | |
Net Expense Ratio1 | 0.55% | 0.80% |
Past performance does not guarantee future results. The performance data quoted represents past performance and current returns may be lower or higher. The investment return and net asset value will fluctuate so that an investor’s shares, when redeemed, may be worth more or less than the original cost. To obtain performance information current to the most recent month end, please visit our website at brownadvisoryfunds.com/performance.html. The performance table and graph above do not reflect the deduction of taxes that a shareholder would pay on Fund distributions or the redemption of Fund shares. Investment performance reflects periods during which fee waivers were in effect. In the absence of such waivers, total return would have been reduced. Performance data does not reflect the imposition of the redemption fee of 1.00% on shares redeemed within 14 days, and if it did, performance would have been lower.
1 | Per the Fund’s prospectus dated October 31, 2017. Refer to the financial highlights for the gross and net expense ratios for the year ended as of the date of this report. Please note that the expense ratios per the prospectus include acquired fund fees and expenses (as applicable) and the expense ratios in the financial highlights do not. |
36
Brown Advisory Intermediate Income Fund
Schedule of Investments
June 30, 2018
| Par Value | Security Description | Rate | Maturity | Value $ | |||||||||
| Corporate Bonds & Notes — 25.3% | |||||||||||||
| 665,000 | 21st Century Fox America, Inc. | 3.00 | % | 09/15/2022 | 652,090 | ||||||||
| 1,200,000 | Activision Blizzard, Inc.^ | 6.13 | % | 09/15/2023 | 1,243,403 | ||||||||
| 1,345,000 | AerCap Ireland Capital DAC | 3.30 | % | 01/23/2023 | 1,294,139 | ||||||||
| 1,365,000 | American Express Credit Corp. (3 Month LIBOR USD + 0.70%) | 3.02 | % | 03/03/2022 | 1,374,412 | ||||||||
| 1,390,000 | American Tower Corp. | 2.25 | % | 01/15/2022 | 1,330,006 | ||||||||
| 1,355,000 | Analog Devices, Inc. | 3.13 | % | 12/05/2023 | 1,317,238 | ||||||||
| 1,365,000 | AstraZeneca PLC | 1.95 | % | 09/18/2019 | 1,351,238 | ||||||||
| 1,000,000 | AutoZone, Inc. | 2.50 | % | 04/15/2021 | 976,443 | ||||||||
| 1,330,000 | BB&T Corp. | 2.75 | % | 04/01/2022 | 1,299,811 | ||||||||
| 1,280,000 | Boston Properties L.P. | 3.85 | % | 02/01/2023 | 1,287,767 | ||||||||
| 1,306,000 | CC Holdings GS V LLC | 3.85 | % | 04/15/2023 | 1,295,572 | ||||||||
| 665,000 | Clorox Co. | 3.05 | % | 09/15/2022 | 657,275 | ||||||||
| 970,000 | Digital Realty Trust L.P. | 3.95 | % | 07/01/2022 | 980,777 | ||||||||
| 650,000 | Dollar General Corp. | 4.15 | % | 11/01/2025 | 651,397 | ||||||||
| 1,025,000 | Enterprise Products Operating LLC (Fixed until 08/16/2027, then 3 Month LIBOR USD + 3.03%) | 5.25 | % | 08/16/2077 | 955,813 | ||||||||
| 665,000 | Exelon Corp. | 2.45 | % | 04/15/2021 | 646,708 | ||||||||
| 1,220,000 | Fidelity National Information Services, Inc. | 5.00 | % | 10/15/2025 | 1,284,628 | ||||||||
| 1,295,000 | Goldman Sachs Group, Inc. (3 Month LIBOR USD + 0.75%) | 3.08 | % | 02/23/2023 | 1,290,973 | ||||||||
| 1,400,000 | Hasbro, Inc. | 3.50 | % | 09/15/2027 | 1,297,583 | ||||||||
| 675,000 | Healthcare Trust of America Holdings L.P. | 3.75 | % | 07/01/2027 | 641,667 | ||||||||
| 655,000 | JB Hunt Transport Services, Inc. | 3.30 | % | 08/15/2022 | 650,468 | ||||||||
| 685,000 | Kroger Co. | 3.70 | % | 08/01/2027 | 652,630 | ||||||||
| 1,210,000 | Land O’Lakes, Inc.^ | 6.00 | % | 11/15/2022 | 1,288,650 | ||||||||
| 670,000 | Morgan Stanley | 2.63 | % | 11/17/2021 | 650,750 | ||||||||
| 1,295,000 | MPLX L.P. | 4.50 | % | 07/15/2023 | 1,323,818 | ||||||||
| 1,370,000 | Mylan NV | 3.95 | % | 06/15/2026 | 1,310,542 | ||||||||
| 1,005,000 | Noble Energy, Inc. | 3.85 | % | 01/15/2028 | 962,305 | ||||||||
| 1,350,000 | Royal Bank of Canada (3 Month LIBOR USD + 0.73%) | 3.09 | % | 02/01/2022 | 1,361,666 | ||||||||
| 640,000 | Verizon Communications, Inc. (3 Month LIBOR USD + 1.00%) | 3.33 | % | 03/16/2022 | 650,495 | ||||||||
| 1,215,000 | Weyerhaeuser Co. | 7.38 | % | 10/01/2019 | 1,277,085 | ||||||||
| 685,000 | Xylem, Inc. | 3.25 | % | 11/01/2026 | 645,104 | ||||||||
| Total Corporate Bonds & Notes (Cost $33,362,801) | 32,602,453 | ||||||||||||
| Mortgage Backed Securities — 14.6% | |||||||||||||
| 1,990 | FHLMC PC, Pool# C0-0210 | 8.00 | % | 01/01/2023 | 2,117 | ||||||||
| 295,108 | FHLMC PC, Pool# 1B-0889 (12 Month LIBOR USD + 1.59%) | 3.95 | % | 05/01/2033 | 309,158 | ||||||||
| 1,689,485 | FHLMC PC, Pool# Q2-5749 | 4.00 | % | 04/01/2044 | 1,729,896 | ||||||||
| 1,172,214 | FHLMC PC, Pool# Q4-2019 | 3.00 | % | 07/01/2046 | 1,136,899 | ||||||||
| 36,272 | FHLMC REMIC, Series 2782 PA | 4.00 | % | 11/15/2033 | 36,219 | ||||||||
| 1,600,000 | FHMS, Series K-042 | 2.67 | % | 12/25/2024 | 1,557,173 | ||||||||
| 1,525,000 | FHMS, Series K-046 | 3.21 | % | 03/25/2025 | 1,527,195 | ||||||||
| 700,000 | FHMS, Series K-047# | 3.33 | % | 05/25/2025 | 705,828 | ||||||||
| 1,550,000 | FHMS, Series K-048# | 3.28 | % | 06/25/2025 | 1,558,705 | ||||||||
| 37,221 | FNMA, Pool# 628837 | 6.50 | % | 03/01/2032 | 41,059 | ||||||||
| 78,890 | FNMA, Pool# 663238 | 5.50 | % | 09/01/2032 | 84,598 | ||||||||
| 32,952 | FNMA, Pool# 744805 (6 Month LIBOR USD + 1.52%) | 3.77 | % | 11/01/2033 | 33,328 | ||||||||
| 12,244 | FNMA, Pool# 741373 (1 Year CMT Rate + 2.28%) | 3.53 | % | 12/01/2033 | 12,677 | ||||||||
| 61,892 | FNMA, Pool# 764342 (6 Month LIBOR USD + 1.52%) | 3.40 | % | 02/01/2034 | 63,871 | ||||||||
| 24,989 | FNMA, Pool# 848817 | 5.00 | % | 01/01/2036 | 26,598 | ||||||||
| 1,923,507 | FNMA, Pool# AB9339 | 3.00 | % | 05/01/2043 | 1,880,053 | ||||||||
| 471,942 | FNMA, Pool# AS1474 | 4.50 | % | 01/01/2044 | 496,038 | ||||||||
| 620,253 | FNMA, Pool# AV7911 | 4.50 | % | 01/01/2044 | 649,787 | ||||||||
| 3,127,063 | FNMA, Pool# AY3879 | 3.50 | % | 11/01/2045 | 3,123,182 | ||||||||
| 1,463,099 | FNMA, Pool# AY3880 | 4.00 | % | 11/01/2045 | 1,497,229 | ||||||||
| 1,231,447 | FNMA, Pool# AS2826 | 4.00 | % | 07/01/2044 | 1,260,126 | ||||||||
| 1,407,484 | FNMA REMIC Trust, Series 2013-115 AI~ | 3.00 | % | 04/25/2031 | 168,040 | ||||||||
| 15,042 | GNMA, Pool# 487110X | 6.50 | % | 04/15/2029 | 16,811 | ||||||||
The accompanying notes are an integral part of these financial statements.
37
Brown Advisory Intermediate Income Fund
Schedule of Investments
June 30, 2018
| Par Value | Security Description | Rate | Maturity | Value $ | |||||||||
| Mortgage Backed Securities — 14.6% (Continued) | |||||||||||||
| 25,048 | GNMA, Pool# 781186X | 9.00 | % | 06/15/2030 | 27,042 | ||||||||
| 5,926 | GNMA, Pool# 571166X | 7.00 | % | 08/15/2031 | 6,041 | ||||||||
| 900,000 | MSC, Series 2017-CLS A (1 Month LIBOR USD + 0.70%)^ | 2.77 | % | 11/15/2034 | 899,453 | ||||||||
| Total Mortgage Backed Securities (Cost $19,287,710) | 18,849,123 | ||||||||||||
| Municipal Bonds — 11.1% | |||||||||||||
| 670,000 | District of Columbia | 4.71 | % | 12/01/2022 | 711,975 | ||||||||
| 1,600,000 | District of Columbia# | 5.73 | % | 08/01/2038 | 1,519,616 | ||||||||
| 1,395,000 | Florida Hurricane Catastrophe Fund | 2.11 | % | 07/01/2018 | 1,395,000 | ||||||||
| 1,000,000 | Illinois, State of | 2.30 | % | 06/15/2019 | 994,060 | ||||||||
| 1,390,000 | Maryland Health & Higher Educational Facilities Authority | 3.43 | % | 07/01/2023 | 1,381,021 | ||||||||
| 2,000,000 | Miami-Dade County Florida Aviation | 2.37 | % | 10/01/2023 | 1,919,580 | ||||||||
| 1,315,000 | New York State Dormitory Authority | 4.00 | % | 07/01/2039 | 1,325,231 | ||||||||
| 750,000 | New York State Energy Research & Development Authority# | 0.94 | % | 12/01/2023 | 750,000 | ||||||||
| 1,500,000 | New York State Energy Research & Development Authority# | 5.23 | % | 07/01/2029 | 1,500,000 | ||||||||
| 1,250,000 | North Texas Tollway Authority | 8.91 | % | 02/01/2030 | 1,360,225 | ||||||||
| 470,000 | Regional Transportation Authority | 3.01 | % | 05/29/2020 | 470,653 | ||||||||
| 1,000,000 | Texas A&M University | 3.23 | % | 05/15/2027 | 992,380 | ||||||||
| Total Municipal Bonds (Cost $14,497,633) | 14,319,741 | ||||||||||||
| Asset Backed Securities — 7.8% | |||||||||||||
| 163,568 | AmeriCredit Automobile Receivables Trust, Series 2015-4 A3 | 1.70 | % | 07/08/2020 | 163,387 | ||||||||
| 859,391 | AmeriCredit Automobile Receivables Trust, Series 2015-3 B | 2.08 | % | 09/08/2020 | 858,607 | ||||||||
| 455,389 | Continental Airlines Trust, Series 1999-1 A< | 6.55 | % | 08/02/2020 | 459,396 | ||||||||
| 1,550,000 | Drive Auto Receivables Trust, Series 2018-1 B | 2.88 | % | 02/15/2022 | 1,546,246 | ||||||||
| 638,884 | Federal Express Corp., Series 1998-1< | 6.72 | % | 07/15/2023 | 672,426 | ||||||||
| 1,000,000 | Neuberger Berman Loan Advisers CLO, Series 2017-26A A (3 Month LIBOR USD + 1.17%)^ | 3.53 | % | 10/18/2030 | 1,001,243 | ||||||||
| 1,500,000 | Octagon Investment Partners 24, Ltd., Series 2015-1A A2AR (3 Month LIBOR USD + 1.35%)^ | 3.68 | % | 05/21/2027 | 1,501,766 | ||||||||
| 1,000,000 | Octagon Investment Partners 30, Ltd., Series 2017-1A B (3 Month LIBOR USD + 2.35%)^ | 4.71 | % | 03/17/2030 | 1,006,950 | ||||||||
| 28,770 | OSCAR U.S. Funding Trust IV, Series 2016-1A A2B (1 Month LIBOR USD + 1.70%)^ | 3.62 | % | 07/15/2020 | 28,904 | ||||||||
| 22,451 | OSCAR U.S. Funding Trust V, Series 2016-2A A2B (1 Month LIBOR USD + 1.40%)^ | 3.47 | % | 11/15/2019 | 22,487 | ||||||||
| 1,500,000 | OZLM XIII, Ltd., Series 2015-13A A2 (3 Month LIBOR USD + 2.10%)^ | 4.46 | % | 07/30/2027 | 1,505,199 | ||||||||
| 592,000 | Verizon Owner Trust, Series 2016-2A B^ | 2.15 | % | 05/20/2021 | 581,751 | ||||||||
| 424,000 | Verizon Owner Trust, Series 2017-1A B^ | 2.45 | % | 09/20/2021 | 417,606 | ||||||||
| 300,000 | Verizon Owner Trust, Series 2018-1A C^ | 3.20 | % | 09/20/2022 | �� | 298,844 | |||||||
| Total Asset Backed Securities (Cost $10,082,891) | 10,064,812 | ||||||||||||
| U.S. Treasury Notes — 19.6% | |||||||||||||
| 5,330,000 | United States Treasury Note | 1.38 | % | 02/29/2020 | 5,232,353 | ||||||||
| 6,750,000 | United States Treasury Note | 1.88 | % | 08/31/2022 | 6,531,020 | ||||||||
| 5,000,000 | United States Treasury Note | 1.63 | % | 05/15/2026 | 4,574,512 | ||||||||
| 2,500,000 | United States Treasury Note | 1.50 | % | 08/15/2026 | 2,257,911 | ||||||||
| 2,630,000 | United States Treasury Note | 0.75 | % | 07/31/2018 | 2,627,779 | ||||||||
| 4,000,000 | United States Treasury Note | 2.88 | % | 05/15/2028 | 4,008,516 | ||||||||
| Total U.S. Treasury Notes (Cost $25,721,431) | 25,232,091 | ||||||||||||
The accompanying notes are an integral part of these financial statements.
38
Brown Advisory Intermediate Income Fund
Schedule of Investments
June 30, 2018
| Shares | Security Description | Value $ | ||||||
| Affiliated Mutual Funds (Note 3) — 18.9% | ||||||||
| 2,520,036 | Brown Advisory Mortgage Securities Fund — Institutional Shares | 24,318,345 | ||||||
| Total Affiliated Mutual Funds (Cost $25,415,007) | 24,318,345 | |||||||
| Short-Term Investments — 2.1% | ||||||||
| Money Market Funds — 2.1% | ||||||||
| 2,724,095 | First American Treasury Obligations Fund — Class Z, 1.75%* | 2,724,095 | ||||||
| Total Short-Term Investments (Cost $2,724,095) | 2,724,095 | |||||||
| Total Investments — 99.4% (Cost $131,091,568) | 128,110,660 | |||||||
| Other Assets in Excess of Liabilities — 0.6% | 732,022 | |||||||
| NET ASSETS — 100.0% | $ | 128,842,682 | ||||||
| # | Variable rate security. Rate disclosed is as of June 30, 2018. | |
| * | Annualized seven-day yield as of June 30, 2018. | |
| ^ | Security exempt from registration under Rule 144A of the Securities Act of 1933. These securities may be resold in transactions exempt from registration, normally to qualified institutional buyers. At June 30, 2018, the value of these securities amounted to $9,796,256 or 7.6% of net assets. | |
< | These securities are being fair valued, using significant unobservable inputs (Level 3), under the supervision of the Board of Trustees. | |
| ~ | Interest Only Security |
The accompanying notes are an integral part of these financial statements.
39
Brown Advisory Total Return Fund
A Message to Our Shareholders
June 30, 2018
Dear Shareholders:
During the year ended June 30, 2018, the Brown Advisory Total Return Fund – Institutional Shares (the “Fund”) gained 0.61%, ahead of the -0.40% return for the Fund’s benchmark, the Bloomberg Barclays US Aggregate Bond Index (the “Index”).
The Fund aims to generate performance primarily through individual security analysis, supported by a detailed and disciplined credit process and a focus on risk mitigation as we seek to limit the downside risk of our investments. Interest rate and sector weightings are mainly set by an analysis of the intermediate-term risk/reward, as opposed to any particular macro forecast.
To this end, our individual security selections were the main driver of outperformance, adding 0.90% to relative performance. About half of that came from corporate bond picks, with the rest roughly split evenly between asset-backed securities, taxable municipals and mortgages.
Among our largest positive contributing individual selections were Superior Energy, Springs Industries, Oasis Petroleum, Canadian Natural Resources and Capital One.
Sector weightings had very little effect on relative performance. For the year, corporate credit spreads moved tighter through January, but have widened since, ending slightly weaker for the entire period. Our overweight to corporate bonds was generally somewhat of a detractor; however, selection was strong enough to make corporate credit a net contributor to performance.
Interest rates moved meaningfully higher over the period, resulting in an overall negative return for the Index. The Fund’s duration was mostly neutral during the year, leaving little relative effect from the direction of rates. However the Fund was also positioned for longer-term rates to rise less than shorter-term rates, which did come to fruition. This effect benefitted the portfolio’s relative return.
It is always hard to know when a cycle will turn. If the U.S. economy turns weaker a year from now, we will look back at the flattening yield curve and widening credit spreads as warning signs. However both of these indicators have produced false signals many times in the past. We will seek to perform well whatever the macro economy does by buying bonds with attractive yields and focusing our analysis on downside risks.
Sincerely,
Thomas D.D. Graff, CFA
Portfolio Manager
Past performance is not a guarantee of future results.
Mutual fund investing involves risk. Principal loss is possible. Investments in debt securities typically decrease in value when interest rates rise. This risk is usually greater for longer-term debt securities. Investments in Asset-Backed and Mortgage-Backed securities include additional risks that investor should be aware of including credit risk, prepayment risk, possible illiquidity and default, as well as increased susceptibility to adverse economic developments. Investments in lower rated and non-rated securities present a great risk of loss to principal and interest than higher rated securities. In addition, the fund is susceptible to risks from investments in derivatives, U.S. Government securities, and changes in interest rates. Income from tax-exempt funds may be subject to state and local taxes and a portion of income may be subject to the Federal Alternative minimum tax for certain investors.
Fund holdings and sector allocations are subject to change and should not be considered a recommendation to buy or sell any security. For a complete list of fund holdings, please refer to the Schedule of Investments provided in this report.
Definitions for terms and indices are provided in the Glossary of Terms.
40
Brown Advisory Total Return Fund
Performance Information & Portfolio Holdings Summary
June 30, 2018
| PORTFOLIO HOLDINGS | % of Net Assets |
| Asset Backed Securities | 30.5% |
| Corporate Bonds & Notes | 28.7% |
| Mortgage Backed Securities | 28.7% |
| Money Market Funds | 7.4% |
| Municipal Bonds | 7.2% |
| U.S. Treasury Notes | 4.8% |
| U.S. Treasury Bills | 0.3% |
| Preferred Stocks | 0.1% |
| Other Assets and Liabilities | (7.7)% |
100.0% |
GROWTH OF A $1,000,000 INVESTMENT
The following chart reflects the change in value of a hypothetical $1,000,000 investment, including reinvested dividends and distributions, in the Fund as measured against a broad-based securities market index. The Bloomberg Barclays US Aggregate Bond Index (“Index”) is a broad-based benchmark that measures the investment grade US dollar-denominated, fixed rate taxable bond market. The Index includes Treasuries, government-related and corporate securities, MBS, ABS and CMBS. The Index is unmanaged and does not reflect the deduction of fees, such as investment management fees. Investors cannot invest directly in an index.
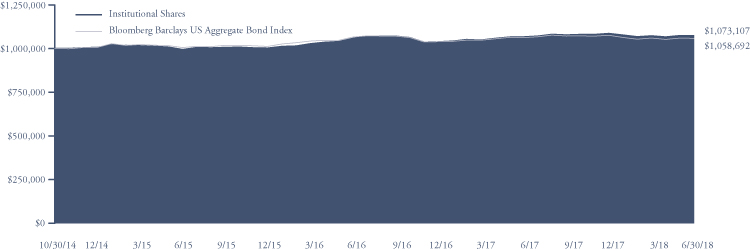
| Since Inception | ||
Average Annual Total Return | One Year | (10/30/14) |
| Institutional Shares | 0.61% | 1.94% |
| Investor Shares | 0.56% | 1.89% |
| Bloomberg Barclays US Aggregate Bond Index | -0.40% | 1.57% |
Institutional Shares | Investor Shares | |
Gross Expense Ratio1 | 0.53% | 0.58% |
Net Expense Ratio1 | 0.53% | 0.58% |
Past performance does not guarantee future results. The performance data quoted represents past performance and current returns may be lower or higher. The investment return and net asset value will fluctuate so that an investor’s shares, when redeemed, may be worth more or less than the original cost. To obtain performance information current to the most recent month end, please visit our website at brownadvisoryfunds.com/performance.html. The performance table and graph above do not reflect the deduction of taxes that a shareholder would pay on Fund distributions or the redemption of Fund shares. Performance data does not reflect the imposition of the redemption fee of 1.00% on shares redeemed within 14 days, and if it did, performance would have been lower. Short-term performance, in particular, is not a good indication of the Fund’s future performance, and an investment should not be made based solely on returns.
1 | Per the Fund’s prospectus dated October 31, 2017. Refer to the financial highlights for the gross and net expense ratios for the year ended as of the date of this report. Please note that the expense ratios per the prospectus include acquired fund fees and expenses (as applicable) and the expense ratios in the financial highlights do not. |
41
Brown Advisory Total Return Fund
Schedule of Investments
June 30, 2018
| Par Value | Security Description | Rate | Maturity | Value $ | ||||||||
| Asset Backed Securities — 30.5% | ||||||||||||
| 159,591 | Aircraft Certificate Owner Trust, Series 2003-1A E^< | 7.00 | % | 09/20/2022 | 164,977 | |||||||
| 500,000 | American Credit Acceptance Receivables Trust, Series 2016-1A C^ | 5.55 | % | 06/13/2022 | 507,459 | |||||||
| 650,000 | American Credit Acceptance Receivables Trust, Series 2017-4 C^ | 2.94 | % | 01/10/2024 | 646,016 | |||||||
| 500,000 | BlueMountain CLO, Ltd., Series 2013-3A DR (3 Month LIBOR USD + 2.90%)^ | 5.26 | % | 10/29/2025 | 499,753 | |||||||
| 650,000 | BlueMountain CLO, Ltd., Series 2015-2A B (3 Month LIBOR USD + 1.85%)^ | 4.21 | % | 07/18/2027 | 651,854 | |||||||
| 127,664 | BRE Grand Islander Timeshare Issuer LLC, Series 2017-1A A^ | 2.94 | % | 05/25/2029 | 124,755 | |||||||
| 750,000 | Carlyle Global Market Strategies CLO, Ltd., Series 2015-1 C-R (3 Month LIBOR USD + 2.00%)^ | 4.36 | % | 04/20/2027 | 753,285 | |||||||
| 1,000,000 | Carlyle Global Market Strategies CLO, Ltd., Series 2015-2 C-R (3 Month LIBOR USD + 2.25%)^ | 4.62 | % | 04/27/2027 | 997,265 | |||||||
| 304,193 | Continental Airlines Trust, Series 1999-1 A< | 6.55 | % | 08/02/2020 | 306,870 | |||||||
| 68,316 | Continental Airlines Trust, Series 2000-1 A-1< | 8.05 | % | 05/01/2022 | 72,155 | |||||||
| 650,000 | CPS Auto Receivables Trust, Series 2015-A^ | 5.60 | % | 02/16/2021 | 668,791 | |||||||
| 235,000 | CPS Auto Receivables Trust, Series 2015-C^ | 4.63 | % | 08/16/2021 | 238,514 | |||||||
| 300,000 | CPS Auto Receivables Trust, Series 2016-C^ | 8.39 | % | 09/15/2023 | 323,866 | |||||||
| 200,000 | Dell Equipment Finance Trust, Series 2018-1^ | 3.85 | % | 06/24/2024 | 200,281 | |||||||
| 400,000 | Drive Auto Receivables Trust, Series 2018-1 C | 3.22 | % | 03/15/2023 | 398,731 | |||||||
| 1,000,000 | Drive Auto Receivables Trust, Series 2018-1 D | 3.81 | % | 05/15/2024 | 999,034 | |||||||
| 400,000 | Drive Auto Receivables Trust, Series 2018-2 | 4.14 | % | 08/15/2024 | 402,540 | |||||||
| 750,000 | DT Auto Owner Trust, Series 2018-1A C^ | 3.47 | % | 12/15/2023 | 749,308 | |||||||
| 500,000 | DT Auto Owner Trust, Series 2018-2^ | 3.67 | % | 03/15/2024 | 499,954 | |||||||
| 600,000 | DT Auto Owner Trust, Series 2017-3^ | 5.60 | % | 08/15/2024 | 607,500 | |||||||
| 200,000 | Exeter Automobile Receivables Trust, Series 2016-3A C^ | 4.22 | % | 06/15/2022 | 202,350 | |||||||
| 574,996 | Federal Express Corp., Series 1998-1< | 6.72 | % | 07/15/2023 | 605,183 | |||||||
| 2,000,000 | GoldenTree Loan Opportunities XI, Ltd., Series 2015-11A AR2 FLT | |||||||||||
| (3 Month LIBOR USD + 1.07%)^ | 3.43 | % | 01/21/2031 | 2,002,282 | ||||||||
| 1,000,000 | GreatAmerica Leasing Receivables Funding LLC, Series 2015-1 B^ | 2.39 | % | 06/21/2021 | 998,584 | |||||||
| 300,000 | GreatAmerica Leasing Receivables Funding LLC, Series 2018-1 C^ | 3.14 | % | 06/16/2025 | 297,201 | |||||||
| 500,000 | Grippen Park CLO, Ltd., Series 2017-1A C (3 Month LIBOR USD + 2.30%)^ | 4.66 | % | 01/20/2030 | 501,582 | |||||||
| 800,000 | Highbridge Loan Management, Ltd., Series 7A-2015 CR (3 Month LIBOR USD + 1.70%)^ | 4.04 | % | 03/15/2027 | 791,446 | |||||||
| 300,000 | Invitation Homes Trust, Series 2017-SFR2 B (1 Month LIBOR USD + 1.15%)^ | 3.24 | % | 12/19/2036 | 302,280 | |||||||
| 200,000 | Invitation Homes Trust, Series 2017-SFR2 C (1 Month LIBOR USD + 1.45%)^ | 3.54 | % | 12/19/2036 | 201,168 | |||||||
| 250,000 | Invitation Homes Trust, Series 2018-SFR1 C (1 Month LIBOR USD + 1.25%)^ | 3.34 | % | 03/19/2037 | 250,781 | |||||||
| 200,000 | Invitation Homes Trust, Series 2018-SFR2 C (1 Month LIBOR USD + 1.28%)^ | 3.35 | % | 06/18/2037 | 201,149 | |||||||
| 750,000 | Madison Park Funding XVII, Ltd., Series 2015-17A B1R (3 Month LIBOR USD + 1.75%)^ | 4.11 | % | 07/21/2030 | 753,793 | |||||||
| 625,000 | Madison Park Funding XVII, Ltd., Series 2015-17A CR (3 Month LIBOR USD + 2.40%)^ | 4.76 | % | 07/22/2030 | 631,748 | |||||||
| 500,000 | Madison Park Funding XXI, Ltd., Series 2016-21 B (3 Month LIBOR USD + 2.75%)^ | 5.11 | % | 07/25/2029 | 506,876 | |||||||
| 86,073 | MVW Owner Trust, Series 2017-1A B^ | 2.75 | % | 12/20/2034 | 83,583 | |||||||
| 2,000,000 | Neuberger Berman Loan Advisers CLO, Series 2017-26A A (3 Month LIBOR USD + 1.17%)^ | 3.53 | % | 10/18/2030 | 2,002,486 | |||||||
| 750,000 | Octagon Investment Partners 25, Ltd., Series 2015-1A AR (3 Month LIBOR USD + 0.80%)^ | 3.16 | % | 10/20/2026 | 749,993 | |||||||
| 750,000 | Octagon Investment Partners 25, Ltd., Series 2015-1A BR (3 Month LIBOR USD + 1.20%)^ | 3.56 | % | 10/20/2026 | 746,290 | |||||||
| 1,000,000 | Octagon Investment Partners 30, Ltd., Series 2017-1A B (3 Month LIBOR USD + 2.35%)^ | 4.71 | % | 03/17/2030 | 1,006,950 | |||||||
| 2,000,000 | Octagon Investment Partners 36, Ltd., Series 2018-1A A1 (3 Month LIBOR USD + 0.97%)^ | 2.73 | % | 04/15/2031 | 2,000,000 | |||||||
| 500,000 | Octagon Investment Partners XXI, Ltd., Series 2014-21 C (3 Month LIBOR USD + 3.65%)^ | 6.01 | % | 11/14/2026 | 502,663 | |||||||
| 250,000 | Oportun Funding LLC, Series 2018-B A^ | 3.91 | % | 07/08/2024 | 249,972 | |||||||
| 250,000 | Oportun Funding LLC, Series 2018-B B^ | 4.50 | % | 07/08/2024 | 249,975 | |||||||
| 178,985 | Orange Lake Timeshare Trust, Series 2018-A B^ | 3.35 | % | 11/08/2030 | 177,425 | |||||||
| 57,540 | OSCAR U.S. Funding Trust IV, Series 2016-1A A2B (1 Month LIBOR USD + 1.70%)^ | 3.62 | % | 07/15/2020 | 57,808 | |||||||
| 8,981 | OSCAR U.S. Funding Trust V, Series 2016-2A A2B (1 Month LIBOR USD + 1.40%)^ | 3.47 | % | 11/15/2019 | 8,995 | |||||||
| 252,296 | OSCAR U.S. Funding Trust VI LLC, Series 2017-1A A2A^ | 2.30 | % | 05/11/2020 | 251,519 | |||||||
| 77,982 | OSCAR U.S. Funding Trust VI LLC, Series 2017-1A A2B (1 Month LIBOR USD + 0.80%)^ | 2.85 | % | 05/11/2020 | 78,126 | |||||||
| 166,360 | OSCAR U.S. Funding Trust VII LLC, Series 2017-2A A2B (1 Month LIBOR USD + 0.65%)^ | 2.70 | % | 11/10/2020 | 166,690 | |||||||
| 1,000,000 | OZLM XIII, Ltd., Series 2015-13A A2 (3 Month LIBOR USD + 2.10%)^ | 4.46 | % | 07/30/2027 | 1,003,466 | |||||||
| 200,000 | Progress Residential Trust, Series 2018-SFR1 B^ | 3.48 | % | 03/17/2035 | 196,695 | |||||||
| 200,000 | Progress Residential Trust, Series 2018-SFR1 C^ | 3.68 | % | 03/17/2035 | 197,059 | |||||||
| 750,000 | Regatta III Funding, Ltd., Series 2014-1A CR (3 Month LIBOR USD + 3.30%)^ | 5.65 | % | 04/15/2026 | 750,573 | |||||||
| 2,275,987 | Santander Drive Auto Receivables Trust, Series 2015-4 C | 2.97 | % | 03/15/2021 | 2,278,138 | |||||||
| 500,000 | Santander Drive Auto Receivables Trust, Series 2017-1 D | 3.17 | % | 04/17/2023 | 497,036 | |||||||
The accompanying notes are an integral part of these financial statements.
42
Brown Advisory Total Return Fund
Schedule of Investments
June 30, 2018
| Par Value | Security Description | Rate | Maturity | Value $ | |||||||||
| Asset Backed Securities — 30.5% (Continued) | |||||||||||||
| 1,000,000 | Santander Drive Auto Receivables Trust, Series 2017-1 E^ | 5.05 | % | 07/15/2024 | 1,017,560 | ||||||||
| 43,024 | Sierra Timeshare Receivables Funding LLC, Series 2015-3A A^ | 2.58 | % | 09/20/2032 | 42,849 | ||||||||
| 78,063 | Sierra Timeshare Receivables Funding LLC, Series 2016-2A A^ | 2.33 | % | 07/20/2033 | 77,081 | ||||||||
| 500,000 | Sound Point CLO XII, Ltd., Series 2016-2A D (3 Month LIBOR USD + 4.25%)^ | 6.61 | % | 10/20/2028 | 506,226 | ||||||||
| 177,395 | Southwest Airlines Co., Series 2007-1 | 6.15 | % | 02/01/2024 | 188,347 | ||||||||
| 4,582 | U.S. Airways Pass Through Trust, Series 1999-1 A< | 8.36 | % | 07/20/2020 | 4,628 | ||||||||
| 375,000 | Verizon Owner Trust, Series 2016-1A A^ | 1.42 | % | 01/20/2021 | 373,133 | ||||||||
| 600,000 | Verizon Owner Trust, Series 2016-2A B^ | 2.15 | % | 05/20/2021 | 589,613 | ||||||||
| 424,000 | Verizon Owner Trust, Series 2017-1A B^ | 2.45 | % | 09/20/2021 | 417,606 | ||||||||
| 300,000 | Verizon Owner Trust, Series 2018-1A C^ | 3.20 | % | 09/20/2022 | 298,844 | ||||||||
| 500,000 | Vibrant CLO, Ltd., Series 2013-2A A2AR (3 Month LIBOR USD + 1.45%)^ | 3.81 | % | 07/24/2024 | 500,635 | ||||||||
| 65,123 | VOLT XXXVIII LLC, Series 2015-NP12 A1ʭ^ | 3.88 | % | 09/25/2045 | 65,270 | ||||||||
| 289,491 | Westgate Resorts LLC, Series 2018-1^ | 3.58 | % | 12/20/2031 | 287,906 | ||||||||
| 385,988 | Westgate Resorts LLC, Series 2018-1^ | 4.10 | % | 12/20/2031 | 385,048 | ||||||||
| 900,000 | Westlake Automobile Receivables Trust, Series 2018-1A D^ | 3.41 | % | 05/15/2023 | 895,030 | ||||||||
| 375,000 | Westlake Automobile Receivables Trust, Series 2018-2 D^ | 4.00 | % | 01/16/2024 | 376,557 | ||||||||
| 500,000 | Westlake Automobile Receivables Trust, Series 2017-2A E^ | 4.63 | % | 07/15/2024 | 501,861 | ||||||||
| Total Asset Backed Securities (Cost $37,904,622) | 37,842,967 | ||||||||||||
| Mortgage Backed Securities — 28.7% | |||||||||||||
| 400,000 | BBCMS Mortgage Trust, Series 2018-TALL C (1 Month LIBOR USD + 1.12%)^ | 3.19 | % | 03/16/2037 | 400,137 | ||||||||
| 4,000,000 | FHLMC Gold, 3.5%, Due TBA July | 3.50 | % | 07/15/2048 | 3,979,316 | ||||||||
| 233,210 | FHLMC PC, Pool# G6-1330 | 6.00 | % | 07/01/2040 | 256,988 | ||||||||
| 296,895 | FHLMC PC, Pool# Q5-2011 | 4.00 | % | 11/01/2047 | 303,761 | ||||||||
| 2,483,136 | FHLMC REMIC, Series 4094~ | 2.50 | % | 03/15/2027 | 159,214 | ||||||||
| 804,124 | FHLMC REMIC, Series 4107~ | 3.00 | % | 08/15/2027 | 156,089 | ||||||||
| 1,754,362 | FHLMC REMIC, Series 4143~ | 3.50 | % | 09/15/2042 | 204,915 | ||||||||
| 898,556 | FHLMC REMIC, Series 4495~ | 3.50 | % | 07/15/2045 | 171,838 | ||||||||
| 275,000 | FHLMC SCRTT, Series 2016-1 M1#^ | 3.00 | % | 09/25/2055 | 268,947 | ||||||||
| 463,916 | FHMS, Series K-J13 | 2.06 | % | 09/25/2021 | 458,667 | ||||||||
| 355,454 | FHMS, Series K-J18 | 2.46 | % | 03/25/2022 | 350,089 | ||||||||
| 280,465 | FHMS, Series K-J09 | 2.02 | % | 04/25/2022 | 275,195 | ||||||||
| 2,018,025 | FHMS, Series K-721#~ | 0.45 | % | 08/25/2022 | 24,035 | ||||||||
| 410,182 | FHMS, Series K-J07 | 1.53 | % | 09/25/2022 | 392,434 | ||||||||
| 1,700,000 | FHMS, Series K-728# | 3.06 | % | 08/25/2024 | 1,692,270 | ||||||||
| 738,069 | FHMS, Series K-J17 | 2.40 | % | 10/25/2024 | 718,783 | ||||||||
| 1,563,022 | FHMS, Series K-055#~ | 1.50 | % | 03/25/2026 | 135,135 | ||||||||
| 697,752 | FHMS, Series K-057#~ | 1.33 | % | 07/25/2026 | 54,340 | ||||||||
| 678,716 | FHMS, Series K-058#~ | 1.06 | % | 08/25/2026 | 42,916 | ||||||||
| 1,394,675 | FHMS, Series K-W03#~ | 0.99 | % | 06/25/2027 | 79,179 | ||||||||
| 976,719 | FHMS, Series Q-004# | 2.71 | % | 01/25/2046 | 978,560 | ||||||||
| 747,817 | FNMA, Pool# BM3352 | 2.55 | % | 12/01/2026 | 706,940 | ||||||||
| 368,639 | FNMA, Pool# AM8082 | 2.92 | % | 02/01/2030 | 353,221 | ||||||||
| 1,568,235 | FNMA, Pool# AS2249 | 4.00 | % | 04/01/2039 | 1,611,396 | ||||||||
| 750,000 | FNMA, Pool# BM4143 | 6.00 | % | 07/01/2041 | 831,317 | ||||||||
| 875,530 | FNMA, Pool# AB9349 | 3.00 | % | 05/01/2043 | 855,586 | ||||||||
| 512,374 | FNMA, Pool# AU6230 | 5.00 | % | 09/01/2043 | 547,891 | ||||||||
| 981,104 | FNMA, Pool# BD3994 | 4.00 | % | 04/01/2047 | 1,002,477 | ||||||||
| 1,086,625 | FNMA, Pool# BD4016 | 4.00 | % | 07/01/2047 | 1,125,905 | ||||||||
| 396,243 | FNMA, Pool# BJ1740 | 4.50 | % | 10/01/2047 | 415,069 | ||||||||
| 396,572 | FNMA, Pool# BD4041 | 4.00 | % | 11/01/2047 | 407,480 | ||||||||
| 396,026 | FNMA, Pool# BJ1991 | 4.00 | % | 11/01/2047 | 405,332 | ||||||||
| 397,099 | FNMA, Pool# BH7686 | 4.50 | % | 12/01/2047 | 416,057 | ||||||||
| 598,580 | FNMA, Pool# BK4172 | 4.50 | % | 04/01/2048 | 625,272 | ||||||||
| 1,136,981 | FNMA, Pool# BJ4049 | 4.00 | % | 05/01/2048 | 1,167,975 | ||||||||
| 299,529 | FNMA, Pool# BJ4051 | 4.50 | % | 05/01/2048 | 315,639 | ||||||||
| 199,778 | FNMA, Pool# BJ4050 | 4.50 | % | 05/01/2048 | 210,454 | ||||||||
The accompanying notes are an integral part of these financial statements.
43
Brown Advisory Total Return Fund
Schedule of Investments
June 30, 2018
| Par Value | Security Description | Rate | Maturity | Value $ | |||||||||
| Mortgage Backed Securities — 28.7% (Continued) | |||||||||||||
| 199,792 | FNMA, Pool# BJ4052 | 4.50 | % | 05/01/2048 | 210,538 | ||||||||
| 199,802 | FNMA, Pool# BK5105 | 5.50 | % | 05/01/2048 | 216,632 | ||||||||
| 300,000 | FNMA, Pool# BJ4054 | 4.00 | % | 06/01/2048 | 307,899 | ||||||||
| 300,000 | FNMA, Pool# BJ4057 | 4.50 | % | 06/01/2048 | 315,670 | ||||||||
| 99,942 | FNMA REMIC Trust, Series 2017-T1 A | 2.90 | % | 06/25/2027 | 96,300 | ||||||||
| 923,000 | FNMA REMIC Trust, Series 2017-M13 A2# | 3.04 | % | 09/25/2027 | 889,435 | ||||||||
| 750,000 | FNMA REMIC Trust, Series 2018-M8 A2# | 3.33 | % | 06/25/2028 | 745,083 | ||||||||
| 498,675 | FNMA REMIC Trust, Series 2018-M3 A1# | 3.09 | % | 02/25/2030 | 493,612 | ||||||||
| 717,244 | FNMA REMIC Trust, Series 2012-65 | 5.00 | % | 07/25/2040 | 769,028 | ||||||||
| 1,000,000 | FNMA, 2.5%, Due TBA July | 2.50 | % | 07/15/2033 | 971,956 | ||||||||
| 1,000,000 | FNMA, 3.0%, Due TBA July | 3.00 | % | 07/15/2033 | 994,208 | ||||||||
| 3,000,000 | FNMA, 3.5%, Due TBA July | 3.50 | % | 07/15/2033 | 3,036,094 | ||||||||
| 1,000,000 | FNMA, 5.0%, Due TBA July | 5.00 | % | 07/15/2048 | 1,059,467 | ||||||||
| 750,000 | FREMF Mortgage Trust, Series 2017-K725 B#^ | 4.01 | % | 02/25/2024 | 735,283 | ||||||||
| 650,000 | FREMF Mortgage Trust, Series 2017-K729 B#^ | 3.80 | % | 11/25/2024 | 635,845 | ||||||||
| 1,113,352 | GNMA REMIC Trust, Series 2014-45 B1#~ | 0.75 | % | 07/16/2054 | 52,103 | ||||||||
| 996,736 | GNMA REMIC Trust, Series 2014-135 I0#~ | 0.83 | % | 01/16/2056 | 53,694 | ||||||||
| 953,358 | GNMA REMIC Trust, Series 2015-172 I0#~ | 0.90 | % | 03/16/2057 | 60,104 | ||||||||
| 1,292,686 | GNMA REMIC Trust, Series 2016-40 I0#~ | 0.77 | % | 07/16/2057 | 73,846 | ||||||||
| 1,054,675 | GNMA REMIC Trust, Series 2016-56 I0#~ | 0.97 | % | 11/16/2057 | 75,263 | ||||||||
| 1,279,334 | GNMA REMIC Trust, Series 2016-98 I0#~ | 0.95 | % | 05/16/2058 | 95,690 | ||||||||
| 196,604 | JPMCC, Series 2016-ASH A (1 Month LIBOR USD + 1.50%)^ | 3.57 | % | 10/16/2034 | 196,818 | ||||||||
| 385,000 | MAD Mortgage Trust, Series 2017-330M B#^ | 3.48 | % | 08/17/2034 | 376,930 | ||||||||
| 275,000 | MSC, Series 2017-CLS C (1 Month LIBOR USD + 1.00%)^ | 3.07 | % | 11/15/2034 | 274,920 | ||||||||
| 175,000 | MSC, Series 2017-CLS D (1 Month LIBOR USD + 1.40%)^ | 3.47 | % | 11/15/2034 | 175,063 | ||||||||
| 555,000 | WFCM, Series 2017-RB1 AS | 3.76 | % | 03/17/2050 | 549,177 | ||||||||
| Total Mortgage Backed Securities (Cost $35,950,894) | 35,561,477 | ||||||||||||
| Corporate Bonds & Notes — 28.7% | |||||||||||||
| 1,310,000 | AerCap Ireland Capital DAC | 3.30 | % | 01/23/2023 | 1,260,462 | ||||||||
| 545,000 | AK Steel Corp. | 7.50 | % | 07/15/2023 | 570,887 | ||||||||
| 605,000 | Allison Transmission, Inc.^ | 4.75 | % | 10/01/2027 | 565,675 | ||||||||
| 1,285,000 | American Tower Corp. | 3.13 | % | 01/15/2027 | 1,150,521 | ||||||||
| 1,180,000 | Analog Devices, Inc. | 3.90 | % | 12/15/2025 | 1,170,865 | ||||||||
| 585,000 | Asbury Automotive Group, Inc. | 6.00 | % | 12/15/2024 | 582,625 | ||||||||
| 940,000 | AutoZone, Inc. | 3.13 | % | 04/21/2026 | 875,958 | ||||||||
| 600,000 | Boston Properties L.P. | 3.65 | % | 02/01/2026 | 579,646 | ||||||||
| 1,430,000 | BWX Technologies, Inc.^ | 5.38 | % | 07/15/2026 | 1,451,450 | ||||||||
| 1,175,000 | Capital One Financial Corp. (Fixed until 06/01/2020, then 3 Month LIBOR USD + 3.80%) | 5.55 | % | 12/29/2049 | 1,203,435 | ||||||||
| 1,185,000 | CC Holdings GS V LLC | 3.85 | % | 04/15/2023 | 1,175,538 | ||||||||
| 1,245,000 | Clorox Co. | 3.10 | % | 10/01/2027 | 1,173,332 | ||||||||
| 610,000 | Core & Main L.P.^ | 6.13 | % | 08/15/2025 | 581,025 | ||||||||
| 615,000 | Delphi Technologies PLC^ | 5.00 | % | 10/01/2025 | 588,094 | ||||||||
| 1,193,000 | Dollar General Corp. | 4.15 | % | 11/01/2025 | 1,195,565 | ||||||||
| 1,180,000 | Energy Transfer Partners L.P. (Fixed until 02/15/2023, then 3 Month LIBOR USD + 4.03%) | 6.25 | % | 05/15/2023 | 1,095,187 | ||||||||
| 1,205,000 | Enterprise Products Operating LLC (Fixed until 08/16/2027, then 3 Month LIBOR USD + 3.03%) | 5.25 | % | 08/16/2077 | 1,123,662 | ||||||||
| 570,000 | Equinix, Inc. | 5.88 | % | 01/15/2026 | 578,835 | ||||||||
| 1,115,000 | Fidelity National Information Services, Inc. | 5.00 | % | 10/15/2025 | 1,174,066 | ||||||||
| 595,000 | First Quality Finance Co., Inc.^ | 5.00 | % | 07/01/2025 | 545,912 | ||||||||
| 1,185,000 | Harris Corp. | 4.40 | % | 06/15/2028 | 1,196,607 | ||||||||
| 1,265,000 | Hasbro, Inc. | 3.50 | % | 09/15/2027 | 1,172,459 | ||||||||
| 930,000 | Healthcare Trust of America Holdings L.P. | 3.75 | % | 07/01/2027 | 884,074 | ||||||||
| 1,130,000 | Hudbay Minerals, Inc.^ | 7.25 | % | 01/15/2023 | 1,169,550 | ||||||||
| 1,160,000 | Keysight Technologies, Inc. | 4.55 | % | 10/30/2024 | 1,175,515 | ||||||||
| 920,000 | Kroger Co. | 3.70 | % | 08/01/2027 | 876,525 | ||||||||
| 555,000 | Mercer International, Inc. | 6.50 | % | 02/01/2024 | 563,325 | ||||||||
| 1,220,000 | Mylan NV | 3.95 | % | 06/15/2026 | 1,167,052 | ||||||||
The accompanying notes are an integral part of these financial statements.
44
Brown Advisory Total Return Fund
Schedule of Investments
June 30, 2018
| Par | |||||||||||||
| Value/Shares | Security Description | Rate | Maturity | Value $ | |||||||||
| Corporate Bonds & Notes — 28.7% (Continued) | |||||||||||||
| 910,000 | Noble Energy, Inc. | 3.85 | % | 01/15/2028 | 871,341 | ||||||||
| 590,000 | Novelis Corp.^ | 6.25 | % | 08/15/2024 | 591,475 | ||||||||
| 540,000 | ServiceMaster Co. LLC | 7.45 | % | 08/15/2027 | 576,450 | ||||||||
| 575,000 | SESI LLC | 7.13 | % | 12/15/2021 | 585,781 | ||||||||
| 650,000 | Staples, Inc.^ | 8.50 | % | 09/15/2025 | 607,750 | ||||||||
| 1,225,000 | TechnipFMC PLC | 3.45 | % | 10/01/2022 | 1,191,791 | ||||||||
| 525,000 | Teck Resources, Ltd.^ | 8.50 | % | 06/01/2024 | 576,844 | ||||||||
| 553,000 | Tenneco, Inc. | 5.00 | % | 07/15/2026 | 495,211 | ||||||||
| 620,000 | Trinidad Drilling, Ltd.^ | 6.63 | % | 02/15/2025 | 599,850 | ||||||||
| 1,200,000 | Verisk Analytics, Inc. | 4.00 | % | 06/15/2025 | 1,181,994 | ||||||||
| 625,000 | Viking Cruises, Ltd.^ | 5.88 | % | 09/15/2027 | 592,188 | ||||||||
| 930,000 | Xylem, Inc. | 3.25 | % | 11/01/2026 | 875,835 | ||||||||
| Total Corporate Bonds & Notes (Cost $36,970,929) | 35,594,357 | ||||||||||||
| Municipal Bonds — 7.2% | |||||||||||||
| 230,000 | American Municipal Power, Inc. | 6.05 | % | 02/15/2043 | 291,092 | ||||||||
| 450,000 | District of Columbia# | 5.70 | % | 08/01/2038 | 427,392 | ||||||||
| 2,000,000 | District of Columbia# | 5.73 | % | 08/01/2038 | 1,899,520 | ||||||||
| 1,200,000 | Health Care Authority for Baptist Health | 5.50 | % | 11/15/2043 | 1,351,644 | ||||||||
| 750,000 | Massachusetts Port Authority# | 4.19 | % | 01/01/2031 | 750,000 | ||||||||
| 1,300,000 | Mosaic District Community Development Authority | 7.25 | % | 03/01/2036 | 1,387,256 | ||||||||
| 1,000,000 | New York State Energy Research & Development Authority# | 0.94 | % | 12/01/2023 | 1,000,000 | ||||||||
| 1,000,000 | New York State Energy Research & Development Authority# | 5.23 | % | 07/01/2029 | 1,000,000 | ||||||||
| 800,000 | North Texas Tollway Authority | 8.91 | % | 02/01/2030 | 870,544 | ||||||||
| Total Municipal Bonds (Cost $8,829,749) | 8,977,448 | ||||||||||||
| U.S. Treasury Notes — 4.8% | |||||||||||||
| 5,955,000 | United States Treasury Note | 0.75 | % | 07/31/2018 | 5,949,971 | ||||||||
| Total U.S. Treasury Notes (Cost $5,949,997) | 5,949,971 | ||||||||||||
| Preferred Stocks — 0.1% | |||||||||||||
| 2,076 | AGNC Investment Corp., Series C, 7.00% (Fixed until 10/15/2022, then 3 Month LIBOR USD + 5.11%) | 53,976 | |||||||||||
| Total Preferred Stocks (Cost $52,793) | 53,976 | ||||||||||||
| Short-Term Investments — 7.7% | |||||||||||||
| Money Market Funds — 7.4% | |||||||||||||
| 9,187,484 | First American Treasury Obligations Fund — Class Z, 1.75%* | 9,187,484 | |||||||||||
| U.S. Treasury Bills — 0.3% | |||||||||||||
| 350,000 | United States Treasury Bill† | 349,690 | |||||||||||
| Total Short-Term Investments (Cost $9,537,174) | 9,537,174 | ||||||||||||
| Total Investments — 107.7% (Cost $135,196,158) | 133,517,370 | ||||||||||||
| Liabilities in Excess of Other Assets — (7.7)% | (9,517,610 | ) | |||||||||||
| NET ASSETS — 100.0% | $ | 123,999,760 | |||||||||||
| # | Variable rate security. Rate disclosed is as of June 30, 2018. | |
| ʭ | Step bond; the interest rate shown is the rate in effect as of June 30, 2018. | |
| ^ | Security exempt from registration under Rule 144A of the Securities Act of 1933. These securities may be resold in transactions exempt from registration, normally to qualified institutional buyers. At June 30, 2018, the value of these securities amounted to $43,024,061 or 34.7% of net assets. | |
< | These securities are being fair valued, using significant unobservable inputs (Level 3), under the supervision of the Board of Trustees. | |
| ~ | Interest Only Security | |
| † | This security is pledged as collateral in connection with open futures contracts. | |
| * | Annualized seven-day yield as of June 30, 2018. |
The accompanying notes are an integral part of these financial statements.
45
Brown Advisory Total Return Fund
Schedule of Investments
June 30, 2018
| Futures Contracts — Long (Note 6) | |||||||||||||||||
| Notional | Notional | Unrealized Appreciation | |||||||||||||||
Issue | Contracts | Expiration Date | Amount | Value | (Depreciation) | ||||||||||||
| U.S. Treasury Long Bond Futures | 26 | 09/19/2018 | $ | 3,713,999 | $ | 3,770,000 | $ | 56,001 | |||||||||
| U.S. Treasury Ultra Bond Futures | 105 | 09/19/2018 | 16,275,707 | 16,754,063 | 478,356 | ||||||||||||
| $ | 19,989,706 | $ | 20,524,063 | $ | 534,357 | ||||||||||||
| Futures Contracts — Short (Note 6) | |||||||||||||||||
| Notional | Notional | Unrealized Appreciation | |||||||||||||||
Issue | Contracts | Expiration Date | Amount | Value | (Depreciation) | ||||||||||||
| U.S. Treasury 5-Year Note Futures | (30) | 09/28/2018 | $ | (3,391,969 | ) | $ | (3,408,516 | ) | $ | (16,547 | ) | ||||||
| U.S. Treasury 10-Year Note Futures | (24) | 09/19/2018 | (2,857,573 | ) | (2,884,500 | ) | (26,927 | ) | |||||||||
| $ | (6,249,542 | ) | $ | (6,293,016 | ) | $ | (43,474 | ) | |||||||||
There is no variation margin due to or from the Fund as of June 30, 2018.
The accompanying notes are an integral part of these financial statements.
46
Brown Advisory Strategic Bond Fund
A Message to Our Shareholders
June 30, 2018
Dear Shareholders:
The Brown Advisory Strategic Bond Fund – Advisor Shares (the “Fund”) gained 1.54% during the year ended June 30, 2018, beating the -0.32% return for its benchmark, the Bloomberg Barclays Intermediate US Aggregate Bond Index (the “Index”).
The Fund’s strategy is founded upon deep credit research that, in turn, feeds our proprietary, factor-based risk pricing models – a process that we believe helps us to consistently identify individual securities offering the best risk-adjusted return. We analyze investment ideas using rigorous underwriting standards and fundamental analysis to identify, assess, and price a bond’s risks. Our methodology allows us to compare the expected return of bonds across multiple sectors, using our due diligence process to adjust for both the impairment risk and interest rate risk, thereby driving our capital allocation decisions from the bottom-up. We seek to mitigate idiosyncratic risks through the strict application of a sizing model focused on a bond’s estimated downside.
The Fund attempts to mitigate duration risk and has been operating with a duration less than half that of the Index. As such, the Fund has been managed with a duration of between 1.3 and 2.0 over the past 12 months. As we previously stated, we are not attempting to generate meaningful alpha by making a bet on the direction of interest rates. Instead, we aim to keep our sensitivity to interest rates low by buying shorter-dated bonds, using hedges like Treasury futures, and by purchasing floating-rate instruments, which comprised nearly half of Fund assets at year-end.
The Fund’s gain came despite a negative return for the intermediate portion of the Treasury curve, which weighed on the performance of the Index. The Fund’s low duration, relatively higher yield, and the strong performance of its corporate bonds, collateralized loan obligations, asset-backed securities, and municipal bond holdings contributed to its outperformance vs. the Index.
Structured products continue comprising the majority of our holdings, as the relative value offered by other sectors, such as corporate bonds, has not warranted any material change to our allocation. However, the risk premiums for lower-rated investments has remained low and hence we have maintained our weighting in favor of higher-rated and shorter-tenor notes. We believe that structured products are instrumental in helping us improve the overall credit quality of the portfolio, enhance returns, reduce duration and provide diversification. The Fund maintained its exposure to taxable municipal bonds, taking advantage of pockets of value in certain floating-rate securities. Municipal bonds were a smaller position in the Fund at year-end, but were our best-performers.
Despite the continued use of structured products, we expect that the bulk of our alpha will be driven by investments in corporate bonds. Indeed, the Fund’s corporate bonds meaningfully outperformed those in the Index. Despite the brief uptick in volatility in March, the risk premium offered by high yield corporate bonds remains near historical lows. As a result, our high yield exposure ended the period under 20%.
Our investment process focuses on maximizing risk-adjusted return through the disciplined application of a deep due diligence process and proprietary risk pricing models designed to optimize capital allocation decisions. Further, we believe that our process is designed to facilitate consistently better decision-making, grounded in our core tenets and our ability to price risk based on an investment’s cash flow profile, liquidity, structural terms, and enterprise value coverage. We believe that adhering to this process has the potential to continue adding value whether credit is widening or tightening, and may be a key driver of performance through market and business cycles.
Sincerely,
Robert H. Snyder
Portfolio Manager
Thomas D.D. Graff, CFA
Portfolio Manager
47
Brown Advisory Strategic Bond Fund
A Message to Our Shareholders
June 30, 2018
Past performance is not a guarantee of future results.
Mutual fund investing involves risk. Principal loss is possible. Investments in debt securities typically decrease in value when interest rates rise. This risk is usually greater for longer-term debt securities. Investments in lower-rated and non-rated securities present a greater risk of loss to principal and interest than higher-rated securities. Municipal securities are subject to adverse political or economic factors, including changes in the tax law. Inflation-indexed bonds see the principal value of the security increased as the Consumer Price Index increases. Should the Consumer Price Index decline, those securities should be adversely impacted. A non-diversified fund may concentrate its assets in fewer individual holdings than a diversified fund. Therefore, a non-diversified fund is more exposed to individual stock volatility than a diversified fund. The fund may make short sales of securities, which involve the risk that losses in a security may exceed the original amount invested in that security. The risks of investments in derivatives, including options on futures contracts and options on futures contracts include imperfect correlation between the value of these instruments and the underlying assets; risks of default by the other party to the derivative transactions; risks that the transactions may result in losses that partially or completely offset gains in portfolio positions; and risks that the derivative transactions may not be liquid. Income from tax-exempt securities may be subject to state and local taxes and a portion of income may be subject to the federal alternative minimum tax for certain investors. Bond ratings are grades given to bonds that indicate their credit quality as determined by a private independent rating service such as Standard & Poor’s. The firm evaluates a bond issuer’s financial strength, or its ability to pay a bond’s principal and interest in a timely fashion. Ratings are expressed as letters ranging from ‘AAA’, which is the highest grade, to ‘D’, which is the lowest grade. In limited situations when the rating agency has not issued a formal rating, the Adviser will classify the security as non-rated.
Diversification does not assure a profit or protect against loss in a declining market.
Fund holdings and sector allocations are subject to change and should not be considered a recommendation to buy or sell any security. For a complete list of fund holdings, please refer to the Schedule of Investments provided in this report.
Definitions for terms and indices are provided in the Glossary of Terms.
48
Brown Advisory Strategic Bond Fund
Performance Information & Portfolio Holdings Summary
June 30, 2018
| PORTFOLIO HOLDINGS | % of Net Assets |
| Asset Backed Securities | 44.9% |
| Corporate Bonds & Notes | 34.3% |
| Mortgage Backed Securities | 24.8% |
| Municipal Bonds | 6.4% |
| Money Market Funds | 2.3% |
| Preferred Stocks | 0.5% |
| Closed-End Funds | 0.3% |
| Other Assets and Liabilities | (13.5)% |
100.0% |
GROWTH OF A $10,000 INVESTMENT
The following chart reflects the change in value of a hypothetical $10,000 investment, including reinvested dividends and distributions, in the Fund as measured against a broad-based bond index. The Bloomberg Barclays Intermediate US Aggregate Bond Index (“Index”) represents domestic taxable investment grade bonds, with index components for government and corporate securities, mortgage pass-through securities, and asset-backed securities with average maturities and durations in the intermediate range. The Index is unmanaged and does not reflect the deduction of fees, such as investment management fees. Investors cannot invest directly in an index.
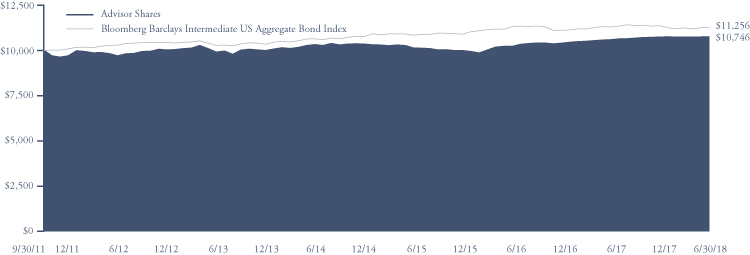
| Since Inception | |||
Average Annual Total Return | One Year | Five Year | (9/30/11) |
Investor Shares1 | 1.80% | 1.96% | 1.35% |
| Advisor Shares | 1.54% | 1.67% | 1.07% |
| Bloomberg Barclays Intermediate US Aggregate Bond Index | -0.32% | 1.83% | 1.77% |
Investor Shares | Advisor Shares | ||
Gross Expense Ratio2 | 0.78% | 1.03% | |
Net Expense Ratio2 | 0.76% | 1.01% |
Past performance does not guarantee future results. The performance data quoted represents past performance and current returns may be lower or higher. The investment return and net asset value will fluctuate so that an investor’s shares, when redeemed, may be worth more or less than the original cost. To obtain performance information current to the most recent month end, please visit our website at brownadvisoryfunds.com/performance.html. The performance table and graph above do not reflect the deduction of taxes that a shareholder would pay on Fund distributions or the redemption of Fund shares. Investment performance reflects periods during which fee waivers were in effect. In the absence of such waivers, total return would have been reduced. Performance data does not reflect the imposition of the redemption fee of 1.00% on shares redeemed within 14 days, and if it did, performance would have been lower.
1 | Performance information for the Investor Shares, prior to commencement of operations on October 31, 2014, is based on the performance of Advisor Shares, and adjusted for the lower expenses applicable to Investor Shares. |
2 | Per the Fund’s prospectus dated October 31, 2017. Refer to the financial highlights for the gross and net expense ratios for the year ended as of the date of this report. Please note that the expense ratios per the prospectus include acquired fund fees and expenses (as applicable) and the expense ratios in the financial highlights do not. |
49
Brown Advisory Strategic Bond Fund
Schedule of Investments
June 30, 2018
| Par Value | Security Description | Rate | Maturity | Value $ | ||||||||
| Asset Backed Securities – 44.9% | ||||||||||||
| 133,140 | Aircraft Certificate Owner Trust, Series 2003-1A E^< | 7.00 | % | 09/20/2022 | 137,633 | |||||||
| 350,000 | American Credit Acceptance Receivables Trust, Series 2017-3 C^ | 2.72 | % | 06/10/2022 | 348,591 | |||||||
| 500,000 | American Credit Acceptance Receivables Trust, Series 2016-1A C^ | 5.55 | % | 06/13/2022 | 507,459 | |||||||
| 650,000 | American Credit Acceptance Receivables Trust, Series 2017-4 C^ | 2.94 | % | 01/10/2024 | 646,016 | |||||||
| 200,000 | AmeriCredit Automobile Receivables Trust, Series 2016-3 D | 2.71 | % | 09/08/2022 | 196,653 | |||||||
| 500,000 | BlueMountain CLO, Ltd., Series 2013-3A DR (3 Month LIBOR USD + 2.90%)^ | 5.26 | % | 10/29/2025 | 499,752 | |||||||
| 1,000,000 | BlueMountain CLO, Ltd., Series 2014-1A D (3 Month LIBOR USD + 3.45%)^ | 5.81 | % | 04/30/2026 | 1,005,211 | |||||||
| 650,000 | BlueMountain CLO, Ltd., Series 2015-2A B (3 Month LIBOR USD + 1.85%)^ | 4.21 | % | 07/18/2027 | 651,854 | |||||||
| 750,000 | BlueMountain CLO, Ltd., Series 2015-2A D (3 Month LIBOR USD + 3.55%)^ | 5.91 | % | 07/19/2027 | 753,998 | |||||||
| 127,664 | BRE Grand Islander Timeshare Issuer LLC, Series 2017-1A A^ | 2.94 | % | 05/25/2029 | 124,755 | |||||||
| 750,000 | Carlyle Global Market Strategies CLO, Ltd., Series 2015-1 C-R (3 Month LIBOR USD + 2.00%)^ | 4.36 | % | 04/20/2027 | 753,285 | |||||||
| 1,000,000 | Carlyle Global Market Strategies CLO, Ltd., Series 2015-2 C-R (3 Month LIBOR USD + 2.25%)^ | 4.62 | % | 04/27/2027 | 997,265 | |||||||
| 2,000,000 | Carlyle Global Market Strategies CLO, Ltd., Series 2013-4A A1RR (3 Month LIBOR USD + 1.00%)^ | 2.72 | % | 01/15/2031 | 1,996,796 | |||||||
| 2,000,000 | Carlyle US CLO, Ltd., Series 2017-2 (3 Month LIBOR USD + 1.22%)^ | 3.58 | % | 07/21/2031 | 2,004,076 | |||||||
| 1,000,000 | CBAM, Ltd., Series 2017-1A B (3 Month LIBOR USD + 1.80%)^ | 4.16 | % | 07/20/2030 | 1,003,529 | |||||||
| 109,752 | Continental Airlines Trust, Series 1999-1 A< | 6.55 | % | 08/02/2020 | 110,718 | |||||||
| 68,316 | Continental Airlines Trust, Series 2000-1 A-1< | 8.05 | % | 05/01/2022 | 72,155 | |||||||
| 650,000 | CPS Auto Receivables Trust, Series 2015-A^ | 5.60 | % | 02/16/2021 | 668,791 | |||||||
| 235,000 | CPS Auto Receivables Trust, Series 2015-C^ | 4.63 | % | 08/16/2021 | 238,514 | |||||||
| 300,000 | CPS Auto Receivables Trust, Series 2016-C^ | 8.39 | % | 09/15/2023 | 323,866 | |||||||
| 1,250,000 | Dell Equipment Finance Trust, Series 2017-2^ | 2.47 | % | 10/24/2022 | 1,232,768 | |||||||
| 200,000 | Dell Equipment Finance Trust, Series 2018-1^ | 3.85 | % | 06/24/2024 | 200,281 | |||||||
| 400,000 | Drive Auto Receivables Trust, Series 2018-1 C | 3.22 | % | 03/15/2023 | 398,731 | |||||||
| 600,000 | Drive Auto Receivables Trust, Series 2017-2 C | 2.75 | % | 09/15/2023 | 598,813 | |||||||
| 1,000,000 | Drive Auto Receivables Trust, Series 2018-1 D | 3.81 | % | 05/15/2024 | 999,034 | |||||||
| 400,000 | Drive Auto Receivables Trust, Series 2018-2 | 4.14 | % | 08/15/2024 | 402,540 | |||||||
| 750,000 | DT Auto Owner Trust, Series 2018-1A C^ | 3.47 | % | 12/15/2023 | 749,309 | |||||||
| 500,000 | DT Auto Owner Trust, Series 2018-2^ | 3.67 | % | 03/15/2024 | 499,954 | |||||||
| 400,000 | DT Auto Owner Trust, Series 2017-3^ | 5.60 | % | 08/15/2024 | 405,000 | |||||||
| 200,000 | Exeter Automobile Receivables Trust, Series 2016-3A C^ | 4.22 | % | 06/15/2022 | 202,350 | |||||||
| 383,331 | Federal Express Corp., Series 1998-1< | 6.72 | % | 07/15/2023 | 403,455 | |||||||
| 1,000,000 | GoldenTree Loan Management CLO, Ltd., Series 2017-1A C (3 Month LIBOR USD + 2.20%)^ | 4.56 | % | 04/20/2029 | 1,003,990 | |||||||
| 2,000,000 | GoldenTree Loan Opportunities XI, Ltd., Series 2015-11A AR2 FLT | |||||||||||
| (3 Month LIBOR USD + 1.07%)^ | 3.43 | % | 01/21/2031 | 2,002,282 | ||||||||
| 1,000,000 | GreatAmerica Leasing Receivables Funding LLC, Series 2015-1 B^ | 2.39 | % | 06/21/2021 | 998,584 | |||||||
| 300,000 | GreatAmerica Leasing Receivables Funding LLC, Series 2018-1 C^ | 3.14 | % | 06/16/2025 | 297,201 | |||||||
| 1,000,000 | Grippen Park CLO, Ltd., Series 2017-1A C (3 Month LIBOR USD + 2.30%)^ | 4.66 | % | 01/20/2030 | 1,003,163 | |||||||
| 1,000,000 | Highbridge Loan Management, Ltd., Series 2015-7A DR (3 Month LIBOR USD + 2.40%)^ | 4.74 | % | 03/15/2027 | 988,920 | |||||||
| 1,975,000 | Highbridge Loan Management, Ltd., Series 2013-2A A2R (3 Month LIBOR USD + 1.63%)^ | 3.98 | % | 10/20/2029 | 1,976,726 | |||||||
| 300,000 | Invitation Homes Trust, Series 2017-SFR2 B (1 Month LIBOR USD + 1.15%)^ | 3.24 | % | 12/19/2036 | 302,280 | |||||||
| 200,000 | Invitation Homes Trust, Series 2017-SFR2 C (1 Month LIBOR USD + 1.45%)^ | 3.54 | % | 12/19/2036 | 201,168 | |||||||
| 250,000 | Invitation Homes Trust, Series 2018-SFR1 C (1 Month LIBOR USD + 1.25%)^ | 3.34 | % | 03/19/2037 | 250,781 | |||||||
| 200,000 | Invitation Homes Trust, Series 2018-SFR2 C (1 Month LIBOR USD + 1.28%)^ | 3.35 | % | 06/18/2037 | 201,149 | |||||||
| 930,000 | LCM XXV, Ltd., Series 2017-25A C2 (3 Month LIBOR USD + 2.30%)^ | 4.66 | % | 07/22/2030 | 938,045 | |||||||
| 750,000 | Madison Park Funding XVII, Ltd., Series 2015-17A B1R (3 Month LIBOR USD + 1.75%)^ | 4.11 | % | 07/21/2030 | 753,793 | |||||||
| 700,000 | Madison Park Funding XVII, Ltd., Series 2015-17A CR (3 Month LIBOR USD + 2.40%)^ | 4.76 | % | 07/22/2030 | 707,557 | |||||||
| 500,000 | Madison Park Funding XXI, Ltd., Series 2016-21 B (3 Month LIBOR USD + 2.75%)^ | 5.11 | % | 07/25/2029 | 506,876 | |||||||
| 1,000,000 | Madison Park Funding XXV, Ltd., Series 2017-25A B (3 Month LIBOR USD + 2.35%)^ | 4.71 | % | 04/25/2029 | 1,008,368 | |||||||
| 1,000,000 | Magnetite IX, Ltd., Series 2014-9A BR (3 Month LIBOR USD + 2.00%)^ | 4.36 | % | 07/25/2026 | 1,003,979 | |||||||
| 750,000 | Magnetite IX, Ltd., Series 2014-9A CR (3 Month LIBOR USD + 3.10%)^ | 5.46 | % | 07/25/2026 | 753,884 | |||||||
| 86,073 | MVW Owner Trust, Series 2017-1A B^ | 2.75 | % | 12/20/2034 | 83,583 | |||||||
| 142,918 | Nationstar HECM Loan Trust, Series 2017-1A A^< | 1.97 | % | 05/25/2027 | 142,432 | |||||||
| 2,000,000 | Neuberger Berman Loan Advisers CLO, Series 2017-26A A (3 Month LIBOR USD + 1.17%)^ | 3.53 | % | 10/18/2030 | 2,002,486 | |||||||
| 1,000,000 | Octagon Investment Partners 24, Ltd., Series 2015-1A A2AR FLT (3 Month LIBOR USD + 1.35%)^ | 3.68 | % | 05/21/2027 | 1,001,177 | |||||||
| 750,000 | Octagon Investment Partners 25, Ltd., Series 2015-1A AR (3 Month LIBOR USD + 0.80%)^ | 3.16 | % | 10/20/2026 | 749,993 | |||||||
| 750,000 | Octagon Investment Partners 25, Ltd., Series 2015-1A BR (3 Month LIBOR USD + 1.20%)^ | 3.56 | % | 10/20/2026 | 746,290 | |||||||
The accompanying notes are an integral part of these financial statements.
50
Brown Advisory Strategic Bond Fund
Schedule of Investments
June 30, 2018
| Par Value | Security Description | Rate | Maturity | Value $ | ||||||||
| Asset Backed Securities — 44.9% (Continued) | ||||||||||||
| 1,000,000 | Octagon Investment Partners 30, Ltd., Series 2017-1A B (3 Month LIBOR USD + 2.35%)^ | 4.71 | % | 03/17/2030 | 1,006,950 | |||||||
| 2,000,000 | Octagon Investment Partners 36, Ltd., Series 2018-1A A1 (3 Month LIBOR USD + 0.97%)^ | 2.73 | % | 04/15/2031 | 2,000,000 | |||||||
| 1,000,000 | Octagon Investment Partners XIV, Ltd., Series 2012-1A CR (3 Month LIBOR USD + 4.00%)^ | 6.35 | % | 07/15/2029 | 1,015,181 | |||||||
| 500,000 | Octagon Investment Partners XIX, Ltd., Series 2014-1A CR (3 Month LIBOR USD + 2.10%)^ | 4.45 | % | 04/15/2026 | 503,055 | |||||||
| 1,000,000 | Octagon Investment Partners XVI, Ltd., Series 2013-1A D (3 Month LIBOR USD + 3.35%)^ | 5.70 | % | 07/17/2025 | 1,005,118 | |||||||
| 500,000 | Octagon Investment Partners XXI Ltd., Series 2014-21 C (3 Month LIBOR USD + 3.65%)^ | 6.01 | % | 11/14/2026 | 502,663 | |||||||
| 300,000 | Oportun Funding IX LLC, Series 2018-B A^ | 3.91 | % | 07/08/2024 | 299,967 | |||||||
| 250,000 | Oportun Funding IX LLC, Series 2018-B B^ | 4.50 | % | 07/08/2024 | 249,975 | |||||||
| 178,985 | Orange Lake Timeshare Trust, Series 2018-A B^ | 3.35 | % | 11/08/2030 | 177,425 | |||||||
| 106,665 | OSCAR U.S. Funding Trust, Series 2014-1A A4^ | 2.55 | % | 12/15/2021 | 106,509 | |||||||
| 172,620 | OSCAR U.S. Funding Trust IV, Series 2016-1A A2A^ | 2.53 | % | 07/15/2020 | 172,582 | |||||||
| 8,981 | OSCAR U.S. Funding Trust V, Series 2016-2A A2B (1 Month LIBOR USD + 1.40%)^ | 3.47 | % | 11/15/2019 | 8,995 | |||||||
| 940,376 | OSCAR U.S. Funding Trust VI LLC, Series 2017-1A A2A^ | 2.30 | % | 05/11/2020 | 937,479 | |||||||
| 77,982 | OSCAR U.S. Funding Trust VI LLC, Series 2017-1A A2B (1 Month LIBOR USD + 0.80%)^ | 2.85 | % | 05/11/2020 | 78,126 | |||||||
| 166,360 | OSCAR U.S. Funding Trust VII LLC, Series 2017-2A A2B (1 Month LIBOR USD + 0.65%)^ | 2.70 | % | 11/10/2020 | 166,690 | |||||||
| 260,000 | OSCAR U.S. Funding Trust VII LLC, Series 2017-2A A3^ | 2.45 | % | 12/10/2021 | 257,368 | |||||||
| 750,000 | OSCAR U.S. Funding Trust VIII LLC, Series 2018-1A A2B (1 Month LIBOR USD + 0.49%)^ | 2.54 | % | 04/12/2021 | 752,718 | |||||||
| 500,000 | OZLM XII, Ltd., Series 2015-12A C (3 Month LIBOR USD + 3.70%)^ | 6.06 | % | 04/30/2027 | 502,604 | |||||||
| 1,000,000 | OZLM XIII, Ltd., Series 2015-13A A2 (3 Month LIBOR USD + 2.10%)^ | 4.46 | % | 07/30/2027 | 1,003,466 | |||||||
| 200,000 | Progress Residential Trust, Series 2018-SFR1 B^ | 3.48 | % | 03/17/2035 | 196,695 | |||||||
| 200,000 | Progress Residential Trust, Series 2018-SFR1 C^ | 3.68 | % | 03/17/2035 | 197,059 | |||||||
| 1,000,000 | Regatta Funding L.P., Series 2013-2A BR (3 Month LIBOR USD + 2.90%)^ | 5.25 | % | 01/15/2029 | 1,008,641 | |||||||
| 1,500,000 | Regatta III Funding, Ltd., Series 2014-1A A2R (3 Month LIBOR USD + 1.50%)^ | 3.85 | % | 04/15/2026 | 1,500,338 | |||||||
| 750,000 | Regatta III Funding, Ltd., Series 2014-1A CR (3 Month LIBOR USD + 3.30%)^ | 5.65 | % | 04/15/2026 | 750,573 | |||||||
| 500,000 | Santander Drive Auto Receivables Trust, Series 2017-1 D | 3.17 | % | 04/17/2023 | 497,036 | |||||||
| 600,000 | Santander Drive Auto Receivables Trust, Series 2017-1 E^ | 5.05 | % | 07/15/2024 | 610,536 | |||||||
| 43,024 | Sierra Timeshare Receivables Funding LLC, Series 2015-3A A^ | 2.58 | % | 09/20/2032 | 42,849 | |||||||
| 39,032 | Sierra Timeshare Receivables Funding LLC, Series 2016-2A A^ | 2.33 | % | 07/20/2033 | 38,540 | |||||||
| 500,000 | Sound Point CLO XII, Ltd., Series 2016-2A D (3 Month LIBOR USD + 4.25%)^ | 6.61 | % | 10/20/2028 | 506,226 | |||||||
| 251,031 | Southwest Airlines Co., Series 2007-1 | 6.15 | % | 02/01/2024 | 266,528 | |||||||
| 4,582 | U.S. Airways Pass Through Trust, Series 1999-1 A< | 8.36 | % | 07/20/2020 | 4,628 | |||||||
| 375,000 | Verizon Owner Trust, Series 2016-1A A^ | 1.42 | % | 01/20/2021 | 373,133 | |||||||
| 750,000 | Verizon Owner Trust, Series 2016-2A B^ | 2.15 | % | 05/20/2021 | 737,016 | |||||||
| 400,000 | Verizon Owner Trust, Series 2017-1A B^ | 2.45 | % | 09/20/2021 | 393,968 | |||||||
| 700,000 | Verizon Owner Trust, Series 2017-2^ | 1.92 | % | 12/20/2021 | 690,304 | |||||||
| 400,000 | Verizon Owner Trust, Series 2018-1A C^ | 3.20 | % | 09/20/2022 | 398,459 | |||||||
| 500,000 | Vibrant CLO II, Ltd., Series 2013-2A A2AR (3 Month LIBOR USD + 1.45%)^ | 3.81 | % | 07/24/2024 | 500,635 | |||||||
| 65,123 | VOLT XXXVIII LLC, Series 2015-NP12 A1ʭ^ | 3.88 | % | 09/25/2045 | 65,270 | |||||||
| 1,000,000 | Voya CLO, Ltd., Series 2016-3A C (3 Month LIBOR USD + 3.85%)^ | 6.21 | % | 10/18/2027 | 1,007,427 | |||||||
| 1,500,000 | Voya CLO, Ltd., Series 2013-1A A2R (3 Month LIBOR USD + 1.55%)^ | 3.90 | % | 10/15/2030 | 1,503,728 | |||||||
| 289,491 | Westgate Resorts LLC, Series 2018-1^ | 3.58 | % | 12/20/2031 | 287,906 | |||||||
| 385,988 | Westgate Resorts LLC, Series 2018-1^ | 4.10 | % | 12/20/2031 | 385,048 | |||||||
| 300,000 | Westlake Automobile Receivables Trust, Series 2017-2A D^ | 3.28 | % | 12/15/2022 | 298,278 | |||||||
| 900,000 | Westlake Automobile Receivables Trust, Series 2018-1A D^ | 3.41 | % | 05/15/2023 | 895,030 | |||||||
| 375,000 | Westlake Automobile Receivables Trust, Series 2018-2 D^ | 4.00 | % | 01/16/2024 | 376,557 | |||||||
| 500,000 | Westlake Automobile Receivables Trust, Series 2017-2A E^ | 4.63 | % | 07/15/2024 | 501,861 | |||||||
| Total Asset Backed Securities (Cost $63,503,727) | 63,538,999 | |||||||||||
| Corporate Bonds & Notes – 34.3% | ||||||||||||
| 250,000 | Activision Blizzard, Inc.^ | 6.13 | % | 09/15/2023 | 259,042 | |||||||
| 400,000 | AerCap Ireland Capital DAC | 3.30 | % | 01/23/2023 | 384,874 | |||||||
| 750,000 | AK Steel Corp. | 7.50 | % | 07/15/2023 | 785,625 | |||||||
| 350,000 | AK Steel Corp. | 6.38 | % | 10/15/2025 | 327,250 | |||||||
| 200,000 | Allison Transmission, Inc.^ | 5.00 | % | 10/01/2024 | 197,250 | |||||||
| 500,000 | Allison Transmission, Inc.^ | 4.75 | % | 10/01/2027 | 467,500 | |||||||
| 310,000 | Analog Devices, Inc. | 3.90 | % | 12/15/2025 | 307,600 | |||||||
| 650,000 | Asbury Automotive Group, Inc. | 6.00 | % | 12/15/2024 | 647,361 | |||||||
The accompanying notes are an integral part of these financial statements.
51
Brown Advisory Strategic Bond Fund
Schedule of Investments
June 30, 2018
| Par Value | Security Description | Rate | Maturity | Value $ | ||||||||
| Corporate Bonds & Notes – 34.3% (Continued) | ||||||||||||
| 500,000 | Ball Corp. | 5.00 | % | 03/15/2022 | 515,625 | |||||||
| 1,400,000 | BWX Technologies, Inc.^ | 5.38 | % | 07/15/2026 | 1,421,000 | |||||||
| 500,000 | California Resources Corp.^ | 8.00 | % | 12/15/2022 | 456,250 | |||||||
| 300,000 | Capital One Financial Corp. (Fixed until 06/01/2020, then 3 Month LIBOR USD + 3.80%) | 5.55 | % | 12/29/2049 | 307,260 | |||||||
| 500,000 | Caterpillar Financial Services Corp. (3 Month LIBOR USD + 0.59%) | 2.90 | % | 06/06/2022 | 502,438 | |||||||
| 500,000 | Clorox Co. | 3.10 | % | 10/01/2027 | 471,218 | |||||||
| 200,000 | CommScope Technologies LLC^ | 6.00 | % | 06/15/2025 | 205,250 | |||||||
| 100,000 | CommScope Technologies LLC^ | 5.00 | % | 03/15/2027 | 94,375 | |||||||
| 400,000 | Core & Main L.P.^ | 6.13 | % | 08/15/2025 | 381,000 | |||||||
| 250,000 | Cornerstone Chemical Co.^ | 6.75 | % | 08/15/2024 | 245,312 | |||||||
| 1,220,000 | Crown Castle International Corp. | 4.88 | % | 04/15/2022 | 1,258,797 | |||||||
| 1,100,000 | Delphi Technologies PLC^ | 5.00 | % | 10/01/2025 | 1,051,875 | |||||||
| 600,000 | Digital Realty Trust L.P. | 3.70 | % | 08/15/2027 | 571,283 | |||||||
| 358,000 | Dollar General Corp. | 4.15 | % | 11/01/2025 | 358,770 | |||||||
| 2,000,000 | Dollar Tree, Inc. (3 Month LIBOR USD + 0.70%) | 3.06 | % | 04/17/2020 | 2,004,326 | |||||||
| 1,200,000 | Energy Transfer Partners L.P. (Fixed until 02/15/2023, then 3 Month LIBOR USD + 4.03%) | 6.25 | % | 05/15/2023 | 1,113,750 | |||||||
| 1,800,000 | Enterprise Products Operating LLC (Fixed until 08/16/2027, then 3 Month LIBOR USD + 3.03%) | 5.25 | % | 08/16/2077 | 1,678,500 | |||||||
| 1,000,000 | Equinix, Inc. | 5.88 | % | 01/15/2026 | 1,015,500 | |||||||
| 380,000 | Equinix, Inc. | 5.38 | % | 05/15/2027 | 380,000 | |||||||
| 1,100,000 | Exelon Corp. | 2.85 | % | 06/15/2020 | 1,090,721 | |||||||
| 700,000 | First Quality Finance Co., Inc.^ | 5.00 | % | 07/01/2025 | 642,250 | |||||||
| 750,000 | Goldman Sachs Group, Inc. (3 Month LIBOR USD + 0.75%) | 3.08 | % | 02/23/2023 | 747,668 | |||||||
| 500,000 | Harris Corp. | 3.83 | % | 04/27/2025 | 490,993 | |||||||
| 1,000,000 | Hasbro, Inc. | 3.15 | % | 05/15/2021 | 991,723 | |||||||
| 1,000,000 | Hasbro, Inc. | 3.50 | % | 09/15/2027 | 926,845 | |||||||
| 200,000 | Healthcare Trust of America Holdings L.P. | 3.75 | % | 07/01/2027 | 190,123 | |||||||
| 250,000 | High Ridge Brands Co.^ | 8.88 | % | 03/15/2025 | 112,500 | |||||||
| 650,000 | Hot Topic, Inc.^ | 9.25 | % | 06/15/2021 | 623,187 | |||||||
| 450,000 | Hudbay Minerals, Inc.^ | 7.25 | % | 01/15/2023 | 465,750 | |||||||
| 1,000,000 | Huntsman International LLC | 4.88 | % | 11/15/2020 | 1,018,750 | |||||||
| 300,000 | JB Hunt Transport Services, Inc. | 2.40 | % | 03/15/2019 | 299,296 | |||||||
| 1,100,000 | JC Penney Corp, Inc.^ | 5.88 | % | 07/01/2023 | 1,035,375 | |||||||
| 300,000 | Keysight Technologies, Inc. | 4.55 | % | 10/30/2024 | 304,012 | |||||||
| 500,000 | Kinross Gold Corp. | 5.95 | % | 03/15/2024 | 515,000 | |||||||
| 710,000 | Lamar Media Corp. | 5.75 | % | 02/01/2026 | 721,537 | |||||||
| 340,000 | Land O’ Lakes, Inc.^ | 7.25 | % | 07/14/2027 | 371,450 | |||||||
| 1,000,000 | Martin Marietta Materials, Inc. (3 Month LIBOR USD + 0.50%) | 2.82 | % | 12/20/2019 | 1,001,865 | |||||||
| 68,000 | Mercer International, Inc. | 7.75 | % | 12/01/2022 | 71,485 | |||||||
| 1,000,000 | Mercer International, Inc. | 6.50 | % | 02/01/2024 | 1,015,000 | |||||||
| 1,000,000 | Mercer International, Inc.^ | 5.50 | % | 01/15/2026 | 972,500 | |||||||
| 950,000 | Micron Technology, Inc. | 5.50 | % | 02/01/2025 | 993,938 | |||||||
| 300,000 | MPLX L.P. | 5.50 | % | 02/15/2023 | 306,045 | |||||||
| 750,000 | MPLX L.P. | 4.88 | % | 12/01/2024 | 774,249 | |||||||
| 350,000 | Mylan NV | 3.15 | % | 06/15/2021 | 346,399 | |||||||
| 400,000 | Mylan NV | 3.95 | % | 06/15/2026 | 382,640 | |||||||
| 350,000 | Noble Energy, Inc. | 3.85 | % | 01/15/2028 | 335,131 | |||||||
| 947,000 | Oasis Petroleum, Inc. | 6.88 | % | 03/15/2022 | 965,665 | |||||||
| 165,000 | Outfront Media Capital LLC | 5.88 | % | 03/15/2025 | 166,963 | |||||||
| 1,057,000 | Regency Centers L.P. | 4.80 | % | 04/15/2021 | 1,087,302 | |||||||
| 250,000 | Rivers Pittsburgh Borrower L.P.^ | 6.13 | % | 08/15/2021 | 248,125 | |||||||
| 232,000 | ServiceMaster Co. LLC | 7.45 | % | 08/15/2027 | 247,660 | |||||||
| 450,000 | SESI LLC | 7.13 | % | 12/15/2021 | 458,438 | |||||||
| 500,000 | SESI LLC | 7.75 | % | 09/15/2024 | 515,625 | |||||||
| 450,000 | Staples, Inc.^ | 8.50 | % | 09/15/2025 | 420,750 | |||||||
| 600,000 | Steel Dynamics, Inc. | 5.13 | % | 10/01/2021 | 606,750 | |||||||
| 370,000 | TechnipFMC PLC | 3.45 | % | 10/01/2022 | 359,969 | |||||||
The accompanying notes are an integral part of these financial statements.
52
Brown Advisory Strategic Bond Fund
Schedule of Investments
June 30, 2018
| Par Value | Security Description | Rate | Maturity | Value $ | ||||||||
| Corporate Bonds & Notes – 34.3% (Continued) | ||||||||||||
| 125,000 | Teck Resources, Ltd. | 3.75 | % | 02/01/2023 | 119,063 | |||||||
| 530,000 | Teck Resources, Ltd.^ | 8.50 | % | 06/01/2024 | 582,338 | |||||||
| 555,000 | Tenneco, Inc. | 5.00 | % | 07/15/2026 | 497,003 | |||||||
| 800,000 | Trinidad Drilling, Ltd.^ | 6.63 | % | 02/15/2025 | 774,000 | |||||||
| 400,000 | USA Compression Partners L.P.^ | 6.88 | % | 04/01/2026 | 415,500 | |||||||
| 610,000 | Verisk Analytics, Inc. | 4.00 | % | 06/15/2025 | 600,847 | |||||||
| 350,000 | Verizon Communications, Inc. (3 Month LIBOR USD + 1.00%) | 3.33 | % | 03/16/2022 | 355,740 | |||||||
| 1,050,000 | Versum Materials, Inc.^ | 5.50 | % | 09/30/2024 | 1,067,220 | |||||||
| 1,175,000 | Viking Cruises, Ltd.^ | 5.88 | % | 09/15/2027 | 1,113,313 | |||||||
| 1,000,000 | Vulcan Materials Co. (3 Month LIBOR USD + 0.60%) | 2.94 | % | 06/15/2020 | 998,951 | |||||||
| 1,500,000 | Weyerhaeuser Co. | 7.38 | % | 10/01/2019 | 1,576,648 | |||||||
| 1,100,000 | Zimmer Biomet Holdings, Inc. (3 Month LIBOR USD + 0.75%) | 3.08 | % | 03/19/2021 | 1,101,972 | |||||||
| Total Corporate Bonds & Notes (Cost $49,585,675) | 48,435,305 | |||||||||||
| Mortgage Backed Securities – 24.8% | ||||||||||||
| 400,000 | BBCMS Mortgage Trust, Series 2018-TALL C (1 Month LIBOR USD + 1.12%)^ | 3.19 | % | 03/16/2037 | 400,137 | |||||||
| 41,386 | FHLMC PC, Pool# E0-1654 | 5.00 | % | 06/01/2019 | 42,078 | |||||||
| 45,648 | FHLMC PC, Pool# N3-1000 | 4.50 | % | 08/01/2033 | 47,003 | |||||||
| 804,123 | FHLMC REMIC, Series 4107† | 3.00 | % | 08/15/2027 | 156,088 | |||||||
| 61,532 | FHLMC REMIC, Series 3878 | 3.00 | % | 04/15/2041 | 60,670 | |||||||
| 1,754,362 | FHLMC REMIC, Series 4143† | 3.50 | % | 09/15/2042 | 204,915 | |||||||
| 1,024,669 | FHLMC REMIC, Series 4495† | 3.50 | % | 07/15/2045 | 195,956 | |||||||
| 335,000 | FHLMC SCRTT, Series 2016-1 M1#^ | 3.00 | % | 09/25/2055 | 327,626 | |||||||
| 570,071 | FHLMC STACR Debt Notes, Series 2014-HQ2 (1 Month LIBOR USD + 2.20%) | 4.29 | % | 09/25/2024 | 587,503 | |||||||
| 578,068 | FHLMC STACR Debt Notes, Series 2015-HQ2 (1 Month LIBOR USD + 1.95%) | 4.04 | % | 05/27/2025 | 593,362 | |||||||
| 680,993 | FHLMC STACR Debt Notes, Series 2015-DNA1 (1 Month LIBOR USD + 1.85%) | 3.94 | % | 10/25/2027 | 693,837 | |||||||
| 479,290 | FHLMC STACR Debt Notes, Series 2016-DNA1 (1 Month LIBOR USD + 2.90%) | 4.99 | % | 07/25/2028 | 491,742 | |||||||
| 463,916 | FHMS, Series K-J13 | 2.06 | % | 09/25/2021 | 458,667 | |||||||
| 343,937 | FHMS, Series K-021 | 1.60 | % | 01/25/2022 | 336,167 | |||||||
| 266,590 | FHMS, Series K-J18 | 2.46 | % | 03/25/2022 | 262,567 | |||||||
| 280,465 | FHMS, Series K-J09 | 2.02 | % | 04/25/2022 | 275,195 | |||||||
| 2,018,025 | FHMS, Series K-721#† | 0.45 | % | 08/25/2022 | 24,035 | |||||||
| 2,583,016 | FHMS, Series K-023#† | 1.39 | % | 08/25/2022 | 111,567 | |||||||
| 410,182 | FHMS, Series K-J07 | 1.53 | % | 09/25/2022 | 392,434 | |||||||
| 199,669 | FHMS, Series K-J12 | 2.38 | % | 04/25/2023 | 196,371 | |||||||
| 226,613 | FHMS, Series K-J14 | 2.20 | % | 11/25/2023 | 219,354 | |||||||
| 738,069 | FHMS, Series K-J17 | 2.40 | % | 10/25/2024 | 718,783 | |||||||
| 805,193 | FHMS, Series K-055#† | 1.50 | % | 03/25/2026 | 69,615 | |||||||
| 1,345,665 | FHMS, Series K-057#† | 1.33 | % | 07/25/2026 | 104,799 | |||||||
| 678,716 | FHMS, Series K-058#† | 1.06 | % | 08/25/2026 | 42,916 | |||||||
| 1,394,675 | FHMS, Series K-W03#† | 0.99 | % | 06/25/2027 | 79,179 | |||||||
| 1,243,097 | FHMS, Series Q-004# | 2.71 | % | 01/25/2046 | 1,245,440 | |||||||
| 1,057 | FNMA, Pool# 931676 | 5.50 | % | 01/01/2019 | 1,058 | |||||||
| 4,520 | FNMA, Pool# 774887 | 5.50 | % | 05/01/2019 | 4,527 | |||||||
| 15,106 | FNMA, Pool# 794149 | 5.50 | % | 08/01/2019 | 15,201 | |||||||
| 19,527 | FNMA, Pool# 255359 | 5.50 | % | 09/01/2019 | 19,749 | |||||||
| 3,162 | FNMA, Pool# 778775 | 5.50 | % | 09/01/2019 | 3,178 | |||||||
| 13,957 | FNMA, Pool# 785732 | 5.50 | % | 11/01/2019 | 14,046 | |||||||
| 27,932 | FNMA, Pool# 255645 | 4.00 | % | 01/01/2020 | 28,681 | |||||||
| 7,320 | FNMA, Pool# 826868 | 5.50 | % | 08/01/2020 | 7,355 | |||||||
| 34,389 | FNMA, Pool# 879409 | 5.50 | % | 02/01/2021 | 35,135 | |||||||
| 16,843 | FNMA, Pool# 745562 | 5.50 | % | 04/01/2021 | 17,187 | |||||||
| 5,952 | FNMA, Pool# 745525 | 5.50 | % | 05/01/2021 | 6,101 | |||||||
| 31,598 | FNMA, Pool# AD0230 | 5.50 | % | 05/01/2021 | 32,321 | |||||||
| 6,497 | FNMA, Pool# 936481 | 5.50 | % | 07/01/2021 | 6,645 | |||||||
| 1,785 | FNMA, Pool# 889849 | 5.50 | % | 09/01/2021 | 1,797 | |||||||
| 7,737 | FNMA, Pool# 888555 | 5.50 | % | 09/01/2021 | 7,887 | |||||||
The accompanying notes are an integral part of these financial statements.
53
Brown Advisory Strategic Bond Fund
Schedule of Investments
June 30, 2018
| Par Value | Security Description | Rate | Maturity | Value $ | ||||||||
| Mortgage Backed Securities – 24.8% (Continued) | ||||||||||||
| 8,740 | FNMA, Pool# 908560 | 5.50 | % | 01/01/2022 | 8,902 | |||||||
| 6,113 | FNMA, Pool# 889716 | 5.50 | % | 10/01/2022 | 6,323 | |||||||
| 4,295 | FNMA, Pool# 889198 | 5.50 | % | 11/01/2022 | 4,384 | |||||||
| 51,058 | FNMA, Pool# 911073 | 5.50 | % | 12/01/2022 | 52,680 | |||||||
| 14,839 | FNMA, Pool# 972932 | 5.50 | % | 02/01/2023 | 15,254 | |||||||
| 394,781 | FNMA, Pool# AB9392 | 2.50 | % | 05/01/2023 | 393,276 | |||||||
| 75,097 | FNMA, Pool# 975076 | 6.00 | % | 09/01/2023 | 77,954 | |||||||
| 6,892 | FNMA, Pool# 995217 | 5.50 | % | 12/01/2023 | 7,148 | |||||||
| 15,661 | FNMA, Pool# 930334 | 5.50 | % | 01/01/2024 | 16,335 | |||||||
| 8,384 | FNMA, Pool# AE0467 | 5.50 | % | 03/01/2024 | 8,709 | |||||||
| 7,647 | FNMA, Pool# AD0365 | 5.50 | % | 09/01/2024 | 7,919 | |||||||
| 58,893 | FNMA, Pool# AL1081 | 5.00 | % | 07/01/2025 | 60,120 | |||||||
| 35,311 | FNMA, Pool# AL0517 | 5.50 | % | 08/01/2025 | 36,694 | |||||||
| 257,264 | FNMA, Pool# 813714 (1 Year CMT Rate + 1.94%) | 3.32 | % | 01/01/2035 | 269,491 | |||||||
| 289,266 | FNMA, Pool# 815323 (6 Month LIBOR USD + 1.54%) | 3.73 | % | 01/01/2035 | 299,544 | |||||||
| 90,927 | FNMA, Pool# 910181 (12 Month LIBOR USD + 1.71%) | 3.73 | % | 03/01/2037 | 95,098 | |||||||
| 278,497 | FNMA, Pool# 915191 (12 Month LIBOR USD + 1.73%) | 4.10 | % | 04/01/2037 | 293,714 | |||||||
| 416,894 | FNMA, Pool# AL6262 (1 Year CMT Rate + 2.38%) | 3.72 | % | 04/01/2038 | 434,789 | |||||||
| 265,145 | FNMA, Pool# 965184 (12 Month LIBOR USD + 1.59%) | 3.34 | % | 09/01/2038 | 277,327 | |||||||
| 750,000 | FNMA, Pool# BM4143 | 6.00 | % | 07/01/2041 | 831,317 | |||||||
| 512,374 | FNMA, Pool# AU6230 | 5.00 | % | 09/01/2043 | 547,892 | |||||||
| 261,187 | FNMA, Pool# 947512 (12 Month LIBOR USD + 1.75%) | 3.50 | % | 09/01/2047 | 273,103 | |||||||
| 20,712 | FNMA CAS, Series 2013-C01 (1 Month LIBOR USD + 2.00%) | 4.09 | % | 10/25/2023 | 20,801 | |||||||
| 350,916 | FNMA CAS, Series 2014-C02 (1 Month LIBOR USD + 0.95%) | 3.04 | % | 05/28/2024 | 351,938 | |||||||
| 77,022 | FNMA CAS, Series 2016-C02 (1 Month LIBOR USD + 2.15%) | 4.24 | % | 09/25/2028 | 77,475 | |||||||
| 88,749 | FNMA REMIC Trust, Series 2002-16 | 6.00 | % | 04/25/2022 | 92,440 | |||||||
| 717,244 | FNMA REMIC Trust, Series 2012-65 | 5.00 | % | 07/25/2040 | 769,028 | |||||||
| 7,500,000 | FNMA, 2.5%, Due TBA July | 2.50 | % | 07/15/2033 | 7,289,667 | |||||||
| 7,500,000 | FNMA, 3.0%, Due TBA July | 3.00 | % | 07/15/2033 | 7,456,558 | |||||||
| 4,000,000 | FNMA, 5.0%, Due TBA July | 5.00 | % | 07/15/2048 | 4,237,869 | |||||||
| 650,000 | FREMF Mortgage Trust, Series 2017-K729 B#^ | 3.80 | % | 11/25/2024 | 635,845 | |||||||
| 90,000 | FREMF Mortgage Trust, Series 2011-K10#^ | 4.78 | % | 11/25/2049 | 92,475 | |||||||
| 256,826 | GNMA, Pool# 004527M | 5.00 | % | 09/20/2024 | 275,973 | |||||||
| 567,715 | GNMA REMIC Trust, Series 2014-45 B1#† | 0.75 | % | 07/16/2054 | 26,568 | |||||||
| 498,368 | GNMA REMIC Trust, Series 2014-135 I0#† | 0.83 | % | 01/16/2056 | 26,847 | |||||||
| 476,679 | GNMA REMIC Trust, Series 2015-172 I0#† | 0.90 | % | 03/16/2057 | 30,052 | |||||||
| 646,343 | GNMA REMIC Trust, Series 2016-40 I0#† | 0.77 | % | 07/16/2057 | 36,923 | |||||||
| 525,236 | GNMA REMIC Trust, Series 2016-56 I0#† | 0.97 | % | 11/16/2057 | 37,482 | |||||||
| 639,667 | GNMA REMIC Trust, Series 2016-98 I0#† | 0.95 | % | 05/16/2058 | 47,845 | |||||||
| 196,604 | JPMCC, Series 2016-ASH A (1 Month LIBOR USD + 1.50%)^ | 3.57 | % | 10/16/2034 | 196,818 | |||||||
| 385,000 | MAD Mortgage Trust, Series 2017-330M B#^ | 3.48 | % | 08/17/2034 | 376,930 | |||||||
| 275,000 | MSC, Series 2017-CLS C (1 Month LIBOR USD + 1.00%)^ | 3.07 | % | 11/15/2034 | 274,920 | |||||||
| 175,000 | MSC, Series 2017-CLS D (1 Month LIBOR USD + 1.40%)^ | 3.47 | % | 11/15/2034 | 175,063 | |||||||
| Total Mortgage Backed Securities (Cost $35,001,685) | 35,086,364 | |||||||||||
| Municipal Bonds – 6.4% | ||||||||||||
| 500,000 | District of Columbia# | 5.70 | % | 08/01/2038 | 474,880 | |||||||
| 1,500,000 | District of Columbia# | 5.73 | % | 08/01/2038 | 1,424,640 | |||||||
| 750,000 | Massachusetts Port Authority# | 4.19 | % | 01/01/2031 | 750,000 | |||||||
| 700,000 | Mosaic District Community Development Authority | 7.25 | % | 03/01/2036 | 746,984 | |||||||
| 2,000,000 | New York State Energy Research & Development Authority# | 0.94 | % | 12/01/2023 | 2,000,000 | |||||||
| 1,000,000 | New York State Energy Research & Development Authority# | 5.23 | % | 07/01/2029 | 1,000,000 | |||||||
| 640,000 | New York Transportation Development Corp. | 5.00 | % | 08/01/2026 | 675,802 | |||||||
| 225,000 | North Texas Tollway Authority | 8.91 | % | 02/01/2030 | 244,840 | |||||||
| 500,000 | Public Finance Authority^ | 5.00 | % | 09/01/2030 | 523,700 | |||||||
| 385,000 | Utah Charter School Finance Authority | 5.80 | % | 06/15/2038 | 385,674 | |||||||
The accompanying notes are an integral part of these financial statements.
54
Brown Advisory Strategic Bond Fund
Schedule of Investments
June 30, 2018
| Par | |||||||||||||
| Value/Shares | Security Description | Rate | Maturity | Value $ | |||||||||
| Municipal Bonds – 6.4% (Continued) | |||||||||||||
| 550,000 | Washington State Housing Finance Commission^ | 4.00 | % | 01/01/2024 | 547,298 | ||||||||
| 255,000 | Yamhill County Oregon Hospital Authority | 3.50 | % | 11/15/2020 | 253,246 | ||||||||
| Total Municipal Bonds (Cost $8,937,638) | 9,027,064 | ||||||||||||
| Preferred Stocks – 0.5% | |||||||||||||
| 2,400 | AGNC Investment Corp., Series B, 7.75% | 61,608 | |||||||||||
| 2,076 | AGNC Investment Corp., Series C, 7.00% (Fixed until 10/15/2022, then 3 Month LIBOR USD + 5.11%) | 53,976 | |||||||||||
| 24,630 | Digital Realty Trust, Inc., Series J, 5.25% | 588,657 | |||||||||||
| Total Preferred Stocks (Cost $715,359) | 704,241 | ||||||||||||
| Closed-End Funds – 0.3% | |||||||||||||
| 17,204 | BlackRock MuniYield Michigan Quality Fund | 225,545 | |||||||||||
| 9,600 | Nuveen Massachusetts Quality Municipal Income Fund | 119,414 | |||||||||||
| 3,184 | Nuveen Michigan Quality Municipal Income Fund | 40,309 | |||||||||||
| Total Closed-End Funds (Cost $425,613) | 385,268 | ||||||||||||
| Short-Term Investments – 2.3% | |||||||||||||
| Money Market Funds – 2.3% | |||||||||||||
| 3,252,219 | First American Treasury Obligations Fund – Class Z, 1.75%* | 3,252,219 | |||||||||||
| Total Short-Term Investments (Cost $3,252,219) | 3,252,219 | ||||||||||||
| Total Investments – 113.5% (Cost $161,421,916) | 160,429,460 | ||||||||||||
| Other Assets in Excess of Liabilities – (13.5)% | (19,065,863 | ) | |||||||||||
| NET ASSETS – 100.0% | $ | 141,363,597 | |||||||||||
| # | Variable rate security. Rate disclosed is as of June 30, 2018. | |
| ʭ | Step bond; the interest rate shown is the rate in effect as of June 30, 2018. | |
| ^ | Security exempt from registration under Rule 144A of the Securities Act of 1933. These securities may be resold in transactions exempt from registration, normally to qualified institutional buyers. At June 30, 2018, the value of these securities amounted to $76,762,632 or 54.3% of net assets. | |
< | These securities are being fair valued, using significant unobservable inputs (Level 3), under the supervision of the Board of Trustees. | |
| † | Interest Only Security | |
| * | Annualized seven-day yield as of June 30, 2018. |
Futures Contracts – Short (Note 6)
| Notional | Notional | Unrealized Appreciation | |||||||||||||||
Issue | Contracts | Expiration Date | Amount | Value | (Depreciation) | ||||||||||||
| U.S. Treasury 5-Year Note Futures | (165) | 09/28/2018 | $ | (18,676,339 | ) | $ | (18,746,836 | ) | $ | (70,497 | ) | ||||||
| $ | (18,676,339 | ) | $ | (18,746,836 | ) | $ | (70,497 | ) | |||||||||
There is no variation margin due to or from the Fund as of June 30, 2018.
The accompanying notes are an integral part of these financial statements.
55
Brown Advisory Sustainable Bond Fund
A Message to Our Shareholders
June 30, 2018
Dear Shareholders:
From inception on August 7, 2017 to June 30, 2018, the Brown Advisory Sustainable Bond Fund – Investor Shares (the “Fund”) returned -1.27%, slightly behind the -1.05% return for the Fund’s benchmark, the Bloomberg Barclays US Aggregate Bond Index.
The Fund aims to generate performance primarily through individual security analysis, supported by a detailed and disciplined credit process and a focus on ways to seek the mitigation of downside risk. The Fund augments fundamental credit analysis with ESG research and invests meaningfully in bonds that fund projects with compelling ESG profiles and positive environmental and social impact. Interest rate and sector weightings are set mainly by an analysis of the intermediate-term risk/reward, as opposed to any particular macro forecast.
To this end, our individual security selections were the main driver of performance. Our main spread sector allocations all outperformed the same sector in the benchmark including corporate bonds, mortgages, and taxable municipals. Somewhat offsetting this was allocation, as credit spreads were generally wider over this period, and fees.
Among our largest positive contributing individual selections were Land O’ Lakes, Morgan Stanley Green Bond, Bank of America Green Bond and Ball Corp.
The Fund puts equal weight on driving positive ESG impact and driving financial performance. At year-end, over 90% of the portfolio was invested in bonds with specifically identified impact, with the remainder in cash and U.S. Treasury securities for duration management. An example of a recent impact investment is a green bond issued by Alexandria Real Estate (“ARE”). ARE owns, operates and develops collaborative life science and technology campuses in the top urban innovation clusters. It has created sustainable and vibrant environments to support the development of breakthrough technologies and therapies to help cure disease, end hunger, and improve the way we live and work. Proceeds of the bond are funding its aggressive targets of 100% new ground-up developments with a minimum LEED Gold certification.
It is always hard to know when a cycle will turn. If the U.S. economy turns weaker a year from now, we will look back at the flattening yield curve and widening credit spreads as warning signs. However, both of these indicators have produced false signals many times in the past. We will seek to perform well whatever the macro economy does by buying bonds with attractive yields and focusing our analysis on downside risks.
Sincerely,
Thomas D.D. Graff, CFA
Portfolio Manager
Past performance is not a guarantee of future results.
Mutual fund investing involves risk. Principal loss is possible. Investments in debt securities typically decrease in value when interest rates rise. This risk is usually greater for longer-term debt securities. Investments in Asset-Backed and Mortgage-Backed securities include additional risks that investor should be aware of including credit risk, prepayment risk, possible illiquidity and default, as well as increased susceptibility to adverse economic developments. Investments in lower rated and non-rated securities present a great risk of loss to principal and interest than higher rated securities. In addition, the fund is susceptible to risks from investments in derivatives, U.S. Government securities, and changes in interest rates. Income from tax-exempt funds may be subject to state and local taxes and a portion of income may be subject to the Federal Alternative minimum tax for certain investors.
Fund holdings and sector allocations are subject to change and should not be considered a recommendation to buy or sell any security. For a complete list of fund holdings, please refer to the Schedule of Investments provided in this report.
Definitions for terms and indices are provided in the Glossary of Terms.
56
Brown Advisory Sustainable Bond Fund
Performance Information & Portfolio Holdings Summary
June 30, 2018
| PORTFOLIO HOLDINGS | % of Net Assets |
| Corporate Bonds & Notes | 42.6% |
| Mortgage Backed Securities | 19.4% |
| Municipal Bonds | 17.8% |
| Foreign Government Bonds | 10.3% |
| U.S. Treasury Securities | 6.2% |
| Money Market Funds | 2.7% |
| Asset Backed Securities | 1.6% |
| Other Assets and Liabilities | (0.6)% |
100.0% |
GROWTH OF A $10,000 INVESTMENT
The following chart reflects the change in value of a hypothetical $10,000 investment, including reinvested dividends and distributions, in the Fund as measured against a broad-based securities market index. The Bloomberg Barclays US Aggregate Bond Index (“Index”) is a broad-based benchmark that measures the investment grade US dollar-denominated, fixed rate taxable bond market. The Index includes Treasuries, government-related and corporate securities, MBS, ABS and CMBS. The Index is unmanaged and does not reflect the deduction of fees, such as investment management fees. Investors cannot invest directly in an index.

| Since Inception | |
Cumulative Total Return | (8/7/17) |
| Investor Shares | -1.27% |
| Bloomberg Barclays US Aggregate Bond Index | -1.05% |
Investor Shares | |
Gross Expense Ratio1 | 0.70% |
Net Expense Ratio1 | 0.61% |
Past performance does not guarantee future results. The performance data quoted represents past performance and current returns may be lower or higher. The investment return and net asset value will fluctuate so that an investor’s shares, when redeemed, may be worth more or less than the original cost. To obtain performance information current to the most recent month end, please visit our website at brownadvisoryfunds.com/performance.html. The performance table and graph above do not reflect the deduction of taxes that a shareholder would pay on Fund distributions or the redemption of Fund shares. Investment performance reflects periods during which fee waivers were in effect. In the absence of such waivers, total return would have been reduced. Performance data does not reflect the imposition of the redemption fee of 1.00% on shares redeemed within 14 days, and if it did, performance would have been lower. Short-term performance, in particular, is not a good indication of the Fund’s future performance, and an investment should not be made based solely on returns.
1 | Per the Fund’s prospectus dated October 31, 2017. Refer to the financial highlights for the gross and net expense ratios for the year ended as of the date of this report. Please note that the expense ratios per the prospectus include acquired fund fees and expenses (as applicable) and the expense ratios in the financial highlights do not. |
57
Brown Advisory Sustainable Bond Fund
Schedule of Investments
June 30, 2018
| Par Value | Security Description | Rate | Maturity | Value $ | |||||||||
| Corporate Bonds & Notes – 42.6% | |||||||||||||
| 515,000 | Albemarle Corp. | 4.15 | % | 12/01/2024 | 520,769 | ||||||||
| 530,000 | Alexandria Real Estate Equities, Inc. | 4.00 | % | 01/15/2024 | 533,566 | ||||||||
| 845,000 | Allison Transmission, Inc.^ | 4.75 | % | 10/01/2027 | 790,074 | ||||||||
| 865,000 | American Tower Corp. | 3.13 | % | 01/15/2027 | 774,475 | ||||||||
| 525,000 | Analog Devices, Inc. | 3.90 | % | 12/15/2025 | 520,936 | ||||||||
| 520,000 | AvalonBay Communities, Inc. | 3.63 | % | 10/01/2020 | 524,139 | ||||||||
| 920,000 | Ball Corp. | 4.88 | % | 03/15/2026 | 918,850 | ||||||||
| 700,000 | Bank of America Corp. (Fixed until 05/17/21, then 3 Month LIBOR USD + 0.63%) | 3.50 | % | 05/17/2022 | 700,044 | ||||||||
| 680,000 | Boston Properties L.P. | 3.65 | % | 02/01/2026 | 656,933 | ||||||||
| 790,000 | Children’s Hospital Corp. | 4.12 | % | 01/01/2047 | 818,420 | ||||||||
| 560,000 | Clorox Co. | 3.10 | % | 10/01/2027 | 527,764 | ||||||||
| 540,000 | Core & Main L.P.^ | 6.13 | % | 08/15/2025 | 514,350 | ||||||||
| 550,000 | Delphi Technologies PLC^ | 5.00 | % | 10/01/2025 | 525,938 | ||||||||
| 515,000 | Digital Realty Trust L.P. | 3.95 | % | 07/01/2022 | 520,722 | ||||||||
| 880,000 | Ecolab, Inc. | 4.35 | % | 12/08/2021 | 909,017 | ||||||||
| 1,020,000 | Equinix, Inc. | 5.88 | % | 01/15/2026 | 1,035,810 | ||||||||
| 850,000 | Hasbro, Inc. | 3.50 | % | 09/15/2027 | 787,818 | ||||||||
| 530,000 | JB Hunt Transport Services, Inc. | 3.30 | % | 08/15/2022 | 526,333 | ||||||||
| 20,000 | Kaiser Foundation Hospitals | 3.15 | % | 05/01/2027 | 19,176 | ||||||||
| 770,000 | Keysight Technologies, Inc. | 4.55 | % | 10/30/2024 | 780,299 | ||||||||
| 685,000 | Kroger Co. | 3.70 | % | 08/01/2027 | 652,629 | ||||||||
| 745,000 | Land O’ Lakes, Inc.^ | 7.25 | % | 07/14/2027 | 813,913 | ||||||||
| 545,000 | MidAmerican Energy Co. | 3.10 | % | 05/01/2027 | 525,081 | ||||||||
| 915,000 | Morgan Stanley | 2.20 | % | 12/07/2018 | 913,809 | ||||||||
| 1,015,000 | Northwell Healthcare, Inc. | 4.26 | % | 11/01/2047 | 975,810 | ||||||||
| 475,000 | Northwestern University | 3.81 | % | 12/01/2050 | 476,245 | ||||||||
| 255,000 | Novelis Corp.^ | 6.25 | % | 08/15/2024 | 255,638 | ||||||||
| 535,000 | Regency Centers L.P. | 3.75 | % | 06/15/2024 | 524,436 | ||||||||
| 285,000 | Staples, Inc.^ | 8.50 | % | 09/15/2025 | 266,475 | ||||||||
| 434,000 | Tenneco, Inc. | 5.00 | % | 07/15/2026 | 388,647 | ||||||||
| 830,000 | Toronto-Dominion Bank | 1.85 | % | 09/11/2020 | 808,908 | ||||||||
| 900,000 | Trustees of the University of Pennsylvania | 4.01 | % | 08/15/2047 | 895,561 | ||||||||
| 660,000 | Verisk Analytics, Inc. | 4.00 | % | 06/15/2025 | 650,096 | ||||||||
| 615,000 | Weyerhaeuser Co. | 7.38 | % | 10/01/2019 | 646,426 | ||||||||
| 820,000 | William Marsh Rice University | 3.57 | % | 05/15/2045 | 804,358 | ||||||||
| 685,000 | Xylem, Inc. | 3.25 | % | 11/01/2026 | 645,104 | ||||||||
| Total Corporate Bonds & Notes (Cost $23,678,183) | 23,148,569 | ||||||||||||
| Mortgage Backed Securities – 19.4% | |||||||||||||
| 597,718 | FHMS, Series K-W03 X1#~ | 0.99 | % | 06/25/2027 | 33,934 | ||||||||
| 300,000 | FHMS, Series K-W03 A2 | 3.02 | % | 06/25/2027 | 290,321 | ||||||||
| 644,420 | FHMS, Series K-W04 A (1 Month LIBOR USD + 0.24%) | 2.24 | % | 09/25/2028 | 645,149 | ||||||||
| 998,667 | FNMA, Pool# BJ4049 | 4.00 | % | 05/01/2048 | 1,025,891 | ||||||||
| 318,484 | FNMA, Pool# AS3724 | 3.50 | % | 11/01/2044 | 318,204 | ||||||||
| 312,902 | FNMA, Pool# AS5917 | 3.50 | % | 10/01/2045 | 312,465 | ||||||||
| 447,618 | FNMA, Pool# AS6127 | 3.50 | % | 11/01/2045 | 446,993 | ||||||||
| 298,196 | FNMA, Pool# AS8808 | 3.50 | % | 02/01/2047 | 297,710 | ||||||||
| 299,529 | FNMA, Pool# BJ4051 | 4.50 | % | 05/01/2048 | 315,639 | ||||||||
| 199,778 | FNMA, Pool# BJ4050 | 4.50 | % | 05/01/2048 | 210,454 | ||||||||
| 199,792 | FNMA, Pool# BJ4052 | 4.50 | % | 05/01/2048 | 210,538 | ||||||||
| 199,802 | FNMA, Pool# BK5105 | 5.50 | % | 05/01/2048 | 216,632 | ||||||||
| 200,000 | FNMA, Pool# BJ4054 | 4.00 | % | 06/01/2048 | 205,266 | ||||||||
| 200,000 | FNMA, Pool# BJ4057 | 4.50 | % | 06/01/2048 | 210,446 | ||||||||
| 324,276 | FNMA, Pool# AS2826 | 4.00 | % | 07/01/2044 | 331,827 | ||||||||
| 300,000 | FNMA REMIC Trust, Series 2017-M10 AV2# | 2.65 | % | 07/25/2024 | 290,870 | ||||||||
| 80,000 | FNMA REMIC Trust, Series 2017-M2 A2# | 2.88 | % | 02/25/2027 | 76,689 | ||||||||
| 831,000 | FNMA REMIC Trust, Series 2017-M13 A2# | 3.04 | % | 09/25/2027 | 800,781 | ||||||||
The accompanying notes are an integral part of these financial statements.
58
Brown Advisory Sustainable Bond Fund
Schedule of Investments
June 30, 2018
| Par Value | Security Description | Rate | Maturity | Value $ | |||||||||
| Mortgage Backed Securities – 19.4% (Continued) | |||||||||||||
| 865,000 | FNMA REMIC Trust, Series 2017-M15# | 3.06 | % | 09/25/2027 | 839,793 | ||||||||
| 1,491,510 | FNMA REMIC Trust, Series 2018-M2# | 2.90 | % | 01/25/2028 | 1,470,687 | ||||||||
| 1,600,000 | FNMA REMIC Trust, Series 2018-M8# | 3.33 | % | 06/25/2028 | 1,589,510 | ||||||||
| 200,000 | MSC, Series 2017-CLS A (1 Month LIBOR USD + 0.70%)^ | 2.77 | % | 11/15/2034 | 199,878 | ||||||||
| 100,000 | MSC, Series 2017-CLS C (1 Month LIBOR USD + 1.00%)^ | 3.07 | % | 11/15/2034 | 99,971 | ||||||||
| 100,000 | MSC, Series 2017-CLS D (1 Month LIBOR USD + 1.40%)^ | 3.47 | % | 11/15/2034 | 100,036 | ||||||||
| Total Mortgage Backed Securities (Cost $10,617,643) | 10,539,684 | ||||||||||||
| Municipal Bonds – 17.8% | |||||||||||||
| 300,000 | Atlanta Development Authority | 3.57 | % | 12/01/2036 | 292,824 | ||||||||
| 75,000 | District of Columbia# | 5.70 | % | 08/01/2038 | 71,232 | ||||||||
| 550,000 | District of Columbia# | 5.73 | % | 08/01/2038 | 522,368 | ||||||||
| 1,060,000 | Grant County Washington Public Utility | 5.63 | % | 01/01/2027 | 1,229,111 | ||||||||
| 100,000 | Honolulu, City & County Hawaii | 3.00 | % | 09/01/2027 | 96,468 | ||||||||
| 30,000 | Los Angeles California Community College District | 6.60 | % | 08/01/2042 | 42,035 | ||||||||
| 430,000 | Los Angeles California Wastewater System Revenue | 3.49 | % | 06/01/2029 | 428,142 | ||||||||
| 40,000 | Maryland Community Development Administration | 3.24 | % | 09/01/2048 | 39,518 | ||||||||
| 110,000 | Massachusetts, Commonwealth of | 3.28 | % | 06/01/2046 | 101,437 | ||||||||
| 530,000 | Miami-Dade County Florida Aviation | 3.98 | % | 10/01/2041 | 528,505 | ||||||||
| 675,000 | Miami-Dade County Florida Educational Facilities Authority | 4.47 | % | 04/01/2051 | 685,787 | ||||||||
| 340,000 | New York State Dormitory Authority | 4.00 | % | 07/01/2039 | 342,645 | ||||||||
| 780,000 | New York State Environmental Facilities Corp. | 2.77 | % | 07/15/2031 | 719,776 | ||||||||
| 250,000 | New York Transportation Development Corp. | 5.00 | % | 01/01/2036 | 279,643 | ||||||||
| 100,000 | Ohio Air Quality Development Authority^ | 3.75 | % | 01/15/2028 | 101,686 | ||||||||
| 475,000 | Oregon State University | 3.75 | % | 04/01/2049 | 451,198 | ||||||||
| 250,000 | Pennsylvania Economic Development | 3.20 | % | 11/15/2027 | 240,118 | ||||||||
| 1,100,000 | Permanent University Fund – Texas A&M University System | 3.66 | % | 07/01/2047 | 1,043,855 | ||||||||
| 20,000 | San Diego California Redevelopment Agency Successor Agency | 4.00 | % | 09/01/2040 | 19,991 | ||||||||
| 500,000 | San Francisco, City & County of California Community Facilities | 3.75 | % | 09/01/2037 | 497,335 | ||||||||
| 60,000 | San Francisco, City & County of California Public Utilities Commission Water Revenue | 3.55 | % | 11/01/2031 | 58,287 | ||||||||
| 480,000 | Southern California Public Power Authority | 4.31 | % | 07/01/2029 | 496,810 | ||||||||
| 355,000 | University of California | 2.99 | % | 05/15/2026 | 340,505 | ||||||||
| 850,000 | University of Massachusetts Building Authority | 5.45 | % | 11/01/2040 | 1,020,621 | ||||||||
| 25,000 | University of North Texas | 3.69 | % | 04/15/2030 | 24,977 | ||||||||
| Total Municipal Bonds (Cost $9,763,196) | 9,674,874 | ||||||||||||
| Foreign Government Bonds – 10.3% | |||||||||||||
| 1,030,000 | Bank Nederlandse Gemeenten NV^ | 2.13 | % | 12/14/2020 | 1,013,050 | ||||||||
| 765,000 | European Bank for Reconstruction & Development | 0.88 | % | 07/22/2019 | 751,954 | ||||||||
| 705,000 | European Investment Bank | 2.38 | % | 05/24/2027 | 669,465 | ||||||||
| 1,050,000 | Export Development Canada | 1.25 | % | 12/10/2018 | 1,044,575 | ||||||||
| 1,085,000 | International Finance Corp. | 2.00 | % | 10/24/2022 | 1,047,774 | ||||||||
| 1,090,000 | Kreditanstalt fuer Wiederaufbau | 2.00 | % | 09/29/2022 | 1,052,121 | ||||||||
| Total Foreign Government Bonds (Cost $5,659,479) | 5,578,939 | ||||||||||||
| U.S. Treasury Securities – 6.2% | |||||||||||||
| 2,100,000 | United States Treasury Note | 0.88 | % | 10/15/2018 | 2,093,298 | ||||||||
| 290,000 | United States Treasury Bond | 4.38 | % | 02/15/2038 | 353,551 | ||||||||
| 1,015,000 | United States Treasury Bond | 2.50 | % | 05/15/2046 | 922,342 | ||||||||
| Total U.S. Treasury Securities (Cost $3,340,097) | 3,369,191 | ||||||||||||
| Asset Backed Securities – 1.6% | |||||||||||||
| 250,000 | Oportun Funding IX LLC, Series 2018-B A^ | 3.91 | % | 07/08/2024 | 249,972 | ||||||||
| 598,769 | Tesla Auto Lease Trust, Series 2018-A^ | 2.32 | % | 12/20/2019 | 596,896 | ||||||||
| Total Asset Backed Securities (Cost $848,728) | 846,868 | ||||||||||||
The accompanying notes are an integral part of these financial statements.
59
Brown Advisory Sustainable Bond Fund
Schedule of Investments
June 30, 2018
| Shares | Security Description | Value $ | ||||||
| Short-Term Investments – 2.7% | ||||||||
| Money Market Funds – 2.7% | ||||||||
| 1,475,036 | First American Treasury Obligations Fund – Class Z, 1.75%* | 1,475,036 | ||||||
| Total Short-Term Investments (Cost $1,475,036) | 1,475,036 | |||||||
| Total Investments – 100.6% (Cost $55,382,362) | 54,633,161 | |||||||
| Liabilities in Excess of Other Assets – (0.6)% | (341,676 | ) | ||||||
| NET ASSETS – 100.0% | $ | 54,291,485 | ||||||
| # | Variable rate security. Rate disclosed is as of June 30, 2018. | |
| * | Annualized seven-day yield as of June 30, 2018. | |
| ^ | Security exempt from registration under Rule 144A of the Securities Act of 1933. These securities may be resold in transactions exempt from registration, normally to qualified institutional buyers. At June 30, 2018, the value of these securities amounted to $5,527,877 or 10.2% of net assets. | |
| ~ | Interest Only Security |
| Futures Contracts – Long (Note 6) | |||||||||||||||||
| Notional | Notional | Unrealized Appreciation | |||||||||||||||
Issue | Contracts | Expiration Date | Amount | Value | (Depreciation) | ||||||||||||
| U.S. Treasury Long Bond Futures | 7 | 09/19/2018 | $ | 989,658 | $ | 1,015,000 | $ | 25,342 | |||||||||
| U.S. Treasury Ultra Bond Futures | 6 | 09/19/2018 | 926,982 | 957,375 | 30,393 | ||||||||||||
| $ | 1,916,640 | $ | 1,972,375 | $ | 55,735 | ||||||||||||
| Futures Contracts – Short (Note 6) | |||||||||||||||||
| Notional | Notional | Unrealized Appreciation | |||||||||||||||
Issue | Contracts | Expiration Date | Amount | Value | (Depreciation) | ||||||||||||
| U.S. Treasury 10-Year Ultra Bond Futures | (35) | 09/28/2018 | $ | (4,422,684 | ) | $ | (4,488,203 | ) | $ | (65,519 | ) | ||||||
| $ | (4,422,684 | ) | $ | (4,488,203 | ) | $ | (65,519 | ) | |||||||||
There is no variation margin due to or from the Fund as of June 30, 2018.
The accompanying notes are an integral part of these financial statements.
60
Brown Advisory Maryland Bond Fund
A Message to Our Shareholders
June 30, 2018
Dear Shareholders:
During the year ended June 30, 2018, the Brown Advisory Maryland Bond Fund (the “Fund”) increased 1.29% in value. During the same period, the Bloomberg Barclays 1-10 Year Blended Municipal Bond Index (the “Index”), the Fund’s benchmark, increased 0.61%.
The Fund posted attractive relative performance for the year ended June 30, 2018 – a period where broad intermediate municipal yields moved higher. The Fund benefitted from a combination of our bottom-up credit and sector selection, as well as solid performance from our municipal floating-rate holdings once short-term municipal yields finally began to move higher.
Following a tumultuous period at the end of 2016, the municipal market began to find its footing in early 2017. However, policy uncertainty continued to hang like a cloud over the market as the year progressed. In an attempt to dampen market volatility stemming from both the effects of U.S. federal tax reform and an active Fed tightening cycle, many investors sought refuge in the perceived safety of short-maturity bonds. This flight-to-quality bid in short-maturity municipal securities temporarily suppressed yields on those bonds to levels that we viewed as unsustainable given investable alternatives. While we never make investment decisions based on predicting interest rates, as a consequence of the poor risk/reward profile in two-to-five year fixed rate bonds, we favored floating-rate securities and ultra-short callable bond structures while maintaining the duration of the Fund.
These defensive positions benefitted the Fund as short- and intermediate-term municipal yields began to normalize to higher levels. After being imperiled by potential tax legislation for much of the year as negotiations continued, the tax exemptions most essential to the municipal bond market came away basically unscathed in the final tax bill. To be clear, we do not attempt to predict political policy outcomes or specific interest rate movements. Instead, we took notice of the high valuations (on a risk-adjusted basis) of short-term fixed rate bonds and sought other municipal structures that we believed offered a better risk/reward balance while remaining appropriate for the mandate.
Turning to credit, we again saw strong relative performance in many of our credit-sensitive revenue-backed sectors. Generic BBB and lower-rated revenue-backed municipals outperformed bonds with higher ratings for the period; but, our specific selection effect provided meaningful relative outperformance compared to the broad market.
We rotated out of many of our lower-rated holdings and added exposure to AA-rated essential service revenue bonds. We saw the relative strength in lower-rated municipal credit as an opportunity to increase overall credit quality in the portfolio without, in our view, sacrificing much in opportunity cost. While we are not specifically concerned about weakening trends in municipal credit, our holistic approach to risk management seeks to protect against downside risk. In the current environment of continued spread compression, we are happy to trim credit exposure in favor of other lower-risk, high-quality structures, like municipal floating-rate bonds.
Finding the right balance of risk and reward at this point in the market cycle requires a disciplined process, an open mind and discerning analysis. We are benchmark-aware, but not benchmark-beholden. In the current environment, we believe our use of non-benchmark securities, like municipal floating-rate bonds, can offer a better return profile and more extensive diversification from the various risks of the market than the Index. We will seek to provide opportunities for both principal stability and upside potential in a wide variety of economic scenarios.
Sincerely,
Stephen M. Shutz, CFA
Portfolio Manager
61
Brown Advisory Maryland Bond Fund
A Message to Our Shareholders
June 30, 2018
Past performance is not a guarantee of future results.
Mutual fund investing involves risk. Principal loss is possible. The Fund is non-diversified which means it may invest a large percentage of its assets in the securities of fewer issuers. Investment in a limited number of issuers exposes the Fund to greater market risk than if its assets were diversified among a greater number of issuers. The Fund is also subject to interest rate risk which is the risk that debt securities in the Fund’s portfolio will decline in value because of an increase in market interest rates. Municipal securities are subject to adverse political or economic factors, including changes in the tax law. Income from tax-exempt funds may be subject to state and local taxes and a portion of income may be subject to the federal alternative minimum tax for certain investors.
Fund holdings and sector allocations are subject to change and should not be considered a recommendation to buy or sell any security. For a complete list of fund holdings, please refer to the Schedule of Investments provided in this report. Credit Quality weights by rating are derived from the highest bond rating as determined by Standard & Poor’s (“S&P”), Moody’s or Fitch. Bond ratings are grades given to bonds that indicate their credit quality as determined by private independent rating services such as S&P, Moody’s and Fitch. These firms evaluate a bond issuer’s financial strength, or its ability to pay a bond’s principal and interest in a timely fashion. Ratings are expressed as letters ranging from ‘AAA’, which is the highest grade, to ‘D’, which is the lowest grade. In limited situations when none of the three rating agencies have issued a formal rating, the Advisor will classify the security as nonrated.
Definitions for terms and indices are provided in the Glossary of Terms.
62
Brown Advisory Maryland Bond Fund
Performance Information & Portfolio Holdings Summary
June 30, 2018
| PORTFOLIO HOLDINGS | % of Net Assets |
| Revenue Bonds | 68.3% |
| General Obligation Bonds | 29.8% |
| Money Market Funds | 0.7% |
| Other Assets and Liabilities | 1.2% |
100.0% |
GROWTH OF A $10,000 INVESTMENT
The following chart reflects the change in value of a hypothetical $10,000 investment, including reinvested dividends and distributions, in the Fund as measured against the broad-based municipal bond index. The Bloomberg Barclays 1-10 Year Blended Municipal Bond Index (“Index”) is a market index of high quality, domestic fixed income securities with maturities of less than 10 years. The Index is unmanaged and does not reflect the deduction of fees, such as investment management fees. Investors cannot invest directly in an index.
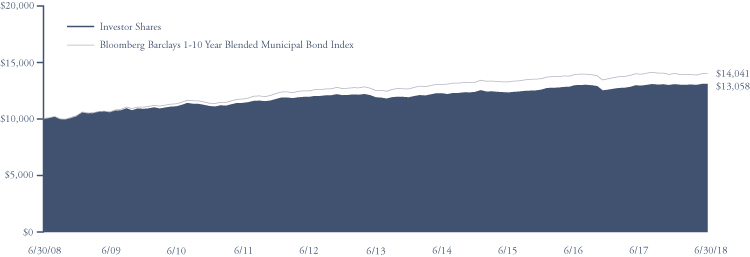
Average Annual Total Return | One Year | Five Year | Ten Year |
| Investor Shares | 1.29% | 1.94% | 2.70% |
| Bloomberg Barclays 1-10 Year Blended Municipal Bond Index | 0.61% | 2.31% | 3.45% |
Investor Shares | |||
Gross Expense Ratio1 | 0.49% | ||
Net Expense Ratio1 | 0.49% |
Past performance does not guarantee future results. The performance data quoted represents past performance and current returns may be lower or higher. The investment return and net asset value will fluctuate so that an investor’s shares, when redeemed, may be worth more or less than the original cost. To obtain performance information current to the most recent month end, please visit our website at brownadvisoryfunds.com/performance.html. The performance table and graph above do not reflect the deduction of taxes that a shareholder would pay on Fund distributions or the redemption of Fund shares. Investment performance reflects periods during which fee waivers were in effect. In the absence of such waivers, total return would have been reduced. Performance data does not reflect the imposition of the redemption fee of 1.00% on shares redeemed within 14 days, and if it did, performance would have been lower.
1 | Per the Fund’s prospectus dated October 31, 2017. Refer to the financial highlights for the gross and net expense ratios for the year ended as of the date of this report. Please note that the expense ratios per the prospectus include acquired fund fees and expenses (as applicable) and the expense ratios in the financial highlights do not. |
63
Brown Advisory Maryland Bond Fund
Schedule of Investments
June 30, 2018
| Par Value | Security Description | Rate | Maturity | Value $ | |||||||||
| Municipal Bonds — 98.1% | |||||||||||||
| General Obligation Bonds — 29.8% | |||||||||||||
| 2,225,000 | Anne Arundel County Maryland | 5.00 | % | 04/01/2022 | 2,472,242 | ||||||||
| 1,265,000 | Anne Arundel County Maryland | 5.00 | % | 10/01/2026 | 1,488,905 | ||||||||
| 3,000,000 | Baltimore County Maryland | 4.50 | % | 09/01/2020 | 3,178,740 | ||||||||
| 1,115,000 | Baltimore County Maryland | 5.00 | % | 03/01/2026 | 1,321,019 | ||||||||
| 1,360,000 | Cecil County Maryland | 4.00 | % | 12/01/2021 | 1,453,419 | ||||||||
| 1,390,000 | Charles County Maryland | 5.00 | % | 11/01/2019 | 1,452,939 | ||||||||
| 1,970,000 | Charles County Maryland | 5.00 | % | 11/01/2021 | 2,170,684 | ||||||||
| 1,145,000 | Easton, Town of Maryland | 4.00 | % | 02/01/2020 | 1,187,273 | ||||||||
| 1,145,000 | Easton, Town of Maryland | 4.00 | % | 02/01/2021 | 1,208,158 | ||||||||
| 1,085,000 | Maryland National Capital Park & Planning Commission | 5.00 | % | 01/15/2020 | 1,140,823 | ||||||||
| 1,000,000 | Maryland State | 5.00 | % | 11/01/2019 | 1,045,690 | ||||||||
| 1,255,000 | Maryland State | 5.00 | % | 06/01/2023 | 1,428,993 | ||||||||
| 3,145,000 | Maryland State | 5.00 | % | 08/01/2023 | 3,591,842 | ||||||||
| 1,945,000 | Maryland State | 5.00 | % | 08/01/2023 | 2,173,985 | ||||||||
| 2,400,000 | Maryland State | 5.00 | % | 08/01/2024 | 2,786,232 | ||||||||
| 5,000,000 | Montgomery County Maryland | 5.00 | % | 11/01/2023 | 5,738,000 | ||||||||
| 1,000,000 | Prince George’s County Maryland | 5.00 | % | 09/15/2019 | 1,041,330 | ||||||||
| 3,320,000 | Prince George’s County Maryland | 5.00 | % | 09/15/2026 | 3,645,559 | ||||||||
| 5,000,000 | Prince George’s County Maryland | 4.00 | % | 07/15/2037 | 5,314,400 | ||||||||
| 1,270,000 | Talbot County Maryland | 5.00 | % | 12/15/2019 | 1,332,192 | ||||||||
| 1,940,000 | Wicomico County Maryland | 4.00 | % | 11/01/2019 | 2,001,925 | ||||||||
| 1,985,000 | Wicomico County Maryland | 4.00 | % | 11/01/2020 | 2,085,937 | ||||||||
| 2,040,000 | Wicomico County Maryland | 4.00 | % | 11/01/2021 | 2,178,149 | ||||||||
| 2,225,000 | Worcester County Maryland | 5.00 | % | 03/01/2023 | 2,515,296 | ||||||||
| 53,953,732 | |||||||||||||
| Revenue Bonds — 68.3% | |||||||||||||
| 3,480,000 | Austin, Texas | 7.88 | % | 09/01/2026 | 3,761,462 | ||||||||
| 1,000,000 | Baltimore, Maryland | 5.00 | % | 07/01/2028 | 1,169,410 | ||||||||
| 1,320,000 | Baltimore, Maryland | 5.00 | % | 07/01/2028 | 1,552,360 | ||||||||
| 520,000 | Baltimore, Maryland | 5.00 | % | 06/15/2030 | 572,411 | ||||||||
| 2,255,000 | Baltimore, Maryland | 5.00 | % | 09/01/2031 | 2,580,780 | ||||||||
| 1,000,000 | Baltimore, Maryland | 5.00 | % | 07/01/2032 | 1,129,240 | ||||||||
| 670,000 | Baltimore, Maryland | 5.00 | % | 06/15/2033 | 732,203 | ||||||||
| 1,150,000 | Baltimore, Maryland | 5.00 | % | 09/01/2033 | 1,307,320 | ||||||||
| 1,000,000 | Denver County Colorado | 5.00 | % | 10/01/2032 | 1,076,710 | ||||||||
| 1,550,000 | Franklin County Ohio | 5.00 | % | 11/15/2034 | 1,661,491 | ||||||||
| 1,900,000 | Frederick County Maryland^ | 5.00 | % | 09/01/2032 | 2,067,542 | ||||||||
| 1,110,000 | Frederick County Maryland^ | 5.00 | % | 09/01/2037 | 1,191,740 | ||||||||
| 2,320,000 | Frederick County Maryland Series B | 5.50 | % | 07/01/2040 | 2,429,643 | ||||||||
| 2,000,000 | Lancaster County Pennsylvania Hospital Authority | 5.00 | % | 07/01/2035 | 2,143,660 | ||||||||
| 1,000,000 | Maryland Community Development Administration | 3.25 | % | 03/01/2036 | 1,008,770 | ||||||||
| 1,025,000 | Maryland Economic Development Corp.# | 2.55 | % | 12/01/2025 | 1,025,369 | ||||||||
| 700,000 | Maryland Economic Development Corp. | 5.00 | % | 06/01/2027 | 754,516 | ||||||||
| 400,000 | Maryland Economic Development Corp. | 5.00 | % | 07/01/2027 | 435,880 | ||||||||
| 850,000 | Maryland Economic Development Corp. | 5.00 | % | 07/01/2031 | 929,602 | ||||||||
| 2,300,000 | Maryland Economic Development Corp. | 5.75 | % | 06/01/2035 | 2,473,949 | ||||||||
| 1,400,000 | Maryland Economic Development Corp.# | 1.47 | % | 02/15/2043 | 1,400,000 | ||||||||
| 4,500,000 | Maryland Economic Development Corp. | 4.50 | % | 07/01/2044 | 4,615,020 | ||||||||
| 3,000,000 | Maryland Stadium Authority | 5.00 | % | 05/01/2030 | 3,449,550 | ||||||||
| 1,000,000 | Maryland State Department of Transportation | 5.00 | % | 12/15/2020 | 1,079,350 | ||||||||
| 1,055,000 | Maryland State Department of Transportation | 4.00 | % | 05/15/2022 | 1,135,560 | ||||||||
| 260,000 | Maryland State Health & Higher Educational Facilities | 5.00 | % | 07/01/2018 | 260,000 | ||||||||
| 1,015,000 | Maryland State Health & Higher Educational Facilities | 4.00 | % | 07/01/2019 | 1,038,731 | ||||||||
| 515,000 | Maryland State Health & Higher Educational Facilities | 5.00 | % | 07/01/2023 | 560,315 | ||||||||
The accompanying notes are an integral part of these financial statements.
64
Brown Advisory Maryland Bond Fund
Schedule of Investments
June 30, 2018
| Par Value | Security Description | Rate | Maturity | Value $ | ||||||||
| Municipal Bonds — 98.1% (Continued) | ||||||||||||
| Revenue Bonds — 68.3% (Continued) | ||||||||||||
| 485,000 | Maryland State Health & Higher Educational Facilities | 5.00 | % | 07/01/2023 | 527,083 | |||||||
| 500,000 | Maryland State Health & Higher Educational Facilities | 5.00 | % | 08/15/2023 | 565,835 | |||||||
| 465,000 | Maryland State Health & Higher Educational Facilities | 5.50 | % | 07/01/2024 | 465,000 | |||||||
| 500,000 | Maryland State Health & Higher Educational Facilities | 5.00 | % | 07/01/2024 | 542,280 | |||||||
| 1,000,000 | Maryland State Health & Higher Educational Facilities | 6.00 | % | 07/01/2025 | 1,095,220 | |||||||
| 900,000 | Maryland State Health & Higher Educational Facilities | 5.00 | % | 07/01/2025 | 998,775 | |||||||
| 1,500,000 | Maryland State Health & Higher Educational Facilities | 5.00 | % | 07/01/2025 | 1,704,225 | |||||||
| 1,450,000 | Maryland State Health & Higher Educational Facilities | 5.00 | % | 07/01/2025 | 1,648,041 | |||||||
| 1,060,000 | Maryland State Health & Higher Educational Facilities | 5.00 | % | 07/01/2025 | 1,170,335 | |||||||
| 420,000 | Maryland State Health & Higher Educational Facilities | 5.00 | % | 07/01/2026 | 482,924 | |||||||
| 2,500,000 | Maryland State Health & Higher Educational Facilities | 5.25 | % | 07/01/2026 | 2,807,975 | |||||||
| 1,605,000 | Maryland State Health & Higher Educational Facilities | 5.00 | % | 07/01/2028 | 1,792,047 | |||||||
| 3,500,000 | Maryland State Health & Higher Educational Facilities | 5.00 | % | 07/01/2029 | 4,051,215 | |||||||
| 100,000 | Maryland State Health & Higher Educational Facilities | 4.00 | % | 10/01/2030 | 105,070 | |||||||
| 1,130,000 | Maryland State Health & Higher Educational Facilities | 6.25 | % | 07/01/2031 | 1,238,503 | |||||||
| 300,000 | Maryland State Health & Higher Educational Facilities | 4.00 | % | 10/01/2031 | 315,036 | |||||||
| 1,070,000 | Maryland State Health & Higher Educational Facilities | 5.00 | % | 07/01/2032 | 1,181,055 | |||||||
| 250,000 | Maryland State Health & Higher Educational Facilities | 5.00 | % | 06/01/2033 | 279,188 | |||||||
| 1,250,000 | Maryland State Health & Higher Educational Facilities | 5.00 | % | 08/15/2033 | 1,393,425 | |||||||
| 235,000 | Maryland State Health & Higher Educational Facilities | 5.00 | % | 07/01/2034 | 242,828 | |||||||
| 15,000 | Maryland State Health & Higher Educational Facilities | 5.00 | % | 07/01/2034 | 15,383 | |||||||
| 200,000 | Maryland State Health & Higher Educational Facilities | 4.50 | % | 07/01/2035 | 200,174 | |||||||
| 430,000 | Maryland State Health & Higher Educational Facilities | 5.00 | % | 06/01/2036 | 479,570 | |||||||
| 3,400,000 | Maryland State Health & Higher Educational Facilities | 5.00 | % | 05/15/2040 | 3,608,454 | |||||||
| 1,350,000 | Maryland State Health & Higher Educational Facilities# | 1.49 | % | 07/01/2041 | 1,350,000 | |||||||
| 1,200,000 | Maryland State Health & Higher Educational Facilities | 5.00 | % | 07/01/2044 | 1,335,912 | |||||||
| 4,255,000 | Maryland State Transportation Authority | 5.00 | % | 03/01/2022 | 4,657,608 | |||||||
| 1,000,000 | Maryland State Transportation Authority | 5.00 | % | 06/01/2022 | 1,098,840 | |||||||
| 4,420,000 | Maryland State Transportation Authority | 5.00 | % | 07/01/2028 | 5,277,657 | |||||||
| 7,000,000 | Maryland State Transportation Authority | 5.00 | % | 07/01/2036 | 7,000,000 | |||||||
| 2,525,000 | Maryland Water Quality Financing Administration | 5.00 | % | 03/01/2020 | 2,663,850 | |||||||
| 5,000,000 | Massachusetts Port Authority # | 4.19 | % | 01/01/2031 | 5,000,000 | |||||||
| 1,370,000 | Montgomery County Maryland Housing Opportunities Commission# | 1.50 | % | 01/01/2049 | 1,370,000 | |||||||
| 1,185,000 | New Hope Texas Cultural Education Facilities Finance Corp. | 5.75 | % | 07/01/2051 | 1,298,523 | |||||||
| 4,000,000 | New York State Energy Research & Development Authority# | 5.23 | % | 07/01/2029 | 4,000,000 | |||||||
| 4,000,000 | New York Transportation Development Corp. | 5.00 | % | 08/01/2026 | 4,223,760 | |||||||
| 2,000,000 | Newport News Virginia Economic Development Authority | 5.00 | % | 12/01/2031 | 2,129,760 | |||||||
| 2,000,000 | North Carolina Medical Care Commission | 5.00 | % | 10/01/2031 | 2,169,640 | |||||||
| 1,005,000 | Prince William County Virginia Industrial Development Authority | 5.00 | % | 01/01/2023 | 1,105,339 | |||||||
| 400,000 | St Mary’s College of Maryland | 4.00 | % | 09/01/2018 | 403,328 | |||||||
| 4,335,000 | University System of Maryland | 5.00 | % | 04/01/2022 | 4,815,058 | |||||||
| 3,280,000 | Washington State Housing Finance Commission^ | 4.00 | % | 01/01/2026 | 3,391,717 | |||||||
| 123,743,217 | ||||||||||||
| Total Municipal Bonds (Cost $178,247,536) | 177,696,949 | |||||||||||
The accompanying notes are an integral part of these financial statements.
65
Brown Advisory Maryland Bond Fund
Schedule of Investments
June 30, 2018
| Shares | Security Description | Value $ | ||||||
| Short-Term Investments — 0.7% | ||||||||
| Money Market Funds — 0.7% | ||||||||
| 1,354,987 | First American Treasury Obligations Fund — Class Z, 1.75%* | 1,354,987 | ||||||
| Total Short-Term Investments (Cost $1,354,987) | 1,354,987 | |||||||
| Total Investments — 98.8% (Cost $179,602,523) | 179,051,936 | |||||||
| Other Assets in Excess of Liabilities — 1.2% | 2,178,436 | |||||||
| NET ASSETS — 100.0% | $ | 181,230,372 | ||||||
| # | Variable rate security. Rate disclosed is as of June 30, 2018. | |
| * | Annualized seven-day yield as of June 30, 2018. | |
| ^ | Security exempt from registration under Rule 144A of the Securities Act of 1933. These securities may be resold in transactions exempt from registration, normally to qualified institutional buyers. At June 30, 2018, the value of these securities amounted to $6,650,999 or 3.7% of net assets. |
The accompanying notes are an integral part of these financial statements.
66
Brown Advisory Tax Exempt Bond Fund
A Message to Our Shareholders
June 30, 2018
Dear Shareholders:
During the year ended June 30, 2018, the Brown Advisory Tax Exempt Bond Fund (the “Fund”) increased 2.78% in value. During the same period, the Fund’s benchmark, the Bloomberg Barclays 1-10 Year Blended Municipal Blend Index (the “Index”), increased 0.61%.
The Fund posted attractive relative performance for the year ended June 30, 2018 – a period where broad intermediate-term municipal yields moved higher. The Fund benefitted from a combination of our bottom-up credit and sector selection, as well as solid performance from our municipal floating-rate holdings once short-term municipal yields began moving higher.
Following a tumultuous period at the end of 2016, the municipal market began finding its footing in early 2017. However, policy uncertainty hung like a cloud over the market as the year progressed. In an attempt to dampen market volatility stemming from both the effects of U.S. federal tax reform and an active Fed tightening cycle, many investors sought refuge in the perceived safety of short-maturity bonds. This flight-to-quality bid in short-maturity municipal securities temporarily suppressed yields on those bonds to levels that we viewed as unsustainable given investable alternatives. While we generally avoid making investment decisions based on predicting interest rates, as a consequence of the poor risk/reward profile in two-to-five year fixed rate bonds, we favored floating-rate securities and ultra-short callable bond structures while maintaining the duration of the Fund.
These defensive positions benefitted the Fund as short- and intermediate-term municipal yields began to normalize to higher levels. After being imperiled by potential tax legislation for much of the year as negotiations continued, the tax exemptions most essential to the municipal bond market came away basically unscathed in the final bill. To be clear, we do not attempt to predict political policy outcomes or specific interest rate movements. Instead, we took notice of the high valuations (on a risk-adjusted basis) of short-term fixed rate bonds and sought other municipal structures that we believed offered a better risk/reward balance while remaining appropriate for the mandate.
Turning to credit, we again saw strong relative performance in many of our credit-sensitive revenue-backed sectors. Generic BBB and lower-rated revenue-backed municipals outperformed bonds with higher ratings for the period; but, our specific selection effect provided meaningful relative outperformance compared to the broad market.
We rotated out of many of our lower-rated holdings and added exposure to AA-rated essential service revenue bonds. We saw the relative strength in lower-rated municipal credit as an opportunity to increase overall credit quality in the portfolio without sacrificing much in opportunity cost. While we are not specifically concerned about weakening trends in municipal credit, our holistic approach to risk management seeks to protect against downside risk. In the current environment of continued spread compression, we are happy to trim credit exposure in favor of other high-quality structures that we believe have lower risk, such as municipal floating-rate bonds.
Finding the right balance of risk and reward at this point in the market cycle requires a disciplined process, an open mind and discerning analysis. We are benchmark-aware, but not benchmark-beholden. In the current environment, we believe that our use of outside-of-benchmark securities, like municipal floating-rate bonds, can offer a better return profile and more extensive diversification from the various risks of the market than the Index. We will seek to provide opportunities for both principal stability and upside potential in a wide variety of economic scenarios.
Sincerely,
Stephen M. Shutz, CFA
Portfolio Manager
67
Brown Advisory Tax Exempt Bond Fund
A Message to Our Shareholders
June 30, 2018
Past performance is not a guarantee of future results.
Mutual fund investing involves risk. Principal loss is possible. The Fund is non-diversified which means it may invest a large percentage of its assets in the securities of fewer issuers. Concentration in a limited number of issuers exposes the Fund to greater market risk than if its assets were diversified among a greater number of issuers. The Fund is also subject to interest rate risk which is the risk that debt securities in the Fund’s portfolio will decline in value because of an increase in market interest rates. This risk is usually greater for longer-term debt securities. Income from tax-exempt funds may be subject to state and local taxes and a portion of income may be subject to the Federal Alternative minimum tax for certain investors.
Fund holdings and sector allocations are subject to change and should not be considered a recommendation to buy or sell any security. For a complete list of fund holdings, please refer to the Schedule of Investments provided in this report.
Credit Quality weights by rating are derived from the highest bond rating as determined by Standard & Poor’s (“S&P”), Moody’s or Fitch. Bond ratings are grades given to bonds that indicate their credit quality as determined by private independent rating services such as S&P, Moody’s and Fitch. These firms evaluate a bond issuer’s financial strength, or its ability to pay a bond’s principal and interest in a timely fashion. Ratings are expressed as letters ranging from ‘AAA’, which is the highest grade, to ‘D’, which is the lowest grade. In limited situations when none of the three rating agencies have issued a formal rating, the Advisor will classify the security as nonrated.
Definitions for terms and indices are provided in the Glossary of Terms.
68
Brown Advisory Tax Exempt Bond Fund
Performance Information & Portfolio Holdings Summary
June 30, 2018
| PORTFOLIO HOLDINGS | % of Net Assets |
| Revenue Bonds | 83.6% |
| General Obligation Bonds | 12.3% |
| Money Market Funds | 2.6% |
| Other Assets and Liabilities | 1.5% |
100.0% |
GROWTH OF A $10,000 INVESTMENT
The following chart reflects the change in value of a hypothetical $10,000 investment, including reinvested dividends and distributions, in the Fund as measured against the broad-based municipal bond index. The Bloomberg Barclays 1-10 Year Blended Municipal Bond Index (“Index”) is a market index of high quality, domestic fixed income securities with maturities of less than 10 years. The Index is unmanaged and does not reflect the deduction of fees, such as investment management fees. Investors cannot invest directly in an index.

| Since Inception | |||
Average Annual Total Return | One Year | Five Year | (6/29/12) |
| Investor Shares | 2.78% | 2.60% | 2.17% |
| Bloomberg Barclays 1-10 Year Blended Municipal Bond Index | 0.61% | 2.31% | 1.98% |
Investor Shares | |||
Gross Expense Ratio1 | 0.49% | ||
Net Expense Ratio1 | 0.49% |
Past performance does not guarantee future results. The performance data quoted represents past performance and current returns may be lower or higher. The investment return and net asset value will fluctuate so that an investor’s shares, when redeemed, may be worth more or less than the original cost. To obtain performance information current to the most recent month end, please visit our website at brownadvisoryfunds.com/performance.html. The performance table and graph above do not reflect the deduction of taxes that a shareholder would pay on Fund distributions or the redemption of Fund shares. Performance data does not reflect the imposition of the redemption fee of 1.00% on shares redeemed within 14 days, and if it did, performance would have been lower.
1 | Per the Fund’s prospectus dated October 31, 2017. Refer to the financial highlights for the gross and net expense ratios for the year ended as of the date of this report. Please note that the expense ratios per the prospectus include acquired fund fees and expenses (as applicable) and the expense ratios in the financial highlights do not. |
69
Brown Advisory Tax Exempt Bond Fund
Schedule of Investments
June 30, 2018
| Par Value | Security Description | Rate | Maturity | Value $ | |||||||||
| Municipal Bonds — 95.9% | |||||||||||||
| General Obligation Bonds — 12.3% | |||||||||||||
| 2,350,000 | Baltimore County Maryland | 4.00 | % | 03/01/2034 | 2,527,354 | ||||||||
| 1,320,000 | Connecticut, State of | 5.00 | % | 10/15/2022 | 1,453,201 | ||||||||
| 1,750,000 | Connecticut, State of | 4.00 | % | 06/15/2036 | 1,774,395 | ||||||||
| 1,700,000 | Connecticut, State of | 4.00 | % | 06/15/2037 | 1,722,287 | ||||||||
| 1,025,000 | District of Columbia | 5.00 | % | 06/01/2029 | 1,183,885 | ||||||||
| 6,000,000 | District of Columbia | 4.00 | % | 06/01/2034 | 6,340,860 | ||||||||
| 2,210,000 | Florida, State of | 4.00 | % | 06/01/2031 | 2,401,452 | ||||||||
| 305,000 | Grundy & Will Counties Illinois Community Unit School District | 5.88 | % | 08/01/2028 | 306,058 | ||||||||
| 1,020,000 | Honolulu, City & County of Hawaii | 5.00 | % | 10/01/2029 | 1,182,843 | ||||||||
| 2,500,000 | Illinois, State of | 5.00 | % | 04/01/2022 | 2,504,125 | ||||||||
| 3,535,000 | Massachusetts, Commonwealth of (3 Month LIBOR USD + 0.57%) | 2.15 | % | 05/01/2037 | 3,411,416 | ||||||||
| 2,130,000 | Pennsylvania, Commonwealth of | 5.00 | % | 01/15/2028 | 2,446,880 | ||||||||
| 2,205,000 | Pennsylvania, Commonwealth of | 5.00 | % | 02/01/2028 | 2,505,078 | ||||||||
| 1,365,000 | Rosemont, Village of Illinois | 5.00 | % | 12/01/2025 | 1,530,711 | ||||||||
| 3,700,000 | Roseville Independent School District | 5.00 | % | 02/01/2030 | 4,289,299 | ||||||||
| 6,000,000 | Texas, State of | 5.00 | % | 08/01/2031 | 6,015,240 | ||||||||
| 5,000,000 | Washington, State of | 5.00 | % | 02/01/2033 | 5,679,050 | ||||||||
| 3,340,000 | West Contra Costa California Unified School District | 4.00 | % | 08/01/2038 | 3,550,787 | ||||||||
| 3,060,000 | West Contra Costa California Unified School District | 4.00 | % | 08/01/2038 | 3,253,117 | ||||||||
| 54,078,038 | |||||||||||||
| Revenue Bonds — 83.6% | |||||||||||||
| 550,000 | AltaPointe Health Systems, Inc. | 3.00 | % | 05/01/2019 | 552,365 | ||||||||
| 565,000 | AltaPointe Health Systems, Inc. | 3.00 | % | 05/01/2020 | 567,187 | ||||||||
| 1,285,000 | Arizona Sports & Tourism Authority | 5.00 | % | 07/01/2028 | 1,376,068 | ||||||||
| 1,125,000 | Arlington Texas Higher Education Finance Corp. | 5.00 | % | 02/15/2025 | 1,293,289 | ||||||||
| 1,500,000 | Arlington, Texas | 5.00 | % | 02/15/2037 | 1,729,995 | ||||||||
| 4,500,000 | Austin, Texas | 7.88 | % | 09/01/2026 | 4,863,960 | ||||||||
| 2,970,000 | Central Texas Turnpike System | 5.00 | % | 08/15/2027 | 3,301,363 | ||||||||
| 2,615,000 | Chattanooga Tennessee Health Educational & Housing Facility Board | 5.25 | % | 01/01/2040 | 2,799,305 | ||||||||
| 3,000,000 | Chicago Illinois Midway International Airport | 5.00 | % | 01/01/2028 | 3,335,580 | ||||||||
| 1,000,000 | Colorado Health Facilities Authority | 5.00 | % | 06/01/2027 | 1,120,000 | ||||||||
| 1,300,000 | Colorado Health Facilities Authority | 5.00 | % | 12/01/2027 | 1,413,373 | ||||||||
| 1,300,000 | Colorado Health Facilities Authority | 5.25 | % | 02/01/2031 | 1,371,669 | ||||||||
| 1,500,000 | Colorado Health Facilities Authority | 5.00 | % | 12/01/2035 | 1,629,345 | ||||||||
| 5,000,000 | Commonwealth Financing Authority | 5.00 | % | 06/01/2025 | 5,676,650 | ||||||||
| 2,855,000 | Connecticut Special Tax Revenue | 5.00 | % | 01/01/2024 | 3,151,520 | ||||||||
| 2,000,000 | Connecticut Special Tax Revenue | 5.00 | % | 01/01/2028 | 2,183,720 | ||||||||
| 1,000,000 | Connecticut Special Tax Revenue | 5.00 | % | 10/01/2029 | 1,096,850 | ||||||||
| 2,095,000 | Connecticut Special Tax Revenue | 5.00 | % | 08/01/2031 | 2,319,500 | ||||||||
| 4,390,000 | Cumberland County Pennsylvania Municipal Authority | 4.00 | % | 01/01/2033 | 4,424,988 | ||||||||
| 1,100,000 | Denver Colorado Convention Center Hotel Authority | 5.00 | % | 12/01/2028 | 1,250,183 | ||||||||
| 9,000,000 | Detroit Michigan Sewage Disposal System (3 Month LIBOR USD + 0.60%) | 2.15 | % | 07/01/2032 | 8,608,050 | ||||||||
| 2,425,000 | District of Columbia# | 5.73 | % | 08/01/2038 | 2,303,168 | ||||||||
| 5,075,000 | District of Columbia# | 5.70 | % | 08/01/2038 | 4,820,032 | ||||||||
| 1,700,000 | Educational Enhancement Funding Corp. | 5.00 | % | 06/01/2023 | 1,896,061 | ||||||||
| 1,000,000 | Fairfax County Virginia Economic Development Authority | 5.00 | % | 10/01/2029 | 1,184,320 | ||||||||
| 500,000 | Florida Municipal Power Agency | 5.25 | % | 10/01/2023 | 504,755 | ||||||||
| 1,000,000 | Hamilton County Ohio Convention Facilities Authority | 5.00 | % | 12/01/2033 | 1,097,090 | ||||||||
| 1,000,000 | Harris County Texas Cultural Education Facilities Finance Corp. | 5.00 | % | 12/01/2035 | 1,098,950 | ||||||||
| 1,000,000 | Harris County-Houston Texas Sports Authority | 5.00 | % | 11/15/2028 | 1,126,200 | ||||||||
| 10,000,000 | Harris County Texas (3 Month LIBOR USD + 0.67%) | 2.24 | % | 08/15/2035 | 9,342,300 | ||||||||
| 4,925,000 | Hawaii Department of Budget & Finance, State of | 6.50 | % | 07/01/2039 | 5,138,154 | ||||||||
| 10,000,000 | Health & Educational Facilities Authority of the State of Missouri# | 3.08 | % | 06/01/2031 | 10,000,000 | ||||||||
| 12,375,000 | Health & Educational Facilities Authority of the State of Missouri# | 3.08 | % | 06/01/2031 | 12,375,000 | ||||||||
The accompanying notes are an integral part of these financial statements.
70
Brown Advisory Tax Exempt Bond Fund
Schedule of Investments
June 30, 2018
| Par Value | Security Description | Rate | Maturity | Value $ | ||||||||
| Municipal Bonds — 95.9% (Continued) | ||||||||||||
| Revenue Bonds — 83.6% (Continued) | ||||||||||||
| 1,500,000 | Henrico County Virginia Economic Development Authority# | 3.50 | % | 08/23/2027 | 1,500,000 | |||||||
| 2,050,000 | Houston Texas Airport System# | 3.80 | % | 07/01/2030 | 2,050,000 | |||||||
| 6,645,000 | Houston Texas Combined Utility System | 5.00 | % | 11/15/2035 | 7,632,314 | |||||||
| 6,070,000 | Imperial California Irrigation District Electric System | 4.00 | % | 11/01/2037 | 6,423,517 | |||||||
| 1,000,000 | Indiana Finance Authority | 5.00 | % | 09/15/2025 | 1,096,920 | |||||||
| 1,750,000 | Indiana Finance Authority | 5.00 | % | 09/15/2028 | 1,903,213 | |||||||
| 1,250,000 | Kentucky Economic Development Finance Authority | 5.00 | % | 05/01/2024 | 1,275,400 | |||||||
| 3,000,000 | Lancaster County Pennsylvania Hospital Authority | 5.00 | % | 07/01/2035 | 3,215,490 | |||||||
| 2,280,000 | Las Vegas Nevada Redevelopment Agency | 5.00 | % | 06/15/2028 | 2,588,279 | |||||||
| 1,000,000 | Long Island Power Authority | 5.00 | % | 09/01/2030 | 1,167,850 | |||||||
| 2,000,000 | Louisiana Public Facilities Authority | 3.50 | % | 06/01/2030 | 2,016,520 | |||||||
| 1,000,000 | Louisiana Public Facilities Authority | 5.00 | % | 06/01/2036 | 1,108,170 | |||||||
| 985,000 | Lower Colorado River Texas Authority | 5.50 | % | 05/15/2036 | 1,017,131 | |||||||
| 5,030,000 | Maryland Health & Higher Educational Facilities Authority | 5.50 | % | 01/01/2036 | 5,751,805 | |||||||
| 7,400,000 | Massachusetts Health & Educational Facilities Authority# | 3.95 | % | 07/01/2023 | 7,400,000 | |||||||
| 150,000 | Massachusetts Health & Educational Facilities Authority | 5.00 | % | 10/01/2024 | 150,416 | |||||||
| 1,160,000 | Massachusetts Health & Educational Facilities Authority | 6.25 | % | 11/15/2032 | 1,206,934 | |||||||
| 1,425,000 | Massachusetts Municipal Wholesale Electric Co.# | 3.40 | % | 07/01/2018 | 1,425,000 | |||||||
| 1,800,000 | Massachusetts Municipal Wholesale Electric Co.# | 3.36 | % | 07/01/2019 | 1,800,000 | |||||||
| 9,525,000 | Massachusetts Port Authority# | 4.19 | % | 01/01/2031 | 9,525,000 | |||||||
| 2,140,000 | Metropolitan Transportation Authority | 6.50 | % | 11/15/2028 | 2,178,520 | |||||||
| 1,895,000 | Miami Beach Florida Health Facilities | 5.00 | % | 11/15/2029 | 2,024,940 | |||||||
| 6,135,000 | Miami-Dade County Florida Water & Sewer System Revenue | 4.00 | % | 10/01/2035 | 6,509,726 | |||||||
| 3,565,000 | Montgomery County Ohio | 5.00 | % | 05/01/2039 | 3,625,962 | |||||||
| 1,600,000 | Mountain House California Public Financing Authority | 5.00 | % | 12/01/2027 | 1,604,240 | |||||||
| 2,565,000 | Mountain House California Public Financing Authority | 5.00 | % | 12/01/2032 | 2,570,976 | |||||||
| 1,000,000 | New Hope Texas Cultural Education Facilities Finance Corp. | 5.00 | % | 04/01/2029 | 1,084,980 | |||||||
| 1,080,000 | New Hope Texas Cultural Education Facilities Finance Corp. | 5.00 | % | 07/01/2031 | 1,164,002 | |||||||
| 1,750,000 | New Hope Texas Cultural Education Facilities Finance Corp. | 5.25 | % | 07/01/2036 | 1,883,525 | |||||||
| 1,250,000 | New Hope Texas Cultural Education Facilities Finance Corp. | 5.50 | % | 07/01/2046 | 1,357,613 | |||||||
| 1,000,000 | New Hope Texas Cultural Education Facilities Finance Corp. | 5.75 | % | 07/01/2051 | 1,095,800 | |||||||
| 5,010,000 | New York City Industrial Development Agency# | 2.80 | % | 10/01/2029 | 5,010,000 | |||||||
| 2,375,000 | New York City Industrial Development Agency | 5.00 | % | 01/01/2039 | 2,404,854 | |||||||
| 3,000,000 | New York City Industrial Development Agency | 5.00 | % | 01/01/2046 | 3,040,500 | |||||||
| 1,000,000 | New York City Transitional Finance Authority | 5.00 | % | 08/01/2033 | 1,138,970 | |||||||
| 10,000,000 | New York State Energy Research & Development Authority# | 0.94 | % | 12/01/2023 | 10,000,000 | |||||||
| 700,000 | New York State Energy Research & Development Authority# | 5.26 | % | 12/01/2025 | 700,000 | |||||||
| 430,000 | New York State Energy Research & Development Authority# | 5.25 | % | 12/01/2025 | 430,000 | |||||||
| 150,000 | New York State Energy Research & Development Authority# | 5.18 | % | 12/01/2026 | 150,000 | |||||||
| 9,000,000 | New York State Energy Research & Development Authority# | 5.23 | % | 07/01/2029 | 9,000,000 | |||||||
| 5,900,000 | New York State Energy Research & Development Authority# | 2.73 | % | 05/01/2032 | 5,900,000 | |||||||
| 2,250,000 | New York State Energy Research & Development Authority# | 2.69 | % | 05/01/2034 | 2,250,000 | |||||||
| 5,950,000 | New York State Energy Research & Development Authority# | 2.71 | % | 05/01/2034 | 5,950,000 | |||||||
| 550,000 | New York State Energy Research & Development Authority# | 2.56 | % | 10/01/2036 | 550,000 | |||||||
| 500,000 | New York State Energy Research & Development Authority# | 2.58 | % | 10/01/2036 | 500,000 | |||||||
| 3,375,000 | Newport News Virginia Economic Development Authority | 5.00 | % | 12/01/2031 | 3,593,970 | |||||||
| 1,760,000 | Niagara County New York Tobacco Asset Securitization Corp. | 5.00 | % | 05/15/2024 | 2,003,813 | |||||||
| 2,000,000 | North Carolina Medical Care Commission | 5.00 | % | 10/01/2031 | 2,169,640 | |||||||
| 1,000,000 | North Texas Tollway Authority | 5.00 | % | 01/01/2030 | 1,143,440 | |||||||
| 4,165,000 | North Texas Tollway Authority | 5.00 | % | 01/01/2032 | 4,676,754 | |||||||
| 1,000,000 | North Texas Tollway Authority | 5.00 | % | 01/01/2038 | 1,090,980 | |||||||
| 5,000,000 | North Texas Tollway Authority | 5.25 | % | 01/01/2044 | 5,079,800 | |||||||
| 5,950,000 | Ohio Air Quality Development Authority^ | 3.75 | % | 01/15/2028 | 6,050,317 | |||||||
| 8,500,000 | Orange County Florida Health Facilities Authority | 5.00 | % | 01/01/2039 | 8,629,455 | |||||||
| 3,790,000 | Oregon State Facilities Authority | 5.00 | % | 10/01/2031 | 4,263,219 | |||||||
The accompanying notes are an integral part of these financial statements.
71
Brown Advisory Tax Exempt Bond Fund
Schedule of Investments
June 30, 2018
| Par Value/ | ||||||||||||
| Shares | Security Description | Rate | Maturity | Value $ | ||||||||
| Municipal Bonds — 95.9% (Continued) | ||||||||||||
| Revenue Bonds — 83.6% (Continued) | ||||||||||||
| 1,250,000 | Palm Beach County Florida Health Facilities Authority | 5.00 | % | 12/01/2031 | 1,363,550 | |||||||
| 1,000,000 | Park Creek Metropolitan District | 5.00 | % | 12/01/2034 | 1,127,040 | |||||||
| 1,535,000 | Pennsylvania Economic Development Financing Authority | 5.00 | % | 11/01/2027 | 1,663,863 | |||||||
| 1,000,000 | Pennsylvania Turnpike Commission | 5.00 | % | 12/01/2034 | 1,132,220 | |||||||
| 6,360,000 | Pennsylvania Turnpike Commission | 4.00 | % | 12/01/2036 | 6,540,878 | |||||||
| 10,000,000 | Pinellas County Florida Health Facilities Authority# | 2.97 | % | 11/15/2023 | 10,000,000 | |||||||
| 1,000,000 | Port of Seattle Washington | 5.00 | % | 02/01/2030 | 1,147,050 | |||||||
| 1,110,000 | Prince William County Virginia Industrial Development Authority | 5.00 | % | 01/01/2025 | 1,232,511 | |||||||
| 1,420,000 | Prince William County Virginia Industrial Development Authority | 5.00 | % | 01/01/2031 | 1,543,781 | |||||||
| 1,500,000 | Public Finance Authority | 2.63 | % | 11/01/2025 | 1,453,575 | |||||||
| 1,500,000 | Public Finance Authority^ | 5.00 | % | 09/01/2030 | 1,571,100 | |||||||
| 4,410,000 | San Diego California Tobacco Settlement Revenue Funding Corp. | 4.00 | % | 06/01/2032 | 4,500,449 | |||||||
| 1,000,000 | School Board of Miami-Dade County Florida | 5.00 | % | 08/01/2023 | 1,002,800 | |||||||
| 1,400,000 | Springfield, City of Illinois Electric | 5.00 | % | 03/01/2026 | 1,580,488 | |||||||
| 1,000,000 | St. Louis County Missouri Industrial Development Authority | 5.00 | % | 11/15/2041 | 1,035,440 | |||||||
| 6,800,000 | Syracuse New York Industrial Development Agency# | 2.91 | % | 12/01/2029 | 6,800,000 | |||||||
| 1,125,000 | Tarrant County Texas Cultural Education Facilities Finance Corp. | 5.00 | % | 11/15/2021 | 1,216,373 | |||||||
| 1,185,000 | Tarrant County Texas Cultural Education Facilities Finance Corp. | 5.00 | % | 11/15/2022 | 1,300,620 | |||||||
| 8,000,000 | Texas Water Development Board | 4.00 | % | 10/15/2035 | 8,477,200 | |||||||
| 1,115,000 | Tobacco Settlement Authority | 5.25 | % | 06/01/2032 | 1,197,298 | |||||||
| 2,405,000 | University of Connecticut | 5.00 | % | 03/15/2029 | 2,682,609 | |||||||
| 5,000,000 | University of Houston | 5.00 | % | 02/15/2027 | 5,831,750 | |||||||
| 2,600,000 | University of Houston | 5.00 | % | 02/15/2028 | 3,020,784 | |||||||
| 5,755,000 | Virginia Public Building Authority | 4.00 | % | 08/01/2036 | 6,108,012 | |||||||
| 4,000,000 | Virginia Small Business Financing Authority | 5.00 | % | 07/01/2034 | 4,252,600 | |||||||
| 1,000,000 | Washington State Housing Finance Commission^ | 4.00 | % | 01/01/2026 | 1,034,060 | |||||||
| 2,655,000 | Washington State Housing Finance Commission^ | 5.00 | % | 01/01/2031 | 2,865,064 | |||||||
| 1,505,000 | Washoe County Nevada | 5.00 | % | 02/01/2043 | 1,530,615 | |||||||
| 970,000 | Wayne County Michigan Airport Authority | 5.75 | % | 12/01/2024 | 986,451 | |||||||
| 1,610,000 | Wisconsin Health & Educational Facilities Authority | 5.00 | % | 05/01/2027 | 1,759,311 | |||||||
| 1,730,000 | Wisconsin Health & Educational Facilities Authority | 5.00 | % | 08/15/2028 | 1,898,104 | |||||||
| 650,000 | Wisconsin Health & Educational Facilities Authority | 5.00 | % | 09/15/2037 | 679,978 | |||||||
| 1,010,000 | Yamhill County Oregon Hospital Authority | 4.00 | % | 11/15/2026 | 1,041,593 | |||||||
| 480,000 | Yamhill County Oregon Hospital Authority | 5.00 | % | 11/15/2031 | 521,832 | |||||||
| 460,000 | Yamhill County Oregon Hospital Authority | 5.00 | % | 11/15/2036 | 495,457 | |||||||
| 1,085,000 | Yamhill County Oregon Hospital Authority | 5.00 | % | 11/15/2046 | 1,161,037 | |||||||
| 367,786,438 | ||||||||||||
| Total Municipal Bonds (Cost $422,062,638) | 421,864,476 | |||||||||||
| Short-Term Investments — 2.6% | ||||||||||||
| Money Market Funds — 2.6% | ||||||||||||
| 11,334,014 | First American Treasury Obligations Fund — Class Z, 1.75%* | 11,334,014 | ||||||||||
| Total Short-Term Investments (Cost $11,334,014) | 11,334,014 | |||||||||||
| Total Investments — 98.5% (Cost $433,396,652) | 433,198,490 | |||||||||||
| Other Assets in Excess of Liabilities — 1.5% | 6,707,540 | |||||||||||
| NET ASSETS — 100.0% | $ | 439,906,030 | ||||||||||
| # | Variable rate security. Rate disclosed is as of June 30, 2018. | |
| ^ | Security exempt from registration under Rule 144A of the Securities Act of 1933. These securities may be resold in transactions exempt from registration, normally to qualified institutional buyers. At June 30, 2018 the value of these securities amounted to $11,520,541 or 2.6% of net assets. | |
| * | Annualized seven-day yield as of June 30, 2018. |
The accompanying notes are an integral part of these financial statements.
72
Brown Advisory Mortgage Securities Fund
A Message to Our Shareholders
June 30, 2018
Dear Shareholders:
During the year ended June 30, 2018, the Brown Advisory Mortgage Securities Fund – Investor Shares (the “Fund”) gained 0.21%, in line with the 0.15% return for the Fund’s primary benchmark, the Bloomberg Barclays Mortgage Backed Securities Index.
The Fund seeks to generate performance through current income generation from high-quality mortgage-related securities. The mortgage sector in particular is highly sensitive to forward-looking interest rate volatility and assumptions around borrower refinancing behavior; detailed individual security selection with a keen focus on downside risk across all interest rate environments supports our disciplined process.
To this end, our individual security selections were the main driver of performance, allowing the Fund to perform in line with the benchmark while maintaining a more defensive stance with respect to rate volatility. Our allocation to out-of-benchmark securities contributed to the majority of the Fund’s total return.
Sector weightings to securities with credit sensitivity helped performance through the year as they outperformed mortgage-backed securities implicitly backed by the United States government. During the year, spreads in these products moved tighter through January, but then saw a period of widening, ending in-line or slightly better for the entire year.
As interest rates moved higher over the period, our allocation to low duration asset-backed securities and floating-rate securitized products were among the Fund’s best performers. The Fund’s duration was roughly neutral during the entire period, leaving little relative effect from the direction of rates. However, the Fund was also positioned for longer-term rates to rise less than shorter-term rates, which did come to fruition.
It is always hard to know when a cycle will turn. If the U.S. economy is turning weaker a year from now, we will look back at the flattening yield curve and widening credit spreads as warning signs. However both of these indicators have produced false signals many times in the past. We will seek to perform well whatever the macro economy does by buying bonds with attractive yields and focusing our analysis on downside risks.
Sincerely,
Thomas D.D. Graff, CFA
Portfolio Manager
Past performance is not a guarantee of future results.
Mutual fund investing involves risk. Principal loss is possible. Investments in debt securities typically decrease in value when interest rates rise. This risk is usually greater for longer-term debt securities. Investments in Asset-Backed and Mortgage-Backed securities include additional risks that investor should be aware of including credit risk, prepayment risk, possible illiquidity and default, as well as increased susceptibility to adverse economic developments. Certain fixed income securities held by the Fund may be difficult (or impossible) to sell at the time and at the price the Adviser would like. As a result, the Fund may have to hold these securities longer than it would like and may forego other investment opportunities. Issuers may experience an acceleration in prepayments of mortgage loans or other receivables backing the issuers’ fixed income securities when interest rates decline, which can shorten the maturity of the security, force the Fund to invest in securities with lower interest rates, and reduce the Fund’s return. Issuers may decrease prepayments of principal when interest rates increase, extending the maturity of a fixed income security and causing the value of the security to decline. Investing involves risk. Principal loss is possible. Investors should consult a tax professional for advice and information concerning the tax features of mortgage backed securities and fixed coupon bonds. Mortgage-backed securities (MBS) are bonds secured by a mortgage or collection of mortgages. Diversification does not assure a profit nor protect against loss in a declining market.
Fund holdings and sector allocations are subject to change and should not be considered a recommendation to buy or sell any security. For a complete list of fund holdings, please refer to the Schedule of Investments provided in this report.
Definitions for terms and indices are provided in the Glossary of Terms.
73
Brown Advisory Mortgage Securities Fund
Performance Information & Portfolio Holdings Summary
June 30, 2018
| PORTFOLIO HOLDINGS | % of Net Assets |
| Mortgage Backed Securities | 100.3% |
| Asset Backed Securities | 18.1% |
| Municipal Bonds | 5.4% |
| Money Market Funds | 2.1% |
| U.S. Treasury Bills | 0.4% |
| Preferred Stocks | 0.2% |
| Other Assets and Liabilities | (26.5)% |
100.0% |
GROWTH OF A $10,000 INVESTMENT
The following chart reflects the change in value of a hypothetical $10,000 investment, including reinvested dividends and distributions, in the Fund as measured against a broad-based bond index. The Bloomberg Barclays Mortgage Backed Securities Index (“Index”) is a market value-weighted index which covers the mortgage-backed securities component of the Barclays US Aggregate Bond Index. The Index is composed of agency mortgage-backed passthrough securities of the Government National Mortgage Association (Ginnie Mae), the Federal National Mortgage Association (Fannie Mae), and the Federal Home Loan Mortgage Corporation (Freddie Mac) with a minimum $150 million par amount outstanding and a weighted-average maturity of at least 1 year. The Index includes reinvestment of income. The Index is unmanaged and does not reflect the deduction of fees, such as investment management fees. Investors cannot invest directly in an index.
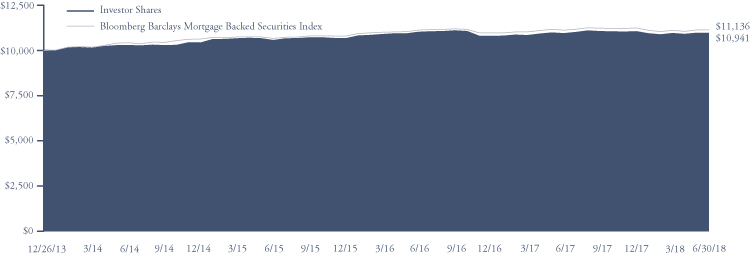
| Since Inception | |||
Average Annual Total Return | One Year | (12/26/13) | |
Institutional Shares1 | 0.16% | 2.06% | |
| Investor Shares | 0.21% | 2.01% | |
| Bloomberg Barclays Mortgage Backed Securities Index | 0.15% | 2.41% | |
Institutional Shares | Investor Shares | ||
Gross Expense Ratio2 | 0.47% | 0.52% | |
Net Expense Ratio2 | 0.47% | 0.52% |
Past performance does not guarantee future results. The performance data quoted represents past performance and current returns may be lower or higher. The investment return and net asset value will fluctuate so that an investor’s shares, when redeemed, may be worth more or less than the original cost. To obtain performance information current to the most recent month end, please visit our website at brownadvisoryfunds.com/performance.html. The performance table and graph above do not reflect the deduction of taxes that a shareholder would pay on Fund distributions or the redemption of Fund shares. Performance data does not reflect the imposition of the redemption fee of 1.00% on shares redeemed within 14 days, and if it did, performance would have been lower. Short-term performance, in particular, is not a good indication of the Fund’s future performance, and an investment should not be made based solely on returns.
1 | Performance information for the Institutional Shares, prior to commencement of operations on May 13, 2014, is based on the performance of the Investor Shares, and adjusted for the lower expenses applicable to the Institutional Shares. |
2 | Per the Fund’s prospectus dated October 31, 2017. Refer to the financial highlights for the gross and net expense ratios for the year ended as of the date of this report. Please note that the expense ratios per the prospectus include acquired fund fees and expenses (as applicable) and the expense ratios in the financial highlights do not. |
74
Brown Advisory Mortgage Securities Fund
Schedule of Investments
June 30, 2018
| Par Value | Security Description | Rate | Maturity | Value $ | ||||||||
| Mortgage Backed Securities – 100.3% | ||||||||||||
| 1,200,000 | BBCMS Mortgage Trust, Series 2018-TALL C (1 Month LIBOR USD + 1.12%)^ | 3.19 | % | 03/16/2037 | 1,200,412 | |||||||
| 34,156 | FHLMC PC, Pool# M3-0034 | 4.00 | % | 12/01/2020 | 34,322 | |||||||
| 52,271 | FHLMC PC, Pool# G8-0074 | 7.75 | % | 12/17/2021 | 53,280 | |||||||
| 115,505 | FHLMC PC, Pool# Z6-0016 | 5.50 | % | 04/01/2023 | 123,562 | |||||||
| 3,740,717 | FHLMC PC, Pool# G1-6375 | 6.00 | % | 01/01/2024 | 3,903,441 | |||||||
| 3,879,806 | FHLMC PC, Pool# G1-6444 | 5.50 | % | 12/01/2024 | 4,014,507 | |||||||
| 2,135,808 | FHLMC PC, Pool# G1-6443 | 5.00 | % | 06/01/2026 | 2,221,652 | |||||||
| 1,860,348 | FHLMC PC, Pool# G1-6442 | 4.50 | % | 09/01/2026 | 1,923,780 | |||||||
| 26,402 | FHLMC PC, Pool# G8-0294 | 6.20 | % | 10/20/2027 | 27,642 | |||||||
| 57,935 | FHLMC PC, Pool# N3-0530 | 5.50 | % | 01/01/2029 | 57,876 | |||||||
| 1,005,411 | FHLMC PC, Pool# J3-2643 | 3.50 | % | 09/01/2030 | 1,019,116 | |||||||
| 68,587 | FHLMC PC, Pool# N5-0056 | 6.50 | % | 02/01/2031 | 72,680 | |||||||
| 346,776 | FHLMC PC, Pool# C9-1366 | 4.50 | % | 04/01/2031 | 362,367 | |||||||
| 17,838 | FHLMC PC, Pool# G8-0285 | 9.00 | % | 04/17/2031 | 19,563 | |||||||
| 68,098 | FHLMC PC, Pool# C6-6421 | 6.50 | % | 02/01/2032 | 75,823 | |||||||
| 37,415 | FHLMC PC, Pool# P0-0023 | 6.50 | % | 11/01/2032 | 39,710 | |||||||
| 270,022 | FHLMC PC, Pool# N7-0078 | 5.50 | % | 01/01/2033 | 281,568 | |||||||
| 137,877 | FHLMC PC, Pool# 1B-0889 (12 Month LIBOR USD + 1.59%) | 3.95 | % | 05/01/2033 | 144,441 | |||||||
| 207,962 | FHLMC PC, Pool# A1-4256 | 5.50 | % | 10/01/2033 | 227,883 | |||||||
| 409,902 | FHLMC PC, Pool# G3-0932 | 4.50 | % | 03/01/2034 | 428,321 | |||||||
| 73,115 | FHLMC PC, Pool# 1J-0204 (12 Month LIBOR USD + 1.75%) | 4.17 | % | 05/01/2035 | 76,997 | |||||||
| 250,122 | FHLMC PC, Pool# N7-0071 | 6.00 | % | 06/01/2035 | 264,677 | |||||||
| 106,034 | FHLMC PC, Pool# A4-6629 | 5.00 | % | 08/01/2035 | 113,321 | |||||||
| 1,373,429 | FHLMC PC, Pool# K9-3365 | 3.50 | % | 11/01/2035 | 1,385,918 | |||||||
| 1,039,529 | FHLMC PC, Pool# K9-3349 | 4.00 | % | 11/01/2035 | 1,072,638 | |||||||
| 173,194 | FHLMC PC, Pool# A3-9555 | 5.50 | % | 11/01/2035 | 189,794 | |||||||
| 46,154 | FHLMC PC, Pool# 1L-1263 (1 Year CMT Rate + 2.25%) | 4.10 | % | 03/01/2036 | 48,648 | |||||||
| 53,795 | FHLMC PC, Pool# 1H-1348 (1 Year CMT Rate + 2.14%) | 3.29 | % | 10/01/2036 | 56,511 | |||||||
| 112,141 | FHLMC PC, Pool# B3-1891 | 5.38 | % | 01/01/2037 | 119,504 | |||||||
| 203,470 | FHLMC PC, Pool# 84-7727 (12 Month LIBOR USD + 1.74%) | 3.51 | % | 02/01/2037 | 211,840 | |||||||
| 213,057 | FHLMC PC, Pool# B3-1900 | 5.38 | % | 02/01/2037 | 227,144 | |||||||
| 235,220 | FHLMC PC, Pool# B3-1917 | 5.10 | % | 04/01/2037 | 249,010 | |||||||
| 125,702 | FHLMC PC, Pool# B3-1934 | 5.38 | % | 04/01/2037 | 133,913 | |||||||
| 32,506 | FHLMC PC, Pool# A5-9109 | 7.50 | % | 04/01/2037 | 36,364 | |||||||
| 245,526 | FHLMC PC, Pool# B3-1976 | 5.10 | % | 05/01/2037 | 259,952 | |||||||
| 85,135 | FHLMC PC, Pool# B3-1950 | 5.10 | % | 05/01/2037 | 90,160 | |||||||
| 185,641 | FHLMC PC, Pool# A6-7884 | 5.38 | % | 05/01/2037 | 197,829 | |||||||
| 122,624 | FHLMC PC, Pool# 1J-1681 (12 Month LIBOR USD + 1.98%) | 4.61 | % | 06/01/2037 | 129,340 | |||||||
| 180,238 | FHLMC PC, Pool# B3-2000 | 5.10 | % | 06/01/2037 | 190,754 | |||||||
| 101,915 | FHLMC PC, Pool# B3-2032 | 5.10 | % | 07/01/2037 | 107,804 | |||||||
| 101,889 | FHLMC PC, Pool# U3-0471 | 5.10 | % | 07/01/2037 | 107,862 | |||||||
| 58,629 | FHLMC PC, Pool# U3-0653 | 5.13 | % | 07/01/2037 | 62,485 | |||||||
| 80,155 | FHLMC PC, Pool# U3-0606 | 5.10 | % | 09/01/2037 | 84,858 | |||||||
| 241,597 | FHLMC PC, Pool# U3-0681 | 5.10 | % | 09/01/2037 | 255,650 | |||||||
| 55,184 | FHLMC PC, Pool# 1G-2249 (12 Month LIBOR USD + 1.78%) | 3.53 | % | 10/01/2037 | 57,665 | |||||||
| 281,310 | FHLMC PC, Pool# T3-0346 | 5.38 | % | 10/01/2037 | 299,822 | |||||||
| 89,630 | FHLMC PC, Pool# U3-0800 | 5.10 | % | 11/01/2037 | 94,863 | |||||||
| 153,312 | FHLMC PC, Pool# U3-1874 | 5.38 | % | 04/01/2038 | 163,436 | |||||||
| 372,958 | FHLMC PC, Pool# N7-0082 | 6.00 | % | 07/01/2038 | 393,404 | |||||||
| 120,778 | FHLMC PC, Pool# U3-2470 | 5.10 | % | 11/01/2038 | 127,841 | |||||||
| 187,668 | FHLMC PC, Pool# G0-8348 | 5.00 | % | 06/01/2039 | 200,403 | |||||||
| 102,788 | FHLMC PC, Pool# A8-9112 | 4.50 | % | 10/01/2039 | 107,075 | |||||||
| 205,030 | FHLMC PC, Pool# G0-7053 | 5.00 | % | 10/01/2039 | 220,836 | |||||||
| 972,943 | FHLMC PC, Pool# G6-1330 | 6.00 | % | 07/01/2040 | 1,072,144 | |||||||
| 651,804 | FHLMC PC, Pool# Q3-8585 | 4.00 | % | 10/01/2043 | 669,554 | |||||||
| 579,362 | FHLMC PC, Pool# Q2-6108 | 5.00 | % | 05/01/2044 | 613,247 | |||||||
The accompanying notes are an integral part of these financial statements.
75
Brown Advisory Mortgage Securities Fund
Schedule of Investments
June 30, 2018
| Par Value | Security Description | Rate | Maturity | Value $ | ||||||||
| Mortgage Backed Securities – 100.3% (Continued) | ||||||||||||
| 780,142 | FHLMC PC, Pool# Q4-6965 | 4.50 | % | 03/01/2047 | 818,384 | |||||||
| 1,048,391 | FHLMC PC, Pool# Q5-2011 | 4.00 | % | 11/01/2047 | 1,072,634 | |||||||
| 4,666,748 | FHLMC REMIC, Series 4318~ | 2.50 | % | 08/15/2022 | 181,187 | |||||||
| 17,115 | FHLMC REMIC, Series 2516 | 5.50 | % | 10/15/2022 | 17,812 | |||||||
| 35,148 | FHLMC REMIC, Series 3925 | 4.00 | % | 11/15/2022 | 35,102 | |||||||
| 3,995,787 | FHLMC REMIC, Series 4329~ | 2.50 | % | 01/15/2023 | 179,224 | |||||||
| 74,353 | FHLMC REMIC, Series 3571 | 4.00 | % | 09/15/2024 | 75,667 | |||||||
| 64,803 | FHLMC REMIC, Series 1843 | 7.00 | % | 04/15/2026 | 69,634 | |||||||
| 1,326,508 | FHLMC REMIC, Series 4092~ | 3.00 | % | 09/15/2031 | 137,527 | |||||||
| 205,317 | FHLMC REMIC, Series 2517 | 5.50 | % | 10/15/2032 | 211,583 | |||||||
| 507,531 | FHLMC REMIC, Series 2890 | 5.00 | % | 11/15/2034 | 539,571 | |||||||
| 622,747 | FHLMC REMIC, Series 2986 | 5.00 | % | 06/15/2035 | 662,485 | |||||||
| 273,065 | FHLMC REMIC, Series 3294 | 5.50 | % | 03/15/2037 | 294,443 | |||||||
| 1,890,832 | FHLMC REMIC, Series 4309~ | 3.00 | % | 08/15/2039 | 230,668 | |||||||
| 1,912,067 | FHLMC REMIC, Series 4015~ | 4.00 | % | 11/15/2039 | 234,555 | |||||||
| 210,609 | FHLMC REMIC, Series 3878 | 3.00 | % | 04/15/2041 | 207,659 | |||||||
| 1,273,500 | FHLMC REMIC, Series 4126~ | 3.50 | % | 05/15/2041 | 157,621 | |||||||
| 4,302,090 | FHLMC REMIC, Series 4495~ | 3.50 | % | 07/15/2045 | 822,723 | |||||||
| 1,450,000 | FHLMC SCRTT, Series 2016-1 M1#^ | 3.00 | % | 09/25/2055 | 1,418,084 | |||||||
| 1,025,863 | FHLMC SCRTT, Series 2017-1 Haʭ | 2.50 | % | 01/25/2056 | 1,001,892 | |||||||
| 1,000,000 | FHLMC SCRTT, Series 2017-1 M1#^ | 4.00 | % | 01/25/2056 | 978,750 | |||||||
| 1,834,901 | FHLMC SCRTT, Series 2017-2 Haʭ | 2.25 | % | 08/25/2056 | 1,781,885 | |||||||
| 555,989 | FHLMC WLST, Series 2017-SC02 | 3.50 | % | 05/25/2047 | 556,083 | |||||||
| 1,570,178 | FHMS, Series K-J13 | 2.06 | % | 09/25/2021 | 1,552,413 | |||||||
| 1,599,542 | FHMS, Series K-J18 | 2.46 | % | 03/25/2022 | 1,575,401 | |||||||
| 841,394 | FHMS, Series K-J09 | 2.02 | % | 04/25/2022 | 825,586 | |||||||
| 16,104,827 | FHMS, Series K-721#~ | 0.45 | % | 08/25/2022 | 191,808 | |||||||
| 1,472,748 | FHMS, Series K-J07 | 1.53 | % | 09/25/2022 | 1,409,024 | |||||||
| 431,285 | FHMS, Series K-J12 | 2.38 | % | 04/25/2023 | 424,161 | |||||||
| 3,072,877 | FHMS, Series K-J14 | 2.20 | % | 11/25/2023 | 2,974,443 | |||||||
| 6,110,000 | FHMS, Series K-725 | 3.00 | % | 01/25/2024 | 6,077,507 | |||||||
| 4,915,000 | FHMS, Series K-726 | 2.91 | % | 04/25/2024 | 4,856,426 | |||||||
| 1,955,000 | FHMS, Series K-728# | 3.06 | % | 08/25/2024 | 1,946,111 | |||||||
| 2,380,000 | FHMS, Series K-040 | 3.24 | % | 09/25/2024 | 2,394,732 | |||||||
| 2,214,208 | FHMS, Series K-J17 | 2.40 | % | 10/25/2024 | 2,156,349 | |||||||
| 3,000,000 | FHMS, Series K-729 | 3.14 | % | 10/25/2024 | 2,994,540 | |||||||
| 7,104,647 | FHMS, Series K-055#~ | 1.50 | % | 03/25/2026 | 614,250 | |||||||
| 6,728,324 | FHMS, Series K-057#~ | 1.33 | % | 07/25/2026 | 523,994 | |||||||
| 5,429,731 | FHMS, Series K-058#~ | 1.06 | % | 08/25/2026 | 343,329 | |||||||
| 4,404,185 | FHMS, Series K-W03#~ | 0.99 | % | 06/25/2027 | 250,036 | |||||||
| 4,119,978 | FHMS, Series Q-004# | 2.71 | % | 01/25/2046 | 4,127,745 | |||||||
| 13,313 | FNMA, Pool# 932309 | 5.00 | % | 06/01/2019 | 13,285 | |||||||
| 48,396 | FNMA, Pool# 773482 | 4.50 | % | 08/01/2019 | 48,621 | |||||||
| 4,219 | FNMA, Pool# 803941 (12 Month LIBOR USD + 1.81%) | 3.56 | % | 11/01/2019 | 4,229 | |||||||
| 62,767 | FNMA, Pool# 922791 | 6.50 | % | 12/01/2021 | 63,627 | |||||||
| 38,291 | FNMA, Pool# 965546 | 5.50 | % | 01/01/2023 | 39,204 | |||||||
| 1,086,498 | FNMA, Pool# 995185 | 5.00 | % | 12/01/2023 | 1,130,605 | |||||||
| 201,446 | FNMA, Pool# AL7409 | 6.00 | % | 02/01/2024 | 210,205 | |||||||
| 354,742 | FNMA, Pool# 930741 | 4.50 | % | 03/01/2024 | 364,121 | |||||||
| 15,668 | FNMA, Pool# 934900 | 5.50 | % | 07/01/2024 | 15,827 | |||||||
| 6,957,923 | FNMA, Pool# BM3006 | 6.00 | % | 11/01/2024 | 7,257,985 | |||||||
| 117,786 | FNMA, Pool# AL1081 | 5.00 | % | 07/01/2025 | 120,240 | |||||||
| 65,200 | FNMA, Pool# 336422 (3 Year CMT Rate + 2.30%) | 3.87 | % | 10/01/2025 | 65,048 | |||||||
| 131,890 | FNMA, Pool# 356232 | 6.50 | % | 01/01/2026 | 145,459 | |||||||
| 82,999 | FNMA, Pool# 890591 | 4.50 | % | 03/01/2026 | 85,583 | |||||||
| 215,152 | FNMA, Pool# AI1806 | 4.50 | % | 04/01/2026 | 222,481 | |||||||
The accompanying notes are an integral part of these financial statements.
76
Brown Advisory Mortgage Securities Fund
Schedule of Investments
June 30, 2018
| Par Value | Security Description | Rate | Maturity | Value $ | ||||||||
| Mortgage Backed Securities – 100.3% (Continued) | ||||||||||||
| 50,507 | FNMA, Pool# 406521 (1 Year CMT Rate + 2.52%) | 3.65 | % | 05/01/2026 | 50,944 | |||||||
| 534,090 | FNMA, Pool# AL8215 | 5.00 | % | 06/01/2026 | 555,833 | |||||||
| 4,237,627 | FNMA, Pool# BM3352 | 2.55 | % | 12/01/2026 | 4,005,991 | |||||||
| 74,025 | FNMA, Pool# 356329 (1 Year CMT Rate + 2.64%) | 4.01 | % | 01/01/2027 | 75,217 | |||||||
| 178,371 | FNMA, Pool# AL9746 | 4.50 | % | 01/01/2027 | 184,373 | |||||||
| 4,779,365 | FNMA, Pool# BM1809 | 4.50 | % | 01/01/2027 | 4,940,566 | |||||||
| 834,803 | FNMA, Pool# AN4845 | 3.45 | % | 03/01/2027 | 837,182 | |||||||
| 1,031,227 | FNMA, Pool# AN4848 | 3.45 | % | 03/01/2027 | 1,029,911 | |||||||
| 49,883 | FNMA, Pool# 363850 (1 Year CMT Rate + 2.13%) | 3.98 | % | 04/01/2027 | 50,748 | |||||||
| 53,299 | FNMA, Pool# 406380 (1 Year CMT Rate + 2.17%) | 3.56 | % | 11/01/2027 | 54,045 | |||||||
| 901,755 | FNMA, Pool# 957502 | 3.98 | % | 07/01/2029 | 917,323 | |||||||
| 53,210 | FNMA, Pool# 520478 (1 Year CMT Rate + 2.10%) | 3.35 | % | 11/01/2029 | 53,812 | |||||||
| 1,405,437 | FNMA, Pool# AM8082 | 2.92 | % | 02/01/2030 | 1,346,655 | |||||||
| 45,148 | FNMA, Pool# 559439 (1 Year CMT Rate + 2.27%) | 3.52 | % | 09/01/2030 | 45,967 | |||||||
| 59,551 | FNMA, Pool# 573097 (1 Year CMT Rate + 2.21%) | 3.46 | % | 02/01/2031 | 60,088 | |||||||
| 44,573 | FNMA, Pool# 590852 (1 Year CMT Rate + 2.11%) | 3.24 | % | 07/01/2031 | 44,954 | |||||||
| 68,022 | FNMA, Pool# 656181 (1 Year CMT Rate + 2.16%) | 3.68 | % | 08/01/2031 | 70,277 | |||||||
| 43,330 | FNMA, Pool# 723313 (1 Year CMT Rate + 2.54%) | 3.67 | % | 09/01/2031 | 43,560 | |||||||
| 26,079 | FNMA, Pool# 642122 (1 Year CMT Rate + 2.27%) | 4.15 | % | 03/01/2032 | 26,560 | |||||||
| 34,894 | FNMA, Pool# 628837 | 6.50 | % | 03/01/2032 | 38,493 | |||||||
| 45,660 | FNMA, Pool# 640225 (1 Year CMT Rate + 2.27%) | 4.15 | % | 04/01/2032 | 47,218 | |||||||
| 46,027 | FNMA, Pool# 662138 (1 Year CMT Rate + 2.30%) | 3.43 | % | 09/01/2032 | 46,805 | |||||||
| 56,524 | FNMA, Pool# 668309 (1 Year CMT Rate + 2.02%) | 3.14 | % | 11/01/2032 | 56,786 | |||||||
| 60,709 | FNMA, Pool# 696546 (6 Month LIBOR USD + 2.26%) | 4.20 | % | 03/01/2033 | 60,940 | |||||||
| 130,622 | FNMA, Pool# 687887 | 5.50 | % | 03/01/2033 | 144,540 | |||||||
| 38,619 | FNMA, Pool# 555819 (6 Month LIBOR USD + 1.52%) | 4.00 | % | 07/01/2033 | 39,841 | |||||||
| 45,550 | FNMA, Pool# 751498 (1 Year CMT Rate + 2.22%) | 3.46 | % | 11/01/2033 | 48,246 | |||||||
| 49,088 | FNMA, Pool# 744805 (6 Month LIBOR USD + 1.52%) | 3.77 | % | 11/01/2033 | 49,648 | |||||||
| 31,169 | FNMA, Pool# 741373 (1 Year CMT Rate + 2.28%) | 3.53 | % | 12/01/2033 | 32,271 | |||||||
| 31,770 | FNMA, Pool# 754767 | 6.50 | % | 12/01/2033 | 35,028 | |||||||
| 426,902 | FNMA, Pool# 725599 | 5.50 | % | 01/01/2034 | 473,526 | |||||||
| 74,043 | FNMA, Pool# 764342 (6 Month LIBOR USD + 1.52%) | 3.40 | % | 02/01/2034 | 76,412 | |||||||
| 218,966 | FNMA, Pool# 725205 | 5.00 | % | 03/01/2034 | 235,046 | |||||||
| 182,958 | FNMA, Pool# 774969 (1 Year CMT Rate + 2.20%) | 4.08 | % | 04/01/2034 | 188,965 | |||||||
| 132,647 | FNMA, Pool# 783554 (1 Year CMT Rate + 2.21%) | 3.34 | % | 07/01/2034 | 135,371 | |||||||
| 32,659 | FNMA, Pool# 789060 (12 Month LIBOR USD + 1.75%) | 3.50 | % | 07/01/2034 | 34,285 | |||||||
| 531,846 | FNMA, Pool# AM7615 | 3.63 | % | 12/01/2034 | 535,620 | |||||||
| 107,310 | FNMA, Pool# 995316 | 5.00 | % | 12/01/2034 | 114,982 | |||||||
| 17,378 | FNMA, Pool# 796283 | 5.50 | % | 12/01/2034 | 18,689 | |||||||
| 129,232 | FNMA, Pool# 735230 | 5.50 | % | 02/01/2035 | 140,796 | |||||||
| 47,377 | FNMA, Pool# 819649 (12 Month LIBOR USD + 1.52%) | 3.50 | % | 03/01/2035 | 49,482 | |||||||
| 211,874 | FNMA, Pool# AD0250 | 5.50 | % | 04/01/2035 | 230,169 | |||||||
| 101,062 | FNMA, Pool# 889829 | 5.00 | % | 07/01/2035 | 108,430 | |||||||
| 51,778 | FNMA, Pool# 830970 (12 Month LIBOR USD + 1.83%) | 3.65 | % | 08/01/2035 | 54,458 | |||||||
| 150,878 | FNMA, Pool# 837329 (1 Year CMT Rate + 2.04%) | 3.17 | % | 09/01/2035 | 158,971 | |||||||
| 80,883 | FNMA, Pool# 836335 (1 Year CMT Rate + 2.23%) | 3.48 | % | 10/01/2035 | 81,071 | |||||||
| 113,195 | FNMA, Pool# 836715 (12 Month LIBOR USD + 1.74%) | 3.49 | % | 10/01/2035 | 113,204 | |||||||
| 149,570 | FNMA, Pool# 842006 | 4.25 | % | 10/01/2035 | 154,203 | |||||||
| 61,474 | FNMA, Pool# 922680 (12 Month LIBOR USD + 1.91%) | 4.19 | % | 11/01/2035 | 65,011 | |||||||
| 291,686 | FNMA, Pool# 850232 | 4.25 | % | 12/01/2035 | 300,838 | |||||||
| 8,452 | FNMA, Pool# 848817 | 5.00 | % | 01/01/2036 | 8,996 | |||||||
| 33,955 | FNMA, Pool# 865849 (12 Month LIBOR USD + 1.58%) | 3.54 | % | 03/01/2036 | 34,894 | |||||||
| 74,293 | FNMA, Pool# 877009 (12 Month LIBOR USD + 2.38%) | 4.58 | % | 03/01/2036 | 80,082 | |||||||
| 78,049 | FNMA, Pool# 868568 (12 Month LIBOR USD + 1.77%) | 4.02 | % | 04/01/2036 | 82,163 | |||||||
| 50,453 | FNMA, Pool# 745626 (1 Year CMT Rate + 2.10%) | 3.70 | % | 05/01/2036 | 52,306 | |||||||
| 71,562 | FNMA, Pool# 882017 (6 Month LIBOR USD + 1.56%) | 3.91 | % | 05/01/2036 | 74,134 | |||||||
The accompanying notes are an integral part of these financial statements.
77
Brown Advisory Mortgage Securities Fund
Schedule of Investments
June 30, 2018
| Par Value | Security Description | Rate | Maturity | Value $ | ||||||||
| Mortgage Backed Securities – 100.3% (Continued) | ||||||||||||
| 42,405 | FNMA, Pool# 872895 (12 Month LIBOR USD + 1.71%) | 4.42 | % | 06/01/2036 | 44,556 | |||||||
| 35,214 | FNMA, Pool# 886163 (12 Month LIBOR USD + 1.77%) | 3.65 | % | 07/01/2036 | 37,020 | |||||||
| 550,018 | FNMA, Pool# 896838 | 5.45 | % | 07/01/2036 | 583,319 | |||||||
| 133,905 | FNMA, Pool# AD0766 | 7.00 | % | 08/01/2036 | 153,494 | |||||||
| 196,076 | FNMA, Pool# 745818 | 6.50 | % | 09/01/2036 | 216,342 | |||||||
| 175,353 | FNMA, Pool# 894270 (1 Year CMT Rate + 2.50%) | 3.75 | % | 10/01/2036 | 176,304 | |||||||
| 30,016 | FNMA, Pool# 905193 (12 Month LIBOR USD + 1.99%) | 3.74 | % | 11/01/2036 | 30,783 | |||||||
| 87,227 | FNMA, Pool# 902770 | 5.38 | % | 11/01/2036 | 93,267 | |||||||
| 114,862 | FNMA, Pool# 745959 | 5.50 | % | 11/01/2036 | 124,569 | |||||||
| 93,322 | FNMA, Pool# 906289 | 5.38 | % | 12/01/2036 | 99,719 | |||||||
| 129,837 | FNMA, Pool# 940309 (12 Month LIBOR USD + 1.50%) | 3.25 | % | 01/01/2037 | 132,199 | |||||||
| 47,641 | FNMA, Pool# 910181 (12 Month LIBOR USD + 1.71%) | 3.73 | % | 03/01/2037 | 49,826 | |||||||
| 49,820 | FNMA, Pool# 888445 (12 Month LIBOR USD + 1.57%) | 3.48 | % | 04/01/2037 | 52,815 | |||||||
| 71,920 | FNMA, Pool# 995521 (12 Month LIBOR USD + 1.84%) | 4.26 | % | 05/01/2037 | 75,115 | |||||||
| 144,226 | FNMA, Pool# 888418 | 5.50 | % | 05/01/2037 | 159,719 | |||||||
| 96,889 | FNMA, Pool# 950382 (6 Month LIBOR USD + 1.09%) | 2.98 | % | 08/01/2037 | 98,766 | |||||||
| 166,974 | FNMA, Pool# 941050 (12 Month LIBOR USD + 1.70%) | 3.50 | % | 08/01/2037 | 166,277 | |||||||
| 65,100 | FNMA, Pool# 953988 | 5.38 | % | 08/01/2037 | 66,543 | |||||||
| 155,741 | FNMA, Pool# 995024 | 5.50 | % | 08/01/2037 | 169,116 | |||||||
| 70,034 | FNMA, Pool# 952835 (1 Year CMT Rate + 2.32%) | 3.84 | % | 09/01/2037 | 74,245 | |||||||
| 65,113 | FNMA, Pool# 946403 (1 Year CMT Rate + 2.32%) | 4.44 | % | 09/01/2037 | 65,199 | |||||||
| 242,071 | FNMA, Pool# 955233 | 6.50 | % | 12/01/2037 | 267,046 | |||||||
| 912,263 | FNMA, Pool# AD0555 | 5.50 | % | 02/01/2038 | 991,774 | |||||||
| 119,679 | FNMA, Pool# 962656 (12 Month LIBOR USD + 1.25%) | 3.41 | % | 04/01/2038 | 122,657 | |||||||
| 34,110 | FNMA, Pool# 982237 (12 Month LIBOR USD + 1.84%) | 4.34 | % | 05/01/2038 | 36,045 | |||||||
| 202,643 | FNMA, Pool# AL1543 | 5.50 | % | 12/01/2038 | 220,522 | |||||||
| 142,484 | FNMA, Pool# 930507 | 6.50 | % | 02/01/2039 | 156,594 | |||||||
| 3,659,215 | FNMA, Pool# AS2249 | 4.00 | % | 04/01/2039 | 3,759,924 | |||||||
| 12,356 | FNMA, Pool# AI1170 | 5.00 | % | 04/01/2041 | 13,259 | |||||||
| 5,458,216 | FNMA, Pool# BM3797 | 6.00 | % | 07/01/2041 | 5,996,123 | |||||||
| 3,500,000 | FNMA, Pool# BM4143 | 6.00 | % | 07/01/2041 | 3,879,479 | |||||||
| 315,209 | FNMA, Pool# AL2903 | 5.50 | % | 09/01/2041 | 349,574 | |||||||
| 382,556 | FNMA, Pool# MA1065 | 4.00 | % | 05/01/2042 | 393,094 | |||||||
| 11,583 | FNMA, Pool# AR1150 | 3.00 | % | 01/01/2043 | 11,326 | |||||||
| 935,586 | FNMA, Pool# BC1738 | 4.50 | % | 09/01/2043 | 980,258 | |||||||
| 1,708,784 | FNMA, Pool# AU6230 | 5.00 | % | 09/01/2043 | 1,827,237 | |||||||
| 780,721 | FNMA, Pool# AS1429 | 4.00 | % | 12/01/2043 | 799,624 | |||||||
| 614,832 | FNMA, Pool# AV7739 | 4.00 | % | 01/01/2044 | 633,347 | |||||||
| 2,001,698 | FNMA, Pool# BC1737 | 4.00 | % | 01/01/2044 | 2,056,741 | |||||||
| 935,472 | FNMA, Pool# AW6485 | 4.00 | % | 06/01/2044 | 960,513 | |||||||
| 967,444 | FNMA, Pool# AY0382 | 4.00 | % | 11/01/2044 | 974,721 | |||||||
| 190,176 | FNMA, Pool# AY1007 | 4.00 | % | 02/01/2045 | 194,257 | |||||||
| 742,743 | FNMA, Pool# AW9534 | 4.00 | % | 03/01/2045 | 764,376 | |||||||
| 917,420 | FNMA, Pool# AZ4154 | 4.00 | % | 06/01/2045 | 942,069 | |||||||
| 297,198 | FNMA, Pool# AZ8061 | 4.00 | % | 08/01/2045 | 303,514 | |||||||
| 3,304,542 | FNMA, Pool# AZ7828 | 4.00 | % | 08/01/2045 | 3,374,060 | |||||||
| 187,965 | FNMA, Pool# AZ1494 | 4.00 | % | 09/01/2045 | 192,542 | |||||||
| 1,331,087 | FNMA, Pool# AZ7073 | 4.00 | % | 09/01/2045 | 1,362,064 | |||||||
| 243,387 | FNMA, Pool# BA2936 | 4.00 | % | 10/01/2045 | 248,750 | |||||||
| 1,393,819 | FNMA, Pool# BA3674 | 4.50 | % | 10/01/2045 | 1,462,657 | |||||||
| 1,553,287 | FNMA, Pool# BA5587 | 4.00 | % | 01/01/2046 | 1,592,108 | |||||||
| 1,061,557 | FNMA, Pool# BC1231 | 4.00 | % | 02/01/2046 | 1,088,054 | |||||||
| 799,729 | FNMA, Pool# BC6366 | 4.50 | % | 02/01/2046 | 841,885 | |||||||
| 914,957 | FNMA, Pool# BD1241 | 4.50 | % | 05/01/2046 | 957,682 | |||||||
| 1,468,037 | FNMA, Pool# BD1026 | 4.00 | % | 06/01/2046 | 1,498,488 | |||||||
| 1,652,853 | FNMA, Pool# BD5189 | 4.50 | % | 07/01/2046 | 1,730,969 | |||||||
The accompanying notes are an integral part of these financial statements.
78
Brown Advisory Mortgage Securities Fund
Schedule of Investments
June 30, 2018
| Par Value | Security Description | Rate | Maturity | Value $ | ||||||||
| Mortgage Backed Securities – 100.3% (Continued) | ||||||||||||
| 1,057,215 | FNMA, Pool# BD7779 | 4.00 | % | 08/01/2046 | 1,081,993 | |||||||
| 1,008,196 | FNMA, Pool# BD8599 | 4.50 | % | 11/01/2046 | 1,064,915 | |||||||
| 1,146,246 | FNMA, Pool# BD3988 | 4.00 | % | 02/01/2047 | 1,171,038 | |||||||
| 1,170,688 | FNMA, Pool# BE8875 | 4.00 | % | 03/01/2047 | 1,195,342 | |||||||
| 630,462 | FNMA, Pool# BH0264 | 4.50 | % | 03/01/2047 | 657,249 | |||||||
| 1,496,757 | FNMA, Pool# BD3994 | 4.00 | % | 04/01/2047 | 1,529,363 | |||||||
| 1,087,126 | FNMA, Pool# BH0073 | 4.00 | % | 04/01/2047 | 1,112,560 | |||||||
| 1,140,811 | FNMA, Pool# BD3998 | 4.00 | % | 05/01/2047 | 1,167,534 | |||||||
| 1,065,348 | FNMA, Pool# BD3999 | 4.50 | % | 05/01/2047 | 1,115,467 | |||||||
| 1,149,944 | FNMA, Pool# BD4003 | 4.00 | % | 06/01/2047 | 1,177,208 | |||||||
| 1,072,579 | FNMA, Pool# BD4010 | 4.00 | % | 07/01/2047 | 1,110,292 | |||||||
| 1,117,771 | FNMA, Pool# BD4009 | 4.00 | % | 07/01/2047 | 1,158,755 | |||||||
| 1,099,749 | FNMA, Pool# BH3574 | 4.00 | % | 07/01/2047 | 1,125,537 | |||||||
| 778,050 | FNMA, Pool# BJ1740 | 4.50 | % | 10/01/2047 | 815,014 | |||||||
| 807,008 | FNMA, Pool# BD4041 | 4.00 | % | 11/01/2047 | 829,206 | |||||||
| 1,379,996 | FNMA, Pool# BJ1991 | 4.00 | % | 11/01/2047 | 1,412,424 | |||||||
| 1,186,214 | FNMA, Pool# BH7686 | 4.50 | % | 12/01/2047 | 1,242,844 | |||||||
| 1,494,024 | FNMA, Pool# BJ8287 | 4.50 | % | 01/01/2048 | 1,567,911 | |||||||
| 1,043,083 | FNMA, Pool# BJ4035 | 4.50 | % | 02/01/2048 | 1,099,343 | |||||||
| 1,959,470 | FNMA, Pool# BK4172 | 4.50 | % | 04/01/2048 | 2,046,847 | |||||||
| 689,400 | FNMA, Pool# BJ4050 | 4.50 | % | 05/01/2048 | 726,241 | |||||||
| 689,990 | FNMA, Pool# BJ4052 | 4.50 | % | 05/01/2048 | 727,103 | |||||||
| 1,061,053 | FNMA, Pool# BJ4051 | 4.50 | % | 05/01/2048 | 1,118,123 | |||||||
| 979,826 | FNMA, Pool# BK5105 | 5.50 | % | 05/01/2048 | 1,062,356 | |||||||
| 1,063,464 | FNMA, Pool# BJ4054 | 4.00 | % | 06/01/2048 | 1,091,464 | |||||||
| 1,280,407 | FNMA, Pool# BJ4057 | 4.50 | % | 06/01/2048 | 1,347,286 | |||||||
| 3,553 | FNMA REMIC Trust, Series 2003-122 | 4.00 | % | 12/25/2018 | 3,552 | |||||||
| 28 | FNMA REMIC Trust, Series 1990-105 | 6.50 | % | 09/25/2020 | 29 | |||||||
| 73,238 | FNMA REMIC Trust, Series 1990-116 | 9.00 | % | 10/25/2020 | 76,637 | |||||||
| 62,403 | FNMA REMIC Trust, Series 1991-136 | 7.50 | % | 10/25/2021 | 65,558 | |||||||
| 3,410 | FNMA REMIC Trust, Series 2012-1 | 1.75 | % | 12/25/2021 | 3,378 | |||||||
| 147,916 | FNMA REMIC Trust, Series 2002-16 | 6.00 | % | 04/25/2022 | 154,067 | |||||||
| 154,237 | FNMA REMIC Trust, Series 1996-23 | 6.50 | % | 07/25/2026 | 169,752 | |||||||
| 1,499,124 | FNMA REMIC Trust, Series 2017-T1 A | 2.90 | % | 06/25/2027 | 1,444,496 | |||||||
| 1,705,000 | FNMA REMIC Trust, Series 2017-M13 A2# | 3.04 | % | 09/25/2027 | 1,642,998 | |||||||
| 2,820,630 | FNMA REMIC Trust, Series 2012-139~ | 2.50 | % | 12/25/2027 | 222,200 | |||||||
| 1,988,680 | FNMA REMIC Trust, Series 2018-M2# | 2.90 | % | 01/25/2028 | 1,960,915 | |||||||
| 202,235 | FNMA REMIC Trust, Series 2013-15~ | 3.00 | % | 03/25/2028 | 18,833 | |||||||
| 1,625,000 | FNMA REMIC Trust, Series 2018-M8# | 3.33 | % | 06/25/2028 | 1,614,347 | |||||||
| 967,517 | FNMA REMIC Trust, Series 2016-M10 | 2.10 | % | 07/25/2028 | 908,279 | |||||||
| 148,540 | FNMA REMIC Trust, Series 2009-60 | 5.00 | % | 08/25/2029 | 156,096 | |||||||
| 1,496,026 | FNMA REMIC Trust, Series 2018-M3# | 3.09 | % | 02/25/2030 | 1,480,836 | |||||||
| 7,782,418 | FNMA REMIC Trust, Series 2014-14~ | 3.00 | % | 04/25/2031 | 570,338 | |||||||
| 2,652,504 | FNMA REMIC Trust, Series 2013-115 AI~ | 3.00 | % | 04/25/2031 | 316,684 | |||||||
| 343,634 | FNMA REMIC Trust, Series 2001-80 | 6.00 | % | 01/25/2032 | 362,912 | |||||||
| 6,227,358 | FNMA REMIC Trust, Series 2013-104~ | 3.00 | % | 08/25/2032 | 500,282 | |||||||
| 376,127 | FNMA REMIC Trust, Series 2006-M2# | 5.27 | % | 10/25/2032 | 404,408 | |||||||
| 752,083 | FNMA REMIC Trust, Series 2003-71 | 5.50 | % | 08/25/2033 | 818,642 | |||||||
| 2,903,723 | FNMA REMIC Trust, Series 2005-73 | 5.50 | % | 08/25/2035 | 3,186,694 | |||||||
| 97,644 | FNMA REMIC Trust, Series 2012-30 | 3.00 | % | 08/25/2036 | 96,950 | |||||||
| 995,176 | FNMA REMIC Trust, Series 2006-112 | 5.50 | % | 11/25/2036 | 1,084,536 | |||||||
| 64,344 | FNMA REMIC Trust, Series 2009-103# | 3.87 | % | 12/25/2039 | 68,869 | |||||||
| 692,816 | FNMA REMIC Trust, Series 2010-43 | 5.50 | % | 05/25/2040 | 756,649 | |||||||
| 2,868,976 | FNMA REMIC Trust, Series 2012-65 | 5.00 | % | 07/25/2040 | 3,076,110 | |||||||
| 373,791 | FNMA REMIC Trust, Series 2011-52 | 5.00 | % | 06/25/2041 | 399,129 | |||||||
| 249,724 | FNMA REMIC Trust, Series 2012-10 (1 Month LIBOR USD + 0.55%) | 2.64 | % | 02/25/2042 | 251,759 | |||||||
The accompanying notes are an integral part of these financial statements.
79
Brown Advisory Mortgage Securities Fund
Schedule of Investments
June 30, 2018
| Par Value | Security Description | Rate | Maturity | Value $ | ||||||||
| Mortgage Backed Securities – 100.3% (Continued) | ||||||||||||
| 1,475,131 | FNMA REMIC Trust, Series 2013-34~ | 3.00 | % | 05/25/2042 | 214,388 | |||||||
| 1,177,713 | FNMA REMIC Trust, Series 2012-99~ | 4.50 | % | 05/25/2042 | 205,202 | |||||||
| 12,654 | FNMA REMIC Trust, Series 2003-W10 | 4.30 | % | 06/25/2043 | 12,862 | |||||||
| 4,356 | FNMA REMIC Trust, Series 2003-W12 | 4.48 | % | 06/25/2043 | 4,537 | |||||||
| 26,137 | FNMA REMIC Trust, Series 2003-W12 | 4.55 | % | 06/25/2043 | 27,069 | |||||||
| 14,605 | FNMA REMIC Trust, Series 2003-W12 | 4.68 | % | 06/25/2043 | 15,012 | |||||||
| 17,039 | FNMA REMIC Trust, Series 2003-W12 | 5.00 | % | 06/25/2043 | 17,703 | |||||||
| 1,171,669 | FNMA REMIC Trust, Series 2015-40~ | 4.50 | % | 03/25/2045 | 299,291 | |||||||
| 19,500,000 | FNMA, 2.5%, Due TBA July | 2.50 | % | 07/15/2033 | 18,953,135 | |||||||
| 16,000,000 | FNMA, 3.0%, Due TBA July | 3.00 | % | 07/15/2033 | 15,907,324 | |||||||
| 20,000,000 | FNMA, 3.5%, Due TBA July | 3.50 | % | 07/15/2033 | 20,240,624 | |||||||
| 8,000,000 | FNMA, 4.5%, Due TBA July | 4.50 | % | 07/15/2048 | 8,331,319 | |||||||
| 12,000,000 | FNMA, 5.0%, Due TBA July | 5.00 | % | 07/15/2048 | 12,713,606 | |||||||
| 2,250,000 | FREMF Mortgage Trust, Series 2017-K725 B#^ | 4.01 | % | 02/25/2024 | 2,205,848 | |||||||
| 1,950,000 | FREMF Mortgage Trust, Series 2017-K729 B#^ | 3.80 | % | 11/25/2024 | 1,907,536 | |||||||
| 310,000 | FREMF Mortgage Trust, Series 2015-K44#^ | 3.81 | % | 01/25/2048 | 305,266 | |||||||
| 800,000 | FREMF Mortgage Trust, Series 2015-K49#^ | 3.85 | % | 10/25/2048 | 785,560 | |||||||
| 98,425 | GNMA, Pool# 782602X | 5.00 | % | 09/15/2022 | 101,946 | |||||||
| 4,951 | GNMA, Pool# 780576X | 7.00 | % | 12/15/2022 | 5,297 | |||||||
| 59,466 | GNMA, Pool# 672701X | 4.00 | % | 05/15/2023 | 61,486 | |||||||
| 52,768 | GNMA, Pool# 782396X | 6.00 | % | 09/15/2023 | 55,464 | |||||||
| 47,563 | GNMA, Pool# 004295M | 6.00 | % | 10/20/2023 | 48,426 | |||||||
| 371,358 | GNMA, Pool# 783374X | 5.50 | % | 04/15/2024 | 385,735 | |||||||
| 23,928 | GNMA, Pool# 710732X | 4.50 | % | 08/15/2024 | 24,968 | |||||||
| 444,026 | GNMA, Pool# 728160X | 5.25 | % | 11/15/2024 | 469,801 | |||||||
| 22,310 | GNMA, Pool# 723460X | 4.00 | % | 12/15/2024 | 22,899 | |||||||
| 352,786 | GNMA, Pool# 005247M | 3.50 | % | 11/20/2026 | 354,118 | |||||||
| 10,153 | GNMA, Pool# 487110X | 6.50 | % | 04/15/2029 | 11,347 | |||||||
| 503,083 | GNMA, Pool# 589694X | 4.50 | % | 08/15/2029 | 527,899 | |||||||
| 140,539 | GNMA, Pool# 728157X | 3.75 | % | 11/15/2029 | 143,268 | |||||||
| 4,693 | GNMA, Pool# 571166X | 7.00 | % | 08/15/2031 | 4,784 | |||||||
| 501,288 | GNMA, Pool# 770225C | 4.25 | % | 08/20/2031 | 524,028 | |||||||
| 675,563 | GNMA, Pool# 003160M | 6.00 | % | 11/20/2031 | 745,405 | |||||||
| 1,767,114 | GNMA, Pool# 752099X | 3.50 | % | 12/15/2032 | 1,794,900 | |||||||
| 342,785 | GNMA, Pool# 758872X | 3.00 | % | 03/15/2033 | 337,093 | |||||||
| 2,054,330 | GNMA, Pool# 711773C | 3.50 | % | 06/20/2033 | 2,063,461 | |||||||
| 1,050,786 | GNMA, Pool# 711788C | 3.50 | % | 07/20/2033 | 1,055,372 | |||||||
| 951,627 | GNMA, Pool# 003489M | 6.00 | % | 12/20/2033 | 1,061,001 | |||||||
| 408,101 | GNMA, Pool# 770226C | 4.75 | % | 09/20/2036 | 430,409 | |||||||
| 8,890 | GNMA, Pool# 646058X | 6.00 | % | 11/15/2037 | 9,725 | |||||||
| 445,547 | GNMA, Pool# 767055X | 3.00 | % | 05/15/2038 | 439,716 | |||||||
| 544,532 | GNMA, Pool# 763853X | 3.00 | % | 07/15/2038 | 537,414 | |||||||
| 100,746 | GNMA, Pool# 706295C | 5.10 | % | 12/20/2038 | 106,089 | |||||||
| 7,245 | GNMA REMIC Trust, Series 201-03 | 3.00 | % | 01/16/2027 | 7,235 | |||||||
| 922,064 | GNMA REMIC Trust, Series 2013-168 IA~ | 2.50 | % | 11/16/2028 | 69,710 | |||||||
| 246 | GNMA REMIC Trust, Series 2003-97 | 4.50 | % | 03/20/2033 | 248 | |||||||
| 135,154 | GNMA REMIC Trust, Series 2003-94 | 4.00 | % | 04/16/2033 | 139,027 | |||||||
| 182,609 | GNMA REMIC Trust, Series 2006-40 | 6.00 | % | 08/20/2036 | 197,501 | |||||||
| 944,131 | GNMA REMIC Trust, Series 2012-52# | 6.15 | % | 04/20/2038 | 1,055,361 | |||||||
| 1,386,141 | GNMA REMIC Trust, Series 2011-2# | 5.46 | % | 03/20/2039 | 1,500,919 | |||||||
| 682,000 | GNMA REMIC Trust, Series 2011-156 | 2.00 | % | 04/20/2040 | 544,360 | |||||||
| 831,612 | GNMA REMIC Trust, Series 2012-97 | 2.00 | % | 08/16/2042 | 684,418 | |||||||
| 494,875 | GNMA REMIC Trust, Series 2011-121 (1 Month LIBOR USD + 0.40%) | 2.49 | % | 03/16/2043 | 494,098 | |||||||
| 725,000 | GNMA REMIC Trust, Series 2012-44 | 2.95 | % | 08/16/2043 | 711,774 | |||||||
| 4,734,495 | GNMA REMIC Trust, Series 2014-135 I0#~ | 0.83 | % | 01/16/2056 | 255,045 | |||||||
| 4,528,450 | GNMA REMIC Trust, Series 2015-172 I0#~ | 0.90 | % | 03/16/2057 | 285,495 | |||||||
The accompanying notes are an integral part of these financial statements.
80
Brown Advisory Mortgage Securities Fund
Schedule of Investments
June 30, 2018
| Par Value | Security Description | Rate | Maturity | Value $ | ||||||||
| Mortgage Backed Securities – 100.3% (Continued) | ||||||||||||
| 6,294,637 | GNMA REMIC Trust, Series 2016-40 I0#~ | 0.77 | % | 07/16/2057 | 359,587 | |||||||
| 5,143,114 | GNMA REMIC Trust, Series 2016-56 I0#~ | 0.97 | % | 11/16/2057 | 367,022 | |||||||
| 6,076,838 | GNMA REMIC Trust, Series 2016-98 I0#~ | 0.95 | % | 05/16/2058 | 454,529 | |||||||
| 1,081,322 | JPMCC, Series 2016-ASH A (1 Month LIBOR USD + 1.50%)^ | 3.57 | % | 10/16/2034 | 1,082,497 | |||||||
| 1,230,000 | MAD Mortgage Trust, Series 2017-330M B#^ | 3.48 | % | 08/17/2034 | 1,204,218 | |||||||
| 750,000 | MSC, Series 2017-CLS C (1 Month LIBOR USD + 1.00%)^ | 3.07 | % | 11/15/2034 | 749,782 | |||||||
| 550,000 | MSC, Series 2017-CLS D (1 Month LIBOR USD + 1.40%)^ | 3.47 | % | 11/15/2034 | 550,199 | |||||||
| 1,300,000 | WFCM, Series 2017-RB1 AS | 3.76 | % | 03/17/2050 | 1,286,362 | |||||||
| Total Mortgage Backed Securities (Cost $305,865,926) | 301,920,279 | |||||||||||
| Asset Backed Securities – 18.1% | ||||||||||||
| 818,235 | Aircraft Certificate Owner Trust, Series 2003-1A E^< | 7.00 | % | 09/20/2022 | 845,850 | |||||||
| 1,500,000 | American Credit Acceptance Receivables Trust, Series 2016-1A C^ | 5.55 | % | 06/13/2022 | 1,522,378 | |||||||
| 1,950,000 | American Credit Acceptance Receivables Trust, Series 2017-4 C^ | 2.94 | % | 01/10/2024 | 1,938,049 | |||||||
| 474,179 | BRE Grand Islander Timeshare Issuer LLC, Series 2017-1A A^ | 2.94 | % | 05/25/2029 | 463,377 | |||||||
| 1,500,000 | Carlyle Global Market Strategies CLO, Ltd., Series 2015-1A CR (3 Month LIBOR USD + 2.00%)^ | 4.36 | % | 04/20/2027 | 1,506,570 | |||||||
| 2,000,000 | Carlyle Global Market Strategies CLO, Ltd., Series 2015-2A CR (3 Month LIBOR USD + 2.25%)^ | 4.62 | % | 04/27/2027 | 1,994,530 | |||||||
| 508,681 | Continental Airlines Trust, Series 1999-1 A< | 6.55 | % | 08/02/2020 | 513,158 | |||||||
| 539,157 | Continental Airlines Trust, Series 2000-1 A-1< | 8.05 | % | 05/01/2022 | 569,457 | |||||||
| 1,710,000 | CPS Auto Receivables Trust, Series 2015-A D^ | 5.60 | % | 02/16/2021 | 1,759,434 | |||||||
| 900,000 | CPS Auto Receivables Trust, Series 2016-C E^ | 8.39 | % | 09/15/2023 | 971,597 | |||||||
| 600,000 | Dell Equipment Finance Trust, Series 2018-1 D^ | 3.85 | % | 06/24/2024 | 600,843 | |||||||
| 220,000 | Drive Auto Receivables Trust, Series 2017-BA D^ | 3.72 | % | 10/17/2022 | 221,416 | |||||||
| 1,025,000 | Drive Auto Receivables Trust, Series 2018-1 C | 3.22 | % | 03/15/2023 | 1,021,749 | |||||||
| 3,000,000 | Drive Auto Receivables Trust, Series 2018-1 D | 3.81 | % | 05/15/2024 | 2,997,101 | |||||||
| 290,000 | Drive Auto Receivables Trust, Series 2017-AA D^ | 4.16 | % | 05/15/2024 | 293,700 | |||||||
| 945,000 | Drive Auto Receivables Trust, Series 2018-2 D | 4.14 | % | 08/15/2024 | 951,001 | |||||||
| 235,000 | DT Auto Owner Trust, Series 2016-4A D^ | 3.77 | % | 10/17/2022 | 235,947 | |||||||
| 2,500,000 | DT Auto Owner Trust, Series 2018-1A C^ | 3.47 | % | 12/15/2023 | 2,497,695 | |||||||
| 1,000,000 | DT Auto Owner Trust, Series 2018-2A C^ | 3.67 | % | 03/15/2024 | 999,908 | |||||||
| 1,500,000 | DT Auto Owner Trust, Series 2017-3A E^ | 5.60 | % | 08/15/2024 | 1,518,749 | |||||||
| 660,000 | Exeter Automobile Receivables Trust, Series 2016-3A C^ | 4.22 | % | 06/15/2022 | 667,757 | |||||||
| 138,638 | Federal Express Corp., Series 1998-1< | 6.72 | % | 07/15/2023 | 145,916 | |||||||
| 3,000,000 | Highbridge Loan Management, Ltd., Series 2015-7A DR (3 Month LIBOR USD + 2.40%)^ | 4.74 | % | 03/15/2027 | 2,966,760 | |||||||
| 500,000 | Invitation Homes Trust, Series 2015-SFR3 B (1 Month LIBOR USD + 1.75%)^ | 3.82 | % | 08/19/2032 | 500,417 | |||||||
| 900,000 | Invitation Homes Trust, Series 2017-SFR2 B (1 Month LIBOR USD + 1.15%)^ | 3.24 | % | 12/19/2036 | 906,839 | |||||||
| 600,000 | Invitation Homes Trust, Series 2017-SFR2 C (1 Month LIBOR USD + 1.45%)^ | 3.54 | % | 12/19/2036 | 603,504 | |||||||
| 600,000 | Invitation Homes Trust, Series 2018-SFR2 C (1 Month LIBOR USD + 1.28%)^ | 3.35 | % | 06/18/2037 | 603,447 | |||||||
| 1,000,000 | Madison Park Funding XXI, Ltd., Series 2016-21A B (3 Month LIBOR USD + 2.75%)^ | 5.11 | % | 07/25/2029 | 1,013,752 | |||||||
| 750,000 | Magnetite IX, Ltd., Series 2014-9A CR (3 Month LIBOR USD + 3.10%)^ | 5.46 | % | 07/25/2026 | 753,884 | |||||||
| 2,496 | MMAF Equipment Finance LLC, Series 2013-AA A4^ | 1.68 | % | 05/11/2020 | 2,495 | |||||||
| 258,218 | MVW Owner Trust, Series 2017-1A B^ | 2.75 | % | 12/20/2034 | 250,750 | |||||||
| 1,600,000 | Neuberger Berman Loan Advisers CLO, Series 2017-26A A (3 Month LIBOR USD + 1.17%)^ | 3.53 | % | 10/18/2030 | 1,601,989 | |||||||
| 1,000,000 | Octagon Investment Partners XXI Ltd., Series 2014-1A C (3 Month LIBOR USD + 3.65%)^ | 6.01 | % | 11/14/2026 | 1,005,325 | |||||||
| 700,000 | Oportun Funding IX LLC, Series 2018-B A^ | 3.91 | % | 07/08/2024 | 699,922 | |||||||
| 500,000 | Oportun Funding IX LLC, Series 2018-B B^ | 4.50 | % | 07/08/2024 | 499,951 | |||||||
| 536,955 | Orange Lake Timeshare Trust, Series 2018-A B^ | 3.35 | % | 11/08/2030 | 532,274 | |||||||
| 109,326 | OSCAR U.S. Funding Trust IV, Series 2016-1A A2B (1 Month LIBOR USD + 1.70%)^ | 3.62 | % | 07/15/2020 | 109,835 | |||||||
| 58,373 | OSCAR U.S. Funding Trust V, Series 2016-2A A2B (1 Month LIBOR USD + 1.40%)^ | 3.47 | % | 11/15/2019 | 58,467 | |||||||
| 371,563 | OSCAR U.S. Funding Trust VI LLC, Series 2017-1A A2B (1 Month LIBOR USD + 0.80%)^ | 2.85 | % | 05/11/2020 | 372,248 | |||||||
| 499,080 | OSCAR U.S. Funding Trust VII LLC, Series 2017-2A A2B (1 Month LIBOR USD + 0.65%)^ | 2.70 | % | 11/10/2020 | 500,069 | |||||||
| 254,000 | Prestige Auto Receivables Trust, Series 2016-1 B^ | 2.98 | % | 11/16/2020 | 254,247 | |||||||
| 35,509 | Prestige Auto Receivables Trust, Series 2015-1 B^ | 2.04 | % | 04/15/2021 | 35,497 | |||||||
| 600,000 | Progress Residential Trust, Series 2018-SFR1 B^ | 3.48 | % | 03/17/2035 | 590,085 | |||||||
| 600,000 | Progress Residential Trust, Series 2018-SFR1 C^ | 3.68 | % | 03/17/2035 | 591,178 | |||||||
| 2,000,000 | Regatta III Funding, Ltd., Series 2014-1A A2R (3 Month LIBOR USD + 1.50%)^ | 3.85 | % | 04/15/2026 | 2,000,450 | |||||||
| 3,110,000 | Santander Drive Auto Receivables Trust, Series 2017-1 E^ | 5.05 | % | 07/15/2024 | 3,164,611 | |||||||
The accompanying notes are an integral part of these financial statements.
81
Brown Advisory Mortgage Securities Fund
Schedule of Investments
June 30, 2018
| Par | |||||||||||||
| Value/Shares | Security Description | Rate | Maturity | Value $ | |||||||||
| Asset Backed Securities – 18.1% (Continued) | |||||||||||||
| 442,533 | Sierra Timeshare Receivables Funding LLC, Series 2015-3A A^ | 2.58 | % | 09/20/2032 | 440,737 | ||||||||
| 370,801 | Sierra Timeshare Receivables Funding LLC, Series 2016-2A A^ | 2.33 | % | 07/20/2033 | 366,134 | ||||||||
| 1,000,000 | Sound Point CLO XII, Ltd., Series 2016-2A D (3 Month LIBOR USD + 4.25%)^ | 6.61 | % | 10/20/2028 | 1,012,452 | ||||||||
| 500,000 | Symphony CLO XIV, Ltd., Series 2014-14A D2 (3 Month LIBOR USD + 3.60%)^ | 5.95 | % | 07/14/2026 | 502,554 | ||||||||
| 44,998 | U.S. Airways Pass Through Trust, Series 1999-1 A< | 8.36 | % | 07/20/2020 | 45,448 | ||||||||
| 303,909 | VOLT XXXVIII LLC, Series 2015-NP12 A1ʭ^ | 3.88 | % | 09/25/2045 | 304,595 | ||||||||
| 90,685 | Welk Resorts LLC, Series 2015-AA A^ | 2.79 | % | 06/15/2031 | 89,070 | ||||||||
| 868,473 | Westgate Resorts LLC, Series 2018-1A B^ | 3.58 | % | 12/20/2031 | 863,718 | ||||||||
| 1,157,964 | Westgate Resorts LLC, Series 2018-1A C^ | 4.10 | % | 12/20/2031 | 1,155,143 | ||||||||
| 2,980,000 | Westlake Automobile Receivables Trust, Series 2018-1A D^ | 3.41 | % | 05/15/2023 | 2,963,544 | ||||||||
| 1,000,000 | Westlake Automobile Receivables Trust, Series 2018-2A D^ | 4.00 | % | 01/16/2024 | 1,004,152 | ||||||||
| 2,000,000 | Westlake Automobile Receivables Trust, Series 2017-2A E^ | 4.63 | % | 07/15/2024 | 2,007,444 | ||||||||
| Total Asset Backed Securities (Cost $54,738,119) | 54,609,169 | ||||||||||||
| Municipal Bonds – 5.4% | |||||||||||||
| 1,475,000 | District of Columbia# | 5.70 | % | 08/01/2038 | 1,400,896 | ||||||||
| 2,700,000 | District of Columbia# | 5.73 | % | 08/01/2038 | 2,564,352 | ||||||||
| 850,000 | Landis Sewage Authority# | 4.50 | % | 09/19/2019 | 850,000 | ||||||||
| 1,590,000 | Maryland Community Development Administration | 3.24 | % | 09/01/2048 | 1,570,841 | ||||||||
| 1,000,000 | Massachusetts Port Authority# | 4.19 | % | 01/01/2031 | 1,000,000 | ||||||||
| 3,000,000 | Mosaic District Community Development Authority | 7.25 | % | 03/01/2036 | 3,201,360 | ||||||||
| 4,250,000 | New York State Energy Research & Development Authority# | 0.94 | % | 12/01/2023 | 4,250,000 | ||||||||
| 1,500,000 | New York State Energy Research & Development Authority# | 5.23 | % | 07/01/2029 | 1,500,000 | ||||||||
| Total Municipal Bonds (Cost $16,164,934) | 16,337,449 | ||||||||||||
| Preferred Stocks – 0.2% | |||||||||||||
| 15,000 | AGNC Investment Corp., Series B, 7.75% | 385,050 | |||||||||||
| 2,768 | AGNC Investment Corp., Series C, 7.00% (Fixed until 10/15/2022, then 3 Month LIBOR USD + 5.11%) | 71,968 | |||||||||||
| Total Preferred Stocks (Cost $453,684) | 457,018 | ||||||||||||
| Short-Term Investments – 2.5% | |||||||||||||
| Money Market Funds – 2.1% | |||||||||||||
| 6,115,021 | First American Treasury Obligations Fund – Class Z, 1.75%* | 6,115,021 | |||||||||||
| U.S. Treasury Bills – 0.4% | |||||||||||||
| 1,275,000 | United States Treasury Bill† | 1,273,865 | |||||||||||
| Total Short-Term Investments (Cost $7,388,886) | 7,388,886 | ||||||||||||
| Total Investments – 126.5% (Cost $384,611,549) | 380,712,801 | ||||||||||||
| Liabilities in Excess of Other Assets – (26.5)% | (79,749,328 | ) | |||||||||||
| NET ASSETS – 100.0% | $ | 300,963,473 | |||||||||||
| # | Variable rate security. Rate disclosed is as of June 30, 2018. | |
| ʭ | Step bond; the interest rate shown is the rate in effect as of June 30, 2018. | |
| ^ | Security exempt from registration under Rule 144A of the Securities Act of 1933. These securities may be resold in transactions exempt from registration, normally to qualified institutional buyers. At June 30, 2018, the value of these securities amounted to $60,753,491 or 20.2% of net assets. | |
< | These securities are being fair valued, using significant observable inputs (Level 3), under the supervision of the Board of Trustees. | |
| ~ | Interest Only Security | |
| † | A portion of this security is pledged as collateral in connection with open futures contracts. | |
| * | Annualized seven-day yield as of June 30, 2018. |
The accompanying notes are an integral part of these financial statements.
82
Brown Advisory Mortgage Securities Fund
Schedule of Investments
June 30, 2018
| Futures Contracts – Long (Note 6) | |||||||||||||||||
| Notional | Notional | Unrealized Appreciation | |||||||||||||||
Issue | Contracts | Expiration Date | Amount | Value | (Depreciation) | ||||||||||||
| U.S. Treasury Long Bond Futures | 165 | 09/19/2018 | $ | 23,327,662 | $ | 23,925,000 | $ | 597,338 | |||||||||
| U.S. Treasury Ultra Bond Futures | 25 | 09/19/2018 | 3,862,426 | 3,989,062 | 126,636 | ||||||||||||
| U.S. Treasury 10-Year Ultra Bond Futures | 110 | 09/19/2018 | 13,900,907 | 14,105,781 | 204,874 | ||||||||||||
| $ | 41,090,995 | $ | 42,019,843 | $ | 928,848 | ||||||||||||
| Futures Contracts – Short (Note 6) | |||||||||||||||||
| Notional | Notional | Unrealized Appreciation | |||||||||||||||
Issue | Contracts | Expiration Date | Amount | Value | (Depreciation) | ||||||||||||
| U.S. Treasury 2-Year Note Futures | (190) | 09/28/2018 | $ | (40,204,901 | ) | $ | (40,247,344 | ) | $ | (42,443 | ) | ||||||
| U.S. Treasury 5-Year Note Futures | (190) | 09/28/2018 | (21,482,472 | ) | (21,587,266 | ) | (104,794 | ) | |||||||||
| U.S. Treasury 10-Year Note Futures | (130) | 09/19/2018 | (15,478,520 | ) | (15,624,375 | ) | (145,855 | ) | |||||||||
| $ | (77,165,893 | ) | $ | (77,458,985 | ) | $ | (293,092 | ) | |||||||||
There is no variation margin due to or from the Fund as of June 30, 2018.
The accompanying notes are an integral part of these financial statements.
83
Brown Advisory – WMC Strategic European Equity Fund
A Message to Our Shareholders
June 30, 2018
Dear Shareholders:
During the year ended June 30, 2018, the Brown Advisory – WMC Strategic European Equity Fund – Institutional Shares (the “Fund”) increased 3.97%. During the same period, the MSCI Europe Index , the Fund’s benchmark, returned 5.28%.
Our bottom-up approach aims to identify companies that we believe benefit from a structural growth advantage, are competitively positioned, and attractively valued. This fundamental process leads us to hold certain sectors over- and underweight.
Sector allocation, a residual of the bottom-up stock selection process, was the primary driver of relative underperformance during the period. The Fund’s underweight to energy and materials detracted most from relative returns. This was partially offset by positive results from our overweight to information technology and our underweights in financials and telecommunication services. Stock selection was positive during the period. Selection was strongest within industrials, healthcare, and consumer staples while holdings in consumer discretionary detracted.
Top detractors from relative returns included Elior Group, Reckitt Benckiser, and Merck, along with not holding Royal Dutch Shell.
Elior is one of the world’s leading operators in the catering concessions and services industry. The stock underperformed over the period as the company issued multiple profit warnings and reported numbers below expectations. The previous CEO had been too aggressive on pricing in France and pursuing growth and the subsequent transition caused instability. There have also been concerns about the leverage of the company, although we think that it is manageable. We believe the new CEO is much better suited to stabilize the company and we still have conviction in both the stock and the industry. Despite the recent issues, we have a positive view on contract catering and concessions. We believe the company now has a sound longer-term strategy with a strong market position in Europe, where they have been the clear market leader, and also have growth opportunities in the United States.
Reckitt Benckiser is a UK-based, global consumer goods and health care company. The company has faced ongoing challenges regarding the impact of currency and organic growth missed expectations. Though the business continues to face headwinds, we believe there is still a positive long-term outlook. The company has a structural advantage in marketing, strong consumer focus, and lean cost management. We continue to hold our position.
Merck is a German-based global pharmaceutical, life sciences, and chemicals conglomerate. The stock underperformed in part due to the strong Euro— a large portion of sales are denominated in U.S. dollars with a cost base mostly in Euros—and also due to pressure in its Performance Materials segment. The stock also suffered following a failed trial of cancer drug, Bavencio; however, during the year, we saw positive data relating to the company’s immune-oncology pipeline. We feel the company is well positioned to perform well over the longer term, particularly in the Life Sciences business.
Top contributors to relative returns during the period included DSV, Electrocomponents, and Rentokil.
DSV is a Denmark-based freight logistics company with a large road network across Europe. The company has had both a profitable position within European freight and contract logistics, as well as exposure to sea and air. The company released solid returns during the year and has seen success with the UTI acquisition, which makes us more confident that the company has the potential to continue to create value going forward by rolling up the industry. In addition, DSV is a very competent and well run organization. We think the freight forwarding sector continues to be interesting from a fundamental side and that the large players with strong technology infrastructure are in the best position to drive changes in the industry. We trimmed our position in DSV slightly, and continue to hold the stock.
Electrocomponents is a UK-based service distributor serving small-order requirements in the industrial and electronics market. For a long time the business was structurally challenged but the company is now growing thanks to its new operational CEO, who has returned focus to the customer and implemented regional P&L responsibility. Additionally, compared to other peers in the electrical component distribution, the company has had one of the highest gross margins. The stock outperformed after reporting strong full year results. Over the longer term, we continue to see positive potential for profit and free cash flow growth in the company. We added to our position over the period.
Rentokil is a UK-based multi-divisional service-company primarily involved in pest control, textile services, and hygiene. It is geographically diversified across North America, Europe, Latin America, and Asia Pacific. Following recent underperformance, the market started to appreciate the quality of the business model and its global growth prospects, particularly within pest control. Additionally, the company has seen strong revenue from its acquisitions. Management has also continued to talk of future merger
84
Brown Advisory – WMC Strategic European Equity Fund
A Message to Our Shareholders
June 30, 2018
and acquisition prospects, which is encouraging. We maintain a favorable view of the structural growth outlook of the pest control and hygiene industries and think that Rentokil has an operating model that may allow them to continue to gain market share and drive margins. We added to our position over the period.
While there are signals of improved confidence and optimism in the economy, we think the current environment is one of rising, albeit low, interest rates and improving longer-term growth. We believe that central banks will likely remain accommodative, though interest rates are certainly trending upward given the European Central Bank will begin tapering asset purchases and increasing rates in the U.S. and U.K. Some of the Euro strength has now reversed, though this does not fundamentally change our view on any existing holdings or any new positions. We think that while a relatively strong Euro has the potential to continue to create headwinds for European companies, as we have seen in the past, it should not meaningfully impact share prices over the longer term. Against this backdrop, some political unease still lingers and we believe that the shorter-term outlook remains unclear with a degree of volatility likely.
As we have done over time, we continue to seek to identify and invest in companies that are exposed to structural growth drivers and have built what we believe to be strong competitive advantages. These intrinsic qualities drive margins and returns, as well as high free-cash-flow generation, which we believe can contribute to the creation of long term value.
Sincerely,
C. Dirk Enderlein, CFA
Portfolio Manager
Past performance is not a guarantee of future results.
Mutual fund investing involves risk. Principal loss is possible. Investments focused in a single geographic region may be exposed to greater risk than investments diversified among various geographies. Investments in foreign securities entail certain risks not associated with investments in domestic securities, such as volatility of currency exchange rates, and in some cases, political and economic instability and relatively illiquid markets. These risks are greater in emerging markets. Investments in smaller and medium capitalization companies generally carry greater risk than is customarily associated with larger companies for various reasons such as narrower markets, limited financial resources and less liquid stock. The Fund may invest in ETFs, which may trade at a discount to the aggregate value of the underlying securities and although expense ratios for ETFs are generally low, frequent trading of ETFs by the Fund can generate brokerage expenses. The value of investments in REITs may change in response to changes in the real estate market such as declines in the value of real estate, lack of available capital or financing opportunities, and increases in property taxes or operating costs. Derivatives involve risks different from, and in certain cases, greater than the risks presented by more traditional investments. Investors will indirectly bear the principal risks and its share of the fees and expenses of the Fund’s investment in other Investment Companies.
Fund holdings and sector allocations are subject to change and should not be considered a recommendation to buy or sell any security. For a complete list of fund holdings, please refer to the Schedule of Investments provided in this report.
Definitions for terms and indices are provided in the Glossary of Terms.
85
Brown Advisory – WMC Strategic European Equity Fund
Performance Information & Portfolio Holdings Summary
June 30, 2018
| PORTFOLIO HOLDINGS | % of Net Assets |
| United Kingdom | 25.1% |
| Switzerland | 14.4% |
| France | 13.9% |
| Germany | 13.5% |
| Sweden | 11.0% |
| Netherlands | 7.5% |
| Finland | 4.5% |
| Denmark | 3.7% |
| Belgium | 2.3% |
| Spain | 1.1% |
| Money Market Funds | 0.6% |
| Austria | 0.6% |
| Italy | 0.5% |
| Norway | 0.3% |
| Other Assets and Liabilities | 1.0% |
100.0% |
GROWTH OF A $1,000,000 INVESTMENT
The following chart reflects the change in value of a hypothetical $1,000,000 investment, including reinvested dividends and distributions, in the Fund as measured against a broad-based securities market index. The MSCI Europe Index (“Index”) is an index that captures large and mid cap representation across 15 developed market countries in Europe. The Index is unmanaged and does not reflect the deduction of fees, such as investment management fees. Investors cannot invest directly in an index.
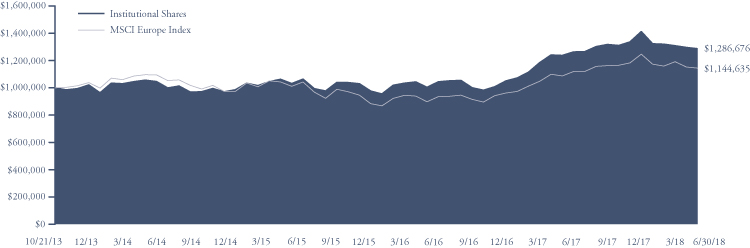
| Since Inception | |||
Average Annual Total Return | One Year | (10/21/13) | |
| Institutional Shares | 3.97% | 5.52% | |
| Investor Shares | 3.85% | 5.38% | |
| Advisor Shares | 3.54% | 5.12% | |
| MSCI Europe Index | 5.28% | 2.92% | |
Institutional Shares | Investor Shares | Advisor Shares | |
Gross Expense Ratio1 | 1.09% | 1.24% | 1.49% |
Net Expense Ratio1 | 1.09% | 1.24% | 1.49% |
Past performance does not guarantee future results. The performance data quoted represents past performance and current returns may be lower or higher. The investment return and net asset value will fluctuate so that an investor’s shares, when redeemed, may be worth more or less than the original cost. To obtain performance information current to the most recent month end, please visit our website at brownadvisoryfunds.com/performance.html. The performance table and graph above do not reflect the deduction of taxes that a shareholder would pay on Fund distributions or the redemption of Fund shares. Performance data does not reflect the imposition of the redemption fee of 1.00% on shares redeemed within 14 days, and if it did, performance would have been lower. Short-term performance, in particular, is not a good indication of the Fund’s future performance, and an investment should not be made based solely on returns.
1 | Per the Fund’s prospectus dated October 31, 2017. Refer to the financial highlights for the gross and net expense ratios for the year ended as of the date of this report. Please note that the expense ratios per the prospectus include acquired fund fees and expenses (as applicable) and the expense ratios in the financial highlights do not. |
86
Brown Advisory – WMC Strategic European Equity Fund
Schedule of Investments
June 30, 2018
| Shares | Security Description | Value $ | ||||||
| Common Stocks — 97.8% | ||||||||
| Austria — 0.6% | ||||||||
| 167,518 | Porr AG | 5,633,732 | ||||||
| Belgium — 2.3% | ||||||||
| 272,983 | UCB S.A. | 21,399,247 | ||||||
| Denmark — 3.7% | ||||||||
| 43,555 | ALK-Abello A/S* | 7,257,657 | ||||||
| 305,793 | DSV A/S | 24,616,862 | ||||||
| 360,978 | Spar Nord Bank A/S | 3,857,997 | ||||||
| 35,732,516 | ||||||||
| Finland — 4.5% | ||||||||
| 484,652 | Kone OYJ | 24,642,416 | ||||||
| 259,574 | Nokian Renkaat OYJ | 10,221,504 | ||||||
| 167,942 | Sampo OYJ | 8,178,902 | ||||||
| 43,042,822 | ||||||||
| France — 13.9% | ||||||||
| 810,494 | Altran Technologies S.A. | 11,713,963 | ||||||
| 37,309 | BioMerieux S.A. | 3,352,155 | ||||||
| 61,676 | Capgemini SE | 8,265,204 | ||||||
| 668,552 | Elior Group S.A. | 9,635,840 | ||||||
| 1,028,653 | Elis S.A. | 23,523,581 | ||||||
| 420,926 | Legrand S.A. | 30,831,647 | ||||||
| 63,389 | L’Oreal S.A. | 15,627,102 | ||||||
| 132,900 | Pernod Ricard S.A. | 21,689,946 | ||||||
| 28,018 | Virbac S.A.* | 3,817,685 | ||||||
| 70,854 | Worldline S.A.* | 4,006,171 | ||||||
| 132,463,294 | ||||||||
| Germany — 12.9% | ||||||||
| 53,912 | Adidas AG | 11,737,616 | ||||||
| 165,587 | Beiersdorf AG | 18,768,997 | ||||||
| 272,454 | Brenntag AG | 15,138,015 | ||||||
| 581,774 | Infineon Technologies AG | 14,777,833 | ||||||
| 290,876 | Merck KGaA | 28,316,047 | ||||||
| 254,661 | Siemens Healthineers AG* | 10,494,238 | ||||||
| 314,351 | United Internet AG | 17,946,878 | ||||||
| 69,690 | Washtec AG | 6,143,424 | ||||||
| 123,323,048 | ||||||||
| Italy — 0.5% | ||||||||
| 39,100 | DiaSorin S.p.A. | 4,443,515 | ||||||
| Netherlands — 7.5% | ||||||||
| 289,186 | Heineken NV | 28,973,150 | ||||||
| 1,283,012 | ING Groep NV | �� | 18,417,048 | |||||
| 436,559 | Unilever NV | 24,323,780 | ||||||
| 71,713,978 | ||||||||
| Norway — 0.3% | ||||||||
| 132,829 | Kongsberg Gruppen ASA | 2,824,012 | ||||||
| Spain — 1.1% | ||||||||
| 157,878 | Viscofan S.A. | 10,740,092 | ||||||
| Sweden — 11.0% | ||||||||
| 557,334 | Alfa Laval AB | 13,157,470 | ||||||
| 1,330,314 | Assa Abloy AB | 28,218,092 | ||||||
| 597,499 | Atlas Copco AB | 17,303,901 | ||||||
| 1,699,727 | Cloetta AB | 5,144,507 | ||||||
| 2,272,029 | Epiroc AB* | 23,842,131 | ||||||
| 97,752 | Sandvik AB | 1,726,396 | ||||||
| 755,875 | Trelleborg AB | 16,072,708 | ||||||
| 105,465,205 | ||||||||
| Switzerland — 14.4% | ||||||||
| 884 | BELIMO Holding AG | 3,843,287 | ||||||
| 310,402 | Cie Financiere Richemont S.A. | 26,239,668 | ||||||
| 46,193 | Geberit AG | 19,778,177 | ||||||
| 7,458 | INFICON Holding AG* | 3,790,979 | ||||||
| 446,682 | Julius Baer Group, Ltd.* | 26,162,821 | ||||||
| 102,210 | Kuehne & Nagel International AG | 15,343,918 | ||||||
| 1,690 | LEM Holding S.A. | 2,517,551 | ||||||
| 10,154 | Tecan Group AG | 2,464,216 | ||||||
| 2,448,064 | UBS Group AG* | 37,529,709 | ||||||
| 137,670,326 | ||||||||
| United Kingdom — 25.1% | ||||||||
| 357,056 | Bunzl PLC | 10,783,483 | ||||||
| 1,288,949 | Compass Group PLC | 27,474,734 | ||||||
| 329,787 | Diploma PLC | 5,688,508 | ||||||
| 2,211,108 | Electrocomponents PLC | 22,043,097 | ||||||
| 471,823 | Halma PLC | 8,495,778 | ||||||
| 818,902 | Jardine Lloyd Thompson Group PLC | 13,833,534 | ||||||
| 1,021,724 | Prudential PLC | 23,291,528 | ||||||
| 515,242 | Reckitt Benckiser Group PLC | 42,334,732 | ||||||
| 4,574,415 | Rentokil Initial PLC | 21,090,907 | ||||||
| 1,553,701 | Smith & Nephew PLC | 28,619,627 | ||||||
| 469,336 | Smiths Group PLC | 10,483,759 | ||||||
| 154,130 | Spirax-Sarco Engineering PLC | 13,217,188 | ||||||
| 595,760 | SSP Group PLC | 4,970,819 | ||||||
| 291,127 | WH Smith PLC | 7,663,057 | ||||||
| 239,990,751 | ||||||||
| Total Common Stocks (Cost $772,915,168) | 934,442,538 | |||||||
| Preferred Stocks — 0.6% | ||||||||
| Germany — 0.6% | ||||||||
| 119,059 | Fuchs Petrolub SE | 5,858,472 | ||||||
| Total Preferred Stocks (Cost $5,254,697) | 5,858,472 | |||||||
| Short-Term Investments — 0.6% | ||||||||
| Money Market Funds — 0.6% | ||||||||
| 5,800,490 | Deutsche Government & | |||||||
| Agency Securities Portfolio — | ||||||||
| Institutional Shares, 1.82%# | 5,800,490 | |||||||
| Total Short-Term Investments (Cost $5,800,490) | 5,800,490 | |||||||
| Total Investments — 99.0% (Cost $783,970,355) | 946,101,500 | |||||||
| Other Assets in Excess of Liabilities — 1.0% | 9,796,370 | |||||||
| NET ASSETS — 100.0% | $ | 955,897,870 | ||||||
| * | Non-Income Producing | |
| # | Annualized seven-day yield as of June 30, 2018. |
The accompanying notes are an integral part of these financial statements.
87
Brown Advisory – WMC Japan Alpha Opportunities Fund
A Message to Our Shareholders
June 30, 2018
Dear Shareholders:
During the year ended June 30, 2018, the Brown Advisory – WMC Japan Alpha Opportunities Fund – Institutional Shares (the “Fund”) increased 6.75% in value. During the same period, the TOPIX Total Return Index, the Fund’s benchmark, returned 10.98%.
During the year, Japan’s unemployment rate reached 2.2%, the lowest level in over 25 years; the consumer price index (CPI), a measure of inflation, improved and is holding steady at 0.6%; consumer confidence rose to its highest level since 2013; and manufacturing activity, as measured by the Bank of Japan’s Tankan Survey, reached new highs not seen in a decade.
Security selection was the primary driver of underperformance during the period. Across sectors, weak selection within information technology, consumer staples, and consumer discretionary was only partially offset by stronger selection within industrials, materials, and real estate.
From an individual stock perspective, tire company Toyo Tire & Rubber was the top detractor during the period. The company’s stock declined due to troubles within its auto parts segment and the negative effects of a product recall related to the company’s earthquake shock absorbers. Fujitsu, the largest IT service company in Japan, was another detractor. The company reported disappointing earnings during the period and cut profit expectations for its Technology Solutions segment. The company has been unable to rebound from earlier losses.
Kyoritsu Maintenance was the top contributor during the period. Kyoritsu Maintenance is a dormitory and budget hotel chain operator. The company delivered on its plans to expand room adds while simultaneously cleaning up its balance sheet—and the market reacted favorably. Japan Steel Works, a manufacturer of steel products and industrial machineries, was also a top contributor. The company raised earnings forecasts earlier in the year due to strong demand from the auto sector and better-than-expected operating leverage within its machinery business. The company has since delivered results slightly above consensus estimates but with little change to forward guidance.
During the year we added new positions in Sumitomo Electronic Industries, Shin-Etsu Chemical, and Kawasaki Heavy Industries; we eliminated positions in Alps Electric, Alpine Electronics, and Capcom.
The Fund utilized stock index futures during the period as a means of managing cash flows. Futures are not intended to be material performance drivers over time.
Looking forward, economic sentiment in Japan has remained positive even as economic data has been somewhat mixed. Inflation has been low but modestly positive. Productivity growth may be contributing to low inflation. Investments in labor efficiency strategies and IT have been supportive of productivity growth, which is typically good in the long run but can suppress inflation in the short run. The yen has weakened in recent months, which is typically a good sign for exporters. However, with global trade tensions escalating and other risks on the horizon, the benefit of a weaker yen has been moot.
Meaningful uncertainties have persisted: a slowdown in China would likely have negative impacts on Japanese growth, and recent remarks from policy makers have suggested that the Bank of Japan may be researching the impact of a shift in policy.
From a factor perspective, value factors were generally down, quality factors generally outperformed, and growth factors were mixed. Deep value factors continue to look undervalued; however we remain cautious on these exposures as they are heavily overweight financials and sensitive to macro risks like changes in monetary policy.
With meaningful factor breadth and a strong fundamental backdrop, we continue to see meaningful opportunities for stock picking in Japan.
Sincerely,
Kent M. Stahl, CFA
Portfolio Manager
Gregg R. Thomas, CFA
Portfolio Manager
88
Brown Advisory – WMC Japan Alpha Opportunities Fund
A Message to Our Shareholders
June 30, 2018
Past performance is not a guarantee of future results.
Mutual fund investing involves risk. Principal loss is possible. Investments focused in a single geographic region may be exposed to greater risk than investments diversified among various geographies. Investments in foreign securities entail certain risks not associated with investments in domestic securities, such as volatility of currency exchange rates, and in some cases, political and economic instability and relatively illiquid markets. These risks are greater in emerging markets. Investments in smaller and medium capitalization companies generally carry greater risk than is customarily associated with larger companies for various reasons such as narrower markets, limited financial resources and less liquid stock. The Fund may invest in ETFs, which may trade at a discount to the aggregate value of the underlying securities and although expense ratios for ETFs are generally low, frequent trading of ETFs by the Fund can generate brokerage expenses. The value of investments in REITs may change in response to changes in the real estate market such as declines in the value of real estate, lack of available capital or financing opportunities, and increases in property taxes or operating costs. Derivatives involve risks different from, and in certain cases, greater than the risks presented by more traditional investments. Investors will indirectly bear the principal risks and its share of the fees and expenses of the Fund’s investment in other Investment Companies. Earnings growth is not representative of the fund’s future performance.
Fund holdings and sector allocations are subject to change and should not be considered a recommendation to buy or sell any security. For a complete list of fund holdings, please refer to the Schedule of Investments provided in this report.
Definitions for terms and indices are provided in the Glossary of Terms.
89
Brown Advisory – WMC Japan Alpha Opportunities Fund
Performance Information & Portfolio Holdings Summary
June 30, 2018
| PORTFOLIO HOLDINGS | % of Net Assets |
| Consumer Discretionary | 21.4% |
| Financials | 16.8% |
| Industrials | 15.6% |
| Information Technology | 14.1% |
| Materials | 10.8% |
| Money Market Funds | 5.4% |
| Consumer Staples | 4.4% |
| Health Care | 4.3% |
| Telecommunication Services | 1.9% |
| Energy | 1.4% |
| Utilities | 1.3% |
| Real Estate | 1.2% |
| Exchange Traded Funds | 0.9% |
| Real Estate Investment Trusts | 0.3% |
| Other Assets and Liabilities | 0.2% |
100.0% |
GROWTH OF A $1,000,000 INVESTMENT
The following chart reflects the change in value of a hypothetical $1,000,000 investment, including reinvested dividends and distributions, in the Fund as measured against broad-based securities market indices. TOPIX Total Return Index is a market capitalization-weighted index of all companies listed on the First Section of the Tokyo Stock Exchange. The index is unmanaged and does not reflect the deduction of fees, such as investment management fees. Investors cannot invest directly in an index.
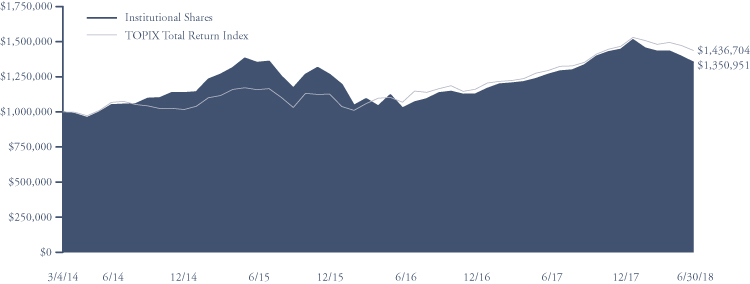
| Since Inception | |||
Average Annual Total | One Year | (3/4/14) | |
| Institutional Shares | 6.75% | 7.21% | |
| Investor Shares | 6.58% | 7.04% | |
| Advisor Shares | 6.33% | 6.78% | |
| TOPIX Total Return Index | 10.98% | 8.74% | |
Institutional Shares | Investor Shares | Advisor Shares | |
Gross Expense Ratio1 | 1.15% | 1.30% | 1.55% |
Net Expense Ratio1 | 1.15% | 1.30% | 1.55% |
Past performance does not guarantee future results. The performance data quoted represents past performance and current returns may be lower or higher. The investment return and net asset value will fluctuate so that an investor’s shares, when redeemed, may be worth more or less than the original cost. To obtain performance information current to the most recent month end, please visit our website at brownadvisoryfunds.com/performance.html. The performance table and graph above do not reflect the deduction of taxes that a shareholder would pay on Fund distributions or the redemption of Fund shares. Performance data does not reflect the imposition of the redemption fee of 1.00% on shares redeemed within 14 days, and if it did, performance would have been lower. Short-term performance, in particular, is not a good indication of the Fund’s future performance, and an investment should not be made based solely on returns.
1 | Per the Fund’s prospectus dated October 31, 2017. Refer to the financial highlights for the gross and net expense ratios for the year ended as of the date of this report. Please note that the expense ratios per the prospectus include acquired fund fees and expenses (as applicable) and the expense ratios in the financial highlights do not. |
90
Brown Advisory – WMC Japan Alpha Opportunities Fund
Schedule of Investments
June 30, 2018
| Shares | Security Description | Value $ | ||||||
| Common Stocks – 93.2% | ||||||||
| Consumer Discretionary – 21.4% | ||||||||
| 117,200 | Adastria Co., Ltd. | 1,484,168 | ||||||
| 35,608 | Aeon Delight Co., Ltd. | 1,210,031 | ||||||
| 266,700 | Aisan Industry Co., Ltd. | 2,245,627 | ||||||
| 120,074 | Altech Corp. | 2,615,804 | ||||||
| 332,298 | ASKUL Corp. | 10,757,999 | ||||||
| 376,600 | Avex, Inc. | 5,222,395 | ||||||
| 153,504 | Bandai Namco Holdings, Inc. | 6,323,062 | ||||||
| 61,400 | BayCurrent Consulting, Inc. | 2,045,807 | ||||||
| 49,700 | BELC Co., Ltd. | 2,627,325 | ||||||
| 115,500 | Benesse Holdings, Inc. | 4,095,889 | ||||||
| 72,029 | Bridgestone Corp. | 2,813,658 | ||||||
| 19,800 | Canon Marketing Japan, Inc. | 412,411 | ||||||
| 306,500 | DaikyoNishikawa Corp. | 4,478,093 | ||||||
| 182,500 | DIP Corp. | 4,681,176 | ||||||
| 226,100 | Exedy Corp. | 6,998,089 | ||||||
| 351,045 | Fuji Media Holdings, Inc. | 5,990,345 | ||||||
| 143,400 | FUJIFILM Holdings Corp. | 5,592,984 | ||||||
| 457,700 | Funai Electric Co., Ltd.* | 2,625,088 | ||||||
| 96,300 | Gendai Agency, Inc. | 465,031 | ||||||
| 6,240 | Hikari Tsushin, Inc. | 1,095,115 | ||||||
| 790,910 | Honda Motor Co., Ltd. | 23,190,260 | ||||||
| 169,420 | Honeys Holdings Co., Ltd. | 1,455,203 | ||||||
| 543,300 | IDOM, Inc. | 2,999,779 | ||||||
| 187,100 | IJT Technology Holdings Co., Ltd. | 1,502,125 | ||||||
| 166,176 | Isuzu Motors, Ltd. | 2,203,024 | ||||||
| 240,516 | ITOCHU Corp. | 4,349,933 | ||||||
| 183,100 | JAC Recruitment Co., Ltd. | 3,943,178 | ||||||
| 388,400 | Keihin Corp. | 7,881,560 | ||||||
| 210,816 | Kyoritsu Maintenance Co., Ltd. | 11,551,637 | ||||||
| 149,814 | Marui Group Co., Ltd. | 3,151,350 | ||||||
| 238,565 | NGK Spark Plug Co., Ltd. | 6,782,110 | ||||||
| 326,800 | Nikon Corp. | 5,193,643 | ||||||
| 986,853 | Nippon Television Holdings, Inc. | 16,633,245 | ||||||
| 375,466 | Nishimatsuya Chain Co., Ltd. | 4,315,128 | ||||||
| 254,482 | Nissan Motor Co., Ltd. | 2,476,159 | ||||||
| 309,459 | Nissin Kogyo Co., Ltd. | 5,471,755 | ||||||
| 225,889 | Pacific Industrial Co., Ltd. | 3,314,559 | ||||||
| 122,900 | PAL Group Holdings Co., Ltd. | 2,901,979 | ||||||
| 185,050 | Persol Holdings Co., Ltd. | 4,121,137 | ||||||
| 4,505,200 | Pioneer Corp.* | 6,252,374 | ||||||
| 322,400 | Prestige International, Inc. | 4,317,399 | ||||||
| 65,800 | Proto Corp. | 861,265 | ||||||
| 131,300 | Raksul, Inc.* | 2,901,965 | ||||||
| 78,200 | Relia, Inc. | 1,115,053 | ||||||
| 196,570 | Sankyo Co., Ltd. | 7,686,832 | ||||||
| 178,800 | Sanyo Shokai, Ltd. | 3,580,200 | ||||||
| 178,300 | Seibu Holdings, Inc. | 3,002,523 | ||||||
| 168,566 | Seiren Co., Ltd. | 2,622,558 | ||||||
| 37,901 | Seria Co., Ltd. | 1,816,385 | ||||||
| 37,706 | Shimamura Co., Ltd. | 3,315,035 | ||||||
| 121,100 | Strike Co., Ltd. | 4,688,440 | ||||||
| 167,918 | Suzuki Motor Corp. | 9,253,645 | ||||||
| 170,960 | TechnoPro Holdings, Inc. | 10,497,791 | ||||||
| 569,334 | Tokai Rika Co., Ltd. | 10,794,122 | ||||||
| 13,528 | Token Corp. | 1,192,007 | ||||||
| 423,700 | Toppan Forms Co., Ltd. | 4,283,727 | ||||||
| 386,800 | Toppan Printing Co., Ltd. | 3,025,962 | ||||||
| 1,408,588 | Toyo Tire & Rubber Co., Ltd. | 20,535,541 | ||||||
| 345,100 | Toyoda Gosei Co., Ltd. | 8,734,370 | ||||||
| 79,496 | Toyota Industries Corp. | 4,449,850 | ||||||
| 105,500 | Trusco Nakayama Corp. | 2,632,304 | ||||||
| 159,060 | TV Asahi Holdings Corp. | 3,489,202 | ||||||
| 100,900 | United Arrows, Ltd. | 3,759,702 | ||||||
| 305,900 | XEBIO Holdings Co., Ltd. | 4,864,805 | ||||||
| 199,600 | Zojirushi Corp. | 2,435,696 | ||||||
| 319,326,614 | ||||||||
| Consumer Staples – 4.4% | ||||||||
| 32,200 | Ain Holdings, Inc. | 2,373,263 | ||||||
| 623,274 | Ajinomoto Co., Inc. | 11,798,002 | ||||||
| 72,193 | Asahi Group Holdings, Ltd. | 3,702,614 | ||||||
| 96,700 | Cawachi, Ltd. | 1,977,208 | ||||||
| 70,700 | Ci:z Holdings Co., Ltd. | 3,359,253 | ||||||
| 49,688 | Cocokara Fine, Inc. | 3,055,040 | ||||||
| 273,825 | Ezaki Glico Co., Ltd. | 13,153,410 | ||||||
| 717,100 | Itoham Yonekyu Holdings, Inc. | 6,169,666 | ||||||
| 281,429 | Japan Tobacco, Inc. | 7,864,932 | ||||||
| 250,636 | Seven & I Holdings Co., Ltd. | 10,931,660 | ||||||
| 82,600 | Warabeya Nichiyo Holdings Co., Ltd. | 1,894,841 | ||||||
| 66,279,889 | ||||||||
| Energy – 1.4% | ||||||||
| 1,205,910 | Inpex Corp. | 12,524,439 | ||||||
| 308,700 | Japan Petroleum Exploration Co., Ltd. | 8,048,069 | ||||||
| 20,572,508 | ||||||||
| Financials – 16.8% | ||||||||
| 2,426,405 | Acom Co., Ltd. | 9,314,951 | ||||||
| 95,527 | Bank of Kyoto, Ltd. | 4,410,615 | ||||||
| 349,000 | Chiba Bank, Ltd. | 2,461,465 | ||||||
| 62,800 | Chugoku Bank, Ltd. | 633,718 | ||||||
| 516,400 | Concordia Financial Group, Ltd. | 2,624,256 | ||||||
| 213,250 | Credit Saison Co., Ltd. | 3,350,362 | ||||||
| 941,400 | Dai-ichi Life Holdings Co., Inc. | 16,754,706 | ||||||
| 446,000 | Fukuoka Financial Group, Inc. | 2,238,162 | ||||||
| 321,100 | Hachijuni Bank, Ltd. | 1,368,141 | ||||||
| 103,900 | Hiroshima Bank, Ltd. | 689,097 | ||||||
| 301,800 | Ichiyoshi Securities Co., Ltd. | 3,263,444 | ||||||
| 250,200 | Japan Post Bank Co., Ltd. | 2,908,961 | ||||||
| 536,500 | Japan Post Holdings Co., Ltd. | 5,871,335 | ||||||
| 292,100 | Kyushu Financial Group, Inc. | 1,405,720 | ||||||
| 582,200 | Mebuki Financial Group, Inc. | 1,952,917 | ||||||
| 9,076,395 | Mitsubishi UFJ Financial Group, Inc. | 51,416,728 | ||||||
| 15,391,810 | Mizuho Financial Group, Inc. | 25,927,282 | ||||||
| 103,294 | MS&AD Insurance Group Holdings, Inc. | 3,208,167 | ||||||
| 712,500 | Resona Holdings, Inc. | 3,797,468 | ||||||
| 441,393 | San-In Godo Bank, Ltd. | 3,940,331 | ||||||
| 115,000 | Shinsei Bank, Ltd. | 1,764,488 | ||||||
| 280,000 | Shizuoka Bank, Ltd. | 2,517,568 | ||||||
| 178,929 | Sony Financial Holdings, Inc. | 3,409,152 | ||||||
| 761,200 | Sumitomo Mitsui Financial Group, Inc. | 29,691,365 | ||||||
| 493,222 | Sumitomo Mitsui Trust Holdings, Inc. | 19,459,395 | ||||||
| 1,134,417 | T&D Holdings, Inc. | 17,014,065 | ||||||
| 604,100 | Tochigi Bank, Ltd. | 2,090,479 | ||||||
The accompanying notes are an integral part of these financial statements.
91
Brown Advisory – WMC Japan Alpha Opportunities Fund
Schedule of Investments
June 30, 2018
| Shares | Security Description | Value $ | ||||||
| Common Stocks — 93.2% (Continued) | ||||||||
| Financials – 16.8% (Continued) | ||||||||
| 268,853 | Tokio Marine Holdings, Inc. | 12,577,816 | ||||||
| 125,730 | Tokyo TY Financial Group, Inc. | 3,013,008 | ||||||
| 190,000 | Yamaguchi Financial Group, Inc. | 2,137,431 | ||||||
| 189,909 | Zenkoku Hosho Co., Ltd. | 8,598,602 | ||||||
| 249,811,195 | ||||||||
| Health Care – 4.3% | ||||||||
| 124,500 | Asahi Intecc Co., Ltd. | 4,700,632 | ||||||
| 44,437 | BML, Inc. | 1,143,818 | ||||||
| 98,500 | CMIC Holdings Co., Ltd. | 2,038,878 | ||||||
| 122,460 | Eisai Co., Ltd. | 8,619,966 | ||||||
| 164,700 | EPS Holdings, Inc. | 3,523,945 | ||||||
| 98,200 | Japan Lifeline Co Ltd. | 2,407,485 | ||||||
| 120,300 | Nippon Shinyaku Co., Ltd. | 7,465,586 | ||||||
| 1,018,503 | Nipro Corp. | 11,751,392 | ||||||
| 238,070 | ONO Pharmaceutical Co., Ltd. | 5,573,416 | ||||||
| 25,321 | Suzuken Co., Ltd. | 1,070,811 | ||||||
| 387,000 | Takeda Pharmaceutical Co., Ltd. | 16,280,353 | ||||||
| 64,576,282 | ||||||||
| Industrials – 15.6% | ||||||||
| 211,140 | Amada Holdings Co., Ltd. | 2,026,385 | ||||||
| 831,070 | Chiyoda Corp. | 7,205,965 | ||||||
| 157,100 | Daiseki Co., Ltd. | 4,605,953 | ||||||
| 244,600 | DMG Mori Co., Ltd. | 3,381,582 | ||||||
| 358,500 | Fujitsu General, Ltd. | 5,602,896 | ||||||
| 61,300 | Furukawa Electric Co., Ltd. | 2,138,709 | ||||||
| 985,081 | Hazama Ando Corp. | 8,953,820 | ||||||
| 714,213 | Hino Motors, Ltd. | 7,615,853 | ||||||
| 140,900 | Hisaka Works, Ltd. | 1,332,450 | ||||||
| 385,500 | Hitachi Chemical Co., Ltd. | 7,760,729 | ||||||
| 853,960 | Hitachi Metals, Ltd. | 8,854,529 | ||||||
| 248,400 | Hosiden Corp. | 2,082,052 | ||||||
| 138,400 | IHI Corp. | 4,814,106 | ||||||
| 118,100 | Jamco Corp. | 2,684,915 | ||||||
| 81,657 | Japan Airlines Co., Ltd. | 2,893,195 | ||||||
| 164,400 | Japan Steel Works, Ltd. | 4,138,553 | ||||||
| 524,619 | JGC Corp. | 10,552,717 | ||||||
| 574,416 | Kawasaki Heavy Industries, Ltd. | 16,893,939 | ||||||
| 85,185 | Kinden Corp. | 1,389,328 | ||||||
| 67,388 | Kumagai Gumi Co., Ltd. | 2,362,387 | ||||||
| 171,000 | Kyudenko Corp. | 8,240,489 | ||||||
| 173,500 | Mirait Holdings Corp. | 2,683,108 | ||||||
| 401,990 | Mitsubishi Heavy Industries, Ltd. | 14,612,880 | ||||||
| 70,200 | Mitsui O.S.K. Lines, Ltd. | 1,688,190 | ||||||
| 912,810 | NGK Insulators, Ltd. | 16,218,883 | ||||||
| 579,726 | Nippon Yusen K.K. | 11,485,385 | ||||||
| 110,300 | Nissin Electric Co., Ltd. | 1,014,223 | ||||||
| 48,887 | Noritz Corp. | 795,744 | ||||||
| 549,800 | Sanwa Holdings Corp. | 5,810,018 | ||||||
| 63,500 | Shima Seiki Manufacturing, Ltd. | 3,026,303 | ||||||
| 56,568 | SHO-BOND Holdings Co., Ltd. | 3,930,303 | ||||||
| 4,828 | SMC Corp. | 1,767,486 | ||||||
| 1,442,658 | Sumitomo Electric Industries, Ltd. | 21,456,118 | ||||||
| 384,234 | Tadano, Ltd. | 4,712,332 | ||||||
| 50,301 | Taisei Corp. | 2,770,049 | ||||||
| 153,695 | Takuma Co., Ltd. | 1,869,050 | ||||||
| 734,000 | Toshiba Machine Co., Ltd. | 3,494,608 | ||||||
| 102,691 | Toshiba Plant Systems & Services Corp. | 2,346,401 | ||||||
| 355,600 | Toyo Engineering Corp.* | 2,432,877 | ||||||
| 231,480 | Tsubaki Nakashima Co., Ltd. | 5,447,414 | ||||||
| 460,200 | Ushio, Inc. | 5,844,400 | ||||||
| 133,600 | Yokogawa Bridge Holdings Corp. | 3,163,947 | ||||||
| 232,100,271 | ||||||||
| Information Technology – 14.1% | ||||||||
| 31,606 | Alpha Systems, Inc. | 655,264 | ||||||
| 332,200 | Canon, Inc. | 10,893,353 | ||||||
| 933,700 | Citizen Watch Co., Ltd. | 6,122,559 | ||||||
| 129,000 | Cresco, Ltd. | 3,784,482 | ||||||
| 1,057,847 | DeNA Co., Ltd. | 19,808,952 | ||||||
| 40,099 | DTS Corp. | 1,487,612 | ||||||
| 101,605 | Enplas Corp. | 2,827,267 | ||||||
| 345,447 | Ferrotec Holdings Corp. | 5,308,776 | ||||||
| 4,261,853 | Fujitsu, Ltd. | 25,790,674 | ||||||
| 1,113,400 | GREE, Inc. | 5,954,833 | ||||||
| 267,426 | Hitachi High-Technologies Corp. | 10,878,954 | ||||||
| 309,780 | Ibiden Co., Ltd. | 4,949,853 | ||||||
| 193,123 | Kyocera Corp. | 10,860,838 | ||||||
| 222,200 | LAC Co., Ltd. | 3,437,744 | ||||||
| 526,001 | Maxell Holdings, Ltd. | 8,850,928 | ||||||
| 63,410 | Melco Holdings, Inc. | 2,348,467 | ||||||
| 94,400 | Miraial Co., Ltd. | 1,037,254 | ||||||
| 114,100 | Mitsubishi Electric Corp. | 1,513,869 | ||||||
| 24,400 | Murata Manufacturing Co., Ltd. | 4,096,185 | ||||||
| 244,600 | Nexon Co., Ltd.* | 3,548,991 | ||||||
| 504,700 | Nichicon Corp. | 6,343,562 | ||||||
| 149,400 | Nippon Ceramic Co., Ltd. | 3,885,698 | ||||||
| 38,647 | NSD Co., Ltd. | 879,771 | ||||||
| 7,300 | ORO Co., Ltd.* | 251,275 | ||||||
| 438,300 | Renesas Electronics Corp.* | 4,284,738 | ||||||
| 339,300 | Ricoh Co., Ltd. | 3,107,219 | ||||||
| 132,200 | SCSK Corp. | 6,138,431 | ||||||
| 48,500 | Shibaura Electronics Co., Ltd. | 1,938,108 | ||||||
| 741,400 | Shinko Electric Industries Co., Ltd. | 6,616,806 | ||||||
| 253,400 | SIIX Corp. | 5,545,433 | ||||||
| 312,466 | SMK Corp. | 1,066,271 | ||||||
| 117,100 | Systena Corp. | 1,193,524 | ||||||
| 182,100 | TechMatrix Corp. | 3,760,602 | ||||||
| 287,434 | Tokyo Seimitsu Co., Ltd. | 9,473,467 | ||||||
| 88,200 | UT Group Co., Ltd.* | 3,294,214 | ||||||
| 3,982,030 | Yahoo! Japan Corp. | 13,191,934 | ||||||
| 113,000 | Yamaichi Electronics Co., Ltd. | 1,541,304 | ||||||
| 177,100 | Yume No Machi Souzou Iinkai Co., Ltd. | 3,676,055 | ||||||
| 210,345,267 | ||||||||
| Materials – 10.8% | ||||||||
| 126,121 | ADEKA Corp. | 2,019,579 | ||||||
| 144,700 | Chubu Steel Plate Co., Ltd. | 1,018,517 | ||||||
| 307,589 | Daicel Corp. | 3,397,893 | ||||||
| 174,600 | Denka Co., Ltd. | 5,811,833 | ||||||
| 46,035 | Fujimi, Inc. | 1,018,635 | ||||||
| 602,656 | JFE Holdings, Inc. | 11,382,788 | ||||||
| 724,355 | JSR Corp. | 12,309,874 | ||||||
| 321,019 | Kanto Denka Kogyo Co., Ltd. | 2,668,425 | ||||||
The accompanying notes are an integral part of these financial statements.
92
Brown Advisory – WMC Japan Alpha Opportunities Fund
Schedule of Investments
June 30, 2018
| Shares | Security Description | Value $ | ||||||
| Common Stocks — 93.2% (Continued) | ||||||||
| Materials – 10.8% % (Continued) | ||||||||
| 186,500 | KH Neochem Co., Ltd. | 5,642,897 | ||||||
| 704,701 | Kobe Steel, Ltd. | 6,439,939 | ||||||
| 303,400 | Kyoei Steel, Ltd. | 5,725,117 | ||||||
| 614,451 | MinebeaMitsumi, Inc. | 10,354,585 | ||||||
| 155,200 | Mitsui Mining & Smelting Co., Ltd. | 6,587,038 | ||||||
| 421,000 | Nakayama Steel Works, Ltd. | 2,546,029 | ||||||
| 161,400 | Neturen Co., Ltd. | 1,404,307 | ||||||
| 497,940 | NOK Corp. | 9,617,530 | ||||||
| 162,000 | Pacific Metals Co., Ltd.* | 5,942,994 | ||||||
| 19,897 | Sanyo Chemical Industries, Ltd. | 861,040 | ||||||
| 159,162 | Sekisui Chemical Co., Ltd. | 2,707,441 | ||||||
| 170,214 | Shin-etsu Chemical Co., Ltd. | 15,126,653 | ||||||
| 381,800 | Sumitomo Riko Co., Ltd. | 3,912,628 | ||||||
| 163,000 | Taiheiyo Cement Corp. | 5,362,104 | ||||||
| 239,500 | Tocalo Co., Ltd. | 2,498,128 | ||||||
| 102,700 | Tokuyama Corp. | 3,289,409 | ||||||
| 150,800 | Tokyo Ohka Kogyo Co., Ltd. | 5,810,138 | ||||||
| 1,279,100 | Tokyo Steel Manufacturing Co., Ltd. | 11,347,613 | ||||||
| 146,100 | Toyo Seikan Group Holdings, Ltd. | 2,564,024 | ||||||
| 184,600 | Toyobo Co., Ltd. | 3,068,619 | ||||||
| 12,800 | UACJ Corp. | 275,867 | ||||||
| 324,912 | Yamato Kogyo Co., Ltd. | 9,801,470 | ||||||
| 160,513,114 | ||||||||
| Real Estate – 1.2% | ||||||||
| 1,740,600 | Ichigo, Inc. | 8,152,876 | ||||||
| 763,000 | Kenedix, Inc. | 4,629,217 | ||||||
| 236,812 | Mitsubishi Estate Co., Ltd. | 4,134,005 | ||||||
| 500,000 | Takara Leben Co., Ltd. | 1,870,904 | ||||||
| 18,787,002 | ||||||||
| Telecommunication Services – 1.9% | ||||||||
| 153,904 | KDDI Corp. | 4,208,491 | ||||||
| 361,258 | Nippon Telegraph & Telephone Corp. | 16,411,233 | ||||||
| 100,483 | SoftBank Group Corp. | 7,175,306 | ||||||
| 27,795,030 | ||||||||
| Utilities – 1.3% | ||||||||
| 325,000 | Chubu Electric Power Co., Inc. | 4,873,177 | ||||||
| 252,400 | Chugoku Electric Power Co., Inc. | 3,260,527 | ||||||
| 90,900 | Electric Power Development Co., Ltd. | 2,346,155 | ||||||
| 83,400 | Nippon Gas Co., Ltd. | 4,855,963 | ||||||
| 768,900 | Tokyo Electric Power Company | |||||||
| Holdings, Inc.* | 3,579,651 | |||||||
| 18,915,473 | ||||||||
| Total Common Stocks (Cost $1,309,809,096) | 1,389,022,645 | |||||||
| Real Estate Investment Trusts – 0.3% | ||||||||
| 278 | Hoshino Resorts, Inc. | 1,443,950 | ||||||
| 3,369 | LaSalle Logiport | 3,339,481 | ||||||
| Total Real Estate Investment Trusts (Cost $4,991,391) | 4,783,431 | |||||||
| Exchange Traded Funds – 0.9% | ||||||||
| 798,382 | Nomura AM TOPIX ETF | 12,974,763 | ||||||
| Total Exchange Traded Funds (Cost $13,207,523) | 12,974,763 | |||||||
| Short-Term Investments – 5.4% | ||||||||
| Money Market Funds – 5.4% | ||||||||
| 80,010,800 | Deutsche Government & Agency Securities | |||||||
| Portfolio – Institutional Shares, 1.82%# | 80,010,800 | |||||||
| Total Short-Term Investments (Cost $80,010,800) | 80,010,800 | |||||||
| Total Investments – 99.8% (Cost $1,408,018,810) | 1,486,791,639 | |||||||
| Other Assets in Excess of Liabilities – 0.2% | 3,541,246 | |||||||
| NET ASSETS – 100.0% | $ | 1,490,332,885 | ||||||
| * | Non-Income Producing | |
| # | Annualized seven-day yield as of June 30, 2018. |
| Futures Contracts – Long (Note 6) | |||||||||||||||||
| Notional | Notional | Unrealized Appreciation | |||||||||||||||
Issue | Contracts | Expiration Date | Amount | Value | (Depreciation) | ||||||||||||
| TOPIX Index Futures^ | 290 | 09/13/2018 | $ | 46,375,721 | $ | 45,327,643 | $ | (1,048,078 | ) | ||||||||
| $ | 46,375,721 | $ | 45,327,643 | $ | (1,048,078 | ) | |||||||||||
| ^ | Contracts are denominated in Japanese Yen. Notional amount, notional value and unrealized appreciation (depreciation) have been translated into U.S. Dollars as of June 30, 2018. |
There is $186,736 of variation margin due from the broker to the Fund as of June 30, 2018.
Forward Foreign Currency Exchange Contracts (Note 7)
| Unrealized | |||||||||||||||
| Appreciation | |||||||||||||||
| Currency to be Delivered | Currency to be Received | Settlement Date | Counterparty | (Depreciation) | |||||||||||
| U.S. Dollars | (9,220,691 | ) | Japanese Yen | 1,009,200,000 | 07/31/18 | ANZ Securities | $ | (85,313 | ) | ||||||
| U.S. Dollars | (15,380,969 | ) | Japanese Yen | 1,681,832,000 | 07/31/18 | Barclays Capital | (156,860 | ) | |||||||
| U.S. Dollars | (21,459,411 | ) | Japanese Yen | 2,354,968,000 | 07/31/18 | Morgan Stanley & Co. | (142,008 | ) | |||||||
| $ | (384,181 | ) | |||||||||||||
The accompanying notes are an integral part of these financial statements.
93
Brown Advisory – Somerset Emerging Markets Fund
A Message to Our Shareholders
June 30, 2018
Dear Shareholders:
During the year ended June 30, 2018, the Brown Advisory – Somerset Emerging Markets Fund – Institutional Shares (the “Fund”) returned -0.12%. During the same period, the MSCI Emerging Markets Index (the “Index”), the Fund’s benchmark, increased 8.20%.
During the year, the Fund’s underperformance can be attributed to three central factors (1) China (and specifically Chinese technology); (2) currency fluctuations; and (3) increased geopolitical tensions. Our underweight to China has been a relative headwind, and has accounted for a meaningful portion of underperformance over the past 12 months. In particular, our underweight to Chinese internet platforms, which were a narrow but strong source of performance over the past year for the Index, is based on upon our quality bias and thus caution over businesses trading at over 40x earnings as well as the potential governance risk associated with Variable Interest Entity Structures which underpin the securities. Additionally, our holdings in Korean and Taiwanese technology hardware cooled in the second half of 2017, after a strong first half. Currency fluctuations have generally hurt relative performance year-to-date. As well as being underexposed to some of the stronger EM currencies such as the Chinese Yuan, the Strategy has also been adversely impacted by its exposure to the Hungarian Forint and the Turkish Lira, which have both been extremely weak.
The Fund has been more susceptible to increased international tensions than expected, particularly in relation to U.S. sanctions on Russia (an overweight for the Fund) and more recently the threat of a trade war. However, in keeping with the more defensive profile of the Fund we believe it is well positioned to make back some ground should volatility persist (which we began to see in June 2018, underpinned by negative sentiment in Chinese markets).
From an individual stock perspective, SK Hynix was both a key contributor, especially in the third quarter of 2017 (before cooling off in the fourth quarter), and also a detractor, having been unexpectedly caught up in the Sino-U.S. trade war/technology transfer debate. Energy stock CNOOC, Ltd. has been a key contributor in the first six months of 2018, a beneficiary of favorable oil price forecasts and an upward revision of company production output and reserves.
We made 3 buys and 3 sells during the year. Turnover was 13% during the year, which is in line with historical averages. Stocks purchased included three banks, Alpha Bank and Piraeus Bank in Greece, and Sberbank in Russia. In particular, a turnaround in the Greek banking sector towards the end of 2016, along with a steady recovery in the national economy leave both Piraeus and Alpha well-positioned, in our view, to capitalize on their rejuvenated loan books and a sector which has undergone significant consolidation since the 2011 financial crisis. Metrobank and Axis Bank were sold based on our view that both were fully valued. Finally, we sold the Samart warrants that we received while we held the stock (which we sold in 2016).
Despite the turbulence of recent months, we remain bullish in our outlook for markets on a medium term basis and believe that there is potential for significant upside in the portfolio – particularly following a difficult few months for some of our high conviction positions. Critically, we believe that the Fund remains well-positioned to guard against key risks to our bull thesis, with our underweight to China providing cover from June’s Chinese stock market rout.
Overall, our view is that the Fund is currently well positioned to capture more broad-based performance (outside of China tech) in emerging markets.
Sincerely,
Edward Lam
Lead Portfolio Manager
Past performance is not a guarantee of future results.
Mutual fund investing involves risk. Principal loss is possible. The Fund may invest in ETFs, which may trade at a discount to the aggregate value of the underlying securities and although expense ratios for ETFs are generally low, frequent trading of ETFs by the Fund can generate brokerage expenses. The Fund may invest in foreign securities which involve greater volatility and political, economic and currency risks and differences in accounting methods. These risks are greater in emerging markets. Derivatives may involve certain costs and risks such as liquidity, interest rate, market, credit, management, and the risk that a position could not be closed when most advantageous. Investing in derivatives could lose more than the amount invested. The Fund invests in smaller and medium-sized companies which carry greater risk than is associated with larger companies for various reasons, such as narrower markets, limited financial resources and less liquid stock.
Fund holdings and sector allocations are subject to change and should not be considered a recommendation to buy or sell any security. For a complete list of fund holdings, please refer to the Schedule of Investments provided in this report.
Definitions for terms and indices are provided in the Glossary of Terms.
94
Brown Advisory – Somerset Emerging Markets Fund
Performance Information & Portfolio Holdings Summary
June 30, 2018
| PORTFOLIO HOLDINGS | % of Net Assets |
| South Korea | 20.1% |
| India | 10.5% |
| Taiwan | 9.7% |
| Hungary | 8.4% |
| United Kingdom | 6.7% |
| China | 5.4% |
| Brazil | 5.3% |
| South Africa | 4.9% |
| Chile | 4.0% |
| Turkey | 3.7% |
| United Arab Emirates | 3.4% |
| Russia | 3.2% |
| Poland | 3.1% |
| Greece | 3.0% |
| Netherlands | 2.9% |
| Indonesia | 1.7% |
| Nigeria | 1.0% |
| Philippines | 1.0% |
| Portugal | 0.9% |
| Germany | 0.5% |
| Money Market Funds | 0.1% |
| Other Assets and Liabilities | 0.5% |
100.0% |
GROWTH OF A $1,000,000 INVESTMENT
The following chart reflects the change in value of a hypothetical $1,000,000 investment, including reinvested dividends and distributions, in the Fund as measured against a broad-based securities market index. The MSCI Emerging Markets Index (“Index”) is a free float-adjusted market capitalization index that is designed to measure equity market performance in the global emerging markets. The Index is unmanaged and does not reflect the deduction of fees, such as investment management fees. Investors cannot invest directly in an index.
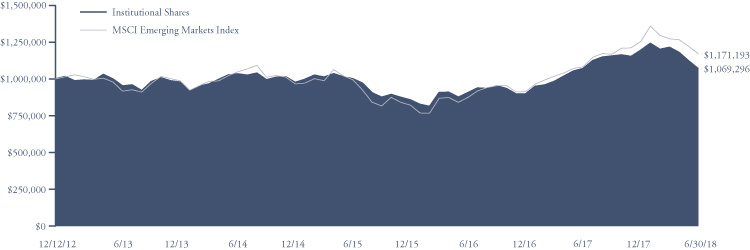
| Since Inception | |||
Average Annual Total Return | One Year | Five Year | (12/12/12) |
| Institutional Shares | -0.12% | 2.34% | 1.21% |
| Investor Shares | -0.37% | 2.18% | 1.05% |
| Advisor Shares | -0.60% | 1.92% | 0.78% |
| MSCI Emerging Markets Index | 8.20% | 5.01% | 2.89% |
Institutional Shares | Investor Shares | Advisor Shares | |
Gross Expense Ratio1 | 1.17% | 1.32% | 1.57% |
Net Expense Ratio1 | 1.17% | 1.32% | 1.57% |
Past performance does not guarantee future results. The performance data quoted represents past performance and current returns may be lower or higher. The investment return and net asset value will fluctuate so that an investor’s shares, when redeemed, may be worth more or less than the original cost. To obtain performance information current to the most recent month end, please visit our website at brownadvisoryfunds.com/performance.html. The performance table and graph above do not reflect the deduction of taxes that a shareholder would pay on Fund distributions or the redemption of Fund shares. Performance data does not reflect the imposition of the redemption fee of 1.00% on shares redeemed within 14 days, and if it did, performance would have been lower. Short-term performance, in particular, is not a good indication of the Fund’s future performance, and an investment should not be made based solely on returns.
1 | Per the Fund’s prospectus dated October 31, 2017. Refer to the financial highlights for the gross and net expense ratios for the year ended as of the date of this report. Please note that the expense ratios per the prospectus include acquired fund fees and expenses (as applicable) and the expense ratios in the financial highlights do not. |
95
Brown Advisory – Somerset Emerging Markets Fund
Schedule of Investments
June 30, 2018
| Shares | Security Description | Value $ | ||||||
| Common Stocks — 99.4% | ||||||||
| Brazil — 5.3% | ||||||||
| 2,292,671 | Ambev S.A. | 10,635,935 | ||||||
| 1,767,579 | Porto Seguro S.A. | 18,452,234 | ||||||
| 29,088,169 | ||||||||
| Chile — 4.0% | ||||||||
| 3,204,703 | AFP Habitat S.A.† | 4,747,744 | ||||||
| 2,408,711 | Aguas Andinas S.A. | 1,315,696 | ||||||
| 1,247,316 | Cia Cervecerias Unidas S.A.† | 15,615,813 | ||||||
| 229,870 | Inversiones Aguas Metropolitanas S.A. | 351,070 | ||||||
| 22,030,323 | ||||||||
| China — 5.4% | ||||||||
| 9,777,216 | CNOOC, Ltd. | 16,753,704 | ||||||
| 1,367,695 | Henderson Land Development Co., Ltd | 7,212,235 | ||||||
| 585,663 | Hengan International Group Co., Ltd. | 5,617,595 | ||||||
| 29,583,534 | ||||||||
| Germany — 0.5% | ||||||||
| 75,429 | Hapag-Lloyd AG | 2,681,394 | ||||||
| Greece — 3.0% | ||||||||
| 6,603,969 | Alpha Bank AE* | 14,716,167 | ||||||
| 536,313 | Piraeus Bank S.A.* | 1,814,738 | ||||||
| 16,530,905 | ||||||||
| Hungary — 8.4% | ||||||||
| 1,763,936 | MOL Hungarian Oil & Gas PLC.† | 16,973,674 | ||||||
| 817,752 | OTP Bank | 29,525,093 | ||||||
| 46,498,767 | ||||||||
| India — 10.5% | ||||||||
| 1,572,168 | HCL Technologies, Ltd. | 21,243,254 | ||||||
| 188,978 | Hero MotoCorp, Ltd. | 9,582,118 | ||||||
| 3,774,298 | Power Grid Corp. of India, Ltd. | 10,297,706 | ||||||
| 211,978 | Shriram Transport Finance Co., Ltd. | 4,022,672 | ||||||
| 2,624,721 | Yes Bank, Ltd. | 13,042,327 | ||||||
| 58,188,077 | ||||||||
| Indonesia — 1.7% | ||||||||
| 8,146,719 | AKR Corporindo Tbk PT | 2,440,351 | ||||||
| 27,505,683 | Telekomunikasi Indonesia Persero Tbk PT | 7,203,596 | ||||||
| 9,643,947 | ||||||||
| Netherlands — 2.9% | ||||||||
| 613,862 | X5 Retail Group NV GDR | 16,212,333 | ||||||
| Nigeria — 1.0% | ||||||||
| 198,749,515 | Access Bank PLC† | 5,674,376 | ||||||
| Philippines — 1.0% | ||||||||
| 8,268,181 | Aboitiz Power Corp. | 5,385,083 | ||||||
| Poland — 3.1% | ||||||||
| 780,262 | Eurocash S.A.† | 4,507,086 | ||||||
| 1,219,313 | Powszechny Zaklad Ubezpieczen S.A. | 12,641,245 | ||||||
| 17,148,331 | ||||||||
| Portugal — 0.9% | ||||||||
| 328,723 | Jeronimo Martins SGPS S.A. | 4,735,092 | ||||||
| Russia — 3.2% | ||||||||
| 1,221,769 | Sberbank of Russia PJSC ADR | 17,491,202 | ||||||
| South Africa — 4.9% | ||||||||
| 3,036,292 | Sanlam, Ltd. | 15,426,303 | ||||||
| 732,997 | Shoprite Holdings, Ltd. | 11,749,003 | ||||||
| 27,175,306 | ||||||||
| South Korea — 20.1% | ||||||||
| 49,171 | KT&G Corp. | 4,724,592 | ||||||
| 3,889 | NCSoft Corp. | 1,294,201 | ||||||
| 839,940 | Nexen Tire Corp.† | 7,724,886 | ||||||
| 44,294 | NongShim Co., Ltd. | 12,919,664 | ||||||
| 569,845 | Samsung Electronics Co., Ltd. | 23,870,569 | ||||||
| 54,669 | Samsung Fire & Marine Insurance Co., Ltd. | 12,953,306 | ||||||
| 616,963 | SK Hynix, Inc. | 47,357,616 | ||||||
| 110,844,834 | ||||||||
| Taiwan — 9.7% | ||||||||
| 597,613 | eMemory Technology, Inc.† | 7,481,579 | ||||||
| 872,400 | Formosa International Hotels Corp.† | 4,262,277 | ||||||
| 6,276,224 | Pou Chen Corp. | 7,282,152 | ||||||
| 869,000 | President Chain Store Corp. | 9,847,008 | ||||||
| 771,750 | Taiwan Semiconductor Manufacturing Co., Ltd. | 5,480,258 | ||||||
| 2,699,584 | Win Semiconductors Corp. | 19,330,717 | ||||||
| 53,683,991 | ||||||||
| Turkey — 3.7% | ||||||||
| 2,222,773 | Aksa Akrilik Kimya Sanayii A/S† | 5,548,320 | ||||||
| 2,628,593 | Anadolu Hayat Emeklilik A/S† | 4,932,388 | ||||||
| 196,051 | AvivaSA Emeklilik ve Hayat A/S† | 630,764 | ||||||
| 8,804,634 | Turk Telekomunikasyon A/S* | 9,571,523 | ||||||
| 20,682,995 | ||||||||
| United Arab Emirates — 3.4% | ||||||||
| 4,384,282 | First Abu Dhabi Bank | 14,509,721 | ||||||
| 3,988,700 | Union National Bank | 4,039,575 | ||||||
| 18,549,296 | ||||||||
| United Kingdom — 6.7% | ||||||||
| 492,170 | Coca-Cola HBC AG* | 16,381,682 | ||||||
| 2,204,086 | HSBC Holdings PLC | 20,621,452 | ||||||
| 37,003,134 | ||||||||
| Total Common Stocks (Cost $469,653,154) | 548,831,089 | |||||||
| Short-Term Investments — 0.1% | ||||||||
| Money Market Funds — 0.1% | ||||||||
| 338,107 | Deutsche Government & | |||||||
| Agency Securities Portfolio — | ||||||||
| Institutional Shares, 1.82%# | 338,107 | |||||||
| Total Short-Term Investments — 99.5% (Cost $338,107) | 338,107 | |||||||
| Total Investments — 99.5% (Cost $469,991,261) | 549,169,196 | |||||||
| Other Assets in Excess of Liabilities — 0.5% | 2,644,344 | |||||||
| NET ASSETS — 100.0% | $ | 551,813,540 | ||||||
| † | All or a portion of this security is considered illiquid. At June 30, 2018, the total market value of securities considered illiquid was $35,079,998 or 6.4% of net assets. | |
| # | Annualized seven-day yield as of June 30, 2018. | |
| * | Non-Income Producing |
GDR — Global Depository Receipt
ADR — American Depositary Receipt
The accompanying notes are an integral part of these financial statements.
96
Brown Advisory – Macquarie Asia New Stars Fund
A Message to Our Shareholders
June 30, 2018
Dear Shareholders:
During the year ended June 30, 2018, the Brown Advisory – Macquarie Asia New Stars Fund – Institutional Shares (the “Fund”) increased 3.26% in value. During the same period, the MSCI AC Asia ex Japan SMID Cap Index , the Fund’s benchmark, increased 8.47%.
The year ended June 30, 2018 was characterized by two distinctive, albeit unequal, halves as the Fund underperformed a strong performing market for the first 7 months ended January 31, 2018 and subsequently outperformed a volatile, falling market for the subsequent 5 months ended June 30, 2018. The market volatility seen since February 2018 has been driven by macro concerns as investors fret over the potential impacts of global trade disputes as well as increases in oil prices, the U.S. dollar and U.S. bond yields. Our focus on quality companies and an underweight to exporters has materially limited the Fund’s exposure to the recent macro driven volatility and we continue to remain focused on company fundamentals, monitoring the situation and the opportunities it presents.
The largest detractor from the Fund’s performance was positioning in the Industrials sector as stock specific issues hampered sentiment toward the Fund’s exposures, a situation that was compounded by the losses experienced across the sector, which was the worst performing market sector during the period.
At the country level it was the region’s two worst performing markets, Indonesia and Malaysia, where the Fund lost the most ground. Performance in Indonesia was particularly weak as Matahari Department Store’s (an Indonesian department store operator) share price fell dramatically following a cyclical slowdown in the country’s consumption levels. Looking through this short-term slowdown we retain conviction in the strength of the company and its ability to deliver over the long term.
The Fund’s Consumer Staples and Information Technology positions have delivered the best returns over the period with key stocks in these sectors posting impressive and sustained rallies. From a country perspective the Fund’s Chinese and Taiwanese exposures, which are dominated by stocks from the Consumer and Information Technology sectors, delivered the best returns.
From an individual stock perspective, the following names were key contributors:
| • | TCI (a Taiwanese manufacturer of dietary and skin care products) rose 182.2% as investors recognized its delivery of strong results and high future growth prospects. The management team’s significant expansion plans have been well received by the market and, we believe, the firm is well placed to benefit from aging populations. |
| • | Autohome (a Chinese online auto classifieds company) produced a strong 125.0% rally as it continually delivered results that surpassed the market’s expectations. This stock remains a staple in our portfolio and we hold conviction in the expectation it has the potential to continue to expand its profit margins and increase advertising revenues as Chinese auto market competition intensifies. |
| • | Huazhu (formerly named China Lodging, a Chinese hotel operator) rose 109.4% as it consistently delivered strong results and operational data. The firm’s revenue per available room continued to accelerate and is expected to have the potential to drive earnings growth. We believe the trend of increasing revenue per available room has the potential to be both long term and structural, giving us a high level of confidence in this position. |
The following names were key detractors: | |
| • | China State Construction International (a Chinese construction management services company) fell 37.7% as it suffered a tough period primarily caused by a temporary industry slowdown in public-private partnership projects. We believe the slowdown in projects may be a short-term issue and note the company remains confident in its ability to deliver on its growth targets. |
| • | Zhejiang Expressway (a Chinese toll road operator) fell 30.5% as the stock was dragged down by the general weakness of the Chinese brokerage sector, as it owns majority stake in Zheshang securities. This brokerage subsidiary contributes approximately 30% of the company’s total earnings, however we remain optimistic as its main asset, the toll road, has been performing very well. We believe the potential exists to see sustainable growth in earnings and operating cash flow from this asset going forward, which could support the firm’s earnings growth and sustain a high dividend payout. |
| • | China Biologic Products (a Chinese biopharmaceutical company) fell 12.2% during the period. While the market spent much of the year worrying over the falling price for one of its key products, albumin, we have retained conviction as our research indicated the albumin price had likely bottomed and we saw value in the firm’s growth potential. The share price spiked over 20% in June after the company received a take-over offer at a 20% premium to the stock’s trading price. While the premium |
97
Brown Advisory – Macquarie Asia New Stars Fund
A Message to Our Shareholders
June 30, 2018
| offered provides recognition of the underlying value of the business, our view is that this opportunistically timed offer has been made at a significant discount to intrinsic value. |
On July 16, 2018, the Board of Trustees, based on the recommendation of Brown Advisory, has determined to close and liquidate the Fund. As a result of the recent action taken to terminate the Fund, this will be the last time we will be reporting to you with respect to the results of the Fund.
Sincerely,
John Bugg
Portfolio Manager
Sam Le Cornu
Portfolio Manager
Past performance is not a guarantee of future results.
Mutual fund investing involves risk. Principal loss is possible. The Fund may invest in foreign securities which involve political, economic and currency risks, greater volatility and differences in accounting methods. These risks are greater for investments in emerging markets. Derivatives may involve certain costs and risks such as liquidity, interest rate, market, credit, management, and the risk that a position could not be closed when most advantageous. Investing in derivatives could lose more than the amount invested. Investments in small and medium capitalization companies generally carry greater risk than is customarily associated with larger companies for various reasons such as narrower markets, limited financial resources and less liquid stock. The Fund may invest in ETFs, which may trade at a discount to the aggregate value of the underlying securities and although expense ratios for ETFs are generally low, frequent trading of ETFs by the Fund can generate brokerage expenses. In addition, the fund is susceptible to risks from investments in derivatives, private placements, REITs, and its investments in other investment companies.
Fund holdings and sector allocations are subject to change and should not be considered a recommendation to buy or sell any security. For a complete list of fund holdings, please refer to the Schedule of Investments provided in this report.
Definitions for terms and indices are provided in the Glossary of Terms.
98
Brown Advisory – Macquarie Asia New Stars Fund
Performance Information & Portfolio Holdings Summary
June 30, 2018
| PORTFOLIO HOLDINGS | % of Net Assets |
| China | 41.0% |
| South Korea | 18.1% |
| India | 11.2% |
| Taiwan | 11.2% |
| Money Market Funds | 6.7% |
| Malaysia | 4.5% |
| Philippines | 3.1% |
| Singapore | 2.1% |
| Thailand | 1.8% |
| Indonesia | 1.6% |
| Other Assets and Liabilities | (1.3)% |
100.0% |
GROWTH OF A $1,000,000 INVESTMENT
The following chart reflects the change in value of a hypothetical $1,000,000 investment, including reinvested dividends and distributions, in the Fund as measured against a broad-based securities market index. The MSCI AC Asia ex Japan SMID Cap Index captures mid and small-cap representation across 2 of 3 Developed Markets (DM) countries (excluding Japan) and 8 Emerging Markets (EM) countries in Asia. With 2,001 constituents, the index covers approximately 28% of the free float-adjusted market capitalization in each country. The Index is unmanaged and does not reflect the deduction of fees, such as investment management fees. Investors cannot invest directly in an index.

| Since Inception | ||
Average Annual Total Return | One Year | (11/21/14) |
| Institutional Shares | 3.26% | 1.71% |
| Investor Shares | 3.17% | 1.57% |
| MSCI AC Asia ex Japan SMID Cap Index | 8.47% | 4.98% |
Institutional Shares | Investor Shares | |
Gross Expense Ratio1 | 1.57% | 1.72% |
Net Expense Ratio1 | 1.57% | 1.72% |
Past performance does not guarantee future results. The performance data quoted represents past performance and current returns may be lower or higher. The investment return and net asset value will fluctuate so that an investor’s shares, when redeemed, may be worth more or less than the original cost. To obtain performance information current to the most recent month end, please visit our website at brownadvisoryfunds.com/performance.html. The performance table and graph above do not reflect the deduction of taxes that a shareholder would pay on Fund distributions or the redemption of Fund shares. Performance data does not reflect the imposition of the redemption fee of 1.00% on shares redeemed within 14 days, and if it did, performance would have been lower. Short-term performance, in particular, is not a good indication of the Fund’s future performance, and an investment should not be made based solely on returns.
1 | Per the Fund’s prospectus dated October 31, 2017. Refer to the financial highlights for the gross and net expense ratios for the year ended as of the date of this report. Please note that the expense ratios per the prospectus include acquired fund fees and expenses (as applicable) and the expense ratios in the financial highlights do not. |
99
Brown Advisory – Macquarie Asia New Stars Fund
Schedule of Investments
June 30, 2018
| Shares | Security Description | Value $ | ||||||
| Common Stocks — 94.6% | ||||||||
| China — 41.0% | ||||||||
| 115,203 | Autohome, Inc. ADR | 11,635,503 | ||||||
| 60,700 | China Biologic Products Holdings, Inc.* | 6,029,331 | ||||||
| 20,554,000 | China Power International Development, Ltd. | 4,734,273 | ||||||
| 8,998,000 | China State Construction | |||||||
| International Holdings, Ltd. | 9,203,639 | |||||||
| 1,530,200 | China Taiping Insurance Holdings Co., Ltd. | 4,757,496 | ||||||
| 1,407,000 | Haier Electronics Group Co., Ltd. | 4,800,286 | ||||||
| 161,136 | Huazhu Group, Ltd. ADR | 6,766,101 | ||||||
| 13,320,000 | Li & Fung, Ltd. | 4,878,888 | ||||||
| 6,940,500 | Li Ning Co., Ltd.* | 7,634,789 | ||||||
| 2,301,000 | Melco International Development, Ltd. | 7,058,553 | ||||||
| 202,100 | Momo, Inc. ADR* | 8,791,350 | ||||||
| 95,478 | New Oriental Education & | |||||||
| Technology Group, Inc. ADR | 9,037,947 | |||||||
| 89,000 | SINA Corp.* | 7,537,410 | ||||||
| 4,642,000 | Zhejiang Expressway Co., Ltd. | 4,134,133 | ||||||
| 1,022,700 | Zhuzhou CRRC Times Electric Co., Ltd. | 4,850,111 | ||||||
| 101,849,810 | ||||||||
| India — 11.2% | ||||||||
| 457,137 | Apollo Hospitals Enterprise, Ltd. | 7,000,917 | ||||||
| 2,408,105 | Petronet LNG, Ltd. | 7,723,215 | ||||||
| 529,115 | UPL, Ltd.* | 4,783,526 | ||||||
| 1,703,292 | Yes Bank, Ltd. | 8,463,715 | ||||||
| 27,971,373 | ||||||||
| Indonesia — 1.6% | ||||||||
| 6,610,400 | Matahari Department Store Tbk PT | 4,048,571 | ||||||
| Malaysia — 4.5% | ||||||||
| 3,950,700 | CIMB Group Holdings Bhd | 5,326,480 | ||||||
| 9,517,900 | Sime Darby Bhd | 5,767,654 | ||||||
| 11,094,134 | ||||||||
| Philippines — 3.1% | ||||||||
| 8,752,000 | Bloomberry Resorts Corp. | 1,597,681 | ||||||
| 4,501,302 | Metropolitan Bank & Trust Co. | 6,186,924 | ||||||
| 7,784,605 | ||||||||
| Singapore — 2.1% | ||||||||
| 977,100 | Singapore Exchange, Ltd. | 5,134,566 | ||||||
| South Korea — 18.1% | ||||||||
| 18,010 | Hugel, Inc.* | 7,788,641 | ||||||
| 41,615 | Innox Advanced Materials Co., Ltd.* | 2,131,731 | ||||||
| 225,860 | KB Financial Group, Inc. | 10,631,631 | ||||||
| 66,958 | Korea Kolmar Co., Ltd. | 5,075,718 | ||||||
| 65,527 | Samsung SDI Co., Ltd. | 12,568,631 | ||||||
| 68,336 | S-Oil Corp. | 6,710,728 | ||||||
| 44,907,080 | ||||||||
| Taiwan — 11.2% | ||||||||
| 234,000 | Airtac International Group | 3,321,454 | ||||||
| 416,539 | Gourmet Master Co., Ltd. | 4,024,293 | ||||||
| 4,126,346 | Macronix International Co., Ltd.* | 5,851,563 | ||||||
| 993,000 | Nanya Technology Corp. | 2,695,467 | ||||||
| 544,000 | TCI Co., Ltd. | 8,382,932 | ||||||
| 1,635,000 | Zhen Ding Technology Holding, Ltd. | 3,609,459 | ||||||
| 27,885,168 | ||||||||
| Thailand — 1.8% | ||||||||
| 4,445,500 | Minor International PCL | 4,359,755 | ||||||
| Total Common Stocks (Cost $231,153,991) | 235,035,062 | |||||||
| Short-Term Investments — 6.7% | ||||||||
| Money Market Funds — 6.7% | ||||||||
| 16,758,594 | Deutsche Government & | |||||||
| Agency Securities Portfolio — | ||||||||
| Institutional Shares, 1.82%# | 16,758,594 | |||||||
| Total Short-Term Investments (Cost $16,758,594) | 16,758,594 | |||||||
| Total Investments — 101.3% (Cost $247,912,585) | 251,793,656 | |||||||
| Liabilities in Excess of Other Assets — (1.3)% | (3,149,885 | ) | ||||||
| NET ASSETS — 100.0% | $ | 248,643,771 | ||||||
ADR — American Depositary Receipt
| * | Non-Income Producing | |
| # | Annualized seven-day yield as of June 30, 2018. |
The accompanying notes are an integral part of these financial statements.
100
Brown Advisory – Beutel Goodman Large-Cap Value Fund
A Message to Our Shareholders
June 30, 2018
Dear Shareholders:
During the period commencing with the Fund’s inception, February 13, 2018, and ending June 30, 2018, the Brown Advisory – Beutel Goodman Large-Cap Value Fund (the “Fund”) decreased 4.20% in value. During the same period, the Russell 1000 Value Index (the “Index”), the Fund’s benchmark, increased 0.45%.
U.S. equities started the year strong, hitting highs in January following strong economic reports across the globe. A selloff in February was the low point year-to-date, after interest rate and inflation fears drove profit taking in equities. U.S. equities recovered somewhat, but remained volatile in March as a potential trade war with China worried markets. The Index gained until mid-June, when escalating trade hostilities between the U.S., Europe, and China caused the market to retreat.
Underperformance in the portfolio was driven primarily by stock selection in the period under review, where our Information Technology holdings detracted the most significant amount of value. Sector weighting effects were negative overall, as underweight positions in the Energy, Real Estate and Utilities sectors, as well as overweight positions in the Industrials and Telecommunications sectors, hurt performance.
From an individual stock perspective, oil field services company Halliburton lagged the market, giving back some of its earlier energy-fueled rally late in the period. Parker Hannifin, the Fund’s most significant detractor, was down for similar reasons, as the stock has exposure to energy based end markets. Software providers Oracle and Symantec in the Information Technology space detracted following recent earnings and corporate communication that dampened near term visibility (despite both reporting solid earnings and cash flow). Symantec also announced an independent investigation around concerns raised by a former employee regarding certain non-GAAP accounting methodologies, which further hurt sentiment. Consumer names Campbell Soup and Harley-Davidson also underperformed in the period. Campbell Soup lowered its full year earnings outlook following the announcement of weakness in its Fresh business and unanticipated challenges in its newly acquired snacks business Snyder Lance. News of the removal of Campbell’s CEO also pressured the shares. Harley-Davidson shares continued to struggle, with recent negative price action influenced by the company’s plan to move some production for non-U.S. demand overseas in response to proposed European tariff announcements. On the positive side, positions in Verizon and Eli Lilly provided meaningful performance in the period, as operating results in both names exceeded low expectations. Health Care names Amgen and Merck also added value, as did the Fund’s positions in Kellogg and American Express.
New positions added over the period include leading biotechnology firm Amgen, cable company Comcast, and industrial flow management company Flowserve.
We added to our positions in Harley-Davidson and AmerisourceBergen, as these names continue to offer very attractive return opportunities. We also added to American Express and Symantec due to attractive valuations.
To fund our new names, we exited our positions in Baxter, Teradyne, and United Technologies. Baxter and Teradyne had eclipsed newly revised upside targets with updated risk-reward profiles and valuations deemed unfavourable for the Fund. United Technologies also went through our target, at which time the entire position was sold.
In addition to these full sales, the Fund trimmed positions in LyondellBasell, Merck, Ingersoll-Rand, Oracle, Amdocs, JP Morgan and Wells Fargo to better align the weights with their respective return profiles.
The growth and momentum aura that has driven market volatility for the past several months has persisted, with downtrodden value stocks having been subjected to escalating investor anxiety, while overvalued growth stocks have marched higher with increasing exuberance. Share price reaction to news flow around each of these groups was often exaggerated in both directions causing the spread between growth and value indices to widen to unprecedented levels. Consequently, as value investors attracted with high conviction to out-of-favor names, this market environment has been particularly difficult, with little forgiveness being extended to high quality franchises where negative sentiment has moved to the forefront.
101
Brown Advisory – Beutel Goodman Large-Cap Value Fund
A Message to Our Shareholders
June 30, 2018
All of our holdings in the portfolio continue to generate free cash flow, have strong balance sheets and capital allocation policies that we feel strike the right balance between corporate needs and shareholder returns. High quality business models and company-specific catalysts factor into attractive risk/reward profiles and, importantly, have the potential to help mitigate downside risk. The portfolio is positioned with a high concentration of companies with under-levered balance sheets and managements that are well aligned with shareholders, which we believe may lead to positive corporate actions like share buy-backs, dividend increases and value-enhancing deals.
Sincerely,
Rui Cardoso, CFA
Portfolio Manager
Glenn Fortin, CFA
Portfolio Manager
Past performance is not a guarantee of future results.
Mutual fund investing involves risk. Principal loss is possible. The Fund may invest in ETFs, which may trade at a discount to the aggregate value of the underlying securities and although expense ratios for ETFs are generally low, frequent trading of ETFs by the Fund can generate brokerage expenses. In addition, the Fund is susceptible to risks from investments in derivatives, private placements, REITs, and its investments in other investment companies. The Fund is non-diversified, which means that it may invest a significant portion of its assets in the securities of a single issuer or small number of issuers. Investment by the Fund in securities of a limited number of issuers exposes it to greater risk and potential monetary losses than if its assets were diversified among the securities of a greater number of issuers. If a Fund is non-diversified, then its investments are not required to meet certain requirements under Federal law. A non-diversified fund is permitted to invest a greater percentage of its assets in the securities of a single issuer than a diversified fund. Thus, the Fund may have fewer holdings than other funds. As a result, a decline in the value of those investments would cause the Fund’s overall value to decline to a greater degree than if the Fund held a more diversified portfolio. The risks of derivatives include imperfect correlation between the value of the instruments and the underlying assets; risks of default by the other party to the derivative transactions; risks that the transactions may result in losses that partially or completely offset gains in portfolio positions ad risks that the derivative transactions may not be liquid.
Fund holdings and sector allocations are subject to change and should not be considered a recommendation to buy or sell any security. For a complete list of fund holdings, please refer to the Schedule of Investments provided in this report.
Definitions for terms and indices are provided in the Glossary of Terms.
102
Brown Advisory – Beutel Goodman Large-Cap Value Fund
Performance Information & Portfolio Holdings Summary
June 30, 2018
| PORTFOLIO HOLDINGS | % of Net Assets |
| Consumer Discretionary | 18.0% |
| Health Care | 16.3% |
| Industrials | 12.7% |
| Financials | 12.5% |
| Information Technology | 11.8% |
| Consumer Staples | 10.0% |
| Telecommunication Services | 6.7% |
| Materials | 4.1% |
| Energy | 3.9% |
| Money Market Funds | 2.0% |
| Other Assets and Liabilities | 2.0% |
100.0% |
GROWTH OF A $1,000,000 INVESTMENT
The following chart reflects the change in value of a hypothetical $1,000,000 investment, including reinvested dividends and distributions, in the Fund as measured against a broad-based securities market index. The Russell 1000® Value Index (“Index”) measures the performance of the large-cap value segment of the U.S. equity universe. It includes those Russell 1000® companies with lower price to book ratios and lower expected growth values. The Index is unmanaged and does not reflect the deduction of fees, such as investment management fees. Investors cannot invest directly in an index.
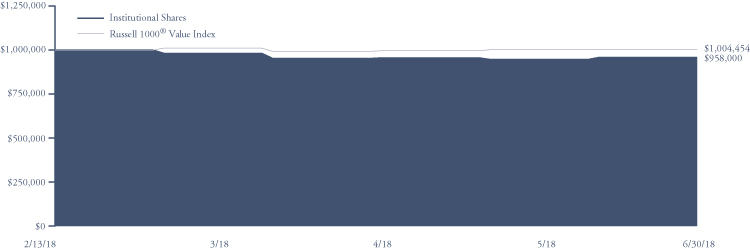
| Since Inception | |
Cumulative Total Return | (2/13/18) |
| Institutional Shares | -4.20% |
Russell 1000® Value Index | 0.45% |
Institutional Shares | |
Gross Expense Ratio1 | 0.82% |
Net Expense Ratio1 | 0.71% |
Past performance does not guarantee future results. The performance data quoted represents past performance and current returns may be lower or higher. The investment return and net asset value will fluctuate so that an investor’s shares, when redeemed, may be worth more or less than the original cost. To obtain performance information current to the most recent month end, please visit our website at brownadvisoryfunds.com/performance.html. The performance table and graph above do not reflect the deduction of taxes that a shareholder would pay on Fund distributions or the redemption of Fund shares. Performance data does not reflect the imposition of the redemption fee of 1.00% on shares redeemed within 14 days, and if it did, performance would have been lower.
1 | Per the Fund’s prospectus dated February 13, 2018. Refer to the financial highlights for the gross and net expense ratios for the year ended as of the date of this report. Please note that the expense ratios per the prospectus include acquired fund fees and expenses (as applicable) and the expense ratios in the financial highlights do not. |
103
Brown Advisory – Beutel Goodman Large-Cap Value Fund
Schedule of Investments
June 30, 2018
| Shares | Security Description | Value $ | ||||||
| Common Stocks — 96.0% | ||||||||
| Consumer Discretionary — 18.0% | ||||||||
| 12,540 | AutoZone, Inc.* | 8,413,462 | ||||||
| 164,490 | Comcast Corp. | 5,396,917 | ||||||
| 145,880 | Harley-Davidson, Inc. | 6,138,630 | ||||||
| 94,060 | Omnicom Group, Inc. | 7,173,957 | ||||||
| 27,122,966 | ||||||||
| Consumer Staples — 10.0% | ||||||||
| 109,810 | Campbell Soup Co. | 4,451,697 | ||||||
| 105,950 | Kellogg Co. | 7,402,727 | ||||||
| 41,590 | Procter & Gamble Co. | 3,246,515 | ||||||
| 15,100,939 | ||||||||
| Energy — 3.9% | ||||||||
| 132,270 | Halliburton Co. | 5,960,086 | ||||||
| Financials — 12.5% | ||||||||
| 77,120 | American Express Co. | 7,557,760 | ||||||
| 41,840 | Ameriprise Financial, Inc. | 5,852,579 | ||||||
| 29,980 | JPMorgan Chase & Co. | 3,123,916 | ||||||
| 43,300 | Wells Fargo & Co. | 2,400,552 | ||||||
| 18,934,807 | ||||||||
| Health Care — 16.3% | ||||||||
| 94,320 | AmerisourceBergen Corp. | 8,042,666 | ||||||
| 27,610 | Amgen, Inc. | 5,096,530 | ||||||
| 90,450 | Eli Lilly & Co. | 7,718,099 | ||||||
| 11,030 | Johnson & Johnson | 1,338,380 | ||||||
| 38,550 | Merck & Co., Inc. | 2,339,985 | ||||||
| 24,535,660 | ||||||||
| Industrials — 12.7% | ||||||||
| 20,170 | Allegion PLC | 1,560,351 | ||||||
| 83,890 | Flowserve Corp. | 3,389,156 | ||||||
| 73,760 | Ingersoll-Rand PLC | 6,618,485 | ||||||
| 48,640 | Parker-Hannifin Corp. | 7,580,544 | ||||||
| 19,148,536 | ||||||||
| Information Technology — 11.8% | ||||||||
| 94,180 | Amdocs, Ltd. | 6,233,774 | ||||||
| 174,150 | Oracle Corp. | 7,673,049 | ||||||
| 189,850 | Symantec Corp. | 3,920,403 | ||||||
| 17,827,226 | ||||||||
| Materials — 4.1% | ||||||||
| 57,020 | LyondellBasell Industries NV | 6,263,647 | ||||||
| Telecommunication Services — 6.7% | ||||||||
| 202,090 | Verizon Communications, Inc. | 10,167,148 | ||||||
| Total Common Stocks (Cost $148,968,468) | 145,061,015 | |||||||
| Short-Term Investments — 2.0% | ||||||||
| Money Market Funds — 2.0% | ||||||||
| 2,967,792 | Deutsche Government & | |||||||
| Agency Securities Portfolio — | ||||||||
| Institutional Shares, 1.82%# | 2,967,792 | |||||||
| Total Short-Term Investments (Cost $2,967,792) | 2,967,792 | |||||||
| Total Investments — 98.0% (Cost $151,936,260) | 148,028,807 | |||||||
| Other Assets in Excess of Liabilities — 2.0% | 2,975,154 | |||||||
| NET ASSETS — 100.0% | $ | 151,003,961 | ||||||
| * | Non-Income Producing | |
| # | Annualized seven-day yield as of June 30, 2018. |
The accompanying notes are an integral part of these financial statements.
104
Statements of Assets and Liabilities
June 30, 2018
| BROWN | BROWN | BROWN | BROWN | |||||||||||||
| ADVISORY | ADVISORY | ADVISORY | ADVISORY | |||||||||||||
| GROWTH | FLEXIBLE | EQUITY | SUSTAINABLE | |||||||||||||
| EQUITY | EQUITY | INCOME | GROWTH | |||||||||||||
| FUND | FUND | FUND | FUND | |||||||||||||
| ASSETS | ||||||||||||||||
| Investments: | ||||||||||||||||
| Total investments, at cost | $ | 1,148,605,340 | $ | 264,407,976 | $ | 61,051,680 | $ | 478,471,302 | ||||||||
| Net unrealized appreciation (depreciation) | 915,186,523 | 189,472,022 | 34,964,778 | 206,136,912 | ||||||||||||
| Total investments, at market value | 2,063,791,863 | 453,879,998 | 96,016,458 | 684,608,214 | ||||||||||||
| Foreign currency (Cost of $—, $24,433, $— and $—, respectively.) | — | 24,653 | — | — | ||||||||||||
| Receivables: | ||||||||||||||||
| Investments sold | 13,373,571 | — | — | — | ||||||||||||
| Fund shares sold | 2,272,771 | 50,957 | 1,628 | 871,301 | ||||||||||||
| Interest and dividends | 390,323 | 157,858 | 288,313 | 355,274 | ||||||||||||
| Prepaid expenses and other assets | 67,739 | 30,430 | 33,447 | 71,992 | ||||||||||||
| Total Assets | 2,079,896,267 | 454,143,896 | 96,339,846 | 685,906,781 | ||||||||||||
| LIABILITIES | ||||||||||||||||
| Payables: | ||||||||||||||||
| Investments purchased | 6,867,868 | — | — | — | ||||||||||||
| Fund shares redeemed | 611,095 | 15,010 | 407,902 | 153,785 | ||||||||||||
| Distribution to shareholders | — | — | 274,412 | — | ||||||||||||
| Accrued Liabilities: | ||||||||||||||||
| Investment advisory fees | 1,033,976 | 228,369 | 48,674 | 340,330 | ||||||||||||
| Service fees | 222,331 | 40,615 | 8,676 | 38,998 | ||||||||||||
| Administration, accounting and transfer agent fees | 137,063 | 29,928 | 6,617 | 43,707 | ||||||||||||
| Business management fees | 86,165 | 19,031 | 4,056 | 28,361 | ||||||||||||
| Trustee fees | 11,198 | 2,529 | 537 | 3,719 | ||||||||||||
| Distribution fees | 3,522 | 3,805 | 666 | 128,864 | ||||||||||||
| Professional fees | 49,324 | 26,321 | 21,091 | 28,528 | ||||||||||||
| Custody fees | 11,176 | 3,000 | 639 | 4,298 | ||||||||||||
| Other liabilities | 33,351 | 3,917 | 2,025 | 30,858 | ||||||||||||
| Total Liabilities | 9,067,069 | 372,525 | 775,295 | 801,448 | ||||||||||||
| NET ASSETS | $ | 2,070,829,198 | $ | 453,771,371 | $ | 95,564,551 | $ | 685,105,333 | ||||||||
| COMPONENTS OF NET ASSETS | ||||||||||||||||
| Paid-in capital | $ | 1,025,220,984 | $ | 253,813,158 | $ | 50,913,830 | $ | 453,295,301 | ||||||||
| Undistributed (Accumulated) net investment income (loss) | (4,270,996 | ) | 577,497 | 85,270 | — | |||||||||||
| Accumulated net realized gain (loss) | 134,692,687 | 9,908,472 | 9,600,673 | 25,673,120 | ||||||||||||
| Unrealized appreciation (depreciation) on investments | 915,186,523 | 189,472,022 | 34,964,778 | 206,136,912 | ||||||||||||
| Unrealized appreciation (depreciation) on foreign currency/receivables | — | 222 | — | — | ||||||||||||
| NET ASSETS | $ | 2,070,829,198 | $ | 453,771,371 | $ | 95,564,551 | $ | 685,105,333 | ||||||||
| COMPUTATION OF NET ASSET VALUE | ||||||||||||||||
| Institutional Shares: | ||||||||||||||||
| Net assets | $ | 289,433,616 | $ | 131,217,789 | $ | 27,975,413 | $ | 369,642,098 | ||||||||
| Shares outstanding (unlimited shares authorized) | 12,104,934 | 5,980,064 | 1,941,740 | 16,055,931 | ||||||||||||
| Net asset value per share | $ | 23.91 | $ | 21.94 | $ | 14.41 | $ | 23.02 | ||||||||
| Investor Shares: | ||||||||||||||||
| Net assets | $ | 1,775,180,088 | $ | 316,108,524 | $ | 66,511,936 | $ | 102,201,469 | ||||||||
| Shares outstanding (unlimited shares authorized) | 74,944,198 | 14,434,329 | 4,617,451 | 4,484,335 | ||||||||||||
| Net asset value per share | $ | 23.69 | $ | 21.90 | $ | 14.40 | $ | 22.79 | ||||||||
| Advisor Shares: | ||||||||||||||||
| Net assets | $ | 6,215,494 | $ | 6,445,058 | $ | 1,077,202 | $ | 213,261,766 | ||||||||
| Shares outstanding (unlimited shares authorized) | 275,867 | 294,143 | 74,819 | 9,502,617 | ||||||||||||
| Net asset value per share | $ | 22.53 | $ | 21.91 | $ | 14.40 | $ | 22.44 | ||||||||
The accompanying notes are an integral part of these financial statements.
105
Statements of Assets and Liabilities
June 30, 2018
| BROWN | BROWN | BROWN | BROWN | |||||||||||||
| ADVISORY | ADVISORY | ADVISORY | ADVISORY | |||||||||||||
| MID-CAP | SMALL-CAP | SMALL-CAP | GLOBAL | |||||||||||||
| GROWTH | GROWTH | FUNDAMENTAL | LEADERS | |||||||||||||
| FUND | FUND | VALUE FUND | FUND | |||||||||||||
| ASSETS | ||||||||||||||||
| Investments: | ||||||||||||||||
| Total investments, at cost | $ | 19,911,253 | $ | 679,670,285 | $ | 984,712,763 | $ | 71,988,599 | ||||||||
| Net unrealized appreciation (depreciation) | 1,457,376 | 240,304,898 | 327,782,412 | 14,758,654 | ||||||||||||
| Total investments, at market value | 21,368,629 | 919,975,183 | 1,312,495,175 | 86,747,253 | ||||||||||||
| Receivables: | ||||||||||||||||
| Investments sold | — | 777,042 | 4,902,779 | — | ||||||||||||
| Fund shares sold | 500 | 1,075,136 | 698,206 | 83,500 | ||||||||||||
| Interest and dividends | 4,948 | 245,129 | 2,019,396 | 188,459 | ||||||||||||
| Prepaid expenses and other assets | 28,996 | 73,931 | 40,267 | 26,236 | ||||||||||||
| Total Assets | 21,403,073 | 922,146,421 | 1,320,155,823 | 87,045,448 | ||||||||||||
| LIABILITIES | ||||||||||||||||
| Payables: | ||||||||||||||||
| Investments purchased | — | 758,982 | 7,764,329 | 856,806 | ||||||||||||
| Fund shares redeemed | — | 789,841 | 1,020,067 | — | ||||||||||||
| Accrued Liabilities: | ||||||||||||||||
| Investment advisory fees, net | 1,715 | 646,666 | 924,566 | 21,416 | ||||||||||||
| Service fees | 2,577 | 61,478 | 112,166 | 10,467 | ||||||||||||
| Administration, accounting and transfer agent fees | 1,881 | 59,983 | 92,058 | 6,243 | ||||||||||||
| Business management fees | 859 | 38,039 | 54,386 | 3,489 | ||||||||||||
| Trustee fees | 140 | 5,011 | 7,142 | 458 | ||||||||||||
| Distribution fees | — | 11,467 | 15,333 | — | ||||||||||||
| Professional fees | 12,925 | 33,064 | 39,191 | 21,071 | ||||||||||||
| Custody fees | 2,022 | 5,867 | 7,224 | 7,675 | ||||||||||||
| Other liabilities | 3,460 | 51,949 | 33,510 | 5,367 | ||||||||||||
| Total Liabilities | 25,579 | 2,462,347 | 10,069,972 | 932,992 | ||||||||||||
| NET ASSETS | $ | 21,377,494 | $ | 919,684,074 | $ | 1,310,085,851 | $ | 86,112,456 | ||||||||
| COMPONENTS OF NET ASSETS | ||||||||||||||||
| Paid-in capital | $ | 19,846,086 | $ | 678,029,248 | $ | 913,341,498 | $ | 71,844,208 | ||||||||
| Undistributed (Accumulated) net investment income (loss) | — | 3,777,600 | 2,099,754 | 347,066 | ||||||||||||
| Accumulated net realized gain (loss) | 74,032 | (2,427,672 | ) | 66,862,187 | (836,774 | ) | ||||||||||
| Unrealized appreciation (depreciation) on investments | 1,457,376 | 240,304,898 | 327,782,412 | 14,758,654 | ||||||||||||
| Unrealized appreciation (depreciation) on foreign receivables | — | — | — | (698 | ) | |||||||||||
| NET ASSETS | $ | 21,377,494 | $ | 919,684,074 | $ | 1,310,085,851 | $ | 86,112,456 | ||||||||
| COMPUTATION OF NET ASSET VALUE | ||||||||||||||||
| Institutional Shares: | ||||||||||||||||
| Net assets | $ | — | $ | 424,448,621 | $ | 410,785,196 | $ | — | ||||||||
| Shares outstanding (unlimited shares authorized) | — | 10,444,353 | 14,089,442 | — | ||||||||||||
| Net asset value per share | $ | — | $ | 40.64 | $ | 29.16 | $ | — | ||||||||
| Investor Shares: | ||||||||||||||||
| Net assets | $ | 21,377,494 | $ | 476,786,037 | $ | 874,268,527 | $ | 86,112,456 | ||||||||
| Shares outstanding (unlimited shares authorized) | 1,882,335 | 23,435,957 | 30,024,585 | 6,232,150 | ||||||||||||
| Net asset value per share | $ | 11.36 | $ | 20.34 | $ | 29.12 | $ | 13.82 | ||||||||
| Advisor Shares: | ||||||||||||||||
| Net assets | $ | — | $ | 18,449,416 | $ | 25,032,128 | $ | — | ||||||||
| Shares outstanding (unlimited shares authorized) | — | 948,276 | 863,677 | — | ||||||||||||
| Net asset value per share | $ | — | $ | 19.46 | $ | 28.98 | $ | — | ||||||||
The accompanying notes are an integral part of these financial statements.
106
Statements of Assets and Liabilities
June 30, 2018
| BROWN | BROWN | BROWN | BROWN | |||||||||||||
| ADVISORY | ADVISORY | ADVISORY | ADVISORY | |||||||||||||
| INTERMEDIATE | TOTAL | STRATEGIC | SUSTAINABLE | |||||||||||||
| INCOME | RETURN | BOND | BOND | |||||||||||||
| FUND | FUND | FUND | FUND | |||||||||||||
| ASSETS | ||||||||||||||||
| Investments: | ||||||||||||||||
| Total investments – unaffiliated, at cost | $ | 105,676,561 | $ | 135,196,158 | $ | 161,421,916 | $ | 55,382,362 | ||||||||
| Total investments – affiliated, at cost (Note 3) | 25,415,007 | — | — | — | ||||||||||||
| Total cost of investments | 131,091,568 | 135,196,158 | 161,421,916 | 55,382,362 | ||||||||||||
| Net unrealized appreciation (depreciation) – unaffiliated | (1,884,246 | ) | (1,678,788 | ) | (992,456 | ) | (749,201 | ) | ||||||||
| Net unrealized appreciation (depreciation) – affiliated (Note 3) | (1,096,662 | ) | — | — | — | |||||||||||
| Total unrealized appreciation (depreciation) | (2,980,908 | ) | (1,678,788 | ) | (992,456 | ) | (749,201 | ) | ||||||||
| Total investments – unaffiliated, at market value | 103,792,315 | 133,517,370 | 160,429,460 | 54,633,161 | ||||||||||||
| Total investments – affiliated, at market value (Note 3) | 24,318,345 | — | — | — | ||||||||||||
| Total investments, at market value | 128,110,660 | 133,517,370 | 160,429,460 | 54,633,161 | ||||||||||||
| Cash deposit at broker – futures contracts (Note 6) | — | 191,406 | 235,452 | 99,912 | ||||||||||||
| Gross unrealized appreciation – futures contracts (Note 6) | — | 534,357 | — | 55,735 | ||||||||||||
| Receivables: | ||||||||||||||||
| Investments sold | 1,648 | 2,893,531 | — | — | ||||||||||||
| Fund shares sold | 222,990 | 217,711 | 1,137,561 | 502,000 | ||||||||||||
| Interest and dividends | 766,440 | 901,968 | 1,227,371 | 428,041 | ||||||||||||
| Prepaid expenses and other assets | 30,791 | 25,045 | 28,151 | 41,428 | ||||||||||||
| Total Assets | 129,132,529 | 138,281,388 | 163,057,995 | 55,760,277 | ||||||||||||
| LIABILITIES | ||||||||||||||||
| Gross unrealized depreciation on futures contracts (Note 6) | — | 43,474 | 70,497 | 65,519 | ||||||||||||
| Payables: | ||||||||||||||||
| Investments purchased | — | 13,910,491 | 19,980,006 | 249,972 | ||||||||||||
| Fund shares redeemed | 34,183 | 22,215 | 1,257,528 | 1,006,737 | ||||||||||||
| Distribution to shareholders | 178,743 | 227,003 | 256,744 | 97,008 | ||||||||||||
| Accrued Liabilities: | ||||||||||||||||
| Investment advisory fees, net | 26,025 | 29,743 | 66,444 | 15,222 | ||||||||||||
| Service fees | 5,337 | 107 | 6,002 | 2,210 | ||||||||||||
| Administration, accounting and transfer agent fees | 11,603 | 17,137 | 19,826 | 7,280 | ||||||||||||
| Business management fees | 5,337 | 4,957 | 6,002 | 2,210 | ||||||||||||
| Trustee fees | 405 | 676 | 825 | 302 | ||||||||||||
| Distribution fees | 2,372 | — | 133 | — | ||||||||||||
| Professional fees | 21,843 | 21,998 | 22,275 | 13,336 | ||||||||||||
| Custodian fees | 1,207 | 912 | 2,289 | 875 | ||||||||||||
| Other liabilities | 2,792 | 2,915 | 5,827 | 8,121 | ||||||||||||
| Total Liabilities | 289,847 | 14,281,628 | 21,694,398 | 1,468,792 | ||||||||||||
| NET ASSETS | $ | 128,842,682 | $ | 123,999,760 | $ | 141,363,597 | $ | 54,291,485 | ||||||||
| COMPONENTS OF NET ASSETS | ||||||||||||||||
| Paid-in capital | $ | 132,692,988 | $ | 126,968,935 | $ | 145,467,875 | $ | 55,140,516 | ||||||||
| Undistributed (Accumulated) net investment income (loss) | (156,555 | ) | 22,517 | 28,984 | 8,564 | |||||||||||
| Accumulated net realized gain (loss) | (712,843 | ) | (1,803,787 | ) | (3,070,309 | ) | (98,610 | ) | ||||||||
| Unrealized appreciation (depreciation) on investments | (2,980,908 | ) | (1,678,788 | ) | (992,456 | ) | (749,201 | ) | ||||||||
| Unrealized appreciation (depreciation) on futures contracts (Note 6) | — | 490,883 | (70,497 | ) | (9,784 | ) | ||||||||||
| NET ASSETS | $ | 128,842,682 | $ | 123,999,760 | $ | 141,363,597 | $ | 54,291,485 | ||||||||
| COMPUTATION OF NET ASSET VALUE | ||||||||||||||||
| Institutional Shares: | ||||||||||||||||
| Net assets | $ | — | $ | 121,380,744 | $ | — | $ | — | ||||||||
| Shares outstanding (unlimited shares authorized) | — | 12,416,569 | — | — | ||||||||||||
| Net asset value per share | $ | — | $ | 9.78 | $ | — | $ | — | ||||||||
| Investor Shares: | ||||||||||||||||
| Net assets | $ | 125,060,310 | $ | 2,619,016 | $ | 141,149,592 | $ | 54,291,485 | ||||||||
| Shares outstanding (unlimited shares authorized) | 12,085,444 | 267,880 | 14,847,147 | 5,595,208 | ||||||||||||
| Net asset value per share | $ | 10.35 | $ | 9.78 | $ | 9.51 | $ | 9.70 | ||||||||
| Advisor Shares: | ||||||||||||||||
| Net assets | $ | 3,782,372 | $ | — | $ | 214,005 | $ | — | ||||||||
| Shares outstanding (unlimited shares authorized) | 373,366 | — | 22,495 | — | ||||||||||||
| Net asset value per share | $ | 10.13 | $ | — | $ | 9.51 | $ | — | ||||||||
The accompanying notes are an integral part of these financial statements.
107
Statements of Assets and Liabilities
June 30, 2018
| BROWN | ||||||||||||||||
| ADVISORY – | ||||||||||||||||
| BROWN | BROWN | BROWN | WMC | |||||||||||||
| ADVISORY | ADVISORY | ADVISORY | STRATEGIC | |||||||||||||
| MARYLAND | TAX EXEMPT | MORTGAGE | EUROPEAN | |||||||||||||
| BOND | BOND | SECURITIES | EQUITY | |||||||||||||
| FUND | FUND | FUND | FUND | |||||||||||||
| ASSETS | ||||||||||||||||
| Investments: | ||||||||||||||||
| Total investments, at cost | $ | 179,602,523 | $ | 433,396,652 | $ | 384,611,549 | $ | 783,970,355 | ||||||||
| Net unrealized appreciation (depreciation) | (550,587 | ) | (198,162 | ) | (3,898,748 | ) | 162,131,145 | |||||||||
| Total investments, at market value | 179,051,936 | 433,198,490 | 380,712,801 | 946,101,500 | ||||||||||||
| Foreign currency (Cost of $—, $—, $— and $1,465,282, respectively.) | — | — | — | 1,478,177 | ||||||||||||
| Cash deposit at broker – futures contracts (Note 6) | — | — | — | 5 | ||||||||||||
| Gross unrealized appreciation – futures contracts (Note 6) | — | — | 928,848 | — | ||||||||||||
| Receivables: | ||||||||||||||||
| Investments sold | — | 25,000 | 7,752,442 | 3,692,373 | ||||||||||||
| Fund shares sold | 125,539 | 5,822,000 | 183,000 | 3,931,153 | ||||||||||||
| Interest and dividends | 2,510,430 | 4,058,111 | 1,343,087 | 4,011,065 | ||||||||||||
| Prepaid expenses and other assets | 9,661 | 54,527 | 38,131 | 33,527 | ||||||||||||
| Total Assets | 181,697,566 | 443,158,128 | 390,958,309 | 959,247,800 | ||||||||||||
| LIABILITIES | ||||||||||||||||
| Cash deficit at broker – futures contracts (Note 6) | — | — | 166,497 | — | ||||||||||||
| Gross unrealized depreciation on futures contracts (Note 6) | — | — | 293,092 | — | ||||||||||||
| Payables: | ||||||||||||||||
| Investments purchased | — | 1,003,475 | 88,635,141 | 1,500,925 | ||||||||||||
| Fund shares redeemed | 95,272 | 1,176,452 | 144,020 | 541,157 | ||||||||||||
| Distribution to shareholders | 268,878 | 856,180 | 589,572 | — | ||||||||||||
| Accrued Liabilities: | ||||||||||||||||
| Investment advisory fees | 45,392 | 102,315 | 74,340 | 856,685 | ||||||||||||
| Service fees | 7,565 | 17,052 | 14 | 3,640 | ||||||||||||
| Administration, accounting and transfer agent fees | 15,822 | 31,144 | 42,638 | 81,134 | ||||||||||||
| Business management fees | 7,565 | 17,053 | 12,390 | 47,594 | ||||||||||||
| Trustee fees | 1,027 | 2,167 | 1,669 | 7,213 | ||||||||||||
| Distribution fees | — | — | — | 10,070 | ||||||||||||
| Professional fees | 23,059 | 25,529 | 25,437 | 40,719 | ||||||||||||
| Custodian fees | 965 | 2,168 | 6,677 | 55,963 | ||||||||||||
| Other liabilities | 1,649 | 18,563 | 3,349 | 204,830 | ||||||||||||
| Total Liabilities | 467,194 | 3,252,098 | 89,994,836 | 3,349,930 | ||||||||||||
| NET ASSETS | $ | 181,230,372 | $ | 439,906,030 | $ | 300,963,473 | $ | 955,897,870 | ||||||||
| COMPONENTS OF NET ASSETS | ||||||||||||||||
| Paid-in capital | $ | 182,397,055 | $ | 443,871,688 | $ | 316,986,684 | $ | 756,027,058 | ||||||||
| Undistributed (Accumulated) net investment income (loss) | 60 | (160 | ) | 49,257 | 13,352,323 | |||||||||||
| Accumulated net realized gain (loss) | (616,156 | ) | (3,767,336 | ) | (12,809,476 | ) | 24,374,298 | |||||||||
| Unrealized appreciation (depreciation) on investments | (550,587 | ) | (198,162 | ) | (3,898,748 | ) | 162,131,145 | |||||||||
| Unrealized appreciation (depreciation) on futures contracts (Note 6) | — | — | 635,756 | — | ||||||||||||
| Unrealized appreciation (depreciation) on foreign currency/receivables | — | — | — | 13,046 | ||||||||||||
| NET ASSETS | $ | 181,230,372 | $ | 439,906,030 | $ | 300,963,473 | $ | 955,897,870 | ||||||||
| COMPUTATION OF NET ASSET VALUE | ||||||||||||||||
| Institutional Shares: | ||||||||||||||||
| Net assets | $ | — | $ | — | $ | 300,642,734 | $ | 927,916,490 | ||||||||
| Shares outstanding (unlimited shares authorized) | — | — | 31,144,280 | 74,699,728 | ||||||||||||
| Net asset value per share | $ | — | $ | — | $ | 9.65 | $ | 12.42 | ||||||||
| Investor Shares: | ||||||||||||||||
| Net assets | $ | 181,230,372 | $ | 439,906,030 | $ | 320,739 | $ | 14,668,845 | ||||||||
| Shares outstanding (unlimited shares authorized) | 17,253,544 | 44,440,189 | 33,203 | 1,182,483 | ||||||||||||
| Net asset value per share | $ | 10.50 | $ | 9.90 | $ | 9.66 | $ | 12.41 | ||||||||
| Advisor Shares: | ||||||||||||||||
| Net assets | $ | — | $ | — | $ | — | $ | 13,312,535 | ||||||||
| Shares outstanding (unlimited shares authorized) | — | — | — | 1,082,072 | ||||||||||||
| Net asset value per share | $ | — | $ | — | $ | — | $ | 12.30 | ||||||||
The accompanying notes are an integral part of these financial statements.
108
Statements of Assets and Liabilities
June 30, 2018
| BROWN | BROWN | BROWN | BROWN | |||||||||||||
| ADVISORY – | ADVISORY – | ADVISORY – | ADVISORY – | |||||||||||||
| WMC | SOMERSET | MACQUARIE | BEUTEL | |||||||||||||
| JAPAN ALPHA | EMERGING | ASIA NEW | GOODMAN | |||||||||||||
| OPPORTUNITIES | MARKETS | STARS | LARGE-CAP | |||||||||||||
| FUND | FUND | FUND | VALUE FUND | |||||||||||||
| ASSETS | ||||||||||||||||
| Investments: | ||||||||||||||||
| Total investments, at cost | $ | 1,408,018,810 | $ | 469,991,261 | $ | 247,912,585 | $ | 151,936,260 | ||||||||
| Net unrealized appreciation (depreciation) | 78,772,829 | 79,177,935 | 3,881,071 | (3,907,453 | ) | |||||||||||
| Total investments, at market value | 1,486,791,639 | 549,169,196 | 251,793,656 | 148,028,807 | ||||||||||||
| Foreign currency (Cost of $2,258, $297,964, $1.520 and $—, respectively.) | 2,258 | 297,860 | 1,476 | — | ||||||||||||
| Cash deposit at broker – futures contracts (Note 6) | 2,222,304 | — | — | — | ||||||||||||
| Variation margin due from broker (Note 6) | 186,736 | — | — | — | ||||||||||||
| Gross unrealized appreciation – futures contracts (Note 6) | — | — | — | — | ||||||||||||
| Gross unrealized appreciation – forward foreign currency contracts (Note 7) | — | — | — | — | ||||||||||||
| Receivables: | ||||||||||||||||
| Investments sold | 6,848,380 | 2,322,680 | — | — | ||||||||||||
| Fund shares sold | 3,523,492 | 464,345 | 192,944 | 2,931,490 | ||||||||||||
| Interest and dividends | 3,878,663 | 2,647,704 | 608,179 | 130,142 | ||||||||||||
| Prepaid expenses and other assets | 84,850 | 61,618 | 28,921 | 22,887 | ||||||||||||
| Total Assets | 1,503,538,322 | 554,963,403 | 252,625,176 | 151,113,326 | ||||||||||||
| LIABILITIES | ||||||||||||||||
| Gross unrealized depreciation on futures contracts (Note 6) | 1,048,078 | — | — | — | ||||||||||||
| Gross unrealized depreciation – forward foreign currency contracts (Note 7) | 384,181 | — | — | — | ||||||||||||
| Payables: | ||||||||||||||||
| Investments purchased | 8,359,436 | 632,567 | 3,565,814 | — | ||||||||||||
| Fund shares redeemed | 1,815,823 | 1,848,515 | 28,044 | 5,733 | ||||||||||||
| Interest expense on line of credit | — | 3,461 | — | — | ||||||||||||
| Accrued Liabilities: | ||||||||||||||||
| Investment advisory fees | 1,254,336 | 439,846 | 271,502 | 53,592 | ||||||||||||
| Service fees | 426 | 4,875 | 381 | — | ||||||||||||
| Administration, accounting and transfer agent fees | 99,895 | 39,614 | 20,078 | 8,768 | ||||||||||||
| Business management fees | 62,717 | 24,436 | 10,860 | 5,955 | ||||||||||||
| Trustee fees | 8,665 | 3,281 | 1,446 | 779 | ||||||||||||
| Distribution fees | 191 | 116 | — | — | ||||||||||||
| Professional fees | 34,876 | 29,708 | 23,860 | 14,197 | ||||||||||||
| Custodian fees | 53,074 | 119,249 | 56,363 | 2,960 | ||||||||||||
| Other liabilities | 83,739 | 4,195 | 3,057 | 17,381 | ||||||||||||
| Total Liabilities | 13,205,437 | 3,149,863 | 3,981,405 | 109,365 | ||||||||||||
| NET ASSETS | $ | 1,490,332,885 | $ | 551,813,540 | $ | 248,643,771 | $ | 151,003,961 | ||||||||
| COMPONENTS OF NET ASSETS | ||||||||||||||||
| Paid-in capital | $ | 1,344,643,821 | $ | 516,969,659 | $ | 252,757,489 | $ | 154,665,175 | ||||||||
| Undistributed (Accumulated) net investment income (loss) | 9,705,814 | 7,814,031 | 1,145,390 | 664,783 | ||||||||||||
| Accumulated net realized gain (loss) | 58,653,378 | (52,126,851 | ) | (9,122,195 | ) | (418,544 | ) | |||||||||
| Unrealized appreciation (depreciation) on investments | 78,772,829 | 79,177,935 | 3,881,071 | (3,907,453 | ) | |||||||||||
| Unrealized appreciation (depreciation) on futures contracts (Note 6) | (1,048,078 | ) | — | — | — | |||||||||||
| Unrealized appreciation (depreciation) on | ||||||||||||||||
| forward foreign currency contracts (Note 7) | (384,181 | ) | — | — | — | |||||||||||
| Unrealized appreciation (depreciation) on foreign currency/receivables | (10,698 | ) | (21,234 | ) | (17,984 | ) | — | |||||||||
| NET ASSETS | $ | 1,490,332,885 | $ | 551,813,540 | $ | 248,643,771 | $ | 151,003,961 | ||||||||
| COMPUTATION OF NET ASSET VALUE | ||||||||||||||||
| Institutional Shares: | ||||||||||||||||
| Net assets | $ | 1,487,583,877 | $ | 513,535,268 | $ | 245,931,074 | $ | 151,003,961 | ||||||||
| Shares outstanding (unlimited shares authorized) | 138,922,031 | 51,054,046 | 24,199,603 | 15,766,388 | ||||||||||||
| Net asset value per share | $ | 10.71 | $ | 10.06 | $ | 10.16 | $ | 9.58 | ||||||||
| Investor Shares: | ||||||||||||||||
| Net assets | $ | 2,460,719 | $ | 38,106,054 | $ | 2,712,697 | $ | — | ||||||||
| Shares outstanding (unlimited shares authorized) | 231,062 | 3,798,929 | 268,147 | — | ||||||||||||
| Net asset value per share | $ | 10.65 | $ | 10.03 | $ | 10.12 | $ | — | ||||||||
| Advisor Shares: | ||||||||||||||||
| Net assets | $ | 288,289 | $ | 172,218 | $ | — | $ | — | ||||||||
| Shares outstanding (unlimited shares authorized) | 27,306 | 17,102 | — | — | ||||||||||||
| Net asset value per share | $ | 10.56 | $ | 10.07 | $ | — | $ | — | ||||||||
The accompanying notes are an integral part of these financial statements.
109
Statements of Operations
For the Year Ended June 30, 2018
| BROWN | BROWN | BROWN | BROWN | |||||||||||||
| ADVISORY | ADVISORY | ADVISORY | ADVISORY | |||||||||||||
| GROWTH | FLEXIBLE | EQUITY | SUSTAINABLE | |||||||||||||
| EQUITY | EQUITY | INCOME | GROWTH | |||||||||||||
| FUND | FUND | FUND | FUND | |||||||||||||
| INVESTMENT INCOME | ||||||||||||||||
| Dividend income | $ | 7,676,258 | $ | 5,247,271 | $ | 2,752,170 | $ | 3,923,836 | ||||||||
| Less: foreign taxes withheld | (6,451 | ) | (37,561 | ) | (42,930 | ) | (62,942 | ) | ||||||||
| Interest income | 543,424 | 135,757 | 49,235 | 236,570 | ||||||||||||
| Total Investment Income | 8,213,231 | 5,345,467 | 2,758,475 | 4,097,464 | ||||||||||||
| EXPENSES | ||||||||||||||||
| Investment advisory fees | 11,536,934 | 2,665,061 | 670,503 | 3,179,942 | ||||||||||||
| Service fees – Investor Shares (Note 3) | 2,440,438 | 485,772 | 119,967 | 90,561 | ||||||||||||
| Business management fees | 961,411 | 222,089 | 55,875 | 264,995 | ||||||||||||
| Administration, accounting and transfer agent fees | 684,018 | 159,176 | 40,889 | 192,656 | ||||||||||||
| Miscellaneous expenses | 144,735 | 28,966 | 10,181 | 52,192 | ||||||||||||
| Professional fees | 126,053 | 44,003 | 25,733 | 48,498 | ||||||||||||
| Registration fees | 103,181 | 50,445 | 45,264 | 68,246 | ||||||||||||
| Trustee fees | 82,939 | 19,373 | 4,903 | 22,856 | ||||||||||||
| Custody fees | 61,085 | 16,366 | 4,303 | 20,210 | ||||||||||||
| Insurance fees | 29,464 | 6,886 | 1,872 | 7,260 | ||||||||||||
| Distribution fees – Advisor Shares (Note 3) | 14,322 | 15,103 | 5,299 | 472,230 | ||||||||||||
| Service fees –Advisor Shares (Note 3) | 8,593 | 9,062 | 3,179 | 283,338 | ||||||||||||
| Interest expense on line of credit | 410 | — | — | — | ||||||||||||
| Total Expenses | 16,193,583 | 3,722,302 | 987,968 | 4,702,984 | ||||||||||||
| NET INVESTMENT INCOME (LOSS) | (7,980,352 | ) | 1,623,165 | 1,770,507 | (605,520 | ) | ||||||||||
| NET REALIZED AND UNREALIZED GAIN (LOSS) | ||||||||||||||||
| Net realized gain (loss) on investments | 189,010,520 | 11,789,560 | 10,709,083 | 29,170,107 | ||||||||||||
| Net change in unrealized appreciation (depreciation) on: | ||||||||||||||||
| Investments | 301,958,936 | 63,268,604 | (2,043,861 | ) | 78,562,772 | |||||||||||
| Foreign receivables | — | 133 | — | — | ||||||||||||
| Net change in unrealized appreciation (depreciation) | 301,958,936 | 63,268,737 | (2,043,861 | ) | 78,562,772 | |||||||||||
| NET REALIZED AND UNREALIZED GAIN (LOSS) | 490,969,456 | 75,058,297 | 8,665,222 | 107,732,879 | ||||||||||||
| INCREASE (DECREASE) IN NET ASSETS FROM OPERATIONS | $ | 482,989,104 | $ | 76,681,462 | $ | 10,435,729 | $ | 107,127,359 | ||||||||
The accompanying notes are an integral part of these financial statements.
110
Statements of Operations
For the Year Ended June 30, 2018
| BROWN | BROWN | BROWN | BROWN | |||||||||||||
| ADVISORY | ADVISORY | ADVISORY | ADVISORY | |||||||||||||
| MID-CAP | SMALL-CAP | SMALL-CAP | GLOBAL | |||||||||||||
| GROWTH | GROWTH | FUNDAMENTAL | LEADERS | |||||||||||||
| FUND* | FUND | VALUE FUND | FUND | |||||||||||||
| INVESTMENT INCOME | ||||||||||||||||
| Dividend income | $ | 52,447 | $ | 3,578,465 | $ | 18,223,617 | $ | 853,897 | ||||||||
| Less: foreign taxes withheld | (460 | ) | (38,357 | ) | — | (68,855 | ) | |||||||||
| Interest income | 4,938 | 651,360 | 669,610 | 22,786 | ||||||||||||
| Total Investment Income | 56,925 | 4,191,468 | 18,893,227 | 807,828 | ||||||||||||
| EXPENSES | ||||||||||||||||
| Investment advisory fees | 53,470 | 6,378,351 | 10,798,605 | 361,760 | ||||||||||||
| Registration fees | 18,050 | 104,880 | 69,418 | 25,491 | ||||||||||||
| Custodian fees | 15,290 | 28,196 | 41,168 | 48,080 | ||||||||||||
| Professional fees | 13,119 | 61,460 | 89,818 | 23,132 | ||||||||||||
| Service fees – Investor Shares (Note 3) | 12,339 | 585,625 | 1,297,471 | 83,483 | ||||||||||||
| Miscellaneous expenses | 7,487 | 85,797 | 131,081 | 14,629 | ||||||||||||
| Administration, accounting and transfer agent fees | 5,415 | 272,151 | 454,802 | 24,393 | ||||||||||||
| Business management fees | 4,113 | 375,197 | 635,212 | 27,828 | ||||||||||||
| Trustee fees | 370 | 32,870 | 56,045 | 2,401 | ||||||||||||
| Insurance fees | 143 | 8,957 | 19,740 | 674 | ||||||||||||
| Distribution fees – Advisor Shares (Note 3) | — | 53,688 | 61,715 | — | ||||||||||||
| Service fees – Advisor Shares (Note 3) | — | 32,213 | 37,029 | — | ||||||||||||
| Total Expenses | 129,796 | 8,019,385 | 13,692,104 | 611,871 | ||||||||||||
| Expenses waived by adviser – expense cap (Note 3) | (59,874 | ) | — | — | (138,801 | ) | ||||||||||
| Net Expenses | 69,922 | 8,019,385 | 13,692,104 | 473,070 | ||||||||||||
| NET INVESTMENT INCOME (LOSS) | (12,997 | ) | (3,827,917 | ) | 5,201,123 | 334,758 | ||||||||||
| NET REALIZED AND UNREALIZED GAIN (LOSS) | ||||||||||||||||
| Net realized gain (loss) on investments | 87,029 | 16,272,365 | 90,515,972 | 870,610 | ||||||||||||
| Net change in unrealized appreciation (depreciation) on: | ||||||||||||||||
| Investments | 1,457,376 | 110,459,513 | 48,605,436 | 7,508,843 | ||||||||||||
| Foreign receivables | — | — | — | (3,823 | ) | |||||||||||
| Net change in unrealized appreciation (depreciation) | 1,457,376 | 110,459,513 | 48,605,436 | 7,505,020 | ||||||||||||
| NET REALIZED AND UNREALIZED GAIN (LOSS) | 1,544,405 | 126,731,878 | 139,121,408 | 8,375,630 | ||||||||||||
| INCREASE (DECREASE) IN NET ASSETS FROM OPERATIONS | $ | 1,531,408 | $ | 122,903,961 | $ | 144,322,531 | $ | 8,710,388 | ||||||||
* Commenced operations October 2, 2017. The information presented is for the period from October 2, 2017 to June 30, 2018.
The accompanying notes are an integral part of these financial statements.
111
Statements of Operations
For the Year Ended June 30, 2018
| BROWN | BROWN | BROWN | BROWN | |||||||||||||
| ADVISORY | ADVISORY | ADVISORY | ADVISORY | |||||||||||||
| INTERMEDIATE | TOTAL | STRATEGIC | SUSTAINABLE | |||||||||||||
| INCOME | RETURN | BOND | BOND | |||||||||||||
| FUND | FUND | FUND | FUND* | |||||||||||||
| INVESTMENT INCOME | ||||||||||||||||
| Dividend income – unaffiliated | $ | — | $ | 908 | $ | 225,118 | $ | — | ||||||||
| Dividend income – affiliated (Note 3) | 658,867 | — | — | — | ||||||||||||
| Interest income | 2,888,339 | 3,831,845 | 4,431,139 | 765,237 | ||||||||||||
| Total Investment Income | 3,547,206 | 3,832,753 | 4,656,257 | 765,237 | ||||||||||||
| EXPENSES | ||||||||||||||||
| Investment advisory fees | 401,710 | 349,412 | 525,631 | 76,326 | ||||||||||||
| Business management fees | 66,952 | 58,235 | 65,704 | 12,721 | ||||||||||||
| Administration, accounting and transfer agent fees | 64,982 | 91,762 | 129,458 | 22,463 | ||||||||||||
| Service fees – Investor Shares (Note 3) | 64,975 | 1,442 | 65,596 | 12,721 | ||||||||||||
| Registration fees | 34,553 | 34,703 | 37,582 | 24,657 | ||||||||||||
| Professional fees | 27,351 | 26,687 | 27,573 | 14,020 | ||||||||||||
| Miscellaneous expenses | 12,028 | 6,819 | 9,031 | 12,710 | ||||||||||||
| Distribution fees – Advisor Shares (Note 3) | 9,883 | — | 541 | — | ||||||||||||
| Custodian fees | 6,472 | 8,627 | 12,223 | 4,274 | ||||||||||||
| Trustee fees | 5,607 | 5,161 | 5,774 | 1,140 | ||||||||||||
| Insurance fees | 2,272 | 1,800 | 1,902 | 179 | ||||||||||||
| Service fees – Advisor Shares (Note 3) | 1,977 | — | 108 | — | ||||||||||||
| Total Expenses | 698,762 | 584,648 | 881,123 | 181,211 | ||||||||||||
| Expenses waived by adviser – expense cap (Note 3) | — | — | — | (28,558 | ) | |||||||||||
| Expenses waived by adviser – investments in affiliates (Note 3) | (83,346 | ) | — | — | — | |||||||||||
| Previously waived expenses recovered by adviser (Note 3) | — | — | 36,683 | — | ||||||||||||
| Net Expenses | 615,416 | 584,648 | 917,806 | 152,653 | ||||||||||||
| NET INVESTMENT INCOME (LOSS) | 2,931,790 | 3,248,105 | 3,738,451 | 612,584 | ||||||||||||
| NET REALIZED AND UNREALIZED GAIN (LOSS) | ||||||||||||||||
| Net realized gain (loss) on: | ||||||||||||||||
| Investments – unaffiliated | (288,972 | ) | (449,900 | ) | (288,146 | ) | (74,948 | ) | ||||||||
| Investments – affiliated (Note 3) | (223,434 | ) | — | — | — | |||||||||||
| Capital gain distribution from other RIC | — | — | 10 | — | ||||||||||||
| Futures contracts (Note 6) | — | (627,388 | ) | 414,729 | (20,619 | ) | ||||||||||
| Net realized gain (loss) | (512,406 | ) | (1,077,288 | ) | 126,593 | (95,567 | ) | |||||||||
| Net change in unrealized appreciation (depreciation) on: | ||||||||||||||||
| Investments – unaffiliated | (2,157,368 | ) | (1,922,164 | ) | (1,537,231 | ) | (749,201 | ) | ||||||||
| Investments – affiliated (Note 3) | (420,736 | ) | — | — | — | |||||||||||
| Futures contracts (Note 6) | — | 357,273 | (96,569 | ) | (9,784 | ) | ||||||||||
| Net change in unrealized appreciation (depreciation) | (2,578,104 | ) | (1,564,891 | ) | (1,633,800 | ) | (758,985 | ) | ||||||||
| NET REALIZED AND UNREALIZED GAIN (LOSS) | (3,090,510 | ) | (2,642,179 | ) | (1,507,207 | ) | (854,552 | ) | ||||||||
| INCREASE (DECREASE) IN NET ASSETS FROM OPERATIONS | $ | (158,720 | ) | $ | 605,926 | $ | 2,231,244 | $ | (241,968 | ) | ||||||
* Commenced operations August 7, 2017. Information presented is for the period from August 7, 2017 to June 30, 2018.
The accompanying notes are an integral part of these financial statements.
112
Statements of Operations
For the Year Ended June 30, 2018
| BROWN | ||||||||||||||||
| ADVISORY – | ||||||||||||||||
| BROWN | BROWN | BROWN | WMC | |||||||||||||
| ADVISORY | ADVISORY | ADVISORY | STRATEGIC | |||||||||||||
| MARYLAND | TAX EXEMPT | MORTGAGE | EUROPEAN | |||||||||||||
| BOND | BOND | SECURITIES | EQUITY | |||||||||||||
| FUND | FUND | FUND | FUND | |||||||||||||
| INVESTMENT INCOME | ||||||||||||||||
| Dividend income | $ | — | $ | — | $ | 30,273 | $ | 29,671,378 | ||||||||
| Less: foreign taxes withheld | — | — | — | (2,648,591 | ) | |||||||||||
| Interest income | 5,349,984 | 11,633,470 | 7,761,366 | 256,497 | ||||||||||||
| Total Investment Income | 5,349,984 | 11,633,470 | 7,791,639 | 27,279,284 | ||||||||||||
| EXPENSES | ||||||||||||||||
| Investment advisory fees | 553,264 | 958,397 | 1,001,027 | 11,709,843 | ||||||||||||
| Service fees – Investor Shares (Note 3) | 92,211 | 159,733 | 227 | 19,638 | ||||||||||||
| Business management fees | 92,211 | 159,733 | 166,838 | 650,547 | ||||||||||||
| Administration, accounting and transfer agent fees | 86,166 | 141,982 | 250,581 | 468,018 | ||||||||||||
| Professional fees | 30,536 | 37,740 | 39,473 | 93,579 | ||||||||||||
| Miscellaneous expenses | 11,387 | 17,480 | 21,387 | 412,072 | ||||||||||||
| Trustee fees | 8,162 | 14,003 | 14,801 | 57,548 | ||||||||||||
| Registration fees | 7,182 | 40,000 | 33,731 | 88,869 | ||||||||||||
| Custody fees | 5,725 | 10,388 | 40,287 | 402,664 | ||||||||||||
| Insurance fees | 2,989 | 4,343 | 5,723 | 19,555 | ||||||||||||
| Distribution fees – Advisor Shares (Note 3) | — | — | — | 41,721 | ||||||||||||
| Service fees – Advisor Shares (Note 3) | — | — | — | 25,033 | ||||||||||||
| Interest expense on line of credit | — | — | — | 1,766 | ||||||||||||
| Total Expenses | 889,833 | 1,543,799 | 1,574,075 | 13,990,853 | ||||||||||||
| NET INVESTMENT INCOME (LOSS) | 4,460,151 | 10,089,671 | 6,217,564 | 13,288,431 | ||||||||||||
| NET REALIZED AND UNREALIZED GAIN (LOSS) | ||||||||||||||||
| Net realized gain (loss) on: | ||||||||||||||||
| Investments | (208,324 | ) | (1,355,285 | ) | (2,679,973 | ) | 90,841,223 | |||||||||
| Futures contracts (Note 6) | — | — | (1,720,471 | ) | (928,272 | ) | ||||||||||
| Forward foreign currency contracts (Note 7) | — | — | — | (55,291 | ) | |||||||||||
| Net realized gain (loss) | (208,324 | ) | (1,355,285 | ) | (4,400,444 | ) | 89,857,660 | |||||||||
| Net change in unrealized appreciation (depreciation) on: | ||||||||||||||||
| Investments | (1,885,045 | ) | 18,081 | (2,178,522 | ) | (45,618,944 | ) | |||||||||
| Futures contracts (Note 6) | — | — | 713,975 | — | ||||||||||||
| Foreign currency/receivables | — | — | — | (57,253 | ) | |||||||||||
| Net change in unrealized appreciation (depreciation) | (1,885,045 | ) | 18,081 | (1,464,547 | ) | (45,676,197 | ) | |||||||||
| NET REALIZED AND UNREALIZED GAIN (LOSS) | (2,093,369 | ) | (1,337,204 | ) | (5,864,991 | ) | 44,181,463 | |||||||||
| INCREASE (DECREASE) IN NET ASSETS FROM OPERATIONS | $ | 2,366,782 | $ | 8,752,467 | $ | 352,573 | $ | 57,469,894 | ||||||||
The accompanying notes are an integral part of these financial statements.
113
Statements of Operations
For the Year Ended June 30, 2018
| BROWN | BROWN | BROWN | BROWN | |||||||||||||
| ADVISORY – | ADVISORY – | ADVISORY – | ADVISORY – | |||||||||||||
| WMC | SOMERSET | MACQUARIE | BEUTEL | |||||||||||||
| JAPAN ALPHA | EMERGING | ASIA NEW | GOODMAN | |||||||||||||
| OPPORTUNITIES | MARKETS | STARS | LARGE-CAP | |||||||||||||
| FUND | FUND | FUND | VALUE FUND* | |||||||||||||
| INVESTMENT INCOME | ||||||||||||||||
| Dividend income | $ | 26,427,549 | $ | 19,951,526 | $ | 5,534,600 | $ | 909,012 | ||||||||
| Less: foreign taxes withheld | (2,642,872 | ) | (2,411,750 | ) | (483,858 | ) | — | |||||||||
| Interest income | 889,102 | 298,393 | 121,670 | 31,399 | ||||||||||||
| Total Investment Income | 24,673,779 | 17,838,169 | 5,172,412 | 940,411 | ||||||||||||
| EXPENSES | ||||||||||||||||
| Investment advisory fees | 12,789,564 | 5,903,179 | 3,381,605 | 185,906 | ||||||||||||
| Business management fees | 639,478 | 327,954 | 135,264 | 20,656 | ||||||||||||
| Administration, accounting and transfer agent fees | 496,561 | 239,090 | 104,047 | 15,816 | ||||||||||||
| Custodian fees | 307,446 | 846,543 | 273,730 | 7,507 | ||||||||||||
| Miscellaneous expenses | 300,815 | 49,327 | 33,257 | 4,702 | ||||||||||||
| Professional fees | 83,545 | 56,254 | 34,851 | 14,920 | ||||||||||||
| Registration fees | 78,316 | 64,358 | 40,667 | 24,105 | ||||||||||||
| Trustee fees | 51,031 | 28,582 | 11,802 | 1,829 | ||||||||||||
| Insurance fees | 16,694 | 9,624 | 3,985 | 187 | ||||||||||||
| Service fees – Investor Shares (Note 3) | 5,242 | 193,638 | 4,653 | — | ||||||||||||
| Distribution fees – Advisor Shares (Note 3) | 889 | 631 | — | — | ||||||||||||
| Service fees – Advisor Shares (Note 3) | 533 | 379 | — | — | ||||||||||||
| Interest expense on line of credit | — | 3,461 | 114 | — | ||||||||||||
| Total Expenses | 14,770,114 | 7,723,020 | 4,023,975 | 275,628 | ||||||||||||
| NET INVESTMENT INCOME (LOSS) | 9,903,665 | 10,115,149 | 1,148,437 | 664,783 | ||||||||||||
| NET REALIZED AND UNREALIZED GAIN (LOSS) | ||||||||||||||||
| Net realized gain (loss) on: | ||||||||||||||||
| Investments | 118,589,071 | (780,021 | ) | 15,605,833 | (418,544 | ) | ||||||||||
| Less: foreign capital gain taxes paid | — | — | (398,218 | ) | — | |||||||||||
| Futures contracts (Note 6) | (859,571 | ) | — | — | — | |||||||||||
| Forward foreign currency contracts (Note 7) | 2,464,665 | — | — | — | ||||||||||||
| Net realized gain (loss) | 120,194,165 | (780,021 | ) | 15,207,615 | (418,544 | ) | ||||||||||
| Net change in unrealized appreciation (depreciation) on: | ||||||||||||||||
| Investments | (106,931,924 | ) | (8,843,006 | ) | (7,559,281 | ) | (3,907,453 | ) | ||||||||
| Futures contracts (Note 6) | (1,285,234 | ) | — | — | — | |||||||||||
| Forward foreign currency contracts (Note 7) | (384,181 | ) | — | — | — | |||||||||||
| Foreign currency/receivables | 15,987 | (25,073 | ) | (17,838 | ) | — | ||||||||||
| Net change in unrealized appreciation (depreciation) | (108,585,352 | ) | (8,868,079 | ) | (7,577,119 | ) | (3,907,453 | ) | ||||||||
| NET REALIZED AND UNREALIZED GAIN (LOSS) | 11,608,813 | (9,648,100 | ) | 7,630,496 | (4,325,997 | ) | ||||||||||
| INCREASE (DECREASE) IN NET ASSETS FROM OPERATIONS | $ | 21,512,478 | $ | 467,049 | $ | 8,778,933 | $ | (3,661,214 | ) | |||||||
* Commenced operations February 13, 2018. Information presented is for the period from February 13, 2018 to June 30, 2018.
The accompanying notes are an integral part of these financial statements.
114
Statements of Changes in Net Assets
| BROWN ADVISORY | BROWN ADVISORY | |||||||||||||||
| GROWTH EQUITY FUND | FLEXIBLE EQUITY FUND | |||||||||||||||
| Fiscal | Fiscal | Fiscal | Fiscal | |||||||||||||
| Year Ended | Year Ended | Year Ended | Year Ended | |||||||||||||
| June 30, | June 30, | June 30, | June 30, | |||||||||||||
| 2018 | 2017 | 2018 | 2017 | |||||||||||||
| OPERATIONS | ||||||||||||||||
| Net investment income (loss) | $ | (7,980,352 | ) | $ | (5,558,657 | ) | $ | 1,623,165 | $ | 1,796,492 | ||||||
| Net realized gain (loss) | 189,010,520 | 237,349,413 | 11,789,560 | 9,225,463 | ||||||||||||
| Net change in unrealized appreciation (depreciation) | 301,958,936 | 2,508,322 | 63,268,737 | 65,792,893 | ||||||||||||
| Increase (Decrease) in Net Assets from Operations | 482,989,104 | 234,299,078 | 76,681,462 | 76,814,848 | ||||||||||||
| DISTRIBUTIONS TO SHAREHOLDERS FROM | ||||||||||||||||
| Net investment income: | ||||||||||||||||
| Institutional Shares | — | — | (643,925 | ) | (296,958 | ) | ||||||||||
| Investor Shares | — | — | (1,422,429 | ) | (1,264,674 | ) | ||||||||||
| Advisor Shares | — | — | (9,268 | ) | (11,536 | ) | ||||||||||
| Net realized gain: | ||||||||||||||||
| Institutional Shares | (23,141,509 | ) | (21,177,151 | ) | — | — | ||||||||||
| Investor Shares | (120,503,157 | ) | (123,877,317 | ) | — | — | ||||||||||
| Advisor Shares | (469,496 | ) | (2,370,151 | ) | — | — | ||||||||||
| Total Distributions to Shareholders | (144,114,162 | ) | (147,424,619 | ) | (2,075,622 | ) | (1,573,168 | ) | ||||||||
| CAPITAL SHARE TRANSACTIONS | ||||||||||||||||
| Sale of shares: | ||||||||||||||||
| Institutional Shares | 55,826,305 | 119,319,112 | 24,771,706 | 81,914,255 | ||||||||||||
| Investor Shares | 242,524,550 | 211,845,143 | 24,311,427 | 32,256,785 | ||||||||||||
| Advisor Shares | 1,099,275 | 2,984,886 | 746,297 | 541,315 | ||||||||||||
| Reinvestment of distributions: | ||||||||||||||||
| Institutional Shares | 18,263,760 | 17,528,304 | 294,182 | 116,213 | ||||||||||||
| Investor Shares | 113,405,269 | 116,018,940 | 278,371 | 330,267 | ||||||||||||
| Advisor Shares | 435,592 | 2,309,631 | 8,519 | 10,376 | ||||||||||||
| Redemption of shares: | ||||||||||||||||
| Institutional Shares | (112,225,735 | ) | (126,100,789 | ) | (14,207,288 | ) | (16,178,545 | ) | ||||||||
| Investor Shares | (352,089,999 | ) | (834,155,207 | ) | (73,507,427 | ) | (133,656,620 | ) | ||||||||
| Advisor Shares | (1,740,283 | ) | (33,588,840 | ) | (1,163,850 | ) | (4,314,983 | ) | ||||||||
| Redemption fees: | ||||||||||||||||
| Institutional Shares | 311 | 8 | 3 | 456 | ||||||||||||
| Investor Shares | 1,329 | 522 | 82 | 904 | ||||||||||||
| Advisor Shares | 96 | 671 | 95 | 6 | ||||||||||||
| Shares issued in connection with the acquisition of | ||||||||||||||||
| the Brown Advisory Value Equity Fund: | ||||||||||||||||
| Institutional Shares | N/A | N/A | N/A | 1,202,936 | ||||||||||||
| Investor Shares | N/A | N/A | N/A | 41,538,801 | ||||||||||||
| Advisor Shares | N/A | N/A | N/A | 992,710 | ||||||||||||
| Increase (Decrease) from Capital Share Transactions | (34,499,530 | ) | (523,837,619 | ) | (38,467,883 | ) | 4,754,876 | |||||||||
| Increase (Decrease) in Net Assets | 304,375,412 | (436,963,160 | ) | 36,137,957 | 79,996,556 | |||||||||||
| NET ASSETS | ||||||||||||||||
| Beginning of period | 1,766,453,786 | 2,203,416,946 | 417,633,414 | 337,636,858 | ||||||||||||
| End of period | $ | 2,070,829,198 | $ | 1,766,453,786 | $ | 453,771,371 | $ | 417,633,414 | ||||||||
| Undistributed (Accumulated) net investment income (loss) | $ | (4,270,996 | ) | $ | (848,321 | ) | $ | 577,497 | $ | 1,031,757 | ||||||
| SHARE TRANSACTIONS | ||||||||||||||||
| Sale of shares: | ||||||||||||||||
| Institutional Shares | 2,520,724 | 6,213,516 | 1,176,283 | 4,821,892 | ||||||||||||
| Investor Shares | 11,032,342 | 11,129,360 | 1,192,054 | 1,894,148 | ||||||||||||
| Advisor Shares | 50,292 | 166,276 | 34,532 | 31,755 | ||||||||||||
| Reinvestment of distributions: | ||||||||||||||||
| Institutional Shares | 865,991 | 998,195 | 14,123 | 7,005 | ||||||||||||
| Investor Shares | 5,423,494 | 6,652,462 | 13,383 | 19,920 | ||||||||||||
| Advisor Shares | 21,867 | 138,218 | 409 | 625 | ||||||||||||
| Redemption of shares: | ||||||||||||||||
| Institutional Shares | (5,087,579 | ) | (6,642,253 | ) | (683,544 | ) | (1,013,033 | ) | ||||||||
| Investor Shares | (16,142,426 | ) | (43,687,505 | ) | (3,549,882 | ) | (7,908,695 | ) | ||||||||
| Advisor Shares | (84,091 | ) | (1,831,432 | ) | (56,568 | ) | (250,475 | ) | ||||||||
| Shares issued in connection with the acquisition of | ||||||||||||||||
| the Brown Advisory Value Equity Fund (Note 9): | ||||||||||||||||
| Institutional Shares | N/A | N/A | N/A | 72,612 | ||||||||||||
| Investor Shares | N/A | N/A | N/A | 2,509,981 | ||||||||||||
| Advisor Shares | N/A | N/A | N/A | 59,882 | ||||||||||||
| Increase (Decrease) in shares outstanding | (1,399,386 | ) | (26,863,163 | ) | (1,859,210 | ) | 245,617 | |||||||||
The accompanying notes are an integral part of these financial statements.
115
Statements of Changes in Net Assets
| BROWN ADVISORY | BROWN ADVISORY | |||||||||||||||
| EQUITY INCOME FUND | SUSTAINABLE GROWTH FUND | |||||||||||||||
| Fiscal | Fiscal | Fiscal | Fiscal | |||||||||||||
| Year Ended | Year Ended | Year Ended | Year Ended | |||||||||||||
| June 30, | June 30, | June 30, | June 30, | |||||||||||||
| 2018 | 2017 | 2018 | 2017 | |||||||||||||
| OPERATIONS | ||||||||||||||||
| Net investment income (loss) | $ | 1,770,507 | $ | 2,130,205 | $ | (605,520 | ) | $ | (1,164,258 | ) | ||||||
| Net realized gain (loss) | 10,709,083 | 7,663,911 | 29,170,107 | 19,653,792 | ||||||||||||
| Net change in unrealized appreciation (depreciation) | (2,043,861 | ) | 4,432,257 | 78,562,772 | 45,736,422 | |||||||||||
| Increase (Decrease) in Net Assets from Operations | 10,435,729 | 14,226,373 | 107,127,359 | 64,225,956 | ||||||||||||
| DISTRIBUTIONS TO SHAREHOLDERS FROM | ||||||||||||||||
| Net investment income: | ||||||||||||||||
| Institutional Shares | (512,185 | ) | (300,565 | ) | — | — | ||||||||||
| Investor Shares | (1,236,776 | ) | (1,754,976 | ) | — | — | ||||||||||
| Advisor Shares | (24,423 | ) | (45,555 | ) | — | — | ||||||||||
| Net realized gain: | ||||||||||||||||
| Institutional Shares | (916,839 | ) | (408,109 | ) | (4,421,769 | ) | (1,045,872 | ) | ||||||||
| Investor Shares | (2,572,585 | ) | (3,601,920 | ) | (802,354 | ) | (198,697 | ) | ||||||||
| Advisor Shares | (78,544 | ) | (110,477 | ) | (3,143,772 | ) | (1,263,054 | ) | ||||||||
| Total Distributions to Shareholders | (5,341,352 | ) | (6,221,602 | ) | (8,367,895 | ) | (2,507,623 | ) | ||||||||
| CAPITAL SHARE TRANSACTIONS | ||||||||||||||||
| Sale of shares: | ||||||||||||||||
| Institutional Shares | 3,800,667 | 30,529,529 | 122,220,935 | 100,732,392 | ||||||||||||
| Investor Shares | 3,156,796 | 5,936,447 | 79,916,263 | 28,660,628 | ||||||||||||
| Advisor Shares | 11,604 | 4,735 | 32,423,797 | 31,487,091 | ||||||||||||
| Reinvestment of distributions: | ||||||||||||||||
| Institutional Shares | 1,168,517 | 533,195 | 3,046,077 | 743,538 | ||||||||||||
| Investor Shares | 1,369,084 | 2,223,909 | 658,241 | 175,109 | ||||||||||||
| Advisor Shares | 98,704 | 145,768 | 2,961,244 | 1,188,453 | ||||||||||||
| Redemption of shares: | ||||||||||||||||
| Institutional Shares | (7,864,535 | ) | (16,718,684 | ) | (29,645,324 | ) | (29,877,900 | ) | ||||||||
| Investor Shares | (23,608,528 | ) | (44,793,123 | ) | (25,813,176 | ) | (22,743,144 | ) | ||||||||
| Advisor Shares | (1,561,239 | ) | (903,287 | ) | (29,567,360 | ) | (91,353,897 | ) | ||||||||
| Redemption fees: | ||||||||||||||||
| Institutional Shares | — | — | 379 | 201 | ||||||||||||
| Investor Shares | 20 | — | 848 | 1,047 | ||||||||||||
| Advisor Shares | — | 1 | 759 | 370 | ||||||||||||
| Increase (Decrease) from Capital Share Transactions | (23,428,910 | ) | (23,041,510 | ) | 156,202,683 | 19,013,888 | ||||||||||
| Increase (Decrease) in Net Assets | (18,334,533 | ) | (15,036,739 | ) | 254,962,147 | 80,732,221 | ||||||||||
| NET ASSETS | ||||||||||||||||
| Beginning of period | 113,899,084 | 128,935,823 | 430,143,186 | 349,410,965 | ||||||||||||
| End of period | $ | 95,564,551 | $ | 113,899,084 | $ | 685,105,333 | $ | 430,143,186 | ||||||||
| Undistributed (Accumulated) net investment income (loss) | $ | 85,270 | $ | 67,756 | $ | — | $ | (468,926 | ) | |||||||
| SHARE TRANSACTIONS | ||||||||||||||||
| Sale of shares: | ||||||||||||||||
| Institutional Shares | 264,042 | 2,320,504 | 5,634,586 | 5,731,486 | ||||||||||||
| Investor Shares | 218,695 | 453,386 | 3,662,250 | 1,664,640 | ||||||||||||
| Advisor Shares | 800 | 354 | 1,527,066 | 1,881,748 | ||||||||||||
| Reinvestment of distributions: | ||||||||||||||||
| Institutional Shares | 80,076 | 40,657 | 144,982 | 44,075 | ||||||||||||
| Investor Shares | 93,297 | 171,641 | 31,616 | 10,461 | ||||||||||||
| Advisor Shares | 6,755 | 11,225 | 144,240 | 71,766 | ||||||||||||
| Redemption of shares: | ||||||||||||||||
| Institutional Shares | (546,258 | ) | (1,292,954 | ) | (1,402,766 | ) | (1,697,204 | ) | ||||||||
| Investor Shares | (1,629,814 | ) | (3,407,417 | ) | (1,177,511 | ) | (1,317,790 | ) | ||||||||
| Advisor Shares | (108,542 | ) | (67,821 | ) | (1,445,494 | ) | (5,459,074 | ) | ||||||||
| Increase (Decrease) in shares outstanding | (1,620,949 | ) | (1,770,425 | ) | 7,118,969 | 930,108 | ||||||||||
The accompanying notes are an integral part of these financial statements.
116
Statements of Changes in Net Assets
| BROWN ADVISORY | ||||||||||||
| MID-CAP GROWTH | BROWN ADVISORY | |||||||||||
| FUND | SMALL-CAP GROWTH FUND | |||||||||||
| Fiscal | Fiscal | Fiscal | ||||||||||
| Year Ended | Year Ended | Year Ended | ||||||||||
| June 30, | June 30, | June 30, | ||||||||||
| 2018* | 2018 | 2017 | ||||||||||
| OPERATIONS | ||||||||||||
| Net investment income (loss) | $ | (12,997 | ) | $ | (3,827,917 | ) | $ | (2,625,257 | ) | |||
| Net realized gain (loss) | 87,029 | 16,272,365 | 12,097,018 | |||||||||
| Net change in unrealized appreciation (depreciation) | 1,457,376 | 110,459,513 | 51,670,727 | |||||||||
| Increase (Decrease) in Net Assets from Operations | 1,531,408 | 122,903,961 | 61,142,488 | |||||||||
| DISTRIBUTIONS TO SHAREHOLDERS FROM | ||||||||||||
| Net investment income: | ||||||||||||
| Institutional Shares | — | (1,427,349 | ) | — | ||||||||
| Investor Shares | — | (1,204,104 | ) | — | ||||||||
| Advisor Shares | — | (25,859 | ) | — | ||||||||
| Net realized gain: | ||||||||||||
| Institutional Shares | — | (4,901,077 | ) | (3,125,896 | ) | |||||||
| Investor Shares | — | (5,113,684 | ) | (9,911,936 | ) | |||||||
| Advisor Shares | — | (261,389 | ) | (1,153,765 | ) | |||||||
| Total Distributions to Shareholders | — | (12,933,462 | ) | (14,191,597 | ) | |||||||
| CAPITAL SHARE TRANSACTIONS | ||||||||||||
| Sale of shares: | ||||||||||||
| Institutional Shares | — | 251,107,663 | 153,338,783 | |||||||||
| Investor Shares | 20,644,989 | 141,526,587 | 87,942,206 | |||||||||
| Advisor Shares | — | 3,086,119 | 34,620,167 | |||||||||
| Reinvestment of distributions: | ||||||||||||
| Institutional Shares | — | 5,632,861 | 2,803,928 | |||||||||
| Investor Shares | — | 3,636,951 | 6,192,098 | |||||||||
| Advisor Shares | — | 199,271 | 804,864 | |||||||||
| Redemption of shares: | ||||||||||||
| Institutional Shares | — | (48,046,237 | ) | (16,925,963 | ) | |||||||
| Investor Shares | (798,980 | ) | (60,450,109 | ) | (62,439,748 | ) | ||||||
| Advisor Shares | — | (20,641,592 | ) | (14,767,401 | ) | |||||||
| Redemption fees: | ||||||||||||
| Institutional Shares | — | 9,528 | 239 | |||||||||
| Investor Shares | 77 | 316 | 38 | |||||||||
| Advisor Shares | — | 120 | 912 | |||||||||
| Increase (Decrease) from Capital Share Transactions | 19,846,086 | 276,061,478 | 191,570,123 | |||||||||
| Increase (Decrease) in Net Assets | 21,377,494 | 386,031,977 | 238,521,014 | |||||||||
| NET ASSETS | ||||||||||||
| Beginning of period | — | 533,652,097 | 295,131,083 | |||||||||
| End of period | $ | 21,377,494 | $ | 919,684,074 | $ | 533,652,097 | ||||||
| Undistributed (Accumulated) net investment income (loss) | $ | — | $ | 3,777,600 | $ | (1,466,067 | ) | |||||
| SHARE TRANSACTIONS | ||||||||||||
| Sale of shares: | ||||||||||||
| Institutional Shares | — | 6,841,265 | 4,584,294 | |||||||||
| Investor Shares | 1,955,128 | 7,365,046 | 5,239,278 | |||||||||
| Advisor Shares | — | 171,520 | 2,170,147 | |||||||||
| Reinvestment of distributions: | ||||||||||||
| Institutional Shares | — | 150,581 | 85,694 | |||||||||
| Investor Shares | — | 194,006 | 377,337 | |||||||||
| Advisor Shares | — | 11,119 | 51,200 | |||||||||
| Redemption of shares: | ||||||||||||
| Institutional Shares | — | (1,259,137 | ) | (504,564 | ) | |||||||
| Investor Shares | (72,793 | ) | (3,155,860 | ) | (3,732,469 | ) | ||||||
| Advisor Shares | — | (1,183,625 | ) | (918,376 | ) | |||||||
| Increase (Decrease) in shares outstanding | 1,882,335 | 9,134,915 | 7,352,541 | |||||||||
* Commenced operations October 2, 2017. The information presented is for the period from October 2, 2017 to June 30, 2018.
The accompanying notes are an integral part of these financial statements.
117
Statements of Changes in Net Assets
| BROWN ADVISORY SMALL-CAP | BROWN ADVISORY | |||||||||||||||
| FUNDAMENTAL VALUE FUND | GLOBAL LEADERS FUND | |||||||||||||||
| Fiscal | Fiscal | Fiscal | Fiscal | |||||||||||||
| Year Ended | Year Ended | Year Ended | Year Ended | |||||||||||||
| June 30, | June 30, | June 30, | June 30, | |||||||||||||
| 2018 | 2017 | 2018 | 2017 | |||||||||||||
| OPERATIONS | ||||||||||||||||
| Net investment income (loss) | $ | 5,201,123 | $ | 6,232,823 | $ | 334,758 | $ | 123,094 | ||||||||
| Net realized gain (loss) | 90,515,972 | 33,184,360 | 870,610 | (697,183 | ) | |||||||||||
| Net change in unrealized appreciation (depreciation) | 48,605,436 | 158,498,930 | 7,505,020 | 6,298,725 | ||||||||||||
| Increase (Decrease) in Net Assets from Operations | 144,322,531 | 197,916,113 | 8,710,388 | 5,724,636 | ||||||||||||
| DISTRIBUTIONS TO SHAREHOLDERS FROM | ||||||||||||||||
| Net investment income: | ||||||||||||||||
| Institutional Shares | (2,681,377 | ) | (988,540 | ) | — | — | ||||||||||
| Investor Shares | (4,805,086 | ) | (1,873,774 | ) | (43,629 | ) | (53,915 | ) | ||||||||
| Advisor Shares | (62,036 | ) | — | — | — | |||||||||||
| Net realized gain: | ||||||||||||||||
| Institutional Shares | (13,597,047 | ) | (334,931 | ) | — | — | ||||||||||
| Investor Shares | (30,834,877 | ) | (1,026,309 | ) | — | — | ||||||||||
| Advisor Shares | (858,046 | ) | (71,853 | ) | — | — | ||||||||||
| Total Distributions to Shareholders | (52,838,469 | ) | (4,295,407 | ) | (43,629 | ) | (53,915 | ) | ||||||||
| CAPITAL SHARE TRANSACTIONS | ||||||||||||||||
| Sale of shares: | ||||||||||||||||
| Institutional Shares | 91,821,131 | 179,876,139 | — | — | ||||||||||||
| Investor Shares | 129,081,238 | 150,643,608 | 41,258,390 | 10,428,188 | ||||||||||||
| Advisor Shares | 4,185,998 | 4,622,183 | — | — | ||||||||||||
| Reinvestment of distributions: | ||||||||||||||||
| Institutional Shares | 11,905,214 | 1,028,123 | — | — | ||||||||||||
| Investor Shares | 21,281,919 | 1,463,959 | 19,205 | 27,050 | ||||||||||||
| Advisor Shares | 890,719 | 70,862 | — | — | ||||||||||||
| Redemption of shares: | ||||||||||||||||
| Institutional Shares | (61,182,890 | ) | (39,625,716 | ) | — | — | ||||||||||
| Investor Shares | (172,896,660 | ) | (233,263,118 | ) | (3,185,671 | ) | (3,139,577 | ) | ||||||||
| Advisor Shares | (6,814,344 | ) | (41,744,149 | ) | — | — | ||||||||||
| Redemption fees: | ||||||||||||||||
| Institutional Shares | 83 | 596 | — | — | ||||||||||||
| Investor Shares | 836 | 293 | — | — | ||||||||||||
| Advisor Shares | 34 | 17 | — | — | ||||||||||||
| Increase (Decrease) from Capital Share Transactions | 18,273,278 | 23,072,797 | 38,091,924 | 7,315,661 | ||||||||||||
| Increase (Decrease) in Net Assets | 109,757,340 | 216,693,503 | 46,758,683 | 12,986,382 | ||||||||||||
| NET ASSETS | ||||||||||||||||
| Beginning of period | 1,200,328,511 | 983,635,008 | 39,353,773 | 26,367,391 | ||||||||||||
| End of period | $ | 1,310,085,851 | $ | 1,200,328,511 | $ | 86,112,456 | $ | 39,353,773 | ||||||||
| Undistributed (Accumulated) net investment income (loss) | $ | 2,099,754 | $ | 4,459,274 | $ | 347,066 | $ | 36,421 | ||||||||
| SHARE TRANSACTIONS | ||||||||||||||||
| Sale of shares: | ||||||||||||||||
| Institutional Shares | 3,252,145 | 7,218,027 | — | — | ||||||||||||
| Investor Shares | 4,590,806 | 5,983,204 | 3,053,558 | 997,773 | ||||||||||||
| Advisor Shares | 147,739 | 186,049 | — | — | ||||||||||||
| Reinvestment of distributions: | ||||||||||||||||
| Institutional Shares | 416,146 | 38,734 | — | — | ||||||||||||
| Investor Shares | 744,919 | 55,176 | 1,474 | 2,772 | ||||||||||||
| Advisor Shares | 31,366 | 2,683 | — | — | ||||||||||||
| Redemption of shares: | ||||||||||||||||
| Institutional Shares | (2,158,295 | ) | (1,544,437 | ) | — | — | ||||||||||
| Investor Shares | (6,120,611 | ) | (9,311,268 | ) | (246,142 | ) | (308,305 | ) | ||||||||
| Advisor Shares | (242,164 | ) | (1,599,518 | ) | — | — | ||||||||||
| Increase (Decrease) in shares outstanding | 662,051 | 1,028,650 | 2,808,890 | 692,240 | ||||||||||||
The accompanying notes are an integral part of these financial statements.
118
Statements of Changes in Net Assets
| BROWN ADVISORY | BROWN ADVISORY | |||||||||||||||
| INTERMEDIATE INCOME FUND | TOTAL RETURN FUND | |||||||||||||||
| Fiscal | Fiscal | Fiscal | Fiscal | |||||||||||||
| Year Ended | Year Ended | Year Ended | Year Ended | |||||||||||||
| June 30, | June 30, | June 30, | June 30, | |||||||||||||
| 2018 | 2017 | 2018 | 2017 | |||||||||||||
| OPERATIONS | ||||||||||||||||
| Net investment income (loss) | $ | 2,931,790 | $ | 2,678,957 | $ | 3,248,105 | $ | 2,300,033 | ||||||||
| Net realized gain (loss) | (512,406 | ) | 1,158,501 | (1,077,288 | ) | 233,570 | ||||||||||
| Net change in unrealized appreciation (depreciation) | (2,578,104 | ) | (3,387,615 | ) | (1,564,891 | ) | (1,459,774 | ) | ||||||||
| Increase (Decrease) in Net Assets from Operations | (158,720 | ) | 449,843 | 605,926 | 1,073,829 | |||||||||||
| DISTRIBUTIONS TO SHAREHOLDERS FROM | ||||||||||||||||
| Net investment income: | ||||||||||||||||
| Institutional Shares | — | — | (3,247,038 | ) | (2,343,658 | ) | ||||||||||
| Investor Shares | (2,930,957 | ) | (2,831,381 | ) | (80,086 | ) | (80,256 | ) | ||||||||
| Advisor Shares | (80,947 | ) | (140,836 | ) | — | — | ||||||||||
| Net realized gain: | ||||||||||||||||
| Institutional Shares | — | — | — | (98,534 | ) | |||||||||||
| Investor Shares | — | — | — | (3,277 | ) | |||||||||||
| Advisor Shares | — | — | — | — | ||||||||||||
| Total Distributions to Shareholders | (3,011,904 | ) | (2,972,217 | ) | (3,327,124 | ) | (2,525,725 | ) | ||||||||
| CAPITAL SHARE TRANSACTIONS | ||||||||||||||||
| Sale of shares: | ||||||||||||||||
| Institutional Shares | — | — | 42,259,249 | 49,027,136 | ||||||||||||
| Investor Shares | 27,591,617 | 25,077,370 | 865,839 | 3,462,904 | ||||||||||||
| Advisor Shares | 42,334 | 38,794 | — | — | ||||||||||||
| Reinvestment of distributions: | ||||||||||||||||
| Institutional Shares | — | — | 914,158 | 612,556 | ||||||||||||
| Investor Shares | 776,065 | 724,852 | 50,718 | 60,281 | ||||||||||||
| Advisor Shares | 44,524 | 86,263 | — | — | ||||||||||||
| Redemption of shares: | ||||||||||||||||
| Institutional Shares | — | — | (26,826,272 | ) | (24,464,517 | ) | ||||||||||
| Investor Shares | (32,172,093 | ) | (29,404,931 | ) | (896,218 | ) | (2,704,739 | ) | ||||||||
| Advisor Shares | (307,597 | ) | (4,833,940 | ) | — | — | ||||||||||
| Redemption fees: | ||||||||||||||||
| Institutional Shares | — | — | — | 99 | ||||||||||||
| Investor Shares | — | — | — | — | ||||||||||||
| Advisor Shares | — | — | — | — | ||||||||||||
| Increase (Decrease) from Capital Share Transactions | (4,025,150 | ) | (8,311,592 | ) | 16,367,474 | 25,993,720 | ||||||||||
| Increase (Decrease) in Net Assets | (7,195,774 | ) | (10,833,966 | ) | 13,646,276 | 24,541,824 | ||||||||||
| NET ASSETS | ||||||||||||||||
| Beginning of period | 136,038,456 | 146,872,422 | 110,353,484 | 85,811,660 | ||||||||||||
| End of period | $ | 128,842,682 | $ | 136,038,456 | $ | 123,999,760 | $ | 110,353,484 | ||||||||
| Undistributed (Accumulated) net investment income (loss) | $ | (156,555 | ) | $ | (169,025 | ) | $ | 22,517 | $ | 4,229 | ||||||
| SHARE TRANSACTIONS | ||||||||||||||||
| Sale of shares: | ||||||||||||||||
| Institutional Shares | — | — | 4,246,452 | 4,910,349 | ||||||||||||
| Investor Shares | 2,634,707 | 2,357,775 | 86,723 | 341,146 | ||||||||||||
| Advisor Shares | 4,147 | 3,759 | — | — | ||||||||||||
| Reinvestment of distributions: | ||||||||||||||||
| Institutional Shares | — | — | 92,154 | 61,510 | ||||||||||||
| Investor Shares | 74,019 | 68,181 | 5,106 | 6,013 | ||||||||||||
| Advisor Shares | 4,334 | 8,282 | — | — | ||||||||||||
| Redemption of shares: | ||||||||||||||||
| Institutional Shares | — | — | (2,694,044 | ) | (2,439,943 | ) | ||||||||||
| Investor Shares | (3,073,377 | ) | (2,768,529 | ) | (90,812 | ) | (272,638 | ) | ||||||||
| Advisor Shares | (29,898 | ) | (466,686 | ) | — | — | ||||||||||
| Increase (Decrease) in shares outstanding | (386,068 | ) | (797,218 | ) | 1,645,579 | 2,606,437 | ||||||||||
The accompanying notes are an integral part of these financial statements.
119
Statements of Changes in Net Assets
| BROWN ADVISORY | ||||||||||||
| BROWN ADVISORY | SUSTAINABLE | |||||||||||
| STRATEGIC BOND FUND | BOND FUND | |||||||||||
| Fiscal | Fiscal | Fiscal | ||||||||||
| Year Ended | Year Ended | Year Ended | ||||||||||
| June 30, | June 30, | June 30, | ||||||||||
| 2018 | 2017 | 2018* | ||||||||||
| OPERATIONS | ||||||||||||
| Net investment income (loss) | $ | 3,738,451 | $ | 1,599,614 | $ | 612,584 | ||||||
| Net realized gain (loss) | 126,593 | 210,713 | (95,567 | ) | ||||||||
| Net change in unrealized appreciation (depreciation) | (1,633,800 | ) | 723,724 | (758,985 | ) | |||||||
| Increase (Decrease) in Net Assets from Operations | 2,231,244 | 2,534,051 | (241,968 | ) | ||||||||
| DISTRIBUTIONS TO SHAREHOLDERS FROM | ||||||||||||
| Net investment income: | ||||||||||||
| Investor Shares | (3,754,542 | ) | (1,644,060 | ) | (607,063 | ) | ||||||
| Advisor Shares | (5,508 | ) | (14,139 | ) | — | |||||||
| Total Distributions to Shareholders | (3,760,050 | ) | (1,658,199 | ) | (607,063 | ) | ||||||
| CAPITAL SHARE TRANSACTIONS | ||||||||||||
| Sale of shares: | ||||||||||||
| Investor Shares | 75,949,692 | 90,428,155 | 58,724,426 | |||||||||
| Advisor Shares | 3,026 | 222,462 | — | |||||||||
| Reinvestment of distributions: | ||||||||||||
| Investor Shares | 715,397 | 288,868 | 87,382 | |||||||||
| Advisor Shares | 5,481 | 13,108 | — | |||||||||
| Redemption of shares: | ||||||||||||
| Investor Shares | (48,641,279 | ) | (16,143,207 | ) | (3,671,592 | ) | ||||||
| Advisor Shares | (40,830 | ) | (861,525 | ) | — | |||||||
| Redemption fees: | ||||||||||||
| Investor Shares | 1,150 | 25 | 300 | |||||||||
| Advisor Shares | — | — | — | |||||||||
| Increase (Decrease) from Capital Share Transactions | 27,992,637 | 73,947,886 | 55,140,516 | |||||||||
| Increase (Decrease) in Net Assets | 26,463,831 | 74,823,738 | 54,291,485 | |||||||||
| NET ASSETS | ||||||||||||
| Beginning of period | 114,899,766 | 40,076,028 | — | |||||||||
| End of period | $ | 141,363,597 | $ | 114,899,766 | $ | 54,291,485 | ||||||
| Undistributed (Accumulated) net investment income (loss) | $ | 28,984 | $ | (67,975 | ) | $ | 8,564 | |||||
| SHARE TRANSACTIONS | ||||||||||||
| Sale of shares: | ||||||||||||
| Investor Shares | 7,918,222 | 9,446,682 | 5,962,310 | |||||||||
| Advisor Shares | 316 | 23,202 | — | |||||||||
| Reinvestment of distributions: | ||||||||||||
| Investor Shares | 74,680 | 30,161 | 8,943 | |||||||||
| Advisor Shares | 572 | 1,370 | — | |||||||||
| Redemption of shares: | ||||||||||||
| Investor Shares | (5,081,400 | ) | (1,682,618 | ) | (376,045 | ) | ||||||
| Advisor Shares | (4,245 | ) | (89,988 | ) | — | |||||||
| Increase (Decrease) in shares outstanding | 2,908,145 | 7,728,809 | 5,595,208 | |||||||||
* Commenced operations August 7, 2017. Information presented is for the period from August 7, 2017 to June 30, 2018.
The accompanying notes are an integral part of these financial statements.
120
Statements of Changes in Net Assets
| BROWN ADVISORY | BROWN ADVISORY | |||||||||||||||
| MARYLAND BOND FUND | TAX EXEMPT BOND FUND | |||||||||||||||
| Fiscal | Fiscal | Fiscal | Fiscal | |||||||||||||
| Year Ended | Year Ended | Year Ended | Year Ended | |||||||||||||
| June 30, | June 30, | June 30, | June 30, | |||||||||||||
| 2018 | 2017 | 2018 | 2017 | |||||||||||||
| OPERATIONS | ||||||||||||||||
| Net investment income (loss) | $ | 4,460,151 | $ | 3,794,122 | $ | 10,089,671 | $ | 7,112,207 | ||||||||
| Net realized gain (loss) | (208,324 | ) | (80,218 | ) | (1,355,285 | ) | (1,333,781 | ) | ||||||||
| Net change in unrealized appreciation (depreciation) | (1,885,045 | ) | (4,730,549 | ) | 18,081 | (6,441,873 | ) | |||||||||
| Increase (Decrease) in Net Assets from Operations | 2,366,782 | (1,016,645 | ) | 8,752,467 | (663,447 | ) | ||||||||||
| DISTRIBUTIONS TO SHAREHOLDERS FROM | ||||||||||||||||
| Net investment income: | ||||||||||||||||
| Investor Shares | (4,460,151 | ) | (3,794,168 | ) | (10,089,715 | ) | (7,112,373 | ) | ||||||||
| Net realized gain: | ||||||||||||||||
| Investor Shares | — | (627,717 | ) | — | — | |||||||||||
| Total Distributions to Shareholders | (4,460,151 | ) | (4,421,885 | ) | (10,089,715 | ) | (7,112,373 | ) | ||||||||
| CAPITAL SHARE TRANSACTIONS | ||||||||||||||||
| Sale of shares: | ||||||||||||||||
| Investor Shares | 35,879,457 | 99,282,076 | 246,120,438 | 141,861,579 | ||||||||||||
| Reinvestment of distributions: | ||||||||||||||||
| Investor Shares | 1,054,555 | 1,035,598 | 2,167,523 | 1,288,963 | ||||||||||||
| Redemption of shares: | ||||||||||||||||
| Investor Shares | (35,128,638 | ) | (97,065,553 | ) | (64,647,222 | ) | (111,448,107 | ) | ||||||||
| Redemption fees: | ||||||||||||||||
| Investor Shares | — | — | 398 | 200 | ||||||||||||
| Increase (Decrease) from Capital Share Transactions | 1,805,374 | 3,252,121 | 183,641,137 | 31,702,635 | ||||||||||||
| Increase (Decrease) in Net Assets | (287,995 | ) | (2,186,409 | ) | 182,303,889 | 23,926,815 | ||||||||||
| NET ASSETS | ||||||||||||||||
| Beginning of period | 181,518,367 | 183,704,776 | 257,602,141 | 233,675,326 | ||||||||||||
| End of period | $ | 181,230,372 | $ | 181,518,367 | $ | 439,906,030 | $ | 257,602,141 | ||||||||
| Undistributed (Accumulated) net investment income (loss) | $ | 60 | $ | 60 | $ | (160 | ) | $ | (116 | ) | ||||||
| SHARE TRANSACTIONS | ||||||||||||||||
| Sale of shares: | ||||||||||||||||
| Investor Shares | 3,393,000 | 9,426,718 | 24,817,937 | 14,282,097 | ||||||||||||
| Reinvestment of distributions: | ||||||||||||||||
| Investor Shares | 99,934 | 97,920 | 218,428 | 129,259 | ||||||||||||
| Redemption of shares: | ||||||||||||||||
| Investor Shares | (3,327,151 | ) | (9,255,940 | ) | (6,517,455 | ) | (11,259,154 | ) | ||||||||
| Increase (Decrease) in shares outstanding | 165,783 | 268,698 | 18,518,910 | 3,152,202 | ||||||||||||
The accompanying notes are an integral part of these financial statements.
121
Statements of Changes in Net Assets
| BROWN ADVISORY – | ||||||||||||||||
| BROWN ADVISORY | WMC STRATEGIC | |||||||||||||||
| MORTGAGE SECURITIES FUND | EUROPEAN EQUITY FUND | |||||||||||||||
| Fiscal | Fiscal | Fiscal | Fiscal | |||||||||||||
| Year Ended | Year Ended | Year Ended | Year Ended | |||||||||||||
| June 30, | June 30, | June 30, | June 30, | |||||||||||||
| 2018 | 2017 | 2018 | 2017 | |||||||||||||
| OPERATIONS | ||||||||||||||||
| Net investment income (loss) | $ | 6,217,564 | $ | 5,716,816 | $ | 13,288,431 | $ | 11,698,240 | ||||||||
| Net realized gain (loss) | (4,400,444 | ) | (2,985,711 | ) | 89,857,660 | 273,046 | ||||||||||
| Net change in unrealized appreciation (depreciation) | (1,464,547 | ) | (5,459,374 | ) | (45,676,197 | ) | 213,131,625 | |||||||||
| Increase (Decrease) in Net Assets from Operations | 352,573 | (2,728,269 | ) | 57,469,894 | 225,102,911 | |||||||||||
| DISTRIBUTIONS TO SHAREHOLDERS FROM | ||||||||||||||||
| Net investment income: | ||||||||||||||||
| Institutional Shares | (7,958,014 | ) | (7,650,400 | ) | (11,440,046 | ) | (12,504,477 | ) | ||||||||
| Investor Shares | (9,960 | ) | (17,169 | ) | (101,939 | ) | (101,420 | ) | ||||||||
| Advisor Shares | — | — | (150,711 | ) | (6,394 | ) | ||||||||||
| Net realized gain: | ||||||||||||||||
| Institutional Shares | — | (2,569,582 | ) | — | — | |||||||||||
| Investor Shares | — | (5,800 | ) | — | — | |||||||||||
| Advisor Shares | — | — | — | — | ||||||||||||
| Total Distributions to Shareholders | (7,967,974 | ) | (10,242,951 | ) | (11,692,696 | ) | (12,612,291 | ) | ||||||||
| CAPITAL SHARE TRANSACTIONS | ||||||||||||||||
| Sale of shares: | ||||||||||||||||
| Institutional Shares | 39,751,492 | 88,368,686 | 339,470,651 | 180,461,066 | ||||||||||||
| Investor Shares | 216,903 | 921,398 | 11,622,830 | 5,963,037 | ||||||||||||
| Advisor Shares | — | — | 16,766,170 | 10,062,207 | ||||||||||||
| Reinvestment of distributions: | ||||||||||||||||
| Institutional Shares | 1,241,725 | 3,217,466 | 7,878,218 | 10,024,075 | ||||||||||||
| Investor Shares | 9,914 | 21,133 | 90,587 | 97,787 | ||||||||||||
| Advisor Shares | — | — | 144,260 | 6,394 | ||||||||||||
| Redemption of shares: | ||||||||||||||||
| Institutional Shares | (75,445,993 | ) | (113,841,299 | ) | (641,379,961 | ) | (284,509,328 | ) | ||||||||
| Investor Shares | (638,352 | ) | (1,974,570 | ) | (4,408,236 | ) | (12,990,457 | ) | ||||||||
| Advisor Shares | — | — | (14,664,337 | ) | (654,097 | ) | ||||||||||
| Redemption fees: | ||||||||||||||||
| Institutional Shares | — | 47 | 1,843 | 1,001 | ||||||||||||
| Investor Shares | — | — | 55 | — | ||||||||||||
| Advisor Shares | — | — | 5 | — | ||||||||||||
| Increase (Decrease) from Capital Share Transactions | (34,864,311 | ) | (23,287,139 | ) | (284,477,915 | ) | (91,538,315 | ) | ||||||||
| Increase (Decrease) in Net Assets | (42,479,712 | ) | (36,258,359 | ) | (238,700,717 | ) | 120,952,305 | |||||||||
| NET ASSETS | ||||||||||||||||
| Beginning of period | 343,443,185 | 379,701,544 | 1,194,598,587 | 1,073,646,282 | ||||||||||||
| End of period | $ | 300,963,473 | $ | 343,443,185 | $ | 955,897,870 | $ | 1,194,598,587 | ||||||||
| Undistributed (Accumulated) net investment income (loss) | $ | 49,257 | $ | 18,945 | $ | 13,352,323 | $ | 11,692,431 | ||||||||
| SHARE TRANSACTIONS | ||||||||||||||||
| Sale of shares: | ||||||||||||||||
| Institutional Shares | 4,037,680 | 8,791,904 | 26,506,741 | 16,985,955 | ||||||||||||
| Investor Shares | 22,023 | 92,228 | 908,527 | 546,811 | ||||||||||||
| Advisor Shares | — | — | 1,340,426 | 881,239 | ||||||||||||
| Reinvestment of distributions: | ||||||||||||||||
| Institutional Shares | 126,980 | 327,155 | 614,047 | 1,032,346 | ||||||||||||
| Investor Shares | 1,011 | 2,133 | 7,066 | 10,071 | ||||||||||||
| Advisor Shares | — | — | 11,332 | 661 | ||||||||||||
| Redemption of shares: | ||||||||||||||||
| Institutional Shares | (7,741,968 | ) | (11,431,849 | ) | (50,042,495 | ) | (27,468,737 | ) | ||||||||
| Investor Shares | (64,569 | ) | (195,291 | ) | (344,483 | ) | (1,261,668 | ) | ||||||||
| Advisor Shares | — | — | (1,166,163 | ) | (61,070 | ) | ||||||||||
| Increase (Decrease) in shares outstanding | (3,618,843 | ) | (2,413,720 | ) | (22,165,002 | ) | (9,334,392 | ) | ||||||||
The accompanying notes are an integral part of these financial statements.
122
Statements of Changes in Net Assets
| BROWN ADVISORY – | BROWN ADVISORY – | |||||||||||||||
| WMC JAPAN ALPHA | SOMERSET EMERGING | |||||||||||||||
| OPPORTUNITIES FUND | MARKETS FUND | |||||||||||||||
| Fiscal | Fiscal | Fiscal | Fiscal | |||||||||||||
| Year Ended | Year Ended | Year Ended | Year Ended | |||||||||||||
| June 30, | June 30, | June 30, | June 30, | |||||||||||||
| 2018 | 2017 | 2018 | 2017 | |||||||||||||
| OPERATIONS | ||||||||||||||||
| Net investment income (loss) | $ | 9,903,665 | $ | 12,204,136 | $ | 10,115,149 | $ | 6,905,565 | ||||||||
| Net realized gain (loss) | 120,194,165 | 202,544,697 | (780,021 | ) | (22,275,180 | ) | ||||||||||
| Net change in unrealized appreciation (depreciation) | (108,585,352 | ) | 118,599,837 | (8,868,079 | ) | 107,847,138 | ||||||||||
| Increase (Decrease) in Net Assets from Operations | 21,512,478 | 333,348,670 | 467,049 | 92,477,523 | ||||||||||||
| DISTRIBUTIONS TO SHAREHOLDERS FROM | ||||||||||||||||
| Net investment income: | ||||||||||||||||
| Institutional Shares | — | — | (4,634,486 | ) | (4,318,101 | ) | ||||||||||
| Investor Shares | — | — | (1,520,480 | ) | (2,188,677 | ) | ||||||||||
| Advisor Shares | — | — | (1,572 | ) | (1,624 | ) | ||||||||||
| Net realized gain: | ||||||||||||||||
| Institutional Shares | (89,654,329 | ) | — | — | — | |||||||||||
| Investor Shares | (275,411 | ) | — | — | — | |||||||||||
| Advisor Shares | (29,957 | ) | — | — | — | |||||||||||
| Total Distributions to Shareholders | (89,959,697 | ) | — | (6,156,538 | ) | (6,508,402 | ) | |||||||||
| CAPITAL SHARE TRANSACTIONS | ||||||||||||||||
| Sale of shares: | ||||||||||||||||
| Institutional Shares | 695,456,636 | 1,045,283,865 | 268,323,043 | 95,997,254 | ||||||||||||
| Investor Shares | 1,836,749 | 2,155,914 | 12,555,778 | 20,716,006 | ||||||||||||
| Advisor Shares | 9,524 | 56,165 | 15,769 | 16,703 | ||||||||||||
| Reinvestment of distributions: | ||||||||||||||||
| Institutional Shares | 24,849,668 | — | 1,577,593 | 1,750,302 | ||||||||||||
| Investor Shares | 224,178 | — | 1,425,207 | 2,152,636 | ||||||||||||
| Advisor Shares | 29,197 | — | 1,571 | 1,624 | ||||||||||||
| Redemption of shares: | ||||||||||||||||
| Institutional Shares | (150,105,105 | ) | (2,221,364,487 | ) | (139,753,965 | ) | (67,106,538 | ) | ||||||||
| Investor Shares | (2,238,481 | ) | (1,290,024 | ) | (177,784,349 | ) | (65,282,879 | ) | ||||||||
| Advisor Shares | (137,976 | ) | (467,014 | ) | (104,083 | ) | (83,388 | ) | ||||||||
| Redemption fees: | ||||||||||||||||
| Institutional Shares | 60 | 10,627 | 87 | 94 | ||||||||||||
| Investor Shares | 40 | — | — | — | ||||||||||||
| Advisor Shares | 1 | — | — | — | ||||||||||||
| Increase (Decrease) from Capital Share Transactions | 569,924,491 | (1,175,614,954 | ) | (33,743,349 | ) | (11,838,186 | ) | |||||||||
| Increase (Decrease) in Net Assets | 501,477,272 | (842,266,284 | ) | (39,432,838 | ) | 74,130,935 | ||||||||||
| NET ASSETS | ||||||||||||||||
| Beginning of period | 988,855,613 | 1,831,121,897 | 591,246,378 | 517,115,443 | ||||||||||||
| End of period | $ | 1,490,332,885 | $ | 988,855,613 | $ | 551,813,540 | $ | 591,246,378 | ||||||||
| Undistributed (Accumulated) net investment income (loss) | $ | 9,705,814 | $ | (16,075,640 | ) | $ | 7,814,031 | $ | 4,336,702 | |||||||
| SHARE TRANSACTIONS | ||||||||||||||||
| Sale of shares: | ||||||||||||||||
| Institutional Shares | 59,396,066 | 106,706,685 | 23,671,478 | 10,479,269 | ||||||||||||
| Investor Shares | 154,623 | 212,688 | 1,152,310 | 2,316,631 | ||||||||||||
| Advisor Shares | 827 | 6,003 | 1,423 | 1,899 | ||||||||||||
| Reinvestment of distributions: | ||||||||||||||||
| Institutional Shares | 2,187,471 | — | 142,382 | 207,136 | ||||||||||||
| Investor Shares | 19,821 | — | 128,745 | 255,052 | ||||||||||||
| Advisor Shares | 2,602 | — | 141 | 191 | ||||||||||||
| Redemption of shares: | ||||||||||||||||
| Institutional Shares | (13,150,538 | ) | (223,388,247 | ) | (12,830,641 | ) | (7,274,648 | ) | ||||||||
| Investor Shares | (202,674 | ) | (134,436 | ) | (15,549,972 | ) | (7,106,002 | ) | ||||||||
| Advisor Shares | (12,053 | ) | (48,232 | ) | (9,249 | ) | (9,519 | ) | ||||||||
| Increase (Decrease) in shares outstanding | 48,396,145 | (116,645,539 | ) | (3,293,383 | ) | (1,129,991 | ) | |||||||||
The accompanying notes are an integral part of these financial statements.
123
Statements of Changes in Net Assets
| BROWN ADVISORY – | ||||||||||||
| BROWN ADVISORY – | BEUTEL GOODMAN | |||||||||||
| MACQUARIE ASIA | LARGE-CAP | |||||||||||
| NEW STARS FUND | VALUE FUND | |||||||||||
| Fiscal | Fiscal | Fiscal | ||||||||||
| Year Ended | Year Ended | Year Ended | ||||||||||
| June 30, | June 30, | June 30, | ||||||||||
| 2018 | 2017 | 2018* | ||||||||||
| OPERATIONS | ||||||||||||
| Net investment income (loss) | $ | 1,148,437 | $ | 527,679 | $ | 664,783 | ||||||
| Net realized gain (loss) | 15,207,615 | 14,763,577 | (418,544 | ) | ||||||||
| Net change in unrealized appreciation (depreciation) | (7,577,119 | ) | (720,513 | ) | (3,907,453 | ) | ||||||
| Increase (Decrease) in Net Assets from Operations | 8,778,933 | 14,570,743 | (3,661,214 | ) | ||||||||
| DISTRIBUTIONS TO SHAREHOLDERS FROM | ||||||||||||
| Net investment income: | ||||||||||||
| Institutional Shares | (885,536 | ) | — | — | ||||||||
| Investor Shares | (5,842 | ) | — | — | ||||||||
| Total Distributions to Shareholders | (891,378 | ) | — | — | ||||||||
| CAPITAL SHARE TRANSACTIONS | ||||||||||||
| Sale of shares: | ||||||||||||
| Institutional Shares | 67,000,059 | 94,155,195 | 158,358,440 | |||||||||
| Investor Shares | 3,005,699 | 2,866,009 | — | |||||||||
| Reinvestment of distributions: | ||||||||||||
| Institutional Shares | 155,941 | — | — | |||||||||
| Investor Shares | 5,768 | — | — | |||||||||
| Redemption of shares: | ||||||||||||
| Institutional Shares | (68,869,669 | ) | (80,949,002 | ) | (3,694,661 | ) | ||||||
| Investor Shares | (4,189,553 | ) | (4,974,688 | ) | — | |||||||
| Redemption fees: | ||||||||||||
| Institutional Shares | 886 | 1,853 | 1,396 | |||||||||
| Investor Shares | — | 50 | — | |||||||||
| Increase (Decrease) from Capital Share Transactions | (2,890,869 | ) | 11,099,417 | 154,665,175 | ||||||||
| Increase (Decrease) in Net Assets | 4,996,686 | 25,670,160 | 151,003,961 | |||||||||
| NET ASSETS | ||||||||||||
| Beginning of period | 243,647,085 | 217,976,925 | — | |||||||||
| End of period | $ | 248,643,771 | $ | 243,647,085 | $ | 151,003,961 | ||||||
| Undistributed (Accumulated) net investment income (loss) | $ | 1,145,390 | $ | 393,440 | $ | 664,783 | ||||||
| SHARE TRANSACTIONS | ||||||||||||
| Sale of shares: | ||||||||||||
| Institutional Shares | 6,317,265 | 10,353,255 | 16,152,897 | |||||||||
| Investor Shares | 280,867 | 310,586 | — | |||||||||
| Reinvestment of distributions: | ||||||||||||
| Institutional Shares | 14,466 | — | — | |||||||||
| Investor Shares | 537 | — | — | |||||||||
| Redemption of shares: | ||||||||||||
| Institutional Shares | (6,427,343 | ) | (9,199,650 | ) | (386,509 | ) | ||||||
| Investor Shares | (403,317 | ) | (535,893 | ) | — | |||||||
| Increase (Decrease) in shares outstanding | (217,525 | ) | 928,298 | 15,766,388 | ||||||||
* Commenced operations February 13, 2018. Information presented is for the period from February 13, 2018 to June 30, 2018.
The accompanying notes are an integral part of these financial statements.
124
Financial Highlights
From Investment Operations(a) | Distributions to Shareholders From | Ratios to Average Net Assets(b) | ||||||||||||||||||||||||||||||||||||||||||||||||||||||
| Net | ||||||||||||||||||||||||||||||||||||||||||||||||||||||||
For a Share Outstanding Throughout Each Fiscal Period: | Realized | Net | Net | |||||||||||||||||||||||||||||||||||||||||||||||||||||
| Net Asset | Net | & | Asset | Assets at | Net | |||||||||||||||||||||||||||||||||||||||||||||||||||
| Value, | Investment | Unrealized | Net | Net | Value, | End of | Investment | Gross | Portfolio | |||||||||||||||||||||||||||||||||||||||||||||||
| Beginning | Income | Gains | Investment | Realized | End of | Total | Period | Income | Net | Expenses | Turnover | |||||||||||||||||||||||||||||||||||||||||||||
| Beginning | Ending | of Period | (Loss) | (Losses) | Total | Income | Gains | Total | Period | Return(c) | (000’s | ) | (Loss) | Expenses | (d) | Rate(c) | ||||||||||||||||||||||||||||||||||||||||
| BROWN ADVISORY GROWTH EQUITY FUND: | ||||||||||||||||||||||||||||||||||||||||||||||||||||||||
| Institutional Shares* | ||||||||||||||||||||||||||||||||||||||||||||||||||||||||
| 07/01/17 | 06/30/18 | $ | 20.03 | (0.06 | ) | 5.62 | 5.56 | — | (1.68 | ) | (1.68 | ) | $ | 23.91 | 28.89 | % | $ | 289,434 | (0.29 | )% | 0.71 | % | 0.71 | % | 25 | % | ||||||||||||||||||||||||||||||
| 07/01/16 | 06/30/17 | 19.16 | (0.03 | ) | 2.47 | 2.44 | — | (1.57 | ) | (1.57 | ) | 20.03 | 13.91 | 276,592 | (0.16 | ) | 0.72 | 0.72 | 40 | |||||||||||||||||||||||||||||||||||||
| 07/01/15 | 06/30/16 | 20.33 | (0.02 | ) | 0.13 | 0.11 | — | (1.28 | ) | (1.28 | ) | 19.16 | 0.49 | 253,640 | (0.12 | ) | 0.72 | 0.72 | 24 | |||||||||||||||||||||||||||||||||||||
| 07/01/14 | 06/30/15 | 19.10 | 0.02 | 1.82 | 1.84 | — | (0.61 | ) | (0.61 | ) | 20.33 | 9.73 | 259,098 | 0.09 | 0.72 | 0.72 | 24 | |||||||||||||||||||||||||||||||||||||||
| 07/01/13 | 06/30/14 | 16.22 | — | 2.99 | 2.99 | — | (0.11 | ) | (0.11 | ) | 19.10 | 18.46 | 233,627 | 0.03 | 0.74 | 0.74 | 25 | |||||||||||||||||||||||||||||||||||||||
| Investor Shares* | ||||||||||||||||||||||||||||||||||||||||||||||||||||||||
| 07/01/17 | 06/30/18 | 19.89 | (0.10 | ) | 5.58 | 5.48 | — | (1.68 | ) | (1.68 | ) | 23.69 | 28.69 | 1,775,180 | (0.44 | ) | 0.86 | 0.86 | 25 | |||||||||||||||||||||||||||||||||||||
| 07/01/16 | 06/30/17 | 19.06 | (0.06 | ) | 2.46 | 2.40 | — | (1.57 | ) | (1.57 | ) | 19.89 | 13.77 | 1,484,383 | (0.31 | ) | 0.87 | 0.87 | 40 | |||||||||||||||||||||||||||||||||||||
| 07/01/15 | 06/30/16 | 20.26 | (0.05 | ) | 0.13 | 0.08 | — | (1.28 | ) | (1.28 | ) | 19.06 | 0.34 | 1,916,472 | (0.27 | ) | 0.87 | 0.87 | 24 | |||||||||||||||||||||||||||||||||||||
| 07/01/14 | 06/30/15 | 19.07 | (0.01 | ) | 1.81 | 1.80 | — | (0.61 | ) | (0.61 | ) | 20.26 | 9.54 | 2,143,325 | (0.06 | ) | 0.87 | 0.87 | 24 | |||||||||||||||||||||||||||||||||||||
| 07/01/13 | 06/30/14 | 16.21 | (0.02 | ) | 2.99 | 2.97 | — | (0.11 | ) | (0.11 | ) | 19.07 | 18.35 | 2,497,036 | (0.12 | ) | 0.89 | 0.89 | 25 | |||||||||||||||||||||||||||||||||||||
| Advisor Shares* | ||||||||||||||||||||||||||||||||||||||||||||||||||||||||
| 07/01/17 | 06/30/18 | 19.04 | (0.14 | ) | 5.31 | 5.17 | — | (1.68 | ) | (1.68 | ) | 22.53 | 28.32 | 6,215 | (0.69 | ) | 1.11 | 1.11 | 25 | |||||||||||||||||||||||||||||||||||||
| 07/01/16 | 06/30/17 | 18.35 | (0.10 | ) | 2.36 | 2.26 | — | (1.57 | ) | (1.57 | ) | 19.04 | 13.53 | 5,479 | (0.56 | ) | 1.12 | 1.12 | 40 | |||||||||||||||||||||||||||||||||||||
| 07/01/15 | 06/30/16 | 19.60 | (0.10 | ) | 0.13 | 0.03 | — | (1.28 | ) | (1.28 | ) | 18.35 | 0.09 | 33,304 | (0.52 | ) | 1.12 | 1.12 | 24 | |||||||||||||||||||||||||||||||||||||
| 07/01/14 | 06/30/15 | 18.51 | (0.06 | ) | 1.76 | 1.70 | — | (0.61 | ) | (0.61 | ) | 19.60 | 9.28 | 44,587 | (0.31 | ) | 1.12 | 1.12 | 24 | |||||||||||||||||||||||||||||||||||||
| 07/01/13 | 06/30/14 | 15.78 | (0.07 | ) | 2.91 | 2.84 | — | (0.11 | ) | (0.11 | ) | 18.51 | 18.02 | 48,632 | (0.37 | ) | 1.14 | 1.14 | 25 | |||||||||||||||||||||||||||||||||||||
| BROWN ADVISORY FLEXIBLE EQUITY FUND: | ||||||||||||||||||||||||||||||||||||||||||||||||||||||||
| Institutional Shares* | ||||||||||||||||||||||||||||||||||||||||||||||||||||||||
| 07/01/17 | 06/30/18 | 18.53 | 0.10 | 3.43 | 3.53 | (0.12 | ) | — | (0.12 | ) | 21.94 | 19.07 | 131,218 | 0.48 | 0.72 | 0.72 | 15 | |||||||||||||||||||||||||||||||||||||||
| 07/01/16 | 06/30/17 | 15.15 | 0.11 | 3.37 | 3.48 | (0.10 | ) | — | (0.10 | ) | 18.53 | 23.05 | 101,431 | 0.61 | 0.73 | 0.73 | 15 | |||||||||||||||||||||||||||||||||||||||
| 07/01/15 | 06/30/16 | 15.92 | 0.11 | (0.77 | ) | (0.66 | ) | (0.11 | ) | — | (0.11 | ) | 15.15 | (4.16 | ) | 24,012 | 0.71 | 0.73 | 0.73 | 15 | ||||||||||||||||||||||||||||||||||||
| 07/01/14 | 06/30/15 | 14.81 | 0.12 | 1.08 | 1.20 | (0.09 | ) | — | (0.09 | ) | 15.92 | 8.09 | 4,240 | 0.76 | 0.76 | 0.76 | 7 | |||||||||||||||||||||||||||||||||||||||
| 07/01/13 | 06/30/14 | 12.28 | 0.09 | 2.49 | 2.58 | (0.05 | ) | — | (0.05 | ) | 14.81 | 21.06 | 3,126 | 0.66 | 0.82 | 0.81 | 15 | |||||||||||||||||||||||||||||||||||||||
| Investor Shares* | ||||||||||||||||||||||||||||||||||||||||||||||||||||||||
| 07/01/17 | 06/30/18 | 18.50 | 0.07 | 3.42 | 3.49 | (0.09 | ) | — | (0.09 | ) | 21.90 | 18.88 | 316,109 | 0.33 | 0.87 | 0.87 | 15 | |||||||||||||||||||||||||||||||||||||||
| 07/01/16 | 06/30/17 | 15.12 | 0.08 | 3.37 | 3.45 | (0.07 | ) | — | (0.07 | ) | 18.50 | 22.90 | 310,360 | 0.46 | 0.88 | 0.88 | 15 | |||||||||||||||||||||||||||||||||||||||
| 07/01/15 | 06/30/16 | 15.89 | 0.08 | (0.76 | ) | (0.68 | ) | (0.09 | ) | — | (0.09 | ) | 15.12 | (4.30 | ) | 306,456 | 0.56 | 0.88 | 0.88 | 15 | ||||||||||||||||||||||||||||||||||||
| 07/01/14 | 06/30/15 | 14.79 | 0.10 | 1.07 | 1.17 | (0.07 | ) | — | (0.07 | ) | 15.89 | 7.92 | 268,569 | 0.61 | 0.91 | 0.91 | 7 | |||||||||||||||||||||||||||||||||||||||
| 07/01/13 | 06/30/14 | 12.28 | 0.07 | 2.48 | 2.55 | (0.04 | ) | — | (0.04 | ) | 14.79 | 20.78 | 162,615 | 0.51 | 0.97 | 0.96 | 15 | |||||||||||||||||||||||||||||||||||||||
| Advisor Shares* | ||||||||||||||||||||||||||||||||||||||||||||||||||||||||
| 07/01/17 | 06/30/18 | 18.50 | 0.02 | 3.42 | 3.44 | (0.03 | ) | — | (0.03 | ) | 21.91 | 18.61 | 6,445 | 0.08 | 1.12 | 1.12 | 15 | |||||||||||||||||||||||||||||||||||||||
| 07/01/16 | 06/30/17 | 15.12 | 0.04 | 3.37 | 3.41 | (0.03 | ) | — | (0.03 | ) | 18.50 | 22.56 | 5,842 | 0.21 | 1.13 | 1.13 | 15 | |||||||||||||||||||||||||||||||||||||||
| 07/01/15 | 06/30/16 | 15.88 | 0.05 | (0.77 | ) | (0.72 | ) | (0.04 | ) | — | (0.04 | ) | 15.12 | (4.56 | ) | 7,168 | 0.31 | 1.13 | 1.13 | 15 | ||||||||||||||||||||||||||||||||||||
| 07/01/14 | 06/30/15 | 14.77 | 0.06 | 1.07 | 1.13 | (0.02 | ) | — | (0.02 | ) | 15.88 | 7.68 | 11,540 | 0.36 | 1.16 | 1.16 | 7 | |||||||||||||||||||||||||||||||||||||||
| 07/01/13 | 06/30/14 | 12.28 | 0.04 | 2.48 | 2.52 | (0.03 | ) | — | (0.03 | ) | 14.77 | 20.52 | 14,831 | 0.26 | 1.22 | 1.21 | 15 | |||||||||||||||||||||||||||||||||||||||
The accompanying notes are an integral part of these financial statements.
125
Financial Highlights
From Investment Operations(a) | Distributions to Shareholders From | Ratios to Average Net Assets(b) | |||||||||||||||||||||||||||||||||||||||||||||||||||||||
| Net | |||||||||||||||||||||||||||||||||||||||||||||||||||||||||
For a Share Outstanding Throughout Each Fiscal Period: | Realized | Net | Net | ||||||||||||||||||||||||||||||||||||||||||||||||||||||
| Net Asset | Net | & | Asset | Assets at | Net | ||||||||||||||||||||||||||||||||||||||||||||||||||||
| Value, | Investment | Unrealized | Net | Net | Value, | End of | Investment | Gross | Portfolio | ||||||||||||||||||||||||||||||||||||||||||||||||
| Beginning | Income | Gains | Investment | Realized | End of | Total | Period | Income | Net | Expenses | Turnover | ||||||||||||||||||||||||||||||||||||||||||||||
| Beginning | Ending | of Period | (Loss) | (Losses) | Total | Income | Gains | Total | Period | Return(c) | (000’s | ) | (Loss) | Expenses | (d) | Rate(c) | |||||||||||||||||||||||||||||||||||||||||
| BROWN ADVISORY EQUITY INCOME FUND: | |||||||||||||||||||||||||||||||||||||||||||||||||||||||||
| Institutional Shares* | |||||||||||||||||||||||||||||||||||||||||||||||||||||||||
| 07/01/17 | 06/30/18 | $ | 13.80 | 0.24 | 1.07 | 1.31 | (0.25 | ) | (0.45 | ) | (0.70 | ) | $ | 14.41 | 9.51 | % | $ | 27,975 | 1.70 | % | 0.77 | % | 0.77 | % | 14 | % | |||||||||||||||||||||||||||||||
| 07/01/16 | 06/30/17 | 12.87 | 0.26 | 1.41 | 1.67 | (0.26 | ) | (0.48 | ) | (0.74 | ) | 13.80 | 13.36 | 29,587 | 1.94 | 0.77 | 0.77 | 7 | |||||||||||||||||||||||||||||||||||||||
| 07/01/15 | 06/30/16 | 13.14 | 0.28 | (0.13 | ) | 0.15 | (0.29 | ) | (0.13 | ) | (0.42 | ) | 12.87 | 1.31 | 13,840 | 2.24 | 0.75 | 0.75 | 17 | ||||||||||||||||||||||||||||||||||||||
| 07/01/14 | 06/30/15 | 13.70 | 0.29 | 0.08 | 0.37 | (0.30 | ) | (0.63 | ) | (0.93 | ) | 13.14 | 2.60 | 18,134 | 2.16 | 0.75 | 0.75 | 18 | |||||||||||||||||||||||||||||||||||||||
| 07/01/13 | 06/30/14 | 12.16 | 0.29 | 1.99 | 2.28 | (0.29 | ) | (0.45 | ) | (0.74 | ) | 13.70 | 19.30 | 17,663 | 2.23 | 0.77 | 0.77 | 32 | |||||||||||||||||||||||||||||||||||||||
| Investor Shares* | |||||||||||||||||||||||||||||||||||||||||||||||||||||||||
| 07/01/17 | 06/30/18 | 13.80 | 0.22 | 1.06 | 1.28 | (0.23 | ) | (0.45 | ) | (0.68 | ) | 14.40 | 9.27 | 66,512 | 1.55 | 0.92 | 0.92 | 14 | |||||||||||||||||||||||||||||||||||||||
| 07/01/16 | 06/30/17 | 12.86 | 0.24 | 1.42 | 1.66 | (0.24 | ) | (0.48 | ) | (0.72 | ) | 13.80 | 13.28 | 81,890 | 1.79 | 0.92 | 0.92 | 7 | |||||||||||||||||||||||||||||||||||||||
| 07/01/15 | 06/30/16 | 13.13 | 0.26 | (0.13 | ) | 0.13 | (0.27 | ) | (0.13 | ) | (0.40 | ) | 12.86 | 1.15 | 112,116 | 2.09 | 0.90 | 0.90 | 17 | ||||||||||||||||||||||||||||||||||||||
| 07/01/14 | 06/30/15 | 13.69 | 0.27 | 0.08 | 0.35 | (0.28 | ) | (0.63 | ) | (0.91 | ) | 13.13 | 2.45 | 183,001 | 2.01 | 0.90 | 0.90 | 18 | |||||||||||||||||||||||||||||||||||||||
| 07/01/13 | 06/30/14 | 12.16 | 0.27 | 1.98 | 2.25 | (0.27 | ) | (0.45 | ) | (0.72 | ) | 13.69 | 19.04 | 180,372 | 2.08 | 0.92 | 0.92 | 32 | |||||||||||||||||||||||||||||||||||||||
| Advisor Shares* | |||||||||||||||||||||||||||||||||||||||||||||||||||||||||
| 07/01/17 | 06/30/18 | 13.78 | 0.19 | 1.06 | 1.25 | (0.18 | ) | (0.45 | ) | (0.63 | ) | 14.40 | 9.04 | 1,077 | 1.30 | 1.17 | 1.17 | 14 | |||||||||||||||||||||||||||||||||||||||
| 07/01/16 | 06/30/17 | 12.84 | 0.20 | 1.43 | 1.63 | (0.21 | ) | (0.48 | ) | (0.69 | ) | 13.78 | 13.02 | 2,422 | 1.54 | 1.17 | 1.17 | 7 | |||||||||||||||||||||||||||||||||||||||
| 07/01/15 | 06/30/16 | 13.11 | 0.23 | (0.13 | ) | 0.10 | (0.24 | ) | (0.13 | ) | (0.37 | ) | 12.84 | 0.90 | 2,980 | 1.84 | 1.15 | 1.15 | 17 | ||||||||||||||||||||||||||||||||||||||
| 07/01/14 | 06/30/15 | 13.67 | 0.24 | 0.07 | 0.31 | (0.24 | ) | (0.63 | ) | (0.87 | ) | 13.11 | 2.19 | 3,148 | 1.76 | 1.15 | 1.15 | 18 | |||||||||||||||||||||||||||||||||||||||
| 07/01/13 | 06/30/14 | 12.14 | 0.24 | 1.98 | 2.22 | (0.24 | ) | (0.45 | ) | (0.69 | ) | 13.67 | 18.79 | 3,298 | 1.83 | 1.17 | 1.17 | 32 | |||||||||||||||||||||||||||||||||||||||
| BROWN ADVISORY SUSTAINABLE GROWTH FUND: | |||||||||||||||||||||||||||||||||||||||||||||||||||||||||
| Institutional Shares* | |||||||||||||||||||||||||||||||||||||||||||||||||||||||||
| 07/01/17 | 06/30/18 | 18.94 | 0.01 | 4.42 | 4.43 | — | (0.35 | ) | (0.35 | ) | 23.02 | 23.59 | 369,642 | 0.05 | 0.73 | 0.73 | 29 | ||||||||||||||||||||||||||||||||||||||||
| 07/01/16 | 06/30/17 | 16.05 | (0.02 | ) | 3.03 | 3.01 | — | (0.12 | ) | (0.12 | ) | 18.94 | 18.83 | 221,177 | (0.10 | ) | 0.73 | 0.73 | 41 | ||||||||||||||||||||||||||||||||||||||
| 07/01/15 | 06/30/16 | 15.69 | (0.02 | ) | 1.13 | 1.11 | — | (0.75 | ) | (0.75 | ) | 16.05 | 7.17 | 122,008 | (0.11 | ) | 0.74 | 0.74 | 30 | ||||||||||||||||||||||||||||||||||||||
| 07/01/14 | 06/30/15 | 14.11 | (0.02 | ) | 1.91 | 1.89 | — | (0.31 | ) | (0.31 | ) | 15.69 | 13.50 | 67,789 | (0.11 | ) | 0.75 | 0.75 | 37 | ||||||||||||||||||||||||||||||||||||||
| 07/01/13 | 06/30/14 | 11.64 | — | 2.61 | 2.61 | — | (0.14 | ) | (0.14 | ) | 14.11 | 22.51 | 30,374 | (0.01 | ) | 0.77 | 0.77 | 30 | |||||||||||||||||||||||||||||||||||||||
| Investor Shares* | |||||||||||||||||||||||||||||||||||||||||||||||||||||||||
| 07/01/17 | 06/30/18 | 18.78 | (0.02 | ) | 4.38 | 4.36 | — | (0.35 | ) | (0.35 | ) | 22.79 | 23.41 | 102,201 | (0.10 | ) | 0.88 | 0.88 | 29 | ||||||||||||||||||||||||||||||||||||||
| 07/01/16 | 06/30/17 | 15.94 | (0.04 | ) | 3.00 | 2.96 | — | (0.12 | ) | (0.12 | ) | 18.78 | 18.65 | 36,954 | (0.25 | ) | 0.88 | 0.88 | 41 | ||||||||||||||||||||||||||||||||||||||
| 07/01/15 | 06/30/16 | 15.61 | (0.04 | ) | 1.12 | 1.08 | — | (0.75 | ) | (0.75 | ) | 15.94 | 7.01 | 25,676 | (0.26 | ) | 0.89 | 0.89 | 30 | ||||||||||||||||||||||||||||||||||||||
| 07/01/14 | 06/30/15 | 14.06 | (0.04 | ) | 1.90 | 1.86 | — | (0.31 | ) | (0.31 | ) | 15.61 | 13.34 | 11,206 | (0.26 | ) | 0.90 | 0.90 | 37 | ||||||||||||||||||||||||||||||||||||||
| 07/01/13 | 06/30/14 | 11.62 | (0.02 | ) | 2.60 | 2.58 | — | (0.14 | ) | (0.14 | ) | 14.06 | 22.29 | 46,823 | (0.16 | ) | 0.92 | 0.92 | 30 | ||||||||||||||||||||||||||||||||||||||
| Advisor Shares* | |||||||||||||||||||||||||||||||||||||||||||||||||||||||||
| 07/01/17 | 06/30/18 | 18.54 | (0.07 | ) | 4.32 | 4.25 | — | (0.35 | ) | (0.35 | ) | 22.44 | 23.12 | 213,262 | (0.35 | ) | 1.13 | 1.13 | 29 | ||||||||||||||||||||||||||||||||||||||
| 07/01/16 | 06/30/17 | 15.78 | (0.08 | ) | 2.96 | 2.88 | — | (0.12 | ) | (0.12 | ) | 18.54 | 18.33 | 172,012 | (0.50 | ) | 1.13 | 1.13 | 41 | ||||||||||||||||||||||||||||||||||||||
| 07/01/15 | 06/30/16 | 15.50 | (0.08 | ) | 1.11 | 1.03 | — | (0.75 | ) | (0.75 | ) | 15.78 | 6.73 | 201,727 | (0.51 | ) | 1.14 | 1.14 | 30 | ||||||||||||||||||||||||||||||||||||||
| 07/01/14 | 06/30/15 | 14.00 | (0.07 | ) | 1.88 | 1.81 | — | (0.31 | ) | (0.31 | ) | 15.50 | 13.03 | 137,410 | (0.51 | ) | 1.15 | 1.15 | 37 | ||||||||||||||||||||||||||||||||||||||
| 07/01/13 | 06/30/14 | 11.60 | (0.05 | ) | 2.59 | 2.54 | — | (0.14 | ) | (0.14 | ) | 14.00 | 21.99 | 132,846 | (0.41 | ) | 1.17 | 1.17 | 30 | ||||||||||||||||||||||||||||||||||||||
The accompanying notes are an integral part of these financial statements.
126
Financial Highlights
From Investment Operations(a) | Distributions to Shareholders From | Ratios to Average Net Assets(b) | |||||||||||||||||||||||||||||||||||||||||||||||||||||||
| Net | |||||||||||||||||||||||||||||||||||||||||||||||||||||||||
For a Share Outstanding Throughout Each Fiscal Period: | Realized | Net | Net | ||||||||||||||||||||||||||||||||||||||||||||||||||||||
| Net Asset | Net | & | Asset | Assets at | Net | ||||||||||||||||||||||||||||||||||||||||||||||||||||
| Value, | Investment | Unrealized | Net | Net | Value, | End of | Investment | Gross | Portfolio | ||||||||||||||||||||||||||||||||||||||||||||||||
| Beginning | Income | Gains | Investment | Realized | End of | Total | Period | Income | Net | Expenses | Turnover | ||||||||||||||||||||||||||||||||||||||||||||||
| Beginning | Ending | of Period | (Loss) | (Losses) | Total | Income | Gains | Total | Period | Return(c) | (000’s | ) | (Loss) | Expenses | (d) | Rate(c) | |||||||||||||||||||||||||||||||||||||||||
| BROWN ADVISORY MID-CAP GROWTH FUND: | |||||||||||||||||||||||||||||||||||||||||||||||||||||||||
| Investor Shares* | |||||||||||||||||||||||||||||||||||||||||||||||||||||||||
| 10/02/17^ | 06/30/18 | $ | 10.00 | $ | (0.01 | ) | $ | 1.37 | $ | 1.36 | — | — | — | $ | 11.36 | 13.60 | % | $ | 21,377 | (0.16 | )% | 0.85 | % | 1.58 | % | 29 | % | ||||||||||||||||||||||||||||||
| BROWN ADVISORY SMALL-CAP GROWTH FUND: | |||||||||||||||||||||||||||||||||||||||||||||||||||||||||
| �� | |||||||||||||||||||||||||||||||||||||||||||||||||||||||||
| Institutional Shares* | |||||||||||||||||||||||||||||||||||||||||||||||||||||||||
| 07/01/17 | 06/30/18 | 35.15 | (0.16 | ) | 6.31 | 6.15 | (0.15 | ) | (0.51 | ) | (0.66 | ) | 40.64 | 17.64 | 424,449 | (0.42 | ) | 0.98 | 0.98 | 30 | |||||||||||||||||||||||||||||||||||||
| 07/01/16 | 06/30/17 | 31.19 | (0.16 | ) | 5.25 | 5.09 | — | (1.13 | ) | (1.13 | ) | 35.15 | 16.57 | 165,615 | (0.49 | ) | 0.98 | 0.98 | 22 | ||||||||||||||||||||||||||||||||||||||
| 07/01/15 | 06/30/16 | 35.91 | (0.14 | ) | 0.51 | 0.37 | — | (5.09 | ) | (5.09 | ) | 31.19 | 1.61 | 17,037 | (0.45 | ) | 0.98 | 0.98 | 32 | ||||||||||||||||||||||||||||||||||||||
| 07/01/14 | 06/30/15 | 35.85 | (0.18 | ) | 4.45 | 4.27 | — | (4.21 | ) | (4.21 | ) | 35.91 | 12.98 | 12,841 | (0.51 | ) | 0.99 | 0.99 | 28 | ||||||||||||||||||||||||||||||||||||||
| 07/01/13 | 06/30/14 | 31.67 | (0.22 | ) | 6.08 | 5.86 | — | (1.68 | ) | (1.68 | ) | 35.85 | 18.59 | 8,497 | (0.63 | ) | 1.01 | 1.01 | 19 | ||||||||||||||||||||||||||||||||||||||
| Investor Shares* | |||||||||||||||||||||||||||||||||||||||||||||||||||||||||
| 07/01/17 | 06/30/18 | 17.61 | (0.11 | ) | 3.15 | 3.04 | (0.06 | ) | (0.25 | ) | (0.31 | ) | 20.34 | 17.44 | 476,786 | (0.57 | ) | 1.13 | 1.13 | 30 | |||||||||||||||||||||||||||||||||||||
| 07/01/16 | 06/30/17 | 15.65 | (0.11 | ) | 2.63 | 2.52 | — | (0.56 | ) | (0.56 | ) | 17.61 | 16.40 | 335,185 | (0.64 | ) | 1.13 | 1.13 | 22 | ||||||||||||||||||||||||||||||||||||||
| 07/01/15 | 06/30/16 | 18.05 | (0.10 | ) | 0.26 | 0.16 | — | (2.56 | ) | (2.56 | ) | 15.65 | 1.43 | 268,390 | (0.60 | ) | 1.13 | 1.13 | 32 | ||||||||||||||||||||||||||||||||||||||
| 07/01/14 | 06/30/15 | 18.04 | (0.11 | ) | 2.24 | 2.13 | — | (2.12 | ) | (2.12 | ) | 18.05 | 12.86 | 262,426 | (0.66 | ) | 1.14 | 1.14 | 28 | ||||||||||||||||||||||||||||||||||||||
| 07/01/13 | 06/30/14 | 15.96 | (0.14 | ) | 3.07 | 2.93 | — | (0.85 | ) | (0.85 | ) | 18.04 | 18.42 | 285,287 | (0.78 | ) | 1.16 | 1.16 | 19 | ||||||||||||||||||||||||||||||||||||||
| Advisor Shares* | |||||||||||||||||||||||||||||||||||||||||||||||||||||||||
| 07/01/17 | 06/30/18 | 16.85 | (0.15 | ) | 3.02 | 2.87 | (0.02 | ) | (0.24 | ) | (0.26 | ) | 19.46 | 17.21 | 18,449 | (0.82 | ) | 1.38 | 1.38 | 30 | |||||||||||||||||||||||||||||||||||||
| 07/01/16 | 06/30/17 | 15.02 | (0.14 | ) | 2.51 | 2.37 | — | (0.54 | ) | (0.54 | ) | 16.85 | 16.04 | 32,852 | (0.89 | ) | 1.38 | 1.38 | 22 | ||||||||||||||||||||||||||||||||||||||
| 07/01/15 | 06/30/16 | 17.35 | (0.13 | ) | 0.26 | 0.13 | — | (2.46 | ) | (2.46 | ) | 15.02 | 1.27 | 9,704 | (0.85 | ) | 1.38 | 1.38 | 32 | ||||||||||||||||||||||||||||||||||||||
| 07/01/14 | 06/30/15 | 17.39 | (0.15 | ) | 2.15 | 2.00 | — | (2.04 | ) | (2.04 | ) | 17.35 | 12.54 | 6,348 | (0.91 | ) | 1.39 | 1.39 | 28 | ||||||||||||||||||||||||||||||||||||||
| 07/01/13 | 06/30/14 | 15.43 | (0.18 | ) | 2.96 | 2.78 | — | (0.82 | ) | (0.82 | ) | 17.39 | 18.07 | 7,300 | (1.03 | ) | 1.41 | 1.41 | 19 | ||||||||||||||||||||||||||||||||||||||
| BROWN ADVISORY SMALL-CAP FUNDAMENTAL VALUE FUND: | |||||||||||||||||||||||||||||||||||||||||||||||||||||||||
| Institutional Shares* | |||||||||||||||||||||||||||||||||||||||||||||||||||||||||
| 07/01/17 | 06/30/18 | 27.11 | 0.15 | 3.11 | 3.26 | (0.20 | ) | (1.01 | ) | (1.21 | ) | 29.16 | 12.13 | 410,785 | 0.52 | 0.97 | 0.97 | 32 | |||||||||||||||||||||||||||||||||||||||
| 07/01/16 | 06/30/17 | 22.75 | 0.17 | 4.31 | 4.48 | (0.09 | ) | (0.03 | ) | (0.12 | ) | 27.11 | 19.73 | 341,038 | 0.68 | 0.97 | 0.97 | 30 | |||||||||||||||||||||||||||||||||||||||
| 07/01/15 | 06/30/16 | 23.61 | 0.13 | (0.44 | ) | (0.31 | ) | (0.10 | ) | (0.45 | ) | (0.55 | ) | 22.75 | (1.17 | ) | 156,205 | 0.59 | 0.98 | 0.98 | 30 | ||||||||||||||||||||||||||||||||||||
| 07/01/14 | 06/30/15 | 23.96 | 0.10 | 0.86 | 0.96 | (0.14 | ) | (1.17 | ) | (1.31 | ) | 23.61 | 4.04 | 75,994 | 0.43 | 0.98 | 0.98 | 26 | |||||||||||||||||||||||||||||||||||||||
| 07/01/13 | 06/30/14 | 20.06 | 0.12 | 4.91 | 5.03 | (0.19 | ) | (0.94 | ) | (1.13 | ) | 23.96 | 25.37 | 19,515 | 0.51 | 1.00 | 1.00 | 30 | |||||||||||||||||||||||||||||||||||||||
| Investor Shares* | |||||||||||||||||||||||||||||||||||||||||||||||||||||||||
| 07/01/17 | 06/30/18 | 27.08 | 0.10 | 3.10 | 3.20 | (0.15 | ) | (1.01 | ) | (1.16 | ) | 29.12 | 11.95 | 874,269 | 0.37 | 1.12 | 1.12 | 32 | |||||||||||||||||||||||||||||||||||||||
| 07/01/16 | 06/30/17 | 22.73 | 0.13 | 4.31 | 4.44 | (0.06 | ) | (0.03 | ) | (0.09 | ) | 27.08 | 19.54 | 834,317 | 0.53 | 1.12 | 1.12 | 30 | |||||||||||||||||||||||||||||||||||||||
| 07/01/15 | 06/30/16 | 23.59 | 0.10 | (0.44 | ) | (0.34 | ) | (0.07 | ) | (0.45 | ) | (0.52 | ) | 22.73 | (1.32 | ) | 774,547 | 0.44 | 1.13 | 1.13 | 30 | ||||||||||||||||||||||||||||||||||||
| 07/01/14 | 06/30/15 | 23.94 | 0.07 | 0.86 | 0.93 | (0.11 | ) | (1.17 | ) | (1.28 | ) | 23.59 | 3.90 | 748,003 | 0.28 | 1.13 | 1.13 | 26 | |||||||||||||||||||||||||||||||||||||||
| 07/01/13 | 06/30/14 | 20.06 | 0.08 | 4.90 | 4.98 | (0.16 | ) | (0.94 | ) | (1.10 | ) | 23.94 | 25.13 | 567,799 | 0.36 | 1.15 | 1.15 | 30 | |||||||||||||||||||||||||||||||||||||||
| Advisor Shares* | |||||||||||||||||||||||||||||||||||||||||||||||||||||||||
| 07/01/17 | 06/30/18 | 26.95 | 0.03 | 3.08 | 3.11 | (0.07 | ) | (1.01 | ) | (1.08 | ) | 28.98 | 11.65 | 25,032 | 0.12 | 1.37 | 1.37 | 32 | |||||||||||||||||||||||||||||||||||||||
| 07/01/16 | 06/30/17 | 22.62 | 0.07 | 4.29 | 4.36 | — | (0.03 | ) | (0.03 | ) | 26.95 | 19.29 | 24,974 | 0.28 | 1.37 | 1.37 | 30 | ||||||||||||||||||||||||||||||||||||||||
| 07/01/15 | 06/30/16 | 23.48 | 0.04 | (0.44 | ) | (0.40 | ) | (0.01 | ) | (0.45 | ) | (0.46 | ) | 22.62 | (1.58 | ) | 52,883 | 0.19 | 1.38 | 1.38 | 30 | ||||||||||||||||||||||||||||||||||||
| 07/01/14 | 06/30/15 | 23.87 | 0.01 | 0.85 | 0.86 | (0.08 | ) | (1.17 | ) | (1.25 | ) | 23.48 | 3.61 | 58,583 | 0.03 | 1.38 | 1.38 | 26 | |||||||||||||||||||||||||||||||||||||||
| 07/01/13 | 06/30/14 | 20.01 | 0.02 | 4.89 | 4.91 | (0.11 | ) | (0.94 | ) | (1.05 | ) | 23.87 | 24.83 | 21,416 | 0.11 | 1.40 | 1.40 | 30 | |||||||||||||||||||||||||||||||||||||||
The accompanying notes are an integral part of these financial statements.
127
Financial Highlights
From Investment Operations(a) | Distributions to Shareholders From | �� | Ratios to Average Net Assets(b) | ||||||||||||||||||||||||||||||||||||||||||||||||||||||
| Net | |||||||||||||||||||||||||||||||||||||||||||||||||||||||||
For a Share Outstanding Throughout Each Fiscal Period: | Realized | Net | Net | ||||||||||||||||||||||||||||||||||||||||||||||||||||||
| Net Asset | Net | & | Asset | Assets at | Net | ||||||||||||||||||||||||||||||||||||||||||||||||||||
| Value, | Investment | Unrealized | Net | Net | Value, | End of | Investment | Gross | Portfolio | ||||||||||||||||||||||||||||||||||||||||||||||||
| Beginning | Income | Gains | Investment | Realized | End of | Total | Period | Income | Net | Expenses | Turnover | ||||||||||||||||||||||||||||||||||||||||||||||
| Beginning | Ending | of Period | (Loss) | (Losses) | Total | Income | Gains | Total | Period | Return(c) | (000’s | ) | (Loss) | Expenses | (d) | Rate(c) | |||||||||||||||||||||||||||||||||||||||||
| BROWN ADVISORY GLOBAL LEADERS FUND: | |||||||||||||||||||||||||||||||||||||||||||||||||||||||||
| Investor Shares* | |||||||||||||||||||||||||||||||||||||||||||||||||||||||||
| 07/01/17 | 06/30/18 | $ | 11.50 | 0.08 | 2.25 | 2.33 | (0.01 | ) | — | (0.01 | ) | $ | 13.82 | 20.28 | % | $ | 86,112 | 0.60 | % | 0.85 | % | 1.10 | % | 26 | % | ||||||||||||||||||||||||||||||||
| 07/01/16 | 06/30/17 | 9.65 | 0.04 | 1.83 | 1.87 | (0.02 | ) | — | (0.02 | ) | 11.50 | 19.39 | 39,354 | 0.39 | 0.85 | 1.16 | 35 | ||||||||||||||||||||||||||||||||||||||||
| 07/01/15^ | 06/30/16 | 10.00 | 0.05 | (0.40 | ) | (0.35 | ) | — | — | — | 9.65 | (3.50 | ) | 26,367 | 0.55 | 0.85 | 1.41 | 53 | |||||||||||||||||||||||||||||||||||||||
| BROWN ADVISORY INTERMEDIATE INCOME FUND: | |||||||||||||||||||||||||||||||||||||||||||||||||||||||||
| Investor Shares* | |||||||||||||||||||||||||||||||||||||||||||||||||||||||||
| 07/01/17 | 06/30/18 | 10.60 | 0.23 | (0.24 | ) | (0.01 | ) | (0.24 | ) | — | (0.24 | ) | 10.35 | (0.12 | ) | 125,060 | 2.20 | 0.45 | 0.51 | 35 | |||||||||||||||||||||||||||||||||||||
| 07/01/16 | 06/30/17 | 10.78 | 0.20 | (0.16 | ) | 0.04 | (0.22 | ) | — | (0.22 | ) | 10.60 | 0.40 | 131,941 | 1.88 | 0.45 | 0.51 | 62 | |||||||||||||||||||||||||||||||||||||||
| 07/01/15 | 06/30/16 | 10.63 | 0.20 | 0.22 | 0.42 | (0.21 | ) | (0.06 | ) | (0.27 | ) | 10.78 | 3.99 | 137,900 | 1.92 | 0.43 | 0.50 | 68 | |||||||||||||||||||||||||||||||||||||||
| 07/01/14 | 06/30/15 | 10.74 | 0.19 | (0.08 | ) | 0.11 | (0.22 | ) | — | (0.22 | ) | 10.63 | 1.01 | 140,006 | 1.78 | 0.45 | 0.50 | 130 | |||||||||||||||||||||||||||||||||||||||
| 07/01/13 | 06/30/14 | 10.85 | 0.17 | 0.12 | 0.29 | (0.18 | ) | (0.22 | ) | (0.40 | ) | 10.74 | 2.66 | 207,371 | 1.54 | 0.52 | 0.52 | 162 | |||||||||||||||||||||||||||||||||||||||
| Advisor Shares* | |||||||||||||||||||||||||||||||||||||||||||||||||||||||||
| 07/01/17 | 06/30/18 | 10.38 | 0.20 | (0.24 | ) | (0.04 | ) | (0.21 | ) | — | (0.21 | ) | 10.13 | (0.38 | ) | 3,782 | 1.95 | 0.70 | 0.76 | 35 | |||||||||||||||||||||||||||||||||||||
| 07/01/16 | 06/30/17 | 10.56 | 0.17 | (0.15 | ) | 0.02 | (0.20 | ) | — | (0.20 | ) | 10.38 | 0.16 | 4,098 | 1.63 | 0.70 | 0.76 | 62 | |||||||||||||||||||||||||||||||||||||||
| 07/01/15 | 06/30/16 | 10.42 | 0.17 | 0.21 | 0.38 | (0.18 | ) | (0.06 | ) | (0.24 | ) | 10.56 | 3.71 | 8,972 | 1.67 | 0.68 | 0.75 | 68 | |||||||||||||||||||||||||||||||||||||||
| 07/01/14 | 06/30/15 | 10.53 | 0.16 | (0.08 | ) | 0.08 | (0.19 | ) | — | (0.19 | ) | 10.42 | 0.78 | 9,608 | 1.53 | 0.70 | 0.75 | 130 | |||||||||||||||||||||||||||||||||||||||
| 07/01/13 | 06/30/14 | 10.65 | 0.14 | 0.11 | 0.25 | (0.15 | ) | (0.22 | ) | (0.37 | ) | 10.53 | 2.36 | 12,613 | 1.29 | 0.77 | 0.77 | 162 | |||||||||||||||||||||||||||||||||||||||
| BROWN ADVISORY TOTAL RETURN FUND: | |||||||||||||||||||||||||||||||||||||||||||||||||||||||||
| Institutional Shares* | |||||||||||||||||||||||||||||||||||||||||||||||||||||||||
| 07/01/17 | 06/30/18 | 10.00 | 0.28 | (0.22 | ) | 0.06 | (0.28 | ) | — | (0.28 | ) | 9.78 | 0.61 | 121,381 | 2.79 | 0.50 | 0.50 | 209 | |||||||||||||||||||||||||||||||||||||||
| 07/01/16 | 06/30/17 | 10.18 | 0.24 | (0.16 | ) | 0.08 | (0.25 | ) | (0.01 | ) | (0.26 | ) | 10.00 | 0.80 | 107,686 | 2.36 | 0.51 | 0.51 | 216 | ||||||||||||||||||||||||||||||||||||||
| 07/01/15 | 06/30/16 | 9.83 | 0.25 | 0.37 | 0.62 | (0.27 | ) | — | (0.27 | ) | 10.18 | 6.46 | 83,854 | 2.55 | 0.51 | 0.51 | 218 | ||||||||||||||||||||||||||||||||||||||||
| 10/30/14^ | 06/30/15 | 10.00 | 0.13 | (0.19 | ) | (0.06 | ) | (0.11 | ) | — | (0.11 | ) | 9.83 | (0.60 | ) | 73,735 | 1.89 | 0.54 | 0.54 | 235 | |||||||||||||||||||||||||||||||||||||
| Investor Shares* | |||||||||||||||||||||||||||||||||||||||||||||||||||||||||
| 07/01/17 | 06/30/18 | 10.00 | 0.27 | (0.21 | ) | 0.06 | (0.28 | ) | — | (0.28 | ) | 9.78 | 0.56 | 2,619 | 2.74 | 0.55 | 0.55 | 209 | |||||||||||||||||||||||||||||||||||||||
| 07/01/16 | 06/30/17 | 10.18 | 0.23 | (0.16 | ) | 0.07 | (0.24 | ) | (0.01 | ) | (0.25 | ) | 10.00 | 0.75 | 2,668 | 2.31 | 0.56 | 0.56 | 216 | ||||||||||||||||||||||||||||||||||||||
| 07/01/15 | 06/30/16 | 9.83 | 0.25 | 0.37 | 0.62 | (0.27 | ) | — | (0.27 | ) | 10.18 | 6.40 | 1,957 | 2.50 | 0.56 | 0.56 | 218 | ||||||||||||||||||||||||||||||||||||||||
| 10/30/14^ | 06/30/15 | 10.00 | 0.12 | (0.18 | ) | (0.06 | ) | (0.11 | ) | — | (0.11 | ) | 9.83 | (0.63 | ) | 9,081 | 1.84 | 0.59 | 0.59 | 235 | |||||||||||||||||||||||||||||||||||||
| BROWN ADVISORY STRATEGIC BOND FUND: | |||||||||||||||||||||||||||||||||||||||||||||||||||||||||
| Investor Shares* | |||||||||||||||||||||||||||||||||||||||||||||||||||||||||
| 07/01/17 | 06/30/18 | 9.61 | 0.27 | (0.10 | ) | 0.17 | (0.27 | ) | — | (0.27 | ) | 9.51 | 1.80 | 141,150 | 2.85 | 0.70 | 0.67 | 200 | |||||||||||||||||||||||||||||||||||||||
| 07/01/16 | 06/30/17 | 9.47 | 0.23 | 0.14 | 0.37 | (0.23 | ) | — | (0.23 | ) | 9.61 | 3.92 | 114,651 | 2.39 | 0.70 | 0.72 | 259 | ||||||||||||||||||||||||||||||||||||||||
| 07/01/15 | 06/30/16 | 9.83 | 0.30 | (0.19 | ) | 0.11 | (0.47 | ) | — | (0.47 | ) | 9.47 | 1.18 | 39,211 | 3.21 | 0.70 | 0.73 | 288 | |||||||||||||||||||||||||||||||||||||||
| 10/31/14^ | 06/30/15 | 10.07 | 0.16 | (0.35 | ) | (0.19 | ) | (0.05 | ) | — | (0.05 | ) | 9.83 | (1.85 | ) | 59,680 | 2.42 | 0.70 | 0.72 | 317 | |||||||||||||||||||||||||||||||||||||
| Advisor Shares* | |||||||||||||||||||||||||||||||||||||||||||||||||||||||||
| 07/01/17 | 06/30/18 | 9.61 | 0.25 | (0.10 | ) | 0.15 | (0.25 | ) | — | (0.25 | ) | 9.51 | 1.54 | 214 | 2.60 | 0.95 | 0.92 | 200 | |||||||||||||||||||||||||||||||||||||||
| 07/01/16 | 06/30/17 | 9.47 | 0.20 | 0.14 | 0.34 | (0.20 | ) | — | (0.20 | ) | 9.61 | 3.65 | 248 | 2.14 | 0.95 | 0.97 | 259 | ||||||||||||||||||||||||||||||||||||||||
| 07/01/15 | 06/30/16 | 9.82 | 0.28 | (0.20 | ) | 0.08 | (0.43 | ) | — | (0.43 | ) | 9.47 | 0.84 | 865 | 2.96 | 0.95 | 0.98 | 288 | |||||||||||||||||||||||||||||||||||||||
| 07/01/14 | 06/30/15 | 10.04 | 0.19 | (0.37 | ) | (0.18 | ) | (0.04 | ) | — | (0.04 | ) | 9.82 | (1.80 | ) | 1,692 | 1.91 | 1.21 | 1.22 | 317 | |||||||||||||||||||||||||||||||||||||
| 07/01/13 | 06/30/14 | 9.68 | (0.01 | ) | 0.42 | 0.41 | (0.05 | ) | — | (0.05 | ) | 10.04 | 4.22 | 24,399 | (0.07 | ) | 1.33 | 1.33 | 1,010 | ||||||||||||||||||||||||||||||||||||||
The accompanying notes are an integral part of these financial statements.
128
Financial Highlights
From Investment Operations(a) | Distributions to Shareholders From | Ratios to Average Net Assets(b) | |||||||||||||||||||||||||||||||||||||||||||||||||||||||
| Net | |||||||||||||||||||||||||||||||||||||||||||||||||||||||||
For a Share Outstanding Throughout Each Fiscal Period: | Realized | Net | Net | ||||||||||||||||||||||||||||||||||||||||||||||||||||||
| Net Asset | Net | & | Asset | Assets at | Net | ||||||||||||||||||||||||||||||||||||||||||||||||||||
| Value, | Investment | Unrealized | Net | Net | Value, | End of | Investment | Gross | Portfolio | ||||||||||||||||||||||||||||||||||||||||||||||||
| Beginning | Income | Gains | Investment | Realized | End of | Total | Period | Income | Net | Expenses | Turnover | ||||||||||||||||||||||||||||||||||||||||||||||
| Beginning | Ending | of Period | (Loss) | (Losses) | Total | Income | Gains | Total | Period | Return(c) | (000’s | ) | (Loss) | Expenses | (d) | Rate(c) | |||||||||||||||||||||||||||||||||||||||||
| BROWN ADVISORY SUSTAINABLE BOND FUND: | |||||||||||||||||||||||||||||||||||||||||||||||||||||||||
| Investor Shares* | |||||||||||||||||||||||||||||||||||||||||||||||||||||||||
| 08/07/17^ | 06/30/18 | $ | 10.00 | $ | 0.21 | $ | (0.34 | ) | $ | (0.13 | ) | $ | (0.17 | ) | $ | — | $ | (0.17 | ) | $ | 9.70 | (1.27 | )% | $ | 54,291 | 2.41 | % | 0.60 | % | 0.71 | % | 64 | % | ||||||||||||||||||||||||
| BROWN ADVISORY MARYLAND BOND FUND: | |||||||||||||||||||||||||||||||||||||||||||||||||||||||||
| Investor Shares* | |||||||||||||||||||||||||||||||||||||||||||||||||||||||||
| 07/01/17 | 06/30/18 | 10.62 | 0.26 | (0.12 | ) | 0.14 | (0.26 | ) | — | (0.26 | ) | 10.50 | 1.29 | 181,230 | 2.42 | 0.48 | 0.48 | 25 | |||||||||||||||||||||||||||||||||||||||
| 07/01/16 | 06/30/17 | 10.92 | 0.23 | (0.26 | ) | (0.03 | ) | (0.23 | ) | (0.04 | ) | (0.27 | ) | 10.62 | (0.27 | ) | 181,518 | 2.14 | �� | 0.49 | 0.49 | 53 | |||||||||||||||||||||||||||||||||||
| 07/01/15 | 06/30/16 | 10.65 | 0.23 | 0.32 | 0.55 | (0.23 | ) | (0.05 | ) | (0.28 | ) | 10.92 | 5.24 | 183,705 | 2.12 | 0.48 | 0.48 | 80 | |||||||||||||||||||||||||||||||||||||||
| 07/01/14 | 06/30/15 | 10.82 | 0.18 | (0.12 | ) | 0.06 | (0.18 | ) | (0.05 | ) | (0.23 | ) | 10.65 | 0.58 | 199,469 | 1.66 | 0.49 | 0.49 | 61 | ||||||||||||||||||||||||||||||||||||||
| 07/01/13 | 06/30/14 | 10.81 | 0.21 | 0.10 | 0.31 | (0.21 | ) | (0.09 | ) | (0.30 | ) | 10.82 | 2.94 | 205,717 | 1.99 | 0.52 | 0.52 | 56 | |||||||||||||||||||||||||||||||||||||||
| BROWN ADVISORY TAX EXEMPT BOND FUND: | |||||||||||||||||||||||||||||||||||||||||||||||||||||||||
| Investor Shares* | |||||||||||||||||||||||||||||||||||||||||||||||||||||||||
| 07/01/17 | 06/30/18 | 9.94 | 0.31 | (0.04 | ) | 0.27 | (0.31 | ) | — | (0.31 | ) | 9.90 | 2.78 | 439,906 | 3.16 | 0.48 | 0.48 | 55 | |||||||||||||||||||||||||||||||||||||||
| 07/01/16 | 06/30/17 | 10.26 | 0.29 | (0.32 | ) | (0.03 | ) | (0.29 | ) | — | (0.29 | ) | 9.94 | (0.29 | ) | 257,602 | 2.88 | 0.49 | 0.49 | 55 | |||||||||||||||||||||||||||||||||||||
| 07/01/15 | 06/30/16 | 9.93 | 0.25 | 0.33 | 0.58 | (0.25 | ) | — | (0.25 | ) | 10.26 | 5.94 | 233,675 | 2.51 | 0.49 | 0.49 | 119 | ||||||||||||||||||||||||||||||||||||||||
| 07/01/14 | 06/30/15 | 10.03 | 0.18 | (0.10 | ) | 0.08 | (0.18 | ) | — | (0.18 | ) | 9.93 | 0.78 | 224,154 | 1.78 | 0.50 | 0.50 | 109 | |||||||||||||||||||||||||||||||||||||||
| 07/01/13 | 06/30/14 | 9.84 | 0.19 | 0.19 | 0.38 | (0.19 | ) | (— | )(e) | (0.19 | ) | 10.03 | 3.94 | 205,177 | 1.96 | 0.52 | 0.52 | 157 | |||||||||||||||||||||||||||||||||||||||
| BROWN ADVISORY MORTGAGE SECURITIES FUND: | |||||||||||||||||||||||||||||||||||||||||||||||||||||||||
| Institutional Shares* | |||||||||||||||||||||||||||||||||||||||||||||||||||||||||
| 07/01/17 | 06/30/18 | 9.87 | 0.18 | (0.16 | ) | 0.02 | (0.24 | ) | — | (0.24 | ) | 9.65 | 0.16 | 300,643 | 1.86 | 0.47 | 0.47 | 336 | |||||||||||||||||||||||||||||||||||||||
| 07/01/16 | 06/30/17 | 10.20 | 0.15 | (0.21 | ) | (0.06 | ) | (0.20 | ) | (0.07 | ) | (0.27 | ) | 9.87 | (0.52 | ) | 342,705 | 1.53 | 0.46 | 0.46 | 414 | ||||||||||||||||||||||||||||||||||||
| 07/01/15 | 06/30/16 | 10.06 | 0.22 | 0.21 | 0.43 | (0.25 | ) | (0.04 | ) | (0.29 | ) | 10.20 | 4.32 | 377,908 | 2.12 | 0.45 | 0.45 | 244 | |||||||||||||||||||||||||||||||||||||||
| 07/01/14 | 06/30/15 | 10.16 | 0.27 | 0.01 | 0.28 | (0.30 | ) | (0.08 | ) | (0.38 | ) | 10.06 | 2.74 | 206,299 | 2.68 | 0.47 | 0.47 | 147 | |||||||||||||||||||||||||||||||||||||||
| 05/13/14^ | 06/30/14 | 10.15 | 0.03 | 0.02 | 0.05 | (0.04 | ) | — | (0.04 | ) | 10.16 | 0.49 | 131,415 | 1.98 | 0.52 | 0.52 | 88 | ||||||||||||||||||||||||||||||||||||||||
| Investor Shares* | |||||||||||||||||||||||||||||||||||||||||||||||||||||||||
| 07/01/17 | 06/30/18 | 9.87 | 0.18 | (0.16 | ) | 0.02 | (0.23 | ) | — | (0.23 | ) | 9.66 | 0.21 | 321 | 1.81 | 0.52 | 0.52 | 336 | |||||||||||||||||||||||||||||||||||||||
| 07/01/16 | 06/30/17 | 10.21 | 0.15 | (0.22 | ) | (0.07 | ) | (0.20 | ) | (0.07 | ) | (0.27 | ) | 9.87 | (0.68 | ) | 738 | 1.48 | 0.51 | 0.51 | 414 | ||||||||||||||||||||||||||||||||||||
| 07/01/15 | 06/30/16 | 10.06 | 0.21 | 0.22 | 0.43 | (0.24 | ) | (0.04 | ) | (0.28 | ) | 10.21 | 4.33 | 1,793 | 2.07 | 0.50 | 0.50 | 244 | |||||||||||||||||||||||||||||||||||||||
| 07/01/14 | 06/30/15 | 10.16 | 0.27 | — | 0.27 | (0.29 | ) | (0.08 | ) | (0.37 | ) | 10.06 | 2.68 | 28,649 | 2.63 | 0.52 | 0.52 | 147 | |||||||||||||||||||||||||||||||||||||||
| 12/26/13^ | 06/30/14 | 10.00 | 0.10 | 0.16 | 0.26 | (0.10 | ) | — | (0.10 | ) | 10.16 | 2.62 | 67,776 | 1.93 | 0.57 | 0.57 | 88 | ||||||||||||||||||||||||||||||||||||||||
The accompanying notes are an integral part of these financial statements.
129
Financial Highlights
From Investment Operations(a) | Distributions to Shareholders From | Ratios to Average Net Assets(b) | |||||||||||||||||||||||||||||||||||||||||||||||||||||||
| Net | |||||||||||||||||||||||||||||||||||||||||||||||||||||||||
For a Share Outstanding Throughout Each Fiscal Period: | Realized | Net | Net | ||||||||||||||||||||||||||||||||||||||||||||||||||||||
| Net Asset | Net | & | Asset | Assets at | Net | ||||||||||||||||||||||||||||||||||||||||||||||||||||
| Value, | Investment | Unrealized | Net | Net | Value, | End of | Investment | Gross | Portfolio | ||||||||||||||||||||||||||||||||||||||||||||||||
| Beginning | Income | Gains | Investment | Realized | End of | Total | Period | Income | Net | Expenses | Turnover | ||||||||||||||||||||||||||||||||||||||||||||||
| Beginning | Ending | of Period | (Loss) | (Losses) | Total | Income | Gains | Total | Period | Return(c) | (000’s | ) | (Loss) | Expenses | (d) | Rate(c) | |||||||||||||||||||||||||||||||||||||||||
| BROWN ADVISORY – WMC STRATEGIC EUROPEAN EQUITY FUND: | |||||||||||||||||||||||||||||||||||||||||||||||||||||||||
| Institutional Shares* | |||||||||||||||||||||||||||||||||||||||||||||||||||||||||
| 07/01/17 | 06/30/18 | $ | 12.05 | 0.13 | 0.35 | 0.48 | (0.11 | ) | — | (0.11 | ) | $ | 12.42 | 3.97 | % | $ | 927,916 | 1.03 | % | 1.07 | % | 1.07 | % | 33 | % | ||||||||||||||||||||||||||||||||
| 07/01/16 | 06/30/17 | 9.90 | 0.12 | 2.16 | 2.28 | (0.13 | ) | — | (0.13 | ) | 12.05 | 23.32 | 1,176,492 | 1.10 | 1.09 | 1.09 | 27 | ||||||||||||||||||||||||||||||||||||||||
| 07/01/15 | 06/30/16 | 10.20 | 0.13 | (0.40 | ) | (0.27 | ) | (0.03 | ) | — | (0.03 | ) | 9.90 | (2.68 | ) | 1,059,870 | 1.30 | 1.11 | 1.11 | 31 | |||||||||||||||||||||||||||||||||||||
| 07/01/14 | 06/30/15 | 10.46 | 0.14 | (0.29 | ) | (0.15 | ) | (0.11 | ) | — | (0.11 | ) | 10.20 | (1.42 | ) | 240,182 | 1.35 | 1.13 | 1.13 | 48 | |||||||||||||||||||||||||||||||||||||
| 10/21/13^ | 06/30/14 | 10.00 | 0.14 | 0.32 | 0.46 | — | — | — | 10.46 | 4.60 | 202,616 | 2.01 | 1.23 | 1.23 | 25 | ||||||||||||||||||||||||||||||||||||||||||
| Investor Shares* | |||||||||||||||||||||||||||||||||||||||||||||||||||||||||
| 07/01/17 | 06/30/18 | 12.05 | 0.11 | 0.36 | 0.47 | (0.11 | ) | — | (0.11 | ) | 12.41 | 3.85 | 14,669 | 0.88 | 1.22 | 1.22 | 33 | ||||||||||||||||||||||||||||||||||||||||
| 07/01/16 | 06/30/17 | 9.90 | 0.10 | 2.17 | 2.27 | (0.12 | ) | — | (0.12 | ) | 12.05 | 23.18 | 7,367 | 0.95 | 1.24 | 1.24 | 27 | ||||||||||||||||||||||||||||||||||||||||
| 07/01/15 | 06/30/16 | 10.19 | 0.12 | (0.41 | ) | (0.29 | ) | — | — | — | 9.90 | (2.85 | ) | 13,031 | 1.15 | 1.26 | 1.26 | 31 | |||||||||||||||||||||||||||||||||||||||
| 07/01/14 | 06/30/15 | 10.45 | 0.12 | (0.29 | ) | (0.17 | ) | (0.09 | ) | — | (0.09 | ) | 10.19 | (1.56 | ) | 25,840 | 1.20 | 1.28 | 1.28 | 48 | |||||||||||||||||||||||||||||||||||||
| 10/21/13^ | 06/30/14 | 10.00 | 0.13 | 0.32 | 0.45 | — | — | — | 10.45 | 4.50 | 18,011 | 1.86 | 1.38 | 1.38 | 25 | ||||||||||||||||||||||||||||||||||||||||||
| Advisor Shares* | |||||||||||||||||||||||||||||||||||||||||||||||||||||||||
| 07/01/17 | 06/30/18 | 11.98 | 0.08 | 0.35 | 0.43 | (0.11 | ) | — | (0.11 | ) | 12.30 | 3.54 | 13,313 | 0.63 | 1.47 | 1.47 | 33 | ||||||||||||||||||||||||||||||||||||||||
| 07/01/16 | 06/30/17 | 9.85 | 0.08 | 2.15 | 2.23 | (0.10 | ) | — | (0.10 | ) | 11.98 | 22.91 | 10,740 | 0.70 | 1.49 | 1.49 | 27 | ||||||||||||||||||||||||||||||||||||||||
| 07/01/15 | 06/30/16 | 10.17 | 0.09 | (0.41 | ) | (0.32 | ) | — | — | — | 9.85 | (3.15 | ) | 745 | 0.90 | 1.51 | 1.51 | 31 | |||||||||||||||||||||||||||||||||||||||
| 07/01/14 | 06/30/15 | 10.44 | 0.10 | (0.29 | ) | (0.19 | ) | (0.08 | ) | — | (0.08 | ) | 10.17 | (1.78 | ) | 1,076 | 0.95 | 1.53 | 1.53 | 48 | |||||||||||||||||||||||||||||||||||||
| 10/21/13^ | 06/30/14 | 10.00 | 0.11 | 0.33 | 0.44 | — | — | — | 10.44 | 4.40 | 240 | 1.61 | 1.63 | 1.63 | 25 | ||||||||||||||||||||||||||||||||||||||||||
| BROWN ADVISORY – WMC JAPAN ALPHA OPPORTUNITIES FUND: | |||||||||||||||||||||||||||||||||||||||||||||||||||||||||
| Institutional Shares* | |||||||||||||||||||||||||||||||||||||||||||||||||||||||||
| 07/01/17 | 06/30/18 | 10.89 | 0.09 | 0.70 | 0.79 | — | (0.97 | ) | (0.97 | ) | 10.71 | 6.75 | 1,487,584 | 0.77 | 1.15 | 1.15 | 62 | ||||||||||||||||||||||||||||||||||||||||
| 07/01/16 | 06/30/17 | 8.83 | 0.08 | 1.98 | 2.06 | — | — | — | 10.89 | 23.33 | 985,654 | 0.80 | 1.15 | 1.15 | 100 | ||||||||||||||||||||||||||||||||||||||||||
| 07/01/15 | 06/30/16 | 12.83 | 0.06 | (2.91 | ) | (2.85 | ) | (0.95 | ) | (0.20 | ) | (1.15 | ) | 8.83 | (24.02 | ) | 1,828,840 | 0.53 | 1.14 | 1.14 | 105 | ||||||||||||||||||||||||||||||||||||
| 07/01/14 | 06/30/15 | 10.50 | 0.05 | 2.86 | 2.91 | (0.51 | ) | (0.07 | ) | (0.58 | ) | 12.83 | 28.62 | 1,582,214 | 0.41 | 1.15 | 1.15 | 70 | |||||||||||||||||||||||||||||||||||||||
| 03/04/14^ | 06/30/14 | 10.00 | 0.05 | 0.45 | 0.50 | — | — | — | 10.50 | 5.00 | 1,080,717 | 1.59 | 1.21 | 1.21 | 26 | ||||||||||||||||||||||||||||||||||||||||||
| Investor Shares* | |||||||||||||||||||||||||||||||||||||||||||||||||||||||||
| 07/01/17 | 06/30/18 | 10.85 | 0.07 | 0.70 | 0.77 | — | (0.97 | ) | (0.97 | ) | 10.65 | 6.58 | 2,461 | 0.62 | 1.30 | 1.30 | 62 | ||||||||||||||||||||||||||||||||||||||||
| 07/01/16 | 06/30/17 | 8.81 | 0.07 | 1.97 | 2.04 | — | — | — | 10.85 | 23.16 | 2,814 | 0.65 | 1.30 | 1.30 | 100 | ||||||||||||||||||||||||||||||||||||||||||
| 07/01/15 | 06/30/16 | 12.82 | 0.04 | (2.91 | ) | (2.87 | ) | (0.94 | ) | (0.20 | ) | (1.14 | ) | 8.81 | (24.20 | ) | 1,595 | 0.38 | 1.29 | 1.29 | 105 | ||||||||||||||||||||||||||||||||||||
| 07/01/14 | 06/30/15 | 10.49 | 0.03 | 2.87 | 2.90 | (0.50 | ) | (0.07 | ) | (0.57 | ) | 12.82 | 28.57 | 25,628 | 0.26 | 1.30 | 1.30 | 70 | |||||||||||||||||||||||||||||||||||||||
| 03/04/14^ | 06/30/14 | 10.00 | 0.05 | 0.44 | 0.49 | — | — | — | 10.49 | 4.90 | 4,522 | 1.44 | 1.36 | 1.36 | 26 | ||||||||||||||||||||||||||||||||||||||||||
| Advisor Shares* | |||||||||||||||||||||||||||||||||||||||||||||||||||||||||
| 07/01/17 | 06/30/18 | 10.79 | 0.04 | 0.70 | 0.74 | — | (0.97 | ) | (0.97 | ) | 10.56 | 6.33 | 288 | 0.37 | 1.55 | 1.55 | 62 | ||||||||||||||||||||||||||||||||||||||||
| 07/01/16 | 06/30/17 | 8.78 | 0.04 | 1.97 | 2.01 | — | — | — | 10.79 | 22.89 | 388 | 0.40 | 1.55 | 1.55 | 100 | ||||||||||||||||||||||||||||||||||||||||||
| 07/01/15 | 06/30/16 | 12.79 | 0.01 | (2.90 | ) | (2.89 | ) | (0.92 | ) | (0.20 | ) | (1.12 | ) | 8.78 | (24.39 | ) | 687 | 0.13 | 1.54 | 1.54 | 105 | ||||||||||||||||||||||||||||||||||||
| 07/01/14 | 06/30/15 | 10.48 | — | 2.87 | 2.87 | (0.49 | ) | (0.07 | ) | (0.56 | ) | 12.79 | 28.22 | 1,670 | 0.01 | 1.55 | 1.55 | 70 | |||||||||||||||||||||||||||||||||||||||
| 03/04/14^ | 06/30/14 | 10.00 | 0.04 | 0.44 | 0.48 | — | — | — | 10.48 | 4.80 | 59 | 1.19 | 1.61 | 1.61 | 26 | ||||||||||||||||||||||||||||||||||||||||||
The accompanying notes are an integral part of these financial statements.
130
Financial Highlights
From Investment Operations(a) | Distributions to Shareholders From | Ratios to Average Net Assets(b) | |||||||||||||||||||||||||||||||||||||||||||||||||||||||
| Net | |||||||||||||||||||||||||||||||||||||||||||||||||||||||||
For a Share Outstanding Throughout Each Fiscal Period: | Realized | Net | Net | ||||||||||||||||||||||||||||||||||||||||||||||||||||||
| Net Asset | Net | & | Asset | Assets at | Net | ||||||||||||||||||||||||||||||||||||||||||||||||||||
| Value, | Investment | Unrealized | Net | Net | Value, | End of | Investment | Gross | Portfolio | ||||||||||||||||||||||||||||||||||||||||||||||||
| Beginning | Income | Gains | Investment | Realized | End of | Total | Period | Income | Net | Expenses | Turnover | ||||||||||||||||||||||||||||||||||||||||||||||
| Beginning | Ending | of Period | (Loss) | (Losses) | Total | Income | Gains | Total | Period | Return(c) | (000’s | ) | (Loss) | Expenses | (d) | Rate(c) | |||||||||||||||||||||||||||||||||||||||||
| BROWN ADVISORY – SOMERSET EMERGING MARKETS FUND: | |||||||||||||||||||||||||||||||||||||||||||||||||||||||||
| Institutional Shares* | |||||||||||||||||||||||||||||||||||||||||||||||||||||||||
| 07/01/17 | 06/30/18 | $ | 10.17 | 0.17 | (0.17 | ) | — | (0.11 | ) | — | (0.11 | ) | $ | 10.06 | (0.12 | )% | $ | 513,535 | 1.57 | % | 1.15 | % | 1.15 | % | 13 | % | |||||||||||||||||||||||||||||||
| 07/01/16 | 06/30/17 | 8.73 | 0.12 | 1.43 | 1.55 | (0.11 | ) | — | (0.11 | ) | 10.17 | 18.04 | 407,616 | 1.31 | 1.17 | 1.17 | 23 | ||||||||||||||||||||||||||||||||||||||||
| 07/01/15 | 06/30/16 | 9.74 | 0.13 | (1.05 | ) | (0.92 | ) | (0.09 | ) | — | (0.09 | ) | 8.73 | (9.40 | ) | 319,993 | 1.56 | 1.17 | 1.17 | 19 | |||||||||||||||||||||||||||||||||||||
| 07/01/14 | 06/30/15 | 10.22 | 0.13 | (0.46 | ) | (0.33 | ) | (0.15 | ) | — | (0.15 | ) | 9.74 | (3.22 | ) | 268,530 | 1.31 | 1.22 | 1.22 | 22 | |||||||||||||||||||||||||||||||||||||
| 07/01/13 | 06/30/14 | 9.52 | 0.20 | 0.61 | 0.81 | (0.11 | ) | — | (0.11 | ) | 10.22 | 8.62 | 193,676 | 2.08 | 1.25 | 1.25 | 19 | ||||||||||||||||||||||||||||||||||||||||
| Investor Shares* | |||||||||||||||||||||||||||||||||||||||||||||||||||||||||
| 07/01/17 | 06/30/18 | 10.15 | 0.16 | (0.19 | ) | (0.03 | ) | (0.09 | ) | — | (0.09 | ) | 10.03 | (0.37 | ) | 38,106 | 1.42 | 1.30 | 1.30 | 13 | |||||||||||||||||||||||||||||||||||||
| 07/01/16 | 06/30/17 | 8.71 | 0.11 | 1.43 | 1.54 | (0.10 | ) | — | (0.10 | ) | 10.15 | 17.90 | 183,378 | 1.16 | 1.32 | 1.32 | 23 | ||||||||||||||||||||||||||||||||||||||||
| 07/01/15 | 06/30/16 | 9.73 | 0.12 | (1.06 | ) | (0.94 | ) | (0.08 | ) | — | (0.08 | ) | 8.71 | (9.60 | ) | 196,841 | 1.41 | 1.32 | 1.32 | 19 | |||||||||||||||||||||||||||||||||||||
| 07/01/14 | 06/30/15 | 10.21 | 0.11 | (0.45 | ) | (0.34 | ) | (0.14 | ) | — | (0.14 | ) | 9.73 | (3.33 | ) | 155,919 | 1.16 | 1.37 | 1.37 | 22 | |||||||||||||||||||||||||||||||||||||
| 07/01/13 | 06/30/14 | 9.51 | 0.19 | 0.61 | 0.80 | (0.10 | ) | — | (0.10 | ) | 10.21 | 8.51 | 24,291 | 1.93 | 1.40 | 1.40 | 19 | ||||||||||||||||||||||||||||||||||||||||
| Advisor Shares* | |||||||||||||||||||||||||||||||||||||||||||||||||||||||||
| 07/01/17 | 06/30/18 | 10.19 | 0.13 | (0.18 | ) | (0.05 | ) | (0.07 | ) | — | (0.07 | ) | 10.07 | (0.60 | ) | 172 | 1.17 | 1.55 | 1.55 | 13 | |||||||||||||||||||||||||||||||||||||
| 07/01/16 | 06/30/17 | 8.73 | 0.08 | 1.45 | 1.53 | (0.07 | ) | — | (0.07 | ) | 10.19 | 17.65 | 253 | 0.91 | 1.57 | 1.57 | 23 | ||||||||||||||||||||||||||||||||||||||||
| 07/01/15 | 06/30/16 | 9.70 | 0.10 | (1.05 | ) | (0.95 | ) | (0.02 | ) | — | (0.02 | ) | 8.73 | (9.82 | ) | 281 | 1.16 | 1.57 | 1.57 | 19 | |||||||||||||||||||||||||||||||||||||
| 07/01/14 | 06/30/15 | 10.18 | 0.09 | (0.46 | ) | (0.37 | ) | (0.11 | ) | — | (0.11 | ) | 9.70 | (3.60 | ) | 942 | 0.91 | 1.62 | 1.62 | 22 | |||||||||||||||||||||||||||||||||||||
| 07/01/13 | 06/30/14 | 9.49 | 0.16 | 0.61 | 0.77 | (0.08 | ) | — | (0.08 | ) | 10.18 | 8.19 | 533 | 1.68 | 1.65 | 1.65 | 19 | ||||||||||||||||||||||||||||||||||||||||
| BROWN ADVISORY – MACQUARIE ASIA NEW STARS FUND: | |||||||||||||||||||||||||||||||||||||||||||||||||||||||||
| Institutional Shares* | |||||||||||||||||||||||||||||||||||||||||||||||||||||||||
| 07/01/17 | 06/30/18 | 9.87 | 0.04 | 0.28 | 0.32 | (0.03 | ) | — | (0.03 | ) | 10.16 | 3.26 | 245,931 | 0.43 | 1.49 | 1.49 | 88 | ||||||||||||||||||||||||||||||||||||||||
| 07/01/16 | 06/30/17 | 9.18 | 0.02 | 0.67 | 0.69 | — | — | — | 9.87 | 7.52 | 239,812 | 0.25 | 1.55 | 1.55 | 169 | ||||||||||||||||||||||||||||||||||||||||||
| 07/01/15 | 06/30/16 | 11.70 | — | (2.10 | ) | (2.10 | ) | — | (0.42 | ) | (0.42 | ) | 9.18 | (18.16 | ) | 212,344 | (0.03 | ) | 1.51 | 1.51 | 126 | ||||||||||||||||||||||||||||||||||||
| 11/21/14^ | 06/30/15 | 10.00 | 0.02 | 1.68 | 1.70 | — | — | — | 11.70 | 17.00 | 187,901 | 0.27 | 1.83 | 1.83 | 89 | ||||||||||||||||||||||||||||||||||||||||||
| Investor Shares* | |||||||||||||||||||||||||||||||||||||||||||||||||||||||||
| 07/01/17 | 06/30/18 | 9.83 | 0.03 | 0.28 | 0.31 | (0.02 | ) | — | (0.02 | ) | 10.12 | 3.17 | 2,713 | 0.28 | 1.64 | 1.64 | 88 | ||||||||||||||||||||||||||||||||||||||||
| 07/01/16 | 06/30/17 | 9.15 | 0.01 | 0.67 | 0.68 | — | — | — | 9.83 | 7.43 | 3,835 | 0.10 | 1.70 | 1.70 | 169 | ||||||||||||||||||||||||||||||||||||||||||
| 07/01/15 | 06/30/16 | 11.69 | (0.02 | ) | (2.10 | ) | (2.12 | ) | — | (0.42 | ) | (0.42 | ) | 9.15 | (18.35 | ) | 5,633 | (0.18 | ) | 1.66 | 1.66 | 126 | |||||||||||||||||||||||||||||||||||
| 11/21/14^ | 06/30/15 | 10.00 | 0.01 | 1.68 | 1.69 | — | — | — | 11.69 | 16.90 | 18,992 | 0.12 | 1.98 | 1.98 | 89 | ||||||||||||||||||||||||||||||||||||||||||
| BROWN ADVISORY – BEUTEL GOODMAN LARGE-CAP VALUE FUND: | |||||||||||||||||||||||||||||||||||||||||||||||||||||||||
| Institutional Shares* | |||||||||||||||||||||||||||||||||||||||||||||||||||||||||
| 02/13/18^ | 06/30/18 | 10.00 | 0.06 | (0.48 | ) | (0.42 | ) | — | — | — | 9.58 | (4.20 | ) | 151,004 | 1.61 | 0.67 | 0.67 | 11 | |||||||||||||||||||||||||||||||||||||||
| * | Redemption fees of less than $0.005/share are not presented and are included in net realized & unrealized gains (losses) from investment operations. |
| ^ | Commencement of operations. |
| (a) | Calculated based on average shares outstanding during the fiscal period. |
| (b) | Annualized for periods less than one year. Ratios include only income and expenses of the funds themselves, as presented in the Statements of Operations, and do not include any additional or pro rata amounts of income or expenses from the ownership of any other investment companies (as applicable). |
| (c) | Not annualized for periods less than one year. Portfolio turnover rates are calculated at the fund level (not by individual share class). |
| (d) | Reflects the expense ratio excluding any expense waivers or expense recoupments. |
| (e) | Less than $0.005/share. |
The accompanying notes are an integral part of these financial statements.
131
Notes to Financial Statements
June 30, 2018
Note 1. Organization
The Brown Advisory Growth Equity Fund (“Growth Equity Fund”), Brown Advisory Flexible Equity Fund (“Flexible Equity Fund”), Brown Advisory Equity Income Fund (“Equity Income Fund”), Brown Advisory Sustainable Growth Fund (“Sustainable Growth Fund”), Brown Advisory Mid-Cap Growth Fund (“Mid-Cap Growth Fund”), Brown Advisory Small-Cap Growth Fund (“Small-Cap Growth Fund”), Brown Advisory Small-Cap Fundamental Value Fund (“Small-Cap Fundamental Value Fund”), Brown Advisory Global Leaders Fund (“Global Leaders Fund”), Brown Advisory Intermediate Income Fund (“Intermediate Income Fund”), Brown Advisory Total Return Fund (“Total Return Fund”), Brown Advisory Strategic Bond Fund (“Strategic Bond Fund”), Brown Advisory Sustainable Bond Fund (“Sustainable Bond Fund”), Brown Advisory Maryland Bond Fund (“Maryland Bond Fund”), Brown Advisory Tax Exempt Bond Fund (“Tax Exempt Bond Fund”), Brown Advisory Mortgage Securities Fund (“Mortgage Securities Fund”), Brown Advisory – WMC Strategic European Equity Fund (“WMC Strategic European Equity Fund”), Brown Advisory –WMC Japan Alpha Opportunities Fund (“WMC Japan Alpha Opportunities Fund”), Brown Advisory – Somerset Emerging Markets Fund (“Somerset Emerging Markets Fund”) Brown Advisory – Macquarie Asia New Stars Fund (“Macquarie Asia New Stars Fund”) and Brown Advisory – Beutel Goodman Large-Cap Value Fund (“Beutel Goodman Large-Cap Value Fund”) (individually a “Fund,” and collectively, the “Funds”) are each a series of shares of beneficial interest of Brown Advisory Funds (the “Trust”), which is registered under the Investment Company Act of 1940 as an open-ended management investment company.
The Funds commenced operations as follows:
| Institutional | Investor | Advisor | |
Shares | Shares | Shares | |
| Growth Equity Fund | 10/19/2012 | 6/28/1999 | 5/18/2006 |
| Flexible Equity Fund | 10/19/2012 | 11/30/2006 | 1/24/2007 |
| Equity Income Fund | 10/19/2012 | 12/29/2011 | 12/29/2011 |
| Sustainable Growth Fund | 6/29/2012 | 6/29/2012 | 6/29/2012 |
| Mid-Cap Growth Fund | — | 10/2/2017 | — |
| Small-Cap Growth Fund | 9/20/2002 | 6/28/1999 | 4/25/2006 |
| Small-Cap Fundamental Value Fund | 10/19/2012 | 12/31/2008 | 7/28/2011 |
| Global Leaders Fund | — | 7/1/2015 | — |
| Intermediate Income Fund | — | 11/2/1995 | 5/13/1991 |
| Total Return Fund | 10/30/2014 | 10/30/2014 | — |
| Strategic Bond Fund | — | 10/31/2014 | 9/30/2011 |
| Sustainable Bond Fund | — | 8/7/2017 | — |
| Maryland Bond Fund | — | 12/21/2000 | — |
| Tax Exempt Bond Fund | — | 6/29/2012 | — |
| Mortgage Securities Fund | — | 12/26/2013 | — |
| WMC Strategic European Equity Fund | 10/21/2013 | 10/21/2013 | 10/21/2013 |
| WMC Japan Alpha Opportunities Fund | 3/4/2014 | 3/4/2014 | 3/4/2014 |
| Somerset Emerging Markets Fund | 12/12/2012 | 12/12/2012 | 12/12/2012 |
| Macquarie Asia New Stars Fund | 11/21/2014 | 11/21/2014 | — |
| Beutel Goodman Large-Cap Value Fund | 2/13/2018 | — | — |
Each share class has equal rights as to earnings and assets except that each class bears different shareholder servicing and distribution expenses. Each share class has exclusive voting rights with respect to matters that affect just that class. Income, expenses (other than expenses attributable to a specific class), and realized and unrealized gains or losses on investments are allocated to each share class on the basis of its relative net assets.
The investment objective of Growth Equity Fund and Small-Cap Growth Fund is to achieve capital appreciation by primarily investing in equity securities. The investment objective of Small-Cap Fundamental Value Fund is to achieve long-term capital appreciation. Flexible Equity Fund’s investment objective is to achieve long-term growth of capital. Mid-Cap Growth Fund seeks to achieve capital appreciation. Maryland Bond Fund’s investment objective is to provide a high level of current income exempt from both Federal and Maryland State income taxes without undue risk. Intermediate Income Fund’s investment objective is to provide a high level of current income consistent with preservation of principal within an intermediate-term maturity structure. Equity Income Fund’s investment objective is to provide current dividend yield and dividend growth. Sustainable Growth Fund’s investment objective is to seek capital appreciation by investing at least 80% of its net assets in equity securities of environmentally sustainable domestic
132
Notes to Financial Statements
June 30, 2018
companies. The investment objective of the Strategic Bond Fund is to achieve capital appreciation and income with a low correlation to interest rate movements. Sustainable Bond Fund seeks to provide a competitive return consistent with preservation of principal while giving special considerations to certain environmental, social and governance criteria. Tax Exempt Bond Fund’s investment objective is to seek to provide a high level of current income exempt from Federal income tax by investing primarily in intermediate-term investment grade municipal bonds. The investment objective of the Somerset Emerging Markets Fund is to seek to achieve total return by investing principally in equity securities issued by companies established or operating in emerging markets. The investment objective of the WMC Strategic European Equity Fund seeks to achieve total return by investing principally in equity securities issued by companies established or operating in Europe. The investment objective of the Mortgage Securities Fund seeks to maximize total return consistent with preservation of capital. The investment objective of the WMC Japan Alpha Opportunities Fund seeks to achieve total return by investing principally in equity securities of companies which are domiciled in or exercise the predominant part of their economic activity in Japan. Global Leaders Fund seeks to achieve capital appreciation by investing primarily in global equities. The investment objective of the Total Return Fund is to provide a competitive total return consistent with preservation of principal. The Macquarie Asia New Stars Fund’s investment objective is to achieve total return by investing principally in equity securities issued by small and medium capitalization companies which are domiciled in or exercise the predominant part of their economic activity in Asia (excluding Japan). The Beutel Goodman Large-Cap Value Fund seeks to achieve capital appreciation.
Note 2. Significant Accounting Policies
The following is a summary of significant accounting policies consistently followed by the Funds. These policies are in conformity with accounting principles generally accepted in the United States of America.
A. Security Valuation – The Funds have adopted fair valuation accounting standards which establish an authoritative definition of fair value and set out a hierarchy for measuring fair value. These standards require additional disclosures about the various inputs and valuation techniques used to develop the measurements of fair value and a discussion of changes in valuation techniques and related inputs, if any, during the period. These inputs are summarized in the three broad levels listed below:
| Level 1 – | Quoted prices in active markets for identical securities. |
| Level 2 – | Evaluated price based on other significant observable inputs (including quoted prices for similar securities, interest rates, prepayment spreads, credit risk, etc). |
| Level 3 – | Significant unobservable inputs (including the Fund’s own assumptions in determining the fair value of investments). |
The inputs or methodology used for valuing securities are not necessarily an indication of the risk associated with investing in those securities.
Equity securities that are traded on a national securities exchange, except those listed on the NASDAQ Global Market® (“NASDAQ”), are valued at the last reported sale price on the exchange on which the security is principally traded. Securities traded on NASDAQ will be valued at the NASDAQ Official Closing Price (“NOCP”). If, on a particular day, an exchange-traded or NASDAQ security does not trade, then the mean between the most recent quoted bid and asked prices will be used. All equity securities that are not traded on a listed exchange are valued at the last sale price in the over-the counter market. If a non-exchange traded security does not trade on a particular day, then the mean between the last quoted closing bid and asked price will be used. Such domestic equity securities are typically categorized as Level 1 securities. Investments in other domestic investment companies (open-ended mutual funds) are valued at their reported Net Asset Value (“NAV”) and are typically categorized as Level 1 securities. Investments in Exchange Traded Funds (“ETFs”) and Closed-End Funds are valued at their last reported sale price and are typically categorized as Level 1 securities.
For foreign securities that are traded on foreign exchanges, the Funds have selected ICE Data Services (“ICE”) to provide pricing data for those such securities that are held by the Funds. The use of ICE’s pricing services with respect to these foreign exchange traded securities is designed to capture events occurring after a foreign exchange closes that may affect the value of certain holdings of the Funds that are traded on those foreign exchanges. The Funds utilize a confidence interval when determining whether or not to utilize these prices provided by ICE. The confidence interval is a measure of the relationship that each foreign exchange traded security has to movements in various indices and the price of the foreign exchange traded security’s corresponding American Depositary Receipt, if one exists. ICE provides a confidence interval for each foreign exchange traded security for which it provides a price. If the confidence interval provided by ICE is equal to or greater than a predefined level utilized by the Funds, the Funds will value that foreign exchange traded security at that price. If the confidence interval provided by ICE is less than the predefined level utilized by the Funds, the Funds will value that foreign exchange traded security at the preceding closing price on its respective foreign exchange, or, if there were no transactions on the preceding day, at the mean between the bid and the asked
133
Notes to Financial Statements
June 30, 2018
prices. Such foreign securities are typically categorized as Level 2 securities. Foreign securities for which the local market closing prices are utilized are typically categorized as Level 1 securities.
Debt securities are valued by using the mean between the closing bid and asked prices provided by an independent pricing service. If the closing bid and asked prices are not readily available, the independent pricing service may provide a price determined by a matrix pricing method. These techniques generally consider such factors as yields or prices of bonds of comparable quality, type of issue, coupon, maturity, ratings and general market conditions. Fixed income debt instruments, such as commercial paper, banker’s acceptances and U.S. Treasury Bills, having a maturity of less than 60 days are valued at amortized cost when the amortized cost value is determined to approximate fair value established using market-based and issuer-specific factors. Such debt securities are typically categorized as Level 2. Debt securities that are valued using the mean between the closing bid and asked prices, based upon a quote from a single broker and provided by an independent pricing service, are generally categorized as Level 3.
Exchange traded options are valued at the composite price, using the National Best Bid and Offer quotes (NBBO). NBBO consists of the highest bid price and lowest ask price across any of the exchanges on which an option is quoted, thus providing a view across the entire U.S. options marketplace. Specifically, composite pricing calculates the mean of the highest bid price and lowest ask price across the exchanges where the option is traded. Such options are typically categorized as Level 2.
Futures contracts are generally valued at the settlement prices established each day on the exchange on which they are traded and are categorized as Level 1 securities.
Forward foreign currency contracts are valued at the prevailing forward exchange rate of the underlying currencies and are categorized as Level 2 securities.
Securities for which quotations are not readily available are valued at their respective fair values as determined in good faith under guidelines and procedures adopted by the Board of Trustees. These are generally considered Level 3 securities when significant unobservable inputs are utilized in the determination of the fair value. When a security is “fair valued,” consideration is given to the facts and circumstances relevant to the particular situation, including a review of various factors set forth in the guidelines and procedures adopted by the Board of Trustees. Fair value pricing is an inherently subjective process, and no single standard exists for determining fair value. Different funds could reasonably arrive at different values for the same security. The use of fair value pricing by a fund may cause the net asset value of its shares to differ significantly from the net asset value that would be calculated without regard to such considerations. As of June 30, 2018, the Small-Cap Growth Fund, Intermediate Income Fund, Total Return Fund, Strategic Bond Fund and Mortgage Securities Fund held Level 3 securities for which significant and unobservable inputs or assumptions were used in the determination of fair value. The total market value of such securities held as of June 30, 2018 was $2,582,063 or 0.3% of Small-Cap Growth Fund’s net assets, $1,131,822 or 0.9% of Intermediate Income Fund’s net assets, $1,153,813 or 0.9% of Total Return Fund’s net assets, $871,021 or 0.6% of Strategic Bond Fund’s net assets and $2,119,829 or 0.7% of Mortgage Securities Fund’s net assets.
The following is a summary of inputs used to value the Funds’ investments as of June 30, 2018:
| Level 1 | Level 2 | Level 3 | ||||||||||
| Growth Equity Fund | ||||||||||||
| Common Stocks | $ | 1,945,104,321 | $ | — | $ | — | ||||||
| REIT^ | 69,942,520 | — | — | |||||||||
| Short-Term Investments | 48,745,022 | — | — | |||||||||
| Total Investments | $ | 2,063,791,863 | $ | — | $ | — | ||||||
| Flexible Equity Fund | ||||||||||||
| Common Stocks | $ | 424,449,847 | $ | — | $ | — | ||||||
| REIT^ | 10,802,981 | — | — | |||||||||
| Closed-End Funds | 12,060,688 | — | — | |||||||||
| Warrants | 440,400 | — | — | |||||||||
| Short-Term Investments | 6,126,082 | — | — | |||||||||
| Total Investments | $ | 453,879,998 | $ | — | $ | — | ||||||
| Equity Income Fund | ||||||||||||
| Common Stocks | $ | 85,971,187 | $ | — | $ | — | ||||||
| REIT^ | 7,048,069 | — | — | |||||||||
| Short-Term Investments | 2,997,202 | — | — | |||||||||
| Total Investments | $ | 96,016,458 | $ | — | $ | — | ||||||
| Sustainable Growth Fund | ||||||||||||
| Common Stocks | $ | 633,277,165 | $ | — | $ | — | ||||||
| REIT^ | 29,393,524 | — | — | |||||||||
| Short-Term Investments | 21,937,525 | — | — | |||||||||
| Total Investments | $ | 684,608,214 | $ | — | $ | — | ||||||
| Mid-Cap Growth Fund | ||||||||||||
| Common Stocks | $ | 20,391,317 | $ | — | $ | — | ||||||
| REIT^ | 413,791 | — | — | |||||||||
| Short-Term Investments | 563,521 | — | — | |||||||||
| Total Investments | $ | 21,368,629 | $ | — | $ | — | ||||||
| Small-Cap Growth Fund | ||||||||||||
| Common Stocks | $ | 864,601,670 | $ | — | $ | — | ||||||
| Private Placements | — | — | 2,450,871 | |||||||||
| Contingent Value Rights | — | — | 131,192 | |||||||||
| Short-Term Investments | 52,791,450 | — | — | |||||||||
| Total Investments | $ | 917,393,120 | $ | — | $ | 2,582,063 | ||||||
134
Notes to Financial Statements
June 30, 2018
| Level 1 | Level 2 | Level 3 | ||||||||||
| Small-Cap Fundamental Value Fund | ||||||||||||
| Common Stocks | $ | 1,113,544,913 | $ | — | $ | — | ||||||
| REIT^ | 123,511,767 | — | — | |||||||||
| Investment Companies | 32,567,449 | — | — | |||||||||
| Short-Term Investments | 42,871,046 | — | — | |||||||||
| Total Investments | $ | 1,312,495,175 | $ | — | $ | — | ||||||
| Global Leaders Fund | ||||||||||||
| Common Stocks: | ||||||||||||
| China | $ | 1,955,497 | $ | 2,668,158 | $ | — | ||||||
| France | — | 3,013,941 | — | |||||||||
| Germany | — | 3,979,853 | — | |||||||||
| India | 1,894,344 | — | — | |||||||||
| Indonesia | — | 1,605,311 | — | |||||||||
| Japan | — | 1,727,966 | — | |||||||||
| Netherlands | — | 2,814,570 | — | |||||||||
| Sweden | 496,088 | 1,447,022 | — | |||||||||
| Switzerland | — | 2,440,966 | — | |||||||||
| Taiwan | 2,709,206 | — | — | |||||||||
| United Kingdom | — | 5,877,157 | — | |||||||||
| United States | 51,704,201 | — | — | |||||||||
| Short-Term Investments | 2,412,973 | — | — | |||||||||
| Total Investments | $ | 61,172,309 | $ | 25,574,944 | $ | — | ||||||
| Intermediate Income Fund | ||||||||||||
| Corporate Bonds & Notes | $ | — | $ | 32,602,453 | $ | — | ||||||
| Mortgage Backed Securities | — | 18,849,123 | — | |||||||||
| Municipal Bonds | — | 14,319,741 | — | |||||||||
| Asset Backed Securities | — | 8,932,990 | 1,131,822 | |||||||||
| U.S. Treasury Notes | — | 25,232,091 | — | |||||||||
| Affiliated Mutual Funds | 24,318,345 | — | — | |||||||||
| Short-Term Investments | 2,724,095 | — | — | |||||||||
| Total Investments | $ | 27,042,440 | $ | 99,936,398 | $ | 1,131,822 | ||||||
| Total Return Fund | ||||||||||||
| Asset Backed Securities | $ | — | $ | 36,689,154 | $ | 1,153,813 | ||||||
| Mortgage Backed Securities | — | 35,561,477 | — | |||||||||
| Corporate Bonds & Notes | — | 35,594,357 | — | |||||||||
| Municipal Bonds | — | 8,977,448 | — | |||||||||
| U.S. Treasury Notes | — | 5,949,971 | — | |||||||||
| Preferred Stocks | 53,976 | — | — | |||||||||
| Short-Term Investments | 9,187,484 | 349,690 | — | |||||||||
| Total Investments | $ | 9,241,460 | $ | 123,122,097 | $ | 1,153,813 | ||||||
| Futures Contracts – Long* | $ | 534,357 | $ | — | $ | — | ||||||
| Futures Contracts – Short* | $ | (43,474 | ) | $ | — | $ | — | |||||
| Strategic Bond Fund | ||||||||||||
| Asset Backed Securities | $ | — | $ | 62,667,978 | $ | 871,021 | ||||||
| Corporate Bonds & Notes | — | 48,435,305 | — | |||||||||
| Mortgage Backed Securities | — | 35,086,364 | — | |||||||||
| Municipal Bonds | — | 9,027,064 | — | |||||||||
| Preferred Stocks | 704,241 | — | — | |||||||||
| Closed-End Funds | 385,268 | — | — | |||||||||
| Short-Term Investments | 3,252,219 | — | — | |||||||||
| Total Investments | $ | 4,341,728 | $ | 155,216,711 | $ | 871,021 | ||||||
| Futures Contracts – Short* | $ | (70,497 | ) | $ | — | $ | — | |||||
| Sustainable Bond Fund | ||||||||||||
| Corporate Bonds & Notes | $ | — | $ | 23,148,569 | $ | — | ||||||
| Mortgage Backed Securities | — | 10,539,684 | — | |||||||||
| Municipal Bonds | — | 9,674,874 | — | |||||||||
| Foreign Government Bonds | — | 5,578,939 | — | |||||||||
| U.S. Treasury Securities | — | 3,369,191 | — | |||||||||
| Asset Backed Securities | — | 846,868 | — | |||||||||
| Short-Term Investments | 1,475,036 | — | — | |||||||||
| Total Investments | $ | 1,475,036 | $ | 53,158,125 | $ | — | ||||||
| Futures Contracts – Long* | $ | 55,735 | $ | — | $ | — | ||||||
| Futures Contracts – Short* | $ | (65,519 | ) | $ | — | $ | — | |||||
| Maryland Bond Fund | ||||||||||||
| Municipal Bonds | $ | — | $ | 177,696,949 | $ | — | ||||||
| Short-Term Investments | 1,354,987 | — | — | |||||||||
| Total Investments | $ | 1,354,987 | $ | 177,696,949 | $ | — | ||||||
| Tax Exempt Bond Fund | ||||||||||||
| Municipal Bonds | $ | — | $ | 421,864,476 | $ | — | ||||||
| Short-Term Investments | 11,334,014 | — | — | |||||||||
| Total Investments | $ | 11,334,014 | $ | 421,864,476 | $ | — | ||||||
| Mortgage Securities Fund | ||||||||||||
| Mortgage Backed Securities | $ | — | $ | 301,920,279 | $ | — | ||||||
| Asset Backed Securities | — | 52,489,340 | 2,119,829 | |||||||||
| Municipal Bonds | — | 16,337,449 | — | |||||||||
| Preferred Stocks | 457,018 | — | — | |||||||||
| Short-Term Investments | 6,115,021 | 1,273,865 | — | |||||||||
| Total Investments | $ | 6,572,039 | $ | 372,020,933 | $ | 2,119,829 | ||||||
| Futures Contracts – Long* | $ | 928,848 | $ | — | $ | — | ||||||
| Futures Contracts – Short* | $ | (293,092 | ) | $ | — | $ | — | |||||
| WMC Strategic European Equity Fund | ||||||||||||
| Common Stocks: | ||||||||||||
| Austria | $ | — | $ | 5,633,732 | $ | — | ||||||
| Belgium | — | 21,399,247 | — | |||||||||
| Denmark | — | 35,732,516 | — | |||||||||
| Finland | — | 43,042,822 | — | |||||||||
| France | — | 132,463,294 | — | |||||||||
| Germany | — | 123,323,048 | — | |||||||||
| Italy | — | 4,443,515 | — | |||||||||
| Netherlands | — | 71,713,978 | — | |||||||||
| Norway | — | 2,824,012 | — | |||||||||
| Spain | — | 10,740,092 | — | |||||||||
| Sweden | 23,842,131 | 81,623,074 | — | |||||||||
| Switzerland | — | 137,670,326 | — | |||||||||
| United Kingdom | 13,833,534 | 226,157,217 | — | |||||||||
| Preferred Stocks | — | 5,858,472 | — | |||||||||
| Short-Term Investments | 5,800,490 | — | — | |||||||||
| Total Investments | $ | 43,476,155 | $ | 902,625,345 | $ | — | ||||||
135
Notes to Financial Statements
June 30, 2018
| Level 1 | Level 2 | Level 3 | ||||||||||
| WMC Japan Alpha Opportunities Fund | ||||||||||||
| Common Stocks | $ | 2,901,965 | $ | 1,386,120,680 | $ | — | ||||||
| REIT^ | — | 4,783,431 | — | |||||||||
| Exchange Traded Funds | — | 12,974,763 | — | |||||||||
| Short-Term Investments | 80,010,800 | — | — | |||||||||
| Total Investments | $ | 82,912,765 | $ | 1,403,878,874 | $ | — | ||||||
| Futures Contracts – Long* | $ | (1,048,078 | ) | $ | — | $ | — | |||||
| Forward Foreign Currency | ||||||||||||
| Exchange Contracts* | $ | — | $ | (384,181 | ) | $ | — | |||||
| Somerset Emerging Markets Fund | ||||||||||||
| Common Stocks: | ||||||||||||
| Brazil | $ | 29,088,169 | $ | — | $ | — | ||||||
| Chile | 22,030,323 | — | — | |||||||||
| China | — | 29,583,534 | — | |||||||||
| Germany | — | 2,681,394 | — | |||||||||
| Greece | — | 16,530,905 | — | |||||||||
| Hungary | — | 46,498,767 | — | |||||||||
| India | — | 58,188,077 | — | |||||||||
| Indonesia | — | 9,643,947 | — | |||||||||
| Netherlands | — | 16,212,333 | — | |||||||||
| Nigeria | — | 5,674,376 | — | |||||||||
| Philippines | — | 5,385,083 | — | |||||||||
| Poland | — | 17,148,331 | — | |||||||||
| Portugal | — | 4,735,092 | — | |||||||||
| Russia | 4,090,228 | 13,400,974 | — | |||||||||
| South Africa | — | 27,175,306 | — | |||||||||
| South Korea | 7,724,886 | 103,119,948 | — | |||||||||
| Taiwan | — | 53,683,991 | — | |||||||||
| Turkey | 630,764 | 20,052,231 | — | |||||||||
| United Arab Emirates | 4,039,575 | 14,509,721 | — | |||||||||
| United Kingdom | — | 37,003,134 | — | |||||||||
| Short-Term Investments | 338,107 | — | — | |||||||||
| Total Investments | $ | 67,942,052 | $ | 481,227,144 | $ | — | ||||||
| Macquarie Asia New Stars Fund | ||||||||||||
| Common Stocks: | ||||||||||||
| China | $ | 49,797,642 | $ | 52,052,168 | $ | — | ||||||
| India | — | 27,971,373 | — | |||||||||
| Indonesia | — | 4,048,571 | — | |||||||||
| Malaysia | — | 11,094,134 | — | |||||||||
| Philippines | — | 7,784,605 | — | |||||||||
| Singapore | — | 5,134,566 | — | |||||||||
| South Korea | — | 44,907,080 | — | |||||||||
| Taiwan | — | 27,885,168 | — | |||||||||
| Thailand | — | 4,359,755 | — | |||||||||
| Short-Term Investments | 16,758,594 | — | — | |||||||||
| Total Investments | $ | 66,556,236 | $ | 185,237,420 | $ | — | ||||||
| Beutel Goodman Large-Cap Value Fund | ||||||||||||
| Common Stocks | $ | 145,061,015 | $ | — | $ | — | ||||||
| Short-Term Investments | 2,967,792 | — | — | |||||||||
| Total Investments | $ | 148,028,807 | $ | — | $ | — | ||||||
| ^ | Real Estate Investment Trusts |
| * | Amounts presented for Futures Contracts and Forward Foreign Currency Exchange Contracts represent total unrealized appreciation (depreciation) as of June 30, 2018. |
The Funds recognize transfers between levels as of the end of the fiscal year. There were no transfers into or out of Level 1, Level 2 or Level 3 securities as of June 30, 2018, except in the Intermediate Income Fund, Total Return Fund, Strategic Bond Fund and Mortgage Securities Fund, in which asset backed securities previously categorized in Level 2 have been transferred into Level 3.
The following is a reconciliation of Level 3 securities for which significant unobservable inputs were used to determine fair value.
Small-Cap Growth Fund | Contingent Value Rights | Private Placements | ||||||
| Balance as of June 30, 2017 | $ | 131,192 | $ | 2,415,460 | ||||
| Acquisitions / Purchases | — | 43,000 | ||||||
| Distributions / Returns of Capital | — | (274,350 | ) | |||||
| Realized Gains | — | 208,000 | ||||||
| Change in Unrealized Appreciation | — | 58,761 | ||||||
| Balance as of June 30, 2018 | $ | 131,192 | $ | 2,450,871 | ||||
The Contingent Value Rights (“CVR”) were acquired as a result of Dyax Corp. (which was a portfolio holding of the Fund) being acquired by Shire PLC. In exchange for the Fund’s shares in Dyax Corp., the Fund received cash considerations from Shire PLC as well as the CVR. The CVR are valued at the difference between the cash price at which Dyax Corp. was acquired by Shire PLC and the closing price of Dyax Corp. on its last day of trading prior to the acquisition.
136
Notes to Financial Statements
June 30, 2018
The inputs utilized in valuing the Private Placements consist of annual audited financial statements and quarterly capital statements which are provided by the issuer. These valuations are adjusted periodically for certain events (additional contributions of capital or purchases made by the Fund, distributions to the Fund made by the issuer, etc) that may occur prior to receipt of the next quarterly capital statement or Annual Report.
| Asset Backed Securities | ||||||||||||||||
| Intermediate | Total | Strategic | Mortgage | |||||||||||||
| Income Fund | Return Fund | Bond Fund | Securities Fund | |||||||||||||
| Balance as of June 30, 2017 | $ | — | $ | — | $ | — | $ | — | ||||||||
| Transfers into Level 3 as of June 30, 2018 | 1,131,822 | 1,153,813 | 871,021 | 2,119,829 | ||||||||||||
| Balance as of June 30, 2018 | $ | 1,131,822 | $ | 1,153,813 | $ | 871,021 | $ | 2,119,829 | ||||||||
These asset backed securities are valued utilizing prices from an independent pricing service that are based upon quotes from a single broker.
B. Securities Transactions and Investment Income – Investment securities transactions are accounted for on the trade date. Discounts/premiums on debt securities purchased are accreted/amortized over the life of the respective securities. Dividend income is recorded on the ex-dividend date. Interest income is recorded on an accrual basis. Income and capital gains on some foreign securities may be subject to foreign withholding or capital gains taxes. Identified cost of investments sold is used to determine the gain and loss for both financial statement and Federal income tax purposes. Distributions deemed to be a return of capital are recorded as a reduction of the cost of the related investments.
C. Foreign Currency – Investment securities and other assets and liabilities denominated in foreign currencies are translated into U.S. Dollar amounts at the date of valuation. Purchases and sales of investment securities and income and expense items denominated in foreign currencies are translated into U.S. Dollar amounts on the respective dates of such transactions.
The Funds do not isolate the portion of the results of operations resulting from changes in foreign exchange rates on investments from the fluctuations arising from changes in market prices of securities held. Such fluctuations are included with the net realized and unrealized gain or loss from investments.
Some of the Funds may invest in forward foreign currency contracts. These amounts are presented separately from realized and unrealized gains and losses from investments in the financial statements.
D. Options – The Funds may invest in options. When a Fund writes an option, an amount equal to the premium received by a Fund is recorded as a liability and is subsequently adjusted to the current value of the option written. Premiums received from writing options that expire unexercised are treated by a Fund on the expiration date as realized gain from investments. The difference between the premium and the amount paid on effecting a closing purchase transaction, including brokerage commissions, is also treated as a realized gain, or if the premium is less than the amount paid for closing purchase transaction, as a realized loss. If a call option is exercised, the premium is added to the proceeds from the sale of the underlying security or currency determining whether a Fund has a realized gain or loss. If a put option is exercised, the premium reduces the cost basis of the securities purchase by a Fund. A Fund, as a writer of an option, bears the market risk of an unfavorable change in the price of the security underlying the written option.
When a Fund purchases an option, an amount equal to the premium paid by a Fund is recorded as an investment and is subsequently adjusted to the current value of the option purchased. If an option expires on the stipulated expiration date or if a Fund enters into a closing sale transaction, a gain or loss is realized. If a call option is exercised, the cost of the security acquired is increased by the premium paid for the call. If a put option is exercised, a gain or loss is realized from the sale of the underlying security, and the proceeds from such sale are decreased by the premium originally paid. Written and purchased options are non-income producing securities.
None of the Funds purchased, sold or wrote any options during the year ended June 30, 2018.
E. Distributions to Shareholders – For the Maryland Bond Fund and Tax Exempt Bond Fund, distributions of net investment income, if any, are declared daily and paid monthly. Distributions to shareholders of net investment income, if any, are declared and paid monthly for the Intermediate Income Fund, Total Return Fund, Strategic Bond Fund, Sustainable Bond Fund and Mortgage Securities Fund and quarterly for the Equity Income Fund. The remaining Funds declare and pay net investment income, if any, at least annually. Distributions to shareholders of net capital gains, if any, are declared and paid at least annually. Distributions are recorded on the ex-dividend date.
137
Notes to Financial Statements
June 30, 2018
F. Use of Estimates – The preparation of financial statements in conformity with accounting principles generally accepted in the United States of America requires management to make estimates and assumptions that affect the reported amounts of assets and liabilities at the date of the financial statements and the reported amount of revenue and expenses during the reporting period. Actual results could differ from those estimates.
G. Federal Taxes – Each Fund has elected to be taxed as a “regulated investment company” and intends to distribute substantially all taxable income to its shareholders and otherwise comply with the provisions of the Internal Revenue Code applicable to regulated investment companies. Therefore, no provision for federal income taxes or excise taxes has been made.
The Funds recognize tax benefits of uncertain tax positions only where the position is “more likely than not” to be sustained assuming examination by tax authorities.
The Funds have analyzed their tax positions and have concluded that no liability for unrecognized tax benefits should be recorded related to uncertain income tax positions taken on returns filed for open tax years (2015-2017) as of June 30, 2018 or are expected to be taken in the Funds’ 2018 tax returns. The Funds identify their major tax jurisdictions as U.S. Federal and Delaware State; however the Funds are not aware of any tax position for which it is reasonably possible that the total amounts of unrecognized tax benefits will change materially in the next year.
H. Redemption Fees – A shareholder who redeems or exchanges shares of the Funds within fourteen days of purchase will incur a redemption fee of 1.00% of the current net asset value of shares redeemed or exchanged, subject to certain exceptions. The fee is charged for the benefit of the remaining shareholders and will be paid to the Fund to help offset transaction costs. The fee is accounted for as an addition to paid-in capital. Each Fund reserves the right to modify the terms of or terminate the fee at any time. There are limited exceptions to the imposition of the redemption fee.
I. Guarantees and Indemnifications – In the normal course of business, the Funds enter into contracts with service providers that contain general indemnification clauses. The Funds’ maximum exposure under these arrangements is unknown as this would involve future claims that may be made against the Funds that have not yet occurred. However, based on experience, the Funds expect the risk of loss to be remote.
J. New Accounting Pronouncements – In March 2017, the Financial Accounting Standards Board (FASB) issued Accounting Standards Update (ASU) No. 2017-08, Receivables—Nonrefundable Fees and Other Costs (Subtopic 310-20): Premium Amortization on Purchased Callable Debt Securities. The amendments in the ASU shorten the amortization period for certain callable debt securities, held at a premium, to be amortized to the earliest call date. The ASU does not require an accounting change for securities held at a discount; which continues to be amortized to maturity. The ASU is effective for fiscal years and interim periods within those fiscal years beginning after December 15, 2018. Management is currently evaluating the impact of applying this provision.
Note 3. Commitments and Other Affiliated Party Transactions
Investment Adviser – Brown Advisory LLC serves as Investment Adviser (“the Adviser”) to the Funds. Pursuant to investment advisory agreements, the Adviser receives an advisory fee, accrued daily and payable monthly, from each Fund at an annual rate of the Fund’s average daily net assets as follows:
Annual Advisory Fee | Annual Advisory Fee | ||
| Growth Equity Fund | 0.60% | Strategic Bond Fund | 0.40% |
| Flexible Equity Fund | 0.60% | Sustainable Bond Fund | 0.30% |
| Equity Income Fund | 0.60% | Maryland Bond Fund | 0.30% |
| Sustainable Growth Fund | 0.60% | Tax Exempt Bond Fund | 0.30% |
| Mid-Cap Growth Fund | 0.65% | Mortgage Securities Fund | 0.30% |
| Small-Cap Growth Fund | 0.85% | WMC Strategic European Equity Fund2 | 0.90% |
| Small-Cap Fundamental Value Fund | 0.85% | WMC Japan Alpha Opportunities Fund2 | 1.00% |
Global Leaders Fund1 | 0.65% | Somerset Emerging Markets Fund3 | 0.90% |
| Intermediate Income Fund | 0.30% | Macquarie Asia New Stars Fund4 | 1.25% |
| Total Return Fund | 0.30% | Beutel Goodman Large-Cap Value Fund5 | 0.45% |
1 | Subject to the general oversight of the Adviser and Board of Trustees for the year ended June 30, 2018, Brown Advisory Ltd. (“BAL”) served as sub-adviser to the Global Leaders Fund and made investment decisions on its behalf. BAL is compensated for its services by the Adviser. |
138
Notes to Financial Statements
June 30, 2018
2 | Subject to the general oversight of the Adviser and Board of Trustees for the year ended June 30, 2018, Wellington Management Company LLP (“Wellington”) served as sub-adviser to the WMC Strategic European Equity Fund and the WMC Japan Alpha Opportunities Fund and made investment decisions on their behalf. Wellington is compensated for its services by the Adviser. |
3 | Subject to the general oversight of the Adviser and Board of Trustees for the year ended June 30, 2018, Somerset Capital Management LLP (“Somerset”) served as sub-adviser to the Somerset Emerging Markets Fund and made investment decisions on its behalf. Somerset is compensated for its services by the Adviser. |
4 | Subject to the general oversight of the Adviser and Board of Trustees for the year ended June 30, 2018, Macquarie Funds Management Hong Kong Limited (“MFMHKL”) served as sub-adviser to the Macquarie Asia New Stars Fund and made investment decisions on its behalf. MFMHKL is compensated for its services by the Adviser. |
5 | Subject to the general oversight of the Adviser and Board of Trustees during the period ended June 30, 2018, Beutel, Goodman & Company Ltd. (“Beutel Goodman”) served as sub-adviser to the Beutel Goodman Large-Cap Value Fund and made investment decisions on its behalf. Beutel Goodman is compensated for its services by the Adviser. |
These fees are reported on the Funds’ Statements of Operations as “Investment advisory fees”.
Business Management Fees – The Adviser is also entitled to receive an annual business management fee of 0.05%, accrued daily and payable monthly, of the Funds’ average daily net assets in exchange for its management and oversight of the non-investment advisory services provided to the Funds and the Trust. These fees are reported on the Funds’ Statements of Operations as “Business management fees”.
Fee Waivers and Expense Reimbursements (Operating Expense Caps) – The Adviser has contractually agreed to waive a portion of its fees and reimburse certain expenses to limit total annual operating expenses as follows:
Fund(s): | Institutional Shares | Investor Shares | Advisor Shares |
| Growth Equity, Flexible Equity, Equity Income and Sustainable Growth | 1.00% | 1.15% | 1.35% |
| Mid-Cap Growth, Global Leaders and Beutel Goodman Large-Cap Value | 0.70% | 0.85% | 1.10% |
| Small-Cap Growth and Small-Cap Fundamental Value | 1.25% | 1.40% | 1.60% |
| Intermediate Income, Total Return, | |||
| Sustainable Bond, Maryland Bond, Tax Exempt Bond and Mortgage Securities | 0.55% | 0.60% | 0.80% |
| Strategic Bond | 0.65% | 0.70% | 0.95% |
| WMC Strategic European Equity and Somerset Emerging Markets | 1.60% | 1.75% | 2.00% |
| WMC Japan Alpha Opportunities | 1.70% | 1.85% | 2.10% |
| Macquarie Asia New Stars | 1.95% | 2.10% | 2.35% |
During the year ended June 30, 2018, the Adviser waived $59,874 in expenses for the Mid-Cap Growth Fund, $138,801 in expenses for Global Leaders Fund, and $28,558 in expenses for Sustainable Bond Fund. The Adviser may recoup any waived amounts from the Funds if such reimbursement does not cause the Funds to exceed its existing expense limitations or the limitation in place at the time the reduction was originally made and the amount recouped is made within three years after the date on which the Adviser incurred the expense. The Funds must pay their current ordinary operating expenses before the Adviser is entitled to any recoupment of previously waived fees and/or expenses. At June 30, 2018, the cumulative amounts of previously waived fees that the Adviser may recoup from the Funds is shown below:
2019 | 2020 | 2021 | Total | |
| Mid-Cap Growth Fund | N/A | N/A | $ 59,874 | $ 59,874 |
| Global Leaders Fund | $84,282 | $99,017 | 138,801 | 322,100 |
| Sustainable Bond Fund | N/A | N/A | 28,558 | 28,558 |
During the year ended June 30, 2018, the Adviser recovered $36,683 of previously waived fees in the Strategic Bond Fund.
Distribution – Quasar Distributors, LLC (“the Distributor��) serves as principal underwriter for shares of the Funds, and acts as each Fund’s Distributor in a continuous public offering of each Fund’s shares. The Distributor is an affiliate of the Administrator.
Under a Distribution Plan adopted pursuant to Rule 12b-1 under the Act (“Distribution Plan”), each Fund pays the Distributor or any other entity as authorized by the Board, as compensation for the distribution-related and/or shareholder services provided by such entities an aggregate fee equal to 0.25% of the average daily net assets of Advisor Shares for each Fund. The Distributor may pay any or all amounts received under the Rule 12b-1 Plan to other persons, including the Adviser, for any distribution or service activity. These fees are reported in the Funds’ Statements of Operations as “Distribution Fees – Advisor Shares”.
139
Notes to Financial Statements
June 30, 2018
Shareholder Servicing – The Trust has also adopted a Shareholder Service Plan under which each Fund may pay a fee of up to 0.15% of the average daily net assets of each Fund’s Investor and Advisor Shares (except for the Intermediate Income Fund, Total Return Fund, Strategic Bond Fund, Sustainable Bond Fund, Maryland Bond Fund, Tax Exempt Bond Fund and Mortgage Securities Fund, which may pay a fee of up to 0.05%) for shareholder services provided to the Funds by financial institutions, including the Adviser. These fees are reported in the Funds’ Statements of Operations as “Service Fees – Investor Shares” and “Service Fees – Advisor Shares”.
Investments in Affiliates – Intermediate Income Fund
The Intermediate Income Fund and Mortgage Securities Fund are considered affiliates since Brown Advisory LLC is the Adviser to both of the Funds. In seeking to achieve its investment objective, the Intermediate Income Fund invests a portion of its assets into the Mortgage Securities Fund. As of June 30, 2018, the Intermediate Income Fund owned shares of the Mortgage Securities Fund with a total market value of $24,318,345, or 18.9% of the Intermediate Income Fund’s net assets.
The Intermediate Income Fund has entered into a Fee Waiver Agreement (“the Agreement”) with the Adviser. Per the Agreement, the Intermediate Income Fund will waive Advisory Fees in an amount equal to the Advisory Fees earned by the Mortgage Securities Fund on the assets invested into it by the Intermediate Income Fund. For example, if the Intermediate Income Fund owned $10,000,000 worth of the Mortgage Securities Fund for an entire year, it would waive, on an annual basis, $30,000 in Advisory Fees ($10,000,000 multiplied by 0.30%, the annual Advisory Fee ratio for the Mortgage Securities Fund). For the year ended June 30, 2018, the Intermediate Income Fund waived $83,346 in Advisory Fees per the terms of the Agreement. This is a permanent waiver of fees and these waived fees may not be recouped by the Adviser at any time in the future.
See the table below for details of the Intermediate Income Fund’s investment in the Mortgage Securities Fund Institutional Shares for the year ended June 30, 2018:
| Beginning | Purchases | Proceeds | Unrealized | Net | Change In | Ending Market | ||
| Market Value | at Cost | from Sales | Appreciation | Realized | Unrealized | Value | Capital | |
| [# of shares held] | [# of shares | [# of shares | (Depreciation) | Gains | Appreciation | [# of shares held] | Dividend | Gain |
7/01/2017 | purchased] | sold] | 6/30/2018 | (Losses) | (Depreciation) | 6/30/2018 | Income | Distributions |
| $29,562,515 | $ — | $4,600,000 | $(1,096,662) | $(223,434) | $(420,736) | $24,318,345 | $658,867 | $ — |
| [2,995,189] | [—] | [475,153] | [2,520,036] |
Other Service Providers – U.S. Bancorp Fund Services, LLC (“USBFS”), an indirect wholly-owned subsidiary of U.S. Bancorp, serves as the Funds’ Administrator (“Administrator”), and in that capacity, performs various administrative and accounting services for the Funds. USBFS also serves as the Funds’ fund accountant and transfer agent. Certain officers of the Trust are employees of USBFS and the Funds’ custodian, U.S. Bank, N.A., is an affiliate of the Administrator. Fees paid to USBFS and U.S. Bank, N.A. for its services can be found in the Statements of Operations as “Administration, accounting and transfer agent fees” and “Custodian fees”, respectively. Additional amounts for miscellaneous expenses may be paid by the Funds to USBFS and included in “Miscellaneous expenses” in the Statements of Operations.
Rule 17a-7 Transactions – Each Fund is permitted to purchase and sell securities to certain affiliated parties under specified conditions outlined in procedures adopted by the Board of Trustees pursuant to Rule 17a-7 under the 1940 Act. Pursuant to these procedures, for the year ended June 30, 2018, the Sustainable Bond Fund, WMC Strategic European Equity Fund and WMC Japan Alpha Opportunities Fund engaged in securities purchases of $1,260,252, $312,245 and $299,210, respectively, and the WMC Strategic European Equity Fund and WMC Japan Alpha Opportunities Fund engaged in securities sales of $468,008 and $744,853, respectively. These transactions are included in the purchases and sales table in Note 4.
140
Notes to Financial Statements
June 30, 2018
Note 4. Purchases and Sales of Securities
The cost of purchases and the proceeds from sales of investments (including maturities), other than short-term investments, for the year ended June 30, 2018 were as follows:
| Fund | Purchases | Sales | Fund | Purchases | Sales | |
| Growth Equity | $468,352,992 | $644,039,579 | Strategic Bond | $ 314,386,150 | $ 280,247,935 | |
| Flexible Equity | 63,609,754 | 93,531,968 | Sustainable Bond | 61,545,832 | 16,792,197 | |
| Equity Income | 15,435,609 | 40,930,936 | Maryland Bond | 49,780,541 | 44,242,873 | |
| Sustainable Growth | 291,524,178 | 147,460,704 | Tax Exempt Bond | 345,641,714 | 171,041,760 | |
| Mid-Cap Growth | 22,338,215 | 3,077,512 | Mortgage Securities | 1,359,777,904 | 1,420,062,109 | |
| Small-Cap Growth | 457,919,264 | 209,375,265 | WMC Strategic European Equity | 417,189,270 | 699,825,654 | |
| Small-Cap Fundamental Value | 392,940,688 | 405,730,735 | WMC Japan Alpha Opportunities | 1,227,402,907 | 747,275,543 | |
| Global Leaders | 51,528,597 | 13,998,336 | Somerset Emerging Markets | 80,028,029 | 95,524,809 | |
| Intermediate Income | 44,786,571 | 49,374,529 | Macquarie Asia New Stars | 227,344,693 | 232,772,057 | |
| Total Return | 267,152,427 | 253,251,930 | Beutel Goodman Large-Cap Value | 159,101,655 | 9,714,644 |
The Intermediate Income Fund purchased $10,426,253 and sold $4,171,953 in U.S. Government securities for the year ended June 30, 2018. The Sustainable Bond Fund purchased $7,790,277 and sold $6,515,858 in U.S. Government Securities for the year ended June 30, 2018. Purchases and sales of U.S. Government securities are included in the totals above and include U.S. Treasury Bonds and Notes.
Note 5. Federal Income Tax and Distribution Information
At June 30, 2018, the components of distributable earnings (accumulated losses) on a tax basis were as follows:
| Growth | Flexible | Equity | Sustainable | Mid-Cap | Small-Cap | |||||||||||||||||||
| Equity | Equity | Income | Growth | Growth | Growth | |||||||||||||||||||
| Fund | Fund | Fund | Fund | Fund | Fund | |||||||||||||||||||
| Cost of investments | $ | 1,150,097,532 | $ | 265,218,577 | $ | 60,742,672 | $ | 478,946,275 | $ | 19,913,983 | $ | 681,257,570 | ||||||||||||
| Unrealized appreciation | 918,018,420 | 193,835,673 | 35,603,534 | 211,409,511 | 1,736,453 | 253,847,435 | ||||||||||||||||||
| Unrealized depreciation | (4,324,089 | ) | (5,174,252 | ) | (329,748 | ) | (5,747,572 | ) | (281,807 | ) | (15,129,822 | ) | ||||||||||||
| Net unrealized app (dep) | 913,694,331 | 188,661,421 | 35,273,786 | 205,661,939 | 1,454,646 | 238,717,613 | ||||||||||||||||||
| Undistributed income | — | 1,405,219 | 328,341 | 1,432,439 | 76,762 | 3,777,600 | ||||||||||||||||||
| Undistributed capital gains | 136,184,879 | 9,891,351 | 9,048,594 | 24,715,654 | — | — | ||||||||||||||||||
| Total distributable earnings | 136,184,879 | 11,296,570 | 9,376,935 | 26,148,093 | 76,762 | 3,777,600 | ||||||||||||||||||
| Other accumulated losses | (4,270,996 | ) | 222 | — | — | — | (840,387 | ) | ||||||||||||||||
| Total earnings (losses) | $ | 1,045,608,214 | $ | 199,958,213 | $ | 44,650,721 | $ | 231,810,032 | $ | 1,531,408 | $ | 241,654,826 | ||||||||||||
| Small-Cap | Global | Intermediate | Total | Strategic | Sustainable | |||||||||||||||||||
| Fundamental | Leaders | Income | Return | Bond | Bond | |||||||||||||||||||
| Value Fund | Fund | Fund | Fund | Fund | Fund | |||||||||||||||||||
| Cost of investments | $ | 986,432,337 | $ | 72,147,010 | $ | 131,157,197 | $ | 135,197,764 | $ | 161,424,628 | $ | 55,385,214 | ||||||||||||
| Unrealized appreciation | 344,442,294 | 16,037,076 | 233,181 | 634,339 | 743,999 | 139,369 | ||||||||||||||||||
| Unrealized depreciation | (18,379,456 | ) | (1,436,833 | ) | (3,279,718 | ) | (2,314,733 | ) | (1,739,167 | ) | (891,422 | ) | ||||||||||||
| Net unrealized app (dep) | 326,062,838 | 14,600,243 | (3,046,537 | ) | (1,680,394 | ) | (995,168 | ) | (752,053 | ) | ||||||||||||||
| Undistributed income | 7,897,792 | 347,066 | 22,188 | 249,520 | 285,728 | 105,572 | ||||||||||||||||||
| Undistributed capital gains | 62,783,723 | — | — | — | — | — | ||||||||||||||||||
| Total distributable earnings | 70,681,515 | 347,066 | 22,188 | 249,520 | 285,728 | 105,572 | ||||||||||||||||||
| Other accumulated losses | — | (679,061 | ) | (825,957 | ) | (1,538,301 | ) | (3,394,838 | ) | (202,550 | ) | |||||||||||||
| Total earnings (losses) | $ | 396,744,353 | $ | 14,268,248 | $ | (3,850,306 | ) | $ | (2,969,175 | ) | $ | (4,104,278 | ) | $ | (849,031 | ) | ||||||||
141
Notes to Financial Statements
June 30, 2018
| WMC Japan | ||||||||||||||||||||||||
| Maryland | Tax | Mortgage | WMC Strategic | Alpha | Somerset | |||||||||||||||||||
| Bond | Exempt | Securities | European | Opportunities | Emerging | |||||||||||||||||||
| Fund | Bond Fund | Fund | Equity Fund | Fund | Markets Fund | |||||||||||||||||||
| Cost of investments | $ | 179,602,523 | $ | 433,526,187 | $ | 384,611,549 | $ | 795,515,265 | $ | 1,458,225,394 | $ | 470,147,304 | ||||||||||||
| Gross unrealized appreciation | 1,722,711 | 3,445,770 | 1,621,523 | 181,562,131 | 171,222,018 | 123,762,857 | ||||||||||||||||||
| Gross unrealized depreciation | (2,273,298 | ) | (3,773,467 | ) | (5,520,271 | ) | (30,975,896 | ) | (142,655,773 | ) | (44,740,965 | ) | ||||||||||||
| Net unrealized app (dep) | (550,587 | ) | (327,697 | ) | (3,898,748 | ) | 150,586,235 | 28,566,245 | 79,021,892 | |||||||||||||||
| Undistributed income | 268,938 | ^ | 856,020 | ^ | 638,829 | 13,352,323 | 63,962,954 | 7,814,031 | ||||||||||||||||
| Undistributed capital gains | — | — | — | 35,919,208 | 54,218,641 | — | ||||||||||||||||||
| Total distributable earnings | 268,938 | ^ | 856,020 | ^ | 638,829 | 49,271,531 | 118,181,595 | 7,814,031 | ||||||||||||||||
| Other accumulated losses | (885,034 | ) | (4,493,981 | ) | (12,763,292 | ) | 13,046 | (1,058,776 | ) | (51,992,042 | ) | |||||||||||||
| Total earnings (losses) | $ | (1,166,683 | ) | $ | (3,965,658 | ) | $ | (16,023,211 | ) | $ | 199,870,812 | $ | 145,689,064 | $ | 34,843,881 | |||||||||
^ Represents income that is exempt from federal income taxes.
| Beutel | ||||||||
| Macquarie | Goodman | |||||||
| Asia New | Large-Cap | |||||||
| Stars Fund | Value Fund | |||||||
| Cost of investments | $ | 249,350,560 | $ | 152,354,695 | ||||
| Gross unrealized appreciation | 31,773,269 | 2,746,156 | ||||||
| Gross unrealized depreciation | (29,330,173 | ) | (7,072,044 | ) | ||||
| Net unrealized app (dep) | 2,443,096 | (4,325,888 | ) | |||||
| Undistributed income | 2,583,365 | 664,783 | ||||||
| Undistributed capital gains | — | — | ||||||
| Total distributable earnings | 2,583,365 | 664,783 | ||||||
| Other accumulated losses | (9,140,179 | ) | (109 | ) | ||||
| Total earnings (losses) | $ | (4,113,718 | ) | $ | (3,661,214 | ) | ||
The differences between components of distributable earnings on a tax basis and the amounts reflected in the Statements of Assets and Liabilities are primarily due to wash sales, post-October losses, post-December ordinary losses and distributions payable.
142
Notes to Financial Statements
June 30, 2018
At June 30, 2018, the following capital loss carryforwards and tax deferrals were available and outstanding, respectively:
| Capital Loss Carryforwards | Tax Deferrals | |||||||||||||||||||
| Post-October | Post-December | |||||||||||||||||||
| Fund | Short-Term | Long-Term | Total | Capital Losses | Ordinary Losses | |||||||||||||||
| Growth Equity | $ | — | $ | — | $ | — | $ | — | $ | 4,270,996 | ||||||||||
| Flexible Equity | — | — | — | — | — | |||||||||||||||
| Equity Income | — | — | — | — | — | |||||||||||||||
| Sustainable Growth | — | — | — | — | — | |||||||||||||||
| Mid-Cap Growth | — | — | — | — | — | |||||||||||||||
| Small-Cap Growth | — | — | — | 840,387 | — | |||||||||||||||
| Small-Cap Fundamental Value | — | — | — | — | — | |||||||||||||||
| Global Leaders | 678,363 | — | 678,363 | — | — | |||||||||||||||
| Intermediate Income | 172,582 | 474,632 | 647,214 | — | — | |||||||||||||||
| Total Return | 483,368 | 827,930 | 1,311,298 | — | — | |||||||||||||||
| Strategic Bond | 2,860,454 | 277,640 | 3,138,094 | — | — | |||||||||||||||
| Sustainable Bond | 87,300 | 18,242 | 105,542 | — | — | |||||||||||||||
| Maryland Bond | 155,204 | 460,952 | 616,156 | — | — | |||||||||||||||
| Tax Exempt Bond | 884,245 | 2,753,556 | 3,637,801 | — | — | |||||||||||||||
| Mortgage Securities | 7,992,874 | 4,180,845 | 12,173,719 | — | — | |||||||||||||||
| WMC Strategic European Equity | — | — | — | — | — | |||||||||||||||
| WMC Japan Alpha Opportunities | — | — | — | — | — | |||||||||||||||
| Somerset Emerging Markets | 19,667,123 | 32,303,685 | 51,970,808 | — | — | |||||||||||||||
| Macquarie Asia New Stars | 9,122,195 | — | 9,122,195 | — | — | |||||||||||||||
| Beutel Goodman Large-Cap Value | 109 | — | 109 | — | — | |||||||||||||||
Distributions during the fiscal periods ended as noted were characterized for tax purposes as follows:
| Tax Exempt Income | Ordinary Income | Long-Term Capital Gain^ | ||||||||||||||||||||||
| June 30, | June 30, | June 30, | June 30, | June 30, | June 30, | |||||||||||||||||||
| Fund | 2018 | 2017 | 2018 | 2017 | 2018 | 2017 | ||||||||||||||||||
| Growth Equity | $ | — | $ | — | $ | — | $ | — | $ | 144,114,162 | $ | 147,424,619 | ||||||||||||
| Flexible Equity | — | — | 2,075,622 | 1,573,168 | — | — | ||||||||||||||||||
| Equity Income | — | — | 2,012,078 | 2,223,795 | 3,329,274 | 3,997,807 | ||||||||||||||||||
| Sustainable Growth | — | — | — | — | 8,367,895 | 2,507,623 | ||||||||||||||||||
| Mid-Cap Growth | — | N/A | — | N/A | — | N/A | ||||||||||||||||||
| Small-Cap Growth | — | — | 2,657,312 | 2,227,897 | 10,276,150 | 11,963,700 | ||||||||||||||||||
| Small-Cap Fundamental Value | — | — | 19,877,192 | 3,609,251 | 32,961,277 | 686,156 | ||||||||||||||||||
| Global Leaders | — | — | 43,629 | 53,915 | — | — | ||||||||||||||||||
| Intermediate Income | — | — | 3,011,904 | 2,972,217 | — | — | ||||||||||||||||||
| Total Return | — | — | 3,327,124 | 2,424,000 | — | 101,725 | ||||||||||||||||||
| Strategic Bond | — | — | 3,760,050 | 1,658,199 | — | — | ||||||||||||||||||
| Sustainable Bond | — | N/A | 607,063 | N/A | — | N/A | ||||||||||||||||||
| Maryland Bond | 4,411,293 | 3,777,617 | 48,858 | 262,963 | — | 381,305 | ||||||||||||||||||
| Tax Exempt Bond | 9,857,181 | 7,094,476 | 232,534 | 17,897 | — | — | ||||||||||||||||||
| Mortgage Securities | — | — | 7,967,974 | 10,242,951 | — | — | ||||||||||||||||||
| WMC Strategic European Equity | — | — | 11,692,696 | 12,612,291 | — | — | ||||||||||||||||||
| WMC Japan Alpha Opportunities | — | — | — | — | 89,959,697 | — | ||||||||||||||||||
| Somerset Emerging Markets | — | — | 6,156,538 | 6,508,402 | — | — | ||||||||||||||||||
| Macquarie Asia New Stars | — | — | 891,378 | — | — | — | ||||||||||||||||||
| Beutel Goodman Large-Cap Value | — | N/A | — | N/A | — | N/A | ||||||||||||||||||
^ Designated as a long-term capital gain dividend, pursuant to Internal Revenue Code Section 852(b)(3).
143
Notes to Financial Statements
June 30, 2018
In the Statements of Assets and Liabilities, as a result of net operating losses incurred, adjustments to holdings of Real Estate Investment Trusts, currency gains and losses, distribution reclassifications and income adjustments to asset-backed security transactions, certain amounts of income, realized gains, and paid-in capital have been reclassified for the year ended June 30, 2018. These reclassifications have no impact on the net assets of the Funds:
| Undistributed | Accumulated | |||||||||||
| Paid-in | Net Investment | Net Realized | ||||||||||
| Fund | Capital | Income (Loss) | Gain (Loss) | |||||||||
| Growth Equity | $ | 16,174,911 | $ | 4,557,677 | $ | (20,732,588 | ) | |||||
| Flexible Equity | 598,433 | (1,803 | ) | (596,630 | ) | |||||||
| Equity Income | 1,541,878 | 20,391 | (1,562,269 | ) | ||||||||
| Sustainable Growth | 2,276,258 | 1,074,446 | (3,350,704 | ) | ||||||||
| Mid-Cap Growth | — | 12,997 | (12,997 | ) | ||||||||
| Small-Cap Growth | — | 11,728,896 | (11,728,896 | ) | ||||||||
| Small-Cap Fundamental Value | 5,787,264 | (12,144 | ) | (5,775,120 | ) | |||||||
| Global Leaders | — | 19,516 | (19,516 | ) | ||||||||
| Intermediate Income | — | 92,584 | (92,584 | ) | ||||||||
| Total Return | — | 97,307 | (97,307 | ) | ||||||||
| Strategic Bond | — | 118,558 | (118,558 | ) | ||||||||
| Sustainable Bond | — | 3,043 | (3,043 | ) | ||||||||
| Maryland Bond | — | — | — | |||||||||
| Tax Exempt Bond | — | — | — | |||||||||
| Mortgage Securities | — | 1,780,722 | (1,780,722 | ) | ||||||||
| WMC Strategic European Equity | 14,550,278 | 64,157 | (14,614,435 | ) | ||||||||
| WMC Japan Alpha Opportunities | 11,425,755 | 15,877,789 | (27,303,544 | ) | ||||||||
| Somerset Emerging Markets | — | (481,282 | ) | 481,282 | ||||||||
| Macquarie Asia New Stars | — | 494,891 | (494,891 | ) | ||||||||
| Beutel Goodman Large-Cap Value | — | — | — | |||||||||
Note 6. Futures Contracts
The Total Return Fund, Strategic Bond Fund, Sustainable Bond Fund, Mortgage Securities Fund, WMC Strategic European Equity Fund and WMC Japan Alpha Opportunities Fund invested in futures contracts during the year ended June 30, 2018. At the time a Fund purchases or enters into a futures contract, the Fund deposits and maintains as collateral an initial margin with the broker, as required by the terms of the contract. This collateral may consist of cash, foreign currency and / or securities (generally U.S. Treasury Bills). Such cash and foreign currency amounts are included on the Statements of Assets and Liabilities as “Cash deposit at broker – futures contracts” or “Cash deficit at broker – futures contracts”(a deficit balance is not indicative of any amount due to the broker, as such amounts are offset in full and meet collateralization requirements from the Funds’ pledging of securities). Securities pledged as collateral are included on the Statements of Assets and Liabilities as part of “Total investments, at market value”. These securities are tickmarked on the Schedules of Investments as being pledged in connection with open futures contracts. At June 30, 2018, the Funds had the following collateral balances with their brokers in connection with their futures accounts:
| Foreign Currency | Securities | Total Collateral | ||||||||||||||
Fund | Cash | (in USD) | Pledged | at Broker | ||||||||||||
| Total Return | $ | 191,406 | $ | — | $ | 349,690 | $ | 541,096 | ||||||||
| Strategic Bond | 235,452 | — | — | 235,452 | ||||||||||||
| Sustainable Bond | 99,912 | — | — | 99,912 | ||||||||||||
| Mortgage Securities | (166,497 | ) | — | 399,644 | 233,147 | |||||||||||
| WMC Strategic European Equity | 5 | — | — | 5 | ||||||||||||
| WMC Japan Alpha Opportunities | 1,491,960 | 730,344 | — | 2,222,304 | ||||||||||||
Pursuant to the contract, the Fund agrees to receive from or pay to the broker an amount of cash equal to the fluctuation in the value of the contract. These daily fluctuations are known as variation margin and are recorded by the Fund as unrealized gains or losses on
144
Notes to Financial Statements
June 30, 2018
futures contracts. When these futures contracts are closed, realized gains or losses on futures contracts are recorded by the Fund. The realized gains or losses are reported in the Statement of Operations as net realized gains or losses from futures contracts. Depending upon the agreement with the broker, the Funds may or may not settle variation margin daily. The Funds attempt to mitigate counterparty credit risk by only entering into futures contracts with brokers that the Funds believe have the financial resources to honor their obligations and by monitoring the financial stability of these brokers. The “Notional Amount” of futures contracts shown on the Schedule of Investments represents the notional market value of the futures contracts on the day they were opened. The “Notional Value” of futures contracts shown on the Schedule of Investments represents the notional market value of the futures contracts as of the date of this report. For long futures contracts, an excess of Notional Value over Notional Amount results in unrealized appreciation on the futures contract (and an excess of Notional Amount over Notional Value results in unrealized depreciation on the futures contract). The opposite is true for short futures contracts. For futures contracts denominated in foreign currencies, both the Notional Amount and Notional Value have been translated into U.S. Dollars as of the date of this report. These unrealized appreciation (depreciation) amounts represent the net impact on a Fund’s net assets as a result of open futures contracts as of the date of this report. The use of long futures contracts by the Funds subjects them to a risk of loss in excess of the gross unrealized appreciation and/or gross unrealized depreciation amounts shown on the Statements of Assets and Liabilities and up to the total Notional Amount of the futures contract as shown on the Schedule of Investments. The use of short futures contracts by the Funds subjects them to a risk of loss in excess of the gross unrealized appreciation and/or gross unrealized depreciation amounts shown on the Statements of Assets and Liabilities and, hypothetically, up to an unlimited amount of loss that could exceed the Notional Amount of the futures contracts as shown on the Schedules of Investments.
The impact of futures contracts, not accounted for as hedging instruments, was as follows:
| Statements of Assets and Liabilities | Statements of Operations for the | |||||||||||||||
| as of June 30, 2018 | year ended June 30, 2018 | |||||||||||||||
| Net Change | ||||||||||||||||
| in Unrealized | ||||||||||||||||
| Gross Unrealized | Gross Unrealized | Net Realized | Appreciation | |||||||||||||
| Appreciation – | Depreciation – | Gain (Loss) – | (Depreciation) – | |||||||||||||
Fund | Futures Contracts | Futures Contracts | Futures Contracts | Futures Contracts | ||||||||||||
| Total Return | $ | 534,357 | $ | 43,474 | $ | (627,388 | ) | $ | 357,273 | |||||||
| Strategic Bond | — | 70,497 | 414,729 | (96,569 | ) | |||||||||||
| Sustainable Bond | 55,735 | 65,519 | (20,619 | ) | (9,784 | ) | ||||||||||
| Mortgage Securities | 928,848 | 293,092 | (1,720,471 | ) | 713,975 | |||||||||||
| WMC Strategic European Equity | — | — | (928,272 | ) | — | |||||||||||
| WMC Japan Alpha Opportunities | — | 1,048,078 | (859,571 | ) | (1,285,234 | ) | ||||||||||
Net unrealized appreciation (depreciation) on futures contracts is also presented on the Statements of Assets and Liabilities in the Components of Net Assets section.
During the year ended June 30, 2018, the average Notional Value of long futures contracts held by the Total Return Fund, Sustainable Bond Fund, Mortgage Securities Fund, WMC Strategic European Equity Fund and WMC Japan Alpha Opportunities Fund were $16,730,446, $1,633,702, $33,814,113, $271,093 and $40,229,987, respectively. The Total Return Fund, Sustainable Bond Fund and Mortgage Securities Fund were invested in long U.S. Treasury futures contracts, which gave the funds exposure to interest rate risk. The WMC Strategic European Equity Fund and WMC Japan Alpha Opportunities Fund were invested in long stock index futures contracts, which were denominated in foreign currencies, and which gave the Funds exposure to both foreign equity risk and foreign currency risk.
During the year ended June 30, 2018, the average Notional Value of the short futures contracts held by the Total Return Fund, Strategic Bond Fund, Sustainable Bond Fund and the Mortgage Securities Fund were $4,801,361, $12,349,739, $2,583,634 and $31,771,942, respectively. The Total Return Fund, Strategic Bond Fund, Sustainable Bond Fund and Mortgage Securities Fund were invested in short U.S. Treasury futures contracts, which served to hedge or reduce the funds exposure to interest rate risk. The Funds activity in futures contracts, and the resulting assets or liabilities, were not subject to any arrangements wherein these assets or liabilities were, or could have been, settled on a net basis with any other derivative related obligations.
145
Notes to Financial Statements
June 30, 2018
Note 7. Forward Foreign Currency Contracts
The WMC Strategic European Equity Fund and WMC Japan Alpha Opportunities Fund held forward foreign currency contracts during the year ended June 30, 2018.
A forward foreign currency contract is a commitment to purchase or sell a foreign currency at a future date at an agreed upon price. These contracts are traded over-the-counter and not on an organized exchange. The contracts are marked-to-market daily and the change in market value is recorded as unrealized appreciation or depreciation. When the contract is closed, a realized gain or loss equal to the difference between the value at the time it was opened and the value at the time it was closed is recorded. The realized gains or losses are reported in the Statement of Operations as net realized gains or losses from forward foreign currency contracts. “Gross unrealized appreciation – forward foreign currency contracts” and “gross unrealized depreciation – forward foreign currency contracts” are reported on the Statement of Assets and Liabilities for those contracts that remain open as of year end. Risks may arise from the potential inability of a counterparty to meet the terms of the contract. There is generally no collateral exchanged by the Fund or counterparty to the contract in connection with these contracts. The Fund’s risk of loss from counterparty credit risk on these contracts is generally limited to the aggregate unrealized appreciation (depreciation) on open contracts on a counterparty by counterparty basis. The Fund attempts to mitigate counterparty credit risk by only entering into agreements with counterparties that it believes have the financial resources to honor their obligations and by monitoring the financial stability of those counterparties.
The effect of forward foreign currency contracts, not accounted for as hedging instruments, was as follows:
| Statements of Assets and Liabilities | Statements of Operations for the | |||||||||||||||
| as of June 30, 2018 | year ended June 30, 2018 | |||||||||||||||
| Net Change | ||||||||||||||||
| in Unrealized | ||||||||||||||||
| Gross Unrealized | Gross Unrealized | Net Realized | Appreciation | |||||||||||||
| Appreciation – | Depreciation – | Gain (Loss) – | (Deprecation) – | |||||||||||||
| Forward Foreign | Forward Foreign | Forward Foreign | Forward Foreign | |||||||||||||
Fund | Currency Contracts | Currency Contracts | Currency Contracts | Currency Contracts | ||||||||||||
| WMC Strategic European Equity | N/A | N/A | $ | (55,291 | ) | N/A | ||||||||||
| WMC Japan Alpha Opportunities | $ | — | $ | 384,181 | 2,464,665 | $ | (384,181 | ) | ||||||||
During the year ended June 30, 2018, the average net exposure, in U.S. Dollars, of forward foreign currency contracts held by the WMC Strategic European Equity Fund and WMC Japan Alpha Opportunities Fund was $(399,222) and $(27,868,607), respectively. The WMC Strategic European Equity Fund was, on a net basis, long, or buying, the British Pound Sterling, Euro and Swedish Krona, while it was short, or selling, the U.S. Dollar. The WMC Japan Alpha Opportunities Fund was, on a net basis, long, or buying the Japanese Yen, while it was short, or selling, the U.S. Dollar. The Funds use of forward foreign currency contracts, and the resulting assets or liabilities, were not subject to any arrangements wherein these assets or liabilities were, or could have been, settled on a net basis with any other derivative related obligations.
Note 8. Line of Credit
As of June 30, 2018, Brown Advisory Funds has an unsecured line of credit of up to $100,000,000 with U.S. Bank, N.A. The interest rate on the line of credit as of June 30, 2018 was 5.00% (prime rate). The following table shows the details of the Funds’ borrowing activity during the year ended June 30, 2018. Funds that are not listed did not utilize the line of credit during the period.
| Maximum | Average | Total | Average | |||||||||||||
| Outstanding | Daily | Interest | Interest | |||||||||||||
Fund | Balance | Balance | Incurred | Rate | ||||||||||||
| Growth Equity | $ | 3,278,000 | $ | 8,981 | $ | 410 | 4.50 | % | ||||||||
| WMC Strategic European Equity | 10,774,000 | 35,118 | 1,766 | 4.96 | % | |||||||||||
| Somerset Emerging Markets | 11,648,000 | 68,263 | 3,461 | 5.00 | % | |||||||||||
| Macquarie Asia New Stars | 322,000 | 2,647 | 114 | 4.25 | % | |||||||||||
As of June 30, 2018, none of the Funds had any outstanding borrowings under the line of credit.
146
Notes to Financial Statements
June 30, 2018
Note 9. Subsequent Events
Strategic Bond Fund – Effective July 1, 2018, in accordance with recommendations made by the Adviser and approved by the Board, all outstanding Investor Shares of the Strategic Bond Fund were redesignated and began operating as Institutional Shares and all outstanding Advisor Shares of the Strategic Bond Fund were redesignated and began operating as Investor Shares. Advisor Shares of the Strategic Bond Fund are no longer available for purchase.
Macquarie Asia New Stars Fund – On July 16, 2018, the Board of Trustees (the “Board”) of Brown Advisory Funds, based upon the recommendation of the Adviser, has determined to close and liquidate the Brown Advisory – Macquarie Asia New Stars Fund (the “Fund”). The Board concluded that it would be in the best interests of the Fund and its shareholders that the Fund be closed and liquidated as of the close of business on August 30, 2018.
In preparing these financial statements, the Funds have evaluated events and transactions for potential recognition through the date the financial statements were issued. No other material events or transactions occurred subsequent to June 30, 2018 that would require recognition or disclosure in these financial statements.
147
Report of Independent Registered Public Accounting Firm
To the Shareholders and Board of Trustees
Brown Advisory Funds
Baltimore, MD
Opinion on the Financial Statements
We have audited the accompanying statements of assets and liabilities of Brown Advisory Growth Equity Fund, Brown Advisory Flexible Equity Fund, Brown Advisory Equity Income Fund, Brown Advisory Sustainable Growth Fund, Brown Advisory Mid-Cap Growth Fund, Brown Advisory Small-Cap Growth Fund, Brown Advisory Small-Cap Fundamental Value Fund, Brown Advisory Global Leaders Fund, Brown Advisory Intermediate Income Fund, Brown Advisory Total Return Fund, Brown Advisory Strategic Bond Fund, Brown Advisory Sustainable Bond Fund, Brown Advisory Maryland Bond Fund, Brown Advisory Tax Exempt Bond Fund, Brown Advisory Mortgage Securities Fund, Brown Advisory – WMC Strategic European Equity Fund, Brown Advisory – WMC Japan Alpha Opportunities Fund, Brown Advisory – Somerset Emerging Markets Fund, Brown Advisory – Macquarie Asia New Stars Fund and Brown Advisory – Beutel Goodman Large-Cap Value Fund (the “Funds”), each a series of Brown Advisory Funds (the “Trust”), including the schedules of investments, as of June 30, 2018, the related statements of operations, the statements of changes in net assets, financial highlights for the periods indicated thereon, and the related notes (collectively referred to as the “financial statements”). In our opinion, the financial statements present fairly, in all material respects, the financial position of the Funds as of June 30, 2018, the results of their operations, the changes in their net assets, and their financial highlights for the periods indicated thereon, in conformity with accounting principles generally accepted in the United States of America.
Basis for Opinion
These financial statements are the responsibility of the Funds’ management. Our responsibility is to express an opinion on the Funds’ financial statements based on our audits. We are a public accounting firm registered with the Public Company Accounting Oversight Board (United States) (“PCAOB”) and are required to be independent with respect to the Funds in accordance with the U.S. federal securities laws and the applicable rules and regulations of the Securities and Exchange Commission and the PCAOB. We have served as the auditor of one or more of the funds in the Trust since 2008.
We conducted our audits in accordance with the standards of the PCAOB. Those standards require that we plan and perform the audits to obtain reasonable assurance about whether the financial statements are free of material misstatement, whether due to error or fraud. The Funds are not required to have, nor were we engaged to perform, an audit of the Funds’ internal control over financial reporting. As part of our audits we are required to obtain an understanding of internal control over financial reporting, but not for the purpose of expressing an opinion on the effectiveness of the Funds’ internal control over financial reporting. Accordingly, we express no such opinion.
Our audits included performing procedures to assess the risks of material misstatement of the financial statements, whether due to error or fraud, and performing procedures that respond to those risks. Such procedures included examining, on a test basis, evidence regarding the amounts and disclosures in the financial statements. Our audits also included evaluating the accounting principles used and significant estimates made by management, as well as evaluating the overall presentation of the financial statements. Our procedures included confirmation of securities owned as of June 30, 2018 by correspondence with the custodian and brokers; when replies were not received from brokers, we performed other auditing procedures. We believe that our audits provide a reasonable basis for our opinion.
| TAIT, WELLER & BAKER LLP |
Philadelphia, Pennsylvania
August 29, 2018
148
Expense Example For the Six Months Ended June 30, 2018 (Unaudited)
As a shareholder of a Fund you incur two types of costs: (1) transaction costs, including redemption fees and exchange fees; and (2) ongoing costs, including investment advisory fees; distribution and/or service fees; and other Fund expenses. This example is intended to help you understand your ongoing costs (in dollars) of investing in a Fund and to compare these costs with the ongoing costs of investing in other mutual funds. The example is based on an investment of $1,000 invested at the beginning of the six month period and held for the entire period (January 1, 2018 – June 30, 2018).
Actual Expenses
The Actual Expenses columns in the following table provides information about actual account values based on actual returns and actual expenses. As a shareholder you will be assessed fees for outgoing wire transfers, returned checks and stop payment orders at prevailing rates charged by U.S. Bancorp Fund Services, LLC, the Funds’ transfer agent. If you request that a redemption be made by wire transfer, currently, the Funds’ transfer agent charges a $15.00 fee. You will be charged a redemption fee equal to 1.00% of the net amount of the redemption if you redeem your shares less than 14 days after you purchase, with certain limited exceptions. Individual Retirement Accounts (“IRA”) that are held directly at the Funds will be charged a $15.00 annual maintenance fee. IRAs held by broker-dealers or through other means, may or may not incur an annual maintenance fee. Yet, if IRAs maintenance fees are charged to accounts held elsewhere, the fees charged may be more or may be less than $15.00. To the extent the Funds invest in shares of other investment companies as part of their investment strategy, you will indirectly bear your proportionate share of any fees and expenses charged by the underlying funds in which the Funds invest in addition to the expenses of the Funds. Actual expenses of the underlying funds may vary. These expenses are not included in the example below. The example below includes, but is not limited to, investment advisory, shareholder servicing, fund accounting, custody and transfer agent fees. However, the example below does not include portfolio trading commissions and related expenses. You may use the information in this line, together with the amount you invested, to estimate the expenses that you paid over the period. Simply divide your account value by $1,000 (for example, an $8,600 account value divided by $1,000 = 8.6). Then, multiply the result by the number in the first line under the heading entitled “Expenses Paid During the Period” to estimate the expenses you paid on your account during this period.
Hypothetical Example for Comparison Purposes
The Hypothetical Expenses columns in the following table provides information about hypothetical account values based on a hypothetical return and hypothetical expenses based on the Funds’ actual expense ratio and an assumed rate of return of 5% per year before expenses, which is not the Funds’ actual return. The hypothetical account values and expenses may not be used to estimate the actual ending account balance or expenses you paid for the period. You may use this information to compare the ongoing costs of investing in the Funds and other funds. To do so, compare this 5% hypothetical example with the 5% hypothetical examples that appear in the shareholder reports of the other funds. Please note that the expenses shown in the table are meant to highlight your ongoing costs only and do not reflect any transactional costs, such as sales charges (loads), redemption fees or exchange fees. Therefore, the hypothetical information in the table is useful in comparing ongoing costs only and will not help you determine the relative total costs of owning different funds. In addition, if these transactional costs were included, your costs would have been higher.
| Actual Expenses | Hypothetical Expenses | ||||||
| Beginning | Ending | Ending | Annualized | ||||
| Account Value | Account Value | Expenses Paid | Account Value | Expenses Paid | Net Expense | ||
January 1, 2018 | June 30, 2018 | During the Period* | June 30, 2018 | During the Period* | Ratio* | ||
| Growth Equity Fund | |||||||
| Institutional Shares | $1,000.00 | $1,139.70 | $3.77 | $1,021.27 | $3.56 | 0.71% | |
| Investor Shares | $1,000.00 | $1,138.90 | $4.56 | $1,020.53 | $4.31 | 0.86% | |
| Advisor Shares | $1,000.00 | $1,137.30 | $5.88 | $1,019.29 | $5.56 | 1.11% | |
| Flexible Equity Fund | |||||||
| Institutional Shares | $1,000.00 | $1,056.80 | $3.67 | $1,021.22 | $3.61 | 0.72% | |
| Investor Shares | $1,000.00 | $1,055.90 | $4.43 | $1,020.48 | $4.36 | 0.87% | |
| Advisor Shares | $1,000.00 | $1,054.90 | $5.71 | $1,019.24 | $5.61 | 1.12% | |
| Equity Income Fund | |||||||
| Institutional Shares | $1,000.00 | $ 993.50 | $3.81 | $1,020.98 | $3.86 | 0.77% | |
| Investor Shares | $1,000.00 | $ 992.70 | $4.55 | $1,020.23 | $4.61 | 0.92% | |
| Advisor Shares | $1,000.00 | $ 991.70 | $5.78 | $1,018.99 | $5.86 | 1.17% | |
149
Expense Example For the Six Months Ended June 30, 2018 (Unaudited)
| Actual Expenses | Hypothetical Expenses | ||||||
| Beginning | Ending | Ending | Annualized | ||||
| Account Value | Account Value | Expenses Paid | Account Value | Expenses Paid | Net Expense | ||
January 1, 2018 | June 30, 2018 | During the Period* | June 30, 2018 | During the Period* | Ratio* | ||
| Sustainable Growth Fund | |||||||
| Institutional Shares | $1,000.00 | $1,104.10 | $3.81 | $1,021.17 | $3.66 | 0.73% | |
| Investor Shares | $1,000.00 | $1,103.60 | $4.59 | $1,020.43 | $4.41 | 0.88% | |
| Advisor Shares | $1,000.00 | $1,102.20 | $5.89 | $1,019.19 | $5.66 | 1.13% | |
| Mid-Cap Growth Fund | |||||||
| Investor Shares | $1,000.00 | $1,105.10 | $4.44 | $1,020.58 | $4.26 | 0.85% | |
| Small-Cap Growth Fund | |||||||
| Institutional Shares | $1,000.00 | $1,096.30 | $5.09 | $1,019.93 | $4.91 | 0.98% | |
| Investor Shares | $1,000.00 | $1,095.30 | $5.87 | $1,019.19 | $5.66 | 1.13% | |
| Advisor Shares | $1,000.00 | $1,094.50 | $7.17 | $1,017.95 | $6.90 | 1.38% | |
| Small-Cap Fundamental Value Fund | |||||||
| Institutional Shares | $1,000.00 | $1,025.00 | $4.87 | $1,019.98 | $4.86 | 0.97% | |
| Investor Shares | $1,000.00 | $1,023.90 | $5.62 | $1,019.24 | $5.61 | 1.12% | |
| Advisor Shares | $1,000.00 | $1,022.60 | $6.87 | $1,018.00 | $6.85 | 1.37% | |
| Global Leaders Fund | |||||||
| Investor Shares | $1,000.00 | $1,059.80 | $4.34 | $1,020.58 | $4.26 | 0.85% | |
| Intermediate Income Fund | |||||||
| Investor Shares | $1,000.00 | $ 992.00 | $2.22 | $1,022.56 | $2.26 | 0.45% | |
| Advisor Shares | $1,000.00 | $ 990.60 | $3.45 | $1,021.32 | $3.51 | 0.70% | |
| Total Return Fund | |||||||
| Institutional Shares | $1,000.00 | $ 988.20 | $2.46 | $1,022.32 | $2.51 | 0.50% | |
| Investor Shares | $1,000.00 | $ 987.90 | $2.71 | $1,022.07 | $2.76 | 0.55% | |
| Strategic Bond Fund | |||||||
| Investor Shares | $1,000.00 | $1,002.70 | $3.48 | $1,021.32 | $3.51 | 0.70% | |
| Advisor Shares | $1,000.00 | $1,001.50 | $4.71 | $1,020.08 | $4.76 | 0.95% | |
| Sustainable Bond Fund | |||||||
| Investor Shares | $1,000.00 | $ 984.90 | $2.95 | $1,021.82 | $3.01 | 0.60% | |
| Maryland Bond Fund | |||||||
| Investor Shares | $1,000.00 | $1,003.00 | $2.38 | $1,022.41 | $2.41 | 0.48% | |
| Tax Exempt Bond Fund | |||||||
| Investor Shares | $1,000.00 | $1,006.80 | $2.39 | $1,022.41 | $2.41 | 0.48% | |
| Mortgage Securities Fund | |||||||
| Institutional Shares | $1,000.00 | $ 992.60 | $2.27 | $1,022.51 | $2.31 | 0.46% | |
| Investor Shares | $1,000.00 | $ 992.40 | $2.52 | $1,022.27 | $2.56 | 0.51% | |
| WMC Strategic European Equity Fund | |||||||
| Institutional Shares | $1,000.00 | $ 962.80 | $5.21 | $1,019.49 | $5.36 | 1.07% | |
| Investor Shares | $1,000.00 | $ 962.80 | $5.94 | $1,018.74 | $6.11 | 1.22% | |
| Advisor Shares | $1,000.00 | $ 960.90 | $7.15 | $1,017.50 | $7.35 | 1.47% | |
| WMC Japan Alpha Opportunities Fund | |||||||
| Institutional Shares | $1,000.00 | $ 935.40 | $5.47 | $1,019.14 | $5.71 | 1.14% | |
| Investor Shares | $1,000.00 | $ 934.20 | $6.19 | $1,018.40 | $6.46 | 1.29% | |
| Advisor Shares | $1,000.00 | $ 932.90 | $7.38 | $1,017.16 | $7.70 | 1.54% | |
| Somerset Emerging Markets Fund | |||||||
| Institutional Shares | $1,000.00 | $ 895.00 | $5.40 | $1,019.09 | $5.76 | 1.15% | |
| Investor Shares | $1,000.00 | $ 893.90 | $6.10 | $1,018.35 | $6.51 | 1.30% | |
| Advisor Shares | $1,000.00 | $ 893.50 | $7.28 | $1,017.11 | $7.75 | 1.55% | |
150
Expense Example For the Six Months Ended June 30, 2018 (Unaudited)
| Actual Expenses | Hypothetical Expenses | ||||||
| Beginning | Ending | Ending | Annualized | ||||
| Account Value | Account Value | Expenses Paid | Account Value | Expenses Paid | Net Expense | ||
January 1, 2018 | June 30, 2018 | During the Period* | June 30, 2018 | During the Period* | Ratio* | ||
| Macquarie Asia New Stars Fund | |||||||
| Institutional Shares | $1,000.00 | $ 933.80 | $7.05 | $1,017.50 | $7.35 | 1.47% | |
| Investor Shares | $1,000.00 | $ 933.60 | $7.77 | $1,016.76 | $8.10 | 1.62% | |
| Beutel Goodman Large-Cap Value Fund | |||||||
| Institutional Shares^ | $1,000.00 | $ 958.00 | $2.46 | $1,021.47 | $3.36 | 0.67% | |
| * | The calculations are based on expenses incurred during the most recent six-month period ended as of the date of this report. The dollar amounts shown as expenses paid during the period are equal to the annualized six-month net expense ratio multiplied by the average account value during the period, multiplied by the number of days (181) in the most recent six-month period divided by the number of days in the Funds’ fiscal year (365). |
| ^ | Commenced operations as of the close of business on February 13, 2018. Actual expense information is presented for the period from February 14, 2018 to June 30, 2018 (137 days). |
151
Board of Trustees Approval of the Investment Advisory Agreement and Sub-Investment Advisory Agreement for the Brown Advisory – Beutel Goodman Large-Cap Value Fund (Unaudited)
The Investment Advisory Agreement between the Trust, on behalf of the Brown Advisory – Beutel Goodman Large-Cap Value Fund (the “Fund”), and Brown Advisory LLC (“Brown Advisory” or the “Adviser”), was approved by the Board of Trustees at a meeting of the Board held on February 8, 2018. At the same meeting, the Board of Trustees also approved the Sub-Investment Advisory Agreement with respect to the Fund between Brown Advisory and Beutel, Goodman & Company, Ltd. (“Beutel Goodman” or the “Sub-Adviser”), the sub-investment adviser to the Fund.
In accordance with the Investment Company Act of 1940, the Board of Trustees was required to consider the approval of both the Investment Advisory Agreement and the Sub-Investment Advisory Agreement, and this was required to take place at an in-person meeting of the Board. The relevant provisions of the Investment Company Act of 1940 specifically provide that it is the duty of the Board to request and evaluate such information as the Board determines is necessary to allow them to properly consider the approval of each of the Agreements, and it is the duty of the Adviser and the Sub-Adviser, as applicable, to furnish the Trustees with such information that is responsive to their request.
Accordingly, in determining whether to approve: (1) the Investment Advisory Agreement between the Adviser and the Trust with respect to the Fund, and (2) the Sub-Investment Advisory Agreement between Brown Advisory and Beutel Goodman, the Board of Trustees requested, and both the Adviser and the Sub-Adviser each provided, information and data relevant to the Board’s consideration.
This included materials prepared by the Adviser, the Sub-Adviser and by the Fund’s administrator that provided the Board with information regarding the investment performance of the Sub-Adviser’s separate accounts having similar investment objectives and strategies as the Fund, and information regarding the estimated fees and expenses of the Fund, as compared to other similar mutual funds.
The Board initially reviewed certain matters with respect to the proposed organization of the Fund at a meeting of the Board held on November 8, 2017 in order to consider the proposed approval of each of the Agreements. At this meeting, the Board discussed with representatives of the Adviser various matters with respect to the proposed establishment and organization of the Fund, the proposed sub-advisory services to be provided to the Fund by the Sub-Adviser, the nature and extent of the duties and responsibilities of the Adviser and the Sub-Adviser with respect to the Fund, the compliance oversight process involving the Fund and its operations, and the proposed fees and expenses of the Fund, including the proposed sub-advisory fees applicable to the Fund. During this meeting representatives of the Adviser made a presentation to the Board regarding their recommendation to retain the Sub-Adviser to provide sub-advisory services to the Fund and they reviewed the process that they had followed in determining to select Beutel Goodman to serve as Sub-Adviser. Representatives of Beutel Goodman also made a presentation to the Board at this meeting during which they reviewed their plans for providing sub-advisory services to the Fund.
The Board then met again at in-person meeting of the Board of Trustees held on February 8, 2018 to consider matters with respect to the Fund and the members of the Board reviewed and considered the approval of the Investment Advisory Agreement and the Sub-Investment Advisory Agreement. In addition, the Board also considered the adoption of an Expense Limitation Agreement with respect to the Fund which would limit the total operating expenses of the Fund through October 31, 2019, as well as a Business Management Agreement with Brown Advisory pursuant to which Brown Advisory would provide certain business management services to the Fund. At this meeting, representatives of the Sub-Adviser, including one of the proposed portfolio managers of the Fund, reviewed for the members of the Board Beutel Goodman’s experience and background in managing US large cap value equity securities, and they also reviewed information regarding the investment advisory process followed by the Sub-Adviser and the compliance program of the Sub-Adviser. In addition, the members of the Board reviewed with the proposed co-portfolio manager of the Fund various matters with respect to the proposed sub-advisory services to be provided to the Fund by Beutel Goodman and the investment strategies that would be employed by the firm in managing the Fund.
Following their review and consideration of these matters, the Trustees determined that the Investment Advisory Agreement with the Adviser with respect to the Fund would enable shareholders of the Fund to obtain high quality services at a cost that is appropriate, reasonable, and in the best interests of the Fund and its shareholders. Accordingly, the Board, including those Trustees who are not considered to be “interested persons” of the Trust, as that term is defined in the Investment Company Act of 1940 (the “Independent Trustees”), unanimously approved the Investment Advisory Agreement for the Fund. In reaching their decision, the Trustees requested and obtained from the Adviser such information as they deemed reasonably necessary to evaluate the Investment Advisory Agreement. The Trustees also carefully considered the projected profitability data and comparative fee, expense and performance information prepared by Trust management. In considering the Investment Advisory Agreement with respect to the Fund, the Trustees evaluated a number of factors that they believed, in light of their reasonable business judgment,
152
Board of Trustees Approval of the Investment Advisory Agreement and Sub-Investment Advisory Agreement for the Brown Advisory – Beutel Goodman Large-Cap Value Fund (Unaudited)
to be relevant. They based their decision on the following considerations, among others, although they did not identify any one specific consideration or any particular information that was controlling of their decision:
The nature, extent and quality of the advisory services to be provided. The Trustees concluded that Brown Advisory is capable of providing high quality services to the Fund, as indicated by the nature, extent and quality of services provided in the past to the other Funds in the Trust, Brown Advisory’s management capabilities demonstrated with respect to the other Funds in the Trust, the professional qualifications and experience of the members of Brown Advisory’s Investment Solutions Group who will be responsible for the ongoing supervision and oversight of Beutel Goodman’s investment activities with respect to the Fund, Brown Advisory’s investment and compliance oversight processes, and the competitive investment performance of the other Funds in the Trust. The Trustees also determined that Brown Advisory proposed to provide investment advisory services that were of the same quality as services provided to the other Funds in the Trust, and that these services are appropriate in scope and extent in light of the Fund’s proposed operations, the competitive landscape of the investment company business and investor needs. On the basis of the Trustees’ assessment of the nature, extent and quality of the advisory services to be provided by Brown Advisory, the Trustees concluded that Brown Advisory is capable of generating a level of long-term investment performance that is appropriate in light of the Fund’s investment objectives, policies and strategies and competitive with many other comparable investment companies.
The cost of advisory services to be provided and the expected level of profitability. On the basis of comparative information derived from the data that was provided to the Board, the Trustees determined that the overall projected expense ratios for each respective class of shares of the Fund were competitive with industry averages. The Trustees also noted that Brown Advisory had proposed a contractual commitment for the benefit of shareholders of the Fund to limit the Fund’s operating expenses through October 31, 2019. The Board also focused on Brown Advisory’s projected level of profitability with respect to the Fund, and noted that Brown Advisory’s expected level of profitability was acceptable and not unreasonable. Accordingly, on the basis of the Board’s review of the fees to be charged by Brown Advisory for investment advisory services, the investment advisory services and sub-advisory oversight services to be provided to the Fund by Brown Advisory, and the estimated level of profitability from Brown Advisory’s relationship with the Fund, the Board concluded that the level of investment advisory fees, the level of the sub-investment advisory fees and Brown Advisory’s projected profitability are appropriate in light of the management fees, overall expense ratios and investment performance of comparable investment companies.
The extent to which economies of scale may be realized as the Fund grows and whether the advisory fees reflect possible economies of scale. While it was noted that the Fund’s investment advisory fees will not decrease as the Fund’s assets grow because they will not be subject to investment advisory fee breakpoints, the Trustees concluded that the Fund’s investment advisory fees are appropriate in light of the projected size of the Fund, and appropriately reflect the current economic environment for Brown Advisory and the competitive nature of the mutual fund market. The Trustees then noted that they will have the opportunity to periodically re-examine whether the Fund has achieved economies of scale, and the appropriateness of the investment advisory fees payable to Brown Advisory with respect to the Fund, in the future at which time the implementation of fee breakpoints on the Fund could further be considered.
Benefits to Brown Advisory from its relationship with the Fund (and any corresponding benefits to the Fund). The Trustees concluded that other benefits that may be derived by Brown Advisory from its relationship with the Fund, including any potential “soft dollar” benefits in connection with the Fund’s brokerage transactions and use of the Fund’s performance track record in advertising materials, are reasonable and fair, and consistent with industry practice and the best interests of the Fund and its shareholders. In addition, the Trustees determined that the Fund will benefit from its relationship with Brown Advisory by virtue of Brown Advisory’s provision of business management and shareholder services, in addition to investment advisory services, at a cost to the Fund that is generally comparable to the costs of an outside service provider, which the Trustees determined to be reasonable, fair and in the best interests of the shareholders of the Fund in light of the nature and quality of the services to be provided and the necessity of the services for the Fund’s operations.
Other Considerations. In approving the Investment Advisory Agreement, the Trustees determined that Brown Advisory has made a substantial commitment to the recruitment and retention of high quality personnel, and maintains the financial, compliance and operational resources reasonably necessary to manage the Fund in a professional manner that is consistent with the best interests of the Fund and its shareholders. The Board also considered the nature of the oversight duties to be performed by Brown Advisory which include extensive investment management and compliance due diligence with respect to the operations of the Sub-Adviser, and the Board determined that the investment advisory fee fairly compensated Brown Advisory for the services that it is to perform pursuant to the Investment Advisory Agreement. The Trustees also concluded that Brown Advisory has made a significant
153
Board of Trustees Approval of the Investment Advisory Agreement and Sub-Investment Advisory Agreement for the Brown Advisory – Beutel Goodman Large-Cap Value Fund (Unaudited)
entrepreneurial commitment to the management and success of the Fund, which entails a substantial financial and professional commitment, including the Expense Limitation Agreement under which Brown Advisory has undertaken to waive a portion of its fees to the benefit of the Fund’s shareholders to the extent necessary in accordance with the terms of the Expense Limitation Agreement. The Board also considered matters with respect to the brokerage practices of Brown Advisory, including its soft dollar arrangements and its best-execution procedures, and noted that these were reasonable and consistent with standard industry practice.
In considering information regarding the investment management fees payable by the Fund to the Adviser under the Investment Advisory Agreement, the Board also took note of the business management fees that are payable by the Fund to Brown Advisory under the terms of the Business Management Agreement. In considering the approval of the Business Management Agreement with respect to the Fund, the Board members considered various factors with respect to the business management fees, including the level and amount of these fees and the services to be provided by Brown Advisory in connection with the Business Management Agreement, in determining the reasonableness of the total fees to be paid by the Fund to Brown Advisory for the overall level of services that Brown Advisory is to provide to the Fund and its shareholders. In considering the nature and extent of the non-advisory business management services to be provided to the Fund by the Adviser, the Board took into consideration: (1) whether the Business Management Agreement is in the best interest of the Fund and its shareholders; (2) whether the services to be performed under the Business Management Agreement are required for the operation of the Fund; (3) whether the services to be provided are of a nature and quality at least equal to the same or similar services provided by independent third parties; and (4) whether the fees for the services are fair and reasonable in light of the usual and customary charges made by others for services of the same nature and quality. After reviewing these factors with respect to the Business Management Agreement, the Board of Trustees determined that approval of the Business Management Agreement was advisable and in the best interest of the Fund and its shareholders and that the fees payable to Brown Advisory under the terms of the Business Management Agreement were fair and reasonable in light of the services to be provided.
The Board also considered various matters with respect to the proposed distribution and shareholder servicing arrangements applicable to the Fund and they considered the distribution fees and the non-distribution shareholder servicing fees payable with respect to certain of the share classes of the Fund, including certain of such fees which may be payable to the Adviser for the shareholder administrative services that it provides to shareholders of the Fund. The Board took note of the fact that the non-distribution related shareholder administrative fees payable to the Adviser are intended to compensate the Adviser for providing certain administrative services to those Fund shareholders covered by the applicable servicing arrangements in the relevant share classes.
It was noted that in making their determinations, the Trustees had considered and relied upon the materials provided to them with respect to the proposed contract and the presentation of the representatives of Brown Advisory, as well as the information and materials that they had been provided with in connection with their November 8, 2017 meeting at which they had considered various matters with respect to the proposed establishment and operation of the Fund, and during which meetings they had reviewed matters with respect to the Fund with representatives of the Adviser and Beutel Goodman. In reaching their conclusion with respect to the approval of the Investment Advisory Agreement and the level of fees to be paid under the Agreement, the Trustees did not identify any one single factor as being controlling, rather, the Trustees took note of a combination of factors that had influenced their decision making process. They noted the level and quality of investment advisory services provided by Brown Advisory to each of the other Funds in the Trust, and they found that these services will benefit the Fund and its shareholders and also reflected management’s overall commitment to the growth and development of the Fund.
The Board then undertook the consideration of various matters with respect to the proposed approval of the Sub-Advisory Agreement between Brown Advisory and Beutel Goodman. They considered various matters involving the respective services to be provided by each of the Adviser and the Sub-Adviser in connection with the management and operation of the Fund and they took note of the extensive oversight duties to be performed by the Adviser including investment management and compliance oversight of the operations of the Sub-Adviser.
The Board reviewed and evaluated the information that the Adviser and the Sub-Adviser had presented for the Board’s review. The Board particularly noted, among other considerations, that the Fund’s proposed investment advisory fees and overall operating expenses were competitive with comparable mutual funds, and that Beutel Goodman has successfully managed other accounts with similar investment objectives and policies. The Board took note of the fact that Beutel Goodman has experience serving as investment adviser to mutual funds that it operates in Canada. Based on its review of all of the information, the Board determined that the Sub-Investment Advisory Agreement was consistent with the best interests of the Fund and its shareholders and would enable the Fund to receive high quality sub-advisory services at a cost that is appropriate, reasonable, and in the best interests of the Fund and its shareholders. In reaching these conclusions, the Board considered the following:
154
Board of Trustees Approval of the Investment Advisory Agreement and Sub-Investment Advisory Agreement for the Brown Advisory – Beutel Goodman Large-Cap Value Fund (Unaudited)
The nature, extent and quality of the sub-investment advisory services to be provided. The Trustees concluded that Beutel Goodman is capable of providing high quality sub-advisory services to the Fund, as indicated by the nature and quality of services provided to its other managed accounts having a similar investment objective and strategy as the Fund, the professional qualifications and experience of the proposed portfolio managers of the Fund, and Beutel Goodman’s investment management processes. On the basis of the Trustees’ assessment of the nature, extent and quality of the sub-advisory services to be provided by Beutel Goodman, the Trustees concluded that Beutel Goodman is capable of generating a level of long-term investment performance that is appropriate in light of the Fund’s investment objectives, policies and strategies and competitive with many other comparable investment companies.
The cost of advisory services to be provided and the expected level of profitability. On the basis of comparative information derived from the data that had been provided to the Board members, the Trustees determined that the overall projected expense ratios for each respective class of shares of the Fund are competitive with industry averages. The Trustees also noted that the Fund will be subject to a contractual expense limitation agreement for the benefit of shareholders of the Fund to limit the Fund’s operating expenses through October 31, 2019. The Board took note of the fact that the sub-advisory fee had been separately negotiated by Brown Advisory and Beutel Goodman and was consistent with fee arrangements for sub-advisory services in connection with other sub-advised mutual funds. Accordingly, on the basis of the Board’s review of the fees to be charged by Beutel Goodman for sub-investment advisory services to be provided to the Fund, the Board concluded that the level of sub-investment advisory fees are appropriate in light of the management fees, overall expense ratios and investment performance of comparable investment companies, and that the sub-advisory fee had been separately negotiated at arms-length by independent third parties.
The extent to which economies of scale may be realized as the Fund grows and whether the advisory fees reflect possible economies of scale. While it was noted that the Fund’s investment advisory fees will not decrease as the Fund’s assets grow because they will not be subject to investment advisory fee breakpoints, the Trustees concluded that the Fund’s investment advisory fees are appropriate in light of the projected size of the Fund, and appropriately reflect the current economic environment for Brown Advisory and Beutel Goodman and the competitive nature of the mutual fund market. The Trustees then noted that they will have the opportunity to periodically re-examine whether the Fund has achieved economies of scale, and the appropriateness of the investment advisory fees and sub-investment advisory fees with respect to the Fund, in the future at which time the implementation of fee breakpoints on the Fund could be further considered.
Benefits to Beutel Goodman from its relationship with the Fund (and any corresponding benefits to the Fund). The Trustees concluded that other benefits that may be derived by Beutel Goodman from its relationship with the Fund, including any potential “soft dollar” benefits in connection with the Fund’s brokerage transactions and use of the Fund’s performance track record in advertising materials, are reasonable and fair, and consistent with industry practice and the best interests of the Fund and its shareholders.
Other Considerations. In approving the Sub-Investment Advisory Agreement, the Trustees determined that Beutel Goodman has made a substantial commitment to the recruitment and retention of high quality personnel, and maintains the financial, compliance and operational resources reasonably necessary to provide sub-advisory services to the Fund in a professional manner that is consistent with the best interests of the Fund and its shareholders. The Board also considered matters with respect to the brokerage practices of Beutel Goodman, including its soft dollar arrangements and its best-execution procedures, and noted that these were reasonable and consistent with standard industry practice.
It was noted that in making their determinations, the Trustees had considered and relied upon the materials provided to them with respect to the proposed contract and the presentation of the representatives of Brown Advisory and Beutel Goodman, as well as the information and materials that they had been provided with in connection with their November 8, 2017 Board meeting at which they had considered various matters with respect to the proposed establishment and operation of the Fund. In reaching their conclusion with respect to the approval of the Sub-Investment Advisory Agreement and the level of fees to be paid under the Agreement, the Trustees did not identify any one single factor as being controlling, rather, the Trustees took note of a combination of factors that had influenced their decision making process. They noted the level and quality of investment advisory services provided by Beutel Goodman to its other investment advisory clients and they found that these services will benefit the Fund and its shareholders. They also considered the nature of the allocation of the duties and responsibilities for the management and operation of the Fund between Brown Advisory and Beutel Goodman and they determined that the sub-advisory fee, as negotiated by Brown Advisory and Beutel Goodman, reasonably reflected the nature and extent of the services to be provided by Beutel Goodman with respect to the Fund.
155
Trustees and Executive Officers
The Board is responsible for the overall management of the Trust, including general supervision and review of the investment activities of the Funds. The Board, in turn, elects the Officers of the Trust, who are responsible for administering the day-to-day operations of the Trust and each of the Funds. The current Trustees and Officers of the Trust, their ages and positions with the Trust, term of office with the Trust and length of time served, their principal occupations for the past five years and other directorships held during the past five years are set forth in the table below.
Additional information about the Trustees of the Trust can be found in the Statement of Additional Information, which is available, without charge, upon request, by calling Brown Advisory Funds toll free at 1-800-540-6807 or by accessing our website at www.brownadvisoryfunds.com.
| Number of | Other | ||||
| Term of | Portfolios in | Directorships | |||
| Office and | Fund Complex | Held During | |||
| Name, Age | Position with | Length of | Principal Occupation(s) | Overseen by | the Past |
| and Address | the Trust | Time Served | During Past 5 Years | Trustees | 5 Years(2) |
Independent Trustees of the Trust(1) | |||||
| Henry H. Hopkins | Trustee | Indefinite Term; | Retired; Formerly, Vice President and Chief | 20 | None. |
| Age: 75 | Since May 2012 | Legal Counsel, T. Rowe Price Associates, Inc. | |||
| c/o Brown Advisory LLC | Lead | Indefinite Term; | (investment management firm) (1998 to 2008). | ||
| 901 South Bond Street | Independent | Since May 2015 | |||
| Suite 400 | Trustee | ||||
| Baltimore, MD 21231 | |||||
| Kyle Prechtl Legg | Trustee | Indefinite Term; | Retired; Formerly President and Chief Executive | 20 | Director, SunTrust |
| Age: 66 | Since May 2012 | Officer, Legg Mason Capital Management, LLC | Banks, Inc. (bank | ||
| c/o Brown Advisory LLC | (investment management firm) (2006 to 2009). | holding company) | |||
| 901 South Bond Street | (since 2011); Director, | ||||
| Suite 400 | BrightSphere | ||||
| Baltimore, MD 21231 | Investment Group | ||||
| plc (asset management | |||||
| holding company) | |||||
| (since 2014); Director, | |||||
| Eastman Kodak Co. | |||||
| (printing equipment | |||||
| and supplies company) | |||||
| (2010 to 2013). | |||||
| Thomas F. O’Neil III | Trustee | Indefinite Term; | Global Compliance Officer, Cigna Corporation | 20 | None. |
| Age: 61 | Since May 2012 | (health services company) (since February 2017), | |||
| c/o Brown Advisory LLC | Formerly, President, The Saranac Group LLC | ||||
| 901 South Bond Street | (strategic consulting firm) (since 2010); Formerly, | ||||
| Suite 400 | Executive Vice Chairman (previously, Senior | ||||
| Baltimore, MD 21231 | Vice President, General Counsel and Secretary) | ||||
| WellCare Health Plans, Inc.(managed healthcare | |||||
| organization) (2008 to 2009); Formerly, Partner | |||||
| and Joint Global Practice Group Leader, DLA | |||||
| Piper US LLP (law firm) (2002 to 2008). | |||||
| Neal F. Triplett, CFA | Trustee | Indefinite Term; | President, DUMAC, Inc. (university endowment | 20 | None. |
| Age: 47 | Since May 2012 | investment organization) (since 1999). | |||
| c/o Brown Advisory LLC | |||||
| 901 South Bond Street | |||||
| Suite 400 | |||||
| Baltimore, MD 21231 | |||||
| Interested Trustees and Officers of the Trust | |||||
Michael D. Hankin(3) | Trustee | Indefinite Term | President and Chief Executive Officer, Brown | 20 | Stanley Black & |
| Age: 60 | Since May 2012 | Advisory Incorporated and affiliates (investment | Decker, Inc. (industrial | ||
| c/o Brown Advisory | management firm) (since 1993). | tools and hardware) | |||
| Incorporated | (since 2016). | ||||
| 901 South Bond Street | |||||
| Suite 400 | |||||
| Baltimore, MD 21231 |
156
Trustees and Executive Officers
| Number of | Other | |||||
| Term of | Portfolios in | Directorships | ||||
| Office and | Fund Complex | Held During | ||||
| Name, Age | Position with | Length of | Principal Occupation(s) | Overseen by | the Past | |
| and Address | the Trust | Time Served | During Past 5 Years | Trustees | 5 Years(2) | |
| Interested Trustees and Officers of the Trust | ||||||
Joseph R. Hardiman(3) | Chairman | Indefinite Term; | Business Consultant (financial services industry | 20 | Director of Franklin | |
| Age: 81 | and Trustee | Since May 2012 | consulting) (since 1997); Formerly; Director of | Resources, Inc. | ||
| c/o Brown Advisory LLC | Brown Advisory Incorporated (investment | (investment | ||||
| 901 South Bond Street | management firm) (2001 to 2012). | management firm) | ||||
| Suite 400 | (2005 to 2013). | |||||
| Baltimore, MD 21231 | ||||||
| David M. Churchill | President/ | Indefinite Term; | Chief Operating Officer and Chief Financial | Not | Not | |
| Age: 53 | Principal | Since May 2012 | Officer, Brown Advisory Incorporated and | Applicable. | Applicable. | |
| c/o Brown Advisory | Executive | affiliates (investment management firm) | ||||
| Incorporated | Officer | (since 1993). | ||||
| 901 South Bond Street | ||||||
| Suite 400 | ||||||
| Baltimore, MD 21231 | ||||||
| Paul J. Chew | Senior Vice | Indefinite Term; | Chief Investment Officer, Brown Advisory | Not | Not | |
| Age: 52 | President | Since May 2016 | Incorporated and affiliates (investment | Applicable. | Applicable. | |
| c/o Brown Advisory | management firm) (since 1995). | |||||
| Incorporated | ||||||
| 901 South Bond Street | ||||||
| Suite 400 | ||||||
| Baltimore, MD 21231 | ||||||
| Carey E. Taylor | Vice | Indefinite Term; | Chief Operating Officer of | Not | Not | |
| Age: 30 | President | Since November | Institutional Investing, Brown Advisory | Applicable. | Applicable. | |
| c/o Brown Advisory | 2015 | Incorporated and affiliates (investment | ||||
| Incorporated | management firm) (since 2013); Formerly, | |||||
| 901 South Bond Street | Senior Associate, Intermediary Risk | |||||
| Suite 400 | Management, T. Rowe Price (investment | |||||
| Baltimore, MD 21231 | management firm) (2010 to 2013). | |||||
| Jason T. Meix | Treasurer/ | Indefinite Term; | Vice President, U.S. Bancorp Fund | Not | Not | |
| Age: 39 | Principal | Since May 2012 | Services, LLC (fund administrative services firm) | Applicable. | Applicable. | |
| c/o Brown Advisory LLC | Financial | (since 2008). | ||||
| 901 South Bond Street | Officer | |||||
| Suite 400 | ||||||
| Baltimore, MD 21231 | ||||||
| Edward L. Paz | Secretary | Indefinite Term; | Vice President and Counsel, U.S. Bancorp Fund | Not | Not | |
| Age: 47 | Since May 2012 | Services, LLC (fund administrative services firm) | Applicable. | Applicable. | ||
| c/o Brown Advisory LLC | (since 2007). | |||||
| 901 South Bond Street | ||||||
| Suite 400 | ||||||
| Baltimore, MD 21231 | ||||||
| Brett D. Rogers | Chief | Indefinite Term; | General Counsel and Chief Compliance | Not | Not | |
| Age: 42 | Compliance | Since May 2012 | Officer, Brown Advisory Incorporated and | Applicable. | Applicable. | |
| c/o Brown Advisory | Officer | affiliates (investment management firm) | ||||
| Incorporated | (since 2009). | |||||
| 901 South Bond Street | Anti-Money | Indefinite Term: | ||||
| Suite 400 | Laundering | Since May 2012 | ||||
| Baltimore, MD 21231 | Officer |
(1) | The Trustees of the Trust who are not “interested persons” of the Trust as defined in the 1940 Act (“Independent Trustees”). |
(2) | The directorships disclosed in this column include only the directorships of those companies that a Trustee serves on that are required to report to the SEC under applicable Federal securities laws including publicly traded corporations that are registered with the SEC under the 1934 Act and investment companies that are registered with the SEC under the 1940 Act, and it therefore excludes various other types of directorships that the Trustees of the Trust may currently hold in other types of organizations, including private companies and not-for-profit organizations, which are expressly excluded from the disclosure requirements for mutual fund board members. |
(3) | Mr. Hankin is considered an “interested person” of the Trust, as defined in the 1940 Act, because of his current position with Brown Advisory Incorporated, the parent company of the Adviser, and Mr. Hardiman is considered an “interested person” of the Trust, as defined in the 1940 Act, because of his previous position with Brown Advisory Incorporated and his ownership interest in Brown Advisory Incorporated. |
157
Information About Proxy Voting (Unaudited)
A description of the policies and procedures that the Funds use to determine how to vote proxies relating to portfolio securities is available without charge upon request by calling toll-free at (800) 540-6807 and by accessing the Funds’ website at www.brownadvisoryfunds.com. Furthermore, you can obtain the description on the SEC’s website at www.sec.gov.
Information regarding how the Funds voted proxies relating to portfolio securities during the 12-month period ended June 30 is available without charge, by calling toll-free at (800) 540-6807. In addition, you can obtain the Funds’ proxy voting records on the SEC’s website at www.sec.gov.
Information About the Portfolio Holdings (Unaudited)
The Funds file their complete schedule of portfolio holdings for their first and third fiscal quarters with the SEC on Form N-Q. The Funds’ Form N-Q is available without charge, upon request, by calling toll-free at (800) 540-6807. Furthermore, you can obtain the Form N-Q on the SEC’s website at www.sec.gov. The Funds’ schedules of portfolio holdings are posted on their website at www.brownadvisoryfunds.com within ten business days after calendar quarter end.
Householding (Unaudited)
In an effort to decrease costs, the Funds will reduce the number of duplicate Prospectuses and annual and semi-annual reports that you receive by sending only one copy of each to those addresses shown by two or more accounts. Please call the Transfer Agent toll free at (800) 540-6807 to request individual copies of these documents. The Funds will begin sending individual copies 30 days after receiving your request. This policy does not apply to account statements.
Federal Tax Status of Dividends Declared during the Tax Year (Unaudited)
For Federal Income Tax purposes, distributions from short-term capital gains are classified as ordinary income. The percentage of ordinary income distributions designated as qualifying for the corporate dividend received deduction (“DRD”), the individual qualified dividend rate (“QDI”), the qualifying interest income exempt from U.S. tax for foreign shareholders (“QII”) and the qualifying short-term capital gain distributions exempt from U.S. tax for foreign shareholders (“QSTCG”) is presented below:
| Income Distributions | |||||
Fund | Exempt from Federal Tax | QDI | DRD | QII | QSTCG |
| Growth Equity | 0.00% | 0.00% | 0.00% | 0.00% | 0.00% |
| Flexible Equity | 0.00% | 100.00% | 100.00% | 1.82% | 0.00% |
| Equity Income | 0.00% | 100.00% | 99.85% | 1.48% | 11.86% |
| Sustainable Growth | 0.00% | 0.00% | 0.00% | 0.00% | 0.00% |
| Mid-Cap Growth | 0.00% | 0.00% | 0.00% | 0.00% | 0.00% |
| Small-Cap Growth | 0.00% | 52.70% | 48.88% | 4.51% | 0.00% |
| Small-Cap Fundamental Value | 0.00% | 69.38% | 68.53% | 1.34% | 62.02% |
| Global Leaders | 0.00% | 100.00% | 97.34% | 2.13% | 0.00% |
| Intermediate Income | 0.00% | 0.00% | 0.00% | 91.85% | 0.00% |
| Total Return | 0.00% | 0.00% | 0.00% | 100.00% | 0.00% |
| Strategic Bond | 0.00% | 0.00% | 0.00% | 100.00% | 0.00% |
| Sustainable Bond | 0.00% | 0.00% | 0.00% | 100.00% | 0.00% |
| Maryland Bond | 98.90% | 0.00% | 0.00% | 57.92% | 0.00% |
| Tax Exempt Bond | 97.70% | 0.00% | 0.00% | 100.00% | 0.00% |
| Mortgage Securities | 0.00% | 0.36% | 0.36% | 100.00% | 0.00% |
| WMC Strategic European Equity | 0.00% | 100.00% | 0.00% | 0.21% | 0.00% |
| WMC Japan Alpha Opportunities | 0.00% | 0.00% | 0.00% | 0.00% | 0.00% |
| Somerset Emerging Markets | 0.00% | 100.00% | 3.81% | 0.83% | 0.00% |
| Macquarie Asia New Stars | 0.00% | 5.60% | 0.00% | 1.07% | 0.00% |
| Beutel Goodman Large-Cap Value | 0.00% | 0.00% | 0.00% | 0.00% | 0.00% |
The Funds, as applicable, intend to elect to pass through to shareholders the credit for taxes paid to foreign countries. Such credits for taxes paid to foreign countries will be included in shareholders' Form 1099-DIV.
158
BROWN ADVISORY FUNDS
At Brown Advisory, we believe that you deserve frank and open communication on all aspects of our relationship. In this spirit, we provide this annual summary of our policies relating to confidentiality and privacy of client information, mutual funds, conflicts of interest, trading commissions, proxy voting and Form ADV annual notice.
CONFIDENTIALITY AND PRIVACY POLICY
Brown Advisory takes the confidentiality of your personal information and the privacy of your account very seriously. Our commitment to safeguard your personal information goes beyond our legal obligation to process your transactions accurately and securely. Whether we serve you online, in person, on the telephone or by mail, the principles that guide the way in which we conduct business are built upon the core values of trust and integrity.
We limit access to your personal information to only those employees with a business reason to know such information. We train and consistently remind all employees to respect client privacy and to recognize the importance of the confidentiality of such information. Those who violate our privacy policy are subject to disciplinary action. This commitment also applies to the sharing of information among Brown Advisory and its affiliates.
We maintain physical, electronic and procedural safeguards that comply with applicable laws and regulations to protect your personal information, including various measures to protect your personal information while it is stored electronically.
Federal law requires us to inform you that we have on record personal information about you and that we obtain such information from you directly (e.g., information you provide to us on account applications and other forms, such as your name, address, social security number, occupation, assets and income) and indirectly (e.g., information on our computer systems about your transactions with us, such as your account balance and account holdings). Any personal information you choose to provide is kept confidential and allows us to: (i) provide better and more complete investment and strategic advice; (ii) develop new services that meet additional needs you may have; and, (iii) comply with legal and regulatory requirements.
In addition, in the normal conduct of our business, it may become necessary for us to share information relating to our clients that we have on record, as described above, with companies not affiliated with us who are under contract to perform services on our behalf. For example, we have contracted with companies to assist us in complying with anti-terrorist and anti-money laundering statutory requirements (including the identification and reporting of activities that may involve terrorist acts or money laundering activities), companies that provide clearing services, and other vendors that provide services directly related to your account relationship with us. Our agreements with these companies require that they keep your information confidential and not use such information for any unrelated purpose.
We do not sell information about you to third parties, and we do not otherwise disclose information to third parties without your permission or unless required by law.
159
INVESTMENT ADVISER
Brown Advisory LLC
901 South Bond Street, Suite 400
Baltimore, MD 21231
www.brownadvisory.com
DISTRIBUTOR
Quasar Distributors, LLC
777 East Wisconsin Avenue
Milwaukee, WI 53202
CUSTODIAN
U.S. Bank, N.A.
Custody Operations
1555 North Rivercenter Drive, Suite 302
Milwaukee, WI 53212
TRANSFER AGENT
U.S. Bancorp Fund Services, LLC
P.O. Box 701
Milwaukee, WI 53201
(800) 540-6807
INDEPENDENT REGISTERED PUBLIC ACCOUNTING FIRM
Tait, Weller & Baker LLP
1818 Market Street, Suite 2400
Philadelphia, PA 19103
LEGAL COUNSEL
Dechert LLP
1900 K Street, NW
Washington, DC 20006
| Institutional Shares | Investor Shares | Advisor Shares | ||||||
Symbol | CUSIP | Symbol | CUSIP | Symbol | CUSIP | |||
| Growth Equity Fund | BAFGX | 115233702 | BIAGX | 115233504 | BAGAX | 115233603 | ||
| Flexible Equity Fund | BAFFX | 115233843 | BIAFX | 115233868 | BAFAX | 115233850 | ||
| Equity Income Fund | BAFDX | 115233660 | BIADX | 115233686 | BADAX | 115233678 | ||
| Sustainable Growth Fund | BAFWX | 115233207 | BIAWX | 115233306 | BAWAX | 115233405 | ||
| Mid-Cap Growth Fund | BAFMX | 115233413 | BMIDX | 115233439 | — | — | ||
| Small-Cap Growth Fund | BAFSX | 115233819 | BIASX | 115233835 | BASAX | 115233827 | ||
| Small-Cap Fundamental Value Fund | BAUUX | 115233777 | BIAUX | 115233793 | BAUAX | 115233785 | ||
| Global Leaders Fund | — | — | BIALX | 115233462 | — | — | ||
| Intermediate Income Fund | — | — | BIAIX | 115233744 | BAIAX | 115233736 | ||
| Total Return Fund | BAFTX | 115233538 | BIATX | 115233520 | — | — | ||
| Strategic Bond Fund | BIABX | 115233470 | BATBX | 115233710 | — | — | ||
| Sustainable Bond Fund | BAISX | 115233389 | BASBX | 115233447 | — | — | ||
| Maryland Bond Fund | — | — | BIAMX | 115233751 | — | — | ||
| Tax Exempt Bond Fund | BTEIX | 115233371 | BIAEX | 115233108 | — | — | ||
| Mortgage Securities Fund | BAFZX | 115233546 | BIAZX | 115233587 | — | — | ||
| WMC Strategic European Equity Fund | BAFHX | 115233629 | BIAHX | 115233611 | BAHAX | 115233595 | ||
| WMC Japan Alpha Opportunities Fund | BAFJX | 115233579 | BIAJX | 115233561 | BAJAX | 115233553 | ||
| Somerset Emerging Markets Fund | BAFQX | 115233652 | BIAQX | 115233645 | BAQAX | 115233637 | ||
| Beutel Goodman Large-Cap Value Fund | BVALX | 115233421 | — | — | — | — | ||
This report is submitted for the general information of the shareholders of each Fund. It is not authorized for distribution to prospective investors unless preceded or accompanied by an effective prospectus, which includes information regarding the Funds’ risks, objectives, fees and expenses, experience of their management, and other information.
BX-ANNUAL
Item 2. Code of Ethics.
The registrant has adopted a code of ethics that applies to the registrant’s principal executive officer and principal financial officer. The registrant has not made any amendments to its code of ethics during the period covered by this report. The registrant has not granted any waivers from any provisions of the code of ethics during the period covered by this report.
A copy of the registrant’s Code of Ethics is filed herewith.
Item 3. Audit Committee Financial Expert.
The Registrant’s Board of Trustees has not designated an audit committee financial expert. The Registrant has determined that it will retain the services of an independent third party to assist it if circumstances arise that require specific investment company auditing expertise.
Item 4. Principal Accountant Fees and Services.
The Registrant has engaged its principal accountant to perform audit services, audit-related services, tax services and other services during the past two fiscal years. “Audit services” refer to performing an audit of the Registrant's annual financial statements or services that are normally provided by the accountant in connection with statutory and regulatory filings or engagements for those fiscal years. “Audit-related services” refer to the assurance and related services by the principal accountant that are reasonably related to the performance of the audit. “Tax services” refer to professional services rendered by the principal accountant for tax compliance, tax advice, and tax planning. There were no “Other services” provided by the principal accountant. The following table details the aggregate fees billed or expected to be billed for each of the last two fiscal years for audit fees, audit-related fees, tax fees and other fees by the principal accountant.
Brown Advisory Growth Equity Fund
| FYE 6/30/2018 | FYE 6/30/2017 | |
| Audit Fees | $17,200 | $16,800 |
| Audit-Related Fees | N/A | N/A |
| Tax Fees | $2,800 | $2,800 |
| All Other Fees | N/A | N/A |
Brown Advisory Flexible Equity Fund
| FYE 6/30/2018 | FYE 6/30/2017 | |
| Audit Fees | $17,200 | $16,800 |
| Audit-Related Fees | N/A | N/A |
| Tax Fees | $2,800 | $2,800 |
| All Other Fees | N/A | N/A |
Brown Advisory Equity Income Fund
| FYE 6/30/2018 | FYE 6/30/2017 | |
| Audit Fees | $17,200 | $16,800 |
| Audit-Related Fees | N/A | N/A |
| Tax Fees | $2,800 | $2,800 |
| All Other Fees | N/A | N/A |
Brown Advisory Sustainable Growth Fund
| FYE 6/30/2018 | FYE 6/30/2017 | |
| Audit Fees | $17,200 | $16,800 |
| Audit-Related Fees | N/A | N/A |
| Tax Fees | $2,800 | $2,800 |
| All Other Fees | N/A | N/A |
Brown Advisory Mid-Cap Growth Fund
| FYE 6/30/2018 | FYE 6/30/2017 | |
| Audit Fees | $10,000 | N/A |
| Audit-Related Fees | N/A | N/A |
| Tax Fees | $2,500 | N/A |
| All Other Fees | N/A | N/A |
Brown Advisory Small-Cap Growth Fund
| FYE 6/30/2018 | FYE 6/30/2017 | |
| Audit Fees | $17,200 | $16,800 |
| Audit-Related Fees | N/A | N/A |
| Tax Fees | $2,800 | $2,800 |
| All Other Fees | N/A | N/A |
Brown Advisory Small-Cap Fundamental Value Fund
| FYE 6/30/2018 | FYE 6/30/2017 | |
| Audit Fees | $17,200 | $16,800 |
| Audit-Related Fees | N/A | N/A |
| Tax Fees | $2,800 | $2,800 |
| All Other Fees | N/A | N/A |
Brown Advisory Global Leaders Fund
| FYE 6/30/2018 | FYE 6/30/2017 | |
| Audit Fees | $17,400 | $16,800 |
| Audit-Related Fees | N/A | N/A |
| Tax Fees | $2,800 | $2,800 |
| All Other Fees | N/A | N/A |
Brown Advisory Intermediate Income Fund
| FYE 6/30/2018 | FYE 6/30/2017 | |
| Audit Fees | $17,400 | $16,800 |
| Audit-Related Fees | N/A | N/A |
| Tax Fees | $2,800 | $2,800 |
| All Other Fees | N/A | N/A |
Brown Advisory Total Return Fund
| FYE 6/30/2018 | FYE 6/30/2017 | |
| Audit Fees | $17,650 | $16,800 |
| Audit-Related Fees | N/A | N/A |
| Tax Fees | $2,800 | $2,800 |
| All Other Fees | N/A | N/A |
Brown Advisory Strategic Bond Fund
| FYE 6/30/2018 | FYE 6/30/2017 | |
| Audit Fees | $17,650 | $16,800 |
| Audit-Related Fees | N/A | N/A |
| Tax Fees | $2,800 | $2,800 |
| All Other Fees | N/A | N/A |
Brown Advisory Sustainable Bond Fund
| FYE 6/30/2018 | FYE 6/30/2017 | |
| Audit Fees | $10,000 | N/A |
| Audit-Related Fees | N/A | N/A |
| Tax Fees | $2,500 | N/A |
| All Other Fees | N/A | N/A |
Brown Advisory Maryland Bond Fund
| FYE 6/30/2018 | FYE 6/30/2017 | |
| Audit Fees | $17,200 | $16,800 |
| Audit-Related Fees | N/A | N/A |
| Tax Fees | $2,800 | $2,800 |
| All Other Fees | N/A | N/A |
Brown Advisory Tax Exempt Bond Fund
| FYE 6/30/2018 | FYE 6/30/2017 | |
| Audit Fees | $17,200 | $16,800 |
| Audit-Related Fees | N/A | N/A |
| Tax Fees | $2,800 | $2,800 |
| All Other Fees | N/A | N/A |
Brown Advisory Mortgage Securities Fund
| FYE 6/30/2018 | FYE 6/30/2017 | |
| Audit Fees | $17,650 | $16,800 |
| Audit-Related Fees | N/A | N/A |
| Tax Fees | $2,800 | $2,800 |
| All Other Fees | N/A | N/A |
Brown Advisory – WMC Strategic European Equity Fund
| FYE 6/30/2018 | FYE 6/30/2017 | |
| Audit Fees | $17,650 | $16,800 |
| Audit-Related Fees | N/A | N/A |
| Tax Fees | $2,800 | $2,800 |
| All Other Fees | N/A | N/A |
Brown Advisor – WMC Japan Alpha Opportunities Fund
| FYE 6/30/2018 | FYE 6/30/2017 | |
| Audit Fees | $17,650 | $16,800 |
| Audit-Related Fees | N/A | N/A |
| Tax Fees | $2,800 | $2,800 |
| All Other Fees | N/A | N/A |
Brown Advisory – Somerset Emerging Markets Fund
| FYE 6/30/2018 | FYE 6/30/2017 | |
| Audit Fees | $17,400 | $16,800 |
| Audit-Related Fees | N/A | N/A |
| Tax Fees | $2,800 | $2,800 |
| All Other Fees | N/A | N/A |
Brown Advisory – Macquarie Asia New Stars Fund
| FYE 6/30/2018 | FYE 6/30/2017 | |
| Audit Fees | $17,400 | $16,800 |
| Audit-Related Fees | N/A | N/A |
| Tax Fees | $2,800 | $2,800 |
| All Other Fees | N/A | N/A |
Brown Advisory – Beutel Goodman Large-Cap Value Fund
| FYE 6/30/2018 | FYE 6/30/2017 | |
| Audit Fees | $10,000 | N/A |
| Audit-Related Fees | N/A | N/A |
| Tax Fees | $2,500 | N/A |
| All Other Fees | N/A | N/A |
The audit committee has adopted pre-approval policies and procedures that require the audit committee to pre‑approve all audit and non‑audit services of the Registrant, including services provided to any entity affiliated with the Registrant.
The percentages of fees billed by Tait, Weller & Baker LLP applicable to non-audit services pursuant to waiver of pre-approval requirement were as follows:
| FYE 6/30/2018 | FYE 6/30/2017 | |
| Audit-Related Fees | 0% | 0% |
| Tax Fees | 0% | 0% |
| All Other Fees | 0% | 0% |
All of the principal accountant’s hours spent on auditing the Registrant’s financial statements were attributed to work performed by full‑time permanent employees of the principal accountant.
The following table indicates the non-audit fees billed or expected to be billed by the Registrant’s accountant for services to the Registrant and to the Registrant’s investment adviser (and any other controlling entity, etc.—not sub-adviser) for the last two fiscal years. The audit committee of the board of trustees has considered whether the provision of non-audit services that were rendered to the Registrant's investment adviser is compatible with maintaining the principal accountant's independence and has concluded that the provision of such non-audit services by the accountant has not compromised the accountant’s independence.
| Non-Audit Related Fees | FYE 6/30/2018 | FYE 6/30/2017 |
| Registrant | N/A | N/A |
| Registrant’s Investment Adviser | N/A | N/A |
Item 5. Audit Committee of Listed Registrants.
| (a) | Not applicable to registrants who are not listed issuers (as defined in Rule 10A-3 under the Securities Exchange Act of 1934). |
| (b) | Not applicable. |
Item 6. Schedule of Investments.
| (a) | Schedule of Investments is included as part of the report to shareholders filed under Item 1 of this Form. |
| (b) | Not applicable. |
Item 7. Disclosure of Proxy Voting Policies and Procedures for Closed-End Management Investment Companies.
Not applicable to open-end investment companies.
Item 8. Portfolio Managers of Closed-End Management Investment Companies.
Not applicable to open-end investment companies.
Item 9. Purchases of Equity Securities by Closed‑End Management Investment Company and Affiliated Purchasers.
Not applicable to open-end investment companies.
Item 10. Submission of Matters to a Vote of Security Holders.
There have been no material changes to the procedures by which shareholders may recommend nominees to the registrant’s board of trustees.
Item 11. Controls and Procedures.
| (a) | The Registrant’s Principal Executive Officer and Principal Financial Officer have reviewed the Registrant's disclosure controls and procedures (as defined in Rule 30a-3(c) under the Investment Company Act of 1940 (the “Act”)) as of a date within 90 days of the filing of this report, as required by Rule 30a-3(b) under the Act and Rules 13a-15(b) or 15d‑15(b) under the Securities Exchange Act of 1934. Based on their review, such officers have concluded that the disclosure controls and procedures are effective in ensuring that information required to be disclosed in this report is appropriately recorded, processed, summarized and reported and made known to them by others within the Registrant and by the Registrant’s service provider. |
| (b) | There were no changes in the Registrant's internal control over financial reporting (as defined in Rule 30a-3(d) under the Act) that occurred during the fourth fiscal quarter of the period covered by this report that have materially affected, or are reasonably likely to materially affect, the Registrant's internal control over financial reporting. |
Item 12. Disclosure of Securities Lending Activities for Closed-End Management Investment Companies.
Not applicable to open-end investment companies.
Item 13. Exhibits.
| (a) | (1) Any code of ethics or amendment thereto, that is subject of the disclosure required by Item 2, to the extent that the registrant intends to satisfy Item 2 requirements through filing an exhibit. Filed herewith. |
(2) A separate certification for each principal executive officer and principal financial officer pursuant to Section 302 of the Sarbanes-Oxley Act of 2002. Filed herewith.
(3) Any written solicitation to purchase securities under Rule 23c‑1 under the Act sent or given during the period covered by the report by or on behalf of the registrant to 10 or more persons. Not applicable to open-end investment companies.
(4) Change in the registrant’s independent public accountant. There was no change in the registrant’s independent public accountant for the period covered by this report.
| (b) | Certifications pursuant to Section 906 of the Sarbanes‑Oxley Act of 2002. Furnished herewith. |
SIGNATURES
Pursuant to the requirements of the Securities Exchange Act of 1934 and the Investment Company Act of 1940, the Registrant has duly caused this report to be signed on its behalf by the undersigned, thereunto duly authorized.
(Registrant) Brown Advisory Funds
By (Signature and Title)* /s/David M. Churchill
David M. Churchill, Principal Executive Officer
Date September 6, 2018
Pursuant to the requirements of the Securities Exchange Act of 1934 and the Investment Company Act of 1940, this report has been signed below by the following persons on behalf of the Registrant and in the capacities and on the dates indicated.
By (Signature and Title)* /s/David M. Churchill
David M. Churchill, Principal Executive Officer
Date September 6, 2018
By (Signature and Title)* /s/Jason T. Meix
Jason T. Meix, Principal Financial Officer
Date September 6, 2018
* Print the name and title of each signing officer under his or her signature.