UNITED STATES
SECURITIES AND EXCHANGE COMMISSION
Washington, D.C. 20549
FORM N-CSR
CERTIFIED SHAREHOLDER REPORT OF REGISTERED
MANAGEMENT INVESTMENT COMPANIES
Investment Company Act file number 811-22781
Goldman Sachs Trust II
(Exact name of registrant as specified in charter)
200 West Street
15th Floor
New York, New York 10282
(Address of principal executive offices) (Zip code)
| | |
Copies to: |
Caroline Kraus | | Stephen H. Bier, Esq. |
Goldman Sachs & Co. LLC | | Dechert LLP |
200 West Street | | 1095 Avenue of the Americas |
New York, New York 10282 | | New York, NY 10036 |
(Name and address of agents for service)
Registrant’s telephone number, including area code: (212) 902-1000
Date of fiscal year end: October 31
Date of reporting period: October 31, 2022
| ITEM 1. | REPORTS TO STOCKHOLDERS. |
| | The Annual Report to Shareholders is filed herewith. |
Active Equity Multi-Manager Funds
∎ MULTI-MANAGER INTERNATIONAL EQUITY
∎ MULTI-MANAGER U.S. SMALL CAP EQUITY
| | | | | | | | |
| | | | | |
NOT FDIC-INSURED | | May Lose Value | | No Bank Guarantee | | | | |
MARKET REVIEW
Active Equity Multi-Manager Funds
Market Review
The global equity markets broadly declined during the 12-month period ended October 31, 2022 (the “Reporting Period”), as persistent inflation, supply-chain shortages, recession fears and tightening central bank monetary policy created a challenging backdrop for investors.
Global equities started the Reporting Period strongly, with the MSCI All Country World Index (“MSCI ACWI”) Investable Market Index rising 1.2% in November and December 2021 overall to post a double-digit gain for the 2021 calendar year. For the remainder of the Reporting Period, however, global equity markets were volatile and broadly negative on the back of elevated inflation, rising interest rates and global supply-chain disruptions. In response to stubbornly high inflation, major central banks around the world picked up the pace of interest rate hikes, including the U.S. Federal Reserve (the “Fed”), which raised the targeted federal funds rate to a range between 3.00% and 3.25% by the end of October 2022, its highest level since 2008. Uncertainty about whether central banks could successfully combat inflation and also avoid an economic recession kept equity valuations depressed. Geopolitical tensions further dampened market sentiment, as Russia’s invasion of Ukraine in February 2022 pushed up energy prices and as ongoing COVID-19-related lockdowns in China continued to disrupt global supply chains.
For the Reporting Period overall, the MSCI ACWI Investable Market Index, representing global equities, returned -19.96%, with growth stocks broadly underperforming value stocks. From a sector perspective, the higher interest rate environment and macroeconomic uncertainty contributed to a sell-off in long-duration growth stocks within the information technology and consumer discretionary sectors. (Long-duration stocks are those that tend to deliver a higher proportion of their cash flows in the distant future. Duration is a measure of sensitivity to changes in interest rates.) Energy was the best performing sector in the MSCI ACWI Investable Market Index during the Reporting Period, benefiting from rising commodity prices. From a regional standpoint, North American stocks performed better than European, Australian and Asian stocks, but each global region recorded negative absolute returns overall. Within the U.S. equity market, small-cap stocks, as measured by the Russell 2000® Total Return Index, outperformed large-cap stocks, as measured by the Russell 1000® Index. However, all capitalization segments of the U.S. equity market posted negative absolute returns during the Reporting Period. Emerging markets equities were particularly challenged during the Reporting Period, mainly by the uncertain geopolitical environment and the sharp decline in China’s stock market. The MSCI China All Shares Index returned -42.58% during the Reporting Period overall, as economic growth concerns fueled by the Chinese government’s “zero-COVID” policies and its continuing regulatory crackdown weighed on investor sentiment. Instability within Eastern Europe was also a drag on the performance of emerging markets equities, with a number of index providers, including MSCI Inc., excluding Russian securities from their indices in response to Russia’s invasion of Ukraine and also as geopolitical concerns drove significant equity declines in Eastern Europe, especially in Hungary and Poland.
Looking Ahead
At the end of the Reporting Period, we believed investors would continue to face headwinds from tightening monetary policy, as persistent inflation kept central banks on their interest rate hiking paths. While many observers anticipated some kind of economic slowdown, they continued to debate whether central bankers could engineer a “soft landing” or if a more protracted economic decline would be the likely outcome. (A soft landing, in economics, is a cyclical downturn that avoids recession. It typically describes attempts by central banks to raise interest rates just enough to stop an economy from overheating and experiencing high inflation, without causing a significant increase in unemployment, or a hard landing.) In our view, the war in Ukraine and its broader geopolitical risks were likely to remain threats to the global capital markets in the near term and could also push energy and food prices higher. Although supply-chain issues appeared to be moderating at the end of the Reporting Period, we expected them to remain obstacles in the fight against inflation.
1
FUND RESULTS
Multi-Manager International Equity Fund
|
| |
Investment Objective |
| |
The Fund seeks to provide long-term capital growth. |
Portfolio Management Discussion and Analysis
Below, the Goldman Sachs Alternative Investments & Manager Selection (“AIMS”) Group discusses the Multi-Manager International Equity Fund’s (the “Fund”) performance and positioning for the 12-month period ended October 31, 2022 (the “Reporting Period”).
| Q | | How did the Fund perform during the Reporting Period? |
| A | | During the Reporting Period, the Fund’s Class P Shares generated an average annual total return of -23.15%. This return compares to the -23.00% average annual total return of the Fund’s benchmark, the MSCI Europe, Australasia and Far East (“EAFE”) Index (Net, USD, Unhedged) (the “MSCI® EAFE® Index”), during the same time period. |
| Q | | What key factors were responsible for the Fund’s performance during the Reporting Period? |
| A | | The Fund uses a multi-manager approach and generally seeks to achieve its investment objective by dynamically allocating its assets among unaffiliated investment managers (“Underlying Managers”) that employ an international equity investment strategy. The AIMS Group is responsible for making recommendations with respect to hiring, terminating or replacing the Fund’s Underlying Managers as well as for determining the Fund’s asset allocations. The AIMS Group applies a multifaceted process with respect to manager due diligence, portfolio construction and risk management. |
| | During the Reporting Period, the Fund generated a negative absolute return, underperforming the Index on a relative basis. These relative results can be attributed to the performance of the Fund’s Underlying Managers overall. During the Reporting Period, the Fund allocated capital to four Underlying Managers as part of its top-level strategy allocation—Causeway Capital Management LLC (“Causeway”), Lazard Asset Management LLC (“Lazard”), Massachusetts Financial Services Company doing business as MFS Investment Management (“MFS”) and WCM Investment Management (“WCM”). |
| | All four of the Underlying Managers produced negative absolute returns during the Reporting Period. On a relative basis, growth-oriented Underlying Manager WCM and core-oriented Underlying Manager Lazard underperformed their respective benchmark indices. Value-oriented Underlying Manager Causeway and core-oriented Underlying Manager MFS outperformed their respective benchmark indices during the Reporting Period. |
| Q | | Which international equity strategies most significantly affected Fund performance? |
| A | | Growth-oriented Underlying Manager WCM underperformed its benchmark index, the MSCI ACWI ex-USA Index, during the Reporting Period, due to weak stock selection and a relative overweight in information technology as well as a lack of exposure to the energy sector. These losses were partly offset by a lack of exposure to the communication services and real estate sectors, which added value. From a regional perspective, poor stock selection across the board detracted from performance, though allocation decisions contributed positively. |
| | Lazard, a core-oriented Underlying Manager, underperformed its benchmark index, the MSCI® EAFE® Index, primarily because of poor stock selection within the consumer discretionary and real estate sectors. On a regional basis, weak stock selection in continental Europe and Japan detracted the most from relative returns. These negative results were partially offset by effective stock selection in the financials and consumer staples sectors, out-of-benchmark exposure to North America, primarily Canada, and a relative overweight to and stock selection in the U.K. |
| | Value-oriented Underlying Manager Causeway outperformed its benchmark index, the MSCI® EAFE® Index, during the Reporting Period, largely as a result of strong stock selection within the consumer discretionary and financials sectors. These gains were slightly offset by weak stock selection in the materials and industrials sectors. From a regional perspective, the majority of its outperformance was driven by strong stock selection in Europe, while a lack of exposure to Asia ex-Japan detracted from relative performance. |
| | Core-oriented Underlying Manager MFS outperformed the MSCI® EAFE® Index, its benchmark index, due largely to broad-based positive stock selection across the consumer discretionary, information technology, financials and industrials sectors. Additionally, the strategy benefited from a lack of exposure to the real estate sector. Conversely, a relative underweight position in energy, along with challenged stock selection within communication services, detracted from relative performance. From a regional perspective, stock selection was strong in continental Europe. |
2
FUND RESULTS
| | | Modest out-of-benchmark exposure to North America, especially Canada, added further to returns. Meanwhile, stock selection in the emerging markets—namely, modest out-of-benchmark exposure to China and Taiwan—detracted somewhat from relative performance. |
| Q | | How did the Fund use derivatives and similar instruments during the Reporting Period? |
| A | | The Fund used forward foreign currency exchange contracts during the Reporting Period to take positions in select non-U.S. markets. Rights were employed to give the Fund the opportunity, but not the obligation, to buy additional shares of specific stocks at a discount. The use of forward foreign currency exchange contracts had a positive impact on the Fund’s performance during the Reporting Period, while the use of rights had a neutral impact. |
| Q | | Were there any notable changes in the Fund’s allocations during the Reporting Period? |
| A | | There were no notable changes to the Fund’s allocations during the Reporting Period. At the beginning and end of the Reporting Period, the Fund’s assets were allocated approximately 30% to MFS, 29% to Causeway, 20% to WCM and 20% to Lazard, with the remainder invested in cash and cash equivalents. |
| Q | | What is the Fund’s tactical view and strategy for the months ahead? |
| A | | We intend to continue to position the Fund in alignment with our longer-term strategic views within the international equity complex. We further intend to continue to monitor allocations and Underlying Manager performance as we seek to generate long-term capital growth. |
3
FUND BASICS
Multi-Manager International Equity Fund
as of October 31, 2022
| | | | | | | |
|
| TOP TEN HOLDINGS AS OF 10/31/22 ± |
| | |
| Holding | | % of Net Assets | | Line of Business |
| | |
| Roche Holding AG | | | | 2.4 | % | | Pharmaceuticals |
| | |
| RELX PLC | | | | 1.9 | | | Professional Services |
| | |
| Nestle SA | | | | 1.7 | | | Food Products |
| | |
| Aon PLC Class A | | | | 1.7 | | | Insurance |
| | |
| Pernod Ricard SA | | | | 1.6 | | | Beverages |
| | |
| Compass Group PLC | | | | 1.5 | | | Hotels, Restaurants & Leisure |
| | |
| SAP SE | | | | 1.5 | | | Software |
| | |
| Air Liquide SA | | | | 1.4 | | | Chemicals |
| | |
| Novo Nordisk A/S Class B | | | | 1.4 | | | Pharmaceuticals |
| | |
| LVMH Moet Hennessy Louis Vuitton SE | | | | 1.4 | | | Textiles, Apparel & Luxury Goods |
| ± | | The top 10 holdings may not be representative of the Fund’s future investments. The top 10 holdings exclude investments in money market funds. |
|
|
| FUND VS. BENCHMARK SECTOR ALLOCA TION † |
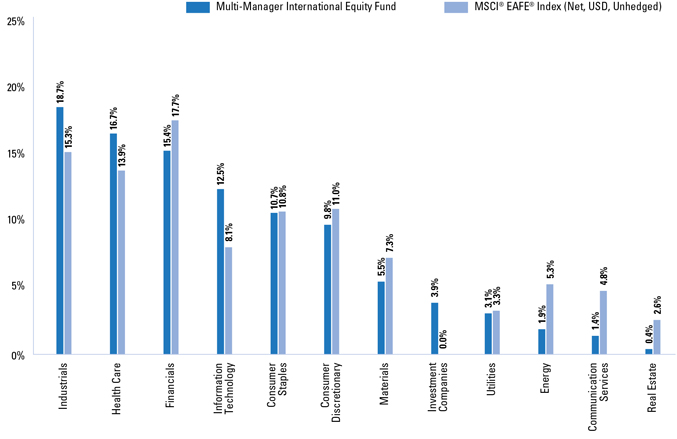
| † | | The Fund is actively managed and, as such, its composition may differ over time. Consequently, the Fund’s overall sector allocations may differ from the percentages contained in the graph above. The graph categorizes investments using the Global Industry Classification Standard (“GICS”), however, the sector classifications used by the portfolio management team may differ from GICS. The percentage shown for each investment category reflects the value of investments in that category as a percentage of the total value of the Fund’s equity investments. The graph depicts the Fund’s investments but may not represent the Fund’s market exposure due to the exclusion of certain derivatives, if any, as listed in the Additional Investment Information section of the Schedule of Investments. |
| | | For more information about your Fund, please refer to www.GSAMFUNDS.com. There, you can learn more about your Fund’s investment strategies, holdings, and performance. |
4
GOLDMAN SACHS MULTI-MANAGER INTERNATIONAL EQUITY FUND
Performance Summary
October 31, 2022
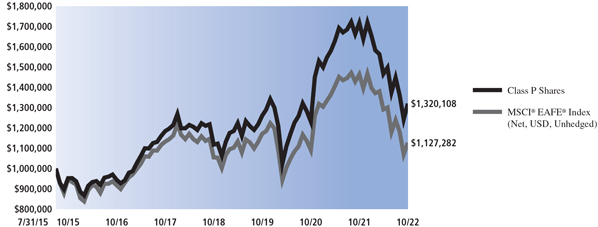
The following graph shows the value, as of October 31, 2022, of a $1,000,000 investment made on July 31, 2015 (commencement of operations) in Class P Shares at NAV. For comparative purposes, the performance of the Fund’s benchmark, the MSCI® EAFE® Index (Net, USD, Unhedged) is shown. Performance reflects applicable fee waivers and/or expense limitations in effect during the periods shown and in their absence, performance would be reduced. Returns do not reflect the deduction of taxes that a shareholder would pay on Fund distributions or the redemption of Fund shares. The returns set forth below represent past performance. Past performance does not guarantee future results. The Fund’s investment return and principal value will fluctuate so that an investor’s shares, when redeemed, may be worth more or less than their original cost. Current performance may be lower or higher than the performance quoted below. Please visit our web site at www.GSAMFUNDS.com to obtain the most recent month-end returns.
|
|
| Multi-Manager International Equity Fund’s Lifetime Performance |
Performance of a $1,000,000 investment, with distributions reinvested, from July 31, 2015 through October 31, 2022.
| | | | | | |
| | | |
| Average Annual Total Return through October 31, 2022* | | One Year | | Five Years | | Since Inception |
Class P (Commenced July 31, 2015) | | -23.15% | | 2.19% | | 3.90% |
|
| * | | Because Class P Shares does not involve a sales charge, such a charge is not applied to its Average Annual Total Return. |
5
FUND RESULTS
Multi-Manager U.S. Small Cap Equity Fund
Investment Objective
The Fund seeks to provide long-term capital growth.
Portfolio Management Discussion and Analysis
Below, the Goldman Sachs Alternative Investments & Manager Selection (“AIMS”) Group discusses the Multi-Manager U.S. Small Cap Equity Fund’s (the “Fund”) performance and positioning for the 12-month period ended October 31, 2022 (the “Reporting Period”).
| Q | | How did the Fund perform during the Reporting Period? |
| A | | During the Reporting Period, the Fund’s Class P Shares generated an average annual total return of -15.77%. This return compares to the -18.54% average annual total return of the Fund’s benchmark, the Russell 2000® Total Return Index (the “Index”), during the same time period. |
| Q | | What key factors were responsible for the Fund’s performance during the Reporting Period? |
| A | | The Fund uses a multi-manager approach and generally seeks to achieve its investment objective by dynamically allocating its assets among unaffiliated investment managers (“Underlying Managers”) that employ a small-cap equity investment strategy. The AIMS Group is responsible for making recommendations with respect to hiring, terminating or replacing the Fund’s Underlying Managers as well as for determining the Fund’s asset allocations. The AIMS Group applies a multifaceted process with respect to manager due diligence, portfolio construction and risk management. |
| | | The Fund generated a negative absolute return during the Reporting Period but outperformed the Index. The relative outperformance can be attributed to the performance of the Fund’s Underlying Managers overall. During the Reporting Period, the Fund allocated capital to three Underlying Managers, one of which managed two strategies, as part of its top-level strategy allocation—Boston Partners Global Investors (“Boston Partners”), Brown Advisory, LLC (“Brown Advisory”) and Victory Capital Management, Inc. (“Victory RS” and “Victory Sycamore”). |
| | All four of the strategies managed by these Underlying Managers generated negative absolute returns during the Reporting Period. On a relative basis, growth-oriented Underlying Manager Brown Advisory, value-oriented Underlying Manager Boston Partners and value-oriented Underlying Manager Victory Sycamore outperformed their |
| | respective benchmark indices. Growth-oriented Underlying Manager Victory RS underperformed its benchmark index during the Reporting Period. |
| Q | | Which small-cap equity strategies most significantly affected Fund performance? |
| A | | Growth-oriented Underlying Manager Brown Advisory outperformed its benchmark index, the Russell 2000® Growth Index, during the Reporting Period, driven primarily by strong stock selection within the information technology and financials sectors. Conversely, an allocation to the energy sector and stock selection within consumer discretionary partly offset these positive results. |
| | Value-oriented Underlying Manager Boston Partners outperformed its benchmark index, the Russell 2000® Value Index. Strong stock selection in and a relative underweight to health care, as well as stock selection in communication services, added to performance. Meanwhile, stock selection within consumer staples, along with an overweight in information technology, detracted from returns. |
| | Victory Sycamore, the other value-oriented Underlying Manager, outperformed its benchmark index, the Russell 2000® Value Index, mainly because of strong stock selection in and a relative overweight to the industrials sector. Effective stock selection in and an underweight to the health care sector was also advantageous. These positive results were offset somewhat by an underweight in energy, as well as stock selection within consumer staples, which detracted. |
| | Victory RS, the other growth-oriented Underlying Manager, underperformed its benchmark index, the Russell 2000® Growth Index during the Reporting Period. The negative results were primarily attributable to weak stock selection within the health care and information technology sectors. On the other hand, the strategy benefited from stock selection in the real estate sector. |
6
FUND RESULTS
| Q | | How did the Fund use derivatives and similar instruments during the Reporting Period? |
| A | | During the Reporting Period, the Fund did not use derivatives or similar instruments. |
| Q | | Were there any notable changes in the Fund’s allocations during the Reporting Period? |
| A | At the beginning of the Reporting Period, the Fund’s assets were allocated approximately 32% to Brown Advisory, 29% to Boston Partners, 24% to Victory Sycamore and 14% to Victory RS, with the remainder invested in cash and cash equivalents. |
| | In April 2022, the AIMS Group decided to trim the Fund’s allocation to growth-oriented Underlying Manager Victory RS. The assets were reallocated to growth-oriented Brown Advisory and value-oriented Victory Sycamore. This redeployment helped the AIMS Group keep the Fund in balance from both a risk budget and style perspective. |
| | At the end of the Reporting Period, the Fund’s assets were allocated approximately 36% to Brown Advisory, 29% to Boston Partners, 25% to Victory Sycamore and 9% to Victory RS, with the remainder invested in cash and cash equivalents. |
| Q | | What is the Fund’s tactical view and strategy for the months ahead? |
| A | | We intend to continue to position the Fund in alignment with our longer-term strategic views within the U.S. small-cap equity complex. We further intend to continue to monitor allocations and Underlying Manager performance as we seek to generate long-term capital growth. |
7
FUND BASICS
Multi-Manager U.S. Small Cap Equity Fund
as of October 31, 2022
| | | | | | | |
TOP TEN HOLDINGS AS OF 10/31/22 ± |
| | |
| Holding | | % of Net Assets | | Line of Business |
| | |
| Genpact Ltd. | | | | 1.4 | % | | IT Services |
| Casey’s General Stores, Inc. | | | | 1.2 | | | Food & Staples Retailing |
| Evo Payments, Inc. Class A | | | | 1.1 | | | IT Services |
| HealthEquity, Inc. | | | | 1.1 | | | Health Care Providers & Services |
| Prosperity Bancshares, Inc. | | | | 1.0 | | | Banks |
| ChampionX Corp. | | | | 1.0 | | | Energy Equipment & Services |
| IAA, Inc. | | | | 0.9 | | | Commerical Services & Supplies |
| SPDR S&P Biotech ETF | | | | 0.9 | | | Exchange Traded Funds |
| Wintrust Financial Corp. | | | | 0.9 | | | Banks |
| ABM Industries, Inc. | | | | 0.8 | | | Commerical Services & Supplies |
| ± | | The top 10 holdings may not be representative of the Fund’s future investments. The top 10 holdings exclude investments in money market funds. |
|
FUND VS. BENCHMARK SECTOR ALLOCATION † |
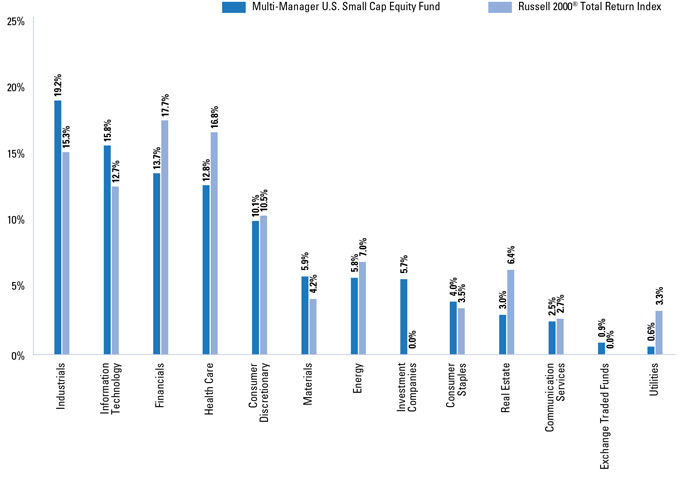
| † | | The Fund is actively managed and, as such, its composition may differ over time. Consequently, the Fund’s overall sector allocations may differ from the percentages contained in the graph above. The graph categorizes investments using the Global Industry Classification Standard (“GICS”), however, the sector classifications used by the portfolio management team may differ from GICS. The percentage shown for each investment category reflects the value of investments in that category as a percentage of the total value of the Fund’s equity investments. The graph depicts the Fund’s investments but may not represent the Fund’s market exposure due to the exclusion of certain derivatives, if any, as listed in the Additional Investment Information section of the Schedule of Investments. |
| | | For more information about your Fund, please refer to www.GSAMFUNDS.com. There, you can learn more about your Fund’s investment strategies, holdings, and performance. |
8
GOLDMAN SACHS MULTI-MANAGER U.S. SMALL CAP EQUITY FUND
Performance Summary
October 31, 2022
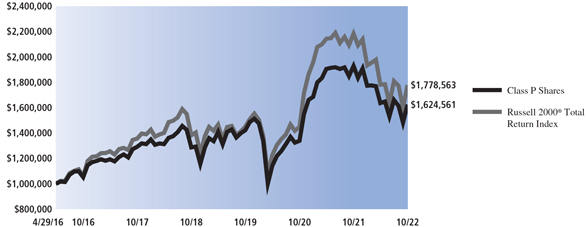
The following graph shows the value, as of October 31, 2022, of a $1,000,000 investment made on April 29, 2016 (commencement of operations) in Class P Shares at NAV. For comparative purposes, the performance of the Fund’s benchmark, the Russell 2000® Total Return Index is shown. Performance reflects applicable fee waivers and/or expense limitations in effect during the periods shown and in their absence, performance would be reduced. Returns do not reflect the deduction of taxes that a shareholder would pay on Fund distributions or the redemption of Fund shares. The returns set forth below represent past performance. Past performance does not guarantee future results. The Fund’s investment return and principal value will fluctuate so that an investor’s shares, when redeemed, may be worth more or less than their original cost. Current performance may be lower or higher than the performance quoted below. Please visit our web site at www.GSAMFUNDS.com to obtain the most recent month-end returns.
|
|
| Multi-Manager U.S. Small Cap Equity Fund’s Lifetime Performance |
Performance of a $1,000,000 investment, with distributions reinvested, from April 29, 2016 through October 31, 2022.
| | | | | | |
| | | |
| Average Annual Total Return through October 31, 2022* | | One Year | | Five Years | | Since Inception |
Class P (Commenced April 29, 2016) | | -15.77% | | 4.69% | | 7.74% |
|
| * | | Because Class P Shares does not involve a sales charge, such a charge is not applied to its Average Annual Total Return. |
9
FUND BASICS
Index Definitions
Market Review
MSCI All Country World Index Investable Market Index is designed to represent performance of the full opportunity set of large- and mid-cap stocks across 23 developed and 24 emerging markets.
MSCI China All Shares Index captures large and mid-cap representation across China A shares, B shares, H shares, Red chips, P chips and foreign listings (e.g., American Depositary Receipts). The index aims to reflect the opportunity set of China share classes listed in Hong Kong, Shanghai, Shenzhen and outside of China.
Russell 1000® Index measures the performance of the large-cap segment of the U.S. equity universe. The Russell 1000® Index is a subset of the Russell 3000® Index and includes approximately 1000 of the largest securities based on a combination of their market cap and current index membership. The Russell 1000® Index represents approximately 92% of the U.S. market. The Russell 1000® Index is constructed to provide a comprehensive and unbiased barometer for the large-cap segment and is completely reconstituted annually to ensure new and growing equities are reflected.
Russell 2000® Total Return Index is an unmanaged index of common stock prices that measures the performance of the 2000 smallest companies in the Russell 3000® Index. The Index is constructed to provide a comprehensive and unbiased small-cap barometer and is completely reconstituted annually to ensure larger stocks do not distort the performance and characteristics of the true small-cap opportunity set.
Multi-Manager International Equity Fund
MSCI ACWI ex USA Index captures large and mid cap representation across 22 of 23 developed markets countries.
MSCI® EAFE® Index is a stock market index that is designed to measure the equity market performance of developed markets in Europe, Australasia and the Far East, excluding the U.S. and Canada.
Multi-Manager U.S. Small Cap Equity Fund
Russell 2000® Growth Index measures the performance of the small-cap growth stocks of the U.S. equity universe.
Russell 2000® Total Return Index is an unmanaged index of common stock prices that measures the performance of the 2000 smallest companies in the Russell 3000® Index. The Index is constructed to provide a comprehensive and unbiased small-cap barometer and is completely reconstituted annually to ensure larger stocks do not distort the performance and characteristics of the true small-cap opportunity set.
Russell 2000® Value Index measures the performance of the small-cap value stocks of the U.S. equity universe.
It is not possible to invest directly in an unmanaged index.
10
GOLDMAN SACHS MULTI-MANAGER INTERNATIONAL EQUITY FUND
Schedule of Investments
October 31, 2022
| | | | | | | | | | | | |
| | | | Shares | | | Description | | Value | |
| |
| | | | Common Stocks – 95.6% | |
| | | | Australia – 0.8% | |
| | | | | 50,812 | | | CSL Ltd. (Biotechnology) | | $ | 9,096,131 | |
| | | | | | |
| | | | Belgium – 0.5% | |
| | | | | 66,306 | | | Anheuser-Busch InBev SA (Beverages) | | | 3,316,652 | |
| | | | | 40,308 | | | KBC Group NV (Banks) | | | 2,020,065 | |
| | | | | | | | | | | | |
| | | | | | | | | | | 5,336,717 | |
| | | | | | |
| | | | Canada – 6.0% | |
| | | | | 72,190 | | | Alimentation Couche-Tard, Inc. (Food & Staples Retailing) | | | 3,232,348 | |
| | | | | 17,190 | | | BRP, Inc. (Leisure Products) | | | 1,149,365 | |
| | | | | 303,729 | | | CAE, Inc.* (Aerospace & Defense) | | | 5,796,568 | |
| | | | | 104,549 | | | Canadian National Railway Co. (Road & Rail) | | | 12,384,491 | |
| | | | | 195,516 | | | Canadian Pacific Railway Ltd. (Road & Rail) | | | 14,566,806 | |
| | | | | 20,441 | | | Intact Financial Corp. (Insurance) | | | 3,106,024 | |
| | | | | 21,938 | | | Lululemon Athletica, Inc.* (Textiles, Apparel & Luxury Goods) | | | 7,218,479 | |
| | | | | 93,966 | | | National Bank of Canada (Banks) | | | 6,397,978 | |
| | | | | 252,769 | | | Suncor Energy, Inc. (Oil, Gas & Consumable Fuels) | | | 8,694,355 | |
| | | | | 59,519 | | | The Toronto-Dominion Bank (Banks) | | | 3,809,198 | |
| | | | | 36,530 | | | TMX Group Ltd. (Capital Markets) | | | 3,512,093 | |
| | | | | | | | | | | | |
| | | | | | | | | | | 69,867,705 | |
| | | | | | |
| | | | China – 1.6% | |
| | | | | 3,892,000 | | | Beijing Capital International Airport Co. Ltd. Class H* (Transportation Infrastructure) | | | 2,107,653 | |
| | | | | 1,883,000 | | | China Longyuan Power Group Corp. Ltd. Class H (Independent Power and Renewable Electricity Producers) | | | 2,151,648 | |
| | | | | 736,500 | | | Li Ning Co. Ltd. (Textiles, Apparel & Luxury Goods) | | | 3,809,855 | |
| | | | | 294,761 | | | Ming Yang Smart Energy Group | | | | |
| | | | | | | | Ltd. (Electrical Equipment) | | | 1,003,607 | |
| | | | | 112,600 | | | NetEase, Inc. (Entertainment) | | | 1,249,325 | |
| | | | | 379,600 | | | Shenzhou International Group Holdings Ltd. (Textiles, Apparel & Luxury Goods) | | | 2,635,561 | |
| | | | | 113,800 | | | Tencent Holdings Ltd. (Interactive | | | | |
| | | | | | | | Media & Services) | | | 2,990,297 | |
| | | | | 62,608 | | | Yum China Holdings, Inc. (Hotels, Restaurants & Leisure) | | | 2,588,841 | |
| | | | | | | | | | | | |
| | | | | | | | | | | 18,536,787 | |
| | | | | | |
| | | | Denmark – 2.9% | |
| | | | | 77,031 | | | Carlsberg AS Class B (Beverages) | | | 9,070,061 | |
| | | | | 20,495 | | | DSV A/S (Air Freight & Logistics) | | | 2,769,453 | |
| | | | | 9,371 | | | Genmab A/S* (Biotechnology) | | | 3,609,780 | |
| | | | | | |
| | | | | | | | | | | | |
| | | | Shares | | | Description | | Value | |
| |
| | | | Common Stocks (continued) | |
| | | | Denmark (continued) | |
| | | | | 153,587 | | | Novo Nordisk A/S Class B (Pharmaceuticals) | | $ | 16,699,707 | |
| | | | | 78,195 | | | Vestas Wind Systems AS (Electrical | | | | |
| | | | | | | | Equipment) | | | 1,541,510 | |
| | | | | | | | | | | | |
| | | | | | | | | | | 33,690,511 | |
| | | | | | |
| | | | Finland – 0.4% | |
| | | | | 110,132 | | | Sampo Oyj Class A (Insurance) | | | 5,036,087 | |
| | | | | | |
| | | | France – 14.1% | |
| | | | | 128,348 | | | Air Liquide SA (Chemicals) | | | 16,789,675 | |
| | | | | 49,251 | | | Airbus SE (Aerospace & Defense) | | | 5,329,141 | |
| | | | | 374,466 | | | Alstom SA (Machinery) | | | 7,706,969 | |
| | | | | 1,574 | | | Amundi SA(a) (Capital Markets) | | | 74,261 | |
| | | | | 270,175 | | | AXA SA (Insurance) | | | 6,671,939 | |
| | | | | 54,771 | | | BNP Paribas SA (Banks) | | | 2,568,425 | |
| | | | | 143,012 | | | Bureau Veritas SA (Professional Services) | | | 3,538,154 | |
| | | | | 47,686 | | | Capgemini SE (IT Services) | | | 7,815,292 | |
| | | | | 207,622 | | | Carrefour SA (Food & Staples | | | | |
| | | | | | | | Retailing) | | | 3,341,769 | |
| | | | | 63,355 | | | Cie de Saint-Gobain (Building Products) | | | 2,590,011 | |
| | | | | 89,984 | | | Cie Generale des Etablissements | | | | |
| | | | | | | | Michelin SCA (Auto Components) | | | 2,293,157 | |
| | | | | 151,219 | | | Danone SA (Food Products) | | | 7,515,507 | |
| | | | | 58,667 | | | Dassault Systemes SE (Software) | | | 1,966,445 | |
| | | | | 844,716 | | | Engie SA (Multi-Utilities) | | | 10,975,692 | |
| | | | | 36,634 | | | EssilorLuxottica SA (Textiles, Apparel & Luxury Goods) | | | 5,792,867 | |
| | | | | 41,565 | | | Legrand SA (Electrical Equipment) | | | 3,167,445 | |
| | | | | 8,873 | | | L’Oreal SA (Personal Products) | | | 2,786,159 | |
| | | | | 26,185 | | | LVMH Moet Hennessy Louis Vuitton SE (Textiles, Apparel & Luxury Goods) | | | 16,522,593 | |
| | | | | 108,814 | | | Pernod Ricard SA (Beverages) | | | 19,098,073 | |
| | | | | 97,925 | | | Sanofi (Pharmaceuticals) | | | 8,427,209 | |
| | | | | 115,883 | | | Schneider Electric SE (Electrical Equipment) | | | 14,654,136 | |
| | | | | 32,341 | | | Thales SA (Aerospace & Defense) | | | 4,113,125 | |
| | | | | 64,821 | | | TotalEnergies SE (Oil, Gas & Consumable Fuels) | | | 3,536,203 | |
| | | | | 89,834 | | | Valeo (Auto Components) | | | 1,479,833 | |
| | | | | 52,865 | | | Vinci SA (Construction & Engineering) | | | 4,865,533 | |
| | | | | | | | | | | | |
| | | | | | | | | | | 163,619,613 | |
| | | | | | |
| | | | Germany–7.3% | |
| | | | | 198,250 | | | Bayer AG (Pharmaceuticals) | | | 10,424,189 | |
| | | | | 61,974 | | | Beiersdorf AG (Personal Products) | | | 5,949,205 | |
| | | | | 1,074,998 | | | BNP Paribas SA (Banks) | | | 10,577,534 | |
| | | | | 53,485 | | | Continental AG (Auto Components) | | | 2,770,291 | |
| | | | | 44,865 | | | Deutsche Boerse AG (Capital Markets) | | | 7,295,930 | |
| | | | | | |
| | |
| The accompanying notes are an integral part of these financial statements. | | 11 |
GOLDMAN SACHS MULTI-MANAGER INTERNATIONAL EQUITY FUND
Schedule of Investments (continued)
October 31, 2022
| | | | | | | | | | | | |
| | | | Shares | | | Description | | Value | |
| |
| | | | Common Stocks (continued) | |
| | | | Germany (continued) | |
| | | | | 267,922 | | | Deutsche Telekom AG (Diversified Telecommunication Services) | | $ | 5,057,158 | |
| | | | | 90,229 | | | Infineon Technologies AG (Semiconductors & Semiconductor Equipment) | | | 2,189,448 | |
| | | | | 66,999 | | | Merck KGaA (Pharmaceuticals) | | | 10,918,492 | |
| | | | | 11,613 | | | MTU Aero Engines AG (Aerospace & Defense) | | | 2,078,241 | |
| | | | | 153,600 | | | RWE AG (Independent Power and Renewable Electricity Producers) | | | 5,912,853 | |
| | | | | 177,969 | | | SAP SE (Software) | | | 17,130,008 | |
| | | | | 24,522 | | | Siemens AG (Industrial Conglomerates) | | | 2,678,022 | |
| | | | | 85,293 | | | Vonovia SE (Real Estate Management & Development) | | | 1,885,880 | |
| | | | | | | | | | | | |
| | | | | | | | | | | 84,867,251 | |
| | | | | | |
| | | | Hong Kong – 1.5% | |
| | | | | 1,989,190 | | | AIA Group Ltd. (Insurance) | | | 15,067,697 | |
| | | | | 1,434,000 | | | ESR Group Ltd.(a) (Real Estate Management & Development) | | | 2,445,474 | |
| | | | | | | | | | | | |
| | | | | | | | | | | 17,513,171 | |
| | | | | | |
| | | | India – 0.9% | |
| | | | | 109,013 | | | HDFC Bank Ltd. (Banks) | | | 1,978,416 | |
| | | | | 200,021 | | | Housing Development Finance Corp. Ltd. (Diversified Financial Services) | | | 5,980,380 | |
| | | | | 62,752 | | | Tata Consultancy Services Ltd. (IT Services) | | | 2,421,729 | |
| | | | | | | | | | | | |
| | | | | | | | | | | 10,380,525 | |
| | | | | | |
| | | | Ireland – 4.4% | |
| | | | | 47,022 | | | Accenture PLC Class A (IT Services) | | | 13,349,546 | |
| | | | | 384,620 | | | Experian PLC (Professional Services) | | | 12,263,709 | |
| | | | | 57,279 | | | ICON PLC* (Life Sciences Tools & Services) | | | 11,332,077 | |
| | | | | 199,516 | | | Ryanair Holdings PLC ADR* (Airlines) | | | 13,744,657 | |
| | | | | | | | | | | | |
| | | | | | | | | | | 50,689,989 | |
| | | | Israel – 1.1% | |
| | | | | | |
| | | | | 762,367 | | | Bank Leumi Le-Israel BM (Banks) | | | 7,272,786 | |
| | | | | 42,543 | | | Check Point Software Technologies Ltd.* (Software) | | | 5,497,832 | |
| | | | | | | | | | | | |
| | | | | | | | | | | 12,770,618 | |
| | | | | | |
| | | | Italy – 3.2% | |
| | | | | 2,122,505 | | | Enel SpA (Electric Utilities) | | | 9,481,967 | |
| | | | | 317,994 | | | Eni SpA (Oil, Gas & Consumable Fuels) | | | 4,176,444 | |
| | | | | 36,459 | | | Ferrari NV (Automobiles) | | | 7,187,464 | |
| | | | | 2,024,811 | | | Intesa Sanpaolo SpA (Banks) | | | 3,860,358 | |
| | | | | | |
| | | | | | | | | | | | |
| | | | Shares | | | Description | | Value | |
| |
| | | | Common Stocks (continued) | |
| | | | Italy (continued) | |
| | | | | 1,027,367 | | | UniCredit SpA (Banks) | | $ | 12,740,649 | |
| | | | | | | | | | | | |
| | | | | | | | | | | 37,446,882 | |
| | | | | | |
| | | | Japan – 9.7% | |
| | | | | 124,000 | | | BayCurrent Consulting, Inc. (Professional Services) | | | 3,479,090 | |
| | | | | 64,000 | | | Daikin Industries Ltd. (Building Products) | | | 9,586,380 | |
| | | | | 57,900 | | | Denso Corp. (Auto Components) | | | 2,872,761 | |
| | | | | 69,900 | | | FANUC Corp. (Machinery) | | | 9,146,528 | |
| | | | | 162,800 | | | Hitachi Ltd. (Industrial Conglomerates) | | | 7,386,856 | |
| | | | | 31,800 | | | Hoya Corp. (Health Care Equipment & Supplies) | | | 2,956,170 | |
| | | | | 15,400 | | | Keyence Corp. (Electronic Equipment, Instruments & Components) | | | 5,806,802 | |
| | | | | 111,300 | | | Kobe Bussan Co. Ltd. (Food & Staples Retailing) | | | 2,414,165 | |
| | | | | 127,400 | | | Koito Manufacturing Co. Ltd. (Auto Components) | | | 1,808,677 | |
| | | | | 28,700 | | | Kose Corp. (Personal Products) | | | 2,864,847 | |
| | | | | 297,200 | | | Kubota Corp. (Machinery) | | | 4,145,819 | |
| | | | | 89,300 | | | Kyocera Corp. (Electronic Equipment, Instruments & Components) | | | 4,324,480 | |
| | | | | 38,100 | | | Lasertec Corp. (Semiconductors & Semiconductor Equipment) | | | 5,353,463 | |
| | | | | 97,600 | | | Murata Manufacturing Co. Ltd. (Electronic Equipment, Instruments & Components) | | | 4,620,327 | |
| | | | | 456,900 | | | Olympus Corp. (Health Care Equipment & Supplies) | | | 9,633,503 | |
| | | | | 14,900 | | | Shimano, Inc. (Leisure Products) | | | 2,305,673 | |
| | | | | 16,100 | | | Shin-Etsu Chemical Co. Ltd. (Chemicals) | | | 1,673,272 | |
| | | | | 7,000 | | | SMC Corp. (Machinery) | | | 2,809,814 | |
| | | | | 60,300 | | | Sony Group Corp. (Household Durables) | | | 4,066,308 | |
| | | | | 119,900 | | | Sumitomo Mitsui Financial Group, Inc. (Banks) | | | 3,366,979 | |
| | | | | 74,400 | | | Suzuki Motor Corp. (Automobiles) | | | 2,515,450 | |
| | | | | 262,600 | | | Takeda Pharmaceutical Co. Ltd. (Pharmaceuticals) | | | 6,935,003 | |
| | | | | 143,200 | | | Terumo Corp. (Health Care Equipment & Supplies) | | | 4,345,976 | |
| | | | | 18,900 | | | Tokyo Electron Ltd. (Semiconductors & Semiconductor Equipment) | | | 4,972,522 | |
| | | | | 80,900 | | | Yamaha Corp. (Leisure Products) | | | 3,054,319 | |
| | | | | | | | | | | | |
| | | | | | | | | | | 112,445,184 | |
| | | | | | |
| | | | Luxembourg – 0.1% | |
| | | | | 68,940 | | | ArcelorMittal SA (Metals & Mining) | | | 1,541,060 | |
| | | | | | |
| | |
| 12 | | The accompanying notes are an integral part of these financial statements. |
GOLDMAN SACHS MULTI-MANAGER INTERNATIONAL EQUITY FUND
| | | | | | | | | | | | |
| | | | Shares | | | Description | | Value | |
| |
| | | | Common Stocks (continued) | |
| | | | Macau* – 0.4% | |
| | | | | 2,658,400 | | | Sands China Ltd. (Hotels, Restaurants & Leisure) | | $ | 4,647,479 | |
| | | | | | |
| | | | Mexico – 0.4% | |
| | | | | 579,600 | | | Arca Continental SAB de CV (Beverages) | | | 4,747,554 | |
| | | | | | |
| | | | Netherlands – 3.9% | |
| | | | | 4,261 | | | Adyen NV*(a) (IT Services) | | | 6,082,998 | |
| | | | | 217,631 | | | Akzo Nobel NV (Chemicals) | | | 13,435,545 | |
| | | | | 16,422 | | | ASM International NV (Semiconductors & Semiconductor Equipment) | | | 3,632,870 | |
| | | | | 15,043 | | | ASML Holding NV (Semiconductors & Semiconductor Equipment) | | | 7,106,614 | |
| | | | | 288,912 | | | Koninklijke Philips NV (Health Care Equipment & Supplies) | | | 3,664,813 | |
| | | | | 66,514 | | | QIAGEN NV* (Life Sciences Tools & Services) | | | 2,872,284 | |
| | | | | 60,418 | | | Randstad NV (Professional Services) | | | 3,011,184 | |
| | | | | 245,998 | | | Universal Music Group NV (Entertainment) | | | 4,830,281 | |
| | | | | | | | | | | | |
| | | | | | | | | | | 44,636,589 | |
| | | | | | |
| | | | Portugal – 0.5% | |
| | | | | 913,362 | | | EDP - Energias de Portugal SA (Electric Utilities) | | | 3,990,765 | |
| | | | | 229,399 | | | Galp Energia SGPS SA (Oil, Gas & Consumable Fuels) | | | 2,329,111 | |
| | | | | | | | | | | | |
| | | | | | | | | | | 6,319,876 | |
| | | | | | |
| | | | Singapore – 0.8% | |
| | | | | 389,700 | | | DBS Group Holdings Ltd. (Banks) | | | 9,421,505 | |
| | | | | | |
| | | | South Korea – 1.2% | |
| | | | | 9,092 | | | Samsung Electronics Co. Ltd. GDR (Technology Hardware, Storage & Peripherals) | | | 9,390,202 | |
| | | | | 67,462 | | | SK Hynix, Inc. (Semiconductors & Semiconductor Equipment) | | | 3,905,477 | |
| | | | | | | | | | | | |
| | | | | | | | | | | 13,295,679 | |
| | | | | | |
| | | | Spain – 2.8% | |
| | | | | 48,465 | | | Aena SME SA*(a) (Transportation Infrastructure) | | | 5,696,160 | |
| | | | | 313,079 | | | Amadeus IT Group SA* (IT Services) | | | 16,328,717 | |
| | | | | 85,851 | | | Bankinter SA (Banks) | | | 519,309 | |
| | | | | 185,912 | | | CaixaBank SA (Banks) | | | 616,492 | |
| | | | | 335,646 | | | Iberdrola SA (Electric Utilities) | | | 3,413,276 | |
| | | | | 242,404 | | | Industria de Diseno Textil SA (Specialty Retail) | | | 5,502,134 | |
| | | | | | | | | | | | |
| | | | | | | | | | | 32,076,088 | |
| | | | | | |
| | | | | | | | | | | | |
| | | | Shares | | | Description | | Value | |
| |
| | | | Common Stocks (continued) | |
| | | | Sweden – 1.6% | |
| | | | | 299,277 | | | Atlas Copco AB Class A (Machinery) | | $ | 3,194,258 | |
| | | | | 100,649 | | | Electrolux AB Class B (Household Durables) | | | 1,241,724 | |
| | | | | 63,803 | | | Evolution AB(a) (Hotels, Restaurants & Leisure) | | | 5,951,714 | |
| | | | | 282,466 | | | Hexagon AB Class B (Electronic Equipment, Instruments & Components) | | | 2,792,427 | |
| | | | | 285,878 | | | Swedbank AB Class A (Banks) | | | 4,261,883 | |
| | | | | 186,678 | | | Volvo Car AB* (Automobiles) | | | 792,277 | |
| | | | | | | | | | | | |
| | | | | | | | | | | 18,234,283 | |
| | | | | | |
| | | | Switzerland – 9.9% | |
| | | | | 230,992 | | | ABB Ltd. (Electrical Equipment) | | | 6,414,717 | |
| | | | | 101,633 | | | Alcon, Inc. (Health Care Equipment & Supplies) | | | 6,187,961 | |
| | | | | 88,803 | | | Cie Financiere Richemont SA Class A (Textiles, Apparel & Luxury Goods) | | | 8,679,031 | |
| | | | | 89,870 | | | Idorsia Ltd.* (Biotechnology) | | | 1,391,378 | |
| | | | | 53,021 | | | Julius Baer Group Ltd. (Capital | | | | |
| | | | | | | | Markets) | | | 2,543,887 | |
| | | | | 6,713 | | | Lonza Group AG (Life Sciences Tools & Services) | | | 3,455,744 | |
| | | | | 182,298 | | | Nestle SA (Food Products) | | | 19,844,742 | |
| | | | | 155,275 | | | Novartis AG (Pharmaceuticals) | | | 12,560,305 | |
| | | | | 84,674 | | | Roche Holding AG (Pharmaceuticals) | | | 28,094,674 | |
| | | | | 41,210 | | | Sika AG (Chemicals) | | | 9,291,855 | |
| | | | | 441,163 | | | UBS Group AG (Capital Markets) | | | 6,994,265 | |
| | | | | 20,894 | | | Zurich Insurance Group AG (Insurance) | | | 8,904,477 | |
| | | | | | | | | | | | |
| | | | | | | | | | | 114,363,036 | |
| | | | | | |
| | | | Taiwan – 0.4% | |
| | | | | 131,000 | | | Taiwan Semiconductor Manufacturing Co. Ltd. (Semiconductors & Semiconductor Equipment) | | | 1,574,909 | |
| | | | | 55,242 | | | Taiwan Semiconductor Manufacturing Co. Ltd. ADR (Semiconductors & Semiconductor | | | | |
| | | | | | | | Equipment) | | | 3,400,145 | |
| | | | | | | | | | | | |
| | | | | | | | | | | 4,975,054 | |
| | | | | | |
| | | | United Kingdom – 14.5% | |
| | | | | 115,301 | | | AstraZeneca PLC (Pharmaceuticals) | | | 13,528,510 | |
| | | | | 4,054,230 | | �� | Barclays PLC (Banks) | | | 6,889,158 | |
| | | | | 38,899 | | | Berkeley Group Holdings PLC (Household Durables) | | | 1,547,688 | |
| | | | | 635,376 | | | BP PLC (Oil, Gas & Consumable Fuels) | | | 3,515,282 | |
| | | | | 76,094 | | | British American Tobacco PLC (Tobacco) | | | 3,005,214 | |
| | | | | | |
| | |
| The accompanying notes are an integral part of these financial statements. | | 13 |
GOLDMAN SACHS MULTI-MANAGER INTERNATIONAL EQUITY FUND
Schedule of Investments (continued)
October 31, 2022
| | | | | | | | | | | | |
| | | | Shares | | | Description | | Value | |
| |
| | | | Common Stocks (continued) | |
| | | | United Kingdom (continued) | |
| | | | | 146,423 | | | Coca-Cola European Partners PLC (Beverages) | | $ | 6,911,658 | |
| | | | | 814,795 | | | Compass Group PLC (Hotels, Restaurants & Leisure) | | | 17,161,061 | |
| | | | | 14,898 | | | Covestro AG(a) (Chemicals) | | | 505,728 | |
| | | | | 139,607 | | | Diageo PLC (Beverages) | | | 5,745,172 | |
| | | | | 35,266 | | | Ferguson PLC (Trading Companies & Distributors) | | | 3,846,063 | |
| | | | | 178,695 | | | GSK PLC (Pharmaceuticals) | | | 2,927,217 | |
| | | | | 383,563 | | | Informa PLC (Media) | | | 2,444,032 | |
| | | | | 34,671 | | | Linde PLC (Chemicals) | | | 10,352,034 | |
| | | | | 37,826 | | | London Stock Exchange Group PLC (Capital Markets) | | | 3,278,833 | |
| | | | | 1,383,104 | | | Prudential PLC (Insurance) | | | 12,848,564 | |
| | | | | 191,190 | | | Reckitt Benckiser Group PLC (Household Products) | | | 12,688,125 | |
| | | | | 816,543 | | | RELX PLC (Professional Services) | | | 21,935,756 | |
| | | | | 196,342 | | | Rio Tinto PLC (Metals & Mining) | | | 10,261,151 | |
| | | | | 15,452,027 | | | Rolls-Royce Holdings PLC* (Aerospace & Defense) | | | 13,858,345 | |
| | | | | 1,167,145 | | | Tesco PLC (Food & Staples Retailing) | | | 2,882,708 | |
| | | | | 178,428 | | | Unilever PLC (Personal Products) | | | 8,110,327 | |
| | | | | 252,207 | | | WH Smith PLC* (Specialty Retail) | | | 3,409,680 | |
| | | | | | | | | | | | |
| | | | | | | | | | | 167,652,306 | |
| | | | | | |
| | | | United States – 4.7% | |
| | | | | 68,586 | | | Aon PLC Class A (Insurance) | | | 19,306,273 | |
| | | | | 37,590 | | | Atlassian Corp. PLC Class A* (Software) | | | 7,620,621 | |
| | | | | 18,919 | | | EPAM Systems, Inc.* (IT Services) | | | 6,621,650 | |
| | | | | 3,661 | | | Mettler-Toledo International, Inc.* (Life Sciences Tools & Services) | | | 4,630,909 | |
| | | | | 31,547 | | | ResMed, Inc. (Health Care Equipment & Supplies) | | | 7,056,748 | |
| | | | | 30,812 | | | STERIS PLC (Health Care Equipment & Supplies) | | | 5,317,535 | |
| | | | | 32,029 | | | Waste Connections, Inc. (Commerical Services & Supplies) | | | 4,224,945 | |
| | | | | | | | | | | | |
| | | | | | | | | | | 54,778,681 | |
| | | | | | |
| | | | | TOTAL COMMON STOCKS | |
| | | | | (Cost $1,100,656,621) | | $ | 1,107,986,361 | |
| | | | | | |
| | | | | | | | | | | | |
| | | | Shares | | | Dividend
Rate | | Value | |
| |
| | | | Investment Company(b) – 3.8% | |
| | | |
| Goldman Sachs Financial Square Government Fund -
Institutional Shares |
|
| | | | | 44,385,198 | | | 3.066% | | $ | 44,385,198 | |
| | | | | (Cost $ 44,385,198) | |
| | | | | | |
| | | | | TOTAL INVESTMENTS – 99.4% | |
| | | | | (Cost $1,145,041,819) | | $ | 1,152,371,559 | |
| | | | | | |
| | | |
| OTHER ASSETS IN EXCESS OF
LIABILITIES – 0.6% | | | 6,648,188 | |
| | | | | | |
| | | | | NET ASSETS – 100.0% | | $ | 1,159,019,747 | |
| | | | | | |
| | |
|
| The percentage shown for each investment category reflects the value of investments in that category as a percentage of net assets. |
| |
* | | Non-income producing security. |
| |
(a) | | Exempt from registration under Rule 144A of the Securities Act of 1933. |
| |
(b) | | Represents an affiliated issuer. |
| | | | | |
|
SECTOR ALLOCATION AS OF OCTOBER 31, 2022 |
| | | | | |
| Sector | | % of Total
Market Value |
| |
Industrials | | 18.7% |
| |
Health Care | | 16.7 |
| |
Financials | | 15.4 |
| |
Information Technology | | 12.5 |
| |
Consumer Staples | | 10.7 |
| |
Consumer Discretionary | | 9.8 |
| |
Materials | | 5.5 |
| |
Investment Company | | 3.9 |
| |
Utilities | | 3.1 |
| |
Energy | | 1.9 |
| |
Communication Services | | 1.4 |
| |
Real Estate | | 0.4 |
| |
| | | 100.0% |
| | |
|
|
Investment Abbreviations: |
ADR | | —American Depositary Receipt |
GDR | | —Global Depository Receipt |
PLC | | —Public Limited Company |
|
| | |
| 14 | | The accompanying notes are an integral part of these financial statements. |
GOLDMAN SACHS MULTI-MANAGER U.S. SMALL CAP EQUITY FUND
Schedule of Investments
October 31, 2022
| | | | | | | | | | | | |
| | | | Shares | | | Description | | Value | |
| |
| | | | Common Stocks – 93.2% | |
| | | | Aerospace & Defense – 1.6% | |
| | | | | 14,850 | | | AAR Corp.* | | $ | 658,152 | |
| | | | | 22,459 | | | BWX Technologies, Inc. | | | 1,279,714 | |
| | | | | 18,640 | | | Curtiss-Wright Corp. | | | 3,128,351 | |
| | | | | 36,075 | | | Hexcel Corp. | | | 2,009,378 | |
| | | | | 33,340 | | | Mercury Systems, Inc.* | | | 1,613,656 | |
| | | | | 27,056 | | | Woodward, Inc. | | | 2,481,035 | |
| | | | | | | | | | | | |
| | | | | | | | | | | 11,170,286 | |
| | | | | | |
| | | | Air Freight & Logistics – 0.6% | |
| | | | | 11,300 | | | Forward Air Corp. | | | 1,196,331 | |
| | | | | 35,323 | | | Hub Group, Inc. Class A* | | | 2,741,065 | |
| | | | | | | | | | | | |
| | | | | | | | | | | 3,937,396 | |
| | | | | | |
| | | | Auto Components – 0.9% | |
| | | | | 27,866 | | | LCI Industries | | | 2,956,862 | |
| | | | | 16,669 | | | Standard Motor Products, Inc. | | | 632,255 | |
| | | | | 18,000 | | | Visteon Corp.* | | | 2,348,460 | |
| | | | | 6,006 | | | XPEL, Inc.* | | | 415,555 | |
| | | | | | | | | | | | |
| | | | | | | | | | | 6,353,132 | |
| | | | | | |
| | | | Automobiles – 0.7% | |
| | | | | 88,935 | | | Harley-Davidson, Inc. | | | 3,824,205 | |
| | | | | 8,884 | | | Thor Industries, Inc. | | | 723,779 | |
| | | | | | | | | | | | |
| | | | | | | | | | | 4,547,984 | |
| | | | | | |
| | | | Banks – 6.8% | |
| | | | | 12,701 | | | Ameris Bancorp | | | 654,229 | |
| | | | | 33,600 | | | Bank of Hawaii Corp. | | | 2,551,920 | |
| | | | | 33,215 | | | BankUnited, Inc. | | | 1,194,079 | |
| | | | | 26,626 | | | Berkshire Hills Bancorp, Inc. | | | 778,810 | |
| | | | | 14,990 | | | Customers Bancorp, Inc.* | | | 505,013 | |
| | | | | 23,575 | | | Eagle Bancorp, Inc. | | | 1,067,476 | |
| | | | | 29,083 | | | First Hawaiian, Inc. | | | 743,943 | |
| | | | | 37,755 | | | First Merchants Corp. | | | 1,695,199 | |
| | | | | 14,873 | | | Hancock Whitney Corp. | | | 830,955 | |
| | | | | 46,986 | | | Heritage Commerce Corp. | | | 671,900 | |
| | | | | 34,600 | | | Independent Bank Corp. | | | 3,010,546 | |
| | | | | 18,700 | | | Lakeland Financial Corp. | | | 1,545,555 | |
| | | | | 27,533 | | | OceanFirst Financial Corp. | | | 621,695 | |
| | | | | 59,416 | | | PacWest Bancorp. | | | 1,477,082 | |
| | | | | 26,052 | | | Peapack-Gladstone Financial Corp. | | | 1,030,878 | |
| | | | | 12,200 | | | Pinnacle Financial Partners, Inc. | | | 1,012,478 | |
| | | | | 13,425 | | | Preferred Bank | | | 1,031,980 | |
| | | | | 96,915 | | | Prosperity Bancshares, Inc. | | | 6,936,207 | |
| | | | | 30,800 | | | Renasant Corp. | | | 1,243,396 | |
| | | | | 47,851 | | | SouthState Corp. | | | 4,327,166 | |
| | | | | 46,389 | | | Synovus Financial Corp. | | | 1,848,602 | |
| | | | | 28,900 | | | UMB Financial Corp. | | | 2,405,058 | |
| | | | | 31,791 | | | Umpqua Holdings Corp. | | | 632,005 | |
| | | | | 23,682 | | | Univest Financial Corp. | | | 666,411 | |
| | | | | 142,537 | | | Valley National Bancorp | | | 1,691,914 | |
| | | | | 15,107 | | | Veritex Holdings, Inc. | | | 477,079 | |
| | | | | 62,010 | | | Wintrust Financial Corp. | | | 5,805,376 | |
| | | | | | | | | | | | |
| | | | | | | | | | | 46,456,952 | |
| | | | | | |
| | | | | | | | | | | | |
| | | | Shares | | | Description | | Value | |
| |
| | | | Common Stocks – (continued) | |
| | | | Beverages* – 0.1% | |
| | | | | 6,040 | | | Celsius Holdings, Inc. | | $ | 550,123 | |
| | | | | | |
| | | | Biotechnology* – 3.0% | |
| | | | | 175,659 | | | Abcam PLC ADR | | | 2,733,254 | |
| | | | | 18,640 | | | Agios Pharmaceuticals, Inc. | | | 513,346 | |
| | | | | 10,220 | | | Apellis Pharmaceuticals, Inc. | | | 618,208 | |
| | | | | 15,813 | | | Ascendis Pharma A/S ADR | | | 1,818,495 | |
| | | | | 60,530 | | | BioCryst Pharmaceuticals, Inc. | | | 808,075 | |
| | | | | 11,260 | | | Biohaven Ltd. | | | 186,578 | |
| | | | | 23,101 | | | Blueprint Medicines Corp. | | | 1,197,556 | |
| | | | | 24,890 | | | Chinook Therapeutics, Inc. | | | 541,358 | |
| | | | | 12,600 | | | Cytokinetics, Inc. | | | 550,116 | |
| | | | | 62,620 | | | Equillium, Inc. | | | 116,473 | |
| | | | | 62,132 | | | Fate Therapeutics, Inc. | | | 1,299,801 | |
| | | | | 14,140 | | | Halozyme Therapeutics, Inc. | | | 676,033 | |
| | | | | 10,069 | | | Karuna Therapeutics, Inc. | | | 2,208,534 | |
| | | | | 52,810 | | | Kezar Life Sciences, Inc. | | | 396,867 | |
| | | | | 7,200 | | | Krystal Biotech, Inc. | | | 550,800 | |
| | | | | 29,880 | | | Kura Oncology, Inc. | | | 463,738 | |
| | | | | 15,790 | | | Mirum Pharmaceuticals, Inc. | | | 356,065 | |
| | | | | 40,753 | | | Neurocrine Biosciences, Inc. | | | 4,691,485 | |
| | | | | 22,140 | | | Opthea, Ltd. ADR | | | 108,043 | |
| | | | | 22,690 | | | SpringWorks Therapeutics, Inc. | | | 544,787 | |
| | | | | 8,820 | | | Twist Bioscience Corp. | | | 289,561 | |
| | | | | | | | | | | | |
| | | | | | | | | | | 20,669,173 | |
| | | | | | |
| | | | Building Products – 1.8% | |
| | | | | 15,080 | | | AAON, Inc. | | | 972,509 | |
| | | | | 26,600 | | | Gibraltar Industries, Inc.* | | | 1,358,728 | |
| | | | | 8,459 | | | Masonite International Corp.* | | | 605,072 | |
| | | | | 116,035 | | | Resideo Technologies, Inc.* | | | 2,740,747 | |
| | | | | 3,870 | | | Simpson Manufacturing Co., Inc. | | | 330,808 | |
| | | | | 67,281 | | | The AZEK Co., Inc.,* | | | 1,178,090 | |
| | | | | 24,325 | | | UFP Industries, Inc. | | | 1,732,670 | |
| | | | | 129,241 | | | Zurn Elkay Water Solutions Corp. | | | 3,035,871 | |
| | | | | | | | | | | | |
| | | | | | | | | | | 11,954,495 | |
| | | | | | |
| | | | Capital Markets – 0.7% | |
| | | | | 16,195 | | | Artisan Partners Asset Management, Inc. Class A | | | 461,719 | |
| | | | | 24,100 | | | Cohen & Steers, Inc. | | | 1,449,856 | |
| | | | | 18,417 | | | Evercore, Inc. Class A | | | 1,935,627 | |
| | | | | 14,060 | | | Focus Financial Partners, Inc. Class A* | | | 489,147 | |
| | | | | 7,236 | | | StoneX Group, Inc.* | | | 675,264 | |
| | | | | | | | | | | | |
| | | | | | | | | | | 5,011,613 | |
| | | | | | |
| | | | Chemicals – 2.9% | |
| | | | | 11,540 | | | Avient Corp. | | | 398,015 | |
| | | | | 22,093 | | | Cabot Corp. | | | 1,623,394 | |
| | | | | 106,654 | | | Ecovyst, Inc.* | | | 1,061,207 | |
| | | | | 67,271 | | | H.B. Fuller Co. | | | 4,689,461 | |
| | | | | 17,343 | | | Ingevity Corp.* | | | 1,166,664 | |
| | | | | 20,800 | | | Innospec, Inc. | | | 2,079,792 | |
| | | | | 53,002 | | | Mativ Holdings, Inc. | | | 1,258,267 | |
| | | | | 29,060 | | | Minerals Technologies, Inc. | | | 1,598,591 | |
| | | | | | |
| | |
| The accompanying notes are an integral part of these financial statements. | | 15 |
GOLDMAN SACHS MULTI-MANAGER U. S. SMALL CAP EQUITY FUND
Schedule of Investments (continued)
October 31, 2022
| | | | | | | | | | | | |
| | | | Shares | | | Description | | Value | |
| |
| | | | Common Stocks – (continued) | |
| | | | Chemicals – (continued) | |
| | | | | 23,957 | | | Quaker Chemical Corp. | | $ | 3,896,366 | |
| | | | | 77,956 | | | Valvoline, Inc. | | | 2,288,788 | |
| | | | | | | | | | | | |
| | | | | | | | | | | 20,060,545 | |
| | | | | | |
| | | | Commerical Services & Supplies – 4.5% | |
| | | | | 123,933 | | | ABM Industries, Inc. | | | 5,516,258 | |
| | | | | 21,803 | | | Casella Waste Systems, Inc. Class A* | | | 1,783,703 | |
| | | | | 4,920 | | | Clean Harbors, Inc.* | | | 602,503 | |
| | | | | 160,674 | | | IAA, Inc.* | | | 6,094,365 | |
| | | | | 52,004 | | | KAR Auction Services, Inc.* | | | 755,618 | |
| | | | | 27,711 | | | MSA Safety, Inc. | | | 3,719,925 | |
| | | | | 41,643 | | | Rentokil Initial PLC ARD | | | 1,288,434 | |
| | | | | 24,904 | | | The Brink’s Co. | | | 1,485,026 | |
| | | | | 8,500 | | | UniFirst Corp. | | | 1,564,085 | |
| | | | | 61,850 | | | Viad Corp.* | | | 2,305,768 | |
| | | | | 41,380 | | | Waste Connections, Inc. | | | 5,458,436 | |
| | | | | | | | | | | | |
| | | | | | | | | | | 30,574,121 | |
| | | | | | |
| | | | Communications Equipment* – 1.0% | |
| | | | | 22,524 | | | Ciena Corp. | | | 1,078,900 | |
| | | | | 122,060 | | | CommScope Holding Co., Inc. | | | 1,616,074 | |
| | | | | 9,880 | | | Digi International, Inc. | | | 398,460 | |
| | | | | 471,577 | | | Infinera Corp. | | | 2,645,547 | |
| | | | | 52,250 | | | NETGEAR, Inc. | | | 1,026,713 | |
| | | | | | | | | | | | |
| | | | | | | | | | | 6,765,694 | |
| | | | | | |
| | | | Construction & Engineering – 1.5% | |
| | | | | 9,800 | | | Comfort Systems USA, Inc. | | | 1,208,144 | |
| | | | | 30,128 | | | EMCOR Group, Inc. | | | 4,251,061 | |
| | | | | 11,100 | | | MYR Group, Inc.* | | | 971,361 | |
| | | | | 11,112 | | | Valmont Industries, Inc. | | | 3,547,172 | |
| | | | | | | | | | | | |
| | | | | | | | | | | 9,977,738 | |
| | | | | | |
| | | | Construction Materials – 0.4% | |
| | | | | 14,100 | | | Eagle Materials, Inc. | | | 1,724,571 | |
| | | | | 50,863 | | | Summit Materials, Inc. Class A* | | | 1,340,240 | |
| | | | | | | | | | | | |
| | | | | | | | | | | 3,064,811 | |
| | | | | | |
| | | | Consumer Finance – 1.2% | |
| | | | | 8,370 | | | FirstCash Holdings, Inc. | | | 824,026 | |
| | | | | 13,575 | | | Nelnet, Inc. Class A | | | 1,209,397 | |
| | | | | 52,789 | | | PRA Group, Inc.* | | | 1,768,431 | |
| | | | | 263,589 | | | SLM Corp. | | | 4,372,942 | |
| | | | | | | | | | | | |
| | | | | | | | | | | 8,174,796 | |
| | | | | | |
| | | | Containers & Packaging – 1.9% | |
| | | | | 239,907 | | | Graphic Packaging Holding Co. | | | 5,508,265 | |
| | | | | 71,050 | | | Silgan Holdings, Inc. | | | 3,364,928 | |
| | | | | 37,900 | | | Sonoco Products Co. | | | 2,352,832 | |
| | | | | 64,925 | | | TriMas Corp. | | | 1,483,536 | |
| | | | | | | | | | | | |
| | | | | | | | | | | 12,709,561 | |
| | | | | | |
| | | | Distributors* – 0.1% | |
| | | | | 32,260 | | | Funko, Inc. Class A | | | 666,169 | |
| | | | | | |
| | | | | | | | | | | | |
| | | | Shares | | | Description | | Value | |
| |
| | | | Common Stocks – (continued) | |
| | | | Diversified Consumer Services* – 1.5% | |
| | | | | 62,870 | | | Bright Horizons Family Solutions, Inc. | | $ | 4,106,668 | |
| | | | | 251,938 | | | Mister Car Wash, Inc. | | | 2,224,613 | |
| | | | | 113,116 | | | Stride, Inc. | | | 3,790,517 | |
| | | | | | | | | | | | |
| | | | | | | | | | | 10,121,798 | |
| | | | | | |
| | | | Diversified Financial Services – 0.2% | |
| | | | | 15,571 | | | Voya Financial, Inc. | | | 1,064,434 | |
| | | | | | |
| | | | Diversified Telecommunication Services – 0.5% | |
| | | | | 38,263 | | | Cogent Communications Holdings, Inc. | | | 2,009,190 | |
| | | | | 93,713 | | | DigitalBridge Group, Inc. | | | 1,199,527 | |
| | | | | | | | | | | | |
| | | | | | | | | | | 3,208,717 | |
| | | | | | |
| | | | Electric Utilities – 0.3% | |
| | | | | 20,100 | | | ALLETE, Inc. | | | 1,131,027 | |
| | | | | 13,975 | | | MGE Energy, Inc. | | | 951,558 | |
| | | | | | | | | | | | |
| | | | | | | | | | | 2,082,585 | |
| | | | | | |
| | | | Electrical Equipment – 0.4% | |
| | | | | 40,300 | | | Bloom Energy Corp. Class A* | | | 754,013 | |
| | | | | 16,570 | | | EnerSys | | | 1,098,425 | |
| | | | | 80,301 | | | GrafTech International Ltd. | | | 408,732 | |
| | | | | 12,000 | | | Shoals Technologies Group, Inc. Class A* | | | 277,320 | |
| | | | | | | | | | | | |
| | | | | | | | | | | 2,538,490 | |
| | | | | | |
| | | | Electronic Equipment, Instruments & Components – 3.7% | |
| | | | | 46,206 | | | Advanced Energy Industries, Inc. | | | 3,634,102 | |
| | | | | 57,148 | | | Avnet, Inc. | | | 2,296,778 | |
| | | | | 73,343 | | | Belden, Inc. | | | 5,106,873 | |
| | | | | 20,000 | | | Fabrinet* | | | 2,288,000 | |
| | | | | 43,744 | | | Insight Enterprises, Inc.* | | | 4,134,245 | |
| | | | | 19,366 | | | Littelfuse, Inc. | | | 4,265,362 | |
| | | | | 12,400 | | | Plexus Corp.* | | | 1,220,160 | |
| | | | | 35,100 | | | ScanSource, Inc.* | | | 1,087,398 | |
| | | | | 15,372 | | | TD SYNNEX Corp. | | | 1,406,692 | |
| | | | | | | | | | | | |
| | | | | | | | | | | 25,439,610 | |
| | | | | | |
| | | | Energy Equipment & Services – 2.1% | |
| | | | | 85,901 | | | Cactus, Inc. Class A | | | 4,442,800 | |
| | | | | 238,401 | | | ChampionX Corp. | | | 6,823,037 | |
| | | | | 48,061 | | | National Energy Services Reunited Corp.* | | | 363,341 | |
| | | | | 141,264 | | | NexTier Oilfield Solutions, Inc.* | | | 1,423,941 | |
| | | | | 80,925 | | | ProPetro Holding Corp.* | | | 958,152 | |
| | | | | | | | | | | | |
| | | | | | | | | | | 14,011,271 | |
| | | | | | |
| | | | Entertainment – 0.3% | |
| | | | | 9,721 | | | Take-Two Interactive Software, Inc.* | | | 1,151,744 | |
| | | | | 7,250 | | | World Wrestling Entertainment, Inc. Class A | | | 571,953 | |
| | | | | | | | | | | | |
| | | | | | | | | | | 1,723,697 | |
| | | | | | |
| | |
| 16 | | The accompanying notes are an integral part of these financial statements. |
GOLDMAN SACHS MULTI-MANAGER U. S. SMALL CAP EQUITY FUND
| | | | | | | | | | | | |
| | | | Shares | | | Description | | Value | |
| |
| | | | Common Stocks – (continued) | |
| | | | Equity Real Estate Investment Trusts (REITs) – 2.4% | |
| | | | | 121,400 | | | Apple Hospitality REIT, Inc. | | $ | 2,078,368 | |
| | | | | 79,200 | | | Corporate Office Properties Trust | | | 2,110,680 | |
| | | | | 62,684 | | | Cousins Properties, Inc. | | | 1,489,372 | |
| | | | | 24,442 | | | EastGroup Properties, Inc. | | | 3,829,817 | |
| | | | | 29,425 | | | First Industrial Realty Trust, Inc. | | | 1,401,513 | |
| | | | | 84,375 | | | Four Corners Property Trust, Inc. | | | 2,161,687 | |
| | | | | 62,200 | | | Rayonier, Inc. | | | 2,096,140 | |
| | | | | 25,752 | | | Spirit Realty Capital, Inc. | | | 999,950 | |
| | | | | | | | | | | | |
| | | | | | | | | | | 16,167,527 | |
| | | | | | |
| | | | Food & Staples Retailing – 1.8% | |
| | | | | 35,378 | | | Casey’s General Stores, Inc. | | | 8,232,814 | |
| | | | | 29,270 | | | Grocery Outlet Holding Corp.* | | | 1,011,864 | |
| | | | | 52,100 | | | Performance Food Group Co.* | | | 2,711,284 | |
| | | | | | | | | | | | |
| | | | | | | | | | | 11,955,962 | |
| | | | | | |
| | | | Food Products – 1.2% | |
| | | | | 50,706 | | | Fresh Del Monte Produce, Inc. | | | 1,322,412 | |
| | | | | 12,470 | | | Hostess Brands, Inc. * | | | 330,206 | |
| | | | | 22,550 | | | Ingredion, Inc. | | | 2,009,656 | |
| | | | | 8,100 | | | Lancaster Colony Corp. | | | 1,460,268 | |
| | | | | 82,665 | | | The Simply Good Foods Co.* | | | 3,166,070 | |
| | | | | | | | | | | | |
| | | | | | | | | | | 8,288,612 | |
| | | | | | |
| | | | Gas Utilities – 0.2% | |
| | | | | 13,950 | | | ONE Gas, Inc. | | | 1,080,846 | |
| | | | | | |
| | | | Health Care Equipment & Supplies – 3.3% | |
| | | | | 75,616 | | | AngioDynamics, Inc.* | | | 1,065,429 | |
| | | | | 12,100 | | | Axonics, Inc.* | | | 884,994 | |
| | | | | 19,908 | | | CryoPort, Inc.* | | | 552,646 | |
| | | | | 53,393 | | | Envista Holdings Corp.* | | | 1,762,503 | |
| | | | | 64,523 | | | Establishment Labs Holdings, Inc.* | | | 3,638,452 | |
| | | | | 11,479 | | | Haemonetics Corp.* | | | 975,141 | |
| | | | | 38,034 | | | Inari Medical, Inc.* | | | 2,925,956 | |
| | | | | 5,790 | | | Inspire Medical Systems, Inc.* | | | 1,128,761 | |
| | | | | 20,100 | | | Integer Holdings Corp.* | | | 1,252,833 | |
| | | | | 9,730 | | | LivaNova PLC* | | | 458,283 | |
| | | | | 17,383 | | | Nevro Corp.* | | | 666,464 | |
| | | | | 54,040 | | | OrthoPediatrics Corp.* | | | 2,296,160 | |
| | | | | 5,223 | | | QuidelOrtho Corp.* | | | 469,130 | |
| | | | | 4,230 | | | Shockwave Medical, Inc.* | | | 1,240,024 | |
| | | | | 134,516 | | | SI-BONE, Inc.* | | | 2,614,991 | |
| | | | | 3,390 | | | Teleflex, Inc. | | | 727,358 | |
| | | | | | | | | | | | |
| | | | | | | | | | | 22,659,125 | |
| | | | | | |
| | | | Health Care Providers & Services – 3.7% | |
| | | | | 14,440 | | | Acadia Healthcare Co., Inc.* | | | 1,173,972 | |
| | | | | 186,666 | | | Accolade, Inc.* | | | 2,012,260 | |
| | | | | 124,609 | | | agilon health, Inc.* | | | 2,473,489 | |
| | | | | 175,967 | | | Alignment Healthcare, Inc.* | | | 2,329,803 | |
| | | | | 11,578 | | | Amedisys, Inc.* | | | 1,129,897 | |
| | | | | 5,964 | | | AMN Healthcare Services, Inc.* | | | 748,482 | |
| | | | | 3,920 | | | Chemed Corp. | | | 1,830,131 | |
| | | | | 63,069 | | | Encompass Health Corp. | | | 3,433,476 | |
| | | | | 92,089 | | | HealthEquity, Inc.* | | | 7,174,654 | |
| | | | | | |
| | | | | | | | | | | | |
| | | | Shares | | | Description | | Value | |
| |
| | | | Common Stocks – (continued) | |
| | | | Health Care Providers & Services – (continued) | |
| | | | | 27,740 | | | Option Care Health, Inc.* | | $ | 839,412 | |
| | | | | 24,455 | | | Owens & Minor, Inc. | | | 415,735 | |
| | | | | 57,868 | | | PetIQ, Inc. * | | | 475,675 | |
| | | | | 5,880 | | | Privia Health Group, Inc.* | | | 196,862 | |
| | | | | 23,690 | | | Surgery Partners, Inc.* | | | 644,131 | |
| | | | | | | | | | | | |
| | | | | | | | | | | 24,877,979 | |
| | | | | | |
| | | | Health Care Technology* – 0.6% | |
| | | | | 25,530 | | | Evolent Health, Inc. Class A | | | 812,109 | |
| | | | | 108,487 | | | Phreesia, Inc. | | | 2,963,865 | |
| | | | | | | | | | | | |
| | | | | | | | | | | 3,775,974 | |
| | | | | | |
| | | | Hotels, Restaurants & Leisure – 2.7% | |
| | | | | 35,065 | | | Choice Hotels International, Inc. | | | 4,552,840 | |
| | | | | 19,455 | | | Churchill Downs, Inc. | | | 4,044,889 | |
| | | | | 41,532 | | | First Watch Restaurant Group, Inc.* | | | 708,121 | |
| | | | | 17,600 | | | Hyatt Hotels Corp. Class A* | | | 1,658,096 | |
| | | | | 47,238 | | | International Game Technology PLC | | | 947,122 | |
| | | | | 118,944 | | | MakeMyTrip Ltd.* | | | 3,310,211 | |
| | | | | 17,967 | | | Six Flags Entertainment Corp.* | | | 400,664 | |
| | | | | 3,860 | | | Texas Roadhouse, Inc. | | | 381,947 | |
| | | | | 37,107 | | | Travel + Leisure Co. | | | 1,409,324 | |
| | | | | 4,380 | | | Wingstop, Inc. | | | 693,748 | |
| | | | | | | | | | | | |
| | | | | | | | | | | 18,106,962 | |
| | | | | | |
| | | | Household Durables – 0.8% | |
| | | | | 8,875 | | | Helen of Troy Ltd.* | | | 839,753 | |
| | | | | 62,305 | | | Tempur Sealy International, Inc. | | | 1,675,381 | |
| | | | | 9,858 | | | TopBuild Corp.* | | | 1,677,240 | |
| | | | | 119,055 | | | Vizio Holding Corp. Class A* | | | 1,333,416 | |
| | | | | | | | | | | | |
| | | | | | | | | | | 5,525,790 | |
| | | | | | |
| | | | Household Products – 0.5% | |
| | | | | 36,526 | | | Central Garden & Pet Co. Class A* | | | 1,429,628 | |
| | | | | 43,445 | | | Energizer Holdings, Inc. | | | 1,255,126 | |
| | | | | 21,660 | | | Spectrum Brands Holdings, Inc. | | | 999,392 | |
| | | | | | | | | | | | |
| | | | | | | | | | | 3,684,146 | |
| | | | | | |
| | | | Insurance – 3.6% | |
| | | | | 26,800 | | | AMERISAFE, Inc. | | | 1,565,388 | |
| | | | | 31,817 | | | Assured Guaranty Ltd. | | | 1,883,248 | |
| | | | | 47,213 | | | Axis Capital Holdings Ltd. | | | 2,581,135 | |
| | | | | 18,066 | | | Employers Holdings, Inc. | | | 787,858 | |
| | | | | 23,675 | | | First American Financial Corp. | | | 1,193,220 | |
| | | | | 2,330 | | | Kinsale Capital Group, Inc. | | | 734,346 | |
| | | | | 5,030 | | | Palomar Holdings, Inc.* | | | 447,469 | |
| | | | | 9,600 | | | Primerica, Inc. | | | 1,389,120 | |
| | | | | 5,415 | | | RenaissanceRe Holdings Ltd. | | | 837,592 | |
| | | | | 24,400 | | | Ryan Specialty Holdings, Inc. * | | | 1,094,340 | |
| | | | | 13,100 | | | Safety Insurance Group, Inc. | | | 1,139,045 | |
| | | | | 19,600 | | | Selective Insurance Group, Inc. | | | 1,922,368 | |
| | | | | 21,800 | | | Stewart Information Services Corp. | | | 849,328 | |
| | | | | 32,715 | | | The Hanover Insurance Group, Inc. | | | 4,792,421 | |
| | | | | | |
| | |
| The accompanying notes are an integral part of these financial statements. | | 17 |
GOLDMAN SACHS MULTI-MANAGER U. S. SMALL CAP EQUITY FUND
Schedule of Investments (continued)
October 31, 2022
| | | | | | | | | | | | |
| | | | Shares | | | Description | | Value | |
| |
| | | | Common Stocks – (continued) | |
| | | | Insurance – (continued) | |
| | | | | 2,146 | | | White Mountains Insurance Group Ltd. | | $ | 3,039,058 | |
| | | | | | | | | | | | |
| | | | | | | | | | | 24,255,936 | |
| | | | | | |
| | | | Interactive Media & Services* – 0.7% | |
| | | | | 363,237 | | | Angi, Inc. | | | 780,959 | |
| | | | | 111,570 | | | Pinterest, Inc. Class A | | | 2,744,622 | |
| | | | | 20,187 | | | Yelp, Inc. | | | 775,383 | |
| | | | | 37,170 | | | ZipRecruiter, Inc. Class A | | | 623,341 | |
| | | | | | | | | | | | |
| | | | | | | | | | | 4,924,305 | |
| | | | | | |
| | | | IT Services – 4.3% | |
| | | | | 23,306 | | | Concentrix Corp. | | | 2,848,692 | |
| | | | | 11,670 | | | DigitalOcean Holdings, Inc.* | | | 419,186 | |
| | | | | 214,191 | | | Evo Payments, Inc. Class A* | | | 7,216,095 | |
| | | | | 17,900 | | | Flywire Corp.* | | | 392,905 | |
| | | | | 192,892 | | | Genpact Ltd. | | | 9,355,262 | |
| | | | | 41,640 | | | Marqeta, Inc. Class A* | | | 328,123 | |
| | | | | 26,536 | | | MAXIMUS, Inc. | | | 1,636,475 | |
| | | | | 11,540 | | | Paya Holdings, Inc.* | | | 92,782 | |
| | | | | 55,350 | | | Payoneer Global, Inc.* | | | 428,963 | |
| | | | | 22,484 | | | TTEC Holdings, Inc. | | | 999,863 | |
| | | | | 80,053 | | | Unisys Corp.* | | | 680,451 | |
| | | | | 19,850 | | | WEX, Inc.* | | | 3,258,179 | |
| | | | | 15,980 | | | WNS Holdings Ltd. ADR* | | | 1,375,558 | |
| | | | | | | | | | | | |
| | | | | | | | | | | 29,032,534 | |
| | | | | | |
| | | | Leisure Products – 1.2% | |
| | | | | 25,030 | | | Acushnet Holdings Corp. | | | 1,165,647 | |
| | | | | 193,467 | | | Clarus Corp. | | | 2,342,886 | |
| | | | | 100,800 | | | Mattel, Inc.* | | | 1,911,168 | |
| | | | | 153,764 | | | Topgolf Callaway Brands Corp.* | | | 2,878,462 | |
| | | | | | | | | | | | |
| | | | | | | | | | | 8,298,163 | |
| | | | | | |
| | | | Life Sciences Tools & Services – 2.0% | |
| | | | | 68,202 | | | Azenta, Inc. | | | 3,028,169 | |
| | | | | 65,237 | | | Bruker Corp. | | | 4,034,256 | |
| | | | | 9,257 | | | Charles River Laboratories International, Inc.* | | | 1,964,798 | |
| | | | | 253,192 | | | NeoGenomics, Inc.* | | | 1,925,525 | |
| | | | | 106,878 | | | Sotera Health Co.* | | | 735,321 | |
| | | | | 44,543 | | | Syneos Health, Inc.* | | | 2,244,076 | |
| | | | | | | | | | | | |
| | | | | | | | | | | 13,932,145 | |
| | | | | | |
| | | | Machinery – 3.6% | |
| | | | | 13,500 | | | Alamo Group, Inc. | | | 2,053,080 | |
| | | | | 26,825 | | | Allison Transmission Holdings, Inc. | | | 1,133,356 | |
| | | | | 33,906 | | | Altra Industrial Motion Corp. | | | 2,039,107 | |
| | | | | 32,547 | | | Astec Industries, Inc. | | | 1,420,677 | |
| | | | | 6,670 | | | Chart Industries, Inc.* | | | 1,486,610 | |
| | | | | 24,900 | | | Columbus McKinnon Corp. | | | 710,148 | |
| | | | | 12,800 | | | Crane Holdings Co. | | | 1,284,352 | |
| | | | | 41,200 | | | Evoqua Water Technologies Corp.* | | | 1,614,216 | |
| | | | | 60,284 | | | Hillenbrand, Inc. | | | 2,663,347 | |
| | | | | 6,889 | | | IDEX Corp. | | | 1,531,494 | |
| | | | | | |
| | | | | | | | | | | | |
| | | | Shares | | | Description | | Value | |
| |
| | | | Common Stocks – (continued) | |
| | | | Machinery – (continued) | |
| | | | | 27,651 | | | John Bean Technologies Corp. | | $ | 2,521,771 | |
| | | | | 46,850 | | | Kennametal, Inc. | | | 1,251,363 | |
| | | | | 19,475 | | | Mueller Industries, Inc. | | | 1,219,914 | |
| | | | | 18,066 | | | Terex Corp. | | | 732,396 | |
| | | | | 45,042 | | | Wabash National Corp. | | | 975,159 | |
| | | | | 13,300 | | | Watts Water Technologies, Inc. Class A | | | 1,946,588 | |
| | | | | | | | | | | | |
| | | | | | | | | | | 24,583,578 | |
| | | | | | |
| | | | Media – 1.2% | |
| | | | | 53,576 | | | Gray Television, Inc. | | | 758,100 | |
| | | | | 13,650 | | | John Wiley & Sons, Inc. Class A | | | 575,894 | |
| | | | | 18,440 | | | Nexstar Media Group, Inc. | | | 3,158,772 | |
| | | | | 68,099 | | | TEGNA, Inc. | | | 1,421,907 | |
| | | | | 146,000 | | | The E.W. Scripps Co. Class A* | | | 2,071,740 | |
| | | | | | | | | | | | |
| | | | | | | | | | | 7,986,413 | |
| | | | | | |
| | | | Metals & Mining – 0.6% | |
| | | | | 29,200 | | | Kaiser Aluminum Corp. | | | 2,359,068 | |
| | | | | 31,725 | | | Worthington Industries, Inc. | | | 1,508,841 | |
| | | | | | | | | | | | |
| | | | | | | | | | | 3,867,909 | |
| | | | | | |
| | | | Mortgage Real Estate Investment Trusts (REITs) – 0.5% | |
| | | | | 32,939 | | | Ares Commercial Real Estate Corp. | | | 406,467 | |
| | | | | 61,686 | | | Blackstone Mortgage Trust, Inc. Class A | | | 1,539,683 | |
| | | | | 74,612 | | | Starwood Property Trust, Inc. | | | 1,541,484 | |
| | | | | | | | | | | | |
| | | | | | | | | | | 3,487,634 | |
| | | | | | |
| | | | Multiline Retail* – 0.1% | |
| | | | | 16,540 | | | Ollie’s Bargain Outlet Holdings, Inc. | | | 926,240 | |
| | | | | | |
| | | | Multi-Utilities – 0.2% | |
| | | | | 27,650 | | | NorthWestern Corp. | | | 1,460,749 | |
| | | | | | |
| | | | Oil, Gas & Consumable Fuels – 3.8% | |
| | | | | 7,780 | | | Callon Petroleum Co.* | | | 342,009 | |
| | | | | 10,905 | | | Chord Energy Corp. | | | 1,669,446 | |
| | | | | 63,713 | | | Delek U.S. Holdings, Inc. | | | 1,889,728 | |
| | | | | 45,892 | | | Denbury, Inc.* | | | 4,194,988 | |
| | | | | 128,937 | | | Enerplus Corp. | | | 2,231,899 | |
| | | | | 238,984 | | | Kosmos Energy Ltd.* | | | 1,551,006 | |
| | | | | 89,400 | | | Magnolia Oil & Gas Corp. Class A | | | 2,295,792 | |
| | | | | 14,750 | | | Matador Resources Co. | | | 980,137 | |
| | | | | 34,312 | | | Par Pacific Holdings, Inc.* | | | 785,059 | |
| | | | | 47,904 | | | PDC Energy, Inc. | | | 3,455,795 | |
| | | | | 7,800 | | | Range Resources Corp. | | | 222,144 | |
| | | | | 19,330 | | | Ranger Oil Corp. Class A | | | 790,597 | |
| | | | | 80,200 | | | Viper Energy Partners LP | | | 2,674,670 | |
| | | | | 100,739 | | | World Fuel Services Corp. | | | 2,567,837 | |
| | | | | | | | | | | | |
| | | | | | | | | | | 25,651,107 | |
| | | | | | |
| | | | Personal Products* – 0.3% | |
| | | | | 49,130 | | | BellRing Brands, Inc. | | | 1,189,929 | |
| | | | | 8,370 | | | elf Beauty, Inc. | | | 362,086 | |
| | | | | | |
| | |
| 18 | | The accompanying notes are an integral part of these financial statements. |
GOLDMAN SACHS MULTI-MANAGER U. S. SMALL CAP EQUITY FUND
| | | | | | | | | | | | |
| | | | Shares | | | Description | | Value | |
| |
| | | | Common Stocks – (continued) | |
| | | | Personal Products* – (continued) | |
| | | | | 33,650 | | | The Beauty Health Co. | | $ | 384,619 | |
| | | | | | | | | | | | |
| | | | | | | | | | | 1,936,634 | |
| | | | | | |
| | | | Pharmaceuticals* – 0.2% | |
| | | | | 20,958 | | | Arvinas, Inc. | | | 1,041,822 | |
| | | | | | |
| | | | Professional Services – 2.1% | |
| | | | | 24,156 | | | ASGN, Inc.* | | | 2,047,946 | |
| | | | | 31,700 | | | CBIZ, Inc.* | | | 1,573,588 | |
| | | | | 27,937 | | | FTI Consulting, Inc.* | | | 4,347,835 | |
| | | | | 17,600 | | | ICF International, Inc. | | | 2,105,488 | |
| | | | | 28,098 | | | Korn Ferry | | | 1,561,968 | |
| | | | | 26,726 | | | Science Applications International Corp. | | | 2,895,495 | |
| | | | | | | | | | | | |
| | | | | | | | | | | 14,532,320 | |
| | | | | | |
| | | | Real Estate Management & Development – 0.4% | |
| | | | | 83,196 | | | Anywhere Real Estate, Inc.* | | | 618,146 | |
| | | | | 10,800 | | | Colliers International Group, Inc. | | | 1,014,552 | |
| | | | | 76,625 | | | Cushman & Wakefield PLC* | | | 885,019 | |
| | | | | 31,667 | | | Kennedy-Wilson Holdings, Inc. | | | 525,989 | |
| | | | | | | | | | | | |
| | | | | | | | | | | 3,043,706 | |
| | | | | | |
| | | | Road & Rail – 1.0% | |
| | | | | 32,111 | | | Knight-Swift Transportation | | | | |
| | | | | | | | Holdings, Inc. | | | 1,542,291 | |
| | | | | 3,344 | | | Landstar System, Inc. | | | 522,400 | |
| | | | | 99,300 | | | Marten Transport Ltd. | | | 1,863,861 | |
| | | | | 77,715 | | | Werner Enterprises, Inc. | | | 3,046,428 | |
| | | | | | | | | | | | |
| | | | | | | | | | | 6,974,980 | |
| | | | | | |
| | | | Semiconductors & Semiconductor Equipment – 2.2% | |
| | | | | 56,625 | | | Cohu, Inc.* | | | 1,864,095 | |
| | | | | 36,933 | | | Entegris, Inc. | | | 2,930,264 | |
| | | | | 11,050 | | | Impinj, Inc.* | | | 1,266,662 | |
| | | | | 37,475 | | | Kulicke & Soffa Industries, Inc. | | | 1,571,701 | |
| | | | | 29,872 | | | Lattice Semiconductor Corp.* | | | 1,449,091 | |
| | | | | 35,700 | | | MACOM Technology Solutions Holdings, Inc.* | | | 2,065,959 | |
| | | | | 36,693 | | | Power Integrations, Inc. | | | 2,447,790 | |
| | | | | 49,983 | | | SMART Global Holdings, Inc.* | | | 676,270 | |
| | | | | 34,137 | | | Ultra Clean Holdings, Inc.* | | | 1,062,002 | |
| | | | | | | | | | | | |
| | | | | | | | | | | 15,333,834 | |
| | | | | | |
| | | | Software – 4.5% | |
| | | | | 35,360 | | | ACI Worldwide, Inc.* | | | 860,309 | |
| | | | | 59,135 | | | Bentley Systems, Inc. Class B | | | 2,086,283 | |
| | | | | 57,140 | | | Blackline, Inc.* | | | 3,199,840 | |
| | | | | 34,200 | | | Box, Inc. Class A* | | | 993,510 | |
| | | | | 10,810 | | | Braze, Inc. Class A* | | | 320,084 | |
| | | | | 4,150 | | | CyberArk Software Ltd.* | | | 651,176 | |
| | | | | 91,459 | | | Dynatrace, Inc.* | | | 3,223,015 | |
| | | | | 51,174 | | | Envestnet, Inc.* | | | 2,523,390 | |
| | | | | 8,870 | | | Gitlab, Inc. Class A* | | | 429,840 | |
| | | | | 27,474 | | | InterDigital, Inc. | | | 1,370,128 | �� |
| | | | | 11,800 | | | Jamf Holding Corp.* | | | 279,306 | |
| | | | | | |
| | | | | | | | | | | | |
| | | | Shares | | | Description | | Value | |
| |
| | | | Common Stocks – (continued) | |
| | | | Software – (continued) | |
| | | | | 48,835 | | | NCR Corp.* | | $ | 1,038,232 | |
| | | | | 22,680 | | | Paycor HCM, Inc.* | | | 691,060 | |
| | | | | 82,550 | | | PROS Holdings, Inc.* | | | 2,059,622 | |
| | | | | 14,930 | | | Smartsheet, Inc. Class A* | | | 521,356 | |
| | | | | 20,270 | | | Sprout Social, Inc. Class A* | | | 1,222,889 | |
| | | | | 84,465 | | | Sumo Logic, Inc.* | | | 651,225 | |
| | | | | 21,660 | | | Telos Corp.* | | | 229,596 | |
| | | | | 21,470 | | | Varonis Systems, Inc.* | | | 574,752 | |
| | | | | 53,600 | | | Verint Systems, Inc.* | | | 1,899,048 | |
| | | | | 61,797 | | | Workiva, Inc.* | | | 4,808,425 | |
| | | | | 139,898 | | | Zuora, Inc. Class A* | | | 1,075,816 | |
| | | | | | | | | | | | |
| | | | | | | | | | | 30,708,902 | |
| | | | | | |
| | | | Specialty Retail – 1.0% | |
| | | | | 25,627 | | | American Eagle Outfitters, Inc. | | | 291,123 | |
| | | | | 26,277 | | | Foot Locker, Inc. | | | 832,981 | |
| | | | | 97,801 | | | Leslie’s, Inc.* | | | 1,373,126 | |
| | | | | 1,950 | | | Murphy USA, Inc. | | | 613,294 | |
| | | | | 42,796 | | | Petco Health & Wellness Co., Inc.* | | | 450,642 | |
| | | | | 24,300 | | | Signet Jewelers Ltd. | | | 1,585,332 | |
| | | | | 15,175 | | | The Buckle, Inc. | | | 596,833 | |
| | | | | 24,754 | | | Victoria’s Secret & Co.* | | | 930,750 | |
| | | | | | | | | | | | |
| | | | | | | | | | | 6,674,081 | |
| | | | | | |
| | | | Textiles, Apparel & Luxury Goods – 1.0% | |
| | | | | 30,886 | | | Carter’s, Inc. | | | 2,096,233 | |
| | | | | 24,075 | | | Columbia Sportswear Co. | | | 1,793,587 | |
| | | | | 81,300 | | | Hanesbrands, Inc. | | | 554,466 | |
| | | | | 29,521 | | | Skechers USA, Inc. Class A* | | | 1,016,408 | |
| | | | | 55,847 | | | Steven Madden Ltd. | | | 1,668,150 | |
| | | | | | | | | | | | |
| | | | | | | | | | | 7,128,844 | |
| | | | | | |
| | | | Thrifts & Mortgage Finance – 0.7% | |
| | | | | 33,089 | | | Essent Group Ltd. | | | 1,309,663 | |
| | | | | 12,926 | | | Federal Agricultural Mortgage Corp. Class C | | | 1,489,075 | |
| | | | | 11,978 | | | PennyMac Financial Services, Inc. | | | 638,667 | |
| | | | | 17,917 | | | Walker & Dunlop, Inc. | | | 1,611,813 | |
| | | | | | | | | | | | |
| | | | | | | | | | | 5,049,218 | |
| | | | | | |
| | | | Tobacco – 0.1% | |
| | | | | 17,992 | | | Universal Corp. | | | 910,575 | |
| | | | | | |
| | | | Trading Companies & Distributors – 2.0% | |
| | | | | 27,950 | | | Applied Industrial Technologies, Inc. | | | 3,476,421 | |
| | | | | 68,600 | | | Core & Main, Inc. Class A* | | | 1,617,588 | |
| | | | | 22,125 | | | McGrath RentCorp | | | 2,080,856 | |
| | | | | 58,367 | | | NOW, Inc.* | | | 743,012 | |
| | | | | 6,285 | | | SiteOne Landscape Supply, Inc.* | | | 728,243 | |
| | | | | 37,455 | | | WESCO International, Inc.* | | | 5,160,175 | |
| | | | | | | | | | | | |
| | | | | | | | | | | 13,806,295 | |
| | | | | | |
| | | | | TOTAL COMMON STOCKS | |
| | | | | (Cost $599,122,741) | | $ | 634,506,038 | |
| | | | | | |
| | |
| The accompanying notes are an integral part of these financial statements. | | 19 |
GOLDMAN SACHS MULTI-MANAGER U. S. SMALL CAP EQUITY FUND
Schedule of Investments (continued)
October 31, 2022
| | | | | | | | | | | | |
| | | | Shares | | | Description | | Value | |
| |
| | | | Exchange Traded Funds – 0.9% | |
| | | | | 71,152 | | | SPDR S&P Biotech ETF | | $ | 5,845,136 | |
| | | | (Cost $5,718,818) | |
| | | | | | |
| | | | Shares | | | Dividend Rate | | Value | |
| |
| | | | Investment Company(a) –5.7% | |
| | | |
| Goldman Sachs Financial Square Government Fund –
Institutional Shares |
|
| | | | | 38,902,135 | | | 3.066% | | $ | 38,902,135 | |
| | | | | (Cost $38,902,135) | |
| | | | | | |
| | | | | TOTAL INVESTMENTS – 99.8% | |
| | | | | (Cost $643,743,694) | | $ | 679,253,309 | |
| | | | | | |
| | | | | OTHER ASSETS IN EXCESS OF | |
| | | | | LIABILITIES – 0.2% | | | 1,579,329 | |
| | | | | | |
| | | | | NET ASSETS – 100.0% | | $ | 680,832,638 | |
| | | | | | |
| | |
|
| The percentage shown for each investment category reflects the value of investments in that category as a percentage of net assets. |
| |
* | | Non-income producing security. |
| |
(a) | | Represents an affiliated issuer. |
| | |
|
Investment Abbreviations: |
ADR | | —American Depositary Receipt |
ETF | | —Exchange Traded Fund |
LP | | —Limited Partnership |
PLC | | —Public Limited Company |
REIT | | —Real Estate Investment Trust |
SPDR | | —Standard and Poor’s Depository Receipt |
|
| | |
| 20 | | The accompanying notes are an integral part of these financial statements. |
ACTIVE EQUITY MULTI-MANAGER FUNDS
Statements of Assets and Liabilities
October 31, 2022
| | | | | | | | | | |
| | | | | Multi-Manager
International
Equity Fund | | | Multi-Manager
U.S. Small Cap
Equity Fund | |
| | | |
| | Assets: | | | | | | | | |
| | | |
| | Investments in unaffiliated issuers, at value (cost $1,100,656,621 and $604,841,559, respectively) | | $ | 1,107,986,361 | | | $ | 640,351,174 | |
| | | |
| | Investments in affiliated issuers, at value (cost $44,385,198 and $38,902,135, respectively) | | | 44,385,198 | | | | 38,902,135 | |
| | | |
| | Cash | | | 920,747 | | | | 994,373 | |
| | | |
| | Foreign currencies, at value (cost $1,242,795 and $0, respectively) | | | 1,106,567 | | | | — | |
| | | |
| | Receivables: | | | | | | | | |
| | | |
| | Foreign tax reclaims | | | 3,798,387 | | | | — | |
| | | |
| | Investments sold | | | 1,741,949 | | | | 2,527,429 | |
| | | |
| | Dividends | | | 1,408,189 | | | | 221,436 | |
| | | |
| | Fund shares sold | | | 1,064,000 | | | | 2,130,000 | |
| | | |
| | Reimbursement from investment adviser | | | 28,535 | | | | — | |
| | | |
| | Other assets | | | 25,489 | | | | 15,172 | |
| | | |
| | | |
| | Total assets | | | 1,162,465,422 | | | | 685,141,719 | |
| | | |
| | | | | | | | | | |
| | | |
| | Liabilities: | | | | | | | | |
| | | |
| | Payables: | | | | | | | | |
| | | |
| | Investments purchased | | | 1,668,264 | | | | 3,470,166 | |
| | | |
| | Fund shares redeemed | | | 644,200 | | | | 115,300 | |
| | | |
| | Management fees | | | 415,556 | | | | 308,094 | |
| | | |
| | Transfer agency fees | | | 18,986 | | | | 10,989 | |
| | | |
| | Accrued expenses | | | 698,669 | | | | 404,532 | |
| | | |
| | | |
| | Total liabilities | | | 3,445,675 | | | | 4,309,081 | |
| | | |
| | | | | | | | | | |
| | | |
| | Net Assets: | | | | | | | | |
| | | |
| | Paid-in capital | | | 1,190,294,781 | | | | 674,607,063 | |
| | | |
| | Total distributable earnings (loss) | | | (31,275,034 | ) | | | 6,225,575 | |
| | | |
| | | |
| | NET ASSETS | | $ | 1,159,019,747 | | | $ | 680,832,638 | |
| | | |
| | | |
| | Shares Outstanding $0.001 par value (unlimited shares authorized): | | | 105,984,574 | | | | 55,668,152 | |
| | | |
| | Net asset value, offering and redemption price per share: | | $ | 10.94 | | | $ | 12.23 | |
| | | |
| | |
| The accompanying notes are an integral part of these financial statements. | | 21 |
ACTIVE EQUITY MULTI-MANAGER FUNDS
Statements of Operations
For the Fiscal Year Ended October 31, 2022
| | | | | | | | | | | | |
| | | | | Multi-Manager
International
Equity Fund | | Multi-Manager
U.S. Small Cap
Equity Fund |
| | Investment Income: | | | | | | | | | | |
| | | |
| | Dividends — unaffiliated issuers (net of tax withholding of $3,218,257 and $8,890, respectively) | | | $ | 25,640,771 | | | | $ | 6,485,568 | |
| | | |
| | Dividends — affiliated issuers | | | | 460,595 | | | | | 393,576 | |
| | | |
| | | |
| | Total investment income | | | | 26,101,366 | | | | | 6,879,144 | |
| | | |
| | | |
| | | | | | | | | | | | |
| | Expenses: | | | | | | | | | | |
| | | |
| | Management fees | | | | 7,585,493 | | | | | 4,777,602 | |
| | | |
| | Custody, accounting and administrative services | | | | 906,603 | | | | | 500,174 | |
| | | |
| | Transfer Agency fees | | | | 252,850 | | | | | 127,403 | |
| | | |
| | Professional fees | | | | 222,119 | | | | | 176,716 | |
| | | |
| | Printing and mailing costs | | | | 72,885 | | | | | 59,919 | |
| | | |
| | Registration fees | | | | 69,967 | | | | | 51,777 | |
| | | |
| | Trustee fees | | | | 39,503 | | | | | 35,542 | |
| | | |
| | Other | | | | 50,679 | | | | | 28,251 | |
| | | |
| | | |
| | Total expenses | | | | 9,200,099 | | | | | 5,757,384 | |
| | | |
| | | |
| | Less — expense reductions | | | | (2,071,339 | ) | | | | (1,097,048 | ) |
| | | |
| | | |
| | Net expenses | | | | 7,128,760 | | | | | 4,660,336 | |
| | | |
| | | |
| | NET INVESTMENT INCOME | | | | 18,972,606 | | | | | 2,218,808 | |
| | | |
| | | |
| | | | | | | | | | | | |
| | Realized and unrealized gain (loss): | | | | | | | | | | |
| | | |
| | Net realized gain (loss) from: | | | | | | | | | | |
| | | |
| | Investments — unaffiliated issuers (including commission recapture of $10,074 and $18,847, respectively) | | | | (21,675,985 | ) | | | | (20,693,376 | ) |
| | | |
| | Forward foreign currency exchange contracts | | | | 657 | | | | | — | |
| | | |
| | Foreign currency transactions | | | | (167,271 | ) | | | | (16 | ) |
| | | |
| | Net change in unrealized loss on: | | | | | | | | | | |
| | | |
| | Investments — unaffiliated issuers | | | | (329,426,461 | ) | | | | (87,787,185 | ) |
| | | |
| | Foreign currency translation | | | | (576,940 | ) | | | | — | |
| | | |
| | | |
| | Net realized and unrealized loss | | | | (351,846,000 | ) | | | | (108,480,577 | ) |
| | | |
| | | |
| | NET DECREASE IN NET ASSETS RESULTING FROM OPERATIONS | | | $ | (332,873,394 | ) | | | $ | (106,261,769 | ) |
| | | |
| | |
| 22 | | The accompanying notes are an integral part of these financial statements. |
ACTIVE EQUITY MULTI-MANAGER FUNDS
Statements of Changes in Net Assets
| | | | | | | | | | | | | | | | | | | | | | | | |
| | | | | Multi-Manager International Equity Fund | | | | Multi-Manager U.S. Small Cap Equity Fund |
| | | | | For the Fiscal
Year Ended
October 31, 2022 | | For the Fiscal
Year Ended
October 31, 2021 | | | | For the Fiscal
Year Ended
October 31, 2022 | | For the Fiscal
Year Ended
October 31, 2021 |
| | From operations: | | | | | | | | | | | | | | | | | | | | | | |
| | | | | | |
| | Net investment income | | | $ | 18,972,606 | | | | $ | 18,090,255 | | | | | | $ | 2,218,808 | | | | | 954,014 | |
| | | | | | |
| | Net realized gain (loss) | | | | (21,842,599 | ) | | | | 102,420,107 | | | | | | | (20,693,392 | ) | | | | 114,402,053 | |
| | | | | | |
| | Net change in unrealized gain (loss) | | | | (330,003,401 | ) | | | | 238,748,775 | | | | | | | (87,787,185 | ) | | | | 74,845,990 | |
| | | |
| | | | | | |
| | Net increase (decrease) in net assets resulting from operations | | | | (332,873,394 | ) | | | | 359,259,137 | | | | | | | (106,261,769 | ) | | | | 190,202,057 | |
| | | |
| | | | | | | | | | | | | | | | | | | | | | | | |
| | Distributions to shareholders: | | | | | | | | | | | | | | | | | | | | | | |
| | | | | | |
| | From distributable earnings | | | | (105,675,977 | ) | | | | (10,201,242 | ) | | | | | | (105,459,295 | ) | | | | (1,238,041 | ) |
| | | |
| | | | | | | | | | | | | | | | | | | | | | | | |
| | From share transactions: | | | | | | | | | | | | | | | | | | | | | | |
| | | | | | |
| | Proceeds from sales of shares | | | | 300,829,170 | | | | | 371,379,307 | | | | | | | 175,288,130 | | | | | 163,430,350 | |
| | | | | | |
| | Reinvestment of distributions | | | | 105,675,977 | | | | | 10,201,242 | | | | | | | 105,459,295 | | | | | 1,238,041 | |
| | | | | | |
| | Cost of shares redeemed | | | | (182,135,814 | ) | | | | (243,797,703 | ) | | | | | | (35,693,851 | ) | | | | (147,446,731 | ) |
| | | |
| | | | | | |
| | Net increase in net assets resulting from share transactions | | | | 224,369,333 | | | | | 137,782,846 | | | | | | | 245,053,574 | | | | | 17,221,660 | |
| | | |
| | | | | | |
| | TOTAL INCREASE (DECREASE) | | | | (214,180,038 | ) | | | | 486,840,741 | | | | | | | 33,332,510 | | | | | 206,185,676 | |
| | | |
| | | | | | | | | | | | | | | | | | | | | | | | |
| | Net assets: | | | | | | | | | | | | | | | | | | | | | | |
| | | | | | |
| | Beginning of year | | | | 1,373,199,785 | | | | | 886,359,044 | | | | | | | 647,500,128 | | | | | 441,314,452 | |
| | | |
| | | | | | |
| | End of year | | | $ | 1,159,019,747 | | | | $ | 1,373,199,785 | | | | | | $ | 680,832,638 | | | | $ | 647,500,128 | |
| | | |
| | |
| The accompanying notes are an integral part of these financial statements. | | 23 |
Financial Highlights
Selected Share Data for a Share Outstanding Throughout Each Year
| | | | | | | | | | | | | | | | | | | | | | |
| | | | | Goldman Sachs Multi-Manager International Equity Fund | |
| | | | | Class P Shares | |
| | | | | Year Ended October 31, | |
| | | | | 2022 | | | 2021 | | | 2020 | | | 2019 | | | 2018 |
| | Per Share Data | | | | | | | | | | | | | | | | | | | | |
| | | | | | |
| | Net asset value, beginning of year | | $ | 15.42 | | | $ | 11.16 | | | $ | 11.70 | | | $ | 10.80 | | | $ | 11.62 | |
| | | |
| | | | | | |
| | Net investment income(a) | | | 0.19 | | | | 0.22 | | | | 0.16 | | | | 0.28 | | | | 0.22 | |
| | | | | | |
| | Net realized and unrealized gain (loss) | | | (3.52 | ) | | | 4.17 | | | | (0.40 | ) | | | 1.03 | | | | (0.86) | |
| | | |
| | | | | | |
| | Total from investment operations | | | (3.33 | ) | | | 4.39 | | | | (0.24 | ) | | | 1.31 | | | | (0.64) | |
| | | |
| | | | | | |
| | Distributions to shareholders from net investment income | | | (0.23 | ) | | | (0.13 | ) | | | (0.28 | ) | | | (0.16 | ) | | | (0.18) | |
| | | | | | |
| | Distributions to shareholders from net realized gains | | | (0.92 | ) | | | — | | | | (0.02 | ) | | | (0.25 | ) | | | —(b) | |
| | | |
| | | | | | |
| | Total distributions | | | (1.15 | ) | | | (0.13 | ) | | | (0.30 | ) | | | (0.41 | ) | | | (0.18) | |
| | | |
| | | | | | |
| | Net asset value, end of year | | $ | 10.94 | | | $ | 15.42 | | | $ | 11.16 | | | $ | 11.70 | | | $ | 10.80 | |
| | | |
| | | | | | |
| | Total return(c) | | | (23.15 | )% | | | 39.46 | % | | | (2.28 | )% | | | 12.78 | % | | | (5.63)% | |
| | | |
| | | | | | |
| | Net assets, end of year (in 000s) | | $ | 1,159,020 | | | $ | 1,373,200 | | | $ | 886,359 | | | $ | 823,204 | | | $ | 626,971 | |
| | | | | | |
| | Ratio of net expenses to average net assets | | | 0.56 | % | | | 0.56 | % | | | 0.57 | % | | | 0.56 | % | | | 0.57% | |
| | | | | | |
| | Ratio of total expenses to average net assets | | | 0.73 | % | | | 0.72 | % | | | 0.74 | % | | | 0.76 | % | | | 0.79% | |
| | | | | | |
| | Ratio of net investment income to average net assets | | | 1.50 | % | | | 1.50 | % | | | 1.39 | % | | | 2.51 | % | | | 1.85% | |
| | | | | | |
| | Portfolio turnover rate(d) | | | 39 | % | | | 61 | % | | | 52 | % | | | 29 | % | | | 28% | |
| | | |
| | (a) | | Calculated based on the average shares outstanding methodology. |
| | (b) | | Amount is less than $0.005 per share. |
| | (c) | | Assumes investment at the NAV at the beginning of the year, reinvestment of all dividends and distributions, a complete redemption of the investment at the NAV at the end of the year and no sales or redemption charges (if any). Total returns would be reduced if a sales or redemption charge was taken into account. Returns do not reflect the impact of taxes to shareholders relating to Fund distributions or the redemption of Fund shares. |
| | (d) | | The Fund’s portfolio turnover rate is calculated in accordance with regulatory requirements, without regard to transactions involving short term investments and certain derivatives. If such transactions were included, the Fund’s portfolio turnover rate may be higher. |
| | |
| 24 | | The accompanying notes are an integral part of these financial statements. |
Financial Highlights (Continued)
Selected Share Data for a Share Outstanding Throughout Each Year
| | | | | | | | | | | | | | | | | | | | | | |
| | | | | Goldman Sachs Multi-Manager U.S. Small Cap Equity Fund | |
| | | | | Class P Shares | |
| | | | | Year Ended October 31, | |
| | | | | 2022 | | | 2021 | | | 2020 | | | 2019 | | | 2018 | |
| | Per Share Data | | | | | | | | | | | | | | | | | | | | |
| | | | | | |
| | Net asset value, beginning of year | | $ | 17.45 | | | $ | 12.14 | | | $ | 13.31 | | | $ | 12.40 | | | $ | 12.77 | |
| | | |
| | | | | | |
| | Net investment income(a) | | | 0.05 | | | | 0.03 | (b) | | | 0.05 | | | | 0.08 | | | | 0.05(c) | |
| | | | | | |
| | Net realized and unrealized gain (loss) | | | (2.47 | ) | | | 5.31 | | | | (0.79 | ) | | | 1.17 | | | | (0.10) | |
| | | |
| | | | | | |
| | Total from investment operations | | | (2.42 | ) | | | 5.34 | | | | (0.74 | ) | | | 1.25 | | | | (0.05) | |
| | | |
| | | | | | |
| | Distributions to shareholders from net investment income | | | (0.03 | ) | | | (0.03 | ) | | | (0.08 | ) | | | (0.04 | ) | | | (0.07) | |
| | | | | | |
| | Distributions to shareholders from net realized gains | | | (2.77 | ) | | | — | | | | (0.35 | ) | | | (0.30 | ) | | | (0.25) | |
| | | |
| | | | | | |
| | Total distributions | | | (2.80 | ) | | | (0.03 | ) | | | (0.43 | ) | | | (0.34 | ) | | | (0.32) | |
| | | |
| | | | | | |
| | Net asset value, end of year | | $ | 12.23 | | | $ | 17.45 | | | $ | 12.14 | | | $ | 13.31 | | | $ | 12.40 | |
| | | |
| | | | | | |
| | Total return(d) | | | (15.77 | )% | | | 44.07 | % | | | (5.88 | )% | | | 10.56 | % | | | (0.40)% | |
| | | |
| | | | | | |
| | Net assets, end of year (in 000s) | | $ | 680,833 | | | $ | 647,500 | | | $ | 441,314 | | | $ | 377,898 | | | $ | 318,166 | |
| | | | | | |
| | Ratio of net expenses to average net assets | | | 0.73 | % | | | 0.75 | % | | | 0.77 | % | | | 0.79 | % | | | 0.80% | |
| | | | | | |
| | Ratio of total expenses to average net assets | | | 0.90 | % | | | 0.92 | % | | | 0.95 | % | | | 0.96 | % | | | 1.00% | |
| | | | | | |
| | Ratio of net investment income to average net assets | | | 0.35 | % | | | 0.17 | %(b) | | | 0.44 | % | | | 0.62 | % | | | 0.35% | (c) |
| | | | | | |
| | Portfolio turnover rate(e) | | | 57 | % | | | 105 | % | | | 85 | % | | | 88 | % | | | 32% | |
| | | |
| | (a) | | Calculated based on the average shares outstanding methodology. |
| | (b) | | Reflects income recognized from special dividends which amounted to $0.02 per share and 0.12% of average net assets. |
| | (c) | | Reflects income recognized from special dividends which amounted to $0.03 per share and 0.23% of average net assets. |
| | (d) | | Assumes investment at the NAV at the beginning of the year, reinvestment of all dividends and distributions, a complete redemption of the investment at the NAV at the end of the year and no sales or redemption charges (if any). Total returns would be reduced if a sales or redemption charge was taken into account. Returns do not reflect the impact of taxes to shareholders relating to Fund distributions or the redemption of Fund shares. |
| | (e) | | The Fund’s portfolio turnover rate is calculated in accordance with regulatory requirements, without regard to transactions involving short term investments and certain derivatives. If such transactions were included, the Fund’s portfolio turnover rate may be higher. |
| | |
| The accompanying notes are an integral part of these financial statements. | | 25 |
ACTIVE EQUITY MULTI-MANAGER FUNDS
Notes to Financial Statements
October 31, 2022
Goldman Sachs Trust II (the “Trust”) is a Delaware statutory trust registered under the Investment Company Act of 1940, as amended (the “Act”), as an open-end management investment company. The following table lists those series of the Trust that are included in this report (collectively, the “Funds” or individually a “Fund”), along with their corresponding share classes and respective diversification status under the Act:
| | | | | | |
Fund | | | | Share Classes Offered | | Diversified/ Non-diversified |
| | | |
Multi-Manager International Equity | | | | Class P | | Diversified |
| | | |
Multi-Manager U.S. Small Cap Equity | | | | Class P | | Diversified |
Goldman Sachs Asset Management, L.P. (“GSAM”), an affiliate of Goldman Sachs & Co. LLC (“Goldman Sachs”), serves as investment adviser to the Funds pursuant to a management agreement (the “Agreement”) with the Trust. As of October 31, 2022, GSAM had sub-advisory agreements (the “Sub-Advisory Agreements”) for the Multi-Manager International Equity Fund with Causeway Capital Management LLC, Lazard Asset Management LLC, Massachusetts Financial Services Company, doing business as MFS Investment Management, and WCM Investment Management, LLC and for the Multi-Manager U.S. Small Cap Equity Fund with Boston Partners Global Investors, Inc., Brown Advisory LLC and Victory Capital Management, Inc., (the “Underlying Managers”). Pursuant to the terms of the Sub-Advisory Agreements, the Underlying Managers are responsible for making investment decisions and managing the investments of the applicable Fund. GSAM compensates the Underlying Managers directly in accordance with the terms of the applicable Sub-Advisory Agreements. The Funds are not charged any separate or additional investment advisory fees by the Underlying Managers.
|
2. SIGNIFICANT ACCOUNTING POLICIES |
The financial statements have been prepared in accordance with accounting principles generally accepted in the United States of America (“GAAP”) and require management to make estimates and assumptions that may affect the reported amounts and disclosures. Actual results may differ from those estimates and assumptions. Each Fund is an investment company under GAAP and follows the accounting and reporting guidance applicable to investment companies.
A. Investment Valuation — The Funds’ valuation policy is to value investments at fair value.
B. Investment Income and Investments — Investment income includes interest income, dividend income and securities lending income, if any. Interest income is accrued daily and adjusted for amortization of premiums and accretion of discounts. Dividend income is recognized on ex-dividend date or, for certain foreign securities, as soon as such information is obtained subsequent to the ex-dividend date. Non-cash dividends, if any, are recorded at the fair market value of the securities received. Investment transactions are reflected on trade date. Realized gains and losses are calculated using identified cost. Investment transactions are recorded on the following business day for daily net asset value (“NAV”) calculations. Investment income is recorded net of any foreign withholding taxes, less any amounts reclaimable. The Funds may file withholding tax reclaims in certain jurisdictions to recover a portion of amounts previously withheld. Any foreign capital gains tax is accrued daily based upon net unrealized gains, and is payable upon sale of such investments. Distributions received from the Funds’ investments in U.S. real estate investment trusts (“REITs”) may be characterized as ordinary income, net capital gain and/or a return of capital. A return of capital is recorded by the Funds as a reduction to the cost basis of the REIT.
For derivative contracts, unrealized gains and losses are recorded daily and become realized gains and losses upon disposition or termination of the contract.
C. Expenses — Expenses incurred directly by a Fund are charged to the Fund, and certain expenses incurred by the Trust are allocated across the applicable Funds on a straight-line and/or pro-rata basis, depending upon the nature of the expenses, and are accrued daily.
26
ACTIVE EQUITY MULTI-MANAGER FUNDS
|
2. SIGNIFICANT ACCOUNTING POLICIES (continued) |
D. Federal Taxes and Distributions to Shareholders — It is each Fund’s policy to comply with the requirements of the Internal Revenue Code of 1986, as amended (the “Code”), applicable to regulated investment companies (mutual funds) and to distribute each year substantially all of its investment company taxable income and capital gains to its shareholders. Accordingly, the Fund is not required to make any provisions for the payment of federal income tax. Distributions to shareholders are recorded on the ex-dividend date. Income and capital gains distributions, if any, are declared and paid annually.
Net capital losses, if any, are carried forward to future fiscal years and may be used to the extent allowed by the Code to offset any future capital gains. Losses that are carried forward will retain their character as either short-term or long-term capital losses. Utilization of capital loss carryforwards will reduce the requirement of future capital gains distributions.
The characterization of distributions to shareholders for financial reporting purposes is determined in accordance with federal income tax rules, which may differ from GAAP. The source of each Fund’s distributions may be shown in the accompanying financial statements as either from distributable earnings or capital. Certain components of the Funds’ net assets on the Statements of Assets and Liabilities reflect permanent GAAP/tax differences based on the appropriate tax character.
E. Foreign Currency Translation — The accounting records and reporting currency of the Funds are maintained in U.S. dollars. Assets and liabilities denominated in foreign currencies are translated into U.S. dollars using the current exchange rates at the close of each business day. The effect of changes in foreign currency exchange rates on investments is included within net realized and unrealized gain (loss) on investments. Changes in the value of other assets and liabilities as a result of fluctuations in foreign exchange rates are included in the Statements of Operations within net change in unrealized gain (loss) on foreign currency translation. Transactions denominated in foreign currencies are translated into U.S. dollars on the date the transaction occurred, the effects of which are included within net realized gain (loss) on foreign currency transactions.
F. Commission Recapture — GSAM, on behalf of certain Funds, may direct portfolio trades, subject to seeking best execution, to various brokers who have agreed to rebate a portion of the commissions generated. Such rebates are made directly to a Fund as cash payments and are included in net realized gain (loss) from investments on the Statements of Operations.
|
3. INVESTMENTS AND FAIR VALUE MEASUREMENTS |
U.S. GAAP defines the fair value of a financial instrument as the amount that would be received to sell an asset or paid to transfer a liability in an orderly transaction between market participants at the measurement date (i.e., the exit price); the Funds’ policy is to use the market approach. GAAP establishes a fair value hierarchy that prioritizes the inputs to valuation techniques used to measure fair value. The hierarchy gives the highest priority to unadjusted quoted prices in active markets for identical assets or liabilities (Level 1 measurements) and the lowest priority to unobservable inputs (Level 3 measurements). The level in the fair value hierarchy within which the fair value measurement in its entirety falls shall be determined based on the lowest level input that is significant to the fair value measurement in its entirety. The levels used for classifying investments are not necessarily an indication of the risk associated with investing in these investments. The three levels of the fair value hierarchy are described below:
Level 1 — Unadjusted quoted prices in active markets that are accessible at the measurement date for identical, unrestricted assets or liabilities;
Level 2 — Quoted prices in markets that are not active or financial instruments for which significant inputs are observable (including, but not limited to, quoted prices for similar investments, interest rates, foreign exchange rates, volatility and credit spreads), either directly or indirectly;
Level 3 — Prices or valuations that require significant unobservable inputs (including GSAM’s assumptions in determining fair value measurement).
The Board of Trustees (“Trustees”) has approved Valuation Procedures that govern the valuation of the portfolio investments held by the Funds, including investments for which market quotations are not readily available. With respect to the Funds’ investments that do not have readily available market quotations, the Trustees have designated the Adviser as the valuation designee to perform
27
ACTIVE EQUITY MULTI-MANAGER FUNDS
Notes to Financial Statements (continued)
October 31, 2022
|
3. INVESTMENTS AND FAIR VALUE MEASUREMENTS (continued) |
fair valuations pursuant to Rule 2a-5 under the Investment Company Act of 1940 (the “Valuation Designee”).GSAM has day-today responsibility for implementing and maintaining internal controls and procedures related to the valuation of the Funds’ investments. To assess the continuing appropriateness of pricing sources and methodologies, GSAM regularly performs price verification procedures and issues challenges as necessary to third party pricing vendors or brokers, and any differences are reviewed in accordance with the Valuation Procedures.
A. Level 1 and Level 2 Fair Value Investments — The valuation techniques and significant inputs used in determining the fair values for investments classified as Level 1 and Level 2 are as follows:
Equity Securities — Equity securities traded on a United States (“U.S.”) securities exchange or the NASDAQ system, or those located on certain foreign exchanges, including but not limited to the Americas, are valued daily at their last sale price or official closing price on the principal exchange or system on which they are traded. If there is no sale or official closing price or such price is believed by GSAM to not represent fair value, equity securities will be valued at the valid closing bid price for long positions and at the valid closing ask price for short positions (i.e., where there is sufficient volume, during normal exchange trading hours). If no valid bid/ask price is available, the equity security will be valued pursuant to the Valuation Procedures and consistent with applicable regulatory guidance. To the extent these investments are actively traded, they are classified as Level 1 of the fair value hierarchy, otherwise they are generally classified as Level 2. Certain equity securities containing unique attributes may be classified as Level 2.
Unlisted equity securities for which market quotations are available are valued at the last sale price on the valuation date, or if no sale occurs, at the last bid price for long positions or the last ask price for short positions, and are generally classified as Level 2. Securities traded on certain foreign securities exchanges are valued daily at fair value determined by an independent fair value service (if available) under the Valuation Procedures and consistent with applicable regulatory guidance. The independent fair value service takes into account multiple factors including, but not limited to, movements in the securities markets, certain depositary receipts, futures contracts and foreign currency exchange rates that have occurred subsequent to the close of the foreign securities exchange. These investments are generally classified as Level 2 of the fair value hierarchy.
Underlying Funds (including Money Market Funds) — Underlying funds (“Underlying Funds”) include other investment companies and exchange-traded funds (“ETFs”). Investments in the Underlying Funds (except ETFs) are valued at the NAV per share on the day of valuation. ETFs are valued daily at the last sale price or official closing price on the principal exchange or system on which the investment is traded. Because the Funds invest in Underlying Funds that fluctuate in value, the Funds’ shares will correspondingly fluctuate in value. Underlying Funds are generally classified as Level 1 of the fair value hierarchy. To the extent that underlying ETFs are actively traded, they are classified as Level 1 of the fair value hierarchy, otherwise they are generally classified as Level 2. For information regarding an Underlying Fund’s accounting policies and investment holdings, please see the Underlying Fund’s shareholder report.
Derivative Contracts — A derivative is an instrument whose value is derived from underlying assets, indices, reference rates or a combination of these factors. A Fund enters into derivative transactions to hedge against changes in interest rates, securities prices, and/or currency exchange rates, to increase total return, or to gain access to certain markets or attain exposure to other underliers. For financial reporting purposes, cash collateral that has been pledged to cover obligations of a Fund and cash collateral received, if any, is reported separately on the Statements of Assets and Liabilities as either due to broker/receivable for collateral on certain derivative contracts. Non-cash collateral pledged by a Fund, if any, is noted in the Schedules of Investments.
Exchange-traded derivatives, including futures and options contracts, are generally valued at the last sale or settlement price on the exchange where they are principally traded. Exchange-traded options without settlement prices are generally valued at the midpoint of the bid and ask prices on the exchange where they are principally traded (or, in the absence of two-way trading, at the last bid price for long positions and the last ask price for short positions). Exchange-traded derivatives typically fall within Level 1 of the fair value hierarchy. Over-the-counter (“OTC”) and centrally cleared derivatives are valued using market transactions and other market evidence, including market-based inputs to models, calibration to market-clearing transactions, broker or dealer quotations, or other alternative pricing sources. Where models are used, the selection of a particular model to value OTC and centrally cleared derivatives depends upon the contractual terms of, and specific risks inherent in, the instrument, as well as the
28
ACTIVE EQUITY MULTI-MANAGER FUNDS
|
3. INVESTMENTS AND FAIR VALUE MEASUREMENTS (continued) |
availability of pricing information in the market. Valuation models require a variety of inputs, including contractual terms, market prices, yield curves, credit curves, measures of volatility, voluntary and involuntary prepayment rates, loss severity rates and correlations of such inputs. For OTC and centrally cleared derivatives that trade in liquid markets, model inputs can generally be verified and model selection does not involve significant management judgment. OTC and centrally cleared derivatives are classified within Level 2 of the fair value hierarchy when significant inputs are corroborated by market evidence.
i. Forward Contracts — A forward contract is a contract between two parties to buy or sell an asset at a specified price on a future date. A forward contract settlement can occur on a cash or delivery basis. Forward contracts are marked-to-market daily using independent vendor prices, and the change in value, if any, is recorded as an unrealized gain or loss. Cash and certain investments may be used to collateralize forward contracts.
A forward foreign currency exchange contract is a forward contract in which the Fund agrees to receive or deliver a fixed quantity of one currency for another, at a pre-determined price at a future date. All forward foreign currency exchange contracts are marked to market daily by using the outright forward rates or interpolating based upon maturity dates, where available. Non-deliverable forward foreign currency exchange contracts are settled with the counterparty in cash without the delivery of foreign currency.
B. Level 3 Fair Value Investments — To the extent that significant inputs to valuation models and other alternative pricing sources are unobservable, or if quotations are not readily available, or if GSAM believes that such quotations do not accurately reflect fair value, the fair value of a Fund’s investments may be determined under the Valuation Procedures. GSAM, consistent with its procedures and applicable regulatory guidance, may make an adjustment to the most recent valuation prices of either domestic or foreign securities in light of significant events to reflect what it believes to be the fair value of the securities at the time of determining a Fund’s NAV. To the extent investments are valued using single source broker quotations obtained directly from the broker or passed through from third party pricing vendors, such investments are classified as Level 3 investments.
C. Fair Value Hierarchy — The following is a summary of the Funds’ investments and derivatives classified in the fair value hierarchy as of October 31, 2022:
| | | | | | | | | | | | |
| MULTI-MANAGER INTERNATIONAL EQUITY | | | | | | | | | | | | |
| | | |
| Investment Type | | Level 1 | | | Level 2 | | | Level 3 | |
| | | |
| Assets | | | | | | | | | | | | |
| | | |
Common Stock and/or Other Equity Investments(a) | | | | | | | | | | | | |
| | | |
Asia | | $ | 11,486,818 | | | $ | 192,499,184 | | | $ | — | |
| | | |
Australia and Oceania | | | — | | | | 9,096,131 | | | | — | |
| | | |
Europe | | | 45,532,894 | | | | 719,977,394 | | | | — | |
| | | |
North America | | | 129,393,940 | | | | — | | | | — | |
| | | |
Investment Company | | | 44,385,198 | | | | — | | | | — | |
| | | |
Total | | $ | 230,798,850 | | | $ | 921,572,709 | | | $ | — | |
| | (a) | | Amounts are disclosed by continent to highlight the impact of time zone differences between local market close and the calculation of NAV. Security valuations are based on the principal exchange or system on which they are traded, which may differ from country of domicile. The Funds utilize fair value model prices provided by an independent fair value service for international equities, resulting in a Level 2 classification. |
29
ACTIVE EQUITY MULTI-MANAGER FUNDS
Notes to Financial Statements (continued)
October 31, 2022
|
3. INVESTMENTS AND FAIR VALUE MEASUREMENTS (continued) |
| | | | | | | | | | | | |
| MULTI-MANAGER U.S. SMALL CAP EQUITY | | | | | | | | | | | | |
| | | |
| Investment Type | | Level 1 | | | Level 2 | | | Level 3 | |
| | | |
| Assets | | | | | | | | | | | | |
| | | |
Common Stock and/or Other Equity Investments(a) | | | | | | | | | | | | |
| | | |
Asia | | $ | 12,089,328 | | | $ | — | | | $ | — | |
| | | |
Australia and Oceania | | | 108,043 | | | | — | | | | — | |
| | | |
Europe | | | 7,870,167 | | | | — | | | | — | |
| | | |
North America | | | 614,438,500 | | | | — | | | | — | |
| | | |
Exchange Traded Funds | | | 5,845,136 | | | | — | | | | — | |
| | | |
Investment Company | | | 38,902,135 | | | | — | | | | — | |
| | | |
Total | | $ | 679,253,309 | | | $ | — | | | $ | — | |
| | (a) | | Amounts are disclosed by continent to highlight the impact of time zone differences between local market close and the calculation of NAV. Security valuations are based on the principal exchange or system on which they are traded, which may differ from country of domicile. The Funds utilize fair value model prices provided by an independent fair value service for international equities, resulting in a Level 2 classification. |
For further information regarding security characteristics, see the Schedules of Investments.
|
4. INVESTMENTS IN DERIVATIVES |
The following tables set forth, by certain risk types, the Funds’ gains (losses) related to these derivatives and their indicative volumes for the fiscal year ended October 31, 2022. These gains (losses) should be considered in the context that these derivative contracts may have been executed to create investment opportunities and/or economically hedge certain investments, and accordingly, certain gains (losses) on such derivative contracts may offset certain (losses) gains attributable to investments. These gains (losses) are included in “Net realized gain (loss)” or “Net change in unrealized gain (loss)” on the Statements of Operations:
| | | | | | | | | | |
| | |
| MULTI-MANAGER INTERNATIONAL EQUITY | | | | | | | | |
| Risk | | Statement of Operations | | Net Realized Gain | | | Net Change in
Unrealized
Gain (Loss) | |
| | | |
| Currency | | Net realized gain from forward foreign currency exchange contracts | | | $657 | | | | $— | |
| | | | | | |
For the fiscal year ended October 31, 2022, the relevant values for each derivative type was as follows: | |
| | | | | Notional Amounts(a) | |
| | | | | Forward contracts | |
Multi-Manager International Equity | | | | | $83,159 | |
| | (a) | | Amounts disclosed represent notional amounts for forward contracts, based on absolute values, which is indicative of volume for this derivative type, for the months that the Funds held such derivatives for the fiscal year ended October 31, 2022. |
|
5. AGREEMENTS AND AFFILIATED TRANSACTIONS |
A. Management Agreement — Under the Agreement, GSAM manages the Funds, subject to the general supervision of the Trustees.
As compensation for the services rendered pursuant to the Agreement, the assumption of the expenses related thereto and administration of the Funds’ business affairs, including providing facilities, GSAM is entitled to a management fee, accrued daily and paid monthly, equal to an annual percentage rate of each Fund’s average daily net assets.
30
ACTIVE EQUITY MULTI-MANAGER FUNDS
|
5. AGREEMENTS AND AFFILIATED TRANSACTIONS ( continued) |
For the fiscal year ended October 31, 2022, contractual and effective net management fees with GSAM were at the following rates:
| | | | | | | | |
| Fund | | | | Effective Rate | | Effective Net
Management
Rate#* | |
| | | |
Multi-Manager International Equity | | | | 0.60% | | | 0.44 | % |
| | | |
Multi-Manager U.S. Small Cap Equity | | | | 0.75 | | | 0.58 | |
| | * | | GSAM has agreed to waive a portion of its management fee for each Fund in order to achieve an effective net management fee rate that is equal to the actual cost of fees paid to the Fund’s Underlying Managers. These arrangements will remain in effect through at least February 28, 2023, and prior to such date, GSAM may not terminate the applicable arrangement without the approval of the Trustees. |
| | # | | Effective Net Management Rate includes impact of management fee waivers of underlying funds, if any. |
The Funds invest in Institutional Shares of the Goldman Sachs Financial Square Government Fund, which is an affiliated Underlying Fund. GSAM has agreed to waive a portion of its management fee payable by the Funds in an amount equal to the management fee it earns as an investment adviser to the affiliated Underlying Fund in which the Funds invest. For the fiscal year ended October 31, 2022, the management fee waived by GSAM for each Fund was as follows:
| | |
| Fund | | Management Fee Waived |
| |
Multi-Manager International Equity | | $77,264 |
| |
Multi-Manager U.S. Small Cap Equity | | 60,673 |
B. Transfer Agency Agreement — Goldman Sachs also serves as the transfer agent of the Funds for a fee pursuant to the Transfer Agency Agreement. The fees charged for such transfer agency services are accrued daily and paid monthly at annual rates as follows: 0.02% of the average daily net assets of Class P Shares.
C. Other Expense Agreements and Affiliated Transactions — GSAM has agreed to reduce or limit “Other Expenses” of the Funds (excluding acquired fund fees and expenses, transfer agency fees and expenses, service fees and shareholder administration fees, taxes, interest, brokerage fees, expenses of shareholder meetings, litigation and indemnification, and extraordinary expenses) to the extent such expenses exceed, on an annual basis, a percentage rate of the average daily net assets of each Fund. Such Other Expense reimbursements, if any, are accrued daily and paid monthly. In addition, the Funds are not obligated to reimburse GSAM for prior fiscal year expense reimbursements, if any. The Total Annual Operating Expense limitations as an annual percentage rate of average daily net assets for the Multi-Manager International Equity and Multi-Manager U.S. Small Cap Equity Funds are 0.57% and 0.80%, respectively. These Other Expense limitations will remain in place through at least February 28, 2023, and prior to such date GSAM may not terminate the arrangements without the approval of the Trustees. In addition, the Funds have entered into certain offset arrangements with the transfer agent, which may result in a reduction of the Funds’ expenses and are received irrespective of the application of the “Other Expense” limitations described above.
For the fiscal year ended October 31, 2022, these expense reductions, including any fee waivers and Other Expense reimbursements, were as follows:
| | | | | | | | | | | | |
| Fund | | Management
Fee Waiver | | | Other Expense
Reimbursements | | | Total
Expense
Reductions | |
| | | |
Multi-Manager International Equity | | | $2,042,804 | | | | $28,535 | | | | 2,071,339 | |
| | | |
Multi-Manager U.S. Small Cap Equity | | | 1,097,048 | | | | — | | | | 1,097,048 | |
31
ACTIVE EQUITY MULTI-MANAGER FUNDS
Notes to Financial Statements (continued)
October 31, 2022
|
5. AGREEMENTS AND AFFILIATED TRANSACTIONS (continued) |
D. Line of Credit Facility — As of October 31, 2022, the Funds participated in a $1,250,000,000 committed, unsecured revolving line of credit facility (the “facility”) together with other funds of the Trust and certain registered investment companies having management agreements with GSAM or its affiliates. This facility is to be used for temporary emergency purposes, or to allow for an orderly liquidation of securities to meet redemption requests. The interest rate on borrowings is based on the federal funds rate. The facility also requires a fee to be paid by the Funds based on the amount of the commitment that has not been utilized. For the fiscal year ended October 31, 2022, the Funds did not have any borrowings under the facility. Prior to April 22, 2022, the facility was $1,000,000,000.
E. Other Transactions with Affiliates — For the fiscal year ended October 31, 2022, Goldman Sachs earned $3,861 and $2,046 in brokerage commissions from portfolio transactions, including futures transactions executed with Goldman Sachs as the Futures Commission Merchant, on behalf of the Multi-Manager International Equity and Multi-Manager U.S. Small Cap Equity Funds, respectively..
The following table provides information about the Funds’ investments in the Goldman Sachs Financial Square Government Fund as of and for the fiscal year ended October 31, 2022:
| | | | | | | | | | | | | | | | | | | | | | | | | | |
| Fund | | Underlying Fund | | Beginning
Value as of
October 31,
2021 | | | Purchases at Cost | | | Proceeds from Sales | | | Ending Value
as of
October 31,
2022 | | | Shares as of
October 31,
2022 | | | Dividend
Income | |
| | | | | | | |
Multi-Manager International Equity | | Goldman Sachs Financial Square Government Fund – Institutional Shares | | | $51,983,928 | | | | $905,448,215 | | | | $ | (913,046,945) | | | $44,385,198 | | | | 44,385,198 | | | | $460,595 | |
| | | | | | | |
Multi-Manager U.S. Small Cap Equity | | Goldman Sachs Financial Square Government Fund – Institutional Shares | | | 32,813,363 | | | | 549,271,765 | | | | (543,182,993 | ) | | | 38,902,135 | | | | 38,902,135 | | | | 393,576 | |
|
6. PORTFOLIO SECURITIES TRANSACTIONS |
The cost of purchases and proceeds from sales and maturities of long-term securities for the fiscal year ended October 31, 2022, were as follows:
| | | | | | | | |
| Fund | | | | Purchases (Excluding U.S. Government and Agency Obligations) | | Sales and
Maturities of (Excluding
U.S. Government and
Agency Obligations) | |
| | | |
Multi-Manager International Equity | | | | $609,740,538 | | | $471,411,718 | |
| | | |
Multi-Manager U.S. Small Cap Equity | | | | 480,389,103 | | | 341,027,717 | |
The tax character of distributions paid during the fiscal year ended October 31, 2022 was as follows:
| | | | | | | | |
| | | Multi-Manager
International Equity Fund | | | Multi-Manager U.S. Small Cap
Equity Fund | |
Distributions paid from: | | | | | | | | |
Ordinary income | | | $ 54,624,570 | | | | $ 55,229,489 | |
| | |
Net long-term capital gains | | | 51,051,407 | | | | 50,229,806 | |
| | |
Total taxable distributions | | | $105,675,977 | | | | $105,459,295 | |
32
ACTIVE EQUITY MULTI-MANAGER FUNDS
|
7. TAX INFORMATION (continued) |
The tax character of distributions paid during the fiscal year ended October 31, 2021 was as follows:
| | | | | | | | |
| | | Multi-Manager
International
Equity Fund | | | Multi-Manager
U.S. Small Cap
Equity Fund | |
Distributions paid from: | | | | | | | | |
Ordinary income | | | $10,201,242 | | | | $1,238,041 | |
As of October 31, 2022, the components of accumulated earnings (losses) on a tax basis were as follows:
| | | | | | | | |
| | | Multi-Manager
International Equity Fund | | | Multi-Manager U.S. Small Cap
Equity Fund | |
Undistributed ordinary income — net | | | $ 15,217,540 | | | | $ 2,008,045 | |
Capital loss carryforwards: | | | | | | | | |
Perpetual Short-Term | | | (7,666,401) | | | | (12,021,387) | |
Unrealized gains (loss) — net | | | (38,826,173) | | | | 16,238,917 | |
Total accumulated earnings (loss) net | | | $(31,275,034) | | | | $ 6,225,575 | |
As of October 31, 2022, the Funds’ aggregate security unrealized gains and losses based on cost for U.S. federal income tax purposes were as follows:
| | | | | | | | |
| | | Multi-Manager
International Equity Fund | | | Multi-Manager U.S. Small Cap
Equity Fund | |
Tax Cost | | | $1,190,577,567 | | | | $663,014,392 | |
Gross unrealized gain | | | 151,544,347 | | | | 67,953,666 | |
Gross unrealized loss | | | (190,370,520 | ) | | | (51,714,749 | ) |
Net unrealized gain (loss) | | | $ (38,826,173 | ) | | | $ 16,238,917 | |
The difference between GAAP-basis and tax basis unrealized gains (losses) is attributable primarily to wash sales and differences in the tax treatment of passive foreign investment company investments.
GSAM has reviewed the Funds’ tax positions for all open tax years (the current and prior three years, as applicable) and has concluded that no provision for income tax is required in the Funds’ financial statements. Such open tax years remain subject to examination and adjustment by tax authorities.
The Funds’ risks include, but are not limited to, the following:
Derivatives Risk — The Funds’ use of derivatives and other similar instruments (together, referred to in this paragraph as “derivatives”) may result in loss, including due to adverse market movements. Derivatives, which may pose risks in addition to and greater than those associated with investing directly in securities, currencies or other instruments, may be illiquid or less liquid, volatile, difficult to price and leveraged so that small changes in the value of the underlying instruments may produce disproportionate losses to the Funds. Changes in the value of a derivative may also create margin delivery or settlement payment obligations for the Funds. Derivatives are also subject to counterparty risk, which is the risk that the other party in the transaction will not, or lacks the capacity or authority to, fulfill its contractual obligation. The use of derivatives is a highly specialized activity that involves investment techniques and risks different from those associated with investments in more traditional securities and
33
ACTIVE EQUITY MULTI-MANAGER FUNDS
Notes to Financial Statements (continued)
October 31, 2022
|
8. OTHER RISKS (continued) |
instruments. The use of derivatives is also subject to operational and legal risks. Operational risks refer to risks related to potential operational issues, including documentation issues, settlement issues, system failures, inadequate controls, and human error. Legal risks refer to the risks of loss resulting from insufficient documentation, or legality or enforceability of a contract. Losses from derivatives can also result from a lack of correlation between changes in the value of derivative instruments and the portfolio assets (if any) being hedged.
Foreign and Emerging Countries Risk — Investing in foreign markets may involve special risks and considerations not typically associated with investing in the U.S. Foreign securities may be subject to risk of loss because of more or less foreign government regulation; less public information; less stringent investor protections; less stringent accounting, corporate governance, financial reporting and disclosure standards; and less economic, political and social stability in the countries in which a Fund invests. The imposition of sanctions, exchange controls (including repatriation restrictions), confiscation of assets and property, trade restrictions (including tariffs) and other government restrictions by the U.S. or other governments, or from problems in share registration, settlement or custody, may also result in losses. The type and severity of sanctions and other similar measures, including counter sanctions and other retaliatory actions, that may be imposed could vary broadly in scope, and their impact is impossible to predict. For example, the imposition of sanctions and other similar measures could, among other things, cause a decline in the value and/or liquidity of securities issued by the sanctioned country or companies located in or economically tied to the sanctioned country and increase market volatility and disruption in the sanctioned country and throughout the world. Sanctions and other similar measures could limit or prevent a Fund from buying and selling securities (in the sanctioned country and other markets), significantly delay or prevent the settlement of securities transactions, and significantly impact a Fund’s liquidity and performance. Foreign risk also involves the risk of negative foreign currency exchange rate fluctuations, which may cause the value of securities denominated in such foreign currency (or other instruments through which a Fund has exposure to foreign currencies) to decline in value. Currency exchange rates may fluctuate significantly over short periods of time. To the extent that a Fund also invests in securities of issuers located in, or economically tied to, emerging markets, these risks may be more pronounced.
Foreign Custody Risk — A Fund invests in foreign securities, and as such the Fund may hold such securities and cash with foreign banks, agents, and securities depositories appointed by the Fund’s custodian (each a “Foreign Custodian”). Some foreign custodians may be recently organized or new to the foreign custody business. In some countries, Foreign Custodians may be subject to little or no regulatory oversight over, or independent evaluation of, their operations. Further, the laws of certain countries may place limitations on the Fund’s ability to recover its assets if a Foreign Custodian enters bankruptcy. Investments in emerging markets may be subject to even greater custody risks than investments in more developed markets. Custody services in emerging market countries are very often undeveloped and may be considerably less well regulated than in more developed countries, and thus may not afford the same level of investor protection as would apply in developed countries.
Geographic Risk — If a Fund focuses its investments in securities of issuers located in a particular country or geographic region, the Fund may be subjected, to a greater extent than if its investments were less focused, to the risks of volatile economic cycles and/or conditions and developments that may be particular to that country or region, such as: adverse securities markets; adverse exchange rates; adverse social, political, regulatory, economic, business, environmental or other developments; or natural disasters.
Investments in Other Investment Companies Risk — As a shareholder of another investment company, including an exchange-traded fund (“ETF”), a Fund will indirectly bear its proportionate share of any net management fees and other expenses paid by such other investment companies, in addition to the fees and expenses regularly borne by the Fund. ETFs are subject to risks that do not apply to conventional mutual funds, including but not limited to the following: (i) the market price of the ETF’s shares may trade at a premium or a discount to their NAV; and (ii) an active trading market for an ETF’s shares may not develop or be maintained.
Large Shareholder Transactions Risk — A Fund may experience adverse effects when certain large shareholders, such as other funds, institutional investors (including those trading by use of non-discretionary mathematical formulas), financial intermediaries (who may make investment decisions on behalf of underlying clients and/or include a Fund in their investment model), individuals, accounts and Goldman Sachs affiliates, purchase or redeem large amounts of shares of a Fund. Such large shareholder
34
ACTIVE EQUITY MULTI-MANAGER FUNDS
|
8. OTHER RISKS (continued) |
redemptions, which may occur rapidly or unexpectedly, may cause a Fund to sell portfolio securities at times when it would not otherwise do so, which may negatively impact a Fund’s NAV and liquidity. These transactions may also accelerate the realization of taxable income to shareholders if such sales of investments resulted in gains, and may also increase transaction costs. In addition, a large redemption could result in a Fund’s current expenses being allocated over a smaller asset base, leading to an increase in the Fund’s expense ratio. Similarly, large Fund share purchases may adversely affect a Fund’s performance to the extent that the Fund is delayed in investing new cash or otherwise maintains a larger cash position than it ordinarily would.
Liquidity Risk — A Fund may make investments that are illiquid or that may become less liquid in response to market developments or adverse investor perceptions. Illiquid investments may be more difficult to value. Liquidity risk may also refer to the risk that a Fund will not be able to pay redemption proceeds within the allowable time period or without significant dilution to remaining investors’ interests because of unusual market conditions, an unusually high volume of redemption requests, or other reasons. To meet redemption requests, a Fund may be forced to sell investments at an unfavorable time and/or under unfavorable conditions. If a Fund is forced to sell securities at an unfavorable time and/or under unfavorable conditions, such sales may adversely affect Fund’s NAV and dilute remaining investors’ interests. Liquidity risk may be the result of, among other things, the reduced number and capacity of traditional market participants to make a market in fixed income securities or the lack of an active market. The potential for liquidity risk may be magnified by a rising interest rate environment or other circumstances where investor redemptions from fixed income funds may be higher than normal, potentially causing increased supply in the market due to selling activity. These risks may be more pronounced in connection with the Funds’ investments in securities of issuers located in emerging market countries. Redemptions by large shareholders may have a negative impact on a Fund’s liquidity.
Market and Credit Risks — In the normal course of business, a Fund trades financial instruments and enters into financial transactions where risk of potential loss exists due to changes in the market (market risk). The value of the securities in which a Fund invests may go up or down in response to the prospects of individual companies, particular sectors or governments and/or general economic conditions throughout the world due to increasingly interconnected global economies and financial markets. Events such as war, acts of terrorism, social unrest, natural disasters, the spread of infectious illness or other public health threats could also significantly impact a Fund and its investments. Additionally, a Fund may also be exposed to credit risk in the event that an issuer or guarantor fails to perform or that an institution or entity with which the Fund has unsettled or open transactions defaults.
Multi-Manager Approach Risk — The Funds’ performance depends on the ability of the Investment Adviser in selecting, overseeing, and allocating Fund assets to the Underlying Managers. The Underlying Managers’ investment styles may not always be complementary. The Funds’ multi-manager approach may result in the Fund investing a significant percentage of its assets in certain types of investments, which could be beneficial or detrimental to the Funds’ performance depending on the performance of those investments and the overall market environment. The Funds’ Underlying Managers may underperform the market generally or underperform other investment managers that could have been selected for the Funds. Because the Funds’ Underlying Managers may trade with counterparties, prime brokers, clearing brokers or futures commission merchants on terms that are different than those on which the Investment Adviser would trade, and because each Underlying Manager applies its own risk analysis in evaluating potential counterparties for the Funds, the Funds may be subject to greater counterparty risk than if they were managed directly by the Investment Adviser.
Under the Trust’s organizational documents, its Trustees, officers, employees and agents are indemnified, to the extent permitted by the Act and state law, against certain liabilities that may arise out of performance of their duties to the Funds. Additionally, in the course of business, the Funds enter into contracts that contain a variety of indemnification clauses. The Funds maximum exposure under these arrangements is unknown, as this would involve future claims that may be made against the Funds that have not yet occurred. However, GSAM believes the risk of loss under these arrangements to be remote.
35
ACTIVE EQUITY MULTI-MANAGER FUNDS
Notes to Financial Statements (continued)
October 31, 2022
Subsequent events after the Statements of Assets and Liabilities date have been evaluated, and GSAM has concluded that there is no impact requiring adjustment or disclosure in the financial statements.
|
11. SUMMARY OF SHARE TRANSACTIONS |
Share activity is as follows:
| | | | | | | | | | | | | | | | |
| | | Multi-Manager International Equity Fund | |
| | | | |
| | | For the Fiscal Year Ended
October 31, 2022 | | | For the Fiscal Year Ended
October 31, 2021 | |
| | | | |
| | | Shares | | | Dollars | | | Shares | | | Dollars | |
| | | | |
| Class P Shares | | | | | | | | | | | | | | | | |
| | | | |
Shares sold | | | 24,271,194 | | | $ | 300,829,170 | | | | 26,007,978 | | | $ | 371,379,307 | |
| | | | |
Reinvestment of distributions | | | 7,532,433 | | | | 105,675,977 | | | | 738,685 | | | | 10,201,242 | |
| | | | |
Shares redeemed | | | (14,891,826 | ) | | | (182,135,814 | ) | | | (17,085,264 | ) | | | (243,797,703 | ) |
| |
| | | | |
NET INCREASE | | | 16,911,801 | | | $ | 224,369,333 | | | | 9,661,399 | | | $ | 137,782,846 | |
| |
| | | | | | | | | | | | | | | | |
| | | Multi-Manager U.S. Small Cap Equity Fund | |
| | | | |
| | | For the Fiscal Year Ended
October 31, 2022 | | | For the Fiscal Year Ended
October 31, 2021 | |
| | | | |
| | | Shares | | | Dollars | | | Shares | | | Dollars | |
| | | | |
| Class P Shares | | | | | | | | | | | | | | | | |
| | | | |
Shares sold | | | 13,542,686 | | | $ | 175,288,130 | | | | 9,890,011 | | | $ | 163,430,350 | |
| | | | |
Reinvestment of distributions | | | 7,600,474 | | | | 105,459,295 | | | | 82,371 | | | | 1,238,041 | |
| | | | |
Shares redeemed | | | (2,587,393 | ) | | | (35,693,851 | ) | | | (9,219,404 | ) | | | (147,446,731 | ) |
| |
| | | | |
NET INCREASE | | | 18,555,767 | | | $ | 245,053,574 | | | | 752,978 | | | $ | 17,221,660 | |
| |
36
Report of Independent Registered Public Accounting Firm
To the Board of Trustees of Goldman Sachs Trust II and Shareholders of Goldman Sachs Multi-Manager International Equity Fund and Goldman Sachs Multi-Manager U.S. Small Cap Equity Fund
Opinions on the Financial Statements
We have audited the accompanying statements of assets and liabilities, including the schedules of investments, of Goldman Sachs Multi-Manager International Equity Fund and Goldman Sachs Multi-Manager U.S. Small Cap Equity Fund (two of the funds constituting Goldman Sachs Trust II, hereafter collectively referred to as the “Funds”) as of October 31, 2022, the related statements of operations for the year ended October 31, 2022, the statements of changes in net assets for each of the two years in the period ended October 31, 2022, including the related notes, and the financial highlights for each of the five years in the period ended October, 2022 (collectively referred to as the “financial statements”). In our opinion, the financial statements present fairly, in all material respects, the financial position of each of the Funds as of October 31, 2022, the results of each of their operations for the year then ended, the changes in each of their net assets for each of the two years in the period ended October 31, 2022 and each of the financial highlights for each of the five years in the period ended October 31, 2022 in conformity with accounting principles generally accepted in the United States of America.
Basis for Opinions
These financial statements are the responsibility of the Funds’ management. Our responsibility is to express an opinion on the Funds’ financial statements based on our audits. We are a public accounting firm registered with the Public Company Accounting Oversight Board (United States) (PCAOB) and are required to be independent with respect to the Funds in accordance with the U.S. federal securities laws and the applicable rules and regulations of the Securities and Exchange Commission and the PCAOB.
We conducted our audits of these financial statements in accordance with the standards of the PCAOB. Those standards require that we plan and perform the audit to obtain reasonable assurance about whether the financial statements are free of material misstatement, whether due to error or fraud.
Our audits included performing procedures to assess the risks of material misstatement of the financial statements, whether due to error or fraud, and performing procedures that respond to those risks. Such procedures included examining, on a test basis, evidence regarding the amounts and disclosures in the financial statements. Our audits also included evaluating the accounting principles used and significant estimates made by management, as well as evaluating the overall presentation of the financial statements. Our procedures included confirmation of securities owned as of October 31, 2022 by correspondence with the custodian, transfer agent and brokers; when replies were not received from brokers, we performed other auditing procedures. We believe that our audits provide a reasonable basis for our opinions.
/s/ PricewaterhouseCoopers LLP
Boston, Massachusetts
December 23, 2022
We have served as the auditor of one or more investment companies in the Goldman Sachs fund complex since 2000.
37
ACTIVE EQUITY MULTI-MANAGER FUNDS
| | |
| | |
Fund Expenses — Six Month Period Ended October 31, 2022 (Unaudited) | | |
As a shareholder of Class P Shares of the Funds, you incur two types of costs: (1) transaction costs, and (2) ongoing costs, including management fees; and other Fund expenses. This example is intended to help you understand your ongoing costs (in dollars) of investing in the Funds and to compare these costs with the ongoing costs of investing in other mutual funds.
The example is based on an investment of $1,000 invested at the beginning of the period and held for the entire period from May 1, 2022 through October 31, 2022, which represents a period of 184 days of a 365 day year. This projection assumes that annualized expense ratios were in effect during the period.
Actual Expenses — The first line in the table below provides information about actual account values and actual expenses. You may use the information in this line, together with the amount you invested, to estimate the expenses that you paid over the period. Simply divide your account value by $1,000 (for example, an $8,600 account value divided by $1,000=8.6), then multiply the result by the number in the first line under the heading entitled “Expenses Paid” to estimate the expenses you paid on your account during this period.
Hypothetical Example for Comparison Purposes — The second line in the table below provides information about hypothetical account values and hypothetical expenses based on the Funds’ actual net expense ratios and an assumed rate of return of 5% per year before expenses, which is not the Funds’ actual return. The hypothetical account values and expenses may not be used to estimate the actual ending account balance or expenses you paid for the period. You may use this information to compare the ongoing costs of investing in the Funds and other funds. To do so, compare this 5% hypothetical example with the 5% hypothetical examples that appear in the shareholder reports of the other funds.
Please note that the expenses shown in the table are meant to highlight your ongoing costs only and do not reflect any transactional costs, such as sales charges, redemption fees, or exchange fees. Therefore, the second line of the table is useful in comparing ongoing costs only, and will not help you determine the relative total costs of owning different funds. In addition, if these transactional costs were included, your costs would have been higher.
| | | | | | | | | | | | | | | | | | | | | | | | |
| | |
| | | Multi-Manager International Equity Fund | | | Multi-Manager U.S. Small Cap Equity Fund | |
| Share Class | | Beginning
Account
Value
5/1/22 | | | Ending
Account
Value
10/31/22 | | | Expenses
Paid for the 6 months ended
10/31/22* | | | Beginning
Account
Value
5/1/22 | | | Ending
Account
Value
10/31/22 | | | Expenses
Paid for the
6 months ended
10/31/22* | |
| Class P | | | | | | | | | | | | | | | | | | | | | | | | |
Actual | | | $1,000.00 | | | | $ 900.40 | | | | $5.78 | | | | $1,000.00 | | | | $ 992.70 | | | | $7.30 | |
Hypothetical 5% return | | | 1,000.00 | | | | 1,019.10+ | | | | 6.14 | | | | 1,000.00 | | | | 1,017.90+ | | | | 7.39 | |
| | * | | Expenses for each share class are calculated using each Fund’s annualized net expense ratio for each class, which represents the ongoing expenses as a percentage of net assets for the six months ended October 31, 2022. Expenses are calculated by multiplying the annualized net expense ratio by the average account value for the period; then multiplying the result by the number of days in the most recent fiscal half year; and then dividing that result by the number of days in the fiscal year. The annualized net expense ratios for the period were as follows: | |
| | | | | | | | | | | | | | | | | | | | |
| Fund | | Class P | |
| |
Multi-Manager International Equity | | | 0.58 | % |
Multi-Manager U.S. Small Cap Equity | | | 0.74 | |
| | + | | Hypothetical expenses are based on each Fund’s actual annualized net expense ratios (excluding proxy fee which is not annualized) and an assumed rate of return of 5% per year before expenses. | |
38
ACTIVE EQUITY MULTI-MANAGER FUNDS
Statement Regarding Basis for Approval of Management Agreement and Sub-Advisory Agreements (Unaudited)
Background
The Multi-Manager International Equity Fund and Multi-Manager U.S. Small Cap Equity Fund (the “Funds”) are investment portfolios of Goldman Sachs Trust II (the “Trust”). The Board of Trustees (the “Board”) oversees the management of the Trust and reviews the investment performance and expenses of the Funds at regularly scheduled meetings held throughout the year. Each Fund employs a “manager of managers” structure, whereby Goldman Sachs Asset Management, L.P. (the “Investment Adviser”) is responsible for selecting sub-advisers (subject to Board approval), allocating the Fund’s assets among them, and overseeing their day-to-day management of Fund assets. The Board determines annually whether to approve the continuance of the Trust’s investment management agreement (the “Management Agreement”) with the Investment Adviser on behalf of the Funds.
The Management Agreement was approved for continuation until June 30, 2023 at a meeting on June 9-10, 2022 and was most recently approved for continuation until September 30, 2023 at a meeting held on September 19-20, 2022 (together, the “Annual Meetings”) by the Board, including those Trustees who are not parties to the Management Agreement or “interested persons” (as defined in the Investment Company Act of 1940, as amended) of any party thereto (the “Independent Trustees”). At the Annual Meetings, the Board also considered the sub-advisory agreements (each a “Designated Sub-Advisory Agreement” and, together with the Management Agreement, the “Agreements”) between the Investment Adviser and (i) each of Causeway Capital Management LLC, Lazard Asset Management LLC, Massachusetts Financial Services Company (d/b/a MFS Investment Management)t, and WCM Investment Management (on behalf of Multi-Manager International Equity Fund); and (ii) each of Boston Partners Global Investors, Inc., Brown Advisory LLC, and Victory Capital Management, Inc. (on behalf of Multi-Manager U.S. Small Cap Equity Fund) (each, a “Designated Sub-Adviser” and collectively, the “Designated Sub-Advisers”).
The review process undertaken by the Trustees spans the course of the year and culminates with the Annual Meetings. To assist the Trustees in their deliberations, the Trustees have established a Contract Review Committee (the “Committee”), comprised of the Independent Trustees. The Committee held five meetings over the course of the year since the Management Agreement was last approved. At those Committee meetings, regularly scheduled Board or other committee meetings, and/or the Annual Meetings, matters relevant to the renewal of the Management Agreement and the Designated Sub-Advisory Agreements were considered by the Board, or the Independent Trustees, as applicable. With respect to each Fund, such matters included:
| | (a) | | the nature and quality of the advisory, administrative, and other services provided to the Fund by the Investment Adviser and its affiliates, and the Designated Sub-Advisers, including, as applicable, information about: |
| | (i) | | the structure, staff, and capabilities of the Investment Adviser and the Designated Sub-Advisers and the Designated Sub-Advisers’ portfolio management teams; |
| | (ii) | | the groups within the Investment Adviser and its affiliates that support the portfolio management teams or provide other types of necessary services, including fund services groups (e.g., accounting and financial reporting, tax, shareholder services, and operations); controls and risk management groups (e.g., legal, compliance, valuation oversight, credit risk management, internal audit, compliance testing, market risk analysis, finance, and central funding); sales and distribution support groups, and others (e.g., information technology and training); |
| | (iii) | | trends in employee headcount; |
| | (iv) | | the Investment Adviser’s financial resources and ability to hire and retain talented personnel and strengthen its operations; and |
| | (v) | | the parent company’s support of the Investment Adviser and its mutual fund business, as expressed by the firm’s senior management; |
| | (b) | | information on the investment performance of the Fund, including comparisons to the performance of similar mutual funds, as provided by a third-party mutual fund data provider engaged as part of the contract review process (the “Outside Data Provider”), benchmark performance indices, and commingled investment vehicles with comparable investment strategies managed by the Investment Adviser, and information on general investment outlooks in the markets in which the Fund invests; |
| | (c) | | information provided by the Investment Adviser indicating the Investment Adviser’s views on whether the Fund’s peer group and/or benchmark index had high, medium, or low relevance given the Fund’s particular investment strategy; |
| | (d) | | the terms of the Agreements and other agreements with affiliated service providers entered into by the Trust on behalf of the Fund; |
| | (e) | | fee and expense information for the Fund, including: |
| | (i) | | the relative management fee and expense levels of the Fund as compared to those of comparable funds managed by other advisers, as provided by the Outside Data Provider; |
| | (ii) | | the Fund’s expense trends over time; and |
| | (iii) | | comparative information on the advisory fees charged and services provided by the Investment Adviser to certain collective investment vehicles that it manages with comparable investment strategies; |
39
ACTIVE EQUITY MULTI-MANAGER FUNDS
Statement Regarding Basis for Approval of Management Agreement and Sub-Advisory Agreements (Unaudited) (continued)
| | (f) | | with respect to the extensive investment performance and expense comparison data provided by the Outside Data Provider, its processes in producing that data for the Fund; |
| | (g) | | the undertakings of the Investment Adviser and its affiliates to implement fee waivers and expense limitations; |
| | (h) | | information relating to the profitability of the Management Agreement and the transfer agency arrangements of the Fund to the Investment Adviser and its affiliates; |
| | (i) | | whether the Fund’s existing management fee schedule adequately addressed any economies of scale; |
| | (j) | | a summary of the “fall-out” benefits derived by the Investment Adviser and its affiliates from their relationships with the Fund, including the fees received by the Investment Adviser’s affiliates from the Fund for transfer agency, portfolio trading, distribution and other services; |
| | (k) | | a summary of potential benefits derived by the Fund as a result of its relationship with the Investment Adviser; |
| | (l) | | with respect to the Investment Adviser, portfolio manager ownership of Fund shares; the manner in which portfolio manager compensation is determined; information on the Designated Sub-Advisers’ compensation arrangements; and the number and types of accounts managed by the portfolio managers; |
| | (m) | | the nature and quality of the services provided to the Fund by its unaffiliated service providers (as well as the Designated Sub-Advisers), and the Investment Adviser’s general oversight and evaluation (including reports on due diligence) of those service providers as part of the administrative services provided under the Management Agreement; and |
| | (n) | | the Investment Adviser’s and Designated Sub-Advisers’ processes and policies addressing various types of potential conflicts of interest; their approaches to risk management; the annual review of the effectiveness of the Fund’s compliance program; and periodic compliance reports. |
The Trustees also received an overview of the Funds’ distribution arrangements. They received information regarding the Funds’ assets and share purchase and redemption activity. Information was also provided to the Trustees relating to revenue sharing payments made by and services provided by the Investment Adviser and its affiliates to intermediaries that promote the sale, distribution, and/or servicing of Fund shares.
The presentations made at the Board and Committee meetings and at the Annual Meetings encompassed the Funds and other mutual funds for which the Board has responsibility. In evaluating the Agreements at the Annual Meetings, the Trustees relied upon their knowledge, resulting from their meetings and other interactions throughout the year, of the Funds and the respective services of the Investment Adviser and its affiliates, and the Designated Sub-Advisers. In conjunction with these meetings, the Trustees received written materials and oral presentations on the topics covered, and the Investment Adviser addressed the questions and concerns of the Trustees, including concerns regarding the investment performance of certain of the funds they oversee. In addition, the Trustees periodically received written materials and oral presentations from the Funds’ various sub-advisers, including the Designated Sub-Advisers. The Independent Trustees were advised by their independent legal counsel regarding their responsibilities and other regulatory requirements related to the approval and continuation of mutual fund investment management agreements under applicable law. In addition, the Investment Adviser and its affiliates provided the Independent Trustees with a written response to a formal request for information sent on behalf of the Independent Trustees by their independent legal counsel. The Trustees reviewed a written response prepared by each Designated Sub-Adviser to a similar request for information submitted to the Designated Sub-Adviser by the Investment Adviser. During the course of their deliberations, the Independent Trustees met in executive sessions with their independent legal counsel, without representatives of the Investment Adviser or its affiliates present.
Nature, Extent, and Quality of the Services Provided Under the Management Agreements
As part of their review, the Trustees considered the nature, extent, and quality of the services provided to the Funds by the Investment Adviser. In this regard, the Trustees considered both the investment advisory services and non-advisory services that are provided by the Investment Adviser and its affiliates. The Trustees noted the transition in the leadership and changes in personnel of various of the Investment Adviser’s portfolio management teams that had occurred in recent periods, and the ongoing recruitment efforts aimed at bringing high quality investment talent to the Investment Adviser. They also noted the Investment Adviser’s commitment to maintaining high quality systems and expending substantial resources to respond to ongoing changes to the market, regulatory and control environment in which the Funds and their service providers operate, including developments associated with the COVID-19 pandemic, geopolitical events, and economic sanctions, as well as the efforts of the Investment Adviser and its affiliates to combat cyber security risks. The Trustees also considered information regarding the Investment Adviser’s and the Funds’ various sub-advisers’ business continuity planning and remote operations capabilities. The Trustees concluded that the Investment Adviser continued to commit substantial financial and operational resources to the Funds and expressed confidence that the Investment Adviser would continue to do so in the future. The Trustees also recognized that the
40
ACTIVE EQUITY MULTI-MANAGER FUNDS
Statement Regarding Basis for Approval of Management Agreement and Sub-Advisory Agreements (Unaudited) (continued)
Investment Adviser had made significant commitments to address regulatory compliance requirements applicable to the Funds and the Investment Adviser and its affiliates. In addition, the Trustees reviewed the sub-adviser oversight process that the Investment Adviser had employed, which included areas such as investment analytics, risk management, and compliance.
Investment Performance
The Trustees also considered the investment performance of the Funds. In this regard, they compared the investment performance of each Fund to its peers using rankings and ratings compiled by the Outside Data Provider as of December 31, 2021, and updated performance information prepared by the Investment Adviser as of March 31, 2022. The information on each Fund’s investment performance was provided for the one-, three-, and five-year periods ending on the applicable dates. The Trustees also reviewed each Fund’s investment performance relative to its performance benchmark. As part of this review, they considered the investment performance trends of the Funds over time, and reviewed the investment performance of each Fund in light of its investment objective and policies and market conditions. The Trustees considered the Investment Adviser’s representations that each Fund had significant differences from its Outside Data Provider peer group that caused it to be an imperfect basis for comparison. The Trustees also received information comparing each Fund’s performance to that of comparable unregistered funds managed by the Investment Adviser. They considered that the unregistered funds provide an imperfect performance comparison because they are not subject to the requirements of the Investment Company Act of 1940, as amended.
In addition, the Trustees considered materials prepared and presentations made by the Investment Adviser’s senior management and the Sub-Advisers’ portfolio management personnel in which Fund performance was assessed. The Trustees also considered the Investment Adviser’s periodic reports with respect to the Funds’ risk profiles, and how the Investment Adviser’s approach to risk monitoring and management influences portfolio management.
The Trustees noted that the Multi-Manager International Equity Fund had placed in the top half of its performance peer group for the one-, three, and five-year periods ended December 31, 2021 and had underperformed its benchmarked index for the one-year period and outperformed for the three- and five-year periods ended March 31, 2022. They noted that the Multi Manager U.S. Small Cap Equity Fund had placed in the fourth quartile of its performance peer group for the one-year period and the third quartile for the three- and five-years periods ended December 31, 2021 and had outperformed its benchmark index for the one-year period and underperformed for the three- and five-year periods ended March 31, 2022.
Costs of Services Provided and Competitive Information
The Trustees considered the contractual terms of the Management Agreement, the fee rates payable by each Fund thereunder. In this regard, the Trustees considered information on the services rendered by the Investment Adviser to the Funds, which included both advisory and administrative services that were directed to the needs and operations of the Funds as registered mutual funds.
In particular, the Trustees reviewed analyses prepared by the Outside Data Provider regarding the expense rankings of the Funds, as well as additional information provided by the Investment Adviser throughout the year. The analyses provided a comparison of each Fund’s management fee to those of a relevant peer group and category universe; an expense analysis which compared each Fund’s overall net and gross expenses to a peer group and a category universe; and data comparing each Fund’s net expenses to the peer and category medians. The analyses also compared each Fund’s other expenses and fee waivers/ reimbursements to those of the peer group and category medians. The Trustees also considered comparative fee information for services provided by the Investment Adviser to collective investment vehicles having investment objectives and policies similar to those of the Funds. The Trustees considered that services provided to the Funds differed in various significant respects from the services provided to these collective investment vehicles, which generally operated under less stringent regulatory and financial reporting requirements and required fewer services from the Investment Adviser. The Trustees concluded that the comparisons provided by the Outside Data Provider and the Investment Adviser were useful in evaluating the reasonableness of the management fees and total expenses paid by the Funds.
The Trustees considered the Investment Adviser’s undertaking to waive a portion of the management fee payable by each Fund. In this regard the Trustees noted that shareholders that are invested in the Funds consist of institutional clients that have entered into a separate management agreement with the Investment Adviser and pay a single management fee for the Investment Adviser’s management of their accounts, and that the Investment Adviser waives a portion of the management fee with respect to each Fund in order to achieve an effective net management fee rate that is equal to the actual cost of fees paid to the Fund’s sub-advisers. They also considered the Investment Adviser’s undertaking to limit certain expenses of the Funds that exceed specified levels. In addition, the Trustees noted that shareholders are able to redeem their shares at any time if shareholders believe that the Fund fees and expenses are too high or if they are dissatisfied with the performance of the Fund.
41
ACTIVE EQUITY MULTI-MANAGER FUNDS
Statement Regarding Basis for Approval of Management Agreement and Sub-Advisory Agreements (Unaudited) (continued)
Profitability
The Trustees reviewed each Fund’s contribution to the Investment Adviser’s revenues and pre-tax profit margins. In this regard the Trustees noted that they had received, among other things, profitability analyses and summaries, revenue and expense schedules by Fund and by function (i.e., investment management, transfer agency and distribution and service), and information on the Investment Adviser’s expense allocation methodology. They observed that the profitability and expense figures are substantially similar to those used by the Investment Adviser for many internal purposes, including compensation decisions among various business groups, and are thus subject to a vigorous internal debate about how certain revenue and expenses should be allocated. The Trustees also noted that the internal audit group within the Goldman Sachs organization periodically audits the expense allocation methodology and that the internal audit group was satisfied with the reasonableness, consistency, and accuracy of the Investment Adviser’s expense allocation methodology. Profitability data for each Fund was provided for 2021 and 2020, and the Trustees considered this information in relation to the Investment Adviser’s overall profitability.
Economies of Scale
The Trustees considered the information that had been provided regarding whether there have been economies of scale with respect to the management of the Funds. The Trustees also considered that the Funds are offered to the Investment Adviser’s institutional clients as part of an investment model whereby the Funds and other funds act as core “building blocks” with which the client and the Investment Adviser form an investment strategy for the client’s portfolio. The Trustees considered the Investment Adviser’s representations that its clients benefit from this investment model with increased liquidity, increased investment oversight, access to new investment strategies, economies of scale, and reduced complexity in managing client portfolios. The Trustees noted that, pursuant to the model, clients pay a management fee for the Investment Adviser’s management of their accounts, and that the fund-level management fees in excess of the weighted average sub-advisory fees are waived in order to avoid charging two layers of management fees.
The Trustees considered that there are no breakpoints in the fee rate payable under the Management Agreement for each of the Funds. The Trustees considered the amounts of assets in the Funds; the Funds’ recent purchase and redemption activity; the information provided by the Investment Adviser relating to the costs of the services provided by the Investment Adviser and its affiliates and the profits realized by them (if any); information comparing the fee rates charged by the Investment Adviser with fee rates charged to other funds in the peer groups; and the Investment Adviser’s undertakings to waive a portion of its management fee and to limit certain expenses of the Funds that exceed specified levels. The Trustees also considered the relationship between the advisory and sub-advisory fee rate schedules.
Other Benefits to the Investment Adviser and Its Affiliates
The Trustees also considered the other benefits derived by the Investment Adviser and its affiliates from their relationships with the Funds, as stated above, including: (a) transfer agency fees received by Goldman Sachs & Co. LLC (“Goldman Sachs”); (b) brokerage and futures commissions earned by Goldman Sachs for executing securities transactions (in its capacity as clearing broker) and futures transactions on behalf of the Funds; (c) the Investment Adviser’s ability to leverage the infrastructure designed to service the Funds on behalf of its other clients; (d) the Investment Adviser’s ability to cross-market other products and services to Fund shareholders; (e) the Investment Adviser’s ability to negotiate better pricing with the Funds’ custodian on behalf of its other clients, as a result of the relationship with the Funds; (f) the investment of cash in money market funds managed by the Investment Adviser that will result in increased assets under management for those money market funds; and (g) the possibility that the working relationship between the Investment Adviser and the Funds’ third-party service providers (including the Funds’ sub-advisers) may cause those service providers to be more likely to do business with other areas of Goldman Sachs. In the course of considering the foregoing, the Independent Trustees requested and received further information quantifying certain of these fall-out benefits.
Other Benefits to the Funds and Their Shareholders
The Trustees also noted that the Funds receive certain other potential benefits as a result of their relationship with the Investment Adviser, including: (a) enhanced servicing from vendors due to the volume of business generated by the Investment Adviser and its affiliates; (b) the advantages received from the Investment Adviser’s knowledge and experience gained from managing other accounts and products; (c) the Investment Adviser’s ability to hire and retain qualified personnel to provide services to the Funds because of the reputation of the Goldman Sachs organization; (d) the Funds’ access, through the Investment Adviser, to certain firm-wide resources (e.g., proprietary risk management systems and databases), subject to certain restrictions;
42
ACTIVE EQUITY MULTI-MANAGER FUNDS
Statement Regarding Basis for Approval of Management Agreement and Sub-Advisory Agreements (Unaudited) (continued)
(e) the Funds’ ability to aggregate assets managed by certain sub-advisers with those of other clients of the Investment Adviser for purposes of applying breakpoints in a sub-advisory agreement; and (f) the Funds’ access to certain affiliated distribution channels.
Conclusion
In connection with their consideration of the Management Agreement, the Trustees gave weight to each of the factors described above, but did not identify any particular factor as controlling their decision. After deliberation and consideration of all of the information provided, including the factors described above, the Trustees concluded, in the exercise of their business judgment, that the management fees paid by each of the Funds were reasonable in light of the factors considered, and that the Management Agreement should be approved and continued with respect to each Fund until September 30, 2023.
Designated Sub-Advisory Agreements
Nature, Extent, and Quality of the Services Provided Under the Designated Sub-Advisory Agreements and Performance
In evaluating the Designated Sub-Advisory Agreements, the Trustees relied upon materials furnished and presentations made by the Investment Adviser and the Designated Sub-Advisers. In evaluating the nature, extent, and quality of services provided by each Designated Sub-Adviser, the Trustees considered information on the services provided to the Funds by their respective Designated Sub-Advisers, including information about each Designated Sub-Adviser’s (a) personnel and compensation structure; (b) track record in managing the Fund and, if applicable, other funds and/or accounts with investment strategies similar to those employed on behalf of the Funds; (c) policies and procedures in place to address potential conflicts of interest; and (d) compliance program and code of ethics. In this regard, they also considered assessments provided by the Investment Adviser of each Designated Sub-Adviser, the Designated Sub-Adviser’s investment strategies and personnel, and its compliance program. The Trustees also considered information regarding each Designated Sub-Adviser’s business continuity planning and remote operations capabilities. The Trustees also reviewed the operations and investment performance of each Designated Sub-Adviser’s respective sleeve of the applicable Fund since its inception, including a comparison of each Designated Sub-Adviser to relevant benchmark indices based on various metrics, including realized beta, excess return, alpha, and volatility.
Costs of Services Provided
The Trustees reviewed the terms of each Designated Sub-Advisory Agreement, including the schedule of fees payable to the Designated Sub-Advisers. They considered any breakpoints in the sub-advisory fee rate payable under each Designated Sub-Advisory Agreement. The Trustees noted that the compensation paid to each Designated Sub-Adviser is paid by the Investment Adviser, not by the Funds. The Trustees considered that certain Designated Sub-Advisers had agreed to reduce their sub-advisory fee rate, which benefited shareholders of the applicable Funds in light of the existing management fee waiver arrangement. The Trustees reviewed the blended average of all sub-advisory fees paid by the Investment Adviser with respect to each Fund in light of the overall management fee paid by each Fund. They also considered the Investment Adviser’s undertaking to waive a portion of its management fee which is in excess of the weighted average of each Fund’s sub-advisory fees.
Conclusion
In connection with their consideration of the Designated Sub-Advisory Agreements, the Trustees gave weight to various factors, but did not identify any particular factor as controlling their decision. After deliberation and consideration of the information provided, including the factors described above, the Trustees, including the Independent Trustees, unanimously concluded, in the exercise of their business judgment, that the sub-advisory fees paid by the Investment Adviser to each Designated Sub-Adviser were reasonable in light of the factors considered, and that each Designated Sub-Advisory Agreement should be approved and continued until September 30, 2023.
43
ACTIVE EQUITY MULTI-MANAGER FUNDS
Voting Results of Special Meeting of Shareholders (Unaudited)
A Special Meeting (the “Meeting”) of the Goldman Sachs Trust II (the “Trust”) was held on December 3, 2021 to consider and act upon the proposal below. Each Fund has amortized its respective share of the proxy, shareholder meeting and other related costs and GSAM has agreed to reimburse the Fund in an amount equal to the portion of the increase in the Fund’s total expense ratio that exceeds a specified percentage.
At the Meeting, Steven D. Krichmar, Linda A. Lang, Michael Latham and Lawrence W. Stranghoener were elected to the Trust’s Board of Trustees. In electing trustees, the Trust’s shareholders voted as follows:
| | | | | | |
| Proposal 1 | | | | | | |
| Election of Trustees | | For | | Against/Withhold | | Abstain |
| | | |
| Steven D. Krichmar | | 997,212,261 | | 10,105,414 | | 0 |
| | | |
| Linda A. Lang | | 1,004,981,372 | | 2,336,303 | | 0 |
| | | |
| Michael Latham | | 995,719,416 | | 11,598,259 | | 0 |
| | | |
| Lawrence W. Stranghoener | | 995,630,574 | | 11,687,101 | | 0 |
44
ACTIVE EQUITY MULTI-MANAGER FUNDS
Trustees and Officers (Unaudited)
Independent Trustees
| | | | | | | | | | |
Name,
Address and Age1 | | Position(s) Held
with the Trust | | Term of
Office and
Length of
Time Served2 | | Principal Occupation(s)
During Past 5 Years | | Number of
Portfolios in
Fund Complex
Overseen by
Trustee3 | | Other
Directorships
Held by Trustee4 |
| | | | | |
Cheryl K. Beebe Age: 66 | | Chair of the Board of Trustees | | Since 2017 (Trustee since 2015) | | Ms. Beebe is retired. She is Director, Packaging Corporation of America (2008-Present); Director, The Mosaic Company (2019-Present); Director, HanesBrands Inc. (2020-Present); and was formerly Director, Convergys Corporation (a global leader in customer experience outsourcing) (2015-2018); and formerly held the position of Executive Vice President, (2010-2014); and Chief Financial Officer, Ingredion, Inc. (a leading global ingredient solutions company) (2004-2014). Chair of the Board of Trustees — Goldman Sachs Trust II; Goldman Sachs MLP and Energy Renaissance Fund; Goldman Sachs ETF Trust; Goldman Sachs ETF Trust II; and Goldman Sachs Real Estate Diversified Income Fund. | | 67 | | Packaging Corporation of America (producer of container board); The Mosaic Company (producer of phosphate and potash fertilizer); HanesBrands Inc. (a multinational clothing company) |
| | | | | |
Lawrence Hughes Age: 64 | | Trustee | | Since 2016 | | Mr. Hughes is retired. Formerly, he held senior management positions with BNY Mellon Wealth Management, a division of The Bank of New York Mellon Corporation (a financial services company) (1991-2015), most recently as Chief Executive Officer (2010-2015). He serves as a Member of the Board of Directors, (2012-Present) and formerly served as Chairman (2012-2019), Ellis Memorial and Eldredge House (a not-for-profit organization). Previously, Mr. Hughes served as an Advisory Board Member of Goldman Sachs Trust II (February 2016-April 2016). Trustee — Goldman Sachs Trust II; Goldman Sachs MLP and Energy Renaissance Fund; Goldman Sachs ETF Trust; Goldman Sachs ETF Trust II; and Goldman Sachs Real Estate Diversified Income Fund. | | 67 | | None |
| | | | | |
John F. Killian Age: 67 | | Trustee | | Since 2015 | | Mr. Killian is retired. He is Director, Consolidated Edison, Inc. (2007-Present); and was formerly Director, Houghton Mifflin Harcourt Publishing Company (2011-2022). Previously, he held senior management positions with Verizon Communications, Inc., including Executive Vice President and Chief Financial Officer (2009-2010); and President, Verizon Business, Verizon Communications, Inc. (2005-2009). Trustee — Goldman Sachs Trust II; Goldman Sachs MLP and Energy Renaissance Fund; Goldman Sachs ETF Trust; Goldman Sachs ETF Trust II; and Goldman Sachs Real Estate Diversified Income Fund. | | 67 | | Consolidated Edison, Inc. (a utility holding company); Houghton Mifflin Harcourt Publishing Company |
| | | | | |
Steven D. Krichmar Age: 67 | | Trustee | | Since 2018 | | Mr. Krichmar is retired. Formerly, he held senior management and governance positions with Putnam Investments, LLC, a financial services company (2001-2016). He was most recently Chief of Operations and a member of the Operating Committee of Putnam Investments, LLC and Principal Financial Officer of The Putnam Funds. Previously, Mr. Krichmar served as an Audit Partner with PricewaterhouseCoopers LLP and its predecessor company (1990-2001). Trustee — Goldman Sachs Trust II; Goldman Sachs MLP and Energy Renaissance Fund; Goldman Sachs ETF Trust; Goldman Sachs ETF Trust II; and Goldman Sachs Real Estate Diversified Income Fund. | | 67 | | None |
| | | | | |
Linda A. Lang Age: 64 | | Trustee | | Since 2021 | | Ms. Lang is retired. She was formerly Chair of the Board of Directors, (2016-2019) and Member of the Board of Directors, WD-40 Company (a global consumer products company) (2004-2019); Chairman and Chief Executive Officer (2005-2014); and Director, President and Chief Operating Officer, Jack in the Box, Inc. (a restaurant company) (2003-2005). Previously, Ms. Lang served as an Advisory Board Member of Goldman Sachs MLP and Energy Renaissance Fund (February 2016-March 2016). Trustee — Goldman Sachs Trust II; Goldman Sachs MLP and Energy Renaissance Fund; Goldman Sachs ETF Trust; Goldman Sachs ETF Trust II; Goldman Sachs Credit Income Fund; and Goldman Sachs Real Estate Diversified Income Fund. | | 68 | | None |
45
ACTIVE EQUITY MULTI-MANAGER FUNDS
Trustees and Officers (Unaudited) (continued)
Independent Trustees
| | | | | | | | | | |
Name,
Address and Age1 | | Position(s) Held
with the Trust | | Term of
Office and
Length of
Time Served2 | | Principal Occupation(s)
During Past 5 Years | | Number of
Portfolios in
Fund Complex
Overseen by
Trustee3 | | Other
Directorships
Held by Trustee4 |
| | | | | |
Michael Latham Age: 57 | | Trustee | | Since 2021 | | Mr. Latham is retired. He currently serves as Chief Operating Officer and Director of FinTech Evolution Acquisition Group (a special purpose acquisition company) (2021-Present). Formerly, Mr. Latham held senior management positions with the iShares exchange-traded fund business owned by BlackRock, Inc., including Chairman (2011-2014); Global Head (2010-2011); U.S. Head (2007-2010); and Chief Operating Officer (2003-2007). Trustee — Goldman Sachs Trust II; Goldman Sachs MLP and Energy Renaissance Fund; Goldman Sachs ETF Trust; Goldman Sachs ETF Trust II; Goldman Sachs Credit Income Fund; and Goldman Sachs Real Estate Diversified Income Fund. | | 68 | | FinTech Evolution Acquisition Group (a special purpose acquisition company) |
| | | | | |
Lawrence W. Stranghoener Age: 68 | | Trustee | | Since 2021 | | Mr. Stranghoener is retired. He is Chairman, Kennametal, Inc. (a global manufacturer and distributor of tooling and industrial materials) (2003-Present); and was formerly Director, Aleris Corporation and Aleris International, Inc. (a producer of aluminum rolled products) (2011- 2020); Interim Chief Executive Officer (2014) and Executive Vice President and Chief Financial Officer (2004-2014), Mosaic Company (a fertilizer manufacturing company). Trustee — Goldman Sachs Trust II; Goldman Sachs MLP and Energy Renaissance Fund; Goldman Sachs ETF Trust; Goldman Sachs ETF Trust II; and Goldman Sachs Real Estate Diversified Income Fund. Chair of the Board of Trustees — Goldman Sachs Credit Income Fund. | | 68 | | Kennametal, Inc. (a global manufacturer and distributor of tooling and industrial materials) |
46
ACTIVE EQUITY MULTI-MANAGER FUNDS
Trustees and Officers (Unaudited) (continued)
Interested Trustee*
| | | | | | | | | | |
Name,
Address and Age1 | | Position(s) Held
with the Trust | | Term of
Office and
Length of
Time Served2 | | Principal Occupation(s)
During Past 5 Years | | Number of
Portfolios in
Fund Complex
Overseen by
Trustee3 | | Other
Directorships
Held by Trustee4 |
| | | | | |
James A. McNamara Age: 60 | | President and Trustee | | Since 2012 | | Advisory Director, Goldman Sachs (January 2018-Present); Managing Director, Goldman Sachs (January 2000-December 2017); Director of Institutional Fund Sales, GSAM (April 1998- December 2000); and Senior Vice President and Manager, Dreyfus Institutional Service Corporation (January 1993- April 1998). President and Trustee — Goldman Sachs Trust II; Goldman Sachs Trust; Goldman Sachs Variable Insurance Trust; Goldman Sachs MLP and Energy Renaissance Fund; Goldman Sachs ETF Trust; Goldman Sachs ETF Trust II; Goldman Sachs Credit Income Fund; and Goldman Sachs Real Estate Diversified Income Fund. | | 171 | | None |
| * | | Mr. McNamara is considered to be an “Interested Trustee” because he holds positions with Goldman Sachs and owns securities issued by The Goldman Sachs Group, Inc. Mr. McNamara holds comparable positions with certain other companies of which Goldman Sachs, GSAM or an affiliate thereof is the investment adviser, administrator and/or distributor. |
| 1 | | Each Trustee may be contacted by writing to the Trustee, c/o Goldman Sachs, 200 West Street, New York, New York, 10282, Attn: Caroline Kraus. Information is provided as of October 31, 2022. |
| 2 | | Subject to such policies as may be adopted by the Board from time-to-time, each Trustee holds office for an indefinite term, until the earliest of: (a) the election of his or her successor; (b) the date the Trustee resigns or is removed by the Board or shareholders, in accordance with the Trust’s Declaration of Trust; or (c)the termination of the Trust. The Board has adopted policies which provide that each Independent Trustee shall retire as of December 31st of the calendar year in which he or she reaches (a) his or her 75th birthday or (b) the 15th anniversary of the date he or she became a Trustee, whichever is earlier, unless a waiver of such requirements shall have been adopted by a majority of the other Trustees. These policies may be changed by the Trustees without shareholder vote. |
| 3 | | The Goldman Sachs Fund Complex includes certain other companies listed above for each respective Trustee. As of October 31, 2022, Goldman Sachs Trust II consisted of 18 portfolios (16 of which offered shares to the public); Goldman Sachs Trust consisted of 88 portfolios; Goldman Sachs Variable Insurance Trust consisted of 15 portfolios (12 of which offered shares to the public); Goldman Sachs ETF Trust consisted of 46 portfolios (29 of which offered shares to the public); Goldman Sachs ETF Trust II consisted of 2 portfolios (1 of which offered shares to the public); and Goldman Sachs MLP and Energy Renaissance Fund, Goldman Sachs Credit Income Fund and Goldman Sachs Real Estate Diversified Income Fund each consisted of one portfolio. Goldman Sachs Credit Income Fund did not offer shares to the public. |
| 4 | | This column includes only directorships of companies required to report to the Securities and Exchange Commission under the Securities Exchange Act of 1934 (i.e., “public companies”) or other investment companies registered under the Act. |
Additional information about the Trustees is available in the Funds’ Statement of Additional Information, which can be obtained from Goldman Sachs free of charge by calling this toll-free number (in the United States of America): 1-800-526-7384.
47
ACTIVE EQUITY MULTI-MANAGER FUNDS
Trustees and Officers (Unaudited) (continued)
Officers of the Trust*
| | | | | | |
| Name, Address and Age1 | | Position(s) Held
with the Trust | | Term of
Office and
Length of
Time Served2 | | Principal Occupation(s) During Past 5 Years |
| | | |
James A. McNamara 200 West Street New York, NY 10282 Age: 60 | | President and Trustee | | Since 2012 | | Advisory Director, Goldman Sachs (January 2018-Present); Managing Director, Goldman Sachs (January 2000-December 2017); Director of Institutional Fund Sales, GSAM (April 1998-December 2000); and Senior Vice President and Manager, Dreyfus Institutional Service Corporation (January 1993-April 1998). President and Trustee — Goldman Sachs Trust II; Goldman Sachs Trust; Goldman Sachs Variable Insurance Trust; Goldman Sachs MLP and Energy Renaissance Fund; Goldman Sachs ETF Trust II ; Goldman Sachs Credit Income Fund; and Goldman Sachs Real Estate Diversified Income Fund. |
| | | |
Joseph F. DiMaria 30 Hudson Street Jersey City, NJ 07302 Age: 54 | | Treasurer, Principal Financial Officer and Principal Accounting Officer | | Since 2017 (Treasurer and Principal Financial Officer Since 2019) | | Managing Director, Goldman Sachs (November 2015-Present) and Vice President—Mutual Fund Administration, Columbia Management Investment Advisers, LLC (May 2010-October 2015). Treasurer, Principal Financial Officer and Principal Accounting Officer—Goldman Sachs Trust II (previously Assistant Treasurer (2017)); Goldman Sachs Trust (previously Assistant Treasurer (2016)); Goldman Sachs Variable Insurance Trust (previously Assistant Treasurer (2016)); Goldman Sachs MLP and Energy Renaissance Fund (previously Assistant Treasurer (2017)); Goldman Sachs ETF Trust (previously Assistant Treasurer (2017)); Goldman Sachs ETF Trust II; Goldman Sachs Credit Income Fund; and Goldman Sachs Real Estate Diversified Income Fund. |
| | | |
Caroline L. Kraus 200 West Street New York, NY 10282 Age: 45 | | Secretary | | Since 2012 | | Managing Director, Goldman Sachs (January 2016-Present); Vice President, Goldman Sachs (August 2006-December 2015); Senior Counsel, Goldman Sachs (January 2020-Present); Associate General Counsel, Goldman Sachs (2012-December 2019);Assistant General Counsel, Goldman Sachs (August 2006-December 2011); and Associate,Weil, Gotshal & Manges, LLP (2002-2006). Secretary—Goldman Sachs Trust II; Goldman Sachs Trust (previously Assistant Secretary (2012)); Goldman Sachs Variable Insurance Trust (previously Assistant Secretary (2012)); Goldman Sachs BDC, Inc.; Goldman Sachs Private Middle Market Credit LLC; Goldman Sachs Private Middle Market Credit II LLC; Goldman Sachs Middle Market Lending Corp.; Goldman Sachs MLP and Energy Renaissance Fund; Goldman Sachs ETF Trust; Goldman Sachs ETF Trust II; Goldman Sachs Credit Income Fund; and Goldman Sachs Real Estate Diversified Income Fund. |
| * | | Represents a partial list of officers of the Trust. Additional information about all the officers is available in the Funds’ Statement of Additional Information, which can be obtained from Goldman Sachs free of charge by calling this toll-free number (in the United States): 1-800-526-7384. |
| 1 | | Information is provided as of October 31, 2022. |
| 2 | | Officers hold office at the pleasure of the Board of Trustees or until their successors are duly elected and qualified. Each officer holds comparable positions with certain other companies of which Goldman Sachs, GSAM or an affiliate thereof is the investment adviser, administrator and/or distributor. |
Goldman Sachs Trust – Active Equity Multi-Manager Funds - Tax Information (Unaudited)
For the year ended October 31, 2022, 0.17% and 8.79% of the dividends paid from net investment company taxable income by the Multi-Manager International Equity and Multi-Manager U.S. Small Cap Equity Funds qualify for the dividends received deduction available to corporations.
For the year ended October 31, 2022, 44.83% and 8.17% of the dividends paid from net investment company taxable income by the Multi-Manager International Equity and Multi-Manager U.S. Small Cap Equity Funds qualify for the reduced tax rate under the Jobs and Growth Tax Relief and Reconciliation Act of 2003.
From distributions paid during the year ended October 31, 2022, the total amount of income received by the Multi-Manager International Equity Fund from sources within foreign countries and possessions of the United States was $0.2600 per share, all of which is attributable to qualified passive income. The percentage of net investment income dividends paid from foreign sources by the Multi-Manager International Equity Fund was 43.62%. The total amount of taxes paid by the Multi-Manager International Equity Fund to such countries was $0.0350 per share.
Pursuant to Section 852 of the Internal Revenue Code, the Multi-Manager International Equity and Multi-Manager U.S. Small Cap Equity Funds designate $51,051.407 and $50,229,806, respectively, or if different, the maximum amount allowable, as capital gain dividends paid during the fiscal year ended October 31, 2022.
During the year ended October 31, 2022, the Multi-Manager International Equity and Multi-Manager U.S. Small Cap Equity Funds designate $32,536,467 and $54,116,976 as short-term capital gain dividends pursuant to Section 871(k) of the Internal Revenue Code.
48
FUNDS PROFILE
Goldman Sachs Funds
Goldman Sachs is a premier financial services firm, known since 1869 for creating thoughtful and customized investment solutions in complex global markets.
Today, the Asset Management Division of Goldman Sachs serves a diverse set of clients worldwide, including private institutions, public entities and individuals. With approximately $2.19 trillion in assets under supervision as of September 30, 2022, Goldman Sachs Asset Management (“GSAM”) has portfolio management teams located around the world and our investment professionals bring firsthand knowledge of local markets to every investment decision. Assets under supervision includes assets under management and other client assets for which Goldman Sachs does not have full discretion. Goldman Sachs Asset Management leverages the resources of Goldman Sachs & Co. LLC subject to legal, internal and regulatory restrictions.
| | | | | | |
| Money Market | | ∎ Short Duration Tax-Free Fund | | Equity Insights | | Total Portfolio Solutions |
| Financial Square FundsSM | | ∎ Municipal Income Completion Fund | | ∎ Small Cap Equity Insights Fund | | ∎ Global Managed Beta Fund |
∎ Financial Square Treasury Solutions Fund1 ∎ Financial Square Government Fund1 ∎ Financial Square Money Market Fund2 ∎ Financial Square Prime Obligations Fund2 ∎ Financial Square Treasury Instruments Fund1 ∎ Financial Square Treasury Obligations Fund1 ∎ Financial Square Federal Instruments Fund1 Investor FundsSM ∎ Investor Money Market Fund3 ∎ Investor Tax-Exempt Money Market Fund3 Fixed Income Short Duration and Government ∎ Enhanced Income Fund ∎ Short-Term Conservative Income Fund ∎ Short Duration Government Fund ∎ Short Duration Income Fund ∎ Government Income Fund ∎ Inflation Protected Securities Fund Multi-Sector ∎ Bond Fund ∎ Core Fixed Income Fund ∎ Global Core Fixed Income Fund ∎ Strategic Income Fund ∎ Income Fund Municipal and Tax-Free ∎ High Yield Municipal Fund ∎ Dynamic Municipal Income Fund | | Single Sector ∎ Investment Grade Credit Fund ∎ U.S. Mortgages Fund ∎ High Yield Fund ∎ High Yield Floating Rate Fund ∎ Emerging Markets Debt Fund ∎ Local Emerging Markets Debt Fund Fixed Income Alternatives ∎ Long Short Credit Strategies Fund Fundamental Equity ∎ Equity Income Fund ∎ Small Cap Growth Fund ∎ Small Cap Value Fund ∎ Small/Mid Cap Value Fund ∎ Mid Cap Value Fund ∎ Large Cap Value Fund ∎ Focused Value Fund ∎ Large Cap Core Fund4 ∎ Strategic Growth Fund ∎ Small/Mid Cap Growth Fund ∎ Flexible Cap Fund ∎ Concentrated Growth Fund ∎ Technology Opportunities Fund ∎ Mid Cap Growth Fund5 ∎ Rising Dividend Growth Fund ∎ U.S. Equity ESG Fund ∎ Income Builder Fund Tax-Advantaged Equity ∎ U.S. Tax-Managed Equity Fund ∎ International Tax-Managed Equity Fund ∎ U.S. Equity Dividend and Premium Fund ∎ International Equity Dividend and Premium Fund | | ∎ U.S. Equity Insights Fund ∎ Small Cap Growth Insights Fund ∎ Large Cap Growth Insights Fund ∎ Large Cap Value Insights Fund ∎ Small Cap Value Insights Fund ∎ International Small Cap Insights Fund ∎ International Equity Insights Fund ∎ Emerging Markets Equity Insights Fund Fundamental Equity International ∎ International Equity Income Fund ∎ International Equity ESG Fund ∎ China Equity Fund ∎ Emerging Markets Equity Fund ∎ Emerging Markets Equity ex. China Fund ∎ ESG Emerging Markets Equity Fund Alternative ∎ Clean Energy Income Fund ∎ Defensive Equity Fund ∎ Real Estate Securities Fund ∎ Commodity Strategy Fund ∎ Global Real Estate Securities Fund ∎ Absolute Return Tracker Fund ∎ Managed Futures Strategy Fund ∎ MLP Energy Infrastructure Fund ∎ Energy Infrastructure Fund ∎ Multi-Manager Alternatives Fund ∎ Global Infrastructure Fund | | ∎ Multi-Manager Non-Core Fixed Income Fund ∎ Multi-Manager Global Equity Fund ∎ Multi-Manager International Equity ∎ Fund Tactical Tilt Overlay Fund ∎ Balanced Strategy Portfolio ∎ Multi-Manager U.S. Small Cap Equity Fund ∎ Fund Growth and Income Strategy Portfolio ∎ Growth Strategy Portfolio ∎ Dynamic Global Equity Fund ∎ Satellite Strategies Portfolio ∎ Enhanced Dividend Global Equity Portfolio ∎ Tax-Advantaged Global Equity Portfolio ∎ Strategic Factor Allocation Fund ∎ Strategic Volatility Premium Fund ∎ Target Date Retirement Portfolio ∎ Target Date 2025 Portfolio ∎ Target Date 2030 Portfolio ∎ Target Date 2035 Portfolio ∎ Target Date 2040 Portfolio ∎ Target Date 2045 Portfolio ∎ Target Date 2050 Portfolio ∎ Target Date 2055 Portfolio ∎ Target Date 2060 Portfolio ∎ GQG Partners International Opportunities Fund |
|
|
|
|
|
|
|
|
|
|
|
|
|
|
|
|
|
|
|
|
|
|
|
|
| 1 | | You could lose money by investing in the Fund. Although the Fund seeks to preserve the value of your investment at $1.00 per share, it cannot guarantee it will do so. An investment in the Fund is not a deposit of a bank and is not insured or guaranteed by the Federal Deposit Insurance Corporation or any other government agency. The Fund’s sponsor has no legal obligation to provide financial support to the Fund, and you should not expect that the sponsor will provide financial support to the Fund at any time. |
| 2 | | You could lose money by investing in the Fund. Because the share price of the Fund will fluctuate, when you sell your shares they may be worth more or less than what you originally paid for them. The Fund may impose a fee upon sale of your shares or may temporarily suspend your ability to sell shares if the Fund’s liquidity falls below required minimums because of market conditions or other factors. An investment in the Fund is not a deposit of a bank and is not insured or guaranteed by the Federal Deposit Insurance Corporation or any other government agency. The Fund’s sponsor has no legal obligation to provide financial support to the Fund, and you should not expect that the sponsor will provide financial support to the Fund at any time. |
| 3 | | You could lose money by investing in the Fund. Although the Fund seeks to preserve the value of your investment at $1.00 per share, it cannot guarantee it will do so. The Fund may impose a fee upon sale of your shares or may temporarily suspend your ability to sell shares if the Fund’s liquidity falls below required minimums because of market conditions or other factors. An investment in the Fund is not a deposit of a bank and is not insured or guaranteed by the Federal Deposit Insurance Corporation or any other government agency. The Fund’s sponsor has no legal obligation to provide financial support to the Fund, and you should not expect that the sponsor will provide financial support to the Fund at any time. |
| 4 | | Effective after the close of business on April 13, 2022, the Goldman Sachs Capital Growth Fund was renamed the Goldman Sachs Large Cap Core Fund. |
| 5 | | Effective after the close of business on April 13, 2022, the Goldman Sachs Growth Opportunities Fund was renamed the Goldman Sachs Mid Cap Growth Fund. |
| | | Financial Square FundsSM and Investor FundsSM are registered service marks of Goldman Sachs & Co. LLC. |
| * | | This list covers open-end funds only. Please visit our website at www.GSAMFUNDS.com to learn about our closed-end funds and exchange-traded funds. |
Goldman Sachs Funds Annual Report October 31, 2022 GQG Partners International Opportunities Fund
Goldman Sachs GQG Partners
International Opportunities Fund
TABLE O F CONTENTS
| | | | | | |
| | | | |
| NOT FDIC-INSURED | | May Lose Value | | No Bank Guarantee | | |
FUND RESULTS
Goldman Sachs GQG Partners International
Opportunities Fund
|
| |
Investment Objective The Fund seeks long-term capital appreciation. |
Portfolio Management Discussion and Analysis
Below, the portfolio management team of GQG Partners LLC, the Goldman Sachs GQG Partners International Opportunities Fund’s (the “Fund”) sub-adviser, discusses the Fund’s performance and positioning for the 12-month period ended October 31, 2022 (the “Reporting Period”).
| Q | How did the Fund perform during the Reporting Period? |
| A | During the Reporting Period, the Fund’s Class A, Class C, Institutional, Investor, Class R6, Class R and Class P Shares generated average annual total returns, without sales charges, of -19.55%, -20.12%, -19.23%, -19.35%, -19.17%, -19.73% and -19.22%, respectively. These returns compare to the -24.73% average annual total return of the Fund’s benchmark, the MSCI ACWI ex USA Index (Net, Unhedged) (the “Index”), during the same time period. |
| Q | What economic and market factors most influenced the Fund during the Reporting Period? |
| A | International (or non-U.S. developed markets) equities and emerging markets equities broadly declined during the Reporting Period, with inflation pressures, tightening central bank monetary policy, recession fears, geopolitical conflict and supply-chain issues creating a challenging backdrop for investors. |
| | When the Reporting Period began in November 2021, international and emerging markets equities retreated, as the Omicron variant of COVID-19 spread across regions, dampening investor sentiment and leading to mixed outlooks for the global economic recovery. Travel restrictions were re-imposed to curtail the variant’s spread, and lockdown measures were re-instituted in Europe. Persistently high inflation and supply-chain issues also weighed on investor sentiment. In December, international and emerging markets equities posted gains, as the initial scare around the Omicron variant dissipated given that studies showed its symptoms were less severe than prior variants. Global economic data were encouraging, though inflation remained top of mind for investors. Still, China’s heightened regulations, mainly in the technology sector, dampened investor sentiment. |
| | During the first quarter of 2022, international and emerging markets equities declined amid concerns about elevated global inflation, planned interest rate hikes by the U.S. Federal Reserve (the “Fed”), rising bond yields, valuation concerns, and Russia’s invasion of Ukraine. Major countries around the world took a public stance condemning Russia’s action and imposed various economic sanctions, |
| | including removal of Russian financial institutions from bank connectivity network SWIFT, banning transactions with the Russian central bank and halting trading of Russian securities. Such sanctions boosted the price of crude oil in the global markets. Beyond the broader concerns around the geopolitical crisis, the impact on commodity prices reinforced concerns around supply-side inflation and led markets to worry about a potential stagflation scenario—particularly in Europe. (Stagflation is characterized by slow economic growth and high inflation.) Driven by increased market volatility, the U.S. Fed signaled a slower than anticipated pace of monetary policy tightening while retaining a cautionary focus on rising inflation. Other macroeconomic uncertainties included those around regulation in China, the status of Chinese shares listed in the U.S., and slowing economic growth in China, all exacerbated by the imposition of lockdowns and manufacturing halts due to a rise in COVID-19 cases, leading, in turn, to further supply-chain issues. |
| | During the second quarter of 2022, international and emerging markets equities continued to decline. As inflation loomed internationally, the acceleration in global food prices rivaled the move in oil prices. In this environment, central banks in Europe, Asia and South America announced plans to raise interest rates in the next 12 months in an effort to get ahead of rising consumer prices. Supply-chain issues worsened as China initially instituted lockdowns following a surge in COVID-19 cases. However, as the quarter progressed, China began easing its restrictions, thereby mitigating the disruption. In Europe, the geopolitical crisis persisted as a result of the ongoing war in Ukraine and potential gas shortages due to reduced supply from Russia. This was particularly concerning for countries with high energy dependence, such as Italy, France, Spain and Germany. |
| | International and emerging markets equities were down for the third quarter of 2022. Overall, the markets were volatile and facing a number of macroeconomic headwinds, including inflationary pressures and interest rate hikes as the chances of a recession grew. European economies remained depressed by accelerating inflation, rising interest rates and strained supply chains. Europe also continued to battle an |
1
| | energy crisis and subsequent mobile network blackouts during the quarter. The European Central Bank raised interest rates in July and September, heightening concerns around slowing economic growth and leading to the depreciation of the euro against the U.S. dollar. In China, new lockdowns placed several million Chinese citizens under heavy COVID-19 restrictions, weighing on industrial activity and consumption. However, elsewhere in Asia, the Indian equity market rose, as flows from foreign portfolio investors were net positive for a second consecutive month after nine months of net outflows. In Latin America, the Brazilian equity market also rose, as its labor market and economic activity remained surprisingly strong despite its central bank raising interest rates. |
| | In October 2022, international equities rallied, while emerging markets equities continued to struggle. In Europe, equities benefited from resilient third quarter 2022 earnings from companies that had reported thus far as well as from optimism that the pace of interest rate increases could soon slow. In the emerging markets, Chinese equities fell dramatically, as lockdowns continued to place several cities under COVID-19 restrictions and the closely watched 20th Party Congress in China offered no signal to investors that this strategy would change in the near future. Investor confidence was further dampened following the news that China’s government planned to maintain its “zero-COVID” policy. Still, lifting emerging markets equities somewhat were major transitions of political power, including in Brazil. As a growing list of opposition leaders recognized Lula’s victory as incoming President in Brazil, markets rallied slightly because investors grew increasingly confident that a peaceful transition of power would take place. |
| | For the Reporting Period overall, global equities, as represented by the Index, posted double-digit negative absolute returns. Energy was the only sector in the Index to record a positive absolute return. Utilities, financials and consumer staples each posted a double-digit negative absolute return but were among those sectors that still outperformed the Index during the Reporting Period. The weakest performing sectors in the Index were information technology, consumer discretionary, communication services and real estate, with each generating substantially larger double-digit negative absolute returns during the Reporting Period. |
| Q | What key factors were responsible for the Fund’s performance during the Reporting Period? |
| A | The Fund outperformed the Index during the Reporting Period, driven by our asset allocation decisions. These positive results were partially offset by stock selection, which detracted from performance. |
| Q | Which equity market sectors and countries most significantly affected Fund performance? |
| A | During the Reporting Period, the Fund benefited from asset allocation, especially our decision to rotate from certain higher valuation sectors to those that have, in our opinion, more reasonable multiples and higher visibility on earnings. A material overweight versus the Index in energy, the only sector in the Index to post a gain, added most to relative performance. The Fund was also aided by a substantial underweight in consumer discretionary. In addition, as equity markets sold off during the Reporting Period, the Fund was helped by its allocation, albeit small, to cash. Overweight positions in the materials and health care sectors detracted modestly from the Fund’s relative returns. |
| | From a stock selection perspective, the Fund was hurt by investments in four of the 11 sectors in the Index. The largest detractors on a relative basis came from the consumer discretionary sector, followed by the financials, information technology and utilities sectors. Within consumer discretionary, the Fund’s investments for part of the Reporting Period in certain Chinese e-commerce businesses detracted from relative results. In financials, the Fund’s European holdings were adversely affected by the pressure put on Europe’s economy by a shortage of fuel and energy supplies, exacerbated by the Russia/Ukraine war and the resulting sanctions on Russian commodities that made up a significant portion of European imports. In information technology, the hawkish stance of global central banks pressured market multiples, while new licensing requirements announced by the U.S. Department of Commerce for companies exporting computing technology and equipment weighed heavily on the semiconductor and equipment companies held by the Fund during the Reporting Period. (Hawkish tends to imply higher interest rates; opposite of dovish. A multiple is a ratio calculated by dividing the market or estimated value of an asset by a specific item on the financial statements as a way to value a stock, e.g. price/earnings, price/book or price/sales.) On the positive side, the Fund benefited from its investments in the consumer staples, health care and materials sectors during the Reporting Period. |
| | From a country perspective, the Fund was helped on a relative basis by select out-of-benchmark positions in the U.S. (specifically, an investment in ExxonMobil), an overweight position versus the Index in Brazil and an underweight position in China. Brazil benefited from a rather strong economy and current account surplus, a budget surplus and ongoing job growth. Also, its central bank started raising interest rates several calendar quarters in advance of many other global central banks. As for China, its political leadership appeared to migrate from a market-driven economic model to one that pays more attention to social stability and common prosperity to narrow a large and growing wealth gap. We witnessed an increasingly onerous, and unpredictable, regulatory environment that targeted |
2
FUND RESULTS
| | diverse areas, including anti-trust, data security, social equality and capital markets. On the downside, the Fund was hurt by its exposure to Russia and the U.S. Regarding Russia, increasingly antagonistic government rhetoric and actions in late 2021 started to outweigh the positive fundamentals we saw in many Russian companies, and we began to reduce the Fund’s exposure to Russian stocks. That said, after Russia invaded Ukraine in late February 2022, the Moscow Stock Exchange closed for almost four weeks and then prohibited selling by non-Russian investors. Due to impaired price discovery and sanctions from foreign governments on investing in Russia, index provider MSCI Inc. declared in March that the Russian equity market was “uninvestable” and reduced the price of each Russian stock in the Index to less than one cent. (Price discovery is the process of setting the spot price, but most commonly the proper price, for a security, commodity or currency.) As for the U.S., which is not a constituent of the Index, the poor performance was predominantly among the Fund’s investments in global blue-chip information technology stocks. |
| Q | What were some of the Fund’s best-performing individual stocks during the Reporting Period? |
| A | The Fund’s best-performing individual holdings during the Reporting Period were ExxonMobil, Petróleo Brasileiro (“Petrobras”) and Banco Itaú Unibanco. |
| | ExxonMobil is a Texas-based oil and natural gas producer, which also markets petroleum, petrochemicals and other specialty products. Its stock price increased during the Reporting Period, driven by ExxonMobil’s strong earnings and cash flow, including record earnings in the second quarter of 2022. The production profile from the company’s existing assets in Guyana and the Permian Basin in west Texas appeared to be robust. Meanwhile, investors anticipated elevated refining margins for the next several years until planned capacity additions come online in Asia and the Middle East. |
| | Petrobras is a Brazil-headquartered oil and gas exploration and production company with additional operations in refining, transportation, petrochemicals and power generation. Its stock rallied for much of the Reporting Period after its management announced earnings well ahead of consensus expectations, helped in part by strong margins in the company’s refinery business. In addition, Petrobras declared and paid substantial dividends, which were higher than consensus expected. Petrobras posted a dividend yield of 21% for the third quarter of 2022, noting that this return of capital to shareholders was sustainable. |
| | Banco Itaú Unibanco is a Brazil-based financial institution offering retail, corporate and investment banking services as well as life, property and casualty insurance. The company reported better than market expected earnings, as its total loans increased 19% during the third quarter of 2022 versus the third quarter of 2021, while its net interest income |
| | increased 20% in the third quarter of 2022. Its management also raised guidance for the rest of 2022, increasing loan and fee growth targets, citing positive macro and employment conditions. |
| Q | Which stocks detracted most from the Fund’s relative performance during the Reporting Period? |
| A | During the Reporting Period, Lukoil, Rosneft Oil and Gazprom—all Russia-based energy-related companies— detracted most from the Fund’s relative returns. As mentioned previously, in March, MSCI Inc. declared the Russian market to be “uninvestable” and reduced the price of each Russian stock in its equity indices to less than one cent. Lukoil, which produces, refines and distributes oil and natural gas, also has power generation and transmission assets. Rosneft Oil is an oil and natural gas producer and has refining, petrochemical and pipeline businesses. Gazprom’s primary business is the production, storage and distribution of natural gas. |
| Q | Were there any significant purchases or sales during the Reporting Period? |
| A | During the Reporting Period, the Fund’s three largest new purchases were Enbridge, TotalEnergies and Deutsche Telekom. |
| | Enbridge is an energy infrastructure company based in Canada. It operates five business segments: liquids pipelines, natural gas pipelines, natural gas utility operations, renewable power generation and marketing services. Enbridge owns what we consider to be high quality assets, and we believe it has a reduced-risk business model that focuses on pipelines and utility franchises. The company has the highest cash flow stability in the energy sector, in our opinion, and has an enviable record of consistent dividend increases. We expect Enbridge to perform well in the near term based on a combination of earnings per share growth and dividends. |
| | TotalEnergies is a France-headquartered oil and gas producer with additional operations in liquefied natural gas, renewable energy sources, refining and petrochemicals. In our opinion, the company has a strong management team and operates with one of the industry’s lowest breakeven cost structures. We expect Europe to pivot away from Russia as a supplier of natural gas in the wake of the Russian invasion of Ukraine, and we think that TotalEnergies is well-positioned to facilitate that pivot with its liquefied natural gas assets. |
| | Deutsche Telekom provides voice and data communication services to retail and corporate clients in Europe and the U.S. The company, based in Germany, owns 48% of U.S. mobile communications operator T-Mobile. We purchased the stock because free cash flow at T-Mobile is likely, in our |
3
| | view, to improve significantly during the next three years as that company’s network infrastructure investments decline and the business realizes synergies from its merger with Sprint in 2020. |
| | Among the Fund’s largest sales during the Reporting Period were payment transactions and electronic funds processing company Visa and technology conglomerate and Google parent company Alphabet, each based in the U.S., as well as European financial companies France-based BNP Paribas and Spain-headquartered Banco Bilbao Vizcaya Argentaria. We eliminated these holdings in favor of what we considered to be better risk-adjusted opportunities elsewhere. |
| Q | What changes were made to the Fund’s sector and country weightings during the Reporting Period? |
| A | In terms of sector weightings, we reduced the Fund’s exposures to financials, information technology and communication services during the Reporting Period. In financials, we decreased the Fund’s exposure to European financials stocks, as we re-evaluated our assumptions on loss provisions for existing loans and loan growth in the wake of Russia’s invasion of Ukraine. In information technology, we believed certain information technology and communication services companies had pulled forward earnings from future periods due to changing end-market behavior during the COVID-19 pandemic. As a result, we thought the recent earnings growth demonstrated by these companies was at risk of downward revision, while the valuation multiples on their stocks were likely to fall. Also, during the Reporting Period, we increased the Fund’s exposures to the energy and materials sectors. In our view, positive fundamental trends were strong in both sectors, even before the war in Ukraine, because of years of underinvestment that had resulted in lower supplies of certain commodities. |
| | Regarding countries, we increased the Fund’s exposures to Brazil, the U.K., Canada and India during the Reporting Period. As mentioned earlier, we considered the Brazilian economy to be quite strong. In addition, we believed the country’s commodity exporters were well-positioned to address potential shortfalls in some Ukrainian and Russian production, while we thought accommodative monetary policy in China should drive an increase in demand for raw materials. Brazil’s financials were also seeing strong underlying fundamental data, including loan growth from both commercial borrowers and consumers. Conversely, we reduced the Fund’s exposures to China, Russia, Spain and the U.S. during the Reporting Period. Although the Fund has been underweight China for some time, we thought the environment had become more challenging for foreign investors, and as a result, we shifted capital to other regions where we believed we had more earnings visibility and saw the potential for better risk-adjusted returns. |
| Q | How did the Fund use derivatives and similar instruments during the Reporting Period? |
| A | The Fund did not use derivatives or similar instruments as a part of its investment strategy during the Reporting Period. |
| Q | How was the Fund positioned relative to its benchmark index at the end of the Reporting Period? |
| A | At the end of the Reporting Period, the Fund was overweight relative to the Index in the energy, health care, consumer staples and materials sectors. Compared to the Index, it was underweight industrials, consumer discretionary, information technology, financials, communication services, real estate and utilities. |
| | In terms of countries, the Fund had modest exposure to the U.S., which is not a constituent of the Index, at the end of the Reporting Period. The Fund was overweight versus the Index in the U.K., Brazil, Canada, Denmark, Germany, India, Indonesia, Ireland, Italy, Luxembourg, Netherlands and Switzerland at the end of the Reporting Period. Compared to the Index, the Fund was underweight Australia and Spain. At the end of the Reporting Period, the Fund had no exposure to the other country constituents of the Index. |
| Q | Were there any changes to the Fund’s portfolio management team during the Reporting Period? |
| A | Effective July 1, 2022, Brian Kersmanc’s title was updated from deputy portfolio manager for the Fund to portfolio manager for the Fund. On the same date, James Anders and Sudarshan Murthy became portfolio managers for the Fund. At the end of the Reporting Period, Rajiv Jain, James Anders, Brian Kersmanc and Sudarshan Murthy served as portfolio managers of the Fund. (Effective December 5, 2022, after the end of the Reporting Period, James Anders no longer served as a portfolio manager for the Fund. Rajiv Jain, Brian Kersmanc and Sudarshan Murthy continued to serve as portfolio managers of the Fund.) |
| Q | What is the Fund’s tactical view and strategy for the months ahead? |
| A | Despite the equity bear market that emerged in 2022, we chose to see the glass as half full at the end of the Reporting Period. (A bear market is a condition in which securities prices fall 20% or more from recent highs amid widespread pessimism and negative investor sentiment.) At the end of 2021, we had been early adopters of a higher-for-longer inflation argument and had positioned the Fund accordingly, in our opinion, at that time. By the end of the Reporting Period, our view had evolved, and we expected year-over-year inflation comparisons to be more difficult in the near term, which may lead to a deceleration in consumer price increases. In our view, the investment community did not need 2% inflation, the U.S. Fed’s target, to become more bullish on equity markets. If inflation demonstrated a solid inflection to the downside, we thought it would be enough to |
4
FUND RESULTS
| | unleash the requisite “animal spirits,” economist John Maynard Keynes’ term for the confidence and willingness to invest. Although we are not economists, we monitor macro data as part of our risk framework. We analyze the existing, and potential, companies in the Fund, with a focus on the visibility of their future free cash flows. Ignoring the macro conditions in which these companies operate would impact the accuracy of any investor’s earnings outlook, in our opinion. If the global economy enters a recession, earnings growth may decline in the near term, but we noted at the end of the Reporting Period that valuation multiples for certain companies had compressed to levels that were discounting more aggressive downward revisions to earnings than were warranted, in our view. Adapting the Fund to reflect new information is a hallmark of our process, and we planned to continue going where the data leads us. |
| | In terms of the Fund’s positioning at the end of the Reporting Period, we intended to maintain its overweight versus the Index in the energy sector. In our view, commodity price cycles can last longer than many investors may appreciate due to supply dynamics. The lack of capital spending on oil and natural gas exploration during the last several years, coupled with what we consider to be real discipline in production growth by the larger energy companies and the Organization of the Petroleum Exporting Countries (“OPEC”) and Russia, known as OPEC+, could provide a floor above $75 a barrel for crude oil prices in the medium term. Meanwhile, we did not expect demand for oil and natural gas to decline materially if the global economy continued to slow or even entered a mild recession. At the same time, we noted that the global release of strategic petroleum reserves to address higher prices earlier in 2022 appeared to be nearing its end. We believed these reserves were likely to be re-stocked during the next 12-18 months and should act as a source of incremental demand. In addition, we had observed a renewed focus on profitability from many energy companies, resulting in strong free cash flow and solid balance sheets. We had also witnessed a commitment from their management teams to return capital to shareholders. In our opinion, the energy stocks held by the Fund should pay what we consider to be meaningful dividends, which may cushion some potential volatility in their share prices. That said, if the pace of global economic activity deteriorates in the wake of tighter central bank policy and the threat of a deep recession increases, lower demand is likely to affect the energy sector’s near-term earnings power, in our opinion. We planned to monitor the relevant data closely and adapt to the changing environment. |
| | At the end of the Reporting Period, we planned to maintain the Fund’s underweight in the information technology sector. As mentioned previously, the U.S. Commerce Department has mandated new licensing requirements for the export of high-end semiconductors to China to limit their use in military applications. Which technology companies can sell what products to China, and for how long, depends on the type and amount of technology that is sourced in the U.S. |
| | and the overall role of U.S. citizens. These new export license requirements are subject to broad interpretation, in our opinion, and have created uncertainty around the visibility of earnings for certain technology companies. |
| | In addition, at the end of the Reporting Period, we intended to add to the Fund’s holdings in the financials sector, as we have identified select companies that we expect to benefit from a rising interest rate environment and/or solid loan growth. |
5
GQG Partners International Opportunities Fund
as of October 31, 2022
|
|
| TOP TEN HOLDINGS AS OF 10/31/22 ± |
| | | | | | | |
| | |
| Holding | | % of Net Assets | | Line of Business |
British American Tobacco PLC | | | | 6.8 | % | | Tobacco |
AstraZeneca PLC | | | | 6.4 | | | Pharmaceuticals |
TotalEnergies SE | | | | 4.6 | | | Oil, Gas & Consumable Fuels |
Enbridge, Inc. | | | | 4.4 | | | Oil, Gas & Consumable Fuels |
Glencore PLC | | | | 4.2 | | | Metals & Mining |
Novo Nordisk A/S Class B | | | | 3.9 | | | Pharmaceuticals |
Housing Development Finance Corp. Ltd. | | | | 3.4 | | | Diversified Financial Services |
Itau Unibanco Holding SA | | | | 3.4 | | | Banks |
Philip Morris International, Inc. | | | | 3.3 | | | Tobacco |
ASML Holding NV | | | | 3.3 | | | Semiconductors & Semiconductor Equipment |
| ± | The top 10 holdings may not be representative of the Fund’s future investments. The top 10 holdings exclude investments in money market funds. |
|
|
| FUND VS. BENCHMARK SECTOR ALLOCA TION † |
| † | The Fund is actively managed and, as such, its composition may differ over time. Consequently, the Fund’s overall sector allocations may differ from the percentages contained in the graph above. Figures in the graph may not sum to 100% due to rounding and/or the exclusion of other assets and liabilities. The graph categorizes investments using the Global Industry Classification Standard (“GICS”); however, the sector classifications used by the portfolio management team may differ from GICS. The percentage shown for each investment category reflects the value of investments in that category as a percentage of market value (excluding investments in the securities lending reinvestment vehicle, if any). The graph depicts the Fund’s investments but may not represent the Fund’s market exposure due to the exclusion of certain derivatives, if any, as listed in the Additional Investment Information section of the Schedule of Investments. |
| | For more information about your Fund, please refer to www.GSAMFUNDS.com. There, you can learn more about your Fund’s investment strategies, holdings, and performance. |
6
GOLDMAN SACHS GQG PARTNERS INTERNATIONAL OPPORTUNITIES FUND
Performance Summary
October 31, 2022
The following graph shows the value, as of October 31, 2022, of a $1,000,000 investment made on December 15, 2016 (commencement of operations) in Institutional Shares at NAV. For comparative purposes, the performance of the Fund’s benchmark, the MSCI All Country World Index ex USA Index (Net, Unhedged) is shown. Performance reflects applicable fee waivers and/or expense limitations in effect during the periods shown and in their absence, performance would be reduced. Returns do not reflect the deduction of taxes that a shareholder would pay on Fund distributions or the redemption of Fund shares. The returns set forth below represent past performance. Past performance does not guarantee future results. The Fund’s investment return and principal value will fluctuate so that an investor’s shares, when redeemed, may be worth more or less than their original cost. Current performance may be lower or higher than the performance quoted below. Please visit our web site at www.GSAMFUNDS.com to obtain the most recent month-end returns.
|
|
| Goldman Sachs GQG Partners International Opportunities Fund’s Lifetime Performance |
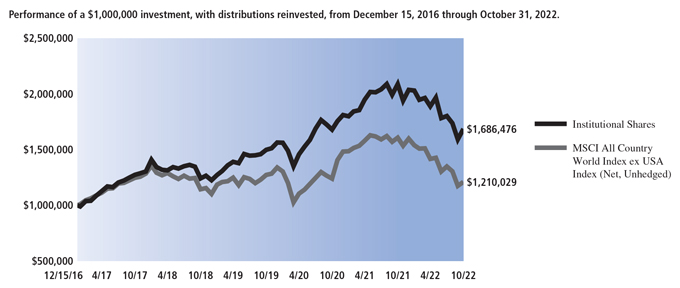
| | | | | | | | | | | | | | | | | |
| | | | |
| | | Average Annual Total Return through October 31, 2022* | | | | One Year | | | | | Five Years | | | | | Since Inception | |
| | | | |
| | Class A (Commenced December 15, 2016) | | | | | | | | | | | | | | | |
| | Excluding sales charges | | | | -19.55% | | | | | 5.36% | | | | | 8.87% | |
| | Including sales charges | | | | -23.96% | | | | | 4.17% | | | | | 7.83% | |
| | | |
| | | | |
| | Class C (Commenced December 15, 2016) | | | | | | | | | | | | | | | |
| | Excluding contingent deferred sales charges | | | | -20.12% | | | | | 4.58% | | | | | 8.06% | |
| | Including contingent deferred sales charges | | | | -20.92% | | | | | 4.58% | | | | | 8.06% | |
| | | |
| | | | |
| | Institutional (Commenced December 15, 2016) | | | | -19.23% | | | | | 5.77% | | | | | 9.29% | |
| | | |
| | | | |
| | Investor (Commenced December 15, 2016) | | | | -19.35% | | | | | 5.62% | | | | | 9.13% | |
| | | |
| | | | |
| | Class R6 (Commenced December 15, 2016) | | | | -19.17% | | | | | 5.78% | | | | | 9.31% | |
| | | |
| | | | |
| | Class R (Commenced December 15, 2016) | | | | -19.73% | | | | | 5.09% | | | | | 8.59% | |
| | | |
| | | | |
| | Class P (Commenced April 16, 2018) | | | | -19.22% | | | | | N/A | | | | | 5.54% | |
| | | |
| * | These returns assume reinvestment of all distributions at NAV and reflect a maximum initial sales charge of 5.50% for Class A Shares and the assumed contingent deferred sales charge for Class C Shares (1% if redeemed within 12 months of purchase). Because Institutional, Investor, Class R6, and Class P Shares do not involve a sales charge, such a charge is not applied to their Average Annual Total Return. |
7
Index Definitions
The MSCI ACWI ex USA Index is an international equity index that tracks stocks from 22 developed and 26 emerging markets countries. Developed countries include Australia, Austria, Belgium, Canada, Denmark, Finland, France, Germany, Hong Kong, Ireland, Israel, Italy, Japan, the Netherlands, New Zealand, Norway, Portugal, Singapore, Spain, Sweden, Switzerland, and the U.K. Emerging markets countries include: Argentina, Brazil, Chile, China, Colombia, Czech Republic, Egypt, Greece, Hungary, India, Indonesia, Korea, Malaysia, Mexico, Pakistan, Peru, the Philippines, Poland, Russia, Qatar, Saudi Arabia, South Africa, Taiwan, Thailand, Turkey and United Arab Emirates. It is not possible to invest directly in an unmanaged index.
8
GOLDMAN SACHS GQG PARTNERS INTERNATIONAL OPPORTUNITIES FUND
Schedule of Investments
October 31, 2022
| | | | | | | | | | | | |
| | | |
Shares | | | Description | | Value | |
| |
| | | | | Common Stocks – 90.0% | |
| |
| | | | | Australia – 0.8% | |
| | | | | 29,260,226 | | | Whitehaven Coal Ltd. (Oil, Gas & Consumable Fuels) | | $ | 169,966,660 | |
| | | | | | |
| | | | | Brazil – 5.2% | |
| | | | | 45,542,998 | | | Petroleo Brasileiro SA ADR (Oil, Gas & Consumable Fuels) | | | 583,861,235 | |
| | | | | 44,590,024 | | | Vale SA (Metals & Mining) | | | 579,484,718 | |
| | | | | | | | | | | | |
| | | | | | | | | | | 1,163,345,953 | |
| | | | | | |
| | | | | Canada – 9.2% | |
| | | | | 1,816,424 | | | Dollarama, Inc. (Multiline Retail) | | | 107,930,798 | |
| | | | | 24,996,649 | | | Enbridge, Inc.(a) (Oil, Gas & Consumable Fuels) | | | 973,921,627 | |
| | | | | 9,471,132 | | | Fortis, Inc. (Electric Utilities) | | | 369,501,718 | |
| | | | | 4,298,378 | | | Metro, Inc. (Food & Staples Retailing) | | | 225,180,929 | |
| | | | | 6,721,284 | | | Tourmaline Oil Corp. (Oil, Gas & Consumable Fuels) | | | 378,702,800 | |
| | | | | | | | | | | | |
| | | | | | | | | | | 2,055,237,872 | |
| | | | | | |
| | | | | Denmark – 4.0% | |
| | | | | 60,342 | | | Genmab A/S* (Biotechnology) | | | 23,244,194 | |
| | | | | 8,023,852 | | | Novo Nordisk A/S Class B (Pharmaceuticals) | | | 872,443,455 | |
| | | | | | | | | | | | |
| | | | | | | | | | | 895,687,649 | |
| | | | | | |
| | | | | France – 7.2% | |
| | | | | 1,016,678 | | | L’Oreal SA (Personal Products) | | | 319,241,136 | |
| | | | | 176,237 | | | LVMH Moet Hennessy Louis Vuitton SE (Textiles, Apparel & Luxury Goods) | | | 111,204,592 | |
| | | | | 1,145,770 | | | Thales SA (Aerospace & Defense) | | | 145,718,913 | |
| | | | | 18,646,944 | | | TotalEnergies SE (Oil, Gas & Consumable Fuels) | | | 1,017,253,275 | |
| | | | | | | | | | | | |
| | | | | | | | | | | 1,593,417,916 | |
| | | | | | |
| | | | | Germany – 5.3% | |
| | | | | 2,975,979 | | | Deutsche Boerse AG (Capital Markets) | | | 483,952,626 | |
| | | | | 36,836,700 | | | Deutsche Telekom AG (Diversified Telecommunication Services) | | | 695,310,596 | |
| | | | | | | | | | | | |
| | | | | | | | | | | 1,179,263,222 | |
| | | | | | |
| | | | | India – 8.3% | |
| | | | | 25,383,309 | | | Housing Development Finance Corp. Ltd. (Diversified Financial Services) | | | 758,929,460 | |
| | | | | 22,397,391 | | | ICICI Bank Ltd. ADR (Banks) | | | 493,638,498 | |
| | | | | 75,721,053 | | | ITC Ltd. (Tobacco) | | | 319,265,003 | |
| | | | | 8,734,301 | | | Reliance Industries Ltd. (Oil, Gas & Consumable Fuels) | | | 269,512,221 | |
| | | | | | | | | | | | |
| | | | | | | | | | | 1,841,345,182 | |
| | | | | | |
| | | | | | | | | | | | |
| | | |
Shares | | | Description | | Value | |
| |
| | | | | Common Stocks (continued) | |
| |
| | | | | Indonesia – 1.5% | |
| | | | | 602,278,998 | | | Bank Central Asia Tbk PT (Banks) | | $ | 340,454,681 | |
| | | | | | |
| | | | | Italy – 2.3% | |
| | | | | 26,726,872 | | | Eni SpA (Oil, Gas & Consumable Fuels) | | | 351,023,202 | |
| | | | | 13,144,282 | | | UniCredit SpA (Banks) | | | 163,005,711 | |
| | | | | | | | | | | | |
| | | | | | | | | | | 514,028,913 | |
| | | | | | |
| | | | | Luxembourg – 1.3% | |
| | | | | 12,516,748 | | | ArcelorMittal SA (Metals & Mining) | | | 280,420,934 | |
| | | | | | |
| | | | | Netherlands – 6.0% | |
| | | | | 1,545,337 | | | ASML Holding NV (Semiconductors & Semiconductor Equipment) | | | 726,608,205 | |
| | | | | 7,146,126 | | | Heineken NV (Beverages) | | | 596,945,858 | |
| | | | | | | | | | | | |
| | | | | | | | | | | 1,323,554,063 | |
| | | | | | |
| | | | | Russia(b) –0.0% | |
| | | | | 48,039,056 | | | Gazprom PJSC (Oil, Gas & Consumable Fuels) | | | — | |
| | | | | 3,681,622 | | | LUKOIL PJSC (Oil, Gas & Consumable Fuels) | | | — | |
| | | | | 34,154,161 | | | Rosneft Oil Co. PJSC (Oil, Gas & Consumable Fuels) | | | — | |
| | | | | | | | | | | | |
| | | | | | | | | | | — | |
| | | | | | |
| | | | | Spain – 0.7% | |
| | | | | 8,185,036 | | | Banco Bilbao Vizcaya Argentaria SA (Banks) | | | 42,224,865 | |
| | | | | 31,971,045 | | | CaixaBank SA (Banks) | | | 106,017,368 | |
| | | | | | | | | | | | |
| | | | | | | | | | | 148,242,233 | |
| | | | | | |
| | | | | Switzerland – 10.2% | |
| | | | | 2,873,409 | | | Cie Financiere Richemont SA Class A (Textiles, Apparel & Luxury Goods) | | | 280,828,395 | |
| | | | | 162,034,423 | | | Glencore PLC (Metals & Mining) | | | 928,954,471 | |
| | | | | 3,078,732 | | | Nestle SA (Food Products) | | | 335,147,076 | |
| | | | | 4,211,798 | | | Novartis AG (Pharmaceuticals) | | | 340,695,325 | |
| | | | | 1,161,474 | | | Roche Holding AG (Pharmaceuticals) | | | 385,374,891 | |
| | | | | | | | | | | | |
| | | | | | | | | | | 2,271,000,158 | |
| | | | | | |
| | | | | United Kingdom – 20.2% | |
| | | | | 12,036,437 | | | AstraZeneca PLC (Pharmaceuticals) | | | 1,412,260,643 | |
| | | | | 38,297,534 | | | British American Tobacco PLC (Tobacco) | | | 1,514,668,668 | |
| | | | | 5,184,203 | | | Diageo PLC (Beverages) | | | 213,342,713 | |
| | | | | 17,681,446 | | | Imperial Brands PLC (Tobacco) | | | 430,703,557 | |
| | | | | 2,837,296 | | | Reckitt Benckiser Group PLC (Household Products) | | | 188,294,188 | |
| | | | | | |
The accompanying notes are an integral part of these financial statements. 9
|
| GOLDMAN SACHS GQG PARTNERS INTERNATIONAL OPPORTUNITIES FUND |
Schedule of Investments (continued)
October 31, 2022
| | | | | | | | | | | | |
| | | |
Shares | | | Description | | Value | |
| |
| | | | | Common Stocks (continued) | |
| |
| | | | | United Kingdom (continued) | |
| | | | | 5,656,150 | | | Rio Tinto PLC (Metals & Mining) | | $ | 301,755,602 | |
| | | | | 15,570,653 | | | Shell PLC (Oil, Gas & Consumable Fuels) | | | 431,386,258 | |
| | | | | | | | | | | | |
| | | | | | | | | | | 4,492,411,629 | |
| | | | | | |
| | | | | United States – 7.8% | |
| | | | | 1,581,034 | | | Aon PLC Class A (Insurance) | | | 445,045,261 | |
| | | | | 5,111,584 | | | Exxon Mobil Corp. (Oil, Gas & Consumable Fuels) | | | 566,414,623 | |
| | | | | 7,956,203 | | | Philip Morris International, Inc. (Tobacco) | | | 730,777,245 | |
| | | | | | | | | | | | |
| | | | | | | | | | | 1,742,237,129 | |
| | | | | | |
| | | |
| TOTAL COMMON STOCKS
(Cost $20,297,310,974) | | $ | 20,010,614,194 | |
| | | | | | |
| | | | | | | | | | | | | |
| | | | Shares | | | Dividend
Rate | | Value | |
| |
| | | | | Preferred Stocks – 6.1% | |
| |
| | | | | Brazil – 6.1% | |
| | | | | Itau Unibanco Holding SA (Banks) | |
| | | | | 127,157,688 | | | 3.160% | | $ | 748,348,411 | |
| | | | | Petroleo Brasileiro SA (Oil, Gas & Consumable Fuels) | |
| | | | | 106,392,680 | | | 9.200 | | | 613,990,086 | |
| | | | | | |
| | | |
| TOTAL PREFERRED STOCKS
(Cost $1,223,536,091) | | $ | 1,362,338,497 | |
| | | | | | |
| | | | | | | | | | | | | |
| |
| | | | | Investment Company(c) –4.3% | |
| | | |
| Goldman Sachs Financial Square Government Fund - Institutional
Shares |
|
| | | | | 955,445,315 | | | 3.066% | | $ | 955,445,315 | |
| | | | | (Cost $955,445,315) | |
| | | | | | |
| | | | | | | | | | | | | |
| | | | Shares | | | Dividend
Rate | | Value | |
| |
| | | | | Securities Lending Reinvestment Vehicle(c) – 0.5% | |
| | | |
| Goldman Sachs Financial Square Government Fund - Institutional
Shares |
|
| | | | | 114,482,373 | | | 3.066% | | $ | 114,482,373 | |
| | | | | (Cost $114,482,373) | |
| | | | | | |
| | | |
| TOTAL INVESTMENTS – 100.9%
(Cost $22,590,774,753) | | $ | 22,442,880,379 | |
| | | | | | |
| | | |
| LIABILITIES IN EXCESS OF OTHER
ASSETS – ( 0.9)% | | | (203,831,416 | ) |
| | | | | | |
| | | | | NET ASSETS – 100.0% | | $ | 22,239,048,963 | |
| | | | | | |
The percentage shown for each investment category reflects the value of investments in that category as a percentage of net assets.
| | * | Non-income producing security. |
| | (a) | All or a portion of security is on loan. |
| | (b) | Significant unobservable inputs were used in the valuation of this portfolio security; i.e., Level 3. |
| | (c) | Represents an affiliated issuer. |
| | | | |
|
| SECTOR ALLOCATION AS OF OCTOBER 31, 2022 | |
| |
| Sector | | % of Total
Market Value | |
Energy | | | 24.0 | % |
Consumer Staples | | | 21.8 | |
Financials | | | 16.0 | |
Health Care | | | 13.6 | |
Materials | | | 9.4 | |
Investment Company | | | 4.3 | |
Information Technology | | | 3.3 | |
Communication Services | | | 3.1 | |
Consumer Discretionary | | | 2.2 | |
Utilities | | | 1.7 | |
Industrials | | | 0.6 | |
| |
| | | 100.0 | % |
| |
| | |
Investment Abbreviations: |
ADR | | —American Depositary Receipt |
PLC | | —Public Limited Company |
|
10 The accompanying notes are an integral part of these financial statements.
GOLDMAN SACHS GQG PARTNERS INTERNATIONAL OPPORTUNITIES FUND
Statement of Assets and Liabilities
October 31, 2022
| | | | | | |
| | |
| | Assets: | | | | |
| | |
| | Investments in unaffiliated issuers, at value (cost $21,520,847,065)(a) | | $ | 21,372,952,691 | |
| | Investments in affiliated issuers, at value (cost $955,445,315) | | | 955,445,315 | |
| | Investments in securities lending reinvestment vehicle — affiliated issuer, at value (cost $114,482,373) | | | 114,482,373 | |
| | Cash | | | 19,443,380 | |
| | Foreign currencies, at value (cost $7,431,888) | | | 7,404,358 | |
| | Receivables: | | | | |
| | Fund shares sold | | | 74,676,303 | |
| | Investments sold | | | 57,442,042 | |
| | Dividends | | | 45,000,153 | |
| | Foreign tax reclaims | | | 22,117,414 | |
| | Reimbursement from investment adviser | | | 354,504 | |
| | Securities lending income | | | 19,552 | |
| | Other assets | | | 686,814 | |
| | | |
| | Total assets | | | 22,670,024,899 | |
| | | |
| | |
| | | | | | |
| | |
| | Liabilities: | | | | |
| | |
| | Payables: | | | | |
| | Investments purchased | | | 190,879,190 | |
| | Payable upon return of securities loaned | | | 114,482,373 | |
| | Investments purchased on an extended-settlement basis | | | 58,716,595 | |
| | Fund shares redeemed | | | 49,808,506 | |
| | Management fees | | | 13,008,140 | |
| | Distribution and Service fees and Transfer Agency fees | | | 1,330,467 | |
| | Accrued expenses | | | 2,750,665 | |
| | | |
| | Total liabilities | | | 430,975,936 | |
| | | |
| | |
| | | | | | |
| | |
| | Net Assets: | | | | |
| | |
| | Paid-in capital | | | 22,567,750,738 | |
| | Total distributable loss | | | (328,701,775) | |
| | | |
| | NET ASSETS | | $ | 22,239,048,963 | |
| | | Net Assets: | | | | |
| | | Class A | | $ | 417,464,205 | |
| | | Class C | | | 78,661,537 | |
| | | Institutional | | | 14,193,048,193 | |
| | | Investor | | | 4,425,913,012 | |
| | | Class R6 | | | 1,023,098,532 | |
| | | Class R | | | 1,215,063 | |
| | | Class P | | | 2,099,648,421 | |
| | | Total Net Assets | | $ | 22,239,048,963 | |
| | | Shares Outstanding $0.001 par value (unlimited number of shares authorized): | | | | |
| | | Class A | | | 25,970,713 | |
| | | Class C | | | 5,048,228 | |
| | | Institutional | | | 874,477,423 | |
| | | Investor | | | 273,806,260 | |
| | | Class R6 | | | 63,050,117 | |
| | | Class R | | | 76,508 | |
| | | Class P | | | 129,426,305 | |
| | | Net asset value, offering and redemption price per share:(b) | | | | |
| | | Class A | | | $16.07 | |
| | | Class C | | | 15.58 | |
| | | Institutional | | | 16.23 | |
| | | Investor | | | 16.16 | |
| | | Class R6 | | | 16.23 | |
| | | Class R | | | 15.88 | |
| | | Class P | | | 16.22 | |
| | (a) | Includes loaned securities having market value of $108,656,420. |
| | (b) | Maximum public offering price per share for Class A Shares is $17.01. At redemption, Class C Shares may be subject to a contingent deferred sales charge, assessed on the amount equal to the lesser of the current net asset value (“NAV”) or the original purchase price of the shares. |
The accompanying notes are an integral part of these financial statements. 11
|
| GOLDMAN SACHS GQG PARTNERS INTERNATIONAL OPPORTUNITIES FUND |
Statement of Operations
For the Fiscal Year Ended October 31, 2022
| | | | | | |
| | |
| | Investment Income: | | | | |
| | |
| | Dividends — unaffiliated issuers (net of tax withholding of $60,206,840) | | $ | 1,186,139,147 | |
| | Dividends — affiliated issuers | | | 9,147,476 | |
| | Securities lending income — affiliated issuers | | | 1,519,529 | |
| | Interest | | | 26,686 | |
| | | |
| | Total investment income | | | 1,196,832,838 | |
| | | |
| | |
| | | | | | |
| | |
| | Expenses: | | | | |
| | |
| | Management fees | | | 161,341,584 | |
| | Transfer Agency fees(a) | | | 14,937,248 | |
| | Custody, accounting and administrative services | | | 4,697,996 | |
| | Distribution and Service (12b-1) fees(a) | | | 1,850,283 | |
| | Registration fees | | | 1,222,073 | |
| | Printing and mailing costs | | | 899,610 | |
| | Professional fees | | | 248,822 | |
| | Service fees — Class C | | | 221,287 | |
| | Trustee fees | | | 179,556 | |
| | Shareholder meeting expense | | | 64,859 | |
| | Other | | | 396,631 | |
| | | |
| | Total expenses | | | 186,059,949 | |
| | | |
| | Less — expense reductions | | | (6,291,075) | |
| | | |
| | Net expenses | | | 179,768,874 | |
| | | |
| | NET INVESTMENT INCOME | | | 1,017,063,964 | |
| | | |
| | |
| | | | | | |
| | |
| | Realized and unrealized gain (loss): | | | | |
| | |
| | Net realized gain (loss) from: | | | | |
| | Investments — unaffiliated issuers | | | (892,066,718) | |
| | Foreign currency transactions | | | (45,600,479) | |
| | Net change in unrealized loss on: | | | | |
| | Investments — unaffiliated issuers | | | (4,955,993,803) | |
| | Foreign currency translation | | | (2,833,608) | |
| | | |
| | Net realized and unrealized loss | | | (5,896,494,608) | |
| | | |
| | NET DECREASE IN NET ASSETS RESULTING FROM OPERATIONS | | $ | (4,879,430,644) | |
| | | |
| | (a) | Class specific Distribution and/or Service (12b-1) and Transfer Agency fees were as follows: |
| | | | | | | | | | | | | | | | | | | | | | | | | | | | | | | | | | | | | | | | | | |
| | | | | Distribution and/or Service (12b-1) Fees | | | Transfer Agency Fees | |
| | | Fund | | Class A | | | Class C | | | Class R | | | Class A | | | Class C | | | Institutional | | | Investor | | | Class R6 | | | Class R | | | Class P | |
| | GQG Partners International Opportunities Fund | | | $1,180,817 | | | | $663,861 | | | | $5,605 | | | | $787,472 | | | | $147,740 | | | | $5,780,124 | | | | $7,262,516 | | | | $270,153 | | | | $1,867 | | | | $687,376 | |
12 The accompanying notes are an integral part of these financial statements.
GOLDMAN SACHS GQG PARTNERS INTERNATIONAL OPPORTUNITIES FUND
Statements of Changes in Net Assets
| | | | | | | | | | |
| | | | | GQG Partners International Opportunities Fund | |
| | | | | For the Fiscal
Year Ended
October 31, 2022 | | | For the Fiscal
Year Ended
October 31, 2021 | |
| | | |
| | From operations: | | | | | | | | |
| | | |
| | Net investment income | | $ | 1,017,063,964 | | | $ | 330,623,552 | |
| | Net realized gain (loss) | | | (937,667,197) | | | | 180,724,754 | |
| | Net change in unrealized gain (loss) | | | (4,958,827,411) | | | | 3,150,187,045 | |
| | | |
| | Net increase (decrease) in net assets resulting from operations | | | (4,879,430,644) | | | | 3,661,535,351 | |
| | | |
| | | |
| | | | | | | | | | |
| | | |
| | Distributions to shareholders: | | | | | | | | |
| | | |
| | From distributable earnings: | | | | | | | | |
| | Class A Shares | | | (8,694,077) | | | | — | |
| | Class C Shares | | | (1,158,748) | | | | — | |
| | Institutional Shares | | | (316,943,861) | | | | (17,220,587) | |
| | Investor Shares | | | (90,597,219) | | | | (2,382,538) | |
| | Class R6 Shares | | | (17,024,099) | | | | (822,599) | |
| | Class R Shares | | | (17,099) | | | | — | |
| | Class P Shares | | | (51,959,366) | | | | (2,597,062) | |
| | | |
| | Total distributions to shareholders | | | (486,394,469) | | | | (23,022,786) | |
| | | |
| | | |
| | | | | | | | | | |
| | | |
| | From share transactions: | | | | | | | | |
| | | |
| | Proceeds from sales of shares | | | 11,534,197,993 | | | | 8,412,241,720 | |
| | Reinvestment of distributions | | | 403,333,721 | | | | 18,334,826 | |
| | Cost of shares redeemed | | | (6,650,124,656) | | | | (2,817,730,450) | |
| | | |
| | Net increase in net assets resulting from share transactions | | | 5,287,407,058 | | | | 5,612,846,096 | |
| | | |
| | TOTAL INCREASE (DECREASE) | | | (78,418,055) | | | | 9,251,358,661 | |
| | | |
| | | |
| | | | | | | | | | |
| | | |
| | Net assets: | | | | | | | | |
| | | |
| | Beginning of year | | | 22,317,467,018 | | | | 13,066,108,357 | |
| | | |
| | End of year | | $ | 22,239,048,963 | | | $ | 22,317,467,018 | |
| | | |
The accompanying notes are an integral part of these financial statements. 13
|
| GOLDMAN SACHS GQG PARTNERS INTERNATIONAL OPPORTUNITIES FUND |
Financial Highlights
Selected Share Data for a Share Outstanding Throughout Each Year
| | | | | | | | | | | | | | | | | | | | | | |
| | | | | Goldman Sachs GQG Partners International Opportunities Fund | |
| | | | | Class A Shares | |
| | | | | Year Ended October 31, | |
| | | | | 2022 | | | 2021 | | | 2020 | | | 2019 | | | 2018 | |
| | | | | | |
| | Per Share Data | | | | | | | | | | | | | | | | | | | | |
| | | | | | |
| | Net asset value, beginning of year | | $ | 20.36 | | | $ | 16.44 | | | $ | 14.78 | | | $ | 12.32 | | | $ | 12.69 | |
| |
| | | |
| | | | | | |
| | Net investment income (a) | | | 0.75 | | | | 0.28 | | | | 0.04 | | | | 0.10 | | | | 0.08 | |
| | | | | | |
| | Net realized and unrealized gain (loss) | | | (4.67 | ) | | | 3.64 | | | | 1.68 | | | | 2.38 | | | | (0.45) | |
| |
| | | |
| | | | | | |
| | Total from investment operations | | | (3.92 | ) | | | 3.92 | | | | 1.72 | | | | 2.48 | | | | (0.37) | |
| |
| | | |
| | | | | | |
| | Distributions to shareholders from net investment income | | | (0.37 | ) | | | — | | | | (0.06 | ) | | | (0.02 | ) | | | — | |
| |
| | | |
| | | | | | |
| | Net asset value, end of year | | $ | 16.07 | | | $ | 20.36 | | | $ | 16.44 | | | $ | 14.78 | | | $ | 12.32 | |
| |
| | | |
| | | | | | |
| | Total return(b) | | | (19.55 | )% | | | 23.84 | % | | | 11.66 | % | | | 20.19 | % | | | (2.92)% | |
| |
| | | |
| | | | | | |
| | Net assets, end of year (in 000s) | | $ | 417,464 | | | $ | 479,794 | | | $ | 252,603 | | | $ | 89,592 | | | $ | 44,887 | |
| | | | | | |
| | Ratio of net expenses to average net assets | | | 1.14 | % | | | 1.15 | % | | | 1.17 | % | | | 1.23 | % | | | 1.28% | |
| | | | | | |
| | Ratio of total expenses to average net assets | | | 1.17 | % | | | 1.19 | % | | | 1.20 | % | | | 1.29 | % | | | 1.38% | |
| | | | | | |
| | Ratio of net investment income to average net assets | | | 4.17 | % | | | 1.47 | % | | | 0.23 | % | | | 0.71 | % | | | 0.57% | |
| | | | | | |
| | Portfolio turnover rate(c) | | | 137 | % | | | 94 | % | | | 72 | % | | | 55 | % | | | 90% | |
| |
| | | |
| | (a) | Calculated based on the average shares outstanding methodology. |
| | (b) | Assumes investment at the NAV at the beginning of the year, reinvestment of all dividends and distributions, a complete redemption of the investment at the NAV at the end of the year and no sales or redemption charges (if any). Total returns would be reduced if a sales or redemption charge was taken into account. Returns do not reflect the impact of taxes to shareholders relating to Fund distributions or the redemption of Fund shares. |
| | (c) | The Fund’s portfolio turnover rate is calculated in accordance with regulatory requirements, without regard to transactions involving short term investments. If such transactions were included, the Fund’s portfolio turnover rate may be higher. |
14 The accompanying notes are an integral part of these financial statements.
GOLDMAN SACHS GQG PARTNERS INTERNATIONAL OPPORTUNITIES FUND
Financial Highlights (continued)
Selected Share Data for a Share Outstanding Throughout Each Year
| | | | | | | | | | | | | | | | | | | | | | |
| | | | | Goldman Sachs GQG Partners International Opportunities
Fund | |
| | | | | Class C Shares | |
| | | | | Year Ended October 31, | |
| | | | | 2022 | | | 2021 | | | 2020 | | | 2019 | | | 2018 | |
| | | | | | |
| | Per Share Data | | | | | | | | | | | | | | | | | | | | |
| | | | | | |
| | Net asset value, beginning of year | | $ | 19.76 | | | $ | 16.08 | | | $ | 14.50 | | | $ | 12.16 | | | $ | 12.61 | |
| |
| | | |
| | | | | | |
| | Net investment income (loss)(a) | | | 0.59 | | | | 0.13 | | | | (0.08 | ) | | | — | (b) | | | (0.02) | |
| | | | | | |
| | Net realized and unrealized gain (loss) | | | (4.53 | ) | | | 3.55 | | | | 1.66 | | | | 2.34 | | | | (0.43) | |
| |
| | | |
| | | | | | |
| | Total from investment operations | | | (3.94 | ) | | | 3.68 | | | | 1.58 | | | | 2.34 | | | | (0.45) | |
| |
| | | |
| | | | | | |
| | Distributions to shareholders from net investment income | | | (0.24 | ) | | | — | | | | — | | | | — | | | | — | |
| |
| | | |
| | | | | | |
| | Net asset value, end of year | | $ | 15.58 | | | $ | 19.76 | | | $ | 16.08 | | | $ | 14.50 | | | $ | 12.16 | |
| |
| | | |
| | | | | | |
| | Total return(c) | | | (20.12 | )% | | | 22.82 | % | | | 10.87 | % | | | 19.24 | % | | | (3.57)% | |
| |
| | | |
| | | | | | |
| | Net assets, end of year (in 000s) | | $ | 78,662 | | | $ | 97,057 | | | $ | 61,784 | | | $ | 32,620 | | | $ | 20,147 | |
| | | | | | |
| | Ratio of net expenses to average net assets | | | 1.89 | % | | | 1.90 | % | | | 1.92 | % | | | 1.98 | % | | | 2.04% | |
| | | | | | |
| | Ratio of total expenses to average net assets | | | 1.92 | % | | | 1.94 | % | | | 1.95 | % | | | 2.04 | % | | | 2.12% | |
| | | | | | |
| | Ratio of net investment income (loss) to average net assets | | | 3.36 | % | | | 0.69 | % | | | (0.51 | )% | | | (0.02 | )% | | | (0.18)% | |
| | | | | | |
| | Portfolio turnover rate(d) | | | 137 | % | | | 94 | % | | | 72 | % | | | 55 | % | | | 90% | |
| |
| | | |
| | (a) | Calculated based on the average shares outstanding methodology. |
| | (b) | Amount is less than $0.005 per share. |
| | (c) | Assumes investment at the NAV at the beginning of the year, reinvestment of all dividends and distributions, a complete redemption of the investment at the NAV at the end of the year and no sales or redemption charges (if any). Total returns would be reduced if a sales or redemption charge was taken into account. Returns do not reflect the impact of taxes to shareholders relating to Fund distributions or the redemption of Fund shares. |
| | (d) | The Fund’s portfolio turnover rate is calculated in accordance with regulatory requirements, without regard to transactions involving short term investments. If such transactions were included, the Fund’s portfolio turnover rate may be higher. |
The accompanying notes are an integral part of these financial statements. 15
|
| GOLDMAN SACHS GQG PARTNERS INTERNATIONAL OPPORTUNITIES FUND |
Financial Highlights (continued)
Selected Share Data for a Share Outstanding Throughout Each Year
| | | | | | | | | | | | | | | | | | | | | | |
| | | | | Goldman Sachs GQG Partners International Opportunities Fund | |
| | | | | Institutional Shares | |
| | | | | Year Ended October 31, | |
| | | | | 2022 | | | 2021 | | | 2020 | | | 2019 | | | 2018 | |
| | | | | | |
| | Per Share Data | | | | | | | | | | | | | | | | | | | | |
| | | | | | |
| | Net asset value, beginning of year | | $ | 20.55 | | | $ | 16.56 | | | $ | 14.87 | | | $ | 12.39 | | | $ | 12.73 | |
| |
| | | |
| | | | | | |
| | Net investment income(a) | | | 0.82 | | | | 0.35 | | | | 0.09 | | | | 0.15 | | | | 0.13 | |
| | | | | | |
| | Net realized and unrealized gain (loss) | | | (4.70 | ) | | | 3.67 | | | | 1.70 | | | | 2.39 | | | | (0.45) | |
| |
| | | |
| | | | | | |
| | Total from investment operations | | | (3.88 | ) | | | 4.02 | | | | 1.79 | | | | 2.54 | | | | (0.32) | |
| |
| | | |
| | | | | | |
| | Distributions to shareholders from net investment income | | | (0.44 | ) | | | (0.03 | ) | | | (0.10 | ) | | | (0.06 | ) | | | (0.02) | |
| |
| | | |
| | | | | | |
| | Net asset value, end of year | | $ | 16.23 | | | $ | 20.55 | | | $ | 16.56 | | | $ | 14.87 | | | $ | 12.39 | |
| |
| | | |
| | | | | | |
| | Total return(b) | | | (19.23 | )% | | | 24.31 | % | | | 12.06 | % | | | 20.65 | % | | | (2.52)% | |
| |
| | | |
| | | | | | |
| | Net assets, end of year (in 000s) | | $ | 14,193,048 | | | $ | 14,481,792 | | | $ | 8,683,860 | | | $ | 1,996,934 | | | $ | 713,691 | |
| | | | | | |
| | Ratio of net expenses to average net assets | | | 0.76 | % | | | 0.77 | % | | | 0.79 | % | | | 0.84 | % | | | 0.90% | |
| | | | | | |
| | Ratio of total expenses to average net assets | | | 0.79 | % | | | 0.81 | % | | | 0.82 | % | | | 0.90 | % | | | 0.98% | |
| | | | | | |
| | Ratio of net investment income to average net assets | | | 4.54 | % | | | 1.83 | % | | | 0.55 | % | | | 1.10 | % | | | 0.96% | |
| | | | | | |
| | Portfolio turnover rate(c) | | | 137 | % | | | 94 | % | | | 72 | % | | | 55 | % | | | 90% | |
| |
| | | |
| | (a) | Calculated based on the average shares outstanding methodology. |
| | (b) | Assumes investment at the NAV at the beginning of the year, reinvestment of all dividends and distributions, a complete redemption of the investment at the NAV at the end of the year and no sales or redemption charges (if any). Total returns would be reduced if a sales or redemption charge was taken into account. Returns do not reflect the impact of taxes to shareholders relating to Fund distributions or the redemption of Fund shares. |
| | (c) | The Fund’s portfolio turnover rate is calculated in accordance with regulatory requirements, without regard to transactions involving short term investments. If such transactions were included, the Fund’s portfolio turnover rate may be higher. |
16 The accompanying notes are an integral part of these financial statements.
GOLDMAN SACHS GQG PARTNERS INTERNATIONAL OPPORTUNITIES FUND
Financial Highlights (continued)
Selected Share Data for a Share Outstanding Throughout Each Year
| | | | | | | | | | | | | | | | | | | | | | |
| | | | | Goldman Sachs GQG Partners International Opportunities Fund | |
| | | | | Investor Shares | |
| | | | | Year Ended October 31, | |
| | | | | 2022 | | | 2021 | | | 2020 | | | 2019 | | | 2018 | |
| | | | | | |
| | Per Share Data | | | | | | | | | | | | | | | | | | | | |
| | | | | | |
| | Net asset value, beginning of year | | $ | 20.47 | | | $ | 16.51 | | | $ | 14.82 | | | $ | 12.36 | | | $ | 12.71 | |
| |
| | | |
| | | | | | |
| | Net investment income(a) | | | 0.80 | | | | 0.33 | | | | 0.08 | | | | 0.15 | | | | 0.10 | |
| | | | | | |
| | Net realized and unrealized gain (loss) | | | (4.69 | ) | | | 3.64 | | | | 1.70 | | | | 2.36 | | | | (0.43) | |
| |
| | | |
| | | | | | |
| | Total from investment operations | | | (3.89 | ) | | | 3.97 | | | | 1.78 | | | | 2.51 | | | | (0.33) | |
| |
| | | |
| | | | | | |
| | Distributions to shareholders from net investment income | | | (0.42 | ) | | | (0.01 | ) | | | (0.09 | ) | | | (0.05 | ) | | | (0.02) | |
| |
| | | |
| | | | | | |
| | Net asset value, end of year | | $ | 16.16 | | | $ | 20.47 | | | $ | 16.51 | | | $ | 14.82 | | | $ | 12.36 | |
| |
| | | |
| | | | | | |
| | Total return(b) | | | (19.35 | )% | | | 24.09 | % | | | 12.00 | % | | | 20.42 | % | | | (2.64)% | |
| |
| | | |
| | | | | | |
| | Net assets, end of year (in 000s) | | $ | 4,425,913 | | | $ | 4,169,364 | | | $ | 2,488,875 | | | $ | 1,098,284 | | | $ | 234,587 | |
| | | | | | |
| | Ratio of net expenses to average net assets | | | 0.89 | % | | | 0.90 | % | | | 0.92 | % | | | 0.98 | % | | | 1.03% | |
| | | | | | |
| | Ratio of total expenses to average net assets | | | 0.92 | % | | | 0.94 | % | | | 0.95 | % | | | 1.04 | % | | | 1.13% | |
| | | | | | |
| | Ratio of net investment income to average net assets | | | 4.42 | % | | | 1.70 | % | | | 0.48 | % | | | 1.09 | % | | | 0.77% | |
| | | | | | |
| | Portfolio turnover rate(c) | | | 137 | % | | | 94 | % | | | 72 | % | | | 55 | % | | | 90% | |
| |
| | | |
| | (a) | Calculated based on the average shares outstanding methodology. |
| | (b) | Assumes investment at the NAV at the beginning of the year, reinvestment of all dividends and distributions, a complete redemption of the investment at the NAV at the end of the year and no sales or redemption charges (if any). Total returns would be reduced if a sales or redemption charge was taken into account. Returns do not reflect the impact of taxes to shareholders relating to Fund distributions or the redemption of Fund shares. |
| | (c) | The Fund’s portfolio turnover rate is calculated in accordance with regulatory requirements, without regard to transactions involving short term investments. If such transactions were included, the Fund’s portfolio turnover rate may be higher. |
The accompanying notes are an integral part of these financial statements. 17
|
| GOLDMAN SACHS GQG PARTNERS INTERNATIONAL OPPORTUNITIES FUND |
Financial Highlights (continued)
Selected Share Data for a Share Outstanding Throughout Each Year
| | | | | | | | | | | | | | | | | | | | | | |
| | | | | Goldman Sachs GQG Partners International Opportunities Fund | |
| | | | | Class R6 Shares | |
| | | | | Year Ended October 31, | |
| | | | | 2022 | | | 2021 | | | 2020 | | | 2019 | | | 2018 | |
| | | | | | |
| | Per Share Data | | | | | | | | | | | | | | | | | | | | |
| | | | | | |
| | Net asset value, beginning of year | | $ | 20.55 | | | $ | 16.56 | | | $ | 14.87 | | | $ | 12.39 | | | $ | 12.73 | |
| |
| | | |
| | | | | | |
| | Net investment income(a) | | | 0.83 | | | | 0.38 | | | | 0.07 | | | | 0.05 | | | | 0.12 | |
| | | | | | |
| | Net realized and unrealized gain (loss) | | | (4.71 | ) | | | 3.64 | | | | 1.72 | | | | 2.50 | | | | (0.44) | |
| |
| | | |
| | | | | | |
| | Total from investment operations | | | (3.88 | ) | | | 4.02 | | | | 1.79 | | | | 2.55 | | | | (0.32) | |
| |
| | | |
| | | | | | |
| | Distributions to shareholders from net investment income | | | (0.44 | ) | | | (0.03 | ) | | | (0.10 | ) | | | (0.07 | ) | | | (0.02) | |
| |
| | | |
| | | | | | |
| | Net asset value, end of year | | $ | 16.23 | | | $ | 20.55 | | | $ | 16.56 | | | $ | 14.87 | | | $ | 12.39 | |
| |
| | | |
| | | | | | |
| | Total return(b) | | | (19.17 | )% | | | 24.27 | % | | | 12.09 | % | | | 20.68 | % | | | (2.52)% | |
| |
| | | |
| | | | | | |
| | Net assets, end of year (in 000s) | | $ | 1,023,099 | | | $ | 757,796 | | | $ | 391,507 | | | $ | 34,263 | | | $ | 540 | |
| | | | | | |
| | Ratio of net expenses to average net assets | | | 0.74 | % | | | 0.75 | % | | | 0.77 | % | | | 0.81 | % | | | 0.87% | |
| | | | | | |
| | Ratio of total expenses to average net assets | | | 0.78 | % | | | 0.80 | % | | | 0.81 | % | | | 0.92 | % | | | 0.98% | |
| | | | | | |
| | Ratio of net investment income to average net assets | | | 4.63 | % | | | 1.97 | % | | | 0.42 | % | | | 0.34 | % | | | 0.92% | |
| | | | | | |
| | Portfolio turnover rate(c) | | | 137 | % | | | 94 | % | | | 72 | % | | | 55 | % | | | 90% | |
| |
| | | |
| | (a) | Calculated based on the average shares outstanding methodology. |
| | (b) | Assumes investment at the NAV at the beginning of the year, reinvestment of all dividends and distributions, a complete redemption of the investment at the NAV at the end of the year and no sales or redemption charges (if any). Total returns would be reduced if a sales or redemption charge was taken into account. Returns do not reflect the impact of taxes to shareholders relating to Fund distributions or the redemption of Fund shares. |
| | (c) | The Fund’s portfolio turnover rate is calculated in accordance with regulatory requirements, without regard to transactions involving short term investments. If such transactions were included, the Fund’s portfolio turnover rate may be higher. |
18 The accompanying notes are an integral part of these financial statements.
GOLDMAN SACHS GQG PARTNERS INTERNATIONAL OPPORTUNITIES FUND
Financial Highlights (continued)
Selected Share Data for a Share Outstanding Throughout Each Year
| | | | | | | | | | | | | | | | | | | | | | |
| | | | | Goldman Sachs GQG Partners International
Opportunities Fund | |
| | | | | Class R Shares | |
| | | | | Year Ended October 31, | |
| | | | | 2022 | | | 2021 | | | 2020 | | | 2019 | | | 2018 | |
| | | | | | |
| | Per Share Data | | | | | | | | | | | | | | | | | | | | |
| | | | | | |
| | Net asset value, beginning of year | | $ | 20.11 | | | $ | 16.28 | | | $ | 14.69 | | | $ | 12.26 | | | $ | 12.66 | |
| |
| | | |
| | | | | | |
| | Net investment income(a) | | | 0.69 | | | | 0.22 | | | | 0.01 | | | | 0.01 | | | | 0.02 | |
| | | | | | |
| | Net realized and unrealized gain (loss) | | | (4.61 | ) | | | 3.61 | | | | 1.65 | | | | 2.43 | | | | (0.42) | |
| |
| | | |
| | | | | | |
| | Total from investment operations | | | (3.92 | ) | | | 3.83 | | | | 1.66 | | | | 2.44 | | | | (0.40) | |
| |
| | | |
| | | | | | |
| | Distributions to shareholders from net investment income | | | (0.31 | ) | | | — | | | | (0.07 | ) | | | (0.01 | ) | | | — | |
| |
| | | |
| | | | | | |
| | Net asset value, end of year | | $ | 15.88 | | | $ | 20.11 | | | $ | 16.28 | | | $ | 14.69 | | | $ | 12.26 | |
| |
| | | |
| | | | | | |
| | Total return(b) | | | (19.73 | )% | | | 23.53 | % | | | 11.32 | % | | | 19.91 | % | | | (3.16)% | |
| |
| | | |
| | | | | | |
| | Net assets, end of year (in 000s) | | $ | 1,215 | | | $ | 1,095 | | | $ | 735 | | | $ | 208 | | | $ | 25 | |
| | | | | | |
| | Ratio of net expenses to average net assets | | | 1.39 | % | | | 1.40 | % | | | 1.42 | % | | | 1.47 | % | | | 1.53% | |
| | | | | | |
| | Ratio of total expenses to average net assets | | | 1.42 | % | | | 1.44 | % | | | 1.45 | % | | | 1.54 | % | | | 1.62% | |
| | | | | | |
| | Ratio of net investment income to average net assets | | | 3.88 | % | | | 1.19 | % | | | 0.07 | % | | | 0.05 | % | | | 0.15% | |
| | | | | | |
| | Portfolio turnover rate(c) | | | 137 | % | | | 94 | % | | | 72 | % | | | 55 | % | | | 90% | |
| |
| | | |
| | (a) | Calculated based on the average shares outstanding methodology. |
| | (b) | Assumes investment at the NAV at the beginning of the year, reinvestment of all dividends and distributions, a complete redemption of the investment at the NAV at the end of the year and no sales or redemption charges (if any). Total returns would be reduced if a sales or redemption charge was taken into account. Returns do not reflect the impact of taxes to shareholders relating to Fund distributions or the redemption of Fund shares. |
| | (c) | The Fund’s portfolio turnover rate is calculated in accordance with regulatory requirements, without regard to transactions involving short term investments. If such transactions were included, the Fund’s portfolio turnover rate may be higher. |
The accompanying notes are an integral part of these financial statements. 19
|
| GOLDMAN SACHS GQG PARTNERS INTERNATIONAL OPPORTUNITIES FUND |
Financial Highlights (continued)
Selected Share Data for a Share Outstanding Throughout Each Period
| | | | | | | | | | | | | | | | | | | | | | |
| | | | | Goldman Sachs GQG Partners International Opportunities Fund | |
| | | | | Class P Shares | |
| | | | | Year Ended October 31, | | | Period Ended October 31, 2018(a) | |
| | | | | 2022 | | | 2021 | | | 2020 | | | 2019 | |
| | | | | | |
| | Per Share Data | | | | | | | | | | | | | | | | | | | | |
| | | | | | |
| | Net asset value, beginning of period | | $ | 20.54 | | | $ | 16.55 | | | $ | 14.86 | | | $ | 12.39 | | | $ | 13.17 | |
| |
| | | |
| | | | | | |
| | Net investment income(b) | | | 0.83 | | | | 0.37 | | | | 0.10 | | | | 0.16 | | | | 0.02 | |
| | | | | | |
| | Net realized and unrealized gain (loss) | | | (4.71) | | | | 3.65 | | | | 1.69 | | | | 2.38 | | | | (0.80) | |
| |
| | | |
| | | | | | |
| | Total from investment operations | | | (3.88) | | | | 4.02 | | | | 1.79 | | | | 2.54 | | | | (0.78) | |
| |
| | | |
| | | | | | |
| | Distributions to shareholders from net investment income | | | (0.44) | | | | (0.03) | | | | (0.10) | | | | (0.07) | | | | — | |
| |
| | | |
| | | | | | |
| | Net asset value, end of period | | $ | 16.22 | | | $ | 20.54 | | | $ | 16.55 | | | $ | 14.86 | | | $ | 12.39 | |
| |
| | | |
| | | | | | |
| | Total return(c) | | | (19.22)% | | | | 24.34% | | | | 12.08% | | | | 20.61% | | | | (5.92)% | |
| |
| | | |
| | | | | | |
| | Net assets, end of period (in 000s) | | $ | 2,099,648 | | | $ | 2,330,569 | | | $ | 1,186,744 | | | $ | 477,609 | | | $ | 233,541 | |
| | | | | | |
| | Ratio of net expenses to average net assets | | | 0.74% | | | | 0.75% | | | | 0.77% | | | | 0.82% | | | | 0.87%(d) | |
| | | | | | |
| | Ratio of total expenses to average net assets | | | 0.78% | | | | 0.80% | | | | 0.81% | | | | 0.89% | | | | 1.02%(d) | |
| | | | | | |
| | Ratio of net investment income to average net assets | | | 4.55% | | | | 1.90% | | | | 0.61% | | | | 1.14% | | | | 0.33%(d) | |
| | | | | | |
| | Portfolio turnover rate(e) | | | 137% | | | | 94% | | | | 72% | | | | 55% | | | | 90% | |
| |
| | | |
| | (a) | Commenced operations on April 16, 2018. |
| | (b) | Calculated based on the average shares outstanding methodology. |
| | (c) | Assumes investment at the NAV at the beginning of the period, reinvestment of all dividends and distributions, a complete redemption of the investment at the NAV at the end of the period and no sales or redemption charges (if any). Total returns would be reduced if a sales or redemption charge was taken into account. Returns do not reflect the impact of taxes to shareholders relating to Fund distributions or the redemption of Fund shares. Total returns for periods less than one full year are not annualized. |
| | (e) | The Fund’s portfolio turnover rate is calculated in accordance with regulatory requirements, without regard to transactions involving short term investments. If such transactions were included, the Fund’s portfolio turnover rate may be higher. |
20 The accompanying notes are an integral part of these financial statements.
GOLDMAN SACHS GQG PARTNERS INTERNATIONAL OPPORTUNITIES FUND
Notes to Financial Statements
October 31, 2022
Goldman Sachs Trust II (the “Trust”) is a Delaware statutory trust registered under the Investment Company Act of 1940, as amended (the “Act”), as an open-end management investment company. The Trust includes the Goldman Sachs GQG Partners International Opportunities Fund (the “Fund”). The Fund is a diversified portfolio that currently offers seven classes of shares: Class A, Class C, Institutional, Investor, Class R6, Class R and Class P Shares.
Class A Shares are sold with a front-end sales charge of up to 5.50%. Class C Shares are sold with a contingent deferred sales charge (“CDSC”) of 1.00%, which is imposed on redemptions made within 12 months of purchase. Institutional, Investor, Class R6, Class R, and Class P Shares are not subject to a sales charge.
Goldman Sachs Asset Management, L.P. (“GSAM”), an affiliate of Goldman Sachs & Co. LLC (“Goldman Sachs”), serves as investment adviser to the Fund pursuant to a management agreement (the “Agreement”) with the Trust.
GQG Partners LLC (“GQG Partners” or the “Sub-Adviser”) serves as the sub-adviser to the Fund. GSAM compensates the Sub-Adviser directly in accordance with the terms of the Sub-Advisory Agreement. The Fund is not charged any separate or additional investment advisory fees by the Sub-Adviser.
|
|
| 2. SIGNIFICANT ACCOUNTING POLICIES |
The financial statements have been prepared in accordance with accounting principles generally accepted in the United States of America (“GAAP”) and require management to make estimates and assumptions that may affect the reported amounts and disclosures. Actual results may differ from those estimates and assumptions. The Fund is an investment company under GAAP and follows the accounting and reporting guidance applicable to investment companies.
A. Investment Valuation — The Fund’s valuation policy is to value investments at fair value.
B. Investment Income and Investments — Investment income includes interest income, dividend income and securities lending income, if any. Interest income is accrued daily and adjusted for amortization of premiums and accretion of discounts. Dividend income is recognized on ex-dividend date or, for certain foreign securities, as soon as such information is obtained subsequent to the ex-dividend date. Non-cash dividends, if any, are recorded at the fair market value of the securities received. Investment transactions are reflected on trade date. Realized gains and losses are calculated using identified cost. Investment transactions are recorded on the following business day for daily net asset value (“NAV”) calculations. Investment income is recorded net of any foreign withholding taxes, less any amounts reclaimable. The Fund may file withholding tax reclaims in certain jurisdictions to recover a portion of amounts previously withheld. Any foreign capital gains tax is accrued daily based upon net unrealized gains, and is payable upon sale of such investments.
C. Class Allocations and Expenses — Investment income, realized and unrealized gain (loss), if any, and non-class specific expenses of the Fund are allocated daily based upon the proportion of net assets of each class. Non-class specific expenses directly incurred by the Fund are charged to the Fund, while such expenses incurred by the Trust are allocated across the Fund on a straight-line and/or pro-rata basis depending upon the nature of the expenses. Class specific expenses, where applicable, are borne by the respective share classes and include Distribution and Service, Transfer Agency and Service and Shareholder Administration fees.
D. Federal Taxes and Distributions to Shareholders — It is the Fund’s policy to comply with the requirements of the Internal Revenue Code of 1986, as amended (the “Code”), applicable to regulated investment companies and to distribute each year substantially all of its investment company taxable income and capital gains to its shareholders. Accordingly, the Fund is not required to make any provisions for the payment of federal income tax. Distributions to shareholders are recorded on the ex-dividend date. Income and capital gains distributions, if any, are declared and paid annually.
Net capital losses, if any, are carried forward to future fiscal years and may be used to the extent allowed by the Code to offset any future capital gains. Losses that are carried forward will retain their character as either short-term or long-term capital losses. Utilization of capital loss carryforwards will reduce the requirement of future capital gains distributions.
21
|
| GOLDMAN SACHS GQG PARTNERS INTERNATIONAL OPPORTUNITIES FUND |
Notes to Financial Statements (continued)
October 31, 2022
|
|
| 2. SIGNIFICANT ACCOUNTING POLICIES ( continued) |
The characterization of distributions to shareholders for financial reporting purposes is determined in accordance with federal income tax rules, which may differ from GAAP. The source of the Fund’s distributions may be shown in the accompanying financial statements as either from distributable earnings or capital. Certain components of the Fund’s net assets on the Statement of Assets and Liabilities reflect permanent GAAP/tax differences based on the appropriate tax character.
E. Foreign Currency Translation — The accounting records and reporting currency of the Fund are maintained in U.S. dollars. Assets and liabilities denominated in foreign currencies are translated into U.S. dollars using the current exchange rates at the close of each business day. The effect of changes in foreign currency exchange rates on investments is included within net realized and unrealized gain (loss) on investments. Changes in the value of other assets and liabilities as a result of fluctuations in foreign exchange rates are included in the Statement of Operations within net change in unrealized gain (loss) on foreign currency translation. Transactions denominated in foreign currencies are translated into U.S. dollars on the date the transaction occurred, the effects of which are included within net realized gain (loss) on foreign currency transactions.
|
|
| 3. INVESTMENTS AND FAIR VALUE MEASUREMENTS |
U.S. GAAP defines the fair value of a financial instrument as the amount that would be received to sell an asset or paid to transfer a liability in an orderly transaction between market participants at the measurement date (i.e., the exit price); the Fund’s policy is to use the market approach. GAAP establishes a fair value hierarchy that prioritizes the inputs to valuation techniques used to measure fair value. The hierarchy gives the highest priority to unadjusted quoted prices in active markets for identical assets or liabilities (Level 1 measurements) and the lowest priority to unobservable inputs (Level 3 measurements). The level in the fair value hierarchy within which the fair value measurement in its entirety falls shall be determined based on the lowest level input that is significant to the fair value measurement in its entirety. The levels used for classifying investments are not necessarily an indication of the risk associated with investing in these investments. The three levels of the fair value hierarchy are described below:
Level 1 — Unadjusted quoted prices in active markets that are accessible at the measurement date for identical, unrestricted assets or liabilities;
Level 2 — Quoted prices in markets that are not active or financial instruments for which significant inputs are observable (including, but not limited to, quoted prices for similar investments, interest rates, foreign exchange rates, volatility and credit spreads), either directly or indirectly;
Level 3 — Prices or valuations that require significant unobservable inputs (including GSAM’s assumptions in determining fair value measurement).
The Board of Trustees (“Trustees”) has approved Valuation Procedures that govern the valuation of the portfolio investments held by the Fund, including investments for which market quotations are not readily available. With respect to the Fund’s investments that do not have readily available market quotations, the Trustees have designated the Adviser as the valuation designee to perform fair valuations pursuant to Rule 2a-5 under the Investment Company Act of 1940 (the “Valuation Designee”). GSAM has day-to-day responsibility for implementing and maintaining internal controls and procedures related to the valuation of the Fund’s investments. To assess the continuing appropriateness of pricing sources and methodologies, GSAM regularly performs price verification procedures and issues challenges as necessary to third party pricing vendors or brokers, and any differences are reviewed in accordance with the Valuation Procedures.
A. Level 1 and Level 2 Fair Value Investments — The valuation techniques and significant inputs used in determining the fair values for investments classified as Level 1 and Level 2 are as follows:
Equity Securities — Equity securities traded on a United States (“U.S.”) securities exchange or the NASDAQ system, or those located on certain foreign exchanges, including but not limited to the Americas, are valued daily at their last sale price or official closing price on the principal exchange or system on which they are traded. If there is no sale or official closing price or such price is believed by GSAM to not represent fair value, equity securities will be valued at the valid closing bid price for long positions and at the valid closing ask price for short positions (i.e., where there is sufficient volume, during normal exchange trading hours).
22
GOLDMAN SACHS GQG PARTNERS INTERNATIONAL OPPORTUNITIES FUND
|
|
| 3. INVESTMENTS AND FAIR VALUE MEASUREMENTS (continued) |
If no valid bid/ask price is available, the equity security will be valued pursuant to the Valuation Procedures and consistent with applicable regulatory guidance. To the extent these investments are actively traded, they are classified as Level 1 of the fair value hierarchy, otherwise they are generally classified as Level 2. Certain equity securities containing unique attributes may be classified as Level 2.
Unlisted equity securities for which market quotations are available are valued at the last sale price on the valuation date, or if no sale occurs, at the last bid price for long positions or the last ask price for short positions, and are generally classified as Level 2. Securities traded on certain foreign securities exchanges are valued daily at fair value determined by an independent fair value service (if available) under the Valuation Procedures and consistent with applicable regulatory guidance. The independent fair value service takes into account multiple factors including, but not limited to, movements in the securities markets, certain depositary receipts, futures contracts and foreign currency exchange rates that have occurred subsequent to the close of the foreign securities exchange. These investments are generally classified as Level 2 of the fair value hierarchy.
Money Market Funds — Investments in the Goldman Sachs Financial Square Government Fund (“Underlying Money Market Fund”) are valued at the NAV per share of the Institutional Share class on the day of valuation. These investments are generally classified as Level 1 of the fair value hierarchy. For information regarding the Underlying Money Market Fund’s accounting policies and investment holdings, please see the Underlying Money Market Fund’s shareholder report.
B. Level 3 Fair Value Investments — To the extent that significant inputs to valuation models and other alternative pricing sources are unobservable, or if quotations are not readily available, or if GSAM believes that such quotations do not accurately reflect fair value, the fair value of the Fund’s investments may be determined under the Valuation Procedures. GSAM, consistent with its procedures and applicable regulatory guidance, may make an adjustment to the most recent valuation prices of either domestic or foreign securities in light of significant events to reflect what it believes to be the fair value of the securities at the time of determining the Fund’s NAV. To the extent investments are valued using single source broker quotations obtained directly from the broker or passed through from third party pricing vendors, such investments are classified as Level 3 investments.
C. Fair Value Hierarchy — The following is a summary of the Fund’s investments classified in the fair value hierarchy as of October 31, 2022:
| | | | | | | | | | | | |
| Investment Type | | Level 1 | | | Level 2 | | | Level 3 | |
Assets | | | | | | | | | | | | |
Common Stock and/or Other Equity Investments(a) | | | | | | | | | | | | |
Asia | | $ | 493,638,498 | | | $ | 1,688,161,365 | | | $ | — | (b) |
Australia and Oceania | | | — | | | | 169,966,660 | | | | — | |
Europe | | | 1,368,574,795 | | | | 11,329,451,922 | | | | — | |
North America | | | 3,797,475,001 | | | | — | | | | — | |
South America | | | 1,163,345,953 | | | | — | | | | — | |
Preferred Stocks | | | — | | | | 1,362,338,497 | | | | — | |
Securities Lending Reinvestment Vehicle | | | 114,482,373 | | | | — | | | | — | |
Investment Company | | | 955,445,315 | | | | — | | | | — | |
| |
Total | | $ | 7,892,961,935 | | | $ | 14,549,918,444 | | | $ | — | |
| |
| | (a) | Amounts are disclosed by continent to highlight the impact of time zone differences between local market close and the calculation of NAV. Security valuations are based on the principal exchange or system on which they are traded, which may differ from country of domicile. The Fund utilizes fair value model prices provided by an independent fair value service for international equities, resulting in a Level 2 classification. |
| | (b) | Amount includes valuations of Russian investments for which GSAM has determined include significant unobservable inputs as of October 31, 2022. To the extent that the same positions were held as of the Fund’s prior fiscal year end, October 31, 2021, they were classified as either Level 1 or Level 2. |
For further information regarding security characteristics, see the Schedule of Investments.
23
|
| GOLDMAN SACHS GQG PARTNERS INTERNATIONAL OPPORTUNITIES FUND |
Notes to Financial Statements (continued)
October 31, 2022
|
|
| 4. AGREEMENTS AND AFFILIATED TRANSACTIONS |
A. Management Agreement — Under the Agreement, GSAM manages the Fund, subject to the general supervision of the Trustees.
As compensation for the services rendered pursuant to the Agreement, the assumption of the expenses related thereto and administration of the Fund’s business affairs, including providing facilities, GSAM is entitled to a management fee, accrued daily and paid monthly, equal to an annual percentage rate of the Fund’s average daily net assets. For the fiscal year ended October 31, 2022, contractual and effective net management fees with GSAM were at the following rates:
| | | | | | | | | | | | | | | | | | | | | | | | | | | | |
| | | Contractual Management Rate | | | | | | | |
| Fund | | First
$1 billion | | | Next
$1 billion | | | Next
$3 billion | | | Next
$3 billion | | | Over
$8 billion | | | Effective Rate | | | Effective Net
Management
Rate^ | |
GQG Partners International Opportunities Fund | | | 0.85 | % | | | 0.77 | % | | | 0.73 | % | | | 0.71 | % | | | 0.70 | % | | | 0.72 | % | | | 0.71% | |
| |
| ^ | Effective Net Management Rate includes the impact of management fee waivers of affiliated underlying funds, if any. |
The Fund invests in Institutional Shares of the Goldman Sachs Financial Square Government Fund, which is an affiliated Underlying Fund. GSAM has agreed to waive a portion of its management fee payable by the Fund in an amount equal to the management fee it earns as an investment adviser to the affiliated Underlying Fund in which the Fund invests, except those management fees it earns from the Fund’s investments of cash collateral received in connection with securities lending transactions in the Goldman Sachs Financial Square Government Fund. For the fiscal year ended October 31, 2022, GSAM waived $1,484,432 of the Fund’s management fee.
B. Distribution and/or Service (12b-1) Plans — The Trust, on behalf of Class A and Class R Shares of the Fund, has adopted Distribution and Service Plans subject to Rule 12b-1 under the Act. Under the Distribution and Service Plans, Goldman Sachs, which serves as distributor (the “Distributor”), is entitled to a fee accrued daily and paid monthly for distribution services and personal and account maintenance services, which may then be paid by Goldman Sachs to authorized dealers. These fees are equal to an annual percentage rate of the average daily net assets attributable to Class A or Class R Shares of the Fund, as applicable, as set forth below.
The Trust, on behalf of Class C Shares of the Fund, has adopted a Distribution Plan subject to Rule 12b-1 under the Act. Under the Distribution Plan, Goldman Sachs as Distributor is entitled to a fee accrued daily and paid monthly for distribution services, which may then be paid by Goldman Sachs to authorized dealers. These fees are equal to an annual percentage rate of the average daily net assets attributable to Class C Shares of the Fund, as set forth below.
| | | | | | | | | | | | |
| | | Distribution and/or Service Plan Rates | |
| | | Class A* | | | Class C | | | Class R* | |
Distribution and/or Service Plan | | | 0.25% | | | | 0.75% | | | | 0.50% | |
| |
| * | With respect to Class A and Class R Shares, the Distributor at its discretion may use compensation for distribution services paid under the Distribution Plan to compensate service organizations for personal and account maintenance services and expenses as long as such total compensation does not exceed the maximum cap on “service fees” imposed by the Financial Industry Regulatory Authority. |
C. Distribution Agreement — Goldman Sachs, as Distributor of the shares of the Fund pursuant to a Distribution Agreement, may retain a portion of the Class A Shares’ front end sales charge and Class C Shares’ CDSC. During the fiscal year ended October 31, 2022, Goldman Sachs retained the following amounts:
| | | | |
| | | Front End
Sales Charge | |
| Fund | | Class A | |
GQG Partners International Opportunities Fund | | | $51,303 | |
| |
24
GOLDMAN SACHS GQG PARTNERS INTERNATIONAL OPPORTUNITIES FUND
|
|
| 4. AGREEMENTS AND AFFILIATED TRANSACTIONS ( continued) |
During the fiscal year ended October 31, 2022, Goldman Sachs did not retain any portion of Class C Shares’ CDSC.
D. Service Plan — The Trust, on behalf of the Fund, has adopted a Service Plan to allow Class C Shares to compensate service organizations (including Goldman Sachs) for providing varying levels of personal and account maintenance services to their customers who are beneficial owners of such shares. The Service Plan provides for compensation to the service organizations equal to an annual percentage rate of 0.25% of the average daily net assets attributable to Class C Shares of the Fund.
E. Transfer Agency Agreement — Goldman Sachs also serves as the transfer agent of the Fund for a fee pursuant to the Transfer Agency Agreement. The fees charged for such transfer agency services are accrued daily and paid monthly at annual rates as follows: 0.16% of the average daily net assets of Class A, Class C, Investor and Class R Shares; 0.03% of the average daily net assets of Class R6 and Class P Shares; and 0.04% of the average daily net assets of Institutional Shares. Goldman Sachs has agreed to waive a portion of its transfer agency fees equal to 0.01% as an annual percentage rate of the average daily net assets attributable to Class R6 Shares of the Fund. These arrangements will remain in effect through at least February 28, 2023. Prior to July 1, 2022, fees charged for such transfer agency services were 0.17% of the average daily net assets of Class A, Class C, Investor and Class R Shares.
F. Other Expense Agreements and Affiliated Transactions — GSAM has agreed to reduce or limit certain “Other Expenses” of the Fund (excluding acquired fund fees and expenses, transfer agency fees and expenses, service fees and shareholder administration fees (as applicable), taxes, interest, brokerage fees, expenses of shareholder meetings, litigation and indemnification and extraordinary expenses) to the extent such expenses exceed, on an annual basis, a percentage rate of the average daily net assets of the Fund. Such Other Expense reimbursements, if any, are accrued daily and paid monthly. In addition, the Fund is not obligated to reimburse GSAM for prior fiscal year expense reimbursements, if any. The Other Expense limitation as an annual percentage rate of average daily net assets for the Fund is 0.014%. The Other Expense limitation will remain in place through at least February 28, 2023, and prior to such date GSAM may not terminate the arrangement without the approval of the Trustees. In addition, the Fund has entered into certain offset arrangements with the transfer agent, which may result in a reduction of the Fund’s expenses and are received irrespective of the application of the “Other Expense” limitations described above.
GSAM may voluntarily waive a portion of any payments under the Fund’s Distribution and Service Plan, Service Plan and Shareholder Administration Plan, and Transfer Agency Agreement, and these waivers are in addition to what is stipulated in any contractual fee waiver arrangements (as applicable). These temporary waivers may be modified or terminated at any time at the option of Goldman Sachs without shareholder approval.
For the fiscal year ended October 31, 2022, these expense reductions, including any fee waivers and Other Expense reimbursements, were as follows:
| | | | | | | | |
| Fund | | Management
Fee Waiver | | Transfer Agency
Waivers/Credits | | Other Expense
Reimbursements | | Total
Expense
Reductions |
GQG Partners International Opportunities Fund | | $1,484,432 | | $320,788 | | $4,485,855 | | $6,291,075 |
|
G. Line of Credit Facility — As of October 31, 2022, the Fund participated in a $1,250,000,000 committed, unsecured revolving line of credit facility (the “facility”) together with other funds of the Trust and certain registered investment companies having management agreements with GSAM or its affiliates. This facility is to be used for temporary emergency purposes, or to allow for an orderly liquidation of securities to meet redemption requests. The interest rate on borrowings is based on the federal funds rate. The facility also requires a fee to be paid by the Fund based on the amount of the commitment that has not been utilized. For the fiscal year ended October 31, 2022, the Fund did not have any borrowings under the facility. Prior to April 22, 2022, the facility was $1,000,000,000.
H. Other Transactions with Affiliates — For the fiscal year ended October 31, 2022, Goldman Sachs did not earn any brokerage commissions from portfolio transactions, on behalf of the Fund.
25
|
| GOLDMAN SACHS GQG PARTNERS INTERNATIONAL OPPORTUNITIES FUND |
Notes to Financial Statements (continued)
October 31, 2022
|
|
| 4. AGREEMENTS AND AFFILIATED TRANSACTIONS ( continued) |
The table below provides information about the Fund’s investments in the Goldman Sachs Financial Square Government Fund for the fiscal year ended October 31, 2022:
| | | | | | | | | | | | | | | | | | | | | | | | | | |
| Fund | | Underlying Fund | | Beginning
Value as of
October 31,
2021 | | | Purchases
at Cost | | | Proceeds
from Sales | | | Ending
Value as of
October 31,
2022 | | | Shares as of
October 31,
2022 | | | Dividend
Income | |
GQG Partners International Opportunities Fund | | Goldman Sachs
Financial Square
Government Fund —
Institutional Shares | | $ | 386,087,268 | | | $ | 10,613,779,909 | | | $ | (10,044,421,862 | ) | | $ | 955,445,315 | | | | 955,445,315 | | | $ | 9,147,476 | |
| |
|
|
| 5. PORTFOLIO SECURITIES TRANSACTIONS |
The cost of purchases and proceeds from sales and maturities of long-term securities for the fiscal year ended October 31, 2022, were $34,958,526,537 and $29,469,338,810, respectively.
Pursuant to exemptive relief granted by the Securities and Exchange Commission (“SEC”) and the terms and conditions contained therein, the Fund may lend its securities through a securities lending agent, Goldman Sachs Agency Lending (“GSAL”), a wholly-owned subsidiary of Goldman Sachs, to certain qualified borrowers including Goldman Sachs and affiliates. In accordance with the Fund’s securities lending procedures, the Fund receives cash collateral at least equal to the market value of the securities on loan. The market value of the loaned securities is determined at the close of business of the Fund, at their last sale price or official closing price on the principal exchange or system on which they are traded, and any additional required collateral is delivered to the Fund on the next business day. As with other extensions of credit, the Fund may experience delay in the recovery of its securities or incur a loss should the borrower of the securities breach its agreement with the Fund or become insolvent at a time when the collateral is insufficient to cover the cost of repurchasing securities on loan. Dividend income received from securities on loan may not be subject to withholding taxes and therefore withholding taxes paid may differ from the amounts listed in the Statement of Operations. Loans of securities are terminable at any time and as such 1) the remaining contractual maturities of the outstanding securities lending transactions are considered to be overnight and continuous and 2) the borrower, after notice, is required to return borrowed securities within the standard time period for settlement of securities transactions.
The Fund invests the cash collateral received in connection with securities lending transactions in the Goldman Sachs Financial Square Government Fund (“Government Money Market Fund”), an affiliated series of the Goldman Sachs Trust. The Government Money Market Fund is registered under the Act as an open end investment company, is subject to Rule 2a-7 under the Act, and is managed by GSAM, for which GSAM may receive a management fee of up to 0.16% on an annualized basis of the average daily net assets of the Government Money Market Fund.
In the event of a default by a borrower with respect to any loan, GSAL will exercise any and all remedies provided under the applicable borrower agreement to make the Fund whole. These remedies include purchasing replacement securities by applying the collateral held from the defaulting broker against the purchase cost of the replacement securities. If GSAL is unable to purchase replacement securities, GSAL will indemnify the Fund by paying the Fund an amount equal to the market value of the securities loaned minus the value of cash collateral received from the borrower for the loan, subject to an exclusion for any shortfalls resulting from a loss of value in such cash collateral due to reinvestment risk. The Fund’s master netting agreements with certain borrowers provide the right, in the event of a default (including bankruptcy or insolvency), for the non-defaulting party to liquidate the collateral and calculate net exposure to the defaulting party or request additional collateral. However, in the event of a default by a borrower, a resolution authority could determine that such rights are not enforceable due to the restrictions or prohibitions against the right of set-off that may be imposed in accordance with a particular jurisdiction’s bankruptcy or insolvency laws. The Fund’s loaned securities were all subject to enforceable Securities Lending Agreements and the value of the collateral was at least equal to the value of the cash received. The amounts of the Fund’s overnight and continuous agreements, which represent the gross
26
GOLDMAN SACHS GQG PARTNERS INTERNATIONAL OPPORTUNITIES FUND
|
|
| 6. SECURITIES LENDING (continued) |
amounts of recognized liabilities for securities lending transactions outstanding as of October 31, 2022, are disclosed as “Payable upon return of securities loaned” on the Statement of Assets and Liabilities, where applicable.
Both the Fund and GSAL received compensation relating to the lending of the Fund’s securities. The amounts earned, if any, by the Fund for the fiscal year ended October 31, 2022, are reported under Investment Income on the Statement of Operations.
The table below details securities lending activity with affiliates of Goldman Sachs:
| | | | | | |
| | | For the Fiscal Year Ended October 31, 2022 | | |
| Fund | | Earnings of GSAL
Relating to
Securities
Loaned | | Amounts Received
by the Funds
from Lending to
Goldman Sachs | | Amounts Payable to
Goldman Sachs
Upon Return of
Securities Loaned as of
October 31, 2022 |
GQG Partners International Opportunities Fund | | $168,918 | | $112,560 | | $— |
|
The following table provides information about the Fund’s investment in the Government Money Market Fund for the fiscal year ended October 31, 2022:
| | | | | | | | | | | | | | | | |
| Fund | | Beginning
Value as of
October 31,
2021 | | | Purchases
at cost | | | Proceeds
from Sales | | | Ending
Value as of
October 31, 2022 | |
GQG Partners International Opportunities Fund | | $ | 100,750,000 | | | $ | 8,215,321,269 | | | $ | (8,201,588,896 | ) | | $ | 114,482,373 | |
| |
The tax character of distributions paid during the for the fiscal year ended October 31, 2022 was as follows:
| | | | |
Distributions paid from: | | | | |
Ordinary income | | $ | 486,394,469 | |
| |
Total taxable distributions | | $ | 486,394,469 | |
| |
The tax character of distributions paid during the fiscal year ended October 31, 2021 was as follows:
| | | | |
Distributions paid from: | | | | |
Ordinary income | | $ | 23,022,786 | |
Net long-term capital gains | | | — | |
| |
Total taxable distributions | | $ | 23,022,786 | |
| |
As of October 31, 2022, the components of accumulated earnings (losses) on a tax basis were as follows:
| | | | |
Undistributed ordinary income — net | | $ | 886,206,865 | |
| |
Capital loss carryforwards: | | | | |
Perpetual Short-Term | | | (949,841,806 | ) |
| |
Unrealized gains (loss) — net | | | (265,066,834 | ) |
| |
Total accumulated earnings (loss) net | | $ | (328,701,775 | ) |
| |
27
|
| GOLDMAN SACHS GQG PARTNERS INTERNATIONAL OPPORTUNITIES FUND |
Notes to Financial Statements (continued)
October 31, 2022
|
|
| 7. TAX INFORMATION (continued) |
As of October 31, 2022, the Fund’s aggregate security unrealized gains and losses based on cost for U.S. federal income tax purposes were as follows:
| | | | |
Tax Cost | | $ | 22,705,208,607 | |
| |
Gross unrealized gain | | | 1,461,446,690 | |
Gross unrealized loss | | | (1,726,513,524 | ) |
| |
Net unrealized loss | | $ | (265,066,834 | ) |
| |
The difference between GAAP-basis and tax basis unrealized gains (losses) is attributable primarily to wash sales and differences in the tax treatment of passive foreign investment company investments.
GSAM has reviewed the Fund’s tax positions for all open tax years (the current and prior three years, as applicable) and has concluded that no provision for income tax is required in the Fund’s financial statements. Such open tax years remain subject to examination and adjustment by tax authorities.
The Fund’s risks include, but are not limited to, the following:
Depositary Receipts Risk — Foreign securities may trade in the form of depositary receipts (“Depositary Receipts”), which include American Depositary Receipts (“ADRs”). To the extent the Fund acquires Depositary Receipts through banks which do not have a contractual relationship with the foreign issuer of the security underlying the Depositary Receipts to issue and service such unsponsored Depositary Receipts, there may be an increased possibility that the Fund would not become aware of and be able to respond to corporate actions such as stock splits or rights offerings involving the foreign issuer in a timely manner. In addition, the lack of information may result in inefficiencies in the valuation of such instruments. Investment in Depositary Receipts does not eliminate all the risks inherent in investing in securities of non-U.S. issuers. The market value of Depositary Receipts is dependent upon the market value of the underlying securities and fluctuations in the relative value of the currencies in which the Depositary Receipts and the underlying securities are quoted.
Foreign and Emerging Countries Risk — Investing in foreign markets may involve special risks and considerations not typically associated with investing in the U.S. Foreign securities may be subject to risk of loss because of more or less foreign government regulation; less public information; less stringent investor protections; less stringent accounting, corporate governance, financial reporting and disclosure standards; and less economic, political and social stability in the countries in which a Fund invests. The imposition of sanctions, exchange controls (including repatriation restrictions), confiscation of assets and property, trade restrictions (including tariffs) and other government restrictions by the U.S. or other governments, or from problems in share registration, settlement or custody, may also result in losses. The type and severity of sanctions and other similar measures, including counter sanctions and other retaliatory actions, that may be imposed could vary broadly in scope, and their impact is impossible to predict. For example, the imposition of sanctions and other similar measures could, among other things, cause a decline in the value and/or liquidity of securities issued by the sanctioned country or companies located in or economically tied to the sanctioned country and increase market volatility and disruption in the sanctioned country and throughout the world. Sanctions and other similar measures could limit or prevent a Fund from buying and selling securities (in the sanctioned country and other markets), significantly delay or prevent the settlement of securities transactions, and significantly impact a Fund’s liquidity and performance. Foreign risk also involves the risk of negative foreign currency exchange rate fluctuations, which may cause the value of securities denominated in such foreign currency (or other instruments through which a Fund has exposure to foreign currencies) to decline in value. Currency exchange rates may fluctuate significantly over short periods of time. To the extent that a Fund also invests in securities of issuers located in, or economically tied to, emerging markets, these risks may be more pronounced.
28
GOLDMAN SACHS GQG PARTNERS INTERNATIONAL OPPORTUNITIES FUND
|
|
| 8. OTHER RISKS (continued) |
Foreign Custody Risk — The Fund invests in foreign securities, and as such the Fund may hold such securities and cash with foreign banks, agents, and securities depositories appointed by the Fund’s custodian (each a “Foreign Custodian”). Some foreign custodians may be recently organized or new to the foreign custody business. In some countries, Foreign Custodians may be subject to little or no regulatory oversight over, or independent evaluation of, their operations. Further, the laws of certain countries may place limitations on the Fund’s ability to recover its assets if a Foreign Custodian enters bankruptcy. Investments in emerging markets may be subject to even greater custody risks than investments in more developed markets. Custody services in emerging market countries are very often undeveloped and may be considerably less well regulated than in more developed countries, and thus may not afford the same level of investor protection as would apply in developed countries.
Geographic Risk — If the Fund focuses its investments in securities of issuers located in a particular country or geographic region, the Fund may be subjected, to a greater extent than if its investments were less focused, to the risks of volatile economic cycles and/or conditions and developments that may be particular to that country or region, such as: adverse securities markets; adverse exchange rates; adverse social, political, regulatory, economic, business, environmental or other developments; or natural disasters.
Investments in Other Investment Companies Risk — As a shareholder of another investment company, the Fund will indirectly bear its proportionate share of any net management fees and other expenses paid by such other investment companies, in addition to the fees and expenses regularly borne by the Fund.
Large Shareholder Transactions Risk — The Fund may experience adverse effects when certain large shareholders, such as other funds, institutional investors (including those trading by use of non-discretionary mathematical formulas), financial intermediaries (who may make investment decisions on behalf of underlying clients and/or include the Fund in their investment model), individuals, accounts and Goldman Sachs affiliates, purchase or redeem large amounts of shares of a Fund. Such large shareholder redemptions, which may occur rapidly or unexpectedly, may cause the Fund to sell portfolio securities at times when it would not otherwise do so, which may negatively impact the Fund’s NAV and liquidity. These transactions may also accelerate the realization of taxable income to shareholders if such sales of investments resulted in gains, and may also increase transaction costs. In addition, a large redemption could result in the Fund’s current expenses being allocated over a smaller asset base, leading to an increase in the Fund’s expense ratio. Similarly, large Fund share purchases may adversely affect the Fund’s performance to the extent that the Fund is delayed in investing new cash or otherwise maintains a larger cash position than it ordinarily would.
Liquidity Risk — The Fund may make investments that are illiquid or that may become less liquid in response to market developments or adverse investor perceptions. Illiquid investments may be more difficult to value. Liquidity risk may also refer to the risk that the Fund will not be able to pay redemption proceeds within the allowable time period or without significant dilution to remaining investors’ interests because of unusual market conditions, an unusually high volume of redemption requests, or other reasons. To meet redemption requests, the Fund may be forced to sell investments at an unfavorable time and/or under unfavorable conditions. If the Fund is forced to sell securities at an unfavorable time and/or under unfavorable conditions, such sales may adversely affect the Fund’s NAV and dilute remaining investors’ interests. These risks may be more pronounced in connection with the Fund’s investments in securities of issuers located in emerging market countries. Redemptions by large shareholders may have a negative impact on the Fund’s liquidity.
Market and Credit Risks — In the normal course of business, the Fund trades financial instruments and enters into financial transactions where risk of potential loss exists due to changes in the market (market risk). The value of the securities in which the Fund invests may go up or down in response to the prospects of individual companies, particular sectors or governments and/or general economic conditions throughout the world due to increasingly interconnected global economies and financial markets. Events such as war, acts of terrorism, social unrest, natural disasters, the spread of infectious illness or other public health threats could also significantly impact the Fund and its investments. Additionally, the Fund may also be exposed to credit risk in the event that an issuer or guarantor fails to perform or that an institution or entity with which the Fund has unsettled or open transactions defaults.
29
|
| GOLDMAN SACHS GQG PARTNERS INTERNATIONAL OPPORTUNITIES FUND |
Notes to Financial Statements (continued)
October 31, 2022
Under the Trust’s organizational documents, its Trustees, officers, employees and agents are indemnified, to the extent permitted by the Act and state law, against certain liabilities that may arise out of performance of their duties to the Fund. Additionally, in the course of business, the Fund enters into contracts that contain a variety of indemnification clauses. The Fund’s maximum exposure under these arrangements is unknown, as this would involve future claims that may be made against the Fund that have not yet occurred. However, GSAM believes the risk of loss under these arrangements to be remote.
Subsequent events after the Statement of Assets and Liabilities date have been evaluated, and GSAM has concluded that there is no impact requiring adjustment or disclosure in the financial statements.
In late February 2022, Russia began an invasion of Ukraine. Following such invasion, the United States, the European Union, and other countries and entities imposed wide-ranging sanctions on Russia and related entities. Certain Funds have limited market value in Russian and Ukrainian securities, which are being valued to reflect the limited liquidity and transferability in the current environment. With the closure of local Russian markets and imposition of sanctions in late February and early March, there are currently limited portfolio management actions possible as many of these assets are either sanctioned and/or cannot be transferred or settled. These sanctions and current environment could impair the ability of these Funds to buy, sell, hold, receive, deliver or otherwise transact in certain securities and other instruments. The full impact of the sanctions and the conflict on these Funds, the financial markets and the global economy is not yet known. Management is continuing to monitor these developments and evaluate other impacts they may have on these Funds.
30
GOLDMAN SACHS GQG PARTNERS INTERNATIONAL OPPORTUNITIES FUND
|
|
| 12. SUMMARY OF SHARE TRANSACTIONS |
Share activity is as follows:
| | | | | | | | | | | | | | | | |
| | | GQG Partners International Opportunities Fund | |
| | | For the Fiscal Year Ended
October 31, 2022 | | | For the Fiscal Year Ended
October 31, 2021 | |
| | | Shares | | | Dollars | | | Shares | | | Dollars | |
Class A Shares | | | | | | | | | | | | | | | | |
Shares sold | | | 17,718,616 | | | $ | 323,617,669 | | | | 15,327,690 | | | $ | 285,754,759 | |
Reinvestment of distributions | | | 409,602 | | | | 7,850,949 | | | | — | | | | — | |
Shares redeemed | | | (15,719,170 | ) | | | (277,398,513 | ) | | | (7,127,502 | ) | | | (136,492,176 | ) |
| |
| | | 2,409,048 | | | | 54,070,105 | | | | 8,200,188 | | | | 149,262,583 | |
| |
Class C Shares | | | | | | | | | | | | | | | | |
Shares sold | | | 950,808 | | | | 16,801,761 | | | | 1,835,193 | | | | 33,309,917 | |
Reinvestment of distributions | | | 55,958 | | | | 1,047,010 | | | | — | | | | — | |
Shares redeemed | | | (870,662 | ) | | | (15,153,818 | ) | | | (766,377 | ) | | | (13,973,158 | ) |
| |
| | | 136,104 | | | | 2,694,953 | | | | 1,068,816 | | | | 19,336,759 | |
| |
Institutional Shares | | | | | | | | | | | | | | | | |
Shares sold | | | 395,831,125 | | | | 7,132,314,224 | | | | 266,940,746 | | | | 5,069,586,246 | |
Reinvestment of distributions | | | 12,354,795 | | | | 238,278,563 | | | | 714,993 | | | | 12,734,017 | |
Shares redeemed | | | (238,319,685 | ) | | | (4,220,749,463 | ) | | | (87,331,187 | ) | | | (1,667,176,087 | ) |
| |
| | | 169,866,235 | | | | 3,149,843,324 | | | | 180,324,552 | | | | 3,415,144,176 | |
| |
Investor Shares | | | | | | | | | | | | | | | | |
Shares sold | | | 143,023,441 | | | | 2,582,325,151 | | | | 89,461,745 | | | | 1,687,883,379 | |
Reinvestment of distributions | | | 4,708,902 | | | | 90,582,637 | | | | 134,073 | | | | 2,381,133 | |
Shares redeemed | | | (77,566,273 | ) | | | (1,384,894,667 | ) | | | (36,741,877 | ) | | | (698,655,239 | ) |
| |
| | | 70,166,070 | | | | 1,288,013,121 | | | | 52,853,941 | | | | 991,609,273 | |
| |
Class R6 Shares | | | | | | | | | | | | | | | | |
Shares sold | | | 37,517,687 | | | | 678,102,440 | | | | 20,141,520 | | | | 380,845,722 | |
Reinvestment of distributions | | | 705,431 | | | | 13,598,097 | | | | 34,978 | | | | 622,614 | |
Shares redeemed | | | (12,051,480 | ) | | | (215,924,549 | ) | | | (6,940,777 | ) | | | (131,493,149 | ) |
| |
| | | 26,171,638 | | | | 475,775,988 | | | | 13,235,721 | | | | 249,975,187 | |
| |
Class R Shares | | | | | | | | | | | | | | | | |
Shares sold | | | 27,258 | | | | 468,440 | | | | 23,242 | | | | 436,058 | |
Reinvestment of distributions | | | 901 | | | | 17,099 | | | | — | | | | — | |
Shares redeemed | | | (6,098 | ) | | | (105,826 | ) | | | (13,934 | ) | | | (273,200 | ) |
| |
| | | 22,061 | | | | 379,713 | | | | 9,308 | | | | 162,858 | |
| |
Class P Shares | | | | | | | | | | | | | | | | |
Shares sold | | | 44,042,460 | | | | 800,568,308 | | | | 50,605,904 | | | | 954,425,639 | |
Reinvestment of distributions | | | 2,695,523 | | | | 51,959,366 | | | | 145,902 | | | | 2,597,062 | |
Shares redeemed | | | (30,759,058 | ) | | | (535,897,820 | ) | | | (8,992,585 | ) | | | (169,667,441 | ) |
| |
| | | 15,978,925 | | | | 316,629,854 | | | | 41,759,221 | | | | 787,355,260 | |
| |
NET INCREASE | | | 284,750,081 | | | $ | 5,287,407,058 | | | | 297,451,747 | | | $ | 5,612,846,096 | |
| |
31
Report of Independent Registered Public
Accounting Firm
To the Board of Trustees of Goldman Sachs Trust II and Shareholders of Goldman Sachs GQG Partners International Opportunities Fund
Opinion on the Financial Statements
We have audited the accompanying statement of assets and liabilities, including the schedule of investments, of Goldman Sachs GQG Partners International Opportunities Fund (one of the funds constituting Goldman Sachs Trust II, referred to hereafter as the “Fund”) as of October 31, 2022, the related statement of operations for the year ended October 31, 2022, the statements of changes in net assets for each of the two years in the period ended October 31, 2022, including the related notes, and the financial highlights for each of the periods indicated therein (collectively referred to as the “financial statements”). In our opinion, the financial statements present fairly, in all material respects, the financial position of the Fund as of October 31, 2022, the results of its operations for the year then ended, the changes in its net assets for each of the two years in the period ended October 31, 2022 and the financial highlights for each of the periods indicated therein in conformity with accounting principles generally accepted in the United States of America.
Basis for Opinion
These financial statements are the responsibility of the Fund’s management. Our responsibility is to express an opinion on the Fund’s financial statements based on our audits. We are a public accounting firm registered with the Public Company Accounting Oversight Board (United States) (PCAOB) and are required to be independent with respect to the Fund in accordance with the U.S. federal securities laws and the applicable rules and regulations of the Securities and Exchange Commission and the PCAOB.
We conducted our audits of these financial statements in accordance with the standards of the PCAOB. Those standards require that we plan and perform the audit to obtain reasonable assurance about whether the financial statements are free of material misstatement, whether due to error or fraud.
Our audits included performing procedures to assess the risks of material misstatement of the financial statements, whether due to error or fraud, and performing procedures that respond to those risks. Such procedures included examining, on a test basis, evidence regarding the amounts and disclosures in the financial statements. Our audits also included evaluating the accounting principles used and significant estimates made by management, as well as evaluating the overall presentation of the financial statements. Our procedures included confirmation of securities owned as of October 31, 2022 by correspondence with the custodian, transfer agent and brokers; when replies were not received from brokers, we performed other auditing procedures. We believe that our audits provide a reasonable basis for our opinion.
/s/PricewaterhouseCoopersLLP
Boston, Massachusetts
December 23, 2022
We have served as the auditor of one or more investment companies in the Goldman Sachs fund complex since 2000.
32
GOLDMAN SACHS GQG PARTNERS INTERNATIONAL OPPORTUNITIES FUND
|
Fund Expenses — Six Month Period Ended October 31, 2022 (Unaudited) |
As a shareholder of Class A, Class C, Administration, Preferred, Institutional, Service, Investor, Class R6, Class R or Class P Shares of a Fund, you incur two types of costs: (1) transaction costs, including sales charges on purchase payments (with respect to Class A Shares for certain Funds), contingent deferred sales charges on redemptions (generally with respect to Class C Shares), and (2) ongoing costs, including management fees; distribution and/or service (12b-1) fees (with respect to Class A, Class C, and Class R and Service Shares); and other Fund expenses. This example is intended to help you understand your ongoing costs (in dollars) of investing in Class A, Class C, Administration, Preferred, Institutional, Service, Investor, Class R6, Class R or Class P Shares of the Fund and to compare these costs with the ongoing costs of investing in other mutual funds.
The example is based on an investment of $1,000 invested at the beginning of the period and held for the entire period from May 1, 2022 through October 31, 2022, which represents a period of 184 days of a 365-day year. This projection assumes that annualized expense ratios were in effect during the period.
Actual Expenses — The first line under each share class in the table below provides information about actual account values and actual expenses. You may use the information in this line, together with the amount you invested, to estimate the expenses that you paid over the period. Simply divide your account value by $1,000 (for example, an $8,600 account value divided by $1,000=8.6), then multiply the result by the number in the first line under the heading entitled “Expenses Paid” to estimate the expenses you paid on your account during this period.
Hypothetical Example for Comparison Purposes — The second line under each share class in the table below provides information about hypothetical account values and hypothetical expenses based on the Funds’ actual net expense ratios and an assumed rate of return of 5% per year before expenses, which is not the Funds’ actual return. The hypothetical account values and expenses may not be used to estimate the actual ending account balance or expenses you paid for the period. You may use this information to compare the ongoing costs of investing in the Funds and other funds. To do so, compare this 5% hypothetical example with the 5% hypothetical examples that appear in the shareholder reports of the other funds. Please note that the expenses shown in the table are meant to highlight your ongoing costs only and do not reflect any transactional costs, such as sales charges, redemption fees, or exchange fees. Therefore, the second line of the table is useful in comparing ongoing costs only, and will not help you determine the relative total costs of owning different funds. In addition, if these transactional costs were included, your costs would have been higher.
| | | | | | | | | | | | |
| | | GQG Partners International Opportunities Fund | |
| | | Beginning | | | Ending | | | Expenses | |
| | | Account | | | Account | | | Paid for the | |
| | | Value | | | Value | | | 6 months ended | |
| Share Class | | 5/1/22 | | | 10/31/22 | | | 10/31/22* | |
Class A | | | | | | | | | | | | |
Actual | | | $1,000.00 | | | | $890.80 | | | | $5.41 | |
Hypothetical 5% return | | | 1,000.00 | | | | 1,019.50 | + | | | 5.78 | |
Class C | | | | | | | | | | | | |
Actual | | | 1,000.00 | | | | 887.70 | | | | 8.97 | |
Hypothetical 5% return | | | 1,000.00 | | | | 1,015.70 | + | | | 9.58 | |
Institutional | | | | | | | | | | | | |
Actual | | | 1,000.00 | | | | 892.70 | | | | 3.63 | |
Hypothetical 5% return | | | 1,000.00 | | | | 1,021.40 | + | | | 3.88 | |
Investor | | | | | | | | | | | | |
Actual | | | 1,000.00 | | | | 891.80 | | | | 4.22 | |
Hypothetical 5% return | | | 1,000.00 | | | | 1,020.70 | + | | | 4.51 | |
Class R6 | | | | | | | | | | | | |
Actual | | | 1,000.00 | | | | 893.20 | | | | 3.54 | |
Hypothetical 5% return | | | 1,000.00 | | | | 1,021.50 | + | | | 3.78 | |
Class R | | | | | | | | | | | | |
Actual | | | 1,000.00 | | | | 890.10 | | | | 6.60 | |
Hypothetical 5% return | | | 1,000.00 | | | | 1,018.20 | + | | | 7.05 | |
Class P | | | | | | | | | | | | |
Actual | | | 1,000.00 | | | | 892.70 | | | | 3.54 | |
Hypothetical 5% return | | | 1,000.00 | | | | 1,021.50 | + | | | 3.78 | |
| * | Expenses for each share class are calculated using the Fund’s annualized net expense ratio for each class, which represents the ongoing expenses as a percentage of net assets for the six months ended October 31, 2022. Expenses are calculated by multiplying the annualized net expense ratio by the average account value for the period; then multiplying the result by the number of days in the most recent fiscal half year; and then dividing that result by the number of days in the fiscal year. The annualized net expense ratios for the period were as follows: |
| + | Hypothetical expenses are based on the Fund’s actual annualized net expenses ratios and an assumed rate of return of 5% per year before expenses. |
| | | | | | | | | | | | | | | | | | | | | | | | | | | | |
| Fund | | Class A | | | Class C | | | Institutional | | | Investor | | | Class R6 | | | Class R | | | Class P | |
GQG Partners International Opportunities Fund | | | 1.14 | % | | | 1.89 | % | | | 0.76 | % | | | 0.89 | % | | | 0.74 | % | | | 1.39 | % | | | 0.74 | % |
33
|
| GOLDMAN SACHS GQG PARTNERS INTERNATIONAL OPPORTUNITIES FUND |
Statement Regarding Basis for Approval of Management Agreement and Sub-Advisory
Agreement (Unaudited)
Background
The Goldman Sachs GQG Partners International Opportunities Fund (the “Fund”) is an investment portfolio of Goldman Sachs Trust II (the “Trust”). The Board of Trustees (the “Board”) oversees the management of the Trust and reviews the investment performance and expenses of the Fund at regularly scheduled meetings held throughout the year. In addition, the Board determines annually whether to approve the continuance of the Trust’s investment management agreement (the “Management Agreement”) with Goldman Sachs Asset Management, L.P. (the “Investment Adviser”) on behalf of the Fund.
The Management Agreement was approved for continuation until June 30, 2023 at a meeting on June 9-10, 2022 and was most recently approved for continuation until September 30, 2023 at a meeting held on September 19-20, 2022 (together, the “Annual Meetings”) by the Board, including those Trustees who are not parties to the Management Agreement or “interested persons” (as defined in the Investment Company Act of 1940, as amended) of any party thereto (the “Independent Trustees”). At the Annual Meetings, the Board also considered the sub-advisory agreement (the “Sub-Advisory Agreement” and, together with the Management Agreement, the “Agreements”) between the Investment Adviser and GQG Partners LLC (the “Sub-Adviser”).
The review process undertaken by the Trustees spans the course of the year and culminates with the Annual Meetings. To assist the Trustees in their deliberations, the Trustees have established a Contract Review Committee (the “Committee”), comprised of the Independent Trustees. The Committee held five meetings over the course of the year since the Management Agreement was last approved. At those Committee meetings, regularly scheduled Board or other committee meetings, and/or the Annual Meetings, matters relevant to the renewal of the Management Agreement and the Sub-Advisory Agreement were considered by the Board, or the Independent Trustees, as applicable. With respect to the Fund, such matters included:
| | (a) | the nature and quality of the advisory, administrative, and other services provided to the Fund by the Investment Adviser and its affiliates and the Sub-Adviser, including, as applicable, information about: |
| | (i) | the structure, staff, and capabilities of the Investment Adviser and the Sub-Adviser and the Sub-Adviser’s portfolio management teams; |
| | (ii) | the groups within the Investment Adviser and its affiliates that support the portfolio management teams or provide other types of necessary services, including fund services groups (e.g., accounting and financial reporting, tax, shareholder services, and operations); controls and risk management groups (e.g., legal, compliance, valuation oversight, credit risk management, internal audit, compliance testing, market risk analysis, finance, and central funding); sales and distribution support groups, and others (e.g., information technology and training); |
| | (iii) | trends in employee headcount; |
| | (iv) | the Investment Adviser’s financial resources and ability to hire and retain talented personnel and strengthen its operations; and |
| | (v) | the parent company’s support of the Investment Adviser and its mutual fund business, as expressed by the firm’s senior management; |
| | (b) | information on the investment performance of the Fund, including comparisons to the performance of similar mutual funds, as provided by a third-party mutual fund data provider engaged as part of the contract review process (the “Outside Data Provider”), and a benchmark performance index; and information on general investment outlooks in the markets in which the Fund invests; |
| | (c) | information provided by the Investment Adviser indicating the Investment Adviser’s views on whether the Fund’s peer group and/or benchmark index had high, medium, or low relevance given the Fund’s particular investment strategy; |
| | (d) | the terms of the Agreements and other agreements with affiliated service providers entered into by the Trust on behalf of the Fund; |
| | (e) | fee and expense information for the Fund, including: |
| | (i) | the relative management fee and expense levels of the Fund as compared to those of comparable funds managed by other advisers, as provided by the Outside Data Provider; and |
| | (ii) | the Fund’s expense trends over time; |
| | (f) | with respect to the extensive investment performance and expense comparison data provided by the Outside Data Provider, its processes in producing that data for the Fund; |
| | (g) | the undertakings of the Investment Adviser and its affiliates to implement fee waivers and expense limitations; |
| | (h) | information relating to the profitability of the Management Agreement and the transfer agency and distribution and service arrangements of the Fund to the Investment Adviser and its affiliates; |
| | (i) | whether the Fund’s existing management fee schedule adequately addressed any economies of scale; |
| | (j) | a summary of the “fall-out” benefits derived by the Investment Adviser and its affiliates from their relationships with the Fund, including the fees received by the Investment Adviser’s affiliates from the Fund for transfer agency, securities lending, portfolio trading, distribution and other services; |
34
GOLDMAN SACHS GQG PARTNERS INTERNATIONAL OPPORTUNITIES FUND
Statement Regarding Basis for Approval of Management Agreement and Sub-Advisory
Agreement (Unaudited) (continued)
| | (k) | a summary of potential benefits derived by the Fund as a result of its relationship with the Investment Adviser; |
| | (l) | portfolio manager ownership of Fund shares; the manner in which portfolio manager compensation is determined; information on the Sub-Adviser’s compensation arrangements; and the number and types of accounts managed by the portfolio managers; |
| | (m) | the nature and quality of the services provided to the Fund by its unaffiliated service providers (as well as the Sub-Adviser), and the Investment Adviser’s general oversight and evaluation (including reports on due diligence) of those service providers as part of the administrative services provided under the Management Agreement; and |
| | (n) | the Investment Adviser’s and Sub-Adviser’s processes and policies addressing various types of potential conflicts of interest; their approaches to risk management; the annual review of the effectiveness of the Fund’s compliance program; and periodic compliance reports. |
The Trustees also received an overview of the Fund’s distribution arrangements. They received information regarding the Fund’s assets, share purchase and redemption activity, and payment of distribution and service fees. Information was also provided to the Trustees relating to revenue sharing payments made by and services provided by the Investment Adviser and its affiliates to intermediaries that promote the sale, distribution, and/or servicing of Fund shares. The Trustees also discussed the broad range of other investment choices that are available to Fund investors, including the availability of comparable funds managed by other advisers.
The presentations made at the Board and Committee meetings and at the Annual Meetings encompassed the Fund and other mutual funds for which the Board has responsibility. In evaluating the Agreements at the Annual Meetings, the Trustees relied upon their knowledge, resulting from their meetings and other interactions throughout the year, of the Fund and the respective services of the Investment Adviser and its affiliates, and the Sub-Adviser. In conjunction with these meetings, the Trustees received written materials and oral presentations on the topics covered, and the Investment Adviser addressed the questions and concerns of the Trustees, including concerns regarding the investment performance of certain of the funds they oversee. In addition, the Trustees periodically received written materials and oral presentations from the Sub-Adviser. The Independent Trustees were advised by their independent legal counsel regarding their responsibilities and other regulatory requirements related to the approval and continuation of mutual fund investment management agreements under applicable law. In addition, the Investment Adviser and its affiliates provided the Independent Trustees with a written response to a formal request for information sent on behalf of the Independent Trustees by their independent legal counsel. The Trustees reviewed a written response prepared by the Sub-Adviser to a similar request for information submitted to the Sub-Adviser by the Investment Adviser. During the course of their deliberations, the Independent Trustees met in executive sessions with their independent legal counsel, without representatives of the Investment Adviser or its affiliates present.
Nature, Extent, and Quality of the Services Provided Under the Management Agreement
As part of their review, the Trustees considered the nature, extent, and quality of the services provided to the Fund by the Investment Adviser. In this regard, the Trustees considered both the investment advisory services and non-advisory services that are provided by the Investment Adviser and its affiliates. The Trustees noted the transition in the leadership and the changes in personnel of various of the Investment Adviser’s portfolio management teams that had occurred in recent periods, and the ongoing recruitment efforts aimed at bringing high quality investment talent to the Investment Adviser. They also noted the Investment Adviser’s commitment to maintaining high quality systems and expending substantial resources to respond to ongoing changes to the market, regulatory and control environment in which the Fund and its service providers operate, including developments associated with the COVID-19 pandemic, geopolitical events, and economic sanctions, as well as the efforts of the Investment Adviser and its affiliates to combat cyber security risks. The Trustees also considered information regarding the Investment Adviser’s and the Sub-Adviser’s business continuity planning and remote operations capabilities. The Trustees concluded that the Investment Adviser continued to commit substantial financial and operational resources to the Fund and expressed confidence that the Investment Adviser would continue to do so in the future. The Trustees also recognized that the Investment Adviser had made significant commitments to address regulatory compliance requirements applicable to the Fund and the Investment Adviser and its affiliates. In addition, the Trustees reviewed the Sub-Adviser oversight process that the Investment Adviser had employed, which included areas such as investment analytics, risk management and compliance.
Investment Performance
The Trustees also considered the investment performance of the Fund. In this regard, they compared the investment performance of the Fund to its peers using rankings and ratings compiled by the Outside Data Provider as of December 31, 2021, and updated performance information prepared by the Investment Adviser as of March 31, 2022. The information on the Fund’s
35
|
| GOLDMAN SACHS GQG PARTNERS INTERNATIONAL OPPORTUNITIES FUND |
Statement Regarding Basis for Approval of Management Agreement and Sub-Advisory
Agreement (Unaudited) (continued)
investment performance was provided for the one-, three-, and five-year periods ending on the applicable dates. The Trustees also reviewed the Fund’s investment performance relative to its performance benchmark. As part of this review, they considered the investment performance trends of the Fund over time, and reviewed the investment performance of the Fund in light of its investment objective and policies and market conditions.
In addition, the Trustees considered materials prepared and presentations made by the Investment Adviser’s senior management and the Sub-Adviser’s portfolio management personnel in which Fund performance was assessed. The Trustees also considered the Investment Adviser’s periodic reports with respect to the Fund’s risk profile, and how the Investment Adviser’s approach to risk monitoring and management influences portfolio management.
The Trustees noted that the Fund’s Institutional Shares had placed in the top half of the Fund’s performance peer group for the one- and five-year periods and in the third quartile for the three-year period ended December 31, 2021 and had outperformed the Fund’s benchmark index for the one-, three-, and five-year periods ended March 31, 2022.
Costs of Services Provided and Competitive Information
The Trustees considered the contractual terms of the Management Agreement, the fee rates payable by the Fund thereunder, and the net amount retained by the Investment Adviser after payment of sub-advisory fees. In this regard, the Trustees considered information on the services rendered by the Investment Adviser to the Fund, which included both advisory and administrative services that were directed to the needs and operations of the Fund as a registered mutual fund.
In particular, the Trustees reviewed analyses prepared by the Outside Data Provider regarding the expense rankings of the Fund, as well as additional information provided by the Investment Adviser throughout the year. The analyses provided a comparison of the Fund’s management fee and breakpoints to those of a relevant peer group and category universe; an expense analysis which compared the Fund’s overall net and gross expenses to a peer group and a category universe; and data comparing the Fund’s net expenses to the peer and category medians. The analyses also compared the Fund’s other expenses and fee waivers/reimbursements to those of the peer group and category medians. The Trustees concluded that the comparisons provided by the Outside Data Provider and the Investment Adviser were useful in evaluating the reasonableness of the management fees and total expenses paid by the Fund.
The Trustees considered the Investment Adviser’s undertaking to limit certain expenses of the Fund that exceed a specified level. In addition, the Trustees noted that shareholders are able to redeem their shares at any time if shareholders believe that the Fund fees and expenses are too high or if they are dissatisfied with the performance of the Fund.
Profitability
The Trustees reviewed the Fund’s contribution to the Investment Adviser’s revenues and pre-tax profit margins. In this regard the Trustees noted that they had received, among other things, profitability analyses and summaries, revenue and expense schedules by Fund and by function (i.e., investment management, transfer agency and distribution and service), and information on the Investment Adviser’s expense allocation methodology. They observed that the profitability and expense figures are substantially similar to those used by the Investment Adviser for many internal purposes, including compensation decisions among various business groups, and are thus subject to a vigorous internal debate about how certain revenue and expenses should be allocated. The Trustees also noted that the internal audit group within the Goldman Sachs organization periodically audits the expense allocation methodology and that the internal audit group was satisfied with the reasonableness, consistency, and accuracy of the Investment Adviser’s expense allocation methodology. Profitability data for the Fund was provided for 2021 and 2020, and the Trustees considered this information in relation to the Investment Adviser’s overall profitability. They noted the impact that the substantial asset growth of the Fund had on the associated revenues and expenses.
Economies of Scale
The Trustees considered the information that had been provided regarding whether there have been economies of scale with respect to the management of the Fund. The Trustees also considered the breakpoints in the fee rate payable under the Management Agreement for the Fund at the following annual percentage rates of the average daily net assets of the Fund:
36
GOLDMAN SACHS GQG PARTNERS INTERNATIONAL OPPORTUNITIES FUND
Statement Regarding Basis for Approval of Management Agreement and Sub-Advisory
Agreement (Unaudited) (continued)
| | |
| Average Daily Net Assets | | Management Fee Annual Rate |
First $1 billion | | 0.85% |
Next $1 billion | | 0.77 |
Next $3 billion | | 0.73 |
Next $3 billion | | 0.71 |
Over $8 billion | | 0.70 |
The Trustees noted that the breakpoints were designed to share potential economies of scale, if any, with the Fund and its shareholders as assets under management reach those asset levels. The Trustees considered the amounts of assets in the Fund; the Fund’s recent purchase and redemption activity; the information provided by the Investment Adviser relating to the costs of the services provided by the Investment Adviser and its affiliates and the profits realized by them (if any); information comparing the fee rates charged by the Investment Adviser with fee rates charged to other funds in the peer group; and the Investment Adviser’s undertakings to waive certain fees and to limit certain expenses of the Fund that exceed a specified level, as well as Goldman Sachs & Co. LLC’s (“Goldman Sachs”) undertaking to waive a portion of the transfer agency fees paid by the Fund’s Class R6 Shares. The Trustees also considered the relationship between the advisory and sub-advisory fee rate schedules. Upon reviewing these matters at the Annual Meetings, the Trustees concluded that the fee breakpoints represented a means of assuring that benefits of scalability, if any, would be passed along to shareholders at the specified asset levels. They also noted that the Investment Adviser had passed along savings to shareholders of the Fund, which had asset levels above the highest breakpoint.
Other Benefits to the Investment Adviser and Its Affiliates
The Trustees also considered the other benefits derived by the Investment Adviser and its affiliates from their relationships with the Fund as stated above, including: (a) transfer agency fees received by Goldman Sachs; (b) brokerage and futures commissions earned by Goldman Sachs for executing securities transactions (in its capacity as clearing broker) and futures transactions on behalf of the Fund; (c) fees earned by Goldman Sachs Agency Lending (“GSAL”), an affiliate of the Investment Adviser, as securities lending agent (and fees earned by the Investment Adviser for managing the fund in which the Fund’s cash collateral is invested); (d) the Investment Adviser’s ability to leverage the infrastructure designed to service the Fund on behalf of its other clients; (e) the Investment Adviser’s ability to cross-market other products and services to Fund shareholders; (f) Goldman Sachs’ retention of certain fees as Fund distributor; (g) the Investment Adviser’s ability to negotiate better pricing with the Fund’s custodian on behalf of its other clients, as a result of the relationship with the Fund; (h) the investment of cash and cash collateral in money market funds managed by the Investment Adviser that will result in increased assets under management for those money market funds; and (i) the possibility that the working relationship between the Investment Adviser and the Fund’s third-party service providers (including the Sub-Adviser) may cause those service providers to be more likely to do business with other areas of Goldman Sachs. In the course of considering the foregoing, the Independent Trustees requested and received further information quantifying certain of these fall-out benefits.
Other Benefits to the Fund and Its Shareholders
The Trustees also noted that the Fund receives certain other potential benefits as a result of their relationship with the Investment Adviser, including: (a) enhanced servicing from vendors due to the volume of business generated by the Investment Adviser and its affiliates; (b) the advantages received from the Investment Adviser’s knowledge and experience gained from managing other accounts and products; (c) the Investment Adviser’s ability to hire and retain qualified personnel to provide services to the Fund because of the reputation of the Goldman Sachs organization; (d) the Fund’s access, through the Investment Adviser, to certain firm-wide resources (e.g., proprietary risk management systems and databases), subject to certain restrictions; (e) the Fund’s ability to participate in the securities lending program administered by GSAL, as measured by the revenue received by the Fund in connection with the program; and (f) the Fund’s access to certain affiliated distribution channels.
Conclusion
In connection with their consideration of the Management Agreement, the Trustees gave weight to each of the factors described above, but did not identify any particular factor as controlling their decision. After deliberation and consideration of all of the information provided, including the factors described above, the Trustees concluded, in the exercise of their business judgment, that the management fees paid by the Fund were reasonable in light of the factors considered, and that the Management Agreement should be approved and continued with respect to the Fund until September 30, 2023.
37
|
| GOLDMAN SACHS GQG PARTNERS INTERNATIONAL OPPORTUNITIES FUND |
Statement Regarding Basis for Approval of Management Agreement and Sub-Advisory
Agreement (Unaudited) (continued)
Sub-Advisory Agreement with GQG Partners LLC
Nature, Extent, and Quality of the Services Provided Under the Sub-Advisory Agreement
In evaluating the Sub-Advisory Agreement, the Trustees relied upon materials furnished and presentations made by the Investment Adviser and Sub-Adviser. In evaluating the nature, extent, and quality of services provided by the Sub-Adviser, the Trustees considered information on the services provided to the Fund by the Sub-Adviser, including information about the Sub-Adviser’s (a) personnel and compensation structure; (b) track record in managing the Fund and other funds and/or accounts with investment strategies similar to those employed on behalf of the Fund; (c) policies and procedures in place to address potential conflicts of interest; and (d) compliance program and code of ethics. In this regard, they also considered assessments provided by the Investment Adviser of the Sub-Adviser, the Sub-Adviser’s investment strategies and personnel, and its compliance program. The Trustees also considered information regarding the Sub-Adviser’s business continuity planning and remote operations capabilities.
Costs of Services Provided
The Trustees reviewed the terms of the Sub-Advisory Agreement, including the schedule of fees payable to the Sub-Adviser. They considered the breakpoints in the sub-advisory fee rate payable under the Sub-Advisory Agreement. The Trustees noted that the compensation paid to the Sub-Adviser is paid by the Investment Adviser, not by the Fund. They also considered the expense limitations that substantially reduce the fees retained by the Investment Adviser, and that the retention of the Sub-Adviser does not directly increase the fees incurred by the Fund for advisory services. They considered the Investment Adviser’s belief that the relationship between the management fees paid by the Fund and the sub-advisory fees paid by the Investment Adviser is appropriate given the level of services the Investment Adviser provides to the Fund and significant differences in cost drivers and risks associated with the respective services offered by the Investment Adviser and the Sub-Adviser.
Conclusion
In connection with their consideration of the Sub-Advisory Agreement, the Trustees gave weight to various factors, but did not identify any particular factor as controlling their decision. After deliberation and consideration of the information provided, including the factors described above, the Trustees, including the Independent Trustees, unanimously concluded, in the exercise of their business judgment, that the sub-advisory fees paid by the Investment Adviser to the Sub-Adviser were reasonable in light of the factors considered, and that the Sub-Advisory Agreement should be approved and continued until September 30, 2023.
38
GOLDMAN SACHS GQG PARTNERS INTERNATIONAL OPPORTUNITIES FUND
Voting Results of Special Meeting of Shareholders (Unaudited)
A Special Meeting (the “Meeting”) of the Goldman Sachs Trust II (the “Trust”) was held on December 3, 2021 to consider and act upon the proposal below. Each Fund has amortized its respective share of the proxy, shareholder meeting and other related costs and GSAM has agreed to reimburse the Fund in an amount equal to the portion of the increase in the Fund’s total expense ratio that exceeds a specified percentage.
At the Meeting, Steven D. Krichmar, Linda A. Lang, Michael Latham and Lawrence W. Stranghoener were elected to the Trust’s Board of Trustees. In electing trustees, the Trust’s shareholders voted as follows:
| | | | | | | | | | |
| Proposal 1 | | | | | | | | |
| Election of Trustees | | For | | | Against/Withhold | | | Abstain |
Steven D. Krichmar | | | 997,212,261 | | | | 10,105,414 | | | 0 |
Linda A. Lang | | | 1,004,981,372 | | | | 2,336,303 | | | 0 |
Michael Latham | | | 995,719,416 | | | | 11,598,259 | | | 0 |
Lawrence W. Stranghoener | | | 995,630,574 | | | | 11,687,101 | | | 0 |
39
|
| GOLDMAN SACHS GQG PARTNERS INTERNATIONAL OPPORTUNITIES FUND |
Trustees and Officers (Unaudited)
Independent Trustees
| | | | | | | | | | |
Name,
Address and Age1 | | Position(s) Held
with the Trust | | Term of
Office and
Length of
Time Served2 | | Principal Occupation(s) During Past 5 Years | | Number of
Portfolios in
Fund Complex
Overseen by
Trustee3 | | Other
Directorships
Held by Trustee4 |
Cheryl K. Beebe Age: 66 | | Chair of the Board of Trustees | | Since 2017 (Trustee since 2015) | | Ms. Beebe is retired. She is Director, Packaging Corporation of America (2008-Present); Director, The Mosaic Company (2019-Present); Director, HanesBrands Inc. (2020-Present); and was formerly Director, Convergys Corporation (a global leader in customer experience outsourcing) (2015-2018); and formerly held the position of Executive Vice President, (2010-2014); and Chief Financial Officer, Ingredion, Inc. (a leading global ingredient solutions company) (2004-2014). Chair of the Board of Trustees — Goldman Sachs Trust II; Goldman Sachs MLP and Energy Renaissance Fund; Goldman Sachs ETF Trust; Goldman Sachs ETF Trust II; and Goldman Sachs Real Estate Diversified Income Fund. | | 67 | | Packaging Corporation of America (producer of container board); The Mosaic Company (producer of phosphate and potash fertilizer); HanesBrands Inc. (a multinational clothing company) |
Lawrence Hughes Age: 64 | | Trustee | | Since 2016 | | Mr. Hughes is retired. Formerly, he held senior management positions with BNY Mellon Wealth Management, a division of The Bank of New York Mellon Corporation (a financial services company) (1991-2015), most recently as Chief Executive Officer (2010-2015). He serves as a Member of the Board of Directors, (2012-Present) and formerly served as Chairman (2012-2019), Ellis Memorial and Eldredge House (a not-for-profit organization). Previously, Mr. Hughes served as an Advisory Board Member of Goldman Sachs Trust II (February 2016-April 2016). Trustee — Goldman Sachs Trust II; Goldman Sachs MLP and Energy Renaissance Fund; Goldman Sachs ETF Trust; Goldman Sachs ETF Trust II; and Goldman Sachs Real Estate Diversified Income Fund. | | 67 | | None |
John F. Killian Age: 67 | | Trustee | | Since 2015 | | Mr. Killian is retired. He is Director, Consolidated Edison, Inc. (2007-Present); and was formerly Director, Houghton Mifflin Harcourt Publishing Company (2011-2022). Previously, he held senior management positions with Verizon Communications, Inc., including Executive Vice President and Chief Financial Officer (2009-2010); and President, Verizon Business, Verizon Communications, Inc. (2005-2009). Trustee — Goldman Sachs Trust II; Goldman Sachs MLP and Energy Renaissance Fund; Goldman Sachs ETF Trust; Goldman Sachs ETF Trust II; and Goldman Sachs Real Estate Diversified Income Fund. | | 67 | | Consolidated Edison, Inc. (a utility holding company) |
Steven D. Krichmar Age: 64 | | Trustee | | Since 2018 | | Mr. Krichmar is retired. Formerly, he held senior management and governance positions with Putnam Investments, LLC, a financial services company (2001-2016). He was most recently Chief of Operations and a member of the Operating Committee of Putnam Investments, LLC and Principal Financial Officer of The Putnam Funds. Previously, Mr. Krichmar served as an Audit Partner with PricewaterhouseCoopers LLP and its predecessor company (1990-2001). Trustee — Goldman Sachs Trust II; Goldman Sachs MLP and Energy Renaissance Fund; Goldman Sachs ETF Trust; Goldman Sachs ETF Trust II; and Goldman Sachs Real Estate Diversified Income Fund. | | 67 | | None |
Linda A. Lang Age: 64 | | Trustee | | Since 2021 | | Ms. Lang is retired. She was formerly Chair of the Board of Directors, (2016-2019) and Member of the Board of Directors, WD-40 Company (a global consumer products company) (2004-2019); Chairman and Chief Executive Officer (2005-2014); and Director, President and Chief Operating Officer, Jack in the Box, Inc. (a restaurant company) (2003-2005). Previously, Ms. Lang served as an Advisory Board Member of Goldman Sachs MLP and Energy Renaissance Fund (February 2016-March 2016). Trustee — Goldman Sachs Trust II; Goldman Sachs MLP and Energy Renaissance Fund; Goldman Sachs ETF Trust; Goldman Sachs ETF Trust II; Goldman Sachs Credit Income Fund; and Goldman Sachs Real Estate Diversified Income Fund. | | 68 | | None |
| | | | | | | | | | |
40
GOLDMAN SACHS GQG PARTNERS INTERNATIONAL OPPORTUNITIES FUND
Trustees and Officers (Unaudited) (continued)
Independent Trustees
| | | | | | | | | | |
Name,
Address and Age1 | | Position(s) Held
with the Trust | | Term of
Office and
Length of
Time Served2 | | Principal Occupation(s) During Past 5 Years | | Number of
Portfolios in
Fund Complex
Overseen by
Trustee3 | | Other
Directorships
Held by
Trustee4 |
Michael Latham Age: 57 | | Trustee | | Since 2021 | | Mr. Latham is retired. He currently serves as Chief Operating Officer and Director of FinTech Evolution Acquisition Group (a special purpose acquisition company) (2021-Present). Formerly, Mr. Latham held senior management positions with the iShares exchange-traded fund business owned by BlackRock, Inc., including Chairman (2011-2014); Global Head (2010-2011); U.S. Head (2007-2010); and Chief Operating Officer (2003-2007). Trustee — Goldman Sachs Trust II; Goldman Sachs MLP and Energy Renaissance Fund; Goldman Sachs ETF Trust; Goldman Sachs ETF Trust II; Goldman Sachs Credit Income Fund; and Goldman Sachs Real Estate Diversified Income Fund. | | 68 | | FinTech Evolution Acquisition Group (a special purpose acquisition company) |
Lawrence W. Stranghoener Age: 68 | | Trustee | | Since 2021 | | Mr. Stranghoener is retired. He is Chairman, Kennametal, Inc. (a global manufacturer and distributor of tooling and industrial materials) (2003-Present); and was formerly Director, Aleris Corporation and Aleris International, Inc. (a producer of aluminum rolled products) (2011- 2020); Interim Chief Executive Officer (2014) and Executive Vice President and Chief Financial Officer (2004-2014), Mosaic Company (a fertilizer manufacturing company). Trustee — Goldman Sachs Trust II; Goldman Sachs MLP and Energy Renaissance Fund; Goldman Sachs ETF Trust; Goldman Sachs ETF Trust II; and Goldman Sachs Real Estate Diversified Income Fund. Chair of the Board of Trustees — Goldman Sachs Credit Income Fund. | | 68 | | Kennametal, Inc. (a global manufacturer and distributor of tooling and industrial materials) |
| | | | | | | | | | |
41
|
| GOLDMAN SACHS GQG PARTNERS INTERNATIONAL OPPORTUNITIES FUND |
Trustees and Officers (Unaudited) (continued)
Interested Trustee*
| | | | | | | | | | |
Name,
Address and Age1 | | Position(s) Held
with the Trust | | Term of
Office and
Length of
Time Served2 | | Principal Occupation(s) During Past 5 Years | | Number of
Portfolios in
Fund Complex
Overseen by
Trustee3 | | Other
Directorships
Held by
Trustee4 |
James A. McNamara Age: 60 | | President and Trustee | | Since 2012 | | Advisory Director, Goldman Sachs (January 2018-Present); Managing Director, Goldman Sachs (January 2000-December 2017); Director of Institutional Fund Sales, GSAM (April 1998- December 2000); and Senior Vice President and Manager, Dreyfus Institutional Service Corporation (January 1993- April 1998). President and Trustee — Goldman Sachs Trust II; Goldman Sachs Trust; Goldman Sachs Variable Insurance Trust; Goldman Sachs MLP and Energy Renaissance Fund; Goldman Sachs ETF Trust; Goldman Sachs ETF Trust II; Goldman Sachs Credit Income Fund; and Goldman Sachs Real Estate Diversified Income Fund. | | 171 | | None |
| | | | | | | | | | |
| * | Mr. McNamara is considered to be an “Interested Trustee” because he holds positions with Goldman Sachs and owns securities issued by The Goldman Sachs Group, Inc. Mr. McNamara holds comparable positions with certain other companies of which Goldman Sachs, GSAM or an affiliate thereof is the investment adviser, administrator and/or distributor. |
| 1 | Each Trustee may be contacted by writing to the Trustee, c/o Goldman Sachs, 200 West Street, New York, New York, 10282, Attn: Caroline Kraus. Information is provided as of October 31, 2022. |
| 2 | Subject to such policies as may be adopted by the Board from time-to-time, each Trustee holds office for an indefinite term, until the earliest of: (a) the election of his or her successor; (b) the date the Trustee resigns or is removed by the Board or shareholders, in accordance with the Trust’s Declaration of Trust; or (c)the termination of the Trust. The Board has adopted policies which provide that each Independent Trustee shall retire as of December 31st of the calendar year in which he or she reaches (a) his or her 75th birthday or (b) the 15th anniversary of the date he or she became a Trustee, whichever is earlier, unless a waiver of such requirements shall have been adopted by a majority of the other Trustees. These policies may be changed by the Trustees without shareholder vote. |
| 3 | The Goldman Sachs Fund Complex includes certain other companies listed above for each respective Trustee. As of October 31, 2022, Goldman Sachs Trust II consisted of 18 portfolios (16 of which offered shares to the public); Goldman Sachs Trust consisted of 88 portfolios; Goldman Sachs Variable Insurance Trust consisted of 15 portfolios (12 of which offered shares to the public); Goldman Sachs ETF Trust consisted of 46 portfolios (29 of which offered shares to the public); Goldman Sachs ETF Trust II consisted of 2 portfolios (1 of which offered shares to the public); and Goldman Sachs MLP and Energy Renaissance Fund, Goldman Sachs Credit Income Fund and Goldman Sachs Real Estate Diversified Income Fund each consisted of one portfolio. Goldman Sachs Credit Income Fund did not offer shares to the public. |
| 4 | This column includes only directorships of companies required to report to the Securities and Exchange Commission under the Securities Exchange Act of 1934 (i.e., “public companies”) or other investment companies registered under the Act. |
Additional information about the Trustees is available in the Fund’s Statement of Additional Information, which can be obtained from Goldman Sachs free of charge by calling this toll-free number (in the United States of America): 1-800-526-7384.
42
GOLDMAN SACHS GQG PARTNERS INTERNATIONAL OPPORTUNITIES FUND
Trustees and Officers (Unaudited) (continued)
Officers of the Trust*
| | | | | | | | | | |
| Name, Address and Age1 | | Position(s) Held with
the Trust | | | Term of
Office and
Length of
Time Served2 | | | Principal Occupation(s) During Past 5 Years |
James A. McNamara 200 West Street New York, NY 10282 Age: 60 | |
| President and
Trustee |
| | | Since 2012 | | | Advisory Director, Goldman Sachs (January 2018-Present); Managing Director, Goldman Sachs (January 2000-December 2017); Director of Institutional Fund Sales, GSAM (April 1998-December 2000); and Senior Vice President and Manager, Dreyfus Institutional Service Corporation (January 1993- April 1998). President and Trustee — Goldman Sachs Trust II; Goldman Sachs Trust; Goldman Sachs Variable Insurance Trust; Goldman Sachs MLP and Energy Renaissance Fund; Goldman Sachs ETF Trust; Goldman Sachs ETF Trust II; Goldman Sachs Credit Income Fund; and Goldman Sachs Real Estate Diversified Income Fund. |
Joseph F. DiMaria 30 Hudson Street Jersey City, NJ 07302 Age: 54 | |
| Treasurer, Principal
Financial Officer and
Principal
Accounting Officer |
| |
| Since 2017
(Treasurer
and
Principal
Financial
Officer
Since 2019) |
| | Managing Director, Goldman Sachs (November 2015-Present) and Vice President — Mutual Fund Administration, Columbia Management Investment Advisers, LLC (May 2010-October 2015). Treasurer, Principal Financial Officer and Principal Accounting Officer — Goldman Sachs Trust II (previously Assistant Treasurer (2017)); Goldman Sachs Trust (previously Assistant Treasurer (2016)); Goldman Sachs Variable Insurance Trust (previously Assistant Treasurer (2016)); Goldman Sachs MLP and Energy Renaissance Fund (previously Assistant Treasurer (2017)); Goldman Sachs ETF Trust (previously Assistant Treasurer (2017)); Goldman Sachs ETF Trust II; Goldman Sachs Credit Income Fund; and Goldman Sachs Real Estate Diversified Income Fund. |
Caroline L. Kraus 200 West Street New York, NY 10282 Age: 45 | | | Secretary | | | | Since 2012 | | | Managing Director, Goldman Sachs (January 2016-Present); Vice President, Goldman Sachs (August 2006-December 2015); Senior Counsel, Goldman Sachs (January 2020-Present); Associate General Counsel, Goldman Sachs (2012-December 2019); Assistant General Counsel, Goldman Sachs (August 2006-December 2011); and Associate, Weil, Gotshal & Manges, LLP (2002-2006). Secretary — Goldman Sachs Trust II; Goldman Sachs Trust (previously Assistant Secretary (2012)); Goldman Sachs Variable Insurance Trust (previously Assistant Secretary (2012)); Goldman Sachs BDC, Inc.; Goldman Sachs Private Middle Market Credit LLC; Goldman Sachs Private Middle Market Credit II LLC; Goldman Sachs Middle Market Lending Corp.; Goldman Sachs MLP and Energy Renaissance Fund; Goldman Sachs ETF Trust; Goldman Sachs ETF Trust II; Goldman Sachs Credit Income Fund; and Goldman Sachs Real Estate Diversified Income Fund. |
| | | | | | | | | | |
| * | Represents a partial list of officers of the Trust. Additional information about all the officers is available in the Fund’s Statement of Additional Information, which can be obtained from Goldman Sachs free of charge by calling this toll-free number (in the United States): 1-800-526-7384. |
| 1 | Information is provided as of October 31, 2022. |
| 2 | Officers hold office at the pleasure of the Board of Trustees or until their successors are duly elected and qualified. Each officer holds comparable positions with certain other companies of which Goldman Sachs, GSAM or an affiliate thereof is the investment adviser, administrator and/or distributor. |
Goldman Sachs GQG Partners International Opportunities Fund—Tax Information (Unaudited)
For the year ended October 31, 2022, 7.49% of the dividends paid from net investment company taxable income by the Goldman Sachs GQG Partners International Opportunities Fund qualify for the dividends received deduction available to corporations.
For the year ended October 31, 2022, 100% of the dividends paid from net investment company taxable income by the Goldman Sachs GQG Partners International Opportunities Fund qualify for the reduced tax rate under the Jobs and Growth Tax Relief and Reconciliation Act of 2003.
From distributions paid during the year ended October 31, 2022, the total amount of income received by the Goldman Sachs GQG Partners International Opportunities Fund from sources within foreign countries and possessions of the United States was $0.2802 per share, all of which is attributable to qualified passive income. The percentage of net investment income dividends paid from foreign sources by the Goldman Sachs GQG Partners International Opportunities Fund was 94.38%. The total amount of taxes paid by the Goldman Sachs GQG Partners International Opportunities Fund to such countries was $0.0287 per share.
43
(This page intentionally left blank)
FUNDS PROFILE
Goldman Sachs Funds
Goldman Sachs is a premier financial services firm, known since 1869 for creating thoughtful and customized investment solutions in complex global markets.
Today, the Asset Management Division of Goldman Sachs serves a diverse set of clients worldwide, including private institutions, public entities and individuals. With approximately $2.19 trillion in assets under supervision as of September 30, 2022, Goldman Sachs Asset Management (“GSAM”) has portfolio management teams located around the world and our investment professionals bring firsthand knowledge of local markets to every investment decision. Assets under supervision includes assets under management and other client assets for which Goldman Sachs does not have full discretion. GSAM leverages the resources of Goldman Sachs & Co. LLC subject to legal, internal and regulatory restrictions.
Money Market
Financial Square FundsSM
| ∎ | Financial Square Treasury Solutions Fund1 |
| ∎ | Financial Square Government Fund1 |
| ∎ | Financial Square Money Market Fund2 |
| ∎ | Financial Square Prime Obligations Fund2 |
| ∎ | Financial Square Treasury Instruments Fund1 |
| ∎ | Financial Square Treasury Obligations Fund1 |
| ∎ | Financial Square Federal Instruments Fund1 |
Investor FundsSM
| ∎ | Investor Money Market Fund3 |
| ∎ | Investor Tax-Exempt Money Market Fund3 |
Fixed Income
Short Duration and Government
| ∎ | Short-Term Conservative Income Fund |
| ∎ | Short Duration Government Fund |
| ∎ | Short Duration Income Fund |
| ∎ | Inflation Protected Securities Fund |
Multi-Sector
| ∎ | Global Core Fixed Income Fund |
Municipal and Tax-Free
| ∎ | High Yield Municipal Fund |
| ∎ | Dynamic Municipal Income Fund |
| ∎ | Short Duration Tax-Free Fund |
| ∎ | Municipal Income Completion Fund |
Single Sector
| ∎ | Investment Grade Credit Fund |
| ∎ | High Yield Floating Rate Fund |
| ∎ | Emerging Markets Debt Fund |
| ∎ | Local Emerging Markets Debt Fund |
Fixed Income Alternatives
| ∎ | Long Short Credit Strategies Fund |
Fundamental Equity
| ∎ | Small/Mid Cap Value Fund |
| ∎ | Small/Mid Cap Growth Fund |
| ∎ | Concentrated Growth Fund |
| ∎ | Technology Opportunities Fund |
| ∎ | Rising Dividend Growth Fund |
Tax-Advantaged Equity
| ∎ | U.S. Tax-Managed Equity Fund |
| ∎ | International Tax-Managed Equity Fund |
| ∎ | U.S. Equity Dividend and Premium Fund |
| ∎ | International Equity Dividend and Premium Fund |
Equity Insights
| ∎ | Small Cap Equity Insights Fund |
| ∎ | U.S. Equity Insights Fund |
| ∎ | Small Cap Growth Insights Fund |
| ∎ | Large Cap Growth Insights Fund |
| ∎ | Large Cap Value Insights Fund |
| ∎ | Small Cap Value Insights Fund |
| ∎ | International Small Cap Insights Fund |
| ∎ | International Equity Insights Fund |
| ∎ | Emerging Markets Equity Insights Fund |
Fundamental Equity International
| ∎ | International Equity Income Fund |
| ∎ | International Equity ESG Fund |
| ∎ | Emerging Markets Equity Fund |
| ∎ | Emerging Markets Equity ex. China Fund |
| ∎ | ESG Emerging Markets Equity Fund |
Alternative
| ∎ | Clean Energy Income Fund |
| ∎ | Real Estate Securities Fund |
| ∎ | Global Real Estate Securities Fund |
| ∎ | Absolute Return Tracker Fund |
| ∎ | Managed Futures Strategy Fund |
| ∎ | MLP Energy Infrastructure Fund |
| ∎ | Energy Infrastructure Fund |
| ∎ | Multi-Manager Alternatives Fund |
| ∎ | Global Infrastructure Fund |
Total Portfolio Solutions
| ∎ | Global Managed Beta Fund |
| ∎ | Multi-Manager Non-Core Fixed Income Fund |
| ∎ | Multi-Manager Global Equity Fund |
| ∎ | Multi-Manager International Equity Fund |
| ∎ | Tactical Tilt Overlay Fund |
| ∎ | Balanced Strategy Portfolio |
| ∎ | Multi-Manager U.S. Small Cap Equity Fund |
| ∎ | Multi-Manager Real Assets Strategy Fund |
| ∎ | Growth and Income Strategy Portfolio |
| ∎ | Growth Strategy Portfolio |
| ∎ | Dynamic Global Equity Fund |
| ∎ | Satellite Strategies Portfolio |
| ∎ | Enhanced Dividend Global Equity Portfolio |
| ∎ | Tax-Advantaged Global Equity Portfolio |
| ∎ | Strategic Factor Allocation Fund |
| ∎ | Strategic Volatility Premium Fund |
| ∎ | Target Date Retirement Portfolio |
| ∎ | Target Date 2025 Portfolio |
| ∎ | Target Date 2030 Portfolio |
| ∎ | Target Date 2035 Portfolio |
| ∎ | Target Date 2040 Portfolio |
| ∎ | Target Date 2045 Portfolio |
| ∎ | Target Date 2050 Portfolio |
| ∎ | Target Date 2055 Portfolio |
| ∎ | Target Date 2060 Portfolio |
| ∎ | GQG Partners International Opportunities Fund |
| 1 | You could lose money by investing in the Fund. Although the Fund seeks to preserve the value of your investment at $1.00 per share, it cannot guarantee it will do so. An investment in the Fund is not a deposit of a bank and is not insured or guaranteed by the Federal Deposit Insurance Corporation or any other government agency. The Fund’s sponsor has no legal obligation to provide financial support to the Fund, and you should not expect that the sponsor will provide financial support to the Fund at any time. |
| 2 | You could lose money by investing in the Fund. Because the share price of the Fund will fluctuate, when you sell your shares they may be worth more or less than what you originally paid for them. The Fund may impose a fee upon sale of your shares or may temporarily suspend your ability to sell shares if the Fund’s liquidity falls below required minimums because of market conditions or other factors. An investment in the Fund is not a deposit of a bank and is not insured or guaranteed by the Federal Deposit Insurance Corporation or any other government agency. The Fund’s sponsor has no legal obligation to provide financial support to the Fund, and you should not expect that the sponsor will provide financial support to the Fund at any time. |
| 3 | You could lose money by investing in the Fund. Although the Fund seeks to preserve the value of your investment at $1.00 per share, it cannot guarantee it will do so. The Fund may impose a fee upon sale of your shares or may temporarily suspend your ability to sell shares if the Fund’s liquidity falls below required minimums because of market conditions or other factors. An investment in the Fund is not a deposit of a bank and is not insured or guaranteed by the Federal Deposit Insurance Corporation or any other government agency. The Fund’s sponsor has no legal obligation to provide financial support to the Fund, and you should not expect that the sponsor will provide financial support to the Fund at any time. |
| 4 | Effective after the close of business on April 13, 2022, the Goldman Sachs Capital Growth Fund was renamed the Goldman Sachs Large Cap Core Fund. |
| 5 | Effective after the close of business on April 13, 2022, the Goldman Sachs Growth Opportunities Fund was renamed the Goldman Sachs Mid Cap Growth Fund. |
| | Financial Square FundsSM and Investor FundsSM are registered service marks of Goldman Sachs & Co. LLC. |
| * | This list covers open-end funds only. Please visit our website at www.GSAMFUNDS.com to learn about our closed-end funds and exchange-traded funds. |

TRUSTEES Cheryl K. Beebe, Chair Lawrence Hughes John F. Killian Steven D. Krichmar Linda A. Lang Michael Latham James A. McNamara Lawrence W. Stranghoener GOLDMAN SACHS & CO. LLC Distributor and Transfer Agent OFFICERS James A. McNamara, President Joseph F. DiMaria, Principal Financial Officer, Principal Accounting Officer and Treasurer Caroline L. Kraus, Secretary GOLDMAN SACHS ASSET MANAGEMENT, L.P. Investment Adviser Visit at www.GSAMFUNDS.com to obtain the most recent month-end returns. Goldman Sachs Asset Management, L.P., 200West Street, New York, New York 10282 The reports concerning the Fund included in this shareholder report may contain certain forward-looking statements about the factors that may affect the performance of the Fund in the future. These statements are based on Fund managements predictions and expectations concerning certain future events and their expected impact on the Fund, such as performance of the economy as a whole and of specific industry sectors, changes in the levels of interest rates, the impact of developing world events, and other factors that may influence the future performance of the Fund. Management believes these forward-looking statements to be reasonable, although they are inherently uncertain and difficult to predict. Actual events may cause adjustments in portfolio management strategies from those currently expected to be employed. A description of the policies and procedures that the Fund uses to determine how to vote proxies relating to portfolio securities and information regarding how the Fund voted proxies relating to portfolio securities during the most recent 12-month period ended June 30 is available (i) without charge, upon request by calling 1-800-526-7384 (for Retail Shareholders) or 1-800-621-2550 (for Institutional Shareholders); and (ii) on the Securities and Exchange Commission (SEC) web site at http://www.sec.gov. The Fund will file portfolio holdings information for each month in a fiscal quarter within 60 days after the end of the relevant fiscal quarter on Form N-PORT. Portfolio holdings information for the third month of each fiscal quarter will be made available on the SECs web site at http://www.sec.gov. Portfolio holdings information may be obtained upon request and without charge by calling 1-800-526-7384 (for Retail Shareholders) or 1-800-621-2550 (for Institutional Shareholders). Goldman Sachs & Co. LLC (Goldman Sachs) does not provide legal, tax or accounting advice. Any statement contained in this communication (including any attachments) concerning U.S. tax matters was not intended or written to be used, and cannot be used, for the purpose of avoiding penalties under the Internal Revenue Code, and was written to support the promotion or marketing of the transaction(s) or matter(s) addressed. Clients of Goldman Sachs should obtain their own independent tax advice based on their particular circumstances. Holdings and allocations shown are as of October 31, 2022 and may not be representative of future investments. Fund holdings should not be relied on in making investment decisions and should not be construed as research or investment advice regarding particular securities. Current and future holdings are subject to risk. The Global Industry Classification Standard (GICS) was developed by and is the exclusive property and a service mark of Morgan Stanley Capital International Inc. (MSCI) and Standard & Poors, a division of The McGraw-Hill Companies, Inc. (S&P) and is licensed for use by Goldman Sachs. Neither MSCI, S&P nor any other party involved in making or compiling the GICS or any GICS classifications makes any express or implied warranties or representations with respect to such standard or classification (or the results to be obtained by the use thereof), and all such parties hereby expressly disclaim all warranties of originality, accuracy, completeness, merchantability or fitness for a particular purpose with respect to any of such standard or classification. Without limiting any of the foregoing, in no event shall MSCI, S&P, any of their affiliates or any third party involved in making or compiling the GICS or any GICS classifications have any liability for any direct, indirect, special, punitive, consequential or any other damages (including lost profits) even if notified of the possibility of such damages. The portfolio risk management process includes an effort to monitor and manage risk, but does not imply low risk. This material is not authorized for distribution to prospective investors unless preceded or accompanied by a current prospectus or summary prospectus, if applicable. Investors should consider the Fund objective, risks, and charges and expenses, and read the summary prospectus, if available, and/or the carefully before investing or sending money. The summary prospectus, if available, and the prospectus contain this and other information about the Fund and may be obtained from your authorized dealer or from Goldman Sachs & Co. LLC by by calling (retail 1-800-526-7384) (institutional 1-800-621-2550). (C) 2022 Goldman Sachs. All rights reserved. 301381-OTU-1718822 GQGPIOAR-22
Goldman Sachs Multi-Manager Alternatives Fund
TABLE OF CONTENTS
| | | | | | |
| | | | |
| NOT FDIC-INSURED | | May Lose Value | | No Bank Guarantee | | |
Multi-Manager Alternatives Fund
|
Investment Objective The Fund seeks long-term growth of capital. |
Portfolio Management Discussion and Analysis
As of the close of business on January 12, 2022, the HFRXTM Global Hedge Fund Index was no longer used as a secondary benchmark of the Goldman Sachs Multi-Manager Alternatives Fund (the “Fund”). Below, the Goldman Sachs Alternative Investments & Manager Selection (“AIMS”) Group discusses the Fund’s performance and positioning for the 12-month period ended October 31, 2022 (the “Reporting Period”).
| Q | How did the Fund perform during the Reporting Period? |
| A | During the Reporting Period, the Fund’s Class A, Class C, Institutional, Investor, Class R6, Class R and Class P Shares generated average annual total returns, without sales charges, of -5.31%, -6.08%, -5.07%, -5.10%, -5.06%, -5.57% and -5.07%, respectively. These returns compare to the 0.79% average annual total return of the Fund’s benchmark, the ICE BofAML Three-Month U.S. Treasury Bill Index (the “ICE BofA Index”), which reflects no deductions for fees or expenses, during the same time period. |
| | References to the Fund’s benchmark mentioned herein are for informational purposes only, and unless otherwise noted, are not an indication of how the Fund is managed. The use of the ICE BofA Index as the Fund’s benchmark does not imply the Fund is being managed like cash and does not imply low risk or low volatility. |
| Q | What economic and market factors most influenced the financial markets as a whole during the Reporting Period? |
| A | The capital markets broadly declined during the Reporting Period, as persistent inflation, supply-chain shortages, recession fears and tightening central bank monetary policy created a challenging backdrop for investors. |
| | Global equity markets started the Reporting Period strongly, with the MSCI All Country World Index (“MSCI ACWI”) Investable Market Index rising 1.2% in November and December 2021 overall to post a double-digit gain for the 2021 calendar year. For the remainder of the Reporting Period, however, global equity markets were volatile and broadly negative on the back of elevated inflation, rising interest rates and global supply-chain disruptions. In response to stubbornly high inflation, major central banks around the world picked up the pace of interest rate hikes, |
| | including the U.S. Federal Reserve (the “Fed”), which raised the targeted federal funds rate to a range between 3.00% and 3.25% by the end of October 2022, its highest level since 2008. Uncertainty about whether central banks could successfully combat inflation and also avoid an economic recession kept equity valuations depressed. Geopolitical tensions further dampened market sentiment, as Russia’s invasion of Ukraine in February 2022 pushed up energy prices and as ongoing COVID-19-related lockdowns in China continued to disrupt global supply chains. For the Reporting Period overall, the MSCI ACWI Investable Market Index, representing global equities, returned -19.96%, with growth stocks broadly underperforming value stocks. From a sector perspective, the higher interest rate environment and macroeconomic uncertainty contributed to a sell-off in long-duration growth stocks within the information technology and consumer discretionary sectors. (Long-duration stocks are those that tend to deliver a higher proportion of their cash flows in the distant future. Duration is a measure of sensitivity to changes in interest rates.) Energy was the best performing sector in the MSCI ACWI Investable Market Index during the Reporting Period, benefiting from rising commodity prices. From a regional standpoint, North American stocks performed better than European, Australian and Asian stocks, but each global region recorded negative absolute returns overall. Emerging markets equities were particularly challenged during the Reporting Period, mainly by the uncertain geopolitical environment and the sharp decline in China’s stock market. The MSCI China All Shares Index returned -42.58% during the Reporting Period overall, as economic growth concerns fueled by the Chinese government’s “zero-COVID” policies and its continuing regulatory crackdown weighed on investor sentiment. Instability and geopolitical concerns within Eastern Europe were also a drag on the performance of emerging markets equities, especially in Hungary and |
1
| | Poland, with a number of index providers, including MSCI Inc., excluding Russian securities from their indices in response to Russia’s invasion of Ukraine. |
| | Credit markets broadly fell during the Reporting Period, as interest rates rose and credit spreads widened. (Credit spreads are yield differentials between corporate bonds and U.S. Treasury securities of comparable maturity.) Other headwinds included the ongoing impact of the COVID-19 pandemic, elevated inflation, Russia’s invasion of Ukraine, supply-chain disruptions and changing central bank monetary policies. Bank loans held up better than most other fixed income sectors during the Reporting Period, benefiting from their floating rate nature and strong investor demand. On the other hand, investment grade corporate bonds, which tend to be of longer duration, were hurt by higher interest rates and lagged most other segments of the fixed income market. High yield corporate bonds also weakened during the Reporting Period. Within the emerging markets, U.S. dollar-denominated bonds trailed local currency-denominated bonds due to rising U.S. interest rates and widening credit spreads. Additionally, the exclusion of Russian debt from a number of fixed income indices, along with the resulting fallout on other index constituents, broadly weighed on emerging markets debt. Commodity-rich regions, such as the Middle East and Latin America, generally outperformed Asia and Europe as commodity prices increased during the Reporting Period. |
| Q | What key factors were responsible for the Fund’s performance during the Reporting Period? |
| A | The Fund generally seeks to achieve its investment objective by allocating its assets among multiple unaffiliated investment managers (“Underlying Managers”) that employ one or more non-traditional and alternative investment strategies. The AIMS Group is responsible for making recommendations with respect to hiring, terminating or replacing the Fund’s Underlying Managers as well as for determining the Fund’s asset allocations. The AIMS Group applies a multifaceted process with respect to manager due diligence, portfolio construction and risk management. |
| | During the Reporting Period, the Fund’s results can be attributed to the performance of the Fund’s Underlying Managers. |
| | At various points during the Reporting Period, the Fund had 13 Underlying Managers, though not all were allocated capital. The 13 Underlying Managers were Algert Global LLC (“Algert”); Artisan Partners LP (“Artisan”); Bardin Hill Arbitrage IC Management LP (“Bardin Hill”); Brigade Capital Management, LP (“Brigade”); Crabel |
| | Capital Management, LLC (“Crabel”); GQG Partners LLC (“GQG Partners”); Longfellow Investment Management Co., LLC (“Longfellow”); Marathon Asset Management, L.P. (“Marathon”); River Canyon Fund Management LLC (“River Canyon”); Russell Investments Commodity Advisor, LLC (“RICA”); TCW Investment Management Company LLC (“TCW”), Trium Capital LLP (“Trium”), and Wellington Management Company LLC (“Wellington”). |
| | These 13 Underlying Managers represented five strategies—equity long/short (Wellington); event driven and credit (Bardin Hill, Brigade, Longfellow, Marathon and River Canyon); tactical trading (Crabel); relative value (Algert, TCW and Trium); and dynamic equity (Artisan and GQG Partners). RICA managed a beta completion mandate for the Fund, which provided us with an additional tool to manage the beta of the Fund and is not used to override any views and/or decisions of the Fund’s Underlying Managers. (Beta is a measure of the sensitivity of a portfolio’s returns to broad market returns.) |
| | Of the five Underlying Managers with allocated capital for the entire Reporting Period, three produced negative absolute returns and two produced positive absolute returns. Wellington generated negative absolute returns between the start of the Reporting Period and January 6, 2022, when its assets were redeemed. Marathon produced negative absolute returns between the beginning of the Reporting Period and December 2, 2021, when its assets were redeemed. Longfellow generated negative absolute returns from December 2, 2021, when it was allocated capital, and the end of the Reporting Period. TCW produced negative absolute returns from May 27, 2022, when it was allocated capital, and the end of the Reporting Period. RICA generated a positive absolute return between November 17, 2021, when it was allocated capital, and the end of the Reporting Period. Algert, Brigade and Trium did not have allocated capital during the Reporting Period. |
| Q | Which strategies most significantly affected Fund performance? |
| A | Five strategies were employed by the Underlying Managers at various points during the Reporting Period. Four of these five strategies generated negative absolute returns and one generated a positive absolute return. The Fund did not have an allocation to the opportunistic fixed income strategy during the Reporting Period. |
| | The Fund’s dynamic equity strategy detracted most from performance, with both Underlying Managers recording negative returns. From a sector perspective, these results were driven by losses in the information technology, |
2
| | consumer discretionary, financials and communication services sectors. Among the largest detractors were managed health care company UnitedHealth Group, technology and e-commerce company Amazon.com and financial software maker Intuit—all U.S. companies. At the regional level, exposure to North America, predominantly the U.S., hurt performance, offset slightly by exposure to the emerging markets. Dynamic equity strategies generally involve investing in equity instruments, often with a long-term view, and may have low excess return correlations to traditional long-only equity strategies. Dynamic equity strategies are less likely to track a benchmark than traditional long-only strategies, and dynamic equity managers are less constrained than traditional long-only managers with respect to factors such as position concentration, sector and country weights, style and market capitalization. |
| | The event driven and credit strategy overall also detracted from the Fund’s returns, as gains within merger arbitrage were more than offset by losses in structured credit. Meanwhile, the performance of special purpose acquisition company (“SPAC”) strategies was rather flat during the Reporting Period amid economic uncertainty and regulatory concerns that had the effect of decreasing SPAC initial public offering (“IPO”) activity. Within merger arbitrage, positions in the industrials and energy sectors added to results. Within structured credit, losses were concentrated among mortgage-backed securities and, to a much lesser extent, asset-backed securities. A top contributor during the Reporting Period was a U.S. information, data and market measurement firm that performed well on news that a large shareholder had stopped opposing an acquisition deal and had agreed to vote in favor of it. A top detractor was an Australian supplier of information solutions to the global auto industry, which was pressured by delays in the signing of a definitive acquisition agreement. Event driven and credit strategies seek to achieve gains from market movements in security prices caused by specific corporate events or changes in perceived relative value. These strategies may include, among others, merger arbitrage, distressed credit, opportunistic credit and value with a catalyst investing style. |
| | The equity long/short strategy had a slightly negative impact on the Fund’s performance between the beginning of the Reporting Period and January 2022, when we removed the Fund’s allocation to the strategy. The Underlying Manager’s exposure to the information technology sector detracted most. Equity long/short strategies generally involve long and short investing, based on fundamental evaluations, research and various analytical measurements, in equity and equity-related investments. Equity long/short managers may, |
| | for example, buy stocks they expect to outperform or they believe are undervalued, and may also sell short stocks they believe will underperform or they believe are overvalued. Long positions benefit from an increase in the price of the underlying instrument or asset class, while short positions benefit from a decrease in that price. |
| | The relative value strategy detracted slightly from the Fund performance between May 2022, when we reestablished the Fund’s allocation, and the end of the Reporting Period. Exposure to the financials and communications services sectors added most to returns during this time period, while short index hedges detracted. (A short index hedge is an investment strategy used to protect (hedge) against the risk of a declining index price in the future.) Relative value strategies seek to identify and capitalize on price discrepancies between related assets (assets that share a common financial factor, such as interest rates, an issuer or an index). Relative value strategies generally rely on arbitrage (the simultaneous purchase and sale of related assets) and may exist between two issuers or within the capital structure of a single issuer. These strategies attempt to exploit a source of return with low correlation to the market and include, among others, fixed income arbitrage, convertible arbitrage, volatility arbitrage, statistical arbitrage and equity market neutral strategies. |
| | The tactical trading strategy added to the Fund’s returns during the Reporting Period, as the Underlying Manager’s gains in foreign currency positions and fixed income more than offset marginal losses in equities and commodities. Within commodities, performance was mixed overall, with positive returns in metals but losses across the broader commodities complex, including livestock, energy and agriculture. Crude oil was one of the most challenging market segments during the Reporting Period. Within macro strategies, opportunistic models contributed positively to performance, primarily across the equity markets, while factor timing, reversal and volatility breakout models detracted from returns. Broadly speaking, the whipsawing of the equity markets during the Reporting Period hurt volatility breakout models but benefited opportunistic models. Tactical trading strategies seek to produce total return by long and short investing across global fixed income, currency, equity and commodity markets. Tactical trading managers may employ various investment styles of which the two major strategies are macro and managed futures. Tactical trading managers that employ a global macro style may select their investments based upon fundamental and/or technical analysis. Tactical trading managers that employ a managed futures investing style may use quantitative modeling |
3
| | techniques, e.g., determining an asset’s value based upon an analysis of price history, price momentum and the asset’s value relative to that of other assets, among other factors. Some tactical trading managers may employ both fundamental analysis and quantitative modeling techniques. Tactical trading managers typically have no bias to be long, short or neutral, but at any given time may have significant long or short exposures in a particular market or asset. |
| Q | How did the Fund use derivatives and similar instruments during the Reporting Period? |
| A | The Underlying Managers of the Fund employ derivatives and similar instruments as part of their underlying strategies to hedge market exposure and/or to gain implicit leverage, subject to the constraints of the Investment Company Act of 1940. The derivatives used most by Underlying Managers during the Reporting Period were equity futures, interest rate futures, options (single name and index), warrants, rights, interest rate swaps, total return swaps (single name and index), forward contracts, forward foreign currency exchange contracts, structured securities, commodity-linked derivatives, inverse floaters and their related floaters, interest only securities and stripped mortgage-backed securities. Overall, the use of derivatives and similar instruments by the Underlying Managers had a positive impact on the Fund’s performance during the Reporting Period. |
| Q | Were there any notable changes in the Fund’s allocations and Underlying Managers during the Reporting Period? |
| A | During the Reporting Period, shifts in the Fund’s asset allocation were made in response to the market environment and were also the result of changes in allocations to the Fund’s various strategies. One of the shifts in strategy allocation during the Reporting Period was an increase in the Fund’s exposure to the tactical trading strategy, accomplished through a larger allocation to Crabel. We also reinitiated the Fund’s exposure to the relative value strategy, accomplished by allocating assets to TCW. We funded these increases by decreasing the Fund’s exposure to the event driven and credit strategy and by reducing, and then removing, exposure to the equity long/short strategy. In the process of removing the allocation to the equity long/short strategy, we fully redeemed assets from Wellington, though Wellington remained an Underlying Manager of the Fund. In addition, during November 2021, we reestablished the Fund’s allocation to a beta completion mandate, managed by RICA. |
| | During the Reporting Period overall, we added three Underlying Managers and did not remove any Underlying Managers. In November 2021, Longfellow was added as an Underlying Manager, joining Bardin Hill, Brigade, Marathon and River Canyon, within the event driven and credit strategy, and was allocated capital in December 2021. Longfellow focuses on the equity or fixed income securities of companies involved in corporate event-driven activities, specifically SPAC arbitrage. We funded the allocation to Longfellow by fully redeeming Marathon, though Marathon remained an Underlying Manager of the Fund. During February 2022, TCW became an Underlying Manager within the relative value strategy, focusing on high dividend-paying stock sectors, including real estate and financials. TCW was allocated capital in May 2022. In June, Trium became an Underlying Manager of the Fund within the relative value strategy, joining TCW. Trium, which focuses on opportunities created by index and capital market arbitrage, did not have allocated capital during the Reporting Period. |
| | At the start of the Reporting Period, the Fund’s assets were allocated 7.2% to the equity long/short strategy, 40.0% to the event driven and credit strategy, 20.8% to the tactical trading strategy and 32.0% to the dynamic equity strategy, with the remainder in cash and cash equivalents. At the end of the Reporting Period, the Fund’s assets were allocated 55.8% to the event driven and credit strategy, 22.2% to the tactical trading strategy, 11.4% to the dynamic equity strategy and 10.6% to the relative value strategy. |
| Q | What is the Fund’s tactical view and strategy for the months ahead? |
| A | We intend to continue to closely monitor global economic growth, monetary policy and market volatility, while using active portfolio management and alternative investment strategies to position the Fund as we aim to deliver long-term growth of capital across a variety of market environments. We believe the flexibility to allocate tactically across these alternative strategies may enable us to navigate a variety of market conditions and provide investors with significant diversification benefits. We intend to continue to actively explore adding new managers with what we consider to be unique alternative capabilities as market conditions warrant. |
4
Multi-Manager Alternatives Fund
as of October 31, 2022
| * | The percentage shown for each investment category reflects the value of investments in that category as a percentage of the Fund’s market value, excluding cash and the allocation to Russell Investments Commodity Advisor, LLC, which manages a beta completion mandate. Figures in the graph may not sum to 100% due to rounding and/or the exclusion of other assets and liabilities. The graph depicts the Fund’s investments but may not represent the Fund’s market exposure due to the exclusion of certain derivatives, if any, as listed in the Additional Investment Information section of the Consolidated Schedule of Investments. |
5
| | | | | | | | | | |
| | |
| TOP TEN EQUITY HOLDINGS AS OF 10/31/22 ± | | | | | | | |
| | |
| Holding | | % of Net Assets | | Line of Business |
| | |
Switch, Inc. Class A | | | | 2.2 | % | | IT Services | |
| | |
STORE Capital Corp. | | | | 2.1 | | | Equity Real Estate Investment Trusts (REITs) | |
| | |
Zendesk, Inc. | | | | 1.4 | | | Software | |
| | |
HomeServe PLC | | | | 1.1 | | | Commerical Services & Supplies | |
| | |
Intertrust NV | | | | 1.1 | | | Professional Services | |
| | |
Tenneco, Inc. Class A | | | | 1.0 | | | Auto Components | |
| | |
Atlantia SpA | | | | 0.9 | | | Transportation Infrastructure | |
| | |
Atlas Corp. | | | | 0.9 | | | Transportation Infrastructure | |
| | |
Climate Real Impact Solutions II Acquisition Corp. | | | | 0.8 | | | Diversified Financial Services | |
| | |
Clarim Acquisition Corp. | | | | 0.8 | | | Diversified Financial Services | |
| | ± | The top 10 holdings may not be representative of the Portfolio’s future investments. The top 10 holdings exclude investments in money market funds. |
| | | | | |
| |
| | | Percentage of
Net Assets
as of 10/31/22 |
| |
Bardin Hill Arbitrage IC Management LP | | | | 28.6 | % |
| |
Crabel Capital Management, LLC | | | | 22.2 | |
| |
Longfellow Investment Management Co., LLC | | | | 21.5 | |
| |
TCW Investment Management Company LLC | | | | 10.6 | |
| |
GQG Partners LLC | | | | 8.1 | |
| |
Russell Investments Commodity Advisor, LLC | | | | 5.2 | |
| |
Artisan Partners Limited Partnership | | | | 3.2 | |
| |
Algert Global LLC | | | | 0.0 | |
| |
Trium Capital LLP | | | | 0.0 | |
| |
Wellington Management Company LLP | | | | 0.0 | |
| |
Brigade Capital Management, LP | | | | 0.0 | |
| |
Marathon Asset Management, L.P. | | | | 0.0 | |
| |
River Canyon Fund Management LLC | | | | 0.0 | |
| × | The chart above represents capital allocated to the Underlying Managers, as a percentage of net assets, excluding cash, and the allocation to Russell Investments Commodity Advisor, LLC which manages a beta completion mandate for the Fund, and as such the weightings may not sum to 100%. |
6
FUND BASICS
As of October 31, 2022
| d | Equity Long/Short Strategies generally involve long and short investing, based on fundamental evaluations, research and various analytical measurements, in equity and equity-related investments. Dynamic Equity Strategies generally are long-biased strategies that are less constrained than traditional long-only managers with respect to factors such as position concentration, sector and country weights, style, and market capitalization. Relative Value Strategies seek to identify and capitalize on price discrepancies between related assets (assets that share a common financial factor, such as interest rates, an issuer or an index). Event Driven and Credit Strategies seek to achieve gains from market movements in security prices caused by specific corporate events or changes in perceived relative value. Tactical Trading Strategies seek to produce total return by long and short investing across global fixed income, currency, equity, and commodity markets. Tactical Trading managers typically have no bias to be long, short, or neutral but at any given time may have significant long or short exposures in a particular market or asset class. The percentages above exclude cash and the allocation to Russell Investments Commodity Advisor, LLC, which manages a beta completion mandate for the Fund. |
| | For more information about your Fund, please refer to www.GSAMFUNDS.com. There, you can learn more about your Fund’s investment strategies, holdings, and performance. |
7
|
| GOLDMAN SACHS MULTI-MANAGER ALTERNATIVES FUND |
Performance Summary
October 31, 2022
| | The following graph shows the value, as of October 31, 2022, of a $1,000,000 investment made on April 30, 2013 (commencement of operations) in Institutional Shares at NAV. For comparative purposes, the performance of the Fund’s current benchmark, the ICE BofA Three-Month U.S. Treasury Bill Index is shown. Performance reflects applicable fee waivers and/or expense limitations in effect during the periods shown and in their absence, performance would be reduced. Returns do not reflect the deduction of taxes that a shareholder would pay on Fund distributions or the redemption of Fund shares. The returns set forth below represent past performance. Past performance does not guarantee future results. The Fund’s investment return and principal value will fluctuate so that an investor’s shares, when redeemed, may be worth more or less than their original cost. Current performance may be lower or higher than the performance quoted below. Please visit our web site at www.GSAMFUNDS.com to obtain the most recent month-end returns. |
|
|
| Goldman Sachs Multi-Manager Alternatives Fund’s Lifetime Performance |
Performance of a $1,000,000 investment, with distributions reinvested, from April 30, 2013 through October 31, 2022.
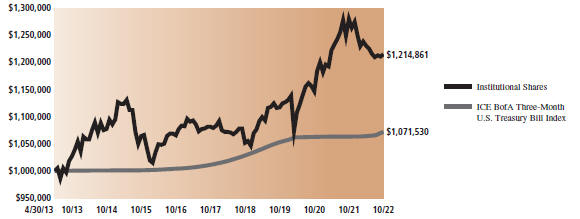
| | | | | | | | | | | | | | | |
| | | |
| Average Annual Total Return through October 31, 2022* | | One Year | | Five Years | | Since Inception |
| | | |
Class A (Commenced April 30, 2013) | | | | | | | | | | | | | | | |
| | | |
Excluding sales charges | | | | -5.31% | | | | | 2.02% | | | | | 1.71% | |
| | | |
Including sales charges | | | | -10.52% | | | | | 0.89% | | | | | 1.11% | |
| | | |
Class C (Commenced April 30, 2013) | | | | | | | | | | | | | | | |
| | | |
Excluding contingent deferred sales charges | | | | -6.08% | | | | | 1.27% | | | | | 0.94% | |
| | | |
Including contingent deferred sales charges | | | | -7.02% | | | | | 1.27% | | | | | 0.94% | |
| | | |
Institutional (Commenced April 30, 2013) | | | | -5.07% | | | | | 2.36% | | | | | 2.07% | |
| | | |
Investor (Commenced April 30, 2013) | | | | -5.10% | | | | | 2.29% | | | | | 1.96% | |
| | | |
Class R6 (Commenced February 28, 2018) | | | | -5.06% | | | | | N/A | | | | | 2.68% | |
| | | |
Class R (Commenced April 30, 2013) | | | | -5.57% | | | | | 1.78% | | | | | 1.45% | |
| | | |
Class P (Commenced April 16, 2018) | | | | -5.07% | | | | | N/A | | | | | 2.76% | |
| * | These returns assume reinvestment of all distributions at NAV and reflect a maximum initial sales charge of 5.50% for Class A Shares and the assumed contingent deferred sales charge for Class C Shares (1% if redeemed within 12 months of purchase). Because Institutional, Investor, Class R6, Class R and Class P Shares do not involve a sales charge, such a charge is not applied to their Average Annual Total Return. |
8
FUND BASICS
Index Definitions
The ICE BofA Three-Month U.S. Treasury Bill Index is comprised of a single issue purchased at the beginning of the month and held for a full month. At the end of the month that issue is sold and rolled into a newly selected issue. The issue selected at each month-end rebalancing is the outstanding Treasury Bill that matures closest to, but not beyond, three months from the rebalancing date. To qualify for selection, an issue must have settled on or before the month-end rebalancing date. While the index will often hold the Treasury Bill issued at the most recent 3-month auction, it is also possible for a seasoned 6-month Bill to be selected.
The HFRX Global Hedge Fund Index is designed to be representative of the overall composition of the hedge fund universe. It is comprised of all eligible hedge fund strategies, including but not limited to convertible arbitrage, distressed securities, equity hedge, equity market neutral, event driven, macro, merger arbitrage, and relative value arbitrage. The strategies are asset weighted based on the distribution of assets in the hedge fund industry. The index is investable through products managed by HFR Asset Management, LLC that track HFRX Indices. The HFRX Global Hedge Fund Index is a trademark of Hedge Fund Research, Inc. (“HFR”). HFR has not participated in the formation of the Fund. HFR does not endorse or approve the Fund or make any recommendation with respect to investing in the Fund.
HFRI and HFRX and related indices are trademarks and service marks of HFR which has no affiliation with GSAM. Information regarding HFR indices was obtained from HFR’s website and other public sources and is provided for comparison purposes only. HFR does not endorse or approve any of the statements made herein.
MSCI All Country World Index Investable Market Index is designed to represent performance of the full opportunity set of large- and mid-cap stocks across 23 developed and 24 emerging markets.
MSCI China All Shares Index captures large and mid-cap representation across China A shares, B shares, H shares, Red chips, P chips and foreign listings (e.g., American Depositary Receipts). The index aims to reflect the opportunity set of China share classes listed in Hong Kong, Shanghai, Shenzhen and outside of China.
It is not possible to invest directly in an unmanaged index.
9
|
| GOLDMAN SACHS MULTI-MANAGER ALTERNATIVES FUND |
Consolidated Schedule of Investments
October 31, 2022
| | | | | | | | | | | | |
| | | | | Shares | | | Description | | Value | |
| | |
| | Common Stocks – 32.1% | | | | |
| | |
| | Aerospace & Defense – 0.2% | | | | |
| | | | | 225 | | | Northrop Grumman Corp. | | $ | 123,527 | |
| | | | | 619 | | | Thales SA | | | 78,725 | |
| | | | | 274 | | | TransDigm Group, Inc. | | | 157,758 | |
| | | | | | | | | | | | |
| | | | | | | | | | | 360,010 | |
| | | |
| | Air Freight & Logistics* – 0.8% | | | | |
| | | | | 11,840 | | | Atlas Air Worldwide Holdings, | | | | |
| | | | | | | | Inc. | | | 1,197,498 | |
| | | |
| | Airlines* – 0.1% | | | | |
| | | | | 5,100 | | | Southwest Airlines Co. | | | 185,385 | |
| | | |
| | Auto Components*(a) – 1.0% | | | | |
| | | | | 76,748 | | | Tenneco, Inc. Class A | | | 1,511,936 | |
| | | |
| | Banks – 0.4% | | | | |
| | | | | 780 | | | Banco Bilbao Vizcaya Argentaria | | | | |
| | | | | | | | SA | | | 4,024 | |
| | | | | 325,716 | | | Bank Central Asia Tbk PT | | | 184,120 | |
| | | | | 17,312 | | | CaixaBank SA | | | 57,407 | |
| | | | | 11,961 | | | ICICI Bank Ltd. ADR | | | 263,621 | |
| | | | | 500 | | | M&T Bank Corp. | | | 84,185 | |
| | | | | 7,118 | | | UniCredit SpA | | | 88,272 | |
| | | | | | | | | | | | |
| | | | | | | | | | | 681,629 | |
| | | |
| | Beverages – 0.4% | | | | |
| | | | | 2,806 | | | Diageo PLC | | | 115,474 | |
| | | | | 3,972 | | | Heineken NV | | | 331,798 | |
| | | | | 1,174 | | | Monster Beverage Corp.* | | | 110,027 | |
| | | | | | | | | | | | |
| | | | | | | | | | | 557,299 | |
| | | |
| | Biotechnology* – 0.9% | | | | |
| | | | | 23,436 | | | AVEO Pharmaceuticals, Inc.(a) | | | 346,150 | |
| | | | | 4,488 | | | Biohaven Ltd. | | | 74,366 | |
| | | | | 33 | | | Genmab A/S | | | 12,712 | |
| | | | | 32,252 | | | Myovant Sciences Ltd.(a) | | | 862,418 | |
| | | | | | | | | | | | |
| | | | | | | | | | | 1,295,646 | |
| | | |
| | Capital Markets – 1.1% | | | | |
| | | | | 22,322 | | | Cowen, Inc. Class A(a) | | | 862,076 | |
| | | | | 1,596 | | | Deutsche Boerse AG | | | 259,541 | |
| | | | | 89 | | | Moody’s Corp. | | | 23,573 | |
| | | | | 45,800 | | | Oaktree Specialty Lending Corp. | | | 302,280 | |
| | | | | 513 | | | S&P Global, Inc. | | | 164,801 | |
| | | | | | |
| | | | | | | | | | | 1,612,271 | |
| | | |
| | Commerical Services & Supplies – 1.4% | | | | |
| | | | | 90,781 | | | Biffa PLC(b) | | | 428,299 | |
| | | | | 126,377 | | | HomeServe PLC | | | 1,720,057 | |
| | | | | | | | | | | | |
| | | | | | | | | | | 2,148,356 | |
| | | |
| | Communications Equipment – 0.1% | | | | |
| | | | | 726 | | | Motorola Solutions, Inc. | | | 181,289 | |
| | | |
| | Construction & Engineering – 0.1% | | | | |
| | | | | 675 | | | Quanta Services, Inc. | | | 95,877 | |
| | | |
| | | | | | | | | | | | |
| | | | | Shares | | | Description | | Value | |
| | |
| | Common Stocks – (continued) | | | | |
| | |
| | Diversified Consumer Services(c) – 0.0% | | | | |
| | | | | 5,019 | | | Gymboree Holding Corp. | | $ | — | |
| | | |
| | Diversified Financial Services – 0.3% | | | | |
| | | | | 13,728 | | | Housing Development Finance | | | | |
| | | | | | | | Corp. Ltd. | | | 410,450 | |
| | | |
| | Diversified Telecommunication Services – 0.7% | | | | |
| | | | | 19,800 | | | Deutsche Telekom AG | | | 373,735 | |
| | | | | 29,000 | | | Frontier Communications Parent, | | | | |
| | | | | | | | Inc.* | | | 679,180 | |
| | | | | | |
| | | | | | | | | | | 1,052,915 | |
| | | |
| | Electric Utilities – 0.3% | | | | |
| | | | | 5,124 | | | Fortis, Inc. | | | 199,905 | |
| | | | | 3,845 | | | NextEra Energy, Inc. | | | 297,987 | |
| | | | | | | | | | | | |
| | | | | | | | | | | 497,892 | |
| | | |
| | Electronic Equipment, Instruments & Components – 0.7% | |
| | | | | 37,637 | | | Hollysys Automation | | | | |
| | | | | | | | Technologies Ltd. | | | 599,934 | |
| | | | | 1,904 | | | Rogers Corp.*(a) | | | 448,068 | |
| | | | | | | | | | | | |
| | | | | | | | | | | 1,048,002 | |
| | | |
| | Entertainment – 0.7% | | | | |
| | | | | 14,126 | | | Activision Blizzard, Inc.(a) | | | 1,028,373 | |
| | | | | 96 | | | Netflix, Inc.* | | | 28,020 | |
| | | | | | | | | | | | |
| | | | | | | | | | | 1,056,393 | |
| | | |
| | Equity Real Estate Investment Trusts (REITs) – 2.5% | | | | |
| | | | | 1,169 | | | American Tower Corp. | | | 242,205 | |
| | | | | 16,900 | | | Pebblebrook Hotel Trust | | | 271,076 | |
| | | | | 265 | | | SBA Communications Corp. | | | 71,524 | |
| | | | | 98,808 | | | STORE Capital Corp.(a) | | | 3,142,094 | |
| | | | | | | | | | | | |
| | | | | | | | | | | 3,726,899 | |
| | | |
| | Food & Staples Retailing – 0.1% | | | | |
| | | | | 2,344 | | | Metro, Inc. | | | 122,796 | |
| | | |
| | Food Products – 0.7% | | | | |
| | | | | 1,686 | | | Nestle SA | | | 183,536 | |
| | | | | 248,789 | | | Tassal Group Ltd. | | | 826,119 | |
| | | | | | | | | | | | |
| | | | | | | | | | | 1,009,655 | |
| | | |
| | Health Care Equipment & Supplies* – 0.1% | | | | |
| | | | | 34,826 | | | SeaSpine Holdings Corp. | | | 223,931 | |
| | | |
| | Health Care Providers & Services – 1.0% | | | | |
| | | | | 316 | | | Elevance Health, Inc. | | | 172,779 | |
| | | | | 267 | | | HCA Healthcare, Inc. | | | 58,065 | |
| | | | | 3,789 | | | LHC Group, Inc.*(a) | | | 633,142 | |
| | | | | 618 | | | McKesson Corp. | | | 240,631 | |
| | | | | 689 | | | UnitedHealth Group, Inc. | | | 382,498 | |
| | | | | | | | | | | | |
| | | | | | | | | | | 1,487,115 | |
| | | |
| | Hotels, Restaurants & Leisure – 0.1% | | | | |
| | | | | 33,875 | | | F45 Training Holdings, Inc.* | | | 113,143 | |
| | | |
10 The accompanying notes are an integral part of these financial statements.
GOLDMAN SACHS MULTI-MANAGER ALTERNATIVES FUND
| | | | | | | | | | | | |
| | | | | Shares | | | Description | | Value | |
| | |
| | Common Stocks – (continued) | | | | |
| |
| | Hotels, Restaurants & Leisure – (continued) | |
| | | | | 185 | | | Starbucks Corp. | | $ | 16,019 | |
| | | | | | | | | | | | |
| | | | | | | | | | | 129,162 | |
| | | |
| | Household Durables* – 0.2% | |
| | | | | 7,250 | | | M/I Homes, Inc. | | | 300,802 | |
| | | |
| | Household Products – 0.1% | |
| | | | | 1,536 | | | Reckitt Benckiser Group PLC | | | 101,935 | |
| | | |
| | Insurance – 0.2% | |
| | | | | 1,075 | | | Aon PLC Class A | | | 302,602 | |
| | | |
| | Internet & Direct Marketing Retail* – 0.1% | |
| | | | | 1,296 | | | Amazon.com, Inc. | | | 132,762 | |
| | | |
| | IT Services – 3.6% | |
| | | | | 154,028 | | | Be Shaping the Future SpA | | | 523,611 | |
| | | | | 30,449 | | | Evo Payments, Inc. Class A* | | | 1,025,827 | |
| | | | | 65,242 | | | Link Administration Holdings | | | | |
| | | | | | | | Ltd. | | | 142,678 | |
| | | | | 96,814 | | | Switch, Inc. Class A | | | 3,296,517 | |
| | | | | 1,555 | | | Visa, Inc. Class A | | | 322,134 | |
| | | | | 20,927 | | | Vnet Group, Inc. ADR* | | | 87,684 | |
| | | | | | | | | | | | |
| | | | | | | | | | | 5,398,451 | |
| | | |
| | Life Sciences Tools & Services – 0.2% | |
| | | | | 577 | | | Danaher Corp. | | | 145,214 | |
| | | | | 390 | | | Thermo Fisher Scientific, Inc. | | | 200,448 | |
| | | | | | | | | | | | |
| | | | | | | | | | | 345,662 | |
| | | |
| | Media – 1.1% | |
| | | | | 71,453 | | | Clear Channel Outdoor Holdings, | | | | |
| | | | | | | | Inc. | | | 102,178 | |
| | | | | 35,879 | | | Shaw Communications, Inc. | | | | |
| | | | | | | | Class B | | | 921,542 | |
| | | | | 28,224 | | | TEGNA, Inc. | | | 589,317 | |
| | | | | | | | | | | | |
| | | | | | | | | | | 1,613,037 | |
| | | |
| | Metals & Mining – 0.8% | |
| | | | | 6,715 | | | ArcelorMittal SA | | | 150,422 | |
| | | | | 87,455 | | | Glencore PLC | | | 501,385 | |
| | | | | 8,004 | | | OZ Minerals Ltd. | | | 123,934 | |
| | | | | 3,061 | | | Rio Tinto PLC | | | 163,304 | |
| | | | | 24,123 | | | Vale SA | | | 313,499 | |
| | | | | | | | | | | | |
| | | | | | | | | | | 1,252,544 | |
| | | |
| | Multiline Retail – 0.1% | | | | |
| | | | | 462 | | | Dollar Tree, Inc.* | | | 73,227 | |
| | | | | 982 | | | Dollarama, Inc. | | | 58,350 | |
| | | | | | | | | | | | |
| | | | | | | | | | | 131,577 | |
| | | |
| | Oil, Gas & Consumable Fuels – 1.9% | |
| | | | | 11,277 | | | Archaea Energy, Inc.*(a) | | | 291,059 | |
| | | | | 271 | | | Cheniere Energy, Inc. | | | 47,807 | |
| | | | | 13,487 | | | Enbridge, Inc. | | | 525,482 | |
| | | | | 13,765 | | | Eni SpA | | | 180,786 | |
| | | | | 2,818 | | | Exxon Mobil Corp. | | | 312,262 | |
| | | | | 39,366 | | | Gazprom PJSC(c) | | | — | |
| | | |
| | | | | | | | | | | | |
| | | | | Shares | | | Description | | Value | |
| | |
| | Common Stocks – (continued) | | | | |
| |
| | Oil, Gas & Consumable Fuels – (continued) | |
| | | | | 3,021 | | | LUKOIL PJSC(c) | | $ | — | |
| | | | | 25,442 | | | Petroleo Brasileiro SA ADR | | | 326,166 | |
| | | | | 4,498 | | | Reliance Industries Ltd. | | | 138,794 | |
| | | | | 27,893 | | | Rosneft Oil Co. PJSC(c) | | | — | |
| | | | | 8,424 | | | Shell PLC | | | 233,388 | |
| | | | | 10,096 | | | TotalEnergies SE | | | 550,771 | |
| | | | | 3,612 | | | Tourmaline Oil Corp. | | | 203,514 | |
| | | | | 15,193 | | | Whitehaven Coal Ltd. | | | 88,253 | |
| | | | | | | | | | | | |
| | | | | | | | | | | 2,898,282 | |
| | | |
| | Personal Products – 0.1% | |
| | | | | 550 | | | L’Oreal SA | | | 172,702 | |
| | | |
| | Pharmaceuticals – 1.1% | |
| | | | | 6,508 | | | AstraZeneca PLC | | | 763,598 | |
| | | | | 2,277 | | | Novartis AG | | | 184,188 | |
| | | | | 4,338 | | | Novo Nordisk A/S Class B | | | 471,676 | |
| | | | | 623 | | | Roche Holding AG | | | 206,710 | |
| | | | | | | | | | | | |
| | | | | | | | | | | 1,626,172 | |
| | | |
| | Professional Services*(b) – 1.1% | |
| | | | | 85,307 | | | Intertrust NV | | | 1,682,720 | |
| | | |
| | Real Estate Management & Development(c) – 0.0% | |
| | | | | 16,347 | | | Immofinanz AG | | | — | |
| | | |
| | Road & Rail – 0.3% | | | | |
| | | | | 798 | | | Canadian National Railway Co. | | | 94,515 | |
| | | | | 4,458 | | | Canadian Pacific Railway Ltd. | | | 332,076 | |
| | | | | | | | | | | | |
| | | | | | | | | | | 426,591 | |
| | | |
| | Semiconductors & Semiconductor Equipment – 0.3% | |
| | | | | 386 | | | Advanced Micro Devices, Inc.* | | | 23,183 | |
| | | | | 831 | | | ASML Holding NV | | | 390,738 | |
| | | | | 111 | | | KLA Corp. | | | 35,126 | |
| | | | | 122 | | | Lam Research Corp. | | | 49,383 | |
| | | | | | | | | | | | |
| | | | | | | | | | | 498,430 | |
| | | |
| | Software – 3.8% | |
| | | | | 22,067 | | | AVEVA Group PLC | | | 789,738 | |
| | | | | 107,302 | | | BTRS Holdings, Inc.* | | | 1,012,931 | |
| | | | | 5,082 | | | ChannelAdvisor Corp.* | | | 117,089 | |
| | | | | 249,231 | | | Infomedia Ltd. | | | 195,921 | |
| | | | | 110 | | | Intuit, Inc. | | | 47,025 | |
| | | | | 29,962 | | | KnowBe4, Inc. Class A* | | | 736,466 | |
| | | | | 466,873 | | | Nearmap Ltd.* | | | 613,803 | |
| | | | | 2,576 | | | Oracle Corp. | | | 201,108 | |
| | | | | 26,710 | | | Zendesk, Inc.*(a) | | | 2,048,390 | |
| | | | | | | | | | | | |
| | | | | | | | | | | 5,762,471 | |
| | | |
| | Textiles, Apparel & Luxury Goods – 0.1% | |
| | | | | 1,680 | | | Cie Financiere Richemont SA | | | | |
| | | | | | | | Class A | | | 164,192 | |
| | | | | 95 | | | LVMH Moet Hennessy Louis | | | | |
| | | | | | | | Vuitton SE | | | 59,945 | |
| | | | | | | | | | | | |
| | | | | | | | | | | 224,137 | |
| | | |
The accompanying notes are an integral part of these financial statements. 11
|
| GOLDMAN SACHS MULTI-MANAGER ALTERNATIVES FUND |
Consolidated Schedule of Investments (continued)
October 31, 2022
| | | | | | | | | | | | |
| | | | |
| | | | | Shares | | | Description | | Value | |
| |
| | Common Stocks – (continued) | |
| |
| | Tobacco – 1.1% | |
| | | | | 20,536 | | | British American Tobacco PLC | | $ | 812,187 | |
| | | | | 9,563 | | | Imperial Brands PLC | | | 232,946 | |
| | | | | 40,961 | | | ITC Ltd. | | | 172,705 | |
| | | | | 4,369 | | | Philip Morris International, Inc. | | | 401,293 | |
| | | | | | | | | | | | |
| | | | | | | | | | | 1,619,131 | |
| | | |
| | Transportation Infrastructure – 1.8% | |
| | | | | 63,136 | | | Atlantia SpA | | | 1,408,407 | |
| | | | | 89,663 | | | Atlas Corp. | | | 1,326,116 | |
| | | | | | | | | | | | |
| | | | | | | | | | | 2,734,523 | |
| | | |
| | Wireless Telecommunication Services – 0.4% | |
| | | | | 12,888 | | | Telephone & Data Systems, Inc. | | | 219,096 | |
| | | | | 2,663 | | | T-Mobile US, Inc.* | | | 403,604 | |
| | | | | | | | | | | | |
| | | | | | | | | | | 622,700 | |
| | | |
| | TOTAL COMMON STOCKS (Cost $48,588,896) | | $ | 48,439,637 | |
| | | |
| | | | |
| | | | | Shares | | | Dividend Rate | | Value | |
| |
| | Special Purpose Acquisition Company – 21.2% | |
| | | | | 100,000 | | | Black Spade Acquisition Co.* | | $ | 989,000 | |
| | | | | 25,000 | | | B Riley Principal 250 Merger | | | | |
| | | | | | | | Corp.* | | | 246,250 | |
| | | | | 837 | | | Churchill Capital Corp. VI Class A*(a) | | | 8,320 | |
| | | | | 25,409 | | | Churchill Capital Corp. VII* | | | 253,074 | |
| | | | | 8,096 | | | Mason Industrial Technology, Inc. Class A*(a) | | | 80,393 | |
| | | | | 100,000 | | | BlueRiver Acquisition Corp.* | | | 997,000 | |
| | | | | 125,000 | | | Anzu Special Acquisition Corp. I* | | | 1,240,000 | |
| | | | | 75,000 | | | Arrowroot Acquisition Corp.* | | | 742,500 | |
| | | | | 25,000 | | | CF Acquisition Corp. IV* | | | 250,000 | |
| | | | | 14,669 | | | Churchill Capital Corp. VI* | | | 145,663 | |
| | | | | 8,804 | | | Churchill Capital Corp. VII
Class A*(a) | | | 87,688 | |
| | | | | 12,312 | | | Churchill Capital Corp. V* | | | 122,935 | |
| | | | | 125,000 | | | Clarim Acquisition Corp.* | | | 1,250,000 | |
| | | | | 125,000 | | | Climate Real Impact Solutions II Acquisition Corp.* | | | 1,250,000 | |
| | | | | 114,056 | | | Compute Health Acquisition Corp.* | | | 1,142,841 | |
| | | | | 125,000 | | | Gaming & Hospitality Acquisition Corp.* | | | 1,246,250 | |
| | | | | 125,000 | | | Gores Holdings VII, Inc.* | | | 1,241,250 | |
| | | | | 100,000 | | | Health Assurance Acquisition Corp.* | | | 1,004,000 | |
| | | | | 125,000 | | | JOFF Fintech Acquisition Corp.* | | | 1,240,000 | |
| | | | | 50,000 | | | Kadem Sustainable Impact Corp.* | | | 495,000 | |
| | | | | 75,000 | | | Landcadia Holdings IV, Inc.* | | | 741,750 | |
| | | |
| | | | | | | | | | | | |
| | | | | Shares | | | Dividend Rate | | Value | |
| |
| | Special Purpose Acquisition Company – (continued) | |
| | | | | 50,000 | | | Mason Industrial Technology, Inc.* | | $ | 495,000 | |
| | | | | 17,881 | | | Newbury Street Acquisition Corp.* | | | 177,022 | |
| | | | | 100,000 | | | Priveterra Acquisition Corp.* | | | 990,000 | |
| | | | | 30,462 | | | SportsTek Acquisition Corp.* | | | 303,097 | |
| | | | | 75,000 | | | TCW Special Purpose Acquisition Corp.* | | | 742,500 | |
| | | | | 125,000 | | | Thunder Bridge Capital Partners III, Inc.* | | | 1,236,250 | |
| | | | | 100,000 | | | Z-Work Acquisition Corp.* | | | 989,000 | |
| | | | | 125,000 | | | Apollo Strategic Growth Capital II* | | | 1,241,250 | |
| | | | | 125,000 | | | Arctos NorthStar Acquisition Corp.* | | | 1,246,250 | |
| | | | | 55,000 | | | Authentic Equity Acquisition Corp.* | | | 550,000 | |
| | | | | 52,649 | | | Colonnade Acquisition Corp. II* | | | 523,858 | |
| | | | | 100,000 | | | Constellation Acquisition Corp. I* | | | 999,000 | |
| | | | | 100,000 | | | Ares Acquisition Corp.* | | | 997,000 | |
| | | | | 37,731 | | | FTAC Hera Acquisition Corp.* | | | 376,555 | |
| | | | | 75,000 | | | Marlin Technology Corp.* | | | 750,000 | |
| | | | | 100,000 | | | New Vista Acquisition Corp.* | | | 999,000 | |
| | | | | 40,044 | | | North Atlantic Acquisition Corp. Class A* | | | 400,440 | |
| | | | | 90,000 | | | Pontem Corp.* | | | 900,000 | |
| | | | | 58,919 | | | Powered Brands* | | | 589,190 | |
| | | | | 75,000 | | | RMG Acquisition Corp. III* | | | 749,250 | |
| | | | | 100,000 | | | Ross Acquisition Corp. II* | | | 996,000 | |
| | | | | 75,000 | | | Tailwind International Acquisition Corp.* | | | 747,750 | |
| | | | | 30,000 | | | Progress Acquisition Corp. | | | 301,500 | |
| | | |
| | TOTAL SPECIAL PURPOSE ACQUISITION COMPANY | | | | |
| | (Cost $32,222,190) | | $ | 32,073,826 | |
| | | |
| | | | | Shares | | | Dividend Rate | | Value | |
| | |
| | Preferred Stocks – 0.5% | | | | |
| | |
| | Oil & Gas – 0.2% | | | | |
| | |
| | Petroleo Brasileiro SA | | | | |
| | | | | 55,523 | | | 9.200% | | $ | 320,422 | |
| | | |
| | Regional Banks – 0.3% | |
| | Itau Unibanco Holding SA | | | | |
| | | | | 68,794 | | | 3.160 | | | 404,867 | |
| | | |
| | TOTAL PREFERRED STOCKS | |
| | (Cost $596,288) | | $ | 725,289 | |
| | | |
12 The accompanying notes are an integral part of these financial statements.
GOLDMAN SACHS MULTI-MANAGER ALTERNATIVES FUND
| | | | | | | | | | | | |
| | | Units | | | Expiration Date | | Value | |
| | | | | | | | | |
| |
| | Warrants – 0.0% | |
| |
| | Biote Corp.* | |
| | | | |
| | | | | 10,000 | | | 03/05/28 | | $ | 2,100 | |
| |
| | North Atlantic Acquisition Corp.* | |
| | | | |
| | | | | 13,348 | | | 10/20/25 | | | 133 | |
| |
| | Progress Acquisition Corp. | |
| | | | |
| | | | | 15,000 | | | 12/31/27 | | | 900 | |
| | | |
| | |
| | TOTAL WARRANTS (Cost $8,636) | | $ | 3,133 | |
| | | |
| | | |
| | | Shares | | | Dividend Rate | | Value | |
| | | | | | | | | |
| |
| | Investment Company(d) – 36.3% | |
| |
| | Goldman Sachs Financial Square Government Fund - Institutional Shares | |
| | | | |
| | | | | 54,883,978 | | | 3.066% | | $ | 54,883,978 | |
| |
| | (Cost $54,883,978) | |
| | | |
| | | |
| | | Shares | | | Description | | Value | |
| | | | | | | | | |
| |
| | Common Stocks Sold Short – (0.6)% | |
| |
| | Diversified Telecommunication Services – (0.0)% | |
| | | | |
| | CAD | | | 41 | | | TELUS Corp. | | $ | (856 | ) |
| | | |
| |
| | Health Care Equipment & Supplies – (0.1)% | |
| | | | |
| | $ | | | 14,498 | | | Orthofix Medical, Inc. | | | (232,838 | ) |
| | | |
| |
| | Health Care Providers & Services – (0.1)% | |
| | | | |
| | | | | 7,408 | | | Signify Health, Inc. Class A | | | (216,536 | ) |
| | | |
| | | | | | | | | | | | |
| | | Shares | | | Description | | Value | |
| | | | | | | | | |
| |
| | Common Stocks Sold Short – (continued) | |
| |
| | Household Durables – (0.3)% | |
| | | | |
| | $ | | | 7,504 | | | iRobot Corp. | | $ | (423,976 | ) |
| | | |
| |
| | Metals & Mining – (0.1)% | |
| | | | |
| | | | | 3,779 | | | Turquoise Hill Resources Ltd. | | | (106,228 | ) |
| | | |
| | |
| | TOTAL COMMON STOCKS SOLD SHORT (Cost $(986,591)) | | $ | (980,434 | ) |
| | | |
| | |
| | TOTAL SECURITIES SOLD SHORT – (0.6)% | | | | |
| | |
| | (Cost $(986,591)) | | | (980,434 | ) |
| | | |
| | |
| | OTHER ASSETS IN EXCESS OF LIABILITIES – 10.5% | | | 15,844,949 | |
| | | |
| | |
| | NET ASSETS – 100.0% | | $ | 150,990,378 | |
| | | |
The percentage shown for each investment category reflects the value of investments in that category as a percentage of net assets.
| | * | Non-income producing security. |
| | (a) | All or portion of security is pledged as collateral for short sales. Total market value of securities pledged as collateral on short sales amounts to $1,825,471, which represents approximately 1.2% of net assets as of October 31, 2022. |
| | (b) | Exempt from registration under Rule 144A of the Securities Act of 1933. |
| | (c) | Significant unobservable inputs were used in the valuation of this portfolio security; i.e., Level 3. |
| | (d) | Represents an affiliated issuer. |
|
|
| ADDITIONAL INVESTMENT INFORMATION |
FORWARD FOREIGN CURRENCY EXCHANGE CONTRACTS WITH UNREALIZED GAIN
| | | | | | | | | | | | | | | | | | | | | | | | | | | | | | | | |
Counterparty | | Currency Purchased | | | | | | Currency Sold | | | | | | Settlement
Date | | | | | | Unrealized
Gain | |
| |
Deutsche Bank AG (London) | | AUD | | | 200,000 | | | | | | | CAD | | | 173,346 | | | | | | | | 11/16/22 | | | | | | | $ | 739 | |
| | AUD | | | 583,027 | | | | | | | EUR | | | 375,000 | | | | | | | | 11/16/22 | | | | | | | | 2,090 | |
| | AUD | | | 224,338 | | | | | | | GBP | | | 125,000 | | | | | | | | 11/16/22 | | | | | | | | 150 | |
| | AUD | | | 1,000,000 | | | | | | | JPY | | | 94,306,600 | | | | | | | | 11/16/22 | | | | | | | | 4,589 | |
| | AUD | | | 3,300,000 | | | | | | | USD | | | 2,080,727 | | | | | | | | 11/16/22 | | | | | | | | 31,070 | |
| | BRL | | | 6,860,651 | | | | | | | USD | | | 1,300,000 | | | | | | | | 11/03/22 | | | | | | | | 27,193 | |
| | CAD | | | 175,164 | | | | | | | AUD | | | 200,000 | | | | | | | | 11/16/22 | | | | | | | | 596 | |
| | CAD | | | 168,905 | | | | | | | EUR | | | 125,000 | | | | | | | | 11/16/22 | | | | | | | | 319 | |
| | CAD | | | 800,000 | | | | | | | JPY | | | 86,689,360 | | | | | | | | 11/16/22 | | | | | | | | 3,229 | |
| | CAD | | | 1,400,000 | | | | | | | USD | | | 1,020,074 | | | | | | | | 11/16/22 | | | | | | | | 7,631 | |
| | CHF | | | 250,000 | | | | | | | USD | | | 250,045 | | | | | | | | 11/16/22 | | | | | | | | 45 | |
| | CLP | | | 99,170,756 | | | | | | | USD | | | 100,000 | | | | | | | | 11/28/22 | | | | | | | | 4,566 | |
| | COP | | | 499,202,000 | | | | | | | USD | | | 100,000 | | | | | | | | 11/25/22 | | | | | | | | 626 | |
| | EUR | | | 200,000 | | | | | | | GBP | | | 171,667 | | | | | | | | 11/16/22 | | | | | | | | 919 | |
| | EUR | | | 1,400,000 | | | | | | | JPY | | | 203,319,454 | | | | | | | | 11/16/22 | | | | | | | | 15,327 | |
| | EUR | | | 3,000,000 | | | | | | | USD | | | 2,954,385 | | | | | | | | 11/16/22 | | | | | | | | 13,694 | |
| | GBP | | | 250,000 | | | | | | | AUD | | | 447,786 | | | | | | | | 11/16/22 | | | | | | | | 268 | |
| | GBP | | | 125,000 | | | | | | | CHF | | | 143,108 | | | | | | | | 11/16/22 | | | | | | | | 252 | |
The accompanying notes are an integral part of these financial statements. 13
|
| GOLDMAN SACHS MULTI-MANAGER ALTERNATIVES FUND |
Consolidated Schedule of Investments (continued)
October 31, 2022
|
|
| ADDITIONAL INVESTMENT INFORMATION (continued) |
FORWARD FOREIGN CURRENCY EXCHANGE CONTRACTS WITH UNREALIZED GAIN (continued)
| | | | | | | | | | | | | | | | | | | | | | | | |
| Counterparty | | Currency Purchased | | | Currency Sold | | | Settlement
Date | | | Unrealized
Gain | |
| |
| | | | | | |
Deutsche Bank AG (London) (continued) | | | GBP | | | | 2,351,329 | | | | EUR | | | | 2,700,000 | | | | 11/16/22 | | | $ | 26,395 | |
| | | GBP | | | | 375,000 | | | | JPY | | | | 63,160,440 | | | | 11/16/22 | | | | 4,720 | |
| | | GBP | | | | 1,437,500 | | | | USD | | | | 1,619,808 | | | | 11/16/22 | | | | 29,428 | |
| | | INR | | | | 8,316,887 | | | | USD | | | | 100,000 | | | | 11/21/22 | | | | 217 | |
| | | JPY | | | | 73,593,740 | | | | EUR | | | | 500,000 | | | | 11/16/22 | | | | 1,126 | |
| | | JPY | | | | 641,922,959 | | | | USD | | | | 4,313,957 | | | | 11/16/22 | | | | 10,720 | |
| | | KRW | | | | 142,922,259 | | | | USD | | | | 100,000 | | | | 11/04/22 | | | | 212 | |
| | | KRW | | | | 286,522,789 | | | | USD | | | | 200,000 | | | | 11/07/22 | | | | 717 | |
| | | KRW | | | | 143,307,113 | | | | USD | | | | 100,000 | | | | 11/14/22 | | | | 398 | |
| | | KRW | | | | 143,006,689 | | | | USD | | | | 100,000 | | | | 11/18/22 | | | | 192 | |
| | | KRW | | | | 143,006,289 | | | | USD | | | | 100,000 | | | | 11/28/22 | | | | 203 | |
| | | MXN | | | | 98,500,000 | | | | USD | | | | 4,919,275 | | | | 11/16/22 | | | | 37,171 | |
| | | NOK | | | | 500,000 | | | | SEK | | | | 529,059 | | | | 11/16/22 | | | | 153 | |
| | | NZD | | | | 443,672 | | | | AUD | | | | 400,000 | | | | 11/16/22 | | | | 2,048 | |
| | | NZD | | | | 2,400,000 | | | | JPY | | | | 203,109,680 | | | | 11/16/22 | | | | 27,386 | |
| | | NZD | | | | 2,700,000 | | | | USD | | | | 1,550,021 | | | | 11/16/22 | | | | 20,197 | |
| | | TRY | | | | 47,009,870 | | | | USD | | | | 2,400,000 | | | | 12/06/22 | | | | 57,986 | |
| | | TWD | | | | 3,230,485 | | | | USD | | | | 100,000 | | | | 11/28/22 | | | | 124 | |
| | | USD | | | | 322,272 | | | | AUD | | | | 500,000 | | | | 11/16/22 | | | | 2,302 | |
| | | USD | | | | 661,621 | | | | CAD | | | | 900,000 | | | | 11/16/22 | | | | 955 | |
| | | USD | | | | 879,380 | | | | CHF | | | | 875,000 | | | | 11/16/22 | | | | 4,065 | |
| | | USD | | | | 2,500,000 | | | | CNH | | | | 18,093,213 | | | | 11/16/22 | | | | 31,526 | |
| | | USD | | | | 100,000 | | | | COP | | | | 481,627,000 | | | | 11/08/22 | | | | 2,573 | |
| | | USD | | | | 100,000 | | | | COP | | | | 464,200,643 | | | | 11/15/22 | | | | 6,235 | |
| | | USD | | | | 100,000 | | | | COP | | | | 488,050,643 | | | | 11/25/22 | | | | 1,622 | |
| | | USD | | | | 3,730,838 | | | | EUR | | | | 3,750,000 | | | | 11/16/22 | | | | 20,739 | |
| | | USD | | | | 434,784 | | | | GBP | | | | 375,000 | | | | 11/16/22 | | | | 4,548 | |
| | | USD | | | | 200,000 | | | | INR | | | | 16,379,226 | | | | 11/14/22 | | | | 2,461 | |
| | | USD | | | | 500,000 | | | | INR | | | | 41,259,976 | | | | 11/21/22 | | | | 2,823 | |
| | | USD | | | | 100,000 | | | | INR | | | | 8,294,743 | | | | 11/28/22 | | | | 137 | |
| | | USD | | | | 4,222,610 | | | | JPY | | | | 625,000,000 | | | | 11/16/22 | | | | 11,945 | |
| | | USD | | | | 100,000 | | | | KRW | | | | 140,655,311 | | | | 11/14/22 | | | | 1,460 | |
| | | USD | | | | 100,000 | | | | SEK | | | | 1,092,318 | | | | 11/16/22 | | | | 967 | |
| | | USD | | | | 100,000 | | | | ZAR | | | | 1,812,841 | | | | 11/16/22 | | | | 1,432 | |
MS & Co. Int. PLC | | | AUD | | | | 486,000 | | | | USD | | | | 306,619 | | | | 12/20/22 | | | | 4,772 | |
| | | CAD | | | | 2,505,000 | | | | USD | | | | 1,828,464 | | | | 12/20/22 | | | | 11,400 | |
| | | EUR | | | | 651,000 | | | | USD | | | | 631,208 | | | | 12/20/22 | | | | 14,927 | |
| | | GBP | | | | 155,000 | | | | USD | | | | 174,558 | | | | 12/20/22 | | | | 3,519 | |
| | | JPY | | | | 90,823,000 | | | | USD | | | | 613,039 | | | | 12/20/22 | | | | 1,856 | |
| | | USD | | | | 2,092,803 | | | | AUD | | | | 3,118,000 | | | | 12/20/22 | | | | 95,024 | |
| | | USD | | | | 3,104,812 | | | | CAD | | | | 4,137,000 | | | | 12/20/22 | | | | 66,280 | |
| | | USD | | | | 240,943 | | | | CHF | | | | 231,000 | | | | 12/20/22 | | | | 8,791 | |
| | | USD | | | | 4,339,358 | | | | EUR | | | | 4,307,000 | | | | 12/20/22 | | | | 64,543 | |
| | | USD | | | | 174,690 | | | | GBP | | | | 150,000 | | | | 12/20/22 | | | | 2,357 | |
| | | USD | | | | 2,135,636 | | | | JPY | | | | 303,375,000 | | | | 12/20/22 | | | | 81,708 | |
| |
| | | | | | |
TOTAL | | | | | | | | | | | | | | | | | | | | | | $ | 783,663 | |
| |
FORWARD FOREIGN CURRENCY EXCHANGE CONTRACTS WITH UNREALIZED LOSS | |
| Counterparty | | Currency Purchased | | | Currency Sold | | | Settlement
Date | | | Unrealized
Loss | |
| |
| | | | | | |
Deutsche Bank AG (London) | | | AUD | | | | 200,000 | | | | CAD | | | | 176,174 | | | | 11/16/22 | | | $ | (1,337 | ) |
14 The accompanying notes are an integral part of these financial statements.
GOLDMAN SACHS MULTI-MANAGER ALTERNATIVES FUND
|
|
| ADDITIONAL INVESTMENT INFORMATION (continued) |
FORWARD FOREIGN CURRENCY EXCHANGE CONTRACTS WITH UNREALIZED LOSS (continued)
| | | | | | | | | | | | | | | | | | |
| Counterparty | | Currency Purchased | | | Currency Sold | | | Settlement
Date | | Unrealized
Loss | |
| |
| | | | | | |
Deutsche Bank AG (London) (continued) | | AUD | | | 400,000 | | | NZD | | | 446,344 | | | 11/16/22 | | | $ (3,601 | ) |
| | AUD | | | 200,000 | | | USD | | | 129,137 | | | 11/16/22 | | | (1,149 | ) |
| | BRL | | | 516,609 | | | USD | | | 100,000 | | | 11/03/22 | | | (62 | ) |
| | CAD | | | 172,987 | | | AUD | | | 200,000 | | | 11/16/22 | | | (1,003 | ) |
| | CAD | | | 100,000 | | | USD | | | 73,707 | | | 11/16/22 | | | (300 | ) |
| | CHF | | | 142,919 | | | GBP | | | 125,000 | | | 11/16/22 | | | (441 | ) |
| | CHF | | | 1,250,000 | | | USD | | | 1,259,600 | | | 11/16/22 | | | (9,150 | ) |
| | CNH | | | 23,109,193 | | | USD | | | 3,200,000 | | | 11/16/22 | | | (47,190 | ) |
| | COP | | | 457,089,357 | | | USD | | | 100,000 | | | 11/08/22 | | | (7,536 | ) |
| | COP | | | 461,909,357 | | | USD | | | 100,000 | | | 11/15/22 | | | (6,697 | ) |
| | COP | | | 482,824,000 | | | USD | | | 100,000 | | | 11/21/22 | | | (2,595 | ) |
| | EUR | | | 625,000 | | | AUD | | | 973,548 | | | 11/16/22 | | | (4,662 | ) |
| | EUR | | | 125,000 | | | CAD | | | 169,213 | | | 11/16/22 | | | (545 | ) |
| | EUR | | | 3,000,000 | | | GBP | | | 2,608,620 | | | 11/16/22 | | | (24,775 | ) |
| | EUR | | | 900,000 | | | JPY | | | 132,358,167 | | | 11/16/22 | | | (1,282 | ) |
| | EUR | | | 125,000 | | | NOK | | | 1,294,569 | | | 11/16/22 | | | (917 | ) |
| | EUR | | | 1,750,000 | | | USD | | | 1,752,753 | | | 11/16/22 | | | (21,373 | ) |
| | GBP | | | 125,000 | | | AUD | | | 224,180 | | | 11/16/22 | | | (49 | ) |
| | GBP | | | 125,000 | | | JPY | | | 21,401,769 | | | 11/16/22 | | | (773 | ) |
| | GBP | | | 750,000 | | | USD | | | 865,949 | | | 11/16/22 | | | (5,477 | ) |
| | HUF | | | 81,796,890 | | | USD | | | 200,000 | | | 11/16/22 | | | (3,551 | ) |
| | INR | | | 16,505,100 | | | USD | | | 200,000 | | | 11/14/22 | | | (943 | ) |
| | INR | | | 32,940,749 | | | USD | | | 400,000 | | | 11/21/22 | | | (3,070 | ) |
| | INR | | | 8,256,750 | | | USD | | | 100,000 | | | 11/28/22 | | | (594 | ) |
| | INR | | | 16,506,050 | | | USD | | | 200,000 | | | 11/30/22 | | | (1,327 | ) |
| | JPY | | | 56,504,800 | | | AUD | | | 600,000 | | | 11/16/22 | | | (3,287 | ) |
| | JPY | | | 86,159,080 | | | CAD | | | 800,000 | | | 11/16/22 | | | (6,801 | ) |
| | JPY | | | 44,009,826 | | | EUR | | | 300,000 | | | 11/16/22 | | | (310 | ) |
| | JPY | | | 84,380,875 | | | GBP | | | 500,000 | | | 11/16/22 | | | (5,168 | ) |
| | JPY | | | 236,199,060 | | | NZD | | | 2,800,000 | | | 11/16/22 | | | (37,085 | ) |
| | JPY | | | 162,500,000 | | | USD | | | 1,104,810 | | | 11/16/22 | | | (10,037 | ) |
| | KRW | | | 139,786,689 | | | USD | | | 100,000 | | | 11/14/22 | | | (2,068 | ) |
| | NOK | | | 1,283,764 | | | EUR | | | 125,000 | | | 11/16/22 | | | (123 | ) |
| | NOK | | | 1,031,489 | | | USD | | | 100,000 | | | 11/16/22 | | | (731 | ) |
| | NZD | | | 200,000 | | | USD | | | 116,780 | | | 11/16/22 | | | (468 | ) |
| | SGD | | | 141,269 | | | USD | | | 100,000 | | | 11/16/22 | | | (196 | ) |
| | TRY | | | 1,910,310 | | | USD | | | 100,000 | | | 12/06/22 | | | (116 | ) |
| | USD | | | 3,074,060 | | | AUD | | | 4,900,000 | | | 11/16/22 | | | (61,637 | ) |
| | USD | | | 1,400,000 | | | BRL | | | 7,407,815 | | | 11/03/22 | | | (33,042 | ) |
| | USD | | | 100,000 | | | BRL | | | 536,062 | | | 12/02/22 | | | (3,030 | ) |
| | USD | | | 1,600,689 | | | CAD | | | 2,200,000 | | | 11/16/22 | | | (14,275 | ) |
| | USD | | | 1,121,075 | | | CHF | | | 1,125,000 | | | 11/16/22 | | | (4,330 | ) |
| | USD | | | 100,000 | | | CLP | | | 96,946,394 | | | 11/28/22 | | | (2,221 | ) |
| | USD | | | 500,000 | | | CNH | | | 3,668,435 | | | 11/16/22 | | | (488 | ) |
| | USD | | | 100,000 | | | COP | | | 498,544,643 | | | 11/21/22 | | | (577 | ) |
| | USD | | | 3,800,594 | | | EUR | | | 3,875,000 | | | 11/16/22 | | | (33,175 | ) |
| | USD | | | 2,253,805 | | | GBP | | | 2,000,000 | | | 11/16/22 | | | (40,784 | ) |
| | USD | | | 200,000 | | | HUF | | | 84,651,700 | | | 11/16/22 | | | (3,304 | ) |
| | USD | | | 1,539,041 | | | JPY | | | 229,422,959 | | | 11/16/22 | | | (6,596 | ) |
| | USD | | | 100,000 | | | KRW | | | 143,604,211 | | | 11/04/22 | | | (690 | ) |
| | USD | | | 200,000 | | | KRW | | | 286,621,150 | | | 11/07/22 | | | (786 | ) |
| | USD | | | 100,000 | | | KRW | | | 142,914,260 | | | 11/14/22 | | | (123 | ) |
| | USD | | | 100,000 | | | KRW | | | 143,307,614 | | | 11/18/22 | | | (403 | ) |
| | USD | | | 100,000 | | | KRW | | | 143,957,811 | | | 11/28/22 | | | (870 | ) |
The accompanying notes are an integral part of these financial statements. 15
|
| GOLDMAN SACHS MULTI-MANAGER ALTERNATIVES FUND |
Consolidated Schedule of Investments (continued)
October 31, 2022
|
|
| ADDITIONAL INVESTMENT INFORMATION (continued) |
FORWARD FOREIGN CURRENCY EXCHANGE CONTRACTS WITH UNREALIZED LOSS (continued)
| | | | | | | | | | | | | | | | | | | | |
| Counterparty | | Currency Purchased | | | Currency Sold | | | Settlement
Date | | | Unrealized
Loss | |
| |
| | | | | | |
Deutsche Bank AG (London) (continued) | | USD | | | 3,347,139 | | | MXN | | | 67,000,000 | | | | 11/16/22 | | | | $ (24,249 | ) |
| | USD | | | 200,000 | | | NOK | | | 2,127,056 | | | | 11/16/22 | | | | (4,703 | ) |
| | USD | | | 2,031,913 | | | NZD | | | 3,600,000 | | | | 11/16/22 | | | | (61,709 | ) |
| | USD | | | 100,000 | | | SGD | | | 142,608 | | | | 11/16/22 | | | | (750 | ) |
| | USD | | | 2,100,000 | | | TRY | | | 41,525,210 | | | | 12/06/22 | | | | (71,215 | ) |
| | USD | | | 299,988 | | | TWD | | | 9,711,647 | | | | 11/28/22 | | | | (1,009 | ) |
| | ZAR | | | 1,830,560 | | | USD | | | 100,000 | | | | 11/16/22 | | | | (468 | ) |
MS & Co. Int. PLC | | AUD | | | 458,000 | | | USD | | | 302,087 | | | | 12/20/22 | | | | (8,636 | ) |
| | CAD | | | 261,000 | | | USD | | | 191,791 | | | | 12/20/22 | | | | (92 | ) |
| | GBP | | | 3,000 | | | USD | | | 3,487 | | | | 12/20/22 | | | | (40 | ) |
| | JPY | | | 147,083,000 | | | USD | | | 1,023,442 | | | | 12/20/22 | | | | (27,653 | ) |
| | USD | | | 478,818 | | | AUD | | | 759,000 | | | | 12/20/22 | | | | (7,493 | ) |
| | USD | | | 14,639 | | | CAD | | | 20,000 | | | | 12/20/22 | | | | (50 | ) |
| | USD | | | 2,854,085 | | | GBP | | | 2,607,000 | | | | 12/20/22 | | | | (141,061 | ) |
| |
| | | | | | |
TOTAL | | | | | | | | | | | | | | | | | | | $(772,248 | ) |
| |
FUTURES CONTRACTS — At October 31, 2022, the Fund had the following futures contracts:
| | | | | | | | | | | | | | | | | | | | |
| Description | | Number of
Contracts | | | | Expiration
Date | | | | Notional
Amount | | | | | | Unrealized
Appreciation/
(Depreciation) | |
| |
| | | | | | | |
Long position contracts: | | | | | | | | | | | | | | | | | | | | |
20 Year U.S. Treasury Bonds | | 2 | | | | 12/20/22 | | | | $ | 241,000 | | | | | | | | $ (1,002 | ) |
Canola | | 3 | | | | 01/13/23 | | | | | 38,713 | | | | | | | | 4 | |
Cattle Feeder | | 2 | | | | 01/26/23 | | | | | 179,450 | | | | | | | | 521 | |
Copper | | 1 | | | | 11/01/22 | | | | | 190,475 | | | | | | | | (4,841 | ) |
Copper | | 2 | | | | 11/04/22 | | | | | 376,158 | | | | | | | | (10,599 | ) |
Copper | | 1 | | | | 11/08/22 | | | | | 188,144 | | | | | | | | (10,959 | ) |
Copper | | 2 | | | | 11/09/22 | | | | | 376,321 | | | | | | | | (25,782 | ) |
Copper | | 1 | | | | 11/14/22 | | | | | 188,242 | | | | | | | | (13,786 | ) |
Copper | | 1 | | | | 11/15/22 | | | | | 188,259 | | | | | | | | (12,763 | ) |
Copper | | 1 | | | | 11/18/22 | | | | | 188,153 | | | | | | | | (12,762 | ) |
Copper | | 1 | | | | 11/22/22 | | | | | 188,060 | | | | | | | | (12,831 | ) |
Copper | | 3 | | | | 11/23/22 | | | | | 564,038 | | | | | | | | (49,059 | ) |
Copper | | 1 | | | | 12/01/22 | | | | | 188,075 | | | | | | | | (8,365 | ) |
Copper | | 1 | | | | 12/08/22 | | | | | 187,950 | | | | | | | | (8,487 | ) |
Copper | | 1 | | | | 12/12/22 | | | | | 187,900 | | | | | | | | (8,391 | ) |
Copper | | 1 | | | | 12/13/22 | | | | | 187,853 | | | | | | | | 3,788 | |
Copper | | 1 | | | | 12/21/22 | | | | | 187,475 | | | | | | | | 3,635 | |
Copper | | 1 | | | | 12/23/22 | | | | | 187,075 | | | | | | | | (928 | ) |
Copper | | 1 | | | | 12/28/22 | | | | | 187,125 | | | | | | | | 4,359 | |
Copper | | 1 | | | | 01/04/23 | | | | | 187,031 | | | | | | | | (5,059 | ) |
Copper | | 3 | | | | 01/05/23 | | | | | 561,038 | | | | | | | | (7,453 | ) |
Copper | | 3 | | | | 01/06/23 | | | | | 560,981 | | | | | | | | (6,990 | ) |
Copper | | 1 | | | | 01/10/23 | | | | | 186,973 | | | | | | | | (3,030 | ) |
Copper | | 2 | | | | 01/11/23 | | | | | 373,925 | | | | | | | | (4,069 | ) |
Copper | | 3 | | | | 01/13/23 | | | | | 560,438 | | | | | | | | (6,834 | ) |
Copper | | 2 | | | | 01/18/23 | | | | | 373,100 | | | | | | | | 319 | |
Copper | | 2 | | | | 01/20/23 | | | | | 372,638 | | | | | | | | (3,081 | ) |
Copper | | 3 | | | | 01/25/23 | | | | | 582,450 | | | | | | | | 16,125 | |
Copper | | 2 | | | | 01/26/23 | | | | | 372,513 | | | | | | | | (11,819 | ) |
Corn | | 3 | | | | 12/14/22 | | | | | 103,725 | | | | | | | | 931 | |
16 The accompanying notes are an integral part of these financial statements.
GOLDMAN SACHS MULTI-MANAGER ALTERNATIVES FUND
|
|
| ADDITIONAL INVESTMENT INFORMATION (continued) |
FUTURES CONTRACTS (continued)
| | | | | | | | | | | | | | | | | | |
| Description | | Number of
Contracts | | | | Expiration
Date | | | | Notional
Amount | | | | | Unrealized
Appreciation/
(Depreciation) | |
| |
| | | | | | | |
Long position contracts: | | | | | | | | | | | | | | | | | | |
Crude Palm Oil | | 8 | | | | 01/13/23 | | | | $ | 171,489 | | | | | | $ (4,078 | ) |
DAX Index | | 2 | | | | 12/16/22 | | | | | 656,643 | | | | | | 8,546 | |
E-mini Consumer Discretionary Select Sector | | 1 | | | | 12/16/22 | | | | | 146,050 | | | | | | 2,979 | |
E-Mini Crude Oil | | 1 | | | | 11/18/22 | | | | | 43,265 | | | | | | (724 | ) |
E-Mini Russell 2000 Index | | 2 | | | | 12/16/22 | | | | | 185,300 | | | | | | 5,557 | |
Euro Stoxx 50 Index | | 7 | | | | 12/16/22 | | | | | 250,284 | | | | | | 1,312 | |
Fcoj-A | | 1 | | | | 01/10/23 | | | | | 30,165 | | | | | | (602 | ) |
FTSE China A50 Index | | 3 | | | | 11/29/22 | | | | | 33,483 | | | | | | (775 | ) |
FTSE KLCI Index | | 1 | | | | 11/30/22 | | | | | 15,451 | | | | | | 103 | |
Gasoline RBOB | | 1 | | | | 11/30/22 | | | | | 106,079 | | | | | | (5,038 | ) |
Gasoline RBOB | | 1 | | | | 12/30/22 | | | | | 103,274 | | | | | | (1,262 | ) |
Japan 10 Year Government Bonds | | 1 | | | | 12/13/22 | | | | | 1,000,504 | | | | | | 2,554 | |
Lead | | 1 | | | | 11/04/22 | | | | | 49,446 | | | | | | (1,532 | ) |
Lead | | 1 | | | | 11/08/22 | | | | | 49,446 | | | | | | (157 | ) |
Lead | | 1 | | | | 11/30/22 | | | | | 49,368 | | | | | | (266 | ) |
Lead | | 1 | | | | 12/13/22 | | | | | 49,365 | | | | | | 611 | |
Lead | | 1 | | | | 12/15/22 | | | | | 49,365 | | | | | | 3,424 | |
Lead | | 1 | | | | 12/21/22 | | | | | 49,365 | | | | | | 3,274 | |
Lead | | 1 | | | | 12/22/22 | | | | | 49,358 | | | | | | 2,430 | |
Lead | | 1 | | | | 12/28/22 | | | | | 49,346 | | | | | | 3,430 | |
Lead | | 2 | | | | 01/03/23 | | | | | 98,737 | | | | | | 3,918 | |
Lead | | 1 | | | | 01/04/23 | | | | | 49,377 | | | | | | 2,711 | |
Lead | | 1 | | | | 01/06/23 | | | | | 49,377 | | | | | | (2,814 | ) |
Lead | | 1 | | | | 01/10/23 | | | | | 49,377 | | | | | | (2,164 | ) |
Lead | | 1 | | | | 01/13/23 | | | | | 49,369 | | | | | | 2,060 | |
Lead | | 1 | | | | 01/18/23 | | | | | 49,358 | | | | | | 2,080 | |
Lead | | 1 | | | | 01/20/23 | | | | | 49,344 | | | | | | 991 | |
Live Cattle | | 7 | | | | 12/30/22 | | | | | 426,930 | | | | | | 435 | |
Low Sulphur Gas Oil | | 1 | | | | 01/12/23 | | | | | 98,750 | | | | | | (276 | ) |
Maize | | 1 | | | | 03/06/23 | | | | | 16,800 | | | | | | (50 | ) |
Mexican Peso | | 5 | | | | 12/19/22 | | | | | 125,100 | | | | | | 597 | |
Mini FTSE/MIB Index | | 2 | | | | 12/16/22 | | | | | 44,556 | | | | | | 939 | |
Mini Topix Index | | 2 | | | | 12/08/22 | | | | | 25,905 | | | | | | 70 | |
MSCI Emerging Markets Index | | 11 | | | | 12/16/22 | | | | | 469,480 | | | | | | (9,113 | ) |
Nickel | | 1 | | | | 12/01/22 | | | | | 130,423 | | | | | | (17,147 | ) |
Nickel | | 2 | | | | 12/05/22 | | | | | 260,911 | | | | | | 9,745 | |
Nickel | | 1 | | | | 12/07/22 | | | | | 130,472 | | | | | | 419 | |
Nickel | | 2 | | | | 12/12/22 | | | | | 261,024 | | | | | | (34,037 | ) |
Nickel | | 1 | | | | 12/16/22 | | | | | 130,512 | | | | | | (16,191 | ) |
Nickel | | 1 | | | | 12/21/22 | | | | | 130,512 | | | | | | (441 | ) |
Nickel | | 2 | | | | 01/03/23 | | | | | 261,336 | | | | | | 3,270 | |
Nickel | | 1 | | | | 01/06/23 | | | | | 130,696 | | | | | | (461 | ) |
Nickel | | 1 | | | | 01/11/23 | | | | | 130,743 | | | | | | (489 | ) |
Nickel | | 1 | | | | 01/12/23 | | | | | 130,749 | | | | | | (492 | ) |
Nickel | | 1 | | | | 01/17/23 | | | | | 130,779 | | | | | | 876 | |
Nickel | | 1 | | | | 01/24/23 | | | | | 130,795 | | | | | | (369 | ) |
Nikkei 225 Index | | 3 | | | | 12/08/22 | | | | | 415,626 | | | | | | 1,458 | |
Nikkei 225 Mini Index | | 3 | | | | 12/08/22 | | | | | 55,584 | | | | | | 473 | |
NY Harbor ULSD | | 2 | | | | 11/30/22 | | | | | 308,624 | | | | | | (3,221 | ) |
Primary Aluminum | | 6 | | | | 11/01/22 | | | | | 330,111 | | | | | | (41,451 | ) |
Primary Aluminum | | 1 | | | | 11/02/22 | | | | | 55,419 | | | | | | (5,184 | ) |
Primary Aluminum | | 2 | | | | 11/03/22 | | | | | 110,878 | | | | | | (8,304 | ) |
The accompanying notes are an integral part of these financial statements. 17
|
| GOLDMAN SACHS MULTI-MANAGER ALTERNATIVES FUND |
Consolidated Schedule of Investments (continued)
October 31, 2022
|
|
| ADDITIONAL INVESTMENT INFORMATION (continued) |
FUTURES CONTRACTS (continued)
| | | | | | | | | | | | | | | | | | | | | | |
| Description | | Number of
Contracts | | | | | Expiration
Date | | | | | Notional
Amount | | | | | Unrealized
Appreciation/
(Depreciation) | |
| |
| | | | | | | |
Long position contracts: | | | | | | | | | | | | | | | | | | | | | | |
Primary Aluminum | | | 3 | | | | | | 11/04/22 | | | | | $ | 166,350 | | | | | | $ (13,172 | ) |
Primary Aluminum | | | 1 | | | | | | 11/10/22 | | | | | | 55,487 | | | | | | (4,795 | ) |
Primary Aluminum | | | 2 | | | | | | 11/14/22 | | | | | | 111,000 | | | | | | (14,231 | ) |
Primary Aluminum | | | 1 | | | | | | 11/15/22 | | | | | | 55,500 | | | | | | (4,797 | ) |
Primary Aluminum | | | 2 | | | | | | 11/16/22 | | | | | | 111,000 | | | | | | (10,819 | ) |
Primary Aluminum | | | 1 | | | | | | 11/18/22 | | | | | | 55,475 | | | | | | (5,016 | ) |
Primary Aluminum | | | 1 | | | | | | 11/22/22 | | | | | | 55,497 | | | | | | (379 | ) |
Primary Aluminum | | | 2 | | | | | | 11/25/22 | | | | | | 111,025 | | | | | | (7,412 | ) |
Primary Aluminum | | | 1 | | | | | | 11/30/22 | | | | | | 55,539 | | | | | | (376 | ) |
Primary Aluminum | | | 1 | | | | | | 12/05/22 | | | | | | 55,565 | | | | | | (304 | ) |
Primary Aluminum | | | 1 | | | | | | 12/07/22 | | | | | | 55,575 | | | | | | (728 | ) |
Primary Aluminum | | | 1 | | | | | | 12/08/22 | | | | | | 55,588 | | | | | | 510 | |
Primary Aluminum | | | 1 | | | | | | 12/09/22 | | | | | | 55,600 | | | | | | (2,053 | ) |
Primary Aluminum | | | 1 | | | | | | 12/13/22 | | | | | | 55,650 | | | | | | (1,906 | ) |
Primary Aluminum | | | 1 | | | | | | 12/14/22 | | | | | | 55,650 | | | | | | (2,116 | ) |
Primary Aluminum | | | 1 | | | | | | 12/16/22 | | | | | | 55,650 | | | | | | (2,134 | ) |
Primary Aluminum | | | 1 | | | | | | 12/23/22 | | | | | | 55,592 | | | | | | 364 | |
Primary Aluminum | | | 1 | | | | | | 01/03/23 | | | | | | 55,576 | | | | | | (2,077 | ) |
Primary Aluminum | | | 1 | | | | | | 01/04/23 | | | | | | 55,588 | | | | | | (1,066 | ) |
Primary Aluminum | | | 1 | | | | | | 01/10/23 | | | | | | 55,563 | | | | | | (1,928 | ) |
Primary Aluminum | | | 1 | | | | | | 01/12/23 | | | | | | 55,550 | | | | | | (2,953 | ) |
Primary Aluminum | | | 2 | | | | | | 01/13/23 | | | | | | 111,050 | | | | | | (5,669 | ) |
Primary Aluminum | | | 1 | | | | | | 01/17/23 | | | | | | 55,545 | | | | | | (1,058 | ) |
Primary Aluminum | | | 1 | | | | | | 01/18/23 | | | | | | 55,550 | | | | | | (591 | ) |
Primary Aluminum | | | 1 | | | | | | 01/20/23 | | | | | | 55,450 | | | | | | 409 | |
Primary Aluminum | | | 1 | | | | | | 01/26/23 | | | | | | 55,544 | | | | | | (2,672 | ) |
Primary Aluminum | | | 1 | | | | | | 01/27/23 | | | | | | 55,513 | | | | | | (2,428 | ) |
S&P 500 E-Mini Index | | | 2 | | | | | | 12/16/22 | | | | | | 388,300 | | | | | | (2,938 | ) |
S&P Toronto Stock Exchange 60 Index | | | 1 | | | | | | 12/15/22 | | | | | | 172,878 | | | | | | (132 | ) |
SGX Nifty 50 Index | | | 3 | | | | | | 11/24/22 | | | | | | 108,363 | | | | | | 847 | |
Silver | | | 1 | | | | | | 12/28/22 | | | | | | 95,595 | | | | | | (1,957 | ) |
Soybean | | | 7 | | | | | | 12/14/22 | | | | | | 305,250 | | | | | | 5,437 | |
Soybean | | | 15 | | | | | | 01/13/23 | | | | | | 1,064,625 | | | | | | 15,490 | |
Stoxx 600 Index | | | 1 | | | | | | 12/16/22 | | | | | | 16,850 | | | | | | 1,072 | |
SX5E Dividend | | | 1 | | | | | | 12/15/23 | | | | | | 12,136 | | | | | | 78 | |
TOPIX Index | | | 3 | | | | | | 12/08/22 | | | | | | 388,581 | | | | | | 432 | |
U.S. Dollar | | | 3 | | | | | | 12/19/22 | | | | | | 334,260 | | | | | | 3,540 | |
US Dollar | | | 16 | | | | | | 11/21/22 | | | | | | 160,185 | | | | | | 422 | |
Wheat | | | 1 | | | | | | 12/12/22 | | | | | | 17,406 | | | | | | 85 | |
Wheat | | | 2 | | | | | | 12/14/22 | | | | | | 97,875 | | | | | | 258 | |
WTI Crude Oil | | | 3 | | | | | | 11/21/22 | | | | | | 259,593 | | | | | | (9,062 | ) |
Zinc | | | 1 | | | | | | 12/30/22 | | | | | | 67,638 | | | | | | (7,130 | ) |
Zinc | | | 1 | | | | | | 01/24/23 | | | | | | 67,463 | | | | | | (7,042 | ) |
| |
| | | | | | | |
Total | | | | | | | | | | | | | | | | | | | | | $ (381,581 | ) |
| |
| | | | | | | |
Short position contracts: | | | | | | | | | | | | | | | | | | | | | | |
10 Year German Euro-Bund | | | (31) | | | | | | 12/08/22 | | | | | | (4,241,212 | ) | | | | | 1,484 | |
10 Year U.K. Long Gilt | | | (10) | | | | | | 12/28/22 | | | | | | (1,171,226 | ) | | | | | (153 | ) |
10 Year U.S. Treasury Notes | | | (47) | | | | | | 12/20/22 | | | | | | (5,197,906 | ) | | | | | 698 | |
2 Year Italian Government Notes | | | (1) | | | | | | 12/08/22 | | | | | | (104,814 | ) | | | | | 96 | |
2 Year U.S. Treasury Notes | | | (10) | | | | | | 12/30/22 | | | | | | (2,043,828 | ) | | | | | 2,481 | |
18 The accompanying notes are an integral part of these financial statements.
GOLDMAN SACHS MULTI-MANAGER ALTERNATIVES FUND
|
|
| ADDITIONAL INVESTMENT INFORMATION (continued) |
FUTURES CONTRACTS (continued)
| | | | | | | | | | | | | | | | |
Description | | Number of
Contracts | | | Expiration
Date | | | Notional
Amount | | | Unrealized
Appreciation/
(Depreciation) | |
| |
| | | | |
Short position contracts: | | | | | | | | | | | | | | | | |
5 Year German Euro-Bobl | | | (13) | | | | 12/08/22 | | | $ | (1,537,430 | ) | | $ | 126 | |
5 Year U.S. Treasury Notes | | | (37) | | | | 12/30/22 | | | | (3,943,969 | ) | | | 13,738 | |
Amsterdam Exchanges Index | | | (3) | | | | 11/18/22 | | | | (264,412 | ) | | | (12,554 | ) |
Brent Crude | | | (4) | | | | 11/30/22 | | | | (371,240 | ) | | | (2,294 | ) |
Brent Crude | | | (1) | | | | 12/29/22 | | | | (91,020 | ) | | | 710 | |
British Pound | | | (1) | | | | 12/19/22 | | | | (71,788 | ) | | | 475 | |
CAC40 Index | | | (17) | | | | 11/18/22 | | | | (929,227 | ) | | | (29,606 | ) |
Canada 10 Year Government Bonds | | | (3) | | | | 12/19/22 | | | | (270,922 | ) | | | (2,697 | ) |
CBOE Volatility Index | | | (47) | | | | 11/16/22 | | | | (1,216,139 | ) | | | 137,377 | |
CBOE Volatility Index | | | (21) | | | | 12/21/22 | | | | (554,392 | ) | | | 21,223 | |
Cocoa | | | (2) | | | | 12/14/22 | | | | (46,700 | ) | | | (1,015 | ) |
Coffee | | | (2) | | | | 12/19/22 | | | | (133,275 | ) | | | (1,031 | ) |
Copper | | | (1) | | | | 11/01/22 | | | | (190,475 | ) | | | 10,628 | |
Copper | | | (2) | | | | 11/04/22 | | | | (376,158 | ) | | | 25,962 | |
Copper | | | (1) | | | | 11/08/22 | | | | (188,144 | ) | | | 12,906 | |
Copper | | | (2) | | | | 11/09/22 | | | | (376,321 | ) | | | 22,848 | |
Copper | | | (1) | | | | 11/14/22 | | | | (188,242 | ) | | | 12,986 | |
Copper | | | (1) | | | | 11/15/22 | | | | (188,259 | ) | | | 8,838 | |
Copper | | | (1) | | | | 11/18/22 | | | | (188,153 | ) | | | 12,819 | |
Copper | | | (1) | | | | 11/22/22 | | | | (188,060 | ) | | | 12,787 | |
Copper | | | (3) | | | | 11/23/22 | | | | (564,038 | ) | | | 34,191 | |
Copper | | | (1) | | | | 12/01/22 | | | | (188,075 | ) | | | 2,759 | |
Copper | | | (1) | | | | 12/08/22 | | | | (187,950 | ) | | | 5,634 | |
Copper | | | (1) | | | | 12/12/22 | | | | (187,900 | ) | | | 8,474 | |
Copper | | | (1) | | | | 12/13/22 | | | | (187,853 | ) | | | 9,506 | |
Copper | | | (1) | | | | 12/21/22 | | | | (187,475 | ) | | | 4,522 | |
Copper | | | (1) | | | | 12/23/22 | | | | (187,075 | ) | | | (3,565 | ) |
Copper | | | (5) | | | | 12/28/22 | | | | (524,625 | ) | | | (169 | ) |
Copper | | | (1) | | | | 01/04/23 | | | | (187,031 | ) | | | 2,485 | |
Copper | | | (3) | | | | 01/05/23 | | | | (561,038 | ) | | | 12,503 | |
Copper | | | (3) | | | | 01/06/23 | | | | (560,981 | ) | | | 5,822 | |
Copper | | | (1) | | | | 01/10/23 | | | | (186,973 | ) | | | 2,422 | |
Copper | | | (2) | | | | 01/11/23 | | | | (373,925 | ) | | | 4,794 | |
Copper | | | (3) | | | | 01/13/23 | | | | (560,438 | ) | | | 7,991 | |
Copper | | | (2) | | | | 01/18/23 | | | | (373,100 | ) | | | 5,044 | |
Copper | | | (2) | | | | 01/20/23 | | | | (372,638 | ) | | | 4,857 | |
Copper | | | (3) | | | | 01/25/23 | | | | (582,450 | ) | | | (20,772 | ) |
Copper | | | (2) | | | | 01/26/23 | | | | (372,513 | ) | | | 4,994 | |
Copper | | | (1) | | | | 01/27/23 | | | | (186,275 | ) | | | 2,650 | |
Copper | | | (1) | | | | 01/31/23 | | | | (186,250 | ) | | | 309 | |
DAX Index | | | (1) | | | | 12/16/22 | | | | (328,321 | ) | | | (275 | ) |
DJIA E-Mini Index | | | (3) | | | | 12/16/22 | | | | (491,625 | ) | | | (6,155 | ) |
Euro Stoxx 50 Index | | | (20) | | | | 12/16/22 | | | | (715,097 | ) | | | 3,577 | |
Eurodollars | | | (1) | | | | 12/18/23 | | | | (239,601 | ) | | | 37 | |
French 10 Year Government Bonds | | | (8) | | | | 12/08/22 | | | | (1,050,549 | ) | | | 2,182 | |
FTSE 100 Index | | | (16) | | | | 12/16/22 | | | | (1,059,614 | ) | | | 53,470 | |
FTSE/JSE Top 40 Index | | | (1) | | | | 12/15/22 | | | | (32,917 | ) | | | (1 | ) |
FTSE/MIB Index | | | (7) | | | | 12/16/22 | | | | (111,391 | ) | | | (16,947 | ) |
German10 Year Government Bonds | | | (9) | | | | 12/08/22 | | | | (951,106 | ) | | | 655 | |
Gold 100 Oz | | | (7) | | | | 12/28/22 | | | | (1,148,490 | ) | | | 8,365 | |
Hang Seng Index | | | (3) | | | | 11/29/22 | | | | (186,467 | ) | | | 16,559 | |
HSCEI | | | (3) | | | | 11/29/22 | | | | (94,380 | ) | | | 8,182 | |
The accompanying notes are an integral part of these financial statements. 19
|
| GOLDMAN SACHS MULTI-MANAGER ALTERNATIVES FUND |
Consolidated Schedule of Investments (continued)
October 31, 2022
|
|
| ADDITIONAL INVESTMENT INFORMATION (continued) |
FUTURES CONTRACTS (continued)
| | | | | | | | | | | | | | | | |
| Description | | Number of
Contracts | | | Expiration
Date | | | Notional
Amount | | | Unrealized
Appreciation/
(Depreciation) | |
| |
| | | | |
Short position contracts: | | | | | | | | | | | | | | | | |
IBEX 35 Index | | | (2) | | | | 11/18/22 | | | $ | (157,132 | ) | | $ | (7,911 | ) |
Italian 10 Year Government Bonds | | | (12) | | | | 12/08/22 | | | | (1,359,634 | ) | | | (8,621 | ) |
Kospi 200 Index | | | (10) | | | | 12/08/22 | | | | (527,748 | ) | | | (5,894 | ) |
Lead | | | (1) | | | | 11/04/22 | | | | (49,446 | ) | | | 226 | |
Lead | | | (1) | | | | 11/08/22 | | | | (49,446 | ) | | | 3,764 | |
Lead | | | (1) | | | | 11/30/22 | | | | (49,368 | ) | | | 554 | |
Lead | | | (1) | | | | 12/13/22 | | | | (49,365 | ) | | | (3,430 | ) |
Lead | | | (1) | | | | 12/15/22 | | | | (49,365 | ) | | | (1,305 | ) |
Lead | | | (1) | | | | 12/21/22 | | | | (49,365 | ) | | | (3,467 | ) |
Lead | | | (1) | | | | 12/22/22 | | | | (49,358 | ) | | | (1,977 | ) |
Lead | | | (1) | | | | 12/28/22 | | | | (49,346 | ) | | | (5,299 | ) |
Lead | | | (2) | | | | 01/03/23 | | | | (98,737 | ) | | | (5,068 | ) |
Lead | | | (1) | | | | 01/04/23 | | | | (49,377 | ) | | | (2,049 | ) |
Lead | | | (1) | | | | 01/10/23 | | | | (49,377 | ) | | | (1,989 | ) |
Lead | | | (1) | | | | 01/13/23 | | | | (49,369 | ) | | | 1,541 | |
Lead | | | (1) | | | | 01/18/23 | | | | (49,358 | ) | | | 951 | |
Lead | | | (1) | | | | 01/20/23 | | | | (49,344 | ) | | | (2,097 | ) |
Lead | | | (1) | | | | 01/26/23 | | | | (49,344 | ) | | | (1,997 | ) |
Low Sulphur Gas Oil | | | (1) | | | | 12/12/22 | | | | (101,975 | ) | | | 774 | |
Mini HSI Index | | | (5) | | | | 11/29/22 | | | | (93,233 | ) | | | 6,756 | |
MSCI Emerging Markets Index | | | (72) | | | | 12/16/22 | | | | (3,072,960 | ) | | | 424,652 | |
Nasdaq 100 E-Mini Index | | | (7) | | | | 12/16/22 | | | | (1,602,615 | ) | | | 2,985 | |
Natural Gas | | | (1) | | | | 11/28/22 | | | | (63,550 | ) | | | (4,072 | ) |
New Zealand Dollar | | | (1) | | | | 12/19/22 | | | | (58,135 | ) | | | (1,196 | ) |
Nickel | | | (1) | | | | 12/01/22 | | | | (130,423 | ) | | | (6,526 | ) |
Nickel | | | (2) | | | | 12/05/22 | | | | (260,911 | ) | | | 34,079 | |
Nickel | | | (1) | | | | 12/07/22 | | | | (130,472 | ) | | | 17,032 | |
Nickel | | | (2) | | | | 12/12/22 | | | | (261,024 | ) | | | 21,300 | |
Nickel | | | (1) | | | | 12/16/22 | | | | (130,512 | ) | | | 439 | |
Nickel | | | (1) | | | | 12/21/22 | | | | (130,512 | ) | | | 23,265 | |
Nickel | | | (2) | | | | 01/03/23 | | | | (261,336 | ) | | | 876 | |
Nickel | | | (2) | | | | 01/06/23 | | | | (261,392 | ) | | | 11,362 | |
Nickel | | | (1) | | | | 01/11/23 | | | | (130,743 | ) | | | 1,074 | |
Nickel | | | (1) | | | | 01/12/23 | | | | (130,749 | ) | | | (642 | ) |
Nickel | | | (1) | | | | 01/17/23 | | | | (130,779 | ) | | | 501 | |
Nickel | | | (3) | | | | 01/27/23 | | | | (392,460 | ) | | | 8,217 | |
Nickel | | | (1) | | | | 01/31/23 | | | | (130,854 | ) | | | (207 | ) |
OMXS 30 Index | | | (14) | | | | 11/18/22 | | | | (195,568 | ) | | | (2,413 | ) |
Primary Aluminum | | | (6) | | | | 11/01/22 | | | | (330,111 | ) | | | 35,545 | |
Primary Aluminum | | | (1) | | | | 11/02/22 | | | | (55,419 | ) | | | 4,778 | |
Primary Aluminum | | | (2) | | | | 11/03/22 | | | | (110,878 | ) | | | 13,538 | |
Primary Aluminum | | | (3) | | | | 11/04/22 | | | | (166,350 | ) | | | 20,228 | |
Primary Aluminum | | | (1) | | | | 11/10/22 | | | | (55,487 | ) | | | 6,260 | |
Primary Aluminum | | | (2) | | | | 11/14/22 | | | | (111,000 | ) | | | 5,069 | |
Primary Aluminum | | | (1) | | | | 11/15/22 | | | | (55,500 | ) | | | 5,234 | |
Primary Aluminum | | | (2) | | | | 11/16/22 | | | | (111,000 | ) | | | 409 | |
Primary Aluminum | | | (1) | | | | 11/18/22 | | | | (55,475 | ) | | | 4,259 | |
Primary Aluminum | | | (1) | | | | 11/22/22 | | | | (55,497 | ) | | | 4,238 | |
Primary Aluminum | | | (2) | | | | 11/25/22 | | | | (111,025 | ) | | | 12,194 | |
Primary Aluminum | | | (1) | | | | 11/30/22 | | | | (55,539 | ) | | | 4,170 | |
Primary Aluminum | | | (1) | | | | 12/05/22 | | | | (55,565 | ) | | | 1,632 | |
Primary Aluminum | | | (1) | | | | 12/07/22 | | | | (55,575 | ) | | | 697 | |
20 The accompanying notes are an integral part of these financial statements.
GOLDMAN SACHS MULTI-MANAGER ALTERNATIVES FUND
|
|
| ADDITIONAL INVESTMENT INFORMATION (continued) |
FUTURES CONTRACTS (continued)
| | | | | | | | | | | | | | | | |
| Description | | Number of
Contracts | | | Expiration
Date | | | Notional
Amount | | | Unrealized
Appreciation/
(Depreciation) | |
| |
| | | | |
Short position contracts: | | | | | | | | | | | | | | | | |
Primary Aluminum | | | (1) | | | | 12/08/22 | | | $ | (55,588 | ) | | $ | 1,297 | |
Primary Aluminum | | | (1) | | | | 12/09/22 | | | | (55,600 | ) | | | (603 | ) |
Primary Aluminum | | | (1) | | | | 12/13/22 | | | | (55,650 | ) | | | 1,834 | |
Primary Aluminum | | | (1) | | | | 12/14/22 | | | | (55,650 | ) | | | 1,999 | |
Primary Aluminum | | | (1) | | | | 12/16/22 | | | | (55,650 | ) | | | 1,910 | |
Primary Aluminum | | | (1) | | | | 12/23/22 | | | | (55,592 | ) | | | 1,930 | |
Primary Aluminum | | | (1) | | | | 01/03/23 | | | | (55,576 | ) | | | (2,004 | ) |
Primary Aluminum | | | (1) | | | | 01/04/23 | | | | (55,588 | ) | | | 2,072 | |
Primary Aluminum | | | (1) | | | | 01/10/23 | | | | (55,563 | ) | | | 2,110 | |
Primary Aluminum | | | (1) | | | | 01/11/23 | | | | (55,556 | ) | | | (372 | ) |
Primary Aluminum | | | (2) | | | | 01/13/23 | | | | (111,050 | ) | | | 5,681 | |
Primary Aluminum | | | (2) | | | | 01/17/23 | | | | (111,090 | ) | | | 1,079 | |
Primary Aluminum | | | (1) | | | | 01/20/23 | | | | (55,450 | ) | | | 184 | |
Primary Aluminum | | | (1) | | | | 01/24/23 | | | | (55,515 | ) | | | (656 | ) |
Primary Aluminum | | | (1) | | | | 01/27/23 | | | | (55,513 | ) | | | 709 | |
S&P 500 E-Mini Index | | | (98) | | | | 12/16/22 | | | | (19,026,700 | ) | | | 935,706 | |
S&P Toronto Stock Exchange 60 Index | | | (5) | | | | 12/15/22 | | | | (864,389 | ) | | | 12,648 | |
Soybean | | | (1) | | | | 01/13/23 | | | | (41,910 | ) | | | (572 | ) |
SPI 200 Index | | | (5) | | | | 12/15/22 | | | | (548,180 | ) | | | 11,969 | |
Stoxx 600 Banks Index | | | (1) | | | | 12/16/22 | | | | (6,367 | ) | | | (77 | ) |
Swiss Frank | | | (1) | | | | 12/19/22 | | | | (125,506 | ) | | | 793 | |
TOPIX Index | | | (12) | | | | 12/08/22 | | | | (1,554,323 | ) | | | (11,799 | ) |
Ultra Long U.S. Treasury Bonds | | | (6) | | | | 12/20/22 | | | | (765,938 | ) | | | (5,568 | ) |
Wheat | | | (3) | | | | 12/14/22 | | | | (137,288 | ) | | | (5,307 | ) |
WTI Crude | | | (1) | | | | 12/20/22 | | | | (85,400 | ) | | | (982 | ) |
Zinc | | | (1) | | | | 12/28/22 | | | | (67,675 | ) | | | 5,680 | |
Zinc | | | (1) | | | | 01/06/23 | | | | (67,563 | ) | | | 7,458 | |
| |
| | | | |
Total | | | | | | | | | | | | | | | $1,992,490 | |
| |
| | | | |
TOTAL FUTURES CONTRACTS | | | | | | | | | | | | | | | $1,610,909 | |
| |
SWAP CONTRACTS — At October 31, 2022, the Fund had the following swap contracts:
OVER THE COUNTER TOTAL RETURN SWAP CONTRACTS#
| | | | | | | | | | | | | | | | |
| Reference Obligation/Index(a) | | Financing Rate
Paid/(Received)
by the Fund | | Counterparty | | Termination Date | | Notional
Amount
(000s) | | | Unrealized
Application/
(Depreciation)* | |
| |
Alexandria Real Estate Equities, Inc. | | (0.400)% | | BofA Securities LLC | | 07/10/23-07/12/23 | | | | | 683 | | | | $ — | |
Alexandria Real Estate Equities, Inc. | | 0.000 | | BofA Securities LLC | | 07/18/23 | | | | | 102 | | | | — | |
American Airlines Group, Inc. | | (0.350) | | BofA Securities LLC | | 07/05/23 | | | | | 116 | | | | — | |
American Airlines Group, Inc. | | 0.000 | | BofA Securities LLC | | 07/13/23 | | | | | 177 | | | | — | |
Blackstone Mortgage Trust, Inc. | | 0.000 | | BofA Securities LLC | | 07/24/23 | | | | | 280 | | | | — | |
Blackstone Mortgage Trust, Inc. | | (0.350) | | BofA Securities LLC | | 07/27/23 | | | | | 137 | | | | — | |
Boston Properties, Inc. | | (0.350) | | BofA Securities LLC | | 11/03/23 | | | | | 313 | | | | — | |
Brixmor Property Group, Inc. | | 0.400 | | BofA Securities LLC | | 11/03/23 | | | | | 558 | | | | — | |
Brixmor Property Group, Inc. | | 0.000 | | BofA Securities LLC | | 11/07/23 | | | | | 558 | | | | — | |
Calnex Solutions PLC | | (0.350) | | BofA Securities LLC | | 11/07/23 | | | | | 175 | | | | — | |
Capitol Federal Financial, Inc. | | (0.350) | | BofA Securities LLC | | 07/07/23 | | | | | 146 | | | | — | |
Capitol Federal Financial, Inc. | | 0.000 | | BofA Securities LLC | | 07/13/23 | | | | | 202 | | | | — | |
Choice Hotels International, Inc. | | (0.350) | | BofA Securities LLC | | 07/03/23-07/13/23 | | | | | 416 | | | | — | |
The accompanying notes are an integral part of these financial statements. 21
|
| GOLDMAN SACHS MULTI-MANAGER ALTERNATIVES FUND |
Consolidated Schedule of Investments (continued)
October 31, 2022
|
|
| ADDITIONAL INVESTMENT INFORMATION (continued) |
OVER THE COUNTER TOTAL RETURN SWAP CONTRACTS# (continued)
| | | | | | | | | | | | | | | | |
| Reference Obligation/Index(a) | | Financing Rate
Paid/(Received)
by the Fund | | Counterparty | | Termination Date | | Notional
Amount
(000s) | | | Unrealized
Application/
(Depreciation)* | |
| |
Clorox Co. | | (0.350)% | | BofA Securities LLC | | 07/03/23-07/17/23 | | | | | 360 | | | | $ — | |
Digital Realty Trust, Inc. | | (0.350) | | BofA Securities LLC | | 07/31/23 | | | | | 251 | | | | — | |
Digital Realty Trust, Inc. | | 0.000 | | BofA Securities LLC | | 07/31/23 | | | | | 251 | | | | — | |
Equinix, Inc. | | (0.400) | | BofA Securities LLC | | 07/12/23 | | | | | 283 | | | | — | |
Essex Property Trust, Inc. | | (0.350) | | BofA Securities LLC | | 07/07/23 | | | | | 169 | | | | — | |
Essex Property Trust, Inc. | | 0.000 | | BofA Securities LLC | | 07/13/23 | | | | | 156 | | | | — | |
First Financial Bankshares, Inc. | | 0.000 | | BofA Securities LLC | | 07/14/23 | | | | | 242 | | | | — | |
Frontier Communications Parent, Inc. | | 0.000 | | BofA Securities LLC | | 07/18/23-07/27/23 | | | | | 281 | | | | — | |
Gaming & Leisure Properties, Inc. | | 0.000 | | BofA Securities LLC | | 11/13/23 | | | | | 521 | | | | — | |
Hercules Capital, Inc. | | (2.810) | | BofA Securities LLC | | 07/07/23 | | | | | 199 | | | | — | |
Hercules Capital, Inc. | | (2.781) | | BofA Securities LLC | | 07/13/23 | | | | | 141 | | | | — | |
Hercules Capital, Inc. | | (3.193) | | BofA Securities LLC | | 07/27/23 | | | | | 169 | | | | — | |
Hilton Worldwide Holdings, Inc. | | (0.350) | | BofA Securities LLC | | 07/05/23-07/14/23 | | | | | 351 | | | | — | |
Iron Mountain, Inc. | | (0.350) | | BofA Securities LLC | | 08/18/23 | | | | | 270 | | | | — | |
Kimco Realty Corp. | | (0.350) | | BofA Securities LLC | | 07/18/23 | | | | | 346 | | | | — | |
KKR Real Estate Finance Trust, Inc. | | (0.350) | | BofA Securities LLC | | 07/07/23 | | | | | 106 | | | | — | |
M&T Bank Corp. | | (0.400) | | BofA Securities LLC | | 07/12/23 | | | | | 337 | | | | — | |
M&T Bank Corp. | | 0.000 | | BofA Securities LLC | | 07/17/23-07/18/23 | | | | | 607 | | | | — | |
M/I Homes, Inc. | | 0.000 | | BofA Securities LLC | | 07/13/23-11/13/23 | | | | | 703 | | | | — | |
Main Street Capital Corp. | | (1.260) | | BofA Securities LLC | | 07/07/23 | | | | | 107 | | | | — | |
Main Street Capital Corp. | | (1.271) | | BofA Securities LLC | | 07/17/23 | | | | | 229 | | | | — | |
McCormick & Co., Inc. | | (0.350) | | BofA Securities LLC | | 06/07/23-07/17/23 | | | | | 291 | | | | — | |
National Beverage Corp. | | (0.350) | | BofA Securities LLC | | 07/17/23 | | | | | 251 | | | | — | |
NexPoint Diversified Real Estate Trust | | 0.000 | | BofA Securities LLC | | 11/07/23-11/13/23 | | | | | 163 | | | | — | |
Oaktree Specialty Lending Corp. | | (0.400) | | BofA Securities LLC | | 07/13/23 | | | | | 391 | | | | — | |
OC5L Index | | 0.000 | | BofA Securities LLC | | 11/07/23 | | | | | 76 | | | | — | |
Oculus Innovative Sciences, Inc. | | 0.000 | | BofA Securities LLC | | 11/13/23 | | | | | 9 | | | | — | |
Office Properties Income Trust | | (0.350) | | BofA Securities LLC | | 07/19/23 | | | | | 124 | | | | — | |
Pebblebrook Hotel Trust | | (0.400) | | BofA Securities LLC | | 07/12/23 | | | | | 231 | | | | — | |
PennyMac Financial Services, Inc. | | 0.000 | | BofA Securities LLC | | 08/14/23 | | | | | 357 | | | | — | |
PetMed Express, Inc. | | (0.932) | | BofA Securities LLC | | 08/18/23 | | | | | 197 | | | | — | |
PetMed Express, Inc. | | (0.899) | | BofA Securities LLC | | 08/21/23 | | | | | 40 | | | | — | |
Prospect Capital Corp. | | (0.120) | | BofA Securities LLC | | 07/03/23 | | | | | 174 | | | | — | |
Prospect Capital Corp. | | (2.259) | | BofA Securities LLC | | 07/13/23 | | | | | 131 | | | | — | |
Realty Income Corp. | | (0.350) | | BofA Securities LLC | | 07/05/23 | | | | | 199 | | | | — | |
Realty Income Corp. | | 0.000 | | BofA Securities LLC | | 07/13/23 | | | | | 174 | | | | — | |
Regency Centers Corp. | | (0.350) | | BofA Securities LLC | | 06/07/23-07/13/23 | | | | | 308 | | | | — | |
Shenandoah Telecommunications Co. | | (0.350) | | BofA Securities LLC | | 07/03/23 | | | | | 122 | | | | — | |
Shenandoah Telecommunications Co. | | 0.000 | | BofA Securities LLC | | 07/13/23 | | | | | 197 | | | | — | |
Southwest Airlines Co. | | 0.000 | | BofA Securities LLC | | 07/13/23-07/18/23 | | | | | 534 | | | | — | |
Target Corp. | | (0.350) | | BofA Securities LLC | | 07/27/23 | | | | | 99 | | | | — | |
Target Corp. | | 0.000 | | BofA Securities LLC | | 11/07/22 | | | | | 345 | | | | — | |
Telephone & Data Systems, Inc. | | (0.400) | | BofA Securities LLC | | 07/12/23 | | | | | 415 | | | | — | |
TPG RE Finance Trust, Inc. | | 0.000 | | BofA Securities LLC | | 07/13/23 | | | | | 385 | | | | — | |
22 The accompanying notes are an integral part of these financial statements.
GOLDMAN SACHS MULTI-MANAGER ALTERNATIVES FUND
|
|
| ADDITIONAL INVESTMENT INFORMATION (continued) |
OVER THE COUNTER TOTAL RETURN SWAP CONTRACTS# (continued)
| | | | | | | | | | | | | | | | |
| Reference Obligation/Index(a) | | Financing Rate
Paid/(Received)
by the Fund | | Counterparty | | Termination Date | | Notional
Amount
(000s) | | | Unrealized
Application/
(Depreciation)* | |
| |
VICI Properties, Inc. | | 0.000% | | BofA Securities LLC | | 07/17/23-07/18/23 | | | | | 798 | | | $ | — | |
WD-40 Co. | | (0.350) | | BofA Securities LLC | | 07/14/23-11/07/23 | | | | | 288 | | | | — | |
Wyndham Hotels & Resorts, Inc. | | 0.000 | | BofA Securities LLC | | 11/27/23 | | | | | 326 | | | | — | |
Atlantia SpA | | 0.740 | | MS & Co. Int. PLC | | 07/07/23 | | | | | 40 | | | | 9,558 | |
ContourGlobal PLC | | 2.190 | | MS & Co. Int. PLC | | 08/14/23 | | | | | 113 | | | | 8,912 | |
Electricite de France SA | | 0.740 | | MS & Co. Int. PLC | | 07/07/23 | | | | | 56 | | | | 3,372 | |
Euromoney Institutional Investor PLC | | 2.190 | | MS & Co. Int. PLC | | 08/14/23 | | | | | 13 | | | | 2,045 | |
Ramsay Health Care Ltd | | 2.740 | | MS & Co. Int. PLC | | 03/25/24 | | | | | 3 | | | | 9,753 | |
Schroders PLC | | 0.000 | | MS & Co. Int. PLC | | 12/31/99 | | | | | 130 | | | | (13,977) | |
|
| |
| | | | | | |
TOTAL | | | | | | | | | | | | | | $ | 19,663 | |
| |
| | # | The Fund pays/receives annual coupon payments in accordance with the swap contract(s). On the termination date of the swap contract(s), the Fund will either receive from or pay to the counterparty an amount equal to the net of the accrued financing fees and the value of the reference security subtracted from the original notional cost (notional multiplied by the price change of the reference security, converted to U.S. Dollars). |
| | * | There are no upfront payments on the swap contracts, therefore the unrealized gain (loss) on the swap contracts is equal to their market value. |
| | (a) | Payments made monthly. |
PURCHASED AND WRITTEN OPTIONS CONTRACTS — At October 31, 2022, the Fund had the following purchased and written options:
EXCHANGE TRADED OPTIONS ON EQUITIES CONTRACTS
| | | | | | | | | | | | | | | | | | | | | | | | | | | | |
| Description | | Exercise
Price | | | Expiration
Date | | | Number of
Contracts | | | Notional
Amount | | | Market
Value | | | Premiums Paid
(Received) by Fund | | | Unrealized Appreciation/
(Depreciation) | |
| |
| | | | | | |
Purchased option contracts | | | | | | | | | | | | | | | | | | | | | | | | | |
Calls | | | | | | | | | | | | | | | | | | | | | | | | | | | | |
Magnachip Semiconductor Corp. | | $ | 17.500 | | | | 12/16/2022 | | | | 80 | | | $ | 140,000 | | | $ | 400 | | | | $ 11,322 | | | | $ (10,922) | |
Signify Health, Inc. | | | 30.000 | | | | 11/18/2022 | | | | 74 | | | | 222,000 | | | | 370 | | | | 1,593 | | | | (1,223) | |
| |
| | | | | | | |
| | | | | | | | | | | 154 | | | $ | 362,000 | | | $ | 770 | | | | $ 12,915 | | | | $ (12,145) | |
| |
| | | | | | |
Puts | | | | | | | | | | | | | | | | | | | | | | | | | |
Atlas Corp. | | | 12.500 | | | | 11/18/2022 | | | | 162 | | | | 202,500 | | | | 2,025 | | | | 6,509 | | | | (4,484) | |
Atlas Corp. | | | 12.500 | | | | 01/20/2023 | | | | 72 | | | | 90,000 | | | | 1,260 | | | | 1,880 | | | | (620) | |
Capitol Federal Financial, Inc. | | | 10.000 | | | | 02/17/2023 | | | | 200 | | | | 200,000 | | | | 39,000 | | | | 33,698 | | | | 5,302 | |
Ishares Russel 2000 ETF | | | 180.000 | | | | 01/20/2023 | | | | 83 | | | | 1,494,000 | | | | 66,732 | | | | 84,902 | | | | (18,170) | |
SPDR S&P 500 ETF | | | 340.000 | | | | 03/17/2023 | | | | 60 | | | | 2,040,000 | | | | 47,490 | | | | 99,471 | | | | (51,981) | |
Tenneco, Inc. | | | 18.000 | | | | 11/18/2022 | | | | 84 | | | | 151,200 | | | | 1,890 | | | | 9,788 | | | | (7,898) | |
Turquoise Hill Resources Ltd. | | | 27.000 | | | | 11/18/2022 | | | | 68 | | | | 183,600 | | | | 15,470 | | | | 12,360 | | | | 3,110 | |
Twitter, Inc. | | | 50.000 | | | | 11/04/2022 | | | | 323 | | | | 1,615,000 | | | | — | | | | 105,475 | | | | (105,475) | |
Usertesting, Inc. | | | 7.500 | | | | 12/16/2022 | | | | 34 | | | | 25,500 | | | | 595 | | | | 715 | | | | (120) | |
Usertesting, Inc. | | | 7.500 | | | | 02/17/2023 | | | | 224 | | | | 168,000 | | | | 4,480 | | | | 5,513 | | | | (1,033) | |
Vonage Holdings Corp. | | | 15.000 | | | | 12/16/2022 | | | | 221 | | | | 331,500 | | | | — | | | | 44,829 | | | | (44,829) | |
Vonage Holdings Corp. | | | 16.000 | | | | 12/16/2022 | | | | 94 | | | | 150,400 | | | | — | | | | 13,816 | | | | (13,816) | |
| |
| | | | | | | |
| | | | | | | | | | | 1,625 | | | $ | 6,651,700 | | | $ | 178,942 | | | | $418,956 | | | | $(240,014) | |
| |
| | | | | | | |
Total purchased option contracts | | | | | | | | | | | 1,779 | | | $ | 7,013,700 | | | $ | 179,712 | | | | $431,871 | | | | $(252,159) | |
| |
The accompanying notes are an integral part of these financial statements. 23
|
| GOLDMAN SACHS MULTI-MANAGER ALTERNATIVES FUND |
Consolidated Schedule of Investments (continued)
October 31, 2022
|
|
| ADDITIONAL INVESTMENT INFORMATION (continued) |
EXCHANGE TRADED OPTIONS ON EQUITIES CONTRACTS (continued)
| | | | | | | | | | | | | | | | | | | | | | | | | | | | |
| Description | | Exercise
Price | | | Expiration
Date | | | Number of
Contracts | | | Notional
Amount | | | Market
Value | | | Premiums Paid
(Received) by Fund | | | Unrealized Appreciation/
(Depreciation) | |
| |
| | | | | | |
Written option contracts | | | | | | | | | | | | | | | | | | | | | | | | | |
Calls | | | | | | | | | | | | | | | | | | | | | | | | | | | | |
Biohaven Pharmaceutical Holdings | | $ | 150.000 | | | | 12/16/2022 | | | | (58 | ) | | $ | (870,000 | ) | | $ | (36,540 | ) | | | $ (5,305 | ) | | | $ (31,235) | |
Magnachip Semiconductor Corp. | | | 22.500 | | | | 12/16/2022 | | | | (80 | ) | | | (180,000 | ) | | | (400 | ) | | | (2,478 | ) | | | 2,078 | |
| |
| | | | | | | |
| | | | | | | | | | | (138 | ) | | $ | (1,050,000 | ) | | $ | (36,940 | ) | | | $ (7,783 | ) | | | $ (29,157) | |
| |
| | | | | | |
Puts | | | | | | | | | | | | | | | | | | | | | | | | | |
SPDR S&P 500 ETF | | | 270.000 | | | | 03/17/2023 | | | | (60 | ) | | | (1,620,000 | ) | | | (10,620 | ) | | | (28,285 | ) | | | 17,665 | |
| |
| | | | | | | |
Total written option contracts | | | | | | | | | | | (198 | ) | | $ | (2,670,000 | ) | | $ | (47,560 | ) | | | $ (36,068 | ) | | | $ (11,492) | |
| |
| | | | | | | |
TOTAL | | | | | | | | | | | 1,581 | | | $ | 4,343,700 | | | $ | 132,152 | | | | $395,803 | | | | $(263,651) | |
| |
| | | | |
| | |
| Currency Abbreviations: | | |
| AUD | | —Australian Dollar | | |
| BRL | | —Brazil Real | | |
| CAD | | —Canadian Dollar | | |
| CHF | | —Swiss Franc | | |
| CLP | | —Chilean Peso | | |
| CNH | | —Chinese Yuan Renminbi Offshore | | |
| COP | | —Colombia Peso | | |
| EUR | | —Euro | | |
| GBP | | —British Pound | | |
| HUF | | —Hungarian Forint | | |
| INR | | —Indian Rupee | | |
| JPY | | —Japanese Yen | | |
| KRW | | —South Korean Won | | |
| MXN | | —Mexican Peso | | |
| NOK | | —Norwegian Krone | | |
| NZD | | —New Zealand Dollar | | |
| SEK | | —Swedish Krona | | |
| SGD | | —Singapore Dollar | | |
| TRY | | —Turkish Lira | | |
| TWD | | —Taiwan Dollar | | |
| USD | | —U.S. Dollar | | |
| ZAR | | —South African Rand | | |
| | |
| | | | |
| | |
| Investment Abbreviations: | | |
| ADR | | —American Depositary Receipt | | |
| PLC | | —Public Limited Company | | |
| | | | |
| | |
| Abbreviations: | | |
| BOFA | | —BofA Securities LLC | | |
| ETF | | —Exchange Traded Fund | | |
| EURO | | —Euro Offered Rate | | |
| MS & Co. Int. PLC | | —Morgan Stanley & Co. International PLC | | |
| SPDR | | —Standard and Poor’s Depository Receipt | | |
24 The accompanying notes are an integral part of these financial statements.
GOLDMAN SACHS MULTI-MANAGER ALTERNATIVES FUND
Consolidated Statement of Assets and Liabilities(a)
October 31, 2022
| | | | | | | | |
| | | |
| | | | Assets: | | | | |
| | | |
| | | | Investments in unaffiliated issuers, at value (cost $81,416,010) | | | $ 81,241,885 | |
| | | | Investments in affiliated issuers, at value (cost $54,883,978) | | | 54,883,978 | |
| | | | Purchased options, at value (premium paid $431,872) | | | 179,712 | |
| | | | Cash | | | 3,885,961 | |
| | | | Unrealized gain on swap contracts | | | 33,640 | |
| | | | Unrealized gain on forward foreign currency exchange contracts | | | 783,663 | |
| | | | Variation margin on futures contracts | | | 299,762 | |
| | | | Receivables: | | | | |
| | | | Collateral on certain derivative contracts(b) | | | 12,588,860 | |
| | | | Investments sold | | | 3,236,810 | |
| | | | Dividends | | | 134,449 | |
| | | | Due from broker | | | 97,975 | |
| | | | Foreign tax reclaims | | | 71,594 | |
| | | | Reimbursement from investment adviser | | | 26,780 | |
| | | | Other assets | | | 51,199 | |
| | | | | |
| | | | Total assets | | | 157,516,268 | |
| | | | | |
| | | |
| | | | | | | | |
| | | |
| | | | Liabilities: | | | | |
| | | | Securities sold short, at value (proceeds received $986,591) | | | 980,434 | |
| | | | Unrealized loss on forward foreign currency exchange contracts | | | 772,248 | |
| | | | Foreign currency overdraft, at value (identified cost $396,694) | | | 398,472 | |
| | | | Variation margin on futures contracts | | | 151,508 | |
| | | | Written option contracts, at value (premium received $36,068) | | | 47,560 | |
| | | | Unrealized loss on swap contracts | | | 13,977 | |
| | | | Payables: | | | | |
| | | | Investments purchased | | | 2,798,099 | |
| | | | Fund shares redeemed | | | 253,224 | |
| | | | Due to broker — upfront payment | | | 221,877 | |
| | | | Management fees | | | 193,193 | |
| | | | Distribution and Service fees and Transfer Agency fees | | | 9,387 | |
| | | | Accrued expenses | | | 685,911 | |
| | | | | |
| | | | Total liabilities | | | 6,525,890 | |
| | | | | |
| | | |
| | | | | | | | |
| | | |
| | | | Net Assets: | | | | |
| | | | Paid-in capital | | | 190,582,139 | |
| | | | Total distributable loss | | | (39,591,761) | |
| | | | | |
| | | | NET ASSETS | | | $150,990,378 | |
| | | | Net Assets: | | | | |
| | | | Class A | | | $ 8,666,312 | |
| | | | Class C | | | 1,809,718 | |
| | | | Institutional | | | 35,164,960 | |
| | | | Investor | | | 5,852,790 | |
| | | | Class R6 | | | 36,897 | |
| | | | Class R | | | 28,938 | |
| | | | Class P | | | 99,430,763 | |
| | | | Total Net Assets | | | $150,990,378 | |
| | | | Shares Outstanding $0.001 par value (unlimited number of shares authorized): | | | | |
| | | | Class A | | | 772,395 | |
| | | | Class C | | | 170,054 | |
| | | | Institutional | | | 3,078,498 | |
| | | | Investor | | | 515,702 | |
| | | | Class R6 | | | 3,224 | |
| | | | Class R | | | 2,625 | |
| | | | Class P | | | 8,703,666 | |
| | | | Net asset value, offering and redemption price per share:(c) | | | | |
| | | | Class A | | | $11.22 | |
| | | | Class C | | | 10.64 | |
| | | | Institutional | | | 11.42 | |
| | | | Investor | | | 11.35 | |
| | | | Class R6 | | | 11.44 | |
| | | | Class R | | | 11.02 | |
| | | | Class P | | | 11.42 | |
| | (a) | Statement of Assets and Liabilities for the Fund is consolidated and includes the balances of the wholly-owned subsidiary, Cayman Commodity- MMA IV, LLC. Accordingly, all interfund balances and transactions have been eliminated. |
| | (b) | Includes segregated cash of $4,168,860, $670,000, $1,250,000 and $6,500,000 relating to initial margin requirements and/or collateral on futures, forward foreign currency, options and swaps transactions, respectively. |
| | (c) | Maximum public offering price per share for Class A Shares is $11.87. At redemption, Class C Shares may be subject to a contingent deferred sales charge, assessed on the amount equal to the lesser of the current net asset value (“NAV”) or the original purchase price of the shares. |
The accompanying notes are an integral part of these financial statements. 25
|
| GOLDMAN SACHS MULTI-MANAGER ALTERNATIVES FUND |
Consolidated Statement of Operations(a)
For the Fiscal Year Ended October 31, 2022
| | | | | | |
| | |
| | Investment Income: | | | | |
| | |
| | Dividends — unaffiliated issuers (net of tax withholding of $61,552) | | $ | 727,807 | |
| | Dividends — affiliated issuers | | | 563,911 | |
| | Non-cash dividends — unaffiliated issuers | | | 163,409 | |
| |
| | | |
| | |
| | Total investment income | | | 1,455,127 | |
| | | |
| | | | | | |
| | |
| | Expenses: | | | | |
| | |
| | Management fees | | | 3,051,936 | |
| | Custody, accounting and administrative services | | | 774,873 | |
| | Professional fees | | | 445,394 | |
| | Interest expense | | | 128,236 | |
| | Registration fees | | | 108,911 | |
| | Printing and mailing costs | | | 100,705 | |
| | Transfer Agency fees(b) | | | 75,646 | |
| | Distribution and Service (12b-1) fees(b) | | | 41,257 | |
| | Trustee fees | | | 32,485 | |
| | Prime broker fees | | | 26,692 | |
| | Dividend expense for securities sold short | | | 24,485 | |
| | Other | | | 47,472 | |
| | Service fees — Class C | | | 7,057 | |
| | | |
| | |
| | Total expenses | | | 4,865,149 | |
| | | |
| | |
| | Less — expense reductions | | | (1,841,126) | |
| | | |
| | |
| | Net expenses | | | 3,024,023 | |
| | | |
| | |
| | NET INVESTMENT LOSS | | | (1,568,896) | |
| | | |
| | | | | | |
| | |
| | Realized and unrealized gain (loss): | | | | |
| | |
| | Net realized gain (loss) from: | | | | |
| | Investments — unaffiliated issuers (including commission recapture of $5,813) | | | 3,359,064 | |
| | Securities sold short | | | 156,137 | |
| | Purchased options | | | (667,497) | |
| | Futures contracts | | | 1,480,205 | |
| | Written options | | | 286,948 | |
| | Swap contracts | | | 393,790 | |
| | Forward foreign currency exchange contracts | | | 1,713,756 | |
| | Foreign currency transactions | | | (471,399) | |
| | Net change in unrealized gain (loss) on: | | | | |
| | Investments — unaffiliated issuers | | | (15,139,533) | |
| | Securities short sales | | | 828,236 | |
| | Purchased options | | | (325,744) | |
| | Futures contracts | | | 1,331,833 | |
| | Written options | | | (84,311) | |
| | Swap contracts | | | 110,210 | |
| | Forward foreign currency exchange contracts | | | 33,203 | |
| | Foreign currency translation | | | (19,872) | |
| | | |
| | |
| | Net realized and unrealized loss | | | (7,014,974) | |
| | | |
| | |
| | NET DECREASE IN NET ASSETS RESULTING FROM OPERATIONS | | $ | (8,583,870) | |
| | | |
| | (a) | Statement of Operations for the Fund is consolidated and includes the balances of the wholly-owned subsidiary, Cayman Commodity- MMA IV, LLC. Accordingly, all interfund balances and transactions have been eliminated. |
| | (b) | Class specific Distribution and/or Service (12b-1) and Transfer Agency fees were as follows: |
| | | | | | | | | | | | | | | | | | | | | | | | | | | | | | | | | | | | | | | | | | | | |
| Distribution and/or Service (12b-1) Fees | | | | | | Transfer Agency Fees | | | |
| | | | | | | | | | | | | | | | | | | | | | | | | | | | | | | | | | |
| Class A | | | Class C | | | Class R | | | | | | Class A | | | Class C | | | Institutional | | | Investor | | | Class R6 | | | Class R | | | Class P | | | |
| $ | 19,938 | | | $ | 21,171 | | | $ | 148 | | | | | | | $ | 13,270 | | | $ | 4,726 | | | $ | 14,877 | | | $ | 11,215 | | | $ | 10 | | | $ | 50 | | | $ | 31,498 | | | |
26 The accompanying notes are an integral part of these financial statements.
GOLDMAN SACHS MULTI-MANAGER ALTERNATIVES FUND
Consolidated Statements of Changes in Net Assets(a)
| | | | | | | | | | |
| | | | | Multi-Manager Alternatives Fund | |
| | | | | For the Fiscal | | | For the Fiscal | |
| | | | | Year Ended | | | Year Ended | |
| | | | | October 31, 2022 | | | October 31, 2021 | |
| | | |
| | From operations: | | | | | | | | |
| | | |
| | Net investment loss | | | $ (1,568,896 | ) | | | $ (557,594) | |
| | | |
| | Net realized gain | | | 6,251,004 | | | | 13,515,567 | |
| | | |
| | Net change in unrealized gain (loss) | | | (13,265,978 | ) | | | 4,678,340 | |
| | | |
| | | |
| | Net increase (decrease) in net assets resulting from operations | | | (8,583,870 | ) | | | 17,636,313 | |
| | | |
| | | | | | | | | | |
| | | |
| | From share transactions: | | | | | | | | |
| | Proceeds from sales of shares | | | 21,896,074 | | | | 65,592,984 | |
| | | |
| | Cost of shares redeemed | | | (38,848,647 | ) | | | (56,398,293) | |
| | | |
| | | |
| | Net increase (decrease) in net assets resulting from share transactions | | | (16,952,573 | ) | | | 9,194,691 | |
| | | |
| | | |
| | TOTAL INCREASE (DECREASE) | | | (25,536,443 | ) | | | 26,831,004 | |
| | | |
| | | | | | | | | | |
| | | |
| | Net assets: | | | | | | | | |
| | | |
| | Beginning of year | | | 176,526,821 | | | | 149,695,817 | |
| | | |
| | | |
| | End of year | | | $150,990,378 | | | | $176,526,821 | |
| | | |
| | (a) | Statements of Changes in Net Assets for the Fund is consolidated and includes the balances of the wholly-owned subsidiary, Cayman Commodity — MMA IV, LLC. Accordingly, all interfund balances and transactions have been eliminated. |
The accompanying notes are an integral part of these financial statements. 27
|
| GOLDMAN SACHS MULTI-MANAGER ALTERNATIVES FUND |
Consolidated Financial Highlights
Selected Share Data for a Share Outstanding Throughout Each Year
| | | | | | | | | | | | | | | | | | | | | | |
| | | | | Goldman Sachs Multi-Manager Alternatives Fund | |
| | | | | Class A Shares | |
| | | | | Year Ended October 31, | |
| | | | | 2022 | | | 2021 | | | 2020 | | | 2019 | | | 2018 | |
| | | | | | |
| | Per Share Data | | | | | | | | | | | | | | | | | | | | |
| | | | | | |
| | Net asset value, beginning of year | | $ | 11.86 | | | $ | 10.66 | | | $ | 10.48 | | | $ | 9.91 | | | $ | 10.22 | |
| | | | | | |
| | Net investment income (loss)(a) | | | (0.14 | ) | | | (0.07 | ) | | | (0.01 | ) | | | 0.04 | | | | (0.04 | ) |
| | Net realized and unrealized gain (loss) | | | (0.50 | ) | | | 1.27 | | | | 0.25 | | | | 0.53 | | | | (0.27 | ) |
| | | | | | |
| | Total from investment operations | | | (0.64 | ) | | | 1.20 | | | | 0.24 | | | | 0.57 | | | | (0.31 | ) |
| | | | | | |
| | Distributions to shareholders from net investment income | | | — | | | | — | | | | (0.06 | ) | | | — | | | | — | |
| | | | | | |
| | Net asset value, end of year | | $ | 11.22 | | | $ | 11.86 | | | $ | 10.66 | | | $ | 10.48 | | | $ | 9.91 | |
| | | | | | |
| | Total return(b) | | | (5.31 | )% | | | 11.26 | % | | | 2.33 | % | | | 5.75 | % | | | (3.03 | )% |
| | | | | | |
| | Net assets, end of year (in 000s) | | $ | 8,666 | | | $ | 7,943 | | | $ | 8,015 | | | $ | 11,538 | | | $ | 19,155 | |
| | | | | | |
| | Ratio of net expenses to average net assets (including dividend and interest payments and other expenses relating to securities sold short) | | | 2.18 | % | | | 2.15 | % | | | 2.13 | % | | | 2.12 | % | | | 2.31 | % |
| | | | | | |
| | Ratio of net expenses to average net assets (excluding dividend and interest payments and other expenses relating to securities sold short) | | | 2.08 | % | | | 2.08 | % | | | 2.07 | % | | | 2.07 | % | | | 2.23 | % |
| | | | | | |
| | Ratio of total expenses to average net assets (including dividend and interest payments and other expenses relating to securities sold short) | | | 3.38 | % | | | 3.36 | % | | | 4.32 | % | | | 3.51 | % | | | 2.91 | % |
| | | | | | |
| | Ratio of total expenses to average net assets (excluding dividend and interest payments and other expenses relating to securities sold short) | | | 3.29 | % | | | 3.30 | % | | | 4.27 | % | | | 3.46 | % | | | 2.82 | % |
| | | | | | |
| | Ratio of net investment income (loss) to average net assets | | | (1.21 | )% | | | (0.63 | )% | | | (0.17 | )% | | | 0.39 | % | | | (0.43 | )% |
| | | | | | |
| | Portfolio turnover rate(c) | | | 236 | % | | | 269 | % | | | 222 | % | | | 202 | % | | | 232 | % |
| | (a) | Calculated based on the average shares outstanding methodology. |
| | (b) | Assumes investment at the NAV at the beginning of the year, reinvestment of all dividends and distributions, a complete redemption of the investment at the NAV at the end of the year and no sales or redemption charges (if any). Total returns would be reduced if a sales or redemption charge was taken into account. Returns do not reflect the impact of taxes to shareholders relating to Fund distributions or the redemption of Fund shares. |
| | (c) | The Fund’s portfolio turnover rate is calculated in accordance with regulatory requirements, without regard to transactions involving short term investments and certain derivatives. If such transactions were included, the Fund’s portfolio turnover rate may be higher. |
28 The accompanying notes are an integral part of these financial statements.
GOLDMAN SACHS MULTI-MANAGER ALTERNATIVES FUND
Consolidated Financial Highlights (continued)
Selected Share Data for a Share Outstanding Throughout Each Year
| | | | | | | | | | | | | | | | | | | | | | |
| | | | | Goldman Sachs Multi-Manager Alternatives Fund | |
| | | | | Class C Shares | |
| | | | | Year Ended October 31, | |
| | | | | 2022 | | | 2021 | | | 2020 | | | 2019 | | | 2018 | |
| | | | | | |
| | Per Share Data | | | | | | | | | | | | | | | | | | | | |
| | | | | | |
| | Net asset value, beginning of year | | $ | 11.34 | | | $ | 10.26 | | | $ | 10.11 | | | $ | 9.62 | | | $ | 10.00 | |
| | | | | | |
| | Net investment loss(a) | | | (0.24 | ) | | | (0.15 | ) | | | (0.09 | ) | | | (0.03 | ) | | | (0.12) | |
| | Net realized and unrealized gain (loss) | | | (0.46 | ) | | | 1.23 | | | | 0.24 | | | | 0.52 | | | | (0.26) | |
| | | | | | |
| | Total from investment operations | | | (0.70 | ) | | | 1.08 | | | | 0.15 | | | | 0.49 | | | | (0.38) | |
| | | | | | |
| | Net asset value, end of year | | $ | 10.64 | | | $ | 11.34 | | | $ | 10.26 | | | $ | 10.11 | | | $ | 9.62 | |
| | | | | | |
| | Total return(b) | | | (6.08 | )% | | | 10.53 | % | | | 1.48 | % | | | 4.98 | % | | | (3.70)% | |
| | | | | | |
| | Net assets, end of year (in 000s) | | $ | 1,810 | | | $ | 3,544 | | | $ | 5,045 | | | $ | 7,646 | | | $ | 12,333 | |
| | | | | | |
| | Ratio of net expenses to average net assets (including dividend and interest payments and other expenses relating to securities sold short) | | | 2.93 | % | | | 2.89 | % | | | 2.88 | % | | | 2.87 | % | | | 3.07% | |
| | | | | | |
| | Ratio of net expenses to average net assets (excluding dividend and interest payments and other expenses relating to securities sold short) | | | 2.83 | % | | | 2.84 | % | | | 2.82 | % | | | 2.82 | % | | | 2.99% | |
| | | | | | |
| | Ratio of total expenses to average net assets (including dividend and interest payments and other expenses relating to securities sold short) | | | 4.11 | % | | | 4.15 | % | | | 5.09 | % | | | 4.27 | % | | | 3.65% | |
| | | | | | |
| | Ratio of total expenses to average net assets (excluding dividend and interest payments and other expenses relating to securities sold short) | | | 4.01 | % | | | 4.09 | % | | | 5.03 | % | | | 4.21 | % | | | 3.57% | |
| | | | | | |
| | Ratio of net investment loss to average net assets | | | (2.16 | )% | | | (1.39 | )% | | | (0.92 | )% | | | (0.36 | )% | | | (1.23)% | |
| | | | | | |
| | Portfolio turnover rate(c) | | | 236 | % | | | 269 | % | | | 222 | % | | | 202 | % | | | 232% | |
| | (a) | Calculated based on the average shares outstanding methodology. |
| | (b) | Assumes investment at the NAV at the beginning of the year, reinvestment of all dividends and distributions, a complete redemption of the investment at the NAV at the end of the year and no sales or redemption charges (if any). Total returns would be reduced if a sales or redemption charge was taken into account. Returns do not reflect the impact of taxes to shareholders relating to Fund distributions or the redemption of Fund shares. |
| | (c) | The Fund’s portfolio turnover rate is calculated in accordance with regulatory requirements, without regard to transactions involving short term investments and certain derivatives. If such transactions were included, the Fund’s portfolio turnover rate may be higher. |
The accompanying notes are an integral part of these financial statements. 29
|
| GOLDMAN SACHS MULTI-MANAGER ALTERNATIVES FUND |
Consolidated Financial Highlights (continued)
Selected Share Data for a Share Outstanding Throughout Each Year
| | | | | | | | | | | | | | | | | | | | | | |
| | | | | Goldman Sachs Multi-Manager Alternatives Fund | |
| | | | | Institutional Shares | |
| | | | | Year Ended October 31, | |
| | | | | 2022 | | | 2021 | | | 2020 | | | 2019 | | | 2018 | |
| | | | | | |
| | Per Share Data | | | | | | | | | | | | | | | | | | | | |
| | | | | | |
| | Net asset value, beginning of year | | $ | 12.04 | | | $ | 10.78 | | | $ | 10.62 | | | $ | 10.00 | | | $ | 10.28 | |
| |
| | | |
| | | | | | |
| | Net investment income (loss)(a) | | | (0.11 | ) | | | (0.03 | ) | | | 0.01 | | | | 0.07 | | | | (0.01) | |
| | | | | | |
| | Net realized and unrealized gain (loss) | | | (0.51 | ) | | | 1.29 | | | | 0.26 | | | | 0.55 | | | | (0.27) | |
| |
| | | |
| | | | | | |
| | Total from investment operations | | | (0.62 | ) | | | 1.26 | | | | 0.27 | | | | 0.62 | | | | (0.28) | |
| |
| | | |
| | | | | | |
| | Distributions to shareholders from net investment income | | | — | | | | — | | | | (0.11 | ) | | | — | | | | — | |
| |
| | | |
| | | | | | |
| | Net asset value, end of year | | $ | 11.42 | | | $ | 12.04 | | | $ | 10.78 | | | $ | 10.62 | | | $ | 10.00 | |
| |
| | | |
| | | | | | |
| | Total return(b) | | | (5.07 | )% | | | 11.58 | % | | | 2.66 | % | | | 6.20 | % | | | (2.72)% | |
| |
| | | |
| | | | | | |
| | Net assets, end of year (in 000s) | | $ | 35,165 | | | $ | 54,438 | | | $ | 67,354 | | | $ | 158,958 | | | $ | 361,962 | |
| | | | | | |
| | Ratio of net expenses to average net assets (including dividend and interest payments and other expenses relating to securities sold short) | | | 1.86 | % | | | 1.82 | % | | | 1.81 | % | | | 1.80 | % | | | 1.97% | |
| | | | | | |
| | Ratio of net expenses to average net assets (excluding dividend and interest payments and other expenses relating to securities sold short) | | | 1.76 | % | | | 1.76 | % | | | 1.75 | % | | | 1.74 | % | | | 1.89% | |
| | | | | | |
| | Ratio of total expenses to average net assets (including dividend and interest payments and other expenses relating to securities sold short) | | | 3.00 | % | | | 3.00 | % | | | 3.94 | % | | | 3.03 | % | | | 2.51% | |
| | | | | | |
| | Ratio of total expenses to average net assets (excluding dividend and interest payments and other expenses relating to securities sold short) | | | 2.90 | % | | | 2.94 | % | | | 3.88 | % | | | 2.98 | % | | | 2.43% | |
| | | | | | |
| | Ratio of net investment income (loss) to average net assets | | | (0.98 | )% | | | (0.28 | )% | | | 0.14 | % | | | 0.71 | % | | | (0.12)% | |
| | | | | | |
| | Portfolio turnover rate(c) | | | 236 | % | | | 269 | % | | | 222 | % | | | 202 | % | | | 232% | |
| |
| | | |
| | (a) | Calculated based on the average shares outstanding methodology. |
| | (b) | Assumes investment at the NAV at the beginning of the year, reinvestment of all dividends and distributions, a complete redemption of the investment at the NAV at the end of the year and no sales or redemption charges (if any). Total returns would be reduced if a sales or redemption charge was taken into account. Returns do not reflect the impact of taxes to shareholders relating to Fund distributions or the redemption of Fund shares. |
| | (c) | The Fund’s portfolio turnover rate is calculated in accordance with regulatory requirements, without regard to transactions involving short term investments and certain derivatives. If such transactions were included, the Fund’s portfolio turnover rate may be higher. |
30 The accompanying notes are an integral part of these financial statements.
GOLDMAN SACHS MULTI-MANAGER ALTERNATIVES FUND
Consolidated Financial Highlights (continued)
Selected Share Data for a Share Outstanding Throughout Each Year
| | | | | | | | | | | | | | | | | | | | | | |
| | | | | Goldman Sachs Multi-Manager Alternatives Fund | |
| | | | | Investor Shares | |
| | | | | Year Ended October 31, | |
| | | | | 2022 | | | 2021 | | | 2020 | | | 2019 | | | 2018 | |
| | | | | | |
| | Per Share Data | | | | | | | | | | | | | | | | | | | | |
| | | | | | |
| | Net asset value, beginning of year | | $ | 11.97 | | | $ | 10.73 | | | $ | 10.56 | | | $ | 9.95 | | | $ | 10.24 | |
| |
| | | |
| | | | | | |
| | Net investment income (loss)(a) | | | (0.12 | ) | | | (0.04 | ) | | | 0.01 | | | | 0.07 | | | | (0.03) | |
| | | | | | |
| | Net realized and unrealized gain (loss) | | | (0.50 | ) | | | 1.28 | | | | 0.26 | | | | 0.54 | | | | (0.26) | |
| |
| | | |
| | | | | | |
| | Total from investment operations | | | (0.62 | ) | | | 1.24 | | | | 0.27 | | | | 0.61 | | | | (0.29) | |
| |
| | | |
| | | | | | |
| | Distributions to shareholders from net investment income | | | — | | | | — | | | | (0.10 | ) | | | — | | | | — | |
| |
| | | |
| | | | | | |
| | Net asset value, end of year | | $ | 11.35 | | | $ | 11.97 | | | $ | 10.73 | | | $ | 10.56 | | | $ | 9.95 | |
| |
| | | |
| | | | | | |
| | Total return(b) | | | (5.10 | )% | | | 11.56 | % | | | 2.59 | % | | | 6.02 | % | | | (2.73)% | |
| |
| | | |
| | | | | | |
| | Net assets, end of year (in 000s) | | $ | 5,853 | | | $ | 7,478 | | | $ | 10,061 | | | $ | 12,457 | | | $ | 30,347 | |
| | | | | | |
| | Ratio of net expenses to average net assets (including dividend and interest payments and other expenses relating to securities sold short) | | | 1.93 | % | | | 1.89 | % | | | 1.88 | % | | | 1.87 | % | | | 2.09% | |
| | | | | | |
| | Ratio of net expenses to average net assets (excluding dividend and interest payments and other expenses relating to securities sold short) | | | 1.83 | % | | | 1.83 | % | | | 1.82 | % | | | 1.82 | % | | | 2.01% | |
| | | | | | |
| | Ratio of total expenses to average net assets (including dividend and interest payments and other expenses relating to securities sold short) | | | 3.12 | % | | | 3.10 | % | | | 4.07 | % | | | 3.23 | % | | | 2.64% | |
| | | | | | |
| | Ratio of total expenses to average net assets (excluding dividend and interest payments and other expenses relating to securities sold short) | | | 3.02 | % | | | 3.04 | % | | | 4.02 | % | | | 3.18 | % | | | 2.56% | |
| | | | | | |
| | Ratio of net investment income (loss) to average net assets | | | (1.07 | )% | | | (0.38 | )% | | | 0.07 | % | | | 0.63 | % | | | (0.26)% | |
| | | | | | |
| | Portfolio turnover rate(c) | | | 236 | % | | | 269 | % | | | 222 | % | | | 202 | % | | | 232% | |
| |
| | | |
| | (a) | Calculated based on the average shares outstanding methodology. |
| | (b) | Assumes investment at the NAV at the beginning of the year, reinvestment of all dividends and distributions, a complete redemption of the investment at the NAV at the end of the year and no sales or redemption charges (if any). Total returns would be reduced if a sales or redemption charge was taken into account. Returns do not reflect the impact of taxes to shareholders relating to Fund distributions or the redemption of Fund shares. |
| | (c) | The Fund’s portfolio turnover rate is calculated in accordance with regulatory requirements, without regard to transactions involving short term investments and certain derivatives. If such transactions were included, the Fund’s portfolio turnover rate may be higher. |
The accompanying notes are an integral part of these financial statements. 31
|
| GOLDMAN SACHS MULTI-MANAGER ALTERNATIVES FUND |
Consolidated Financial Highlights (continued)
Selected Share Data for a Share Outstanding Throughout Each Period
| | | | | | | | | | | | | | | | | | | | | | | | | | | |
| | | | | Goldman Sachs Multi-Manager Alternatives Fund |
| | | | | Class R6 Shares |
| | | | | Year Ended October 31, | | Period Ended |
| | | | | 2022 | | 2021 | | 2020 | | 2019 | | October 31, 2018(a) |
| | | | | | |
| | Per Share Data | | | | | | | | | | | | | | | | | | | | | | | | | |
| | | | | | |
| | Net asset value, beginning of period | | | $ | 12.05 | | | | $ | 10.79 | | | | $ | 10.63 | | | | $ | 10.01 | | | | $ | 10.22 | |
| | | | | | |
| | Net investment income (loss)(b) | | | | (0.10 | ) | | | | (0.04 | ) | | | | 0.02 | | | | | 0.08 | | | | | 0.01 | |
| | Net realized and unrealized gain (loss) | | | | (0.51 | ) | | | | 1.30 | | | | | 0.25 | | | | | 0.54 | | | | | (0.22 | ) |
| | | | | | |
| | Total from investment operations | | | | (0.61 | ) | | | | 1.26 | | | | | 0.27 | | | | | 0.62 | | | | | (0.21 | ) |
| | | | | | |
| | Distributions to shareholders from net investment income | | | | — | | | | | — | | | | | (0.11 | ) | | | | — | | | | | — | |
| | | | | | |
| | Net asset value, end of period | | | $ | 11.44 | | | | $ | 12.05 | | | | $ | 10.79 | | | | $ | 10.63 | | | | $ | 10.01 | |
| | | | | | |
| | Total return(c) | | | | (5.06 | )% | | | | 11.68 | % | | | | 2.60 | % | | | | 6.19 | % | | | | (2.05 | )% |
| | | | | | |
| | Net assets, end of period (in 000s) | | | $ | 37 | | | | $ | 12 | | | | $ | 11 | | | | $ | 10 | | | | $ | 10 | |
| | | | | | |
| | Ratio of net expenses to average net assets (including dividend and interest payments and other expenses relating to securities sold short) | | | | 1.87 | % | | | | 1.83 | % | | | | 1.81 | % | | | | 1.79 | % | | | | 1.90 | %(d) |
| | | | | | |
| | Ratio of net expenses to average net assets (excluding dividend and interest payments and other expenses relating to securities sold short) | | | | 1.77 | % | | | | 1.76 | % | | | | 1.76 | % | | | | 1.74 | % | | | | 1.81 | %(d) |
| | | | | | |
| | Ratio of total expenses to average net assets (including dividend and interest payments and other expenses relating to securities sold short) | | | | 3.01 | % | | | | 2.96 | % | | | | 3.93 | % | | | | 3.23 | % | | | | 2.63 | %(d) |
| | | | | | |
| | Ratio of total expenses to average net assets (excluding dividend and interest payments and other expenses relating to securities sold short) | | | | 2.91 | % | | | | 2.89 | % | | | | 3.88 | % | | | | 3.18 | % | | | | 2.54 | %(d) |
| | | | | | |
| | Ratio of net investment income (loss) to average net assets | | | | (0.91 | )% | | | | (0.30 | )% | | | | 0.12 | % | | | | 0.75 | % | | | | 0.13 | %(d) |
| | | | | | |
| | Portfolio turnover rate(e) | | | | 236 | % | | | | 269 | % | | | | 222 | % | | | | 202 | % | | | | 232 | % |
| | (a) | Commenced operations on February 28, 2018. |
| | (b) | Calculated based on the average shares outstanding methodology. |
| | (c) | Assumes investment at the NAV at the beginning of the period, reinvestment of all dividends and distributions, a complete redemption of the investment at the NAV at the end of the period and no sales or redemption charges (if any). Total returns would be reduced if a sales or redemption charge was taken into account. Returns do not reflect the impact of taxes to shareholders relating to Fund distributions or the redemption of Fund shares. Total returns for periods less than one full year are not annualized. |
| | (e) | The Fund’s portfolio turnover rate is calculated in accordance with regulatory requirements, without regard to transactions involving short term investments and certain derivatives. If such transactions were included, the Fund’s portfolio turnover rate may be higher. |
32 The accompanying notes are an integral part of these financial statements.
GOLDMAN SACHS MULTI-MANAGER ALTERNATIVES FUND
Consolidated Financial Highlights (continued)
Selected Share Data for a Share Outstanding Throughout Each Year
| | | | | | | | | | | | | | | | | | | | | | | | | | | |
| | | | | Goldman Sachs Multi-Manager Alternatives Fund |
| | | | | Class R Shares |
| | | | | Year Ended October 31, |
| | | | | 2022 | | 2021 | | 2020 | | 2019 | | 2018 |
| | | | | | |
| | Per Share Data | | | | | | | | | | | | | | | | | | | | | | | | | |
| | | | | | |
| | Net asset value, beginning of year | | | $ | 11.68 | | | | $ | 10.52 | | | | $ | 10.37 | | | | $ | 9.82 | | | | $ | 10.15 | |
| | | | | | |
| | Net investment income (loss)(a) | | | | (0.17 | ) | | | | (0.10 | ) | | | | (0.05 | ) | | | | 0.02 | | | | | (0.09 | ) |
| | Net realized and unrealized gain (loss) | | | | (0.49 | ) | | | | 1.26 | | | | | 0.26 | | | | | 0.53 | | | | | (0.24 | ) |
| | | | | | |
| | Total from investment operations | | | | (0.66 | ) | | | | 1.16 | | | | | 0.21 | | | | | 0.55 | | | | | (0.33 | ) |
| | | | | | |
| | Distributions to shareholders from net investment income | | | | — | | | | | — | | | | | (0.06 | ) | | | | — | | | | | — | |
| | | | | | |
| | Net asset value, end of year | | | $ | 11.02 | | | | $ | 11.68 | | | | $ | 10.52 | | | | $ | 10.37 | | | | $ | 9.82 | |
| | | | | | |
| | Total return(b) | | | | (5.57 | )% | | | | 11.03 | % | | | | 1.98 | % | | | | 5.60 | % | | | | (3.25 | )% |
| | | | | | |
| | Net assets, end of year (in 000s) | | | $ | 29 | | | | $ | 31 | | | | $ | 27 | | | | $ | 27 | | | | $ | 25 | |
| | Ratio of net expenses to average net assets (including dividend and interest payments and other expenses relating to securities sold short) | | | | 2.42 | % | | | | 2.39 | % | | | | 2.38 | % | | | | 2.38 | % | | | | 2.61 | % |
| | | | | | |
| | Ratio of net expenses to average net assets (excluding dividend and interest payments and other expenses relating to securities sold short) | | | | 2.32 | % | | | | 2.33 | % | | | | 2.32 | % | | | | 2.32 | % | | | | 2.53 | % |
| | | | | | |
| | Ratio of total expenses to average net assets (including dividend and interest payments and other expenses relating to securities sold short) | | | | 3.62 | % | | | | 3.59 | % | | | | 4.56 | % | | | | 3.86 | % | | | | 3.12 | % |
| | | | | | |
| | Ratio of total expenses to average net assets (excluding dividend and interest payments and other expenses relating to securities sold short) | | | | 3.52 | % | | | | 3.53 | % | | | | 4.50 | % | | | | 3.81 | % | | | | 3.04 | % |
| | | | | | |
| | Ratio of net investment income (loss) to average net assets | | | | (1.50 | )% | | | | (0.87 | )% | | | | (0.44 | )% | | | | 0.15 | % | | | | (0.91 | )% |
| | | | | | |
| | Portfolio turnover rate(c) | | | | 236 | % | | | | 269 | % | | | | 222 | % | | | | 202 | % | | | | 232 | % |
| | (a) | Calculated based on the average shares outstanding methodology. |
| | (b) | Assumes investment at the NAV at the beginning of the year, reinvestment of all dividends and distributions, a complete redemption of the investment at the NAV at the end of the year and no sales or redemption charges (if any). Total returns would be reduced if a sales or redemption charge was taken into account. Returns do not reflect the impact of taxes to shareholders relating to Fund distributions or the redemption of Fund shares. |
| | (c) | The Fund’s portfolio turnover rate is calculated in accordance with regulatory requirements, without regard to transactions involving short term investments and certain derivatives. If such transactions were included, the Fund’s portfolio turnover rate may be higher. |
The accompanying notes are an integral part of these financial statements. 33
|
| GOLDMAN SACHS MULTI-MANAGER ALTERNATIVES FUND |
Consolidated Financial Highlights (continued)
Selected Share Data for a Share Outstanding Throughout Each Period
| | | | | | | | | | | | | | | | | | | | | | | | | | | |
| | | | | Goldman Sachs Multi-Manager Alternatives Fund |
| | | | | Class P Shares |
| | | | | Year Ended October 31, | | Period Ended |
| | | | | 2022 | | 2021 | | 2020 | | 2019 | | October 31, 2018(a) |
| | | | | | |
| | Per Share Data | | | | | | | | | | | | | | | | | | | | | | | | | |
| | | | | | |
| | Net asset value, beginning of period | | | $ | 12.04 | | | | $ | 10.78 | | | | $ | 10.62 | | | | $ | 10.00 | | | | $ | 10.21 | |
| | | | | | |
| | Net investment income (loss)(b) | | | | (0.11 | ) | | | | (0.03 | ) | | | | 0.02 | | | | | 0.08 | | | | | 0.02 | |
| | Net realized and unrealized gain (loss) | | | | (0.51 | ) | | | | 1.29 | | | | | 0.25 | | | | | 0.54 | | | | | (0.23 | ) |
| | | | | | |
| | Total from investment operations | | | | (0.62 | ) | | | | 1.26 | | | | | 0.27 | | | | | 0.62 | | | | | (0.21 | ) |
| | | | | | |
| | Distributions to shareholders from net investment income | | | | — | | | | | — | | | | | (0.11 | ) | | | | — | | | | | — | |
| | | | | | |
| | Net asset value, end of period | | | $ | 11.42 | | | | $ | 12.04 | | | | $ | 10.78 | | | | $ | 10.62 | | | | $ | 10.00 | |
| | | | | | |
| | Total return(c) | | | | (5.07 | )% | | | | 11.69 | % | | | | 2.60 | % | | | | 6.20 | % | | | | (2.06 | )% |
| | | | | | |
| | Net assets, end of period (in 000s) | | | $ | 99,431 | | | | $ | 103,080 | | | | $ | 59,182 | | | | $ | 73,641 | | | | $ | 108,718 | |
| | | | | | |
| | Ratio of net expenses to average net assets (including dividend and interest payments and other expenses relating to securities sold short) | | | | 1.85 | % | | | | 1.81 | % | | | | 1.80 | % | | | | 1.79 | % | | | | 1.83 | %(d) |
| | | | | | |
| | Ratio of net expenses to average net assets (excluding dividend and interest payments and other expenses relating to securities sold short) | | | | 1.75 | % | | | | 1.76 | % | | | | 1.74 | % | | | | 1.73 | % | | | | 1.74 | %(d) |
| | | | | | |
| | Ratio of total expenses to average net assets (including dividend and interest payments and other expenses relating to securities sold short) | | | | 2.99 | % | | | | 2.91 | % | | | | 3.93 | % | | | | 3.13 | % | | | | 2.68 | %(d) |
| | | | | | |
| | Ratio of total expenses to average net assets (excluding dividend and interest payments and other expenses relating to securities sold short) | | | | 2.89 | % | | | | 2.85 | % | | | | 3.88 | % | | | | 3.08 | % | | | | 2.58 | %(d) |
| | | | | | |
| | Ratio of net investment income to average net assets | | | | (0.93 | )% | | | | (0.29 | )% | | | | 0.15 | % | | | | 0.73 | % | | | | 0.45 | %(d) |
| | | | | | |
| | Portfolio turnover rate(e) | | | | 236 | % | | | | 269 | % | | | | 222 | % | | | | 202 | % | | | | 232 | % |
| | (a) | Commenced operations on April 16, 2018. |
| | (b) | Calculated based on the average shares outstanding methodology. |
| | (c) | Assumes investment at the NAV at the beginning of the period, reinvestment of all dividends and distributions, a complete redemption of the investment at the NAV at the end of the period and no sales or redemption charges (if any). Total returns would be reduced if a sales or redemption charge was taken into account. Returns do not reflect the impact of taxes to shareholders relating to Fund distributions or the redemption of Fund shares. Total returns for periods less than one full year are not annualized. |
| | (e) | The Fund’s portfolio turnover rate is calculated in accordance with regulatory requirements, without regard to transactions involving short term investments and certain derivatives. If such transactions were included, the Fund’s portfolio turnover rate may be higher. |
34 The accompanying notes are an integral part of these financial statements.
GOLDMAN SACHS MULTI-MANAGER ALTERNATIVES FUND
Consolidated Notes to Financial Statements
October 31, 2022
Goldman Sachs Trust II (the “Trust”) is a Delaware statutory trust registered under the Investment Company Act of 1940, as amended (the “Act”), as an open-end management investment company. The Trust includes the Goldman Sachs Multi-Manager Alternatives Fund (the “Fund”). The Fund is a diversified portfolio and currently offers seven classes of shares: Class A, Class C, Institutional, Investor, Class R6 Shares, Class R and Class P Shares.
Class A Shares are sold with a front-end sales charge of up to 5.50%. Class C Shares are sold with a contingent deferred sales charge (“CDSC”) of 1.00%, which is imposed on redemptions made within 12 months of purchase. Institutional, Investor, Class R6, Class R and Class P Shares are not subject to a sales charge.
Goldman Sachs Asset Management, L.P. (“GSAM”), an affiliate of Goldman Sachs & Co. LLC (“Goldman Sachs”), serves as investment adviser to the Fund pursuant to a management agreement (the “Agreement”) with the Trust. As of October 31, 2022, GSAM had sub-advisory agreements (the “Sub-Advisory Agreements”) for the Fund with Algert Global LLC (“Algert”), Artisan Partners Limited Partnership (“Artisan Partners”), Bardin Hill Arbitrage IC Management LP (“Bardin Hill”), Brigade Capital Management, LP (“Brigade”), Crabel Capital Management, LLC (“Crabel”), GQG Partners LLC (“GQG Partners”), Longfellow Investment Management Co., LLC (“Longfellow”), Marathon Asset Management, L.P. (“Marathon”), River Canyon Fund Management LLC (“River Canyon”), Russell Investments Commodity Advisor, LLC (“RICA”), TCW Investment Management Company LLC (“TCW”), Trium Capital LLP (“Trium”) and Wellington Management Company LLP (“Wellington”) (the “Underlying Managers”). Crabel also serves as an Underlying Manager for the Subsidiary (as defined below). Pursuant to the terms of the Sub-Advisory Agreements, the Underlying Managers are responsible for making investment decisions and managing the investments of the Fund. GSAM compensates the Underlying Managers directly in accordance with the terms of the Sub-Advisory Agreements. The Fund is not charged any separate or additional investment advisory fees by the Underlying Managers.
|
|
| 2. SIGNIFICANT ACCOUNTING POLICIES |
The financial statements have been prepared in accordance with accounting principles generally accepted in the United States of America (“GAAP”) and require management to make estimates and assumptions that may affect the reported amounts and disclosures. Actual results may differ from those estimates and assumptions. The Fund is an investment company under GAAP and follows the accounting and reporting guidance applicable to investment companies.
A. Basis of Consolidation for the Goldman Sachs Multi-Manager Alternatives Fund — The Cayman Commodity — MMA IV, LLC (the “Subsidiary”), a Cayman Islands exempted company, is currently a wholly-owned subsidiary of the Fund. The Subsidiary acts as an investment vehicle for the Fund to enable the Fund to gain exposure to certain types of commodity-linked derivative instruments. The Fund is the sole shareholder of the Subsidiary and it is intended that the Fund will remain the sole shareholder and will continue to control the Subsidiary. All inter-fund balances and transactions have been eliminated in consolidation. As of October 31, 2022, the Fund’s net assets were $150,990,378 of which, $3,368,029, or 2.2%, represented the Subsidiary’s net assets.
B. Investment Valuation — The Fund’s valuation policy is to value investments at fair value.
C. Investment Income and Investments — Investment income includes interest income, dividend income and securities lending income, if any. Interest income is accrued daily and adjusted for amortization of premiums and accretion of discounts. Dividend income is recognized on ex-dividend date or, for certain foreign securities, as soon as such information is obtained subsequent to the ex-dividend date. Non-cash dividends, if any, are recorded at the fair market value of the securities received. Investment transactions are reflected on trade date. Realized gains and losses are calculated using identified cost. Investment transactions are recorded on the following business day for daily net asset value (“NAV”) calculations. Investment income is recorded net of any foreign withholding taxes, less any amounts reclaimable. The Fund may file withholding tax reclaims in certain jurisdictions to recover a portion of amounts previously withheld. Any foreign capital gains tax is accrued daily based upon net unrealized gains, and is payable upon sale of such investments.
Distributions received from the Fund’s investments in U.S. real estate investment trusts (“REITs”) may be characterized as ordinary income, net capital gain or a return of capital. A return of capital is recorded by the Fund as a reduction to the cost basis of the REIT.
35
|
| GOLDMAN SACHS MULTI-MANAGER ALTERNATIVES FUND |
Consolidated Notes to Financial Statements (continued)
October 31, 2022
|
|
| 2. SIGNIFICANT ACCOUNTING POLICIES (continued) |
For derivative contracts, unrealized gains and losses are recorded daily and become realized gains and losses upon disposition or termination of the contract. Upfront payments, if any, are made or received upon entering into a swap agreement and are reflected in the Consolidated Statement of Assets and Liabilities. Upfront payments are recognized over the contract’s term/event as realized gains or losses, with the exception of forward starting swap contracts whose realized gains or losses are recognized from the effective start date. For securities with paydown provisions, principal payments received are treated as a proportionate reduction to the cost basis of the securities, and excess or shortfall amounts are recorded as income. For treasury inflation protected securities (“TIPS”), adjustments to principal due to inflation/ deflation are reflected as increases/decreases to interest income with a corresponding adjustment to cost.
Class Allocations and Expenses — Investment income, realized and unrealized gain (loss), if any, and non-class specific expenses of the Fund are allocated daily based upon the proportion of net assets of each class. Non-class specific expenses directly incurred by the Fund are charged to the Fund, while such expenses incurred by the Trust are allocated across the Fund on a straight-line and/or pro-rata basis depending upon the nature of the expenses. Class specific expenses, where applicable, are borne by the respective share classes and include Distribution and Service and Transfer Agency fees.
D. Federal Taxes and Distributions to Shareholders — It is the Fund’s policy to comply with the requirements of the Internal Revenue Code of 1986, as amended (the “Code”), applicable to regulated investment companies and to distribute each year substantially all of its investment company taxable income and capital gains to its shareholders. Accordingly, the Fund is not required to make any provisions for the payment of federal income tax. Distributions to shareholders are recorded on the ex-dividend date. Income and capital gains distributions, if any, are declared and paid annually.
The Subsidiary is classified as a controlled foreign corporation under the Code. Therefore, the Fund is required to increase its taxable income by its share of the Subsidiary’s income. Net losses of the Subsidiary cannot be deducted by the Fund in the current period nor carried forward to offset taxable income in future periods.
Net capital losses, if any, are carried forward to future fiscal years and may be used to the extent allowed by the Code to offset any future capital gains. Losses that are carried forward will retain their character as either short-term or long-term capital losses. Utilization of capital loss carryforwards will reduce the requirement of future capital gains distributions.
The characterization of distributions to shareholders for financial reporting purposes is determined in accordance with federal income tax rules, which may differ from GAAP. The source of the Fund’s distributions may be shown in the accompanying financial statements as either from distributable earnings or capital. Certain components of the Fund’s net assets on the Consolidated Statement of Assets and Liabilities reflect permanent GAAP/tax differences based on the appropriate tax character.
E. Foreign Currency Translation — The accounting records and reporting currency of the Fund are maintained in U.S. dollars. Assets and liabilities denominated in foreign currencies are translated into U.S. dollars using the current exchange rates at the close of each business day. The effect of changes in foreign currency exchange rates on investments is included within net realized and unrealized gain (loss) on investments. Changes in the value of other assets and liabilities as a result of fluctuations in foreign exchange rates are included in the Consolidated Statement of Operations within net change in unrealized gain (loss) on foreign currency translation. Transactions denominated in foreign currencies are translated into U.S. dollars on the date the transaction occurred, the effects of which are included within net realized gain (loss) on foreign currency transactions.
F. Commission Recapture — GSAM, on behalf of certain Funds, may direct portfolio trades, subject to seeking best execution, to various brokers who have agreed to rebate a portion of the commissions generated. Such rebates are made directly to the Fund as cash payments and are included in net realized gain (loss) from investments on the Consolidated Statement of Operations.
|
|
| 3. INVESTMENTS AND FAIR VALUE MEASUREMENTS |
U.S. GAAP defines the fair value of a financial instrument as the amount that would be received to sell an asset or paid to transfer a liability in an orderly transaction between market participants at the measurement date (i.e., the exit price); the Fund’s policy is to use the market approach. GAAP establishes a fair value hierarchy that prioritizes the inputs to valuation techniques used to measure fair value. The hierarchy gives the highest priority to unadjusted quoted prices in active markets for identical assets or liabilities (Level 1 measurements) and the lowest priority to unobservable inputs (Level 3 measurements). The level in the fair
36
GOLDMAN SACHS MULTI-MANAGER ALTERNATIVES FUND
|
|
| 3. INVESTMENTS AND FAIR VALUE MEASUREMENTS (continued) |
value hierarchy within which the fair value measurement in its entirety falls shall be determined based on the lowest level input that is significant to the fair value measurement in its entirety. The levels used for classifying investments are not necessarily an indication of the risk associated with investing in these investments. The three levels of the fair value hierarchy are described below:
Level 1 — Unadjusted quoted prices in active markets that are accessible at the measurement date for identical, unrestricted assets or liabilities;
Level 2 — Quoted prices in markets that are not active or financial instruments for which significant inputs are observable (including, but not limited to, quoted prices for similar investments, interest rates, foreign exchange rates, volatility and credit spreads), either directly or indirectly;
Level 3 — Prices or valuations that require significant unobservable inputs (including GSAM’s assumptions in determining fair value measurement).
The Board of Trustees (“Trustees”) has approved Valuation Procedures that govern the valuation of the portfolio investments held by the Fund, including investments for which market quotations are not readily available. With respect to the Fund’s investments that do not have readily available market quotations, the Trustees have designated the Adviser as the valuation designee to perform fair valuations pursuant to Rule 2a-5 under the Investment Company Act of 1940 (the “Valuation Designee”).GSAM has day-to-day responsibility for implementing and maintaining internal controls and procedures related to the valuation of the Fund’s investments. To assess the continuing appropriateness of pricing sources and methodologies, GSAM regularly performs price verification procedures and issues challenges as necessary to third party pricing vendors or brokers, and any differences are reviewed in accordance with the Valuation Procedures.
A. Level 1 and Level 2 Fair Value Investments — The valuation techniques and significant inputs used in determining the fair values for investments classified as Level 1 and Level 2 are as follows:
Equity Securities — Equity securities traded on a United States (“U.S.”) securities exchange or the NASDAQ system, or those located on certain foreign exchanges, including but not limited to the Americas, are valued daily at their last sale price or official closing price on the principal exchange or system on which they are traded. If there is no sale or official closing price or such price is believed by GSAM to not represent fair value, equity securities will be valued at the valid closing bid price for long positions and at the valid closing ask price for short positions (i.e., where there is sufficient volume, during normal exchange trading hours). If no valid bid/ask price is available, the equity security will be valued pursuant to the Valuation Procedures and consistent with applicable regulatory guidance. To the extent these investments are actively traded, they are classified as Level 1 of the fair value hierarchy, otherwise they are generally classified as Level 2. Certain equity securities containing unique attributes may be classified as Level 2.
Unlisted equity securities for which market quotations are available are valued at the last sale price on the valuation date, or if no sale occurs, at the last bid price for long positions or the last ask price for short positions, and are generally classified as Level 2. Securities traded on certain foreign securities exchanges are valued daily at fair value determined by an independent fair value service (if available) under the Valuation Procedures and consistent with applicable regulatory guidance. The independent fair value service takes into account multiple factors including, but not limited to, movements in the securities markets, certain depositary receipts, futures contracts and foreign currency exchange rates that have occurred subsequent to the close of the foreign securities exchange. These investments are generally classified as Level 2 of the fair value hierarchy.
Special Purpose Acquisition Companies — The Fund may invest in stock of, warrants to purchase stock of, and other interests in, special purpose acquisition companies or similar special purpose entities that pool funds to seek potential merger and acquisition opportunities (collectively, “SPACs”). SPACs are companies that have no operations but go public with the intention of merging with or acquiring a company using the proceeds of the SPAC’s initial public offering. Stock purchased in a SPAC’s initial public offering are valued the same as other equity securities as noted above. Certain private SPAC investments (e.g. “founder shares” and private warrants), however, may be subject to forfeiture or expire worthless if certain events do not take place. A Probability Value Adjustment (PVA) is applied to such securities until such contingencies have been satisfied. An LVA may also be applied to securities which are subject to externally imposed and legally enforceable trading restrictions. Such positions are
37
|
| GOLDMAN SACHS MULTI-MANAGER ALTERNATIVES FUND |
Consolidated Notes to Financial Statements (continued)
October 31, 2022
|
|
| 3. INVESTMENTS AND FAIR VALUE MEASUREMENTS (continued) |
generally classified as Level 3. The Fund may also enter into an unfunded commitment to purchase securities in a PIPE transaction and will satisfy the commitment if and when the SPAC completes its merger or acquisition. The Fund may purchase securities in a SPAC PIPE transaction only upon such contingencies being satisfied. Such investments are valued similar to founder shares mentioned above and are generally classified as Level 3.
Money Market Funds — Investments in the Goldman Sachs Financial Square Government Fund (“Underlying Money Market Fund”) are valued at the NAV per share of the Institutional Share class on the day of valuation. These investments are generally classified as Level 1 of the fair value hierarchy. For information regarding the Underlying Money Market Fund’s accounting policies and investment holdings, please see the Underlying Money Market Fund’s shareholder report.
Debt Securities — Debt securities for which market quotations are readily available are valued daily on the basis of quotations supplied by dealers or an independent pricing service. The pricing services may use valuation models or matrix pricing, which consider: (i) yield or price with respect to bonds that are considered comparable in characteristics such as rating, interest rate and maturity date or (ii) quotations from securities dealers to determine current value. With the exception of treasury securities of G7 countries, which are generally classified as Level 1, these investments are generally classified as Level 2 of the fair value hierarchy.
i. Mortgage-Backed and Asset-Backed Securities — Mortgage-backed securities represent direct or indirect participations in, or are collateralized by and payable from, mortgage loans secured by residential and/or commercial real estate property. Asset-backed securities include securities whose principal and interest payments are collateralized by pools of other assets or receivables. The value of certain mortgage-backed and asset-backed securities (including adjustable rate mortgage loans) may be particularly sensitive to changes in prevailing interest rates. The value of these securities may also fluctuate in response to the market’s perception of the creditworthiness of the issuers.
Asset-backed securities may present credit risks that are not presented by mortgage-backed securities because they generally do not have the benefit of a security interest in collateral that is comparable to mortgage assets. Some asset-backed securities may only have a subordinated claim on collateral.
Stripped mortgage-backed securities are usually structured with two different classes: one that receives substantially all interest payments (interest-only, or “IO” and/or high coupon rate with relatively low principal amount, or “IOette”), and the other that receives substantially all principal payments (principal-only, or “PO”) from a pool of mortgage loans. Little to no principal will be received at the maturity of an IO; as a result, periodic adjustments are recorded to reduce the cost of the security until maturity. These adjustments are included in interest income.
Securities Sold Short — Securities sold short are those securities which the Fund has sold but which it does not own. When the Fund sells a security it does not own, it must borrow the security that was sold and generally delivers the proceeds from the short sale to the broker through which it made the short sale. In addition, cash and certain investments in securities may be used to collateralize the securities sold short. Each day the securities sold short transaction is open, the liability to replace the borrowed security is marked to market and an unrealized gain or loss is recorded. While the transaction remains open, the Fund may also incur expenses for any dividends or interest which will be paid to the lender of the securities as well as a fee to borrow the delivered security. During the term of the short sale, the value of the securities pledged as collateral on short sales is required to exceed the value of the securities sold short. The market value of securities pledged as collateral is included in the Schedule of Investments.
Derivative Contracts — A derivative is an instrument whose value is derived from underlying assets, indices, reference rates or a combination of these factors. The Fund enters into derivative transactions to hedge against changes in interest rates, securities prices, and/or currency exchange rates, to increase total return, or to gain access to certain markets or attain exposure to other underliers. For financial reporting purposes, cash collateral that has been pledged to cover obligations of the Fund and cash collateral received, if any, is reported separately on the Consolidated Statement of Assets and Liabilities as either due to broker/receivable for collateral on certain derivative contracts. Non-cash collateral pledged by the Fund, if any, is noted in the Consolidated Schedule of Investments.
38
GOLDMAN SACHS MULTI-MANAGER ALTERNATIVES FUND
|
|
| 3. INVESTMENTS AND FAIR VALUE MEASUREMENTS (continued) |
Exchange-traded derivatives, including futures and options contracts, are generally valued at the last sale or settlement price on the exchange where they are principally traded. Exchange-traded options without settlement prices are generally valued at the midpoint of the bid and ask prices on the exchange where they are principally traded (or, in the absence of two-way trading, at the last bid price for long positions and the last ask price for short positions). Exchange-traded derivatives typically fall within Level 1 of the fair value hierarchy. Over-the-counter (“OTC”) and centrally cleared derivatives are valued using market transactions and other market evidence, including market-based inputs to models, calibration to market-clearing transactions, broker or dealer quotations, or other alternative pricing sources. Where models are used, the selection of a particular model to value OTC and centrally cleared derivatives depends upon the contractual terms of, and specific risks inherent in, the instrument, as well as the availability of pricing information in the market. Valuation models require a variety of inputs, including contractual terms, market prices, yield curves, credit curves, measures of volatility, voluntary and involuntary prepayment rates, loss severity rates and correlations of such inputs. For OTC and centrally cleared derivatives that trade in liquid markets, model inputs can generally be verified and model selection does not involve significant management judgment. OTC and centrally cleared derivatives are classified within Level 2 of the fair value hierarchy when significant inputs are corroborated by market evidence.
i. Forward Contracts — A forward contract is a contract between two parties to buy or sell an asset at a specified price on a future date. A forward contract settlement can occur on a cash or delivery basis. Forward contracts are marked-to-market daily using independent vendor prices, and the change in value, if any, is recorded as an unrealized gain or loss. Cash and certain investments may be used to collateralize forward contracts.
A forward foreign currency exchange contract is a forward contract in which the Fund agrees to receive or deliver a fixed quantity of one currency for another, at a pre-determined price at a future date. All forward foreign currency exchange contracts are marked to market daily by using the outright forward rates or interpolating based upon maturity dates, where available. Non-deliverable forward foreign currency exchange contracts are settled with the counterparty in cash without the delivery of foreign currency.
ii. Futures Contracts — Futures contracts are contracts to buy or sell a standardized quantity of a specified commodity or security. Upon entering into a futures contract, the Fund deposits cash or securities in an account on behalf of the broker in an amount sufficient to meet the initial margin requirement. Subsequent payments are made or received by the Fund equal to the daily change in the contract value and are recorded as variation margin receivable or payable with a corresponding offset to unrealized gains or losses.
iii. Options — When the Fund writes call or put options, an amount equal to the premium received is recorded as a liability and is subsequently marked-to-market to reflect the current value of the option written. Swaptions are options on swap contracts.
Upon the purchase of a call option or a put option by the Fund, the premium paid is recorded as an investment and subsequently marked-to-market to reflect the current value of the option. Certain options may be purchased with premiums to be determined on a future date. The premiums for these options are based upon implied volatility parameters at specified terms.
iv. Swap Contracts — Bilateral swap contracts are agreements in which the Fund and a counterparty agree to exchange periodic payments on a specified notional amount or make a net payment upon termination. Bilateral swap transactions are privately negotiated in the OTC market and payments are settled through direct payments between the Fund and the counterparty. By contrast, certain swap transactions are subject to mandatory central clearing. These swaps are executed through a derivatives clearing member (“DCM”), acting in an agency capacity, and submitted to a central counterparty (“CCP”) (“centrally cleared swaps”), in which case all payments are settled with the CCP through the DCM. Swaps are marked-to-market daily using pricing vendor quotations, counterparty or clearinghouse prices or model prices, and the change in value, if any, is recorded as an unrealized gain or loss. Upon entering into a swap contract, the Fund is required to satisfy an initial margin requirement by delivering cash or securities to the counterparty (or in some cases, segregated in a triparty
39
|
| GOLDMAN SACHS MULTI-MANAGER ALTERNATIVES FUND |
Consolidated Notes to Financial Statements (continued)
October 31, 2022
|
|
| 3. INVESTMENTS AND FAIR VALUE MEASUREMENTS (continued) |
account on behalf of the counterparty), which can be adjusted by any mark-to-market gains or losses pursuant to bilateral or centrally cleared arrangements. For centrally cleared swaps the daily change in valuation, if any, is recorded as a receivable or payable for variation margin.
A total return swap is an agreement that gives the Fund the right to receive or pay the appreciation or depreciation, as applicable, in the value of a specified security, an index, a basket of securities or indices or other instrument in return for a fee paid to the counterparty, which will typically be an agreed upon interest rate. If the underlying asset declines in value over the term of the swap, the Fund may also be required to pay the dollar value of that decline to the counterparty.
B. Level 3 Fair Value Investments — To the extent that significant inputs to valuation models and other alternative pricing sources are unobservable, or if quotations are not readily available, or if GSAM believes that such quotations do not accurately reflect fair value, the fair value of the Fund’s investments may be determined under the Valuation Procedures. GSAM, consistent with its procedures and applicable regulatory guidance, may make an adjustment to the most recent valuation prices of either domestic or foreign securities in light of significant events to reflect what it believes to be the fair value of the securities at the time of determining the Fund’s NAV. To the extent investments are valued using single source broker quotations obtained directly from the broker or passed through from third party pricing vendors, such investments are classified as Level 3 investments.
C. Fair Value Hierarchy — The following is a summary of the Fund’s investments and derivatives classified in the fair value hierarchy as of October 31, 2022:
| | | | | | | | | | | | |
| Investment Type | | Level 1 | | | Level 2 | | | Level 3 | |
| |
| | | |
Assets | | | | | | | | | | | | |
| | | |
Common Stock and/or Other Equity Investments(a) | | | | | | | | | | | | |
| | | |
Asia | | $ | 263,621 | | | $ | 906,069 | | | $ | — | (b) |
| | | |
Australia and Oceania | | | — | | | | 1,990,708 | | | | — | |
| | | |
Europe | | | 4,389,483 | | | | 10,559,482 | | | | — | |
| | | |
North America | | | 29,690,609 | | | | — | | | | — | |
| | | |
South America | | | 639,665 | | | | — | | | | — | |
| | | |
Special Purpose Acquisition Company | | | 32,073,826 | | | | — | | | | — | |
| | | |
Preferred Stocks | | | — | | | | 725,289 | | | | — | |
| | | |
Warrants | | | — | | | | 3,133 | | | | — | |
| | | |
Investment Company | | | 54,883,978 | | | | — | | | | — | |
| |
| | | |
Total | | $ | 121,941,182 | | | $ | 14,184,681 | | | $ | — | |
| |
| | | |
Liabilities | | | | | | | | | | | | |
| | | |
Common Stock and/or Other Equity Investments(a) | | | | | | | | | | | | |
| | | |
North America | | $ | (980,434) | | | $ | — | | | $ | — | |
| |
Derivative Type | | | | | | | | | | | | |
| |
| | | |
Assets | | | | | | | | | | | | |
| | | |
Forward Foreign Currency Exchange Contracts(c) | | $ | — | | | $ | 783,663 | | | $ | — | |
| | | |
Futures Contracts(c) | | | 2,306,712 | | | | — | | | | — | |
| | | |
Total Return Swap Contracts(c) | | | — | | | | 33,640 | | | | — | |
| | | |
Purchased Option Contracts | | | 179,712 | | | | — | | | | — | |
| |
| | | |
Total | | $ | 2,486,424 | | | $ | 817,303 | | | $ | — | |
| |
40
GOLDMAN SACHS MULTI-MANAGER ALTERNATIVES FUND
|
|
| 3. INVESTMENTS AND FAIR VALUE MEASUREMENTS (continued) |
| | | | | | | | | | | | |
| Derivative Type | | Level 1 | | | Level 2 | | | Level 3 | |
| |
| | | |
Liabilities | | | | | | | | | | | | |
| | | |
Forward Foreign Currency Exchange Contracts(c) | | $ | — | | | $ | (772,248) | | | $ | — | |
| | | |
Futures Contracts(c) | | | (695,803) | | | | — | | | | — | |
| | | |
Total Return Swap Contracts(c) | | | — | | | | (13,977) | | | | — | |
| | | |
Written Option Contracts | | | (47,560) | | | | — | | | | — | |
| |
| | | |
Total | | $ | (743,363) | | | $ | (786,225) | | | $ | — | |
| |
| | (a) | Amounts are disclosed by continent to highlight the impact of time zone differences between local market close and the calculation of NAV. Security valuations are based on the principal exchange or system on which they are traded, which may differ from country of domicile. The Fund utilizes fair value model prices provided by an independent fair value service for international equities, resulting in a Level 2 classification. |
| | (b) | Amount includes valuations of Russian investments for which GSAM has determined include significant unobservable inputs as of October 31, 2022. To the extent that the same positions were held as of the Fund’s prior fiscal year end, October 31, 2021, they were classified as Level 1 or level 2. |
| | (c) | Amount shown represents unrealized gain (loss) at period end. |
For further information regarding security characteristics, see the Schedule of Investments.
|
|
| 4. INVESTMENTS IN DERIVATIVES |
The following table sets forth, by certain risk types, the gross value of derivative contracts (not considered to be hedging instruments for accounting disclosure purposes) as of October 31, 2022. These instruments were used as part of the Fund’s investment strategies and to obtain and/or manage exposure related to the risks below. The values in the tables below exclude the effects of cash collateral received or posted pursuant to these derivative contracts, and therefore are not representative of the Fund’s net exposure.
MULTI-MANAGER ALTERNATIVES
| | | | | | | | | | | | |
| Risk | | Consolidated Statements of Assets and Liabilities | | Assets | | | Consolidated Statements of Assets and Liabilities | | Liabilities | |
| | | | |
Commodity | | Variation margin on futures contracts | | $ | 617,864 | (a) | | Variation margin on futures contracts | | $ | (569,976 | )(a) |
| | | | |
Currency | | Receivable for unrealized gain on forward foreign currency exchange contracts; Variation margin on futures contracts | | | 789,527 | (a) | | Payable for unrealized loss on forward foreign currency exchange contracts; Variation margin on futures contracts | | | (773,444 | )(a) |
| | | | |
Equity | | Receivable for unrealized gain on swap contracts; Variation margin on futures contracts; and Purchased options, at value | | | 1,872,322 | (a) | | Payable for unrealized loss on swap contracts; Variation margin on futures contracts; Written option contracts | | | (168,127 | )(a)(b) |
| | | | |
Interest rate | | Variation margin on futures contracts | | | 24,014 | (a) | | Variation margin on futures contracts | | | (18,041 | )(a) |
| | | | |
Total | | | | $ | 3,303,727 | | | | | $ | (1,529,588 | ) |
| | (a) | Includes unrealized gain (loss) on futures contracts described in the Additional Investment Information sections of the Consolidated Schedule of Investments. Only current day’s variation margin is reported within the Consolidated Statement of Assets and Liabilities. |
| | (b) | Aggregate of amounts include $13,977, which represents the payments to be made pursuant to bilateral agreements should counterparties exercise their “right to terminate” provisions based on, among others, the Fund’s performance, their failure to pay on their obligations or failure to pledge collateral. Such amount does not include incremental charges directly associated with the close-out of the agreements. It also does not reflect the fair value of any assets pledged as collateral which, through the daily margining process, substantially offsets the aforementioned amounts and for which the Fund is entitled to a full return. |
The following tables set forth, by certain risk types, the Fund’s gains (losses) related to these derivatives and their indicative volumes for the fiscal year ended October 31, 2022. These gains (losses) should be considered in the context that these derivative contracts may have been executed to create investment opportunities and/or economically hedge certain investments, and accordingly, certain gains (losses) on such derivative contracts may offset certain (losses) gains attributable to investments. These
41
|
| GOLDMAN SACHS MULTI-MANAGER ALTERNATIVES FUND |
Consolidated Notes to Financial Statements (continued)
October 31, 2022
|
|
| 4. INVESTMENTS IN DERIVATIVES ( continued) |
gains (losses) are included in “Net realized gain (loss)” or “Net change in unrealized gain (loss)” on the Consolidated Statement of Operations:
MULTI-MANAGER ALTERNATIVES
| | | | | | | | | | | | |
| Risk | | Consolidated Statement of Operations | | Net Realized Gain (Loss) | | Net Change in
Unrealized
Gain (Loss) |
| | | |
Commodity | | Net realized gain (loss) from futures contracts/Net change in unrealized gain (loss) on futures contracts | | | $ | (39,825 | ) | | | $ | (88,931 | ) |
| | | |
Currency | | Net realized gain (loss) from forward foreign currency exchange Contracts and futures contracts/Net change in unrealized gain (loss) on forward foreign currency exchange contracts and futures contracts | | | | 1,674,623 | | | | | 38,292 | |
| | | |
Equity | | Net realized gain (loss) from purchased options, futures contracts, swap contracts and written options/Net change in unrealized gain (loss) on purchase options, futures contracts, swaps contracts and written options | | | | 1,974,634 | | | | | 1,163,408 | |
| | | |
Interest rate | | Net realized gain (loss) from swap contracts and futures contracts/Net change in unrealized gain (loss) on futures contracts | | | | (402,230 | ) | | | | (47,578 | ) |
| | | |
Total | | | | | $ | 3,207,202 | | | | $ | 1,065,191 | |
For the fiscal year ended October 31, 2022, the relevant values for each derivative type was as follows:
| | | | | | | | |
| | | Average Number of Contracts, Notional Amounts, or Shares/Units(a) | | |
| | | | |
Futures contracts | | Forward contracts | | Swap Agreements | | Purchased Options | | Written Options |
| | | | |
664 | | $94,333,893 | | $17,438,829 | | 65,365 | | 38,218 |
| | (a) | Amounts disclosed represent average number of contracts for futures contracts, notional amounts for forward contracts, swap agreements for purchased options and written options, based on absolute values, which is indicative of volume for this derivative type, for the months that the Fund held such derivatives during the fiscal year ended October 31, 2022. |
In order to better define its contractual rights and to secure rights that will help the Fund mitigate its counterparty risk, the Fund may enter into an International Swaps and Derivatives Association, Inc. Master Agreement (“ISDA Master Agreement”) or similar agreement with its derivatives counterparties. An ISDA Master Agreement is a bilateral agreement between the Fund and a counterparty that governs OTC derivatives (including forward foreign currency exchange contracts, and certain options and swaps), and typically contains, among other things, collateral posting terms and netting provisions in the event of a default and/or termination event. The provisions of the ISDA Master Agreement typically permit a single net payment in the event of a default (close-out netting) or similar event, including the bankruptcy or insolvency of the counterparty.
Collateral and margin requirements differ between exchange traded derivatives and OTC derivatives. Margin requirements are established by the broker or clearing house for exchange-traded and centrally cleared derivatives (financial futures contracts, options and centrally cleared swaps) pursuant to governing agreements for those instrument types. Brokers can ask for margin in excess of the minimum in certain circumstances. Collateral terms are contract-specific for OTC derivatives. For derivatives traded under an ISDA Master Agreement, the collateral requirements are typically calculated by netting the marked to market amount for each transaction under such agreement and comparing that amount to the value of any collateral currently pledged by the Fund and the counterparty. Additionally, the Fund may be required to post initial margin to the counterparty, the terms of which would be outlined in the confirmation of the OTC transaction.
Generally, the amount of collateral due from or to a counterparty must exceed a minimum transfer amount threshold before a transfer is required to be made. To the extent amounts due to the Fund from its counterparties are not fully collateralized, contractually or otherwise, the Fund bears the risk of loss from counterparty nonperformance. The Fund attempts to mitigate
42
GOLDMAN SACHS MULTI-MANAGER ALTERNATIVES FUND
|
|
| 4. INVESTMENTS IN DERIVATIVES ( continued) |
counterparty risk by only entering into agreements with counterparties that the Underlying Managers believe to be of good standing and by monitoring the financial stability of those counterparties.
Additionally, the netting of assets and liabilities and the offsetting of collateral pledged or received are based on contractual netting/set-off provisions in the ISDA Master Agreement or similar agreements. However, in the event of a default or insolvency of a counterparty, a court could determine that such rights are not enforceable due to the restrictions or prohibitions against the right of setoff that may be imposed in accordance with a particular jurisdiction’s bankruptcy or insolvency laws.
The following table sets forth the Fund’s net exposure for derivative instruments that are subject to enforceable master netting arrangements or similar agreements as of October 31, 2022:
Multi-Manager Alternatives Fund
| | | | | | | | | | | | | | | | | | | | | | | | | | | | | | | | | | | | | | | | |
| | | Derivative Assets(1) | | | Derivative Liabilities(1) | | | | | | | | | | |
| | | | | | | | | |
| | | | | | Forward | | | | | | | | | Forward | | | | | | Net Derivative | | | Collateral | | | | |
| | | | | | Currency | | | | | | | | | Currency | | | | | | Asset | | | (Received) | | | Net | |
| Counterparty | | Swaps | | | Contracts | | | Total | | | Swaps | | | Contracts | | | Total | | | (Liabilities) | | | Pledged(1) | | | Amount(2) | |
| |
| | | | | | | | | | |
Deutsche Bank AG (London) | | $ | — | | | $ | 428,486 | | | $ | 428,486 | | | $ | — | | | $ | (587,223 | ) | | $ | (587,223 | ) | | $ | (158,737 | ) | | $ | 158,737 | | | | | | | $ | — | |
| | | | | | | | | |
MS & Co. Int. PLC | | | 33,640 | | | | 355,177 | | | | 388,817 | | | | (13,977 | ) | | | (185,025 | ) | | | (199,002 | ) | | | 189,815 | | | | — | | | | 189,815 | |
| |
Total | | $ | 33,640 | | | $ | 783,663 | | | $ | 817,303 | | | $ | (13,977 | ) | | $ | (772,248 | ) | | $ | (786,225 | ) | | $ | 31,078 | | | $ | 158,737 | | | | $189,815 | |
| |
| | (1) | Gross amounts available for offset but not netted in the Consolidated Statement of Assets and Liabilities. |
| | (2) | Net amount represents the net amount due (to) from counterparty in the event of a default based on the contractual set-off rights under the agreement. Net amount excludes any over-collateralized amounts. |
|
|
| 5. AGREEMENTS AND AFFILIATED TRANSACTIONS |
A. Management Agreement — Under the Agreement, GSAM manages the Fund, subject to the general supervision of the Trustees.
As compensation for the services rendered pursuant to the Agreement, the assumption of the expenses related thereto and administration of the Fund’s business affairs, including providing facilities, GSAM is entitled to a management fee, accrued daily and paid monthly, equal to an annual percentage rate of the Fund’s average daily net assets. For the fiscal year ended October 31, 2022, contractual and effective net management fees with GSAM were at the following rates:
| | | | | | | | | | | | | | | | | | |
| | | Contractual Management Rate | | | Effective Net Management Rate*^(a) |
| | | | | | | | | | | | | | | | |
| First | | Next | | | Next | | | Over | | | | |
| $2 billion | | $3 billion | | | $3 billion | | | $8 billion | | | Effective Rate | |
|
| | | | | |
1.90% | | | 1.80% | | | | 1.71% | | | | 1.68% | | | | 1.90% | | | 1.51% |
|
| | * | GSAM has agreed to waive a portion of its management fee in order to achieve a net management fee rate of 1.57% as an annual percentage of the average daily net assets of the Fund as defined in the Fund’s most recent prospectus. This arrangement will be effective through at least February 28, 2023, and prior to such date GSAM may not terminate the arrangement without the approval of the Trustees. |
| | ^ | Effective Net Management Rate includes the impact of management fee waivers of affiliated underlying funds, if any. |
| | (a) | Reflects combined management fees paid to GSAM under the Agreement and the Subsidiary Agreements as defined below after waivers. |
The Fund invests in Institutional Shares of the Goldman Sachs Financial Square Government Fund, which is an affiliated Underlying Fund. GSAM has agreed to waive a portion of its management fee payable by the Fund in an amount equal to the management fee it earns as an investment adviser to the affiliated Underlying Fund in which the Fund invests. For the fiscal year ended October 31, 2022, GSAM waived $98,402 of the Fund’s management fee.
GSAM also provides management services to the Subsidiary pursuant to a Subsidiary Management Agreement (the “Subsidiary Agreement”) and is entitled to a management fee accrued daily and paid monthly, equal to an annual percentage rate of 0.42% of the Subsidiary’s average daily net assets. In consideration of the Subsidiary’s management fee, and for as long as the Subsidiary Agreement remains in effect, GSAM has contractually agreed to waive irrevocably a portion of the Fund’s management
43
|
| GOLDMAN SACHS MULTI-MANAGER ALTERNATIVES FUND |
Consolidated Notes to Financial Statements (continued)
October 31, 2022
|
|
| 5. AGREEMENTS AND AFFILIATED TRANSACTIONS ( continued) |
fee in an amount equal to the management fee accrued and paid to GSAM by the Subsidiary under the Subsidiary Agreement. For the fiscal year ended October 31, 2022, GSAM waived $16,417 of the Fund’s management fee.
B. Distribution and/or Service (12b-1) Plans — The Trust, on behalf of Class A and Class R Shares of the Fund, has adopted Distribution and Service Plans subject to Rule 12b-1 under the Act. Under the Distribution and Service Plans, Goldman Sachs, which serves as distributor (the “Distributor”), is entitled to a fee accrued daily and paid monthly for distribution services and personal and account maintenance services, which may then be paid by Goldman Sachs to authorized dealers. These fees are equal to an annual percentage rate of the average daily net assets attributable to Class A or Class R Shares of the Fund, as applicable, as set forth below.
The Trust, on behalf of Class C Shares of the Fund, has adopted a Distribution Plan subject to Rule 12b-1 under the Act. Under the Distribution Plan, Goldman Sachs as Distributor is entitled to a fee accrued daily and paid monthly for distribution services, which may then be paid by Goldman Sachs to authorized dealers. These fees are equal to an annual percentage rate of the average daily net assets attributable to Class C Shares of the Fund, as set forth below.
| | | | | | | | | | | | |
| | | Distribution and/or Service Plan Rates | |
| | | | |
| | | |
| | | Class A* | | | Class C | | | Class R* | |
| |
| | | |
Distribution and/or Service Plan | | | 0.25 | % | | | 0.75 | % | | | 0.50% | |
| |
| | * | With respect to Class A and Class R Shares, the Distributor at its discretion may use compensation for distribution services paid under the Distribution Plan to compensate service organizations for personal and account maintenance services and expenses as long as such total compensation does not exceed the maximum cap on “service fees” imposed by the Financial Industry Regulatory Authority. |
C. Distribution Agreement — Goldman Sachs, as Distributor of the shares of the Fund pursuant to a Distribution Agreement, may retain a portion of the Class A Shares’ front end sales charge and Class C Shares’ CDSC. During the fiscal year ended October 31, 2022, Goldman Sachs retained the following amounts:
| | | | |
| | | Front End
Sales Charge | |
| Fund | | Class A | |
| |
| |
Multi-Manager Alternatives | | | $138 | |
| |
During the fiscal year ended October 31, 2022, Goldman Sachs did not retain any portion of Class C Shares’ CDSC.
D. Service Plan — The Trust, on behalf of the Fund, has adopted a Service Plan to allow Class C Shares to compensate service organizations (including Goldman Sachs) for providing varying levels of personal and account maintenance services to their customers who are beneficial owners of such shares. The Service Plan provides for compensation to the service organizations equal to an annual percentage rate of 0.25% of the average daily net assets attributable to Class C Shares of the Fund.
E. Transfer Agency Agreement — Goldman Sachs also serves as the transfer agent of the Fund for a fee pursuant to the Transfer Agency Agreement. The fees charged for such transfer agency services are accrued daily and paid monthly at annual rates as follows: 0.16% of the average daily net assets of Class A, Class C, Investor and Class R Shares; 0.04% of the average daily net assets of Institutional Shares; and 0.03% of the average daily net assets of Class R6 and Class P Shares. Goldman Sachs has agreed to waive a portion of the transfer agency fees equal to 0.06% of the average daily net assets attributable to Class A, Class C, Investor and Class R Shares of the Fund through at least February 28, 2023 (the “TA Fee Waiver”). Prior to such date, Goldman Sachs may not terminate the arrangement without approval of the Board of Trustees.
F. Other Expense Agreements and Affiliated Transactions — GSAM has agreed to reduce or limit certain “Other Expenses” of the Fund (excluding acquired fund fees and expenses, transfer agency fees and expenses, service fees and shareholder administration fees (as applicable), taxes, dividends and interest payments on securities sold short, interest, brokerage fees, expenses of shareholder meetings, litigation and indemnification, and extraordinary expenses) to 0.194% of the average daily net
44
GOLDMAN SACHS MULTI-MANAGER ALTERNATIVES FUND
|
|
| 5. AGREEMENTS AND AFFILIATED TRANSACTIONS ( continued) |
assets of the Fund and limit the Fund’s total annual operating expenses (excluding acquired fund fees and expenses, dividend and interest payments on securities sold short, taxes, interest, brokerage fees, expenses of shareholder meetings, litigation and indemnification, and extraordinary expenses) of Class A, Class C, Institutional, Investor, Class R6, Class R and Class P Shares to (after the application of the TA Fee Waiver described above) 2.12%, 2.87%, 1.80%, 1.87%, 1.79%, 2.37%, and 1.79%, respectively. These Other Expense limitations will remain in place through at least February 28, 2023, and prior to such date GSAM may not terminate the arrangements without the approval of the Trustees.
In addition, the Fund has entered into certain offset arrangements with the transfer agent, which may result in a reduction of the Fund’s expenses and are received irrespective of the application of the “Other Expense” limitations described above. For the fiscal year ended October 31, 2022, these expense reductions, including any fee waivers and Other Expense reimbursements, were as follows:
| | | | | | | | | | |
| | | | |
| | | | | | | Other | | Total | |
| | | Management | | Transfer Agency | | Expense | | Expense | |
| Fund | | Fee Waiver | | Waivers/Credits | | Reimbursements | | Reductions | |
| |
| | | | |
Multi-Manager Alternatives | | $630,857 | | $10,526 | | $1,199,743 | | | $1,841,126 | |
| |
G. Line of Credit Facility — As of October 31, 2022, the Fund participated in a $1,250,000,000 committed, unsecured revolving line of credit facility (the “facility”) together with other funds of the Trust and certain registered investment companies having management agreements with GSAM or its affiliates. This facility is to be used for temporary emergency purposes, or to allow for an orderly liquidation of securities to meet redemption requests. The interest rate on borrowings is based on the federal funds rate. The facility also requires a fee to be paid by the Fund based on the amount of the commitment that has not been utilized. For the fiscal year ended October 31, 2022, the Fund did not have any borrowings under the facility. Prior to April 22, 2022, the facility was $1,000,000,000.
H. Other Transactions with Affiliates — For the fiscal year ended October 31, 2022, Goldman Sachs earned $8,834 in brokerage commissions from portfolio transactions, including futures transactions executed with Goldman Sachs as the Futures Commission Merchant, on behalf of the Fund.
As of October 31, 2022, The Goldman Sachs Group, Inc. was the beneficial owner of approximately 31% of Class R6 and 99% of Class R Shares of the Fund.
The table below shows the transaction in and earnings from investments in the Goldman Sachs Financial Square Government Fund for the fiscal year ended October 31, 2022.
| | | | | | | | | | | | | | | | | | | | | | | | | | |
| | | | | Beginning | | | | | | | | | Ending | | | | | | | |
| | | | | | | |
| | | | | Value as of | | | | | | | | | Value as of | | | Shares as of | | | | |
| Fund | | Underlying Fund | | October 31,
2021 | | | Purchases at
Cost | | | Proceeds
from Sales | | | October 31,
2022 | | | October 31,
2022 | | | Dividend
Income | |
| |
| | | | | | | |
Multi-Manager Alternatives | | Goldman Sachs Financial
Square Government Fund —
Institutional Shares | | | $58,782,541 | | | | $309,011,065 | | | | $(312,909,628) | | | | $54,883,978 | | | | 54,883,978 | | | | $563,911 | |
| |
|
|
| 6. PORTFOLIO SECURITIES TRANSACTIONS |
The cost of purchases and proceeds from sales and maturities of long-term securities for the fiscal year ended October 31, 2022, were as follows:
| | | | |
| | | | | Sales and |
| | |
| | | Purchases (Excluding | | Maturities of (Excluding |
| | |
| | | U.S. Government and | | U.S. Government and |
| | |
| Fund | | Agency Obligations) | | Agency Obligations) |
|
| | |
Multi-Manager Alternatives | | $223,946,596 | | $226,426,371 |
|
45
|
| GOLDMAN SACHS MULTI-MANAGER ALTERNATIVES FUND |
Consolidated Notes to Financial Statements (continued)
October 31, 2022
|
|
| 6. PORTFOLIO SECURITIES TRANSACTIONS ( continued) |
The following table sets forth the Fund’s net exposure for short securities that are subject to enforceable master netting arrangements or similar agreements as of October 31, 2022:
| | | | | | | | |
| | | Securities Sold | | Collateral | | Net | |
| | | |
| Counterparty | | Short | | Pledged | | Amount | |
| |
| | | |
State Street Bank & Trust | | (980,434) | | $1,825,471 | | | $845,037 | |
| |
There were no distributions by the Fund during the fiscal years ended October 31, 2022 and October 31, 2021.
As of October 31, 2022, the components of accumulated earnings (losses) on a tax basis were as follows:
| | | | |
| |
| |
Undistributed ordinary income — net | | | $ 626,258 | |
| |
| |
Capital loss carryforwards(1): | | | | |
Perpetual Short-Term | | | (38,910,611) | |
| |
| |
Timing differences (Straddle Loss Deferral) | | | (67,381) | |
| |
Unrealized gains (loss) — net | | | (1,240,027) | |
| |
| |
Total accumulated earnings (loss) net | | | $(39,591,761) | |
| |
| | (1) | The Fund utilized $5,449,098 of capital losses in the current fiscal year. |
As of October 31, 2022, the Funds’ aggregate security unrealized gains and losses based on cost for U.S. federal income tax purposes were as follows:
| | | | |
| |
| |
Tax Cost | | | $139,161,341 | |
| |
| |
Gross unrealized gain | | | 3,284,781 | |
Gross unrealized loss | | | (4,524,808) | |
| |
| |
Net unrealized loss | | | $ (1,240,027) | |
| |
The difference between GAAP-basis and tax basis unrealized gains (losses) is attributable primarily to wash sales, net mark to market gains/(losses) on regulated futures contracts, net mark to market gains/(losses) on foreign currency contracts, and differences in the tax treatment of underlying fund investments, passive foreign investment company investments, and swap transactions.
The Fund reclassed $575,965 from paid in capital to distributable earnings for the year ending October 31, 2022. In order to present certain components of the Funds’ capital accounts on a tax-basis, certain reclassifications have been recorded to the Funds’ accounts. These reclassifications have no impact on the net asset value of the Funds’ and result primarily from primarily from net operating losses and differences in the tax treatment of underlying fund investments.
GSAM has reviewed the Fund’s tax positions for all open tax years (the current and prior three years, as applicable) and has concluded that no provision for income tax is required in the Fund’s financial statements. Such open tax years remain subject to examination and adjustment by tax authorities.
46
GOLDMAN SACHS MULTI-MANAGER ALTERNATIVES FUND
The Fund’s risks include, but are not limited to, the following:
Derivatives Risk — The Fund’s use of derivatives and other similar instruments (together, referred to in this paragraph as “derivatives”) may result in loss, including due to adverse market movements. Derivatives, which may pose risks in addition to and greater than those associated with investing directly in securities, currencies or other instruments, may be illiquid or less liquid, volatile, difficult to price and leveraged so that small changes in the value of the underlying instruments may produce disproportionate losses to the Fund. Changes in the value of a derivative may also create margin delivery or settlement payment obligations for the Fund. Derivatives are also subject to counterparty risk, which is the risk that the other party in the transaction will not, or lacks the capacity or authority to, fulfill its contractual obligation. The use of derivatives is a highly specialized activity that involves investment techniques and risks different from those associated with investments in more traditional securities and instruments. The use of derivatives is also subject to operational and legal risks. Operational risks refer to risks related to potential operational issues, including documentation issues, settlement issues, system failures, inadequate controls, and human error. Legal risks refer to the risks of loss resulting from insufficient documentation, or legality or enforceability of a contract. Losses from derivatives can also result from a lack of correlation between changes in the value of derivative instruments and the portfolio assets (if any) being hedged.
Floating and Variable Rate Obligations Risk — Floating rate and variable rate obligations are debt instruments issued by companies or other entities with interest rates that reset periodically (typically daily, monthly, quarterly, or semiannually) in response to changes in the market rate of interest on which the interest rate is based. Such market rates are generally the Secured Overnight Financing Rate, London Interbank Offered Rate (“LIBOR”), the Prime Rate of a designated U.S. bank, the Federal Funds Rate, or another base lending rate used by commercial lenders. For floating and variable rate obligations, there may be a lag between an actual change in the underlying interest rate benchmark and the reset time for an interest payment of such an obligation, which could harm or benefit the Fund, depending on the interest rate environment or other circumstances. In a rising interest rate environment, for example, a floating or variable rate obligation that does not reset immediately would prevent the Fund from taking full advantage of rising interest rates in a timely manner. However, in a declining interest rate environment, the Fund may benefit from a lag due to an obligation’s interest rate payment not being immediately impacted by a decline in interest rates.
At the end of 2021, certain LIBORs were discontinued, but the most widely used LIBORs may continue to be provided on a representative basis until June 2023. The unavailability or replacement of LIBOR may affect the value, liquidity or return on certain Fund investments and may result in costs incurred in connection with closing out positions and entering into new trades. Any pricing adjustments to a Fund’s investments resulting from a substitute reference rate may also adversely affect the Fund’s performance and/or NAV.
Foreign and Emerging Countries Risk — Investing in foreign markets may involve special risks and considerations not typically associated with investing in the U.S. Foreign securities may be subject to risk of loss because of more or less foreign government regulation; less public information; less stringent investor protections; less stringent accounting, corporate governance, financial reporting and disclosure standards; and less economic, political and social stability in the countries in which a Fund invests. The imposition of sanctions, exchange controls (including repatriation restrictions), confiscation of assets and property, trade restrictions (including tariffs) and other government restrictions by the U.S. or other governments, or from problems in share registration, settlement or custody, may also result in losses. The type and severity of sanctions and other similar measures, including counter sanctions and other retaliatory actions, that may be imposed could vary broadly in scope, and their impact is impossible to predict. For example, the imposition of sanctions and other similar measures could, among other things, cause a decline in the value and/or liquidity of securities issued by the sanctioned country or companies located in or economically tied to the sanctioned country and increase market volatility and disruption in the sanctioned country and throughout the world. Sanctions and other similar measures could limit or prevent a Fund from buying and selling securities (in the sanctioned country and other markets), significantly delay or prevent the settlement of securities transactions, and significantly impact a Fund’s liquidity and performance. Foreign risk also involves the risk of negative foreign currency exchange rate fluctuations, which may cause the value of securities denominated in such foreign currency (or other instruments through which a Fund has exposure to foreign
47
|
GOLDMAN SACHS MULTI-MANAGER ALTERNATIVES FUND |
Consolidated Notes to Financial Statements (continued)
October 31, 2022
|
|
| 8. OTHER RISKS (continued) |
currencies) to decline in value. Currency exchange rates may fluctuate significantly over short periods of time. To the extent that a Fund also invests in securities of issuers located in, or economically tied to, emerging markets, these risks may be more pronounced.
Foreign Custody Risk — The Fund invests in foreign securities, and as such the Fund may hold such securities and cash with foreign banks, agents, and securities depositories appointed by the Fund’s custodian (each a “Foreign Custodian”). Some foreign custodians may be recently organized or new to the foreign custody business. In some countries, Foreign Custodians may be subject to little or no regulatory oversight over, or independent evaluation of, their operations. Further, the laws of certain countries may place limitations on the Fund’s ability to recover its assets if a Foreign Custodian enters bankruptcy. Investments in emerging markets may be subject to even greater custody risks than investments in more developed markets. Custody services in emerging market countries are very often undeveloped and may be considerably less well regulated than in more developed countries, and thus may not afford the same level of investor protection as would apply in developed countries.
Interest Rate Risk — When interest rates increase, fixed income securities or instruments held by the Fund will generally decline in value. The Fund may face a heightened level of interest rate risk in connection with the type and extent of certain monetary policy changes made by the Federal Reserve, such as target interest rate changes. Long-term fixed income securities or instruments will normally have more price volatility because of this risk than short-term fixed income securities or instruments. A wide variety of market factors can cause interest rates to rise, including central bank monetary policy, rising inflation and changes in general economic conditions. The risks associated with changing interest rates may have unpredictable effects on the markets and the Fund’s investments. Fluctuations in interest rates may also affect the liquidity of fixed income securities and instruments held by the Fund. A sudden or unpredictable increase in interest rates may cause the volatility in the market and may decease the liquidity of the Fund’s investments, which would make it harder for the Fund to sell the investments at an advantageous time.
Investments in Other Investment Companies Risk — As a shareholder of another investment company, the Fund will indirectly bear its proportionate share of any net management fees and other expenses paid by such other investment companies, in addition to the fees and expenses regularly borne by the Fund.
Large Shareholder Transactions Risk — The Fund may experience adverse effects when certain large shareholders, such as other funds, institutional investors (including those trading by use of non-discretionary mathematical formulas), financial intermediaries (who may make investment decisions on behalf of underlying clients and/or include the Fund in their investment model), individuals, accounts and Goldman Sachs affiliates, purchase or redeem large amounts of shares of a Fund. Such large shareholder redemptions, which may occur rapidly or unexpectedly, may cause the Fund to sell portfolio securities at times when it would not otherwise do so, which may negatively impact the Fund’s NAV and liquidity. These transactions may also accelerate the realization of taxable income to shareholders if such sales of investments resulted in gains, and may also increase transaction costs. In addition, a large redemption could result in the Fund’s current expenses being allocated over a smaller asset base, leading to an increase in the Fund’s expense ratio. Similarly, large Fund share purchases may adversely affect the Fund’s performance to the extent that the Fund is delayed in investing new cash or otherwise maintains a larger cash position than it ordinarily would.
Liquidity Risk — The Fund may make investments that are illiquid or that may become less liquid in response to market developments or adverse investor perceptions. Illiquid investments may be more difficult to value. Liquidity risk may also refer to the risk that the Fund will not be able to pay redemption proceeds within the allowable time period or without significant dilution to remaining investors’ interests because of unusual market conditions, an unusually high volume of redemption requests, or other reasons. To meet redemption requests, the Fund may be forced to sell investments at an unfavorable time and/or under unfavorable conditions. If the Fund is forced to sell securities at an unfavorable time and/or under unfavorable conditions, such sales may adversely affect the Fund’s NAV and dilute remaining investors’ interests. These risks may be more pronounced in connection with the Fund’s investments in securities of issuers located in emerging market countries. Redemptions by large shareholders may have a negative impact on the Fund’s liquidity.
48
GOLDMAN SACHS MULTI-MANAGER ALTERNATIVES FUND
|
|
| 8. OTHER RISKS (continued) |
Market and Credit Risks — In the normal course of business, the Fund trades financial instruments and enters into financial transactions where risk of potential loss exists due to changes in the market (market risk). The value of the securities in which the Fund invests may go up or down in response to the prospects of individual companies, particular sectors or governments and/or general economic conditions throughout the world due to increasingly interconnected global economies and financial markets. Events such as war, acts of terrorism, social unrest, natural disasters, the spread of infectious illness or other public health threats could also significantly impact the Fund and its investments. Additionally, the Fund may also be exposed to credit risk in the event that an issuer or guarantor fails to perform or that an institution or entity with which the Fund has unsettled or open transactions defaults.
Multi-Manager Approach Risk — The Fund’s performance depends on the ability of the Investment Adviser in selecting, overseeing, and allocating Fund assets to the Underlying Managers. The Underlying Managers’ investment styles may not always be complementary. The Fund’s multi-manager approach may result in the Fund investing a significant percentage of its assets in certain types of investments, which could be beneficial or detrimental to the Fund’s performance depending on the performance of those investments and the overall market environment. The Fund’s Underlying Managers may underperform the market generally or underperform other investment managers that could have been selected for the Fund. Because the Fund’s Underlying Managers may trade with counterparties, prime brokers, clearing brokers or futures commission merchants on terms that are different than those on which the Investment Adviser would trade, and because each Underlying Manager applies its own risk analysis in evaluating potential counterparties for the Fund, the Fund may be subject to greater counterparty risk than if it was managed directly by the Investment Adviser.
Short Position Risk — The Fund may enter into a short position through a futures contract, an option or swap agreement or through short sales of any instrument that the Fund may purchase for investment. Taking short positions involves leverage of a Fund’s assets and presents various risks, including counterparty risk. If the value of the underlying instrument or market in which the Fund has taken a short position increases, then the Fund will incur a loss equal to the increase in value from the time that the short position was entered into plus any related interest payments or other fees. Taking short positions involves the risk that losses may be disproportionate, may exceed the amount invested, and may be unlimited. To the extent that the Fund uses the proceeds it receives from a short position to take additional long positions, the risks associated with the short position, including leverage risks, may be heightened, because doing so increases the exposure of the Fund to the markets and therefore could magnify changes to the Fund’s NAV.
Special Purpose Acquisition Companies Risk — The Fund may invest in stock, warrants, and other securities of SPACs or similar special purpose entities that pool funds to seek potential acquisition opportunities. Because SPACs and similar entities are in essence blank check companies without operating history or ongoing business other than seeking acquisitions, in a predetermined time frame (typically 18-24 months) the value of their securities is particularly dependent on the ability of the entity’s management to identify and complete a profitable acquisition. An investment in a SPAC is subject to a variety of risks, including that (i) a portion of the monies raised by the SPAC for the purpose of effecting an acquisition or merger may be expended prior to the transaction for payment of taxes and other purposes; (ii) prior to any acquisition or merger, a SPAC’s assets are typically invested in U.S. government securities, money market funds and similar investments whose returns or yields may be significantly lower than those of the Fund’s other investments; (iii) the Fund generally will not receive significant income from its investments in SPACs and, therefore, the Fund’s investments in SPACs will not significantly contribute to the Fund’s distributions to shareholders; (iv) an attractive acquisition or merger target may not be identified at all, in which case the SPAC will be required to return any remaining monies to shareholders, or an attractive acquisition target may become scarce if the number of SPACs seeking to acquire operating businesses increases, which could negatively impact the value of SPAC shares held by the Fund; (v) under any circumstances in which the Fund receives a refund of all or a portion of its original investment (which typically represents a pro rata share of the proceeds of the SPAC’s assets, less any applicable taxes), the returns on that investment may be negligible, and the Fund may be subject to opportunity costs to the extent that alternative investments would have produced higher returns; (vi) the Fund may be delayed in receiving any redemption or liquidation proceeds from a SPAC to which it is entitled; (vii) an investment in a SPAC may be diluted by additional later offerings of interests in the SPAC or by other investors exercising existing rights to purchase shares of the SPAC; (viii) only a thinly traded market for shares of or interests in a SPAC may develop,
49
|
GOLDMAN SACHS MULTI-MANAGER ALTERNATIVES FUND |
Consolidated Notes to Financial Statements (continued)
October 31, 2022
|
|
| 8. OTHER RISKS (continued) |
or there may be no market at all, leaving the Fund unable to sell its interest in a SPAC or to sell its interest only at a price below what the Fund believes is the SPAC interest’s intrinsic value; and (ix) the values of investments in SPACs may be highly volatile and may depreciate significantly over time.
Tax Risk — The Fund will seek to gain exposure to the commodity markets primarily through investments in the Subsidiary and/ or commodity index-linked structured notes, as applicable. Historically, the Internal Revenue Service (“IRS”) issued private letter rulings (“PLRs”) in which the IRS specifically concluded that income and gains from investments in commodity index-linked structured notes (the “Notes Rulings”) or a wholly-owned foreign subsidiary that invests in commodity-linked instruments are “qualifying income” for purposes of compliance with Subchapter M of the Code. However, the Fund has not received a PLR, and is/are not able to rely on PLRs issued to other taxpayers. The IRS recently issued final regulations that, would generally treat the Fund’s income inclusion with respect to a subsidiary as qualifying income either if (A) there is a distribution out of the earnings and profits of a subsidiary that are attributable to such income inclusion or (B) such inclusion is derived with respect to the Fund’s business of investing in stock, securities, or currencies.
The IRS also issued a revenue procedure, which states that the IRS will not in the future issue PLRs that would require a determination of whether an asset (such as a commodity index-linked note) is a “security” under the Investment Company Act of 1940. In connection with issuing such revenue procedure, the IRS has revoked the Notes Ruling on a prospective basis. In light of the revocation of the Notes Rulings, the Fund has limited its investments in commodity index-linked structured notes. The Fund has obtained an opinion of counsel that the Fund’s income from investments in the Subsidiary should constitute “qualifying income.” However, no assurances can be provided that the IRS would not be able to successfully assert that the Fund’s income from such investments was not “qualifying income,” in which case the Fund would fail to qualify as a regulated investment company (“RIC”) under Subchapter M of the Code if over 10% of its gross income were derived from these investments. If the Fund failed to qualify as a RIC, it would be subject to federal and state income tax on all of its taxable income at regular corporate tax rates with no deduction for any distributions paid to shareholders, which would significantly adversely affect the returns to, and could cause substantial losses for, Fund shareholders.
Under the Trust’s organizational documents, its Trustees, officers, employees and agents are indemnified, to the extent permitted by the Act and state law, against certain liabilities that may arise out of performance of their duties to the Fund. Additionally, in the course of business, the Fund enters into contracts that contain a variety of indemnification clauses. The Fund’s maximum exposure under these arrangements is unknown, as this would involve future claims that may be made against the Fund that have not yet occurred. However, GSAM believes the risk of loss under these arrangements to be remote.
Subsequent events after the Consolidated Statement of Assets and Liabilities date have been evaluated, and GSAM has concluded that there is no impact requiring adjustment or disclosure in the financial statements.
In late February 2022, Russia began an invasion of Ukraine. Following such invasion, the United States, the European Union, and other countries and entities imposed wide-ranging sanctions on Russia and related entities. Certain Funds have limited market value in Russian and Ukrainian securities, which are being valued to reflect the limited liquidity and transferability in the current environment. With the closure of local Russian markets and imposition of sanctions in late February and early March, there are currently limited portfolio management actions possible as many of these assets are either sanctioned and/or cannot be transferred or settled. These sanctions and current environment could impair the ability of these Funds to buy, sell, hold, receive, deliver or otherwise transact in certain securities and other instruments. The full impact of the sanctions and the conflict on these Funds, the
50
GOLDMAN SACHS MULTI-MANAGER ALTERNATIVES FUND
|
|
| 11. OTHER MATTERS (continued) |
financial markets and the global economy is not yet known. Management is continuing to monitor these developments and evaluate other impacts they may have on these Funds.
|
|
| 12. SUMMARY OF SHARE TRANSACTIONS |
Share activity is as follows:
| | | | | | | | | | | | | | | | |
| | | Multi-Manager Alternatives Fund | |
| | |
| | | For the Fiscal Year Ended | | | For the Fiscal Year Ended | |
| | |
| | | October 31, 2022 | | | October 31, 2021 | |
| |
| | | | |
| | | | |
| | | Shares | | | Dollars | | | Shares | | | Dollars | |
| |
| | | | |
| | | | |
Class A Shares | | | | | | | | | | | | | | | | |
| | | | |
Shares sold | | | 228,560 | | | $ | 2,589,593 | | | | 226,160 | | | $ | 2,575,162 | |
| | | | |
Shares redeemed | | | (125,663 | ) | | | (1,439,448 | ) | | | (308,659 | ) | | | (3,503,751 | ) |
| | | | |
| | | | 102,897 | | | | 1,150,145 | | | | (82,499 | ) | | | (928,589 | ) |
| | | | |
Class C Shares | | | | | | | | | | | | | | | | |
| | | | |
Shares sold | | | 4,047 | | | | 45,050 | | | | 1,013 | | | | 10,669 | |
| | | | |
Shares redeemed | | | (146,539 | ) | | | (1,578,078 | ) | | | (180,009 | ) | | | (1,949,519 | ) |
| | | | |
| | | | (142,492 | ) | | | (1,533,028 | ) | | | (178,996 | ) | | | (1,938,850 | ) |
| | | | |
Institutional Shares | | | | | | | | | | | | | | | | |
| | | | |
Shares sold | | | 628,917 | | | | 7,341,641 | | | | 1,222,192 | | | | 14,039,830 | |
| | | | |
Shares redeemed | | | (2,070,507 | ) | | | (24,657,300 | ) | | | (2,947,320 | ) | | | (34,316,720 | ) |
| | | | |
| | | | (1,441,590 | ) | | | (17,315,659 | ) | | | (1,725,128 | ) | | | (20,276,890 | ) |
| | | | |
Investor Shares | | | | | | | | | | | | | | | | |
| | | | |
Shares sold | | | 119,216 | | | | 1,376,997 | | | | 108,432 | | | | 1,244,198 | |
| | | | |
Shares redeemed | | | (228,237 | ) | | | (2,628,654 | ) | | | (421,581 | ) | | | (4,910,613 | ) |
| | | | |
| | | | (109,021 | ) | | | (1,251,657 | ) | | | (313,149 | ) | | | (3,666,415 | ) |
| | | | |
Class R6 Shares | | | | | | | | | | | | | | | | |
| | | | |
Shares sold | | | 2,235 | | | | 27,024 | | | | — | | | | — | |
| | | | |
| | | | 2,235 | | | | 27,024 | | | | — | | | | — | |
| | | | |
Class R Shares | | | | | | | | | | | | | | | | |
| | | | |
Shares sold | | | — | | | | — | | | | 25 | | | | 297 | |
| | | | |
| | | | — | | | | — | | | | 25 | | | | 297 | |
| | | | |
Class P Shares | | | | | | | | | | | | | | | | |
| | | | |
Shares sold | | | 888,469 | | | | 10,515,769 | | | | 4,103,614 | | | | 47,722,828 | |
| | | | |
Shares redeemed | | | (745,158 | ) | | | (8,545,167 | ) | | | (1,032,351 | ) | | | (11,717,690 | ) |
| | | | |
| | | | 143,311 | | | | 1,970,602 | | | | 3,071,263 | | | | 36,005,138 | |
| | | | |
NET INCREASE (DECREASE) | | | (1,444,660 | ) | | $ | (16,952,573 | ) | | | 771,516 | | | $ | 9,194,691 | |
51
Report of Independent Registered Public Accounting Firm
To the Board of Trustees of Goldman Sachs Trust II and Shareholders of Goldman Sachs Multi-Manager Alternatives Fund
Opinion on the Consolidated Financial Statements
We have audited the accompanying consolidated statement of assets and liabilities, including the consolidated schedule of investments, of Goldman Sachs Multi-Manager Alternatives Fund and its subsidiary (one of the funds constituting Goldman Sachs Trust II, referred to hereafter as the “Fund”) as of October 31, 2022, the related consolidated statement of operations for the year ended October 31, 2022, the consolidated statements of changes in net assets for each of the two years in the period ended October 31, 2022, including the related notes, and the consolidated financial highlights for each of the periods indicated therein (collectively referred to as the “consolidated financial statements”). In our opinion, the consolidated financial statements present fairly, in all material respects, the financial position of the Fund as of October 31, 2022, the results of its operations for the year then ended, the changes in its net assets for each of the two years in the period ended October 31, 2022 and the consolidated financial highlights for each of the periods indicated therein in conformity with accounting principles generally accepted in the United States of America.
Basis for Opinion
These consolidated financial statements are the responsibility of the Fund’s management. Our responsibility is to express an opinion on the Fund’s consolidated financial statements based on our audits. We are a public accounting firm registered with the Public Company Accounting Oversight Board (United States) (PCAOB) and are required to be independent with respect to the Fund in accordance with the U.S. federal securities laws and the applicable rules and regulations of the Securities and Exchange Commission and the PCAOB.
We conducted our audits of these consolidated financial statements in accordance with the standards of the PCAOB. Those standards require that we plan and perform the audit to obtain reasonable assurance about whether the consolidated financial statements are free of material misstatement, whether due to error or fraud.
Our audits included performing procedures to assess the risks of material misstatement of the consolidated financial statements, whether due to error or fraud, and performing procedures that respond to those risks. Such procedures included examining, on a test basis, evidence regarding the amounts and disclosures in the consolidated financial statements. Our audits also included evaluating the accounting principles used and significant estimates made by management, as well as evaluating the overall presentation of the consolidated financial statements. Our procedures included confirmation of securities owned as of October 31, 2022 by correspondence with the custodian, transfer agent and brokers; when replies were not received from brokers, we performed other auditing procedures. We believe that our audits provide a reasonable basis for our opinion.
|
| /s/ PricewaterhouseCoopers LLP |
|
| Boston, Massachusetts |
| December 23, 2022 |
|
We have served as the auditor of one or more investment companies in the Goldman Sachs fund complex since 2000.
52
GOLDMAN SACHS MULTI-MANAGER ALTERNATIVES FUND
| | |
| Fund Expenses — Six Month Period Ended October 31, 2022 (Unaudited) | | |
As a shareholder of Class A, Class C, Institutional, Investor, Class R6, Class R or Class P Shares of the Fund, you incur two types of costs: (1) transaction costs, including sales charges on purchase payments (with respect to Class A Shares), contingent deferred sales charges on redemptions (with respect to Class C Shares), and (2) ongoing costs, including management fees; distribution and service (12b-1) fees (with respect to Class A and Class R Shares); and other Fund expenses. This example is intended to help you understand your ongoing costs (in dollars) of investing in Class A, Class C, Institutional, Investor, Class R6, Class R or Class P Shares of the Fund and to compare these costs with the ongoing costs of investing in other mutual funds.
The example is based on an investment of $1,000 invested at the beginning of the period and held for the entire period from May 1, 2022 through October 31, 2022, which represents a period of 184 days of a 365 day year. This projection assumes that annualized expense ratios were in effect during the period.
Actual Expenses — The first line under each share class in the table below provides information about actual account values and actual expenses. You may use the information in this line, together with the amount you invested, to estimate the expenses that you paid over the period. Simply divide your account value by $1,000 (for example, an $8,600 account value divided by $1,000=8.6), then multiply the result by the number in the first line under the heading entitled “Expenses Paid” to estimate the expenses you paid on your account during this period.
Hypothetical Example for Comparison Purposes —The second line under each share class in the table below provides information about hypothetical account values and hypothetical expenses based on the Fund’s actual net expense ratios and an assumed rate of return of 5% per year before expenses, which is not the Fund’s actual return. The hypothetical account values and expenses may not be used to estimate the actual ending account balance or expenses you paid for the period. You may use this information to compare the ongoing costs of investing in the Fund and other funds. To do so, compare this 5% hypothetical example with the 5% hypothetical examples that appear in the shareholder reports of the other funds.
Please note that the expenses shown in the table are meant to highlight your ongoing costs only and do not reflect any transactional costs, such as sales charges, redemption fees, or exchange fees. Therefore, the second line of the table is useful in comparing ongoing costs only, and will not help you determine the relative total costs of owning different funds. In addition, if these transactional costs were included, your costs would have been higher.
| | | | | | | | | | | | | | | | | | |
| | | | | Multi-Manager Alternatives Fund | | | | |
| | | | | Beginning | | | Ending | | | Expenses | | | | |
| | | | | Account | | | Account | | | Paid for the | | | | |
| | | | | Value | | | Value | | | 6 months ended | | | | |
| | | Share Class | | 5/1/22 | | | 10/31/22 | | | 10/31/22* | | | | |
| | Class A | | | | | | | | | | | | | | | | |
| | Actual | | | $1,000.00 | | | $ | 986.00 | | | $ | 10.51 | | | | | |
| | Hypothetical 5% return | | | 1,000.00 | | | | 1,014.60+ | | | | 10.66 | | | | | |
| | Class C | | | | | | | | | | | | | | | | |
| | Actual | | | 1,000.00 | | | | 982.50 | | | | 13.96 | | | | | |
| | Hypothetical 5% return | | | 1,000.00 | | | | 1,011.10+ | | | | 14.16 | | | | | |
| | Institutional | | | | | | | | | | | | | | | | |
| | Actual | | | 1,000.00 | | | | 987.00 | | | | 8.95 | | | | | |
| | Hypothetical 5% return | | | 1,000.00 | | | | 1,016.20+ | | | | 9.08 | | | | | |
| | Investor | | | | | | | | | | | | | | | | |
| | Actual | | | 1,000.00 | | | | 987.80 | | | | 9.10 | | | | | |
| | Hypothetical 5% return | | | 1,000.00 | | | | 1,016.10+ | | | | 9.23 | | | | | |
| | Class R6 | | | | | | | | | | | | | | | | |
| | Actual | | | 1,000.00 | | | | 987.10 | | | | 8.38 | | | | | |
| | Hypothetical 5% return | | | 1,000.00 | | | | 1,016.80+ | | | | 8.50 | | | | | |
| | Class R | | | | | | | | | | | | | | | | |
| | Actual | | | 1,000.00 | | | | 984.80 | | | | 11.67 | | | | | |
| | Hypothetical 5% return | | | 1,000.00 | | | | 1,013.40+ | | | | 11.84 | | | | | |
| | Class P | | | | | | | | | | | | | | | | |
| | Actual | | | 1,000.00 | | | | 987.00 | | | | 8.81 | | | | | |
| | Hypothetical 5% return | | | 1,000.00 | | | | 1,016.30+ | | | | 8.94 | | | | | |
| | * | Expenses for each share class are calculated using the Fund’s annualized net expense ratio for each class, which represents the ongoing expenses as a percentage of net assets for the six months ended October 31, 2022. Expenses are calculated by multiplying the annualized net expense ratio by the average account value for the period; then multiplying the result by the number of days in the most recent fiscal half year; and then dividing that result by the number of days in the fiscal year. The annualized net expense ratios for the period were as follows: | |
| | | | | | | | | | | | | | | | |
| Fund | | Class A | | Class C | | Institutional | | Investor | | Class R6 | | Class R | | Class P | | |
Multi-Manager Alternatives | | 2.10% | | 2.79% | | 1.79% | | 1.82% | | 1.67% | | 2.33% | | 1.76% |
| | + | Hypothetical expenses are based on the Fund’s actual annualized net expenses ratios and an assumed rate of return of 5% per year before expenses. | |
53
|
| GOLDMAN SACHS MULTI-MANAGER ALTERNATIVES FUND |
Statement Regarding Basis for Approval of Management Agreement and Sub-Advisory Agreements (Unaudited)
Background
The Goldman Sachs Multi-Manager Alternatives Fund (the “Fund”) is an investment portfolio of Goldman Sachs Trust II (the “Trust”). The Board of Trustees (the “Board”) oversees the management of the Trust and reviews the investment performance and expenses of the Fund at regularly scheduled meetings held throughout the year. The Fund employs a “manager of managers” structure, whereby Goldman Sachs Asset Management, L.P. (the “Investment Adviser”) is responsible for selecting sub-advisers (subject to Board approval), allocating the Fund’s assets among them, and overseeing their day-to-day management of Fund assets. In addition, the Board determines annually whether to approve the continuance of the Trust’s investment management agreement (the “Management Agreement”) with the Investment Adviser on behalf of the Fund.
The Management Agreement was approved for continuation until June 30, 2023 at a meeting on June 9-10, 2022 and was most recently approved for continuation until September 30, 2023 at a meeting held on September 19-20, 2022 (together, the “Annual Meetings”) by the Board, including those Trustees who are not parties to the Management Agreement or “interested persons” (as defined in the Investment Company Act of 1940, as amended) of any party thereto (the “Independent Trustees”). At the Annual Meetings, the Board also considered the sub-advisory agreements (each a “Designated Sub-Advisory Agreement” and, together with the Management Agreement, the “Agreements”) between the Investment Adviser and each of Algert Global LLC, Artisan Partners Limited Partnership, Bardin Hill Arbitrage IC Management LP, Brigade Capital Management, LP, Crabel Capital Management, LLC, GQG Partners LLC, Marathon Asset Management, L.P., River Canyon Fund Management LLC, Russell Investments Commodity Advisor, LLC, and Wellington Management Company LLP (each a “Designated Sub-Adviser” and collectively, the “Designated Sub-Advisers”).
The review process undertaken by the Trustees spans the course of the year and culminates with the Annual Meetings. To assist the Trustees in their deliberations, the Trustees have established a Contract Review Committee (the “Committee”), comprised of the Independent Trustees. The Committee held five meetings over the course of the year since the Management Agreement was last approved. At those Committee meetings, regularly scheduled Board or other committee meetings, and/or the Annual Meetings, matters relevant to the renewal of the Management Agreement and the Designated Sub-Advisory Agreements were considered by the Board, or the Independent Trustees, as applicable. With respect to the Fund, such matters included:
| | (a) | the nature and quality of the advisory, administrative, and other services provided to the Fund by the Investment Adviser and its affiliates, and the Designated Sub-Advisers, including, as applicable, information about: |
| | (i) | the structure, staff, and capabilities of the Investment Adviser and the Designated Sub-Advisers and the Designated Sub-Advisers’ portfolio management teams; |
| | (ii) | the groups within the Investment Adviser and its affiliates that support the portfolio management teams or provide other types of necessary services, including fund services groups (e.g., accounting and financial reporting, tax, shareholder services, and operations); controls and risk management groups (e.g., legal, compliance, valuation oversight, credit risk management, internal audit, compliance testing, market risk analysis, finance, and central funding); sales and distribution support groups, and others (e.g., information technology and training); |
| | (iii) | trends in employee headcount; |
| | (iv) | the Investment Adviser’s financial resources and ability to hire and retain talented personnel and strengthen its operations; and |
| | (v) | the parent company’s support of the Investment Adviser and its mutual fund business, as expressed by the firm’s senior management; |
| | (b) | information on the investment performance of the Fund, including comparisons to the performance of similar mutual funds, as provided by a third-party mutual fund data provider engaged as part of the contract review process (the “Outside Data Provider”), benchmark performance indices, and commingled investment vehicles with comparable investment strategies managed by the Investment Adviser, and information on general investment outlooks in the markets in which the Fund invests; |
| | (c) | information provided by the Investment Adviser indicating the Investment Adviser’s views on whether the Fund’s peer group and/or benchmark index had high, medium, or low relevance given the Fund’s particular investment strategy; |
| | (d) | the terms of the Agreements and other agreements with affiliated service providers entered into by the Trust on behalf of the Fund; |
| | (e) | fee and expense information for the Fund, including: |
| | (i) | the relative management fee and expense levels of the Fund as compared to those of comparable funds managed by other advisers, as provided by the Outside Data Provider; |
| | (ii) | the Fund’s expense trends over time; and |
| | (iii) | comparative information on the advisory fees charged and services provided by the Investment Adviser to certain collective investment vehicles that it manages with comparable investment strategies; |
54
GOLDMAN SACHS MULTI-MANAGER ALTERNATIVES FUND
Statement Regarding Basis for Approval of Management Agreement and Sub-Advisory Agreements (Unaudited) (continued)
| | (f) | with respect to the extensive investment performance and expense comparison data provided by the Outside Data Provider, its processes in producing that data for the Fund; |
| | (g) | the undertakings of the Investment Adviser and its affiliates to implement fee waivers and/or expense limitations; |
| | (h) | information relating to the profitability of the Management Agreement and the transfer agency arrangements of the Fund to the Investment Adviser and its affiliates; |
| | (i) | whether the Fund’s existing management fee schedule adequately addressed any economies of scale; |
| | (j) | a summary of the “fall-out” benefits derived by the Investment Adviser and its affiliates from their relationships with the Fund, including the fees received by the Investment Adviser’s affiliates from the Fund for transfer agency, portfolio trading, distribution and other services; |
| | (k) | a summary of potential benefits derived by the Fund as a result of its relationship with the Investment Adviser; |
| | (l) | with respect to the Investment Adviser, portfolio manager ownership of Fund shares; the manner in which portfolio manager compensation is determined; information on the Designated Sub-Advisers’ compensation arrangements; and the number and types of accounts managed by the portfolio managers; |
| | (m) | the nature and quality of the services provided to the Fund by its unaffiliated service providers (as well as the Designated Sub-Advisers), and the Investment Adviser’s general oversight and evaluation (including reports on due diligence) of those service providers as part of the administrative services provided under the Management Agreement; and |
| | (n) | the Investment Adviser’s and Designated Sub-Advisers’ processes and policies addressing various types of potential conflicts of interest; their approaches to risk management; the annual review of the effectiveness of the Fund’s compliance program; and periodic compliance reports. |
The Trustees also received an overview of the Fund’s distribution arrangements. They received information regarding the Fund’s assets, share purchase and redemption activity, and payment of distribution and service fees. Information was also provided to the Trustees relating to revenue sharing payments made by and services provided by the Investment Adviser and its affiliates to intermediaries that promote the sale, distribution, and/or servicing of Fund shares.
The presentations made at the Board and Committee meetings and at the Annual Meetings encompassed the Fund and other mutual funds for which the Board has responsibility. In evaluating the Agreements at the Annual Meetings, the Trustees relied upon their knowledge, resulting from their meetings and other interactions throughout the year, of the Fund and the respective services of the Investment Adviser and its affiliates, and the Designated Sub-Advisers. In conjunction with these meetings, the Trustees received written materials and oral presentations on the topics covered, and the Investment Adviser addressed the questions and concerns of the Trustees, including concerns regarding the investment performance of certain of the funds they oversee. In addition, the Trustees periodically received written materials and oral presentations from the Designated Sub-Advisers. The Independent Trustees were advised by their independent legal counsel regarding their responsibilities and other regulatory requirements related to the approval and continuation of mutual fund investment management agreements under applicable law. In addition, the Investment Adviser and its affiliates provided the Independent Trustees with a written response to a formal request for information sent on behalf of the Independent Trustees by their independent legal counsel. The Trustees reviewed a written response prepared by each Designated Sub-Adviser to a similar request for information submitted to the Designated Sub-Adviser by the Investment Adviser. During the course of their deliberations, the Independent Trustees met in executive sessions with their independent legal counsel, without representatives of the Investment Adviser or its affiliates present.
Nature, Extent, and Quality of the Services Provided Under the Management Agreement
As part of their review, the Trustees considered the nature, extent, and quality of the services provided to the Fund by the Investment Adviser. In this regard, the Trustees considered both the investment advisory services and non-advisory services that are provided by the Investment Adviser and its affiliates. The Trustees noted the transition in the leadership and changes in personnel of various of the Investment Adviser’s portfolio management teams that had occurred in recent periods, and the ongoing recruitment efforts aimed at bringing high quality investment talent to the Investment Adviser. They also noted the Investment Adviser’s commitment to maintaining high quality systems and expending substantial resources to respond to ongoing changes to the market, regulatory and control environment in which the Fund and its service providers operate, including developments associated with the COVID-19 pandemic, geopolitical events, and economic sanctions, as well as the efforts of the Investment Adviser and its affiliates to combat cyber security risks. The Trustees also considered information regarding the Investment Adviser’s and the Fund’s various sub-advisers’ business continuity planning and remote operations capabilities. The Trustees concluded that the Investment Adviser continued to commit substantial financial and operational resources to the Fund and expressed confidence that the Investment Adviser would continue to do so in the future. The Trustees also recognized that the Investment Adviser had made significant commitments to address regulatory compliance requirements applicable to the Fund and
55
|
| GOLDMAN SACHS MULTI-MANAGER ALTERNATIVES FUND |
Statement Regarding Basis for Approval of Management Agreement and Sub-Advisory Agreements (Unaudited) (continued)
the Investment Adviser and its affiliates. In addition, the Trustees reviewed the Sub-Adviser oversight process that the Investment Adviser had employed, which included areas such as investment analytics, risk management and compliance.
Investment Performance
The Trustees also considered the investment performance of the Fund. In this regard, they compared the investment performance of the Fund to its peers using rankings and ratings compiled by the Outside Data Provider as of December 31, 2021, and updated performance information prepared by the Investment Adviser as of March 31, 2022. The information on the Fund’s investment performance prepared by the Outside Data Provider was provided for the one-, three-, and five-year periods. The Trustees also reviewed the Fund’s investment performance relative to its performance benchmark. As part of this review, they considered the investment performance trends of the Fund over time, and reviewed the investment performance of the Fund in light of its investment objective and policies and market conditions. The Trustees considered the Investment Adviser’s representations that the Fund had significant differences from its Outside Data Provider peer group and benchmark index that caused them to be imperfect bases for comparison. The Trustees also compared the investment performance of the Fund to the performance of comparable unregistered funds for which the Investment Adviser also serves as investment adviser. They considered that the unregistered funds provide an imperfect performance comparison because they are not subject to the requirements of the Investment Company Act of 1940, as amended.
In addition, the Trustees considered materials prepared and presentations made by the Investment Adviser’s senior management and the Sub-Advisers’ portfolio management personnel in which Fund performance was assessed. The Trustees also considered the Investment Adviser’s periodic reports with respect to the Fund’s risk profile, and how the Investment Adviser’s approach to risk monitoring and management influences portfolio management.
The Trustees noted that the Fund’s Institutional Shares had placed in the top half of the Fund’s performance peer group for the one-, three-, and five-year periods and had outperformed the Fund’s U.S. Treasury-based benchmark index for the one-year period ended December 31, 2021.
Costs of Services Provided and Competitive Information
The Trustees considered the contractual terms of the Management Agreement, the fee rates payable by the Fund thereunder, and the net amount retained by the Investment Adviser after payment of sub-advisory fees. In this regard, the Trustees considered information on the services rendered by the Investment Adviser to the Fund, which included both advisory and administrative services that were directed to the needs and operations of the Fund as a registered mutual fund.
In particular, the Trustees reviewed analyses prepared by the Outside Data Provider regarding the expense rankings of the Fund, as well as additional information provided by the Investment Adviser throughout the year. The analyses provided a comparison of the Fund’s management fee and breakpoints to those of a relevant peer group and category universe; an expense analysis which compared the Fund’s overall net and gross expenses to a peer group and a category universe; and data comparing the Fund’s net expenses to the peer and category medians. The analyses also compared the Fund’s other expenses and fee waivers/reimbursements to those of the peer group and category medians. The Trustees also considered comparative fee information for services provided by the Investment Adviser to collective investment vehicles having investment objectives and policies similar to those of the Fund. They also noted that, in some cases, these collective investment vehicles have a compensation structure that includes performance fees and also pay additional asset-based fees and performance fees to the managers of underlying hedge funds. The Trustees considered that services provided to the Fund differed in various significant respects from the services provided to these collective investment vehicles, which generally operated under less stringent regulatory and financial reporting requirements, required fewer services from the Investment Adviser to a smaller number of client contact points, and were less time-sensitive. The Trustees concluded that the comparisons provided by the Outside Data Provider and the Investment Adviser were useful in evaluating the reasonableness of the management fees and total expenses paid by the Fund.
In addition, the Trustees considered the Investment Adviser’s undertakings to implement fee waivers and expense limitations. The Trustees noted that the Investment Adviser had agreed to waive a portion of its management fee in an amount equal to the aggregate management fees paid to the Investment Adviser as the investment adviser to the Fund’s wholly-owned subsidiaries. In addition, the Trustees noted that shareholders are able to redeem their shares at any time if shareholders believe that the Fund fees and expenses are too high or if they are dissatisfied with the performance of the Fund.
56
GOLDMAN SACHS MULTI-MANAGER ALTERNATIVES FUND
Statement Regarding Basis for Approval of Management Agreement and Sub-Advisory Agreements (Unaudited) (continued)
Profitability
The Trustees reviewed the Fund’s contribution to the Investment Adviser’s revenues and pre-tax profit margins. In this regard the Trustees noted that they had received, among other things, profitability analyses and summaries, revenue and expense schedules by Fund and by function (i.e., investment management, transfer agency and distribution and service), and information on the Investment Adviser’s expense allocation methodology. They observed that the profitability and expense figures are substantially similar to those used by the Investment Adviser for many internal purposes, including compensation decisions among various business groups, and are thus subject to a vigorous internal debate about how certain revenue and expenses should be allocated. The Trustees also noted that the internal audit group within the Goldman Sachs organization periodically audits the expense allocation methodology and that the internal audit group was satisfied with the reasonableness, consistency, and accuracy of the Investment Adviser’s expense allocation methodology. Profitability data for the Fund was provided for 2021 and 2020, and the Trustees considered this information in relation to the Investment Adviser’s overall profitability.
Economies of Scale
The Trustees considered the information that had been provided regarding whether there have been economies of scale with respect to the management of the Fund. The Trustees also considered the breakpoints in the fee rate payable under the Management Agreement for the Fund at the following annual percentage rates of the average daily net assets of the Fund:
| | |
Average Daily Net Assets | | Management Fee Annual Rate |
| |
First $2 billion | | 1.90% |
| |
Next $3 billion | | 1.80 |
| |
Next $3 billion | | 1.71 |
| |
Over $8 billion | | 1.68 |
The Trustees noted that the breakpoints were designed to share potential economies of scale, if any, with the Fund and its shareholders as assets under management reach those asset levels. The Trustees considered the amounts of assets in the Fund; the Fund’s recent purchase and redemption activity; the information provided by the Investment Adviser relating to the costs of the services provided by the Investment Adviser and its affiliates and the profits realized by them (if any); information comparing the fee rates charged by the Investment Adviser with fee rates charged to other funds in the peer group; and the Investment Adviser’s undertakings to waive a portion of its management fee and to limit certain expenses of the Fund that exceed a specified level, as well as Goldman Sachs & Co. LLC’s (“Goldman Sachs”) undertaking to waive a portion of the transfer agency fees paid by the Fund’s Class A, Class C, Investor and Class R Shares. The Trustees also considered the relationship between the advisory and sub-advisory fee rate schedules. Upon reviewing these matters at the Annual Meetings, the Trustees concluded that the fee breakpoints represented a means of assuring that benefits of scalability, if any, would be passed along to shareholders at the specified asset levels.
Other Benefits to the Investment Adviser and Its Affiliates
The Trustees also considered the other benefits derived by the Investment Adviser and its affiliates from their relationships with the Fund, as stated above, including: (a) transfer agency fees received by Goldman Sachs; (b) brokerage and futures commissions earned by Goldman Sachs for executing securities transactions (in its capacity as clearing broker) and futures transactions on behalf of the Fund; (c) the Investment Adviser’s ability to leverage the infrastructure designed to service the Fund on behalf of its other clients; (d) the Investment Adviser’s ability to cross-market other products and services to Fund shareholders; (e) the Investment Adviser’s ability to negotiate better pricing with the Fund’s custodian on behalf of its other clients, as a result of the relationship with the Fund; (f) the investment of cash and cash collateral in money market funds managed by the Investment Adviser that will result in increased assets under management for those money market funds; (g) the Investment Adviser’s ability to aggregate client assets, including those of the Fund, to reach breakpoints that result in an overall reduction of sub-advisory fees owed by the Investment Adviser; and (h) the possibility that the working relationship between the Investment Adviser and the Fund’s third-party service providers (including the Sub-Advisers) may cause those service providers to be more likely to do business with other areas of Goldman Sachs. In the course of considering the foregoing, the Independent Trustees requested and received further information quantifying certain of these fall-out benefits.
57
|
| GOLDMAN SACHS MULTI-MANAGER ALTERNATIVES FUND |
Statement Regarding Basis for Approval of Management Agreement and Sub-Advisory Agreements (Unaudited) (continued)
Other Benefits to the Fund and Its Shareholders
The Trustees also noted that the Fund receives certain other potential benefits as a result of its relationship with the Investment Adviser, including: (a) enhanced servicing from vendors due to the volume of business generated by the Investment Adviser and its affiliates; (b) the advantages received from the Investment Adviser’s knowledge and experience gained from managing other accounts and products; (c) the Investment Adviser’s ability to hire and retain qualified personnel to provide services to the Fund because of the reputation of the Goldman Sachs organization; (d) the Fund’s access, through the Investment Adviser, to certain firm-wide resources (e.g., proprietary risk management systems and databases), subject to certain restrictions; and (e) the Fund’s access to certain affiliated distribution channels.
Conclusion
In connection with their consideration of the Management Agreement, the Trustees gave weight to each of the factors described above, but did not identify any particular factor as controlling their decision. After deliberation and consideration of all of the information provided, including the factors described above, the Trustees concluded, in the exercise of their business judgment, that the management fees paid by the Fund were reasonable in light of the factors considered, and that the Management Agreement should be approved and continued with respect to the Fund until September 30, 2023.
Designated Sub-Advisory Agreements
Nature, Extent, and Quality of the Services Provided Under the Designated Sub-Advisory Agreements and Performance
In evaluating the Designated Sub-Advisory Agreements, the Trustees relied upon materials furnished and presentations made by the Investment Adviser and the Designated Sub-Advisers. In evaluating the nature, extent, and quality of services provided by each Designated Sub-Adviser, the Trustees considered information on the services provided to the Fund by each Designated Sub-Adviser, including information about each Designated Sub-Adviser’s (a) personnel and compensation structure; (b) track record in managing the Fund and, if applicable, other funds and/or accounts with investment strategies similar to those employed on behalf of the Fund; (c) policies and procedures in place to address potential conflicts of interest; and (d) compliance program and code of ethics. In this regard, they also considered assessments provided by the Investment Adviser of each Designated Sub-Adviser, the Designated Sub-Adviser’s investment strategies and personnel, and its compliance program. The Trustees also considered information regarding each Designated Sub-Adviser’s business continuity planning and remote operations capabilities. The Trustees also reviewed the operations and investment performance of each Designated Sub-Adviser’s respective sleeve of the Fund since its inception, including a comparison of each Designated Sub-Adviser to relevant benchmark indices based on various metrics, including realized beta, excess return, alpha, and volatility.
Costs of Services Provided
The Trustees reviewed the terms of each Designated Sub-Advisory Agreement, including the schedule of fees payable to the Designated Sub-Advisers. They considered any breakpoints in the sub-advisory fee rate payable under each Designated Sub-Advisory Agreement. The Trustees noted that the compensation paid to each Designated Sub-Adviser is paid by the Investment Adviser, not by the Fund, and that the retention of the Designated Sub-Advisers does not directly increase the fees incurred by the Fund for advisory services. They considered the Investment Adviser’s belief that the relationship between the management fees paid by the Fund and the sub-advisory fees paid by the Investment Adviser is appropriate given the level of services the Investment Adviser provides to the Fund and significant differences in cost drivers and risks associated with the respective services offered by the Investment Adviser and each Designated Sub-Adviser. They also considered the management fee waivers and expense limitations that substantially reduce the fees retained by the Investment Adviser. The Trustees reviewed the blended average of all sub-advisory fees paid by the Investment Adviser with respect to the Fund in light of the overall management fee paid by the Fund.
Conclusion
In connection with their consideration of the Designated Sub-Advisory Agreements, the Trustees gave weight to various factors, but did not identify any particular factor as controlling their decision. After deliberation and consideration of the information provided, including the factors described above, the Trustees, including the Independent Trustees, unanimously concluded, in the exercise of their business judgment, that the sub-advisory fees paid by the Investment Adviser to each Designated Sub-Adviser were reasonable in light of the factors considered, and that each Designated Sub-Advisory Agreement should be approved and continued until September 30, 2023.
58
GOLDMAN SACHS MULTI-MANAGER ALTERNATIVES FUND
Statement Regarding Basis for Approval of Management Agreement and Sub-Advisory Agreements (Unaudited) (continued)
Background
The Goldman Sachs Multi-Manager Alternatives Fund (the “Fund”) is an investment portfolio of Goldman Sachs Trust II (the “Trust”). The Board of Trustees oversees the management of the Trust and reviews the investment performance and expenses of the Fund at regularly scheduled meetings held throughout the year. The Fund employs a “manager of managers” structure, whereby Goldman Sachs Asset Management, L.P. (the “Investment Adviser”) is responsible for selecting sub-advisers (subject to Board approval), allocating the assets of the Fund among them, and overseeing their day-to-day management of Fund assets.
Upon the recommendation of the Investment Adviser, at a meeting held on June 9-10, 2022, the Trustees, including those Trustees who are not “interested persons” as defined in the Investment Company Act of 1940, as amended (the “Independent Trustees”), approved a sub-advisory agreement (the “Sub-Advisory Agreement”) between the Investment Adviser and Trium Capital LLP (the “Sub-Adviser”) on behalf of the Fund. In connection with their evaluation of the Sub-Advisory Agreement, the Trustees received written materials and oral presentations prepared by the Investment Adviser and the Sub-Adviser on the topics covered, and were advised by their independent legal counsel. In addition, the Trustees received information prepared by the Sub-Adviser in a written response to a formal request from the Investment Adviser.
Nature, Extent, and Quality of the Services to be Provided Under the Sub-Advisory Agreement
In evaluating the Sub-Advisory Agreement, the Trustees relied on the information provided by the Investment Adviser and the Sub-Adviser. In evaluating the nature, extent and quality of services to be provided by the Sub-Adviser, the Trustees considered information about the Sub-Adviser’s (a) personnel and compensation structure; (b) track record in managing other funds and accounts with investment strategies similar to those to be employed on behalf of the Fund; (c) policies and procedures in place to address potential conflicts of interest; and (d) compliance program and code of ethics. In this regard, they considered assessments provided by the Investment Adviser of the Sub-Adviser, the Sub-Adviser’s investment strategies and personnel, and its compliance program. They noted that, because the Sub-Adviser had not previously provided services to the Fund, there was no performance information to evaluate with respect to the Fund.
Costs of Services to be Provided
The Trustees reviewed the terms of the Sub-Advisory Agreement and the proposed fee schedule. They noted that the compensation to be paid to the Sub-Adviser would be paid by the Investment Adviser, not by the Fund. They also noted that the terms of the Sub-Advisory Agreement were the result of arms’ length negotiations between the Investment Adviser and the Sub-Adviser. The Trustees reviewed the anticipated blended average of all sub-advisory fees to be paid by the Investment Adviser with respect to the Fund and how it would change upon hiring the Sub-Adviser. The Trustees considered this information in light of the overall management fee expected to be retained by the Investment Adviser.
Conclusion
In connection with their consideration of the Sub-Advisory Agreement, the Trustees gave weight to various factors, but did not identify any particular factor as controlling their decision. After deliberation and consideration of the information provided, including the factors described above, the Trustees, including the Independent Trustees, unanimously concluded, in the exercise of their business judgment, that the sub-advisory fees to be paid by the Investment Adviser to the Sub-Adviser were reasonable in light of the factors considered, and that the Sub-Advisory Agreement, and the terms thereof, should be approved for a period of two years from its effective date.
59
|
| GOLDMAN SACHS MULTI-MANAGER ALTERNATIVES FUND |
Statement Regarding Basis for Approval of Management Agreement and Sub-Advisory Agreements (Unaudited) (continued)
Background
The Goldman Sachs Multi-Manager Alternatives Fund (the “Fund”) is an investment portfolio of Goldman Sachs Trust II (the “Trust”). The Board of Trustees oversees the management of the Trust and reviews the investment performance and expenses of the Fund at regularly scheduled meetings held throughout the year. The Fund employs a “manager of managers” structure, whereby Goldman Sachs Asset Management, L.P. (the “Investment Adviser”) is responsible for selecting sub-advisers (subject to Board approval), allocating the assets of the Fund among them, and overseeing their day-to-day management of Fund assets.
Upon the recommendation of the Investment Adviser, at a meeting held on February 3-4, 2022, the Trustees, including those Trustees who are not “interested persons” as defined in the Investment Company Act of 1940, as amended (the “Independent Trustees”), approved a sub-advisory agreement (the “Sub-Advisory Agreement”) between the Investment Adviser and TCW Investment Management Company LLC (the “Sub-Adviser”) on behalf of the Fund. In connection with their evaluation of the Sub-Advisory Agreement, the Trustees received written materials and oral presentations prepared by the Investment Adviser and the Sub-Adviser on the topics covered, and were advised by their independent legal counsel. In addition, the Trustees received information prepared by the Sub-Adviser in a written response to a formal request from the Investment Adviser.
Nature, Extent, and Quality of the Services to be Provided Under the Sub-Advisory Agreement
In evaluating the Sub-Advisory Agreement, the Trustees relied on the information provided by the Investment Adviser and the Sub-Adviser. In evaluating the nature, extent and quality of services to be provided by the Sub-Adviser, the Trustees considered information about the Sub-Adviser’s (a) personnel and compensation structure; (b) track record in managing other funds and accounts with investment strategies similar to those to be employed on behalf of the Fund; (c) policies and procedures in place to address potential conflicts of interest; and (d) compliance program and code of ethics. In this regard, they considered assessments provided by the Investment Adviser of the Sub-Adviser, the Sub-Adviser’s investment strategies and personnel, and its compliance program. The Trustees considered that the Sub-Adviser currently manages a sleeve of another series of the Trust using a different strategy. They noted that, because the Sub-Adviser had not previously provided services to the Fund, there was no performance information to evaluate with respect to the Fund.
Costs of Services to be Provided
The Trustees reviewed the terms of the Sub-Advisory Agreement and the proposed fee schedule, which includes breakpoints. They noted that the compensation to be paid to the Sub-Adviser would be paid by the Investment Adviser, not by the Fund. They also noted that the terms of the Sub-Advisory Agreement were the result of arms’ length negotiations between the Investment Adviser and the Sub-Adviser. The Trustees reviewed the anticipated blended average of all sub-advisory fees to be paid by the Investment Adviser with respect to the Fund and how it would change upon hiring the Sub-Adviser. The Trustees considered this information in light of the overall management fee expected to be retained by the Investment Adviser.
Conclusion
In connection with their consideration of the Sub-Advisory Agreement, the Trustees gave weight to various factors, but did not identify any particular factor as controlling their decision. After deliberation and consideration of the information provided, including the factors described above, the Trustees, including the Independent Trustees, unanimously concluded, in the exercise of their business judgment, that the sub-advisory fees to be paid by the Investment Adviser to the Sub-Adviser were reasonable in light of the factors considered, and that the Sub-Advisory Agreement, and the terms thereof, should be approved for a period of two years from its effective date.
60
GOLDMAN SACHS MULTI-MANAGER ALTERNATIVES FUND
Voting Results of Special Meeting of Shareholders (Unaudited)
A Special Meeting (the “Meeting”) of the Goldman Sachs Trust II (the “Trust”) was held on December 3, 2021 to consider and act upon the proposal below. Each Fund has amortized its respective share of the proxy, shareholder meeting and other related costs and GSAM has agreed to reimburse the Fund in an amount equal to the portion of the increase in the Fund’s total expense ratio that exceeds a specified percentage.
At the Meeting, Steven D. Krichmar, Linda A. Lang, Michael Latham and Lawrence W. Stranghoener were elected to the Trust’s Board of Trustees. In electing trustees, the Trust’s shareholders voted as follows:
| | | | | | | | | | |
| Proposal 1 | | | | | | | | |
| Election of Trustees | | For | | | Against/Withhold | | | Abstain |
| | | |
Steven D. Krichmar | | | 997,212,261 | | | | 10,105,414 | | | 0 |
| | | |
Linda A. Lang | | | 1,004,981,372 | | | | 2,336,303 | | | 0 |
| | | |
Michael Latham | | | 995,719,416 | | | | 11,598,259 | | | 0 |
| | | |
Lawrence W. Stranghoener | | | 995,630,574 | | | | 11,687,101 | | | 0 |
61
|
| GOLDMAN SACHS MULTI-MANAGER ALTERNATIVES FUND |
Trustees and Officers (Unaudited)
Independent Trustees
| | | | | | | | | | |
Name, Address and Age1 | | Position(s) Held with the Trust | | Term of Office and Length of Time Served2 | | Principal Occupation(s) During Past 5 Years | | Number of
Portfolios in
Fund Complex
Overseen by
Trustee3 | | Other Directorships Held by Trustee4 |
| | | | | |
Cheryl K. Beebe Age: 66 | | Chair of the Board of Trustees | | Since 2017 (Trustee since 2015) | | Ms. Beebe is retired. She is Director, Packaging Corporation of America (2008-Present); Director, The Mosaic Company (2019-Present); Director, HanesBrands Inc. (2020-Present); and was formerly Director, Convergys Corporation (a global leader in customer experience outsourcing) (2015-2018); and formerly held the position of Executive Vice President, (2010-2014); and Chief Financial Officer, Ingredion, Inc. (a leading global ingredient solutions company) (2004-2014). Chair of the Board of Trustees — Goldman Sachs Trust II; Goldman Sachs MLP and Energy Renaissance Fund; Goldman Sachs ETF Trust; Goldman Sachs ETF Trust II; and Goldman Sachs Real Estate Diversified Income Fund. | | 68 | | Packaging Corporation
of America (producer
of container board);
The Mosaic Company
(producer of
phosphate and potash
fertilizer);
HanesBrands Inc. (a
multinational clothing
company) |
| | | | | |
Lawrence Hughes Age: 64 | | Trustee | | Since 2016 | | Mr. Hughes is retired. Formerly, he held senior management positions with BNY Mellon Wealth Management, a division of The Bank of New York Mellon Corporation (a financial services company) (1991-2015), most recently as Chief Executive Officer (2010-2015). He serves as a Member of the Board of Directors, (2012-Present) and formerly served as Chairman (2012-2019), Ellis Memorial and Eldredge House (a not-for-profit organization). Previously, Mr. Hughes served as an Advisory Board Member of Goldman Sachs Trust II (February 2016-April 2016). Trustee — Goldman Sachs Trust II; Goldman Sachs MLP and Energy Renaissance Fund; Goldman Sachs ETF Trust; Goldman Sachs ETF Trust II; and Goldman Sachs Real Estate Diversified Income Fund. | | 68 | | None |
| | | | | |
John F. Killian Age: 67 | | Trustee | | Since 2015 | | Mr. Killian is retired. He is Director, Consolidated Edison, Inc. (2007-Present); and was formerly Director, Houghton Mifflin Harcourt Publishing Company (2011-2022). Previously, he held senior management positions with Verizon Communications, Inc., including Executive Vice President and Chief Financial Officer (2009-2010); and President, Verizon Business, Verizon Communications, Inc. (2005-2009). Trustee — Goldman Sachs Trust II; Goldman Sachs MLP and Energy Renaissance Fund; Goldman Sachs ETF Trust; Goldman Sachs ETF Trust II; and Goldman Sachs Real Estate Diversified Income Fund. | | 68 | | Consolidated Edison,
Inc. (a utility holding
company) |
| | | | | |
Steven D. Krichmar Age: 64 | | Trustee | | Since 2018 | | Mr. Krichmar is retired. Formerly, he held senior management and governance positions with Putnam Investments, LLC, a financial services company (2001-2016). He was most recently Chief of Operations and a member of the Operating Committee of Putnam Investments, LLC and Principal Financial Officer of The Putnam Funds. Previously, Mr. Krichmar served as an Audit Partner with PricewaterhouseCoopers LLP and its predecessor company (1990-2001). Trustee — Goldman Sachs Trust II; Goldman Sachs MLP and Energy Renaissance Fund; Goldman Sachs ETF Trust; Goldman Sachs ETF Trust II; and Goldman Sachs Real Estate Diversified Income Fund. | | 68 | | None |
| | | | | |
Linda A. Lang Age: 64 | | Trustee | | Since 2021 | | Ms. Lang is retired. She was formerly Chair of the Board of Directors, (2016-2019) and Member of the Board of Directors, WD-40 Company (a global consumer products company) (2004-2019); Chairman and Chief Executive Officer (2005-2014); and Director, President and Chief Operating Officer, Jack in the Box, Inc. (a restaurant company) (2003-2005). Previously, Ms. Lang served as an Advisory Board Member of Goldman Sachs MLP and Energy Renaissance Fund (February 2016-March 2016). Trustee — Goldman Sachs Trust II; Goldman Sachs MLP and Energy Renaissance Fund; Goldman Sachs ETF Trust; Goldman Sachs ETF Trust II; Goldman Sachs Credit Income Fund; and Goldman Sachs Real Estate Diversified Income Fund. | | 69 | | None |
62
GOLDMAN SACHS MULTI-MANAGER ALTERNATIVES FUND
Trustees and Officers (Unaudited) (continued)
Independent Trustees
| | | | | | | | | | |
Name, Address and Age1 | | Position(s) Held with the Trust | | Term of Office and Length of Time Served2 | | Principal Occupation(s) During Past 5 Years | | Number of Portfolios in Fund Complex Overseen by Trustee3 | | Other Directorships Held by Trustee4 |
| | | | | |
Michael Latham Age: 57 | | Trustee | | Since 2021 | | Mr. Latham is retired. He currently serves as Chief Operating Officer and Director of FinTech Evolution Acquisition Group (a special purpose acquisition company) (2021-Present). Formerly, Mr. Latham held senior management positions with the iShares exchange-traded fund business owned by BlackRock, Inc., including Chairman (2011-2014); Global Head (2010-2011); U.S. Head (2007-2010); and Chief Operating Officer (2003-2007). Trustee — Goldman Sachs Trust II; Goldman Sachs MLP and Energy Renaissance Fund; Goldman Sachs ETF Trust; Goldman Sachs ETF Trust II; Goldman Sachs Credit Income Fund; and Goldman Sachs Real Estate Diversified Income Fund. | | 69 | | FinTech Evolution Acquisition Group (a special purpose acquisition company) |
| | | | | |
Lawrence W. Stranghoener Age: 68 | | Trustee | | Since 2021 | | Mr. Stranghoener is retired. He is Chairman, Kennametal, Inc. (a global manufacturer and distributor of tooling and industrial materials) (2003-Present); and was formerly Director, Aleris Corporation and Aleris International, Inc. (a producer of aluminum rolled products) (2011- 2020); Interim Chief Executive Officer (2014) and Executive Vice President and Chief Financial Officer (2004-2014), Mosaic Company (a fertilizer manufacturing company). Trustee — Goldman Sachs Trust II; Goldman Sachs MLP and Energy Renaissance Fund; Goldman Sachs ETF Trust; Goldman Sachs ETF Trust II; and Goldman Sachs Real Estate Diversified Income Fund. Chair of the Board of Trustees — Goldman Sachs Credit Income Fund. | | 69 | | Kennametal, Inc. (a global manufacturer and distributor of tooling and industrial materials) |
| | | | | |
| | | | | | | | | | |
Interested Trustee* |
Name, Address and Age1 | | Position(s) Held with the Trust | | Term of Office and Length of
Time Served2 | | Principal Occupation(s) During Past 5 Years | | Number of
Portfolios in
Fund Complex
Overseen by
Trustee3 | | Other
Directorships
Held by Trustee4 |
| | | | | |
James A. McNamara Age: 60 | | President and Trustee | | Since 2012 | | Advisory Director, Goldman Sachs (January 2018-Present); Managing Director, Goldman Sachs (January 2000-December 2017); Director of Institutional Fund Sales, GSAM (April 1998- December 2000); and Senior Vice President and Manager, Dreyfus Institutional Service Corporation (January 1993- April 1998). President and Trustee — Goldman Sachs Trust II; Goldman Sachs Trust; Goldman Sachs Variable Insurance Trust; Goldman Sachs MLP and Energy Renaissance Fund; Goldman Sachs ETF Trust; Goldman Sachs ETF Trust II; Goldman Sachs Credit Income Fund; and Goldman Sachs Real Estate Diversified Income Fund. | | 171 | | None |
| | | | | |
| | | | | | | | | | |
| * | Mr. McNamara is considered to be an “Interested Trustee” because he holds positions with Goldman Sachs and owns securities issued by The Goldman Sachs Group, Inc. Mr. McNamara holds comparable positions with certain other companies of which Goldman Sachs, GSAM or an affiliate thereof is the investment adviser, administrator and/or distributor. |
| 1 | Each Trustee may be contacted by writing to the Trustee, c/o Goldman Sachs, 200 West Street, New York, New York, 10282, Attn: Caroline Kraus. Information is provided as of October 31, 2022. |
| 2 | Subject to such policies as may be adopted by the Board from time-to-time, each Trustee holds office for an indefinite term, until the earliest of: (a) the election of his or her successor; (b) the date the Trustee resigns or is removed by the Board or shareholders, in accordance with the Trust’s Declaration of Trust; or (c)the termination of the Trust. The Board has adopted policies which provide that each Independent Trustee shall retire as of December 31st of the calendar year in which he or she reaches (a) his or her 75th birthday or (b) the 15th anniversary of the date he or she became a Trustee, whichever is earlier, unless a waiver of such requirements shall have been adopted by a majority of the other Trustees. These policies may be changed by the Trustees without shareholder vote. |
| 3 | The Goldman Sachs Fund Complex includes certain other companies listed above for each respective Trustee. As of October 31, 2022, Goldman Sachs Trust II consisted of 18 portfolios (16 of which offered shares to the public); Goldman Sachs Trust consisted of 88 portfolios; Goldman Sachs Variable Insurance Trust consisted of 15 portfolios (12 of which offered shares to the public); Goldman Sachs ETF Trust consisted of 46 portfolios (29 of which offered shares to the public); Goldman Sachs ETF Trust II consisted of 2 portfolios (1 of which offered shares to the public); and Goldman Sachs MLP and Energy Renaissance Fund, Goldman Sachs Credit Income Fund and Goldman Sachs Real Estate Diversified Income Fund each consisted of one portfolio. Goldman Sachs Credit Income Fund did not offer shares to the public. |
| 4 | This column includes only directorships of companies required to report to the Securities and Exchange Commission under the Securities Exchange Act of 1934 (i.e., “public companies”) or other investment companies registered under the Act. |
Additional information about the Trustees is available in the Fund’s Statement of Additional Information, which can be obtained from Goldman Sachs free of charge by calling this toll-free number (in the United States of America): 1-800-526-7384.
63
|
| GOLDMAN SACHS MULTI-MANAGER ALTERNATIVES FUND |
Trustees and Officers (Unaudited) (continued)
Officers of the Trust*
| | | | | | |
| Name, Address and Age1 | | Position(s) Held with the Trust | | Term of Office and Length of Time Served2 | | Principal Occupation(s) During Past 5 Years |
| | | |
James A. McNamara 200 West Street New York, NY 10282 Age: 60 | | President and Trustee | | Since 2012 | | Advisory Director, Goldman Sachs (January 2018-Present); Managing Director, Goldman Sachs (January 2000-December 2017); Director of Institutional Fund Sales, GSAM (April 1998-December 2000); and Senior Vice President and Manager, Dreyfus Institutional Service Corporation (January 1993- April 1998). President and Trustee — Goldman Sachs Trust II; Goldman Sachs Trust; Goldman Sachs Variable Insurance Trust; Goldman Sachs MLP and Energy Renaissance Fund; Goldman Sachs ETF Trust; Goldman Sachs ETF Trust II; Goldman Sachs Credit Income Fund; and Goldman Sachs Real Estate Diversified Income Fund. |
| | | |
Joseph F. DiMaria 30 Hudson Street Jersey City, NJ 07302 Age: 54 | | Treasurer, Principal Financial Officer and Principal Accounting Officer | | Since 2017 (Treasurer and Principal Financial Officer Since 2019) | | Managing Director, Goldman Sachs (November 2015-Present) and Vice President — Mutual Fund Administration, Columbia Management Investment Advisers, LLC (May 2010-October 2015). Treasurer, Principal Financial Officer and Principal Accounting Officer — Goldman Sachs Trust II (previously Assistant Treasurer (2017)); Goldman Sachs Trust (previously Assistant Treasurer (2016)); Goldman Sachs Variable Insurance Trust (previously Assistant Treasurer (2016)); Goldman Sachs MLP and Energy Renaissance Fund (previously Assistant Treasurer (2017)); Goldman Sachs ETF Trust (previously Assistant Treasurer (2017)); Goldman Sachs ETF Trust II; Goldman Sachs Credit Income Fund; and Goldman Sachs Real Estate Diversified Income Fund. |
| | | |
Caroline L. Kraus 200 West Street New York, NY 10282 Age: 45 | | Secretary | | Since 2012 | | Managing Director, Goldman Sachs (January 2016-Present); Vice President, Goldman Sachs (August 2006-December 2015); Senior Counsel, Goldman Sachs (January 2020-Present); Associate General Counsel, Goldman Sachs (2012-December 2019); Assistant General Counsel, Goldman Sachs (August 2006-December 2011); and Associate, Weil, Gotshal & Manges, LLP (2002-2006). Secretary — Goldman Sachs Trust II; Goldman Sachs Trust (previously Assistant Secretary (2012)); Goldman Sachs Variable Insurance Trust (previously Assistant Secretary (2012)); Goldman Sachs BDC, Inc.; Goldman Sachs Private Middle Market Credit LLC; Goldman Sachs Private Middle Market Credit II LLC; Goldman Sachs Middle Market Lending Corp.; Goldman Sachs MLP and Energy Renaissance Fund; Goldman Sachs ETF Trust; Goldman Sachs ETF Trust II; Goldman Sachs Credit Income Fund; and Goldman Sachs Real Estate Diversified Income Fund. |
| | | |
| | | | | | |
| * | Represents a partial list of officers of the Trust. Additional information about all the officers is available in the Fund’s Statement of Additional Information, which can be obtained from Goldman Sachs free of charge by calling this toll-free number (in the United States): 1-800-526-7384. |
| 1 | Information is provided as of October 31, 2022. |
| 2 | Officers hold office at the pleasure of the Board of Trustees or until their successors are duly elected and qualified. Each officer holds comparable positions with certain other companies of which Goldman Sachs, GSAM or an affiliate thereof is the investment adviser, administrator and/or distributor. |
64
FUNDS PROFILE
Goldman Sachs Funds
Goldman Sachs is a premier financial services firm, known since 1869 for creating thoughtful and customized investment solutions in complex global markets.
Today, the Asset Management Division of Goldman Sachs serves a diverse set of clients worldwide, including private institutions, public entities and individuals. With approximately $2.19 trillion in assets under supervision as of September 30, 2022, Goldman Sachs Asset Management (“GSAM”) has portfolio management teams located around the world and our investment professionals bring firsthand knowledge of local markets to every investment decision. Assets under supervision includes assets under management and other client assets for which Goldman Sachs does not have full discretion. GSAM leverages the resources of Goldman Sachs & Co. LLC subject to legal, internal and regulatory restrictions.
| | |
| Money Market |
| Financial Square FundsSM |
| ∎ | | Financial Square Treasury Solutions Fund1 |
| ∎ | | Financial Square Government Fund1 |
| ∎ | | Financial Square Money Market Fund2 |
| ∎ | | Financial Square Prime Obligations Fund2 |
| ∎ | | Financial Square Treasury Instruments Fund1 |
| ∎ | | Financial Square Treasury Obligations Fund1 |
| ∎ | | Financial Square Federal Instruments Fund1 |
| Investor FundsSM |
| ∎ | | Investor Money Market Fund3 |
| ∎ | | Investor Tax-Exempt Money Market Fund3 |
|
| Fixed Income |
| Short Duration and Government |
| ∎ | | Enhanced Income Fund |
| ∎ | | Short-Term Conservative Income Fund |
| ∎ | | Short Duration Government Fund |
| ∎ | | Short Duration Income Fund |
| ∎ | | Government Income Fund |
| ∎ | | Inflation Protected Securities Fund |
| Multi-Sector |
| ∎ | | Bond Fund |
| ∎ | | Core Fixed Income Fund |
| ∎ | | Global Core Fixed Income Fund |
| ∎ | | Strategic Income Fund |
| ∎ | | Income Fund |
| Municipal and Tax-Free |
| ∎ | | High Yield Municipal Fund |
| ∎ | | Dynamic Municipal Income Fund |
| | |
| ∎ | | Short Duration Tax-Free Fund |
| ∎ | | Municipal Income Completion Fund |
| Single Sector |
| ∎ | | Investment Grade Credit Fund |
| ∎ | | U.S. Mortgages Fund |
| ∎ | | High Yield Fund |
| ∎ | | High Yield Floating Rate Fund |
| ∎ | | Emerging Markets Debt Fund |
| ∎ | | Local Emerging Markets Debt Fund |
| Fixed Income Alternatives |
| ∎ | | Long Short Credit Strategies Fund |
|
| Fundamental Equity |
| ∎ | | Equity Income Fund |
| ∎ | | Small Cap Growth Fund |
| ∎ | | Small Cap Value Fund |
| ∎ | | Small/Mid Cap Value Fund |
| ∎ | | Mid Cap Value Fund |
| ∎ | | Large Cap Value Fund |
| ∎ | | Focused Value Fund |
| ∎ | | Large Cap Core Fund4 |
| ∎ | | Strategic Growth Fund |
| ∎ | | Small/Mid Cap Growth Fund |
| ∎ | | Flexible Cap Fund |
| ∎ | | Concentrated Growth Fund |
| ∎ | | Technology Opportunities Fund |
| ∎ | | Mid Cap Growth Fund5 |
| ∎ | | Rising Dividend Growth Fund |
| ∎ | | U.S. Equity ESG Fund |
| ∎ | | Income Builder Fund |
|
| Tax-Advantaged Equity |
| ∎ | | U.S. Tax-Managed Equity Fund |
| ∎ | | International Tax-Managed Equity Fund |
| ∎ | | U.S. Equity Dividend and Premium Fund |
| ∎ | | International Equity Dividend and Premium Fund |
| | |
| Equity Insights |
| ∎ | | Small Cap Equity Insights Fund |
| ∎ | | U.S. Equity Insights Fund |
| ∎ | | Small Cap Growth Insights Fund |
| ∎ | | Large Cap Growth Insights Fund |
| ∎ | | Large Cap Value Insights Fund |
| ∎ | | Small Cap Value Insights Fund |
| ∎ | | International Small Cap Insights Fund |
| ∎ | | International Equity Insights Fund |
| ∎ | | Emerging Markets Equity Insights Fund |
|
| Fundamental Equity International |
| ∎ | | International Equity Income Fund |
| ∎ | | International Equity ESG Fund |
| ∎ | | China Equity Fund |
| ∎ | | Emerging Markets Equity Fund |
| ∎ | | Emerging Markets Equity ex. China Fund |
| ∎ | | ESG Emerging Markets Equity Fund |
|
| Alternative |
| ∎ | | Clean Energy Income Fund |
| ∎ | | Defensive Equity Fund |
| ∎ | | Real Estate Securities Fund |
| ∎ | | Commodity Strategy Fund |
| ∎ | | Global Real Estate Securities Fund |
| ∎ | | Absolute Return Tracker Fund |
| ∎ | | Managed Futures Strategy Fund |
| ∎ | | MLP Energy Infrastructure Fund |
| ∎ | | Energy Infrastructure Fund |
| ∎ | | Multi-Manager Alternatives Fund |
| ∎ | | Global Infrastructure Fund |
| | |
| Total Portfolio Solutions |
| ∎ | | Global Managed Beta Fund |
| ∎ | | Multi-Manager Non-Core Fixed Income Fund |
| ∎ | | Multi-Manager Global Equity Fund |
| ∎ | | Multi-Manager International Equity Fund |
| ∎ | | Tactical Tilt Overlay Fund |
| ∎ | | Balanced Strategy Portfolio |
| ∎ | | Multi-Manager U.S. Small Cap Equity Fund |
| ∎ | | Multi-Manager Real Assets Strategy Fund |
| ∎ | | Growth and Income Strategy Portfolio |
| ∎ | | Growth Strategy Portfolio |
| ∎ | | Dynamic Global Equity Fund |
| ∎ | | Satellite Strategies Portfolio |
| ∎ | | Enhanced Dividend Global Equity Portfolio |
| ∎ | | Tax-Advantaged Global Equity Portfolio |
| ∎ | | Strategic Factor Allocation Fund |
| ∎ | | Strategic Volatility Premium Fund |
| ∎ | | Target Date Retirement Portfolio |
| ∎ | | Target Date 2025 Portfolio |
| ∎ | | Target Date 2030 Portfolio |
| ∎ | | Target Date 2035 Portfolio |
| ∎ | | Target Date 2040 Portfolio |
| ∎ | | Target Date 2045 Portfolio |
| ∎ | | Target Date 2050 Portfolio |
| ∎ | | Target Date 2055 Portfolio |
| ∎ | | Target Date 2060 Portfolio |
| ∎ | | GQG Partners International Opportunities Fund |
| 1 | You could lose money by investing in the Fund. Although the Fund seeks to preserve the value of your investment at $1.00 per share, it cannot guarantee it will do so. An investment in the Fund is not a deposit of a bank and is not insured or guaranteed by the Federal Deposit Insurance Corporation or any other government agency. The Fund’s sponsor has no legal obligation to provide financial support to the Fund, and you should not expect that the sponsor will provide financial support to the Fund at any time. |
| 2 | You could lose money by investing in the Fund. Because the share price of the Fund will fluctuate, when you sell your shares they may be worth more or less than what you originally paid for them. The Fund may impose a fee upon sale of your shares or may temporarily suspend your ability to sell shares if the Fund’s liquidity falls below required minimums because of market conditions or other factors. An investment in the Fund is not a deposit of a bank and is not insured or guaranteed by the Federal Deposit Insurance Corporation or any other government agency. The Fund’s sponsor has no legal obligation to provide financial support to the Fund, and you should not expect that the sponsor will provide financial support to the Fund at any time. |
| 3 | You could lose money by investing in the Fund. Although the Fund seeks to preserve the value of your investment at $1.00 per share, it cannot guarantee it will do so. The Fund may impose a fee upon sale of your shares or may temporarily suspend your ability to sell shares if the Fund’s liquidity falls below required minimums because of market conditions or other factors. An investment in the Fund is not a deposit of a bank and is not insured or guaranteed by the Federal Deposit Insurance Corporation or any other government agency. The Fund’s sponsor has no legal obligation to provide financial support to the Fund, and you should not expect that the sponsor will provide financial support to the Fund at any time. |
| 4 | Effective after the close of business on April 13, 2022, the Goldman Sachs Capital Growth Fund was renamed the Goldman Sachs Large Cap Core Fund. |
| 5 | Effective after the close of business on April 13, 2022, the Goldman Sachs Growth Opportunities Fund was renamed the Goldman Sachs Mid Cap Growth Fund. |
| | Financial Square FundsSM and Investor FundsSM are registered service marks of Goldman Sachs & Co. LLC. |
| * | This list covers open-end funds only. Please visit our website at www.GSAMFUNDS.com to learn about our closed-end funds and exchange-traded funds. |
TRUSTEES OFFICERS Cheryl K. Beebe, Chair James A. McNamara, President Lawrence Hughes Joseph F. DiMaria, Principal Financial Officer, John F. Killian Principal Accounting Officer and Treasurer Steven D. Krichmar Caroline L. Kraus, Secretary Linda A. Lang Michael Latham James A. McNamara Lawrence W. Stranghoener GOLDMAN SACHS & CO. LLC GOLDMAN SACHS ASSET MANAGEMENT, L.P. Distributor and Transfer Agent Investment Adviser Visit our web site at www.GSAMFUNDS.com to obtain the most recent month-end returns. Goldman Sachs Asset Management, L.P. 200 West Street, New York, New York 10282 The reports concerning the Fund included in this shareholder report may contain certain forward-looking statements about the factors that may affectthe performance of the Fund in the future. These statements are based on Fund management’s predictions and expectations concerning certain future events and their expected impact on the Fund, such as performance of the economy as a whole and of specific industry sectors, changes in the levels of interest rates, the impact of developing world events, and other factors that may influence the future performance of the Fund. Management believes these forward-looking statements to be reasonable, although they are inherently uncertain and difficult to predict. Actual events may cause adjustments in portfolio management strategies from those currently expected to be employed. A description of the policies and procedures that the Fund uses to determine how to vote proxies relating to portfolio securities and information regarding how the Fund voted proxies relating to portfolio securities during the most recent 12-month period ended June 30 is available (I) without charge, upon request by calling 1-800-526-7384 (for Retail Shareholders) or 1-800-621-2550 (for Institutional Shareholders); and (II) on the Securities and Exchange Commission (“SEC”) web site at http://www.sec.gov. The Fund will file its portfolio holdings for each month in a fiscal quarter within 60 days after the end of the relevant fiscal quarter on Form N-PORT. Portfolio holdings information for the third month of each fiscal quarter will be made available on the SEC’s web site at http://www.sec.gov. Portfolio holdings information may be obtained upon request and without charge by calling 1-800-526-7384 (for Retail Shareholders) or 1-800-621-2550 (for Institutional Shareholders). Fund holdings and allocations shown are unaudited, and may not be representative of current or future investments. Fund holdings and allocations may not include the Fund’s entire investment portfolio, which may change at any time. Fund holdings should not be relied on in making investment decisions and should not be construed as research or investment advice regarding particular securities. Current and future holdings are subject to risk. Economic and market forecasts presented herein reflect our judgment as of the date of this presentation and are subject to change without notice. These forecasts do not take into account the specific investment objectives, restrictions, tax and financial situation or other needs of any specific client. Actual data will vary and may not be reflected here. These forecasts are subject to high levels of uncertainty that may affect actual performance. Accordingly, these forecasts should be viewed as merely representative of a broad range of possible outcomes. These forecasts are estimated, based on assumptions, and are subject to significant revision and may change materially as economic and market conditions change. Goldman Sachs has no obligation to provide updates or changes to these forecasts. Case studies and examples are for illustrative purposes only. The portfolio risk management process includes an effort to monitor and manage risk, but does not imply low risk. Past correlations are not indicative of future correlations, which may vary. This material is not authorized for distribution to prospective investors unless preceded or accompanied by a current prospectus or summary prospectus, if applicable. Investors should consider the Fund objective, risks, and charges and expenses, and read the summary prospectus, if available, and/or the Prospectus carefully before investing or sending money. The summary prospectus, if available, and the prospectus contain this and other information about the Fund and may be obtained from your authorized dealer or from Goldman Sachs & Co. LLC by calling (retail – 1-800-526-7384) (institutional – 1-800-621-2550) © 2022 Goldman Sachs. All rights reserved. 301371-OTU-1717624 MMALTAR 22
Annual Report Goldman Sachs Funds October 31, 2022 Strategic Multi-Asset Class Funds Multi-Manager Global Equity Multi-Manager Non-Core Fixed Income Multi-Manager Real Assets Strategy
Strategic Multi-Asset Class Funds
| ∎ | MULTI-MANAGER GLOBAL EQUITY |
| ∎ | MULTI-MANAGER NON-CORE FIXED INCOME |
| ∎ | MULTI-MANAGER REAL ASSETS STRATEGY |
TABLE OF CONTENTS
| | | | | | |
| | | | |
| NOT FDIC-INSURED | | May Lose Value | | No Bank Guarantee | | |
MARKET REVIEW
Goldman Sachs Strategic Multi-Asset Class Funds
Market Review
The capital markets broadly declined during the 12-month period ended October 31, 2022 (the “Reporting Period”), as persistent inflation, supply-chain shortages, recession fears and tightening central bank monetary policy created a challenging backdrop for investors.
Global equity markets started the Reporting Period strongly, with the MSCI All Country World Index (“MSCI ACWI IMI”) Investable Market Index rising 1.2% in November and December 2021 overall to post a double-digit gain for the 2021 calendar year. For the remainder of the Reporting Period, however, global equity markets were volatile and broadly negative on the back of elevated inflation, rising interest rates and global supply-chain disruptions. In response to stubbornly high inflation, major central banks around the world picked up the pace of interest rate hikes, including the U.S. Federal Reserve (the “Fed”), which raised the targeted federal funds rate to a range between 3.00% and 3.25% by the end of October 2022, its highest level since 2008. Uncertainty about whether central banks could successfully combat inflation and avoid an economic recession kept equity valuations depressed. Geopolitical tensions further dampened market sentiment, as Russia’s invasion of Ukraine in February 2022 pushed up energy prices and as ongoing COVID-19-related lockdowns in China continued to disrupt global supply chains. For the Reporting Period overall, the MSCI ACWI Investable Market Index, representing global equities, returned -19.96%, with growth stocks broadly underperforming value stocks. From a sector perspective, the higher interest rate environment and macroeconomic uncertainty contributed to a sell-off in long-duration growth stocks within the information technology and consumer discretionary sectors. (Long-duration stocks are those that tend to deliver a higher proportion of their cash flows in the distant future. Duration is a measure of sensitivity to changes in interest rates.) Energy was the best performing sector in the MSCI ACWI Investable Market Index during the Reporting Period, benefiting from rising commodity prices. From a regional standpoint, North American stocks performed better than European, Australian and Asian stocks, but each global region recorded negative absolute returns overall. Emerging markets equities were particularly challenged during the Reporting Period, mainly by the uncertain geopolitical environment and the sharp decline in China’s stock market. The MSCI China All Shares Index returned -42.58% during the Reporting Period overall, as economic growth concerns fueled by the Chinese government’s “zero-COVID” policies and its continuing regulatory crackdown weighed on investor sentiment. Instability and geopolitical concerns within Eastern Europe were also a drag on the performance of emerging markets equities, especially in Hungary and Poland, with a number of index providers, including MSCI Inc., excluding Russian securities from their indices in response to Russia’s invasion of Ukraine.
Credit markets broadly fell during the Reporting Period, as interest rates rose and credit spreads widened. (Credit spreads are yield differentials between corporate bonds and U.S. Treasury securities of comparable maturity.) Other headwinds included the ongoing impact of the COVID-19 pandemic, elevated inflation, Russia’s invasion of Ukraine, supply-chain disruptions and changing central bank monetary policies. Bank loans held up better than most other fixed income sectors during the Reporting Period, benefiting from their floating rate nature and strong investor demand. On the other hand, investment grade corporate bonds, which tend to be of longer duration, were hurt by higher interest rates and lagged most other segments of the fixed income market. High yield corporate bonds also weakened during the Reporting Period. Within the emerging markets, U.S. dollar-denominated bonds trailed local currency-denominated bonds due to rising U.S. interest rates and widening credit spreads. Additionally, the exclusion of Russian debt from a number of fixed income indices, along with the resulting fallout on other index constituents, broadly weighed on emerging markets debt. Commodity-rich regions, such as the Middle East and Latin America, generally outperformed Asia and Europe as commodity prices increased during the Reporting Period.
Global real estate securities dropped during the Reporting Period and underperformed the broader global equity markets. Rising interest rates, driven by the Fed’s accelerated, aggressive monetary policy tightening, and energy supply constraints driven by the Russia/Ukraine war fueled the decline. Historically, global real estate securities are hurt more than global equities as a whole by higher interest rates. Geography was the most critical determinant of performance during the Reporting Period. Continental Europe and U.K. real estate securities were sharply lower compared to global real estate securities broadly, while Asia-Pacific real estate securities generally performed in line with global real estate securities and North American real estate securities outperformed global real estate securities. Investor sentiment in Europe was notably impacted by the Russia/Ukraine war, concerns about energy scarcity and fears about a recession in the region. Regarding property types, those with more favorable secular growth characteristics, such as industrial and residential real estate investment trusts (“REITs”), largely generated weaker results than property types with more “value-like” characteristics, such as retail REITs. Office REITs experienced substantial declines during
1
the Reporting Period, as a drop in post-COVID-19 occupancy levels dampened investor sentiment. Lease duration was also top of mind for investors. For example, short-duration leased property types, such as self-storage facilities, held up relatively well compared to long-duration leased assets, such as cell towers.
Global infrastructure securities declined during the Reporting Period, but they significantly outperformed the broader global equity market. From a sector perspective, utilities held up well despite rising interest rates, as their business models generally have explicit, regulated cost pass-through mechanisms. Furthermore, utilities, particularly in North America, benefited from anticipation of higher renewables capital expenditure spending, which could translate directly into earnings growth for a sector not known historically for its earnings growth potential. Certain provisions of the Inflation Reduction Act of 2022, signed into law during August, may also have contributed to the shift in investor perceptions. Elsewhere, midstream energy stocks performed strongly during the Reporting Period, primarily due to sharply higher global energy prices but also because of significant fundamental improvements, including better governance structures and a strong focus by management teams on free cash flow. (The midstream component of the energy industry is usually defined as those companies providing products or services that help link the supply side, i.e., energy producers, and the demand side, i.e., energy end-users, for any type of energy commodity. Such midstream businesses can include, but are not limited to, those that process, store, market and transport various energy commodities.) Meanwhile, cell towers, which are considered both infrastructure and real estate assets, were negatively impacted during the Reporting Period by higher interest rates and the strong performance of value-oriented equities. Transportation-related infrastructure securities were modestly weak amid investor concerns that a possible global recession could lead to cyclical pressures, especially in Europe.
Looking Ahead
At the end of the Reporting Period, we believed investors would continue to face headwinds from tightening monetary policy, as persistent inflation kept central banks on their interest rate hiking paths. While many observers anticipated some kind of economic slowdown, they continued to debate whether central bankers could engineer a “soft landing” or if a more protracted economic decline would be the likely outcome. (A soft landing, in economics, is a cyclical downturn that avoids recession. It typically describes attempts by central banks to raise interest rates just enough to stop an economy from overheating and experiencing high inflation, without causing a significant increase in unemployment, or a hard landing.) In our view, the war in Ukraine and its broader geopolitical risks were likely to remain threats to the global capital markets in the near term and could also push energy and food prices higher. Although supply-chain issues appeared to be moderating at the end of the Reporting Period, we expect them to remain obstacles in the fight against inflation.
2
FUND RESULTS
Goldman Sachs Multi-Manager Global Equity Fund
|
Investment Objective The Fund seeks to provide long-term capital growth. |
Portfolio Management Discussion and Analysis
Below, the Goldman Sachs Multi-Asset Solutions (“MAS”) Group and the Goldman Sachs Alternative Investments & Manager Selection (“AIMS”) Group discuss the Goldman Sachs Multi-Manager Global Equity Fund’s (the “Fund”) performance and positioning for 12-month period ended October 31, 2022 (the “Reporting Period”).
| Q | How did the Fund perform during the Reporting Period? |
| A | During the Reporting Period, the Fund’s Class R6 Shares generated an average annual total return of -19.61%. This return compares to the -18.04% average annual total return of the Fund’s benchmark, the MSCI All Country World Index Investable Market Index (“MSCI ACWI IMI”) (Net, USD, 50% Non-U.S. Developed Hedged to USD) (the “Index”), during the same time period. |
| Q | What key factors were responsible for the Fund’s performance during the Reporting Period? |
| A | The Fund uses a multi-manager approach and generally seeks to achieve its investment objective by dynamically allocating its assets among unaffiliated investment managers (“Underlying Managers”) that employ a mix of international, emerging markets and U.S.-focused equity investment strategies. The MAS Group is responsible for the Fund’s asset allocation, wherein it applies a risk-based approach that draws from both fundamental and quantitative disciplines with the intention of dynamically accessing a diversified set of risks and returns in a market cycle aware manner. The AIMS Group is responsible for making recommendations with respect to hiring, terminating or replacing the Fund’s Underlying Managers and applying a multifaceted process for manager due diligence, portfolio construction and risk management. The MAS Group also provides certain risk management services to the Fund. |
| | During the Reporting Period, the Fund generated a negative absolute return and underperformed the Index. The Fund’s relative results can be attributed to the performance of the Fund’s Underlying Managers overall. Strategic asset allocation outperformed the Index during the Reporting Period. |
| | At various points during the Reporting Period, the Fund had capital allocated to the following Underlying Managers—Axiom International Investors LLC (“Axiom”); Boston Partners Global Investors, Inc. (“Boston Partners”), Causeway Capital Management LLC (“Causeway”), Diamond Hill Capital Management Inc. (“Diamond Hill”); DWS Investment Management Americas, Inc. (“DIMA”), |
| | GW&K Investment Management, LLC (“GW&K”), Massachusetts Financial Services Company, doing business as MFS Investment Management, (“MFS”), Principal Global Investors, LLC (“Principal”), T. Rowe Price Associates, Inc. (“T. Rowe Price”), Vaughan Nelson Investment Management, L.P. (“Vaughan Nelson”), Vulcan Value Partners, LLC (“Vulcan”), WCM Investment Management, LLC (“WCM”) and Wellington Management Company LLP (“Wellington”). |
| | These Underlying Managers represented five market segments across global equity as part of the Fund’s top-level strategy allocation—U.S. large cap (Diamond Hill, T. Rowe Price, Vaughan Nelson and Vulcan); Europe, Australasia and Far East (“EAFE”) large cap (Causeway, MFS and WCM); U.S. small cap (Boston Partners and GW&K); EAFE small cap (Principal); and emerging markets (Axiom and Wellington). DIMA managed a diversified beta strategy for the Fund from the beginning of the Reporting Period through February 8, 2022, when its assets were redeemed. |
| | Nine of these Underlying Managers had allocated capital for the entire Reporting Period, with all nine generating negative absolute returns. Diamond Hill and T. Rowe Price each generated a negative absolute return between December 7, 2021, when they were both allocated capital, and the end of the Reporting Period. Vulcan generated a negative absolute return between the beginning of the Reporting Period and June 23, 2022, when its assets were redeemed. DIMA generated a negative absolute return from the start of the Reporting Period until February 8, 2022, when its assets were redeemed. |
| | On a relative basis, five Underlying Managers outperformed their respective benchmark indices and four underperformed their respective benchmark indices during the Reporting Period. Diamond Hill and T. Rowe Price underperformed their respective benchmark indices between December 7, 2021, when they were each allocated capital, and the end of the Reporting Period. Vulcan underperformed its benchmark index from the beginning of the Reporting Period through June 23, 2022, when its assets were redeemed. DIMA underperformed its benchmark index between the beginning of the Reporting Period and February 8, 2022, when its assets were redeemed. |
3
| | During the Reporting Period, the MAS Group managed a passive currency overlay, which is designed to hedge exposure to non-U.S. currencies by selling the currencies in which the Fund’s equity securities are traded and investing in the U.S. dollar. The currency overlay seeks to minimize unintended currency exposures for the Fund. Also, in connection with the risk management services it provides, the MAS Group maintained passive equity exposure to the Fund in order to keep the Fund’s beta closer to that of the Index. (Beta refers to the component of the returns that is attributable market risk exposure, rather than manager skill.) |
| | Strategic asset allocation, which reflects a longer-term perspective to diversify and invest across global equity markets, outperformed the Index during the Reporting Period. The outperformance was driven largely by the Fund’s overweight relative to the Index in U.S. large-cap equities and its underweights in global small-cap equities and EAFE equities, as non-U.S. developed markets equities were hurt by geopolitical tensions in Eastern Europe and China’s continued “zero-Covid” policies. |
| Q | Which global equity asset classes most significantly affected Fund performance? |
| A | In U.S. large cap, Underlying Manager Vaughan Nelson outperformed the S&P 500® Index due to strong stock selection within information technology, as well as to a relative underweight to and effective stock selection in the consumer discretionary sector. Underlying Manager Vulcan underperformed the S&P 500® Index between the start of the Reporting Period and June 23, 2022, when its assets were redeemed. Weak stock selection and an overweight position in information technology, as well as ineffective stock selection within financials drove the negative results. Underlying Manager Diamond Hill underperformed the Russell 1000® Value Index between December 7, 2021, when it was allocated capital, and the end of the Reporting Period. A relative overweight to and weak stock selection in consumer discretionary, along with an underweight to the energy sector, were the largest detractors from relative returns. Conversely, effective stock selection within industrials added to performance. Underlying Manager T. Rowe Price underperformed the Russell 1000® Growth Index between December 7, 2021, when it was allocated capital, and the end of the Reporting Period. Its largest detractor was a relative overweight to communication services, the weakest-performing sector in the Russell 1000® Growth Index for that time period. An underweight to consumer staples also hurt results. On the positive side, stock selection within the health care sector added to relative returns during the Reporting Period. |
| | In U.S. small cap, Boston Partners, the value-oriented Underlying Manager, outperformed the Russell 2000® Value Index primarily because of strong stock selection in and a relative underweight to the health care sector. Effective stock selection in the communication services sector also boosted |
| | Boston Partners’ results. Underlying Manager GW&K outperformed the Russell 2000® Index due largely to strong stock selection in the health care and consumer discretionary sectors. |
| | In EAFE large cap, Underlying Manager WCM underperformed its benchmark index, the MSCI ACWI ex USA Index, because of weak stock selection in and a relative overweight to information technology, as well as a lack of exposure to energy. These losses were partially offset by a lack of exposure to the communication services and real estate sectors, which added value. Underlying Manager MFS outperformed its benchmark index, the MSCI EAFE Index, as a result of broad-based positive stock selection across the consumer discretionary, information technology, financials and industrials sectors. A lack of exposure to the real estate sector was also advantageous. These positive results were offset somewhat by a relative underweight to the energy sector and weak stock selection in communication services, which detracted. Regionally, stock selection was strong in continental Europe, while modest out-of-benchmark exposure to North America—specifically, Canada—added further to relative performance. Conversely, stock selection in the emerging markets—namely, modest out-of-benchmark exposure to China and Taiwan—partially detracted from returns. Underlying Manager Causeway outperformed the MSCI EAFE Index, its benchmark index, due primarily to strong stock selection within the consumer discretionary and financials sectors. These gains were slightly offset by weak stock selection in the materials and industrials sectors, which detracted from relative performance. |
| | In EAFE small cap, Underlying Manager Principal underperformed its benchmark index, the MSCI World ex USA Small Cap Index, largely because of weak stock selection in the consumer staples, consumer discretionary and financials sectors. On a regional basis, stock selection in the U.K. and Japan also detracted from its relative returns. |
| | In emerging markets, which we measure relative to the MSCI Emerging Markets Index, Underlying Manager Axiom underperformed the benchmark index due primarily to underweight positions and weak stock selection in the financials and materials sectors. These negative results were partially offset by a relative overweight position and solid stock selection in the information technology sector, as well as effective stock selection in the consumer discretionary sector, all of which added to performance. From a regional perspective, stock selection within Latin America detracted most from relative returns, while effective stock selection within emerging Asia added most. Underlying Manager Wellington also underperformed the benchmark index, largely because of stock-specific effects (i.e., stock returns that are not explainable by Wellington’s models and their factors). Although Wellington’s quantitative equity model’s factors and region-based factors added to performance during the Reporting Period, these positive results were partly offset by weakness in country-based and style-based factors. Within Wellington’s quantitative equity model, the |
4
FUND RESULTS
| | momentum factor, driven by the strong results of its long-term signals, bolstered relative returns. The value factor, including both the pure value and fair value signals, also added to performance. In addition, the quality factor contributed positively, mainly because of earnings quality signals. |
| | Diversified beta manager DIMA underperformed its benchmark index, the MSCI World Index, between the beginning of the Reporting Period and February 8, 2022, when its assets were redeemed. This performance was largely the result of exposure to the value and low volatility factors, offset by exposure to the momentum and quality factors, as value-oriented equities broadly outpaced growth-oriented equities during this time period. |
| Q | How did the Fund use derivatives and similar instruments during the Reporting Period? |
| A | During the Reporting Period, the MAS Group managed a passive currency overlay that sought to minimize unintended currency exposures for the Fund. As part of this currency overlay, the MAS Group used forward foreign currency exchange contracts, which had a positive impact on performance. The MAS Group also used equity futures within the Fund’s U.S. large-cap equity allocation in an effort to maintain target exposure relative to the Index and to facilitate the capital required for the currency overlay. This had a negative impact on the Fund’s performance. In addition, during the Reporting Period, the Fund employed equity futures to equitize its cash holdings and manage investment inflows, which had a negative impact on the Fund’s performance. The Fund’s Underlying Managers employed rights and warrants to implement their strategies. The use of rights and warrants did not have a material impact on the Fund’s performance during the Reporting Period overall. |
| Q | Were there any notable changes in the Fund’s allocations during the Reporting Period? |
| A | We made a number of changes in the Fund’s allocations during the Reporting Period. In the second quarter of 2022, we eliminated the Fund’s diversified beta allocation and reallocated the assets to U.S. large-cap equities. In the third calendar quarter, we reduced the Fund’s allocations to international small-cap and large-cap equities and increased its allocations to U.S. and Canadian large-cap equities. |
| | During November 2021, Diamond Hill and T. Rowe Price were added as Underlying Managers for the Fund and both were allocated capital in December. Diamond Hill manages a large-cap value strategy that seeks to invest in companies selling at a discount to its team’s estimation of intrinsic value, with sustainable competitive advantages, conservative balance sheets and a management team with an ownership mentality. T. Rowe Price manages a large-cap growth strategy that invests in emerging and leading growth companies with high-quality earnings, strong free cash flow growth and shareholder-oriented management teams. The |
| | AIMS Group believes the addition of these Underlying Managers should provide greater flexibility in managing the Fund’s factor exposures through market cycles. |
| | On March 21, 2022, related to the elimination of the Fund’s diversified beta allocation, DIMA was removed as an Underlying Manager of the Fund. For the same reason, we removed the Fund’s positions in the iShares® Edge MSCI Multifactor USA ETF and the iShares® Edge MSCI Multifactor International ETF during March. |
| | In April 2022, we sold the Fund’s position in the Vanguard S&P 500 ETF, which seeks to track the investment results of the S&P 500® Index, a measure of the performance of U.S. large-cap stocks. We reallocated the assets to Diamond Hill and T. Rowe Price. |
| | In June 2022, Vulcan was redeemed and the proceeds were reallocated to T. Rowe Price. At the end of the Reporting Period, Vulcan remained an Underlying Manager of the Fund but did not have allocated capital. |
| | Regarding the Fund’s strategic asset allocation, the Fund’s assets were allocated at the beginning of the Reporting Period 50.7% to U.S. large cap, 28.1% to non-U.S. developed large cap, 7.5% to U.S. small cap, 5.1% to non-U.S. developed small cap, 11.9% to emerging markets and 0.4% to cash and cash equivalents. At the end of the Reporting Period, the Fund’s assets were allocated 53.2% to U.S. large cap, 26.3% to non-U.S. developed large cap, 6.5% to U.S. small cap, 4.1% to non-U.S. developed small cap, 11.1% to emerging markets and 0.4% to cash and cash equivalents. This sector breakout is inclusive of derivative exposure across all asset classes. |
| Q | What is the Fund’s tactical view and strategy for the months ahead? |
| A | Overall, we intend to continue to position the Fund in alignment with our longer-term strategic views within the equity complex as a complement to additional strategic market exposures. We further intend to continue to monitor allocations and Underlying Manager performance as we seek to generate long-term capital growth. |
5
Multi-Manager Global Equity Fund
as of October 31, 2022
| | | | | | | | | | |
| | |
| TOP TEN HOLDINGS AS OF 10/31/22 ‡ | | | | | | | |
| | |
| Holding | | % of Net Assets | | Line of Business |
| | |
Microsoft Corp. | | | | 2.9 | % | | Software | |
| | |
Alphabet, Inc. Class A | | | | 2.3 | | | Interactive Media & Services | |
| | |
Amazon.com, Inc. | | | | 1.8 | | | Internet & Direct Marketing Retail | |
| | |
Dollar General Corp. | | | | 1.3 | | | Multiline Retail | |
| | |
The Sherwin-Williams Co. | | | | 1.2 | | | Chemicals | |
| | |
Salesforce, Inc. | | | | 1.1 | | | Software | |
| | |
Union Pacific Corp. | | | | 1.1 | | | Road & Rail | |
| | |
NextEra Energy, Inc. | | | | 1.0 | | | Electric Utilities | |
| | |
Danaher Corp. | | | | 0.9 | | | Life Sciences Tools & Services | |
| | |
The Clorox Co. | | | | 0.9 | | | Household Products | |
| ‡ | The top 10 holdings may not be representative of the Fund’s future investments. The Fund’s overall top 10 holdings differ from the table above due to the exclusion of the Goldman Sachs Financial Square Government Fund, which represents approximately 7.6% of the Fund’s net assets as of 10/31/22. |
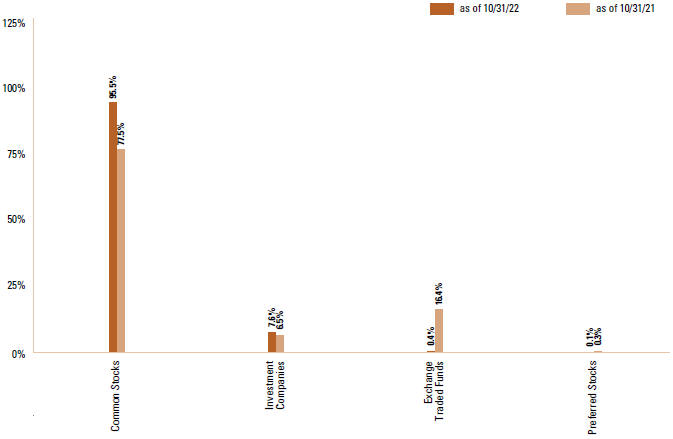
| * | The percentage shown for each investment category reflects the value of investments in that category as a percentage of net assets. Underlying compositions of exchange traded funds and investment companies held by the Fund are not reflected in the graph above. Figures in the graph may not sum to 100% due to the exclusion of other assets and liabilities. The graph depicts the Fund’s investments but may not represent the Fund’s market exposure due to the exclusion of certain derivatives, if any, as listed in the Additional Investment Information section of the Schedule of Investments. |
| | For more information about your Fund, please refer to www.GSAMFUNDS.com. There, you can learn more about your Fund’s investment strategies, holdings, and performance. |
6
GOLDMAN SACHS MULTI-MANAGER GLOBAL EQUITY FUND
Performance Summary
October 31, 2022
| | The following graph shows the value, as of October 31, 2022, of a $1,000,000 investment made on June 24, 2015 (commencement of operations) in Class R6 Shares at net asset value (“NAV”). For comparative purposes, the performance of the Fund’s benchmark, the MSCI ACWI IMI (Net, USD, 50% Non-U.S. Developed Hedged to USD) is shown. Performance reflects applicable fee waivers and/or expense limitations in effect during the periods shown and in their absence, performance would be reduced. Returns do not reflect the deduction of taxes that a shareholder would pay on Fund distributions or the redemption of Fund shares. The returns set forth below represent past performance. Past performance does not guarantee future results. The Fund’s investment return and principal value will fluctuate so that an investor’s shares, when redeemed, may be worth more or less than their original cost. Current performance may be lower or higher than the performance quoted below. Please visit our web site at www.GSAMFUNDS.com to obtain the most recent month-end returns. |
|
|
| Multi-Manager Global Equity Fund’s Lifetime Performance |
Performance of a $1,000,000 investment, with distributions reinvested, from June 24, 2015 through October 31, 2022.
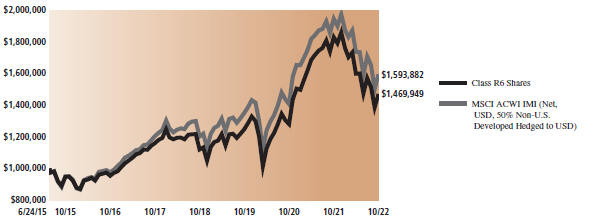
| | | | | | | | | | |
| | | | | |
| | | Average Annual Total Return through October 31, 2022* | | One Year | | Five Years | | Since Inception | | |
| | | | | |
| | Class R6 Shares (Commenced June 24, 2015) | | -19.61% | | 4.86% | | 5.37% | | |
| | * | Effective January 16, 2018, Institutional Shares were redesignated as Class R6 Shares. These returns assume reinvestment of all distributions at NAV. Because Class R6 Shares do not involve a sales charge, such a charge is not applied to their Average Annual Total Returns. |
7
Goldman Sachs Multi-Manager Non-Core Fixed Income Fund
|
Investment Objective The Fund seeks a total return consisting of income and capital appreciation. |
Portfolio Management Discussion and Analysis
Below, the Goldman Sachs Multi-Asset Solutions (“MAS”) Group and the Goldman Sachs Alternative Investments & Manager Selection (“AIMS”) Group discuss the Goldman Sachs Multi-Manager Non-Core Fixed Income Fund’s (the “Fund”) performance and positioning for 12-month period ended October 31, 2022 (the “Reporting Period”).
| Q | How did the Fund perform during the Reporting Period? |
| A | During the Reporting Period, the Fund’s Class R6 Shares generated an average annual total return of -15.42%. This return compares to the -15.19% average annual total return of the Fund’s benchmark, the Multi-Manager Non-Core Fixed Income Composite Dynamic Index (the “Index”), during the same time period. |
| | The Index is comprised of the Bloomberg Global High Yield Corporate Index (Gross, USD, Unhedged) (the “Bloomberg Index”), the Credit Suisse Leveraged Loan Index (Gross, USD, Unhedged) (the “Credit Suisse Index”), the J.P. Morgan Emerging Market Bond Index (“EMBISM”) Global Diversified Index (Gross, USD, Unhedged) (the “J.P. Morgan EMBISM Index”) and the J.P. Morgan Government Bond Index—Emerging Markets (“GBI-EMSM”) Global Diversified Index (Gross, USD, Unhedged) (the “J.P. Morgan GBI-EMSM Index”), which are weighted in accordance with the relative market capitalizations of each constituent index (as determined by the constituent index providers) as of the last business day of the previous calendar year. During the Reporting Period, the Bloomberg Index, the Credit Suisse Index, the J.P. Morgan EMBISM Index and the J.P. Morgan GBI-EMSM Index returned -16.31%, -2.03%, -24.19% and -20.27%, respectively. |
| Q | What key factors were responsible for the Fund’s performance during the Reporting Period? |
| A | The Fund uses a multi-manager approach and generally seeks to achieve its investment objective by dynamically allocating its assets among unaffiliated investment managers (“Underlying Managers”) that employ a non-core fixed income investment strategy. (Non-core fixed income includes non-investment grade securities, bank loans and emerging markets debt). The MAS Group is responsible for the Fund’s asset allocation, wherein it applies a risk-based approach that draws from both fundamental and quantitative disciplines with the intention of dynamically accessing a diversified set of risks and returns in a market cycle aware manner. The AIMS Group is responsible for making recommendations |
| | with respect to hiring, terminating or replacing the Fund’s Underlying Managers and applying a multifaceted process for manager due diligence, portfolio construction and risk management. |
| | During the Reporting Period, the Fund recorded a negative absolute return and modestly underperformed the Index. The Fund’s relative results can be attributed to the performance of the Underlying Managers overall. Strategic asset allocation underperformed the Index during the Reporting Period. |
| | At various points during the Reporting Period, the Fund had the following Underlying Managers, though not all were allocated capital—Ares Capital Management II LLC (“Ares”), BlueBay Asset Management LLP (“BlueBay”), Brigade Capital Management, LP (“Brigade”), Marathon Asset Management, L.P. (“Marathon”), Nuveen Asset Management, LLC (“Nuveen”), Pacific Asset Management LLC (“Pacific”), RBC Global Asset Management (U.S.) Inc. (“RBC GAM-US”) (formerly, Blue Bay Asset Management USA LLC), River Canyon Fund Management LLC (“River Canyon”), and TCW Investment Management Company LLC (“TCW”). As a reminder, in August 2021, RBC GAM-US had been added as an Underlying Manager for the Fund to allow us to enhance BlueBay’s ability to coordinate its management services to the Fund, and thus for these reporting purposes are being discussed as one Underlying Manager. |
| | These Underlying Managers represented five sectors across non-core fixed income as part of the Fund’s top-level strategy allocation—high yield (Ares, BlueBay/RBC GAM-US and Brigade), bank loans (Nuveen and Pacific), external emerging markets debt (Marathon), local emerging markets debt (TCW) and structured credit (River Canyon). |
| | Of the Underlying Managers with allocated capital for the entire Reporting Period, all generated negative absolute returns. River Canyon generated negative absolute returns from the beginning of the Reporting Period through March 31, 2022, when its assets were redeemed. Ares produced negative absolute returns between December 16, 2021, when it was allocated capital, and the end of the |
8
FUND RESULTS
| | Reporting Period. Pacific generated negative absolute returns between January 18, 2022, when it was allocated capital, and the end of the Reporting Period. |
| | On a relative basis, three Underlying Managers underperformed their respective benchmark indices and two outperformed their respective benchmark indices during the Reporting Period. Ares outperformed its benchmark index between December 16, 2021, when it was allocated capital, and the end of the Reporting Period. Pacific underperformed its benchmark index between January 18, 2022, when it was allocated capital, and the end of the Reporting Period. We do not measure River Canyon against a benchmark index. |
| | Strategic asset allocation, which reflects a longer-term perspective to diversify and invest in non-core fixed income sectors, underperformed the Index during the Reporting Period. The underperformance was due in part to an overweight versus the Index to high yield corporate bonds versus bank loans broadly. During the Reporting Period, high yield corporate bonds underperformed bank loans. In addition, the Fund was hurt by its overweight positions in external emerging markets debt and local emerging markets debt, which were adversely affected during the Reporting Period by the rising interest rate environment. |
| Q | Which non-core fixed income Underlying Managers most significantly affected Fund performance? |
| A | BlueBay/RBC GAM-US, a high yield Underlying Manager, outperformed the ICE BofA Global High Yield Investment Grade Country Constrained Index during the Reporting Period. The outperformance was driven primarily by security selection. Overall, the strategy benefited from its underweight positions versus the benchmark index in cyclical market segments, such as real estate, leisure, automotive and transportation, which were hurt more than most other market segments during the Reporting Period by supply-chain issues and rising inflation. In addition, underweight positions within defensive market segments, including telecommunications, health care and consumer goods, bolstered relative performance. An underweight to emerging markets corporate bonds was also positive for performance. Conversely, overweight positions in banking and financial services detracted from returns, driven primarily by positioning in European banks. From a ratings perspective, a preference for lower-rated credits and selection amongst credits rated B and rated CCC and below added to results, as rising government bond yields led to the underperformance of higher-rated credits. The strategy was further aided by term structure effects, wherein it benefited from its short duration position relative to its benchmark index. (Term structure, most often depicted as a yield curve, refers to the term structure of interest rates, which is the relationship between the yield to maturity and the time to maturity for pure discount bonds. Duration is a measure of sensitivity to changes in interest rates.) |
| | Brigade, another high yield Underlying Manager, outperformed the ICE BofA Global High Yield Investment Grade Country Constrained Index during the Reporting Period. Security selection was the primary driver of outperformance. Credit selection within the energy and basic industry market segments added most to relative performance, as commodity prices rose. An out-of-benchmark allocation to bank loans added further to relative returns. From a ratings perspective, credit selection across rating tiers was advantageous, driven by selection among BB-rated and B-rated credits. Conversely, an overweight versus the benchmark index in CCC-rated credits weighed on performance during the Reporting Period. Regarding sector allocations, an underweight position in real estate, most notably the strategy’s avoidance of Chinese real estate debt, contributed positively. |
| | Ares, another high yield Underlying Manager, outperformed the ICE BofA Global High Yield Investment Grade Country Constrained Index from December 16, 2021 through the end of the Reporting Period. Much of its outperformance was driven by credit selection within the energy market segment, as commodity prices increased significantly. Strong credit selection in the real estate market segment also added to relative returns. Specifically, the strategy avoided Chinese real estate debt, which faced significant pressure during the Reporting Period. Conversely, credit selection within the basic industry, financial services, and services market segments weighed on relative performance. From a ratings perspective, selection among BB-rated and B-rated credits added to returns, while selection of CCC-rated credits detracted from returns. An out-of-benchmark allocation to bank loans further bolstered relative performance. |
| | Nuveen, a bank loans Underlying Manager, underperformed the Credit Suisse Leveraged Loan Index during the Reporting Period. Credit selection in consumer staples, technology and communication services detracted most from relative performance. These negative results were offset somewhat by credit selection in health care and real estate, which contributed positively. Regarding allocations, the strategy’s overweight positions relative to the benchmark index in the communication services and technology market segments weighed on returns. However, an underweight in consumer staples was beneficial. From a credit ratings perspective, selection of CCC-rated credits was a drag on relative performance, though this was partially offset by an underweight allocation to these credits. Additionally, overweight positions in defaulted issuers hurt results, as did credit selection among non-rated issuers. |
| | Pacific, the other bank loans Underlying Manager, underperformed the Credit Suisse Leveraged Loan Index between January 18, 2022, when it was allocated capital, and the end of the Reporting Period. From an asset allocation perspective, the strategy’s focus on larger and liquid issuers weighed on its relative performance, as smaller issuers outperformed. Exposure to high yield corporate bonds also hurt results, as high yield corporate bonds underperformed |
9
| | bank loans. However, limited exposure to distressed issuers contributed positively. Additionally, the strategy’s lack of exposure to the metals/minerals and consumer durables market segments added to relative performance. Conversely, an underweight compared to the benchmark index in utilities, as well as an overweight in health care, detracted from results. From a credit ratings perspective, an overweight to B-rated loans and an underweight to BB-rated loans hurt performance. On the other hand, despite an overweight to CCC-rated loans, which lagged BB-rated and B-rated loans, the strategy was concentrated in positively performing second-lien loans, which added to returns overall. |
| | Marathon, the external emerging markets debt Underlying Manager, slightly underperformed the J.P. Morgan EMBISM Global Diversified Index during the Reporting Period. Overweight positions versus the benchmark index in Ukraine and Israel detracted from returns. Selection in Egypt, Hungary and Colombia also weighed on relative performance. On the positive side, the strategy benefited from its legacy holdings in Russia, as J.P. Morgan excluded Russian securities from its indices in response to Russia’s invasion of Ukraine and these issues rose in value amidst opportunistic buying. In addition, selection in China, the United Arab Emirates and Chile contributed positively to relative returns. |
| | TCW, the local emerging markets debt Underlying Manager, underperformed the J.P. Morgan GBI-EMSM Global Diversified Index during the Reporting Period. An underweight versus the benchmark index in Turkey, where local bonds rallied due largely to supply and demand factors, detracted from relative returns. The strategy remains underweight Turkey’s local bonds in light of the country’s unorthodox monetary policy, high inflation and significantly negative real rates. In addition, the timing of certain trades in South Africa and out-of-index exposure to Ukraine in early 2022 hurt relative performance. The Ukraine position was sold in early February as the potential for a Russia/Ukraine conflict grew. Conversely, the strategy benefited from its underweight positioning in Egypt, which reflected TCW’s expectations of weaker fundamentals on the back of food and energy shocks and a potential currency devaluation. A position in Russia’s local bonds added further to returns. Additionally, after J.P. Morgan excluded Russian securities from its indices in response to Russia’s invasion of Ukraine, TCW was able to exit this position in an illiquid market at attractive valuations. Finally, overweight positions in Brazil and Mexico, which were based on positive views about the attractive risk-adjusted carry and supportive commodity environment, were also beneficial to relative performance. |
| | River Canyon, the structured credit Underlying Manager, which we do not measure against a benchmark index, produced negative absolute returns from the beginning of the Reporting Period through March 31, 2022, when its assets were redeemed. (Structured credit refers to instruments that pool debt obligations and sell the resulting cash flows, such as collateralized mortgage obligations or collateralized loan |
| | obligations (“CLOs”).) The negative performance was driven by allocations to CLOs, non-agency residential mortgage-backed securities and agency inverse interest only securities. Overall, the strategy was negatively impacted by the rise in interest rates. |
| Q | How did the Fund use derivatives and similar instruments during the Reporting Period? |
| A | During the Reporting Period, a specialized index of credit default swaps (“CDX”) was used as a cost-efficient instrument to help manage the Fund’s cash position. The use of CDX had a negative impact on the Fund’s performance. The Fund’s Underlying Managers employed credit default swaps, warrants, U.S. Treasury futures, interest-only securities, forward foreign currency exchange contracts and structured securities to implement their strategies. The use of credit default swaps and U.S. Treasury futures by Underlying Managers each had a negative impact on the Fund’s performance. The use of forward foreign currency exchange contracts, warrants, interest-only securities and structured securities by Underlying Managers each had a neutral impact on the Fund’s results during the Reporting Period. |
| Q | Were there any notable changes in the Fund’s allocations during the Reporting Period? |
| A | We made a number of changes in the Fund’s allocations during the Reporting Period. In the first quarter of 2022, we eliminated the Fund’s allocation to structured credit and reallocated the assets to high yield corporate bonds and bank loans. During the third calendar quarter, we decreased the Fund’s allocations to external and local emerging markets debt in favor of greater allocations to high yield corporate bonds and bank loans. |
| | Pacific was added as an Underlying Manager of the Fund in November 2021 and allocated capital in January 2022. Pacific manages a bank loan strategy, with a focus on larger issue size loans, which seeks to avoid losses and aims to generate excess returns via relative value trading. The AIMS Group believed it was prudent to diversify the Fund’s bank loan manager exposure beyond existing Underlying Manager Nuveen, which employs an opportunistic approach that may at times invest in lower dollar-priced loans with an expected catalyst. |
| | In December 2021, Ares was allocated capital in an effort to further diversify the Fund’s exposure to high yield corporate bonds and bank loans. |
| | In March 2022, we redeemed River Canyon’s allocated capital due to the elimination of the Fund’s strategic allocation to structured credit. We reallocated the proceeds to the Fund’s high yield and bank loan Underlying Managers. At the end of the Reporting Period, River Canyon remained an Underlying Manager of the Fund but did not have allocated capital. |
10
FUND RESULTS
| | In terms of the Fund’s strategic allocation, at the start of the Reporting Period, the Fund’s assets were allocated 40.8% to high yield corporate bonds, 22.0% to local emerging markets debt, 18.2% to external emerging markets debt, 16.1% to bank loans, 5.0% to structured credit and 0.7% to cash and cash equivalents. At the end of the Reporting Period, the Fund’s assets were allocated 39.8% to high yield corporate bonds, 23.6% to bank loans, 22.5% to local emerging markets debt, 14.7% to external emerging markets debt and 2.2% to cash and cash equivalents. This sector breakout is inclusive of derivative exposure across all asset classes. |
| Q | What is the Fund’s tactical view and strategy for the months ahead? |
| A | Overall, we intend to continue to position the Fund in alignment with our longer-term strategic views on the non-core fixed income market as a complement to additional strategic market exposures. We further intend to continue to monitor allocations and Underlying Manager performance as we seek to generate total return consisting of income and capital appreciation. |
11
Multi-Manager Non-Core Fixed Income Fund
as of October 31, 2022
| | | | | | | | | | |
| | |
| TOP TEN HOLDINGS AS OF 10/31/22 ‡ | | | | | | | |
| | |
| Holding | | % of Net Assets | | Line of Business |
| | |
Brazil Notas do Tesouro Nacional | | | | 1.3 | % | | Sovereign Debt Obligations | |
| | |
China Government Bond | | | | 0.8 | | | Sovereign Debt Obligations | |
| | |
Brazil Notas do Tesouro Nacional | | | | 0.7 | | | Sovereign Debt Obligations | |
| | |
United Mexican States | | | | 0.5 | | | Sovereign Debt Obligations | |
| | |
United Mexican States | | | | 0.5 | | | Sovereign Debt Obligations | |
| | |
Thailand Government Bond | | | | 0.5 | | | Sovereign Debt Obligations | |
| | |
China Government Bond | | | | 0.5 | | | Sovereign Debt Obligations | |
| | |
Thailand Government Bond | | | | 0.5 | | | Sovereign Debt Obligations | |
| | |
Brazil Notas do Tesouro Nacional | | | | 0.4 | | | Sovereign Debt Obligations | |
| | |
Republic of South Africa | | | | 0.4 | | | Sovereign Debt Obligations | |
| ‡ | The top 10 holdings may not be representative of the Fund’s future investments. The Fund’s overall top 10 holdings differ from the table above due to the exclusion of the Goldman Sachs Financial Square Government Fund, which represents approximately 4.2% of the Fund’s net assets as of 10/31/22. |
12
FUND BASICS
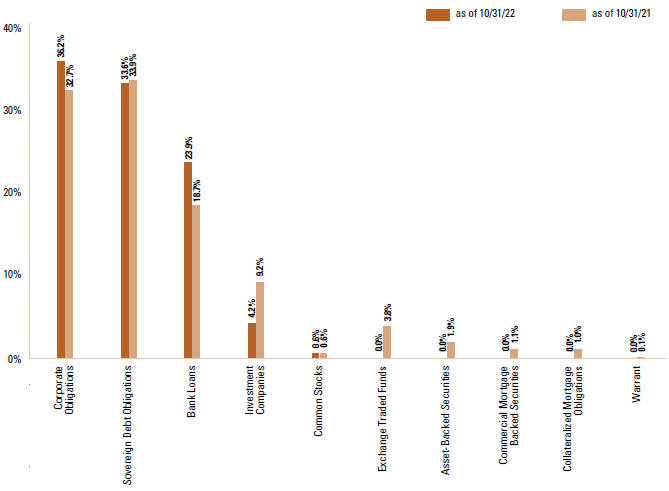
| * | The percentage shown for each investment category reflects the value of investments in that category as a percentage of net assets. Underlying compositions of exchange traded funds and investment companies held by the Fund are not reflected in the graph above. Figures in the graph may not sum to 100% due to the exclusion of other assets and liabilities. The graph depicts the Fund’s investments but may not represent the Fund’s market exposure due to the exclusion of certain derivatives, if any, as listed in the Additional Investment Information section of the Schedule of Investments. |
| | For more information about your Fund, please refer to www.GSAMFUNDS.com. There, you can learn more about your Fund’s investment strategies, holdings, and performance. |
13
|
| GOLDMAN SACHS MULTI-MANAGER NON-CORE FIXED INCOME FUND |
Performance Summary
October 31, 2022
| | The following graph shows the value, as of October 31, 2022, of a $1,000,000 investment made on March 31, 2015 (commencement of operations) in Class R6 Shares at NAV. For comparative purposes, the performance of the Fund’s current benchmark, the Multi-Manager Non-Core Fixed Income Composite Dynamic Index, which is comprised of the Bloomberg Global High Yield Corporate Index (Gross, USD, Unhedged), the Credit Suisse Leveraged Loan Index (Gross, USD, Unhedged), the J.P. Morgan EMBISM Global Diversified Index (Gross, USD, Unhedged) and the J.P. Morgan GBI-EMSM Global Diversified Index (Gross, USD, Unhedged), is shown. Performance reflects applicable fee waivers and/or expense limitations in effect during the periods shown and in their absence, performance would be reduced. Returns do not reflect the deduction of taxes that a shareholder would pay on Fund distributions or the redemption of Fund shares. The returns set forth below represent past performance. Past performance does not guarantee future results. The Fund’s investment return and principal value will fluctuate so that an investor’s shares, when redeemed, may be worth more or less than their original cost. Current performance may be lower or higher than the performance quoted below. Please visit our website at www.GSAMFUNDS.com to obtain the most recent month-end returns. |
|
|
| Goldman Sachs Multi-Manager Non-Core Fixed Income Fund’s Lifetime Performance |
Performance of a $1,000,000 investment, with distributions reinvested, from March 31, 2015 through October 31, 2022.
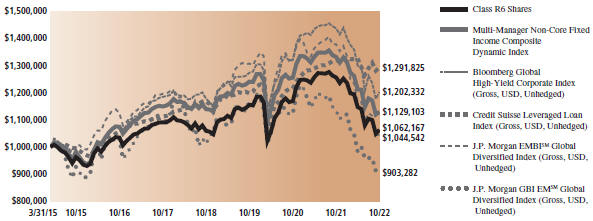
| | | | | | | | |
| | | | |
| Average Annual Total Return through October 31, 2022* | | One Year | | Five Years | | Since Inception | | |
| | | | |
Class R6 Shares (Commenced March 31, 2015) | | -15.42% | | -0.51% | | 0.80% | | |
| | * | Effective January 16, 2018, Institutional Shares were redesignated as Class R6 Shares. These returns assume reinvestment of all distributions at NAV. Because Class R6 Shares do not involve a sales charge, such a charge is not applied to their Average Annual Total Returns. |
14
FUND RESULTS
Goldman Sachs Multi-Manager Real Assets
Strategy Fund
|
Investment Objective The Fund seeks to provide long-term capital growth through investments related to real assets. |
Portfolio Management Discussion and Analysis
Below, the Goldman Sachs Multi-Asset Solutions (“MAS”) Group and the Goldman Sachs Alternative Investments & Manager Selection (“AIMS”) Group discuss the Goldman Sachs Multi-Manager Real Assets Strategy Fund’s (the “Fund”) performance and positioning for 12-month period ended October 31, 2022 (the “Reporting Period”).
| Q | How did the Fund perform during the Reporting Period? |
| A | During the Reporting Period, the Fund’s Class R6 Shares generated an average annual total return of -19.78%. This return compares to the -18.66% average annual total return of the Fund’s benchmark, the Multi-Manager Real Assets Strategy Composite Dynamic Index (the “Index”), during the same time period. |
| | The Index is comprised of the FTSE EPRA/NAREIT Developed Index (Net, USD, Unhedged) (the “FTSE Index”) and the Dow Jones Brookfield Global Infrastructure Index (Net, USD, Unhedged) (the “Dow Jones Brookfield Index”), which are weighted in accordance with the relative market capitalizations of each constituent index (as determined by the constituent index providers) as of the last business day of the previous calendar year. During the Reporting Period, the FTSE Index and the Dow Jones Brookfield Index returned -24.82% and -8.10%, respectively. |
| Q | What key factors were responsible for the Fund’s performance during the Reporting Period? |
| A | The Fund uses a multi-manager approach and generally seeks to achieve its investment objective by dynamically allocating its assets among unaffiliated investment managers (“Underlying Managers”) that invest primarily in real assets. (Real assets are defined broadly by the Fund and include any assets that have physical properties or inflation sensitive characteristics, such as energy, real estate, infrastructure, commodities and inflation linked or floating rate fixed income securities. Inflation is a sustained increase in prices that erodes the purchasing power of money. Assets with inflation sensitive characteristics are assets that benefit from rising real cash flows in times of rising inflation.) The MAS Group is responsible for the Fund’s asset allocation, wherein it applies a risk-based approach that draws from both fundamental and quantitative disciplines with the intention of dynamically accessing a diversified set of risks and returns in a market cycle aware manner. The AIMS Group is responsible for making recommendations with respect to hiring, terminating or replacing the Fund’s Underlying Managers and applying a multifaceted process for manager due diligence, portfolio construction and risk management. |
| | The Fund posted a negative absolute return during the Reporting Period and underperformed the Index. The Fund’s relative results can be attributed to the performance of the Underlying Managers overall. Strategic asset allocation outperformed the Index during the Reporting Period. |
| | At various points during the Reporting Period, the Fund allocated capital to the following Underlying Managers—Cohen & Steers Capital Management, Inc. (“Cohen & Steers”), PGIM Real Estate, a business unit of PGIM, Inc. (“PRE”), Presima Inc. (“Presima”), Principal Real Estate Investors, LLC (“PrinREI”) and RREEF America L.L.C. (“RREEF”), a wholly-owned subsidiary of DWS Group GmbH & COVID-19. KgaA, an affiliate of Deutsche Bank AG. |
| | These Underlying Managers represented two sectors of real assets as part of the Fund’s top-level strategy allocation—global real estate (PRE, Presima and PrinREI) and global infrastructure (Cohen & Steers and RREEF). |
| | All three of the Underlying Managers with allocated capital for the entire Reporting Period generated negative absolute returns. Presima produced a negative absolute return from the beginning of the Reporting Period until February 24, 2022, when its assets were redeemed. PrinREI produced a negative absolute return from February 24, 2022, when it was allocated capital, and the end of the Reporting Period. |
| | On a relative basis, three of the Underlying Managers underperformed their respective benchmark indices during the Reporting Period overall. Presima outperformed its benchmark index between the start of the Reporting Period and February 24, 2022, when its assets were redeemed. PrinREI underperformed its benchmark index between February 24, 2022, when it was allocated capital, and the end of the Reporting Period. |
| | Strategic asset allocation, which reflects a longer-term perspective to diversify and invest across real assets, outperformed the Index. During the Reporting Period, the Fund’s strategic allocation to global infrastructure securities was larger than that of the Index, while its strategic allocation to global real estate securities was smaller. As a reminder, the Index has a comparatively larger weighting in global real estate securities than in global infrastructure securities. |
15
| | During the Reporting Period, global infrastructure securities performed better than global real estate securities, as energy prices remained elevated and rising long-term interest rates hurt the valuations of global real estate securities. |
| Q | Which real assets asset classes most significantly affected Fund performance? |
| A | In global infrastructure, which we measure against the Dow Jones Brookfield Index, Underlying Manager RREEF modestly underperformed the benchmark index during the Reporting Period. A relative overweight to and challenged stock selection within the transportation infrastructure sector detracted from relative returns. In addition, an underweight to North American midstream1 energy companies hurt performance. Conversely, an underweight position and strong stock selection within North American digital communications infrastructure added to relative returns. |
| | Underlying Manager Cohen & Steers also modestly underperformed its benchmark index during the Reporting Period. The strategy was hampered by ineffective stock selection within utilities as well as by overall positioning within European transportation infrastructure. On the other hand, stock selection within midstream energy and an underweight to non-U.S. cell towers added to relative returns. |
| | In global real estate, which we measure against the FTSE Index, Underlying Manager PRE underperformed the benchmark index during the Reporting Period. The negative results were driven by weak stock selection within specialized real estate investment trusts (“REITs”), especially relative underweight positions in gaming and casino REITs. In addition, challenged stock selection among retail REITs detracted from relative performance. On the positive side, the strategy benefited from an underweight to office REITs. |
| | Also in global real estate, PrinREI moderately underperformed its benchmark index between February 24, 2022, when it was allocated capital as an Underlying Manager for the Fund, and the end of the Reporting Period. Its underperformance was due both to a relative underweight to retail REITs, notably in triple net lease REITs, as well as to an underweight to hotels. Selection within specialized REITs added to returns. Selection among industrial REITs and residential REITs further bolstered performance. |
| | Presima, another global real estate Underlying Manager, outperformed its benchmark index between the beginning of the Reporting Period and February 24, 2022, when it was fully redeemed. Stock selection among real estate operating companies and retail REITs contributed positively to relative returns. |
| Q | How did the Fund use derivatives and similar instruments during the Reporting Period? |
| A | Forward foreign currency exchange contracts were used by Underlying Managers to facilitate equity transactions settling in foreign currencies. The use of forward foreign currency |
| | exchange contracts had a negative impact on the Fund’s performance during the Reporting Period. Real estate index futures were used to equitize the Fund’s cash holdings. In other words, we put the Fund’s cash holdings to work by using them as collateral for the purchase of real estate index futures, which helped us increase the Fund’s exposure to U.S. real estate securities. During the Reporting Period, the use of real estate index futures had a negative impact on the Fund’s performance. |
| Q | Were there any notable changes in the Fund’s allocations during the Reporting Period? |
| A | We made some changes to the Fund’s allocations during the Reporting Period. In the first quarter of 2022, we reduced the Fund’s overweight allocation relative to the Index in global infrastructure securities. During the third quarter of 2022, we decreased the Fund’s overall allocation to global real estate securities in favor of an increased overall allocation to global infrastructure securities. |
| | In February 2022, Presima was fully redeemed. Presima was removed as an Underlying Manager of the Fund on March 7, 2022. |
| | PrinREI was added as an Underlying Manager in February 2022 and was immediately allocated capital. The AIMS Group selected PrinREI as a replacement for Presima based on its core strategy, which was diversified and which, in the AIMS Group’s view, could be appropriate even on a standalone basis compared to Presima’s more concentrated, satellite approach. |
| | In terms of the Fund’s strategic asset allocation at the start of the Reporting Period, the Fund’s assets were allocated 54.2% to global real estate and 45.8% to global infrastructure, with the remainder in cash and cash equivalents. At the end of the Reporting Period, the Fund’s assets were allocated 59.8% to global real estate and 40.2% to global infrastructure, with the remainder in cash and cash equivalents. |
| Q | What is the Fund’s tactical view and strategy for the months ahead? |
| A | Overall, we intend to continue to position the Fund in alignment with our longer-term strategic views on the real assets complex as a complement to additional strategic market exposures. We further intend to continue to monitor allocations and Underlying Manager performance as we seek to generate long-term capital growth through investments related to real assets. |
| 1 | The midstream component of the energy industry is usually defined as those companies providing products or services that help link the supply side, i.e., energy producers, and the demand side, i.e., energy end-users, for any type of energy commodity. Such midstream businesses can include, but are not limited to, those that process, store, market and transport various energy commodities. |
16
FUND BASICS
Multi-Manager Real Assets Strategy Fund
as of October 31, 2022
| | | | | | | |
| | |
| TOP TEN HOLDINGS AS OF 10/31/22 ‡ | | | | | | | |
| | |
| Holding | | % of Net Assets | | Line of Business |
| | |
Prologis, Inc. | | | | 4.3 | % | | Equity Real Estate Investment Trusts (REITs) |
| | |
American Tower Corp. | | | | 3.4 | | | Equity Real Estate Investment Trusts (REITs) |
| | |
Enbridge, Inc. | | | | 2.5 | | | Oil, Gas & Consumable Fuels |
| | |
Welltower, Inc. | | | | 2.0 | | | Equity Real Estate Investment Trusts (REITs) |
| | |
Sempra Energy | | | | 1.9 | | | Multi-Utilities |
| | |
Crown Castle, Inc. | | | | 1.8 | | | Equity Real Estate Investment Trusts (REITs) |
| | |
TC Energy Corp. | | | | 1.7 | | | Oil, Gas & Consumable Fuels |
| | |
Digital Realty Trust, Inc. | | | | 1.7 | | | Equity Real Estate Investment Trusts (REITs) |
| | |
National Grid PLC | | | | 1.6 | | | Multi-Utilities |
| | |
SBA Communications Corp. | | | | 1.6 | | | Equity Real Estate Investment Trusts (REITs) |
| ‡ | The top 10 holdings may not be representative of the Fund’s future investments. The Fund’s overall top 10 holdings differ from the table above due to the exclusion of the Goldman Sachs Financial Square Government Fund, which represents approximately 1.9% of the Fund’s net assets as of 10/31/22. |
|
|
| FUND SECTOR ALLOCATIONS * |
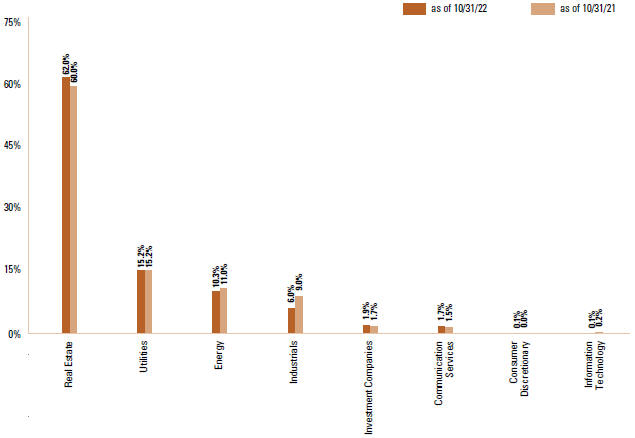
| * | The Fund is actively managed and, as such, its composition may differ over time. Consequently, the Fund’s overall sector allocations may differ from the percentages contained in the graph above. The graph categorizes investments using the Global Industry Classification Standard (“GICS”), however, the sector classifications used by the portfolio management team may differ from GICS. The percentage shown for each investment category reflects the value of investments in that category as a percentage of market value. Figures in the graph may not sum to 100% due to the exclusion of other assets and liabilities. The graph depicts the Fund’s investments but may not represent the Fund’s market exposure due to the exclusion of certain derivatives, if any, as listed in the Additional Investment Information section of the Schedule of Investments. |
| | For more information about your Fund, please refer to www.GSAMFUNDS.com. There, you can learn more about your Fund’s investment strategies, holdings, and performance. |
17
|
| GOLDMAN SACHS MULTI-MANAGER REAL ASSETS STRATEGY FUND |
Performance Summary
October 31, 2022
| | The following graph shows the value, as of October 31, 2022, of a $1,000,000 investment made on June 30, 2015 (commencement of operations) in Class R6 Shares at NAV. For comparative purposes, the performance of the Fund’s current benchmark, the Multi-Manager Real Assets Strategy Composite Dynamic Index, which is comprised of the FTSE EPRA/NAREIT Developed Index (Net, USD, Unhedged) and the Dow Jones Brookfield Global Infrastructure Index (Net, USD, Unhedged), is shown. Performance reflects applicable fee waivers and/or expense limitations in effect during the periods shown and in their absence, performance would be reduced. Returns do not reflect the deduction of taxes that a shareholder would pay on Fund distributions or the redemption of Fund shares. The returns set forth below represent past performance. Past performance does not guarantee future results. The Fund’s investment return and principal value will fluctuate so that an investor’s shares, when redeemed, may be worth more or less than their original cost. Current performance may be lower or higher than the performance quoted below. Please visit our website at www.GSAMFUNDS.com to obtain the most recent month-end returns. |
|
|
| Goldman Sachs Multi-Manager Real Assets Strategy Fund’s Lifetime Performance |
Performance of a $1,000,000 investment, with distributions reinvested, from June 30, 2015 through October 31, 2022.
| | | | | | | | |
| | | | |
| Average Annual Total Return through October 31, 2022* | | One Year | | Five Years | | Since Inception | | |
| | | | |
Class R6 Shares (Commenced June 30, 2015) | | -19.78% | | 1.93% | | 1.55% | | |
| | * | Effective January 16, 2018, Institutional Shares were redesignated as Class R6 Shares. These returns assume reinvestment of all distributions at NAV. Because Class R6 Shares do not involve a sales charge, such a charge is not applied to their Average Annual Total Returns. |
18
FUND BASICS
Index Definitions
Market Review
MSCI All Country World Index Investable Market Index is designed to represent performance of the full opportunity set of large- and mid-cap stocks across 23 developed and 24 emerging markets.
MSCI China All Shares Index captures large and mid-cap representation across China A shares, B shares, H shares, Red chips, P chips and foreign listings (e.g., American Depositary Receipts). The index aims to reflect the opportunity set of China share classes listed in Hong Kong, Shanghai, Shenzhen and outside of China.
Multi-Manager Global Equity
MSCI All Country World Index Investable Market Index is designed to represent performance of the full opportunity set of large- and mid-cap stocks across 23 developed and 24 emerging markets.
MSCI Emerging Markets Index captures large-cap and mid-cap representation across 27 emerging markets countries. The index covers approximately 85% of the free float-adjusted market capitalization in each country.
S&P 500® Index is the Standard & Poor’s 500 composite index of 500 stocks, an unmanaged index of common stock prices.
Russell 1000®Growth Index is an unmanaged index of common stock prices that measures the performance of those Russell 1000® Index companies with higher price-to-book ratios and higher forecasted growth values.
Russell 1000®Value Index is an unmanaged index of common stock prices that measures the performance those Russell 1000® Index companies with lower price-to-book ratios and lower expected growth values.
Russell 2000®Value Index measures the performance of small-cap value segment of the U.S. equity universe. It includes those Russell 2000 companies with lower price-to-book ratios and lower forecasted growth values. The Index is completely reconstituted annually to ensure larger stocks do not distort the performance and characteristics of the true small-cap opportunity set and that the represented companies continue to reflect value characteristics.
MSCI ACWI ex USA Index captures large and mid cap representation across 22 of 23 developed markets countries (excluding the U.S.) and 27 emerging markets countries.
MSCI EAFE Index is a stock market index that is designed to measure the equity market performance of developed markets in Europe, Australasia and the Far East, excluding the U.S. and Canada.
MSCI World Index is a broad global equity index that represents large and mid-cap equity performance across 23 developed markets countries.
Multi-Manager Non-Core Fixed Income
Bloomberg Global High Yield Corporate Index is a multi-currency measure of the global high yield debt market.
ICE BofA Global High Yield Investment Grade Country Constrained Index contains all securities in the ICE BofA Global High Yield Index but caps issuer exposure at 2%. Index constituents are capitalization-weighted, based on their current amount outstanding, provided the total allocation to an individual issuer does not exceed 2%. Issuers that exceed the limit are reduced to 2% and the face value of each of their bonds is adjusted on a pro-rata basis. Similarly, the face values of bonds of all other issuers that fall below the 2% cap are increased on a pro-rata basis. In the event there are fewer than 50 issuers in the Index, each is equally weighted and the face values of their respective bonds are increased or decreased on a pro-rata basis.
Credit Suisse Leveraged Loan Index is designed to mirror the investable universe of the U.S. dollar-denominated leveraged loan market.
J.P. Morgan Emerging Market Bond Index (“EMBISM”) Global Diversified Index tracks total returns for U.S. dollar-denominated debt instruments issued by emerging market sovereign and quasi-sovereign entities.
J.P. Morgan Government Bond Index – Emerging Markets (“GBI-EMSM”) Global Diversified Index is a comprehensive local emerging markets index, consisting of regularly traded, fixed-rate, local currency government bonds.
19
Multi-Manager Real Assets Strategy
FTSE EPRA/NAREIT Developed Index is designed to track the performance of listed real estate companies and real estate investment trusts (“REITs”) worldwide. The index incorporates REITs and real estate holding & development companies.
Dow Jones Brookfield Global Infrastructure Index intends to measure the stock performance of pure-play infrastructure companies domiciled globally. The index covers all sectors of the infrastructure market. Components are required to have more than 70% of cash flows derived from infrastructure lines of business.
It is not possible to invest directly in an unmanaged index.
20
GOLDMAN SACHS MULTI-MANAGER GLOBAL EQUITY FUND
Schedule of Investments
October 31, 2022
| | | | | | | | |
| | | Shares | | Description | | Value | |
| |
| | Common Stocks – 95.5% | |
| | |
| | Australia – 0.6% | | | | |
| | | 7,258 | | Allkem Ltd.* (Metals & Mining) | | $ | 67,061 | |
| | 5,174 | | Ampol Ltd. (Oil, Gas & Consumable Fuels) | | | 90,244 | |
| | 11,671 | | Challenger Ltd. (Diversified Financial Services) | | | 52,442 | |
| | 10,469 | | Charter Hall Group (Equity Real Estate Investment Trusts (REITs)) | | | 86,902 | |
| | 3,988 | | CSL Ltd. (Biotechnology) | | | 713,913 | |
| | 20,849 | | Deterra Royalties Ltd. (Metals & Mining) | | | 54,707 | |
| | 20,340 | | Downer EDI Ltd. (Commerical Services & Supplies) | | | 58,456 | |
| | 10,470 | | Eagers Automotive Ltd. (Specialty Retail) | | | 83,003 | |
| | 16,222 | | GrainCorp Ltd. (Food & Staples Retailing) | | | 87,207 | |
| | 71,324 | | HomeCo Daily Needs REIT (Equity Real Estate Investment Trusts (REITs)) | | | 58,362 | |
| | 13,539 | | IGO Ltd. (Metals & Mining) | | | 132,411 | |
| | 54,332 | | Incitec Pivot Ltd. (Chemicals) | | | 130,666 | |
| | 73,227 | | Nine Entertainment Co. Holdings Ltd. (Media) | | | 96,705 | |
| | 47,988 | | Orora Ltd. (Containers & Packaging) | | | 93,122 | |
| | 24,801 | | Pilbara Minerals Ltd.* (Metals & Mining) | | | 80,609 | |
| | 2,932 | | Pro Medicus Ltd. (Health Care Technology) | | | 104,459 | |
| | 6,232 | | Seven Group Holdings Ltd. (Trading Companies & Distributors) | | | 73,079 | |
| | 15,502 | | Super Retail Group Ltd. (Specialty Retail) | | | 101,929 | |
| | | | | | | | |
| | | | | | | 2,165,277 | |
| | | |
| | Austria – 0.1% | | | | |
| | 1,690 | | ANDRITZ AG (Machinery) | | | 78,545 | |
| | 2,801 | | BAWAG Group AG*(a) (Banks) | | | 135,221 | |
| | 1,835 | | CA Immobilien Anlagen AG (Real Estate Management & Development) | | | 57,957 | |
| | 1,487 | | Wienerberger AG (Construction Materials) | | | 33,991 | |
| | | | | | | | |
| | | | | | | 305,714 | |
| | | |
| | Belgium – 0.2% | | | | |
| | 718 | | Aedifica SA (Equity Real Estate Investment Trusts (REITs)) | | | 54,757 | |
| | 7,803 | | Anheuser-Busch InBev SA (Beverages) | | | 390,309 | |
| | 602 | | Cofinimmo SA (Equity Real Estate Investment Trusts (REITs)) | | | 49,927 | |
| | 4,903 | | KBC Group NV (Banks) | | | 245,717 | |
| | | |
| | | | | | | | |
| | | Shares | | Description | | Value | |
| |
| | Common Stocks (continued) | |
| |
| | Belgium (continued) | |
| | | 2,335 | | Warehouses De Pauw CVA (Equity | | | | |
| | | | Real Estate Investment Trusts (REITs)) | | $ | 59,930 | |
| | | | | | | | |
| | | | | | | 800,640 | |
| | | |
| | Bermuda – 0.1% | | | | |
| | 1,553 | | Assured Guaranty Ltd. (Insurance) | | | 91,922 | |
| | 2,321 | | Axis Capital Holdings Ltd. (Insurance) | | | 126,889 | |
| | 265 | | RenaissanceRe Holdings Ltd. (Insurance) | | | 40,990 | |
| | | | | | | | |
| | | | | | | 259,801 | |
| | | |
| | Brazil – 0.8% | | | | |
| | 60,100 | | B3 SA - Brasil Bolsa Balcao (Capital Markets) | | | 174,989 | |
| | 11,550 | | Banco BTG Pactual SA (Capital Markets) | | | 64,709 | |
| | 44,050 | | Banco do Brasil SA (Banks) | | | 315,696 | |
| | 23,250 | | Cielo SA (IT Services) | | | 26,781 | |
| | 2,200 | | Gerdau SA (Metals & Mining) | | | 10,967 | |
| | 31,300 | | Hypera SA (Pharmaceuticals) | | | 307,880 | |
| | 33,089 | | JBS SA (Food Products) | | | 159,888 | |
| | 23,572 | | Localiza Rent a Car SA (Road & Rail) | | | 321,899 | |
| | 7,100 | | Marfrig Global Foods SA (Food Products) | | | 14,707 | |
| | 5,550 | | Multiplan Empreendimentos Imobiliarios SA (Real Estate Management & Development) | | | 28,322 | |
| | 17,300 | | Pagseguro Digital Ltd. Class A* (IT Services) | | | 236,664 | |
| | 6,914 | | StoneCo Ltd. Class A* (IT Services) | | | 72,597 | |
| | 39,800 | | TOTVS SA (Software) | | | 255,497 | |
| | 20,950 | | Vale SA (Metals & Mining) | | | 272,263 | |
| | 64,900 | | WEG SA (Electrical Equipment) | | | 506,083 | |
| | 6,800 | | XP, Inc. Class A* (Capital Markets) | | | 124,644 | |
| | | | | | | | |
| | | | | | | 2,893,586 | |
| | | |
| | Canada – 2.8% | | | | |
| | 14,500 | | Alamos Gold, Inc. Class A (Metals & Mining) | | | 114,416 | |
| | 8,335 | | Alimentation Couche-Tard, Inc. (Food & Staples Retailing) | | | 373,204 | |
| | 6,100 | | ARC Resources Ltd. (Oil, Gas & Consumable Fuels) | | | 85,880 | |
| | 3,200 | | ATS Automation Tooling Systems, Inc.* (Machinery) | | | 101,237 | |
| | 9,300 | | Birchcliff Energy Ltd. (Oil, Gas & Consumable Fuels) | | | 72,292 | |
| | 3,300 | | Boralex, Inc. Class A (Independent Power and Renewable Electricity Producers) | | | 93,573 | |
| | 1,490 | | BRP, Inc. (Leisure Products) | | | 99,625 | |
| | | |
The accompanying notes are an integral part of these financial statements. 21
|
| GOLDMAN SACHS MULTI-MANAGER GLOBAL EQUITY FUND |
Schedule of Investments (continued)
October 31, 2022
| | | | | | | | |
| | | Shares | | Description | | Value | |
| |
| | Common Stocks (continued) | |
| | |
| | Canada (continued) | | | | |
| | | 11,051 | | Canadian National Railway Co. (Road & Rail) | | $ | 1,309,070 | |
| | 12,388 | | Canadian Pacific Railway Ltd. (Road & Rail) | | | 922,782 | |
| | 4,100 | | Capital Power Corp. (Independent Power and Renewable Electricity Producers) | | | 137,233 | |
| | 12,700 | | Capstone Mining Corp.* (Metals & Mining) | | | 29,458 | |
| | 12,700 | | Crescent Point Energy Corp. (Oil, Gas & Consumable Fuels) | | | 99,281 | |
| | 3,200 | | Definity Financial Corp. (Insurance) | | | 94,777 | |
| | 5,500 | | Element Fleet Management Corp. (Diversified Financial Services) | | | 73,274 | |
| | 3,600 | | Empire Co. Ltd. Class A (Food & Staples Retailing) | | | 92,487 | |
| | 6,339 | | Enerplus Corp. (Oil, Gas & Consumable Fuels) | | | 109,728 | |
| | 7,500 | | First Capital Real Estate Investment Trust (Equity Real Estate Investment Trusts (REITs)) | | | 87,257 | |
| | 1,850 | | Gildan Activewear, Inc. (Textiles, Apparel & Luxury Goods) | | | 58,378 | |
| | 1,600 | | Granite Real Estate Investment Trust (Equity Real Estate Investment Trusts (REITs)) | | | 81,765 | |
| | 2,161 | | Intact Financial Corp. (Insurance) | | | 328,365 | |
| | 3,300 | | Keyera Corp. (Oil, Gas & Consumable Fuels) | | | 70,731 | |
| | 2,618 | | Lululemon Athletica, Inc.* (Textiles, Apparel & Luxury Goods) | | | 861,427 | |
| | 3,190 | | Northland Power, Inc. (Independent Power and Renewable Electricity Producers) | | | 92,819 | |
| | 3,196 | | Ritchie Bros. Auctioneers, Inc. (Commerical Services & Supplies) | | | 208,795 | |
| | 2,410 | | Stantec, Inc. (Professional Services) | | | 117,922 | |
| | 6,000 | | Summit Industrial Income REIT (Equity Real Estate Investment Trusts (REITs)) | | | 76,676 | |
| | 8,372 | | Suncor Energy, Inc. (Oil, Gas & Consumable Fuels) | | | 287,967 | |
| | 1,200 | | TFI International, Inc. (Road & Rail) | | | 109,232 | |
| | 5,089 | | The Descartes Systems Group, Inc.* (Software) | | | 351,361 | |
| | 6,317 | | The Toronto-Dominion Bank (Banks) | | | 404,286 | |
| | 1,027 | | Toromont Industries Ltd. (Trading Companies & Distributors) | | | 78,928 | |
| | 1,250 | | Tourmaline Oil Corp. (Oil, Gas & Consumable Fuels) | | | 70,430 | |
| | 98,925 | | Wheaton Precious Metals Corp. (Metals & Mining) | | | 3,233,858 | |
| | 13,300 | | Whitecap Resources, Inc. (Oil, Gas & Consumable Fuels) | | | 103,092 | |
| | | |
| | | | | | | | |
| | | Shares | | Description | | Value | |
| |
| | Common Stocks (continued) | |
| | |
| | Canada (continued) | | | | |
| | 24,100 | | Yamana Gold, Inc. (Metals & Mining) | | $ | 105,786 | |
| | | | | | | | |
| | | | | | | 10,537,392 | |
| | | |
| | Chile – 0.1% | | | | |
| | | 62,278 | | Cencosud SA (Food & Staples Retailing) | | | 83,829 | |
| | 1,710 | | Sociedad Quimica y Minera de Chile SA ADR (Chemicals) | | | 160,193 | |
| | | | | | | | |
| | | | | | | 244,022 | |
| | | |
| | China – 3.1% | | | | |
| | 145,350 | | 3SBio, Inc.(a) (Biotechnology) | | | 102,647 | |
| | 466,074 | | Agricultural Bank of China Ltd. Class H (Banks) | | | 133,033 | |
| | 4,600 | | Airtac International Group (Machinery) | | | 105,264 | |
| | 143,900 | | Alibaba Group Holding Ltd.* (Internet & Direct Marketing Retail) | | | 1,118,809 | |
| | 275 | | Alibaba Group Holding Ltd. ADR* (Internet & Direct Marketing Retail) | | | 17,485 | |
| | 5,715 | | Autohome, Inc. ADR (Interactive Media & Services) | | | 149,276 | |
| | 2,705 | | Baidu, Inc. ADR* (Interactive Media & Services) | | | 207,122 | |
| | 21,150 | | Baidu, Inc. Class A* (Interactive Media & Services) | | | 202,765 | |
| | 1,177,787 | | Bank of China Ltd. Class H (Banks) | | | 379,338 | |
| | 492,363 | | Bank of Communications Co. Ltd. Class H (Banks) | | | 240,233 | |
| | 364,000 | | Beijing Capital International Airport Co. Ltd. Class H* (Transportation Infrastructure) | | | 197,119 | |
| | 22,550 | | BYD Co. Ltd. Class H (Automobiles) | | | 505,191 | |
| | 5,850 | | CanSino Biologics, Inc. Class H(a) (Pharmaceuticals) | | | 54,389 | |
| | 37,100 | | Centre Testing International Group Co. Ltd. Class A (Professional Services) | | | 94,803 | |
| | 111,300 | | China Aoyuan Group Ltd.*(b) (Real Estate Management & Development) | | | 16,731 | |
| | 522,311 | | China Cinda Asset Management Co. Ltd. Class H (Capital Markets) | | | 48,518 | |
| | 115,050 | | China CITIC Bank Corp. Ltd. Class H (Banks) | | | 43,369 | |
| | 25,800 | | China Coal Energy Co. Ltd. Class H (Oil, Gas & Consumable Fuels) | | | 18,973 | |
| | 176,650 | | China Feihe Ltd.(a) (Food Products) | | | 101,760 | |
| | 160,862 | | China Galaxy Securities Co. Ltd. Class H (Capital Markets) | | | 60,236 | |
| | 63,600 | | China Hongqiao Group Ltd. (Metals & Mining) | | | 45,013 | |
| | 202,000 | | China Longyuan Power Group Corp. Ltd. Class H (Independent Power and Renewable Electricity Producers) | | | 230,819 | |
| | | |
22 The accompanying notes are an integral part of these financial statements.
GOLDMAN SACHS MULTI-MANAGER GLOBAL EQUITY FUND
| | | | | | | | |
| | | Shares | | Description | | Value | |
| |
| | | Common Stocks (continued) | |
| | |
| | China (continued) | | | | |
| | 64,532 | | China Medical System Holdings Ltd. (Pharmaceuticals) | | $ | 70,529 | |
| | 15,500 | | China Merchants Bank Co. Ltd. Class H (Banks) | | | 50,745 | |
| | 74,500 | | China Minsheng Banking Corp. Ltd. Class H (Banks) | | | 21,637 | |
| | 193,000 | | China Resources Pharmaceutical Group Ltd.(a) (Pharmaceuticals) | | | 130,194 | |
| | 26,550 | | China Shenhua Energy Co. Ltd. Class H (Oil, Gas & Consumable Fuels) | | | 69,743 | |
| | 262,900 | | China Tower Corp. Ltd. Class H(a) (Diversified Telecommunication Services) | | | 23,786 | |
| | 53,800 | | China Yangtze Power Co. Ltd. Class A (Independent Power and Renewable Electricity Producers) | | | 148,936 | |
| | 74,000 | | China Yongda Automobiles Services Holdings Ltd. (Specialty Retail) | | | 33,192 | |
| | 52,500 | | China Yuhua Education Corp. Ltd.*(a) (Diversified Consumer Services) | | | 5,754 | |
| | 15,200 | | Chongqing Brewery Co. Ltd. (Beverages) | | | 180,957 | |
| | 2,900 | | Contemporary Amperex Technology Co. Ltd. Class A (Electrical Equipment) | | | 148,047 | |
| | 26,250 | | Cosco Shipping Energy Transportation Co. Ltd. Class H* (Oil, Gas & Consumable Fuels) | | | 19,121 | |
| | 71,500 | | COSCO Shipping Holdings Co. Ltd. Class H (Marine) | | | 77,054 | |
| | 73,700 | | Country Garden Holdings Co. Ltd. (Real Estate Management & Development) | | | 9,499 | |
| | 37,000 | | Country Garden Services Holdings Co. Ltd. (Real Estate Management & Development) | | | 32,339 | |
| | 156,600 | | CSPC Pharmaceutical Group Ltd. (Pharmaceuticals) | | | 160,854 | |
| | 811 | | Daqo New Energy Corp. ADR* (Semiconductors & Semiconductor Equipment) | | | 35,676 | |
| | 121,850 | | Dongfeng Motor Group Co. Ltd. Class H (Automobiles) | | | 55,125 | |
| | 41,750 | | Dongyue Group Ltd. (Chemicals) | | | 36,234 | |
| | 28,800 | | East Money Information Co. Ltd. (Capital Markets) | | | 61,415 | |
| | 34,550 | | Great Wall Motor Co. Ltd. Class H (Automobiles) | | | 37,743 | |
| | 132,400 | | Guangzhou R&F Properties Co. Ltd. Class H (Real Estate Management & Development) | | | 18,065 | |
| | 79,550 | | Haichang Ocean Park Holdings Ltd.*(a) (Hotels, Restaurants & Leisure) | | | 70,446 | |
| | | |
| | | | | | | | |
| | | Shares | | Description | | Value | |
| |
| | Common Stocks (continued) | |
| | |
| | | China (continued) | | | | |
| | 37,100 | | Haier Smart Home Co., Ltd. Class H (Household Durables) | | $ | 92,861 | |
| | 13,049 | | Hello Group, Inc. ADR (Interactive Media & Services) | | | 61,330 | |
| | 75,950 | | Industrial & Commercial Bank of China Ltd. Class H (Banks) | | | 32,975 | |
| | 5,650 | | JD Health International, Inc.*(a) (Internet & Direct Marketing Retail) | | | 30,996 | |
| | 23,890 | | JD.com, Inc. Class A (Internet & Direct Marketing Retail) | | | 435,049 | |
| | 62,000 | | Jiumaojiu International Holdings, Ltd.(a) (Hotels, Restaurants & Leisure) | | | 97,443 | |
| | 228,000 | | Lenovo Group Ltd. (Technology Hardware, Storage & Peripherals) | | | 182,219 | |
| | 813 | | Li Auto, Inc. ADR* (Automobiles) | | | 11,073 | |
| | 59,500 | | Li Ning Co. Ltd. (Textiles, Apparel & Luxury Goods) | | | 307,789 | |
| | 21,600 | | LONGi Green Energy Technology Co. Ltd. Class A (Semiconductors & Semiconductor Equipment) | | | 141,903 | |
| | 4,300 | | Luzhou Laojiao Co. Ltd. Class A (Beverages) | | | 91,755 | |
| | 1,350 | | Meituan Class B*(a) (Internet & Direct Marketing Retail) | | | 21,614 | |
| | 83,500 | �� | Metallurgical Corp. of China Ltd. Class H (Construction & Engineering) | | | 13,296 | |
| | 36,650 | | NetEase, Inc. (Entertainment) | | | 406,641 | |
| | 904 | | NetEase, Inc. ADR (Entertainment) | | | 50,281 | |
| | 7,100 | | Nongfu Spring Co. Ltd. Class H(a) (Beverages) | | | 35,662 | |
| | 43,450 | | PICC Property & Casualty Co. Ltd. Class H (Insurance) | | | 40,074 | |
| | 1,934 | | Pinduoduo, Inc. ADR* (Internet & Direct Marketing Retail) | | | 106,041 | |
| | 132,950 | | Ping An Insurance Group Co. of China Ltd. Class H (Insurance) | | | 532,251 | |
| | 47,950 | | Powerlong Real Estate Holdings Ltd. (Real Estate Management & Development) | | | 3,913 | |
| | 26,533 | | RLX Technology, Inc. ADR* (Tobacco) | | | 33,166 | |
| | 88,600 | | Seazen Group Ltd.* (Real Estate Management & Development) | | | 14,232 | |
| | 24,800 | | Shenzhen Inovance Technology Co. Ltd. Class A (Machinery) | | | 226,023 | |
| | 3,800 | | Shenzhen Mindray Bio-Medical Electronics Co. Ltd. Class A (Health Care Equipment & Supplies) | | | 168,979 | |
| | 30,100 | | Shenzhou International Group Holdings Ltd. (Textiles, Apparel & Luxury Goods) | | | 208,984 | |
| | 116,350 | | Shimao Services Holdings Ltd.*(a) (Real Estate Management & Development) | | | 18,688 | |
| | | |
The accompanying notes are an integral part of these financial statements. 23
|
| GOLDMAN SACHS MULTI-MANAGER GLOBAL EQUITY FUND |
Schedule of Investments (continued)
October 31, 2022
| | | | | | | | |
| | | Shares | | Description | | Value | |
| |
| | Common Stocks (continued) | |
| | |
| | China (continued) | | | | |
| | | 57,000 | | Sinopec Engineering Group Co. Ltd. Class H (Construction & Engineering) | | $ | 20,382 | |
| | 27,465 | | Sinotruk Hong Kong Ltd. (Machinery) | | | 24,485 | |
| | 87,600 | | Sunac China Holdings Ltd.*(b) (Real Estate Management & Development) | | | 51,112 | |
| | 45,616 | | Tencent Holdings Ltd. (Interactive Media & Services) | | | 1,198,641 | |
| | 12,451 | | Tencent Music Entertainment Group ADR* (Entertainment) | | | 44,948 | |
| | 1,450 | | Trip.com Group Ltd.* (Hotels, Restaurants & Leisure) | | | 32,570 | |
| | 9,157 | | Trip.com Group Ltd. ADR* (Hotels, Restaurants & Leisure) | | | 207,223 | |
| | 10,150 | | Tsingtao Brewery Co. Ltd. Class H (Beverages) | | | 71,061 | |
| | 31,639 | | Wuxi Lead Intelligent Equipment Co. Ltd. Class A (Machinery) | | | 216,389 | |
| | 11,300 | | Xinte Energy Co. Ltd. Class H (Construction & Engineering) | | | 22,045 | |
| | 29,300 | | Yadea Group Holdings Ltd.(a) (Automobiles) | | | 44,738 | |
| | 7,171 | | Yum China Holdings, Inc. (Hotels, Restaurants & Leisure) | | | 296,521 | |
| | 9,900 | | Yunnan Botanee Bio-Technology Group Co. Ltd. Class A (Personal Products) | | | 193,109 | |
| | 8,300 | | Yunnan Energy New Material Co. Ltd. Class A (Chemicals) | | | 167,446 | |
| | 11,200 | | ZTE Corp. Class H (Communications Equipment) | | | 19,979 | |
| | | | | | | | |
| | | | | | | 11,545,871 | |
| | | |
| | Colombia – 0.0% | | | | |
| | 664 | | Bancolombia SA ADR (Banks) | | | 16,846 | |
| | | |
| | Cyprus – 0.0% | | | | |
| | 815 | | Galaxy Cosmos Mezz PLC (Diversified Financial Services) | | | 132 | |
| | | |
| | Czech Republic – 0.0% | | | | |
| | 4,900 | | CEZ AS (Electric Utilities) | | | 160,247 | |
| | | |
| | Denmark – 0.6% | | | | |
| | 4,952 | | ALK-Abello A/S* (Pharmaceuticals) | | | 81,876 | |
| | 425 | | Bavarian Nordic A/S* (Biotechnology) | | | 13,524 | |
| | 2,657 | | Carlsberg AS Class B (Beverages) | | | 312,850 | |
| | 1,731 | | DSV A/S (Air Freight & Logistics) | | | 233,907 | |
| | 1,082 | | NKT A/S* (Electrical Equipment) | | | 53,999 | |
| | 14,478 | | Novo Nordisk A/S Class B (Pharmaceuticals) | | | 1,574,211 | |
| | 1,684 | | Royal Unibrew A/S (Beverages) | | | 96,197 | |
| | | | | | | | |
| | | | | | | 2,366,564 | |
| | | |
| | France – 4.2% | | | | |
| | 13,632 | | Air Liquide SA (Chemicals) | | | 1,783,252 | |
| | | |
| | | | | | | | |
| | | Shares | | Description | | Value | |
| |
| | Common Stocks (continued) | |
| | |
| | | France (continued) | | | | |
| | 43,694 | | Alstom SA (Machinery) | | $ | 899,276 | |
| | 692 | | Alten SA (IT Services) | | | 80,846 | |
| | 200 | | Amundi SA(a) (Capital Markets) | | | 9,436 | |
| | 29,629 | | AXA SA (Insurance) | | | 731,685 | |
| | 6,274 | | BNP Paribas SA (Banks) | | | 294,212 | |
| | 4,981 | | Capgemini SE (IT Services) | | | 816,340 | |
| | 21,205 | | Carrefour SA (Food & Staples Retailing) | | | 341,304 | |
| | 3,222 | | Cellectis SA ADR* (Biotechnology) | | | 8,007 | |
| | 6,540 | | Cie de Saint-Gobain (Building Products) | | | 267,361 | |
| | 9,878 | | Cie Generale des Etablissements Michelin SCA (Auto Components) | | | 251,731 | |
| | 2,285 | | Constellium SE* (Metals & Mining) | | | 25,181 | |
| | 17,025 | | Danone SA (Food Products) | | | 846,134 | |
| | 6,157 | | Dassault Systemes SE (Software) | | | 206,375 | |
| | 38,917 | | Engie SA (Multi-Utilities) | | | 505,662 | |
| | 3,851 | | EssilorLuxottica SA (Textiles, Apparel & Luxury Goods) | | | 608,951 | |
| | 4,300 | | Euroapi SA* (Pharmaceuticals) | | | 75,246 | |
| | 4,578 | | Faurecia SE* (Auto Components) | | | 68,345 | |
| | 674 | | Gaztransport Et Technigaz SA (Oil, Gas & Consumable Fuels) | | | 78,412 | |
| | 4,135 | | Klepierre SA* (Equity Real Estate Investment Trusts (REITs)) | | | 83,106 | |
| | 4,361 | | Legrand SA (Electrical Equipment) | | | 332,328 | |
| | 925 | | L’Oreal SA (Personal Products) | | | 290,454 | |
| | 2,500 | | LVMH Moet Hennessy Louis Vuitton SE (Textiles, Apparel & Luxury Goods) | | | 1,577,486 | |
| | 807 | | Nexans SA (Electrical Equipment) | | | 75,357 | |
| | 8,065 | | Pernod Ricard SA (Beverages) | | | 1,415,498 | |
| | 6,544 | | Rexel SA* (Trading Companies & Distributors) | | | 116,780 | |
| | 10,013 | | Sanofi (Pharmaceuticals) | | | 861,697 | |
| | 11,549 | | Schneider Electric SE (Electrical Equipment) | | | 1,460,444 | |
| | 695 | | Sopra Steria Group SACA (IT Services) | | | 91,992 | |
| | 5,466 | | SPIE SA (Commerical Services & Supplies) | | | 127,869 | |
| | 6,773 | | TotalEnergies SE (Oil, Gas & Consumable Fuels) | | | 369,490 | |
| | 9,610 | | Valeo (Auto Components) | | | 158,305 | |
| | 7,924 | | Vallourec SA* (Energy Equipment & Services) | | | 84,309 | |
| | 6,656 | | Vinci SA (Construction & Engineering) | | | 612,598 | |
| | | | | | | | |
| | | | | | | 15,555,469 | |
| | | |
| | Germany – 2.2% | | | | |
| | 21,802 | | Bayer AG (Pharmaceuticals) | | | 1,146,372 | |
| | 6,490 | | Beiersdorf AG (Personal Products) | | | 623,009 | |
| | 118,933 | | BNP Paribas SA (Banks) | | | 1,170,251 | |
| | | |
24 The accompanying notes are an integral part of these financial statements.
GOLDMAN SACHS MULTI-MANAGER GLOBAL EQUITY FUND
| | | | | | | | |
| | | Shares | | Description | | Value | |
| |
| | | Common Stocks (continued) | |
| | |
| | Germany (continued) | | | | |
| | 1,226 | | CompuGroup Medical SE & Co KgaA (Health Care Technology) | | $ | 38,734 | |
| | 1,978 | | CTS Eventim AG & Co. KGaA* (Entertainment) | | | 94,423 | |
| | 4,705 | | Deutsche Boerse AG (Capital Markets) | | | 765,125 | |
| | 29,866 | | Deutsche Telekom AG (Diversified Telecommunication Services) | | | 563,735 | |
| | 3,494 | | Encavis AG (Independent Power and Renewable Electricity Producers) | | | 65,050 | |
| | 664 | | K&S AG (Chemicals) | | | 14,660 | |
| | 4,199 | | Merck KGaA (Pharmaceuticals) | | | 684,290 | |
| | 1,207 | | MTU Aero Engines AG (Aerospace & Defense) | | | 216,003 | |
| | 521 | | Rheinmetall AG (Aerospace & Defense) | | | 84,689 | |
| | 15,089 | | RWE AG (Independent Power and Renewable Electricity Producers) | | | 580,853 | |
| | 1,142 | | Salzgitter AG (Metals & Mining) | | | 25,522 | |
| | 18,363 | | SAP SE (Software) | | | 1,767,490 | |
| | 1,234 | | Scout24 SE(a) (Interactive Media & Services) | | | 63,236 | |
| | 2,678 | | Siemens AG (Industrial Conglomerates) | | | 292,462 | |
| | 694 | | Sixt SE (Road & Rail) | | | 65,093 | |
| | 1,021 | | Stroeer SE & Co. KGaA (Media) | | | 41,625 | |
| | | | | | | | |
| | | | | | | 8,302,622 | |
| | | |
| | Greece – 0.0% | | | | |
| | 22,000 | | Alpha Services & Holdings SA* (Banks) | | | 20,374 | |
| | 21,150 | | Eurobank Ergasias Services and Holdings SA Class A* (Banks) | | | 20,879 | |
| | 4,600 | | Hellenic Telecommunications Organization SA (Diversified Telecommunication Services) | | | 72,241 | |
| | 13,900 | | National Bank of Greece SA* (Banks) | | | 50,364 | |
| | | | | | | | |
| | | | | | | 163,858 | |
| | | |
| | Hong Kong – 0.6% | | | | |
| | 210,125 | | AIA Group Ltd. (Insurance) | | | 1,591,653 | |
| | 21,600 | | BOE Varitronix Ltd. (Electronic Equipment, Instruments & Components) | | | 32,029 | |
| | 284,350 | | China Jinmao Holdings Group Ltd. (Real Estate Management & Development) | | | 37,674 | |
| | 112,150 | | China Traditional Chinese Medicine Holdings Co. Ltd. (Pharmaceuticals) | | | 48,477 | |
| | 143,850 | | GCL Technology Holdings, Ltd.* (Semiconductors & Semiconductor Equipment) | | | 36,460 | |
| | 46,800 | | Geely Automobile Holdings Ltd. (Automobiles) | | | 50,365 | |
| | | |
| | | | | | | | |
| | | Shares | | Description | | Value | |
| |
| | Common Stocks (continued) | |
| | |
| | Hong Kong (continued) | | | | |
| | 46,629 | | Hopson Development Holdings Ltd. (Real Estate Management & Development) | | $ | 37,424 | |
| | 23,000 | | Kingboard Holdings Ltd. (Electronic Equipment, Instruments & Components) | | | 56,779 | |
| | 24,150 | | Kingboard Laminates Holdings Ltd. (Electronic Equipment, Instruments & Components) | | | 19,293 | |
| | 133,350 | | Kunlun Energy Co. Ltd. (Gas Utilities) | | | 79,699 | |
| | 2,750 | | Orient Overseas International Ltd. (Marine) | | | 40,186 | |
| | 192,400 | | Shimao Group Holdings Ltd.(b) (Real Estate Management & Development) | | | 108,337 | |
| | 65,800 | | Sino Biopharmaceutical Ltd. (Pharmaceuticals) | | | 31,929 | |
| | 126,150 | | Sun Art Retail Group Ltd. (Food & Staples Retailing) | | | 20,070 | |
| | 180,100 | | Truly International Holdings Ltd. (Electronic Equipment, Instruments & Components) | | | 22,011 | |
| | 30,500 | | Yue Yuen Industrial Holdings Ltd. (Textiles, Apparel & Luxury Goods) | | | 31,008 | |
| | 9,300 | | Yuexiu Property Co. Ltd. (Real Estate Management & Development) | | | 7,936 | |
| | | | | | | | |
| | | | | | | 2,251,330 | |
| | | |
| | India – 1.8% | | | | |
| | | 10,550 | | Adani Power Ltd.* (Independent Power and Renewable Electricity Producers) | | | 42,773 | |
| | 3,013 | | Adani Total Gas Ltd. (Gas Utilities) | | | 131,128 | |
| | 1,482 | | Apollo Hospitals Enterprise Ltd. (Health Care Providers & Services) | | | 80,923 | |
| | 5,150 | | Aurobindo Pharma Ltd. (Pharmaceuticals) | | | 33,481 | |
| | 9,850 | | Axis Bank Ltd. (Banks) | | | 108,020 | |
| | 5,168 | | Bajaj Finance Ltd. (Consumer Finance) | | | 446,722 | |
| | 500 | | Bajaj Holdings & Investment Ltd. (Diversified Financial Services) | | | 40,250 | |
| | 121,725 | | Bharat Electronics Ltd. (Aerospace & Defense) | | | 157,088 | |
| | 38,237 | | Bharti Airtel Ltd. (Wireless Telecommunication Services) | | | 384,542 | |
| | 58,850 | | Coal India Ltd. (Oil, Gas & Consumable Fuels) | | | 174,700 | |
| | 13,650 | | Devyani International Ltd.* (Hotels, Restaurants & Leisure) | | | 31,969 | |
| | 434 | | Divi’s Laboratories Ltd. (Life Sciences Tools & Services) | | | 18,931 | |
| | 5,450 | | Easy Trip Planners Ltd. (Hotels, Restaurants & Leisure) | | | 25,510 | |
| | 15,600 | | HCL Technologies Ltd. (IT Services) | | | 196,383 | |
| | | |
The accompanying notes are an integral part of these financial statements. 25
|
GOLDMAN SACHS MULTI-MANAGER GLOBAL EQUITY FUND |
Schedule of Investments (continued)
October 31, 2022
| | | | | | | | |
| | | Shares | | Description | | Value | |
| |
| | Common Stocks (continued) | |
| | |
| | | India (continued) | | | | |
| | 37,504 | | HDFC Bank Ltd. (Banks) | | $ | 680,639 | |
| | 950 | | Hindustan Aeronautics Ltd. (Aerospace & Defense) | | | 29,007 | |
| | 10,276 | | Housing Development Finance Corp. Ltd. (Diversified Financial Services) | | | 307,240 | |
| | 30,771 | | ICICI Bank Ltd. (Banks) | | | 338,338 | |
| | 18,700 | | Indian Hotels Co. Ltd. (Hotels, Restaurants & Leisure) | | | 75,443 | |
| | 12,285 | | Infosys Ltd. (IT Services) | | | 228,969 | |
| | 85,650 | | ITC Ltd. (Tobacco) | | | 361,129 | |
| | 3,550 | | KPIT Technologies Ltd. (Software) | | | 30,453 | |
| | 26,900 | | Lemon Tree Hotels Ltd.*(a) (Hotels, Restaurants & Leisure) | | | 27,423 | |
| | 10,950 | | Mahindra & Mahindra Ltd. (Automobiles) | | | 178,715 | |
| | 21,550 | | National Aluminium Co. Ltd. (Metals & Mining) | | | 18,270 | |
| | 2,150 | | Oberoi Realty Ltd. (Real Estate Management & Development) | | | 24,064 | |
| | 46,000 | | Oil & Natural Gas Corp. Ltd. (Oil, Gas & Consumable Fuels) | | | 74,308 | |
| | 256 | | Page Industries Ltd. (Textiles, Apparel & Luxury Goods) | | | 154,007 | |
| | 28,035 | | Power Finance Corp. Ltd. (Diversified Financial Services) | | | 39,057 | |
| | 45,350 | | Power Grid Corp. of India Ltd. (Electric Utilities) | | | 125,124 | |
| | 80,354 | | REC Ltd. (Diversified Financial Services) | | | 99,559 | |
| | 16,762 | | Reliance Industries Ltd. (Oil, Gas & Consumable Fuels) | | | 517,221 | |
| | 132,308 | | Samvardhana Motherson International Ltd. (Auto Components) | | | 103,141 | |
| | 1,050 | | SRF Ltd. (Chemicals) | | | 32,497 | |
| | 10,412 | | Tata Consultancy Services Ltd. (IT Services) | | | 401,821 | |
| | 796 | | Tata Elxsi Ltd. (Software) | | | 67,283 | |
| | 146,990 | | Tata Steel Ltd. (Metals & Mining) | | | 180,285 | |
| | 6,137 | | Titan Co. Ltd. (Textiles, Apparel & Luxury Goods) | | | 204,780 | |
| | 1,100 | | Tube Investments of India Ltd. (Auto Components) | | | 36,448 | |
| | 7,197 | | TVS Motor Co. Ltd. (Automobiles) | | | 99,741 | |
| | 7,200 | | Varun Beverages Ltd. (Beverages) | | | 91,360 | |
| | 19,250 | | Vedanta Ltd. (Metals & Mining) | | | 65,230 | |
| | 1,443 | | WNS Holdings Ltd. ADR* (IT Services) | | | 124,213 | |
| | | | | | | | |
| | | | | | | 6,588,185 | |
| | | |
| | Indonesia – 0.4% | |
| | 152,050 | | Adaro Energy Indonesia Tbk PT (Oil, Gas & Consumable Fuels) | | | 38,791 | |
| | 156,300 | | Astra International Tbk PT (Automobiles) | | | 66,792 | |
| | 878,500 | | Bank Central Asia Tbk PT (Banks) | | | 496,596 | |
| | | |
| | | | | | | | |
| | | Shares | | Description | | Value | |
| |
| | Common Stocks (continued) | |
| | |
| | | Indonesia (continued) | | | | |
| | 450,800 | | Bank Mandiri Persero Tbk PT (Banks) | | $ | 304,539 | |
| | 89,950 | | Bank Negara Indonesia Persero Tbk PT (Banks) | | | 54,234 | |
| | 872,900 | | Bank Rakyat Indonesia Persero Tbk PT (Banks) | | | 260,415 | |
| | 451,850 | | Sumber Alfaria Trijaya Tbk PT (Food & Staples Retailing) | | | 81,650 | |
| | 487,800 | | Telekomunikasi Indonesia Persero Tbk PT (Diversified Telecommunication Services) | | | 136,999 | |
| | 13,400 | | United Tractors Tbk PT (Oil, Gas & Consumable Fuels) | | | 27,718 | |
| | | | | | | | |
| | | | | | | 1,467,734 | |
| | | |
| | Ireland – 1.4% | |
| | 3,479 | | Accenture PLC Class A (IT Services) | | | 987,688 | |
| | 21,025 | | Bank of Ireland Group PLC (Banks) | | | 151,393 | |
| | 37,454 | | Experian PLC (Professional Services) | | | 1,194,231 | |
| | 4 | | Flutter Entertainment PLC* (Hotels, Restaurants & Leisure) | | | 528 | |
| | 2,747 | | ICON PLC* (Life Sciences Tools & Services) | | | 543,467 | |
| | 3,513 | | Keywords Studios PLC (IT Services) | | | 97,145 | |
| | 12,868 | | Medtronic PLC (Health Care Equipment & Supplies) | | | 1,123,891 | |
| | 16,037 | | Ryanair Holdings PLC ADR* (Airlines) | | | 1,104,789 | |
| | | | | | | | |
| | | | | | | 5,203,132 | |
| | | |
| | Israel – 0.2% | |
| | 84,511 | | Bezeq The Israeli Telecommunication Corp. Ltd. (Diversified Telecommunication Services) | | | 149,605 | |
| | 4,374 | | Check Point Software Technologies Ltd.* (Software) | | | 565,252 | |
| | 568 | | CyberArk Software Ltd.* (Software) | | | 89,125 | |
| | 1,227 | | Nova Ltd.* (Semiconductors & Semiconductor Equipment) | | | 90,442 | |
| | | | | | | | |
| | | | | | | 894,424 | |
| | | |
| | Italy – 1.1% | |
| | 13,792 | | Banca Mediolanum SpA (Diversified Financial Services) | | | 103,191 | |
| | 259,013 | | Enel SpA (Electric Utilities) | | | 1,157,101 | |
| | 33,454 | | Eni SpA (Oil, Gas & Consumable Fuels) | | | 439,375 | |
| | 3,083 | | Ferrari NV (Automobiles) | | | 607,777 | |
| | 33,690 | | Hera SpA (Multi-Utilities) | | | 80,273 | |
| | 210,442 | | Intesa Sanpaolo SpA (Banks) | | | 401,213 | |
| | 2,711 | | Prysmian SpA (Electrical Equipment) | | | 88,238 | |
| | 112,664 | | UniCredit SpA (Banks) | | | 1,397,176 | |
| | | | | | | | |
| | | | | | | 4,274,344 | |
| | | |
26 The accompanying notes are an integral part of these financial statements.
GOLDMAN SACHS MULTI-MANAGER GLOBAL EQUITY FUND
| | | | | | | | |
| | | Shares | | Description | | Value | |
| |
| | Common Stocks (continued) | |
| | |
| | | Japan – 3.7% | | | | |
| | 1,900 | | ABC-Mart, Inc. (Specialty Retail) | | $ | 84,688 | |
| | 3,900 | | ADEKA Corp. (Chemicals) | | | 58,307 | |
| | 16,200 | | Amada Co. Ltd. (Machinery) | | | 113,944 | |
| | 3,200 | | Amano Corp. (Electronic Equipment, Instruments & Components) | | | 54,760 | |
| | 3,000 | | BayCurrent Consulting, Inc. (Professional Services) | | | 84,172 | |
| | 4,100 | | BIPROGY, Inc. (IT Services) | | | 88,566 | |
| | 4,500 | | Canon Marketing Japan, Inc. (Electronic Equipment, Instruments & Components) | | | 94,959 | |
| | 5,300 | | CKD Corp. (Machinery) | | | 65,001 | |
| | 3,900 | | Daikin Industries Ltd. (Building Products) | | | 584,170 | |
| | 5,700 | | Denso Corp. (Auto Components) | | | 282,811 | |
| | 7,600 | | FANUC Corp. (Machinery) | | | 994,472 | |
| | 7,200 | | Fukuoka Financial Group, Inc. (Banks) | | | 122,512 | |
| | 8,100 | | H2O Retailing Corp. (Multiline Retail) | | | 68,165 | |
| | 2,500 | | Hanwa Co. Ltd. (Trading Companies & Distributors) | | | 60,460 | |
| | 17,100 | | Hitachi Ltd. (Industrial Conglomerates) | | | 775,892 | |
| | 14,800 | | Hitachi Zosen Corp. (Machinery) | | | 85,322 | |
| | 4,300 | | Hoya Corp. (Health Care Equipment & Supplies) | | | 399,734 | |
| | 1,600 | | IHI Corp. (Machinery) | | | 35,686 | |
| | 9,600 | | INFRONEER Holdings, Inc. (Construction & Engineering) | | | 66,550 | |
| | 5,700 | | Internet Initiative Japan, Inc. (Diversified Telecommunication Services) | | | 89,470 | |
| | 12,400 | | J. Front Retailing Co. Ltd. (Multiline Retail) | | | 100,230 | |
| | 197 | | Japan Hotel REIT Investment Corp. (Equity Real Estate Investment Trusts (REITs)) | | | 103,791 | |
| | 5,100 | | Japan Material Co. Ltd. (Semiconductors & Semiconductor Equipment) | | | 67,145 | |
| | 115 | | Japan Metropolitan Fund Investment Corp. (Equity Real Estate Investment Trusts (REITs)) | | | 84,724 | |
| | 31 | | Japan Prime Realty Investment Corp. (Equity Real Estate Investment Trusts (REITs)) | | | 84,191 | |
| | 6,500 | | Kamigumi Co. Ltd. (Transportation Infrastructure) | | | 123,608 | |
| | 1,220 | | Keyence Corp. (Electronic Equipment, Instruments & Components) | | | 460,019 | |
| | 13,700 | | Koito Manufacturing Co. Ltd. (Auto Components) | | | 194,497 | |
| | | |
| | | | | | | | |
| | | Shares | | Description | | Value | |
| |
| | Common Stocks (continued) | |
| | |
| | | Japan (continued) | | | | |
| | 4,800 | | KOMEDA Holdings Co. Ltd. (Hotels, Restaurants & Leisure) | | $ | 80,166 | |
| | 3,100 | | Kose Corp. (Personal Products) | | | 309,443 | |
| | 29,600 | | Kubota Corp. (Machinery) | | | 412,908 | |
| | 2,100 | | Kumagai Gumi Co. Ltd. (Construction & Engineering) | | | 35,501 | |
| | 1,600 | | Kureha Corp. (Chemicals) | | | 102,735 | |
| | 9,500 | | Kyocera Corp. (Electronic Equipment, Instruments & Components) | | | 460,051 | |
| | 3,000 | | Lasertec Corp. (Semiconductors & Semiconductor Equipment) | | | 421,533 | |
| | 1,200 | | M&A Capital Partners Co. Ltd.* (Capital Markets) | | | 30,534 | |
| | 13,500 | | Mazda Motor Corp. (Automobiles) | | | 90,895 | |
| | 5,700 | | MIRAIT ONE Corp. (Construction & Engineering) | | | 54,775 | |
| | 31 | | Mitsui Fudosan Logistics Park, Inc. (Equity Real Estate Investment Trusts (REITs)) | | | 102,853 | |
| | 11,300 | | Murata Manufacturing Co. Ltd. (Electronic Equipment, Instruments & Components) | | | 534,935 | |
| | 1,800 | | Nippon Express Holdings, Inc. (Road & Rail) | | | 90,446 | |
| | 1,800 | | Nippon Shinyaku Co. Ltd. (Pharmaceuticals) | | | 99,659 | |
| | 25,900 | | Olympus Corp. (Health Care Equipment & Supplies) | | | 546,088 | |
| | 5,600 | | Persol Holdings Co. Ltd. (Professional Services) | | | 112,125 | |
| | 9,500 | | Pola Orbis Holdings, Inc. (Personal Products) | | | 104,929 | |
| | 20,400 | | Rengo Co. Ltd. (Containers & Packaging) | | | 113,335 | |
| | 2,500 | | Sankyu, Inc. (Road & Rail) | | | 74,542 | |
| | 4,400 | | SBI Holdings, Inc. (Capital Markets) | | | 79,482 | |
| | 9,000 | | Sega Sammy Holdings, Inc. (Leisure Products) | | | 115,122 | |
| | 1,500 | | Shin-Etsu Chemical Co. Ltd. (Chemicals) | | | 155,895 | |
| | 3,100 | | Ship Healthcare Holdings, Inc. (Health Care Providers & Services) | | | 59,454 | |
| | 900 | | SMC Corp. (Machinery) | | | 361,262 | |
| | 2,200 | | SMS Co. Ltd. (Professional Services) | | | 50,470 | |
| | 6,300 | | Sony Group Corp. (Household Durables) | | | 424,838 | |
| | 1,000 | | Square Enix Holdings Co. Ltd. (Entertainment) | | | 44,622 | |
| | 7,800 | | Sumitomo Forestry Co. Ltd. (Household Durables) | | | 122,020 | |
| | 16,100 | | Sumitomo Mitsui Financial Group, Inc. (Banks) | | | 452,113 | |
| | 2,400 | | Sumitomo Osaka Cement Co. Ltd. (Construction Materials) | | | 51,098 | |
| | | |
The accompanying notes are an integral part of these financial statements. 27
|
GOLDMAN SACHS MULTI-MANAGER GLOBAL EQUITY FUND |
Schedule of Investments (continued)
October 31, 2022
| | | | | | | | |
| | | Shares | | Description | | Value | |
| |
| | Common Stocks (continued) | |
| | |
| | | Japan (continued) | | | | |
| | 3,700 | | Suzuken Co. Ltd. (Health Care Providers & Services) | | $ | 82,376 | |
| | 28,800 | | Takeda Pharmaceutical Co. Ltd. (Pharmaceuticals) | | | 760,579 | |
| | 14,300 | | Terumo Corp. (Health Care Equipment & Supplies) | | | 433,991 | |
| | 19,900 | | The Chiba Bank Ltd. (Banks) | | | 109,034 | |
| | 5,900 | | The Yokohama Rubber Co. Ltd. (Auto Components) | | | 92,259 | |
| | 4,100 | | TIS, Inc. (IT Services) | | | 110,543 | |
| | 1,000 | | Tokyo Electron Ltd. (Semiconductors & Semiconductor Equipment) | | | 263,096 | |
| | 24,100 | | Tokyu Fudosan Holdings Corp. (Real Estate Management & Development) | | | 122,273 | |
| | 3,900 | | Toyo Suisan Kaisha Ltd. (Food Products) | | | 146,317 | |
| | 4,800 | | Toyoda Gosei Co. Ltd. (Auto Components) | | | 76,736 | |
| | 5,200 | | Toyota Boshoku Corp. (Auto Components) | | | 66,168 | |
| | 4,500 | | TRE Holdings Corp. (Commerical Services & Supplies) | | | 48,534 | |
| | 1,700 | | Trend Micro, Inc. (Software) | | | 85,720 | |
| | 2,800 | | Ulvac, Inc. (Semiconductors & Semiconductor Equipment) | | | 110,379 | |
| | 1,500 | | Zenkoku Hosho Co. Ltd. (Diversified Financial Services) | | | 49,495 | |
| | | | | | | | |
| | | | | | | 13,679,175 | |
| | | |
| | Luxembourg – 0.1% | |
| | 7,532 | | ArcelorMittal SA (Metals & Mining) | | | 168,367 | |
| | 2,387 | | Ternium SA ADR (Metals & Mining) | | | 68,722 | |
| | | | | | | | |
| | | | | | | 237,089 | |
| | | |
| | Macau* – 0.1% | |
| | 290,400 | | Sands China Ltd. (Hotels, Restaurants & Leisure) | | | 507,684 | |
| | | |
| | Malaysia – 0.1% | |
| | 58,050 | | Gamuda Bhd (Construction & Engineering) | | | 47,232 | |
| | 56,000 | | Hartalega Holdings Bhd (Health Care Equipment & Supplies) | | | 25,566 | |
| | 78,950 | | Kossan Rubber Industries Bhd (Health Care Equipment & Supplies) | | | 20,906 | |
| | 53,400 | | Petronas Chemicals Group Bhd (Chemicals) | | | 98,450 | |
| | 56,050 | | Sime Darby Plantation Bhd (Food Products) | | | 52,184 | |
| | 129,830 | | Supermax Corp. Bhd (Health Care Equipment & Supplies) | | | 26,506 | |
| | | | | | | | |
| | | | | | | 270,844 | |
| | | |
| | Mexico – 0.5% | |
| | 2,850 | | Arca Continental SAB de CV (Beverages) | | | 23,345 | |
| | | |
| | | | | | | | |
| | | Shares | | Description | | Value | |
| |
| | Common Stocks (continued) | |
| | |
| | | Mexico (continued) | | | | |
| | 8,900 | | Banco del Bajio SA(a) (Banks) | | $ | 25,101 | |
| | 6,650 | | Grupo Aeroportuario del Pacifico SAB de CV Class B (Transportation Infrastructure) | | | 103,007 | |
| | 5,100 | | Grupo Aeroportuario del Sureste SAB de CV Class B (Transportation Infrastructure) | | | 119,360 | |
| | 48,300 | | Grupo Bimbo SAB de CV Series A (Food Products) | | | 187,003 | |
| | 60,400 | | Grupo Financiero Banorte SAB de CV Class O (Banks) | | | 490,961 | |
| | 26,350 | | Grupo Financiero Inbursa SAB de CV Class O* (Banks) | | | 48,636 | |
| | 32,700 | | Grupo Mexico SAB de CV Series B (Metals & Mining) | | | 118,550 | |
| | 22,650 | | Orbia Advance Corp. SAB de CV (Chemicals) | | | 38,240 | |
| | 145,750 | | Wal-Mart de Mexico SAB de CV (Food & Staples Retailing) | | | 562,976 | |
| | | | | | | | |
| | | | | | | 1,717,179 | |
| | | |
| | Netherlands – 1.3% | |
| | 2,378 | | Aalberts NV (Machinery) | | | 82,497 | |
| | 355 | | Adyen NV*(a) (IT Services) | | | 506,798 | |
| | 17,127 | | Akzo Nobel NV (Chemicals) | | | 1,057,343 | |
| | 2,368 | | Arcadis NV (Construction & Engineering) | | | 80,363 | |
| | 1,395 | | ASM International NV (Semiconductors & Semiconductor Equipment) | | | 308,601 | |
| | 3,219 | | ASML Holding NV (Semiconductors & Semiconductor Equipment) | | | 1,520,720 | |
| | 4,225 | | ASR Nederland NV (Insurance) | | | 186,039 | |
| | 1,440 | | Euronext NV(a) (Capital Markets) | | | 91,395 | |
| | 34,360 | | Koninklijke Philips NV (Health Care Equipment & Supplies) | | | 435,852 | |
| | 2,367 | | OCI NV (Chemicals) | | | 90,533 | |
| | 6,597 | | QIAGEN NV* (Life Sciences Tools & Services) | | | 284,879 | |
| | 6,335 | | Randstad NV (Professional Services) | | | 315,731 | |
| | 2,922 | | Signify NV(a) (Electrical Equipment) | | | 80,954 | |
| | | | | | | | |
| | | | | | | 5,041,705 | |
| | | |
| | Philippines – 0.0% | |
| | 7,450 | | International Container Terminal Services, Inc. (Transportation Infrastructure) | | | 22,333 | |
| | | |
| | Poland* – 0.0% | |
| | 16,156 | | PGE Polska Grupa Energetyczna SA (Electric Utilities) | | | 18,414 | |
| | | |
| | Portugal – 0.1% | |
| | 24,721 | | Galp Energia SGPS SA (Oil, Gas & Consumable Fuels) | | | 250,995 | |
| | | |
28 The accompanying notes are an integral part of these financial statements.
GOLDMAN SACHS MULTI-MANAGER GLOBAL EQUITY FUND
| | | | | | | | |
| | | Shares | | Description | | Value | |
| |
| | Common Stocks (continued) | |
| | |
| | Portugal (continued) | | | | |
| | 89,713 | | Sonae SGPS SA (Food & Staples Retailing) | | $ | 86,160 | |
| | | | | | | | |
| | | | | | | 337,155 | |
| | | |
| | Qatar – 0.1% | |
| | | 94,764 | | Barwa Real Estate Co. (Real Estate Management & Development) | | | 88,426 | |
| | 76,332 | | Industries Qatar QSC (Industrial Conglomerates) | | | 330,442 | |
| | 12,497 | | Ooredoo QPSC (Diversified Telecommunication Services) | | | 33,527 | |
| | 15,400 | | Qatar Islamic Bank SAQ (Banks) | | | 103,048 | |
| | 53,424 | | United Development Co. QSC (Real Estate Management & Development) | | | 21,014 | |
| | | | | | | | |
| | | | | | | 576,457 | |
| | | |
| | Russia(b) – 0.0% | |
| | 61,284 | | Gazprom PJSC (Oil, Gas & Consumable Fuels) | | | — | |
| | 5,200 | | LUKOIL PJSC ADR (Oil, Gas & Consumable Fuels) | | | — | |
| | 2,390 | | Magnit PJSC GDR (Food & Staples Retailing) | | | — | |
| | 3,393 | | Novolipetsk Steel PJSC (Metals & Mining) | | | — | |
| | 36 | | PhosAgro PJSC (Chemicals) | | | — | |
| | 5,614 | | PhosAgro PJSC GDR (Chemicals) | | | — | |
| | 19,000 | | Surgutneftegas PJSC ADR* (Oil, Gas & Consumable Fuels) | | | — | |
| | 23,847 | | VTB Bank PJSC GDR* (Banks) | | | — | |
| | | | | | | | |
| | | | | | | — | |
| | | |
| | Singapore – 0.3% | |
| | 13,400 | | City Developments Ltd. (Real Estate Management & Development) | | | 72,247 | |
| | 91,900 | | ComfortDelGro Corp. Ltd. (Road & Rail) | | | 82,498 | |
| | 22,500 | | DBS Group Holdings Ltd. (Banks) | | | 543,967 | |
| | 52,613 | | Digital Core REIT Management Pte Ltd. (Equity Real Estate Investment Trusts (REITs)) | | | 26,289 | |
| | 62,500 | | First Resources Ltd. (Food Products) | | | 65,665 | |
| | 129,100 | | Lendlease Global Commercial Reit (Equity Real Estate Investment Trusts (REITs)) | | | 63,900 | |
| | 57,100 | | Sembcorp Industries Ltd. (Multi-Utilities) | | | 117,378 | |
| | | | | | | | |
| | | | | | | 971,944 | |
| | | |
| | South Africa – 0.3% | |
| | 4,100 | | African Rainbow Minerals Ltd. (Metals & Mining) | | | 57,734 | |
| | 1,700 | | Anglo American Platinum Ltd. (Metals & Mining) | | | 135,364 | |
| | | |
| | | | | | | | |
| | | Shares | | Description | | Value | |
| |
| | Common Stocks (continued) | |
| | |
| | South Africa (continued) | | | | |
| | 3,150 | | Aspen Pharmacare Holdings Ltd. (Pharmaceuticals) | | $ | 25,912 | |
| | 1,222 | | Capitec Bank Holdings Ltd. (Banks) | | | 126,534 | |
| | 6,454 | | Clicks Group Ltd. (Food & Staples Retailing) | | | 109,360 | |
| | | 34,769 | | FirstRand Ltd. (Diversified Financial Services) | | | 121,552 | |
| | 8,815 | | Investec Ltd. (Capital Markets) | | | 43,358 | |
| | 3,000 | | Kumba Iron Ore Ltd. (Metals & Mining) | | | 56,438 | |
| | 3,350 | | Mr Price Group Ltd. (Specialty Retail) | | | 32,243 | |
| | 23,056 | | MTN Group Ltd. (Wireless Telecommunication Services) | | | 162,947 | |
| | 7,412 | | MultiChoice Group (Media) | | | 48,433 | |
| | 31,750 | | Pepkor Holdings Ltd.(a) (Specialty Retail) | | | 39,185 | |
| | 4,482 | | Sasol Ltd. (Chemicals) | | | 75,343 | |
| | | | | | | | |
| | | | | | | 1,034,403 | |
| | | |
| | South Korea – 1.8% | |
| | 350 | | BGF retail Co. Ltd. (Food & Staples Retailing) | | | 45,770 | |
| | 11,298 | | BNK Financial Group, Inc. (Banks) | | | 50,772 | |
| | 17,839 | | Coupang, Inc.* (Internet & Direct Marketing Retail) | | | 308,080 | |
| | 350 | | Daesung Holdings Co. Ltd. (Gas Utilities) | | | 24,251 | |
| | 550 | | DB Insurance Co. Ltd. (Insurance) | | | 21,706 | |
| | 4,856 | | Hana Financial Group, Inc. (Banks) | | | 140,394 | |
| | 1,500 | | Hankook Tire & Technology Co. Ltd. (Auto Components) | | | 38,421 | |
| | 1,707 | | Hyundai Mobis Co. Ltd. (Auto Components) | | | 261,818 | |
| | 1,250 | | Hyundai Motor Co. (Automobiles) | | | 144,048 | |
| | 1,050 | | Hyundai Steel Co. (Metals & Mining) | | | 20,662 | |
| | 13,617 | | Industrial Bank of Korea (Banks) | | | 99,794 | |
| | 1,750 | | JYP Entertainment Corp. (Entertainment) | | | 68,030 | |
| | 9,312 | | KB Financial Group, Inc. (Banks) | | | 313,340 | |
| | 7,665 | | Kia Corp. (Automobiles) | | | 356,199 | |
| | 3,156 | | Korea Aerospace Industries Ltd. (Aerospace & Defense) | | | 104,812 | |
| | 4,718 | | KT Corp. (Diversified Telecommunication Services) | | | 121,134 | |
| | 1,903 | | KT Corp. ADR (Diversified Telecommunication Services) | | | 24,187 | |
| | 250 | | Kumho Petrochemical Co. Ltd. (Chemicals) | | | 22,919 | |
| | 224 | | LG Innotek Co. Ltd. (Electronic Equipment, Instruments & Components) | | | 46,472 | |
| | 350 | | LX Semicon Co. Ltd. (Semiconductors & Semiconductor Equipment) | | | 20,307 | |
| | | |
The accompanying notes are an integral part of these financial statements. 29
|
| GOLDMAN SACHS MULTI-MANAGER GLOBAL EQUITY FUND |
Schedule of Investments (continued)
October 31, 2022
| | | | | | | | |
| | | Shares | | Description | | Value | |
| |
| | Common Stocks (continued) | |
| | |
| | South Korea (continued) | | | | |
| | | 1,780 | | POSCO Holdings, Inc. (Metals & Mining) | | $ | 310,237 | |
| | 265 | | Samsung Biologics Co. Ltd.*(a) (Life Sciences Tools & Services) | | | 162,852 | |
| | 33,280 | | Samsung Electronics Co. Ltd. (Technology Hardware, Storage & Peripherals) | | | 1,363,108 | |
| | 1,051 | | Samsung Electronics Co. Ltd. GDR (Technology Hardware, Storage & Peripherals) | | | 1,085,471 | |
| | 1,084 | | Samsung SDI Co. Ltd. (Electronic Equipment, Instruments & Components) | | | 559,252 | |
| | 700 | | Seegene, Inc. (Biotechnology) | | | 14,073 | |
| | 7,409 | | Shinhan Financial Group Co. Ltd. (Banks) | | | 188,311 | |
| | 8,815 | | SK Hynix, Inc. (Semiconductors & Semiconductor Equipment) | | | 510,314 | |
| | 1 | | SK Innovation Co. Ltd.* (Oil, Gas & Consumable Fuels) | | | 121 | |
| | 1,387 | | S-Oil Corp. (Oil, Gas & Consumable Fuels) | | | 84,100 | |
| | 8,205 | | Woori Financial Group, Inc. (Banks) | | | 67,708 | |
| | | | | | | | |
| | | | | | | 6,578,663 | |
| | | |
| | Spain – 0.9% | | | | |
| | 5,059 | | Aena SME SA*(a) (Transportation Infrastructure) | | | 594,591 | |
| | 31,381 | | Amadeus IT Group SA* (IT Services) | | | 1,636,684 | |
| | 139,427 | | Banco de Sabadell SA (Banks) | | | 109,702 | |
| | 19,952 | | CaixaBank SA (Banks) | | | 66,162 | |
| | 2,700 | | CIE Automotive SA (Auto Components) | | | 68,777 | |
| | 38,061 | | Iberdrola SA (Electric Utilities) | | | 387,053 | |
| | 26,054 | | Industria de Diseno Textil SA (Specialty Retail) | | | 591,379 | |
| | | | | | | | |
| | | | | | | 3,454,348 | |
| | | |
| | Sweden – 0.6% | | | | |
| | 6,066 | | AAK AB (Food Products) | | | 88,427 | |
| | 25,386 | | Atlas Copco AB Class A (Machinery) | | | 270,951 | |
| | 11,091 | | Electrolux AB Class B (Household Durables) | | | 136,832 | |
| | 5,387 | | Evolution AB(a) (Hotels, Restaurants & Leisure) | | | 502,514 | |
| | 3,449 | | Loomis AB Class B (Commerical Services & Supplies) | | | 96,567 | |
| | 577 | | Olink Holding AB ADR* (Life Sciences Tools & Services) | | | 10,576 | |
| | 2,948 | | Saab AB Class B (Aerospace & Defense) | | | 104,165 | |
| | 4,374 | | Spotify Technology SA* (Entertainment) | | | 352,457 | |
| | 30,645 | | Swedbank AB Class A (Banks) | | | 456,857 | |
| | | |
| | | | | | | | |
| | | Shares | | Description | | Value | |
| |
| | Common Stocks (continued) | |
| | |
| | Sweden (continued) | | | | |
| | | 5,224 | | Trelleborg AB Class B (Machinery) | | $ | 115,027 | |
| | | | | | | | |
| | | | | | | 2,134,373 | |
| | | |
| | Switzerland – 2.9% | | | | |
| | 8,571 | | Alcon, Inc. (Health Care Equipment | | | | |
| | | | & Supplies) | | | 521,848 | |
| | 664 | | BKW AG (Electric Utilities) | | | 77,464 | |
| | 9,455 | | Cie Financiere Richemont SA Class A | | | | |
| | | | (Textiles, Apparel & Luxury Goods) | | | 924,070 | |
| | 416 | | Comet Holding AG (Electronic | | | | |
| | | | Equipment, Instruments & | | | | |
| | | | Components) | | | 66,226 | |
| | 1,526 | | Galenica AG(a) (Health Care | | | | |
| | | | Providers & Services) | | | 109,640 | |
| | 5,567 | | Julius Baer Group Ltd. (Capital | | | | |
| | | | Markets) | | | 267,098 | |
| | 569 | | Lonza Group AG (Life Sciences | | | | |
| | | | Tools & Services) | | | 292,912 | |
| | 17,906 | | Nestle SA (Food Products) | | | 1,949,226 | |
| | 16,944 | | Novartis AG (Pharmaceuticals) | | | 1,370,612 | |
| | 1,123 | | PSP Swiss Property AG (Real Estate Management & Development) | | | 119,970 | |
| | 6,394 | | Roche Holding AG (Pharmaceuticals) | | | 2,121,517 | |
| | 4,660 | | SIG Group AG* (Containers & Packaging) | | | 89,579 | |
| | 3,764 | | Sika AG (Chemicals) | | | 848,691 | |
| | 2,053 | | Sophia Genetics SA* (Health Care Technology) | | | 4,517 | |
| | 321 | | Tecan Group AG* (Life Sciences Tools & Services) | | | 117,754 | |
| | 46,791 | | UBS Group AG (Capital Markets) | | | 741,832 | |
| | 278 | | VAT Group AG*(a) (Machinery) | | | 63,468 | |
| | 2,213 | | Zurich Insurance Group AG (Insurance) | | | 943,123 | |
| | | | | | | | |
| | | | | | | 10,629,547 | |
| | | |
| | Taiwan – 1.3% | | | | |
| | 2,950 | | Accton Technology Corp. (Communications Equipment) | | | 22,184 | |
| | 24,100 | | ASE Technology Holding Co. Ltd. (Semiconductors & Semiconductor Equipment) | | | 59,506 | |
| | 13,250 | | Asustek Computer, Inc. (Technology Hardware, Storage & Peripherals) | | | 96,874 | |
| | 41,000 | | Chailease Holding Co. Ltd. (Diversified Financial Services) | | | 189,120 | |
| | 36,500 | | Delta Electronics, Inc. (Electronic Equipment, Instruments & Components) | | | 290,424 | |
| | 24,250 | | E Ink Holdings, Inc. (Electronic Equipment, Instruments & Components) | | | 154,089 | |
| | 4,200 | | Eclat Textile Co. Ltd. (Textiles, Apparel & Luxury Goods) | | | 55,115 | |
| | | |
30 The accompanying notes are an integral part of these financial statements.
GOLDMAN SACHS MULTI-MANAGER GLOBAL EQUITY FUND
| | | | | | | | |
| | | Shares | | Description | | Value | |
| |
| | Common Stocks (continued) | |
| | |
| | | Taiwan (continued) | | | | |
| | 10,400 | | Evergreen Marine Corp. Taiwan Ltd. (Marine) | | $ | 44,245 | |
| | 188,667 | | Fubon Financial Holding Co. Ltd. (Insurance) | | | 298,006 | |
| | 16,450 | | Gigabyte Technology Co. Ltd. (Technology Hardware, Storage & Peripherals) | | | 46,967 | |
| | 2,300 | | Global Unichip Corp. (Semiconductors & Semiconductor Equipment) | | | 34,598 | |
| | 5,382 | | Great Tree Pharmacy Co. Ltd. (Food & Staples Retailing) | | | 45,093 | |
| | 58,950 | | Hon Hai Precision Industry Co. Ltd. (Electronic Equipment, Instruments & Components) | | | 187,230 | |
| | 10,350 | | International Games System Co. Ltd. Class C (Entertainment) | | | 112,686 | |
| | 3,150 | | King Slide Works Co. Ltd. (Technology Hardware, Storage & Peripherals) | | | 40,873 | |
| | 850 | | Largan Precision Co. Ltd. (Electronic Equipment, Instruments & Components) | | | 48,630 | |
| | 2,950 | | Lotes Co. Ltd. (Electronic Equipment, Instruments & Components) | | | 70,797 | |
| | 5,250 | | Lotus Pharmaceutical Co. Ltd.* (Pharmaceuticals) | | | 25,079 | |
| | 15,117 | | MediaTek, Inc. (Semiconductors & Semiconductor Equipment) | | | 275,556 | |
| | 2,800 | | Nien Made Enterprise Co. Ltd. (Household Durables) | | | 21,589 | |
| | 29,700 | | Pou Chen Corp. (Textiles, Apparel & Luxury Goods) | | | 25,073 | |
| | 19,588 | | Radiant Opto-Electronics Corp. (Semiconductors & Semiconductor Equipment) | | | 59,682 | |
| | 155,605 | | Taiwan Semiconductor Manufacturing Co. Ltd. (Semiconductors & Semiconductor Equipment) | | | 1,870,715 | |
| | 6,136 | | Taiwan Semiconductor Manufacturing Co. Ltd. ADR (Semiconductors & Semiconductor Equipment) | | | 377,671 | |
| | 12,800 | | Unimicron Technology Corp. (Electronic Equipment, Instruments & Components) | | | 49,182 | |
| | 289,685 | | United Microelectronics Corp.* (Semiconductors & Semiconductor Equipment) | | | 348,335 | |
| | 350 | | Voltronic Power Technology Corp. (Electrical Equipment) | | | 14,190 | |
| | 4,350 | | Wistron NeWeb Corp. (Communications Equipment) | | | 11,279 | |
| | | |
| | | | | | | | |
| | | Shares | | Description | | Value | |
| |
| | Common Stocks (continued) | |
| | |
| | Taiwan (continued) | | | | |
| | | 11,500 | | XinTec, Inc. (Semiconductors & Semiconductor Equipment) | | $ | 34,047 | |
| | 7,350 | | Zhen Ding Technology Holding Ltd. (Electronic Equipment, Instruments & Components) | | | 24,088 | |
| | | | | | | | |
| | | | | | | 4,932,923 | |
| | | |
| | Thailand – 0.5% | |
| | 51,300 | | Airports of Thailand PCL NVDR* (Transportation Infrastructure) | | | 99,793 | |
| | 16,150 | | Bangkok Bank PCL (Banks) | | | 61,845 | |
| | 94,000 | | Bangkok Chain Hospital PCL (Health Care Providers & Services) | | | 45,728 | |
| | 70,500 | | Bangkok Dusit Medical Services PCL (Health Care Providers & Services) | | | 54,718 | |
| | 326,000 | | Bangkok Dusit Medical Services PCL NVDR (Health Care Providers & Services) | | | 253,024 | |
| | 25,400 | | Bumrungrad Hospital PCL (Health Care Providers & Services) | | | 151,410 | |
| | 8,050 | | Ditto Thailand PCL (IT Services) | | | 14,911 | |
| | 20,900 | | Forth Corp. PCL NVDR (Electronic Equipment, Instruments & Components) | | | 29,179 | |
| | 19,350 | | Kasikornbank PCL (Banks) | | | 74,453 | |
| | 42,800 | | Kasikornbank PCL NVDR (Banks) | | | 164,682 | |
| | 40,100 | | Kiatnakin Phatra Bank PCL (Banks) | | | 77,017 | |
| | 398,800 | | Krung Thai Bank PCL (Banks) | | | 183,764 | |
| | 36,350 | | PTT Exploration & Production PCL (Oil, Gas & Consumable Fuels) | | | 173,799 | |
| | 55,100 | | PTT Exploration & Production PCL NVDR (Oil, Gas & Consumable Fuels) | | | 263,447 | |
| | 25,450 | | Thonburi Healthcare Group PCL (Health Care Providers & Services) | | | 45,181 | |
| | 1,404,450 | | TMBThanachart Bank PCL (Banks) | | | 50,259 | |
| | | | | | | | |
| | | | | | | 1,743,210 | |
| | | |
| | Turkey – 0.0% | |
| | 14,400 | | BIM Birlesik Magazalar AS (Food & Staples Retailing) | | | 103,678 | |
| | 15,123 | | Haci Omer Sabanci Holding AS (Banks) | | | 27,235 | |
| | 73,229 | | Turkiye Is Bankasi AS Class C (Banks) | | | 36,684 | |
| | | | | | | | |
| | | | | | | 167,597 | |
| | | |
| | United Arab Emirates – 0.3% | |
| | 76,500 | | Abu Dhabi Commercial Bank PJSC (Banks) | | | 196,924 | |
| | 52,415 | | Abu Dhabi Islamic Bank PJSC (Banks) | | | 135,619 | |
| | 167,291 | | Emaar Properties PJSC (Real Estate Management & Development) | | | 276,156 | |
| | 28,647 | | Emirates NBD Bank PJSC (Banks) | | | 103,442 | |
| | | |
The accompanying notes are an integral part of these financial statements. 31
|
| GOLDMAN SACHS MULTI-MANAGER GLOBAL EQUITY FUND |
Schedule of Investments (continued)
October 31, 2022
| | | | | | | | |
| | | Shares | | Description | | Value | |
| |
| | Common Stocks (continued) | |
| | |
| | United Arab Emirates (continued) | | | | |
| | 104,279 | | Fertiglobe PLC (Chemicals) | | $ | 144,457 | |
| | 37,076 | | First Abu Dhabi Bank PJSC (Banks) | | | 180,811 | |
| | 5,869 | | Yalla Group Ltd.* (Interactive Media & Services) | | | 18,135 | |
| | | | | | | | |
| | | | | | | 1,055,544 | |
| | | |
| | United Kingdom – 4.8% | |
| | 3,291 | | Anglo American PLC (Metals & Mining) | | | 98,579 | |
| | 11,634 | | AstraZeneca PLC (Pharmaceuticals) | | | 1,365,042 | |
| | 13,349 | | B&M European Value Retail SA (Multiline Retail) | | | 49,332 | |
| | 25,601 | | Balfour Beatty PLC (Construction & Engineering) | | | 87,667 | |
| | 461,621 | | Barclays PLC (Banks) | | | 784,410 | |
| | 17,156 | | Beazley PLC (Insurance) | | | 123,040 | |
| | 4,292 | | Berkeley Group Holdings PLC (Household Durables) | | | 170,767 | |
| | 67,639 | | BP PLC (Oil, Gas & Consumable Fuels) | | | 374,220 | |
| | 8,637 | | British American Tobacco PLC (Tobacco) | | | 341,105 | |
| | 60,608 | | Compass Group PLC (Hotels, Restaurants & Leisure) | | | 1,276,514 | |
| | 2,897 | | Computacenter PLC (IT Services) | | | 60,109 | |
| | 26,367 | | ConvaTec Group PLC(a) (Health Care Equipment & Supplies) | | | 65,976 | |
| | 1,595 | | Covestro AG(a) (Chemicals) | | | 54,144 | |
| | 1,660 | | Cranswick PLC (Food Products) | | | 56,675 | |
| | 4,419 | | CVS Group PLC (Health Care Providers & Services) | | | 95,520 | |
| | 3,001 | | Dechra Pharmaceuticals PLC (Pharmaceuticals) | | | 90,217 | |
| | 2,380 | | Derwent London PLC (Equity Real Estate Investment Trusts (REITs)) | | | 58,903 | |
| | 14,623 | | Diageo PLC (Beverages) | | | 601,772 | |
| | 30,925 | | Dr. Martens PLC (Textiles, Apparel & Luxury Goods) | | | 87,947 | |
| | 42,759 | | DS Smith PLC (Containers & Packaging) | | | 142,598 | |
| | 874 | | Endava PLC ADR* (IT Services) | | | 66,634 | |
| | 4,239 | | Entain PLC (Hotels, Restaurants & Leisure) | | | 61,324 | |
| | 2,981 | | Ferguson PLC (Trading Companies & Distributors) | | | 325,104 | |
| | 3,977 | | Future PLC (Media) | | | 55,736 | |
| | 12,504 | | GB Group PLC (Software) | | | 54,584 | |
| | 19,376 | | GSK PLC (Pharmaceuticals) | | | 317,400 | |
| | 10,795 | | Harbour Energy PLC (Oil, Gas & Consumable Fuels) | | | 46,848 | |
| | 17,881 | | Ibstock PLC(a) (Construction Materials) | | | 31,879 | |
| | 11,526 | | IG Group Holdings PLC (Capital Markets) | | | 105,132 | |
| | 6,303 | | IMI PLC (Machinery) | | | 88,789 | |
| | | |
| | | | | | | | |
| | | Shares | | Description | | Value | |
| |
| | Common Stocks (continued) | |
| | |
| | United Kingdom (continued) | | | | |
| | 186 | | Immunocore Holdings PLC ADR* (Biotechnology) | | $ | 10,628 | |
| | 16,468 | | J Sainsbury PLC (Food & Staples Retailing) | | | 36,709 | |
| | 72,020 | | JD Sports Fashion PLC (Specialty Retail) | | | 80,477 | |
| | 5,009 | | Linde PLC (Chemicals) | | | 1,491,570 | |
| | 3,978 | | London Stock Exchange Group PLC (Capital Markets) | | | 344,821 | |
| | 37,715 | | Man Group PLC (Capital Markets) | | | 93,820 | |
| | 10,313 | | OSB Group PLC (Thrifts & Mortgage Finance) | | | 49,147 | |
| | 150,335 | | Prudential PLC (Insurance) | | | 1,396,561 | |
| | 14,113 | | QinetiQ Group PLC (Aerospace & Defense) | | | 58,172 | |
| | 20,693 | | Reckitt Benckiser Group PLC (Household Products) | | | 1,373,269 | |
| | 56,316 | | RELX PLC (Professional Services) | | | 1,513,010 | |
| | 13,282 | | Rio Tinto PLC (Metals & Mining) | | | 694,139 | |
| | 1,664,091 | | Rolls-Royce Holdings PLC* (Aerospace & Defense) | | | 1,492,461 | |
| | 11,697 | | RS Group PLC (Trading Companies & Distributors) | | | 128,707 | |
| | 6,412 | | Safestore Holdings PLC (Equity Real Estate Investment Trusts (REITs)) | | | 66,431 | |
| | 51,775 | | Serco Group PLC (Commerical Services & Supplies) | | | 96,834 | |
| | 3,482 | | St. James’s Place PLC (Capital Markets) | | | 42,521 | |
| | 39,140 | | Supermarket Income Reit PLC (Equity Real Estate Investment Trusts (REITs)) | | | 46,013 | |
| | 122,767 | | Tesco PLC (Food & Staples Retailing) | | | 303,220 | |
| | 4,855 | | The Weir Group PLC (Machinery) | | | 84,593 | |
| | 43,840 | | Tritax Big Box REIT PLC (Equity Real Estate Investment Trusts (REITs)) | | | 70,492 | |
| | 17,839 | | Unilever PLC (Personal Products) | | | 810,860 | |
| | 25,397 | | WH Smith PLC* (Specialty Retail) | | | 343,351 | |
| | 1,651 | | Whitbread PLC (Hotels, Restaurants | | | | |
| | | | & Leisure) | | | 48,592 | |
| | | | | | | | |
| | | | | | | 17,814,365 | |
| | | |
| | United States – 55.4% | |
| | 20,211 | | Abbott Laboratories (Health Care Equipment & Supplies) | | | 1,999,676 | |
| | 5,318 | | AbbVie, Inc. (Biotechnology) | | | 778,555 | |
| | 4,430 | | ABM Industries, Inc. (Commerical Services & Supplies) | | | 197,179 | |
| | 4,950 | | Advanced Micro Devices, Inc.* (Semiconductors & Semiconductor Equipment) | | | 297,297 | |
| | 5,455 | | Affirm Holdings, Inc.* (IT Services) | | | 109,482 | |
| | | |
32 The accompanying notes are an integral part of these financial statements.
GOLDMAN SACHS MULTI-MANAGER GLOBAL EQUITY FUND
| | | | | | | | |
| | | Shares | | Description | | Value | |
| |
| | Common Stocks (continued) | |
| | |
| | | United States (continued) | | | | |
| | 2,970 | | Agree Realty Corp. (Equity Real Estate Investment Trusts (REITs)) | | $ | 204,039 | |
| | 1,665 | | Alamo Group, Inc. (Machinery) | | | 253,213 | |
| | 1,360 | | Allegiant Travel Co.* (Airlines) | | | 102,068 | |
| | 1,319 | | Allison Transmission Holdings, Inc. (Machinery) | | | 55,728 | |
| | 92,019 | | Alphabet, Inc. Class A* (Interactive Media & Services) | | | 8,696,716 | |
| | 4,581 | | Alphabet, Inc. Class C* (Interactive Media & Services) | | | 433,637 | |
| | 1,160 | | Altra Industrial Motion Corp. (Machinery) | | | 69,762 | |
| | 64,775 | | Amazon.com, Inc.* (Internet & Direct Marketing Retail) | | | 6,635,551 | |
| | 570 | | Amedisys, Inc.* (Health Care Providers & Services) | | | 55,626 | |
| | 1,260 | | American Eagle Outfitters, Inc. (Specialty Retail) | | | 14,314 | |
| | 52,383 | | American International Group, Inc. (Insurance) | | | 2,985,831 | |
| | 6,534 | | Ameris Bancorp (Banks) | | | 336,566 | |
| | 2,746 | | AMERISAFE, Inc. (Insurance) | | | 160,394 | |
| | 293 | | AMN Healthcare Services, Inc.* (Health Care Providers & Services) | | | 36,771 | |
| | 11,384 | | Amphenol Corp. Class A (Electronic Equipment, Instruments & Components) | | | 863,249 | |
| | 4,088 | | Anywhere Real Estate, Inc.* (Real Estate Management & Development) | | | 30,374 | |
| | 10,617 | | Aon PLC Class A (Insurance) | | | 2,988,579 | |
| | 18,002 | | Apple, Inc. (Technology Hardware, Storage & Peripherals) | | | 2,760,427 | |
| | 4,615 | | Arcutis Biotherapeutics, Inc.* (Biotechnology) | | | 81,593 | |
| | 1,631 | | Ares Commercial Real Estate Corp. (Mortgage Real Estate Investment Trusts (REITs)) | | | 20,127 | |
| | 4,939 | | Arista Networks, Inc.* (Communications Equipment) | | | 596,928 | |
| | 796 | | Artisan Partners Asset Management, Inc. Class A (Capital Markets) | | | 22,694 | |
| | 6,941 | | Artivion, Inc.* (Health Care Equipment & Supplies) | | | 77,462 | |
| | 1,188 | | ASGN, Inc.* (Professional Services) | | | 100,719 | |
| | 5,501 | | Atlassian Corp. PLC Class A* (Software) | | | 1,115,218 | |
| | 4,630 | | AtriCure, Inc.* (Health Care Equipment & Supplies) | | | 195,016 | |
| | 19,385 | | Avantor, Inc.* (Life Sciences Tools & Services) | | | 390,995 | |
| | 6,346 | | Avient Corp. (Chemicals) | | | 218,874 | |
| | 1,399 | | Avnet, Inc. (Electronic Equipment, Instruments & Components) | | | 56,226 | |
| | 2,669 | | Azenta, Inc. (Life Sciences Tools & Services) | | | 118,504 | |
| | | |
| | | | | | | | |
| | | Shares | | Description | | Value | |
| |
| | Common Stocks (continued) | |
| | |
| | | United States (continued) | | | | |
| | 1,589 | | Balchem Corp. (Chemicals) | | $ | 222,142 | |
| | 56,844 | | Bank of America Corp. (Banks) | | | 2,048,658 | |
| | 1,620 | | BankUnited, Inc. (Banks) | | | 58,239 | |
| | 7,216 | | Becton Dickinson & Co. (Health Care Equipment & Supplies) | | | 1,702,759 | |
| | 2,245 | | Belden, Inc. (Electronic Equipment, Instruments & Components) | | | 156,319 | |
| | 9,469 | | Berkshire Hathaway, Inc. Class B* (Diversified Financial Services) | | | 2,794,207 | |
| | 1,313 | | Berkshire Hills Bancorp, Inc. (Banks) | | | 38,405 | |
| | 5,150 | | BioCryst Pharmaceuticals, Inc.* (Biotechnology) | | | 68,752 | |
| | 3,034 | | Blackstone Mortgage Trust, Inc. Class A (Mortgage Real Estate Investment Trusts (REITs)) | | | 75,729 | |
| | 879 | | Booking Holdings, Inc.* (Hotels, Restaurants & Leisure) | | | 1,643,273 | |
| | 2,098 | | Boot Barn Holdings, Inc.* (Specialty Retail) | | | 119,166 | |
| | 19,566 | | BorgWarner, Inc. (Auto Components) | | | 734,312 | |
| | 1,103 | | BWX Technologies, Inc. (Aerospace & Defense) | | | 62,849 | |
| | 836 | | Cabot Corp. (Chemicals) | | | 61,429 | |
| | 1,106 | | Cactus, Inc. Class A (Energy Equipment & Services) | | | 57,202 | |
| | 4,058 | | Cadence Design Systems, Inc.* (Software) | | | 614,341 | |
| | 19,603 | | Carrier Global Corp. (Building Products) | | | 779,415 | |
| | 380 | | Carter’s, Inc. (Textiles, Apparel & Luxury Goods) | | | 25,791 | |
| | 3,599 | | Carvana Co.* (Specialty Retail) | | | 48,694 | |
| | 2,377 | | Castle Biosciences, Inc.* (Health Care Providers & Services) | | | 60,661 | |
| | 6,772 | | Caterpillar, Inc. (Machinery) | | | 1,465,867 | |
| | 5,789 | | Cathay General Bancorp (Banks) | | | 263,978 | |
| | 5,456 | | Central Garden & Pet Co. Class A* (Household Products) | | | 213,548 | |
| | 6,541 | | ChampionX Corp. (Energy Equipment & Services) | | | 187,203 | |
| | 3,185 | | Chemed Corp. (Health Care Providers & Services) | | | 1,486,981 | |
| | 301 | | Chipotle Mexican Grill, Inc.* (Hotels, Restaurants & Leisure) | | | 450,997 | |
| | 538 | | Chord Energy Corp. (Oil, Gas & Consumable Fuels) | | | 82,362 | |
| | 1,144 | | Churchill Downs, Inc. (Hotels, Restaurants & Leisure) | | | 237,849 | |
| | 3,647 | | Chuy’s Holdings, Inc.* (Hotels, Restaurants & Leisure) | | | 106,857 | |
| | 6,753 | | Cigna Corp. (Health Care Providers & Services) | | | 2,181,624 | |
| | 36,215 | | Cogent Communications Holdings, Inc. (Diversified Telecommunication Services) | | | 1,901,650 | |
| | | |
The accompanying notes are an integral part of these financial statements. 33
|
| GOLDMAN SACHS MULTI-MANAGER GLOBAL EQUITY FUND |
Schedule of Investments (continued)
October 31, 2022
| | | | | | | | |
| | | Shares | | Description | | Value | |
| |
| | Common Stocks (continued) | |
| | |
| | | United States (continued) | | | | |
| | 2,888 | | Cohen & Steers, Inc. (Capital Markets) | | $ | 173,742 | |
| | 10,836 | | Comcast Corp. Class A (Media) | | | 343,935 | |
| | 6,008 | | CommScope Holding Co., Inc.* (Communications Equipment) | | | 79,546 | |
| | 1,146 | | Concentrix Corp. (IT Services) | | | 140,076 | |
| | 22,425 | | ConocoPhillips (Oil, Gas & Consumable Fuels) | | | 2,827,568 | |
| | 3,080 | | Cousins Properties, Inc. (Equity Real Estate Investment Trusts (REITs)) | | | 73,181 | |
| | 3,791 | | CryoPort, Inc.* (Health Care Equipment & Supplies) | | | 105,238 | |
| | 917 | | Curtiss-Wright Corp. (Aerospace & Defense) | | | 153,900 | |
| | 13,285 | | Danaher Corp. (Life Sciences Tools & Services) | | | 3,343,436 | |
| | 2,520 | | Deere & Co. (Machinery) | | | 997,466 | |
| | 1,006 | | Delek U.S. Holdings, Inc. (Oil, Gas & Consumable Fuels) | | | 29,838 | |
| | 18,842 | | Dollar General Corp. (Multiline Retail) | | | 4,805,652 | |
| | 12,710 | | Dominion Energy, Inc. (Multi- Utilities) | | | 889,319 | |
| | 5,406 | | Ecovyst, Inc.* (Chemicals) | | | 53,790 | |
| | 2,769 | | Eli Lilly & Co. (Pharmaceuticals) | | | 1,002,627 | |
| | 609 | | EMCOR Group, Inc. (Construction & Engineering) | | | 85,930 | |
| | 887 | | Employers Holdings, Inc. (Insurance) | | | 38,682 | |
| | 2,122 | | Energizer Holdings, Inc. (Household Products) | | | 61,305 | |
| | 813 | | EnerSys (Electrical Equipment) | | | 53,894 | |
| | 15,625 | | Entegris, Inc. (Semiconductors & Semiconductor Equipment) | | | 1,239,687 | |
| | 2,607 | | Envista Holdings Corp.* (Health Care Equipment & Supplies) | | | 86,057 | |
| | 1,658 | | EPAM Systems, Inc.* (IT Services) | | | 580,300 | |
| | 1,627 | | Essent Group Ltd. (Thrifts & Mortgage Finance) | | | 64,397 | |
| | 906 | | Evercore, Inc. Class A (Capital Markets) | | | 95,221 | |
| | 636 | | Federal Agricultural Mortgage Corp. Class C (Thrifts & Mortgage Finance) | | | 73,267 | |
| | 4,205 | | Fidelity National Information Services, Inc. (IT Services) | | | 348,973 | |
| | 1,450 | | First Hawaiian, Inc. (Banks) | | | 37,091 | |
| | 1,918 | | First Merchants Corp. (Banks) | | | 86,118 | |
| | 417 | | FirstCash Holdings, Inc. (Consumer Finance) | | | 41,054 | |
| | 16,935 | | Fiserv, Inc.* (IT Services) | | | 1,739,902 | |
| | 819 | | Five Below, Inc.* (Specialty Retail) | | | 119,861 | |
| | 3,475 | | Flywire Corp.* (IT Services) | | | 76,276 | |
| | 1,291 | | Foot Locker, Inc. (Specialty Retail) | | | 40,925 | |
| | 5,863 | | Fortinet, Inc.* (Software) | | | 335,129 | |
| | 43,112 | | Freeport-McMoRan, Inc. (Metals & Mining) | | | 1,366,219 | |
| | | |
| | | | | | | | |
| | | Shares | | Description | | Value | |
| |
| | Common Stocks (continued) | |
| | |
| | | United States (continued) | | | | |
| | 2,491 | | Fresh Del Monte Produce, Inc. (Food Products) | | $ | 64,965 | |
| | 468 | | FTI Consulting, Inc.* (Professional Services) | | | 72,835 | |
| | 44,178 | | General Motors Co. (Automobiles) | | | 1,733,986 | |
| | 3,712 | | Glacier Bancorp, Inc. (Banks) | | | 212,623 | |
| | 6,821 | | Global Payments, Inc. (IT Services) | | | 779,367 | |
| | 4,184 | | Globus Medical, Inc. Class A* (Health Care Equipment & Supplies) | | | 280,328 | |
| | 3,949 | | GrafTech International Ltd. (Electrical Equipment) | | | 20,100 | |
| | 2,542 | | Grand Canyon Education, Inc.* (Diversified Consumer Services) | | | 255,801 | |
| | 11,788 | | Graphic Packaging Holding Co. (Containers & Packaging) | | | 270,652 | |
| | 2,635 | | Gray Television, Inc. (Media) | | | 37,285 | |
| | 565 | | Haemonetics Corp.* (Health Care Equipment & Supplies) | | | 47,997 | |
| | 7,129 | | Halozyme Therapeutics, Inc.* (Biotechnology) | | | 340,837 | |
| | 733 | | Hancock Whitney Corp. (Banks) | | | 40,953 | |
| | 3,996 | | Hanesbrands, Inc. (Textiles, Apparel & Luxury Goods) | | | 27,253 | |
| | 4,369 | | Harley-Davidson, Inc. (Automobiles) | | | 187,867 | |
| | 1,794 | | HashiCorp, Inc. Class A* (Software) | | | 55,130 | |
| | 6,117 | | HCA Healthcare, Inc. (Health Care Providers & Services) | | | 1,330,264 | |
| | 3,675 | | HealthEquity, Inc.* (Health Care Providers & Services) | | | 286,319 | |
| | 4,510 | | Heartland Express, Inc. (Road & Rail) | | | 67,109 | |
| | 1,183 | | Helen of Troy Ltd.* (Household Durables) | | | 111,935 | |
| | 3,079 | | Helios Technologies, Inc. (Machinery) | | | 174,548 | |
| | 2,316 | | Heritage Commerce Corp. (Banks) | | | 33,119 | |
| | 1,608 | | Hillenbrand, Inc. (Machinery) | | | 71,041 | |
| | 4,332 | | Honeywell International, Inc. (Industrial Conglomerates) | | | 883,815 | |
| | 6,429 | | Horace Mann Educators Corp. (Insurance) | | | 253,688 | |
| | 2,825 | | Houlihan Lokey, Inc. (Capital Markets) | | | 252,329 | |
| | 718 | | Hub Group, Inc. Class A* (Air Freight & Logistics) | | | 55,717 | |
| | 3,840 | | Humana, Inc. (Health Care Providers & Services) | | | 2,143,027 | |
| | 3,089 | | IAC, Inc.* (Interactive Media & Services) | | | 150,373 | |
| | 2,231 | | ICF International, Inc. (Professional Services) | | | 266,895 | |
| | 885 | | ICU Medical, Inc.* (Health Care Equipment & Supplies) | | | 131,343 | |
| | 1,900 | | IDACORP, Inc. (Electric Utilities) | | | 198,930 | |
| | 315 | | Illumina, Inc.* (Biotechnology) | | | 72,078 | |
| | 2,292 | | Independent Bank Corp. (Banks) | | | 199,427 | |
| | | |
34 The accompanying notes are an integral part of these financial statements.
GOLDMAN SACHS MULTI-MANAGER GLOBAL EQUITY FUND
| | | | | | | | |
| | | Shares | | Description | | Value | |
| |
| | Common Stocks (continued) | |
| | |
| | | United States (continued) | | | | |
| | 13,326 | | Ingersoll Rand, Inc. (Machinery) | | $ | 672,963 | |
| | 851 | | Ingevity Corp.* (Chemicals) | | | 57,247 | |
| | 2,250 | | Insight Enterprises, Inc.* (Electronic Equipment, Instruments & Components) | | | 212,647 | |
| | 1,670 | | Insulet Corp.* (Health Care Equipment & Supplies) | | | 432,213 | |
| | 3,526 | | Integra LifeSciences Holdings Corp.* (Health Care Equipment & Supplies) | | | 177,181 | |
| | 33,650 | | Intercontinental Exchange, Inc. (Capital Markets) | | | 3,215,930 | |
| | 1,570 | | InterDigital, Inc. (Software) | | | 78,296 | |
| | 2,322 | | International Game Technology PLC (Hotels, Restaurants & Leisure) | | | 46,556 | |
| | 3,282 | | Intra-Cellular Therapies, Inc.* (Pharmaceuticals) | | | 149,889 | |
| | 5,009 | | Intuit, Inc. (Software) | | | 2,141,347 | |
| | 4,808 | | Intuitive Surgical, Inc.* (Health Care Equipment & Supplies) | | | 1,185,028 | |
| | 2,275 | | ITT, Inc. (Machinery) | | | 173,787 | |
| | 7,235 | | Jack Henry & Associates, Inc. (IT Services) | | | 1,440,199 | |
| | 671 | | John Wiley & Sons, Inc. Class A (Media) | | | 28,309 | |
| | 12,280 | | Johnson & Johnson (Pharmaceuticals) | | | 2,136,352 | |
| | 2,645 | | KAR Auction Services, Inc.* (Commerical Services & Supplies) | | | 38,432 | |
| | 1,566 | | Kennedy-Wilson Holdings, Inc. (Real Estate Management & Development) | | | 26,011 | |
| | 37,049 | | KKR & Co., Inc. (Capital Markets) | | | 1,801,693 | |
| | 1,379 | | Korn Ferry (Professional Services) | | | 76,659 | |
| | 307,653 | | Kosmos Energy Ltd.* (Oil, Gas & Consumable Fuels) | | | 1,996,668 | |
| | 4,258 | | L3Harris Technologies, Inc. (Aerospace & Defense) | | | 1,049,469 | |
| | 166 | | Landstar System, Inc. (Road & Rail) | | | 25,933 | |
| | 928 | | LCI Industries (Auto Components) | | | 98,470 | |
| | 835 | | Lithia Motors, Inc. (Specialty Retail) | | | 165,455 | |
| | 3,865 | | Live Nation Entertainment, Inc.* (Entertainment) | | | 307,693 | |
| | 88,345 | | Luminar Technologies, Inc.* (Auto Components) | | | 714,711 | |
| | 5,143 | | MACOM Technology Solutions Holdings, Inc.* (Semiconductors & Semiconductor Equipment) | | | 297,625 | |
| | 10,806 | | Magnolia Oil & Gas Corp. Class A (Oil, Gas & Consumable Fuels) | | | 277,498 | |
| | 7,487 | | Marsh & McLennan Cos., Inc. (Insurance) | | | 1,209,076 | |
| | 1,973 | | Martin Marietta Materials, Inc. (Construction Materials) | | | 662,889 | |
| | 414 | | Masonite International Corp.* (Building Products) | | | 29,613 | |
| | 3,777 | | Mastercard, Inc. Class A (IT Services) | | | 1,239,536 | |
| | | |
| | | | | | | | |
| | | Shares | | Description | | Value | |
| |
| | Common Stocks (continued) | |
| | |
| | | United States (continued) | | | | |
| | 6,100 | | Matador Resources Co. (Oil, Gas & Consumable Fuels) | | $ | 405,345 | |
| | 5,069 | | Match Group, Inc.* (Interactive Media & Services) | | | 218,981 | |
| | 2,625 | | Mativ Holdings, Inc. (Chemicals) | | | 62,317 | |
| | 389 | | MAXIMUS, Inc. (IT Services) | | | 23,990 | |
| | 37,865 | | McCormick & Co., Inc. (Food Products) | | | 2,977,704 | |
| | 1,099 | | Medpace Holdings, Inc.* (Life Sciences Tools & Services) | | | 243,956 | |
| | 5,022 | | Meta Platforms, Inc. Class A* (Interactive Media & Services) | | | 467,849 | |
| | 308 | | Mettler-Toledo International, Inc.* (Life Sciences Tools & Services) | | | 389,598 | |
| | 45,669 | | Microsoft Corp. (Software) | | | 10,601,145 | |
| | 4,003 | | Minerals Technologies, Inc. (Chemicals) | | | 220,205 | |
| | 1,355 | | MongoDB, Inc.* (IT Services) | | | 248,006 | |
| | 3,640 | | Monolithic Power Systems, Inc. (Semiconductors & Semiconductor Equipment) | | | 1,235,598 | |
| | 4,835 | | Monster Beverage Corp.* (Beverages) | | | 453,136 | |
| | 12,280 | | Motorola Solutions, Inc. (Communications Equipment) | | | 3,066,439 | |
| | 18,942 | | Nasdaq, Inc. (Capital Markets) | | | 1,178,950 | |
| | 2,361 | | National Energy Services Reunited Corp.* (Energy Equipment & Services) | | | 17,849 | |
| | 2,530 | | National Health Investors, Inc. (Equity Real Estate Investment Trusts (REITs)) | | | 143,451 | |
| | 2,427 | | NCR Corp.* (Software) | | | 51,598 | |
| | 678 | | Nelnet, Inc. Class A (Consumer Finance) | | | 60,403 | |
| | 2,132 | | Netflix, Inc.* (Entertainment) | | | 622,288 | |
| | 910 | | Nexstar Media Group, Inc. (Media) | | | 155,883 | |
| | 49,235 | | NextEra Energy, Inc. (Electric Utilities) | | | 3,815,712 | |
| | 6,942 | | NexTier Oilfield Solutions, Inc.* (Energy Equipment & Services) | | | 69,975 | |
| | 2,701 | | NIKE, Inc. Class B (Textiles, Apparel & Luxury Goods) | | | 250,329 | |
| | 4,146 | | NorthWestern Corp. (Multi-Utilities) | | | 219,033 | |
| | 1,842 | | Novanta, Inc.* (Electronic Equipment, Instruments & Components) | | | 260,459 | |
| | 2,871 | | NOW, Inc.* (Trading Companies & Distributors) | | | 36,548 | |
| | 21,937 | | NVIDIA Corp. (Semiconductors & Semiconductor Equipment) | | | 2,960,837 | |
| | 379 | | NVR, Inc.* (Household Durables) | | | 1,606,107 | |
| | 10,176 | | OceanFirst Financial Corp. (Banks) | | | 229,774 | |
| | 709 | | Old Dominion Freight Line, Inc. (Road & Rail) | | | 194,691 | |
| | | |
The accompanying notes are an integral part of these financial statements. 35
|
| GOLDMAN SACHS MULTI-MANAGER GLOBAL EQUITY FUND |
Schedule of Investments (continued)
October 31, 2022
| | | | | | | | |
| | | Shares | | Description | | Value | |
| |
| | Common Stocks (continued) | |
| | |
| | | United States (continued) | | | | |
| | 1,203 | | Owens & Minor, Inc. (Health Care Providers & Services) | | $ | 20,451 | |
| | 2,164 | | Oxford Industries, Inc. (Textiles, Apparel & Luxury Goods) | | | 220,144 | |
| | 6,532 | | Pacific Premier Bancorp, Inc. (Banks) | | | 237,830 | |
| | 2,920 | | PacWest Bancorp. (Banks) | | | 72,591 | |
| | 1,692 | | Par Pacific Holdings, Inc.* (Oil, Gas & Consumable Fuels) | | | 38,713 | |
| | 4,749 | | Parker-Hannifin Corp. (Machinery) | | | 1,380,154 | |
| | 1,961 | | Patrick Industries, Inc. (Auto Components) | | | 89,637 | |
| | 5,000 | | Patterson-UTI Energy, Inc. (Energy Equipment & Services) | | | 88,250 | |
| | 7,033 | | Paycor HCM, Inc.* (Software) | | | 214,295 | |
| | 586 | | PDC Energy, Inc. (Oil, Gas & Consumable Fuels) | | | 42,274 | |
| | 1,291 | | Peapack-Gladstone Financial Corp. (Banks) | | | 51,085 | |
| | 23,853 | | Peloton Interactive, Inc. Class A* (Leisure Products) | | | 200,365 | |
| | 588 | | PennyMac Financial Services, Inc. (Thrifts & Mortgage Finance) | | | 31,352 | |
| | 10,423 | | PepsiCo, Inc. (Beverages) | | | 1,892,608 | |
| | 7,159 | | Performance Food Group Co.* (Food & Staples Retailing) | | | 372,554 | |
| | 2,104 | | Petco Health & Wellness Co., Inc.* (Specialty Retail) | | | 22,155 | |
| | 2,845 | | PetIQ, Inc. * (Health Care Providers & Services) | | | 23,386 | |
| | 32,122 | | Pfizer, Inc. (Pharmaceuticals) | | | 1,495,279 | |
| | 8,136 | | Phreesia, Inc.* (Health Care Technology) | | | 222,276 | |
| | 1,376 | | PRA Group, Inc.* (Consumer Finance) | | | 46,096 | |
| | 659 | | Preferred Bank (Banks) | | | 50,657 | |
| | 8,420 | | Primoris Services Corp. (Construction & Engineering) | | | 170,000 | |
| | 4,400 | | Progyny, Inc.* (Health Care Providers & Services) | | | 195,668 | |
| | 13,560 | | Prologis, Inc. (Equity Real Estate Investment Trusts (REITs)) | | | 1,501,770 | |
| | 3,978 | | ProPetro Holding Corp.* (Energy Equipment & Services) | | | 47,100 | |
| | 257 | | QuidelOrtho Corp.* (Health Care Equipment & Supplies) | | | 23,084 | |
| | 2,700 | | Rapid7, Inc.* (Software) | | | 122,229 | |
| | 1,520 | | RBC Bearings, Inc.* (Machinery) | | | 385,366 | |
| | 5,701 | | Resideo Technologies, Inc.* (Building Products) | | | 134,658 | |
| | 2,659 | | ResMed, Inc. (Health Care Equipment & Supplies) | | | 594,792 | |
| | 1,891 | | Revolve Group, Inc.* (Internet & Direct Marketing Retail) | | | 45,384 | |
| | 50,575 | | Rivian Automotive, Inc. Class A* (Automobiles) | | | 1,768,608 | |
| | | |
| | | | | | | | |
| | | Shares | | Description | | Value | |
| |
| | Common Stocks (continued) | |
| | |
| | | United States (continued) | | | | |
| | 11,036 | | Ross Stores, Inc. (Specialty Retail) | | $ | 1,056,035 | |
| | 2,717 | | Ryman Hospitality Properties, Inc. (Equity Real Estate Investment Trusts (REITs)) | | | 241,596 | |
| | 6,985 | | Saia, Inc.* (Road & Rail) | | | 1,389,037 | |
| | 25,898 | | Salesforce, Inc.* (Software) | | | 4,210,756 | |
| | 2,424 | | SBA Communications Corp. (Equity Real Estate Investment Trusts (REITs)) | | | 654,238 | |
| | 1,320 | | Science Applications International Corp. (Professional Services) | | | 143,009 | |
| | 8,122 | | Seacoast Banking Corp. of Florida (Banks) | | | 250,970 | |
| | 1,979 | | ServiceNow, Inc.* (Software) | | | 832,644 | |
| | 3,463 | | Shoals Technologies Group, Inc. Class A* (Electrical Equipment) | | | 80,030 | |
| | 3,730 | | Silgan Holdings, Inc. (Containers & Packaging) | | | 176,653 | |
| | 1,498 | | Silicon Laboratories, Inc.* (Semiconductors & Semiconductor Equipment) | | | 172,150 | |
| | 884 | | Six Flags Entertainment Corp.* (Hotels, Restaurants & Leisure) | | | 19,713 | |
| | 1,451 | | Skechers USA, Inc. Class A* (Textiles, Apparel & Luxury Goods) | | | 49,958 | |
| | 3,441 | | Skyline Champion Corp.* (Household Durables) | | | 200,301 | |
| | 12,952 | | SLM Corp. (Consumer Finance) | | | 214,874 | |
| | 2,457 | | SMART Global Holdings, Inc.* (Semiconductors & Semiconductor Equipment) | | | 33,243 | |
| | 651 | | Snowflake, Inc. Class A* (IT Services) | | | 104,355 | |
| | 5,251 | | Sotera Health Co.* (Life Sciences Tools & Services) | | | 36,127 | |
| | 627 | | SouthState Corp. (Banks) | | | 56,700 | |
| | 1,064 | | Spectrum Brands Holdings, Inc. (Household Products) | | | 49,093 | |
| | 1,265 | | Spirit Realty Capital, Inc. (Equity Real Estate Investment Trusts (REITs)) | | | 49,120 | |
| | 5,461 | | SPX Technologies, Inc.* (Machinery) | | | 359,552 | |
| | 22,296 | | SS&C Technologies Holdings, Inc. (IT Services) | | | 1,146,460 | |
| | 5,258 | | SSR Mining, Inc. (Metals & Mining) | | | 72,404 | |
| | 8,676 | | STAG Industrial, Inc. (Equity Real Estate Investment Trusts (REITs)) | | | 274,075 | |
| | 820 | | Standard Motor Products, Inc. (Auto Components) | | | 31,103 | |
| | 3,666 | | Starwood Property Trust, Inc. (Mortgage Real Estate Investment Trusts (REITs)) | | | 75,740 | |
| | 2,603 | | STERIS PLC (Health Care Equipment & Supplies) | | | 449,226 | |
| | | |
36 The accompanying notes are an integral part of these financial statements.
GOLDMAN SACHS MULTI-MANAGER GLOBAL EQUITY FUND
| | | | | | | | |
| | | Shares | | Description | | Value | |
| |
| | Common Stocks (continued) | |
| | |
| | | United States (continued) | | | | |
| | 2,837 | | Steven Madden Ltd. (Textiles, Apparel & Luxury Goods) | | $ | 84,741 | |
| | 3,872 | | Stifel Financial Corp. (Capital Markets) | | | 239,561 | |
| | 348 | | StoneX Group, Inc.* (Capital Markets) | | | 32,475 | |
| | 5,558 | | Stride, Inc.* (Diversified Consumer Services) | | | 186,249 | |
| | 9,953 | | Stryker Corp. (Health Care Equipment & Supplies) | | | 2,281,626 | |
| | 8,347 | | Supernus Pharmaceuticals, Inc.* (Pharmaceuticals) | | | 286,052 | |
| | 1,085 | | SVB Financial Group* (Banks) | | | 250,592 | |
| | 5,460 | | Syneos Health, Inc.* (Life Sciences Tools & Services) | | | 275,075 | |
| | 2,280 | | Synovus Financial Corp. (Banks) | | | 90,858 | |
| | 5,072 | | Take-Two Interactive Software, Inc.* (Entertainment) | | | 600,931 | |
| | 753 | | TD SYNNEX Corp. (Electronic Equipment, Instruments & Components) | | | 68,907 | |
| | 3,352 | | TEGNA, Inc. (Media) | | | 69,990 | |
| | 3,046 | | Tempur Sealy International, Inc. (Household Durables) | | | 81,907 | |
| | 5,471 | | Terex Corp. (Machinery) | | | 221,794 | |
| | 1,351 | | Tesla, Inc.* (Automobiles) | | | 307,407 | |
| | 11,099 | | Texas Instruments, Inc. (Semiconductors & Semiconductor Equipment) | | | 1,782,832 | |
| | 3,469 | | Texas Roadhouse, Inc. (Hotels, Restaurants & Leisure) | | | 343,258 | |
| | 1,226 | | The Brink’s Co. (Commerical Services & Supplies) | | | 73,106 | |
| | 757 | | The Buckle, Inc. (Specialty Retail) | | | 29,773 | |
| | 22,365 | | The Clorox Co. (Household Products) | | | 3,266,185 | |
| | 930 | | The Hanover Insurance Group, Inc. (Insurance) | | | 136,236 | |
| | 10,166 | | The Hartford Financial Services Group, Inc. (Insurance) | | | 736,120 | |
| | 4,349 | | The Home Depot, Inc. (Specialty Retail) | | | 1,287,869 | |
| | 19,188 | | The Sherwin-Williams Co. (Chemicals) | | | 4,317,876 | |
| | 6,990 | | The Shyft Group, Inc. (Machinery) | | | 160,630 | |
| | 3,911 | | The Trade Desk, Inc. Class A* (Software) | | | 208,222 | |
| | 9,507 | | The Walt Disney Co.* (Entertainment) | | | 1,012,876 | |
| | 437 | | Thor Industries, Inc. (Automobiles) | | | 35,602 | |
| | 10,270 | | Thoughtworks Holding, Inc.* (IT Services) | | | 98,695 | |
| | 7,557 | | Topgolf Callaway Brands Corp.* (Leisure Products) | | | 141,467 | |
| | 1,823 | | Travel + Leisure Co. (Hotels, Restaurants & Leisure) | | | 69,238 | |
| | | |
| | | | | | | | |
| | | Shares | | Description | | Value | |
| |
| | Common Stocks (continued) | |
| | |
| | | United States (continued) | | | | |
| | 38,240 | | Truist Financial Corp. (Banks) | | $ | 1,712,770 | |
| | 1,189 | | TTEC Holdings, Inc. (IT Services) | | | 52,875 | |
| | 3,150 | | UFP Industries, Inc. (Building Products) | | | 224,374 | |
| | 1,676 | | Ultra Clean Holdings, Inc.* (Semiconductors & Semiconductor Equipment) | | | 52,140 | |
| | 1,568 | | Umpqua Holdings Corp. (Banks) | | | 31,172 | |
| | 20,070 | | Union Pacific Corp. (Road & Rail) | | | 3,956,600 | |
| | 3,933 | | Unisys Corp.* (IT Services) | | | 33,430 | |
| | 5,028 | | UnitedHealth Group, Inc. (Health Care Providers & Services) | | | 2,791,294 | |
| | 885 | | Universal Corp. (Tobacco) | | | 44,790 | |
| | 1,169 | | Univest Financial Corp. (Banks) | | | 32,896 | |
| | 7,007 | | Valley National Bancorp (Banks) | | | 83,173 | |
| | 3,820 | | Valvoline, Inc. (Chemicals) | | | 112,155 | |
| | 3,978 | | Veracyte, Inc.* (Biotechnology) | | | 79,998 | |
| | 8,270 | | VeriSign, Inc.* (IT Services) | | | 1,657,804 | |
| | 6,985 | | Veritex Holdings, Inc. (Banks) | | | 220,586 | |
| | 23,189 | | Verizon Communications, Inc. (Diversified Telecommunication Services) | | | 866,573 | |
| | 10,165 | | Vertex Pharmaceuticals, Inc.* (Biotechnology) | | | 3,171,480 | |
| | 31,182 | | VF Corp. (Textiles, Apparel & Luxury Goods) | | | 880,891 | |
| | 671 | | Viad Corp.* (Commerical Services & Supplies) | | | 25,015 | |
| | 15,450 | | Viavi Solutions, Inc.* (Communications Equipment) | | | 233,295 | |
| | 1,217 | | Victoria’s Secret & Co.* (Specialty Retail) | | | 45,759 | |
| | 3,949 | | Viper Energy Partners LP (Oil, Gas & Consumable Fuels) | | | 131,699 | |
| | 11,527 | | Visa, Inc. Class A (IT Services) | | | 2,387,933 | |
| | 764 | | Voya Financial, Inc. (Diversified Financial Services) | | | 52,227 | |
| | 2,216 | | Wabash National Corp. (Machinery) | | | 47,976 | |
| | 881 | | Walker & Dunlop, Inc. (Thrifts & Mortgage Finance) | | | 79,255 | |
| | 2,868 | | Waste Connections, Inc. (Commerical Services & Supplies) | | | 378,318 | |
| | 5,845 | | Waste Management, Inc. (Commerical Services & Supplies) | | | 925,673 | |
| | 20,925 | | Wells Fargo & Co. (Banks) | | | 962,341 | |
| | 926 | | Werner Enterprises, Inc. (Road & Rail) | | | 36,299 | |
| | 1,841 | | WESCO International, Inc.* (Trading Companies & Distributors) | | | 253,635 | |
| | 25,701 | | Weyerhaeuser Co. (Equity Real Estate Investment Trusts (REITs)) | | | 794,932 | |
| | 104 | | White Mountains Insurance Group Ltd. (Insurance) | | | 147,280 | |
| | 1,138 | | Wintrust Financial Corp. (Banks) | | | 106,540 | |
| | | |
The accompanying notes are an integral part of these financial statements. 37
|
| GOLDMAN SACHS MULTI-MANAGER GLOBAL EQUITY FUND |
Schedule of Investments (continued)
October 31, 2022
| | | | | | | | | | |
| | | Shares | | | Description | | Value | |
| |
| | | Common Stocks (continued) | |
| | |
| | | | United States (continued) | | | | |
| | | 5,212 | | | Wolverine World Wide, Inc. (Textiles, Apparel & Luxury Goods) | | $ | 89,282 | |
| | | 4,952 | | | World Fuel Services Corp. (Oil, Gas & Consumable Fuels) | | | 126,226 | |
| | | 992 | | | Yelp, Inc.* (Interactive Media & Services) | | | 38,103 | |
| | | | | | | | | | |
| | | | | | | | | 206,238,630 | |
| | | | |
| | | Uruguay* – 0.1% | | | | |
| | | 3,450 | | | Dlocal Ltd. (IT Services) | | | 76,935 | |
| | | 520 | | | Globant SA (IT Services) | | | 98,113 | |
| | | 390 | | | MercadoLibre, Inc. (Internet & Direct Marketing Retail) | | | 351,632 | |
| | | | | | | | | | |
| | | | | | | | | 526,680 | |
| | | | |
| | | TOTAL COMMON STOCKS | | | | |
| | | (Cost $360,027,258) | | $ | 355,687,452 | |
| | | | |
| | | |
| | | Shares | | | Dividend Rate | | Value | |
| |
| | | Preferred Stocks – 0.1% | |
| | |
| | | Brazil – 0.1% | | | | |
| | | Itausa SA (Banks) | | | | |
| | | 19,400 | | | 5.080% | | $ | 40,336 | |
| |
| Petroleo Brasileiro SA (Oil, Gas &
Consumable Fuels) | | | | |
| | | 62,900 | | | 9.200 | | | 362,995 | |
| | | | |
| | | TOTAL PREFERRED STOCKS | | | | |
| | | (Cost $313,704) | | $ | 403,331 | |
| | | | |
| | | |
| | | Shares | | | Description | | Value | |
| |
| | | Exchange Traded Funds – 0.4% | |
| | | |
| | | 12,900 | | | iShares Core MSCI Emerging Markets ETF% | | $ | 546,315 | |
| | | 20,101 | | | iShares MSCI Saudi Arabia ETF | | | 861,127 | |
| | | | |
| | | TOTAL EXCHANGE TRADED FUNDS | | | | |
| | | (Cost $1,609,714) | | $ | 1,407,442 | |
| | | | |
| | | |
| | | Shares | | | Dividend Rate | | Value | |
| |
| | | Investment Companies(c) – 7.6% | |
| | | Goldman Sachs Financial Square Government Fund - Class R6 | |
| | | 13,221,910 | | | 3.066% | | $ | 13,221,910 | |
| | | | |
| | | | | | | | |
| | | Shares | | Dividend Rate | | Value | |
| |
| | | Investment Companies(c) | |
| |
| | Goldman Sachs Financial Square Government Fund - Institutional Shares | |
| | 14,902,614 | | 3.066% | | $ | 14,902,614 | |
| | | |
| | TOTAL INVESTMENT COMPANIES – 7.6% | | | | |
| | (Cost $ 28,124,524) | | $ | 28,124,524 | |
| | | |
| | TOTAL INVESTMENTS – 103.6% | | | | |
| | (Cost $ 390,075,200) | | $ | 385,622,749 | |
| | | |
| | LIABILITIES IN EXCESS OF OTHER ASSETS – (3.6)% | | | (13,292,769 | ) |
| | | |
| | NET ASSETS – 100.0% | | $ | 372,329,980 | |
| | | |
| | |
| | | The percentage shown for each investment category reflects the value of investments in that category as a percentage of net assets. * Non-income producing security. (a) Exempt from registration under Rule 144A of the Securities Act of 1933. (b) Significant unobservable inputs were used in the valuation of this portfolio security; i.e., Level 3. (c) Represents an affiliated issuer. |
| | | | |
| |
| | SECTOR ALLOCATION AS OF OCTOBER 31, 2022 |
| | |
| | | Sector | | % of Total
Market Value |
| | |
| | Information Technology | | 18.5% |
| | Health Care | | 14.1 |
| | Financials | | 13.4 |
| | Consumer Discretionary | | 11.5 |
| | Industrials | | 10.9 |
| | Investment Companies | | 7.3 |
| | Consumer Staples | | 6.0 |
| | Communication Services | | 5.5 |
| | Materials | | 5.5 |
| | Energy | | 2.8 |
| | Utilities | | 2.4 |
| | Real Estate | | 1.7 |
| | Exchange Traded Funds | | 0.4 |
| | |
| | | | 100.0% |
| | |
38 The accompanying notes are an integral part of these financial statements.
GOLDMAN SACHS MULTI-MANAGER GLOBAL EQUITY FUND
|
|
| ADDITIONAL INVESTMENT INFORMATION |
FORWARD FOREIGN CURRENCY EXCHANGE CONTRACTS WITH UNREALIZED GAIN
| | | | | | | | | | | | | | | | | | | | |
| Counterparty | | Currency Purchased | | | Currency Sold | | | Settlement Date | | Unrealized
Gain | |
| |
| | | | | | |
BNP Paribas SA | | | AUD | | | | 160,000 | | | USD | | | 100,889 | | | 11/02/22 | | $ | 1,460 | |
| | | DKK | | | | 490,000 | | | USD | | | 64,962 | | | 11/02/22 | | | 84 | |
| | | EUR | | | | 2,810,000 | | | USD | | | 2,771,610 | | | 11/02/22 | | | 5,751 | |
| | | GBP | | | | 400,000 | | | USD | | | 452,976 | | | 11/02/22 | | | 5,767 | |
| | | JPY | | | | 28,000,000 | | | USD | | | 187,862 | | | 11/02/22 | | | 483 | |
| | | NZD | | | | 150,000 | | | USD | | | 86,756 | | | 11/02/22 | | | 457 | |
| | | SEK | | | | 2,925,000 | | | USD | | | 263,747 | | | 11/02/22 | | | 1,203 | |
| | | SGD | | | | 40,000 | | | USD | | | 28,154 | | | 11/02/22 | | | 103 | |
| | | USD | | | | 3,222,996 | | | AUD | | | 4,980,000 | | | 11/02/22 | | | 37,366 | |
| | | USD | | | | 3,124,950 | | | AUD | | | 4,820,000 | | | 12/02/22 | | | 38,946 | |
| | | USD | | | | 4,835,546 | | | CHF | | | 4,770,000 | | | 11/02/22 | | | 70,986 | |
| | | USD | | | | 4,123,654 | | | CHF | | | 4,060,000 | | | 12/02/22 | | | 54,727 | |
| | | USD | | | | 1,075,197 | | | DKK | | | 7,950,000 | | | 12/02/22 | | | 17,351 | |
| | | USD | | | | 12,200,460 | | | EUR | | | 12,140,000 | | | 12/02/22 | | | 174,932 | |
| | | USD | | | | 6,113,079 | | | GBP | | | 5,270,000 | | | 12/02/22 | | | 63,888 | |
| | | USD | | | | 1,384,335 | | | HKD | | | 10,860,000 | | | 11/02/22 | | | 776 | |
| | | USD | | | | 228,408 | | | ILS | | | 800,000 | | | 12/02/22 | | | 1,528 | |
| | | USD | | | | 8,979,207 | | | JPY | | | 1,295,000,000 | | | 11/02/22 | | | 268,222 | |
| | | USD | | | | 8,655,761 | | | JPY | | | 1,267,000,000 | | | 12/02/22 | | | 103,614 | |
| | | USD | | | | 316,193 | | | NOK | | | 3,250,000 | | | 12/02/22 | | | 3,252 | |
| | | USD | | | | 1,357,007 | | | SEK | | | 14,775,000 | | | 12/02/22 | | | 15,905 | |
| | | USD | | | | 511,925 | | | SGD | | | 720,000 | | | 12/02/22 | | | 3,208 | |
JPMorgan Securities, Inc. | | | NZD | | | | 60,000 | | | USD | | | 34,860 | | | 11/02/22 | | | 26 | |
| | | USD | | | | 1,151,995 | | | AUD | | | 1,780,000 | | | 11/02/22 | | | 13,356 | |
| | | USD | | | | 1,154,027 | | | AUD | | | 1,780,000 | | | 12/02/22 | | | 14,382 | |
| | | USD | | | | 1,713,223 | | | CHF | | | 1,690,000 | | | 11/02/22 | | | 25,150 | |
| | | USD | | | | 1,716,496 | | | CHF | | | 1,690,000 | | | 12/02/22 | | | 22,781 | |
| | | USD | | | | 416,554 | | | DKK | | | 3,080,000 | | | 12/02/22 | | | 6,722 | |
| | | USD | | | | 5,215,847 | | | EUR | | | 5,190,000 | | | 12/02/22 | | | 74,786 | |
| | | USD | | | | 2,232,956 | | | GBP | | | 1,925,000 | | | 12/02/22 | | | 23,337 | |
| | | USD | | | | 565,971 | | | HKD | | | 4,440,000 | | | 11/02/22 | | | 317 | |
| | | USD | | | | 57,102 | | | ILS | | | 200,000 | | | 12/02/22 | | | 382 | |
| | | USD | | | | 3,300,465 | | | JPY | | | 476,000,000 | | | 11/02/22 | | | 98,590 | |
| | | USD | | | | 3,251,888 | | | JPY | | | 476,000,000 | | | 12/02/22 | | | 38,927 | |
| | | USD | | | | 102,155 | | | NOK | | | 1,050,000 | | | 12/02/22 | | | 1,051 | |
| | | USD | | | | 564,846 | | | SEK | | | 6,150,000 | | | 12/02/22 | | | 6,620 | |
| | | USD | | | | 184,862 | | | SGD | | | 260,000 | | | 12/02/22 | | | 1,158 | |
UBS AG (London) | | | USD | | | | 811 | | | ZAR | | | 14,542 | | | 11/01/22 | | | 19 | |
| |
| | | | | | |
TOTAL | | | | | | | | | | | | | | | | | | $ | 1,197,613 | |
| |
FORWARD FOREIGN CURRENCY EXCHANGE CONTRACTS WITH UNREALIZED LOSS
| | | | | | | | | | | | | | | | | | |
| Counterparty | | Currency Purchased | | | Currency Sold | | | Settlement
Date | | Unrealized
Loss | |
| |
| | | | | | |
BNP Paribas SA | | AUD | | | 4,820,000 | | | USD | | | 3,122,342 | | | 11/02/22 | | $ | (39,061 | ) |
| | CHF | | | 4,770,000 | | | USD | | | 4,825,375 | | | 11/02/22 | | | (60,816 | ) |
| | DKK | | | 7,950,000 | | | USD | | | 1,072,807 | | | 11/02/22 | | | (17,478 | ) |
| | EUR | | | 12,140,000 | | | USD | | | 12,174,624 | | | 11/02/22 | | | (175,636 | ) |
| | GBP | | | 5,270,000 | | | USD | | | 6,108,483 | | | 11/02/22 | | | (64,535 | ) |
| | HKD | | | 10,860,000 | | | USD | | | 1,383,669 | | | 11/02/22 | | | (110 | ) |
| | JPY | | | 1,267,000,000 | | | USD | | | 8,626,759 | | | 11/02/22 | | | (104,120 | ) |
The accompanying notes are an integral part of these financial statements. 39
|
| GOLDMAN SACHS MULTI-MANAGER GLOBAL EQUITY FUND |
| | |
| | | Schedule of Investments (continued) October 31, 2022 |
|
|
| ADDITIONAL INVESTMENT INFORMATION (continued) |
|
FORWARD FOREIGN CURRENCY EXCHANGE CONTRACTS WITH UNREALIZED LOSS (continued) |
| | | | | | | | | | | | | | | | | | | | |
| Counterparty | | Currency Purchased | | | Currency Sold | | | Settlement
Date | | Unrealized
Loss | |
| |
| | | | | | |
BNP Paribas SA (continued) | | | NOK | | | | 3,250,000 | | | USD | | | 315,890 | | | 11/02/22 | | $ | (3,254 | ) |
| | | SEK | | | | 14,775,000 | | | USD | | | 1,354,437 | | | 11/02/22 | | | (16,098 | ) |
| | | SGD | | | | 720,000 | | | USD | | | 511,892 | | | 11/02/22 | | | (3,268 | ) |
| | | USD | | | | 1,094,956 | | | DKK | | | 8,440,000 | | | 11/02/22 | | | (25,418 | ) |
| | | USD | | | | 14,424,522 | | | EUR | | | 14,950,000 | | | 11/02/22 | | | (351,826 | ) |
| | | USD | | | | 6,111,959 | | | GBP | | | 5,670,000 | | | 11/02/22 | | | (390,732 | ) |
| | | USD | | | | 1,074,538 | | | HKD | | | 8,430,000 | | | 12/02/22 | | | (44 | ) |
| | | USD | | | | 225,939 | | | ILS | | | 800,000 | | | 11/02/22 | | | (486 | ) |
| | | USD | | | | 302,259 | | | NOK | | | 3,250,000 | | | 11/02/22 | | | (10,377 | ) |
| | | USD | | | | 85,127 | | | NZD | | | 150,000 | | | 11/02/22 | | | (2,087 | ) |
| | | USD | | | | 69,746 | | | NZD | | | 120,000 | | | 12/02/22 | | | (58 | ) |
| | | USD | | | | 1,567,897 | | | SEK | | | 17,700,000 | | | 11/02/22 | | | (35,392 | ) |
| | | USD | | | | 529,201 | | | SGD | | | 760,000 | | | 11/02/22 | | | (7,680 | ) |
JPMorgan Securities, Inc. | | | AUD | | | | 1,780,000 | | | USD | | | 1,153,064 | | | 11/02/22 | | | (14,425 | ) |
| | | CHF | | | | 1,690,000 | | | USD | | | 1,711,078 | | | 11/02/22 | | | (23,005 | ) |
| | | DKK | | | | 3,080,000 | | | USD | | | 415,628 | | | 11/02/22 | | | (6,771 | ) |
| | | EUR | | | | 5,190,000 | | | USD | | | 5,204,802 | | | 11/02/22 | | | (75,087 | ) |
| | | GBP | | | | 1,925,000 | | | USD | | | 2,231,277 | | | 11/02/22 | | | (23,573 | ) |
| | | HKD | | | | 4,440,000 | | | USD | | | 565,671 | | | 11/02/22 | | | (17 | ) |
| | | JPY | | | | 476,000,000 | | | USD | | | 3,240,992 | | | 11/02/22 | | | (39,117 | ) |
| | | NOK | | | | 1,050,000 | | | USD | | | 102,057 | | | 11/02/22 | | | (1,051 | ) |
| | | SEK | | | | 6,150,000 | | | USD | | | 563,776 | | | 11/02/22 | | | (6,701 | ) |
| | | SGD | | | | 260,000 | | | USD | | | 184,850 | | | 11/02/22 | | | (1,180 | ) |
| | | USD | | | | 399,581 | | | DKK | | | 3,080,000 | | | 11/02/22 | | | (9,276 | ) |
| | | USD | | | | 5,007,577 | | | EUR | | | 5,190,000 | | | 11/02/22 | | | (122,139 | ) |
| | | USD | | | | 2,075,048 | | | GBP | | | 1,925,000 | | | 11/02/22 | | | (132,656 | ) |
| | | USD | | | | 565,949 | | | HKD | | | 4,440,000 | | | 12/02/22 | | | (23 | ) |
| | | USD | | | | 56,529 | | | ILS | | | 200,000 | | | 11/02/22 | | | (77 | ) |
| | | USD | | | | 97,597 | | | NOK | | | 1,050,000 | | | 11/02/22 | | | (3,408 | ) |
| | | USD | | | | 34,051 | | | NZD | | | 60,000 | | | 11/02/22 | | | (835 | ) |
| | | USD | | | | 34,873 | | | NZD | | | 60,000 | | | 12/02/22 | | | (29 | ) |
| | | USD | | | | 544,778 | | | SEK | | | 6,150,000 | | | 11/02/22 | | | (12,297 | ) |
| | | USD | | | | 181,042 | | | SGD | | | 260,000 | | | 11/02/22 | | | (2,628 | ) |
State Street Bank and Trust | | | USD | | | | 8,873 | | | QAR | | | 32,639 | | | 11/01/22 | | | (91 | ) |
| | | USD | | | | 4,407 | | | QAR | | | 16,210 | | | 11/02/22 | | | (46 | ) |
| |
| | | | | | |
TOTAL | | | | | | | | | | | | | | | | | | | $(1,782,908 | ) |
| |
FUTURES CONTRACTS — At October 31, 2022, the Fund had the following futures contracts:
| | | | | | | | | | | | |
| Description | | Number of
Contracts | | Expiration
Date | | Notional
Amount | | | Unrealized
Appreciation/
(Depreciation) | |
| |
| | | | |
Long position contracts: | | | | | | | | | | | | |
S&P Toronto Stock Exchange 60 Index | | 57 | | 12/15/22 | | | $9,854,032 | | | | $44,169 | |
| |
40 The accompanying notes are an integral part of these financial statements.
GOLDMAN SACHS MULTI-MANAGER GLOBAL EQUITY FUND
|
|
| ADDITIONAL INVESTMENT INFORMATION (continued) |
| | | | |
| | |
| Currency Abbreviations: | | |
| AUD | | —Australian Dollar | | |
| CHF | | —Swiss Franc | | |
| DKK | | —Denmark Krone | | |
| EUR | | —Euro | | |
| GBP | | —British Pound | | |
| HKD | | —Hong Kong Dollar | | |
| ILS | | —Israeli Shekel | | |
| JPY | | —Japanese Yen | | |
| NOK | | —Norwegian Krone | | |
| NZD | | —New Zealand Dollar | | |
| QAR | | —Qatar Riyal | | |
| SEK | | —Swedish Krona | | |
| SGD | | —Singapore Dollar | | |
| USD | | —U.S. Dollar | | |
| ZAR | | —South African Rand | | |
| | | | |
| | |
| Investment Abbreviations: | | |
| ADR | | —American Depositary Receipt | | |
| ETF | | —Exchange Traded Fund | | |
| GDR | | —Global Depository Receipt | | |
| LP | | —Limited Partnership | | |
| MTN | | —Medium Term Note | | |
| PLC | | —Public Limited Company | | |
| REIT | | —Real Estate Investment Trust | | |
The accompanying notes are an integral part of these financial statements. 41
|
| GOLDMAN SACHS MULTI-MANAGER NON-CORE FIXED INCOME FUND |
Schedule of Investments
October 31, 2022
| | | | | | | | | | | | | | | | |
| | | Principal Amount | | | Interest Rate | | | Maturity Date | | Value | |
| | |
| | Corporate Obligations – 36.2% | | | | |
| |
| | Advertising(a) – 0.3% | |
| | CMG Media Corp. | | | | |
| | $ | | | 3,074,000 | | | | 8.875 | %(b) | | 12/15/27 | | $ | 2,603,032 | |
| | Summer BC Holdco B S.a.r.l. | | | | |
| | EUR | | | 988,000 | | | | 5.750 | | | 10/31/26 | | | 846,980 | |
| | | | | | | | | | | | | | | | |
| | | | | 3,450,012 | |
| | | |
| | Aerospace & Defense(a) – 0.4% | |
| | Bombardier, Inc. | | | | |
| | $ | | | 825,000 | | | | 7.875 | (b) | | 04/15/27 | | | 783,882 | |
| | | | | 1,182,000 | | | | 6.000 | | | 02/15/28 | | | 1,053,221 | |
| | Raytheon Technologies Corp. | | | | |
| | | | | 650,000 | | | | 2.820 | | | 09/01/51 | | | 398,138 | |
| | | | | 390,000 | | | | 3.030 | | | 03/15/52 | | | 247,837 | |
| | TransDigm, Inc. | | | | |
| | | | | 10,000 | | | | 8.000 | | | 12/15/25 | | | 10,176 | |
| | | | | 987,000 | | | | 6.250 | (b) | | 03/15/26 | | | 973,281 | |
| | Triumph Group, Inc. | | | | |
| | | | | 615,000 | | | | 7.750 | | | 08/15/25 | | | 466,508 | |
| | | | | | | | | | | | | | | | |
| | | | | 3,933,043 | |
| | | |
| | Agriculture(a)(b) – 0.2% | |
| | Vector Group Ltd. | | | | |
| | | | | 525,000 | | | | 10.500 | | | 11/01/26 | | | 518,117 | |
| | | | | 2,060,000 | | | | 5.750 | | | 02/01/29 | | | 1,803,695 | |
| | | | | | | | | | | | | | | | |
| | | | | 2,321,812 | |
| | | |
| | Airlines – 0.5% | |
| | American Airlines, Inc./AAdvantage Loyalty IP Ltd. | | | | |
| | | | | 1,023,000 | | | | 5.500 | | | 04/20/26 | | | 974,960 | |
| | Avianca Midco 2 Ltd. | | | | |
| | | | | 2,723,873 | | | | 9.000 | (a) | | 12/01/28 | | | 2,047,971 | |
| | Hawaiian Brand Intellectual Property Ltd./HawaiianMiles Loyalty Ltd. | |
| | | | | 1,469,928 | | | | 5.750 | (a) | | 01/20/26 | | | 1,356,141 | |
| | United Airlines, Inc.(a) | | | | |
| | | | | 180,000 | | | | 4.375 | | | 04/15/26 | | | 164,691 | |
| | | | | 180,000 | | | | 4.625 | | | 04/15/29 | | | 154,534 | |
| | | | | | | | | | | | | | | | |
| | | | | 4,698,297 | |
| | | |
| | Apparel(a) – 0.2% | |
| | CT Investment GmbH | | | | |
| | EUR | | | 1,145,000 | | | | 5.500 | | | 04/15/26 | | | 929,678 | |
| | Hanesbrands, Inc. | | | | |
| | $ | | | 400,000 | | | | 4.875 | | | 05/15/26 | | | 367,132 | |
| | Wolverine World Wide, Inc. | | | | |
| | | | | 475,000 | | | | 4.000 | | | 08/15/29 | | | 378,504 | |
| | | | | | | | | | | | | | | | |
| | | | | 1,675,314 | |
| | | |
| | Automotive – 1.1% | |
| | Clarios Global LP/Clarios U.S. Finance Co.(a) | | | | |
| | | | | 156,000 | | | | 6.250 | | | 05/15/26 | | | 152,153 | |
| | | | | 394,000 | | | | 8.500 | | | 05/15/27 | | | 387,456 | |
| | Dana, Inc. | | | | |
| | | | | 266,000 | | | | 5.625 | (a) | | 06/15/28 | | | 240,658 | |
| | | |
| | | | | | | | | | | | | | | | |
| | | Principal Amount | | | Interest
Rate | | | Maturity Date | | Value | |
| | |
| | Corporate Obligations – (continued) | | | | |
| | |
| | Automotive – (continued) | | | | |
| | Dealer Tire LLC/DT Issuer LLC | | | | |
| | $ | | | 748,000 | | | | 8.000 | %(a)(b) | | 02/01/28 | | $ | 655,390 | |
| | Ford Motor Co. | | | | |
| | | | | 591,000 | | | | 6.100 | (a) | | 08/19/32 | | | 541,498 | |
| | Ford Motor Credit Co. LLC | | | | |
| | | | | 250,000 | | | | 4.063 | (a) | | 11/01/24 | | | 239,365 | |
| | | | | 2,035,000 | | | | 2.300 | (a) | | 02/10/25 | | | 1,842,225 | |
| | EUR | | | 450,000 | | | | 2.386 | | | 02/17/26 | | | 402,518 | |
| | $ | | | 336,000 | | | | 4.125 | (a) | | 08/17/27 | | | 298,264 | |
| | | | | 100,000 | | | | 3.815 | (a) | | 11/02/27 | | | 86,755 | |
| | | | | 2,080,000 | | | | 5.113 | (a) | | 05/03/29 | | | 1,858,314 | |
| | Gestamp Automocion SA | | | | |
| | EUR | | | 300,000 | | | | 3.250 | (a) | | 04/30/26 | | | 264,559 | |
| | Grupo Antolin-Irausa SA | | | | |
| | | | | 450,000 | | | | 3.375 | (a) | | 04/30/26 | | | 342,562 | |
| | IHO Verwaltungs GmbH(a)(b)(c) | | | | |
| | $ | | | 335,000 | | | | 6.000 | | | 05/15/27 | | | 287,835 | |
| | | | | 535,000 | | | | 6.375 | | | 05/15/29 | | | 456,376 | |
| | Jaguar Land Rover Automotive PLC | | | | |
| | EUR | | | 1,100,000 | | | | 4.500 | (a) | | 07/15/28 | | | 781,215 | |
| | Nissan Motor Acceptance Co. LLC | | | | |
| | $ | | | 1,090,000 | | | | 1.850 | (a) | | 09/16/26 | | | 855,476 | |
| | Nissan Motor Co. Ltd. | | | | |
| | | | | 366,000 | | | | 4.345 | (a) | | 09/17/27 | | | 308,600 | |
| | Tenneco, Inc. | | | | |
| | | | | 640,000 | | | | 5.125 | (a) | | 04/15/29 | | | 634,701 | |
| | | | | | | | | | | | | | | | |
| | | | | 10,635,920 | |
| | | |
| | Banks – 2.1% | |
| | Banca Monte dei Paschi di Siena SpA (5 year EUR Swap + 5.005%) | |
| | EUR | | | 1,964,000 | | | | 5.375 | (a)(d) | | 01/18/28 | | | 1,434,594 | |
| | Banco de Sabadell SA (-1X 5 year EUR Swap + 6.198%) | | | | |
| | | | | 800,000 | | | | 5.750 | (a)(d) | | 12/31/99 | | | 658,380 | |
| | Banco Nacional de Comercio Exterior SNC (5 year CMT + 2.000%) | | | | |
| | $ | | | 1,019,000 | | | | 2.720 | (a)(b)(d) | | 08/11/31 | | | 855,960 | |
| | Barclays PLC(a) | | | | |
| | | | | 1,100,000 | | | | 7.385 | | | 11/02/28 | | | 1,094,566 | |
| | (5 year CMT + 5.431%) | | | | |
| | | | | 521,000 | | | | 8.000 | (d) | | 12/31/99 | | | 467,587 | |
| | (5 year CMT + 5.867%) | | | | |
| | | | | 365,000 | | | | 6.125 | (d) | | 12/31/99 | | | 317,083 | |
| | (5 year USD Swap + 4.842%) | | | | |
| | | | | 245,000 | | | | 7.750 | (d) | | 12/31/99 | | | 230,082 | |
| | BNP Paribas SA (5 year CMT + 4.899%) | | | | |
| | | | | 839,000 | | | | 7.750 | (a)(b)(d) | | 12/31/99 | | | 792,234 | |
| | CaixaBank SA (-1X 5 year EUR Swap + 3.857%) | | | | |
| | EUR | | | 800,000 | | | | 3.625 | (a)(d) | | 12/31/99 | | | 536,762 | |
| | Commerzbank AG(a)(d) | | | | |
| | (-1X 5 year EUR Swap + 6.363%) | | | | |
| | | | | 600,000 | | | | 6.125 | | | 03/31/99 | | | 521,796 | |
| | (5 year USD Swap + 5.228%) | | | | |
| | $ | | | 1,000,000 | | | | 7.000 | | | 12/31/99 | | | 855,000 | |
| | | |
42 The accompanying notes are an integral part of these financial statements.
GOLDMAN SACHS MULTI-MANAGER NON-CORE FIXED INCOME FUND
| | | | | | | | | | | | | | | | |
| | | Principal Amount | | | Interest
Rate | | | Maturity Date | | Value | |
| |
| | Corporate Obligations – (continued) | |
| |
| | Banks – (continued) | |
| | Cooperatieve Rabobank UA (5 year EUR Swap + 3.717%) | |
| | EUR | | | 1,000,000 | | | | 4.875 | %(a)(d) | | 12/31/99 | | $ | 812,845 | |
| | Credit Suisse Group AG(a)(b)(d) | |
| | (5 year CMT + 6.383%) | |
| | $ | | | 750,000 | | | | 9.750 | | | 06/23/27 | | | 714,893 | |
| | (SOFR + 3.700%) | |
| | | | | 1,240,000 | | | | 6.442 | | | 08/11/28 | | | 1,129,987 | |
| | Deutsche Bank AG (-1X 5 year EUR Swap + 4.747%) | |
| | EUR | | | 1,600,000 | | | | 4.625 | (a)(d) | | 12/31/99 | | | 1,148,330 | |
| | Freedom Mortgage Corp.(a) | |
| | $ | | | 1,355,000 | | | | 8.125 | (b) | | 11/15/24 | | | 1,194,080 | |
| | | | | 1,225,000 | | | | 8.250 | (b) | | 04/15/25 | | | 1,054,554 | |
| | | | | 280,000 | | | | 7.625 | (b) | | 05/01/26 | | | 221,074 | |
| | | | | 1,212,750 | | | | 6.625 | | | 01/15/27 | | | 904,299 | |
| | Ibercaja Banco SA (-1X 5 year EUR Swap + 2.882%) | |
| | EUR | | | 700,000 | | | | 2.750 | (a)(d) | | 07/23/30 | | | 564,232 | |
| | Intesa Sanpaolo SpA | |
| | $ | | | 625,000 | | | | 5.710 | (b) | | 01/15/26 | | | 568,519 | |
| | (5 year EUR Swap + 7.192%) | |
| | EUR | | | 851,000 | | | | 7.750 | (a)(d) | | 12/29/49 | | | 796,730 | |
| | Lloyds Banking Group PLC (5 year USD Swap + 4.496%) | |
| | $ | | | 740,000 | | | | 7.500 | (a)(d) | | 09/27/25 | | | 685,788 | |
| | Novo Banco SA/Luxembourg | |
| | EUR | | | 95,000 | | | | 3.500 | | | 01/02/43 | | | 80,772 | |
| | | | | 1,015,000 | | | | 3.500 | | | 01/23/43 | | | 862,974 | |
| | UniCredit SpA(a)(d) | |
| | (-1X 5 year EUR Swap + 4.606%) | |
| | | | | 1,137,000 | | | | 4.450 | | | 12/31/99 | | | 792,166 | |
| | (5 year USD ICE Swap + 3.703%) | |
| | $ | | | 2,075,000 | | | | 5.861 | (b) | | 06/19/32 | | | 1,722,727 | |
| | | | | | | | | | | | | | | | |
| | | | | | | | | | | | | | | 21,018,014 | |
| | | |
| | Beverages – 0.0% | |
| | The Coca-Cola Co. | |
| | | | | 254,000 | | | | 2.750 | | | 06/01/60 | | | 154,546 | |
| | | |
| | Biotechnology(a) – 0.1% | |
| | | | | Cidron Aida Finco Sarl | |
| | EUR | | | 1,123,000 | | | | 5.000 | | | 04/01/28 | | | 870,653 | |
| | | |
| | Building Materials – 0.5% | |
| | CEMEX Materials LLC | |
| | $ | | | 1,098,000 | | | | 7.700 | (b) | | 07/21/25 | | | 1,081,530 | |
| | CP Atlas Buyer, Inc. | |
| | | | | 676,000 | | | | 7.000 | (a) | | 12/01/28 | | | 487,295 | |
| | Griffon Corp. | |
| | | | | 1,125,000 | | | | 5.750 | (a) | | 03/01/28 | | | 1,030,669 | |
| | PCF GmbH | |
| | EUR | | | 400,000 | | | | 4.750 | (a) | | 04/15/26 | | | 319,335 | |
| | SRM Escrow Issuer LLC | |
| | $ | | | 1,349,000 | | | | 6.000 | (a)(b) | | 11/01/28 | | | 1,154,137 | |
| | Summit Materials LLC/Summit Materials Finance Corp. | |
| | | | | 522,000 | | | | 5.250 | (a) | | 01/15/29 | | | 478,094 | |
| | | | | | | | | | | | | | | | |
| | | | | | | | | | | | | | | 4,551,060 | |
| | | |
| | | | | | | | | | | | | | | | |
| | | Principal Amount | | | Interest
Rate | | | Maturity Date | | Value | |
| |
| | Corporate Obligations – (continued) | |
| |
| | Capital Goods – 0.0% | |
| | Cirsa Finance International S.a.r.l. | |
| | EUR | | | 100,000 | | | | 10.375 | % | | 11/30/27 | | $ | 98,972 | |
| | | |
| | Chemicals – 1.6% | |
| | ASP Unifrax Holdings, Inc. | |
| | $ | | | 1,377,000 | | | | 5.250 | (a) | | 09/30/28 | | | 1,107,136 | |
| | Axalta Coating Systems LLC | |
| | | | | 605,000 | | | | 3.375 | (a) | | 02/15/29 | | | 499,627 | |
| | Cerdia Finanz GmbH | |
| | | | | 1,200,000 | | | | 10.500 | (a) | | 02/15/27 | | | 973,128 | |
| | CF Industries, Inc. | |
| | | | | 331,000 | | | | 5.150 | | | 03/15/34 | | | 298,946 | |
| | Cornerstone Chemical Co. | |
| | | | | 5,195,000 | | | | 6.750 | (a)(b) | | 08/15/24 | | | 3,903,055 | |
| | GPD Cos., Inc. | |
| | | | | 1,037,000 | | | | 10.125 | (a)(b) | | 04/01/26 | | | 930,635 | |
| | Innophos Holdings, Inc. | |
| | | | | 965,000 | | | | 9.375 | (a)(b) | | 02/15/28 | | | 919,162 | |
| | Iris Holdings, Inc.(c) | |
| | | | | 615,000 | | | | 8.750 | (a)(b) | | 02/15/26 | | | 537,338 | |
| | NOVA Chemicals Corp. | |
| | | | | 1,815,000 | | | | 4.250 | (a)(b) | | 05/15/29 | | | 1,482,347 | |
| | OCI NV | |
| | | | | 490,000 | | | | 4.625 | (a) | | 10/15/25 | | | 456,543 | |
| | Rain CII Carbon LLC/CII Carbon Corp. | |
| | | | | 1,855,000 | | | | 7.250 | (a)(b) | | 04/01/25 | | | 1,591,312 | |
| | Rayonier AM Products, Inc. | |
| | | | | 1,418,000 | | | | 7.625 | (a)(b) | | 01/15/26 | | | 1,232,313 | |
| | SCIH Salt Holdings, Inc.(a) | |
| | | | | 350,000 | | | | 4.875 | | | 05/01/28 | | | 304,146 | |
| | | | | 200,000 | | | | 6.625 | | | 05/01/29 | | | 162,320 | |
| | The Chemours Co. | |
| | | | | 95,000 | | | | 4.625 | (a) | | 11/15/29 | | | 74,029 | |
| | Tronox, Inc. | |
| | | | | 593,000 | | | | 4.625 | (a) | | 03/15/29 | | | 460,257 | |
| | Venator Finance S.a.r.l./Venator Materials LLC | |
| | | | | 383,000 | | | | 5.750 | (a) | | 07/15/25 | | | 126,306 | |
| | Vibrantz Technologies, Inc. | |
| | | | | 789,000 | | | | 9.000 | (a) | | 02/15/30 | | | 522,065 | |
| | | | | | | | | | | | | | | | |
| | | | | | | | | | | | | | | 15,580,665 | |
| | | |
| | Commercial Services(a) – 1.0% | |
| | Allied Universal Holdco LLC/Allied Universal Finance Corp. | |
| | | | | 750,000 | | | | 6.625 | | | 07/15/26 | | | 717,938 | |
| | Avis Budget Finance Plc | |
| | EUR | | | 1,047,000 | | | | 4.750 | | | 01/30/26 | | | 967,939 | |
| | Castor SpA | |
| | | | | 450,000 | | | | 6.000 | | | 02/15/29 | | | 382,341 | |
| | CPI CG, Inc. | |
| | $ | | | 538,000 | | | | 8.625 | (b) | | 03/15/26 | | | 506,360 | |
| | GEMS MENASA Cayman Ltd./GEMS Education Delaware LLC | |
| | | | | 1,781,000 | | | | 7.125 | (b) | | 07/31/26 | | | 1,670,801 | |
| | Korn Ferry | |
| | | | | 400,000 | | | | 4.625 | | | 12/15/27 | | | 363,428 | |
| | | |
The accompanying notes are an integral part of these financial statements. �� 43
|
| GOLDMAN SACHS MULTI-MANAGER NON-CORE FIXED INCOME FUND |
Schedule of Investments (continued)
October 31, 2022
| | | | | | | | | | | | | | | | |
| | | Principal Amount | | | Interest
Rate | | | Maturity Date | | Value | |
| |
| | Corporate Obligations – (continued) | |
| |
| | Commercial Services(a) – (continued) | |
| | Loxam SAS | |
| | EUR | | | 450,000 | | | | 4.500 | % | | 04/15/27 | | $ | 349,748 | |
| | Metis Merger Sub LLC | |
| | $ | | | 578,000 | | | | 6.500 | | | 05/15/29 | | | 465,446 | |
| | Movida Europe SA | |
| | | | | 1,299,000 | | | | 5.250 | (b) | | 02/08/31 | | | 949,413 | |
| | Paysafe Finance PLC/Paysafe Holdings U.S. Corp. | |
| | | | | 478,000 | | | | 4.000 | | | 06/15/29 | | | 344,141 | |
| | Prime Security Services Borrower LLC/Prime Finance, Inc. | |
| | | | | 465,000 | | | | 6.250 | (b) | | 01/15/28 | | | 430,632 | |
| | StoneMor, Inc. | |
| | | | | 975,000 | | | | 8.500 | | | 05/15/29 | | | 801,021 | |
| | Team Health Holdings, Inc. | |
| | | | | 1,226,000 | | | | 6.375 | (b) | | 02/01/25 | | | 929,884 | |
| | The ADT Security Corp. | |
| | | | | 651,000 | | | | 4.125 | | | 08/01/29 | | | 558,031 | |
| | The House of Finance NV | |
| | EUR | | | 450,000 | | | | 4.375 | | | 07/15/26 | | | 445,922 | |
| | WW International, Inc. | |
| | $ | | | 730,000 | | | | 4.500 | | | 04/15/29 | | | 405,157 | |
| | | | | | | | | | | | | | | | |
| | | | | 10,288,202 | |
| | | |
| | Computers(a) – 0.6% | |
| | Ahead DB Holdings LLC | |
| | | | | 723,000 | | | | 6.625 | | | 05/01/28 | | | 587,683 | |
| | Apple, Inc. | |
| | | | | 265,000 | | | | 2.375 | | | 02/08/41 | | | 177,264 | |
| | | | | 1,505,000 | | | | 2.650 | | | 05/11/50 | | | 946,028 | |
| | | | | 285,000 | | | | 2.650 | | | 02/08/51 | | | 177,327 | |
| | | | | 145,000 | | | | 2.700 | | | 08/05/51 | | | 90,944 | |
| | CA Magnum Holdings | |
| | | | | 1,570,000 | | | | 5.375 | | | 10/31/26 | | | 1,314,875 | |
| | Centurion Bidco SpA | |
| | EUR | | | 450,000 | | | | 5.875 | | | 09/30/26 | | | 393,010 | |
| | Condor Merger Sub, Inc. | |
| | $ | | | 1,283,000 | | | | 7.375 | | | 02/15/30 | | | 1,062,812 | |
| | Libra Groupco SpA | |
| | EUR | | | 450,000 | | | | 5.000 | | | 05/15/27 | | | 344,314 | |
| | Science Applications International Corp. | |
| | $ | | | 479,000 | | | | 4.875 | | | 04/01/28 | | | 437,533 | |
| | Seagate HDD Cayman | |
| | | | | 270,000 | | | | 3.375 | | | 07/15/31 | | | 192,901 | |
| | | | | | | | | | | | | | | | |
| | | | | 5,724,691 | |
| | | |
| | Construction – 0.0% | |
| | Enerflex Ltd. | |
| | | | | 160,000 | | | | 9.000 | | | 10/15/27 | | | 155,635 | |
| | | |
| | Cosmetics & Personal Care(a)(b) – 0.1% | |
| | Coty, Inc. | |
| | | | | 895,000 | | | | 5.000 | | | 04/15/26 | | | 843,171 | |
| | | |
| | Distribution & Wholesale(a) – 0.2% | |
| | American Builders & Contractors Supply Co., Inc. | |
| | | | | 255,000 | | | | 3.875 | | | 11/15/29 | | | 209,228 | |
| | | |
| | | | | | | | | | | | | | | | |
| | | Principal Amount | | | Interest
Rate | | | Maturity Date | | Value | |
| |
| | Corporate Obligations – (continued) | |
| |
| | Distribution & Wholesale(a) – (continued) | |
| | G-III Apparel Group Ltd. | |
| | $ | | | 1,142,000 | | | | 7.875 | %(b) | | 08/15/25 | | $ | 1,082,136 | |
| | H&E Equipment Services, Inc. | |
| | | | | 618,000 | | | | 3.875 | | | 12/15/28 | | | 522,667 | |
| | | | | | | | | | | | | | | | |
| | | | | 1,814,031 | |
| | | |
| | Diversified Financial Services – 1.5% | |
| | Aircastle Ltd. (5 year CMT + 4.410%) | |
| | | | | 1,106,000 | | | | 5.250 | (a)(b)(d) | | 12/31/99 | | | 823,859 | |
| | Armor Holdco, Inc. | |
| | | | | 675,000 | | | | 8.500 | (a) | | 11/15/29 | | | 504,103 | |
| | Coinbase Global, Inc. | |
| | | | | 945,000 | | | | 3.375 | (a) | | 10/01/28 | | | 625,628 | |
| | Finance of America Funding LLC | |
| | | | | 1,960,000 | | | | 7.875 | (a) | | 11/15/25 | | | 1,186,702 | |
| | Global Aircraft Leasing Co. Ltd.(c) (PIK 7.250%, Cash 6.500%) | |
| | | | | 2,112,194 | | | | 6.500 | (a)(b) | | 09/15/24 | | | 1,693,473 | |
| | Home Point Capital, Inc. | |
| | | | | 1,070,000 | | | | 5.000 | (a) | | 02/01/26 | | | 632,841 | |
| | Jefferies Finance LLC/JFIN Co-Issuer Corp. | |
| | | | | 984,000 | | | | 5.000 | (a) | | 08/15/28 | | | 773,335 | |
| | LD Holdings Group LLC(a) | |
| | | | | 165,000 | | | | 6.500 | | | 11/01/25 | | | 112,147 | |
| | | | | 1,420,000 | | | | 6.125 | (b) | | 04/01/28 | | | 795,214 | |
| | LPL Holdings, Inc. | |
| | | | | 498,000 | | | | 4.625 | (a) | | 11/15/27 | | | 460,530 | |
| | Midcap Financial Issuer Trust(a) | |
| | | | | 1,227,000 | | | | 6.500 | (b) | | 05/01/28 | | | 1,043,060 | |
| | | | | 870,000 | | | | 5.625 | | | 01/15/30 | | | 670,083 | |
| | Nationstar Mortgage Holdings, Inc. | |
| | | | | 184,000 | | | | 5.500 | (a) | | 08/15/28 | | | 150,068 | |
| | Navient Corp.(a) | |
| | | | | 452,000 | | | | 5.000 | | | 03/15/27 | | | 381,104 | |
| | | | | 52,000 | | | | 4.875 | | | 03/15/28 | | | 41,474 | |
| | | | | 530,000 | | | | 5.500 | | | 03/15/29 | | | 422,436 | |
| | OneMain Finance Corp. | |
| | | | | 240,000 | | | | 7.125 | | | 03/15/26 | | | 231,053 | |
| | | | | 122,000 | | | | 3.500 | (a) | | 01/15/27 | | | 100,474 | |
| | | | | 515,000 | | | | 3.875 | (a) | | 09/15/28 | | | 402,102 | |
| | | | | 400,000 | | | | 5.375 | (a) | | 11/15/29 | | | 327,800 | |
| | PennyMac Financial Services, Inc. | |
| | | | | 730,000 | | | | 4.250 | (a) | | 02/15/29 | | | 552,968 | |
| | PRA Group, Inc. | |
| | | | | 557,000 | | | | 7.375 | (a)(b) | | 09/01/25 | | | 534,854 | |
| | Rocket Mortgage LLC/Rocket Mortgage Co-Issuer, Inc. | |
| | | | | 640,000 | | | | 3.625 | (a) | | 03/01/29 | | | 495,962 | |
| | VistaJet Malta Finance PLC/XO Management Holding, Inc. | |
| | | | | 565,000 | | | | 6.375 | (a) | | 02/01/30 | | | 472,131 | |
| | Voyager Aviation Holdings LLC | |
| | | | | 1,020,000 | | | | 8.500 | (a) | | 05/09/26 | | | 897,223 | |
| | | | | | | | | | | | | | | | |
| | | | | 14,330,624 | |
| | | |
| | Electrical – 0.7% | |
| | Calpine Corp. | |
| | | | | 308,000 | | | | 4.500 | (a) | | 02/15/28 | | | 277,249 | |
| | | |
44 The accompanying notes are an integral part of these financial statements.
GOLDMAN SACHS MULTI-MANAGER NON-CORE FIXED INCOME FUND
| | | | | | | | | | | | | | | | |
| | | Principal Amount | | | Interest
Rate | | | Maturity Date | | Value | |
| |
| | Corporate Obligations – (continued) | |
| |
| | Electrical – (continued) | |
| | Electricite de France SA(a)(d) | |
| | (-1X 5 year EUR Swap + 3.198%) | |
| | EUR | | | 1,000,000 | | | | 3.000 | % | | 09/03/49 | | $ | 701,628 | |
| | (-1X 5 year EUR Swap + 3.970%) | |
| | | | | 1,000,000 | | | | 3.375 | | | 12/31/99 | | | 647,501 | |
| | Eskom Holdings SOC Ltd. | |
| | $ | | | 352,000 | | | | 6.750 | | | 08/06/23 | | | 343,420 | |
| | | | | 190,000 | | | | 6.750 | | | 08/06/23 | | | 185,369 | |
| | (e) | | | 667,000 | | | | 4.314 | | | 07/23/27 | | | 559,987 | |
| | | | | 840,000 | | | | 8.450 | | | 08/10/28 | | | 737,100 | |
| | Mercury Chile Holdco LLC | |
| | | | | 1,879,000 | | | | 6.500 | (a) | | 01/24/27 | | | 1,550,175 | |
| | NPC Ukrenergo(e) | |
| | | | | 263,000 | | | | 6.875 | | | 11/09/28 | | | 43,033 | |
| | NRG Energy, Inc. | |
| | | | | 460,000 | | | | 3.625 | (a) | | 02/15/31 | | | 366,100 | |
| | Pattern Energy Operations LP/Pattern Energy Operations, Inc. | |
| | | | | 3,000 | | | | 4.500 | (a) | | 08/15/28 | | | 2,696 | |
| | Vistra Corp. (5 year CMT + 5.740%) | |
| | | | | 867,000 | | | | 7.000 | (a)(b)(d) | | 12/31/99 | | | 770,512 | |
| | Vistra Operations Co. LLC(a) | |
| | | | | 385,000 | | | | 5.625 | | | 02/15/27 | | | 366,920 | |
| | | | | 140,000 | | | | 5.000 | | | 07/31/27 | | | 129,153 | |
| | | | | 47,000 | | | | 4.300 | | | 07/15/29 | | | 41,000 | |
| | | | | | | | | | | | | | | | |
| | | | | 6,721,843 | |
| | | |
| | Electrical Components & Equipment(a) – 0.1% | |
| | Belden, Inc. | |
| | EUR | | | 756,000 | | | | 3.375 | | | 07/15/31 | | | 557,065 | |
| | | |
| | Electronics(a) – 0.0% | |
| | II-VI, Inc. | |
| | $ | | | 566,000 | | | | 5.000 | | | 12/15/29 | | | 484,824 | |
| | | |
| | Energy-Alternate Sources(a) – 0.1% | |
| | Cullinan Holdco Scsp | |
| | EUR | | | 450,000 | | | | 4.625 | | | 10/15/26 | | | 369,089 | |
| | Enviva Partners LP/Enviva Partners Finance Corp. | |
| | $ | | | 201,000 | | | | 6.500 | | | 01/15/26 | | | 192,805 | |
| | TerraForm Power Operating LLC | |
| | | | | 435,000 | | | | 5.000 | | | 01/31/28 | | | 407,621 | |
| | | | | | | | | | | | | | | | |
| | | | | 969,515 | |
| | | |
| | Engineering & Construction – 0.4% | |
| | Abertis Infraestructuras Finance BV (-1X 5 year EUR Swap + 3.694%) | |
| | EUR 900,000 | | | | 3.248 | (a)(d) | | 12/31/99 | | | 738,641 | |
| | Artera Services LLC | |
| | $ | | | 367,737 | | | | 9.033 | (a)(b) | | 12/04/25 | | | 307,799 | |
| | Bioceanico Sovereign Certificate Ltd. | |
| | | | | 1,436,944 | | | | 0.000 | (f) | | 06/05/34 | | | 887,762 | |
| | Global Infrastructure Solutions, Inc. | |
| | | | | 866,000 | | | | 5.625 | (a) | | 06/01/29 | | | 641,784 | |
| | Tutor Perini Corp. | |
| | | | | 2,030,000 | | | | 6.875 | (a)(b) | | 05/01/25 | | | 1,627,735 | |
| | | | | | | | | | | | | | | | |
| | | | | 4,203,721 | |
| | | |
| | | | | | | | | | | | | | | | |
| | | Principal Amount | | | Interest
Rate | | | Maturity Date | | Value | |
| |
| | Corporate Obligations – (continued) | |
| |
| | Entertainment(a) – 0.9% | |
| | 888 Acquisitions Ltd. | |
| | EUR | | | 450,000 | | | | 7.558 | % | | 07/15/27 | | $ | 381,794 | |
| | AMC Entertainment Holdings, Inc. | |
| | $ | | | 25,000 | | | | 5.750 | | | 06/15/25 | | | 13,058 | |
| | | | | 235,000 | | | | 6.125 | | | 05/15/27 | | | 82,741 | |
| | Banijay Group SAS | |
| | EUR | | | 919,000 | | | | 6.500 | | | 03/01/26 | | | 840,659 | |
| | Caesars Entertainment, Inc. | |
| | $ | | | 555,000 | | | | 8.125 | (b) | | 07/01/27 | | | 539,893 | |
| | Cirsa Finance International S.a.r.l. | |
| | EUR | | | 450,000 | | | | 4.750 | | | 05/22/25 | | | 413,636 | |
| | 1,160,000 | | | | 4.500 | | | 03/15/27 | | | 952,369 | |
| | Empire Resorts, Inc. | |
| | $ | | | 1,515,000 | | | | 7.750 | | | 11/01/26 | | | 1,245,315 | |
| | Gamma Bidco SpA | |
| | EUR | | | 450,000 | | | | 6.250 | | | 07/15/25 | | | 422,268 | |
| | International Game Technology PLC | |
| | $ | | | 410,000 | | | | 6.250 | (b) | | 01/15/27 | | | 406,253 | |
| | Jacobs Entertainment, Inc. | |
| | | | | 770,000 | | | | 6.750 | | | 02/15/29 | | | 680,064 | |
| | Live Nation Entertainment, Inc. | |
| | | | | 650,000 | | | | 5.625 | | | 03/15/26 | | | 622,953 | |
| | | | | 615,000 | | | | 4.750 | | | 10/15/27 | | | 547,578 | |
| | Merlin Entertainments Ltd. | |
| | | | | 250,000 | | | | 5.750 | | | 06/15/26 | | | 232,505 | |
| | Raptor Acquisition Corp./Raptor Co.-Issuer LLC | |
| | | | | 670,000 | | | | 4.875 | | | 11/01/26 | | | 593,533 | |
| | Scientific Games Holdings LP/Scientific Games U.S. FinCo, Inc. | |
| | | | | 595,000 | | | | 6.625 | | | 03/01/30 | | | 515,484 | |
| | Six Flags Entertainment Corp. | |
| | | | | 694,000 | | | | 4.875 | | | 07/31/24 | | | 671,813 | |
| | Wynn Resorts Finance LLC/Wynn Resorts Capital Corp. | |
| | | | | 230,000 | | | | 7.750 | (b) | | 04/15/25 | | | 224,183 | |
| | | | | | | | | | | | | | | | |
| | | | | 9,386,099 | |
| | | |
| | Environmental(a) – 0.1% | |
| | Clean Harbors, Inc. | |
| | | | | 307,000 | | | | 4.875 | | | 07/15/27 | | | 289,127 | |
| | GFL Environmental, Inc. | |
| | | | | 460,000 | | | | 4.375 | | | 08/15/29 | | | 390,181 | |
| | | | | | | | | | | | | | | | |
| | | | | 679,308 | |
| | | |
| | Federal Home Loan Banks(a) – 0.1% | |
| | HSBC Holdings PLC | |
| | | | | 1,100,000 | | | | 7.390 | | | 11/03/28 | | | 1,099,527 | |
| | | |
| | Food & Drug Retailing – 0.3% | |
| | Chobani LLC/Chobani Finance Corp., Inc. | |
| | | | | 454,000 | | | | 7.500 | (a) | | 04/15/25 | | | 431,304 | |
| | Iceland Bondco PLC | |
| | GBP | | | 375,000 | | | | 4.625 | (a) | | 03/15/25 | | | 338,828 | |
| | JBS USA LUX SA/JBS USA Food Co./JBS USA Finance, Inc. | |
| | $ | | | 412,000 | | | | 5.500 | (a) | | 01/15/30 | | | 376,210 | |
| | New Albertsons LP | |
| | | | | 1,015,000 | | | | 8.700 | | | 05/01/30 | | | 1,078,082 | |
| | | |
��
The accompanying notes are an integral part of these financial statements. 45
|
| GOLDMAN SACHS MULTI-MANAGER NON-CORE FIXED INCOME FUND |
Schedule of Investments (continued)
October 31, 2022
| | | | | | | | | | | | | | | | |
| | | Principal Amount | | | Interest
Rate | | | Maturity Date | | Value | |
| |
| | Corporate Obligations – (continued) | |
| |
| | Food & Drug Retailing – (continued) | |
| | $ | | | 435,000 | | | | 8.000 | % | | 05/01/31 | | $ | 443,861 | |
| | Simmons Foods, Inc./Simmons Prepared Foods, Inc./Simmons Pet Food, Inc./Simmons Feed | |
| | | | | 380,000 | | | | 4.625 | (a) | | 03/01/29 | | | 317,106 | |
| | | | | | | | | | | | | | | | |
| | | | | 2,985,391 | |
| | | |
| | Forest Products&Paper(a) – 0.4% | |
| | Domtar Corp. | |
| | | | | 2,852,000 | | | | 6.750 | | | 10/01/28 | | | 2,435,266 | |
| | Resolute Forest Products, Inc. | |
| | | | | 808,000 | | | | 4.875 | (b) | | 03/01/26 | | | 798,425 | |
| | Sylvamo Corp. | |
| | | | | 1,231,000 | | | | 7.000 | | | 09/01/29 | | | 1,155,072 | |
| | | | | | | | | | | | | | | | |
| | | | | 4,388,763 | |
| | | |
| | Gaming(a) – 0.2% | |
| | MGM Resorts International | |
| | | | | 149,000 | | | | 6.750 | | | 05/01/25 | | | 147,034 | |
| | Station Casinos LLC | |
| | | | | 510,000 | | | | 4.500 | | | 02/15/28 | | | 439,207 | |
| | Wynn Las Vegas LLC/Wynn Las Vegas Capital Corp. | |
| | | | | 225,000 | | | | 5.250 | (b) | | 05/15/27 | | | 195,964 | |
| | Wynn Macau Ltd. | |
| | | | | 365,000 | | | | 5.500 | | | 01/15/26 | | | 250,025 | |
| | | | | 135,000 | | | | 5.500 | | | 10/01/27 | | | 81,038 | |
| | | | | 35,000 | | | | 5.625 | | | 08/26/28 | | | 20,650 | |
| | | | | 730,000 | | | | 5.125 | | | 12/15/29 | | | 427,050 | |
| | | | | | | | | | | | | | | | |
| | | | | 1,560,968 | |
| | | |
| | Healthcare Providers & Services(a) – 1.0% | |
| | Acadia Healthcare Co., Inc. | |
| | | | | 461,000 | | | | 5.000 | | | 04/15/29 | | | 415,324 | |
| | Air Methods Corp. | |
| | | | | 303,000 | | | | 8.000 | | | 05/15/25 | | | 154,957 | |
| | Akumin, Inc. | |
| | | | | 3,076,000 | | | | 7.000 | (b) | | 11/01/25 | | | 2,494,882 | |
| | Centene Corp. | |
| | | | | 805,000 | | | | 2.500 | | | 03/01/31 | | | 615,229 | |
| | | | | 645,000 | | | | 2.625 | | | 08/01/31 | | | 493,193 | |
| | Envision Healthcare Corp. | |
| | | | | 835,000 | | | | 8.750 | | | 10/15/26 | | | 254,725 | |
| | Global Medical Response, Inc. | |
| | | | | 400,000 | | | | 6.500 | | | 10/01/25 | | | 309,376 | |
| | HCA, Inc. | |
| | | | | 331,000 | | | | 3.500 | | | 09/01/30 | | | 273,846 | |
| | IQVIA, Inc. | |
| | EUR | | | 400,000 | | | | 2.875 | | | 06/15/28 | | | 348,829 | |
| | Legacy LifePoint Health LLC | |
| | $ | | | 300,000 | | | | 4.375 | | | 02/15/27 | | | 236,865 | |
| | LifePoint Health, Inc. | |
| | | | | 150,000 | | | | 5.375 | (b) | | 01/15/29 | | | 95,337 | |
| | Medline Borrower LP | |
| | | | | 825,000 | | | | 3.875 | | | 04/01/29 | | | 673,860 | |
| | | | | 220,000 | | | | 5.250 | | | 10/01/29 | | | 171,486 | |
| | | |
| | | | | | | | | | | | | | | | |
| | | Principal Amount | | | Interest
Rate | | | Maturity Date | | Value | |
| |
| | Corporate Obligations – (continued) | |
| |
| | Healthcare Providers & Services(a) – (continued) | |
| | ModivCare Escrow Issuer, Inc. | |
| | $ | | | 675,000 | | | | 5.000 | % | | 10/01/29 | | $ | 578,833 | |
| | Molina Healthcare, Inc. | |
| | | | | 348,000 | | | | 4.375 | | | 06/15/28 | | | 312,803 | |
| | RegionalCare Hospital Partners Holdings, Inc./LifePoint Health, Inc. | |
| | | | | 520,000 | | | | 9.750 | | | 12/01/26 | | | 415,324 | |
| | Syneos Health, Inc. | |
| | | | | 482,000 | | | | 3.625 | | | 01/15/29 | | | 397,462 | |
| | Tenet Healthcare Corp. | |
| | | | | 19,000 | | | | 4.625 | | | 07/15/24 | | | 18,520 | |
| | | | | 1,071,000 | | | | 6.125 | (b) | | 10/01/28 | | | 928,578 | |
| | | | | 582,000 | | | | 6.125 | | | 06/15/30 | | | 541,173 | |
| | | | | | | | | | | | | | | | |
| | | | | 9,730,602 | |
| | | |
| | Home Builders(a) – 0.1% | |
| | Ashton Woods USA LLC/Ashton Woods Finance Co. | |
| | | | | 515,000 | | | | 4.625 | | | 08/01/29 | | | 386,755 | |
| | Mattamy Group Corp. | |
| | | | | 605,000 | | | | 4.625 | (b) | | 03/01/30 | | | 478,010 | |
| | Meritage Homes Corp. | |
| | | | | 300,000 | | | | 3.875 | | | 04/15/29 | | | 243,198 | |
| | | | | | | | | | | | | | | | |
| | | | | 1,107,963 | |
| | | |
| | Household Products(a)(b) – 0.1% | |
| | Kronos Acquisition Holdings, Inc./KIK Custom Products, Inc. | |
| | | | | 761,000 | | | | 7.000 | | | 12/31/27 | | | 641,622 | |
| | | |
| | Housewares(a) – 0.2% | |
| | American Greetings Corp. | |
| | | | | 990,000 | | | | 8.750 | (b) | | 04/15/25 | | | 947,331 | |
| | Newell Brands, Inc. | |
| | | | | 599,000 | | | | 6.625 | | | 09/15/29 | | | 585,373 | |
| | | | | | | | | | | | | | | | |
| | | | | 1,532,704 | |
| | | |
| | Insurance(a) – 0.6% | |
| | Acrisure LLC/Acrisure Finance, Inc. | |
| | | | | 500,000 | | | | 7.000 | | | 11/15/25 | | | 474,010 | |
| | | | | 135,000 | | | | 10.125 | | | 08/01/26 | | | 134,762 | |
| | | | | 451,000 | | | | 4.250 | | | 02/15/29 | | | 368,530 | |
| | Alliant Holdings Intermediate LLC/Alliant Holdings Co-Issuer | |
| | | | | 498,000 | | | | 6.750 | | | 10/15/27 | | | 455,167 | |
| | AssuredPartners, Inc. | |
| | | | | 875,000 | | | | 7.000 | | | 08/15/25 | | | 843,964 | |
| | Highlands Holdings Bond Issuer Ltd./Highlands Holdings Bond Co.-Issuer, Inc.(c) | |
| | | | | 1,851,875 | | | | 7.625 | (b) | | 10/15/25 | | | 1,733,392 | |
| | HUB International Ltd. | |
| | | | | 750,000 | | | | 7.000 | | | 05/01/26 | | | 740,205 | |
| | Ryan Specialty Group LLC | |
| | | | | 500,000 | | | | 4.375 | | | 02/01/30 | | | 426,515 | |
| | Sagicor Financial Co. Ltd. | |
| | | | | 264,000 | | | | 5.300 | | | 05/13/28 | | | 240,795 | |
| | | | | 200,000 | | | | 5.300 | | | 05/13/28 | | | 182,900 | |
| | | | | | | | | | | | | | | | |
| | | | | 5,600,240 | |
| | | |
46 The accompanying notes are an integral part of these financial statements.
GOLDMAN SACHS MULTI-MANAGER NON-CORE FIXED INCOME FUND
| | | | | | | | | | | | | | | | |
| | | Principal Amount | | | Interest Rate | | | Maturity Date | | Value | |
| | |
| | Corporate Obligations – (continued) | | | | |
| | |
| | Internet – 0.7% | | | | |
| | ANGI Group LLC | | | | |
| | $ | | | 176,000 | | | | 3.875 | %(a) | | 08/15/28 | | $ | 128,292 | |
| | Cablevision Lightpath LLC | | | | |
| | | | | 880,000 | | | | 5.625 | (a)(b) | | 09/15/28 | | | 699,011 | |
| | HSE Finance S.a.r.l | | | | |
| | EUR | | | 150,000 | | | | 5.625 | (a) | | 10/15/26 | | | 80,714 | |
| | Netflix, Inc. | | | | |
| | | | | 529,000 | | | | 4.625 | | | 05/15/29 | | | 509,730 | |
| | | | | 607,000 | | | | 3.875 | | | 11/15/29 | | | 556,923 | |
| | | | | 1,020,000 | | | | 3.625 | (a) | | 06/15/30 | | | 912,747 | |
| | NortonLifeLock, Inc.(a) | | | | |
| | $ | | | 660,000 | | | | 6.750 | | | 09/30/27 | | | 651,083 | |
| | | | | 580,000 | | | | 7.125 | | | 09/30/30 | | | 572,437 | |
| | Rakuten Group, Inc.(a) | | | | |
| | | | | 1,398,000 | | | | 5.125 | | | 12/31/99 | | | 1,033,108 | |
| | | | | 537,000 | | | | 6.250 | | | 12/31/99 | | | 366,046 | |
| | Uber Technologies, Inc.(a) | | | | |
| | | | | 500,000 | | | | 7.500 | | | 05/15/25 | | | 500,055 | |
| | | | | 500,000 | | | | 8.000 | | | 11/01/26 | | | 501,635 | |
| | United Group B.V. | | | | |
| | EUR | | | 870,000 | | | | 5.250 | (a) | | 02/01/30 | | | 613,709 | |
| | | | | | | | | | | | | | | | |
| | | | | | | | | | | | | | | 7,125,490 | |
| | | |
| | Investment Companies – 0.1% | | | | |
| | Blackstone Private Credit Fund | | | | |
| | $ | | | 388,000 | | | | 2.625 | (a) | | 12/15/26 | | | 320,733 | |
| | MDGH GMTN RSC Ltd. | | | | |
| | | | | 821,000 | | | | 5.500 | | | 04/28/33 | | | 816,238 | |
| | | | | | | | | | | | | | | | |
| | | | | | | | | | | | | | | 1,136,971 | |
| | | |
| | Iron/Steel(a) – 0.9% | | | | |
| | Baffinland Iron Mines Corp./Baffinland Iron Mines LP | | | | |
| | | | | 4,330,000 | | | | 8.750 | (b) | | 07/15/26 | | | 3,957,793 | |
| | Mineral Resources Ltd. | | | | |
| | | | | 3,520,000 | | | | 8.125 | (b) | | 05/01/27 | | | 3,503,034 | |
| | | | | 387,000 | | | | 8.000 | | | 11/01/27 | | | 380,533 | |
| | | | | 393,000 | | | | 8.500 | | | 05/01/30 | | | 389,605 | |
| | Tacora Resources, Inc. | | | | |
| | | | | 615,000 | | | | 8.250 | | | 05/15/26 | | | 516,329 | |
| | | | | | | | | | | | | | | | |
| | | | | | | | | | | | | | | 8,747,294 | |
| | | |
| | Leisure Time(a) – 0.3% | | | | |
| | Carnival Corp.(b) | | | | |
| | | | | 40,000 | | | | 10.500 | | | 02/01/26 | | | 39,196 | |
| | | | | 1,110,000 | | | | 9.875 | | | 08/01/27 | | | 1,034,908 | |
| | Pinnacle Bidco PLC | | | | |
| | EUR | | | 948,000 | | | | 5.500 | | | 02/15/25 | | | 846,960 | |
| | Royal Caribbean Cruises Ltd. | | | | |
| | $ | | | 395,000 | | | | 5.500 | | | 08/31/26 | | | 322,581 | |
| | TUI Cruises GmbH | | | | |
| | EUR | | | 350,000 | | | | 6.500 | | | 05/15/26 | | | 255,313 | |
| | VOC Escrow Ltd. | | | | |
| | $ | | | 765,000 | | | | 5.000 | | | 02/15/28 | | | 637,406 | |
| | | | | | | | | | | | | | | | |
| | | | | | | | | | | | | | | 3,136,364 | |
| | | |
| | | | | | | | | | | | | | | | |
| | | Principal Amount | | | Interest Rate | | | Maturity Date | | Value | |
| | |
| | Corporate Obligations – (continued) | | | | |
| | |
| | Machinery - Construction & Mining(a) – 0.0% | | | | |
| | BWX Technologies, Inc. | |
| | $ | | | 445,000 | | | | 4.125 | % | | 06/30/28 | | $ | 392,761 | |
| | | |
| | Machinery-Diversified(a) – 0.1% | |
| | Novafives SAS | | | | |
| | EUR | | | 300,000 | | | | 5.000 | | | 06/15/25 | | | 187,526 | |
| | OT Merger Corp. | | | | |
| | $ | | | 984,000 | | | | 7.875 | | | 10/15/29 | | | 629,485 | |
| | | | | | | | | | | | | | | | |
| | | | | | | | | | | | | | | 817,011 | |
| | | |
| | Media – 4.3% | | | | |
| | Altice Financing SA(a) | | | | |
| | | | | 512,000 | | | | 5.000 | | | 01/15/28 | | | 409,068 | |
| | | | | 2,845,000 | | | | 5.750 | | | 08/15/29 | | | 2,240,381 | |
| | Audacy Capital Corp.(a) | | | | |
| | | | | 585,000 | | | | 6.500 | | | 05/01/27 | | | 170,370 | |
| | | | | 760,000 | | | | 6.750 | | | 03/31/29 | | | 216,068 | |
| | Beasley Mezzanine Holdings LLC | |
| | | | | 1,610,000 | | | | 8.625 | (a) | | 02/01/26 | | | 1,172,982 | |
| | CCO Holdings LLC/CCO Holdings Capital Corp.(a) | |
| | | | | 1,273,000 | | | | 5.125 | | | 05/01/27 | | | 1,179,536 | |
| | | | | 435,000 | | | | 5.375 | (b) | | 06/01/29 | | | 388,938 | |
| | | | | 915,000 | | | | 6.375 | | | 09/01/29 | | | 847,601 | |
| | | | | 815,000 | | | | 4.500 | | | 08/15/30 | | | 662,367 | |
| | | | | 450,000 | | | | 4.250 | | | 02/01/31 | | | 355,487 | |
| | Cengage Learning, Inc. | | | | |
| | | | | 915,000 | | | | 9.500 | (a)(b) | | 06/15/24 | | | 866,999 | |
| | Charter Communications Operating LLC / Charter Communications Operating Capital(a) | |
| | | | | 200,000 | | | | 3.900 | | | 06/01/52 | | | 123,716 | |
| | | | | 100,000 | | | | 4.400 | | | 12/01/61 | | | 63,531 | |
| | | | | 90,000 | | | | 3.950 | | | 06/30/62 | | | 52,838 | |
| | Comcast Corp.(a) | | | | |
| | | | | 725,000 | | | | 2.937 | | | 11/01/56 | | | 419,956 | |
| | | | | 1,090,000 | | | | 2.987 | | | 11/01/63 | | | 614,422 | |
| | CSC Holdings LLC(a) | | | | |
| | | | | 847,000 | | | | 5.500 | | | 04/15/27 | | | 797,755 | |
| | | | | 1,355,000 | | | | 7.500 | (b) | | 04/01/28 | | | 1,171,519 | |
| | | | | 445,000 | | | | 6.500 | (b) | | 02/01/29 | | | 418,990 | |
| | | | | 941,000 | | | | 5.750 | | | 01/15/30 | | | 724,570 | |
| | Diamond Sports Group LLC/Diamond Sports Finance Co.(a) | |
| | | | | 2,069,000 | | | | 5.375 | | | 08/15/26 | | | 412,848 | |
| | | | | 1,274,000 | | | | 6.625 | (b) | | 08/15/27 | | | 64,987 | |
| | Directv Financing LLC/Directv Financing Co.-Obligor, Inc. | |
| | | | | 755,000 | | | | 5.875 | (a) | | 08/15/27 | | | 679,515 | |
| | Discovery Communications LLC | | | | |
| | | | | 610,000 | | | | 4.125 | (a) | | 05/15/29 | | | 515,340 | |
| | DISH DBS Corp. | | | | |
| | | | | 180,000 | | | | 5.875 | | | 11/15/24 | | | 166,014 | |
| | | | | 923,000 | | | | 7.750 | | | 07/01/26 | | | 779,732 | |
| | | | | 1,675,000 | | | | 5.250 | (a) | | 12/01/26 | | | 1,454,352 | |
| | | | | 1,378,000 | | | | 5.750 | (a) | | 12/01/28 | | | 1,112,170 | |
| | | | | 683,000 | | | | 5.125 | | | 06/01/29 | | | 461,653 | |
| | Gray Television, Inc.(a) | | | | |
| | | | | 1,541,000 | | | | 7.000 | (b) | | 05/15/27 | | | 1,467,941 | |
| | | |
The accompanying notes are an integral part of these financial statements. 47
|
| GOLDMAN SACHS MULTI-MANAGER NON-CORE FIXED INCOME FUND |
Schedule of Investments (continued)
October 31, 2022
| | | | | | | | | | | | | | | | |
| | | Principal Amount | | | Interest Rate | | | Maturity Date | | Value | |
| |
| | Corporate Obligations – (continued) | |
| |
| | Media – (continued) | |
| | $ | | | 356,000 | | | | 4.750 | % | | 10/15/30 | | $ | 281,165 | |
| | iHeartCommunications, Inc. | |
| | | | | 137,309 | | | | 8.375 | (a) | | 05/01/27 | | | 123,445 | |
| | LCPR Senior Secured Financing DAC | |
| | | | | 1,636,000 | | | | 6.750 | (a)(b) | | 10/15/27 | | | 1,526,290 | |
| | Liberty Interactive LLC | |
| | | | | 3,954,785 | | | | 4.000 | (a) | | 11/15/29 | | | 1,779,653 | |
| | | | | 45,000 | | | | 8.250 | | | 02/01/30 | | | 28,140 | |
| | | | | 341,479 | | | | 3.750 | (a) | | 02/15/30 | | | 153,666 | |
| | McGraw-Hill Education, Inc. | |
| | | | | 1,500,000 | | | | 5.750 | (a) | | 08/01/28 | | | 1,320,510 | |
| | News Corp. | |
| | | | | 949,000 | | | | 3.875 | (a) | | 05/15/29 | | | 815,865 | |
| | Nexstar Media, Inc. | |
| | | | | 543,000 | | | | 5.625 | (a)(b) | | 07/15/27 | | | 511,158 | |
| | Paramount Global (5 year CMT + 3.999%) | |
| | | | | 1,000,000 | | | | 6.375 | (a)(d) | | 03/30/62 | | | 852,080 | |
| | Radiate Holdco LLC/Radiate Finance, Inc. | |
| | | | | 401,000 | | | | 6.500 | (a)(b) | | 09/15/28 | | | 252,393 | |
| | Salem Media Group, Inc. | |
| | | | | 947,000 | | | | 6.750 | (a)(b) | | 06/01/24 | | | 915,740 | |
| | Scripps Escrow II, Inc. | |
| | | | | 432,000 | | | | 3.875 | (a) | | 01/15/29 | | | 358,815 | |
| | Sinclair Television Group, Inc.(a) | |
| | | | | 1,601,000 | | | | 5.500 | (b) | | 03/01/30 | | | 1,197,164 | |
| | | | | 1,622,000 | | | | 4.125 | | | 12/01/30 | | | 1,253,206 | |
| | Sirius XM Radio, Inc.(a) | |
| | | | | 312,000 | | | | 5.000 | | | 08/01/27 | | | 287,040 | |
| | | | | 260,000 | | | | 5.500 | (b) | | 07/01/29 | | | 239,759 | |
| | | | | 310,000 | | | | 3.875 | | | 09/01/31 | | | 247,851 | |
| | Spanish Broadcasting System, Inc. | |
| | | | | 1,120,000 | | | | 9.750 | (a)(b) | | 03/01/26 | | | 689,875 | |
| | Summer BidCo B.V.(c) | |
| | EUR | | | 550,000 | | | | 9.000 | (a) | | 11/15/25 | | | 402,272 | |
| | TEGNA, Inc. | |
| | $ | | | 2,423,000 | | | | 4.625 | (a) | | 03/15/28 | | | 2,305,703 | |
| | Telenet Finance Luxembourg Notes S.a.r.l. | |
| | | | | 2,000,000 | | | | 5.500 | (a) | | 03/01/28 | | | 1,755,920 | |
| | Univision Communications, Inc.(a) | |
| | | | | 1,127,000 | | | | 6.625 | (b) | | 06/01/27 | | | 1,112,236 | |
| | | | | 450,000 | | | | 7.375 | | | 06/30/30 | | | 438,187 | |
| | Urban One, Inc. | |
| | | | | 1,435,000 | | | | 7.375 | (a)(b) | | 02/01/28 | | | 1,255,941 | |
| | Virgin Media Finance PLC | |
| | | | | 104,000 | | | | 5.000 | (a) | | 07/15/30 | | | 83,322 | |
| | Virgin Media Vendor Financing Notes IV DAC | |
| | | | | 450,000 | | | | 5.000 | (a) | | 07/15/28 | | | 384,943 | |
| | VTR Finance NV | |
| | | | | 900,000 | | | | 6.375 | (a)(b) | | 07/15/28 | | | 453,544 | |
| | VZ Secured Financing B.V. | |
| | | | | 1,205,000 | | | | 5.000 | (a) | | 01/15/32 | | | 966,699 | |
| | | | | | | | | | | | | | | | |
| | | | | 42,004,228 | |
| | | |
| | | | | | | | | | | | | | | | |
| | | Principal Amount | | | Interest Rate | | | Maturity Date | | Value | |
| |
| | Corporate Obligations – (continued) | |
| |
| | Mining(a) – 0.8% | |
| | First Quantum Minerals Ltd. | |
| | $ | | | 370,000 | | | | 6.500 | %(b) | | 03/01/24 | | $ | 360,935 | |
| | | | | 580,000 | | | | 7.500 | (b) | | 04/01/25 | | | 558,540 | |
| | | | | 500,000 | | | | 6.875 | | | 03/01/26 | | | 467,958 | |
| | FMG Resources August Pty. Ltd. | |
| | | | | 1,488,000 | | | | 5.875 | | | 04/15/30 | | | 1,320,734 | |
| | Freeport Indonesia PT | |
| | | | | 798,000 | | | | 5.315 | | | 04/14/32 | | | 665,332 | |
| | Freeport-McMoRan, Inc. | |
| | | | | 220,000 | | | | 4.625 | | | 08/01/30 | | | 194,744 | |
| | | | | 272,000 | | | | 5.400 | | | 11/14/34 | | | 243,040 | |
| | | | | 1,150,000 | | | | 5.450 | | | 03/15/43 | | | 952,039 | |
| | Hudbay Minerals, Inc. | |
| | | | | 7,000 | | | | 4.500 | | | 04/01/26 | | | 6,151 | |
| | Mountain Province Diamonds, Inc. | |
| | | | | 3,210,000 | | | | 8.000 | (b) | | 12/15/22 | | | 3,159,988 | |
| | Northwest Acquisitions ULC/Dominion Finco, Inc. | |
| | | | | 1,260,000 | | | | 7.125 | (b)(g) | | 11/01/22 | | | 13 | |
| | | | | | | | | | | | | | | | |
| | | | | 7,929,474 | |
| | | |
| | Miscellaneous Manufacturing(a) – 0.1% | |
| | LSB Industries, Inc. | |
| | | | | 745,000 | | | | 6.250 | | | 10/15/28 | | | 678,293 | |
| | | |
| | Oil Field Services – 4.3% | |
| | Antero Resources Corp. | |
| | | | | 127,000 | | | | 7.625 | (a) | | 02/01/29 | | | 129,522 | |
| | Apache Corp. | |
| | | | | 705,000 | | | | 5.100 | (a) | | 09/01/40 | | | 570,796 | |
| | Archrock Partners LP/Archrock Partners Finance Corp. | |
| | | | | 620,000 | | | | 6.250 | (a) | | 04/01/28 | | | 576,557 | |
| | Ascent Resources Utica Holdings LLC/ARU Finance Corp. | |
| | | | | 605,000 | | | | 5.875 | (a) | | 06/30/29 | | | 533,392 | |
| | Chesapeake Energy Corp.(h) | |
| | | | | 195,000 | | | | 7.000 | | | 10/01/24 | | | 4,388 | |
| | | | | 935,000 | | | | 7.500 | | | 10/01/26 | | | 25,713 | |
| | Citgo Holding, Inc. | |
| | | | | 395,000 | | | | 9.250 | (a) | | 08/01/24 | | | 395,549 | |
| | CITGO Petroleum Corp.(a) | |
| | | | | 1,771,000 | | | | 7.000 | (b) | | 06/15/25 | | | 1,745,657 | |
| | | | | 150,000 | | | | 6.375 | | | 06/15/26 | | | 147,651 | |
| | Colgate Energy Partners III LLC(a) | |
| | | | | 464,000 | | | | 7.750 | | | 02/15/26 | | | 462,432 | |
| | | | | 853,000 | | | | 5.875 | | | 07/01/29 | | | 796,037 | |
| | Earthstone Energy Holdings LLC | |
| | | | | 1,144,000 | | | | 8.000 | (a) | | 04/15/27 | | | 1,082,075 | |
| | Ecopetrol SA | |
| | | | | 776,000 | | | | 5.875 | (a) | | 11/02/51 | | | 456,676 | |
| | EQT Corp. | |
| | | | | 222,000 | | | | 7.000 | (a) | | 02/01/30 | | | 227,752 | |
| | Guara Norte S.a.r.l. | |
| | | | | 664,666 | | | | 5.198 | (b) | | 06/15/34 | | | 518,440 | |
| | KazMunayGas National Co. JSC | |
| | | | | 1,123,000 | | | | 3.500 | (a) | | 04/14/33 | | | 762,447 | |
| | | |
48 The accompanying notes are an integral part of these financial statements.
GOLDMAN SACHS MULTI-MANAGER NON-CORE FIXED INCOME FUND
| | | | | | | | | | | | | | | | |
| | | Principal Amount | | | Interest Rate | | | Maturity Date | | Value | |
| |
| | Corporate Obligations – (continued) | |
| |
| | Oil Field Services – (continued) | |
| | Kosmos Energy Ltd.(a) | |
| | $ | | | 671,000 | | | | 7.125 | % | | 04/04/26 | | $ | 558,608 | |
| | | | | 1,142,000 | | | | 7.750 | | | 05/01/27 | | | 907,890 | |
| | Matador Resources Co. | |
| | | | | 1,263,000 | | | | 5.875 | (a) | | 09/15/26 | | | 1,240,897 | |
| | MEG Energy Corp. | |
| | | | | 1,321,000 | | | | 7.125 | (a)(b) | | 02/01/27 | | | 1,344,302 | |
| | Moss Creek Resources Holdings, Inc. | |
| | | | | 459,000 | | | | 7.500 | (a) | | 01/15/26 | | | 422,197 | |
| | Northern Oil & Gas, Inc. | |
| | | | | 510,000 | | | | 8.125 | (a)(b) | | 03/01/28 | | | 484,036 | |
| | NuVista Energy Ltd. | |
| | CAD | | | 1,825,000 | | | | 7.875 | (a) | | 07/23/26 | | | 1,354,667 | |
| | Occidental Petroleum Corp. | |
| | $ | | | 917,000 | | | | 8.500 | (a) | | 07/15/27 | | | 1,004,115 | |
| | | | | 462,000 | | | | 7.500 | | | 05/01/31 | | | 496,632 | |
| | | | | 965,000 | | | | 4.625 | (a) | | 06/15/45 | | | 798,402 | |
| | PBF Holding Co. LLC/PBF Finance Corp. | |
| | | | | 305,000 | | | | 7.250 | (a) | | 06/15/25 | | | 301,755 | |
| | Penn Virginia Holdings LLC | |
| | | | | 1,304,000 | | | | 9.250 | (a) | | 08/15/26 | | | 1,286,826 | |
| | Petroleos de Venezuela SA | |
| | | | | 700,000 | | | | 6.000 | (g) | | 11/15/26 | | | 13,300 | |
| | Petroleos del Peru SA | |
| | | | | 1,192,000 | | | | 5.625 | | | 06/19/47 | | | 759,900 | |
| | Petroleos Mexicanos | |
| | | | | 1,076,000 | | | | 6.500 | | | 03/13/27 | | | 937,734 | |
| | | | | 1,840,826 | | | | 8.750 | | | 06/02/29 | | | 1,650,991 | |
| | | | | 1,323,000 | | | | 6.840 | (a) | | 01/23/30 | | | 1,049,311 | |
| | | | | 1,994,000 | | | | 5.950 | (a) | | 01/28/31 | | | 1,432,689 | |
| | | | | 4,338,000 | | | | 6.700 | (a) | | 02/16/32 | | | 3,259,207 | |
| | | | | 623,000 | | | | 6.375 | | | 01/23/45 | | | 363,832 | |
| | | | | 2,062,000 | | | | 6.750 | | | 09/21/47 | | | 1,240,293 | |
| | Petronas Capital Ltd.(a) | |
| | | | | 1,364,000 | | | | 3.500 | | | 04/21/30 | | | 1,210,135 | |
| | | | | 1,287,000 | | | | 2.480 | | | 01/28/32 | | | 1,022,322 | |
| | | | | 1,258,000 | | | | 4.550 | | | 04/21/50 | | | 1,023,030 | |
| | Qatar Energy | |
| | | | | 1,855,000 | | | | 2.250 | (a) | | 07/12/31 | | | 1,488,637 | |
| | Rockcliff Energy II LLC | |
| | | | | 339,000 | | | | 5.500 | (a) | | 10/15/29 | | | 302,588 | |
| | SA Global Sukuk Ltd. | |
| | | | | 567,000 | | | | 1.602 | (a) | | 06/17/26 | | | 496,976 | |
| | Saudi Arabian Oil Co. | |
| | | | | 1,193,000 | | | | 1.625 | (a) | | 11/24/25 | | | 1,065,945 | |
| | Shelf Drilling Holdings Ltd. | |
| | | | | 2,060,000 | | | | 8.250 | (a)(b) | | 02/15/25 | | | 1,730,400 | |
| | Strathcona Resources Ltd. | |
| | | | | 1,670,000 | | | | 6.875 | (a) | | 08/01/26 | | | 1,413,622 | |
| | Tengizchevroil Finance Co. International Ltd. | |
| | | | | 352,000 | | | | 2.625 | (a) | | 08/15/25 | | | 272,360 | |
| | Transocean Pontus Ltd. | |
| | | | | 889,280 | | | | 6.125 | (a)(b) | | 08/01/25 | | | 853,318 | |
| | Transocean, Inc. | |
| | | | | 1,160,000 | | | | 11.500 | (a)(b) | | 01/30/27 | | | 1,165,301 | |
| | | |
| | | | | | | | | | | | | | | | |
| | | Principal Amount | | | Interest Rate | | | Maturity Date | | Value | |
| |
| | Corporate Obligations – (continued) | |
| |
| | Oil Field Services – (continued) | |
| | $ | | | 480,000 | | | | 7.500 | % | | 04/15/31 | | $ | 313,862 | |
| | Wintershall Dea Finance 2 BV Series NC8 (-1X 5 year EUR Swap + 3.319%) | |
| | EUR | | | 1,100,000 | | | | 3.000 | (a)(d) | | 12/31/99 | | | 804,403 | |
| | | | | | | | | | | | | | | | |
| | | | | 42,505,567 | |
| | | |
| | Packaging(a) – 0.5% | |
| | Ardagh Metal Packaging Finance USA LLC/Ardagh Metal Packaging Finance PLC | |
| | | | | 350,000 | | | | 2.000 | | | 09/01/28 | | | 266,323 | |
| | Ardagh Packaging Finance PLC/Ardagh Holdings USA, Inc. | |
| | $ | | | 177,000 | | | | 5.250 | | | 04/30/25 | | | 167,279 | |
| | | | | 116,000 | | | | 4.125 | (b) | | 08/15/26 | | | 99,789 | |
| | | | | 670,000 | | | | 5.250 | (b) | | 08/15/27 | | | 479,961 | |
| | Berry Global, Inc. | |
| | EUR | | | 625,000 | | | | 1.000 | | | 01/15/25 | | | 567,262 | |
| | Canpack SA / Canpack US LLC | |
| | | | | 400,000 | | | | 2.375 | | | 11/01/27 | | | 319,853 | |
| | Intelligent Packaging Ltd. Finco, Inc./Intelligent Packaging Ltd. Co.-Issuer LLC | |
| | $ | | | 1,637,000 | | | | 6.000 | (b) | | 09/15/28 | | | 1,221,660 | |
| | Mauser Packaging Solutions Holding Co. | |
| | EUR | | | 150,000 | | | | 4.750 | | | 04/15/24 | | | 138,851 | |
| | $ | | | 511,000 | | | | 7.250 | | | 04/15/25 | | | 459,895 | |
| | OI European Group BV | |
| | | | | 50,000 | | | | 4.750 | | | 02/15/30 | | | 42,466 | |
| | Owens-Brockway Glass Container, Inc. | |
| | | | | 386,000 | | | | 6.625 | | | 05/13/27 | | | 369,128 | |
| | Trident TPI Holdings, Inc. | |
| | | | | 357,000 | | | | 9.250 | | | 08/01/24 | | | 333,777 | |
| | | | | | | | | | | | | | | | |
| | | | | 4,466,244 | |
| | | |
| | Pharmaceuticals(a) – 0.8% | |
| | AdaptHealth LLC | |
| | | | | 530,000 | | | | 4.625 | (b) | | 08/01/29 | | | 451,422 | |
| | Almirall SA | |
| | EUR | | | 300,000 | | | | 2.125 | | | 09/30/26 | | | 259,416 | |
| | Bausch Health Cos., Inc.(b) | |
| | $ | | | 1,355,000 | | | | 6.250 | | | 02/15/29 | | | 528,464 | |
| | | | | 1,500,000 | | | | 5.250 | | | 01/30/30 | | | 581,925 | |
| | Bristol-Myers Squibb Co. | |
| | | | | 705,000 | | | | 2.550 | | | 11/13/50 | | | 422,817 | |
| | Cheplapharm Arzneimittel GmbH | |
| | | | | 1,401,000 | | | | 5.500 | (b) | | 01/15/28 | | | 1,161,429 | |
| | Embecta Corp. | |
| | | | | 690,000 | | | | 5.000 | | | 02/15/30 | | | 592,275 | |
| | Endo Dac/Endo Finance LLC/Endo Finco, Inc.(b)(g) | |
| | | | | 1,183,000 | | | | 9.500 | | | 07/31/27 | | | 134,460 | |
| | | | | 946,000 | | | | 6.000 | | | 06/30/28 | | | 45,749 | |
| | Gruenenthal GmbH | |
| | EUR | | | 620,000 | | | | 4.125 | | | 05/15/28 | | | 508,351 | |
| | Lannett Co., Inc. | |
| | $ | | | 2,355,000 | | | | 7.750 | (b) | | 04/15/26 | | | 650,263 | |
| | Nidda BondCo GmbH | |
| | EUR | | | 450,000 | | | | 5.000 | | | 09/30/25 | | | 359,336 | |
| | | |
The accompanying notes are an integral part of these financial statements. 49
|
| GOLDMAN SACHS MULTI-MANAGER NON-CORE FIXED INCOME FUND |
Schedule of Investments (continued)
October 31, 2022
| | | | | | | | | | | | | | | | |
| | | Principal Amount | | | Interest Rate | | | Maturity Date | | Value | |
| |
| | Corporate Obligations – (continued) | |
| |
| | Pharmaceuticals(a) – (continued) | |
| | Organon & Co./Organon Foreign Debt Co.-Issuer BV | |
| | $ | | | 645,000 | | | | 5.125 | % | | 04/30/31 | | $ | 547,650 | |
| | Owens & Minor, Inc. | |
| | | | | 575,000 | | | | 6.625 | | | 04/01/30 | | | 480,027 | |
| | Par Pharmaceutical, Inc. | |
| | | | | 344,000 | | | | 7.500 | (b)(g) | | 04/01/27 | | | 255,220 | |
| | Teva Pharmaceutical Finance Netherlands II BV | |
| | EUR | | | 810,000 | | | | 4.375 | | | 05/09/30 | | | 644,484 | |
| | | | | | | | | | | | | | | | |
| | | | | 7,623,288 | |
| | | |
| | Pipelines – 2.2% | |
| | Blue Racer Midstream LLC/Blue Racer Finance Corp. | |
| | $ | | | 519,000 | | | | 7.625 | (a) | | 12/15/25 | | | 513,696 | |
| | Cheniere Energy Partners LP | |
| | | | | 551,000 | | | | 4.500 | (a) | | 10/01/29 | | | 486,483 | |
| | CQP Holdco LP/BIP-V Chinook Holdco LLC | |
| | | | | 1,010,000 | | | | 5.500 | (a) | | 06/15/31 | | | 896,496 | |
| | DCP Midstream Operating LP | |
| | | | | 350,000 | | | | 8.125 | | | 08/16/30 | | | 374,773 | |
| | EIG Pearl Holdings S.a.r.l | |
| | | | | 672,000 | | | | 3.545 | | | 08/31/36 | | | 515,760 | |
| | | | | 841,000 | | | | 4.387 | | | 11/30/46 | | | 569,778 | |
| | EnLink Midstream LLC | |
| | | | | 347,000 | | | | 5.375 | (a) | | 06/01/29 | | | 320,243 | |
| | EQM Midstream Partners LP(a) | |
| | | | | 1,504,000 | | | | 7.500 | | | 06/01/27 | | | 1,487,817 | |
| | | | | 729,000 | | | | 7.500 | | | 06/01/30 | | | 709,426 | |
| | | | | 539,000 | | | | 6.500 | | | 07/15/48 | | | 415,219 | |
| | Galaxy Pipeline Assets Bidco Ltd. | |
| | | | | 1,621,854 | | | | 2.160 | | | 03/31/34 | | | 1,319,783 | |
| | | | | 2,576,769 | | | | 2.940 | | | 09/30/40 | | | 1,924,202 | |
| | Genesis Energy LP/Genesis Energy Finance Corp.(a) | |
| | | | | 460,000 | | | | 8.000 | | | 01/15/27 | | | 446,591 | |
| | | | | 1,500,000 | | | | 7.750 | | | 02/01/28 | | | 1,430,085 | |
| | Global Partners LP/GLP Finance Corp. | |
| | | | | 1,202,000 | | | | 7.000 | (a) | | 08/01/27 | | | 1,152,802 | |
| | Howard Midstream Energy Partners LLC | |
| | | | | 760,000 | | | | 6.750 | (a) | | 01/15/27 | | | 689,616 | |
| | ITT Holdings LLC | |
| | | | | 2,251,000 | | | | 6.500 | (a) | | 08/01/29 | | | 1,811,942 | |
| | KazTransGas JSC | |
| | | | | 590,000 | | | | 4.375 | | | 09/26/27 | | | 481,470 | |
| | New Fortress Energy, Inc. | |
| | | | | 587,000 | | | | 6.500 | (a) | | 09/30/26 | | | 569,513 | |
| | NGL Energy Operating LLC/NGL Energy Finance Corp. | |
| | | | | 205,000 | | | | 7.500 | (a)(b) | | 02/01/26 | | | 185,599 | |
| | NGL Energy Partners LP/NGL Energy Finance Corp.(a) | |
| | | | | 561,000 | | | | 7.500 | | | 11/01/23 | | | 547,121 | |
| | | | | 1,624,000 | | | | 6.125 | | | 03/01/25 | | | 1,266,850 | |
| | | | | 725,000 | | | | 7.500 | | | 04/15/26 | | | 529,352 | |
| | Summit Midstream Holdings LLC/Summit Midstream Finance Corp. | |
| | | | | 278,000 | | | | 8.500 | (a) | | 10/15/26 | | | 266,950 | |
| | Tallgrass Energy Partners LP/Tallgrass Energy Finance Corp.(a)(b) | |
| | | | | 1,180,000 | | | | 6.000 | | | 03/01/27 | | | 1,120,504 | |
| | | |
| | | | | | | | | | | | | | | | |
| | | Principal Amount | | | Interest Rate | | | Maturity Date | | Value | |
| |
| | Corporate Obligations – (continued) | |
| |
| | Pipelines – (continued) | |
| | $ | | | 1,262,000 | | | | 6.000 | % | | 12/31/30 | | $ | 1,144,785 | |
| | Western Midstream Operating LP | |
| | | | | 579,000 | | | | 5.500 | (a) | | 02/01/50 | | | 454,793 | |
| | | | | | | | | | | | | | | | |
| | | | | 21,631,649 | |
| | | |
| | Real Estate(b) – 0.1% | |
| | WeWork Cos., Inc. | |
| | | | | 1,965,000 | | | | 7.875 | | | 05/01/25 | | | 1,073,558 | |
| | | |
| | Real Estate Investment Trust – 1.0% | |
| | American Tower Corp.(a) | |
| | | | | 90,000 | | | | 3.700 | | | 10/15/49 | | | 58,982 | |
| | | | | 345,000 | | | | 3.100 | | | 06/15/50 | | | 203,850 | |
| | | | | 265,000 | | | | 2.950 | | | 01/15/51 | | | 150,949 | |
| | Brookfield Property REIT, Inc./BPR Cumulus LLC/BPR Nimbus LLC/GGSI Sellco LL | |
| | | | | 646,000 | | | | 4.500 | (a) | | 04/01/27 | | | 551,025 | |
| | Crown Castle, Inc.(a) | |
| | | | | 795,000 | | | | 2.900 | | | 04/01/41 | | | 504,809 | |
| | | | | 135,000 | | | | 3.250 | | | 01/15/51 | | | 82,808 | |
| | Diversified Healthcare Trust(a) | |
| | | | | 200,000 | | | | 9.750 | | | 06/15/25 | | | 188,924 | |
| | | | | 680,000 | | | | 4.375 | | | 03/01/31 | | | 452,832 | |
| | Global Net Lease, Inc./Global Net Lease Operating Partnership LP | |
| | | | | 721,000 | | | | 3.750 | (a) | | 12/15/27 | | | 582,020 | |
| | GLP Capital LP/GLP Financing II, Inc. | |
| | | | | 520,000 | | | | 5.300 | (a) | | 01/15/29 | | | 470,683 | |
| | HAT Holdings I LLC/HAT Holdings II LLC | |
| | | | | 251,000 | | | | 6.000 | (a) | | 04/15/25 | | | 239,291 | |
| | | | | 251,000 | | | | 3.375 | (a) | | 06/15/26 | | | 204,671 | |
| | | | | 15,000 | | | | 3.750 | | | 09/15/30 | | | 10,383 | |
| | Host Hotels & Resorts LP | |
| | | | | 979,000 | | | | 3.375 | (a) | | 12/15/29 | | | 785,726 | |
| | Iron Mountain, Inc.(a) | |
| | | | | 465,000 | | | | 5.250 | | | 03/15/28 | | | 427,893 | |
| | | | | 136,000 | | | | 4.875 | (b) | | 09/15/29 | | | 117,205 | |
| | Ladder Capital Finance Holdings LLLP/Ladder Capital Finance Corp. | |
| | | | | 616,000 | | | | 4.250 | (a) | | 02/01/27 | | | 520,699 | |
| | Rithm Capital Corp. | |
| | | | | 680,000 | | | | 6.250 | (a)(b) | | 10/15/25 | | | 596,591 | |
| | Service Properties Trust(a) | |
| | | | | 490,000 | | | | 4.950 | | | 02/15/27 | | | 397,135 | |
| | | | | 345,000 | | | | 5.500 | | | 12/15/27 | | | 297,200 | |
| | | | | 125,000 | | | | 4.950 | | | 10/01/29 | | | 91,319 | |
| | | | | 770,000 | | | | 4.375 | | | 02/15/30 | | | 548,941 | |
| | VICI Properties LP/VICI Note Co., Inc.(a) | |
| | | | | 949,000 | | | | 3.500 | | | 02/15/25 | | | 883,272 | |
| | | | | 1,254,000 | | | | 4.625 | | | 06/15/25 | | | 1,179,901 | |
| | | | | 593,000 | | | | 3.750 | | | 02/15/27 | | | 520,387 | |
| | | | | | | | | | | | | | | | |
| | | | | 10,067,496 | |
| | | |
50 The accompanying notes are an integral part of these financial statements.
GOLDMAN SACHS MULTI-MANAGER NON-CORE FIXED INCOME FUND
| | | | | | | | | | | | | | | | |
| | | Principal Amount | | | Interest Rate | | | Maturity Date | | Value | |
| |
| | Corporate Obligations – (continued) | |
| |
| | Retailing – 1.5% | |
| | 1011778 BC ULC/New Red Finance, Inc. | |
| | $ | | | 580,000 | | | | 4.375 | %(a) | | 01/15/28 | | $ | 509,866 | |
| | Asbury Automotive Group, Inc.(a) | |
| | | | | 580,000 | | | | 4.500 | | | 03/01/28 | | | 503,231 | |
| | | | | 695,000 | | | | 4.625 | | | 11/15/29 | | | 571,512 | |
| | Bath & Body Works, Inc. | |
| | | | | 176,000 | | | | 9.375 | | | 07/01/25 | | | 183,376 | |
| | | | | 100,000 | | | | 5.250 | | | 02/01/28 | | | 88,418 | |
| | | | | 275,000 | | | | 6.875 | | | 11/01/35 | | | 233,846 | |
| | | | | 575,000 | | | | 6.750 | | | 07/01/36 | | | 474,571 | |
| | BCPE Ulysses Intermediate, Inc.(c) | |
| | | | | 905,667 | | | | 7.750 | (a)(b) | | 04/01/27 | | | 599,488 | |
| | Carvana Co.(a) | |
| | | | | 90,000 | | | | 5.625 | | | 10/01/25 | | | 58,950 | |
| | | | | 10,000 | | | | 10.250 | | | 05/01/30 | | | 5,998 | |
| | Doman Building Materials Group Ltd. | |
| | CAD | | | 2,340,000 | | | | 5.250 | (a) | | 05/15/26 | | | 1,466,418 | |
| | eG Global Finance PLC(a) | |
| | EUR | | | 450,000 | | | | 3.625 | | | 02/07/24 | | | 400,041 | |
| | $ | | | 301,000 | | | | 6.750 | | | 02/07/25 | | | 272,899 | |
| | Ferrellgas LP/Ferrellgas Finance Corp. | |
| | | | | 1,860,000 | | | | 5.375 | (a)(b) | | 04/01/26 | | | 1,688,024 | |
| | KFC Holding Co./Pizza Hut Holdings LLC/Taco Bell of America LLC | |
| | | | | 245,000 | | | | 4.750 | (a)(b) | | 06/01/27 | | | 234,365 | |
| | LBM Acquisition LLC | |
| | | | | 1,274,000 | | | | 6.250 | (a)(b) | | 01/15/29 | | | 890,004 | |
| | LCM Investments Holdings II LLC | |
| | | | | 663,000 | | | | 4.875 | (a) | | 05/01/29 | | | 561,157 | |
| | Lithia Motors, Inc. | |
| | | | | 385,000 | | | | 3.875 | (a) | | 06/01/29 | | | 311,769 | |
| | Mobilux Finance SAS | |
| | EUR | | | 400,000 | | | | 4.250 | (a) | | 07/15/28 | | | 276,781 | |
| | Neiman Marcus Group Ltd. LLC | |
| | $ | | | 605,000 | | | | 8.000 | (h)(i) | | 10/15/21 | | | 171,048 | |
| | Rite Aid Corp. | |
| | | | | 896,000 | | | | 8.000 | (a)(b) | | 11/15/26 | | | 581,997 | |
| | | | | 47,000 | | | | 7.700 | | | 02/15/27 | | | 25,223 | |
| | Shiba Bidco SpA | |
| | EUR | | | 450,000 | | | | 4.500 | (a) | | 10/31/28 | | | 345,946 | |
| | Specialty Building Products Holdings LLC/SBP Finance Corp. | |
| | $ | | | 1,580,000 | | | | 6.375 | (a) | | 09/30/26 | | | 1,279,753 | |
| | SRS Distribution, Inc.(a) | |
| | | | | 231,000 | | | | 4.625 | | | 07/01/28 | | | 203,229 | |
| | | | | 36,000 | | | | 6.125 | | | 07/01/29 | | | 29,573 | |
| | Stonegate Pub Co. Financing 2019 PLC | |
| | GBP | | | 778,000 | | | | 8.250 | (a) | | 07/31/25 | | | 807,450 | |
| | The Gap, Inc. | |
| | $ | | | 1,142,000 | | | | 3.625 | (a) | | 10/01/29 | | | 802,312 | |
| | White Cap Parent LLC(c) | |
| | | | | 810,000 | | | | 8.250 | (a)(b) | | 03/15/26 | | | 697,548 | |
| | Yum! Brands, Inc. | |
| | | | | 615,000 | | | | 6.875 | | | 11/15/37 | | | 608,782 | |
| | | | | 14,883,575 | |
| | | |
| | | | | | | | | | | | | | | | |
| | | Principal Amount | | | Interest Rate | | | Maturity Date | | Value | |
| |
| | Corporate Obligations – (continued) | |
| |
| | Semiconductors(a) – 0.1% | |
| | Entegris, Inc. | |
| | $ | | | 100,000 | | | | 3.625 | % | | 05/01/29 | | $ | 81,757 | |
| | Intel Corp. | |
| | | | | 445,000 | | | | 3.100 | | | 02/15/60 | | | 252,680 | |
| | | | | 465,000 | | | | 3.200 | | | 08/12/61 | | | 268,914 | |
| | Synaptics, Inc. | |
| | | | | 672,000 | | | | 4.000 | | | 06/15/29 | | | 556,947 | |
| | | | | | | | | | | | | | | | |
| | | | | 1,160,298 | |
| | | |
| | Software(a) – 0.3% | |
| | Castle U.S. Holding Corp. | |
| | | | | 750,000 | | | | 9.500 | (b) | | 02/15/28 | | | 340,080 | |
| | Elastic NV | |
| | | | | 460,000 | | | | 4.125 | | | 07/15/29 | | | 384,385 | |
| | Open Text Holdings, Inc. | |
| | | | | 375,000 | | | | 4.125 | | | 02/15/30 | | | 298,553 | |
| | PTC, Inc. | |
| | | | | 351,000 | | | | 4.000 | | | 02/15/28 | | | 320,186 | |
| | SS&C Technologies, Inc. | |
| | | | | 965,000 | | | | 5.500 | | | 09/30/27 | | | 896,842 | |
| | Veritas US, Inc./Veritas Bermuda Ltd. | |
| | | | | 1,290,000 | | | | 7.500 | (b) | | 09/01/25 | | | 1,084,696 | |
| | | | | | | | | | | | | | | | |
| | | | | 3,324,742 | |
| | | |
| | Telecommunication Services – 2.1% | |
| | Altice France Holding SA(a) | |
| | EUR | | | 614,000 | | | | 8.000 | | | 05/15/27 | | | 441,849 | |
| | $ | | | 1,172,000 | | | | 10.500 | (b) | | 05/15/27 | | | 912,578 | |
| | Altice France SA | |
| | | | | 850,000 | | | | 5.500 | (a) | | 10/15/29 | | | 647,921 | |
| | America Movil SAB de CV | |
| | | | | 1,675,000 | | | | 5.375 | (a) | | 04/04/32 | | | 1,414,642 | |
| | Avaya, Inc. | |
| | | | | 1,812,000 | | | | 6.125 | (a) | | 09/15/28 | | | 766,621 | |
| | Ciena Corp. | |
| | | | | 520,000 | | | | 4.000 | (a) | | 01/31/30 | | | 436,925 | |
| | CommScope, Inc.(a) | |
| | | | | 2,408,000 | | | | 8.250 | (b) | | 03/01/27 | | | 2,142,518 | |
| | | | | 965,000 | | | | 7.125 | | | 07/01/28 | | | 818,310 | |
| | DKT Finance ApS | |
| | EUR | | | 500,000 | | | | 7.000 | (a) | | 06/17/23 | | | 480,655 | |
| | Frontier Communications Holdings LLC(a) | |
| | $ | | | 130,000 | | | | 5.875 | | | 11/01/29 | | | 102,185 | |
| | | | | 410,000 | | | | 8.750 | | | 05/15/30 | | | 418,598 | |
| | Iliad Holding SASU(a) | |
| | | | | 2,458,000 | | | | 6.500 | | | 10/15/26 | | | 2,278,320 | |
| | EUR | | | 450,000 | | | | 5.625 | | | 10/15/28 | | | 400,059 | |
| | $ | | | 1,545,000 | | | | 7.000 | | | 10/15/28 | | | 1,397,514 | |
| | Level 3 Financing, Inc.(a) | |
| | | | | 149,000 | | | | 4.625 | | | 09/15/27 | | | 129,643 | |
| | | | | 200,000 | | | | 4.250 | | | 07/01/28 | | | 164,826 | |
| | | | | 96,000 | | | | 3.625 | | | 01/15/29 | | | 73,251 | |
| | Lumen Technologies, Inc.(a) | |
| | | | | 270,000 | | | | 4.000 | | | 02/15/27 | | | 229,811 | |
| | | | | 1,555,000 | | | | 4.500 | | | 01/15/29 | | | 1,098,359 | |
| | | |
The accompanying notes are an integral part of these financial statements. 51
|
| GOLDMAN SACHS MULTI-MANAGER NON-CORE FIXED INCOME FUND |
Schedule of Investments (continued)
October 31, 2022
| | | | | | | | | | | | | | | | |
| | | Principal Amount | | | Interest Rate | | | Maturity Date | | Value | |
| |
| | Corporate Obligations – (continued) | |
| |
| | Telecommunication Services – (continued) | |
| | Maxar Technologies, Inc. | |
| | $ | | | 1,350,000 | | | | 7.750 | %(a) | | 06/15/27 | | $ | 1,329,129 | |
| | SoftBank Group Corp. | |
| | EUR | | | 1,144,000 | | | | 3.375 | (a) | | 07/06/29 | | | 827,704 | |
| | Telecom Italia Capital SA | |
| | $ | | | 376,000 | | | | 6.000 | | | 09/30/34 | | | 274,059 | |
| | Telecom Italia SpA | |
| | | | | 245,000 | | | | 5.303 | (b) | | 05/30/24 | | | 230,724 | |
| | EUR | | | 179,000 | | | | 3.625 | | | 05/25/26 | | | 157,617 | |
| | | | | 401,000 | | | | 2.375 | (a) | | 10/12/27 | | | 320,629 | |
| | Telesat Canada/Telesat LLC(a) | |
| | $ | | | 299,000 | | | | 5.625 | | | 12/06/26 | | | 141,989 | |
| | | | | 188,000 | | | | 6.500 | (b) | | 10/15/27 | | | 65,684 | |
| | Total Play Telecomunicaciones SA de CV(a) | |
| | | | | 846,000 | | | | 7.500 | (b) | | 11/12/25 | | | 709,633 | |
| | | | | 1,102,000 | | | | 6.375 | | | 09/20/28 | | | 759,898 | |
| | Verizon Communications, Inc.(a) | |
| | | | | 580,000 | | | | 2.987 | | | 10/30/56 | | | 333,691 | |
| | | | | 95,000 | | | | 3.000 | | | 11/20/60 | | | 53,118 | |
| | Vmed O2 U.K. Financing I PLC | |
| | | | | 870,000 | | | | 4.250 | (a) | | 01/31/31 | | | 700,367 | |
| | Windstream Escrow LLC/Windstream Escrow Finance Corp. | |
| | | | | 570,000 | | | | 7.750 | (a)(b) | | 08/15/28 | | | 493,409 | |
| | | | | | | | | | | | | | | | |
| | | | | | | | | | | | | | | 20,752,236 | |
| | | |
| | Transportation(a) – 0.1% | |
| | Cargo Aircraft Management, Inc. | |
| | | | | 238,000 | | | | 4.750 | | | 02/01/28 | | | 212,541 | |
| | Western Global Airlines LLC | |
| | | | | 610,000 | | | | 10.375 | (b) | | 08/15/25 | | | 513,413 | |
| | | | | | | | | | | | | | | | |
| | | | | | | | | | | | | | | 725,954 | |
| | | |
| | Trucking & Leasing(a)(b) – 0.1% | |
| | Fortress Transportation & Infrastructure Investors LLC | |
| | | | | 1,650,000 | | | | 5.500 | | | 05/01/28 | | | 1,408,423 | |
| | | |
| | Water Utilities(a) – 0.1% | |
| | Aegea Finance S.a.r.l. | |
| | | | | 1,406,000 | | | | 6.750 | | | 05/20/29 | | | 1,284,381 | |
| | | |
| | TOTAL CORPORATE OBLIGATIONS
(Cost $426,359,113) | | $ | 356,670,114 | |
| | | |
| | | |
| |
| | Sovereign Debt Obligations – 33.6% | |
| | Brazil Real – 2.7% | |
| | Brazil Letras do Tesouro Nacional Series LTN | |
| | BRL | | | 7,819,000 | | | | 0.000 | %(f) | | 01/01/23 | | $ | 1,481,294 | |
| | Brazil Notas do Tesouro Nacional | |
| | | | | 9,745,000 | | | | 10.000 | | | 01/01/31 | | | 1,717,167 | |
| | | | | 23,487,000 | | | | 10.000 | | | 01/01/29 | | | 4,218,308 | |
| | | | | 67,294,000 | | | | 10.000 | | | 01/01/25 | | | 12,597,416 | |
| | | | | 38,411,000 | | | | 10.000 | | | 01/01/27 | | | 7,061,432 | |
| | | | | | | | | | | | | | | | |
| | | | | | | | | | | | | | | 27,075,617 | |
| | | |
| | | | | | | | | | | | | | |
| | | Principal Amount | | Interest Rate | | | Maturity Date | | Value | |
| |
| | Sovereign Debt Obligations – (continued) | |
| |
| | Chilean Peso – 0.5% | |
| | Bonos de la Tesoreria de la Republica en pesos | |
| | CLP | | 2,555,000,000 | | | 4.700 | % | | 09/01/30 | | $ | 2,405,110 | |
| | | | 845,000,000 | | | 4.500 | | | 03/01/26 | | | 831,611 | |
| | Bonos de la Tesoreria de la Republica en Pesos | |
| | | | 240,000,000 | | | 2.500 | | | 03/01/25 | | | 228,566 | |
| | | | 560,000,000 | | | 5.000 | | | 10/01/28 | | | 544,009 | |
| | | | 550,000,000 | | | 5.000 | | | 03/01/35 | | | 515,336 | |
| | | | 69,200,700 | | | 2.000 | | | 03/01/35 | | | 68,551 | |
| | | | | | | | | | | | | | |
| | | | | | | | | | | | | 4,593,183 | |
| | | |
| | Chinese Yuan Renminbi – 2.2% | |
| | Agricultural Development Bank of China | |
| | CNY | | 29,390,000 | | | 2.250 | | | 04/22/25 | | | 3,996,659 | |
| | China Government Bond | |
| | | | 17,170,000 | | | 2.850 | | | 06/04/27 | | | 2,380,593 | |
| | | | 33,810,000 | | | 3.280 | | | 12/03/27 | | | 4,794,739 | |
| | | | 17,380,000 | | | 2.750 | | | 06/15/29 | | | 2,380,273 | |
| | | | 55,990,000 | | | 3.270 | | | 11/19/30 | | | 7,970,879 | |
| | | | | | | | | | | | | | |
| | | | | | | | | | | | | 21,523,143 | |
| | | |
| | Colombia Peso – 0.8% | |
| | Republic of Colombia | |
| | COP | | 7,384,300,000 | | | 5.750 | | | 11/03/27 | | | 1,083,987 | |
| | | | 17,093,200,000 | | | 7.000 | | | 06/30/32 | | | 2,219,027 | |
| | | | 12,205,100,000 | | | 7.500 | | | 08/26/26 | | | 2,049,209 | |
| | | | 8,545,200,000 | | | 6.000 | | | 04/28/28 | | | 1,229,384 | |
| | | | 11,315,500,000 | | | 7.750 | | | 09/18/30 | | | 1,640,556 | |
| | | | | | | | | | | | | | |
| | | | | | | | | | | | | 8,222,163 | |
| | | |
| | Czech Republic Koruna – 0.7% | |
| | Czech Republic Government Bond | |
| | CZK | | 21,020,000 | | | 1.250 | | | 02/14/25 | | | 759,234 | |
| | | | 20,360,000 | | | 2.400 | | | 09/17/25 | | | 743,262 | |
| | | | 38,250,000 | | | 1.000 | | | 06/26/26 | | | 1,293,084 | |
| | | | 34,680,000 | | | 0.950 | | | 05/15/30 | | | 977,671 | |
| | | | 54,550,000 | | | 1.750 | | | 06/23/32 | | | 1,546,365 | |
| | | | 53,840,000 | | | 2.000 | | | 10/13/33 | | | 1,511,033 | |
| | | | 17,320,000 | | | 3.500 | | | 05/30/35 | | | 559,134 | |
| | | | | | | | | | | | | | |
| | | | | | | | | | | | | 7,389,783 | |
| | | |
| | Hungarian Forint – 0.6% | |
| | Hungary Government Bond | |
| | HUF | | 310,030,000 | | | 2.750 | | | 12/22/26 | | | 528,657 | |
| | | | 94,750,000 | | | 3.000 | | | 10/27/38 | | | 109,341 | |
| | | | 188,730,000 | | | 1.000 | | | 11/26/25 | | | 331,529 | |
| | | | 1,798,730,000 | | | 3.000 | | | 06/26/24 | | | 3,701,485 | |
| | | | 263,510,000 | | | 3.000 | | | 10/27/27 | | | 437,227 | |
| | | | 733,960,000 | | | 3.250 | | | 10/22/31 | | | 1,074,640 | |
| | | | | | | | | | | | | | |
| | | | | | | | | | | | | 6,182,879 | |
| | | |
| | Indonesia Rupiah – 2.5% | |
| | Indonesia Treasury Bond | |
| | IDR | | 34,771,000,000 | | | 8.375 | | | 09/15/26 | | | 2,309,521 | |
| | | | 54,822,000,000 | | | 7.000 | | | 09/15/30 | | | 3,400,563 | |
| | | | 69,591,000,000 | | | 6.500 | | | 02/15/31 | | | 4,167,206 | |
| | | |
52 The accompanying notes are an integral part of these financial statements.
GOLDMAN SACHS MULTI-MANAGER NON-CORE FIXED INCOME FUND
| | | | | | | | | | | | | | | | |
| | | Principal Amount | | | Interest
Rate | | | Maturity Date | | Value | |
| |
| | Sovereign Debt Obligations – (continued) | |
| |
| | Indonesia Rupiah – (continued) | |
| | IDR | | | 51,781,000,000 | | | | 6.375 | % | | 04/15/32 | | $ | 3,054,241 | |
| | | | | 46,252,000,000 | | | | 7.500 | | | 08/15/32 | | | 2,920,867 | |
| | | | | 6,810,000,000 | | | | 7.500 | | | 06/15/35 | | | 430,059 | |
| | | | | 36,031,000,000 | | | | 6.125 | | | 05/15/28 | | | 2,171,447 | |
| | | | | 58,128,000,000 | | | | 9.000 | | | 03/15/29 | | | 4,002,531 | |
| | | | | 25,445,000,000 | | | | 8.375 | | | 03/15/34 | | | 1,706,393 | |
| | | | | | | | | | | | | | | | |
| | | | | | | | | | | | | | | 24,162,828 | |
| | | |
| | Malaysia Ringgit – 2.1% | |
| | Malaysia Government Bond | |
| | MYR | | | 17,838,000 | | | | 3.885 | | | 08/15/29 | | | 3,641,736 | |
| | | | | 2,403,000 | | | | 2.632 | | | 04/15/31 | | | 440,174 | |
| | | | | 17,855,000 | | | | 3.582 | | | 07/15/32 | | | 3,535,464 | |
| | | | | 5,422,000 | | | | 4.762 | | | 04/07/37 | | | 1,157,393 | |
| | | | | 5,250,000 | | | | 3.757 | | | 05/22/40 | | | 957,359 | |
| | | | | 2,042,000 | | | | 4.181 | | | 07/15/24 | | | 436,188 | |
| | | | | 10,329,000 | | | | 3.955 | | | 09/15/25 | | | 2,185,912 | |
| | | | | 7,350,000 | | | | 3.900 | | | 11/30/26 | | | 1,541,370 | |
| | | | | 11,300,000 | | | | 3.899 | | | 11/16/27 | | | 2,355,218 | |
| | | | | 13,815,000 | | | | 3.733 | | | 06/15/28 | | | 2,828,130 | |
| | Malaysia Government Investment Issue | |
| | | | | 6,994,000 | | | | 3.465 | | | 10/15/30 | | | 1,376,907 | |
| | | | | | | | | | | | | | | | |
| | | | | | | | | | | | | | | 20,455,851 | |
| | | |
| | Mexican Peso – 2.6% | |
| | Mexican Bonos | |
| | MXN | | | 46,949,700 | | | | 5.000 | | | 03/06/25 | | | 2,112,713 | |
| | United Mexican States | |
| | | | | 23,443,300 | | | | 10.000 | | | 12/05/24 | | | 1,177,312 | |
| | | | | 86,361,000 | | | | 5.750 | | | 03/05/26 | | | 3,843,245 | |
| | | | | 115,186,300 | | | | 7.500 | | | 06/03/27 | | | 5,316,793 | |
| | | | | 108,255,400 | | | | 8.500 | | | 05/31/29 | | | 5,111,274 | |
| | | | | 88,564,700 | | | | 7.750 | | | 05/29/31 | | | 3,929,436 | |
| | | | | 20,609,500 | | | | 10.000 | | | 11/20/36 | | | 1,043,615 | |
| | | | | 80,842,700 | | | | 8.500 | | | 11/18/38 | | | 3,586,826 | |
| | | | | | | | | | | | | | | | |
| | | | | | | | | | | | | | | 26,121,214 | |
| | | |
| | Peru Nuevo Sol – 0.6% | |
| | Republic of Peru | |
| | PEN | | | 4,561,000 | | | | 6.350 | | | 08/12/28 | | | 1,064,855 | |
| | | | | 1,730,000 | | | | 5.940 | | | 02/12/29 | | | 389,567 | |
| | | | | 4,216,000 | | | | 6.950 | | | 08/12/31 | | | 973,971 | |
| | | | | 8,108,000 | | | | 6.150 | | | 08/12/32 | | | 1,735,088 | |
| | | | | 3,900,000 | | | | 6.900 | | | 08/12/37 | | | 842,206 | |
| | | | | 3,168,000 | | | | 5.350 | | | 08/12/40 | | | 565,486 | |
| | | | | | | | | | | | | | | | |
| | | | | | | | | | | | | | | 5,571,173 | |
| | | |
| | Polish Zloty – 1.0% | |
| | Republic of Poland | |
| | PLN | | | 9,674,000 | | | | 0.750 | | | 04/25/25 | | | 1,683,087 | |
| | | | | 6,449,000 | | | | 2.750 | | | 10/25/29 | | | 961,508 | |
| | | | | 18,803,000 | | | | 2.500 | | | 07/25/26 | | | 3,183,249 | |
| | | | | 4,456,000 | | | | 2.500 | | | 07/25/27 | | | 720,524 | |
| | | | | 8,246,000 | | | | 1.250 | | | 10/25/30 | | | 1,033,958 | |
| | | |
| | | | | | | | | | | | | | | | |
| | | Principal Amount | | | Interest
Rate | | | Maturity Date | | Value | |
| |
| | Sovereign Debt Obligations – (continued) | |
| |
| | Polish Zloty – (continued) | |
| | Republic of Poland Government Bond | |
| | PLN | | | 11,725,000 | | | | 2.250 | % | | 10/25/24 | | $ | 2,183,324 | |
| | | | | | | | | | | | | | | | |
| | | | | | | | | | | | | | | 9,765,650 | |
| | | |
| | Romania New Leu – 0.7% | |
| | Republic of Romania | |
| | RON | | | 3,840,000 | | | | 5.850 | | | 04/26/23 | | | 763,278 | |
| | | | | 6,510,000 | | | | 4.250 | | | 06/28/23 | | | 1,275,201 | |
| | | | | 5,945,000 | | | | 3.250 | | | 04/29/24 | | | 1,108,862 | |
| | | | | 3,295,000 | | | | 4.750 | | | 02/24/25 | | | 604,518 | |
| | | | | 10,995,000 | | | | 3.250 | | | 06/24/26 | | | 1,819,124 | |
| | | | | 4,955,000 | | | | 4.150 | | | 01/26/28 | | | 794,197 | |
| | Romania Government Bond | |
| | | | | 6,030,000 | | | | 6.700 | | | 02/25/32 | | | 1,029,046 | |
| | | | | | | | | | | | | | | | |
| | | | | | | | | | | | | | | 7,394,226 | |
| | | |
| | South African Rand – 2.2% | |
| | Republic of South Africa | |
| | ZAR | | | 26,000,000 | | | | 10.500 | | | 12/21/26 | | | 1,483,098 | |
| | | | | 89,802,346 | | | | 8.000 | | | 01/31/30 | | | 4,198,497 | |
| | | | | 89,011,285 | | | | 7.000 | | | 02/28/31 | | | 3,756,865 | |
| | | | | 43,024,980 | | | | 8.250 | | | 03/31/32 | | | 1,928,420 | |
| | | | | 86,732,260 | | | | 8.875 | | | 02/28/35 | | | 3,851,937 | |
| | | | | 97,113,856 | | | | 6.250 | | | 03/31/36 | | | 3,350,330 | |
| | | | | 70,856,471 | | | | 8.500 | | | 01/31/37 | | | 2,969,749 | |
| | | | | | | | | | | | | | | | |
| | | | | | | | | | | | | | | 21,538,896 | |
| | | |
| | Thailand Baht – 2.0% | |
| | Thailand Government Bond | |
| | THB | | | 186,435,000 | | | | 1.000 | | | 06/17/27 | | | 4,534,637 | |
| | | | | 195,859,000 | | | | 2.875 | | | 12/17/28 | | | 5,110,015 | |
| | | | | 87,913,000 | | | | 1.600 | | | 12/17/29 | | | 2,100,964 | |
| | | | | 144,728,000 | | | | 2.000 | | | 12/17/31 | | | 3,458,049 | |
| | | | | 39,964,000 | | | | 1.585 | | | 12/17/35 | | | 820,759 | |
| | | | | 56,162,000 | | | | 3.300 | | | 06/17/38 | | | 1,369,374 | |
| | | | | 76,169,000 | | | | 2.125 | | | 12/17/26 | | | 1,961,187 | |
| | | | | | | | | | | | | | | | |
| | | | | | | | | | | | | | | 19,354,985 | |
| | | |
| | United States Dollar – 12.4% | |
| | Abu Dhabi Government International Bond | |
| | $ | | | 1,032,000 | | | | 1.700 | | | 03/02/31 | | | 810,313 | |
| | | | | 1,357,000 | | | | 2.500 | | | 04/16/25 | | | 1,288,980 | |
| | | | | 808,000 | | | | 1.625 | | | 06/02/28 | | | 682,659 | |
| | | | | 454,000 | | | | 3.000 | | | 09/15/51 | | | 291,638 | |
| | Bahrain Government International Bonds | |
| | | | | 766,000 | | | | 4.250 | | | 01/25/28 | | | 667,521 | |
| | China Government Bond | |
| | | | | 1,210,000 | | | | 1.875 | | | 12/03/22 | | | 1,207,338 | |
| | | | | 1,387,000 | | | | 3.250 | | | 10/19/23 | | | 1,369,760 | |
| | | | | 1,618,000 | | | | 0.400 | | | 10/21/23 | | | 1,554,671 | |
| | | | | 1,242,000 | | | | 0.550 | | | 10/21/25 | | | 1,102,884 | |
| | Dominican Republic International Bond | |
| | | | | 1,837,000 | | | | 4.500 | | | 01/30/30 | | | 1,466,500 | |
| | | | | 1,955,000 | | | | 6.000 | (a) | | 02/22/33 | | | 1,629,126 | |
| | | | | 1,566,000 | | | | 5.300 | | | 01/21/41 | | | 1,073,982 | |
| | | |
The accompanying notes are an integral part of these financial statements. 53
|
| GOLDMAN SACHS MULTI-MANAGER NON-CORE FIXED INCOME FUND |
Schedule of Investments (continued)
October 31, 2022
| | | | | | | | | | | | | | | | |
| | | Principal Amount | | | Interest
Rate | | | Maturity Date | | Value | |
| |
| | Sovereign Debt Obligations – (continued) | |
| |
| | United States Dollar – (continued) | |
| | Ethiopia International Bond | |
| | $ | | | 200,000 | | | | 6.625 | % | | 12/11/24 | | $ | 100,538 | |
| | Export-Import Bank of India | |
| | | | | 380,000 | | | | 3.250 | | | 01/15/30 | | | 309,153 | |
| | | | | 1,032,000 | | | | 2.250 | | | 01/13/31 | | | 754,041 | |
| | Georgia Government International Bond | |
| | | | | 329,000 | | | | 2.750 | | | 04/22/26 | | | 275,538 | |
| | Hazine Mustesarligi Varlik Kiralama AS | |
| | | | | 2,031,000 | | | | 7.250 | | | 02/24/27 | | | 1,873,344 | |
| | Honduras Government International Bond | |
| | | | | 409,000 | | | | 5.625 | (a) | | 06/24/30 | | | 277,941 | |
| | Hungary Government Bond | |
| | | | | 1,573,000 | | | | 2.125 | | | 09/22/31 | | | 1,120,074 | |
| | | | | 2,651,000 | | | | 3.125 | | | 09/21/51 | | | 1,444,464 | |
| | Indonesia Government International Bond | |
| | | | | 252,000 | | | | 3.550 | (a) | | 03/31/32 | | | 215,488 | |
| | Jordan Government International Bond | |
| | | | | 848,000 | | | | 7.750 | | | 01/15/28 | | | 822,560 | |
| | | | | 458,000 | | | | 5.850 | | | 07/07/30 | | | 378,995 | |
| | Jordan Government International Bonds | |
| | | | | 591,000 | | | | 7.375 | | | 10/10/47 | | | 441,034 | |
| | Kingdom of Bahrain | |
| | | | | 4,022,000 | | | | 5.450 | | | 09/16/32 | | | 3,240,686 | |
| | KSA Sukuk Ltd. | |
| | | | | 1,739,000 | | | | 2.250 | | | 05/17/31 | | | 1,404,242 | |
| | Kuwait International Government Bond | |
| | | | | 624,000 | | | | 3.500 | | | 03/20/27 | | | 594,867 | |
| | Malaysia Wakala Sukuk Bhd | |
| | | | | 1,304,000 | | | | 2.070 | | | 04/28/31 | | | 1,072,377 | |
| | Mongolia Government International Bond | |
| | | | | 943,000 | | | | 3.500 | | | 07/07/27 | | | 641,240 | |
| | Morocco Government International Bond | |
| | | | | 682,000 | | | | 4.000 | | | 12/15/50 | | | 401,655 | |
| | Nigeria Government International Bond | |
| | | | | 200,000 | | | | 8.375 | | | 03/24/29 | | | 144,500 | |
| | | | | 1,830,000 | | | | 8.375 | | | 03/24/29 | | | 1,322,175 | |
| | Oman Government International Bond | |
| | | | | 1,105,000 | | | | 7.000 | | | 01/25/51 | | | 942,012 | |
| | Republic of Angola | |
| | | | | 460,000 | | | | 9.500 | | | 11/12/25 | | | 447,350 | |
| | | | | 993,000 | | | | 8.000 | | | 11/26/29 | | | 806,812 | |
| | | | | 603,000 | | | | 8.750 | | | 04/14/32 | | | 482,400 | |
| | Republic of Angolan | |
| | | | | 935,000 | | | | 8.750 | | | 04/14/32 | | | 748,000 | |
| | Republic of Argentina (a)(j) | |
| | | | | 1,862,000 | | | | 1.500 | | | 07/09/35 | | | 368,676 | |
| | | | | 5,388,502 | | | | 3.500 | | | 07/09/41 | | | 1,279,769 | |
| | Republic of Armenia International Bond | |
| | | | | 431,000 | | | | 3.600 | | | 02/02/31 | | | 293,296 | |
| | Republic of Azerbaijan | |
| | | | | 417,000 | | | | 5.125 | | | 09/01/29 | | | 378,427 | |
| | | | | 835,000 | | | | 5.125 | | | 09/01/29 | | | 757,762 | |
| | | | | 204,000 | | | | 3.500 | | | 09/01/32 | | | 163,111 | |
| | Republic of Belarus | |
| | | | | 1,204,000 | | | | 5.875 | | | 02/24/26 | | | 234,780 | |
| | | |
| | | | | | | | | | | | | | | | |
| | | Principal Amount | | | Interest
Rate | | | Maturity Date | | Value | |
| |
| | Sovereign Debt Obligations – (continued) | |
| |
| | United States Dollar – (continued) | |
| | Republic of Brazil | |
| | $ | | | 2,730,000 | | | | 3.750 | % | | 09/12/31 | | $ | 2,244,060 | |
| | | | | 2,268,000 | | | | 2.875 | | | 06/06/25 | | | 2,128,518 | |
| | | | | 1,491,000 | | | | 4.750 | (a) | | 01/14/50 | | | 996,454 | |
| | Republic of Chile (a) | |
| | | | | 867,000 | | | | 2.750 | | | 01/31/27 | | | 778,132 | |
| | | | | 5,042,000 | | | | 2.550 | | | 07/27/33 | | | 3,748,727 | |
| | | | | 453,000 | | | | 3.100 | | | 05/07/41 | | | 298,527 | |
| | Republic of Colombia (a) | |
| | | | | 486,000 | | | | 3.875 | | | 04/25/27 | | | 404,686 | |
| | | | | 340,000 | | | | 4.500 | | | 03/15/29 | | | 274,295 | |
| | | | | 3,209,000 | | | | 3.250 | | | 04/22/32 | | | 2,129,171 | |
| | | | | 2,625,000 | | | | 4.125 | | | 02/22/42 | | | 1,460,812 | |
| | Republic of Costa Rica | |
| | | | | 656,000 | | | | 6.125 | | | 02/19/31 | | | 607,948 | |
| | | | | 962,000 | | | | 7.000 | | | 04/04/44 | | | 813,672 | |
| | Republic of Ecuador (j) | |
| | | | | 449,575 | | | | 5.500 | | | 07/31/30 | | | 238,219 | |
| | | | | 4,792,227 | | | | 2.500 | | | 07/31/35 | | | 1,741,076 | |
| | | | | 253,071 | | | | 1.500 | | | 07/31/40 | | | 82,058 | |
| | Republic of Egypt | |
| | | | | 1,489,000 | | | | 7.300 | | | 09/30/33 | | | 925,041 | |
| | | | | 3,181,000 | | | | 7.625 | | | 05/29/32 | | | 2,016,555 | |
| | | | | 971,000 | | | | 7.903 | | | 02/21/48 | | | 542,546 | |
| | Republic of El Salvador | |
| | | | | 1,287,000 | | | | 9.500 | (a) | | 07/15/52 | | | 482,625 | |
| | Republic of Gabon | |
| | | | | 635,000 | | | | 7.000 | (a) | | 11/24/31 | | | 442,635 | |
| | Republic of Ghana | |
| | | | | 223,000 | | | | 10.750 | | | 10/14/30 | | | 143,835 | |
| | | | | 959,000 | | | | 7.625 | | | 05/16/29 | | | 263,725 | |
| | | | | 2,007,000 | | | | 8.625 | | | 04/07/34 | | | 564,469 | |
| | | | | 995,000 | | | | 7.875 | | | 02/11/35 | | | 275,988 | |
| | Republic of Guatemala (a) | |
| | | | | 673,000 | | | | 4.650 | | | 10/07/41 | | | 493,099 | |
| | | | | 1,066,000 | | | | 5.250 | | | 08/10/29 | | | 976,589 | |
| | | | | 1,102,000 | | | | 4.900 | | | 06/01/30 | | | 997,172 | |
| | Republic of Indonesia | |
| | | | | 299,000 | | | | 4.150 | (a) | | 09/20/27 | | | 282,214 | |
| | | | | 842,000 | | | | 3.500 | | | 01/11/28 | | | 768,220 | |
| | | | | 2,818,000 | | | | 2.850 | | | 02/14/30 | | | 2,386,141 | |
| | | | | 2,380,000 | | | | 2.150 | (a) | | 07/28/31 | | | 1,853,687 | |
| | | | | 586,000 | | | | 4.625 | | | 04/15/43 | | | 489,374 | |
| | | | | 923,000 | | | | 3.050 | | | 03/12/51 | | | 586,207 | |
| | Republic of Kazakhstan | |
| | | | | 2,058,000 | | | | 4.875 | | | 10/14/44 | | | 1,563,823 | |
| | Republic of Kenya | |
| | | | | 1,504,000 | | | | 7.000 | | | 05/22/27 | | | 1,191,920 | |
| | | | | 443,000 | | | | 6.300 | | | 01/23/34 | | | 279,090 | |
| | Republic of Lebanon (g) | |
| | | | | 464,000 | | | | 7.000 | | | 03/20/28 | | | 26,477 | |
| | | | | 1,259,000 | | | | 6.650 | | | 11/03/28 | | | 71,448 | |
| | | | | 4,703,000 | | | | 6.100 | | | 10/04/22 | | | 286,001 | |
| | Republic of Morocco | |
| | | | | 681,000 | | | | 3.000 | | | 12/15/32 | | | 489,384 | |
| | | |
54 The accompanying notes are an integral part of these financial statements.
GOLDMAN SACHS MULTI-MANAGER NON-CORE FIXED INCOME FUND
| | | | | | | | | | | | | | | | |
| | | Principal Amount | | | Interest
Rate | | | Maturity Date | | Value | |
| |
| | Sovereign Debt Obligations – (continued) | |
| |
| | United States Dollar – (continued) | |
| | Republic of Mozambique | |
| | $ | | | 269,000 | | | | 5.000 | %(j) | | 09/15/31 | | $ | 180,112 | |
| | Republic of Nigeria | |
| | | | | 2,169,000 | | | | 7.375 | | | 09/28/33 | | | 1,306,822 | |
| | Republic of Oman | |
| | | | | 2,573,000 | | | | 6.750 | | | 10/28/27 | | | 2,576,699 | |
| | | | | 1,328,000 | | | | 6.250 | | | 01/25/31 | | | 1,264,920 | |
| | Republic of Pakistan | |
| | | | | 2,070,000 | | | | 7.375 | | | 04/08/31 | | | 626,403 | |
| | | | | 562,000 | | | | 8.875 | | | 04/08/51 | | | 168,662 | |
| | Republic of Panama(a) | |
| | | | | 914,000 | | | | 3.750 | | | 03/16/25 | | | 871,899 | |
| | | | | 2,197,000 | | | | 2.252 | | | 09/29/32 | | | 1,523,208 | |
| | | | | 278,000 | | | | 3.298 | | | 01/19/33 | | | 212,114 | |
| | | | | 1,426,000 | | | | 3.870 | | | 07/23/60 | | | 818,524 | |
| | | | | 1,293,000 | | | | 4.500 | | | 01/19/63 | | | 822,348 | |
| | Republic of Paraguay | |
| | | | | 798,000 | | | | 2.739 | | | 01/29/33 | | | 590,670 | |
| | Republic of Peru(a) | |
| | | | | 2,915,000 | | | | 2.783 | | | 01/23/31 | | | 2,297,020 | |
| | | | | 1,729,000 | | | | 3.230 | (g)(k) | | 07/28/21 | | | 909,670 | |
| | Republic of Peruvian | |
| | | | | 493,000 | | | | 3.550 | (a) | | 03/10/51 | | | 321,929 | |
| | Republic of Philippines | |
| | | | | 650,000 | | | | 5.170 | | | 10/13/27 | | | 646,821 | |
| | | | | 1,697,000 | | | | 1.648 | | | 06/10/31 | | | 1,262,330 | |
| | | | | 4,274,000 | | | | 1.950 | | | 01/06/32 | | | 3,227,340 | |
| | | | | 820,000 | | | | 3.200 | | | 07/06/46 | | | 536,165 | |
| | Republic of Qatar | |
| | | | | 2,685,000 | | | | 3.750 | | | 04/16/30 | | | 2,496,969 | |
| | | | | 2,204,000 | | | | 4.400 | | | 04/16/50 | | | 1,851,316 | |
| | Republic of Romania | |
| | | | | 364,000 | | | | 3.000 | | | 02/27/27 | | | 311,516 | |
| | | | | 984,000 | | | | 3.625 | | | 03/27/32 | | | 721,579 | |
| | | | | 1,468,000 | | | | 4.000 | | | 02/14/51 | | | 854,009 | |
| | Republic of Senegal | |
| | | | | 592,000 | | | | 6.750 | | | 03/13/48 | | | 374,921 | |
| | Republic of Serbia | |
| | | | | 400,000 | | | | 2.125 | | | 12/01/30 | | | 275,325 | |
| | Republic of South Africa | |
| | | | | 1,878,000 | | | | 5.875 | | | 04/20/32 | | | 1,603,342 | |
| | | | | 2,452,000 | | | | 5.750 | | | 09/30/49 | | | 1,624,450 | |
| | Republic of Sri Lanka | |
| | | | | 539,000 | | | | 5.750 | (g) | | 04/18/23 | | | 120,029 | |
| | | | | 565,000 | | | | 6.350 | | | 06/28/24 | | | 126,878 | |
| | | | | 2,236,000 | | |
| 6.750
| (g)
| | 04/18/28 | | | 491,640 | |
| | Republic of Turkey | |
| | | | | 2,070,000 | | | | 5.950 | | | 01/15/31 | | | 1,580,962 | |
| | | | | 2,334,000 | | | | 4.875 | | | 04/16/43 | | | 1,365,390 | |
| | | | | 782,000 | | | | 5.750 | | | 05/11/47 | | | 480,930 | |
| | Republic of Uruguay | |
| | | | | 719,865 | | | | 4.375 | (a) | | 01/23/31 | | | 685,132 | |
| | | | | 3,313,433 | | | | 5.750 | | | 10/28/34 | | | 3,363,134 | |
| | | | | 983,562 | | | | 4.975 | | | 04/20/55 | | | 854,961 | |
| | | |
| | | | | | | | | | | | | | | | |
| | | Principal Amount | | | Interest
Rate | | | Maturity Date | | Value | |
| |
| | Sovereign Debt Obligations – (continued) | |
| |
| | United States Dollar – (continued) | |
| | Republic of Uzbekistan | |
| | $ | | | 200,000 | | | | 3.700 | % | | 11/25/30 | | $ | 143,663 | |
| | | | | 420,000 | | | | 3.900 | | | 10/19/31 | | | 298,410 | |
| | Republic of Venezuela (g) | |
| | | | | 203,000 | | | | 9.000 | | | 05/07/23 | | | 14,718 | |
| | | | | 175,000 | | | | 8.250 | | | 10/13/24 | | | 12,688 | |
| | | | | 165,000 | | | | 9.250 | | | 09/15/27 | | | 11,963 | |
| | | | | 145,000 | | | | 9.250 | | | 05/07/28 | | | 10,513 | |
| | | | | 152,000 | | | | 9.375 | | | 01/13/34 | | | 11,020 | |
| | | | | 110,000 | | | | 7.750 | | | 10/13/19 | | | 7,975 | |
| | | | | 85,000 | | | | 6.000 | | | 12/09/20 | | | 6,163 | |
| | | | | 140,000 | | | | 12.750 | | | 08/23/22 | | | 10,150 | |
| | | | | 199,000 | | | | 7.650 | | | 04/21/25 | | | 14,428 | |
| | | | | 205,000 | | | | 11.750 | | | 10/21/26 | | | 14,863 | |
| | | | | 205,000 | | | | 11.950 | | | 08/05/31 | | | 14,863 | |
| | | | | 190,000 | | | | 7.000 | | | 03/31/38 | | | 13,775 | |
| | Republic of Zambia | |
| | | | | 884,000 | | | | 5.375 | (g) | | 09/20/22 | | | 294,648 | |
| | Romanian Government International Bond | |
| | | | | 100,000 | | | | 3.000 | | | 02/27/27 | | | 85,581 | |
| | | | | 634,000 | | | | 5.250 | | | 11/25/27 | | | 579,436 | |
| | Russian Federation Bond | |
| | | | | 2,400,000 | | | | 4.375 | (g) | | 03/21/29 | | | 1,032,000 | |
| | Saudi Government International Bond | |
| | | | | 974,000 | | | | 3.250 | | | 10/22/30 | | | 851,929 | |
| | | | | 1,500,000 | | | | 3.250 | | | 11/17/51 | | | 964,155 | |
| | | | | 300,000 | | | | 3.250 | | | 11/17/51 | | | 192,831 | |
| | | | | 418,000 | | | | 3.450 | | | 02/02/61 | | | 267,215 | |
| | State Agency of Roads of Ukraine (e) | |
| | | | | 901,000 | | | | 6.250 | | | 06/24/30 | | | 116,736 | |
| | State of Israel | |
| | | | | 200,000 | | | | 3.800 | | | 05/13/60 | | | 142,600 | |
| | | | | 918,000 | | | | 4.500 | (l) | | 04/03/20 | | | 692,115 | |
| | Tunisian Republic | |
| | | | | 400,000 | | | | 5.750 | | | 01/30/25 | | | 249,950 | |
| | Turkiye Ihracat Kredi Bankasi AS | |
| | | | | 629,000 | | | | 5.750 | | | 07/06/26 | | | 525,923 | |
| | Ukraine Government Bond | |
| | | | | 494,000 | | | | 9.750 | | | 11/01/28 | | | 90,556 | |
| | | | | 5,339,000 | | | | 6.876 | | | 05/21/31 | | | 773,488 | |
| | | | | 245,000 | | | | 7.375 | | | 09/25/34 | | | 36,719 | |
| | | | | 250,000 | | | | 7.253 | | | 03/15/35 | | | 37,313 | |
| | | | | 390,000 | | | | 7.750 | | | 09/01/24 | | | 96,233 | |
| | United Mexican States | |
| | | | | 2,402,000 | | | | 2.659 | (a) | | 05/24/31 | | | 1,860,349 | |
| | Uzbekneftegaz JSC | |
| | | | | 222,000 | | | | 4.750 | (a) | | 11/16/28 | | | 164,280 | |
| | | | | | | | | | | | | | | | |
| | | | | 122,212,687 | |
| | | |
| | TOTAL SOVEREIGN DEBT OBLIGATIONS (Cost $397,531,668) | | $ | 331,564,278 | |
| | | |
The accompanying notes are an integral part of these financial statements. 55
|
| GOLDMAN SACHS MULTI-MANAGER NON-CORE FIXED INCOME FUND |
Schedule of Investments (continued)
October 31, 2022
| | | | | | | | | | | | | | | | |
| | | Principal
Amount | | | Interest
Rate | | | Maturity Date | | Value | |
| | |
| | Bank Loans(d) – 23.9% | | | | |
| |
| | Advertising(m) – 0.2% | |
| | Clear Channel Outdoor Holdings, Inc. (3M USD LIBOR + 3.500%) | |
| | $ | | | 2,146,373 | | | | 4.739 | % | | 08/21/26 | | $ | 1,960,755 | |
| | Dotdash Meredith, Inc. (1M USD SOFR + 4.000%) | |
| | | | | 64,673 | | | | 7.120 | (i) | | 12/01/28 | | | 57,397 | |
| | | | | | | | | | | | | | | | |
| | | | | 2,018,152 | |
| | | |
| | Aerospace & Defense(m) – 0.2% | | | | |
| | Dynasty Acquisition Co., Inc. | |
| | (1M USD LIBOR + 3.500%) | |
| | | | | 645,360 | | | | 7.254 | | | 11/30/22 | | | 604,302 | |
| | (1M USD LIBOR + 3.500%) | |
| | | | | 346,968 | | | | 7.254 | | | 11/30/22 | | | 324,894 | |
| | TransDigm, Inc. | |
| | (3M USD LIBOR + 2.250%) | |
| | | | | 240,635 | | | | 5.924 | | | 08/22/24 | | | 236,479 | |
| | (3M USD LIBOR + 2.250%) | |
| | | | | 14,961 | | | | 5.924 | | | 12/09/25 | | | 14,596 | |
| | WP CPP Holdings LLC (1M USD LIBOR + 3.750%) | |
| | | | | 496,297 | | | | 7.510 | | | 11/30/22 | | | 421,853 | |
| | | | | | | | | | | | | | | | |
| | | | | 1,602,124 | |
| | | |
| | Airlines(m) – 1.0% | | | | |
| | Air Canada (3M USD LIBOR + 3.500%) | |
| | | | | 997,500 | | | | 6.421 | | | 08/11/28 | | | 972,562 | |
| | American Airlines, Inc. | |
| | (3M USD LIBOR + 4.750%) | |
| | | | | 2,098,000 | | | | 8.993 | | | 04/20/28 | | | 2,074,775 | |
| | (1M USD LIBOR + 2.000%) | |
| | | | | 99,532 | | | | 5.412 | | | 12/15/23 | | | 98,979 | |
| | Kestrel Bidco, Inc. (6M USD LIBOR + 3.000%) | |
| | | | | 2,042,522 | | | | 4.000 | | | 12/11/26 | | | 1,773,706 | |
| | Mileage Plus Holdings LLC (3M USD LIBOR + 5.250%) | |
| | | | | 988,000 | | | | 8.777 | | | 06/21/27 | | | 1,007,345 | |
| | SkyMiles IP Ltd. (3M USD LIBOR + 3.750%) | |
| | | | | 1,125,000 | | | | 7.993 | | | 10/20/27 | | | 1,134,146 | |
| | United Airlines, Inc. | |
| | (3M USD LIBOR + 3.750%) | |
| | | | | 371,227 | | | | 8.108 | | | 01/25/23 | | | 361,638 | |
| | (3M USD LIBOR + 3.750%) | |
| | | | | 1,973,712 | | | | 8.108 | | | 01/25/23 | | | 1,922,731 | |
| | | | | | | | | | | | | | | | |
| | | | | 9,345,882 | |
| | | |
| | Apparel(m) – 0.2% | | | | |
| | Birkenstock GmbH & Co. KG (6M USD LIBOR + 3.250%) | |
| | | | | 1,111,247 | | | | 5.098 | | | 04/28/28 | | | 1,053,184 | |
| | Boardriders, Inc. (3M USD LIBOR + 8.000%) | |
| | | | | 523,986 | | | | 9.371 | | | 11/09/22 | | | 468,968 | |
| | | | | | | | | | | | | | | | |
| | | | | 1,522,152 | |
| | | |
| | Beverages(m) – 0.1% | | | | |
| | Triton Water Holdings, Inc (3M USD LIBOR + 3.500%) | |
| | | | | 650,259 | | | | 7.174 | | | 03/31/28 | | | 576,377 | |
| | | |
| | | | | | | | | | | | | | | | |
| | | Principal
Amount | | | Interest
Rate | | | Maturity Date | | Value | |
| | |
| | Bank Loans(d) – (continued) | | | | |
| | Building Materials(m) – 0.1% | | | | |
| | Flynn Canada (1M USD LIBOR + 4.250%) | |
| | $ | | | 248,418 | | | | 8.313 | %(i) | | 07/31/28 | | $ | 209,913 | |
| | Ingersoll-Rand Services Co. (1M USD SOFR + 1.750%) | |
| | | | | 93,816 | | | | 5.579 | | | 03/01/27 | | | 91,588 | |
| | Solis IV BV (3M USD SOFR + 3.500%) | |
| | | | | 798,000 | | | | 6.340 | | | 11/25/22 | | | 660,177 | |
| | Wilsonart LLC (3M USD LIBOR + 3.250%) | |
| | | | | 267,856 | | | | 6.930 | | | 12/30/22 | | | 247,864 | |
| | | | | | | | | | | | | | | | |
| | | | | 1,209,542 | |
| | | |
| | Chemicals(m) – 0.3% | | | | |
| | H.B. Fuller Co. (1M USD LIBOR + 2.000%) | |
| | | | | 251,028 | | | | 5.489 | | | 10/20/24 | | | 250,849 | |
| | Lonza Group AG (3M USD LIBOR + 4.000%) | |
| | | | | 744,389 | | | | 7.674 | | | 12/30/22 | | | 653,998 | |
| | Messer Industries GmbH (3M USD LIBOR + 2.500%) | |
| | | | | 229,461 | | | | 6.174 | | | 03/02/26 | | | 225,216 | |
| | PMHC II, Inc. (3M USD SOFR + 4.250%) | |
| | | | | 625,000 | | | | 8.494 | | | 01/31/23 | | | 483,988 | |
| | Trinseo Materials Operating SCA (1M USD LIBOR + 2.000%) | |
| | | | | 208,752 | | | | 5.754 | | | 09/06/24 | | | 194,010 | |
| | Vantage Specialty Chemicals, Inc. (3M USD LIBOR + 3.500%) | |
| | | | | 695,243 | | | | 7.174 | | | 12/30/22 | | | 663,088 | |
| | | | | | | | | | | | | | | | |
| | | | | 2,471,149 | |
| | | |
| | Commercial Services(m) – 1.1% | | | | |
| | Allied Universal Holdco LLC (1M USD LIBOR + 3.750%) | |
| | | | | 743,111 | | | | 7.504 | | | 11/30/22 | | | 672,983 | |
| | Avis Budget Car Rental LLC | |
| | (1M USD LIBOR + 1.750%) | |
| | | | | 454,152 | | | | 5.510 | | | 08/06/27 | | | 437,335 | |
| | (1M USD SOFR + 3.500%) | |
| | | | | 59,850 | | | | 7.329 | | | 03/16/29 | | | 59,052 | |
| | CHG Healthcare Services Inc. (3M USD LIBOR + 3.250%) | |
| | | | | 366,892 | | | | 7.004 | | | 09/29/28 | | | 355,493 | |
| | CoreLogic, Inc. | |
| | (1M USD LIBOR + 6.500%) | |
| | | | | 500,000 | | | | 10.313 | | | 11/30/22 | | | 323,335 | |
| | (1M USD LIBOR + 3.500%) | |
| | | | | 496,241 | | | | 7.313 | | | 11/30/22 | | | 364,598 | |
| | Fly Funding II S.a.r.l. (3M USD LIBOR + 1.750%) | |
| | | | | 824,549 | | | | 4.620 | | | 08/11/25 | | | 681,028 | |
| | Mavis Tire Express Services Corp. (1M USD SOFR + 4.000%) | |
| | | | | 1,367,454 | | | | 7.750 | | | 11/25/22 | | | 1,285,927 | |
| | Prime Security Services Borrower LLC (12M USD LIBOR + 2.750%) | |
| | | | | 1,968,739 | | | | 3.500 | | | 09/23/26 | | | 1,938,932 | |
| | Sabert Corp. (1M USD LIBOR + 4.500%) | |
| | | | | 199,096 | | | | 8.313 | | | 12/10/26 | | | 194,616 | |
| | Spin Holdco Inc. (3M USD LIBOR + 4.000%) | |
| | | | | 867,435 | | | | 7.144 | | | 12/05/22 | | | 761,539 | |
| | Spin Holdco, Inc. (3M USD LIBOR + 4.000%) | |
| | | | | 243,144 | | | | 7.144 | | | 12/05/22 | | | 213,461 | |
| | Syniverse Holdings, Inc. (3M USD SOFR + 7.000%) | |
| | | | | 600,000 | | | | 10.553 | | | 05/13/27 | | | 510,900 | |
| | | |
56 The accompanying notes are an integral part of these financial statements.
GOLDMAN SACHS MULTI-MANAGER NON-CORE FIXED INCOME FUND
| | | | | | | | | | | | | | | | |
| | | Principal Amount | | | Interest Rate | | | Maturity Date | | Value | |
| | |
| | Bank Loans(d) – (continued) | | | | |
| |
| | Commercial Services(m) – (continued) | |
| | Team Health Holdings, Inc. | |
| | (1M USD LIBOR + 2.750%) | |
| | $ | | | 612,726 | | | | 6.504 | % | | 11/30/22 | | $ | 556,392 | |
| | (1M USD SOFR + 5.250%) | |
| | | | | 831,023 | | | | 8.979 | | | 11/30/22 | | | 687,672 | |
| | (1M USD SOFR + 5.250%) | |
| | | | | 1,590,687 | | | | 8.979 | | | 11/30/22 | | | 1,316,293 | |
| | | | | | | | | | | | | | | | |
| | | | | 10,359,556 | |
| | | |
| | Computers(m) – 0.4% | |
| | Ahead DB Holdings LLC (3M USD LIBOR + 3.750%) | |
| | | | | 501,081 | | | | 7.430 | | | 10/18/27 | | | 487,392 | |
| | iQor US Inc. | |
| | (1M USD LIBOR + 7.500%) | |
| | | | | 59,829 | | | | 11.254 | | | 11/19/24 | | | 59,007 | |
| | (1M USD LIBOR + 7.500%) | |
| | | | | 165,266 | | | | 10.615 | | | 11/19/25 | | | 123,950 | |
| | McAfee, LLC (1M USD SOFR + 3.750%) | |
| | | | | 928,420 | | | | 6.870 | | | 03/01/29 | | | 847,768 | |
| | NCR Corp. (1M USD LIBOR + 2.500%) | |
| | | | | 619,860 | | | | 4.150 | | | 08/28/26 | | | 593,516 | |
| | Peraton Corp. | |
| | (1M USD LIBOR + 7.750%) | |
| | | | | 492,702 | | | | 11.162 | | | 11/17/22 | | | 466,835 | |
| | (1M USD LIBOR + 3.750%) | |
| | | | | 861,244 | | | | 7.504 | | | 11/30/22 | | | 827,715 | |
| | Perforce Software, Inc. (1M USD LIBOR + 3.750%) | |
| | | | | 243,125 | | | | 7.504 | | | 07/01/26 | | | 224,283 | |
| | Tempo Acquisition LLC (1M USD LIBOR + 2.750%) | |
| | | | | 77,056 | | | | 4.648 | | | 05/01/24 | | | 76,213 | |
| | Virtusa Corp. (1M USD LIBOR + 3.750%) | |
| | | | | 1,864 | | | | 7.504 | | | 02/11/28 | | | 1,787 | |
| | Vision Solutions, Inc. (3M USD LIBOR + 4.000%) | |
| | | | | 251,864 | | | | 8.358 | | | 04/24/28 | | | 215,764 | |
| | | | | | | | | | | | | | | | |
| | | | | 3,924,230 | |
| | | |
| | Consumer Cyclical Services(m) – 0.2% | |
| | The Hertz Corp. | |
| | (1M USD LIBOR + 3.250%) | |
| | | | | 281,808 | | | | 4.000 | | | 06/30/28 | | | 271,107 | |
| | (1M USD LIBOR + 3.250%) | |
| | | | | 1,477,139 | | | | 7.010 | | | 06/30/28 | | | 1,421,053 | |
| | | | | | | | | | | | | | | | |
| | | | | 1,692,160 | |
| | | |
| | Cosmetics & Personal Care(m) – 0.1% | |
| | Coty, Inc. (1M USD LIBOR + 2.250%) | |
| | | | | 72,034 | | | | 5.448 | | | 04/07/25 | | | 70,256 | |
| | Revlon Consumer Products Corp. | |
| | (3M USD LIBOR + 3.500%) | |
| | | | | 1,396,052 | | | | 5.624 | (h) | | 09/07/23 | | | 411,835 | |
| | (3M USD LIBOR + 3.500%) | |
| | | | | 1,325,641 | | | | 5.624 | | | 09/07/23 | | | 391,064 | |
| | | | | | | | | | | | | | | | |
| | | | | 873,155 | |
| | | |
| | | | | | | | | | | | | | | | |
| | | Principal Amount | | | Interest Rate | | | Maturity Date | | Value | |
| | |
| | Bank Loans(d) – (continued) | | | | |
| | Distribution & Wholesale(m) – 0.1% | |
| | BCPE Empire Holdings, Inc. (1M USD SOFR + 4.630%) | |
| | $ | | | 498,747 | | | | 8.454 | % | | 11/30/22 | | $ | 481,012 | |
| | Core & Main LP (1M USD LIBOR + 2.500%) | |
| | | | | 490,650 | | | | 2.592 | | | 07/27/28 | | | 477,466 | |
| | | | | | | | | | | | | | | | |
| | | | | 958,478 | |
| | | |
| | Diversified Financial Services(m) – 0.5% | |
| | Apex Group Treasury LLC (3M USD LIBOR + 3.750%) | |
| | | | | 1,243,101 | | | | 6.557 | | | 11/04/22 | | | 1,193,378 | |
| | Astra Acquisition Corp. (1M USD LIBOR + 5.250%) | |
| | | | | 554,111 | | | | 9.004 | | | 10/25/28 | | | 478,381 | |
| | Deerfield Dakota Holding LLC | |
| | (1M USD SOFR + 3.750%) | |
| | | | | 1,892,241 | | | | 7.419 | | | 11/30/22 | | | 1,785,802 | |
| | (1M USD LIBOR) | |
| | | | | 1,000,000 | | | | 10.336 | | | 04/07/28 | | | 963,750 | |
| | Delos Finance S.a.r.l. (3M USD LIBOR + 1.750%) | |
| | | | | 130,000 | | | | 5.424 | | | 10/06/23 | | | 129,605 | |
| | Ditech Holding Corp. (3M USD LIBOR) | |
| | | | | 213,611 | | | | 7.721 | (i) | | 06/30/23 | | | 24,565 | |
| | Focus Financial Partners LLC (1M USD LIBOR + 2.000%) | |
| | | | | 98,356 | | | | 5.754 | | | 11/30/22 | | | 96,758 | |
| | | | | | | | | | | | | | | | |
| | | | | 4,672,239 | |
| | | |
| | Electrical(m) – 0.2% | |
| | Pacific Gas & Electric Co. (1M USD LIBOR + 3.000%) | |
| | | | | 496,193 | | | | 6.813 | | | 11/30/22 | | | 487,385 | |
| | Talen Energy Supply LLC | |
| | (1M USD LIBOR + 1.500%) | |
| | | | | 453,000 | | | | 8.239 | | | 11/10/23 | | | 452,774 | |
| | (1M USD LIBOR + 3.750%) | |
| | | | | 829,000 | | | | 7.504 | | | 07/08/26 | | | 834,082 | |
| | | | | | | | | | | | | | | | |
| | | | | 1,774,241 | |
| | | |
| | Electronics(m) – 0.1% | |
| | Ingram Micro Inc. (3M USD LIBOR + 3.500%) | |
| | | | | 486,888 | | | | 7.174 | | | 06/30/28 | | | 469,847 | |
| | TTM Technologies, Inc. (1M USD LIBOR + 2.500%) | |
| | | | | 125,912 | | | | 5.628 | | | 09/28/24 | | | 124,260 | |
| | | | | | | | | | | | | | | | |
| | | | | 594,107 | |
| | | |
| | Engineering & Construction – 0.5% | |
| | Artera Services LLC (3M USD LIBOR + 3.500%) | |
| | | | | 248,115 | | | | 7.174 | (m) | | 12/30/22 | | | 202,628 | |
| | Brown Group Holding LLC (1M USD SOFR + 2.500%) | |
| | | | | 1,000,000 | | | | 7.419 | (m) | | 11/30/22 | | | 989,170 | |
| | Covetrus INC. (1M USD LIBOR + 2.750%) | |
| | | | | 625,000 | | | | 6.500 | (i) | | 09/23/28 | | | 990,000 | |
| | KKR Apple Bidco LLC(m) | |
| | (1M USD LIBOR + 2.750%) | |
| | | | | 248,125 | | | | 6.504 | | | 09/23/28 | | | 587,500 | |
| | (1M USD LIBOR + 2.750%) | |
| | $ | | | 248,125 | | | | 6.504 | | | 09/23/28 | | | 240,150 | |
| | (1M USD LIBOR + 5.750%) | |
| | | | | 940,852 | | | | 9.504 | | | 11/30/22 | | | 896,453 | |
| | | |
The accompanying notes are an integral part of these financial statements. 57
|
| GOLDMAN SACHS MULTI-MANAGER NON-CORE FIXED INCOME FUND |
Schedule of Investments (continued)
October 31, 2022
| | | | | | | | | | | | | | | | |
| | | Principal Amount | | | Interest
Rate | | | Maturity Date | | Value | |
| |
| | Bank Loans(d) – (continued) | |
| |
| | Engineering & Construction – (continued) | |
| | USIC Holdings, Inc.(m) | |
| | (1M USD LIBOR + 3.500%) | |
| | $ | | | 496,241 | | | | 7.254 | % | | 11/30/22 | | $ | 470,704 | |
| | (1M USD LIBOR + 6.500%) | |
| | | | | 575,984 | | | | 10.254 | | | 11/30/22 | | | 525,586 | |
| | | | | | | | | | | | | | | | |
| | | | | 4,902,191 | |
| | | |
| | Entertainment(m) – 1.1% | |
| | AMC Entertainment Holdings, Inc. (1M USD LIBOR + 3.000%) | |
| | | | | 1,391,597 | | | | 3.083 | | | 04/22/26 | | | 985,250 | |
| | Bally’s Corp. (3M USD LIBOR + 3.250%) | |
| | | | | 730,709 | | | | 6.550 | | | 10/02/28 | | | 678,010 | |
| | Churchill Downs, Inc. | |
| | (1M USD LIBOR + 2.000%) | |
| | | | | 187,018 | | | | 5.760 | | | 12/27/24 | | | 185,324 | |
| | (1M USD LIBOR + 2.000%) | |
| | | | | 33,914 | | | | 5.760 | | | 03/17/28 | | | 32,812 | |
| | Crown Finance US, Inc. | |
| | (1M TSFR) | |
| | | | | 62,781 | | | | 13.761 | | | 09/07/23 | | | 62,664 | |
| | (1M TSFR) | |
| | | | | 859,092 | | | | 13.491 | | | 09/07/23 | | | 857,486 | |
| | (3M USD LIBOR + 0.00%) | |
| | | | | 1,278,461 | | | | 0.000 | | | 02/28/25 | | | 399,979 | |
| | (3M USD LIBOR + 0.00%) | |
| | | | | 223,853 | | | | 0.000 | | | 09/30/26 | | | 67,380 | |
| | Delta 2 (LUX) S.a.r.l. (1M USD LIBOR + 2.500%) | |
| | | | | 2,068,000 | | | | 4.993 | | | 02/01/24 | | | 2,061,961 | |
| | East Valley Tourist Development Authority (1M USD LIBOR + 7.500%) | |
| | | | | 1,203,548 | | | | 10.064 | (i) | | 11/23/26 | | | 1,167,442 | |
| | Everi Holdings Inc. (1M USD LIBOR + 2.500%) | |
| | | | | 741,259 | | | | 6.254 | | | 08/03/28 | | | 721,594 | |
| | NASCAR Holdings, Inc (1M USD LIBOR + 2.500%) | |
| | | | | 865,431 | | | | 2.604 | | | 10/19/26 | | | 861,242 | |
| | Scientific Games Holdings LP (3M USD SOFR + 3.500%) | |
| | | | | 250,000 | | | | 7.097 | | | 04/04/29 | | | 235,095 | |
| | Scientific Games International, Inc. (1M USD SOFR + 3.000%) | |
| | | | | 64,838 | | | | 6.402 | | | 04/14/29 | | | 63,851 | |
| | SeaWorld Parks & Entertainment, Inc. (1M USD LIBOR + 3.000%) | |
| | | | | 495,000 | | | | 6.813 | | | 08/25/28 | | | 482,417 | |
| | The Stars Group Holdings B.V. (1M USD LIBOR + 2.250%) | |
| | | | | 1,000,000 | | | | 6.666 | | | 07/22/28 | | | 986,250 | |
| | William Morris Endeavor Entertainment LLC (1M USD LIBOR + 2.750%) | |
| | | | | 924,497 | | | | 6.510 | | | 05/18/25 | | | 897,918 | |
| | | | | | | | | | | | | | | | |
| | | | | 10,746,675 | |
| | | |
| | Environmental(m) – 0.1% | |
| | GFL Environmental, Inc. (3M USD LIBOR + 3.000%) | |
| | | | | 992,424 | | | | 3.500 | | | 05/30/25 | | | 986,063 | |
| | | |
| | | | | | | | | | | | | | | | |
| | | Principal Amount | | | Interest
Rate | | | Maturity Date | | Value | |
| |
| | Bank Loans(d) – (continued) | |
| |
| | Environmental(m) – (continued) | |
| | Madison IAQ LLC (3M USD LIBOR + 3.250%) | |
| | $ | | | 148,496 | | | | 6.815 | % | | 06/21/28 | | $ | 133,976 | |
| | | | | | | | | | | | | | | | |
| | | | | 1,120,039 | |
| | | |
| | Food & Drug Retailing(m) – 0.0% | |
| | 8th Avenue Food & Provisions, Inc. (1M USD LIBOR + 3.750%) | |
| | | | | 233,183 | | | | 7.504 | | | 10/01/25 | | | 201,995 | |
| | UTZ Quality Foods LLC (1M USD LIBOR + 3.000%) | |
| | | | | 9,005 | | | | 5.524 | | | 01/20/28 | | | 8,820 | |
| | | | | | | | | | | | | | | | |
| | | | | 210,815 | |
| | | |
| | Gaming(m) – 0.7% | |
| | Caesars Resort Collection LLC (1M USD LIBOR + 2.750%) | |
| | | | | 2,862,554 | | | | 6.504 | | | 11/30/22 | | | 2,828,061 | |
| | Fertitta Entertainment LLC | |
| | (1M USD SOFR + 4.000%) | |
| | | | | 945,250 | | | | 7.729 | | | 11/30/22 | | | 884,754 | |
| | (1W USD SOFR + 4.000%) | |
| | | | | 2,078,500 | | | | 7.729 | | | 11/30/22 | | | 1,945,476 | |
| | Playa Resorts Holding B.V. (1M USD LIBOR + 2.750%) | |
| | | | | 1,123,297 | | | | 6.500 | | | 11/30/22 | | | 1,092,755 | |
| | Station Casinos LLC (1M USD LIBOR + 2.250%) | |
| | | | | 95,608 | | | | 6.010 | | | 02/08/27 | | | 93,522 | |
| | The Stars Group Holdings B.V. (3M USD LIBOR + 2.250%) | |
| | | | | 517,699 | | | | 2.368 | | | 07/21/26 | | | 507,774 | |
| | | | | | | | | | | | | | | | |
| | | | | 7,352,342 | |
| | | |
| | Hand/Machine Tools(m) – 0.0% | |
| | Alliance Laundry Systems LLC (3M USD LIBOR + 3.500%) | |
| | | | | 224,358 | | | | 7.409 | | | 10/08/27 | | | 216,185 | |
| | | |
| | Health Care - Services(m) – 0.2% | |
| | ICON Luxembourg S.a.r.l. (3M USD LIBOR + 2.250%) | |
| | | | | 477,971 | | | | 5.938 | | | 07/03/28 | | | 472,593 | |
| | Verscend Holding Corp. (1M USD LIBOR + 4.000%) | |
| | | | | 1,233,647 | | | | 7.754 | | | 08/27/25 | | | 1,216,685 | |
| | | | | | | | | | | | | | | | |
| | | | | 1,689,278 | |
| | | |
| | Health Care Products(m) – 0.5% | |
| | Bausch & Lomb, Inc. | |
| | (1M USD SOFR + 3.250%) | |
| | | | | 748,125 | | | | 6.618 | | | 11/10/22 | | | 700,058 | |
| | (1M USD SOFR + 3.250%) | |
| | | | | 1,645,875 | | | | 6.618 | | | 11/10/22 | | | 1,540,127 | |
| | Carestream Dental Equipment, Inc (1M USD LIBOR + 3.250%) | |
| | | | | 241,377 | | | | 7.004 | | | 09/01/24 | | | 226,894 | |
| | Carestream Health, Inc. (1M TSFR) | |
| | | | | 1,272,491 | | | | 10.542 | | | 09/30/27 | | | 1,075,255 | |
| | Viant Medical Holdings, Inc. (1M USD LIBOR + 3.750%) | |
| | | | | 880,591 | | | | 7.504 | | | 07/02/25 | | | 773,820 | |
| | Vyaire Medical, Inc. (3M USD LIBOR + 4.750%) | |
| | | | | 369,698 | | | | 7.080 | | | 04/16/25 | | | 266,952 | |
| | | | | | | | | | | | | | | | |
| | | | | 4,583,106 | |
| | | |
58 The accompanying notes are an integral part of these financial statements.
GOLDMAN SACHS MULTI-MANAGER NON-CORE FIXED INCOME FUND
| | | | | | | | | | | | | | | | |
| | | Principal Amount | | | Interest
Rate | | | Maturity Date | | Value | |
| |
| | Bank Loans(d) – (continued) | |
| |
| | Health Care Services(m) – 0.1% | |
| | Envision Healthcare Corp. | |
| | (3M USD SOFR + 7.880%) | |
| | $ | | | 331,621 | | | | 10.531 | % | | 03/31/27 | | $ | 301,775 | |
| | (3M USD SOFR + 4.250%) | |
| | | | | 2,322,362 | | | | 6.825 | | | 03/31/27 | | | 905,721 | |
| | | | | | | | | | | | | | | | |
| | | | | 1,207,496 | |
| | | |
| | Healthcare Providers & Services(m) – 1.7% | |
| | Da Vinci Purchaser Corp. (3M USD LIBOR + 4.000%) | |
| | | | | 245,558 | | | | 7.115 | | | 12/30/22 | | | 232,207 | |
| | DaVita, Inc. (1M USD LIBOR + 1.750%) | |
| | | | | 187,095 | | | | 3.416 | | | 08/12/26 | | | 180,586 | |
| | Dermatology Intermediate Holdings III, Inc.(i) | |
| | (1M USD SOFR + 4.000%) | |
| | | | | 19,036 | | | | 4.000 | | | 12/30/22 | | | 18,274 | |
| | (1M USD SOFR + 4.250%) | |
| | | | | 210,103 | | | | 7.979 | | | 11/30/22 | | | 201,699 | |
| | Global Medical Response, Inc. (3M USD LIBOR + 4.250%) | |
| | | | | 1,410,722 | | | | 5.750 | | | 10/02/25 | | | 1,086,256 | |
| | Heartland Dental LLC | |
| | (1M USD LIBOR + 3.500%) | |
| | | | | 744,176 | | | | 7.254 | | | 11/30/22 | | | 693,482 | |
| | (1M USD LIBOR + 4.000%) | |
| | | | | 124,684 | | | | 7.576 | | | 11/28/22 | | | 117,203 | |
| | Lifescan Global Corp. (3M USD LIBOR + 6.000%) | |
| | | | | 3,701,935 | | | | 9.743 | | | 10/01/24 | | | 2,705,485 | |
| | MED ParentCo LP (1M USD LIBOR + 4.250%) | |
| | | | | 243,794 | | | | 8.004 | | | 08/31/26 | | | 190,769 | |
| | Medline Borrower, LP (1M USD LIBOR + 3.250%) | |
| | | | | 2,932,731 | | | | 7.004 | | | 10/23/28 | | | 2,693,215 | |
| | Onex TSG Intermediate Corp. (3M USD LIBOR + 4.750%) | |
| | | | | 493,750 | | | | 9.165 | | | 02/28/28 | | | 438,203 | |
| | Parexel International Corp. (1M USD LIBOR + 3.250%) | |
| | | | | 2,577,025 | | | | 7.004 | | | 11/15/28 | | | 2,478,145 | |
| | Phoenix Guarantor Inc | |
| | (1M USD LIBOR + 3.250%) | |
| | | | | 340,375 | | | | 3.361 | | | 03/05/26 | | | 325,838 | |
| | (1M USD LIBOR + 3.500%) | |
| | | | | 233,520 | | | | 7.254 | | | 03/05/26 | | | 223,850 | |
| | PRA Health Sciences, Inc. (3M USD LIBOR + 2.250%) | |
| | | | | 119,087 | | | | 5.938 | | | 07/03/28 | | | 117,747 | |
| | Quorum Health Corp. (3M USD LIBOR + 8.250%) | |
| | | | | 61,892 | | | | 9.250 | | | 04/29/25 | | | 41,275 | |
| | RegionalCare Hospital Partners Holdings, Inc. (1M USD LIBOR + 3.750%) | |
| | | | | 1,776,556 | | | | 6.554 | | | 11/16/25 | | | 1,565,590 | |
| | Select Medical Corp. (1M USD LIBOR + 2.500%) | |
| | | | | 914,077 | | | | 6.260 | | | 03/06/25 | | | 887,514 | |
| | Surgery Center Holdings, Inc. (1M USD LIBOR + 3.750%) | |
| | | | | 3,090,615 | | | | 7.070 | | | 08/31/26 | | | 2,945,943 | |
| | | | | | | | | | | | | | | | |
| | | | | | | | 17,143,281 | |
| | | |
| | Home Builders(m) – 0.0% | |
| | Tecta America Corp. (1M USD LIBOR + 4.250%) | |
| | | | | 124,370 | | | | 8.004 | | | 11/30/22 | | | 118,276 | |
| | | |
| | | | | | | | | | | | | | | | |
| | | Principal Amount | | | Interest
Rate | | | Maturity Date | | Value | |
| |
| | Bank Loans(d) – (continued) | |
| |
| | Home Furnishings(m) – 0.2% | |
| | AI Aqua Merger Sub, Inc. (1M USD LIBOR + 3.750%) | |
| | $ | | | 872,812 | | | | 4.187 | % | | 07/31/28 | | $ | 810,441 | |
| | Herman Miller, Inc (1M USD LIBOR + 2.000%) | |
| | | | | 493,136 | | | | 5.750 | | | 07/19/28 | | | 466,280 | |
| | Weber-Stephen Products LLC (6M USD LIBOR + 3.250%) | |
| | | | | 693,058 | | | | 4.750 | | | 10/30/27 | | | 570,477 | |
| | | | | | | | | | | | | | | | |
| | | | | 1,847,198 | |
| | | |
| | Household Products(m) – 0.0% | |
| | Kronos Acquisition Holdings, Inc. (3M USD LIBOR + 3.750%) | |
| | | | | 254 | | | | 4.250 | | | 12/22/26 | | | 239 | |
| | | |
| | Housewares(m) – 0.1% | |
| | Springs Windows Fashions LLC | |
| | (1M USD LIBOR + 4.000%) | |
| | | | | 1,118,366 | | | | 7.754 | | | 11/30/22 | | | 1,058,254 | |
| | (1M USD LIBOR + 4.000%) | |
| | | | | 497,500 | | | | 7.602 | | | 12/22/22 | | | 385,095 | |
| | | | | | | | | | | | | | | | |
| | | | | 1,443,349 | |
| | | |
| | Industrial Services(i)(m) – 0.1% | |
| | LaserShip, Inc. (6M USD LIBOR + 4.500%) | |
| | | | | 620,926 | | | | 7.377 | | | 12/30/22 | | | 487,427 | |
| | | |
| | Insurance(m) – 1.6% | |
| | Acrisure LLC (1M USD LIBOR + 4.250%) | |
| | | | | 1,619,676 | | | | 8.004 | | | 11/30/22 | | | 1,533,963 | |
| | Alliant Holdings Intermediate LLC | |
| | (1M USD LIBOR + 3.250%) | |
| | | | | 1,123,047 | | | | 7.004 | | | 11/30/22 | | | 1,089,535 | |
| | (1M USD LIBOR + 3.500%) | |
| | | | | 247,497 | | | | 6.980 | | | 11/06/27 | | | 238,701 | |
| | (1M USD LIBOR + 3.250%) | |
| | | | | 974,914 | | | | 7.004 | | | 11/30/22 | | | 945,823 | |
| | AssuredPartners, Inc. | |
| | (1M USD LIBOR + 3.500%) | |
| | | | | 748,077 | | | | 7.254 | | | 11/30/22 | | | 712,543 | |
| | (1M USD LIBOR + 3.500%) | |
| | | | | 249,369 | | | | 7.254 | | | 11/30/22 | | | 237,461 | |
| | (1M USD SOFR + 3.500%) | |
| | | | | 497,500 | | | | 5.025 | | | 02/12/27 | | | 473,869 | |
| | Asurion LLC | |
| | (1M USD LIBOR + 5.250%) | |
| | | | | 486,000 | | | | 9.004 | | | 01/20/29 | | | 336,555 | |
| | (1M USD LIBOR + 3.000%) | |
| | | | | 1,482,000 | | | | 5.524 | | | 11/03/24 | | | 1,396,518 | |
| | (1M USD LIBOR + 3.250%) | |
| | | | | 504,937 | | | | 7.004 | | | 07/31/27 | | | 444,344 | |
| | Broadstreet Partners, Inc. | |
| | (1M USD LIBOR + 3.000%) | |
| | | | | 741,756 | | | | 6.754 | | | 01/27/27 | | | 708,258 | |
| | (1M USD LIBOR + 3.250%) | |
| | | | | 487,538 | | | | 7.004 | | | 01/27/27 | | | 467,125 | |
| | Hub International Limited (3M USD LIBOR + 3.250%) | |
| | | | | 1,488,308 | | | | 7.232 | | | 12/30/22 | | | 1,460,060 | |
| | | |
The accompanying notes are an integral part of these financial statements. 59
|
| GOLDMAN SACHS MULTI-MANAGER NON-CORE FIXED INCOME FUND |
Schedule of Investments (continued)
October 31, 2022
| | | | | | | | | | | | | | | | |
| | | Principal Amount | | | Interest
Rate | | | Maturity Date | | Value | |
| |
| | Bank Loans(d) – (continued) | |
| |
| | Insurance(m) – (continued) | |
| | HUB International Ltd. | |
| | (3M USD LIBOR + 3.000%) | |
| | $ | | | 997,396 | | | | 6.010 | % | | 11/25/22 | | $ | 976,930 | |
| | (3M USD LIBOR + 3.250%) | |
| | | | | 1,227,398 | | | | 7.232 | | | 12/30/22 | | | 1,204,102 | |
| | OneDigital Borrower LLC (3M USD SOFR + 4.250%) | |
| | | | | 1,142,992 | | | | 8.494 | | | 01/31/23 | | | 1,085,842 | |
| | USI, Inc. | |
| | (3M USD LIBOR + 2.750%) | |
| | | | | 857,786 | | | | 6.424 | | | 12/30/22 | | | 846,532 | |
| | (3M USD LIBOR + 2.750%) | |
| | | | | 1,296,841 | | | | 6.424 | | | 12/30/22 | | | 1,279,827 | |
| | (3M USD LIBOR + 3.250%) | |
| | | | | 245,588 | | | | 6.924 | | | 12/02/26 | | | 239,755 | |
| | | | | | | | | | | | | | | | |
| | | | | 15,677,743 | |
| | | |
| | Internet(m) – 0.4% | |
| | Arches Buyer Inc. (1M USD LIBOR + 3.250%) | |
| | | | | 494,949 | | | | 7.004 | | | 11/30/22 | | | 436,897 | |
| | CNT Holdings I Corp. | |
| | (3M USD SOFR + 3.500%) | |
| | | | | 244,332 | | | | 7.239 | | | 01/12/23 | | | 237,430 | |
| | (3M USD SOFR + 3.500%) | |
| | | | | 123,744 | | | | 7.239 | | | 01/12/23 | | | 120,248 | |
| | (3M USD LIBOR + 6.750%) | |
| | | | | 1,000,000 | | | | 10.489 | | | 01/12/23 | | | 945,000 | |
| | Hunter Holdco 3 Ltd. (3M USD LIBOR + 4.250%) | |
| | | | | 500,000 | | | | 7.924 | | | 12/30/22 | | | 480,000 | |
| | MH Sub I LLC (1M USD LIBOR + 3.750%) | |
| | | | | 496,193 | | | | 7.504 | | | 11/30/22 | | | 477,069 | |
| | Proofpoint, Inc. (3M USD LIBOR + 3.250%) | |
| | | | | 327,603 | | | | 6.320 | | | 08/31/28 | | | 311,223 | |
| | PUG LLC | |
| | (1M USD LIBOR + 3.500%) | |
| | | | | 744,895 | | | | 7.254 | | | 11/30/22 | | | 639,678 | |
| | (1M USD LIBOR + 4.250%) | |
| | | | | 498,741 | | | | 8.004 | | | 11/30/22 | | | 430,164 | |
| | | | | | | | | | | | | | | | |
| | | | | 4,077,709 | |
| | | |
| | Leisure Time(m) – 0.9% | |
| | Alterra Mountain Co. (1M USD LIBOR + 2.750%) | |
| | | | | 703,362 | | | | 6.504 | | | 07/31/24 | | | 695,800 | |
| | Alterra Mountain Company (1M USD LIBOR + 3.500%) | |
| | | | | 496,241 | | | | 7.254 | | | 08/17/28 | | | 484,147 | |
| | Carnival Corp. | |
| | (6M USD LIBOR + 3.000%) | |
| | | | | 870,236 | | | | 5.877 | | | 12/30/22 | | | 814,941 | |
| | (6M USD LIBOR + 3.000%) | |
| | | | | 1,146,918 | | | | 5.877 | | | 12/30/22 | | | 1,074,043 | |
| | (6M USD LIBOR + 3.250%) | |
| | | | | 744,375 | | | | 6.127 | | | 12/30/22 | | | 680,642 | |
| | (6M USD LIBOR + 3.250%) | |
| | | | | 262,490 | | | | 6.127 | | | 12/30/22 | | | 240,016 | |
| | | |
| | | | | | | | | | | | | | | | |
| | | Principal Amount | | | Interest
Rate | | | Maturity Date | | Value | |
| |
| | Bank Loans(d) – (continued) | |
| |
| | Leisure Time(m) – (continued) | |
| | ClubCorp Holdings, Inc. | |
| | (3M USD LIBOR + 2.750%) | |
| | $ | | | 1,243,785 | | | | 6.424 | % | | 12/30/22 | | $ | 1,116,471 | |
| | (3M USD LIBOR + 2.750%) | |
| | | | | 2,607,880 | | | | 6.424 | | | 12/30/22 | | | 2,340,938 | |
| | Equinox Holdings, Inc. (3M USD LIBOR + 3.000%) | |
| | | | | 1,236,201 | | | | 6.674 | | | 03/08/24 | | | 899,856 | |
| | Hornblower Sub LLC (3M USD LIBOR + 4.500%) | |
| | | | | 45,695 | | | | 8.670 | | | 04/27/25 | | | 33,052 | |
| | Life Time Fitness Inc (3M USD LIBOR + 4.750%) | |
| | | | | 482,868 | | | | 5.750 | | | 12/16/24 | | | 475,195 | |
| | | | | | | | | | | | | | | | |
| | | | | 8,855,101 | |
| | | |
| | Machinery(m) – 0.0% | |
| | Brown Group Holding LLC (1M USD LIBOR + 2.500%) | |
| | | | | 245,341 | | | | 6.254 | | | 06/07/28 | | | 238,135 | |
| | | |
| | Machinery - Construction & Mining(m) – 0.0% | |
| | Vertiv Group Corp. (1M USD LIBOR + 2.750%) | |
| | | | | 63,707 | | | | 5.878 | | | 03/02/27 | | | 61,238 | |
| | | |
| | Machinery-Diversified(m) – 0.3% | |
| | Ali Group North America Corp. (1M USD LIBOR + 2.000%) | |
| | | | | 452,222 | | | | 5.843 | | | 07/30/29 | | | 443,368 | |
| | Engineered Machinery Holdings, Inc. (3M USD LIBOR + 3.750%) | |
| | | | | 246,878 | | | | 7.424 | | | 12/30/22 | | | 238,494 | |
| | Pro Mach Group, Inc. (1M USD LIBOR + 4.000%) | |
| | | | | 992,779 | | | | 7.674 | | | 12/30/22 | | | 966,719 | |
| | SPX Flow, Inc. (1M USD SOFR + 4.500%) | |
| | | | | 775,000 | | | | 8.329 | | | 04/05/29 | | | 731,267 | |
| | Star US Bidco LLC (1M USD LIBOR + 4.250%) | |
| | | | | 494,757 | | | | 8.004 | | | 11/30/22 | | | 465,071 | |
| | Vertical US Newco Inc (6M USD LIBOR + 3.500%) | |
| | | | | 53,068 | | | | 6.871 | | | 07/30/27 | | | 50,315 | |
| | | | | | | | | | | | | | | | |
| | | | | 2,895,234 | |
| | | |
| | Media(m) – 0.7% | |
| | Cengage Learning, Inc. (3M USD LIBOR + 4.750%) | |
| | | | | 1,393,588 | | | | 7.814 | | | 07/14/26 | | | 1,228,099 | |
| | CSC Holdings LLC (1M USD LIBOR + 2.250%) | |
| | | | | 740,445 | | | | 5.662 | | | 07/17/25 | | | 714,996 | |
| | CSC Holdings, LLC (1M USD LIBOR + 2.250%) | |
| | | | | 175,888 | | | | 5.662 | | | 01/15/26 | | | 170,172 | |
| | Diamond Sports Group LLC (3M USD SOFR + 8.100%) | |
| | | | | 287,847 | | | | 9.000 | | | 05/26/26 | | | 275,853 | |
| | Diamond Sports Group, LLC (1M USD SOFR + 3.350%) | |
| | | | | 1,266,534 | | | | 6.458 | | | 08/24/26 | | | 245,708 | |
| | DirecTV Financing LLC (1M USD LIBOR + 5.000%) | |
| | | | | 1,337,790 | | | | 8.754 | | | 08/02/27 | | | 1,271,904 | |
| | iHeartCommunications, Inc. (1M USD LIBOR + 3.000%) | |
| | | | | 2,075,431 | | | | 6.754 | | | 05/01/26 | | | 1,956,094 | |
| | LCPR Loan Financing LLC (1M USD LIBOR + 3.750%) | |
| | | | | 454,208 | | | | 7.162 | | | 10/16/28 | | | 441,717 | |
| | | |
60 The accompanying notes are an integral part of these financial statements.
GOLDMAN SACHS MULTI-MANAGER NON-CORE FIXED INCOME FUND
| | | | | | | | | | | | | | | | |
| | | Principal Amount | | | Interest
Rate | | | Maturity Date | | Value | |
| |
| | Bank Loans(d) – (continued) | |
| |
| | Media(m) – (continued) | |
| | McGraw-Hill Global Education Holdings LLC (3M USD LIBOR + 4.750%) | |
| | $ | | | 117,407 | | | | 7.820 | % | | 07/28/28 | | $ | 108,572 | |
| | Sinclair Television Group Inc. (1M USD LIBOR + 2.500%) | |
| | | | | 15,977 | | | | 6.260 | | | 09/30/26 | | | 15,046 | |
| | Ziggo Financing Partnership (1M USD LIBOR + 2.500%) | |
| | | | | 740,000 | | | | 5.912 | | | 04/30/28 | | | 719,731 | |
| | | | | | | | | | | | | | | | |
| | | | | 7,147,892 | |
| | | |
| | Media - Broadcasting & Radio(m) – 0.0% | |
| | Grinding Media, Inc. (3M USD LIBOR + 4.000%) | |
| | | | | 495,620 | | | | 4.750 | | | 10/12/28 | | | 423,755 | |
| | | |
| | Media - Non Cable(m) – 0.1% | |
| | Lions Gate Capital Holdings LLC (1M USD LIBOR + 2.250%) | |
| | | | | 500,000 | | | | 2.342 | | | 03/24/25 | | | 488,750 | |
| | | |
| | Metal Fabricate & Hardware(m) – 0.0% | |
| | Crosby U.S. Acquisition Corp. (1M TSFR) | |
| | | | | 250,000 | | | | 8.729 | | | 06/27/26 | | | 220,000 | |
| | | |
| | Mining(i)(m) – 0.1% | |
| | Arctic Canadian Diamond Co. Ltd. (3M USD LIBOR + 12.500%) | |
| | | | | 713,091 | | | | 12.500 | | | 12/30/22 | | | 709,882 | |
| | | |
| | Miscellaneous Manufacturing(m) – 0.1% | |
| | Cenveo Worldwide, Ltd. (1M USD SOFR + 7.500%) | |
| | | | | 348,650 | | | | 10.620 | (i) | | 11/03/22 | | | 348,650 | |
| | Gates Global LLC (1M USD LIBOR + 2.500%) | |
| | | | | 240,038 | | | | 6.254 | | | 03/31/27 | | | 232,887 | |
| | LTI Holdings, Inc. (1M USD LIBOR + 3.500%) | |
| | | | | 745,475 | | | | 7.004 | | | 11/30/22 | | | 693,135 | |
| | | | | | | | | | | | | | | | |
| | | | | 1,274,672 | |
| | | |
| | Oil Field Services(m) – 0.5% | |
| | Citgo Petroleum Corp. (1M USD LIBOR + 6.250%) | |
| | | | | 980,876 | | | | 10.004 | | | 03/28/24 | | | 980,140 | |
| | Delek US Holdings, Inc. (1M USD LIBOR + 2.250%) | |
| | | | | 482,396 | | | | 6.004 | | | 03/31/25 | | | 468,267 | |
| | Gulf Finance LLC (1M USD LIBOR + 6.750%) | |
| | | | | 2,442,704 | | | | 9.940 | | | 11/07/22 | | | 1,958,242 | |
| | QuarterNorth Energy Holding Inc. (1M USD LIBOR + 8.000%) | |
| | | | | 1,002,844 | | | | 11.754 | | | 08/27/26 | | | 994,490 | |
| | | | | | | | | | | | | | | | |
| | | | | 4,401,139 | |
| | | |
| | Packaging(m) – 0.7% | |
| | BWAY Holding Co. (3M USD LIBOR + 3.250%) | |
| | | | | 1,616,546 | | | | 6.378 | | | 11/01/22 | | | 1,535,718 | |
| | Charter NEX US, Inc. (3M USD LIBOR + 3.750%) | |
| | | | | 744,318 | | | | 7.504 | | | 11/30/22 | | | 720,128 | |
| | Clydesdale Acquisition Holdings, Inc. (3M USD LIBOR + 6.500%) | |
| | | | | 374,062 | | | | 8.004 | | | 04/13/29 | | | 359,773 | |
| | Graham Packaging Company Inc. (1M USD LIBOR + 3.000%) | |
| | | | | 369,026 | | | | 6.754 | | | 11/30/22 | | | 359,235 | |
| | | |
| | | | | | | | | | | | | | | | |
| | | Principal Amount | | | Interest
Rate | | | Maturity Date | | Value | |
| |
| | Bank Loans(d) – (continued) | |
| |
| | Packaging(m) – (continued) | |
| | Klockner-Pentaplast of America, Inc. | |
| | (6M USD LIBOR + 4.750%) | |
| | $ | | | 297,912 | | | | 8.259 | % | | 02/28/23 | | $ | 248,757 | |
| | (6M USD LIBOR + 4.750%) | |
| | | | | 248,111 | | | | 8.259 | | | 02/28/23 | | | 207,173 | |
| | LABL, Inc. (1M USD LIBOR + 5.000%) | |
| | | | | 1,243,747 | | | | 8.754 | | | 11/30/22 | | | 1,145,105 | |
| | Pregis TopCo Corp. (1M USD LIBOR + 4.000%) | |
| | | | | 496,173 | | | | 7.843 | | | 11/30/22 | | | 473,072 | |
| | Pretium PKG Holdings, Inc. (3M USD LIBOR + 4.000%) | |
| | | | | 496,250 | | | | 7.168 | | | 12/08/22 | | | 432,978 | |
| | Proampac PG Borrower LLC (3M USD LIBOR + 3.750%) | |
| | | | | 869,364 | | | | 9.000 | | | 12/30/22 | | | 823,723 | |
| | Reynolds Group Holdings, Inc. (1M USD LIBOR + 3.250%) | |
| | | | | 577,316 | | | | 3.343 | | | 02/05/26 | | | 560,614 | |
| | TricorBraun Holdings, Inc. (1M USD LIBOR + 3.250%) | |
| | | | | 234,763 | | | | 7.004 | | | 03/03/28 | | | 221,874 | |
| | | | | | | | | | | | | | | | |
| | | | | 7,088,150 | |
| | | |
| | Pharmaceuticals(m) – 1.6% | |
| | Bausch Health Companies Inc. (1M USD SOFR + 5.250%) | |
| | | | | 319,868 | | | | 7.174 | | | 02/01/27 | | | 238,516 | |
| | Curium BidCo S.a r.l. (3M USD LIBOR + 4.250%) | |
| | | | | 373,125 | | | | 7.924 | | | 12/30/22 | | | 352,137 | |
| | Gainwell Acquisition Corp. | |
| | (3M USD LIBOR + 4.000%) | |
| | | | | 992,424 | | | | 7.674 | | | 12/30/22 | | | 941,146 | |
| | (3M USD LIBOR + 4.000%) | |
| | | | | 607,472 | | | | 7.674 | | | 12/30/22 | | | 576,084 | |
| | Grifols Worldwide Operations USA, Inc. (1M USD LIBOR + 2.000%) | |
| | | | | 448,754 | | | | 5.754 | | | 11/15/27 | | | 429,906 | |
| | Jazz Financing Lux S.a.r.l. | |
| | (1M USD LIBOR + 3.500%) | |
| | | | | 673,093 | | | | 7.254 | | | 11/30/22 | | | 664,261 | |
| | (1M USD LIBOR + 3.500%) | |
| | | | | 1,953,420 | | | | 7.254 | | | 11/30/22 | | | 1,927,791 | |
| | Mallinckrodt International Finance S.A. | |
| | (1M USD LIBOR + 5.750%) | |
| | | | | 207,512 | | | | 8.815 | | | 09/30/27 | | | 167,956 | |
| | (3M USD LIBOR) | |
| | | | | 2,154,113 | | | | 9.065 | | | 09/30/27 | | | 1,736,754 | |
| | Midwest Veterinary Partners LLC (2M USD LIBOR + 4.000%) | |
| | | | | 1,244,351 | | | | 4.750 | | | 11/30/22 | | | 1,157,247 | |
| | Organon & Co (3M USD LIBOR + 3.000%) | |
| | | | | 944,873 | | | | 5.563 | | | 06/02/28 | | | 920,070 | |
| | Packaging Coordinators Midco, Inc. (3M USD LIBOR + 3.750%) | |
| | | | | 1,243,067 | | | | 7.424 | | | 12/30/22 | | | 1,199,174 | |
| | Pathway Vet Alliance LLC (3M USD LIBOR + 4.000%) | |
| | | | | 1,616,155 | | | | 7.424 | | | 12/30/22 | | | 1,454,540 | |
| | Pearl Intermediate Parent LLC (1M USD LIBOR + 6.250%) | |
| | | | | 1,000,000 | | | | 10.004 | | | 11/30/22 | | | 943,330 | |
| | PetVet Care Centers LLC (1M USD SOFR + 5.000%) | |
| | | | | 374,063 | | | | 8.625 | | | 11/25/22 | | | 354,735 | |
| | | |
The accompanying notes are an integral part of these financial statements. 61
|
| GOLDMAN SACHS MULTI-MANAGER NON-CORE FIXED INCOME FUND |
Schedule of Investments (continued)
October 31, 2022
| | | | | | | | | | | | | | | | |
| | | Principal Amount | | | Interest Rate | | | Maturity Date | | Value | |
| |
| | Bank Loans(d) – (continued) | |
| |
| | Pharmaceuticals(m) – (continued) | |
| | PetVet Care Centers, LLC (1M USD LIBOR + 3.500%) | |
| | $ | | | 1,491,042 | | | | 7.254 | % | | 11/30/22 | | $ | 1,394,870 | |
| | Sunshine Luxembourg VII S.a.r.l. (3M USD LIBOR + 3.750%) | |
| | | | | 1,840,291 | | | | 7.424 | | | 12/30/22 | | | 1,749,436 | |
| | | | | | | | | | | | | | | | |
| | | | | | | | 16,207,953 | |
| | | |
| | Pipelines(m) – 0.7% | |
| | Epic Y-Grade Services LP (3M USD LIBOR + 6.000%) | |
| | | | | 2,191,961 | | | | 8.080 | | | 11/30/22 | | | 1,855,495 | |
| | Freeport LNG Investments LLLP (1M USD LIBOR + 3.500%) | |
| | | | | 1,077,616 | | | | 7.243 | | | 11/17/26 | | | 1,006,676 | |
| | Mashantucket (Western) Pequot Tribe (3M USD LIBOR + 7.130%) | |
| | | | | 974,470 | | | | 10.879 | | | 02/16/25 | | | 962,289 | |
| | TransMontaigne Operating Company LP (1M USD LIBOR + 3.500%) | |
| | | | | 992,500 | | | | 7.072 | | | 11/17/28 | | | 956,522 | |
| | Traverse Midstream Partners LLC | |
| | (1M USD SOFR + 4.250%) | |
| | | | | 1,170,018 | | | | 7.977 | | | 11/28/22 | | | 1,155,884 | |
| | (1M USD SOFR + 4.250%) | |
| | | | | 1,168,178 | | | | 7.977 | | | 11/28/22 | | | 1,154,067 | |
| | | | | | | | | | | | | | | | |
| | | | | 7,090,933 | |
| | | |
| | Real Estate(m) – 0.0% | |
| | Cushman & Wakefield U.S. Borrower LLC (1M USD LIBOR + 2.750%) | |
| | | | | 390,000 | | | | 6.504 | | | 08/21/25 | | | 381,014 | |
| | | |
| | Retailers(m) – 0.1% | |
| | IRB Holding Corp. (1M USD LIBOR + 2.750%) | |
| | | | | 448,241 | | | | 6.504 | | | 11/30/22 | | | 441,020 | |
| | Jo-Ann Stores, Inc. (3M USD LIBOR + 4.750%) | |
| | | | | 291,262 | | | | 9.077 | | | 07/07/28 | | | 193,896 | |
| | | | | | | | | | | | | | | | |
| | | | | 634,916 | |
| | | |
| | Retailing(m) – 0.8% | |
| | 1011778 B.C. Unlimited Liability Co. (1M USD LIBOR + 1.750%) | |
| | | | | 858,912 | | | | 5.504 | | | 11/19/26 | | | 834,648 | |
| | Academy Ltd. (1M USD LIBOR + 4.000%) | |
| | | | | 1,231,869 | | | | 6.878 | | | 11/01/22 | | | 1,212,627 | |
| | Belk, Inc. | |
| | (3M USD LIBOR + 7.500%) | |
| | | | | 112,852 | | | | 10.480 | | | 07/31/25 | | | 98,745 | |
| | (3M USD LIBOR + 13.000%) | |
| | | | | 541,983 | | | | 13.000 | | | 07/31/25 | | | 82,652 | |
| | EG Group Ltd. (3M USD LIBOR + 4.000%) | |
| | | | | 389,796 | | | | 7.674 | | | 02/07/25 | | | 352,668 | |
| | Great Outdoors Group LLC (1M USD LIBOR + 3.750%) | |
| | | | | 767,481 | | | | 7.504 | | | 11/30/22 | | | 721,049 | |
| | Medical Solutions Holdings, Inc. | |
| | (3M USD LIBOR + 0.000%) | |
| | | | | 16,595 | | | | 5.543 | | | 11/01/28 | | | 15,972 | |
| | (3M USD LIBOR + 3.500%) | |
| | | | | 103,147 | | | | 7.174 | | | 11/01/28 | | | 99,279 | |
| | | |
| | | | | | | | | | | | | | | | |
| | | Principal Amount | | | Interest Rate | | | Maturity Date | | Value | |
| |
| | Bank Loans(d) – (continued) | |
| |
| | Retailing(m) – (continued) | |
| | PetSmart, Inc. | |
| | (1M USD LIBOR + 3.750%) | |
| | $ | | | 619,044 | | | | 7.500 | % | | 11/30/22 | | $ | 594,542 | |
| | (1M USD LIBOR + 3.750%) | |
| | | | | 1,573,275 | | | | 7.500 | | | 11/30/22 | | | 1,511,005 | |
| | Restoration Hardware, Inc. (1M USD LIBOR + 2.500%) | |
| | | | | 245,639 | | | | 6.254 | | | 10/20/28 | | | 229,243 | |
| | Serta Simmons Bedding LLC (1M USD LIBOR + 7.500%) | |
| | | | | 644,642 | | | | 10.793 | | | 08/10/23 | | | 312,045 | |
| | SRS Distribution Inc. (3M USD LIBOR + 3.500%) | |
| | | | | 990,912 | | | | 7.254 | | | 11/30/22 | | | 919,071 | |
| | Staples, Inc. | |
| | (3M USD LIBOR + 4.500%) | |
| | | | | 497,429 | | | | 7.282 | | | 09/12/24 | | | 477,602 | |
| | (3M USD LIBOR + 5.000%) | |
| | | | | 238,550 | | | | 7.782 | | | 04/16/26 | | | 207,264 | |
| | | | | | | | | | | | | | | | |
| | | | | 7,668,412 | |
| | | |
| | Semiconductors(m) – 0.1% | |
| | Bright Bidco B.V. | |
| | (1M USD SOFR + 8.000%) | |
| | | | | 328,303 | | | | 10.903 | | | 02/28/23 | | | 328,303 | |
| | (6M USD LIBOR + 3.500%) | |
| | | | | 2,802,409 | | | | 4.774 | | | 06/30/24 | | | 908,457 | |
| | MACOM Technology Solutions Holdings, Inc. (1M USD LIBOR + 2.250%) | |
| | | | | 89,956 | | | | 6.004 | | | 05/17/24 | | | 88,067 | |
| | | | | | | | | | | | | | | | |
| | | | | 1,324,827 | |
| | | |
| | Services Cyclical - Business Services(m) – 0.0% | |
| | Travelport Finance (Luxembourg) S.a.r.l. (3M USD LIBOR + 1.500%) | |
| | | | | 438,591 | | | | 5.174 | | | 02/28/25 | | | 432,999 | |
| | | |
| | Software(m) – 3.8% | |
| | Applied Systems, Inc. | |
| | (3M USD LIBOR + 3.000%) | |
| | | | | 2,000,000 | | | | 6.674 | | | 12/30/22 | | | 1,972,300 | |
| | (3M USD LIBOR + 3.000%) | |
| | | | | 580,021 | | | | 6.674 | | | 12/30/22 | | | 571,987 | |
| | (3M USD LIBOR + 5.500%) | |
| | | | | 1,000,000 | | | | 9.174 | | | 12/30/22 | | | 979,170 | |
| | Apttus Corp. (3M USD LIBOR + 4.250%) | |
| | | | | 375,560 | | | | 8.665 | | | 05/08/28 | | | 342,935 | |
| | Athenahealth, Inc. | |
| | (1M USD SOFR + 3.500%) | |
| | | | | 746,318 | | | | 6.967 | | | 11/21/22 | | | 680,396 | |
| | (1M USD SOFR + 3.500%) | |
| | | | | 144,542 | | | | 6.967 | | | 11/21/22 | | | 131,775 | |
| | Avaya, Inc. (1M USD SOFR + 10.000%) | |
| | | | | 600,000 | | | | 13.376 | | | 12/15/27 | | | 369,000 | |
| | Banff Merger Sub, Inc. (1M USD LIBOR + 3.750%) | |
| | | | | 734,267 | | | | 7.504 | | | 10/02/25 | | | 704,713 | |
| | | |
62 The accompanying notes are an integral part of these financial statements.
GOLDMAN SACHS MULTI-MANAGER NON-CORE FIXED INCOME FUND
| | | | | | | | | | | | | | | | |
| | | Principal Amount | | | Interest
Rate | | | Maturity Date | | Value | |
| |
| | Bank Loans(d) – (continued) | |
| |
| | Software(m) – (continued) | |
| | Camelot U.S. Acquisition LLC | |
| | (1M USD LIBOR + 3.000%) | |
| | $ | | | 222,621 | | | | 6.754 | % | | 10/30/26 | | $ | 218,818 | |
| | (1M USD LIBOR + 3.000%) | |
| | | | | 926,973 | | | | 6.754 | | | 10/30/26 | | | 909,787 | |
| | CDK Global, Inc. (3M USD SOFR + 4.500%) | |
| | | | | 775,000 | | | | 8.112 | | | 12/30/22 | | | 757,725 | |
| | Ceridian HCM Holding, Inc. (1M USD LIBOR + 2.500%) | |
| | | | | 1,710,305 | | | | 6.254 | | | 04/30/25 | | | 1,649,589 | |
| | Dynatrace LLC (1M USD LIBOR + 2.250%) | |
| | | | | 146,689 | | | | 4.794 | | | 08/22/25 | | | 145,344 | |
| | Epicor Software Corp. | |
| | (1M USD LIBOR + 3.000%) | |
| | | | | 997,283 | | | | 6.754 | | | 11/30/22 | | | 974,705 | |
| | (1M USD LIBOR + 3.250%) | |
| | | | | 2,681,477 | | | | 4.000 | | | 07/30/27 | | | 2,550,085 | |
| | (1M USD LIBOR + 7.750%) | |
| | | | | 1,825,000 | | | | 11.504 | | | 11/30/22 | | | 1,784,503 | |
| | Finastra USA, Inc. | |
| | (3M USD LIBOR + 3.500%) | |
| | | | | 1,454,682 | | | | 6.871 | | | 01/31/23 | | | 1,312,036 | |
| | (3M USD LIBOR + 3.500%) | |
| | | | | 2,462,681 | | | | 6.871 | | | 01/31/23 | | | 2,221,191 | |
| | Greenway Health LLC (3M USD LIBOR + 3.750%) | |
| | | | | 122,813 | | | | 4.750 | | | 02/16/24 | | | 104,391 | |
| | Hyland Software, Inc. (1M USD LIBOR + 3.500%) | |
| | | | | 460,908 | | | | 7.254 | | | 11/30/22 | | | 449,003 | |
| | Informatica LLC (1M USD LIBOR + 2.750%) | |
| | | | | 1,243,750 | | | | 6.563 | | | 10/27/28 | | | 1,209,024 | |
| | Polaris Newco LLC (1M USD LIBOR + 4.000%) | |
| | | | | 1,740,282 | | | | 7.754 | | | 11/30/22 | | | 1,586,076 | |
| | Press Ganey Holdings, Inc. (1M USD SOFR + 3.750%) | |
| | | | | 149,250 | | | | 7.479 | | | 11/30/22 | | | 139,176 | |
| | Project Ruby Ultimate Parent Corp. (1M USD LIBOR + 3.250%) | |
| | | | | 496,222 | | | | 7.004 | | | 11/30/22 | | | 466,215 | |
| | Quest Software US Holdings Inc. (3M USD SOFR + 7.500%) | |
| | | | | 100,000 | | | | 11.594 | | | 01/31/23 | | | 60,458 | |
| | Rackspace Technology Global, Inc. (3M USD LIBOR + 2.750%) | |
| | | | | 2,611,154 | | | | 3.500 | | | 02/15/28 | | | 1,645,758 | |
| | RealPage, Inc (1M USD LIBOR + 6.500%) | |
| | | | | 1,625,000 | | | | 10.254 | | | 11/30/22 | | | 1,560,000 | |
| | Riverbed Technology, Inc. (3M USD LIBOR + 3.250%) | |
| | | | | 1,230,169 | | | | 9.200 | | | 12/07/26 | | | 454,400 | |
| | Seattle SpinCo, Inc. (1M USD LIBOR + 2.750%) | |
| | | | | 2,105,702 | | | | 2.855 | | | 06/21/24 | | | 2,078,075 | |
| | Sophia LP (3M USD LIBOR + 3.500%) | |
| | | | | 1,226,972 | | | | 7.174 | | | 12/30/22 | | | 1,177,893 | |
| | Sophia, LP | |
| | (3M USD LIBOR + 3.500%) | |
| | | | | 250,000 | | | | 11.674 | | | 12/30/22 | | | 247,813 | |
| | (3M USD LIBOR + 3.500%) | |
| | | | | 623,426 | | | | 7.174 | | | 12/30/22 | | | 598,489 | |
| | Sovos Compliance LLC (1M USD LIBOR + 4.500%) | |
| | | | | 1,428,202 | | | | 8.254 | | | 11/30/22 | | | 1,379,229 | |
| | | |
| | | | | | | | | | | | | | | | |
| | | Principal Amount | | | Interest
Rate | | | Maturity Date | | Value | |
| |
| | Bank Loans(d) – (continued) | |
| |
| | Software(m) – (continued) | |
| | The Dun & Bradstreet Corp. (1M USD LIBOR + 3.250%) | |
| | $ | | | 716,257 | | | | 3.378 | % | | 02/06/26 | | $ | 704,080 | |
| | The Ultimate Software Group, Inc. | |
| | (1M USD LIBOR + 3.750%) | |
| | | | | 1,244,236 | | | | 7.504 | | | 11/30/22 | | | 1,208,178 | |
| | (3M USD LIBOR + 3.250%) | |
| | | | | 2,100,362 | | | | 6.998 | | | 05/04/26 | | | 2,023,636 | |
| | (3M USD LIBOR + 3.750%) | |
| | | | | 1,772,530 | | | | 8.998 | | | 01/05/23 | | | 1,626,296 | |
| | Zelis Healthcare Corp. (1M USD LIBOR + 3.500%) | |
| | | | | 494,962 | | | | 7.254 | | | 09/30/26 | | | 486,815 | |
| | | | | | | | | | | | | | | | |
| | | | | 37,481,064 | |
| | | |
| | Telecommunication Services(m) – 1.1% | |
| | Altice France S.A. (1M USD LIBOR + 4.000%) | |
| | | | | 215,980 | | | | 6.158 | | | 08/14/26 | | | 197,443 | |
| | Altice France SA (3M USD LIBOR + 3.690%) | |
| | | | | 234,875 | | | | 7.767 | | | 01/31/26 | | | 210,655 | |
| | Avaya, Inc. (1M USD LIBOR + 4.000%) | |
| | | | | 1,807,000 | | | | 7.412 | | | 12/15/27 | | | 854,711 | |
| | Cincinnati Bell, Inc. (1M USD SOFR + 3.250%) | |
| | | | | 264,667 | | | | 7.079 | | | 11/22/28 | | | 259,043 | |
| | CommScope, Inc. (1M USD LIBOR + 3.250%) | |
| | | | | 257,866 | | | | 7.004 | | | 04/06/26 | | | 245,295 | |
| | Cyxtera DC Holdings, Inc. (3M USD LIBOR + 3.000%) | |
| | | | | 1,605,763 | | | | 7.360 | | | 05/01/24 | | | 1,363,903 | |
| | Dawn Acquisition LLC (3M USD LIBOR + 3.750%) | |
| | | | | 1,293,642 | | | | 7.424 | | | 12/31/25 | | | 925,317 | |
| | Delta TopCo, Inc. (3M USD LIBOR + 3.750%) | |
| | | | | 407,715 | | | | 5.836 | | | 12/01/27 | | | 370,894 | |
| | Frontier Communications Corp. (3M USD LIBOR + 3.750%) | |
| | | | | 1,482,475 | | | | 7.438 | | | 05/01/28 | | | 1,397,766 | |
| | GOGO Intermediate Holdings LLC (3M USD LIBOR + 3.750%) | |
| | | | | 1,234,994 | | | | 8.165 | | | 04/30/28 | | | 1,209,985 | |
| | Intrado Corp. (2M USD LIBOR + 4.000%) | |
| | | | | 1,895,554 | | | | 4.110 | | | 10/10/24 | | | 1,661,624 | |
| | MetroNet Systems Holdings LLC (1M USD LIBOR + 3.750%) | |
| | | | | 493,778 | | | | 4.664 | | | 06/02/28 | | | 479,582 | |
| | MLN US Holding Co. LLC (3M USD LIBOR + 4.500%) | |
| | | | | 1,573,687 | | | | 8.252 | | | 11/30/25 | | | 876,355 | |
| | West Corp. (3M USD LIBOR + 3.500%) | |
| | | | | 232,241 | | | | 7.915 | | | 10/10/24 | | | 202,179 | |
| | Xplornet Communications, Inc. (1M USD LIBOR + 4.000%) | |
| | | | | 744,981 | | | | 7.754 | | | 11/30/22 | | | 638,821 | |
| | | | | | | | | | | | | | | | |
| | | | | 10,893,573 | |
| | | |
| | Telecommunications(m) – 0.2% | |
| | Avaya, Inc. (1M USD LIBOR + 10.000%) | |
| | | | | 530,000 | | | | 7.846 | | | 12/15/27 | | | 251,527 | |
| | Delta TopCo, Inc. (3M USD LIBOR + 7.250%) | |
| | | | | 147,619 | | | | 10.332 | | | 12/01/22 | | | 125,993 | |
| | EOS Finco Sarl (3M USD SOFR + 6.000%) | |
| | | | | 500,000 | | | | 9.612 | | | 10/08/29 | | | 475,000 | |
| | Intelsat Jackson Holdings S.A. (6M USD SOFR + 4.250%) | |
| | | | | 1,514,713 | | | | 7.445 | | | 02/01/29 | | | 1,456,972 | |
| | | |
The accompanying notes are an integral part of these financial statements. 63
|
| GOLDMAN SACHS MULTI-MANAGER NON-CORE FIXED INCOME FUND |
Schedule of Investments (continued)
October 31, 2022
| | | | | | | | | | | | | | | | |
| | | Principal Amount | | | Interest
Rate | | | Maturity Date | | Value | |
| |
| | Bank Loans(d) – (continued) | |
| |
| | Telecommunications(m) – (continued) | |
| | MLN US HoldCo LLC (3M USD LIBOR + 4.500%) | |
| | $ | | | 104,264 | | | | 11.850 | % | | 11/30/26 | | $ | 29,715 | |
| | | | | | | | | | | | | | | | |
| | | | | 2,339,207 | |
| | | |
| | Transportation(m) – 0.0% | |
| | First Student Bidco, Inc. | |
| | (1M USD LIBOR) | |
| | | | | 101,474 | | | | 6.586 | | | 07/21/28 | | | 95,258 | |
| | (1M USD LIBOR) | |
| | | | | 272,839 | | | | 6.586 | | | 07/21/28 | | | 256,128 | |
| | | | | | | | | | | | | | | | |
| | | | | 351,386 | |
| | | |
| | TOTAL BANK LOANS (Cost $256,242,373) | | $ | 235,027,125 | |
| | | |
| | | |
| | | Shares | | | Description | | Value | |
| | |
| | Common Stocks – 0.6% | | | | |
| | |
| | Commerical Services & Supplies(g) – 0.0% | | | | |
| | | | | 65,182 | | | | Monitronics International, Inc. | | $ | 16,295 | |
| | | |
| | Diversified Consumer Services – 0.0% | |
| | | | | 7,679 | | |
| Premier Brands Group
Holdings LLC | | | 5,890 | |
| | | |
| | Diversified Financial Services – 0.0% | |
| | | | | 20,510 | | | | Avation Capital SA(g) | | | — | |
| | | | | 5,500 | | | | Copper Earnout Trust(h) | | | 33,000 | |
| | | | | 240 | | |
| Voyager Aviation Holdings
LLC(i) | | | — | |
| | | | | | | | | | | | | | | | |
| | | | | | | | | 33,000 | |
| | | |
| | Energy Equipment & Services(g) – 0.0% | |
| | | | | 8,479 | | | | Noble Corp. PLC | | | 305,583 | |
| | | | | 17,981 | | | | Parker Drilling Co. | | | 87,658 | |
| | | | | | | | | | | | | | | | |
| | | | | | | | | 393,241 | |
| | | |
| | Media(g) – 0.0% | |
| | | | | 33,365 | | |
| Clear Channel Outdoor
Holdings, Inc. | | | 47,712 | |
| | | | | 3,675 | | | | Cumulus Media, Inc. Class A | | | 27,085 | |
| | | | | | | | | | | | | | | | |
| | | | | | | | | 74,797 | |
| | | |
| | Metals & Mining(i) – 0.0% | |
| | | | | 627 | | |
| Arctic Canadian Diamond Co.
Ltd | | | — | |
| | | |
| | Multiline Retail – 0.0% | |
| | | | | 68 | | | | Belk, Inc. | | | 578 | |
| | | |
| | Oil, Gas & Consumable Fuels – 0.2% | |
| | | | | 304 | | | | California Resources Corp.(g) | | | 13,714 | |
| | | | | 18,456 | | | | Fieldwood Energy, Inc. | | | 2,233,176 | |
| | | |
| | | | | | | | | | | | | | |
| | | |
| | | Shares | | | Description | | Value | |
| | |
| | Common Stocks – (continued) | | | | |
| | |
| | Oil, Gas & Consumable Fuels – (continued) | | | | |
| | | | | 2,295 | | | Valaris Ltd. | | $ | 153,604 | |
| | | | | | | | | | | | | | |
| | | | | | | | 2,400,494 | |
| | | |
| | Professional Services(g) – 0.0% | |
| | | | | 17,300 | | | Skillsoft Corp. | | | 30,967 | |
| | | |
| | Real Estate – 0.1% | |
| | | | | 41,250 | | | Copper Property CTL Pass Through Trust | | | 546,562 | |
| | | |
| | Specialty Retail(i) – 0.2% | |
| | | | | 7,504 | | | Guitar Center, Inc. | | | 1,436,566 | |
| | | | | 3,972 | | | Guitar Center, Inc.(g) | | | 296,075 | |
| | | | | | | | | | | | | | |
| | | | | | | | 1,732,641 | |
| | | |
| | Wireless Telecommunication Services – 0.1% | |
| | | | | 5,606 | | | iQor US Inc.(i) | | | 22,424 | |
| | | | | 16,319 | | | Windstream Corp. | | | 244,785 | |
| | | | | 27,912 | | | Windstream Corp.(g) | | | 418,680 | |
| | | | | | | | | | | | | | |
| | | | | | | | 685,889 | |
| | | |
| | TOTAL COMMON STOCKS (Cost $6,494,610) | | $ | 5,920,354 | |
| | | |
| | | |
| | | Shares | | | Dividend Rate | | Value | |
| |
| | Preferred Stocks – 0.0% | |
| | Post Secondary Education – 0.0% | |
| | Riverbed Technology, Inc. | |
| | | | | 10,686 | | | 0.000% | | $ | 2,671 | |
| | Voyager Aviation Holdings LLC | |
| | | | | 1,441 | | | 0.000(i) | | | 180,125 | |
| | | | | | | | | | | | | | |
| | | | | | | | 182,796 | |
| | | |
| | |
| | Specialty Retail(i) – 0.0% | | | | |
| | Guitar Center, Inc. | |
| | | | | 104 | | | 0.000 | | | 9,504 | |
| | | |
| | TOTAL PREFERRED STOCKS (Cost $319,237) | | $ | 192,300 | |
| | | |
| | | |
| | | Units | | | Expiration Date | | Value | |
| |
| | Warrants(g) – 0.0% | |
| | California Resources Corp. | |
| | | | | 671 | | | 10/27/24 | | $ | 9,515 | |
| | Fieldwood Energy, Inc. | |
| | | | | 6,687 | | | 08/01/29 | | | 40,290 | |
| | Noble Corp. | |
| | | | | 9,802 | | | 02/05/28 | | | 129,876 | |
| | | |
| | TOTAL WARRANTS (Cost $250,395) | | $ | 179,681 | |
| | | |
64 The accompanying notes are an integral part of these financial statements.
GOLDMAN SACHS MULTI-MANAGER NON-CORE FIXED INCOME FUND
| | | | | | | | | | | | | | |
| | | Shares | | | Dividend Rate | | Value | |
| |
| | Investment Company(n) – 4.2% | |
| | Goldman Sachs Financial Square Government Fund - Institutional Shares | |
| | | | | 41,576,524 | | | 3.066% | | $ | 41,576,524 | |
| | (Cost $ 41,576,524) | |
| | | |
| |
| | TOTAL INVESTMENTS – 98.5% | |
| | (Cost $ 1,128,773,920) | | $ | 971,130,376 | |
| | | |
| | |
| | OTHER ASSETS IN EXCESS OF
LIABILITIES – 1.5% | | | 14,485,991 | |
| | | |
| | |
| | NET ASSETS – 100.0% | | $ | 985,616,367 | |
| | | |
The percentage shown for each investment category reflects the value of investments in that category as a percentage of net assets.
| | (a) | Security with “Call” features with resetting interest rates. Maturity dates disclosed are the final maturity dates. |
| | (b) | Exempt from registration under Rule 144A of the Securities Act of 1933. |
| | (c) | Pay-in-kind securities. |
| | (d) | Variable rate security. Except for floating rate notes (for which final maturity is disclosed), maturity date disclosed is the next interest reset date. Interest rate disclosed is that which is in effect on October 31, 2022. |
| | (e) | Guaranteed by a foreign government until maturity. Total market value of these securities amounts to $719,756, which represents approximately 0.1 % of the Fund’s net assets as of October 31, 2022. |
| | (f) | Issued with a zero coupon. Income is recognized through the accretion of discount. |
| | (g) | Security is currently in default and/or non-income producing. |
| | (h) | Restricted securities are not registered under the Securities Act of 1933, as amended, and are subject to legal restrictions on resale. These securities generally may be resold in transactions exempt from registration or to the public if the securities are subsequently registered. Disposal of these securities may involve time consuming negotiations and prompt sale at an acceptable price may be difficult. Total market value of Restricted securities amounts to $645,984, which represents approximately 0.1% of the Fund’s net assets as of October 31, 2022. See additional details below: |
| | | | | | | | |
Restricted Security | | Acquisition Date | | | Cost | |
Chesapeake Energy Corp. | | | 06/21/19 | | | $ | 42,991 | |
Chesapeake Energy Corp. | | | 06/21/19 | | | | 316,924 | |
Copper Earnout Trust | | | 12/07/20 | | | | 39,600 | |
Neiman Marcus Group Ltd. LLC | | | 10/15/21 | | | | 605,000 | |
Revlon Consumer Products Corp. | | | 12/31/20 | | | | 1,334,630 | |
| | (i) | Significant unobservable inputs were used in the valuation of this portfolio security; i.e., Level 3. |
| | (j) | Coupon changes periodically based upon a predetermined schedule. Interest rate disclosed is that which is in effect on October 31, 2022. |
| | (k) | Actual maturity date is July 28, 2121. |
| | (l) | Actual maturity date is April 03, 2120. |
| | (m) | Bank Loans often require prepayments from excess cash flows or permit the borrower to repay at its election. The degree to which borrowers repay, whether as a contractual requirement or at their election, cannot be predicted with accuracy. As a result, the actual remaining maturity may be substantially less than the stated maturities shown. As bank loan positions may involve multiple underlying tranches for which the aggregate position is presented, the stated interest rate represents the weighted average interest rate of all contracts on October 31, 2022. Bank Loans typically have rates of interest which are predetermined either daily, monthly, quarterly or semi-annually by reference to a base lending rate, plus a premium. These base lending rates are primarily the London-Interbank Offered Rate (“LIBOR”), and secondarily the prime rate offered by one or more major United States banks (the “Prime Rate”) and the certificate of deposit (“CD”) rate or other base lending rates used by commercial lenders. |
| | (n) | Represents an affiliated issuer. |
The accompanying notes are an integral part of these financial statements. 65
|
| GOLDMAN SACHS MULTI-MANAGER NON-CORE FIXED INCOME FUND |
Schedule of Investments (continued)
October 31, 2022
|
|
| ADDITIONAL INVESTMENT INFORMATION |
UNFUNDED LOAN COMMITMENTS — At October 31, 2022, the Fund had unfunded loan commitments which could be extended at the option of the borrowers, pursuant to the following loan agreements:
| | | | | | | | | | | | |
Borrower | | Principal Amount | | | Current Value | | | Unrealized Gain (Loss) | |
| |
| | | |
Athenahealth, Inc. (B-/B2), due 12/30/22 | | $ | 126,812 | | | $ | 115,610 | | | | $ (8,241 | ) |
Athenahealth, Inc. (B-/B2), due 02/15/29 | | | 24,560 | | | | 22,391 | | | | (2,113 | ) |
Dermatology Intermediate Holdings III, Inc. (NR/NR), due 12/30/22 | | | 20,334 | | | | 19,521 | | | | (813 | ) |
| |
TOTAL | | | | | | | | | | | $(11,167 | ) |
| |
FORWARD FOREIGN CURRENCY EXCHANGE CONTRACTS WITH UNREALIZED GAIN
| | | | | | | | | | | | | | | | | | | | | | | | |
Counterparty | | Currency Purchased | | | Currency Sold | | | Settlement Date | | | Unrealized Gain | |
| |
| | | | | | |
Bank of America, NA | | | USD | | | | 4,288,900 | | | | EUR | | | | 4,173,949 | | | | 11/08/22 | | | $ | 161,730 | |
Barclays Bank PLC | | | MXN | | | | 52,864,000 | | | | USD | | | | 2,560,000 | | | | 02/21/23 | | | | 53,048 | |
| | | USD | | | | 2,539,502 | | | | CNH | | | | 17,226,710 | | | | 11/14/22 | | | | 189,519 | |
| | | USD | | | | 1,015,000 | | | | CNH | | | | 6,938,492 | | | | 12/07/22 | | | | 67,172 | |
| | | USD | | | | 2,201,800 | | | | MYR | | | | 9,806,817 | | | | 11/03/22 | | | | 126,848 | |
BNP Paribas SA | | | CZK | | | | 106,487,150 | | | | USD | | | | 4,238,805 | | | | 12/08/22 | | | | 48,649 | |
| | | PLN | | | | 15,304,252 | | | | USD | | | | 3,005,809 | | | | 01/12/23 | | | | 155,253 | |
| | | USD | | | | 1,135,700 | | | | CNH | | | | 8,300,127 | | | | 12/07/22 | | | | 1,867 | |
| | | USD | | | | 1,235,164 | | | | EUR | | | | 1,240,000 | | | | 01/04/23 | | | | 2,719 | |
Citibank NA | | | CAD | | | | 1,559,143 | | | | USD | | | | 1,136,078 | | | | 01/19/23 | | | | 9,642 | |
| | | EUR | | | | 10,038,817 | | | | USD | | | | 9,913,043 | | | | 01/19/23 | | | | 75,513 | |
| | | GBP | | | | 2,259,511 | | | | USD | | | | 2,574,962 | | | | 01/19/23 | | | | 23,556 | |
| | | USD | | | | 1,062,000 | | | | EUR | | | | 1,046,609 | | | | 01/19/23 | | | | 20,631 | |
JPMorgan Securities, Inc. | | | EUR | | | | 784,249 | | | | USD | | | | 775,100 | | | | 11/08/22 | | | | 360 | |
| | | USD | | | | 1,892,464 | | | | COP | | | | 8,711,338,560 | | | | 11/01/22 | | | | 128,775 | |
MS & Co. Int. PLC | | | CAD | | | | 467,024 | | | | USD | | | | 342,411 | | | | 11/30/22 | | | | 453 | |
| | | USD | | | | 1,278,300 | | | | MYR | | | | 5,726,784 | | | | 12/01/22 | | | | 66,547 | |
| |
TOTAL | | | | | | | | | | | | | | | | | | | | | | $ | 1,132,282 | |
| |
FORWARD FOREIGN CURRENCY EXCHANGE CONTRACTS WITH UNREALIZED LOSS
| | | | | | | | | | | | | | | | | | | | |
Counterparty | | Currency Purchased | | | Currency Sold | | | Settlement Date | | | Unrealized Loss | |
| |
| | | | | | |
Bank of America, NA | | COP | | | 4,355,669,280 | | | USD | | | 982,600 | | | | 11/01/22 | | | $ | (100,756 | ) |
| | HUF | | | 489,749,700 | | | USD | | | 1,219,800 | | | | 01/04/23 | | | | (59,608 | ) |
| | USD | | | 3,337,300 | | | HUF | | | 1,475,086,600 | | | | 01/04/23 | | | | (157,104 | ) |
| | USD | | | 2,542,944 | | | MXN | | | 52,864,000 | | | | 02/21/23 | | | | (70,104 | ) |
Barclays Bank PLC | | EUR | | | 32,460,000 | | | USD | | | 33,441,250 | | | | 11/04/22 | | | | (1,353,911 | ) |
| | GBP | | | 3,511,000 | | | USD | | | 4,260,085 | | | | 11/04/22 | | | | (233,252 | ) |
| | MYR | | | 9,806,817 | | | USD | | | 2,209,240 | | | | 11/03/22 | | | | (134,288 | ) |
| | MYR | | | 5,726,784 | | | USD | | | 1,214,794 | | | | 12/01/22 | | | | (3,041 | ) |
| | USD | | | 1,861,850 | | | EUR | | | 1,903,000 | | | | 11/04/22 | | | | (19,303 | ) |
BNP Paribas SA | | CNH | | | 17,226,710 | | | USD | | | 2,570,000 | | | | 11/14/22 | | | | (220,017 | ) |
| | HUF | | | 2,320,281,531 | | | USD | | | 5,535,762 | | | | 01/04/23 | | | | (39,134 | ) |
| | PLN | | | 6,924,614 | | | USD | | | 1,447,754 | | | | 12/06/22 | | | | (5,165 | ) |
| | USD | | | 2,878,000 | | | EUR | | | 2,900,303 | | | | 01/04/23 | | | | (4,631 | ) |
| | USD | | | 3,808,270 | | | HUF | | | 1,654,597,893 | | | | 01/04/23 | | | | (111,388 | ) |
Citibank NA | | EUR | | | 450,000 | | | USD | | | 456,572 | | | | 01/19/23 | | | | (8,825 | ) |
| | USD | | | 832,000 | | | EUR | | | 845,559 | | | | 01/19/23 | | | | (9,325 | ) |
| | USD | | | 91,000 | | | GBP | | | 80,891 | | | | 01/19/23 | | | | (2,027 | ) |
JPMorgan Securities, Inc. | | COP | | | 4,355,669,280 | | | USD | | | 903,775 | | | | 11/01/22 | | | | (21,930 | ) |
66 The accompanying notes are an integral part of these financial statements.
GOLDMAN SACHS MULTI-MANAGER NON-CORE FIXED INCOME FUND
|
|
| ADDITIONAL INVESTMENT INFORMATION (continued) |
FORWARD FOREIGN CURRENCY EXCHANGE CONTRACTS WITH UNREALIZED LOSS (continued)
| | | | | | | | | | | | | | | | | | |
Counterparty | | Currency Purchased | | | Currency Sold | | | Settlement Date | | Unrealized Loss | |
| |
| | | | | | |
JPMorgan Securities, Inc. (continued) | | HUF | | | 319,653,262 | | | USD | | | 772,109 | | | 01/04/23 | | $ | (14,867 | ) |
MS & Co. Int. PLC | | EUR | | | 2,531,955 | | | USD | | | 2,542,387 | | | 11/30/22 | | | (34,856 | ) |
| | GBP | | | 1,069,783 | | | USD | | | 1,239,855 | | | 11/30/22 | | | (12,023 | ) |
| | USD | | | 1,135,000 | | | TWD | | | 36,558,350 | | | 01/30/23 | | | (3,109 | ) |
| |
| | | | | | |
TOTAL | | | | | | | | | | | | | | | | $ | (2,618,664 | ) |
| |
SWAP CONTRACTS — At October 31, 2022, the Fund had the following swap contracts:
CENTRALLY CLEARED CREDIT DEFAULT SWAP CONTRACTS
| | | | | | | | | | | | | | | | | | | | | | | | | | | | |
Referenced Obligation/Index | | Financing Rate Received/(Paid) by the Fund(a) | | | Credit Spread at October 31, 2022(b) | | | Termination Date | | | Notional Amount (000s) | | | Value | | | Upfront Premiums (Received) Paid | | | Unrealized Appreciation/ (Depreciation) | |
| |
| | | | | | | |
Protection Sold: | | | | | | | | | | | | | | | | | | | | | | | | | | | | |
CDX.NA.HY Index 39 | | | 5.000% | | | | 6.080% | | | | 12/20/27 | | | $ | 29,090 | | | $ | (57,208 | ) | | $ | (1,181,286 | ) | | | $1,124,078 | |
| |
| | (a) | Payments made quarterly. |
| | (b) | Credit spread on the referenced obligation, together with the term of the swap contract, are indicators of payment/performance risk. The likelihood of a credit event occurring which would require a fund or its counterparty to make a payment or otherwise be required to perform under the swap contract is generally greater as the credit spread and the term of the swap contract increase. |
| | | | |
| | |
| Currency Abbreviations: | | |
| BRL | | —Brazil Real | | |
| CAD | | —Canadian Dollar | | |
| CLP | | —Chilean Peso | | |
| CNH | | —Chinese Yuan Renminbi Offshore | | |
| CNY | | —Chinese Yuan Renminbi | | |
| COP | | —Colombia Peso | | |
| CZK | | —Czech Republic Koruna | | |
| EUR | | —Euro | | |
| GBP | | —British Pound | | |
| HUF | | —Hungarian Forint | | |
| IDR | | —Indonesia Rupiah | | |
| MXN | | —Mexican Peso | | |
| MYR | | —Malaysia Ringgit | | |
| PEN | | —Peru Nuevo Sol | | |
| PLN | | —Polish Zloty | | |
| RON | | —Romania New Leu | | |
| THB | | —Thailand Baht | | |
| TWD | | —Taiwan Dollar | | |
| USD | | —U.S. Dollar | | |
| ZAR | | —South African Rand | | |
The accompanying notes are an integral part of these financial statements. 67
|
| GOLDMAN SACHS MULTI-MANAGER NON-CORE FIXED INCOME FUND |
Schedule of Investments (continued)
October 31, 2022
|
|
| ADDITIONAL INVESTMENT INFORMATION (continued) |
| | | | |
| | |
| Investment Abbreviations: | | |
| CMT | | —Constant Maturity Treasury Indexes | | |
| CPI | | —Consumer Price Index | | |
| ICE | | —Inter-Continental Exchange | | |
| LIBOR | | —London Interbank Offered Rate | | |
| LLC | | —Limited Liability Company | | |
| LP | | —Limited Partnership | | |
| PIK | | —Payment in kind | | |
| PLC | | —Public Limited Company | | |
| REIT | | —Real Estate Investment Trust | | |
| SOFR | | —Secured Overnight Funding Rate | | |
| TSFR | | —Term Secured Overnight Financing Rate | | |
| | | | |
| | |
| Abbreviations: | | |
| MS & Co. Int. PLC | | —Morgan Stanley & Co. International PLC | | |
| SOFR | | —Secured Overnight Funding Rate | | |
68 The accompanying notes are an integral part of these financial statements.
GOLDMAN SACHS MULTI-MANAGER REAL ASSETS STRATEGY FUND
Schedule of Investments
October 31, 2022
| | | | | | | | |
| | | Shares | | Description | | Value | |
| |
| | Common Stocks – 95.4% | |
| | |
| | Australia – 3.6% | | | | |
| | | 138,242 | | APA Group (Gas Utilities) | | $ | 930,699 | |
| | 166,717 | | Atlas Arteria Ltd. (Transportation Infrastructure) | | | 701,841 | |
| | 39,204 | | Charter Hall Group (Equity Real Estate Investment Trusts (REITs)) | | | 325,426 | |
| | 108,785 | | Dexus (Equity Real Estate Investment Trusts (REITs)) | | | 542,087 | |
| | 84,270 | | Goodman Group (Equity Real Estate Investment Trusts (REITs)) | | | 916,917 | |
| | 187,368 | | Ingenia Communities Group (Equity Real Estate Investment Trusts (REITs)) | | | 470,179 | |
| | 1,029,823 | | National Storage REIT (Equity Real Estate Investment Trusts (REITs)) | | | 1,723,236 | |
| | 72,985 | | NEXTDC Ltd.* (IT Services) | | | 387,271 | |
| | 230,894 | | Qube Holdings Ltd. (Transportation Infrastructure) | | | 401,976 | |
| | 1,550,662 | | Scentre Group (Equity Real Estate Investment Trusts (REITs)) | | | 2,885,814 | |
| | 297,735 | | Shopping Centres Australasia Property Group (Equity Real Estate Investment Trusts (REITs)) | | | 518,570 | |
| | 357,002 | | The GPT Group (Equity Real Estate Investment Trusts (REITs)) | | | 986,598 | |
| | 516,107 | | Transurban Group (Transportation Infrastructure) | | | 4,378,108 | |
| | | | | | | | |
| | | | | | | 15,168,722 | |
| | | |
| | Belgium – 0.4% | | | | |
| | 18,411 | | Aedifica SA (Equity Real Estate Investment Trusts (REITs)) | | | 1,404,073 | |
| | 3,660 | | Cofinimmo SA (Equity Real Estate Investment Trusts (REITs)) | | | 303,544 | |
| | 612 | | Warehouses De Pauw CVA (Equity Real Estate Investment Trusts (REITs)) | | | 15,708 | |
| | | | | | | | |
| | | | | | | 1,723,325 | |
| | | |
| | Brazil – 0.2% | | | | |
| | 475,158 | | Santos Brasil Participacoes SA (Transportation Infrastructure) | | | 837,080 | |
| | | |
| | Canada – 8.7% | | | | |
| | 45,720 | | Allied Properties Real Estate Investment Trust (Equity Real Estate Investment Trusts (REITs)) | | | 885,639 | |
| | 50,969 | | AltaGas Ltd. (Gas Utilities) | | | 919,227 | |
| | 17,668 | | Boardwalk Real Estate Investment Trust (Equity Real Estate Investment Trusts (REITs)) | | | 628,726 | |
| | 25,325 | | Canadian Apartment Properties REIT (Equity Real Estate Investment Trusts (REITs)) | | | 784,278 | |
| | 8,718 | | Canadian National Railway Co. (Road & Rail) | | | 1,032,837 | |
| | 18,557 | | Canadian Pacific Railway Ltd. (Road & Rail) | | | 1,383,381 | |
| | 266,395 | | Enbridge, Inc. (Oil, Gas & Consumable Fuels) | | | 10,379,305 | |
| | | |
| | | | | | | | |
| | | Shares | | Description | | Value | |
| |
| | Common Stocks (continued) | |
| | |
| | | Canada (continued) | | | | |
| | 97,477 | | Gibson Energy, Inc. (Oil, Gas & Consumable Fuels) | | $ | 1,663,552 | |
| | 28,064 | | Hydro One Ltd.(a) (Electric Utilities) | | | 703,686 | |
| | 168,298 | | InterRent Real Estate Investment Trust (Equity Real Estate Investment Trusts (REITs)) | | | 1,416,947 | |
| | 157,752 | | Pembina Pipeline Corp. (Oil, Gas & Consumable Fuels) | | | 5,208,416 | |
| | 319,863 | | Summit Industrial Income REIT (Equity Real Estate Investment Trusts (REITs)) | | | 4,087,654 | |
| | 159,892 | | TC Energy Corp. (Oil, Gas & Consumable Fuels) | | | 7,023,112 | |
| | | | | | | | |
| | | | | | | 36,116,760 | |
| | | |
| | China – 0.4% | | | | |
| | 7,258,000 | | China Tower Corp. Ltd. Class H(a) (Diversified Telecommunication Services) | | | 656,667 | |
| | 87,300 | | ENN Energy Holdings Ltd. (Gas Utilities) | | | 867,940 | |
| | | | | | | | |
| | | | | | | 1,524,607 | |
| | | |
| | Denmark(a) – 0.2% | | | | |
| | 11,544 | | Orsted A/S (Electric Utilities) | | | 952,446 | |
| | | |
| | Finland – 0.3% | | | | |
| | 96,797 | | Kojamo Oyj (Real Estate Management & Development) | | | 1,259,775 | |
| | | |
| | France – 2.4% | | | | |
| | 6,494 | | Gecina SA (Equity Real Estate Investment Trusts (REITs)) | | | 578,967 | |
| | 48,114 | | Getlink SE (Transportation Infrastructure) | | | 761,379 | |
| | 89,345 | | Klepierre SA* (Equity Real Estate Investment Trusts (REITs)) | | | 1,795,678 | |
| | 72,920 | | Vinci SA (Construction & Engineering) | | | 6,711,334 | |
| | | | | | | | |
| | | | | | | 9,847,358 | |
| | | |
| | Germany – 0.6% | | | | |
| | 27,440 | | RWE AG (Independent Power and Renewable Electricity Producers) | | | 1,056,306 | |
| | 66,071 | | Vonovia SE (Real Estate Management & Development) | | | 1,460,870 | |
| | | | | | | | |
| | | | | | | 2,517,176 | |
| | | |
| | Hong Kong – 3.0% | | | | |
| | 302,800 | | China Gas Holdings Ltd. (Gas Utilities) | | | 268,729 | |
| | 213,000 | | China Resources Gas Group Ltd. (Gas Utilities) | | | 545,529 | |
| | 444,156 | | CK Asset Holdings Ltd. (Real Estate Management & Development) | | | 2,455,546 | |
| | 804,049 | | COSCO SHIPPING Ports Ltd. (Transportation Infrastructure) | | | 396,510 | |
| | | |
The accompanying notes are an integral part of these financial statements. 69
|
| GOLDMAN SACHS MULTI-MANAGER REAL ASSETS STRATEGY FUND |
Schedule of Investments (continued)
October 31, 2022
| | | | | | | | |
| | | Shares | | Description | | Value | |
| |
| | Common Stocks (continued) | |
| | |
| | Hong Kong (continued) | | | | |
| | 540,000 | | Guangdong Investment Ltd. (Water Utilities) | | $ | 340,457 | |
| | 1,387,250 | | Hong Kong & China Gas Co. Ltd. (Gas Utilities) | | | 1,069,249 | |
| | 79,944 | | Hongkong Land Holdings Ltd. (Real Estate Management & Development) | | | 307,775 | |
| | 264,000 | | Kunlun Energy Co. Ltd. (Gas Utilities) | | | 157,785 | |
| | 492,420 | | Link REIT (Equity Real Estate Investment Trusts (REITs)) | | | 2,910,504 | |
| | 3,000 | | New World Development Co. Ltd. (Real Estate Management & Development) | | | 6,136 | |
| | 248,231 | | Sun Hung Kai Properties Ltd. (Real Estate Management & Development) | | | 2,667,569 | |
| | 337,167 | | Swire Properties Ltd. (Real Estate Management & Development) | | | 648,006 | |
| | 144,540 | | Wharf Real Estate Investment Co. Ltd. (Real Estate Management & Development) | | | 569,496 | |
| | | | | | | | |
| | | | | | | 12,343,291 | |
| | | |
| | Italy – 0.9% | | | | |
| | 159,275 | | Enel SpA (Electric Utilities) | | | 711,537 | |
| | 153,456 | | Snam SpA (Gas Utilities) | | | 682,344 | |
| | 342,749 | | Terna - Rete Elettrica Nazionale (Electric Utilities) | | | 2,272,996 | |
| | | | | | | | |
| | | | | | | 3,666,877 | |
| | | |
| | Japan – 7.1% | | | | |
| | 329 | | Daiwa House REIT Investment Corp. (Equity Real Estate Investment Trusts (REITs)) | | | 664,019 | |
| | 159 | | Daiwa Office Investment Corp. (Equity Real Estate Investment Trusts (REITs)) | | | 751,158 | |
| | 21,300 | | East Japan Railway Co. (Road & Rail) | | | 1,134,978 | |
| | 2,273 | | GLP J-REIT (Equity Real Estate Investment Trusts (REITs)) | | | 2,357,288 | |
| | | 209 | | Hoshino Resorts REIT, Inc. (Equity Real Estate Investment Trusts (REITs)) | | | 992,034 | |
| | 599 | | Industrial & Infrastructure Fund Investment Corp. (Equity Real Estate Investment Trusts (REITs)) | | | 632,628 | |
| | 4,864 | | Invincible Investment Corp. (Equity Real Estate Investment Trusts (REITs)) | | | 1,526,875 | |
| | 2,515 | | Japan Hotel REIT Investment Corp. (Equity Real Estate Investment Trusts (REITs)) | | | 1,325,045 | |
| | 3,604 | | Japan Metropolitan Fund Investment Corp. (Equity Real Estate Investment Trusts (REITs)) | | | 2,655,172 | |
| | 227,933 | | Mitsubishi Estate Co. Ltd. (Real Estate Management & Development) | | | 2,866,324 | |
| | 300,800 | | Mitsui Fudosan Co. Ltd. (Real Estate Management & Development) | | | 5,759,828 | |
| | 336 | | Mori Hills REIT Investment Corp. (Equity Real Estate Investment Trusts (REITs)) | | | 368,045 | |
| | | |
| | | | | | | | |
| | | Shares | | Description | | Value | |
| |
| | Common Stocks (continued) | |
| | |
| | Japan (continued) | | | | |
| | 277 | | Nippon Accommodations Fund, Inc. (Equity Real Estate Investment Trusts (REITs)) | | $ | 1,179,553 | |
| | 354 | | Nippon Building Fund, Inc. (Equity Real Estate Investment Trusts (REITs)) | | | 1,573,616 | |
| | 1,512 | | Nomura Real Estate Master Fund, Inc. (Equity Real Estate Investment Trusts (REITs)) | | | 1,724,937 | |
| | 763 | | Sekisui House Reit, Inc. (Equity Real Estate Investment Trusts (REITs)) | | | 411,140 | |
| | 85,000 | | The Kansai Electric Power Co., Inc. (Electric Utilities) | | | 643,897 | |
| | | 18,200 | | Toho Gas Co. Ltd. (Gas Utilities) | | | 339,099 | |
| | 27,300 | | Tokyo Gas Co. Ltd. (Gas Utilities) | | | 487,892 | |
| | 180,835 | | Tokyu Fudosan Holdings Corp. (Real Estate Management & Development) | | | 917,480 | |
| | 26,600 | | West Japan Railway Co. (Road & Rail) | | | 1,054,599 | |
| | | | | | | | |
| | | | | | | 29,365,607 | |
| | | |
| | Luxembourg – 0.8% | | | | |
| | 182,333 | | SES SA (Media) | | | 1,293,278 | |
| | 30,857 | | Shurgard Self Storage SA (Real Estate Management & Development) | | | 1,343,543 | |
| | 7,064 | | VGP NV (Real Estate Management & Development) | | | 535,623 | |
| | | | | | | | |
| | | | | | | 3,172,444 | |
| | | |
| | Mexico – 0.3% | | | | |
| | 5,695 | | Grupo Aeroportuario del Pacifico SAB de CV ADR (Transportation Infrastructure) | | | 883,067 | |
| | 149,470 | | Prologis Property Mexico SA de CV (Equity Real Estate Investment Trusts (REITs)) | | | 383,840 | |
| | | | | | | | |
| | | | | | | 1,266,907 | |
| | | |
| | New Zealand* – 0.1% | | | | |
| | 126,745 | | Auckland International Airport Ltd. (Transportation Infrastructure) | | | 566,603 | |
| | | |
| | Philippines – 0.0% | | | | |
| | 75,510 | | International Container Terminal Services, Inc. (Transportation Infrastructure) | | | 226,354 | |
| | | |
| | Singapore – 2.0% | | | | |
| | 2,040,267 | | CapitaLand Integrated Commercial Trust (Equity Real Estate Investment Trusts (REITs)) | | | 2,707,748 | |
| | 1,002,443 | | Capitaland Investment Ltd. (Real Estate Management & Development) | | | 2,131,840 | |
| | 957,137 | | CapLand Ascendas REIT (Equity Real Estate Investment Trusts (REITs)) | | | 1,770,886 | |
| | 174,370 | | Digital Core REIT Management Pte Ltd. (Equity Real Estate Investment Trusts (REITs)) | | | 87,128 | |
| | | |
70 The accompanying notes are an integral part of these financial statements.
GOLDMAN SACHS MULTI-MANAGER REAL ASSETS STRATEGY FUND
| | | | | | | | |
| | | Shares | | Description | | Value | |
| |
| | Common Stocks (continued) | |
| | |
| | Singapore (continued) | | | | |
| | 2,011,269 | | Lendlease Global Commercial Reit (Equity Real Estate Investment Trusts (REITs)) | | $ | 995,503 | |
| | 292,700 | | Mapletree Industrial Trust (Equity Real Estate Investment Trusts (REITs)) | | | 455,127 | |
| | | | | | | 8,148,232 | |
| | | |
| | | Spain – 2.2% | | | | |
| | 8,238 | | Aena SME SA*(a) (Transportation Infrastructure) | | | 968,224 | |
| | 153,020 | | Cellnex Telecom SA(a) (Diversified Telecommunication Services) | | | 5,008,380 | |
| | 79,481 | | Ferrovial SA (Construction & Engineering) | | | 1,942,385 | |
| | 94,929 | | Inmobiliaria Colonial Socimi SA (Equity Real Estate Investment Trusts (REITs)) | | | 500,637 | |
| | 82,830 | | Merlin Properties Socimi SA (Equity Real Estate Investment Trusts (REITs)) | | | 702,115 | |
| | | | | | | | |
| | | | | | | 9,121,741 | |
| | | |
| | Sweden – 0.8% | | | | |
| | 62,384 | | Castellum AB (Real Estate Management & Development) | | | 713,304 | |
| | 46,246 | | Fabege AB (Real Estate Management & Development) | | | 335,746 | |
| | 69,560 | | Fastighets AB Balder Class B* (Real Estate Management & Development) | | | 261,103 | |
| | 116,069 | | Pandox AB * (Real Estate Management & Development) | | | 1,421,397 | |
| | 227,850 | | Samhallsbyggnadsbolaget i Norden AB (Real Estate Management & Development) | | | 313,040 | |
| | 42,546 | | Wihlborgs Fastigheter AB (Real Estate Management & Development) | | | 278,728 | |
| | | | | | | | |
| | | | | | | 3,323,318 | |
| | | |
| | Switzerland – 0.2% | | | | |
| | 3,551 | | PSP Swiss Property AG (Real Estate Management & Development) | | | 379,353 | |
| | 6,695 | | Swiss Prime Site AG (Real Estate Management & Development) | | | 540,239 | |
| | | | | | | | |
| | | | | | | 919,592 | |
| | | |
| | United Kingdom – 4.5% | | | | |
| | 123,261 | | Big Yellow Group PLC (Equity Real Estate Investment Trusts (REITs)) | | | 1,586,068 | |
| | 532,647 | | Grainger PLC (Real Estate Management & Development) | | | 1,386,605 | |
| | 40,529 | | Great Portland Estates PLC (Equity Real Estate Investment Trusts (REITs)) | | | 238,900 | |
| | 103,682 | | Land Securities Group PLC (Equity Real Estate Investment Trusts (REITs)) | | | 677,965 | |
| | 630,633 | | National Grid PLC (Multi-Utilities) | | | 6,870,820 | |
| | 130,083 | | Pennon Group PLC (Water Utilities) | | | 1,250,058 | |
| | 68,857 | | Safestore Holdings PLC (Equity Real Estate Investment Trusts (REITs)) | | | 713,385 | |
| | | |
| | | | | | | | |
| | | Shares | | Description | | Value | |
| |
| | Common Stocks (continued) | |
| | |
| | United Kingdom (continued) | | | | |
| | 413,260 | | Segro PLC (Equity Real Estate Investment Trusts (REITs)) | | $ | 3,719,339 | |
| | 16,148 | | SSE PLC (Electric Utilities) | | | 288,579 | |
| | 84,910 | | The British Land Co. PLC (Equity Real Estate Investment Trusts (REITs)) | | | 356,188 | |
| | | 87,208 | | The UNITE Group PLC (Equity Real Estate Investment Trusts (REITs)) | | | 890,825 | |
| | 562,069 | | Tritax Big Box REIT PLC (Equity Real Estate Investment Trusts (REITs)) | | | 903,775 | |
| | | | | | | | |
| | | | | | | 18,882,507 | |
| | | |
| | United States – 56.7% | | | | |
| | 57,466 | | Agree Realty Corp. (Equity Real Estate Investment Trusts (REITs)) | | | 3,947,914 | |
| | 14,807 | | Alexandria Real Estate Equities, Inc. (Equity Real Estate Investment Trusts (REITs)) | | | 2,151,457 | |
| | 16,564 | | ALLETE, Inc. (Electric Utilities) | | | 932,056 | |
| | 19,143 | | Alliant Energy Corp. (Electric Utilities) | | | 998,690 | |
| | 29,325 | | Ameren Corp. (Multi-Utilities) | | | 2,390,574 | |
| | 109,606 | | American Homes 4 Rent Class A (Equity Real Estate Investment Trusts (REITs)) | | | 3,500,816 | |
| | 67,899 | | American Tower Corp. (Equity Real Estate Investment Trusts (REITs)) | | | 14,067,994 | |
| | 16,572 | | American Water Works Co., Inc. (Water Utilities) | | | 2,408,574 | |
| | 111,676 | | Americold Realty Trust, Inc. (Equity Real Estate Investment Trusts (REITs)) | | | 2,708,143 | |
| | 27,406 | | Apartment Income REIT Corp. (Equity Real Estate Investment Trusts (REITs)) | | | 1,053,213 | |
| | 27,778 | | Apple Hospitality REIT, Inc. (Equity Real Estate Investment Trusts (REITs)) | | | 475,559 | |
| | 19,145 | | Atmos Energy Corp. (Gas Utilities) | | | 2,039,900 | |
| | 15,950 | | AvalonBay Communities, Inc. (Equity Real Estate Investment Trusts (REITs)) | | | 2,793,164 | |
| | 5,990 | | Boston Properties, Inc. (Equity Real Estate Investment Trusts (REITs)) | | | 435,473 | |
| | 8,609 | | Brandywine Realty Trust (Equity Real Estate Investment Trusts (REITs)) | | | 56,475 | |
| | 98,793 | | Brixmor Property Group, Inc. (Equity Real Estate Investment Trusts (REITs)) | | | 2,105,279 | |
| | 47,862 | | Broadstone Net Lease, Inc. (Equity Real Estate Investment Trusts (REITs)) | | | 820,355 | |
| | 23,106 | | Camden Property Trust (Equity Real Estate Investment Trusts (REITs)) | | | 2,669,898 | |
| | 176,740 | | CenterPoint Energy, Inc. (Multi-Utilities) | | | 5,056,531 | |
| | 33,542 | | Cheniere Energy, Inc. (Oil, Gas & Consumable Fuels) | | | 5,917,144 | |
| | 45,586 | | Community Healthcare Trust, Inc. (Equity Real Estate Investment Trusts (REITs)) | | | 1,577,276 | |
| | 14,650 | | Consolidated Edison, Inc. (Multi-Utilities) | | | 1,288,614 | |
| | 5,995 | | Constellation Energy Corp. (Electric Utilities) | | | 566,767 | |
| | | |
The accompanying notes are an integral part of these financial statements. 71
|
| GOLDMAN SACHS MULTI-MANAGER REAL ASSETS STRATEGY FUND |
Schedule of Investments (continued)
October 31, 2022
| | | | | | | | |
| | | Shares | | Description | | Value | |
| |
| | Common Stocks (continued) | |
| | |
| | United States (continued) | | | | |
| | | 28,655 | | Cousins Properties, Inc. (Equity Real Estate Investment Trusts (REITs)) | | $ | 680,843 | |
| | 57,249 | | Crown Castle, Inc. (Equity Real Estate Investment Trusts (REITs)) | | | 7,629,002 | |
| | 81,212 | | CubeSmart (Equity Real Estate Investment Trusts (REITs)) | | | 3,400,346 | |
| | 69,097 | | Digital Realty Trust, Inc. (Equity Real Estate Investment Trusts (REITs)) | | | 6,926,974 | |
| | 30,780 | | DTE Midstream, Inc.* (Oil, Gas & Consumable Fuels) | | | 1,837,566 | |
| | 13,760 | | Edison International (Electric Utilities) | | | 826,150 | |
| | 10,816 | | Equinix, Inc. (Equity Real Estate Investment Trusts (REITs)) | | | 6,126,615 | |
| | 45,220 | | Equitrans Midstream Corp. (Oil, Gas & Consumable Fuels) | | | 380,752 | |
| | 43,318 | | Equity LifeStyle Properties, Inc. (Equity Real Estate Investment Trusts (REITs)) | | | 2,770,619 | |
| | 91,521 | | Equity Residential (Equity Real Estate Investment Trusts (REITs)) | | | 5,767,653 | |
| | 99,039 | | Essential Properties Realty Trust, Inc. (Equity Real Estate Investment Trusts (REITs)) | | | 2,131,319 | |
| | 18,759 | | Essential Utilities, Inc. (Water Utilities) | | | 829,523 | |
| | 9,729 | | Essex Property Trust, Inc. (Equity Real Estate Investment Trusts (REITs)) | | | 2,162,173 | |
| | 13,390 | | Evergy, Inc. (Electric Utilities) | | | 818,531 | |
| | 12,391 | | Eversource Energy (Electric Utilities) | | | 945,185 | |
| | 57,842 | | Exelon Corp. (Electric Utilities) | | | 2,232,123 | |
| | 17,224 | | Extra Space Storage, Inc. (Equity Real Estate Investment Trusts (REITs)) | | | 3,056,227 | |
| | 45,052 | | First Industrial Realty Trust, Inc. (Equity Real Estate Investment Trusts (REITs)) | | | 2,145,827 | |
| | 16,839 | | FirstEnergy Corp. (Electric Utilities) | | | 634,999 | |
| | 130,638 | | Healthcare Realty Trust, Inc. (Equity Real Estate Investment Trusts (REITs)) | | | 2,655,871 | |
| | 86,762 | | Host Hotels & Resorts, Inc. (Equity Real Estate Investment Trusts (REITs)) | | | 1,638,067 | |
| | 122,564 | | Independence Realty Trust, Inc. (Equity Real Estate Investment Trusts (REITs)) | | | 2,054,173 | |
| | 102,293 | | Invitation Homes, Inc. (Equity Real Estate Investment Trusts (REITs)) | | | 3,241,665 | |
| | 20,967 | | Kilroy Realty Corp. (Equity Real Estate Investment Trusts (REITs)) | | | 896,130 | |
| | 46,162 | | Kimco Realty Corp. (Equity Real Estate Investment Trusts (REITs)) | | | 986,944 | |
| | 79,910 | | Kinder Morgan, Inc. (Oil, Gas & Consumable Fuels) | | | 1,447,969 | |
| | 59,991 | | Kite Realty Group Trust (Equity Real Estate Investment Trusts (REITs)) | | | 1,178,223 | |
| | 6,486 | | Life Storage, Inc. (Equity Real Estate Investment Trusts (REITs)) | | | 717,416 | |
| | 4,137 | | Marriott Vacations Worldwide Corp. (Hotels, Restaurants & Leisure) | | | 611,283 | |
| | | |
| | | | | | | | |
| | | | | | | | |
| | | Shares | | Description | | Value | |
| |
| | Common Stocks (continued) | |
| | |
| | United States (continued) | | | | |
| | | 217,533 | | Medical Properties Trust, Inc. (Equity Real Estate Investment Trusts (REITs)) | | $ | 2,490,753 | |
| | 2,757 | | Mid-America Apartment Communities, Inc. (Equity Real Estate Investment Trusts (REITs)) | | | 434,090 | |
| | 40,631 | | National Retail Properties, Inc. (Equity Real Estate Investment Trusts (REITs)) | | | 1,707,721 | |
| | 70,287 | | NETSTREIT Corp. (Equity Real Estate Investment Trusts (REITs)) | | | 1,322,801 | |
| | 13,919 | | NextEra Energy, Inc. (Electric Utilities) | | | 1,078,722 | |
| | 165,033 | | NiSource, Inc. (Multi-Utilities) | | | 4,239,698 | |
| | 4,966 | | Norfolk Southern Corp. (Road & Rail) | | | 1,132,596 | |
| | 90,623 | | Omega Healthcare Investors, Inc. (Equity Real Estate Investment Trusts (REITs)) | | | 2,879,999 | |
| | 49,146 | | ONEOK, Inc. (Oil, Gas & Consumable Fuels) | | | 2,915,341 | |
| | 218,891 | | PG&E Corp.* (Electric Utilities) | | | 3,268,043 | |
| | 51,775 | | PPL Corp. (Electric Utilities) | | | 1,371,520 | |
| | 159,362 | | Prologis, Inc. (Equity Real Estate Investment Trusts (REITs)) | | | 17,649,341 | |
| | 17,735 | | Public Storage (Equity Real Estate Investment Trusts (REITs)) | | | 5,493,416 | |
| | 35,847 | | Realty Income Corp. (Equity Real Estate Investment Trusts (REITs)) | | | 2,232,193 | |
| | 55,321 | | Regency Centers Corp. (Equity Real Estate Investment Trusts (REITs)) | | | 3,347,474 | |
| | 54,993 | | Rexford Industrial Realty, Inc. (Equity Real Estate Investment Trusts (REITs)) | | | 3,040,013 | |
| | 42,778 | | Sabra Health Care REIT, Inc. (Equity Real Estate Investment Trusts (REITs)) | | | 584,347 | |
| | 25,136 | | SBA Communications Corp. (Equity Real Estate Investment Trusts (REITs)) | | | 6,784,206 | |
| | 52,980 | | Sempra Energy (Multi-Utilities) | | | 7,996,801 | |
| | 23,073 | | Simon Property Group, Inc. (Equity Real Estate Investment Trusts (REITs)) | | | 2,514,496 | |
| | 62,548 | | Spirit Realty Capital, Inc. (Equity Real Estate Investment Trusts (REITs)) | | | 2,428,739 | |
| | 41,953 | | Sun Communities, Inc. (Equity Real Estate Investment Trusts (REITs)) | | | 5,657,362 | |
| | 71,778 | | Sunstone Hotel Investors, Inc. (Equity Real Estate Investment Trusts (REITs)) | | | 800,325 | |
| | 26,127 | | Targa Resources Corp. (Oil, Gas & Consumable Fuels) | | | 1,786,303 | |
| | 10,227 | | Terreno Realty Corp. (Equity Real Estate Investment Trusts (REITs)) | | | 584,371 | |
| | 131,371 | | The Williams Cos., Inc. (Oil, Gas & Consumable Fuels) | | | 4,299,773 | |
| | 87,674 | | UDR, Inc. (Equity Real Estate Investment Trusts (REITs)) | | | 3,485,918 | |
| | 66,823 | | Ventas, Inc. (Equity Real Estate Investment Trusts (REITs)) | | | 2,614,784 | |
| | 122,812 | | VICI Properties, Inc. (Equity Real Estate Investment Trusts (REITs)) | | | 3,932,440 | |
| | 3,670 | | Waste Connections, Inc. (Commerical Services & Supplies) | | | 484,110 | |
| | | |
72 The accompanying notes are an integral part of these financial statements.
GOLDMAN SACHS MULTI-MANAGER REAL ASSETS STRATEGY FUND
| | | | | | | | |
| | | Shares | | Description | | Value | |
| |
| | Common Stocks (continued) | |
| | |
| | United States (continued) | | | | |
| | | 136,356 | | Welltower, Inc. (Equity Real Estate Investment Trusts (REITs)) | | $ | 8,323,170 | |
| | 26,000 | | Xcel Energy, Inc. (Electric Utilities) | | | 1,692,860 | |
| | | | | | | | |
| | | | | | | 235,265,760 | |
| | | |
| | TOTAL COMMON STOCKS (Cost $399,970,092) | | $ | 396,216,482 | |
| | | |
| | | |
| | | Shares | | Dividend Rate | | Value | |
| |
| | Investment Company(b) – 1.9% | |
| | Goldman Sachs Financial Square Government Fund - Institutional Shares | |
| | 7,810,169 | | 3.066% | | $ | 7,810,169 | |
| | (Cost $ 7,810,169) | | | | |
| | | |
| | TOTAL INVESTMENTS – 97.3% | | | | |
| | (Cost $407,780,261) | | $ | 404,026,651 | |
| | | |
| | OTHER ASSETS IN EXCESS OF LIABILITIES – 2.7% | | | 11,192,167 | |
| | | |
| | NET ASSETS – 100.0% | | $ | 415,218,818 | |
| | | |
| | |
| | | The percentage shown for each investment category reflects the value of investments in that category as a percentage of net assets. * Non-income producing security. (a) Exempt from registration under Rule 144A of the Securities Act of 1933. (b) Represents an affiliated issuer. |
| | | | |
| |
| | SECTOR ALLOCATION AS OF OCTOBER 31, 2022 |
| | |
| | | Sector | | % of Total
Market Value |
| | |
| | Real Estate | | 63.7% |
| | Utilities | | 15.6 |
| | Energy | | 10.6 |
| | Industrials | | 6.2 |
| | Investment Company | | 1.9 |
| | Communication Services | | 1.7 |
| | Consumer Discretionary | | 0.2 |
| | Information Technology | | 0.1 |
| | |
| | | | 100.0% |
| | |
|
| ADDITIONAL INVESTMENT INFORMATION |
FUTURES CONTRACTS — At October 31, 2022, the Fund had the following futures contracts:
| | | | | | | | | | | | | | | | |
| Description | | Number of
Contracts | | | Expiration Date | | | Notional Amount | | | Unrealized
Appreciation/
(Depreciation) | |
| |
| | | | |
Long position contracts: | | | | | | | | | | | | | | | | |
Dow Jones U.S.Real Estate Index | | | 228 | | | | 12/16/22 | | | | $7,446,480 | | | | $(1,060,633 | ) |
| |
|
Investment Abbreviations: |
ADR —American Depositary Receipt |
PLC —Public Limited Company |
REIT —Real Estate Investment Trust |
The accompanying notes are an integral part of these financial statements. 73
|
| GOLDMAN SACHS STRATEGIC MULTI-ASSET CLASS FUNDS |
Statements of Assets and Liabilities
October 31, 2022
| | | | | | | | | | | | | | |
| | | | | Goldman Sachs
Multi-Manager
Global Equity
Fund | | | Goldman Sachs
Multi-Manager
Non-Core Fixed
Income Fund | | | Goldman Sachs
Multi-Manager
Real Assets
Strategy Fund | |
| | | | |
| | Assets: | | | | | | | | | | | | |
| | Investments in unaffiliated issuers, at value (cost $361,950,676, $1,087,197,396 and $399,970,092, respectively) | | | $357,498,225 | | | | $929,553,852 | | | | $396,216,482 | |
| | Investments in affiliated issuers, at value (cost $28,124,524, $41,576,524 and $7,810,169, respectively) | | | 28,124,524 | | | | 41,576,524 | | | | 7,810,169 | |
| | Cash | | | — | | | | 9,693,186 | | | | 890,031 | |
| | Foreign currencies, at value (cost $257,351, $2,094,775 and $219,561, respectively) | | | 297,706 | | | | 2,064,522 | | | | 220,998 | |
| | Unrealized gain on forward foreign currency exchange contracts | | | 1,197,613 | | | | 1,132,282 | | | | — | |
| | Variation margin on futures contracts | | | 950,943 | | | | — | | | | — �� | |
| | Receivables: | | | | | | | | | | | | |
| | Collateral on certain derivative contracts(a) | | | 2,959,539 | | | | 7,590,630 | | | | 677,160 | |
| | Investments sold | | | 1,006,144 | | | | 44,037,781 | | | | 2,658,122 | |
| | Due from broker | | | 808,113 | | | | — | | | | — | |
| | Foreign tax reclaims | | | 622,946 | | | | 292,513 | | | | 133,427 | |
| | Dividends | | | 377,572 | | | | 14,505,155 | | | | 708,735 | |
| | Reimbursement from investment adviser | | | 190,049 | | | | — | | | | — | |
| | Investments sold on an extended-settlement basis | | | 39,789 | | | | 206,638 | | | | 51,851 | |
| | Fund shares sold | | | — | | | | — | | | | 9,500,000 | |
| | Other assets | | | 14,532 | | | | 18,278 | | | | 15,862 | |
| | | |
| | | | |
| | Total assets | | | 394,087,695 | | | | 1,050,671,361 | | | | 418,882,837 | |
| | | |
| | | | |
| | | | | | | | | | | | | | |
| | | | |
| | Liabilities: | | | | | | | | | | | | |
| | Unrealized loss on forward foreign currency exchange contracts | | | 1,782,908 | | | | 2,618,664 | | | | — | |
| | Variation margin on futures contracts | | | — | | | | — | | | | 13,684 | |
| | Variation margin on swaps contracts | | | — | | | | 223,745 | | | | — | |
| | Unrealized loss on unfunded loan commitment | | | — | | | | 11,167 | | | | — | |
| | Payables: | | | | | | | | | | | | |
| | Fund shares redeemed | | | 18,100,000 | | | | 29,022,000 | | | | — | |
| | Investments purchased | | | 617,097 | | | | 28,557,892 | | | | 2,478,445 | |
| | Management fees | | | 134,772 | | | | 322,492 | | | | 186,534 | |
| | Investments purchased on an extended-settlement basis | | | 58,064 | | | | 2,355,743 | | | | — | |
| | Due to custodian | | | 24,167 | | | | — | | | | — | |
| | Distribution and Service fees and Transfer Agency fees | | | 6,529 | | | | 17,420 | | | | 6,894 | |
| | Due to broker | | | — | | | | 812,321 | | | | 568,880 | |
| | Accrued expenses | | | 1,034,178 | | | | 1,113,550 | | | | 409,582 | |
| | | |
| | | | |
| | Total liabilities | | | 21,757,715 | | | | 65,054,994 | | | | 3,664,019 | |
| | | |
| | | | |
| | | | | | | | | | | | | | |
| | | | |
| | Net Assets: | | | | | | | | | | | | |
| | | | |
| | Paid-in capital | | | 350,568,537 | | | | 1,251,200,058 | | | | 415,188,754 | |
| | Total distributable earnings (loss) | | | 21,761,443 | | | | (265,583,691 | ) | | | 30,064 | |
| | | |
| | | | |
| | NET ASSETS | | | $ 372,329,980 | | | | $ 985,616,367 | | | | $ 415,218,818 | |
| | | |
| | Shares Outstanding $0.001 par value (unlimited number of shares authorized): | | | 40,979,865 | | | | 138,257,595 | | | | 46,407,906 | |
| | Net asset value, offering and redemption price per share: | | | $ 9.09 | | | | $ 7.13 | | | | $ 8.95 | |
| | | |
| | (a) | Segregated for initial margin and/or collateral as follows: |
| | | | | | | | | | | | | | | | | | |
| | Fund | | Futures | | | Swaps | | | Forwards | | | | |
| | Multi-Manager Global Equity | | $ | 619,539 | | | $ | — | | | $ | 2,340,000 | | | | | |
| | Multi-Manager Non-Core Fixed Income | | | — | | | | 7,080,630 | | | | 510,000 | | | | | |
| | Multi-Manager Real Assets Strategy | | | 677,160 | | | | — | | | | — | | | | | |
74 The accompanying notes are an integral part of these financial statements.
GOLDMAN SACHS STRATEGIC MULTI-ASSET CLASS FUNDS
Statements of Operations
For the Fiscal Year Ended October 31, 2022
| | | | | | | | | | | | | | |
| | | | | Goldman Sachs
Multi-Manager
Global Equity
Fund | | | Goldman Sachs
Multi-Manager
Non-Core Fixed
Income Fund | | | Goldman Sachs
Multi-Manager
Real Assets
Strategy Fund | |
| | | | |
| | Investment Income: | | | | | | | | | | | | |
| | | | |
| | Dividends — unaffiliated issuers (net of tax withholding of $513,927, $11,123 and $698,428, respectively) | | $ | 7,123,623 | | | $ | 1,108,316 | | | $ | 14,076,976 | |
| | Dividends — affiliated issuers | | | 280,814 | | | | 573,304 | | | | 125,438 | |
| | Interest (net of foreign withholding taxes of $0, $345,754 and $0, respectively) | | | 44 | | | | 70,157,372 | | | | 2,439 | |
| | | |
| | | | |
| | Total investment income | | | 7,404,481 | | | | 71,838,992 | | | | 14,204,853 | |
| | | |
| | | | |
| | | | | | | | | | | | | | |
| | | | |
| | Expenses: | | | | | | | | | | | | |
| | | | |
| | Management fees | | | 4,445,727 | | | | 10,388,846 | | | | 5,438,408 | |
| | Custody, accounting and administrative services | | | 1,430,809 | | | | 1,221,991 | | | | 689,636 | |
| | Professional fees | | | 271,767 | | | | 254,052 | | | | 193,583 | |
| | Transfer Agency fees | | | 86,325 | | | | 244,443 | | | | 108,768 | |
| | Printing and mailing costs | | | 41,584 | | | | 53,834 | | | | 40,838 | |
| | Trustee fees | | | 34,121 | | | | 39,274 | | | | 34,875 | |
| | Registration fees | | | 32,056 | | | | 174,826 | | | | 60,662 | |
| | Prime broker fees | | | 6,933 | | | | 1,401 | | | | — | |
| | Other | | | 34,295 | | | | 43,418 | | | | 20,215 | |
| | | |
| | | | |
| | Total expenses | | | 6,383,617 | | | | 12,422,085 | | | | 6,586,985 | |
| | | |
| | | | |
| | Less — expense reductions | | | (4,129,626 | ) | | | (5,629,227 | ) | | | (2,535,532) | |
| | | |
| | | | |
| | Net expenses | | | 2,253,991 | | | | 6,792,858 | | | | 4,051,453 | |
| | | |
| | | | |
| | NET INVESTMENT INCOME | | | 5,150,490 | | | | 65,046,134 | | | | 10,153,400 | |
| | | |
| | | | |
| | | | | | | | | | | | | | |
| | | | |
| | Realized and unrealized gain (loss): | | | | | | | | | | | | |
| | | | |
| | Net realized gain (loss) from: | | | | | | | | | | | | |
| | Investments — unaffiliated issuers (including commission recapture of $14,949, $0 and $16,823, respectively) | | | 23,737,153 | | | | (102,093,499 | ) | | | 20,675,672 | |
| | Futures contracts | | | (4,164,292 | ) | | | 1,081,401 | | | | (820,761) | |
| | Swap contracts | | | — | | | | (2,141,201 | ) | | | — | |
| | Forward foreign currency exchange contracts | | | 13,893,824 | | | | (12,573,020 | ) | | | (9,172) | |
| | Foreign currency transactions | | | (394,402 | ) | | | (692,565 | ) | | | (225,374) | |
| | Net change in unrealized gain (loss) on: | | | | | | | | | | | | |
| | Investments — unaffiliated issuers | | | (127,141,835 | ) | | | (153,523,798 | ) | | | (131,329,746) | |
| | Unfunded loan commitment | | | — | | | | (10,881 | ) | | | — | |
| | Futures contracts | | | (1,071,752 | ) | | | (232,716 | ) | | | (1,430,604) | |
| | Swap contracts | | | — | | | | 1,116,971 | | | | — | |
| | Forward foreign currency exchange contracts | | | (1,193,833 | ) | | | 40,409 | | | | — | |
| | Foreign currency translation | | | (33,567 | ) | | | (125,088 | ) | | | (36,036) | |
| | | |
| | | | |
| | Net realized and unrealized loss | | | (96,368,704 | ) | | | (269,153,987 | ) | | | (113,176,021) | |
| | | |
| | | | |
| | NET DECREASE IN NET ASSETS RESULTING FROM OPERATIONS | | $ | (91,218,214 | ) | | $ | (204,107,853 | ) | | $ | (103,022,621) | |
| | | |
The accompanying notes are an integral part of these financial statements. 75
|
| GOLDMAN SACHS STRATEGIC MULTI-ASSET CLASS FUNDS |
Statements of Changes in Net Assets
| | | | | | | | | | | | | | | | | | |
| | | | | Multi-Manager Global Equity Fund | | | Multi-Manager Non-Core Fixed Income Fund | |
| | | | | |
| | | | | For the Fiscal Year Ended
October 31, 2022 | | | For the Fiscal Year Ended
October 31, 2021 | | | For the Fiscal Year Ended
October 31, 2022 | | | For the Fiscal Year Ended
October 31, 2021 | |
| | | | | |
| | From operations: | | | | | | | | | | | | | | | | |
| | | | | |
| | Net investment income | | $ | 5,150,490 | | | $ | 5,925,652 | | | $ | 65,046,134 | | | | 52,169,031 | |
| | Net realized gain (loss) | | | 33,072,283 | | | | 121,160,990 | | | | (116,418,884 | ) | | | (4,138,875) | |
| | Net change in unrealized gain (loss) | | | (129,440,987 | ) | | | 70,851,939 | | | | (152,735,103 | ) | | | 21,040,650 | |
| | | |
| | | | | |
| | Net increase (decrease) in net assets resulting from operations | | | (91,218,214 | ) | | | 197,938,581 | | | | (204,107,853 | ) | | | 69,070,806 | |
| | | |
| | | | | |
| | | | | | | | | | | | | | | | | | |
| | | | | |
| | Distributions to shareholders: | | | | | | | | | | | | | | | | |
| | | | | |
| | From distributable earnings | | | (127,713,203 | ) | | | (11,198,105 | ) | | | (35,392,743 | ) | | | (49,948,317) | |
| | From return of capital | | | — | | | | — | | | | (30,807,327 | ) | | | (3,326,163) | |
| | | |
| | | | | |
| | Total distributions to shareholders | | | (127,713,203 | ) | | | (11,198,105 | ) | | | (66,200,070 | ) | | | (53,274,480) | |
| | | |
| | | | | |
| | | | | | | | | | | | | | | | | | |
| | | | | |
| | From share transactions: | | | | | | | | | | | | | | | | |
| | | | | |
| | Proceeds from sales of shares | | | 66,510,000 | | | | 27,650,000 | | | | 121,791,000 | | | | 664,383,000 | |
| | Reinvestment of distributions | | | 127,713,203 | | | | 11,198,105 | | | | 66,188,753 | | | | 53,171,912 | |
| | Cost of shares redeemed | | | (129,359,280 | ) | | | (226,639,947 | ) | | | (357,134,496 | ) | | | (248,296,288) | |
| | | |
| | | | | |
| | Net increase (decrease) in net assets resulting from share transactions | | | 64,863,923 | | | | (187,791,842 | ) | | | (169,154,743 | ) | | | 469,258,624 | |
| | | |
| | | | | |
| | TOTAL INCREASE (DECREASE) | | | (154,067,494 | ) | | | (1,051,366 | ) | | | (439,462,666 | ) | | | 485,054,950 | |
| | | |
| | | | | |
| | | | | | | | | | | | | | | | | | |
| | | | | |
| | Net assets: | | | | | | | | | | | | | | | | |
| | | | | |
| | Beginning of year | | | 526,397,474 | | | | 527,448,840 | | | | 1,425,079,033 | | | | 940,024,083 | |
| | | |
| | End of year | | $ | 372,329,980 | | | $ | 526,397,474 | | | $ | 985,616,367 | | | $ | 1,425,079,033 | |
| | | |
76 The accompanying notes are an integral part of these financial statements.
GOLDMAN SACHS STRATEGIC MULTI-ASSET CLASS FUNDS
Statements of Changes in Net Assets (continued)
| | | | | | | | | | |
| | | | | Multi-Manager Real Assets Strategy Fund | |
| | | | | For the Fiscal Year Ended
October 31, 2022 | | | For the Fiscal Year Ended
October 31, 2021 | |
| | | |
| | From operations: | | | | | | | | |
| | | |
| | Net investment income | | | $ 10,153,400 | | | | $ 12,550,336 | |
| | Net realized gain | | | 19,620,365 | | | | 44,666,452 | |
| | Net change in unrealized gain (loss) | | | (132,796,386 | ) | | | 108,096,361 | |
| | | |
| | | |
| | Net increase (decrease) in net assets resulting from operations | | | (103,022,621 | ) | | | 165,313,149 | |
| | | |
| |
| | | |
| | | |
| | Distributions to shareholders: | | | | | | | | |
| | | |
| | From distributable earnings | | | (37,115,315 | ) | | | (7,892,296) | |
| | | |
| |
| | | |
| | | |
| | From share transactions: | | | | | | | | |
| | | |
| | Proceeds from sales of shares | | | 97,110,000 | | | | 229,310,000 | |
| | Reinvestment of distributions | | | 37,115,315 | | | | 7,892,296 | |
| | Cost of shares redeemed | | | (312,175,941 | ) | | | (121,265,768) | |
| | | |
| | | |
| | Net increase (decrease) in net assets resulting from share transactions | | | (177,950,626 | ) | | | 115,936,528 | |
| | | |
| | | |
| | TOTAL INCREASE (DECREASE) | | | (318,088,562 | ) | | | 273,357,381 | |
| | | |
| |
| | | |
| | | |
| | Net assets: | | | | | | | | |
| | | |
| | Beginning of year | | | 733,307,380 | | | | 459,949,999 | |
| | | |
| | End of year | | | $ 415,218,818 | | | | $ 733,307,380 | |
| | | |
The accompanying notes are an integral part of these financial statements. 77
|
| GOLDMAN SACHS MULTI-MANAGER GLOBAL EQUITY FUND |
Financial Highlights
Selected Share Data for a Share Outstanding Throughout Each Year
| | | | | | | | | | | | | | | | | | | | | | | | | | | |
| | | | | Goldman Sachs Multi-Manager Global Equity Fund |
| | |
| | | | | Class R6 Shares(a) |
| | |
| | | | | Year Ended October 31, |
| | | | | | |
| | | | | 2022 | | 2021 | | 2020 | | 2019 | | 2018 |
| | | | | | |
| | Per Share Data | | | | | | | | | | | | | | | | | | | | | | | | | |
| | | | | | |
| | Net asset value, beginning of year | | | $ | 14.91 | | | | $ | 10.64 | | | | $ | 10.97 | | | | $ | 10.62 | | | | $ | 11.36 | |
| |
| | | |
| | | | | | |
| | Net investment income(b) | | | | 0.13 | | | | | 0.14 | | | | | 0.14 | | | | | 0.19 | | | | | 0.15 | |
| | | | | | |
| | Net realized and unrealized gain (loss) | | | | (2.39 | ) | | | | 4.37 | | | | | 0.15 | | | | | 0.91 | | | | | (0.52) | |
| |
| | | |
| | | | | | |
| | Total from investment operations | | | | (2.26 | ) | | | | 4.51 | | | | | 0.29 | | | | | 1.10 | | | | | (0.37) | |
| |
| | | |
| | | | | | |
| | Distributions to shareholders from net investment income | | | | (0.18 | ) | | | | (0.09 | ) | | | | (0.33 | ) | | | | (0.19 | ) | | | | (0.15) | |
| | | | | | |
| | Distributions to shareholders from net realized gains | | | | (3.38 | ) | | | | (0.15 | ) | | | | (0.29 | ) | | | | (0.56 | ) | | | | (0.22) | |
| |
| | | |
| | | | | | |
| | Total distributions | | | | (3.56 | ) | | | | (0.24 | ) | | | | (0.62 | ) | | | | (0.75 | ) | | | | (0.37) | |
| |
| | | |
| | | | | | |
| | Net asset value, end of year | | | $ | 9.09 | | | | $ | 14.91 | | | | $ | 10.64 | | | | $ | 10.97 | | | | $ | 10.62 | |
| |
| | | |
| | | | | | |
| | Total return(c) | | | | (19.61 | )% | | | | 42.93 | % | | | | 2.60 | % | | | | 11.39 | % | | | | (3.43)% | |
| | | |
| | | | | | |
| | Net assets, end of year (in 000s) | | | $ | 372,330 | | | | $ | 526,397 | | | | $ | 527,449 | | | | $ | 462,441 | | | | $ | 633,577 | |
| | | | | | |
| | Ratio of net expenses to average net assets | | | | 0.52 | % | | | | 0.51 | % | | | | 0.46 | % | | | | 0.72 | % | | | | 0.80% | |
| | | | | | |
| | Ratio of total expenses to average net assets | | | | 1.48 | % | | | | 1.31 | % | | | | 1.53 | % | | | | 1.42 | % | | | | 1.39% | |
| | | | | | |
| | Ratio of net investment income to average net assets | | | | 1.19 | % | | | | 1.07 | % | | | | 1.34 | % | | | | 1.81 | % | | | | 1.29% | |
| | | | | | |
| | Portfolio turnover rate(d) | | | | 90 | % | | | | 83 | % | | | | 79 | % | | | | 91 | % | | | | 76% | |
| |
| | | |
| | (a) | Effective January 16, 2018, the Institutional Shares were redesignated as Class R6 Shares. |
| | (b) | Calculated based on the average shares outstanding methodology. |
| | (c) | Assumes investment at the NAV at the beginning of the year, reinvestment of all dividends and distributions, a complete redemption of the investment at the NAV at the end of the year and no sales or redemption charges (if any). Total returns would be reduced if a sales or redemption charge was taken into account. Returns do not reflect the impact of taxes to shareholders relating to Fund distributions or the redemption of Fund shares. |
| | (d) | The Fund’s portfolio turnover rate is calculated in accordance with regulatory requirements, without regard to transactions involving short term investments and certain derivatives. If such transactions were included, the Fund’s portfolio turnover rate may be higher. |
78 The accompanying notes are an integral part of these financial statements.
GOLDMAN SACHS MULTI-MANAGER NON-CORE FIXED INCOME FUND
Financial Highlights (continued)
Selected Share Data for a Share Outstanding Throughout Each Year
| | | | | | | | | | | | | | | | | | | | | | | | | | | |
| | | | | Goldman Sachs Multi-Manager Non-Core Fixed Income Fund |
| | |
| | | | | Class R6 Shares(a) |
| | |
| | | | | Year Ended October 31, |
| | | | | | |
| | | | | 2022 | | 2021 | | 2020 | | 2019 | | 2018 |
| | | | | | |
| | Per Share Data | | | | | | | | | | | | | | | | | | | | | | | | | |
| | | | | | |
| | Net asset value, beginning of year | | | $ | 8.91 | | | | $ | 8.70 | | | | $ | 9.06 | | | | $ | 8.83 | | | | $ | 9.60 | |
| |
| | | |
| | | | | | |
| | Net investment income(b) | | | | 0.43 | | | | | 0.43 | | | | | 0.45 | | | | | 0.54 | | | | | 0.51 | |
| | | | | | |
| | Net realized and unrealized gain (loss) | | | | (1.77 | ) | | | | 0.22 | | | | | (0.35 | ) | | | | 0.31 | | | | | (0.77) | |
| |
| | | |
| | | | | | |
| | Total from investment operations | | | | (1.34 | ) | | | | 0.65 | | | | | 0.10 | | | | | 0.85 | | | | | (0.26) | |
| |
| | | |
| | | | | | |
| | Distributions to shareholders from net investment income | | | | (0.24 | ) | | | | (0.41 | ) | | | | (0.40 | ) | | | | (0.55 | ) | | | | (0.39) | |
| | | | | | |
| | Distributions to shareholders from return of capital | | | | (0.20 | ) | | | | (0.03 | ) | | | | (0.06 | ) | | | | (0.07 | ) | | | | (0.12) | |
| |
| | | |
| | | | | | |
| | Total distributions | | | | (0.44 | ) | | | | (0.44 | ) | | | | (0.46 | ) | | | | (0.62 | ) | | | | (0.51) | |
| |
| | | |
| | | | | | |
| | Net asset value, end of year | | | $ | 7.13 | | | | $ | 8.91 | | | | $ | 8.70 | | | | $ | 9.06 | | | | $ | 8.83 | |
| |
| | | |
| | | | | | |
| | Total return(c) | | | | (15.42 | )% | | | | 7.47 | % | | | | 1.21 | % | | | | 9.03 | % | | | | (2.84)% | |
| | | |
| | | | | | |
| | Net assets, end of year (in 000s) | | | $ | 985,616 | | | | $ | 1,425,079 | | | | $ | 940,024 | | | | $ | 820,164 | | | | $ | 683,830 | |
| | | | | | |
| | Ratio of net expenses to average net assets | | | | 0.56 | % | | | | 0.55 | % | | | | 0.60 | % | | | | 0.61 | % | | | | 0.70% | |
| | | | | | |
| | Ratio of total expenses to average net assets | | | | 1.02 | % | | | | 0.98 | % | | | | 1.04 | % | | | | 1.05 | % | | | | 1.08% | |
| | | | | | |
| | Ratio of net investment income to average net assets | | | | 5.32 | % | | | | 4.69 | % | | | | 5.20 | % | | | | 6.01 | % | | | | 5.52% | |
| | | | | | |
| | Portfolio turnover rate(d) | | | | 78 | % | | | | 96 | % | | | | 102 | % | | | | 150 | % | | | | 123% | |
| |
| | | |
| | (a) | Effective January 16, 2018, the Institutional Shares were redesignated as Class R6 Shares. |
| | (b) | Calculated based on the average shares outstanding methodology. |
| | (c) | Assumes investment at the NAV at the beginning of the year, reinvestment of all dividends and distributions, a complete redemption of the investment at the NAV at the end of the year and no sales or redemption charges (if any). Total returns would be reduced if a sales or redemption charge was taken into account. Returns do not reflect the impact of taxes to shareholders relating to Fund distributions or the redemption of Fund shares. |
| | (d) | The Fund’s portfolio turnover rate is calculated in accordance with regulatory requirements, without regard to transactions involving short term investments and certain derivatives. If such transactions were included, the Fund’s portfolio turnover rate may be higher. |
The accompanying notes are an integral part of these financial statements. 79
|
| GOLDMAN SACHS MULTI-MANAGER REAL ASSETS STRATEGY FUND |
Financial Highlights (continued)
Selected Share Data for a Share Outstanding Throughout Each Year
| | | | | | | | | | | | | | | | | | | | | | | | | | | |
| | | | | Goldman Sachs Multi-Manager Real Assets Strategy Fund |
| | |
| | | | | Class R6 Shares(a) |
| | |
| | | | | Year Ended October 31, |
| | | | | | |
| | | | | 2022 | | 2021 | | 2020 | | 2019 | | 2018 |
| | | | | | |
| | Per Share Data | | | | | | | | | | | | | | | | | | | | | | | | | |
| | | | | | |
| | Net asset value, beginning of year | | | $ | 11.76 | | | | $ | 8.93 | | | | $ | 10.78 | | | | $ | 9.24 | | | | $ | 9.66 | |
| |
| | | |
| | | | | | |
| | Net investment income(b) | | | | 0.20 | | | | | 0.22 | | | | | 0.19 | | | | | 0.22 | | | | | 0.23(c) | |
| | | | | | |
| | Net realized and unrealized gain (loss) | | | | (2.40 | ) | | | | 2.76 | | | | | (1.51 | ) | | | | 1.57 | | | | | (0.41) | |
| |
| | | |
| | | | | | |
| | Total from investment operations | | | | (2.20 | ) | | | | 2.98 | | | | | (1.32 | ) | | | | 1.79 | | | | | (0.18) | |
| |
| | | |
| | | | | | |
| | Distributions to shareholders from net investment income | | | | (0.35 | ) | | | | (0.15 | ) | | | | (0.35 | ) | | | | (0.20 | ) | | | | (0.05) | |
| | | | | | |
| | Distributions to shareholders from net realized gains | | | | (0.26 | ) | | | | — | | | | | (0.18 | ) | | | | (0.05 | ) | | | | (0.19) | |
| |
| | | |
| | | | | | |
| | Total distributions | | | | (0.61 | ) | | | | (0.15 | ) | | | | (0.53 | ) | | | | (0.25 | ) | | | | (0.24) | |
| |
| | | |
| | | | | | |
| | Net asset value, end of year | | | $ | 8.95 | | | | $ | 11.76 | | | | $ | 8.93 | | | | $ | 10.78 | | | | $ | 9.24 | |
| |
| | | |
| | | | | | |
| | Total return(d) | | | | (19.78 | )% | | | | 33.70 | % | | | | (12.86 | )% | | | | 20.04 | % | | | | (1.88)% | |
| | | |
| | | | | | |
| | Net assets, end of year (in 000s) | | | $ | 415,219 | | | | $ | 733,307 | | | | $ | 459,950 | | | | $ | 449,938 | | | | $ | 387,008 | |
| | | | | | |
| | Ratio of net expenses to average net assets | | | | 0.74 | % | | | | 0.69 | % | | | | 0.77 | % | | | | 0.81 | % | | | | 0.90% | |
| | | | | | |
| | Ratio of total expenses to average net assets | | | | 1.21 | % | | | | 1.16 | % | | | | 1.21 | % | | | | 1.24 | % | | | | 1.32% | |
| | | | | | |
| | Ratio of net investment income to average net assets | | | | 1.87 | % | | | | 2.08 | % | | | | 2.02 | % | | | | 2.23 | % | | | | 2.37% | |
| | | | | | |
| | Portfolio turnover rate(e) | | | | 104 | % | | | | 96 | % | | | | 92 | % | | | | 97 | % | | | | 86% | |
| |
| | | |
| | (a) | Effective January 16, 2018, the Institutional Shares were redesignated as Class R6 Shares. |
| | (b) | Calculated based on the average shares outstanding methodology. |
| | (c) | Reflects income recognized from special dividends which amounted to $0.04 per share and 0.45% of average net assets. |
| | (d) | Assumes investment at the NAV at the beginning of the year, reinvestment of all dividends and distributions, a complete redemption of the investment at the NAV at the end of the year and no sales or redemption charges (if any). Total returns would be reduced if a sales or redemption charge was taken into account. Returns do not reflect the impact of taxes to shareholders relating to Fund distributions or the redemption of Fund shares. |
| | (e) | The Fund’s portfolio turnover rate is calculated in accordance with regulatory requirements, without regard to transactions involving short term investments and certain derivatives. If such transactions were included, the Fund’s portfolio turnover rate may be higher. |
80 The accompanying notes are an integral part of these financial statements.
GOLDMAN SACHS STRATEGIC MULTI-ASSET CLASS FUNDS
Notes to Financial Statements
October 31, 2022
Goldman Sachs Trust II (the “Trust”) is a Delaware statutory trust registered under the Investment Company Act of 1940, as amended (the “Act”), as an open-end management investment company. The following table lists those series of the Trust that are included in this report (collectively, the “Funds” or individually a “Fund”), along with their corresponding share classes and respective diversification status under the Act:
| | | | | | |
| Fund | | | | Share Classes Offered | | Diversified/ Non-diversified |
| | | |
| Multi-Manager Global Equity | | | | Class R6 | | Diversified |
| | | |
| Multi-Manager Non-Core Fixed Income | | | | Class R6 | | Diversified |
| | | |
| Multi-Manager Real Assets Strategy | | | | Class R6 | | Diversified |
Goldman Sachs Asset Management, L.P. (“GSAM”), an affiliate of Goldman Sachs & Co. LLC (“Goldman Sachs”), serves as investment adviser to the Funds pursuant to management agreements (each, an “Agreement”) with the Trust. As of October 31, 2022, GSAM had sub-advisory agreements (the “Sub-Advisory Agreements”) for the Multi-Manager Global Equity Fund with Axiom Investors LLC, Boston Partners Global Investors, Inc., Causeway Capital Management LLC, Diamond Hill Capital Management Inc., GW&K Investment Management, LLC, Massachusetts Financial Services Company, doing business as MFS Investment Management, Principal Global Investors, LLC, T. Rowe Price Associates, Inc., Vaughan Nelson Investment Management, L.P., Vulcan Value Partners, LLC, WCM Investment Management, LLC and Wellington Management Company LLP; for the Multi-Manager Non-Core Fixed Income Fund with Ares Capital Management II LLC, BlueBay Asset Management LLP*, Brigade Capital Management, LP, Marathon Asset Management, L.P., Nuveen Asset Management, LLC, Pacific Asset Management LLC, RBC Global Asset Management (U.S.) Inc.*, River Canyon Fund Management, LLC, and TCW Investment Management Company LLC; and for the Multi-Manager Real Assets Strategy Fund with Cohen & Steers Capital Management, Inc., Principal Real Estate Investors, LLC, PGIM Real Estate, a business unit of PGIM, Inc., and RREEF America L.L.C. (the “Underlying Managers”). Pursuant to the terms of the Sub-Advisory Agreements, the Underlying Managers are responsible for making investment decisions and managing the investments of the Fund. GSAM compensates the Underlying Managers directly in accordance with the terms of the Sub-Advisory Agreements. The Funds are not charged any separate or additional investment advisory fees by the Underlying Managers.
*As of November 1, 2021, RBC Global Asset Management (U.S.) Inc. assumed investment management responsibilities from BlueBay Asset Management USA LLC. BlueBay Asset Management LLP and RBC Global Asset Management (U.S.) Inc. co-manage an allocation of global high yield debt for the Fund.
|
|
| 2. SIGNIFICANT ACCOUNTING POLICIES |
The financial statements have been prepared in accordance with accounting principles generally accepted in the United States of America (“GAAP”) and require management to make estimates and assumptions that may affect the reported amounts and disclosures. Actual results may differ from those estimates and assumptions. Each Fund is an investment company under GAAP and follows the accounting and reporting guidance applicable to investment companies.
A. Investment Valuation — The Funds’ valuation policy is to value investments at fair value.
B. Investment Income and Investments — Investment income includes interest income, dividend income and securities lending income, if any. Interest income is accrued daily and adjusted for amortization of premiums and accretion of discounts. Dividend income is recognized on ex-dividend date or, for certain foreign securities, as soon as such information is obtained subsequent to the ex-dividend date. Non-cash dividends, if any, are recorded at the fair market value of the securities received. Investment transactions are reflected on trade date. Realized gains and losses are calculated using identified cost. Investment transactions are recorded on the following business day for daily net asset value (“NAV”) calculations. Investment income is recorded net of any foreign withholding taxes, less any amounts reclaimable. The Funds may file withholding tax reclaims in certain jurisdictions to recover a portion of amounts previously withheld. Any foreign capital gains tax is accrued daily based upon net unrealized gains, and is payable upon sale of such investments. Distributions received from the Funds’ investments in U.S. real
81
|
| GOLDMAN SACHS STRATEGIC MULTI-ASSET CLASS FUNDS |
Notes to Financial Statements (continued)
October 31, 2022
|
|
| 2. SIGNIFICANT ACCOUNTING POLICIES (continued) |
estate investment trusts (“REITs”) may be characterized as ordinary income, net capital gain and/or a return of capital. A return of capital is recorded by the Funds as a reduction to the cost basis of the REIT.
For derivative contracts, unrealized gains and losses are recorded daily and become realized gains and losses upon disposition or termination of the contract. Upfront payments, if any, are made or received upon entering into a swap agreement and are reflected in the Statements of Assets and Liabilities. Upfront payments are recognized over the contract’s term/event as realized gains or losses, with the exception of forward starting swap contracts whose realized gains or losses are recognized from the effective start date.
C. Expenses — Expenses incurred directly by a Fund are charged to the Fund, and certain expenses incurred by the Trust are allocated across the applicable Funds on a straight-line and/or pro-rata basis, depending upon the nature of the expenses, and are accrued daily.
D. Federal Taxes and Distributions to Shareholders — It is each Fund’s policy to comply with the requirements of the Internal Revenue Code of 1986, as amended (the “Code”), applicable to regulated investment companies and to distribute each year substantially all of its investment company taxable income and capital gains to its shareholders. Accordingly, each Fund is not required to make any provisions for the payment of federal income tax. Distributions to shareholders are recorded on the ex-dividend date. Income and capital gains distributions, if any, are declared and paid according to the following schedule:
| | | | | | |
| Fund | | | | Income Distributions
Declared/Paid | | Capital Gains Distributions
Declared/Paid |
| | | |
| Multi-Manager Global Equity | | | | Annually | | Annually |
| | | |
| Multi-Manager Non-Core Fixed Income | | | | Daily/Monthly | | Annually |
| | | |
| Multi-Manager Real Assets Strategy | | | | Annually | | Annually |
Net capital losses, if any, are carried forward to future fiscal years and may be used to the extent allowed by the Code to offset any future capital gains. Losses that are carried forward will retain their character as either short-term or long-term capital losses. Utilization of capital loss carryforwards will reduce the requirement of future capital gains distributions.
The characterization of distributions to shareholders for financial reporting purposes is determined in accordance with federal income tax rules, which may differ from GAAP. The source of each Fund’s distributions may be shown in the accompanying financial statements as either from distributable earnings or capital. Certain components of the Funds’ net assets on the Statements of Assets and Liabilities reflect permanent GAAP/tax differences based on the appropriate tax character.
E. Foreign Currency Translation — The accounting records and reporting currency of a Fund are maintained in U.S. dollars. Assets and liabilities denominated in foreign currencies are translated into U.S. dollars using the current exchange rates at the close of each business day. The effect of changes in foreign currency exchange rates on investments is included within net realized and unrealized gain (loss) on investments. Changes in the value of other assets and liabilities as a result of fluctuations in foreign exchange rates are included in the Statements of Operations within net change in unrealized gain (loss) on foreign currency translation. Transactions denominated in foreign currencies are translated into U.S. dollars on the date the transaction occurred, the effects of which are included within net realized gain (loss) on foreign currency transactions.
F. Commission Recapture — GSAM, on behalf of certain Funds, may direct portfolio trades, subject to seeking best execution, to various brokers who have agreed to rebate a portion of the commissions generated. Such rebates are made directly to a Fund as cash payments and are included in net realized gain (loss) from investments on the Statements of Operations.
|
|
| 3. INVESTMENTS AND FAIR VALUE MEASUREMENTS |
U.S. GAAP defines the fair value of a financial instrument as the amount that would be received to sell an asset or paid to transfer a liability in an orderly transaction between market participants at the measurement date (i.e., the exit price); the Funds’ policy is to use the market approach. GAAP establishes a fair value hierarchy that prioritizes the inputs to valuation techniques used to
82
GOLDMAN SACHS STRATEGIC MULTI-ASSET CLASS FUNDS
|
|
| 3. INVESTMENTS AND FAIR VALUE MEASUREMENTS (continued) |
measure fair value. The hierarchy gives the highest priority to unadjusted quoted prices in active markets for identical assets or liabilities (Level 1 measurements) and the lowest priority to unobservable inputs (Level 3 measurements). The level in the fair value hierarchy within which the fair value measurement in its entirety falls shall be determined based on the lowest level input that is significant to the fair value measurement in its entirety. The levels used for classifying investments are not necessarily an indication of the risk associated with investing in these investments. The three levels of the fair value hierarchy are described below:
Level 1 — Unadjusted quoted prices in active markets that are accessible at the measurement date for identical, unrestricted assets or liabilities;
Level 2 — Quoted prices in markets that are not active or financial instruments for which significant inputs are observable (including, but not limited to, quoted prices for similar investments, interest rates, foreign exchange rates, volatility and credit spreads), either directly or indirectly;
Level 3 — Prices or valuations that require significant unobservable inputs (including GSAM’s assumptions in determining fair value measurement).
The Board of Trustees (“Trustees”) has approved Valuation Procedures that govern the valuation of the portfolio investments held by the Funds, including investments for which market quotations are not readily available. With respect to the Funds’ investments that do not have readily available market quotations, the Trustees have designated the Adviser as the valuation designee to perform fair valuations pursuant to Rule 2a-5 under the Investment Company Act of 1940 (the “Valuation Designee”). GSAM has day-to-day responsibility for implementing and maintaining internal controls and procedures related to the valuation of the Funds’ investments. To assess the continuing appropriateness of pricing sources and methodologies, GSAM regularly performs price verification procedures and issues challenges as necessary to third party pricing vendors or brokers, and any differences are reviewed in accordance with the Valuation Procedures.
A. Level 1 and Level 2 Fair Value Investments — The valuation techniques and significant inputs used in determining the fair values for investments classified as Level 1 and Level 2 are as follows:
Equity Securities — Equity securities traded on a United States (“U.S.”) securities exchange or the NASDAQ system, or those located on certain foreign exchanges, including but not limited to the Americas, are valued daily at their last sale price or official closing price on the principal exchange or system on which they are traded. If there is no sale or official closing price or such price is believed by GSAM to not represent fair value, equity securities will be valued at the valid closing bid price for long positions and at the valid closing ask price for short positions (i.e., where there is sufficient volume, during normal exchange trading hours). If no valid bid/ask price is available, the equity security will be valued pursuant to the Valuation Procedures and consistent with applicable regulatory guidance. To the extent these investments are actively traded, they are classified as Level 1 of the fair value hierarchy, otherwise they are generally classified as Level 2. Certain equity securities containing unique attributes may be classified as Level 2.
Unlisted equity securities for which market quotations are available are valued at the last sale price on the valuation date, or if no sale occurs, at the last bid price for long positions or the last ask price for short positions, and are generally classified as Level 2. Securities traded on certain foreign securities exchanges are valued daily at fair value determined by an independent fair value service (if available) under the Valuation Procedures and consistent with applicable regulatory guidance. The independent fair value service takes into account multiple factors including, but not limited to, movements in the securities markets, certain depositary receipts, futures contracts and foreign currency exchange rates that have occurred subsequent to the close of the foreign securities exchange. These investments are generally classified as Level 2 of the fair value hierarchy.
Underlying Funds (including Money Market Funds) — Underlying Funds (“Underlying Funds”) include other investment companies and exchange-traded funds (“ETFs”). Investments in the Underlying Funds (except ETFs) are valued at the NAV per share on the day of valuation. ETFs are valued daily at the last sale price or official closing price on the principal exchange or system on which the investment is traded. Because the Funds invest in Underlying Funds that fluctuate in value, the Funds’ shares will correspondingly fluctuate in value. Underlying Funds are generally classified as Level 1 of the fair value hierarchy. To the extent that underlying ETFs are actively traded, they are classified as Level 1 of the fair value hierarchy, otherwise they are
83
|
| GOLDMAN SACHS STRATEGIC MULTI-ASSET CLASS FUNDS |
Notes to Financial Statements (continued)
October 31, 2022
|
|
| 3. INVESTMENTS AND FAIR VALUE MEASUREMENTS (continued) |
generally classified as Level 2. For information regarding an Underlying Fund’s accounting policies and investment holdings, please see the Underlying Fund’s shareholder report.
Debt Securities — Debt securities for which market quotations are readily available are valued daily on the basis of quotations supplied by dealers or an independent pricing service. The pricing services may use valuation models or matrix pricing, which consider: (i) yield or price with respect to bonds that are considered comparable in characteristics such as rating, interest rate and maturity date or (ii) quotations from securities dealers to determine current value. With the exception of treasury securities of G7 countries, which are generally classified as Level 1, these investments are generally classified as Level 2 of the fair value hierarchy.
i. Bank Loans — Bank loans (“Loans”) are interests in amounts owed by corporate, governmental, or other borrowers to lenders or lending syndicates. Loans are arranged through private negotiations between the borrower and one or more financial institutions (“Lenders”). A Fund’s investments in Loans are in the form of either participations in Loans (“Participations”) or assignments of all or a portion of Loans from third parties (“Assignments”). With respect to Participations, a Fund has the right to receive payments of principal, interest and any fees to which it is entitled from the Lender selling the Participations and only upon receipt by the Lender of the payments from the borrower. A Fund generally has no right to enforce compliance by the borrower with the terms of the loan agreement with respect to Participations. Conversely, assignments result in a Fund having a direct contractual relationship with the borrower, and the Fund may be permitted to enforce compliance by the borrower with the terms of the loan agreement.
The Multi-Manager Non-Core Fixed Income Fund may also enter into certain credit arrangements, all or a portion of which may be unfunded. Unfunded loan commitments represent the remaining obligation of the Fund to the borrower. The Fund is obligated to fund these commitments at the borrower’s discretion. The Fund may receive a commitment fee based on the undrawn portion of the underlying line of credit of a loan. All loans and unfunded loan commitments involve interest rate risk, liquidity risk and credit risk, including the potential default or insolvency of the borrower. Loans, including unfunded loan commitments, are marked to market daily using pricing vendor quotations and the change in value, if any, is recorded as an unrealized gain or loss.
Derivative Contracts — A derivative is an instrument whose value is derived from underlying assets, indices, reference rates or a combination of these factors. A Fund enters into derivative transactions to hedge against changes in interest rates, securities prices, and/or currency exchange rates, to increase total return, or to gain access to certain markets or attain exposure to other underliers. For financial reporting purposes, cash collateral that has been pledged to cover obligations of a Fund and cash collateral received, if any, is reported separately on the Statements of Assets and Liabilities as either due to broker/receivable for collateral on certain derivative contracts. Non-cash collateral pledged by a Fund, if any, is noted in the Schedules of Investments.
Exchange-traded derivatives, including futures and options contracts, are generally valued at the last sale or settlement price on the exchange where they are principally traded. Exchange-traded options without settlement prices are generally valued at the midpoint of the bid and ask prices on the exchange where they are principally traded (or, in the absence of two-way trading, at the last bid price for long positions and the last ask price for short positions). Exchange-traded derivatives typically fall within Level 1 of the fair value hierarchy. Over-the-counter (“OTC”) and centrally cleared derivatives are valued using market transactions and other market evidence, including market-based inputs to models, calibration to market-clearing transactions, broker or dealer quotations, or other alternative pricing sources. Where models are used, the selection of a particular model to value OTC and centrally cleared derivatives depends upon the contractual terms of, and specific risks inherent in, the instrument, as well as the availability of pricing information in the market. Valuation models require a variety of inputs, including contractual terms, market prices, yield curves, credit curves, measures of volatility, voluntary and involuntary prepayment rates, loss severity rates and correlations of such inputs. For OTC and centrally cleared derivatives that trade in liquid markets, model inputs can generally be verified and model selection does not involve significant management judgment. OTC and centrally cleared derivatives are classified within Level 2 of the fair value hierarchy when significant inputs are corroborated by market evidence.
84
GOLDMAN SACHS STRATEGIC MULTI-ASSET CLASS FUNDS
|
|
| 3. INVESTMENTS AND FAIR VALUE MEASUREMENTS (continued) |
i. Forward Contracts — A forward contract is a contract between two parties to buy or sell an asset at a specified price on a future date. A forward contract settlement can occur on a cash or delivery basis. Forward contracts are marked-to-market daily using independent vendor prices, and the change in value, if any, is recorded as an unrealized gain or loss. Cash and certain investments may be used to collateralize forward contracts.
A forward foreign currency exchange contract is a forward contract in which a Fund agrees to receive or deliver a fixed quantity of one currency for another, at a pre-determined price at a future date. All forward foreign currency exchange contracts are marked to market daily by using the outright forward rates or interpolating based upon maturity dates, where available. Non-deliverable forward foreign currency exchange contracts are settled with the counterparty in cash without the delivery of foreign currency.
ii. Futures Contracts — Futures contracts are contracts to buy or sell a standardized quantity of a specified commodity or security. Upon entering into a futures contract, a Fund deposits cash or securities in an account on behalf of the broker in an amount sufficient to meet the initial margin requirement. Subsequent payments are made or received by a Fund equal to the daily change in the contract value and are recorded as variation margin receivable or payable with a corresponding offset to unrealized gains or losses.
iii. Swap Contracts — Bilateral swap contracts are agreements in which a Fund and a counterparty agree to exchange periodic payments on a specified notional amount or make a net payment upon termination. Bilateral swap transactions are privately negotiated in the OTC market and payments are settled through direct payments between a Fund and the counterparty. By contrast, certain swap transactions are subject to mandatory central clearing. These swaps are executed through a derivatives clearing member (“DCM”), acting in an agency capacity, and submitted to a central counterparty (“CCP”) (“centrally cleared swaps”), in which case all payments are settled with the CCP through the DCM. Swaps are marked-to-market daily using pricing vendor quotations, counterparty or clearinghouse prices or model prices, and the change in value, if any, is recorded as an unrealized gain or loss. Upon entering into a swap contract, a Fund is required to satisfy an initial margin requirement by delivering cash or securities to the counterparty (or in some cases, segregated in a triparty account on behalf of the counterparty), which can be adjusted by any mark-to-market gains or losses pursuant to bilateral or centrally cleared arrangements. For centrally cleared swaps the daily change in valuation, if any, is recorded as a receivable or payable for variation margin.
A credit default swap is an agreement that involves one party (the buyer of protection) making a stream of payments to another party (the seller of protection) in exchange for the right to receive protection on a reference security or obligation, including a group of assets or exposure to the performance of an index. A Fund’s investment in credit default swaps may involve greater risks than if the Fund had invested in the referenced obligation directly. Credit events are contract specific but may include bankruptcy, failure to pay, restructuring and obligation acceleration. If a Fund buys protection through a credit default swap and no credit event occurs, its payments are limited to the periodic payments previously made to the counterparty. Upon the occurrence of a specified credit event, a Fund, as a buyer of credit protection, is entitled to receive an amount equal to the notional amount of the swap and deliver to the seller the defaulted reference obligation in a physically settled trade. A Fund may also receive a net settlement amount in the form of cash or securities equal to the notional amount of the swap reduced by the recovery value of the reference obligation in a cash settled trade.
As a seller of protection, a Fund generally receives a payment stream throughout the term of the swap, provided that there is no credit event. In addition, if a Fund sells protection through a credit default swap, the Fund could suffer a loss because the value of the referenced obligation and the premium payments received may be less than the notional amount of the swap paid to the buyer of protection. Upon the occurrence of a specified credit event, a Fund, as a seller of credit protection, may be required to take possession of the defaulted reference obligation and pay the buyer an amount equal to the notional amount of the swap in a physically settled trade. A Fund may also pay a net settlement amount in the form of cash or securities equal to the notional amount of the swap reduced by the recovery value of the reference obligation in a cash settled trade. Recovery values are at times established through the credit event auction process in which market participants are ensured that a transparent price has been set for the defaulted security or obligation. In addition, a Fund is entitled to a return of any assets, which have been pledged as collateral to the counterparty upon settlement.
85
|
| GOLDMAN SACHS STRATEGIC MULTI-ASSET CLASS FUNDS |
Notes to Financial Statements (continued)
October 31, 2022
|
|
| 3. INVESTMENTS AND FAIR VALUE MEASUREMENTS (continued) |
The maximum potential amount of future payments (undiscounted) that a Fund as seller of protection could be required to make under a credit default swap would be an amount equal to the notional amount of the agreement. These potential amounts would be partially offset by any recovery values of the respective referenced obligations or net amounts received from a settlement of a credit default swap for the same reference security or obligation where a Fund bought credit protection.
B. Level 3 Fair Value Investments — To the extent that significant inputs to valuation models and other alternative pricing sources are unobservable, or if quotations are not readily available, or if GSAM believes that such quotations do not accurately reflect fair value, the fair value of a Fund’s investments may be determined under the Valuation Procedures. GSAM, consistent with its procedures and applicable regulatory guidance, may make an adjustment to the most recent valuation prices of either domestic or foreign securities in light of significant events to reflect what it believes to be the fair value of the securities at the time of determining a Fund’s NAV. To the extent investments are valued using single source broker quotations obtained directly from the broker or passed through from third party pricing vendors, such investments are classified as Level 3 investments.
C. Fair Value Hierarchy — The following is a summary of the Funds’ investments and derivatives classified in the fair value hierarchy as of October 31, 2022:
MULTI-MANAGER GLOBAL EQUITY
| | | | | | | | | | | | |
| Investment Type | | Level 1 | | | Level 2 | | | Level 3 | |
| |
| | | |
Assets | | | | | | | | | | | | |
| | | |
Common Stock and/or Other Equity Investments(a) | | | | | | | | | | | | |
| | | |
Africa | | $ | 298,070 | | | $ | 736,333 | | | $ | — | |
| | | |
Asia | | | 2,912,449 | | | | 49,997,692 | | | | 176,180 | (b) |
| | | |
Australia and Oceania | | | — | | | | 2,165,277 | | | | — | |
| | | |
Europe | | | 7,046,039 | | | | 69,921,276 | | | | — | |
| | | |
North America | | | 218,753,002 | | | | — | | | | — | |
| | | |
South America | | | 3,669,184 | | | | 11,950 | | | | — | |
| | | |
Exchange Traded Funds | | | 1,407,442 | | | | — | | | | — | |
| | | |
Preferred Stocks | | | — | | | | 403,331 | | | | — | |
| | | |
Investment Companies | | | 28,124,524 | | | | — | | | | — | |
| |
| | | |
Total | | $ | 262,210,710 | | | $ | 123,235,859 | | | $ | 176,180 | |
| |
| | | |
| Derivative Type | | | | | | | | | |
| |
| | | |
Assets(c) | | | | | | | | | | | | |
| | | |
Forward Foreign Currency Exchange Contracts | | $ | — | | | $ | 1,197,613 | | | $ | — | |
| | | |
Futures Contracts | | | 44,169 | | | | — | | | | — | |
| |
| | | |
Total | | $ | 44,169 | | | $ | 1,197,613 | | | $ | — | |
|
| |
| | | |
Liabilities(c) | | | | | | | | | | | | |
| | | |
Forward Foreign Currency Exchange Contracts | | $ | — | | | $ | (1,782,908) | | | $ | — | |
|
| |
| | (a) | Amounts are disclosed by continent to highlight the impact of time zone differences between local market close and the calculation of NAV. Security valuations are based on the principal exchange or system on which they are traded, which may differ from country of domicile. The Funds utilize fair value model prices provided by an independent fair value service for international equities, resulting in a Level 2 classification. |
| | (b) | Amount includes valuations of Russian investments for which GSAM has determined include significant unobservable inputs as of October 31, 2022. To the extent that the same positions were held as of the Fund’s prior fiscal year end, October 31, 2021, they were classified as Level 1 or level 2. |
| | (c) | Amount shown represents unrealized gain (loss) at period end. |
86
GOLDMAN SACHS STRATEGIC MULTI-ASSET CLASS FUNDS
|
|
| 3. INVESTMENTS AND FAIR VALUE MEASUREMENTS (continued) |
| | | | | | | | | | | | |
MULTI-MANAGER NON-CORE FIXED INCOME | | | | | | | | | | | | |
| | | |
| Investment Type | | Level 1 | | | Level 2 | | | Level 3 | |
| |
| | | |
Assets | | | | | | | | | | | | |
| | | |
Fixed Income | | | | | | | | | | | | |
| | | |
Corporate Obligations | | $ | — | | | $ | 356,499,066 | | | $ | 171,048 | |
| | | |
Sovereign Debt Obligations | | | — | | | | 331,564,278 | | | | — | |
| | | |
Bank Loans | | | — | | | | 230,811,876 | | | | 4,215,249 | |
| | | |
Common Stock and/or Other Equity Investments(a) | | | | | | | | | | | | |
| | | |
Europe | | | 305,583 | | | | — | | | | — | |
| | | |
North America | | | 135,773 | | | | 3,723,933 | | | | 1,755,065 | |
| | | |
Preferred Stocks | | | — | | | | 2,671 | | | | 189,629 | |
| | | |
Warrants | | | — | | | | 179,681 | | | | — | |
| | | |
Investment Company | | | 41,576,524 | | | | — | | | | — | |
| |
| | | |
Total | | $ | 42,017,880 | | | $ | 922,781,505 | | | $ | 6,330,991 | |
| |
| | | |
Liabilities | | | | | | | | | | | | |
| | | |
Fixed Income | | | | | | | | | | | | |
| | | |
Unfunded Loan Committments | | $ | — | | | $ | (11,167) | | | $ | — | |
| |
| | | |
Derivative Type | | | | | | | | | | | | |
| |
| | | |
Assets(b) | | | | | | | | | | | | |
| | | |
Forward Foreign Currency Exchange Contracts | | $ | — | | | $ | 1,132,282 | | | $ | — | |
| | | |
Credit Default Swap Contracts | | | — | | | | 1,124,078 | | | | — | |
| |
| | | |
Total | | $ | — | | | $ | 2,256,360 | | | $ | — | |
| |
| | | |
Liabilities(b) | | | | | | | | | | | | |
| | | |
Forward Foreign Currency Exchange Contracts | | $ | — | | | $ | (2,618,664) | | | $ | — | |
| |
| | (a) | Amounts are disclosed by continent to highlight the impact of time zone differences between local market close and the calculation of NAV. Security valuations are based on the principal exchange or system on which they are traded, which may differ from country of domicile. The Funds utilize fair value model prices provided by an independent fair value service for international equities, resulting in a Level 2 classification. |
| | (b) | Amount shown represents unrealized gain (loss) at period end. |
| | | | | | | | | | | | |
MULTI-MANAGER REAL ASSETS STRATEGY | | | | | | | | | | | | |
| | | |
| Investment Type | | Level 1 | | | Level 2 | | | Level 3 | |
| |
| | | |
Assets | | | | | | | | | | | | |
| | | |
Common Stock and/or Other Equity Investments(a) | | | | | | | | | | | | |
| | | |
Asia | | $ | — | | | $ | 51,608,091 | | | $ | — | |
| | | |
Australia and Oceania | | | — | | | | 15,735,325 | | | | — | |
| | | |
Europe | | | 1,625,505 | | | | 53,761,054 | | | | — | |
| | | |
North America | | | 272,649,427 | | | | — | | | | — | |
| | | |
South America | | | 837,080 | | | | — | | | | — | |
| | | |
Investment Company | | | 7,810,169 | | | | — | | | | — | |
| |
| | | |
Total | | $ | 282,922,181 | | | $ | 121,104,470 | | | $ | — | |
| |
87
|
| GOLDMAN SACHS STRATEGIC MULTI-ASSET CLASS FUNDS |
Notes to Financial Statements (continued)
October 31, 2022
|
|
| 3. INVESTMENTS AND FAIR VALUE MEASUREMENTS (continued) |
| | | | | | | | | | | | |
MULTI-MANAGER REAL ASSETS STRATEGY (continued) | | | | | | | | | | | | |
| | | |
| Derivative Type | | Level 1 | | | Level 2 | | | Level 3 | |
| |
| | | |
Liabilities(b) | | | | | | | | | | | | |
| | | |
Futures Contracts | | $ | (1,060,633 | ) | | $ | — | | | $ | — | |
| |
| | (a) | Amounts are disclosed by continent to highlight the impact of time zone differences between local market close and the calculation of NAV. Security valuations are based on the principal exchange or system on which they are traded, which may differ from country of domicile. The Funds utilize fair value model prices provided by an independent fair value service for international equities, resulting in a Level 2 classification. |
| | (b) | Amount shown represents unrealized gain (loss) at period end. |
For further information regarding security characteristics, see the Schedules of Investments.
|
|
| 4. INVESTMENTS IN DERIVATIVES |
The following tables set forth, by certain risk types, the gross value of derivative contracts (not considered to be hedging instruments for accounting disclosure purposes) as of October 31, 2022. These instruments were used as part of the Funds’ investment strategies and to obtain and/or manage exposure related to the risks below. The values in the tables below exclude the effects of cash collateral received or posted pursuant to these derivative contracts, and therefore are not representative of the Fund’s net exposure.
MULTI-MANAGER GLOBAL EQUITY
| | | | | | | | | | | | |
| Risk | | Statements of Assets and Liabilities | | Assets | | | Statements of Assets and Liabilities | | Liabilities | |
| | | | |
Currency | | Receivable for unrealized gain on forward foreign currency exchange contracts | | $ | 1,197,613 | | | Payable for unrealized loss on forward foreign currency exchange contracts | | $ | (1,782,908) | |
| | | | |
Equity | | Variation margin on futures contracts | | | 44,169 | (a) | | — | | | — | |
| | | | |
Total | | | | $ | 1,241,782 | | | | | $ | (1,782,908) | |
| | | |
| MULTI-MANAGER NON-CORE FIXED INCOME | | | | | | | | |
| | | | |
| Risk | | Statements of Assets and Liabilities | | Assets | | | Statements of Assets and Liabilities | | Liabilities | |
| | | | |
Credit | | Variation margin on swap contracts | | $ | 1,124,078 | (a) | | Variation margin on swap contracts | | $ | — | |
| | | | |
Currency | | Receivable for unrealized gain on forward foreign currency exchange contracts | | | 1,132,282 | | | Payable for unrealized loss on forward foreign currency exchange contracts | | | (2,618,664) | |
| | | | |
Total | | | | $ | 2,256,360 | | | | | $ | (2,618,664) | |
| | | |
| MULTI-MANAGER REAL ASSETS STRATEGY | | | | | | | | |
| | | | |
| Risk | | Statements of Assets and Liabilities | | Assets | | | Statements of Assets and Liabilities | | Liabilities | |
| | | | |
Equity | | — | | $ | — | | | Variation margin on futures contracts | | $ | (1,060,633)(a) | |
| | (a) | Includes unrealized gain (loss) on futures contracts and centrally cleared swaps described in the Additional Investment Information sections of the Schedules of Investments. Only current day’s variation margin is reported within the Statements of Assets and Liabilities. |
88
GOLDMAN SACHS STRATEGIC MULTI-ASSET CLASS FUNDS
|
|
| 4. INVESTMENTS IN DERIVATIVES (continued) |
The following tables set forth, by certain risk types, the Funds’ gains (losses) related to these derivatives and their indicative volumes for the fiscal year ended October 31, 2022. These gains (losses) should be considered in the context that these derivative contracts may have been executed to create investment opportunities and/or economically hedge certain investments, and accordingly, certain gains (losses) on such derivative contracts may offset certain (losses) gains attributable to investments. These gains (losses) are included in “Net realized gain (loss)” or “Net change in unrealized gain (loss)” on the Statements of Operations:
| | | | | | | | | | |
| MULTI-MANAGER GLOBAL EQUITY | | | | | |
| | | |
| Risk | | Statement of Operations | | Net Realized Gain (Loss) | | Net Change in
Unrealized
Gain (Loss) | |
| | | |
Currency | | Net realized gain (loss) from forward foreign currency exchange contracts/Net unrealized gain(loss) on forward foreign currency exchange contracts | | | $ 13,893,824 | | | $ | (1,193,833 | ) |
| | | |
Equity | | Net realized gain (loss) from futures contracts/Net change in unrealized gain (loss) on futures contracts | | | (4,164,292 | ) | | | (1,071,752 | ) |
| | | |
Total | | | | | $ 9,729,532 | | | $ | (2,265,585 | ) |
| | |
| MULTI-MANAGER NON-CORE FIXED INCOME | | | | | |
| | | |
| Risk | | Statement of Operations | | Net Realized Gain (Loss) | | Net Change in
Unrealized
Gain (Loss) | |
| | | |
Credit | | Net realized gain (loss) from swap contracts/ Net change in unrealized gain (loss) on swap contracts | | | $ (2,141,201 | ) | | $ | 1,116,971 | |
| | | |
Currency | | Net realized gain (loss) from purchased options and forward foreign currency exchange contracts/ Net change in unrealized gain (loss) on purchased options and forward foreign currency exchange contracts | | | (12,573,020 | ) | | | 40,409 | |
| | | |
Interest rate | | Net realized gain (loss) from futures contracts / Net change in unrealized gain (loss) on futures contracts | | | 1,081,401 | | | | (232,716 | ) |
| | | |
Total | | | | | $ (13,632,820 | ) | | $ | 924,664 | |
| | |
| MULTI-MANAGER REAL ASSETS STRATEGY | | | | | |
| | | |
| Risk | | Statement of Operations | | Net Realized Gain (Loss) | | Net Change in
Unrealized
Gain (Loss) | |
| | | |
Currency | | Net realized gain (loss) from forward foreign currency exchange contracts | | | $ (9,172 | ) | | $ | — | |
| | | |
Equity | | Net realized gain (loss) from futures contracts/Net change in unrealized gain (loss) on futures contracts | | | (820,761 | ) | | | (1,430,604 | ) |
| | | |
Total | | | | | $ (829,933 | ) | | $ | (1,430,604 | ) |
89
|
| GOLDMAN SACHS STRATEGIC MULTI-ASSET CLASS FUNDS |
Notes to Financial Statements (continued)
October 31, 2022
|
|
| 4. INVESTMENTS IN DERIVATIVES (continued) |
For the fiscal year ended October 31, 2022, the relevant values for each derivative type was as follows:
| | | | | | | | | | |
| | | Average Number of Contracts, Notional Amounts, or Shares/Units(a) | |
| | | |
| | | Futures contracts | | Forward contracts | | | Swap Agreements | |
| |
| | | |
Multi-Manager Global Equity | | 158 | | | $213,458,516 | | | | $ — | |
| |
| | | |
Multi-Manager Non-Core Fixed Income | | 100 | | | 163,763,742 | | | | 36,837,685 | |
| |
| | | |
Multi-Manager Real Assets Strategy | | 275 | | | 163,587 | | | | — | |
| |
| | (a) | Amounts disclosed represent average number of contracts for futures contracts, notional amounts for forward contracts, swaptions, swap agreements, purchased and written swaptions, or shares/units outstanding for purchased options and written options, based on absolute values, which is indicative of volume for this derivative type, for the months that the Fund held such derivatives during the fiscal year ended October 31, 2022. |
|
|
| 5. AGREEMENTS AND AFFILIATED TRANSACTIONS |
A. Management Agreement — Under the Agreement, GSAM manages the Funds, subject to the general supervision of the Trustees.
As compensation for the services rendered pursuant to the Agreement, the assumption of the expenses related thereto and administration of the Funds’ business affairs, including providing facilities, GSAM is entitled to a management fee, accrued daily and paid monthly, equal to an annual percentage rate of each Fund’s average daily net assets.
For the fiscal year ended October 31, 2022, contractual and effective net management fees with GSAM were at the following rates:
| | | | | | | | | | | | | | |
| | | Contractual Management Rate | | | | Effective Net Management Rate^* |
Fund | | First
$1 billion | | Next
$1 billion | | Next
$3 billion | | Next
$3 billion | | Over
$8 billion | | Effective Rate |
|
| | | | | | | |
Multi-Manager Global Equity | | 1.03% | | 0.93% | | 0.89% | | 0.87% | | 0.84% | | 1.03% | | 0.40% |
|
| | | | | | | |
Multi-Manager Non-Core Fixed Income | | 0.85 | | 0.85 | | 0.77 | | 0.73 | | 0.71 | | 0.85 | | 0.39 |
|
| | | | | | | |
Multi-Manager Real Assets Strategy | | 1.00 | | 0.90 | | 0.86 | | 0.84 | | 0.82 | | 1.00 | | 0.53 |
|
| | * | GSAM has agreed to waive a portion of its management fee for each Fund in order to achieve an effective net management fee rate that is equal to the actual cost of fees paid to the Fund’s Underlying Managers. These arrangements will remain in effect through at least February 28, 2023, and prior to such date GSAM may not terminate the arrangements without the approval of the Board of Trustees. |
| | ^ | Effective Net Management Rate includes the impact of management fee waivers of affiliated underlying funds, if any. |
The Funds invest in Institutional Shares and/or Class R6 Shares of the Goldman Sachs Financial Square Government Fund, which is an affiliated Underlying Fund. GSAM has agreed to waive a portion of its management fee payable by the Funds in an amount equal to the management fee it earns as an investment adviser to the affiliated Underlying Fund in which the Funds invest. For the fiscal year ended October 31, 2022, GSAM waived $47,011, $123,194 and $23,791 of the Multi-Manager Global Equity, Multi-Manager Non-Core Fixed Income and Multi-Manager Real Assets Strategy Funds’ management fees, respectively.
B. Transfer Agency Agreement — Goldman Sachs also serves as the transfer agent of the Funds for a fee pursuant to the Transfer Agency Agreement. The fees charged for such transfer agency services are accrued daily and paid monthly at annual rates of 0.02% of the average daily net assets of Class R6 Shares.
C. Other Expense Agreements and Affiliated Transactions — GSAM has agreed to reduce or limit each Fund’s “Total Annual Operating Expenses” (excluding acquired fund fees and expenses, taxes, interest, brokerage fees, expenses of shareholder meetings, litigation and indemnification, and extraordinary expenses) to the extent such expenses exceed, on an annual basis, a percentage rate of the average daily net assets of each Fund. Such Total Annual Operating Expense reimbursements, if any,
90
GOLDMAN SACHS STRATEGIC MULTI-ASSET CLASS FUNDS
|
|
| 5. AGREEMENTS AND AFFILIATED TRANSACTIONS (continued) |
are accrued daily and paid monthly. In addition, the Funds are not obligated to reimburse GSAM for prior fiscal year expense reimbursements, if any. The Total Annual Operating Expense limitations as an annual percentage rate of average daily net assets for the Multi-Manager Global Equity Fund, Multi-Manager Non-Core Fixed Income Fund and Multi-Manager Real Assets Strategy Fund are 0.75%, 0.70%, and 0.90% respectively. In addition, GSAM has agreed to reduce or limit certain “Other Expenses” of the Multi-Manager Global Equity Fund (excluding acquired fund fees and expenses, transfer agency fees and expenses, service fees, taxes, interest, brokerage fees, expenses of shareholder meetings, litigation and indemnification, and extraordinary expenses) to 0.10% of its average daily net assets. The Total Annual Operating Expenses and Other Expense limitations will remain in place through at least February 28, 2023, and prior to such date GSAM may not terminate the arrangements without the approval of the Trustees. In addition, the Funds have entered into certain offset arrangements with the transfer agent, which may result in a reduction of the Funds’ expenses and are received irrespective of the application of the “Other Expense” limitations described above.
For the fiscal year ended October 31, 2022, these expense reductions, including any fee waivers and Other Expense reimbursements, were as follows:
| | | | | | | | | | | | | | | | | | | | |
| | | | | |
| Fund | | Management
Fee Waiver | | | | | | Other
Expense
Reimbursements | | | | | | Total
Expense
Reductions | |
| |
| | | | | |
Multi-Manager Global Equity | | | $2,716,341 | | | | | | | | $1,413,285 | | | | | | | | $4,129,626 | |
| |
| | | | | |
Multi-Manager Non-Core Fixed Income | | | 5,629,227 | | | | | | | | — | | | | | | | | 5,629,227 | |
| |
| | | | | |
Multi-Manager Real Assets Strategy | | | 2,535,532 | | | | | | | | — | | | | | | | | 2,535,532 | |
| |
D. Line of Credit Facility — As of October 31, 2022, the Funds participated in a $1,250,000,000 committed, unsecured revolving line of credit facility (the “facility”) together with other funds of the Trust and certain registered investment companies having management agreements with GSAM or its affiliates. This facility is to be used for temporary emergency purposes, or to allow for an orderly liquidation of securities to meet redemption requests. The interest rate on borrowings is based on the federal funds rate. The facility also requires a fee to be paid by the Funds based on the amount of the commitment that has not been utilized. For the fiscal year ended October 31, 2022, the Funds did not have any borrowings under the facility. Prior to April 22, 2022, the facility was $1,000,000,000.
E. Other Transactions with Affiliates — For the fiscal year ended October 31, 2022, Goldman Sachs earned $206 and $2,068 in brokerage commissions from portfolio transactions, including futures transactions executed with Goldman Sachs as the Futures Commission Merchant, on behalf of the Multi-Manager Global Equity Fund, Multi-Manager Non-Core Fixed Income Fund and Multi-Manager Real Assets Strategy Fund, respectively.
The following table provides information about the Funds’ investments in the Goldman Sachs Financial Square Government Fund as of and for the fiscal year ended October 31, 2022:
| | | | | | | | | | | | | | | | | | | | | | | | | | |
| Fund | | Underlying Fund | | Market Value as of
October 31,
2021 | | | Purchases
at Cost | | | Proceeds
from Sales | | | Market
Value as of
October 31,
2022 | | | Shares as of
October 31,
2022 | | | Dividend
Income | |
| |
| | | | | | | |
Multi-Manager Global Equity | | Goldman Sachs Financial
Square Government Fund —Class R6 | | $ | 21,160,598 | | | $ | 87,803,555 | | | $ | (95,742,243 | ) | | $ | 13,221,910 | | | | 13,221,910 | | | $ | 116,623 | |
| |
| | | | | | | |
| | Goldman Sachs Financial
Square Government Fund —
Institutional Shares | | | 12,999,041 | | | | 318,506,336 | | | | (316,602,763 | ) | | | 14,902,614 | | | | 14,902,614 | | | | 164,191 | |
| |
91
|
| GOLDMAN SACHS STRATEGIC MULTI-ASSET CLASS FUNDS |
Notes to Financial Statements (continued)
October 31, 2022
|
|
| 5. AGREEMENTS AND AFFILIATED TRANSACTIONS (continued) |
| | | | | | | | | | | | | | | | | | | | | | | | | | |
| | | | | | | | | | | | | | Market | | | | | | | |
| | | | | | | |
| | | | | Market Value as of | | | | | | | | | Value as of | | | Shares as of | | | | |
| | | | | | | |
| | | | | October 31, | | | Purchases | | | Proceeds | | | October 31, | | | October 31, | | | Dividend | |
| | | | | | | |
| Fund | | Underlying Fund | | 2021 | | | at Cost | | | from Sales | | | 2022 | | | 2022 | | | Income | |
| |
| | | | | | | |
Multi-Manager Non-Core | | Goldman Sachs Financial | | | | | | | | | | | | | | | | | | | | | | | | |
Fixed Income | | Square Government Fund
— Institutional Shares | | | $131,055,477 | | | $ | 1,010,160,060 | | | $ | (1,099,639,013 | ) | | $ | 41,576,524 | | | | 41,576,524 | | | $ | 573,304 | |
| |
| | | | | | | |
Multi-Manager Real | | Goldman Sachs Financial | | | | | | | | | | | | | | | | | | | | | | | | |
Assets Strategy | | Square Government Fund
— Institutional Shares | | | 12,166,287 | | | | 278,187,091 | | | | (282,543,209 | ) | | | 7,810,169 | | | | 7,810,169 | | | | 125,438 | |
| |
|
|
| 6. PORTFOLIO SECURITIES TRANSACTIONS |
The cost of purchases and proceeds from sales and maturities of long-term securities for the fiscal year ended October 31, 2022, were as follows:
| | | | | | | | | | | | | | | | |
| | | | | | Purchases | | | | | | | |
| | | | |
| | | Purchases of | | | Excluding | | | Sales of | | | Sales Excluding | |
| | | | |
| | | Government | | | Government | | | Government | | | Government | |
| | | | |
| Fund | | Securities | | | Securities | | | Securities | | | Securities | |
| |
| | | | |
Multi-Manager Global Equity | | $ | — | | | $ | 359,221,677 | | | $ | — | | | $ | 394,090,372 | |
| |
| | | | |
Multi-Manager Non-Core Fixed Income | | | 13,995,792 | | | | 869,182,544 | | | | 25,390,518 | | | | 1,011,190,250 | |
| |
| | | | |
Multi-Manager Real Assets Strategy | | | — | | | | 546,230,649 | | | | — | | | | 747,241,459 | |
| |
The tax character of distributions paid during the for the fiscal year ended October 31, 2022 was as follows:
| | | | | | | | | | | | |
| | | | | | Multi-Manager | | | Multi-Manager | |
| | | |
| | | Multi-Manager | | | Non-Core | | | Real Assets | |
| | | |
| | | Global Equity | | | Fixed Income | | | Strategy | |
| |
| | | |
Distributions paid from: | | | | | | | | | | | | |
| | | |
Ordinary income | | $ | 65,041,708 | | | $ | 35,392,743 | | | $ | 24,023,817 | |
| | | |
Net long-term capital gains | | | 62,671,495 | | | | — | | | | 13,091,498 | |
| |
| | | |
Total taxable distributions | | $ | 127,713,203 | | | $ | 35,392,743 | | | $ | 37,115,315 | |
| |
| | | |
Tax return of capital | | $ | — | | | $ | 30,807,327 | | | $ | — | |
| |
The tax character of distributions paid during the fiscal year ended October 31, 2021 was as follows:
| | | | | | | | | | | | |
| | | | | | Multi-Manager | | | Multi-Manager | |
| | | |
| | | Multi-Manager | | | Non-Core | | | Real Assets | |
| | | |
| | | Global Equity | | | Fixed Income | | | Strategy | |
| |
| | | |
Distributions paid from: | | | | | | | | | | | | |
| | | |
Ordinary income | | $ | 4,360,815 | | | $ | 49,948,317 | | | $ | 7,892,296 | |
| | | |
Net long-term capital gains | | | 6,837,290 | | | | — | | | | — | |
|
| |
| | | |
Total taxable distributions | | $ | 11,198,105 | | | $ | 49,948,317 | | | $ | 7,892,296 | |
|
| |
| | | |
Tax return of capital | | $ | — | | | $ | 3,326,163 | | | $ | — | |
| |
92
GOLDMAN SACHS STRATEGIC MULTI-ASSET CLASS FUNDS
|
|
| 7. TAX INFORMATION (continued) |
As of the Funds’ most recent fiscal year end, October 31, 2022, the Funds’ capital loss carryforwards and certain timing differences on a tax basis were as follows:
| | | | | | | | | | | | |
| | | |
| | | Multi-Manager Global Equity | | | Multi-Manager Non-Core Fixed Income | | | Multi-Manager Real Assets Strategy | |
| |
| | | |
Undistributed ordinary income — net | | $ | 15,869,607 | | | $ | — | | | $ | 3,174,048 | |
| | | |
Undistributed long-term capital gains | | | 22,312,840 | | | | — | | | | 20,177,684 | |
| |
| | | |
Total Undistributed Earnings | | $ | 38,182,447 | | | $ | — | | | $ | 23,351,732 | |
| |
| | | |
Capital loss carryforwards: | | | | | | | | | | | | |
| | | |
Perpetual Short-Term | | | — | | | | (69,091,413) | | | | — | |
| | | |
Perpetual Long-Term | | | — | | | | (29,990,550) | | | | — | |
| |
| | | |
Total capital loss carryforwards | | | — | | | | (99,081,963) | | | | — | |
| |
| | | |
Timing differences(Straddle Loss Deferral/Dividend Payable) | | $ | (49) | | | $ | (1,635,568) | | | $ | — | |
| | | |
Unrealized gains (loss) — net | | | (16,420,955) | | | | (164,866,128) | | | | (23,321,668) | |
| |
| | | |
Total accumulated earnings (loss) net | | $ | 21,761,443 | | | $ | (265,583,659) | | | $ | 30,064 | |
| |
As of October 31, 2022, the Funds’ aggregate security unrealized gains and losses based on cost for U.S. federal income tax purposes were as follows:
| | | | | | | | | | | | |
| | | |
| | | | | | Multi-Manager | | | Multi-Manager | |
| | | |
| | | Multi-Manager | | | Non-Core | | | Real Assets | |
| | | |
| | | Global Equity | | | Fixed Income | | | Strategy | |
| |
| | | |
Tax Cost | | $ | 401,363,123 | | | $ | 1,135,242,795 | | | $ | 426,242,388 | |
| |
| | | |
Gross unrealized gain | | | 36,260,778 | | | | 6,045,179 | | | | 33,413,843 | |
| | | |
Gross unrealized loss | | | (52,681,733) | | | | (170,911,307) | | | | (56,735,511) | |
| |
| | | |
Net unrealized loss on securities | | $ | (16,420,955) | | | $ | (164,866,128) | | | $ | (23,321,668) | |
| |
The difference between GAAP-basis and tax basis unrealized gains (losses) is attributable primarily to wash sales, net mark to market gains (losses) on regulated futures, net mark to market gains (losses) on foreign currency contracts, and differences in the tax treatment of swap transactions, material modification of debt securities, market discount accretion and premium amortization, passive foreign investment company investments.
GSAM has reviewed the Funds’ tax positions for all open tax years (the current and prior three years, as applicable) and has concluded that no provision for income tax is required in the Funds’ financial statements. Such open tax years remain subject to examination and adjustment by tax authorities.
The Funds’ risks include, but are not limited to, the following:
Derivatives Risk — The Funds’ use of derivatives and other similar instruments (together, referred to in this paragraph as “derivatives”) may result in loss, including due to adverse market movements. Derivatives, which may pose risks in addition to and greater than those associated with investing directly in securities, currencies or other instruments, may be illiquid or less liquid, volatile, difficult to price and leveraged so that small changes in the value of the underlying instruments may produce disproportionate losses to the Funds. Changes in the value of a derivative may also create margin delivery or settlement payment obligations for the Funds. Derivatives are also subject to counterparty risk, which is the risk that the other party in the transaction
93
|
| GOLDMAN SACHS STRATEGIC MULTI-ASSET CLASS FUNDS |
Notes to Financial Statements (continued)
October 31, 2022
|
|
| 8. OTHER RISKS (continued) |
will not, or lacks the capacity or authority to, fulfill its contractual obligation. The use of derivatives is a highly specialized activity that involves investment techniques and risks different from those associated with investments in more traditional securities and instruments. The use of derivatives is also subject to operational and legal risks. Operational risks refer to risks related to potential operational issues, including documentation issues, settlement issues, system failures, inadequate controls, and human error. Legal risks refer to the risks of loss resulting from insufficient documentation, or legality or enforceability of a contract. Losses from derivatives can also result from a lack of correlation between changes in the value of derivative instruments and the portfolio assets (if any) being hedged.
Dividend-Paying Investments Risk — A Fund’s investments in dividend-paying securities could cause a Fund to underperform other funds. Securities that pay dividends, as a group, can fall out of favor with the market, causing such securities to underperform securities that do not pay dividends. Depending upon market conditions and political and legislative responses to such conditions, dividend-paying securities that meet a Fund’s investment criteria may not be widely available and/or may be highly concentrated in only a few market sectors. In addition, issuers that have paid regular dividends or distributions to shareholders may not continue to do so at the same level or at all in the future. This may limit the ability of a Fund to produce current income.
Floating and Variable Rate Obligations Risk — Floating rate and variable rate obligations are debt instruments issued by companies or other entities with interest rates that reset periodically (typically daily, monthly, quarterly, or semiannually) in response to changes in the market rate of interest on which the interest rate is based. Such market rates are generally the Secured Overnight Financing Rate, London Interbank Offered Rate (“LIBOR”), the Prime Rate of a designated U.S. bank, the Federal Funds Rate, or another base lending rate used by commercial lenders. For floating and variable rate obligations, there may be a lag between an actual change in the underlying interest rate benchmark and the reset time for an interest payment of such an obligation, which could harm or benefit the Fund, depending on the interest rate environment or other circumstances. In a rising interest rate environment, for example, a floating or variable rate obligation that does not reset immediately would prevent the Fund from taking full advantage of rising interest rates in a timely manner. However, in a declining interest rate environment, the Fund may benefit from a lag due to an obligation’s interest rate payment not being immediately impacted by a decline in interest rates.
At the end of 2021, certain LIBORs were discontinued, but the most widely used LIBORs may continue to be provided on a representative basis until June 2023. The unavailability or replacement of LIBOR may affect the value, liquidity or return on certain Fund investments and may result in costs incurred in connection with closing out positions and entering into new trades. Any pricing adjustments to a Fund’s investments resulting from a substitute reference rate may also adversely affect the Fund’s performance and/or NAV.
Foreign and Emerging Countries Risk — Investing in foreign markets may involve special risks and considerations not typically associated with investing in the U.S. Foreign securities may be subject to risk of loss because of more or less foreign government regulation; less public information; less stringent investor protections; less stringent accounting, corporate governance, financial reporting and disclosure standards; and less economic, political and social stability in the countries in which a Fund invests. The imposition of sanctions, exchange controls (including repatriation restrictions), confiscation of assets and property, trade restrictions (including tariffs) and other government restrictions by the U.S. or other governments, or from problems in share registration, settlement or custody, may also result in losses. The type and severity of sanctions and other similar measures, including counter sanctions and other retaliatory actions, that may be imposed could vary broadly in scope, and their impact is impossible to predict. For example, the imposition of sanctions and other similar measures could, among other things, cause a decline in the value and/or liquidity of securities issued by the sanctioned country or companies located in or economically tied to the sanctioned country and increase market volatility and disruption in the sanctioned country and throughout the world. Sanctions and other similar measures could limit or prevent a Fund from buying and selling securities (in the sanctioned country and other markets), significantly delay or prevent the settlement of securities transactions, and significantly impact a Fund’s liquidity and performance. Foreign risk also involves the risk of negative foreign currency exchange rate fluctuations, which may cause the value of securities denominated in such foreign currency (or other instruments through which a Fund has exposure to foreign currencies) to decline in value. Currency exchange rates may fluctuate significantly over short periods of time. To the extent that a Fund also invests in securities of issuers located in, or economically tied to, emerging markets, these risks may be more pronounced.
94
GOLDMAN SACHS STRATEGIC MULTI-ASSET CLASS FUNDS
|
|
| 8. OTHER RISKS (continued) |
Foreign Custody Risk — The Fund invests in foreign securities, and as such the Fund may hold such securities and cash with foreign banks, agents, and securities depositories appointed by the Fund’s custodian (each a “Foreign Custodian”). Some foreign custodians may be recently organized or new to the foreign custody business. In some countries, Foreign Custodians may be subject to little or no regulatory oversight over, or independent evaluation of, their operations. Further, the laws of certain countries may place limitations on the Fund’s ability to recover its assets if a Foreign Custodian enters bankruptcy. Investments in emerging markets may be subject to even greater custody risks than investments in more developed markets. Custody services in emerging market countries are very often undeveloped and may be considerably less well regulated than in more developed countries, and thus may not afford the same level of investor protection as would apply in developed countries.
Industry Concentration Risk — Concentrating Fund investments in a limited number of issuers conducting business in the same industry or group of industries will subject the Fund to a greater risk of loss as a result of adverse economic, business, political, environmental or other developments than if its investments were diversified across different industries.
Interest Rate Risk — When interest rates increase, fixed income securities or instruments held by a Fund will generally decline in value. The Fund may face a heightened level of interest rate risk in connection with the type and extent of certain monetary policy changes made by the Federal Reserve, such as target interest rate changes. Long-term fixed income securities or instruments will normally have more price volatility because of this risk than short-term fixed income securities or instruments. A wide variety of market factors can cause interest rates to rise, including central bank monetary policy, rising inflation and changes in general economic conditions. The risks associated with changing interest rates may have unpredictable effects on the markets and a Fund’s investments. Fluctuations in interest rates may also affect the liquidity of fixed income securities and instruments held by the Funds. A sudden or unpredictable increase in interest rates may cause volatility in the market and may decrease the liquidity of the Fund’s investments, which would make it harder for the Fund to sell its investments at an advantageous time.
Investments in Other Investment Companies Risk — As a shareholder of another investment company, including an exchange-traded fund (“ETF”), a Fund will indirectly bear its proportionate share of any net management fees and other expenses paid by such other investment companies, in addition to the fees and expenses regularly borne by the Fund. ETFs are subject to risks that do not apply to conventional mutual funds, including but not limited to the following: (i) the market price of the ETF’s shares may trade at a premium or a discount to their NAV; and (ii) an active trading market for an ETF’s shares may not develop or be maintained.
Large Shareholder Transactions Risk — A Fund may experience adverse effects when certain large shareholders, such as other funds, institutional investors (including those trading by use of non-discretionary mathematical formulas), financial intermediaries (who may make investment decisions on behalf of underlying clients and/or include a Fund in their investment model), individuals, accounts and Goldman Sachs affiliates, purchase or redeem large amounts of shares of a Fund. Such large shareholder redemptions, which may occur rapidly or unexpectedly, may cause a Fund to sell portfolio securities at times when it would not otherwise do so, which may negatively impact a Fund’s NAV and liquidity. These transactions may also accelerate the realization of taxable income to shareholders if such sales of investments resulted in gains, and may also increase transaction costs. In addition, a large redemption could result in a Fund’s current expenses being allocated over a smaller asset base, leading to an increase in the Fund’s expense ratio. Similarly, large Fund share purchases may adversely affect a Fund’s performance to the extent that the Fund is delayed in investing new cash or otherwise maintains a larger cash position than it ordinarily would.
Liquidity Risk — A Fund may make investments that are illiquid or that may become less liquid in response to market developments or adverse investor perceptions. Illiquid investments may be more difficult to value. Liquidity risk may also refer to the risk that a Fund will not be able to pay redemption proceeds within the allowable time period or without significant dilution to remaining investors’ interests because of unusual market conditions, an unusually high volume of redemption requests, or other reasons. To meet redemption requests, a Fund may be forced to sell investments at an unfavorable time and/or under unfavorable conditions. If a Fund is forced to sell securities at an unfavorable time and/or under unfavorable conditions, such sales may adversely affect Fund’s NAV and dilute remaining investors’ interests. Liquidity risk may be the result of, among other things, the reduced number and capacity of traditional market participants to make a market in fixed income securities or the lack of an active market. The potential for liquidity risk may be magnified by a rising interest rate environment or other circumstances where
95
|
| GOLDMAN SACHS STRATEGIC MULTI-ASSET CLASS FUNDS |
Notes to Financial Statements (continued)
October 31, 2022
|
|
| 8. OTHER RISKS (continued) |
investor redemptions from fixed income funds may be higher than normal, potentially causing increased supply in the market due to selling activity. These risks may be more pronounced in connection with the Funds’ investments in securities of issuers located in emerging market countries. Redemptions by large shareholders may have a negative impact on a Fund’s liquidity.
Loan-Related Investments Risk — In addition to risks generally associated with debt investments (e.g., interest rate risk and default risk), loan-related investments such as loan participations and assignments are subject to other risks. Although a loan obligation may be fully collateralized at the time of acquisition, the collateral may decline in value, or become illiquid or less liquid, or lose all or substantially all of its value subsequent to investment. Many loan investments are subject to legal or contractual restrictions on resale and certain loan investments may be or become illiquid or less liquid and more difficult to value, particularly in the event of a downgrade of the loan or the borrower. There is less readily available, reliable information about most loan investments than is the case for many other types of securities. Substantial increases in interest rates may cause an increase in loan obligation defaults. With respect to loan participations, the Fund may not always have direct recourse against a borrower if the borrower fails to pay scheduled principal and/or interest; may be subject to greater delays, expenses and risks than if the Fund had purchased a direct obligation of the borrower; and may be regarded as the creditor of the agent lender (rather than the borrower), subjecting the Fund to the creditworthiness of that lender as well. Investors in loans, such as the Fund, may not be entitled to rely on the anti-fraud protections of the federal securities laws, although they may be entitled to certain contractual remedies. The market for loan obligations may be subject to irregular trading activity, wide bid/ask spreads and extended trade settlement periods. Because transactions in many loans are subject to extended trade settlement periods, the Fund may not receive the proceeds from the sale of a loan for a period after the sale. As a result, sale proceeds related to the sale of loans may not be available to make additional investments or to meet the Fund’s redemption obligations for a period after the sale of the loans, and, as a result, the Fund may have to sell other investments or engage in borrowing transactions, such as borrowing from its credit facility, if necessary to raise cash to meet its obligations.
Senior Loans hold the most senior position in the capital structure of a business entity, and are typically secured with specific collateral, but are nevertheless usually rated below investment grade. Because Second Lien Loans are subordinated or unsecured and thus lower in priority of payment to Senior Loans, they are subject to the additional risk that the cash flow of the borrower and property securing the loan or debt, if any, may be insufficient to meet scheduled payments after giving effect to the senior secured obligations of the borrower. Second Lien Loans generally have greater price volatility than Senior Loans and may be less liquid.
Market and Credit Risks — In the normal course of business, a Fund trades financial instruments and enters into financial transactions where risk of potential loss exists due to changes in the market (market risk). The value of the securities in which a Fund invests may go up or down in response to the prospects of individual companies, particular sectors or governments and/or general economic conditions throughout the world due to increasingly interconnected global economies and financial markets. Events such as war, acts of terrorism, social unrest, natural disasters, the spread of infectious illness or other public health threats could also significantly impact a Fund and its investments. Additionally, a Fund may also be exposed to credit risk in the event that an issuer or guarantor fails to perform or that an institution or entity with which the Fund has unsettled or open transactions defaults.
Multi-Manager Approach Risk — The Funds’ performance depends on the ability of the Investment Adviser in selecting, overseeing, and allocating Fund assets to the Underlying Managers. The Underlying Managers’ investment styles may not always be complementary. The Funds’ multi-manager approach may result in the Fund investing a significant percentage of its assets in certain types of investments, which could be beneficial or detrimental to the Funds’ performance depending on the performance of those investments and the overall market environment. The Funds’ Underlying Managers may underperform the market generally or underperform other investment managers that could have been selected for the Funds. Because the Funds’ Underlying Managers may trade with counterparties, prime brokers, clearing brokers or futures commission merchants on terms that are different than those on which the Investment Adviser would trade, and because each Underlying Manager applies its own risk analysis in evaluating potential counterparties for the Funds, the Funds may be subject to greater counterparty risk than if they were managed directly by the Investment Adviser.
96
GOLDMAN SACHS STRATEGIC MULTI-ASSET CLASS FUNDS
Under the Trust’s organizational documents, its Trustees, officers, employees and agents are indemnified, to the extent permitted by the Act and state law, against certain liabilities that may arise out of performance of their duties to the Funds. Additionally, in the course of business, the Funds enter into contracts that contain a variety of indemnification clauses. The Funds maximum exposure under these arrangements is unknown, as this would involve future claims that may be made against the Funds that have not yet occurred. However, GSAM believes the risk of loss under these arrangements to be remote.
Subsequent events after the Statements of Assets and Liabilities date have been evaluated, and GSAM has concluded that there is no impact requiring adjustment or disclosure in the financial statements.
In late February 2022, Russia began an invasion of Ukraine. Following such invasion, the United States, the European Union, and other countries and entities imposed wide-ranging sanctions on Russia and related entities. Certain Funds have limited market value in Russian and Ukrainian securities, which are being valued to reflect the limited liquidity and transferability in the current environment. With the closure of local Russian markets and imposition of sanctions in late February and early March, there are currently limited portfolio management actions possible as many of these assets are either sanctioned and/or cannot be transferred or settled. These sanctions and current environment could impair the ability of these Funds to buy, sell, hold, receive, deliver or otherwise transact in certain securities and other instruments. The full impact of the sanctions and the conflict on these Funds, the financial markets and the global economy is not yet known. Management is continuing to monitor these developments and evaluate other impacts they may have on these Funds.
|
|
| 12. SUMMARY OF SHARE TRANSACTIONS |
Share activity is as follows:
| | | | | | | | | | | | | | | | |
| | | Multi-Manager Global Equity Fund | |
| | | For the Fiscal Year Ended | | | For the Fiscal Year Ended | |
| | | October 31, 2022 | | | October 31, 2021 | |
| | | | |
| | | Shares | | | Dollars | | | Shares | | | Dollars | |
| | | | |
Class R6 Shares | | | | | | | | | | | | | | | | |
| | | | |
Shares sold | | | 7,042,360 | | | $ | 66,510,000 | | | | 1,915,368 | | | $ | 27,650,000 | |
| | | | |
Reinvestment of distributions | | | 11,242,054 | | | | 127,713,203 | | | | 926,961 | | | | 11,198,105 | |
| | | | |
Shares redeemed | | | (12,609,091 | ) | | | (129,359,280 | ) | | | (17,114,617 | ) | | | (226,639,947 | ) |
| |
NET INCREASE (DECREASE) | | | 5,675,323 | | | $ | 64,863,923 | | | | (14,272,288 | ) | | $ | (187,791,842 | ) |
| |
| | | | | | | | | | | | | | | | |
| | | Multi-Manager Non-Core Fixed Income Fund | |
| | | For the Fiscal Year Ended | | | For the Fiscal Year Ended | |
| | | October 31, 2022 | | | October 31, 2021 | |
| | | | |
| | | Shares | | | Dollars | | | Shares | | | Dollars | |
| | | | |
Class R6 Shares | | | | | | | | | | | | | | | | |
| | | | |
Shares sold | | | 15,306,628 | | | $ | 121,791,000 | | | | 73,449,726 | | | $ | 664,383,000 | |
| | | | |
Reinvestment of distributions | | | 8,400,275 | | | | 66,188,753 | | | | 5,845,623 | | | | 53,171,912 | |
| | | | |
Shares redeemed | | | (45,428,653 | ) | | | (357,134,496 | ) | | | (27,333,492 | ) | | | (248,296,288 | ) |
| |
NET INCREASE (DECREASE) | | | (21,721,750 | ) | | $ | (169,154,743 | ) | | | 51,961,857 | | | $ | 469,258,624 | |
| |
97
|
| GOLDMAN SACHS STRATEGIC MULTI-ASSET CLASS FUNDS |
Notes to Financial Statements (continued)
October 31, 2022
|
|
| 12. SUMMARY OF SHARE TRANSACTIONS (continued) |
| | | | | | | | | | | | | | | | |
| | | Multi-Manager Real Assets Strategy Fund | |
| | | For the Fiscal Year Ended | | | For the Fiscal Year Ended | |
| | | October 31, 2022 | | | October 31, 2021 | |
| | | | |
| | | Shares | | | Dollars | | | Shares | | | Dollars | |
| | | | |
Class R6 Shares | | | | | | | | | | | | | | | | |
| | | | |
Shares sold | | | 9,498,167 | | | $ | 97,110,000 | | | | 21,161,423 | | | $ | 229,310,000 | |
| | | | |
Reinvestment of distributions | | | 3,236,155 | | | | 37,115,315 | | | | 807,809 | | | | 7,892,296 | |
| | | | |
Shares redeemed | | | (28,693,770 | ) | | | (312,175,941 | ) | | | (11,109,422 | ) | | | (121,265,768 | ) |
| |
NET INCREASE (DECREASE) | | | (15,959,448 | ) | | $ | (177,950,626 | ) | | | 10,859,810 | | | $ | 115,936,528 | |
| |
98
Report of Independent Registered Public
Accounting Firm
To the Board of Trustees of Goldman Sachs Trust II and Shareholders of Goldman Sachs Multi-Manager Global Equity Fund, Goldman Sachs Multi-Manager Non-Core Fixed Income Fund, and Goldman Sachs Multi-Manager Real Assets Strategy Fund
Opinions on the Financial Statements
We have audited the accompanying statements of assets and liabilities, including the schedules of investments, of Goldman Sachs Multi-Manager Global Equity Fund, Goldman Sachs Multi-Manager Non-Core Fixed Income Fund, and Goldman Sachs Multi-Manager Real Assets Strategy Fund (three of the funds constituting Goldman Sachs Trust II, hereafter collectively referred to as the “Funds”) as of October 31, 2022, the related statements of operations for the year ended October 31, 2022, the statements of changes in net assets for each of the two years in the period ended October 31, 2022, including the related notes, and the financial highlights for each of the five years in the period ended October 31, 2022 (collectively referred to as the “financial statements”). In our opinion, the financial statements present fairly, in all material respects, the financial position of each of the Funds as of October 31, 2022, the results of each of their operations for the year then ended, the changes in each of their net assets for each of the two years in the period ended October 31, 2022 and each of the financial highlights for each of the five years in the period ended October 31, 2022 in conformity with accounting principles generally accepted in the United States of America.
Basis for Opinions
These financial statements are the responsibility of the Funds’ management. Our responsibility is to express an opinion on the Funds’ financial statements based on our audits. We are a public accounting firm registered with the Public Company Accounting Oversight Board (United States) (PCAOB) and are required to be independent with respect to the Funds in accordance with the U.S. federal securities laws and the applicable rules and regulations of the Securities and Exchange Commission and the PCAOB.
We conducted our audits of these financial statements in accordance with the standards of the PCAOB. Those standards require that we plan and perform the audit to obtain reasonable assurance about whether the financial statements are free of material misstatement, whether due to error or fraud.
Our audits included performing procedures to assess the risks of material misstatement of the financial statements, whether due to error or fraud, and performing procedures that respond to those risks. Such procedures included examining, on a test basis, evidence regarding the amounts and disclosures in the financial statements. Our audits also included evaluating the accounting principles used and significant estimates made by management, as well as evaluating the overall presentation of the financial statements. Our procedures included confirmation of securities owned as of October 31, 2022 by correspondence with the custodian, transfer agent and brokers; when replies were not received from brokers, we performed other auditing procedures. We believe that our audits provide a reasonable basis for our opinions.
/s/ PricewaterhouseCoopers LLP
Boston, Massachusetts
December 23, 2022
We have served as the auditor of one or more investment companies in the Goldman Sachs fund complex since 2000.
99
GOLDMAN SACHS STRATEGIC MULTI-ASSET CLASS FUNDS
Fund Expenses — Six Month Period Ended October 31, 2022 (Unaudited)
As a shareholder of Class R6 Shares of a Fund, you incur two types of costs: (1) transaction costs, including sales charges on purchase payments, and (2) ongoing costs, including management fees and other Fund expenses. This example is intended to help you understand your ongoing costs (in dollars) of investing in the Funds and to compare these costs with the ongoing costs of investing in other mutual funds.
The example is based on an investment of $1,000 invested at the beginning of the period and held for the entire period from May 01, 2022 through October 31, 2022, which represents a period of 184 days of a 365-day year. This projection assumes that annualized expense ratios were in effect during the period.
Actual Expenses — The first line under each share class in the table below provides information about actual account values and actual expenses. You may use the information in this line, together with the amount you invested, to estimate the expenses that you paid over the period. Simply divide your account value by $1,000 (for example, an $8,600 account value divided by $1,000=8.6), then multiply the result by the number in the first line under the heading entitled “Expenses Paid” to estimate the expenses you paid on your account during this period.
Hypothetical Example for Comparison Purposes — The second line under each share class in the table below provides information about hypothetical account values and hypothetical expenses based on the Funds’ actual net expense ratios and an assumed rate of return of 5% per year before expenses, which is not the Funds’ actual return. The hypothetical account values and expenses may not be used to estimate the actual ending account balance or expenses you paid for the period. You may use this information to compare the ongoing costs of investing in the Funds and other funds. To do so, compare this 5% hypothetical example with the 5% hypothetical examples that appear in the shareholder reports of the other funds.
Please note that the expenses shown in the table are meant to highlight your ongoing costs only and do not reflect any transactional costs, such as sales charges, redemption fees, or exchange fees. Therefore, the second line of the table is useful in comparing ongoing costs only, and will not help you determine the relative total costs of owning different funds. In addition, if these transactional costs were included, your costs would have been higher.
| | | | | | | | | | | | | | | | | | | | | | | | | | | | | | | | | | | | |
| | | Multi-Manager Global Equity Fund | | | Multi-Manager Non-Core Fixed Income Fund | | | Multi-Manager Real Assets Strategy Fund | |
| | | Beginning | | | Ending | | | Expenses | | | Beginning | | | Ending | | | Expenses | | | Beginning | | | Ending | | | Expenses | |
| | | Account | | | Account | | | Paid for the | | | Account | | | Account | | | Paid for the | | | Account | | | Account | | | Paid for the | |
| | | Value | | | Value | | | 6 months ended | | | Value | | | Value | | | 6 months ended | | | Value | | | Value | | | 6 months ended | |
| Share Class | | 5/1/22 | | | 10/31/22 | | | 10/31/22* | | | 5/1/22 | | | 10/31/22 | | | 10/31/22* | | | 5/1/22 | | | 10/31/22 | | | 10/31/22* | |
Class R6 | | | | | | | | | | | | | | | | | | | | | | | | | | | | | | | | | | | | |
Actual | | | $1,000.00 | | | | $ 920.00 | | | | $2.61 | | | | $1,000.00 | | | | $ 926.20 | | | | $2.80 | | | | $1,000.00 | | | | $ 823.40 | | | | $3.77 | |
Hypothetical 5% return | | | 1,000.00 | | | | 1,022.50 | + | | | 2.75 | | | | 1,000.00 | | | | 1,022.30 | + | | | 2.94 | | | | 1,000.00 | | | | 1,021.10 | + | | | 4.18 | |
| | * | Expenses for each share class are calculated using each Fund’s annualized net expense ratio for each class, which represents the ongoing expenses as a percentage of net assets for the six months ended October 31, 2022. Expenses are calculated by multiplying the annualized net expense ratio by the average account value for the period; then multiplying the result by the number of days in the most recent fiscal half year; and then dividing that result by the number of days in the fiscal year. The annualized net expense ratios for the period were as follows: | |
| | | | | | |
| Fund | | Class R6 | | | |
Multi-Manager Global Equity | | | 0.54 | % |
Multi-Manager Non-Core Fixed Income | | | 0.58 | |
Multi-Manager Real Assets Strategy | | | 0.82 | |
| | + | Hypothetical expenses are based on the Fund’s actual annualized net expenses ratios and an assumed rate of return of 5% per year before expenses. | |
100
GOLDMAN SACHS STRATEGIC MULTI-ASSET CLASS FUNDS
Statement Regarding Basis for Approval of Management Agreement and Sub-Advisory Agreements (Unaudited)
Background
The Goldman Sachs Multi-Manager Global Equity Fund, Goldman Sachs Multi-Manager Non-Core Fixed Income Fund, and Goldman Sachs Multi-Manager Real Assets Strategy Fund (the “Funds”) are investment portfolios of Goldman Sachs Trust II (the “Trust”). The Board of Trustees (the “Board”) oversees the management of the Trust and reviews the investment performance and expenses of the Funds at regularly scheduled meetings held throughout the year. Each Fund employs a “manager of managers” structure, whereby Goldman Sachs Asset Management, L.P. (the “Investment Adviser”) is responsible for selecting sub-advisers (subject to Board approval), allocating the Fund’s assets among them, and overseeing their day-to-day management of Fund assets. The Board determines annually whether to approve the continuance of the Trust’s investment management agreement (the “Management Agreement”) with the Investment Adviser on behalf of the Funds.
The Management Agreement was approved for continuation until June 30, 2023 at a meeting on June 9-10, 2022 and was most recently approved for continuation until September 30, 2023 at a meeting held on September 19-20, 2022 (together, the “Annual Meetings”) by the Board, including those Trustees who are not parties to the Management Agreement or “interested persons” (as defined in the Investment Company Act of 1940, as amended) of any party thereto (the “Independent Trustees”). At the Annual Meetings, the Board also considered the sub-advisory agreements (each a “Designated Sub-Advisory Agreement” and, together with the Management Agreement, the “Agreements”) between the Investment Adviser and (i) each of Axiom Investors LLC, Boston Partners Global Investors, Inc., Causeway Capital Management LLC, GW&K Investment Management, LLC, Massachusetts Financial Services Company (d/b/a MFS Investment Management), Principal Global Investors, LLC, Vaughan Nelson Investment Management, L.P., Vulcan Value Partners, LLC, WCM Investment Management, and Wellington Management Company LLP (on behalf of Goldman Sachs Multi-Manager Global Equity Fund); (ii) each of Ares Capital Management II LLC, BlueBay Asset Management LLP, Brigade Capital Management, LP, Marathon Asset Management, L.P., Nuveen Asset Management, LLC, River Canyon Fund Management LLC, RBC Global Asset Management (U.S.) Inc. and TCW Investment Management Company LLC (on behalf of Goldman Sachs Multi-Manager Non-Core Fixed Income Fund); and (iii) each of Cohen & Steers Capital Management, Inc., PGIM Real Estate, a business unit of PGIM, Inc., and RREEF America L.L.C. (on behalf of Goldman Sachs Multi-Manager Real Assets Strategy Fund) (each, a “Designated Sub-Adviser” and collectively, the “Designated Sub-Advisers”).
The review process undertaken by the Trustees spans the course of the year and culminates with the Annual Meetings. To assist the Trustees in their deliberations, the Trustees have established a Contract Review Committee (the “Committee”), comprised of the Independent Trustees. The Committee held five meetings over the course of the year since the Management Agreement was last approved. At those Committee meetings, regularly scheduled Board or other committee meetings, and/or the Annual Meetings, matters relevant to the renewal of the Management Agreement and the Designated Sub-Advisory Agreements were considered by the Board, or the Independent Trustees, as applicable. With respect to each Fund, such matters included:
| | (a) | the nature and quality of the advisory, administrative, and other services provided to the Fund by the Investment Adviser and its affiliates, and the Designated Sub-Advisers, including, as applicable, information about: |
| | (i) | the structure, staff, and capabilities of the Investment Adviser and the Designated Sub-Advisers and the Designated Sub-Advisers’ portfolio management teams; |
| | (ii) | the groups within the Investment Adviser and its affiliates that support the portfolio management teams or provide other types of necessary services, including fund services groups (e.g., accounting and financial reporting, tax, shareholder services, and operations); controls and risk management groups (e.g., legal, compliance, valuation oversight, credit risk management, internal audit, compliance testing, market risk analysis, finance, and central funding); sales and distribution support groups, and others (e.g., information technology and training); |
| | (iii) | trends in employee headcount; |
| | (iv) | the Investment Adviser’s financial resources and ability to hire and retain talented personnel and strengthen its operations; and |
| | (v) | the parent company’s support of the Investment Adviser and its mutual fund business, as expressed by the firm’s senior management; |
| | (b) | information on the investment performance of the Fund, including comparisons to the performance of similar mutual funds, as provided by a third-party mutual fund data provider engaged as part of the contract review process (the “Outside Data Provider”), benchmark performance indices, and, with respect to the Goldman Sachs Multi-Manager Global Equity Fund, commingled investment vehicles with comparable investment strategies managed by the Investment Adviser, and information on general investment outlooks in the markets in which the Fund invests; |
| | (c) | information provided by the Investment Adviser indicating the Investment Adviser’s views on whether the Fund’s peer group and/or benchmark index had high, medium, or low relevance given the Fund’s particular investment strategy; |
101
|
| GOLDMAN SACHS STRATEGIC MULTI-ASSET CLASS FUNDS |
Statement Regarding Basis for Approval of Management Agreement and Sub-Advisory Agreements (Unaudited) (continued)
| | (d) | the terms of the Agreements and other agreements with affiliated service providers entered into by the Trust on behalf of the Fund; |
| | (e) | fee and expense information for the Fund, including: |
| | (i) | the relative management fee and expense levels of the Fund as compared to those of comparable funds managed by other advisers, as provided by the Outside Data Provider; |
| | (ii) | the Fund’s expense trends over time; and |
| | (iii) | with respect to the Goldman Sachs Multi-Manager Global Equity Fund, comparative information on the advisory fees charged and services provided by the Investment Adviser to certain collective investment vehicles that it manages with comparable investment strategies; |
| | (f) | with respect to the extensive investment performance and expense comparison data provided by the Outside Data Provider, its processes in producing that data for the Fund; |
| | (g) | the undertakings of the Investment Adviser and its affiliates to implement fee waivers and expense limitations; |
| | (h) | information relating to the profitability of the Management Agreement and the transfer agency arrangements of the Fund to the Investment Adviser and its affiliates; |
| | (i) | whether the Fund’s existing management fee schedule adequately addressed any economies of scale; |
| | (j) | a summary of the “fall-out” benefits derived by the Investment Adviser and its affiliates from their relationships with the Fund, including the fees received by the Investment Adviser’s affiliates from the Fund for transfer agency, portfolio trading, distribution and other services; |
| | (k) | a summary of potential benefits derived by the Fund as a result of its relationship with the Investment Adviser; |
| | (l) | with respect to the Investment Adviser, portfolio manager ownership of Fund shares; the manner in which portfolio manager compensation is determined; information on the Designated Sub-Advisers’ compensation arrangements; and the number and types of accounts managed by the portfolio managers; |
| | (m) | the nature and quality of the services provided to the Fund by its unaffiliated service providers (as well as the Designated Sub-Advisers), and the Investment Adviser’s general oversight and evaluation (including reports on due diligence) of those service providers as part of the administrative services provided under the Management Agreement; and |
| | (n) | the Investment Adviser’s and Designated Sub-Advisers’ processes and policies addressing various types of potential conflicts of interest; their approaches to risk management; the annual review of the effectiveness of the Fund’s compliance program; and periodic compliance reports. |
The Trustees also received an overview of the Funds’ distribution arrangements. They received information regarding the Funds’ assets and share purchase and redemption activity. Information was also provided to the Trustees relating to revenue sharing payments made by and services provided by the Investment Adviser and its affiliates to intermediaries that promote the sale, distribution, and/or servicing of Fund shares.
The presentations made at the Board and Committee meetings and at the Annual Meetings encompassed the Funds and other mutual funds for which the Board has responsibility. In evaluating the Agreements at the Annual Meetings, the Trustees relied upon their knowledge, resulting from their meetings and other interactions throughout the year, of the Funds and the respective services of the Investment Adviser and its affiliates, and the Designated Sub-Advisers. In conjunction with these meetings, the Trustees received written materials and oral presentations on the topics covered, and the Investment Adviser addressed the questions and concerns of the Trustees, including concerns regarding the investment performance of certain of the funds they oversee. In addition, the Trustees periodically received written materials and oral presentations from the Funds’ various sub-advisers, including the Designated Sub-Advisers. The Independent Trustees were advised by their independent legal counsel regarding their responsibilities and other regulatory requirements related to the approval and continuation of mutual fund investment management agreements under applicable law. In addition, the Investment Adviser and its affiliates provided the Independent Trustees with a written response to a formal request for information sent on behalf of the Independent Trustees by their independent legal counsel. The Trustees reviewed a written response prepared by each Designated Sub-Adviser to a similar request for information submitted to the Designated Sub-Adviser by the Investment Adviser. During the course of their deliberations, the Independent Trustees met in executive sessions with their independent legal counsel, without representatives of the Investment Adviser or its affiliates present.
Nature, Extent, and Quality of the Services Provided Under the Management Agreements
As part of their review, the Trustees considered the nature, extent, and quality of the services provided to the Funds by the Investment Adviser. In this regard, the Trustees considered both the investment advisory services and non-advisory services that are provided by the Investment Adviser and its affiliates. The Trustees noted the transition in the leadership and the changes in
102
GOLDMAN SACHS STRATEGIC MULTI-ASSET CLASS FUNDS
Statement Regarding Basis for Approval of Management Agreement and Sub-Advisory Agreements (Unaudited) (continued)
personnel of various of the Investment Adviser’s portfolio management teams that had occurred in recent periods, and the ongoing recruitment efforts aimed at bringing high quality investment talent to the Investment Adviser. They also noted the Investment Adviser’s commitment to maintaining high quality systems and expending substantial resources to respond to ongoing changes to the market, regulatory and control environment in which the Funds and their service providers operate, including developments associated with the COVID-19 pandemic, geopolitical events, and economic sanctions, as well as the efforts of the Investment Adviser and its affiliates to combat cyber security risks. The Trustees also considered information regarding the Investment Adviser’s and the Funds’ various sub-advisers’ business continuity planning and remote operations capabilities. The Trustees concluded that the Investment Adviser continued to commit substantial financial and operational resources to the Funds and expressed confidence that the Investment Adviser would continue to do so in the future. The Trustees also recognized that the Investment Adviser had made significant commitments to address regulatory compliance requirements applicable to the Funds and the Investment Adviser and its affiliates. In addition, the Trustees reviewed the sub-adviser oversight process that the Investment Adviser had employed, which included areas such as investment analytics, risk management and compliance.
Investment Performance
The Trustees also considered the investment performance of the Funds. In this regard, they compared the investment performance of each Fund to its peers using rankings and ratings compiled by the Outside Data Provider as of December 31, 2021, and updated performance information prepared by the Investment Adviser as of March 31, 2022. The Trustees also reviewed each Fund’s investment performance relative to its performance benchmark. As part of this review, they considered the investment performance trends of the Funds over time, and reviewed the investment performance of each Fund in light of its investment objective and policies and market conditions. The Trustees considered the Investment Adviser’s representations that each Fund had significant differences from its Outside Data Provider peer group that caused it to be an imperfect basis for comparison. The Trustees also received information comparing the performance of the Goldman Sachs Multi-Manager Global Equity Fund to that of comparable unregistered funds managed by the Investment Adviser. They considered that the unregistered funds provide an imperfect performance comparison because they are not subject to the requirements of the Investment Company Act of 1940, as amended.
In addition, the Trustees considered materials prepared and presentations made by the Investment Adviser’s senior management and the Designated Sub-Advisers’ portfolio management personnel in which Fund performance was assessed. The Trustees also considered the Investment Adviser’s periodic reports with respect to the Funds’ risk profiles, and how the Investment Adviser’s approach to risk monitoring and management influences portfolio management.
The Trustees noted that the Goldman Sachs Multi-Manager Global Equity Fund had placed in the top half of its performance peer group for the one- and three-year periods and in the third quartile for the five-year period ended December 31, 2021 and had underperformed its benchmark index for the one-, three-, and five-year periods ended March 31, 2022. They observed that Goldman Sachs Multi-Manager Non-Core Fixed Income Fund had placed in the third quartile of its performance peer group for the one-year period and in the top half for the three- and five-year periods ended December 31, 2021 and had outperformed its composite benchmark index for the one- and three-year periods and underperformed for the five-year period ended March 31, 2022. The Trustees noted that the Goldman Sachs Multi-Manager Real Assets Strategy Fund had placed in the top half of its performance peer group for the one-, three, and five-year periods ended December 31, 2021, and had outperformed its composite benchmark index for the one-, three, and five-year periods ended March 31, 2022.
Costs of Services Provided and Competitive Information
The Trustees considered the contractual terms of the Management Agreement and the fee rates payable by each Fund thereunder. In this regard, the Trustees considered information on the services rendered by the Investment Adviser to the Funds, which included both advisory and administrative services that were directed to the needs and operations of the Funds as registered mutual funds.
In particular, the Trustees reviewed analyses prepared by the Outside Data Provider regarding the expense rankings of the Funds, as well as additional information provided by the Investment Adviser throughout the year. The analyses provided a comparison of each Fund’s management fee and breakpoints to those of a relevant peer group and category universe; an expense analysis which compared each Fund’s overall net and gross expenses to a peer group and a category universe; and data comparing each Fund’s net expenses to the peer and category medians. The analyses also compared each Fund’s other expenses and fee waivers/reimbursements to those of the peer group and category medians. With respect to the Goldman Sachs Multi-Manager Global Equity Fund, the Trustees also considered comparative fee information for services provided by the Investment Adviser to collective investment vehicles having investment objectives and policies similar to those of the Fund. The Trustees considered that
103
|
| GOLDMAN SACHS STRATEGIC MULTI-ASSET CLASS FUNDS |
Statement Regarding Basis for Approval of Management Agreement and Sub-Advisory Agreements (Unaudited) (continued)
services provided to the Funds differed in various significant respects from the services provided to these collective investment vehicles, which generally operated under less stringent regulatory and financial reporting requirements and required fewer services from the Investment Adviser. The Trustees concluded that the comparisons provided by the Outside Data Provider and the Investment Adviser were useful in evaluating the reasonableness of the management fees and total expenses paid by the Funds.
The Trustees considered the Investment Adviser’s undertaking to waive a portion of the management fee payable by each Fund. In this regard the Trustees noted that shareholders that are invested in the Funds consist of institutional clients that have entered into a separate management agreement with the Investment Adviser and pay a single management fee for the Investment Adviser’s management of their accounts, and that the Investment Adviser waives a portion of the management fee with respect to each Fund in order to achieve an effective net management fee rate that is equal to the actual cost of fees paid to the Fund’s sub-advisers. They also considered the Investment Adviser’s undertaking to limit certain expenses of the Funds that exceed specified levels. In addition, the Trustees noted that shareholders are able to redeem their shares at any time if shareholders believe that the Fund fees and expenses are too high or if they are dissatisfied with the performance of the Fund.
Profitability
The Trustees reviewed each Fund’s contribution to the Investment Adviser’s revenues and pre-tax profit margins. In this regard the Trustees noted that they had received, among other things, profitability analyses and summaries, revenue and expense schedules by Fund and by function (i.e., investment management, transfer agency and distribution and service), and information on the Investment Adviser’s expense allocation methodology. They observed that the profitability and expense figures are substantially similar to those used by the Investment Adviser for many internal purposes, including compensation decisions among various business groups, and are thus subject to a vigorous internal debate about how certain revenue and expenses should be allocated. The Trustees also noted that the internal audit group within the Goldman Sachs organization periodically audits the expense allocation methodology and that the internal audit group was satisfied with the reasonableness, consistency, and accuracy of the Investment Adviser’s expense allocation methodology. Profitability data for each Fund was provided for 2021 and 2020, and the Trustees considered this information in relation to the Investment Adviser’s overall profitability.
Economies of Scale
The Trustees considered the information that had been provided regarding whether there have been economies of scale with respect to the management of the Funds. The Trustees also considered that the Funds are offered to the Investment Adviser’s institutional clients as part of an investment model whereby the Funds and other funds act as core “building blocks” with which the client and the Investment Adviser form an investment strategy for the client’s portfolio. The Trustees considered the Investment Adviser’s representations that its clients benefit from this investment model with increased liquidity, increased investment oversight, access to new investment strategies, economies of scale, and reduced complexity in managing client portfolios. The Trustees noted that, pursuant to the model, clients pay a management fee for the Investment Adviser’s management of their accounts, and that the fund-level management fees in excess of the weighted average sub-advisory fees are waived in order to avoid charging two layers of management fees. The Trustees also considered the breakpoints in the fee rate payable under the Management Agreement for each of the Funds at the following annual percentage rates of the average daily net assets of the Funds:
| | | | | | |
| Average Daily Net Assets | | Goldman Sachs
Multi-Manager
Global Equity
Fund | | Goldman Sachs
Multi-Manager
Non-Core Fixed
Income Fund | | Goldman Sachs
Multi-Manager
Real Assets
Strategy Fund |
|
First $1 billion | | 1.03% | | 0.85% | | 1.00% |
Next $1 billion | | 0.93 | | 0.85 | | 0.90 |
Next $3 billion | | 0.89 | | 0.77 | | 0.86 |
Next $3 billion | | 0.87 | | 0.73 | | 0.84 |
Over $8 billion | | 0.84 | | 0.71 | | 0.82 |
The Trustees noted that the breakpoints were designed to share potential economies of scale, if any, with the Funds and their shareholders as assets under management reach those asset levels. The Trustees considered the amounts of assets in the Funds; the Funds’ recent purchase and redemption activity; the information provided by the Investment Adviser relating to the costs of the services provided by the Investment Adviser and its affiliates and the profits realized by them (if any); information comparing the fee rates charged by the Investment Adviser with fee rates charged to other funds in the peer groups; and the Investment Adviser’s undertakings to waive a portion of its management fee and to limit certain expenses of the Funds that exceed specified levels. The
104
GOLDMAN SACHS STRATEGIC MULTI-ASSET CLASS FUNDS
Statement Regarding Basis for Approval of Management Agreement and Sub-Advisory Agreements (Unaudited) (continued)
Trustees also considered the relationship between the advisory and sub-advisory fee rate schedules. Upon reviewing these matters at the Annual Meetings, the Trustees concluded that the fee breakpoints represented a means of assuring that benefits of scalability, if any, would be passed along to shareholders at the specified asset levels.
Other Benefits to the Investment Adviser and Its Affiliates
The Trustees also considered the other benefits derived by the Investment Adviser and its affiliates from their relationships with the Funds, as stated above, including: (a) transfer agency fees received by Goldman Sachs & Co. LLC (“Goldman Sachs”); (b) brokerage and futures commissions earned by Goldman Sachs for executing securities transactions (in its capacity as clearing broker) and futures transactions on behalf of the Funds; (c) the Investment Adviser’s ability to leverage the infrastructure designed to service the Funds on behalf of its other clients; (d) the Investment Adviser’s ability to cross-market other products and services to Fund shareholders; (e) the Investment Adviser’s ability to negotiate better pricing with the Funds’ custodian on behalf of its other clients, as a result of the relationship with the Funds; (f) the investment of cash in money market funds managed by the Investment Adviser that will result in increased assets under management for those money market funds; and (g) the possibility that the working relationship between the Investment Adviser and the Funds’ third-party service providers (including the Funds’ sub-advisers) may cause those service providers to be more likely to do business with other areas of Goldman Sachs. In the course of considering the foregoing, the Independent Trustees requested and received further information quantifying certain of these fall-out benefits.
Other Benefits to the Funds and Their Shareholders
The Trustees also noted that the Funds receive certain other potential benefits as a result of their relationship with the Investment Adviser, including: (a) enhanced servicing from vendors due to the volume of business generated by the Investment Adviser and its affiliates; (b) the advantages received from the Investment Adviser’s knowledge and experience gained from managing other accounts and products; (c) the Investment Adviser’s ability to hire and retain qualified personnel to provide services to the Funds because of the reputation of the Goldman Sachs organization; (d) the Funds’ access, through the Investment Adviser, to certain firm-wide resources (e.g., proprietary risk management systems and databases), subject to certain restrictions; (e) the Funds’ ability to aggregate assets managed by certain sub-advisers with those of other clients of the Investment Adviser for purposes of applying breakpoints in a sub-advisory agreement; and (f) the Funds’ access to certain affiliated distribution channels.
Conclusion
In connection with their consideration of the Management Agreement, the Trustees gave weight to each of the factors described above, but did not identify any particular factor as controlling their decision. After deliberation and consideration of all of the information provided, including the factors described above, the Trustees concluded, in the exercise of their business judgment, that the management fees paid by each of the Funds were reasonable in light of the factors considered, and that the Management Agreement should be approved and continued with respect to each Fund until September 30, 2023.
Designated Sub-Advisory Agreements
Nature, Extent, and Quality of the Services Provided Under the Designated Sub-Advisory Agreements and Performance
In evaluating the Designated Sub-Advisory Agreements, the Trustees relied upon materials furnished and presentations made by the Investment Adviser and the Designated Sub-Advisers. In evaluating the nature, extent, and quality of services provided by each Designated Sub-Adviser, the Trustees considered information on the services provided to the Funds by their respective Designated Sub-Advisers, including information about each Designated Sub-Adviser’s (a) personnel and compensation structure; (b) track record in managing the Fund and, if applicable, other funds and/or accounts with investment strategies similar to those employed on behalf of the Funds; (c) policies and procedures in place to address potential conflicts of interest; and (d) compliance program and code of ethics. In this regard, they also considered assessments provided by the Investment Adviser of each Designated Sub-Adviser, the Designated Sub-Adviser’s investment strategies and personnel, and its compliance program. The Trustees also considered information regarding each Designated Sub-Adviser’s business continuity planning and remote operations capabilities. The Trustees also reviewed the operations and investment performance of each Designated Sub-Adviser’s respective sleeve of the applicable Fund since its inception, including a comparison of each Designated Sub-Adviser to relevant benchmark indices based on various metrics, including realized beta, excess return, alpha, and volatility.
105
|
| GOLDMAN SACHS STRATEGIC MULTI-ASSET CLASS FUNDS |
Statement Regarding Basis for Approval of Management Agreement and Sub-Advisory Agreements (Unaudited) (continued)
Costs of Services Provided
The Trustees reviewed the terms of each Designated Sub-Advisory Agreement, including the schedule of fees payable to the Designated Sub-Advisers. They considered any breakpoints in the sub-advisory fee rate payable under each Designated Sub-Advisory Agreement. The Trustees noted that the compensation paid to each Designated Sub-Adviser is paid by the Investment Adviser, not by the Funds. The Trustees considered that certain Designated Sub-Advisers had agreed to reduce their sub-advisory fee rate, which benefited shareholders of the applicable Funds in light of the existing management fee waiver arrangement. The Trustees reviewed the blended average of all sub-advisory fees paid by the Investment Adviser with respect to each Fund in light of the overall management fee paid by each Fund. They also considered the Investment Adviser’s undertaking to waive a portion of its management fee which is in excess of the weighted average of each Fund’s sub-advisory fees.
Conclusion
In connection with their consideration of the Designated Sub-Advisory Agreements, the Trustees gave weight to various factors, but did not identify any particular factor as controlling their decision. After deliberation and consideration of the information provided, including the factors described above, the Trustees, including the Independent Trustees, unanimously concluded, in the exercise of their business judgment, that the sub-advisory fees paid by the Investment Adviser to each Designated Sub-Adviser were reasonable in light of the factors considered, and that each Designated Sub-Advisory Agreement should be approved and continued until September 30, 2023.
106
GOLDMAN SACHS STRATEGIC MULTI-ASSET CLASS FUNDS
Voting Results of Special Meeting of Shareholders (Unaudited)
A Special Meeting (the “Meeting”) of the Goldman Sachs Trust II (the “Trust”) was held on December 3, 2021 to consider and act upon the proposal below. Each Fund has amortized its respective share of the proxy, shareholder meeting and other related costs and GSAM has agreed to reimburse the Fund in an amount equal to the portion of the increase in the Fund’s total expense ratio that exceeds a specified percentage.
At the Meeting, Steven D. Krichmar, Linda A. Lang, Michael Latham and Lawrence W. Stranghoener were elected to the Trust’s Board of Trustees. In electing trustees, the Trust’s shareholders voted as follows:
| | | | | | | | | | |
| Proposal 1 | | | | | | | | |
| Election of Trustees | | For | | | Against/Withhold | | | Abstain |
| | | |
Steven D. Krichmar | | | 997,212,261 | | | | 10,105,414 | | | 0 |
| | | |
Linda A. Lang | | | 1,004,981,372 | | | | 2,336,303 | | | 0 |
| | | |
Michael Latham | | | 995,719,416 | | | | 11,598,259 | | | 0 |
| | | |
Lawrence W. Stranghoener | | | 995,630,574 | | | | 11,687,101 | | | 0 |
107
|
| GOLDMAN SACHS STRATEGIC MULTI-ASSET CLASS FUNDS |
Trustees and Officers (Unaudited)
Independent Trustees
| | | | | | | | | | |
| | | | | |
Name, Address and Age1 | | Position(s) Held with the Trust | | Term of
Office and
Length of
Time Served2 | | Principal Occupation(s) During Past 5 Years | | Number of
Portfolios in
Fund Complex
Overseen by
Trustee3 | | Other Directorships Held by Trustee4 |
| | | | | |
Cheryl K. Beebe Age: 66 | | Chair of the Board of Trustees | | Since 2017 (Trustee since 2015) | | Ms. Beebe is retired. She is Director, Packaging Corporation of America (2008-Present); Director, The Mosaic Company (2019-Present); Director, HanesBrands Inc. (2020-Present); and was formerly Director, Convergys Corporation (a global leader in customer experience outsourcing) (2015-2018); and formerly held the position of Executive Vice President, (2010-2014); and Chief Financial Officer, Ingredion, Inc. (a leading global ingredient solutions company) (2004-2014). Chair of the Board of Trustees — Goldman Sachs Trust II; Goldman Sachs MLP and Energy Renaissance Fund; Goldman Sachs ETF Trust; Goldman Sachs ETF Trust II; and Goldman Sachs Real Estate Diversified Income Fund. | | 67 | | Packaging Corporation of America (producer of container board); The Mosaic Company (producer of phosphate and potash fertilizer); HanesBrands Inc. (a multinational clothing company) |
| | | | | |
Lawrence Hughes Age: 64 | | Trustee | | Since 2016 | | Mr. Hughes is retired. Formerly, he held senior management positions with BNY Mellon Wealth Management, a division of The Bank of New York Mellon Corporation (a financial services company) (1991-2015), most recently as Chief Executive Officer (2010-2015). He serves as a Member of the Board of Directors, (2012-Present) and formerly served as Chairman (2012-2019), Ellis Memorial and Eldredge House (a not-for-profit organization). Previously, Mr. Hughes served as an Advisory Board Member of Goldman Sachs Trust II (February 2016-April 2016). Trustee — Goldman Sachs Trust II; Goldman Sachs MLP and Energy Renaissance Fund; Goldman Sachs ETF Trust; Goldman Sachs ETF Trust II; and Goldman Sachs Real Estate Diversified Income Fund. | | 67 | | None |
| | | | | |
John F. Killian Age: 67 | | Trustee | | Since 2015 | | Mr. Killian is retired. He is Director, Consolidated Edison, Inc. (2007-Present); and was formerly Director, Houghton Mifflin Harcourt Publishing Company (2011-2022). Previously, he held senior management positions with Verizon Communications, Inc., including Executive Vice President and Chief Financial Officer (2009-2010); and President, Verizon Business, Verizon Communications, Inc. (2005-2009). Trustee — Goldman Sachs Trust II; Goldman Sachs MLP and Energy Renaissance Fund; Goldman Sachs ETF Trust; Goldman Sachs ETF Trust II; and Goldman Sachs Real Estate Diversified Income Fund. | | 67 | | Consolidated Edison, Inc. (a utility holding company) |
| | | | | |
Steven D. Krichmar Age: 64 | | Trustee | | Since 2018 | | Mr. Krichmar is retired. Formerly, he held senior management and governance positions with Putnam Investments, LLC, a financial services company (2001-2016). He was most recently Chief of Operations and a member of the Operating Committee of Putnam Investments, LLC and Principal Financial Officer of The Putnam Funds. Previously, Mr. Krichmar served as an Audit Partner with PricewaterhouseCoopers LLP and its predecessor company (1990-2001). Trustee — Goldman Sachs Trust II; Goldman Sachs MLP and Energy Renaissance Fund; Goldman Sachs ETF Trust; Goldman Sachs ETF Trust II; and Goldman Sachs Real Estate Diversified Income Fund. | | 67 | | None |
| | | | | |
Linda A. Lang Age: 64 | | Trustee | | Since 2021 | | Ms. Lang is retired. She was formerly Chair of the Board of Directors, (2016-2019) and Member of the Board of Directors, WD-40 Company (a global consumer products company) (2004-2019); Chairman and Chief Executive Officer (2005-2014); and Director, President and Chief Operating Officer, Jack in the Box, Inc. (a restaurant company) (2003-2005). Previously, Ms. Lang served as an Advisory Board Member of Goldman Sachs MLP and Energy Renaissance Fund (February 2016-March 2016). Trustee — Goldman Sachs Trust II; Goldman Sachs MLP and Energy Renaissance Fund; Goldman Sachs ETF Trust; Goldman Sachs ETF Trust II; Goldman Sachs Credit Income Fund; and Goldman Sachs Real Estate Diversified Income Fund. | | 68 | | None |
| | | | | |
| | | | | | | | | | |
108
GOLDMAN SACHS STRATEGIC MULTI-ASSET CLASS FUNDS
Trustees and Officers (Unaudited) (continued)
Independent Trustees
| | | | | | | | | | |
| | | | | |
Name, Address and Age1 | | Position(s) Held with the Trust | | Term of
Office and
Length of
Time Served2 | | Principal Occupation(s) During Past 5 Years | | Number of
Portfolios in
Fund Complex
Overseen by
Trustee3 | | Other Directorships Held by Trustee4 |
| | | | | |
Michael Latham Age: 57 | | Trustee | | Since 2021 | | Mr. Latham is retired. He currently serves as Chief Operating Officer and Director of FinTech Evolution Acquisition Group (a special purpose acquisition company) (2021-Present). Formerly, Mr. Latham held senior management positions with the iShares exchange-traded fund business owned by BlackRock, Inc., including Chairman (2011-2014); Global Head (2010-2011); U.S. Head (2007-2010); and Chief Operating Officer (2003-2007). Trustee — Goldman Sachs Trust II; Goldman Sachs MLP and Energy Renaissance Fund; Goldman Sachs ETF Trust; Goldman Sachs ETF Trust II; Goldman Sachs Credit Income Fund; and Goldman Sachs Real Estate Diversified Income Fund. | | 68 | | FinTech Evolution Acquisition Group (a special purpose acquisition company) |
| | | | | |
Lawrence W. Stranghoener Age: 68 | | Trustee | | Since 2021 | | Mr. Stranghoener is retired. He is Chairman, Kennametal, Inc. (a global manufacturer and distributor of tooling and industrial materials) (2003-Present); and was formerly Director, Aleris Corporation and Aleris International, Inc. (a producer of aluminum rolled products) (2011- 2020); Interim Chief Executive Officer (2014) and Executive Vice President and Chief Financial Officer (2004-2014), Mosaic Company (a fertilizer manufacturing company). Trustee — Goldman Sachs Trust II; Goldman Sachs MLP and Energy Renaissance Fund; Goldman Sachs ETF Trust; Goldman Sachs ETF Trust II; and Goldman Sachs Real Estate Diversified Income Fund. Chair of the Board of Trustees — Goldman Sachs Credit Income Fund. | | 68 | | Kennametal, Inc. (a global manufacturer and distributor of tooling and industrial materials) |
| | | | | |
| | | | | | | | | | |
109
|
| GOLDMAN SACHS STRATEGIC MULTI-ASSET CLASS FUNDS |
Trustees and Officers (Unaudited) (continued)
Interested Trustee*
| | | | | | | | | | |
| | | | | |
Name, Address and Age1 | | Position(s) Held with the Trust | | Term of
Office and
Length of
Time Served2 | | Principal Occupation(s) During Past 5 Years | | Number of
Portfolios in
Fund Complex
Overseen by
Trustee3 | | Other Directorships Held by Trustee4 |
| | | | | |
James A. McNamara Age: 60 | | President and Trustee | | Since 2012 | | Advisory Director, Goldman Sachs (January 2018-Present); Managing Director, Goldman Sachs (January 2000-December 2017); Director of Institutional Fund Sales, GSAM (April 1998- December 2000); and Senior Vice President and Manager, Dreyfus Institutional Service Corporation (January 1993- April 1998). President and Trustee — Goldman Sachs Trust II; Goldman Sachs Trust; Goldman Sachs Variable Insurance Trust; Goldman Sachs MLP and Energy Renaissance Fund; Goldman Sachs ETF Trust; Goldman Sachs ETF Trust II; Goldman Sachs Credit Income Fund; and Goldman Sachs Real Estate Diversified Income Fund. | | 171 | | None |
| | | | | |
| | | | | | | | | | |
| * | Mr. McNamara is considered to be an “Interested Trustee” because he holds positions with Goldman Sachs and owns securities issued by The Goldman Sachs Group, Inc. Mr. McNamara holds comparable positions with certain other companies of which Goldman Sachs, GSAM or an affiliate thereof is the investment adviser, administrator and/or distributor. |
| 1 | Each Trustee may be contacted by writing to the Trustee, c/o Goldman Sachs, 200 West Street, New York, New York, 10282, Attn: Caroline Kraus. Information is provided as of October 31, 2022. |
| 2 | Subject to such policies as may be adopted by the Board from time-to-time, each Trustee holds office for an indefinite term, until the earliest of: (a) the election of his or her successor; (b) the date the Trustee resigns or is removed by the Board or shareholders, in accordance with the Trust’s Declaration of Trust; or (c)the termination of the Trust. The Board has adopted policies which provide that each Independent Trustee shall retire as of December 31st of the calendar year in which he or she reaches (a) his or her 75th birthday or (b) the 15th anniversary of the date he or she became a Trustee, whichever is earlier, unless a waiver of such requirements shall have been adopted by a majority of the other Trustees. These policies may be changed by the Trustees without shareholder vote. |
| 3 | The Goldman Sachs Fund Complex includes certain other companies listed above for each respective Trustee. As of October 31, 2022, Goldman Sachs Trust II consisted of 18 portfolios (16 of which offered shares to the public); Goldman Sachs Trust consisted of 88 portfolios; Goldman Sachs Variable Insurance Trust consisted of 15 portfolios (12 of which offered shares to the public); Goldman Sachs ETF Trust consisted of 46 portfolios (29 of which offered shares to the public); Goldman Sachs ETF Trust II consisted of 2 portfolios (1 of which offered shares to the public); and Goldman Sachs MLP and Energy Renaissance Fund, Goldman Sachs Credit Income Fund and Goldman Sachs Real Estate Diversified Income Fund each consisted of one portfolio. Goldman Sachs Credit Income Fund did not offer shares to the public. |
| 4 | This column includes only directorships of companies required to report to the Securities and Exchange Commission under the Securities Exchange Act of 1934 (i.e., “public companies”) or other investment companies registered under the Act. |
Additional information about the Trustees is available in the Funds’ Statement of Additional Information, which can be obtained from Goldman Sachs free of charge by calling this toll-free number (in the United States of America): 1-800-526-7384.
110
GOLDMAN SACHS STRATEGIC MULTI-ASSET CLASS FUNDS
Trustees and Officers (Unaudited) (continued)
Officers of the Trust*
| | | | | | |
| | | |
| Name, Address and Age1 | | Position(s) Held
with the Trust | | Term of
Office and
Length of
Time Served2 | | Principal Occupation(s) During Past 5 Years |
| | | |
James A. McNamara 200 West Street New York, NY 10282 Age: 60 | | President and Trustee | | Since 2012 | | Advisory Director, Goldman Sachs (January 2018-Present); Managing Director, Goldman Sachs (January 2000-December 2017); Director of Institutional Fund Sales, GSAM (April 1998-December 2000); and Senior Vice President and Manager, Dreyfus Institutional Service Corporation (January 1993- April 1998). President and Trustee — Goldman Sachs Trust II; Goldman Sachs Trust; Goldman Sachs Variable Insurance Trust; Goldman Sachs MLP and Energy Renaissance Fund; Goldman Sachs ETF Trust; Goldman Sachs ETF Trust II; Goldman Sachs Credit Income Fund; and Goldman Sachs Real Estate Diversified Income Fund. |
| | | |
Joseph F. DiMaria 30 Hudson Street Jersey City, NJ 07302 Age: 54 | | Treasurer, Principal Financial Officer and Principal Accounting Officer | | Since 2017 (Treasurer and Principal Financial Officer Since 2019) | | Managing Director, Goldman Sachs (November 2015-Present) and Vice President — Mutual Fund Administration, Columbia Management Investment Advisers, LLC (May 2010-October 2015). Treasurer, Principal Financial Officer and Principal Accounting Officer — Goldman Sachs Trust II (previously Assistant Treasurer (2017)); Goldman Sachs Trust (previously Assistant Treasurer (2016)); Goldman Sachs Variable Insurance Trust (previously Assistant Treasurer (2016)); Goldman Sachs MLP and Energy Renaissance Fund (previously Assistant Treasurer (2017)); Goldman Sachs ETF Trust (previously Assistant Treasurer (2017)); Goldman Sachs ETF Trust II; Goldman Sachs Credit Income Fund; and Goldman Sachs Real Estate Diversified Income Fund. |
| | | |
Caroline L. Kraus 200 West Street New York, NY 10282 Age: 45 | | Secretary | | Since 2012 | | Managing Director, Goldman Sachs (January 2016-Present); Vice President, Goldman Sachs (August 2006-December 2015); Senior Counsel, Goldman Sachs (January 2020-Present); Associate General Counsel, Goldman Sachs (2012-December 2019); Assistant General Counsel, Goldman Sachs (August 2006-December 2011); and Associate, Weil, Gotshal & Manges, LLP (2002-2006). Secretary — Goldman Sachs Trust II; Goldman Sachs Trust (previously Assistant Secretary (2012)); Goldman Sachs Variable Insurance Trust (previously Assistant Secretary (2012)); Goldman Sachs BDC, Inc.; Goldman Sachs Private Middle Market Credit LLC; Goldman Sachs Private Middle Market Credit II LLC; Goldman Sachs Middle Market Lending Corp.; Goldman Sachs MLP and Energy Renaissance Fund; Goldman Sachs ETF Trust; Goldman Sachs ETF Trust II; Goldman Sachs Credit Income Fund; and Goldman Sachs Real Estate Diversified Income Fund. |
| | | |
| | | | | | |
| * | Represents a partial list of officers of the Trust. Additional information about all the officers is available in the Funds’ Statement of Additional Information, which can be obtained from Goldman Sachs free of charge by calling this toll-free number (in the United States): 1-800-526-7384. |
| 1 | Information is provided as of October 31, 2022. |
| 2 | Officers hold office at the pleasure of the Board of Trustees or until their successors are duly elected and qualified. Each officer holds comparable positions with certain other companies of which Goldman Sachs, GSAM or an affiliate thereof is the investment adviser, administrator and/or distributor. |
Goldman Sachs Trust II –Strategic Multi-Asset Class Funds - Tax Information (Unaudited)
For the year ended October 31, 2022, 3.65%, 0.17% and 13.38% of the dividends paid from net investment company taxable income by the Multi-Manager Global Equity, Multi-Manager Non-Core Fixed Income Fund, and Multi-Manager Real Assets Strategy Fund, respectively, qualify for the dividends received deduction available to corporations.
For the year ended October 31, 2022, 0.08% and 14.76% of the dividend paid from net investment company taxable income by the Multi-Manager Global Equity Fund and Multi-Manager Real Assets Strategy Fund qualify as section 199A dividends.
For the year ended October 31, 2022, 12.87% and 37.84% of the dividends paid from net investment company taxable income by the Multi-Manager Global Equity Fund and Multi-Manager Real Assets Strategy Fund, respectively, qualify for the reduced tax rate under the Jobs and Growth Tax Relief and Reconciliation Act of 2003.
Pursuant to Section 852 of the Internal Revenue Code, the Multi-Manager Global Equity Fund and the Multi-Manager Real Assets Strategy Fund designate $62,671,495 and $13,091,498, or if different, the maximum amount allowable, as capital gain dividends paid during the fiscal year ended October 31, 2022.
During the fiscal year ended October 31, 2022, the Multi-Manager Global Equity Fund and the Multi-Manager Real Assets Strategy Fund designate $56,719,801 and 3,452,415, respectively, as short-term capital gain dividends pursuant to Section 871(k) of the Internal Revenue Code.
For the year ended October 31, 2022, the Multi-Manager Non-Core Fixed Income designates 100% of the dividends paid from net investment company taxable income as section 163(j) Interest Dividends.
111
(This page intentionally left blank)
Goldman Sachs Funds
Goldman Sachs is a premier financial services firm, known since 1869 for creating thoughtful and customized investment solutions in complex global markets.
Today, the Asset Management Division of Goldman Sachs serves a diverse set of clients worldwide, including private institutions, public entities and individuals. With approximately $2.19 trillion in assets under supervision as of September 30, 2022, Goldman Sachs Asset Management (“GSAM”) has portfolio management teams located around the world and our investment professionals bring firsthand knowledge of local markets to every investment decision. Assets under supervision includes assets under management and other client assets for which Goldman Sachs does not have full discretion. GSAM leverages the resources of Goldman Sachs & Co. LLC subject to legal, internal and regulatory restrictions.
Money Market
Financial Square FundsSM
| ∎ | Financial Square Treasury Solutions Fund1 |
| ∎ | Financial Square Government Fund1 |
| ∎ | Financial Square Money Market Fund2 |
| ∎ | Financial Square Prime Obligations Fund2 |
| ∎ | Financial Square Treasury Instruments Fund1 |
| ∎ | Financial Square Treasury Obligations Fund1 |
| ∎ | Financial Square Federal Instruments Fund1 |
Investor FundsSM
| ∎ | Investor Money Market Fund3 |
| ∎ | Investor Tax-Exempt Money Market Fund3 |
Fixed Income
Short Duration and Government
| ∎ | Short-Term Conservative Income Fund |
| ∎ | Short Duration Government Fund |
| ∎ | Short Duration Income Fund |
| ∎ | Inflation Protected Securities Fund |
Multi-Sector
∎ Global Core Fixed Income Fund
Municipal and Tax-Free
| ∎ | High Yield Municipal Fund |
| ∎ | Dynamic Municipal Income Fund |
| ∎ | Short Duration Tax-Free Fund |
| ∎ | Municipal Income Completion Fund |
Single Sector
| ∎ | Investment Grade Credit Fund |
| ∎ | High Yield Floating Rate Fund |
| ∎ | Emerging Markets Debt Fund |
| ∎ | Local Emerging Markets Debt Fund |
Fixed Income Alternatives
| ∎ | Long Short Credit Strategies Fund |
Fundamental Equity
| ∎ | Small/Mid Cap Value Fund |
| ∎ | Small/Mid Cap Growth Fund |
| ∎ | Concentrated Growth Fund |
| ∎ | Technology Opportunities Fund |
| ∎ | Rising Dividend Growth Fund |
Tax-Advantaged Equity
| ∎ | U.S. Tax-Managed Equity Fund |
| ∎ | International Tax-Managed Equity Fund |
| ∎ | U.S. Equity Dividend and Premium Fund |
| ∎ | International Equity Dividend and Premium Fund |
Equity Insights
| ∎ | Small Cap Equity Insights Fund |
| ∎ | U.S. Equity Insights Fund |
| ∎ | Small Cap Growth Insights Fund |
| ∎ | Large Cap Growth Insights Fund |
| ∎ | Large Cap Value Insights Fund |
| ∎ | Small Cap Value Insights Fund |
| ∎ | International Small Cap Insights Fund |
| ∎ | International Equity Insights Fund |
| ∎ | Emerging Markets Equity Insights Fund |
Fundamental Equity International
| ∎ | International Equity Income Fund |
| ∎ | International Equity ESG Fund |
| ∎ | Emerging Markets Equity Fund |
| ∎ | Emerging Markets Equity ex. China Fund |
| ∎ | ESG Emerging Markets Equity Fund |
Alternative
| ∎ | Clean Energy Income Fund |
| ∎ | Real Estate Securities Fund |
| ∎ | Global Real Estate Securities Fund |
| ∎ | Absolute Return Tracker Fund |
| ∎ | Managed Futures Strategy Fund |
| ∎ | MLP Energy Infrastructure Fund |
| ∎ | Energy Infrastructure Fund |
| ∎ | Multi-Manager Alternatives Fund |
| ∎ | Global Infrastructure Fund |
Total Portfolio Solutions
| ∎ | Global Managed Beta Fund |
| ∎ | Multi-Manager Non-Core Fixed Income Fund |
| ∎ | Multi-Manager Global Equity Fund |
| ∎ | Multi-Manager International Equity Fund |
| ∎ | Tactical Tilt Overlay Fund |
| ∎ | Balanced Strategy Portfolio |
| ∎ | Multi-Manager U.S. Small Cap Equity Fund |
| ∎ | Multi-Manager Real Assets Strategy Fund |
| ∎ | Growth and Income Strategy Portfolio |
| ∎ | Growth Strategy Portfolio |
| ∎ | Dynamic Global Equity Fund |
| ∎ | Satellite Strategies Portfolio |
| ∎ | Enhanced Dividend Global Equity Portfolio |
| ∎ | Tax-Advantaged Global Equity Portfolio |
| ∎ | Strategic Factor Allocation Fund |
| ∎ | Strategic Volatility Premium Fund |
| ∎ | Target Date Retirement Portfolio |
| ∎ | Target Date 2025 Portfolio |
| ∎ | Target Date 2030 Portfolio |
| ∎ | Target Date 2035 Portfolio |
| ∎ | Target Date 2040 Portfolio |
| ∎ | Target Date 2045 Portfolio |
| ∎ | Target Date 2050 Portfolio |
| ∎ | Target Date 2055 Portfolio |
| ∎ | Target Date 2060 Portfolio |
| ∎ | GQG Partners International Opportunities Fund |
| 1 | You could lose money by investing in the Fund. Although the Fund seeks to preserve the value of your investment at $1.00 per share, it cannot guarantee it will do so. An investment in the Fund is not a deposit of a bank and is not insured or guaranteed by the Federal Deposit Insurance Corporation or any other government agency. The Fund’s sponsor has no legal obligation to provide financial support to the Fund, and you should not expect that the sponsor will provide financial support to the Fund at any time. |
| 2 | You could lose money by investing in the Fund. Because the share price of the Fund will fluctuate, when you sell your shares they may be worth more or less than what you originally paid for them. The Fund may impose a fee upon sale of your shares or may temporarily suspend your ability to sell shares if the Fund’s liquidity falls below required minimums because of market conditions or other factors. An investment in the Fund is not a deposit of a bank and is not insured or guaranteed by the Federal Deposit Insurance Corporation or any other government agency. The Fund’s sponsor has no legal obligation to provide financial support to the Fund, and you should not expect that the sponsor will provide financial support to the Fund at any time. |
| 3 | You could lose money by investing in the Fund. Although the Fund seeks to preserve the value of your investment at $1.00 per share, it cannot guarantee it will do so. The Fund may impose a fee upon sale of your shares or may temporarily suspend your ability to sell shares if the Fund’s liquidity falls below required minimums because of market conditions or other factors. An investment in the Fund is not a deposit of a bank and is not insured or guaranteed by the Federal Deposit Insurance Corporation or any other government agency. The Fund’s sponsor has no legal obligation to provide financial support to the Fund, and you should not expect that the sponsor will provide financial support to the Fund at any time. |
| 4 | Effective after the close of business on April 13, 2022, the Goldman Sachs Capital Growth Fund was renamed the Goldman Sachs Large Cap Core Fund. |
| 5 | Effective after the close of business on April 13, 2022, the Goldman Sachs Growth Opportunities Fund was renamed the Goldman Sachs Mid Cap Growth Fund. Financial Square FundsSM and Investor FundsSM are registered service marks of Goldman Sachs & Co. LLC. |
| * | This list covers open-end funds only. Please visit our website at www.GSAMFUNDS.com to learn about our closed-end funds and exchange-traded funds. |
(a) As of the end of the period covered by this report, the registrant has adopted a code of ethics that applies to the registrant’s principal executive officer, principal financial officer, principal accounting officer or controller, or persons performing similar functions, regardless of whether these individuals are employed by the registrant or a third party (the “Code of Ethics”).
(b) Not applicable.
(c) During the period covered by this report, no amendments were made to the provisions of the Code of Ethics.
(d) During the period covered by this report, the registrant did not grant any waivers, including an implicit waiver, from any provision of the Code of Ethics.
(e) Not applicable.
(f) A copy of the Code of Ethics is available as provided in Item 13(a)(1) of this report.
| ITEM 3. | AUDIT COMMITTEE FINANCIAL EXPERT. |
The registrant’s board of trustees has determined that the registrant has at least one “audit committee financial expert” (as defined in Item 3 of Form N-CSR) serving on its audit committee. John F. Killian is the “audit committee financial expert” and is “independent” (as each term is defined in Item 3 of Form N-CSR).
| ITEM 4. | PRINCIPAL ACCOUNTANT FEES AND SERVICES. |
Table 1 — Items 4(a) - 4(d). The accountant fees below reflect the aggregate fees billed by the Funds of the Goldman Sachs Trust II to which this certified shareholder report relates.
| | | | | | | | | | | | |
| | | 2022 | | 2021 | | Description of Services Rendered |
| | | |
Audit Fees: | | | | | | | | | | | | |
| | | |
• PricewaterhouseCoopers LLP
(“PwC”) | | | $ | 562,318 | | | | $ | 158,900 | | | Financial Statement audits. |
| | | |
Audit-Related Fees: | | | | | | | | | | | | |
| | | |
• PwC | | | $ | 64,000 | | | | $ | 33,496 | | | Other attest services. |
| | | |
Tax Fees: | | | | | | | | | | | | |
| | | |
• PwC | | | $ | 0 | | | | $ | 0 | | | |
Table 2 — Items 4(b)(c) & (d). Non-Audit Services to the Goldman Sachs Trust II’s service affiliates* that were pre-approved by the Audit Committee of the Goldman Sachs Trust II pursuant to Rule 2-01(c)(7)(ii) of Regulation S-X.
| | | | | | | | | | | | |
| | | 2022 | | 2021 | | Description of Services Rendered |
| | | |
Audit-Related Fees: | | | | | | | | | | | | |
| | | |
• PwC | | | $ | 1,906,448 | | | | $ | 1,906,448 | | | Internal control review performed in accordance with Statement on Standards for Attestation Engagements No. 16 and semi-annual updates relating to withholding tax accrual for non-US jurisdictions. These fees are borne by the Funds’ Adviser. |
| * | These include the advisor (excluding sub-advisors) and any entity controlling, controlled by or under common control with the advisor that provides ongoing services to the registrant (hereinafter referred to as “service affiliates”). |
Item 4(e)(1) — Audit Committee Pre-Approval Policies and Procedures
Pre-Approval of Audit and Non-Audit Services Provided to the Funds of the Goldman Sachs Trust II. The Audit and Non-Audit Services Pre-Approval Policy (the “Policy”) adopted by the Audit Committee of Goldman Sachs Trust II (“GST II”) sets forth the procedures and the conditions pursuant to which services performed by an independent auditor for GST II may be pre-approved. Services may be pre-approved specifically by the Audit Committee as a whole or, in certain circumstances, by the Audit Committee Chairman or the person designated as the Audit Committee Financial Expert. In addition, subject to specified cost limitations, certain services may be pre-approved under the provisions of the Policy. The Policy provides that the Audit Committee will consider whether the services provided by an independent auditor are consistent with the Securities and Exchange Commission’s rules on auditor independence. The Policy provides for periodic review and pre-approval by the Audit Committee of the services that may be provided by the independent auditor.
De Minimis Waiver. The pre-approval requirements of the Policy may be waived with respect to the provision of non-audit services that are permissible for an independent auditor to perform, provided (1) the aggregate amount of all such services provided constitutes no more than five percent of the total amount of revenues subject to pre-approval that was paid to the independent auditors during the fiscal year in which the services are provided; (2) such services were not recognized by GST II at the time of the engagement to be non-audit services; and (3) such services are promptly brought to the attention of the Audit Committee and approved prior to the completion of the audit by the Audit Committee or by one or more members of the Audit Committee to whom authority to grant such approvals has been delegated by the Audit Committee, pursuant to the pre-approval provisions of the Policy.
Pre-Approval of Non-Audit Services Provided to GST’s Investment Advisers. The Policy provides that, in addition to requiring pre-approval of audit and non-audit services provided to GST II, the Audit Committee will pre-approve those non-audit services provided to GST II’s investment advisers (and entities controlling, controlled by or under common control with the investment advisers that provide ongoing services to GST II) where the engagement relates directly to the operations or financial reporting of GST II.
Item 4(e)(2) – 0% of the audit-related fees, tax fees and other fees listed in Table 1 were approved by GST II’s Audit Committee pursuant to the “de minimis” exception of Rule 2-01(c)(7)(i)(C) of Regulation S-X. In addition, 0% of the non-audit services to the GST II’s service affiliates listed in Table 2 were approved by GST II’s Audit Committee pursuant to the “de minimis” exception of Rule 2-01(c)(7)(i)(C) of Regulation S-X.
Item 4(f) – Not applicable.
Item 4(g) Aggregate Non-Audit Fees Disclosure
The aggregate non-audit fees billed to GST II by PwC for the twelve months ended October 31, 2022 and October 31, 2021 were $64,000 and $33,496, respectively. The aggregate non-audit fees billed to GST II’s adviser and service affiliates by PwC for the twelve months ended December 31, 2021 and December 31, 2020 were approximately $14.4 million and $14.5 million, respectively. The figures for these entities are not yet available for the twelve months ended December 31, 2022. With regard to the aggregate non-audit fees billed to GST II’s adviser and service affiliates, the 2021 and 2020 amounts include fees for non-audit services required to be pre-approved [see Table 2] and fees for non-audit services that did not require pre-approval since they did not directly relate to GST II’s operations or financial reporting.
Item 4(h) — GST II’s Audit Committee has considered whether the provision of non-audit services to GST II’s investment adviser and service affiliates that did not require pre-approval pursuant to paragraph (c)(7)(ii) of Rule 2-01 of Regulation S-X is compatible with maintaining the auditors’ independence.
| ITEM 5. | AUDIT COMMITTEE OF LISTED REGISTRANTS. |
| ITEM 6. | SCHEDULE OF INVESTMENTS. |
| | Schedule of Investments is included as part of the Report to Shareholders filed under Item 1. |
| ITEM 7. | DISCLOSURE OF PROXY VOTING POLICIES AND PROCEDURES FOR CLOSED-END MANAGEMENT INVESTMENT COMPANIES. |
| ITEM 8. | PORTFOLIO MANAGERS OF CLOSED-END MANAGEMENT INVESTMENT COMPANIES. |
| ITEM 9. | PURCHASES OF EQUITY SECURITIES BY CLOSED-END MANAGEMENT INVESTMENT COMPANY AND AFFILIATED PURCHASERS. |
| ITEM 10. | SUBMISSION OF MATTERS TO A VOTE OF SECURITY HOLDERS. |
| | There have been no material changes to the procedures by which shareholders may recommend nominees to the registrant’s board of trustees. |
| ITEM 11. | CONTROLS AND PROCEDURES. |
| | (a) | The registrant’s principal executive and principal financial officers, or persons performing similar functions have concluded that the registrant’s disclosure controls and procedures (as defined in Rule 30a-3(c) under the Investment Company Act of 1940, as amended (the “1940 Act”)) are effective as of a date within 90 days of the filing of this report that includes the disclosure required by this paragraph, based on the evaluation of these controls and procedures required by Rule 30a-3(b) under the 1940 Act and 15d-15(b) under the Securities Exchange Act of 1934, as amended. |
| | (b) | There were no changes in the registrant’s internal control over financial reporting (as defined in Rule 30a-3(d) under the 1940 Act) that occurred during the period covered by this report that have materially affected, or are reasonably likely to materially affect, the registrant’s internal control over financial reporting. |
| ITEM 12. | DISCLOSURE OF SECURITIES LENDING ACTIVITIES FOR CLOSED-END MANAGEMENT INVESTMENT COMPANIES. |
SIGNATURES
Pursuant to the requirements of the Securities Exchange Act of 1934 and the Investment Company Act of 1940, the registrant has duly caused this report to be signed on its behalf by the undersigned, thereunto duly authorized.
| | | | |
| | | | Goldman Sachs Trust II |
| | |
| By: | | | | /s/ James A. McNamara |
| | |
| | | | James A. McNamara |
| | | | President/Chief Executive Officer |
| | | | Goldman Sachs Trust II |
| | |
| Date: | | | | January 4, 2023 |
Pursuant to the requirements of the Securities Exchange Act of 1934 and the Investment Company Act of 1940, this report has been signed below by the following persons on behalf of the registrant and in the capacities and on the dates indicated.
| | | | |
| | |
| By: | | | | /s/ James A. McNamara |
| | |
| | | | James A. McNamara |
| | | | President/Chief Executive Officer |
| | | | Goldman Sachs Trust II |
| | |
| Date: | | | | January 4, 2023 |
| | |
| By: | | | | /s/ Joseph F. DiMaria |
| | |
| | | | Joseph F. DiMaria |
| | | | Principal Financial Officer |
| | | | Goldman Sachs Trust II |
| | |
| Date: | | | | January 4, 2023 |