UNITED STATES
SECURITIES AND EXCHANGE COMMISSION
Washington, D.C. 20549
FORM N-CSR
CERTIFIED SHAREHOLDER REPORT OF REGISTERED
MANAGEMENT INVESTMENT COMPANIES
Investment Company Act file number 811-22781
Goldman Sachs Trust II
(Exact name of registrant as specified in charter)
200 West Street
15th Floor
New York, New York 10282
(Address of principal executive offices) (Zip code)
| | |
Copies to: |
Robert Griffith, Esq. | | Stephen H. Bier, Esq. |
Goldman Sachs & Co. LLC | | Dechert LLP |
200 West Street | | 1095 Avenue of the Americas |
New York, New York 10282 | | New York, NY 10036 |
(Name and address of agents for service)
Registrant’s telephone number, including area code: (212) 902-1000
Date of fiscal year end: October 31
Date of reporting period: October 31, 2023
| ITEM 1. | REPORTS TO STOCKHOLDERS. |
| | The Annual Report to Shareholders is filed herewith. |
Active Equity Multi-Manager Funds
| | |
| ∎ | | MULTI-MANAGER INTERNATIONAL EQUITY |
| | |
| ∎ | | MULTI-MANAGER U.S. SMALL CAP EQUITY |
TABLE OF CONTENTS
| | | | | | |
| | | | |
| NOT FDIC-INSURED | | May Lose Value | | No Bank Guarantee | | |
MARKET REVIEW
Active Equity Multi-Manager Funds
Market Review
The global equity markets recorded strong gains during the 12-month period ended October 31, 2023 (the “Reporting Period”). Performance was driven by macro factors, chief among them rising interest rates, inflation data, volatile energy prices and speculation about whether central banks would achieve soft or hard economic landings. (A soft landing, in economics, is a cyclical downturn that avoids recession. It typically describes attempts by central banks to raise interest rates just enough to stop an economy from overheating and experiencing high inflation, without causing a significant increase in unemployment, or a hard landing.)
During the Reporting Period, global equities, as represented by the MSCI All Country World Index (Net Total Return, Unhedged, USD) (“MSCI ACWI Index”), generated a return of 10.5%. The majority of the gains occurred during the first nine months of the Reporting Period. The final three months saw corrections across most regions and sectors within the MSCI ACWI Index. (A correction is a condition in which securities prices fall 10% or more from recent highs.)
Non-U.S. developed markets stocks, as represented by the MSCI® EAFE® Index (Net, Unhedged, USD), performed best, posting a return of 14.4% during the Reporting Period overall, with value stocks outpacing growth stocks. From a regional standpoint, Japanese and European equities were the strongest performers. Despite significant depreciation in the Japanese yen relative to the U.S. dollar, Japan’s stock market was one of the best performing developed markets regions, as it benefited from continuation of the central bank’s accommodative monetary policy, rising share buybacks and growing corporate investment. Market technicals (i.e., supply/demand conditions) also supported the performance of Japanese equities, as investment inflows increased, perhaps driven by optimism that long-promised corporate governance reforms were finally starting to bear fruit. As for European equities, they appreciated significantly early in the Reporting Period, recovering from previously depressed levels. Investors had been bearish on European stocks due both to inflation worries, especially concerns about energy price inflation caused by Russia’s invasion of Ukraine, and to rising interest rates and overall economic weakness. However, reduced energy demand because of a warmer than expected winter, success in securing alternative energy imports and generous government support for the consumer improved investor sentiment, led to a significant rally in European equity performance. Challenges then followed, with March 2023 especially difficult, as a U.S. regional banking crisis spilled over to European banks, leading to the high-profile bankruptcy of Credit Suisse but not much further fallout due to prompt government intervention. European equities were volatile for the rest of the Reporting Period, with the outlook for economies and interest rates weighing on market sentiment. Overall, macroeconomic fundamentals in European countries were lethargic during the Reporting Period, with Germany, for example, entering a technical recession and its inflation remaining above target, although employment in the country stayed robust. (A technical recession is commonly defined as two consecutive quarters of negative growth in a country’s gross domestic product.)
In the U.S., where growth stocks beat value stocks by a wide margin, the broad equity market generated a return of 9.5%, as measured by the Russell 1000® Index. The rally in growth stocks was led by the so-called “Magnificent Seven” (specifically, Apple, Microsoft, Alphabet, Amazon.com, Nvidia, Meta Platforms and Tesla), which were responsible for almost all of the U.S equity market’s gains in the first half of 2023. The rally was driven by a combination of factors, including a reversal of previous multiples compression and the strong fundamental performance of some of these companies. (Multiple compression, or valuation derating, is when a company’s valuation multiples, such as the price/earnings ratio, is reduced either because of increased earnings without a corresponding increase in stock price or because of a decreased stock price without a corresponding decrease in earnings.) Many of the Magnificent Seven were beneficiaries of investor optimism about artificial intelligence (“AI”) following the release of ChatGPT as well as excitement about generative AI. Within the U.S. equity market, small-cap stocks, as measured by the Russell 2000® Index, recorded a decline of 8.6% during the Reporting Period. Geopolitical strife, inflation concerns and uncertainty over U.S. Federal Reserve monetary policy created a difficult backdrop for small-cap equities, which are generally considered more volatile and cyclical than their large-cap counterparts.
Emerging markets equities returned 10.8%, as measured by the MSCI Emerging Markets Index (Net, USD, Unhedged), during the Reporting Period. Chinese equities posted the strongest gains, with the MSCI China All Shares Index (Net Total Return, USD, Unhedged) notching a 21.1% return during the Reporting Period, though performance was highly volatile. At first, Chinese equities benefited from the reopening of the country’s economy following COVID-19-related lockdowns, but they subsequently weakened, as an expected surge in consumer spending did not materialize due in part to worries about China’s property crisis and level of unemployment. These investor concerns were exacerbated by geopolitical and regulatory issues.
1
Looking Ahead
At the end of the Reporting Period, many investors continued to debate whether central banks could engineer soft landings or if protracted economic declines were more probable. Although inflation had come down substantially, central banks remained cautious at the end of the Reporting Period about declaring victory due to the potentially sticky components of core inflation, such as wages, that could keep inflation above policymakers’ desired 2% target in major developed markets economies. In most developed markets countries, consumer spending was solid and employment robust, and we thought investors would continue assessing whether this strength could be sustained. In the emerging markets, some countries, such as Mexico, India and Indonesia, were benefiting from “near-shoring” trends wherein Western firms were trying to reduce supply-chain dependency on China, leading to increased investment in other emerging markets countries. Meanwhile, China’s future path was a point of debate, with many investors bearish for both the short term and long term and no signs apparent of a clear catalyst that might fuel a rally without significant government stimulus. Geopolitical risks also remained top of mind for many investors at the end of the Reporting Period, as the Russia/Ukraine war entered another winter, Israel/Hamas war risks escalated and impacted the broader Middle East region, and trade tensions persisted between the U.S. and China.
2
FUND RESULTS
Multi-Manager International Equity Fund
|
| |
Investment Objective The Fund seeks to provide long-term capital growth. |
Portfolio Management Discussion and Analysis
Below, the Goldman Sachs External Investing Group (“XIG”) (formerly, the Goldman Sachs Alternative Investments & Manager Selection (“AIMS”) Group) discusses the Multi-Manager International Equity Fund’s (the “Fund”) performance and positioning for the 12-month period ended October 31, 2023 (the “Reporting Period”).
| Q | How did the Fund perform during the Reporting Period? |
| A | During the Reporting Period, the Fund’s Class P Shares generated an average annual total return of 15.32%. This return compares to the 14.40% average annual total return of the Fund’s benchmark, the MSCI Europe, Australasia and Far East (“EAFE”) Index (Net, USD, Unhedged) (the “MSCI® EAFE® Index”), during the same time period. |
| Q | What key factors were responsible for the Fund’s performance during the Reporting Period? |
| A | The Fund uses a multi-manager approach and generally seeks to achieve its investment objective by dynamically allocating its assets among unaffiliated investment managers (“Underlying Managers”) that employ an international equity investment strategy. XIG is responsible for making recommendations with respect to hiring, terminating or replacing the Fund’s Underlying Managers as well as for determining the Fund’s asset allocations. XIG applies a multifaceted process with respect to manager due diligence, portfolio construction and risk management. |
| | During the Reporting Period, the Fund generated a positive absolute return and outperformed the Index on a relative basis. These relative results can be attributed to the performance of the Fund’s Underlying Managers overall. During the Reporting Period, the Fund allocated capital to four Underlying Managers as part of its top-level strategy allocation—Causeway Capital Management LLC (“Causeway”), Lazard Asset Management LLC (“Lazard”), Massachusetts Financial Services Company doing business as MFS Investment Management (“MFS”) and WCM Investment Management (“WCM”). |
| | Of the four Underlying Managers, two produced positive absolute returns and two produced negative absolute returns during the Reporting Period. On a relative basis, value-oriented Underlying Manager Causeway and core-oriented Underlying Manager MFS outperformed their respective benchmark indices during the Reporting Period. Core-oriented Underlying Manager Lazard and growth-oriented Underlying Manager WCM underperformed their respective benchmark indices. |
| Q | Which international equity strategies most significantly affected Fund performance? |
| A | During the Reporting Period, value-oriented Underlying Manager Causeway significantly outperformed its benchmark index, the MSCI® EAFE® Index. The gains were due in part to style tailwinds, as value stocks generally outpaced growth stocks within the MSCI® EAFE® Index during the Reporting Period. The strategy also benefited from strong stock selection within the industrials and financials sectors. |
| | Core-oriented Underlying Manager MFS outperformed the MSCI® EAFE® Index, its benchmark index, driven by broad-based positive stock selection across the communication services, industrials and materials sectors. Effective stock selection within communication services was highlighted by out-of-benchmark exposure to Asian gaming companies, while exposure to European chemical and industrial gas providers added to relative performance in the materials sector. The strategy’s lack of exposure to real estate also contributed positively given that rising interest rates pressured that sector during the Reporting Period. Conversely, stock selection across the health care and financials sectors, as well as an overweight position versus the MSCI® EAFE® Index in the consumer staples sector, detracted somewhat from relative performance. Within health care, exposure to medical equipment makers and to Japanese pharmaceutical companies hampered returns. Within financials, the strategy was hurt by its lack of exposure to Japanese banks, which appreciated amid higher Japanese interest rates and an improved economic growth outlook. From a regional perspective, stock selection in the U.K. and an underweight in Asia ex Japan, especially the strategy’s lack of exposure to Australia, added to relative returns. However, stock selection in Japan—namely, a preference for health care, retailers and manufacturers over banks—and out-of-benchmark exposure to North America, predominantly to Canadian transportation and financials, detracted from relative performance. |
| | Lazard, another core-oriented Underlying Manager, underperformed its benchmark index, the MSCI® EAFE® Index, primarily because of poor stock selection in the financials, health care and consumer discretionary sectors. |
3
| | However, stock selection in information technology, consumer staples and communication services contributed positively, partially offsetting these negative results. On a regional basis, stock selection in continental Europe was the largest detractor from relative performance, while stock selection in the U.K. added most to returns. |
| | Growth-oriented Underlying Manager WCM underperformed its benchmark index, the MSCI ACWI ex-USA Index, during the Reporting Period, due primarily to weak stock selection within the information technology and financials sectors. These losses were partially offset by an overweight in the health care sector as well as lack of exposure to the real estate sector, which added value. |
| Q | How did the Fund use derivatives and similar instruments during the Reporting Period? |
| A | During the Reporting Period, the Fund used forward foreign currency exchange contracts to take positions in select non-U.S. markets. The use of forward foreign currency exchange contracts had a negative impact on the Fund’s performance. Rights were employed to give the Fund the opportunity, but not the obligation, to buy additional shares in specific stocks at a discount. Warrants were utilized to give the Fund the right, but not the obligation, to buy or sell specific stocks at a certain price before expiration. The use of rights and warrants each had a neutral impact on the Fund’s performance during the Reporting Period. |
| Q | Were there any notable changes in the Fund’s allocations during the Reporting Period? |
| A | There were no notable changes to the Fund’s allocations during the Reporting Period. At the beginning and end of the Reporting Period, the Fund’s assets were allocated approximately 30% to MFS, 29% to Causeway, 20% to WCM and 20% to Lazard, with the remainder invested in cash and cash equivalents. |
| Q | What is the Fund’s tactical view and strategy for the months ahead? |
| A | We intend to continue to position the Fund in alignment with our longer-term strategic views within the international equity complex. We further intend to continue to monitor allocations and Underlying Manager performance as we seek to generate long-term capital growth. |
4
FUND BASICS
Multi-Manager International Equity Fund
as of October 31, 2023
|
|
| TOP TEN HOLDINGS AS OF 10/31/23 ± |
| | | | | | | |
| | |
Holding | | % of Net Assets | | Line of Business |
| | |
Novo Nordisk AS Class B | | | | 3.1 | % | | Pharmaceuticals |
Compass Group PLC | | | | 1.9 | | | Hotels, Restaurants & Leisure |
RELX PLC | | | | 1.9 | | | Professional Services |
Canadian Pacific Kansas City Ltd. | | | | 1.7 | | | Ground Transportation |
Rolls-Royce Holdings PLC | | | | 1.7 | | | Aerospace & Defense |
Nestle SA | | | | 1.6 | | | Food Products |
ICON PLC ADR | | | | 1.5 | | | Life Sciences Tools & Services |
Samsung Electronics Co. Ltd. | | | | 1.5 | | | Technology Hardware, Storage & Peripherals |
Roche Holding AG | | | | 1.5 | | | Pharmaceuticals |
Aon PLC Class A | | | | 1.5 | | | Insurance |
| ± | The top 10 holdings may not be representative of the Fund’s future investments. The top 10 holdings exclude investments in money market funds. |
|
|
| FUND VS. BENCHMARK SECTOR ALLOCATION† |
As of October 31, 2023
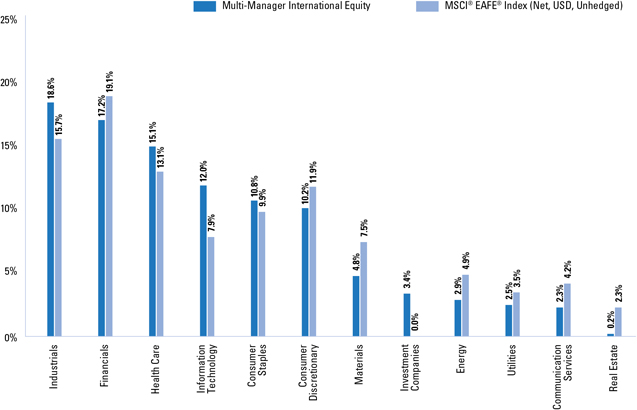
| † | The Fund is actively managed and, as such, its composition may differ over time. Consequently, the Fund’s overall sector allocations may differ from the percentages contained in the graph above. The graph categorizes investments using the Global Industry Classification Standard (“GICS”), however, the sector classifications used by the portfolio management team may differ from GICS. The percentage shown for each investment category reflects the value of investments in that category as a percentage of the total value of the Fund’s equity investments. The graph depicts the Fund’s investments but may not represent the Fund’s market exposure due to the exclusion of certain derivatives, if any, as listed in the Additional Investment Information section of the Schedule of Investments. Figures in the above graph may not sum to 100% due to the exclusion of other assets and liabilities. |
| | For more information about your Fund, please refer to www.GSAMFUNDS.com. There, you can learn more about your Fund’s investment strategies, holdings, and performance. |
5
|
| MULTI-MANAGER INTERNATIONAL EQUITY FUND |
Performance Summary
October 31, 2023
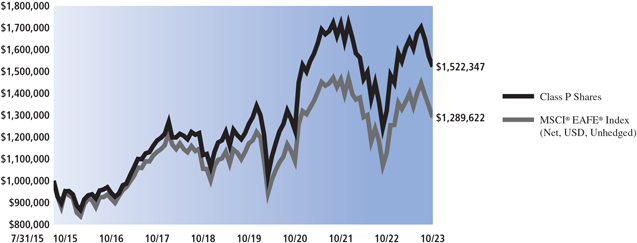
The following graph shows the value, as of October 31, 2023, of a $1,000,000 investment made on July 31, 2015 (commencement of operations) in Class P Shares at NAV. For comparative purposes, the performance of the Fund’s benchmark, the MSCI® EAFE® Index (Net, USD, Unhedged) is shown. Performance reflects applicable fee waivers and/or expense limitations in effect during the periods shown and in their absence, performance would be reduced. Returns do not reflect the deduction of taxes that a shareholder would pay on Fund distributions or the redemption of Fund shares. The returns set forth below represent past performance. Past performance does not guarantee future results. The Fund’s investment return and principal value will fluctuate so that an investor’s shares, when redeemed, may be worth more or less than their original cost. Current performance may be lower or higher than the performance quoted below. Please visit our web site at www.GSAMFUNDS.com to obtain the most recent month-end returns.
|
|
Multi-Manager International Equity Fund’s Lifetime Performance |
| | Performance of a $1,000,000 investment, with distributions reinvested, from July 31, 2015 through October 31, 2023. |
| | | | | | | | | | | | | | | | | |
| | | | |
| | | Average Annual Total Return through October 31, 2023* | | One Year | | Five Years | | Since Inception |
| | | | |
| | Class P Shares (Commenced July 31, 2015) | | 15.32% | | 6.37% | | 5.22% |
| | * | Because Class P Shares does not involve a sales charge, such a charge is not applied to its Average Annual Total Return. |
6
FUND RESULTS
Multi-Manager U.S. Small Cap Equity Fund
|
| |
Investment Objective The Fund seeks to provide long-term capital growth. |
Portfolio Management Discussion and Analysis
Below, the Goldman Sachs External Investing Group (“XIG”) (formerly, the Goldman Sachs Alternative Investments & Manager Selection (“AIMS”) Group) discusses the Multi-Manager U.S. Small Cap Equity Fund’s (the “Fund”) performance and positioning for the 12-month period ended October 31, 2023 (the “Reporting Period”).
| Q | How did the Fund perform during the Reporting Period? |
| A | During the Reporting Period, the Fund’s Class P Shares generated an average annual total return of -5.00%. This return compares to the -8.56% average annual total return of the Fund’s benchmark, the Russell 2000® Total Return Index (the “Index”), during the same time period. |
| Q | What key factors were responsible for the Fund’s performance during the Reporting Period? |
| A | The Fund uses a multi-manager approach and generally seeks to achieve its investment objective by dynamically allocating its assets among unaffiliated investment managers (“Underlying Managers”) that employ a small-cap equity investment strategy. XIG is responsible for making recommendations with respect to hiring, terminating or replacing the Fund’s Underlying Managers as well as for determining the Fund’s asset allocations. XIG applies a multifaceted process with respect to manager due diligence, portfolio construction and risk management. |
| | The Fund generated a negative absolute return during the Reporting Period but outperformed the Index. The relative outperformance can be attributed to the performance of the Fund’s Underlying Managers overall. At various points during the Reporting Period, the Fund allocated capital to four Underlying Managers, one of which managed two strategies, as part of its top-level strategy allocation—Boston Partners Global Investors (“Boston Partners”), Brown Advisory, LLC (“Brown Advisory”), Victory Capital Management, Inc. (“Victory RS” and “Victory Sycamore”) and Westfield Capital Management Company, L.P. (“Westfield”). |
| | The three Underlying Managers with allocated capital during the entire Reporting Period generated negative absolute returns. Victory RS generated a negative absolute return between the beginning of the Reporting Period and |
| | March 13, 2023, when its assets were redeemed. Westfield generated a negative absolute return between March 6, 2023, when it was allocated capital, and the end of the Reporting Period. |
| | On a relative basis, value-oriented Underlying Manager Boston Partners, value-oriented Underlying Manager Victory Sycamore and growth-oriented Underlying Manager Brown Advisory outperformed their respective benchmark indices during the Reporting Period. Growth-oriented Underlying Manager Victory RS underperformed its benchmark index between the start of the Reporting Period and March 13, 2023. Westfield, a growth-oriented Underlying Manager, outperformed its benchmark index between March 6, 2023 and the end of the Reporting Period. |
| Q | Which small-cap equity strategies most significantly affected Fund performance? |
| A | Value-oriented Underlying Manager Boston Partners outperformed its benchmark index, the Russell 2000® Value Index, the most during the Reporting Period. Strong stock selection and a relative underweight in the health care sector, as well as effective selection and an overweight in information technology, added to performance. These positive results were partially offset by stock selection within the energy and materials sectors, which detracted. |
| | Victory Sycamore, the other value-oriented Underlying Manager, also outperformed its benchmark index, the Russell 2000® Value Index, during the Reporting Period. The relative outperformance was driven by effective stock selection and an underweight in the health care sector as well as by an overweight in the industrials sector. An underweight in the energy sector, as well as weak stock selection in consumer discretionary, detracted, partly offsetting these positive results. |
7
| | Growth-oriented Underlying Manager Brown Advisory outperformed its benchmark index, the Russell 2000® Growth Index, during the Reporting Period, due to strong selection within health care, communication services and real estate. Partly offsetting these results was stock selection within consumer discretionary and financials, which detracted from relative performance. |
| | Victory RS, a growth-oriented Underlying Manager, underperformed its benchmark index, the Russell 2000® Growth Index, between the beginning of the Reporting Period and March 13, 2023 when its assets were redeemed. The negative results were driven by weak stock selection in the health care sector, notably among biotechnology companies. Selection in consumer discretionary also detracted from relative returns as did selection in information technology, specifically software stocks. On the positive side, stock selection in the industrials and energy sectors added to relative performance. |
| | Westfield, a growth-oriented Underlying Manager, outperformed its benchmark index, the Russell 2000® Growth Index, between March 6, 2023, when it was allocated assets, and the end of the Reporting Period. Its outperformance was primarily attributable to effective stock selection in the health care sector, particularly among biotechnology companies. A relative overweight in financials and stock selection in real estate further added to returns. Conversely, stock selection in the industrials and consumer discretionary sectors detracted from relative performance during the Reporting Period. |
| Q | How did the Fund use derivatives and similar instruments during the Reporting Period? |
| A | During the Reporting Period, the Fund did not use derivatives or similar instruments. |
| Q | Were there any notable changes in the Fund’s allocations during the Reporting Period? |
| A | At the beginning of the Reporting Period, the Fund’s assets were allocated approximately 36% to Brown Advisory, 29% to Boston Partners, 25% to Victory Sycamore and 9% to Victory RS, with the remainder invested in cash and cash equivalents. |
| | In December 2022, XIG reduced the Fund’s allocation to value-oriented Underlying Manager Boston Partners and redeployed the capital to Victory Sycamore, the Fund’s other value-oriented Underlying Manager. |
| | Effective January 24, 2023, Westfield became a growth-oriented Underlying Manager for the Fund but was not allocated capital at that time. |
| | In March 2023, the Fund’s allocation to growth-oriented Underlying Manager Victory RS was eliminated and the capital reallocated to Westfield. This redeployment allowed XIG to allocate assets to a strategy in which it had greater conviction while keeping the Fund in balance from both a risk budget and style perspective. Subsequently, XIG increased the Fund’s allocation to Westfield by reducing its allocation to growth-oriented Brown Advisory. Lastly, after substantial outperformance by value-oriented Victory Sycamore, XIG trimmed the Fund’s allocation to that Underlying Manager and further increased its allocation to Westfield. These adjustments allowed the Fund to reach an equal weighting between its growth-oriented and value-oriented Underlying Managers. |
| | At the end of the Reporting Period, the Fund’s assets were allocated approximately 29.50% to Brown Advisory, 24.75% to Boston Partners, 24.75% to Victory Sycamore and 20.00% to Westfield, with the remainder in cash and cash equivalents. |
| Q | What is the Fund’s tactical view and strategy for the months ahead? |
| A | We intend to continue to position the Fund in alignment with our longer-term strategic views within the U.S. small-cap equity complex. We further intend to continue to monitor allocations and Underlying Manager performance as we seek to generate long-term capital growth. |
8
FUND BASICS
Multi-Manager U.S. Small Cap Equity Fund
as of October 31, 2023
|
|
| TOP TEN HOLDINGS AS OF 10/31/23 ± |
| | | | | | | |
| | |
Holding | | % of Net Assets | | Line of Business |
ChampionX Corp. | | | | 1.3 | % | | Energy Equipment & Services |
Curtiss-Wright Corp. | | | | 0.9 | | | Aerospace & Defense |
Casella Waste Systems, Inc. Class A | | | | 0.9 | | | Commercial Services & Supplies |
Bright Horizons Family Solutions, Inc. | | | | 0.9 | | | Diversified Consumer Services |
Haemonetics Corp. | | | | 0.9 | | | Health Care Equipment & Supplies |
Casey’s General Stores, Inc. | | | | 0.9 | | | Consumer Staples Distribution & Retail |
Wintrust Financial Corp. | | | | 0.9 | | | Banks |
Ascendis Pharma AS ADR | | | | 0.9 | | | Biotechnology |
FTI Consulting, Inc. | | | | 0.8 | | | Professional Services |
Dynatrace, Inc. | | | | 0.8 | | | Software |
| ± | The top 10 holdings may not be representative of the Fund’s future investments. The top 10 holdings exclude investments in money market funds. |
|
|
| FUND VS. BENCHMARK SECTOR ALLOCATION † |
As of October 31, 2023
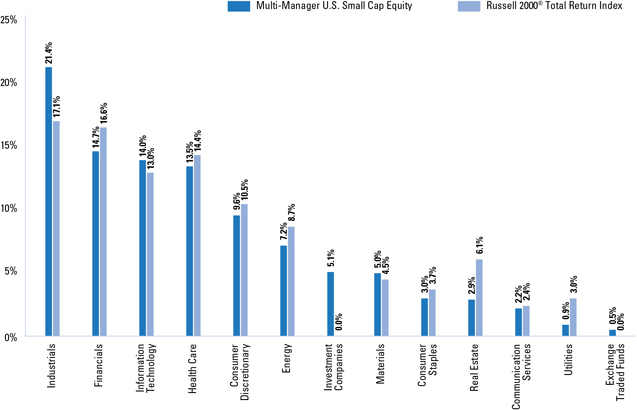
| † | The Fund is actively managed and, as such, its composition may differ over time. Consequently, the Fund’s overall sector allocations may differ from the percentages contained in the graph above. The graph categorizes investments using the Global Industry Classification Standard (“GICS”), however, the sector classifications used by the portfolio management team may differ from GICS. The percentage shown for each investment category reflects the value of investments in that category as a percentage of the total value of the Fund’s equity investments. The graph depicts the Fund’s investments but may not represent the Fund’s market exposure due to the exclusion of certain derivatives, if any, as listed in the Additional Investment Information section of the Schedule of Investments. Figures in the above graph may not sum to 100% due to the exclusion of other assets and liabilities. |
| | For more information about your Fund, please refer to www.GSAMFUNDS.com. There, you can learn more about your Fund’s investment strategies, holdings, and performance. |
9
|
| MULTI-MANAGER U. S. SMALL CAP EQUITY FUND |
Performance Summary
October 31, 2023
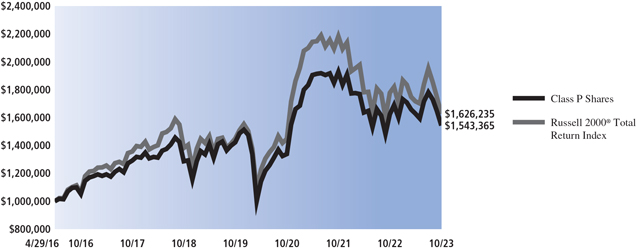
The following graph shows the value, as of October 31, 2023, of a $1,000,000 investment made on April 29, 2016 (commencement of operations) in Class P Shares at NAV. For comparative purposes, the performance of the Fund’s benchmark, the Russell 2000® Total Return is shown. Performance reflects applicable fee waivers and/or expense limitations in effect during the periods shown and in their absence, performance would be reduced. Returns do not reflect the deduction of taxes that a shareholder would pay on Fund distributions or the redemption of Fund shares. The returns set forth below represent past performance. Past performance does not guarantee future results. The Fund’s investment return and principal value will fluctuate so that an investor’s shares, when redeemed, may be worth more or less than their original cost. Current performance may be lower or higher than the performance quoted below. Please visit our web site at www.GSAMFUNDS.com to obtain the most recent month-end returns.
|
|
| Multi-Manager U.S. Small Cap Equity Fund’s Lifetime Performance |
| | Performance of a $1,000,000 investment, with distributions reinvested, from April 29, 2016 through October 31, 2023 |
| | | | | | | | | | | | | | | | | |
| | | | |
| | | Average Annual Total Return through October 31, 2023* | | One Year | | Five Years | | Since Inception |
| | | | |
| | Class P Shares (Commenced April 29, 2016) | | -5.00% | | 3.70% | | 5.95% |
| | * | Because Class P Shares does not involve a sales charge, such a charge is not applied to its Average Annual Total Return. |
10
FUND BASICS
Index Definitions
Market Review
MSCI All Country World Index Investable Market Index is designed to represent performance of the full opportunity set of large- and mid-cap stocks across 23 developed and 24 emerging markets.
MSCI China All Shares Index captures large and mid-cap representation across China A shares, B shares, H shares, Red chips, P chips and foreign listings (e.g., American Depositary Receipts). The index aims to reflect the opportunity set of China share classes listed in Hong Kong, Shanghai, Shenzhen and outside of China.
Russell 1000® Index measures the performance of the large-cap segment of the U.S. equity universe. The Russell 1000® Index is a subset of the Russell 3000® Index and includes approximately 1000 of the largest securities based on a combination of their market cap and current index membership. The Russell 1000® Index represents approximately 92% of the U.S. market. The Russell 1000® Index is constructed to provide a comprehensive and unbiased barometer for the large-cap segment and is completely reconstituted annually to ensure new and growing equities are reflected.
Russell 2000® Total Return Index is an unmanaged index of common stock prices that measures the performance of the 2000 smallest companies in the Russell 3000® Index. The Index is constructed to provide a comprehensive and unbiased small-cap barometer and is completely reconstituted annually to ensure larger stocks do not distort the performance and characteristics of the true small-cap opportunity set.
Multi-Manager International Equity Fund
MSCI ACWI ex USA Index captures large and mid cap representation across 22 of 23 developed markets countries.
MSCI® EAFE® Index is a stock market index that is designed to measure the equity market performance of developed markets in Europe, Australasia and the Far East, excluding the U.S. and Canada.
Multi-Manager U.S. Small Cap Equity Fund
Russell 2000® Growth Index measures the performance of the small-cap growth stocks of the U.S. equity universe.
Russell 2000® Total Return Index is an unmanaged index of common stock prices that measures the performance of the 2000 smallest companies in the Russell 3000® Index. The Index is constructed to provide a comprehensive and unbiased small-cap barometer and is completely reconstituted annually to ensure larger stocks do not distort the performance and characteristics of the true small-cap opportunity set.
Russell 2000® Value Index measures the performance of the small-cap value stocks of the U.S. equity universe.
It is not possible to invest directly in an unmanaged index.
11
|
| MULTI-MANAGER INTERNATIONAL EQUITY FUND |
Schedule of Investments
October 31, 2023
| | | | | | | | | | | | |
| | | |
Shares | | | Description | | Value | |
| |
| | | | | Common Stocks – 95.8% | |
| |
| | | | | Belgium – 0.9% | |
| | | | | 117,981 | | | Anheuser-Busch InBev SA (Beverages) | | $ | 6,712,889 | |
| | | | | 82,195 | | | KBC Group NV (Banks) | | | 4,523,589 | |
| | | | | | | | | | | | |
| | | | | | | | | | | 11,236,478 | |
| | | | | | |
| | | | | Bermuda* – 0.7% | |
| | | | | 99,310 | | | Arch Capital Group Ltd. (Insurance) | | | 8,608,191 | |
| | | | | | |
| | | | | Brazil – 0.2% | |
| | | | | 816,219 | | | Banco Bradesco SA ADR (Banks) | | | 2,277,251 | |
| | | | | | |
| | | | | Canada – 4.8% | |
| | | | | 87,493 | | | Alimentation Couche-Tard, Inc.
(Consumer Staples Distribution & Retail) | | | 4,762,824 | |
| | | | | 151,828 | | | CAE, Inc.* (Aerospace & Defense) | | | 3,170,679 | |
| | | | | 46,879 | | | Canadian National Railway Co.
(Ground Transportation) | | | 4,958,861 | |
| | | | | 299,501 | | | Canadian Pacific Kansas City Ltd.
(Ground Transportation) | | | 21,258,824 | |
| | | | | 18,862 | | | Intact Financial Corp. (Insurance) | | | 2,650,133 | |
| | | | | 54,624 | | | National Bank of Canada (Banks) | | | 3,396,201 | |
| | | | | 273,523 | | | Suncor Energy, Inc. (Oil, Gas & Consumable Fuels) | | | 8,858,062 | |
| | | | | 44,290 | | | Thomson Reuters Corp.
(Professional Services) | | | 5,305,219 | |
| | | | | 70,013 | | | Toronto-Dominion Bank (Banks) | | | 3,910,731 | |
| | | | | | | | | | | | |
| | | | | | | | | | | 58,271,534 | |
| | | | | | |
| | | | | China – 1.2% | |
| | | | | 28,935 | | | Alibaba Group Holding Ltd. ADR* (Broadline Retail) | | | 2,388,295 | |
| | | | | 2,024,000 | | | Beijing Capital International Airport Co. Ltd. Class H* (Transportation Infrastructure) | | | 745,515 | |
| | | | | 157,800 | | | NetEase, Inc. (Entertainment) | | | 3,377,165 | |
| | | | | 169,900 | | | Tencent Holdings Ltd. (Interactive Media & Services) | | | 6,287,783 | |
| | | | | 44,736 | | | Yum China Holdings, Inc. (Hotels, Restaurants & Leisure) | | | 2,351,324 | |
| | | | | | | | | | | | |
| | | | | | | | | | | 15,150,082 | |
| | | | | | |
| | | | | Denmark – 4.7% | |
| | | | | 73,406 | | | Carlsberg AS Class B (Beverages) | | | 8,748,022 | |
| | | | | 36,677 | | | DSV AS (Air Freight & Logistics) | | | 5,481,044 | |
| | | | | 9,072 | | | Genmab AS* (Biotechnology) | | | 2,564,499 | |
| | | | | 396,488 | | | Novo Nordisk AS Class B (Pharmaceuticals) | | | 38,251,658 | |
| | | | | 98,371 | | | Vestas Wind Systems AS*
(Electrical Equipment) | | | 2,132,168 | |
| | | | | | | | | | | | |
| | | | | | | | | | | 57,177,391 | |
| | | | | | |
| | | | | Finland – 0.4% | |
| | | | | 115,594 | | | Sampo OYJ Class A (Insurance) | | | 4,546,174 | |
| | | | | | |
| | | | | France – 12.1% | |
| | | | | 88,711 | | | Air Liquide SA (Chemicals) | | | 15,200,822 | |
| | | | | | |
| | | | | | | | | | | | |
| | | |
Shares | | | Description | | Value | |
| |
| | | �� | | Common Stocks (continued) | |
| | | | | France (continued) | |
| | | | | 417,040 | | | Alstom SA (Machinery) | | $ | 5,647,748 | |
| | | | | 184,151 | | | AXA SA (Insurance) | | | 5,456,472 | |
| | | | | 37,147 | | | BNP Paribas SA (Banks) | | | 2,136,101 | |
| | | | | 140,995 | | | Bureau Veritas SA (Professional Services) | | | 3,211,553 | |
| | | | | 47,136 | | | Capgemini SE (IT Services) | | | 8,330,290 | |
| | | | | 222,727 | | | Carrefour SA (Consumer Staples Distribution & Retail) | | | 3,904,730 | |
| | | | | 75,874 | | | Cie de Saint-Gobain SA (Building Products) | | | 4,130,137 | |
| | | | | 89,079 | | | Cie Generale des Etablissements Michelin SCA (Automobile Components) | | | 2,646,399 | |
| | | | | 142,449 | | | Danone SA (Food Products) | | | 8,474,356 | |
| | | | | 54,133 | | | Dassault Systemes SE (Software) | | | 2,229,921 | |
| | | | | 554,174 | | | Engie SA (Multi-Utilities) | | | 8,814,073 | |
| | | | | 33,802 | | | EssilorLuxottica SA (Health Care Equipment & Supplies) | | | 6,120,982 | |
| | | | | 12,954 | | | Kering SA (Textiles, Apparel & Luxury Goods) | | | 5,268,411 | |
| | | | | 38,353 | | | Legrand SA (Electrical Equipment) | | | 3,317,779 | |
| | | | | 14,098 | | | L’Oreal SA (Personal Products) | | | 5,925,819 | |
| | | | | 21,603 | | | LVMH Moet Hennessy Louis Vuitton SE (Textiles, Apparel & Luxury Goods) | | | 15,466,243 | |
| | | | | 60,723 | | | Pernod Ricard SA (Beverages) | | | 10,782,968 | |
| | | | | 67,536 | | | Sanofi SA (Pharmaceuticals) | | | 6,132,690 | |
| | | | | 93,700 | | | Schneider Electric SE (Electrical Equipment) | | | 14,416,429 | |
| | | | | 31,299 | | | Thales SA (Aerospace & Defense) | | | 4,619,030 | |
| | | | | 174,214 | | | Valeo SE (Automobile Components) | | | 2,301,905 | |
| | | | | 33,924 | | | Vinci SA (Construction & Engineering) | | | 3,751,127 | |
| | | | | | | | | | | | |
| | | | | | | | | | | 148,285,985 | |
| | | | | | |
| | | | | Germany–7.0% | |
| | | | | 25,337 | | | Allianz SE (Insurance) | | | 5,935,002 | |
| | | | | 167,608 | | | Bayer AG (Pharmaceuticals) | | | 7,242,100 | |
| | | | | 57,185 | | | Beiersdorf AG (Personal Products) | | | 7,520,971 | |
| | | | | 62,130 | | | Continental AG (Automobile Components) | | | 4,056,403 | |
| | | | | 39,178 | | | Deutsche Boerse AG (Capital Markets) | | | 6,448,562 | |
| | | | | 377,743 | | | Deutsche Telekom AG (Diversified Telecommunication Services) | | | 8,198,407 | |
| | | | | 22,994 | | | Gerresheimer AG (Life Sciences Tools & Services) | | | 2,144,724 | |
| | | | | 72,508 | | | Infineon Technologies AG
(Semiconductors & Semiconductor Equipment) | | | 2,117,974 | |
| | | | | 115,708 | | | LANXESS AG (Chemicals) | | | 2,651,399 | |
| | | | | 62,515 | | | Merck KGaA (Pharmaceuticals) | | | 9,442,165 | |
| | | | | 10,719 | | | MTU Aero Engines AG (Aerospace & Defense) | | | 2,014,708 | |
| | | | | | |
12 The accompanying notes are an integral part of these financial statements.
MULTI-MANAGER INTERNATIONAL EQUITY FUND
| | | | | | | | | | | | |
| | | |
Shares | | | Description | | Value | |
| |
| | | | | Common Stocks (continued) | |
| | | | | Germany (continued) | |
| | | | | 121,049 | | | RWE AG (Independent Power and Renewable Electricity Producers) | | $ | 4,631,989 | |
| | | | | 125,568 | | | SAP SE (Software) | | | 16,842,728 | |
| | | | | 68,137 | | | Schott Pharma AG & Co. KGaA* (Life Sciences Tools & Services) | | | 1,975,424 | |
| | | | | 30,944 | | | Siemens AG (Industrial Conglomerates) | | | 4,106,233 | |
| | | | | | | | | | | | |
| | | | | | | | | | | 85,328,789 | |
| | | | | | |
| | | | | Hong Kong – 1.0% | |
| | | | | 1,298,400 | | | AIA Group Ltd. (Insurance) | | | 11,275,050 | |
| | | | | 1,171,000 | | | ESR Group Ltd.(a) (Real Estate Management & Development) | | | 1,504,612 | |
| | | | | | | | | | | | |
| | | | | | | | | | | 12,779,662 | |
| | | | | | |
| | | | | India – 1.4% | |
| | | | | 425,874 | | | HDFC Bank Ltd. (Banks) | | | 7,556,934 | |
| | | | | 316,710 | | | ICICI Bank Ltd. ADR (Banks) | | | 7,027,795 | |
| | | | | 46,273 | | | Tata Consultancy Services Ltd.
(IT Services) | | | 1,873,297 | |
| | | | | | | | | | | | |
| | | | | | | | | | | 16,458,026 | |
| | | | | | |
| | | | | Ireland – 6.7% | |
| | | | | 38,611 | | | Accenture PLC Class A (IT Services) | | | 11,470,942 | |
| | | | | 58,074 | | | Aon PLC Class A (Insurance) | | | 17,968,096 | |
| | | | | 340,220 | | | Experian PLC (Professional Services) | | | 10,321,862 | |
| | | | | 75,346 | | | ICON PLC ADR* (Life Sciences Tools & Services) | | | 18,381,410 | |
| | | | | 30,573 | | | Linde PLC (Chemicals) | | | 11,683,778 | |
| | | | | 142,761 | | | Ryanair Holdings PLC ADR* (Passenger Airlines) | | | 12,520,140 | |
| | | | | | | | | | | | |
| | | | | | | | | | | 82,346,228 | |
| | | | | | |
| | | | | Israel – 0.7% | |
| | | | | 712,965 | | | Bank Leumi Le-Israel BM (Banks) | | | 4,592,148 | |
| | | | | 25,511 | | | Check Point Software Technologies Ltd.* (Software) | | | 3,424,852 | |
| | | | | | | | | | | | |
| | | | | | | | | | | 8,017,000 | |
| | | | | | |
| | | | | Italy – 3.8% | |
| | | | | 1,528,944 | | | Enel SpA (Electric Utilities) | | | 9,705,095 | |
| | | | | 321,925 | | | Eni SpA (Oil, Gas & Consumable Fuels) | | | 5,262,722 | |
| | | | | 37,934 | | | Ferrari NV (Automobiles) | | | 11,482,769 | |
| | | | | 2,106,773 | | | Intesa Sanpaolo SpA (Banks) | | | 5,489,810 | |
| | | | | 550,827 | | | UniCredit SpA (Banks) | | | 13,809,020 | |
| | | | | | | | | | | | |
| | | | | | | | | | | 45,749,416 | |
| | | | | | |
| | | | | Japan – 9.1% | |
| | | | | 295,200 | | | Advantest Corp. (Semiconductors & Semiconductor Equipment) | | | 7,603,944 | |
| | | | | 126,200 | | | BayCurrent Consulting, Inc. (Professional Services) | | | 3,168,471 | |
| | | | | | |
| | | | | | | | | | | | |
| | | |
Shares | | | Description | | Value | |
| |
| | | | | Common Stocks (continued) | |
| | | | | Japan (continued) | |
| | | | | 60,500 | | | Daikin Industries Ltd.
(Building Products) | | $ | 8,722,822 | |
| | | | | 313,400 | | | Denso Corp. (Automobile Components) | | | 4,627,768 | |
| | | | | 266,800 | | | FANUC Corp. (Machinery) | | | 6,621,014 | |
| | | | | 132,100 | | | Hitachi Ltd. (Industrial Conglomerates) | | | 8,373,367 | |
| | | | | 48,900 | | | Hoya Corp. (Health Care Equipment & Supplies) | | | 4,707,534 | |
| | | | | 16,500 | | | Keyence Corp. (Electronic Equipment, Instruments & Components) | | | 6,387,454 | |
| | | | | 107,000 | | | Kobe Bussan Co. Ltd. (Consumer Staples Distribution & Retail) | | | 2,648,042 | |
| | | | | 211,600 | | | Koito Manufacturing Co. Ltd. (Automobile Components) | | | 3,170,346 | |
| | | | | 127,500 | | | Kokusai Electric Corp.*
(Semiconductors & Semiconductor Equipment) | | | 2,077,684 | |
| | | | | 26,200 | | | Kose Corp. (Personal Products) | | | 1,735,776 | |
| | | | | 112,200 | | | Kubota Corp. (Machinery) | | | 1,509,005 | |
| | | | | 82,500 | | | Kyocera Corp. (Electronic Equipment, Instruments & Components) | | | 4,066,541 | |
| | | | | 245,200 | | | Mitsubishi Electric Corp.
(Electrical Equipment) | | | 2,811,588 | |
| | | | | 445,200 | | | Murata Manufacturing Co. Ltd.
(Electronic Equipment, Instruments & Components) | | | 7,625,999 | |
| | | | | 239,900 | | | Olympus Corp. (Health Care Equipment & Supplies) | | | 3,203,949 | |
| | | | | 276,600 | | | Renesas Electronics Corp.*
(Semiconductors & Semiconductor Equipment) | | | 3,633,312 | |
| | | | | 77,700 | | | Seven & i Holdings Co. Ltd.
(Consumer Staples Distribution & Retail) | | | 2,846,827 | |
| | | | | 75,300 | | | Shin-Etsu Chemical Co. Ltd. (Chemicals) | | | 2,251,724 | |
| | | | | 8,100 | | | SMC Corp. (Machinery) | | | 3,740,280 | |
| | | | | 64,100 | | | Sony Group Corp. (Household Durables) | | | 5,329,200 | |
| | | | | 48,200 | | | Sumitomo Mitsui Financial Group, Inc. (Banks) | | | 2,323,624 | |
| | | | | 72,200 | | | Suzuki Motor Corp. (Automobiles) | | | 2,802,227 | |
| | | | | 185,000 | | | Takeda Pharmaceutical Co. Ltd. (Pharmaceuticals) | | | 5,021,774 | |
| | | | | 118,900 | | | Terumo Corp. (Health Care Equipment & Supplies) | | | 3,252,888 | |
| | | | | 70,300 | | | ZOZO, Inc. (Specialty Retail) | | | 1,336,737 | |
| | | | | | | | | | | | |
| | | | | | | | | | | 111,599,897 | |
| | | | | | |
| | | | | Mexico – 0.4% | |
| | | | | 560,700 | | | Arca Continental SAB de CV (Beverages) | | | 5,027,920 | |
| | | | | | |
The accompanying notes are an integral part of these financial statements. 13
|
| MULTI-MANAGER INTERNATIONAL EQUITY FUND |
Schedule of Investments (continued)
October 31, 2023
| | | | | | | | | | | | |
| | | |
Shares | | | Description | | Value | |
| |
| | | | | Common Stocks (continued) | |
| | | | | Netherlands – 5.9% | |
| | | | | 8,839 | | | Adyen NV*(a) (Financial Services) | | $ | 5,961,780 | |
| | | | | 47,667 | | | Airbus SE (Aerospace & Defense) | | | 6,391,008 | |
| | | | | 185,400 | | | Akzo Nobel NV (Chemicals) | | | 12,437,501 | |
| | | | | 17,714 | | | ASM International NV (Semiconductors & Semiconductor Equipment) | | | 7,310,215 | |
| | | | | 22,700 | | | ASML Holding NV (Semiconductors & Semiconductor Equipment) | | | 13,619,167 | |
| | | | | 837,464 | | | ING Groep NV (Banks) | | | 10,736,728 | |
| | | | | 342,784 | | | Koninklijke Philips NV* (Health Care Equipment & Supplies) | | | 6,520,600 | |
| | | | | 79,325 | | | QIAGEN NV* (Life Sciences Tools & Services) | | | 2,956,292 | |
| | | | | 36,357 | | | Randstad NV (Professional Services) | | | 1,882,738 | |
| | | | | 159,073 | | | Universal Music Group NV (Entertainment) | | | 3,895,511 | |
| | | | | | | | | | | | |
| | | | | | | | | | | 71,711,540 | |
| | | | | | |
| | | | | Portugal – 0.6% | |
| | | | | 883,450 | | | EDP - Energias de Portugal SA
(Electric Utilities) | | | 3,712,696 | |
| | | | | 201,722 | | | Galp Energia SGPS SA (Oil, Gas & Consumable Fuels) | | | 3,036,876 | |
| | | | | | | | | | | | |
| | | | | | | | | | | 6,749,572 | |
| | | | | | |
| | | | | Singapore – 1.0% | |
| | | | | 364,400 | | | DBS Group Holdings Ltd. (Banks) | | | 8,754,096 | |
| | | | | 148,600 | | | United Overseas Bank Ltd. (Banks) | | | 2,931,089 | |
| | | | | | | | | | | | |
| | | | | | | | | | | 11,685,185 | |
| | | | | | |
| | | | | South Korea – 1.9% | |
| | | | | 68,621 | | | Samsung Electronics Co. Ltd. (Technology Hardware, Storage & Peripherals) | | | 3,415,602 | |
| | | | | 11,838 | | | Samsung Electronics Co. Ltd. GDR (Technology Hardware, Storage & Peripherals) | | | 14,803,130 | |
| | | | | 56,234 | | | SK Hynix, Inc. (Semiconductors & Semiconductor Equipment) | | | 4,883,479 | |
| | | | | | | | | | | | |
| | | | | | | | | | | 23,102,211 | |
| | | | | | |
| | | | | Spain – 1.3% | |
| | | | | 37,214 | | | Aena SME SA(a) (Transportation Infrastructure) | | | 5,399,776 | |
| | | | | 120,070 | | | Amadeus IT Group SA
(Hotels, Restaurants & Leisure) | | | 6,852,732 | |
| | | | | 329,581 | | | Iberdrola SA (Electric Utilities) | | | 3,665,606 | |
| | | | | | | | | | | | |
| | | | | | | | | | | 15,918,114 | |
| | | | | | |
| | | | | Sweden – 1.2% | |
| | | | | 50,003 | | | Assa Abloy AB Class B (Building Products) | | | 1,065,817 | |
| | | | | | |
| | | | | | | | | | | | |
| | | |
Shares | | | Description | | Value | |
| |
| | | | | Common Stocks (continued) | |
| | | | | Sweden (continued) | |
| | | | | 323,706 | | | Atlas Copco AB Class A (Machinery) | | $ | 4,191,675 | |
| | | | | 68,930 | | | Evolution AB(a)
(Hotels, Restaurants & Leisure) | | | 6,142,036 | |
| | | | | 363,770 | | | Hexagon AB Class B
(Electronic Equipment, Instruments & Components) | | | 2,964,591 | |
| | | | | 6,460 | | | Sandvik AB (Machinery) | | | 110,033 | |
| | | | | | | | | | | | |
| | | | | | | | | | | 14,474,152 | |
| | | | | | |
| | | | | Switzerland – 7.7% | |
| | | | | 84,801 | | | ABB Ltd. (Electrical Equipment) | | | 2,849,119 | |
| | | | | 74,490 | | | Cie Financiere Richemont SA Class A (Textiles, Apparel & Luxury Goods) | | | 8,787,992 | |
| | | | | 46,934 | | | Julius Baer Group Ltd.
(Capital Markets) | | | 2,781,388 | |
| | | | | 401 | | | Lonza Group AG (Life Sciences Tools & Services) | | | 140,432 | |
| | | | | 175,817 | | | Nestle SA (Food Products) | | | 18,959,881 | |
| | | | | 120,082 | | | Novartis AG (Pharmaceuticals) | | | 11,242,024 | |
| | | | | 1,397 | | | Partners Group Holding AG
(Capital Markets) | | | 1,479,232 | |
| | | | | 70,063 | | | Roche Holding AG (Pharmaceuticals) | | | 18,055,905 | |
| | | | | 30,100 | | | Sika AG (Chemicals) | | | 7,203,212 | |
| | | | | 16,452 | | | Sonova Holding AG (Health Care Equipment & Supplies) | | | 3,899,342 | |
| | | | | 364,059 | | | UBS Group AG (Capital Markets) | | | 8,554,086 | |
| | | | | 20,151 | | | Zurich Insurance Group AG (Insurance) | | | 9,571,575 | |
| | | | | | | | | | | | |
| | | | | | | | | | | 93,524,188 | |
| | | | | | |
| | | | | Taiwan – 0.6% | |
| | | | | 235,000 | | | Taiwan Semiconductor Manufacturing Co. Ltd. (Semiconductors & Semiconductor Equipment) | | | 3,838,139 | |
| | | | | 44,612 | | | Taiwan Semiconductor Manufacturing Co. Ltd. ADR (Semiconductors & Semiconductor Equipment) | | | 3,850,462 | |
| | | | | | | | | | | | |
| | | | | | | | | | | 7,688,601 | |
| | | | | | |
| | | | | United Kingdom – 17.5% | |
| | | | | 361,387 | | | Allfunds Group PLC (Capital Markets) | | | 1,849,624 | |
| | | | | 113,082 | | | AstraZeneca PLC (Pharmaceuticals) | | | 14,158,274 | |
| | | | | 5,167,525 | | | Barclays PLC (Banks) | | | 8,294,114 | |
| | | | | 45,350 | | | Berkeley Group Holdings PLC (Household Durables) | | | 2,229,251 | |
| | | | | 1,594,663 | | | BP PLC (Oil, Gas & Consumable Fuels) | | | 9,737,033 | |
| | | | | 177,924 | | | British American Tobacco PLC (Tobacco) | | | 5,315,018 | |
| | | | | | |
14 The accompanying notes are an integral part of these financial statements.
MULTI-MANAGER INTERNATIONAL EQUITY FUND
| | | | | | | | | | | | |
| | | |
Shares | | | Description | | Value | |
| |
| | | | | Common Stocks (continued) | |
| | | | | United Kingdom (continued) | |
| | | | | 141,711 | | | Coca-Cola Europacific Partners PLC (Beverages) | | $ | 8,266,723 | |
| | | | | 917,348 | | | Compass Group PLC (Hotels, Restaurants & Leisure) | | | 23,127,588 | |
| | | | | 320,705 | | | Diageo PLC (Beverages) | | | 12,127,772 | |
| | | | | 47,433 | | | Ferguson PLC (Trading Companies & Distributors) | | | 7,124,614 | |
| | | | | 375,571 | | | GSK PLC (Pharmaceuticals) | | | 6,695,214 | |
| | | | | 785,062 | | | HSBC Holdings PLC (Banks) | | | 5,668,474 | |
| | | | | 409,325 | | | Informa PLC (Media) | | | 3,546,585 | |
| | | | | 555,474 | | | Kingfisher PLC (Specialty Retail) | | | 1,418,412 | |
| | | | | 1,025,667 | | | Legal & General Group PLC (Insurance) | | | 2,642,633 | |
| | | | | 47,755 | | | London Stock Exchange Group PLC (Capital Markets) | | | 4,818,242 | |
| | | | | 976,998 | | | NatWest Group PLC (Banks) | | | 2,125,768 | |
| | | | | 1,094,045 | | | Prudential PLC (Insurance) | | | 11,439,751 | |
| | | | | 150,101 | | | Reckitt Benckiser Group PLC (Household Products) | | | 10,042,796 | |
| | | | | 657,740 | | | RELX PLC (Professional Services) | | | 22,969,094 | |
| | | | | 108,342 | | | Rio Tinto PLC (Metals & Mining) | | | 6,912,269 | |
| | | | | 7,891,928 | | | Rolls-Royce Holdings PLC* (Aerospace & Defense) | | | 20,773,316 | |
| | | | | 168,057 | | | Segro PLC (Industrial REITs) | | | 1,460,775 | |
| | | | | 259,752 | | | Shell PLC (Oil, Gas & Consumable Fuels) | | | 8,485,483 | |
| | | | | 943,625 | | | Tesco PLC (Consumer Staples Distribution & Retail) | | | 3,096,560 | |
| | | | | 74,387 | | | Unilever PLC (Personal Products) | | | 3,523,014 | |
| | | | | 245,599 | | | WH Smith PLC (Specialty Retail) | | | 3,462,752 | |
| | | | | 333,567 | | | WPP PLC (Media) | | | 2,872,418 | |
| | | | | | | | | | | | |
| | | | | | | | | | | 214,183,567 | |
| | | | | | |
| | | | | United States – 2.4% | |
| | | | | 53,027 | | | Atlassian Corp. Class A* (Software) | | | 9,578,797 | |
| | | | | 16,313 | | | EPAM Systems, Inc.* (IT Services) | | | 3,549,219 | |
| | | | | 3,943 | | | Mettler-Toledo International, Inc.* (Life Sciences Tools & Services) | | | 3,884,644 | |
| | | | | 33,224 | | | STERIS PLC (Health Care Equipment & Supplies) | | | 6,976,376 | |
| | | | | 44,799 | | | Waste Connections, Inc. (Commercial Services & Supplies) | | | 5,801,470 | |
| | | | | | | | | | | | |
| | | | | | | | | | | 29,790,506 | |
| | | | | | |
| | | | | Uruguay* – 0.6% | |
| | | | | 6,320 | | | MercadoLibre, Inc. (Broadline Retail) | | | 7,841,477 | |
| | | | | | |
| | | |
| TOTA L C OMMON S TOCKS
(Cost $1,022,822,030) | | $ | 1,169,529,137 | |
| | | | | | |
| | | | | | | | | | | | |
| | | | Shares | | | Dividend
Rate | | Value | |
| |
| | | | | Investment Company(b) – 3.3% | |
| | | |
| Goldman Sachs Financial Square Government Fund —
Institutional Shares |
|
| | | | | 40,942,755 | | | 5.258% | | $ | 40,942,755 | |
| | | | | (Cost $ 40,942,755) | |
| | | | | | |
| | | |
| TOTAL INVESTMENTS – 99.1%
(Cost $ 1,063,764,785) | | $ | 1,210,471,892 | |
| | | | | | |
| | | |
| OTHER ASSETS IN EXCESS OF
LIABILITIES – 0.9% | | | 10,579,442 | |
| | | | | | |
| | | | | NET ASSETS – 100.0% | | $ | 1,221,051,334 | |
| | | | | | |
The percentage shown for each investment category reflects the value of investments in that category as a percentage of net assets.
| | * | Non-income producing security. |
| | (a) | Exempt from registration under Rule 144A of the Securities Act of 1933. |
| | (b) | Represents an Affiliated Issuer. |
| | | | |
|
| SECTOR ALLOCATION AS OF OCTOBER 31, 2023 | |
| |
| Sector | | % of Total
Market Value | |
Industrials | | | 18.6% | |
Financials | | | 17.2 | |
Health Care | | | 15.1 | |
Information Technology | | | 12.0 | |
Consumer Staples | | | 10.8 | |
Consumer Discretionary | | | 10.2 | |
Materials | | | 4.8 | |
Investment Company | | | 3.4 | |
Energy | | | 2.9 | |
Utilities | | | 2.5 | |
Communication Services | | | 2.3 | |
Real Estate | | | 0.2 | |
| |
| | | 100.0% | |
| |
| | |
Investment Abbreviations: |
ADR | | —American Depositary Receipt |
GDR | | —Global Depository Receipt |
PLC | | —Public Limited Company |
|
The accompanying notes are an integral part of these financial statements. 15
|
| MULTI-MANAGER U.S. SMALL CAP EQUITY FUND |
Schedule of Investments
October 31, 2023
| | | | | | | | |
| | |
Shares | | Description | | Value | |
| |
| | Common Stocks – 94.0% | |
| |
| | Aerospace & Defense – 2.5% | |
| | 33,040 | | Curtiss-Wright Corp. | | $ | 6,568,683 | |
| | 67,360 | | Hexcel Corp. | | | 4,170,931 | |
| | 106,431 | | Leonardo DRS, Inc.* | | | 2,029,639 | |
| | 39,300 | | Mercury Systems, Inc.* | | | 1,414,014 | |
| | 32,492 | | Woodward, Inc. | | | 4,051,752 | |
| | | | | | | | |
| | | | | | | 18,235,019 | |
| | | |
| |
| | Air Freight & Logistics* – 0.5% | |
| | 50,280 | | Hub Group, Inc. Class A | | | 3,456,750 | |
| | | |
| |
| | Automobile Components – 1.1% | |
| | 31,894 | | LCI Industries | | | 3,460,180 | |
| | 32,540 | | Visteon Corp.* | | | 3,746,330 | |
| | 13,728 | | XPEL, Inc.* | | | 635,607 | |
| | | | | | | | |
| | | | | | | 7,842,117 | |
| | | |
| |
| | Automobiles – 0.1% | |
| | 8,456 | | Thor Industries, Inc. | | | 743,536 | |
| | | |
| |
| | Banks – 5.0% | |
| | 20,016 | | Ameris Bancorp | | | 746,597 | |
| | 25,700 | | Bank of Hawaii Corp. | | | 1,269,323 | |
| | 29,582 | | Berkshire Hills Bancorp, Inc. | | | 580,103 | |
| | 28,621 | | Dime Community Bancshares, Inc. | | | 526,340 | |
| | 41,860 | | First Merchants Corp. | | | 1,143,197 | |
| | 28,214 | | Hancock Whitney Corp. | | | 971,408 | |
| | 54,602 | | Heritage Commerce Corp. | | | 446,644 | |
| | 72,955 | | Hope Bancorp, Inc. | | | 639,086 | |
| | 34,800 | | Independent Bank Corp. | | | 1,698,240 | |
| | 33,300 | | Lakeland Financial Corp. | | | 1,640,025 | |
| | 88,962 | | OceanFirst Financial Corp. | | | 1,126,259 | |
| | 89,535 | | Old National Bancorp | | | 1,226,629 | |
| | 35,526 | | Peapack-Gladstone Financial Corp. | | | 830,243 | |
| | 19,405 | | Preferred Bank | | | 1,155,956 | |
| | 98,188 | | Prosperity Bancshares, Inc. | | | 5,355,173 | |
| | 67,750 | | Renasant Corp. | | | 1,652,422 | |
| | 26,164 | | S&T Bancorp, Inc. | | | 673,985 | |
| | 58,650 | | SouthState Corp. | | | 3,876,765 | |
| | 39,500 | | UMB Financial Corp. | | | 2,477,440 | |
| | 26,386 | | Univest Financial Corp. | | | 439,591 | |
| | 29,891 | | Western Alliance Bancorp | | | 1,228,520 | |
| | 82,845 | | Wintrust Financial Corp. | | | 6,187,693 | |
| | | | | | | | |
| | | | | | | 35,891,639 | |
| | | |
| |
| | Biotechnology* – 4.1% | |
| | 98,670 | | 89bio, Inc. | | | 730,158 | |
| | 166,709 | | Abcam PLC ADR | | | 3,820,970 | |
| | 85,052 | | Alkermes PLC | | | 2,057,408 | |
| | 68,953 | | Ascendis Pharma AS ADR | | | 6,158,192 | |
| | 23,101 | | Blueprint Medicines Corp. | | | 1,359,725 | |
| | 57,506 | | Catalyst Pharmaceuticals, Inc. | | | 713,649 | |
| | 82,360 | | Cerevel Therapeutics Holdings, Inc. | | | 1,947,814 | |
| | 23,820 | | CRISPR Therapeutics AG | | | 927,313 | |
| | 10,706 | | Karuna Therapeutics, Inc. | | | 1,783,727 | |
| | 23,818 | | MoonLake Immunotherapeutics | | | 1,234,011 | |
| | 40,753 | | Neurocrine Biosciences, Inc. | | | 4,521,138 | |
| | | |
| | | | | | | | |
| | |
Shares | | Description | | Value | |
| |
| | Common Stocks – (continued) | |
| |
| | Biotechnology* – (continued) | |
| | 135,130 | | Rocket Pharmaceuticals, Inc. | | $ | 2,445,853 | |
| | 44,834 | | Vaxcyte, Inc. | | | 2,156,515 | |
| | | | | | | | |
| | | | | | | 29,856,473 | |
| | | |
| |
| | Building Products – 2.4% | |
| | 32,999 | | AAON, Inc. | | | 1,797,786 | |
| | 23,650 | | Apogee Enterprises, Inc. | | | 1,015,058 | |
| | 153,871 | | AZEK Co., Inc.* | | | 4,031,420 | |
| | 24,100 | | Gibraltar Industries, Inc.* | | | 1,466,726 | |
| | 79,000 | | Hayward Holdings, Inc.* | | | 829,500 | |
| | 147,476 | | Janus International Group, Inc.* | | | 1,380,375 | |
| | 11,485 | | Masonite International Corp.* | | | 908,923 | |
| | 28,767 | | PGT Innovations, Inc.* | | | 861,284 | |
| | 20,000 | | UFP Industries, Inc. | | | 1,903,400 | |
| | 103,981 | | Zurn Elkay Water Solutions Corp. | | | 2,751,337 | |
| | | | | | | | |
| | | | | | | 16,945,809 | |
| | | |
| |
| | Capital Markets – 1.6% | |
| | 28,270 | | Avantax, Inc.* | | | 729,649 | |
| | 333,009 | | BGC Group, Inc. Class A | | | 1,954,763 | |
| | 36,650 | | Cohen & Steers, Inc. | | | 1,914,596 | |
| | 20,459 | | Evercore, Inc. Class A | | | 2,663,352 | |
| | 13,000 | | Houlihan Lokey, Inc. | | | 1,306,760 | |
| | 57,070 | | StepStone Group, Inc. Class A | | | 1,615,081 | |
| | 11,909 | | StoneX Group, Inc.* | | | 1,135,166 | |
| | | | | | | | |
| | | | | | | 11,319,367 | |
| | | |
| |
| | Chemicals – 3.4% | |
| | 47,275 | | AdvanSix, Inc. | | | 1,302,426 | |
| | 13,923 | | Ashland, Inc. | | | 1,066,919 | |
| | 71,500 | | Avient Corp. | | | 2,260,830 | |
| | 94,800 | | Axalta Coating Systems Ltd.* | | | 2,486,604 | |
| | 148,696 | | Ecovyst, Inc.* | | | 1,368,003 | |
| | 82,214 | | HB Fuller Co. | | | 5,438,456 | |
| | 50,004 | | Ingevity Corp.* | | | 2,014,161 | |
| | 24,600 | | Innospec, Inc. | | | 2,410,800 | |
| | 16,858 | | Methanex Corp. | | | 695,393 | |
| | 35,775 | | Minerals Technologies, Inc. | | | 1,933,997 | |
| | 26,700 | | Orion SA | | | 542,010 | |
| | 23,023 | | Quaker Chemical Corp. | | | 3,308,866 | |
| | | | | | | | |
| | | | | | | 24,828,465 | |
| | | |
| |
| | Commercial Services & Supplies – 3.9% | |
| | 31,401 | | ABM Industries, Inc. | | | 1,235,315 | |
| | 51,608 | | Brink’s Co. | | | 3,450,511 | |
| | 86,786 | | Casella Waste Systems, Inc. Class A* | | | 6,548,004 | |
| | 127,867 | | CoreCivic, Inc.* | | | 1,623,911 | |
| | 25,764 | | MSA Safety, Inc. | | | 4,067,620 | |
| | 113,538 | | Rentokil Initial PLC ADR | | | 2,905,437 | |
| | 9,250 | | UniFirst Corp. | | | 1,520,978 | |
| | 70,283 | | Viad Corp.* | | | 1,702,957 | |
| | 41,380 | | Waste Connections, Inc. | | | 5,358,710 | |
| | | | | | | | |
| | | | | | | 28,413,443 | |
| | | |
16 The accompanying notes are an integral part of these financial statements.
MULTI-MANAGER U.S. SMALL CAP EQUITY FUND
| | | | | | | | |
| | | Shares | | Description | | Value | |
| |
| | Common Stocks – (continued) | |
| |
| | Communications Equipment* – 1.3% | |
| | 50,610 | | Calix, Inc. | | $ | 1,676,203 | |
| | 48,500 | | Ciena Corp. | | | 2,046,700 | |
| | 25,757 | | Clearfield, Inc. | | | 618,683 | |
| | 76,574 | | Extreme Networks, Inc. | | | 1,578,956 | |
| | 12,910 | | F5, Inc. | | | 1,957,027 | |
| | 477,772 | | Infinera Corp. | | | 1,399,872 | |
| | | | | | | | |
| | | | | | | 9,277,441 | |
| | | |
| |
| | Construction & Engineering – 1.2% | |
| | 1,280 | | Comfort Systems USA, Inc. | | | 232,768 | |
| | 3,300 | | EMCOR Group, Inc. | | | 681,945 | |
| | 28,731 | | Granite Construction, Inc. | | | 1,163,031 | |
| | 4,700 | | MYR Group, Inc.* | | | 544,401 | |
| | 33,254 | | Primoris Services Corp. | | | 999,615 | |
| | 14,839 | | Valmont Industries, Inc. | | | 2,921,948 | |
| | 61,520 | | WillScot Mobile Mini Holdings Corp.* | | | 2,424,503 | |
| | | | | | | | |
| | | | | | | 8,968,211 | |
| | | |
| |
| | Construction Materials – 0.4% | |
| | 8,500 | | Eagle Materials, Inc. | | | 1,308,235 | |
| | 54,000 | | Summit Materials, Inc. Class A* | | | 1,776,600 | |
| | | | | | | | |
| | | | | | | 3,084,835 | |
| | | |
| |
| | Consumer Finance – 1.0% | |
| | 22,161 | | FirstCash Holdings, Inc. | | | 2,413,776 | |
| | 11,172 | | Nelnet, Inc. Class A | | | 947,497 | |
| | 292,717 | | SLM Corp. | | | 3,805,321 | |
| | | | | | | | |
| | | | | | | 7,166,594 | |
| | | |
| |
| | Consumer Staples Distribution & Retail – 1.1% | |
| | 22,803 | | Casey’s General Stores, Inc. | | | 6,200,364 | |
| | 33,900 | | Performance Food Group Co.* | | | 1,958,064 | |
| | | | | | | | |
| | | | | | | 8,158,428 | |
| | | |
| |
| | Containers & Packaging – 0.8% | |
| | 46,000 | | Silgan Holdings, Inc. | | | 1,842,760 | |
| | 46,000 | | Sonoco Products Co. | | | 2,383,260 | |
| | 53,475 | | TriMas Corp. | | | 1,294,630 | |
| | | | | | | | |
| | | | | | | 5,520,650 | |
| | | |
| |
| | Diversified Consumer Services – 2.1% | |
| | 86,596 | | Bright Horizons Family Solutions, Inc.* | | | 6,413,300 | |
| | 36,981 | | Frontdoor, Inc.* | | | 1,069,860 | |
| | 224,437 | | Laureate Education, Inc. | | | 3,173,539 | |
| | 430,651 | | Mister Car Wash, Inc.* | | | 2,239,385 | |
| | 38,905 | | Stride, Inc.* | | | 2,138,997 | |
| | | | | | | | |
| | | | | | | 15,035,081 | |
| | | |
| |
| | Diversified Telecommunication Services – 0.4% | |
| | 42,405 | | Cogent Communications Holdings, Inc. | | | 2,755,477 | |
| | | |
| |
| | Electric Utilities – 0.5% | |
| | 21,500 | | IDACORP, Inc. | | | 2,036,265 | |
| | | |
| | | | | | | | |
| | | Shares | | Description | | Value | |
| |
| | Common Stocks – (continued) | |
| |
| | Electric Utilities – (continued) | |
| | 18,000 | | MGE Energy, Inc. | | $ | 1,289,340 | |
| | 10,857 | | Portland General Electric Co. | | | 434,497 | |
| | | | | | | | |
| | | | | | | 3,760,102 | |
| | | |
| |
| | Electrical Equipment – 1.0% | |
| | 9,509 | | Acuity Brands, Inc. | | | 1,540,173 | |
| | 12,415 | | Atkore, Inc.* | | | 1,542,936 | |
| | 14,219 | | EnerSys | | | 1,216,862 | |
| | 31,225 | | NEXTracker, Inc. Class A* | | | 1,085,381 | |
| | 67,030 | | Sensata Technologies Holding PLC | | | 2,136,916 | |
| | | | | | | | |
| | | | | | | 7,522,268 | |
| | | |
| |
| | Electronic Equipment, Instruments & Components – 3.5% | |
| | 19,400 | | Advanced Energy Industries, Inc. | | | 1,692,844 | |
| | 50,538 | | Avnet, Inc. | | | 2,341,426 | |
| | 30,986 | | Belden, Inc. | | | 2,196,907 | |
| | 23,600 | | Crane NXT Co. | | | 1,227,200 | |
| | 20,890 | | Fabrinet* | | | 3,237,950 | |
| | 38,618 | | Insight Enterprises, Inc.* | | | 5,533,960 | |
| | 18,866 | | Littelfuse, Inc. | | | 4,087,696 | |
| | 12,740 | | OSI Systems, Inc.* | | | 1,328,400 | |
| | 8,100 | | Plexus Corp.* | | | 796,392 | |
| | 14,725 | | Rogers Corp.* | | | 1,809,555 | |
| | 44,000 | | ScanSource, Inc.* | | | 1,337,600 | |
| | | | | | | | |
| | | | | | | 25,589,930 | |
| | | |
| |
| | Energy Equipment & Services – 3.7% | |
| | 72,927 | | Cactus, Inc. Class A | | | 3,423,193 | |
| | 298,203 | | ChampionX Corp. | | | 9,184,652 | |
| | 61,857 | | Expro Group Holdings NV* | | | 974,248 | |
| | 53,000 | | Helmerich & Payne, Inc. | | | 2,097,210 | |
| | 95,411 | | National Energy Services Reunited Corp.* | | | 539,072 | |
| | 27,050 | | Noble Corp. PLC | | | 1,262,965 | |
| | 293,149 | | Patterson-UTI Energy, Inc. | | | 3,722,992 | |
| | 90,366 | | ProPetro Holding Corp.* | | | 947,036 | |
| | 99,432 | | Select Water Solutions, Inc. | | | 739,774 | |
| | 11,443 | | Tidewater, Inc.* | | | 782,129 | |
| | 52,125 | | U.S. Silica Holdings, Inc.* | | | 629,149 | |
| | 22,266 | | Weatherford International PLC* | | | 2,072,742 | |
| | | | | | | | |
| | | | | | | 26,375,162 | |
| | | |
| |
| | Entertainment* – 0.3% | |
| | 9,721 | | Take-Two Interactive Software, Inc. | | | 1,300,184 | |
| | 84,606 | | Vivid Seats, Inc. Class A | | | 497,483 | |
| | | | | | | | |
| | | | | | | 1,797,667 | |
| | | |
| |
| | Financial Services – 3.0% | |
| | 42,986 | | Essent Group Ltd. | | | 2,030,659 | |
| | 21,253 | | Federal Agricultural Mortgage Corp. Class C | | | 3,157,346 | |
| | 114,660 | | Flywire Corp.* | | | 3,083,207 | |
| | 170,220 | | Marqeta, Inc. Class A* | | | 880,037 | |
| | 67,516 | | NCR Atleos Corp.* | | | 1,489,403 | |
| | 49,810 | | Shift4 Payments, Inc. Class A* | | | 2,217,541 | |
| | | |
The accompanying notes are an integral part of these financial statements. 17
|
| MULTI-MANAGER U.S. SMALL CAP EQUITY FUND |
Schedule of Investments (continued)
October 31, 2023
| | | | | | | | |
| | |
Shares | | Description | | Value | |
| |
| | Common Stocks – (continued) | |
| |
| | Financial Services – (continued) | |
| | 22,156 | | Voya Financial, Inc. | | $ | 1,479,356 | |
| | 24,796 | | Walker & Dunlop, Inc. | | | 1,606,781 | |
| | 35,888 | | WEX, Inc.* | | | 5,974,634 | |
| | | | | | | | |
| | | | | | | 21,918,964 | |
| | | |
| |
| | Food Products – 1.2% | |
| | 56,355 | | Fresh Del Monte Produce, Inc. | | | 1,408,875 | |
| | 44,094 | | Hostess Brands, Inc. * | | | 1,472,739 | |
| | 16,900 | | Ingredion, Inc. | | | 1,581,502 | |
| | 7,200 | | Lancaster Colony Corp. | | | 1,218,024 | |
| | 73,589 | | Simply Good Foods Co.* | | | 2,744,134 | |
| | | | | | | | |
| | | | | | | 8,425,274 | |
| | | |
| |
| | Gas Utilities – 0.1% | |
| | 17,700 | | ONE Gas, Inc. | | | 1,069,080 | |
| | | |
| |
| | Ground Transportation – 1.1% | |
| | 18,613 | | Knight-Swift Transportation Holdings, Inc. | | | 909,989 | |
| | 93,300 | | Marten Transport Ltd. | | | 1,640,214 | |
| | 8,710 | | Saia, Inc.* | | | 3,122,448 | |
| | 67,000 | | Werner Enterprises, Inc. | | | 2,433,440 | |
| | | | | | | | |
| | | | | | | 8,106,091 | |
| | | |
| |
| | Health Care Equipment & Supplies* – 3.6% | |
| | 60,458 | | Establishment Labs Holdings, Inc. | | | 1,770,210 | |
| | 73,066 | | Haemonetics Corp. | | | 6,227,415 | |
| | 7,400 | | ICU Medical, Inc. | | | 725,644 | |
| | 45,381 | | Inari Medical, Inc. | | | 2,755,081 | |
| | 30,652 | | Inmode Ltd. | | | 585,453 | |
| | 15,170 | | Inspire Medical Systems, Inc. | | | 2,232,417 | |
| | 30,900 | | Integer Holdings Corp. | | | 2,508,153 | |
| | 20,250 | | Integra LifeSciences Holdings Corp. | | | 728,190 | |
| | 57,706 | | Lantheus Holdings, Inc. | | | 3,727,808 | |
| | 57,742 | | OrthoPediatrics Corp. | | | 1,412,369 | |
| | 5,353 | | QuidelOrtho Corp. | | | 326,961 | |
| | 155,950 | | SI-BONE, Inc. | | | 2,652,710 | |
| | | | | | | | |
| | | | | | | 25,652,411 | |
| | | |
| |
| | Health Care Providers & Services – 3.8% | |
| | 207,450 | | Accolade, Inc.* | | | 1,348,425 | |
| | 139,050 | | agilon health, Inc.* | | | 2,502,900 | |
| | 175,967 | | Alignment Healthcare, Inc.* | | | 1,210,653 | |
| | 9,418 | | Amedisys, Inc.* | | | 861,653 | |
| | 12,851 | | AMN Healthcare Services, Inc.* | | | 974,877 | |
| | 3,550 | | Chemed Corp. | | | 1,997,407 | |
| | 66,215 | | Encompass Health Corp. | | | 4,142,410 | |
| | 60,166 | | HealthEquity, Inc.* | | | 4,312,699 | |
| | 158,587 | | LifeStance Health Group, Inc.* | | | 924,562 | |
| | 338,389 | | NeoGenomics, Inc.* | | | 4,744,214 | |
| | 113,590 | | Option Care Health, Inc.* | | | 3,149,851 | |
| | 64,385 | | PetIQ, Inc. * | | | 1,208,506 | |
| | | | | | | | |
| | | | | | | 27,378,157 | |
| | | |
| |
| | Health Care Technology* – 0.6% | |
| | 140,703 | | Definitive Healthcare Corp. | | | 810,449 | |
| | | |
| | | | | | | | |
| | |
Shares | | Description | | Value | |
| |
| | Common Stocks – (continued) | |
| |
| | Health Care Technology* – (continued) | |
| | 121,434 | | Phreesia, Inc. | | $ | 1,658,789 | |
| | 166,800 | | Veradigm, Inc. | | | 2,200,092 | |
| | | | | | | | |
| | | | | | | 4,669,330 | |
| | | |
| |
| | Hotel & Resort REITs – 0.3% | |
| | 115,000 | | Apple Hospitality REIT, Inc. | | | 1,803,200 | |
| | | |
| |
| | Hotels, Restaurants & Leisure – 2.3% | |
| | 31,510 | | Bloomin’ Brands, Inc. | | | 735,443 | |
| | 123,584 | | Bowlero Corp. Class A* | | | 1,246,963 | |
| | 9,582 | | Choice Hotels International, Inc. | | | 1,058,811 | |
| | 40,711 | | Churchill Downs, Inc. | | | 4,471,696 | |
| | 23,912 | | Dave & Buster’s Entertainment, Inc.* | | | 835,485 | |
| | 41,532 | | First Watch Restaurant Group, Inc.* | | | 694,000 | |
| | 45,608 | | International Game Technology PLC | | | 1,159,355 | |
| | 37,530 | | Texas Roadhouse, Inc. | | | 3,810,796 | |
| | 14,050 | | Wingstop, Inc. | | | 2,567,919 | |
| | | | | | | | |
| | | | | | | 16,580,468 | |
| | | |
| |
| | Household Durables – 1.3% | |
| | 5,300 | | Helen of Troy Ltd.* | | | 521,096 | |
| | 28,246 | | M/I Homes, Inc.* | | | 2,318,149 | |
| | 25,700 | | Meritage Homes Corp. | | | 2,930,314 | |
| | 23,765 | | Tempur Sealy International, Inc. | | | 948,937 | |
| | 9,047 | | TopBuild Corp.* | | | 2,069,592 | |
| | 144,192 | | Vizio Holding Corp. Class A* | | | 733,937 | |
| | | | | | | | |
| | | | | | | 9,522,025 | |
| | | |
| |
| | Household Products* – 0.4% | |
| | 66,100 | | Central Garden & Pet Co. Class A | | | 2,623,509 | |
| | | |
| |
| | Industrial REITs – 0.9% | |
| | 24,830 | | EastGroup Properties, Inc. | | | 4,053,498 | |
| | 28,400 | | First Industrial Realty Trust, Inc. | | | 1,201,320 | |
| | 47,670 | | STAG Industrial, Inc. | | | 1,583,597 | |
| | | | | | | | |
| | | | | | | 6,838,415 | |
| | | |
| |
| | Insurance – 3.9% | |
| | 30,700 | | AMERISAFE, Inc. | | | 1,564,779 | |
| | 33,218 | | Assured Guaranty Ltd. | | | 2,072,803 | |
| | 52,421 | | Axis Capital Holdings Ltd. | | | 2,993,239 | |
| | 20,108 | | Employers Holdings, Inc. | | | 764,104 | |
| | 38,500 | | First American Financial Corp. | | | 1,980,440 | |
| | 19,600 | | Hanover Insurance Group, Inc. | | | 2,297,316 | |
| | 7,540 | | Kinsale Capital Group, Inc. | | | 2,517,682 | |
| | 31,766 | | Palomar Holdings, Inc.* | | | 1,590,841 | |
| | 14,200 | | Primerica, Inc. | | | 2,714,472 | |
| | 38,100 | | Ryan Specialty Holdings, Inc. * | | | 1,645,920 | |
| | 25,300 | | Safety Insurance Group, Inc. | | | 1,901,801 | |
| | 21,600 | | Selective Insurance Group, Inc. | | | 2,248,776 | |
| | 15,000 | | Stewart Information Services Corp. | | | 655,050 | |
| | 2,381 | | White Mountains Insurance Group Ltd. | | | 3,406,616 | |
| | | | | | | | |
| | | | | | | 28,353,839 | |
| | | |
18 The accompanying notes are an integral part of these financial statements.
MULTI-MANAGER U.S. SMALL CAP EQUITY FUND
| | | | | | | | | | | | |
| | | |
Shares | | | Description | | Value | |
| |
| | | | | Common Stocks – (continued) | |
| |
| | | | | Interactive Media & Services* – 0.9% | |
| | | | | 300,830 | | | Angi, Inc. | | $ | 484,336 | |
| | | | | 46,690 | | | Bumble, Inc. Class A | | | 627,514 | |
| | | | | 28,585 | | | Cars.com, Inc. | | | 435,350 | |
| | | | | 154,223 | | | Pinterest, Inc. Class A | | | 4,608,183 | |
| | | | | | | | | | | | |
| | | | | | | | | | | 6,155,383 | |
| | | | | | |
| |
| | | | | IT Services – 0.3% | |
| | | | | 30,634 | | | Hackett Group, Inc. | | | 682,832 | |
| | | | | 24,000 | | | Perficient, Inc.* | | | 1,396,560 | |
| | | | | | | | | | | | |
| | | | | | | | | | | 2,079,392 | |
| | | | | | |
| |
| | | | | Leisure Products – 1.0% | |
| | | | | 30,540 | | | BRP, Inc. | | | 2,065,115 | |
| | | | | 16,900 | | | Brunswick Corp. | | | 1,174,043 | |
| | | | | 193,467 | | | Clarus Corp. | | | 1,120,174 | |
| | | | | 112,875 | | | Mattel, Inc.* | | | 2,153,655 | |
| | | | | 82,389 | | | Topgolf Callaway Brands Corp.* | | | 1,006,793 | |
| | | | | | | | | | | | |
| | | | | | | | | | | 7,519,780 | |
| | | | | | |
| |
| | | | | Life Sciences Tools & Services – 1.1% | |
| | | | | 6,480 | | | Bio-Rad Laboratories, Inc. Class A* | | | 1,783,815 | |
| | | | | 63,142 | | | Bruker Corp. | | | 3,599,094 | |
| | | | | 8,300 | | | Charles River Laboratories International, Inc.* | | | 1,397,388 | |
| | | | | 32,166 | | | Fortrea Holdings, Inc.* | | | 913,514 | |
| | | | | | | | | | | | |
| | | | | | | | | | | 7,693,811 | |
| | | | | | |
| |
| | | | | Machinery – 4.1% | |
| | | | | 7,400 | | | Alamo Group, Inc. | | | 1,186,220 | |
| | | | | 33,310 | | | Allison Transmission Holdings, Inc. | | | 1,679,490 | |
| | | | | 42,500 | | | Astec Industries, Inc. | | | 1,701,700 | |
| | | | | 17,300 | | | Columbus McKinnon Corp. | | | 528,861 | |
| | | | | 18,100 | | | Crane Co. | | | 1,761,673 | |
| | | | | 58,200 | | | Hillenbrand, Inc. | | | 2,213,346 | |
| | | | | 6,889 | | | IDEX Corp. | | | 1,318,624 | |
| | | | | 39,100 | | | ITT, Inc. | | | 3,649,985 | |
| | | | | 42,260 | | | John Bean Technologies Corp. | | | 4,395,885 | |
| | | | | 63,200 | | | Kennametal, Inc. | | | 1,460,552 | |
| | | | | 15,630 | | | Lincoln Electric Holdings, Inc. | | | 2,732,124 | |
| | | | | 35,200 | | | Mueller Industries, Inc. | | | 1,327,392 | |
| | | | | 101,765 | | | Mueller Water Products, Inc. Class A | | | 1,258,833 | |
| | | | | 10,893 | | | SPX Technologies, Inc.* | | | 872,747 | |
| | | | | 16,110 | | | Terex Corp. | | | 737,838 | |
| | | | | 49,688 | | | Wabash National Corp. | | | 1,028,045 | |
| | | | | 11,100 | | | Watts Water Technologies, Inc. Class A | | | 1,920,411 | |
| | | | | | | | | | | | |
| | | | | | | | | | | 29,773,726 | |
| | | | | | |
| |
| | | | | Media – 0.8% | |
| | | | | 116,017 | | | Entravision Communications Corp. Class A | | | 415,341 | |
| | | | | 137,550 | | | EW Scripps Co. Class A* | | | 752,398 | |
| | | | | 14,826 | | | Nexstar Media Group, Inc. | | | 2,076,826 | |
| | | | | 152,406 | | | TEGNA, Inc. | | | 2,211,411 | |
| | | | | | | | | | | | |
| | | | | | | | | | | 5,455,976 | |
| | | | | | |
| | | | | | | | | | | | |
| | | |
Shares | | | Description | | Value | |
| |
| | | | | Common Stocks – (continued) | |
| |
| | | | | Metals & Mining – 0.3% | |
| | | | | 83,329 | | | Eldorado Gold Corp.* | | $ | 900,786 | |
| | | | | 27,500 | | | Kaiser Aluminum Corp. | | | 1,562,000 | |
| | | | | | | | | | | | |
| | | | | | | | | | | 2,462,786 | |
| | | | | | |
| |
| | | | | Mortgage Real Estate Investment Trusts (REITs) – 0.1% | |
| | | | | 109,163 | | | Redwood Trust, Inc. | | | 685,544 | |
| | | | | | | | | | | | |
| | | | | | | | | | | | |
| | | | | | |
| |
| | | | | Multi-Utilities – 0.2% | |
| | | | | 35,300 | | | Northwestern Energy Group, Inc. | | | 1,694,753 | |
| | | | | | |
| |
| | | | | Office REITs – 0.4% | |
| | | | | 81,000 | | | COPT Defense Properties | | | 1,846,800 | |
| | | | | 43,541 | | | Cousins Properties, Inc. | | | 778,078 | |
| | | | | | | | | | | | |
| | | | | | | | | | | 2,624,878 | |
| | | | | | |
| |
| | | | | Oil, Gas & Consumable Fuels – 3.5% | |
| | | | | 35,800 | | | Civitas Resources, Inc. | | | 2,700,394 | |
| | | | | 57,000 | | | Delek U.S. Holdings, Inc. | | | 1,501,950 | |
| | | | | 47,749 | | | Denbury, Inc.* | | | 4,244,408 | |
| | | | | 49,781 | | | Enerplus Corp. | | | 841,797 | |
| | | | | 208,484 | | | Kosmos Energy Ltd.* | | | 1,509,424 | |
| | | | | 130,000 | | | Magnolia Oil & Gas Corp. Class A | | | 2,918,500 | |
| | | | | 44,700 | | | Matador Resources Co. | | | 2,757,543 | |
| | | | | 95,100 | | | Northern Oil & Gas, Inc. | | | 3,646,134 | |
| | | | | 49,262 | | | Par Pacific Holdings, Inc.* | | | 1,616,779 | |
| | | | | 89,090 | | | Viper Energy Partners LP | | | 2,537,283 | |
| | | | | 60,780 | | | World Kinect Corp. | | | 1,124,430 | |
| | | | | | | | | | | | |
| | | | | | | | | | | 25,398,642 | |
| | | | | | |
| |
| | | | | Personal Products* – 0.2% | |
| | | | | 21,974 | | | BellRing Brands, Inc. | | | 960,923 | |
| | | | | 28,567 | | | Herbalife Ltd. | | | 407,080 | |
| | | | | | | | | | | | |
| | | | | | | | | | | 1,368,003 | |
| | | | | | |
| |
| | | | | Pharmaceuticals* – 0.3% | |
| | | | | 13,074 | | | Arvinas, Inc. | | | 210,753 | |
| | | | | 154,330 | | | Innoviva, Inc. | | | 1,915,235 | |
| | | | | | | | | | | | |
| | | | | | | | | | | 2,125,988 | |
| | | | | | |
| |
| | | | | Professional Services – 3.4% | |
| | | | | 113,294 | | | Alight, Inc. Class A* | | | 752,272 | |
| | | | | 19,700 | | | ASGN, Inc.* | | | 1,644,162 | |
| | | | | 15,975 | | | CBIZ, Inc.* | | | 830,061 | |
| | | | | 28,847 | | | FTI Consulting, Inc.* | | | 6,123,064 | |
| | | | | 94,956 | | | Genpact Ltd. | | | 3,184,825 | |
| | | | | 12,200 | | | ICF International, Inc. | | | 1,546,106 | |
| | | | | 128,403 | | | Legalzoom.com, Inc.* | | | 1,280,178 | |
| | | | | 31,200 | | | Maximus, Inc. | | | 2,331,264 | |
| | | | | 32,866 | | | Science Applications International Corp. | | | 3,590,282 | |
| | | | | 94,834 | | | Sterling Check Corp.* | | | 1,060,244 | |
| | | | | 41,710 | | | WNS Holdings Ltd. ADR* | | | 2,265,687 | |
| | | | | | | | | | | | |
| | | | | | | | | | | 24,608,145 | |
| | | | | | |
| |
| | | | | Real Estate Management & Development – 0.6% | |
| | | | | 14,000 | | | Colliers International Group, Inc. | | | 1,270,220 | |
| | | | | | |
The accompanying notes are an integral part of these financial statements. 19
MULTI-MANAGER U.S. SMALL CAP EQUITY FUND
Schedule of Investments (continued)
October 31, 2023
| | | | | | | | |
| | | Shares | | Description | | Value | |
| |
| | Common Stocks – (continued) | |
| |
| | Real Estate Management & Development – (continued) | |
| | 94,000 | | Cushman & Wakefield PLC* | | $ | 692,780 | |
| | 94,944 | | DigitalBridge Group, Inc. | | | 1,504,863 | |
| | 48,729 | | Kennedy-Wilson Holdings, Inc. | | | 627,142 | |
| | | | | | | | |
| | | | | | | 4,095,005 | |
| | | |
| |
| | Retail REITs – 0.1% | |
| | 28,637 | | Spirit Realty Capital, Inc. | | | 1,030,646 | |
| | | |
| |
| | Semiconductors & Semiconductor Equipment – 2.8% | |
| | 16,860 | | Camtek Ltd.* | | | 886,836 | |
| | 62,400 | | Cohu, Inc.* | | | 1,880,736 | |
| | 36,933 | | Entegris, Inc. | | | 3,251,581 | |
| | 25,980 | | Impinj, Inc.* | | | 1,678,568 | |
| | 84,470 | | Kulicke & Soffa Industries, Inc. | | | 3,514,797 | |
| | 27,668 | | Lattice Semiconductor Corp.* | | | 1,538,618 | |
| | 6,725 | | Onto Innovation, Inc.* | | | 755,688 | |
| | 38,913 | | Power Integrations, Inc. | | | 2,697,838 | |
| | 2,344 | | SiTime Corp.* | | | 233,931 | |
| | 45,600 | | Tower Semiconductor Ltd.* | | | 1,049,712 | |
| | 37,890 | | Ultra Clean Holdings, Inc.* | | | 904,055 | |
| | 13,400 | | Universal Display Corp. | | | 1,865,012 | |
| | | | | | | | |
| | | | | | | 20,257,372 | |
| | | |
| |
| | Software – 6.0% | |
| | 74,148 | | Adeia, Inc. | | | 625,068 | |
| | 47,786 | | Bentley Systems, Inc. Class B | | | 2,324,311 | |
| | 66,320 | | BlackLine, Inc.* | | | 3,256,312 | |
| | 323,376 | | CCC Intelligent Solutions Holdings, Inc.* | | | 3,482,760 | |
| | 114,911 | | Clear Secure, Inc. Class A | | | 1,932,803 | |
| | 16,021 | | Clearwater Analytics Holdings, Inc. Class A* | | | 289,660 | |
| | 133,669 | | Dynatrace, Inc.* | | | 5,976,341 | |
| | 39,057 | | Envestnet, Inc.* | | | 1,445,109 | |
| | 20,634 | | Guidewire Software, Inc.* | | | 1,859,742 | |
| | 30,540 | | InterDigital, Inc. | | | 2,298,135 | |
| | 125,232 | | NCR Voyix Corp.* | | | 1,914,797 | |
| | 105,499 | | PROS Holdings, Inc.* | | | 3,286,294 | |
| | 108,830 | | Samsara, Inc. Class A* | | | 2,510,708 | |
| | 129,190 | | SentinelOne, Inc. Class A* | | | 2,019,240 | |
| | 81,650 | | Smartsheet, Inc. Class A* | | | 3,228,441 | |
| | 44,540 | | Tenable Holdings, Inc.* | | | 1,875,579 | |
| | 68,075 | | Verint Systems, Inc.* | | | 1,280,491 | |
| | 38,602 | | Workiva, Inc.* | | | 3,361,848 | |
| | | | | | | | |
| | | | | | | 42,967,639 | |
| | | |
| |
| | Specialized REITs – 0.6% | |
| | 91,000 | | Four Corners Property Trust, Inc. | | | 1,938,300 | |
| | 86,000 | | Rayonier, Inc. | | | 2,170,640 | |
| | | | | | | | |
| | | | | | | 4,108,940 | |
| | | |
| |
| | Specialty Retail – 0.9% | |
| | 27,365 | | Buckle, Inc. | | | 924,116 | |
| | 32,165 | | Caleres, Inc. | | | 822,781 | |
| | 38,971 | | Foot Locker, Inc. | | | 818,001 | |
| | 2,992 | | Group 1 Automotive, Inc. | | | 754,972 | |
| | | |
| | | | | | | | |
| | | Shares | | Description | | Value | |
| |
| | Common Stocks – (continued) | |
| |
| | Specialty Retail – (continued) | |
| | 3,825 | | Murphy USA, Inc. | | $ | 1,387,289 | |
| | 27,700 | | Signet Jewelers Ltd. | | | 1,934,291 | |
| | | | | | | | |
| | | | | | | 6,641,450 | |
| | | |
| |
| | Technology Hardware, Storage & Peripherals* – 0.1% | |
| | 2,770 | | Super Micro Computer, Inc. | | | 663,332 | |
| | | |
| |
| | Textiles, Apparel & Luxury Goods – 0.7% | |
| | 32,200 | | Columbia Sportswear Co. | | | 2,376,360 | |
| | 74,097 | | Steven Madden Ltd. | | | 2,429,641 | |
| | | | | | | | |
| | | | | | | 4,806,001 | |
| | | |
| |
| | Tobacco – 0.1% | |
| | 91,731 | | Vector Group Ltd. | | | 942,995 | |
| | | |
| |
| | Trading Companies & Distributors – 1.1% | |
| | 7,700 | | Applied Industrial Technologies, Inc. | | | 1,182,027 | |
| | 16,396 | | Beacon Roofing Supply, Inc.* | | | 1,166,903 | |
| | 63,500 | | Core & Main, Inc. Class A* | | | 1,910,080 | |
| | 18,500 | | McGrath RentCorp | | | 1,861,100 | |
| | 64,921 | | NOW, Inc.* | | | 715,429 | |
| | 6,285 | | SiteOne Landscape Supply, Inc.* | | | 865,885 | |
| | | | | | | | |
| | | | | | | 7,701,424 | |
| | | |
| | TOTAL COMMON STOCKS (Cost $695,167,777) | | $ | 678,346,838 | |
| | | |
| | | | | | |
| |
| | Exchange Traded Funds – 0.6% | |
| | 59,170 | | SPDR S&P Biotech ETF | | $ | 3,918,829 | |
| | (Cost $4,719,171) | | | | |
| | | |
| | | Shares | | Dividend
Rate | | Value | |
| |
| | Investment Company(a) –5.0% | |
| | Goldman Sachs Financial Square Government Fund — Institutional Shares | | | | |
| | 36,290,923 | | 5.258% | | $ | 36,290,923 | |
| | (Cost $36,290,923) | | | | |
| | | |
| | TOTAL INVESTMENTS – 99.6% (Cost $736,177,871) | | $ | 718,556,590 | |
| | | |
| | OTHER ASSETS IN EXCESS OF
LIABILITIES – 0.4% | | | 3,058,059 | |
| | | |
| | NET ASSETS – 100.0% | | $ | 721,614,649 | |
| | | |
The percentage shown for each investment category reflects the value of investments in that category as a percentage of net assets.
| * | Non-income producing security. |
| (a) | Represents an Affiliated Issuer. |
20 The accompanying notes are an integral part of these financial statements.
MULTI-MANAGER U.S. SMALL CAP EQUITY FUND
| | |
|
| Investment Abbreviations: |
| ADR | | —American Depositary Receipt |
| ETF | | —Exchange Traded Fund |
| LP | | —Limited Partnership |
| PLC | | —Public Limited Company |
| REIT | | —Real Estate Investment Trust |
| SPDR | | —Standard and Poor’s Depository Receipt |
|
The accompanying notes are an integral part of these financial statements. 21
|
| ACTIVE EQUITY MULTI-MANAGER FUNDS |
Statements of Assets and Liabilities
October 31, 2023
| | | | | | | | | | |
| | | | | Multi-Manager
International
Equity Fund | | | Multi-Manager
U.S. Small Cap
Equity Fund | |
| | | |
| | Assets: | | | | | | | | |
| | | |
| | Investments in unaffiliated issuers, at value (cost $1,022,822,030 and $699,886,948, respectively) | | $ | 1,169,529,137 | | | $ | 682,265,667 | |
| | | |
| | Investments in affiliated issuers, at value (cost $40,942,755 and $36,290,923, respectively) | | | 40,942,755 | | | | 36,290,923 | |
| | | |
| | Cash | | | 831,759 | | | | 791,972 | |
| | | |
| | Receivables: | | | | | | | | |
| | Investments sold | | | 8,195,893 | | | | 5,106,425 | |
| | Foreign tax reclaims | | | 4,002,953 | | | | — | |
| | Dividends | | | 1,429,494 | | | | 283,720 | |
| | Fund shares sold | | | 590,300 | | | | 877,299 | |
| | Other assets | | | 33,958 | | | | 44,340 | |
| | | |
| | Total assets | | | 1,225,556,249 | | | | 725,660,346 | |
| | | |
| | | |
| | | | | | | | | | |
| | | |
| | Liabilities: | | | | | | | | |
| | | |
| | Foreign currency overdraft, at value (identified cost $40,929 and $0, respectively) | | | 35,813 | | | | — | |
| | Payables: | | | | | | | | |
| | Investments purchased | | | 3,376,215 | | | | 3,312,296 | |
| | Management fees | | | 438,355 | | | | 360,457 | |
| | Fund shares redeemed | | | 39,000 | | | | — | |
| | Transfer agency fees | | | 21,047 | | | | 12,616 | |
| | Accrued expenses | | | 594,485 | | | | 360,328 | |
| | | |
| | Total liabilities | | | 4,504,915 | | | | 4,045,697 | |
| | | |
| | | |
| | | | | | | | | | |
| | | |
| | Net Assets: | | | | | | | | |
| | | |
| | Paid-in capital | | | 1,092,654,210 | | | | 757,851,484 | |
| | Total distributable earnings (loss) | | | 128,397,124 | | | | (36,236,835) | |
| | | |
| | NET ASSETS | | $ | 1,221,051,334 | | | $ | 721,614,649 | |
| | | |
| | | |
| | Shares Outstanding $0.001 par value (unlimited shares authorized): | | | 98,043,587 | | | | 62,398,815 | |
| | | |
| | Net asset value, offering and redemption price per share: | | $ | 12.45 | | | $ | 11.56 | |
| | | |
22 The accompanying notes are an integral part of these financial statements.
ACTIVE EQUITY MULTI-MANAGER FUNDS
Statements of Operations
For the Fiscal Year Ended October 31, 2023
| | | | | | | | | | |
| | | | | Multi-Manager
International
Equity Fund | | | Multi-Manager
U.S. Small Cap
Equity Fund | |
| | | |
| | Investment Income: | | | | | | | | |
| | | |
| | Dividends — unaffiliated issuers (net of tax withholding of $2,491,416 and $12,012, respectively) | | $ | 26,785,880 | | | $ | 7,697,160 | |
| | Dividends — affiliated issuers | | | 1,777,483 | | | | 1,728,356 | |
| | | |
| | Total investment income | | | 28,563,363 | | | | 9,425,516 | |
| | | |
| | | |
| | | | | | | | | | |
| | | |
| | Expenses: | | | | | | | | |
| | | |
| | Management fees | | | 7,676,900 | | | | 5,470,415 | |
| | Custody, accounting and administrative services | | | 751,865 | | | | 536,626 | |
| | Professional fees | | | 258,249 | | | | 189,947 | |
| | Transfer Agency fees | | | 255,897 | | | | 145,878 | |
| | Registration fees | | | 53,663 | | | | 61,531 | |
| | Trustee fees | | | 48,576 | | | | 44,059 | |
| | Printing and mailing costs | | | 7,946 | | | | 14,040 | |
| | Other | | | 71,395 | | | | 41,158 | |
| | | |
| | Total expenses | | | 9,124,491 | | | | 6,503,654 | |
| | | |
| | Less — expense reductions | | | (2,248,509 | ) | | | (1,344,069) | |
| | | |
| | Net expenses | | | 6,875,982 | | | | 5,159,585 | |
| | | |
| | NET INVESTMENT INCOME | | | 21,687,381 | | | | 4,265,931 | |
| | | |
| | | |
| | | | | | | | | | |
| | | |
| | Realized and unrealized gain (loss): | | | | | | | | |
| | | |
| | Net realized gain (loss) from: | | | | | | | | |
| | Investments — unaffiliated issuers (including commission recapture of $17,086 and $34,674, respectively) | | | 14,533,954 | | | | 9,768,550 | |
| | Forward foreign currency exchange contracts | | | (25,318 | ) | | | — | |
| | Foreign currency transactions | | | (208,527 | ) | | | (27) | |
| | Net change in unrealized gain (loss) on: | | | | | | | | |
| | Investments — unaffiliated issuers | | | 139,410,996 | | | | (53,130,896) | |
| | Foreign currency translation | | | 392,882 | | | | — | |
| | | |
| | Net realized and unrealized gain (loss) | | | 154,103,987 | | | | (43,362,373) | |
| | | |
| | NET INCREASE (DECREASE) IN NET ASSETS RESULTING FROM OPERATIONS | | $ | 175,791,368 | | | $ | (39,096,442) | |
| | | |
The accompanying notes are an integral part of these financial statements. 23
|
| ACTIVE EQUITY MULTI-MANAGER FUNDS |
Statements of Changes in Net Assets
| | | | | | | | | | | | | | | | | | |
| | | | | Multi-Manager International Equity Fund | | | Multi-Manager U.S. Small Cap Equity Fund | |
| | | | | For the Fiscal
Year Ended
October 31, 2023 | | | For the Fiscal
Year Ended
October 31, 2022 | | | For the Fiscal
Year Ended
October 31, 2023 | | | For the Fiscal
Year Ended
October 31, 2022 | |
| | | | | |
| | From operations: | | | | | | | | | | | | | | | | |
| | | | | |
| | Net investment income | | $ | 21,687,381 | | | $ | 18,972,606 | | | $ | 4,265,931 | | | $ | 2,218,808 | |
| | Net realized gain (loss) | | | 14,300,109 | | | | (21,842,599 | ) | | | 9,768,523 | | | | (20,693,392) | |
| | Net change in unrealized gain (loss) | | | 139,803,878 | | | | (330,003,401 | ) | | | (53,130,896 | ) | | | (87,787,185) | |
| | | |
| | Net increase (decrease) in net assets resulting from operations | | | 175,791,368 | | | | (332,873,394 | ) | | | (39,096,442 | ) | | | (106,261,769) | |
| | | |
| | | | | |
| | | | | | | | | | | | | | | | | | |
| | | | | |
| | Distributions to shareholders: | | | | | | | | | | | | | | | | |
| | | | | |
| | From distributable earnings | | | (16,119,210 | ) | | | (105,675,977 | ) | | | (3,365,968 | ) | | | (105,459,295) | |
| | | |
| | | | | |
| | | | | | | | | | | | | | | | | | |
| | | | | |
| | From share transactions: | | | | | | | | | | | | | | | | |
| | | | | |
| | Proceeds from sales of shares | | | 143,090,181 | | | | 300,829,170 | | | | 139,489,002 | | | | 175,288,130 | |
| | Reinvestment of distributions | | | 16,119,210 | | | | 105,675,977 | | | | 3,365,968 | | | | 105,459,295 | |
| | Cost of shares redeemed | | | (256,849,962 | ) | | | (182,135,814 | ) | | | (59,610,549 | ) | | | (35,693,851) | |
| | | |
| | Net increase (decrease) in net assets resulting from share transactions | | | (97,640,571 | ) | | | 224,369,333 | | | | 83,244,421 | | | | 245,053,574 | |
| | | |
| | TOTAL INCREASE (DECREASE) | | | 62,031,587 | | | | (214,180,038 | ) | | | 40,782,011 | | | | 33,332,510 | |
| | | |
| | | | | |
| | | | | | | | | | | | | | | | | | |
| | | | | |
| | Net assets: | | | | | | | | | | | | | | | | |
| | | | | |
| | Beginning of year | | | 1,159,019,747 | | | | 1,373,199,785 | | | | 680,832,638 | | | | 647,500,128 | |
| | | |
| | End of year | | $ | 1,221,051,334 | | | $ | 1,159,019,747 | | | $ | 721,614,649 | | | $ | 680,832,638 | |
| | | |
24 The accompanying notes are an integral part of these financial statements.
Financial Highlights
Selected Share Data for a Share Outstanding Throughout Each Year
| | | | | | | | | | | | | | | | | | | | | | |
| | | | | Multi-Manager International Equity Fund | |
| | | | | Class P Shares | |
| | | | | Year Ended October 31, | |
| | | | | 2023 | | | 2022 | | | 2021 | | | 2020 | | | 2019 | |
| | | | | | |
| | Per Share Data | | | | | | | | | | | | | | | | | | | | |
| | | | | | |
| | Net asset value, beginning of year | | $ | 10.94 | | | $ | 15.42 | | | $ | 11.16 | | | $ | 11.70 | | | $ | 10.80 | |
| |
| | | |
| | | | | | |
| | Net investment income(a) | | | 0.22 | (b) | | | 0.19 | | | | 0.22 | | | | 0.16 | | | | 0.28 | |
| | | | | | |
| | Net realized and unrealized gain (loss) | | | 1.45 | | | | (3.52 | ) | | | 4.17 | | | | (0.40 | ) | | | 1.03 | |
| |
| | | |
| | | | | | |
| | Total from investment operations | | | 1.67 | | | | (3.33 | ) | | | 4.39 | | | | (0.24 | ) | | | 1.31 | |
| |
| | | |
| | | | | | |
| | Distributions to shareholders from net investment income | | | (0.16 | ) | | | (0.23 | ) | | | (0.13 | ) | | | (0.28 | ) | | | (0.16) | |
| | | | | | |
| | Distributions to shareholders from net realized gains | | | — | | | | (0.92 | ) | | | — | | | | (0.02 | ) | | | (0.25) | |
| |
| | | |
| | | | | | |
| | Total distributions | | | (0.16 | ) | | | (1.15 | ) | | | (0.13 | ) | | | (0.30 | ) | | | (0.41) | |
| |
| | | |
| | | | | | |
| | Net asset value, end of year | | $ | 12.45 | | | $ | 10.94 | | | $ | 15.42 | | | $ | 11.16 | | | $ | 11.70 | |
| |
| | | |
| | | | | | |
| | Total return(c) | | | 15.32 | % | | | (23.15 | )% | | | 39.46 | % | | | (2.28 | )% | | | 12.78% | |
| |
| | | |
| | | | | | |
| | Net assets, end of year (in 000s) | | $ | 1,221,051 | | | $ | 1,159,020 | | | $ | 1,373,200 | | | $ | 886,359 | | | $ | 823,204 | |
| | | | | | |
| | Ratio of net expenses to average net assets | | | 0.54 | % | | | 0.56 | % | | | 0.56 | % | | | 0.57 | % | | | 0.56% | |
| | | | | | |
| | Ratio of total expenses to average net assets | | | 0.71 | % | | | 0.73 | % | | | 0.72 | % | | | 0.74 | % | | | 0.76% | |
| | | | | | |
| | Ratio of net investment income to average net assets | | | 1.70 | % | | | 1.50 | % | | | 1.50 | % | | | 1.39 | % | | | 2.51% | |
| | | | | | |
| | Portfolio turnover rate(d) | | | 35 | % | | | 39 | % | | | 61 | % | | | 52 | % | | | 29% | |
| |
| | | |
| | (a) | Calculated based on the average shares outstanding methodology. |
| | (b) | Reflects income recognized from withholding tax reclaims which amounted to $0.01 per share and 0.09% of average net assets. |
| | (c) | Assumes investment at the NAV at the beginning of the year, reinvestment of all dividends and distributions, a complete redemption of the investment at the NAV at the end of the year and no sales or redemption charges (if any). Total returns would be reduced if a sales or redemption charge was taken into account. Returns do not reflect the impact of taxes to shareholders relating to Fund distributions or the redemption of Fund shares. |
| | (d) | The Fund’s portfolio turnover rate is calculated in accordance with regulatory requirements, without regard to transactions involving short term investments and certain derivatives. If such transactions were included, the Fund’s portfolio turnover rate may be higher. |
The accompanying notes are an integral part of these financial statements. 25
Financial Highlights (continued)
Selected Share Data for a Share Outstanding Throughout Each Year
| | | | | | | | | | | | | | | | | | | | | | |
| | | | | Multi-Manager U.S. Small Cap Equity Fund | |
| | | | | Class P Shares | |
| | | | | Year Ended October 31, | |
| | | | | 2023 | | | 2022 | | | 2021 | | | 2020 | | | 2019 | |
| | | | | | |
| | Per Share Data | | | | | | | | | | | | | | | | | | | | |
| | | | | | |
| | Net asset value, beginning of year | | $ | 12.23 | | | $ | 17.45 | | | $ | 12.14 | | | $ | 13.31 | | | $ | 12.40 | |
| |
| | | |
| | | | | | |
| | Net investment income(a) | | | 0.07 | | | | 0.05 | | | | 0.03 | (b) | | | 0.05 | | | | 0.08 | |
| | | | | | |
| | Net realized and unrealized gain (loss) | | | (0.68 | ) | | | (2.47 | ) | | | 5.31 | | | | (0.79 | ) | | | 1.17 | |
| |
| | | |
| | | | | | |
| | Total from investment operations | | | (0.61 | ) | | | (2.42 | ) | | | 5.34 | | | | (0.74 | ) | | | 1.25 | |
| |
| | | |
| | | | | | |
| | Distributions to shareholders from net investment income | | | (0.06 | ) | | | (0.03 | ) | | | (0.03 | ) | | | (0.08 | ) | | | (0.04) | |
| | | | | | |
| | Distributions to shareholders from net realized gains | | | — | | | | (2.77 | ) | | | — | | | | (0.35 | ) | | | (0.30) | |
| |
| | | |
| | | | | | |
| | Total distributions | | | (0.06 | ) | | | (2.80 | ) | | | (0.03 | ) | | | (0.43 | ) | | | (0.34) | |
| |
| | | |
| | | | | | |
| | Net asset value, end of year | | $ | 11.56 | | | $ | 12.23 | | | $ | 17.45 | | | $ | 12.14 | | | $ | 13.31 | |
| |
| | | |
| | | | | | |
| | Total return(c) | | | (5.00 | )% | | | (15.77 | )% | | | 44.07 | % | | | (5.88 | )% | | | 10.56% | |
| |
| | | |
| | | | | | |
| | Net assets, end of year (in 000s) | | $ | 721,615 | | | $ | 680,833 | | | $ | 647,500 | | | $ | 441,314 | | | $ | 377,898 | |
| | | | | | |
| | Ratio of net expenses to average net assets | | | 0.71 | % | | | 0.73 | % | | | 0.75 | % | | | 0.77 | % | | | 0.79% | |
| | | | | | |
| | Ratio of total expenses to average net assets | | | 0.89 | % | | | 0.90 | % | | | 0.92 | % | | | 0.95 | % | | | 0.96% | |
| | | | | | |
| | Ratio of net investment income to average net assets | | | 0.58 | % | | | 0.35 | % | | | 0.17 | %(b) | | | 0.44 | % | | | 0.62% | |
| | | | | | |
| | Portfolio turnover rate(d) | | | 62 | % | | | 57 | % | | | 105 | % | | | 85 | % | | | 88% | |
| |
| | | |
| | (a) | Calculated based on the average shares outstanding methodology. |
| | (b) | Reflects income recognized from special dividends which amounted to $0.02 per share and 0.12% of average net assets. |
| | (c) | Assumes investment at the NAV at the beginning of the year, reinvestment of all dividends and distributions, a complete redemption of the investment at the NAV at the end of the year and no sales or redemption charges (if any). Total returns would be reduced if a sales or redemption charge was taken into account. Returns do not reflect the impact of taxes to shareholders relating to Fund distributions or the redemption of Fund shares. |
| | (d) | The Fund’s portfolio turnover rate is calculated in accordance with regulatory requirements, without regard to transactions involving short term investments and certain derivatives. If such transactions were included, the Fund’s portfolio turnover rate may be higher. |
26 The accompanying notes are an integral part of these financial statements.
ACTIVE EQUITY MULTI-MANAGER FUNDS
Notes to Financial Statements
October 31, 2023
Goldman Sachs Trust II (the “Trust”) is a Delaware statutory trust registered under the Investment Company Act of 1940, as amended (the “Act”), as an open-end management investment company. The following table lists those series of the Trust that are included in this report (collectively, the “Funds” or individually a “Fund”), along with their corresponding share classes and respective diversification status under the Act:
| | | | |
| Fund | | Share Classes Offered | | Diversified/ Non-diversified |
| | |
Multi-Manager International Equity | | Class P | | Diversified |
|
| | |
Multi-Manager U.S. Small Cap Equity | | Class P | | Diversified |
|
Goldman Sachs Asset Management, L.P. (“GSAM”), an affiliate of Goldman Sachs & Co. LLC (“Goldman Sachs”), serves as investment adviser to the Funds pursuant to a management agreement (the “Agreement”) with the Trust. As of October 31, 2023, GSAM had sub-advisory agreements (the “Sub-Advisory Agreements”) for the Multi-Manager International Equity Fund with Causeway Capital Management LLC, Lazard Asset Management LLC, Massachusetts Financial Services Company, doing business as MFS Investment Management, and WCM Investment Management, LLC and for the Multi-Manager U.S. Small Cap Equity Fund with Boston Partners Global Investors, Inc., Brown Advisory LLC, Victory Capital Management, Inc., and Westfield Capital Management Company, L.P., (the “Underlying Managers”). Pursuant to the terms of the Sub-Advisory Agreements, the Underlying Managers are responsible for making investment decisions and managing the investments of the applicable Fund. GSAM compensates the Underlying Managers directly in accordance with the terms of the applicable Sub-Advisory Agreements. The Funds are not charged any separate or additional investment advisory fees by the Underlying Managers.
|
|
| 2. SIGNIFICANT ACCOUNTING POLICIES |
The financial statements have been prepared in accordance with accounting principles generally accepted in the United States of America (“GAAP”) and require management to make estimates and assumptions that may affect the reported amounts and disclosures. Actual results may differ from those estimates and assumptions. Each Fund is an investment company under GAAP and follows the accounting and reporting guidance applicable to investment companies.
A. Investment Valuation — The Funds’ valuation policy is to value investments at fair value.
B. Investment Income and Investments — Investment income includes interest income, dividend income and securities lending income, if any. Interest income is accrued daily and adjusted for amortization of premiums and accretion of discounts. Dividend income is recognized on ex-dividend date or, for certain foreign securities, as soon as such information is obtained subsequent to the ex-dividend date. Non-cash dividends, if any, are recorded at the fair market value of the securities received. Investment transactions are reflected on trade date. Realized gains and losses are calculated using identified cost. Investment transactions are recorded on the following business day for daily net asset value (“NAV”) calculations. Investment income is recorded net of any foreign withholding taxes, less any amounts reclaimable. The Funds may file withholding tax reclaims in certain jurisdictions to recover a portion of amounts previously withheld. These reclaims, if any, are recorded when the amount is known and there are no significant uncertainties on collectability. Such amounts recovered, if any, are reflected as other income in the Statements of Operations. Any foreign capital gains tax is accrued daily based upon net unrealized gains, and is payable upon sale of such investments. Distributions received from the Funds’ investments in U.S. real estate investment trusts (“REITs”) may be characterized as ordinary income, net capital gain and/or a return of capital. A return of capital is recorded by the Funds as a reduction to the cost basis of the REIT.
For derivative contracts, unrealized gains and losses are recorded daily and become realized gains and losses upon disposition or termination of the contract.
C. Expenses — Expenses incurred directly by a Fund are charged to the Fund, and certain expenses incurred by the Trust are allocated across the applicable Funds on a straight-line and/or pro-rata basis, depending upon the nature of the expenses, and are accrued daily.
27
|
| ACTIVE EQUITY MULTI-MANAGER FUNDS |
Notes to Financial Statements (continued)
October 31, 2023
|
|
| 2. SIGNIFICANT ACCOUNTING POLICIES (continued) |
D. Federal Taxes and Distributions to Shareholders — It is each Fund’s policy to comply with the requirements of the Internal Revenue Code of 1986, as amended (the “Code”), applicable to regulated investment companies and to distribute each year substantially all of its investment company taxable income and capital gains to its shareholders. Accordingly, each Fund is not required to make any provisions for the payment of federal income tax. Distributions to shareholders are recorded on the ex-dividend date. Income and capital gains distributions, if any, are declared and paid annually.
Net capital losses, if any, are carried forward to future fiscal years and may be used to the extent allowed by the Code to offset any future capital gains. Losses that are carried forward will retain their character as either short-term or long-term capital losses. Utilization of capital loss carryforwards will reduce the requirement of future capital gains distributions.
The characterization of distributions to shareholders for financial reporting purposes is determined in accordance with federal income tax rules, which may differ from GAAP. The source of each Fund’s distributions may be shown in the accompanying financial statements as either from distributable earnings or capital. Certain components of the Funds’ net assets on the Statements of Assets and Liabilities reflect permanent GAAP/tax differences based on the appropriate tax character.
E. Foreign Currency Translation — The accounting records and reporting currency of a Fund are maintained in U.S. dollars. Assets and liabilities denominated in foreign currencies are translated into U.S. dollars using the current exchange rates at the close of each business day. The effect of changes in foreign currency exchange rates on investments is included within net realized and unrealized gain (loss) on investments. Changes in the value of other assets and liabilities as a result of fluctuations in foreign exchange rates are included in the Statements of Operations within net change in unrealized gain (loss) on foreign currency translation. Transactions denominated in foreign currencies are translated into U.S. dollars on the date the transaction occurred, the effects of which are included within net realized gain (loss) on foreign currency transactions.
F. Commission Recapture — GSAM, on behalf of certain Funds, may direct portfolio trades, subject to seeking best execution, to various brokers who have agreed to rebate a portion of the commissions generated. Such rebates are made directly to a Fund as cash payments and are included in net realized gain (loss) from investments on the Statements of Operations.
|
|
| 3. INVESTMENTS AND FAIR VALUE MEASUREMENTS |
U.S. GAAP defines the fair value of a financial instrument as the amount that would be received to sell an asset or paid to transfer a liability in an orderly transaction between market participants at the measurement date (i.e., the exit price); the Funds’ policy is to use the market approach. GAAP establishes a fair value hierarchy that prioritizes the inputs to valuation techniques used to measure fair value. The hierarchy gives the highest priority to unadjusted quoted prices in active markets for identical assets or liabilities (Level 1 measurements) and the lowest priority to unobservable inputs (Level 3 measurements). The level in the fair value hierarchy within which the fair value measurement in its entirety falls shall be determined based on the lowest level input that is significant to the fair value measurement in its entirety. The levels used for classifying investments are not necessarily an indication of the risk associated with investing in these investments. The three levels of the fair value hierarchy are described below:
Level 1 — Unadjusted quoted prices in active markets that are accessible at the measurement date for identical, unrestricted assets or liabilities;
Level 2 — Quoted prices in markets that are not active or financial instruments for which significant inputs are observable (including, but not limited to, quoted prices for similar investments, interest rates, foreign exchange rates, volatility and credit spreads), either directly or indirectly;
Level 3 — Prices or valuations that require significant unobservable inputs (including GSAM’s assumptions in determining fair value measurement).
The Board of Trustees (“Trustees”) has approved Valuation Procedures that govern the valuation of the portfolio investments held by the Funds, including investments for which market quotations are not readily available. With respect to the Funds’ investments that do not have readily available market quotations, the Trustees have designated GSAM as the valuation designee to perform fair valuations pursuant to Rule 2a-5 under the Investment Company Act of 1940 (the “Valuation Designee”). GSAM has day-to-day
28
ACTIVE EQUITY MULTI-MANAGER FUNDS
|
|
| 3. INVESTMENTS AND FAIR VALUE MEASUREMENTS (continued) |
responsibility for implementing and maintaining internal controls and procedures related to the valuation of the Funds’ investments. To assess the continuing appropriateness of pricing sources and methodologies, GSAM regularly performs price verification procedures and issues challenges as necessary to third party pricing vendors or brokers, and any differences are reviewed in accordance with the Valuation Procedures.
A. Level 1 and Level 2 Fair Value Investments — The valuation techniques and significant inputs used in determining the fair values for investments classified as Level 1 and Level 2 are as follows:
Equity Securities — Equity securities traded on a United States (“U.S.”) securities exchange or the NASDAQ system, or those located on certain foreign exchanges, including but not limited to the Americas, are valued daily at their last sale price or official closing price on the principal exchange or system on which they are traded. If there is no sale or official closing price or such price is believed by GSAM to not represent fair value, equity securities will be valued at the valid closing bid price for long positions and at the valid closing ask price for short positions (i.e., where there is sufficient volume, during normal exchange trading hours). If no valid bid/ask price is available, the equity security will be valued pursuant to the Valuation Procedures and consistent with applicable regulatory guidance. To the extent these investments are actively traded, they are classified as Level 1 of the fair value hierarchy, otherwise they are generally classified as Level 2. Certain equity securities containing unique attributes may be classified as Level 2.
Unlisted equity securities for which market quotations are available are valued at the last sale price on the valuation date, or if no sale occurs, at the last bid price for long positions or the last ask price for short positions, and are generally classified as Level 2. Securities traded on certain foreign securities exchanges are valued daily at fair value determined by an independent fair value service (if available) under the Valuation Procedures and consistent with applicable regulatory guidance. The independent fair value service takes into account multiple factors including, but not limited to, movements in the securities markets, certain depositary receipts, futures contracts and foreign currency exchange rates that have occurred subsequent to the close of the foreign securities exchange. These investments are generally classified as Level 2 of the fair value hierarchy.
Underlying Funds (including Money Market Funds) — Underlying funds (“Underlying Funds”) include exchange-traded funds (“ETFs”) and other investment companies. Investments in the Underlying Funds (except ETFs) are valued at the NAV per share on the day of valuation. ETFs are valued daily at the last sale price or official closing price on the principal exchange or system on which the investment is traded. Because the Funds invest in Underlying Funds that fluctuate in value, the Funds’ shares will correspondingly fluctuate in value. Underlying Funds are generally classified as Level 1 of the fair value hierarchy. To the extent that underlying ETFs are actively traded, they are classified as Level 1 of the fair value hierarchy, otherwise they are generally classified as Level 2. For information regarding an Underlying Fund’s accounting policies and investment holdings, please see the Underlying Fund’s shareholder report.
Derivative Contracts — A derivative is an instrument whose value is derived from underlying assets, indices, reference rates or a combination of these factors. A Fund enters into derivative transactions to hedge against changes in interest rates, securities prices, and/or currency exchange rates, to increase total return, or to gain access to certain markets or attain exposure to other underliers. For financial reporting purposes, cash collateral that has been pledged to cover obligations of a Fund and cash collateral received, if any, is reported separately on the Statements of Assets and Liabilities as either due to broker/receivable for collateral on certain derivative contracts. Non-cash collateral pledged by a Fund, if any, is noted in the Schedules of Investments.
Exchange-traded derivatives, including futures and options contracts, are generally valued at the last sale or settlement price on the exchange where they are principally traded. Exchange-traded options without settlement prices are generally valued at the midpoint of the bid and ask prices on the exchange where they are principally traded (or, in the absence of two-way trading, at the last bid price for long positions and the last ask price for short positions). Exchange-traded derivatives typically fall within Level 1 of the fair value hierarchy. Over-the-counter (“OTC”) and centrally cleared derivatives are valued using market transactions and other market evidence, including market-based inputs to models, calibration to market- clearing transactions, broker or dealer quotations, or other alternative pricing sources. Where models are used, the selection of a particular model to value OTC and centrally cleared derivatives depends upon the contractual terms of, and specific risks inherent in, the instrument, as well as the availability of pricing information in the market. Valuation models require a variety of inputs, including contractual terms, market
29
|
| ACTIVE EQUITY MULTI-MANAGER FUNDS |
Notes to Financial Statements (continued)
October 31, 2023
|
|
| 3. INVESTMENTS AND FAIR VALUE MEASUREMENTS (continued) |
prices, yield curves, credit curves, measures of volatility, voluntary and involuntary prepayment rates, loss severity rates and correlations of such inputs. For OTC and centrally cleared derivatives that trade in liquid markets, model inputs can generally be verified and model selection does not involve significant management judgment. OTC and centrally cleared derivatives are classified within Level 2 of the fair value hierarchy when significant inputs are corroborated by market evidence.
i. Forward Contracts — A forward contract is a contract between two parties to buy or sell an asset at a specified price on a future date. A forward contract settlement can occur on a cash or delivery basis. Forward contracts are marked-to-market daily using independent vendor prices, and the change in value, if any, is recorded as an unrealized gain or loss. Cash and certain investments may be used to collateralize forward contracts.
A forward foreign currency exchange contract is a forward contract in which a Fund agrees to receive or deliver a fixed quantity of one currency for another, at a pre-determined price at a future date. All forward foreign currency exchange contracts are marked to market daily by using the outright forward rates or interpolating based upon maturity dates, where available. Non-deliverable forward foreign currency exchange contracts are settled with the counterparty in cash without the delivery of foreign currency.
B. Level 3 Fair Value Investments — To the extent that significant inputs to valuation models and other alternative pricing sources are unobservable, or if quotations are not readily available, or if GSAM believes that such quotations do not accurately reflect fair value, the fair value of a Fund’s investments may be determined under the Valuation Procedures. GSAM, consistent with its procedures and applicable regulatory guidance, may make an adjustment to the most recent valuation prices of either domestic or foreign securities in light of significant events to reflect what it believes to be the fair value of the securities at the time of determining a Fund’s NAV. To the extent investments are valued using single source broker quotations obtained directly from the broker or passed through from third party pricing vendors, such investments are classified as Level 3 investments.
C. Fair Value Hierarchy — The following is a summary of the Funds’ investments and derivatives classified in the fair value hierarchy as of October 31, 2023:
MULTI-MANAGER INTERNATIONAL EQUITY
| | | | | | | | | | | | |
| Investment Type | | Level 1 | | | Level 2 | | | Level 3 | |
Assets | | | | | | | | | | | | |
Common Stock and/or Other Equity Investments(a) | | | | | | | | | | | | |
Asia | | $ | 21,120,412 | | | $ | 185,360,252 | | | $ | — | |
Europe | | | 91,246,789 | | | | 766,961,181 | | | | — | |
North America | | | 102,563,252 | | | | — | | | | — | |
South America | | | 2,277,251 | | | | — | | | | — | |
Investment Company | | | 40,942,755 | | | | — | | | | — | |
| |
Total | | $ | 258,150,459 | | | $ | 952,321,433 | | | $ | — | |
| |
| | (a) | Amounts are disclosed by continent to highlight the impact of time zone differences between local market close and the calculation of NAV. Security valuations are based on the principal exchange or system on which they are traded, which may differ from country of domicile. The Funds utilize fair value model prices provided by an independent fair value service for international equities, resulting in a Level 2 classification. |
30
ACTIVE EQUITY MULTI-MANAGER FUNDS
|
|
| 3. INVESTMENTS AND FAIR VALUE MEASUREMENTS (continued) |
MULTI-MANAGER U.S. SMALL CAP EQUITY
| | | | | | | | | | | | |
| Investment Type | | Level 1 | | | Level 2 | | | Level 3 | |
Assets | | | | | | | | | | | | |
Common Stock and/or Other Equity Investments(a) | | | | | | | | | | | | |
Asia | | $ | 5,174,498 | | | $ | — | | | $ | — | |
Europe | | | 19,303,295 | | | | 927,313 | | | | — | |
North America | | | 652,941,732 | | | | — | | | | — | |
Exchange Traded Funds | | | 3,918,829 | | | | — | | | | — | |
Investment Company | | | 36,290,923 | | | | — | | | | — | |
| |
Total | | $ | 717,629,277 | | | $ | 927,313 | | | $ | — | |
| |
| | (a) | Amounts are disclosed by continent to highlight the impact of time zone differences between local market close and the calculation of NAV. Security valuations are based on the principal exchange or system on which they are traded, which may differ from country of domicile. The Funds utilize fair value model prices provided by an independent fair value service for international equities, resulting in a Level 2 classification. |
For further information regarding security characteristics, see the Schedules of Investments.
|
|
| 4. INVESTMENTS IN DERIVATIVES |
The following table sets forth, by certain risk types, the Multi-Manager International Equity Fund’s gains (losses) related to these derivatives and their indicative volumes for the fiscal year ended October 31, 2023. These gains (losses) should be considered in the context that these derivative contracts may have been executed to create investment opportunities and/or economically hedge certain investments, and accordingly, certain gains (losses) on such derivative contracts may offset certain (losses) gains attributable to investments. These gains (losses) are included in “Net realized gain (loss)” or “Net change in unrealized gain (loss)” on the Statements of Operations:
Multi-Manager International Equity
| | | | | | |
| Risk | | Statements of Operations | | Net Realized Gain | | Net Change in
Unrealized
Gain (Loss) |
Currency | | Net realized gain from forward foreign currency exchange contracts | | $(25,318) | | $— |
|
For the fiscal year ended October 31, 2023, the relevant values for each derivative type were as follows:
| | |
| | | Notional Amounts(a) |
| Fund | | Forward Contracts |
Multi-Manager International Equity | | $484,920 |
|
| | (a) | Amounts disclosed represent notional amounts for forward contracts, based on absolute values, which is indicative of volume for this derivative type, for the months that the Fund held such derivatives for the fiscal year ended October 31, 2023. |
|
|
| 5. AGREEMENTS AND AFFILIATED TRANSACTIONS |
A. Management Agreement — Under the Agreement, GSAM manages the Funds, subject to the general supervision of the Trustees.
As compensation for the services rendered pursuant to the Agreement, the assumption of the expenses related thereto and administration of the Funds’ business affairs, including providing facilities, GSAM is entitled to a management fee, accrued daily and paid monthly, equal to an annual percentage rate of each Fund’s average daily net assets.
31
|
| ACTIVE EQUITY MULTI-MANAGER FUNDS |
Notes to Financial Statements (continued)
October 31, 2023
|
|
| 5. AGREEMENTS AND AFFILIATED TRANSACTIONS (continued) |
For the fiscal year ended October 31, 2023, contractual and effective net management fees with GSAM were at the following rates:
| | | | |
| Fund | | Effective Contractual Management Rate | | Effective Net
Management
Rate#* |
Multi-Manager International Equity | | 0.60% | | 0.42% |
|
Multi-Manager U.S. Small Cap Equity | | 0.75 | | 0.57 |
|
| | * | GSAM has agreed to waive a portion of its management fee for each Fund in order to achieve an effective net management fee rate that is equal to the actual cost of fees paid to the Fund’s Underlying Managers. These arrangements will remain in effect through at least February 28, 2024, and prior to such date, GSAM may not terminate the applicable arrangement without the approval of the Trustees. |
| | # | Effective Net Management Rate includes impact of management fee waivers of underlying funds, if any. |
The Funds invest in Institutional Shares of the Goldman Sachs Financial Square Government Fund, which is an affiliated Underlying Fund. GSAM has agreed to waive a portion of its management fee payable by the Funds in an amount equal to the management fee it earns as an investment adviser to the affiliated Underlying Fund in which the Funds invest. For the fiscal year ended October 31, 2023, the management fees waived by GSAM for each Fund was as follows:.
| | |
| Fund | | Management
Fee Waived |
Multi-Manager International Equity | | $60,261 |
|
Multi-Manager U.S. Small Cap Equity | | 59,428 |
|
B. Transfer Agency Agreement — Goldman Sachs also serves as the transfer agent of the Funds for a fee pursuant to the Transfer Agency Agreement. The fees charged for such transfer agency services are accrued daily and paid monthly at annual rates as follows: 0.02% of the average daily net assets of Class P Shares.
C. Other Expense Agreements and Affiliated Transactions — GSAM has agreed to reduce or limit certain “Other Expenses” of the Funds (excluding acquired fund fees and expenses, transfer agency fees and expenses, service fees and shareholder administration fees (as applicable), taxes, interest, brokerage fees, expenses of shareholder meetings, litigation and indemnification, and extraordinary expenses) to the extent such expenses exceed, on an annual basis, a percentage rate of the average daily net assets of each Fund. Such Other Expense reimbursements, if any, are accrued daily and paid monthly. In addition, the Funds are not obligated to reimburse GSAM for prior fiscal year expense reimbursements, if any. The Total Annual Operating Expense limitations as an annual percentage rate of average daily net assets for the Multi-Manager International Equity and Multi-Manager U.S. Small Cap Equity Funds are 0.57% and 0.80%, respectively. These Other Expense limitations will remain in place through at least February 28, 2024, and prior to such date GSAM may not terminate the arrangements without the approval of the Trustees. In addition, the Funds have entered into certain offset arrangements with the transfer agent, which may result in a reduction of the Funds’ expenses and are received irrespective of the application of the “Other Expense” limitations described above.
For the fiscal year ended October 31, 2023, these expense reductions, including any fee waivers, were as follows:
| | |
| Fund | | Management
Fee Waiver |
Multi-Manager International Equity | | $2,248,509 |
|
Multi-Manager U.S. Small Cap Equity | | 1,344,069 |
|
32
ACTIVE EQUITY MULTI-MANAGER FUNDS
|
|
| 5. AGREEMENTS AND AFFILIATED TRANSACTIONS (continued) |
D. Line of Credit Facility — As of October 31, 2023, the Funds participated in a $1,110,000,000 committed, unsecured revolving line of credit facility (the “facility”) together with other funds of the Trust and certain registered investment companies having management agreements with GSAM or its affiliates. This facility is to be used for temporary emergency purposes, or to allow for an orderly liquidation of securities to meet redemption requests. The interest rate on borrowings is based on the federal funds rate. The facility also requires a fee to be paid by the Funds based on the amount of the commitment that has not been utilized. For the fiscal year ended October 31, 2023, the Funds did not have any borrowings under the facility. Prior to April 19, 2023, the facility was $1,250,000,000.
E. Other Transactions with Affiliates — For the fiscal year ended October 31, 2023, Goldman Sachs earned $2,990 and $2,465 in brokerage commissions from portfolio transactions, including futures transactions executed with Goldman Sachs as the Futures Commission Merchant, on behalf of the Multi-Manager International Equity and Multi-Manager U.S. Small Cap Equity Funds, respectively.
The following table provides information about the Funds’ investments in the Goldman Sachs Financial Square Government Fund as of and for the fiscal year ended October 31, 2023:
| | | | | | | | | | | | | | | | | | | | | | | | | | |
| Fund | | Underlying Fund | | Beginning
Value as of
October 31,
2022 | | | Purchases
at Cost | | | Proceeds
from Sales | | | Ending
Value as of
October 31,
2023 | | | Shares as of
October 31,
2023 | | | Dividend
Income | |
Multi-Manager International Equity | | Goldman Sachs Financial
Square Government
Fund — Institutional
Shares | | $ | 44,385,198 | | | $ | 661,319,792 | | | $ | (664,762,235 | ) | | | $40,942,755 | | | | 40,942,755 | | | $ | 1,777,483 | |
| |
Multi-Manager U.S. Small Cap Equity | | Goldman Sachs Financial
Square Government
Fund — Institutional
Shares | | | 38,902,135 | | | | 387,295,243 | | | | (389,906,455 | ) | | | 36,290,923 | | | | 36,290,923 | | | | 1,728,356 | |
| �� |
|
|
| 6. PORTFOLIO SECURITIES TRANSACTIONS |
The cost of purchases and proceeds from sales and maturities of long-term securities for the fiscal year ended October 31, 2023, were as follows:
| | | | |
| Fund | | Purchases (Excluding
U.S. Government and
Agency Obligations) | | Sales and Maturities of (Excluding
U.S. Government and
Agency Obligations) |
Multi-Manager International Equity | | $426,726,568 | | $519,151,685 |
|
Multi-Manager U.S. Small Cap Equity | | 516,904,753 | | 430,792,322 |
|
The tax character of distributions paid during the fiscal year ended October 31, 2023 was as follows:
| | | | | | | | |
| | | Multi-Manager
International
Equity Fund | | | Multi-Manager
U.S. Small Cap
Equity Fund | |
Distributions paid from: | | | | | | | | |
Ordinary income | | | $16,119,210 | | | | $3,365,968 | |
| |
Total taxable distributions | | | $16,119,210 | | | | $3,365,968 | |
| |
33
|
| ACTIVE EQUITY MULTI-MANAGER FUNDS |
Notes to Financial Statements (continued)
October 31, 2023
|
|
| 7. TAX INFORMATION (continued) |
The tax character of distributions paid during the fiscal year ended October 31, 2022 was as follows:
| | | | | | | | | | |
| | | Multi-Manager
International
Equity Fund | | Multi-Manager
U.S. Small Cap
Equity Fund |
Distributions paid from: | | | | | | | | | | |
Ordinary income | | | $ | 54,624,570 | | | | $ | 55,229,489 | |
Net long-term capital gains | | | | 51,051,407 | | | | | 50,229,806 | |
Total taxable distributions | | | $ | 105,675,977 | | | | $ | 105,459,295 | |
As of October 31, 2023, the components of accumulated earnings (losses) on a tax basis were as follows:
| | | | | | | | | | |
| | | Multi-Manager
International
Equity Fund | | Multi-Manager U.S. Small Cap
Equity Fund |
Undistributed ordinary income — net | | | $ | 21,120,857 | | | | $ | 3,564,953 | |
Capital loss carryforwards(1): | | | | | | | | | | |
Perpetual Short-Term | | | | — | | | | | (11,565,678 | ) |
Perpetual Long-Term | | | | (1,869,895 | ) | | | | — | |
Total capital loss carryforwards | | | | (1,869,895 | ) | | | | (11,565,678 | ) |
Unrealized gains (loss) — net | | | $ | 109,146,162 | | | | $ | (28,236,110 | ) |
Total accumulated earnings (loss) net | | | $ | 128,397,124 | | | | $ | (36,236,835 | ) |
| | (1) | The Multi-Manager International Equity and Multi-Manager U.S. Small Cap Equity Funds utilized $5,796,506 and $438,227, respectively, of capital losses in the current fiscal year. |
As of October 31, 2023, the Funds’ aggregate security unrealized gains and losses based on cost for U.S. federal income tax purposes were as follows:
| | | | | | | | | | |
| | | Multi-Manager
International
Equity Fund | | Multi-Manager
U.S. Small Cap
Equity Fund |
Tax Cost | | | $ | 1,101,132,076 | | | | $ | 746,792,700 | |
Gross unrealized gain | | | | 178,551,832 | | | | | 67,998,904 | |
Gross unrealized loss | | | | (69,405,670 | ) | | | | (96,235,014 | ) |
Net unrealized gain (loss) | | | $ | 109,146,162 | | | | $ | (28,236,110 | ) |
The difference between GAAP-basis and tax basis unrealized gains (losses) is attributable primarily to wash sales and differences in the tax treatment of passive foreign investment company investments.
GSAM has reviewed the Funds’ tax positions for all open tax years (the current and prior three years, as applicable) and has concluded that no provision for income tax is required in the Funds’ financial statements. Such open tax years remain subject to examination and adjustment by tax authorities.
34
ACTIVE EQUITY MULTI-MANAGER FUNDS
The Funds’ risks include, but are not limited to, the following:
Asset Allocation Risk — The Funds’ allocations to the various asset classes and to the Underlying Managers may cause the Funds to underperform other funds with a similar investment objective.
Derivatives Risk — The Funds’ use of derivatives and other similar instruments (collectively referred to in this paragraph as “derivatives”) may result in loss, including due to adverse market movements. Derivatives, which may pose risks in addition to and greater than those associated with investing directly in securities, currencies or other assets and instruments, may increase market exposure and be illiquid or less liquid, volatile, difficult to price and leveraged so that small changes in the value of the underlying assets or instruments may produce disproportionate losses to the Funds. Certain derivatives are also subject to counterparty risk, which is the risk that the other party in the transaction will not, or lacks the capacity or authority to, fulfill its contractual obligations, liquidity risk, which includes the risk that the Funds will not be able to exit the derivative when it is advantageous to do so, and risks arising from margin requirements, which include the risk that the Funds will be required to pay additional margin or set aside additional collateral to maintain open derivative positions. The use of derivatives is a highly specialized activity that involves investment techniques and risks different from those associated with investments in more traditional securities and instruments. Losses from derivatives can also result from a lack of correlation between changes in the value of derivative instruments and the portfolio assets (if any) being hedged.
Foreign and Emerging Countries Risk — Investing in foreign markets may involve special risks and considerations not typically associated with investing in the U.S. Foreign securities may be subject to risk of loss because of more or less foreign government regulation; less public information; less stringent investor protections; less stringent accounting, corporate governance, financial reporting and disclosure standards; and less economic, political and social stability in the countries in which a Fund invests. The imposition of sanctions, exchange controls (including repatriation restrictions), confiscation of assets and property, trade restrictions (including tariffs) and other government restrictions by the U.S. or other governments, or from problems in registration, settlement or custody, may also result in losses. The type and severity of sanctions and other similar measures, including counter sanctions and other retaliatory actions, that may be imposed could vary broadly in scope, and their impact is impossible to predict. For example, the imposition of sanctions and other similar measures could, among other things, cause a decline in the value and/or liquidity of securities issued by the sanctioned country or companies located in or economically tied to the sanctioned country and increase market volatility and disruption in the sanctioned country and throughout the world. Sanctions and other similar measures could limit or prevent a Fund from buying and selling securities (in the sanctioned country and other markets), significantly delay or prevent the settlement of securities transactions, and significantly impact a Fund’s liquidity and performance. Foreign risk also involves the risk of negative foreign currency exchange rate fluctuations, which may cause the value of securities denominated in such foreign currency (or other instruments through which a Fund has exposure to foreign currencies) to decline in value. Currency exchange rates may fluctuate significantly over short periods of time. To the extent that a Fund also invests in securities of issuers located in, or economically tied to, emerging markets, these risks may be more pronounced.
Geographic Risk — If a Fund focuses its investments in securities of issuers located in a particular country or geographic region, the Fund may be subjected, to a greater extent than if its investments were less focused, to the risks of volatile economic cycles and/or conditions and developments that may be particular to that country or region, such as: adverse securities markets; adverse exchange rates; adverse social, political, regulatory, economic, business, environmental or other developments; or natural disasters.
Index/Tracking Error Risk — To the extent that an index-tracking strategy or implementation of a sub-strategy by a transition manager is used with respect to a portion of a Fund’s assets, including through investment in an ETF that seeks to track an index or implementation of an index-tracking strategy, the Fund will be negatively affected by general declines in the securities and asset classes represented in the relevant index. There is no guarantee that the Fund, or relevant portion of the Fund, will achieve a high degree of correlation to the relevant index. Market disruptions and regulatory restrictions could have an adverse effect on the Fund’s ability, or the ability of an ETF in which it invests, to adjust its exposure to the required levels in order for the relevant portion of the Fund to track the relevant index. In addition, because that portion of the Fund is not “actively” managed, unless a specific security is removed from the relevant index, the Fund or an ETF in which it invests generally would not sell a security
35
|
| ACTIVE EQUITY MULTI-MANAGER FUNDS |
Notes to Financial Statements (continued)
October 31, 2023
|
|
| 8. OTHER RISKS (continued) |
because the security’s issuer was in financial trouble. At times when an index-tracking strategy is used with respect to a portion of the Fund’s assets, the Fund’s performance could be lower than funds that may actively shift all of their portfolio assets to take advantage of market opportunities or to lessen the impact of a market decline or a decline in the value of one or more issuers.
Investment Style Risk — Different investment styles (e.g., “growth”, “value” or “quantitative”) tend to shift in and out of favor depending upon market and economic conditions and investor sentiment. The Funds may outperform or underperform other funds that invest in similar asset classes but employ different investment styles.
Investments in Other Investment Companies Risk — As a shareholder of another investment company, including an exchange-traded fund (“ETF”), a Fund will indirectly bear its proportionate share of any net management fees and other expenses paid by such other investment companies, in addition to the fees and expenses regularly borne by the Fund. ETFs are subject to risks that do not apply to conventional mutual funds, including but not limited to the following: (i) the market price of the ETF’s shares may trade at a premium or a discount to their NAV; and (ii) an active trading market for an ETF’s shares may not develop or be maintained.
Large Shareholder Transactions Risk — A Fund may experience adverse effects when certain large shareholders, such as other funds, institutional investors (including those trading by use of non-discretionary mathematical formulas), financial intermediaries (who may make investment decisions on behalf of underlying clients and/or include a Fund in their investment model), individuals, accounts and Goldman Sachs affiliates, purchase or redeem large amounts of shares of a Fund. Such large shareholder redemptions, which may occur rapidly or unexpectedly, may cause a Fund to sell portfolio securities at times when it would not otherwise do so, which may negatively impact a Fund’s NAV and liquidity. These transactions may also accelerate the realization of taxable income to shareholders if such sales of investments resulted in gains, and may also increase transaction costs. In addition, a large redemption could result in a Fund’s current expenses being allocated over a smaller asset base, leading to an increase in a Fund’s expense ratio. Similarly, large Fund share purchases may adversely affect a Fund’s performance to the extent that the Fund is delayed in investing new cash or otherwise maintains a larger cash position than it ordinarily would.
Liquidity Risk — A Fund may make investments that are illiquid or that may become less liquid in response to market developments or adverse investor perceptions. Illiquid investments may be more difficult to value. Liquidity risk may also refer to the risk that a Fund will not be able to pay redemption proceeds within the allowable time period or without significant dilution to remaining investors’ interests because of unusual market conditions, declining prices of the securities sold, an unusually high volume of redemption requests, or other reasons. To meet redemption requests, a Fund may be forced to sell investments at an unfavorable time and/or under unfavorable conditions. If a Fund is forced to sell securities at an unfavorable time and/or under unfavorable conditions, such sales may adversely affect a Fund’s NAV and dilute remaining investors’ interests. Liquidity risk may be the result of, among other things, the reduced number and capacity of traditional market participants to make a market in fixed income securities or the lack of an active market. The potential for liquidity risk may be magnified by a rising interest rate environment or other circumstances where investor redemptions from fixed income funds may be higher than normal, potentially causing increased supply in the market due to selling activity. These risks may be more pronounced in connection with the Funds’ investments in securities of issuers located in emerging market countries. Redemptions by large shareholders may have a negative impact on a Fund’s liquidity.
Market and Credit Risks — In the normal course of business, a Fund trades financial instruments and enters into financial transactions where risk of potential loss exists due to changes in the market (market risk). The value of the securities in which a Fund invests may go up or down in response to the prospects of individual companies, particular sectors or governments and/or general economic conditions throughout the world due to increasingly interconnected global economies and financial markets. Events such as war, military conflict, acts of terrorism, social unrest, natural disasters, recessions, inflation, rapid interest rate changes, supply chain disruptions, sanctions, the spread of infectious illness or other public health threats could also significantly impact a Fund and its investments. Additionally, a Fund may also be exposed to credit risk in the event that an issuer or guarantor fails to perform or that an institution or entity with which a Fund has unsettled or open transactions defaults.
36
ACTIVE EQUITY MULTI-MANAGER FUNDS
|
|
| 8. OTHER RISKS (continued) |
Mid-Cap and Small-Cap Risk — Investments in mid-capitalization and small-capitalization companies involve greater risks than those associated with larger, more established companies. These securities may be subject to more abrupt or erratic price movements and may lack sufficient market liquidity, and these issuers often face greater business risks.
Multi-Manager Approach Risk — The Funds’ performance depends on the ability of the Investment Adviser in selecting, overseeing, and allocating Fund assets to the Underlying Managers. The Underlying Managers’ investment styles may not always be complementary. The Funds’ multi-manager approach may result in the Fund investing a significant percentage of its assets in certain types of investments, which could be beneficial or detrimental to the Funds’ performance depending on the performance of those investments and the overall market environment. The Funds’ Underlying Managers may underperform the market generally or underperform other investment managers that could have been selected for the Funds. Because the Funds’ Underlying Managers may trade with counterparties, prime brokers, clearing brokers or futures commission merchants on terms that are different than those on which the Investment Adviser would trade, and because each Underlying Manager applies its own risk analysis in evaluating potential counterparties for the Funds, the Funds may be subject to greater counterparty risk than if they were managed directly by the Investment Adviser.
Under the Trust’s organizational documents, its Trustees, officers, employees and agents are indemnified, to the extent permitted by the Act and state law, against certain liabilities that may arise out of performance of their duties to the Funds. Additionally, in the course of business, the Funds enter into contracts that contain a variety of indemnification clauses. The Funds’ maximum exposure under these arrangements is unknown, as this would involve future claims that may be made against the Funds that have not yet occurred. However, GSAM believes the risk of loss under these arrangements to be remote.
Pursuant to an effort to consolidate the membership of the Board of Trustees of the Trust (the “Board”) with the Board of Trustees of each of Goldman Sachs ETF Trust, Goldman Sachs ETF Trust II, Goldman Sachs Real Estate Diversified Income Fund, Goldman Sachs Trust and Goldman Sachs Variable Insurance Trust, in July 2023, the Board voted to nominate Gregory G. Weaver, Dwight L. Bush, Kathryn A. Cassidy, John G. Chou, Joaquin Delgado, Eileen H. Dowling and Paul C. Wirth (the “Nominees”) for election as Trustees of the Trust. At a virtual special joint meeting of shareholders held on November 16, 2023, each of the Nominees was elected to serve as Trustees alongside the current Trustees of the Trust, effective January 1, 2024.
Subsequent events after the Statements of Assets and Liabilities date have been evaluated, and GSAM has concluded that there is no impact requiring adjustment or disclosure in the financial statements.
37
|
| ACTIVE EQUITY MULTI-MANAGER FUNDS |
Notes to Financial Statements (continued)
October 31, 2023
|
|
| 12. SUMMARY OF SHARE TRANSACTIONS |
Share activity is as follows:
| | | | | | | | | | | | | | | | |
| | | Multi-Manager International Equity Fund | |
| | | For the Fiscal Year Ended
October 31, 2023 | | | For the Fiscal Year Ended
October 31, 2022 | |
| | | Shares | | | Dollars | | | Shares | | | Dollars | |
| | | | |
Class P Shares | | | | | | | | | | | | | | | | |
| | | | |
Shares sold | | | 10,853,620 | | | $ | 143,090,181 | | | | 24,271,194 | | | $ | 300,829,170 | |
| | | | |
Reinvestment of distributions | | | 1,364,878 | | | | 16,119,210 | | | | 7,532,433 | | | | 105,675,977 | |
| | | | |
Shares redeemed | | | (20,159,485 | ) | | | (256,849,962 | ) | | | (14,891,826 | ) | | | (182,135,814 | ) |
| |
| | | | |
NET INCREASE (DECREASE) | | | (7,940,987 | ) | | $ | (97,640,571 | ) | | | 16,911,801 | | | $ | 224,369,333 | |
| |
| |
| | | Multi-Manager U.S. Small Cap Equity Fund | |
| | | For the Fiscal Year Ended
October 31, 2023 | | | For the Fiscal Year Ended
October 31, 2022 | |
| | | Shares | | | Dollars | | | Shares | | | Dollars | |
| | | | |
Class P Shares | | | | | | | | | | | | | | | | |
| | | | |
Shares sold | | | 11,178,433 | | | $ | 139,489,002 | | | | 13,542,686 | | | $ | 175,288,130 | |
| | | | |
Reinvestment of distributions | | | 284,048 | | | | 3,365,968 | | | | 7,600,474 | | | | 105,459,295 | |
| | | | |
Shares redeemed | | | (4,731,818 | ) | | | (59,610,549 | ) | | | (2,587,393 | ) | | | (35,693,851 | ) |
| |
| | | | |
NET INCREASE | | | 6,730,663 | | | $ | 83,244,421 | | | | 18,555,767 | | | $ | 245,053,574 | |
| |
38
Report of Independent Registered Public
Accounting Firm
To the Board of Trustees of Goldman Sachs Trust II and Shareholders of Multi-Manager International Equity Fund and Multi-Manager U.S. Small Cap Equity Fund
Opinions on the Financial Statements
We have audited the accompanying statements of assets and liabilities, including the schedules of investments, of Multi-Manager International Equity Fund and Multi-Manager U.S. Small Cap Equity Fund (two of the funds constituting Goldman Sachs Trust II, hereafter collectively referred to as the “Funds”) as of October 31, 2023, the related statements of operations for the year ended October 31, 2023, the statements of changes in net assets for each of the two years in the period ended October 31, 2023, including the related notes, and the financial highlights for each of the five years in the period ended October 31, 2023 (collectively referred to as the “financial statements”). In our opinion, the financial statements present fairly, in all material respects, the financial position of each of the Funds as of October 31, 2023, the results of each of their operations for the year then ended, the changes in each of their net assets for each of the two years in the period ended October 31, 2023 and each of the financial highlights for each of the five years in the period ended October 31, 2023 in conformity with accounting principles generally accepted in the United States of America.
Basis for Opinions
These financial statements are the responsibility of the Funds’ management. Our responsibility is to express an opinion on the Funds’ financial statements based on our audits. We are a public accounting firm registered with the Public Company Accounting Oversight Board (United States) (PCAOB) and are required to be independent with respect to the Funds in accordance with the U.S. federal securities laws and the applicable rules and regulations of the Securities and Exchange Commission and the PCAOB.
We conducted our audits of these financial statements in accordance with the standards of the PCAOB. Those standards require that we plan and perform the audit to obtain reasonable assurance about whether the financial statements are free of material misstatement, whether due to error or fraud.
Our audits included performing procedures to assess the risks of material misstatement of the financial statements, whether due to error or fraud, and performing procedures that respond to those risks. Such procedures included examining, on a test basis, evidence regarding the amounts and disclosures in the financial statements. Our audits also included evaluating the accounting principles used and significant estimates made by management, as well as evaluating the overall presentation of the financial statements. Our procedures included confirmation of securities owned as of October 31, 2023 by correspondence with the custodian, transfer agent, and brokers; when replies were not received from brokers, we performed other auditing procedures. We believe that our audits provide a reasonable basis for our opinions.
/s/ PricewaterhouseCoopers LLP
Boston, Massachusetts
December 21, 2023
We have served as the auditor of one or more investment companies in the Goldman Sachs fund complex since 2000.
39
|
| ACTIVE EQUITY MULTI-MANAGER FUNDS |
|
Fund Expenses — Six Month Period Ended October 31, 2023 (Unaudited) |
As a shareholder of Class P Shares of the Funds, you incur two types of costs: (1) transaction costs, and (2) ongoing costs, including management fees; and other Fund expenses. This example is intended to help you understand your ongoing costs (in dollars) of investing in the Funds and to compare these costs with the ongoing costs of investing in other mutual funds.
The example is based on an investment of $1,000 invested at the beginning of the period and held for the entire period from May 1, 2023 through October 31, 2023, which represents a period of 184 days of a 365 day year. This projection assumes that annualized expense ratios were in effect during the period.
Actual Expenses — The first line in the table below provides information about actual account values and actual expenses. You may use the information in this line, together with the amount you invested, to estimate the expenses that you paid over the period. Simply divide your account value by $1,000 (for example, an $8,600 account value divided by $1,000=8.6), then multiply the result by the number in the first line under the heading entitled “Expenses Paid” to estimate the expenses you paid on your account during this period.
Hypothetical Example for Comparison Purposes — The second line in the table below provides information about hypothetical account values and hypothetical expenses based on the Funds’ actual net expense ratios and an assumed rate of return of 5% per year before expenses, which is not the Funds’ actual return. The hypothetical account values and expenses may not be used to estimate the actual ending account balance or expenses you paid for the period. You may use this information to compare the ongoing costs of investing in the Funds and other funds. To do so, compare this 5% hypothetical example with the 5% hypothetical examples that appear in the shareholder reports of the other funds.
Please note that the expenses shown in the table are meant to highlight your ongoing costs only and do not reflect any transactional costs, such as sales charges, redemption fees, or exchange fees. Therefore, the second line of the table is useful in comparing ongoing costs only, and will not help you determine the relative total costs of owning different funds. In addition, if these transactional costs were included, your costs would have been higher.
| | | | | | | | | | | | | | | | | | | | | | | | |
| | | Multi-Manager International Equity Fund | | | Multi-Manager U.S. Small Cap Equity Fund | |
| Share Class | | Beginning Account Value 5/1/23 | | | Ending Account Value 10/31/23 | | | Expenses Paid for the 6 months ended 10/31/23* | | | Beginning Account Value 5/1/23 | | | Ending Account Value 10/31/23 | | | Expenses Paid for the 6 months ended 10/31/23* | |
| Class P | | | | | | | | | | | | | | | | | | | | | | | | |
Actual | | | $1,000.00 | | | | $ 924.30 | + | | | $2.58 | | | | $1,000.00 | | | | $ 947.50 | + | | | $3.52 | |
Hypothetical 5% return | | | 1,000.00 | | | | 1,022.50 | + | | | 2.71 | | | | 1,000.00 | | | | 1,021.60 | + | | | 3.66 | |
| * | Expenses for each share class are calculated using each Fund’s annualized net expense ratio for each class, which represents the ongoing expenses as a percentage of net assets for the six months ended October 31, 2023. Expenses are calculated by multiplying the annualized net expense ratio by the average account value for the period; then multiplying the result by the number of days in the most recent fiscal half year; and then dividing that result by the number of days in the fiscal year. The annualized net expense ratios for the period were as follows: |
| | | | | | |
| Fund | | Class P | | | |
Multi-Manager International Equity | | | 0.53 | % | | |
Multi-Manager U.S. Small Cap Equity | | | 0.72 | | | |
| + | Hypothetical expenses are based on each Fund’s actual annualized net expense ratios (excluding proxy fee which is not annualized) and an assumed rate of return of 5% per year before expenses. |
40
ACTIVE EQUITY MULTI-MANAGER FUNDS
Statement Regarding Basis for Approval of Management Agreement and Sub-Advisory
Agreements (Unaudited)
Background
The Multi-Manager International Equity Fund and Multi-Manager U.S. Small Cap Equity Fund (the “Funds”) are investment portfolios of Goldman Sachs Trust II (the “Trust”). The Board of Trustees (the “Board”) oversees the management of the Trust and reviews the investment performance and expenses of the Funds at regularly scheduled meetings held throughout the year. Each Fund employs a “manager of managers” structure, whereby Goldman Sachs Asset Management, L.P. (the “Investment Adviser”) is responsible for selecting sub-advisers (subject to Board approval), allocating the Fund’s assets among them, and overseeing their day-to-day management of Fund assets. The Board determines annually whether to approve the continuance of the Trust’s investment management agreement (the “Management Agreement”) with the Investment Adviser on behalf of the Funds.
The Management Agreement was most recently approved for continuation until September 30, 2024 by the Board, including those Trustees who are not parties to the Management Agreement or “interested persons” (as defined in the Investment Company Act of 1940, as amended) of any party thereto (the “Independent Trustees”), at a meeting held on September 19-20, 2023 (the “Annual Meeting”). At the Annual Meeting, the Board also considered the sub-advisory agreements (each a “Designated Sub-Advisory Agreement” and, together with the Management Agreement, the “Agreements”) between the Investment Adviser and (i) each of Causeway Capital Management LLC, Lazard Asset Management LLC, Massachusetts Financial Services Company (d/b/a MFS Investment Management), and WCM Investment Management (on behalf of Multi-Manager International Equity Fund); and (ii) each of Boston Partners Global Investors, Inc., Brown Advisory LLC, and Victory Capital Management, Inc. (on behalf of Multi-Manager U.S. Small Cap Equity Fund) (each, a “Designated Sub-Adviser” and collectively, the “Designated Sub-Advisers”).
The review process undertaken by the Trustees spans the course of the year and culminates with the Annual Meeting. To assist the Trustees in their deliberations, the Trustees have established a Contract Review Committee (the “Committee”), comprised of the Independent Trustees. The Committee held four meetings over the course of the year since the Management Agreement was last approved. At those Committee meetings, regularly scheduled Board or other committee meetings, and/or the Annual Meeting, matters relevant to the renewal of the Management Agreement and the Designated Sub-Advisory Agreements were considered by the Board, or the Independent Trustees, as applicable. With respect to each Fund, such matters included:
| | (a) | the nature and quality of the advisory, administrative, and other services provided to the Fund by the Investment Adviser and its affiliates, and the Designated Sub-Advisers, including, as applicable, information about: |
| | (i) | the structure, staff, and capabilities of the Investment Adviser and the Designated Sub-Advisers and the Designated Sub-Advisers’ portfolio management teams; |
| | (ii) | the groups within the Investment Adviser and its affiliates that support the portfolio management teams or provide other types of necessary services, including fund services groups (e.g., accounting and financial reporting, tax, shareholder services, and operations); controls and risk management groups (e.g., legal, compliance, valuation oversight, credit risk management, internal audit, compliance testing, market risk analysis, finance, and central funding); sales and distribution support groups, and others (e.g., information technology and training); |
| | (iii) | trends in employee headcount; |
| | (iv) | the Investment Adviser’s financial resources and ability to hire and retain talented personnel and strengthen its operations; and |
| | (v) | the parent company’s support of the Investment Adviser and its mutual fund business, as expressed by the firm’s senior management; |
| | (b) | information on the investment performance of the Fund, including comparisons to the performance of similar mutual funds, as provided by a third-party mutual fund data provider engaged as part of the contract review process (the “Outside Data Provider”), benchmark performance indices, and commingled investment vehicles with comparable investment strategies managed by the Investment Adviser, and information on general investment outlooks in the markets in which the Fund invests; |
| | (c) | information provided by the Investment Adviser indicating the Investment Adviser’s views on whether the Fund’s peer group and/or benchmark index had high, medium, or low relevance given the Fund’s particular investment strategy; |
| | (d) | the terms of the Agreements and other agreements with affiliated service providers entered into by the Trust on behalf of the Fund; |
| | (e) | fee and expense information for the Fund, including: |
| | (i) | the relative management fee and expense levels of the Fund as compared to those of comparable funds managed by other advisers, as provided by the Outside Data Provider; |
| | (ii) | the Fund’s expense trends over time; and |
41
|
| ACTIVE EQUITY MULTI-MANAGER FUNDS |
Statement Regarding Basis for Approval of Management Agreement and Sub-Advisory
Agreements (Unaudited) (continued)
| | (iii) | to the extent the Investment Adviser manages other types of accounts (such as bank collective trusts, private wealth management accounts, institutional separate accounts, sub-advised mutual funds, and non-U.S. funds) having investment objectives and policies similar to those of the Fund, comparative information on the advisory fees charged and services provided to those accounts by the Investment Adviser; |
| | (f) | with respect to the extensive investment performance and expense comparison data provided by the Outside Data Provider, its processes in producing that data for the Fund; |
| | (g) | the undertakings of the Investment Adviser and its affiliates to implement fee waivers and expense limitations; |
| | (h) | information relating to the profitability of the Management Agreement and the transfer agency arrangements of the Fund to the Investment Adviser and its affiliates; |
| | (i) | whether the Fund’s existing management fee schedule adequately addressed any economies of scale; |
| | (j) | a summary of the “fall-out” benefits derived by the Investment Adviser and its affiliates from their relationships with the Fund, including the fees received by the Investment Adviser’s affiliates from the Fund for transfer agency, portfolio trading, distribution and other services; |
| | (k) | a summary of potential benefits derived by the Fund as a result of its relationship with the Investment Adviser; |
| | (l) | with respect to the Investment Adviser, portfolio manager ownership of Fund shares; the manner in which portfolio manager compensation is determined; information on the Designated Sub-Advisers’ compensation arrangements; and the number and types of accounts managed by the portfolio managers; |
| | (m) | the nature and quality of the services provided to the Fund by its unaffiliated service providers (as well as the Designated Sub-Advisers), and the Investment Adviser’s general oversight and evaluation (including reports on due diligence) of those service providers as part of the administrative services provided under the Management Agreement; and |
| | (n) | the Investment Adviser’s and Designated Sub-Advisers’ processes and policies addressing various types of potential conflicts of interest; their approaches to risk management; the annual review of the effectiveness of the Fund’s compliance program; and periodic compliance reports. |
The Trustees also received an overview of the Funds’ distribution arrangements. They received information regarding the Funds’ assets and share purchase and redemption activity. Information was also provided to the Trustees relating to revenue sharing payments made by and services provided by the Investment Adviser and its affiliates to intermediaries that promote the sale, distribution, and/or servicing of Fund shares.
The presentations made at the Board and Committee meetings and at the Annual Meeting encompassed the Funds and other mutual funds for which the Board has responsibility. In evaluating the Agreements at the Annual Meeting, the Trustees relied upon their knowledge, resulting from their meetings and other interactions throughout the year, of the Investment Adviser and its affiliates and Designated Sub-Advisers, their respective services, and the Funds. In conjunction with these meetings, the Trustees received written materials and oral presentations on the topics covered, and the Investment Adviser addressed the questions and concerns of the Trustees, including concerns regarding the investment performance of certain of the funds they oversee. In addition, the Trustees periodically received written materials and oral presentations from the Funds’ various sub-advisers, including the Designated Sub-Advisers. The Independent Trustees were advised by their independent legal counsel regarding their responsibilities and other regulatory requirements related to the approval and continuation of mutual fund investment management agreements under applicable law. In addition, the Investment Adviser and its affiliates provided the Independent Trustees with a written response to a formal request for information sent on behalf of the Independent Trustees by their independent legal counsel. The Trustees reviewed a written response prepared by each Designated Sub-Adviser to a similar request for information submitted to the Designated Sub-Adviser by the Investment Adviser. During the course of their deliberations, the Independent Trustees met in executive sessions with their independent legal counsel, without representatives of the Investment Adviser or its affiliates present.
Nature, Extent, and Quality of the Services Provided Under the Management Agreement
As part of their review, the Trustees considered the nature, extent, and quality of the services provided to the Funds by the Investment Adviser. In this regard, the Trustees considered both the investment advisory services and non-advisory services that are provided by the Investment Adviser and its affiliates. The Trustees noted the transition in the leadership and changes in personnel of various of the Investment Adviser’s portfolio management teams that had occurred in recent periods, and the ongoing recruitment efforts aimed at bringing high quality investment talent to the Investment Adviser. They also noted the Investment Adviser’s commitment to maintaining high quality systems and expending substantial resources to respond to ongoing changes to the market, regulatory and control environment in which the Funds and their service providers operate, including developments associated with the COVID-19 pandemic, geopolitical events, and economic sanctions, as well as the efforts of the Investment
42
ACTIVE EQUITY MULTI-MANAGER FUNDS
Statement Regarding Basis for Approval of Management Agreement and Sub-Advisory
Agreements (Unaudited) (continued)
Adviser and its affiliates to combat cyber security risks. The Trustees also considered information regarding the Investment Adviser’s and the Funds’ various sub-advisers’ business continuity planning and remote operations capabilities. The Trustees concluded that the Investment Adviser continued to commit substantial financial and operational resources to the Funds and expressed confidence that the Investment Adviser would continue to do so in the future. The Trustees also recognized that the Investment Adviser had made significant commitments to address regulatory compliance requirements applicable to the Funds and the Investment Adviser and its affiliates. In addition, the Trustees reviewed the sub-adviser oversight process that the Investment Adviser had employed, which included areas such as investment analytics, risk management, and compliance.
Investment Performance
The Trustees also considered the investment performance of the Funds. In this regard, they compared the investment performance of each Fund to its peers using rankings and ratings compiled by the Outside Data Provider as of March 31, 2023, and updated performance information prepared by the Investment Adviser as of June 30, 2023. The information on each Fund’s investment performance prepared by the Outside Data Provider was provided for the one-, three-, and five-year periods ending on the applicable dates. The Trustees also reviewed each Fund’s investment performance relative to its performance benchmark. As part of this review, they considered the investment performance trends of the Funds over time, and reviewed the investment performance of each Fund in light of its investment objective and policies and market conditions. The Trustees considered the Investment Adviser’s representations that each Fund had significant differences from its Outside Data Provider peer group that caused it to be an imperfect basis for comparison. The Trustees also received information comparing each Fund’s performance to that of comparable unregistered funds and separate accounts managed by the Investment Adviser. They considered that the unregistered funds and separate accounts provide an imperfect performance comparison because they are not subject to the requirements of the Investment Company Act of 1940, as amended.
In addition, the Trustees considered materials prepared and presentations made by the Investment Adviser’s senior management and the Sub-Advisers’ portfolio management personnel in which Fund performance was assessed. The Trustees also considered the Investment Adviser’s periodic reports with respect to the Funds’ risk profiles, and how the Investment Adviser’s approach to risk monitoring and management influences portfolio management.
The Trustees noted that the Multi-Manager International Equity Fund had placed in the top half of its performance peer group for the one- and five-year periods and the fourth quartile for the three-year period, and had outperformed its benchmark index for the one-, three- and five-year periods ended March 31, 2023. They noted that the Multi-Manager U.S. Small Cap Equity Fund had placed in the top half of its performance peer group for the one-year period, the fourth quartile of its peer group for the three-year period and the third quartile of its peer group for the five-year period, and had outperformed its benchmark index for the one- and three-year periods and underperformed for the five-year period ended March 31, 2023.
Costs of Services Provided and Competitive Information
The Trustees considered the contractual terms of the Management Agreement and the fee rates payable by each Fund thereunder. In this regard, the Trustees considered information on the services rendered by the Investment Adviser to the Funds, which included both advisory and administrative services that were directed to the needs and operations of the Funds as registered mutual funds.
In particular, the Trustees reviewed analyses prepared by the Outside Data Provider regarding the expense rankings of the Funds, as well as additional information provided by the Investment Adviser throughout the year. The analyses provided a comparison of each Fund’s management fee to those of a relevant peer group and category universe; an expense analysis which compared each Fund’s overall net and gross expenses to a peer group and a category universe; and data comparing each Fund’s net expenses to the peer and category medians. The analyses also compared each Fund’s other expenses and fee waivers/ reimbursements to those of the peer group and category medians. The Trustees also considered comparative fee information for services provided by the Investment Adviser to collective investment vehicles having investment objectives and policies similar to those of the Funds. The Trustees considered that services provided to the Funds differed in various significant respects from the services provided to these collective investment vehicles, which generally operated under less stringent regulatory and financial reporting requirements and required fewer services from the Investment Adviser. The Trustees concluded that the comparisons provided by the Outside Data Provider and the Investment Adviser were useful in evaluating the reasonableness of the management fees and total expenses paid by the Funds.
In addition. the Trustees considered the Investment Adviser’s undertakings to implement fee waivers and expense limitations. In this regard the Trustees noted that shareholders that are invested in the Funds consist of institutional clients that have entered into a separate management agreement with the Investment Adviser and pay a single management fee for the Investment Adviser’s
43
|
| ACTIVE EQUITY MULTI-MANAGER FUNDS |
Statement Regarding Basis for Approval of Management Agreement and Sub-Advisory
Agreements (Unaudited) (continued)
management of their accounts, and that the Investment Adviser waives a portion of the management fee with respect to each Fund in order to achieve an effective net management fee rate that is equal to the actual cost of fees paid to the Fund’s sub-advisers. In addition, the Trustees noted that shareholders are able to redeem their shares at any time if shareholders believe that the Fund fees and expenses are too high or if they are dissatisfied with the performance of the Fund.
Profitability
The Trustees reviewed each Fund’s contribution to the Investment Adviser’s revenues and pre-tax profit margins. In this regard the Trustees noted that they had received, among other things, profitability analyses and summaries, revenue and expense schedules by Fund and by function (i.e., investment management, transfer agency and distribution and service), and information on the Investment Adviser’s expense allocation methodology. They observed that the profitability and expense figures are substantially similar to those used by the Investment Adviser for many internal purposes, including compensation decisions among various business groups, and are thus subject to a vigorous internal debate about how certain revenue and expenses should be allocated. The Trustees also noted that the internal audit group within the Goldman Sachs organization periodically audits the expense allocation methodology and that the internal audit group was satisfied with the reasonableness, consistency, and accuracy of the Investment Adviser’s expense allocation methodology. Profitability data for each Fund was provided for 2022 and 2021, and the Trustees considered this information in relation to the Investment Adviser’s overall profitability.
Economies of Scale
The Trustees considered the information that had been provided regarding whether there have been economies of scale with respect to the management of the Funds. The Trustees also considered that the Funds are offered to the Investment Adviser’s institutional clients as part of an investment program whereby the Funds and other funds act as core “building blocks” for the client’s portfolio. The Trustees considered the Investment Adviser’s representations that its clients benefit from this investment model with increased liquidity, increased investment oversight, access to new investment strategies, economies of scale, and reduced complexity in managing client portfolios. The Trustees noted that, pursuant to the model, clients pay a management fee for the Investment Adviser’s management of their accounts, and that the fund-level management fees in excess of the weighted average sub-advisory fees are waived in order to avoid charging two layers of management fees.
The Trustees considered that there are no breakpoints in the fee rate payable under the Management Agreement for each of the Funds. The Trustees considered the amounts of assets in the Funds; the Funds’ recent purchase and redemption activity; the information provided by the Investment Adviser relating to the costs of the services provided by the Investment Adviser and its affiliates and the profits realized by them (if any); information comparing the fee rates charged by the Investment Adviser with fee rates charged to other funds in the peer groups; and the Investment Adviser’s undertakings to waive a portion of its management fee and to limit certain expenses of the Funds that exceed specified levels. The Trustees also considered the relationship between the advisory and sub-advisory fee rate schedules.
Other Benefits to the Investment Adviser and Its Affiliates
The Trustees also considered the other benefits derived by the Investment Adviser and its affiliates from their relationships with the Funds, as stated above, including: (a) transfer agency fees received by Goldman Sachs & Co. LLC (“Goldman Sachs”); (b) brokerage and futures commissions earned by Goldman Sachs for executing securities transactions (in its capacity as clearing broker) and futures transactions on behalf of the Funds; (c) the Investment Adviser’s ability to leverage the infrastructure designed to service the Funds on behalf of its other clients; (d) the Investment Adviser’s ability to cross-market other products and services to Fund shareholders; (e) the Investment Adviser’s ability to negotiate better pricing with the Funds’ custodian on behalf of its other clients, as a result of the relationship with the Funds; (f) the investment of cash in money market funds managed by the Investment Adviser that will result in increased assets under management for those money market funds; and (g) the possibility that the working relationship between the Investment Adviser and the Funds’ third-party service providers (including the Funds’ sub-advisers) may cause those service providers to be more likely to do business with other areas of Goldman Sachs. In the course of considering the foregoing, the Independent Trustees requested and received further information quantifying certain of these fall-out benefits.
Other Benefits to the Funds and Their Shareholders
The Trustees also noted that the Funds receive certain other potential benefits as a result of their relationship with the Investment Adviser, including: (a) enhanced servicing from vendors due to the volume of business generated by the Investment Adviser and its affiliates; (b) the advantages received from the Investment Adviser’s knowledge and experience gained from
44
ACTIVE EQUITY MULTI-MANAGER FUNDS
Statement Regarding Basis for Approval of Management Agreement and Sub-Advisory
Agreements (Unaudited) (continued)
managing other accounts and products; (c) the Investment Adviser’s ability to hire and retain qualified personnel to provide services to the Funds because of the reputation of the Goldman Sachs organization; (d) the Funds’ access, through the Investment Adviser, to certain firm-wide resources (e.g., proprietary risk management systems and databases), subject to certain restrictions; (e) the Funds’ ability to aggregate assets managed by certain sub-advisers with those of other clients of the Investment Adviser for purposes of applying breakpoints in a sub-advisory agreement; and (f) the Funds’ access to certain affiliated distribution channels. In addition, the Trustees noted the competitive nature of the mutual fund marketplace, and considered that many of the Funds’ shareholders invested in the Funds in part because of the Funds’ relationship with the Investment Adviser and that those shareholders have a general expectation that the relationship will continue.
Conclusion
In connection with their consideration of the Management Agreement, the Trustees gave weight to each of the factors described above, but did not identify any particular factor as controlling their decision. After deliberation and consideration of all of the information provided, including the factors described above, the Trustees concluded, in the exercise of their business judgment, that the management fees paid by each of the Funds were reasonable in light of the services provided to it by the Investment Adviser, the Investment Adviser’s costs and each Fund’s current and reasonably foreseeable asset levels. The Trustees unanimously concluded that the Investment Adviser’s continued management likely would benefit each Fund and its shareholders and that the Management Agreement should be approved and continued with respect to each Fund until September 30, 2024.
Designated Sub-Advisory Agreements
Nature, Extent, and Quality of the Services Provided Under the Designated Sub-Advisory Agreements and Performance
In evaluating the Designated Sub-Advisory Agreements, the Trustees relied upon materials furnished and presentations made by the Investment Adviser and the Designated Sub-Advisers. In evaluating the nature, extent, and quality of services provided by each Designated Sub-Adviser, the Trustees considered information on the services provided to the Funds by their respective Designated Sub-Advisers, including information about each Designated Sub-Adviser’s (a) personnel and compensation structure; (b) track record in managing the Fund and, if applicable, other funds and/or accounts with investment strategies similar to those employed on behalf of the Funds; (c) policies and procedures in place to address potential conflicts of interest; and (d) compliance program and code of ethics. In this regard, they also considered assessments provided by the Investment Adviser of each Designated Sub-Adviser, the Designated Sub-Adviser’s investment strategies and personnel, and its compliance program. The Trustees also considered information regarding each Designated Sub-Adviser’s business continuity planning and remote operations capabilities. The Trustees also reviewed the operations and investment performance of each Designated Sub-Adviser’s respective sleeve of the applicable Fund since its inception, including a comparison of each Designated Sub-Adviser to relevant benchmark indices based on various metrics.
Costs of Services Provided
The Trustees reviewed the terms of each Designated Sub-Advisory Agreement, including the schedule of fees payable to the Designated Sub-Advisers. They considered any breakpoints in the sub-advisory fee rate payable under each Designated Sub-Advisory Agreement. The Trustees noted that the compensation paid to each Designated Sub-Adviser is paid by the Investment Adviser, not by the Funds. The Trustees considered that certain Designated Sub-Advisers had agreed to reduce their sub-advisory fee rate, which benefited shareholders of the applicable Funds in light of the existing management fee waiver arrangement. The Trustees reviewed the blended average of all sub-advisory fees paid by the Investment Adviser with respect to each Fund in light of the overall management fee paid by each Fund. They also considered the Investment Adviser’s undertaking to waive a portion of its management fee which is in excess of the weighted average of each Fund’s sub-advisory fees.
Conclusion
In connection with their consideration of the Designated Sub-Advisory Agreements, the Trustees gave weight to various factors, but did not identify any particular factor as controlling their decision. After deliberation and consideration of the information provided, including the factors described above, the Trustees, including the Independent Trustees, unanimously concluded, in the exercise of their business judgment, that the sub-advisory fees paid by the Investment Adviser to each Designated Sub-Adviser were reasonable in light of the factors considered, and that each Designated Sub-Advisory Agreement should be approved and continued until September 30, 2024.
45
|
| ACTIVE EQUITY MULTI-MANAGER FUNDS |
Trustees and Officers (Unaudited)
Independent Trustees
| | | | | | | | | | |
Name,
Address and Age1 | | Position(s) Held
with the Trust | | Term of
Office and
Length of
Time Served2 | | Principal Occupation(s) During Past 5 Years | | Number of
Portfolios in
Fund Complex
Overseen by
Trustee3 | | Other
Directorships
Held by Trustee4 |
Cheryl K. Beebe Age: 67 | | Chair of the Board of Trustees | | Since 2017 (Trustee since 2015) | | Ms. Beebe is retired. She is Director, Packaging Corporation of America (2008-Present); Director, The Mosaic Company (2019-Present); Director, HanesBrands Inc. (2020-Present); and was formerly Director, Convergys Corporation (a global leader in customer experience outsourcing) (2015-2018); and formerly held the position of Executive Vice President, (2010-2014); and Chief Financial Officer, Ingredion, Inc. (a leading global ingredient solutions company) (2004-2014). Chair of the Board of Trustees — Goldman Sachs Trust II; Goldman Sachs MLP and Energy Renaissance Fund; Goldman Sachs ETF Trust; Goldman Sachs ETF Trust II; and Goldman Sachs Real Estate Diversified Income Fund. | | 90 | | Packaging Corporation of America (producer of container board); The Mosaic Company (producer of phosphate and potash fertilizer); HanesBrands Inc. (a multinational clothing company) |
Lawrence Hughes Age: 65 | | Trustee | | Since 2016 | | Mr. Hughes is retired. Formerly, he held senior management positions with BNY Mellon Wealth Management, a division of The Bank of New York Mellon Corporation (a financial services company)(1991-2015), most recently as Chief Executive Officer (2010-2015). Previously, Mr. Hughes served as an Advisory Board Member of Goldman Sachs Trust II (February 2016-April 2016). Trustee — Goldman Sachs Trust II; Goldman Sachs MLP and Energy Renaissance Fund; Goldman Sachs ETF Trust; Goldman Sachs ETF Trust II; and Goldman Sachs Real Estate Diversified Income Fund. | | 90 | | None |
John F. Killian Age: 68 | | Trustee | | Since 2015 | | Mr. Killian is retired. He is Director, Consolidated Edison, Inc. (2007-Present); and was formerly Director, Houghton Mifflin Harcourt Publishing Company (2011-2022). Previously, he held senior management positions with Verizon Communications, Inc., including Executive Vice President and Chief Financial Officer (2009-2010); and President, Verizon Business, Verizon Communications, Inc. (2005-2009). Trustee — Goldman Sachs Trust II; Goldman Sachs MLP and Energy Renaissance Fund; Goldman Sachs ETF Trust; Goldman Sachs ETF Trust II; and Goldman Sachs Real Estate Diversified Income Fund. | | 90 | | Consolidated Edison, Inc. (a utility holding company); |
Steven D. Krichmar Age: 65 | | Trustee | | Since 2018 | | Mr. Krichmar is retired. Formerly, he held senior management and governance positions with Putnam Investments, LLC, a financial services company (2001-2016). He was most recently Chief of Operations and a member of the Operating Committee of Putnam Investments, LLC and Principal Financial Officer of The Putnam Funds. Previously, Mr. Krichmar served as an Audit Partner with PricewaterhouseCoopers LLP and its predecessor company (1990-2001). Trustee — Goldman Sachs Trust II; Goldman Sachs MLP and Energy Renaissance Fund; Goldman Sachs ETF Trust; Goldman Sachs ETF Trust II; and Goldman Sachs Real Estate Diversified Income Fund. | | 90 | | None |
Michael Latham Age: 58 | | Trustee | | Since 2021 | | Mr. Latham is retired. Formerly, he held senior management positions with the iShares exchange-traded fund business owned by BlackRock, Inc., including Chairman (2011-2014); Global Head (2010-2011); U.S. Head (2007-2010); and Chief Operating Officer (2003-2007). Trustee — Goldman Sachs Trust II; Goldman Sachs MLP and Energy Renaissance Fund; Goldman Sachs ETF Trust; Goldman Sachs ETF Trust II; Goldman Sachs Credit Income Fund; and Goldman Sachs Real Estate Diversified Income Fund. | | 91 | | None |
| | | | | | | | | | |
46
ACTIVE EQUITY MULTI-MANAGER FUNDS
Trustees and Officers (Unaudited) (continued)
Independent Trustees
| | | | | | | | | | | | |
Name,
Address and Age1 | | Position(s) Held
with the Trust | | Term of
Office and
Length of
Time Served2 | | Principal Occupation(s) During Past 5 Years | | Number of
Portfolios in
Fund Complex
Overseen by
Trustee3 | | | Other
Directorships
Held by Trustee4 |
Lawrence W. Stranghoener Age: 69 | | Trustee | | Since 2021 | | Mr. Stranghoener is retired. He is Chairman, Kennametal, Inc. (a global manufacturer and distributor of tooling and industrial materials) (2003-Present); and was formerly Director, Aleris Corporation and Aleris International, Inc. (a producer of aluminum rolled products) (2011-2020); Interim Chief Executive Officer (2014) and Executive Vice President and Chief Financial Officer (2004-2014), Mosaic Company (a fertilizer manufacturing company). Trustee — Goldman Sachs Trust II; Goldman Sachs MLP and Energy Renaissance Fund; Goldman Sachs ETF Trust; Goldman Sachs ETF Trust II; and Goldman Sachs Real Estate Diversified Income Fund. Chair of the Board of Trustees — Goldman Sachs Credit Income Fund. | | | 91 | | | Kennametal, Inc. (a global manufacturer and distributor of tooling and industrial materials) |
| | | | | | | | | | | | |
Interested Trustee* | | | | | | | | | | |
Name,
Address and Age1 | | Position(s) Held
with the Trust | | Term of
Office and
Length of
Time Served2 | | Principal Occupation(s) During Past 5 Years | | Number of
Portfolios in
Fund Complex
Overseen by
Trustee3 | | | Other
Directorships
Held by Trustee4 |
James A. McNamara Age: 61 | | President and Trustee | | | | Advisory Director, Goldman Sachs (January 2018-Present); Managing Director, Goldman Sachs (January 2000-December 2017); Director of Institutional Fund Sales, GSAM (April 1998-December 2000); and Senior Vice President and Manager, Dreyfus Institutional Service Corporation (January 1993-April 1998). President and Trustee — Goldman Sachs Trust II; Goldman Sachs Trust; Goldman Sachs Variable Insurance Trust; Goldman Sachs ETF Trust; Goldman Sachs ETF Trust II; Goldman Sachs MLP and Energy Renaissance Fund; Goldman Sachs Credit Income Fund; and Goldman Sachs Real Estate Diversified Income Fund. | | | 193 | | | None |
| | | | | | | | | | | | |
| * | Mr. McNamara is considered to be an “Interested Trustee” because he holds positions with Goldman Sachs and owns securities issued by The Goldman Sachs Group, Inc. Mr. McNamara holds comparable positions with certain other companies of which Goldman Sachs, GSAM or an affiliate thereof is the investment adviser, administrator and/or distributor. |
| 1 | Each Trustee may be contacted by writing to the Trustee, c/o Goldman Sachs, 200 West Street, New York, New York, 10282, Attn: Robert Griffith. Information is provided as of October 31, 2023. |
| 2 | Subject to such policies as may be adopted by the Board from time-to-time, each Trustee holds office for an indefinite term, until the earliest of: (a) the election of his or her successor; (b) the date the Trustee resigns or is removed by the Board or shareholders, in accordance with the Trust’s Declaration of Trust; or (c)the termination of the Trust. The Board has adopted policies which provide that each Independent Trustee shall retire as of December 31st of the calendar year in which he or she reaches (a) his or her 75th birthday or (b) the 15th anniversary of the date he or she became a Trustee, whichever is earlier, unless a waiver of such requirements shall have been adopted by a majority of the other Trustees. These policies may be changed by the Trustees without shareholder vote. |
| 3 | The Goldman Sachs Fund Complex includes certain other companies listed above for each respective Trustee. As of October 31, 2023, Goldman Sachs Trust II consisted of 18 portfolios (7 of which offered shares to the public); Goldman Sachs Trust consisted of 87 portfolios; Goldman Sachs Variable Insurance Trust consisted of 15 portfolios (11 of which offered shares to the public); Goldman Sachs ETF Trust consisted of 68 portfolios (34 of which offered shares to the public); Goldman Sachs ETF Trust II consisted of 2 portfolios; and Goldman Sachs MLP and Energy Renaissance Fund, Goldman Sachs Credit Income Fund and Goldman Sachs Real Estate Diversified Income Fund each consisted of one portfolio. Goldman Sachs MLP and Energy Renaissance Fund and Goldman Sachs Credit Income Fund did not offer shares to the public. |
| 4 | This column includes only directorships of companies required to report to the Securities and Exchange Commission under the Securities Exchange Act of 1934 (i.e., “public companies”) or other investment companies registered under the Act. |
Additional information about the Trustees is available in the Funds’ Statement of Additional Information, which can be obtained from Goldman Sachs free of charge by calling this toll-free number (in the United States of America): 1-800-526-7384.
47
|
| ACTIVE EQUITY MULTI-MANAGER FUNDS |
Trustees and Officers (Unaudited) (continued)
Officers of the Trust*
| | | | | | | | | | |
| Name, Address and Age1 | | Position(s) Held
with the Trust | | | Term of
Office and
Length of
Time Served2 | | | Principal Occupation(s) During Past 5 Years |
James A. McNamara 200 West Street New York, NY 10282 Age: 61 | |
| President and
Trustee |
| | | Since 2012 | | | Advisory Director, Goldman Sachs (January 2018-Present); Managing Director, Goldman Sachs (January 2000-December 2017); Director of Institutional Fund Sales, GSAM (April 1998-December 2000); and Senior Vice President and Manager, Dreyfus Institutional Service Corporation (January 1993-April 1998). President and Trustee — Goldman Sachs Trust II; Goldman Sachs Trust; Goldman Sachs Variable Insurance Trust; Goldman Sachs ETF Trust; Goldman Sachs ETF Trust II; Goldman Sachs MLP and Energy Renaissance Fund; Goldman Sachs Credit Income Fund; and Goldman Sachs Real Estate Diversified Income Fund. |
Joseph F. DiMaria 30 Hudson Street Jersey City, NJ 07302 Age: 55 | |
| Treasurer, Principal
Financial Officer and
Principal
Accounting Officer |
| |
| Since 2017
(Treasurer
and
Principal
Financial
Officer
Since 2019) |
| | Managing Director, Goldman Sachs (November 2015-Present) and Vice President — Mutual Fund Administration, Columbia Management Investment Advisers, LLC (May 2010-October 2015). Treasurer, Principal Financial Officer and Principal Accounting Officer — Goldman Sachs Trust II (previously Assistant Treasurer (2017)); Goldman Sachs Trust (previously Assistant Treasurer (2016)); Goldman Sachs Variable Insurance Trust (previously Assistant Treasurer (2016)); Goldman Sachs MLP and Energy Renaissance Fund (previously Assistant Treasurer (2017)); Goldman Sachs ETF Trust (previously Assistant Treasurer (2017)); Goldman Sachs ETF Trust II; Goldman Sachs Credit Income Fund; and Goldman Sachs Real Estate Diversified Income Fund. |
Robert Griffith 200 West Street New York, NY 10282 Age: 49 | | | Secretary | | | | Since 2022 | | | Managing Director, Goldman Sachs (September 2022 – Present); General Counsel, Exchange Traded Concepts, LLC (October 2021 – September 2022); Vice President, Goldman Sachs (August 2011 – October 2021); Associate General Counsel, Goldman Sachs (December 2014 – Present); Assistant General Counsel, Goldman Sachs (August 2011 – December 2014); Vice President and Counsel, Nomura Holding America, Inc. (2010 – 2011); and Associate, Simpson Thacher & Bartlett LLP (2005 – 2010). Secretary — Goldman Sachs Trust II (previously Assistant Secretary (2022)); Goldman Sachs Trust (previously Assistant Secretary (2022)); Goldman Sachs Variable Insurance Trust (previously Assistant Secretary (2022)); Goldman Sachs ETF Trust (previously Assistant Secretary (2022)); Goldman Sachs ETF Trust II (previously Assistant Secretary (2022)); and Goldman Sachs Real Estate Diversified Income Fund (previously Assistant Secretary (2022)). Assistant Secretary — Goldman Sachs MLP and Energy Renaissance Fund. |
| | | | | | | | | | |
| * | Represents a partial list of officers of the Trust. Additional information about all the officers is available in the Funds’ Statement of Additional Information, which can be obtained from Goldman Sachs free of charge by calling this toll-free number (in the United States): 1-800-526-7384. |
| 1 | Information is provided as of October 31, 2023. |
| 2 | Officers hold office at the pleasure of the Board of Trustees or until their successors are duly elected and qualified. Each officer holds comparable positions with certain other companies of which Goldman Sachs, GSAM or an affiliate thereof is the investment adviser, administrator and/or distributor. |
Goldman Sachs Trust – Active Equity Multi-Manager Funds—Tax Information (Unaudited)
For the year ended October 31, 2023, 0.44% and 100% of the dividends paid from net investment company taxable income by the Multi-Manager International Equity and Multi-Manager U.S. Small Cap Equity Funds qualify for the dividends received deduction available to corporations.
For the year ended October 31, 2023, 100% and 100% of the dividends paid from net investment company taxable income by the Multi-Manager International Equity and Multi-Manager U.S. Small Cap Equity Funds qualify for the reduced tax rate under the Jobs and Growth Tax Relief and Reconciliation Act of 2003.
From distributions paid during the year ended October 31, 2023, the total amount of income received by the Multi-Manager International Equity Fund from sources within foreign countries and possessions of the United States was $0.2139 per share, all of which is attributable to qualified passive income. The percentage of net investment income dividends paid from foreign sources by the Multi-Manager International Equity Fund was 98.12%. The total amount of taxes paid by the Multi-Manager International Equity Fund to such countries was $0.0315 per share.
48
FUNDS PROFILE
Goldman Sachs Funds
Goldman Sachs is a premier financial services firm, known since 1869 for creating thoughtful and customized investment solutions in complex global markets.
Today, the Asset Management Division of Goldman Sachs serves a diverse set of clients worldwide, including private institutions, public entities and individuals. With approximately $2.42 trillion in assets under supervision as of September 30, 2023, Goldman Sachs Asset Management has portfolio management teams located around the world and our investment professionals bring firsthand knowledge of local markets to every investment decision. Assets under supervision includes assets under management and other client assets for which Goldman Sachs does not have full discretion. Goldman Sachs Asset Management leverages the resources of Goldman Sachs & Co. LLC subject to legal, internal and regulatory restrictions.
Money Market
Financial Square FundsSM
| ∎ | Financial Square Treasury Solutions Fund1 |
| ∎ | Financial Square Government Fund1 |
| ∎ | Financial Square Money Market Fund2 |
| ∎ | Financial Square Prime Obligations Fund2 |
| ∎ | Financial Square Treasury Instruments Fund1 |
| ∎ | Financial Square Treasury Obligations Fund1 |
| ∎ | Financial Square Federal Instruments Fund1 |
Investor FundsSM
| ∎ | Investor Money Market Fund3 |
| ∎ | Investor Tax-Exempt Money Market Fund3 |
Fixed Income
Short Duration and Government
| ∎ | Short-Term Conservative Income Fund |
| ∎ | Short Duration Government Fund |
| ∎ | Short Duration Bond Fund |
| ∎ | Inflation Protected Securities Fund |
Multi-Sector
| ∎ | Global Core Fixed Income Fund |
Municipal and Tax-Free
| ∎ | High Yield Municipal Fund |
| ∎ | Dynamic Municipal Income Fund |
| ∎ | Short Duration Tax-Free Fund |
| ∎ | Municipal Income Completion Fund |
Single Sector
| ∎ | Investment Grade Credit Fund |
| ∎ | High Yield Floating Rate Fund |
| ∎ | Emerging Markets Debt Fund |
| ∎ | Emerging Markets Credit Fund4 |
Fixed Income Alternatives
| ∎ | Long Short Credit Strategies Fund |
∎ Fundamental Equity
| ∎ | Small/Mid Cap Value Fund |
| ∎ | Small/Mid Cap Growth Fund |
| ∎ | Concentrated Growth Fund |
| ∎ | Technology Opportunities Fund |
| ∎ | Rising Dividend Growth Fund |
Tax-Advantaged Equity
| ∎ | U.S. Tax-Managed Equity Fund |
| ∎ | International Tax-Managed Equity Fund |
| ∎ | U.S. Equity Dividend and Premium Fund |
| ∎ | International Equity Dividend and Premium Fund |
Equity Insights
| ∎ | Small Cap Equity Insights Fund |
| ∎ | U.S. Equity Insights Fund |
| ∎ | Small Cap Growth Insights Fund |
| ∎ | Large Cap Growth Insights Fund |
| ∎ | Large Cap Value Insights Fund |
| ∎ | Small Cap Value Insights Fund |
| ∎ | International Small Cap Insights Fund |
| ∎ | International Equity Insights Fund |
| ∎ | Emerging Markets Equity Insights Fund |
Fundamental Equity International
| ∎ | International Equity Income Fund |
| ∎ | International Equity ESG Fund |
| ∎ | Emerging Markets Equity Fund |
| ∎ | Emerging Markets Equity ex. China Fund |
| ∎ | ESG Emerging Markets Equity Fund |
Alternative
| ∎ | Clean Energy Income Fund |
| ∎ | Real Estate Securities Fund |
| ∎ | Global Real Estate Securities Fund |
| ∎ | Absolute Return Tracker Fund |
| ∎ | Managed Futures Strategy Fund |
| ∎ | MLP Energy Infrastructure Fund |
| ∎ | Energy Infrastructure Fund |
| ∎ | Multi-Strategy Alternatives Fund5 |
| ∎ | Global Infrastructure Fund |
∎ Total Portfolio Solutions
| ∎ | Global Managed Beta Fund |
| ∎ | Multi-Manager Non-Core Fixed Income Fund |
| ∎ | Multi-Manager Global Equity Fund |
| ∎ | Multi-Manager International Equity Fund |
| ∎ | Tactical Tilt Overlay Fund |
| ∎ | Balanced Strategy Portfolio |
| ∎ | Multi-Manager U.S. Small Cap Equity Fund |
| ∎ | Multi-Manager Real Assets Strategy Fund |
| ∎ | Growth and Income Strategy Portfolio |
| ∎ | Growth Strategy Portfolio |
| ∎ | Dynamic Global Equity Fund |
| ∎ | Satellite Strategies Portfolio |
| ∎ | Enhanced Dividend Global Equity Portfolio |
| ∎ | Tax-Advantaged Global Equity Portfolio |
| ∎ | Strategic Factor Allocation Fund |
| ∎ | Strategic Volatility Premium Fund |
| ∎ | GQG Partners International Opportunities Fund |
| 1 | You could lose money by investing in the Fund. Although the Fund seeks to preserve the value of your investment at $1.00 per share, it cannot guarantee it will do so. An investment in the Fund is not a deposit of a bank and is not insured or guaranteed by the Federal Deposit Insurance Corporation or any other government agency. The Fund’s sponsor has no legal obligation to provide financial support to the Fund, and you should not expect that the sponsor will provide financial support to the Fund at any time. |
| 2 | You could lose money by investing in the Fund. Because the share price of the Fund will fluctuate, when you sell your shares they may be worth more or less than what you originally paid for them. The Fund may impose a fee upon sale of your shares or may temporarily suspend your ability to sell shares if the Fund’s liquidity falls below required minimums because of market conditions or other factors. An investment in the Fund is not a deposit of a bank and is not insured or guaranteed by the Federal Deposit Insurance Corporation or any other government agency. The Fund’s sponsor has no legal obligation to provide financial support to the Fund, and you should not expect that the sponsor will provide financial support to the Fund at any time. |
| 3 | You could lose money by investing in the Fund. Although the Fund seeks to preserve the value of your investment at $1.00 per share, it cannot guarantee it will do so. The Fund may impose a fee upon sale of your shares or may temporarily suspend your ability to sell shares if the Fund’s liquidity falls below required minimums because of market conditions or other factors. An investment in the Fund is not a deposit of a bank and is not insured or guaranteed by the Federal Deposit Insurance Corporation or any other government agency. The Fund’s sponsor has no legal obligation to provide financial support to the Fund, and you should not expect that the sponsor will provide financial support to the Fund at any time. |
| 4 | Effective after the close of business on October 31, 2023, the Goldman Sachs Local Emerging Markets Debt Fund was renamed the Goldman Sachs Emerging Markets Credit Fund. |
| 5 | Effective after the close of business on September 22, 2023, the Goldman Sachs Multi-Manager Alternatives Fund was renamed the Goldman Sachs Multi-Strategy Alternatives Fund. |
| | Financial Square FundsSM and Investor FundsSM are registered service marks of Goldman Sachs & Co. LLC. |
| * | This list covers open-end funds only. Please visit our website at www.GSAMFUNDS.com to learn about our closed-end funds and exchange-traded funds. |

TRUSTEESCheryl K. Beebe, ChairLawrence HughesJohn F. KillianSteven D. KrichmarMichael LathamJames A. McNamaraLawrence W. StranghoenerOFFICERSJames A. McNamara, PresidentJoseph F. DiMaria, Principal Financial Officer,Principal Accounting Officer and TreasurerRobert Griffith, SecretaryGOLDMAN SACHS & CO. LLCDistributor and Transfer AgentGOLDMAN SACHS ASSET MANAGEMENT, L.P.Investment AdviserVisit our website at www.GSAMFUNDS.com to obtain the most recent month-end returns.Goldman Sachs Asset Management, L.P., 200West Street, New York, New York 10282The reports concerning the Funds included in this shareholder report may contain certain forward-looking statements about the factors that may affect theperformance of the Funds in the future. These statements are based on Fund managements predictions and expectations concerning certain future events andtheir expected impact on the Funds, such as performance of the economy as a whole and of specific industry sectors, changes in the levels of interest rates, theimpact of developing world events, and other factors that may influence the future performance of the Funds. Management believes these forward-lookingstatements to be reasonable, although they are inherently uncertain and difficult to predict. Actual events may cause adjustments in portfolio managementstrategies from those currently expected to be employed.A description of the policies and procedures that the Funds use to determine how to vote proxies relating to portfolio securities and information regarding how aFund voted proxies relating to portfolio securities during the most recent 12-month period ended June 30 is available (i) without charge, upon request by calling1-800-526-7384 (for Retail Shareholders) or 1-800-621-2550 (for Institutional Shareholders); and (ii) on the Securities and Exchange Commission (SEC) website at http://www.sec.gov.The Funds will file its portfolio holdings information for each month in a fiscal quarter within 60 days after the end of the relevant fiscal quarter on FormN-PORT. Portfolio holdings information for the third month of each fiscal quarter will be made available on the SECs web site at http://www.sec.gov. Portfolioholdings information may be obtained upon request and without charge by calling 1-800-621-2550.Fund holdings and allocations shown are unaudited, and may not be representative of current or future investments. Fund holdings and allocations may notinclude a Funds entire investment portfolio, which may change at any time. Fund holdings should not be relied on in making investment decisions and shouldnot be construed as research or investment advice regarding particular securities. Current and future holdings are subject to risk.The Global Industry Classification Standard (GICS) was developed by and is the exclusive property and a service mark of Morgan Stanley CapitalInternational Inc. (MSCI) and Standard & Poors, a division of The McGraw-Hill Companies, Inc. (S&P) and is licensed for use by Goldman Sachs. Neither MSCI,S&P nor any other party involved in making or compiling the GICS or any GICS classifications makes any express or implied warranties or representations withrespect to such standard or classification (or the results to be obtained by the use thereof), and all such parties hereby expressly disclaim all warranties oforiginality, accuracy, completeness, merchantability or fitness for a particular purpose with respect to any of such standard or classification. Without limitingany of the foregoing, in no event shall MSCI, S&P, any of their affiliates or any third party involved in making or compiling the GICS or any GICS classificationshave any liability for any direct, indirect, special, punitive, consequential or any other damages (including lost profits) even if notified of the possibility of suchdamages.The portfolio risk management process includes an effort to monitor and manage risk, but does not imply low risk.Fund holdings and allocations shown are as of October 31, 2023 and may not be representative of future investments. Fund holdings should not be relied on inmaking investment decisions and should not be construed as research or investment advice regarding particular securities. Current and future holdings aresubject to risk.This material is not authorized for distribution to prospective investors unless preceded or accompanied by a current prospectus or summaryprospectus, if applicable. Investors should consider a Funds objective, risks, and charges and expenses, and read the summary prospectus, ifavailable, and/or the prospectus carefully before investing or sending money. The summary prospectus, if available, and the prospectus containthis and other information about a Funds and may be obtained from your authorized dealer or from Goldman Sachs & Co. LLC by calling1-800-526-7384 (for Retail Shareholders) or 1-800-621-2550 (for Institutional Shareholders).© 2023 Goldman Sachs. All rights reserved. 347683-OTU-1928119 MMGRFDSAR-23
Goldman Sachs Funds Annual Report October 31, 2023 GQG Partners International Opportunities Fund
Goldman Sachs GQG Partners
International Opportunities Fund
TABLE OF CONTENTS
| | | | | | |
| | | | |
| NOT FDIC-INSURED | | May Lose Value | | No Bank Guarantee | | |
FUND RESULTS
Goldman Sachs GQG Partners International
Opportunities Fund
|
| |
Investment Objective The Fund seeks long-term capital appreciation. |
Portfolio Management Discussion and Analysis
Below, the portfolio management team of GQG Partners LLC, the Goldman Sachs GQG Partners International Opportunities Fund’s (the “Fund”) sub-adviser, discusses the Fund’s performance and positioning for the 12-month period ended October 31, 2023 (the “Reporting Period”).
| Q | How did the Fund perform during the Reporting Period? |
| A | During the Reporting Period, the Fund’s Class A, Class C, Institutional, Investor, Class R6, Class R and Class P Shares generated average annual total returns, without sales charges, of 13.91%, 13.06%, 14.34%, 14.21%, 14.31%, 13.63% and 14.38%, respectively. These returns compare to the 12.07% average annual total return of the Fund’s benchmark, the MSCI ACWI ex USA Index (Net, Unhedged) (the “Index”), during the same time period. |
| Q | What economic and market factors most influenced the Fund during the Reporting Period? |
| A | International (or non-U.S. developed markets) equities and emerging markets equities broadly produced gains during the Reporting Period, with macro factors—such as economic conditions, inflation, interest rates, energy prices and geopolitical events—as the key influences. |
| | The Reporting Period, which began in November 2022, started with strong rallies in international and emerging equity markets. China’s central government softened its zero-COVID policy by communicating new rules to “optimize and adjust” its mobility restrictions so as to minimize their impact on economic growth and accelerate vaccination among elderly citizens. In addition, China’s central bank lowered its benchmark interest rate in an attempt to spur lending activity, and regulators unwound limits on debt issued by the beleaguered property development industry. During December, most international and emerging equity markets saw modest declines, as several central banks, including the European Central Bank (“ECB”), increased interest rates. Central banks in the U.K., Switzerland, Norway, Denmark, Taiwan and the Philippines also took monetary policy action. Meanwhile, Hong Kong and China’s equity markets extended their rallies after the Chinese government further relaxed its pandemic-era lockdowns and released a statement that monetary policy in 2023 should be “targeted and forceful” as officials “push for overall improvement of the economy.” |
| | During the first quarter of 2023, international and emerging markets equities generated solidly positive returns, particularly in Europe. The strong performance in Europe was driven, in our view, by upward revisions to that continent’s Gross Domestic Product (“GDP”) growth, downward revisions to inflation forecasts, and fourth quarter 2022 corporate earnings that came in well ahead of consensus expectations. A drop in energy prices appeared to be a key catalyst for each. Natural gas prices in Europe tumbled and Brent crude oil prices declined amid mild winter weather and successful conservation efforts by commercial and consumer customers. The lower energy prices increased consumers’ disposable income and added to operating margins for certain manufacturing businesses. Investor sentiment overall also seemed to improve, partly because of a trio of factors in the U.S.—decelerating inflation trends, a swift and strong regulatory response to a regional banking crisis, and comments from the U.S. Federal Reserve (the “Fed”) suggesting that policymakers could stop raising interest rates sooner than markets had previously expected if banking system stress triggered a pullback in lending. |
| | In the second quarter of 2023, most international and emerging markets equities extended their gains, led by the strong performance of the Brazilian equity market. Brazil’s first quarter GDP came in stronger than market expectations, primarily due to an abundant harvest of agricultural crops, which prompted upward revisions for near-term economic activity. Inflation also decelerated in Brazil, with wholesale prices declining meaningfully. As a result, the country appeared well-positioned for a central bank interest rate cut in the second half of 2023, which could drive an expansion in earnings multiples in an equity market that was already inexpensive relative to its history and to the equity markets of other countries. In contrast, Chinese equities posted losses during the second calendar quarter, as geopolitical tensions increased and fundamentals weakened. There were reports that U.S. President Joe Biden intended to issue an executive order restricting new direct U.S. investments into China in areas deemed critical to U.S. national security, including artificial intelligence (“AI”), semiconductors and quantum computing. That executive order was ultimately signed in August 2023. Investor sentiment about China was further |
1
| | impacted by weaker than market expected manufacturing activity and record unemployment for Chinese workers between the ages of 16 and 24. |
| | During the third quarter of 2023, international and emerging markets equities declined. The ECB raised policy rates to an all-time high and trimmed its outlook for 2023 and 2024 Eurozone economic growth. Purchasing manager indices also pointed to an ongoing contraction in the Eurozone economy, with new orders falling each month of the third quarter. Meanwhile, Germany reported three consecutive monthly declines in industrial production. In Hong Kong, investor sentiment was negatively impacted by weak export data from China and more problems with China’s property developers. One of China’s largest real estate companies was at risk of liquidation after regulators blocked key elements of its restructuring plan, its founder was apparently placed under police surveillance, and its shares were suspended from trading in Hong Kong. |
| | In October 2023, international and emerging markets equities posted additional losses. Investor sentiment was hurt by unrest in the Middle East as well as by a rise in U.S. interest rates. During October, Hamas led a surprise attack on Israel from the Gaza Strip, and Israel responded aggressively. Investors appeared concerned about broader escalation in the region, potentially involving the U.S. and Iran, which increased volatility in certain equity and commodity markets. The yield on the 10-year U.S. Treasury Note spiked to its highest level since 2007 after Fed Chair Jerome Powell said U.S. monetary policy was not “too tight.” However, markets appeared concerned the Fed’s higher-for-longer interest rate policy could tip the U.S. economy into a recession, impacting the near-term earnings power of companies that are domiciled outside the U.S. but have significant exports to the U.S. |
| | For the Reporting Period overall, global equities, as represented by the Index, generated double-digit positive returns. All 11 sectors in the Index were up, with six sectors recording double-digit gains. Information technology, consumer discretionary and energy were the strongest performing sectors in the Index during the Reporting Period, with industrials, financials and communication services also outpacing the Index. Although the real estate, health care, consumer staples, utilities and materials sectors produced positive absolute returns, each trailed the Index’s return during the Reporting Period. |
| Q | What key factors were responsible for the Fund’s performance during the Reporting Period? |
| A | The Fund outperformed the Index during the Reporting Period, driven by strong stock selection. Sector allocation decisions detracted from relative performance. |
| Q | Which equity market sectors and countries most significantly affected Fund performance? |
| A | From a stock selection perspective, the Fund was helped by its investments in six of the 11 sectors in the Index. The largest contributors on a relative basis came from the health care, energy and information technology sectors. In health care, the Fund owned the stock of a pharmaceutical company that benefited, we believe, from its leading position in the diabetes and anti-obesity markets. In energy, the Fund’s holdings paid what we considered meaningful dividends, which cushioned some of the volatility in their share prices during the Reporting Period. In information technology, the Fund owned select stocks that benefited from advancements in generative AI. Conversely, selection among consumer staples and financials stocks detracted from relative performance. In consumer staples, the Fund’s investments in the tobacco industry struggled during the Reporting Period amid lower than consensus expected volumes and pricing. In financials, stock selection among banking stocks detracted from the Fund’s performance. |
| | From a sector allocation perspective, the Fund’s overweights versus the Index in energy and information technology, as well as its lack of exposure to consumer discretionary, detracted from relative returns during the Reporting Period. In energy, the Fund was hurt by its substantial overweight position during the first half of the Reporting Period when energy stocks were pressured by investor worries that the global economy might slow and depress demand for oil. These negative returns were offset somewhat during the summer of 2023 when energy stocks generated gains on news Saudi Arabia and Russia had extended their production cuts into year-end and U.S. oil inventories had fallen to their lowest levels since December 2022. In information technology, the best-performing sector in the Index during the Reporting Period, the Fund’s performance was held back by certain industry allocations. On the positive side, a lack of exposure to the real estate sector and an overweight in utilities added to the Fund’s relative results during the Reporting Period. |
| | In terms of countries, the Fund benefited from its exposure to the U.S., which is not a constituent of the Index, as well as from stock selection in Brazil and Denmark. In the U.S., the Fund’s out-of-benchmark holdings in the information technology sector drove strong gains. On the negative side, stock selection in the U.K. and Switzerland detracted from performance. The Fund was also hampered by an overweighted allocation versus the Index in Brazil, as investors appeared concerned that the country’s new president, elected in October 2022, would not demonstrate fiscal discipline. |
2
FUND RESULTS
| Q | What were some of the Fund’s best-performing individual stocks during the Reporting Period? |
| A | The Fund’s best-performing individual holdings during the Reporting Period were Novo Nordisk, NVIDIA and Petróleo Brasileiro (“Petrobras”). |
| | Novo Nordisk, headquartered in Denmark, is a global pharmaceuticals company with a focus on diabetes and obesity. Its stock price increased during the Reporting Period, as demand for Wegovy, the company’s anti-obesity medication, drove strong revenue and earnings growth despite production problems. Furthermore, during the third quarter of 2023, Novo Nordisk released the results of a large study about the efficacy of Wegovy that exceeded investor expectations. According to the study, Wegovy not only helped people lose weight but also reduced their risk of suffering heart attacks, strokes and cardiovascular deaths by 20%. At the end of the Reporting Period, we believed a proven heart-health benefit beyond weight loss could increase the pressure on U.S. employers and insurers to pay for Wegovy and similar anti-obesity drugs, which could increase the company’s total addressable market. |
| | U.S.-based NVIDIA, a new purchase for the Fund during the Reporting Period, designs and markets semiconductors with a focus on graphics processing units (“GPUs”). The company’s GPUs are used in gaming platforms, data centers, automobile infotainment and autonomous driving systems. In our view, the decline in gaming revenue had bottomed, and NVIDIA was able to normalize its inventory levels. Shares of NVIDIA rallied after the company made positive revisions to sales forecasts and guidance, with its GPUs and software products benefiting from increased data center demand for generative AI and large-language model applications, such as ChatGPT. |
| | Petrobras is a Brazil-headquartered oil and gas exploration and production company with additional operations in refining, transportation, petrochemicals and power generation. Petrobras’ shares gained during the Reporting Period as the company announced a new capital return policy that exceeded investor expectations. Under the new policy, 45% of the company’s free cash flow is expected to be paid to shareholders on a quarterly basis, along with a minimum annual dividend of $4 billion. Special dividends and share buybacks will also be considered by Petrobras management. |
| Q | Which stocks detracted most from the Fund’s relative performance during the Reporting Period? |
| A | British American Tobacco, Enbridge and Banco Itaú Unibanco were the Fund’s top relative detractors during the Reporting Period. |
| | British American Tobacco is a U.K.-based manufacturer of tobacco and nicotine products. Primary brands include Newport and Camel in the U.S. and Dunhill, Kent, Pall Mall, Lucky Strike and Rothmans globally. Its stock declined after |
| | the company announced it planned to suspend its share repurchase program in favor of reducing debt. Furthermore, combustible cigarette volumes and pricing in the U.S. appeared to be trending lower than the market had expected. By the end of the Reporting Period, the Fund had sold its position in the stock. We sold the stock after the company exhibited weakening fundamentals, experienced a surprise change in chief executive officer and delayed its share repurchase program until 2024. |
| | Enbridge, a Canadian energy infrastructure company, operates five business segments—liquids pipelines, natural gas pipelines, natural gas utility operations, renewable power generation and marketing services. Despite reporting strong results over consecutive quarters, the company’s stock price was hurt during the Reporting Period by higher interest rates and weaker commodity prices. We eliminated the Fund’s investment in Enbridge during the summer of 2023. |
| | Banco Itaú Unibanco is a Brazil-based financial institution offering retail, corporate and investment banking services as well as life, property and casualty insurance. Although the company had reported robust financial results across consecutive quarters, its stock price fell during the Reporting Period. The decline seemed to be driven by investor concerns that write-offs for loans to low-end consumers were rising towards the end of 2022, even though the company was more focused on higher income individuals. Additionally, there was a significant deceleration in loan growth during the third quarter of 2023, primarily due to higher interest rates. During the Reporting Period, we trimmed the Fund’s position in the stock. |
| Q | Were there any significant purchases or sales during the Reporting Period? |
| A | In addition to the purchase of NVIDIA, already mentioned, we initiated a Fund position in Canadian Natural Resources during the Reporting Period. We believe the oil and gas producer, which has additional operations in natural gas and liquefied natural gas, is a well-diversified and relatively low-cost operator with a rich resource base. In our opinion, the company will likely reach its current debt reduction target, after which its management is expected to distribute 100% of free cash flow to shareholders. The stock also has a 4% dividend yield. |
| | Conversely, in addition to the sale of British American Tobacco, mentioned earlier, we eliminated the Fund’s position in U.S.-based Philip Morris International, which manufactures cigarettes, smoke-free products, associated electronic devices and other nicotine-containing products in markets outside U.S. We exited the stock as near-term fundamentals weakened, in our view. The company had exhibited lower than consensus expected margins due to inflationary pressure on its cost of sales, a disruption in the supply chain for IQOS and currency headwinds from a stronger U.S. dollar. (Cost of sales is the accumulated total of |
3
| | all costs used to create a product or service, which has been sold. IQOS is Philip Morris’ line of heat-not-burn, smoke-free tobacco products.) |
| Q | What changes were made to the Fund’s sector and country weightings during the Reporting Period? |
| A | In terms of sector weightings, we increased the Fund’s exposures to the information technology, industrials and communication services sectors during the Reporting Period. In our opinion, information technology and communication services are likely to benefit from recent advances in generative AI and large-language model applications, with potential upside in the former from online advertising and potential upside in the latter from growth in cloud computing businesses. Meanwhile, we decreased the Fund’s exposures to the consumer staples, materials and energy sectors, mainly by trimming stocks that offered what we considered less compelling risk/reward opportunities than were available in other sectors. |
| | Regarding countries, the Fund’s exposures to the U.S., India and Japan increased, while its exposures to Switzerland, Canada and the U.K. decreased during the Reporting Period. |
| Q | How did the Fund use derivatives and similar instruments during the Reporting Period? |
| A | The Fund did not use derivatives or similar instruments as a part of its investment strategy during the Reporting Period. |
| Q | How was the Fund positioned relative to its benchmark index at the end of the Reporting Period? |
| A | At the end of the Reporting Period, the Fund was overweight relative to the Index in energy, health care, information technology, communication services and utilities. Compared to the Index, it was underweight industrials, financials, consumer staples and materials. The Fund had no exposure to the consumer discretionary and real estate sectors at the end of the Reporting Period. |
| | In terms of countries, the Fund was overweight versus the Index in India, Brazil, the U.K., Denmark, the Netherlands, France, Indonesia, Spain and Ireland. Compared to the Index, the Fund was underweight Japan, Taiwan, Switzerland, Canada, Germany, Italy and Australia. At the end of the Reporting Period, the Fund had no exposure to the other country constituents of the Index. The Fund also had modest exposure to the U.S., which is not a constituent of the Index, at the end of the Reporting Period. |
| Q | Were there any changes to the Fund’s portfolio management team during the Reporting Period? |
| A | Effective December 5, 2022, James Anders no longer served as a portfolio manager for the Fund. Rajiv Jain, Brian Kersmanc and Sudarshan Murthy continued to serve as portfolio managers of the Fund. |
| Q | What is the Fund’s tactical view and strategy for the months ahead? |
| A | At the end of the Reporting Period, we intended to continue monitoring macro data as part of our risk framework. We analyze both existing and potential investments in the Fund with a focus on the visibility of their future free cash flows. Ignoring the macro conditions in which these companies operate would impact the accuracy of any investor’s earnings outlook, in our opinion. |
| | From this standpoint, then, we identified three potential headwinds for the Fund at the end of the Reporting Period. First, there could be a material slowdown in global economic activity, which might drive lower demand for crude oil and also a sharp decline in commodity prices that could, in turn, negatively impact earnings growth in the energy sector. That said, we intended to maintain the Fund’s substantial overweight versus the Index in energy, partly because we see a fundamental supply/demand imbalance in the crude oil markets. Members of the OPEC+ cartel, particularly Saudi Arabia and Russia, exhibited production discipline during the Reporting Period, even though Brent spot prices spiked 22% in the third quarter of 2023.1 (OPEC+ is the Organization of the Petroleum Exporting Countries (“OPEC”) and Russia. Brent spot price is the average price of trading in the North Sea physical market for crude oil and is the benchmark against which most of the crude oil traded every day is priced.) We believe the lack of capital spending on oil and natural gas exploration during the last several years, coupled with disciplined production growth, may provide a floor for crude oil prices in the medium term. If the global economy continues to slow, or even enters a mild recession, our perspective is that demand for oil and natural gas will not decline materially. We believe the release of strategic petroleum reserves around the world, used to address higher oil prices in 2022, has ended. These reserves are likely to be re-stocked in the medium term and could act as a source of incremental demand, in our opinion. Meanwhile, we have observed a renewed focus on profitability from many energy companies, resulting in strong free cash flow and solid balance sheets. We have also witnessed commitment from their management teams to return capital to shareholders. We expect the energy stocks owned by the Fund to pay what we consider to be meaningful dividends, which should cushion some of the potential volatility in their stock prices. However, if the pace of global economic activity deteriorates in the wake of tighter central bank policy and the threat of a deep recession increases, we anticipate lower demand impacting the energy sector’s near-term earnings power. |
| | A second potential headwind for the Fund would be more aggressive central bank monetary policy than market expected, as it could impact the valuation of higher multiple |
4
FUND RESULTS
| | information technology stocks. A third possible headwind—a strong rally in the Japanese equity market where the Fund has minimal exposure—could also be challenging, in our view. |
| | At the end of the Reporting Period, we planned to continue monitoring relevant data and the changing macro environment. Adapting the Fund’s portfolio to reflect new information is a hallmark of our process, and we intend to continue going where the data leads us. |
5
GQG Partners International Opportunities Fund
as of October 31, 2023
|
|
| TOP TEN HOLDINGS AS OF 10/31/23± |
| | | | | | | |
| | |
| Holding | | % of Net Assets | | Line of Business |
| | |
Novo Nordisk AS Class B | | | | 7.3 | % | | Pharmaceuticals |
TotalEnergies SE | | | | 6.1 | | | Oil, Gas & Consumable Fuels |
AstraZeneca PLC | | | | 5.6 | | | Pharmaceuticals |
Glencore PLC | | | | 4.6 | | | Metals & Mining |
ASML Holding NV | | | | 4.6 | | | Semiconductors & Semiconductor Equipment |
NVIDIA Corp. | | | | 4.5 | | | Semiconductors & Semiconductor Equipment |
Petroleo Brasileiro SA ADR | | | | 2.7 | | | Oil, Gas & Consumable Fuels |
Petroleo Brasileiro SA | | | | 2.7 | | | Oil, Gas & Consumable Fuels |
Canadian Natural Resources Ltd. | | | | 2.7 | | | Oil, Gas & Consumable Fuels |
ICICI Bank Ltd. ADR | | | | 2.5 | | | Banks |
| ± | The top 10 holdings may not be representative of the Fund’s future investments. The top 10 holdings exclude investments in money market funds. |
|
|
| FUND VS. BENCHMARK SECTOR ALLOCATION† |
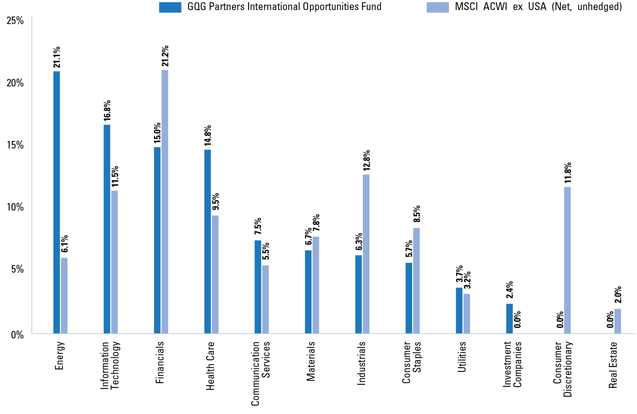
| † | The Fund is actively managed and, as such, its composition may differ over time. Consequently, the Fund’s overall sector allocations may differ from the percentages contained in the graph above. The graph categorizes investments using the Global Industry Classification Standard (“GICS”); however, the sector classifications used by the portfolio management team may differ from GICS. The percentage shown for each investment category reflects the value of investments in that category as a percentage of market value (excluding investments in the securities lending reinvestment vehicle, if any). The graph depicts the Fund’s investments but may not represent the Fund’s market exposure due to the exclusion of certain derivatives, if any, as listed in the Additional Investment Information section of the Schedule of Investments. Underlying sector allocations of exchange traded funds and other investment companies held by the Fund are not reflected in the graph above. Figures in the graph may not sum to 100% due to rounding and/or the exclusion of other assets and liabilities. |
| | For more information about your Fund, please refer to www.GSAMFUNDS.com. There, you can learn more about your Fund’s investment strategies, holdings, and performance. |
6
GOLDMAN SACHS GQG PARTNERS INTERNATIONAL OPPORTUNITIES FUND
Performance Summary
October 31, 2023
The following graph shows the value, as of October 31, 2023, of a $1,000,000 investment made on December 15, 2016 (commencement of operations) in Institutional Shares at NAV. For comparative purposes, the performance of the Fund’s benchmark, the MSCI ACWI ex USA Index (Net, Unhedged) is shown. Performance reflects applicable fee waivers and/or expense limitations in effect during the periods shown and in their absence, performance would be reduced. Returns do not reflect the deduction of taxes that a shareholder would pay on Fund distributions or the redemption of Fund shares. The returns set forth below represent past performance. Past performance does not guarantee future results. The Fund’s investment return and principal value will fluctuate so that an investor’s shares, when redeemed, may be worth more or less than their original cost. Current performance may be lower or higher than the performance quoted below. Please visit our web site at www.GSAMFUNDS.com to obtain the most recent month-end returns.
|
|
| Goldman Sachs GQG Partners International Opportunities Fund’s Lifetime Performance |
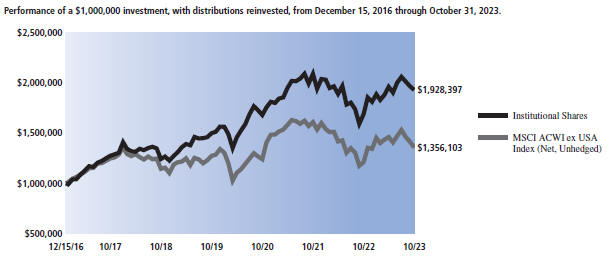
| | | | | | | | | | | | | | | | | |
| | | | |
| | | Average Annual Total Return through October 31, 2023* | | | | One Year | | | | | Five Years | | | | | Since Inception | |
| | | | |
| | Class A (Commenced December 15, 2016) | | | | | | | | | | | | | | | |
| | Excluding sales charges | | | | 13.91% | | | | | 8.78% | | | | | 9.59% | |
| | Including sales charges | | | | 7.62% | | | | | 7.55% | | | | | 8.70% | |
| | | |
| | | | |
| | Class C (Commenced December 15, 2016) | | | | | | | | | | | | | | | |
| | Excluding contingent deferred sales charges | | | | 13.06% | | | | | 7.96% | | | | | 8.78% | |
| | Including contingent deferred sales charges | | | | 12.03% | | | | | 7.96% | | | | | 8.78% | |
| | | |
| | | | |
| | Institutional (Commenced December 15, 2016) | | | | 14.34% | | | | | 9.20% | | | | | 10.01% | |
| | | |
| | | | |
| | Investor (Commenced December 15, 2016) | | | | 14.21% | | | | | 9.04% | | | | | 9.86% | |
| | | |
| | | | |
| | Class R6 (Commenced December 15, 2016) | | | | 14.31% | | | | | 9.21% | | | | | 10.02% | |
| | | |
| | | | |
| | Class R (Commenced December 15, 2016) | | | | 13.63% | | | | | 8.51% | | | | | 9.31% | |
| | | |
| | | | |
| | Class P (Commenced April 16, 2018) | | | | 14.38% | | | | | 9.20% | | | | | 7.08% | |
| | | |
| | * | These returns assume reinvestment of all distributions at NAV and reflect a maximum initial sales charge of 5.50% for Class A Shares and the assumed contingent deferred sales charge for Class C Shares (1% if redeemed within 12 months of purchase). Because Institutional, Investor, Class R6, Class R and Class P Shares do not involve a sales charge, such a charge is not applied to their Average Annual Total Return. |
7
Index Definitions
The MSCI ACWI ex USA Index is an international equity index that tracks stocks from 22 developed and 26 emerging markets countries. Developed countries include Australia, Austria, Belgium, Canada, Denmark, Finland, France, Germany, Hong Kong, Ireland, Israel, Italy, Japan, the Netherlands, New Zealand, Norway, Portugal, Singapore, Spain, Sweden, Switzerland, and the U.K. Emerging markets countries include: Argentina, Brazil, Chile, China, Colombia, Czech Republic, Egypt, Greece, Hungary, India, Indonesia, Korea, Malaysia, Mexico, Pakistan, Peru, the Philippines, Poland, Russia, Qatar, Saudi Arabia, South Africa, Taiwan, Thailand, Turkey and United Arab Emirates. It is not possible to invest directly in an unmanaged index.
8
GOLDMAN SACHS GQG PARTNERS INTERNATIONAL OPPORTUNITIES FUND
Schedule of Investments
October 31, 2023
| | | | | | | | | | |
| | | Shares | | | Description | | Value | |
| |
| | | Common Stocks – 94.0% | |
| |
| | | Australia – 0.7% | |
| | | 23,610,823 | | | Whitehaven Coal Ltd. (Oil, Gas & Consumable Fuels) | | $ | 111,213,715 | |
| | | 2,711,134 | | | WiseTech Global Ltd. (Software) | | | 100,938,931 | |
| | | | | | | | | | |
| | | |
| | | | | | | | | 212,152,646 | |
| | | | |
| |
| | | Brazil – 3.7% | |
| | | 53,438,228 | | | Petroleo Brasileiro SA ADR (Oil, Gas & Consumable Fuels) | | | 801,573,420 | |
| | | 22,010,901 | | | Vale SA (Metals & Mining) | | | 301,235,121 | |
| | | | | | | | | | |
| | | |
| | | | | | | | | 1,102,808,541 | |
| | | | |
| |
| | | Canada – 3.7% | |
| | | 12,342,560 | | | Canadian Natural Resources Ltd. (Oil, Gas & Consumable Fuels) | | | 783,764,798 | |
| | | 5,584,120 | | | Tourmaline Oil Corp. (Oil, Gas & Consumable Fuels) | | | 295,282,870 | |
| | | | | | | | | | |
| | | |
| | | | | | | | | 1,079,047,668 | |
| | | | |
| |
| | | Denmark – 7.3% | |
| | | 22,130,533 | | | Novo Nordisk AS Class B (Pharmaceuticals) | | | 2,135,069,885 | |
| | | | |
| |
| | | France – 9.5% | |
| | | 1,693,524 | | | L’Oreal SA (Personal Products) | | | 711,839,710 | |
| | | 1,961,995 | | | Thales SA (Aerospace & Defense) | | | 289,546,443 | |
| | | 26,773,352 | | | TotalEnergies SE (Oil, Gas & Consumable Fuels) | | | 1,789,999,192 | |
| | | | | | | | | | |
| | | |
| | | | | | | | | 2,791,385,345 | |
| | | | |
| |
| | | Germany – 3.5% | |
| | | 2,198,520 | | | Deutsche Boerse AG (Capital Markets) | | | 361,868,711 | |
| | | 20,569,019 | | | Deutsche Telekom AG (Diversified Telecommunication Services) | | | 446,423,081 | |
| | | 565,943 | | | Muenchener Rueckversicherungs-Gesellschaft AG in Muenchen (Insurance) | | | 227,117,431 | |
| | | | | | | | | | |
| | | |
| | | | | | | | | 1,035,409,223 | |
| | | | |
| |
| | | India – 13.7% | |
| | | 27,917,775 | | | Adani Energy Solutions Ltd.* (Electric Utilities) | | | 258,124,260 | |
| | | 18,469,545 | | | Adani Enterprises Ltd. (Trading Companies & Distributors) | | | 509,287,865 | |
| | | 34,965,900 | | | Adani Green Energy Ltd.* (Independent Power and Renewable Electricity Producers) | | | 382,862,615 | |
| | | 50,891,251 | | | Adani Ports & Special Economic Zone Ltd. (Transportation Infrastructure) | | | 480,098,645 | |
| | | 108,120,543 | | | Adani Power Ltd.* (Independent Power and Renewable Electricity Producers) | | | 471,459,914 | |
| | | 3,178,874 | | | HDFC Bank Ltd. (Banks) | | | 56,407,625 | |
| | | | |
| | | | | | | | |
| | | Shares | | Description | | Value | |
| |
| | Common Stocks (continued) | |
| |
| | India (continued) | |
| | 32,843,071 | | ICICI Bank Ltd. ADR (Banks) | | $ | 728,787,745 | |
| | 132,589,849 | | IDFC First Bank Ltd.* (Banks) | | | 131,761,410 | |
| | 127,438,236 | | ITC Ltd. (Tobacco) | | | 655,993,479 | |
| | 52,839,717 | | State Bank of India (Banks) | | | 359,049,959 | |
| | | | | | | | |
| | | |
| | | | | | | 4,033,833,517 | |
| | | |
| |
| | Indonesia – 1.4% | |
| | 608,808,898 | | Bank Central Asia Tbk. PT (Banks) | | | 335,405,364 | |
| | 239,749,547 | | Bank Mandiri Persero Tbk. PT (Banks) | | | 85,651,019 | |
| | | | | | | | |
| | | |
| | | | | | | 421,056,383 | |
| | | |
| |
| | Ireland – 1.9% | |
| | 1,768,384 | | Aon PLC Class A (Insurance) | | | 547,138,010 | |
| | | |
| |
| | Italy – 1.3% | |
| | 22,678,366 | | Eni SpA (Oil, Gas & Consumable Fuels) | | | 370,738,337 | |
| | | |
| |
| | Japan – 4.0% | |
| | 5,414,500 | | Shin-Etsu Chemical Co. Ltd. (Chemicals) | | | 161,911,779 | |
| | 13,789,430 | | SoftBank Group Corp. (Wireless Telecommunication Services) | | | 564,733,083 | |
| | 8,605,200 | | Tokio Marine Holdings, Inc. (Insurance) | | | 192,517,413 | |
| | 1,932,600 | | Tokyo Electron Ltd. (Semiconductors & Semiconductor Equipment) | | | 255,369,229 | |
| | | | | | | | |
| | | |
| | | | | | | 1,174,531,504 | |
| | | |
| |
| | Netherlands – 6.6% | |
| | 4,464,646 | | Airbus SE (Aerospace & Defense) | | | 598,602,525 | |
| | 2,239,154 | | ASML Holding NV (Semiconductors & Semiconductor Equipment) | | | 1,343,779,165 | |
| | | | | | | | |
| | | |
| | | | | | | 1,942,381,690 | |
| | | |
| |
| | Russia(a) – 0.0% | |
| | 48,039,056 | | Gazprom PJSC* (Oil, Gas & Consumable Fuels) | | | — | |
| | 3,681,622 | | LUKOIL PJSC (Oil, Gas & Consumable Fuels) | | | — | |
| | 34,154,161 | | Rosneft Oil Co. PJSC (Oil, Gas & Consumable Fuels) | | | — | |
| | | | | | | | |
| | | |
| | | | | | | — | |
| | | |
| |
| | Spain – 1.8% | |
| | 58,970,135 | | Banco Bilbao Vizcaya Argentaria SA (Banks) | | | 463,931,590 | |
| | 19,712,559 | | CaixaBank SA (Banks) | | | 80,142,193 | |
| | | | | | | | |
| | | |
| | | | | | | 544,073,783 | |
| | | |
The accompanying notes are an integral part of these financial statements. 9
|
| GOLDMAN SACHS GQG PARTNERS INTERNATIONAL OPPORTUNITIES FUND |
Schedule of Investments (continued)
October 31, 2023
| | | | | | | | | | |
| | | Shares | | | Description | | Value | |
| |
| | | Common Stocks (continued) | |
| |
| | | Switzerland – 7.2% | |
| | | 254,429,927 | | | Glencore PLC (Metals & Mining) | | $ | 1,347,670,459 | |
| | | 4,543,827 | | | Novartis AG (Pharmaceuticals) | | | 425,391,070 | |
| | | 7,233,237 | | | Sandoz Group AG* (Pharmaceuticals) | | | 188,056,990 | |
| | | |
| | | 701,829 | | | Sika AG (Chemicals) | | | 167,954,265 | |
| | | | | | | | | | |
| | | |
| | | | | | | | | 2,129,072,784 | |
| | | | |
| |
| | | Taiwan – 1.9% | |
| | | 33,450,043 | | | Taiwan Semiconductor Manufacturing Co. Ltd. (Semiconductors & Semiconductor Equipment) | | | 546,323,028 | |
| | | | |
| |
| | | United Kingdom – 10.0% | |
| | | 13,111,969 | | | AstraZeneca PLC (Pharmaceuticals) | | | 1,641,665,832 | |
| | | 15,011,467 | | | Imperial Brands PLC (Tobacco) | | | 319,806,715 | |
| | | 2,856,380 | | | London Stock Exchange Group PLC (Capital Markets) | | | 288,194,543 | |
| | | |
| | | 21,274,826 | | | Shell PLC (Oil, Gas & Consumable Fuels) | | | 694,998,179 | |
| | | | | | | | | | |
| | | |
| | | | | | | | | 2,944,665,269 | |
| | | | |
| |
| | | United States – 15.8% | |
| | | 1,468,665 | | | Alphabet, Inc. Class A* (Interactive Media & Services) | | | 182,231,953 | |
| | | 3,493,591 | | | Alphabet, Inc. Class C* (Interactive Media & Services) | | | 437,746,952 | |
| | | 6,947,069 | | | ARM Holdings PLC ADR*(b) (Semiconductors & Semiconductor Equipment) | | | 342,421,031 | |
| | | 702,495 | | | Broadcom, Inc. (Semiconductors & Semiconductor Equipment) | | | 591,058,218 | |
| | | 881,468 | | | Lam Research Corp. (Semiconductors & Semiconductor Equipment) | | | 518,497,107 | |
| | | 2,006,703 | | | Meta Platforms, Inc. Class A* (Interactive Media & Services) | | | 604,559,413 | |
| | | 3,220,437 | | | NVIDIA Corp. (Semiconductors & Semiconductor Equipment) | | | 1,313,294,209 | |
| | | |
| | | 11,596,359 | | | Schlumberger NV (Energy Equipment & Services) | | | 645,453,342 | |
| | | | | | | | | | |
| | | |
| | | | | | | | | 4,635,262,225 | |
| | | | |
| | |
| |
| TOTAL COMMON STOCKS
(Cost $25,188,545,315) | | $ | 27,644,949,838 | |
| | | | |
| | | | | | | | | | | |
| | | Shares | | | Dividend Rate | | Value | |
| |
| | | Preferred Stocks – 4.7% | |
| |
| | | Brazil – 4.7% | |
| | | Itau Unibanco Holding SA (Banks) | |
| | | 111,640,956 | | | 5.576% | | $ | 593,883,164 | |
| | | | | | | | | | | |
| | | | | | | | | | |
| | | Shares | | | Dividend Rate | | Value | |
| |
| | | Preferred Stocks (continued) | |
| |
| | | Brazil (continued) | |
| | | Petroleo Brasileiro SA (Oil, Gas & Consumable Fuels) | |
| | | 115,764,057 | | | 10.467% | | $ | 797,668,139 | |
| | | | |
| | |
| |
| TOTAL PREFERRED STOCKS
(Cost $1,163,166,721) | | $ | 1,391,551,303 | |
| | | | |
| | | | | | | | | | |
| |
| | | Investment Company(c) – 2.4% | |
| |
| |
| Goldman Sachs Financial Square Government Fund — Institutional
Shares |
|
| | | 716,742,511 | | | 5.258% | | $ | 716,742,511 | |
| | | (Cost $716,742,511) | |
| | | | |
| | | | | | | | | | |
| | | Shares | | | Dividend Rate | | Value | |
| |
| | | Securities Lending Reinvestment Vehicle(c) – 0.9% | |
| |
| |
| Goldman Sachs Financial Square Government Fund — Institutional
Shares |
|
| | | 254,172,800 | | | 5.258% | | $ | 254,172,800 | |
| |
| | | (Cost $254,172,800) | |
| | | | |
| | |
| |
| TOTAL INVESTMENTS – 102.0%
(Cost $27,322,627,347) | | $ | 30,007,416,452 | |
| | | | |
| | |
| |
| LIABILITIES IN EXCESS OF OTHER
ASSETS – (2.0)% | | | (593,242,743 | ) |
| | | | |
| | |
| | | NET ASSETS – 100.0% | | $ | 29,414,173,709 | |
| | | | |
The percentage shown for each investment category reflects the value of investments in that category as a percentage of net assets.
| | * | Non-income producing security. |
| | (a) | Significant unobservable inputs were used in the valuation of this portfolio security; i.e., Level 3. |
| | (b) | All or a portion of security is on loan. |
| | (c) | Represents an Affiliated Issuer. |
10 The accompanying notes are an integral part of these financial statements.
GOLDMAN SACHS GQG PARTNERS INTERNATIONAL OPPORTUNITIES FUND
| | | | |
|
| SECTOR ALLOCATION AS OF OCTOBER 31, 2023 | |
| |
| Sector | | % of Total
Market Value | |
| |
Energy | | | 21.1 | % |
| |
Information Technology | | | 16.8 | |
| |
Financials | | | 15.0 | |
| |
Health Care | | | 14.8 | |
| |
Communication Services | | | 7.5 | |
| |
Materials | | | 6.7 | |
| |
Industrials | | | 6.3 | |
| |
Consumer Staples | | | 5.7 | |
| |
Utilities | | | 3.7 | |
| |
Investment Company | | | 2.4 | |
| |
| | | | 100.0 | % |
| | |
| Investment Abbreviations: |
ADR | | —American Depositary Receipt |
PLC | | —Public Limited Company |
|
The accompanying notes are an integral part of these financial statements. 11
|
| GOLDMAN SACHS GQG PARTNERS INTERNATIONAL OPPORTUNITIES FUND |
Statement of Assets and Liabilities
October 31, 2023
| | | | | | |
| | |
| | Assets: | | | | |
| | |
| | Investments in unaffiliated issuers, at value (cost $26,351,712,036)(a) | | $ | 29,036,501,141 | |
| | Investments in affiliated issuers, at value (cost $716,742,511) | | | 716,742,511 | |
| | Investments in affiliated securities lending reinvestment vehicle, at value which equals cost | | | 254,172,800 | |
| | Cash | | | 14,573,924 | |
| | Foreign currencies, at value (cost $27,631,365) | | | 27,620,584 | |
| | Receivables: | | | | |
| | Dividends | | | 90,965,133 | |
| | Fund shares sold | | | 48,651,608 | |
| | Investments sold | | | 31,242,723 | |
| | Foreign tax reclaims | | | 28,703,674 | |
| | Reimbursement from investment adviser | | | 1,525,098 | |
| | Securities lending income | | | 60,803 | |
| | Other assets | | | 477,592 | |
| | | |
| | Total assets | | | 30,251,237,591 | |
| | | |
| | |
| | | | | | |
| | |
| | Liabilities: | | | | |
| | |
| | Payables: | | | | |
| | Investments purchased | | | 516,968,072 | |
| | Payable upon return of securities loaned | | | 254,172,800 | |
| | Fund shares redeemed | | | 40,389,050 | |
| | Management fees | | | 17,791,978 | |
| | Distribution and Service fees and Transfer Agency fees | | | 1,721,632 | |
| | Accrued expenses | | | 6,020,350 | |
| | | |
| | Total liabilities | | | 837,063,882 | |
| | | |
| | |
| | | | | | |
| | |
| | Net Assets: | | | | |
| | |
| | Paid-in capital | | | 27,678,278,375 | |
| | Total distributable earnings | | | 1,735,895,334 | |
| | | |
| | NET ASSETS | | $ | 29,414,173,709 | |
| | | Net Assets: | | | | |
| | | Class A | | $ | 401,254,251 | |
| | | Class C | | | 93,750,602 | |
| | | Institutional | | | 18,487,028,818 | |
| | | Investor | | | 6,227,600,692 | |
| | | Class R6 | | | 1,565,411,468 | |
| | | Class R | | | 3,569,506 | |
| | | Class P | | | 2,635,558,372 | |
| | | Total Net Assets | | $ | 29,414,173,709 | |
| | | Shares Outstanding $0.001 par value (unlimited number of shares authorized): | | | | |
| | | Class A | | | 22,899,083 | |
| | | Class C | | | 5,527,652 | |
| | | Institutional | | | 1,045,263,583 | |
| | | Investor | | | 353,623,928 | |
| | | Class R6 | | | 88,530,202 | |
| | | Class R | | | 206,692 | |
| | | Class P | | | 149,087,948 | |
| | | Net asset value, offering and redemption price per share:(b) | | | | |
| | | Class A | | | $17.52 | |
| | | Class C | | | 16.96 | |
| | | Institutional | | | 17.69 | |
| | | Investor | | | 17.61 | |
| | | Class R6 | | | 17.68 | |
| | | Class R | | | 17.27 | |
| | | Class P | | | 17.68 | |
| | (a) | Includes loaned securities having market value of $248,466,880. |
| | (b) | Maximum public offering price per share for Class A Shares is $18.54. At redemption, Class C Shares may be subject to a contingent deferred sales charge, assessed on the amount equal to the lesser of the current net asset value (“NAV”) or the original purchase price of the shares. |
12 The accompanying notes are an integral part of these financial statements.
GOLDMAN SACHS GQG PARTNERS INTERNATIONAL OPPORTUNITIES FUND
Statement of Operations
For the Fiscal Year Ended October 31, 2023
| | | | | | |
| | |
| | Investment Income: | | | | |
| | |
| | Dividends — unaffiliated issuers (net of tax withholding of $87,474,405) | | $ | 1,145,848,892 | |
| | |
| | Dividends — affiliated issuers | | | 23,405,829 | |
| | |
| | Securities lending income, net of rebates received or paid to borrowers | | | 2,946,822 | |
| | |
| | Interest | | | 124,549 | |
| | | |
| | |
| | Total investment income | | | 1,172,326,092 | |
| | | |
| | |
| | | | | | |
| | |
| | Expenses: | | | | |
| | |
| | Management fees | | | 192,654,378 | |
| | |
| | Transfer Agency fees(a) | | | 17,557,511 | |
| | |
| | Custody, accounting and administrative services | | | 4,309,780 | |
| | |
| | Printing and mailing costs | | | 2,369,048 | |
| | |
| | Registration fees | | | 1,877,406 | |
| | |
| | Distribution and Service (12b-1) fees(a) | | | 1,704,578 | |
| | |
| | Shareholder meeting expense | | | 994,106 | |
| | |
| | Professional fees | | | 502,614 | |
| | |
| | Trustee fees | | | 263,409 | |
| | |
| | Service fees — Class C | | | 226,281 | |
| | |
| | Other | | | 635,645 | |
| | | |
| | |
| | Total expenses | | | 223,094,756 | |
| | | |
| | |
| | Less — expense reductions | | | (7,361,394) | |
| | | |
| | |
| | Net expenses | | | 215,733,362 | |
| | | |
| | |
| | NET INVESTMENT INCOME | | | 956,592,730 | |
| | | |
| | |
| | | | | | |
| | |
| | Realized and unrealized gain (loss): | | | | |
| | |
| | Net realized gain (loss) from: | | | | |
| | |
| | Investments — unaffiliated issuers | | | (583,181,129) | |
| | |
| | Foreign currency transactions | | | (14,376,577) | |
| | |
| | Net change in unrealized gain on: | | | | |
| | |
| | Investments — unaffiliated issuers | | | 2,832,683,479 | |
| | |
| | Foreign currency translation | | | 1,494,048 | |
| | | |
| | |
| | Net realized and unrealized gain | | | 2,236,619,821 | |
| | | |
| | |
| | NET INCREASE IN NET ASSETS RESULTING FROM OPERATIONS | | $ | 3,193,212,551 | |
| | | |
| | (a) | Class specific Distribution and/or Service (12b-1) and Transfer Agency fees were as follows: |
| | | | | | | | | | | | | | | | | | | | | | | | | | | | | | | | | | | | | | | | | | |
| | | | | Distribution and/or Service (12b-1) Fees | | | Transfer Agency Fees | |
| | | Fund | | Class A | | | Class C | | | Class R | | | Class A | | | Class C | | | Institutional | | | Investor | | | Class R6 | | | Class R | | | Class P | |
| | GQG Partners International Opportunities Fund | | | $1,012,979 | | | | $678,842 | | | | $12,757 | | | | $634,527 | | | | $141,582 | | | | $6,885,767 | | | | $8,779,604 | | | | $375,630 | | | | $3,964 | | | | $736,437 | |
The accompanying notes are an integral part of these financial statements. 13
|
| GOLDMAN SACHS GQG PARTNERS INTERNATIONAL OPPORTUNITIES FUND |
Statements of Changes in Net Assets
| | | | | | | | | | |
| | | | | GQG Partners International Opportunities Fund | |
| | | | | For the Fiscal Year Ended October 31, 2023 | | | For the Fiscal Year Ended October 31, 2022 | |
| | | |
| | From operations: | | | | | | | | |
| | | |
| | Net investment income | | | $ 956,592,730 | | | | $ 1,017,063,964 | |
| | | |
| | Net realized loss | | | (597,557,706) | | | | (937,667,197) | |
| | | |
| | Net change in unrealized gain (loss) | | | 2,834,177,527 | | | | (4,958,827,411) | |
| | | |
| | | |
| | Net increase (decrease) in net assets resulting from operations | | | 3,193,212,551 | | | | (4,879,430,644) | |
| | | |
| | | |
| | | | | | | | | | |
| | | |
| | Distributions to shareholders: | | | | | | | | |
| | | |
| | From distributable earnings: | | | | | | | | |
| | | |
| | Class A Shares | | | (17,547,803) | | | | (8,694,077) | |
| | | |
| | Class C Shares | | | (3,133,597) | | | | (1,158,748) | |
| | | |
| | Institutional Shares | | | (728,324,807) | | | | (316,943,861) | |
| | | |
| | Investor Shares | | | (226,000,395) | | | | (90,597,219) | |
| | | |
| | Class R6 Shares | | | (49,848,199) | | | | (17,024,099) | |
| | | |
| | Class R Shares | | | (62,600) | | | | (17,099) | |
| | | |
| | Class P Shares | | | (103,698,041) | | | | (51,959,366) | |
| | | |
| | | |
| | Total distributions to shareholders | | | (1,128,615,442) | | | | (486,394,469) | |
| | | |
| | | |
| | | | | | | | | | |
| | | |
| | From share transactions: | | | | | | | | |
| | | |
| | Proceeds from sales of shares | | | 11,522,771,367 | | | | 11,534,197,993 | |
| | | |
| | Reinvestment of distributions | | | 964,823,979 | | | | 403,333,721 | |
| | | |
| | Cost of shares redeemed | | | (7,377,067,709) | | | | (6,650,124,656) | |
| | | |
| | | |
| | Net increase in net assets resulting from share transactions | | | 5,110,527,637 | | | | 5,287,407,058 | |
| | | |
| | | |
| | TOTAL INCREASE (DECREASE) | | | 7,175,124,746 | | | | (78,418,055) | |
| | | |
| | | |
| | | | | | | | | | |
| | | |
| | Net assets: | | | | | | | | |
| | | |
| | Beginning of year | | | 22,239,048,963 | | | | 22,317,467,018 | |
| | | |
| | | |
| | End of year | | | $29,414,173,709 | | | | $22,239,048,963 | |
| | | |
14 The accompanying notes are an integral part of these financial statements.
GOLDMAN SACHS GQG PARTNERS INTERNATIONAL OPPORTUNITIES FUND
Financial Highlights
Selected Share Data for a Share Outstanding Throughout Each Year
| | | | | | | | | | | | | | | | | | | | | | |
| | |
| | | | | Goldman Sachs GQG Partners International Opportunities Fund | |
| | |
| | | | | Class A Shares | |
| | |
| | | | | Year Ended October 31, | |
| | | | | | |
| | | | | 2023 | | | 2022 | | | 2021 | | | 2020 | | | 2019 | |
| | | | | | |
| | Per Share Data | | | | | | | | | | | | | | | | | | | | |
| | | | | | |
| | Net asset value, beginning of year | | $ | 16.07 | | | $ | 20.36 | | | $ | 16.44 | | | $ | 14.78 | | | $ | 12.32 | |
| |
| | | |
| | | | | | |
| | Net investment income(a) | | | 0.57 | | | | 0.75 | | | | 0.28 | | | | 0.04 | | | | 0.10 | |
| | | | | | |
| | Net realized and unrealized gain (loss) | | | 1.62 | | | | (4.67 | ) | | | 3.64 | | | | 1.68 | | | | 2.38 | |
| |
| | | |
| | | | | | |
| | Total from investment operations | | | 2.19 | | | | (3.92 | ) | | | 3.92 | | | | 1.72 | | | | 2.48 | |
| |
| | | |
| | | | | | |
| | Distributions to shareholders from net investment income | | | (0.74 | ) | | | (0.37 | ) | | | — | | | | (0.06 | ) | | | (0.02) | |
| |
| | | |
| | | | | | |
| | Net asset value, end of year | | $ | 17.52 | | | $ | 16.07 | | | $ | 20.36 | | | $ | 16.44 | | | $ | 14.78 | |
| |
| | | |
| | | | | | |
| | Total return(b) | | | 13.91 | % | | | (19.55 | )% | | | 23.84 | % | | | 11.66 | % | | | 20.19% | |
| |
| | | |
| | | | | | |
| | Net assets, end of year (in 000s) | | $ | 401,254 | | | $ | 417,464 | | | $ | 479,794 | | | $ | 252,603 | | | $ | 89,592 | |
| | | | | | |
| | Ratio of net expenses to average net assets | | | 1.13 | % | | | 1.14 | % | | | 1.15 | % | | | 1.17 | % | | | 1.23% | |
| | | | | | |
| | Ratio of total expenses to average net assets | | | 1.16 | % | | | 1.17 | % | | | 1.19 | % | | | 1.20 | % | | | 1.29% | |
| | | | | | |
| | Ratio of net investment income to average net assets | | | 3.26 | % | | | 4.17 | % | | | 1.47 | % | | | 0.23 | % | | | 0.71% | |
| | | | | | |
| | Portfolio turnover rate(c) | | | 62 | % | | | 137 | % | | | 94 | % | | | 72 | % | | | 55% | |
| |
| | | |
| | (a) | Calculated based on the average shares outstanding methodology. |
| | (b) | Assumes investment at the NAV at the beginning of the year, reinvestment of all dividends and distributions, a complete redemption of the investment at the NAV at the end of the year and no sales or redemption charges (if any). Total returns would be reduced if a sales or redemption charge was taken into account. Returns do not reflect the impact of taxes to shareholders relating to Fund distributions or the redemption of Fund shares. | |
| | (c) | The Fund’s portfolio turnover rate is calculated in accordance with regulatory requirements, without regard to transactions involving short term investments. If such transactions were included, the Fund’s portfolio turnover rate may be higher. | |
The accompanying notes are an integral part of these financial statements. 15
|
| GOLDMAN SACHS GQG PARTNERS INTERNATIONAL OPPORTUNITIES FUND |
Financial Highlights (continued)
Selected Share Data for a Share Outstanding Throughout Each Year
| | | | | | | | | | | | | | | | | | | | | | |
| | |
| | | | | Goldman Sachs GQG Partners International Opportunities Fund | |
| | |
| | | | | Class C Shares | |
| | |
| | | | | Year Ended October 31, | |
| | | | | | |
| | | | | 2023 | | | 2022 | | | 2021 | | | 2020 | | | 2019 | |
| | | | | | |
| | Per Share Data | | | | | | | | | | | | | | | | | | | | |
| | | | | | |
| | Net asset value, beginning of year | | $ | 15.58 | | | $ | 19.76 | | | $ | 16.08 | | | $ | 14.50 | | | $ | 12.16 | |
| |
| | | |
| | | | | | |
| | Net investment income (loss)(a) | | | 0.42 | | | | 0.59 | | | | 0.13 | | | | (0.08 | ) | | | —(b) | |
| | | | | | |
| | Net realized and unrealized gain (loss) | | | 1.58 | | | | (4.53 | ) | | | 3.55 | | | | 1.66 | | | | 2.34 | |
| |
| | | |
| | | | | | |
| | Total from investment operations | | | 2.00 | | | | (3.94 | ) | | | 3.68 | | | | 1.58 | | | | 2.34 | |
| |
| | | |
| | | | | | |
| | Distributions to shareholders from net investment income | | | (0.62 | ) | | | (0.24 | ) | | | — | | | | — | | | | — | |
| |
| | | |
| | | | | | |
| | Net asset value, end of year | | $ | 16.96 | | | $ | 15.58 | | | $ | 19.76 | | | $ | 16.08 | | | $ | 14.50 | |
| |
| | | |
| | | | | | |
| | Total return(c) | | | 13.06 | % | | | (20.12 | )% | | | 22.82 | % | | | 10.87 | % | | | 19.24% | |
| |
| | | |
| | | | | | |
| | Net assets, end of year (in 000s) | | $ | 93,751 | | | $ | 78,662 | | | $ | 97,057 | | | $ | 61,784 | | | $ | 32,620 | |
| | | | | | |
| | Ratio of net expenses to average net assets | | | 1.88 | % | | | 1.89 | % | | | 1.90 | % | | | 1.92 | % | | | 1.98% | |
| | | | | | |
| | Ratio of total expenses to average net assets | | | 1.91 | % | | | 1.92 | % | | | 1.94 | % | | | 1.95 | % | | | 2.04% | |
| | | | | | |
| | Ratio of net investment income (loss) to average net assets | | | 2.48 | % | | | 3.36 | % | | | 0.69 | % | | | (0.51 | )% | | | (0.02)% | |
| | | | | | |
| | Portfolio turnover rate(d) | | | 62 | % | | | 137 | % | | | 94 | % | | | 72 | % | | | 55% | |
| |
| | | |
| | (a) | Calculated based on the average shares outstanding methodology. |
| | (b) | Amount is less than $0.005 per share. |
| | (c) | Assumes investment at the NAV at the beginning of the year, reinvestment of all dividends and distributions, a complete redemption of the investment at the NAV at the end of the year and no sales or redemption charges (if any). Total returns would be reduced if a sales or redemption charge was taken into account. Returns do not reflect the impact of taxes to shareholders relating to Fund distributions or the redemption of Fund shares. | |
| | (d) | The Fund’s portfolio turnover rate is calculated in accordance with regulatory requirements, without regard to transactions involving short term investments. If such transactions were included, the Fund’s portfolio turnover rate may be higher. | |
16 The accompanying notes are an integral part of these financial statements.
GOLDMAN SACHS GQG PARTNERS INTERNATIONAL OPPORTUNITIES FUND
Financial Highlights (continued)
Selected Share Data for a Share Outstanding Throughout Each Year
| | | | | | | | | | | | | | | | | | | | | | |
| | |
| | | | | Goldman Sachs GQG Partners International Opportunities Fund | |
| | |
| | | | | Institutional Shares | |
| | |
| | | | | Year Ended October 31, | |
| | | | | | |
| | | | | 2023 | | | 2022 | | | 2021 | | | 2020 | | | 2019 | |
| | | | | | |
| | Per Share Data | | | | | | | | | | | | | | | | | | | | |
| | | | | | |
| | Net asset value, beginning of year | | $ | 16.23 | | | $ | 20.55 | | | $ | 16.56 | | | $ | 14.87 | | | $ | 12.39 | |
| |
| | | |
| | | | | | |
| | Net investment income(a) | | | 0.63 | | | | 0.82 | | | | 0.35 | | | | 0.09 | | | | 0.15 | |
| | | | | | |
| | Net realized and unrealized gain (loss) | | | 1.64 | | | | (4.70 | ) | | | 3.67 | | | | 1.70 | | | | 2.39 | |
| |
| | | |
| | | | | | |
| | Total from investment operations | | | 2.27 | | | | (3.88 | ) | | | 4.02 | | | | 1.79 | | | | 2.54 | |
| |
| | | |
| | | | | | |
| | Distributions to shareholders from net investment income | | | (0.81 | ) | | | (0.44 | ) | | | (0.03 | ) | | | (0.10 | ) | | | (0.06) | |
| |
| | | |
| | | | | | |
| | Net asset value, end of year | | $ | 17.69 | | | $ | 16.23 | | | $ | 20.55 | | | $ | 16.56 | | | $ | 14.87 | |
| |
| | | |
| | | | | | |
| | Total return(b) | | | 14.34 | % | | | (19.23 | )% | | | 24.31 | % | | | 12.06 | % | | | 20.65% | |
| |
| | | |
| | | | | | |
| | Net assets, end of year (in 000s) | | $ | 18,487,029 | | | $ | 14,193,048 | | | $ | 14,481,792 | | | $ | 8,683,860 | | | $ | 1,996,934 | |
| | | | | | |
| | Ratio of net expenses to average net assets | | | 0.77 | % | | | 0.76 | % | | | 0.77 | % | | | 0.79 | % | | | 0.84% | |
| | | | | | |
| | Ratio of total expenses to average net assets | | | 0.79 | % | | | 0.79 | % | | | 0.81 | % | | | 0.82 | % | | | 0.90% | |
| | | | | | |
| | Ratio of net investment income to average net assets | | | 3.58 | % | | | 4.54 | % | | | 1.83 | % | | | 0.55 | % | | | 1.10% | |
| | | | | | |
| | Portfolio turnover rate(c) | | | 62 | % | | | 137 | % | | | 94 | % | | | 72 | % | | | 55% | |
| |
| | | |
| | (a) | Calculated based on the average shares outstanding methodology. |
| | (b) | Assumes investment at the NAV at the beginning of the year, reinvestment of all dividends and distributions, a complete redemption of the investment at the NAV at the end of the year and no sales or redemption charges (if any). Total returns would be reduced if a sales or redemption charge was taken into account. Returns do not reflect the impact of taxes to shareholders relating to Fund distributions or the redemption of Fund shares. | |
| | (c) | The Fund’s portfolio turnover rate is calculated in accordance with regulatory requirements, without regard to transactions involving short term investments. If such transactions were included, the Fund’s portfolio turnover rate may be higher. | |
The accompanying notes are an integral part of these financial statements. 17
|
| GOLDMAN SACHS GQG PARTNERS INTERNATIONAL OPPORTUNITIES FUND |
Financial Highlights (continued)
Selected Share Data for a Share Outstanding Throughout Each Year
| | | | | | | | | | | | | | | | | | | | | | |
| | |
| | | | | Goldman Sachs GQG Partners International Opportunities Fund | |
| | |
| | | | | Investor Shares | |
| | |
| | | | | Year Ended October 31, | |
| | | | | | |
| | | | | 2023 | | | 2022 | | | 2021 | | | 2020 | | | 2019 | |
| | | | | | |
| | Per Share Data | | | | | | | | | | | | | | | | | | | | |
| | | | | | |
| | Net asset value, beginning of year | | $ | 16.16 | | | $ | 20.47 | | | $ | 16.51 | | | $ | 14.82 | | | $ | 12.36 | |
| |
| | | |
| | | | | | |
| | Net investment income(a) | | | 0.61 | | | | 0.80 | | | | 0.33 | | | | 0.08 | | | | 0.15 | |
| | | | | | |
| | Net realized and unrealized gain (loss) | | | 1.63 | | | | (4.69 | ) | | | 3.64 | | | | 1.70 | | | | 2.36 | |
| |
| | | |
| | | | | | |
| | Total from investment operations | | | 2.24 | | | | (3.89 | ) | | | 3.97 | | | | 1.78 | | | | 2.51 | |
| |
| | | |
| | | | | | |
| | Distributions to shareholders from net investment income | | | (0.79 | ) | | | (0.42 | ) | | | (0.01 | ) | | | (0.09 | ) | | | (0.05) | |
| |
| | | |
| | | | | | |
| | Net asset value, end of year | | $ | 17.61 | | | $ | 16.16 | | | $ | 20.47 | | | $ | 16.51 | | | $ | 14.82 | |
| |
| | | |
| | | | | | |
| | Total return(b) | | | 14.21 | % | | | (19.35 | )% | | | 24.09 | % | | | 12.00 | % | | | 20.42% | |
| |
| | | |
| | | | | | |
| | Net assets, end of year (in 000s) | | $ | 6,227,601 | | | $ | 4,425,913 | | | $ | 4,169,364 | | | $ | 2,488,875 | | | $ | 1,098,284 | |
| | | | | | |
| | Ratio of net expenses to average net assets | | | 0.88 | % | | | 0.89 | % | | | 0.90 | % | | | 0.92 | % | | | 0.98% | |
| | | | | | |
| | Ratio of total expenses to average net assets | | | 0.91 | % | | | 0.92 | % | | | 0.94 | % | | | 0.95 | % | | | 1.04% | |
| | | | | | |
| | Ratio of net investment income to average net assets | | | 3.45 | % | | | 4.42 | % | | | 1.70 | % | | | 0.48 | % | | | 1.09% | |
| | | | | | |
| | Portfolio turnover rate(c) | | | 62 | % | | | 137 | % | | | 94 | % | | | 72 | % | | | 55% | |
| |
| | | |
| | (a) | Calculated based on the average shares outstanding methodology. |
| | (b) | Assumes investment at the NAV at the beginning of the year, reinvestment of all dividends and distributions, a complete redemption of the investment at the NAV at the end of the year and no sales or redemption charges (if any). Total returns would be reduced if a sales or redemption charge was taken into account. Returns do not reflect the impact of taxes to shareholders relating to Fund distributions or the redemption of Fund shares. | |
| | (c) | The Fund’s portfolio turnover rate is calculated in accordance with regulatory requirements, without regard to transactions involving short term investments. If such transactions were included, the Fund’s portfolio turnover rate may be higher. | |
18 The accompanying notes are an integral part of these financial statements.
GOLDMAN SACHS GQG PARTNERS INTERNATIONAL OPPORTUNITIES FUND
Financial Highlights (continued)
Selected Share Data for a Share Outstanding Throughout Each Year
| | | | | | | | | | | | | | | | | | | | | | |
| | |
| | | | | Goldman Sachs GQG Partners International Opportunities Fund | |
| | |
| | | | | Class R6 Shares | |
| | |
| | | | | Year Ended October 31, | |
| | | | | | |
| | | | | 2023 | | | 2022 | | | 2021 | | | 2020 | | | 2019 | |
| | | | | | |
| | Per Share Data | | | | | | | | | | | | | | | | | | | | |
| | | | | | |
| | Net asset value, beginning of year | | $ | 16.23 | | | $ | 20.55 | | | $ | 16.56 | | | $ | 14.87 | | | $ | 12.39 | |
| |
| | | |
| | | | | | |
| | Net investment income(a) | | | 0.62 | | | | 0.83 | | | | 0.38 | | | | 0.07 | | | | 0.05 | |
| | | | | | |
| | Net realized and unrealized gain (loss) | | | 1.65 | | | | (4.71 | ) | | | 3.64 | | | | 1.72 | | | | 2.50 | |
| |
| | | |
| | | | | | |
| | Total from investment operations | | | 2.27 | | | | (3.88 | ) | | | 4.02 | | | | 1.79 | | | | 2.55 | |
| |
| | | |
| | | | | | |
| | Distributions to shareholders from net investment income | | | (0.82 | ) | | | (0.44 | ) | | | (0.03 | ) | | | (0.10 | ) | | | (0.07) | |
| |
| | | |
| | | | | | |
| | Net asset value, end of year | | $ | 17.68 | | | $ | 16.23 | | | $ | 20.55 | | | $ | 16.56 | | | $ | 14.87 | |
| |
| | | |
| | | | | | |
| | Total return(b) | | | 14.31 | % | | | (19.17 | )% | | | 24.27 | % | | | 12.09 | % | | | 20.68% | |
| |
| | | |
| | | | | | |
| | Net assets, end of year (in 000s) | | $ | 1,565,411 | | | $ | 1,023,099 | | | $ | 757,796 | | | $ | 391,507 | | | $ | 34,263 | |
| | | | | | |
| | Ratio of net expenses to average net assets | | | 0.75 | % | | | 0.74 | % | | | 0.75 | % | | | 0.77 | % | | | 0.81% | |
| | | | | | |
| | Ratio of total expenses to average net assets | | | 0.78 | % | | | 0.78 | % | | | 0.80 | % | | | 0.81 | % | | | 0.92% | |
| | | | | | |
| | Ratio of net investment income to average net assets | | | 3.48 | % | | | 4.63 | % | | | 1.97 | % | | | 0.42 | % | | | 0.34% | |
| | | | | | |
| | Portfolio turnover rate(c) | | | 62 | % | | | 137 | % | | | 94 | % | | | 72 | % | | | 55% | |
| |
| | | |
| | (a) | Calculated based on the average shares outstanding methodology. | |
| | (b) | Assumes investment at the NAV at the beginning of the year, reinvestment of all dividends and distributions, a complete redemption of the investment at the NAV at the end of the year and no sales or redemption charges (if any). Total returns would be reduced if a sales or redemption charge was taken into account. Returns do not reflect the impact of taxes to shareholders relating to Fund distributions or the redemption of Fund shares. | |
| | (c) | The Fund’s portfolio turnover rate is calculated in accordance with regulatory requirements, without regard to transactions involving short term investments. If such transactions were included, the Fund’s portfolio turnover rate may be higher. | |
The accompanying notes are an integral part of these financial statements. 19
|
| GOLDMAN SACHS GQG PARTNERS INTERNATIONAL OPPORTUNITIES FUND |
Financial Highlights (continued)
Selected Share Data for a Share Outstanding Throughout Each Year
| | | | | | | | | | | | | | | | | | | | | | |
| | |
| | | | | Goldman Sachs GQG Partners International Opportunities Fund | |
| | |
| | | | | Class R Shares | |
| | |
| | | | | Year Ended October 31, | |
| | | | | | |
| | | | | 2023 | | | 2022 | | | 2021 | | | 2020 | | | 2019 | |
| | | | | | |
| | Per Share Data | | | | | | | | | | | | | | | | | | | | |
| | | | | | |
| | Net asset value, beginning of year | | $ | 15.88 | | | $ | 20.11 | | | $ | 16.28 | | | $ | 14.69 | | | $ | 12.26 | |
| |
| | | |
| | | | | | |
| | Net investment income(a) | | | 0.48 | | | | 0.69 | | | | 0.22 | | | | 0.01 | | | | 0.01 | |
| | | | | | |
| | Net realized and unrealized gain (loss) | | | 1.64 | | | | (4.61 | ) | | | 3.61 | | | | 1.65 | | | | 2.43 | |
| |
| | | |
| | | | | | |
| | Total from investment operations | | | 2.12 | | | | (3.92 | ) | | | 3.83 | | | | 1.66 | | | | 2.44 | |
| |
| | | |
| | | | | | |
| | Distributions to shareholders from net investment income | | | (0.73 | ) | | | (0.31 | ) | | | — | | | | (0.07 | ) | | | (0.01) | |
| |
| | | |
| | | | | | |
| | Net asset value, end of year | | $ | 17.27 | | | $ | 15.88 | | | $ | 20.11 | | | $ | 16.28 | | | $ | 14.69 | |
| |
| | | |
| | | | | | |
| | Total return(b) | | | 13.63 | % | | | (19.73 | )% | | | 23.53 | % | | | 11.32 | % | | | 19.91% | |
| |
| | | |
| | | | | | |
| | Net assets, end of year (in 000s) | | $ | 3,570 | | | $ | 1,215 | | | $ | 1,095 | | | $ | 735 | | | $ | 208 | |
| | | | | | |
| | Ratio of net expenses to average net assets | | | 1.38 | % | | | 1.39 | % | | | 1.40 | % | | | 1.42 | % | | | 1.47% | |
| | | | | | |
| | Ratio of total expenses to average net assets | | | 1.41 | % | | | 1.42 | % | | | 1.44 | % | | | 1.45 | % | | | 1.54% | |
| | | | | | |
| | Ratio of net investment income to average net assets | | | 2.74 | % | | | 3.88 | % | | | 1.19 | % | | | 0.07 | % | | | 0.05% | |
| | | | | | |
| | Portfolio turnover rate(c) | | | 62 | % | | | 137 | % | | | 94 | % | | | 72 | % | | | 55% | |
| |
| | | |
| | (a) | Calculated based on the average shares outstanding methodology. |
| | (b) | Assumes investment at the NAV at the beginning of the year, reinvestment of all dividends and distributions, a complete redemption of the investment at the NAV at the end of the year and no sales or redemption charges (if any). Total returns would be reduced if a sales or redemption charge was taken into account. Returns do not reflect the impact of taxes to shareholders relating to Fund distributions or the redemption of Fund shares. | |
| | (c) | The Fund’s portfolio turnover rate is calculated in accordance with regulatory requirements, without regard to transactions involving short term investments. If such transactions were included, the Fund’s portfolio turnover rate may be higher. | |
20 The accompanying notes are an integral part of these financial statements.
GOLDMAN SACHS GQG PARTNERS INTERNATIONAL OPPORTUNITIES FUND
Financial Highlights (continued)
Selected Share Data for a Share Outstanding Throughout Each Year
| | | | | | | | | | | | | | | | | | | | | | |
| | |
| | | | | Goldman Sachs GQG Partners International Opportunities Fund | |
| | |
| | | | | Class P Shares | |
| | |
| | | | | Year Ended October 31, | |
| | | | | | |
| | | | | 2023 | | | 2022 | | | 2021 | | | 2020 | | | 2019 | |
| | | | | | |
| | Per Share Data | | | | | | | | | | | | | | | | | | | | |
| | | | | | |
| | Net asset value, beginning of year | | $ | 16.22 | | | $ | 20.54 | | | $ | 16.55 | | | $ | 14.86 | | | $ | 12.39 | |
| |
| | | |
| | | | | | |
| | Net investment income(a) | | | 0.64 | | | | 0.83 | | | | 0.37 | | | | 0.10 | | | | 0.16 | |
| | | | | | |
| | Net realized and unrealized gain (loss) | | | 1.63 | | | | (4.71 | ) | | | 3.65 | | | | 1.69 | | | | 2.38 | |
| |
| | | |
| | | | | | |
| | Total from investment operations | | | 2.27 | | | | (3.88 | ) | | | 4.02 | | | | 1.79 | | | | 2.54 | |
| |
| | | |
| | | | | | |
| | Distributions to shareholders from net investment income | | | (0.81 | ) | | | (0.44 | ) | | | (0.03 | ) | | | (0.10 | ) | | | (0.07) | |
| |
| | | |
| | | | | | |
| | Net asset value, end of year | | $ | 17.68 | | | $ | 16.22 | | | $ | 20.54 | | | $ | 16.55 | | | $ | 14.86 | |
| |
| | | |
| | | | | | |
| | Total return(b) | | | 14.38 | % | | | (19.22 | )% | | | 24.34 | % | | | 12.08 | % | | | 20.61% | |
| |
| | | |
| | | | | | |
| | Net assets, end of year (in 000s) | | $ | 2,635,558 | | | $ | 2,099,648 | | | $ | 2,330,569 | | | $ | 1,186,744 | | | $ | 477,609 | |
| | | | | | |
| | Ratio of net expenses to average net assets | | | 0.75 | % | | | 0.74 | % | | | 0.75 | % | | | 0.77 | % | | | 0.82% | |
| | | | | | |
| | Ratio of total expenses to average net assets | | | 0.78 | % | | | 0.78 | % | | | 0.80 | % | | | 0.81 | % | | | 0.89% | |
| | | | | | |
| | Ratio of net investment income to average net assets | | | 3.60 | % | | | 4.55 | % | | | 1.90 | % | | | 0.61 | % | | | 1.14% | |
| | | | | | |
| | Portfolio turnover rate(c) | | | 62 | % | | | 137 | % | | | 94 | % | | | 72 | % | | | 55% | |
| |
| | | |
| | (a) | Calculated based on the average shares outstanding methodology. |
| | (b) | Assumes investment at the NAV at the beginning of the year, reinvestment of all dividends and distributions, a complete redemption of the investment at the NAV at the end of the year and no sales or redemption charges (if any). Total returns would be reduced if a sales or redemption charge was taken into account. Returns do not reflect the impact of taxes to shareholders relating to Fund distributions or the redemption of Fund shares. | |
| | (c) | The Fund’s portfolio turnover rate is calculated in accordance with regulatory requirements, without regard to transactions involving short term investments. If such transactions were included, the Fund’s portfolio turnover rate may be higher. | |
The accompanying notes are an integral part of these financial statements. 21
|
| GOLDMAN SACHS GQG PARTNERS INTERNATIONAL OPPORTUNITIES FUND |
Notes to Financial Statements
October 31, 2023
Goldman Sachs Trust II (the “Trust”) is a Delaware statutory trust registered under the Investment Company Act of 1940, as amended (the “Act”), as an open-end management investment company. The Trust includes the Goldman Sachs GQG Partners International Opportunities Fund (the “Fund”). The Fund is a diversified portfolio that currently offers seven classes of shares: Class A, Class C, Institutional, Investor, Class R6, Class R and Class P Shares.
Class A Shares are sold with a front-end sales charge of up to 5.50%. Class C Shares are sold with a contingent deferred sales charge (“CDSC”) of 1.00%, which is imposed on redemptions made within 12 months of purchase. Institutional, Investor, Class R6, Class R, and Class P Shares are not subject to a sales charge.
Goldman Sachs Asset Management, L.P. (“GSAM”), an affiliate of Goldman Sachs & Co. LLC (“Goldman Sachs”), serves as investment adviser to the Fund pursuant to a management agreement (the “Agreement”) with the Trust.
GQG Partners LLC (“GQG Partners” or the “Sub-Adviser”) serves as the sub-adviser to the Fund. GSAM compensates the Sub-Adviser directly in accordance with the terms of the Sub-Advisory Agreement. The Fund is not charged any separate or additional investment advisory fees by the Sub-Adviser.
|
|
| 2. SIGNIFICANT ACCOUNTING POLICIES |
The financial statements have been prepared in accordance with accounting principles generally accepted in the United States of America (“GAAP”) and require management to make estimates and assumptions that may affect the reported amounts and disclosures. Actual results may differ from those estimates and assumptions. The Fund is an investment company under GAAP and follows the accounting and reporting guidance applicable to investment companies.
A. Investment Valuation — The Fund’s valuation policy is to value investments at fair value.
B. Investment Income and Investments — Investment income includes interest income, dividend income and securities lending income, if any. Interest income is accrued daily and adjusted for amortization of premiums and accretion of discounts. Dividend income is recognized on ex-dividend date or, for certain foreign securities, as soon as such information is obtained subsequent to the ex-dividend date. Non-cash dividends, if any, are recorded at the fair market value of the securities received. Investment transactions are reflected on trade date. Realized gains and losses are calculated using identified cost. Investment transactions are recorded on the following business day for daily net asset value (“NAV”) calculations. Investment income is recorded net of any foreign withholding taxes, less any amounts reclaimable. The Fund may file withholding tax reclaims in certain jurisdictions to recover a portion of amounts previously withheld. Any foreign capital gains tax is accrued daily based upon net unrealized gains, and is payable upon sale of such investments.
C. Class Allocations and Expenses — Investment income, realized and unrealized gain (loss), if any, and non-class specific expenses of the Fund are allocated daily based upon the proportion of net assets of each class. Non-class specific expenses directly incurred by the Fund are charged to the Fund, while such expenses incurred by the Trust are allocated across the Fund on a straight-line and/or pro-rata basis depending upon the nature of the expenses. Class specific expenses, where applicable, are borne by the respective share classes and include Distribution and Service, Transfer Agency and Service fees.
D. Federal Taxes and Distributions to Shareholders — It is the Fund’s policy to comply with the requirements of the Internal Revenue Code of 1986, as amended (the “Code”), applicable to regulated investment companies and to distribute each year substantially all of its investment company taxable income and capital gains to its shareholders. Accordingly, the Fund is not required to make any provisions for the payment of federal income tax. Distributions to shareholders are recorded on the ex-dividend date. Income and capital gains distributions, if any, are declared and paid annually.
Net capital losses, if any, are carried forward to future fiscal years and may be used to the extent allowed by the Code to offset any future capital gains. Losses that are carried forward will retain their character as either short-term or long-term capital losses. Utilization of capital loss carryforwards will reduce the requirement of future capital gains distributions.
22
GOLDMAN SACHS GQG PARTNERS INTERNATIONAL OPPORTUNITIES FUND
|
|
| 2. SIGNIFICANT ACCOUNTING POLICIES (continued) |
The characterization of distributions to shareholders for financial reporting purposes is determined in accordance with federal income tax rules, which may differ from GAAP. The source of the Fund’s distributions may be shown in the accompanying financial statements as either from distributable earnings or capital. Certain components of the Fund’s net assets on the Statement of Assets and Liabilities reflect permanent GAAP/tax differences based on the appropriate tax character.
E. Foreign Currency Translation — The accounting records and reporting currency of the Fund are maintained in U.S. dollars. Assets and liabilities denominated in foreign currencies are translated into U.S. dollars using the current exchange rates at the close of each business day. The effect of changes in foreign currency exchange rates on investments is included within net realized and unrealized gain (loss) on investments. Changes in the value of other assets and liabilities as a result of fluctuations in foreign exchange rates are included in the Statement of Operations within net change in unrealized gain (loss) on foreign currency translation. Transactions denominated in foreign currencies are translated into U.S. dollars on the date the transaction occurred, the effects of which are included within net realized gain (loss) on foreign currency transactions.
|
|
| 3. INVESTMENTS AND FAIR VALUE MEASUREMENTS |
U.S. GAAP defines the fair value of a financial instrument as the amount that would be received to sell an asset or paid to transfer a liability in an orderly transaction between market participants at the measurement date (i.e., the exit price); the Fund’s policy is to use the market approach. GAAP establishes a fair value hierarchy that prioritizes the inputs to valuation techniques used to measure fair value. The hierarchy gives the highest priority to unadjusted quoted prices in active markets for identical assets or liabilities (Level 1 measurements) and the lowest priority to unobservable inputs (Level 3 measurements). The level in the fair value hierarchy within which the fair value measurement in its entirety falls shall be determined based on the lowest level input that is significant to the fair value measurement in its entirety. The levels used for classifying investments are not necessarily an indication of the risk associated with investing in these investments. The three levels of the fair value hierarchy are described below:
Level 1 — Unadjusted quoted prices in active markets that are accessible at the measurement date for identical, unrestricted assets or liabilities;
Level 2 — Quoted prices in markets that are not active or financial instruments for which significant inputs are observable (including, but not limited to, quoted prices for similar investments, interest rates, foreign exchange rates, volatility and credit spreads), either directly or indirectly;
Level 3 — Prices or valuations that require significant unobservable inputs (including GSAM’s assumptions in determining fair value measurement).
The Board of Trustees (“Trustees”) has approved Valuation Procedures that govern the valuation of the portfolio investments held by the Fund, including investments for which market quotations are not readily available. With respect to the Fund’s investments that do not have readily available market quotations, the Trustees have designated GSAM as the valuation designee to perform fair valuations pursuant to Rule 2a-5 under the Investment Company Act of 1940 (the “Valuation Designee”). GSAM has day-to-day responsibility for implementing and maintaining internal controls and procedures related to the valuation of the Fund’s investments. To assess the continuing appropriateness of pricing sources and methodologies, GSAM regularly performs price verification procedures and issues challenges as necessary to third party pricing vendors or brokers, and any differences are reviewed in accordance with the Valuation Procedures.
A. Level 1 and Level 2 Fair Value Investments — The valuation techniques and significant inputs used in determining the fair values for investments classified as Level 1 and Level 2 are as follows:
Equity Securities — Equity securities traded on a United States (“U.S.”) securities exchange or the NASDAQ system, or those located on certain foreign exchanges, including but not limited to the Americas, are valued daily at their last sale price or official closing price on the principal exchange or system on which they are traded. If there is no sale or official closing price or such price is believed by GSAM to not represent fair value, equity securities will be valued at the valid closing bid price for long positions and at the valid closing ask price for short positions (i.e., where there is sufficient volume, during normal exchange trading hours).
23
|
| GOLDMAN SACHS GQG PARTNERS INTERNATIONAL OPPORTUNITIES FUND |
Notes to Financial Statements (continued)
October 31, 2023
|
|
| 3. INVESTMENTS AND FAIR VALUE MEASUREMENTS (continued) |
If no valid bid/ask price is available, the equity security will be valued pursuant to the Valuation Procedures and consistent with applicable regulatory guidance. To the extent these investments are actively traded, they are classified as Level 1 of the fair value hierarchy, otherwise they are generally classified as Level 2. Certain equity securities containing unique attributes may be classified as Level 2.
Unlisted equity securities for which market quotations are available are valued at the last sale price on the valuation date, or if no sale occurs, at the last bid price for long positions or the last ask price for short positions, and are generally classified as Level 2. Securities traded on certain foreign securities exchanges are valued daily at fair value determined by an independent fair value service (if available) under the Valuation Procedures and consistent with applicable regulatory guidance. The independent fair value service takes into account multiple factors including, but not limited to, movements in the securities markets, certain depositary receipts, futures contracts and foreign currency exchange rates that have occurred subsequent to the close of the foreign securities exchange. These investments are generally classified as Level 2 of the fair value hierarchy.
Money Market Funds — Investments in the Goldman Sachs Financial Square Government Fund (“Underlying Money Market Fund”) are valued at the NAV per share of the Institutional Share class on the day of valuation. These investments are generally classified as Level 1 of the fair value hierarchy. For information regarding the Underlying Money Market Fund’s accounting policies and investment holdings, please see the Underlying Money Market Fund’s shareholder report.
B. Level 3 Fair Value Investments — To the extent that significant inputs to valuation models and other alternative pricing sources are unobservable, or if quotations are not readily available, or if GSAM believes that such quotations do not accurately reflect fair value, the fair value of the Fund’s investments may be determined under the Valuation Procedures. GSAM, consistent with its procedures and applicable regulatory guidance, may make an adjustment to the most recent valuation prices of either domestic or foreign securities in light of significant events to reflect what it believes to be the fair value of the securities at the time of determining the Fund’s NAV. To the extent investments are valued using single source broker quotations obtained directly from the broker or passed through from third party pricing vendors, such investments are classified as Level 3 investments.
C. Fair Value Hierarchy — The following is a summary of the Fund’s investments classified in the fair value hierarchy as of October 31, 2023:
| | | | | | | | | | | | | | | | | | | | |
| | | | | |
| Investment Type | | Level 1 | | | | | | Level 2 | | | | | | Level 3 | |
| | | | | |
Assets | | | | | | | | | | | | | | | | | | | | |
| | | | | |
Common Stock and/or Other Equity Investments(a) | | | | | | | | | | | | | | | | | | | | |
| | | | | |
Asia | | $ | 1,841,234,534 | | | | | | | $ | 4,334,509,898 | | | | | | | $ | — | |
| | | | | |
Australia and Oceania | | | — | | | | | | | | 212,152,646 | | | | | | | | — | |
| | | | | |
Europe | | | 1,653,528,734 | | | | | | | | 13,128,826,623 | | | | | | | | — | |
| | | | | |
North America | | | 5,371,888,862 | | | | | | | | — | | | | | | | | — | |
| | | | | |
South America | | | 1,102,808,541 | | | | | | | | — | | | | | | | | — | |
| | | | | |
Preferred Stocks | | | — | | | | | | | | 1,391,551,303 | | | | | | | | — | |
| | | | | |
Securities Lending Reinvestment Vehicle | | | 254,172,800 | | | | | | | | — | | | | | | | | — | |
| | | | | |
Investment Company | | | 716,742,511 | | | | | | | | — | | | | | | | | — | |
|
| |
| | | | | |
Total | | $ | 10,940,375,982 | | | | | | | $ | 19,067,040,470 | | | | | | | $ | — | |
| |
| | (a) | Amounts are disclosed by continent to highlight the impact of time zone differences between local market close and the calculation of NAV. Security valuations are based on the principal exchange or system on which they are traded, which may differ from country of domicile. The Fund utilizes fair value model prices provided by an independent fair value service for international equities, resulting in a Level 2 classification. |
For further information regarding security characteristics, see the Schedule of Investments.
24
GOLDMAN SACHS GQG PARTNERS INTERNATIONAL OPPORTUNITIES FUND
|
|
| 4. AGREEMENTS AND AFFILIATED TRANSACTIONS |
A. Management Agreement — Under the Agreement, GSAM manages the Fund, subject to the general supervision of the Trustees.
As compensation for the services rendered pursuant to the Agreement, the assumption of the expenses related thereto and administration of the Fund’s business affairs, including providing facilities, GSAM is entitled to a management fee, accrued daily and paid monthly, equal to an annual percentage rate of the Fund’s average daily net assets. For the fiscal year ended October 31, 2023, contractual and effective net management fees with GSAM were at the following rates:
| | | | | | | | | | | | | | | | | | | | | | | | |
| | | |
| | | Contractual Management Rate | | | | | |
Fund | | First $1 billion | | | Next $1 billion | | | Next $3 billion | | | Next $3 billion | | | Over $8 billion | | | Effective
Rate | | Effective Net Management Rate^ |
| | | | | | | |
GQG Partners International Opportunities Fund | | | 0.85% | | | | 0.77% | | | | 0.73% | | | | 0.71% | | | | 0.70% | | | 0.71% | | 0.71% |
|
| | ^ | Effective Net Management Rate includes the impact of management fee waivers of affiliated underlying funds, if any. |
The Fund invests in Institutional Shares of the Goldman Sachs Financial Square Government Fund, which is an affiliated Underlying Fund. GSAM has agreed to waive a portion of its management fee payable by the Fund in an amount equal to the management fee it earns as an investment adviser to the affiliated Underlying Fund in which the Fund invests, except those management fees it earns from the Fund’s investments of cash collateral received in connection with securities lending transactions in the Goldman Sachs Financial Square Government Fund. For the fiscal year ended October 31, 2023, GSAM waived $801,545 of the Fund’s management fee.
B. Distribution and/or Service (12b-1) Plans — The Trust, on behalf of Class A and Class R Shares of the Fund, has adopted Distribution and Service Plans subject to Rule 12b-1 under the Act. Under the Distribution and Service Plans, Goldman Sachs, which serves as distributor (the “Distributor”), is entitled to a fee accrued daily and paid monthly for distribution services and personal and account maintenance services, which may then be paid by Goldman Sachs to authorized dealers. These fees are equal to an annual percentage rate of the average daily net assets attributable to Class A or Class R Shares of the Fund, as set forth below.
The Trust, on behalf of Class C Shares of the Fund, has adopted a Distribution Plan subject to Rule 12b-1 under the Act. Under the Distribution Plan, Goldman Sachs as Distributor is entitled to a fee accrued daily and paid monthly for distribution services, which may then be paid by Goldman Sachs to authorized dealers. These fees are equal to an annual percentage rate of the average daily net assets attributable to Class C Shares of the Fund, as set forth below.
| | | | | | | | | | | | |
| |
| | | Distribution and/or Service Plan Rates | |
| | | |
| | | Class A* | | | Class C | | | Class R* | |
| | | |
Distribution and/or Service Plan | | | 0.25% | | | | 0.75% | | | | 0.50% | |
| |
| | * | With respect to Class A and Class R Shares, the Distributor at its discretion may use compensation for distribution services paid under the Distribution Plan to compensate service organizations for personal and account maintenance services and expenses as long as such total compensation does not exceed the maximum cap on “service fees” imposed by the Financial Industry Regulatory Authority. |
C. Distribution Agreement — Goldman Sachs, as Distributor of the shares of the Fund pursuant to a Distribution Agreement, may retain a portion of the Class A Shares’ front end sales charge and Class C Shares’ CDSC. During the fiscal year ended October 31, 2023, Goldman Sachs retained the following amounts:
| | |
| | | Front End
Sales Charge |
| |
| Fund | | Class A |
| |
GQG Partners International Opportunities Fund | | $61,817 |
|
During the fiscal year ended October 31, 2023, Goldman Sachs did not retain any portion of Class C Shares’ CDSC.
25
|
| GOLDMAN SACHS GQG PARTNERS INTERNATIONAL OPPORTUNITIES FUND |
Notes to Financial Statements (continued)
October 31, 2023
|
|
| 4. AGREEMENTS AND AFFILIATED TRANSACTIONS (continued) |
D. Service Plan — The Trust, on behalf of the Fund, has adopted a Service Plan to allow Class C Shares to compensate service organizations (including Goldman Sachs) for providing varying levels of personal and account maintenance services to their customers who are beneficial owners of such shares. The Service Plan provides for compensation to the service organizations equal to an annual percentage rate of 0.25% of the average daily net assets attributable to Class C Shares of the Fund.
E. Transfer Agency Agreement — Goldman Sachs also serves as the transfer agent of the Fund for a fee pursuant to the Transfer Agency Agreement. The fees charged for such transfer agency services are accrued daily and paid monthly at annual rates as follows: 0.15% of the average daily net assets of Class A, Class C, Investor and Class R Shares; 0.03% of the average daily net assets of Class R6 and Class P Shares; and 0.04% of the average daily net assets of Institutional Shares. Goldman Sachs has agreed to waive a portion of its transfer agency fee equal to 0.01% as an annual percentage rate of the average daily net assets attributable to Class R6 and Class P Shares of the Fund. This arrangement will remain in effect through at least February 28, 2024, and prior to such date Goldman Sachs may not terminate the arrangement without the approval of the Trustees. Prior to July 1, 2023, fees charged for such transfer agency services were 0.16% of the average daily net assets of Class A, Class C, Investor and Class R Shares.
F. Other Expense Agreements and Affiliated Transactions — GSAM has agreed to reduce or limit certain “Other Expenses” of the Fund (excluding acquired fund fees and expenses, transfer agency fees and expenses, service fees and shareholder administration fees (as applicable), taxes, interest, brokerage fees, expenses of shareholder meetings, litigation and indemnification and extraordinary expenses) to the extent such expenses exceed, on an annual basis, a percentage rate of the average daily net assets of the Fund. Such Other Expense reimbursements, if any, are accrued daily and paid monthly. In addition, the Fund is not obligated to reimburse GSAM for prior fiscal year expense reimbursements, if any. The Other Expense limitation as an annual percentage rate of average daily net assets for the Fund is 0.014%. The Other Expense limitation will remain in place through at least February 28, 2024, and prior to such date GSAM may not terminate the arrangement without the approval of the Trustees. In addition, the Fund has entered into certain offset arrangements with the transfer agent, which may result in a reduction of the Fund’s expenses and are received irrespective of the application of the “Other Expense” limitations described above.
GSAM may voluntarily waive a portion of any payments under the Fund’s Distribution and Service Plan, Service Plan and Transfer Agency Agreement, and these waivers are in addition to what is stipulated in any contractual fee waiver arrangements (as applicable). These temporary waivers may be modified or terminated at any time at the option of Goldman Sachs without shareholder approval.
For the fiscal year ended October 31, 2023, these expense reductions, including any fee waivers and Other Expense reimbursements, were as follows:
| | | | | | | | |
| | | | |
| Fund | | Management Fee Waiver | | Transfer Agency Waivers/Credits | | Other Expense Reimbursements | | Total Expense Reductions |
| | | | |
GQG Partners International Opportunities Fund | | $801,545 | | $387,034 | | $6,172,815 | | $7,361,394 |
|
G. Line of Credit Facility — As of October 31, 2023, the Fund participated in a $1,110,000,000 committed, unsecured revolving line of credit facility (the “facility”) together with other funds of the Trust and certain registered investment companies having management agreements with GSAM or its affiliates. This facility is to be used for temporary emergency purposes, or to allow for an orderly liquidation of securities to meet redemption requests. The interest rate on borrowings is based on the federal funds rate. The facility also requires a fee to be paid by the Fund based on the amount of the commitment that has not been utilized. For the fiscal year ended October 31, 2023, the Fund did not have any borrowings under the facility. Prior to April 19, 2023, the facility was $1,250,000,000.
H. Other Transactions with Affiliates — For the fiscal year ended October 31, 2023, Goldman Sachs did not earn any brokerage commissions from portfolio transactions, on behalf of the Fund.
26
GOLDMAN SACHS GQG PARTNERS INTERNATIONAL OPPORTUNITIES FUND
|
|
| 4. AGREEMENTS AND AFFILIATED TRANSACTIONS (continued) |
The table below provides information about the Fund’s investments in the Goldman Sachs Financial Square Government Fund for the fiscal year ended October 31, 2023:
| | | | | | | | | | | | | | | | | | | | | | | | | | |
| | | | | | | |
| Fund | | Underlying Fund | | Beginning Value as of October 31, 2022 | | | Purchases at Cost | | | Proceeds from Sales | | | Ending Value as of October 31, 2023 | | | Shares as of October 31, 2023 | | | Dividend Income | |
| | | | | | | |
GQG Partners International Opportunities Fund | | Goldman Sachs Financial Square Government Fund — Institutional Shares | | $ | 955,445,315 | | | $ | 9,053,766,651 | | | $ | (9,292,469,455 | ) | | $ | 716,742,511 | | | | 716,742,511 | | | $ | 23,405,829 | |
| |
|
|
| 5. PORTFOLIO SECURITIES TRANSACTIONS |
The cost of purchases and proceeds from sales and maturities of long-term securities for the fiscal year ended October 31, 2023, were $21,857,911,772 and $16,443,865,671, respectively.
Pursuant to exemptive relief granted by the Securities and Exchange Commission (“SEC”) and the terms and conditions contained therein, the Fund may lend its securities through a securities lending agent, Goldman Sachs Agency Lending (“GSAL”), a wholly-owned subsidiary of Goldman Sachs, to certain qualified borrowers including Goldman Sachs and affiliates. In accordance with the Fund’s securities lending procedures, the Fund receives cash collateral at least equal to the market value of the securities on loan. The market value of the loaned securities is determined at the close of business of the Fund, at their last sale price or official closing price on the principal exchange or system on which they are traded, and any additional required collateral is delivered to the Fund on the next business day. As with other extensions of credit, the Fund may experience delay in the recovery of its securities or incur a loss should the borrower of the securities breach its agreement with the Fund or become insolvent at a time when the collateral is insufficient to cover the cost of repurchasing securities on loan. Dividend income received from securities on loan may not be subject to withholding taxes and therefore withholding taxes paid may differ from the amounts listed in the Statement of Operations. Loans of securities are terminable at any time and as such 1) the remaining contractual maturities of the outstanding securities lending transactions are considered to be overnight and continuous and 2) the borrower, after notice, is required to return borrowed securities within the standard time period for settlement of securities transactions.
The Fund invests the cash collateral received in connection with securities lending transactions in the Goldman Sachs Financial Square Government Fund (“Government Money Market Fund”), an affiliated series of the Goldman Sachs Trust. The Government Money Market Fund is registered under the Act as an open end investment company, is subject to Rule 2a-7 under the Act, and is managed by GSAM, for which GSAM may receive a management fee of up to 0.16% on an annualized basis of the average daily net assets of the Government Money Market Fund.
In the event of a default by a borrower with respect to any loan, GSAL will exercise any and all remedies provided under the applicable borrower agreement to make the Fund whole. These remedies include purchasing replacement securities by applying the collateral held from the defaulting broker against the purchase cost of the replacement securities. If GSAL is unable to purchase replacement securities, GSAL will indemnify the Fund by paying the Fund an amount equal to the market value of the securities loaned minus the value of cash collateral received from the borrower for the loan, subject to an exclusion for any shortfalls resulting from a loss of value in such cash collateral due to reinvestment risk. The Fund’s master netting agreements with certain borrowers provide the right, in the event of a default (including bankruptcy or insolvency), for the non-defaulting party to liquidate the collateral and calculate net exposure to the defaulting party or request additional collateral. However, in the event of a default by a borrower, a resolution authority could determine that such rights are not enforceable due to the restrictions or prohibitions against the right of set-off that may be imposed in accordance with a particular jurisdiction’s bankruptcy or insolvency laws. The Fund’s loaned securities were all subject to enforceable Securities Lending Agreements and the value of the collateral was at least equal to the value of the cash received. The amounts of the Fund’s overnight and continuous agreements, which represent the gross
27
|
| GOLDMAN SACHS GQG PARTNERS INTERNATIONAL OPPORTUNITIES FUND |
Notes to Financial Statements (continued)
October 31, 2023
|
|
| 6. SECURITIES LENDING (continued) |
amounts of recognized liabilities for securities lending transactions outstanding as of October 31, 2023, are disclosed as “Payable upon return of securities loaned” on the Statement of Assets and Liabilities, where applicable.
Both the Fund and GSAL received compensation relating to the lending of the Fund’s securities. The amounts earned, if any, by the Fund for the fiscal year ended October 31, 2023, are reported under Investment Income on the Statement of Operations.
The table below details securities lending activity with affiliates of Goldman Sachs:
| | | | | | |
| | | For the Fiscal Year Ended October 31, 2023 | | |
| | | |
Fund | | Earnings of GSAL Relating to Securities Loaned | | Amounts Received by the Funds from Lending to Goldman Sachs | | Amounts Payable to Goldman Sachs Upon Return of Securities Loaned as of October 31, 2023 |
| | | |
GQG Partners International Opportunities Fund | | $327,320 | | $256,789 | | $— |
|
The following table provides information about the Fund’s investment in the Government Money Market Fund for the fiscal year ended October 31, 2023:
| | | | | | | | | | | | | | | | |
| Fund | | Beginning Value as of October 31, 2022 | | | Purchases at cost | | | Proceeds from Sales | | | Ending Value as of October 31, 2023 | |
| | | | |
GQG Partners International Opportunities Fund | | $ | 114,482,373 | | | $ | 8,194,266,069 | | | $ | (8,054,575,642 | ) | | | $254,172,800 | |
| |
The tax character of distributions paid during the fiscal year ended October 31, 2023 was as follows:
| | | | |
| |
Distributions paid from: | | | | |
| |
Ordinary income | | $ | 1,128,615,442 | |
| |
| |
Total taxable distributions | | $ | 1,128,615,442 | |
| |
The tax character of distributions paid during the fiscal year ended October 31, 2022 was as follows:
| | | | |
| |
Distributions paid from: | | | | |
| |
Ordinary income | | $ | 486,394,469 | |
| |
| |
Total taxable distributions | | $ | 486,394,469 | |
| |
As of October 31, 2023, the components of accumulated earnings (losses) on a tax basis were as follows:
| | | | |
| |
| |
Undistributed ordinary income — net | | $ | 699,807,581 | |
| |
| |
Capital loss carryforwards: | | | | |
| |
Perpetual Short-Term | | | (1,407,239,042) | |
| |
Perpetual Long-Term | | | (109,783,998) | |
| |
| |
Total capital loss carryforwards | | | (1,517,023,040) | |
|
| |
| |
Unrealized gains (loss) — net | | $ | 2,553,110,793 | |
| |
| |
Total accumulated earnings (loss) net | | $ | 1,735,895,334 | |
| |
28
GOLDMAN SACHS GQG PARTNERS INTERNATIONAL OPPORTUNITIES FUND
|
|
| 7. TAX INFORMATION (continued) |
As of October 31, 2023, the Fund’s aggregate security unrealized gains and losses based on cost for U.S. federal income tax purposes were as follows:
| | | | |
| |
| |
Tax Cost | | $ | 27,453,061,101 | |
| |
| |
Gross unrealized gain | | | 4,101,790,979 | |
| |
Gross unrealized loss | | | (1,548,680,186) | |
| |
| |
Net unrealized gain | | $ | 2,553,110,793 | |
| |
The difference between GAAP-basis and tax basis unrealized gains (losses) is attributable primarily to wash sales and differences in the tax treatment of passive foreign investment company investments.
GSAM has reviewed the Fund’s tax positions for all open tax years (the current and prior three years, as applicable) and has concluded that no provision for income tax is required in the Fund’s financial statements. Such open tax years remain subject to examination and adjustment by tax authorities.
The Fund’s risks include, but are not limited to, the following:
Depositary Receipts Risk - Foreign securities may trade in the form of depositary receipts (“Depositary Receipts”), which include American Depositary Receipts (“ADRs”) and Global Depositary Receipts (“GDRs”) (collectively “Depositary Receipts”). To the extent the Fund acquires Depositary Receipts through banks which do not have a contractual relationship with the foreign issuer of the security underlying the Depositary Receipts to issue and service such unsponsored Depositary Receipts, there may be an increased possibility that the Fund would not become aware of and be able to respond to corporate actions such as stock splits or rights offerings involving the foreign issuer in a timely manner. In addition, the lack of information may result in inefficiencies in the valuation of such instruments. Investment in Depositary Receipts does not eliminate all the risks inherent in investing in securities of non-U.S. issuers. The market value of Depositary Receipts is dependent upon the market value of the underlying securities and fluctuations in the relative value of the currencies in which the Depositary Receipts and the underlying securities are quoted. The issuers of Depositary Receipts may discontinue issuing new Depositary Receipts and withdraw existing Depositary Receipts at any time, which may result in costs and delays in the distribution of the underlying assets to the Fund and may negatively impact the Fund’s performance.
Foreign and Emerging Countries Risk — Investing in foreign markets may involve special risks and considerations not typically associated with investing in the U.S. Foreign securities may be subject to risk of loss because of more or less foreign government regulation; less public information; less stringent investor protections; less stringent accounting, corporate governance, financial reporting and disclosure standards; and less economic, political and social stability in the countries in which the Fund invests. The imposition of sanctions, exchange controls (including repatriation restrictions), confiscation of assets and property, trade restrictions (including tariffs) and other government restrictions by the U.S. or other governments, or from problems in registration, settlement or custody, may also result in losses. The type and severity of sanctions and other similar measures, including counter sanctions and other retaliatory actions, that may be imposed could vary broadly in scope, and their impact is impossible to predict. For example, the imposition of sanctions and other similar measures could, among other things, cause a decline in the value and/or liquidity of securities issued by the sanctioned country or companies located in or economically tied to the sanctioned country and increase market volatility and disruption in the sanctioned country and throughout the world. Sanctions and other similar measures could limit or prevent the Fund from buying and selling securities (in the sanctioned country and other markets), significantly delay or prevent the settlement of securities transactions, and significantly impact the Fund’s liquidity and performance. Foreign risk also involves the risk of negative foreign currency exchange rate fluctuations, which may cause the value of securities denominated in such foreign currency (or other instruments through which the Fund has exposure to foreign
29
|
| GOLDMAN SACHS GQG PARTNERS INTERNATIONAL OPPORTUNITIES FUND |
Notes to Financial Statements (continued)
October 31, 2023
|
|
| 8. OTHER RISKS (continued) |
currencies) to decline in value. Currency exchange rates may fluctuate significantly over short periods of time. To the extent that a Fund also invests in securities of issuers located in, or economically tied to, emerging markets, these risks may be more pronounced.
Geographic Risk — If the Fund focuses its investments in securities of issuers located in a particular country or geographic region, the Fund may be subjected, to a greater extent than if its investments were less focused, to the risks of volatile economic cycles and/or conditions and developments that may be particular to that country or region, such as: adverse securities markets; adverse exchange rates; adverse social, political, regulatory, economic, business, environmental or other developments; or natural disasters.
Investment Style Risk — Different investment styles (e.g., “growth”, “value” or “quantitative”) tend to shift in and out of favor depending upon market and economic conditions and investor sentiment. The Fund may outperform or underperform other funds that invest in similar asset classes but employ different investment styles.
Investments in Other Investment Companies Risk — As a shareholder of another investment company, the Fund will indirectly bear its proportionate share of any net management fees and other expenses paid by such other investment companies, in addition to the fees and expenses regularly borne by the Fund.
Large Shareholder Transactions Risk — The Fund may experience adverse effects when certain large shareholders, such as other funds, institutional investors (including those trading by use of non-discretionary mathematical formulas), financial intermediaries (who may make investment decisions on behalf of underlying clients and/or include the Fund in their investment model), individuals, accounts and Goldman Sachs affiliates, purchase or redeem large amounts of shares of a Fund. Such large shareholder redemptions, which may occur rapidly or unexpectedly, may cause the Fund to sell portfolio securities at times when it would not otherwise do so, which may negatively impact the Fund’s NAV and liquidity. These transactions may also accelerate the realization of taxable income to shareholders if such sales of investments resulted in gains, and may also increase transaction costs. In addition, a large redemption could result in the Fund’s current expenses being allocated over a smaller asset base, leading to an increase in the Fund’s expense ratio. Similarly, large Fund share purchases may adversely affect the Fund’s performance to the extent that the Fund is delayed in investing new cash or otherwise maintains a larger cash position than it ordinarily would.
Market and Credit Risks — In the normal course of business, the Fund trades financial instruments and enters into financial transactions where risk of potential loss exists due to changes in the market (market risk). The value of the securities in which the Fund invests may go up or down in response to the prospects of individual companies, particular sectors or governments and/or general economic conditions throughout the world due to increasingly interconnected global economies and financial markets. Events such as war, military conflict, acts of terrorism, social unrest, natural disasters, recessions, inflation, rapid interest rate changes, supply chain disruptions, sanctions, the spread of infectious illness or other public health threats could also significantly impact the Fund and its investments. Additionally, the Fund may also be exposed to credit risk in the event that an issuer or guarantor fails to perform or that an institution or entity with which the Fund has unsettled or open transactions defaults.
Mid-Cap and Small-Cap Risk — Investments in mid-capitalization and small-capitalization companies involve greater risks than those associated with larger, more established companies. These securities may be subject to more abrupt or erratic price movements and may lack sufficient market liquidity, and these issuers often face greater business risks.
Under the Trust’s organizational documents, its Trustees, officers, employees and agents are indemnified, to the extent permitted by the Act and state law, against certain liabilities that may arise out of performance of their duties to the Fund. Additionally, in the course of business, the Fund enters into contracts that contain a variety of indemnification clauses. The Fund’s maximum exposure under these arrangements is unknown, as this would involve future claims that may be made against the Fund that have not yet occurred. However, GSAM believes the risk of loss under these arrangements to be remote.
30 ��
GOLDMAN SACHS GQG PARTNERS INTERNATIONAL OPPORTUNITIES FUND
Pursuant to an effort to consolidate the membership of the Board of Trustees of the Trust (the “Board”) with the Board of Trustees of each of Goldman Sachs ETF Trust, Goldman Sachs ETF Trust II, Goldman Sachs Real Estate Diversified Income Fund, Goldman Sachs Trust and Goldman Sachs Variable Insurance Trust, in July 2023, the Board voted to nominate Gregory G. Weaver, Dwight L. Bush, Kathryn A. Cassidy, John G. Chou, Joaquin Delgado, Eileen H. Dowling and Paul C. Wirth (the “Nominees”) for election as Trustees of the Trust. At a virtual special joint meeting of shareholders held on November 16, 2023, each of the Nominees was elected to serve as Trustees alongside the current Trustees of the Trust, effective January 1, 2024.
Subsequent events after the Statement of Assets and Liabilities date have been evaluated, and GSAM has concluded that there is no impact requiring adjustment or disclosure in the financial statements.
31
|
| GOLDMAN SACHS GQG PARTNERS INTERNATIONAL OPPORTUNITIES FUND |
Notes to Financial Statements (continued)
October 31, 2023
|
|
| 12. SUMMARY OF SHARE TRANSACTIONS |
Share activity is as follows:
| | | | | | | | | | | | | | | | |
| |
| | | GQG Partners International Opportunities Fund | |
| | |
| | | For the Fiscal Year Ended October 31, 2023 | | | For the Fiscal Year Ended October 31, 2022 | |
| | | | |
| | | Shares | | | Dollars | | | Shares | | | Dollars | |
| | | | |
Class A Shares | | | | | | | | | | | | | | | | |
| | | | |
Shares sold | | | 10,461,811 | | | $ | 182,944,586 | | | | 17,718,616 | | | $ | 323,617,669 | |
| | | | |
Reinvestment of distributions | | | 935,354 | | | | 15,367,872 | | | | 409,602 | | | | 7,850,949 | |
| | | | |
Shares redeemed | | | (14,468,795 | ) | | | (249,865,871 | ) | | | (15,719,170 | ) | | | (277,398,513 | ) |
| |
| | | | |
| | | (3,071,630 | ) | | | (51,553,413 | ) | | | 2,409,048 | | | | 54,070,105 | |
| |
| | | | |
Class C Shares | | | | | | | | | | | | | | | | |
| | | | |
Shares sold | | | 1,147,063 | | | | 19,518,625 | | | | 950,808 | | | | 16,801,761 | |
| | | | |
Reinvestment of distributions | | | 175,877 | | | | 2,815,789 | | | | 55,958 | | | | 1,047,010 | |
| | | | |
Shares redeemed | | | (843,516 | ) | | | (14,247,182 | ) | | | (870,662 | ) | | | (15,153,818 | ) |
|
| |
| | | | |
| | | 479,424 | | | | 8,087,232 | | | | 136,104 | | | | 2,694,953 | |
|
| |
| | | | |
Institutional Shares | | | | | | | | | | | | | | | | |
| | | | |
Shares sold | | | 398,800,485 | | | | 6,984,402,392 | | | | 395,831,125 | | | | 7,132,314,224 | |
| | | | |
Reinvestment of distributions | | | 34,889,014 | | | | 577,064,288 | | | | 12,354,795 | | | | 238,278,563 | |
| | | | |
Shares redeemed | | | (262,903,339 | ) | | | (4,592,681,744 | ) | | | (238,319,685 | ) | | | (4,220,749,463 | ) |
|
| |
| | | | |
| | | 170,786,160 | | | | 2,968,784,936 | | | | 169,866,235 | | | | 3,149,843,324 | |
|
| |
| | | | |
Investor Shares | | | | | | | | | | | | | | | | |
| | | | |
Shares sold | | | 169,576,947 | | | | 2,967,354,806 | | | | 143,023,441 | | | | 2,582,325,151 | |
| | | | |
Reinvestment of distributions | | | 13,711,437 | | | | 225,964,484 | | | | 4,708,902 | | | | 90,582,637 | |
| | | | |
Shares redeemed | | | (103,470,716 | ) | | | (1,814,437,962 | ) | | | (77,566,273 | ) | | | (1,384,894,667 | ) |
|
| |
| | | | |
| | | 79,817,668 | | | | 1,378,881,328 | | | | 70,166,070 | | | | 1,288,013,121 | |
|
| |
| | | | |
Class R6 Shares | | | | | | | | | | | | | | | | |
| | | | |
Shares sold | | | 41,030,062 | | | | 730,249,395 | | | | 37,517,687 | | | | 678,102,440 | |
| | | | |
Reinvestment of distributions | | | 2,410,823 | | | | 39,850,905 | | | | 705,431 | | | | 13,598,097 | |
| | | | |
Shares redeemed | | | (17,960,800 | ) | | | (310,270,416 | ) | | | (12,051,480 | ) | | | (215,924,549 | ) |
|
| |
| | | | |
| | | 25,480,085 | | | | 459,829,884 | | | | 26,171,638 | | | | 475,775,988 | |
|
| |
| | | | |
Class R Shares | | | | | | | | | | | | | | | | |
| | | | |
Shares sold | | | 152,241 | | | | 2,645,518 | | | | 27,258 | | | | 468,440 | |
| | | | |
Reinvestment of distributions | | | 3,857 | | | | 62,600 | | | | 901 | | | | 17,099 | |
| | | | |
Shares redeemed | | | (25,914 | ) | | | (451,004 | ) | | | (6,098 | ) | | | (105,826 | ) |
|
| |
| | | | |
| | | 130,184 | | | | 2,257,114 | | | | 22,061 | | | | 379,713 | |
|
| |
| | | | |
Class P Shares | | | | | | | | | | | | | | | | |
| | | | |
Shares sold | | | 36,213,294 | | | | 635,656,045 | | | | 44,042,460 | | | | 800,568,308 | |
| | | | |
Reinvestment of distributions | | | 6,277,121 | | | | 103,698,041 | | | | 2,695,523 | | | | 51,959,366 | |
| | | | |
Shares redeemed | | | (22,828,772 | ) | | | (395,113,530 | ) | | | (30,759,058 | ) | | | (535,897,820 | ) |
|
| |
| | | | |
| | | 19,661,643 | | | | 344,240,556 | | | | 15,978,925 | | | | 316,629,854 | |
|
| |
| | | | |
NET INCREASE | | | 293,283,534 | | | $ | 5,110,527,637 | | | | 284,750,081 | | | $ | 5,287,407,058 | |
| |
32
Report of Independent Registered Public
Accounting Firm
To the Board of Trustees of Goldman Sachs Trust II and Shareholders of Goldman Sachs GQG Partners International Opportunities Fund
Opinion on the Financial Statements
We have audited the accompanying statement of assets and liabilities, including the schedule of investments, of Goldman Sachs GQG Partners International Opportunities Fund (one of the funds constituting Goldman Sachs Trust II, referred to hereafter as the “Fund”) as of October 31, 2023, the related statement of operations for the year ended October 31, 2023, the statement of changes in net assets for each of the two years in the period ended October 31, 2023, including the related notes, and the financial highlights for each of the five years in the period ended October 31, 2023 (collectively referred to as the “financial statements”). In our opinion, the financial statements present fairly, in all material respects, the financial position of the Fund as of October 31, 2023, the results of its operations for the year then ended, the changes in its net assets for each of the two years in the period ended October 31, 2023 and the financial highlights for each of the five years in the period ended October 31, 2023 in conformity with accounting principles generally accepted in the United States of America.
Basis for Opinions
These financial statements are the responsibility of the Fund’s management. Our responsibility is to express an opinion on the Fund’s financial statements based on our audits. We are a public accounting firm registered with the Public Company Accounting Oversight Board (United States) (PCAOB) and are required to be independent with respect to the Fund in accordance with the U.S. federal securities laws and the applicable rules and regulations of the Securities and Exchange Commission and the PCAOB.
We conducted our audits of these financial statements in accordance with the standards of the PCAOB. Those standards require that we plan and perform the audit to obtain reasonable assurance about whether the financial statements are free of material misstatement, whether due to error or fraud.
Our audits included performing procedures to assess the risks of material misstatement of the financial statements, whether due to error or fraud, and performing procedures that respond to those risks. Such procedures included examining, on a test basis, evidence regarding the amounts and disclosures in the financial statements. Our audits also included evaluating the accounting principles used and significant estimates made by management, as well as evaluating the overall presentation of the financial statements. Our procedures included confirmation of securities owned as of October 31, 2023 by correspondence with the custodian, transfer agent and brokers; when replies were not received from brokers, we performed other auditing procedures. We believe that our audits provide a reasonable basis for our opinion.
/s/ PricewaterhouseCoopers LLP
Boston, Massachusetts
December 21, 2023
We have served as the auditor of one or more investment companies in the Goldman Sachs fund complex since 2000.
33
|
| GOLDMAN SACHS GQG PARTNERS INTERNATIONAL OPPORTUNITIES FUND |
| | |
Fund Expenses — Six Month Period Ended October 31, 2023 (Unaudited) | | |
As a shareholder of Class A, Class C, Institutional, Investor, Class R6, Class R or Class P Shares of the Fund, you incur two types of costs: (1) transaction costs, including sales charges on purchase payments (with respect to Class A Shares), contingent deferred sales charges on redemptions (generally with respect to Class C Shares), and (2) ongoing costs, including management fees; distribution and/or service (12b-1) fees (with respect to Class A, Class C and Class R Shares); and other Fund expenses. This example is intended to help you understand your ongoing costs (in dollars) of investing in Class A, Class C, Institutional, Investor, Class R6, Class R or Class P Shares of the Fund and to compare these costs with the ongoing costs of investing in other mutual funds.
The example is based on an investment of $1,000 invested at the beginning of the period and held for the entire period from May 1, 2023 through October 31, 2023, which represents a period of 184 days of a 365-day year. This projection assumes that annualized expense ratios were in effect during the period.
Actual Expenses — The first line under each share class in the table below provides information about actual account values and actual expenses. You may use the information in this line, together with the amount you invested, to estimate the expenses that you paid over the period. Simply divide your account value by $1,000 (for example, an $8,600 account value divided by $1,000=8.6), then multiply the result by the number in the first line under the heading entitled “Expenses Paid” to estimate the expenses you paid on your account during this period.
Hypothetical Example for Comparison Purposes — The second line under each share class in the table below provides information about hypothetical account values and hypothetical expenses based on the Fund’s actual net expense ratios and an assumed rate of return of 5% per year before expenses, which is not the Fund’s actual return. The hypothetical account values and expenses may not be used to estimate the actual ending account balance or expenses you paid for the period. You may use this information to compare the ongoing costs of investing in the Fund and other funds. To do so, compare this 5% hypothetical example with the 5% hypothetical examples that appear in the shareholder reports of the other funds.
Please note that the expenses shown in the table are meant to highlight your ongoing costs only and do not reflect any transactional costs, such as sales charges, redemption fees, or exchange fees. Therefore, the second line of the table is useful in comparing ongoing costs only, and will not help you determine the relative total costs of owning different funds. In addition, if these transactional costs were included, your costs would have been higher.
| | | | | | | | | | | | |
| | | GQG Partners International Opportunities Fund | |
| | | Beginning | | | Ending | | | Expenses | |
| | | Account | | | Account | | | Paid for the | |
| | | Value | | | Value | | | 6 months ended | |
| | | | |
| Share Class | | 5/1/23 | | | 10/31/23 | | | 10/31/23* | |
| | | | |
Class A | | | | | | | | | | | | |
| | | | |
Actual | | | $1,000.00 | | | | $ 982.10 | | | | $5.64 | |
| | | | |
Hypothetical 5% return | | | 1,000.00 | | | | 1,019.50 | + | | | 5.75 | |
| | | | |
Class C | | | | | | | | | | | | |
| | | | |
Actual | | | 1,000.00 | | | | 978.60 | | | | 9.37 | |
| | | | |
Hypothetical 5% return | | | 1,000.00 | | | | 1,015.70 | + | | | 9.55 | |
| | | | |
Institutional | | | | | | | | | | | | |
| | | | |
Actual | | | 1,000.00 | | | | 984.40 | | | | 3.83 | |
| | | | |
Hypothetical 5% return | | | 1,000.00 | | | | 1,021.30 | + | | | 3.90 | |
| | | | |
Investor | | | | | | | | | | | | |
| | | | |
Actual | | | 1,000.00 | | | | 983.80 | | | | 4.40 | |
| | | | |
Hypothetical 5% return | | | 1,000.00 | | | | 1,020.80 | + | | | 4.48 | |
| | | | |
Class R6 | | | | | | | | | | | | |
| | | | |
Actual | | | 1,000.00 | | | | 984.40 | | | | 3.73 | |
| | | | |
Hypothetical 5% return | | | 1,000.00 | | | | 1,021.40 | + | | | 3.80 | |
| | | | |
Class R | | | | | | | | | | | | |
| | | | |
Actual | | | 1,000.00 | | | | 981.20 | | | | 6.89 | |
| | | | |
Hypothetical 5% return | | | 1,000.00 | | | | 1,018.20 | + | | | 7.02 | |
| | | | |
Class P | | | | | | | | | | | | |
| | | | |
Actual | | | 1,000.00 | | | | 984.40 | | | | 3.73 | |
| | | | |
Hypothetical 5% return | | | 1,000.00 | | | | 1,021.40 | + | | | 3.80 | |
| | * | Expenses for each share class are calculated using the Fund’s annualized net expense ratio for each class, which represents the ongoing expenses as a percentage of net assets for the six months ended October 31, 2023. Expenses are calculated by multiplying the annualized net expense ratio by the average account value for the period; then multiplying the result by the number of days in the most recent fiscal half year; and then dividing that result by the number of days in the fiscal year. The annualized net expense ratios for the period were as follows: |
| | | | | | | | | | | | | | | | | | | | | | | | | | | | | | |
| Fund | | Class A | | | Class C | | | Institutional | | Investor | | | Class R6 | | | Class R | | | Class P | | | | |
| | | | | | | | |
GQG Partners International Opportunities Fund | | | 1.13% | | | | 1.88% | | | 0.77% | | | 0.88% | | | | 0.75% | | | | 1.38% | | | | 0.75% | | | | | |
| | + | Hypothetical expenses are based on the Fund’s actual annualized net expenses ratios and an assumed rate of return of 5% per year before expenses. |
34
GOLDMAN SACHS GQG PARTNERS INTERNATIONAL OPPORTUNITIES FUND
Statement Regarding Basis for Approval of Management Agreement and Sub-Advisory
Agreement (Unaudited)
Background
The Goldman Sachs GQG Partners International Opportunities Fund (the “Fund”) is an investment portfolio of Goldman Sachs Trust II (the “Trust”). The Board of Trustees (the “Board”) oversees the management of the Trust and reviews the investment performance and expenses of the Fund at regularly scheduled meetings held throughout the year. In addition, the Board determines annually whether to approve the continuance of the Trust’s investment management agreement (the “Management Agreement”) with Goldman Sachs Asset Management, L.P. (the “Investment Adviser”) on behalf of the Fund.
The Management Agreement was most recently approved for continuation until September 30, 2024 by the Board, including those Trustees who are not parties to the Management Agreement or “interested persons” (as defined in the Investment Company Act of 1940, as amended) of any party thereto (the “Independent Trustees”), at a meeting held on September 19-20, 2023 (the “Annual Meeting”). At the Annual Meeting, the Board also considered the sub-advisory agreement (the “Sub-Advisory Agreement” and, together with the Management Agreement, the “Agreements”) between the Investment Adviser and GQG Partners LLC (the “Sub-Adviser”).
The review process undertaken by the Trustees spans the course of the year and culminates with the Annual Meeting. To assist the Trustees in their deliberations, the Trustees have established a Contract Review Committee (the “Committee”), comprised of the Independent Trustees. The Committee held four meetings over the course of the year since the Management Agreement was last approved. At those Committee meetings, regularly scheduled Board or other committee meetings, and/or the Annual Meeting, matters relevant to the renewal of the Management Agreement and the Sub-Advisory Agreement were considered by the Board, or the Independent Trustees, as applicable. With respect to the Fund, such matters included:
| | (a) | the nature and quality of the advisory, administrative, and other services provided to the Fund by the Investment Adviser and its affiliates and the Sub-Adviser, including, as applicable, information about: |
| | (i) | the structure, staff, and capabilities of the Investment Adviser and the Sub-Adviser and the Sub-Adviser’s portfolio management teams; |
| | (ii) | the groups within the Investment Adviser and its affiliates that support the portfolio management teams or provide other types of necessary services, including fund services groups (e.g., accounting and financial reporting, tax, shareholder services, and operations); controls and risk management groups (e.g., legal, compliance, valuation oversight, credit risk management, internal audit, compliance testing, market risk analysis, finance, and central funding); sales and distribution support groups, and others (e.g., information technology and training); |
| | (iii) | trends in employee headcount; |
| | (iv) | the Investment Adviser’s financial resources and ability to hire and retain talented personnel and strengthen its operations; and |
| | (v) | the parent company’s support of the Investment Adviser and its mutual fund business, as expressed by the firm’s senior management; |
| | (b) | information on the investment performance of the Fund, including comparisons to the performance of similar mutual funds, as provided by a third-party mutual fund data provider engaged as part of the contract review process (the “Outside Data Provider”), and a benchmark performance index; and information on general investment outlooks in the markets in which the Fund invests; |
| | (c) | information provided by the Investment Adviser indicating the Investment Adviser’s views on whether the Fund’s peer group and/or benchmark index had high, medium, or low relevance given the Fund’s particular investment strategy; |
| | (d) | the terms of the Agreements and other agreements with affiliated service providers entered into by the Trust on behalf of the Fund; |
| | (e) | fee and expense information for the Fund, including: |
| | (i) | the relative management fee and expense levels of the Fund as compared to those of comparable funds managed by other advisers, as provided by the Outside Data Provider; and |
| | (ii) | the Fund’s expense trends over time; |
| | (f) | with respect to the extensive investment performance and expense comparison data provided by the Outside Data Provider, its processes in producing that data for the Fund; |
| | (g) | the undertakings of the Investment Adviser and its affiliates to implement fee waivers and an expense limitation; |
| | (h) | information relating to the profitability of the Management Agreement and the transfer agency and distribution and service arrangements of the Fund to the Investment Adviser and its affiliates; |
| | (i) | whether the Fund’s existing management fee schedule adequately addressed any economies of scale; |
| | (j) | a summary of the “fall-out” benefits derived by the Investment Adviser and its affiliates from their relationships with the Fund, including the fees received by the Investment Adviser’s affiliates from the Fund for transfer agency, securities lending, portfolio trading, distribution and other services; |
35
|
| GOLDMAN SACHS GQG PARTNERS INTERNATIONAL OPPORTUNITIES FUND |
Statement Regarding Basis for Approval of Management Agreement and Sub-Advisory
Agreement (Unaudited) (continued)
| | (k) | a summary of potential benefits derived by the Fund as a result of its relationship with the Investment Adviser; |
| | (l) | portfolio manager ownership of Fund shares; the manner in which portfolio manager compensation is determined; information on the Sub-Adviser’s compensation arrangements; and the number and types of accounts managed by the portfolio managers; |
| | (m) | the nature and quality of the services provided to the Fund by its unaffiliated service providers (as well as the Sub-Adviser), and the Investment Adviser’s general oversight and evaluation (including reports on due diligence) of those service providers as part of the administrative services provided under the Management Agreement; and |
| | (n) | the Investment Adviser’s and Sub-Adviser’s processes and policies addressing various types of potential conflicts of interest; their approaches to risk management; the annual review of the effectiveness of the Fund’s compliance program; and periodic compliance reports. |
The Trustees also received an overview of the Fund’s distribution arrangements. They received information regarding the Fund’s assets, share purchase and redemption activity, and payment of distribution and service fees. Information was also provided to the Trustees relating to revenue sharing payments made by and services provided by the Investment Adviser and its affiliates to intermediaries that promote the sale, distribution, and/or servicing of Fund shares. The Independent Trustees also discussed the broad range of other investment choices that are available to Fund investors, including the availability of comparable funds managed by other advisers.
The presentations made at the Board and Committee meetings and at the Annual Meeting encompassed the Fund and other mutual funds for which the Board has responsibility. In evaluating the Agreements at the Annual Meeting, the Trustees relied upon their knowledge, resulting from their meetings and other interactions throughout the year, of the Investment Adviser and its affiliates and Sub-Adviser, their respective services, and the Fund. In conjunction with these meetings, the Trustees received written materials and oral presentations on the topics covered, and the Investment Adviser addressed the questions and concerns of the Trustees, including concerns regarding the investment performance of certain of the funds they oversee. In addition, the Trustees periodically received written materials and oral presentations from the Sub-Adviser. The Independent Trustees were advised by their independent legal counsel regarding their responsibilities and other regulatory requirements related to the approval and continuation of mutual fund investment management agreements under applicable law. In addition, the Investment Adviser and its affiliates provided the Independent Trustees with a written response to a formal request for information sent on behalf of the Independent Trustees by their independent legal counsel. The Trustees reviewed a written response prepared by the Sub-Adviser to a similar request for information submitted to the Sub-Adviser by the Investment Adviser. During the course of their deliberations, the Independent Trustees met in executive sessions with their independent legal counsel, without representatives of the Investment Adviser or its affiliates present.
Nature, Extent, and Quality of the Services Provided Under the Agreement
As part of their review, the Trustees considered the nature, extent, and quality of the services provided to the Fund by the Investment Adviser. In this regard, the Trustees considered both the investment advisory services and non-advisory services that are provided by the Investment Adviser and its affiliates. The Trustees noted the transition in the leadership and the changes in personnel of various of the Investment Adviser’s portfolio management teams that had occurred in recent periods, and the ongoing recruitment efforts aimed at bringing high quality investment talent to the Investment Adviser. They also noted the Investment Adviser’s commitment to maintaining high quality systems and expending substantial resources to respond to ongoing changes to the market, regulatory and control environment in which the Fund and its service providers operate, including developments associated with the COVID-19 pandemic, geopolitical events, and economic sanctions, as well as the efforts of the Investment Adviser and its affiliates to combat cyber security risks. The Trustees also considered information regarding the Investment Adviser’s and the Sub-Adviser’s business continuity planning and remote operations capabilities. The Trustees concluded that the Investment Adviser continued to commit substantial financial and operational resources to the Fund and expressed confidence that the Investment Adviser would continue to do so in the future. The Trustees also recognized that the Investment Adviser had made significant commitments to address regulatory compliance requirements applicable to the Fund and the Investment Adviser and its affiliates. In addition, the Trustees reviewed the Sub-Adviser oversight process that the Investment Adviser had employed, which included areas such as investment analytics, risk management and compliance.
Investment Performance
The Trustees also considered the investment performance of the Fund. In this regard, they compared the investment performance of the Fund to its peers using rankings and ratings compiled by the Outside Data Provider as of March 31, 2023, and updated performance information prepared by the Investment Adviser using the peer group identified by the Outside Data Provider
36
GOLDMAN SACHS GQG PARTNERS INTERNATIONAL OPPORTUNITIES FUND
Statement Regarding Basis for Approval of Management Agreement and Sub-Advisory
Agreement (Unaudited) (continued)
as of June 30, 2023. The information on the Fund’s investment performance prepared by the Outside Data Provider was provided for the one-, three-, and five-year periods ending on the applicable dates. The Trustees also reviewed the Fund’s investment performance relative to its performance benchmark. As part of this review, they considered the investment performance trends of the Fund over time, and reviewed the investment performance of the Fund in light of its investment objective and policies and market conditions.
In addition, the Trustees considered materials prepared and presentations made by the Investment Adviser’s senior management and the Sub-Adviser’s portfolio management personnel in which Fund performance was assessed. The Trustees also considered the Investment Adviser’s periodic reports with respect to the Fund’s risk profile, and how the Investment Adviser’s approach to risk monitoring and management influences portfolio management.
The Trustees noted that the Fund’s Institutional Shares had placed in the top half of the Fund’s performance peer group for the one-, three- and five-year periods and had outperformed the Fund’s benchmark index for the one- and five-year periods and underperformed for the three-year period ended March 31, 2023.
Costs of Services Provided and Competitive Information
The Trustees considered the contractual terms of the Management Agreement, the fee rates payable by the Fund thereunder, and the net amount retained by the Investment Adviser after payment of sub-advisory fees. In this regard, the Trustees considered information on the services rendered by the Investment Adviser to the Fund, which included both advisory and administrative services that were directed to the needs and operations of the Fund as a registered mutual fund.
In particular, the Trustees reviewed analyses prepared by the Outside Data Provider regarding the expense rankings of the Fund, as well as additional information provided by the Investment Adviser throughout the year. The analyses provided a comparison of the Fund’s management fee and breakpoints to those of a relevant peer group and category universe; an expense analysis which compared the Fund’s overall net and gross expenses to a peer group and a category universe; and data comparing the Fund’s net expenses to the peer and category medians. The analyses also compared the Fund’s other expenses and fee waivers/reimbursements to those of the peer group and category medians. The Trustees concluded that the comparisons provided by the Outside Data Provider and the Investment Adviser were useful in evaluating the reasonableness of the management fees and total expenses paid by the Fund.
The Trustees considered the Investment Adviser’s undertakings to implement fee waivers and an expense limitation. In addition, the Trustees noted that shareholders are able to redeem their shares at any time if shareholders believe that the Fund fees and expenses are too high or if they are dissatisfied with the performance of the Fund.
Profitability
The Trustees reviewed the Fund’s contribution to the Investment Adviser’s revenues and pre-tax profit margins. In this regard the Trustees noted that they had received, among other things, profitability analyses and summaries, revenue and expense schedules by Fund and by function (i.e., investment management, transfer agency and distribution and service), and information on the Investment Adviser’s expense allocation methodology. They observed that the profitability and expense figures are substantially similar to those used by the Investment Adviser for many internal purposes, including compensation decisions among various business groups, and are thus subject to a vigorous internal debate about how certain revenue and expenses should be allocated. The Trustees also noted that the internal audit group within the Goldman Sachs organization periodically audits the expense allocation methodology and that the internal audit group was satisfied with the reasonableness, consistency, and accuracy of the Investment Adviser’s expense allocation methodology. Profitability data for the Fund was provided for 2022 and 2021, and the Trustees considered this information in relation to the Investment Adviser’s overall profitability. They noted the impact that the substantial asset growth of the Fund had on the associated revenues and expenses.
Economies of Scale
The Trustees considered the information that had been provided regarding whether there have been economies of scale with respect to the management of the Fund. The Trustees also considered the breakpoints in the fee rate payable under the Management Agreement for the Fund at the following annual percentage rates of the average daily net assets of the Fund:
37
|
| GOLDMAN SACHS GQG PARTNERS INTERNATIONAL OPPORTUNITIES FUND |
Statement Regarding Basis for Approval of Management Agreement and Sub-Advisory
Agreement (Unaudited) (continued)
| | |
| |
| Average Daily Net Assets | | Management Fee Annual Rate |
| |
First $1 billion | | 0.85% |
| |
Next $1 billion | | 0.77 |
| |
Next $3 billion | | 0.73 |
| |
Next $3 billion | | 0.71 |
| |
Over $8 billion | | 0.70 |
The Trustees noted that the breakpoints were designed to share potential economies of scale, if any, with the Fund and its shareholders as assets under management reach those asset levels. The Trustees considered the amounts of assets in the Fund; the Fund’s recent purchase and redemption activity; the information provided by the Investment Adviser relating to the costs of the services provided by the Investment Adviser and its affiliates and the profits realized by them (if any); information comparing the fee rates charged by the Investment Adviser with fee rates charged to other funds in the peer group; and the Investment Adviser’s undertakings to waive a portion of its management fee and certain fees and to limit certain expenses of the Fund that exceed a specified level, as well as Goldman Sachs & Co. LLC’s (“Goldman Sachs”) undertaking to waive a portion of the transfer agency fees paid by the Fund’s Class R6 Shares. The Trustees also considered the relationship between the advisory and sub-advisory fee rate schedules. Upon reviewing these matters at the Annual Meeting, the Trustees concluded that the fee breakpoints represented a means of assuring that benefits of scalability, if any, would be passed along to shareholders at the specified asset levels. They also noted that the Investment Adviser had passed along savings to shareholders of the Fund, which had asset levels above the highest breakpoint.
Other Benefits to the Investment Adviser and Its Affiliates
The Trustees also considered the other benefits derived by the Investment Adviser and its affiliates from their relationships with the Fund as stated above, including: (a) transfer agency fees received by Goldman Sachs; (b) brokerage and futures commissions earned by Goldman Sachs for executing securities transactions (in its capacity as clearing broker) and futures transactions on behalf of the Fund; (c) fees earned by Goldman Sachs Agency Lending (“GSAL”), an affiliate of the Investment Adviser, as securities lending agent (and fees earned by the Investment Adviser for managing the fund in which the Fund’s cash collateral is invested); (d) the Investment Adviser’s ability to leverage the infrastructure designed to service the Fund on behalf of its other clients; (e) the Investment Adviser’s ability to cross-market other products and services to Fund shareholders; (f) Goldman Sachs’ retention of certain fees as Fund Distributor; (g) the Investment Adviser’s ability to negotiate better pricing with the Fund’s custodian on behalf of its other clients, as a result of the relationship with the Fund; (h) the investment of cash and cash collateral in money market funds managed by the Investment Adviser that will result in increased assets under management for those money market funds; and (i) the possibility that the working relationship between the Investment Adviser and the Fund’s third-party service providers (including the Sub-Adviser) may cause those service providers to be more likely to do business with other areas of Goldman Sachs. In the course of considering the foregoing, the Independent Trustees requested and received further information quantifying certain of these fall-out benefits.
Other Benefits to the Fund and Its Shareholders
The Trustees also noted that the Fund receives certain other potential benefits as a result of their relationship with the Investment Adviser, including: (a) enhanced servicing from vendors due to the volume of business generated by the Investment Adviser and its affiliates; (b) the advantages received from the Investment Adviser’s knowledge and experience gained from managing other accounts and products; (c) the Investment Adviser’s ability to hire and retain qualified personnel to provide services to the Fund because of the reputation of the Goldman Sachs organization; (d) the Fund’s access, through the Investment Adviser, to certain firm-wide resources (e.g., proprietary risk management systems and databases), subject to certain restrictions; (e) the Fund’s ability to participate in the securities lending program administered by GSAL, as measured by the revenue received by the Fund in connection with the program; and (f) the Fund’s access to certain affiliated distribution channels.
Conclusion
In connection with their consideration of the Management Agreement, the Trustees gave weight to each of the factors described above, but did not identify any particular factor as controlling their decision. After deliberation and consideration of all of the information provided, including the factors described above, the Trustees concluded, in the exercise of their business judgment, that the management fees paid by the Fund were reasonable in light of services provided to it by the Investment Adviser, the Investment Adviser’s costs and the Fund’s current and reasonably foreseeable asset levels. The Trustees unanimously
38
GOLDMAN SACHS GQG PARTNERS INTERNATIONAL OPPORTUNITIES FUND
Statement Regarding Basis for Approval of Management Agreement and Sub-Advisory
Agreement (Unaudited) (continued)
concluded that the Investment Adviser’s continued management likely would benefit the Fund and its shareholders, the factors considered, and that the Management Agreement should be approved and continued with respect to the Fund until September 30, 2024, and that the Management Agreement should be approved and continued with respect to the Fund until September 30, 2024.
Sub-Advisory Agreement with GQG Partners LLC
Nature, Extent, and Quality of the Services Provided Under the Sub-Advisory Agreement
In evaluating the Sub-Advisory Agreement, the Trustees relied upon materials furnished and presentations made by the Investment Adviser and Sub-Adviser. In evaluating the nature, extent, and quality of services provided by the Sub-Adviser, the Trustees considered information on the services provided to the Fund by the Sub-Adviser, including information about the Sub-Adviser’s (a) personnel and compensation structure; (b) track record in managing the Fund and other funds and/or accounts with investment strategies similar to those employed on behalf of the Fund; (c) policies and procedures in place to address potential conflicts of interest; and (d) compliance program and code of ethics. In this regard, they also considered assessments provided by the Investment Adviser of the Sub-Adviser, the Sub-Adviser’s investment strategies and personnel, and its compliance program. The Trustees also considered information regarding the Sub-Adviser’s business continuity planning and remote operations capabilities.
Costs of Services Provided
The Trustees reviewed the terms of the Sub-Advisory Agreement, including the schedule of fees payable to the Sub-Adviser. They considered the breakpoints in the sub-advisory fee rate payable under the Sub-Advisory Agreement. The Trustees noted that the compensation paid to the Sub-Adviser is paid by the Investment Adviser, not by the Fund. They also considered the expense limitations that substantially reduce the fees retained by the Investment Adviser, and that the retention of the Sub-Adviser does not directly increase the fees incurred by the Fund for advisory services. They considered the Investment Adviser’s belief that the relationship between the management fees paid by the Fund and the sub-advisory fees paid by the Investment Adviser is appropriate given the level of services the Investment Adviser provides to the Fund and significant differences in cost drivers and risks associated with the respective services offered by the Investment Adviser and the Sub-Adviser.
Conclusion
In connection with their consideration of the Sub-Advisory Agreement, the Trustees gave weight to various factors, but did not identify any particular factor as controlling their decision. After deliberation and consideration of the information provided, including the factors described above, the Trustees, including the Independent Trustees, unanimously concluded, in the exercise of their business judgment, that the sub-advisory fees paid by the Investment Adviser to the Sub-Adviser were reasonable in light of the factors considered, and that the Sub-Advisory Agreement should be approved and continued until September 30, 2024.
39
|
| GOLDMAN SACHS GQG PARTNERS INTERNATIONAL OPPORTUNITIES FUND |
Trustees and Officers (Unaudited)
Independent Trustees
| | | | | | | | | | |
Name, Address and Age1 | | Position(s) Held with the Trust | | Term of Office and Length of
Time Served2 | | Principal Occupation(s) During Past 5 Years | | Number of
Portfolios in
Fund Complex
Overseen by
Trustee3 | | Other Directorships Held by Trustee4 |
Cheryl K. Beebe Age: 67 | | Chair of the Board of
Trustees | | Since 2017 (Trustee since 2015) | | Ms. Beebe is retired. She is Director, Packaging Corporation of America (2008-Present); Director, The Mosaic Company (2019-Present); Director, HanesBrands Inc. (2020-Present); and was formerly Director, Convergys Corporation (a global leader in customer experience outsourcing) (2015-2018); and formerly held the position of Executive Vice President, (2010-2014); and Chief Financial Officer, Ingredion, Inc. (a leading global ingredient solutions company) (2004-2014). Chair of the Board of Trustees — Goldman Sachs Trust II; Goldman Sachs MLP and Energy Renaissance Fund; Goldman Sachs ETF Trust; Goldman Sachs ETF Trust II; and Goldman Sachs Real Estate Diversified Income Fund. | | 90 | | Packaging Corporation of America (producer of container board); The Mosaic Company (producer of phosphate and potash fertilizer); HanesBrands Inc. (a multinational clothing company) |
Lawrence Hughes Age: 65 | | Trustee | | Since 2016 | | Mr. Hughes is retired. Formerly, he held senior management positions with BNY Mellon Wealth Management, a division of The Bank of New York Mellon Corporation (a financial services company)(1991-2015), most recently as Chief Executive Officer (2010-2015). Previously, Mr. Hughes served as an Advisory Board Member of Goldman Sachs Trust II (February 2016-April 2016). Trustee — Goldman Sachs Trust II; Goldman Sachs MLP and Energy Renaissance Fund; Goldman Sachs ETF Trust; Goldman Sachs ETF Trust II; and Goldman Sachs Real Estate Diversified Income Fund. | | 90 | | None |
John F. Killian Age: 68 | | Trustee | | Since 2015 | | Mr. Killian is retired. He is Director, Consolidated Edison, Inc. (2007-Present); and was formerly Director, Houghton Mifflin Harcourt Publishing Company (2011-2022). Previously, he held senior management positions with Verizon Communications, Inc., including Executive Vice President and Chief Financial Officer (2009-2010); and President, Verizon Business, Verizon Communications, Inc. (2005-2009). Trustee — Goldman Sachs Trust II; Goldman Sachs MLP and Energy Renaissance Fund; Goldman Sachs ETF Trust; Goldman Sachs ETF Trust II; and Goldman Sachs Real Estate Diversified Income Fund. | | 90 | | Consolidated Edison, Inc. (a utility holding company) |
Steven D. Krichmar Age: 65 | | Trustee | | Since 2018 | | Mr. Krichmar is retired. Formerly, he held senior management and governance positions with Putnam Investments, LLC, a financial services company (2001-2016). He was most recently Chief of Operations and a member of the Operating Committee of Putnam Investments, LLC and Principal Financial Officer of The Putnam Funds. Previously, Mr. Krichmar served as an Audit Partner with PricewaterhouseCoopers LLP and its predecessor company (1990-2001). Trustee — Goldman Sachs Trust II; Goldman Sachs MLP and Energy Renaissance Fund; Goldman Sachs ETF Trust; Goldman Sachs ETF Trust II; and Goldman Sachs Real Estate Diversified Income Fund. | | 90 | | None |
Michael Latham Age: 58 | | Trustee | | Since 2021 | | Mr. Latham is retired. Formerly, he held senior management positions with the iShares exchange-traded fund business owned by BlackRock, Inc., including Chairman (2011-2014); Global Head (2010-2011); U.S. Head (2007-2010); and Chief Operating Officer (2003-2007). Trustee — Goldman Sachs Trust II; Goldman Sachs MLP and Energy Renaissance Fund; Goldman Sachs ETF Trust; Goldman Sachs ETF Trust II; Goldman Sachs Credit Income Fund; and Goldman Sachs Real Estate Diversified Income Fund. | | 91 | | None |
| | | | | | | | | | |
40
GOLDMAN SACHS GQG PARTNERS INTERNATIONAL OPPORTUNITIES FUND
Trustees and Officers (Unaudited) (continued)
Independent Trustees
| | | | | | | | | | |
Name, Address and Age1 | | Position(s) Held
with the Trust | | Term of
Office and
Length of
Time Served2 | | Principal Occupation(s) During Past 5 Years | | Number of
Portfolios in
Fund Complex
Overseen by
Trustee3 | | Other Directorships Held by Trustee4 |
Lawrence W. Stranghoener Age: 69 | | Trustee | | Since 2021 | | Mr. Stranghoener is retired. He is Chairman, Kennametal, Inc. (a global manufacturer and distributor of tooling and industrial materials) (2003-Present); and was formerly Director, Aleris Corporation and Aleris International, Inc. (a producer of aluminum rolled products) (2011- 2020); Interim Chief Executive Officer (2014) and Executive Vice President and Chief Financial Officer (2004-2014), Mosaic Company (a fertilizer manufacturing company). Trustee — Goldman Sachs Trust II; Goldman Sachs MLP and Energy Renaissance Fund; Goldman Sachs ETF Trust; Goldman Sachs ETF Trust II; and Goldman Sachs Real Estate Diversified Income Fund. Chair of the Board of Trustees — Goldman Sachs Credit Income Fund. | | 91 | | Kennametal, Inc. (a global manufacturer and distributor of tooling and industrial materials) |
| | | | | | | | | | |
| | | | |
Interested Trustee* | | | | | | | | |
| | | | | | | | | | |
Name, Address and Age1 | | Position(s) Held
with the Trust | | Term of
Office and
Length of
Time Served2 | | Principal Occupation(s) During Past 5 Years | | Number of
Portfolios in
Fund Complex
Overseen by
Trustee3 | | Other Directorships Held by Trustee4 |
James A. McNamara Age: 61 | | President and Trustee | | | | Advisory Director, Goldman Sachs (January 2018-Present); Managing Director, Goldman Sachs (January 2000-December 2017); Director of Institutional Fund Sales, GSAM (April 1998- December 2000); and Senior Vice President and Manager, Dreyfus Institutional Service Corporation (January 1993-April 1998). President and Trustee — Goldman Sachs Trust II; Goldman Sachs Trust; Goldman Sachs Variable Insurance Trust; Goldman Sachs ETF Trust; Goldman Sachs ETF Trust II; Goldman Sachs MLP and Energy Renaissance Fund; Goldman Sachs Credit Income Fund; and Goldman Sachs Real Estate Diversified Income Fund. | | 193 | | None |
| | | | | | | | | | |
| * | Mr. McNamara is considered to be an “Interested Trustee” because he holds positions with Goldman Sachs and owns securities issued by The Goldman Sachs Group, Inc. Mr. McNamara holds comparable positions with certain other companies of which Goldman Sachs, GSAM or an affiliate thereof is the investment adviser, administrator and/or distributor. |
| 1 | Each Trustee may be contacted by writing to the Trustee, c/o Goldman Sachs, 200 West Street, New York, New York, 10282, Attn: Robert Griffith. Information is provided as of October 31, 2023. |
| 2 | Subject to such policies as may be adopted by the Board from time-to-time, each Trustee holds office for an indefinite term, until the earliest of: (a) the election of his or her successor; (b) the date the Trustee resigns or is removed by the Board or shareholders, in accordance with the Trust’s Declaration of Trust; or (c)the termination of the Trust. The Board has adopted policies which provide that each Independent Trustee shall retire as of December 31st of the calendar year in which he or she reaches (a) his or her 75th birthday or (b) the 15th anniversary of the date he or she became a Trustee, whichever is earlier, unless a waiver of such requirements shall have been adopted by a majority of the other Trustees. These policies may be changed by the Trustees without shareholder vote. |
| 3 | The Goldman Sachs Fund Complex includes certain other companies listed above for each respective Trustee. As of October 31, 2023, Goldman Sachs Trust II consisted of 18 portfolios (7 of which offered shares to the public); Goldman Sachs Trust consisted of 87 portfolios; Goldman Sachs Variable Insurance Trust consisted of 15 portfolios (11 of which offered shares to the public); Goldman Sachs ETF Trust consisted of 68 portfolios (34 of which offered shares to the public); Goldman Sachs ETF Trust II consisted of 2 portfolios; and Goldman Sachs MLP and Energy Renaissance Fund, Goldman Sachs Credit Income Fund and Goldman Sachs Real Estate Diversified Income Fund each consisted of one portfolio. Goldman Sachs MLP and Energy Renaissance Fund and Goldman Sachs Credit Income Fund did not offer shares to the public. |
| 4 | This column includes only directorships of companies required to report to the Securities and Exchange Commission under the Securities Exchange Act of 1934 (i.e., “public companies”) or other investment companies registered under the Act. |
Additional information about the Trustees is available in the Funds’ Statement of Additional Information, which can be obtained from Goldman Sachs free of charge by calling this toll-free number (in the United States of America): 1-800-526-7384.
41
|
| GOLDMAN SACHS GQG PARTNERS INTERNATIONAL OPPORTUNITIES FUND |
Trustees and Officers (Unaudited) (continued)
Officers of the Trust*
| | | | | | |
| Name, Address and Age1 | | Position(s) Held with the Trust | | Term of Office and Length of
Time Served2 | | Principal Occupation(s) During Past 5 Years |
James A. McNamara 200 West Street New York, NY 10282 Age: 61 | | President and Trustee | | Since 2012 | | Advisory Director, Goldman Sachs (January 2018-Present); Managing Director, Goldman Sachs (January 2000-December 2017); Director of Institutional Fund Sales, GSAM (April 1998-December 2000); and Senior Vice President and Manager, Dreyfus Institutional Service Corporation (January 1993-April 1998). President and Trustee — Goldman Sachs Trust II; Goldman Sachs Trust; Goldman Sachs Variable Insurance Trust; Goldman Sachs ETF Trust; Goldman Sachs ETF Trust II; Goldman Sachs MLP and Energy Renaissance Fund; Goldman Sachs Credit Income Fund; and Goldman Sachs Real Estate Diversified Income Fund. |
Joseph F. DiMaria 30 Hudson Street Jersey City, NJ 07302 Age: 55 | | Treasurer, Principal Financial Officer and Principal Accounting Officer | | Since 2017 (Treasurer and Principal Financial Officer Since 2019) | | Managing Director, Goldman Sachs (November 2015-Present) and Vice President — Mutual Fund Administration, Columbia Management Investment Advisers, LLC (May 2010-October 2015). Treasurer, Principal Financial Officer and Principal Accounting Officer — Goldman Sachs Trust II (previously Assistant Treasurer (2017)); Goldman Sachs Trust (previously Assistant Treasurer (2016)); Goldman Sachs Variable Insurance Trust (previously Assistant Treasurer (2016)); Goldman Sachs MLP and Energy Renaissance Fund (previously Assistant Treasurer (2017)); Goldman Sachs ETF Trust (previously Assistant Treasurer (2017)); Goldman Sachs ETF Trust II; Goldman Sachs Credit Income Fund; and Goldman Sachs Real Estate Diversified Income Fund. |
Robert Griffith 200 West Street New York, NY 10282 Age: 49 | | Secretary | | Since 2022 | | Managing Director, Goldman Sachs (September 2022 – Present); General Counsel, Exchange Traded Concepts, LLC (October 2021 – September 2022); Vice President, Goldman Sachs (August 2011 – October 2021); Associate General Counsel, Goldman Sachs (December 2014 – Present); Assistant General Counsel, Goldman Sachs (August 2011 – December 2014); Vice President and Counsel, Nomura Holding America, Inc. (2010 – 2011); and Associate, Simpson Thacher & Bartlett LLP (2005 – 2010). Secretary — Goldman Sachs Trust II (previously Assistant Secretary (2022)); Goldman Sachs Trust (previously Assistant Secretary (2022)); Goldman Sachs Variable Insurance Trust (previously Assistant Secretary (2022)); Goldman Sachs ETF Trust (previously Assistant Secretary (2022)); Goldman Sachs ETF Trust II (previously Assistant Secretary (2022)); and Goldman Sachs Real Estate Diversified Income Fund (previously Assistant Secretary (2022)). Assistant Secretary — Goldman Sachs MLP and Energy Renaissance Fund. |
| | | | | | |
| * | Represents a partial list of officers of the Trust. Additional information about all the officers is available in the Funds’ Statement of Additional Information, which can be obtained from Goldman Sachs free of charge by calling this toll-free number (in the United States): 1-800-526-7384. |
| 1 | Information is provided as of October 31, 2023. |
| 2 | Officers hold office at the pleasure of the Board of Trustees or until their successors are duly elected and qualified. Each officer holds comparable positions with certain other companies of which Goldman Sachs, GSAM or an affiliate thereof is the investment adviser, administrator and/or distributor. |
Goldman Sachs GQG Partners International Opportunities Fund - Tax Information (Unaudited)
For the year ended October 31, 2023, 7.01% of the dividends paid from net investment company taxable income by the Goldman Sachs GQG Partners International Opportunities Fund qualify for the dividends received deduction available to corporations.
For the year ended October 31, 2023, 99.59% of the dividends paid from net investment company taxable income by the GQG Partners International Opportunities Fund qualify for the reduced tax rate under the Jobs and Growth Tax Relief and Reconciliation Act of 2003.
From distributions paid during the year ended October 31, 2023, the total amount of income received by the Goldman Sachs GQG Partners International Opportunities Fund from sources within foreign countries and possessions of the United States was $0.7064 per share, all of which is attributable to qualified passive income. The percentage of net investment income dividends paid from foreign sources by the Goldman Sachs GQG Partners International Opportunities Fund was 86.23%. The total amount of taxes paid by the Goldman Sachs GQG Partners International Opportunities Fund to such countries was $0.0337 per share.
42
(This page intentionally left blank)
(This page intentionally left blank)
FUNDS PROFILE
Goldman Sachs Funds
Goldman Sachs is a premier financial services firm, known since 1869 for creating thoughtful and customized investment solutions in complex global markets.
Today, the Asset Management Division of Goldman Sachs serves a diverse set of clients worldwide, including private institutions, public entities and individuals. With approximately $2.42 trillion in assets under supervision as of September 30, 2023, Goldman Sachs Asset Management has portfolio management teams located around the world and our investment professionals bring firsthand knowledge of local markets to every investment decision. Assets under supervision includes assets under management and other client assets for which Goldman Sachs does not have full discretion. Goldman Sachs Asset Management leverages the resources of Goldman Sachs & Co. LLC subject to legal, internal and regulatory restrictions.
Money Market
Financial Square FundsSM
| ∎ | Financial Square Treasury Solutions Fund1 |
| ∎ | Financial Square Government Fund1 |
| ∎ | Financial Square Money Market Fund2 |
| ∎ | Financial Square Prime Obligations Fund2 |
| ∎ | Financial Square Treasury Instruments Fund1 |
| ∎ | Financial Square Treasury Obligations Fund1 |
| ∎ | Financial Square Federal Instruments Fund1 |
Investor FundsSM
| ∎ | Investor Money Market Fund3 |
| ∎ | Investor Tax-Exempt Money Market Fund3 |
Fixed Income
Short Duration and Government
| ∎ | Short-Term Conservative Income Fund |
| ∎ | Short Duration Government Fund |
| ∎ | Short Duration Bond Fund |
| ∎ | Inflation Protected Securities Fund |
Multi-Sector
| ∎ | Global Core Fixed Income Fund |
∎ Income Fund
Municipal and Tax-Free
| ∎ | High Yield Municipal Fund |
| ∎ | Dynamic Municipal Income Fund |
| ∎ | Short Duration Tax-Free Fund |
| ∎ | Municipal Income Completion Fund |
Single Sector
| ∎ | Investment Grade Credit Fund |
| ∎ | High Yield Floating Rate Fund |
| ∎ | Emerging Markets Debt Fund |
| ∎ | Emerging Markets Credit Fund4 |
Fixed Income Alternatives
| ∎ | Long Short Credit Strategies Fund |
Fundamental Equity
| ∎ | Small/Mid Cap Value Fund |
| ∎ | Small/Mid Cap Growth Fund |
| ∎ | Concentrated Growth Fund |
| ∎ | Technology Opportunities Fund |
| ∎ | Rising Dividend Growth Fund |
Tax-Advantaged Equity
| ∎ | U.S. Tax-Managed Equity Fund |
| ∎ | International Tax-Managed Equity Fund |
| ∎ | U.S. Equity Dividend and Premium Fund |
| ∎ | International Equity Dividend and Premium Fund |
Equity Insights
| ∎ | Small Cap Equity Insights Fund |
| ∎ | U.S. Equity Insights Fund |
| ∎ | Small Cap Growth Insights Fund |
| ∎ | Large Cap Growth Insights Fund |
| ∎ | Large Cap Value Insights Fund |
| ∎ | Small Cap Value Insights Fund |
| ∎ | International Small Cap Insights Fund |
| ∎ | International Equity Insights Fund |
| ∎ | Emerging Markets Equity Insights Fund |
Fundamental Equity International
| ∎ | International Equity Income Fund |
| ∎ | International Equity ESG Fund |
| ∎ | Emerging Markets Equity Fund |
| ∎ | Emerging Markets Equity ex. China Fund |
| ∎ | ESG Emerging Markets Equity Fund |
Alternative
| ∎ | Clean Energy Income Fund |
| ∎ | Real Estate Securities Fund |
| ∎ | Global Real Estate Securities Fund |
| ∎ | Absolute Return Tracker Fund |
| ∎ | Managed Futures Strategy Fund |
| ∎ | MLP Energy Infrastructure Fund |
| ∎ | Energy Infrastructure Fund |
| ∎ | Multi-Strategy Alternatives Fund5 |
| ∎ | Global Infrastructure Fund |
Total Portfolio Solutions
| ∎ | Global Managed Beta Fund |
| ∎ | Multi-Manager Non-Core Fixed Income Fund |
| ∎ | Multi-Manager Global Equity Fund |
| ∎ | Multi-Manager International Equity Fund |
| ∎ | Tactical Tilt Overlay Fund |
| ∎ | Balanced Strategy Portfolio |
| ∎ | Multi-Manager U.S. Small Cap Equity Fund |
| ∎ | Multi-Manager Real Assets Strategy Fund |
| ∎ | Growth and Income Strategy Portfolio |
| ∎ | Growth Strategy Portfolio |
| ∎ | Dynamic Global Equity Fund |
| ∎ | Satellite Strategies Portfolio |
| ∎ | Enhanced Dividend Global Equity Portfolio |
| ∎ | Tax-Advantaged Global Equity Portfolio |
| ∎ | Strategic Factor Allocation Fund |
| ∎ | Strategic Volatility Premium Fund |
| ∎ | GQG Partners International Opportunities Fund |
| 1 | You could lose money by investing in the Fund. Although the Fund seeks to preserve the value of your investment at $1.00 per share, it cannot guarantee it will do so. An investment in the Fund is not a deposit of a bank and is not insured or guaranteed by the Federal Deposit Insurance Corporation or any other government agency. The Fund’s sponsor has no legal obligation to provide financial support to the Fund, and you should not expect that the sponsor will provide financial support to the Fund at any time. |
| 2 | You could lose money by investing in the Fund. Because the share price of the Fund will fluctuate, when you sell your shares they may be worth more or less than what you originally paid for them. The Fund may impose a fee upon sale of your shares or may temporarily suspend your ability to sell shares if the Fund’s liquidity falls below required minimums because of market conditions or other factors. An investment in the Fund is not a deposit of a bank and is not insured or guaranteed by the Federal Deposit Insurance Corporation or any other government agency. The Fund’s sponsor has no legal obligation to provide financial support to the Fund, and you should not expect that the sponsor will provide financial support to the Fund at any time. |
| 3 | You could lose money by investing in the Fund. Although the Fund seeks to preserve the value of your investment at $1.00 per share, it cannot guarantee it will do so. The Fund may impose a fee upon sale of your shares or may temporarily suspend your ability to sell shares if the Fund’s liquidity falls below required minimums because of market conditions or other factors. An investment in the Fund is not a deposit of a bank and is not insured or guaranteed by the Federal Deposit Insurance Corporation or any other government agency. The Fund’s sponsor has no legal obligation to provide financial support to the Fund, and you should not expect that the sponsor will provide financial support to the Fund at any time. |
| 4 | Effective after the close of business on October 31, 2023, the Goldman Sachs Local Emerging Markets Debt Fund was renamed the Goldman Sachs Emerging Markets Credit Fund. |
| 5 | Effective after the close of business on September 22, 2023, the Goldman Sachs Multi-Manager Alternatives Fund was renamed the Goldman Sachs Multi-Strategy Alternatives Fund. |
| | Financial Square FundsSM and Investor FundsSM are registered service marks of Goldman Sachs & Co. LLC. |
| * | This list covers open-end funds only. Please visit our website at www.GSAMFUNDS.com to learn about our closed-end funds and exchange-traded funds. |
Goldman Sachs Funds Annual Report October 31, 2023 Goldman Sachs Multi-Strategy Alternatives Fund* * Effective after the close of business September 22, 2023, The Goldman Sachs Multi-Manager Alternatives Fund was renamed the Multi-Strategy Alternatives Fund.
Goldman Sachs Multi-Strategy Alternatives Fund
TABLE OF CONTENTS
| | | | | | |
| | | | |
| NOT FDIC-INSURED | | May Lose Value | | No Bank Guarantee | | |
FUND RESULTS
Goldman Sachs Multi-Strategy Alternatives Fund
as of October 31, 2023
|
Investment Objective The Fund seeks long-term growth of capital. |
Portfolio Management Discussion and Analysis
Effective September 22, 2023, the Goldman Sachs Multi-Manager Alternatives Fund became the Goldman Sachs Multi-Strategy Alternatives Fund (the “Fund”). At the same time, the Fund’s principal investment strategy changed, and the Goldman Sachs Quantitative Investment Strategies (“QIS”) Team assumed day-to-day management of the Fund from the Goldman Sachs External Investing Group (“XIG”) (formerly, the Goldman Sachs Alternative Investments & Manager Selection (“AIMS”) Group). The performance information reported below is the combined performance of the Fund, reflecting current and prior strategies and policies.
Below, Goldman Sachs XIG and the Goldman Sachs QIS Team discuss the Fund’s performance and positioning for the 12-month period ended October 31, 2023 (the “Reporting Period”).
| Q | How did the Fund perform during the Reporting Period? |
| A | During the Reporting Period, the Fund’s Class A, Class C, Institutional, Investor, Class R6, Class R and Class P Shares generated average annual total returns, without sales charges, of -1.30%, -1.97%, -0.92%, -1.00%, -0.81%, -1.45% and -0.91%, respectively. These returns compare to the 4.77% average annual total return of the Fund’s benchmark, the ICE BofAML Three-Month US Treasury Bill Index (the “ICE BofAMLIndex”), which reflects no deductions for fees or expenses, during the same time period. |
| | References to the Fund’s benchmark mentioned herein are for informational purposes only, and unless otherwise noted, are not an indication of how the Fund is managed. The use of the ICE BofAML Index as the Fund’s benchmark does not imply the Fund is being managed like cash and does not imply low risk or low volatility. |
| Q | What economic and market factors most influenced the capital markets as a whole during the Reporting Period? |
| A | During the Reporting Period, the performance of the capital markets was driven primarily by rising interest rates, inflation data, volatile energy prices and speculation about whether central banks would achieve soft or hard economic landings. (A soft landing, in economics, is a cyclical downturn that avoids recession. It typically describes attempts by central banks to raise interest rates just enough to |
| | stop an economy from overheating and experiencing high inflation, without causing a significant increase in unemployment, or a hard landing.) |
| | Global equity markets posted strong gains during the Reporting Period, with the MSCI All Country World Index (Net Total Return, Unhedged, USD) (“MSCI ACWI Index”) returning 10.5%. The majority of the gains occurred during the first nine months of the Reporting Period. The final three months saw corrections across most regions and sectors within the MSCI ACWI Index. (A correction is a condition in which securities prices fall 10% or more from recent highs.) Non-U.S. developed markets stocks, as represented by the MSCI EAFE Index (Net, Unhedged, USD), performed best, returning 14.4% during the Reporting Period overall, with value stocks outpacing growth stocks. From a regional standpoint, Japanese and European equities were the strongest performers. Despite significant depreciation in the Japanese yen relative to the U.S. dollar, Japan’s stock market was one of the best performing developed markets regions, as it benefited from continuation of the central bank’s accommodative monetary policy, rising share buybacks and growing corporate investment. Market technicals (i.e., supply/demand conditions) also supported the performance of Japanese equities, as investment inflows increased, perhaps driven by optimism that long-promised corporate governance reforms were finally starting to bear fruit. As for European equities, they appreciated significantly early in the Reporting Period, recovering from previously depressed levels. Investors had been bearish on European stocks due both to inflation worries, especially concerns about energy |
FUND RESULTS
| | price inflation caused by Russia’s invasion of Ukraine, and to rising interest rates and overall economic weakness. However, reduced energy demand because of a warmer than expected winter, success in securing alternative energy imports and generous government support for the consumer improved investor sentiment, leading to a significant rally in European equity performance. Challenges then followed, with March 2023 being especially difficult, as a U.S. regional banking crisis spilled over to European banks, leading to the high-profile bankruptcy of Credit Suisse but not much further fallout due to prompt government intervention. European equities were volatile for the rest of the Reporting Period, with the outlook for economies and interest rates weighing on market sentiment. Overall, macroeconomic fundamentals in European countries were lethargic during the Reporting Period, with Germany, for example, entering a technical recession and its inflation remaining above target, although employment in the country stayed robust. (A technical recession is commonly defined as two consecutive quarters of negative growth in a country’s gross domestic product.) In the U.S., where growth stocks beat value stocks by a wide margin, the broad equity market generated a return of 9.5%, as measured by the Russell 1000® Index. The rally in growth stocks was led by the so-called “Magnificent Seven” (specifically, Apple, Microsoft, Alphabet, Amazon.com, Nvidia, Meta Platforms and Tesla), which were responsible for almost all of the U.S equity market’s gains in the first half of 2023. The rally was driven by a combination of factors, including a reversal of previous multiples compression and the strong fundamental performance of some of these companies. (Multiple compression, or valuation derating, is when a company’s valuation multiples, such as the price/earnings ratio, is reduced either because of increased earnings without a corresponding increase in stock price or because of a decreased stock price without a corresponding decrease in earnings.) Many of the Magnificent Seven were beneficiaries of investor optimism about artificial intelligence (“AI”) following the release of ChatGPT as well as excitement about generative AI. As for emerging markets equities, they returned 10.8%, as measured by the MSCI Emerging Markets Index (Net, USD, Unhedged), during the Reporting Period. Chinese equities posted the strongest gains, with the MSCI China All Shares Index (Net Total Return, USD, Unhedged) notching a 21.1% return during the Reporting Period, though performance was highly volatile. At first, Chinese equities benefited from the reopening of the country’s economy following COVID-19-related lockdowns, but they subsequently weakened, as an expected surge in consumer spending did not materialize due in part to worries |
| | about China’s property crisis and level of unemployment. These investor concerns were exacerbated by geopolitical and regulatory issues. |
| | Despite persistent interest rate volatility, global spread, or non-government bond, sectors recorded positive returns during the Reporting Period, recovering from the sell-off they had endured in 2022. Spread sectors benefited overall from the tightening of credit spreads, which are yield differentials between corporate bonds and U.S. Treasury securities of comparable maturity. Bank loans outperformed virtually all other spread sectors, largely due to their floating rate nature and strong investor demand. High yield corporate bonds generated positive returns during the Reporting Period amid positive market technicals and spread tightening, most notably in lower-rated segments of the market. In the emerging markets, U.S. dollar-denominated bonds trailed local currency-denominated bonds, mainly due to higher U.S. interest rates and the strong performance of emerging markets currencies. In local emerging markets debt, select countries with high monetary policy rates and falling inflation, particularly in Latin America and Eastern Europe, were the top performers. In U.S. dollar-denominated emerging markets debt, high yield sovereign bonds produced the strongest returns, as spreads tightened. Investment grade corporate spreads also narrowed during the Reporting Period but not as much as those of other spread sectors. |
| Q | How did the Fund’s principal investment strategy change on September 22, 2023? |
| A | Before September 22, 2023, the Fund generally sought to achieve its investment objective by allocating its assets among multiple unaffiliated investment managers (“Underlying Managers”) that employed one or more non-traditional and alternative investment strategies. XIG was responsible for making recommendations with respect to hiring, terminating or replacing the Fund’s Underlying Managers as well as for determining the Fund’s asset allocations. XIG applied a multifaceted process with respect to manager due diligence, portfolio construction and risk management. |
| | Effective September 22, 2023, the QIS Team began to manage the Fund directly instead of allocating the Fund’s assets among one or more Underlying Managers. The Fund continues to seek to achieve its investment objective by allocating its assets among one or more non-traditional and alternative investment strategies, including, but not limited to, equity long/short, dynamic equity, event driven and credit, relative value, tactical trading and opportunistic fixed income strategies. |
FUND RESULTS
| Q | What key factors were responsible for the Fund’s performance from November 1, 2022 through September 21, 2023 (the “initial part of the Reporting Period”)? |
| A | During the initial part of the Reporting Period, the Fund’s results can be attributed to the performance of the Fund’s Underlying Managers. |
| | At various points during the initial part of the Reporting Period, the Fund had 13 Underlying Managers, though not all were allocated capital. The 13 Underlying Managers were Algert Global LLC (“Algert”); Artisan Partners LP (“Artisan”); Bardin Hill Arbitrage IC Management LP (“Bardin Hill”); Brigade Capital Management, LP (“Brigade”); Crabel Capital Management, LLC (“Crabel”); GQG Partners LLC (“GQG Partners”); Longfellow Investment Management Co., LLC (“Longfellow”); Marathon Asset Management, L.P. (“Marathon”); River Canyon Fund Management LLC (“River Canyon”); Russell Investments Commodity Advisor, LLC (“RICA”); TCW Investment Management Company LLC (“TCW”), Trium Capital LLP (“Trium”), and Wellington Management Company LLC (“Wellington”). |
| | These 13 Underlying Managers represented five strategies—equity long/short (Wellington); event driven and credit (Bardin Hill, Brigade, Longfellow, Marathon and River Canyon); tactical trading (Crabel); relative value (Algert, TCW and Trium); and dynamic equity (Artisan and GQG Partners). RICA managed a beta completion mandate for the Fund, which provided us with an additional tool to manage the beta of the Fund and was not used to override any views and/or decisions of the Fund’s Underlying Managers. (Beta is a measure of the sensitivity of a portfolio’s returns to broad market returns.) |
| | Of the six Underlying Managers with allocated capital during the initial part of the Reporting Period, four produced positive absolute returns and two produced negative absolute returns. RICA generated a negative absolute return during the initial part of the Reporting Period. Trium produced a positive absolute return between January 11, 2023 and the end of the initial part of the Reporting Period. Algert, Marathon, Wellington, Brigade and River Canyon did not have allocated capital during the initial part of Reporting Period. |
| Q | Which strategies most significantly affected Fund performance during the initial part of the Reporting Period? |
| A | Four strategies were employed by the Underlying Managers during the initial part of Reporting Period. Two of these four strategies generated negative absolute returns, and two generated positive absolute returns. The Fund did not have allocations to the equity long/short strategy or the opportunistic fixed income strategy during the initial part of the reporting period. |
| | The relative value strategy detracted from the Fund’s performance during the initial part of the Reporting Period, driven by the losses of the fundamental equity neutral Underlying Manager. The performance of value-oriented strategies, especially in the real estate, financials and consumer staples sectors, were challenged during the initial part of the Reporting Period. Within global arbitrage, the Underlying Manager’s exposures to the financials and industrials sectors had negative results, but the losses were offset somewhat by exposures to consumer non-cyclical and communication stocks, which added value. Relative value strategies seek to identify and capitalize on price discrepancies between related assets (assets that share a common financial factor, such as interest rates, an issuer or an index). Relative value strategies generally rely on arbitrage (the simultaneous purchase and sale of related assets) and may exist between two issuers or within the capital structure of a single issuer. These strategies attempt to exploit a source of return with low correlation to the market and include, among others, fixed income arbitrage, convertible arbitrage, volatility arbitrage, statistical arbitrage and equity market neutral strategies. |
| | The tactical trading strategy detracted slightly from the Fund’s performance during the initial part of the Reporting Period, as modest gains in equities were more than offset by losses in fixed income and currency trading. Within macro strategies, opportunistic and reversal models contributed positively to performance, while factor timing and volatility breakout models detracted from returns. Tactical trading strategies seek to produce total return by long and short investing across global fixed income, currency, equity and commodity markets. Tactical trading managers may employ various investment styles of which the two major strategies are macro and managed futures. Tactical trading managers that employ a global macro style may select their investments based upon fundamental and/or technical analysis. Tactical trading managers that employ a managed futures investing style may use quantitative modeling techniques, e.g., |
FUND RESULTS
| | determining an asset’s value based upon an analysis of price history, price momentum and the asset’s value relative to that of other assets, among other factors. Some tactical trading managers may employ both fundamental analysis and quantitative modeling techniques. Tactical trading managers typically have no bias to be long, short or neutral, but at any given time may have significant long or short exposures in a particular market or asset. |
| | The dynamic equity strategy added most to the Fund’s performance during the initial part of the Reporting Period, with all of the strategy’s Underlying Managers generating positive returns. From a market segment perspective, these results were driven by gains in international equities, which were led by strong stock selection in a variety of sectors, including energy and utilities, and exposure to the information technology sector. Also contributing positively was U.S. equity exposure, highlighted by strong stock selection in the industrials sector, specifically aerospace stocks, as well as in the financials and consumer staples sectors. Dynamic equity strategies generally involve investing in equity instruments, often with a long-term view, and may have low excess return correlations to traditional long-only equity strategies. Dynamic equity strategies are less likely to track a benchmark than traditional long-only strategies, and dynamic equity managers are less constrained than traditional long-only managers with respect to factors such as position concentration, sector and country weights, style and market capitalization. |
| | The event driven and credit strategy added further to the Fund’s performance during the initial part of the Reporting Period, with positive contributions from all of the strategy’s Underlying Managers. Merger arbitrage and special purpose acquisition company strategies generated gains amid a growing opportunity set in the credit markets and the slight resurgence of initial public offering activity. Within merger arbitrage, the top contributor was a position in a gaming company, which benefited from constructive regulatory developments. In addition, exposure to structured credit enhanced performance during the initial part of Reporting Period. Event driven and credit strategies seek to achieve gains from market movements in security prices caused by specific corporate events or changes in perceived relative value. These strategies may include, among others, merger arbitrage, distressed credit, opportunistic credit and value with a catalyst investing style. |
| Q | Were there any notable changes in the Fund’s allocations and Underlying Managers during the initial part of the Reporting Period? |
| A | During the initial Reporting Period, shifts in the Fund’s asset allocation were made in response to the market environment and were also the result of changes in allocations to the Fund’s various strategies. One of the shifts in strategy allocation was an increase in the Fund’s exposure to the dynamic equity strategy, accomplished through larger allocations to GQG Partners and Artisan. We also increased the Fund’s exposure to the relative value strategy, which was accomplished through a larger allocation to TCW and by allocating assets to Trium. We funded these increases by reducing the Fund’s exposure to the event driven and credit strategy, which we accomplished by marginally decreasing the allocation to Bardin Hill and eliminating the allocation to Longfellow, and also by reducing the Fund’s exposure to the tactical trading strategy, which we accomplished by decreasing the Fund’s allocation to Crabel. |
| | On January 11, 2023, relative value Underlying Manager Trium was allocated assets. Also during the initial part of the Reporting Period, we removed one Underlying Manager and did not add any Underlying Managers. On February 28, 2023, event driven and credit strategy Underlying Manager River Canyon, which did not have any allocated assets, was removed as an Underlying Manager of the Fund. |
| | At the beginning of the initial part of the Reporting Period, the Fund’s assets were allocated 55.8% to the event driven and credit strategy, 22.2% to the tactical trading strategy, 11.4% to the dynamic equity strategy and 10.6% to the relative value strategy. At the end of the initial part of the Reporting Period, the Fund’s assets were allocated 25.6% to the event driven and credit strategy, 17.4% to the tactical trading strategy, 20.3% to the dynamic equity strategy and 29.2% to the relative value strategy. |
| Q | What key factors were responsible for the Fund’s performance between September 22, 2023 through October 31, 2023 (the “latter part of the Reporting Period”)? |
| A | During the latter part of the Reporting Period, when the QIS Team was focused on building the Fund’s portfolio, the Fund’s positions in commodities and currencies added to its returns. In commodities, which experienced mixed performance across various market sectors, the Fund benefited from its cross-sectional positions. (Cross-sectional positions seek to capture risk premia by trading assets against each other—that is, by purchasing assets with the highest |
FUND RESULTS
| | expected returns and selling those with the lowest expected returns.) In currencies, as the U.S. dollar appreciated versus most major currencies, the Fund’s cross-sectional positions also delivered positive results. |
| | Conversely, the Fund’s positions in fixed income detracted from its performance, as fixed income markets were challenged by a sharp rise in bond yields during the latter part of the Reporting Period. |
| Q | How did the Fund use derivatives and similar instruments during the Reporting Period? |
| A | During the initial part of the Reporting Period, the Underlying Managers of the Fund employed derivatives and similar instruments as part of their underlying strategies to hedge market exposure and/or to gain implicit leverage, subject to the constraints of the Investment Company Act of 1940. The derivatives used most by Underlying Managers during the Reporting Period were equity futures, interest rate futures, options (single name and index), warrants, rights, interest rate swaps, total return swaps (single name and index), forward contracts, forward foreign currency exchange contracts, structured securities, commodity-linked derivatives, inverse floaters and their related floaters, interest only securities and stripped mortgage-backed securities. Overall, the use of derivatives and similar instruments by the Underlying Managers had a negative impact on the Fund’s performance during the initial part of the Reporting Period. |
| | During the latter part of the Reporting Period, the Fund employed forward foreign currency exchange contracts, government bond futures and commodities futures to implement its views. The use of these instruments, collectively, had a positive impact on the Fund’s performance during the latter part of the Reporting Period. |
| Q | Were there any changes to the Portfolios’ portfolio management team during the Reporting Period? |
| A | When the Reporting Period began, Betsy Gorton, Peter Seok and Jennifer Stack of XIG served as portfolio managers of the Fund. Effective September 22, 2023, the QIS Team assumed day-to-day management of the Fund, with Oliver Bunn, head of the QIS Alternatives team, becoming portfolio manager of the Fund. Betsy Gorton, Peter Seok and Jennifer Stack no longer served as portfolio managers of the Fund. |
| Q | What is the Fund’s tactical view and strategy for the months ahead? |
| A | At the end of the Reporting Period, the QIS Team planned to seek diversifying alpha, or added value, among systematic macro opportunities and intended to employ strategies with low beta to equities. Within fixed income, we believed the dynamic interplay between macroeconomic conditions and the structural intricacies of the market could create investment opportunities, which may be identified through the examination of cross-sectional interest rate differentials and macroeconomic indicators. Regarding commodities, we believed investment opportunities could be uncovered by examining the fundamental complexities of specific commodities, including supply/demand dynamics and seasonality and trends, and also by considering the hedging and risk management activities of other market participants. As for currencies, we believed at the end of the Reporting Period that it was important to analyze and anticipate the macroeconomics driving market dynamics in order to make informed trading decisions. |
FUND BASICS
Multi-Strategy Alternatives Fund
as of October 31, 2023
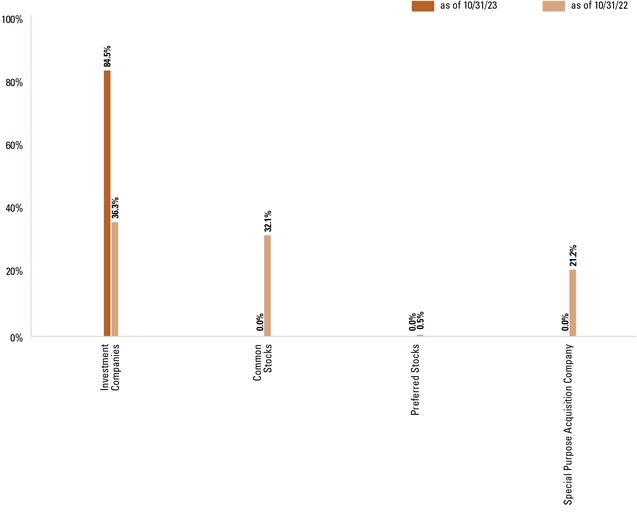
| | * | The percentage shown for each investment category reflects the value of investments in that category as a percentage of the Fund’s market value. Figures in the graph may not sum to 100% due to rounding and/or the exclusion of other assets and liabilities. The graph depicts the Fund’s investments but may not represent the Fund’s market exposure due to the exclusion of certain derivatives, if any, as listed in the Additional Investment Information section of the Consolidated Schedule of Investments. |
GOLDMAN SACHS MULTI-STRATEGY ALTERNATIVES FUND
Performance Summary
October 31, 2023
| | The following graph shows the value, as of October 31, 2023, of a $1,000,000 investment made on November 1, 2013 in Institutional Shares at NAV. For comparative purposes, the performance of the Fund’s current benchmark, the ICE BofAML Three-Month U.S. Treasury Bill Index is shown. Performance reflects applicable fee waivers and/or expense limitations in effect during the periods shown and in their absence, performance would be reduced. Returns do not reflect the deduction of taxes that a shareholder would pay on Fund distributions or the redemption of Fund shares. The returns set forth below represent past performance. Past performance does not guarantee future results. Through September 22, 2023, the Fund had been known as the Goldman Sachs Multi-Manager Alternatives Fund, and certain of its strategies differed. Performance information set forth below reflects the Fund’s former strategies prior to that date. The Fund’s investment return and principal value will fluctuate so that an investor’s shares, when redeemed, may be worth more or less than their original cost. Current performance may be lower or higher than the performance quoted below. Please visit our web site at www.GSAMFUNDS.com to obtain the most recent month-end returns. |
|
|
Goldman Sachs Multi-Strategy Alternatives Fund’s 10 Year Performance |
Performance of a $1,000,000 investment, with distributions reinvested, from November 1, 2013 through October 31, 2023.
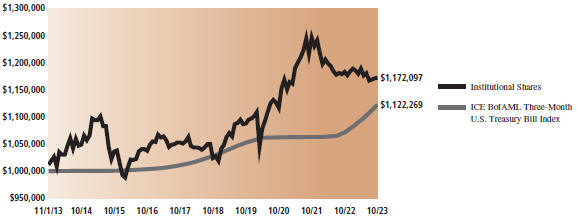
| | | | | | | | | | | | | | | | | | | | | | | | | | | | | | | | | | | | | | | | | | | | | | | | |
| | | | |
| Average Annual Total Return through October 31, 2023* | | One Year | | | Five Years | | | Ten Years | | | Since Inception | |
| | | | | | | | | | | | | |
| | Class A | | | | | | | | | | | | | | | | | | | | | | | | | | | | | | | | | | | | | | | | | | | | | | |
| | | | | | | | | | | | | |
| | | Excluding sales charges | | | | | | | -1.30% | | | | | | | | | | | | 2.39% | | | | | | | | | | | | 1.24% | | | | | | | | | | | — | | | | |
| | | | | | | | | | | | | |
| | Including sales charges | | | | | | | -6.70% | | | | | | | | | | | | 1.23% | | | | | | | | | | | | 0.67% | | | | | | | | | | | — | | | | |
| | | |
| | | | | | | | | | | | | |
| | Class C | | | | | | | | | | | | | | | | | | | | | | | | | | | | | | | | | | | | | | | | | | | | | | |
| | | | | | | | | | | | | |
| | Excluding contingent deferred sales charges | | | | | | | -1.97% | | | | | | | | | | | | 1.63% | | | | | | | | | | | | 0.49% | | | | | | | | | | | — | | | | |
| | | | | | | | | | | | | |
| | Including contingent deferred sales charges | | | | | | | -2.95% | | | | | | | | | | | | 1.63% | | | | | | | | | | | | 0.49% | | | | | | | | | | | — | | | | |
| | | |
| | | | | | | | | | | | | |
| | Institutional | | | | | | | -0.92% | | | | | | | | | | | | 2.73% | | | | | | | | | | | | 1.60% | | | | | | | | | | | — | | | | |
| | | |
| | | | | | | | | | | | | |
| | Investor | | | | | | | -1.00% | | | | | | | | | | | | 2.66% | | | | | | | | | | | | 1.50% | | | | | | | | | | | — | | | | |
| | | |
| | | | | | | | | | | | | |
| | Class R6 (Commenced February 28, 2018) | | | | | | | -0.81% | | | | | | | | | | | | 2.76% | | | | | | | | | | | | N/A | | | | | | | | | | | 2.05% | | | | |
| | | |
| | | | | | | | | | | | | |
| | Class R | | | | | | | -1.45% | | | | | | | | | | | | 2.16% | | | | | | | | | | | | 1.00% | | | | | | | | | | | — | | | | |
| | | |
| | | | | | | | | | | | | |
| | Class P (Commenced April 16, 2018) | | | | | | | -0.91% | | | | | | | | | | | | 2.74% | | | | | | | | | | | | N/A | | | | | | | | | | | 2.09% | | | | |
| | | |
| | * | These returns assume reinvestment of all distributions at NAV and reflect a maximum initial sales charge of 5.50% for Class A Shares and the assumed contingent deferred sales charge for Class C Shares (1% if redeemed within 12 months of purchase). Because Institutional, Investor, Class R6, Class R and Class P Shares do not involve a sales charge, such a charge is not applied to their Average Annual Total Return. |
FUND BASICS
Index Definitions
The ICE BofAML Three-Month U.S. Treasury Bill Index is comprised of a single issue purchased at the beginning of the month and held for a full month. At the end of the month that issue is sold and rolled into a newly selected issue. The issue selected at each month-end rebalancing is the outstanding Treasury Bill that matures closest to, but not beyond, three months from the rebalancing date. To qualify for selection, an issue must have settled on or before the month-end rebalancing date. While the index will often hold the Treasury Bill issued at the most recent 3-month auction, it is also possible for a seasoned 6-month Bill to be selected.
It is not possible to invest directly in an unmanaged index.
GOLDMAN SACHS MULTI-STRATEGY ALTERNATIVES FUND
|
Consolidated Schedule of Investments October 31, 2023 |
| | | | | | | | |
| | | Shares | | Description | | Value | |
| |
| | Common Stocks(a) – 0.0% | |
| |
| | Oil, Gas & Consumable Fuels – 0.0% | |
| | 39,366 | | Gazprom PJSC* | | $ | — | |
| | 3,021 | | LUKOIL PJSC | | | — | |
| | 27,893 | | Rosneft Oil Co. PJSC | | | — | |
| | | | | | | | |
| | | | | | | — | |
| | | |
| | TOTAL COMMON STOCKS (Cost $621,979) | | $ | — | |
| | | |
| | | |
| | | Shares | | Dividend Rate | | Value | |
| |
| | Investment Company(b) – 84.5% | |
| | Goldman Sachs Financial Square Government Fund — Institutional Shares | |
| | 84,998,501 | | 5.258% | | $ | 84,998,501 | |
| | (Cost $84,998,501) | | | | |
| | | |
| | TOTAL INVESTMENTS – 84.5% (Cost $85,620,480) | | $ | 84,998,501 | |
| | | |
| | OTHER ASSETS IN EXCESS OF
LIABILITIES – 15.5% | | | 15,573,322 | |
| | | |
| | NET ASSETS – 100.0% | | $ | 100,571,823 | |
| | | |
| | |
The percentage shown for each investment category reflects the value of investments in that category as a percentage of net assets. |
| |
| * | | Non-income producing security. |
| |
| (a) | | Significant unobservable inputs were used in the valuation of this portfolio security; i.e., Level 3. |
| |
| (b) | | Represents an Affiliated Issuer. |
|
|
ADDITIONAL INVESTMENT INFORMATION |
FORWARD FOREIGN CURRENCY EXCHANGE CONTRACTS — At October 31, 2023, the Fund had the following forward foreign currency exchange contracts:
FORWARD FOREIGN CURRENCY EXCHANGE CONTRACTS WITH UNREALIZED GAIN
| | | | | | | | | | | | | | | | | | | | |
| Counterparty | | Currency Purchased | | | Currency Sold | | | Settlement
Date | | | Unrealized Gain | |
|
| |
| | | | | | |
MS & Co. Int. PLC | | CHF | | | 3,210,000 | | | USD | | | 3,538,906 | | | | 12/20/23 | | | $ | 10,802 | |
| | EUR | | | 23,020,000 | | | USD | | | 24,391,047 | | | | 12/20/23 | | | | 25,529 | |
| | GBP | | | 20,660,000 | | | USD | | | 25,081,709 | | | | 12/20/23 | | | | 39,969 | |
| | NZD | | | 28,120,000 | | | USD | | | 16,384,146 | | | | 12/20/23 | | | | 1,430 | |
| | USD | | | 13,648,585 | | | AUD | | | 21,190,000 | | | | 12/20/23 | | | | 183,447 | |
| | USD | | | 58,393,667 | | | CAD | | | 78,660,000 | | | | 12/20/23 | | | | 1,619,597 | |
| | USD | | | 49,596,805 | | | CHF | | | 44,780,000 | | | | 12/20/23 | | | | 77,838 | |
| | USD | | | 4,496,705 | | | EUR | | | 4,230,000 | | | | 12/20/23 | | | | 10,080 | |
| | USD | | | 613,257 | | | GBP | | | 500,000 | | | | 12/20/23 | | | | 5,278 | |
| | USD | | | 45,781,898 | | | JPY | | | 6,800,190,000 | | | | 12/20/23 | | | | 524,265 | |
| | USD | | | 11,605,137 | | | NOK | | | 124,620,000 | | | | 12/20/23 | | | | 432,416 | |
| | USD | | | 18,376,418 | | | NZD | | | 31,020,000 | | | | 12/20/23 | | | | 301,007 | |
| | USD | | | 2,595,260 | | | SEK | | | 28,600,000 | | | | 12/20/23 | | | | 26,460 | |
|
| |
| | | | | | |
| TOTAL | | | | | | | | | | | | | | | | | | $ | 3,258,118 | |
|
| |
|
| FORWARD FOREIGN CURRENCY EXCHANGE CONTRACTS WITH UNREALIZED LOSS | |
| Counterparty | | Currency Purchased | | | Currency Sold | | | Settlement
Date | | | Unrealized
Loss | |
|
| |
| | | | | | |
MS & Co. Int. PLC | | AUD | | | 45,890,000 | | | USD | | | 29,229,988 | | | | 12/20/23 | | | $ | (69,290 | ) |
| | |
| The accompanying notes are an integral part of these financial statements. | | 9 |
GOLDMAN SACHS MULTI-STRATEGY ALTERNATIVES FUND
|
Consolidated Schedule of Investments (continued) October 31, 2023 |
|
|
ADDITIONAL INVESTMENT INFORMATION (continued) |
FORWARD FOREIGN CURRENCY EXCHANGE CONTRACTS WITH UNREALIZED LOSS (continued)
| | | | | | | | | | | | | | | | | | | | |
| Counterparty | | Currency Purchased | | | Currency Sold | | | Settlement Date | | | Unrealized Loss | |
|
| |
| | | | | | |
MS & Co. Int. PLC (continued) | | CAD | | | 7,450,000 | | | USD | | | 5,455,241 | | | | 12/20/23 | | | $ | (78,089 | ) |
| | CHF | | | 25,080,000 | | | USD | | | 27,944,478 | | | | 12/20/23 | | | | (210,319 | ) |
| | EUR | | | 1,200,000 | | | USD | | | 1,275,022 | | | | 12/20/23 | | | | (2,221 | ) |
| | GBP | | | 18,330,000 | | | USD | | | 22,407,532 | | | | 12/20/23 | | | | (119,035 | ) |
| | JPY | | | 9,548,030,000 | | | USD | | | 64,814,326 | | | | 12/20/23 | | | | (1,268,863 | ) |
| | NOK | | | 429,120,000 | | | USD | | | 38,887,410 | | | | 12/20/23 | | | | (414,947 | ) |
| | NZD | | | 1,950,000 | | | USD | | | 1,144,841 | | | | 12/20/23 | | | | (8,572 | ) |
| | SEK | | | 476,560,000 | | | USD | | | 43,276,662 | | | | 12/20/23 | | | | (472,908 | ) |
| | USD | | | 609,278 | | | AUD | | | 960,000 | | | | 12/20/23 | | | | (752 | ) |
| | USD | | | 252,461 | | | CAD | | | 350,000 | | | | 12/20/23 | | | | (157 | ) |
| | USD | | | 24,607,054 | | | CHF | | | 22,450,000 | | | | 12/20/23 | | | | (218,778 | ) |
| | USD | | | 24,787,052 | | | EUR | | | 23,510,000 | | | | 12/20/23 | | | | (149,251 | ) |
| | USD | | | 44,300,584 | | | GBP | | | 36,500,000 | | | | 12/20/23 | | | | (81,857 | ) |
| | USD | | | 1,175,729 | | | NZD | | | 2,020,000 | | | | 12/20/23 | | | | (1,329 | ) |
|
| |
| | | | | | |
| TOTAL | | | | | | | | | | | | | | | | | | $ | (3,096,368 | ) |
|
| |
|
| FUTURES CONTRACTS — At October 31, 2023, the Fund had the following futures contracts: | |
| | | | | | | | | | | | | | |
| Description | | Number of
Contracts | | Expiration
Date | | Notional
Amount | | | Unrealized
Appreciation/
(Depreciation) | |
|
| |
| | | | |
Long position contracts: | | | | | | | | | | | | | | |
10 Year U.K. Long Gilt | | | 187 | | | 12/27/23 | | | $ 21,174,246 | | | | $ (317,399 | ) |
10 Year U.S. Treasury Notes | | | 60 | | | 12/19/23 | | | 6,370,312 | | | | (53,260 | ) |
5 Year German Euro-Oat | | | 44 | | | 12/07/23 | | | 5,739,940 | | | | 60,566 | |
Australian 10 Year Government Bonds | | | 76 | | | 12/15/23 | | | 5,218,540 | | | | (139,540 | ) |
Brent Crude | | | 11 | | | 11/30/23 | | | 935,220 | | | | (35,750 | ) |
Canada 10 Year Government Bonds | | | 57 | | | 12/18/23 | | | 4,724,002 | | | | 33,005 | |
Coffee | | | 120 | | | 12/18/24 | | | 7,546,500 | | | | 603,501 | |
Copper | | | 55 | | | 12/27/23 | | | 5,017,375 | | | | 87,175 | |
Corn | | | 271 | | | 03/14/24 | | | 6,680,150 | | | | (97,043 | ) |
Cotton No.2 | | | 95 | | | 03/06/24 | | | 3,966,725 | | | | (251,275 | ) |
Gasoline RBOB | | | 25 | | | 11/30/23 | | | 2,328,165 | | | | 53,886 | |
Gasoline RBOB | | | 50 | | | 09/30/24 | | | 4,543,560 | | | | (13,640 | ) |
Gold | | | 11 | | | 12/27/23 | | | 2,193,730 | | | | 106,121 | |
Italian 10 Year Government Bonds | | | 41 | | | 12/07/23 | | | 4,781,576 | | | | 75,242 | |
Japan 10 Year Government Bond | | | 104 | | | 12/13/23 | | | 98,631,041 | | | | (976,018 | ) |
KC HRW Wheat | | | 126 | | | 07/12/24 | | | 4,132,800 | | | | (296,041 | ) |
Lead | | | 79 | | | 11/13/23 | | | 4,098,619 | | | | (150,594 | ) |
Lead | | | 2 | | | 01/15/24 | | | 104,288 | | | | (622 | ) |
Lead | | | 80 | | | 12/18/23 | | | 4,172,500 | | | | (24,536 | ) |
Lead | | | 51 | | | 08/19/24 | | | 2,682,600 | | | | 18,752 | |
Lean Hogs | | | 158 | | | 02/14/24 | | | 4,732,100 | | | | (72,482 | ) |
Live Cattle | | | 157 | | | 02/29/24 | | | 11,594,450 | | | | (458,050 | ) |
Low Sulphur Gas Oil | | | 73 | | | 12/12/23 | | | 6,210,475 | | | | (443,449 | ) |
Natural Gas | | | 72 | | | 03/26/24 | | | 2,337,120 | | | | 126,010 | |
Nickel | | | 73 | | | 11/13/23 | | | 7,851,588 | | | | (226,940 | ) |
Nickel | | | 1 | | | 12/18/23 | | | 108,090 | | | | (2,748 | ) |
Nickel | | | 1 | | | 01/15/24 | | | 108,600 | | | | (2,520 | ) |
Nickel | | | 51 | | | 06/17/24 | | | 5,678,748 | | | | (300,110 | ) |
NY Harbor ULSD | | | 15 | | | 11/30/23 | | | 1,833,300 | | | | (109,360 | ) |
Primary Aluminum | | | 71 | | | 12/18/23 | | | 3,988,691 | | | | 76,453 | |
| | |
| 10 | | The accompanying notes are an integral part of these financial statements. |
GOLDMAN SACHS MULTI-STRATEGY ALTERNATIVES FUND
|
|
ADDITIONAL INVESTMENT INFORMATION (continued) |
FUTURES CONTRACTS (continued)
| | | | | | | | | | | | | | | | |
| Description | | Number of
Contracts | | Expiration
Date | | | Notional
Amount | | | Unrealized
Appreciation/
(Depreciation) | |
|
| |
| | | | |
Long position contracts: | | | | | | | | | | | | | | | | |
Primary Aluminum | | | 171 | | | | 11/13/23 | | | | $ 9,612,979 | | | | $ 289,804 | |
Primary Aluminum | | | 220 | | | | 03/18/24 | | | | 12,480,875 | | | | (11,281 | ) |
Primary Aluminum | | | 9 | | | | 01/15/24 | | | | 506,340 | | | | 12,521 | |
Soybean | | | 53 | | | | 12/14/23 | | | | 2,284,300 | | | | 230,340 | |
Soybean | | | 556 | | | | 07/12/24 | | | | 24,660,782 | | | | (153,562 | ) |
Sugar 11 | | | 358 | | | | 04/30/24 | | | | 10,312,691 | | | | 228,668 | |
Wheat | | | 203 | | | | 07/12/24 | | | | 6,285,388 | | | | (209,189 | ) |
WTI Crude | | | 12 | | | | 12/19/23 | | | | 966,000 | | | | (105,600 | ) |
Zinc | | | 42 | | | | 12/18/23 | | | | 2,551,238 | | | | (37,946 | ) |
Zinc | | | 91 | | | | 11/13/23 | | | | 5,512,325 | | | | (34,413 | ) |
Zinc | | | 2 | | | | 01/15/24 | | | | 121,376 | | | | 551 | |
Zinc | | | 118 | | | | 05/13/24 | | | | 7,205,375 | | | | (163,231 | ) |
Zinc | | | 116 | | | | 08/19/24 | | | | 7,123,125 | | | | (75,838 | ) |
|
| |
| | | | |
| Total | | | | | | | | | | | | | | | $(2,759,842 | ) |
|
| |
| | | | |
Short position contracts: | | | | | | | | | | | | | | | | |
Cattle Feeder | | | (37 | ) | | | 01/25/24 | | | | (4,388,200 | ) | | | 218,394 | |
Cocoa | | | (88 | ) | | | 12/13/23 | | | | (3,358,960 | ) | | | (347,269 | ) |
Coffee | | | (160 | ) | | | 12/18/23 | | | | (10,038,000 | ) | | | (607,781 | ) |
Corn | | | (15 | ) | | | 12/14/23 | | | | (359,063 | ) | | | 5,000 | |
Cotton No.2 | | | (103 | ) | | | 12/06/23 | | | | (4,182,830 | ) | | | 351,675 | |
Gasoline RBOB | | | (46 | ) | | | 12/29/23 | | | | (4,273,004 | ) | | | (11,194 | ) |
German 10 Year Euro-Bund | | | (168 | ) | | | 12/07/23 | | | | (22,929,372 | ) | | | (81,707 | ) |
KC HRW Wheat | | | (42 | ) | | | 12/14/23 | | | | (1,321,425 | ) | | | 123,867 | |
Korea 10 Year Government Bonds | | | (232 | ) | | | 12/19/23 | | | | (18,071,452 | ) | | | 45,322 | |
Lead | | | (79 | ) | | | 11/13/23 | | | | (4,098,619 | ) | | | 36,611 | |
Lead | | | (50 | ) | | | 01/15/24 | | | | (2,607,188 | ) | | | (15,528 | ) |
Lead | | | (3 | ) | | | 12/18/23 | | | | (156,469 | ) | | | (668 | ) |
Lean Hogs | | | (89 | ) | | | 12/14/23 | | | | (2,553,410 | ) | | | 16,936 | |
Live Cattle | | | (86 | ) | | | 12/29/23 | | | | (6,314,120 | ) | | | 137,630 | |
Low Sulphur Gas Oil | | | (94 | ) | | | 01/11/24 | | | | (7,870,150 | ) | | | 150,692 | |
Natural Gas | | | (34 | ) | | | 12/27/23 | | | | (1,296,420 | ) | | | (1,920 | ) |
Natural Gas | | | (4 | ) | | | 11/28/23 | | | | (143,000 | ) | | | (3,840 | ) |
Nickel | | | (73 | ) | | | 11/13/23 | | | | (7,851,588 | ) | | | 420,231 | |
Nickel | | | (49 | ) | | | 01/15/24 | | | | (5,321,400 | ) | | | 145,845 | |
Nickel | | | (26 | ) | | | 12/18/23 | | | | (2,810,340 | ) | | | 89,814 | |
Nickel | | | (2 | ) | | | 06/17/24 | | | | (222,696 | ) | | | 5,733 | |
NY Harbor ULSD | | | (50 | ) | | | 12/29/23 | | | | (5,997,810 | ) | | | 132,882 | |
Primary Aluminum | | | (3 | ) | | | 12/18/23 | | | | (168,536 | ) | | | (4,110 | ) |
Primary Aluminum | | | (171 | ) | | | 11/13/23 | | | | (9,612,979 | ) | | | (85,225 | ) |
Primary Aluminum | | | (220 | ) | | | 03/18/24 | | | | (12,480,875 | ) | | | (256,809 | ) |
Silver | | | (18 | ) | | | 12/27/23 | | | | (2,065,680 | ) | | | (38,470 | ) |
Soybean | | | (71 | ) | | | 12/14/23 | | | | (2,190,492 | ) | | | 92,566 | |
Soybean | | | (462 | ) | | | 01/12/24 | | | | (19,341,131 | ) | | | (165,236 | ) |
Sugar 11 | | | (513 | ) | | | 02/29/24 | | | | (15,564,830 | ) | | | (336,957 | ) |
Wheat | | | (147 | ) | | | 12/14/23 | | | | (4,088,438 | ) | | | 155,363 | |
WTI Crude | | | (49 | ) | | | 11/20/23 | | | | (3,969,980 | ) | | | 29,380 | |
Zinc | | | (91 | ) | | | 11/13/23 | | | | (5,512,325 | ) | | | 127,552 | |
Zinc | | | (112 | ) | | | 01/15/24 | | | | (6,797,028 | ) | | | 70,992 | |
| | |
| The accompanying notes are an integral part of these financial statements. | | 11 |
GOLDMAN SACHS MULTI-STRATEGY ALTERNATIVES FUND
|
Consolidated Schedule of Investments (continued) October 31, 2023 |
|
|
ADDITIONAL INVESTMENT INFORMATION (continued) |
FUTURES CONTRACTS (continued)
| | | | | | | | | | | | | | | | | | | | |
| Description | | Number of
Contracts | | Expiration
Date | | | Notional
Amount | | | Unrealized
Appreciation/
(Depreciation) | |
|
| |
| | | | | |
Short position contracts: | | | | | | | | | | | | | | | | | | | | |
Zinc | | | (118) | | | | 05/13/24 | | | $ | (7,205,375 | ) | | | | | | $ | 77,825 | |
Zinc | | | (3) | | | | 08/19/24 | | | | (184,219 | ) | | | | | | | (1,418 | ) |
|
| |
| | | | | |
| Total | | | | | | | | | | | | | | | | | | $ | 476,178 | |
|
| |
| | | | | |
| TOTAL FUTURES CONTRACTS | | | | | | | | | | | | | | | | | | $ | (2,283,664 | ) |
|
| |
| | |
|
Currency Abbreviations: AUD —Australian Dollar CAD —Canadian Dollar CHF —Swiss Franc EUR —Euro GBP —British Pound JPY —Japanese Yen NOK —Norwegian Krone NZD —New Zealand Dollar SEK —Swedish Krona USD —U.S. Dollar |
|
|
| | |
|
Abbreviation: MS & Co. Int. PLC —Morgan Stanley & Co. International PLC |
|
|
| | |
| 12 | | The accompanying notes are an integral part of these financial statements. |
GOLDMAN SACHS MULTI-STRATEGY ALTERNATIVES FUND
|
Consolidated Statement of Assets and Liabilities(a) October 31, 2023 |
| | | | | | | | |
| | | |
| | | Assets: | | | | | | |
| | | |
| | Investments in affiliated issuers, at value (cost $84,998,501) | | $ | 84,998,501 | | | |
| | Investments in unaffiliated issuers, at value (cost $621,979) | | | — | | | |
| | Cash | | | 7,404,024 | | | |
| | Foreign currencies, at value (cost $1,123) | | | 90 | | | |
| | Unrealized gain on forward foreign currency exchange contracts | | | 3,258,118 | | | |
| | Receivables: | | | | | | |
| | Collateral on certain derivative contracts(b) | | | 9,045,012 | | | |
| | Dividends | | | 398,953 | | | |
| | Reimbursement from investment adviser | | | 113,759 | | | |
| | Foreign tax reclaims | | | 44,763 | | | |
| | Due from broker | | | 3,803 | | | |
| | Investments sold | | | 945 | | | |
| | Other assets | | | 57,076 | | | |
| | |
| | Total assets | | | 105,325,044 | | | |
| | |
| | | | | | | | |
| | | |
| | Liabilities: | | | | | | |
| | | |
| | Unrealized loss on forward foreign currency exchange contracts | | | 3,096,368 | | | |
| | Variation margin on futures contracts | | | 427,678 | | | |
| | Payables: | | | | | | |
| | Investments purchased | | | 363,115 | | | |
| | Fund shares redeemed | | | 146,742 | | | |
| | Management fees | | | 51,570 | | | |
| | Distribution and Service fees and Transfer Agency fees | | | 6,328 | | | |
| | Accrued expenses | | | 661,420 | | | |
| | |
| | Total liabilities | | | 4,753,221 | | | |
| | |
| | | | | | | | |
| | | |
| | Net Assets: | | | | | | |
| | | |
| | Paid-in capital | | | 142,175,592 | | | |
| | Total distributable earnings (loss) | | | (41,603,769 | ) | | |
| | |
| | NET ASSETS | | $ | 100,571,823 | | | |
| | | Net Assets: | | | | | | |
| | | Class A | | $ | 7,875,770 | | | |
| | | Class C | | | 542,182 | | | |
| | | Institutional | | | 26,614,232 | | | |
| | | Investor | | | 4,536,928 | | | |
| | | Class R6 | | | 11,218 | | | |
| | | Class R | | | 28,524 | | | |
| | | Class P | | | 60,962,969 | | | |
| | | Total Net Assets | | $ | 100,571,823 | | | |
| | | Shares Outstanding $0.001 par value (unlimited number of shares authorized): | | | | | | |
| | | Class A | | | 712,283 | | | |
| | | Class C | | | 51,941 | | | |
| | | Institutional | | | 2,362,388 | | | |
| | | Investor | | | 405,243 | | | |
| | | Class R6 | | | 994 | | | |
| | | Class R | | | 2,625 | | | |
| | | Class P | | | 5,411,385 | | | |
| | | Net asset value, offering and redemption price per share:(c) | | | | | | |
| | | Class A | | | $11.06 | | | |
| | | Class C | | | 10.44 | | | |
| | | Institutional | | | 11.27 | | | |
| | | Investor | | | 11.20 | | | |
| | | Class R6 | | | 11.29 | | | |
| | | Class R | | | 10.86 | | | |
| | | Class P | | | 11.27 | | | |
| | (a) | Statement of Assets and Liabilities for the Fund is consolidated and includes the balances of the wholly-owned subsidiary, Cayman Commodity- MMA IV, LLC. Accordingly, all interfund balances and transactions have been eliminated. |
| | (b) | Includes segregated cash of $9,045,012 relating to initial margin requirements and/or collateral on futures transactions. |
| | (c) | Maximum public offering price per share for Class A Shares is $11.70. At redemption, Class C Shares may be subject to a contingent deferred sales charge, assessed on the amount equal to the lesser of the current net asset value (“NAV”) or the original purchase price of the shares. |
| | |
| The accompanying notes are an integral part of these financial statements. | | 13 |
GOLDMAN SACHS MULTI-STRATEGY ALTERNATIVES FUND
|
Consolidated Statement of Operations(a) For the Fiscal Year Ended October 31, 2023 |
| | | | | | | | |
| | | |
| | | Investment Income: | | | | | | |
| | | |
| | Dividends — affiliated issuers | | $ | 2,719,971 | | | |
| | Dividends — unaffiliated issuers (net of tax withholding of $57,801) | | | 799,401 | | | |
| | Interest | | | 556,561 | | | |
| | |
| | | |
| | Total investment income | | | 4,075,933 | | | |
| | |
| | | | | | | | |
| | | |
| | Expenses: | | | | | | |
| | | |
| | Management fees | | | 2,494,521 | | | |
| | Custody, accounting and administrative services | | | 1,061,983 | | | |
| | Professional fees | | | 352,198 | | | |
| | Printing and mailing costs | | | 121,979 | | | |
| | Registration fees | | | 103,739 | | | |
| | Dividend expense for securities sold short | | | 82,457 | | | |
| | Transfer Agency fees(b) | | | 63,236 | | | |
| | Trustee fees | | | 38,994 | | | |
| | Distribution and Service (12b-1) fees(b) | | | 29,791 | | | |
| | Prime broker fees | | | 26,072 | | | |
| | Service fees — Class C | | | 2,984 | | | |
| | Other | | | 42,677 | | | |
| | |
| | | |
| | Total expenses | | | 4,420,631 | | | |
| | |
| | | |
| | Less — expense reductions | | | (2,003,935 | ) | | |
| | |
| | | |
| | Net expenses | | | 2,416,696 | | | |
| | |
| | | |
| | NET INVESTMENT INCOME | | | 1,659,237 | | | |
| | |
| | | | | | | | |
| | | |
| | Realized and unrealized gain (loss): | | | | | | |
| | | |
| | Net realized gain (loss) from: | | | | | | |
| | Investments — unaffiliated issuers (including commission recapture of $6,005) | | | 4,995,662 | | | |
| | Securities sold short | | | 119,330 | | | |
| | Purchased options | | | (1,781,864 | ) | | |
| | Futures contracts | | | (987,599 | ) | | |
| | Written options | | | 421,526 | | | |
| | Swap contracts | | | (903,440 | ) | | |
| | Forward foreign currency exchange contracts | | | (1,159,652 | ) | | |
| | Foreign currency transactions | | | 263,653 | | | |
| | Net change in unrealized gain (loss) on: | | | | | | |
| | Investments — unaffiliated issuers | | | (447,854 | ) | | |
| | Securities short sales | | | (6,157 | ) | | |
| | Purchased options | | | 252,159 | | | |
| | Futures contracts | | | (3,894,573 | ) | | |
| | Written options | | | 11,492 | | | |
| | Swap contracts | | | (19,663 | ) | | |
| | Forward foreign currency exchange contracts | | | 150,335 | | | |
| | Foreign currency translation | | | 1,423 | | | |
| | |
| | | |
| | Net realized and unrealized loss | | | (2,985,222 | ) | | |
| | |
| | | |
| | NET DECREASE IN NET ASSETS RESULTING FROM OPERATIONS | | $ | (1,325,985 | ) | | |
| | |
| | (a) | Statement of Operations for the Fund is consolidated and includes the balances of the wholly-owned subsidiary, Cayman Commodity- MMA IV, LLC. Accordingly, all interfund balances and transactions have been eliminated. |
| | (b) | Class specific Distribution and/or Service (12b-1) and Transfer Agency fees were as follows: |
| | | | | | | | | | | | | | | | | | | | |
| Distribution and/or Service (12b-1) Fees | | Transfer Agency Fees | | |
Class A | | Class C | | Class R | | Class A | | Class C | | Institutional | | Investor | | Class R6 | | Class R | | Class P | | |
| $20,696 | | $8,951 | | $144 | | $12,981 | | $1,885 | | $12,487 | | $8,811 | | $10 | | $46 | | $27,016 | | |
| | |
| 14 | | The accompanying notes are an integral part of these financial statements. |
GOLDMAN SACHS MULTI-STRATEGY ALTERNATIVES FUND
|
Consolidated Statements of Changes in Net Assets(a) |
| | | | | | | | | | | | | | | | | | | | | | | | | | | | |
| | | | | | | | Multi-Strategy Alternatives Fund | | | | | | |
| | | | | For the Fiscal
Year Ended
October 31, 2023 | | | | | | For the Fiscal Year Ended
October 31, 2022 | | | |
| | | | | | | | |
| | | From operations: | | | | | | | | | | | | | | | | | | | | | | | | | | |
| | | | | | | | |
| | Net investment income (loss) | | | | | | $ | 1,659,237 | | | | | | | | | | | $ | (1,568,896 | ) | | | | | | |
| | Net realized gain | | | | | | | 967,616 | | | | | | | | | | | | 6,251,004 | | | | | | | |
| | Net change in unrealized loss | | | | | | | (3,952,838 | ) | | | | | | | | | | | (13,265,978 | ) | | | | | | |
| | |
| | | | | | | | |
| | Net decrease in net assets resulting from operations | | | | | | | (1,325,985 | ) | | | | | | | | | | | (8,583,870 | ) | | | | | | |
| | |
| | | | | | | | | | | | | | | | | | | | | | | | | | | | |
| | | | | | | | |
| | Distributions to shareholders: | | | | | | | | | | | | | | | | | | | | | | | | | | |
| | | | | | | | |
| | From distributable earnings: | | | | | | | | | | | | | | | | | | | | | | | | | | |
| | Class A Shares | | | | | | | (19,132 | ) | | | | | | | | | | | — | | | | | | | |
| | Institutional Shares | | | | | | | (170,765 | ) | | | | | | | | | | | — | | | | | | | |
| | Investor Shares | | | | | | | (25,221 | ) | | | | | | | | | | | — | | | | | | | |
| | Class R6 Shares | | | | | | | (185 | ) | | | | | | | | | | | — | | | | | | | |
| | Class P Shares | | | | | | | (484,761 | ) | | | | | | | | | | | — | | | | | | | |
| | |
| | | | | | | | |
| | Total distributions to shareholders | | | | | | | (700,064 | ) | | | | | | | | | | | — | | | | | | | |
| | |
| | | | | | | | | | | | | | | | | | | | | | | | | | | | |
| | | | | | | | |
| | From share transactions: | | | | | | | | | | | | | | | | | | | | | | | | | | |
| | | | | | | | |
| | Proceeds from sales of shares | | | | | | | 7,328,573 | | | | | | | | | | | | 21,896,074 | | | | | | | |
| | Reinvestment of distributions | | | | | | | 692,421 | | | | | | | | | | | | — | | | | | | | |
| | Cost of shares redeemed | | | | | | | (56,413,500 | ) | | | | | | | | | | | (38,848,647 | ) | | | | | | |
| | |
| | | | | | | | |
| | Net decrease in net assets resulting from share transactions | | | | | | | (48,392,506 | ) | | | | | | | | | | | (16,952,573 | ) | | | | | | |
| | |
| | | | | | | | |
| | TOTAL DECREASE | | | | | | | (50,418,555 | ) | | | | | | | | | | | (25,536,443 | ) | | | | | | |
| | |
| | | | | | | | | | | | | | | | | | | | | | | | | | | | |
| | | | | | | | |
| | Net assets: | | | | | | | | | | | | | | | | | | | | | | | | | | |
| | | | | | | | |
| | Beginning of year | | | | | | | 150,990,378 | | | | | | | | | | | | 176,526,821 | | | | | | | |
| | |
| | | | | | | | |
| | End of year | | | | | | $ | 100,571,823 | | | | | | | | | | | $ | 150,990,378 | | | | | | | |
| | |
| | (a) | Statements of Changes in Net Assets for the Fund is consolidated and includes the balances of the wholly-owned subsidiary, Cayman Commodity — MMA IV, LLC. Accordingly, all interfund balances and transactions have been eliminated. |
| | |
| The accompanying notes are an integral part of these financial statements. | | 15 |
GOLDMAN SACHS MULTI-STRATEGY ALTERNATIVES FUND
|
Consolidated Financial Highlights Selected Share Data for a Share Outstanding Throughout Each Year |
| | | | | | | | | | | | | | | | | | | | | | | | | | | | | |
| | | | | Goldman Sachs Multi-Strategy Alternatives Fund | | |
| | | |
| | | | | Class A Shares | | |
| | | |
| | | | | Year Ended October 31, | | |
| | | | | | | |
| | | | | 2023 | | 2022 | | 2021 | | 2020 | | 2019 | | |
| | | | | | | |
| | Per Share Data | | | | | | | | | | | | | | | | | | | | | | | | | | | |
| | | | | | | |
| | | Net asset value, beginning of year | | | $ | 11.22 | | | | $ | 11.86 | | | | $ | 10.66 | | | | $ | 10.48 | | | | $ | 9.91 | | | |
| | |
| | | | | | | |
| | Net investment income (loss)(a) | | | | 0.11 | | | | | (0.14 | ) | | | | (0.07 | ) | | | | (0.01 | ) | | | | 0.04 | | | |
| | | | | | | |
| | Net realized and unrealized gain (loss) | | | | (0.25 | ) | | | | (0.50 | ) | | | | 1.27 | | | | | 0.25 | | | | | 0.53 | | | |
| | |
| | | | | | | |
| | Total from investment operations | | | | (0.14 | ) | | | | (0.64 | ) | | | | 1.20 | | | | | 0.24 | | | | | 0.57 | | | |
| | |
| | | | | | | |
| | Distributions to shareholders from net investment income | | | | (0.02 | ) | | | | — | | | | | — | | | | | (0.06 | ) | | | | — | | | |
| | |
| | | | | | | |
| | Net asset value, end of year | | | $ | 11.06 | | | | $ | 11.22 | | | | $ | 11.86 | | | | $ | 10.66 | | | | $ | 10.48 | | | |
| | |
| | | | | | | |
| | Total return(b) | | | | (1.30 | )% | | | | (5.31 | )% | | | | 11.26 | % | | | | 2.33 | % | | | | 5.75 | % | | |
| | |
| | | | | | | |
| | Net assets, end of year (in 000s) | | | $ | 7,876 | | | | $ | 8,666 | | | | $ | 7,943 | | | | $ | 8,015 | | | | $ | 11,538 | | | |
| | | | | | | |
| | Ratio of net expenses to average net assets (including dividend and interest payments and other expenses relating to securities sold short) | | | | 2.02 | % | | | | 2.18 | % | | | | 2.15 | % | | | | 2.13 | % | | | | 2.12 | % | | |
| | | | | | | |
| | Ratio of net expenses to average net assets (excluding dividend and interest payments and other expenses relating to securities sold short) | | | | 1.95 | % | | | | 2.08 | % | | | | 2.08 | % | | | | 2.07 | % | | | | 2.07 | % | | |
| | | | | | | |
| | Ratio of total expenses to average net assets (including dividend and interest payments and other expenses relating to securities sold short) | | | | 3.53 | % | | | | 3.38 | % | | | | 3.36 | % | | | | 4.32 | % | | | | 3.51 | % | | |
| | | | | | | |
| | Ratio of total expenses to average net assets (excluding dividend and interest payments and other expenses relating to securities sold short) | | | | 3.46 | % | | | | 3.29 | % | | | | 3.30 | % | | | | 4.27 | % | | | | 3.46 | % | | |
| | | | | | | |
| | Ratio of net investment income (loss) to average net assets | | | | 1.00 | % | | | | (1.21 | )% | | | | (0.63 | )% | | | | (0.17 | )% | | | | 0.39 | % | | |
| | | | | | | |
| | Portfolio turnover rate(c) | | | | 242 | % | | | | 236 | % | | | | 269 | % | | | | 222 | % | | | | 202 | % | | |
| | |
| | (a) | Calculated based on the average shares outstanding methodology. |
| | (b) | Assumes investment at the NAV at the beginning of the year, reinvestment of all dividends and distributions, a complete redemption of the investment at the NAV at the end of the year and no sales or redemption charges (if any). Total returns would be reduced if a sales or redemption charge was taken into account. Returns do not reflect the impact of taxes to shareholders relating to Fund distributions or the redemption of Fund shares. |
| | (c) | The Fund’s portfolio turnover rate is calculated in accordance with regulatory requirements, without regard to transactions involving short term investments and certain derivatives. If such transactions were included, the Fund’s portfolio turnover rate may be higher. |
| | |
| 16 | | The accompanying notes are an integral part of these financial statements. |
GOLDMAN SACHS MULTI-STRATEGY ALTERNATIVES FUND
|
Consolidated Financial Highlights (continued) Selected Share Data for a Share Outstanding Throughout Each Year |
| | | | | | | | | | | | | | | | | | | | | | | | | | | | | |
| | | | | Goldman Sachs Multi-Strategy Alternatives Fund | | |
| | | |
| | | | | Class C Shares | | |
| | | |
| | | | | Year Ended October 31, | | |
| | | | | | | |
| | | | | 2023 | | 2022 | | 2021 | | 2020 | | 2019 | | |
| | | | | | | |
| | | Per Share Data | | | | | | | | | | | | | | | | | | | | | | | | | | | |
| | | | | | | |
| | Net asset value, beginning of year | | | $ | 10.64 | | | | $ | 11.34 | | | | $ | 10.26 | | | | $ | 10.11 | | | | $ | 9.62 | | | |
| | |
| | | | | | | |
| | Net investment loss(a) | | | | 0.00 | | | | | (0.24 | ) | | | | (0.15 | ) | | | | (0.09 | ) | | | | (0.03 | ) | | |
| | | | | | | |
| | Net realized and unrealized gain (loss) | | | | (0.20 | ) | | | | (0.46 | ) | | | | 1.23 | | | | | 0.24 | | | | | 0.52 | | | |
| | |
| | | | | | | |
| | Total from investment operations | | | | (0.20 | ) | | | | (0.70 | ) | | | | 1.08 | | | | | 0.15 | | | | | 0.49 | | | |
| | |
| | | | | | | |
| | Net asset value, end of year | | | $ | 10.44 | | | | $ | 10.64 | | | | $ | 11.34 | | | | $ | 10.26 | | | | $ | 10.11 | | | |
| | |
| | | | | | | |
| | Total return(b) | | | | (1.97 | )% | | | | (6.08 | )% | | | | 10.53 | % | | | | 1.48 | % | | | | 4.98 | % | | |
| | |
| | | | | | | |
| | Net assets, end of year (in 000s) | | | $ | 542 | | | | $ | 1,810 | | | | $ | 3,544 | | | | $ | 5,045 | | | | $ | 7,646 | | | |
| | | | | | | |
| | Ratio of net expenses to average net assets (including dividend and interest payments and other expenses relating to securities sold short) | | | | 2.85 | % | | | | 2.93 | % | | | | 2.89 | % | | | | 2.88 | % | | | | 2.87 | % | | |
| | | | | | | |
| | Ratio of net expenses to average net assets (excluding dividend and interest payments and other expenses relating to securities sold short) | | | | 2.76 | % | | | | 2.83 | % | | | | 2.84 | % | | | | 2.82 | % | | | | 2.82 | % | | |
| | | | | | | |
| | Ratio of total expenses to average net assets (including dividend and interest payments and other expenses relating to securities sold short) | | | | 4.36 | % | | | | 4.11 | % | | | | 4.15 | % | | | | 5.09 | % | | | | 4.27 | % | | |
| | | | | | | |
| | Ratio of total expenses to average net assets (excluding dividend and interest payments and other expenses relating to securities sold short) | | | | 4.27 | % | | | | 4.01 | % | | | | 4.09 | % | | | | 5.03 | % | | | | 4.21 | % | | |
| | | | | | | |
| | Ratio of net investment income (loss) to average net assets | | | | 0.03 | % | | | | (2.16 | )% | | | | (1.39 | )% | | | | (0.92 | )% | | | | (0.36 | )% | | |
| | | | | | | |
| | Portfolio turnover rate(c) | | | | 242 | % | | | | 236 | % | | | | 269 | % | | | | 222 | % | | | | 202 | % | | |
| | |
| | (a) | Calculated based on the average shares outstanding methodology. |
| | (b) | Assumes investment at the NAV at the beginning of the year, reinvestment of all dividends and distributions, a complete redemption of the investment at the NAV at the end of the year and no sales or redemption charges (if any). Total returns would be reduced if a sales or redemption charge was taken into account. Returns do not reflect the impact of taxes to shareholders relating to Fund distributions or the redemption of Fund shares. |
| | (c) | The Fund’s portfolio turnover rate is calculated in accordance with regulatory requirements, without regard to transactions involving short term investments and certain derivatives. If such transactions were included, the Fund’s portfolio turnover rate may be higher. |
| | |
| The accompanying notes are an integral part of these financial statements. | | 17 |
GOLDMAN SACHS MULTI-STRATEGY ALTERNATIVES FUND
|
Consolidated Financial Highlights (continued) Selected Share Data for a Share Outstanding Throughout Each Year |
| | | | | | | | | | | | | | | | | | | | | | | | | | | | | |
| | | | | Goldman Sachs Multi-Strategy Alternatives Fund | | |
| | | |
| | | | | Institutional Shares | | |
| | | |
| | | | | Year Ended October 31, | | |
| | | | | | | |
| | | | | 2023 | | 2022 | | 2021 | | 2020 | | 2019 | | |
| | | | | | | |
| | | Per Share Data | | | | | | | | | | | | | | | | | | | | | | | | | | | |
| | | | | | | |
| | Net asset value, beginning of year | | | $ | 11.42 | | | | $ | 12.04 | | | | $ | 10.78 | | | | $ | 10.62 | | | | $ | 10.00 | | | |
| | |
| | | | | | | |
| | Net investment income (loss)(a) | | | | 0.14 | | | | | (0.11 | ) | | | | (0.03 | ) | | | | 0.01 | | | | | 0.07 | | | |
| | | | | | | |
| | Net realized and unrealized gain (loss) | | | | (0.23 | ) | | | | (0.51 | ) | | | | 1.29 | | | | | 0.26 | | | | | 0.55 | | | |
| | |
| | | | | | | |
| | Total from investment operations | | | | (0.09 | ) | | | | (0.62 | ) | | | | 1.26 | | | | | 0.27 | | | | | 0.62 | | | |
| | |
| | | | | | | |
| | Distributions to shareholders from net investment income | | | | (0.06 | ) | | | | — | | | | | — | | | | | (0.11 | ) | | | | — | | | |
| | |
| | | | | | | |
| | Net asset value, end of year | | | $ | 11.27 | | | | $ | 11.42 | | | | $ | 12.04 | | | | $ | 10.78 | | | | $ | 10.62 | | | |
| | |
| | | | | | | |
| | Total return(b) | | | | (0.92 | )% | | | | (5.07 | )% | | | | 11.58 | % | | | | 2.66 | % | | | | 6.20 | % | | |
| | |
| | | | | | | |
| | Net assets, end of year (in 000s) | | | $ | 26,614 | | | | $ | 35,165 | | | | $ | 54,438 | | | | $ | 67,354 | | | | $ | 158,958 | | | |
| | | | | | | |
| | Ratio of net expenses to average net assets (including dividend and interest payments and other expenses relating to securities sold short) | | | | 1.73 | % | | | | 1.86 | % | | | | 1.82 | % | | | | 1.81 | % | | | | 1.80 | % | | |
| | | | | | | |
| | Ratio of net expenses to average net assets (excluding dividend and interest payments and other expenses relating to securities sold short) | | | | 1.66 | % | | | | 1.76 | % | | | | 1.76 | % | | | | 1.75 | % | | | | 1.74 | % | | |
| | | | | | | |
| | Ratio of total expenses to average net assets (including dividend and interest payments and other expenses relating to securities sold short) | | | | 3.18 | % | | | | 3.00 | % | | | | 3.00 | % | | | | 3.94 | % | | | | 3.03 | % | | |
| | | | | | | |
| | Ratio of total expenses to average net assets (excluding dividend and interest payments and other expenses relating to securities sold short) | | | | 3.10 | % | | | | 2.90 | % | | | | 2.94 | % | | | | 3.88 | % | | | | 2.98 | % | | |
| | | | | | | |
| | Ratio of net investment income (loss) to average net assets | | | | 1.26 | % | | | | (0.98 | )% | | | | (0.28 | )% | | | | 0.14 | % | | | | 0.71 | % | | |
| | | | | | | |
| | Portfolio turnover rate(c) | | | | 242 | % | | | | 236 | % | | | | 269 | % | | | | 222 | % | | | | 202 | % | | |
| | |
| | (a) | Calculated based on the average shares outstanding methodology. |
| | (b) | Assumes investment at the NAV at the beginning of the year, reinvestment of all dividends and distributions, a complete redemption of the investment at the NAV at the end of the year and no sales or redemption charges (if any). Total returns would be reduced if a sales or redemption charge was taken into account. Returns do not reflect the impact of taxes to shareholders relating to Fund distributions or the redemption of Fund shares. |
| | (c) | The Fund’s portfolio turnover rate is calculated in accordance with regulatory requirements, without regard to transactions involving short term investments and certain derivatives. If such transactions were included, the Fund’s portfolio turnover rate may be higher. |
| | |
| 18 | | The accompanying notes are an integral part of these financial statements. |
GOLDMAN SACHS MULTI-STRATEGY ALTERNATIVES FUND
|
Consolidated Financial Highlights (continued) Selected Share Data for a Share Outstanding Throughout Each Year |
| | | | | | | | | | | | | | | | | | | | | | | | | | | | | |
| | | | | Goldman Sachs Multi-Strategy Alternatives Fund | | |
| | | |
| | | | | Investor Shares | | |
| | | |
| | | | | Year Ended October 31, | | |
| | | | | | | |
| | | | | 2023 | | 2022 | | 2021 | | 2020 | | 2019 | | |
| | | | | | | |
| | | Per Share Data | | | | | | | | | | | | | | | | | | | | | | | | | | | |
| | | | | | | |
| | Net asset value, beginning of year | | | $ | 11.35 | | | | $ | 11.97 | | | | $ | 10.73 | | | | $ | 10.56 | | | | $ | 9.95 | | | |
| | |
| | | | | | | |
| | Net investment income (loss)(a) | | | | 0.14 | | | | | (0.12 | ) | | | | (0.04 | ) | | | | 0.01 | | | | | 0.07 | | | |
| | | | | | | |
| | Net realized and unrealized gain (loss) | | | | (0.24 | ) | | | | (0.50 | ) | | | | 1.28 | | | | | 0.26 | | | | | 0.54 | | | |
| | |
| | | | | | | |
| | Total from investment operations | | | | (0.10 | ) | | | | (0.62 | ) | | | | 1.24 | | | | | 0.27 | | | | | 0.61 | | | |
| | |
| | | | | | | |
| | Distributions to shareholders from net investment income | | | | (0.05 | ) | | | | — | | | | | — | | | | | (0.10 | ) | | | | — | | | |
| | |
| | | | | | | |
| | Net asset value, end of year | | | $ | 11.20 | | | | $ | 11.35 | | | | $ | 11.97 | | | | $ | 10.73 | | | | $ | 10.56 | | | |
| | |
| | | | | | | |
| | Total return(b) | | | | (1.00 | )% | | | | (5.10 | )% | | | | 11.56 | % | | | | 2.59 | % | | | | 6.02 | % | | |
| | |
| | | | | | | |
| | Net assets, end of year (in 000s) | | | $ | 4,537 | | | | $ | 5,853 | | | | $ | 7,478 | | | | $ | 10,061 | | | | $ | 12,457 | | | |
| | | | | | | |
| | Ratio of net expenses to average net assets (including dividend and interest payments and other expenses relating to securities sold short) | | | | 1.79 | % | | | | 1.93 | % | | | | 1.89 | % | | | | 1.88 | % | | | | 1.87 | % | | |
| | | | | | | |
| | Ratio of net expenses to average net assets (excluding dividend and interest payments and other expenses relating to securities sold short) | | | | 1.72 | % | | | | 1.83 | % | | | | 1.83 | % | | | | 1.82 | % | | | | 1.82 | % | | |
| | | | | | | |
| | Ratio of total expenses to average net assets (including dividend and interest payments and other expenses relating to securities sold short) | | | | 3.30 | % | | | | 3.12 | % | | | | 3.10 | % | | | | 4.07 | % | | | | 3.23 | % | | |
| | | | | | | |
| | Ratio of total expenses to average net assets (excluding dividend and interest payments and other expenses relating to securities sold short) | | | | 3.22 | % | | | | 3.02 | % | | | | 3.04 | % | | | | 4.02 | % | | | | 3.18 | % | | |
| | | | | | | |
| | Ratio of net investment income (loss) to average net assets | | | | 1.22 | % | | | | (1.07 | )% | | | | (0.38 | )% | | | | 0.07 | % | | | | 0.63 | % | | |
| | | | | | | |
| | Portfolio turnover rate(c) | | | | 242 | % | | | | 236 | % | | | | 269 | % | | | | 222 | % | | | | 202 | % | | |
| | |
| | (a) | Calculated based on the average shares outstanding methodology. |
| | (b) | Assumes investment at the NAV at the beginning of the year, reinvestment of all dividends and distributions, a complete redemption of the investment at the NAV at the end of the year and no sales or redemption charges (if any). Total returns would be reduced if a sales or redemption charge was taken into account. Returns do not reflect the impact of taxes to shareholders relating to Fund distributions or the redemption of Fund shares. |
| | (c) | The Fund’s portfolio turnover rate is calculated in accordance with regulatory requirements, without regard to transactions involving short term investments and certain derivatives. If such transactions were included, the Fund’s portfolio turnover rate may be higher. |
| | |
| The accompanying notes are an integral part of these financial statements. | | 19 |
GOLDMAN SACHS MULTI-STRATEGY ALTERNATIVES FUND
|
Consolidated Financial Highlights (continued) Selected Share Data for a Share Outstanding Throughout Each Year |
| | | | | | | | | | | | | | | | | | | | | | | | | | | | | |
| | | | | Goldman Sachs Multi-Strategy Alternatives Fund | | |
| | | |
| | | | | Class R6 Shares | | |
| | | |
| | | | | Year Ended October 31, | | |
| | | | | | | |
| | | | | 2023 | | 2022 | | 2021 | | 2020 | | 2019 | | |
| | | | | | | |
| | | Per Share Data | | | | | | | | | | | | | | | | | | | | | | | | | | | |
| | | | | | | |
| | Net asset value, beginning of year | | | $ | 11.44 | | | | $ | 12.05 | | | | $ | 10.79 | | | | $ | 10.63 | | | | $ | 10.01 | | | |
| | |
| | | | | | | |
| | Net investment income (loss)(a) | | | | 0.13 | | | | | (0.10 | ) | | | | (0.04 | ) | | | | 0.02 | | | | | 0.08 | | | |
| | | | | | | |
| | Net realized and unrealized gain (loss) | | | | (0.22 | ) | | | | (0.51 | ) | | | | 1.30 | | | | | 0.25 | | | | | 0.54 | | | |
| | |
| | | | | | | |
| | Total from investment operations | | | | (0.09 | ) | | | | (0.61 | ) | | | | 1.26 | | | | | 0.27 | | | | | 0.62 | | | |
| | |
| | | | | | | |
| | Distributions to shareholders from net investment income | | | | (0.06 | ) | | | | — | | | | | — | | | | | (0.11 | ) | | | | — | | | |
| | |
| | | | | | | |
| | Net asset value, end of year | | | $ | 11.29 | | | | $ | 11.44 | | | | $ | 12.05 | | | | $ | 10.79 | | | | $ | 10.63 | | | |
| | |
| | | | | | | |
| | Total return(b) | | | | (0.81 | )% | | | | (5.06 | )% | | | | 11.68 | % | | | | 2.60 | % | | | | 6.19 | % | | |
| | |
| | | | | | | |
| | Net assets, end of year (in 000s) | | | $ | 11 | | | | $ | 37 | | | | $ | 12 | | | | $ | 11 | | | | $ | 10 | | | |
| | | | | | | |
| | Ratio of net expenses to average net assets (including dividend and interest payments and other expenses relating to securities sold short) | | | | 1.80 | % | | | | 1.87 | % | | | | 1.83 | % | | | | 1.81 | % | | | | 1.79 | % | | |
| | | | | | | |
| | Ratio of net expenses to average net assets (excluding dividend and interest payments and other expenses relating to securities sold short) | | | | 1.70 | % | | | | 1.77 | % | | | | 1.76 | % | | | | 1.76 | % | | | | 1.74 | % | | |
| | | | | | | |
| | Ratio of total expenses to average net assets (including dividend and interest payments and other expenses relating to securities sold short) | | | | 3.24 | % | | | | 3.01 | % | | | | 2.96 | % | | | | 3.93 | % | | | | 3.23 | % | | |
| | | | | | | |
| | Ratio of total expenses to average net assets (excluding dividend and interest payments and other expenses relating to securities sold short) | | | | 3.14 | % | | | | 2.91 | % | | | | 2.89 | % | | | | 3.88 | % | | | | 3.18 | % | | |
| | | | | | | |
| | Ratio of net investment income (loss) to average net assets | | | | 1.12 | % | | | | (0.91 | )% | | | | (0.30 | )% | | | | 0.12 | % | | | | 0.75 | % | | |
| | | | | | | |
| | Portfolio turnover rate(c) | | | | 242 | % | | | | 236 | % | | | | 269 | % | | | | 222 | % | | | | 202 | % | | |
| | |
| | (a) | Calculated based on the average shares outstanding methodology. |
| | (b) | Assumes investment at the NAV at the beginning of the year, reinvestment of all dividends and distributions, a complete redemption of the investment at the NAV at the end of the year and no sales or redemption charges (if any). Total returns would be reduced if a sales or redemption charge was taken into account. Returns do not reflect the impact of taxes to shareholders relating to Fund distributions or the redemption of Fund shares. |
| | (c) | The Fund’s portfolio turnover rate is calculated in accordance with regulatory requirements, without regard to transactions involving short term investments and certain derivatives. If such transactions were included, the Fund’s portfolio turnover rate may be higher. |
| | |
| 20 | | The accompanying notes are an integral part of these financial statements. |
GOLDMAN SACHS MULTI-STRATEGY ALTERNATIVES FUND
|
Consolidated Financial Highlights (continued) Selected Share Data for a Share Outstanding Throughout Each Year |
| | | | | | | | | | | | | | | | | | | | | | | | | | | | | |
| | | | | Goldman Sachs Multi-Strategy Alternatives Fund | | |
| | | |
| | | | | Class R Shares | | |
| | | |
| | | | | Year Ended October 31, | | |
| | | | | | | |
| | | | | 2023 | | 2022 | | 2021 | | 2020 | | 2019 | | |
| | | | | | | |
| | | Per Share Data | | | | | | | | | | | | | | | | | | | | | | | | | | | |
| | | | | | | |
| | Net asset value, beginning of year | | | $ | 11.02 | | | | $ | 11.68 | | | | $ | 10.52 | | | | $ | 10.37 | | | | $ | 9.82 | | | |
| | |
| | | | | | | |
| | Net investment income (loss)(a) | | | | 0.08 | | | | | (0.17 | ) | | | | (0.10 | ) | | | | (0.05 | ) | | | | 0.02 | | | |
| | | | | | | |
| | Net realized and unrealized gain (loss) | | | | (0.24 | ) | | | | (0.49 | ) | | | | 1.26 | | | | | 0.26 | | | | | 0.53 | | | |
| | |
| | | | | | | |
| | Total from investment operations | | | | (0.16 | ) | | | | (0.66 | ) | | | | 1.16 | | | | | 0.21 | | | | | 0.55 | | | |
| | |
| | | | | | | |
| | Distributions to shareholders from net investment income | | | | — | | | | | — | | | | | — | | | | | (0.06 | ) | | | | — | | | |
| | |
| | | | | | | |
| | Net asset value, end of year | | | $ | 10.86 | | | | $ | 11.02 | | | | $ | 11.68 | | | | $ | 10.52 | | | | $ | 10.37 | | | |
| | |
| | | | | | | |
| | Total return(b) | | | | (1.45 | )% | | | | (5.57 | )% | | | | 11.03 | % | | | | 1.98 | % | | | | 5.60 | % | | |
| | |
| | | | | | | |
| | Net assets, end of year (in 000s) | | | $ | 29 | | | | $ | 29 | | | | $ | 31 | | | | $ | 27 | | | | $ | 27 | | | |
| | | | | | | |
| | Ratio of net expenses to average net assets (including dividend and interest payments and other expenses relating to securities sold short) | | | | 2.27 | % | | | | 2.42 | % | | | | 2.39 | % | | | | 2.38 | % | | | | 2.38 | % | | |
| | | | | | | |
| | Ratio of net expenses to average net assets (excluding dividend and interest payments and other expenses relating to securities sold short) | | | | 2.20 | % | | | | 2.32 | % | | | | 2.33 | % | | | | 2.32 | % | | | | 2.32 | % | | |
| | | | | | | |
| | Ratio of total expenses to average net assets (including dividend and interest payments and other expenses relating to securities sold short) | | | | 3.77 | % | | | | 3.62 | % | | | | 3.59 | % | | | | 4.56 | % | | | | 3.86 | % | | |
| | | | | | | |
| | Ratio of total expenses to average net assets (excluding dividend and interest payments and other expenses relating to securities sold short) | | | | 3.71 | % | | | | 3.52 | % | | | | 3.53 | % | | | | 4.50 | % | | | | 3.81 | % | | |
| | | | | | | |
| | Ratio of net investment income (loss) to average net assets | | | | 0.77 | % | | | | (1.50 | )% | | | | (0.87 | )% | | | | (0.44 | )% | | | | 0.15 | % | | |
| | | | | | | |
| | Portfolio turnover rate(c) | | | | 242 | % | | | | 236 | % | | | | 269 | % | | | | 222 | % | | | | 202 | % | | |
| | |
| | (a) | Calculated based on the average shares outstanding methodology. |
| | (b) | Assumes investment at the NAV at the beginning of the year, reinvestment of all dividends and distributions, a complete redemption of the investment at the NAV at the end of the year and no sales or redemption charges (if any). Total returns would be reduced if a sales or redemption charge was taken into account. Returns do not reflect the impact of taxes to shareholders relating to Fund distributions or the redemption of Fund shares. |
| | (c) | The Fund’s portfolio turnover rate is calculated in accordance with regulatory requirements, without regard to transactions involving short term investments and certain derivatives. If such transactions were included, the Fund’s portfolio turnover rate may be higher. |
| | |
| The accompanying notes are an integral part of these financial statements. | | 21 |
GOLDMAN SACHS MULTI-STRATEGY ALTERNATIVES FUND
|
Consolidated Financial Highlights (continued) Selected Share Data for a Share Outstanding Throughout Each Year |
| | | | | | | | | | | | | | | | | | | | | | | | | | | | | |
| | | | | Goldman Sachs Multi-Strategy Alternatives Fund | | |
| | | |
| | | | | Class P Shares | | |
| | | |
| | | | | Year Ended October 31, | | |
| | | | | | | |
| | | | | 2023 | | 2022 | | 2021 | | 2020 | | 2019 | | |
| | | | | | | |
| | | Per Share Data | | | | | | | | | | | | | | | | | | | | | | | | | | | |
| | | | | | | |
| | Net asset value, beginning of year | | | $ | 11.42 | | | | $ | 12.04 | | | | $ | 10.78 | | | | $ | 10.62 | | | | $ | 10.00 | | | |
| | |
| | | | | | | |
| | Net investment income (loss)(a) | | | | 0.14 | | | | | (0.11 | ) | | | | (0.03 | ) | | | | 0.02 | | | | | 0.08 | | | |
| | | | | | | |
| | Net realized and unrealized gain (loss) | | | | (0.23 | ) | | | | (0.51 | ) | | | | 1.29 | | | | | 0.25 | | | | | 0.54 | | | |
| | |
| | | | | | | |
| | Total from investment operations | | | | (0.09 | ) | | | | (0.62 | ) | | | | 1.26 | | | | | 0.27 | | | | | 0.62 | | | |
| | |
| | | | | | | |
| | Distributions to shareholders from net investment income | | | | (0.06 | ) | | | | — | | | | | — | | | | | (0.11 | ) | | | | — | | | |
| | |
| | | | | | | |
| | Net asset value, end of year | | | $ | 11.27 | | | | $ | 11.42 | | | | $ | 12.04 | | | | $ | 10.78 | | | | $ | 10.62 | | | |
| | |
| | | | | | | |
| | Total return(b) | | | | (0.91 | )% | | | | (5.07 | )% | | | | 11.69 | % | | | | 2.60 | % | | | | 6.20 | % | | |
| | |
| | | | | | | |
| | Net assets, end of year (in 000s) | | | $ | 60,963 | | | | $ | 99,431 | | | | $ | 103,080 | | | | $ | 59,182 | | | | $ | 73,641 | | | |
| | | | | | | |
| | Ratio of net expenses to average net assets (including dividend and interest payments and other expenses relating to securities sold short) | | | | 1.75 | % | | | | 1.85 | % | | | | 1.81 | % | | | | 1.80 | % | | | | 1.79 | % | | |
| | | | | | | |
| | Ratio of net expenses to average net assets (excluding dividend and interest payments and other expenses relating to securities sold short) | | | | 1.66 | % | | | | 1.75 | % | | | | 1.76 | % | | | | 1.74 | % | | | | 1.73 | % | | |
| | | | | | | |
| | Ratio of total expenses to average net assets (including dividend and interest payments and other expenses relating to securities sold short) | | | | 3.19 | % | | | | 2.99 | % | | | | 2.91 | % | | | | 3.93 | % | | | | 3.13 | % | | |
| | | | | | | |
| | Ratio of total expenses to average net assets (excluding dividend and interest payments and other expenses relating to securities sold short) | | | | 3.11 | % | | | | 2.89 | % | | | | 2.85 | % | | | | 3.88 | % | | | | 3.08 | % | | |
| | | | | | | |
| | Ratio of net investment income (loss) to average net assets | | | | 1.24 | % | | | | (0.93 | )% | | | | (0.29 | )% | | | | 0.15 | % | | | | 0.73 | % | | |
| | | | | | | |
| | Portfolio turnover rate(c) | | | | 242 | % | | | | 236 | % | | | | 269 | % | | | | 222 | % | | | | 202 | % | | |
| | |
| | (a) | Calculated based on the average shares outstanding methodology. |
| | (b) | Assumes investment at the NAV at the beginning of the year, reinvestment of all dividends and distributions, a complete redemption of the investment at the NAV at the end of the year and no sales or redemption charges (if any). Total returns would be reduced if a sales or redemption charge was taken into account. Returns do not reflect the impact of taxes to shareholders relating to Fund distributions or the redemption of Fund shares. |
| | (c) | The Fund’s portfolio turnover rate is calculated in accordance with regulatory requirements, without regard to transactions involving short term investments and certain derivatives. If such transactions were included, the Fund’s portfolio turnover rate may be higher. |
| | |
| 22 | | The accompanying notes are an integral part of these financial statements. |
GOLDMAN SACHS MULTI-STRATEGY ALTERNATIVES FUND
|
Consolidated Notes to Financial Statements October 31, 2023 |
Goldman Sachs Trust II (the “Trust”) is a Delaware statutory trust registered under the Investment Company Act of 1940, as amended (the “Act”), as an open-end management investment company. The Trust includes the Goldman Sachs Multi-Strategy Alternatives Fund (the “Fund”). Effective September 22, 2023, the fund changed its name from Multi-Manager Alternatives Fund to Multi-Strategy Alternatives Fund. The Fund is a diversified portfolio and currently offers seven classes of shares: Class A, Class C, Institutional, Investor, Class R6, Class R and Class P Shares.
Class A Shares are sold with a front-end sales charge of up to 5.50%. Class C Shares are sold with a contingent deferred sales charge (“CDSC”) of 1.00%, which is imposed on redemptions made within 12 months of purchase. Institutional, Investor, Class R6, Class R and Class P Shares are not subject to a sales charge.
Goldman Sachs Asset Management, L.P. (“GSAM”), an affiliate of Goldman Sachs & Co. LLC (“Goldman Sachs”), serves as investment adviser to the Fund pursuant to a management agreement (the “Agreement”) with the Trust.
Effective September 22, 2023, GSAM no longer had sub-advisory agreements for the Fund with Algert Global LLC (“Algert”), Artisan Partners Limited Partnership (“Artisan Partners”), Bardin Hill Arbitrage IC Management LP (“Bardin Hill”), Brigade Capital Management, LP (“Brigade”), Crabel Capital Management, LLC (“Crabel”), GQG Partners LLC (“GQG Partners”), Longfellow Investment Management Co., LLC (“Longfellow”), Marathon Asset Management, L.P. (“Marathon”), Russell Investments Commodity Advisor, LLC (“RICA”), TCW Investment Management Company LLC (“TCW”), Trium Capital LLP (“Trium”) and Wellington Management Company LLP (“Wellington”) (the “Underlying Managers”).
|
|
2. SIGNIFICANT ACCOUNTING POLICIES |
The financial statements have been prepared in accordance with accounting principles generally accepted in the United States of America (“GAAP”) and require management to make estimates and assumptions that may affect the reported amounts and disclosures. Actual results may differ from those estimates and assumptions. The Fund is an investment company under GAAP and follows the accounting and reporting guidance applicable to investment companies.
A. Basis of Consolidation for the Goldman Sachs Multi-Strategy Alternatives Fund — The Cayman Commodity — MMA IV, LLC (the “Subsidiary”), a Cayman Islands exempted company, is currently a wholly-owned subsidiary of the Fund. The Subsidiary acts as an investment vehicle for the Fund to enable the Fund to gain exposure to certain types of commodity-linked derivative instruments. The Fund is the sole shareholder of the Subsidiary and it is intended that the Fund will remain the sole shareholder and will continue to control the Subsidiary. All inter-fund balances and transactions have been eliminated in consolidation. As of October 31, 2023, the Fund’s net assets were $100,571,823 of which, $22,077,468 or 22.0%, represented the Subsidiary’s net assets.
B. Investment Valuation — The Fund’s valuation policy is to value investments at fair value.
C. Investment Income and Investments — Investment income includes interest income, dividend income and securities lending income, if any. Interest income is accrued daily and adjusted for amortization of premiums and accretion of discounts. Dividend income is recognized on ex-dividend date or, for certain foreign securities, as soon as such information is obtained subsequent to the ex-dividend date. Non-cash dividends, if any, are recorded at the fair market value of the securities received. Investment transactions are reflected on trade date. Realized gains and losses are calculated using identified cost. Investment transactions are recorded on the following business day for daily net asset value (“NAV”) calculations. Investment income is recorded net of any foreign withholding taxes, less any amounts reclaimable. The Fund may file withholding tax reclaims in certain jurisdictions to recover a portion of amounts previously withheld. Any foreign capital gains tax is accrued daily based upon net unrealized gains, and is payable upon sale of such investments.
Distributions received from the Fund’s investments in U.S. real estate investment trusts (“REITs”) may be characterized as ordinary income, net capital gain and/or a return of capital. A return of capital is recorded by the Fund as a reduction to the cost basis of the REIT.
For derivative contracts, unrealized gains and losses are recorded daily and become realized gains and losses upon disposition or termination of the contract. Upfront payments, if any, are made or received upon entering into a swap agreement and are reflected in the Consolidated Statement of Assets and Liabilities. Upfront payments are recognized over the contract’s term/event
GOLDMAN SACHS MULTI-STRATEGY ALTERNATIVES FUND
|
Consolidated Notes to Financial Statements (continued) October 31, 2023 |
|
|
2. SIGNIFICANT ACCOUNTING POLICIES (continued) |
as realized gains or losses, with the exception of forward starting swap contracts whose realized gains or losses are recognized from the effective start date. For securities with paydown provisions, principal payments received are treated as a proportionate reduction to the cost basis of the securities, and excess or shortfall amounts are recorded as income. For treasury inflation protected securities (“TIPS”), adjustments to principal due to inflation/ deflation are reflected as increases/decreases to interest income with a corresponding adjustment to cost.
D. Class Allocations and Expenses — Investment income, realized and unrealized gain (loss), if any, and non-class specific expenses of the Fund are allocated daily based upon the proportion of net assets of each class. Non-class specific expenses directly incurred by the Fund are charged to the Fund, while such expenses incurred by the Trust are allocated across the Fund on a straight-line and/or pro-rata basis depending upon the nature of the expenses. Class specific expenses, where applicable, are borne by the respective share classes and include Distribution and Service, Transfer Agency and Service fees.
E. Federal Taxes and Distributions to Shareholders — It is the Fund’s policy to comply with the requirements of the Internal Revenue Code of 1986, as amended (the “Code”), applicable to regulated investment companies and to distribute each year substantially all of its investment company taxable income and capital gains to its shareholders. Accordingly, the Fund is not required to make any provisions for the payment of federal income tax. Distributions to shareholders are recorded on the ex-dividend date. Income and capital gains distributions, if any, are declared and paid annually.
The Subsidiary is classified as a controlled foreign corporation under the Code. Therefore, the Fund is required to increase its taxable income by its share of the Subsidiary’s income. Net losses of the Subsidiary cannot be deducted by the Fund in the current period nor carried forward to offset taxable income in future periods.
Net capital losses, if any, are carried forward to future fiscal years and may be used to the extent allowed by the Code to offset any future capital gains. Losses that are carried forward will retain their character as either short-term or long-term capital losses. Utilization of capital loss carryforwards will reduce the requirement of future capital gains distributions.
The characterization of distributions to shareholders for financial reporting purposes is determined in accordance with federal income tax rules, which may differ from GAAP. The source of the Fund’s distributions may be shown in the accompanying financial statements as either from distributable earnings or capital. Certain components of the Fund’s net assets on the Consolidated Statement of Assets and Liabilities reflect permanent GAAP/tax differences based on the appropriate tax character.
F. Foreign Currency Translation — The accounting records and reporting currency of the Fund is maintained in U.S. dollars. Assets and liabilities denominated in foreign currencies are translated into U.S. dollars using the current exchange rates at the close of each business day. The effect of changes in foreign currency exchange rates on investments is included within net realized and unrealized gain (loss) on investments. Changes in the value of other assets and liabilities as a result of fluctuations in foreign exchange rates are included in the Consolidated Statement of Operations within net change in unrealized gain (loss) on foreign currency translation. Transactions denominated in foreign currencies are translated into U.S. dollars on the date the transaction occurred, the effects of which are included within net realized gain (loss) on foreign currency transactions.
G. Commission Recapture — GSAM, on behalf of certain Funds, may direct portfolio trades, subject to seeking best execution, to various brokers who have agreed to rebate a portion of the commissions generated. Such rebates are made directly to the Fund as cash payments and are included in net realized gain (loss) from investments on the Consolidated Statement of Operations.
|
|
3. INVESTMENTS AND FAIR VALUE MEASUREMENTS |
U.S. GAAP defines the fair value of a financial instrument as the amount that would be received to sell an asset or paid to transfer a liability in an orderly transaction between market participants at the measurement date (i.e., the exit price); the Fund’s policy is to use the market approach. GAAP establishes a fair value hierarchy that prioritizes the inputs to valuation techniques used to measure fair value. The hierarchy gives the highest priority to unadjusted quoted prices in active markets for identical assets or liabilities (Level 1 measurements) and the lowest priority to unobservable inputs (Level 3 measurements). The level in the fair value hierarchy within which the fair value measurement in its entirety falls shall be determined based on the lowest level input that
GOLDMAN SACHS MULTI-STRATEGY ALTERNATIVES FUND
|
|
3. INVESTMENTS AND FAIR VALUE MEASUREMENTS (continued) |
is significant to the fair value measurement in its entirety. The levels used for classifying investments are not necessarily an indication of the risk associated with investing in these investments. The three levels of the fair value hierarchy are described below:
Level 1 — Unadjusted quoted prices in active markets that are accessible at the measurement date for identical, unrestricted assets or liabilities;
Level 2 — Quoted prices in markets that are not active or financial instruments for which significant inputs are observable (including, but not limited to, quoted prices for similar investments, interest rates, foreign exchange rates, volatility and credit spreads), either directly or indirectly;
Level 3 — Prices or valuations that require significant unobservable inputs (including GSAM’s assumptions in determining fair value measurement).
The Board of Trustees (“Trustees”) has approved Valuation Procedures that govern the valuation of the portfolio investments held by the Fund, including investments for which market quotations are not readily available. With respect to the investments that do not have readily available market quotations, the Trustees have designated GSAM as the valuation designee to perform fair valuations pursuant to Rule 2a-5 under the Investment Company Act of 1940 (the “Valuation Designee”). GSAM has day-to-day responsibility for implementing and maintaining internal controls and procedures related to the valuation of the investments. To assess the continuing appropriateness of pricing sources and methodologies, GSAM regularly performs price verification procedures and issues challenges as necessary to third party pricing vendors or brokers, and any differences are reviewed in accordance with the Valuation Procedures.
A. Level 1 and Level 2 Fair Value Investments — The valuation techniques and significant inputs used in determining the fair values for investments classified as Level 1 and Level 2 are as follows:
Equity Securities — Equity securities traded on a United States (“U.S.”) securities exchange or the NASDAQ system, or those located on certain foreign exchanges, including but not limited to the Americas, are valued daily at their last sale price or official closing price on the principal exchange or system on which they are traded. If there is no sale or official closing price or such price is believed by GSAM to not represent fair value, equity securities will be valued at the valid closing bid price for long positions and at the valid closing ask price for short positions (i.e., where there is sufficient volume, during normal exchange trading hours). If no valid bid/ask price is available, the equity security will be valued pursuant to the Valuation Procedures and consistent with applicable regulatory guidance. To the extent these investments are actively traded, they are classified as Level 1 of the fair value hierarchy, otherwise they are generally classified as Level 2. Certain equity securities containing unique attributes may be classified as Level 2.
Unlisted equity securities for which market quotations are available are valued at the last sale price on the valuation date, or if no sale occurs, at the last bid price for long positions or the last ask price for short positions, and are generally classified as Level 2. Securities traded on certain foreign securities exchanges are valued daily at fair value determined by an independent fair value service (if available) under the Valuation Procedures and consistent with applicable regulatory guidance. The independent fair value service takes into account multiple factors including, but not limited to, movements in the securities markets, certain depositary receipts, futures contracts and foreign currency exchange rates that have occurred subsequent to the close of the foreign securities exchange. These investments are generally classified as Level 2 of the fair value hierarchy.
Special Purpose Acquisition Companies — The Fund may invest in stock of, warrants to purchase stock of, and other interests in, special purpose acquisition companies or similar special purpose entities that pool funds to seek potential merger and acquisition opportunities (collectively, “SPACs”). SPACs are companies that have no operations but go public with the intention of merging with or acquiring a company using the proceeds of the SPAC’s initial public offering. Stock purchased in a SPAC’s initial public offering are valued the same as other equity securities as noted above. Certain private SPAC investments (e.g. “founder shares” and private warrants), however, may be subject to forfeiture or expire worthless if certain events do not take place. A Probability Value Adjustment (PVA) is applied to such securities until such contingencies have been satisfied. An LVA may also be applied to securities which are subject to externally imposed and legally enforceable trading restrictions. Such positions are generally classified as Level 3. The Fund may also enter into an unfunded commitment to purchase securities in a PIPE transaction
GOLDMAN SACHS MULTI-STRATEGY ALTERNATIVES FUND
|
Consolidated Notes to Financial Statements (continued) October 31, 2023 |
|
|
3. INVESTMENTS AND FAIR VALUE MEASUREMENTS (continued) |
and will satisfy the commitment if and when the SPAC completes its merger or acquisition. The Fund may purchase securities in a SPAC PIPE transaction only upon such contingencies being satisfied. Such investments are valued similar to founder shares mentioned above and are generally classified as Level 3.
Money Market Funds — Investments in the Goldman Sachs Financial Square Government Fund (“Underlying Money Market Fund”) are valued at the NAV per share of the Institutional Shares class on the day of valuation. These investments are generally classified as Level 1 of the fair value hierarchy. For information regarding the Underlying Money Market Fund’s accounting policies and investment holdings, please see the Underlying Money Market Fund’s shareholder report.
Securities Sold Short — Securities sold short are those securities which the Fund has sold but which it does not own. When the Fund sells a security it does not own, it must borrow the security that was sold and generally delivers the proceeds from the short sale to the broker through which it made the short sale. In addition, cash and certain investments in securities may be used to collateralize the securities sold short. Each day the securities sold short transaction is open, the liability to replace the borrowed security is marked to market and an unrealized gain or loss is recorded. While the transaction remains open, the Fund may also incur expenses for any dividends or interest which will be paid to the lender of the securities as well as a fee to borrow the delivered security. During the term of the short sale, the value of the securities pledged as collateral on short sales is required to exceed the value of the securities sold short.
Derivative Contracts — A derivative is an instrument whose value is derived from underlying assets, indices, reference rates or a combination of these factors. The Fund enters into derivative transactions to hedge against changes in interest rates, securities prices, and/or currency exchange rates, to increase total return, or to gain access to certain markets or attain exposure to other underliers. For financial reporting purposes, cash collateral that has been pledged to cover obligations of the Fund and cash collateral received, if any, is reported separately on the Consolidated Statement of Assets and Liabilities as either due to broker/receivable for collateral on certain derivative contracts. Non-cash collateral pledged by the Fund, if any, is noted in the Consolidated Schedule of Investments.
Exchange-traded derivatives, including futures and options contracts, are generally valued at the last sale or settlement price on the exchange where they are principally traded. Exchange-traded options without settlement prices are generally valued at the midpoint of the bid and ask prices on the exchange where they are principally traded (or, in the absence of two-way trading, at the last bid price for long positions and the last ask price for short positions). Exchange-traded derivatives typically fall within Level 1 of the fair value hierarchy. Over-the-counter (“OTC”) and centrally cleared derivatives are valued using market transactions and other market evidence, including market-based inputs to models, calibration to market-clearing transactions, broker or dealer quotations, or other alternative pricing sources. Where models are used, the selection of a particular model to value OTC and centrally cleared derivatives depends upon the contractual terms of, and specific risks inherent in, the instrument, as well as the availability of pricing information in the market. Valuation models require a variety of inputs, including contractual terms, market prices, yield curves, credit curves, measures of volatility, voluntary and involuntary prepayment rates, loss severity rates and correlations of such inputs. For OTC and centrally cleared derivatives that trade in liquid markets, model inputs can generally be verified and model selection does not involve significant management judgment. OTC and centrally cleared derivatives are classified within Level 2 of the fair value hierarchy when significant inputs are corroborated by market evidence.
i. Forward Contracts — A forward contract is a contract between two parties to buy or sell an asset at a specified price on a future date. A forward contract settlement can occur on a cash or delivery basis. Forward contracts are marked-to-market daily using independent vendor prices, and the change in value, if any, is recorded as an unrealized gain or loss. Cash and certain investments may be used to collateralize forward contracts.
A forward foreign currency exchange contract is a forward contract in which the Fund agrees to receive or deliver a fixed quantity of one currency for another, at a pre-determined price at a future date. All forward foreign currency exchange contracts are marked to market daily by using the outright forward rates or interpolating based upon maturity dates, where available. Non-deliverable forward foreign currency exchange contracts are settled with the counterparty in cash without the delivery of foreign currency.
GOLDMAN SACHS MULTI-STRATEGY ALTERNATIVES FUND
|
|
3. INVESTMENTS AND FAIR VALUE MEASUREMENTS (continued) |
ii. Futures Contracts — Futures contracts are contracts to buy or sell a standardized quantity of a specified commodity or security. Upon entering into a futures contract, a Fund deposits cash or securities in an account on behalf of the broker in an amount sufficient to meet the initial margin requirement. Subsequent payments are made or received by the Fund equal to the daily change in the contract value and are recorded as variation margin receivable or payable with a corresponding offset to unrealized gains or losses.
iii. Options — When the Fund writes call or put options, an amount equal to the premium received is recorded as a liability and is subsequently marked-to-market to reflect the current value of the option written. Swaptions are options on swap contracts.
Upon the purchase of a call option or a put option by the Fund, the premium paid is recorded as an investment and subsequently marked-to-market to reflect the current value of the option. Certain options may be purchased with premiums to be determined on a future date. The premiums for these options are based upon implied volatility parameters at specified terms.
iv. Swap Contracts — Bilateral swap contracts are agreements in which the Fund and a counterparty agree to exchange periodic payments on a specified notional amount or make a net payment upon termination. Bilateral swap transactions are privately negotiated in the OTC market and payments are settled through direct payments between the Fund and the counterparty. By contrast, certain swap transactions are subject to mandatory central clearing. These swaps are executed through a derivatives clearing member (“DCM”), acting in an agency capacity, and submitted to a central counterparty (“CCP”) (“centrally cleared swaps”), in which case all payments are settled with the CCP through the DCM. Swaps are marked-to-market daily using pricing vendor quotations, counterparty or clearinghouse prices or model prices, and the change in value, if any, is recorded as an unrealized gain or loss. Upon entering into a swap contract, the Fund is required to satisfy an initial margin requirement by delivering cash or securities to the counterparty (or in some cases, segregated in a triparty account on behalf of the counterparty), which can be adjusted by any mark-to-market gains or losses pursuant to bilateral or centrally cleared arrangements. For centrally cleared swaps the daily change in valuation, if any, is recorded as a receivable or payable for variation margin.
A total return swap is an agreement that gives the Fund the right to receive or pay the appreciation or depreciation, as applicable, in the value of a specified security, an index, a basket of securities or indices, or other instrument in return for a fee paid to the counterparty, which will typically be an agreed upon interest rate. If the underlying asset declines in value over the term of the swap, the Fund may also be required to pay the dollar value of that decline to the counterparty.
B. Level 3 Fair Value Investments — To the extent that significant inputs to valuation models and other alternative pricing sources are unobservable, or if quotations are not readily available, or if GSAM believes that such quotations do not accurately reflect fair value, the fair value of the Fund’s investments may be determined under the Valuation Procedures. GSAM, consistent with its procedures and applicable regulatory guidance, may make an adjustment to the most recent valuation prices of either domestic or foreign securities in light of significant events to reflect what it believes to be the fair value of the securities at the time of determining the Fund’s NAV. To the extent investments are valued using single source broker quotations obtained directly from the broker or passed through from third party pricing vendors, such investments are classified as Level 3 investments.
C. Fair Value Hierarchy — The following is a summary of the Fund’s investments and derivatives classified in the fair value hierarchy as of October 31, 2023:
| | | | | | | | | | | | |
| | | |
| Investment Type | | Level 1 | | | Level 2 | | | Level 3 | |
|
| |
Assets | | | | | | | | | | | | |
| | | |
Common Stock and/or Other Equity Investments(a) | | | | | | | | | | | | |
| | | |
Asia | | $ | — | | | $ | — | | | $ | — | |
| | | |
Investment Company | | | 84,998,501 | | | | — | | | | — | |
|
| |
| | | |
Total | | $ | 84,998,501 | | | $ | — | | | $ | — | |
|
| |
GOLDMAN SACHS MULTI-STRATEGY ALTERNATIVES FUND
|
Consolidated Notes to Financial Statements (continued) October 31, 2023 |
|
|
3. INVESTMENTS AND FAIR VALUE MEASUREMENTS (continued) |
| | | | | | | | | | | | |
| | | |
| Derivative Type | | Level 1 | | | Level 2 | | | Level 3 | |
|
| |
| | | |
Assets(b) | | | | | | | | | | | | |
| | | |
Forward Foreign Currency Exchange Contracts | | $ | — | | | $ | 3,258,118 | | | $ | — | |
| | | |
Futures Contracts | | | 4,436,905 | | | | — | | | | — | |
|
| |
| | | |
Total | | $ | 4,436,905 | | | $ | 3,258,118 | | | $ | — | |
|
| |
| | | |
Liabilities(b) | | | | | | | | | | | | |
| | | |
Forward Foreign Currency Exchange Contracts | | $ | — | | | $ | (3,096,368 | ) | | $ | — | |
| | | |
Futures Contracts | | | (6,720,569 | ) | | | — | | | | — | |
|
| |
| | | |
Total | | $ | (6,720,569 | ) | | $ | (3,096,368 | ) | | $ | — | |
|
| |
| | (a) | Amounts are disclosed by continent to highlight the impact of time zone differences between local market close and the calculation of net asset value. Security valuations are based on the principal exchange or system on which they are traded, which may differ from country of domicile. |
| | (b) | Amount shown represents unrealized gain (loss) at period end. |
For further information regarding security characteristics, see the Consolidated Schedule of Investments.
|
|
4. INVESTMENTS IN DERIVATIVES |
The following table sets forth, by certain risk types, the gross value of derivative contracts (not considered to be hedging instruments for accounting disclosure purposes) as of October 31, 2023. These instruments were used as part of the Fund’s investment strategies and to obtain and/or manage exposure related to the risks below. The values in the tables below exclude the effects of cash collateral received or posted pursuant to these derivative contracts, and therefore are not representative of the Fund’s net exposure.
| | | | | | | | | | | | |
| | | | |
| Risk | | Consolidated Statement of Assets and Liabilities | | Assets | | | Consolidated Statement of Assets and Liabilities | | Liabilities | |
| | | | |
| Commodity | | Variation margin on futures contracts | | $ | 4,222,770 | (a) | | Variation margin on futures contracts | | $ | (5,152,645 | )(a) |
| | | | |
| Currency | | Receivable for unrealized gain on forward foreign currency exchange contracts | | | 3,258,118 | | | Payable for unrealized loss on forward foreign currency exchange contracts | | | (3,096,368 | ) |
| | | | |
| Interest rate | | Variation margin on futures contracts | | | 214,135 | (a) | | Variation margin on futures contracts | | | (1,567,924 | )(a) |
| | | | |
Total | | | | $ | 7,695,023 | | | | | $ | (9,816,937 | ) |
| | (a) | Includes unrealized gain (loss) on futures contracts described in the Additional Investment Information sections of the Consolidated Schedule of Investments. Only current day’s variation margin is reported within the Consolidated Statement of Assets and Liabilities. |
The following table sets forth, by certain risk types, the Fund’s gains (losses) related to these derivatives and their indicative volumes for the fiscal year ended October 31, 2023. These gains (losses) should be considered in the context that these derivative contracts may have been executed to create investment opportunities and/or economically hedge certain investments, and accordingly, certain gains (losses) on such derivative contracts may offset certain (losses) gains attributable to investments. These
GOLDMAN SACHS MULTI-STRATEGY ALTERNATIVES FUND
|
|
4. INVESTMENTS IN DERIVATIVES (continued) |
gains (losses) are included in “Net realized gain (loss)” or “Net change in unrealized gain (loss)” on the Consolidated Statement of Operations:
| | | | | | | | | | |
| | | |
| Risk | | Consolidated Statement of Operations | | Net Realized Gain (Loss) | | | Net Change in Unrealized Gain (Loss) | |
| | | |
| Commodity | | Net realized gain (loss) from futures contracts/Net change in unrealized gain (loss) on futures contracts | | | $ 2,638,358 | | | | $ (977,763 | ) |
| | | |
| Currency | | Net realized gain (loss) from forward foreign currency exchange Contracts and futures contracts/Net change in unrealized gain (loss) on forward foreign currency exchange contracts and futures contracts | | | (1,161,517 | ) | | | 145,667 | |
| | | |
| Equity | | Net realized gain (loss) from futures contracts, swap contracts, purchased options and written options/Net change in unrealized gain (loss) on futures contracts, swaps contracts, purchase options and written options | | | (4,290,978 | ) | | | (1,308,392 | ) |
| | | |
| Interest rate | | Net realized gain (loss) from futures contracts/Net change in unrealized gain (loss) on futures contracts | | | (1,596,892 | ) | | | (1,359,762 | ) |
| | | |
Total | | | | | $(4,411,029 | ) | | | $(3,500,250 | ) |
For the fiscal year ended October 31, 2023, the relevant values for each derivative type were as follows:
| | | | | | | | |
| Average Number of Contracts, Notional Amounts, or Shares/Units(a) |
|
|
| | | | |
Futures Contracts | | Forward Contracts | | Swap Agreements | | Purchased Options | | Written Options |
|
|
| | | | |
1,671 | | $156,210,475 | | $28,111,376 | | 199,995 | | 75,133 |
|
|
| | (a) | Amounts disclosed represent average number of contracts for futures contracts, notional amounts for forward contracts, swap agreements for purchased options and written options, based on absolute values, which is indicative of volume for this derivative type, for the months that Fund held such derivatives during the fiscal year ended October 31, 2023. |
In order to better define its contractual rights and to secure rights that will help the Fund mitigate its counterparty risk, the Fund may enter into an International Swaps and Derivatives Association, Inc. Master Agreement (“ISDA Master Agreement”) or similar agreement with its derivatives counterparties. An ISDA Master Agreement is a bilateral agreement between the Fund and a counterparty that governs OTC derivatives (including forward foreign currency exchange contracts, and certain options and swaps), and typically contains, among other things, collateral posting terms and netting provisions in the event of a default and/or termination event. The provisions of the ISDA Master Agreement typically permit a single net payment in the event of a default (close-out netting) or similar event, including the bankruptcy or insolvency of the counterparty.
Collateral and margin requirements differ between exchange traded derivatives and OTC derivatives. Margin requirements are established by the broker or clearing house for exchange-traded and centrally cleared derivatives (financial futures contracts, options and centrally cleared swaps) pursuant to governing agreements for those instrument types. Brokers can ask for margin in excess of the minimum in certain circumstances. Collateral terms are contract-specific for OTC derivatives. For derivatives traded under an ISDA Master Agreement, the collateral requirements are typically calculated by netting the marked to market amount for each transaction under such agreement and comparing that amount to the value of any collateral currently pledged by the Fund and the counterparty. Additionally, the Fund may be required to post initial margin to the counterparty, the terms of which would be outlined in the confirmation of the OTC transaction.
Generally, the amount of collateral due from or to a counterparty must exceed a minimum transfer amount threshold before a transfer is required to be made. To the extent amounts due to the Fund from its counterparties are not fully collateralized, contractually or otherwise, the Fund bears the risk of loss from counterparty nonperformance. The Fund attempts to mitigate
GOLDMAN SACHS MULTI-STRATEGY ALTERNATIVES FUND
|
Consolidated Notes to Financial Statements (continued) October 31, 2023 |
|
|
4. INVESTMENTS IN DERIVATIVES (continued) |
counterparty risk by only entering into agreements with counterparties that the Investment Adviser believe to be of good standing and by monitoring the financial stability of those counterparties.
Additionally, the netting of assets and liabilities and the offsetting of collateral pledged or received are based on contractual netting/set-off provisions in the ISDA Master Agreement or similar agreements. However, in the event of a default or insolvency of a counterparty, a court could determine that such rights are not enforceable due to the restrictions or prohibitions against the right of setoff that may be imposed in accordance with a particular jurisdiction’s bankruptcy or insolvency laws.
The following table sets forth the Fund’s net exposure for derivative instruments that are subject to enforceable master netting arrangements or similar agreements as of October 31, 2023:
| | | | | | | | | | |
| Multi-Strategy Alternatives Fund |
| | | | | |
| | | Derivative Assets(1) | | Derivative Liabilities(1) | | | | | | |
| | | | | |
| Counterparty | | Forward Currency
Contracts | | Forward Currency Contracts | | Net Derivative
Asset
(Liabilities) | | Collateral
(Received)
Pledged(1) | | Net
Amount(2) |
|
|
| | | | | |
MS & Co. Int. PLC | | $3,258,118 | | $(3,096,368) | | $161,750 | | $— | | $161,750 |
|
|
| | (1) | Gross amounts available for offset but not netted in the Consolidated Statement of Assets and Liabilities. |
| | (2) | Net amount represents the net amount due (to) from counterparty in the event of a default based on the contractual set-off rights under the agreement. Net amount excludes any over-collateralized amounts. |
|
|
5. AGREEMENTS AND AFFILIATED TRANSACTIONS |
A. Management Agreement — Under the Agreement, GSAM manages the Fund, subject to the general supervision of the Trustees.
As compensation for the services rendered pursuant to the Agreement, the assumption of the expenses related thereto and administration of the Fund’s business affairs, including providing facilities, GSAM is entitled to a management fee, accrued daily and paid monthly, equal to an annual percentage rate of the Fund’s average daily net assets. For the fiscal year ended October 31, 2023 the effective management fee rate was 1.83% and the effective net management fee rate was 1.44%. As of October 31, 2023, contractual management fees with GSAM were at the following rates:
| | | | | | | | | | | | | | | | |
| | | Contractual Management Rate | | |
| | | | | | | | |
| | | First $2 billion | | | | Next $3 billion | | | | Next $3 billion | | | | Over $8 billion | | |
|
|
| | | | | | | | |
| | 0.75% | | | | 0.68% | | | | 0.64% | | | | 0.63% | | |
|
|
Prior to the close of business on September 22, 2023, the contractual management fee rates were as stated below:
| | | | | | | | | | | | | | | | |
| | | Contractual Management Rate | | |
| | | | | | | | |
| | | First $2 billion | | | | Next
$3 billion | | | | Next
$3 billion | | | | Over
$8 billion | | |
|
|
| | | | | | | | |
| | 1.90% | | | | 1.80% | | | | 1.71% | | | | 1.68% | | |
|
|
Prior to September 22, 2023, GSAM had agreed to waive a portion of its management fee in order to achieve a net management fee rate of 1.57% as an annual percentage of the average daily net assets of the Fund as defined in the Fund’s most recent prospectus.
GOLDMAN SACHS MULTI-STRATEGY ALTERNATIVES FUND
|
|
5. AGREEMENTS AND AFFILIATED TRANSACTIONS (continued) |
The Fund invests in Institutional Shares of the Goldman Sachs Financial Square Government Fund, which is an affiliated Underlying Fund. GSAM has agreed to waive a portion of its management fee payable by the Fund in an amount equal to the management fee it earns as an investment adviser to the affiliated Underlying Fund in which the Fund invests. For the fiscal year ended October 31, 2023, GSAM waived $104,877 of the Fund’s management fee.
GSAM also provides management services to the Subsidiary pursuant to a Subsidiary Management Agreement (the “Subsidiary Agreement”) and is entitled to a management fee accrued daily and paid monthly, equal to an annual percentage rate of 0.42% of the Subsidiary’s average daily net assets. In consideration of the Subsidiary’s management fee, and for as long as the Subsidiary Agreement remains in effect, GSAM has contractually agreed to waive irrevocably a portion of the Fund’s management fee in an amount equal to the management fee accrued and paid to GSAM by the Subsidiary under the Subsidiary Agreement. For the fiscal year ended October 31, 2023, GSAM waived $21,494 of the Fund’s management fee.
B. Distribution and/or Service (12b-1) Plans — The Trust, on behalf of Class A and Class R Shares of the Fund, has adopted Distribution and Service Plans subject to Rule 12b-1 under the Act. Under the Distribution and Service Plans, Goldman Sachs, which serves as distributor (the “Distributor”), is entitled to a fee accrued daily and paid monthly for distribution services and personal and account maintenance services, which may then be paid by Goldman Sachs to authorized dealers. These fees are equal to an annual percentage rate of the average daily net assets attributable to Class A or Class R Shares of the Fund, as applicable, as set forth below.
The Trust, on behalf of Class C Shares of the Fund, has adopted a Distribution Plan subject to Rule 12b-1 under the Act. Under the Distribution Plan, Goldman Sachs as Distributor is entitled to a fee accrued daily and paid monthly for distribution services, which may then be paid by Goldman Sachs to authorized dealers. These fees are equal to an annual percentage rate of the average daily net assets attributable to Class C Shares of the Fund, as set forth below.
| | | | | | |
| | | Distribution and/or Service Plan Rates |
| |
| | |
| | | |
| | | Class A* | | Class C | | Class R* |
|
|
| | | |
Distribution and/or Service Plan | | 0.25% | | 0.75% | | 0.50% |
|
|
| | * | With respect to Class A and Class R Shares, the Distributor at its discretion may use compensation for distribution services paid under the Distribution and Service Plan to compensate service organizations for personal and account maintenance services and expenses as long as such total compensation does not exceed the maximum cap on “service fees” imposed by the Financial Industry Regulatory Authority. |
C. Distribution Agreement — Goldman Sachs, as Distributor of the shares of the Fund pursuant to a Distribution Agreement, may retain a portion of the Class A Shares’ front end sales charge and Class C Shares’ CDSC. During the fiscal year ended October 31, 2023, Goldman Sachs retained the following amounts:
| | |
| | | Front End
Sales Charge |
| |
| | |
| |
| Fund | | Class A |
|
|
| |
Multi-Strategy Alternatives | | $681 |
|
|
During the fiscal year ended October 31, 2023, Goldman Sachs did not retain any portion of Class C Shares’ CDSC.
D. Service Plan — The Trust, on behalf of the Fund, has adopted a Service Plan to allow Class C Shares to compensate service organizations (including Goldman Sachs) for providing varying levels of personal and account maintenance services to their customers who are beneficial owners of such shares. The Service Plan provides for compensation to the service organizations equal to an annual percentage rate of 0.25% of the average daily net assets attributable to Class C Shares of the Fund.
E. Transfer Agency Agreement — Goldman Sachs also serves as the transfer agent of the Fund for a fee pursuant to the Transfer Agency Agreement. The fees charged for such transfer agency services are accrued daily and paid monthly at annual rates as follows: 0.15% of the average daily net assets of Class A, Class C, Investor and Class R Shares; 0.04% of the average daily net assets of Institutional Shares; and 0.03% of the average daily net assets of Class R6 and Class P Shares. Goldman Sachs has agreed
GOLDMAN SACHS MULTI-STRATEGY ALTERNATIVES FUND
|
Consolidated Notes to Financial Statements (continued) October 31, 2023 |
|
|
5. AGREEMENTS AND AFFILIATED TRANSACTIONS (continued) |
to waive a portion of the transfer agency fees equal to 0.06% of the average daily net assets attributable to Class A, Class C, Investor and Class R Shares of the Fund through at least February 28, 2025 (the “TA Fee Waiver”). Prior to such date, Goldman Sachs may not terminate the arrangement without approval of the Board of Trustees. Prior to July 1, 2023, fees charged for such transfer agency services were 0.16% of the average daily net assets of Class A, Class C, Investor and Class R Shares.
F. Other Expense Agreements and Affiliated Transactions — GSAM has agreed to reduce or limit certain “Other Expenses” of the Fund (excluding acquired fund fees and expenses, transfer agency fees and expenses, service fees and shareholder administration fees (as applicable), taxes, dividends and interest payments on securities sold short, interest, brokerage fees, expenses of shareholder meetings, litigation and indemnification, and extraordinary expenses) to 0.064% of the average daily net assets of the Fund and limit the Fund’s annual operating expenses. These Other Expense limitations will remain in effect through at least February 28, 2025, and prior to such date GSAM may not terminate the arrangements without the approval of the Trustees. Prior to the close of business on September 22, 2023, GSAM had agreed to reduce or limit certain “Other Expenses” of the Fund (excluding acquired fund fees and expenses, transfer agency fees and expenses, service fees and shareholder administration fees (as applicable), taxes, dividends and interest payments on securities sold short, interest, brokerage fees, expenses of shareholder meetings, litigation and indemnification, and extraordinary expenses) to 0.194% of the average daily net assets of the Fund and limit the Fund’s total annual operating expenses (excluding acquired fund fees and expenses, dividend and interest payments on securities sold short, taxes, interest, brokerage fees, expenses of shareholder meetings, litigation and indemnification, and extraordinary expenses) of Class A, Class C, Institutional, Investor, Class R6, Class R and Class P Shares to (after the application of the TA Fee Waiver described above) 2.12%, 2.87%, 1.80%, 1.87%, 1.79%, 2.37%, and 1.79%, respectively.
In addition, the Fund has entered into certain offset arrangements with the transfer agent, which may result in a reduction of the Fund’s expenses and are received irrespective of the application of the “Other Expense” limitations described above. For the fiscal year ended October 31, 2023, these expense reductions, including any fee waivers and Other Expense reimbursements, were as follows:
| | | | | | | | |
| Fund | | Management
Fee Waiver | | Transfer Agency
Waivers/Credits | | Other Expense
Reimbursements | | Total
Expense
Reductions |
|
|
| | | | |
Multi-Strategy Alternatives | | $527,234 | | $9,070 | | $1,467,631 | | $2,003,935 |
|
|
G. Line of Credit Facility — As of October 31, 2023, the Fund participated in a $1,110,000,000 committed, unsecured revolving line of credit facility (the “facility”) together with other funds of the Trust and certain registered investment companies having management agreements with GSAM or its affiliates. This facility is to be used for temporary emergency purposes, or to allow for an orderly liquidation of securities to meet redemption requests. The interest rate on borrowings is based on the federal funds rate. The facility also requires a fee to be paid by the Fund based on the amount of the commitment that has not been utilized. For the fiscal year ended October 31, 2023, the Fund did not have any borrowings under the facility. Prior to April 19, 2023, the facility was $1,250,000,000.
H. Other Transactions with Affiliates — For the fiscal year ended October 31, 2023, Goldman Sachs earned $6,019 in brokerage commissions from portfolio transactions, including futures transactions executed with Goldman Sachs as the Futures Commission Merchant, on behalf of the Fund.
As of October 31, 2023, The Goldman Sachs Group, Inc. was the beneficial owner of approximately 100% of Class R6 and 99% of Class R Shares of the Fund.
The table below shows the transaction in and earnings from investments in the Goldman Sachs Financial Square Government Fund for the fiscal year ended October 31, 2023.
GOLDMAN SACHS MULTI-STRATEGY ALTERNATIVES FUND
| | | | | | | | | | | | | | |
| | | |
5. AGREEMENTS AND AFFILIATED TRANSACTIONS ( continued) | | | | | | |
| | | | | | | | | | | | | | | | | | | | | | | | | | |
| Fund | | Underlying Fund | | Beginning Value as of October 31, 2022 | | | Purchases at Cost | | | Proceeds from Sales | | | Ending
Value as of
October 31,
2023 | | | Shares as of
October 31,
2023 | | | Dividend
Income | |
|
| |
| | | | | | | |
Multi-Strategy Alternatives | | Goldman Sachs Financial
Square Government Fund
— Institutional Shares | | $ | 54,883,978 | | | $ | 412,177,275 | | | $ | (382,062,752 | ) | | $ | 84,998,501 | | | | 84,998,501 | | | $ | 2,719,971 | |
|
| |
| | | | | | | | | | | | | | |
| | | |
6. PORTFOLIO SECURITIES TRANSACTIONS | | | | | | |
The cost of purchases and proceeds from sales and maturities of long-term securities for the fiscal year ended October 31, 2023, were as follows:
| | | | |
| Fund | | Purchases (Excluding U.S. Government and Agency Obligations) | | Sales and Maturities of (Excluding U.S. Government and Agency Obligations) |
|
|
| | |
Multi-Strategy Alternatives | | $138,174,357 | | $189,671,332 |
|
|
The tax character of distributions paid during the fiscal year ended October 31, 2023 was as follows:
| | | | |
| Distributions paid from: | | | |
| |
Ordinary income | | $ | 700,064 | |
| |
Total taxable distributions | | $ | 700,064 | |
| |
There were no distributions by the Fund during the fiscal year ended October 31, 2022.
As of October 31, 2023, the components of accumulated earnings (losses) on a tax basis were as follows:
| | | | |
| |
| |
Undistributed ordinary income — net | | $ | 3,366,344 | |
| |
| |
Capital loss carryforwards: | | | | |
Perpetual Short-Term | | | (41,474,724 | ) |
Perpetual Long-Term | | | (1,626,550 | ) |
| |
| |
Total capital loss carryforwards | | | (43,101,274 | ) |
| |
| |
Timing differences (Straddles, Russian Dividend Accrual) | | $ | (183,351 | ) |
| |
Unrealized gains (loss) — net | | | (1,685,488 | ) |
| |
| |
Total accumulated earnings (loss) net | | $ | (41,603,769 | ) |
| |
As of October 31, 2023, the Fund’s aggregate security unrealized gains and losses based on cost for U.S. federal income tax purposes were as follows:
| | | | |
| |
| |
Tax Cost | | $ | 84,559,227 | |
| |
| |
Gross unrealized gain | | | 2,863,574 | |
| |
Gross unrealized loss | | | (4,549,062 | ) |
| |
| |
Net unrealized loss | | $ | (1,685,488 | ) |
| |
GOLDMAN SACHS MULTI-STRATEGY ALTERNATIVES FUND
|
Consolidated Notes to Financial Statements (continued) October 31, 2023 |
|
|
7. TAX INFORMATION (continued) |
The difference between GAAP-basis and tax basis unrealized gains (losses) is attributable primarily to wash sales, net mark to market gains/(losses) on regulated futures contracts, net mark to market gains/(losses) on foreign currency contracts, and differences in the tax treatment of underlying fund investments.
The Fund reclassed $14,041 from paid in capital to distributable earnings for the year ending October 31, 2023. In order to present certain components of the Funds’ capital accounts on a tax-basis, certain reclassifications have been recorded to the Funds’ accounts. These reclassifications have no impact on the net asset value of the Funds’ and result primarily from differences in the tax treatment of underlying fund investments.
GSAM has reviewed the Fund’s tax positions for all open tax years (the current and prior three years, as applicable) and has concluded that no provision for income tax is required in the Fund’s financial statements. Such open tax years remain subject to examination and adjustment by tax authorities.
The Fund’s risks include, but are not limited to, the following:
Derivatives Risk — The Fund’s use of derivatives and other similar instruments (collectively referred to in this paragraph as “derivatives”) may result in loss, including due to adverse market movements. Derivatives, which may pose risks in addition to and greater than those associated with investing directly in securities, currencies or other assets and instruments, may increase market exposure and be illiquid or less liquid, volatile, difficult to price and leveraged so that small changes in the value of the underlying assets or instruments may produce disproportionate losses to the Fund. Certain derivatives are also subject to counterparty risk, which is the risk that the other party in the transaction will not, or lacks the capacity or authority to, fulfill its contractual obligations, liquidity risk, which includes the risk that the Fund will not be able to exit the derivative when it is advantageous to do so, and risks arising from margin requirements, which include the risk that the Fund will be required to pay additional margin or set aside additional collateral to maintain open derivative positions. The use of derivatives is a highly specialized activity that involves investment techniques and risks different from those associated with investments in more traditional securities and instruments. Losses from derivatives can also result from a lack of correlation between changes in the value of derivative instruments and the portfolio assets (if any) being hedged.
Foreign and Emerging Countries Risk — Investing in foreign markets may involve special risks and considerations not typically associated with investing in the U.S. Foreign securities may be subject to risk of loss because of more or less foreign government regulation; less public information; less stringent investor protections; less stringent accounting, corporate governance, financial reporting and disclosure standards; and less economic, political and social stability in the countries in which the Fund invests. The imposition of sanctions, exchange controls (including repatriation restrictions), confiscation of assets and property, trade restrictions (including tariffs) and other government restrictions by the U.S. or other governments, or from problems in registration, settlement or custody, may also result in losses. The type and severity of sanctions and other similar measures, including counter sanctions and other retaliatory actions, that may be imposed could vary broadly in scope, and their impact is impossible to predict. For example, the imposition of sanctions and other similar measures could, among other things, cause a decline in the value and/or liquidity of securities issued by the sanctioned country or companies located in or economically tied to the sanctioned country and increase market volatility and disruption in the sanctioned country and throughout the world. Sanctions and other similar measures could limit or prevent the Fund from buying and selling securities (in the sanctioned country and other markets), significantly delay or prevent the settlement of securities transactions, and significantly impact the Fund’s liquidity and performance. Foreign risk also involves the risk of negative foreign currency exchange rate fluctuations, which may cause the value of securities denominated in such foreign currency (or other instruments through which the Fund has exposure to foreign currencies) to decline in value. Currency exchange rates may fluctuate significantly over short periods of time. To the extent that the Fund also invests in securities of issuers located in, or economically tied to, emerging markets, these risks may be more pronounced.
GOLDMAN SACHS MULTI-STRATEGY ALTERNATIVES FUND
|
|
8. OTHER RISKS (continued) |
Geographic Risk — If the Fund focuses its investments in securities of issuers located in a particular country or geographic region, the Fund may be subjected, to a greater extent than if its investments were less focused, to the risks of volatile economic cycles and/or conditions and developments that may be particular to that country or region, such as: adverse securities markets; adverse exchange rates; adverse social, political, regulatory, economic, business, environmental or other developments; or natural disasters.
Interest Rate Risk — When interest rates increase, fixed income securities or instruments held by the Fund will generally decline in value. Long-term fixed income securities or instruments will normally have more price volatility because of this risk than short-term fixed income securities or instruments. A wide variety of market factors can cause interest rates to rise, including central bank monetary policy, rising inflation and changes in general economic conditions. Changing interest rates may have unpredictable effects on the markets, may result in heightened market volatility and may detract from Fund performance. In addition, changes in monetary policy may exacerbate the risks associated with changing interest rates. Funds with longer average portfolio durations will generally be more sensitive to changes in interest rates than funds with a shorter average portfolio duration. Fluctuations in interest rates may also affect the liquidity of fixed income securities and instruments held by the Fund. A sudden or unpredictable increase in interest rates may cause volatility in the market and may decrease the liquidity of the Fund’s investments, which would make it harder for the Fund to sell its investments at an advantageous time.
Investment Style Risk — Different investment styles (e.g., “growth”, “value” or “quantitative”) tend to shift in and out of favor depending upon market and economic conditions and investor sentiment. The Fund may outperform or underperform other funds that invest in similar asset classes but employ different investment styles.
Large Shareholder Transactions Risk — The Fund may experience adverse effects when certain large shareholders, such as other funds, institutional investors (including those trading by use of non-discretionary mathematical formulas), financial intermediaries (who may make investment decisions on behalf of underlying clients and/or include the Fund in their investment model), individuals, accounts and Goldman Sachs affiliates, purchase or redeem large amounts of shares of a Fund. Such large shareholder redemptions, which may occur rapidly or unexpectedly, may cause the Fund to sell portfolio securities at times when it would not otherwise do so, which may negatively impact the Fund’s NAV and liquidity. These transactions may also accelerate the realization of taxable income to shareholders if such sales of investments resulted in gains, and may also increase transaction costs. In addition, a large redemption could result in the Fund’s current expenses being allocated over a smaller asset base, leading to an increase in the Fund’s expense ratio. Similarly, large Fund share purchases may adversely affect the Fund’s performance to the extent that the Fund is delayed in investing new cash or otherwise maintains a larger cash position than it ordinarily would.
Liquidity Risk — The Fund may make investments that are illiquid or that may become less liquid in response to market developments or adverse investor perceptions. Illiquid investments may be more difficult to value. Liquidity risk may also refer to the risk that the Fund will not be able to pay redemption proceeds within the allowable time period or without significant dilution to remaining investors’ interests because of unusual market conditions, declining prices of the securities sold, an unusually high volume of redemption requests, or other reasons. To meet redemption requests, the Fund may be forced to sell investments at an unfavorable time and/or under unfavorable conditions. If the Fund is forced to sell securities at an unfavorable time and/or under unfavorable conditions, such sales may adversely affect the Fund’s NAV and dilute remaining investors’ interests. These risks may be more pronounced in connection with the Fund‘s investments in securities of issuers located in emerging market countries. Redemptions by large shareholders may have a negative impact on the Fund’s liquidity.
Market and Credit Risks — In the normal course of business, the Fund trades financial instruments and enters into financial transactions where risk of potential loss exists due to changes in the market (market risk). The value of the securities in which the Fund invests may go up or down in response to the prospects of individual companies, particular sectors or governments and/or general economic conditions throughout the world due to increasingly interconnected global economies and financial markets. Events such as war, military conflict, acts of terrorism, social unrest, natural disasters, recessions, inflation, rapid interest rate changes, supply chain disruptions, sanctions, the spread of infectious illness or other public health threats could also significantly impact the Fund and its investments. Additionally, the Fund may also be exposed to credit risk in the event that an issuer or guarantor fails to perform or that an institution or entity with which the Fund has unsettled or open transactions defaults.
GOLDMAN SACHS MULTI-STRATEGY ALTERNATIVES FUND
|
Consolidated Notes to Financial Statements (continued) October 31, 2023 |
|
|
8. OTHER RISKS (continued) |
Short Position Risk — The Fund may enter into a short position through a futures contract, an option or swap agreement or through short sales of any instrument that the Fund may purchase for investment. Taking short positions involves leverage of the Fund’s assets and presents various risks, including counterparty risk. If the value of the underlying instrument or market in which the Fund has taken a short position increases, then the Fund will incur a loss equal to the increase in value from the time that the short position was entered into plus any related interest payments or other fees. Taking short positions involves the risk that losses may be disproportionate, may exceed the amount invested, and may be unlimited. To the extent that the Fund uses the proceeds it receives from a short position to take additional long positions, the risks associated with the short position, including leverage risks, may be heightened, because doing so increases the exposure of the Fund to the markets and therefore could magnify changes to the Fund’s NAV.
Tax Risk — The Fund will seek to gain exposure to the commodity markets primarily through investments in the Subsidiary and/ or commodity index-linked structured notes, as applicable. Historically, the Internal Revenue Service (“IRS”) issued private letter rulings (“PLRs”) in which the IRS specifically concluded that income and gains from investments in commodity index-linked structured notes (the “Notes Rulings”) or a wholly-owned foreign subsidiary that invests in commodity-linked instruments are “qualifying income” for purposes of compliance with Subchapter M of the Code. However, the Fund has not received a PLR, and is/are not able to rely on PLRs issued to other taxpayers. The IRS recently issued final regulations that, would generally treat the Fund’s income inclusion with respect to a subsidiary as qualifying income either if (A) there is a distribution out of the earnings and profits of a subsidiary that are attributable to such income inclusion or (B) such inclusion is derived with respect to the Fund’s business of investing in stock, securities, or currencies.
The IRS also issued a revenue procedure, which states that the IRS will not in the future issue PLRs that would require a determination of whether an asset (such as a commodity index-linked note) is a “security” under the Investment Company Act of 1940. In connection with issuing such revenue procedure, the IRS has revoked the Notes Ruling on a prospective basis. In light of the revocation of the Notes Rulings, the Fund has limited its investments in commodity index-linked structured notes. The Fund has obtained an opinion of counsel that the Fund’s income from investments in the Subsidiary should constitute “qualifying income.” However, no assurances can be provided that the IRS would not be able to successfully assert that the Fund’s income from such investments was not “qualifying income,” in which case the Fund would fail to qualify as a regulated investment company (“RIC”) under Subchapter M of the Code if over 10% of its gross income were derived from these investments. If the Fund failed to qualify as a RIC, it would be subject to federal and state income tax on all of its taxable income at regular corporate tax rates with no deduction for any distributions paid to shareholders, which would significantly adversely affect the returns to, and could cause substantial losses for, Fund shareholders.
Under the Trust’s organizational documents, its Trustees, officers, employees and agents are indemnified, to the extent permitted by the Act and state law, against certain liabilities that may arise out of performance of their duties to the Fund. Additionally, in the course of business, the Fund enters into contracts that contain a variety of indemnification clauses. The Fund’s maximum exposure under these arrangements is unknown, as this would involve future claims that may be made against the Fund that have not yet occurred. However, GSAM believes the risk of loss under these arrangements to be remote.
Pursuant to an effort to consolidate the membership of the Board of Trustees of the Trust (the “Board”) with the Board of Trustees of each of Goldman Sachs ETF Trust, Goldman Sachs ETF Trust II, Goldman Sachs Real Estate Diversified Income Fund, Goldman Sachs Trust and Goldman Sachs Variable Insurance Trust, in July 2023, the Board voted to nominate Gregory G. Weaver, Dwight L. Bush, Kathryn A. Cassidy, John G. Chou, Joaquin Delgado, Eileen H. Dowling and Paul C. Wirth (the “Nominees”) for election as Trustees of the Trust. At a virtual special joint meeting of shareholders held on November 16, 2023, each of the Nominees was elected to serve as Trustees alongside the current Trustees of the Trust, effective January 1, 2024.
GOLDMAN SACHS MULTI-STRATEGY ALTERNATIVES FUND
Subsequent events after the Consolidated Statement of Assets and Liabilities date have been evaluated, and GSAM has concluded that there is no impact requiring adjustment or disclosure in the financial statements.
GOLDMAN SACHS MULTI-STRATEGY ALTERNATIVES FUND
|
Consolidated Notes to Financial Statements (continued) October 31, 2023 |
|
|
12. SUMMARY OF SHARE TRANSACTIONS |
Share activity is as follows:
| | | | | | | | | | | | | | | | |
| | | Multi-Strategy Alternatives Fund | |
| | | For the Fiscal Year Ended
October 31, 2023 | | | For the Fiscal Year Ended
October 31, 2022 | |
| |
| | | | |
| | | Shares | | | Dollars | | | Shares | | | Dollars | |
| |
| | | | |
| | | | |
Class A Shares | | | | | | | | | | | | | | | | |
| | | | |
Shares sold | | | 147,853 | | | $ | 1,646,506 | | | | 228,560 | | | $ | 2,589,593 | |
| | | | |
Reinvestment of distributions | | | 1,655 | | | | 18,502 | | | | — | | | | — | |
| | | | |
Shares redeemed | | | (209,620 | ) | | | (2,342,229 | ) | | | (125,663 | ) | | | (1,439,448 | ) |
| | | | |
| | | | (60,112 | ) | | | (677,221 | ) | | | 102,897 | | | | 1,150,145 | |
| | | | |
Class C Shares | | | | | | | | | | | | | | | | |
| | | | |
Shares sold | | | 2,316 | | | | 24,403 | | | | 4,047 | | | | 45,050 | |
| | | | |
Shares redeemed | | | (120,429 | ) | | | (1,267,292 | ) | | | (146,539 | ) | | | (1,578,078 | ) |
| | | | |
| | | | (118,113 | ) | | | (1,242,889 | ) | | | (142,492 | ) | | | (1,533,028 | ) |
| | | | |
Institutional Shares | | | | | | | | | | | | | | | | |
| | | | |
Shares sold | | | 258,269 | | | | 2,933,294 | | | | 628,917 | | | | 7,341,641 | |
| | | | |
Reinvestment of distributions | | | 14,428 | | | | 163,755 | | | | — | | | | — | |
| | | | |
Shares redeemed | | | (988,807 | ) | | | (11,214,686 | ) | | | (2,070,507 | ) | | | (24,657,300 | ) |
| | | | |
| | | | (716,110 | ) | | | (8,117,637 | ) | | | (1,441,590 | ) | | | (17,315,659 | ) |
| | | | |
Investor Shares | | | | | | | | | | | | | | | | |
| | | | |
Shares sold | | | 72,337 | | | | 814,913 | | | | 119,216 | | | | 1,376,997 | |
| | | | |
Reinvestment of distributions | | | 2,234 | | | | 25,218 | | | | — | | | | — | |
| | | | |
Shares redeemed | | | (185,030 | ) | | | (2,074,466 | ) | | | (228,237 | ) | | | (2,628,654 | ) |
| | | | |
| | | | (110,459 | ) | | | (1,234,335 | ) | | | (109,021 | ) | | | (1,251,657 | ) |
| | | | |
Class R6 Shares | | | | | | | | | | | | | | | | |
| | | | |
Shares sold | | | — | | | | — | | | | 2,235 | | | | 27,024 | |
| | | | |
Reinvestment of distributions | | | 16 | | | | 185 | | | | — | | | | — | |
| | | | |
Shares redeemed | | | (2,246 | ) | | | (25,364 | ) | | | — | | | | — | |
| | | | |
| | | | (2,230 | ) | | | (25,179 | ) | | | 2,235 | | | | 27,024 | |
| | | | |
Class R Shares | | | | | | | | | | | | | | | | |
| | | | |
Shares sold | | | — | | | | — | | | | — | | | | — | |
| | | | |
Reinvestment of distributions | | | — | | | | — | | | | — | | | | — | |
| | | | |
Shares redeemed | | | — | | | | — | | | | — | | | | — | |
| | | | |
| | | | — | | | | — | | | | — | | | | — | |
| | | | |
Class P Shares | | | | | | | | | | | | | | | | |
| | | | |
Shares sold | | | 169,134 | | | | 1,909,457 | | | | 888,469 | | | | 10,515,769 | |
| | | | |
Reinvestment of distributions | | | 42,710 | | | | 484,761 | | | | — | | | | — | |
| | | | |
Shares redeemed | | | (3,504,125 | ) | | | (39,489,463 | ) | | | (745,158 | ) | | | (8,545,167 | ) |
| | | | |
| | | | (3,292,281 | ) | | | (37,095,245 | ) | | | 143,311 | | | | 1,970,602 | |
| | | | |
NET DECREASE | | | (4,299,305 | ) | | $ | (48,392,506 | ) | | | (1,444,660 | ) | | $ | (16,952,573 | ) |
Report of Independent Registered Public Accounting Firm
To the Board of Trustees of Goldman Sachs Trust II and Shareholders of Goldman Sachs Multi-Strategy Alternatives Fund
Opinion on the Consolidated Financial Statements
We have audited the accompanying consolidated statement of assets and liabilities, including the consolidated schedule of investments, of Goldman Sachs Multi-Strategy Alternatives Fund and its subsidiary (one of the funds constituting Goldman Sachs Trust II, referred to hereafter as the “Fund”) as of October 31, 2023, the related consolidated statements of operations for the year ended October 31, 2023, the consolidated statement of changes in net assets for each of the two years in the period ended October 31, 2023, including the related notes, and the consolidated financial highlights for each of the five years in the period ended October 31, 2023 (collectively referred to as the “consolidated financial statements”). In our opinion, the consolidated financial statements present fairly, in all material respects, the financial position of the Fund as of October 31, 2023, the results of its operations for the year then ended, the changes in its net assets for each of the two years in the period ended October 31, 2023 and the consolidated financial highlights for each of the five years in the period ended October 31, 2023 in conformity with accounting principles generally accepted in the United States of America.
Basis for Opinion
These consolidated financial statements are the responsibility of the Fund’s management. Our responsibility is to express an opinion on the Fund’s consolidated financial statements based on our audits. We are a public accounting firm registered with the Public Company Accounting Oversight Board (United States) (PCAOB) and are required to be independent with respect to the Fund in accordance with the U.S. federal securities laws and the applicable rules and regulations of the Securities and Exchange Commission and the PCAOB.
We conducted our audits of these consolidated financial statements in accordance with the standards of the PCAOB. Those standards require that we plan and perform the audit to obtain reasonable assurance about whether the consolidated financial statements are free of material misstatement, whether due to error or fraud.
Our audits included performing procedures to assess the risks of material misstatement of the consolidated financial statements, whether due to error or fraud, and performing procedures that respond to those risks. Such procedures included examining, on a test basis, evidence regarding the amounts and disclosures in the consolidated financial statements. Our audits also included evaluating the accounting principles used and significant estimates made by management, as well as evaluating the overall presentation of the consolidated financial statements. Our procedures included confirmation of securities owned as of October 31, 2023 by correspondence with the custodian, transfer agent and brokers; when replies were not received from brokers, we performed other auditing procedures. We believe that our audits provide a reasonable basis for our opinion.
|
| /s/ PricewaterhouseCoopers LLP |
|
| Boston, Massachusetts |
| December 21, 2023 |
We have served as the auditor of one or more investment companies in the Goldman Sachs fund complex since 2000.
GOLDMAN SACHS MULTI-STRATEGY ALTERNATIVES FUND
|
| Fund Expenses — Six Month Period Ended October 31, 2023 (Unaudited) |
As a shareholder of Class A, Class C, Institutional, Investor, Class R6, Class R or Class P Shares of the Fund, you incur two types of costs: (1) transaction costs, including sales charges on purchase payments (with respect to Class A Shares), contingent deferred sales charges on redemptions (with respect to Class C Shares), and (2) ongoing costs, including management fees; distribution and service (12b-1) fees (with respect to Class A and Class R Shares); and other Fund expenses. This example is intended to help you understand your ongoing costs (in dollars) of investing in Class A, Class C, Institutional, Investor, Class R6, Class R or Class P Shares of the Fund and to compare these costs with the ongoing costs of investing in other mutual funds.
The example is based on an investment of $1,000 invested at the beginning of the period and held for the entire period from May 1, 2023 through October 31, 2023, which represents a period of 184 days of a 365 day year. This projection assumes that annualized expense ratios were in effect during the period.
Actual Expenses — The first line under each share class in the table below provides information about actual account values and actual expenses. You may use the information in this line, together with the amount you invested, to estimate the expenses that you paid over the period. Simply divide your account value by $1,000 (for example, an $8,600 account value divided by $1,000=8.6), then multiply the result by the number in the first line under the heading entitled “Expenses Paid” to estimate the expenses you paid on your account during this period.
Hypothetical Example for Comparison Purposes — The second line under each share class in the table below provides information about hypothetical account values and hypothetical expenses based on the Fund’s actual net expense ratios and an assumed rate of return of 5% per year before expenses, which is not the Fund’s actual return. The hypothetical account values and expenses may not be used to estimate the actual ending account balance or expenses you paid for the period. You may use this information to compare the ongoing costs of investing in the Fund and other funds. To do so, compare this 5% hypothetical example with the 5% hypothetical examples that appear in the shareholder reports of the other funds.
Please note that the expenses shown in the table are meant to highlight your ongoing costs only and do not reflect any transactional costs, such as sales charges, redemption fees, or exchange fees. Therefore, the second line of the table is useful in comparing ongoing costs only, and will not help you determine the relative total costs of owning different funds. In addition, if these transactional costs were included, your costs would have been higher.
| | | | | | | | | | | | |
| | | Multi-Strategy Alternatives Fund | |
| Share Class | | Beginning
Account
Value
5/1/23 | | | Ending
Account
Value
10/31/23 | | | Expenses Paid for the
6 months ended
10/31/23* | |
| Class A | | | | | | | | | | | | |
Actual | | | $1,000.00 | | | | $ 984.00 | | | | $ 9.27 | |
Hypothetical 5% return | | | 1,000.00 | | | | 1,015.90 | + | | | 9.42 | |
| Class C | | | | | | | | | | | | |
Actual | | | 1,000.00 | | | | 980.30 | | | | 13.54 | |
Hypothetical 5% return | | | 1,000.00 | | | | 1,011.50 | + | | | 13.75 | |
| Institutional | | | | | | | | | | | | |
Actual | | | 1,000.00 | | | | 986.00 | | | | 7.84 | |
Hypothetical 5% return | | | 1,000.00 | | | | 1,017.30 | + | | | 7.97 | |
| Investor | | | | | | | | | | | | |
Actual | | | 1,000.00 | | | | 985.90 | | | | 8.21 | |
Hypothetical 5% return | | | 1,000.00 | | | | 1,016.90 | + | | | 8.34 | |
| Class R6 | | | | | | | | | | | | |
Actual | | | 1,000.00 | | | | 986.00 | | | | 8.61 | |
Hypothetical 5% return | | | 1,000.00 | | | | 1,016.50 | + | | | 8.75 | |
| Class R | | | | | | | | | | | | |
Actual | | | 1,000.00 | | | | 982.80 | | | | 10.54 | |
Hypothetical 5% return | | | 1,000.00 | | | | 1,014.60 | + | | | 10.71 | |
| Class P | | | | | | | | | | | | |
Actual | | | 1,000.00 | | | | 986.00 | | | | 8.07 | |
Hypothetical 5% return | | | 1,000.00 | | | | 1,017.10 | + | | | 8.20 | |
| | * | Expenses for each share class are calculated using the Fund’s annualized net expense ratio for each class, which represents the ongoing expenses as a percentage of net assets for the six months ended October 31, 2023. Expenses are calculated by multiplying the annualized net expense ratio by the average account value for the period; then multiplying the result by the number of days in the most recent fiscal half year; and then dividing that result by the number of days in the fiscal year. |
The annualized net expense ratios for the period were as follows:
| | | | | | | | | | | | | | | | | | | | | | | | | | | | | | | | | | |
| Fund | | Class A | | | Class C | | | Institutional | | | | | | Investor | | | Class R6 | | | Class R | | | Class P | | | |
Multi-Strategy Alternatives | | | 1.85 | % | | | 2.71 | % | | | 1.57 | % | | | | | | | 1.64 | % | | | 1.72 | % | | | 2.11 | % | | | 1.61 | % | | |
| | + | Hypothetical expenses are based on each Fund’s actual annualized net expense ratios (excluding proxy fee which is not annualized) and an assumed rate of return of 5% per year before expenses. |
40
GOLDMAN SACHS MULTI-STRATEGY ALTERNATIVES FUND
Statement Regarding Basis for Approval of Management Agreements and Sub-Advisory Agreements (Unaudited)
Background
The Goldman Sachs Multi-Strategy Alternatives Fund (the “Fund”) is an investment portfolio of Goldman Sachs Trust II (the “Trust”). The Board of Trustees (the “Board”) oversees the management of the Trust and reviews the investment performance and expenses of the Fund at regularly scheduled meetings held throughout the year. In addition, the Board determines annually whether to approve the continuance of the Trust’s investment management agreement (the “Management Agreement”) with Goldman Sachs Asset Management, L.P. (the “Investment Adviser”) on behalf of the Fund. Prior to September 22, 2023, the Fund employed a “manager of managers” structure, whereby the Investment Adviser was responsible for selecting sub-advisers (subject to Board approval), allocating the Fund’s assets among them, and overseeing their day-to-day management of Fund assets. Effective on September 22, 2023, the Fund was renamed “Goldman Sachs Multi-Strategy Alternatives Fund” and repositioned from a strategy of allocating assets among the Fund’s sub-advisers to being managed solely by the Investment Adviser’s Quantitative Investment Strategies Team.
The Management Agreement was most recently approved for continuation until September 30, 2024 by the Board, including those Trustees who are not parties to the Management Agreement or “interested persons” (as defined in the Investment Company Act of 1940, as amended) of any party thereto (the “Independent Trustees”), at a meeting held on September 19-20, 2023 (the “Annual Meeting”).
The review process undertaken by the Trustees spans the course of the year and culminates with the Annual Meeting. To assist the Trustees in their deliberations, the Trustees have established a Contract Review Committee (the “Committee”), comprised of the Independent Trustees. The Committee held four meetings over the course of the year since the Management Agreement was last approved. At those Committee meetings, regularly scheduled Board or other committee meetings, and/or the Annual Meeting, matters relevant to the renewal of the Management Agreement were considered by the Board, or the Independent Trustees, as applicable. With respect to the Fund, such matters included:
| | (a) | the nature and quality of the advisory, administrative, and other services provided to the Fund by the Investment Adviser and its affiliates, including, as applicable, information about: |
| | (i) | the structure, staff, and capabilities of the Investment Adviser and its portfolio management teams that would manage the Fund following its repositioning; |
| | (ii) | the groups within the Investment Adviser and its affiliates that support the portfolio management teams or provide other types of necessary services, including fund services groups (e.g., accounting and financial reporting, tax, shareholder services, and operations); controls and risk management groups (e.g., legal, compliance, valuation oversight, credit risk management, internal audit, compliance testing, market risk analysis, finance, and central funding); sales and distribution support groups, and others (e.g., information technology and training); |
| | (iii) | trends in employee headcount; |
| | (iv) | the Investment Adviser’s financial resources and ability to hire and retain talented personnel and strengthen its operations; and |
| | (v) | the parent company’s support of the Investment Adviser and its mutual fund business, as expressed by the firm’s senior management; |
| | (b) | information on the investment performance of the Fund, including comparisons to the performance of similar mutual funds, as provided by a third-party mutual fund data provider engaged as part of the contract review process (the “Outside Data Provider”), and a benchmark performance index; and information on general investment outlooks in the markets in which the Fund invests; |
| | (c) | information provided by the Investment Adviser indicating the Investment Adviser’s views on whether the Fund’s peer group and/or benchmark index had high, medium, or low relevance given the Fund’s particular investment strategy; |
| | (d) | the terms of the Management Agreement and other agreements with affiliated service providers entered into by the Trust on behalf of the Fund; |
| | (e) | fee and expense information for the Fund, including: |
| | (i) | the relative management fee and expense levels of the Fund as compared to those of comparable funds managed by other advisers, as provided by the Outside Data Provider; |
| | (ii) | the Fund’s expense trends over time; and |
| | (iii) | to the extent the Investment Adviser manages other types of accounts (such as bank collective trusts, private wealth management accounts, institutional separate accounts, sub-advised mutual funds, and non-U.S. funds) having investment objectives and policies similar to those of the Fund, comparative information on the advisory fees charged and services provided to those accounts by the Investment Adviser; |
| | (f) | with respect to the extensive investment performance and expense comparison data provided by the Outside Data Provider, its processes in producing that data for the Fund; |
GOLDMAN SACHS MULTI-STRATEGY ALTERNATIVES FUND
Statement Regarding Basis for Approval of Management Agreements and Sub-Advisory Agreements (Unaudited) (continued)
| | (g) | the undertakings of the Investment Adviser and its affiliates to implement fee waivers and an expense limitation; |
| | (h) | information relating to the profitability of the Management Agreement and the transfer agency and distribution and service arrangements of the Fund to the Investment Adviser and its affiliates; |
| | (i) | whether the Fund’s existing management fee schedule adequately addressed any economies of scale; |
| | (j) | a summary of the “fall-out” benefits derived by the Investment Adviser and its affiliates from their relationships with the Fund, including the fees received by the Investment Adviser’s affiliates from the Fund for transfer agency, portfolio trading, distribution and other services; |
| | (k) | a summary of potential benefits derived by the Fund as a result of its relationship with the Investment Adviser; |
| | (l) | portfolio manager ownership of Fund shares; the manner in which portfolio manager compensation is determined; and the number and types of accounts managed by the portfolio managers; |
| | (m) | the nature and quality of the services provided to the Fund by its unaffiliated service providers, and the Investment Adviser’s general oversight and evaluation (including reports on due diligence) of those service providers as part of the administrative services provided under the Management Agreement; and |
| | (n) | the Investment Adviser’s processes and policies addressing various types of potential conflicts of interest; its approach to risk management; the annual review of the effectiveness of the Fund’s compliance program; and periodic compliance reports. |
The Trustees also received an overview of the Fund’s distribution arrangements. They received information regarding the Fund’s assets, share purchase and redemption activity, and payment of distribution and service fees. Information was also provided to the Trustees relating to revenue sharing payments made by and services provided by the Investment Adviser and its affiliates to intermediaries that promote the sale, distribution, and/or servicing of Fund shares.
The presentations made at the Board and Committee meetings and at the Annual Meeting encompassed the Fund and other mutual funds for which the Board has responsibility. In evaluating the Agreements at the Annual Meeting, the Trustees relied upon their knowledge, resulting from their meetings and other interactions throughout the year, of the Investment Adviser and its affiliates, their services, and the Fund. In conjunction with these meetings, the Trustees received written materials and oral presentations on the topics covered, and the Investment Adviser addressed the questions and concerns of the Trustees, including concerns regarding the investment performance of certain of the funds they oversee. The Independent Trustees were advised by their independent legal counsel regarding their responsibilities and other regulatory requirements related to the approval and continuation of mutual fund investment management agreements under applicable law. In addition, the Investment Adviser and its affiliates provided the Independent Trustees with a written response to a formal request for information sent on behalf of the Independent Trustees by their independent legal counsel. During the course of their deliberations, the Independent Trustees met in executive sessions with their independent legal counsel, without representatives of the Investment Adviser or its affiliates present.
Nature, Extent, and Quality of the Services Provided Under the Management Agreement
As part of their review, the Trustees considered the nature, extent, and quality of the services provided to the Fund by the Investment Adviser. In this regard, the Trustees considered both the investment advisory services and non-advisory services that are provided by the Investment Adviser and its affiliates. The Trustees noted the transition in the leadership and changes in personnel of various of the Investment Adviser’s portfolio management teams that had occurred in recent periods, and the ongoing recruitment efforts aimed at bringing high quality investment talent to the Investment Adviser. They also noted the Investment Adviser’s commitment to maintaining high quality systems and expending substantial resources to respond to ongoing changes to the market, regulatory and control environment in which the Fund and its service providers operate, including developments associated with the COVID-19 pandemic, geopolitical events, and economic sanctions, as well as the efforts of the Investment Adviser and its affiliates to combat cyber security risks. The Trustees also considered information regarding the Investment Adviser’s business continuity planning and remote operations capabilities. The Trustees concluded that the Investment Adviser continued to commit substantial financial and operational resources to the Fund and expressed confidence that the Investment Adviser would continue to do so in the future. The Trustees also recognized that the Investment Adviser had made significant commitments to address regulatory compliance requirements applicable to the Fund and the Investment Adviser and its affiliates.
Investment Performance
The Trustees also considered the investment performance of the Fund. In this regard, they compared the investment performance of the Fund to its peers using rankings and ratings compiled by the Outside Data Provider as of March 31, 2023, and updated performance information prepared by the Investment Adviser using the peer group identified by the Outside Data Provider as of June 30, 2023. The information on the Fund’s investment performance prepared by the Outside Data Provider was provided
GOLDMAN SACHS MULTI-STRATEGY ALTERNATIVES FUND
Statement Regarding Basis for Approval of Management Agreements and Sub-Advisory Agreements (Unaudited) (continued)
for the one-, three-and five-year periods ending on the applicable dates. The Trustees also reviewed the Fund’s investment performance relative to its performance benchmark. As part of this review, they considered the investment performance trends of the Fund over time, and reviewed the investment performance of the Fund in light of its investment objective and policies and market conditions. The Trustees considered the Investment Adviser’s representations that the Fund had significant differences from its Outside Data Provider peer group and benchmark index that caused them to be imperfect bases for comparison.
In addition, the Trustees considered materials prepared and presentations made by the Investment Adviser’s senior management and portfolio management personnel in which Fund performance was assessed. The Trustees also considered the Investment Adviser’s periodic reports with respect to the Fund’s risk profile, and how the Investment Adviser’s approach to risk monitoring and management influences portfolio management.
The Trustees noted that the Fund’s Institutional Shares had placed in the top half of the Fund’s performance peer group for the five-year period and in the third quartile for the one- and three-year periods, and had outperformed the Fund’s U.S. Treasury-based benchmark index for three- and five-year periods and underperformed for the one-year period ended March 31, 2023.
Costs of Services Provided and Competitive Information
The Trustees considered the contractual terms of the Management Agreement and the fee rates payable by the Fund thereunder before and following its repositioning. In this regard, the Trustees considered information on the services rendered by the Investment Adviser to the Fund, which included both advisory and administrative services that were directed to the needs and operations of the Fund as a registered mutual fund.
In particular, the Trustees reviewed analyses prepared by the Outside Data Provider regarding the expense rankings of the Fund (reflecting the Fund’s expenses prior to its repositioning), as well as additional information provided by the Investment Adviser throughout the year. The analyses provided a comparison of the Fund’s management fee and breakpoints to those of a relevant peer group and category universe; an expense analysis which compared the Fund’s overall net and gross expenses to a peer group and a category universe; and data comparing the Fund’s net expenses to the peer and category medians. The analyses also compared the Fund’s other expenses and fee waivers/reimbursements to those of the peer group and category medians. The Trustees also considered comparative fee information (reflecting the Fund’s expenses following its repositioning) for services provided by the Investment Adviser to collective investment vehicles having investment objectives and policies similar to those of the Fund. They considered that services provided to the Fund differed in various significant respects from the services provided to these collective investment vehicles, which generally operated under less stringent regulatory and financial reporting requirements, required fewer services from the Investment Adviser to a smaller number of client contact points, and were less time-sensitive. The Trustees concluded that the comparisons provided by the Outside Data Provider and the Investment Adviser were useful in evaluating the reasonableness of the management fees and total expenses paid by the Fund.
In addition, the Trustees considered the Investment Adviser’s undertakings to implement fee waivers and an expense limitation. The Trustees noted that the Investment Adviser had agreed to waive a portion of its management fee in an amount equal to the management fee paid to the Investment Adviser as the investment adviser to the Fund’s wholly-owned subsidiary. In addition, the Trustees noted that shareholders are able to redeem their shares at any time if shareholders believe that the Fund fees and expenses are too high or if they are dissatisfied with the performance of the Fund.
Profitability
The Trustees reviewed the Fund’s contribution to the Investment Adviser’s revenues and pre-tax profit margins. In this regard the Trustees noted that they had received, among other things, profitability analyses and summaries, revenue and expense schedules by Fund and by function (i.e., investment management, transfer agency and distribution and service), and information on the Investment Adviser’s expense allocation methodology. They observed that the profitability and expense figures are substantially similar to those used by the Investment Adviser for many internal purposes, including compensation decisions among various business groups, and are thus subject to a vigorous internal debate about how certain revenue and expenses should be allocated. The Trustees also noted that the internal audit group within the Goldman Sachs organization periodically audits the expense allocation methodology and that the internal audit group was satisfied with the reasonableness, consistency, and accuracy of the Investment Adviser’s expense allocation methodology. Profitability data for the Fund was provided for 2022 and 2021, and the Trustees considered this information in relation to the Investment Adviser’s overall profitability.
GOLDMAN SACHS MULTI-STRATEGY ALTERNATIVES FUND
Statement Regarding Basis for Approval of Management Agreements and Sub-Advisory Agreements (Unaudited) (continued)
Economies of Scale
The Trustees considered the information that had been provided regarding whether there have been economies of scale with respect to the management of the Fund. The Trustees also considered the breakpoints in the fee rate payable under the Management Agreement for the Fund (following its repositioning) at the below annual percentage rates of the average daily net assets of the Fund:
| | |
Average Daily Net Assets | | Management Fee Annual Rate |
First $2 billion | | 0.75% |
Next $3 billion | | 0.68 |
Next $3 billion | | 0.64 |
Over $8 billion | | 0.63 |
The Trustees noted that the breakpoints were designed to share potential economies of scale, if any, with the Fund and its shareholders as assets under management reach those asset levels. The Trustees considered the amounts of assets in the Fund; the Fund’s recent share purchase and redemption activity; the information provided by the Investment Adviser relating to the costs of the services provided by the Investment Adviser and its affiliates and the profits realized by them (if any); information comparing the fee rates charged by the Investment Adviser with fee rates charged to other funds in the peer group; and the Investment Adviser’s undertakings to waive a portion of its management fee and certain fees and to limit certain expenses of the Fund that exceed a specified level, as well as Goldman Sachs & Co. LLC’s (“Goldman Sachs”) undertaking to waive a portion of the transfer agency fees paid by the Fund’s Class A, Class C, Investor and Class R Shares. Upon reviewing these matters at the Annual Meeting, the Trustees concluded that the fee breakpoints represented a means of assuring that benefits of scalability, if any, would be passed along to shareholders at the specified asset levels.
Other Benefits to the Investment Adviser and Its Affiliates
The Trustees also considered the other benefits derived by the Investment Adviser and its affiliates from their relationships with the Fund as stated above, including: (a) transfer agency fees received by Goldman Sachs; (b) brokerage and futures commissions earned by Goldman Sachs for executing securities transactions (in its capacity as clearing broker) and futures transactions on behalf of the Fund; (c) the Investment Adviser’s ability to leverage the infrastructure designed to service the Fund on behalf of its other clients; (d) the Investment Adviser’s ability to cross-market other products and services to Fund shareholders; (e) Goldman Sachs’ retention of certain fees as Fund Distributor; (f) the Investment Adviser’s ability to negotiate better pricing with the Fund’s custodian on behalf of its other clients, as a result of the relationship with the Fund; (g) the investment of cash and cash collateral in money market funds managed by the Investment Adviser that will result in increased assets under management for those money market funds; and (h) the possibility that the working relationship between the Investment Adviser and the Fund’s third-party service providers may cause those service providers to be more likely to do business with other areas of Goldman Sachs. In the course of considering the foregoing, the Independent Trustees requested and received further information quantifying certain of these fall-out benefits.
Other Benefits to the Fund and Its Shareholders
The Trustees also noted that the Fund receives certain other potential benefits as a result of its relationship with the Investment Adviser, including: (a) trading efficiencies resulting from aggregation of orders of the Fund with those of other funds or accounts managed by the Investment Adviser; (b) enhanced servicing from vendors due to the volume of business generated by the Investment Adviser and its affiliates; (c) enhanced servicing from broker-dealers due to the volume of business generated by the Investment Adviser and its affiliates; (d) the advantages received from the Investment Adviser’s knowledge and experience gained from managing other accounts and products; (e) the Investment Adviser’s ability to hire and retain qualified personnel to provide services to the Fund because of the reputation of the Goldman Sachs organization; (f) the Fund’s access, through the Investment Adviser, to certain firm-wide resources (e.g., proprietary risk management systems and databases), subject to certain restrictions; and (g) the Fund’s access to certain affiliated distribution channels.
Conclusion
In connection with their consideration of the Management Agreement, the Trustees gave weight to each of the factors described above, but did not identify any particular factor as controlling their decision. After deliberation and consideration of all of the information provided, including the factors described above, the Trustees concluded, in the exercise of their business
GOLDMAN SACHS MULTI-STRATEGY ALTERNATIVES FUND
Statement Regarding Basis for Approval of Management Agreements and Sub-Advisory Agreements (Unaudited) (continued)
judgment, that the management fees paid by the Fund were reasonable in light of services provided to it by the Investment Adviser, the Investment Adviser’s costs and the Fund’s current and reasonably foreseeable asset levels. The Trustees unanimously concluded that the Investment Adviser’s continued management likely would benefit the Fund and its shareholders, and that the Management Agreement should be approved and continued with respect to the Fund until September 30, 2024.
GOLDMAN SACHS MULTI-STRATEGY ALTERNATIVES FUND
Trustees and Officers (Unaudited)
Independent Trustees
| | | | | | | | | | |
Name, Address and Age1 | | Position(s) Held with the Trust | | Term of Office and Length of Time Served2 | | Principal Occupation(s) During Past 5 Years | | Number of
Portfolios in
Fund Complex
Overseen by
Trustee3 | | Other Directorships Held by Trustee4 |
| | | | | |
Cheryl K. Beebe Age: 67 | | Chair of the Board of Trustees | | Since 2017 (Trustee since 2015) | | Ms. Beebe is retired. She is Director, Packaging Corporation of America (2008-Present); Director, The Mosaic Company (2019-Present); Director, HanesBrands Inc. (2020-Present); and was formerly Director, Convergys Corporation (a global leader in customer experience outsourcing) (2015-2018); and formerly held the position of Executive Vice President, (2010-2014); and Chief Financial Officer, Ingredion, Inc. (a leading global ingredient solutions company) (2004-2014). Chair of the Board of Trustees — Goldman Sachs Trust II; Goldman Sachs MLP and Energy Renaissance Fund; Goldman Sachs ETF Trust; Goldman Sachs ETF Trust II; and Goldman Sachs Real Estate Diversified Income Fund. | | 90 | | Packaging
Corporation
of America
(producer of
container
board); The
Mosaic
Company
(producer of
phosphate
and potash
fertilizer);
HanesBrands
Inc. (a
multinational
clothing
company) |
| | | | | |
Lawrence Hughes Age: 65 | | Trustee | | Since 2016 | | Mr. Hughes is retired. Formerly, he held senior management positions with BNY Mellon Wealth Management, a division of The Bank of New York Mellon Corporation (a financial services company)(1991-2015), most recently as Chief Executive Officer (2010-2015). Previously, Mr. Hughes served as an Advisory Board Member of Goldman Sachs Trust II (February 2016-April 2016). Trustee — Goldman Sachs Trust II; Goldman Sachs MLP and Energy Renaissance Fund; Goldman Sachs ETF Trust; Goldman Sachs ETF Trust II; and Goldman Sachs Real Estate Diversified Income Fund. | | 90 | | None |
| | | | | |
John F. Killian Age: 68 | | Trustee | | Since 2015 | | Mr. Killian is retired. He is Director, Consolidated Edison, Inc. (2007-Present); and was formerly Director, Houghton Mifflin Harcourt Publishing Company (2011-2022). Previously, he held senior management positions with Verizon Communications, Inc., including Executive Vice President and Chief Financial Officer (2009-2010); and President, Verizon Business, Verizon Communications, Inc. (2005-2009). Trustee — Goldman Sachs Trust II; Goldman Sachs MLP and Energy Renaissance Fund; Goldman Sachs ETF Trust; Goldman Sachs ETF Trust II; and Goldman Sachs Real Estate Diversified Income Fund. | | 90 | | Consolidated
Edison, Inc.
(a utility
holding
company) |
| | | | | |
Steven D. Krichmar Age: 65 | | Trustee | | Since 2018 | | Mr. Krichmar is retired. Formerly, he held senior management and governance positions with Putnam Investments, LLC, a financial services company (2001-2016). He was most recently Chief of Operations and a member of the Operating Committee of Putnam Investments, LLC and Principal Financial Officer of The Putnam Funds. Previously, Mr. Krichmar served as an Audit Partner with PricewaterhouseCoopers LLP and its predecessor company (1990-2001). Trustee — Goldman Sachs Trust II; Goldman Sachs MLP and Energy Renaissance Fund; Goldman Sachs ETF Trust; Goldman Sachs ETF Trust II; and Goldman Sachs Real Estate Diversified Income Fund. | | 90 | | None |
| | | | | |
Michael Latham Age: 58 | | Trustee | | Since 2021 | | Mr. Latham is retired. Formerly, he held senior management positions with the iShares exchange-traded fund business owned by BlackRock, Inc., including Chairman (2011-2014); Global Head (2010-2011); U.S. Head (2007-2010); and Chief Operating Officer (2003-2007). Trustee — Goldman Sachs Trust II; Goldman Sachs MLP and Energy Renaissance Fund; Goldman Sachs ETF Trust; Goldman Sachs ETF Trust II; Goldman Sachs Credit Income Fund; and Goldman Sachs Real Estate Diversified Income Fund. | | 91 | | None |
GOLDMAN SACHS MULTI-STRATEGY ALTERNATIVES FUND
Trustees and Officers (Unaudited) (continued)
Independent Trustees
| | | | | | | | | | |
Name, Address and Age1 | | Position(s) Held with the Trust | | Term of Office and Length of Time Served2 | | Principal Occupation(s) During Past 5 Years | | Number of
Portfolios in
Fund Complex
Overseen by
Trustee3 | | Other Directorships Held by Trustee4 |
| | | | | |
Lawrence W. Stranghoener Age: 69 | | Trustee | | Since 2021 | | Mr. Stranghoener is retired. He is Chairman, Kennametal, Inc. (a global manufacturer and distributor of tooling and industrial materials) (2003-Present); and was formerly Director, Aleris Corporation and Aleris International, Inc. (a producer of aluminum rolled products) (2011- 2020); Interim Chief Executive Officer (2014) and Executive Vice President and Chief Financial Officer (2004-2014), Mosaic Company (a fertilizer manufacturing company). Trustee — Goldman Sachs Trust II; Goldman Sachs MLP and Energy Renaissance Fund; Goldman Sachs ETF Trust; Goldman Sachs ETF Trust II; and Goldman Sachs Real Estate Diversified Income Fund. Chair of the Board of Trustees — Goldman Sachs Credit Income Fund. | | 91 | | Kennametal,
Inc. (a global
manufacturer
and
distributor of
tooling and
industrial
materials) |
| | | | | |
| | | | | | | | | | |
Interested Trustee* |
Name, Address and Age1 | | Position(s) Held with the Trust | | Term of Office and Length of Time Served2 | | Principal Occupation(s) During Past 5 Years | | Number of
Portfolios in
Fund Complex
Overseen by
Trustee3 | | Other Directorships Held by Trustee4 |
| | | | | |
James A. McNamara Age: 61 | | President and Trustee | | | | Advisory Director, Goldman Sachs (January 2018-Present); Managing Director, Goldman Sachs (January 2000-December 2017); Director of Institutional Fund Sales, GSAM (April 1998- December 2000); and Senior Vice President and Manager, Dreyfus Institutional Service Corporation (January 1993-April 1998). President and Trustee — Goldman Sachs Trust II; Goldman Sachs Trust; Goldman Sachs Variable Insurance Trust; Goldman Sachs ETF Trust; Goldman Sachs ETF Trust II; Goldman Sachs MLP and Energy Renaissance Fund; Goldman Sachs Credit Income Fund; and Goldman Sachs Real Estate Diversified Income Fund. | | 193 | | None |
| | | | | |
| | | | | | | | | | |
| * | Mr. McNamara is considered to be an “Interested Trustee” because he holds positions with Goldman Sachs and owns securities issued by The Goldman Sachs Group, Inc. Mr. McNamara holds comparable positions with certain other companies of which Goldman Sachs, GSAM or an affiliate thereof is the investment adviser, administrator and/or distributor. |
| 1 | Each Trustee may be contacted by writing to the Trustee, c/o Goldman Sachs, 200 West Street, New York, New York, 10282, Attn: Robert Griffith. Information is provided as of October 31, 2023. |
| 2 | Subject to such policies as may be adopted by the Board from time-to-time, each Trustee holds office for an indefinite term, until the earliest of: (a) the election of his or her successor; (b) the date the Trustee resigns or is removed by the Board or shareholders, in accordance with the Trust’s Declaration of Trust; or (c)the termination of the Trust. The Board has adopted policies which provide that each Independent Trustee shall retire as of December 31st of the calendar year in which he or she reaches (a) his or her 75th birthday or (b) the 15th anniversary of the date he or she became a Trustee, whichever is earlier, unless a waiver of such requirements shall have been adopted by a majority of the other Trustees. These policies may be changed by the Trustees without shareholder vote. |
| 3 | The Goldman Sachs Fund Complex includes certain other companies listed above for each respective Trustee. As of October 31, 2023, Goldman Sachs Trust II consisted of 18 portfolios (7 of which offered shares to the public); Goldman Sachs Trust consisted of 87 portfolios; Goldman Sachs Variable Insurance Trust consisted of 15 portfolios (11 of which offered shares to the public); Goldman Sachs ETF Trust consisted of 68 portfolios (34 of which offered shares to the public); Goldman Sachs ETF Trust II consisted of 2 portfolios; and Goldman Sachs MLP and Energy Renaissance Fund, Goldman Sachs Credit Income Fund and Goldman Sachs Real Estate Diversified Income Fund each consisted of one portfolio. Goldman Sachs MLP and Energy Renaissance Fund and Goldman Sachs Credit Income Fund did not offer shares to the public. |
| 4 | This column includes only directorships of companies required to report to the Securities and Exchange Commission under the Securities Exchange Act of 1934 (i.e., “public companies”) or other investment companies registered under the Act. |
Additional information about the Trustees is available in the Funds’ Statement of Additional Information, which can be obtained from Goldman Sachs free of charge by calling this toll-free number (in the United States of America): 1-800-526-7384.
GOLDMAN SACHS MULTI-STRATEGY ALTERNATIVES FUND
Trustees and Officers (Unaudited) (continued)
Officers of the Trust*
| | | | | | |
| Name, Address and Age1 | | Position(s) Held with the Trust | | Term of Office and Length of Time Served2 | | Principal Occupation(s) During Past 5 Years |
| | | |
James A. McNamara 200 West Street New York, NY 10282 Age: 61 | | President and Trustee | | Since 2012 | | Advisory Director, Goldman Sachs (January 2018-Present); Managing Director, Goldman Sachs (January 2000-December 2017); Director of Institutional Fund Sales, GSAM (April 1998-December 2000); and Senior Vice President and Manager, Dreyfus Institutional Service Corporation (January 1993-April 1998). President and Trustee — Goldman Sachs Trust II; Goldman Sachs Trust; Goldman Sachs Variable Insurance Trust; Goldman Sachs ETF Trust; Goldman Sachs ETF Trust II; Goldman Sachs MLP and Energy Renaissance Fund; Goldman Sachs Credit Income Fund; and Goldman Sachs Real Estate Diversified Income Fund. |
| | | |
Joseph F. DiMaria 30 Hudson Street Jersey City, NJ 07302 Age: 55 | | Treasurer, Principal Financial Officer and Principal Accounting Officer | | Since 2017 (Treasurer and Principal Financial Officer Since 2019) | | Managing Director, Goldman Sachs (November 2015-Present) and Vice President — Mutual Fund Administration, Columbia Management Investment Advisers, LLC (May 2010-October 2015). Treasurer, Principal Financial Officer and Principal Accounting Officer — Goldman Sachs Trust II (previously Assistant Treasurer (2017)); Goldman Sachs Trust (previously Assistant Treasurer (2016)); Goldman Sachs Variable Insurance Trust (previously Assistant Treasurer (2016)); Goldman Sachs MLP and Energy Renaissance Fund (previously Assistant Treasurer (2017)); Goldman Sachs ETF Trust (previously Assistant Treasurer (2017)); Goldman Sachs ETF Trust II; Goldman Sachs Credit Income Fund; and Goldman Sachs Real Estate Diversified Income Fund. |
| | | |
Robert Griffith 200 West Street New York, NY 10282 Age: 49 | | Secretary | | Since 2022 | | Managing Director, Goldman Sachs (September 2022 – Present); General Counsel, Exchange Traded Concepts, LLC (October 2021 – September 2022); Vice President, Goldman Sachs (August 2011 – October 2021); Associate General Counsel, Goldman Sachs (December 2014 – Present); Assistant General Counsel, Goldman Sachs (August 2011 – December 2014); Vice President and Counsel, Nomura Holding America, Inc. (2010 – 2011); and Associate, Simpson Thacher & Bartlett LLP (2005 – 2010). Secretary — Goldman Sachs Trust II (previously Assistant Secretary (2022)); Goldman Sachs Trust (previously Assistant Secretary (2022)); Goldman Sachs Variable Insurance Trust (previously Assistant Secretary (2022)); Goldman Sachs ETF Trust (previously Assistant Secretary (2022)); Goldman Sachs ETF Trust II (previously Assistant Secretary (2022)); and Goldman Sachs Real Estate Diversified Income Fund (previously Assistant Secretary (2022)). Assistant Secretary — Goldman Sachs MLP and Energy Renaissance Fund. |
| | | |
| | | | | | |
| * | Represents a partial list of officers of the Trust. Additional information about all the officers is available in the Funds’ Statement of Additional Information, which can be obtained from Goldman Sachs free of charge by calling this toll-free number (in the United States): 1-800-526-7384. |
| 1 | Information is provided as of October 31, 2023. |
| 2 | Officers hold office at the pleasure of the Board of Trustees or until their successors are duly elected and qualified. Each officer holds comparable positions with certain other companies of which Goldman Sachs, GSAM or an affiliate thereof is the investment adviser, administrator and/or distributor. |
|
Goldman Sachs Multi-Strategy Alternatives Fund - Tax Information (Unaudited) For the year ended October 31, 2023, 27.68% of the dividends paid from net investment company taxable income by the Multi-Strategy Alternatives Fund qualify for the dividends received deduction available to corporations. For the year ended October 31, 2023, 100% of the dividends paid from net investment company taxable income by the Multi-Strategy Alternatives Fund qualify for the reduced tax rate under the Jobs and Growth Tax Relief and Reconciliation Act of 2003. |
FUNDS PROFILE
Goldman Sachs Funds
Goldman Sachs is a premier financial services firm, known since 1869 for creating thoughtful and customized investment solutions in complex global markets.
Today, the Asset Management Division of Goldman Sachs serves a diverse set of clients worldwide, including private institutions, public entities and individuals. With approximately $2.42 trillion in assets under supervision as of September 30, 2023, Goldman Sachs Asset Management has portfolio management teams located around the world and our investment professionals bring firsthand knowledge of local markets to every investment decision. Assets under supervision includes assets under management and other client assets for which Goldman Sachs does not have full discretion. Goldman Sachs Asset Management leverages the resources of Goldman Sachs & Co. LLC subject to legal, internal and regulatory restrictions.
Money Market
Financial Square FundsSM
| ∎ | Financial Square Treasury Solutions Fund1 |
| ∎ | Financial Square Government Fund1 |
| ∎ | Financial Square Money Market Fund2 |
| ∎ | Financial Square Prime Obligations Fund2 |
| ∎ | Financial Square Treasury Instruments Fund1 |
| ∎ | Financial Square Treasury Obligations Fund1 |
| ∎ | Financial Square Federal Instruments Fund1 |
Investor FundsSM
| ∎ | Investor Money Market Fund3 |
| ∎ | Investor Tax-Exempt Money Market Fund3 |
Fixed Income
Short Duration and Government
| ∎ | Short-Term Conservative Income Fund |
| ∎ | Short Duration Government Fund |
| ∎ | Short Duration Bond Fund |
| ∎ | Inflation Protected Securities Fund |
Multi-Sector
| ∎ | Global Core Fixed Income Fund |
Municipal and Tax-Free
| ∎ | High Yield Municipal Fund |
| ∎ | Dynamic Municipal Income Fund |
| ∎ | Short Duration Tax-Free Fund |
| ∎ | Municipal Income Completion Fund |
Single Sector
| ∎ | Investment Grade Credit Fund |
| ∎ | High Yield Floating Rate Fund |
| ∎ | Emerging Markets Debt Fund |
| ∎ | Emerging Markets Credit Fund4 |
Fixed Income Alternatives
| ∎ | Long Short Credit Strategies Fund |
Fundamental Equity
| ∎ | Small/Mid Cap Value Fund |
| ∎ | Small/Mid Cap Growth Fund |
| ∎ | Concentrated Growth Fund |
| ∎ | Technology Opportunities Fund |
| ∎ | Rising Dividend Growth Fund |
Tax-Advantaged Equity
| ∎ | U.S. Tax-Managed Equity Fund |
| ∎ | International Tax-Managed Equity Fund |
| ∎ | U.S. Equity Dividend and Premium Fund |
| ∎ | International Equity Dividend and Premium Fund |
Equity Insights
| ∎ | Small Cap Equity Insights Fund |
| ∎ | U.S. Equity Insights Fund |
| ∎ | Small Cap Growth Insights Fund |
| ∎ | Large Cap Growth Insights Fund |
| ∎ | Large Cap Value Insights Fund |
| ∎ | Small Cap Value Insights Fund |
| ∎ | International Small Cap Insights Fund |
| ∎ | International Equity Insights Fund |
| ∎ | Emerging Markets Equity Insights Fund |
Fundamental Equity International
| ∎ | International Equity Income Fund |
| ∎ | International Equity ESG Fund |
| ∎ | Emerging Markets Equity Fund |
| ∎ | Emerging Markets Equity ex. China Fund |
| ∎ | ESG Emerging Markets Equity Fund |
Alternative
| ∎ | Clean Energy Income Fund |
| ∎ | Real Estate Securities Fund |
| ∎ | Global Real Estate Securities Fund |
| ∎ | Absolute Return Tracker Fund |
| ∎ | Managed Futures Strategy Fund |
| ∎ | MLP Energy Infrastructure Fund |
| ∎ | Energy Infrastructure Fund |
| ∎ | Multi-Strategy Alternatives Fund5 |
| ∎ | Global Infrastructure Fund |
Total Portfolio Solutions
| ∎ | Global Managed Beta Fund |
| ∎ | Multi-Manager Non-Core Fixed Income Fund |
| ∎ | Multi-Manager Global Equity Fund |
| ∎ | Multi-Manager International Equity Fund |
| ∎ | Tactical Tilt Overlay Fund |
| ∎ | Balanced Strategy Portfolio |
| ∎ | Multi-Manager U.S. Small Cap Equity Fund |
| ∎ | Multi-Manager Real Assets Strategy Fund |
| ∎ | Growth and Income Strategy Portfolio |
| ∎ | Growth Strategy Portfolio |
| ∎ | Dynamic Global Equity Fund |
| ∎ | Satellite Strategies Portfolio |
| ∎ | Enhanced Dividend Global Equity Portfolio |
| ∎ | Tax-Advantaged Global Equity Portfolio |
| ∎ | Strategic Factor Allocation Fund |
| ∎ | Strategic Volatility Premium Fund |
| ∎ | GQG Partners International Opportunities Fund |
| 1 | You could lose money by investing in the Fund. Although the Fund seeks to preserve the value of your investment at $1.00 per share, it cannot guarantee it will do so. An investment in the Fund is not a deposit of a bank and is not insured or guaranteed by the Federal Deposit Insurance Corporation or any other government agency. The Fund’s sponsor has no legal obligation to provide financial support to the Fund, and you should not expect that the sponsor will provide financial support to the Fund at any time. |
| 2 | You could lose money by investing in the Fund. Because the share price of the Fund will fluctuate, when you sell your shares they may be worth more or less than what you originally paid for them. The Fund may impose a fee upon sale of your shares or may temporarily suspend your ability to sell shares if the Fund’s liquidity falls below required minimums because of market conditions or other factors. An investment in the Fund is not a deposit of a bank and is not insured or guaranteed by the Federal Deposit Insurance Corporation or any other government agency. The Fund’s sponsor has no legal obligation to provide financial support to the Fund, and you should not expect that the sponsor will provide financial support to the Fund at any time. |
| 3 | You could lose money by investing in the Fund. Although the Fund seeks to preserve the value of your investment at $1.00 per share, it cannot guarantee it will do so. The Fund may impose a fee upon sale of your shares or may temporarily suspend your ability to sell shares if the Fund’s liquidity falls below required minimums because of market conditions or other factors. An investment in the Fund is not a deposit of a bank and is not insured or guaranteed by the Federal Deposit Insurance Corporation or any other government agency. The Fund’s sponsor has no legal obligation to provide financial support to the Fund, and you should not expect that the sponsor will provide financial support to the Fund at any time. |
| 4 | Effective after the close of business on October 31, 2023, the Goldman Sachs Local Emerging Markets Debt Fund was renamed the Goldman Sachs Emerging Markets Credit Fund. |
| 5 | Effective after the close of business on September 22, 2023, the Goldman Sachs Multi-Manager Alternatives Fund was renamed the Goldman Sachs Multi-Strategy Alternatives Fund. |
| | Financial Square FundsSM and Investor FundsSM are registered service marks of Goldman Sachs & Co. LLC. |
| * | This list covers open-end funds only. Please visit our website at www.GSAMFUNDS.com to learn about our closed-end funds and exchange-traded funds. |
TRUSTEES Cheryl K. Beebe, Chair Lawrence Hughes John F. Killian Steven D. Krichmar Michael Latham James A. McNamara Lawrence W. Stranghoener GOLDMAN SACHS & CO. LLC Distributor and Transfer Agent OFFICERS James A. McNamara, President Joseph F. DiMaria, Principal Financial Officer, Principal Accounting Officer and Treasurer Robert Griffith, Secretary GOLDMAN SACHS ASSET MANAGEMENT, L.P. Investment Adviser Visit our web site at www.GSAMFUNDS.com to obtain the most recent month-end returns. Goldman Sachs Asset Management, L.P. 200 West Street, New York, New York 10282 The reports concerning the Fund included in this shareholder report may contain certain forward-looking statements about the factors that may affectthe performance of the Fund in the future. These statements are based on Fund management’s predictions and expectations concerning certain future events and their expected impact on the Fund, such as performance of the economy as a whole and of specific industry sectors, changes in the levels of interest rates, the impact of developing world events, and other factors that may influence the future performance of the Fund. Management believes these forward-looking statements to be reasonable, although they are inherently uncertain and difficult to predict. Actual events may cause adjustments in portfolio management strategies from those currently expected to be employed. A description of the policies and procedures that the Fund uses to determine how to vote proxies relating to portfolio securities and information regarding how the Fund voted proxies relating to portfolio securities during the most recent 12-month period ended June 30 is available (I) without charge, upon request by calling 1-800-526-7384 (for Retail Shareholders) or 1-800-621-2550 (for Institutional Shareholders); and (II) on the Securities and Exchange Commission (“SEC”) web site at http://www.sec.gov. The Fund will file its portfolio holdings for each month in a fiscal quarter within 60 days after the end of the relevant fiscal quarter on Form N-PORT. Portfolio holdings information for the third month of each fiscal quarter will be made available on the SEC’s web site at http://www.sec.gov. Portfolio holdings information may be obtained upon request and without charge by calling 1-800-526-7384 (for Retail Shareholders) or 1-800-621-2550 (for Institutional Shareholders). Fund holdings and allocations shown are unaudited, and may not be representative of current or future investments. Fund holdings and allocations may not include the Fund’s entire investment portfolio, which may change at any time. Fund holdings should not be relied on in making investment decisions and should not be construed as research or investment advice regarding particular securities. Current and future holdings are subject to risk. Economic and market forecasts presented herein reflect our judgment as of the date of this presentation and are subject to change without notice. These forecasts do not take into account the specific investment objectives, restrictions, tax and financial situation or other needs of any specific client. Actual data will vary and may not be reflected here. These forecasts are subject to high levels of uncertainty that may affect actual performance. Accordingly, these forecasts should be viewed as merely representative of a broad range of possible outcomes. These forecasts are estimated, based on assumptions, and are subject to significant revision and may change materially as economic and market conditions change. Goldman Sachs has no obligation to provide updates or changes to these forecasts. Case studies and examples are for illustrative purposes only. The portfolio risk management process includes an effort to monitor and manage risk, but does not imply low risk. Past correlations are not indicative of future correlations, which may vary. This material is not authorized for distribution to prospective investors unless preceded or accompanied by a current prospectus or summary prospectus, if applicable. Investors should consider the Fund objective, risks, and charges and expenses, and read the summary prospectus, if available, and/or the prospectus carefully before investing or sending money. The summary prospectus, if available, and the prospectus contain this and other information about the Fund may be obtained from your authorized dealer or from Goldman Sachs & Co. LLC by calling (retail –1-800-526-7384) (institutional – 1-800-621-2550). © 2023 Goldman Sachs. All rights reserved. 348258-OTU-1931273 MMALTAR 23
Strategic Multi-Asset Class Funds
| | |
| ∎ | | MULTI-MANAGER GLOBAL EQUITY |
| | |
| ∎ | | MULTI-MANAGER NON-CORE FIXED INCOME |
| | |
| ∎ | | MULTI-MANAGER REAL ASSETS STRATEGY |
TABLE OF CONTENTS
| | | | | | |
| | | | |
| NOT FDIC-INSURED | | May Lose Value | | No Bank Guarantee | | |
MARKET REVIEW
Goldman Sachs Strategic Multi-Asset Class Funds
Market Review
During the 12-month period ended October 31, 2023 (the “Reporting Period”), the performance of the capital markets was driven primarily by rising interest rates, inflation data, volatile energy prices and speculation about whether central banks would achieve soft or hard economic landings. (A soft landing, in economics, is a cyclical downturn that avoids recession. It typically describes attempts by central banks to raise interest rates just enough to stop an economy from overheating and experiencing high inflation, without causing a significant increase in unemployment, or a hard landing.)
Global equity markets posted strong gains during the Reporting Period, with the MSCI All Country World Index (Net Total Return, Unhedged, USD) (“MSCI ACWI Index”) returning 10.5%. The majority of the gains occurred during the first nine months of the Reporting Period. The final three months saw corrections across most regions and sectors within the MSCI ACWI Index. (A correction is a condition in which securities prices fall 10% or more from recent highs.) Non-U.S. developed markets stocks, as represented by the MSCI EAFE Index (Net, Unhedged, USD), performed best, returning 14.4% during the Reporting Period overall, with value stocks outpacing growth stocks. From a regional standpoint, Japanese and European equities were the strongest performers. Despite significant depreciation in the Japanese yen relative to the U.S. dollar, Japan’s stock market was one of the best performing developed markets regions, as it benefited from continuation of the central bank’s accommodative monetary policy, rising share buybacks and growing corporate investment. Market technicals (i.e., supply/demand conditions) also supported the performance of Japanese equities, as investment inflows increased, perhaps driven by optimism that long-promised corporate governance reforms were finally starting to bear fruit. As for European equities, they appreciated significantly early in the Reporting Period, recovering from previously depressed levels. Investors had been bearish on European stocks due both to inflation worries, especially concerns about energy price inflation caused by Russia’s invasion of Ukraine, and to rising interest rates and overall economic weakness. However, reduced energy demand because of a warmer than expected winter, success in securing alternative energy imports and generous government support for the consumer improved investor sentiment, led to a significant rally in European equity performance. Challenges then followed, with March 2023 especially difficult, as a U.S. regional banking crisis spilled over to European banks, leading to the high-profile bankruptcy of Credit Suisse but not much further fallout due to prompt government intervention. European equities were volatile for the rest of the Reporting Period, with the outlook for economies and interest rates weighing on market sentiment. Overall, macroeconomic fundamentals in European countries were lethargic during the Reporting Period, with Germany, for example, entering a technical recession and its inflation remaining above target, although employment in the country stayed robust. (A technical recession is commonly defined as two consecutive quarters of negative growth in a country’s gross domestic product.) In the U.S., where growth stocks beat value stocks by a wide margin, the broad equity market generated a return of 9.5%, as measured by the Russell 1000® Index. The rally in growth stocks was led by the so-called “Magnificent Seven” (specifically, Apple, Microsoft, Alphabet, Amazon.com, Nvidia, Meta Platforms and Tesla), which were responsible for almost all of the U.S equity market’s gains in the first half of 2023. The rally was driven by a combination of factors, including a reversal of previous multiples compression and the strong fundamental performance of some of these companies. (Multiple compression, or valuation derating, is when a company’s valuation multiples, such as the price/earnings ratio, is reduced either because of increased earnings without a corresponding increase in stock price or because of a decreased stock price without a corresponding decrease in earnings.) Many of the Magnificent Seven were beneficiaries of investor optimism about artificial intelligence (“AI”) following the release of ChatGPT as well as excitement about generative AI. As for emerging markets equities, they returned 10.8%, as measured by the MSCI Emerging Markets Index (Net, USD, Unhedged), during the Reporting Period. Chinese equities posted the strongest gains, with the MSCI China All Shares Index (Net Total Return, USD, Unhedged) notching a 21.1% return during the Reporting Period, though performance was highly volatile. At first, Chinese equities benefited from the reopening of the country’s economy following COVID-19-related lockdowns, but they subsequently weakened, as an expected surge in consumer spending did not materialize due in part to worries about China’s property crisis and level of unemployment. These investor concerns were exacerbated by geopolitical and regulatory issues.
Despite persistent interest rate volatility, global spread, or non-government bond, sectors recorded positive returns during the Reporting Period, recovering from the sell-off they had endured in 2022. Spread sectors benefited overall from the tightening of credit spreads, which are yield differentials between corporate bonds and U.S. Treasury securities of comparable maturity. Bank loans outperformed virtually all other spread sectors, largely due to their floating rate nature and strong investor demand. High yield corporate bonds generated positive returns during the Reporting Period amid positive market technicals and spread tightening, most notably in lower-rated segments of the market. In the emerging markets, U.S. dollar-denominated bonds trailed local currency-denominated bonds, mainly due to higher U.S. interest rates and the strong performance of emerging markets
MARKET REVIEW
currencies. In local emerging markets debt, select countries with high monetary policy rates and falling inflation, particularly in Latin America and Eastern Europe, were the top performers. In U.S. dollar-denominated emerging markets debt, high yield sovereign bonds produced the strongest returns, as spreads tightened. Investment grade corporate spreads also narrowed during the Reporting Period but not as much as those of other spread sectors.
Global real estate securities dropped significantly during the Reporting Period, which was notable given the strong gains of global equities broadly. Rising interest rates, as well as worsening market sentiment for office real estate investment trusts (“REITs”), drove the decline. Dispersion of returns among regions was modestly elevated, with continental European real estate securities outperforming global real estate securities, Japan generally performing in line with global real estate securities, and North American and Asia ex Japan real estate securities underperforming global real estate securities. Negative investor sentiment for European real estate securities eased during the Reporting Period, as recession fears waned and given that time had passed since the energy shortages caused by the Russia/Ukraine war. Japan’s economic growth outlook improved, while China’s economic recovery turned out to be more lackluster than previously anticipated. There was also dispersion of performance among property types during the Reporting Period. Office REITs were hurt by lower post COVID-19 occupancy rates as well as by lease rolls and debt maturities that would be due in upcoming years. (A lease roll is a term used to describe a lease that automatically extends at the end of each year for another full term.) Retail REITs declined on worries about a slowdown in consumer spending driven by higher interest rates, energy prices, inflation and resumption of student debt payments. The performance of self-storage REITs was down sharply, as post-COVID rent increases and demand from populations migrating out of urban areas slowed. Industrial/ warehousing logistics REITs declined amid decelerating rent increases and persistent post-pandemic oversupply concerns. The performance of cell tower REITs was significantly negative, as rising interest rates continued to impact the discount of their longer-duration cash flow profiles and amid some signs of a potential spending slowdown by carriers. On the other hand, senior housing REITs generated strong gains during the Reporting Period given the positive outlook for occupancy as well as demographic tailwinds. Data center REITs performed well, as they began seeing the early benefits of AI-driven demand for their facilities.
Global infrastructure securities declined during the Reporting Period, underperforming the broader global equity market but outpacing global real estate securities. Much of the negative performance came late in the Reporting Period, especially during the final three months, as the rise in long-term interest rates weighed heavily on the utilities sector. In addition, digital infrastructure securities (specifically, cell tower REITs) were hurt during the Reporting Period by the increase in long-term rates and a slowdown in carrier spending. Midstream energy stocks fell, as a decline in crude oil prices during the Reporting Period offset a generally positive outlook for midstream volumes as well as natural gas-related export growth opportunities. (The midstream component of the energy industry is usually defined as those companies providing products or services that help link the supply side, i.e., energy producers, and the demand side, i.e., energy end-users, for any type of energy commodity. Such midstream businesses can include, but are not limited to, those that process, store, market and transport various energy commodities.) On the positive side, transportation infrastructure securities were up substantially during the Reporting Period, due primarily to the performance of European transportation infrastructure securities (i.e., toll roads, airports), which were buoyed by a softer than consensus expected slowdown in the European economy.
Looking Ahead
At the end of the Reporting Period, many investors continued to debate whether central banks could engineer soft landings or if protracted economic declines were more probable. Although inflation had come down substantially, central banks remained cautious at the end of the Reporting Period about declaring victory due to the potentially sticky components of core inflation, such as wages, that could keep inflation above policymakers’ desired 2% target in major developed markets economies. In most developed markets countries, consumer spending was solid and employment robust, and we thought investors would continue assessing whether this strength could be sustained. In the emerging markets, some countries, such as Mexico, India and Indonesia, were benefiting from “near-shoring” trends wherein Western firms were trying to reduce supply-chain dependency on China, leading to increased investment in other emerging markets countries. Meanwhile, China’s future path was a point of debate, with many investors bearish for both the short term and long term and no signs apparent of a clear catalyst that might fuel a rally without
MARKET REVIEW
significant government stimulus. Geopolitical risks also remained top of mind for many investors at the end of the Reporting Period, as the Russia/Ukraine war entered another winter, Israel/Hamas war risks escalated and impacted the broader Middle East region, and trade tensions persisted between the U.S. and China.
FUND RESULTS
Goldman Sachs Multi-Manager Global Equity Fund
|
Investment Objective |
| |
The Fund seeks to provide long-term capital growth. |
Portfolio Management Discussion and Analysis
Below, the Goldman Sachs Multi-Asset Solutions (“MAS”) Group and the Goldman Sachs External Investing Group (“XIG”) (formerly, the Goldman Sachs Alternative Investments & Manager Selection (“AIMS”) Group) discuss the Goldman Sachs Multi-Manager Global Equity Fund’s (the “Fund”) performance and positioning for the 12-month period ended October 31, 2023 (the “Reporting Period”).
| Q | How did the Fund perform during the Reporting Period? |
| A | During the Reporting Period, the Fund’s Class R6 Shares generated an average annual total return of 10.10%. This return compares to the 9.48% average annual total return of the Fund’s benchmark, the MSCI All Country World Index Investable Market Index (“MSCI ACWI IMI”) (Net, USD, 50% Non-U.S. Developed Hedged to USD) (the “Index”), during the same time period. |
| Q | What key factors were responsible for the Fund’s performance during the Reporting Period? |
| A | The Fund uses a multi-manager approach and generally seeks to achieve its investment objective by dynamically allocating its assets among unaffiliated investment managers (“Underlying Managers”) that employ a mix of international, emerging markets and U.S.-focused equity investment strategies. The MAS Group is responsible for the Fund’s asset allocation, wherein it applies a risk-based approach that draws from both fundamental and quantitative disciplines with the intention of dynamically accessing a diversified set of risks and returns in a market cycle aware manner. XIG is responsible for making recommendations with respect to hiring, terminating or replacing the Fund’s Underlying Managers and applying a multifaceted process for manager due diligence, portfolio construction and risk management. The MAS Group also provides certain risk management services to the Fund. |
During the Reporting Period, the Fund generated a positive absolute return and outperformed the Index. The Fund’s relative results can be attributed to the performance of the Fund’s Underlying Managers overall. Strategic asset allocation slightly underperformed the Index during the Reporting Period.
During the Reporting Period, the Fund had the following Underlying Managers, though not all were allocated capital—Axiom International Investors LLC (“Axiom”); Boston Partners Global Investors, Inc. (“Boston Partners”), Causeway Capital Management LLC (“Causeway”), Diamond Hill Capital Management Inc. (“Diamond Hill”),
GW&K Investment Management, LLC (“GW&K”), Massachusetts Financial Services Company, doing business as MFS Investment Management, (“MFS”), Principal Global Investors, LLC (“Principal”), T. Rowe Price Associates, Inc. (“T. Rowe Price”); Vaughan Nelson Investment Management, L.P. (“Vaughan Nelson”), Vulcan Value Partners, LLC (“Vulcan”), WCM Investment Management (“WCM”) and Wellington Management Company LLP (“Wellington”).
These Underlying Managers represented five market segments across global equity as part of the Fund’s top-level strategy allocation—U.S. large cap (Diamond Hill, T. Rowe Price, Vaughan Nelson and Vulcan); Europe, Australasia and Far East (“EAFE”) large cap (Causeway, MFS and WCM); U.S. small cap (Boston Partners and GW&K); EAFE small cap (Principal); and emerging markets (Axiom and Wellington).
Of the 11 Underlying Managers with allocated capital during the Reporting Period, nine generated positive absolute returns and two generated negative absolute returns. On a relative basis, seven Underlying Managers outperformed their respective benchmark indices and four underperformed their respective benchmark indices during the Reporting Period. Vulcan did not have allocated capital during the Reporting Period.
During the Reporting Period, the MAS Group managed a passive currency overlay, which is designed to hedge exposure to non-U.S. currencies by selling the currencies in which the Fund’s equity securities are traded and investing in the U.S. dollar. The currency overlay seeks to minimize unintended currency exposures for the Fund. Also, in connection with the risk management services it provides, the MAS Group maintained passive equity exposure to the Fund in order to keep the Fund’s beta closer to the intended strategic asset allocation and to provide a buffer for liquidity. (Beta refers to the component of the returns that is attributable market risk exposure, rather than manager skill.)
Strategic asset allocation, which reflects a longer-term perspective to diversify and invest across global equity markets, slightly underperformed the Index during the
FUND RESULTS
Reporting Period. The underperformance was driven mostly by the Fund’s small underweight versus the Index in U.S. large-cap equities and its overweights in global small-cap and emerging markets equities. U.S. large cap equities remained resilient during the Reporting Period as recession fears continued to shrink, while emerging markets equities were negatively impacted by geopolitical tensions in Eastern Europe and a number of challenges in China.
| Q | Which global equity asset classes most significantly affected Fund performance? |
| A | In U.S. large cap, Underlying Manager Diamond Hill outperformed the Russell 1000® Value Index during the Reporting Period, largely because of strong stock selection within the health care, consumer discretionary and materials sectors. A relative underweight and weak stock selection in communication services, along with stock selection in industrials and consumer staples, detracted, partially offsetting these positive results. Underlying manager Vaughan Nelson outperformed the S&P 500® Index, driven by effective stock selection in the financials and industrials sectors. Conversely, stock selection in consumer staples, as well as stock selection and an underweight position in utilities, detracted from relative returns. Underlying Manager T. Rowe Price outperformed the Russell 1000® Growth Index due to stock selection and a relative overweight in communication services, stock selection in information technology, and stock selection and an underweight position in consumer staples. These positive results were partly offset by selection in the consumer discretionary and financials sectors and an overweight in the health care sector, which detracted. |
In U.S. small cap, Boston Partners, the value-oriented Underlying Manager, outperformed the Russell 2000® Value Index during the Reporting Period, because of strong stock selection and a relative underweight in health care. Selection and an overweight in information technology also contributed positively. Stock selection within the energy and materials sectors detracted, partially offsetting these results. Underlying Manager GW&K underperformed the Russell 2000® Index mainly because of stock selection in financials, selection and an underweight in energy, and selection and an overweight in health care. Conversely, strong selection in consumer discretionary added to relative returns during the Reporting Period.
In EAFE large cap, Underlying Manager Causeway outperformed its benchmark index, the MSCI EAFE Index, due to effective stock selection within capital goods, banks, and technology hardware and equipment. Underlying Manager MFS outperformed the MSCI EAFE Index during the Reporting Period due to broad-based positive stock selection across the communication services, materials and industrials sectors. In communication services, MFS benefited from out-of-benchmark exposures to Asian gaming companies, while its gains in the materials sector were highlighted by European chemical and industrial gas
providers. A lack of exposure to the real estate sector also contributed positively. Conversely, stock selection in the health care and financials sectors and a relative overweight in consumer staples had a negative impact on results. From a regional perspective, selection in the U.K. and an underweight in Asia ex Japan (especially no exposure to Australia) added to relative returns. Stock selection in Japan, with a preference for health care companies, retailers and manufacturers over banks, and out-of-benchmark exposure to North America, predominantly Canadian transportation and financials, detracted from performance. Underlying Manager WCM underperformed its benchmark index, the MSCI ACWI ex USA Index, during the Reporting Period as a result of weak stock selection in the information technology and financials sectors. These losses were partially offset by an overweight in the health care sector as well as lack of exposure to the real estate sector, which added value.
In EAFE small cap, Underlying Manager Principal outperformed its benchmark index, the MSCI World ex USA Small Cap Index, mainly due to strong stock selection within the consumer discretionary, utilities and real estate sectors. Conversely, stock selection in financials and information technology detracted from relative performance. On a regional basis, selection in developed Asia, North America and continental Europe contributed positively to relative returns, while selection in Japan detracted from performance during the Reporting Period.
In emerging markets, which we measure relative to the MSCI Emerging Markets Index, Underlying Manager Wellington outperformed the benchmark index, largely because of effective stock selection within the financials, communication services and materials sectors. Selection in the utilities and real estate sectors detracted from relative results. Regionally, selection in emerging Asia was the primary driver of relative outperformance, while selection in the Middle East and Africa held back returns. Overall, Wellington’s quantitative equity model’s factors and currency-based factors bolstered returns, though these positive results were partially offset by country-based and style-based factors, which hurt. Within Wellington’s quantitative equity model, the value factor, including both the pure value and fair value signals, added to performance. The momentum factor also contributed positively, driven by the strong results of its long-term signals. As for Underlying Manager Axiom, its strategy underperformed the benchmark index due primarily to stock selection in the information technology and health care sectors. Selection in consumer discretionary and utilities contributed positively, partly offsetting these negative results. From a regional perspective, selection within Latin America was the most meaningful detractor, while stock selection and an underweight in frontier markets added most to relative returns during the Reporting Period. (A frontier market is a country that is more established than the least developed countries but is still less established than the emerging markets broadly.)
FUND RESULTS
| Q | How did the Fund use derivatives and similar instruments during the Reporting Period? |
| A | During the Reporting Period, the MAS Group managed a passive currency overlay that sought to minimize unintended currency exposures for the Fund relative to the Index. As part of this currency overlay, the MAS Group used forward foreign currency exchange contracts, which had a slightly positive impact on performance. The MAS Group also used equity futures within the Fund’s large-cap equity allocation in an effort to maintain target exposure relative to the Index and to facilitate the capital required for the currency overlay and for short-term liquidity needs. This had a negative impact on the Fund’s performance during the Reporting Period. Equity futures were also employed to equitize the Fund’s cash holdings and manage investment inflows, which had a positive impact on performance. The Fund’s Underlying Managers employed rights and warrants to implement their strategies. The use of rights and warrants did not have a material impact on the Fund’s performance during the Reporting Period overall. |
| Q | Were there any notable changes in the Fund’s allocations during the Reporting Period? |
| A | During the Reporting Period, we made some changes to the Fund’s allocations. In May 2023, we refreshed the Fund’s strategic asset allocation to move it toward the MAS Group’s latest framework and long-term risk/return assumptions. |
Regarding the Fund’s strategic asset allocation, at the beginning of the Reporting Period, the Fund’s assets were allocated 53.2% to U.S. large cap, 26.3% to non-U.S. developed large cap, 6.5% to U.S. small cap, 4.1% to non-U.S. developed small cap, 11.1% to emerging markets and 0.4% to cash and cash equivalents. At the end of the Reporting Period, the Fund’s assets were allocated 53.2% to U.S. large cap, 25.1% to non-U.S. developed large cap, 6.5% to U.S. small cap, 4.1% to non-U.S. developed small cap, 12.3% to emerging markets and 0.4% to cash and cash equivalents. This sector breakout is inclusive of derivative exposure across all asset classes.
| Q | Were there any changes to the Fund’s portfolio management team during the Reporting Period? |
| A | Effective July 18, 2023, Neill Nuttall and Siwen Wu no longer served as portfolio managers for the Fund. As of the same date, Scott McDermott and Mao Dong became portfolio managers for the Fund, joining Betsy Gorton. By design, all investment decisions for the Fund are performed within a team structure, with multiple subject matter experts. This strategic decision making has been a cornerstone of our approach and helps ensure continuity in the Fund. |
| Q | What is the Fund’s tactical view and strategy for the months ahead? |
| A | Overall, we intend to continue to position the Fund in alignment with our longer-term strategic views within the equity complex as a complement to additional strategic market exposures. We further intend to continue to monitor allocations and Underlying Manager performance as we seek to generate long-term capital growth. |
FUND BASICS
Multi-Manager Global Equity Fund
as of October 31, 2023
|
|
TOP TEN HOLDINGS AS OF 10/31/23 ‡ |
| | | | |
| | |
Holding | | % of Net Assets | | Line of Business |
| | |
Microsoft Corp. | | 3.0% | | Software |
| | |
Amazon.com, Inc. | | 2.0 | | Broadline Retail |
| | |
Alphabet, Inc. Class A | | 1.9 | | Interactive Media & Services |
| | |
NVIDIA Corp. | | 1.2 | | Semiconductors & Semiconductor Equipment |
| | |
Apple, Inc. | | 1.0 | | Technology Hardware, Storage & Peripherals |
| | |
Berkshire Hathaway, Inc. Class B | | 0.9 | | Financial Services |
| | |
Union Pacific Corp. | | 0.9 | | Ground Transportation |
| | |
Salesforce, Inc. | | 0.9 | | Software |
| | |
Intercontinental Exchange, Inc. | | 0.9 | | Capital Markets |
| | |
O’Reilly Automotive, Inc. | | 0.8 | | Specialty Retail |
| | ‡ | The top 10 holdings may not be representative of the Fund’s future investments. The Fund’s overall top 10 holdings differ from the table above due to the exclusion of the Goldman Sachs Financial Square Government Fund, which represents approximately 7.9% of the Fund’s net assets as of 10/31/23. |

| | * | The percentage shown for each investment category reflects the value of investments in that category as a percentage of net assets. Underlying compositions of exchange traded funds and investment companies held by the Fund are not reflected in the graph above. Figures in the graph may not sum to 100% due to the rounding and/or exclusion of other assets and liabilities. The graph depicts the Fund’s investments but may not represent the Fund’s market exposure due to the exclusion of certain derivatives, if any, as listed in the Additional Investment Information section of the Schedule of Investments. |
| | | For more information about your Fund, please refer to www.GSAMFUNDS.com. There, you can learn more about your Fund’s investment strategies, holdings, and performance. |
MULTI-MANAGER GLOBAL EQUITY FUND
Performance Summary
October 31, 2023
The following graph shows the value, as of October 31, 2023, of a $1,000,000 investment made on June 24, 2015 (commencement of operations) in Class R6 Shares at net asset value (“NAV”). For comparative purposes, the performance of the Fund’s benchmark, the MSCI ACWI IMI (Net, USD, 50% Non-U.S. Developed Hedged to USD) is shown. Performance reflects applicable fee waivers and/or expense limitations in effect during the periods shown and in their absence, performance would be reduced. Returns do not reflect the deduction of taxes that a shareholder would pay on Fund distributions or the redemption of Fund shares. The returns set forth below represent past performance. Past performance does not guarantee future results. The Fund’s investment return and principal value will fluctuate so that an investor’s shares, when redeemed, may be worth more or less than their original cost. Current performance may be lower or higher than the performance quoted below. Please visit our web site at www.GSAMFUNDS.com to obtain the most recent month-end returns.
|
|
Multi-Manager Global Equity Fund’s Lifetime Performance |
Performance of a $1,000,000 investment, with distributions reinvested, from June 24, 2015 through October 31, 2023.
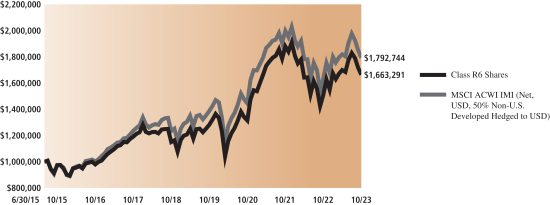
| | | | | | | | |
| | | |
Average Annual Total Return through October 31, 2023* | | One Year | | Five Years | | Since Inception |
| | | | |
Class R6 Shares (Commenced June 24, 2015) | | 10.10% | | 7.65% | | 5.93% | | |
| | * | Effective January 16, 2018, Institutional Shares were redesignated as Class R6 Shares. These returns assume reinvestment of all distributions at NAV. Because Class R6 Shares do not involve a sales charge, such a charge is not applied to their Average Annual Total Returns. |
FUND RESULTS
Goldman Sachs Multi-Manager Non-Core Fixed Income Fund
|
Investment Objective |
| |
The Fund seeks a total return consisting of income and capital appreciation. |
Portfolio Management Discussion and Analysis
Below, the Goldman Sachs Multi-Asset Solutions (“MAS”) Group and the Goldman Sachs External Investing Group (“XIG”) (formerly, the Goldman Sachs Alternative Investments & Manager Selection (“AIMS”) Group) discuss the Goldman Sachs Multi-Manager Non-Core Fixed Income Fund’s (the “Fund”) performance and positioning for the 12-month period ended October 31, 2023 (the “Reporting Period”).
| Q | How did the Fund perform during the Reporting Period? |
| A | During the Reporting Period, the Fund’s Class R6 Shares generated an average annual total return of 9.89%. This return compares to the 10.92% average annual total return of the Fund’s benchmark, the Multi-Manager Non-Core Fixed Income Composite Dynamic Index (the “Index”), during the same time period. |
The Index is comprised of the Bloomberg Global High Yield Corporate Index (Gross, USD, Unhedged) (the “Bloomberg Index”), the Credit Suisse Leveraged Loan Index (Gross, USD, Unhedged) (the “Credit Suisse Index”), the J.P. Morgan Emerging Market Bond Index (“EMBISM”) Global Diversified Index (Gross, USD, Unhedged) (the “J.P. Morgan EMBISM Index”) and the J.P. Morgan Government Bond Index—Emerging Markets (“GBI-EMSM”) Global Diversified Index (Gross, USD, Unhedged) (the “J.P. Morgan GBI-EMSM Index”), which are weighted in accordance with the relative market capitalizations of each constituent index (as determined by the constituent index providers) as of the last business day of the previous calendar year. During the Reporting Period, the Bloomberg Index, the Credit Suisse Index, the J.P. Morgan EMBISM Index and the J.P. Morgan GBI-EMSM Index returned 9.02%, 11.54%, 8.36% and 13.50%, respectively.
| Q | What key factors were responsible for the Fund’s performance during the Reporting Period? |
| A | The Fund uses a multi-manager approach and generally seeks to achieve its investment objective by dynamically allocating its assets among unaffiliated investment managers (“Underlying Managers”) that employ a non-core fixed income investment strategy. (Non-core fixed income includes non-investment grade securities, bank loans and emerging markets debt). The MAS Group is responsible for the Fund’s |
asset allocation, wherein it applies a risk-based approach that draws from both fundamental and quantitative disciplines with the intention of dynamically accessing a diversified set of risks and returns in a market cycle aware manner. XIG is responsible for making recommendations with respect to hiring, terminating or replacing the Fund’s Underlying Managers and applying a multifaceted process for manager due diligence, portfolio construction and risk management.
During the Reporting Period, the Fund recorded a positive absolute return but underperformed the Index. The Fund’s relative results can be attributed to the performance of the Underlying Managers overall. Strategic asset allocation also slightly underperformed the Index during the Reporting Period.
At various points during the Reporting Period, the Fund had the following Underlying Managers, though not all were allocated capital—Ares Capital Management II LLC (“Ares”); Aristotle Pacific Capital, LLC (“Aristotle Pacific”) (formerly, Pacific Asset Management LLC); Brigade Capital Management, LP (“Brigade”); Marathon Emerging Markets Debt, L.P. (“Marathon”); Ninety One North America, Inc. (“Ninety One”); Nuveen Asset Management, LLC (“Nuveen”); RBC Global Asset Management (UK) Limited, doing business as RBC BlueBay Asset Management (“RBC UK”); RBC Global Asset Management (U.S.) Inc., doing business as RBC Global Asset Management (“RBC US”); River Canyon Fund Management LLC (“River Canyon”); and TCW Investment Management Company LLC (“TCW”). As a reminder, RBC US was previously added as an Underlying Manager for the Fund to allow us to enhance RBC UK’s ability to coordinate its management services to the Fund, and thus for these reporting purposes, are being discussed as one Underlying Manager.
FUND RESULTS
These Underlying Managers represented five sectors across non-core fixed income as part of the Fund’s top-level strategy allocation—high yield (Ares, Brigade and RBC UK/RBC US), bank loans (Ares, Aristotle Pacific and Nuveen), external emerging markets debt (Marathon), local emerging markets debt (Ninety One and TCW) and structured credit (River Canyon).
All seven of the Underlying Managers with allocated capital during the Reporting Period generated positive absolute returns. On a relative basis, five of these Underlying Managers underperformed their respective benchmark indices and two outperformed their respective benchmark indices during the Reporting Period. Ninety-One and Ares, the latter as a bank loan Underlying Manager, did not have allocated capital during the Reporting Period.
Strategic asset allocation, which reflects a longer-term perspective to diversify and invest in non-core fixed income sectors, slightly underperformed the Index during the Reporting Period. The underperformance was driven by the Fund’s overweight relative to the Index in high yield corporate bonds versus bank loans broadly. During the Reporting Period, high yield corporate bonds underperformed bank loans.
| Q | Which non-core fixed income Underlying Managers most significantly affected Fund performance? |
| A | RBC UK/RBC US, a high yield Underlying Manager, underperformed the ICE BofA Global High Yield Investment Grade Country Constrained Index during the Reporting Period. Term structure effects hurt performance the most, especially between August and October 2023 when the strategy had marginally long exposure to U.S. interest rates and the yield on 10-year U.S. Treasuries rose dramatically. (Term structure, most often depicted as a yield curve, refers to the term structure of interest rates, which is the relationship between the yield to maturity and the time to maturity for pure discount bonds.) Positioning in consumer cyclicals also had a negative impact on returns as did selection among financials and transportation credits. Conversely, positioning in the energy market segment and credit selection in capital goods contributed positively to relative performance. From a ratings perspective, selection of BB-rated credits detracted from returns. However, selection among credits rated CCC and below, as well as an out-of-benchmark allocation to investment grade rated credits, added value, offsetting some of the negative results. |
From a regional perspective, selection amongst emerging markets credits hampered relative returns, while credit selection in North America and the U.K. added to performance.
Ares, another high yield Underlying Manager, underperformed the ICE BofA Global High Yield Investment Grade Country Constrained Index during the Reporting Period. Much of its underperformance was driven by the timing of investment flows. The strategy received a large inflow in January 2023, which was challenging to invest during a risk-on rally, or a period of increased risk appetite, early in the calendar year. In addition, during the Reporting Period overall, positioning in the basic industry, transportation and utilities market segments weighed on relative returns, while positioning in media, services and energy contributed positively to performance. From a ratings perspective, selection among BB-rated credits detracted from results, offset somewhat by positioning among CCC-rated credits, which contributed positively. Finally, an out-of-benchmark allocation to bank loans bolstered relative returns, given that bank loans broadly outperformed high yield corporate bonds during the Reporting Period.
Brigade, the Fund’s other high yield Underlying Manager, underperformed the ICE BofA Global High Yield Investment Grade Country Constrained Index during the Reporting Period. Credit selection within the services, technology, retail, utility, media and telecommunications market segments detracted from performance. A relative overweight in media and the strategy’s cash position also weighed on results. Conversely, credit selection within financials, energy and capital goods, as well as an overweight in basic industry, added to relative returns. From a ratings perspective, the strategy was hurt by selection across ratings tiers, including BB-rated, B-rated and CCC-rated and below credits.
Aristotle Pacific, a bank loans Underlying Manager, outperformed the Credit Suisse Leveraged Loan Index during the Reporting Period. A relative underweight and strong security selection in media and telecommunications, the worst performing market segment in the benchmark index during the Reporting Period, contributed positively to returns. Effective selection within health care further bolstered relative performance. An overweight position and selection within gaming and leisure, which benefited from strong consumer spending in services and travel, were also advantageous. However, weak security selection in the financials and services market segments hampered relative returns; these results were more a function of not owning issuers that had previously underperformed and subsequently recovered rather than a function of owning underperforming
FUND RESULTS
issuers. From a ratings perspective, the strategy’s underweight in bank loans rated BB and above aided results. In addition, strong selection among CCC-rated bank loans, particularly higher quality second lien loans, bolstered relative performance. However, the strategy was hurt by its allocation to high yield corporate bonds, as interest rates rose.
Nuveen, another bank loans Underlying Manager, underperformed the Credit Suisse Leveraged Loan Index during the Reporting Period. Credit selection in the technology market segment detracted most from relative performance. Credit selection within consumer discretionary, health care and energy contributed positively, helping to offset some of the losses. In terms of positioning, an overweight in the communication services and health care market segments, as well as underweights in real estate and materials, weighed on relative returns. The strategy benefited from an overweight in energy. From a ratings perspective, selection among CCC-rated credits and non-rated issuers hindered relative performance. An overweight in “reorg equity” was another detractor. (Reorg equity refers to equity securities that are issued in connection with a reorganization or restructuring.)
Marathon, the Fund’s external emerging markets debt Underlying Manager, outperformed the J.P. Morgan EMBISM Global Diversified Index during the Reporting Period. Its relative outperformance was driven by selection overall, followed by the strategy’s legacy holdings in specific sovereign bonds. In particular, an investment in Mexico’s state-owned petroleum company and an overweight relative to the benchmark in Colombian higher coupon securities added to results. Legacy holdings in Venezuela also bolstered relative returns, as reports of diplomatic progress with the U.S. pushed up Venezuelan bond prices, though valuations remained highly depressed. On the other hand, selection in Brazil and an underweight in China detracted from relative performance. An overweight in Chile further hurt results.
TCW, the Fund’s local emerging markets debt Underlying Manager, underperformed the J.P. Morgan GBI-EMSM Global Diversified Index during the Reporting Period. Overweight positions versus the benchmark index in South Africa and Thailand detracted most from performance. South African local bonds experienced significant volatility amid idiosyncratic events. Regarding Thailand, the country’s current account did not benefit as much from China’s economic re-opening as TCW had anticipated. Also detracting during the Reporting Period was the strategy’s underweight in Chinese local bonds, which dampened relative returns as Chinese interest rates fell on the back of
weaker than consensus expected economic data and more aggressive central bank monetary easing. An allocation to cash detracted further from performance given that local emerging markets debt posted strong positive absolute returns during the Reporting Period. On the positive side, an underweight in Turkey’s local bonds added to relative results. Turkish local bonds weakened as the country’s central bank tightened monetary policy. The strategy was also helped by an overweight in Hungarian local bonds, which benefited from declining inflation, and an overweight in Colombian local bonds, which benefited from their high carry. (Carry involves borrowing at a low interest rate and investing in an asset that provides a higher rate of return.)
| Q | How did the Fund use derivatives and similar instruments during the Reporting Period? |
| A | During the Reporting Period, a specialized index of credit default swaps (“CDX”) was used as a cost-efficient instrument to help manage the Fund’s cash position. The use of CDX had a positive impact on the Fund’s performance. The Fund’s Underlying Managers employed credit default swaps, U.S. Treasury futures, forward foreign currency exchange contracts, foreign exchange options, rights and warrants to implement their strategies during the Reporting Period. The use of credit default swaps by Underlying Managers had a positive impact on performance. The use of U.S. Treasury futures, forward foreign currency exchange contracts and foreign exchange options by Underlying Managers each had a negative impact on the Fund’s performance. The use of rights and warrants by Underlying Managers each had a neutral impact on the Fund’s results during the Reporting Period. |
| Q | Were there any notable changes in the Fund’s allocations during the Reporting Period? |
| A | We made a number of changes in the Fund’s allocations during the Reporting Period. In January 2023, the Fund’s strategic asset allocation was shifted toward the MAS Group’s latest framework and long-term risk/return assumptions, accounting for Index updates. Such shifts resulted in decreased allocations to high yield corporate bonds and external emerging markets debt and increased allocations to bank loans and local emerging markets debt. Then, at January month-end, we reduced the Fund’s allocation to bank loans in favor of a greater allocation to high yield corporate bonds. We unwound this positioning at May 2023 month-end, increasing the Fund’s exposure to bank loans and decreasing its exposure to high yield corporate bonds. |
FUND RESULTS
On February 28, 2023, River Canyon was removed as an Underlying Manager of the Fund. As a reminder, XIG had previously eliminated the Fund’s allocation to structured credit in March 2022, but River Canyon remained an Underlying Manager of the Fund at that time.
Effective April 1, 2023, Underlying Manager BlueBay Asset Management LLP (“BlueBay”) was consolidated with and into RBC Global Asset Management (UK) Limited (“RBC UK”) in connection with an internal corporate reorganization. Accordingly, this Underlying Manager is now called RBC UK, which does business as RBC BlueBay Asset Management. RBC Global Asset Management (U.S.) Inc., another Underlying Manager of the Fund, does business as RBC Global Asset Management.
On April 17, 2023, Pacific Asset Management LLC, an Underlying Manager of the Fund, was acquired by Aristotle Capital Management, LLC and renamed Aristotle Pacific Capital, LLC (“Aristotle Pacific”).
On September 22, 2023, Ninety One was added as an Underlying Manager of the Fund but was not allocated capital. Its strategy applies a risk conscious and highly structured, fundamental-research driven investment process to identify alpha opportunities primarily across emerging markets currencies and local sovereign interest rates. XIG added Ninety One to provide manager diversification within the Fund’s allocations to local emerging markets debt.
Ares, already a high yield Underlying Manager, was added on September 22, 2023 as an Underlying Manager for bank loans but was not allocated capital. Ares’ bank loan strategy takes a conservative and defensive approach by focusing on higher quality, attractively priced issues, ultimately seeking to maximize alpha while minimizing default risk. XIG added the strategy to provide greater flexibility with managing sector, issuer and credit quality exposures as well as to provide further diversification for the Fund’s bank loans allocation.
In terms of the Fund’s strategic allocation, at the start of the Reporting Period, the Fund’s assets were allocated 39.8% to high yield corporate bonds, 23.6% to bank loans, 22.5% to local emerging markets debt, 14.7% to external emerging markets debt and 2.2% to cash and cash equivalents. At the end of the Reporting Period, the Fund’s assets were allocated 38.2% to high yield corporate bonds, 25.9% to bank loans, 24.7% to local emerging markets debt, 11.8% to external emerging markets debt and 2.2% to cash and cash equivalents. This sector breakout is inclusive of derivative exposure across all asset classes.
| Q | Were there any changes to the Fund’s portfolio management team during the Reporting Period? |
| A | Effective July 18, 2023, Neill Nuttall and Siwen Wu no longer served as portfolio managers for the Fund. As of the same date, Scott McDermott and Mao Dong became portfolio managers for the Fund, joining Betsy Gorton. By design, all investment decisions for the Fund are performed within a team structure, with multiple subject matter experts. This strategic decision making has been a cornerstone of our approach and helps ensure continuity in the Fund. |
| Q | What is the Fund’s tactical view and strategy for the months ahead? |
| A | Overall, we intend to continue to position the Fund in alignment with our longer-term strategic views on the non-core fixed income market as a complement to additional strategic market exposures. We further intend to continue to monitor allocations and Underlying Manager performance as we seek to generate total return consisting of income and capital appreciation. |
FUND BASICS
Multi-Manager Non-Core Fixed Income Fund
as of October 31, 2023
|
|
TOP TEN HOLDINGS AS OF 10/31/23 ‡ |
| | | | | | | | |
| | | | |
Holding | | Coupon Rate | | Maturity Date | | % of Net Assets | | Line of Business |
| | | | |
Brazil Notas do Tesouro Nacional | | 10.000 | | 01/01/2025 | | 1.1% | | Sovereign Debt Obligations |
| | | | |
Brazil Notas do Tesouro Nacional | | 10.000 | | 01/01/2029 | | 1.0 | | Sovereign Debt Obligations |
| | | | |
Brazil Notas do Tesouro Nacional | | 10.000 | | 01/01/2027 | | 0.9 | | Sovereign Debt Obligations |
| | | | |
China Government Bonds | | 3.270 | | 11/19/2030 | | 0.7 | | Sovereign Debt Obligations |
| | | | |
Republic of South Africa Government Bonds | | 8.875 | | 02/28/2035 | | 0.6 | | Sovereign Debt Obligations |
| | | | |
Mexico Bonos | | 8.500 | | 05/31/2029 | | 0.5 | | Sovereign Debt Obligations |
| | | | |
Indonesia Treasury Bonds | | 7.000 | | 02/15/2033 | | 0.5 | | Sovereign Debt Obligations |
| | | | |
International Finance Corp. | | 6.300 | | 11/25/2024 | | 0.5 | | Corporate Obligations |
| | | | |
Malaysia Government Bonds | | 3.733 | | 06/15/2028 | | 0.5 | | Sovereign Debt Obligations |
| | | | |
Thailand Government Bonds | | 2.000 | | 12/17/2031 | | 0.5 | | Sovereign Debt Obligations |
| | ‡ | The top 10 holdings may not be representative of the Fund’s future investments. The Fund’s overall top 10 holdings differ from the table above due to the exclusion of the Goldman Sachs Financial Square Government Fund, which represents approximately 7.3% of the Fund’s net assets as of 10/31/23. |
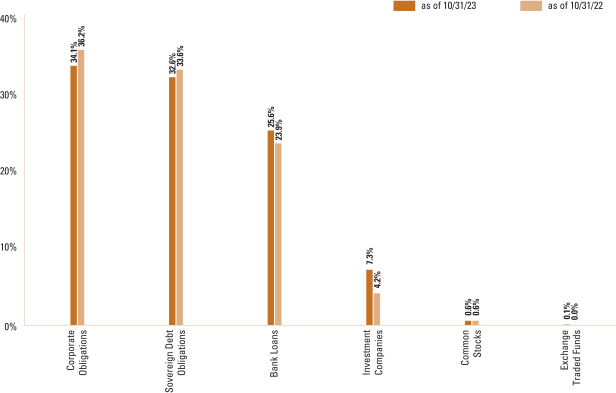
| | * | The percentage shown for each investment category reflects the value of investments in that category as a percentage of net assets. Underlying compositions of exchange traded funds and investment companies held by the Fund are not reflected in the graph above. Figures in the graph may not sum to 100% due to the rounding and/or exclusion of other assets and liabilities. The graph depicts the Fund’s investments but may not represent the Fund’s market exposure due to the exclusion of certain derivatives, if any, as listed in the Additional Investment Information section of the Schedule of Investments. |
| | | For more information about your Fund, please refer to www.GSAMFUNDS.com. There, you can learn more about your Fund’s investment strategies, holdings, and performance. |
MULTI-MANAGER NON-CORE FIXED INCOME FUND
Performance Summary
October 31, 2023
The following graph shows the value, as of October 31, 2023, of a $1,000,000 investment made on March 31, 2015 (commencement of operations) in Class R6 Shares at NAV. For comparative purposes, the performance of the Fund’s current benchmark, the Multi-Manager Non-Core Fixed Income Composite Dynamic Index, which is comprised of the Bloomberg Global High Yield Corporate Index (Gross, USD, Unhedged), the Credit Suisse Leveraged Loan Index (Gross, USD, Unhedged), the J.P. Morgan EMBISM Global Diversified Index (Gross, USD, Unhedged) and the J.P. Morgan GBI-EMSM Global Diversified Index (Gross, USD, Unhedged), is shown. Performance reflects applicable fee waivers and/or expense limitations in effect during the periods shown and in their absence, performance would be reduced. Returns do not reflect the deduction of taxes that a shareholder would pay on Fund distributions or the redemption of Fund shares. The returns set forth below represent past performance. Past performance does not guarantee future results. The Fund’s investment return and principal value will fluctuate so that an investor’s shares, when redeemed, may be worth more or less than their original cost. Current performance may be lower or higher than the performance quoted below. Please visit our website at www.GSAMFUNDS.com to obtain the most recent month-end returns.
|
|
Multi-Manager Non-Core Fixed Income Fund’s Lifetime Performance |
Performance of a $1,000,000 investment, with distributions reinvested, from March 31, 2015 through October 31, 2023.
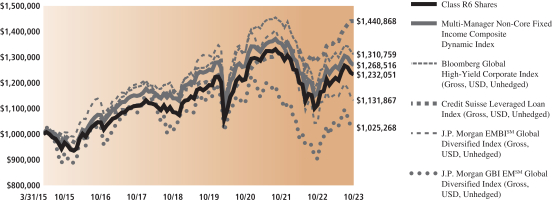
| | | | | | | | |
| | | |
Average Annual Total Return through October 31, 2023* | | One Year | | Five Years | | Since Inception |
| | | | |
Class R6 Shares (Commenced March 31, 2015) | | 9.89% | | 1.97% | | 1.82% | | |
| | * | Effective January 16, 2018, Institutional Shares were redesignated as Class R6 Shares. These returns assume reinvestment of all distributions at NAV. Because Class R6 Shares do not involve a sales charge, such a charge is not applied to their Average Annual Total Returns. |
FUND RESULTS
Goldman Sachs Multi-Manager Real Assets Strategy Fund
|
| |
Investment Objective The Fund seeks to provide long-term capital growth through investments related to real assets. |
Portfolio Management Discussion and Analysis
Below, the Goldman Sachs Multi-Asset Solutions (“MAS”) Group and the Goldman Sachs External Investing Group (“XIG”) (formerly, the Goldman Sachs Alternative Investments & Manager Selection (“AIMS”) Group) discuss the Goldman Sachs Multi-Manager Real Assets Strategy Fund’s (the “Fund”) performance and positioning for the 12-month period ended October 31, 2023 (the “Reporting Period”).
| Q | How did the Fund perform during the Reporting Period? |
| A | During the Reporting Period, the Fund’s Class R6 Shares generated an average annual total return of -2.88%. This return compares to the -4.52% average annual total return of the Fund’s benchmark, the Multi-Manager Real Assets Strategy Composite Dynamic Index (the “Index”), during the same time period. |
The Index is comprised of the FTSE EPRA/NAREIT Developed Index (Net, USD, Unhedged) (the “FTSE Index”) and the Dow Jones Brookfield Global Infrastructure Index (Net, USD, Unhedged) (the “Dow Jones Brookfield Index”), which are weighted in accordance with the relative market capitalizations of each constituent index (as determined by the constituent index providers) as of the last business day of the previous calendar year. During the Reporting Period, the FTSE Index and the Dow Jones Brookfield Index returned -5.86% and -2.90%, respectively.
| Q | What key factors were responsible for the Fund’s performance during the Reporting Period? |
| A | The Fund uses a multi-manager approach and generally seeks to achieve its investment objective by dynamically allocating its assets among unaffiliated investment managers (“Underlying Managers”) that invest primarily in real assets. (Real assets are defined broadly by the Fund and include any assets that have physical properties or inflation sensitive characteristics, such as energy, real estate, infrastructure, commodities and inflation linked or floating rate fixed income securities. Inflation is a sustained increase in prices that erodes the purchasing power of money. Assets with inflation sensitive characteristics are assets that benefit from rising real cash flows in times of rising inflation.) The MAS Group is responsible for the Fund’s asset allocation, wherein it applies a risk-based approach that draws from both fundamental and quantitative disciplines with the intention of dynamically accessing a diversified set of risks and returns in a market cycle aware manner. XIG is responsible for making recommendations with respect to hiring, terminating or |
| | replacing the Fund’s Underlying Managers and applying a multifaceted process for manager due diligence, portfolio construction and risk management. |
The Fund posted a negative absolute return during the Reporting Period but outperformed the Index. The Fund’s relative results can be attributed to the performance of the Underlying Managers overall. Strategic asset allocation slightly underperformed the Index during the Reporting Period.
During the Reporting Period, the Fund allocated capital to the following Underlying Managers—Cohen & Steers Capital Management, Inc. (“Cohen & Steers”), PGIM Real Estate, a business unit of PGIM, Inc. (“PRE”), Principal Real Estate Investors, LLC (“PrinREI”) and RREEF America L.L.C. (“RREEF”), a wholly-owned subsidiary of DWS Group GmbH & Co. KgaA, an affiliate of Deutsche Bank AG.
These Underlying Managers represented two sectors of real assets as part of the Fund’s top-level strategy allocation—global real estate (PRE and PrinREI) and global infrastructure (Cohen & Steers and RREEF).
During the Reporting Period, all four of the Underlying Managers generated modestly negative absolute returns. On a relative basis, three of the Underlying Managers outperformed their respective benchmark indices and one Underlying Manager underperformed its benchmark index during the Reporting Period.
Strategic asset allocation, which reflects a longer-term perspective to diversify and invest across real assets, slightly underperformed the Index during the Reporting Period. For a brief time early in the Reporting Period, the Fund’s strategic allocation to global infrastructure securities was slightly smaller than that of the Index, while its strategic allocation to global real estate securities was slightly larger. As a reminder, the Index has a comparatively larger weighting in global real estate securities than in global infrastructure securities. Although both asset classes generated negative absolute returns during the Reporting Period, global
FUND RESULTS
infrastructure securities performed better than global real estate securities, as rising long-term interest rates hurt the valuations of global real estate securities.
| Q | Which real assets asset classes most significantly affected Fund performance? |
| A | In global real estate, which we measure against the FTSE Index, Underlying Manager PRE strongly outperformed the benchmark index during the Reporting Period. These results were due primarily to security selection and a relative underweight in office real estate investment trusts (“REITs”), which struggled with lower occupancy from post COVID-19 workforce trends. Additionally, an overweight in senior housing health care REITs, as well as an overweight and selection in data center REITs, added to relative performance. Conversely, security selection among real estate operating companies, multi-family residential REITs and single-family residential REITs detracted slightly from performance. |
Also in global real estate, PrinREI strongly outperformed the benchmark index during the Reporting Period. Its outperformance was driven by selection among health care REITs (especially senior housing), multi-family residential REITs and diversified REITs. On the other hand, selection of self-storage REITs and specialized REITs, along with out-of-benchmark exposure to cell tower REITs, detracted from relative returns. Geographically, the strategy benefited from selection in Asia ex Japan (notably, Australia) due to its logistics and data center exposures and in North America due to its senior housing exposures. An underweight position in select North American triple net lease REITs also added to results. Security selection in Japan held back performance during the Reporting Period.
In global infrastructure, which we measure against the Dow Jones Brookfield Index, Underlying Manager Cohen & Steers outperformed the benchmark index during the Reporting Period. Its strategy benefited from positive security selection within utilities and digital infrastructure (specifically, cell towers) as well as from a relative overweight in transportation infrastructure. Within utilities, effective security selection among electric utilities and an overweight in multi-utilities added most to relative returns, while selection among Asia gas utilities detracted. Within transportation, an overweight position and investments in airports, along with an overweight in marine ports, added value, more than offsetting the negative performance of an underweight in European toll roads. There were few sector-level detractors during the Reporting Period within the strategy. However, among cell tower investments, favorable security selection within North America was partially offset by poor security selection within Europe. Regionally, selection in North America and an underweight in Asia ex Japan contributed positively to relative performance, while a modest overweight in the emerging markets weighed on results.
RREEF, the Fund’s other global infrastructure Underlying Manager, modestly underperformed the benchmark index during the Reporting Period. A relative underweight in transportation infrastructure, as well as an overweight and selection in digital infrastructure (specifically, cell towers), detracted from returns. Within transportation infrastructure, the strategy’s underweight in European toll roads hurt relative performance, as these companies generally advanced amid the softening recessionary outlook for Europe. On the positive side, out-of-benchmark holdings in freight rail and security selection among electric utilities added to performance. Regionally, an underweight and selection in Europe ex-U.K. detracted from relative returns. Selection in the emerging markets was also slightly negative during the Reporting Period. However, selection in North America contributed positively.
| Q | How did the Fund use derivatives and similar instruments during the Reporting Period? |
| A | Forward foreign currency exchange contracts were used by Underlying Managers to facilitate equity transactions settling in foreign currencies. The use of forward foreign currency exchange contracts had a negative impact on the Fund’s performance during the Reporting Period. The Fund’s Underlying Managers also employed rights and warrants to implement their strategies. The use of rights and warrants did not have a material impact on the Fund’s performance during the Reporting Period. In addition, real estate index futures were used to equitize the Fund’s cash holdings. In other words, we put the Fund’s cash holdings to work by using them as collateral for the purchase of real estate index futures, which helped us increase the Fund’s exposure to U.S. real estate securities and provide a buffer for short-term liquidity needs. During the Reporting Period, the use of real estate index futures had a negative impact on the Fund’s performance. |
| Q | Were there any notable changes in the Fund’s allocations during the Reporting Period? |
| A | During the Reporting Period, we made some changes in the Fund’s allocations. In January 2023, the Fund’s strategic asset allocation was shifted toward the MAS Group’s latest framework and long-term risk/return assumptions, accounting for Index updates. Such shifts resulted in decreased exposure to global real estate securities and increased exposure to global infrastructure securities. |
In terms of the Fund’s strategic asset allocation, at the beginning of the Reporting Period, the Fund’s assets were allocated 59.8% to global real estate and 40.2% to global infrastructure, with the remainder in cash and cash equivalents. At the end of the Reporting Period, the Fund’s assets were allocated 55.6% to global real estate and 44.4% to global infrastructure, with the remainder in cash and cash equivalents. This sector breakout is inclusive of derivative exposure across all asset classes.
FUND RESULTS
| Q | Were there any changes to the Fund’s portfolio management team during the Reporting Period? |
| A | Effective July 18, 2023, Neill Nuttall and Siwen Wu no longer served as portfolio managers for the Fund. As of the same date, Scott McDermott and Mao Dong became portfolio managers for the Fund, joining Betsy Gorton and Yvonne Wu. By design, all investment decisions for the Fund are performed within a team structure, with multiple subject matter experts. This strategic decision making has been a cornerstone of our approach and helps ensure continuity in the Fund. |
| Q | What is the Fund’s tactical view and strategy for the months ahead? |
| A | Overall, we intend to continue to position the Fund in alignment with our longer-term strategic views on the real assets complex as a complement to additional strategic market exposures. We further intend to continue to monitor allocations and Underlying Manager performance as we seek to generate long-term capital growth through investments related to real assets. |
FUND BASICS
Multi-Manager Real Assets Strategy Fund
as of October 31, 2023
| | | | | | |
| TOP TEN HOLDINGS AS OF 10/31/23 ‡ | | | | |
| | |
| Holding | | % of Net Assets | | Line of Business |
| American Tower Corp. | | | 4.1 | % | | Specialized REITs |
| Prologis, Inc. | | | 2.9 | | | Industrial REITs |
| Vinci SA | | | 2.5 | | | Construction & Engineering |
| Welltower, Inc. | | | 2.4 | | | Health Care REITs |
| National Grid PLC | | | 2.3 | | | Multi-Utilities |
| Equinix, Inc. | | | 2.3 | | | Specialized REITs |
| ONEOK, Inc. | | | 2.2 | | | Oil, Gas & Consumable Fuels |
| Enbridge, Inc. | | | 2.1 | | | Oil, Gas & Consumable Fuels |
| Digital Realty Trust, Inc. | | | 2.1 | | | Specialized REITs |
| Sempra | | | 1.9 | | | Multi-Utilities |
| ‡ | The top 10 holdings may not be representative of the Fund’s future investments. The Fund’s overall top 10 holdings differ from the table above due to the exclusion of the Goldman Sachs Financial Square Government Fund, which represents approximately 2.2% of the Fund’s net assets as of 10/31/23. |
FUND BASICS
|
|
| FUND SECTOR ALLOCATIONS * |
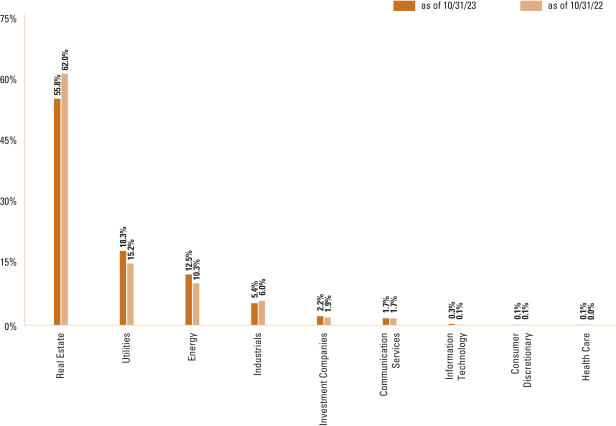
|
| |
† The Fund is actively managed and, as such, its composition may differ over time. Consequently, the Fund’s overall sector allocations may differ from the percentages contained in the graph above. The graph categorizes investments using the Global Industry Classification Standard (“GICS”); however, the sector classifications used by the portfolio management team may differ from GICS. The percentage shown for each investment category reflects the value of investments in that category as a percentage of market value (excluding investments in the securities lending reinvestment vehicle, if any). The graph depicts the Fund’s investments but may not represent the Fund’s market exposure due to the exclusion of certain derivatives, if any, as listed in the Additional Investment Information section of the Schedule of Investments. Figures in the graph may not sum to 100% due to rounding and/or the exclusion of other assets and liabilities. |
For more information about your Fund, please refer to www.GSAMFUNDS.com. There, you can learn more about your Fund’s investment strategies, holdings, and performance.
MULTI-MANAGER REAL ASSETS STRATEGY FUND
Performance Summary
October 31, 2023
The following graph shows the value, as of October 31, 2023, of a $1,000,000 investment made on June 30, 2015 (commencement of operations) in Class R6 Shares at NAV. For comparative purposes, the performance of the Fund’s current benchmark, the Multi-Manager Real Assets Strategy Composite Dynamic Index, which is comprised of the FTSE EPRA/NAREIT Developed Index (Net, USD, Unhedged) and the Dow Jones Brookfield Global Infrastructure Index (Net, USD, Unhedged), is shown. Performance reflects applicable fee waivers and/or expense limitations in effect during the periods shown and in their absence, performance would be reduced. Returns do not reflect the deduction of taxes that a shareholder would pay on Fund distributions or the redemption of Fund shares. The returns set forth below represent past performance. Past performance does not guarantee future results. The Fund’s investment return and principal value will fluctuate so that an investor’s shares, when redeemed, may be worth more or less than their original cost. Current performance may be lower or higher than the performance quoted below. Please visit our website at www.GSAMFUNDS.com to obtain the most recent month-end returns.
|
|
Multi-Manager Real Assets Strategy Fund’s Lifetime Performance |
Performance of a $1,000,000 investment, with distributions reinvested, from June 30, 2015 through October 31, 2023.
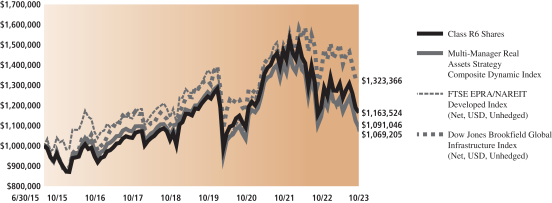
| | | | | | | | |
| | | |
Average Annual Total Return through October 31, 2023* | | One Year | | Five Years | | Since Inception |
| | | | |
Class R6 Shares (Commenced June 30, 2015) | | -2.88% | | 1.72% | | 1.01% | | |
| | * | Effective January 16, 2018, Institutional Shares were redesignated as Class R6 Shares. These returns assume reinvestment of all distributions at NAV. Because Class R6 Shares do not involve a sales charge, such a charge is not applied to their Average Annual Total Returns. |
FUND BASICS
Index Definitions
Market Review
MSCI All Country World Index Investable Market Index is designed to represent performance of the full opportunity set of large- and mid-cap stocks across 23 developed and 24 emerging markets.
MSCI China All Shares Index captures large and mid-cap representation across China A shares, B shares, H shares, Red chips, P chips and foreign listings (e.g., American Depositary Receipts). The index aims to reflect the opportunity set of China share classes listed in Hong Kong, Shanghai, Shenzhen and outside of China.
Multi-Manager Global Equity
MSCI All Country World Index Investable Market Index is designed to represent performance of the full opportunity set of large- and mid-cap stocks across 23 developed and 24 emerging markets.
MSCI Emerging Markets Index captures large-cap and mid-cap representation across 27 emerging markets countries. The index covers approximately 85% of the free float-adjusted market capitalization in each country.
S&P 500® Index is the Standard & Poor’s 500 composite index of 500 stocks, an unmanaged index of common stock prices. Russell 1000®Growth Index is an unmanaged index of common stock prices that measures the performance of those Russell 1000® Index companies with higher price-to-book ratios and higher forecasted growth values.
Russell 1000®Value Index is an unmanaged index of common stock prices that measures the performance those Russell 1000® Index companies with lower price-to-book ratios and lower expected growth values.
Russell 2000®Value Index measures the performance of small-cap value segment of the U.S. equity universe. It includes those Russell 2000 companies with lower price-to-book ratios and lower forecasted growth values. The Index is completely reconstituted annually to ensure larger stocks do not distort the performance and characteristics of the true small-cap opportunity set and that the represented companies continue to reflect value characteristics.
MSCI ACWI ex USA Index captures large and mid cap representation across 22 of 23 developed markets countries (excluding the U.S.) and 27 emerging markets countries.
MSCI EAFE Index is a stock market index that is designed to measure the equity market performance of developed markets in Europe, Australasia and the Far East, excluding the U.S. and Canada.
MSCI World Index is a broad global equity index that represents large and mid-cap equity performance across 23 developed markets countries.
Multi-Manager Non-Core Fixed Income
Bloomberg Global High Yield Corporate Index is a multi-currency measure of the global high yield debt market.
ICE BofA Global High Yield Investment Grade Country Constrained Index contains all securities in the ICE BofA Global High Yield Index but caps issuer exposure at 2%. Index constituents are capitalization-weighted, based on their current amount outstanding, provided the total allocation to an individual issuer does not exceed 2%. Issuers that exceed the limit are reduced to 2% and the face value of each of their bonds is adjusted on a pro-rata basis. Similarly, the face values of bonds of all other issuers that fall below the 2% cap are increased on a pro-rata basis. In the event there are fewer than 50 issuers in the Index, each is equally weighted and the face values of their respective bonds are increased or decreased on a pro-rata basis.
Credit Suisse Leveraged Loan Index is designed to mirror the investable universe of the U.S. dollar-denominated leveraged loan market.
J.P. Morgan Emerging Market Bond Index (“EMBISM”) Global Diversified Index tracks total returns for U.S. dollar-denominated debt instruments issued by emerging market sovereign and quasi-sovereign entities.
J.P. Morgan Government Bond Index – Emerging Markets (“GBI-EMSM”) Global Diversified Index is a comprehensive local emerging markets index, consisting of regularly traded, fixed-rate, local currency government bonds.
FUND BASICS
Multi-Manager Real Assets Strategy
FTSE EPRA/NAREIT Developed Index is designed to track the performance of listed real estate companies and real estate investment trusts (“REITs”) worldwide. The index incorporates REITs and real estate holding & development companies.
Dow Jones Brookfield Global Infrastructure Index intends to measure the stock performance of pure-play infrastructure companies domiciled globally. The index covers all sectors of the infrastructure market. Components are required to have more than 70% of cash flows derived from infrastructure lines of business.
It is not possible to invest directly in an unmanaged index.
GOLDMAN SACHS MULTI-MANAGER GLOBAL EQUITY FUND
|
Schedule of Investments October 31, 2023 |
| | | | | | | | |
| | | Shares | | Description | | Value | |
| |
| | Common Stocks – 90.3% | |
| |
| | Australia – 0.3% | |
| | 12,295 | | Allkem Ltd.* (Metals & Mining) | | $ | 75,131 | |
| | 8,764 | | Ampol Ltd. (Oil, Gas & Consumable Fuels) | | | 177,714 | |
| | 7,759 | | AUB Group Ltd. (Insurance) | | | 133,249 | |
| | 124,816 | | Bellevue Gold Ltd.* (Metals & Mining) | | | 113,511 | |
| | 134,713 | | De Grey Mining Ltd.* (Metals & Mining) | | | 101,250 | |
| | 46,715 | | Deterra Royalties Ltd. (Metals & Mining) | | | 139,585 | |
| | 19,525 | | Eagers Automotive Ltd. (Specialty Retail) | | | 160,585 | |
| | 16,246 | | Flight Centre Travel Group Ltd. (Hotels, Restaurants & Leisure) | | | 193,122 | |
| | 29,580 | | GrainCorp Ltd. Class A (Consumer Staples Distribution & Retail) | | | 130,733 | |
| | 129,223 | | HomeCo Daily Needs REIT (Retail REITs) | | | 88,122 | |
| | 133,816 | | Mirvac Group (Diversified REITs) | | | 155,260 | |
| | 28,057 | | nib holdings Ltd. (Insurance) | | | 129,304 | |
| | 106,874 | | Nine Entertainment Co. Holdings Ltd. (Media) | | | 125,939 | |
| | 52,872 | | Orora Ltd. (Containers & Packaging) | | | 82,857 | |
| | 3,324 | | Pro Medicus Ltd. (Health Care Technology) | | | 158,332 | |
| | 11,386 | | Seven Group Holdings Ltd. (Trading Companies & Distributors) | | | 201,209 | |
| | 18,005 | | Steadfast Group Ltd. (Insurance) | | | 61,915 | |
| | 104,534 | | Ventia Services Group Pty. Ltd. (Construction & Engineering) | | | 182,702 | |
| | | | | | | | |
| | | | | | | 2,410,520 | |
| | | |
| |
| | Austria – 0.1% | |
| | 3,455 | | ANDRITZ AG (Machinery) | | | 159,030 | |
| | 5,183 | | BAWAG Group AG(a) (Banks) | | | 230,853 | |
| | 4,799 | | Erste Group Bank AG (Banks) | | | 171,849 | |
| | 6,054 | | Wienerberger AG (Construction Materials) | | | 146,670 | |
| | | | | | | | |
| | | | | | | 708,402 | |
| | | |
| |
| | Belgium – 0.3% | |
| | 1,759 | | Aedifica SA (Health Care REITs) | | | 95,963 | |
| | 23,728 | | Anheuser-Busch InBev SA (Beverages) | | | 1,350,077 | |
| | 7,253 | | KBC Group NV (Banks) | | | 399,168 | |
| | 5,555 | | Warehouses De Pauw CVA (Industrial REITs) | | | 137,445 | |
| | | | | | | | |
| | | | | | | 1,982,653 | |
| | | |
| |
| | Bermuda – 0.3% | |
| | 14,420 | | Arch Capital Group Ltd.* (Insurance) | | | 1,249,926 | |
| | 3,443 | | Assured Guaranty Ltd. (Insurance) | | | 214,843 | |
| | 5,435 | | Axis Capital Holdings Ltd. (Insurance) | | | 310,339 | |
| | | |
| | | | | | | | |
| | | Shares | | Description | | Value | |
| |
| | Common Stocks (continued) | |
| |
| | Bermuda (continued) | |
| | 3,293 | | Seadrill Ltd.* (Energy Equipment & Services) | | $ | 130,139 | |
| | | | | | | | |
| | | | | | | 1,905,247 | |
| | | |
| |
| | Brazil – 0.7% | |
| | 18,150 | | Allos SA (Real Estate Management & Development) | | | 82,439 | |
| | 99,650 | | Ambev SA (Beverages) | | | 254,177 | |
| | 28,000 | | Auren Energia SA (Independent Power and Renewable Electricity Producers) | | | 74,530 | |
| | 131,900 | | B3 SA - Brasil Bolsa Balcao (Capital Markets) | | | 290,393 | |
| | 152,525 | | Banco Bradesco SA ADR (Banks) | | | 425,545 | |
| | 66,600 | | Banco BTG Pactual SA (Capital Markets) | | | 391,007 | |
| | 56,700 | | Banco do Brasil SA (Banks) | | | 543,749 | |
| | 10,100 | | Embraer SA* (Aerospace & Defense) | | | 35,237 | |
| | 33,300 | | Localiza Rent a Car SA (Ground Transportation) | | | 335,989 | |
| | 91,400 | | NU Holdings Ltd. Class A* (Banks) | | | 749,480 | |
| | 24,300 | | PRIO SA* (Oil, Gas & Consumable Fuels) | | | 229,902 | |
| | 90,200 | | Raia Drogasil SA (Consumer Staples Distribution & Retail) | | | 461,578 | |
| | 2,844 | | Sigma Lithium Corp.* (Metals & Mining) | | | 69,536 | |
| | 13,700 | | SLC Agricola SA (Food Products) | | | 99,888 | |
| | 8,250 | | Telefonica Brasil SA (Diversified Telecommunication Services) | | | 74,028 | |
| | 36,800 | | TOTVS SA (Software) | | | 184,739 | |
| | 24,650 | | Vale SA (Metals & Mining) | | | 337,353 | |
| | 38,500 | | WEG SA (Electrical Equipment) | | | 252,072 | |
| | 2,230 | | XP, Inc. Class A (Capital Markets) | | | 44,600 | |
| | 15,850 | | YDUQS Participacoes SA (Diversified Consumer Services) | | | 55,739 | |
| | | | | | | | |
| | | | | | | 4,991,981 | |
| | | |
| |
| | Canada – 2.2% | |
| | 17,800 | | Alamos Gold, Inc. Class A (Metals & Mining) | | | 220,390 | |
| | 17,452 | | Alimentation Couche-Tard, Inc. (Consumer Staples Distribution & Retail) | | | 950,028 | |
| | 13,400 | | ARC Resources Ltd. (Oil, Gas & Consumable Fuels) | | | 215,579 | |
| | 4,000 | | ATS Corp.* (Machinery) | | | 134,704 | |
| | 2,660 | | BRP, Inc. (Leisure Products) | | | 179,789 | |
| | 5,100 | | Canadian Apartment Properties REIT (Residential REITs) | | | 150,122 | |
| | 8,914 | | Canadian National Railway Co. (Ground Transportation) | | | 942,923 | |
| | 39,619 | | Canadian Pacific Kansas City Ltd. (Ground Transportation) | | | 2,812,112 | |
| | | |
| | |
| The accompanying notes are an integral part of these financial statements. | | 23 |
GOLDMAN SACHS MULTI-MANAGER GLOBAL EQUITY FUND
|
Schedule of Investments (continued) October 31, 2023 |
| | | | | | | | |
| | | Shares | | Description | | Value | |
| |
| | Common Stocks (continued) | |
| |
| | Canada (continued) | |
| | 8,180 | | Capital Power Corp. (Independent Power and Renewable Electricity Producers) | | $ | 209,344 | |
| | 31,100 | | Crescent Point Energy Corp. (Oil, Gas & Consumable Fuels) | | | 249,383 | |
| | 5,200 | | Definity Financial Corp. (Insurance) | | | 143,766 | |
| | 8,899 | | Descartes Systems Group, Inc.* (Software) | | | 642,761 | |
| | 13,200 | | Element Fleet Management Corp. (Financial Services) | | | 178,570 | |
| | 5,950 | | Empire Co. Ltd. Class A (Consumer Staples Distribution & Retail) | | | 163,043 | |
| | 5,160 | | Enerplus Corp. (Oil, Gas & Consumable Fuels) | | | 87,256 | |
| | 10,320 | | Filo Corp.* (Metals & Mining) | | | 134,400 | |
| | 5,910 | | Gildan Activewear, Inc. (Textiles, Apparel & Luxury Goods) | | | 167,871 | |
| | 2,900 | | Granite Real Estate Investment Trust (Industrial REITs) | | | 132,061 | |
| | 3,780 | | Intact Financial Corp. (Insurance) | | | 531,094 | |
| | 8,250 | | Interfor Corp.* (Paper & Forest Products) | | | 101,790 | |
| | 9,981 | | International Petroleum Corp.* (Oil, Gas & Consumable Fuels) | | | 105,865 | |
| | 6,800 | | Keyera Corp. (Oil, Gas & Consumable Fuels) | | | 158,140 | |
| | 1,747 | | Methanex Corp. (Chemicals) | | | 72,064 | |
| | 13,500 | | Osisko Gold Royalties Ltd. (Metals & Mining) | | | 165,008 | |
| | 6,320 | | Parkland Corp. (Oil, Gas & Consumable Fuels) | | | 191,275 | |
| | 7,300 | | Quebecor, Inc. Class B (Diversified Telecommunication Services) | | | 150,606 | |
| | 3,620 | | Stantec, Inc. (Construction & Engineering) | | | 221,494 | |
| | 4,630 | | Stella-Jones, Inc. (Paper & Forest Products) | | | 242,526 | |
| | 20,849 | | Suncor Energy, Inc. (Oil, Gas & Consumable Fuels) | | | 675,196 | |
| | 850 | | TFI International, Inc. (Ground Transportation) | | | 94,032 | |
| | 6,430 | | Thomson Reuters Corp. (Professional Services) | | | 770,209 | |
| | 1,747 | | Toromont Industries Ltd. (Trading Companies & Distributors) | | | 131,521 | |
| | 14,063 | | Toronto-Dominion Bank (Banks) | | | 785,520 | |
| | 108,815 | | Wheaton Precious Metals Corp. (Metals & Mining) | | | 4,597,434 | |
| | 29,400 | | Whitecap Resources, Inc. (Oil, Gas & Consumable Fuels) | | | 227,059 | |
| | | | | | | | |
| | | | | | | 16,934,935 | |
| | | |
| |
| | Cayman Islands – 0.2% | |
| | 955 | | BeiGene Ltd. ADR* (Biotechnology) | | | 177,897 | |
| | | |
| | | | | | | | |
| | | Shares | | Description | | Value | |
| |
| | Common Stocks (continued) | |
| |
| | Cayman Islands (continued) | |
| | 23,900 | | KE Holdings, Inc. ADR (Real Estate Management & Development) | | $ | 351,569 | |
| | 43,550 | | Kingsoft Corp. Ltd. (Entertainment) | | | 151,967 | |
| | 7,418 | | Legend Biotech Corp. ADR* (Biotechnology) | | | 490,107 | |
| | 72,668 | | Lufax Holding Ltd. ADR (Consumer Finance) | | | 69,384 | |
| | 16,594 | | MINISO Group Holding Ltd. ADR (Broadline Retail) | | | 419,994 | |
| | | | | | | | |
| | | | | | | 1,660,918 | |
| | | |
| |
| | Chile – 0.0% | |
| | 54,828 | | Cencosud SA (Consumer Staples Distribution & Retail) | | | 88,827 | |
| | 33,135 | | Enel Chile SA ADR (Electric Utilities) | | | 96,423 | |
| | | | | | | | |
| | | | | | | 185,250 | |
| | | |
| |
| | China – 3.3% | |
| | 59,100 | | 3SBio, Inc.(a) (Biotechnology) | | | 52,578 | |
| | 6,100 | | Airtac International Group (Machinery) | | | 200,553 | |
| | 192,150 | | Alibaba Group Holding Ltd.* (Broadline Retail) | | | 1,978,198 | |
| | 358,100 | | Aluminum Corp. of China Ltd. Class H (Metals & Mining) | | | 191,559 | |
| | 9,955 | | Autohome, Inc. ADR (Interactive Media & Services) | | | 266,296 | |
| | 64,350 | | Baidu, Inc. Class A* (Interactive Media & Services) | | | 844,838 | |
| | 474,013 | | Bank of Communications Co. Ltd. Class H (Banks) | | | 280,381 | |
| | 358,500 | | Baoshan Iron & Steel Co. Ltd. Class A (Metals & Mining) | | | 305,656 | |
| | 384,000 | | Beijing Capital International Airport Co. Ltd. Class H* (Transportation Infrastructure) | | | 141,442 | |
| | 6,332 | | Beijing Kingsoft Office Software, Inc. Class A (Software) | | | 248,230 | |
| | 641,700 | | BOE Technology Group Co. Ltd. Class A (Electronic Equipment, Instruments & Components) | | | 342,807 | |
| | 3,700 | | BYD Co. Ltd. Class A (Automobiles) | | | 120,329 | |
| | 5,700 | | BYD Co. Ltd. Class H (Automobiles) | | | 173,338 | |
| | 28,350 | | BYD Electronic International Co. Ltd. (Communications Equipment) | | | 118,347 | |
| | 877,411 | | China Cinda Asset Management Co. Ltd. Class H (Capital Markets) | | | 85,322 | |
| | 534,900 | | China CITIC Bank Corp. Ltd. Class H (Banks) | | | 238,623 | |
| | 429,000 | | China Construction Bank Corp. Class H (Banks) | | | 242,624 | |
| | 49,632 | | China Medical System Holdings Ltd. (Pharmaceuticals) | | | 79,366 | |
| | | |
| | |
| 24 | | The accompanying notes are an integral part of these financial statements. |
GOLDMAN SACHS MULTI-MANAGER GLOBAL EQUITY FUND
| | | | | | | | |
| | | Shares | | Description | | Value | |
| |
| | Common Stocks (continued) | |
| |
| | China (continued) | |
| | 950,000 | | China Petroleum & Chemical Corp. Class H (Oil, Gas & Consumable Fuels) | | $ | 485,866 | |
| | 31,000 | | China Resources Beer Holdings Co. Ltd. (Beverages) | | | 164,042 | |
| | 138,950 | | China Resources Land Ltd. (Real Estate Management & Development) | | | 520,105 | |
| | 193,000 | | China Resources Pharmaceutical Group
Ltd.(a) (Pharmaceuticals) | | | 119,891 | |
| | 128,100 | | China Taiping Insurance Holdings Co. Ltd. (Insurance) | | | 118,336 | |
| | 3,990,350 | | China Tower Corp. Ltd. Class H(a) (Diversified Telecommunication Services) | | | 372,103 | |
| | 150,450 | | COSCO SHIPPING Holdings Co. Ltd. Class H (Marine Transportation) | | | 153,013 | |
| | 142,200 | | CSPC Pharmaceutical Group Ltd. (Pharmaceuticals) | | | 124,207 | |
| | 88,350 | | Dongyue Group Ltd. (Chemicals) | | | 70,375 | |
| | 10,000 | | Eastroc Beverage Group Co. Ltd. Class A (Beverages) | | | 261,683 | |
| | 741,900 | | Focus Media Information Technology Co. Ltd. Class A (Media) | | | 698,973 | |
| | 68,300 | | Foxconn Industrial Internet Co. Ltd. Class A (Electronic Equipment, Instruments & Components) | | | 137,158 | |
| | 127,250 | | Geely Automobile Holdings Ltd. (Automobiles) | | | 144,470 | |
| | 62,700 | | Gree Electric Appliances, Inc. of Zhuhai Class A (Household Durables) | | | 289,845 | |
| | 126,800 | | Guotai Junan Securities Co. Ltd. Class A (Capital Markets) | | | 255,250 | |
| | 72,100 | | Haidilao International Holding Ltd.(a) (Hotels, Restaurants & Leisure) | | | 180,524 | |
| | 7,390 | | Hello Group, Inc. ADR (Interactive Media & Services) | | | 52,321 | |
| | 35,400 | | Hengdian Group DMEGC Magnetics Co. Ltd. Class A (Electronic Equipment, Instruments & Components) | | | 70,250 | |
| | 61,300 | | Huatai Securities Co. Ltd. Class A (Capital Markets) | | | 133,898 | |
| | 1,273,900 | | Industrial & Commercial Bank of China Ltd. Class H (Banks) | | | 610,510 | |
| | 26,840 | | JA Solar Technology Co. Ltd. Class A (Semiconductors & Semiconductor Equipment) | | | 81,949 | |
| | 29,950 | | Jiangxi Copper Co. Ltd. Class H (Metals & Mining) | | | 42,348 | |
| | 46,300 | | Jinduicheng Molybdenum Co. Ltd. Class A (Metals & Mining) | | | 63,343 | |
| | 1,758 | | JOYY, Inc. ADR (Interactive Media & Services) | | | 68,421 | |
| | 12,750 | | Li Auto, Inc. Class A* (Automobiles) | | | 215,649 | |
| | | |
| | | | | | | | |
| | | Shares | | Description | | Value | |
| |
| | Common Stocks (continued) | |
| |
| | China (continued) | |
| | 13,500 | | LONGi Green Energy Technology Co. Ltd. Class A (Semiconductors & Semiconductor Equipment) | | $ | 44,412 | |
| | 6,200 | | Luzhou Laojiao Co. Ltd. Class A (Beverages) | | | 180,992 | |
| | 18,311 | | Meituan Class B*(a) (Hotels, Restaurants & Leisure) | | | 259,558 | |
| | 84,350 | | NetEase, Inc. (Entertainment) | | | 1,805,221 | |
| | 904 | | NetEase, Inc. ADR (Entertainment) | | | 96,656 | |
| | 21,300 | | New China Life Insurance Co. Ltd. Class A (Insurance) | | | 97,017 | |
| | 4,550 | | PDD Holdings, Inc. ADR* (Broadline Retail) | | | 461,461 | |
| | 213,150 | | People’s Insurance Co. Group of China Ltd. Class H (Insurance) | | | 70,331 | |
| | 1,018,300 | | PetroChina Co. Ltd. Class H (Oil, Gas & Consumable Fuels) | | | 664,660 | |
| | 84,500 | | Ping An Insurance Group Co. of China Ltd. Class H (Insurance) | | | 428,624 | |
| | 30,750 | | Sany Heavy Equipment International Holdings Co. Ltd. (Machinery) | | | 40,394 | |
| | 12,200 | | Shenzhen Inovance Technology Co. Ltd. Class A (Machinery) | | | 100,511 | |
| | 4,450 | | Shenzhen Mindray Bio-Medical Electronics Co. Ltd. Class A (Health Care Equipment & Supplies) | | | 173,352 | |
| | 15,400 | | Sichuan Kelun Pharmaceutical Co. Ltd. Class A (Pharmaceuticals) | | | 57,652 | |
| | 38,750 | | Sinotruk Hong Kong Ltd. (Machinery) | | | 72,986 | |
| | 124,966 | | Tencent Holdings Ltd. (Interactive Media & Services) | | | 4,624,833 | |
| | 18,800 | | Tongwei Co. Ltd. Class A (Semiconductors & Semiconductor Equipment) | | | 69,991 | |
| | 21,050 | | Trip.com Group Ltd.* (Hotels, Restaurants & Leisure) | | | 717,418 | |
| | 24,900 | | Trip.com Group Ltd. ADR* (Hotels, Restaurants & Leisure) | | | 846,600 | |
| | 7,800 | | Tsingtao Brewery Co. Ltd. Class H (Beverages) | | | 59,152 | |
| | 3,363 | | Vipshop Holdings Ltd. ADR* (Broadline Retail) | | | 47,956 | |
| | 10,300 | | Wuliangye Yibin Co. Ltd. Class A (Beverages) | | | 218,833 | |
| | 43,400 | | WuXi AppTec Co. Ltd. Class A (Life Sciences Tools & Services) | | | 511,423 | |
| | 71,650 | | Xiaomi Corp. Class B*(a) (Technology Hardware, Storage & Peripherals) | | | 128,470 | |
| | 24,425 | | Yum China Holdings, Inc. (Hotels, Restaurants & Leisure) | | | 1,283,778 | |
| | 71,150 | | Zhongsheng Group Holdings Ltd. (Specialty Retail) | | | 164,306 | |
| | | |
| | |
| The accompanying notes are an integral part of these financial statements. | | 25 |
GOLDMAN SACHS MULTI-MANAGER GLOBAL EQUITY FUND
|
Schedule of Investments (continued) October 31, 2023 |
| | | | | | | | |
| | | Shares | | Description | | Value | |
| |
| | Common Stocks (continued) | |
| |
| | China (continued) | |
| | 32,400 | | ZTE Corp. Class A (Communications Equipment) | | $ | 115,459 | |
| | 2,169 | | ZTO Express Cayman, Inc. ADR (Air Freight & Logistics) | | | 51,123 | |
| | | | | | | | |
| | | | | | | 24,738,186 | |
| | | |
| |
| | Denmark – 0.8% | |
| | 9,061 | | ALK-Abello AS* (Pharmaceuticals) | | | 100,581 | |
| | 5,325 | | Bavarian Nordic AS* (Biotechnology) | | | 101,497 | |
| | 4,646 | | Carlsberg AS Class B (Beverages) | | | 553,678 | |
| | 5,330 | | DSV AS (Air Freight & Logistics) | | | 796,520 | |
| | 3,129 | | NKT AS* (Electrical Equipment) | | | 157,324 | |
| | 40,998 | | Novo Nordisk AS Class B (Pharmaceuticals) | | | 3,955,331 | |
| | 2,270 | | Royal Unibrew AS (Beverages) | | | 164,209 | |
| | 3,578 | | Sydbank AS (Banks) | | | 155,427 | |
| | | | | | | | |
| | | | | | | 5,984,567 | |
| | | |
| |
| | France – 3.7% | |
| | 17,833 | | Air Liquide SA (Chemicals) | | | 3,055,723 | |
| | 86,214 | | Alstom SA (Machinery) | | | 1,167,550 | |
| | 1,151 | | Alten SA (IT Services) | | | 135,965 | |
| | 1,024 | | Arkema SA (Chemicals) | | | 95,952 | |
| | 36,883 | | AXA SA (Insurance) | | | 1,092,859 | |
| | 7,524 | | BNP Paribas SA (Banks) | | | 432,660 | |
| | 9,335 | | Capgemini SE (IT Services) | | | 1,649,764 | |
| | 45,532 | | Carrefour SA (Consumer Staples Distribution & Retail) | | | 798,242 | |
| | 14,928 | | Cie de Saint-Gobain SA (Building Products) | | | 812,593 | |
| | 18,491 | | Cie Generale des Etablissements Michelin SCA (Automobile Components) | | | 549,339 | |
| | 28,516 | | Danone SA (Food Products) | | | 1,696,430 | |
| | 10,769 | | Dassault Systemes SE (Software) | | | 443,611 | |
| | 14,139 | | Elis SA (Commercial Services & Supplies) | | | 231,879 | |
| | 68,069 | | Engie SA (Multi-Utilities) | | | 1,082,630 | |
| | 6,734 | | EssilorLuxottica SA (Health Care Equipment & Supplies) | | | 1,219,416 | |
| | 12,168 | | Forvia SE* (Automobile Components) | | | 205,039 | |
| | 1,290 | | Gecina SA (Office REITs) | | | 126,666 | |
| | 2,646 | | Kering SA (Textiles, Apparel & Luxury Goods) | | | 1,076,132 | |
| | 7,630 | | Legrand SA (Electrical Equipment) | | | 660,044 | |
| | 2,380 | | L’Oreal SA (Personal Products) | | | 1,000,387 | |
| | 3,785 | | LVMH Moet Hennessy Louis Vuitton SE (Textiles, Apparel & Luxury Goods) | | | 2,709,796 | |
| | 1,693 | | Nexans SA (Electrical Equipment) | | | 119,931 | |
| | 6,308 | | Pernod Ricard SA (Beverages) | | | 1,120,152 | |
| | 9,862 | | Rexel SA (Trading Companies & Distributors) | | | 201,409 | |
| | | |
| | | | | | | | |
| | | Shares | | Description | | Value | |
| |
| | Common Stocks (continued) | |
| |
| | France (continued) | |
| | 4,950 | | Rubis SCA (Gas Utilities) | | $ | 107,774 | |
| | 13,930 | | Sanofi SA (Pharmaceuticals) | | | 1,264,931 | |
| | 17,226 | | Schneider Electric SE (Electrical Equipment) | | | 2,650,346 | |
| | 6,679 | | SCOR SE (Insurance) | | | 199,398 | |
| | 1,423 | | SOITEC* (Semiconductors & Semiconductor Equipment) | | | 212,395 | |
| | 1,002 | | Sopra Steria Group SACA (IT Services) | | | 179,895 | |
| | 7,552 | | SPIE SA (Commercial Services & Supplies) | | | 198,599 | |
| | 5,351 | | Technip Energies NV (Energy Equipment & Services) | | | 117,239 | |
| | 40,830 | | Valeo SE (Automobile Components) | | | 539,490 | |
| | 13,495 | | Vallourec SACA* (Energy Equipment & Services) | | | 162,080 | |
| | 3,647 | | Verallia SA(a) (Containers & Packaging) | | | 118,587 | |
| | 6,816 | | Vinci SA (Construction & Engineering) | | | 753,675 | |
| | | | | | | | |
| | | | | | | 28,188,578 | |
| | | |
| |
| | Germany – 1.9% | |
| | 5,147 | | Allianz SE (Insurance) | | | 1,205,646 | |
| | 34,631 | | Bayer AG (Pharmaceuticals) | | | 1,496,356 | |
| | 11,351 | | Beiersdorf AG (Personal Products) | | | 1,492,883 | |
| | 4,349 | | CompuGroup Medical SE & Co. KgaA (Health Care Technology) | | | 159,464 | |
| | 3,677 | | CTS Eventim AG & Co. KGaA (Entertainment) | | | 222,628 | |
| | 7,785 | | Deutsche Boerse AG (Capital Markets) | | | 1,281,384 | |
| | 77,233 | | Deutsche Telekom AG (Diversified Telecommunication Services) | | | 1,676,239 | |
| | 868 | | Gerresheimer AG (Life Sciences Tools & Services) | | | 80,961 | |
| | 23,549 | | LANXESS AG (Chemicals) | | | 539,615 | |
| | 7,344 | | Merck KGaA (Pharmaceuticals) | | | 1,109,226 | |
| | 2,110 | | MTU Aero Engines AG (Aerospace & Defense) | | | 396,589 | |
| | 26,458 | | RWE AG (Independent Power and Renewable Electricity Producers) | | | 1,012,426 | |
| | 25,389 | | SAP SE (Software) | | | 3,405,486 | |
| | 2,819 | | Scout24 SE(a) (Interactive Media & Services) | | | 173,425 | |
| | 1,258 | | Sixt SE (Ground Transportation) | | | 108,540 | |
| | 3,226 | | Stroeer SE & Co. KGaA (Media) | | | 147,597 | |
| | 18,739 | | TAG Immobilien AG* (Real Estate Management & Development) | | | 204,892 | |
| | | | | | | | |
| | | | | | | 14,713,357 | |
| | | |
| |
| | Greece – 0.1% | |
| | 84,000 | | Alpha Services & Holdings SA* (Banks) | | | 125,742 | |
| | | |
| | |
| 26 | | The accompanying notes are an integral part of these financial statements. |
GOLDMAN SACHS MULTI-MANAGER GLOBAL EQUITY FUND
| | | | | | | | |
| | | Shares | | Description | | Value | |
| |
| | Common Stocks (continued) | |
| |
| | Greece (continued) | |
| | 29,500 | | Eurobank Ergasias Services & Holdings SA Class A* (Banks) | | $ | 48,219 | |
| | 3,250 | | JUMBO SA (Specialty Retail) | | | 85,489 | |
| | 1,700 | | Mytilineos SA (Industrial Conglomerates) | | | 62,921 | |
| | 20,150 | | National Bank of Greece SA* (Banks) | | | 115,406 | |
| | 5,300 | | OPAP SA (Hotels, Restaurants & Leisure) | | | 89,773 | |
| | 29,050 | | Piraeus Financial Holdings SA* (Banks) | | | 86,108 | |
| | | | | | | | |
| | | | | | | 613,658 | |
| | | |
| |
| | Hong Kong – 0.4% | |
| | 168,100 | | AIA Group Ltd. (Insurance) | | | 1,459,747 | |
| | 60,650 | | China Gas Holdings Ltd. (Gas Utilities) | | | 54,525 | |
| | 78,500 | | Galaxy Entertainment Group Ltd. (Hotels, Restaurants & Leisure) | | | 441,285 | |
| | 75,000 | | Hang Lung Properties Ltd. (Real Estate Management & Development) | | | 98,584 | |
| | 61,549 | | Hopson Development Holdings Ltd.* (Real Estate Management & Development) | | | 36,039 | |
| | 242,250 | | Kunlun Energy Co. Ltd. (Gas Utilities) | | | 201,820 | |
| | 12,400 | | Man Wah Holdings Ltd. (Household Durables) | | | 7,701 | |
| | 1,028,650 | | Sino Biopharmaceutical Ltd. (Pharmaceuticals) | | | 399,609 | |
| | | | | | | | |
| | | | | | | 2,699,310 | |
| | | |
| |
| | Hungary – 0.0% | |
| | 3,450 | | OTP Bank Nyrt (Banks) | | | 128,409 | |
| | | |
| |
| | India – 2.0% | |
| | 3,400 | | ABB India Ltd. (Electrical Equipment) | | | 167,690 | |
| | 2,787 | | Apollo Hospitals Enterprise Ltd. (Health Care Providers & Services) | | | 161,376 | |
| | 89,134 | | Ashok Leyland Ltd. (Machinery) | | | 179,710 | |
| | 3,249 | | Asian Paints Ltd. (Chemicals) | | | 117,033 | |
| | 8,900 | | Aurobindo Pharma Ltd. (Pharmaceuticals) | | | 90,818 | |
| | 76,201 | | Axis Bank Ltd. (Banks) | | | 899,157 | |
| | 9,647 | | Bajaj Finance Ltd. (Consumer Finance) | | | 868,417 | |
| | 52,650 | | Bank of Baroda (Banks) | | | 124,144 | |
| | 216,491 | | Bharat Electronics Ltd. (Aerospace & Defense) | | | 346,838 | |
| | 3,400 | | BSE Ltd. (Capital Markets) | | | 76,109 | |
| | 16,650 | | Canara Bank (Banks) | | | 76,923 | |
| | 35,050 | | CG Power & Industrial Solutions Ltd. (Electrical Equipment) | | | 164,142 | |
| | | |
| | | | | | | | |
| | | Shares | | Description | | Value | |
| |
| | Common Stocks (continued) | |
| |
| | India (continued) | |
| | 115,600 | | Coal India Ltd. (Oil, Gas & Consumable Fuels) | | $ | 436,359 | |
| | 2,000 | | Cochin Shipyard Ltd.(a) (Machinery) | | | 22,848 | |
| | 8,000 | | Cummins India Ltd. (Machinery) | | | 161,139 | |
| | 12,616 | | DLF Ltd. (Real Estate Management & Development) | | | 85,466 | |
| | 3,100 | | Dr Reddy’s Laboratories Ltd. (Pharmaceuticals) | | | 200,088 | |
| | 3,500 | | Garden Reach Shipbuilders & Engineers Ltd. (Aerospace & Defense) | | | 31,226 | |
| | 57,301 | | HDFC Bank Ltd. (Banks) | | | 1,016,779 | |
| | 29,164 | | HDFC Life Insurance Co. Ltd.(a) (Insurance) | | | 216,650 | |
| | 7,200 | | Hindustan Aeronautics Ltd. (Aerospace & Defense) | | | 157,570 | |
| | 70,921 | | ICICI Bank Ltd. (Banks) | | | 780,259 | |
| | 45,990 | | ICICI Bank Ltd. ADR (Banks) | | | 1,020,518 | |
| | 121,700 | | IDFC First Bank Ltd.* (Banks) | | | 120,940 | |
| | 3,002 | | IndiaMart InterMesh Ltd.(a) (Trading Companies & Distributors) | | | 95,558 | |
| | 57,392 | | Indian Hotels Co. Ltd. (Hotels, Restaurants & Leisure) | | | 264,334 | |
| | 40,650 | | Indraprastha Gas Ltd. (Gas Utilities) | | | 186,728 | |
| | 14,200 | | KPIT Technologies Ltd. (Software) | | | 207,773 | |
| | 26,768 | | Larsen & Toubro Ltd. (Construction & Engineering) | | | 941,990 | |
| | 20,000 | | Max Healthcare Institute Ltd. (Health Care Providers & Services) | | | 137,823 | |
| | 6,350 | | Natco Pharma Ltd. (Pharmaceuticals) | | | 61,041 | |
| | 47,000 | | National Aluminium Co. Ltd. (Metals & Mining) | | | 52,041 | |
| | 158,800 | | Oil & Natural Gas Corp. Ltd. (Oil, Gas & Consumable Fuels) | | | 355,329 | |
| | 6,600 | | Oil India Ltd. (Oil, Gas & Consumable Fuels) | | | 23,718 | |
| | 700 | | Persistent Systems Ltd. (IT Services) | | | 51,848 | |
| | 5,650 | | PI Industries Ltd. (Chemicals) | | | 230,755 | |
| | 1,600 | | Polycab India Ltd. (Electrical Equipment) | | | 94,552 | |
| | 35,043 | | Power Finance Corp. Ltd. (Financial Services) | | | 103,780 | |
| | 95,300 | | Punjab National Bank (Banks) | | | 83,590 | |
| | 80,354 | | REC Ltd. (Financial Services) | | | 277,744 | |
| | 10,224 | | Reliance Industries Ltd. (Oil, Gas & Consumable Fuels) | | | 281,137 | |
| | 159,078 | | Samvardhana Motherson International Ltd. (Automobile Components) | | | 175,690 | |
| | 4,250 | | Shriram Finance Ltd. (Consumer Finance) | | | 95,902 | |
| | 10,800 | | State Bank of India (Banks) | | | 73,387 | |
| | 11,100 | | Sun TV Network Ltd. (Media) | | | 84,544 | |
| | 3,650 | | Supreme Industries Ltd. (Chemicals) | | | 189,788 | |
| | 4,900 | | Tanla Platforms Ltd. (Software) | | | 56,037 | |
| | | |
| | |
| The accompanying notes are an integral part of these financial statements. | | 27 |
GOLDMAN SACHS MULTI-MANAGER GLOBAL EQUITY FUND
|
Schedule of Investments (continued) October 31, 2023 |
| | | | | | | | |
| | | Shares | | Description | | Value | |
| |
| | | Common Stocks (continued) | |
| |
| | India (continued) | |
| | 6,000 | | Tata Communications Ltd. (Diversified Telecommunication Services) | | $ | 119,961 | |
| | 18,028 | | Tata Consultancy Services Ltd. (IT Services) | | | 729,838 | |
| | 62,550 | | Tata Motors Ltd. (Automobiles) | | | 472,441 | �� |
| | 173,790 | | Tata Steel Ltd. (Metals & Mining) | | | 247,996 | |
| | 7,191 | | Titan Co. Ltd. (Textiles, Apparel & Luxury Goods) | | | 275,672 | |
| | 17,271 | | TVS Motor Co. Ltd. (Automobiles) | | | 330,038 | |
| | 38,623 | | Varun Beverages Ltd. (Beverages) | | | 421,564 | |
| | 35,100 | | Vedanta Ltd. (Metals & Mining) | | | 91,342 | |
| | 69,700 | | Wipro Ltd. (IT Services) | | | 319,973 | |
| | 13,200 | | Zensar Technologies Ltd. (IT Services) | | | 77,723 | |
| | 437,345 | | Zomato Ltd.* (Hotels, Restaurants & Leisure) | | | 553,164 | |
| | | | | | | | |
| | | | | | | 15,287,000 | |
| | | |
| |
| | Indonesia – 0.2% | |
| | 467,750 | | Adaro Energy Indonesia Tbk. PT (Oil, Gas & Consumable Fuels) | | | 75,471 | |
| | 719,100 | | Bank Central Asia Tbk. PT (Banks) | | | 396,167 | |
| | 1,194,000 | | Bank Mandiri Persero Tbk. PT (Banks) | | | 426,559 | |
| | 2,112,300 | | Bank Rakyat Indonesia Persero Tbk. PT (Banks) | | | 660,482 | |
| | 451,850 | | Sumber Alfaria Trijaya Tbk. PT (Consumer Staples Distribution & Retail) | | | 82,206 | |
| | 67,400 | | United Tractors Tbk. PT (Oil, Gas & Consumable Fuels) | | | 106,661 | |
| | | | | | | | |
| | | | | | | 1,747,546 | |
| | | |
| |
| | Ireland – 2.8% | |
| | 18,865 | | Accenture PLC Class A (IT Services) | | | 5,604,603 | |
| | 19,165 | | Aon PLC Class A (Insurance) | | | 5,929,651 | |
| | 17,248 | | Bank of Ireland Group PLC (Banks) | | | 154,572 | |
| | 61,560 | | Experian PLC (Professional Services) | | | 1,867,656 | |
| | 4 | | Flutter Entertainment PLC Class DI* (Hotels, Restaurants & Leisure) | | | 628 | |
| | 6,810 | | ICON PLC ADR* (Life Sciences Tools & Services) | | | 1,661,367 | |
| | 7,841 | | Keywords Studios PLC (IT Services) | | | 124,507 | |
| | 5,298 | | Linde PLC (Chemicals) | | | 2,024,683 | |
| | 30,887 | | Medtronic PLC (Health Care Equipment & Supplies) | | | 2,179,387 | |
| | 18,863 | | Ryanair Holdings PLC ADR* (Passenger Airlines) | | | 1,654,285 | |
| | 2,311 | | Weatherford International PLC* (Energy Equipment & Services) | | | 215,131 | |
| | | | | | | | |
| | | | | | | 21,416,470 | |
| | | |
| | | | | | | | |
| | | Shares | | Description | | Value | |
| |
| | | Common Stocks (continued) | |
| |
| | Israel* – 0.1% | |
| | 4,758 | | Check Point Software Technologies Ltd. (Software) | | $ | 638,761 | |
| | 1,037 | | CyberArk Software Ltd. (Software) | | | 169,695 | |
| | 1,898 | | Nova Ltd. (Semiconductors & Semiconductor Equipment) | | | 180,253 | |
| | | | | | | | |
| | | | | | | 988,709 | |
| | | |
| |
| | Italy – 1.1% | |
| | 27,332 | | Banca Mediolanum SpA (Financial Services) | | | 223,181 | |
| | 17,489 | | BFF Bank SpA(a) (Financial Services) | | | 168,138 | |
| | 2,652 | | Brunello Cucinelli SpA (Textiles, Apparel & Luxury Goods) | | | 213,321 | |
| | 301,570 | | Enel SpA (Electric Utilities) | | | 1,914,240 | |
| | 63,763 | | Eni SpA (Oil, Gas & Consumable Fuels) | | | 1,042,376 | |
| | 5,511 | | Ferrari NV (Automobiles) | | | 1,668,201 | |
| | 355,994 | | Intesa Sanpaolo SpA (Banks) | | | 927,646 | |
| | 85,276 | | UniCredit SpA (Banks) | | | 2,137,836 | |
| | | | | | | | |
| | | | | | | 8,294,939 | |
| | | |
| |
| | Japan – 3.5% | |
| | 7,900 | | ABC-Mart, Inc. (Specialty Retail) | | | 122,363 | |
| | 9,600 | | ADEKA Corp. (Chemicals) | | | 160,495 | |
| | 26,000 | | Advantest Corp. (Semiconductors & Semiconductor Equipment) | | | 669,724 | |
| | 18,100 | | Air Water, Inc. (Chemicals) | | | 228,218 | |
| | 8,264 | | Allegro MicroSystems, Inc.* (Semiconductors & Semiconductor Equipment) | | | 214,533 | |
| | 26,000 | | Amada Co. Ltd. (Machinery) | | | 252,212 | |
| | 6,500 | | Amano Corp. (Electronic Equipment, Instruments & Components) | | | 132,771 | |
| | 8,400 | | Amvis Holdings, Inc. (Health Care Providers & Services) | | | 143,297 | |
| | 4,400 | | Anycolor, Inc.* (Entertainment) | | | 103,297 | |
| | 7,100 | | Asics Corp. (Textiles, Apparel & Luxury Goods) | | | 224,907 | |
| | 8,000 | | BIPROGY, Inc. (IT Services) | | | 199,538 | |
| | 8,000 | | Canon Marketing Japan, Inc. (Electronic Equipment, Instruments & Components) | | | 191,844 | |
| | 31,900 | | Chiba Bank Ltd. (Banks) | | | 237,608 | |
| | 37,100 | | Concordia Financial Group Ltd. (Banks) | | | 172,381 | |
| | 15,500 | | Credit Saison Co. Ltd. (Consumer Finance) | | | 232,342 | |
| | 6,800 | | Daikin Industries Ltd. (Building Products) | | | 980,416 | |
| | 1,600 | | Daito Trust Construction Co. Ltd. (Real Estate Management & Development) | | | 171,626 | |
| | 58,400 | | Denso Corp. (Automobile Components) | | | 862,354 | |
| | 12,800 | | DMG Mori Co. Ltd. (Machinery) | | | 211,712 | |
| | | |
| | |
| 28 | | The accompanying notes are an integral part of these financial statements. |
GOLDMAN SACHS MULTI-MANAGER GLOBAL EQUITY FUND
| | | | | | | | |
| | | Shares | | Description | | Value | |
| |
| | | Common Stocks (continued) | |
| |
| | Japan (continued) | |
| | 55,100 | | FANUC Corp. (Machinery) | | $ | 1,367,383 | |
| | 8,200 | | Ferrotec Holdings Corp. (Semiconductors & Semiconductor Equipment) | | | 144,133 | |
| | 3,100 | | Fuso Chemical Co. Ltd. (Chemicals) | | | 84,233 | |
| | 17,800 | | H2O Retailing Corp. (Consumer Staples Distribution & Retail) | | | 190,693 | |
| | 6,000 | | Hitachi Construction Machinery Co. Ltd. (Machinery) | | | 155,014 | |
| | 26,400 | | Hitachi Ltd. (Industrial Conglomerates) | | | 1,673,406 | |
| | 4,800 | | Hoya Corp. (Health Care Equipment & Supplies) | | | 462,089 | |
| | 10,100 | | Iino Kaiun Kaisha Ltd. (Marine Transportation) | | | 72,444 | |
| | 24,900 | | INFRONEER Holdings, Inc. (Construction & Engineering) | | | 262,667 | |
| | 11,400 | | Internet Initiative Japan, Inc. (Diversified Telecommunication Services) | | | 184,208 | |
| | 435 | | Invincible Investment Corp. (Hotel & Resort REITs) | | | 167,301 | |
| | 14,500 | | J Front Retailing Co. Ltd. (Broadline Retail) | | | 138,233 | |
| | 235 | | Japan Metropolitan Fund Invest (Retail REITs) | | | 151,657 | |
| | 11,700 | | Kajima Corp. (Construction & Engineering) | | | 193,370 | |
| | 9,900 | | Kamigumi Co. Ltd. (Transportation Infrastructure) | | | 200,837 | |
| | 168 | | Kenedix Office Investment Corp. (Office REITs) | | | 175,222 | |
| | 2,420 | | Keyence Corp. (Electronic Equipment, Instruments & Components) | | | 936,827 | |
| | 14,700 | | Koito Manufacturing Co. Ltd. (Automobile Components) | | | 220,246 | |
| | 2,000 | | Kokusai Electric Corp.* (Semiconductors & Semiconductor Equipment) | | | 32,591 | |
| | 10,800 | | KOMEDA Holdings Co. Ltd. (Hotels, Restaurants & Leisure) | | | 197,073 | |
| | 5,400 | | Kose Corp. (Personal Products) | | | 357,755 | |
| | 19,800 | | Kubota Corp. (Machinery) | | | 266,295 | |
| | 16,600 | | Kyocera Corp. (Electronic Equipment, Instruments & Components) | | | 818,237 | |
| | 8,300 | | MatsukiyoCocokara & Co. (Consumer Staples Distribution & Retail) | | | 145,597 | |
| | 8,300 | | Mazda Motor Corp. (Automobiles) | | | 80,228 | |
| | 68,800 | | Mebuki Financial Group, Inc. (Banks) | | | 208,272 | |
| | 51,200 | | Mitsubishi Electric Corp. (Electrical Equipment) | | | 587,085 | |
| | | |
| | | | | | | | |
| | | Shares | | Description | | Value | |
| |
| | | Common Stocks (continued) | |
| |
| | Japan (continued) | |
| | 64 | | Mitsui Fudosan Logistics Park, Inc. (Industrial REITs) | | $ | 193,487 | |
| | 7,900 | | Monogatari Corp. (Hotels, Restaurants & Leisure) | | | 213,936 | |
| | 93,300 | | Murata Manufacturing Co. Ltd. (Electronic Equipment, Instruments & Components) | | | 1,598,171 | |
| | 7,400 | | Nifco, Inc. (Automobile Components) | | | 173,546 | |
| | 5,800 | | NOF Corp. (Chemicals) | | | 228,815 | |
| | 4,200 | | OKUMA Corp. (Machinery) | | | 172,916 | |
| | 50,500 | | Olympus Corp. (Health Care Equipment & Supplies) | | | 674,445 | |
| | 101,300 | | Persol Holdings Co. Ltd. (Professional Services) | | | 151,891 | |
| | 12,200 | | Pola Orbis Holdings, Inc. (Personal Products) | | | 122,545 | |
| | 20,300 | | Rengo Co. Ltd. (Containers & Packaging) | | | 134,435 | |
| | 5,800 | | Rohto Pharmaceutical Co. Ltd. (Personal Products) | | | 135,322 | |
| | 3,300 | | Sankyo Co. Ltd. (Leisure Products) | | | 137,141 | |
| | 5,500 | | Sankyu, Inc. (Air Freight & Logistics) | | | 165,606 | |
| | 4,500 | | SCREEN Holdings Co. Ltd. (Semiconductors & Semiconductor Equipment) | | | 209,215 | |
| | 8,100 | | Sega Sammy Holdings, Inc. (Leisure Products) | | | 126,681 | |
| | 15,200 | | Seven & i Holdings Co. Ltd. (Consumer Staples Distribution & Retail) | | | 556,908 | |
| | 1,100 | | Shimamura Co. Ltd. (Specialty Retail) | | | 108,559 | |
| | 9,000 | | Shin Nippon Biomedical Laboratories Ltd. (Life Sciences Tools & Services) | | | 100,304 | |
| | 12,700 | | Shin-Etsu Chemical Co. Ltd. (Chemicals) | | | 379,773 | |
| | 2,000 | | SMC Corp. (Machinery) | | | 923,526 | |
| | 1,600 | | Socionext, Inc. (Semiconductors & Semiconductor Equipment) | | | 156,059 | |
| | 12,400 | | Sojitz Corp. (Trading Companies & Distributors) | | | 257,491 | |
| | 12,800 | | Sony Group Corp. (Household Durables) | | | 1,064,177 | |
| | 9,600 | | Sumitomo Mitsui Financial Group, Inc. (Banks) | | | 462,797 | |
| | 6,700 | | Sumitomo Osaka Cement Co. Ltd. (Construction Materials) | | | 155,967 | |
| | 6,100 | | Suzuken Co. Ltd. (Health Care Providers & Services) | | | 186,842 | |
| | 38,700 | | Takeda Pharmaceutical Co. Ltd. (Pharmaceuticals) | | | 1,050,501 | |
| | 22,500 | | Terumo Corp. (Health Care Equipment & Supplies) | | | 615,559 | |
| | 7,400 | | TIS, Inc. (IT Services) | | | 158,470 | |
| | | |
| | |
| The accompanying notes are an integral part of these financial statements. | | 29 |
GOLDMAN SACHS MULTI-MANAGER GLOBAL EQUITY FUND
|
Schedule of Investments (continued) October 31, 2023 |
| | | | | | | | |
| | | Shares | | Description | | Value | |
| |
| | | Common Stocks (continued) | |
| |
| | Japan (continued) | |
| | 29,900 | | Tokyu Fudosan Holdings Corp. (Real Estate Management & Development) | | $ | 174,207 | |
| | 6,100 | | Toyo Suisan Kaisha Ltd. (Food Products) | | | 281,399 | |
| | 6,000 | | Toyota Boshoku Corp. (Automobile Components) | | | 104,346 | |
| | 8,200 | | Yamazaki Baking Co. Ltd. (Food Products) | | | 173,386 | |
| | 4,600 | | Yokohama Rubber Co. Ltd. (Automobile Components) | | | 85,006 | |
| | 13,800 | | ZOZO, Inc. (Specialty Retail) | | | 262,404 | |
| | | | | | | | |
| | | | | | | 26,680,567 | |
| | | |
| |
| | Jordan – 0.0% | |
| | 7,883 | | Hikma Pharmaceuticals PLC (Pharmaceuticals) | | | 182,645 | |
| | | |
| |
| | Luxembourg – 0.0% | |
| | 2,769 | | Orion SA (Chemicals) | | | 56,211 | |
| | 4,185 | | Ternium SA ADR (Metals & Mining) | | | 156,895 | |
| | | | | | | | |
| | | | | | | 213,106 | |
| | | |
| |
| | Macau* – 0.0% | |
| | 126,800 | | MGM China Holdings Ltd. (Hotels, Restaurants & Leisure) | | | 157,813 | |
| | | |
| |
| | Malaysia – 0.0% | |
| | 161,600 | | CIMB Group Holdings Bhd. (Banks) | | | 193,613 | |
| | 217,750 | | YTL Power International Bhd. (Multi-Utilities) | | | 96,503 | |
| | | | | | | | |
| | | | | | | 290,116 | |
| | | |
| |
| | Mexico – 0.5% | |
| | 200,650 | | America Movil SAB de CV Series B (Wireless Telecommunication Services) | | | 165,715 | |
| | 61,000 | | Arca Continental SAB de CV (Beverages) | | | 547,000 | |
| | 33,000 | | Cemex SAB de CV ADR* (Construction Materials) | | | 197,010 | |
| | 20,250 | | Corp. Inmobiliaria Vesta SAB de CV (Real Estate Management & Development) | | | 63,494 | |
| | 5,020 | | Fomento Economico Mexicano SAB de CV ADR (Beverages) | | | 569,318 | |
| | 7,300 | | Gruma SAB de CV Class B (Food Products) | | | 127,030 | |
| | 1,738 | | Grupo Aeroportuario del Centro Norte SAB de CV ADR (Transportation Infrastructure) | | | 106,314 | |
| | 1,250 | | Grupo Aeroportuario del Sureste SAB de CV Class B (Transportation Infrastructure) | | | 26,939 | |
| | 89,950 | | Grupo Financiero Banorte SAB de CV Class O (Banks) | | | 730,017 | |
| | | |
| | | | | | | | |
| | | Shares | | Description | | Value | |
| |
| | | Common Stocks (continued) | |
| |
| | Mexico (continued) | |
| | 34,300 | | Grupo Financiero Inbursa SAB de CV Class O* (Banks) | | $ | 70,735 | |
| | 90,100 | | Grupo Mexico SAB de CV Series B (Metals & Mining) | | | 367,467 | |
| | 138,250 | | Kimberly-Clark de Mexico SAB de CV Class A (Household Products) | | | 253,434 | |
| | 69,100 | | Wal-Mart de Mexico SAB de CV (Consumer Staples Distribution & Retail) | | | 247,325 | |
| | | | | | | | |
| | | | | | | 3,471,798 | |
| | | |
| |
| | Netherlands – 1.5% | |
| | 4,566 | | Aalberts NV (Machinery) | | | 142,561 | |
| | 1,280 | | Adyen NV*(a) (Financial Services) | | | 863,342 | |
| | 27,357 | | Akzo Nobel NV (Chemicals) | | | 1,835,236 | |
| | 3,921 | | Arcadis NV (Professional Services) | | | 165,720 | |
| | 2,570 | | ASM International NV (Semiconductors & Semiconductor Equipment) | | | 1,060,588 | |
| | 4,000 | | ASML Holding NV (Semiconductors & Semiconductor Equipment) | | | 2,395,240 | |
| | 5,817 | | ASR Nederland NV (Insurance) | | | 217,081 | |
| | 6,412 | | Expro Group Holdings NV* (Energy Equipment & Services) | | | 100,989 | |
| | 163,330 | | ING Groep NV (Banks) | | | 2,093,976 | |
| | 68,924 | | Koninklijke Philips NV* (Health Care Equipment & Supplies) | | | 1,311,105 | |
| | 45,350 | | NEPI Rockcastle NV* (Real Estate Management & Development) | | | 244,933 | |
| | 15,120 | | QIAGEN NV* (Life Sciences Tools & Services) | | | 563,494 | |
| | 7,215 | | Randstad NV (Professional Services) | | | 373,627 | |
| | | | | | | | |
| | | | | | | 11,367,892 | |
| | | |
| |
| | Poland – 0.1% | |
| | 13,300 | | Bank Polska Kasa Opieki SA (Banks) | | | 404,149 | |
| | 864 | | Dino Polska SA*(a) (Consumer Staples Distribution & Retail) | | | 81,869 | |
| | 1,850 | | Santander Bank Polska SA* (Banks) | | | 200,923 | |
| | | | | | | | |
| | | | | | | 686,941 | |
| | | |
| |
| | Portugal – 0.1% | |
| | 41,501 | | Galp Energia SGPS SA (Oil, Gas & Consumable Fuels) | | | 624,788 | |
| | 164,056 | | Sonae SGPS SA (Consumer Staples Distribution & Retail) | | | 161,395 | |
| | | | | | | | |
| | | | | | | 786,183 | |
| | | |
| |
| | Qatar – 0.0% | |
| | 4,556 | | Barwa Real Estate Co. (Real Estate Management & Development) | | | 3,170 | |
| | 118,200 | | Dukhan Bank (Banks) | | | 117,792 | |
| | 150,450 | | Gulf International Services QSC (Energy Equipment & Services) | | | 113,456 | |
| | | |
| | |
| 30 | | The accompanying notes are an integral part of these financial statements. |
GOLDMAN SACHS MULTI-MANAGER GLOBAL EQUITY FUND
| | | | | | | | |
| | | Shares | | Description | | Value | |
| |
| | | Common Stocks (continued) | |
| |
| | Qatar (continued) | |
| | 39,850 | | Ooredoo QPSC (Diversified Telecommunication Services) | | $ | 108,244 | |
| | | | | | | | |
| | | | | | | 342,662 | |
| | | |
| |
| | Russia(b) – 0.0% | |
| | 61,284 | | Gazprom PJSC* (Oil, Gas & Consumable Fuels) | | | — | |
| | 5,200 | | LUKOIL PJSC ADR* (Oil, Gas & Consumable Fuels) | | | — | |
| | 2,390 | | Magnit PJSC (Consumer Staples Distribution & Retail) | | | — | |
| | 3,393 | | Novolipetsk Steel PJSC GDR* (Metals & Mining) | | | — | |
| | 36 | | PhosAgro PJSC* (Chemicals) | | | — | |
| | 5,614 | | PhosAgro PJSC GDR* (Chemicals) | | | — | |
| | 19,000 | | Surgutneftegas PJSC ADR* (Oil, Gas & Consumable Fuels) | | | — | |
| | 23,847 | | VTB Bank PJSC GDR* (Banks) | | | — | |
| | | | | | | | |
| | | | | | | — | |
| | | |
| |
| | Singapore – 0.3% | |
| | 102,700 | | CapitaLand Ascendas REIT (Industrial REITs) | | | 195,134 | |
| | 39,400 | | DBS Group Holdings Ltd. (Banks) | | | 946,519 | |
| | 56,500 | | Sembcorp Industries Ltd. (Multi-Utilities) | | | 189,552 | |
| | 30,700 | | United Overseas Bank Ltd. (Banks) | | | 605,548 | |
| | | | | | | | |
| | | | | | | 1,936,753 | |
| | | |
| |
| | South Africa – 0.1% | |
| | 9,050 | | Absa Group Ltd. (Banks) | | | 82,578 | |
| | 2,200 | | Bid Corp. Ltd. (Consumer Staples Distribution & Retail) | | | 46,672 | |
| | 56,242 | | FirstRand Ltd. (Financial Services) | | | 185,413 | |
| | 72,150 | | Impala Platinum Holdings Ltd. (Metals & Mining) | | | 300,547 | |
| | 15,015 | | Investec Ltd. (Capital Markets) | | | 82,150 | |
| | 19,300 | | Nedbank Group Ltd. (Banks) | | | 207,700 | |
| | 23,700 | | Truworths International Ltd. (Specialty Retail) | | | 96,008 | |
| | | | | | | | |
| | | | | | | 1,001,068 | |
| | | |
| |
| | South Korea – 1.9% | |
| | 11,298 | | BNK Financial Group, Inc. (Banks) | | | 56,865 | |
| | 2,750 | | Classys, Inc. (Health Care Equipment & Supplies) | | | 67,187 | |
| | 1,450 | | Cosmax, Inc.* (Personal Products) | | | 145,789 | |
| | 35,573 | | Coupang, Inc.* (Broadline Retail) | | | 604,741 | |
| | 400 | | DB Insurance Co. Ltd. (Insurance) | | | 26,024 | |
| | 9,956 | | Hana Financial Group, Inc. (Banks) | | | 289,488 | |
| | 1,614 | | Hanall Biopharma Co. Ltd.* (Pharmaceuticals) | | | 35,009 | |
| | 1,500 | | Hankook Tire & Technology Co. Ltd. (Automobile Components) | | | 42,557 | |
| | | |
| | | | | | | | |
| | | Shares | | Description | | Value | |
| |
| | | Common Stocks (continued) | |
| |
| | South Korea (continued) | |
| | 1,050 | | HD Hyundai Electric Co. Ltd. (Electrical Equipment) | | $ | 58,438 | |
| | 1,800 | | HPSP Co. Ltd. (Semiconductors & Semiconductor Equipment) | | | 41,753 | |
| | 1,353 | | HYBE Co. Ltd.* (Entertainment) | | | 220,354 | |
| | 950 | | Hyundai Autoever Corp. (IT Services) | | | 91,720 | |
| | 7,250 | | Hyundai Engineering & Construction Co. Ltd. (Construction & Engineering) | | | 179,806 | |
| | 307 | | Hyundai Mobis Co. Ltd. (Automobile Components) | | | 47,543 | |
| | 5,050 | | Hyundai Motor Co. (Automobiles) | | | 636,220 | |
| | 13,600 | | Hyundai Steel Co. (Metals & Mining) | | | 330,730 | |
| | 12,317 | | Industrial Bank of Korea (Banks) | | | 101,935 | |
| | 950 | | JYP Entertainment Corp. (Entertainment) | | | 72,314 | |
| | 16,762 | | KB Financial Group, Inc. (Banks) | | | 638,938 | |
| | 12,578 | | Kia Corp. (Automobiles) | | | 718,599 | |
| | 5,167 | | Korea Aerospace Industries Ltd. (Aerospace & Defense) | | | 170,018 | |
| | 2,950 | | Korea Investment Holdings Co. Ltd. (Capital Markets) | | | 110,282 | |
| | 650 | | Krafton, Inc.* (Entertainment) | | | 79,126 | |
| | 7,418 | | KT Corp. (Diversified Telecommunication Services) | | | 179,457 | |
| | 2,200 | | NAVER Corp. (Interactive Media & Services) | | | 307,567 | |
| | 330 | | NongShim Co. Ltd. (Food Products) | | | 108,535 | |
| | 1,250 | | OCI Holdings Co. Ltd. (Chemicals) | | | 90,315 | |
| | 400 | | Orion Corp. (Food Products) | | | 35,402 | |
| | 1,000 | | PharmaResearch Co. Ltd. (Biotechnology) | | | 86,345 | |
| | 491 | | Samsung Biologics Co. Ltd.*(a) (Life Sciences Tools & Services) | | | 258,122 | |
| | 68,456 | | Samsung Electronics Co. Ltd. (Technology Hardware, Storage & Peripherals) | | | 3,407,389 | |
| | 2,413 | | Samsung Electronics Co. Ltd. GDR (Technology Hardware, Storage & Peripherals) | | | 3,017,398 | |
| | 4,450 | | Samsung Engineering Co. Ltd.* (Construction & Engineering) | | | 78,430 | |
| | 1,377 | | Samsung SDI Co. Ltd. (Electronic Equipment, Instruments & Components) | | | 436,006 | |
| | 17,045 | | SK Hynix, Inc. (Semiconductors & Semiconductor Equipment) | | | 1,480,224 | |
| | 1 | | SK Innovation Co. Ltd.* (Oil, Gas & Consumable Fuels) | | | 91 | |
| | 10,550 | | SOLUM Co. Ltd.* (Electronic Equipment, Instruments & Components) | | | 226,668 | |
| | | |
| | |
| The accompanying notes are an integral part of these financial statements. | | 31 |
GOLDMAN SACHS MULTI-MANAGER GLOBAL EQUITY FUND
|
Schedule of Investments (continued) October 31, 2023 |
| | | | | | | | |
| | | Shares | | Description | | Value | |
| |
| | | Common Stocks (continued) | |
| |
| | South Korea (continued) | |
| | 36,505 | | Woori Financial Group, Inc. (Banks) | | $ | 322,440 | |
| | | | | | | | |
| | | | | | | 14,799,825 | |
| | | |
| |
| | Spain – 0.5% | |
| | 7,376 | | Aena SME SA(a) (Transportation Infrastructure) | | | 1,070,263 | |
| | 24,754 | | Amadeus IT Group SA (Hotels, Restaurants & Leisure) | | | 1,412,780 | |
| | 231,144 | | Banco de Sabadell SA (Banks) | | | 287,403 | |
| | 5,037 | | CIE Automotive SA (Automobile Components) | | | 128,428 | |
| | 65,747 | | Iberdrola SA (Electric Utilities) | | | 731,239 | |
| | | | | | | | |
| | | | | | | 3,630,113 | |
| | | |
| |
| | Sweden – 0.5% | |
| | 10,673 | | AAK AB (Food Products) | | | 202,973 | |
| | 10,221 | | Assa Abloy AB Class B (Building Products) | | | 217,861 | |
| | 47,010 | | Atlas Copco AB Class A (Machinery) | | | 608,733 | |
| | 10,010 | | Evolution AB(a) (Hotels, Restaurants & Leisure) | | | 891,945 | |
| | 6,284 | | Loomis AB (Commercial Services & Supplies) | | | 163,241 | |
| | 4,183 | | Saab AB Class B (Aerospace & Defense) | | | 214,887 | |
| | 1,264 | | Sandvik AB (Machinery) | | | 21,530 | |
| | 27,145 | | Securitas AB Class B (Commercial Services & Supplies) | | | 217,442 | |
| | 5,160 | | Spotify Technology SA* (Entertainment) | | | 850,162 | |
| | 9,516 | | Trelleborg AB Class B (Machinery) | | | 240,651 | |
| | | | | | | | |
| | | | | | | 3,629,425 | |
| | | |
| |
| | Switzerland – 2.4% | |
| | 1,276 | | BKW AG (Electric Utilities) | | | 214,506 | |
| | 14,926 | | Cie Financiere Richemont SA Class A (Textiles, Apparel & Luxury Goods) | | | 1,760,902 | |
| | 307 | | Comet Holding AG (Electronic Equipment, Instruments & Components) | | | 60,382 | |
| | 6,449 | | Julius Baer Group Ltd. (Capital Markets) | | | 382,179 | |
| | 57 | | Lonza Group AG (Life Sciences Tools & Services) | | | 19,962 | |
| | 31,541 | | Nestle SA (Food Products) | | | 3,401,341 | |
| | 24,196 | | Novartis AG (Pharmaceuticals) | | | 2,265,219 | |
| | 2,313 | | PSP Swiss Property AG (Real Estate Management & Development) | | | 284,590 | |
| | 14,194 | | Roche Holding AG (Pharmaceuticals) | | | 3,657,929 | |
| | 6,999 | | SIG Group AG (Containers & Packaging) | | | 154,305 | |
| | 5,017 | | Sika AG (Chemicals) | | | 1,200,615 | |
| | 2,268 | | Sonova Holding AG (Health Care Equipment & Supplies) | | | 537,546 | |
| | | |
| | | | | | | | |
| | | Shares | | Description | | Value | |
| |
| | | Common Stocks (continued) | |
| |
| | Switzerland (continued) | |
| | 549 | | Tecan Group AG (Life Sciences Tools & Services) | | $ | 158,002 | |
| | 73,522 | | UBS Group AG (Capital Markets) | | | 1,727,504 | |
| | 433 | | VAT Group AG(a) (Machinery) | | | 153,550 | |
| | 4,039 | | Zurich Insurance Group AG (Insurance) | | | 1,918,495 | |
| | | | | | | | |
| | | | | | | 17,897,027 | |
| | | |
| |
| | Taiwan – 1.7% | |
| | 45,750 | | Accton Technology Corp. (Communications Equipment) | | | 708,862 | |
| | 7,150 | | Alchip Technologies Ltd. (Semiconductors & Semiconductor Equipment) | | | 586,417 | |
| | 10,909 | | Asia Vital Components Co. Ltd. (Technology Hardware, Storage & Peripherals) | | | 96,394 | |
| | 780 | | ASPEED Technology, Inc. (Semiconductors & Semiconductor Equipment) | | | 62,336 | |
| | 11,550 | | Asustek Computer, Inc. (Technology Hardware, Storage & Peripherals) | | | 121,103 | |
| | 8,171 | | Bora Pharmaceuticals Co. Ltd. (Pharmaceuticals) | | | 163,669 | |
| | 28,500 | | Chailease Holding Co. Ltd. (Financial Services) | | | 154,600 | |
| | 175,450 | | China Airlines Ltd. (Passenger Airlines) | | | 105,175 | |
| | 879,550 | | China Development Financial Holding Corp.* (Insurance) | | | 307,454 | |
| | 68,000 | | Compal Electronics, Inc. (Technology Hardware, Storage & Peripherals) | | | 59,149 | |
| | 42,900 | | Delta Electronics, Inc. (Electronic Equipment, Instruments & Components) | | | 386,610 | |
| | 15,500 | | E Ink Holdings, Inc. (Electronic Equipment, Instruments & Components) | | | 80,648 | |
| | 11,000 | | Eclat Textile Co. Ltd. (Textiles, Apparel & Luxury Goods) | | | 175,079 | |
| | 6,650 | | Elite Material Co. Ltd. (Electronic Equipment, Instruments & Components) | | | 74,200 | |
| | 2,600 | | eMemory Technology, Inc. (Semiconductors & Semiconductor Equipment) | | | 162,894 | |
| | 111,450 | | Eva Airways Corp. (Passenger Airlines) | | | 94,511 | |
| | 37,700 | | Evergreen Marine Corp. Taiwan Ltd. (Marine Transportation) | | | 125,457 | |
| | 16,150 | | Fitipower Integrated Technology, Inc. (Semiconductors & Semiconductor Equipment) | | | 133,686 | |
| | | |
| | |
| 32 | | The accompanying notes are an integral part of these financial statements. |
GOLDMAN SACHS MULTI-MANAGER GLOBAL EQUITY FUND
| | | | | | | | |
| | | Shares | | Description | | Value | |
| |
| | Common Stocks (continued) | |
| |
| | Taiwan (continued) | |
| | 11,300 | | Gigabyte Technology Co. Ltd. (Technology Hardware, Storage & Peripherals) | | $ | 76,772 | |
| | 10,350 | | International Games System Co. Ltd. (Entertainment) | | | 199,495 | |
| | 2,850 | | King Slide Works Co. Ltd. (Technology Hardware, Storage & Peripherals) | | | 62,201 | |
| | 30,200 | | Lite-On Technology Corp. ADR (Technology Hardware, Storage & Peripherals) | | | 94,028 | |
| | 12,000 | | Makalot Industrial Co. Ltd. (Textiles, Apparel & Luxury Goods) | | | 134,309 | |
| | 19,400 | | MediaTek, Inc. (Semiconductors & Semiconductor Equipment) | | | 506,327 | |
| | 104,800 | | Nanya Technology Corp. (Semiconductors & Semiconductor Equipment) | | | 210,101 | |
| | 14,350 | | Novatek Microelectronics Corp. (Semiconductors & Semiconductor Equipment) | | | 202,092 | |
| | 123,150 | | Pou Chen Corp. (Textiles, Apparel & Luxury Goods) | | | 109,771 | |
| | 86,800 | | Quanta Computer, Inc. (Technology Hardware, Storage & Peripherals) | | | 512,494 | |
| | 24,638 | | Radiant Opto-Electronics Corp. (Semiconductors & Semiconductor Equipment) | | | 94,437 | |
| | 329,055 | | Taiwan Semiconductor Manufacturing Co. Ltd. (Semiconductors & Semiconductor Equipment) | | | 5,374,293 | |
| | 10,028 | | Taiwan Semiconductor Manufacturing Co. Ltd. ADR (Semiconductors & Semiconductor Equipment) | | | 865,517 | |
| | 20,950 | | Tripod Technology Corp. (Electronic Equipment, Instruments & Components) | | | 107,256 | |
| | 30,600 | | United Integrated Services Co. Ltd. (Construction & Engineering) | | | 227,185 | |
| | 199,000 | | United Microelectronics Corp. (Semiconductors & Semiconductor Equipment) | | | 286,185 | |
| | 5,194 | | Universal Vision Biotechnology Co. Ltd. (Health Care Providers & Services) | | | 47,730 | |
| | 19,700 | | Wistron Corp. (Technology Hardware, Storage & Peripherals) | | | 54,934 | |
| | 11,215 | | Wowprime Corp. (Hotels, Restaurants & Leisure) | | | 82,850 | |
| | 291,100 | | Yuanta Financial Holding Co. Ltd. (Financial Services) | | | 218,708 | |
| | | | | | | | |
| | | | | | | 13,064,929 | |
| | | |
| | | | | | | | |
| | | Shares | | Description | | Value | |
| |
| | Common Stocks (continued) | |
| |
| | Thailand – 0.4% | |
| | 82,700 | | Airports of Thailand PCL NVDR* (Transportation Infrastructure) | | $ | 153,542 | |
| | 115,200 | | Amata Corp. PCL (Real Estate Management & Development) | | | 76,296 | |
| | 22,900 | | Bangkok Bank PCL (Banks) | | | 100,350 | |
| | 551,800 | | Bangkok Dusit Medical Services PCL NVDR (Health Care Providers & Services) | | | 406,767 | |
| | 41,850 | | Bumrungrad Hospital PCL (Health Care Providers & Services) | | | 302,471 | |
| | 20,050 | | Central Pattana PCL (Real Estate Management & Development) | | | 34,880 | |
| | 102,400 | | Kasikornbank PCL (Banks) | | | 374,502 | |
| | 166,800 | | Krung Thai Bank PCL (Banks) | | | 87,214 | |
| | 107,550 | | PTT Exploration & Production PCL (Oil, Gas & Consumable Fuels) | | | 491,163 | |
| | 118,500 | | PTT Exploration & Production PCL NVDR (Oil, Gas & Consumable Fuels) | | | 541,169 | |
| | 61,500 | | SCB X PCL (Banks) | | | 168,618 | |
| | 2,371,150 | | TMBThanachart Bank PCL (Banks) | | | 110,150 | |
| | 1,247,700 | | WHA Corp. PCL (Real Estate Management & Development) | | | 173,723 | |
| | | | | | | | |
| | | | | | | 3,020,845 | |
| | | |
| |
| | Turkey – 0.0% | |
| | 9,650 | | BIM Birlesik Magazalar AS (Consumer Staples Distribution & Retail) | | | 92,686 | |
| | 8,658 | | Eldorado Gold Corp.* (Metals & Mining) | | | 93,593 | |
| | 3,950 | | Migros Ticaret AS (Consumer Staples Distribution & Retail) | | | 47,103 | |
| | 34,050 | | Sok Marketler Ticaret AS (Consumer Staples Distribution & Retail) | | | 71,976 | |
| | | | | | | | |
| | | | | | | 305,358 | |
| | | |
| |
| | United Arab Emirates – 0.2% | |
| | 29,772 | | Abu Dhabi Commercial Bank PJSC (Banks) | | | 65,088 | |
| | 55,915 | | Abu Dhabi Islamic Bank PJSC (Banks) | | | 156,800 | |
| | 68,100 | | Ajman Bank PJSC* (Banks) | | | 38,008 | |
| | 144,098 | | Americana Restaurants International PLC (Hotels, Restaurants & Leisure) | | | 145,157 | |
| | 405,200 | | Emaar Properties PJSC (Real Estate Management & Development) | | | 738,187 | |
| | 107,997 | | Emirates NBD Bank PJSC (Banks) | | | 498,380 | |
| | | | | | | | |
| | | | | | | 1,641,620 | |
| | | |
| |
| | United Kingdom – 5.3% | |
| | 3,310 | | 4imprint Group PLC (Media) | | | 202,576 | |
| | 6,859 | | Anglo American PLC (Metals & Mining) | | | 174,764 | |
| | 20,006 | | AstraZeneca PLC (Pharmaceuticals) | | | 2,504,823 | |
| | | |
| | |
| The accompanying notes are an integral part of these financial statements. | | 33 |
GOLDMAN SACHS MULTI-MANAGER GLOBAL EQUITY FUND
|
Schedule of Investments (continued) October 31, 2023 |
| | | | | | | | |
| | | Shares | | Description | | Value | |
| |
| | Common Stocks (continued) | |
| |
| | United Kingdom (continued) | |
| | 36,903 | | B&M European Value Retail SA (Broadline Retail) | | $ | 237,572 | |
| | 42,942 | | Balfour Beatty PLC (Construction & Engineering) | | | 161,383 | |
| | 1,055,653 | | Barclays PLC (Banks) | | | 1,694,371 | |
| | 30,783 | | Beazley PLC (Insurance) | | | 192,836 | |
| | 9,438 | | Berkeley Group Holdings PLC (Household Durables) | | | 463,940 | |
| | 324,845 | | BP PLC (Oil, Gas & Consumable Fuels) | | | 1,983,508 | |
| | 36,158 | | British American Tobacco PLC (Tobacco) | | | 1,080,126 | |
| | 122,558 | | Centrica PLC (Multi-Utilities) | | | 234,612 | |
| | 124,569 | | Compass Group PLC (Hotels, Restaurants & Leisure) | | | 3,140,554 | |
| | 6,061 | | Computacenter PLC (IT Services) | | | 189,573 | |
| | 80,337 | | ConvaTec Group PLC(a) (Health Care Equipment & Supplies) | | | 199,392 | |
| | 3,091 | | Cranswick PLC (Food Products) | | | 131,423 | |
| | 6,094 | | Derwent London PLC (Office REITs) | | | 135,433 | |
| | 63,875 | | Diageo PLC (Beverages) | | | 2,415,495 | |
| | 5,606 | | Diploma PLC (Trading Companies & Distributors) | | | 194,365 | |
| | 63,186 | | DS Smith PLC (Containers & Packaging) | | | 219,159 | |
| | 5,030 | | Endava PLC ADR* (IT Services) | | | 252,305 | |
| | 9,079 | | Entain PLC (Hotels, Restaurants & Leisure) | | | 103,068 | |
| | 17,233 | | Ferguson PLC (Trading Companies & Distributors) | | | 2,588,423 | |
| | 73,156 | | GSK PLC (Pharmaceuticals) | | | 1,304,135 | |
| | 11,510 | | IMI PLC (Machinery) | | | 205,558 | |
| | 598 | | Immunocore Holdings PLC ADR* (Biotechnology) | | | 26,551 | |
| | 10,043 | | Indivior PLC* (Pharmaceuticals) | | | 192,256 | |
| | 30,054 | | J Sainsbury PLC (Consumer Staples Distribution & Retail) | | | 94,034 | |
| | 126,020 | | JD Sports Fashion PLC (Specialty Retail) | | | 195,940 | |
| | 15,052 | | JET2 PLC (Passenger Airlines) | | | 183,947 | |
| | 110,624 | | Kingfisher PLC (Specialty Retail) | | | 282,480 | |
| | 212,624 | | Legal & General Group PLC (Insurance) | | | 547,826 | |
| | 9,523 | | London Stock Exchange Group PLC (Capital Markets) | | | 960,823 | |
| | 75,606 | | Man Group PLC (Capital Markets) | | | 202,143 | |
| | 201,425 | | NatWest Group PLC (Banks) | | | 438,264 | |
| | 2,804 | | Noble Corp. PLC (Energy Equipment & Services) | | | 130,919 | |
| | 226,317 | | Prudential PLC (Insurance) | | | 2,366,457 | |
| | 29,530 | | QinetiQ Group PLC (Aerospace & Defense) | | | 118,803 | |
| | 30,265 | | Reckitt Benckiser Group PLC (Household Products) RELX PLC | | | 2,024,938 | |
| | 71,820 | | (Professional Services) | | | 2,507,724 | |
| | | |
| | | | | | | | |
| | | Shares | | Description | | Value | |
| |
| | Common Stocks (continued) | |
| |
| | United Kingdom (continued) | |
| | 21,978 | | Rio Tinto PLC (Metals & Mining) | | $ | 1,402,206 | |
| | 1,429,170 | | Rolls-Royce Holdings PLC* (Aerospace & Defense) | | | 3,761,895 | |
| | 41,079 | | Rotork PLC (Machinery) | | | 146,895 | |
| | 13,316 | | Safestore Holdings PLC (Specialized REITs) | | | 110,809 | |
| | 33,560 | | Segro PLC (Industrial REITs) | | | 291,708 | |
| | 111,144 | | Serco Group PLC (Commercial Services & Supplies) | | | 193,179 | |
| | 53,115 | | Shell PLC (Oil, Gas & Consumable Fuels) | | | 1,735,141 | |
| | 190,170 | | Tesco PLC (Consumer Staples Distribution & Retail) | | | 624,054 | |
| | 112,759 | | Tritax Big Box REIT PLC (Industrial REITs) | | | 187,734 | |
| | 14,948 | | Unilever PLC (Personal Products) | | | 707,947 | |
| | 9,998 | | Weir Group PLC (Machinery) | | | 207,664 | |
| | 51,830 | | WH Smith PLC (Specialty Retail) | | | 730,762 | |
| | 4,651 | | Whitbread PLC (Hotels, Restaurants & Leisure) | | | 188,589 | |
| | | | | | | | |
| | | | | | | 40,571,082 | |
| | | |
| |
| | United States – 50.5% | |
| | 44,051 | | Abbott Laboratories (Health Care Equipment & Supplies) | | | 4,165,022 | |
| | 10,744 | | AbbVie, Inc. (Biotechnology) | | | 1,516,838 | |
| | 1,491 | | ABM Industries, Inc. (Commercial Services & Supplies) | | | 58,656 | |
| | 984 | | Acuity Brands, Inc. (Electrical Equipment) | | | 159,378 | |
| | 7,727 | | Adeia, Inc. (Software) | | | 65,139 | |
| | 2,463 | | Adobe, Inc.* (Software) | | | 1,310,464 | |
| | 5,296 | | Advanced Micro Devices, Inc.* (Semiconductors & Semiconductor Equipment) | | | 521,656 | |
| | 15,359 | | Affirm Holdings, Inc.* (Financial Services) | | | 270,472 | |
| | 5,740 | | Agree Realty Corp. (Retail REITs) | | | 321,096 | |
| | 2,895 | | Alamo Group, Inc. (Machinery) | | | 464,068 | |
| | 11,754 | | Alight, Inc. Class A* (Professional Services) | | | 78,047 | |
| | 2,086 | | Allegiant Travel Co. (Passenger Airlines) | | | 138,969 | |
| | 3,453 | | Allison Transmission Holdings, Inc. (Machinery) | | | 174,100 | |
| | 27,031 | | Allstate Corp. (Insurance) | | | 3,463,482 | |
| | 117,248 | | Alphabet, Inc. Class A* (Interactive Media & Services) | | | 14,548,132 | |
| | 113,359 | | Amazon.com, Inc.* (Broadline Retail) | | | 15,086,949 | |
| | 976 | | Amedisys, Inc.* (Health Care Providers & Services) | | | 89,294 | |
| | 96,947 | | American International Group, Inc. (Insurance) | | | 5,943,821 | |
| | 11,819 | | Ameris Bancorp (Banks) | | | 440,849 | |
| | 5,266 | | AMERISAFE, Inc. (Insurance) | | | 268,408 | |
| | | |
| | |
| 34 | | The accompanying notes are an integral part of these financial statements. |
GOLDMAN SACHS MULTI-MANAGER GLOBAL EQUITY FUND
| | | | | | | | |
| | | Shares | | Description | | Value | |
| |
| | Common Stocks (continued) | |
| |
| | United States (continued) | |
| | 1,331 | | AMN Healthcare Services, Inc.* (Health Care Providers & Services) | | $ | 100,970 | |
| | 20,570 | | Amphenol Corp. Class A (Electronic Equipment, Instruments & Components) | | | 1,656,913 | |
| | 3,475 | | Appfolio, Inc. Class A* (Software) | | | 651,806 | |
| | 44,303 | | Apple, Inc. (Technology Hardware, Storage & Peripherals) | | | 7,565,623 | |
| | 17,548 | | Arcutis Biotherapeutics, Inc.* (Biotechnology) | | | 39,483 | |
| | 13,071 | | Artivion, Inc.* (Health Care Equipment & Supplies) | | | 166,525 | |
| | 1,443 | | Ashland, Inc. (Chemicals) | | | 110,577 | |
| | 1,286 | | Atkore, Inc.* (Electrical Equipment) | | | 159,824 | |
| | 13,379 | | Atlassian Corp. Class A* (Software) | | | 2,416,783 | |
| | 8,900 | | AtriCure, Inc.* (Health Care Equipment & Supplies) | | | 308,296 | |
| | 52,067 | | Aurora Innovation, Inc.* (Software) | | | 91,117 | |
| | 2,930 | | Avantax, Inc.* (Capital Markets) | | | 75,623 | |
| | 15,696 | | Avient Corp. (Chemicals) | | | 496,308 | |
| | 5,239 | | Avnet, Inc. (Electronic Equipment, Instruments & Components) | | | 242,723 | |
| | 5,089 | | Azenta, Inc.* (Life Sciences Tools & Services) | | | 231,295 | |
| | 3,209 | | Balchem Corp. (Chemicals) | | | 373,014 | |
| | 135,184 | | Bank of America Corp. (Banks) | | | 3,560,747 | |
| | 1,699 | | Beacon Roofing Supply, Inc.* (Trading Companies & Distributors) | | | 120,918 | |
| | 14,491 | | Becton Dickinson & Co. (Health Care Equipment & Supplies) | | | 3,663,035 | |
| | 3,176 | | Belden, Inc. (Electronic Equipment, Instruments & Components) | | | 225,178 | |
| | 2,278 | | BellRing Brands, Inc.* (Personal Products) | | | 99,617 | |
| | 20,917 | | Berkshire Hathaway, Inc. Class B* (Financial Services) | | | 7,139,600 | |
| | 3,066 | | Berkshire Hills Bancorp, Inc. (Banks) | | | 60,124 | |
| | 34,526 | | BGC Group, Inc. Class A (Capital Markets) | | | 202,668 | |
| | 19,073 | | BioCryst Pharmaceuticals, Inc.* (Biotechnology) | | | 104,711 | |
| | 3,272 | | Bloomin’ Brands, Inc. (Hotels, Restaurants & Leisure) | | | 76,368 | |
| | 570 | | Booking Holdings, Inc.* (Hotels, Restaurants & Leisure) | | | 1,590,049 | |
| | 4,748 | | Boot Barn Holdings, Inc.* (Specialty Retail) | | | 329,986 | |
| | 41,108 | | BorgWarner, Inc. (Automobile Components) | | | 1,516,885 | |
| | 12,814 | | Bowlero Corp. Class A* (Hotels, Restaurants & Leisure) | | | 129,293 | |
| | 5,351 | | Brink’s Co. (Commercial Services & Supplies) | | | 357,768 | |
| | 2,837 | | Buckle, Inc. (Specialty Retail) | | | 95,805 | |
| | | |
| | | | | | | | |
| | | Shares | | Description | | Value | |
| |
| | Common Stocks (continued) | |
| |
| | United States (continued) | |
| | 4,851 | | Bumble, Inc. Class A* (Interactive Media & Services) | | $ | 65,197 | |
| | 1,665 | | Cactus, Inc. Class A (Energy Equipment & Services) | | | 78,155 | |
| | 7,928 | | Cadence Design Systems, Inc.* (Software) | | | 1,901,531 | |
| | 3,334 | | Caleres, Inc. (Specialty Retail) | | | 85,284 | |
| | 46,925 | | CarMax, Inc.* (Specialty Retail) | | | 2,866,648 | |
| | 12,991 | | Carrier Global Corp. (Building Products) | | | 619,151 | |
| | 2,964 | | Cars.com, Inc.* (Interactive Media & Services) | | | 45,142 | |
| | 5,996 | | Catalyst Pharmaceuticals, Inc.* (Biotechnology) | | | 74,410 | |
| | 11,218 | | Caterpillar, Inc. (Machinery) | | | 2,535,829 | |
| | 9,329 | | Cathay General Bancorp (Banks) | | | 316,346 | |
| | 8,800 | | CBIZ, Inc.* (Professional Services) | | | 457,248 | |
| | 13,696 | | Central Garden & Pet Co. Class A* (Household Products) | | | 543,594 | |
| | 16,294 | | ChampionX Corp. (Energy Equipment & Services) | | | 501,855 | |
| | 2,425 | | Chart Industries, Inc.* (Machinery) | | | 281,858 | |
| | 6,740 | | Chemed Corp. (Health Care Providers & Services) | | | 3,792,261 | |
| | 19,699 | | Chevron Corp. (Oil, Gas & Consumable Fuels) | | | 2,870,735 | |
| | 460 | | Chipotle Mexican Grill, Inc.* (Hotels, Restaurants & Leisure) | | | 893,412 | |
| | 6,947 | | Chuy’s Holdings, Inc.* (Hotels, Restaurants & Leisure) | | | 233,836 | |
| | 11,112 | | Cigna Group (Health Care Providers & Services) | | | 3,435,830 | |
| | 2,676 | | Clearfield, Inc.* (Communications Equipment) | | | 64,278 | |
| | 2,460 | | Cognizant Technology Solutions Corp. Class A (IT Services) | | | 158,596 | |
| | 7,127 | | Cohen & Steers, Inc. (Capital Markets) | | | 372,314 | |
| | 42,477 | | ConocoPhillips (Oil, Gas & Consumable Fuels) | | | 5,046,268 | |
| | 9,865 | | Constellium SE* (Metals & Mining) | | | 155,867 | |
| | 13,256 | | CoreCivic, Inc.* (Commercial Services & Supplies) | | | 168,351 | |
| | 4,514 | | Cousins Properties, Inc. (Office REITs) | | | 80,665 | |
| | 28,740 | | Crown Castle, Inc. (Specialized REITs) | | | 2,672,245 | |
| | 7,241 | | CryoPort, Inc.* (Life Sciences Tools & Services) | | | 70,238 | |
| | 2,136 | | Curtiss-Wright Corp. (Aerospace & Defense) | | | 424,658 | |
| | 19,130 | | Danaher Corp. (Life Sciences Tools & Services) | | | 3,673,343 | |
| | 2,479 | | Dave & Buster’s Entertainment, Inc.* (Hotels, Restaurants & Leisure) | | | 86,616 | |
| | | |
| | |
| The accompanying notes are an integral part of these financial statements. | | 35 |
GOLDMAN SACHS MULTI-MANAGER GLOBAL EQUITY FUND
|
Schedule of Investments (continued) October 31, 2023 |
| | | | | | | | |
| | | Shares | | Description | | Value | |
| |
| | Common Stocks (continued) | |
| |
| | United States (continued) | |
| | 5,622 | | Deere & Co. (Machinery) | | $ | 2,054,054 | |
| | 35,480 | | Dexcom, Inc.* (Health Care Equipment & Supplies) | | | 3,151,688 | |
| | 6,266 | | Diamondback Energy, Inc. (Oil, Gas & Consumable Fuels) | | | 1,004,565 | |
| | 2,968 | | Dime Community Bancshares, Inc. (Banks) | | | 54,582 | |
| | 4,657 | | Dollar General Corp. (Consumer Staples Distribution & Retail) | | | 554,369 | |
| | 31,590 | | Dominion Energy, Inc. (Multi-Utilities) | | | 1,273,709 | |
| | 3,600 | | Ducommun, Inc.* (Aerospace & Defense) | | | 172,224 | |
| | 17,618 | | Dynatrace, Inc.* (Software) | | | 787,701 | |
| | 15,416 | | Ecovyst, Inc.* (Chemicals) | | | 141,827 | |
| | 4,327 | | Eli Lilly & Co. (Pharmaceuticals) | | | 2,396,855 | |
| | 2,084 | | Employers Holdings, Inc. (Insurance) | | | 79,192 | |
| | 1,473 | | EnerSys (Electrical Equipment) | | | 126,059 | |
| | 12,028 | | Entravision Communications Corp. Class A (Media) | | | 43,060 | |
| | 2,370 | | EPAM Systems, Inc.* (IT Services) | | | 515,641 | |
| | 4,456 | | Essent Group Ltd. (Financial Services) | | | 210,501 | |
| | 20,225 | | Estee Lauder Cos., Inc. Class A (Personal Products) | | | 2,606,396 | |
| | 2,121 | | Evercore, Inc. Class A (Capital Markets) | | | 276,112 | |
| | 15,021 | | Extra Space Storage, Inc. (Specialized REITs) | | | 1,556,025 | |
| | 7,938 | | Extreme Networks, Inc.* (Communications Equipment) | | | 163,682 | |
| | 830 | | Fair Isaac Corp.* (Software) | | | 702,072 | |
| | 2,204 | | Federal Agricultural Mortgage Corp. Class C (Financial Services) | | | 327,426 | |
| | 4,339 | | First Merchants Corp. (Banks) | | | 118,498 | |
| | 4,308 | | First Watch Restaurant Group, Inc.* (Hotels, Restaurants & Leisure) | | | 71,987 | |
| | 2,286 | | FirstCash Holdings, Inc. (Consumer Finance) | | | 248,991 | |
| | 27,804 | | Fiserv, Inc.* (Financial Services) | | | 3,162,705 | |
| | 21,992 | | Flywire Corp.* (Financial Services) | | | 591,365 | |
| | 4,048 | | Foot Locker, Inc. (Specialty Retail) | | | 84,968 | |
| | 3,340 | | Fortrea Holdings, Inc.* (Life Sciences Tools & Services) | | | 94,856 | |
| | 3,740 | | Fox Factory Holding Corp.* (Automobile Components) | | | 304,698 | |
| | 56,578 | | Freeport-McMoRan, Inc. (Metals & Mining) | | | 1,911,205 | |
| | 5,842 | | Fresh Del Monte Produce, Inc. (Food Products) | | | 146,050 | |
| | 3,858 | | Frontdoor, Inc.* (Diversified Consumer Services) | | | 111,612 | |
| | 1,206 | | FTI Consulting, Inc.* (Professional Services) | | | 255,986 | |
| | 88,593 | | General Motors Co. (Automobiles) | | | 2,498,323 | |
| | | |
| | | | | | | | |
| | | Shares | | Description | | Value | |
| |
| | Common Stocks (continued) | |
| |
| | United States (continued) | |
| | 7,472 | | Glacier Bancorp, Inc. (Banks) | | $ | 225,580 | |
| | 11,520 | | Global Payments, Inc. (Financial Services) | | | 1,223,654 | |
| | 8,404 | | Globus Medical, Inc. Class A* (Health Care Equipment & Supplies) | | | 384,147 | |
| | 5,092 | | Grand Canyon Education, Inc.* (Diversified Consumer Services) | | | 602,536 | |
| | 2,979 | | Granite Construction, Inc. (Construction & Engineering) | | | 120,590 | |
| | 308 | | Group 1 Automotive, Inc. (Specialty Retail) | | | 77,718 | |
| | 3,176 | | Hackett Group, Inc. (IT Services) | | | 70,793 | |
| | 3,197 | | Haemonetics Corp.* (Health Care Equipment & Supplies) | | | 272,480 | |
| | 11,799 | | Halozyme Therapeutics, Inc.* (Biotechnology) | | | 399,632 | |
| | 2,925 | | Hancock Whitney Corp. (Banks) | | | 100,708 | |
| | 22,536 | | Hartford Financial Services Group, Inc. (Insurance) | | | 1,655,269 | |
| | 12,004 | | HCA Healthcare, Inc. (Health Care Providers & Services) | | | 2,714,585 | |
| | 7,885 | | HealthEquity, Inc.* (Health Care Providers & Services) | | | 565,197 | |
| | 8,570 | | Heartland Express, Inc. (Ground Transportation) | | | 99,926 | |
| | 2,263 | | Helen of Troy Ltd.* (Household Durables) | | | 222,498 | |
| | 2,962 | | Herbalife Ltd.* (Personal Products) | | | 42,209 | |
| | 5,661 | | Heritage Commerce Corp. (Banks) | | | 46,307 | |
| | 28,000 | | Hess Corp. (Oil, Gas & Consumable Fuels) | | | 4,043,200 | |
| | 8,676 | | Home Depot, Inc. (Specialty Retail) | | | 2,469,970 | |
| | 9,519 | | Honeywell International, Inc. (Industrial Conglomerates) | | | 1,744,452 | |
| | 7,564 | | Hope Bancorp, Inc. (Banks) | | | 66,261 | |
| | 12,939 | | Horace Mann Educators Corp. (Insurance) | | | 410,554 | |
| | 4,571 | | Hostess Brands, Inc. * (Food Products) | | | 152,671 | |
| | 5,765 | | Houlihan Lokey, Inc. (Capital Markets) | | | 579,498 | |
| | 1,931 | | Hub Group, Inc. Class A* (Air Freight & Logistics) | | | 132,756 | |
| | 7,550 | | Humana, Inc. (Health Care Providers & Services) | | | 3,953,859 | |
| | 3,706 | | ICF International, Inc. (Professional Services) | | | 469,661 | |
| | 1,685 | | ICU Medical, Inc.* (Health Care Equipment & Supplies) | | | 165,231 | |
| | 3,650 | | IDACORP, Inc. (Electric Utilities) | | | 345,691 | |
| | 5,202 | | Independent Bank Corp. (Banks) | | | 253,858 | |
| | 22,227 | | Ingersoll Rand, Inc. (Machinery) | | | 1,348,734 | |
| | 2,364 | | Ingevity Corp.* (Chemicals) | | | 95,222 | |
| | 3,177 | | Inmode Ltd.* (Health Care Equipment & Supplies) | | | 60,681 | |
| | | |
| | |
| 36 | | The accompanying notes are an integral part of these financial statements. |
GOLDMAN SACHS MULTI-MANAGER GLOBAL EQUITY FUND
| | | | | | | | |
| | | Shares | | Description | | Value | |
| |
| | Common Stocks (continued) | |
| |
| | United States (continued) | |
| | 2,308 | | Insight Enterprises, Inc.* (Electronic Equipment, Instruments & Components) | | $ | 330,736 | |
| | 9,127 | | Insmed, Inc.* (Biotechnology) | | | 228,723 | |
| | 4,800 | | Intapp, Inc.* (Software) | | | 164,160 | |
| | 6,716 | | Integra LifeSciences Holdings Corp.* (Health Care Equipment & Supplies) | | | 241,507 | |
| | 60,295 | | Intercontinental Exchange, Inc. (Capital Markets) | | | 6,478,095 | |
| | 3,165 | | InterDigital, Inc. (Software) | | | 238,166 | |
| | 4,728 | | International Game Technology PLC (Hotels, Restaurants & Leisure) | | | 120,186 | |
| | 7,322 | | Intra-Cellular Therapies, Inc.* (Pharmaceuticals) | | | 364,343 | |
| | 7,886 | | Intuit, Inc. (Software) | | | 3,903,176 | |
| | 7,819 | | Intuitive Surgical, Inc.* (Health Care Equipment & Supplies) | | | 2,050,298 | |
| | 4,385 | | ITT, Inc. (Machinery) | | | 409,340 | |
| | 15,291 | | Janus International Group, Inc.* (Building Products) | | | 143,124 | |
| | 20,740 | | Johnson & Johnson (Pharmaceuticals) | | | 3,076,572 | |
| | 19,350 | | JPMorgan Chase & Co. (Banks) | | | 2,690,811 | |
| | 5,052 | | Kennedy-Wilson Holdings, Inc. (Real Estate Management & Development) | | | 65,019 | |
| | 56,847 | | KKR & Co., Inc. (Capital Markets) | | | 3,149,324 | |
| | 627,210 | | Kosmos Energy Ltd.* (Oil, Gas & Consumable Fuels) | | | 4,541,000 | |
| | 11,615 | | L3Harris Technologies, Inc. (Aerospace & Defense) | | | 2,083,847 | |
| | 9,630 | | Laboratory Corp. of America Holdings (Health Care Providers & Services) | | | 1,923,400 | |
| | 2,333 | | Lantheus Holdings, Inc.* (Health Care Equipment & Supplies) | | | 150,712 | |
| | 23,269 | | Laureate Education, Inc. (Diversified Consumer Services) | | | 329,024 | |
| | 2,176 | | LCI Industries (Automobile Components) | | | 236,074 | |
| | 13,392 | | Lear Corp. (Automobile Components) | | | 1,737,746 | |
| | 13,313 | | Legalzoom.com, Inc.* (Professional Services) | | | 132,731 | |
| | 11,033 | | Leonardo DRS, Inc.* (Aerospace & Defense) | | | 210,399 | |
| | 1,675 | | Lithia Motors, Inc. (Specialty Retail) | | | 405,702 | |
| | 6,773 | | MACOM Technology Solutions Holdings, Inc.* (Semiconductors & Semiconductor Equipment) | | | 477,767 | |
| | 23,986 | | Magnolia Oil & Gas Corp. Class A (Oil, Gas & Consumable Fuels) | | | 538,486 | |
| | 6,641 | | Marsh & McLennan Cos., Inc. (Insurance) | | | 1,259,466 | |
| | 3,486 | | Martin Marietta Materials, Inc. (Construction Materials) | | | 1,425,565 | |
| | 1,190 | | Masonite International Corp.* (Building Products) | | | 94,177 | |
| | | |
| | | | | | | | |
| | | Shares | | Description | | Value | |
| |
| | Common Stocks (continued) | |
| |
| | United States (continued) | |
| | 8,780 | | Mastercard, Inc. Class A (Financial Services) | | $ | 3,304,353 | |
| | 12,400 | | Matador Resources Co. (Oil, Gas & Consumable Fuels) | | | 764,956 | |
| | 2,129 | | Medpace Holdings, Inc.* (Life Sciences Tools & Services) | | | 516,644 | |
| | 14,500 | | Meta Platforms, Inc. Class A* (Interactive Media & Services) | | | 4,368,415 | |
| | 570 | | Mettler-Toledo International, Inc.* (Life Sciences Tools & Services) | | | 561,564 | |
| | 68,307 | | Microsoft Corp. (Software) | | | 23,095,280 | |
| | 6,902 | | Minerals Technologies, Inc. (Chemicals) | | | 373,122 | |
| | 767 | | MongoDB, Inc.* (IT Services) | | | 264,301 | |
| | 11,110 | | Monolithic Power Systems, Inc. (Semiconductors & Semiconductor Equipment) | | | 4,907,731 | |
| | 23,337 | | Monster Beverage Corp.* (Beverages) | | | 1,192,521 | |
| | 38,626 | | Nasdaq, Inc. (Capital Markets) | | | 1,915,850 | |
| | 7,910 | | National Energy Services Reunited Corp.* (Energy Equipment & Services) | | | 44,691 | |
| | 4,840 | | National Health Investors, Inc. (Health Care REITs) | | | 242,194 | |
| | 2,741 | | NCR Atleos Corp.* (Financial Services) | | | 60,466 | |
| | 5,622 | | NCR Voyix Corp.* (Software) | | | 85,960 | |
| | 1,158 | | Nelnet, Inc. Class A (Consumer Finance) | | | 98,210 | |
| | 3,263 | | Netflix, Inc.* (Entertainment) | | | 1,343,344 | |
| | 1,538 | | Nexstar Media Group, Inc. (Media) | | | 215,443 | |
| | 55,260 | | NextEra Energy, Inc. (Electric Utilities) | | | 3,221,658 | |
| | 8,406 | | Northwestern Energy Group, Inc. (Multi-Utilities) | | | 403,572 | |
| | 3,992 | | Novanta, Inc.* (Electronic Equipment, Instruments & Components) | | | 527,184 | |
| | 6,733 | | NOW, Inc.* (Trading Companies & Distributors) | | | 74,198 | |
| | 23,188 | | NVIDIA Corp. (Semiconductors & Semiconductor Equipment) | | | 9,456,066 | |
| | 535 | | NVR, Inc.* (Household Durables) | | | 2,895,752 | |
| | 29,134 | | OceanFirst Financial Corp. (Banks) | | | 368,836 | |
| | 9,283 | | Old National Bancorp (Banks) | | | 127,177 | |
| | 6,445 | | O’Reilly Automotive, Inc.* (Specialty Retail) | | | 5,996,686 | |
| | 1,321 | | OSI Systems, Inc.* (Electronic Equipment, Instruments & Components) | | | 137,741 | |
| | 4,354 | | Oxford Industries, Inc. (Textiles, Apparel & Luxury Goods) | | | 367,478 | |
| | 15,582 | | Pacific Premier Bancorp, Inc. (Banks) | | | 296,058 | |
| | | |
| | |
| The accompanying notes are an integral part of these financial statements. | | 37 |
GOLDMAN SACHS MULTI-MANAGER GLOBAL EQUITY FUND
|
Schedule of Investments (continued) October 31, 2023 |
| | | | | | | | |
| | | Shares | | Description | | Value | |
| |
| | Common Stocks (continued) | |
| |
| | United States (continued) | |
| | 5,107 | | Par Pacific Holdings, Inc.* (Oil, Gas & Consumable Fuels) | | $ | 167,612 | |
| | 6,712 | | Parker-Hannifin Corp. (Machinery) | | | 2,476,124 | |
| | 3,711 | | Patrick Industries, Inc. (Automobile Components) | | | 278,882 | |
| | 20,807 | | Patterson-UTI Energy, Inc. (Energy Equipment & Services) | | | 264,249 | |
| | 17,553 | | Paycor HCM, Inc.* (Professional Services) | | | 378,794 | |
| | 3,602 | | Paylocity Holding Corp.* (Professional Services) | | | 646,199 | |
| | 3,684 | | Peapack-Gladstone Financial Corp. (Banks) | | | 86,095 | |
| | 44,255 | | Peloton Interactive, Inc. Class A* (Leisure Products) | | | 210,654 | |
| | 1,669 | | Penumbra, Inc.* (Health Care Equipment & Supplies) | | | 319,029 | |
| | 23,305 | | PepsiCo, Inc. (Beverages) | | | 3,805,240 | |
| | 6,676 | | PetIQ, Inc. * (Health Care Providers & Services) | | | 125,309 | |
| | 52,153 | | Pfizer, Inc. (Pharmaceuticals) | | | 1,593,796 | |
| | 2,983 | | PGT Innovations, Inc.* (Building Products) | | | 89,311 | |
| | 16,416 | | Phreesia, Inc.* (Health Care Technology) | | | 224,243 | |
| | 1,126 | | Portland General Electric Co. (Electric Utilities) | | | 45,063 | |
| | 2,012 | | Preferred Bank (Banks) | | | 119,855 | |
| | 19,803 | | Primoris Services Corp. (Construction & Engineering) | | | 595,278 | |
| | 8,410 | | Progyny, Inc.* (Health Care Providers & Services) | | | 259,533 | |
| | 24,295 | | Prologis, Inc. (Industrial REITs) | | | 2,447,721 | |
| | 9,371 | | ProPetro Holding Corp.* (Energy Equipment & Services) | | | 98,208 | |
| | 555 | | QuidelOrtho Corp.* (Health Care Equipment & Supplies) | | | 33,899 | |
| | 5,170 | | Rapid7, Inc.* (Software) | | | 240,353 | |
| | 2,550 | | RBC Bearings, Inc.* (Machinery) | | | 560,592 | |
| | 11,320 | | Redwood Trust, Inc. (Mortgage Real Estate Investment Trusts (REITs)) | | | 71,090 | |
| | 15,361 | | Regal Rexnord Corp. (Electrical Equipment) | | | 1,818,896 | |
| | 6,931 | | Revolve Group, Inc.* (Specialty Retail) | | | 95,301 | |
| | 24,814 | | Rivian Automotive, Inc. Class A* (Automobiles) | | | 402,483 | |
| | 12,860 | | Ross Stores, Inc. (Specialty Retail) | | | 1,491,374 | |
| | 5,557 | | Ryman Hospitality Properties, Inc. (Hotel & Resort REITs) | | | 475,679 | |
| | 2,713 | | S&T Bancorp, Inc. (Banks) | | | 69,887 | |
| | 15,925 | | Saia, Inc.* (Ground Transportation) | | | 5,708,953 | |
| | 33,923 | | Salesforce, Inc.* (Software) | | | 6,812,756 | |
| | 8,718 | | SBA Communications Corp. (Specialized REITs) | | | 1,818,836 | |
| | | |
| | | | | | | | |
| | | Shares | | Description | | Value | |
| |
| | Common Stocks (continued) | |
| |
| | United States (continued) | |
| | 14,781 | | Schlumberger NV (Energy Equipment & Services) | | $ | 822,710 | |
| | 3,408 | | Science Applications International Corp. (Professional Services) | | | 372,290 | |
| | 15,102 | | Seacoast Banking Corp. of Florida (Banks) | | | 305,211 | |
| | 10,310 | | Select Water Solutions, Inc. (Energy Equipment & Services) | | | 76,706 | |
| | 4,242 | | ServiceNow, Inc.* (Software) | | | 2,468,208 | |
| | 23,135 | | Sherwin-Williams Co. (Chemicals) | | | 5,510,988 | |
| | 18,811 | | Shoals Technologies Group, Inc. Class A* (Electrical Equipment) | | | 288,937 | |
| | 11,830 | | Silgan Holdings, Inc. (Containers & Packaging) | | | 473,910 | |
| | 2,913 | | Silicon Laboratories, Inc.* (Semiconductors & Semiconductor Equipment) | | | 268,520 | |
| | 7,041 | | Skyline Champion Corp.* (Household Durables) | | | 412,814 | |
| | 30,350 | | SLM Corp. (Consumer Finance) | | | 394,550 | |
| | 35,342 | | Snap, Inc. Class A* (Interactive Media & Services) | | | 353,773 | |
| | 1,758 | | SouthState Corp. (Banks) | | | 116,204 | |
| | 2,970 | | Spirit Realty Capital, Inc. (Retail REITs) | | | 106,890 | |
| | 8,301 | | SPX Technologies, Inc.* (Machinery) | | | 665,076 | |
| | 47,684 | | SS&C Technologies Holdings, Inc. (Professional Services) | | | 2,396,121 | |
| | 7,758 | | SSR Mining, Inc. (Metals & Mining) | | | 107,356 | |
| | 17,676 | | STAG Industrial, Inc. (Industrial REITs) | | | 587,197 | |
| | 4,820 | | STERIS PLC (Health Care Equipment & Supplies) | | | 1,012,104 | |
| | 9,833 | | Sterling Check Corp.* (Professional Services) | | | 109,933 | |
| | 7,683 | | Steven Madden Ltd. (Textiles, Apparel & Luxury Goods) | | | 251,926 | |
| | 7,792 | | Stifel Financial Corp. (Capital Markets) | | | 444,144 | |
| | 1,235 | | StoneX Group, Inc.* (Capital Markets) | | | 117,720 | |
| | 4,034 | | Stride, Inc.* (Diversified Consumer Services) | | | 221,789 | |
| | 15,699 | | Stryker Corp. (Health Care Equipment & Supplies) | | | 4,242,184 | |
| | 13,366 | | Supernus Pharmaceuticals, Inc.* (Pharmaceuticals) | | | 318,779 | |
| | 19,347 | | Target Corp. (Consumer Staples Distribution & Retail) | | | 2,143,454 | |
| | 15,801 | | TEGNA, Inc. (Media) | | | 229,273 | |
| | 2,469 | | Tempur Sealy International, Inc. (Household Durables) | | | 98,587 | |
| | 8,619 | | Terex Corp. (Machinery) | | | 394,750 | |
| | | |
| | |
| 38 | | The accompanying notes are an integral part of these financial statements. |
GOLDMAN SACHS MULTI-MANAGER GLOBAL EQUITY FUND
| | | | | | | | |
| | | Shares | | Description | | Value | |
| | |
| | Common Stocks (continued) | | | | |
| |
| | United States (continued) | |
| | 19,858 | | Texas Instruments, Inc. (Semiconductors & Semiconductor Equipment) | | $ | 2,820,035 | |
| | | 7,079 | | Texas Roadhouse, Inc. (Hotels, Restaurants & Leisure) | | | 718,802 | |
| | 877 | | Thor Industries, Inc. (Automobiles) | | | 77,115 | |
| | 1,180 | | Tidewater, Inc.* (Energy Equipment & Services) | | | 80,653 | |
| | 7,013 | | T-Mobile U.S., Inc.* (Wireless Telecommunication Services) | | | 1,008,890 | |
| | 8,543 | | Topgolf Callaway Brands Corp.* (Leisure Products) | | | 104,395 | |
| | 2,346 | | Trade Desk, Inc. Class A* (Media) | | | 166,472 | |
| | 10,166 | | Tradeweb Markets, Inc. Class A (Capital Markets) | | | 915,042 | |
| | 67,279 | | Truist Financial Corp. (Banks) | | | 1,908,032 | |
| | 3,525 | | U.S. Physical Therapy, Inc. (Health Care Providers & Services) | | | 296,488 | |
| | 5,405 | | U.S. Silica Holdings, Inc.* (Energy Equipment & Services) | | | 65,238 | |
| | 5,250 | | UFP Industries, Inc. (Building Products) | | | 499,642 | |
| | 3,928 | | Ultra Clean Holdings, Inc.* (Semiconductors & Semiconductor Equipment) | | | 93,722 | |
| | 33,191 | | Union Pacific Corp. (Ground Transportation) | | | 6,890,784 | |
| | 9,104 | | UnitedHealth Group, Inc. (Health Care Providers & Services) | | | 4,875,738 | |
| | 2,736 | | Univest Financial Corp. (Banks) | | | 45,582 | |
| | 14,209 | | Utz Brands, Inc. (Food Products) | | | 173,208 | |
| | 371 | | Valmont Industries, Inc. (Construction & Engineering) | | | 73,054 | |
| | 9,513 | | Vector Group Ltd. (Tobacco) | | | 97,794 | |
| | 12,593 | | Veracyte, Inc.* (Biotechnology) | | | 260,927 | |
| | 23,555 | | VeriSign, Inc.* (IT Services) | | | 4,702,991 | |
| | 19,850 | | Verisk Analytics, Inc. (Professional Services) | | | 4,513,096 | |
| | 2,743 | | Vertex Pharmaceuticals, Inc.* (Biotechnology) | | | 993,268 | |
| | 3,140 | | Viad Corp.* (Commercial Services & Supplies) | | | 76,082 | |
| | 40,910 | | Viavi Solutions, Inc.* (Communications Equipment) | | | 318,280 | |
| | 9,238 | | Viper Energy Partners LP (Oil, Gas & Consumable Fuels) | | | 263,098 | |
| | 20,020 | | Visa, Inc. Class A (Financial Services) | | | 4,706,702 | |
| | 8,773 | | Vivid Seats, Inc. Class A* (Entertainment) | | | 51,585 | |
| | 2,298 | | Voya Financial, Inc. (Financial Services) | | | 153,437 | |
| | 5,151 | | Wabash National Corp. (Machinery) | | | 106,574 | |
| | 1,576 | | Walker & Dunlop, Inc. (Financial Services) | | | 102,125 | |
| | | |
| | | | | | | | |
| | | Shares | | Description | | Value | |
| | |
| | Common Stocks (continued) | | | | |
| |
| | | United States (continued) | |
| | 6,510 | | Waste Connections, Inc. (Commercial Services & Supplies) | | $ | 843,045 | |
| | 11,600 | | Waste Management, Inc. (Commercial Services & Supplies) | | | 1,906,228 | |
| | 68,662 | | Wells Fargo & Co. (Banks) | | | 2,730,688 | |
| | 3,103 | | Western Alliance Bancorp (Banks) | | | 127,533 | |
| | 248 | | White Mountains Insurance Group Ltd. (Insurance) | | | 354,826 | |
| | 3,049 | | Wintrust Financial Corp. (Banks) | | | 227,730 | |
| | 6,284 | | World Kinect Corp. (Oil, Gas & Consumable Fuels) | | | 116,254 | |
| | 29,925 | | Zoetis, Inc. (Pharmaceuticals) | | | 4,698,225 | |
| | | | | | | | |
| | | | | | | 384,265,250 | |
| | | |
| |
| | Uruguay* – 0.3% | |
| | 1,509 | | MercadoLibre, Inc. (Broadline Retail) | | | 1,872,277 | |
| | | |
| | TOTAL COMMON STOCKS (Cost $658,743,494) | | $ | 687,395,930 | |
| | | |
| | | | | | | | | | |
| | | Shares | | | Dividend Rate | | Value | |
| | |
| | | Preferred Stocks – 0.3% | | | | |
| |
| | | Brazil – 0.2% | |
| |
| CTEEP-Cia de Transmissao de Energia Eletrica Paulista (Electric
Utilities) |
|
| | | 29,700 | | | 5.014% | | $ | 124,826 | |
| |
| | | Gerdau SA (Metals & Mining) | |
| | | 35,340 | | | 14.599 | | | 152,596 | |
| |
| | | Itausa SA (Banks) | |
| | | 46,100 | | | 8.564 | | | 79,001 | |
| |
| | | Metalurgica Gerdau SA (Metals & Mining) | |
| | | 80,200 | | | 11.229 | | | 164,321 | |
| |
| | | Petroleo Brasileiro SA (Oil, Gas & Consumable Fuels) | |
| | | 124,000 | | | 10.467 | | | 854,418 | |
| | | | | | | | | | |
| | | | | | | | | 1,375,162 | |
| | | | |
| |
| | | South Korea – 0.1% | |
| |
| Samsung Electronics Co. Ltd. (Technology Hardware, Storage &
Peripherals) |
|
| | | 17,625 | | | 2.696 | | | 703,673 | |
| | | | |
| |
| TOTAL PREFERRED STOCKS
(Cost $2,051,870) | | $ | 2,078,835 | |
| | | | |
| | | | | | | | |
| | | Shares | | Description | | Value | |
| | |
| | Exchange Traded Funds – 0.2% | | | | |
| | | |
| | 20,800 | | iShares Core MSCI Emerging Markets ETF | | $ | 955,552 | |
| | | |
| | |
| The accompanying notes are an integral part of these financial statements. | | 39 |
GOLDMAN SACHS MULTI-MANAGER GLOBAL EQUITY FUND
|
Schedule of Investments (continued) October 31, 2023 |
| | | | | | | | |
| | | Shares | | Description | | Value | |
| |
| | Exchange Traded Funds | |
| | | |
| | 26,490 | | iShares MSCI Saudi Arabia ETF | | $ | 1,003,706 | |
| | | |
| | TOTAL EXCHANGE TRADED FUNDS
(Cost $2,107,422) | | $ | 1,959,258 | |
| | | |
| | | |
| | | Shares | | Dividend Rate | | Value | |
| | |
| | Investment Companies(c) –7.9% | | | | |
| | Goldman Sachs Financial Square Government Fund — Class R6 | |
| | 24,443,593 | | 5.258% | | | $24,443,593 | |
| | Goldman Sachs Financial Square Government Fund — Institutional Shares | |
| | 35,857,520 | | 5.258 | | | 35,857,520 | |
| | | |
| | TOTAL INVESTMENT COMPANIES – 7.9%
(Cost $60,301,113) | | $ | 60,301,113 | |
| | | |
| | TOTAL INVESTMENTS – 98.7%
(Cost $723,203,899) | | $ | 751,735,136 | |
| | | |
| | OTHER ASSETS IN EXCESS OF LIABILITIES – 1.3% | | | 9,735,309 | |
| | | |
| | NET ASSETS – 100.0% | | $ | 761,470,445 | |
| | | |
The percentage shown for each investment category reflects the value of investments in that category as a percentage of net assets.
| * | Non-income producing security. |
| (a) | Exempt from registration under Rule 144A of the Securities Act of 1933. |
| (b) | Significant unobservable inputs were used in the valuation of this portfolio security; i.e., Level 3. |
| (c) | Represents an Affiliated Issuer. |
| | | | |
|
| SECTOR ALLOCATION AS OF OCTOBER 31, 2023 | |
| |
| Sector | | % of Total
Market Value | |
| |
| |
Information Technology | | | 16.8% | |
| |
Financials | | | 16.0 | |
| |
Health Care | | | 13.0 | |
| |
Industrials | | | 12.2 | |
| |
Consumer Discretionary | | | 10.9 | |
| |
Investment Companies | | | 8.0 | |
| |
Consumer Staples | | | 5.1 | |
| |
Communication Services | | | 4.9 | |
| |
Energy | | | 4.6 | |
| |
Materials | | | 4.4 | |
| |
Real Estate | | | 2.2 | |
| |
Utilities | | | 1.6 | |
| |
Exchange Traded Funds | | | 0.3 | |
| |
| | | 100.0% | |
| |
|
|
ADDITIONAL INVESTMENT INFORMATION |
FORWARD FOREIGN CURRENCY EXCHANGE CONTRACTS — At October 31, 2023, the Fund had the following forward foreign currency exchange contracts:
FORWARD FOREIGN CURRENCY EXCHANGE CONTRACTS WITH UNREALIZED GAIN
| | | | | | | | | | | | | | | | | | |
| Counterparty | | Currency Purchased | | | Currency Sold | | | Settlement
Date | | Unrealized
Gain | |
|
| |
| | | | | | |
BNP Paribas SA | | DKK | | | 19,380,000 | | | USD | | | 2,743,754 | | | 11/02/23 | | $ | 3,988 | |
| | EUR | | | 25,710,000 | | | USD | | | 27,173,459 | | | 11/02/23 | | | 32,443 | |
| | GBP | | | 9,975,000 | | | USD | | | 12,103,499 | | | 11/02/23 | | | 20,739 | |
| | ILS | | | 1,200,000 | | | USD | | | 295,887 | | | 11/02/23 | | | 1,016 | |
| | NOK | | | 6,200,000 | | | USD | | | 553,902 | | | 11/02/23 | | | 1,143 | |
| | SEK | | | 27,975,000 | | | USD | | | 2,503,430 | | | 11/02/23 | | | 2,941 | |
| | SGD | | | 1,460,000 | | | USD | | | 1,065,741 | | | 11/02/23 | | | 706 | |
| | USD | | | 6,088,843 | | | AUD | | | 9,480,000 | | | 11/02/23 | | | 74,780 | |
| | USD | | | 6,030,603 | | | AUD | | | 9,480,000 | | | 12/04/23 | | | 9,910 | |
| | USD | | | 8,229,968 | | | CHF | | | 7,480,000 | | | 11/02/23 | | | 5,315 | |
| | USD | | | 8,325,737 | | | CHF | | | 7,480,000 | | | 12/04/23 | | | 70,854 | |
| | USD | | | 2,761,565 | | | DKK | | | 19,380,000 | | | 11/02/23 | | | 13,822 | |
| | USD | | | 27,311,959 | | | EUR | | | 25,710,000 | | | 11/02/23 | | | 106,056 | |
| | USD | | | 12,158,820 | | | GBP | | | 9,975,000 | | | 11/02/23 | | | 34,582 | |
| | USD | | | 1,858,574 | | | HKD | | | 14,530,000 | | | 11/02/23 | | | 1,679 | |
| | USD | | | 1,858,908 | | | HKD | | | 14,530,000 | | | 12/04/23 | | | 761 | |
| | |
| 40 | | The accompanying notes are an integral part of these financial statements. |
GOLDMAN SACHS MULTI-MANAGER GLOBAL EQUITY FUND
|
|
ADDITIONAL INVESTMENT INFORMATION (continued) |
FORWARD FOREIGN CURRENCY EXCHANGE CONTRACTS WITH UNREALIZED GAIN (continued)
| | | | | | | | | | | | | | | | | | |
| Counterparty | | Currency Purchased | | | Currency Sold | | | Settlement
Date | | Unrealized
Gain | |
|
| |
| | | | | | |
BNP Paribas SA (continued) | | USD | | | 314,686 | | | ILS | | | 1,200,000 | | | 11/02/23 | | $ | 17,783 | |
| | USD | | | 19,453,890 | | | JPY | | | 2,879,000,000 | | | 11/02/23 | | | 454,094 | |
| | USD | | | 19,322,678 | | | JPY | | | 2,879,000,000 | | | 12/04/23 | | | 218,667 | |
| | USD | | | 575,166 | | | NOK | | | 6,200,000 | | | 11/02/23 | | | 20,121 | |
| | USD | | | 161,060 | | | NZD | | | 270,000 | | | 11/02/23 | | | 3,757 | |
| | USD | | | 157,467 | | | NZD | | | 270,000 | | | 12/04/23 | | | 148 | |
| | USD | | | 2,554,987 | | | SEK | | | 27,975,000 | | | 11/02/23 | | | 48,616 | |
| | USD | | | 1,069,460 | | | SGD | | | 1,460,000 | | | 11/02/23 | | | 3,014 | |
JPMorgan Securities, Inc. | | DKK | | | 6,590,000 | | | USD | | | 932,990 | | | 11/02/23 | | | 1,356 | |
| | EUR | | | 8,750,000 | | | USD | | | 9,248,066 | | | 11/02/23 | | | 11,042 | |
| | GBP | | | 3,395,000 | | | USD | | | 4,119,437 | | | 11/02/23 | | | 7,058 | |
| | ILS | | | 400,000 | | | USD | | | 98,629 | | | 11/02/23 | | | 339 | |
| | NOK | | | 2,100,000 | | | USD | | | 187,612 | | | 11/02/23 | | | 387 | |
| | SEK | | | 9,525,000 | | | USD | | | 852,374 | | | 11/02/23 | | | 1,001 | |
| | SGD | | | 500,000 | | | USD | | | 364,980 | | | 11/02/23 | | | 242 | |
| | USD | | | 2,068,151 | | | AUD | | | 3,220,000 | | | 11/02/23 | | | 25,400 | |
| | USD | | | 2,048,370 | | | AUD | | | 3,220,000 | | | 12/04/23 | | | 3,366 | |
| | USD | | | 2,805,671 | | | CHF | | | 2,550,000 | | | 11/02/23 | | | 1,812 | |
| | USD | | | 2,838,319 | | | CHF | | | 2,550,000 | | | 12/04/23 | | | 24,155 | |
| | USD | | | 939,046 | | | DKK | | | 6,590,000 | | | 11/02/23 | | | 4,700 | |
| | USD | | | 9,295,202 | | | EUR | | | 8,750,000 | | | 11/02/23 | | | 36,095 | |
| | USD | | | 4,138,265 | | | GBP | | | 3,395,000 | | | 11/02/23 | | | 11,770 | |
| | USD | | | 631,889 | | | HKD | | | 4,940,000 | | | 11/02/23 | | | 571 | |
| | USD | | | 632,003 | | | HKD | | | 4,940,000 | | | 12/04/23 | | | 259 | |
| | USD | | | 104,895 | | | ILS | | | 400,000 | | | 11/02/23 | | | 5,928 | |
| | USD | | | 6,615,268 | | | JPY | | | 979,000,000 | | | 11/02/23 | | | 154,414 | |
| | USD | | | 6,570,650 | | | JPY | | | 979,000,000 | | | 12/04/23 | | | 74,358 | |
| | USD | | | 194,814 | | | NOK | | | 2,100,000 | | | 11/02/23 | | | 6,815 | |
| | USD | | | 53,687 | | | NZD | | | 90,000 | | | 11/02/23 | | | 1,252 | |
| | USD | | | 52,489 | | | NZD | | | 90,000 | | | 12/04/23 | | | 49 | |
| | USD | | | 869,928 | | | SEK | | | 9,525,000 | | | 11/02/23 | | | 16,553 | |
| | USD | | | 366,253 | | | SGD | | | 500,000 | | | 11/02/23 | | | 1,032 | |
UBS AG (London) | | PLN | | | 139,763 | | | USD | | | 33,161 | | | 11/03/23 | | | 19 | |
|
| |
| | | | | | |
| TOTAL | | | | | | | | | | | | | | | | $ | 1,536,908 | |
| |
|
| FORWARD FOREIGN CURRENCY EXCHANGE CONTRACTS WITH UNREALIZED LOSS | |
| Counterparty | | Currency Purchased | | | Currency Sold | | | Settlement
Date | | Unrealized
Loss | |
|
| |
| | | | | | |
BNP Paribas SA | | AUD | | | 9,480,000 | | | USD | | | 6,024,228 | | | 11/02/23 | | $ | (10,166 | ) |
| | CHF | | | 7,480,000 | | | USD | | | 8,297,779 | | | 11/02/23 | | | (73,126 | ) |
| | HKD | | | 14,530,000 | | | USD | | | 1,857,836 | | | 11/02/23 | | | (942 | ) |
| | JPY | | | 2,879,000,000 | | | USD | | | 19,224,792 | | | 11/02/23 | | | (224,996 | ) |
| | NZD | | | 270,000 | | | USD | | | 157,455 | | | 11/02/23 | | | (151 | ) |
| | USD | | | 2,748,154 | | | DKK | | | 19,380,000 | | | 12/04/23 | | | (4,459 | ) |
| | USD | | | 27,208,474 | | | EUR | | | 25,710,000 | | | 12/04/23 | | | (36,351 | ) |
| | USD | | | 12,105,768 | | | GBP | | | 9,975,000 | | | 12/04/23 | | | (21,156 | ) |
| | USD | | | 296,286 | | | ILS | | | 1,200,000 | | | 12/04/23 | | | (1,079 | ) |
| | USD | | | 554,424 | | | NOK | | | 6,200,000 | | | 12/04/23 | | | (1,182 | ) |
| | |
| The accompanying notes are an integral part of these financial statements. | | 41 |
GOLDMAN SACHS MULTI-MANAGER GLOBAL EQUITY FUND
|
Schedule of Investments (continued) October 31, 2023 |
|
|
ADDITIONAL INVESTMENT INFORMATION (continued) |
FORWARD FOREIGN CURRENCY EXCHANGE CONTRACTS WITH UNREALIZED LOSS (continued)
| | | | | | | | | | | | | | | | | | |
| Counterparty | | Currency Purchased | | | Currency Sold | | | Settlement
Date | | Unrealized
Loss | |
|
| |
| | | | | | |
BNP Paribas SA (continued) | | USD | | | 2,506,610 | | | SEK | | | 27,975,000 | | | 12/04/23 | | $ | (3,378 | ) |
| | USD | | | 1,067,244 | | | SGD | | | 1,460,000 | | | 12/04/23 | | | (795 | ) |
JPMorgan Securities, Inc. | | AUD | | | 3,220,000 | | | USD | | | 2,046,204 | | | 11/02/23 | | | (3,453 | ) |
| | CHF | | | 2,550,000 | | | USD | | | 2,828,788 | | | 11/02/23 | | | (24,929 | ) |
| | HKD | | | 4,940,000 | | | USD | | | 631,639 | | | 11/02/23 | | | (320 | ) |
| | JPY | | | 979,000,000 | | | USD | | | 6,537,364 | | | 11/02/23 | | | (76,509 | ) |
| | NZD | | | 90,000 | | | USD | | | 52,485 | | | 11/02/23 | | | (50 | ) |
| | USD | | | 934,486 | | | DKK | | | 6,590,000 | | | 12/04/23 | | | (1,516 | ) |
| | USD | | | 9,259,982 | | | EUR | | | 8,750,000 | | | 12/04/23 | | | (12,372 | ) |
| | USD | | | 4,120,209 | | | GBP | | | 3,395,000 | | | 12/04/23 | | | (7,201 | ) |
| | USD | | | 98,762 | | | ILS | | | 400,000 | | | 12/04/23 | | | (360 | ) |
| | USD | | | 187,789 | | | NOK | | | 2,100,000 | | | 12/04/23 | | | (400 | ) |
| | USD | | | 853,457 | | | SEK | | | 9,525,000 | | | 12/04/23 | | | (1,150 | ) |
| | USD | | | 365,495 | | | SGD | | | 500,000 | | | 12/04/23 | | | (272 | ) |
|
| |
| | | | | | |
| TOTAL | | | | | | | | | | | | | | | | $ | (506,313 | ) |
| |
FUTURES CONTRACTS — At October 31, 2023, the Fund had the following futures contracts:
| | | | | | | | | | | | | | | | |
| Description | | Number of
Contracts | | | Expiration
Date | | | Notional
Amount | | | Unrealized
Appreciation/
(Depreciation) | |
|
| |
| | | | |
Long position contracts: | | | | | | | | | | | | | | | | |
S&P 500 E-Mini Index | | | 179 | | | | 12/15/23 | | | $ | 37,699,638 | | | | $(2,682,179 | ) |
S&P Toronto Stock Exchange 60 Index | | | 132 | | | | 12/14/23 | | | | 21,607,355 | | | | (1,503,026 | ) |
|
| |
| | | | |
| TOTAL FUTURES CONTRACTS | | | | | | | | | | | | | | | $(4,185,205 | ) |
|
| |
| | |
|
|
| Currency Abbreviations: |
| AUD | | —Australian Dollar |
| CHF | | —Swiss Franc |
| DKK | | —Denmark Krone |
| EUR | | —Euro |
| GBP | | —British Pound |
| HKD | | —Hong Kong Dollar |
| ILS | | —Israeli Shekel |
| JPY | | —Japanese Yen |
| NOK | | —Norwegian Krone |
| NZD | | —New Zealand Dollar |
| PLN | | —Polish Zloty |
| SEK | | —Swedish Krona |
| SGD | | —Singapore Dollar |
| USD | | —U.S. Dollar |
|
|
| | |
| 42 | | The accompanying notes are an integral part of these financial statements. |
GOLDMAN SACHS MULTI-MANAGER GLOBAL EQUITY FUND
|
|
ADDITIONAL INVESTMENT INFORMATION (continued) |
| | |
|
|
| Investment Abbreviations: |
| ADR | | —American Depositary Receipt |
| ETF | | —Exchange Traded Fund |
| GDR | | —Global Depository Receipt |
| LP | | —Limited Partnership |
| MSCI | | —Morgan Stanley Capital International |
| PLC | | —Public Limited Company |
| REIT | | —Real Estate Investment Trust |
|
|
| | |
| The accompanying notes are an integral part of these financial statements. | | 43 |
GOLDMAN SACHS MULTI-MANAGER NON-CORE FIXED INCOME FUND
|
Schedule of Investments October 31, 2023 |
| | | | | | | | | | | | | | | | |
| | | Principal Amount | | | Interest Rate | | | Maturity Date | | Value | |
| |
| | Corporate Obligations – 34.1% | |
| |
| | Advertising(a)(b) – 0.2% | |
| | CMG Media Corp. | |
| | $ | | | 2,329,000 | | | | 8.875 | % | | 12/15/27 | | $ | 1,810,145 | |
| | Summer BC Holdco A SARL | |
| | EUR | | | 282,931 | | | | 9.250 | | | 10/31/27 | | | 238,247 | |
| | Summer BC Holdco B SARL | |
| | | | | 442,000 | | | | 5.750 | | | 10/31/26 | | | 422,732 | |
| | | | | | | | | | | | | | | | |
| | | | | | | | | | | | | | | 2,471,124 | |
| | | |
| |
| | Aerospace & Defense – 0.2% | |
| | Bombardier, Inc.(a)(b) | |
| | $ | | | 560,000 | | | | 7.875 | | | 04/15/27 | | | 539,202 | |
| | | | | 1,142,000 | | | | 7.500 | | | 02/01/29 | | | 1,057,777 | |
| | TransDigm, Inc.(a)(b) | |
| | | | | 913,000 | | | | 6.250 | | | 03/15/26 | | | 892,686 | |
| | | | | | | | | | | | | | | | |
| | | | | | | | | | | | | | | 2,489,665 | |
| | | |
| |
| | Airlines – 0.6% | |
| | Allegiant Travel Co.(a)(b) | |
| | | | | 255,000 | | | | 7.250 | | | 08/15/27 | | | 231,821 | |
| | American Airlines, Inc.(a)(b) | |
| | | | | 504,000 | | | | 7.250 | | | 02/15/28 | | | 469,269 | |
| | Avianca Midco 2 PLC(a)(b) | |
| | | | | 1,743,873 | | | | 9.000 | | | 12/01/28 | | | 1,441,747 | |
| | Azul Secured Finance LLP(a)(b) | |
| | | | | 484,000 | | | | 11.930 | | | 08/28/28 | | | 468,173 | |
| | Hawaiian Brand Intellectual Property Ltd./HawaiianMiles Loyalty Ltd.(a)(b) | |
| | | | | 1,220,000 | | | | 5.750 | | | 01/20/26 | | | 901,202 | |
| | Spirit Loyalty Cayman Ltd./Spirit IP Cayman Ltd.(a)(b) | |
| | | | | 707,000 | | | | 8.000 | | | 09/20/25 | | | 521,702 | |
| | | | | 349,000 | | | | 8.000 | | | 09/20/25 | | | 258,386 | |
| | United Airlines, Inc.(a)(b) | |
| | | | | 345,000 | | | | 4.375 | | | 04/15/26 | | | 320,881 | |
| | | | | 755,000 | | | | 4.625 | | | 04/15/29 | | | 638,315 | |
| | VistaJet Malta Finance PLC/Vista Management Holding, Inc.(a)(b) | |
| | | | | 423,000 | | | | 9.500 | | | 06/01/28 | | | 323,916 | |
| | | | | 943,000 | | | | 6.375 | | | 02/01/30 | | | 631,225 | |
| | | | | | | | | | | | | | | | |
| | | | | | | | | | | | | | | 6,206,637 | |
| | | |
| |
| | Apparel(a)(b) – 0.3% | |
| | CT Investment GmbH | |
| | EUR | | | 1,145,000 | | | | 5.500 | | | 04/15/26 | | | 1,135,029 | |
| | Hanesbrands, Inc. | |
| | $ | | | 873,000 | | | | 9.000 | | | 02/15/31 | | | 811,707 | |
| | Wolverine World Wide, Inc. | |
| | | | | 1,464,000 | | | | 4.000 | | | 08/15/29 | | | 1,090,167 | |
| | | | | | | | | | | | | | | | |
| | | | | | | | | | | | | | | 3,036,903 | |
| | | |
| |
| | Automotive – 1.1% | |
| | Adient Global Holdings Ltd.(a)(b) | |
| | | | | 420,000 | | | | 8.250 | | | 04/15/31 | | | 410,428 | |
| | Allison Transmission, Inc.(a)(b) | |
| | | | | 499,000 | | | | 4.750 | | | 10/01/27 | | | 456,166 | |
| | Benteler International AG(a) | |
| | EUR | | | 333,000 | | | | 9.375 | | | 05/15/28 | | | 355,709 | |
| | | |
| | | | | | | | | | | | | | | | |
| | | Principal Amount | | | Interest Rate | | | Maturity Date | | Value | |
| |
| | Corporate Obligations – (continued) | |
| |
| | Automotive – (continued) | |
| | $ | | | 650,000 | | | | 10.500 | %(b) | | 05/15/28 | | $ | 656,441 | |
| | Clarios Global LP/Clarios U.S. Finance Co.(a) | |
| | EUR | | | 475,000 | | | | 4.375 | | | 05/15/26 | | | 482,132 | |
| | $ | | | 569,000 | | | | 8.500 | (b) | | 05/15/27 | | | 560,624 | |
| | Dana Financing Luxembourg SARL(a) | |
| | EUR | | | 600,000 | | | | 3.000 | (b) | | 07/15/29 | | | 501,997 | |
| | | | | 430,000 | | | | 8.500 | | | 07/15/31 | | | 464,278 | |
| | Dealer Tire LLC/DT Issuer LLC(a)(b) | |
| | $ | | | 755,000 | | | | 8.000 | | | 02/01/28 | | | 707,661 | |
| | Ford Motor Credit Co. LLC(a) | |
| | | | | 360,000 | | | | 4.063 | | | 11/01/24 | | | 350,687 | |
| | | | | 626,000 | | | | 4.125 | | | 08/17/27 | | | 568,809 | |
| | | | | 145,000 | | | | 3.815 | | | 11/02/27 | | | 129,314 | |
| | | | | 425,000 | | | | 6.800 | | | 05/12/28 | | | 423,933 | |
| | | | | 1,220,000 | | | | 5.113 | | | 05/03/29 | | | 1,106,333 | |
| | | | | 1,205,000 | | | | 4.000 | | | 11/13/30 | | | 992,510 | |
| | IHO Verwaltungs GmbH(a)(b)(c) | |
| | | | | 335,000 | | | | 6.000 | | | 05/15/27 | | | 312,193 | |
| | EUR | | | 920,000 | | | | 8.750 | | | 05/15/28 | | | 1,004,087 | |
| | $ | | | 435,000 | | | | 6.375 | | | 05/15/29 | | | 382,317 | |
| | Jaguar Land Rover Automotive PLC(a)(b) | |
| | EUR | | | 685,000 | | | | 4.500 | | | 07/15/28 | | | 660,719 | |
| | $ | | | 934,000 | | | | 5.500 | | | 07/15/29 | | | 805,837 | |
| | Tenneco, Inc.(a)(b) | |
| | | | | 800,000 | | | | 8.000 | | | 11/17/28 | | | 642,000 | |
| | | | | | | | | | | | | | | | |
| | | | | | | | | | | | | | | 11,974,175 | |
| | | |
| |
| | Banks – 2.2% | |
| | Banca Monte dei Paschi di Siena SpA(a)(d) (EIISDB05 + 5.005%) | |
| | EUR | | | 1,580,000 | | | | 7.708 | | | 01/18/28 | | | 1,457,257 | |
| | Banco Bilbao Vizcaya Argentaria SA(a)(d) | |
| | (-1X 5 yr. EUR Swap + 6.039%) | |
| | | | | 600,000 | | | | 6.000 | | | 03/29/24 | | | 628,467 | |
| | (-1X 5 yr. EUR Swap + 6.456%) | |
| | | | | 400,000 | | | | 6.000 | | | 01/15/26 | | | 397,846 | |
| | Banco de Sabadell SA(a)(d) (5 yr. EUR Swap + 6.830%) | |
| | | | | 800,000 | | | | 9.375 | | | 07/18/28 | | | 830,609 | |
| | Barclays PLC(a)(d) | |
| | (5 yr. GBP Swap + 5.639%) | |
| | GBP | | | 778,000 | | | | 9.250 | | | 09/15/28 | | | 863,729 | |
| | (5 yr. UK Government Bond + 6.579%) | |
| | | | | 370,000 | | | | 7.125 | | | 06/15/25 | | | 418,672 | |
| | CaixaBank SA(a)(d) (-1X 5 yr. EUR Swap + 3.857%) | |
| | EUR | | | 800,000 | | | | 3.625 | | | 09/14/28 | | | 569,613 | |
| | Comerica, Inc.(a) | |
| | $ | | | 600,000 | | | | 4.000 | | | 02/01/29 | | | 490,170 | |
| | Commerzbank AG(a)(d) (-1X 5 yr. EUR Swap + 6.363%) | |
| | EUR | | | 600,000 | | | | 6.125 | | | 10/09/25 | | | 585,659 | |
| | Deutsche Bank AG(a)(d) (5 yr. EURIBOR ICE Swap + 6.940%) | |
| | | | | 800,000 | | | | 10.000 | | | 12/01/27 | | | 846,895 | |
| | Freedom Mortgage Corp.(a)(b) | |
| | $ | | | 479,000 | | | | 6.625 | | | 01/15/27 | | | 414,479 | |
| | | | | 1,140,000 | | | | 12.000 | | | 10/01/28 | | | 1,143,933 | |
| | Ibercaja Banco SA(a)(d) (-1X 5 yr. EUR Swap + 2.882%) | |
| | EUR | | | 600,000 | | | | 2.750 | | | 07/23/30 | | | 575,202 | |
| | | |
| | |
| 44 | | The accompanying notes are an integral part of these financial statements. |
GOLDMAN SACHS MULTI-MANAGER NON-CORE FIXED INCOME FUND
| | | | | | | | | | | | | | | | |
| | | Principal Amount | | | Interest Rate | | | Maturity Date | | Value | |
| |
| | Corporate Obligations – (continued) | |
| |
| | Banks – (continued) | |
| | International Finance Corp. | |
| | INR | | | 450,000,000 | | | | 6.300 | % | | 11/25/24 | | $ | 5,352,735 | |
| | Intesa Sanpaolo SpA | |
| | $ | | | 840,000 | | | | 5.710 | (b) | | 01/15/26 | | | 797,328 | |
| | (-1X 5 yr. EUR Swap + 5.848%) | |
| | EUR | | | 621,000 | | | | 5.500 | (a)(d) | | 03/01/28 | | | 548,885 | |
| | (-1X 5 yr. EUR Swap + 6.086%) | |
| | | | | 520,000 | | | | 5.875 | (a)(d) | | 09/01/31 | | | 433,292 | |
| | KeyCorp(a)(d) (Secured Overnight Financing Rate Index + 1.250%) | |
| | $ | | | 500,000 | | | | 3.878 | | | 05/23/25 | | | 477,745 | |
| | Lloyds Banking Group PLC(a)(d) | |
| | (5 yr. UK Government Bond + 5.883%) | |
| | GBP | | | 500,000 | | | | 8.500 | | | 09/27/27 | | | 568,982 | |
| | (5 yr. USD ICE Swap + 4.496%) | |
| | $ | | | 740,000 | | | | 7.500 | | | 09/27/25 | | | 686,557 | |
| | Novo Banco SA | |
| | EUR | | | 95,000 | | | | 3.500 | | | 01/02/43 | | | 74,063 | |
| | | | | 745,000 | | | | 3.500 | | | 01/23/43 | | | 577,915 | |
| | Popular, Inc.(a) | |
| | $ | | | 880,000 | | | | 7.250 | | | 03/13/28 | | | 872,177 | |
| | Societe Generale SA(a)(d) | |
| | (5 yr. CMT + 5.385%) | |
| | | | | 402,000 | | | | 9.375 | | | 11/22/27 | | | 387,777 | |
| | (5 yr. EUR Swap + 5.228%) | |
| | EUR | | | 500,000 | | | | 7.875 | | | 01/18/29 | | | 499,291 | |
| | UniCredit SpA(a)(d) | |
| | (-1X 5 yr. EUR Swap + 4.606%) | |
| | | | | 721,000 | | | | 4.450 | | | 12/03/27 | | | 584,870 | |
| | (5 yr. EURIBOR ICE Swap + 7.334%) | |
| | | | | 690,000 | | | | 7.500 | | | 06/03/26 | | | 710,961 | |
| | (5 yr. USD ICE Swap + 3.703%) | |
| | $ | | | 1,775,000 | | | | 5.861 | (b) | | 06/19/32 | | | 1,601,032 | |
| | | | | | | | | | | | | | | | |
| | | | | | | | | | | | | | | 23,396,141 | |
| | | |
| |
| | Biotechnology(a) – 0.1% | |
| | Cidron Aida Finco SARL | |
| | EUR | | | 819,000 | | | | 5.000 | | | 04/01/28 | | | 778,045 | |
| | | |
| |
| | Building Materials(a) – 0.5% | |
| | AmeriTex HoldCo Intermediate LLC(b) | |
| | $ | | | 801,000 | | | | 10.250 | | | 10/15/28 | | | 758,315 | |
| | Camelot Return Merger Sub, Inc.(b) | |
| | | | | 606,000 | | | | 8.750 | | | 08/01/28 | | | 565,822 | |
| | CP Atlas Buyer, Inc.(b) | |
| | | | | 901,000 | | | | 7.000 | | | 12/01/28 | | | 686,571 | |
| | Emerald Debt Merger Sub LLC(b) | |
| | | | | 808,000 | | | | 6.625 | | | 12/15/30 | | | 769,264 | |
| | Griffon Corp. | |
| | | | | 684,000 | | | | 5.750 | | | 03/01/28 | | | 617,816 | |
| | Knife River Corp.(b) | |
| | | | | 510,000 | | | | 7.750 | | | 05/01/31 | | | 508,200 | |
| | Smyrna Ready Mix Concrete LLC(b) | |
| | | | | 1,256,000 | | | | 6.000 | | | 11/01/28 | | | 1,161,411 | |
| | | |
| | | | | | | | | | | | | | | | |
| | | Principal Amount | | | Interest Rate | | | Maturity Date | | Value | |
| |
| | Corporate Obligations – (continued) | |
| |
| | Building Materials(a) – (continued) | |
| | Summit Materials LLC/Summit Materials Finance Corp.(b) | |
| | $ | | | 563,000 | | | | 5.250 | % | | 01/15/29 | | $ | 510,489 | |
| | | | | | | | | | | | | | | | |
| | | | | | | | | | | | | | | 5,577,888 | |
| | | |
| |
| | Chemicals – 1.5% | |
| | ASP Unifrax Holdings, Inc.(a)(b) | |
| | | | | 775,000 | | | | 5.250 | | | 09/30/28 | | | 526,829 | |
| | Axalta Coating Systems LLC(a)(b) | |
| | | | | 505,000 | | | | 3.375 | | | 02/15/29 | | | 416,231 | |
| | Braskem Netherlands Finance BV(a)(b) | |
| | | | | 560,000 | | | | 8.500 | | | 01/12/31 | | | 524,272 | |
| | | | | 761,000 | | | | 7.250 | | | 02/13/33 | | | 657,314 | |
| | Cerdia Finanz GmbH(a)(b)(e) | |
| | | | | 1,000,000 | | | | 10.500 | | | 02/15/27 | | | 984,510 | |
| | CF Industries, Inc. | |
| | | | | 792,000 | | | | 5.150 | | | 03/15/34 | | | 702,924 | |
| | Chemours Co.(a)(b) | |
| | | | | 522,000 | | | | 5.750 | | | 11/15/28 | | | 441,508 | |
| | | | | 384,000 | | | | 4.625 | | | 11/15/29 | | | 296,920 | |
| | Cornerstone Chemical Co.(a)(b) | |
| | | | | 4,606,648 | | | | 10.250 | | | 09/01/27 | | | 3,924,496 | |
| | Crnrch Ssp Unf | |
| | | | | 152,156 | | | | 0.000 | | | 12/31/50 | | | 152,156 | |
| | GPD Cos., Inc.(a)(b) | |
| | | | | 391,000 | | | | 10.125 | | | 04/01/26 | | | 353,812 | |
| | Innophos Holdings, Inc.(a)(b) | |
| | | | | 715,000 | | | | 9.375 | | | 02/15/28 | | | 674,002 | |
| | Iris Holdings, Inc.(a)(b)(c) | |
| | | | | 615,000 | | | | 8.750 | | | 02/15/26 | | | 547,823 | |
| | NOVA Chemicals Corp.(a)(b) | |
| | | | | 1,500,000 | | | | 4.250 | | | 05/15/29 | | | 1,113,750 | |
| | Rain Carbon, Inc.(a)(b) | |
| | | | | 1,000,000 | | | | 12.250 | | | 09/01/29 | | | 1,017,530 | |
| | Rain CII Carbon LLC/CII Carbon Corp.(a)(b) | |
| | | | | 14,000 | | | | 7.250 | | | 04/01/25 | | | 13,445 | |
| | Rayonier AM Products, Inc.(a)(b) | |
| | | | | 1,168,000 | | | | 7.625 | | | 01/15/26 | | | 991,959 | |
| | SCIH Salt Holdings, Inc.(a)(b) | |
| | | | | 210,000 | | | | 4.875 | | | 05/01/28 | | | 182,717 | |
| | | | | 817,000 | | | | 6.625 | | | 05/01/29 | | | 688,175 | |
| | Tronox, Inc.(a)(b) | |
| | | | | 1,129,000 | | | | 4.625 | | | 03/15/29 | | | 886,434 | |
| | Vibrantz Technologies, Inc.(a)(b) | |
| | | | | 509,000 | | | | 9.000 | | | 02/15/30 | | | 406,976 | |
| | WR Grace Holdings LLC(a)(b) | |
| | | | | 578,000 | | | | 5.625 | | | 08/15/29 | | | 447,962 | |
| | | | | | | | | | | | | | | | |
| | | | | | | | | | | | | | | 15,951,745 | |
| | | |
| |
| | Commercial Services – 1.1% | |
| | ADT Security Corp.(a)(b) | |
| | | | | 527,000 | | | | 4.125 | | | 08/01/29 | | | 452,203 | |
| | Albion Financing 1 SARL/Aggreko Holdings, Inc.(a)(b) | |
| | | | | 570,000 | | | | 6.125 | | | 10/15/26 | | | 527,324 | |
| | Allied Universal Holdco LLC/Allied Universal Finance Corp.(a)(b) | |
| | | | | 1,500,000 | | | | 6.625 | | | 07/15/26 | | | 1,404,270 | |
| | | |
| | |
| The accompanying notes are an integral part of these financial statements. | | 45 |
GOLDMAN SACHS MULTI-MANAGER NON-CORE FIXED INCOME FUND
|
Schedule of Investments (continued) October 31, 2023 |
| | | | | | | | | | | | | | | | |
| | | Principal Amount | | | Interest Rate | | | Maturity Date | | Value | |
| |
| | Corporate Obligations – (continued) | |
| |
| | Commercial Services – (continued) | |
| | BCP V Modular Services Finance II PLC(a)(b) | |
| | EUR | | | 565,000 | | | | 4.750 | % | | 11/30/28 | | $ | 494,917 | |
| | Castor SpA(a)(b) | |
| | | | | 691,000 | | | | 6.000 | | | 02/15/29 | | | 608,797 | |
| | CPI CG, Inc.(a)(b) | |
| | $ | | | 538,000 | | | | 8.625 | | | 03/15/26 | | | 514,931 | |
| | GEMS MENASA Cayman Ltd./GEMS Education Delaware LLC(a)(b) | |
| | | | | 1,445,000 | | | | 7.125 | | | 07/31/26 | | | 1,383,587 | |
| | Korn Ferry(a)(b) | |
| | | | | 915,000 | | | | 4.625 | | | 12/15/27 | | | 835,148 | |
| | Multiversity SRL(a)(b)(d) (3 mo. EUR EURIBOR + 8.218%) | |
| | EUR | | | 250,000 | | | | 8.218 | | | 10/30/28 | | | 262,128 | |
| | Neptune Bidco U.S., Inc.(a)(b) | |
| | $ | | | 711,000 | | | | 9.290 | | | 04/15/29 | | | 628,033 | |
| | Sabre Global, Inc.(a)(b) | |
| | | | | 1,440,000 | | | | 11.250 | | | 12/15/27 | | | 1,281,442 | |
| | StoneMor, Inc.(a)(b) | |
| | | | | 975,000 | | | | 8.500 | | | 05/15/29 | | | 781,706 | |
| | Techem Verwaltungsgesellschaft 674 GmbH(a)(b) | |
| | EUR | | | 571,479 | | | | 6.000 | | | 07/30/26 | | | 585,199 | |
| | United Rentals North America, Inc.(a) | |
| | $ | | | 535,000 | | | | 5.250 | | | 01/15/30 | | | 489,268 | |
| | | | | 595,000 | | | | 4.000 | | | 07/15/30 | | | 500,127 | |
| | Verisure Holding AB(a) | |
| | EUR | | | 470,000 | | | | 9.250 | | | 10/15/27 | | | 528,389 | |
| | | | | 461,000 | | | | 7.125 | (b) | | 02/01/28 | | | 491,443 | |
| | WW International, Inc.(a)(b) | |
| | $ | | | 530,000 | | | | 4.500 | | | 04/15/29 | | | 331,171 | |
| | | | | | | | | | | | | | | | |
| | | | | | | | | | | | | | | 12,100,083 | |
| | | |
| |
| | Computers(a) – 0.3% | |
| | Ahead DB Holdings LLC(b) | |
| | | | | 983,000 | | | | 6.625 | | | 05/01/28 | | | 811,290 | |
| | CA Magnum Holdings(b) | |
| | | | | 1,400,000 | | | | 5.375 | | | 10/31/26 | | | 1,219,204 | |
| | McAfee Corp.(b) | |
| | | | | 906,000 | | | | 7.375 | | | 02/15/30 | | | 724,483 | |
| | Science Applications International Corp.(b) | |
| | | | | 694,000 | | | | 4.875 | | | 04/01/28 | | | 622,802 | |
| | Seagate HDD Cayman | |
| | | | | 325,000 | | | | 3.375 | | | 07/15/31 | | | 222,225 | |
| | | | | | | | | | | | | | | | |
| | | | | | | | | | | | | | | 3,600,004 | |
| | | |
| |
| | Distribution & Wholesale(a)(b) – 0.1% | |
| | H&E Equipment Services, Inc. | |
| | | | | 1,143,000 | | | | 3.875 | | | 12/15/28 | | | 968,430 | |
| | | |
| |
| | Diversified Financial Services – 1.4% | |
| | Ally Financial, Inc.(a) | |
| | | | | 248,000 | | | | 4.750 | | | 06/09/27 | | | 224,539 | |
| | Armor Holdco, Inc.(a)(b) | |
| | | | | 890,000 | | | | 8.500 | | | 11/15/29 | | | 777,370 | |
| | Bach Bidco SpA(a)(b) (3 mo. EUR EURIBOR + 8.215%) | |
| | EUR | | | 575,000 | | | | 8.215 | | | 10/15/28 | | | 602,324 | |
| | | |
| | | | | | | | | | | | | | | | |
| | | Principal Amount | | | Interest Rate | | | Maturity Date | | Value | |
| |
| | Corporate Obligations – (continued) | |
| |
| | Diversified Financial Services – (continued) | |
| | Bread Financial Holdings, Inc.(a)(b) | |
| | $ | | | 455,000 | | | | 7.000 | % | | 01/15/26 | | $ | 415,561 | |
| | Coinbase Global, Inc.(a)(b) | |
| | | | | 600,000 | | | | 3.375 | | | 10/01/28 | | | 441,120 | |
| | Finance of America Funding LLC(a)(b) | |
| | | | | 1,810,000 | | | | 7.875 | | | 11/15/25 | | | 1,470,010 | |
| | Global Aircraft Leasing Co. Ltd.(a)(b)(c) (PIK 7.250%, Cash 6.500%) | |
| | | | | 1,140,656 | | | | 6.500 | | | 09/15/24 | | | 1,024,035 | |
| | Jefferies Finance LLC/JFIN Co.-Issuer Corp.(a)(b) | |
| | | | | 574,000 | | | | 5.000 | | | 08/15/28 | | | 459,590 | |
| | Kane Bidco Ltd.(a) | |
| | GBP | | | 213,000 | | | | 6.500 | | | 02/15/27 | | | 232,735 | |
| | LD Holdings Group LLC(a)(b) | |
| | $ | | | 795,000 | | | | 6.500 | | | 11/01/25 | | | 640,945 | |
| | | | | 1,420,000 | | | | 6.125 | | | 04/01/28 | | | 787,688 | |
| | Midcap Financial Issuer Trust(a)(b) | |
| | | | | 1,012,000 | | | | 6.500 | | | 05/01/28 | | | 861,718 | |
| | | | | 735,000 | | | | 5.625 | | | 01/15/30 | | | 569,191 | |
| | Nationstar Mortgage Holdings, Inc.(a)(b) | |
| | | | | 1,045,000 | | | | 5.500 | | | 08/15/28 | | | 922,913 | |
| | Navient Corp.(a) | |
| | | | | 360,000 | | | | 11.500 | | | 03/15/31 | | | 359,316 | |
| | NFP Corp.(a)(b) | |
| | | | | 1,067,000 | | | | 6.875 | | | 08/15/28 | | | 911,794 | |
| | OneMain Finance Corp. | |
| | | | | 125,000 | | | | 7.125 | | | 03/15/26 | | | 121,476 | |
| | | | | 177,000 | | | | 3.500 | (a) | | 01/15/27 | | | 149,839 | |
| | | | | 745,000 | | | | 3.875 | (a) | | 09/15/28 | | | 591,947 | |
| | | | | 91,000 | | | | 9.000 | (a) | | 01/15/29 | | | 88,757 | |
| | | | | 1,565,000 | | | | 5.375 | (a) | | 11/15/29 | | | 1,292,643 | |
| | PennyMac Financial Services, Inc.(a)(b) | |
| | | | | 555,000 | | | | 4.250 | | | 02/15/29 | | | 453,224 | |
| | Rocket Mortgage LLC/Rocket Mortgage Co.-Issuer, Inc.(a)(b) | |
| | | | | 437,000 | | | | 3.625 | | | 03/01/29 | | | 355,312 | |
| | United Wholesale Mortgage LLC(a)(b) | |
| | | | | 345,000 | | | | 5.500 | | | 11/15/25 | | | 328,799 | |
| | | | | 607,000 | | | | 5.750 | | | 06/15/27 | | | 553,214 | |
| | | | | 80,000 | | | | 5.500 | | | 04/15/29 | | | 66,926 | |
| | Voyager Aviation Holdings LLC(a)(b)(f) | |
| | | | | 1,020,000 | | | | 8.500 | | | 05/09/26 | | | 828,566 | |
| | | | | | | | | | | | | | | | |
| | | | | | | | | | | | | | | 15,531,552 | |
| | | |
| |
| | Electrical – 1.0% | |
| | Calpine Corp.(a)(b) | |
| | | | | 443,000 | | | | 4.500 | | | 02/15/28 | | | 399,555 | |
| | | | | 755,000 | | | | 4.625 | | | 02/01/29 | | | 636,646 | |
| | Electricite de France SA(a)(d) | |
| | (-1X 5 yr. EUR Swap + 3.198%) | |
| | EUR | | | 1,200,000 | | | | 3.000 | | | 09/03/27 | | | 1,067,962 | |
| | (-1X 5 yr. EUR Swap + 3.970%) | |
| | | | | 1,600,000 | | | | 3.375 | | | 06/15/30 | | | 1,301,463 | |
| | Eskom Holdings SOC Ltd.(g) | |
| | $ | | | 867,000 | | | | 4.314 | | | 07/23/27 | | | 758,590 | |
| | | |
| | |
| 46 | | The accompanying notes are an integral part of these financial statements. |
GOLDMAN SACHS MULTI-MANAGER NON-CORE FIXED INCOME FUND
| | | | | | | | | | | | | | | | |
| | | Principal Amount | | | Interest Rate | | | Maturity Date | | Value | |
| |
| | Corporate Obligations – (continued) | |
| |
| | Electrical – (continued) | |
| | Mercury Chile Holdco LLC(a) | |
| | $ | | | 1,687,000 | | | | 6.500 | % | | 01/24/27 | | $ | 1,514,083 | |
| | NPC Ukrenergo(f)(g) | |
| | | | | 263,000 | | | | 6.875 | | | 11/09/28 | | | 69,038 | |
| | NRG Energy, Inc.(a)(b) | |
| | | | | 665,000 | | | | 3.625 | | | 02/15/31 | | | 501,762 | |
| | | | | 571,000 | | | | 7.000 | | | 03/15/33 | | | 538,442 | |
| | (5 yr. CMT + 5.920%) | |
| | | | | 639,000 | | | | 10.250 | (d) | | 03/15/28 | | | 616,635 | |
| | Pattern Energy Operations LP/Pattern Energy Operations, Inc.(a)(b) | |
| | | | | 733,000 | | | | 4.500 | | | 08/15/28 | | | 637,666 | |
| | Talen Energy Supply LLC(a)(b) | |
| | | | | 688,000 | | | | 8.625 | | | 06/01/30 | | | 699,840 | |
| | Vistra Operations Co. LLC(a)(b) | |
| | | | | 700,000 | | | | 5.000 | | | 07/31/27 | | | 642,215 | |
| | | | | 400,000 | | | | 4.375 | | | 05/01/29 | | | 339,076 | |
| | | | | 29,000 | | | | 4.300 | | | 07/15/29 | | | 25,242 | |
| | | | | 667,000 | | | | 7.750 | | | 10/15/31 | | | 643,955 | |
| | | | | | | | | | | | | | | | |
| | | | | | | | | | | | | | | 10,392,170 | |
| | | |
| |
| | Electrical Components & Equipment(a)(b) – 0.1% | |
| | Belden, Inc. | |
| | EUR | | | 751,000 | | | | 3.375 | | | 07/15/31 | | | 655,390 | |
| | | |
| |
| | Electronics(a)(b) – 0.0% | |
| | Coherent Corp. | |
| | $ | | | 556,000 | | | | 5.000 | | | 12/15/29 | | | 472,361 | |
| | | |
| |
| | Energy-Alternate Sources(a)(b) – 0.2% | |
| | Cullinan Holdco SCSp | |
| | EUR | | | 500,000 | | | | 4.625 | | | 10/15/26 | | | 370,885 | |
| | Enviva Partners LP/Enviva Partners Finance Corp. | |
| | $ | | | 1,240,000 | | | | 6.500 | | | 01/15/26 | | | 871,360 | |
| | TerraForm Power Operating LLC | |
| | | | | 952,000 | | | | 5.000 | | | 01/31/28 | | | 871,461 | |
| | | | | | | | | | | | | | | | |
| | | | | | | | | | | | | | | 2,113,706 | |
| | | |
| |
| | Engineering & Construction(a) – 0.3% | |
| | Abertis Infraestructuras Finance BV(d) (-1X 5 yr. EUR Swap + 3.694%) | |
| | EUR | | | 900,000 | | | | 3.248 | | | 11/24/25 | | | 880,611 | |
| | Assemblin Group AB(b) (3 mo. EUR EURIBOR + 5.000%) | |
| | | | | 400,000 | | | | 8.964 | | | 07/05/29 | | | 417,383 | |
| | Global Infrastructure Solutions, Inc.(b) | |
| | $ | | | 989,000 | | | | 5.625 | | | 06/01/29 | | | 798,845 | |
| | Tutor Perini Corp.(b) | |
| | | | | 983,000 | | | | 6.875 | | | 05/01/25 | | | 845,586 | |
| | | | | | | | | | | | | | | | |
| | | | | | | | | | | | | | | 2,942,425 | |
| | | |
| |
| | Entertainment – 1.4% | |
| | 888 Acquisitions Ltd.(a)(b) | |
| | EUR | | | 753,000 | | | | 7.558 | | | 07/15/27 | | | 713,943 | |
| | Allwyn Entertainment Financing U.K. PLC(a)(b) | |
| | | | | 750,000 | | | | 7.250 | | | 04/30/30 | | | 787,623 | |
| | Allwyn International AS(a)(b) | |
| | | | | 350,000 | | | | 3.875 | | | 02/15/27 | | | 341,171 | |
| | | |
| | | | | | | | | | | | | | | | |
| | | Principal Amount | | | Interest Rate | | | Maturity Date | | Value | |
| |
| | Corporate Obligations – (continued) | |
| |
| | Entertainment – (continued) | |
| | Banijay Group SAS(a) | |
| | EUR | | | 505,000 | | | | 6.500 | % | | 03/01/26 | | $ | 527,314 | |
| | Caesars Entertainment, Inc.(a)(b) | |
| | $ | | | 1,675,000 | | | | 8.125 | | | 07/01/27 | | | 1,658,786 | |
| | | | | 839,000 | | | | 4.625 | | | 10/15/29 | | | 690,002 | |
| | | | | 540,000 | | | | 7.000 | | | 02/15/30 | | | 519,761 | |
| | Churchill Downs, Inc.(a)(b) | |
| | | | | 418,000 | | | | 6.750 | | | 05/01/31 | | | 390,345 | |
| | Cirsa Finance International SARL(a)(b) | |
| | EUR | | | 600,000 | | | | 4.750 | | | 05/22/25 | | | 624,004 | |
| | | | | 1,280,000 | | | | 4.500 | | | 03/15/27 | | | 1,233,071 | |
| | Empire Resorts, Inc.(a)(b) | |
| | $ | | | 1,730,000 | | | | 7.750 | | | 11/01/26 | | | 1,410,815 | |
| | International Game Technology PLC(a)(b) | |
| | | | | 335,000 | | | | 6.250 | | | 01/15/27 | | | 326,437 | |
| | EUR | | | 600,000 | | | | 2.375 | | | 04/15/28 | | | 559,725 | |
| | $ | | | 190,000 | | | | 5.250 | | | 01/15/29 | | | 172,940 | |
| | Jacobs Entertainment, Inc.(a)(b) | |
| | | | | 670,000 | | | | 6.750 | | | 02/15/29 | | | 570,398 | |
| | | | | 150,000 | | | | 6.750 | | | 02/15/29 | | | 125,523 | |
| | LHMC Finco 2 SARL(a)(b)(c) | |
| | EUR | | | 260,000 | | | | 7.250 | | | 10/02/25 | | | 265,026 | |
| | Live Nation Entertainment, Inc.(a)(b) | |
| | $ | | | 790,000 | | | | 4.750 | | | 10/15/27 | | | 722,273 | |
| | Loarre Investments SARL(a)(b) | |
| | EUR | | | 600,000 | | | | 6.500 | | | 05/15/29 | | | 593,842 | |
| | Merlin Entertainments Ltd.(a)(b) | |
| | $ | | | 250,000 | | | | 5.750 | | | 06/15/26 | | | 236,188 | |
| | Raptor Acquisition Corp./Raptor Co.-Issuer LLC(a)(b) | |
| | | | | 640,000 | | | | 4.875 | | | 11/01/26 | | | 595,718 | |
| | WMG Acquisition Corp.(a)(b) | |
| | EUR | | | 769,000 | | | | 2.250 | | | 08/15/31 | | | 631,220 | |
| | Wynn Resorts Finance LLC/Wynn Resorts Capital Corp.(a)(b) | |
| | $ | | | 1,351,000 | | | | 7.125 | | | 02/15/31 | | | 1,258,146 | |
| | | | | | | | | | | | | | | | |
| | | | | | | | | | | | | | | 14,954,271 | |
| | | |
| |
| | Environmental(a)(b) – 0.0% | |
| | Madison IAQ LLC | |
| | | | | 573,000 | | | | 5.875 | | | 06/30/29 | | | 443,834 | |
| | | |
| |
| | Food & Drug Retailing – 0.5% | |
| | Iceland Bondco PLC(a)(b) | |
| | GBP | | | 596,000 | | | | 4.625 | | | 03/15/25 | | | 714,512 | |
| | JBS USA LUX SA/JBS USA Food Co./JBS USA Finance, Inc.(a) | |
| | $ | | | 603,000 | | | | 5.500 | | | 01/15/30 | | | 551,317 | |
| | Lamb Weston Holdings, Inc.(a)(b) | |
| | | | | 925,000 | | | | 4.125 | | | 01/31/30 | | | 786,121 | |
| | MARB BondCo PLC(a) | |
| | | | | 1,028,000 | | | | 3.950 | | | 01/29/31 | | | 747,870 | |
| | Minerva Luxembourg SA(a)(b) | |
| | | | | 864,000 | | | | 8.875 | | | 09/13/33 | | | 846,245 | |
| | New Albertsons LP | |
| | | | | 800,000 | | | | 8.700 | | | 05/01/30 | | | 839,824 | |
| | | | | 175,000 | | | | 8.000 | | | 05/01/31 | | | 177,293 | |
| | | |
| | |
| The accompanying notes are an integral part of these financial statements. | | 47 |
GOLDMAN SACHS MULTI-MANAGER NON-CORE FIXED INCOME FUND
|
Schedule of Investments (continued) October 31, 2023 |
| | | | | | | | | | | | | | | | |
| | | Principal Amount | | | Interest Rate | | | Maturity Date | | Value | |
| |
| | Corporate Obligations – (continued) | |
| |
| | Food & Drug Retailing – (continued) | |
| | Nomad Foods Bondco PLC(a)(b) | |
| | EUR | | | 407,000 | | | | 2.500 | % | | 06/24/28 | | $ | 372,746 | |
| | Post Holdings, Inc.(a)(b) | |
| | $ | | | 565,000 | | | | 5.625 | | | 01/15/28 | | | 524,783 | |
| | | | | | | | | | | | | | | | |
| | | | | | | | | | | | | | | 5,560,711 | |
| | | |
| |
| | Forest Products & Paper(a)(b) – 0.2% | |
| | Domtar Corp. | |
| | | | | 2,579,000 | | | | 6.750 | | | 10/01/28 | | | 2,102,091 | |
| | | |
| |
| | Gaming(a) – 0.1% | |
| | MGM Resorts International | |
| | | | | 819,000 | | | | 4.750 | | | 10/15/28 | | | 714,954 | |
| | Wynn Macau Ltd.(b) | |
| | | | | 730,000 | | | | 5.125 | | | 12/15/29 | | | 568,933 | |
| | | | | | | | | | | | | | | | |
| | | | | | | | | | | | | | | 1,283,887 | |
| | | |
| |
| | Hand/Machine Tools(a)(b) – 0.0% | |
| | IMA Industria Macchine Automatiche SpA | |
| | EUR | | | 360,000 | | | | 3.750 | | | 01/15/28 | | | 342,585 | |
| | | |
| |
| | Health Care Services(a)(b) – 0.1% | |
| | Cerba Healthcare SACA | |
| | | | | 700,000 | | | | 3.500 | | | 05/31/28 | | | 599,943 | |
| | | |
| |
| | Healthcare Providers & Services – 1.5% | |
| | Air Methods Corp.(a)(b)(f) | |
| | $ | | | 245,000 | | | | 8.000 | | | 05/15/25 | | | 617 | |
| | Akumin, Inc.(a)(b)(f) | |
| | | | | 2,595,000 | | | | 7.000 | | | 11/01/25 | | | 2,207,359 | |
| | | | | 15,000 | | | | 7.500 | | | 08/01/28 | | | 11,863 | |
| | Avantor Funding, Inc.(a)(b) | |
| | EUR | | | 504,000 | | | | 2.625 | | | 11/01/25 | | | 512,308 | |
| | | | | 195,000 | | | | 3.875 | | | 07/15/28 | | | 188,276 | |
| | CAB SELAS(a)(b) | |
| | | | | 835,000 | | | | 3.375 | | | 02/01/28 | | | 736,674 | |
| | Envision Healthcare Corp.(a)(b)(f) | |
| | $ | | | 835,000 | | | | 8.750 | | | 10/15/26 | | | 39,136 | |
| | Global Medical Response, Inc.(a)(b) | |
| | | | | 3,545,000 | | | | 6.500 | | | 10/01/25 | | | 2,258,519 | |
| | HCA, Inc.(a) | |
| | | | | 611,000 | | | | 3.500 | | | 09/01/30 | | | 505,700 | |
| | Legacy LifePoint Health LLC(a)(b) | |
| | | | | 66,000 | | | | 4.375 | | | 02/15/27 | | | 54,562 | |
| | LifePoint Health, Inc.(a)(b) | |
| | | | | 472,000 | | | | 5.375 | | | 01/15/29 | | | 285,305 | |
| | | | | 914,000 | | | | 9.875 | | | 08/15/30 | | | 825,717 | |
| | Medline Borrower LP(a)(b) | |
| | | | | 1,561,000 | | | | 3.875 | | | 04/01/29 | | | 1,317,375 | |
| | Molina Healthcare, Inc.(a)(b) | |
| | | | | 893,000 | | | | 4.375 | | | 06/15/28 | | | 797,244 | |
| | | | | 650,000 | | | | 3.875 | | | 11/15/30 | | | 530,322 | |
| | Radiology Partners, Inc.(a)(b) | |
| | | | | 645,000 | | | | 9.250 | | | 02/01/28 | | | 240,121 | |
| | RegionalCare Hospital Partners Holdings, Inc./LifePoint Health, Inc.(a)(b) | |
| | | | | 327,000 | | | | 9.750 | | | 12/01/26 | | | 307,942 | |
| | | |
| | | | | | | | | | | | | | | | |
| | | Principal Amount | | | Interest Rate | | | Maturity Date | | Value | |
| |
| | Corporate Obligations – (continued) | |
| |
| | Healthcare Providers & Services – (continued) | |
| | RP Escrow Issuer LLC(a)(b) | |
| | $ | | | 3,200,000 | | | | 5.250 | % | | 12/15/25 | | $ | 2,311,488 | |
| |
| | Team Health Holdings, Inc.(a)(b) | |
| | | | | 956,000 | | | | 6.375 | | | 02/01/25 | | | 766,244 | |
| | Tenet Healthcare Corp.(a) | |
| | | | | 1,131,000 | | | | 6.125 | | | 10/01/28 | | | 1,046,333 | |
| | | | | 1,000,000 | | | | 6.750 | (b) | | 05/15/31 | | | 949,880 | |
| | | | | | | | | | | | | | | | |
| | | | | | | | | | | | | | | 15,892,985 | |
| | | |
| |
| | Home Builders – 0.1% | |
| | Ashton Woods USA LLC/Ashton Woods Finance Co.(a)(b) | |
| | | | | 350,000 | | | | 6.625 | | | 01/15/28 | | | 320,530 | |
| | | | | 321,000 | | | | 4.625 | | | 08/01/29 | | | 260,206 | |
| | | | | | | | | | | | | | | | |
| | | | | | | | | | | | | | | 580,736 | |
| | | |
| |
| | Home Furnishings(a)(b) – 0.1% | |
| | International Design Group SpA | |
| | EUR | | | 600,000 | | | | 6.500 | | | 11/15/25 | | | 605,092 | |
| | | |
| |
| | Household Products(a)(b) – 0.0% | |
| | Kronos Acquisition Holdings, Inc./KIK Custom Products, Inc. | |
| | $ | | | 491,000 | | | | 7.000 | | | 12/31/27 | | | 419,186 | |
| | | |
| |
| | Insurance – 0.5% | |
| | Acrisure LLC/Acrisure Finance, Inc.(a)(b) | |
| | | | | 525,000 | | | | 10.125 | | | 08/01/26 | | | 528,523 | |
| | | | | 131,000 | | | | 4.250 | | | 02/15/29 | | | 107,426 | |
| | Alliant Holdings Intermediate LLC/Alliant Holdings | |
| | Co-Issuer(a)(b) | |
| | | | | 440,000 | | | | 6.750 | | | 10/15/27 | | | 401,447 | |
| | AssuredPartners, Inc.(a)(b) | |
| | | | | 3,250,000 | | | | 7.000 | | | 08/15/25 | | | 3,184,610 | |
| | Highlands Holdings Bond Issuer Ltd./Highlands Holdings Bond | |
| | Co.-Issuer, Inc.(a)(b)(c) | |
| | | | | 1,191,875 | | | | 7.625 | | | 10/15/25 | | | 1,161,423 | |
| | Sagicor Financial Co. Ltd.(a) | |
| | | | | 235,000 | | | | 5.300 | | | 05/13/28 | | | 217,866 | |
| | | | | | | | | | | | | | | | |
| | | | | | | | | | | | | | | 5,601,295 | |
| | | |
| |
| | Internet – 0.3% | |
| | ANGI Group LLC(a)(b) | |
| | | | | 979,000 | | | | 3.875 | | | 08/15/28 | | | 735,797 | |
| | Cablevision Lightpath LLC(a)(b) | |
| | | | | 550,000 | | | | 5.625 | | | 09/15/28 | | | 412,505 | |
| | Engineering - Ingegneria Informatica - SpA(a)(b) | |
| | EUR | | | 650,000 | | | | 5.875 | | | 09/30/26 | | | 608,693 | |
| | Go Daddy Operating Co. LLC/GD Finance Co., Inc.(a)(b) | |
| | $ | | | 346,000 | | | | 5.250 | | | 12/01/27 | | | 326,610 | |
| | | | | 207,000 | | | | 3.500 | | | 03/01/29 | | | 174,093 | |
| | GrubHub Holdings, Inc.(a)(b) | |
| | | | | 470,000 | | | | 5.500 | | | 07/01/27 | | | 346,743 | |
| | HSE Finance SARL(a)(b) | |
| | EUR | | | 150,000 | | | | 5.625 | | | 10/15/26 | | | 80,575 | |
| | Netflix, Inc.(a)(b) | |
| | | | | 323,000 | | | | 3.625 | | | 06/15/30 | | | 327,894 | |
| | | |
| | |
| 48 | | The accompanying notes are an integral part of these financial statements. |
GOLDMAN SACHS MULTI-MANAGER NON-CORE FIXED INCOME FUND
| | | | | | | | | | | | | | | | |
| | | Principal Amount | | | Interest
Rate | | | Maturity Date | | Value | |
| |
| | Corporate Obligations – (continued) | |
| |
| | Internet – (continued) | |
| |
| | United Group BV(a)(b) | |
| | EUR | | | 870,000 | | | | 5.250 | % | | 02/01/30 | | $ | 744,953 | |
| | | | | | | | | | | | | | | | |
| | | | | | | | | | | | | | | 3,757,863 | |
| | | |
| |
| | Investment Companies – 0.6% | |
| | Blackstone Private Credit Fund(a) | |
| | $ | | | 1,000,000 | | | | 2.625 | | | 12/15/26 | | | 856,300 | |
| | Blue Owl Capital Corp.(a) | |
| | | | | 962,000 | | | | 3.400 | | | 07/15/26 | | | 857,748 | |
| | Gaci First Investment Co.(a) | |
| | | | | 478,000 | | | | 4.875 | | | 02/14/35 | | | 422,433 | |
| | | | | 879,000 | | | | 5.125 | | | 02/14/53 | | | 677,929 | |
| | GTCR W-2 Merger Sub LLC(a)(b) | |
| | | | | 500,000 | | | | 7.500 | | | 01/15/31 | | | 493,055 | |
| | Khazanah Capital Ltd. | |
| | | | | 1,471,000 | | | | 4.876 | | | 06/01/33 | | | 1,346,627 | |
| | Khazanah Global Sukuk Bhd. | |
| | | | | 415,000 | | | | 4.687 | | | 06/01/28 | | | 398,010 | |
| | MDGH GMTN RSC Ltd. | |
| | | | | 633,000 | | | | 5.500 | (a) | | 04/28/33 | | | 612,427 | |
| | | | | 925,000 | | | | 5.875 | (b) | | 05/01/34 | | | 914,714 | |
| | | | | | | | | | | | | | | | |
| | | | | | | | | | | | | | | 6,579,243 | |
| | | |
| |
| | Iron/Steel – 0.6% | |
| | Baffinland Iron Mines Corp./Baffinland Iron Mines LP(a)(b) | |
| | | | | 2,215,000 | | | | 8.750 | | | 07/15/26 | | | 2,131,561 | |
| | CSN Resources SA(a) | |
| | | | | 758,000 | | | | 5.875 | | | 04/08/32 | | | 596,925 | |
| | Mineral Resources Ltd.(a)(b) | |
| | | | | 2,000,000 | | | | 8.125 | | | 05/01/27 | | | 1,942,940 | |
| | | | | 442,000 | | | | 8.000 | | | 11/01/27 | | | 428,369 | |
| | | | | 447,000 | | | | 9.250 | | | 10/01/28 | | | 446,258 | |
| | | | | 504,000 | | | | 8.500 | | | 05/01/30 | | | 484,913 | |
| | Tacora Resources, Inc.(a)(b) | |
| | | | | 405,000 | | | | 8.250 | | | 05/15/26 | | | 221,175 | |
| | | | | | | | | | | | | | | | |
| | | | | | | | | | | | | | | 6,252,141 | |
| | | |
| |
| | Leisure Time – 0.4% | |
| | Carnival Corp.(a)(b) | |
| | | | | 1,250,000 | | | | 5.750 | | | 03/01/27 | | | 1,115,675 | |
| | | | | 764,000 | | | | 9.875 | | | 08/01/27 | | | 796,134 | |
| | Deuce Finco PLC(a)(b) | |
| | GBP | | | 150,000 | | | | 5.500 | | | 06/15/27 | | | 158,231 | |
| | NCL Corp. Ltd. Class C(a)(b) | |
| | $ | | | 1,000,000 | | | | 5.875 | | | 03/15/26 | | | 899,120 | |
| | TUI Cruises GmbH(a)(b) | |
| | EUR | | | 450,000 | | | | 6.500 | | | 05/15/26 | | | 440,825 | |
| | Viking Cruises Ltd.(a)(b) | |
| | $ | | | 681,000 | | | | 5.875 | | | 09/15/27 | | | 613,308 | |
| | | | | 449,000 | | | | 9.125 | | | 07/15/31 | | | 441,080 | |
| | | | | | | | | | | | | | | | |
| | | | | | | | | | | | | | | 4,464,373 | |
| | | |
| |
| | Lodging(a)(b) – 0.1% | |
| | Hilton Domestic Operating Co., Inc. | |
| | | | | 575,000 | | | | 4.000 | | | 05/01/31 | | | 475,094 | |
| | | |
| | | | | | | | | | | | | | | | |
| | | Principal Amount | | | Interest
Rate | | | Maturity Date | | Value | |
| |
| | Corporate Obligations – (continued) | |
| | Lodging(a)(b) – (continued) | |
| |
| | NH Hotel Group SA | |
| | EUR | | | 400,000 | | | | 4.000 | % | | 07/02/26 | | $ | 403,094 | |
| | | | | | | | | | | | | | | | |
| | | | | | | | | | | | | | | 878,188 | |
| | | |
| |
| | Machinery - Construction & Mining(a)(b) – 0.1% | |
| | BWX Technologies, Inc. | |
| | $ | | | 645,000 | | | | 4.125 | | | 06/30/28 | | | 569,974 | |
| | | |
| |
| | Machinery-Diversified – 0.3% | |
| | Chart Industries, Inc.(a)(b) | |
| | | | | 717,000 | | | | 7.500 | | | 01/01/30 | | | 704,467 | |
| | | | | 1,048,000 | | | | 9.500 | | | 01/01/31 | | | 1,079,723 | |
| | Novafives SAS(a)(b) | |
| | EUR | | | 300,000 | | | | 5.000 | | | 06/15/25 | | | 304,069 | |
| | (3 mo. EUR EURIBOR + 4.500%) | |
| | | | | 345,000 | | | | 8.345 | | | 06/15/25 | | | 353,418 | |
| | OT Merger Corp.(a)(b) | |
| | $ | | | 614,000 | | | | 7.875 | | | 10/15/29 | | | 362,285 | |
| | SPX FLOW, Inc.(a)(b) | |
| | | | | 538,000 | | | | 8.750 | | | 04/01/30 | | | 492,501 | |
| | | | | | | | | | | | | | | | |
| | | | | | | | | | | | | | | 3,296,463 | |
| | | |
| |
| | Media – 3.4% | |
| | Altice Financing SA(a)(b) | |
| | EUR | | | 300,000 | | | | 2.250 | | | 01/15/25 | | | 306,352 | |
| | $ | | | 417,000 | | | | 5.000 | | | 01/15/28 | | | 339,851 | |
| | | | | 2,570,000 | | | | 5.750 | | | 08/15/29 | | | 1,984,683 | |
| | Altice Finco SA(a)(b) | |
| | EUR | | | 242,000 | | | | 4.750 | | | 01/15/28 | | | 190,278 | |
| | Audacy Capital Corp.(a)(b) | |
| | $ | | | 745,000 | | | | 6.500 | | | 05/01/27 | | | 7,450 | |
| | | | | 925,000 | | | | 6.750 | | | 03/31/29 | | | 10,360 | |
| | Beasley Mezzanine Holdings LLC(a)(b) | |
| | | | | 1,610,000 | | | | 8.625 | | | 02/01/26 | | | 1,062,503 | |
| | CCO Holdings LLC/CCO Holdings Capital Corp.(a)(b) | |
| | | | | 1,344,000 | | | | 6.375 | | | 09/01/29 | | | 1,232,717 | |
| | | | | 1,855,000 | | | | 4.500 | | | 08/15/30 | | | 1,489,268 | |
| | | | | 650,000 | | | | 4.250 | | | 02/01/31 | | | 505,752 | |
| | | | | 1,143,000 | | | | 7.375 | | | 03/01/31 | | | 1,080,158 | |
| | CSC Holdings LLC(a)(b) | |
| | | | | 721,000 | | | | 5.500 | | | 04/15/27 | | | 602,021 | |
| | | | | 215,000 | | | | 6.500 | | | 02/01/29 | | | 169,779 | |
| | | | | 2,538,000 | | | | 5.750 | | | 01/15/30 | | | 1,332,298 | |
| | Diamond Sports Group LLC/Diamond Sports Finance Co.(a)(b)(f) | |
| | | | | 2,069,000 | | | | 5.375 | | | 08/15/26 | | | 23,214 | |
| | | | | 1,274,000 | | | | 6.625 | | | 08/15/27 | | | 12,867 | |
| | DISH DBS Corp. | |
| | | | | 180,000 | | | | 5.875 | | | 11/15/24 | | | 165,150 | |
| | | | | 1,238,000 | | | | 7.750 | | | 07/01/26 | | | 828,853 | |
| | | | | 2,260,000 | | | | 5.250 | (a)(b) | | 12/01/26 | | | 1,825,831 | |
| | | | | 992,000 | | | | 5.750 | (a)(b) | | 12/01/28 | | | 709,211 | |
| | | | | 1,063,000 | | | | 5.125 | | | 06/01/29 | | | 546,520 | |
| | DISH Network Corp.(a)(b) | |
| | | | | 480,000 | | | | 11.750 | | | 11/15/27 | | | 475,411 | |
| | | |
| | |
| The accompanying notes are an integral part of these financial statements. | | 49 |
GOLDMAN SACHS MULTI-MANAGER NON-CORE FIXED INCOME FUND
|
Schedule of Investments (continued) October 31, 2023 |
| | | | | | | | | | | | | | | | |
| | | Principal Amount | | | Interest
Rate | | | Maturity Date | | Value | |
| |
| | Corporate Obligations – (continued) | |
| |
| | Media – (continued) | |
| |
| | Gray Escrow II, Inc.(a)(b) | |
| | $ | | | 840,000 | | | | 5.375 | % | | 11/15/31 | | $ | 526,772 | |
| | Gray Television, Inc.(a)(b) | |
| | | | | 2,363,000 | | | | 7.000 | | | 05/15/27 | | | 1,992,080 | |
| | | | | 1,233,000 | | | | 4.750 | | | 10/15/30 | | | 791,080 | |
| | LCPR Senior Secured Financing DAC(a)(b) | |
| | | | | 1,692,000 | | | | 6.750 | | | 10/15/27 | | | 1,532,004 | |
| | Liberty Interactive LLC(a) | |
| | | | | 3,940,472 | | | | 4.000 | | | 11/15/29 | | | 728,987 | |
| | | | | 340,589 | | | | 3.750 | | | 02/15/30 | | | 63,009 | |
| | McGraw-Hill Education, Inc.(a)(b) | |
| | | | | 450,000 | | | | 5.750 | | | 08/01/28 | | | 379,481 | |
| | Nexstar Media, Inc.(a)(b) | |
| | | | | 583,000 | | | | 5.625 | | | 07/15/27 | | | 524,508 | |
| | | | | 545,000 | | | | 4.750 | | | 11/01/28 | | | 458,628 | |
| | Paramount Global(a)(d) (5 yr. CMT + 3.999%) | |
| | | | | 1,347,000 | | | | 6.375 | | | 03/30/62 | | | 985,613 | |
| | Radiate Holdco LLC/Radiate Finance, Inc.(a)(b) | |
| | | | | 1,775,000 | | | | 4.500 | | | 09/15/26 | | | 1,360,857 | |
| | Scripps Escrow II, Inc.(a)(b) | |
| | | | | 1,077,000 | | | | 3.875 | | | 01/15/29 | | | 816,948 | |
| | Sinclair Television Group, Inc.(a)(b) | |
| | | | | 805,000 | | | | 5.500 | | | 03/01/30 | | | 436,745 | |
| | | | | 957,000 | | | | 4.125 | | | 12/01/30 | | | 601,044 | |
| | Sirius XM Radio, Inc.(a)(b) | |
| | | | | 300,000 | | | | 3.125 | | | 09/01/26 | | | 269,238 | |
| | | | | 858,000 | | | | 5.000 | | | 08/01/27 | | | 787,798 | |
| | | | | 800,000 | | | | 4.000 | | | 07/15/28 | | | 680,088 | |
| | Spanish Broadcasting System, Inc.(a)(b) | |
| | | | | 1,225,000 | | | | 9.750 | | | 03/01/26 | | | 759,868 | |
| | Summer BidCo BV(a)(b)(c) | |
| | EUR | | | 816,675 | | | | 9.000 | | | 11/15/25 | | | 845,087 | |
| | TEGNA, Inc.(a) | |
| | $ | | | 1,392,000 | | | | 4.625 | | | 03/15/28 | | | 1,205,709 | |
| | | | | 624,000 | | | | 5.000 | | | 09/15/29 | | | 523,942 | |
| | Tele Columbus AG(a)(b) | |
| | EUR | | | 200,000 | | | | 3.875 | | | 05/02/25 | | | 115,047 | |
| | Telenet Finance Luxembourg Notes SARL(a)(b) | |
| | $ | | | 1,200,000 | | | | 5.500 | | | 03/01/28 | | | 1,057,068 | |
| | Univision Communications, Inc.(a)(b) | |
| | | | | 468,000 | | | | 6.625 | | | 06/01/27 | | | 427,476 | |
| | | | | 528,000 | | | | 7.375 | | | 06/30/30 | | | 465,601 | |
| | Urban One, Inc.(a)(b) | |
| | | | | 1,215,000 | | | | 7.375 | | | 02/01/28 | | | 1,009,616 | |
| | Virgin Media Secured Finance PLC(a)(b) | |
| | GBP | | | 470,000 | | | | 5.000 | | | 04/15/27 | | | 531,650 | |
| | VTR Comunicaciones SpA(a)(b) | |
| | $ | | | 170,000 | | | | 4.375 | | | 04/15/29 | | | 73,629 | |
| | VTR Finance NV(a)(b) | |
| | | | | 1,145,000 | | | | 6.375 | | | 07/15/28 | | | 196,768 | |
| | VZ Secured Financing BV(a)(b) | |
| | | | | 1,255,000 | | | | 5.000 | | | 01/15/32 | | | 953,662 | |
| | | |
| | | | | | | | | | | | | | | | |
| | | Principal Amount | | | Interest
Rate | | | Maturity Date | | Value | |
| |
| | Corporate Obligations – (continued) | |
| |
| | Media – (continued) | |
| |
| | Ziggo Bond Co. BV(a)(b) | |
| | $ | | | 395,000 | | | | 6.000 | % | | 01/15/27 | | $ | 361,603 | |
| | | | | | | | | | | | | | | | |
| | | | | | | | | | | | | | | 36,362,133 | |
| | | |
| |
| | Mining – 0.8% | |
| | Arsenal AIC Parent LLC(a)(b) | |
| | | | | 403,000 | | | | 8.000 | | | 10/01/30 | | | 397,938 | |
| | Compass Minerals International, Inc.(a)(b) | |
| | | | | 850,000 | | | | 6.750 | | | 12/01/27 | | | 800,870 | |
| | Corp. Nacional del Cobre de Chile(a)(b) | |
| | | | | 1,140,000 | | | | 5.950 | | | 01/08/34 | | | 1,059,060 | |
| | First Quantum Minerals Ltd.(a)(b) | |
| | | | | 175,000 | | | | 7.500 | | | 04/01/25 | | | 163,205 | |
| | | | | 700,000 | | | | 6.875 | | | 03/01/26 | | | 614,075 | |
| | | | | 200,000 | | | | 6.875 | | | 10/15/27 | | | 168,500 | |
| | | | | 727,000 | | | | 8.625 | | | 06/01/31 | | | 612,498 | |
| | FMG Resources August 2006 Pty. Ltd.(a)(b) | |
| | | | | 595,000 | | | | 5.875 | | | 04/15/30 | | | 533,275 | |
| | Freeport-McMoRan, Inc.(a) | |
| | | | | 320,000 | | | | 4.625 | | | 08/01/30 | | | 282,576 | |
| | | | | 795,000 | | | | 5.400 | | | 11/14/34 | | | 701,953 | |
| | Mountain Province Diamonds, Inc.(a)(b)(h) | |
| | | | | 2,861,000 | | | | 9.000 | | | 12/15/25 | | | 2,789,475 | |
| | Northwest Acquisitions ULC/Dominion Finco, Inc.(a)(b)(f) | |
| | | | | 1,260,000 | | | | 7.125 | | | 11/01/22 | | | 126 | |
| | | | | | | | | | | | | | | | |
| | | | | | | | | | | | | | | 8,123,551 | |
| | | |
| |
| | Miscellaneous Manufacturing(a)(b) – 0.1% | |
| | LSB Industries, Inc. | |
| | | | | 730,000 | | | | 6.250 | | | 10/15/28 | | | 648,554 | |
| | | |
| |
| | Office & Business Equipment – 0.1% | |
| | Pitney Bowes, Inc.(a)(b) | |
| | | | | 420,000 | | | | 6.875 | | | 03/15/27 | | | 347,390 | |
| | | | | 705,000 | | | | 7.250 | | | 03/15/29 | | | 532,346 | |
| | | | | | | | | | | | | | | | |
| | | | | | | | | | | | | | | 879,736 | |
| | | |
| |
| | Oil Field Services – 3.0% | |
| | Antero Resources Corp.(a)(b) | |
| | | | | 182,000 | | | | 7.625 | | | 02/01/29 | | | 184,486 | |
| | | | | 873,000 | | | | 5.375 | | | 03/01/30 | | | 797,232 | |
| | Apache Corp.(a) | |
| | | | | 634,000 | | | | 5.100 | | | 09/01/40 | | | 493,170 | |
| | Archrock Partners LP/Archrock Partners Finance Corp.(a)(b) | |
| | | | | 604,000 | | | | 6.250 | | | 04/01/28 | | | 561,925 | |
| | Ascent Resources Utica Holdings LLC/ARU Finance Corp.(a)(b) | |
| | | | | 230,000 | | | | 7.000 | | | 11/01/26 | | | 222,270 | |
| | | | | 500,000 | | | | 8.250 | | | 12/31/28 | | | 496,550 | |
| | Baytex Energy Corp.(a)(b) | |
| | | | | 756,000 | | | | 8.500 | | | 04/30/30 | | | 749,703 | |
| | Callon Petroleum Co.(a)(b) | |
| | | | | 125,000 | | | | 8.000 | | | 08/01/28 | | | 123,908 | |
| | | | | 390,000 | | | | 7.500 | | | 06/15/30 | | | 377,773 | |
| | Chesapeake Energy Corp.(i) | |
| | | | | 195,000 | | | | 7.000 | | | 10/01/24 | | | 4,290 | |
| | | | | 935,000 | | | | 7.500 | | | 10/01/26 | | | 18,700 | |
| | | |
| | |
| 50 | | The accompanying notes are an integral part of these financial statements. |
GOLDMAN SACHS MULTI-MANAGER NON-CORE FIXED INCOME FUND
| | | | | | | | | | | | | | | | |
| | | Principal Amount | | | Interest
Rate | | | Maturity Date | | Value | |
| |
| | Corporate Obligations – (continued) | |
| |
| | Oil Field Services – (continued) | |
| |
| | CITGO Petroleum Corp.(a)(b) | |
| | $ | | | 671,000 | | | | 7.000 | % | | 06/15/25 | | $ | 659,915 | |
| | | | | 774,000 | | | | 6.375 | | | 06/15/26 | | | 761,214 | |
| | | | | 1,243,000 | | | | 8.375 | | | 01/15/29 | | | 1,231,067 | |
| | Civitas Resources, Inc.(a)(b) | |
| | | | | 773,000 | | | | 8.375 | | | 07/01/28 | | | 778,550 | |
| | | | | 578,000 | | | | 8.750 | | | 07/01/31 | | | 583,624 | |
| | Earthstone Energy Holdings LLC(a)(b) | |
| | | | | 1,241,000 | | | | 8.000 | | | 04/15/27 | | | 1,257,865 | |
| | | | | 497,000 | | | | 9.875 | | | 07/15/31 | | | 535,885 | |
| | Ecopetrol SA(a) | |
| | | | | 233,000 | | | | 8.625 | | | 01/19/29 | | | 231,952 | |
| | | | | 736,000 | | | | 8.875 | | | 01/13/33 | | | 703,616 | |
| | EDO Sukuk Ltd.(b) | |
| | | | | 716,000 | | | | 5.875 | | | 09/21/33 | | | 686,823 | |
| | Energian Israel Finance Ltd.(a) | |
| | | | | 970,240 | | | | 8.500 | | | 09/30/33 | | | 845,322 | |
| | Greenfire Resources Ltd.(a)(b) | |
| | | | | 620,000 | | | | 12.000 | | | 10/01/28 | | | 617,092 | |
| | Guara Norte SARL(b) | |
| | | | | 442,130 | | | | 5.198 | | | 06/15/34 | | | 371,864 | |
| | KazMunayGas National Co. JSC(a) | |
| | | | | 462,000 | | | | 3.500 | | | 04/14/33 | | | 336,105 | |
| | Kosmos Energy Ltd.(a)(b) | |
| | | | | 742,000 | | | | 7.750 | | | 05/01/27 | | | 666,375 | |
| | Moss Creek Resources Holdings, Inc.(a)(b) | |
| | | | | 1,001,000 | | | | 7.500 | | | 01/15/26 | | | 957,777 | |
| | Noble Finance II LLC(a)(b) | |
| | | | | 448,000 | | | | 8.000 | | | 04/15/30 | | | 449,537 | |
| | Northern Oil & Gas, Inc.(a)(b) | |
| | | | | 345,000 | | | | 8.125 | | | 03/01/28 | | | 340,546 | |
| | NuVista Energy Ltd.(a)(b) | |
| | CAD | | | 775,000 | | | | 7.875 | | | 07/23/26 | | | 560,258 | |
| | Permian Resources Operating LLC(a)(b) | |
| | $ | | | 410,000 | | | | 7.750 | | | 02/15/26 | | | 410,041 | |
| | Petroleos de Venezuela SA(f) | |
| | | | | 997,000 | | | | 6.000 | | | 11/15/26 | | | 126,121 | |
| | Petroleos del Peru SA | |
| | | | | 1,492,000 | | | | 5.625 | | | 06/19/47 | | | 813,796 | |
| | Petroleos Mexicanos | |
| | | | | 3,835,000 | | | | 10.000 | (a) | | 02/07/33 | | | 3,418,902 | |
| | | | | 3,271,000 | | | | 6.750 | | | 09/21/47 | | | 1,851,386 | |
| | Petronas Capital Ltd.(a) | |
| | | | | 1,200,000 | | | | 3.500 | | | 04/21/30 | | | 1,043,004 | |
| | | | | 694,000 | | | | 2.480 | | | 01/28/32 | | | 538,690 | |
| | | | | 505,000 | | | | 3.404 | | | 04/28/61 | | | 299,312 | |
| | QatarEnergy(a) | |
| | | | | 1,227,000 | | | | 2.250 | | | 07/12/31 | | | 957,827 | |
| | Rockcliff Energy II LLC(a)(b) | |
| | | | | 967,000 | | | | 5.500 | | | 10/15/29 | | | 874,903 | |
| | Strathcona Resources Ltd.(a)(b) | |
| | | | | 1,805,000 | | | | 6.875 | | | 08/01/26 | | | 1,678,524 | |
| | Transocean Titan Financing Ltd.(a)(b) | |
| | | | | 370,000 | | | | 8.375 | | | 02/01/28 | | | 370,821 | |
| | | |
| | | | | | | | | | | | | | | | |
| | | Principal Amount | | | Interest
Rate | | | Maturity Date | | Value | |
| |
| | Corporate Obligations – (continued) | |
| |
| | Oil Field Services – (continued) | |
| |
| | Transocean, Inc.(a)(b) | |
| | $ | | | 583,000 | | | | 7.250 | % | | 11/01/25 | | $ | 568,542 | |
| | | | | 507,000 | | | | 11.500 | | | 01/30/27 | | | 527,315 | |
| | | | | 380,000 | | | | 8.000 | | | 02/01/27 | | | 356,516 | |
| | | | | 738,150 | | | | 8.750 | | | 02/15/30 | | | 736,947 | |
| | Wintershall Dea Finance 2 BV(a)(d) (-1X 5 yr. EUR Swap + 3.319%) | |
| | EUR | | | 1,100,000 | | | | 3.000 | | | 07/20/28 | | | 940,265 | |
| | | | | | | | | | | | | | | | |
| | | | | | | | | | | | | | | 32,118,306 | |
| | | |
| |
| | Packaging – 0.7% | |
| | ARD Finance SA(a)(b)(c) | |
| | | | | 271,000 | | | | 5.000 | | | 06/30/27 | | | 166,662 | |
| | Ardagh Metal Packaging Finance USA LLC/Ardagh Metal Packaging Finance PLC(a)(b) | |
| | | | | 400,000 | | | | 2.000 | | | 09/01/28 | | | 348,525 | |
| | Ardagh Packaging Finance PLC/Ardagh Holdings USA, Inc.(a)(b) | |
| | $ | | | 610,000 | | | | 5.250 | | | 04/30/25 | | | 587,894 | |
| | | | | 362,000 | | | | 5.250 | | | 08/15/27 | | | 263,380 | |
| | | | | 142,000 | | | | 5.250 | | | 08/15/27 | | | 103,394 | |
| | Ball Corp.(a) | |
| | | | | 1,249,000 | | | | 2.875 | | | 08/15/30 | | | 973,633 | |
| | | | | 680,000 | | | | 3.125 | | | 09/15/31 | | | 525,783 | |
| | Canpack SA/Canpack U.S. LLC(a)(b) | |
| | EUR | | | 307,000 | | | | 2.375 | | | 11/01/27 | | | 272,473 | |
| | Fiber Bidco Spa(a)(b) | |
| | | | | 266,000 | | | | 11.000 | | | 10/25/27 | | | 298,500 | |
| | Guala Closures SpA(a)(b) | |
| | | | | 725,000 | | | | 3.250 | | | 06/15/28 | | | 665,042 | |
| | Intelligent Packaging Ltd. Finco, Inc./Intelligent Packaging Ltd. Co.-Issuer LLC(a)(b) | |
| | $ | | | 1,306,000 | | | | 6.000 | | | 09/15/28 | | | 1,079,853 | |
| | Kleopatra Holdings 2 SCA(a)(b) | |
| | EUR | | | 300,000 | | | | 6.500 | | | 09/01/26 | | | 182,522 | |
| | OI European Group BV(a)(b) | |
| | | | | 450,000 | | | | 2.875 | | | 02/15/25 | | | 461,366 | |
| | $ | | | 514,000 | | | | 4.750 | | | 02/15/30 | | | 437,249 | |
| | Trident TPI Holdings, Inc.(a)(b) | |
| | | | | 856,000 | | | | 12.750 | | | 12/31/28 | | | 877,349 | |
| | | | | | | | | | | | | | | | |
| | | | | | | | | | | | | | | 7,243,625 | |
| | | |
| |
| | Pharmaceuticals – 0.7% | |
| | Almirall SA(a)(b) | |
| | EUR | | | 554,000 | | | | 2.125 | | | 09/30/26 | | | 546,872 | |
| | Bormioli Pharma Spa(a)(b) (3 mo. EUR EURIBOR + 5.500%) | |
| | | | | 550,000 | | | | 9.281 | | | 05/15/28 | | | 578,289 | |
| | Cheplapharm Arzneimittel GmbH(a)(b) | |
| | | | | 650,000 | | | | 4.375 | | | 01/15/28 | | | 625,859 | |
| | $ | | | 1,341,000 | | | | 5.500 | | | 01/15/28 | | | 1,198,693 | |
| | Endo Dac/Endo Finance LLC/Endo Finco, Inc.(a)(b)(f) | |
| | | | | 1,183,000 | | | | 9.500 | | | 07/31/27 | | | 81,260 | |
| | | | | 946,000 | | | | 6.000 | | | 06/30/28 | | | 73,211 | |
| | Grifols SA(a)(b) | |
| | EUR | | | 700,000 | | | | 2.250 | | | 11/15/27 | | | 648,716 | |
| | $ | | | 659,000 | | | | 4.750 | | | 10/15/28 | | | 552,282 | |
| | | |
| | |
| The accompanying notes are an integral part of these financial statements. | | 51 |
GOLDMAN SACHS MULTI-MANAGER NON-CORE FIXED INCOME FUND
|
Schedule of Investments (continued) October 31, 2023 |
| | | | | | | | | | | | | | | | |
| | | Principal Amount | | | Interest
Rate | | | Maturity Date | | Value | |
| |
| | Corporate Obligations – (continued) | |
| |
| | Pharmaceuticals – (continued) | |
| | Lannett Co., Inc.(b)(h) | |
| | $ | | | 2,355,000 | | | | 7.750 | % | | 04/15/26 | | $ | — | |
| | Nidda BondCo GmbH(a)(b) | |
| | EUR | | | 450,000 | | | | 5.000 | | | 09/30/25 | | | 471,384 | |
| | Nidda Healthcare Holding GmbH(a)(b) | |
| | | | | 300,000 | | | | 7.500 | | | 08/21/26 | | | 317,763 | |
| | Option Care Health, Inc.(a)(b) | |
| | $ | | | 865,000 | | | | 4.375 | | | 10/31/29 | | | 725,787 | |
| | Organon & Co./Organon Foreign Debt Co.-Issuer BV(a)(b) | |
| | | | | 435,000 | | | | 5.125 | | | 04/30/31 | | | 339,905 | |
| | Par Pharmaceutical, Inc.(a)(b)(f) | |
| | | | | 344,000 | | | | 7.500 | | | 04/01/27 | | | 232,881 | |
| | Teva Pharmaceutical Finance Netherlands II BV(a) | |
| | EUR | | | 451,000 | | | | 7.375 | | | 09/15/29 | | | 482,701 | |
| | | | | 400,000 | | | | 4.375 | | | 05/09/30 | | | 360,503 | |
| | | | | | | | | | | | | | | | |
| | | | | | | | | | | | | | | 7,236,106 | |
| | | |
| |
| | Pipelines – 1.8% | |
| | Cheniere Energy Partners LP(a) | |
| | $ | | | 321,000 | | | | 4.500 | | | 10/01/29 | | | 287,420 | |
| | CQP Holdco LP/BIP-V Chinook Holdco LLC(a)(b) | |
| | | | | 1,000,000 | | | | 5.500 | | | 06/15/31 | | | 872,760 | |
| | EnLink Midstream LLC(a) | |
| | | | | 947,000 | | | | 5.375 | | | 06/01/29 | | | 867,566 | |
| | | | | 1,075,000 | | | | 6.500 | (b) | | 09/01/30 | | | 1,032,666 | |
| | EQM Midstream Partners LP(a) | |
| | | | | 915,000 | | | | 7.500 | (b) | | 06/01/30 | | | 900,616 | |
| | | | | 1,109,000 | | | | 6.500 | | | 07/15/48 | | | 935,819 | |
| | Galaxy Pipeline Assets Bidco Ltd. | |
| | | | | 2,235,755 | | | | 2.940 | | | 09/30/40 | | | 1,647,752 | |
| | Genesis Energy LP/Genesis Energy Finance Corp.(a) | |
| | | | | 855,000 | | | | 7.750 | | | 02/01/28 | | | 806,342 | |
| | Global Partners LP/GLP Finance Corp.(a) | |
| | | | | 992,000 | | | | 7.000 | | | 08/01/27 | | | 934,702 | |
| | | | | 420,000 | | | | 6.875 | | | 01/15/29 | | | 373,309 | |
| | Howard Midstream Energy Partners LLC(a)(b) | |
| | | | | 385,000 | | | | 6.750 | | | 01/15/27 | | | 365,250 | |
| | ITT Holdings LLC(a)(b) | |
| | | | | 2,695,000 | | | | 6.500 | | | 08/01/29 | | | 2,260,889 | |
| | New Fortress Energy, Inc.(a)(b) | |
| | | | | 889,000 | | | | 6.500 | | | 09/30/26 | | | 795,833 | |
| | NGL Energy Partners LP/NGL Energy Finance Corp.(a) | |
| | | | | 851,000 | | | | 6.125 | | | 03/01/25 | | | 832,933 | |
| | QazaqGaz NC JSC | |
| | | | | 390,000 | | | | 4.375 | | | 09/26/27 | | | 354,920 | |
| | Summit Midstream Holdings LLC/Summit Midstream Finance Corp.(a) | |
| | | | | 636,000 | | | | 5.750 | | | 04/15/25 | | | 599,754 | |
| | | | | 210,000 | | | | 9.000 | (b) | | 10/15/26 | | | 201,608 | |
| | Tallgrass Energy Partners LP/Tallgrass Energy Finance Corp.(a)(b) | |
| | | | | 914,000 | | | | 6.000 | | | 03/01/27 | | | 838,824 | |
| | | | | 1,588,000 | | | | 6.000 | | | 12/31/30 | | | 1,346,179 | |
| | Venture Global Calcasieu Pass LLC(a)(b) | |
| | | | | 590,000 | | | | 4.125 | | | 08/15/31 | | | 475,286 | |
| | | | | 220,000 | | | | 3.875 | | | 11/01/33 | | | 166,687 | |
| | | |
| | | | | | | | | | | | | | | | |
| | | Principal Amount | | | Interest
Rate | | | Maturity Date | | Value | |
| |
| | Corporate Obligations – (continued) | |
| |
| | Pipelines – (continued) | |
| | Venture Global LNG, Inc.(a)(b) | |
| | $ | | | 386,000 | | | | 8.125 | % | | 06/01/28 | | $ | 374,760 | |
| | | | | 550,000 | | | | 9.500 | | | 02/01/29 | | | 557,871 | |
| | Western Midstream Operating LP(a) | |
| | | | | 1,369,000 | | | | 5.250 | | | 02/01/50 | | | 1,006,598 | |
| | | | | | | | | | | | | | | | |
| | | | | | | | | | | | | | | 18,836,344 | |
| | | |
| |
| | Real Estate – 0.2% | |
| | Cushman & Wakefield U.S. Borrower LLC(a)(b) | |
| | | | | 500,000 | | | | 8.875 | | | 09/01/31 | | | 474,240 | |
| | Heimstaden Bostad Treasury BV(a) | |
| | EUR | | | 994,000 | | | | 1.625 | | | 10/13/31 | | | 623,194 | |
| | Samhallsbyggnadsbolaget i Norden AB(a) | |
| | | | | 450,000 | | | | 1.750 | | | 01/14/25 | | | 412,275 | |
| | | | | 500,000 | | | | 2.375 | | | 09/04/26 | | | 383,821 | |
| | WeWork Cos LLC(a)(b)(c) | |
| | $ | | | 1,335,000 | | | | 11.000 | | | 08/15/27 | | | 111,940 | |
| | | | | 1,064,106 | | | | 15.000 | | | 08/15/27 | | | 489,489 | |
| | | | | | | | | | | | | | | | |
| | | | | | | | | | | | | | | 2,494,959 | |
| | | |
| |
| | Real Estate Investment Trust – 1.1% | |
| | Brandywine Operating Partnership LP(a) | |
| | | | | 767,000 | | | | 7.800 | | | 03/15/28 | | | 692,018 | |
| | Brookfield Property REIT, Inc./BPR Cumulus LLC/BPR Nimbus LLC/GGSI Sellco LLC(a)(b) | |
| | | | | 1,266,000 | | | | 4.500 | | | 04/01/27 | | | 1,055,059 | |
| | Diversified Healthcare Trust(a) | |
| | | | | 1,050,000 | | | | 4.750 | | | 05/01/24 | | | 985,425 | |
| | | | | 200,000 | | | | 9.750 | | | 06/15/25 | | | 194,088 | |
| | | | | 300,000 | | | | 4.750 | | | 02/15/28 | | | 218,535 | |
| | | | | 1,320,000 | | | | 4.375 | | | 03/01/31 | | | 908,649 | |
| | HAT Holdings I LLC/HAT Holdings II LLC(b) | |
| | | | | 251,000 | | | | 6.000 | (a) | | 04/15/25 | | | 243,937 | |
| | | | | 506,000 | | | | 3.375 | (a) | | 06/15/26 | | | 445,655 | |
| | | | | 275,000 | | | | 3.750 | | | 09/15/30 | | | 197,920 | |
| | Iron Mountain U.K. PLC(a)(b) | |
| | GBP | | | 400,000 | | | | 3.875 | | | 11/15/25 | | | 458,015 | |
| | Iron Mountain, Inc.(a)(b) | |
| | $ | | | 419,000 | | | | 5.250 | | | 03/15/28 | | | 383,565 | |
| | | | | 480,000 | | | | 7.000 | | | 02/15/29 | | | 465,840 | |
| | | | | 635,000 | | | | 4.875 | | | 09/15/29 | | | 553,390 | |
| | | | | 175,000 | | | | 4.500 | | | 02/15/31 | | | 143,274 | |
| | Ladder Capital Finance Holdings LLLP/Ladder Capital Finance Corp.(a)(b) | |
| | | | | 287,000 | | | | 5.250 | | | 10/01/25 | | | 273,129 | |
| | | | | 717,000 | | | | 4.250 | | | 02/01/27 | | | 629,591 | |
| | | | | 1,000,000 | | | | 4.750 | | | 06/15/29 | | | 805,960 | |
| | Piedmont Operating Partnership LP(a) | |
| | | | | 488,000 | | | | 9.250 | | | 07/20/28 | | | 486,043 | |
| | Service Properties Trust(a) | |
| | | | | 490,000 | | | | 4.950 | | | 02/15/27 | | | 408,797 | |
| | | | | 380,000 | | | | 5.500 | | | 12/15/27 | | | 320,428 | |
| | | | | 125,000 | | | | 4.950 | | | 10/01/29 | | | 90,081 | |
| | | | | 625,000 | | | | 4.375 | | | 02/15/30 | | | 430,500 | |
| | | |
| | |
| 52 | | The accompanying notes are an integral part of these financial statements. |
GOLDMAN SACHS MULTI-MANAGER NON-CORE FIXED INCOME FUND
| | | | | | | | | | | | | | | | |
| | | Principal Amount | | | Interest
Rate | | | Maturity Date | | Value | |
| |
| | Corporate Obligations – (continued) | |
| |
| | Real Estate Investment Trust – (continued) | |
| | Uniti Group LP/Uniti Group Finance, Inc./CSL Capital LLC(a)(b) | |
| | $ | | | 510,000 | | | | 10.500 | % | | 02/15/28 | | $ | 491,400 | |
| | VICI Properties LP/VICI Note Co., Inc.(a)(b) | |
| | | | | 898,000 | | | | 3.750 | | | 02/15/27 | | | 808,523 | |
| | | | | | | | | | | | | | | | |
| | | | | | | | | | | | | | | 11,689,822 | |
| | | |
| |
| | Retailing – 1.5% | |
| | 1011778 BC ULC/New Red Finance, Inc.(a)(b) | |
| | | | | 250,000 | | | | 3.875 | | | 01/15/28 | | | 223,390 | |
| | | | | 460,000 | | | | 4.375 | | | 01/15/28 | | | 414,212 | |
| | Asbury Automotive Group, Inc.(a) | |
| | | | | 782,000 | | | | 4.500 | | | 03/01/28 | | | 694,244 | |
| | | | | 138,000 | | | | 4.625 | (b) | | 11/15/29 | | | 116,649 | |
| | Bath & Body Works, Inc. | |
| | | | | 256,000 | | | | 9.375 | (b) | | 07/01/25 | | | 263,759 | |
| | | | | 145,000 | | | | 5.250 | | | 02/01/28 | | | 133,552 | |
| | | | | 395,000 | | | | 6.875 | | | 11/01/35 | | | 348,532 | |
| | | | | 840,000 | | | | 6.750 | | | 07/01/36 | | | 725,693 | |
| | BCPE Ulysses Intermediate, Inc.(a)(b)(c) | |
| | | | | 721,667 | | | | 7.750 | | | 04/01/27 | | | 611,620 | |
| | Constellation Automotive Financing PLC(a)(b) | |
| | GBP | | | 525,000 | | | | 4.875 | | | 07/15/27 | | | 493,617 | |
| | Doman Building Materials Group Ltd.(a)(b) | |
| | CAD | | | 1,590,000 | | | | 5.250 | | | 05/15/26 | | | 1,031,909 | |
| | Ferrellgas LP/Ferrellgas Finance Corp.(a)(b) | |
| | $ | | | 1,073,000 | | | | 5.375 | | | 04/01/26 | | | 1,005,058 | |
| | | | | 435,000 | | | | 5.875 | | | 04/01/29 | | | 384,175 | |
| | Fertitta Entertainment LLC/Fertitta Entertainment Finance Co.,
Inc.(a)(b) | |
| | | | | 789,000 | | | | 6.750 | | | 01/15/30 | | | 627,002 | |
| | LBM Acquisition LLC(a)(b) | |
| | | | | 2,085,000 | | | | 6.250 | | | 01/15/29 | | | 1,647,338 | |
| | LCM Investments Holdings II LLC(a)(b) | |
| | | | | 1,048,000 | | | | 4.875 | | | 05/01/29 | | | 880,163 | |
| | Macy’s Retail Holdings LLC(a)(b) | |
| | | | | 585,000 | | | | 6.125 | | | 03/15/32 | | | 483,801 | |
| | Neiman Marcus Group Ltd. LLC(h)(i) | |
| | | | | 605,000 | | | | 8.000 | | | 10/15/21 | | | 75,959 | |
| | QVC, Inc.(a) | |
| | | | | 445,000 | | | | 4.450 | | | 02/15/25 | | | 383,385 | |
| | | | | 1,485,000 | | | | 4.750 | | | 02/15/27 | | | 845,514 | |
| | Rite Aid Corp.(a)(b)(f) | |
| | | | | 445,000 | | | | 7.500 | | | 07/01/25 | | | 309,644 | |
| | Shiba Bidco SpA(a)(b) | |
| | EUR | | | 343,000 | | | | 4.500 | | | 10/31/28 | | | 325,873 | |
| | Specialty Building Products Holdings LLC/SBP Finance Corp.(a)(b) | |
| | $ | | | 1,797,000 | | | | 6.375 | | | 09/30/26 | | | 1,677,859 | |
| | SRS Distribution, Inc.(a)(b) | |
| | | | | 542,000 | | | | 6.125 | | | 07/01/29 | | | 453,882 | |
| | | | | 544,000 | | | | 6.000 | | | 12/01/29 | | | 452,924 | |
| | Stonegate Pub Co. Financing 2019 PLC(a) | |
| | GBP | | | 114,000 | | | | 8.250 | | | 07/31/25 | | | 127,379 | |
| | Victoria’s Secret & Co.(a)(b) | |
| | $ | | | 365,000 | | | | 4.625 | | | 07/15/29 | | | 268,359 | |
| | | |
| | | | | | | | | | | | | | | | |
| | | Principal Amount | | | Interest
Rate | | | Maturity Date | | Value | |
| |
| | Corporate Obligations – (continued) | |
| |
| | Retailing – (continued) | |
| | White Cap Parent LLC(a)(b)(c) | |
| | $ | | | 655,000 | | | | 8.250 | % | | 03/15/26 | | $ | 622,643 | |
| | Yum! Brands, Inc. | |
| | | | | 465,000 | | | | 6.875 | | | 11/15/37 | | | 460,234 | |
| | | | | | | | | | | | | | | | |
| | | | | | | | | | | | | | | 16,088,369 | |
| | | |
| |
| | Semiconductors(a)(b) – 0.2% | |
| | Entegris Escrow Corp. | |
| | | | | 935,000 | | | | 4.750 | | | 04/15/29 | | | 840,060 | |
| | Entegris, Inc. | |
| | | | | 145,000 | | | | 3.625 | | | 05/01/29 | | | 121,252 | |
| | Synaptics, Inc. | |
| | | | | 972,000 | | | | 4.000 | | | 06/15/29 | | | 808,092 | |
| | | | | | | | | | | | | | | | |
| | | | | | | | | | | | | | | 1,769,404 | |
| | | |
| |
| | Software(a)(b) – 0.3% | |
| | Central Parent LLC/CDK Global II LLC/CDK Financing Co., Inc. | |
| | | | | 450,000 | | | | 8.000 | | | 06/15/29 | | | 446,368 | |
| | Central Parent, Inc./CDK Global, Inc. | |
| | | | | 1,250,000 | | | | 7.250 | | | 06/15/29 | | | 1,199,800 | |
| | Elastic NV | |
| | | | | 540,000 | | | | 4.125 | | | 07/15/29 | | | 454,486 | |
| | Open Text Holdings, Inc. | |
| | | | | 817,000 | | | | 4.125 | | | 02/15/30 | | | 677,620 | |
| | | | | | | | | | | | | | | | |
| | | | | | | | | | | | | | | 2,778,274 | |
| | | |
| |
| | Telecommunication Services – 1.9% | |
| | Altice France Holding SA(a)(b) | |
| | EUR | | | 365,000 | | | | 8.000 | | | 05/15/27 | | | 210,324 | |
| | $ | | | 1,231,000 | | | | 10.500 | | | 05/15/27 | | | 670,821 | |
| | Altice France SA(a)(b) | |
| | EUR | | | 100,000 | | | | 2.500 | | | 01/15/25 | | | 98,685 | |
| | | | | 500,000 | | | | 2.125 | | | 02/15/25 | | | 490,366 | |
| | $ | | | 2,805,000 | | | | 5.500 | | | 10/15/29 | | | 1,935,646 | |
| | Ciena Corp.(a)(b) | |
| | | | | 500,000 | | | | 4.000 | | | 01/31/30 | | | 416,635 | |
| | CommScope, Inc.(a)(b) | |
| | | | | 2,378,000 | | | | 8.250 | | | 03/01/27 | | | 987,702 | |
| | | | | 395,000 | | | | 7.125 | | | 07/01/28 | | | 151,009 | |
| | Iliad Holding SASU(a)(b) | |
| | | | | 155,000 | | | | 6.500 | | | 10/15/26 | | | 144,675 | |
| | | | | 2,868,000 | | | | 7.000 | | | 10/15/28 | | | 2,593,389 | |
| | Level 3 Financing, Inc.(a)(b) | |
| | | | | 125,000 | | | | 3.400 | | | 03/01/27 | | | 116,251 | |
| | | | | 1,371,000 | | | | 4.625 | | | 09/15/27 | | | 923,355 | |
| | | | | 270,000 | | | | 4.250 | | | 07/01/28 | | | 152,477 | |
| | | | | 626,000 | | | | 3.625 | | | 01/15/29 | | | 320,956 | |
| | | | | 300,000 | | | | 3.875 | | | 11/15/29 | | | 274,575 | |
| | | | | 1,023,000 | | | | 10.500 | | | 05/15/30 | | | 1,023,880 | |
| | Lorca Telecom Bondco SA(a)(b) | |
| | EUR | | | 400,000 | | | | 4.000 | | | 09/18/27 | | | 393,258 | |
| | Lumen Technologies, Inc.(a)(b) | |
| | $ | | | 350,000 | | | | 4.000 | | | 02/15/27 | | | 238,445 | |
| | SoftBank Group Corp.(a) | |
| | EUR | | | 1,044,000 | | | | 3.375 | | | 07/06/29 | | | 889,293 | |
| | | |
| | |
| The accompanying notes are an integral part of these financial statements. | | 53 |
GOLDMAN SACHS MULTI-MANAGER NON-CORE FIXED INCOME FUND
|
Schedule of Investments (continued) October 31, 2023 |
| | | | | | | | | | | | | | | | |
| | | Principal Amount | | | Interest
Rate | | | Maturity
Date | | Value | |
| |
| | Corporate Obligations – (continued) | |
| |
| | Telecommunication Services – (continued) | |
| | TDC Net AS(a) | |
| | EUR | | | 232,000 | | | | 5.056 | % | | 05/31/28 | | $ | 242,367 | |
| | | | | 460,000 | | | | 6.500 | | | 06/01/31 | | | 480,092 | |
| | Telecom Italia Capital SA | |
| | $ | | | 326,000 | | | | 6.000 | | | 09/30/34 | | | 268,226 | |
| | Telecom Italia SpA | |
| | | | | 230,000 | | | | 5.303 | (b) | | 05/30/24 | | | 226,120 | |
| | EUR | | | 991,000 | | | | 2.375 | (a) | | 10/12/27 | | | 897,572 | |
| | Telesat Canada/Telesat LLC(a)(b) | |
| | $ | | | 1,020,000 | | | | 5.625 | | | 12/06/26 | | | 647,486 | |
| | Viasat, Inc.(a)(b) | |
| | | | | 752,000 | | | | 7.500 | | | 05/30/31 | | | 491,710 | |
| | Vmed O2 U.K. Financing I PLC(a)(b) | |
| | | | | 1,295,000 | | | | 4.250 | | | 01/31/31 | | | 1,021,056 | |
| | VTR Comunicaciones SpA(a)(b) | |
| | | | | 80,000 | | | | 5.125 | | | 01/15/28 | | | 35,000 | |
| | Windstream Escrow LLC/Windstream Escrow Finance Corp.(a)(b) | |
| | | | | 2,320,000 | | | | 7.750 | | | 08/15/28 | | | 1,838,298 | |
| | Zayo Group Holdings, Inc.(a)(b) | |
| | | | | 2,981,000 | | | | 4.000 | | | 03/01/27 | | | 2,244,007 | |
| | | | | | | | | | | | | | | | |
| | | | | | | | | | | | | | | 20,423,676 | |
| | | |
| |
| | Transportation(b) – 0.1% | |
| | Rand Parent LLC(a) | |
| | | | | 853,000 | | | | 8.500 | | | 02/15/30 | | | 777,296 | |
| | Transnet SOC Ltd. | |
| | | | | 727,000 | | | | 8.250 | | | 02/06/28 | | | 687,015 | |
| | | | | | | | | | | | | | | | |
| | | | | | | | | | | | | | | 1,464,311 | |
| | | |
| |
| | Water(a)(b) – 0.0% | |
| | Aegea Finance SARL | |
| | | | | 521,000 | | | | 9.000 | | | 01/20/31 | | | 519,697 | |
| | | |
| |
| | Water Utilities(a)(b) – 0.1% | |
| | Aegea Finance SARL | |
| | | | | 1,106,000 | | | | 6.750 | | | 05/20/29 | | | 1,009,225 | |
| | | |
| | |
| | TOTAL CORPORATE OBLIGATIONS (Cost $409,442,637) | | $ | 364,529,397 | |
| | | |
| | | | | | | | | | | | | | | | |
| |
| | Sovereign Debt Obligations – 32.6% | |
| |
| | Brazil Real – 3.1% | |
| | Brazil Notas do Tesouro Nacional | |
| | BRL | | | 61,946,000 | | | | 10.000 | % | | 01/01/25 | | $ | 12,141,865 | |
| | | | | 52,911,000 | | | | 10.000 | | | 01/01/27 | | | 10,149,299 | |
| | | | | 56,862,000 | | | | 10.000 | | | 01/01/29 | | | 10,607,055 | |
| | | | | 4,009,000 | | | | 10.000 | | | 01/01/31 | | | 730,144 | |
| | | | | | | | | | | | | | | | |
| | | | | | | | | | | | | | | 33,628,363 | |
| | | |
| |
| | Chilean Peso – 0.5% | |
| | Bonos de la Tesoreria de la Republica en pesos | |
| | CLP | | | 560,000,000 | | | | 5.000 | | | 10/01/28 | | | 584,507 | |
| | | | | 2,445,000,000 | | | | 4.700 | | | 09/01/30 | | | 2,434,537 | |
| | | | | 895,000,000 | | | | 6.000 | | | 04/01/33 | | | 957,289 | |
| | | | | 72,776,140 | | | | 2.000 | | | 03/01/35 | | | 70,185 | |
| | | |
| | | | | | | | | | | | | | | | |
| | | Principal Amount | | | Interest
Rate | | | Maturity Date | | Value | |
| |
| | Sovereign Debt Obligations – (continued) | |
| |
| | Chilean Peso – (continued) | |
| | CLP | | | 665,000,000 | | | | 4.500 | % | | 03/01/26 | | $ | 706,390 | |
| | | | | 550,000,000 | | | | 5.000 | | | 03/01/35 | | | 542,048 | |
| | | | | | | | | | | | | | | | |
| | | | | | | | | | | | | | | 5,294,956 | |
| | | |
| |
| | Chinese Yuan Renminbi – 1.2% | |
| | China Government Bonds | |
| | CNY | | | 50,310,000 | | | | 3.270 | | | 11/19/30 | | | 7,162,589 | |
| | | | | 19,950,000 | | | | 2.600 | | | 09/01/32 | | | 2,688,608 | |
| | | | | 21,110,000 | | | | 2.670 | | | 05/25/33 | | | 2,863,493 | |
| | | | | | | | | | | | | | | | |
| | | | | | | | | | | | | | | 12,714,690 | |
| | | |
| |
| | Colombia Peso – 0.8% | |
| | Colombia TES | |
| | COP | | | 2,463,000,000 | | | | 7.500 | | | 08/26/26 | | | 550,082 | |
| | | | | 10,443,600,000 | | | | 6.000 | | | 04/28/28 | | | 2,097,645 | |
| | | | | 13,143,600,000 | | | | 7.750 | | | 09/18/30 | | | 2,675,374 | |
| | | | | 14,901,700,000 | | | | 7.000 | | | 06/30/32 | | | 2,736,821 | |
| | | | | 3,849,900,000 | | | | 6.250 | | | 07/09/36 | | | 601,694 | |
| | | | | | | | | | | | | | | | |
| | | | | | | | | | | | | | | 8,661,616 | |
| | | |
| |
| | Czech Republic Koruna – 1.6% | |
| | Czech Republic Government Bonds | |
| | CZK | | | 70,860,000 | | | | 5.500 | | | 12/12/28 | | | 3,194,674 | |
| | | | | 14,990,000 | | | | 5.000 | | | 09/30/30 | | | 661,449 | |
| | | | | 47,530,000 | | | | 1.000 | | | 06/26/26 | | | 1,867,587 | |
| | | | | 62,410,000 | | | | 2.000 | | | 10/13/33 | | | 2,120,854 | |
| | | | | 17,320,000 | | | | 3.500 | | | 05/30/35 | | | 666,856 | |
| | | | | 67,260,000 | | | | 1.250 | | | 02/14/25 | | | 2,752,885 | |
| | | | | 44,790,000 | | | | 0.250 | | | 02/10/27 | | | 1,679,791 | |
| | | | | 53,660,000 | | | | 0.950 | | | 05/15/30 | | | 1,845,600 | |
| | | | | 55,150,000 | | | | 1.750 | | | 06/23/32 | | | 1,894,663 | |
| | | | | | | | | | | | | | | | |
| | | | | | | | | | | | | | | 16,684,359 | |
| | | |
| |
| | Hungarian Forint – 0.7% | |
| | Hungary Government Bonds | |
| | HUF | | | 496,810,000 | | | | 3.250 | | | 10/22/31 | | | 1,048,278 | |
| | | | | 569,140,000 | | | | 2.500 | | | 10/24/24 | | | 1,488,805 | |
| | | | | 263,510,000 | | | | 3.000 | | | 10/27/27 | | | 618,728 | |
| | | | | 188,730,000 | | | | 1.000 | | | 11/26/25 | | | 457,006 | |
| | | | | 436,220,000 | | | | 2.750 | | | 12/22/26 | | | 1,039,153 | |
| | | | | 1,264,550,000 | | | | 4.750 | | | 11/24/32 | | | 2,879,841 | |
| | | | | | | | | | | | | | | | |
| | | | | | | | | | | | | | | 7,531,811 | |
| | | |
| |
| | Indonesia Rupiah – 2.5% | |
| | Indonesia Treasury Bonds | |
| | IDR | | | 21,243,000,000 | | | | 8.375 | | | 09/15/26 | | | 1,382,099 | |
| | | | | 39,183,000,000 | | | | 7.000 | | | 09/15/30 | | | 2,456,800 | |
| | | | | 63,186,000,000 | | | | 7.500 | | | 08/15/32 | | | 4,034,717 | |
| | | | | 59,485,000,000 | | | | 6.125 | | | 05/15/28 | | | 3,604,300 | |
| | | | | 61,988,000,000 | | | | 9.000 | | | 03/15/29 | | | 4,228,140 | |
| | | | | 18,457,000,000 | | | | 8.375 | | | 03/15/34 | | | 1,256,610 | |
| | | | | 47,736,000,000 | | | | 6.375 | | | 04/15/32 | | | 2,866,864 | |
| | | | | 87,414,000,000 | | | | 7.000 | | | 02/15/33 | | | 5,475,413 | |
| | | | | 11,642,000,000 | | | | 7.500 | | | 06/15/35 | | | 747,550 | |
| | | |
| | |
| 54 | | The accompanying notes are an integral part of these financial statements. |
GOLDMAN SACHS MULTI-MANAGER NON-CORE FIXED INCOME FUND
| | | | | | | | | | | | | | | | |
| | | Principal Amount | | | Interest
Rate | | | Maturity
Date | | Value | |
| |
| | Sovereign Debt Obligations – (continued) | |
| |
| | Indonesia Rupiah – (continued) | |
| | IDR | | | 3,650,000,000 | | | | 7.125 | % | | 06/15/38 | | $ | 228,628 | |
| | | | | | | | | | | | | | | | |
| | | | | | | | | | | | | | | 26,281,121 | |
| | | |
| |
| | Malaysia Ringgit – 2.5% | |
| | Malaysia Government Bonds | |
| | MYR | | | 22,486,000 | | | | 3.882 | | | 03/14/25 | | | 4,746,106 | |
| | | | | 22,957,000 | | | | 3.885 | | | 08/15/29 | | | 4,789,675 | |
| | | | | 2,403,000 | | | | 2.632 | | | 04/15/31 | | | 457,289 | |
| | | | | 13,479,000 | | | | 3.582 | | | 07/15/32 | | | 2,719,677 | |
| | | | | 12,467,000 | | | | 4.762 | | | 04/07/37 | | | 2,750,040 | |
| | | | | 11,680,000 | | | | 4.893 | | | 06/08/38 | | | 2,623,336 | |
| | | | | 5,250,000 | | | | 3.757 | | | 05/22/40 | | | 1,016,370 | |
| | | | | 5,165,000 | | | | 4.065 | | | 06/15/50 | | | 1,001,129 | |
| | | | | 25,195,000 | | | | 3.733 | | | 06/15/28 | | | 5,251,157 | |
| | Malaysia Government Investment Issue | |
| | | | | 6,994,000 | | | | 3.465 | | | 10/15/30 | | | 1,412,246 | |
| | | | | | | | | | | | | | | | |
| | | | | | | | | | | | | | | 26,767,025 | |
| | | |
| |
| | Mexican Peso – 2.6% | |
| | Mexico Bonos | |
| | MXN | | | 58,332,200 | | | | 10.000 | | | 12/05/24 | | | 3,191,349 | |
| | | | | 26,240,700 | | | | 5.000 | | | 03/06/25 | | | 1,347,327 | |
| | | | | 70,952,700 | | | | 5.750 | | | 03/05/26 | | | 3,529,601 | |
| | | | | 110,329,500 | | | | 8.500 | | | 05/31/29 | | | 5,686,675 | |
| | | | | 97,452,800 | | | | 7.750 | | | 05/29/31 | | | 4,706,412 | |
| | | | | 67,587,200 | | | | 7.500 | | | 05/26/33 | | | 3,131,423 | |
| | | | | 44,372,500 | | | | 7.750 | | | 11/23/34 | | | 2,068,420 | |
| | | | | 18,704,800 | | | | 10.000 | | | 11/20/36 | | | 1,025,885 | |
| | | | | 70,504,100 | | | | 8.500 | | | 11/18/38 | | | 3,409,168 | |
| | | | | | | | | | | | | | | | |
| | | | | | | | | | | | | | | 28,096,260 | |
| | | |
| |
| | Peru Nuevo Sol – 0.4% | |
| | Peru Government Bonds | |
| | PEN | | | 2,594,000 | | | | 6.150 | | | 08/12/32 | | | 616,786 | |
| | | | | 2,422,000 | | | | 7.300 | | | 08/12/33 | | | 617,699 | |
| | | | | 8,912,000 | | | | 5.400 | | | 08/12/34 | | | 1,939,856 | |
| | Peru Government International Bonds | |
| | | | | 6,677,000 | | | | 6.900 | | | 08/12/37 | | | 1,613,647 | |
| | | | | | | | | | | | | | | | |
| | | | | | | | | | | | | | | 4,787,988 | |
| | | |
| |
| | Polish Zloty – 1.9% | |
| | Republic of Poland Government Bonds | |
| | PLN | | | 15,516,000 | | | | 2.250 | | | 10/25/24 | | | 3,585,251 | |
| | | | | 8,372,000 | | | | 2.500 | | | 04/25/24 | | | 1,963,421 | |
| | | | | 9,888,000 | | | | 3.250 | | | 07/25/25 | | | 2,273,133 | |
| | | | | 9,672,000 | | | | 2.500 | | | 07/25/27 | | | 2,094,680 | |
| | | | | 22,369,000 | | | | 1.250 | | | 10/25/30 | | | 4,061,742 | |
| | | | | 7,866,000 | | | | 2.750 | | | 10/25/29 | | | 1,626,349 | |
| | | | | 15,906,000 | | | | 1.750 | | | 04/25/32 | | | 2,813,350 | |
| | | | | 9,667,000 | | | | 0.750 | | | 04/25/25 | | | 2,154,875 | |
| | | | | | | | | | | | | | | | |
| | | | | | | | | | | | | | | 20,572,801 | |
| | | |
| |
| | Romania New Leu – 0.9% | |
| | Romania Government Bonds | |
| | RON | | | 6,405,000 | | | | 3.250 | | | 06/24/26 | | | 1,265,267 | |
| | | |
| | | | | | | | | | | | | | | | |
| | | Principal Amount | | | Interest
Rate | | | Maturity
Date | | Value | |
| |
| | Sovereign Debt Obligations – (continued) | |
| |
| | Romania New Leu – (continued) | |
| | RON | | | 15,410,000 | | | | 4.150 | % | | 01/26/28 | | $ | 2,979,441 | |
| | | | | 4,460,000 | | | | 4.750 | | | 02/24/25 | | | 933,969 | |
| | | | | 23,045,000 | | | | 6.700 | | | 02/25/32 | | | 4,794,309 | |
| | | | | | | | | | | | | | | | |
| | | | | | | | | | | | | | | 9,972,986 | |
| | | |
| |
| | South African Rand – 2.5% | |
| | Republic of South Africa Government Bonds | |
| | ZAR | | | 35,073,349 | | | | 10.500 | | | 12/21/26 | | | 1,938,613 | |
| | | | | 13,322,429 | | | | 8.000 | | | 01/31/30 | | | 628,867 | |
| | | | | 104,425,327 | | | | 7.000 | | | 02/28/31 | | | 4,429,632 | |
| | | | | 93,959,396 | | | | 8.250 | | | 03/31/32 | | | 4,144,281 | |
| | | | | 152,936,986 | | | | 8.875 | | | 02/28/35 | | | 6,528,233 | |
| | | | | 86,991,381 | | | | 6.250 | | | 03/31/36 | | | 2,883,909 | |
| | | | | 84,456,539 | | | | 8.500 | | | 01/31/37 | | | 3,347,367 | |
| | | | | 60,581,606 | | | | 9.000 | | | 01/31/40 | | | 2,410,874 | |
| | | | | | | | | | | | | | | | |
| | | | | | | | | | | | | | | 26,311,776 | |
| | | |
| |
| | Thailand Baht – 1.8% | |
| | Thailand Government Bonds | |
| | THB | | | 122,576,000 | | | | 1.600 | | | 12/17/29 | | | 3,136,486 | |
| | | | | 59,539,000 | | | | 3.350 | | | 06/17/33 | | | 1,668,782 | |
| | | | | 8,577,000 | | | | 3.390 | | | 06/17/37 | | | 234,469 | |
| | | | | 16,409,000 | | | | 3.775 | | | 06/25/32 | | | 473,217 | |
| | | | | 147,171,000 | | | | 2.875 | | | 12/17/28 | | | 4,075,338 | |
| | | | | 206,722,000 | | | | 2.000 | | | 12/17/31 | | | 5,239,469 | |
| | | | | 132,209,000 | | | | 1.585 | | | 12/17/35 | | | 2,998,993 | |
| | | | | 45,283,000 | | | | 3.300 | | | 06/17/38 | | | 1,209,869 | |
| | | | | | | | | | | | | | | | |
| | | | | | | | | | | | | | | 19,036,623 | |
| | | |
| |
| | United States Dollar – 9.6% | |
| | Abu Dhabi Government International Bonds | |
| | $ | | | 1,274,000 | | | | 1.700 | | | 03/02/31 | | | 991,694 | |
| | | | | 1,180,000 | | | | 1.625 | | | 06/02/28 | | | 1,004,475 | |
| | | | | 730,000 | | | | 3.125 | | | 09/30/49 | | | 446,669 | |
| | | | | 454,000 | | | | 3.000 | (b) | | 09/15/51 | | | 268,144 | |
| | Angola Government International Bonds | |
| | | | | 349,000 | | | | 8.750 | (b) | | 04/14/32 | | | 273,093 | |
| | | | | 1,759,000 | | | | 8.750 | | | 04/14/32 | | | 1,376,417 | |
| | Argentina Republic Government International Bonds(a) | |
| | | | | 1,318,924 | | | | 1.000 | | | 07/09/29 | | | 352,812 | |
| | | | | 354,295 | | | | 0.750 | (j) | | 07/09/30 | | | 98,494 | |
| | | | | 4,432,281 | | | | 3.500 | (j) | | 07/09/41 | | | 1,153,778 | |
| | Bahrain Government International Bonds | |
| | | | | 566,000 | | | | 7.750 | (b) | | 04/18/35 | | | 543,360 | |
| | | | | 1,542,000 | | | | 5.450 | | | 09/16/32 | | | 1,297,207 | |
| | | | | 1,046,000 | | | | 4.250 | | | 01/25/28 | | | 936,170 | |
| | Bolivia Government International Bonds | |
| | | | | 409,000 | | | | 4.500 | | | 03/20/28 | | | 204,500 | |
| | Brazil Government International Bonds | |
| | | | | 294,000 | | | | 6.000 | | | 10/20/33 | | | 271,950 | |
| | | | | 3,228,000 | | | | 4.750 | (a) | | 01/14/50 | | | 2,154,690 | |
| | CBB International Sukuk Programme Co. WLL | |
| | | | | 591,000 | | | | 3.875 | | | 05/18/29 | | | 503,089 | |
| | Chile Government International Bonds(a) | |
| | | | | 553,000 | | | | 2.550 | | | 07/27/33 | | | 413,367 | |
| | | |
| | |
| The accompanying notes are an integral part of these financial statements. | | 55 |
GOLDMAN SACHS MULTI-MANAGER NON-CORE FIXED INCOME FUND
|
Schedule of Investments (continued) October 31, 2023 |
| | | | | | | | | | | | | | | | |
| | | | | Principal
Amount | | | Interest
Rate | | | Maturity Date | | Value | |
| |
| | Sovereign Debt Obligations – (continued) | |
| |
| | United States Dollar – (continued) | |
| | $ | | | 3,995,000 | | | | 4.950 | % | | 01/05/36 | | $ | 3,545,562 | |
| | China Government International Bonds | |
| | | | | 707,000 | | | | 0.750 | | | 10/26/24 | | | 675,715 | |
| | | | | 688,000 | | | | 0.550 | | | 10/21/25 | | | 627,367 | |
| | Colombia Government International Bonds(a) | |
| | | | | 3,230,000 | | | | 8.000 | | | 04/20/33 | | | 3,144,405 | |
| | | | | 603,000 | | | | 7.500 | | | 02/02/34 | | | 562,297 | |
| | Costa Rica Government International Bonds(a) | |
| | | | | 1,271,000 | | | | 6.550 | | | 04/03/34 | | | 1,208,085 | |
| | Dominican Republic International Bonds(a) | |
| | | | | 3,503,000 | | | | 7.050 | | | 02/03/31 | | | 3,355,874 | |
| | Ecuador Government International Bonds(j) | |
| | | | | 863,159 | | | | 6.000 | | | 07/31/30 | | | 437,190 | |
| | | | | 2,824,232 | | | | 3.500 | | | 07/31/35 | | | 1,070,384 | |
| | Egypt Government International Bonds | |
| | | | | 710,000 | | | | 7.300 | | | 09/30/33 | | | 390,500 | |
| | | | | 3,495,000 | | | | 7.625 | | | 05/29/32 | | | 1,992,150 | |
| | El Salvador Government International Bonds | |
| | | | | 305,000 | | | | 8.250 | | | 04/10/32 | | | 237,138 | |
| | | | | 686,000 | | | | 9.500 | (a) | | 07/15/52 | | | 503,524 | |
| | Ethiopia International Bonds | |
| | | | | 200,000 | | | | 6.625 | | | 12/11/24 | | | 125,938 | |
| | Export-Import Bank of India | |
| | | | | 1,032,000 | | | | 2.250 | | | 01/13/31 | | | 788,231 | |
| | Gabon Government International Bonds(a) | |
| | | | | 435,000 | | | | 7.000 | (b) | | 11/24/31 | | | 305,587 | |
| | | | | 200,000 | | | | 7.000 | | | 11/24/31 | | | 140,500 | |
| | Ghana Government International Bonds(f) | |
| | | | | 1,551,000 | | | | 8.625 | | | 04/07/34 | | | 668,869 | |
| | | | | 995,000 | | | | 7.875 | | | 02/11/35 | | | 431,581 | |
| | | | | 223,000 | | | | 10.750 | | | 10/14/30 | | | 138,818 | |
| | Guatemala Government Bonds(a)(b) | |
| | | | | 678,000 | | | | 7.050 | | | 10/04/32 | | | 661,050 | |
| | | | | 2,319,000 | | | | 6.600 | | | 06/13/36 | | | 2,142,756 | |
| | Honduras Government International Bonds(a) | |
| | | | | 259,000 | | | | 5.625 | | | 06/24/30 | | | 215,877 | |
| | Hungary Government International Bonds | |
| | | | | 200,000 | | | | 6.125 | (b) | | 05/22/28 | | | 198,414 | |
| | | | | 1,807,000 | | | | 6.125 | | | 05/22/28 | | | 1,792,670 | |
| | | | | 1,650,000 | | | | 3.125 | | | 09/21/51 | | | 871,299 | |
| | | | | 200,000 | | | | 6.750 | | | 09/25/52 | | | 185,000 | |
| | Indonesia Government International Bonds | |
| | | | | 499,000 | | | | 4.150 | (a) | | 09/20/27 | | | 472,478 | |
| | | | | 1,474,000 | | | | 4.550 | (a) | | 01/11/28 | | | 1,415,969 | |
| | | | | 846,000 | | | | 2.850 | | | 02/14/30 | | | 715,073 | |
| | | | | 1,470,000 | | | | 4.850 | (a) | | 01/11/33 | | | 1,370,481 | |
| | | | | 2,178,000 | | | | 5.650 | (a) | | 01/11/53 | | | 1,986,510 | |
| | Israel Government International Bonds | |
| | | | | 388,000 | | | | 4.500 | | | 01/17/33 | | | 339,667 | |
| | | | | 493,000 | | | | 4.500 | (k) | | 04/03/20 | | | 323,014 | |
| | Ivory Coast Government International Bonds(a)(j) | |
| | | | | 429,744 | | | | 5.750 | | | 12/31/32 | | | 382,030 | |
| | Jordan Government International Bonds | |
| | | | | 811,000 | | | | 7.500 | (b) | | 01/13/29 | | | 751,189 | |
| | | | | 591,000 | | | | 7.375 | | | 10/10/47 | | | 445,466 | |
| | | |
| | | | | | | | | | | | | | | | |
| | | Principal Amount | | | Interest Rate | | | Maturity Date | | Value | |
| |
| | Sovereign Debt Obligations – (continued) | |
| |
| | United States Dollar – (continued) | |
| | Kazakhstan Government International Bonds | |
| | $ | | | 1,199,000 | | | | 4.875 | % | | 10/14/44 | | $ | 986,177 | |
| | KSA Sukuk Ltd.(b) | |
| | | | | 3,554,000 | | | | 4.274 | | | 05/22/29 | | | 3,331,875 | |
| | Lebanon Government International Bonds(f) | |
| | | | | 464,000 | | | | 7.000 | | | 03/20/28 | | | 27,840 | |
| | | | | 3,668,000 | | | | 6.100 | | | 10/04/22 | | | 223,821 | |
| | | | | 1,259,000 | | | | 6.650 | | | 11/03/28 | | | 77,164 | |
| | Mexico Government International Bonds(a) | |
| | | | | 824,000 | | | | 2.659 | | | 05/24/31 | | | 641,484 | |
| | | | | 381,000 | | | | 6.350 | | | 02/09/35 | | | 363,093 | |
| | | | | 615,000 | | | | 6.338 | | | 05/04/53 | | | 532,897 | |
| | Mongolia Government International Bonds | |
| | | | | 543,000 | | | | 3.500 | | | 07/07/27 | | | 453,541 | |
| | Morocco Government International Bonds | |
| | | | | 808,000 | | | | 5.950 | (b) | | 03/08/28 | | | 790,830 | |
| | | | | 200,000 | | | | 5.950 | | | 03/08/28 | | | 195,750 | |
| | | | | 238,000 | | | | 4.000 | | | 12/15/50 | | | 140,718 | |
| | Mozambique International Bonds | |
| | | | | 269,000 | | | | 9.000 | | | 09/15/31 | | | 207,743 | |
| | Nigeria Government International Bonds | |
| | | | | 1,582,000 | | | | 8.375 | | | 03/24/29 | | | 1,382,272 | |
| | | | | 1,820,000 | | | | 7.375 | | | 09/28/33 | | | 1,365,000 | |
| | Oman Government International Bonds | |
| | | | | 2,798,000 | | | | 6.750 | | | 10/28/27 | | | 2,821,608 | |
| | | | | 601,000 | | | | 7.000 | | | 01/25/51 | | | 551,417 | |
| | Pakistan Government International Bonds | |
| | | | | 400,000 | | | | 8.250 | | | 09/30/25 | | | 280,344 | |
| | | | | 429,000 | | | | 6.875 | | | 12/05/27 | | | 224,024 | |
| | | | | 788,000 | | | | 7.375 | | | 04/08/31 | | | 382,353 | |
| | Panama Government International Bonds(a) | |
| | | | | 2,272,000 | | | | 6.400 | | | 02/14/35 | | | 2,065,248 | |
| | | | | 2,625,000 | | | | 6.853 | | | 03/28/54 | | | 2,239,125 | |
| | Paraguay Government International Bonds(a) | |
| | | | | 291,000 | | | | 3.849 | | | 06/28/33 | | | 232,655 | |
| | | | | 1,346,000 | | | | 5.850 | (b) | | 08/21/33 | | | 1,238,320 | |
| | Peru Government International Bonds(a) | |
| | | | | 2,792,000 | | | | 2.783 | | | 01/23/31 | | | 2,236,392 | |
| | | | | 286,000 | | | | 3.300 | | | 03/11/41 | | | 188,903 | |
| | | | | 217,000 | | | | 3.230 | (l) | | 07/28/21 | | | 108,826 | |
| | Philippines Government International Bonds | |
| | | | | 517,000 | | | | 5.170 | | | 10/13/27 | | | 508,806 | |
| | | | | 2,843,000 | | | | 1.950 | | | 01/06/32 | | | 2,123,465 | |
| | | | | 1,591,000 | | | | 5.000 | | | 07/17/33 | | | 1,495,540 | |
| | Qatar Government International Bonds | |
| | | | | 1,787,000 | | | | 4.500 | | | 04/23/28 | | | 1,729,030 | |
| | | | | 1,556,000 | | | | 4.817 | | | 03/14/49 | | | 1,271,544 | |
| | | | | 361,000 | | | | 4.400 | | | 04/16/50 | | | 278,196 | |
| | Republic of Armenia International Bonds | |
| | | | | 231,000 | | | | 3.600 | | | 02/02/31 | | | 169,785 | |
| | Republic of Azerbaijan International Bonds | |
| | | | | 33,000 | | | | 5.125 | | | 09/01/29 | | | 30,162 | |
| | | | | 835,000 | | | | 5.125 | | | 09/01/29 | | | 763,198 | |
| | Republic of Kenya Government International Bonds | |
| | | | | 1,490,000 | | | | 7.000 | | | 05/22/27 | | | 1,296,300 | |
| | | |
| | |
| 56 | | The accompanying notes are an integral part of these financial statements. |
GOLDMAN SACHS MULTI-MANAGER NON-CORE FIXED INCOME FUND
| | | | | | | | | | | | | | | | | | |
| | | | | Principal Amount | | | Interest
Rate | | | Maturity Date | | Value | |
| |
| | Sovereign Debt Obligations – (continued) | |
| |
| | United States Dollar – (continued) | |
| | Republic of Poland Government International Bonds(a) | |
| | $ | | | | | 935,000 | | | | 5.500 | % | | 11/16/27 | | $ | 938,805 | |
| | | | | | | 729,000 | | | | 4.875 | | | 10/04/33 | | | 674,230 | |
| | | | | | | 1,034,000 | | | | 5.500 | | | 04/04/53 | | | 908,338 | |
| | Republic of South Africa Government International Bonds | |
| | | | | | | 1,114,000 | | | | 5.875 | | | 04/20/32 | | | 939,937 | |
| | | | | | | 1,840,000 | | | | 5.750 | | | 09/30/49 | | | 1,196,000 | |
| | Republic of Uzbekistan International Bonds | |
| | | | | | | 200,000 | | | | 7.850 | (b) | | 10/12/28 | | | 199,000 | |
| | | | | | | 213,000 | | | | 5.375 | | | 02/20/29 | | | 189,890 | |
| | Romania Government International Bonds | |
| | | | | | | 490,000 | | | | 5.250 | (b) | | 11/25/27 | | | 473,330 | |
| | | | | | | 124,000 | | | | 5.250 | | | 11/25/27 | | | 119,782 | |
| | | | | | | 918,000 | | | | 7.125 | (b) | | 01/17/33 | | | 910,705 | |
| | | | | | | 186,000 | | | | 7.625 | (b) | | 01/17/53 | | | 181,537 | |
| | | | | | | 974,000 | | | | 7.625 | | | 01/17/53 | | | 950,631 | |
| | Russia Foreign Bonds - Eurobond(f) | |
| | | | | | | 1,000,000 | | | | 4.375 | | | 03/21/29 | | | 476,250 | |
| | Saudi Government International Bonds | |
| | | | | | | 295,000 | | | | 4.375 | | | 04/16/29 | | | 276,563 | |
| | | | | | | 364,000 | | | | 5.000 | | | 01/18/53 | | | 288,015 | |
| | | | | | | 796,000 | | | | 5.000 | (b) | | 01/18/53 | | | 629,835 | |
| | Senegal Government International Bonds | |
| | | | | | | 437,000 | | | | 6.750 | | | 03/13/48 | | | 289,512 | |
| | Serbia International Bonds | |
| | | | | | | 351,000 | | | | 6.500 | (b) | | 09/26/33 | | | 329,189 | |
| | | | | | | 200,000 | | | | 6.500 | | | 09/26/33 | | | 187,572 | |
| | Slovenia Government International Bonds(b) | |
| | | | | | | 616,000 | | | | 5.000 | | | 09/19/33 | | | 584,116 | |
| | Sri Lanka Government International Bonds(f) | |
| | | | | | | 339,000 | | | | 5.750 | | | 04/18/23 | | | 176,151 | |
| | | | | | | 2,094,000 | | | | 6.750 | | | 04/18/28 | | | 1,039,922 | |
| | State Agency of Roads of Ukraine(f)(g) | |
| | | | | | | 295,000 | | | | 6.250 | | | 06/24/30 | | | 77,438 | |
| | Trinidad & Tobago Government International Bonds(a)(b) | |
| | | | | | | 686,000 | | | | 5.950 | | | 01/14/31 | | | 661,304 | |
| | Tunisian Republic | |
| | | | | | | 200,000 | | | | 5.750 | | | 01/30/25 | | | 138,250 | |
| | Turkiye Government International Bonds | |
| | | | | | | 2,481,000 | | | | 9.125 | | | 07/13/30 | | | 2,474,797 | |
| | | | | | | 1,731,000 | | | | 5.950 | | | 01/15/31 | | | 1,454,040 | |
| | Turkiye Ihracat Kredi Bankasi AS(b) | |
| | | | | | | 715,000 | | | | 9.000 | | | 01/28/27 | | | 716,787 | |
| | | | | | | 357,000 | | | | 9.375 | | | 01/31/26 | | | 361,016 | |
| | Ukraine Government International Bonds | |
| | | | | | | 390,000 | | | | 7.750 | | | 09/01/24 | | | 122,850 | |
| | | | | | | 794,000 | | | | 9.750 | | | 11/01/30 | | | 230,260 | |
| | | | | | | 606,000 | | | | 7.750 | | | 09/01/29 | | | 168,468 | |
| | | | | | | 1,715,000 | | | | 6.876 | | | 05/21/31 | | | 422,747 | |
| | | | | | | 245,000 | | | | 7.375 | | | 09/25/34 | | | 61,618 | |
| | | | | | | 250,000 | | | | 7.253 | | | 03/15/35 | | | 62,875 | |
| | Uruguay Government International Bonds | |
| | | | | | �� | 1,792,329 | | | | 5.750 | (a) | | 10/28/34 | | | 1,789,641 | |
| | | | | | | 274,916 | | | | 5.100 | | | 06/18/50 | | | 236,978 | |
| | | | | | | 962,561 | | | | 4.975 | | | 04/20/55 | | | 801,813 | |
| | | |
| | | | | | | | | | | | | | | | |
| | | | | Principal
Amount | | | Interest
Rate | | | Maturity Date | | Value | |
| |
| | Sovereign Debt Obligations – (continued) | |
| |
| | United States Dollar – (continued) | |
| | Uzbekneftegaz JSC(a)(b) | |
| | $ | | | 222,000 | | | | 4.750 | % | | 11/16/28 | | $ | 174,270 | |
| | Venezuela Government International Bonds(f) | |
| | | | | 110,000 | | | | 7.750 | | | 10/13/19 | | | 14,850 | |
| | | | | 85,000 | | | | 6.000 | | | 12/09/20 | | | 11,900 | |
| | | | | 140,000 | | | | 12.750 | | | 08/23/22 | | | 24,710 | |
| | | | | 203,000 | | | | 9.000 | | | 05/07/23 | | | 34,003 | |
| | | | | 199,000 | | | | 7.650 | | | 04/21/25 | | | 32,338 | |
| | | | | 205,000 | | | | 11.750 | | | 10/21/26 | | | 38,950 | |
| | | | | 205,000 | | | | 11.950 | | | 08/05/31 | | | 38,438 | |
| | | | | 190,000 | | | | 7.000 | | | 03/31/38 | | | 29,450 | |
| | | | | 175,000 | | | | 8.250 | | | 10/13/24 | | | 28,875 | |
| | | | | 165,000 | | | | 9.250 | | | 09/15/27 | | | 30,938 | |
| | | | | 145,000 | | | | 9.250 | | | 05/07/28 | | | 25,158 | |
| | | | | 152,000 | | | | 9.375 | | | 01/13/34 | | | 26,372 | |
| | Zambia Government International Bonds(f) | |
| | | | | 684,000 | | | | 5.375 | | | 09/20/22 | | | 372,917 | |
| | | | | | | | | | | | | | | | |
| | | | | | | | | | | | | | | 102,487,374 | |
| | | |
| | |
| | TOTAL SOVEREIGN DEBT OBLIGATIONS (Cost $367,730,907) | | $ | 348,829,749 | |
| | | |
| | | | | | | | | | | | | | | | |
| |
| | Bank Loans(m) – 25.6% | |
| |
| | Advertising(d) – 0.2% | |
| | Clear Channel Outdoor Holdings, Inc. (3 mo. USD Term SOFR + 3.500%) | |
| | $ | | | 1,880,425 | | | | 9.145 | % | | 08/21/26 | | $ | 1,802,068 | |
| | Dotdash Meredith, Inc.(h) (1 mo. USD Term SOFR + 4.000%) | |
| | | | | 64,020 | | | | 9.415 | | | 12/01/28 | | | 60,499 | |
| | | | | | | | | | | | | | | | |
| | | | | | | | | | | | | | | 1,862,567 | |
| | | |
| |
| | Aerospace & Defense – 1.1% | |
| | Dynasty Acquisition Co., Inc.(d) | |
| | (1 mo. USD Term SOFR + 4.000%) | |
| | | | | 3,142,125 | | | | 9.324 | | | 08/24/28 | | | 3,102,848 | |
| | (1 mo. USD Term SOFR + 4.000%) | |
| | | | | 1,346,625 | | | | 9.324 | | | 08/24/28 | | | 1,329,792 | |
| | TransDigm, Inc.(d) | |
| | (3 mo. USD Term SOFR + 3.250%) | |
| | | | | 4,520,974 | | | | 8.640 | | | 02/22/27 | | | 4,516,273 | |
| | (3 mo. USD Term SOFR + 3.250%) | |
| | | | | 238,830 | | | | 8.640 | | | 02/22/27 | | | 238,582 | |
| | (3 mo. USD Term SOFR + 3.250%) | |
| | | | | 2,556,088 | | | | 8.640 | | | 08/24/28 | | | 2,552,049 | |
| | (3 mo. USD Term SOFR + 3.250%). | |
| | | | | 12,731 | | | | 8.640 | | | 08/24/28 | | | 12,711 | |
| | | | | | | | | | | | | | | | |
| | | | | | | | | | | | | | | 11,752,255 | |
| | | |
| |
| | Airlines – 0.7% | |
| | Air Canada(d) (3 mo. USD Term SOFR + 3.500%) | |
| | | | | 738,760 | | | | 9.128 | | | 08/11/28 | | | 737,467 | |
| | American Airlines, Inc.(d) (3 mo. USD Term SOFR + 4.750%) | |
| | | | | 1,550,700 | | | | 10.427 | | | 04/20/28 | | | 1,570,084 | |
| | | |
| | |
| The accompanying notes are an integral part of these financial statements. | | 57 |
GOLDMAN SACHS MULTI-MANAGER NON-CORE FIXED INCOME FUND
|
Schedule of Investments (continued) October 31, 2023 |
| | | | | | | | | | | | | | | | |
| | | | | Principal
Amount | | | Interest
Rate | | | Maturity Date | | Value | |
| |
| | Bank Loans(m) – (continued) | |
| |
| | Airlines – (continued) | |
| | Kestrel Bidco, Inc.(d) (3 mo. USD Term SOFR + 3.000%) | |
| | $ | | | 1,521,885 | | | | 8.339 | % | | 12/11/26 | | $ | 1,467,356 | |
| | Mileage Plus Holdings LLC(d) (3 mo. USD Term SOFR + 5.250%) | |
| | | | | 669,706 | | | | 10.798 | | | 06/21/27 | | | 689,154 | |
| | SkyMiles IP Ltd.(d) (3 mo. USD Term SOFR + 3.750%) | |
| | | | | 536,444 | | | | 9.166 | | | 10/20/27 | | | 548,852 | |
| | United Airlines, Inc.(d) | |
| | (1 mo. USD Term SOFR + 3.750%) | |
| | | | | 961,072 | | | | 9.189 | | | 04/21/28 | | | 957,468 | |
| | (3 mo. USD Term SOFR + 3.750%) | |
| | | | | 1,277,264 | | | | 9.189 | | | 04/21/28 | | | 1,272,474 | |
| | | | | | | | | | | | | | | | |
| | | | | | | | | | | | | | | 7,242,855 | |
| | | |
| |
| | Apparel(d) – 0.1% | |
| | Birkenstock GmbH & Co. KG (3mo. USD Term SOFR + 2.750%) | |
| | | | | 910,005 | | | | 8.878 | | | 04/28/28 | | | 906,138 | |
| | | |
| |
| | Beverages(d) – 0.2% | |
| | Arterra Wines Canada, Inc. (3 mo. USD Term SOFR + 3.500%) | |
| | | | | 25,004 | | | | 9.152 | | | 11/24/27 | | | 23,542 | |
| | City Brewing Co. LLC (3 mo. USD Term SOFR + 3.500%) | |
| | | | | 236,586 | | | | 9.164 | | | 04/05/28 | | | 170,342 | |
| | Naked Juice LLC (3 mo. USD Term SOFR + 3.250%) | |
| | | | | 1,244,339 | | | | 8.740 | | | 01/24/29 | | | 1,141,295 | |
| | Triton Water Holdings, Inc. (3 mo. USD Term SOFR + 3.250%) | |
| | | | | 310,380 | | | | 8.902 | | | 03/31/28 | | | 293,591 | |
| | | | | | | | | | | | | | | | |
| | | | | | | | | | | | | | | 1,628,770 | |
| | | |
| |
| | Building Materials(d) – 0.1% | |
| | ACProducts, Inc. (3 mo. USD Term SOFR) | |
| | | | | 104,732 | | | | 4.750 | | | 05/17/28 | | | 82,913 | |
| | Emrld Borrower LP (3 mo. USD Term SOFR + 3.000%) | |
| | | | | 250,000 | | | | 8.380 | | | 05/31/30 | | | 249,335 | |
| | Flynn Canada(h) (1 mo. USD Term SOFR + 4.500%) | |
| | | | | 215,839 | | | | 9.939 | | | 07/31/28 | | | 205,048 | |
| | Icebox Holdco III, Inc. (3 mo. USD Term SOFR + 3.750%) | |
| | | | | 249,367 | | | | 9.402 | | | 12/22/28 | | | 243,964 | |
| | Ingersoll-Rand Services Co. (1 mo. USD Term SOFR + 1.750%) | |
| | | | | 17,857 | | | | 7.174 | | | 03/01/27 | | | 17,871 | |
| | Watlow Electric Manufacturing Co. (1 mo. USD Term SOFR) | |
| | | | | 247,506 | | | | 9.434 | | | 03/02/28 | | | 243,669 | |
| | | | | | | | | | | | | | | | |
| | | | | | | | | | | | | | | 1,042,800 | |
| | | |
| |
| | Chemicals – 0.3% | |
| | Ascend Performance Materials Operations LLC(d) (3 mo. USD Term SOFR + 4.750%) | |
| | | | | 329,154 | | | | 10.318 | | | 08/27/26 | | | 309,757 | |
| | ASP Unifrax Holdings, Inc.(d) (3 mo. USD Term SOFR + 3.750%) | |
| | | | | 448,388 | | | | 9.290 | | | 12/12/25 | | | 416,534 | |
| | Avient Corp.(d) (3 mo. USD Term SOFR + 2.500%) | |
| | | | | 41,814 | | | | 7.872 | | | 08/29/29 | | | 41,879 | |
| | | |
| | | | | | | | | | | | | | | | |
| | | | | Principal
Amount | | | Interest
Rate | | | Maturity Date | | Value | |
| |
| | Bank Loans(m) – (continued) | |
| |
| | Chemicals – (continued) | |
| | Axalta Coating Systems U.S. Holdings, Inc.(d) (3 mo. USD Term SOFR + 2.500%) | |
| | $ | | | 187,404 | | | | 7.890 | % | | 12/20/29 | | $ | 187,476 | |
| | CPC Acquisition Corp.(d) (3 mo. USD Term SOFR + 3.750%) | |
| | | | | 161,000 | | | | 9.402 | | | 12/29/27 | | | 125,868 | |
| | Discovery Purchaser Corp.(d) (3 mo. USD Term SOFR + 4.375%) | |
| | | | | 248,747 | | | | 9.765 | | | 10/04/29 | | | 230,578 | |
| | Ineos U.S. Finance LLC(n) | |
| | | | | 349,125 | | | | 0.000 | | | 02/18/30 | | | 340,921 | |
| | Lonza Group AG(d) (3 mo. USD Term SOFR + 3.925%) | |
| | | | | 410,544 | | | | 9.415 | | | 07/03/28 | | | 345,030 | |
| | (3 mo. USD Term SOFR + 3.925%) | |
| | | | | 400,563 | | | | 9.415 | | | 07/03/28 | | | 336,641 | |
| | Messer Industries GmbH(d) (3 mo. USD Term SOFR + 2.500%) | |
| | | | | 200,624 | | | | 8.152 | | | 03/02/26 | | | 200,401 | |
| | PQ Corp.(d) (3 mo. USD Term SOFR + 2.500%) | |
| | | | | 203,574 | | | | 7.983 | | | 06/09/28 | | | 202,125 | |
| | Tronox Finance LLC(d) (1 mo. USD Term SOFR + 3.500%) | |
| | | | | 250,000 | | | | 8.824 | | | 08/16/28 | | | 245,782 | |
| | | | | | | | | | | | | | | | |
| | | | | | | | | | | | | | | 2,982,992 | |
| | | |
| |
| | Commercial Services – 1.4% | |
| | Allied Universal Holdco LLC(d) (1 mo. USD Term SOFR + 4.750%) | |
| | | | | 3,875,000 | | | | 10.074 | | | 05/12/28 | | | 3,751,504 | |
| | Armorica Lux SARL | |
| | EUR | | | 500,000 | | | | 8.639 | | | 07/28/28 | | | 482,758 | |
| | Avis Budget Car Rental LLC(d) (1 mo. USD Term SOFR + 1.750%) | |
| | $ | | | 388,614 | | | | 7.189 | | | 08/06/27 | | | 385,618 | |
| | (1 mo. USD Term SOFR + 3.500%) | |
| | | | | 59,248 | | | | 8.924 | | | 03/16/29 | | | 59,223 | |
| | AVSC Holding Corp.(d) (1 mo. USD Term SOFR + 3.250%) | |
| | | | | 120,108 | | | | 8.820 | | | 03/03/25 | | | 112,533 | |
| | (1 mo. USD Term SOFR + 5.500%) | |
| | | | | 54,594 | | | | 10.916 | | | 10/15/26 | | | 51,576 | |
| | Belron Finance U.S. LLC(d) (3 mo. USD Term SOFR + 2.750%) | |
| | | | | 249,375 | | | | 8.245 | | | 04/18/29 | | | 249,532 | |
| | Celestial Saturn Parent, Inc.(d) (1 mo. USD Term SOFR + 6.500%) | |
| | | | | 825,000 | | | | 11.939 | | | 06/04/29 | | | 660,000 | |
| | CHG Healthcare Services, Inc.(d) (1 mo. USD Term SOFR + 3.250%) | |
| | | | | 363,186 | | | | 8.575 | | | 09/29/28 | | | 359,057 | |
| | CoreLogic, Inc.(d) (1 mo. USD Term SOFR + 3.500%) | |
| | | | | 1,034,970 | | | | 8.931 | | | 06/02/28 | | | 939,608 | |
| | (1 mo. USD Term SOFR + 3.500%) | |
| | | | | 79,796 | | | | 8.939 | | | 06/02/28 | | | 72,444 | |
| | Driven Holdings LLC(d) (1 mo. USD Term SOFR + 3.000%) | |
| | | | | 349,114 | | | | 8.439 | | | 12/17/28 | | | 339,077 | |
| | Fly Funding II SARL(d) (3 mo.USD LIBOR + 1.750%) | |
| | | | | 677,214 | | | | 7.380 | | | 08/11/25 | | | 642,507 | |
| | | |
| | |
| 58 | | The accompanying notes are an integral part of these financial statements. |
GOLDMAN SACHS MULTI-MANAGER NON-CORE FIXED INCOME FUND
| | | | | | | | | | | | | | | | |
| | | Principal Amount | | | Interest
Rate | | | Maturity Date | | Value | |
| |
| | Bank Loans(m) – (continued) | |
| |
| | Commercial Services – (continued) | |
| | GTCR W Merger Sub LLC(n) | | | | |
| | $ | | | 2,000,000 | | | | 0.000 | % | | 09/20/30 | | $ | 1,984,160 | |
| | PECF USS Intermediate Holding III Corp.(d) (3 mo. USD Term SOFR + 4.250%) | |
| | | | | 808,989 | | | | 9.895 | | | 12/15/28 | | | 609,071 | |
| | Sabert Corp.(d) (1 mo. USD Term SOFR + 4.500%) | | | | |
| | | | | 151,374 | | | | 9.939 | | | 12/10/26 | | | 150,902 | |
| | Sabre GLBL, Inc.(d) (1 mo. USD Term SOFR + 5.000%) | |
| | | | | 165,000 | | | | 10.424 | | | 06/30/28 | | | 139,974 | |
| | Spin Holdco, Inc.(d) (3 mo. USD Term SOFR + 4.000%) | | | | |
| | | | | 1,455,152 | | | | 9.664 | | | 03/04/28 | | | 1,240,517 | |
| | (3 mo. USD Term SOFR + 4.000%) | | | | |
| | | | | 383,058 | | | | 9.664 | | | 03/04/28 | | | 326,557 | |
| | Syniverse Holdings, Inc.(d) (3 mo. USD Term SOFR + 7.000%) | |
| | | | | 594,000 | | | | 12.390 | | | 05/13/27 | | | 522,720 | |
| | Team Health Holdings, Inc.(d) (1 mo.USD LIBOR + 2.750%) | | | | |
| | | | | 595,943 | | | | 8.189 | | | 02/06/24 | | | 580,550 | |
| | (3 mo. USD Term SOFR + 5.250%) | | | | |
| | | | | 2,410,594 | | | | 10.577 | | | 03/02/27 | | | 1,720,224 | |
| | | | | | | | | | | | | | | | |
| | | | | | | | | | | | | | | 15,380,112 | |
| | | |
| |
| | Computers – 0.4% | |
| | Ahead DB Holdings LLC(d) (3 mo. USD Term SOFR + 3.750%) | | | | |
| | | | | 372,638 | | | | 9.240 | | | 10/18/27 | | | 368,912 | |
| | iQor U.S., Inc.(d) (1 mo. USD Term SOFR + 7.600%) | |
| | | | | 59,220 | | | | 12.927 | | | 11/19/24 | | | 58,431 | |
| | (1 mo. USD Term SOFR + 7.600%) | | | | |
| | | | | 163,509 | | | | 12.927 | | | 11/19/25 | | | 115,192 | |
| | Magenta Buyer LLC(d) (3 mo. USD Term SOFR + 5.000%) | | | | |
| | | | | 1,076,438 | | | | 10.380 | | | 07/27/28 | | | 753,507 | |
| | McAfee LLC(d) (1 mo. USD Term SOFR + 3.750%) | |
| | | | | 267,800 | | | | 9.165 | | | 03/01/29 | | | 255,583 | |
| | Peraton Corp.(d) (1 mo. USD Term SOFR + 3.750%) | | | | |
| | | | | 602,535 | | | | 9.174 | | | 02/01/28 | | | 590,484 | |
| | (3 mo. USD Term SOFR + 7.750%) | | | | |
| | | | | 1,361,339 | | | | 13.233 | | | 02/01/29 | | | 1,310,289 | |
| | Perforce Software, Inc.(d) (1 mo. USD Term SOFR + 3.750%) | |
| | | | | 240,625 | | | | 9.189 | | | 07/01/26 | | | 227,051 | |
| | Verifone Systems, Inc.(d) (3 mo. USD Term SOFR + 4.000%) | |
| | | | | 489,113 | | | | 9.383 | | | 08/20/25 | | | 453,501 | |
| | Virtusa Corp.(d) (3 mo. USD Term SOFR + 3.750%) | |
| | | | | 1,845 | | | | 9.331 | | | 02/11/28 | | | 1,829 | |
| | Vision Solutions, Inc.(d) (3 mo. USD Term SOFR + 4.000%) | |
| | | | | 299,193 | | | | 9.640 | | | 04/24/28 | | | 284,308 | |
| | | | | | | | | | | | | | | | |
| | | | | | | | | | | | | | | 4,419,087 | |
| | | |
| |
| | Consumer Cyclical Services – 0.1% | |
| | Asurion LLC(d) (3 mo. USD Term SOFR + 3.250%) | |
| | | | | 126,674 | | | | 8.689 | | | 12/23/26 | | | 122,241 | |
| | | |
| | | | | | | | | | | | | | | | |
| | | Principal Amount | | | Interest
Rate | | | Maturity Date | | Value | |
| |
| | Bank Loans(m) – (continued) | |
| |
| | Consumer Cyclical Services – (continued) | |
| | Hertz Corp.(d) | | | | |
| | (1 mo. USD Term SOFR + 3.250%) | | | | |
| | $ | | | 1,253,485 | | | | 8.691 | % | | 06/30/28 | | $ | 1,241,740 | |
| | (1 mo. USD Term SOFR + 3.250%) | | | | |
| | | | | 241,571 | | | | 8.691 | | | 06/30/28 | | | 239,307 | |
| | | | | | | | | | | | | | | | |
| | | | | | | | | | | | | | | 1,603,288 | |
| | | |
| |
| | Distribution & Wholesale(d) – 0.0% | |
| | Core & Main LP (3 mo. USD Term SOFR + 2.500%) | |
| | | | | 361,318 | | | | 8.056 | | | 07/27/28 | | | 359,623 | |
| | | |
| |
| | Diversified Financial Services – 0.7% | |
| | Apex Group Treasury LLC(d) | | | | |
| | (3 mo. USD Term SOFR + 5.000%) | | | | |
| | | | | 868,749 | | | | 10.426 | | | 07/27/28 | | | 860,608 | |
| | (3 mo. USD Term SOFR + 3.750%) | | | | |
| | | | | 1,602,382 | | | | 9.379 | | | 07/27/28 | | | 1,560,992 | |
| | Deerfield Dakota Holding LLC(d) | | | | |
| | (3 mo. USD Term SOFR + 3.750%) | | | | |
| | | | | 1,424,774 | | | | 9.140 | | | 04/09/27 | | | 1,373,724 | |
| | (3 mo. USD Term SOFR + 6.750%) | | | | |
| | | | | 1,750,000 | | | | 12.402 | | | 04/07/28 | | | 1,641,727 | |
| | Delos Aircraft DAC(d) (3 mo. USD Term SOFR + 2.000%) | |
| | | | | 74,286 | | | | 7.402 | | | 10/31/27 | | | 74,240 | |
| | Ditech Holding Corp.(f)(h)(n) | | | | |
| | | | | 188,851 | | | | 0.000 | | | 06/30/24 | | | 5,288 | |
| | NFP Corp.(d) (1 mo. USD Term SOFR + 3.250%) | |
| | | | | 1,496,124 | | | | 8.689 | | | 02/16/27 | | | 1,465,828 | |
| | Vida Capital, Inc.(d) (1 mo. USD Term SOFR + 6.000%) | |
| | | | | 725,175 | | | | 11.439 | | | 10/01/26 | | | 594,644 | |
| | | | | | | | | | | | | | | | |
| | | | | | | | | | | | | | | 7,577,051 | |
| | | |
| |
| | Electrical – 0.2% | |
| | Hamilton Projects Acquiror LLC(d) (3 mo. USD Term SOFR) | |
| | | | | 237,857 | | | | 5.500 | | | 06/17/27 | | | 236,915 | |
| | Pacific Gas & Electric Co.(d) | | | | |
| | (1 mo. USD Term SOFR + 3.000%) | | | | |
| | | | | 21,635 | | | | 8.439 | | | 06/23/25 | | | 21,581 | |
| | (1 mo. USD Term SOFR + 3.000%) | | | | |
| | | | | 247,439 | | | | 8.439 | | | 06/23/25 | | | 246,820 | |
| | Talen Energy Supply LLC(d) | | | | |
| | (3 mo. USD Term SOFR + 4.500%) | | | | |
| | | | | 895,238 | | | | 9.877 | | | 05/17/30 | | | 893,483 | |
| | (3 mo. USD Term SOFR + 4.500%) | | | | |
| | | | | 1,102,000 | | | | 9.877 | | | 05/17/30 | | | 1,099,840 | |
| | | | | | | | | | | | | | | | |
| | | | | | | | | | | | | | | 2,498,639 | |
| | | |
| |
| | Electronics(d) – 0.1% | |
| | Ingram Micro, Inc. (3 mo. USD Term SOFR + 3.000%) | |
| | | | | 260,869 | | | | 8.439 | | | 06/30/28 | | | 259,760 | |
| | Roper Industrial Products Investment Co. LLC (3 mo. USD Term SOFR + 4.500%) | |
| | | | | 1,237,497 | | | | 9.890 | | | 11/22/29 | | | 1,234,403 | |
| | | | | | | | | | | | | | | | |
| | | | | | | | | | | | | | | 1,494,163 | |
| | | |
| | |
| The accompanying notes are an integral part of these financial statements. | | 59 |
GOLDMAN SACHS MULTI-MANAGER NON-CORE FIXED INCOME FUND
|
Schedule of Investments (continued) October 31, 2023 |
| | | | | | | | | | | | | | | | |
| | | Principal Amount | | | Interest
Rate | | | Maturity Date | | Value | |
| |
| | Bank Loans(m) – (continued) | |
| |
| | Energy(d) – 0.0% | |
| | Oryx Midstream Services Permian Basin LLC (1 mo. USD Term SOFR + 3.250%) | |
| | $ | | | 233,789 | | | | 8.692 | % | | 10/05/28 | | $ | 233,270 | |
| | | |
| |
| | Engineering & Construction – 0.3% | |
| | Brown Group Holding LLC(d) (1 mo. USD Term SOFR + 2.750%) | |
| | | | | 242,687 | | | | 8.075 | | | 06/07/28 | | | 238,035 | |
| | KKR Apple Bidco LLC(d) | | | | |
| | (1 mo. USD Term SOFR + 2.750%) | | | | |
| | | | | 245,625 | | | | 8.189 | | | 09/22/28 | | | 240,609 | |
| | (1 mo. USD Term SOFR + 4.000%) | | | | |
| | | | | 1,979,988 | | | | 9.324 | | | 09/22/28 | | | 1,974,107 | |
| | USIC Holdings, Inc.(d) (1 mo. USD Term SOFR + 6.500%) | |
| | | | | 453,984 | | | | 11.939 | | | 05/14/29 | | | 413,693 | |
| | | | | | | | | | | | | | | | |
| | | | | | | | | | | | | | | 2,866,444 | |
| | | |
| |
| | Entertainment – 0.5% | |
| | AMC Entertainment Holdings, Inc.(d) (1 mo. USD Term SOFR + 3.000%) | |
| | | | | 771,176 | | | | 8.447 | | | 04/22/26 | | | 628,855 | |
| | Caesars Entertainment Corp.(d) (1 mo. USD Term SOFR + 3.250%) | |
| | | | | 398,000 | | | | 8.674 | | | 02/06/30 | | | 396,066 | |
| | Churchill Downs, Inc.(d) (1 mo. USD Term SOFR + 2.000%) | |
| | | | | 33,570 | | | | 7.424 | | | 03/17/28 | | | 33,486 | |
| | Cinemark USA, Inc.(d) (1 mo. USD Term SOFR + 3.750%) | |
| | | | | 299,248 | | | | 9.091 | | | 05/24/30 | | | 298,500 | |
| | Crown Finance U.S., Inc.(d) (1 mo. USD Term SOFR + 8.500%) | |
| | | | | 622,634 | | | | 7.381 | | | 07/31/28 | | | 634,308 | |
| | East Valley Tourist Development Authority(d)(h) (3 mo. USD Term SOFR + 7.500%) | |
| | | | | 1,082,866 | | | | 13.152 | | | 11/23/26 | | | 1,053,629 | |
| | Everi Holdings, Inc.(d) (1 mo. USD Term SOFR + 2.500%) | |
| | | | | 606,900 | | | | 7.939 | | | 08/03/28 | | | 605,535 | |
| | GVC Holdings (Gibraltar) Ltd.(d) (3 mo. USD Term SOFR + 3.500%) | |
| | | | | 148,875 | | | | 8.990 | | | 10/31/29 | | | 148,875 | |
| | Motion Finco SARL(d) | | | | |
| | (3 mo. USD Term SOFR + 3.250%) | | | | |
| | | | | 31,274 | | | | 8.902 | | | 11/12/26 | | | 31,133 | |
| | (3 mo. USD Term SOFR + 3.250%) | | | | |
| | | | | 219,502 | | | | 8.903 | | | 11/12/26 | | | 218,514 | |
| | NASCAR Holdings LLC(d) (1 mo. USD Term SOFR + 2.500%) | |
| | | | | 342,607 | | | | 7.939 | | | 10/19/26 | | | 343,337 | |
| | Scientific Games Holdings LP(d) (3 mo. USD Term SOFR + 3.500%) | |
| | | | | 247,500 | | | | 8.914 | | | 04/04/29 | | | 243,077 | |
| | Scientific Games International, Inc.(d) (1 mo. USD Term SOFR + 3.000%) | |
| | | | | 64,188 | | | | 8.435 | | | 04/14/29 | | | 63,977 | |
| | SeaWorld Parks & Entertainment, Inc.(d) (1 mo. USD Term SOFR +3.000%) | |
| | | | | 241,269 | | | | 8.439 | | | 08/25/28 | | | 240,565 | |
| | | |
| | | | | | | | | | | | | | | | |
| | | Principal Amount | | | Interest
Rate | | | Maturity Date | | Value | |
| |
| | Bank Loans(m) – (continued) | |
| |
| | Entertainment – (continued) | |
| | William Morris Endeavor Entertainment LLC(d) (1 mo. USD Term SOFR + 2.750%) | |
| | $ | | | 183,009 | | | | 8.075 | % | | 05/18/25 | | $ | 182,715 | |
| | | | | | | | | | | | | | | | |
| | | | | | | | | | | | | | | 5,122,572 | |
| | | |
| |
| | Environmental – 0.5% | |
| | Covanta Holding Corp.(d) | | | | |
| | (1 mo. USD Term SOFR + 2.500%) | | | | |
| | | | | 73,247 | | | | 7.825 | | | 11/30/28 | | | 72,114 | |
| | (1 mo. USD Term SOFR + 2.500%) | | | | |
| | | | | 6,009 | | | | 7.825 | | | 11/30/28 | | | 5,916 | |
| | Filtration Group Corp.(d) (1 mo. USD Term SOFR + 4.250%) | |
| | | | | 2,988,117 | | | | 9.689 | | | 10/21/28 | | | 2,986,713 | |
| | GFL Environmental, Inc.(d) | | | | |
| | (3 mo. USD Term SOFR + 2.500%) | | | | |
| | | | | 1,277,927 | | | | 7.912 | | | 05/31/27 | | | 1,276,866 | |
| | (3 mo. USD Term SOFR + 2.500%) | | | | |
| | | | | 489,829 | | | | 7.912 | | | 05/31/27 | | | 489,422 | |
| | Madison IAQ LLC(d) (1 mo. USD Term SOFR + 3.250%) | |
| | | | | 146,993 | | | | 8.703 | | | 06/21/28 | | | 141,563 | |
| | WIN Waste Innovations Holdings, Inc.(d) (1 mo. USD Term SOFR + 2.750%) | |
| | | | | 304,120 | | | | 8.189 | | | 03/24/28 | | | 269,949 | |
| | | | | | | | | | | | | | | | |
| | | | | | | | | | | | | | | 5,242,543 | |
| | | |
| |
| | Food & Drug Retailing – 0.2% | |
| | 8th Avenue Food & Provisions, Inc.(d) | | | | |
| | (1 mo. USD Term SOFR + 7.750%) | | | | |
| | | | | 280,000 | | | | 13.189 | | | 10/01/26 | | | 210,467 | |
| | (1 mo. USD Term SOFR + 3.750%) | | | | |
| | | | | 1,372,055 | | | | 9.189 | | | 10/01/25 | | | 1,292,517 | |
| | (1 mo. USD Term SOFR + 3.750%) | | | | |
| | | | | 790,810 | | | | 9.189 | | | 10/01/25 | | | 744,967 | |
| | (1 mo. USD Term SOFR) | | | | |
| | | | | 249,364 | | | | 4.750 | | | 10/01/25 | | | 234,921 | |
| | U.S. Foods, Inc.(d) (1 mo.USD LIBOR + 2.000%) | |
| | | | | 63,510 | | | | 7.439 | | | 09/13/26 | | | 63,433 | |
| | UTZ Quality Foods LLC(d) (3 mo. USD Term SOFR + 3.000%) | |
| | | | | 8,913 | | | | 8.640 | | | 01/20/28 | | | 8,893 | |
| | | | | | | | | | | | | | | | |
| | | | | | | | | | | | | | | 2,555,198 | |
| | | |
| |
| | Forest Products & Paper(d) – 0.0% | |
| | Asplundh Tree Expert LLC (1 mo. USD Term SOFR + 1.750%) | |
| | | | | 62,357 | | | | 7.174 | | | 09/07/27 | | | 62,386 | |
| | | |
| |
| | Gaming – 0.3% | |
| | Fertitta Entertainment LLC(d) | | | | |
| | (1 mo. USD Term SOFR + 4.000%) | | | | |
| | | | | 755,312 | | | | 9.324 | | | 01/27/29 | | | 737,660 | |
| | (1 mo. USD Term SOFR + 4.000%) | | | | |
| | | | | 755,311 | | | | 9.324 | | | 01/27/29 | | | 737,660 | |
| | Stars Group Holdings BV(d) | | | | |
| | (3 mo. USD Term SOFR + 2.250%) | | | | |
| | | | | 388,104 | | | | 7.902 | | | 07/21/26 | | | 387,692 | |
| | | |
| | |
| 60 | | The accompanying notes are an integral part of these financial statements. |
GOLDMAN SACHS MULTI-MANAGER NON-CORE FIXED INCOME FUND
| | | | | | | | | | | | | | | | |
| | | Principal Amount | | | Interest
Rate | | | Maturity Date | | Value | |
| |
| | Bank Loans(m) – (continued) | |
| |
| | Gaming – (continued) | |
| | (3 mo. USD Term SOFR + 3.250%) | | | | |
| | $ | | | 865,628 | | | | 8.902 | % | | 07/22/28 | | $ | 865,628 | |
| | | | | | | | | | | | | | | | |
| | | | | | | | | | | | | | | 2,728,640 | |
| | | |
| |
| | Hand/Machine Tools(d) – 0.0% | |
| | Alliance Laundry Systems LLC (3 mo. USD Term SOFR + 3.500%) | |
| | | | | 213,804 | | | | 8.932 | | | 10/08/27 | | | 213,231 | |
| | | |
| |
| | Health Care(d) – 0.0% | |
| | Athenahealth Group, Inc. (1 mo. USD Term SOFR + 3.250%) | |
| | | | | 5,585 | | | | 8.577 | | | 02/15/29 | | | 5,403 | |
| | | |
| |
| | Health Care Products – 0.7% | |
| | Auris Luxembourg III SARL (1 mo. USD Term SOFR + 4.000%) | |
| | EUR | | | 600,000 | | | | 7.781 | | | 02/27/26 | | | 610,786 | |
| | Bausch & Lomb Corp.(d) | | | | |
| | (1 mo. USD Term SOFR + 4.000%) | | | | |
| | $ | | | 250,000 | | | | 9.324 | | | 09/29/28 | | | 240,000 | |
| | (3 mo. USD Term SOFR + 3.250%) | | | | |
| | | | | 1,608,097 | | | | 8.755 | | | 05/10/27 | | | 1,536,987 | |
| | (3 mo. USD Term SOFR + 3.250%) | | | | |
| | | | | 1,479,632 | | | | 8.755 | | | 05/10/27 | | | 1,414,203 | |
| | Carestream Dental Equipment, Inc.(d) (3 mo.USD LIBOR + 3.250%) | |
| | | | | 241,377 | | | | 8.981 | | | 09/01/24 | | | 199,539 | |
| | Carestream Health, Inc.(d) (3 mo. USD Term SOFR + 7.500%) | | | | |
| | | | | 1,253,197 | | | | 12.990 | | | 09/30/27 | | | 919,922 | |
| | Medline Borrower LP(d) (1 mo. USD Term SOFR + 3.250%) | |
| | | | | 1,409,560 | | | | 8.689 | | | 10/23/28 | | | 1,399,876 | |
| | Viant Medical Holdings, Inc.(d) (1 mo. USD Term SOFR + 3.750%) | |
| | | | | 622,728 | | | | 9.189 | | | 07/02/25 | | | 609,756 | |
| | Vyaire Medical, Inc.(d) (3 mo. USD Term SOFR + 4.750%) | |
| | | | | 365,837 | | | | 10.408 | | | 04/16/25 | | | 254,868 | |
| | | | | | | | | | | | | | | | |
| | | | | | | | | | | | | | | 7,185,937 | |
| | | |
| |
| | Health Care Services – 0.2% | |
| | Envision Healthcare Corp.(d) | | | | |
| | (3 mo. USD Term SOFR + 4.250%) | | | | |
| | | | | 2,300,294 | | | | 9.148 | | | 03/31/27 | | | 393,350 | |
| | (3 mo. USD Term SOFR + 7.875%) | | | | |
| | | | | 329,958 | | | | 13.267 | | | 03/31/27 | | | 427,296 | |
| | ICON Luxembourg SARL(d) (3 mo. USD Term SOFR + 2.250%) | |
| | | | | 291,559 | | | | 7.902 | | | 07/03/28 | | | 291,627 | |
| | National Mentor Holdings, Inc. | | | | |
| | | | | 44,885 | | | | 0.000 | (n) | | 03/02/28 | | | 39,036 | |
| | (1 mo. USD Term SOFR) | | | | |
| | | | | 2,000 | | | | 3.750 | (d) | | 03/02/28 | | | 1,739 | |
| | Select Medical Corp.(d) (1 mo. USD Term SOFR + 3.000%) | |
| | | | | 163,667 | | | | 8.324 | | | 03/06/27 | | | 163,002 | |
| | Star Parent, Inc.(d) (3 mo.USD LIBOR + 4.000%) | |
| | | | | 1,000,000 | | | | 9.386 | | | 09/27/30 | | | 951,630 | |
| | Verscend Holding Corp.(d) (1 mo. USD Term SOFR + 4.000%) | |
| | | | | 226,244 | | | | 9.325 | | | 08/27/25 | | | 225,914 | |
| | | | | | | | | | | | | | | | |
| | | | | | | | | | | | | | | 2,493,594 | |
| | | |
| | | | | | | | | | | | | | | | |
| | | Principal Amount | | | Interest
Rate | | | Maturity Date | | Value | |
| |
| | Bank Loans(m) – (continued) | |
| |
| | Healthcare Providers & Services – 1.1% | |
| | DaVita, Inc.(d) (1 mo. USD Term SOFR + 1.750%) | |
| | $ | | | 182,893 | | | | 7.189 | % | | 08/12/26 | | $ | 180,676 | |
| | EyeCare Partners LLC(d) (3 mo. USD Term SOFR + 4.500%) | |
| | | | | 374,058 | | | | 9.983 | | | 11/15/28 | | | 215,083 | |
| | Fortrea Holdings, Inc. (1 mo. USD Term SOFR + 3.750%) | |
| | | | | 399,000 | | | | 9.066 | | | 07/01/30 | | | 398,501 | |
| | Global Medical Response, Inc.(d) | | | | |
| | (3 mo. USD Term SOFR + 4.250%) | | | | |
| | | | | 107,376 | | | | 9.895 | | | 03/14/25 | | | 69,303 | |
| | (3 mo. USD Term SOFR + 4.250%) | | | | |
| | | | | 1,963,678 | | | | 9.934 | | | 10/02/25 | | | 1,267,397 | |
| | Heartland Dental LLC(d) (1 mo. USD Term SOFR + 5.000%) | |
| | | | | 658,726 | | | | 10.335 | | | 04/28/28 | | | 637,673 | |
| | Lifescan Global Corp.(d) (3 mo. USD Term SOFR + 6.000%) | |
| | | | | 3,250,874 | | | | 11.747 | | | 12/31/26 | | | 2,562,761 | |
| | Medline Borrower LP(d) (1 mo. USD Term SOFR + 3.250%) | |
| | | | | 2,496,202 | | | | 8.689 | | | 10/23/28 | | | 2,479,054 | |
| | Onex TSG Intermediate Corp.(d) (3 mo. USD Term SOFR + 4.750%) | |
| | | | | 364,386 | | | | 10.395 | | | 02/28/28 | | | 335,465 | |
| | Parexel International Corp.(d) (1 mo. USD Term SOFR + 3.250%) | |
| | | | | 1,308,691 | | | | 8.575 | | | 11/15/28 | | | 1,292,006 | |
| | Phoenix Guarantor, Inc.(d) | | | | |
| | (1 mo. USD Term SOFR + 3.250%) | | | | |
| | | | | 336,875 | | | | 8.689 | | | 03/05/26 | | | 333,038 | |
| | (1 mo. USD Term SOFR + 3.500%) | | | | |
| | | | | 231,149 | | | | 8.939 | | | 03/05/26 | | | 229,184 | |
| | Pluto Acquisition I, Inc.(d) (3 mo. USD Term SOFR + 4.000%) | |
| | | | | 165,736 | | | | 9.684 | | | 06/22/26 | | | 137,975 | |
| | PRA Health Sciences, Inc.(d) (3 mo. USD Term SOFR + 2.250%) | |
| | | | | 72,642 | | | | 7.902 | | | 07/03/28 | | | 72,659 | |
| | Surgery Center Holdings, Inc.(d) (1 mo.USD SOFR) | |
| | | | | 1,786,046 | | | | 9.203 | | | 08/31/26 | | | 1,783,313 | |
| | | | | | | | | | | | | | | | |
| | | | | | | | | | | | | | | 11,994,088 | |
| | | |
| |
| | Home Construction(d) – 0.1% | |
| | Chamberlain Group, Inc. (1 mo. USD Term SOFR + 3.250%) | |
| | | | | 1,370,248 | | | | 8.674 | | | 11/03/28 | | | 1,329,140 | |
| | | |
| |
| | Home Furnishings(d) – 0.1% | |
| | AI Aqua Merger Sub, Inc. (1 mo. USD Term SOFR + 3.750%) | |
| | | | | 615,322 | | | | 9.082 | | | 07/31/28 | | | 602,948 | |
| | Herman Miller, Inc. (1 mo. USD Term SOFR + 2.000%) | |
| | | | | 364,096 | | | | 7.439 | | | 07/19/28 | | | 358,693 | |
| | Weber-Stephen Products LLC (1 mo. USD Term SOFR + 3.250%) | |
| | | | | 763,472 | | | | 8.689 | | | 10/30/27 | | | 665,854 | |
| | | | | | | | | | | | | | | | |
| | | | | | | | | | | | | | | 1,627,495 | |
| | | |
| |
| | Household Products – 0.1% | |
| | Kronos Acquisition Holdings, Inc.(d) | | | | |
| | (3 mo. USD Term SOFR + 3.750%) | | | | |
| | | | | 323,439 | | | | 9.402 | | | 12/22/26 | | | 316,346 | |
| | | |
| | |
| The accompanying notes are an integral part of these financial statements. | | 61 |
GOLDMAN SACHS MULTI-MANAGER NON-CORE FIXED INCOME FUND
|
Schedule of Investments (continued) October 31, 2023 |
| | | | | | | | | | | | | | | | |
| | | Principal Amount | | | Interest
Rate | | | Maturity Date | | Value | |
| |
| | Bank Loans(m) – (continued) | |
| |
| | Household Products – (continued) | |
| | (3 mo. USD Term SOFR + 6.000%) | | | | |
| | $ | | | 272,917 | | | | 11.567 | % | | 12/22/26 | | $ | 272,576 | |
| | | | | | | | | | | | | | | | |
| | | | | | | | | | | | | | | 588,922 | |
| | | |
| |
| | Housewares(d) – 0.3% | |
| | Southern Veterinary Partners LLC (1 mo. USD Term SOFR + 4.000%) | |
| | | | | 2,828,280 | | | | 9.439 | | | 10/05/27 | | | 2,792,926 | |
| | Springs Windows Fashions LLC (1 mo. USD Term SOFR + 4.000%) | | | | |
| | | | | 961,574 | | | | 9.439 | | | 10/06/28 | | | 781,626 | |
| | | | | | | | | | | | | | | | |
| | | | | | | | | | | | | | | 3,574,552 | |
| | | |
| |
| | Industrial Services(d) – 0.2% | |
| | LaserShip, Inc. (3 mo. USD Term SOFR + 4.500%) | |
| | | | | 1,932,999 | | | | 10.396 | | | 05/07/28 | | | 1,725,800 | |
| | | |
| |
| | Insurance – 1.7% | |
| | Acrisure LLC(d) | | | | |
| | (1 mo.USD LIBOR + 3.500%) | | | | |
| | | | | 1,741,609 | | | | 8.939 | | | 02/15/27 | | | 1,693,436 | |
| | (1 mo.USD LIBOR + 4.250%) | | | | |
| | | | | 3,838,824 | | | | 9.689 | | | 02/15/27 | | | 3,808,421 | |
| | Alliant Holdings Intermediate LLC(d) | | | | |
| | (1 mo. USD Term SOFR + 3.500%) | | | | |
| | | | | 248,204 | | | | 8.835 | | | 11/05/27 | | | 247,248 | |
| | (1 mo. USD Term SOFR + 3.500%) | | | | |
| | | | | 248,204 | | | | 8.835 | | | 11/05/27 | | | 247,248 | |
| | (1 mo.USD LIBOR + 3.500%) | | | | |
| | | | | 244,997 | | | | 8.939 | | | 11/05/27 | | | 244,034 | |
| | AssuredPartners, Inc.(d) | | | | |
| | (1 mo. USD Term SOFR + 3.500%) | | | | |
| | | | | 368,131 | | | | 8.824 | | | 02/12/27 | | | 364,726 | |
| | (1 mo. USD Term SOFR + 3.500%) | | | | |
| | | | | 500,000 | | | | 8.939 | | | 02/12/27 | | | 495,280 | |
| | (1 mo. USD Term SOFR + 3.500%) | | | | |
| | | | | 2,110,432 | | | | 8.939 | | | 02/12/27 | | | 2,090,657 | |
| | Asurion LLC(d) | | | | |
| | (1 mo. USD Term SOFR + 5.250%) | | | | |
| | | | | 276,000 | | | | 10.689 | | | 01/20/29 | | | 234,995 | |
| | (3 mo. USD Term SOFR + 3.250%) | | | | |
| | | | | 375,448 | | | | 8.689 | | | 07/31/27 | | | 358,395 | |
| | Broadstreet Partners, Inc.(d) | | | | |
| | (1 mo. USD Term SOFR + 3.000%) | | | | |
| | | | | 736,502 | | | | 8.325 | | | 01/27/27 | | | 728,150 | |
| | (1 mo. USD Term SOFR + 3.250%) | | | | |
| | | | | 332,130 | | | | 8.689 | | | 01/27/27 | | | 328,550 | |
| | (1 mo. USD Term SOFR + 4.000%) | | | | |
| | | | | 2,028,317 | | | | 9.324 | | | 01/27/29 | | | 2,021,137 | |
| | Howden Group Holdings Ltd.(d) (1 mo. USD Term SOFR + 4.000%) | |
| | | | | 1,119,375 | | | | 9.324 | | | 04/18/30 | | | 1,117,629 | |
| | HUB International Ltd.(d) | | | | |
| | (3 mo. USD Term SOFR + 4.250%) | | | | |
| | | | | 2,750,000 | | | | 9.662 | | | 06/20/30 | | | 2,748,047 | |
| | | |
| | | | | | | | | | | | | | | | |
| | | Principal Amount | | | Interest
Rate | | | Maturity Date | | Value | |
| |
| | Bank Loans(m) – (continued) | |
| |
| | Insurance – (continued) | |
| | (3 mo. USD Term SOFR + 4.250%) | | | | |
| | $ | | | 846,645 | | | | 9.662 | % | | 06/20/30 | | $ | 846,044 | |
| | Sedgwick Claims Management Services, Inc.(d) (1 mo. USD Term SOFR + 3.750%) | |
| | | | | 174,561 | | | | 9.074 | | | 02/24/28 | | | 173,798 | |
| | | | | | | | | | | | | | | | |
| | | | | | | | | | | | | | | 17,747,795 | |
| | | |
| |
| | Internet – 0.5% | |
| | Arches Buyer, Inc.(d) (1 mo. USD Term SOFR + 3.250%) | |
| | | | | 1,000,000 | | | | 8.674 | | | 12/06/27 | | | 970,180 | |
| | CNT Holdings I Corp.(d) | | | | |
| | (3 mo. USD Term SOFR + 3.500%) | | | | |
| | | | | 615,893 | | | | 8.926 | | | 11/08/27 | | | 612,333 | |
| | (3 mo. USD Term SOFR + 3.500%) | | | | |
| | | | | 122,487 | | | | 8.926 | | | 11/08/27 | | | 121,779 | |
| | (3 mo. USD Term SOFR + 6.750%) | | | | |
| | | | | 2,118,000 | | | | 12.176 | | | 11/06/28 | | | 2,110,058 | |
| | IU Finance Management GmbH(d) (3 mo. EUR EURIBOR + 4.980%) | |
| | EUR | | | 192,307 | | | | 8.775 | | | 12/08/28 | | | 201,573 | |
| | MH Sub I LLC(d) | | | | |
| | (1 mo. USD Term SOFR + 3.750%) | | | | |
| | $ | | | 216,059 | | | | 9.189 | | | 09/13/24 | | | 216,094 | |
| | (1 mo. USD Term SOFR + 3.750%) | | | | |
| | | | | 474,409 | | | | 9.189 | | | 09/13/24 | | | 474,115 | |
| | Proofpoint, Inc.(d) (1 mo. USD Term SOFR + 3.250%) | |
| | | | | 249,870 | | | | 8.689 | | | 08/31/28 | | | 245,428 | |
| | PUG LLC(d) (1 mo. USD Term SOFR + 4.250%) | |
| | | | | 536,426 | | | | 9.689 | | | 02/12/27 | | | 505,581 | |
| | | | | | | | | | | | | | | | |
| | | | | | | | | | | | | | | 5,457,141 | |
| | | |
| |
| | Leisure Time – 1.1% | |
| | Alterra Mountain Co.(d) | | | | |
| | (1 mo. USD Term SOFR + 3.500%) | | | | |
| | | | | 366,863 | | | | 8.939 | | | 08/17/28 | | | 366,404 | |
| | (1 mo. USD Term SOFR + 3.750%) | | | | |
| | | | | 2,280,852 | | | | 9.174 | | | 05/31/30 | | | 2,279,438 | |
| | (1 mo. USD Term SOFR + 3.750%) | | | | |
| | | | | 448,545 | | | | 9.174 | | | 05/31/30 | | | 448,267 | |
| | Carnival Corp.(d) | | | | |
| | (1 mo. USD Term SOFR + 3.250%) | | | | |
| | | | | 2,728,030 | | | | 8.689 | | | 10/18/28 | | | 2,674,615 | |
| | (1 mo. USD Term SOFR + 3.250%) | | | | |
| | | | | 259,845 | | | | 8.689 | | | 10/18/28 | | | 254,758 | |
| | ClubCorp Holdings, Inc.(d) (1 mo.USD LIBOR + 2.750%) | |
| | | | | 4,290,049 | | | | 8.189 | | | 09/18/24 | | | 4,153,325 | |
| | Equinox Holdings, Inc.(d) (6 mo.USD LIBOR + 3.000%) | | | | |
| | | | | 786,421 | | | | 8.731 | | | 03/08/24 | | | 756,599 | |
| | Hornblower Sub LLC(d) (3 mo.USD LIBOR + 0.000%) | | | | |
| | | | | 45,216 | | | | 10.152 | | | 04/27/25 | | | 15,713 | |
| | Life Time Fitness, Inc.(d) (3 mo. USD Term SOFR + 4.750%) | |
| | | | | 357,868 | | �� | | 10.130 | | | 01/15/26 | | | 357,599 | |
| | | | | | | | | | | | | | | | |
| | | | | | | | | | | | | | | 11,306,718 | |
| | | |
| | |
| 62 | | The accompanying notes are an integral part of these financial statements. |
GOLDMAN SACHS MULTI-MANAGER NON-CORE FIXED INCOME FUND
| | | | | | | | | | | | | | | | |
| | | Principal Amount | | | Interest
Rate | | | Maturity Date | | Value | |
| |
| | Bank Loans(m) – (continued) | |
| |
| | Lodging(h) – 0.1% | |
| | Compass IV Ltd. (1 mo. USD Term SOFR + 4.000%) | |
| | EUR | | | 600,000 | | | | 7.867 | % | | 05/09/25 | | $ | 628,512 | |
| | | |
| |
| | Machinery-Diversified – 1.2% | |
| | Ali Group North America Corp.(d) (1 mo. USD Term SOFR + 2.000%) | |
| | $ | | | 283,456 | | | | 7.439 | | | 07/30/29 | | | 282,968 | |
| | ASP Blade Holdings, Inc.(d) (1 mo. USD Term SOFR + 4.000%) | |
| | | | | 978,561 | | | | 9.325 | | | 10/13/28 | | | 858,081 | |
| | Chart Industries, Inc.(d) | | | | |
| | (1 mo. USD Term SOFR + 3.250%) | | | | |
| | | | | 248,750 | | | | 8.665 | | | 03/15/30 | | | 247,922 | |
| | (1 mo. USD Term SOFR + 3.750%) | | | | |
| | | | | 498,747 | | | | 9.085 | | | 03/15/30 | | | 496,877 | |
| | Pro Mach Group, Inc.(d) | | | | |
| | (1 mo. USD Term SOFR + 4.000%) | | | | |
| | | | | 36,957 | | | | 9.439 | | | 08/31/28 | | | 36,844 | |
| | (1 mo. USD Term SOFR + 5.000%) | | | | |
| | | | | 997,500 | | | | 10.424 | | | 08/31/28 | | | 997,500 | |
| | SPX Flow, Inc.(d) (1 mo. USD Term SOFR + 4.500%) | | | | |
| | | | | 1,823,420 | | | | 9.924 | | | 04/05/29 | | | 1,805,185 | |
| | Star U.S. Bidco LLC(d) (1 mo. USD Term SOFR + 4.250%) | |
| | | | | 1,237,742 | | | | 9.674 | | | 03/17/27 | | | 1,231,813 | |
| | Titan Acquisition Ltd.(d) (3 mo.USD LIBOR + 3.000%) | | | | |
| | | | | 4,905,793 | | | | 8.731 | | | 03/28/25 | | | 4,825,535 | |
| | Vertical U.S. Newco, Inc.(d) | | | | |
| | (6 mo. USD Term SOFR + 3.500%) | | | | |
| | | | | 979,120 | | | | 9.381 | | | 07/30/27 | | | 971,659 | |
| | (6 mo. USD Term SOFR + 3.500%) | | | | |
| | | | | 52,539 | | | | 9.381 | | | 07/30/27 | | | 52,138 | |
| | Victory Buyer LLC(d) (1 mo. USD Term SOFR + 3.750%) | |
| | | | | 588,280 | | | | 9.189 | | | 11/19/28 | | | 550,883 | |
| | | | | | | | | | | | | | | | |
| | | | | | | | | | | | | | | 12,357,405 | |
| | | |
| |
| | Media – 0.6% | |
| | Cengage Learning, Inc.(d) (3 mo. USD Term SOFR + 4.750%) | |
| | | | | 962,137 | | | | 10.406 | | | 07/14/26 | | | 950,659 | |
| | CSC Holdings LLC(d) | | | | |
| | (1 mo. USD Term SOFR + 4.500%) | | | | |
| | | | | 509,338 | | | | 9.835 | | | 01/18/28 | | | 474,958 | |
| | (1 mo.USD LIBOR + 2.250%) | | | | |
| | | | | 183,260 | | | | 7.699 | | | 07/17/25 | | | 177,726 | |
| | (1 mo.USD LIBOR + 2.250%) | | | | |
| | | | | 32,395 | | | | 7.699 | | | 01/15/26 | | | 31,099 | |
| | Diamond Sports Group LLC(d) (1 mo. USD Term SOFR + 5.2500%) | |
| | | | | 573,887 | | | | 0.000 | | | 08/24/26 | | | 6,100 | |
| | DirecTV Financing LLC(d) (1 mo. USD Term SOFR + 5.000%) | |
| | | | | 579,169 | | | | 10.325 | | | 08/02/27 | | | 562,727 | |
| | iHeartCommunications, Inc.(d) (1 mo. USD Term SOFR + 3.000%) | |
| | | | | 545,431 | | | | 8.439 | | | 05/01/26 | | | 463,693 | |
| | LCPR Loan Financing LLC(d) (1 mo. USD Term SOFR + 3.750%) | |
| | | | | 329,208 | | | | 9.199 | | | 10/16/28 | | | 325,504 | |
| | | |
| | | | | | | | | | | | | | | | |
| | | Principal Amount | | | Interest
Rate | | | Maturity Date | | Value | |
| |
| | Bank Loans(m) – (continued) | |
| |
| | Media – (continued) | |
| | McGraw-Hill Global Education Holdings LLC(d) (1 mo. USD Term SOFR + 4.750%) | |
| | $ | | | 140,969 | | | | 10.189 | % | | 07/28/28 | | $ | 133,341 | |
| | NEP/NCP Holdco, Inc.(d) (1 mo. USD Term SOFR + 3.250%) | |
| | | | | 910,874 | | | | 8.689 | | | 10/20/25 | | | 818,812 | |
| | Radiate Holdco LLC(d) (1 mo. USD Term SOFR + 3.250%) | |
| | | | | 256,790 | | | | 8.689 | | | 09/25/26 | | | 211,900 | |
| | Univision Communications, Inc.(d) (1 mo. USD Term SOFR + 3.250%) | |
| | | | | 645,591 | | | | 8.689 | | | 03/15/26 | | | 639,671 | |
| | UPC Financing Partnership(d) (1 mo. USD Term SOFR + 3.000%) | |
| | | | | 250,000 | | | | 8.449 | | | 01/31/29 | | | 244,792 | |
| | Virgin Media Bristol LLC(d) (3 mo. USD Term SOFR + 3.250%) | |
| | | | | 775,000 | | | | 8.790 | | | 03/31/31 | | | 756,958 | |
| | Ziggo Financing Partnership(d) (1 mo. USD Term SOFR + 2.500%) | |
| | | | | 615,000 | | | | 7.949 | | | 04/30/28 | | | 601,242 | |
| | | | | | | | | | | | | | | | |
| | | | | | | | | | | | | | | 6,399,182 | |
| | | |
| |
| | Media - Broadcasting & Radio(d) – 0.0% | |
| | Getty Images, Inc. (3 mo. USD Term SOFR + 4.500%) | |
| | | | | 44,818 | | | | 9.990 | | | 02/19/26 | | | 44,846 | |
| | Grinding Media, Inc. (3 mo. USD Term SOFR + 4.000%) | |
| | | | | 366,563 | | | | 9.684 | | | 10/12/28 | | | 355,567 | |
| | | | | | | | | | | | | | | | |
| | | | | | | | | | | | | | | 400,413 | |
| | | |
| |
| | Metal Fabricate & Hardware – 0.3% | |
| | Crosby U.S. Acquisition Corp.(d) | | | | |
| | (1 mo. USD Term SOFR + 4.750%) | | | | |
| | | | | 1,753,983 | | | | 10.189 | | | 06/26/26 | | | 1,738,635 | |
| | (1 mo. USD Term SOFR + 5.000%) | | | | |
| | | | | 1,997,185 | | | | 10.339 | | | 06/27/26 | | | 1,982,206 | |
| | | | | | | | | | | | | | | | |
| | | | | | | | | | | | | | | 3,720,841 | |
| | | |
| |
| | Mining(h) – 0.0% | |
| | Dominion Diamond (Fixed + 10.000%) | | | | |
| | | | | 467,153 | | | | 10.000 | | | 06/30/26 | | | 467,153 | |
| | | |
| |
| | Miscellaneous Manufacturing – 0.1% | |
| | Gates Global LLC(d) (1 mo. USD Term SOFR + 2.500%) | |
| | | | | 237,595 | | | | 7.924 | | | 03/31/27 | | | 237,001 | |
| | LTI Holdings, Inc.(d) | | | | |
| | (1 mo. USD Term SOFR + 3.500%) | | | | |
| | | | | 1,107,503 | | | | 8.939 | | | 09/06/25 | | | 1,051,341 | |
| | (1 mo. USD Term SOFR + 4.750%) | | | | |
| | | | | 249,350 | | | | 10.189 | | | 07/24/26 | | | 237,507 | |
| | | | | | | | | | | | | | | | |
| | | | | | | | | | | | | | | 1,525,849 | |
| | | |
| |
| | Oil Field Services(d) – 0.3% | |
| | Gulf Finance LLC (1 mo. USD Term SOFR + 6.750%) | |
| | | | | 2,683,740 | | | | 12.202 | | | 08/25/26 | | | 2,685,967 | |
| | QuarterNorth Energy Holding, Inc. (1 mo. USD Term SOFR + 8.000%) | |
| | | | | 1,002,843 | | | | 13.439 | | | 08/27/26 | | | 999,083 | |
| | | | | | | | | | | | | | | | |
| | | | | | | | | | | | | | | 3,685,050 | |
| | | |
| | |
| The accompanying notes are an integral part of these financial statements. | | 63 |
GOLDMAN SACHS MULTI-MANAGER NON-CORE FIXED INCOME FUND
|
Schedule of Investments (continued) October 31, 2023 |
| | | | | | | | | | | | | | | | |
| | | | | Principal Amount | | | Interest
Rate | | | Maturity Date | | Value | |
| |
| | Bank Loans(m) – (continued) | |
| | |
| | Packaging – 0.7% | | | | |
| | Berlin Packaging LLC(d) (3 mo. USD Term SOFR) | | | | |
| | $ | | | 149,618 | | | | 4.250 | % | | 03/11/28 | | $ | 145,905 | |
| | Charter NEX U.S., Inc.(d) (1 mo. USD Term SOFR + 3.750%) | |
| | | | | 1,103,771 | | | | 9.189 | | | 12/01/27 | | | 1,073,417 | |
| | Clydesdale Acquisition Holdings, Inc.(d) (1 mo. USD Term SOFR + 4.175%) | |
| | | | | 186,744 | | | | 9.599 | | | 04/13/29 | | | 180,379 | |
| | Klockner-Pentaplast of America, Inc.(d) (6 mo. USD Term SOFR + 4.725%) | |
| | | | | 344,633 | | | | 10.476 | | | 02/12/26 | | | 324,386 | |
| | LABL, Inc.(d) (1 mo. USD Term SOFR + 5.000%) | | | | |
| | | | | 2,206,080 | | | | 10.424 | | | 10/29/28 | | | 2,071,796 | |
| | (1 mo. USD Term SOFR + 5.000%) | |
| | | | | 149,241 | | | | 10.424 | | | 10/29/28 | | | 140,156 | |
| | Pregis TopCo Corp.(d) (1 mo. USD Term SOFR + 3.750%) | |
| | | | | 739,776 | | | | 9.074 | | | 07/31/26 | | | 729,419 | |
| | Pretium Packaging LLC(d) (3 mo. USD Term SOFR + 5.000%) | |
| | | | | 304,352 | | | | 10.395 | | | 10/02/28 | | | 297,808 | |
| | Pretium Packaging, LLC(d) (3 mo. USD Term SOFR + 5.000%) | |
| | | | | 159,251 | | | | 10.395 | | | 10/02/28 | | | 155,826 | |
| | (3 mo. USD Term SOFR + 4.600%) | |
| | | | | 1,624,123 | | | | 9.991 | | | 10/02/28 | | | 1,234,334 | |
| | Pretium PKG Holdings, Inc.(d) (3 mo. USD Term SOFR + 4.000%) | |
| | | | | 139,689 | | | | 9.317 | | | 10/02/28 | | | 103,641 | |
| | (3 mo. USD Term SOFR + 6.750%) | |
| | | | | 250,000 | | | | 12.195 | | | 10/01/29 | | | 108,750 | |
| | Reynolds Group Holdings, Inc.(d) (1 mo. USD Term SOFR + 3.250%) | |
| | | | | 329,920 | | | | 8.689 | | | 02/05/26 | | | 329,033 | |
| | (1 mo. USD Term SOFR + 3.250%) | |
| | | | | 64,569 | | | | 8.689 | | | 09/24/28 | | | 64,203 | |
| | TricorBraun Holdings, Inc.(d) (1 mo. USD Term SOFR + 3.250%) | |
| | | | | 301,852 | | | | 8.689 | | | 03/03/28 | | | 292,042 | |
| | | | | | | | | | | | | | | | |
| | | | | | | | | | | | | | | 7,251,095 | |
| | | |
| |
| | Pharmaceuticals – 2.1% | |
| | Curium Bidco Sarl(d) (3 mo. USD Term SOFR + 4.500%) | |
| | | | | 1,117,512 | | | | 9.890 | | | 07/31/29 | | | 1,112,628 | |
| | Gainwell Acquisition Corp.(d) | |
| | (3 mo. USD Term SOFR + 8.000%) | |
| | | | | 750,000 | | | | 13.522 | (h) | | 10/02/28 | | | 727,500 | |
| | (3 mo. USD Term SOFR + 4.000%) | |
| | | | | 1,701,783 | | | | 9.490 | | | 10/01/27 | | | 1,623,790 | |
| | (3 mo. USD Term SOFR + 4.000%) | |
| | | | | 307,798 | | | | 9.490 | | | 10/01/27 | | | 293,691 | |
| | Grifols Worldwide Operations USA, Inc.(d) (1 mo. USD Term SOFR + 2.000%) | |
| | | | | 323,754 | | | | 7.424 | | | 11/15/27 | | | 314,770 | |
| | Jazz Financing Lux SARL(d) (1 mo. USD Term SOFR + 3.500%) | |
| | | | | 1,781,778 | | | | 8.939 | | | 05/05/28 | | | 1,780,780 | |
| | Lannett Co., Inc.(d)(h) (3 mo.USD LIBOR + 2.000%) | |
| | | | | 393,583 | | | | 2.000 | | | 06/16/30 | | | 393,583 | |
| | | |
| | | | | | | | | | | | | | | | |
| | | | | Principal Amount | | | Interest
Rate | | | Maturity Date | | Value | |
| |
| | Bank Loans(m) – (continued) | |
| | |
| | Pharmaceuticals – (continued) | | | | |
| | Midwest Veterinary Partners LLC(d) (1 mo. USD Term SOFR + 4.000%) | |
| | $ | | | 1,100,781 | | | | 9.439 | % | | 04/27/28 | | $ | 1,072,799 | |
| | Organon & Co.(d) (1 mo. USD Term SOFR + 3.000%) | |
| | | | | 951,330 | | | | 8.451 | | | 06/02/28 | | | 948,239 | |
| | Pathway Vet Alliance LLC(d) (1 mo. USD Term SOFR + 3.750%) | |
| | | | | 3,125,646 | | | | 9.189 | | | 03/31/27 | | | 2,837,305 | |
| | Pearl Intermediate Parent LLC(d) (1 mo. USD Term SOFR + 2.750%) | |
| | | | | 2,492,093 | | | | 8.174 | | | 02/14/25 | | | 2,487,034 | |
| | (1 mo. USD Term SOFR + 3.250%) | |
| | | | | 497,382 | | | | 8.674 | | | 02/14/25 | | | 496,243 | |
| | (1 mo. USD Term SOFR + 6.250%) | |
| | | | | 2,821,661 | | | | 11.674 | | | 02/13/26 | | | 2,802,615 | |
| | Southern Veterinary Partners LLC(d) (1 mo. USD Term SOFR) | |
| | | | | 375,000 | | | | 13.070 | | | 10/05/28 | | | 357,499 | |
| | Sunshine Luxembourg VII SARL(d) (3 mo. USD Term SOFR + 3.750%) | |
| | | | | 4,917,429 | | | | 9.240 | | | 10/01/26 | | | 4,908,529 | |
| | | | | | | | | | | | | | | | |
| | | | | | | | | | | | | | | 22,157,005 | |
| | | |
| |
| | Pipelines – 0.7% | |
| | Epic Y-Grade Services LP(d) (3 mo. USD Term SOFR + 6.000%) | |
| | | | | 2,169,651 | | | | 11.522 | | | 06/30/27 | | | 2,034,048 | |
| | Freeport LNG Investments LLLP(d) (3 mo. USD Term SOFR + 3.000%) | |
| | | | | 1,605,249 | | | | 8.677 | | | 11/17/26 | | | 1,582,503 | |
| | ITT Holdings LLC(n) | |
| | | | | 750,000 | | | | 0.000 | | | 10/05/30 | | | 739,687 | |
| | TransMontaigne Operating Co. LP(d) (1 mo. USD Term SOFR + 3.500%) | |
| | | | | 857,761 | | | | 8.940 | | | 11/17/28 | | | 846,636 | |
| | Traverse Midstream Partners LLC(d) (1 mo. USD Term SOFR + 3.750%) | |
| | | | | 1,666,053 | | | | 9.240 | | | 02/16/28 | | | 1,659,806 | |
| | (3 mo. USD Term SOFR + 3.750%) | |
| | | | | 334,712 | | | | 9.240 | | | 02/16/28 | | | 333,456 | |
| | | | | | | | | | | | | | | | |
| | | | | | | | | | | | | | | 7,196,136 | |
| | | |
| |
| | Real Estate – 0.1% | |
| | Cushman & Wakefield U.S. Borrower LLC(d) (1 mo. USD Term SOFR + 2.750%) | | | | |
| | | | | 2,336 | | | | 8.189 | | | 08/21/25 | | | 2,327 | |
| | (1 mo. USD Term SOFR + 3.250%) | |
| | | | | 562,891 | | | | 8.674 | | | 01/31/30 | | | 536,153 | |
| | Cushman & Wakefield U.S. Borrower, LLC(d) (1 mo. USD Term SOFR + 2.750%) | | | | |
| | | | | 51,267 | | | | 8.189 | | | 08/21/25 | | | 51,075 | |
| | Forest City Enterprises LP(d) (1 mo. USD Term SOFR + 3.500%) | |
| | | | | 239,000 | | | | 8.939 | | | 12/08/25 | | | 214,727 | |
| | | | | | | | | | | | | | | | |
| | | | | | | | | | | | | | | 804,282 | |
| | | |
| |
| | Retailers(d) – 0.0% | |
| | Jo-Ann Stores, Inc. (3 mo. USD Term SOFR + 4.750%) | |
| | | | | 288,313 | | | | 10.391 | | | 07/07/28 | | | 83,611 | |
| | | |
| | |
| 64 | | The accompanying notes are an integral part of these financial statements. |
GOLDMAN SACHS MULTI-MANAGER NON-CORE FIXED INCOME FUND
| | | | | | | | | | | | | | | | |
| | | | | Principal Amount | | | Interest
Rate | | | Maturity Date | | Value | |
| |
| | Bank Loans(m) – (continued) | |
| |
| | Retailing – 1.1% | |
| | 1011778 BC Unlimited Liability Co.(d) (1 mo. USD Term SOFR + 2.250%) | |
| | $ | | | 104,226 | | | | 7.582 | % | | 09/20/30 | | $ | 103,158 | |
| | Academy Ltd.(d) (1 mo. USD Term SOFR + 3.750%) | |
| | | | | 678,453 | | | | 9.179 | | | 11/05/27 | | | 677,394 | |
| | BCPE Empire Holdings, Inc.(d) (1 mo. USD Term SOFR + 4.750%) | |
| | | | | 1,877,856 | | | | 10.074 | | | 12/11/28 | | | 1,873,631 | |
| | Belk, Inc.(d) (3 mo.USD LIBOR + 10.000%) | |
| | | | | 552,603 | | | | 10.000 | | | 07/31/25 | | | 95,783 | |
| | (3 mo. U.S. (Fed) Prime Rate + 6.500%) | |
| | | | | 112,852 | | | | 15.000 | | | 07/31/25 | | | 95,924 | |
| | EG Finco Ltd. (1 mo. USD Term SOFR + 4.000%) | |
| | | | | 91,145 | | | | 7.858 | | | 02/05/25 | | | 95,878 | |
| | (1 mo. USD Term SOFR + 4.000%) | |
| | | | | 176,555 | | | | 7.858 | | | 02/07/28 | | | 178,900 | |
| | EG Group Ltd.(d) (1 mo. USD Term SOFR + 4.000%) | |
| | $ | | | 356,541 | | | | 9.325 | | | 02/07/25 | | | 355,539 | |
| | IRB Holding Corp.(d) (1 mo. USD Term SOFR + 3.000%) | |
| | | | | 818,452 | | | | 8.424 | | | 12/15/27 | | | 808,901 | |
| | K-Mac Holdings Corp.(d) (1 mo. USD Term SOFR + 6.750%) | |
| | | | | 500,000 | | | | 12.174 | | | 07/21/29 | | | 466,875 | |
| | PetSmart, Inc.(d) (1 mo. USD Term SOFR + 3.750%) | |
| | | | | 1,308,616 | | | | 9.174 | | | 02/11/28 | | | 1,290,897 | |
| | Restoration Hardware, Inc.(d) (1 mo. USD Term SOFR + 2.500%) | |
| | | | | 219,400 | | | | 7.939 | | | 10/20/28 | | | 204,591 | |
| | SRS Distribution, Inc.(d) (1 mo. USD Term SOFR + 3.500%) | |
| | | | | 99,746 | | | | 8.825 | | | 06/02/28 | | | 97,097 | |
| | (1 mo. USD Term SOFR + 3.500%) | |
| | | | | 2,143,664 | | | | 8.939 | | | 06/02/28 | | | 2,090,072 | |
| | (3 mo. USD Term SOFR + 3.500%) | |
| | | | | 249,365 | | | | 8.825 | | | 06/02/28 | | | 242,742 | |
| | Staples, Inc.(d) (3 mo.USD LIBOR + 5.000%) | |
| | | | | 120,386 | | | | 10.634 | | | 04/16/26 | | | 103,307 | |
| | Tacala LLC(d) (1 mo. USD Term SOFR + 3.500%) | |
| | | | | 997,362 | | | | 9.439 | | | 02/05/27 | | | 990,301 | |
| | (1 mo. USD Term SOFR + 7.500%) | |
| | | | | 500,000 | | | | 13.439 | | | 02/04/28 | | | 480,625 | |
| | Whatabrands LLC(d) (1 mo. USD Term SOFR + 3.000%) | |
| | | | | 1,447,589 | | | | 8.439 | | | 08/03/28 | | | 1,432,939 | |
| | | | | | | | | | | | | | | | |
| | | | | | | | | | | | | | | 11,684,554 | |
| | | |
| |
| | Semiconductors(d) – 0.0% | |
| | Bright Bidco BV (3 mo. USD Term SOFR + 1.000%) | |
| | | | | 580,108 | | | | 6.378 | | | 10/31/27 | | | 215,609 | |
| | | |
| |
| | Services Cyclical - Business Services(d) – 0.0% | |
| | Travelport Finance (Luxembourg) SARL (1 mo.USD LIBOR + 7.114%) | |
| | | | | 3,769 | | | | 3.515 | | | 02/28/25 | | | 3,609 | |
| | | |
| | | | | | | | | | | | | | | | |
| | | | | Principal
Amount | | | Interest
Rate | | | Maturity Date | | Value | |
| |
| | Bank Loans(m) – (continued) | |
| |
| | Software – 3.8% | |
| | Applied Systems, Inc.(d) | |
| | (3 mo. USD Term SOFR + 4.500%) | |
| | $ | | | 3,482,500 | | | | 9.890 | % | | 09/18/26 | | $ | 3,487,724 | |
| | (3 mo. USD Term SOFR + 6.750%) | |
| | | | | 2,847,036 | | | | 12.140 | | | 09/17/27 | | | 2,854,752 | |
| | Apttus Corp.(d) | |
| | (1 mo. USD Term SOFR + 4.000%) | |
| | | | | 212,975 | | | | 9.439 | | | 05/08/28 | | | 210,535 | |
| | Banff Merger Sub, Inc.(d) | |
| | (1 mo. USD Term SOFR + 3.750%) | |
| | | | | 1,086,358 | | | | 9.189 | | | 10/02/25 | | | 1,084,663 | |
| | Camelot U.S. Acquisition LLC(d) | |
| | (1 mo. USD Term SOFR + 3.000%) | |
| | | | | 209,248 | | | | 8.439 | | | 10/30/26 | | | 208,882 | |
| | (1 mo. USD Term SOFR + 3.000%) | |
| | | | | 746,301 | | | | 8.439 | | | 10/30/26 | | | 744,906 | |
| | Dun & Bradstreet Corp.(d) | |
| | (1 mo. USD Term SOFR + 2.750%) | |
| | | | | 2,486,853 | | | | 8.176 | | | 02/06/26 | | | 2,482,974 | |
| | (1 mo. USD Term SOFR + 2.750%) | |
| | | | | 584,420 | | | | 8.176 | | | 02/06/26 | | | 583,509 | |
| | Epicor Software Corp.(d) | |
| | (1 mo. USD Term SOFR + 3.250%) | |
| | | | | 1,865,457 | | | | 8.689 | | | 07/30/27 | | | 1,854,189 | |
| | (1 mo. USD Term SOFR + 3.250%) | |
| | | | | 1,758,006 | | | | 8.689 | | | 07/30/27 | | | 1,747,388 | |
| | (1 mo. USD Term SOFR + 3.750%) | |
| | | | | 1,750,000 | | | | 9.074 | | | 07/30/27 | | | 1,750,245 | |
| | Greenway Health LLC(d) (1 mo. USD Term SOFR + 3.750%) | |
| | | | | 121,517 | | | | 9.189 | | | 02/16/24 | | | 108,960 | |
| | Informatica LLC(d) (1 mo. USD Term SOFR + 2.750%) | |
| | | | | 982,513 | | | | 8.189 | | | 10/27/28 | | | 978,524 | |
| | Ivanti Software, Inc.(d) (3 mo. USD Term SOFR + 4.250%) | |
| | | | | 37,980 | | | | 9.652 | | | 12/01/27 | | | 33,691 | |
| | Mavenir Systems, Inc.(d) (3 mo.USD LIBOR + 4.750%) | |
| | | | | 740,454 | | | | 10.389 | | | 08/18/28 | | | 541,642 | |
| | Open Text Corp.(d) (1 mo. USD Term SOFR + 2.750%) | |
| | | | | 1,311,024 | | | | 8.174 | | | 01/31/30 | | | 1,309,568 | |
| | Polaris Newco LLC(d) (1 mo. USD Term SOFR + 4.000%) | |
| | | | | 2,317,729 | | | | 9.439 | | | 06/02/28 | | | 2,184,460 | |
| | Quest Software U.S. Holdings, Inc.(d) (3 mo. USD Term SOFR + 7.500%) | |
| | | | | 312,603 | | | | 13.033 | | | 02/01/30 | | | 209,250 | |
| | Rackspace Technology Global, Inc.(d) (1 mo. USD Term SOFR + 2.750%) | |
| | | | | 2,668,782 | | | | 8.206 | | | 02/15/28 | | | 1,163,349 | |
| | RealPage, Inc.(d) (1 mo. USD Term SOFR + 6.500%) | |
| | | | | 3,989,000 | | | | 11.939 | | | 04/23/29 | | | 3,967,060 | |
| | Rocket Software, Inc.(d) (1 mo. USD Term SOFR + 4.750%) | |
| | | | | 124,349 | | | | 10.145 | �� | | 11/28/28 | | | 121,831 | |
| | Sophia LP(d) | |
| | (1 mo. USD Term SOFR + 8.000%) | |
| | | | | 2,000,000 | | | | 13.424 | | | 10/09/28 | | | 1,995,000 | |
| | (1 mo. USD Term SOFR + 3.500%) | |
| | | | | 1,090,213 | | | | 8.924 | | | 10/07/27 | | | 1,075,222 | |
| | | |
| | |
| The accompanying notes are an integral part of these financial statements. | | 65 |
GOLDMAN SACHS MULTI-MANAGER NON-CORE FIXED INCOME FUND
|
Schedule of Investments (continued) October 31, 2023 |
| | | | | | | | | | | | | | | | |
| | | Principal Amount | | | Interest Rate | | | Maturity Date | | Value | |
| |
| | Bank Loans(m) – (continued) | |
| |
| | | Software – (continued) | |
| | SS&C European Holdings SARL(d) (1 mo. USD Term SOFR + 1.750%) | |
| | $ | | | 429,826 | | | | 7.189 | % | | 04/16/25 | | $ | 429,452 | |
| | SS&C Technologies, Inc.(d) (1 mo. USD Term SOFR + 1.750%) | |
| | | | | 452,678 | | | | 7.189 | | | 04/16/25 | | | 452,284 | |
| | The Ultimate Software Group, Inc.(d) | |
| | (3 mo. USD Term SOFR + 3.250%) | |
| | | | | 1,084,263 | | | | 8.764 | | | 05/04/26 | | | 1,077,606 | |
| | (3 mo. USD Term SOFR + 4.500%) | |
| | | | | 2,244,375 | | | | 10.022 | | | 05/04/26 | | | 2,242,378 | |
| | (3 mo. USD Term SOFR + 5.250%) | |
| | | | | 2,272,530 | | | | 10.764 | | | 05/03/27 | | | 2,267,417 | |
| | Ultimate Software Group, Inc.(d) (3 mo. USD Term SOFR + 3.750%) | |
| | | | | 2,375,000 | | | | 9.233 | | | 05/04/26 | | | 2,368,611 | |
| | West Corp.(d) (3 mo. USD Term SOFR) | |
| | | | | 570,980 | | | | 5.000 | | | 04/10/27 | | | 530,691 | |
| | Zelis Healthcare Corp.(d) (1 mo. USD Term SOFR + 3.500%) | |
| | | | | 241,203 | | | | 8.939 | | | 09/30/26 | | | 240,940 | |
| | | | | | | | | | | | | | | | |
| | | | | | | | | | | | | | | 40,307,703 | |
| | | |
| |
| | Technology - Software(d) – 0.1% | |
| | Quartz Acquireco LLC (1 mo. USD Term SOFR + 3.500%) | |
| | | | | 250,000 | | | | 8.824 | | | 06/28/30 | | | 249,375 | |
| | Riverbed Technology, Inc. (3 mo. USD Term SOFR + 4.000%) | |
| | | | | 504,006 | | | | 9.890 | | | 07/01/28 | | | 323,824 | |
| | | | | | | | | | | | | | | | |
| | | | | | | | | | | | | | | 573,199 | |
| | | |
| |
| | Telecommunication Services – 0.8% | |
| | Altice France SA(d) | |
| | (3 mo.USD LIBOR + 3.688%) | |
| | | | | 232,500 | | | | 9.343 | | | 01/31/26 | | | 216,709 | |
| | (3 mo.USD LIBOR + 4.000%) | |
| | | | | 213,802 | | | | 9.626 | | | 08/14/26 | | | 198,926 | |
| | Avaya, Inc.(d) | |
| | (1 mo. USD Term SOFR + 8.500%) | |
| | | | | 273,468 | | | | 13.824 | | | 08/01/28 | | | 239,741 | |
| | (1 mo. USD Term SOFR + 8.500%) | |
| | | | | 1,532,860 | | | | 13.825 | | | 08/01/28 | | | 1,343,812 | |
| | Cincinnati Bell, Inc.(d) (1 mo. USD Term SOFR + 3.250%) | |
| | | | | 268,159 | | | | 8.674 | | | 11/22/28 | | | 261,903 | |
| | CommScope, Inc.(d) (1 mo. USD Term SOFR + 3.250%) | |
| | | | | 660,703 | | | | 8.689 | | | 04/06/26 | | | 564,623 | |
| | Cyxtera DC Holdings, Inc.(d) | |
| | (1 mo. USD Term SOFR + 8.500%) | |
| | | | | 387,600 | | | | 13.951 | | | 12/07/23 | | | 386,922 | |
| | (3 mo. USD Term SOFR + 3.000%) | |
| | | | | 1,157,899 | | | | 0.000 | (f)(o) | | 05/01/24 | | | 661,079 | |
| | Dawn Acquisition LLC(d) (3 mo. USD Term SOFR + 3.750%) | |
| | | | | 1,457,528 | | | | 9.402 | | | 12/31/25 | | | 1,226,597 | |
| | Delta TopCo, Inc.(d) (6 mo. USD Term SOFR + 3.750%) | |
| | | | | 463,270 | | | | 9.069 | | | 12/01/27 | | | 455,260 | |
| | EOS Finco SARL(d) (3 mo. USD Term SOFR + 5.750%) | |
| | | | | 367,197 | | | | 11.164 | | | 10/08/29 | | | 343,943 | |
| | | |
| | | | | | | | | | | | | | | | |
| | | Principal Amount | | | Interest Rate | | | Maturity Date | | Value | |
| |
| | Bank Loans(m) – (continued) | |
| |
| | Telecommunication Services – (continued) | |
| | Frontier Communications Corp.(d) (1 mo. USD Term SOFR + 3.750%) | |
| | $ | | | 969,975 | | | | 9.189 | % | | 10/08/27 | | $ | 932,389 | |
| | GOGO Intermediate Holdings LLC(d) (1 mo. USD Term SOFR + 3.750%) | |
| | | | | 801,467 | | | | 9.189 | | | 04/30/28 | | | 799,968 | |
| | MLN U.S. HoldCo LLC(d) | |
| | (1 mo. USD Term SOFR + 6.700%) | |
| | | | | 547,835 | | | | 12.195 | | | 11/01/27 | | | 136,959 | |
| | (3 mo. USD Term SOFR + 4.500%) | |
| | | | | 889,178 | | | | 10.011 | | | 11/30/25 | | | 88,918 | |
| | (3 mo. USD Term SOFR + 8.750%) | |
| | | | | 250,000 | | | | 14.261 | | | 11/30/26 | | | 18,750 | |
| | Nuuday AS (1 mo. USD Term SOFR + 6.500%) | |
| | EUR | | | 400,000 | | | | 10.448 | | | 02/03/28 | | | 421,784 | |
| | | | | | | | | | | | | | | | |
| | | | | | | | | | | | | | | 8,298,283 | |
| | | |
| |
| | Telecommunications(d) – 0.0% | |
| | CenturyLink, Inc. (1 mo. USD Term SOFR + 2.250%) | |
| | $ | | | 134,569 | | | | 7.689 | | | 03/15/27 | | | 100,990 | |
| | Level 3 Financing, Inc. (1 mo. USD Term SOFR + 1.750%) | |
| | | | | 460,000 | | | | 7.189 | | | 03/01/27 | | | 428,692 | |
| | | | | | | | | | | | | | | | |
| | | | | | | | | | | | | | | 529,682 | |
| | | |
| |
| | Transportation – 0.1% | |
| | Kenan Advantage Group, Inc.(d) | |
| | (3 mo. USD Term SOFR + 3.750%) | |
| | | | | 247,455 | | | | 9.477 | | | 03/24/26 | | | 245,882 | |
| | (3 mo. USD Term SOFR + 4.000%) | |
| | | | | 498,750 | | | | 9.727 | | | 03/24/26 | | | 496,570 | |
| | | | | | | | | | | | | | | | |
| | | | | | | | | | | | | | | 742,452 | |
| | | |
| | |
| | TOTAL BANK LOANS (Cost $282,803,600) | | $ | 273,842,834 | |
| | | |
| | | | | |
| | | | | Shares | | | Description | | | | | Value | |
| |
| | Common Stocks – 0.6% | |
| |
| | Broadline Retail*(h) – 0.0% | |
| | | | | 68 | | | | Belk, Inc. | | $ | 544 | |
| | | |
| |
| | Commercial Services & Supplies*(h) – 0.0% | |
| | | | | 1,565 | | | | Monitronics International, | | | | |
| | | | | | | | | Inc. | | | | | | — | |
| | | |
| |
| | Diversified Consumer Services* – 0.0% | |
| | | | | 7,679 | | | | Premier Brands Group | | | | |
| | | | | | | | | Holding | | | | | | 6,274 | |
| | | |
| |
| | Energy Equipment & Services* – 0.0% | |
| | | | | 17,933 | | | | Parker Drilling Co. | | | 226,404 | |
| | | |
| |
| | Entertainment* – 0.1% | |
| | | | | 28,924 | | | | Cineworld Group PLC | | | 594,388 | |
| | | |
| | |
| 66 | | The accompanying notes are an integral part of these financial statements. |
GOLDMAN SACHS MULTI-MANAGER NON-CORE FIXED INCOME FUND
| | | | | | | | |
| | | Shares | | Description | | Value | |
| |
| | Common Stocks – (continued) | |
| |
| | Financial Services*(h) – 0.0% | |
| | 5,500 | | Copper Earnout Trust(i) | | $ | 15,125 | |
| | 240 | | Voyager Aviation Holdings LLC | | | — | |
| | | | | | | | |
| | | | | | | 15,125 | |
| | | |
| |
| | Media* – 0.0% | |
| | 24,753 | | Clear Channel Outdoor Holdings, Inc. | | | 27,228 | |
| | | |
| |
| | Metals & Mining* – 0.0% | |
| | 627 | | Arctic Canadian Diamond Co. Ltd.(h) | | | 240,934 | |
| | 1,239,530 | | Burgundy Diamond Mines Ltd. | | | 121,876 | |
| | 1,229,764 | | Tacora Resources, Inc.(h) | | | — | |
| | | | | | | | |
| | | | | | | 362,810 | |
| | | |
| |
| | Oil, Gas & Consumable Fuels – 0.2% | |
| | 304 | | California Resources Corp. | | | 15,988 | |
| | 18,456 | | Fieldwood Energy, Inc.* | | | 2,466,958 | |
| | | | | | | | |
| | | | | | | 2,482,946 | |
| | | |
| |
| | Pharmaceuticals*(h) – 0.0% | |
| | 65,267 | | Lannett Co., Inc. | | | 115,523 | |
| | | |
| |
| | Professional Services – 0.1% | |
| | 11,631 | | Avaya Holdings Corp. | | | 84,325 | |
| | 49,875 | | Avaya Holdings Corp.* | | | 361,593 | |
| | 865 | | Skillsoft Corp.* | | | 16,262 | |
| | | | | | | | |
| | | | | | | 462,180 | |
| | | |
| |
| | Real Estate – 0.1% | |
| | 41,250 | | Copper Property CTL Pass-Through Trust | | | 429,000 | |
| | | |
| |
| | Semiconductors & Semiconductor Equipment* – 0.0% | |
| | 18,377 | | Bright Bidco BV | | | 8,564 | |
| | | |
| |
| | Specialty Retail*(h) – 0.1% | |
| | 7,504 | | Guitar Center, Inc. | | | 1,371,506 | |
| | | |
| |
| | Wireless Telecommunication Services* – 0.0% | |
| | 5,606 | | IQOR US, Inc. | | | 4,905 | |
| | 45,384 | | Windstream Corp. | | | 419,802 | |
| | | | | | | | |
| | | | | | | 424,707 | |
| | | |
| | |
| | TOTAL COMMON STOCKS (Cost $9,748,329) | | $ | 6,527,199 | |
| | | |
| | | | | | | | | | |
| | | | |
| | | | | Units | | Expiration Date | | Value | |
| | |
| | | | Warrants* – 0.0% | |
| |
| | Avation PLC | |
| | | | 20,510 | | 10/31/26 | | $ | 7,479 | |
| | California Resources Corp. | |
| | | | 670 | | 10/27/24 | | | 11,953 | |
| | | |
| | | | | | | | | | |
| | | | | Units | | Expiration Date | | Value | |
| |
| | Warrants* – (continued) | |
| |
| | Fieldwood Energy, Inc. | |
| | | | 6,687 | | 08/01/29 | | $ | 85,318 | |
| | Guitar Center, Inc.(h) | |
| | | | 3,972 | | 12/31/99 | | | 251,341 | |
| | | |
| | TOTAL WARRANTS (Cost $427,767) | | $ | 356,091 | |
| | | |
| | | | |
| | | | | Shares | | Dividend Rate | | Value | |
| |
| | Preferred Stocks(f)(h) – 0.0% | |
| |
| | Post Secondary Education – 0.0% | |
| | Voyager Aviation Holdings LLC | |
| | | | 1,441 | | 0.000% | | $ | — | |
| | | |
| |
| | Specialty Retail – 0.0% | |
| | Guitar Center, Inc. | |
| | | | 103 | | 0.000 | | | 9,632 | |
| | | |
| | TOTAL PREFERRED STOCKS (Cost $84,145) | | $ | 9,632 | |
| | | |
| | | | |
| | | | | Shares | | Description | | Value | |
| |
| | Exchange Traded Funds – 0.1% | |
| | | | |
| | | | 20,730 | | iShares iBoxx High Yield Corporate Bond ETF | | $ | 1,504,376 | |
| | (Cost $1,501,039) | | | | |
| | | |
| | | | |
| | | | | Shares | | Dividend Rate | | Value | |
| |
| | Investment Company(p) – 7.3% | |
| |
| | Goldman Sachs Financial Square Government Fund—Institutional Shares | |
| | | | 78,435,092 | | 5.258% | | $ | 78,435,092 | |
| | (Cost $78,435,092) | |
| | | |
| | TOTAL INVESTMENTS – 100.3% (Cost $1,150,173,516) | | $ | 1,074,034,370 | |
| | | |
| | LIABILITIES IN EXCESS OF OTHER ASSETS – ( 0.3)% | | | (3,359,100 | ) |
| | | |
| | NET ASSETS – 100.0% | | $ | 1,070,675,270 | |
| | | |
| | |
| The percentage shown for each investment category reflects the value of investments in that category as a percentage of net assets. |
| |
| * | | Non-income producing security. |
| |
| (a) | | Security with “Call” features with resetting interest rates. Maturity dates disclosed are the final maturity dates. |
| |
| (b) | | Exempt from registration under Rule 144A of the Securities Act of 1933. |
| |
| (c) | | Pay-in-kind securities. |
| | |
| The accompanying notes are an integral part of these financial statements. | | 67 |
GOLDMAN SACHS MULTI-MANAGER NON-CORE FIXED INCOME FUND
|
Schedule of Investments (continued) October 31, 2023 |
| | |
| |
| (d) | | Variable rate security. Except for floating rate notes (for which final maturity is disclosed), maturity date disclosed is the next interest reset date. Interest rate disclosed is that which is in effect on October 31, 2023. |
| |
| (e) | | Security with “Put” features and resetting interest rates. Maturity dates disclosed are the puttable dates. Interest rate disclosed is that which is in effect on October 31, 2023. |
| |
| (f) | | Security is currently in default and/or non-income producing. |
| |
| (g) | | Guaranteed by a foreign government until maturity. Total market value of these securities amounts to $905,066, which represents approximately 0% of the Fund’s net assets as of October 31, 2023. |
| |
| (h) | | Significant unobservable inputs were used in the valuation of this portfolio security; i.e., Level 3. |
| |
| (i) | | Restricted securities are not registered under the Securities Act of 1933, as amended, and are subject to legal restrictions on resale. These securities generally may be resold in transactions exempt from registration or to the public if the securities are subsequently registered. Disposal of these securities may involve time consuming negotiations and prompt sale at an acceptable price may be difficult. Total market value of Restricted securities amounts to $114,074, which represents approximately 0.0% of the Fund’s net assets as of 10/31/23. See additional details below: |
| | | | | | | | |
| Restricted Security | | Acquisition
Date | | | Cost | |
|
| |
Chesapeake Energy Corp. | | | 06/21/19 | | | $ | 42,991 | |
Chesapeake Energy Corp. | | | 06/21/19 | | | | 316,924 | |
Copper Earnout Trust | | | 12/07/20 | | | | 39,600 | |
Neiman Marcus Group Ltd. LLC | | | 10/15/21 | | | | 605,000 | |
| |
| | |
| |
| (j) | | Coupon changes periodically based upon a predetermined schedule. Interest rate disclosed is that which is in effect on October 31, 2023. |
| |
| (k) | | Actual maturity date is April 03, 2120. |
| |
| (l) | | Actual maturity date is July 28, 2121. |
| |
| (m) | | Bank Loans often require prepayments from excess cash flows or permit the borrower to repay at its election. The degree to which borrowers repay, whether as a contractual requirement or at their election, cannot be predicted with accuracy. As a result, the actual remaining maturity may be substantially less than the stated maturities shown. As bank loan positions may involve multiple underlying tranches for which the aggregate position is presented, the stated interest rate represents the weighted average interest rate of all contracts on October 31, 2023. Bank Loans typically have rates of interest which are predetermined either daily, monthly, quarterly or semi-annually by reference to a base lending rate, plus a premium. These base lending rates are primarily the Secured Overnight Financing Rate (“SOFR”), and secondarily the prime rate offered by one or more major United States banks (the “Prime Rate”) and the certificate of deposit (“CD”) rate or other base lending rates used by commercial lenders. |
| |
| (n) | | This position represents an unsettled loan commitment at period end. Certain details associated with this purchase are not known prior to the settlement date, including coupon rate. |
| |
| (o) | | Issued with a zero coupon. Income is recognized through the accretion of discount. |
| |
| (p) | | Represents an Affiliated Issuer. |
|
|
ADDITIONAL INVESTMENT INFORMATION |
FORWARD FOREIGN CURRENCY EXCHANGE CONTRACTS — At October 31, 2023, the Fund had the following forward foreign currency exchange contracts:
FORWARD FOREIGN CURRENCY EXCHANGE CONTRACTS WITH UNREALIZED GAIN
| | | | | | | | | | | | | | | | | | | | |
| Counterparty | | Currency Purchased | | | Currency Sold | | | Settlement
Date | | | Unrealized Gain | |
|
| |
| | | | | | |
Barclays Bank PLC | | USD | | | 237,581 | | | AUD | | | 369,000 | | | | 12/21/23 | | | | $ 3,093 | |
| | USD | | | 9,339,286 | | | CNH | | | 68,099,088 | | | | 12/12/23 | | | | 35,802 | |
| | USD | | | 3,495,800 | | | PEN | | | 13,083,468 | | | | 03/18/24 | | | | 105,792 | |
BNP Paribas SA | | COP | | | 3,599,692,668 | | | USD | | | 858,368 | | | | 11/15/23 | | | | 13,082 | |
| | HUF | | | 629,607,026 | | | USD | | | 1,697,483 | | | | 01/12/24 | | | | 26,382 | |
| | USD | | | 2,796,600 | | | EUR | | | 2,596,595 | | | | 03/18/24 | | | | 30,965 | |
| | USD | | | 294,672 | | | NGN | | | 266,899,500 | | | | 11/02/23 | | | | 265 | |
BofA Securities LLC | | PLN | | | 14,779,611 | | | USD | | | 3,415,909 | | | | 12/07/23 | | | | 89,984 | |
| | USD | | | 706,460 | | | HUF | | | 256,589,523 | | | | 01/12/24 | | | | 3,917 | |
Citibank NA | | EUR | | | 846,909 | | | USD | | | 896,881 | | | | 01/18/24 | | | | 2,657 | |
| | GBP | | | 375,000 | | | USD | | | 455,682 | | | | 01/18/24 | | | | 412 | |
| | USD | | | 1,086,403 | | | CAD | | | 1,486,198 | | | | 01/18/24 | | | | 13,155 | |
| | USD | | | 1,062,000 | | | EUR | | | 995,113 | | | | 01/18/24 | | | | 5,049 | |
JPMorgan Securities, Inc. | | COP | | | 3,665,611,700 | | | USD | | | 881,581 | | | | 11/15/23 | | | | 5,828 | |
| | THB | | | 253,069,423 | | | USD | | | 6,998,601 | | | | 01/12/24 | | | | 89,493 | |
MS & Co. Int. PLC | | EUR | | | 1,687,787 | | | USD | | | 1,779,606 | | | | 11/16/23 | | | | 7,435 | |
| | TRY | | | 56,055,000 | | | USD | | | 1,850,000 | | | | 01/12/24 | | | | 13,790 | |
| | USD | | | 1,008,855 | | | CAD | | | 1,381,829 | | | | 11/16/23 | | | | 12,192 | |
| | USD | | | 3,963,470 | | | MYR | | | 18,455,900 | | | | 01/12/24 | | | | 71,520 | |
|
| |
| | | | | | |
| TOTAL | | | | | | | | | | | | | | | | | | | $530,813 | |
|
| |
| | |
| 68 | | The accompanying notes are an integral part of these financial statements. |
GOLDMAN SACHS MULTI-MANAGER NON-CORE FIXED INCOME FUND
|
|
ADDITIONAL INVESTMENT INFORMATION (continued) |
FORWARD FOREIGN CURRENCY EXCHANGE CONTRACTS WITH UNREALIZED LOSS
| | | | | | | | | | | | | | | | | | | | |
| Counterparty | | Currency Purchased | | | Currency Sold | | | Settlement
Date | | | Unrealized
Loss | |
|
| |
| | | | | | |
Barclays Bank PLC | | EUR | | | 22,490,000 | | | USD | | | 24,013,945 | | | | 01/25/24 | | | $ | (118,788 | ) |
| | GBP | | | 2,680,000 | | | USD | | | 3,275,306 | | | | 01/25/24 | | | | (15,599 | ) |
| | MYR | | | 18,455,900 | | | USD | | | 3,948,208 | | | | 01/12/24 | | | | (56,258 | ) |
| | USD | | | 1,670,000 | | | COP | | | 6,974,003,500 | | | | 11/15/23 | | | | (18,337 | ) |
BNP Paribas SA | | COP | | | 10,926,254,146 | | | USD | | | 2,663,707 | | | | 11/15/23 | | | | (18,569 | ) |
| | NGN | | | 266,899,500 | | | USD | | | 333,000 | | | | 11/02/23 | | | | (38,593 | ) |
| | NGN | | | 1,195,500,000 | | | USD | | | 1,500,000 | | | | 11/13/23 | | | | (191,733 | ) |
| | NGN | | | 735,335,016 | | | USD | | | 919,169 | | | | 11/15/23 | | | | (115,629 | ) |
| | PLN | | | 13,714,388 | | | USD | | | 3,253,865 | | | | 12/07/23 | | | | (655 | ) |
BofA Securities LLC | | CNH | | | 68,099,088 | | | USD | | | 9,304,552 | | | | 12/12/23 | | | | (1,068 | ) |
| | PLN | | | 9,396,290 | | | USD | | | 2,232,693 | | | | 12/07/23 | | | | (3,786 | ) |
Citibank NA | | CAD | | | 1,464,705 | | | USD | | | 1,069,141 | | | | 01/18/24 | | | | (11,414 | ) |
| | EUR | | | 650,000 | | | USD | | | 692,063 | | | | 01/18/24 | | | | (1,671 | ) |
| | GBP | | | 711,971 | | | USD | | | 867,947 | | | | 01/18/24 | | | | (2,012 | ) |
| | USD | | | 292,832 | | | EUR | | | 277,371 | | | | 01/18/24 | | | | (1,775 | ) |
| | USD | | | 134,430 | | | GBP | | | 110,773 | | | | 01/18/24 | | | | (298 | ) |
JPMorgan Securities, Inc. | | COP | | | 10,381,476,000 | | | USD | | | 2,539,500 | | | | 11/15/23 | | | | (26,247 | ) |
| | COP | | | 28,770,000,000 | | | USD | | | 7,000,000 | | | | 03/18/24 | | | | (230,262 | ) |
| | TRY | | | 73,770,400 | | | USD | | | 2,020,000 | | | | 09/18/24 | | | | (95,757 | ) |
| | USD | | | 8,607,126 | | | PLN | | | 37,890,289 | | | | 12/07/23 | | | | (380,884 | ) |
MS & Co. Int. PLC | | CAD | | | 1,381,829 | | | USD | | | 1,010,257 | | | | 11/16/23 | | | | (13,594 | ) |
| | EUR | | | 452,745 | | | USD | | | 480,000 | | | | 11/16/23 | | | | (630 | ) |
| | GBP | | | 484,402 | | | USD | | | 589,905 | | | | 11/16/23 | | | | (1,082 | ) |
| | TRY | | | 23,302,987 | | | USD | | | 810,000 | | | | 12/11/23 | | | | (13,510 | ) |
| | TRY | | | 51,124,770 | | | USD | | | 1,402,600 | | | | 09/18/24 | | | | (69,051 | ) |
| | USD | | | 15,000 | | | GBP | | | 12,391 | | | | 11/16/23 | | | | (62 | ) |
|
| |
| | | | | | |
| TOTAL | | | | | | | | | | | | | | | | | | $ | (1,427,264 | ) |
|
| |
FUTURES CONTRACTS — At October 31, 2023, the Fund had the following futures contracts:
| | | | | | | | | | | | |
| Description | | Number of
Contracts | | Expiration
Date | | Notional
Amount | | | Unrealized
Appreciation/
(Depreciation) | |
| |
| | | | |
Long position contracts: | | | | | | | | | | | | |
10 Year U.S. Treasury Notes | | 24 | | 12/19/23 | | $ | 2,548,125 | | | | $(80,178 | ) |
| |
SWAP CONTRACTS — At October 31, 2023, the Fund had the following swap contracts:
OVER THE COUNTER CREDIT DEFAULT SWAP CONTRACTS
| | | | | | | | | | | | | | | | | | | | | | | | |
| Reference Obligation/Index | | Financing
Rate Paid
by the Fund(a) | | Credit Spread at October 31,
2023(b) | | Counterparty | | Termination
Date | | | Notional Amount (000s) | | | Value | | | Upfront Premiums (Received) Paid | | | Unrealized Appreciation/ (Depreciation) |
|
| | | | | | | | |
Protection Sold: | | | | | | | | | | | | | | | | | | | | | | | | |
American Airlines Group, Inc. | | 5.000% | | 9.904% | | Citibank NA | | | 06/20/28 | | | $ | 630 | | | $ | (91,578 | ) | | | $ | (46,049) | | $(45,529) |
| | |
| The accompanying notes are an integral part of these financial statements. | | 69 |
GOLDMAN SACHS MULTI-MANAGER NON-CORE FIXED INCOME FUND
|
Schedule of Investments (continued) October 31, 2023 |
|
|
ADDITIONAL INVESTMENT INFORMATION (continued) |
OVER THE COUNTER CREDIT DEFAULT SWAP CONTRACTS (continued)
| | | | | | | | | | | | | | | | | | | | | | | | |
| Reference Obligation/Index | | Financing
Rate Paid
by the Fund(a) | | Credit Spread at October 31,
2023(b) | | Counterparty | | Termination
Date | | | Notional Amount (000s) | | | Value | | | Upfront Premiums (Received) Paid | | | Unrealized Appreciation/ (Depreciation) |
|
|
| | | | | | | | |
Ford Motor Co. | | 5.000% | | 2.243% | | Citibank NA | | | 12/20/27 | | | | $1,490 | | | | $155,790 | | | $ | 92,312 | | | $ 63,478 |
|
|
| | | | | | | | |
| TOTAL | | | | | | | | | | | | | | | | | $ 64,212 | | | $ | 46,263 | | | $ 17,949 |
|
|
| | (a) | Payments made quarterly. |
| | (b) | Credit spread on the referenced obligation, together with the term of the swap contract, are indicators of payment/performance risk. The likelihood of a credit event occurring which would require a fund or its counterparty to make a payment or otherwise be required to perform under the swap contract is generally greater as the credit spread and the term of the swap contract increase. |
CENTRALLY CLEARED CREDIT DEFAULT SWAP CONTRACTS
| | | | | | | | | | | | | | | | | | | | | | | | |
| Referenced Obligation/Index | | Financing Rate
Received/(Paid) by the Fund(a) | | Credit Spread at
October 31,
2023(b) | | Termination
Date | | | Notional Amount (000s) | | | Value | | | Upfront
Premiums
(Received)
Paid | | | Unrealized
Appreciation/
(Depreciation) | |
| |
| | | | | | | |
Protection Sold: | | | | | | | | | | | | | | | | | | | | | | | | |
CDX.NA.HY Index 54 | | 5.000% | | 5.155% | | | 12/20/28 | | | $ | 30,520 | | | $ | (5,060 | ) | | | $(29,749 | ) | | | $24,689 | |
| |
| | (a) | Payments made quarterly. |
| | (b) | Credit spread on the referenced obligation, together with the term of the swap contract, are indicators of payment/performance risk. The likelihood of a credit event occurring which would require a fund or its counterparty to make a payment or otherwise be required to perform under the swap contract is generally greater as the credit spread and the term of the swap contract increase. |
PURCHASED AND WRITTEN OPTIONS CONTRACTS — At October 31, 2023, the Fund had the following purchased and written options:
OVER-THE-COUNTER OPTIONS ON FOREIGN CURRENCY
| | | | | | | | | | | | | | | | | | | | | | | | | | | | | | |
| Description | | Counterparty | | Exercise
Rate | | | Expiration
Date | | | Number of
Contracts | | | Notional
Amount | | | Market
Value | | | Premiums Paid
(Received) by Fund | | | Unrealized Appreciation/
(Depreciation) | |
|
| |
| | | | | |
Purchased option contracts | | | | | | | | | | | | | | | | | | | | | |
Calls | | | | | | | | | | | | | | | | | | | | | | | | | | | | | | |
| Call USD/Put ZAR | | Barclays Bank PLC | | | 19.300 | % | | | 12/15/2023 | | | | 6,625,000 | | | $ | 6,625,000 | | | $ | 63,944 | | | | $169,600 | | | | $(105,656 | ) |
| Call USD/Put ZAR | | BofA Securities LLC | | | 19.300 | | | | 12/15/2023 | | | | 1,191,000 | | | | 1,191,000 | | | | 11,496 | | | | 31,579 | | | | (20,083 | ) |
Written option contracts | | | | | | | | | | | | | | | | | | | | | | | | | | | | |
Calls | | | | | | | | | | | | | | | | | | | | | | | | | | | | | | |
| Call USD/Put ZAR | | Barclays Bank PLC | | | 20.800 | | | | 12/15/2023 | | | | (6,625,000 | ) | | | (6,625,000 | ) | | | (10,706 | ) | | | (58,300) | | | | 47,594 | |
| Call USD/Put ZAR | | BofA Securities LLC | | | 20.800 | | | | 12/15/2023 | | | | (1,191,000 | ) | | | (1,191,000 | ) | | | (1,925 | ) | | | (10,296) | | | | 8,371 | |
|
| |
| | | | | | | |
| TOTAL | | | | | | | | | | | — | | | $ | — | | | $ | 62,809 | | | | $132,583 | | | | $ (69,774 | ) |
|
| |
| | |
| 70 | | The accompanying notes are an integral part of these financial statements. |
GOLDMAN SACHS MULTI-MANAGER NON-CORE FIXED INCOME FUND
|
|
ADDITIONAL INVESTMENT INFORMATION (continued) |
| | |
| AUD | | —Australian Dollar |
| BRL | | —Brazil Real |
| CAD | | —Canadian Dollar |
| CLP | | —Chilean Peso |
| CNH | | —Chinese Yuan Renminbi Offshore |
| CNY | | —Chinese Yuan Renminbi |
| COP | | —Colombia Peso |
| CZK | | —Czech Republic Koruna |
| EUR | | —Euro |
| GBP | | —British Pound |
| HUF | | —Hungarian Forint |
| IDR | | —Indonesia Rupiah |
| INR | | —Indian Rupee |
| MXN | | —Mexican Peso |
| MYR | | —Malaysia Ringgit |
| NGN | | —Nigeria Naira |
| PEN | | —Peru Nuevo Sol |
| PLN | | —Polish Zloty |
| RON | | —Romania New Leu |
| THB | | —Thailand Baht |
| TRY | | —Turkish Lira |
| USD | | —U.S. Dollar |
| ZAR | | —South African Rand |
|
| |
| | |
| | |
| |
| Investment Abbreviations: |
| | |
| CMT | | —Constant Maturity Treasury Indexes |
| ETF | | —Exchange Traded Fund |
| EURIBOR | | —Euro Interbank Offered Rate |
| ICE | | —Inter-Continental Exchange |
| LIBOR | | —London Interbank Offered Rate |
| LLC | | —Limited Liability Company |
| LP | | —Limited Partnership |
| PIK | | —Payment in kind |
| PLC | | —Public Limited Company |
| REIT | | —Real Estate Investment Trust |
| SOFR | | —Secured Overnight Financing Rate |
|
| |
| | | |
| |
| Abbreviations: |
| | |
| BofA Securities LLC | | —Bank of America Securities LLC |
| CDX.NA.HY Ind 54 | | —CDX North America High Yield Index 54 |
| MS & Co. Int. PLC | | —Morgan Stanley & Co. International PLC |
|
| | |
| The accompanying notes are an integral part of these financial statements. | | 71 |
GOLDMAN SACHS MULTI-MANAGER REAL ASSETS STRATEGY FUND
|
Schedule of Investments October 31, 2023 |
| | | | | | | | |
| | | Shares | | Description | | Value | |
| |
| | | Common Stocks – 94.2% | |
| |
| | Australia – 2.7% | |
| | 302,095 | | APA Group (Gas Utilities) | | $ | 1,583,564 | |
| | 256,039 | | Atlas Arteria Ltd. (Transportation Infrastructure) | | | 865,571 | |
| | 622,208 | | Cleanaway Waste Management Ltd. | | | | |
| | | | (Commercial Services & Supplies) | | | 886,364 | |
| | 166,968 | | Goodman Group (Industrial REITs) | | | 2,209,303 | |
| | 1,649,886 | | National Storage REIT (Specialized REITs) | | | 2,103,578 | |
| | 230,170 | | NEXTDC Ltd.* (IT Services) | | | 1,728,314 | |
| | 2,185,341 | | Scentre Group (Retail REITs) | | | 3,385,510 | |
| | 1,239,704 | | Stockland (Diversified REITs) | | | 2,797,939 | |
| | 3 | | Transurban Group (Transportation Infrastructure) | | | 22 | |
| | | | | | | | |
| | | | | | | 15,560,165 | |
| | | |
| |
| | Belgium – 0.5% | |
| | 10,913 | | Aedifica SA (Health Care REITs) | | | 595,365 | |
| | 31,197 | | Shurgard Self Storage Ltd. (Real Estate Management & Development) | | | 1,167,538 | |
| | 50,423 | | Warehouses De Pauw CVA (Industrial REITs) | | | 1,247,591 | |
| | | | | | | | |
| | | | | | | 3,010,494 | |
| | | |
| |
| | Brazil – 0.3% | |
| | 202,885 | | CCR SA (Transportation Infrastructure) | | | 482,087 | |
| | 690,175 | | Santos Brasil Participacoes SA (Transportation Infrastructure) | | | 1,013,000 | |
| | | | | | | | |
| | | | | | | 1,495,087 | |
| | | |
| |
| | Canada – 6.4% | |
| | 89,840 | | Allied Properties Real Estate Investment Trust (Office REITs) | | | 1,026,835 | |
| | 39,553 | | Boardwalk Real Estate Investment Trust (Residential REITs) | | | 1,847,090 | |
| | 46,225 | | Canadian Apartment Properties REIT (Residential REITs) | | | 1,360,667 | |
| | 49,507 | | Chartwell Retirement Residences (Health Care Providers & Services) | | | 362,712 | |
| | 373,948 | | Enbridge, Inc. (Oil, Gas & Consumable Fuels) | | | 11,983,594 | |
| | 42,040 | | GFL Environmental, Inc. (Commercial Services & Supplies) | | | 1,211,593 | |
| | 227,615 | | InterRent Real Estate Investment Trust (Residential REITs) | | | 1,930,234 | |
| | 176,788 | | Keyera Corp. (Oil, Gas & Consumable Fuels) | | | 4,111,349 | |
| | 128,970 | | Pembina Pipeline Corp. (Oil, Gas & Consumable Fuels) | | | 3,969,309 | |
| | 50,148 | | RioCan Real Estate Investment Trust (Retail REITs) | | | 609,334 | |
| | 240,162 | | TC Energy Corp. (Oil, Gas & Consumable Fuels) | | | 8,271,237 | |
| | | | | | | | |
| | | | | | | 36,683,954 | |
| | | |
| | | | | | | | |
| | | Shares | | Description | | Value | |
| |
| | | Common Stocks (continued) | |
| |
| | China – 0.8% | |
| | 13,922,000 | | China Tower Corp. Ltd. Class H(a) | | | | |
| | | | (Diversified Telecommunication Services) | | $ | 1,298,236 | |
| | 340,800 | | ENN Energy Holdings Ltd. (Gas Utilities) | | | 2,581,608 | |
| | 1,026,000 | | Zhejiang Expressway Co. Ltd. Class H (Transportation Infrastructure) | | | 772,307 | |
| | | | | | | | |
| | | | | | | 4,652,151 | |
| | | |
| |
| | France – 3.7% | |
| | 12,118 | | Gecina SA (Office REITs) | | | 1,189,877 | |
| | 151,816 | | Klepierre SA (Retail REITs) | | | 3,686,666 | |
| | 37,294 | | Unibail-Rodamco-Westfield* (Retail REITs) | | | 1,847,887 | |
| | 128,646 | | Vinci SA (Construction & Engineering) | | | 14,224,957 | |
| | | | | | | | |
| | | | | | | 20,949,387 | |
| | | |
| |
| | Germany – 0.6% | |
| | 70,842 | | TAG Immobilien AG* (Real Estate Management & Development) | | | 774,586 | |
| | 106,560 | | Vonovia SE (Real Estate Management & Development) | | | 2,453,233 | |
| | | | | | | | |
| | | | | | | 3,227,819 | |
| | | |
| |
| | Hong Kong – 2.6% | |
| | 288,000 | | China Gas Holdings Ltd. (Gas Utilities) | | | 258,914 | |
| | 175,300 | | China Resources Gas Group Ltd. (Gas Utilities) | | | 518,208 | |
| | 428,741 | | CK Asset Holdings Ltd. (Real Estate Management & Development) | | | 2,142,987 | |
| | 1,014,200 | | Hong Kong & China Gas Co. Ltd. (Gas Utilities) | | | 705,994 | |
| | 1,120,000 | | Kunlun Energy Co. Ltd. (Gas Utilities) | | | 933,076 | |
| | 660,369 | | Link REIT (Retail REITs) | | | 3,030,525 | |
| | 127,000 | | Power Assets Holdings Ltd. (Electric Utilities) | | | 607,165 | |
| | 417,211 | | Sun Hung Kai Properties Ltd. (Real Estate Management & Development) | | | 4,284,214 | |
| | 130,602 | | Swire Properties Ltd. (Real Estate Management & Development) | | | 252,872 | |
| | 575,331 | | Wharf Real Estate Investment Co. Ltd. (Real Estate Management & Development) | | | 2,012,530 | |
| | | | | | | | |
| | | | | | | 14,746,485 | |
| | | |
| |
| | Italy – 1.5% | |
| | 265,330 | | Snam SpA (Gas Utilities) | | | 1,216,682 | |
| | 958,744 | | Terna - Rete Elettrica Nazionale (Electric Utilities) | | | 7,341,135 | |
| | | | | | | | |
| | | | | | | 8,557,817 | |
| | | |
| | |
| 72 | | The accompanying notes are an integral part of these financial statements. |
GOLDMAN SACHS MULTI-MANAGER REAL ASSETS STRATEGY FUND
| | | | | | | | |
| | | Shares | | Description | | Value | |
| |
| | | Common Stocks (continued) | |
| |
| | Japan – 6.1% | |
| | 661 | | Daiwa House REIT Investment Corp. (Diversified REITs) | | $ | 1,169,803 | |
| | 2,368 | | GLP J-Reit (Industrial REITs) | | | 2,120,916 | |
| | 205 | | Hoshino Resorts REIT, Inc. (Hotel & Resort REITs) | | | 806,556 | |
| | 1,163 | | Industrial & Infrastructure Fund Investment Corp. (Industrial REITs) | | | 1,045,303 | |
| | 4,832 | | Invincible Investment Corp. (Hotel & Resort REITs) | | | 1,858,389 | |
| | 32,000 | | Japan Airport Terminal Co. Ltd. (Transportation Infrastructure) | | | 1,407,329 | |
| | 4,819 | | Japan Hotel REIT Investment Corp. (Hotel & Resort REITs) | | | 2,190,878 | |
| | 91,518 | | Mitsubishi Estate Co. Ltd. (Real Estate Management & Development) | | | 1,171,460 | |
| | 332,982 | | Mitsui Fudosan Co. Ltd. (Real Estate Management & Development) | | | 7,217,337 | |
| | 176 | | Mitsui Fudosan Logistics Park, Inc. (Industrial REITs) | | | 532,089 | |
| | 212 | | Nippon Accommodations Fund, Inc. (Residential REITs) | | | 854,105 | |
| | 745 | | Nippon Building Fund, Inc. (Office REITs) | | | 2,993,360 | |
| | 1,058 | | Nippon Prologis REIT, Inc. (Industrial REITs) | | | 1,882,579 | |
| | 1,041 | | Nomura Real Estate Master Fund, Inc. (Diversified REITs) | | | 1,148,700 | |
| | 96,600 | | Osaka Gas Co. Ltd. (Gas Utilities) | | | 1,821,661 | |
| | 2,114 | | Sekisui House Reit, Inc. (Diversified REITs) | | | 1,113,392 | |
| | 123,800 | | Sumitomo Realty & Development Co. Ltd. (Real Estate Management & Development) | | | 3,106,629 | |
| | 60,100 | | Tokyo Gas Co. Ltd. (Gas Utilities) | | | 1,349,675 | |
| | 232,589 | | Tokyu Fudosan Holdings Corp. (Real | | | | |
| | | | Estate Management & Development) | | | 1,355,138 | |
| | | | | | | | |
| | | | | | | 35,145,299 | |
| | | |
| |
| | Mexico – 0.5% | |
| | 77,193 | | Grupo Aeroportuario del Centro Norte SAB de CV (Transportation Infrastructure) | | | 589,277 | |
| | 4,540 | | Grupo Aeroportuario del Pacifico SAB de CV ADR (Transportation Infrastructure) | | | 528,592 | |
| | 444 | | Grupo Aeroportuario del Sureste SAB de CV ADR (Transportation Infrastructure) | | | 95,997 | |
| | 69,026 | | Grupo Aeroportuario del Sureste SAB de CV Class B (Transportation Infrastructure) | | | 1,487,606 | |
| | 117,525 | | Prologis Property Mexico SA de CV (Industrial REITs) | | | 421,171 | |
| | | | | | | | |
| | | | | | | 3,122,643 | |
| | | |
| |
| | Netherlands – 0.5% | |
| | 95,647 | | Ferrovial SE (Construction & Engineering) | | | 2,878,596 | |
| | | |
| | | | | | | | |
| | | Shares | | Description | | Value | |
| |
| | | Common Stocks (continued) | |
| |
| | Portugal – 0.2% | |
| | 293,642 | | EDP - Energias de Portugal SA (Electric Utilities) | | $ | 1,234,030 | |
| | | |
| |
| | Singapore – 1.9% | |
| | 884,700 | | CapitaLand Ascendas REIT (Industrial REITs) | | | 1,680,969 | |
| | 3,014,044 | | CapitaLand Ascott Trust (Hotel & Resort REITs) | | | 1,981,749 | |
| | 945,101 | | CapitaLand Integrated Commercial Trust (Retail REITs) | | | 1,214,662 | |
| | 1,287,875 | | CapitaLand Investment Ltd. (Real Estate Management & Development) | | | 2,765,302 | |
| | 1,028,884 | | Frasers Logistics & Commercial Trust (Industrial REITs) | | | 781,548 | |
| | 971,900 | | Mapletree Industrial Trust (Industrial REITs) | | | 1,527,731 | |
| | 837,539 | | Mapletree Logistics Trust (Industrial REITs) | | | 899,390 | |
| | | | | | | | |
| | | | | | | 10,851,351 | |
| | | |
| |
| | Spain – 2.2% | |
| | 10,817 | | Aena SME SA(a) (Transportation Infrastructure) | | | 1,569,554 | |
| | 300,812 | | Cellnex Telecom SA*(a) (Diversified Telecommunication Services) | | | 8,842,698 | |
| | 177,336 | | Inmobiliaria Colonial Socimi SA (Office REITs) | | | 994,903 | |
| | 154,729 | | Merlin Properties Socimi SA (Diversified REITs) | | | 1,290,097 | |
| | | | | | | | |
| | | | | | | 12,697,252 | |
| | | |
| |
| | Sweden – 0.7% | |
| | 165,411 | | Castellum AB (Real Estate Management & Development) | | | 1,585,259 | |
| | 21,227 | | Catena AB (Real Estate Management & Development) | | | 703,172 | |
| | 43,253 | | Sagax AB Class B (Real Estate Management & Development) | | | 783,006 | |
| | 169,628 | | Wihlborgs Fastigheter AB (Real Estate Management & Development) | | | 1,099,536 | |
| | | | | | | | |
| | | | | | | 4,170,973 | |
| | | |
| |
| | United Kingdom – 5.1% | |
| | 161,918 | | Big Yellow Group PLC (Specialized REITs) | | | 1,883,120 | |
| | 491,084 | | Grainger PLC (Real Estate Management & Development) | | | 1,357,323 | |
| | 198,701 | | Great Portland Estates PLC (Office REITs) | | | 941,893 | |
| | 107,338 | | Land Securities Group PLC (Diversified REITs) | | | 744,035 | |
| | 1,109,791 | | National Grid PLC (Multi-Utilities) | | | 13,232,003 | |
| | 128,623 | | Safestore Holdings PLC (Specialized REITs) | | | 1,070,335 | |
| | | |
| | 323,759 | | Segro PLC (Industrial REITs) | | | 2,814,158 | |
| | 48,166 | | Severn Trent PLC (Water Utilities) | | | 1,554,911 | |
| | 61,640 | | SSE PLC (Electric Utilities) | | | 1,225,006 | |
| | |
| The accompanying notes are an integral part of these financial statements. | | 73 |
GOLDMAN SACHS MULTI-MANAGER REAL ASSETS STRATEGY FUND
|
Schedule of Investments (continued) October 31, 2023 |
| | | | | | | | |
| | | Shares | | Description | | Value | |
| |
| | | Common Stocks (continued) | |
| |
| | United Kingdom (continued) | |
| | 916,762 | | Tritax Big Box REIT PLC (Industrial REITs) | | $ | 1,526,333 | |
| | 237,046 | | UNITE Group PLC (Residential REITs) | | | 2,508,543 | |
| | 36,739 | | United Utilities Group PLC (Water Utilities) | | | 475,166 | |
| | | | | | | | |
| | | | | | | 29,332,826 | |
| | | |
| |
| | United States – 57.9% | |
| | 27,665 | | Agree Realty Corp. (Retail REITs) | | | 1,547,580 | |
| | 33,164 | | Alexandria Real Estate Equities, Inc. (Office REITs) | | | 3,088,563 | |
| | 27,440 | | Alliant Energy Corp. (Electric Utilities) | | | 1,338,798 | |
| | 22,759 | | Ameren Corp. (Multi-Utilities) | | | 1,723,084 | |
| | 144,072 | | American Homes 4 Rent Class A (Residential REITs) | | | 4,716,917 | |
| | 131,183 | | American Tower Corp. (Specialized REITs) | | | 23,375,499 | |
| | 19,602 | | American Water Works Co., Inc. (Water Utilities) | | | 2,306,175 | |
| | 101,764 | | Americold Realty Trust, Inc. (Industrial REITs) | | | 2,668,252 | |
| | 126,061 | | Apartment Income REIT Corp. (Residential REITs) | | | 3,682,242 | |
| | 20,607 | | Atmos Energy Corp. (Gas Utilities) | | | 2,218,550 | |
| | 30,322 | | AvalonBay Communities, Inc. (Residential REITs) | | | 5,025,568 | |
| | 30,998 | | Boston Properties, Inc. (Office REITs) | | | 1,660,563 | |
| | 103,702 | | Brixmor Property Group, Inc. (Retail REITs) | | | 2,155,965 | |
| | 212,071 | | Broadstone Net Lease, Inc. (Diversified REITs) | | | 3,000,805 | |
| | 15,417 | | Camden Property Trust (Residential REITs) | | | 1,308,595 | |
| | 243,757 | | CenterPoint Energy, Inc. (Multi-Utilities) | | | 6,552,188 | |
| | 51,403 | | Cheniere Energy, Inc. (Oil, Gas & Consumable Fuels) | | | 8,554,487 | |
| | 58,460 | | Community Healthcare Trust, Inc. (Health Care REITs) | | | 1,676,048 | |
| | 52,736 | | Consolidated Edison, Inc. (Multi-Utilities) | | | 4,629,693 | |
| | 4,561 | | Constellation Energy Corp. (Electric Utilities) | | | 515,028 | |
| | 53,297 | | Cousins Properties, Inc. (Office REITs) | | | 952,417 | |
| | 35,892 | | Crown Castle, Inc. (Specialized REITs) | | | 3,337,238 | |
| | 25,366 | | CubeSmart (Specialized REITs) | | | 864,727 | |
| | 95,742 | | Digital Realty Trust, Inc. (Specialized REITs) | | | 11,906,475 | |
| | 34,206 | | DT Midstream, Inc. (Oil, Gas & Consumable Fuels) | | | 1,846,098 | |
| | | |
| | 13,034 | | DTE Energy Co. (Multi-Utilities) | | | 1,256,217 | |
| | | | | | | | |
| | | Shares | | Description | | Value | |
| |
| | | Common Stocks (continued) | |
| |
| | United States (continued) | |
| | 44,800 | | Edison International (Electric Utilities) | | $ | 2,825,088 | |
| | 34,531 | | EPR Properties (Specialized REITs) | | | 1,474,474 | |
| | 17,913 | | Equinix, Inc. (Specialized REITs) | | | 13,070,041 | |
| | 144,227 | | Equitrans Midstream Corp. (Oil, Gas & Consumable Fuels) | | | 1,279,294 | |
| | 6,370 | | Equity LifeStyle Properties, Inc. (Residential REITs) | | | 419,146 | |
| | 76,752 | | Equity Residential (Residential REITs) | | | 4,246,688 | |
| | 89,704 | | Essential Properties Realty Trust, Inc. (Diversified REITs) | | | 1,969,003 | |
| | 50,911 | | Essential Utilities, Inc. (Water Utilities) | | | 1,703,482 | |
| | 18,621 | | Essex Property Trust, Inc. (Residential REITs) | | | 3,983,404 | |
| | 9,490 | | Eversource Energy (Electric Utilities) | | | 510,467 | |
| | 277,923 | | Exelon Corp. (Electric Utilities) | | | 10,822,322 | |
| | 67,438 | | Extra Space Storage, Inc. (Specialized REITs) | | | 6,985,902 | |
| | 65,309 | | First Industrial Realty Trust, Inc. (Industrial REITs) | | | 2,762,571 | |
| | 47,297 | | Gaming & Leisure Properties, Inc. (Specialized REITs) | | | 2,146,811 | |
| | 82,560 | | Healthcare Realty Trust, Inc. (Health Care REITs) | | | 1,184,736 | |
| | 197,756 | | Host Hotels & Resorts, Inc. (Hotel & Resort REITs) | | | 3,061,263 | |
| | 33,050 | | InvenTrust Properties Corp. (Retail REITs) | | | 829,555 | |
| | 177,926 | | Invitation Homes, Inc. (Residential REITs) | | | 5,282,623 | |
| | 21,971 | | Iron Mountain, Inc. (Specialized REITs) | | | 1,297,827 | |
| | 81,775 | | Kilroy Realty Corp. (Office REITs) | | | 2,337,130 | |
| | 375,660 | | Kinder Morgan, Inc. (Oil, Gas & Consumable Fuels) | | | 6,085,692 | |
| | 7,362 | | Marriott Vacations Worldwide Corp. (Hotels, Restaurants & Leisure) | | | 661,549 | |
| | 47,738 | | NETSTREIT Corp. (Retail REITs) | | | 680,267 | |
| | 21,718 | | NextEra Energy, Inc. (Electric Utilities) | | | 1,266,159 | |
| | 264,419 | | NiSource, Inc. (Multi-Utilities) | | | 6,652,782 | |
| | 104,047 | | Omega Healthcare Investors, Inc. (Health Care REITs) | | | 3,443,956 | |
| | 188,512 | | ONEOK, Inc. (Oil, Gas & Consumable Fuels) | | | 12,290,982 | |
| | 546,075 | | PG&E Corp.* (Electric Utilities) | | | 8,901,023 | |
| | 7,566 | | PNM Resources, Inc. (Electric Utilities) | | | 319,739 | |
| | 113,963 | | PPL Corp. (Electric Utilities) | | | 2,800,071 | |
| | 162,051 | | Prologis, Inc. (Industrial REITs) | | | 16,326,638 | |
| | 9,617 | | Public Service Enterprise Group, Inc. (Multi-Utilities) | | | 592,888 | |
| | 11,565 | | Public Storage (Specialized REITs) | | | 2,760,681 | |
| | 66,652 | | Realty Income Corp. (Retail REITs) | | | 3,157,972 | |
| | | |
| | |
| 74 | | The accompanying notes are an integral part of these financial statements. |
GOLDMAN SACHS MULTI-MANAGER REAL ASSETS STRATEGY FUND
| | | | | | | | |
| | | Shares | | Description | | Value | |
| |
| | | Common Stocks (continued) | |
| |
| | United States (continued) | |
| | 66,942 | | Regency Centers Corp. (Retail REITs) | | $ | 4,033,925 | |
| | 83,773 | | Rexford Industrial Realty, Inc. (Industrial REITs) | | | 3,622,345 | |
| | 460 | | Ryman Hospitality Properties, Inc. (Hotel & Resort REITs) | | | 39,376 | |
| | 127,976 | | Sabra Health Care REIT, Inc. (Health Care REITs) | | | 1,745,593 | |
| | 46,916 | | SBA Communications Corp. (Specialized REITs) | | | 9,788,085 | |
| | 157,481 | | Sempra (Multi-Utilities) | | | 11,028,394 | |
| | 55,235 | | Simon Property Group, Inc. (Retail REITs) | | | 6,069,774 | |
| | 66,320 | | SITE Centers Corp. (Retail REITs) | | | 773,291 | |
| | 40,218 | | STAG Industrial, Inc. (Industrial REITs) | | | 1,336,042 | |
| | 42,987 | | Sun Communities, Inc. (Residential REITs) | | | 4,781,874 | |
| | 125,863 | | Sunstone Hotel Investors, Inc. (Hotel & Resort REITs) | | | 1,170,526 | |
| | 116,645 | | Targa Resources Corp. (Oil, Gas & Consumable Fuels) | �� | | 9,752,688 | |
| | 15,089 | | Terreno Realty Corp. (Industrial REITs) | | | 803,942 | |
| | 70,730 | | UDR, Inc. (Residential REITs) | | | 2,249,921 | |
| | 12,990 | | Union Pacific Corp. (Ground Transportation) | | | 2,696,854 | |
| | 48,507 | | Urban Edge Properties (Retail REITs) | | | 769,321 | |
| | 198,942 | | Ventas, Inc. (Health Care REITs) | | | 8,447,077 | |
| | 171,893 | | Veris Residential, Inc. (Residential REITs) | | | 2,301,647 | |
| | 242,661 | | VICI Properties, Inc. (Specialized REITs) | | | 6,770,242 | |
| | 4,800 | | Waste Connections, Inc. (Commercial Services & Supplies) | | | 621,517 | |
| | 166,408 | | Welltower, Inc. (Health Care REITs) | | | 13,913,373 | |
| | 74,343 | | Williams Cos., Inc. (Oil, Gas & Consumable Fuels) | | | 2,557,399 | |
| | | | | | | | |
| | | | | | | 331,313,204 | |
| | | |
| | TOTAL COMMON STOCKS (Cost $563,771,816) | | | $539,629,533 | |
| | | |
| | | | | | | | | | | | |
| | | Shares | | Dividend Rate | | Value | |
| |
| | | Investment Company(b) – 2.2% | |
| |
| | Goldman Sachs Financial Square Government Fund — Institutional Shares | |
| | 12,559,159 | | 5.258% | | | $ 12,559,159 | |
| | (Cost $12,559,159) | |
| | | |
| | TOTAL INVESTMENTS – 96.4% (Cost $ 576,330,975) | | | $552,188,692 | |
| | | |
| | OTHER ASSETS IN EXCESS OF
LIABILITIES – 3.6% | | | 20,340,983 | |
| | | |
| | NET ASSETS – 100.0% | | | $572,529,675 | |
| | | |
| | |
| The percentage shown for each investment category reflects the value of investments in that category as a percentage of net assets. |
| |
| * | | Non-income producing security. |
| |
| (a) | | Exempt from registration under Rule 144A of the Securities Act of 1933. |
| |
| (b) | | Represents an affiliated fund. |
|
|
SECTOR ALLOCATION AS OF OCTOBER 31, 2023 |
| | |
| |
| Sector | | % of Total
Market Value |
Real Estate | | 58.0% |
Utilities | | 18.9 |
Energy | | 12.8 |
Industrials | | 5.7 |
Investment Company | | 2.3 |
Communication Services | | 1.8 |
Information Technology | | 0.3 |
Consumer Discretionary | | 0.1 |
Health Care | | 0.1 |
| |
| | | 100.0% |
|
|
ADDITIONAL INVESTMENT INFORMATION |
FUTURES CONTRACTS — At October 31, 2023, the Fund had the following futures contracts:
| | | | | | | | | | | | | | |
| Description | | Number of
Contracts | | | Expiration
Date | | Notional
Amount | | | Unrealized
Appreciation/
(Depreciation) | |
| Long position contracts: | | | | | | | | | | | | | | |
| Dow Jones U.S. Real Estate Index | | | 367 | | | 12/15/23 | | | $10,701,720 | | | | $(1,329,506) | |
| | |
| The accompanying notes are an integral part of these financial statements. | | 75 |
GOLDMAN SACHS MULTI-MANAGER REAL ASSETS STRATEGY FUND
|
Schedule of Investments (continued) October 31, 2023 |
|
|
ADDITIONAL INVESTMENT INFORMATION (continued) |
| | | | |
| |
| | | Investment Abbreviations: |
| | | ADR | | —American Depositary Receipt |
| | PLC | | —Public Limited Company |
| | REIT | | —Real Estate Investment Trust |
| | |
| 76 | | The accompanying notes are an integral part of these financial statements. |
GOLDMAN SACHS STRATEGIC MULTI-ASSET CLASS FUNDS
|
Statements of Assets and Liabilities October 31, 2023 |
| | | | | | | | | | | | | | | | |
| | | | | Goldman Sachs
Multi-Manager
Global Equity
Fund | | Goldman Sachs
Multi-Manager
Non-Core Fixed
Income Fund | | Goldman Sachs
Multi-Manager
Real Assets
Strategy Fund | | |
| | | | | |
| | Assets: | | | | | | | | | | | | | | |
| | | | | |
| | Investments in unaffiliated issuers, at value (cost $662,902,786, $1,071,738,424 and $563,771,816, respectively) | | $ | 691,434,023 | | | $ | 995,599,278 | | | $ | 539,629,533 | | | |
| | Investments in affiliated issuers, at value (cost $60,301,113, $78,435,092 and $12,559,159,respectively) | | | 60,301,113 | | | | 78,435,092 | | | | 12,559,159 | | | |
| | Purchased options, at value (premium paid $0, $201,179 and $0, respectively) | | | — | | | | 75,440 | | | | — | | | |
| | Cash | | | 1,103,112 | | | | 11,853,105 | | | | 433,050 | | | |
| | Foreign currencies, at value (cost $262,055, $2,531,873 and $457,242, respectively) | | | 285,373 | | | | 2,520,463 | | | | 453,008 | | | |
| | Unrealized gain on swap contracts | | | — | | | | 63,478 | | | | — | | | |
| | Unrealized gain on forward foreign currency exchange contracts | | | 1,536,908 | | | | 530,813 | | | | — | | | |
| | Variation margin on futures contracts | | | 824,663 | | | | 22,089 | | | | 190,857 | | | |
| | Variation margin on swaps contracts | | | — | | | | 110,491 | | | | — | | | |
| | Receivables: | | | | | | | | | | | | | | |
| | Fund shares sold | | | 10,600,000 | | | | 3,500,000 | | | | 18,900,000 | | | |
| | Collateral on certain derivative contracts(a) | | | 5,675,129 | | | | 6,098,657 | | | | 847,770 | | | |
| | Investments sold | | | 2,977,105 | | | | 43,487,233 | | | | 2,603,211 | | | |
| | Interest and dividends | | | 815,029 | | | | 16,804,786 | | | | 1,086,439 | | | |
| | Foreign tax reclaims | | | 532,584 | | | | 321,677 | | | | 91,669 | | | |
| | Reimbursement from investment adviser | | | 185,330 | | | | — | | | | — | | | |
| | Investments sold on an extended-settlement basis | | | 49,333 | | | | 1,225,969 | | | | — | | | |
| | Upfront payments made on swap contracts | | | — | | | | 92,312 | | | | — | | | |
| | Other assets | | | 28,784 | | | | 19,826 | | | | 18,048 | | | |
| | |
| | | | | |
| | Total assets | | | 776,348,486 | | | | 1,160,760,709 | | | | 576,812,744 | | | |
| | |
| | | | | | | | | | | | | | | | |
| | | | | | | | | | | | | | | | |
| | | | | |
| | Liabilities: | | | | | | | | | | | | | | |
| | | | | |
| | Unrealized loss on forward foreign currency exchange contracts | | | 506,313 | | | | 1,427,264 | | | | — | | | |
| | Unrealized loss on swap contracts | | | — | | | | 45,529 | | | | — | | | |
| | Written option contracts, at value (premium received $0, $68,596 and $0, respectively) | | | — | | | | 12,631 | | | | — | | | |
| | Payables: | | | | | | | | | | | | | | |
| | Fund shares redeemed | | | 10,200,000 | | | | 45,113,000 | | | | 500,000 | | | |
| | Investments purchased | | | 2,780,923 | | | | 36,906,131 | | | | 3,068,099 | | | |
| | Management fees | | | 261,686 | | | | 360,708 | | | | 255,528 | | | |
| | Due to broker | | | 31,180 | | | | 120,000 | | | | — | | | |
| | Transfer Agency fees | | | 12,950 | | | | 18,728 | | | | 9,408 | | | |
| | Investments purchased on an extended-settlement basis | | | — | | | | 5,257,145 | | | | — | | | |
| | Upfront payments received on swap contracts | | | — | | | | 46,049 | | | | — | | | |
| | Accrued expenses | | | 1,084,989 | | | | 778,254 | | | | 450,034 | | | |
| | |
| | | | | |
| | Total liabilities | | | 14,878,041 | | | | 90,085,439 | | | | 4,283,069 | | | |
| | |
| | | | | | | | | | | | | | | | |
| | | | | |
| | Net Assets: | | | | | | | | | | | | | | |
| | | | | |
| | Paid-in capital | | | 748,925,707 | | | | 1,318,225,977 | | | | 624,151,837 | | | |
| | Total distributable earnings (loss) | | | 12,544,738 | | | | (247,550,707 | ) | | | (51,622,162 | ) | | |
| | |
| | | | | |
| | NET ASSETS | | $ | 761,470,445 | | | $ | 1,070,675,270 | | | $ | 572,529,675 | | | |
| | |
| | Shares Outstanding $0.001 par value (unlimited number of shares authorized): | | | 82,619,774 | | | | 147,385,317 | | | | 69,695,846 | | | |
| | Net asset value, offering and redemption price per share: | | $ | 9.22 | | | $ | 7.26 | | | $ | 8.21 | | | |
| | |
| | (a) | Segregated for initial margin and/or collateral as follows: |
| | | | | | | | | | | | | | |
| Fund | | Futures | | | Swaps | | | Forwards | | | |
Multi-Manager Global Equity | | $ | 3,365,129 | | | $ | 2,310,000 | | | $ | — | | | |
Multi-Manager Non-Core Fixed Income | | | 52,800 | | | | 5,945,857 | | | | 100,000 | | | |
Multi-Manager Real Assets Strategy | | | 847,770 | | | | — | | | | — | | | |
| | |
| The accompanying notes are an integral part of these financial statements. | | 77 |
GOLDMAN SACHS STRATEGIC MULTI-ASSET CLASS FUNDS
|
Statements of Operations For the Fiscal Year Ended October 31, 2023 |
| | | | | | | | | | | | | | | | |
| | | | | Goldman Sachs
Multi-Manager
Global Equity
Fund | | | Goldman Sachs
Multi-Manager
Non-Core Fixed
Income Fund | | | Goldman Sachs
Multi-Manager
Real Assets
Strategy Fund | | | |
| | | | | |
| | Investment Income: | | | | | | | | | | | | | | |
| | | | | |
| | Dividends — unaffiliated issuers (net of tax withholding of $721,091, $0 and $791,052,respectively) | | $ | 9,177,394 | | | $ | 695,780 | | | | $ 15,593,749 | | | |
| | Dividends — affiliated issuers | | | 2,174,529 | | | | 3,481,146 | | | | 653,186 | | | |
| | Interest (net of foreign withholding taxes of $0, $194,105 and $0, respectively) | | | 71,364 | | | | 85,256,462 | | | | 33,293 | | | |
| | |
| | | | | |
| | Total investment income | | | 11,423,287 | | | | 89,433,388 | | | | 16,280,228 | | | |
| | |
| | | | | | | | | | | | | | | | |
| | | | | |
| | Expenses: | | | | | | | | | | | | | | |
| | | | | |
| | Management fees | | | 5,994,497 | | | | 9,445,051 | | | | 4,897,590 | | | |
| | Custody, accounting and administrative services | | | 1,421,245 | | | | 1,163,874 | | | | 616,182 | | | |
| | Professional fees | | | 379,902 | | | | 244,913 | | | | 223,937 | | | |
| | Transfer Agency fees | | | 116,398 | | | | 222,236 | | | | 97,952 | | | |
| | Registration fees | | | 79,911 | | | | 68,211 | | | | 56,434 | | | |
| | Trustee fees | | | 42,445 | | | | 46,979 | | | | 41,725 | | | |
| | Printing and mailing costs | | | 26,251 | | | | 43,090 | | | | 31,362 | | | |
| | Prime broker fees | | | 5,997 | | | | 577 | | | | — | | | |
| | Other | | | 77,779 | | | | 50,682 | | | | 20,608 | | | |
| | |
| | | | | |
| | Total expenses | | | 8,144,425 | | | | 11,285,613 | | | | 5,985,790 | | | |
| | |
| | | | | |
| | Less — expense reductions | | | (5,069,049 | ) | | | (4,897,185 | ) | | | (2,244,767 | ) | | |
| | |
| | | | | |
| | Net expenses | | | 3,075,376 | | | | 6,388,428 | | | | 3,741,023 | | | |
| | |
| | | | | |
| | NET INVESTMENT INCOME | | | 8,347,911 | | | | 83,044,960 | | | | 12,539,205 | | | |
| | |
| �� | | | | | | | | | | | | | | | |
| | | | | |
| | Realized and unrealized gain (loss): | | | | | | | | | | | | | | |
| | | | | |
| | Net realized gain (loss) from: | | | | | | | | | | | | | | |
| | Investments — unaffiliated issuers (including commission recapture of $23,233, $0 and $11,989, respectively) | | | (11,572,359 | ) | | | (66,078,432 | ) | | | (16,314,030 | ) | | |
| | Purchased options | | | — | | | | (478,772 | ) | | | — | | | |
| | Futures contracts | | | 3,276,281 | | | | (110,861 | ) | | | (1,122,794 | ) | | |
| | Written options | | | — | | | | 60,268 | | | | — | | | |
| | Swap contracts | | | — | | | | 2,794,171 | | | | — | | | |
| | Forward foreign currency exchange contracts | | | (952,012 | ) | | | (961,840 | ) | | | (10,636 | ) | | |
| | Foreign currency transactions | | | 504,670 | | | | 219,331 | | | | (125,316 | ) | | |
| | Net change in unrealized gain (loss) on: | | | | | | | | | | | | | | |
| | Investments — unaffiliated issuers | | | 32,932,961 | | | | 81,501,668 | | | | (20,388,673 | ) | | |
| | Unfunded loan commitment | | | — | | | | 11,167 | | | | — | | | |
| | Purchased options | | | — | | | | (125,739 | ) | | | — | | | |
| | Futures contracts | | | (4,229,374 | ) | | | (80,178 | ) | | | (268,873 | ) | | |
| | Written options | | | — | | | | 55,965 | | | | — | | | |
| | Swap contracts | | | — | | | | (1,081,440 | ) | | | — | | | |
| | Forward foreign currency exchange contracts | | | 1,615,890 | | | | 589,931 | | | | — | | | |
| | Foreign currency translation | | | 22,302 | | | | 143,323 | | | | 17,712 | | | |
| | |
| | | | | |
| | Net realized and unrealized gain (loss) | | | 21,598,359 | | | | 16,458,562 | | | | (38,212,610 | ) | | |
| | |
| | | | | |
| | NET INCREASE (DECREASE) IN NET ASSETS RESULTING FROM OPERATIONS | | $ | 29,946,270 | | | $ | 99,503,522 | | | | $(25,673,405 | ) | | |
| | |
| | |
| 78 | | The accompanying notes are an integral part of these financial statements. |
GOLDMAN SACHS STRATEGIC MULTI-ASSET CLASS FUNDS
|
Statements of Changes in Net Assets |
| | | | | | | | | | | | | | | | | | | | |
| | | | | Multi-Manager Global Equity Fund | | | Multi-Manager Non-Core Fixed Income Fund | | | |
| | | | | For the Fiscal
Year Ended
October 31, 2023 | | | For the Fiscal
Year Ended
October 31, 2022 | | | For the Fiscal Year
Ended
October 31, 2023 | | | For the Fiscal Year
Ended
October 31, 2022 | | | |
| | | | | | |
| | From operations: | | | | | | | | | | | | | | | | | | |
| | | | | | |
| | Net investment income | | $ | 8,347,911 | | | $ | 5,150,490 | | | $ | 83,044,960 | | | $ | 65,046,134 | | | |
| | | | | | |
| | Net realized gain (loss) | | | (8,743,420 | ) | | | 33,072,283 | | | | (64,556,135 | ) | | | (116,418,884 | ) | | |
| | | | | | |
| | Net change in unrealized gain (loss) | | | 30,341,779 | | | | (129,440,987 | ) | | | 81,014,697 | | | | (152,735,103 | ) | | |
| | |
| | | | | | |
| | Net increase (decrease) in net assets resulting from operations | | | 29,946,270 | | | | (91,218,214 | ) | | | 99,503,522 | | | | (204,107,853 | ) | | |
| | |
| | | | | | | | | | | | | | | | | | | | |
| | | | | | |
| | Distributions to shareholders: | | | | | | | | | | | | | | | | | | |
| | | | | | |
| | From distributable earnings | | | (39,162,975 | ) | | | (127,713,203 | ) | | | (81,470,590 | ) | | | (35,392,743 | ) | | |
| | | | | | |
| | From return of capital | | | — | | | | — | | | | (3,475,605 | ) | | | (30,807,327 | ) | | |
| | |
| | | | | | |
| | Total distributions to shareholders | | | (39,162,975 | ) | | | (127,713,203 | ) | | | (84,946,195 | ) | | | (66,200,070 | ) | | |
| | |
| | | | | | | | | | | | | | | | | | | | |
| | | | | | |
| | From share transactions: | | | | | | | | | | | | | | | | | | |
| | | | | | |
| | Proceeds from sales of shares | | | 511,675,000 | | | | 66,510,000 | | | | 424,368,538 | | | | 121,791,000 | | | |
| | | | | | |
| | Reinvestment of distributions | | | 39,162,975 | | | | 127,713,203 | | | | 84,946,195 | | | | 66,188,753 | | | |
| | | | | | |
| | Cost of shares redeemed | | | (152,480,805 | ) | | | (129,359,280 | ) | | | (438,813,157 | ) | | | (357,134,496 | ) | | |
| | |
| | | | | | |
| | Net increase (decrease) in net assets resulting from share transactions | | | 398,357,170 | | | | 64,863,923 | | | | 70,501,576 | | | | (169,154,743 | ) | | |
| | |
| | | | | | |
| | TOTAL INCREASE (DECREASE) | | | 389,140,465 | | | | (154,067,494 | ) | | | 85,058,903 | | | | (439,462,666 | ) | | |
| | |
| | | | | | | | | | | | | | | | | | | | |
| | | | | | |
| | Net assets: | | | | | | | | | | | | | | | | | | |
| | | | | | |
| | Beginning of year | | | 372,329,980 | | | | 526,397,474 | | | | 985,616,367 | | | | 1,425,079,033 | | | |
| | |
| | | | | | |
| | End of year | | $ | 761,470,445 | | | $ | 372,329,980 | | | $ | 1,070,675,270 | | | $ | 985,616,367 | | | |
| | |
| | |
| The accompanying notes are an integral part of these financial statements. | | 79 |
GOLDMAN SACHS STRATEGIC MULTI-ASSET CLASS FUNDS
|
Statements of Changes in Net Assets (continued) |
| | | | | | | | | | | | | | |
| | | | | Multi-Manager Real Assets Strategy Fund | | | | |
| | | | | For the Fiscal Year Ended October 31, 2023 | | | For the Fiscal Year Ended October 31, 2022 | | | | |
| | | | |
| | From operations: | | | | | | | | | | | | |
| | | | |
| | Net investment income | | | $ 12,539,205 | | | | $ 10,153,400 | | | | | |
| | | | |
| | Net realized gain (loss) | | | (17,572,776 | ) | | | 19,620,365 | | | | | |
| | | | |
| | Net change in unrealized loss | | | (20,639,834 | ) | | | (132,796,386 | ) | | | | |
| | | |
| | | | |
| | Net decrease in net assets resulting from operations | | | (25,673,405 | ) | | | (103,022,621 | ) | | | | |
| | | |
| | | | | | | | | | | | | | |
| | | | |
| | Distributions to shareholders: | | | | | | | | | | | | |
| | | | |
| | From distributable earnings | | | (25,978,821 | ) | | | (37,115,315 | ) | | | | |
| | | |
| | | | | | | | | | | | | | |
| | | | |
| | From share transactions: | | | | | | | | | | | | |
| | | | |
| | Proceeds from sales of shares | | | 205,108,061 | | | | 97,110,000 | | | | | |
| | | | |
| | Reinvestment of distributions | | | 25,890,049 | | | | 37,115,315 | | | | | |
| | | | |
| | Cost of shares redeemed | | | (22,035,027 | ) | | | (312,175,941 | ) | | | | |
| | | |
| | | | |
| | Net increase (decrease) in net assets resulting from share transactions | | | 208,963,083 | | | | (177,950,626 | ) | | | | |
| | | |
| | | | |
| | TOTAL INCREASE (DECREASE) | | | 157,310,857 | | | | (318,088,562 | ) | | | | |
| | | |
| | | | | | | | | | | | | | |
| | | | |
| | Net assets: | | | | | | | | | | | | |
| | | | |
| | Beginning of year | | | 415,218,818 | | | | 733,307,380 | | | | | |
| | | |
| | | | |
| | End of year | | | $572,529,675 | | | | $ 415,218,818 | | | | | |
| | | |
| | |
| 80 | | The accompanying notes are an integral part of these financial statements. |
GOLDMAN SACHS MULTI-MANAGER GLOBAL EQUITY FUND
|
Financial Highlights Selected Share Data for a Share Outstanding Throughout Each Year |
| | | | | | | | | | | | | | | | | | | | | | | | | | | |
| | | | | Goldman Sachs Multi-Manager Global Equity Fund |
| | |
| | | | | Class R6 Shares |
| | |
| | | | | Year Ended October 31, |
| | | | | | |
| | | | | 2023 | | 2022 | | 2021 | | 2020 | | 2019 |
| | | | | | |
| | Per Share Data | | | | | | | | | | | | | | | | | | | | | | | | | |
| | | | | | |
| | Net asset value, beginning of year | | | $ | 9.09 | | | | $ | 14.91 | | | | $ | 10.64 | | | | $ | 10.97 | | | | $ | 10.62 | |
| | | |
| | | | | | |
| | Net investment income(a) | | | | 0.14 | | | | | 0.13 | | | | | 0.14 | | | | | 0.14 | | | | | 0.19 | |
| | | | | | |
| | Net realized and unrealized gain (loss) | | | | 0.74 | | | | | (2.39 | ) | | | | 4.37 | | | | | 0.15 | | | | | 0.91 | |
| | | |
| | | | | | |
| | Total from investment operations | | | | 0.88 | | | | | (2.26 | ) | | | | 4.51 | | | | | 0.29 | | | | | 1.10 | |
| | | |
| | | | | | |
| | Distributions to shareholders from net investment income | | | | (0.31 | ) | | | | (0.18 | ) | | | | (0.09 | ) | | | | (0.33 | ) | | | | (0.19) | |
| | | | | | |
| | Distributions to shareholders from net realized gains | | | | (0.44 | ) | | | | (3.38 | ) | | | | (0.15 | ) | | | | (0.29 | ) | | | | (0.56) | |
| | | |
| | | | | | |
| | Total distributions | | | | (0.75 | ) | | | | (3.56 | ) | | | | (0.24 | ) | | | | (0.62 | ) | | | | (0.75) | |
| | | |
| | | | | | |
| | Net asset value, end of year | | | $ | 9.22 | | | | $ | 9.09 | | | | $ | 14.91 | | | | $ | 10.64 | | | | $ | 10.97 | |
| | | |
| | | | | | |
| | Total return(b) | | | | 10.10 | % | | | | (19.61 | )% | | | | 42.93 | % | | | | 2.60 | % | | | | 11.39% | |
| | | |
| | | | | | |
| | Net assets, end of year (in 000s) | | | $ | 761,470 | | | | $ | 372,330 | | | | $ | 526,397 | | | | $ | 527,449 | | | | $ | 462,441 | |
| | | | | | |
| | Ratio of net expenses to average net assets | | | | 0.53 | % | | | | 0.52 | % | | | | 0.51 | % | | | | 0.46 | % | | | | 0.72% | |
| | | | | | |
| | Ratio of total expenses to average net assets | | | | 1.40 | % | | | | 1.48 | % | | | | 1.31 | % | | | | 1.53 | % | | | | 1.42% | |
| | | | | | |
| | Ratio of net investment income to average net assets | | | | 1.43 | % | | | | 1.19 | % | | | | 1.07 | % | | | | 1.34 | % | | | | 1.81% | |
| | | | | | |
| | Portfolio turnover rate(c) | | | | 60 | % | | | | 90 | % | | | | 83 | % | | | | 79 | % | | | | 91% | |
| | | |
| (a) | Calculated based on the average shares outstanding methodology. |
| (b) | Assumes investment at the NAV at the beginning of the year, reinvestment of all dividends and distributions, a complete redemption of the investment at the NAV at the end of the year and no sales or redemption charges (if any). Total returns would be reduced if a sales or redemption charge was taken into account. Returns do not reflect the impact of taxes to shareholders relating to Fund distributions or the redemption of Fund shares. |
| (c) | The Fund’s portfolio turnover rate is calculated in accordance with regulatory requirements, without regard to transactions involving short term investments and certain derivatives. If such transactions were included, the Fund’s portfolio turnover rate may be higher. |
| | |
| The accompanying notes are an integral part of these financial statements. | | 81 |
GOLDMAN SACHS MULTI-MANAGER NON-CORE FIXED INCOME FUND
|
Financial Highlights (continued) Selected Share Data for a Share Outstanding Throughout Each Year |
| | | | | | | | | | | | | | | | | | | | | | | | | | | |
| | | | | Goldman Sachs Multi-Manager Non-Core Fixed Income Fund |
| | |
| | | | | Class R6 Shares |
| | |
| | | | | Year Ended October 31, |
| | | | | | |
| | | | | 2023 | | 2022 | | 2021 | | 2020 | | 2019 |
| | | | | | |
| | Per Share Data | | | | | | | | | | | | | | | | | | | | | | | | | |
| | | | | | |
| | Net asset value, beginning of year | | | $ | 7.13 | | | | $ | 8.91 | | | | $ | 8.70 | | | | $ | 9.06 | | | | $ | 8.83 | |
| | | |
| | | | | | |
| | Net investment income(a) | | | | 0.56 | | | | | 0.43 | | | | | 0.43 | | | | | 0.45 | | | | | 0.54 | |
| | | | | | |
| | Net realized and unrealized gain (loss) | | | | 0.14 | | | | | (1.77 | ) | | | | 0.22 | | | | | (0.35 | ) | | | | 0.31 | |
| | | |
| | | | | | |
| | Total from investment operations | | | | 0.70 | | | | | (1.34 | ) | | | | 0.65 | | | | | 0.10 | | | | | 0.85 | |
| | | |
| | | | | | |
| | Distributions to shareholders from net investment income | | | | (0.55 | ) | | | | (0.24 | ) | | | | (0.41 | ) | | | | (0.40 | ) | | | | (0.55) | |
| | | | | | |
| | Distributions to shareholders from return of capital | | | | (0.02 | ) | | | | (0.20 | ) | | | | (0.03 | ) | | | | (0.06 | ) | | | | (0.07) | |
| | | |
| | | | | | |
| | Total distributions | | | | (0.57 | ) | | | | (0.44 | ) | | | | (0.44 | ) | | | | (0.46 | ) | | | | (0.62) | |
| | | |
| | | | | | |
| | Net asset value, end of year | | | $ | 7.26 | | | | $ | 7.13 | | | | $ | 8.91 | | | | $ | 8.70 | | | | $ | 9.06 | |
| | | |
| | | | | | |
| | Total return(b) | | | | 9.89 | % | | | | (15.42 | )% | | | | 7.47 | % | | | | 1.21 | % | | | | 9.03% | |
| | | |
| | | | | | |
| | Net assets, end of year (in 000s) | | | $ | 1,070,675 | | | | $ | 985,616 | | | | $ | 1,425,079 | | | | $ | 940,024 | | | | | $820,164 | |
| | | | | | |
| | Ratio of net expenses to average net assets | | | | 0.57 | % | | | | 0.56 | % | | | | 0.55 | % | | | | 0.60 | % | | | | 0.61% | |
| | | | | | |
| | Ratio of total expenses to average net assets | | | | 1.02 | % | | | | 1.02 | % | | | | 0.98 | % | | | | 1.04 | % | | | | 1.05% | |
| | | | | | |
| | Ratio of net investment income to average net assets | | | | 7.47 | % | | | | 5.32 | % | | | | 4.69 | % | | | | 5.20 | % | | | | 6.01% | |
| | | | | | |
| | Portfolio turnover rate(c) | | | | 101 | % | | | | 78 | % | | | | 96 | % | | | | 102 | % | | | | 150% | |
| | | |
| (a) | Calculated based on the average shares outstanding methodology. |
| (b) | Assumes investment at the NAV at the beginning of the year, reinvestment of all dividends and distributions, a complete redemption of the investment at the NAV at the end of the year and no sales or redemption charges (if any). Total returns would be reduced if a sales or redemption charge was taken into account. Returns do not reflect the impact of taxes to shareholders relating to Fund distributions or the redemption of Fund shares. |
| (c) | The Fund’s portfolio turnover rate is calculated in accordance with regulatory requirements, without regard to transactions involving short term investments and certain derivatives. If such transactions were included, the Fund’s portfolio turnover rate may be higher. |
| | |
| 82 | | The accompanying notes are an integral part of these financial statements. |
GOLDMAN SACHS MULTI-MANAGER REAL ASSETS STRATEGY FUND
|
Financial Highlights (continued) Selected Share Data for a Share Outstanding Throughout Each Year |
| | | | | | | | | | | | | | | | | | | | | | | | | | | |
| | | | | Goldman Sachs Multi-Manager Real Assets Strategy Fund |
| | |
| | | | | Class R6 Shares |
| | |
| | | | | Year Ended October 31, |
| | | | | | |
| | | | | 2023 | | 2022 | | 2021 | | 2020 | | 2019 |
| | | | | | |
| | Per Share Data | | | | | | | | | | | | | | | | | | | | | | | | | |
| | | | | | |
| | Net asset value, beginning of year | | | $ | 8.95 | | | | $ | 11.76 | | | | $ | 8.93 | | | | $ | 10.78 | | | | $ | 9.24 | |
| | | |
| | | | | | |
| | Net investment income(a) | | | | 0.23 | | | | | 0.20 | | | | | 0.22 | | | | | 0.19 | | | | | 0.22 | |
| | | | | | |
| | Net realized and unrealized gain (loss) | | | | (0.44 | ) | | | | (2.40 | ) | | | | 2.76 | | | | | (1.51 | ) | | | | 1.57 | |
| | | |
| | | | | | |
| | Total from investment operations | | | | (0.21 | ) | | | | (2.20 | ) | | | | 2.98 | | | | | (1.32 | ) | | | | 1.79 | |
| | | |
| | | | | | |
| | Distributions to shareholders from net investment income | | | | (0.11 | ) | | | | (0.35 | ) | | | | (0.15 | ) | | | | (0.35 | ) | | | | (0.20) | |
| | | | | | |
| | Distributions to shareholders from net realized gains | | | | (0.42 | ) | | | | (0.26 | ) | | | | — | | | | | (0.18 | ) | | | | (0.05) | |
| | | |
| | | | | | |
| | Total distributions | | | | (0.53 | ) | | | | (0.61 | ) | | | | (0.15 | ) | | | | (0.53 | ) | | | | (0.25) | |
| | | |
| | | | | | |
| | Net asset value, end of year | | | $ | 8.21 | | | | $ | 8.95 | | | | $ | 11.76 | | | | $ | 8.93 | | | | $ | 10.78 | |
| | | |
| | | | | | |
| | Total return(b) | | | | (2.88 | )% | | | | (19.78 | )% | | | | 33.70 | % | | | | (12.86 | )% | | | | 20.04% | |
| | | |
| | | | | | |
| | Net assets, end of year (in 000s) | | | $ | 572,530 | | | | $ | 415,219 | | | | $ | 733,307 | | | | $ | 459,950 | | | | $ | 449,938 | |
| | | | | | |
| | Ratio of net expenses to average net assets | | | | 0.76 | % | | | | 0.74 | % | | | | 0.69 | % | | | | 0.77 | % | | | | 0.81% | |
| | | | | | |
| | Ratio of total expenses to average net assets | | | | 1.22 | % | | | | 1.21 | % | | | | 1.16 | % | | | | 1.21 | % | | | | 1.24% | |
| | | | | | |
| | Ratio of net investment income to average net assets | | | | 2.56 | % | | | | 1.87 | % | | | | 2.08 | % | | | | 2.02 | % | | | | 2.23% | |
| | | | | | |
| | Portfolio turnover rate(c) | | | | 73 | % | | | | 104 | % | | | | 96 | % | | | | 92 | % | | | | 97% | |
| | | |
| (a) | Calculated based on the average shares outstanding methodology. |
| (b) | Assumes investment at the NAV at the beginning of the year, reinvestment of all dividends and distributions, a complete redemption of the investment at the NAV at the end of the year and no sales or redemption charges (if any). Total returns would be reduced if a sales or redemption charge was taken into account. Returns do not reflect the impact of taxes to shareholders relating to Fund distributions or the redemption of Fund shares. |
| (c) | The Fund’s portfolio turnover rate is calculated in accordance with regulatory requirements, without regard to transactions involving short term investments and certain derivatives. If such transactions were included, the Fund’s portfolio turnover rate may be higher. |
| | |
| The accompanying notes are an integral part of these financial statements. | | 83 |
GOLDMAN SACHS STRATEGIC MULTI-ASSET CLASS FUNDS
|
Notes to Financial Statements October 31, 2023 |
Goldman Sachs Trust II (the “Trust”) is a Delaware statutory trust registered under the Investment Company Act of 1940, as amended (the “Act”), as an open-end management investment company. The following table lists those series of the Trust that are included in this report (collectively, the “Funds” or individually a “Fund”), along with their corresponding share classes and respective diversification status under the Act:
| | | | |
| Fund | | Share Classes Offered | | Diversified/ Non-diversified |
| | |
| Multi-Manager Global Equity | | Class R6 | | Diversified |
| | |
| Multi-Manager Non-Core Fixed Income | | Class R6 | | Diversified |
| | |
| Multi-Manager Real Assets Strategy | | Class R6 | | Diversified |
Goldman Sachs Asset Management, L.P. (“GSAM”), an affiliate of Goldman Sachs & Co. LLC (“Goldman Sachs”), serves as investment adviser to the Funds pursuant to management agreements (each, an “Agreement”) with the Trust. As of October 31, 2023, GSAM had sub-advisory agreements (the “Sub-Advisory Agreements”) for the Multi-Manager Global Equity Fund with Axiom Investors LLC, Boston Partners Global Investors, Inc., Causeway Capital Management LLC, Diamond Hill Capital Management Inc., GW&K Investment Management, LLC, Massachusetts Financial Services Company, doing business as MFS Investment Management, Principal Global Investors, LLC, T. Rowe Price Associates, Inc., Vaughan Nelson Investment Management, L.P., Vulcan Value Partners, LLC, WCM Investment Management, LLC and Wellington Management Company LLP; for the Multi-Manager Non-Core Fixed Income Fund with Ares Capital Management II LLC, Aristotle Pacific Capital, LLC (formerly Pacific Asset Management LLC), Brigade Capital Management, LP, Marathon Asset Management, L.P., Nuveen Asset Management, LLC, RBC Global Asset Management (UK) Limited, doing business as RBC BlueBay Asset Management (formerly BlueBay Asset Management LLP), RBC Global Asset Management (U.S.) Inc., doing business as RBC Global Asset Management and TCW Investment Management Company LLC; and for the Multi-Manager Real Assets Strategy Fund with Cohen & Steers Capital Management, Inc., Principal Real Estate Investors, LLC, PGIM Real Estate, a business unit of PGIM, Inc., and RREEF America L.L.C. (the “Underlying Managers”). Pursuant to the terms of the Sub-Advisory Agreements, the Underlying Managers are responsible for making investment decisions and managing the investments of the Fund. GSAM compensates the Underlying Managers directly in accordance with the terms of the Sub-Advisory Agreements. The Funds are not charged any separate or additional investment advisory fees by the Underlying Managers.
|
|
2. SIGNIFICANT ACCOUNTING POLICIES |
The financial statements have been prepared in accordance with accounting principles generally accepted in the United States of America (“GAAP”) and require management to make estimates and assumptions that may affect the reported amounts and disclosures. Actual results may differ from those estimates and assumptions. Each Fund is an investment company under GAAP and follows the accounting and reporting guidance applicable to investment companies.
A. Investment Valuation — The Funds’ valuation policy is to value investments at fair value.
B. Investment Income and Investments — Investment income includes interest income, dividend income and securities lending income, if any. Interest income is accrued daily and adjusted for amortization of premiums and accretion of discounts. Dividend income is recognized on ex-dividend date or, for certain foreign securities, as soon as such information is obtained subsequent to the ex-dividend date. Non-cash dividends, if any, are recorded at the fair market value of the securities received. Investment transactions are reflected on trade date. Realized gains and losses are calculated using identified cost. Investment transactions are recorded on the following business day for daily net asset value (“NAV”) calculations.
Investment income is recorded net of any foreign withholding taxes, less any amounts reclaimable. The Funds may file withholding tax reclaims in certain jurisdictions to recover a portion of amounts previously withheld. These reclaims, if any, are recorded when the amount is known and there are no significant uncertainties on collectability. Such amounts recovered, if any, are reflected as other income in the Statements of Operations. Any foreign capital gains tax is accrued daily based upon net unrealized
GOLDMAN SACHS STRATEGIC MULTI-ASSET CLASS FUNDS
|
|
2. SIGNIFICANT ACCOUNTING POLICIES (continued) |
gains, and is payable upon sale of such investments. Distributions received from the Funds’ investments in U.S. real estate investment trusts (“REITs”) may be characterized as ordinary income, net capital gain and/ or a return of capital. A return of capital is recorded by the Funds as a reduction to the cost basis of the REIT. For derivative contracts, unrealized gains and losses are recorded daily and become realized gains and losses upon disposition or termination of the contract. Upfront payments, if any, are made or received upon entering into a swap agreement and are reflected in the Statements of Assets and Liabilities. Upfront payments are recognized over the contract’s term/event as realized gains or losses, with the exception of forward starting swap contracts whose realized gains or losses are recognized from the effective start date.
C. Expenses — Expenses incurred directly by a Fund are charged to the Fund, and certain expenses incurred by the Trust are allocated across the applicable Funds on a straight-line and/or pro-rata basis, depending upon the nature of the expenses, and are accrued daily.
D. Federal Taxes and Distributions to Shareholders — It is each Fund’s policy to comply with the requirements of the Internal Revenue Code of 1986, as amended (the “Code”), applicable to regulated investment companies and to distribute each year substantially all of its investment company taxable income and capital gains to its shareholders. Accordingly, each Fund is not required to make any provisions for the payment of federal income tax. Distributions to shareholders are recorded on the ex-dividend date. Income and capital gains distributions, if any, are declared and paid according to the following schedule:
| | | | |
| Fund | | Income Distributions Declared/Paid | | Capital Gains Distributions Declared/Paid |
| | |
| Multi-Manager Global Equity | | Annually | | Annually |
| | |
| Multi-Manager Non-Core Fixed Income | | Daily/Monthly | | Annually |
| | |
| Multi-Manager Real Assets Strategy | | Annually | | Annually |
Net capital losses, if any, are carried forward to future fiscal years and may be used to the extent allowed by the Code to offset any future capital gains. Losses that are carried forward will retain their character as either short-term or long-term capital losses. Utilization of capital loss carryforwards will reduce the requirement of future capital gains distributions.
The characterization of distributions to shareholders for financial reporting purposes is determined in accordance with federal income tax rules, which may differ from GAAP. The source of each Fund’s distributions may be shown in the accompanying financial statements as either from distributable earnings or capital. Certain components of the Funds’ net assets on the Statements of Assets and Liabilities reflect permanent GAAP/tax differences based on the appropriate tax character.
E. Foreign Currency Translation — The accounting records and reporting currency of a Fund are maintained in U.S. dollars. Assets and liabilities denominated in foreign currencies are translated into U.S. dollars using the current exchange rates at the close of each business day. The effect of changes in foreign currency exchange rates on investments is included within net realized and unrealized gain (loss) on investments. Changes in the value of other assets and liabilities as a result of fluctuations in foreign exchange rates are included in the Statements of Operations within net change in unrealized gain (loss) on foreign currency translation. Transactions denominated in foreign currencies are translated into U.S. dollars on the date the transaction occurred, the effects of which are included within net realized gain (loss) on foreign currency transactions.
F. Commission Recapture — GSAM, on behalf of certain Funds, may direct portfolio trades, subject to seeking best execution, to various brokers who have agreed to rebate a portion of the commissions generated. Such rebates are made directly to a Fund as cash payments and are included in net realized gain (loss) from investments on the Statements of Operations.
|
|
3. INVESTMENTS AND FAIR VALUE MEASUREMENTS |
U.S. GAAP defines the fair value of a financial instrument as the amount that would be received to sell an asset or paid to transfer a liability in an orderly transaction between market participants at the measurement date (i.e., the exit price); the Funds’ policy is to use the market approach. GAAP establishes a fair value hierarchy that prioritizes the inputs to valuation techniques used to
GOLDMAN SACHS STRATEGIC MULTI-ASSET CLASS FUNDS
|
Notes to Financial Statements (continued) October 31, 2023 |
|
|
3. INVESTMENTS AND FAIR VALUE MEASUREMENTS (continued) |
measure fair value. The hierarchy gives the highest priority to unadjusted quoted prices in active markets for identical assets or liabilities (Level 1 measurements) and the lowest priority to unobservable inputs (Level 3 measurements). The level in the fair value hierarchy within which the fair value measurement in its entirety falls shall be determined based on the lowest level input that is significant to the fair value measurement in its entirety. The levels used for classifying investments are not necessarily an indication of the risk associated with investing in these investments. The three levels of the fair value hierarchy are described below:
Level 1 — Unadjusted quoted prices in active markets that are accessible at the measurement date for identical, unrestricted assets or liabilities;
Level 2 — Quoted prices in markets that are not active or financial instruments for which significant inputs are observable (including, but not limited to, quoted prices for similar investments, interest rates, foreign exchange rates, volatility and credit spreads), either directly or indirectly;
Level 3 — Prices or valuations that require significant unobservable inputs (including GSAM’s assumptions in determining fair value measurement).
The Board of Trustees (“Trustees”) has approved Valuation Procedures that govern the valuation of the portfolio investments held by the Funds, including investments for which market quotations are not readily available. With respect to the Funds’ investments that do not have readily available market quotations, the Trustees have designated GSAM as the valuation designee to perform fair valuations pursuant to Rule 2a-5 under the Investment Company Act of 1940 (the “Valuation Designee”). GSAM has day-to-day responsibility for implementing and maintaining internal controls and procedures related to the valuation of the Funds’ investments. To assess the continuing appropriateness of pricing sources and methodologies, GSAM regularly performs price verification procedures and issues challenges as necessary to third party pricing vendors or brokers, and any differences are reviewed in accordance with the Valuation Procedures.
A. Level 1 and Level 2 Fair Value Investments — The valuation techniques and significant inputs used in determining the fair values for investments classified as Level 1 and Level 2 are as follows:
Equity Securities — Equity securities traded on a United States (“U.S.”) securities exchange or the NASDAQ system, or those located on certain foreign exchanges, including but not limited to the Americas, are valued daily at their last sale price or official closing price on the principal exchange or system on which they are traded. If there is no sale or official closing price or such price is believed by GSAM to not represent fair value, equity securities will be valued at the valid closing bid price for long positions and at the valid closing ask price for short positions (i.e., where there is sufficient volume, during normal exchange trading hours). If no valid bid/ask price is available, the equity security will be valued pursuant to the Valuation Procedures and consistent with applicable regulatory guidance. To the extent these investments are actively traded, they are classified as Level 1 of the fair value hierarchy, otherwise they are generally classified as Level 2. Certain equity securities containing unique attributes may be classified as Level 2.
Unlisted equity securities for which market quotations are available are valued at the last sale price on the valuation date, or if no sale occurs, at the last bid price for long positions or the last ask price for short positions, and are generally classified as Level 2. Securities traded on certain foreign securities exchanges are valued daily at fair value determined by an independent fair value service (if available) under the Valuation Procedures and consistent with applicable regulatory guidance. The independent fair value service takes into account multiple factors including, but not limited to, movements in the securities markets, certain depositary receipts, futures contracts and foreign currency exchange rates that have occurred subsequent to the close of the foreign securities exchange. These investments are generally classified as Level 2 of the fair value hierarchy.
Underlying Funds (including Money Market Funds) — Underlying funds (“Underlying Funds”) include exchange-traded funds (“ETFs”) and other investment companies. Investments in the Underlying Funds (except ETFs) are valued at the NAV per share on the day of valuation. ETFs are valued daily at the last sale price or official closing price on the principal exchange or system on which the investment is traded. Because the Funds invest in Underlying Funds that fluctuate in value, the Funds’ shares will correspondingly fluctuate in value. Underlying Funds are generally classified as Level 1 of the fair value hierarchy. To the extent that underlying ETFs are actively traded, they are classified as Level 1 of the fair value hierarchy, otherwise they are
GOLDMAN SACHS STRATEGIC MULTI-ASSET CLASS FUNDS
|
|
3. INVESTMENTS AND FAIR VALUE MEASUREMENTS (continued) |
generally classified as Level 2. For information regarding an Underlying Fund’s accounting policies and investment holdings, please see the Underlying Fund’s shareholder report.
Debt Securities — Debt securities for which market quotations are readily available are valued daily on the basis of quotations supplied by dealers or an independent pricing service. The pricing services may use valuation models or matrix pricing, which consider: (i) yield or price with respect to bonds that are considered comparable in characteristics such as rating, interest rate and maturity date or (ii) quotations from securities dealers to determine current value. With the exception of treasury securities of G7 countries, which are generally classified as Level 1, these investments are generally classified as Level 2 of the fair value hierarchy.
i. Bank Loans — Bank loans (“Loans”) are interests in amounts owed by corporate, governmental, or other borrowers to lenders or lending syndicates. Loans are arranged through private negotiations between the borrower and one or more financial institutions (“Lenders”). A Fund’s investments in Loans are in the form of either participations in Loans (“Participations”) or assignments of all or a portion of Loans from third parties (“Assignments”). With respect to Participations, a Fund has the right to receive payments of principal, interest and any fees to which it is entitled from the Lender selling the Participations and only upon receipt by the Lender of the payments from the borrower. A Fund generally has no right to enforce compliance by the borrower with the terms of the loan agreement with respect to Participations. Conversely, assignments result in a Fund having a direct contractual relationship with the borrower, and the Fund may be permitted to enforce compliance by the borrower with the terms of the loan agreement.
Derivative Contracts — A derivative is an instrument whose value is derived from underlying assets, indices, reference rates or a combination of these factors. A Fund enters into derivative transactions to hedge against changes in interest rates, securities prices, and/or currency exchange rates, to increase total return, or to gain access to certain markets or attain exposure to other underliers. For financial reporting purposes, cash collateral that has been pledged to cover obligations of a Fund and cash collateral received, if any, is reported separately on the Statements of Assets and Liabilities as either due to broker/receivable for collateral on certain derivative contracts. Non-cash collateral pledged by a Fund, if any, is noted in the Schedules of Investments.
Exchange-traded derivatives, including futures and options contracts, are generally valued at the last sale or settlement price on the exchange where they are principally traded. Exchange-traded options without settlement prices are generally valued at the midpoint of the bid and ask prices on the exchange where they are principally traded (or, in the absence of two-way trading, at the last bid price for long positions and the last ask price for short positions). Exchange-traded derivatives typically fall within Level 1 of the fair value hierarchy. Over-the-counter (“OTC”) and centrally cleared derivatives are valued using market transactions and other market evidence, including market-based inputs to models, calibration to market-clearing transactions, broker or dealer quotations, or other alternative pricing sources. Where models are used, the selection of a particular model to value OTC and centrally cleared derivatives depends upon the contractual terms of, and specific risks inherent in, the instrument, as well as the availability of pricing information in the market. Valuation models require a variety of inputs, including contractual terms, market prices, yield curves, credit curves, measures of volatility, voluntary and involuntary prepayment rates, loss severity rates and correlations of such inputs. For OTC and centrally cleared derivatives that trade in liquid markets, model inputs can generally be verified and model selection does not involve significant management judgment. OTC and centrally cleared derivatives are classified within Level 2 of the fair value hierarchy when significant inputs are corroborated by market evidence.
i. Forward Contracts — A forward contract is a contract between two parties to buy or sell an asset at a specified price on a future date. A forward contract settlement can occur on a cash or delivery basis. Forward contracts are marked-to-market daily using independent vendor prices, and the change in value, if any, is recorded as an unrealized gain or loss. Cash and certain investments may be used to collateralize forward contracts.
A forward foreign currency exchange contract is a forward contract in which a Fund agrees to receive or deliver a fixed quantity of one currency for another, at a pre-determined price at a future date. All forward foreign currency exchange contracts are marked to market daily by using the outright forward rates or interpolating based upon maturity dates, where available. Non-deliverable forward foreign currency exchange contracts are settled with the counterparty in cash without the delivery of foreign currency.
GOLDMAN SACHS STRATEGIC MULTI-ASSET CLASS FUNDS
|
Notes to Financial Statements (continued) October 31, 2023 |
|
|
3. INVESTMENTS AND FAIR VALUE MEASUREMENTS (continued) |
ii. Futures Contracts — Futures contracts are contracts to buy or sell a standardized quantity of a specified commodity or security. Upon entering into a futures contract, a Fund deposits cash or securities in an account on behalf of the broker in an amount sufficient to meet the initial margin requirement. Subsequent payments are made or received by a Fund equal to the daily change in the contract value and are recorded as variation margin receivable or payable with a corresponding offset to unrealized gains or losses.
iii. Options — When a Fund writes call or put options, an amount equal to the premium received is recorded as a liability and is subsequently marked-to-market to reflect the current value of the option written. Swaptions are options on swap contracts.
Upon the purchase of a call option or a put option by a Fund, the premium paid is recorded as an investment and subsequently marked-to-market to reflect the current value of the option. Certain options may be purchased with premiums to be determined on a future date. The premiums for these options are based upon implied volatility parameters at specified terms.
iv. Swap Contracts — Bilateral swap contracts are agreements in which a Fund and a counterparty agree to exchange periodic payments on a specified notional amount or make a net payment upon termination. Bilateral swap transactions are privately negotiated in the OTC market and payments are settled through direct payments between a Fund and the counterparty. By contrast, certain swap transactions are subject to mandatory central clearing. These swaps are executed through a derivatives clearing member (“DCM”), acting in an agency capacity, and submitted to a central counterparty (“CCP”) (“centrally cleared swaps”), in which case all payments are settled with the CCP through the DCM. Swaps are marked-to-market daily using pricing vendor quotations, counterparty or clearinghouse prices or model prices, and the change in value, if any, is recorded as an unrealized gain or loss. Upon entering into a swap contract, a Fund is required to satisfy an initial margin requirement by delivering cash or securities to the counterparty (or in some cases, segregated in a triparty account on behalf of the counterparty), which can be adjusted by any mark-to-market gains or losses pursuant to bilateral or centrally cleared arrangements. For centrally cleared swaps the daily change in valuation, if any, is recorded as a receivable or payable for variation margin.
A credit default swap is an agreement that involves one party (the buyer of protection) making a stream of payments to another party (the seller of protection) in exchange for the right to receive protection on a reference security or obligation, including a group of assets or exposure to the performance of an index. A Fund’s investment in credit default swaps may involve greater risks than if the Fund had invested in the referenced obligation directly. Credit events are contract specific but may include bankruptcy, failure to pay, restructuring and obligation acceleration. If a Fund buys protection through a credit default swap and no credit event occurs, its payments are limited to the periodic payments previously made to the counterparty. Upon the occurrence of a specified credit event, a Fund, as a buyer of credit protection, is entitled to receive an amount equal to the notional amount of the swap and deliver to the seller the defaulted reference obligation in a physically settled trade. A Fund may also receive a net settlement amount in the form of cash or securities equal to the notional amount of the swap reduced by the recovery value of the reference obligation in a cash settled trade.
As a seller of protection, a Fund generally receives a payment stream throughout the term of the swap, provided that there is no credit event. In addition, if a Fund sells protection through a credit default swap, the Fund could suffer a loss because the value of the referenced obligation and the premium payments received may be less than the notional amount of the swap paid to the buyer of protection. Upon the occurrence of a specified credit event, a Fund, as a seller of credit protection, may be required to take possession of the defaulted reference obligation and pay the buyer an amount equal to the notional amount of the swap in a physically settled trade. A Fund may also pay a net settlement amount in the form of cash or securities equal to the notional amount of the swap reduced by the recovery value of the reference obligation in a cash settled trade. Recovery values are at times established through the credit event auction process in which market participants are ensured that a transparent price has been set for the defaulted security or obligation. In addition, a Fund is entitled to a return of any assets, which have been pledged as collateral to the counterparty upon settlement.
GOLDMAN SACHS STRATEGIC MULTI-ASSET CLASS FUNDS
|
|
3. INVESTMENTS AND FAIR VALUE MEASUREMENTS (continued) |
The maximum potential amount of future payments (undiscounted) that a Fund as seller of protection could be required to make under a credit default swap would be an amount equal to the notional amount of the agreement. These potential amounts would be partially offset by any recovery values of the respective referenced obligations or net amounts received from a settlement of a credit default swap for the same reference security or obligation where a Fund bought credit protection.
B. Level 3 Fair Value Investments — To the extent that significant inputs to valuation models and other alternative pricing sources are unobservable, or if quotations are not readily available, or if GSAM believes that such quotations do not accurately reflect fair value, the fair value of a Fund’s investments may be determined under the Valuation Procedures. GSAM, consistent with its procedures and applicable regulatory guidance, may make an adjustment to the most recent valuation prices of either domestic or foreign securities in light of significant events to reflect what it believes to be the fair value of the securities at the time of determining a Fund’s NAV. To the extent investments are valued using single source broker quotations obtained directly from the broker or passed through from third party pricing vendors, such investments are classified as Level 3 investments.
C. Fair Value Hierarchy — The following is a summary of the Funds’ investments and derivatives classified in the fair value hierarchy as of October 31, 2023:
| | | | | | | | | | | | |
| MULTI-MANAGER GLOBAL EQUITY | | | | | | | | | | | | |
| | | |
| Investment Type | | Level 1 | | | Level 2 | | | Level 3 | |
|
| |
| | | |
Assets | | | | | | | | | | | | |
| | | |
Common Stock and/or Other Equity Investments(a) | | | | | | | | | | | | |
| | | |
Africa | | | $ 432,530 | | | | $ 568,538 | | | | $— | |
| | | |
Asia | | | 7,979,435 | | | | 98,530,645 | | | | — | |
| | | |
Australia and Oceania | | | — | | | | 2,410,520 | | | | — | |
| | | |
Europe | | | 27,115,916 | | | | 134,429,028 | | | | — | |
| | | |
North America | | | 410,286,591 | | | | 465,496 | | | | — | |
| | | |
South America | | | 5,177,231 | | | | — | | | | — | |
| | | |
Preferred Stocks | | | — | | | | 2,078,835 | | | | — | |
| | | |
Exchange Traded Funds | | | 1,959,258 | | | | — | | | | — | |
| | | |
Investment Companies | | | 60,301,113 | | | | — | | | | — | |
|
| |
| | | |
Total | | | $513,252,074 | | | | $238,483,062 | | | | $— | |
|
| |
| | | |
| Derivative Type | | | | | | | | | |
|
| |
| | | |
Assets(b) | | | | | | | | | | | | |
| | | |
Forward Foreign Currency Exchange Contracts | | | $ — | | | | $ 1,536,908 | | | | $— | |
|
| |
| | | |
Liabilities(b) | | | | | | | | | | | | |
| | | |
Forward Foreign Currency Exchange Contracts | | | $ — | | | | $ (506,313 | ) | | | $— | |
| | | |
Futures Contracts | | | (4,185,205 | ) | | | — | | | | — | |
|
| |
| | | |
Total | | | $ (4,185,205) | | | | $ (506,313) | | | | $— | |
|
| |
| | (a) | Amounts are disclosed by continent to highlight the impact of time zone differences between local market close and the calculation of NAV. Security valuations are based on the principal exchange or system on which they are traded, which may differ from country of domicile. The Funds utilize fair value model prices provided by an independent fair value service for international equities, resulting in a Level 2 classification. |
| | (b) | Amount shown represents unrealized gain (loss) at period end. |
GOLDMAN SACHS STRATEGIC MULTI-ASSET CLASS FUNDS
|
Notes to Financial Statements (continued) October 31, 2023 |
|
|
3. INVESTMENTS AND FAIR VALUE MEASUREMENTS (continued) |
| | | | | | | | | | | | |
| | | |
| MULTI-MANAGER NON-CORE FIXED INCOME | | | | | | | | | | | | |
| | | |
| Investment Type | | Level 1 | | | Level 2 | | | Level 3 | |
|
| |
| | | |
Assets | | | | | | | | | | | | |
| | | |
Fixed Income | | | | | | | | | | | | |
| | | |
Corporate Obligations | | $ | — | | | $ | 361,663,963 | | | $ | 2,865,434 | |
| | | |
Sovereign Debt Obligations | | | — | | | | 348,829,749 | | | | — | |
| | | |
Bank Loans | | | — | | | | 270,301,622 | | | | 3,541,212 | |
| | | |
Common Stock and/or Other Equity Investments(a) | | | | | | | | | | | | |
| | | |
Europe | | | 121,876 | | | | — | | | | — | |
| | | |
North America | | | 488,478 | | | | 4,173,213 | | | | 1,743,632 | |
| | | |
Warrants | | | — | | | | 104,750 | | | | 251,341 | |
| | | |
Preferred Stocks | | | — | | | | — | | | | 9,632 | |
| | | |
Exchange Traded Funds | | | 1,504,376 | | | | — | | | | — | |
| | | |
Investment Company | | | 78,435,092 | | | | — | | | | — | |
|
| |
| | | |
Total | | $ | 80,549,822 | | | $ | 985,073,297 | | | $ | 8,411,251 | |
|
| |
| | | |
| Derivative Type | | | | | | | | | |
|
| |
| | | |
Assets | | | | | | | | | | | | |
| | | |
Forward Foreign Currency Exchange Contracts(b) | | $ | — | | | $ | 530,813 | | | $ | — | |
| | | |
Credit Default Swap Contracts(b) | | | — | | | | 88,167 | | | | — | |
| | | |
Purchased Option Contracts | | | — | | | | 75,440 | | | | — | |
|
| |
| | | |
Total | | $ | — | | | $ | 694,420 | | | $ | — | |
|
| |
| | | |
Liabilities | | | | | | | | | | | | |
| | | |
Forward Foreign Currency Exchange Contracts(b) | | $ | — | | | $ | (1,427,264 | ) | | $ | — | |
| | | |
Futures Contracts(b) | | | (80,178 | ) | | | — | | | | — | |
| | | |
Credit Default Swap Contracts(b) | | | — | | | | (45,529 | ) | | | — | |
| | | |
Written Option Contracts | | | — | | | | (12,631 | ) | | | — | |
|
| |
| | | |
Total | | $ | (80,178 | ) | | $ | (1,485,424 | ) | | $ | — | |
|
| |
| | (a) | Amounts are disclosed by continent to highlight the impact of time zone differences between local market close and the calculation of NAV. Security valuations are based on the principal exchange or system on which they are traded, which may differ from country of domicile. The Funds utilize fair value model prices provided by an independent fair value service for international equities, resulting in a Level 2 classification. |
| | (b) | Amount shown represents unrealized gain (loss) at period end. |
GOLDMAN SACHS STRATEGIC MULTI-ASSET CLASS FUNDS
|
|
3. INVESTMENTS AND FAIR VALUE MEASUREMENTS (continued) |
| | | | | | | | | | | | |
| | | |
| MULTI-MANAGER REAL ASSETS STRATEGY | | | | | | | | | | | | |
| | | |
| Investment Type | | Level 1 | | | Level 2 | | | Level 3 | |
|
| |
| | | |
Assets | | | | | | | | | | | | |
| | | |
Common Stock and/or Other Equity Investments(a) | | | | | | | | | | | | |
| | | |
Asia | | $ | — | | | $ | 65,395,286 | | | $ | — | |
| | | |
Australia and Oceania | | | — | | | | 15,560,165 | | | | — | |
| | | |
Europe | | | 3,854,127 | | | | 82,205,067 | | | | — | |
| | | |
North America | | | 371,119,801 | | | | — | | | | — | |
| | | |
South America | | | 1,495,087 | | | | — | | | | — | |
| | | |
Investment Company | | | 12,559,159 | | | | — | | | | — | |
|
| |
| | | |
Total | | $ | 389,028,174 | | | $ | 163,160,518 | | | $ | — | |
|
| |
| | | |
| Derivative Type | | | | | | | | | |
|
| |
| | | |
Liabilities | | | | | | | | | | | | |
| | | |
Futures Contracts(b) | | $ | (1,329,506 | ) | | $ | — | | | $ | — | |
|
| |
| | (a) | Amounts are disclosed by continent to highlight the impact of time zone differences between local market close and the calculation of NAV. Security valuations are based on the principal exchange or system on which they are traded, which may differ from country of domicile. The Funds utilize fair value model prices provided by an independent fair value service for international equities, resulting in a Level 2 classification. |
| | (b) | Amount shown represents unrealized gain (loss) at period end. |
For further information regarding security characteristics, see the Schedules of Investments.
|
|
4. INVESTMENTS IN DERIVATIVES |
The following tables set forth, by certain risk types, the gross value of derivative contracts (not considered to be hedging instruments for accounting disclosure purposes) as of October 31, 2023. These instruments were used as part of the Funds’ investment strategies and to obtain and/or manage exposure related to the risks below. The values in the tables below exclude the effects of cash collateral received or posted pursuant to these derivative contracts, and therefore are not representative of the Funds’ net exposure.
| | | | | | | | | | | | | | | | |
| Multi-Manager Global Equity | | | | | | | | | | | | | | |
| | | | | |
| Risk | | Statements of Assets and Liabilities | | Assets | | | | | | Statements of Assets and Liabilities | | Liabilities | |
| | | | | |
| Currency | | Receivable for unrealized gain on forward foreign currency exchange contracts | | $ | 1,536,908 | | | | | | | Payable for unrealized loss on forward foreign currency exchange contracts | | $ | (506,313 | ) |
| | | | | |
| Equity | | — | | | — | | | | | | | Variation margin on futures contracts | | | (4,185,205 | )(a) |
| | | | | |
Total | | | | $ | 1,536,908 | | | | | | | | | $ | (4,691,518 | ) |
GOLDMAN SACHS STRATEGIC MULTI-ASSET CLASS FUNDS
|
Notes to Financial Statements (continued) October 31, 2023 |
|
|
4. INVESTMENTS IN DERIVATIVES (continued) |
| | | | | | | | | | | | |
| Multi-Manager Non-Core Fixed Income | | | | | | | | | | |
| | | | |
| Risk | | Statements of Assets and Liabilities | | Assets | | | Statements of Assets and Liabilities | | Liabilities | |
| | | | |
| Credit | | Variation margin on swap contracts | | $ | 88,167 | (a) | | Variation margin on swap contracts | | $ | (45,529 | )(a) |
| | | | |
| Currency | | Receivable for unrealized gain on forward foreign currency exchange contracts and purchased options | | | 606,253 | | | Payable for unrealized loss on forward foreign currency exchange contracts and written options | | | (1,439,895 | ) |
| | | | |
| Interest rate | | — | | | — | | | Variation margin on futures contracts | | | (80,178 | )(a) |
| | | | |
Total | | | | $ | 694,420 | | | | | $ | (1,565,602 | ) |
| | | |
| Multi-Manager Real Assets Strategy | | | | | | | | | | |
| | | | |
| Risk | | Statements of Assets and Liabilities | | Assets | | | Statements of Assets and Liabilities | | Liabilities | |
| | | | |
Equity | | — | | $ | — | | | Variation margin on futures contracts | | $ | (1,329,506 | )(a) |
| | (a) | Includes unrealized gain (loss) on futures contracts and centrally cleared swaps described in the Additional Investment Information sections of the Schedules of Investments. Only current day’s variation margin is reported within the Statements of Assets and Liabilities. |
The following tables set forth, by certain risk types, the Funds’ gains (losses) related to these derivatives and their indicative volumes for the fiscal year ended October 31, 2023. These gains (losses) should be considered in the context that these derivative contracts may have been executed to create investment opportunities and/or economically hedge certain investments, and accordingly, certain gains (losses) on such derivative contracts may offset certain (losses) gains attributable to investments. These gains (losses) are included in “Net realized gain (loss)” or “Net change in unrealized gain (loss)” on the Statements of Operations:
| | | | | | | | | | |
| Multi-Manager Global Equity | | | | | | | | |
| | | |
| Risk | | Statements of Operations | | Net Realized Gain (Loss) | | | Net Change in
Unrealized
Gain (Loss) | |
| | | |
| Currency | | Net realized gain (loss) from forward foreign currency exchange contracts/Net unrealized gain(loss) on forward foreign currency exchange contracts | | | $ (952,012) | | | | $ 1,615,890 | |
| | | |
| Equity | | Net realized gain (loss) from futures contracts/Net change in unrealized gain (loss) on futures contracts | | | 3,276,281 | | | | (4,229,374 | ) |
| | | |
Total | | | | | $ 2,324,269 | | | | $(2,613,484 | ) |
GOLDMAN SACHS STRATEGIC MULTI-ASSET CLASS FUNDS
|
|
4. INVESTMENTS IN DERIVATIVES (continued) |
| | | | | | | | | | |
| Multi-Manager Non-Core Fixed Income | | | | | | | | |
| | | |
| Risk | | Statements of Operations | | Net Realized Gain (Loss) | | | Net Change in
Unrealized
Gain (Loss) | |
| | | |
| Credit | | Net realized gain (loss) from swap contracts/ Net change in unrealized gain (loss) on swap contracts | | $ | 2,794,171 | | | $ | (1,081,440 | ) |
| | | |
| Currency | | Net realized gain (loss) from purchased options; written options and forward foreign currency exchange contracts/ Net change in unrealized gain (loss) on purchased options; written options and forward foreign currency exchange contracts | | | (1,380,344 | ) | | | 520,157 | |
| | | |
| Interest rate | | Net realized gain (loss) from futures contracts / Net change in unrealized gain (loss) on futures contracts | | | (110,861 | ) | | | (80,178 | ) |
| | | |
Total | | | | $ | 1,302,966 | | | $ | (641,461 | ) |
| | |
| Multi-Manager Real Assets Strategy | | | | | | | | |
| | | |
| Risk | | Statements of Operations | | Net Realized Gain (Loss) | | | Net Change in
Unrealized
Gain (Loss) | |
| | | |
| Currency | | Net realized gain (loss) from forward foreign currency exchange contracts | | $ | (10,636 | ) | | $ | — | |
| | | |
| Equity | | Net realized gain (loss) from futures contracts/Net change in unrealized gain (loss) on futures contracts | | | (1,122,794 | ) | | | (268,873 | ) |
| | | |
Total | | | | $ | (1,133,430 | ) | | $ | (268,873 | ) |
For the fiscal year ended October 31, 2023, the relevant values for each derivative type were as follows:
| | | | | | | | | | | | | | | | | | | | |
| | | Average Number of Contracts(a) | |
| |
| | | | |
| | | | | |
| Fund | | Futures
Contracts | | | Forward
Contracts | | | Swap
Agreements | | | Purchased
Options | | | Written
Options | |
|
| |
| | | | | |
Multi-Manager Global Equity | | | 233 | | | $ | 244,312,765 | | | $ | — | | | | — | | | | — | |
|
| |
| | | | | |
Multi-Manager Non-Core Fixed Income | | | 26 | | | | 135,709,925 | | | | 31,927,083 | | | | 20,419,198 | | | | 7,816,000 | |
|
| |
| | | | | |
Multi-Manager Real Assets Strategy | | | 277 | | | | 138,227 | | | | — | | | | — | | | | — | |
|
| |
| | (a) | Amounts disclosed represent average number of contracts for futures contracts, notional amounts for forward contracts, swaptions, swap agreements, purchased and written swaptions, or shares/units outstanding for purchased options and written options, based on absolute values, which is indicative of volume for this derivative type, for the months that the Fund held such derivatives during the fiscal year ended October 31, 2023. |
|
|
5. AGREEMENTS AND AFFILIATED TRANSACTIONS |
A. Management Agreement — Under the Agreement, GSAM manages the Funds, subject to the general supervision of the Trustees.
As compensation for the services rendered pursuant to the Agreement, the assumption of the expenses related thereto and administration of the Funds’ business affairs, including providing facilities, GSAM is entitled to a management fee, accrued daily and paid monthly, equal to an annual percentage rate of each Fund’s average daily net assets.
GOLDMAN SACHS STRATEGIC MULTI-ASSET CLASS FUNDS
|
Notes to Financial Statements (continued) October 31, 2023 |
|
|
5. AGREEMENTS AND AFFILIATED TRANSACTIONS (continued) |
For the fiscal year ended October 31, 2023, contractual and effective net management fees with GSAM were at the following rates:
| | | | | | | | | | | | | | |
| | | Contractual Management Rate | | | | |
| | | | | | | |
| Fund | | First
$1 billion | | Next
$1 billion | | Next
$3 billion | | Next
$3 billion | | Over
$8 billion | | Effective Rate | | Effective Net
Management
Rate^* |
|
|
| | | | | | | |
Multi-Manager Global Equity | | 1.03% | | 0.93% | | 0.89% | | 0.87% | | 0.84% | | 1.03% | | 0.41% |
|
|
| | | | | | | |
Multi-Manager Non-Core Fixed Income | | 0.85 | | 0.85 | | 0.77 | | 0.73 | | 0.71 | | 0.85 | | 0.41 |
|
|
| | | | | | | |
Multi-Manager Real Assets Strategy | | 1.00 | | 0.90 | | 0.86 | | 0.84 | | 0.82 | | 1.00 | | 0.54 |
|
|
| | * | GSAM has agreed to waive a portion of its management fee for each Fund in order to achieve an effective net management fee rate that is equal to the actual cost of fees paid to the Fund’s Underlying Managers. These arrangements will remain in effect through at least February 28, 2024, and prior to such date GSAM may not terminate the arrangements without the approval of the Board of Trustees. |
| | ^ | Effective Net Management Rate includes the impact of management fee waivers of affiliated underlying funds, if any. |
The Funds invest in Institutional Shares and/or Class R6 Shares of the Goldman Sachs Financial Square Government Fund, which is an affiliated Underlying Fund. GSAM has agreed to waive a portion of its management fee payable by the Funds in an amount equal to the management fee it earns as an investment adviser to the affiliated Underlying Fund in which the Funds invest. For the fiscal year ended October 31, 2023, GSAM waived $72,633, $116,872 and $21,970 of the Multi-Manager Global Equity, Multi-Manager Non-Core Fixed Income and Multi-Manager Real Assets Strategy Funds’ management fees, respectively.
B. Transfer Agency Agreement — Goldman Sachs also serves as the transfer agent of the Funds for a fee pursuant to the Transfer Agency Agreement. The fees charged for such transfer agency services are accrued daily and paid monthly at annual rates of 0.02% of the average daily net assets of Class R6 Shares.
C. Other Expense Agreements and Affiliated Transactions — GSAM has agreed to reduce or limit each Fund’s “Total Annual Operating Expenses” (excluding acquired fund fees and expenses, taxes, interest, brokerage fees, expenses of shareholder meetings, litigation and indemnification, and extraordinary expenses) to the extent such expenses exceed, on an annual basis, a percentage rate of the average daily net assets of each Fund. Such Total Annual Operating Expense reimbursements, if any, are accrued daily and paid monthly. In addition, the Funds are not obligated to reimburse GSAM for prior fiscal year expense reimbursements, if any. The Total Annual Operating Expense limitations as an annual percentage rate of average daily net assets for the Multi-Manager Global Equity Fund, Multi-Manager Non-Core Fixed Income Fund and Multi-Manager Real Assets Strategy Fund are 0.75%, 0.70%, and 0.90% respectively. In addition, GSAM has agreed to reduce or limit certain “Other Expenses” of the Multi-Manager Global Equity Fund (excluding acquired fund fees and expenses, transfer agency fees and expenses, service fees, taxes, interest, brokerage fees, expenses of shareholder meetings, litigation and indemnification, and extraordinary expenses) to 0.10% of its average daily net assets. The Total Annual Operating Expenses and Other Expense limitations will remain in place through at least February 28, 2024, and prior to such date GSAM may not terminate the arrangements without the approval of the Trustees. In addition, the Funds have entered into certain offset arrangements with the transfer agent, which may result in a reduction of the Funds’ expenses and are received irrespective of the application of the “Other Expense” limitations described above.
GOLDMAN SACHS STRATEGIC MULTI-ASSET CLASS FUNDS
|
|
5. AGREEMENTS AND AFFILIATED TRANSACTIONS (continued) |
For the fiscal year ended October 31, 2023, these expense reductions, including any fee waivers and Other Expense reimbursements, were as follows:
| | | | | | | | | | | | |
| Fund | | Management
Fee Waiver | | | Other Expense Reimbursements | | | Total Expense Reductions | |
|
| |
| | | |
Multi-Manager Global Equity | | | $3,623,878 | | | | $1,445,171 | | | | $5,069,049 | |
|
| |
| | | |
Multi-Manager Non-Core Fixed Income | | | 4,897,185 | | | | — | | | | 4,897,185 | |
|
| |
| | | |
Multi-Manager Real Assets Strategy | | | 2,244,767 | | | | — | | | | 2,244,767 | |
|
| |
D. Line of Credit Facility — As of October 31, 2023, the Funds participated in a $1,110,000,000 committed, unsecured revolving line of credit facility (the “facility”) together with other funds of the Trust and certain registered investment companies having management agreements with GSAM or its affiliates. This facility is to be used for temporary emergency purposes, or to allow for an orderly liquidation of securities to meet redemption requests. The interest rate on borrowings is based on the federal funds rate. The facility also requires a fee to be paid by the Funds based on the amount of the commitment that has not been utilized. For the fiscal year ended October 31, 2023, the Funds did not have any borrowings under the facility. Prior to April 19, 2023, the facility was $1,250,000,000.
E. Other Transactions with Affiliates — For the fiscal year ended October 31, 2023, Goldman Sachs earned $611, $294, and $2,916 in brokerage commissions from portfolio transactions, including futures transactions executed with Goldman Sachs as the Futures Commission Merchant, on behalf of the Multi-Manager Global Equity Fund, Multi-Manager Non-Core Fixed Income Fund and Multi-Manager Real Assets Strategy Fund, respectively.
The following table provides information about the Funds’ investments in the Goldman Sachs Financial Square Government Fund as of and for the fiscal year ended October 31, 2023:
| | | | | | | | | | | | | | | | | | | | | | | | | | |
| Fund | | Underlying Fund | | Market Value as of
October 31, 2022 | | | Purchases
at Cost | | | Proceeds
from Sales | | | Market Value as of October 31, 2023 | | | Shares as of October 31, 2023 | | | Dividend Income | |
|
| |
| | | | | | | |
Multi-Manager Global Equity | | Goldman Sachs Financial
Square Government Fund
— Class R6 | | | $13,221,910 | | | $ | 84,266,238 | | | $ | (73,044,555 | ) | | $ | 24,443,593 | | | | 24,443,593 | | | $ | 921,348 | |
|
| |
| | | | | | | |
| | Goldman Sachs Financial
Square Government Fund
— Institutional Shares | | | 14,902,614 | | | | 361,882,482 | | | | (340,927,576 | ) | | | 35,857,520 | | | | 35,857,520 | | | | 1,253,181 | |
|
| |
| | | | | | | |
Multi-Manager Non-Core Fixed Income | | Goldman Sachs Financial
Square Government Fund
— Institutional Shares | | | 41,576,524 | | | | 963,400,777 | | | | (926,542,209 | ) | | | 78,435,092 | | | | 78,435,092 | | | | 3,481,146 | |
|
| |
| | | | | | | |
Multi-Manager Real Assets Strategy | | Goldman Sachs Financial
Square Government Fund
— Institutional Shares | | | 7,810,169 | | | | 291,470,856 | | | | (286,721,866 | ) | | | 12,559,159 | | | | 12,559,159 | | | | 653,186 | |
|
| |
GOLDMAN SACHS STRATEGIC MULTI-ASSET CLASS FUNDS
|
Notes to Financial Statements (continued) October 31, 2023 |
|
|
6. PORTFOLIO SECURITIES TRANSACTIONS |
The cost of purchases and proceeds from sales and maturities of long-term securities for the fiscal year ended October 31, 2023, were as follows:
| | | | | | | | | | | | | | | | |
| | | | |
| Fund | | Purchases of
Government
Securities | | | Purchases
Excluding
Government
Securities | | | Sales of
Government
Securities | | | Sales Excluding
Government
Securities | |
|
| |
| | | | |
Multi-Manager Global Equity | | $ | — | | | $ | 630,411,500 | | | $ | — | | | $ | 317,663,076 | |
|
| |
| | | | |
Multi-Manager Non-Core Fixed Income | | | 1,985,730 | | | | 1,066,243,133 | | | | 1,992,293 | | | | 1,032,534,731 | |
|
| |
| | | | |
Multi-Manager Real Assets Strategy | | | — | | | | 523,897,827 | | | | — | | | | 342,162,227 | |
|
| |
The tax character of distributions paid during the fiscal year ended October 31, 2023 was as follows:
| | | | | | | | | | | | |
| | | |
| | | Multi-Manager
Global Equity | | | Multi-Manager
Non-Core
Fixed Income | | | Multi-Manager
Real Assets
Strategy | |
|
| |
| | | |
Distributions paid from: | | | | | | | | | | | | |
| | | |
Ordinary income | | | $16,854,234 | | | | $81,470,590 | | | | $ 5,471,176 | |
| | | |
Net long-term capital gains | | | 22,308,741 | | | | — | | | | 20,507,645 | |
|
| |
| | | |
Total taxable distributions | | | $39,162,975 | | | | $81,470,590 | | | | $25,978,821 | |
|
| |
| | | |
Tax return of capital | | | $ — | | | | $ 3,475,605 | | | | $ — | |
|
| |
The tax character of distributions paid during the fiscal year ended October 31, 2022 was as follows:
| | | | | | | | | | | | |
| | | |
| | | Multi-Manager
Global Equity | | | Multi-Manager
Non-Core
Fixed Income | | | Multi-Manager
Real Assets
Strategy | |
|
| |
| | | |
Distributions paid from: | | | | | | | | | | | | |
| | | |
Ordinary income | | | $ 65,041,708 | | | | $35,392,691 | | | | $24,023,817 | |
| | | |
Net long-term capital gains | | | 62,671,495 | | | | — | | | | 13,091,498 | |
|
| |
| | | |
Total taxable distributions | | | $127,713,203 | | | | $35,392,691 | | | | $37,115,315 | |
|
| |
| | | |
Tax return of capital | | | $ — | | | | $30,807,379 | | | | $ — | |
|
| |
GOLDMAN SACHS STRATEGIC MULTI-ASSET CLASS FUNDS
|
|
7. TAX INFORMATION (continued) |
As of the Funds’ most recent fiscal year end, October 31, 2023, the Funds’ capital loss carryforwards and certain timing differences on a tax basis were as follows:
| | | | | | | | | | | | |
| | | |
| | | Multi-Manager
Global Equity | | | Multi-Manager
Non-Core
Fixed Income | | | Multi-Manager
Real Assets
Strategy | |
|
| |
| | | |
Undistributed ordinary income — net | | | $ 8,969,215 | | | | $ — | | | | $ 11,206,332 | |
|
| |
| | | |
Capital loss carryforwards: | | | | | | | | | | | | |
| | | |
Perpetual Short-Term | | | (3,017,248 | ) | | | (75,953,624 | ) | | | (7,189,135 | ) |
| | | |
Perpetual Long-Term | | | (2,351,950 | ) | | | (83,294,538 | ) | | | (8,747,023 | ) |
|
| |
| | | |
Total capital loss carryforwards | | | (5,369,198 | ) | | | (159,248,162 | ) | | | (15,936,158 | ) |
|
| |
| | | |
Timing differences(Straddle Loss Deferral) | | | $ (8,263 | ) | | | $ (2,883,303 | ) | | | $ — | |
| | | |
Unrealized gains (loss) — net | | | 8,952,984 | | | | (85,419,242 | ) | | | (46,892,336 | ) |
|
| |
| | | |
Total accumulated earnings (loss) net | | | $12,544,738 | | | | $(247,550,707 | ) | | | $(51,622,162 | ) |
|
| |
As of October 31, 2023, the Funds’ aggregate security unrealized gains and losses based on cost for U.S. federal income tax purposes were as follows:
| | | | | | | | | | | | |
| | | |
| | | Multi-Manager
Global Equity | | | Multi-Manager
Non-Core
Fixed Income | | | Multi-Manager
Real Assets
Strategy | |
|
| |
| | | |
Tax Cost | | | $739,459,662 | | | | $1,158,390,777 | | | | $597,723,936 | |
|
| |
| | | |
Gross unrealized gain | | | 44,027,281 | | | | 9,476,563 | | | | 28,303,720 | |
| | | |
Gross unrealized loss | | | (35,074,297 | ) | | | (94,895,805 | ) | | | (75,196,056 | ) |
|
| |
| | | |
Net unrealized gain (loss) on securities | | | $ 8,952,984 | | | | $ (85,419,242 | ) | | | $(46,892,336 | ) |
|
| |
The difference between GAAP-basis and tax basis unrealized gains (losses) is attributable primarily to wash sales, net mark to market gains (losses) on regulated futures contracts, net mark to market gains (losses) on foreign currency contracts, partnership investments, and differences in the tax treatment of swap transactions, material modification of debt securities, market discount accretion and premium amortization, and passive foreign investment company investments.
The Non-Core Fixed Income Fund reclassed $52 from distributable earnings to paid in capital for the year ending October 31, 2023. In order to present certain components of the Fund’s capital accounts on a tax-basis, certain reclassifications have been recorded to the Fund’s accounts. These reclassifications have no impact on the net asset value of the the Non-Core Fixed Income Fund and result primarily from differences in the tax treatment of underlying fund investments.
GSAM has reviewed the Funds’ tax positions for all open tax years (the current and prior three years, as applicable) and have concluded that no provision for income tax is required in the Funds’ financial statements. Such open tax years remain subject to examination and adjustment by tax authorities.
The Funds’ risks include, but are not limited to, the following:
Asset Allocation Risk — The Funds’ allocations to the various asset classes and to the Underlying Managers may cause the Funds to underperform other funds with a similar investment objective.
GOLDMAN SACHS STRATEGIC MULTI-ASSET CLASS FUNDS
|
Notes to Financial Statements (continued) October 31, 2023 |
|
|
8. OTHER RISKS (continued) |
Derivatives Risk — The Funds’ use of derivatives and other similar instruments (collectively referred to in this paragraph as “derivatives”) may result in loss, including due to adverse market movements. Derivatives, which may pose risks in addition to and greater than those associated with investing directly in securities, currencies or other assets and instruments, may increase market exposure and be illiquid or less liquid, volatile, difficult to price and leveraged so that small changes in the value of the underlying assets or instruments may produce disproportionate losses to the Funds. Certain derivatives are also subject to counterparty risk, which is the risk that the other party in the transaction will not, or lacks the capacity or authority to, fulfill its contractual obligations, liquidity risk, which includes the risk that the Funds will not be able to exit the derivative when it is advantageous to do so, and risks arising from margin requirements, which include the risk that the Funds will be required to pay additional margin or set aside additional collateral to maintain open derivative positions. The use of derivatives is a highly specialized activity that involves investment techniques and risks different from those associated with investments in more traditional securities and instruments. Losses from derivatives can also result from a lack of correlation between changes in the value of derivative instruments and the portfolio assets (if any) being hedged.
Floating and Variable Rate Obligations Risk — Floating rate and variable rate obligations are debt instruments issued by companies or other entities with interest rates that reset periodically (typically, daily, monthly, quarterly, or semiannually) in response to changes in the market rate of interest on which the interest rate is based. Such market rates are generally the Secured Overnight Financing Rate, (“SOFR”), a term SOFR rate published by CME Group Benchmark Administration Limited (CBA) calculated using certain derivatives markets (“Term SOFR”), the Prime Rate of a designated U.S. bank, the Federal Funds Rate, or another base lending rate used by commercial lenders. For floating and variable rate obligations, there may be a lag between an actual change in the underlying interest rate benchmark and the reset time for an interest payment of such an obligation, which could harm or benefit a Fund, depending on the interest rate environment or other circumstances. In a rising interest rate environment, for example, a floating or variable rate obligation that does not reset immediately would prevent a Fund from taking full advantage of rising interest rates in a timely manner. However, in a declining interest rate environment, the Fund may benefit from a lag due to an obligation’s interest rate payment not being immediately impacted by a decline in interest rates.
Some floating or variable rate obligations or investments of a Fund may reference (or may have previously referenced) the London Interbank Offered Rate (“LIBOR”). As a result of benchmark reforms, publication of most LIBOR settings has ceased. Some LIBOR settings continue to be published but only on a temporary, synthetic and non-representative basis and are expected to cease being published in September 2024. Regulated entities have generally ceased entering into new LIBOR contracts in connection with regulatory guidance or prohibitions. Public and private sector actors have worked to establish alternative reference rates, like SOFR or Term SOFR, to be used in place of LIBOR. There is no assurance that any such alternative reference rate will be similar to or produce the same value or economic equivalence as LIBOR or that it will have the same volume or liquidity as did LIBOR which may affect the value, volatility, liquidity or return on certain of a Fund’s floating and variable rate obligations and investments and result in costs incurred in connection with changing reference rates used for positions, closing out positions and entering into new trades. Certain of a Fund’s obligations or investments may have transitioned from LIBOR or may transition from LIBOR in the future. The transition from LIBOR to alternative reference rates may result in operational issues for a Fund or its obligations or investments. Any pricing adjustments to a Fund’s obligations or investments resulting from use of an alternative reference rate may also adversely affect the Fund’s performance and/or NAV. No assurances can be given as to the impact of the LIBOR transition (and the timing of any such impact) on a Fund and its obligations and investments.
Foreign and Emerging Countries Risk — Investing in foreign markets may involve special risks and considerations not typically associated with investing in the U.S. Foreign securities may be subject to risk of loss because of more or less foreign government regulation; less public information; less stringent investor protections; less stringent accounting, corporate governance, financial reporting and disclosure standards; and less economic, political and social stability in the countries in which a Fund invests. The imposition of sanctions, exchange controls (including repatriation restrictions), confiscation of assets and property, trade restrictions (including tariffs) and other government restrictions by the U.S. or other governments, or from problems in share registration, settlement or custody, may also result in losses. The type and severity of sanctions and other similar measures, including counter sanctions and other retaliatory actions, that may be imposed could vary broadly in scope, and their impact is impossible to predict. For example, the imposition of sanctions and other similar measures could, among other things, cause a
GOLDMAN SACHS STRATEGIC MULTI-ASSET CLASS FUNDS
|
|
8. OTHER RISKS (continued) |
decline in the value and/or liquidity of securities issued by the sanctioned country or companies located in or economically tied to the sanctioned country and increase market volatility and disruption in the sanctioned country and throughout the world. Sanctions and other similar measures could limit or prevent a Fund from buying and selling securities (in the sanctioned country and other markets), significantly delay or prevent the settlement of securities transactions, and significantly impact a Fund’s liquidity and performance. Foreign risk also involves the risk of negative foreign currency exchange rate fluctuations, which may cause the value of securities denominated in such foreign currency (or other instruments through which a Fund has exposure to foreign currencies) to decline in value. Currency exchange rates may fluctuate significantly over short periods of time. To the extent that a Fund also invests in securities of issuers located in, or economically tied to, emerging markets, these risks may be more pronounced.
Geographic Risk — If a Fund focuses its investments in securities of issuers located in a particular country or geographic region, the Fund may be subjected, to a greater extent than if its investments were less focused, to the risks of volatile economic cycles and/or conditions and developments that may be particular to that country or region, such as: adverse securities markets; adverse exchange rates; adverse social, political, regulatory, economic, business, environmental or other developments; or natural disasters.
Index/Tracking Error Risk — To the extent that an index-tracking strategy or implementation of a sub-strategy by a transition manager is used with respect to a portion of a Fund’s assets, including through investment in an ETF that seeks to track an index or implementation of an index-tracking strategy, the Fund will be negatively affected by general declines in the securities and asset classes represented in the relevant index. There is no guarantee that the Fund, or relevant portion of the Fund, will achieve a high degree of correlation to the relevant index. Market disruptions and regulatory restrictions could have an adverse effect on the Fund’s ability, or the ability of an ETF in which it invests, to adjust its exposure to the required levels in order for the relevant portion of the Fund to track the relevant index. In addition, because that portion of the Fund is not “actively” managed, unless a specific security is removed from the relevant index, the Fund or an ETF in which it invests generally would not sell a security because the security’s issuer was in financial trouble. At times when an index-tracking strategy is used with respect to a portion of the Fund’s assets, the Fund’s performance could be lower than funds that may actively shift all of their portfolio assets to take advantage of market opportunities or to lessen the impact of a market decline or a decline in the value of one or more issuers.
Interest Rate Risk — When interest rates increase, fixed income securities or instruments held by a Fund will generally decline in value. Long-term fixed income securities or instruments will normally have more price volatility because of this risk than short-term fixed income securities or instruments. A wide variety of market factors can cause interest rates to rise, including central bank monetary policy, rising inflation and changes in general economic conditions. Changing interest rates may have unpredictable effects on the markets, may result in heightened market volatility and may detract from Fund performance. In addition, changes in monetary policy may exacerbate the risks associated with changing interest rates. Funds with longer average portfolio durations will generally be more sensitive to changes in interest rates than funds with a shorter average portfolio duration. Fluctuations in interest rates may also affect the liquidity of fixed income securities and instruments held by the Funds. A sudden or unpredictable increase in interest rates may cause volatility in the market and may decrease the liquidity of a Fund’s investments, which would make it harder for the Fund to sell its investments at an advantageous time.
Large Shareholder Transactions Risk — A Fund may experience adverse effects when certain large shareholders, such as other funds, institutional investors (including those trading by use of non-discretionary mathematical formulas), financial intermediaries (who may make investment decisions on behalf of underlying clients and/or include a Fund in their investment model), individuals, accounts and Goldman Sachs affiliates, purchase or redeem large amounts of shares of a Fund. Such large shareholder redemptions, which may occur rapidly or unexpectedly, may cause a Fund to sell portfolio securities at times when it would not otherwise do so, which may negatively impact a Fund’s NAV and liquidity. These transactions may also accelerate the realization of taxable income to shareholders if such sales of investments resulted in gains, and may also increase transaction costs. In addition, a large redemption could result in a Fund’s current expenses being allocated over a smaller asset base, leading to an increase in a Fund’s expense ratio. Similarly, large Fund share purchases may adversely affect a Fund’s performance to the extent that the Fund is delayed in investing new cash or otherwise maintains a larger cash position than it ordinarily would.
GOLDMAN SACHS STRATEGIC MULTI-ASSET CLASS FUNDS
|
Notes to Financial Statements (continued) October 31, 2023 |
|
|
8. OTHER RISKS (continued) |
Liquidity Risk — A Fund may make investments that are illiquid or that may become less liquid in response to market developments or adverse investor perceptions. Illiquid investments may be more difficult to value. Liquidity risk may also refer to the risk that a Fund will not be able to pay redemption proceeds within the allowable time period or without significant dilution to remaining investors’ interests because of unusual market conditions, declining prices of the securities sold, an unusually high volume of redemption requests, or other reasons. To meet redemption requests, a Fund may be forced to sell investments at an unfavorable time and/or under unfavorable conditions. If a Fund is forced to sell securities at an unfavorable time and/or under unfavorable conditions, such sales may adversely affect a Fund’s NAV and dilute remaining investors’ interests. Liquidity risk may be the result of, among other things, the reduced number and capacity of traditional market participants to make a market in fixed income securities or the lack of an active market. The potential for liquidity risk may be magnified by a rising interest rate environment or other circumstances where investor redemptions from fixed income funds may be higher than normal, potentially causing increased supply in the market due to selling activity. These risks may be more pronounced in connection with the Funds’ investments in securities of issuers located in emerging market countries. Redemptions by large shareholders may have a negative impact on a Fund’s liquidity.
Loan-Related Investments Risk — In addition to risks generally associated with debt investments (e.g., interest rate risk and default risk), loan-related investments such as loan participations and assignments are subject to other risks. Although a loan obligation may be fully collateralized at the time of acquisition, the collateral may decline in value, be or become illiquid or less liquid, or lose all or substantially all of its value subsequent to investment. Many loan investments are subject to legal or contractual restrictions on resale and certain loan investments may be or become illiquid or less liquid and more difficult to value, particularly in the event of a downgrade of the loan or the borrower. There is less readily available, reliable information about most loan investments than is the case for many other types of securities. Substantial increases in interest rates may cause an increase in loan obligation defaults. With respect to loan participations, a Fund may not always have direct recourse against a borrower if the borrower fails to pay scheduled principal and/or interest; may be subject to greater delays, expenses and risks than if a Fund had purchased a direct obligation of the borrower; and may be regarded as the creditor of the agent lender (rather than the borrower), subjecting a Fund to the creditworthiness of that lender as well. Investors in loans, such as a Fund, may not be entitled to rely on the anti-fraud protections of the federal securities laws, although they may be entitled to certain contractual remedies. The market for loan obligations may be subject to irregular trading activity, wide bid/ask spreads and extended trade settlement periods. Because transactions in many loans are subject to extended trade settlement periods, a Fund may not receive the proceeds from the sale of a loan for a period after the sale. As a result, sale proceeds related to the sale of loans may not be available to make additional investments or to meet a Fund’s redemption obligations for a period after the sale of the loans, and, as a result, a Fund may have to sell other investments or engage in borrowing transactions, such as borrowing from its credit facility, if necessary to raise cash to meet its obligations.
Senior Loans hold the most senior position in the capital structure of a business entity, and are typically secured with specific collateral, but are nevertheless usually rated below investment grade. Because Second Lien Loans are subordinated or unsecured and thus lower in priority of payment to Senior Loans, they are subject to the additional risk that the cash flow of the borrower and property securing the loan or debt, if any, may be insufficient to meet scheduled payments after giving effect to the senior secured obligations of the borrower. Second Lien Loans generally have greater price volatility than Senior Loans and may be less liquid.
Market and Credit Risks — In the normal course of business, a Fund trades financial instruments and enters into financial transactions where risk of potential loss exists due to changes in the market (market risk). The value of the securities in which a Fund invests may go up or down in response to the prospects of individual companies, particular sectors or governments and/or general economic conditions throughout the world due to increasingly interconnected global economies and financial markets. Events such as war, military conflict, acts of terrorism, social unrest, natural disasters, recessions, inflation, rapid interest rate changes, supply chain disruptions, sanctions, the spread of infectious illness or other public health threats could also significantly impact a Fund and its investments. Additionally, a Fund may also be exposed to credit risk in the event that an issuer or guarantor fails to perform or that an institution or entity with which a Fund has unsettled or open transactions defaults.
GOLDMAN SACHS STRATEGIC MULTI-ASSET CLASS FUNDS
|
|
8. OTHER RISKS (continued) |
Multi-Manager Approach Risk — The Funds’ performance depends on the ability of the Investment Adviser in selecting, overseeing, and allocating Fund assets to the Underlying Managers. The Underlying Managers’ investment styles may not always be complementary. The Funds’ multi-manager approach may result in the Fund investing a significant percentage of its assets in certain types of investments, which could be beneficial or detrimental to the Funds’ performance depending on the performance of those investments and the overall market environment. The Funds’ Underlying Managers may underperform the market generally or underperform other investment managers that could have been selected for the Funds. Because the Funds’ Underlying Managers may trade with counterparties, prime brokers, clearing brokers or futures commission merchants on terms that are different than those on which the Investment Adviser would trade, and because each Underlying Manager applies its own risk analysis in evaluating potential counterparties for the Funds, the Funds may be subject to greater counterparty risk than if they were managed directly by the Investment Adviser.
Under the Trust’s organizational documents, its Trustees, officers, employees and agents are indemnified, to the extent permitted by the Act and state law, against certain liabilities that may arise out of performance of their duties to the Funds. Additionally, in the course of business, the Funds enter into contracts that contain a variety of indemnification clauses. The Funds’ maximum exposure under these arrangements is unknown, as this would involve future claims that may be made against the Funds that have not yet occurred. However, GSAM believes the risk of loss under these arrangements to be remote.
Pursuant to an effort to consolidate the membership of the Board of Trustees of the Trust (the “Board”) with the Board of Trustees of each of Goldman Sachs ETF Trust, Goldman Sachs ETF Trust II, Goldman Sachs Real Estate Diversified Income Fund, Goldman Sachs Trust and Goldman Sachs Variable Insurance Trust, in July 2023, the Board voted to nominate Gregory G. Weaver, Dwight L. Bush, Kathryn A. Cassidy, John G. Chou, Joaquin Delgado, Eileen H. Dowling and Paul C. Wirth (the “Nominees”) for election as Trustees of the Trust. At a virtual special joint meeting of shareholders held on November 16, 2023, each of the Nominees was elected to serve as Trustees alongside the current Trustees of the Trust, effective January 1, 2024.
Subsequent events after the Statements of Assets and Liabilities date have been evaluated, and GSAM concluded that there is no impact requiring adjustment or disclosure in the financial statements.
|
|
12. SUMMARY OF SHARE TRANSACTIONS |
Share activity is as follows:
| | | | | | | | | | | | | | | | |
| | | Multi-Manager Global Equity Fund | |
| | |
| | | For the Fiscal Year Ended
October 31, 2023 | | | For the Fiscal Year Ended
October 31, 2022 | |
| |
| | | | |
| | | | |
| | | Shares | | | Dollars | | | Shares | | | Dollars | |
| |
| | | | |
| | | | |
Class R6 Shares | | | | | | | | | | | | | | | | |
| | | | |
Shares sold | | | 53,170,599 | | | $ | 511,675,000 | | | | 7,042,360 | | | $ | 66,510,000 | |
| | | | |
Reinvestment of distributions | | | 4,380,658 | | | | 39,162,975 | | | | 11,242,054 | | | | 127,713,203 | |
| | | | |
Shares redeemed | | | (15,911,348 | ) | | | (152,480,805 | ) | | | (12,609,091 | ) | | | (129,359,280 | ) |
|
| |
| | | | |
NET INCREASE | | | 41,639,909 | | | $ | 398,357,170 | | | | 5,675,323 | | | $ | 64,863,923 | |
|
| |
GOLDMAN SACHS STRATEGIC MULTI-ASSET CLASS FUNDS
|
Notes to Financial Statements (continued) October 31, 2023 |
|
|
12. SUMMARY OF SHARE TRANSACTIONS (continued) |
| | | | | | | | | | | | | | | | |
| | | Multi-Manager Non-Core Fixed Income Fund | |
| | | | |
| | |
| | | For the Fiscal Year Ended
October 31, 2023 | | | For the Fiscal Year Ended
October 31, 2022 | |
| |
| | | | |
| | | | |
| | | Shares | | | Dollars | | | Shares | | | Dollars | |
| |
| | | | |
| | | | |
Class R6 Shares | | | | | | | | | | | | | | | | |
| | | | |
Shares sold | | | 56,584,724 | | | | $ 424,368,538 | | | | 15,306,628 | | | | $ 121,791,000 | |
| | | | |
Reinvestment of distributions | | | 11,392,098 | | | | 84,946,195 | | | | 8,400,275 | | | | 66,188,753 | |
| | | | |
Shares redeemed | | | (58,849,100 | ) | | | (438,813,157 | ) | | | (45,428,653 | ) | | | (357,134,496 | ) |
|
| |
| | | | |
NET INCREASE (DECREASE) | | | 9,127,722 | | | | $ 70,501,576 | | | | (21,721,750 | ) | | | $(169,154,743 | ) |
|
| |
| |
| | | Multi-Manager Real Assets Strategy Fund | |
| | | | |
| | |
| | | For the Fiscal Year Ended October 31, 2023 | | | For the Fiscal Year Ended October 31, 2022 | |
| |
| | | | |
| | | | |
| | | Shares | | | Dollars | | | Shares | | | Dollars | |
| |
| | | | |
| | | | |
Class R6 Shares | | | | | | | | | | | | | | | | |
| | | | |
Shares sold | | | 22,983,417 | | | | $205,108,061 | | | | 9,498,167 | | | | $ 97,110,000 | |
| | | | |
Reinvestment of distributions | | | 2,825,332 | | | | 25,890,049 | | | | 3,236,155 | | | | 37,115,315 | |
| | | | |
Shares redeemed | | | (2,520,809 | ) | | | (22,035,027 | ) | | | (28,693,770 | ) | | | (312,175,941 | ) |
|
| |
| | | | |
NET INCREASE (DECREASE) | | | 23,287,940 | | | | $208,963,083 | | | | (15,959,448 | ) | | | $(177,950,626 | ) |
|
| |
Report of Independent Registered Public
Accounting Firm
To the Board of Trustees of Goldman Sachs Trust II and Shareholders of Goldman Sachs Multi-Manager Global Equity Fund, Goldman Sachs Multi-Manager Non-Core Fixed Income Fund, and Goldman Sachs Multi-Manager Real Assets Strategy Fund
Opinions on the Financial Statements
We have audited the accompanying statements of assets and liabilities, including the schedules of investments, of Goldman Sachs Multi-Manager Global Equity Fund, Goldman Sachs Multi-Manager Non-Core Fixed Income Fund, and Goldman Sachs Multi-Manager Real Assets Strategy Fund (three of the funds constituting Goldman Sachs Trust II, hereafter collectively referred to as the “Funds”) as of October 31, 2023, the related statements of operations for the year ended October 31, 2023, the statements of changes in net assets for each of the two years in the period ended October 31, 2023, including the related notes, and the financial highlights for each of the five years in the period ended October 31, 2023 (collectively referred to as the “financial statements”). In our opinion, the financial statements present fairly, in all material respects, the financial position of each of the Funds as of October 31, 2023, the results of each of their operations for the year then ended, the changes in each of their net assets for each of the two years in the period ended October 31, 2023 and each of the financial highlights for each of the five years in the period ended October 31, 2023 in conformity with accounting principles generally accepted in the United States of America.
Basis for Opinions
These financial statements are the responsibility of the Funds’ management. Our responsibility is to express an opinion on the Funds’ financial statements based on our audits. We are a public accounting firm registered with the Public Company Accounting Oversight Board (United States) (PCAOB) and are required to be independent with respect to the Funds in accordance with the U.S. federal securities laws and the applicable rules and regulations of the Securities and Exchange Commission and the PCAOB.
We conducted our audits of these financial statements in accordance with the standards of the PCAOB. Those standards require that we plan and perform the audit to obtain reasonable assurance about whether the financial statements are free of material misstatement, whether due to error or fraud.
Our audits included performing procedures to assess the risks of material misstatement of the financial statements, whether due to error or fraud, and performing procedures that respond to those risks. Such procedures included examining, on a test basis, evidence regarding the amounts and disclosures in the financial statements. Our audits also included evaluating the accounting principles used and significant estimates made by management, as well as evaluating the overall presentation of the financial statements. Our procedures included confirmation of securities owned as of October 31, 2023 by correspondence with the custodian, transfer agent, agent banks and brokers; when replies were not received from agent banks and brokers, we performed other auditing procedures. We believe that our audits provide a reasonable basis for our opinions.
/s/ PricewaterhouseCoopers LLP
Boston, Massachusetts
December 21, 2023
We have served as the auditor of one or more investment companies in the Goldman Sachs fund complex since 2000.
GOLDMAN SACHS STRATEGIC MULTI-ASSET CLASS FUNDS
Fund Expenses — Six Month Period Ended October 31, 2023 (Unaudited)
As a shareholder of Class R6 Shares of a Fund, you incur two types of costs: (1) transaction costs, including sales charges on purchase payments, and (2) ongoing costs, including management fees and other Fund expenses. This example is intended to help you understand your ongoing costs (in dollars) of investing in the Funds and to compare these costs with the ongoing costs of investing in other mutual funds.
The example is based on an investment of $1,000 invested at the beginning of the period and held for the entire period from May 1, 2023 through October 31, 2023, which represents a period of 184 days of a 365-day year. This projection assumes that annualized expense ratios were in effect during the period.
Actual Expenses — The first line under each share class in the table below provides information about actual account values and actual expenses. You may use the information in this line, together with the amount you invested, to estimate the expenses that you paid over the period. Simply divide your account value by $1,000 (for example, an $8,600 account value divided by $1,000=8.6), then multiply the result by the number in the first line under the heading entitled “Expenses Paid” to estimate the expenses you paid on your account during this period.
Hypothetical Example for Comparison Purposes — The second line under each share class in the table below provides information about hypothetical account values and hypothetical expenses based on the Funds’ actual net expense ratios and an assumed rate of return of 5% per year before expenses, which is not the Funds’ actual return. The hypothetical account values and expenses may not be used to estimate the actual ending account balance or expenses you paid for the period. You may use this information to compare the ongoing costs of investing in the Funds and other funds. To do so, compare this 5% hypothetical example with the 5% hypothetical examples that appear in the shareholder reports of the other funds.
Please note that the expenses shown in the table are meant to highlight your ongoing costs only and do not reflect any transactional costs, such as sales charges, redemption fees, or exchange fees. Therefore, the second line of the table is useful in comparing ongoing costs only, and will not help you determine the relative total costs of owning different funds. In addition, if these transactional costs were included, your costs would have been higher.
| | | | | | | | | | | | | | | | | | | | | | | | | | | | | | | | | | | | |
| | | Multi-Manager Global Equity Fund | | | Multi-Manager Non-Core Fixed Income Fund | | | Multi-Manager Real Assets Strategy Fund | |
| Share Class | | Beginning Account Value 5/1/23 | | | Ending Account Value 10/31/23 | | | Expenses Paid for the 6 months ended 10/31/23* | | | Beginning Account Value 5/1/23 | | | Ending Account Value 10/31/23 | | | Expenses Paid for the 6 months ended 10/31/23 | | | Beginning Account Value 5/1/23 | | | Ending Account Value 10/31/23 | | | Expenses Paid for the 6 months ended 10/31/23 | |
| Class R6 | | | | | | | | | | | | | | | | | | | | | | | | | | | | | | | | | | | | |
Actual | | | $1,000.00 | | | | $ 978.80 | | | | $4.68 | | | | $1,000.00 | | | | $1,006.70 | | | | $5.83 | | | | $1,000.00 | | | | $ 885.70 | | | | $3.68 | |
Hypothetical 5% return | | | 1,000.00 | | | | 1,020.50 | + | | | 4.78 | | | | 1,000.00 | | | | 1,019.40 | | | | 5.86 | | | | 1,000.00 | | | | 1,021.30 | | | | 3.94 | |
| * | Expenses for each share class are calculated using each Fund’s annualized net expense ratio for each class, which represents the ongoing expenses as a percentage of net assets for the six months ended October 31, 2023. Expenses are calculated by multiplying the annualized net expense ratio by the average account value for the period; then multiplying the result by the number of days in the most recent fiscal half year; and then dividing that result by the number of days in the fiscal year. The annualized net expense ratios for the period were as follows: |
| | | | | | | | |
| Fund | | Class R6 | | | | |
Multi-Manager Global Equity | | | 0.52 | % | | | | |
Multi-Manager Non-Core Fixed Income | | | 0.64 | | | | | |
Multi-Manager Real Assets Strategy | | | 0.77 | | | | | |
| + | Hypothetical expenses are based on each Fund’s actual annualized net expense ratios and an assumed rate of return of 5% per year before expenses. |
104
GOLDMAN SACHS STRATEGIC MULTI-ASSET CLASS FUNDS
Statement Regarding Basis for Approval of Management Agreement and Sub-Advisory Agreements (Unaudited)
Background
The Goldman Sachs Multi-Manager Global Equity Fund, Goldman Sachs Multi-Manager Non-Core Fixed Income Fund, and Goldman Sachs Multi-Manager Real Assets Strategy Fund (the “Funds”) are investment portfolios of Goldman Sachs Trust II (the “Trust”). The Board of Trustees (the “Board”) oversees the management of the Trust and reviews the investment performance and expenses of the Funds at regularly scheduled meetings held throughout the year. Each Fund employs a “manager of managers” structure, whereby Goldman Sachs Asset Management, L.P. (the “Investment Adviser”) is responsible for selecting sub-advisers (subject to Board approval), allocating the Fund’s assets among them, and overseeing their day-to-day management of Fund assets. The Board determines annually whether to approve the continuance of the Trust’s investment management agreement (the “Management Agreement”) with the Investment Adviser on behalf of the Funds.
The Management Agreement was most recently approved for continuation until September 30, 2024 by the Board, including those Trustees who are not parties to the Management Agreement or “interested persons” (as defined in the Investment Company Act of 1940, as amended) of any party thereto (the “Independent Trustees”) at a meeting held on September 19-20, 2023 (the “Annual Meeting”). At the Annual Meeting, the Board also considered the sub-advisory agreements (each a “Designated Sub-Advisory Agreement” and, together with the Management Agreement, the “Agreements”) between the Investment Adviser and (i) each of Axiom Investors LLC, Boston Partners Global Investors, Inc., Causeway Capital Management LLC, Diamond Hill Capital Management Inc., GW&K Investment Management, LLC, Massachusetts Financial Services Company (d/b/a MFS Investment Management), Principal Global Investors, LLC, T. Rowe Price Associates, Inc., Vaughan Nelson Investment Management, L.P., Vulcan Value Partners, LLC, WCM Investment Management, and Wellington Management Company LLP (on behalf of Goldman Sachs Multi-Manager Global Equity Fund); (ii) each of Ares Capital Management II LLC, Aristotle Pacific Capital, LLC, Brigade Capital Management, LP, Marathon Asset Management, L.P., Nuveen Asset Management, LLC, RBC Global Asset Management (U.K.) Limited (d/b/a RBC BlueBay Asset Management), RBC Global Asset Management (U.S.) Inc. (d/b/a RBC Global Asset Management) and TCW Investment Management Company LLC (on behalf of Goldman Sachs Multi-Manager Non-Core Fixed Income Fund); and (iii) each of Cohen & Steers Capital Management, Inc., Principal Real Estate Investors, LLC, PGIM Real Estate, a business unit of PGIM, Inc., and RREEF America L.L.C. (on behalf of Goldman Sachs Multi-Manager Real Assets Strategy Fund) (each, a “Designated Sub-Adviser” and collectively, the “Designated Sub-Advisers”).
The review process undertaken by the Trustees spans the course of the year and culminates with the Annual Meeting. To assist the Trustees in their deliberations, the Trustees have established a Contract Review Committee (the “Committee”), comprised of the Independent Trustees. The Committee held four meetings over the course of the year since the Management Agreement was last approved. At those Committee meetings, regularly scheduled Board or other committee meetings, and/or the Annual Meeting, matters relevant to the renewal of the Management Agreement and the Designated Sub-Advisory Agreements were considered by the Board, or the Independent Trustees, as applicable. With respect to each Fund, such matters included:
| | (a) | the nature and quality of the advisory, administrative, and other services provided to the Fund by the Investment Adviser and its affiliates, and the Designated Sub-Advisers, including, as applicable, information about: |
| | (i) | the structure, staff, and capabilities of the Investment Adviser and the Designated Sub-Advisers and the Designated Sub-Advisers’ portfolio management teams; |
| | (ii) | the groups within the Investment Adviser and its affiliates that support the portfolio management teams or provide other types of necessary services, including fund services groups (e.g., accounting and financial reporting, tax, shareholder services, and operations); controls and risk management groups (e.g., legal, compliance, valuation oversight, credit risk management, internal audit, compliance testing, market risk analysis, finance, and central funding); sales and distribution support groups, and others (e.g., information technology and training); |
| | (iii) | trends in employee headcount; |
| | (iv) | the Investment Adviser’s financial resources and ability to hire and retain talented personnel and strengthen its operations; and |
| | (v) | the parent company’s support of the Investment Adviser and its mutual fund business, as expressed by the firm’s senior management; |
| | (b) | information on the investment performance of the Fund, including comparisons to the performance of similar mutual funds, as provided by a third-party mutual fund data provider engaged as part of the contract review process (the “Outside Data Provider”), benchmark performance indices, and, with respect to the Goldman Sachs Multi-Manager Global Equity Fund, commingled investment vehicles with comparable investment strategies managed by the Investment Adviser, and information on general investment outlooks in the markets in which the Fund invests; |
| | (c) | information provided by the Investment Adviser indicating the Investment Adviser’s views on whether the Fund’s peer group and/or benchmark index had high, medium, or low relevance given the Fund’s particular investment strategy; |
GOLDMAN SACHS STRATEGIC MULTI-ASSET CLASS FUNDS
Statement Regarding Basis for Approval of Management Agreement and Sub-Advisory Agreements (Unaudited) (continued)
| | (d) | the terms of the Agreements and other agreements with affiliated service providers entered into by the Trust on behalf of the Fund; |
| | (e) | fee and expense information for the Fund, including: |
| | (i) | the relative management fee and expense levels of the Fund as compared to those of comparable funds managed by other advisers, as provided by the Outside Data Provider; |
| | (ii) | the Fund’s expense trends over time; and |
| | (iii) | with respect to the Goldman Sachs Multi-Manager Global Equity Fund, to the extent the Investment Adviser manages other types of accounts (such as bank collective trusts, private wealth management accounts, institutional separate accounts, sub-advised mutual funds, and non-U.S. funds) having investment objectives and policies similar to those of the Fund, comparative information on the advisory fees charged and services provided to those accounts by the Investment Adviser; |
| | (f) | with respect to the extensive investment performance and expense comparison data provided by the Outside Data Provider, its processes in producing that data for the Fund; |
| | (g) | the undertakings of the Investment Adviser and its affiliates to implement fee waivers and expense limitations; |
| | (h) | information relating to the profitability of the Management Agreement and the transfer agency arrangements of the Fund to the Investment Adviser and its affiliates; |
| | (i) | whether the Fund’s existing management fee schedule adequately addressed any economies of scale; |
| | (j) | a summary of the “fall-out” benefits derived by the Investment Adviser and its affiliates from their relationships with the Fund, including the fees received by the Investment Adviser’s affiliates from the Fund for transfer agency, portfolio trading, distribution and other services; |
| | (k) | a summary of potential benefits derived by the Fund as a result of its relationship with the Investment Adviser; |
| | (l) | with respect to the Investment Adviser, portfolio manager ownership of Fund shares;the manner in which portfolio manager compensation is determined; information on the Designated Sub-Advisers’ compensation arrangements; and the number and types of accounts managed by the portfolio managers; |
| | (m) | the nature and quality of the services provided to the Fund by its unaffiliated service providers (as well as the Designated Sub-Advisers), and the Investment Adviser’s general oversight and evaluation (including reports on due diligence) of those service providers as part of the administrative services provided under the Management Agreement; and |
| | (n) | the Investment Adviser’s and Designated Sub-Advisers’ processes and policies addressing various types of potential conflicts of interest; their approaches to risk management; the annual review of the effectiveness of the Fund’s compliance program; and periodic compliance reports. |
The Trustees also received an overview of the Funds’ distribution arrangements. They received information regarding the Funds’ assets and share purchase and redemption activity. Information was also provided to the Trustees relating to revenue sharing payments made by and services provided by the Investment Adviser and its affiliates to intermediaries that promote the sale, distribution, and/or servicing of Fund shares.
The presentations made at the Board and Committee meetings and at the Annual Meeting encompassed the Funds and other mutual funds for which the Board has responsibility. In evaluating the Agreements at the Annual Meeting, the Trustees relied upon their knowledge, resulting from their meetings and other interactions throughout the year, of the Investment Adviser and its affiliates and Designated Sub-Advisers, their services, and the Funds. In conjunction with these meetings, the Trustees received written materials and oral presentations on the topics covered, and the Investment Adviser addressed the questions and concerns of the Trustees, including concerns regarding the investment performance of certain of the funds they oversee. In addition, the Trustees periodically received written materials and oral presentations from the Funds’ various sub-advisers, including the Designated Sub-Advisers. The Independent Trustees were advised by their independent legal counsel regarding their responsibilities and other regulatory requirements related to the approval and continuation of mutual fund investment management agreements under applicable law. In addition, the Investment Adviser and its affiliates provided the Independent Trustees with a written response to a formal request for information sent on behalf of the Independent Trustees by their independent legal counsel. The Trustees reviewed a written response prepared by each Designated Sub-Adviser to a similar request for information submitted to the Designated Sub-Adviser by the Investment Adviser. During the course of their deliberations, the Independent Trustees met in executive sessions with their independent legal counsel, without representatives of the Investment Adviser or its affiliates present.
GOLDMAN SACHS STRATEGIC MULTI-ASSET CLASS FUNDS
Statement Regarding Basis for Approval of Management Agreement and Sub-Advisory Agreements (Unaudited) (continued)
Nature, Extent, and Quality of the Services Provided Under the Agreement
As part of their review, the Trustees considered the nature, extent, and quality of the services provided to the Funds by the Investment Adviser. In this regard, the Trustees considered both the investment advisory services and non-advisory services that are provided by the Investment Adviser and its affiliates. The Trustees noted the transition in the leadership and changes in personnel of various of the Investment Adviser’s portfolio management teams that had occurred in recent periods, and the ongoing recruitment efforts aimed at bringing high quality investment talent to the Investment Adviser. They also noted the Investment Adviser’s commitment to maintaining high quality systems and expending substantial resources to respond to ongoing changes to the market, regulatory and control environment in which the Funds and their service providers operate, including developments associated with the COVID-19 pandemic, geopolitical events, and economic sanctions, as well as the efforts of the Investment Adviser and its affiliates to combat cyber security risks. The Trustees also considered information regarding the Investment Adviser’s and the Funds’ various sub-advisers’ business continuity planning and remote operations capabilities. The Trustees concluded that the Investment Adviser continued to commit substantial financial and operational resources to the Funds and expressed confidence that the Investment Adviser would continue to do so in the future. The Trustees also recognized that the Investment Adviser had made significant commitments to address regulatory compliance requirements applicable to the Funds and the Investment Adviser and its affiliates. In addition, the Trustees reviewed the sub-adviser oversight process that the Investment Adviser had employed, which included areas such as investment analytics, risk management, and compliance.
Investment Performance
The Trustees also considered the investment performance of the Funds. In this regard, they compared the investment performance of each Fund to its peers using rankings and ratings compiled by the Outside Data Provider as of March 31, 2023, and updated performance information prepared by the Investment Adviser as of June 30, 2023 ending on the applicable dates. The information on each Fund’s investment performance prepared by the Outside Data Provider was provided for the one-, three-, and five-year periods. The Trustees also reviewed each Fund’s investment performance relative to its performance benchmark. As part of this review, they considered the investment performance trends of the Funds over time, and reviewed the investment performance of each Fund in light of its investment objective and policies and market conditions. The Trustees considered the Investment Adviser’s representations that each Fund had significant differences from its Outside Data Provider peer group that caused it to be an imperfect basis for comparison. The Trustees also received information comparing the performance of the Goldman Sachs Multi-Manager Global Equity Fund to that of comparable unregistered funds and separate accounts managed by the Investment Adviser. They considered that the unregistered funds and separate accounts provide an imperfect performance comparison because they are not subject to the requirements of the Investment Company Act of 1940, as amended.
In addition, the Trustees considered materials prepared and presentations made by the Investment Adviser’s senior management and the Designated Sub-Advisers’ portfolio management personnel in which Fund performance was assessed. The Trustees also considered the Investment Adviser’s periodic reports with respect to the Funds’ risk profiles, and how the Investment Adviser’s approach to risk monitoring and management influences portfolio management.
The Trustees noted that the Goldman Sachs Multi-Manager Global Equity Fund had placed in the fourth quartile of its performance peer group for the one-, three-, and five-year periods, and had outperformed its benchmark index for the one- and three-year periods and had underperformed for the five-year period ended March 31, 2023. They observed that Goldman Sachs Multi-Manager Non-Core Fixed Income Fund had placed in the fourth quartile of its performance peer group for the one-, three-, and five-year periods, and had underperformed its composite benchmark index for the one-, three-, and five-year periods ended March 31, 2023. The Trustees noted that the Goldman Sachs Multi-Manager Real Assets Strategy Fund had placed in the fourth quartile of its performance peer group for the one- and three-year periods and the top half for the five-year period, and had underperformed its composite benchmark index for the one- and three-year periods and outperformed for the five-year period ended March 31, 2023.
Costs of Services Provided and Competitive Information
The Trustees considered the contractual terms of the Management Agreement and the fee rates payable by each Fund thereunder. In this regard, the Trustees considered information on the services rendered by the Investment Adviser to the Funds, which included both advisory and administrative services that were directed to the needs and operations of the Funds as registered mutual funds.
In particular, the Trustees reviewed analyses prepared by the Outside Data Provider regarding the expense rankings of the Funds, as well as additional information provided by the Investment Adviser throughout the year. The analyses provided a comparison of each Fund’s management fee and breakpoints to those of a relevant peer group and category universe; an expense
GOLDMAN SACHS STRATEGIC MULTI-ASSET CLASS FUNDS
Statement Regarding Basis for Approval of Management Agreement and Sub-Advisory Agreements (Unaudited) (continued)
analysis which compared each Fund’s overall net and gross expenses to a peer group and a category universe; and data comparing each Fund’s net expenses to the peer and category medians. The analyses also compared each Fund’s other expenses and fee waivers/reimbursements to those of the peer group and category medians. With respect to the Goldman Sachs Multi-Manager Global Equity Fund, the Trustees also considered comparative fee information for services provided by the Investment Adviser to collective investment vehicles having investment objectives and policies similar to those of the Fund. The Trustees considered that services provided to the Funds differed in various significant respects from the services provided to these collective investment vehicles, which generally operated under less stringent regulatory and financial reporting requirements and required fewer services from the Investment Adviser. The Trustees concluded that the comparisons provided by the Outside Data Provider and the Investment Adviser were useful in evaluating the reasonableness of the management fees and total expenses paid by the Funds.
In addition, the Trustees considered the Investment Adviser’s undertakings to implement fee waivers and expense limitations. In this regard the Trustees noted that shareholders that are invested in the Funds consist of institutional clients that have entered into a separate management agreement with the Investment Adviser and pay a single management fee for the Investment Adviser’s management of their accounts, and that the Investment Adviser waives a portion of the management fee with respect to each Fund in order to achieve an effective net management fee rate that is equal to the actual cost of fees paid to the Fund’s sub-advisers. In addition, the Trustees noted that shareholders are able to redeem their shares at any time if shareholders believe that the Fund fees and expenses are too high or if they are dissatisfied with the performance of the Fund.
Profitability
The Trustees reviewed each Fund’s contribution to the Investment Adviser’s revenues and pre-tax profit margins. In this regard the Trustees noted that they had received, among other things, profitability analyses and summaries, revenue and expense schedules by Fund and by function (i.e., investment management, transfer agency and distribution and service), and information on the Investment Adviser’s expense allocation methodology. They observed that the profitability and expense figures are substantially similar to those used by the Investment Adviser for many internal purposes, including compensation decisions among various business groups, and are thus subject to a vigorous internal debate about how certain revenue and expenses should be allocated. The Trustees also noted that the internal audit group within the Goldman Sachs organization periodically audits the expense allocation methodology and that the internal audit group was satisfied with the reasonableness, consistency, and accuracy of the Investment Adviser’s expense allocation methodology. Profitability data for each Fund was provided for 2022 and 2021, and the Trustees considered this information in relation to the Investment Adviser’s overall profitability.
Economies of Scale
The Trustees considered the information that had been provided regarding whether there have been economies of scale with respect to the management of the Funds. The Trustees also considered that the Funds are offered to the Investment Adviser’s institutional clients as part of an investment program whereby the Funds and other funds act as core “building blocks” for the client’s portfolio. The Trustees considered the Investment Adviser’s representations that its clients benefit from this investment model with increased liquidity, increased investment oversight, access to new investment strategies, economies of scale, and reduced complexity in managing client portfolios. The Trustees noted that, pursuant to the model, clients pay a management fee for the Investment Adviser’s management of their accounts, and that the fund-level management fees in excess of the weighted average sub-advisory fees are waived in order to avoid charging two layers of management fees. The Trustees also considered the breakpoints in the fee rate payable under the Management Agreement for each of the Funds at the following annual percentage rates of the average daily net assets of the Funds:
| | | | | | |
| Average Daily Net Assets | | Goldman Sachs Multi-Manager
Global Equity Fund | | Goldman Sachs
Multi-Manager
Non-Core Fixed
Income Fund | | Goldman Sachs
Multi-Manager
Real Assets
Strategy Fund |
|
| | | |
First $1 billion | | 1.03% | | 0.85% | | 1.00% |
| | | |
Next $1 billion | | 0.93 | | 0.85 | | 0.90 |
| | | |
Next $3 billion | | 0.89 | | 0.77 | | 0.86 |
| | | |
Next $3 billion | | 0.87 | | 0.73 | | 0.84 |
| | | |
Over $8 billion | | 0.84 | | 0.71 | | 0.82 |
GOLDMAN SACHS STRATEGIC MULTI-ASSET CLASS FUNDS
Statement Regarding Basis for Approval of Management Agreement and Sub-Advisory Agreements (Unaudited) (continued)
The Trustees noted that the breakpoints were designed to share potential economies of scale, if any, with the Funds and their shareholders as assets under management reach those asset levels. The Trustees considered the amounts of assets in the Funds; the Funds’ recent purchase and redemption activity; the information provided by the Investment Adviser relating to the costs of the services provided by the Investment Adviser and its affiliates and the profits realized by them (if any); information comparing the fee rates charged by the Investment Adviser with fee rates charged to other funds in the peer groups; and the Investment Adviser’s undertakings to waive a portion of its management fee and to limit certain expenses of the Funds that exceed specified levels. The Trustees also considered the relationship between the advisory and sub-advisory fee rate schedules. Upon reviewing these matters at the Annual Meeting, the Trustees concluded that the fee breakpoints represented a means of assuring that benefits of scalability, if any, would be passed along to shareholders at the specified asset levels.
Other Benefits to the Investment Adviser and Its Affiliates
The Trustees also considered the other benefits derived by the Investment Adviser and its affiliates from their relationships with the Funds as stated above, including: (a) transfer agency fees received by Goldman Sachs & Co. LLC (“Goldman Sachs”); (b) brokerage and futures commissions earned by Goldman Sachs for executing securities transactions (in its capacity as clearing broker) and futures transactions on behalf of the Funds; (c) the Investment Adviser’s ability to leverage the infrastructure designed to service the Funds on behalf of its other clients; (d) the Investment Adviser’s ability to cross-market other products and services to Fund shareholders; (e) the Investment Adviser’s ability to negotiate better pricing with the Funds’ custodian on behalf of its other clients, as a result of the relationship with the Funds; (f) the investment of cash in money market funds managed by the Investment Adviser that will result in increased assets under management for those money market funds; and (g) the possibility that the working relationship between the Investment Adviser and the Funds’ third-party service providers (including the Funds’ sub-advisers) may cause those service providers to be more likely to do business with other areas of Goldman Sachs. In the course of considering the foregoing, the Independent Trustees requested and received further information quantifying certain of these fall-out benefits.
Other Benefits to the Funds and Their Shareholders
The Trustees also noted that the Funds receive certain other potential benefits as a result of their relationship with the Investment Adviser, including: (a) enhanced servicing from vendors due to the volume of business generated by the Investment Adviser and its affiliates; (b) the advantages received from the Investment Adviser’s knowledge and experience gained from managing other accounts and products; (c) the Investment Adviser’s ability to hire and retain qualified personnel to provide services to the Funds because of the reputation of the Goldman Sachs organization; (d) the Funds’ access, through the Investment Adviser, to certain firm-wide resources (e.g., proprietary risk management systems and databases), subject to certain restrictions; (e) the Funds’ ability to aggregate assets managed by certain sub-advisers with those of other clients of the Investment Adviser for purposes of applying breakpoints in a sub-advisory agreement; and (f) the Funds’ access to certain affiliated distribution channels.
Conclusion
In connection with their consideration of the Management Agreement, the Trustees gave weight to each of the factors described above, but did not identify any particular factor as controlling their decision. After deliberation and consideration of all of the information provided, including the factors described above, the Trustees concluded, in the exercise of their business judgment, that the management fees paid by each of the Funds were reasonable in light of the services provided to it by the Investment Adviser, the Investment Adviser’s costs and each Fund’s current and reasonably foreseeable asset levels. The Trustees unanimously concluded that the Investment Adviser’s continued management likely would benefit each Fund and its shareholders, and that the Management Agreement should be approved and continued with respect to each Fund until September 30, 2024.
GOLDMAN SACHS STRATEGIC MULTI-ASSET CLASS FUNDS
Statement Regarding Basis for Approval of Management Agreement and Sub-Advisory Agreements (Unaudited) (continued)
Designated Sub-Advisory Agreements
Nature, Extent, and Quality of the Services Provided Under the Designated Sub-Advisory Agreements and Performance
In evaluating the Designated Sub-Advisory Agreements, the Trustees relied upon materials furnished and presentations made by the Investment Adviser and the Designated Sub-Advisers. In evaluating the nature, extent, and quality of services provided by each Designated Sub-Adviser, the Trustees considered information on the services provided to the Funds by their respective Designated Sub-Advisers, including information about each Designated Sub-Adviser’s (a) personnel and compensation structure; (b) track record in managing the Fund and, if applicable, other funds and/or accounts with investment strategies similar to those employed on behalf of the Funds; (c) policies and procedures in place to address potential conflicts of interest; and (d) compliance program and code of ethics. In this regard, they also considered assessments provided by the Investment Adviser of each Designated Sub-Adviser, the Designated Sub-Adviser’s investment strategies and personnel, and its compliance program. The Trustees also considered information regarding each Designated Sub-Adviser’s business continuity planning and remote operations capabilities. The Trustees also reviewed the operations and investment performance of each Designated Sub-Adviser’s respective sleeve of the applicable Fund since its inception, including a comparison of each Designated Sub-Adviser to relevant benchmark indices based on various metrics.
Costs of Services Provided
The Trustees reviewed the terms of each Designated Sub-Advisory Agreement, including the schedule of fees payable to the Designated Sub-Advisers. They considered any breakpoints in the sub-advisory fee rate payable under each Designated Sub-Advisory Agreement. The Trustees noted that the compensation paid to each Designated Sub-Adviser is paid by the Investment Adviser, not by the Funds. The Trustees considered that certain Designated Sub-Advisers had agreed to reduce their sub-advisory fee rate, which benefited shareholders of the applicable Funds in light of the existing management fee waiver arrangement. The Trustees reviewed the blended average of all sub-advisory fees paid by the Investment Adviser with respect to each Fund in light of the overall management fee paid by each Fund. They also considered the Investment Adviser’s undertaking to waive a portion of its management fee which is in excess of the weighted average of each Fund’s sub-advisory fees.
Conclusion
In connection with their consideration of the Designated Sub-Advisory Agreements, the Trustees gave weight to various factors, but did not identify any particular factor as controlling their decision. After deliberation and consideration of the information provided, including the factors described above, the Trustees, including the Independent Trustees, unanimously concluded, in the exercise of their business judgment, that the sub-advisory fees paid by the Investment Adviser to each Designated Sub-Adviser were reasonable in light of the factors considered, and that each Designated Sub-Advisory Agreement should be approved and continued until September 30, 2024.
GOLDMAN SACHS STRATEGIC MULTI-ASSET CLASS FUNDS
Statement Regarding Basis for Approval of Management Agreement and Sub-Advisory Agreements (Unaudited) (continued)
Statement Regarding Basis for Approval of Sub-Advisory Agreement (Unaudited)
Background
The Goldman Sachs Multi-Manager Non-Core Fixed Income Fund (the “Fund”) is an investment portfolio of Goldman Sachs Trust II (the “Trust”). The Board of Trustees oversees the management of the Trust and reviews the investment performance and expenses of the Fund at regularly scheduled meetings held throughout the year. The Fund employs a “manager of managers” structure, whereby Goldman Sachs Asset Management, L.P. (the “Investment Adviser”) is responsible for selecting sub-advisers (subject to Board approval), allocating the assets of the Fund among them, and overseeing their day-to-day management of Fund assets.
Upon the recommendation of the Investment Adviser, at a meeting held on September 19-20, 2023, the Trustees, including those Trustees who are not “interested persons” as defined in the Investment Company Act of 1940, as amended (the “Independent Trustees”), unanimously approved a sub-advisory agreement (the “Sub-Advisory Agreement”) between the Investment Adviser and Ninety One North America, Inc. (the “Sub-Adviser”) on behalf of the Fund. In connection with their evaluation of the Sub-Advisory Agreement, the Trustees received written materials and oral presentations prepared by the Investment Adviser and the Sub-Adviser on the topics covered, and were advised by their independent legal counsel. In addition, the Trustees received information prepared by the Sub-Adviser in a written response to a formal request from the Investment Adviser.
Nature, Extent, and Quality of the Services to be Provided Under the Sub-Advisory Agreement
In evaluating the Sub-Advisory Agreement, the Trustees relied on the information provided by the Investment Adviser and the Sub-Adviser. In evaluating the nature, extent and quality of services to be provided by the Sub-Adviser, the Trustees considered information about the Sub-Adviser’s (a) personnel and compensation structure; (b) track record in managing other funds and accounts with investment strategies similar to those to be employed on behalf of the Fund; (c) policies and procedures in place to address potential conflicts of interest; and (d) compliance program and code of ethics. In this regard, they considered assessments provided by the Investment Adviser of the Sub-Adviser, the Sub-Adviser’s investment strategies and personnel, and its compliance program. They noted that, because the Sub-Adviser had not previously provided services to the Fund, there was no performance information to evaluate with respect to the Fund.
Costs of Services to be Provided
The Trustees reviewed the terms of the Sub-Advisory Agreement and the proposed fee schedule. They noted that the compensation to be paid to the Sub-Adviser would be paid by the Investment Adviser, not by the Fund. They also noted that the terms of the Sub-Advisory Agreement were the result of arms’ length negotiations between the Investment Adviser and the Sub-Adviser. The Trustees reviewed the anticipated blended average of all sub-advisory fees to be paid by the Investment Adviser with respect to the Fund and how it would change upon hiring the Sub-Adviser. The Trustees considered the Investment Adviser’s undertaking to waive the portion of its management fee which is in excess of the weighted average of the Fund’s sub-advisory fees.
Conclusion
In connection with their consideration of the Sub-Advisory Agreement, the Trustees gave weight to various factors, but did not identify any particular factor as controlling their decision. After deliberation and consideration of the information provided, including the factors described above, the Trustees, including the Independent Trustees, unanimously concluded, in the exercise of their business judgment, that the sub-advisory fees to be paid by the Investment Adviser to the Sub-Adviser were reasonable in light of the factors considered, and that the Sub-Advisory Agreement, and the terms thereof, should be approved for a period of two years from its effective date.
GOLDMAN SACHS STRATEGIC MULTI-ASSET CLASS FUNDS
Trustees and Officers (Unaudited)
Independent Trustees
| | | | | | | | | | |
Name, Address and Age1 | | Position(s) Held with the Trust | | Term of Office and Length of Time Served2 | | Principal Occupation(s) During Past 5 Years | | Number of Portfolios in Fund Complex Overseen by Trustee3 | | Other Directorships Held by Trustee4 |
|
Cheryl K. Beebe Age: 67 | | Chair of the Board of Trustees | | Since 2017 (Trustee since 2015) | | Ms. Beebe is retired. She is Director, Packaging Corporation of America (2008-Present); Director, The Mosaic Company (2019-Present); Director, HanesBrands Inc. (2020-Present); and was formerly Director, Convergys Corporation (a global leader in customer experience outsourcing) (2015-2018); and formerly held the position of Executive Vice President, (2010-2014); and Chief Financial Officer, Ingredion, Inc. (a leading global ingredient solutions company) (2004-2014). Chair of the Board of Trustees — Goldman Sachs Trust II; Goldman Sachs MLP and Energy Renaissance Fund; Goldman Sachs ETF Trust; Goldman Sachs ETF Trust II; and Goldman Sachs Real Estate Diversified Income Fund. | | 90 | | Packaging Corporation of America (producer of container board); The Mosaic Company (producer of phosphate and potash fertilizer); HanesBrands Inc. (a multinational clothing company) |
|
| | | | | |
Lawrence Hughes Age: 65 | | Trustee | | Since 2016 | | Mr. Hughes is retired. Formerly, he held senior management positions with BNY Mellon Wealth Management, a division of The Bank of New York Mellon Corporation (a financial services company)(1991-2015), most recently as Chief Executive Officer (2010-2015). Previously, Mr. Hughes served as an Advisory Board Member of Goldman Sachs Trust II (February 2016-April 2016). Trustee — Goldman Sachs Trust II; Goldman Sachs MLP and Energy Renaissance Fund; Goldman Sachs ETF Trust; Goldman Sachs ETF Trust II; and Goldman Sachs Real Estate Diversified Income Fund. | | 90 | | None |
|
| | | | | |
John F. Killian Age: 68 | | Trustee | | Since 2015 | | Mr. Killian is retired. He is Director, Consolidated Edison, Inc. (2007-Present); and was formerly Director, Houghton Mifflin Harcourt Publishing Company (2011-2022). Previously, he held senior management positions with Verizon Communications, Inc., including Executive Vice President and Chief Financial Officer (2009-2010); and President, Verizon Business, Verizon Communications, Inc. (2005-2009). Trustee — Goldman Sachs Trust II; Goldman Sachs MLP and Energy Renaissance Fund; Goldman Sachs ETF Trust; Goldman Sachs ETF Trust II; and Goldman Sachs Real Estate Diversified Income Fund. | | 90 | | Consolidated Edison, Inc. (a utility holding company) |
|
| | | | | |
Steven D. Krichmar Age: 65 | | Trustee | | Since 2018 | | Mr. Krichmar is retired. Formerly, he held senior management and governance positions with Putnam Investments, LLC, a financial services company (2001-2016). He was most recently Chief of Operations and a member of the Operating Committee of Putnam Investments, LLC and Principal Financial Officer of The Putnam Funds. Previously, Mr. Krichmar served as an Audit Partner with PricewaterhouseCoopers LLP and its predecessor company (1990-2001). Trustee — Goldman Sachs Trust II; Goldman Sachs MLP and Energy Renaissance Fund; Goldman Sachs ETF Trust; Goldman Sachs ETF Trust II; and Goldman Sachs Real Estate Diversified Income Fund. | | 90 | | None |
|
| | | | | |
Michael Latham Age: 58 | | Trustee | | Since 2021 | | Mr. Latham is retired. Formerly, he held senior management positions with the iShares exchange-traded fund business owned by BlackRock, Inc., including Chairman (2011-2014); Global Head (2010-2011); U.S. Head (2007-2010); and Chief Operating Officer (2003-2007). Trustee — Goldman Sachs Trust II; Goldman Sachs MLP and Energy Renaissance Fund; Goldman Sachs ETF Trust; Goldman Sachs ETF Trust II; Goldman Sachs Credit Income Fund; and Goldman Sachs Real Estate Diversified Income Fund. | | 91 | | FinTech Evolution Acquisition Group (a special purpose acquisition company) |
|
| | | | | |
| | | | | | | | | | |
GOLDMAN SACHS STRATEGIC MULTI-ASSET CLASS FUNDS
Trustees and Officers (Unaudited) (continued)
Independent Trustees
| | | | | | | | | | |
Name, Address and Age1 | | Position(s) Held with the Trust | | Term of Office and Length of Time Served2 | | Principal Occupation(s) During Past 5 Years | | Number of Portfolios in Fund Complex Overseen by Trustee3 | | Other Directorships Held by Trustee4 |
|
Lawrence W. Stranghoener Age: 69 | | Trustee | | Since 2021 | | Mr. Stranghoener is retired. He is Chairman, Kennametal, Inc. (a global manufacturer and distributor of tooling and industrial materials) (2003-Present); and was formerly Director, Aleris Corporation and Aleris International, Inc. (a producer of aluminum rolled products) (2011- 2020); Interim Chief Executive Officer (2014) and Executive Vice President and Chief Financial Officer (2004-2014), Mosaic Company (a fertilizer manufacturing company). Trustee — Goldman Sachs Trust II; Goldman Sachs MLP and Energy Renaissance Fund; Goldman Sachs ETF Trust; Goldman Sachs ETF Trust II; and Goldman Sachs Real Estate Diversified Income Fund. Chair of the Board of Trustees — Goldman Sachs Credit Income Fund. | | 91 | | Kennametal, Inc. (a global manufacturer and distributor of tooling and industrial materials) |
| | | | | | | | | | |
| | | | | | | | | | |
Name, Address and Age1 | | Position(s) Held with the Trust | | Term of Office and Length of Time Served2 | | Principal Occupation(s) During Past 5 Years | | Number of Portfolios in Fund Complex Overseen by Trustee3 | | Other Directorships Held by Trustee4 |
|
James A. McNamara Age: 61 | | President and Trustee | | | | Advisory Director, Goldman Sachs (January 2018-Present); Managing Director, Goldman Sachs (January 2000-December 2017); Director of Institutional Fund Sales, GSAM (April 1998- December 2000); and Senior Vice President and Manager, Dreyfus Institutional Service Corporation (January 1993-April 1998). President and Trustee — Goldman Sachs Trust II; Goldman Sachs Trust; Goldman Sachs Variable Insurance Trust; Goldman Sachs ETF Trust; Goldman Sachs ETF Trust II; Goldman Sachs MLP and Energy Renaissance Fund; Goldman Sachs Credit Income Fund; and Goldman Sachs Real Estate Diversified Income Fund. | | 193 | | None |
| | | | | | | | | | |
| * | Mr. McNamara is considered to be an “Interested Trustee” because he holds positions with Goldman Sachs and owns securities issued by The Goldman Sachs Group, Inc. Mr. McNamara holds comparable positions with certain other companies of which Goldman Sachs, GSAM or an affiliate thereof is the investment adviser, administrator and/or distributor. |
| 1 | Each Trustee may be contacted by writing to the Trustee, c/o Goldman Sachs, 200 West Street, New York, New York, 10282, Attn: Robert Griffith. Information is provided as of October 31, 2023. |
| 2 | Subject to such policies as may be adopted by the Board from time-to-time, each Trustee holds office for an indefinite term, until the earliest of: (a) the election of his or her successor; (b) the date the Trustee resigns or is removed by the Board or shareholders, in accordance with the Trust’s Declaration of Trust; or (c)the termination of the Trust. The Board has adopted policies which provide that each Independent Trustee shall retire as of December 31st of the calendar year in which he or she reaches (a) his or her 75th birthday or (b) the 15th anniversary of the date he or she became a Trustee, whichever is earlier, unless a waiver of such requirements shall have been adopted by a majority of the other Trustees. These policies may be changed by the Trustees without shareholder vote. |
| 3 | The Goldman Sachs Fund Complex includes certain other companies listed above for each respective Trustee. As of October 31, 2023, Goldman Sachs Trust II consisted of 18 portfolios (7 of which offered shares to the public); Goldman Sachs Trust consisted of 87 portfolios; Goldman Sachs Variable Insurance Trust consisted of 15 portfolios (11 of which offered shares to the public); Goldman Sachs ETF Trust consisted of 68 portfolios (34 of which offered shares to the public); Goldman Sachs ETF Trust II consisted of 2 portfolios; and Goldman Sachs MLP and Energy Renaissance Fund, Goldman Sachs Credit Income Fund and Goldman Sachs Real Estate Diversified Income Fund each consisted of one portfolio. Goldman Sachs MLP and Energy Renaissance Fund and Goldman Sachs Credit Income Fund did not offer shares to the public. |
| 4 | This column includes only directorships of companies required to report to the Securities and Exchange Commission under the Securities Exchange Act of 1934 (i.e., “public companies”) or other investment companies registered under the Act. |
Additional information about the Trustees is available in the Funds’ Statement of Additional Information, which can be obtained from Goldman Sachs free of charge by calling this toll-free number (in the United States of America): 1-800-526-7384.
GOLDMAN SACHS STRATEGIC MULTI-ASSET CLASS FUNDS
Trustees and Officers (Unaudited) (continued)
Officers of the Trust*
| | | | | | |
| Name, Address and Age1 | | Position(s) Held with the Trust | | Term of Office and Length of Time Served2 | | Principal Occupation(s) During Past 5 Years |
|
James A. McNamara 200 West Street New York, NY 10282 Age: 61 | | President and Trustee | | Since 2012 | | Advisory Director, Goldman Sachs (January 2018-Present); Managing Director, Goldman Sachs (January 2000-December 2017); Director of Institutional Fund Sales, GSAM (April 1998-December 2000); and Senior Vice President and Manager, Dreyfus Institutional Service Corporation (January 1993-April 1998). President and Trustee — Goldman Sachs Trust II; Goldman Sachs Trust; Goldman Sachs Variable Insurance Trust; Goldman Sachs ETF Trust; Goldman Sachs ETF Trust II; Goldman Sachs MLP and Energy Renaissance Fund; Goldman Sachs Credit Income Fund; and Goldman Sachs Real Estate Diversified Income Fund. |
|
Joseph F. DiMaria 30 Hudson Street Jersey City, NJ 07302 Age: 55 | | Treasurer, Principal Financial Officer and Principal Accounting Officer | | Since 2017 (Treasurer and Principal Financial Officer Since 2019) | | Managing Director, Goldman Sachs (November 2015-Present) and Vice President — Mutual Fund Administration, Columbia Management Investment Advisers, LLC (May 2010-October 2015). Treasurer, Principal Financial Officer and Principal Accounting Officer — Goldman Sachs Trust II (previously Assistant Treasurer (2017)); Goldman Sachs Trust (previously Assistant Treasurer (2016)); Goldman Sachs Variable Insurance Trust (previously Assistant Treasurer (2016)); Goldman Sachs MLP and Energy Renaissance Fund (previously Assistant Treasurer (2017)); Goldman Sachs ETF Trust (previously Assistant Treasurer (2017)); Goldman Sachs ETF Trust II; Goldman Sachs Credit Income Fund; and Goldman Sachs Real Estate Diversified Income Fund. |
|
Robert Griffith 200 West Street New York, NY 10282 Age: 49 | | Secretary | | Since 2022 | | Managing Director, Goldman Sachs (September 2022 – Present); General Counsel, Exchange Traded Concepts, LLC (October 2021 – September 2022); Vice President, Goldman Sachs (August 2011 – October 2021); Associate General Counsel, Goldman Sachs (December 2014 – Present); Assistant General Counsel, Goldman Sachs (August 2011 – December 2014); Vice President and Counsel, Nomura Holding America, Inc. (2010 – 2011); and Associate, Simpson Thacher & Bartlett LLP (2005 – 2010). Secretary — Goldman Sachs Trust II (previously Assistant Secretary (2022)); Goldman Sachs Trust (previously Assistant Secretary (2022)); Goldman Sachs Variable Insurance Trust (previously Assistant Secretary (2022)); Goldman Sachs ETF Trust (previously Assistant Secretary (2022)); Goldman Sachs ETF Trust II (previously Assistant Secretary (2022)); and Goldman Sachs Real Estate Diversified Income Fund (previously Assistant Secretary (2022)). Assistant Secretary — Goldman Sachs MLP and Energy Renaissance Fund. |
|
| | | | | | |
| * | Represents a partial list of officers of the Trust. Additional information about all the officers is available in the Funds’ Statement of Additional Information, which can be obtained from Goldman Sachs free of charge by calling this toll-free number (in the United States): 1-800-526-7384. |
| 1 | Information is provided as of October 31, 2023. |
| 2 | Officers hold office at the pleasure of the Board of Trustees or until their successors are duly elected and qualified. Each officer holds comparable positions with certain other companies of which Goldman Sachs, GSAM or an affiliate thereof is the investment adviser, administrator and/or distributor. |
Goldman Sachs Trust II – Strategic Multi-Asset Class Funds - Tax Information (Unaudited)
For the year ended October 31, 2023, 14.92%, 0.75% and 24.34% of the dividends paid from net investment company taxable income by the Multi-Manager Global Equity, Multi-Manager Non-Core Fixed Income Fund, and Multi-Manager Real Assets Strategy Fund, respectively, qualify for the dividends received deduction available to corporations.
For the year ended October 31, 2023, 0.34% of the dividend paid from net investment company taxable income by the Multi-Manager Global Equity Fund qualify as section 199A dividends.
For the year ended October 31, 2023, 37.10% and 100% of the dividends paid from net investment company taxable income by the Multi-Manager Global Equity Fund and Multi-Manager Real Assets Strategy Fund, respectively, qualify for the reduced tax rate under the Jobs and Growth Tax Relief and Reconciliation Act of 2003.
Pursuant to Section 852 of the Internal Revenue Code, the Multi-Manager Global Equity Fund and the Multi-Manager Real Assets Strategy Fund designate $22,308,741 and $20,507,645, or if different, the maximum amount allowable, as capital gain dividends paid during the fiscal year ended October 31, 2023.
For the year ended October 31, 2023, the Multi-Manager Non-Core Fixed Income designates 100% of the dividends paid from net investment company taxable income as section 163(j) Interest Dividends.
(This page intentionally left blank)
(This page intentionally left blank)
FUNDS PROFILE
Goldman Sachs Funds
Goldman Sachs is a premier financial services firm, known since 1869 for creating thoughtful and customized investment solutions in complex global markets.
Today, the Asset Management Division of Goldman Sachs serves a diverse set of clients worldwide, including private institutions, public entities and individuals. With approximately $2.42 trillion in assets under supervision as of September 30, 2023, Goldman Sachs Asset Management has portfolio management teams located around the world and our investment professionals bring firsthand knowledge of local markets to every investment decision. Assets under supervision includes assets under management and other client assets for which Goldman Sachs does not have full discretion. Goldman Sachs Asset Management leverages the resources of Goldman Sachs & Co. LLC subject to legal, internal and regulatory restrictions.
Money Market
Financial Square FundsSM
| ∎ | Financial Square Treasury Solutions Fund1 |
| ∎ | Financial Square Government Fund1 |
| ∎ | Financial Square Money Market Fund2 |
| ∎ | Financial Square Prime Obligations Fund2 |
| ∎ | Financial Square Treasury Instruments Fund1 |
| ∎ | Financial Square Treasury Obligations Fund1 |
| ∎ | Financial Square Federal Instruments Fund1 |
Investor FundsSM
| ∎ | Investor Money Market Fund3 |
| ∎ | Investor Tax-Exempt Money Market Fund3 |
Fixed Income
Short Duration and Government
| ∎ | Short-Term Conservative Income Fund |
| ∎ | Short Duration Government Fund |
| ∎ | Short Duration Bond Fund |
| ∎ | Inflation Protected Securities Fund |
Multi-Sector
| ∎ | Global Core Fixed Income Fund |
Municipal and Tax-Free
| ∎ | High Yield Municipal Fund |
| ∎ | Dynamic Municipal Income Fund |
| ∎ | Short Duration Tax-Free Fund |
| ∎ | Municipal Income Completion Fund |
Single Sector
| ∎ | Investment Grade Credit Fund |
| ∎ | High Yield Floating Rate Fund |
| ∎ | Emerging Markets Debt Fund |
| ∎ | Emerging Markets Credit Fund4 |
Fixed Income Alternatives
| ∎ | Long Short Credit Strategies Fund |
Fundamental Equity
| ∎ | Small/Mid Cap Value Fund |
| ∎ | Small/Mid Cap Growth Fund |
| ∎ | Concentrated Growth Fund |
| ∎ | Technology Opportunities Fund |
| ∎ | Rising Dividend Growth Fund |
Tax-Advantaged Equity
| ∎ | U.S. Tax-Managed Equity Fund |
| ∎ | International Tax-Managed Equity Fund |
| ∎ | U.S. Equity Dividend and Premium Fund |
| ∎ | International Equity Dividend and Premium Fund |
Equity Insights
| ∎ | Small Cap Equity Insights Fund |
| ∎ | U.S. Equity Insights Fund |
| ∎ | Small Cap Growth Insights Fund |
| ∎ | Large Cap Growth Insights Fund |
| ∎ | Large Cap Value Insights Fund |
| ∎ | Small Cap Value Insights Fund |
| ∎ | International Small Cap Insights Fund |
| ∎ | International Equity Insights Fund |
| ∎ | Emerging Markets Equity Insights Fund |
Fundamental Equity International
| ∎ | International Equity Income Fund |
| ∎ | International Equity ESG Fund |
| ∎ | Emerging Markets Equity Fund |
| ∎ | Emerging Markets Equity ex. China Fund |
| ∎ | ESG Emerging Markets Equity Fund |
Alternative
| ∎ | Clean Energy Income Fund |
| ∎ | Real Estate Securities Fund |
| ∎ | Global Real Estate Securities Fund |
| ∎ | Absolute Return Tracker Fund |
| ∎ | Managed Futures Strategy Fund |
| ∎ | MLP Energy Infrastructure Fund |
| ∎ | Energy Infrastructure Fund |
| ∎ | Multi-Strategy Alternatives Fund5 |
| ∎ | Global Infrastructure Fund |
Total Portfolio Solutions
| ∎ | Global Managed Beta Fund |
| ∎ | Multi-Manager Non-Core Fixed Income Fund |
| ∎ | Multi-Manager Global Equity Fund |
| ∎ | Multi-Manager International Equity Fund |
| ∎ | Tactical Tilt Overlay Fund |
| ∎ | Balanced Strategy Portfolio |
| ∎ | Multi-Manager U.S. Small Cap Equity Fund |
| ∎ | Multi-Manager Real Assets Strategy Fund |
| ∎ | Growth and Income Strategy Portfolio |
| ∎ | Growth Strategy Portfolio |
| ∎ | Dynamic Global Equity Fund |
| ∎ | Satellite Strategies Portfolio |
| ∎ | Enhanced Dividend Global Equity Portfolio |
| ∎ | Tax-Advantaged Global Equity Portfolio |
| ∎ | Strategic Factor Allocation Fund |
| ∎ | Strategic Volatility Premium Fund |
| ∎ | GQG Partners International Opportunities Fund |
| 1 | You could lose money by investing in the Fund. Although the Fund seeks to preserve the value of your investment at $1.00 per share, it cannot guarantee it will do so. An investment in the Fund is not a deposit of a bank and is not insured or guaranteed by the Federal Deposit Insurance Corporation or any other government agency. The Fund’s sponsor has no legal obligation to provide financial support to the Fund, and you should not expect that the sponsor will provide financial support to the Fund at any time. |
| 2 | You could lose money by investing in the Fund. Because the share price of the Fund will fluctuate, when you sell your shares they may be worth more or less than what you originally paid for them. The Fund may impose a fee upon sale of your shares or may temporarily suspend your ability to sell shares if the Fund’s liquidity falls below required minimums because of market conditions or other factors. An investment in the Fund is not a deposit of a bank and is not insured or guaranteed by the Federal Deposit Insurance Corporation or any other government agency. The Fund’s sponsor has no legal obligation to provide financial support to the Fund, and you should not expect that the sponsor will provide financial support to the Fund at any time. |
| 3 | You could lose money by investing in the Fund. Although the Fund seeks to preserve the value of your investment at $1.00 per share, it cannot guarantee it will do so. The Fund may impose a fee upon sale of your shares or may temporarily suspend your ability to sell shares if the Fund’s liquidity falls below required minimums because of market conditions or other factors. An investment in the Fund is not a deposit of a bank and is not insured or guaranteed by the Federal Deposit Insurance Corporation or any other government agency. The Fund’s sponsor has no legal obligation to provide financial support to the Fund, and you should not expect that the sponsor will provide financial support to the Fund at any time. |
| 4 | Effective after the close of business on October 31, 2023, the Goldman Sachs Local Emerging Markets Debt Fund was renamed the Goldman Sachs Emerging Markets Credit Fund. |
| 5 | Effective after the close of business on September 22, 2023, the Goldman Sachs Multi-Manager Alternatives Fund was renamed the Goldman Sachs Multi-Strategy Alternatives Fund. |
| | Financial Square FundsSM and Investor FundsSM are registered service marks of Goldman Sachs & Co. LLC. |
| * | This list covers open-end funds only. Please visit our website at www.GSAMFUNDS.com to learn about our closed-end funds and exchange-traded funds. |
TRUSTEES Cheryl K. Beebe, Chair Lawrence Hughes John F. Killian Steven D. Krichmar Michael Latham James A. McNamara Lawrence W. Stranghoener GOLDMAN SACHS & CO. LLC Distributor and Transfer Agent OFFICERS James A. McNamara, President Joseph F. DiMaria, Principal Financial Officer, Principal Accounting Officer and Treasurer Robert Griffith, Secretary GOLDMAN SACHS ASSET MANAGEMENT, L.P. Investment Adviser Visit our web site at www.GSAMFUNDS.com to obtain the most recent month-end returns. Goldman Sachs Asset Management, L.P., 200 West Street, New York, New York 10282 The reports concerning the Funds included in this shareholder report may contain certain forward-looking statements about the factors that may affect the performance of the Funds in the future. These statements are based on Fund management’s predictions and expectations concerning certain future events and their expected impact on the Funds, such as performance of the economy as a whole and of specific industry sectors, changes in the levels of interest rates, the impact of developing world events, and other factors that may influence the future performance of the Funds. Management believes these forward-looking statements to be reasonable, although they are inherently uncertain and difficult to predict. Actual events may cause adjustments in portfolio management strategies from those currently expected to be employed. A description of the policies and procedures that the Funds use to determine how to vote proxies relating to portfolio securities and information regarding how Funds voted proxies relating to portfolio securities during the most recent 12-month period ended June 30 are available (I) without charge, upon request by calling 1-800-621-2550; and (II) on the Securities and Exchange Commission (’’SEC’’) web site at http://www.sec.gov. The Funds will file their portfolio holdings information for each month in a fiscal quarter within 60 days after the end of the relevant fiscal quarter on Form N-PORT. Portfolio holdings information for the third month of each fiscal quarter will be made available on the SEC’s web site at http://www.sec.gov. Portfolio holdings information may be obtained upon request and without charge by calling 1-800-526-7384 (for Retail Shareholders) or 1-800-621-2550 (for Institutional Shareholders). Goldman Sachs & Co. LLC (‘‘Goldman Sachs’’) does not provide legal, tax or accounting advice. Any statement contained in this communication (including any attachments) concerning U.S. tax matters was not intended or written to be used, and cannot be used, for the purpose of avoiding penalties under the Internal Revenue Code, and was written to support the promotion or marketing of the transaction(s) or matter(s) addressed. Clients of Goldman Sachs should obtain their own independent tax advice based on their particular circumstances. Economic and market forecasts presented herein reflect our judgment as of the date of this presentation and are subject to change without notice. These forecasts do not take into account the specific investment objectives, restrictions, tax and financial situation or other needs of any specific client. Actual data will vary and may not be reflected here. These forecasts are subject to high levels of uncertainty that may affect actual performance. Accordingly, these forecasts should be viewed as merely representative of a broad range of possible outcomes. These forecasts are estimated, based on assumptions, and are subject to significant revision and may change materially as economic and market conditions change. Goldman Sachs has no obligation to provide updates or changes to these forecasts. Case studies and examples are for illustrative purposes only. The Global Industry Classification Standard (GICS) was developed by and is the exclusive property and a service mark of Morgan Stanley Capital International Inc. (MSCI) and Standard & Poor’s, a division of The McGraw-Hill Companies, Inc. (S&P) and is licensed for use by Goldman Sachs. Neither MSCI, S&P nor any other party involved in making or compiling the GICS or any GICS classifications makes any express or implied warranties or representations with respect to such standard or classification (or the results to be obtained by the use thereof), and all such parties hereby expressly disclaim all warranties of originality, accuracy, completeness, merchantability or fitness for a particular purpose with respect to any of such standard or classification. Without limiting any of the foregoing, in no event shall MSCI, S&P, any of their affiliatesorany third party involved in making or compiling the GICS or any GICS classifications have any liability for any direct, indirect, special, punitive, consequential or any other damages (including lost profits) even if notified of the possibility of such damages. The portfolio risk management process includes an effort to monitor and manage risk, but does not imply low risk. Diversification does not protect an investor from market risk and does not ensure a profit. Past correlations are not indicative of future correlations, which may vary. This material is not authorized for distribution to prospective investors unless preceded or accompanied by a current prospectus or summary prospectus, if applicable. Investors should consider each Fund’s objective, risks, and charges and expenses, and read the summary prospectus, if available, and/or the prospectus carefully before investing or sending money. The summary prospectus, if available, and the prospectus contain this and other information about each Fund may be obtained from your authorized dealer or from Goldman Sachs & Co. LLC by calling 1-800-621-2550 © 2023 Goldman Sachs. All rights reserved. 348256-OTU-1929093 SMACAR-23
(a) As of the end of the period covered by this report, the registrant has adopted a code of ethics that applies to the registrant’s principal executive officer, principal financial officer, principal accounting officer or controller, or persons performing similar functions, regardless of whether these individuals are employed by the registrant or a third party (the “Code of Ethics”).
(b) Not applicable.
(c) During the period covered by this report, no amendments were made to the provisions of the Code of Ethics.
(d) During the period covered by this report, the registrant did not grant any waivers, including an implicit waiver, from any provision of the Code of Ethics.
(e) Not applicable.
(f) A copy of the Code of Ethics is available as provided in Item 13(a)(1) of this report.
| ITEM 3. | AUDIT COMMITTEE FINANCIAL EXPERT. |
The registrant’s board of trustees has determined that the registrant has at least one “audit committee financial expert” (as defined in Item 3 of Form N-CSR) serving on its audit committee. John F. Killian is the “audit committee financial expert” and is “independent” (as each term is defined in Item 3 of Form N-CSR).
| ITEM 4. | PRINCIPAL ACCOUNTANT FEES AND SERVICES. |
Table 1 — Items 4(a) - 4(d). The accountant fees below reflect the aggregate fees billed by the Funds of the Goldman Sachs Trust II to which this certified shareholder report relates.
| | | | | | | | | | | | |
| | | 2023 | | 2022 | | Description of Services Rendered |
| | | |
Audit Fees: | | | | | | | | | | | | |
| | | |
• PricewaterhouseCoopers LLP
(“PwC”) | | | $ | 490,622 | | | | $ | 562,318 | | | Financial Statement audits. |
| | | |
Audit-Related Fees: | | | | | | | | | | | | |
| | | |
• PwC | | | $ | 100,800 | | | | $ | 64,000 | | | Other attest services. |
| | | |
Tax Fees: | | | | | | | | | | | | |
| | | |
• PwC | | | $ | 0 | | | | $ | 0 | | | |
Table 2 — Items 4(b)(c) & (d). Non-Audit Services to the Goldman Sachs Trust II’s service affiliates* that were pre-approved by the Audit Committee of the Goldman Sachs Trust II pursuant to Rule 2-01(c)(7)(ii) of Regulation S-X.
| | | | | | | | | | | | |
| | | 2023 | | 2022 | | Description of Services Rendered |
| | | |
Audit-Related Fees: | | | | | | | | | | | | |
| | | |
• PwC | | | $ | 2,075,449 | | | | $ | 1,906,448 | | | Internal control review performed in accordance with Statement on Standards for Attestation Engagements No. 16 and semi-annual updates relating to withholding tax accrual for non-US jurisdictions. These fees are borne by the Funds’ Adviser. |
| * | These include the advisor (excluding sub-advisors) and any entity controlling, controlled by or under common control with the advisor that provides ongoing services to the registrant (hereinafter referred to as “service affiliates”). |
Item 4(e)(1) — Audit Committee Pre-Approval Policies and Procedures
Pre-Approval of Audit and Non-Audit Services Provided to the Funds of the Goldman Sachs Trust II. The Audit and Non-Audit Services Pre-Approval Policy (the “Policy”) adopted by the Audit Committee of Goldman Sachs Trust II (“GST II”) sets forth the procedures and the conditions pursuant to which services performed by an independent auditor for GST II may be pre-approved. Services may be pre-approved specifically by the Audit Committee as a whole or, in certain circumstances, by the Audit Committee Chairman or the person designated as the Audit Committee Financial Expert. In addition, subject to specified cost limitations, certain services may be pre-approved under the provisions of the Policy. The Policy provides that the Audit Committee will consider whether the services provided by an independent auditor are consistent with the Securities and Exchange Commission’s rules on auditor independence. The Policy provides for periodic review and pre-approval by the Audit Committee of the services that may be provided by the independent auditor.
De Minimis Waiver. The pre-approval requirements of the Policy may be waived with respect to the provision of non-audit services that are permissible for an independent auditor to perform, provided (1) the aggregate amount of all such services provided constitutes no more than five percent of the total amount of revenues subject to pre-approval that was paid to the independent auditors during the fiscal year in which the services are provided; (2) such services were not recognized by GST II at the time of the engagement to be non-audit services; and (3) such services are promptly brought to the attention of the Audit Committee and approved prior to the completion of the audit by the Audit Committee or by one or more members of the Audit Committee to whom authority to grant such approvals has been delegated by the Audit Committee, pursuant to the pre-approval provisions of the Policy.
Pre-Approval of Non-Audit Services Provided to GST’s Investment Advisers. The Policy provides that, in addition to requiring pre-approval of audit and non-audit services provided to GST II, the Audit Committee will pre-approve those non-audit services provided to GST II’s investment advisers (and entities controlling, controlled by or under common control with the investment advisers that provide ongoing services to GST II) where the engagement relates directly to the operations or financial reporting of GST II.
Item 4(e)(2) – 0% of the audit-related fees, tax fees and other fees listed in Table 1 were approved by GST II’s Audit Committee pursuant to the “de minimis” exception of Rule 2-01(c)(7)(i)(C) of Regulation S-X. In addition, 0% of the non-audit services to the GST II’s service affiliates listed in Table 2 were approved by GST II’s Audit Committee pursuant to the “de minimis” exception of Rule 2-01(c)(7)(i)(C) of Regulation S-X.
Item 4(f) – Not applicable.
Item 4(g) Aggregate Non-Audit Fees Disclosure
The aggregate non-audit fees billed to GST II by PwC for the twelve months ended October 31, 2023 and October 31, 2022 were $100,800 and $64,000, respectively. The aggregate non-audit fees billed to GST II’s adviser and service affiliates by PwC for the twelve months ended December 31, 2022 and December 31, 2021 were approximately $17.1 million and $14.4 million, respectively. The figures for these entities are not yet available for the twelve months ended December 31, 2023. With regard to the aggregate non-audit fees billed to GST II’s adviser and service affiliates, the 2022 and 2021 amounts include fees for non-audit services required to be pre-approved [see Table 2] and fees for non-audit services that did not require pre-approval since they did not directly relate to GST II’s operations or financial reporting.
Item 4(h) — GST II’s Audit Committee has considered whether the provision of non-audit services to GST II’s investment adviser and service affiliates that did not require pre-approval pursuant to paragraph (c)(7)(ii) of Rule 2-01 of Regulation S-X is compatible with maintaining the auditors’ independence.
Item 4(i) – Not applicable.
Item 4(j) – Not applicable.
| ITEM 5. | AUDIT COMMITTEE OF LISTED REGISTRANTS. |
| ITEM 6. | SCHEDULE OF INVESTMENTS. |
| | Schedule of Investments is included as part of the Report to Shareholders filed under Item 1. |
| ITEM 7. | DISCLOSURE OF PROXY VOTING POLICIES AND PROCEDURES FOR CLOSED-END MANAGEMENT INVESTMENT COMPANIES. |
| ITEM 8. | PORTFOLIO MANAGERS OF CLOSED-END MANAGEMENT INVESTMENT COMPANIES. |
| ITEM 9. | PURCHASES OF EQUITY SECURITIES BY CLOSED-END MANAGEMENT INVESTMENT COMPANY AND AFFILIATED PURCHASERS. |
| ITEM 10. | SUBMISSION OF MATTERS TO A VOTE OF SECURITY HOLDERS. |
| | There have been no material changes to the procedures by which shareholders may recommend nominees to the registrant’s board of trustees. |
| ITEM 11. | CONTROLS AND PROCEDURES. |
| | (a) | The registrant’s principal executive and principal financial officers, or persons performing similar functions have concluded that the registrant’s disclosure controls and procedures (as defined in Rule 30a-3(c) under the Investment Company Act of 1940, as amended (the “1940 Act”)) are effective as of a date within 90 days of the filing of this report that includes the disclosure required by this paragraph, based on the evaluation of these controls and procedures required by Rule 30a-3(b) under the 1940 Act and 15d-15(b) under the Securities Exchange Act of 1934, as amended. |
| | (b) | There were no changes in the registrant’s internal control over financial reporting (as defined in Rule 30a-3(d) under the 1940 Act) that occurred during the period covered by this report that have materially affected, or are reasonably likely to materially affect, the registrant’s internal control over financial reporting. |
| ITEM 12. | DISCLOSURE OF SECURITIES LENDING ACTIVITIES FOR CLOSED-END MANAGEMENT INVESTMENT COMPANIES. |
SIGNATURES
Pursuant to the requirements of the Securities Exchange Act of 1934 and the Investment Company Act of 1940, the registrant has duly caused this report to be signed on its behalf by the undersigned, thereunto duly authorized.
| | | | |
| | | | Goldman Sachs Trust II |
| | |
| By: | | | | /s/ James A. McNamara |
| | |
| | | | James A. McNamara |
| | | | President/Chief Executive Officer |
| | | | Goldman Sachs Trust II |
| | |
| Date: | | | | January 4, 2024 |
Pursuant to the requirements of the Securities Exchange Act of 1934 and the Investment Company Act of 1940, this report has been signed below by the following persons on behalf of the registrant and in the capacities and on the dates indicated.
| | | | |
| | |
| By: | | | | /s/ James A. McNamara |
| | |
| | | | James A. McNamara |
| | | | President/Chief Executive Officer |
| | | | Goldman Sachs Trust II |
| | |
| Date: | | | | January 4, 2024 |
| | |
| By: | | | | /s/ Joseph F. DiMaria |
| | |
| | | | Joseph F. DiMaria |
| | | | Principal Financial Officer |
| | | | Goldman Sachs Trust II |
| | |
| Date: | | | | January 4, 2024 |