UNITED STATES
SECURITIES AND EXCHANGE COMMISSION
Washington, D.C. 20549
FORM N-CSR
CERTIFIED SHAREHOLDER REPORT OF REGISTERED
MANAGEMENT INVESTMENT COMPANIES
Investment Company Act file number 811-22781
Goldman Sachs Trust II
(Exact name of registrant as specified in charter)
200 West Street
15th Floor
New York, New York 10282
(Address of principal executive offices) (Zip code)
Copies to:
| | |
Robert Griffith, Esq. Goldman Sachs & Co. LLC 200 West Street New York, NY 10282 | | Stephen H. Bier, Esq. Dechert LLP 1095 Avenue of the Americas New York, NY 10036 |
(Name and address of agents for service)
Registrant’s telephone number, including area code: (212) 902-1000
Date of fiscal year end: October 31
Date of reporting period: October 31, 2024
| ITEM 1. | REPORTS TO STOCKHOLDERS. |
The Annual Report to Shareholders for the Goldman Sachs Multi-Strategy Alternatives Fund, Goldman Sachs Multi-Manager Non-Core Fixed Income Fund, Goldman Sachs Multi-Manager Global Equity Fund, Goldman Sachs Multi-Manager Real Assets Strategy Fund, Multi-Manager International Equity Fund, and Multi-Manager U.S. Small Cap Equity Fund is filed herewith.
Annual Shareholder Report
October 31, 2024
Goldman Sachs Multi-Manager Global Equity Fund
This annual shareholder report contains important information about Goldman Sachs Multi-Manager Global Equity Fund (the "Fund") for the period of November 1, 2023 to October 31, 2024. You can find additional information about the Fund at am.gs.com or dfinview.com/GoldmanSachs. You can also request this information by contacting us at 1-800-621-2550.
What were the Fund costs for the period?
Based on a hypothetical $10,000 investment.
| Class | Costs of a $10,000 investment | Costs paid as a percentage of a $10,000 investment |
|---|
| R6 | $57 | 0.50% |
How did the Fund perform and what affected its performance?
Global equities broadly rallied as waning inflation levels led to interest rate cuts by a growing number of central banks. U.S. stocks produced the strongest gains, followed closely by non-U.S. developed markets and emerging markets equities. Growth-oriented stocks generally outperformed their value counterparts.
Top Contributors to Performance:
All 11 of the Fund’s underlying managers generated positive absolute returns, with six outperforming their respective benchmark indices.
Underlying manager WCM Investment Management, LLC performed best versus its benchmark, driven by stock selection in consumer discretionary and industrials. Health care picks detracted.
Wellington Management Company LLP outpaced its benchmark on selection in consumer discretionary and industrials. Selection in communication services detracted. All of its quantitative equity model’s factors bolstered returns.
Diamond Hill Capital Management Inc. outperformed its benchmark due to selection in consumer discretionary and materials. Selection in consumer staples detracted.
Axiom Investors LLC beat its benchmark due to selection in consumer discretionary and industrials. Selection in financials detracted.
Causeway Capital Management LLC and MFS Investment Management slightly outperformed their respective benchmarks.
Top Detractors from Performance:
Vaughan Nelson Investment Management, L.P. significantly underperformed its benchmark, with selection in energy and consumer staples detracting. Selection in materials was positive.
GW&K Investment Management, LLC trailed its benchmark largely due to selection in information technology and consumer staples. An underweight in energy added.
Boston Partners Global Investors, Inc. underperformed its benchmark due to selection in health care and communication services. Consumer discretionary selection added.
Principal Global Investors, LLC lagged its benchmark due to selection in health care and consumer discretionary. Information technology picks added.
T. Rowe Price Associates, Inc. modestly underperformed its benchmark.
The above represents the Fund’s overall global equity exposures.
Goldman Sachs Multi-Manager Global Equity Fund
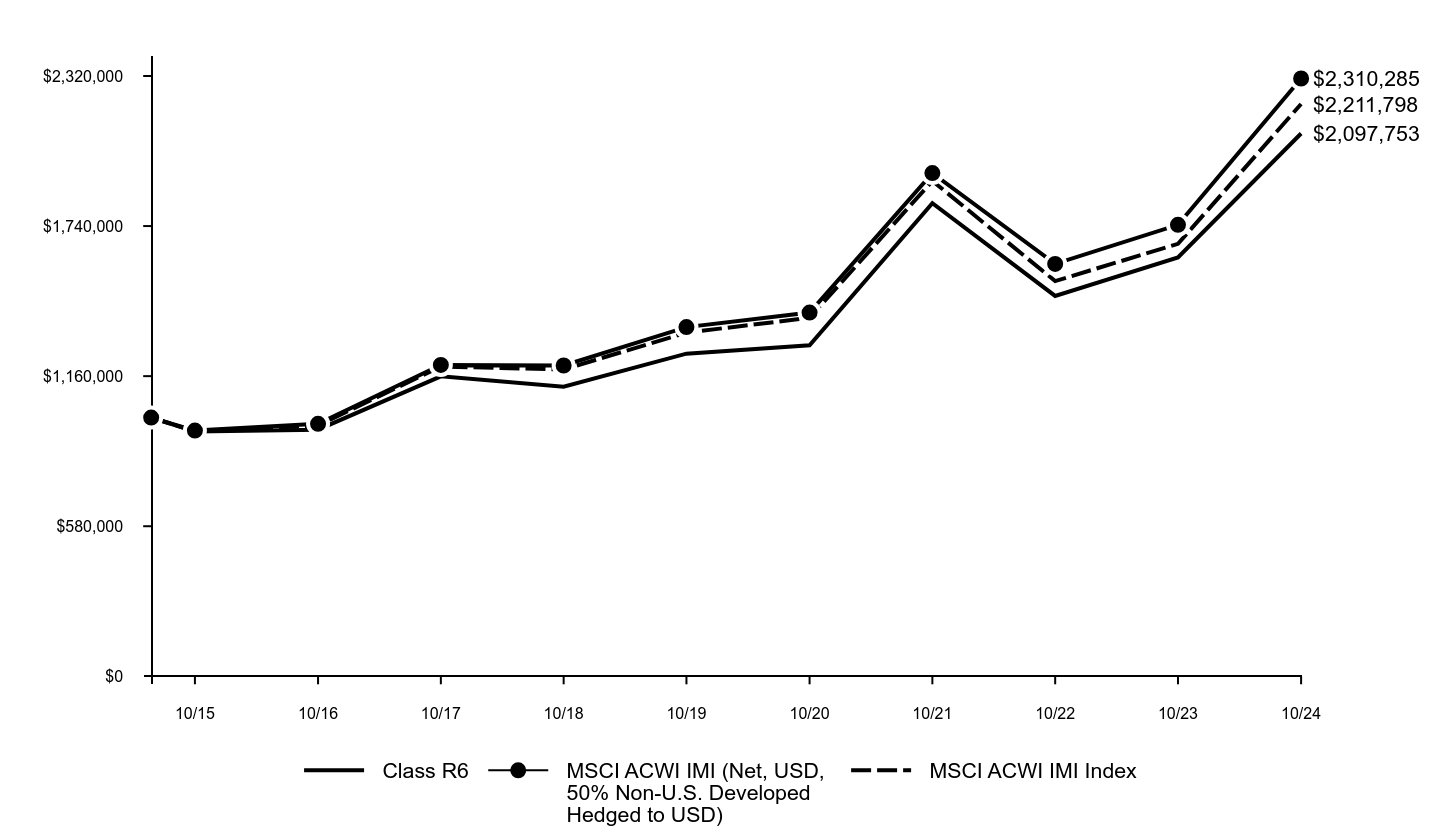
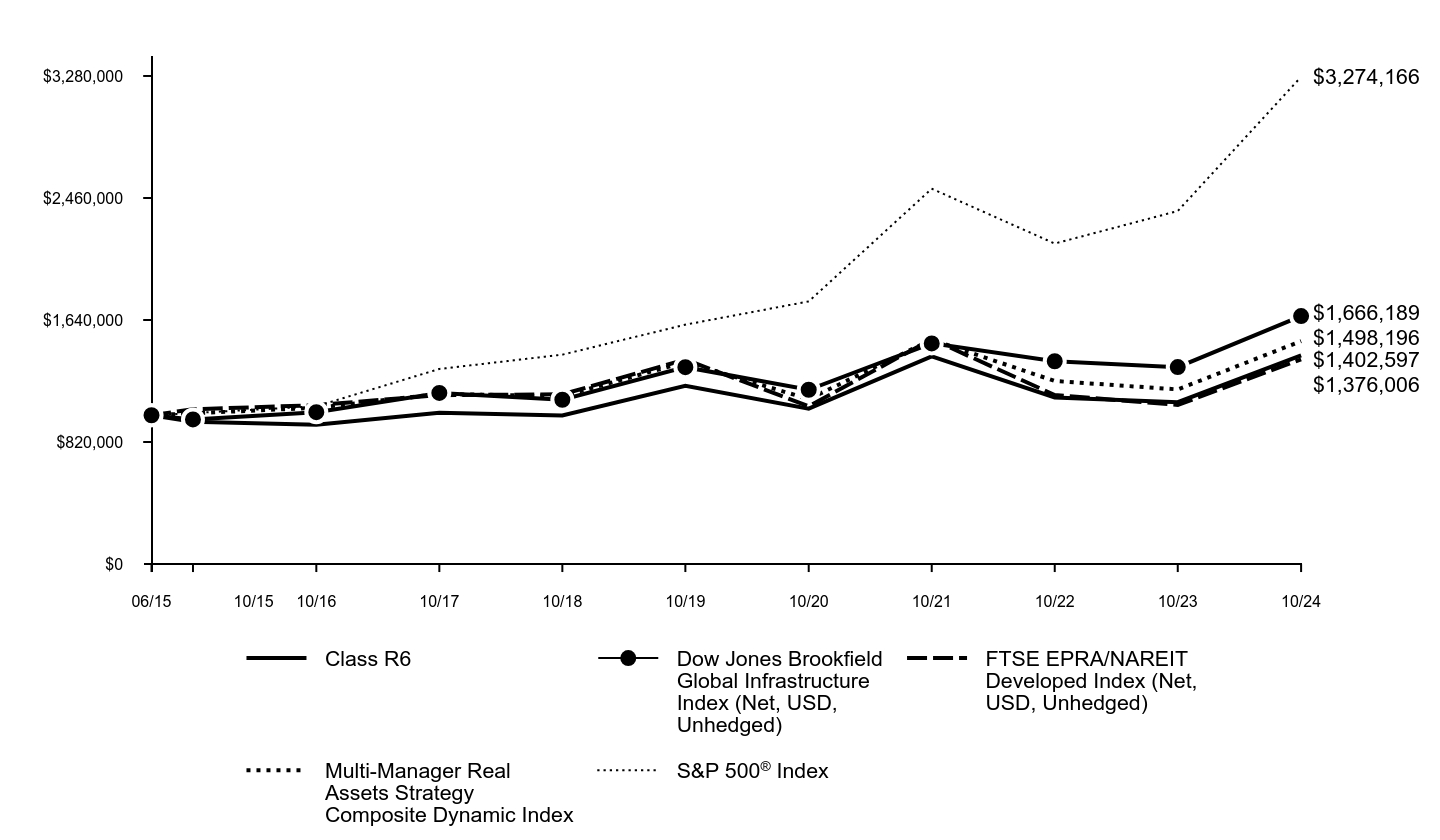
The following graph assumes an initial $1,000,000 investment in the Fund and compares the initial and subsequent account values at the end of each of the most recently completed 10 fiscal years of the Fund's share class (or less if the share class has been in operation for less than 10 years). The Fund's performance reflects applicable sales charges, if any. For comparative purposes, the performance of the Fund's benchmark and any additional performance benchmark(s) are also shown.
| Class R6 | MSCI ACWI IMI (Net, USD, 50% Non-U.S. Developed Hedged to USD) | MSCI ACWI IMI Index |
|---|
| 06/15 | $1,000,000 | $1,000,000 | $1,000,000 |
| 10/15 | $946,000 | $949,700 | $947,000 |
| 10/16 | $953,000 | $975,627 | $969,160 |
| 10/17 | $1,159,134 | $1,203,241 | $1,197,106 |
| 10/18 | $1,119,376 | $1,201,075 | $1,185,734 |
| 10/19 | $1,246,873 | $1,349,528 | $1,328,140 |
| 10/20 | $1,279,292 | $1,405,803 | $1,385,516 |
| 10/21 | $1,828,492 | $1,944,647 | $1,914,506 |
| 10/22 | $1,469,924 | $1,593,833 | $1,527,393 |
| 10/23 | $1,618,387 | $1,744,928 | $1,671,426 |
| 10/24 | $2,097,753 | $2,310,285 | $2,211,798 |
Average Annual Total Returns (%)
| AATR | 1 Year | 5 Years | Since Inception 6/24/15 |
|---|
| Class R6 | 29.62% | 10.95% | 8.23% |
| MSCI ACWI IMI (Net, USD, 50% Non-U.S. Developed Hedged to USD) | 32.40% | 11.34% | 9.35% |
| MSCI ACWI IMI Index | 32.33% | 10.73% | 8.85% |
Performance data quoted above represents past performance. Past performance does not guarantee future results.
The Fund’s investment return and principal value will fluctuate so that an investor’s shares, when redeemed, may be worth more or less than their original cost. Current performance may be lower or higher than the performance quoted above. Please visit our web site at: am.gs.com to obtain the most recent month-end returns. Performance reflects applicable fee waivers and/or expense limitations in effect during the periods shown and in their absence, performance would be reduced. The graph and table do not reflect the deduction of taxes that a shareholder would pay on Fund distributions or redemption of Fund shares. In accordance with changing regulatory requirements, the Fund is now required to compare its performance to a regulatory benchmark, which in this case is the MSCI ACWI IMI Index.
Goldman Sachs Multi-Manager Global Equity Fund
| Total Net Assets | $1,314,598,549 |
| # of Portfolio Holdings | 905 |
| Portfolio Turnover Rate | 66% |
| Total Net Advisory Fees Paid | $4,067,282 |
What did the Fund invest in?
The table below shows the investment makeup of the Fund, representing the percentage of total net assets of the Fund. Figures in the table below may not sum to 100% due to the exclusion of other assets and liabilities and may not represent the Fund’s market exposure due to the exclusion of certain derivatives, if any. These allocations may not be representative of the Fund’s future investments.
| Information Technology | 19.9% |
| Financials | 15.9% |
| Industrials | 12.8% |
| Consumer Discretionary | 11.8% |
| Health Care | 11.6% |
| Communication Services | 5.9% |
| Consumer Staples | 4.1% |
| Materials | 3.9% |
| Energy | 3.0% |
| Other | 11.5% |
Goldman Sachs Multi-Manager Global Equity Fund
If you wish to view additional information about the Fund, including the documents and other information listed below, please visit dfinview.com/GoldmanSachs or call 1-800-621-2550.
prospectus
financial information
fund holdings
proxy voting information
Goldman Sachs & Co. LLC is the distributor of the Goldman Sachs Funds.
The Morgan Stanley Capital International Inc. (MSCI) information may only be used for your internal use, may not be reproduced or redisseminated in any form and may not be used as a basis for or a component of any financial instruments or products or indices. None of the MSCI information is intended to constitute investment advice or a recommendation to make (or refrain from making) any kind of investment decision and may not be relied on as such. Historical data and analysis should not be taken as an indication or guarantee of any future performance analysis, forecast or prediction. The MSCI information is provided on an “as is” basis and the user of this information assumes the entire risk of any use made of this information. MSCI, each of its affiliates and each other person involved in or related to compiling, computing or creating any MSCI information (collectively, the “MSCI Parties”) expressly disclaims all warranties (including, without limitation, any warranties of originality, accuracy, completeness, timeliness, non-infringement, merchantability and fitness for a particular purpose) with respect to this information. Without limiting any of the foregoing, in no event shall any MSCI Party have any liability for any direct, indirect, special, incidental, punitive, consequential, lost profits) or any other damages. (www.msci.com).
The Global Industry Classification Standard (GICS) was developed by and is the exclusive property and a service mark of Morgan Stanley Capital International Inc. (MSCI) and Standard & Poor’s, a division of The McGraw-Hill Companies, Inc. (S&P) and is licensed for use by Goldman Sachs. Neither MSCI, S&P nor any other party involved in making or compiling the GICS or any GICS classifications makes any express or implied warranties or representations with respect to such standard or classification (or the results to be obtained by the use thereof), and all such parties hereby expressly disclaim all warranties of originality, accuracy, completeness, merchantability or fitness for a particular purpose with respect to any of such standard or classification. Without limiting any of the foregoing, in no event shall MSCI, S&P, any of their affiliates or any third party involved in making or compiling the GICS or any GICS classifications have any liability for any direct, indirect, special, punitive, consequential or any other damages (including lost profits) even if notified of the possibility of such damages.
© 2024 Goldman Sachs. All rights reserved.
No Bank Guarantee
May Lose Value
Not FDIC Insured
Goldman Sachs Multi-Manager Global Equity Fund
Annual Shareholder Report
October 31, 2024
Goldman Sachs Multi-Strategy Alternatives Fund
This annual shareholder report contains important information about Goldman Sachs Multi-Strategy Alternatives Fund (the "Fund") for the period of November 1, 2023 to October 31, 2024. You can find additional information about the Fund at am.gs.com or dfinview.com/GoldmanSachs. You can also request this information by contacting us at 1-800-526-7384.
This report describes changes to the Fund that occurred during the reporting period.
What were the Fund costs for the period?
Based on a hypothetical $10,000 investment.
| Class | Costs of a $10,000 investment | Costs paid as a percentage of a $10,000 investment |
|---|
| A | $106 | 1.07% |
How did the Fund perform and what affected its performance?
The performance of the Fund was influenced most by central bank monetary policy, especially interest rate cuts by the U.S. Federal Reserve; the depreciation of major currencies versus the U.S. dollar; and substantial price movements and dispersions across commodities.
Top Contributors to Performance:
The Fund benefited from the fixed income metal spillover factor, which views metals prices as leading indicators of economic performance. When metals prices are high, this factor signals a potential upturn in the general business environment and, therefore, less demand for bonds.
During the annual period, metals prices increased significantly as the U.S. sidestepped an economic recession. The fixed income metal spillover factor led the Fund to sell bonds in anticipation of lower interest rates, resulting in gains across almost all bond durations and global regions.
The Fund was helped by positioning in 10-year Japanese, U.K. and Australian government bonds.
Positioning in the British pound, Swedish krona and Norwegian krone added to returns.
The Fund’s positioning in zinc, soybean oil and wheat was advantageous.
Top Detractors from Performance:
The Fund was hurt by the long-term reversal factor, which aims to detect trends and reversals in commodity prices. This factor signals buying or selling when a commodity is well below or above the moving average in anticipation that fair pricing would lead that commodity to revert to its price average.
The long-term reversal factor led the Fund to short copper, gold and coffee amid steep prices, but these commodities did not return to their price averages during the reporting period, resulting in losses for the Fund.
Positioning in 10-year German and South Korean government bonds detracted from the Fund’s performance.
The Fund was hampered by positioning in the Japanese yen, New Zealand dollar and Canadian dollar.
Positioning in gold, corn and cocoa had a negative impact on performance.
The above represents investment pillars.
Goldman Sachs Multi-Strategy Alternatives Fund
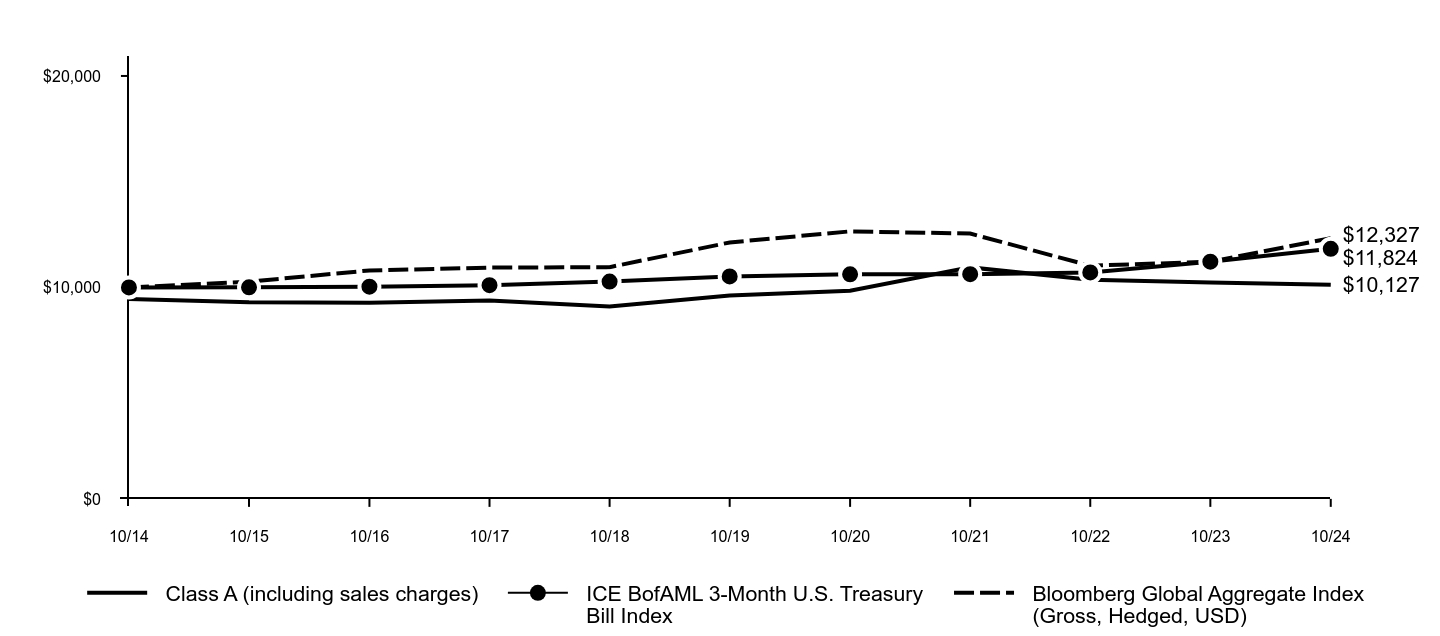
The following graph assumes an initial $10,000 investment in the Fund and compares the initial and subsequent account values at the end of each of the most recently completed 10 fiscal years of the Fund's share class (or less if the share class has been in operation for less than 10 years). The Fund's performance reflects applicable sales charges, if any. For comparative purposes, the performance of the Fund's benchmark and any additional performance benchmark(s) are also shown.
| Class A (including sales charges) | ICE BofAML 3-Month U.S. Treasury Bill Index | Bloomberg Global Aggregate Index (Gross, Hedged, USD) |
|---|
| 10/14 | $9,450 | $10,000 | $10,000 |
| 10/15 | $9,298 | $10,002 | $10,272 |
| 10/16 | $9,276 | $10,033 | $10,803 |
| 10/17 | $9,377 | $10,105 | $10,936 |
| 10/18 | $9,093 | $10,275 | $10,958 |
| 10/19 | $9,615 | $10,522 | $12,127 |
| 10/20 | $9,839 | $10,618 | $12,651 |
| 10/21 | $10,947 | $10,625 | $12,546 |
| 10/22 | $10,366 | $10,708 | $11,025 |
| 10/23 | $10,231 | $11,219 | $11,215 |
| 10/24 | $10,127 | $11,824 | $12,327 |
Average Annual Total Returns (%)
| AATR | 1 Year | 5 Years | 10 Years |
|---|
| Class A excluding sales charges | -1.02% | 1.04% | 0.69% |
| Class A including sales charges | -6.44% | -0.10% | 0.13% |
| ICE BofAML 3-Month U.S. Treasury Bill Index | 5.39% | 2.36% | 1.69% |
| Bloomberg Global Aggregate Index (Gross, Hedged, USD) | 9.92% | 0.33% | 2.11% |
Performance data quoted above represents past performance. Past performance does not guarantee future results.
The Fund’s investment return and principal value will fluctuate so that an investor’s shares, when redeemed, may be worth more or less than their original cost. Current performance may be lower or higher than the performance quoted above. Please visit our web site at: am.gs.com to obtain the most recent month-end returns. Performance reflects applicable fee waivers and/or expense limitations in effect during the periods shown and in their absence, performance would be reduced. The graph and table do not reflect the deduction of taxes that a shareholder would pay on Fund distributions or redemption of Fund shares. In accordance with changing regulatory requirements, the Fund is now required to compare its performance to a regulatory benchmark, which in this case is the Bloomberg Global Aggregate Index (Gross, Hedged, USD).
Goldman Sachs Multi-Strategy Alternatives Fund
| Total Net Assets | $64,670,541 |
| # of Portfolio Holdings | 197 |
| Portfolio Turnover Rate | 0% |
| Total Net Advisory Fees Paid | $542,250 |
This is a summary of certain changes to the Fund for the period. For more complete information, you may review the Fund's next prospectus, which we expect to be available by February 28, 2025 at dfinview.com/GoldmanSachs or upon request at 1-800-526-7384.
The Fund's net expense ratio decreased during the period as a result of a lower management fee rate and lower expense limit.
What did the Fund invest in?
The table below shows the investment makeup of the Fund, representing the percentage of total net assets of the Fund. Figures in the table below may not sum to 100% due to the exclusion of other assets and liabilities and may not represent the Fund’s market exposure due to the exclusion of certain derivatives, if any. These allocations may not be representative of the Fund’s future investments.
Asset Class Exposure (%)*
| Header | Gross | Long | Short | Net |
| Cash | 29.1 | 19.6 | 9.5 | 10.0 |
| Commodities | 94.7 | 49.1 | 45.5 | 3.6 |
| Developed Market Currency | 209.5 | 126.5 | 83.0 | 43.4 |
| Long-Term Fixed Income | 101.5 | 32.0 | 69.5 | -37.5 |
| Short-Term Fixed Income | 39.3 | 39.3 | - | 39.3 |
| Short-Term Investments | 91.4 | 91.4 | - | 91.4 |
*Asset class exposure includes the impact of derivatives. "Gross Exposure" represents the sum of the absolute value of long and short notional contract values in U.S. dollars of the Fund's positions (for a given asset class), divided by the Fund's net assets exposure within each asset class. "Net Exposure" represents the net exposure within the Fund to a given asset class, calculated as the difference between long and short exposures. The exposure of option contracts is delta-adjusted and offsetting forward foreign currency exchange contract positions are netted by currency pair and settlement date for both gross and net exposure calculations. Short-term Investments include investment companies and U.S. Treasury Bills.
Goldman Sachs Multi-Strategy Alternatives Fund
If you wish to view additional information about the Fund, including the documents and other information listed below, please visit dfinview.com/GoldmanSachs or call 1-800-526-7384.
prospectus
financial information
fund holdings
proxy voting information
Goldman Sachs & Co. LLC is the distributor of the Goldman Sachs Funds.
ICE Data Indices, LLC (“ICE DATA”) is used with permission. ICE DATA, ITS AFFILIATES AND THEIR RESPECTIVE THIRD PARTY SUPPLIERS DISCLAIM ANY AND ALL WARRANTIES, REPRESENTATIONS, EXPRESS AND/OR IMPLIED INCLUDING ANY WARRANTIES OF MERCHANTABILITY OR FITNESS FOR A PARTICULAR PURPOSE OR USE, INCLUDING THE INDICES, INDEX DATA AND ANY DATA INCLUDED IN, RELATED TO, OR DERIVED THEREFROM. NEITHER ICE DATA, ITS AFFILIATES NOR THEIR RESPECTIVE THIRD PARTY SUPPLIERS SHALL BE SUBJECT TO ANY DAMAGES OR LIABILITY WITH RESPECT TO THE ADEQUACY, ACCURACY, TIMELINESS OR COMPLETENESS OF THE INDICES OR THE INDEX DATA OR ANY COMPONENT THEREOF, AND THE INDICES AND INDEX DATA AND ALL COMPONENTS THEREOF ARE PROVIDED ON AN “AS IS” BASIS AND YOUR USE IS AT YOUR OWN RISK. ICE DATA, ITS AFFILIATES AND THEIR RESPECTIVE THIRD PARTY SUPPLIERS DO NOT SPONSOR, ENDORSE, OR RECOMMEND GOLDMAN SACHS, OR ANY OF ITS PRODUCTS OR SERVICES.
Bloomberg Index Services Limited. BLOOMBERG® is a trademark and service mark of Bloomberg Finance LP. And its affiliates (collectively “Bloomberg”). Bloomberg or Bloomberg’s licensors own all proprietary rights in the Bloomberg Indices. Neither Bloomberg nor Bloomberg’s licensors approves or endorses this material, or guarantees the accuracy or completeness of any information herein, or makes any warranty, express or implied, as to the results to be obtained therefrom and, to the maximum extent allowed by law, neither shall have any liability or responsibility for injury or damages arising in connection therewith.
© 2024 Goldman Sachs. All rights reserved.
No Bank Guarantee
May Lose Value
Not FDIC Insured
Goldman Sachs Multi-Strategy Alternatives Fund
Annual Shareholder Report
October 31, 2024
Goldman Sachs Multi-Strategy Alternatives Fund
This annual shareholder report contains important information about Goldman Sachs Multi-Strategy Alternatives Fund (the "Fund") for the period of November 1, 2023 to October 31, 2024. You can find additional information about the Fund at am.gs.com or dfinview.com/GoldmanSachs. You can also request this information by contacting us at 1-800-526-7384.
This report describes changes to the Fund that occurred during the reporting period.
What were the Fund costs for the period?
Based on a hypothetical $10,000 investment.
| Class | Costs of a $10,000 investment | Costs paid as a percentage of a $10,000 investment |
|---|
| C | $177 | 1.79% |
How did the Fund perform and what affected its performance?
The performance of the Fund was influenced most by central bank monetary policy, especially interest rate cuts by the U.S. Federal Reserve; the depreciation of major currencies versus the U.S. dollar; and substantial price movements and dispersions across commodities.
Top Contributors to Performance:
The Fund benefited from the fixed income metal spillover factor, which views metals prices as leading indicators of economic performance. When metals prices are high, this factor signals a potential upturn in the general business environment and, therefore, less demand for bonds.
During the annual period, metals prices increased significantly as the U.S. sidestepped an economic recession. The fixed income metal spillover factor led the Fund to sell bonds in anticipation of lower interest rates, resulting in gains across almost all bond durations and global regions.
The Fund was helped by positioning in 10-year Japanese, U.K. and Australian government bonds.
Positioning in the British pound, Swedish krona and Norwegian krone added to returns.
The Fund’s positioning in zinc, soybean oil and wheat was advantageous.
Top Detractors from Performance:
The Fund was hurt by the long-term reversal factor, which aims to detect trends and reversals in commodity prices. This factor signals buying or selling when a commodity is well below or above the moving average in anticipation that fair pricing would lead that commodity to revert to its price average.
The long-term reversal factor led the Fund to short copper, gold and coffee amid steep prices, but these commodities did not return to their price averages during the reporting period, resulting in losses for the Fund.
Positioning in 10-year German and South Korean government bonds detracted from the Fund’s performance.
The Fund was hampered by positioning in the Japanese yen, New Zealand dollar and Canadian dollar.
Positioning in gold, corn and cocoa had a negative impact on performance.
The above represents investment pillars.
Goldman Sachs Multi-Strategy Alternatives Fund
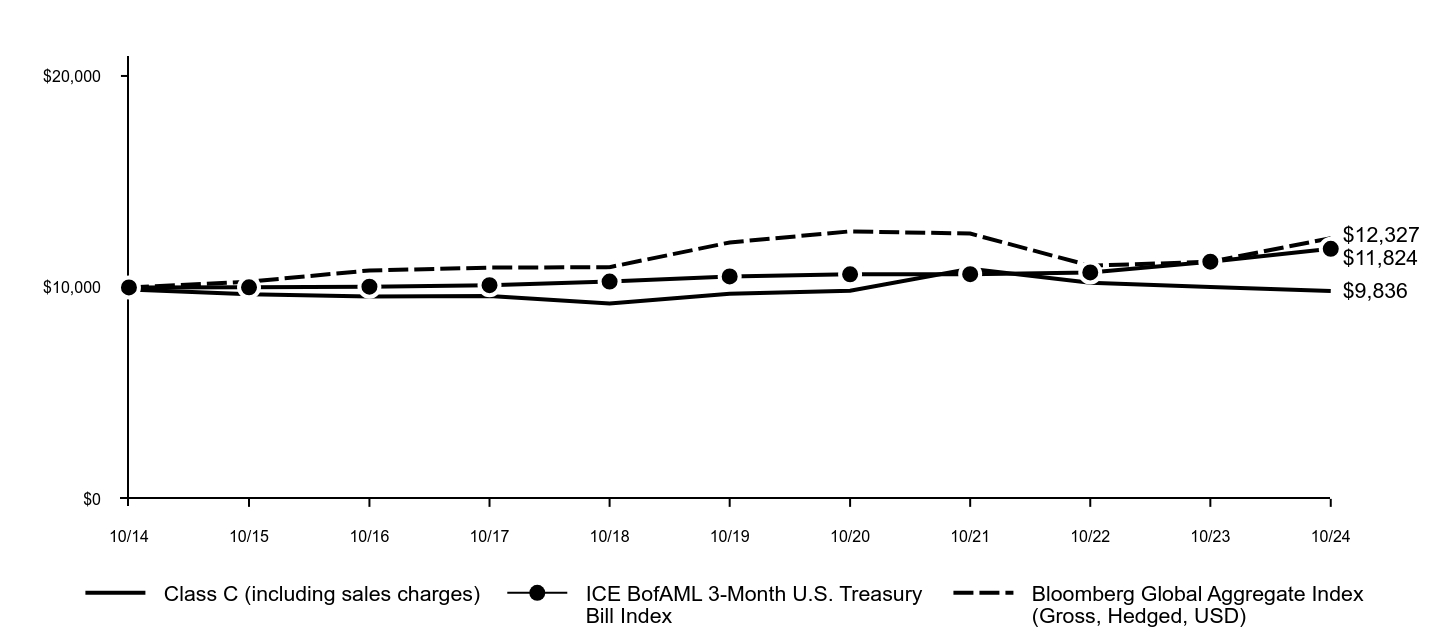
The following graph assumes an initial $10,000 investment in the Fund and compares the initial and subsequent account values at the end of each of the most recently completed 10 fiscal years of the Fund's share class (or less if the share class has been in operation for less than 10 years). The Fund's performance reflects applicable sales charges, if any. For comparative purposes, the performance of the Fund's benchmark and any additional performance benchmark(s) are also shown.
| Class C (including sales charges) | ICE BofAML 3-Month U.S. Treasury Bill Index | Bloomberg Global Aggregate Index (Gross, Hedged, USD) |
|---|
| 10/14 | $9,900 | $10,000 | $10,000 |
| 10/15 | $9,672 | $10,002 | $10,272 |
| 10/16 | $9,573 | $10,033 | $10,803 |
| 10/17 | $9,595 | $10,105 | $10,936 |
| 10/18 | $9,240 | $10,275 | $10,958 |
| 10/19 | $9,700 | $10,522 | $12,127 |
| 10/20 | $9,843 | $10,618 | $12,651 |
| 10/21 | $10,880 | $10,625 | $12,546 |
| 10/22 | $10,218 | $10,708 | $11,025 |
| 10/23 | $10,017 | $11,219 | $11,215 |
| 10/24 | $9,836 | $11,824 | $12,327 |
Average Annual Total Returns (%)
| AATR | 1 Year | 5 Years | 10 Years |
|---|
| Class C excluding sales charges | -1.81% | -2.79% | -0.06% |
| Class C including sales charges | -2.79% | 0.56% | -0.06% |
| ICE BofAML 3-Month U.S. Treasury Bill Index | 5.39% | 2.36% | 1.69% |
| Bloomberg Global Aggregate Index (Gross, Hedged, USD) | 9.92% | 0.33% | 2.11% |
Performance data quoted above represents past performance. Past performance does not guarantee future results.
The Fund’s investment return and principal value will fluctuate so that an investor’s shares, when redeemed, may be worth more or less than their original cost. Current performance may be lower or higher than the performance quoted above. Please visit our web site at: am.gs.com to obtain the most recent month-end returns. Performance reflects applicable fee waivers and/or expense limitations in effect during the periods shown and in their absence, performance would be reduced. The graph and table do not reflect the deduction of taxes that a shareholder would pay on Fund distributions or redemption of Fund shares. In accordance with changing regulatory requirements, the Fund is now required to compare its performance to a regulatory benchmark, which in this case is the Bloomberg Global Aggregate Index (Gross, Hedged, USD).
Goldman Sachs Multi-Strategy Alternatives Fund
| Total Net Assets | $64,670,541 |
| # of Portfolio Holdings | 197 |
| Portfolio Turnover Rate | 0% |
| Total Net Advisory Fees Paid | $542,250 |
This is a summary of certain changes to the Fund for the period. For more complete information, you may review the Fund's next prospectus, which we expect to be available by February 28, 2025 at dfinview.com/GoldmanSachs or upon request at 1-800-526-7384.
The Fund's net expense ratio decreased during the period as a result of a lower management fee rate and lower expense limit.
What did the Fund invest in?
The table below shows the investment makeup of the Fund, representing the percentage of total net assets of the Fund. Figures in the table below may not sum to 100% due to the exclusion of other assets and liabilities and may not represent the Fund’s market exposure due to the exclusion of certain derivatives, if any. These allocations may not be representative of the Fund’s future investments.
Asset Class Exposure (%)*
| Header | Gross | Long | Short | Net |
| Cash | 29.1 | 19.6 | 9.5 | 10.0 |
| Commodities | 94.7 | 49.1 | 45.5 | 3.6 |
| Developed Market Currency | 209.5 | 126.5 | 83.0 | 43.4 |
| Long-Term Fixed Income | 101.5 | 32.0 | 69.5 | -37.5 |
| Short-Term Fixed Income | 39.3 | 39.3 | - | 39.3 |
| Short-Term Investments | 91.4 | 91.4 | - | 91.4 |
*Asset class exposure includes the impact of derivatives. "Gross Exposure" represents the sum of the absolute value of long and short notional contract values in U.S. dollars of the Fund's positions (for a given asset class), divided by the Fund's net assets exposure within each asset class. "Net Exposure" represents the net exposure within the Fund to a given asset class, calculated as the difference between long and short exposures. The exposure of option contracts is delta-adjusted and offsetting forward foreign currency exchange contract positions are netted by currency pair and settlement date for both gross and net exposure calculations. Short-term Investments include investment companies and U.S. Treasury Bills.
Goldman Sachs Multi-Strategy Alternatives Fund
If you wish to view additional information about the Fund, including the documents and other information listed below, please visit dfinview.com/GoldmanSachs or call 1-800-526-7384.
prospectus
financial information
fund holdings
proxy voting information
Goldman Sachs & Co. LLC is the distributor of the Goldman Sachs Funds.
ICE Data Indices, LLC (“ICE DATA”) is used with permission. ICE DATA, ITS AFFILIATES AND THEIR RESPECTIVE THIRD PARTY SUPPLIERS DISCLAIM ANY AND ALL WARRANTIES, REPRESENTATIONS, EXPRESS AND/OR IMPLIED INCLUDING ANY WARRANTIES OF MERCHANTABILITY OR FITNESS FOR A PARTICULAR PURPOSE OR USE, INCLUDING THE INDICES, INDEX DATA AND ANY DATA INCLUDED IN, RELATED TO, OR DERIVED THEREFROM. NEITHER ICE DATA, ITS AFFILIATES NOR THEIR RESPECTIVE THIRD PARTY SUPPLIERS SHALL BE SUBJECT TO ANY DAMAGES OR LIABILITY WITH RESPECT TO THE ADEQUACY, ACCURACY, TIMELINESS OR COMPLETENESS OF THE INDICES OR THE INDEX DATA OR ANY COMPONENT THEREOF, AND THE INDICES AND INDEX DATA AND ALL COMPONENTS THEREOF ARE PROVIDED ON AN “AS IS” BASIS AND YOUR USE IS AT YOUR OWN RISK. ICE DATA, ITS AFFILIATES AND THEIR RESPECTIVE THIRD PARTY SUPPLIERS DO NOT SPONSOR, ENDORSE, OR RECOMMEND GOLDMAN SACHS, OR ANY OF ITS PRODUCTS OR SERVICES.
Bloomberg Index Services Limited. BLOOMBERG® is a trademark and service mark of Bloomberg Finance LP. And its affiliates (collectively “Bloomberg”). Bloomberg or Bloomberg’s licensors own all proprietary rights in the Bloomberg Indices. Neither Bloomberg nor Bloomberg’s licensors approves or endorses this material, or guarantees the accuracy or completeness of any information herein, or makes any warranty, express or implied, as to the results to be obtained therefrom and, to the maximum extent allowed by law, neither shall have any liability or responsibility for injury or damages arising in connection therewith.
© 2024 Goldman Sachs. All rights reserved.
No Bank Guarantee
May Lose Value
Not FDIC Insured
Goldman Sachs Multi-Strategy Alternatives Fund
Annual Shareholder Report
October 31, 2024
Goldman Sachs Multi-Strategy Alternatives Fund
This annual shareholder report contains important information about Goldman Sachs Multi-Strategy Alternatives Fund (the "Fund") for the period of November 1, 2023 to October 31, 2024. You can find additional information about the Fund at am.gs.com or dfinview.com/GoldmanSachs. You can also request this information by contacting us at 1-800-621-2550.
This report describes changes to the Fund that occurred during the reporting period.
What were the Fund costs for the period?
Based on a hypothetical $10,000 investment.
| Class | Costs of a $10,000 investment | Costs paid as a percentage of a $10,000 investment |
|---|
| P | $75 | 0.75% |
How did the Fund perform and what affected its performance?
The performance of the Fund was influenced most by central bank monetary policy, especially interest rate cuts by the U.S. Federal Reserve; the depreciation of major currencies versus the U.S. dollar; and substantial price movements and dispersions across commodities.
Top Contributors to Performance:
The Fund benefited from the fixed income metal spillover factor, which views metals prices as leading indicators of economic performance. When metals prices are high, this factor signals a potential upturn in the general business environment and, therefore, less demand for bonds.
During the annual period, metals prices increased significantly as the U.S. sidestepped an economic recession. The fixed income metal spillover factor led the Fund to sell bonds in anticipation of lower interest rates, resulting in gains across almost all bond durations and global regions.
The Fund was helped by positioning in 10-year Japanese, U.K. and Australian government bonds.
Positioning in the British pound, Swedish krona and Norwegian krone added to returns.
The Fund’s positioning in zinc, soybean oil and wheat was advantageous.
Top Detractors from Performance:
The Fund was hurt by the long-term reversal factor, which aims to detect trends and reversals in commodity prices. This factor signals buying or selling when a commodity is well below or above the moving average in anticipation that fair pricing would lead that commodity to revert to its price average.
The long-term reversal factor led the Fund to short copper, gold and coffee amid steep prices, but these commodities did not return to their price averages during the reporting period, resulting in losses for the Fund.
Positioning in 10-year German and South Korean government bonds detracted from the Fund’s performance.
The Fund was hampered by positioning in the Japanese yen, New Zealand dollar and Canadian dollar.
Positioning in gold, corn and cocoa had a negative impact on performance.
The above represents investment pillars.
Goldman Sachs Multi-Strategy Alternatives Fund
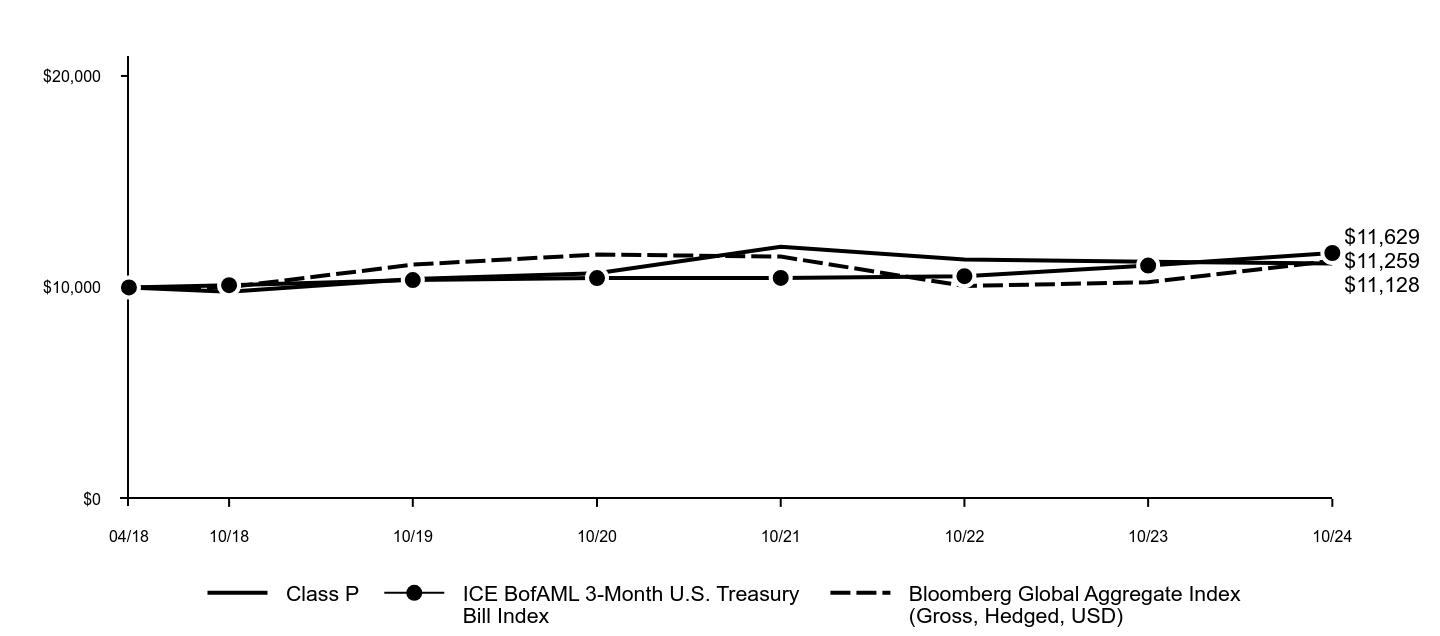
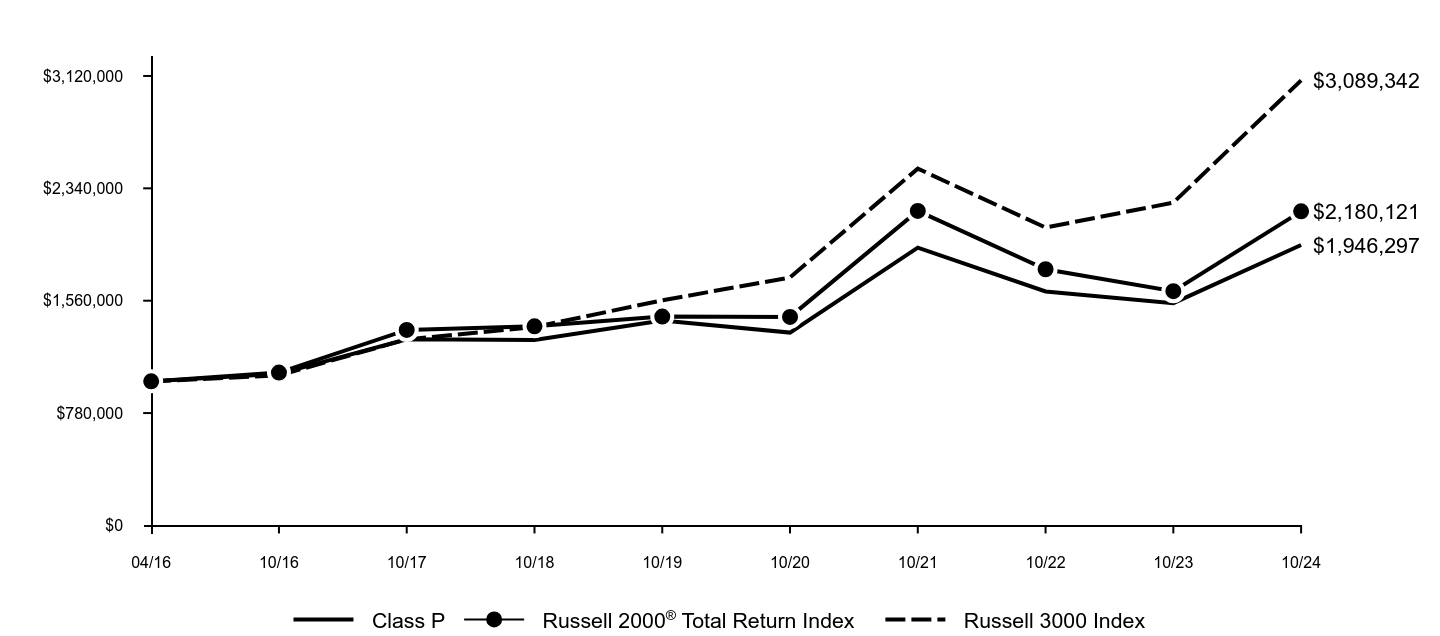
The following graph assumes an initial $10,000 investment in the Fund and compares the initial and subsequent account values at the end of each of the most recently completed 10 fiscal years of the Fund's share class (or less if the share class has been in operation for less than 10 years). The Fund's performance reflects applicable sales charges, if any. For comparative purposes, the performance of the Fund's benchmark and any additional performance benchmark(s) are also shown.
| Class P | ICE BofAML 3-Month U.S. Treasury Bill Index | Bloomberg Global Aggregate Index (Gross, Hedged, USD) |
|---|
| 04/18 | $10,000 | $10,000 | $10,000 |
| 10/18 | $9,794 | $10,105 | $10,008 |
| 10/19 | $10,401 | $10,348 | $11,076 |
| 10/20 | $10,673 | $10,443 | $11,554 |
| 10/21 | $11,920 | $10,449 | $11,458 |
| 10/22 | $11,316 | $10,530 | $10,070 |
| 10/23 | $11,213 | $11,034 | $10,243 |
| 10/24 | $11,128 | $11,629 | $11,259 |
Average Annual Total Returns (%)
| AATR | 1 Year | 5 Years | Since Inception 4/16/18 |
|---|
| Class P | -0.76% | 1.36% | 1.65% |
| ICE BofAML 3-Month U.S. Treasury Bill Index | 5.39% | 2.36% | 2.33% |
| Bloomberg Global Aggregate Index (Gross, Hedged, USD) | 9.92% | 0.33% | 1.83% |
Performance data quoted above represents past performance. Past performance does not guarantee future results.
The Fund’s investment return and principal value will fluctuate so that an investor’s shares, when redeemed, may be worth more or less than their original cost. Current performance may be lower or higher than the performance quoted above. Please visit our web site at: am.gs.com to obtain the most recent month-end returns. Performance reflects applicable fee waivers and/or expense limitations in effect during the periods shown and in their absence, performance would be reduced. The graph and table do not reflect the deduction of taxes that a shareholder would pay on Fund distributions or redemption of Fund shares. In accordance with changing regulatory requirements, the Fund is now required to compare its performance to a regulatory benchmark, which in this case is the Bloomberg Global Aggregate Index (Gross, Hedged, USD).
Goldman Sachs Multi-Strategy Alternatives Fund
| Total Net Assets | $64,670,541 |
| # of Portfolio Holdings | 197 |
| Portfolio Turnover Rate | 0% |
| Total Net Advisory Fees Paid | $542,250 |
This is a summary of certain changes to the Fund for the period. For more complete information, you may review the Fund's next prospectus, which we expect to be available by February 28, 2025 at dfinview.com/GoldmanSachs or upon request at 1-800-621-2550.
The Fund's net expense ratio decreased during the period as a result of a lower management fee rate and lower expense limit.
What did the Fund invest in?
The table below shows the investment makeup of the Fund, representing the percentage of total net assets of the Fund. Figures in the table below may not sum to 100% due to the exclusion of other assets and liabilities and may not represent the Fund’s market exposure due to the exclusion of certain derivatives, if any. These allocations may not be representative of the Fund’s future investments.
Asset Class Exposure (%)*
| Header | Gross | Long | Short | Net |
| Cash | 29.1 | 19.6 | 9.5 | 10.0 |
| Commodities | 94.7 | 49.1 | 45.5 | 3.6 |
| Developed Market Currency | 209.5 | 126.5 | 83.0 | 43.4 |
| Long-Term Fixed Income | 101.5 | 32.0 | 69.5 | -37.5 |
| Short-Term Fixed Income | 39.3 | 39.3 | - | 39.3 |
| Short-Term Investments | 91.4 | 91.4 | - | 91.4 |
*Asset class exposure includes the impact of derivatives. "Gross Exposure" represents the sum of the absolute value of long and short notional contract values in U.S. dollars of the Fund's positions (for a given asset class), divided by the Fund's net assets exposure within each asset class. "Net Exposure" represents the net exposure within the Fund to a given asset class, calculated as the difference between long and short exposures. The exposure of option contracts is delta-adjusted and offsetting forward foreign currency exchange contract positions are netted by currency pair and settlement date for both gross and net exposure calculations. Short-term Investments include investment companies and U.S. Treasury Bills.
Goldman Sachs Multi-Strategy Alternatives Fund
If you wish to view additional information about the Fund, including the documents and other information listed below, please visit dfinview.com/GoldmanSachs or call 1-800-621-2550.
prospectus
financial information
fund holdings
proxy voting information
Goldman Sachs & Co. LLC is the distributor of the Goldman Sachs Funds.
ICE Data Indices, LLC (“ICE DATA”) is used with permission. ICE DATA, ITS AFFILIATES AND THEIR RESPECTIVE THIRD PARTY SUPPLIERS DISCLAIM ANY AND ALL WARRANTIES, REPRESENTATIONS, EXPRESS AND/OR IMPLIED INCLUDING ANY WARRANTIES OF MERCHANTABILITY OR FITNESS FOR A PARTICULAR PURPOSE OR USE, INCLUDING THE INDICES, INDEX DATA AND ANY DATA INCLUDED IN, RELATED TO, OR DERIVED THEREFROM. NEITHER ICE DATA, ITS AFFILIATES NOR THEIR RESPECTIVE THIRD PARTY SUPPLIERS SHALL BE SUBJECT TO ANY DAMAGES OR LIABILITY WITH RESPECT TO THE ADEQUACY, ACCURACY, TIMELINESS OR COMPLETENESS OF THE INDICES OR THE INDEX DATA OR ANY COMPONENT THEREOF, AND THE INDICES AND INDEX DATA AND ALL COMPONENTS THEREOF ARE PROVIDED ON AN “AS IS” BASIS AND YOUR USE IS AT YOUR OWN RISK. ICE DATA, ITS AFFILIATES AND THEIR RESPECTIVE THIRD PARTY SUPPLIERS DO NOT SPONSOR, ENDORSE, OR RECOMMEND GOLDMAN SACHS, OR ANY OF ITS PRODUCTS OR SERVICES.
Bloomberg Index Services Limited. BLOOMBERG® is a trademark and service mark of Bloomberg Finance LP. And its affiliates (collectively “Bloomberg”). Bloomberg or Bloomberg’s licensors own all proprietary rights in the Bloomberg Indices. Neither Bloomberg nor Bloomberg’s licensors approves or endorses this material, or guarantees the accuracy or completeness of any information herein, or makes any warranty, express or implied, as to the results to be obtained therefrom and, to the maximum extent allowed by law, neither shall have any liability or responsibility for injury or damages arising in connection therewith.
© 2024 Goldman Sachs. All rights reserved.
No Bank Guarantee
May Lose Value
Not FDIC Insured
Goldman Sachs Multi-Strategy Alternatives Fund
Annual Shareholder Report
October 31, 2024
Goldman Sachs Multi-Strategy Alternatives Fund
This annual shareholder report contains important information about Goldman Sachs Multi-Strategy Alternatives Fund (the "Fund") for the period of November 1, 2023 to October 31, 2024. You can find additional information about the Fund at am.gs.com or dfinview.com/GoldmanSachs. You can also request this information by contacting us at 1-800-621-2550.
This report describes changes to the Fund that occurred during the reporting period.
What were the Fund costs for the period?
Based on a hypothetical $10,000 investment.
| Class | Costs of a $10,000 investment | Costs paid as a percentage of a $10,000 investment |
|---|
| R6 | $75 | 0.75% |
How did the Fund perform and what affected its performance?
The performance of the Fund was influenced most by central bank monetary policy, especially interest rate cuts by the U.S. Federal Reserve; the depreciation of major currencies versus the U.S. dollar; and substantial price movements and dispersions across commodities.
Top Contributors to Performance:
The Fund benefited from the fixed income metal spillover factor, which views metals prices as leading indicators of economic performance. When metals prices are high, this factor signals a potential upturn in the general business environment and, therefore, less demand for bonds.
During the annual period, metals prices increased significantly as the U.S. sidestepped an economic recession. The fixed income metal spillover factor led the Fund to sell bonds in anticipation of lower interest rates, resulting in gains across almost all bond durations and global regions.
The Fund was helped by positioning in 10-year Japanese, U.K. and Australian government bonds.
Positioning in the British pound, Swedish krona and Norwegian krone added to returns.
The Fund’s positioning in zinc, soybean oil and wheat was advantageous.
Top Detractors from Performance:
The Fund was hurt by the long-term reversal factor, which aims to detect trends and reversals in commodity prices. This factor signals buying or selling when a commodity is well below or above the moving average in anticipation that fair pricing would lead that commodity to revert to its price average.
The long-term reversal factor led the Fund to short copper, gold and coffee amid steep prices, but these commodities did not return to their price averages during the reporting period, resulting in losses for the Fund.
Positioning in 10-year German and South Korean government bonds detracted from the Fund’s performance.
The Fund was hampered by positioning in the Japanese yen, New Zealand dollar and Canadian dollar.
Positioning in gold, corn and cocoa had a negative impact on performance.
The above represents investment pillars.
Goldman Sachs Multi-Strategy Alternatives Fund
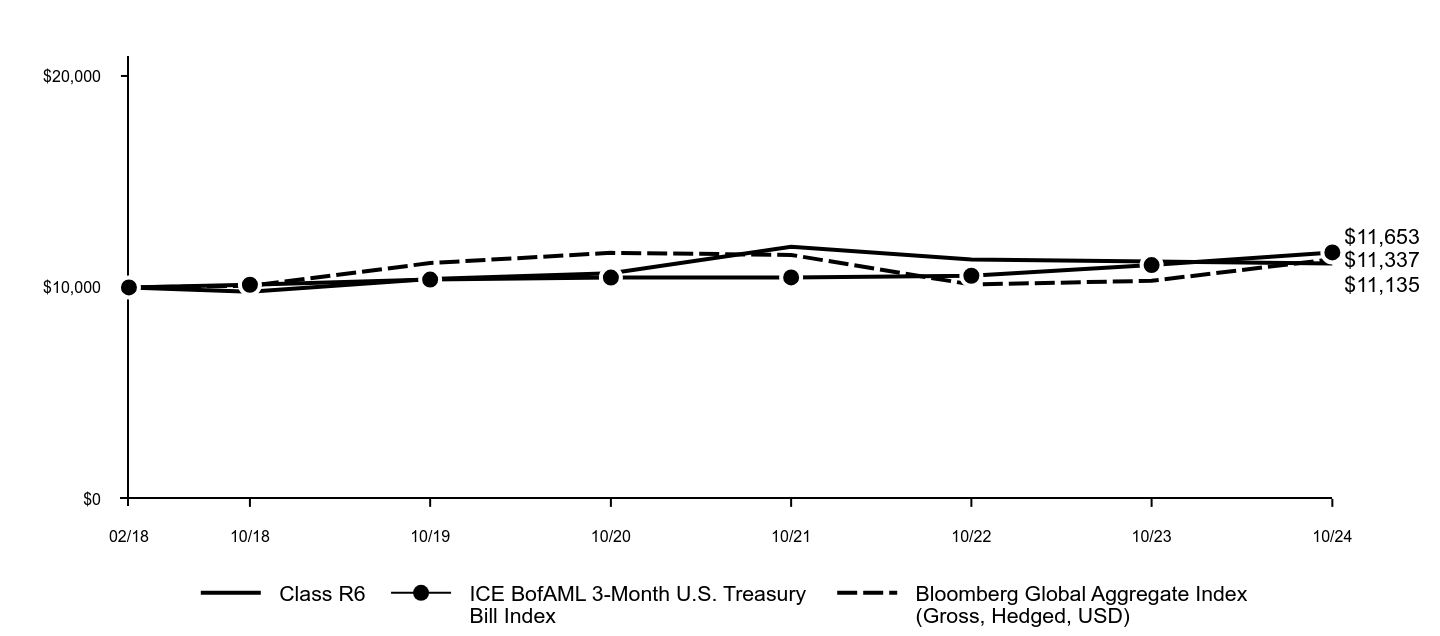
The following graph assumes an initial $10,000 investment in the Fund and compares the initial and subsequent account values at the end of each of the most recently completed 10 fiscal years of the Fund's share class (or less if the share class has been in operation for less than 10 years). The Fund's performance reflects applicable sales charges, if any. For comparative purposes, the performance of the Fund's benchmark and any additional performance benchmark(s) are also shown.
| Class R6 | ICE BofAML 3-Month U.S. Treasury Bill Index | Bloomberg Global Aggregate Index (Gross, Hedged, USD) |
|---|
| 02/18 | $10,000 | $10,000 | $10,000 |
| 10/18 | $9,795 | $10,126 | $10,077 |
| 10/19 | $10,401 | $10,369 | $11,152 |
| 10/20 | $10,673 | $10,464 | $11,634 |
| 10/21 | $11,919 | $10,471 | $11,537 |
| 10/22 | $11,316 | $10,552 | $10,139 |
| 10/23 | $11,225 | $11,057 | $10,313 |
| 10/24 | $11,135 | $11,653 | $11,337 |
Average Annual Total Returns (%)
| AATR | 1 Year | 5 Years | Since Inception 2/28/18 |
|---|
| Class R6 | -0.80% | 1.37% | 1.62% |
| ICE BofAML 3-Month U.S. Treasury Bill Index | 5.39% | 2.36% | 2.31% |
| Bloomberg Global Aggregate Index (Gross, Hedged, USD) | 9.92% | 0.33% | 1.90% |
Performance data quoted above represents past performance. Past performance does not guarantee future results.
The Fund’s investment return and principal value will fluctuate so that an investor’s shares, when redeemed, may be worth more or less than their original cost. Current performance may be lower or higher than the performance quoted above. Please visit our web site at: am.gs.com to obtain the most recent month-end returns. Performance reflects applicable fee waivers and/or expense limitations in effect during the periods shown and in their absence, performance would be reduced. The graph and table do not reflect the deduction of taxes that a shareholder would pay on Fund distributions or redemption of Fund shares. In accordance with changing regulatory requirements, the Fund is now required to compare its performance to a regulatory benchmark, which in this case is the Bloomberg Global Aggregate Index (Gross, Hedged, USD).
Goldman Sachs Multi-Strategy Alternatives Fund
| Total Net Assets | $64,670,541 |
| # of Portfolio Holdings | 197 |
| Portfolio Turnover Rate | 0% |
| Total Net Advisory Fees Paid | $542,250 |
This is a summary of certain changes to the Fund for the period. For more complete information, you may review the Fund's next prospectus, which we expect to be available by February 28, 2025 at dfinview.com/GoldmanSachs or upon request at 1-800-621-2550.
The Fund's net expense ratio decreased during the period as a result of a lower management fee rate and lower expense limit.
What did the Fund invest in?
The table below shows the investment makeup of the Fund, representing the percentage of total net assets of the Fund. Figures in the table below may not sum to 100% due to the exclusion of other assets and liabilities and may not represent the Fund’s market exposure due to the exclusion of certain derivatives, if any. These allocations may not be representative of the Fund’s future investments.
Asset Class Exposure (%)*
| Header | Gross | Long | Short | Net |
| Cash | 29.1 | 19.6 | 9.5 | 10.0 |
| Commodities | 94.7 | 49.1 | 45.5 | 3.6 |
| Developed Market Currency | 209.5 | 126.5 | 83.0 | 43.4 |
| Long-Term Fixed Income | 101.5 | 32.0 | 69.5 | -37.5 |
| Short-Term Fixed Income | 39.3 | 39.3 | - | 39.3 |
| Short-Term Investments | 91.4 | 91.4 | - | 91.4 |
*Asset class exposure includes the impact of derivatives. "Gross Exposure" represents the sum of the absolute value of long and short notional contract values in U.S. dollars of the Fund's positions (for a given asset class), divided by the Fund's net assets exposure within each asset class. "Net Exposure" represents the net exposure within the Fund to a given asset class, calculated as the difference between long and short exposures. The exposure of option contracts is delta-adjusted and offsetting forward foreign currency exchange contract positions are netted by currency pair and settlement date for both gross and net exposure calculations. Short-term Investments include investment companies and U.S. Treasury Bills.
Goldman Sachs Multi-Strategy Alternatives Fund
If you wish to view additional information about the Fund, including the documents and other information listed below, please visit dfinview.com/GoldmanSachs or call 1-800-621-2550.
prospectus
financial information
fund holdings
proxy voting information
Goldman Sachs & Co. LLC is the distributor of the Goldman Sachs Funds.
ICE Data Indices, LLC (“ICE DATA”) is used with permission. ICE DATA, ITS AFFILIATES AND THEIR RESPECTIVE THIRD PARTY SUPPLIERS DISCLAIM ANY AND ALL WARRANTIES, REPRESENTATIONS, EXPRESS AND/OR IMPLIED INCLUDING ANY WARRANTIES OF MERCHANTABILITY OR FITNESS FOR A PARTICULAR PURPOSE OR USE, INCLUDING THE INDICES, INDEX DATA AND ANY DATA INCLUDED IN, RELATED TO, OR DERIVED THEREFROM. NEITHER ICE DATA, ITS AFFILIATES NOR THEIR RESPECTIVE THIRD PARTY SUPPLIERS SHALL BE SUBJECT TO ANY DAMAGES OR LIABILITY WITH RESPECT TO THE ADEQUACY, ACCURACY, TIMELINESS OR COMPLETENESS OF THE INDICES OR THE INDEX DATA OR ANY COMPONENT THEREOF, AND THE INDICES AND INDEX DATA AND ALL COMPONENTS THEREOF ARE PROVIDED ON AN “AS IS” BASIS AND YOUR USE IS AT YOUR OWN RISK. ICE DATA, ITS AFFILIATES AND THEIR RESPECTIVE THIRD PARTY SUPPLIERS DO NOT SPONSOR, ENDORSE, OR RECOMMEND GOLDMAN SACHS, OR ANY OF ITS PRODUCTS OR SERVICES.
Bloomberg Index Services Limited. BLOOMBERG® is a trademark and service mark of Bloomberg Finance LP. And its affiliates (collectively “Bloomberg”). Bloomberg or Bloomberg’s licensors own all proprietary rights in the Bloomberg Indices. Neither Bloomberg nor Bloomberg’s licensors approves or endorses this material, or guarantees the accuracy or completeness of any information herein, or makes any warranty, express or implied, as to the results to be obtained therefrom and, to the maximum extent allowed by law, neither shall have any liability or responsibility for injury or damages arising in connection therewith.
© 2024 Goldman Sachs. All rights reserved.
No Bank Guarantee
May Lose Value
Not FDIC Insured
Goldman Sachs Multi-Strategy Alternatives Fund
Annual Shareholder Report
October 31, 2024
Goldman Sachs Multi-Strategy Alternatives Fund
GSMMX: Institutional Class
This annual shareholder report contains important information about Goldman Sachs Multi-Strategy Alternatives Fund (the "Fund") for the period of November 1, 2023 to October 31, 2024. You can find additional information about the Fund at am.gs.com or dfinview.com/GoldmanSachs. You can also request this information by contacting us at 1-800-621-2550.
This report describes changes to the Fund that occurred during the reporting period.
What were the Fund costs for the period?
Based on a hypothetical $10,000 investment.
| Class | Costs of a $10,000 investment | Costs paid as a percentage of a $10,000 investment |
|---|
| Institutional | $76 | 0.76% |
How did the Fund perform and what affected its performance?
The performance of the Fund was influenced most by central bank monetary policy, especially interest rate cuts by the U.S. Federal Reserve; the depreciation of major currencies versus the U.S. dollar; and substantial price movements and dispersions across commodities.
Top Contributors to Performance:
The Fund benefited from the fixed income metal spillover factor, which views metals prices as leading indicators of economic performance. When metals prices are high, this factor signals a potential upturn in the general business environment and, therefore, less demand for bonds.
During the annual period, metals prices increased significantly as the U.S. sidestepped an economic recession. The fixed income metal spillover factor led the Fund to sell bonds in anticipation of lower interest rates, resulting in gains across almost all bond durations and global regions.
The Fund was helped by positioning in 10-year Japanese, U.K. and Australian government bonds.
Positioning in the British pound, Swedish krona and Norwegian krone added to returns.
The Fund’s positioning in zinc, soybean oil and wheat was advantageous.
Top Detractors from Performance:
The Fund was hurt by the long-term reversal factor, which aims to detect trends and reversals in commodity prices. This factor signals buying or selling when a commodity is well below or above the moving average in anticipation that fair pricing would lead that commodity to revert to its price average.
The long-term reversal factor led the Fund to short copper, gold and coffee amid steep prices, but these commodities did not return to their price averages during the reporting period, resulting in losses for the Fund.
Positioning in 10-year German and South Korean government bonds detracted from the Fund’s performance.
The Fund was hampered by positioning in the Japanese yen, New Zealand dollar and Canadian dollar.
Positioning in gold, corn and cocoa had a negative impact on performance.
The above represents investment pillars.
Goldman Sachs Multi-Strategy Alternatives Fund
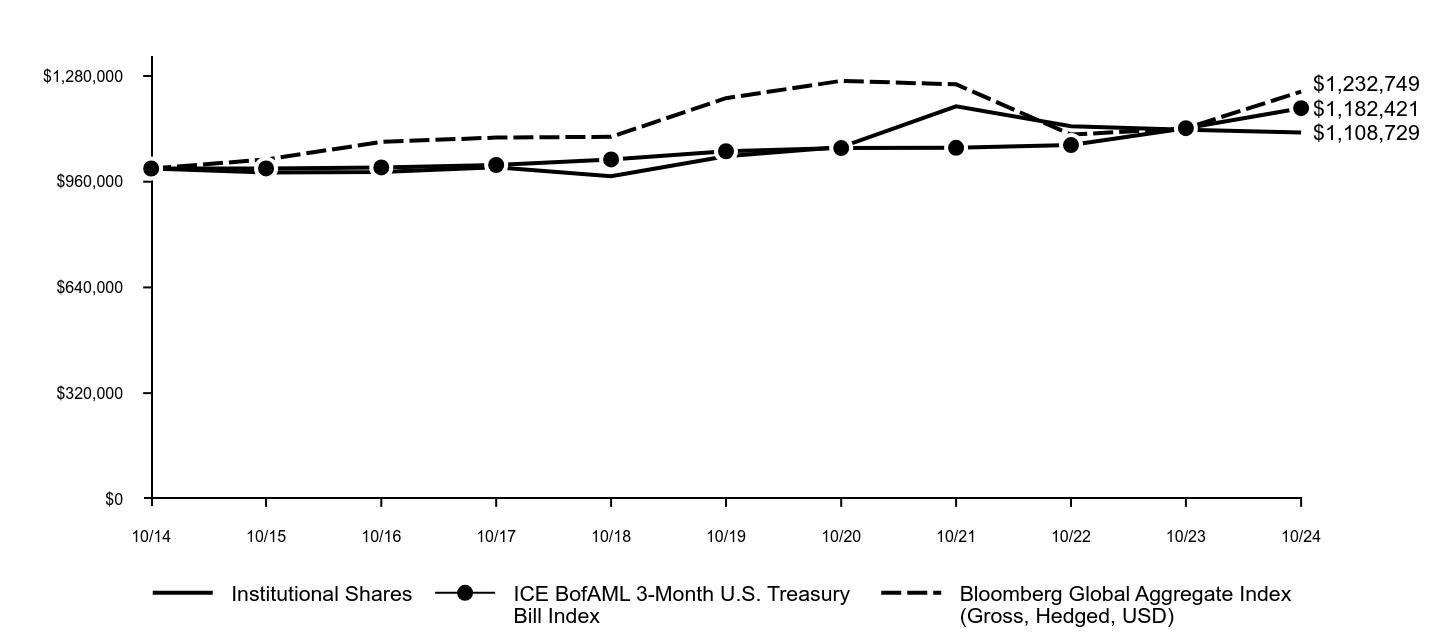
The following graph assumes an initial $1,000,000 investment in the Fund and compares the initial and subsequent account values at the end of each of the most recently completed 10 fiscal years of the Fund's share class (or less if the share class has been in operation for less than 10 years). The Fund's performance reflects applicable sales charges, if any. For comparative purposes, the performance of the Fund's benchmark and any additional performance benchmark(s) are also shown.
| Institutional Shares | ICE BofAML 3-Month U.S. Treasury Bill Index | Bloomberg Global Aggregate Index (Gross, Hedged, USD) |
|---|
| 10/14 | $1,000,000 | $1,000,000 | $1,000,000 |
| 10/15 | $987,900 | $1,000,200 | $1,027,200 |
| 10/16 | $989,184 | $1,003,301 | $1,080,306 |
| 10/17 | $1,003,725 | $1,010,524 | $1,093,594 |
| 10/18 | $976,424 | $1,027,501 | $1,095,781 |
| 10/19 | $1,036,962 | $1,052,161 | $1,212,701 |
| 10/20 | $1,064,649 | $1,061,841 | $1,265,090 |
| 10/21 | $1,187,935 | $1,062,478 | $1,254,589 |
| 10/22 | $1,127,707 | $1,070,766 | $1,102,533 |
| 10/23 | $1,117,332 | $1,121,948 | $1,121,497 |
| 10/24 | $1,108,729 | $1,182,421 | $1,232,749 |
Average Annual Total Returns (%)
| AATR | 1 Year | 5 Years | 10 Years |
|---|
| Institutional Shares | -0.77% | 1.35% | 1.04% |
| ICE BofAML 3-Month U.S. Treasury Bill Index | 5.39% | 2.36% | 1.69% |
| Bloomberg Global Aggregate Index (Gross, Hedged, USD) | 9.92% | 0.33% | 2.11% |
Performance data quoted above represents past performance. Past performance does not guarantee future results.
The Fund’s investment return and principal value will fluctuate so that an investor’s shares, when redeemed, may be worth more or less than their original cost. Current performance may be lower or higher than the performance quoted above. Please visit our web site at: am.gs.com to obtain the most recent month-end returns. Performance reflects applicable fee waivers and/or expense limitations in effect during the periods shown and in their absence, performance would be reduced. The graph and table do not reflect the deduction of taxes that a shareholder would pay on Fund distributions or redemption of Fund shares. In accordance with changing regulatory requirements, the Fund is now required to compare its performance to a regulatory benchmark, which in this case is the Bloomberg Global Aggregate Index (Gross, Hedged, USD).
Goldman Sachs Multi-Strategy Alternatives Fund
| Total Net Assets | $64,670,541 |
| # of Portfolio Holdings | 197 |
| Portfolio Turnover Rate | 0% |
| Total Net Advisory Fees Paid | $542,250 |
This is a summary of certain changes to the Fund for the period. For more complete information, you may review the Fund's next prospectus, which we expect to be available by February 28, 2025 at dfinview.com/GoldmanSachs or upon request at 1-800-621-2550.
The Fund's net expense ratio decreased during the period as a result of a lower management fee rate and lower expense limit.
What did the Fund invest in?
The table below shows the investment makeup of the Fund, representing the percentage of total net assets of the Fund. Figures in the table below may not sum to 100% due to the exclusion of other assets and liabilities and may not represent the Fund’s market exposure due to the exclusion of certain derivatives, if any. These allocations may not be representative of the Fund’s future investments.
Asset Class Exposure (%)*
| Header | Gross | Long | Short | Net |
| Cash | 29.1 | 19.6 | 9.5 | 10.0 |
| Commodities | 94.7 | 49.1 | 45.5 | 3.6 |
| Developed Market Currency | 209.5 | 126.5 | 83.0 | 43.4 |
| Long-Term Fixed Income | 101.5 | 32.0 | 69.5 | -37.5 |
| Short-Term Fixed Income | 39.3 | 39.3 | - | 39.3 |
| Short-Term Investments | 91.4 | 91.4 | - | 91.4 |
*Asset class exposure includes the impact of derivatives. "Gross Exposure" represents the sum of the absolute value of long and short notional contract values in U.S. dollars of the Fund's positions (for a given asset class), divided by the Fund's net assets exposure within each asset class. "Net Exposure" represents the net exposure within the Fund to a given asset class, calculated as the difference between long and short exposures. The exposure of option contracts is delta-adjusted and offsetting forward foreign currency exchange contract positions are netted by currency pair and settlement date for both gross and net exposure calculations. Short-term Investments include investment companies and U.S. Treasury Bills.
Goldman Sachs Multi-Strategy Alternatives Fund
If you wish to view additional information about the Fund, including the documents and other information listed below, please visit dfinview.com/GoldmanSachs or call 1-800-621-2550.
prospectus
financial information
fund holdings
proxy voting information
Goldman Sachs & Co. LLC is the distributor of the Goldman Sachs Funds.
ICE Data Indices, LLC (“ICE DATA”) is used with permission. ICE DATA, ITS AFFILIATES AND THEIR RESPECTIVE THIRD PARTY SUPPLIERS DISCLAIM ANY AND ALL WARRANTIES, REPRESENTATIONS, EXPRESS AND/OR IMPLIED INCLUDING ANY WARRANTIES OF MERCHANTABILITY OR FITNESS FOR A PARTICULAR PURPOSE OR USE, INCLUDING THE INDICES, INDEX DATA AND ANY DATA INCLUDED IN, RELATED TO, OR DERIVED THEREFROM. NEITHER ICE DATA, ITS AFFILIATES NOR THEIR RESPECTIVE THIRD PARTY SUPPLIERS SHALL BE SUBJECT TO ANY DAMAGES OR LIABILITY WITH RESPECT TO THE ADEQUACY, ACCURACY, TIMELINESS OR COMPLETENESS OF THE INDICES OR THE INDEX DATA OR ANY COMPONENT THEREOF, AND THE INDICES AND INDEX DATA AND ALL COMPONENTS THEREOF ARE PROVIDED ON AN “AS IS” BASIS AND YOUR USE IS AT YOUR OWN RISK. ICE DATA, ITS AFFILIATES AND THEIR RESPECTIVE THIRD PARTY SUPPLIERS DO NOT SPONSOR, ENDORSE, OR RECOMMEND GOLDMAN SACHS, OR ANY OF ITS PRODUCTS OR SERVICES.
Bloomberg Index Services Limited. BLOOMBERG® is a trademark and service mark of Bloomberg Finance LP. And its affiliates (collectively “Bloomberg”). Bloomberg or Bloomberg’s licensors own all proprietary rights in the Bloomberg Indices. Neither Bloomberg nor Bloomberg’s licensors approves or endorses this material, or guarantees the accuracy or completeness of any information herein, or makes any warranty, express or implied, as to the results to be obtained therefrom and, to the maximum extent allowed by law, neither shall have any liability or responsibility for injury or damages arising in connection therewith.
© 2024 Goldman Sachs. All rights reserved.
No Bank Guarantee
May Lose Value
Not FDIC Insured
Goldman Sachs Multi-Strategy Alternatives Fund
Annual Shareholder Report
October 31, 2024
Goldman Sachs Multi-Strategy Alternatives Fund
This annual shareholder report contains important information about Goldman Sachs Multi-Strategy Alternatives Fund (the "Fund") for the period of November 1, 2023 to October 31, 2024. You can find additional information about the Fund at am.gs.com or dfinview.com/GoldmanSachs. You can also request this information by contacting us at 1-800-621-2550.
This report describes changes to the Fund that occurred during the reporting period.
What were the Fund costs for the period?
Based on a hypothetical $10,000 investment.
| Class | Costs of a $10,000 investment | Costs paid as a percentage of a $10,000 investment |
|---|
| Investor | $82 | 0.82% |
How did the Fund perform and what affected its performance?
The performance of the Fund was influenced most by central bank monetary policy, especially interest rate cuts by the U.S. Federal Reserve; the depreciation of major currencies versus the U.S. dollar; and substantial price movements and dispersions across commodities.
Top Contributors to Performance:
The Fund benefited from the fixed income metal spillover factor, which views metals prices as leading indicators of economic performance. When metals prices are high, this factor signals a potential upturn in the general business environment and, therefore, less demand for bonds.
During the annual period, metals prices increased significantly as the U.S. sidestepped an economic recession. The fixed income metal spillover factor led the Fund to sell bonds in anticipation of lower interest rates, resulting in gains across almost all bond durations and global regions.
The Fund was helped by positioning in 10-year Japanese, U.K. and Australian government bonds.
Positioning in the British pound, Swedish krona and Norwegian krone added to returns.
The Fund’s positioning in zinc, soybean oil and wheat was advantageous.
Top Detractors from Performance:
The Fund was hurt by the long-term reversal factor, which aims to detect trends and reversals in commodity prices. This factor signals buying or selling when a commodity is well below or above the moving average in anticipation that fair pricing would lead that commodity to revert to its price average.
The long-term reversal factor led the Fund to short copper, gold and coffee amid steep prices, but these commodities did not return to their price averages during the reporting period, resulting in losses for the Fund.
Positioning in 10-year German and South Korean government bonds detracted from the Fund’s performance.
The Fund was hampered by positioning in the Japanese yen, New Zealand dollar and Canadian dollar.
Positioning in gold, corn and cocoa had a negative impact on performance.
The above represents investment pillars.
Goldman Sachs Multi-Strategy Alternatives Fund
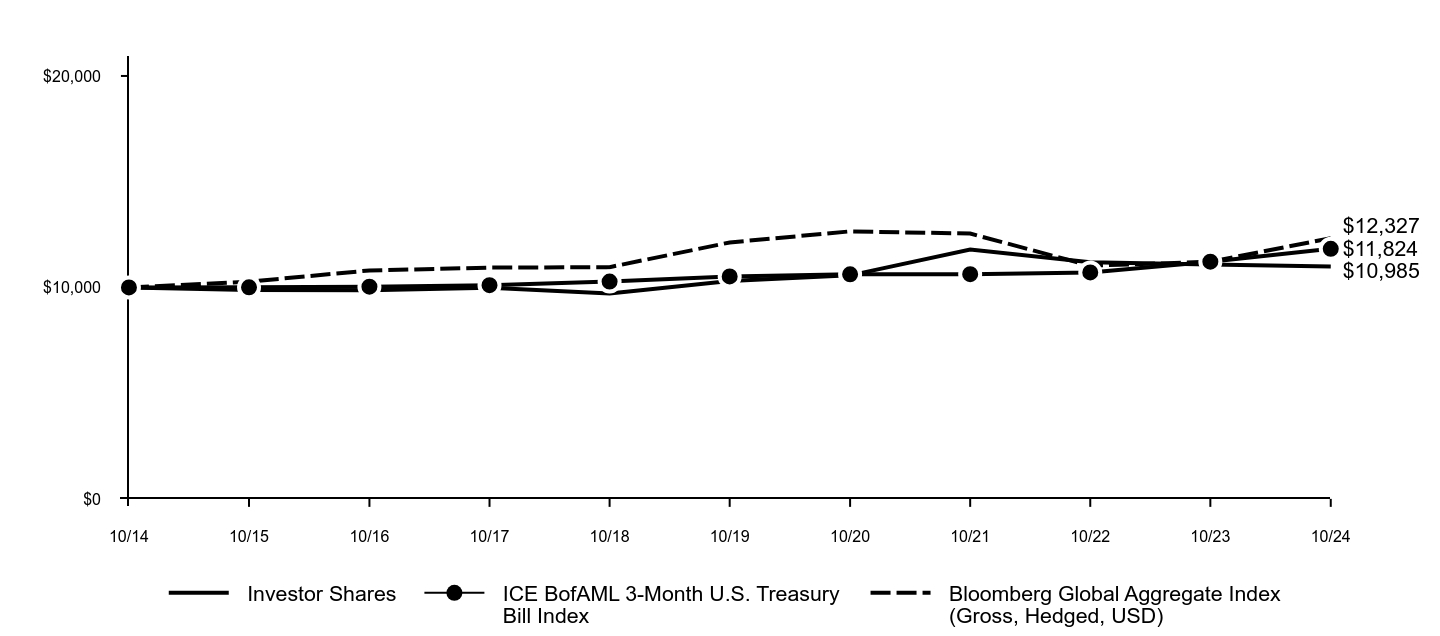
The following graph assumes an initial $10,000 investment in the Fund and compares the initial and subsequent account values at the end of each of the most recently completed 10 fiscal years of the Fund's share class (or less if the share class has been in operation for less than 10 years). The Fund's performance reflects applicable sales charges, if any. For comparative purposes, the performance of the Fund's benchmark and any additional performance benchmark(s) are also shown.
| Investor Shares | ICE BofAML 3-Month U.S. Treasury Bill Index | Bloomberg Global Aggregate Index (Gross, Hedged, USD) |
|---|
| 10/14 | $10,000 | $10,000 | $10,000 |
| 10/15 | $9,874 | $10,002 | $10,272 |
| 10/16 | $9,868 | $10,033 | $10,803 |
| 10/17 | $9,989 | $10,105 | $10,936 |
| 10/18 | $9,717 | $10,275 | $10,958 |
| 10/19 | $10,302 | $10,522 | $12,127 |
| 10/20 | $10,570 | $10,618 | $12,651 |
| 10/21 | $11,791 | $10,625 | $12,546 |
| 10/22 | $11,190 | $10,708 | $11,025 |
| 10/23 | $11,078 | $11,219 | $11,215 |
| 10/24 | $10,985 | $11,824 | $12,327 |
Average Annual Total Returns (%)
| AATR | 1 Year | 5 Years | 10 Years |
|---|
| Investor Shares | -0.84% | 1.29% | 0.94% |
| ICE BofAML 3-Month U.S. Treasury Bill Index | 5.39% | 2.36% | 1.69% |
| Bloomberg Global Aggregate Index (Gross, Hedged, USD) | 9.92% | 0.33% | 2.11% |
Performance data quoted above represents past performance. Past performance does not guarantee future results.
The Fund’s investment return and principal value will fluctuate so that an investor’s shares, when redeemed, may be worth more or less than their original cost. Current performance may be lower or higher than the performance quoted above. Please visit our web site at: am.gs.com to obtain the most recent month-end returns. Performance reflects applicable fee waivers and/or expense limitations in effect during the periods shown and in their absence, performance would be reduced. The graph and table do not reflect the deduction of taxes that a shareholder would pay on Fund distributions or redemption of Fund shares. In accordance with changing regulatory requirements, the Fund is now required to compare its performance to a regulatory benchmark, which in this case is the Bloomberg Global Aggregate Index (Gross, Hedged, USD).
Goldman Sachs Multi-Strategy Alternatives Fund
| Total Net Assets | $64,670,541 |
| # of Portfolio Holdings | 197 |
| Portfolio Turnover Rate | 0% |
| Total Net Advisory Fees Paid | $542,250 |
This is a summary of certain changes to the Fund for the period. For more complete information, you may review the Fund's next prospectus, which we expect to be available by February 28, 2025 at dfinview.com/GoldmanSachs or upon request at 1-800-621-2550.
The Fund's net expense ratio decreased during the period as a result of a lower management fee rate and lower expense limit.
What did the Fund invest in?
The table below shows the investment makeup of the Fund, representing the percentage of total net assets of the Fund. Figures in the table below may not sum to 100% due to the exclusion of other assets and liabilities and may not represent the Fund’s market exposure due to the exclusion of certain derivatives, if any. These allocations may not be representative of the Fund’s future investments.
Asset Class Exposure (%)*
| Header | Gross | Long | Short | Net |
| Cash | 29.1 | 19.6 | 9.5 | 10.0 |
| Commodities | 94.7 | 49.1 | 45.5 | 3.6 |
| Developed Market Currency | 209.5 | 126.5 | 83.0 | 43.4 |
| Long-Term Fixed Income | 101.5 | 32.0 | 69.5 | -37.5 |
| Short-Term Fixed Income | 39.3 | 39.3 | - | 39.3 |
| Short-Term Investments | 91.4 | 91.4 | - | 91.4 |
*Asset class exposure includes the impact of derivatives. "Gross Exposure" represents the sum of the absolute value of long and short notional contract values in U.S. dollars of the Fund's positions (for a given asset class), divided by the Fund's net assets exposure within each asset class. "Net Exposure" represents the net exposure within the Fund to a given asset class, calculated as the difference between long and short exposures. The exposure of option contracts is delta-adjusted and offsetting forward foreign currency exchange contract positions are netted by currency pair and settlement date for both gross and net exposure calculations. Short-term Investments include investment companies and U.S. Treasury Bills.
Goldman Sachs Multi-Strategy Alternatives Fund
If you wish to view additional information about the Fund, including the documents and other information listed below, please visit dfinview.com/GoldmanSachs or call 1-800-621-2550.
prospectus
financial information
fund holdings
proxy voting information
Goldman Sachs & Co. LLC is the distributor of the Goldman Sachs Funds.
ICE Data Indices, LLC (“ICE DATA”) is used with permission. ICE DATA, ITS AFFILIATES AND THEIR RESPECTIVE THIRD PARTY SUPPLIERS DISCLAIM ANY AND ALL WARRANTIES, REPRESENTATIONS, EXPRESS AND/OR IMPLIED INCLUDING ANY WARRANTIES OF MERCHANTABILITY OR FITNESS FOR A PARTICULAR PURPOSE OR USE, INCLUDING THE INDICES, INDEX DATA AND ANY DATA INCLUDED IN, RELATED TO, OR DERIVED THEREFROM. NEITHER ICE DATA, ITS AFFILIATES NOR THEIR RESPECTIVE THIRD PARTY SUPPLIERS SHALL BE SUBJECT TO ANY DAMAGES OR LIABILITY WITH RESPECT TO THE ADEQUACY, ACCURACY, TIMELINESS OR COMPLETENESS OF THE INDICES OR THE INDEX DATA OR ANY COMPONENT THEREOF, AND THE INDICES AND INDEX DATA AND ALL COMPONENTS THEREOF ARE PROVIDED ON AN “AS IS” BASIS AND YOUR USE IS AT YOUR OWN RISK. ICE DATA, ITS AFFILIATES AND THEIR RESPECTIVE THIRD PARTY SUPPLIERS DO NOT SPONSOR, ENDORSE, OR RECOMMEND GOLDMAN SACHS, OR ANY OF ITS PRODUCTS OR SERVICES.
Bloomberg Index Services Limited. BLOOMBERG® is a trademark and service mark of Bloomberg Finance LP. And its affiliates (collectively “Bloomberg”). Bloomberg or Bloomberg’s licensors own all proprietary rights in the Bloomberg Indices. Neither Bloomberg nor Bloomberg’s licensors approves or endorses this material, or guarantees the accuracy or completeness of any information herein, or makes any warranty, express or implied, as to the results to be obtained therefrom and, to the maximum extent allowed by law, neither shall have any liability or responsibility for injury or damages arising in connection therewith.
© 2024 Goldman Sachs. All rights reserved.
No Bank Guarantee
May Lose Value
Not FDIC Insured
Goldman Sachs Multi-Strategy Alternatives Fund
Annual Shareholder Report
October 31, 2024
Goldman Sachs Multi-Manager Non-Core Fixed Income Fund
This annual shareholder report contains important information about Goldman Sachs Multi-Manager Non-Core Fixed Income Fund (the "Fund") for the period of November 1, 2023 to October 31, 2024. You can find additional information about the Fund at am.gs.com or dfinview.com/GoldmanSachs. You can also request this information by contacting us at 1-800-621-2550.
This report describes changes to the Fund that occurred during the reporting period.
What were the Fund costs for the period?
Based on a hypothetical $10,000 investment.
| Class | Costs of a $10,000 investment | Costs paid as a percentage of a $10,000 investment |
|---|
| R6 | $56 | 0.53% |
How did the Fund perform and what affected its performance?
Global fixed income was influenced most by central bank monetary policy, waning inflation and resilient economic growth. Bond yields fell, as many central banks cut interest rates. External emerging markets debt posted the largest gains, followed by high yield corporate bonds, bank loans and local emerging markets debt.
Top Contributors to Performance:
All six underlying managers that managed Fund assets for the entire annual period generated positive absolute returns. Two outperformed their respective benchmark indices.
In high yield, underlying manager RBC BlueBay Asset Management outpaced its benchmark, with positioning in banking credits adding most. Credit quality positioning and term structure effects detracted.
Marathon Asset Management, L.P. outperformed its benchmark, with selection in Mexico, Brazil, Egypt, Peru and Guatemala adding. Positioning in China and security selection in Argentina detracted.
Ares Capital Management II LLC (Ares) outpaced its benchmark between November 2023, when it began managing a bank loan portfolio, and the end of the annual period.
Top Detractors from Performance:
Ares, as a high yield underlying manager, underperformed its benchmark due to selection of electric and communications credits. Selection in energy, transportation, capital goods and basic industry added.
In high yield, Brigade Capital Management, LP trailed its benchmark, with selection in services, basic industry and utilities detracting. Selection in telecommunications, technology, health care and financials added.
In bank loans, Aristotle Pacific Capital, LLC underperformed its benchmark due to underweights in media and telecommunications. Overweights in second lien loans and insurance loans added.
In local emerging markets debt, TCW Investment Management Company LLC lagged its benchmark due to underweights in low yielding markets. Exposure to Egypt and the Turkish lira added.
High Yield Corporate Bonds
The above represents the Fund’s overall global fixed income exposures.
Goldman Sachs Multi-Manager Non-Core Fixed Income Fund
The following graph assumes an initial $1,000,000 investment in the Fund and compares the initial and subsequent account values at the end of each of the most recently completed 10 fiscal years of the Fund's share class (or less if the share class has been in operation for less than 10 years). The Fund's performance reflects applicable sales charges, if any. For comparative purposes, the performance of the Fund's benchmark and any additional performance benchmark(s) are also shown.
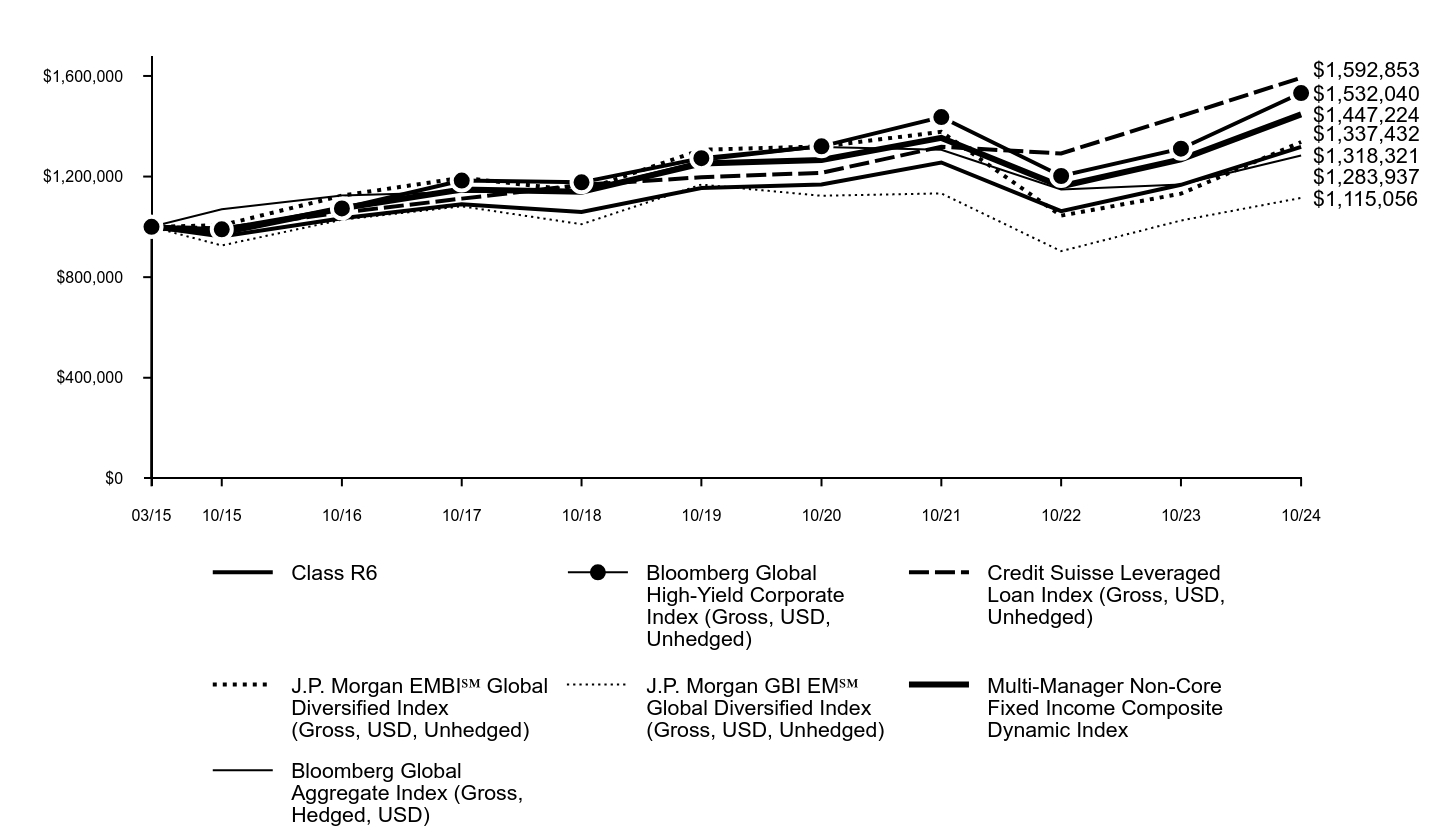
| Class R6 | Bloomberg Global High-Yield Corporate Index (Gross, USD, Unhedged) | Credit Suisse Leveraged Loan Index (Gross, USD, Unhedged) | J.P. Morgan EMBI℠ Global Diversified Index (Gross, USD, Unhedged) | J.P. Morgan GBI EM℠ Global Diversified Index (Gross, USD, Unhedged) | Multi-Manager Non-Core Fixed Income Composite Dynamic Index | Bloomberg Global Aggregate Index (Gross, Hedged, USD) |
|---|
| 03/15 | $1,000,000 | $1,000,000 | $1,000,000 | $1,000,000 | $1,000,000 | $1,000,000 | - |
| 03/15 | $1,000,000 | $1,000,000 | $1,000,000 | $1,000,000 | $1,000,000 | $1,000,000 | $1,000,000 |
| 10/15 | $961,600 | $990,258 | $994,161 | $1,006,446 | $926,134 | $976,539 | $1,069,836 |
| 10/16 | $1,034,297 | $1,073,247 | $1,056,802 | $1,124,209 | $1,028,406 | $1,073,889 | $1,125,130 |
| 10/17 | $1,089,942 | $1,184,010 | $1,112,282 | $1,195,216 | $1,081,698 | $1,148,777 | $1,138,949 |
| 10/18 | $1,058,988 | $1,176,928 | $1,166,695 | $1,142,769 | $1,010,525 | $1,139,496 | $1,141,268 |
| 10/19 | $1,154,614 | $1,273,077 | $1,197,106 | $1,306,728 | $1,168,072 | $1,251,650 | $1,263,075 |
| 10/20 | $1,168,585 | $1,320,060 | $1,215,099 | $1,319,542 | $1,123,536 | $1,265,592 | $1,317,676 |
| 10/21 | $1,255,879 | $1,436,629 | $1,318,546 | $1,377,790 | $1,132,988 | $1,353,667 | $1,306,787 |
| 10/22 | $1,062,222 | $1,202,327 | $1,291,826 | $1,044,541 | $903,282 | $1,161,313 | $1,148,348 |
| 10/23 | $1,167,276 | $1,310,755 | $1,440,871 | $1,131,866 | $1,025,268 | $1,268,515 | $1,168,102 |
| 10/24 | $1,318,321 | $1,532,040 | $1,592,853 | $1,337,432 | $1,115,056 | $1,447,224 | $1,283,937 |
Average Annual Total Returns (%)
| AATR | 1 Year | 5 Years | Since Inception 3/31/15 |
|---|
| Class R6 | 12.94% | 2.68% | 2.92% |
| Bloomberg Global High-Yield Corporate Index (Gross, USD, Unhedged) | 16.88% | 3.77% | 4.55% |
| Credit Suisse Leveraged Loan Index (Gross, USD, Unhedged) | 10.55% | 5.87% | 4.97% |
| J.P. Morgan EMBI℠ Global Diversified Index (Gross, USD, Unhedged) | 18.16% | 0.47% | 3.08% |
| J.P. Morgan GBI-EM℠ Global Diversified Index (Gross, USD, Unhedged) | -0.92% | 11.51% | 1.14% |
| Multi-Manager Non-Core Fixed Income Composite Dynamic Index | 14.09% | 2.94% | 3.93% |
| Bloomberg Global Aggregate Index (Gross, Hedged, USD) | 9.92% | 0.33% | 1.87% |
Performance data quoted above represents past performance. Past performance does not guarantee future results.
The Fund’s investment return and principal value will fluctuate so that an investor’s shares, when redeemed, may be worth more or less than their original cost. Current performance may be lower or higher than the performance quoted above. Please visit our web site at: am.gs.com to obtain the most recent month-end returns. Performance reflects applicable fee waivers and/or expense limitations in effect during the periods shown and in their absence, performance would be reduced. The graph and table do not reflect the deduction of taxes that a shareholder would pay on Fund distributions or redemption of Fund shares. In accordance with changing regulatory requirements, the Fund is now required to compare its performance to a regulatory benchmark, which in this case is the Bloomberg Global Aggregate Index (Gross, Hedged, USD).
Goldman Sachs Multi-Manager Non-Core Fixed Income Fund
| Total Net Assets | $1,625,268,512 |
| # of Portfolio Holdings | 1,331 |
| Portfolio Turnover Rate | 123% |
| Total Net Advisory Fees Paid | $5,584,561 |
This is a summary of certain changes to the Fund for the period. For more complete information, you may review the Fund's next prospectus, which we expect to be available by February 28, 2025 at dfinview.com/GoldmanSachs or upon request at 1-800-621-2550.
Nuveen Asset Management LLC no longer serves as an investment subadviser for the Fund.
What did the Fund invest in?
The table below shows the investment makeup of the Fund, representing the percentage of total net assets of the Fund. Figures in the table below may not sum to 100% due to the exclusion of other assets and liabilities and may not represent the Fund’s market exposure due to the exclusion of certain derivatives, if any. These allocations may not be representative of the Fund’s future investments.
| Sovereign Debt Obligations | 36.5% |
| Software | 4.1% |
| Oil Field Services | 3.6% |
| Commercial Services | 3.5% |
| Media | 2.9% |
| Insurance | 2.9% |
| Packaging | 2.2% |
| Pipelines | 1.9% |
| Diversified Financial Services | 1.9% |
| Other | 39.5% |
Goldman Sachs Multi-Manager Non-Core Fixed Income Fund
If you wish to view additional information about the Fund, including the documents and other information listed below, please visit dfinview.com/GoldmanSachs or call 1-800-621-2550.
prospectus
financial information
fund holdings
proxy voting information
Goldman Sachs & Co. LLC is the distributor of the Goldman Sachs Funds.
Bloomberg Index Services Limited. BLOOMBERG® is a trademark and service mark of Bloomberg Finance LP. And its affiliates (collectively “Bloomberg”). Bloomberg or Bloomberg’s licensors own all proprietary rights in the Bloomberg Indices. Neither Bloomberg nor Bloomberg’s licensors approves or endorses this material, or guarantees the accuracy or completeness of any information herein, or makes any warranty, express or implied, as to the results to be obtained therefrom and, to the maximum extent allowed by law, neither shall have any liability or responsibility for injury or damages arising in connection therewith. Information has been obtained from sources believed to be reliable but J.P. Morgan and its data suppliers do not warrant its completeness or accuracy. This Index is used with permission. The Index may note be copied, used or distributed without J.P. Morgan's prior written approval. Copyright 2014, J.P. Morgan Chase & Co.. All rights reserved.
© 2024 Goldman Sachs. All rights reserved.
No Bank Guarantee
May Lose Value
Not FDIC Insured
Goldman Sachs Multi-Manager Non-Core Fixed Income Fund
Annual Shareholder Report
October 31, 2024
Multi-Manager International Equity Fund
This annual shareholder report contains important information about Multi-Manager International Equity Fund (the "Fund") for the period of November 1, 2023 to October 31, 2024. You can find additional information about the Fund at am.gs.com or dfinview.com/GoldmanSachs. You can also request this information by contacting us at 1-800-621-2550.
This report describes changes to the Fund that occurred during the reporting period.
What were the Fund costs for the period?
Based on a hypothetical $10,000 investment.
| Class | Costs of a $10,000 investment | Costs paid as a percentage of a $10,000 investment |
|---|
| P | $58 | 0.52% |
How did the Fund perform and what affected its performance?
Non-U.S. developed markets equities generated strongly positive returns as waning inflation levels led to interest rate cuts by a number of central banks. Although higher energy prices and political uncertainty weighed on the economies of certain countries, the developed markets broadly avoided a major recession.
Top Contributors to Performance:
All three of the Fund’s underlying managers generated positive absolute returns. Two of these underlying managers added to the Fund’s performance relative to the MSCI EAFE Index.
Growth-oriented underlying manager WCM Investment Management, LLC significantly outperformed its benchmark due to stock selection in the consumer discretionary and industrials sectors. This was partially offset by an overweight in the health care sector, which detracted from results. Regionally, selection in Europe ex-UK added most to performance.
Value-oriented underlying manager Causeway Capital Management LLC outpaced its benchmark, with stock selection in industrials and communication services contributing most positively to returns. Selection in the information technology sector detracted. Regionally, stock selection in the U.K. added to returns, while selection in Asia ex-Japan limited results.
Top Detractors from Performance:
Core-oriented underlying manager MFS Investment Management underperformed its benchmark due to stock selection in the financials, consumer staples and communication services sectors. Selection in Asia ex-Japan and out-of-benchmark exposure to North America also detracted from returns. These negative results were offset somewhat by selection in the industrials, energy and information technology sectors as well as in the U.K. and Japan.
Between the beginning of the annual period and February 2024, when it was eliminated as an underlying manager of the Fund, Lazard Asset Management LLC underperformed its benchmark.
Information Technology—OW
Consumer Discretionary—UW
The above represents sectors.
KEY
OW–Overweight
UW–Underweight
Multi-Manager International Equity Fund
The following graph assumes an initial $1,000,000 investment in the Fund and compares the initial and subsequent account values at the end of each of the most recently completed 10 fiscal years of the Fund's share class (or less if the share class has been in operation for less than 10 years). The Fund's performance reflects applicable sales charges, if any. For comparative purposes, the performance of the Fund's benchmark and any additional performance benchmark(s) are also shown.
| Class P | MSCI EAFE Index (Net, USD, Unhedged) |
|---|
| 07/15 | $1,000,000 | $1,000,000 |
| 10/15 | $952,000 | $948,100 |
| 10/16 | $944,194 | $917,476 |
| 10/17 | $1,184,396 | $1,132,533 |
| 10/18 | $1,117,715 | $1,054,954 |
| 10/19 | $1,260,559 | $1,171,421 |
| 10/20 | $1,231,692 | $1,091,062 |
| 10/21 | $1,717,718 | $1,463,987 |
| 10/22 | $1,320,066 | $1,127,270 |
| 10/23 | $1,522,300 | $1,289,597 |
| 10/24 | $1,894,046 | $1,585,817 |
Average Annual Total Returns (%)
| AATR | 1 Year | 5 Years | Since Inception 7/31/15 |
|---|
| Class P | 24.42% | 8.47% | 7.14% |
| MSCI EAFE Index (Net, USD, Unhedged) | 22.97% | 6.24% | 5.10% |
Performance data quoted above represents past performance. Past performance does not guarantee future results.
The Fund’s investment return and principal value will fluctuate so that an investor’s shares, when redeemed, may be worth more or less than their original cost. Current performance may be lower or higher than the performance quoted above. Please visit our web site at: am.gs.com to obtain the most recent month-end returns. Performance reflects applicable fee waivers and/or expense limitations in effect during the periods shown and in their absence, performance would be reduced. The graph and table do not reflect the deduction of taxes that a shareholder would pay on Fund distributions or redemption of Fund shares.
Multi-Manager International Equity Fund
| Total Net Assets | $1,585,900,228 |
| # of Portfolio Holdings | 160 |
| Portfolio Turnover Rate | 68% |
| Total Net Advisory Fees Paid | $6,153,927 |
This is a summary of certain changes to the Fund for the period. For more complete information, you may review the Fund's next prospectus, which we expect to be available by February 28, 2025 at dfinview.com/GoldmanSachs or upon request at 1-800-621-2550.
Lazard Asset Management LLC no longer serves as an investment subadviser for the Fund.
What did the Fund invest in?
The table below shows the investment makeup of the Fund, representing the percentage of total net assets of the Fund. Figures in the table below may not sum to 100% due to the exclusion of other assets and liabilities and may not represent the Fund’s market exposure due to the exclusion of certain derivatives, if any. These allocations may not be representative of the Fund’s future investments.
| Industrials | 19.4% |
| Financials | 18.1% |
| Health Care | 13.0% |
| Information Technology | 11.8% |
| Consumer Discretionary | 11.1% |
| Consumer Staples | 8.6% |
| Materials | 5.7% |
| Communication Services | 3.9% |
| Energy | 2.6% |
| Other | 5.9% |
Multi-Manager International Equity Fund
If you wish to view additional information about the Fund, including the documents and other information listed below, please visit dfinview.com/GoldmanSachs or call 1-800-621-2550.
prospectus
financial information
fund holdings
proxy voting information
Goldman Sachs & Co. LLC is the distributor of the Goldman Sachs Funds.
The Morgan Stanley Capital International Inc. (MSCI) information may only be used for your internal use, may not be reproduced or redisseminated in any form and may not be used as a basis for or a component of any financial instruments or products or indices. None of the MSCI information is intended to constitute investment advice or a recommendation to make (or refrain from making) any kind of investment decision and may not be relied on as such. Historical data and analysis should not be taken as an indication or guarantee of any future performance analysis, forecast or prediction. The MSCI information is provided on an “as is” basis and the user of this information assumes the entire risk of any use made of this information. MSCI, each of its affiliates and each other person involved in or related to compiling, computing or creating any MSCI information (collectively, the “MSCI Parties”) expressly disclaims all warranties (including, without limitation, any warranties of originality, accuracy, completeness, timeliness, non-infringement, merchantability and fitness for a particular purpose) with respect to this information. Without limiting any of the foregoing, in no event shall any MSCI Party have any liability for any direct, indirect, special, incidental, punitive, consequential, lost profits) or any other damages. (www.msci.com).
The Global Industry Classification Standard (GICS) was developed by and is the exclusive property and a service mark of Morgan Stanley Capital International Inc. (MSCI) and Standard & Poor’s, a division of The McGraw-Hill Companies, Inc. (S&P) and is licensed for use by Goldman Sachs. Neither MSCI, S&P nor any other party involved in making or compiling the GICS or any GICS classifications makes any express or implied warranties or representations with respect to such standard or classification (or the results to be obtained by the use thereof), and all such parties hereby expressly disclaim all warranties of originality, accuracy, completeness, merchantability or fitness for a particular purpose with respect to any of such standard or classification. Without limiting any of the foregoing, in no event shall MSCI, S&P, any of their affiliates or any third party involved in making or compiling the GICS or any GICS classifications have any liability for any direct, indirect, special, punitive, consequential or any other damages (including lost profits) even if notified of the possibility of such damages.
© 2024 Goldman Sachs. All rights reserved.
No Bank Guarantee
May Lose Value
Not FDIC Insured
Multi-Manager International Equity Fund
Annual Shareholder Report
October 31, 2024
Goldman Sachs Multi-Manager Real Assets Strategy Fund
This annual shareholder report contains important information about Goldman Sachs Multi-Manager Real Assets Strategy Fund (the "Fund") for the period of November 1, 2023 to October 31, 2024. You can find additional information about the Fund at am.gs.com or dfinview.com/GoldmanSachs. You can also request this information by contacting us at 1-800-621-2550.
This report describes changes to the Fund that occurred during the reporting period.
What were the Fund costs for the period?
Based on a hypothetical $10,000 investment.
| Class | Costs of a $10,000 investment | Costs paid as a percentage of a $10,000 investment |
|---|
| R6 | $79 | 0.69% |
How did the Fund perform and what affected its performance?
Global real estate and global infrastructure securities overall posted double-digit gains, as global inflation eased and investors focused on the scope of central bank policy easing. Interest rates fell, boosting the performance of global real estate securities and the utilities segment of global infrastructure.
Top Contributors to Performance:
In global infrastructure, RREEF America L.L.C. outperformed its benchmark, driven by selection in midstream energy and transportation infrastructure. An underweight in water utilities also contributed positively. Selection and an overweight in U.S. cell tower real estate investment trusts (REITs), as well as an overweight in electric utilities, detracted from returns. Regionally, selection in North America was positive, while selection in Japan was negative.
Also in global infrastructure, Cohen & Steers Capital Management, Inc. outperformed its benchmark due to selection in midstream energy, marine ports and gas utilities. Selection in transportation infrastructure and positioning in rail transportation detracted. Regionally, selection in North America was positive, while selection within continental Europe, notably in France, was negative.
PGIM Real Estate outperformed its benchmark, with selection of retail, diversified and health care REITs contributing positively. On the negative side were selection and an underweight in self-storage REITs as well as selection of multi-family residential REITs. Regionally, selection in Asia ex-Japan and North America added to returns, while selection in the U.K. detracted.
Top Detractors from Performance:
Principal Real Estate Investors, LLC underperformed its benchmark due to an underweight and selection of retail REITs as well as selection of specialized REITs. Positioning in health care REITs was negative as was selection of Asia-Pacific diversified REITs and of industrial REITs and hotel REITs. Regionally, selection was positive in Asia broadly and in Europe ex-U.K. Selection in North America detracted from performance.
The above represents the Fund’s overall regional exposures.
Goldman Sachs Multi-Manager Real Assets Strategy Fund
The following graph assumes an initial $1,000,000 investment in the Fund and compares the initial and subsequent account values at the end of each of the most recently completed 10 fiscal years of the Fund's share class (or less if the share class has been in operation for less than 10 years). The Fund's performance reflects applicable sales charges, if any. For comparative purposes, the performance of the Fund's benchmark and any additional performance benchmark(s) are also shown.
| Class R6 | Dow Jones Brookfield Global Infrastructure Index (Net, USD, Unhedged) | FTSE EPRA/NAREIT Developed Index (Net, USD, Unhedged) | Multi-Manager Real Assets Strategy Composite Dynamic Index | S&P 500® Index |
|---|
| 06/15 | $1,000,000 | $1,000,000 | $1,000,000 | $1,000,000 | $1,000,000 |
| 06/15 | $1,000,000 | $1,000,000 | $1,000,000 | $1,000,000 | $1,000,000 |
| 10/15 | $957,000 | $972,202 | $1,040,165 | $1,012,892 | $1,014,539 |
| 10/16 | $936,425 | $1,020,643 | $1,067,734 | $1,050,303 | $1,060,285 |
| 10/17 | $1,017,425 | $1,149,831 | $1,135,052 | $1,143,207 | $1,310,855 |
| 10/18 | $998,298 | $1,103,997 | $1,140,503 | $1,128,292 | $1,407,154 |
| 10/19 | $1,198,356 | $1,323,061 | $1,374,123 | $1,357,269 | $1,608,745 |
| 10/20 | $1,043,888 | $1,171,124 | $1,060,461 | $1,108,440 | $1,764,962 |
| 10/21 | $1,395,679 | $1,482,944 | $1,510,774 | $1,507,978 | $2,522,378 |
| 10/22 | $1,119,613 | $1,362,834 | $1,135,738 | $1,230,049 | $2,153,832 |
| 10/23 | $1,087,369 | $1,323,366 | $1,069,205 | $1,173,544 | $2,372,291 |
| 10/24 | $1,402,597 | $1,666,189 | $1,376,006 | $1,498,196 | $3,274,166 |
Average Annual Total Returns (%)
| AATR | 1 Year | 5 Years | Since Inception 6/30/15 |
|---|
| Class R6 | 28.99% | 3.19% | 3.69% |
| Dow Jones Brookfield Global Infrastructure Index (Net, USD, Unhedged) | 25.91% | 4.71% | 5.61% |
| FTSE EPRA/NAREIT Developed Index (Net, USD, Unhedged) | 28.69% | 0.03% | 3.47% |
| Multi-Manager Real Assets Strategy Composite Dynamic Index | 27.66% | 1.99% | 4.42% |
S&P 500® Index | 38.02% | 15.25% | 13.53% |
Performance data quoted above represents past performance. Past performance does not guarantee future results.
The Fund’s investment return and principal value will fluctuate so that an investor’s shares, when redeemed, may be worth more or less than their original cost. Current performance may be lower or higher than the performance quoted above. Please visit our web site at: am.gs.com to obtain the most recent month-end returns. Performance reflects applicable fee waivers and/or expense limitations in effect during the periods shown and in their absence, performance would be reduced. The graph and table do not reflect the deduction of taxes that a shareholder would pay on Fund distributions or redemption of Fund shares. In accordance with changing regulatory requirements, the Fund is now required to compare its performance to a regulatory benchmark, which in this case is the S&P 500® Index.
Goldman Sachs Multi-Manager Real Assets Strategy Fund
| Total Net Assets | $914,496,375 |
| # of Portfolio Holdings | 186 |
| Portfolio Turnover Rate | 85% |
| Total Net Advisory Fees Paid | $4,334,197 |
This is a summary of certain changes to the Fund for the period. For more complete information, you may review the Fund's next prospectus, which we expect to be available by February 28, 2025 at dfinview.com/GoldmanSachs or upon request at 1-800-621-2550.
The Fund's net expense ratio decreased during the period as a result of an increase in average net assets.
What did the Fund invest in?
The table below shows the investment makeup of the Fund, representing the percentage of total net assets of the Fund. Figures in the table below may not sum to 100% due to the exclusion of other assets and liabilities and may not represent the Fund’s market exposure due to the exclusion of certain derivatives, if any. These allocations may not be representative of the Fund’s future investments.
| Real Estate | 58.5% |
| Utilities | 17.5% |
| Energy | 13.5% |
| Industrials | 5.2% |
| Communication Services | 1.9% |
| Information Technology | 0.3% |
| Health Care | 0.2% |
| Consumer Discretionary | 0.1% |
Goldman Sachs Multi-Manager Real Assets Strategy Fund
If you wish to view additional information about the Fund, including the documents and other information listed below, please visit dfinview.com/GoldmanSachs or call 1-800-621-2550.
prospectus
financial information
fund holdings
proxy voting information
Goldman Sachs & Co. LLC is the distributor of the Goldman Sachs Funds.
London Stock Exchange Group plc and its group undertakings (collectively, the “LSE Group”). © LSE Group 2024. FTSE Russell is a trading name of certain of the LSE Group companies. “FTSE®” “Russell®”, “FTSE Russell®”, is/are trade mark(s) of the relevant LSE Group companies and is/are used by any other LSE Group company under license. All rights in the FTSE Russell indexes or data vest in the relevant LSE Group company which owns the index or the data. Neither LSE Group nor its licensors accept any liability for any errors or omissions in the indexes or data and no party may rely on any indexes or data contained in this communication. No further distribution of data from the LSE Group is permitted without the relevant LSE Group company’s express written consent. The LSE Group does not promote, sponsor or endorse the content of this communication.
The S&P 500 (“Index”) is a product of S&P Dow Jones Indices LLC and/or its affiliates and has been licensed for use by Goldman Sachs. Copyright © 2024 S&P Dow Jones Indices LLC, a division of S&P Global, Inc., and/or its affiliates. All rights reserved. Redistribution or reproduction in whole or in part are prohibited without written permission of S&P Dow Jones Indices LLC. For more information on any of S&P Dow Jones Indices LLC’s indices please visit www.spdji.com. S&P® is a registered trademark of S&P Global and Dow Jones® is a registered trademark of Dow Jones Trademark Holdings LLC. Neither S&P Dow Jones Indices LLC, Dow Jones Trademark Holdings LLC, their affiliates nor their third party licensors make any representation or warranty, express or implied, as to the ability of any index to accurately represent the asset class or market sector that it purports to represent and neither S&P Dow Jones Indices LLC, Dow Jones Trademark Holdings LLC, their affiliates nor their third party licensors shall have any liability for any errors, omissions, or interruptions of any index or the data included therein.
The Global Industry Classification Standard (GICS) was developed by and is the exclusive property and a service mark of Morgan Stanley Capital International Inc. (MSCI) and Standard & Poor’s, a division of The McGraw-Hill Companies, Inc. (S&P) and is licensed for use by Goldman Sachs. Neither MSCI, S&P nor any other party involved in making or compiling the GICS or any GICS classifications makes any express or implied warranties or representations with respect to such standard or classification (or the results to be obtained by the use thereof), and all such parties hereby expressly disclaim all warranties of originality, accuracy, completeness, merchantability or fitness for a particular purpose with respect to any of such standard or classification. Without limiting any of the foregoing, in no event shall MSCI, S&P, any of their affiliates or any third party involved in making or compiling the GICS or any GICS classifications have any liability for any direct, indirect, special, punitive, consequential or any other damages (including lost profits) even if notified of the possibility of such damages.
© 2024 Goldman Sachs. All rights reserved.
No Bank Guarantee
May Lose Value
Not FDIC Insured
Goldman Sachs Multi-Manager Real Assets Strategy Fund
Annual Shareholder Report
October 31, 2024
Multi-Manager U.S. Small Cap Equity Fund
This annual shareholder report contains important information about Multi-Manager U.S. Small Cap Equity Fund (the "Fund") for the period of November 1, 2023 to October 31, 2024. You can find additional information about the Fund at am.gs.com or dfinview.com/GoldmanSachs. You can also request this information by contacting us at 1-800-621-2550.
What were the Fund costs for the period?
Based on a hypothetical $10,000 investment.
| Class | Costs of a $10,000 investment | Costs paid as a percentage of a $10,000 investment |
|---|
| P | $80 | 0.71% |
How did the Fund perform and what affected its performance?
U.S. small-cap stocks broadly experienced volatility amid shifting sentiment around inflation and economic growth, Federal Reserve monetary policy and the then-upcoming election but produced strongly positive returns. Excitement around artificial intelligence capabilities drove a significant portion of market gains.
Top Contributors to Performance:
Top Detractors from Performance:
All four underlying managers lagged their respective benchmarks, detracting from the Fund’s performance relative to the Russell 2000® Total Return Index.
Brown Advisory LLC, a growth-oriented underlying manager, underperformed its benchmark due to stock selection in the health care and information technology sectors. These negative results were offset somewhat by selection in consumer discretionary and a lack of exposure to utilities, which contributed positively.
Value-oriented underlying manager Victory Capital Management, Inc. underperformed its benchmark because of stock selection in the industrials and information technology sectors. Partially offsetting these results were an underweight position in energy and stock selection in real estate, both of which added to performance.
Boston Partners Global Investors, Inc. the Fund’s other value-oriented underlying manager, underperformed its benchmark as a result of stock selection in health care and communication services. Effective selection in consumer discretionary, along with selection and an underweight in utilities, partly offset these negative results.
Growth-oriented underlying manager Westfield Capital Management Company, L.P. underperformed its benchmark primarily due to stock selection in the health care and energy sectors. This was partly offset by stock selection in consumer discretionary and materials, which added to performance.
Consumer Discretionary—SS
Information Technology—SS
The above represents sectors.
KEY
SS–Security Selection
UW–Underweight
Multi-Manager U.S. Small Cap Equity Fund
The following graph assumes an initial $1,000,000 investment in the Fund and compares the initial and subsequent account values at the end of each of the most recently completed 10 fiscal years of the Fund's share class (or less if the share class has been in operation for less than 10 years). The Fund's performance reflects applicable sales charges, if any. For comparative purposes, the performance of the Fund's benchmark and any additional performance benchmark(s) are also shown.
| Class P | Russell 2000® Total Return Index | Russell 3000 Index |
|---|
| 04/16 | $1,000,000 | $1,000,000 | $1,000,000 |
| 10/16 | $1,052,000 | $1,061,300 | $1,041,800 |
| 10/17 | $1,291,856 | $1,356,872 | $1,291,624 |
| 10/18 | $1,286,689 | $1,381,974 | $1,376,871 |
| 10/19 | $1,422,563 | $1,449,691 | $1,562,611 |
| 10/20 | $1,338,632 | $1,447,661 | $1,721,216 |
| 10/21 | $1,928,567 | $2,183,073 | $2,476,829 |
| 10/22 | $1,624,432 | $1,778,332 | $2,067,657 |
| 10/23 | $1,543,210 | $1,626,106 | $2,240,927 |
| 10/24 | $1,946,297 | $2,180,121 | $3,089,342 |
Average Annual Total Returns (%)
| AATR | 1 Year | 5 Years | Since Inception 4/29/16 |
|---|
| Class P | 26.12% | 6.46% | 8.14% |
Russell 2000® Total Return Index | 34.07% | 8.49% | 9.59% |
| Russell 3000 Index | 37.86% | 14.59% | 14.16% |
Performance data quoted above represents past performance. Past performance does not guarantee future results.
The Fund’s investment return and principal value will fluctuate so that an investor’s shares, when redeemed, may be worth more or less than their original cost. Current performance may be lower or higher than the performance quoted above. Please visit our web site at: am.gs.com to obtain the most recent month-end returns. Performance reflects applicable fee waivers and/or expense limitations in effect during the periods shown and in their absence, performance would be reduced. The graph and table do not reflect the deduction of taxes that a shareholder would pay on Fund distributions or redemption of Fund shares. In accordance with changing regulatory requirements, the Fund is now required to compare its performance to a regulatory benchmark, which in this case is the Russell 3000 Index.
Multi-Manager U.S. Small Cap Equity Fund
| Total Net Assets | $549,969,117 |
| # of Portfolio Holdings | 353 |
| Portfolio Turnover Rate | 69% |
| Total Net Advisory Fees Paid | $4,701,908 |
What did the Fund invest in?
The table below shows the investment makeup of the Fund, representing the percentage of total net assets of the Fund. Figures in the table below may not sum to 100% due to the exclusion of other assets and liabilities and may not represent the Fund’s market exposure due to the exclusion of certain derivatives, if any. These allocations may not be representative of the Fund’s future investments.
| Industrials | 21.4% |
| Financials | 17.8% |
| Health Care | 15.2% |
| Information Technology | 13.6% |
| Consumer Discretionary | 10.2% |
| Energy | 4.8% |
| Materials | 4.2% |
| Real Estate | 2.6% |
| Consumer Staples | 2.3% |
| Other | 7.8% |
Multi-Manager U.S. Small Cap Equity Fund
If you wish to view additional information about the Fund, including the documents and other information listed below, please visit dfinview.com/GoldmanSachs or call 1-800-621-2550.
prospectus
financial information
fund holdings
proxy voting information
Goldman Sachs & Co. LLC is the distributor of the Goldman Sachs Funds.
London Stock Exchange Group plc and its group undertakings (collectively, the “LSE Group”). © LSE Group 2024. FTSE Russell is a trading name of certain of the LSE Group companies. “FTSE®” “Russell®”, “FTSE Russell®”, is/are trade mark(s) of the relevant LSE Group companies and is/are used by any other LSE Group company under license. All rights in the FTSE Russell indexes or data vest in the relevant LSE Group company which owns the index or the data. Neither LSE Group nor its licensors accept any liability for any errors or omissions in the indexes or data and no party may rely on any indexes or data contained in this communication. No further distribution of data from the LSE Group is permitted without the relevant LSE Group company’s express written consent. The LSE Group does not promote, sponsor or endorse the content of this communication.
The Global Industry Classification Standard (GICS) was developed by and is the exclusive property and a service mark of Morgan Stanley Capital International Inc. (MSCI) and Standard & Poor’s, a division of The McGraw-Hill Companies, Inc. (S&P) and is licensed for use by Goldman Sachs. Neither MSCI, S&P nor any other party involved in making or compiling the GICS or any GICS classifications makes any express or implied warranties or representations with respect to such standard or classification (or the results to be obtained by the use thereof), and all such parties hereby expressly disclaim all warranties of originality, accuracy, completeness, merchantability or fitness for a particular purpose with respect to any of such standard or classification. Without limiting any of the foregoing, in no event shall MSCI, S&P, any of their affiliates or any third party involved in making or compiling the GICS or any GICS classifications have any liability for any direct, indirect, special, punitive, consequential or any other damages (including lost profits) even if notified of the possibility of such damages.
© 2024 Goldman Sachs. All rights reserved.
No Bank Guarantee
May Lose Value
Not FDIC Insured
Multi-Manager U.S. Small Cap Equity Fund
| | (a) | As of the end of the period covered by this report, the registrant has adopted a code of ethics that applies to the registrant’s principal executive officer, principal financial officer, principal accounting officer or controller, or persons performing similar functions, regardless of whether these individuals are employed by the registrant or a third party (the “Code of Ethics”). |
| | (c) | During the period covered by this report, no amendments were made to the provisions of the Code of Ethics. |
| | (d) | During the period covered by this report, the registrant did not grant any waivers, including an implicit waiver, from any provision of the Code of Ethics. |
| | (f) | A copy of the Code of Ethics is available as provided in Item 19(a)(1) of this report. |
| ITEM 3. | AUDIT COMMITTEE FINANCIAL EXPERT. |
The registrant’s board of trustees has determined that the registrant has at least one “audit committee financial expert” (as defined in Item 3 of Form N-CSR) serving on its audit committee. Kathryn A. Cassidy and Michael Latham are each an “audit committee financial expert” and “independent” (as each term is defined in Item 3 of Form N-CSR).
| ITEM 4. | PRINCIPAL ACCOUNTANT FEES AND SERVICES. |
Table 1 — Items 4(a) - 4(d). The accountant fees below reflect the aggregate fees billed by all of the Funds of the Goldman Sachs Trust II and includes the Goldman Sachs Funds to which this certified shareholder report relates.
| | | | | | | | | | | | |
| | | 2024 | | 2023 | | Description of Services Rendered |
| | | |
| | | | | | | | | | | | |
| | | |
Audit Fees: | | | | | | | | | | | | |
| | | |
• PricewaterhouseCoopers LLP
(“PwC”) | | | $ | 414,639 | | | | $ | 490,622 | | | Financial Statement audits. |
| | | |
Audit-Related Fees: | | | | | | | | | | | | |
| | | |
• PwC | | | $ | 44,100 | | | | $ | 100,800 | | | Other attest services. |
| | | |
Tax Fees: | | | | | | | | | | | | |
| | | |
• PwC | | | $ | 0 | | | | $ | 0 | | | |
Table 2 — Items 4(b)(c) & (d). Non-Audit Services to the Goldman Sachs Trust II’s service affiliates* that were pre-approved by the Audit Committee of the Goldman Sachs Trust II pursuant to Rule 2-01(c)(7)(ii) of Regulation S-X.
| | | | | | | | | | | | |
| | | 2024 | | 2023 | | Description of Services Rendered |
| | | |
| | | | | | | | | | | | |
| | | |
Audit-Related Fees: | | | | | | | | | | | | |
| | | |
• PwC | | | $ | 2,122,312 | | | | $ | 2,075,449 | | | Internal control review performed in accordance with Statement on Standards for Attestation Engagements No. 16 and semi-annual updates related to withholding tax accrual for non-US jurisdictions. These fees are borne by the Funds’ Adviser. |
| * | These include the advisor (excluding sub-advisors) and any entity controlling, controlled by or under common control with the advisor that provides ongoing services to the registrant (hereinafter referred to as “service affiliates”). |
Item 4(e)(1) — Audit Committee Pre-Approval Policies and Procedures
Pre-Approval of Audit and Non-Audit Services Provided to the Funds of the Goldman Sachs Trust II. The Audit and Non-Audit Services Pre-Approval Policy (the “Policy”) adopted by the Audit Committee of Goldman Sachs Trust II (“GST II”) sets forth the procedures and the conditions pursuant to which services performed by an independent auditor for GST II may be pre-approved. Services may be pre-approved specifically by the Audit Committee as a whole or, in certain circumstances, by the Audit Committee Chairman or the person designated as the Audit Committee Financial Expert. In addition, subject to specified cost limitations, certain services may be pre-approved under the provisions of the Policy. The Policy provides that the Audit Committee will consider whether the services provided by an independent auditor are consistent with the Securities and Exchange Commission’s rules on auditor independence. The Policy provides for periodic review and pre-approval by the Audit Committee of the services that may be provided by the independent auditor.
De Minimis Waiver. The pre-approval requirements of the Policy may be waived with respect to the provision of non-audit services that are permissible for an independent auditor to perform, provided (1) the aggregate amount of all such services provided constitutes no more than five percent of the total amount of revenues subject to pre-approval that was paid to the independent auditors during the fiscal year in which the services are provided; (2) such services were not recognized by GST II at the time of the engagement to be non-audit services; and (3) such services are promptly brought to the attention of the Audit Committee and approved prior to the completion of the audit by the Audit Committee or by one or more members of the Audit Committee to whom authority to grant such approvals has been delegated by the Audit Committee, pursuant to the pre-approval provisions of the Policy.
Pre-Approval of Non-Audit Services Provided to GST II’s Investment Advisers. The Policy provides that, in addition to requiring pre-approval of audit and non-audit services provided to GST II, the Audit Committee will pre-approve those non-audit services provided to GST II’s investment advisers (and entities controlling, controlled by or under common control with the investment advisers that provide ongoing services to GST II) where the engagement relates directly to the operations or financial reporting of GST II.
Item 4(e)(2) – 0% of the audit-related fees, tax fees and other fees listed in Table 1 were approved by GST II’s Audit Committee pursuant to the “de minimis” exception of Rule 2-01(c)(7)(i)(C) of Regulation S-X. In addition, 0% of the non-audit services to the GST II’s service affiliates listed in Table 2 were approved by GST II’s Audit Committee pursuant to the “de minimis” exception of Rule 2-01 (c)(7)(i)(C) of Regulation S-X.
Item 4(f) – Not applicable.
Item 4(g) Aggregate Non-Audit Fees Disclosure
The aggregate non-audit fees billed to GST II by PwC for the twelve months ended October 31, 2024 and October 31, 2023 were approximately $44,100 and $100,800, respectively. The aggregate non-audit fees billed to GST II’s adviser and service affiliates by PwC for non-audit services for the twelve months ended December 31, 2023 and December 31, 2022 were approximately $18.0 million and $17.1 million, respectively. With regard to the aggregate non-audit fees billed to GST II’s adviser and service affiliates, the 2023 and 2022 amounts include fees for non-audit services required to be pre-approved [see Table 2] and fees for non-audit services that did not require pre-approval since they did not directly relate to GST II’s operations or financial reporting.
Item 4(h) — GST II’s Audit Committee has considered whether the provision of non-audit services to GST II’s investment adviser and service affiliates that did not require pre-approval pursuant to paragraph (c)(7)(ii) of Rule 2-01 of Regulation S-X is compatible with maintaining the auditors’ independence.
Item 4(i) – Not applicable.
Item 4(j) – Not applicable.
| ITEM 5. | AUDIT COMMITTEE OF LISTED REGISTRANTS. |
Not applicable.
Schedule of Investments is included in Item 7 of this report.
| ITEM 7. | FINANCIAL STATEMENTS AND FINANCIAL HIGHLIGHTS FOR OPEN-END MANAGEMENT INVESTMENT COMPANIES. |
Goldman Sachs Funds Annual Financial Statements October 31, 2024 Active Equity Multi-Manager Funds Multi-Manager International Equity Multi-Manager U.S. Small Cap Equity
Active Equity Multi-Manager Funds
TABLE OF CONTENTS
MULTI-MANAGER INTERNATIONAL EQUITY FUND
|
Schedule of Investments October 31, 2024 |
| | | | | | | | |
| | |
Shares | |
Description | |
Value | |
| |
| | Common Stocks – 96.4% | |
| |
| | Belgium – 0.8% | |
| | 151,942 | | Anheuser-Busch InBev SA | | | | |
| | | | (Beverages) | | $ | 9,008,849 | |
| | 50,282 | | KBC Group NV (Banks) | | | 3,662,599 | |
| | | | | | | | |
| | | | | | | 12,671,448 | |
| | | |
| |
| | Bermuda* – 0.7% | |
| | 120,021 | | Arch Capital Group Ltd. (Insurance) | | | 11,829,270 | |
| | | |
| |
| | Brazil – 0.7% | |
| | 760,356 | | Banco Bradesco SA ADR (Banks) | | | 1,878,079 | |
| | 646,231 | | NU Holdings Ltd. Class A* (Banks) | | | 9,751,626 | |
| | | | | | | | |
| | | | | | | 11,629,705 | |
| | | |
| |
| | Canada – 3.4% | |
| | 118,053 | | Barrick Gold Corp. (Metals & Mining) | | | 2,281,615 | |
| | 67,503 | | Canadian National Railway Co. (Ground Transportation) | | | 7,284,924 | |
| | 205,306 | | Canadian Natural Resources Ltd. (Oil, Gas & Consumable Fuels) | | | 6,981,893 | |
| | 273,840 | | Canadian Pacific Kansas City Ltd. (Ground Transportation) | | | 21,127,434 | |
| | 23,545 | | Intact Financial Corp. (Insurance) | | | 4,496,438 | |
| | 158,731 | | Suncor Energy, Inc. (Oil, Gas & Consumable Fuels) | | | 5,991,957 | |
| | 100,810 | | Toronto-Dominion Bank (Banks) | | | 5,572,841 | |
| | | | | | | | |
| | | | | | | 53,737,102 | |
| | | |
| |
| | China – 2.2% | |
| | 561,500 | | Li Ning Co. Ltd. (Textiles, Apparel & Luxury Goods) | | | 1,145,689 | |
| | 604,600 | | Meituan Class B*(a) (Hotels, Restaurants & Leisure) | | | 14,286,922 | |
| | 298,600 | | NetEase, Inc. (Entertainment) | | | 4,804,113 | |
| | 276,100 | | Tencent Holdings Ltd. (Interactive Media & Services) | | | 14,396,431 | |
| | | | | | | | |
| | | | | | | 34,633,155 | |
| | | |
| |
| | Denmark – 2.8% | |
| | 69,566 | | Carlsberg AS Class B (Beverages) | | | 7,687,993 | |
| | 323,436 | | Novo Nordisk AS Class B (Pharmaceuticals) | | | 36,278,196 | |
| | | | | | | | |
| | | | | | | 43,966,189 | |
| | | |
| |
| | France – 15.3% | |
| | 128,811 | | Air Liquide SA (Chemicals) | | | 23,095,974 | |
| | 1,013,145 | | Alstom SA* (Machinery) | | | 22,285,604 | |
| | 167,687 | | AXA SA (Insurance) | | | 6,296,192 | |
| | 71,196 | | BNP Paribas SA (Banks) | | | 4,862,258 | |
| | 72,945 | | Capgemini SE (IT Services) | | | 12,654,556 | |
| | 292,859 | | Carrefour SA (Consumer Staples Distribution & Retail) | | | 4,650,872 | |
| | 218,946 | | Cie de Saint-Gobain SA (Building Products) | | | 19,855,096 | |
| | | |
| | | | | | | | |
| | |
Shares | |
Description | |
Value | |
| |
| | Common Stocks (continued) | |
| |
| | France (continued) | |
| | 153,369 | | Cie Generale des Etablissements Michelin SCA (Automobile Components) | | $ | 5,183,183 | |
| | 105,299 | | Danone SA (Food Products) | | | 7,522,404 | |
| | 111,456 | | Dassault Systemes SE (Software) | | | 3,814,600 | |
| | 145,924 | | Edenred SE (Financial Services) | | | 4,719,569 | |
| | 527,935 | | Engie SA (Multi-Utilities) | | | 8,848,988 | |
| | 44,430 | | EssilorLuxottica SA (Health Care Equipment & Supplies) | | | 10,421,407 | |
| | 67,829 | | Kering SA (Textiles, Apparel & Luxury Goods) | | | 16,941,680 | |
| | 55,224 | | Legrand SA (Electrical Equipment) | | | 6,233,043 | |
| | 18,118 | | L’Oreal SA (Personal Products) | | | 6,797,332 | |
| | 17,164 | | LVMH Moet Hennessy Louis Vuitton SE (Textiles, Apparel & Luxury Goods) | | | 11,426,424 | |
| | 54,331 | | Pernod Ricard SA (Beverages) | | | 6,778,800 | |
| | 70,617 | | Safran SA (Aerospace & Defense) | | | 15,985,257 | |
| | 74,809 | | Sanofi SA (Pharmaceuticals) | | | 7,905,798 | |
| | 114,833 | | Schneider Electric SE (Electrical Equipment) | | | 29,747,333 | |
| | 39,501 | | Sodexo SA (Hotels, Restaurants & Leisure) | | | 3,428,783 | |
| | 387,570 | | Worldline SA*(a) (Financial Services) | | | 2,747,277 | |
| | | | | | | | |
| | | | | | | 242,202,430 | |
| | | |
| |
| | Germany – 6.8% | |
| | 12,886 | | Allianz SE (Insurance) | | | 4,056,580 | |
| | 82,338 | | Beiersdorf AG (Personal Products) | | | 11,115,115 | |
| | 60,963 | | Deutsche Boerse AG (Capital Markets) | | | 14,160,380 | |
| | 347,248 | | Deutsche Telekom AG (Diversified Telecommunication Services) | | | 10,498,526 | |
| | 294,887 | | Infineon Technologies AG (Semiconductors & Semiconductor Equipment) | | | 9,325,693 | |
| | 233,046 | | Lanxess AG (Chemicals) | | | 6,767,692 | |
| | 60,202 | | Merck KGaA (Pharmaceuticals) | | | 9,952,911 | |
| | 14,305 | | MTU Aero Engines AG (Aerospace & Defense) | | | 4,675,462 | |
| | 161,693 | | RWE AG (Independent Power and Renewable Electricity Producers) | | | 5,240,402 | |
| | 123,004 | | SAP SE (Software) | | | 28,719,575 | |
| | 89,072 | | Siemens Energy AG* (Electrical Equipment) | | | 3,658,462 | |
| | | | | | | | |
| | | | | | | 108,170,798 | |
| | | |
| |
| | Hong Kong – 0.8% | |
| | 1,239,400 | | AIA Group Ltd. (Insurance) | | | 9,781,740 | |
| | 547,000 | | Link REIT (Retail REITs) | | | 2,548,701 | |
| | | | | | | | |
| | | | | | | 12,330,441 | |
| | | |
| |
| | India – 1.2% | |
| | 362,369 | | HDFC Bank Ltd. (Banks) | | | 7,448,389 | |
| | | |
| | |
| The accompanying notes are an integral part of these financial statements. | | 1 |
MULTI-MANAGER INTERNATIONAL EQUITY FUND
|
Schedule of Investments (continued) October 31, 2024 |
| | | | | | | | |
| | |
Shares | |
Description | |
Value | |
| |
| | Common Stocks (continued) | |
| |
| | India (continued) | |
| | 312,443 | | ICICI Bank Ltd. ADR (Banks) | | $ | 9,501,392 | |
| | 48,036 | | Tata Consultancy Services Ltd. (IT Services) | | | 2,259,473 | |
| | | | | | | | |
| | | | | | | 19,209,254 | |
| | | |
| |
| | Ireland – 4.5% | |
| | 1,038,956 | | AIB Group PLC (Banks) | | | 5,569,886 | |
| | 24,427 | | Aon PLC Class A (Insurance) | | | 8,961,534 | |
| | 428,065 | | Experian PLC (Professional Services) | | | 20,892,056 | |
| | 56,697 | | ICON PLC* (Life Sciences Tools & Services) | | | 12,592,971 | |
| | 33,115 | | Linde PLC (Chemicals) | | | 15,105,407 | |
| | 209,186 | | Ryanair Holdings PLC ADR (Passenger Airlines) | | | 9,258,572 | |
| | | | | | | | |
| | | | | | | 72,380,426 | |
| | | |
| |
| | Israel* – 0.5% | |
| | 49,089 | | Check Point Software Technologies Ltd. (Software) | | | 8,502,705 | |
| | | |
| |
| | Italy – 3.5% | |
| | 1,614,543 | | Enel SpA (Electric Utilities) | | | 12,244,811 | |
| | 463,534 | | Eni SpA (Oil, Gas & Consumable Fuels) | | | 7,061,098 | |
| | 35,807 | | Ferrari NV (Automobiles) | | | 17,093,156 | |
| | 2,233,342 | | Intesa Sanpaolo SpA (Banks) | | | 9,558,723 | |
| | 217,637 | | UniCredit SpA (Banks) | | | 9,628,082 | |
| | | | | | | | |
| | | | | | | 55,585,870 | |
| | | |
| |
| | Japan – 10.9% | |
| | 69,000 | | Daikin Industries Ltd. (Building | | | | |
| | | | Products) | | | 8,283,913 | |
| | 572,300 | | Denso Corp. (Automobile Components) | | | 8,128,659 | |
| | 437,600 | | FANUC Corp. (Machinery) | | | 11,610,106 | |
| | 454,000 | | Fujitsu Ltd. (IT Services) | | | 8,728,532 | |
| | 761,500 | | Hitachi Ltd. (Industrial Conglomerates) | | | 19,132,581 | |
| | 13,800 | | Hoya Corp. (Health Care Equipment & Supplies) | | | 1,846,357 | |
| | 64,300 | | Kose Corp. (Personal Products) | | | 3,533,660 | |
| | 475,200 | | Kyocera Corp. (Electronic Equipment, Instruments & Components) | | | 4,819,340 | |
| | 479,900 | | Mitsubishi Electric Corp. (Electrical Equipment) | | | 8,442,656 | |
| | 809,000 | | Mitsubishi Heavy Industries Ltd. (Machinery) | | | 11,420,613 | |
| | 286,600 | | Murata Manufacturing Co. Ltd. (Electronic Equipment, Instruments & Components) | | | 5,007,219 | |
| | 51,500 | | Nintendo Co. Ltd. (Entertainment) | | | 2,720,382 | |
| | 384,400 | | Olympus Corp. (Health Care Equipment & Supplies) | | | 6,766,318 | |
| | | |
| | | | | | | | |
| | |
Shares | |
Description | |
Value | |
| |
| | Common Stocks (continued) | |
| |
| | Japan (continued) | |
| | 949,500 | | Renesas Electronics Corp. (Semiconductors & Semiconductor Equipment) | | $ | 12,721,704 | |
| | 872,100 | | Seven & i Holdings Co. Ltd. (Consumer Staples Distribution & Retail) | | | 12,558,182 | |
| | 197,100 | | Shin-Etsu Chemical Co. Ltd. (Chemicals) | | | 7,222,521 | |
| | 25,600 | | SMC Corp. (Machinery) | | | 10,868,382 | |
| | 26,900 | | Sompo Holdings, Inc. (Insurance) | | | 576,711 | |
| | 498,100 | | Sony Group Corp. (Household Durables) | | | 8,765,321 | |
| | 158,900 | | Sumitomo Mitsui Financial Group, Inc. (Banks) | | | 3,370,989 | |
| | 179,100 | | Takeda Pharmaceutical Co. Ltd. (Pharmaceuticals) | | | 4,997,103 | |
| | 342,300 | | Terumo Corp. (Health Care Equipment & Supplies) | | | 6,519,206 | |
| | 147,300 | | ZOZO, Inc. (Specialty Retail) | | | 4,776,269 | |
| | | | | | | | |
| | | | | | | 172,816,724 | |
| | | |
| |
| | Luxembourg – 0.5% | |
| | 299,012 | | ArcelorMittal SA (Metals & Mining) | | | 7,395,848 | |
| | | |
| |
| | Netherlands – 4.5% | |
| | 6,836 | | Adyen NV*(a) (Financial Services) | | | 10,443,077 | |
| | 212,285 | | Akzo Nobel NV (Chemicals) | | | 13,546,639 | |
| | 14,897 | | ASM International NV (Semiconductors & Semiconductor Equipment) | | | 8,320,081 | |
| | 13,738 | | ASML Holding NV (Semiconductors & Semiconductor Equipment) | | | 9,239,492 | |
| | 61,315 | | Heineken NV (Beverages) | | | 5,028,854 | |
| | 846,426 | | ING Groep NV (Banks) | | | 14,364,174 | |
| | 410,436 | | Koninklijke Philips NV* (Health Care Equipment & Supplies) | | | 10,798,082 | |
| | | | | | | | |
| | | | | | | 71,740,399 | |
| | | |
| |
| | Portugal – 0.3% | |
| | 261,475 | | Galp Energia SGPS SA (Oil, Gas & Consumable Fuels) | | | 4,469,099 | |
| | | |
| |
| | Singapore – 1.8% | |
| | 291,880 | | DBS Group Holdings Ltd. (Banks) | | | 8,463,001 | |
| | 159,142 | | Sea Ltd. ADR* (Entertainment) | | | 14,967,305 | |
| | 212,700 | | United Overseas Bank Ltd. (Banks) | | | 5,170,532 | |
| | | | | | | | |
| | | | | | | 28,600,838 | |
| | | |
| |
| | South Korea – 2.3% | |
| | 436,186 | | Coupang, Inc.* (Broadline Retail) | | | 11,249,237 | |
| | 110,004 | | Samsung Electronics Co. Ltd. (Technology Hardware, Storage & Peripherals) | | | 4,670,878 | |
| | | |
| | |
| 2 | | The accompanying notes are an integral part of these financial statements. |
MULTI-MANAGER INTERNATIONAL EQUITY FUND
| | | | | | | | |
| | |
Shares | |
Description | |
Value | |
| |
| | Common Stocks (continued) | |
| |
| | South Korea (continued) | |
| | 17,186 | | Samsung Electronics Co. Ltd. GDR (Technology Hardware, Storage & Peripherals) | | $ | 18,168,688 | |
| | 64,340 | | Shinhan Financial Group Co. Ltd. (Banks) | | | 2,396,678 | |
| | | | | | | | |
| | | | | | | 36,485,481 | |
| | | |
| |
| | Spain – 0.9% | |
| | 13,525 | | Aena SME SA(a) (Transportation Infrastructure) | | | 2,997,412 | |
| | 148,424 | | Amadeus IT Group SA (Hotels, Restaurants & Leisure) | | | 10,759,739 | |
| | | | | | | | |
| | | | | | | 13,757,151 | |
| | | |
| |
| | Sweden* – 0.0% | |
| | 76,899 | | Electrolux AB Class B (Household Durables) | | | 645,387 | |
| | | |
| |
| | Switzerland – 4.6% | |
| | 80,711 | | Cie Financiere Richemont SA Class A (Textiles, Apparel & Luxury Goods) | | | 11,751,551 | |
| | 135,048 | | Julius Baer Group Ltd. (Capital Markets) | | | 8,234,088 | |
| | 115,839 | | Novartis AG (Pharmaceuticals) | | | 12,569,255 | |
| | 16,450 | | Sika AG (Chemicals) | | | 4,581,607 | |
| | 16,275 | | Sonova Holding AG (Health Care Equipment & Supplies) | | | 5,955,633 | |
| | 600,081 | | UBS Group AG (Capital Markets) | | | 18,355,267 | |
| | 18,718 | | Zurich Insurance Group AG (Insurance) | | | 11,036,222 | |
| | | | | | | | |
| | | | | | | 72,483,623 | |
| | | |
| |
| | Taiwan – 2.0% | |
| | 618,000 | | Taiwan Semiconductor Manufacturing Co. Ltd. (Semiconductors & Semiconductor Equipment) | | | 19,380,160 | |
| | 64,234 | | Taiwan Semiconductor Manufacturing Co. Ltd. ADR (Semiconductors & Semiconductor Equipment) | | | 12,239,146 | |
| | | | | | | | |
| | | | | | | 31,619,306 | |
| | | |
| |
| | United Kingdom – 17.7% | |
| | 272,316 | | 3i Group PLC (Capital Markets) | | | 11,167,059 | |
| | 170,608 | | AstraZeneca PLC (Pharmaceuticals) | | | 24,276,424 | |
| | 6,080,940 | | Barclays PLC (Banks) | | | 18,641,146 | |
| | 57,635 | | Berkeley Group Holdings PLC (Household Durables) | | | 3,288,934 | |
| | 2,449,071 | | BP PLC (Oil, Gas & Consumable Fuels) | | | 11,977,964 | |
| | 240,331 | | British American Tobacco PLC (Tobacco) | | | 8,404,160 | |
| | 818,086 | | Compass Group PLC (Hotels, Restaurants & Leisure) | | | 26,568,502 | |
| | | |
| | | | | | | | |
| | |
Shares | |
Description | |
Value | |
| |
| | Common Stocks (continued) | |
| |
| | United Kingdom (continued) | |
| | 552,289 | | Diageo PLC (Beverages) | | $ | 17,055,661 | |
| | 589,262 | | GSK PLC (Pharmaceuticals) | | | 10,641,232 | |
| | 1,206,707 | | Kingfisher PLC (Specialty Retail) | | | 4,563,528 | |
| | 1,605,992 | | Legal & General Group PLC (Insurance) | | | 4,504,622 | |
| | 68,761 | | London Stock Exchange Group PLC (Capital Markets) | | | 9,319,581 | |
| | 110,475 | | National Grid PLC (Multi-Utilities) | | | 1,387,141 | |
| | 652,718 | | NatWest Group PLC (Banks) | | | 3,092,742 | |
| | 1,743,242 | | Prudential PLC (Insurance) | | | 14,512,226 | |
| | 260,394 | | Reckitt Benckiser Group PLC (Household Products) | | | 15,796,553 | |
| | 376,298 | | RELX PLC (Professional Services) | | | 17,295,035 | |
| | 76,005 | | Rio Tinto PLC (Metals & Mining) | | | 4,912,052 | |
| | 6,317,992 | | Rolls-Royce Holdings PLC* (Aerospace & Defense) | | | 43,596,657 | |
| | 371,777 | | Segro PLC (Industrial REITs) | | | 3,766,986 | |
| | 164,833 | | Shell PLC (Oil, Gas & Consumable Fuels) | | | 5,547,758 | |
| | 191,933 | | Smith & Nephew PLC (Health Care Equipment & Supplies) | | | 2,386,269 | |
| | 507,428 | | Standard Chartered PLC (Banks) | | | 5,884,331 | |
| | 1,358,704 | | Tesco PLC (Consumer Staples Distribution & Retail) | | | 5,999,592 | |
| | 332,858 | | WH Smith PLC (Specialty Retail) | | | 5,665,493 | |
| | | | | | | | |
| | | | | | | 280,251,648 | |
| | | |
| |
| | United States – 7.1% | |
| | 38,142 | | Atlassian Corp. Class A* (Software) | | | 7,191,293 | |
| | 19,142 | | EPAM Systems, Inc.* (IT Services) | | | 3,611,138 | |
| | 39,976 | | Ferguson Enterprises, Inc. (Trading Companies & Distributors) | | | 7,860,016 | |
| | 34,571 | | Monday.com Ltd.* (Software) | | | 10,159,380 | |
| | 156,764 | | Nestle SA (Food Products) | | | 14,813,039 | |
| | 110,792 | | Qiagen NV* (Life Sciences Tools & Services) | | | 4,695,195 | |
| | 93,512 | | Roche Holding AG (Pharmaceuticals) | | | 28,979,688 | |
| | 106,231 | | Smurfit WestRock PLC (Containers & Packaging) | | | 5,470,897 | |
| | 33,320 | | Spotify Technology SA* (Entertainment) | | | 12,831,532 | |
| | 40,152 | | STERIS PLC (Health Care Equipment & Supplies) | | | 8,907,721 | |
| | 46,179 | | Waste Connections, Inc. (Commercial Services & Supplies) | | | 8,162,138 | |
| | | | | | | | |
| | | | | | | 112,682,037 | |
| | | |
| |
| | Uruguay* – 0.6% | |
| | 4,656 | | MercadoLibre, Inc. (Broadline Retail) | | | 9,485,110 | |
| | | |
| | |
| | TOTAL COMMON STOCKS
(Cost $1,202,413,066) | | $ | 1,529,281,444 | |
| | | |
| | |
| The accompanying notes are an integral part of these financial statements. | | 3 |
MULTI-MANAGER INTERNATIONAL EQUITY FUND
|
Schedule of Investments (continued) October 31, 2024 |
| | | | | | | | |
| | | Shares | | Dividend
Rate | | Value | |
| |
| | Investment Company(b) – 3.7% | |
| |
| | Goldman Sachs Financial Square Government Fund — Institutional Shares | |
| | 57,892,238 | | 4.766% | | $ | 57,892,238 | |
| | (Cost $ 57,892,238) | | | | |
| | | |
| | |
| | TOTAL INVESTMENTS – 100.1%
(Cost $ 1,260,305,304) | | $ | 1,587,173,682 | |
| | | |
| | |
| | LIABILITIES IN EXCESS OF OTHER
ASSETS – ( 0.1)% | | | (1,273,454 | ) |
| | | |
| | |
| | NET ASSETS – 100.0% | | $ | 1,585,900,228 | |
| | | |
| | |
| The percentage shown for each investment category reflects the value of investments in that category as a percentage of net assets. |
| |
| * | | Non-income producing security. |
| |
| (a) | | Exempt from registration under Rule 144A of the Securities Act of 1933. |
| | |
| |
| (b) | | Represents an affiliated issuer. |
|
|
SECTOR ALLOCATION AS OF OCTOBER 31, 2024 |
| | | | |
| Sector | | % of Total
Market Value | |
| |
Industrials | | | 19.6 | % |
| |
Financials | | | 17.9 | |
| |
Health Care | | | 13.0 | |
| |
Information Technology | | | 11.9 | |
| |
Consumer Discretionary | | | 11.0 | |
| |
Consumer Staples | | | 8.6 | |
| |
Materials | | | 5.7 | |
| |
Communication Services | | | 3.8 | |
| |
Investment Company | | | 3.6 | |
| |
Energy | | | 2.7 | |
| |
Utilities | | | 1.8 | |
| |
Real Estate | | | 0.4 | |
| |
| | | | 100.0 | % |
|
|
ADDITIONAL INVESTMENT INFORMATION |
FORWARD FOREIGN CURRENCY EXCHANGE CONTRACTS — At October 31, 2024, the Fund had the following forward foreign currency exchange contracts:
FORWARD FOREIGN CURRENCY EXCHANGE CONTRACTS WITH UNREALIZED LOSS
| | | | | | | | | | | | | | | | | | | | | | | | | | |
| Counterparty | | Currency
Purchased | | | | | | Currency
Sold | | | | | | Settlement
Date | | | | Unrealized
Loss |
|
|
| | | | | | | | | |
State Street Bank and Trust | | USD | | | 67,780 | | | | | | | JPY | | | 10,358,122 | | | | | | | 11/05/24 | | | | $(436) |
|
|
| | |
|
|
| Currency Abbreviations: |
| JPY | | —Japanese Yen |
| USD | | —U.S. Dollar |
|
|
| |
| | |
|
|
| Investment Abbreviations: |
| ADR | | —American Depositary Receipt |
| GDR | | —Global Depository Receipt |
| PLC | | —Public Limited Company |
| REIT | | —Real Estate Investment Trust |
|
|
| | |
| 4 | | The accompanying notes are an integral part of these financial statements. |
MULTI-MANAGER U.S. SMALL CAP EQUITY FUND
|
Schedule of Investments October 31, 2024 |
| | | | | | | | |
| | |
Shares | |
Description | |
Value | |
| |
| | Common Stocks – 95.5% | |
| |
| | Aerospace & Defense – 1.6% | |
| | 5,579 | | Curtiss-Wright Corp. | | $ | 1,924,532 | |
| | 26,700 | | Mercury Systems, Inc.* | | | 863,745 | |
| | 14,810 | | Moog, Inc. Class A | | | 2,793,166 | |
| | 53,555 | | Standardaero, Inc.* | | | 1,545,062 | |
| | 10,161 | | Woodward, Inc. | | | 1,667,318 | |
| | | | | | | | |
| | | | | | | 8,793,823 | |
| | | |
| |
| | Air Freight & Logistics – 0.5% | |
| | 55,400 | | Air Transport Services Group, Inc.* | | | 955,096 | |
| | 39,300 | | Hub Group, Inc. Class A | | | 1,705,227 | |
| | | | | | | | |
| | | | | | | 2,660,323 | |
| | | |
| |
| | Automobile Components – 0.4% | |
| | 7,700 | | LCI Industries | | | 856,856 | |
| | 12,800 | | Visteon Corp.* | | | 1,155,200 | |
| | | | | | | | |
| | | | | | | 2,012,056 | |
| | | |
| |
| | Banks – 7.7% | |
| | 9,621 | | Axos Financial, Inc.* | | | 651,534 | |
| | 13,900 | | Banner Corp. | | | 890,156 | |
| | 24,011 | | Byline Bancorp, Inc. | | | 646,136 | |
| | 19,562 | | Cadence Bank | | | 653,958 | |
| | 32,068 | | Columbia Banking System, Inc. | | | 914,259 | |
| | 17,846 | | Dime Community Bancshares, Inc. | | | 536,629 | |
| | 22,920 | | Hancock Whitney Corp. | | | 1,193,674 | |
| | 45,651 | | Heritage Commerce Corp. | | | 443,271 | |
| | 26,201 | | Home BancShares, Inc. | | | 715,025 | |
| | 20,900 | | Lakeland Financial Corp. | | | 1,359,963 | |
| | 43,000 | | National Bank Holdings Corp. Class A | | | 1,933,280 | |
| | 8,861 | | Northeast Bank | | | 787,389 | |
| | 31,087 | | OceanFirst Financial Corp. | | | 565,783 | |
| | 157,142 | | Old National Bancorp | | | 3,026,555 | |
| | 22,146 | | Peapack-Gladstone Financial Corp. | | | 711,772 | |
| | 15,378 | | Preferred Bank | | | 1,297,442 | |
| | 53,723 | | Prosperity Bancshares, Inc. | | | 3,932,524 | |
| | 58,700 | | Renasant Corp. | | | 2,002,257 | |
| | 9,711 | | S&T Bancorp, Inc. | | | 368,824 | |
| | 11,000 | | ServisFirst Bancshares, Inc. | | | 914,540 | |
| | 28,775 | | SouthState Corp. | | | 2,806,426 | |
| | 14,200 | | Stock Yards Bancorp, Inc. | | | 915,616 | |
| | 31,600 | | Towne Bank | | | 1,027,632 | |
| | 19,800 | | UMB Financial Corp. | | | 2,172,654 | |
| | 55,200 | | United Bankshares, Inc. | | | 2,079,936 | |
| | 41,159 | | Western Alliance Bancorp | | | 3,424,840 | |
| | 43,796 | | Wintrust Financial Corp. | | | 5,075,518 | |
| | 19,565 | | Zions Bancorp NA | | | 1,018,554 | |
| | | | | | | | |
| | | | | | | 42,066,147 | |
| | | |
| |
| | Biotechnology* – 5.5% | |
| | 126,510 | | 89bio, Inc. | | | 984,248 | |
| | 51,519 | | Ascendis Pharma AS ADR | | | 6,327,564 | |
| | 73,160 | | Bicycle Therapeutics PLC ADR | | | 1,715,236 | |
| | 19,662 | | Biohaven Ltd. | | | 978,381 | |
| | 10,683 | | Blueprint Medicines Corp. | | | 934,869 | |
| | | |
| | | | | | | | |
| | |
Shares | |
Description | |
Value | |
| |
| | Common Stocks – (continued) | |
| |
| | Biotechnology* – (continued) | |
| | 36,077 | | Catalyst Pharmaceuticals, Inc. | | $ | 786,479 | |
| | 45,796 | | Cytokinetics, Inc. | | | 2,335,596 | |
| | 12,696 | | Halozyme Therapeutics, Inc. | | | 642,037 | |
| | 9,361 | | Immunome, Inc. | | | 107,371 | |
| | 10,160 | | Insmed, Inc. | | | 683,565 | |
| | 24,340 | | Merus NV | | | 1,215,296 | |
| | 46,368 | | MoonLake Immunotherapeutics | | | 2,152,402 | |
| | 18,146 | | Neurocrine Biosciences, Inc. | | | 2,182,419 | |
| | 86,600 | | Rocket Pharmaceuticals, Inc. | | | 1,441,890 | |
| | 19,830 | | Soleno Therapeutics, Inc. | | | 1,091,840 | |
| | 46,659 | | Vaxcyte, Inc. | | | 4,962,185 | |
| | 11,110 | | Viking Therapeutics, Inc. | | | 805,919 | |
| | 28,070 | | Xenon Pharmaceuticals, Inc. | | | 1,153,958 | |
| | | | | | | | |
| | | | | | | 30,501,255 | |
| | | |
| |
| | Building Products – 1.7% | |
| | 16,000 | | Apogee Enterprises, Inc. | | | 1,197,440 | |
| | 3,916 | | AZEK Co., Inc.* | | | 172,304 | |
| | 8,524 | | AZZ, Inc. | | | 649,358 | |
| | 19,200 | | Gibraltar Industries, Inc.* | | | 1,295,808 | |
| | 18,211 | | Griffon Corp. | | | 1,145,108 | |
| | 68,600 | | Hayward Holdings, Inc.* | | | 1,115,436 | |
| | 91,990 | | Janus International Group, Inc.* | | | 677,046 | |
| | 28,692 | | Resideo Technologies, Inc.* | | | 564,372 | |
| | 9,500 | | UFP Industries, Inc. | | | 1,162,230 | |
| | 43,928 | | Zurn Elkay Water Solutions Corp. | | | 1,585,801 | |
| | | | | | | | |
| | | | | | | 9,564,903 | |
| | | |
| |
| | Capital Markets – 1.2% | |
| | 175,579 | | BGC Group, Inc. Class A | | | 1,645,175 | |
| | 19,300 | | Cohen & Steers, Inc. | | | 1,906,261 | |
| | 41,650 | | DigitalBridge Group, Inc. | | | 653,489 | |
| | 4,078 | | Houlihan Lokey, Inc. | | | 704,556 | |
| | 14,900 | | Lazard, Inc. | | | 789,551 | |
| | 11,158 | | StoneX Group, Inc.* | | | 1,004,666 | |
| | | | | | | | |
| | | | | | | 6,703,698 | |
| | | |
| |
| | Chemicals – 2.9% | |
| | 36,300 | | AdvanSix, Inc. | | | 1,029,831 | |
| | 7,399 | | Ashland, Inc. | | | 625,733 | |
| | 61,150 | | Avient Corp. | | | 2,850,202 | |
| | 81,210 | | Axalta Coating Systems Ltd.* | | | 3,079,483 | |
| | 49,826 | | Ecovyst, Inc.* | | | 331,841 | |
| | 50,282 | | HB Fuller Co. | | | 3,679,637 | |
| | 13,500 | | Innospec, Inc. | | | 1,455,030 | |
| | 20,313 | | Methanex Corp. | | | 795,660 | |
| | 9,700 | | Minerals Technologies, Inc. | | | 730,313 | |
| | 28,338 | | Orion SA | | | 424,787 | |
| | 5,179 | | Quaker Chemical Corp. | | | 785,033 | |
| | | | | | | | |
| | | | | | | 15,787,550 | |
| | | |
| |
| | Commercial Services & Supplies – 3.6% | |
| | 10,799 | | Brady Corp. Class A | | | 768,241 | |
| | 20,597 | | Brink’s Co. | | | 2,117,166 | |
| | 60,489 | | Casella Waste Systems, Inc. Class A* | | | 5,920,663 | |
| | | |
| | |
| The accompanying notes are an integral part of these financial statements. | | 5 |
MULTI-MANAGER U.S. SMALL CAP EQUITY FUND
|
Schedule of Investments (continued) October 31, 2024 |
| | | | | | | | |
| | |
Shares | |
Description | |
Value | |
| |
| | Common Stocks – (continued) | |
| |
| | Commercial Services & Supplies – (continued) | |
| | 9,051 | | MSA Safety, Inc. | | $ | 1,502,013 | |
| | 73,109 | | Rentokil Initial PLC ADR | | | 1,853,313 | |
| | 9,800 | | UniFirst Corp. | | | 1,762,138 | |
| | 31,000 | | Viad Corp.* | | | 1,160,640 | |
| | 26,894 | | Waste Connections, Inc. | | | 4,753,515 | |
| | | | | | | | |
| | | | | | | 19,837,689 | |
| | | |
| |
| | Communications Equipment* – 1.0% | |
| | 31,217 | | Applied Optoelectronics, Inc. | | | 487,609 | |
| | 17,700 | | Ciena Corp. | | | 1,124,127 | |
| | 23,347 | | Clearfield, Inc. | | | 838,858 | |
| | 46,100 | | Extreme Networks, Inc. | | | 688,273 | |
| | 8,490 | | F5, Inc. | | | 1,985,641 | |
| | 70,961 | | Infinera Corp. | | | 476,858 | |
| | | | | | | | |
| | | | | | | 5,601,366 | |
| | | |
| |
| | Construction & Engineering – 3.9% | |
| | 12,750 | | Comfort Systems USA, Inc. | | | 4,985,760 | |
| | 103,669 | | Fluor Corp.* | | | 5,419,815 | |
| | 17,916 | | Granite Construction, Inc. | | | 1,505,840 | |
| | 33,362 | | Primoris Services Corp. | | | 2,089,129 | |
| | 4,598 | | Sterling Infrastructure, Inc.* | | | 710,161 | |
| | 15,024 | | Valmont Industries, Inc. | | | 4,682,680 | |
| | 65,340 | | WillScot Holdings Corp.* | | | 2,165,368 | |
| | | | | | | | |
| | | | | | | 21,558,753 | |
| | | |
| |
| | Construction Materials – 0.3% | |
| | 1,800 | | Eagle Materials, Inc. | | | 513,828 | |
| | 6,658 | | Knife River Corp.* | | | 647,957 | |
| | 11,800 | | Summit Materials, Inc. Class A* | | | 559,438 | |
| | | | | | | | |
| | | | | | | 1,721,223 | |
| | | |
| |
| | Consumer Finance – 0.9% | |
| | 17,265 | | FirstCash Holdings, Inc. | | | 1,786,409 | |
| | 154,625 | | SLM Corp. | | | 3,406,389 | |
| | | | | | | | |
| | | | | | | 5,192,798 | |
| | | |
| |
| | Consumer Staples Distribution & Retail – 0.9% | |
| | 7,774 | | Casey’s General Stores, Inc. | | | 3,063,111 | |
| | 21,400 | | Performance Food Group Co.* | | | 1,738,750 | |
| | | | | | | | |
| | | | | | | 4,801,861 | |
| | | |
| |
| | Containers & Packaging – 0.3% | |
| | 31,800 | | Silgan Holdings, Inc. | | | 1,645,332 | |
| | 3,475 | | Sonoco Products Co. | | | 182,507 | |
| | | | | | | 1,827,839 | |
| | | |
| |
| | Diversified Consumer Services – 3.5% | |
| | 7,520 | | Adtalem Global Education, Inc.* | | | 608,519 | |
| | 38,405 | | Bright Horizons Family Solutions, Inc.* | | | 5,125,915 | |
| | 59,076 | | Frontdoor, Inc.* | | | 2,935,487 | |
| | 9,549 | | Grand Canyon Education, Inc.* | | | 1,309,263 | |
| | 114,488 | | KinderCare Learning Cos., Inc.* | | | 3,338,470 | |
| | 90,598 | | Laureate Education, Inc. | | | 1,556,474 | |
| | | |
| | | | | | | | |
| | |
Shares | |
Description | |
Value | |
| |
| | Common Stocks – (continued) | |
| |
| | Diversified Consumer Services – (continued) | |
| | 263,800 | | Mister Car Wash, Inc.* | | $ | 1,981,138 | |
| | 49,101 | | Perdoceo Education Corp. | | | 1,097,407 | |
| | 13,000 | | Stride, Inc.* | | | 1,212,640 | |
| | | | | | | | |
| | | | | | | 19,165,313 | |
| | | |
| |
| | Diversified Telecommunication Services – 0.4% | |
| | 29,666 | | Cogent Communications Holdings, Inc. | | | 2,381,290 | |
| | | |
| |
| | Electric Utilities – 0.7% | |
| | 21,200 | | IDACORP, Inc. | | | 2,193,776 | |
| | 14,100 | | MGE Energy, Inc. | | | 1,275,909 | |
| | 6,769 | | Portland General Electric Co. | | | 320,851 | |
| | | | | | | | |
| | | | | | | 3,790,536 | |
| | | |
| |
| | Electrical Equipment – 1.6% | |
| | 15,179 | | EnerSys | | | 1,470,238 | |
| | 67,650 | | NEXTracker, Inc. Class A* | | | 2,693,823 | |
| | 13,510 | | Regal Rexnord Corp. | | | 2,249,955 | |
| | 73,671 | | Sensata Technologies Holding PLC | | | 2,529,862 | |
| | | | | | | | |
| | | | | | | 8,943,878 | |
| | | |
| |
| | Electronic Equipment, Instruments & Components – 2.9% | |
| | 5,540 | | Arrow Electronics, Inc.* | | | 657,432 | |
| | 31,520 | | Avnet, Inc. | | | 1,708,699 | |
| | 7,427 | | Belden, Inc. | | | 845,712 | |
| | 25,450 | | Celestica, Inc.* | | | 1,740,780 | |
| | 16,100 | | Crane NXT Co. | | | 873,747 | |
| | 6,040 | | Fabrinet* | | | 1,455,459 | |
| | 10,300 | | Insight Enterprises, Inc.* | | | 1,801,676 | |
| | 14,084 | | Littelfuse, Inc. | | | 3,445,369 | |
| | 65,657 | | Mirion Technologies, Inc.* | | | 971,724 | |
| | 8,993 | | OSI Systems, Inc.* | | | 1,188,964 | |
| | 13,300 | | Rogers Corp.* | | | 1,333,724 | |
| | | | | | | | |
| | | | | | | 16,023,286 | |
| | | |
| |
| | Energy Equipment & Services – 2.4% | |
| | 36,676 | | Archrock, Inc. | | | 734,254 | |
| | 21,499 | | Cactus, Inc. Class A | | | 1,274,676 | |
| | 174,279 | | ChampionX Corp. | | | 4,918,153 | |
| | 56,396 | | Expro Group Holdings NV* | | | 719,049 | |
| | 40,900 | | Helmerich & Payne, Inc. | | | 1,374,240 | |
| | 69,043 | | Newpark Resources, Inc.* | | | 459,826 | |
| | 65,640 | | Oceaneering International, Inc.* | | | 1,601,616 | |
| | 116,328 | | Select Water Solutions, Inc. | | | 1,233,077 | |
| | 13,909 | | Weatherford International PLC | | | 1,098,811 | |
| | | | | | | | |
| | | | | | | 13,413,702 | |
| | | |
| |
| | Entertainment* – 0.6% | |
| | 20,106 | | Liberty Media Corp.-Liberty Live Class A | | | 1,140,815 | |
| | 10,940 | | Take-Two Interactive Software, Inc. | | | 1,769,217 | |
| | 85,748 | | Vivid Seats, Inc. Class A | | | 348,994 | |
| | | | | | | | |
| | | | | | | 3,259,026 | |
| | | |
| | |
| 6 | | The accompanying notes are an integral part of these financial statements. |
MULTI-MANAGER U.S. SMALL CAP EQUITY FUND
| | | | | | | | |
| | |
Shares | |
Description | |
Value | |
| |
| | Common Stocks – (continued) | |
| |
| | Financial Services – 3.6% | |
| | 28,754 | | Enact Holdings, Inc. | | $ | 980,224 | |
| | 31,411 | | Essent Group Ltd. | | | 1,884,974 | |
| | 29,000 | | EVERTEC, Inc. | | | 950,040 | |
| | 13,547 | | Federal Agricultural Mortgage Corp. Class C | | | 2,482,759 | |
| | 112,350 | | Flywire Corp.* | | | 1,957,137 | |
| | 20,067 | | International Money Express, Inc.* | | | 352,979 | |
| | 146,620 | | Marqeta, Inc. Class A* | | | 829,869 | |
| | 12,509 | | Merchants Bancorp | | | 462,082 | |
| | 36,500 | | NCR Atleos Corp.* | | | 955,570 | |
| | 9,778 | | PennyMac Financial Services, Inc. | | | 974,671 | |
| | 41,099 | | Shift4 Payments, Inc. Class A* | | | 3,716,994 | |
| | 16,215 | | Voya Financial, Inc. | | | 1,302,064 | |
| | 16,900 | | Walker & Dunlop, Inc. | | | 1,848,353 | |
| | 6,195 | | WEX, Inc.* | | | 1,069,257 | |
| | | | | | | | |
| | | | | | | 19,766,973 | |
| | | |
| |
| | Food Products – 0.5% | |
| | 47,706 | | Nomad Foods Ltd. | | | 837,240 | |
| | 36,223 | | Simply Good Foods Co.* | | | 1,219,266 | |
| | 37,168 | | Utz Brands, Inc. | | | 640,033 | |
| | | | | | | | |
| | | | | | | 2,696,539 | |
| | | |
| |
| | Gas Utilities – 0.3% | |
| | 18,700 | | National Fuel Gas Co. | | | 1,131,911 | |
| | 6,700 | | ONE Gas, Inc. | | | 477,509 | |
| | | | | | | | |
| | | | | | | 1,609,420 | |
| | | |
| |
| | Ground Transportation – 1.0% | |
| | 60,100 | | Marten Transport Ltd. | | | 930,348 | |
| | 5,227 | | Saia, Inc.* | | | 2,553,964 | |
| | 52,600 | | Werner Enterprises, Inc. | | | 1,940,414 | |
| | | | | | | | |
| | | | | | | 5,424,726 | |
| | | |
| |
| | Health Care Equipment & Supplies* – 3.9% | |
| | 23,000 | | Envista Holdings Corp. | | | 482,310 | |
| | 47,603 | | Establishment Labs Holdings, Inc. | | | 2,051,213 | |
| | 8,560 | | Glaukos Corp. | | | 1,132,060 | |
| | 55,143 | | Haemonetics Corp. | | | 3,923,976 | |
| | 43,593 | | Inari Medical, Inc. | | | 2,109,901 | |
| | 7,700 | | Integer Holdings Corp. | | | 956,725 | |
| | 27,213 | | iRhythm Technologies, Inc. | | | 1,971,310 | |
| | 37,364 | | Lantheus Holdings, Inc. | | | 4,104,062 | |
| | 22,500 | | Omnicell, Inc. | | | 1,094,400 | |
| | 42,415 | | OrthoPediatrics Corp. | | | 1,125,270 | |
| | 9,968 | | PROCEPT BioRobotics Corp. | | | 897,120 | |
| | 99,648 | | SI-BONE, Inc. | | | 1,375,142 | |
| | | | | | | | |
| | | | | | | 21,223,489 | |
| | | |
| |
| | Health Care Providers & Services – 2.7% | |
| | 5,270 | | Addus HomeCare Corp.* | | | 655,693 | |
| | 30,138 | | Encompass Health Corp. | | | 2,997,526 | |
| | 5,370 | | Ensign Group, Inc. | | | 832,296 | |
| | 40,343 | | HealthEquity, Inc.* | | | 3,439,241 | |
| | 125,485 | | LifeStance Health Group, Inc.* | | | 842,004 | |
| | | |
| | | | | | | | |
| | |
Shares | |
Description | |
Value | |
| |
| | Common Stocks – (continued) | |
| |
| | Health Care Providers & Services – (continued) | |
| | 126,259 | | NeoGenomics, Inc.* | | $ | 1,715,860 | |
| | 152,010 | | Option Care Health, Inc.* | | | 3,502,310 | |
| | 55,358 | | Pediatrix Medical Group, Inc.* | | | 682,011 | |
| | | | | | | | |
| | | | | | | 14,666,941 | |
| | | |
| |
| | Health Care Technology* – 0.7% | |
| | 36,560 | | Evolent Health, Inc. Class A | | | 853,676 | |
| | 150,008 | | Phreesia, Inc. | | | 2,743,646 | |
| | | | | | | | |
| | | | | | | 3,597,322 | |
| | | |
| |
| | Hotel & Resort REITs – 0.4% | |
| | 101,600 | | Apple Hospitality REIT, Inc. | | | 1,500,632 | |
| | 6,200 | | Ryman Hospitality Properties, Inc. | | | 663,710 | |
| | | | | | | | |
| | | | | | | 2,164,342 | |
| | | |
| |
| | Hotels, Restaurants & Leisure – 1.9% | |
| | 84,699 | | Bowlero Corp. Class A | | | 878,329 | |
| | 29,195 | | Boyd Gaming Corp. | | | 2,022,921 | |
| | 4,339 | | Brinker International, Inc.* | | | 445,659 | |
| | 3,100 | | Choice Hotels International, Inc. | | | 432,481 | |
| | 18,580 | | Churchill Downs, Inc. | | | 2,603,058 | |
| | 36,625 | | First Watch Restaurant Group, Inc.* | | | 622,442 | |
| | 19,076 | | Six Flags Entertainment Corp. | | | 751,785 | |
| | 7,910 | | Texas Roadhouse, Inc. | | | 1,511,759 | |
| | 3,980 | | Wingstop, Inc. | | | 1,145,006 | |
| | | | | | | | |
| | | | | | | 10,413,440 | |
| | | |
| |
| | Household Durables – 1.7% | |
| | 36,018 | | Beazer Homes USA, Inc.* | | | 1,107,914 | |
| | 2,027 | | Installed Building Products, Inc. | | | 439,656 | |
| | 14,726 | | M/I Homes, Inc.* | | | 2,232,314 | |
| | 23,401 | | Meritage Homes Corp. | | | 4,240,261 | |
| | 12,191 | | Taylor Morrison Home Corp.* | | | 835,084 | |
| | 653 | | TopBuild Corp.* | | | 230,757 | |
| | | | | | | | |
| | | | | | | 9,085,986 | |
| | | |
| |
| | Household Products* – 0.3% | |
| | 47,300 | | Central Garden & Pet Co. Class A | | | 1,378,322 | |
| | | |
| |
| | Independent Power and Renewable Electricity Producers* – 0.2% | |
| | 4,630 | | Talen Energy Corp. | | | 839,697 | |
| | | |
| |
| | Industrial REITs – 0.7% | |
| | 8,019 | | EastGroup Properties, Inc. | | | 1,373,494 | |
| | 11,267 | | First Industrial Realty Trust, Inc. | | | 591,405 | |
| | 56,870 | | STAG Industrial, Inc. | | | 2,120,114 | |
| | | | | | | | |
| | | | | | | 4,085,013 | |
| | | |
| |
| | Insurance – 4.3% | |
| | 22,431 | | Assured Guaranty Ltd. | | | 1,872,091 | |
| | 44,908 | | Axis Capital Holdings Ltd. | | | 3,514,500 | |
| | 47,760 | | Baldwin Insurance Group, Inc.* | | | 2,209,378 | |
| | 18,800 | | Bowhead Specialty Holdings, Inc.* | | | 547,268 | |
| | 12,287 | | Employers Holdings, Inc. | | | 598,623 | |
| | 45,697 | | First American Financial Corp. | | | 2,931,462 | |
| | 12,000 | | Hanover Insurance Group, Inc. | | | 1,779,960 | |
| | | |
| | |
| The accompanying notes are an integral part of these financial statements. | | 7 |
MULTI-MANAGER U.S. SMALL CAP EQUITY FUND
|
Schedule of Investments (continued) October 31, 2024 |
| | | | | | | | |
| | |
Shares | |
Description | |
Value | |
| |
| | Common Stocks – (continued) | |
| |
| | Insurance – (continued) | |
| | 35,737 | | Kemper Corp. | | $ | 2,225,343 | |
| | 50,900 | | Oscar Health, Inc. Class A* | | | 855,120 | |
| | 15,326 | | Palomar Holdings, Inc.* | | | 1,375,815 | |
| | 5,760 | | Primerica, Inc. | | | 1,594,426 | |
| | 12,500 | | Ryan Specialty Holdings, Inc. | | | 823,375 | |
| | 17,100 | | Safety Insurance Group, Inc. | | | 1,338,331 | |
| | 6,500 | | Stewart Information Services Corp. | | | 447,200 | |
| | 863 | | White Mountains Insurance Group Ltd. | | | 1,550,932 | |
| | | | | | | | |
| | | | | | | 23,663,824 | |
| | | |
| |
| | Interactive Media & Services* – 0.2% | |
| | 61,574 | | Cars.com, Inc. | | | 984,568 | |
| | | |
| |
| | IT Services – 0.3% | |
| | 11,600 | | ASGN, Inc.* | | | 1,068,360 | |
| | 18,714 | | Hackett Group, Inc. | | | 455,124 | |
| | | | | | | | |
| | | | | | | 1,523,484 | |
| | | |
| |
| | Leisure Products – 0.6% | |
| | 16,000 | | Acushnet Holdings Corp. | | | 980,800 | |
| | 12,125 | | Brunswick Corp. | | | 966,848 | |
| | 71,400 | | Mattel, Inc.* | | | 1,455,132 | |
| | | | | | | | |
| | | | | | | 3,402,780 | |
| | | |
| |
| | Life Sciences Tools & Services – 1.5% | |
| | 4,380 | | Bio-Rad Laboratories, Inc. Class A* | | | 1,568,872 | |
| | 23,874 | | Bio-Techne Corp. | | | 1,760,708 | |
| | 38,169 | | Bruker Corp. | | | 2,160,747 | |
| | 4,950 | | Charles River Laboratories International, Inc.* | | | 883,971 | |
| | 39,400 | | Qiagen NV* | | | 1,658,740 | |
| | | | | | | | |
| | | | | | | 8,033,038 | |
| | | |
| |
| | Machinery – 3.9% | |
| | 6,050 | | Alamo Group, Inc. | | | 1,025,717 | |
| | 12,600 | | Albany International Corp. Class A | | | 855,792 | |
| | 20,767 | | Allison Transmission Holdings, Inc. | | | 2,219,162 | |
| | 24,200 | | Astec Industries, Inc. | | | 769,076 | |
| | 20,174 | | Atmus Filtration Technologies, Inc. | | | 785,576 | |
| | 10,828 | | Enpro, Inc. | | | 1,576,665 | |
| | 42,900 | | Hillenbrand, Inc. | | | 1,181,895 | |
| | 3,058 | | IDEX Corp. | | | 656,369 | |
| | 26,930 | | ITT, Inc. | | | 3,773,432 | |
| | 16,600 | | John Bean Technologies Corp. | | | 1,849,572 | |
| | 3,976 | | Kadant, Inc. | | | 1,324,246 | |
| | 40,400 | | Kennametal, Inc. | | | 1,022,928 | |
| | 14,300 | | Mueller Industries, Inc. | | | 1,172,171 | |
| | 46,699 | | Mueller Water Products, Inc. Class A | | | 1,008,231 | |
| | 7,520 | | SPX Technologies, Inc.* | | | 1,079,045 | |
| | 5,400 | | Watts Water Technologies, Inc. Class A | | | 1,029,186 | |
| | | | | | | | |
| | | | | | | 21,329,063 | |
| | | |
| |
| | Marine Transportation – 0.1% | |
| | 5,029 | | Matson, Inc. | | | 778,942 | |
| | | |
| | | | | | | | |
| | |
Shares | |
Description | |
Value | |
| |
| | Common Stocks – (continued) | |
| |
| | Media – 0.9% | |
| | 128,163 | | Magnite, Inc.* | | $ | 1,599,474 | |
| | 9,251 | | Nexstar Media Group, Inc. | | | 1,627,436 | |
| | 96,722 | | Stagwell, Inc.* | | | 600,643 | |
| | 58,990 | | TEGNA, Inc. | | | 969,206 | |
| | | | | | | | |
| | | | | | | 4,796,759 | |
| | | |
| |
| | Metals & Mining – 0.7% | |
| | 32,737 | | Commercial Metals Co. | | | 1,761,250 | |
| | 52,094 | | Eldorado Gold Corp.* | | | 904,873 | |
| | 7,700 | | Kaiser Aluminum Corp. | | | 571,802 | |
| | 35,000 | | MP Materials Corp.* | | | 629,650 | |
| | | | | | | | |
| | | | | | | 3,867,575 | |
| | | |
| |
| | Mortgage Real Estate Investment Trusts (REITs) – 0.1% | |
| | 110,148 | | Redwood Trust, Inc. | | | 806,283 | |
| | | |
| |
| | Multi-Utilities – 0.1% | |
| | 11,100 | | Northwestern Energy Group, Inc. | | | 593,406 | |
| | | |
| |
| | Office REITs – 0.5% | |
| | 51,700 | | COPT Defense Properties | | | 1,664,740 | |
| | 32,512 | | Cousins Properties, Inc. | | | 995,843 | |
| | | | | | | | |
| | | | | | | 2,660,583 | |
| | | |
| |
| | Oil, Gas & Consumable Fuels – 2.3% | |
| | 31,800 | | Civitas Resources, Inc. | | | 1,551,522 | |
| | 46,200 | | Delek U.S. Holdings, Inc. | | | 723,954 | |
| | 77,800 | | Magnolia Oil & Gas Corp. Class A | | | 1,966,784 | |
| | 32,800 | | Matador Resources Co. | | | 1,709,208 | |
| | 57,200 | | Northern Oil & Gas, Inc. | | | 2,073,500 | |
| | 94,930 | | Uranium Energy Corp.* | | | 704,381 | |
| | 55,564 | | Viper Energy, Inc. | | | 2,883,772 | |
| | 45,796 | | World Kinect Corp. | | | 1,197,565 | |
| | | | | | | | |
| | | | | | | 12,810,686 | |
| | | |
| |
| | Personal Products – 0.5% | |
| | 13,717 | | BellRing Brands, Inc.* | | | 902,990 | |
| | 8,260 | | elf Beauty, Inc.* | | | 869,365 | |
| | 6,100 | | Interparfums, Inc. | | | 738,527 | |
| | 274,934 | | Olaplex Holdings, Inc.* | | | 489,383 | |
| | | | | | | | |
| | | | | | | 3,000,265 | |
| | | |
| |
| | Pharmaceuticals – 1.0% | |
| | 78,715 | | Innoviva, Inc.* | | | 1,539,665 | |
| | 20,380 | | Intra-Cellular Therapies, Inc.* | | | 1,727,205 | |
| | 25,848 | | Organon & Co. | | | 485,426 | |
| | 21,400 | | Prestige Consumer Healthcare, Inc.* | | | 1,578,250 | |
| | | | | | | | |
| | | | | | | 5,330,546 | |
| | | |
| |
| | Professional Services – 1.4% | |
| | 13,391 | | Concentrix Corp. | | | 569,251 | |
| | 61,077 | | First Advantage Corp.* | | | 1,106,715 | |
| | 9,747 | | FTI Consulting, Inc.* | | | 1,901,445 | |
| | 6,633 | | Huron Consulting Group, Inc.* | | | 767,637 | |
| | 6,300 | | ICF International, Inc. | | | 1,062,117 | |
| | 44,049 | | Kelly Services, Inc. Class A | | | 880,540 | |
| | | |
| | |
| 8 | | The accompanying notes are an integral part of these financial statements. |
MULTI-MANAGER U.S. SMALL CAP EQUITY FUND
| | | | | | | | |
| | |
Shares | |
Description | |
Value | |
| |
| | Common Stocks – (continued) | |
| |
| | Professional Services – (continued) | |
| | 7,800 | | Maximus, Inc. | | $ | 674,232 | |
| | 5,823 | | Science Applications International Corp. | | | 840,201 | |
| | | | | | | | |
| | | | | | | 7,802,138 | |
| | | |
| |
| | Real Estate Management & Development – 0.5% | |
| | 11,100 | | Colliers International Group, Inc. | | | 1,694,304 | |
| | 78,900 | | Cushman & Wakefield PLC* | | | 1,069,095 | |
| | | | | | | | |
| | | | | | | 2,763,399 | |
| | | |
| |
| | Semiconductors & Semiconductor Equipment – 3.4% | |
| | 16,288 | | Amkor Technology, Inc. | | | 414,530 | |
| | 10,053 | | Axcelis Technologies, Inc.* | | | 857,621 | |
| | 48,700 | | Cohu, Inc.* | | | 1,213,604 | |
| | 14,700 | | Diodes, Inc.* | | | 859,656 | |
| | 17,667 | | Entegris, Inc. | | | 1,849,911 | |
| | 27,720 | | Ichor Holdings Ltd.* | | | 755,647 | |
| | 27,500 | | Kulicke & Soffa Industries, Inc. | | | 1,233,650 | |
| | 42,845 | | Lattice Semiconductor Corp.* | | | 2,170,528 | |
| | 7,060 | | Onto Innovation, Inc.* | | | 1,400,210 | |
| | 19,171 | | Photronics, Inc.* | | | 437,099 | |
| | 21,453 | | Power Integrations, Inc. | | | 1,296,405 | |
| | 44,935 | | Rambus, Inc.* | | | 2,148,792 | |
| | 9,600 | | SiTime Corp.* | | | 1,622,496 | |
| | 34,500 | | Tower Semiconductor Ltd.* | | | 1,447,620 | |
| | 22,599 | | Ultra Clean Holdings, Inc.* | | | 755,936 | |
| | | | | | | | |
| | | | | | | 18,463,705 | |
| | | |
| |
| | Software – 6.0% | |
| | 88,406 | | Adeia, Inc. | | | 1,098,887 | |
| | 10,843 | | BlackLine, Inc.* | | | 600,377 | |
| | 440,095 | | CCC Intelligent Solutions Holdings, Inc.* | | | 4,581,389 | |
| | 31,245 | | Clear Secure, Inc. Class A | | | 1,149,191 | |
| | 119,081 | | Dynatrace, Inc.* | | | 6,406,558 | |
| | 8,756 | | Envestnet, Inc.* | | | 549,702 | |
| | 7,730 | | Guidewire Software, Inc.* | | | 1,439,790 | |
| | 32,300 | | Ingram Micro Holding Corp.* | | | 783,275 | |
| | 19,048 | | InterDigital, Inc. | | | 2,865,581 | |
| | 132,460 | | Lightspeed Commerce, Inc.* | | | 2,002,795 | |
| | 22,805 | | LiveRamp Holdings, Inc.* | | | 570,809 | |
| | 4,025 | | Meridianlink, Inc.* | | | 88,389 | |
| | 66,700 | | NCR Voyix Corp.* | | | 854,427 | |
| | 37,620 | | Onestream, Inc.* | | | 1,110,542 | |
| | 37,390 | | Procore Technologies, Inc.* | | | 2,454,653 | |
| | 78,796 | | PROS Holdings, Inc.* | | | 1,560,161 | |
| | 61,500 | | Samsara, Inc. Class A* | | | 2,939,085 | |
| | 45,800 | | Verint Systems, Inc.* | | | 975,540 | |
| | 11,986 | | Workiva, Inc.* | | | 956,003 | |
| | | | | | | | |
| | | | | | | 32,987,154 | |
| | | |
| |
| | Specialized REITs – 0.5% | |
| | 55,875 | | Four Corners Property Trust, Inc. | | | 1,539,915 | |
| | 39,300 | | Rayonier, Inc. | | | 1,227,339 | |
| | | | | | | | |
| | | | | | | 2,767,254 | |
| | | |
| | | | | | | | |
| | |
Shares | |
Description | |
Value | |
| |
| | Common Stocks – (continued) | |
| |
| | Specialty Retail – 1.4% | |
| | 24,566 | | Abercrombie & Fitch Co. Class A* | | $ | 3,237,553 | |
| | 14,484 | | Caleres, Inc. | | | 432,347 | |
| | 3,155 | | Group 1 Automotive, Inc. | | | 1,149,430 | |
| | 2,200 | | Murphy USA, Inc. | | | 1,074,590 | |
| | 47,822 | | Revolve Group, Inc.* | | | 1,186,942 | |
| | 24,473 | | Victoria’s Secret & Co.* | | | 740,553 | |
| | | | | | | | |
| | | | | | | 7,821,415 | |
| | | |
| |
| | Textiles, Apparel & Luxury Goods – 0.8% | |
| | 13,300 | | Kontoor Brands, Inc. | | | 1,138,879 | |
| | 9,200 | | Oxford Industries, Inc. | | | 668,104 | |
| | 30,900 | | Steven Madden Ltd. | | | 1,389,573 | |
| | 57,000 | | VF Corp. | | | 1,180,470 | |
| | | | | | | | |
| | | | | | | 4,377,026 | |
| | | |
| |
| | Tobacco – 0.1% | |
| | 13,505 | | Universal Corp. | | | 687,675 | |
| | | |
| |
| | Trading Companies & Distributors – 2.0% | |
| | 12,368 | | Applied Industrial Technologies, Inc. | | | 2,864,305 | |
| | 23,706 | | Beacon Roofing Supply, Inc.* | | | 2,182,611 | |
| | 29,940 | | FTAI Aviation Ltd. | | | 4,025,134 | |
| | 9,100 | | McGrath RentCorp | | | 1,034,670 | |
| | 7,608 | | SiteOne Landscape Supply, Inc.* | | | 1,063,142 | |
| | | | | | | | |
| | | | | | | 11,169,862 | |
| | | |
| |
| | Wireless Telecommunication Services*(a) – 0.0% | |
| | 29,864 | | GCI Liberty, Inc. | | | — | |
| | | |
| | TOTAL COMMON STOCKS
(Cost $423,871,854) | | $ | 524,981,955 | |
| | | |
| | | | | | | | |
| | | Shares | | Dividend
Rate | | Value | |
| |
| | Investment Company(b) – 4.4% | |
| | Goldman Sachs Financial Square Government Fund —
Institutional Shares | |
| | 24,476,895 | | 4.766% | | $ | 24,476,895 | |
| | (Cost $24,476,895) | |
| | | |
| | TOTAL INVESTMENTS – 99.9%
(Cost $448,348,749) | | $ | 549,458,850 | |
| | | |
| | OTHER ASSETS IN EXCESS OF
LIABILITIES – 0.1% | | | 510,267 | |
| | | |
| | NET ASSETS – 100.0% | | $ | 549,969,117 | |
| | | |
The percentage shown for each investment category reflects the value of investments in that category as a percentage of net assets.
| * | Non-income producing security. |
| (a) | Significant unobservable inputs were used in the valuation of this portfolio security; i.e., Level 3. |
| (b) | Represents an affiliated issuer. |
| | |
| The accompanying notes are an integral part of these financial statements. | | 9 |
MULTI-MANAGER U.S. SMALL CAP EQUITY FUND
|
Schedule of Investments (continued) October 31, 2024 |
| | |
|
|
| Investment Abbreviations: |
| ADR | | —American Depositary Receipt |
| PLC | | —Public Limited Company |
| REIT | | —Real Estate Investment Trust |
| SPX | | —S&P 500 Index |
|
|
| | |
| 10 | | The accompanying notes are an integral part of these financial statements. |
ACTIVE EQUITY MULTI-MANAGER FUNDS
|
Statements of Assets and Liabilities October 31, 2024 |
| | | | | | | | | | | | |
| | | | | Multi-Manager
International
Equity Fund | | | Multi-Manager
U.S. Small Cap
Equity Fund | | | |
| | | | |
| | Assets: | | | | | | | | | | |
| | | | |
| | Investments in unaffiliated issuers, at value (cost $1,202,413,066 and $423,871,854, respectively) | | | $1,529,281,444 | | | | $524,981,955 | | | |
| | | | |
| | Investments in affiliated issuers, at value (cost $57,892,238 and $24,476,895, respectively) | | | 57,892,238 | | | | 24,476,895 | | | |
| | | | |
| | Cash | | | 1,177,200 | | | | 497,534 | | | |
| | | | |
| | Foreign currencies, at value (cost $303,797 and $0, respectively) | | | 304,159 | | | | — | | | |
| | | | |
| | Receivables: | | | | | | | | | | |
| | | | |
| | Foreign tax reclaims | | | 4,649,632 | | | | — | | | |
| | | | |
| | Investments sold | | | 3,926,464 | | | | 1,181,321 | | | |
| | | | |
| | Dividends | | | 1,900,060 | | | | 175,132 | | | |
| | | | |
| | Fund shares sold | | | 150,000 | | | | 125,000 | | | |
| | | | |
| | Investments sold on an extended-settlement basis | | | 68,172 | | | | — | | | |
| | | | |
| | Other assets | | | 311,157 | | | | 17,973 | | | |
| | |
| | | | |
| | Total assets | | | 1,599,660,526 | | | | 551,455,810 | | | |
| | |
| | | | | | | | | | | | |
| | | | |
| | Liabilities: | | | | | | | | | | |
| | | | |
| | Unrealized loss on forward foreign currency exchange contracts | | | 436 | | | | — | | | |
| | | | |
| | Payables: | | | | | | | | | | |
| | | | |
| | Investments purchased | | | 10,513,373 | | | | 743,726 | | | |
| | | | |
| | Fund shares redeemed | | | 1,210,712 | | | | 170,479 | | | |
| | | | |
| | Investments purchased on an extended-settlement basis | | | 828,839 | | | | — | | | |
| | | | |
| | Management fees | | | 289,652 | | | | 158,411 | | | |
| | | | |
| | Transfer agency fees | | | 14,094 | | | | 5,571 | | | |
| | | | |
| | Accrued expenses | | | 903,192 | | | | 408,506 | | | |
| | |
| | | | |
| | Total liabilities | | | 13,760,298 | | | | 1,486,693 | | | |
| | |
| | | | | | | | | | | | |
| | | | |
| | Net Assets: | | | | | | | | | | |
| | | | |
| | Paid-in capital | | | 1,180,314,533 | | | | 406,132,362 | | | |
| | | | |
| | Total distributable earnings | | | 405,585,695 | | | | 143,836,755 | | | |
| | |
| | | | |
| | NET ASSETS | | | $1,585,900,228 | | | | $549,969,117 | | | |
| | |
| | | | |
| | Shares Outstanding $0.001 par value (unlimited shares authorized): | | | 104,041,070 | | | | 37,960,405 | | | |
| | | | |
| | Net asset value, offering and redemption price per share: | | | $ 15.24 | | | | $ 14.49 | | | |
| | |
| | |
| The accompanying notes are an integral part of these financial statements. | | 11 |
ACTIVE EQUITY MULTI-MANAGER FUNDS
|
Statements of Operations For the Fiscal Year Ended October 31, 2024 |
| | | | | | | | | | | | |
| | | | | Multi-Manager
International
Equity Fund | | | Multi-Manager
U.S. Small Cap
Equity Fund | | | |
| | | | |
| | Investment Income: | | | | | | | | | | |
| | | | |
| | Dividends — unaffiliated issuers (net of tax withholding of $2,563,673 and $14,806, respectively) | | $ | 31,983,912 | | | $ | 8,300,707 | | | |
| | | | |
| | Dividends — affiliated issuers | | | 2,128,041 | | | | 1,769,104 | | | |
| | | | |
| | Other Income | | | 1,839,442 | | | | — | | | |
| | |
| | | | |
| | Total investment income | | | 35,951,395 | | | | 10,069,811 | | | |
| | |
| | | | | | | | | | | | |
| | | | |
| | Expenses: | | | | | | | | | | |
| | | | |
| | Management fees | | | 8,943,381 | | | | 6,203,111 | | | |
| | | | |
| | Custody, accounting and administrative services | | | 870,040 | | | | 600,206 | | | |
| | | | |
| | Transfer Agency fees | | | 298,112 | | | | 165,416 | | | |
| | | | |
| | Professional fees | | | 292,084 | | | | 251,512 | | | |
| | | | |
| | Registration fees | | | 52,056 | | | | 62,705 | | | |
| | | | |
| | Trustee fees | | | 31,189 | | | | 29,675 | | | |
| | | | |
| | Printing and mailing costs | | | 7,937 | | | | 10,486 | | | |
| | | | |
| | Other | | | 60,809 | | | | 36,778 | | | |
| | |
| | | | |
| | Total expenses | | | 10,555,608 | | | | 7,359,889 | | | |
| | |
| | | | |
| | Less — expense reductions | | | (2,789,454 | ) | | | (1,501,203 | ) | | |
| | |
| | | | |
| | Net expenses | | | 7,766,154 | | | | 5,858,686 | | | |
| | |
| | | | |
| | NET INVESTMENT INCOME | | | 28,185,241 | | | | 4,211,125 | | | |
| | |
| | | | | | | | | | | | |
| | | | |
| | Realized and unrealized gain (loss): | | | | | | | | | | |
| | | | |
| | Net realized gain (loss) from: | | | | | | | | | | |
| | | | |
| | Investments — unaffiliated issuers (including commission recapture of $12,742 and $65,208, respectively) | | | 91,717,124 | | | | 62,248,010 | | | |
| | | | |
| | Forward foreign currency exchange contracts | | | 23,985 | | | | — | | | |
| | | | |
| | Foreign currency transactions | | | (200,858 | ) | | | (91 | ) | | |
| | | | |
| | Net change in unrealized gain (loss) on: | | | | | | | | | | |
| | | | |
| | Investments — unaffiliated issuers (including the effects of foreign capital gains tax of $(200,218) and $0, respectively) | | | 179,961,053 | | | | 118,731,382 | | | |
| | | | |
| | Forward foreign currency exchange contracts | | | (436 | ) | | | — | | | |
| | | | |
| | Foreign currency translation | | | 159,550 | | | | — | | | |
| | |
| | | | |
| | Net realized and unrealized gain | | | 271,660,418 | | | | 180,979,301 | | | |
| | |
| | | | |
| | NET INCREASE IN NET ASSETS RESULTING FROM OPERATIONS | | $ | 299,845,659 | | | $ | 185,190,426 | | | |
| | |
| | |
| 12 | | The accompanying notes are an integral part of these financial statements. |
ACTIVE EQUITY MULTI-MANAGER FUNDS
|
Statements of Changes in Net Assets |
| | | | | | | | | | | | | | | | | | | | | | | | |
| | | | | Multi-Manager International Equity Fund | | | | Multi-Manager U.S. Small Cap Equity Fund | | |
| | | | | | | |
| | | | | For the Fiscal
Year Ended
October 31, 2024 | | For the Fiscal
Year Ended
October 31, 2023 | | | | For the Fiscal
Year Ended
October 31, 2024 | | For the Fiscal
Year Ended
October 31, 2023 | | |
| | | | | | | |
| | From operations: | | | | | | | | | | | | | | | | | | | | | | |
| | | | | | | |
| | Net investment income | | | $ 28,185,241 | | | | $ 21,687,381 | | | | | | | | $ 4,211,125 | | | | $ 4,265,931 | | | |
| | | | | | | |
| | Net realized gain | | | 91,540,251 | | | | 14,300,109 | | | | | | | | 62,247,919 | | | | 9,768,523 | | | |
| | | | | | | |
| | Net change in unrealized gain (loss) | | | 180,120,167 | | | | 139,803,878 | | | | | | | | 118,731,382 | | | | (53,130,896 | ) | | |
| | |
| | | | | | | |
| | Net increase (decrease) in net assets resulting from operations | | | 299,845,659 | | | | 175,791,368 | | | | | | | | 185,190,426 | | | | (39,096,442 | ) | | |
| | |
| | | | | | | | | | | | | | | | | | | | | | | | |
| | | | | | | |
| | Distributions to shareholders: | | | | | | | | | | | | | | | | | | | | | | |
| | | | | | | |
| | From distributable earnings | | | (22,657,088 | ) | | | (16,119,210 | ) | | | | | | | (5,116,836 | ) | | | (3,365,968 | ) | | |
| | |
| | | | | | | | | | | | | | | | | | | | | | | | |
| | | | | | | |
| | From share transactions: | | | | | | | | | | | | | | | | | | | | | | |
| | | | | | | |
| | Proceeds from sales of shares | | | 255,706,702 | | | | 143,090,181 | | | | | | | | 121,492,031 | | | | 139,489,002 | | | |
| | | | | | | |
| | Reinvestment of distributions | | | 22,657,088 | | | | 16,119,210 | | | | | | | | 5,116,836 | | | | 3,365,968 | | | |
| | | | | | | |
| | Cost of shares redeemed | | | (190,703,467 | ) | | | (256,849,962 | ) | | | | | | | (478,327,989 | ) | | | (59,610,549 | ) | | |
| | |
| | | | | | | |
| | Net increase (decrease) in net assets resulting from share transactions | | | 87,660,323 | | | | (97,640,571 | ) | | | | | | | (351,719,122 | ) | | | 83,244,421 | | | |
| | |
| | | | | | | |
| | TOTAL INCREASE (DECREASE) | | | 364,848,894 | | | | 62,031,587 | | | | | | | | (171,645,532 | ) | | | 40,782,011 | | | |
| | |
| | | | | | | | | | | | | | | | | | | | | | | | |
| | | | | | | |
| | Net assets: | | | | | | | | | | | | | | | | | | | | | | |
| | | | | | | |
| | Beginning of year | | | 1,221,051,334 | | | | 1,159,019,747 | | | | | | | | 721,614,649 | | | | 680,832,638 | | | |
| | |
| | | | | | | |
| | End of year | | | $1,585,900,228 | | | | $1,221,051,334 | | | | | | | | $549,969,117 | | | | $ 721,614,649 | | | |
| | |
| | |
| The accompanying notes are an integral part of these financial statements. | | 13 |
ACTIVE EQUITY MULTI-MANAGER FUNDS
|
Financial Highlights Selected Share Data for a Share Outstanding Throughout Each Year |
| | | | | | | | | | | | | | | | | | | | | | | | | | | | | |
| | | | | Multi-Manager International Equity Fund | | |
| | | |
| | | | | Class P Shares | | |
| | | |
| | | | | Year Ended October 31, | | |
| | | | | 2024 | | 2023 | | 2022 | | 2021 | | 2020 | | |
| | | | | | | |
| | Per Share Data | | | | | | | | | | | | | | | | | | | | | | | | | | | |
| | | | | | | |
| | | Net asset value, beginning of year | | | $ | 12.45 | | | | $ | 10.94 | | | | $ | 15.42 | | | | $ | 11.16 | | | | $ | 11.70 | | | |
| | |
| | | | | | | |
| | Net investment income(a) | | | | 0.28 | (b) | | | | 0.22 | (c) | | | | 0.19 | | | | | 0.22 | | | | | 0.16 | | | |
| | | | | | | |
| | Net realized and unrealized gain (loss) | | | | 2.74 | | | | | 1.45 | | | | | (3.52 | ) | | | | 4.17 | | | | | (0.40 | ) | | |
| | |
| | | | | | | |
| | Total from investment operations | | | | 3.02 | | | | | 1.67 | | | | | (3.33 | ) | | | | 4.39 | | | | | (0.24 | ) | | |
| | |
| | | | | | | |
| | Distributions to shareholders from net investment income | | | | (0.23 | ) | | | | (0.16 | ) | | | | (0.23 | ) | | | | (0.13 | ) | | | | (0.28 | ) | | |
| | | | | | | |
| | Distributions to shareholders from net realized gains | | | | — | | | | | — | | | | | (0.92 | ) | | | | — | | | | | (0.02 | ) | | |
| | |
| | | | | | | |
| | Total distributions | | | | (0.23 | ) | | | | (0.16 | ) | | | | (1.15 | ) | | | | (0.13 | ) | | | | (0.30 | ) | | |
| | |
| | | | | | | |
| | Net asset value, end of year | | | $ | 15.24 | | | | $ | 12.45 | | | | $ | 10.94 | | | | $ | 15.42 | | | | $ | 11.16 | | | |
| | |
| | | | | | | |
| | Total return(d) | | | | 24.42 | % | | | | 15.32 | % | | | | (23.15 | )% | | | | 39.46 | % | | | | (2.28 | )% | | |
| | |
| | | | | | | |
| | Net assets, end of year (in 000s) | | | $ | 1,585,900 | | | | $ | 1,221,051 | | | | $ | 1,159,020 | | | | $ | 1,373,200 | | | | $ | 886,359 | | | |
| | | | | | | |
| | Ratio of net expenses to average net assets | | | | 0.52 | % | | | | 0.54 | % | | | | 0.56 | % | | | | 0.56 | % | | | | 0.57 | % | | |
| | | | | | | |
| | Ratio of total expenses to average net assets | | | | 0.71 | % | | | | 0.71 | % | | | | 0.73 | % | | | | 0.72 | % | | | | 0.74 | % | | |
| | | | | | | |
| | Ratio of net investment income to average net assets | | | | 1.89 | %(c) | | | | 1.70 | % | | | | 1.50 | % | | | | 1.50 | % | | | | 1.39 | % | | |
| | | | | | | |
| | Portfolio turnover rate(e) | | | | 68 | % | | | | 35 | % | | | | 39 | % | | | | 61 | % | | | | 52 | % | | |
| | |
| | (a) | Calculated based on the average shares outstanding methodology. |
| | (b) | Reflects income recognized from withholding tax reclaims which amounted to $0.02 per share and 0.12% of average net assets. |
| | (c) | Reflects income recognized from withholding tax reclaims which amounted to $0.01 per share and 0.09% of average net assets. |
| | (d) | Assumes investment at the NAV at the beginning of the year, reinvestment of all dividends and distributions, a complete redemption of the investment at the NAV at the end of the year and no sales or redemption charges (if any). Total returns would be reduced if a sales or redemption charge was taken into account. Returns do not reflect the impact of taxes to shareholders relating to Fund distributions or the redemption of Fund shares. |
| | (e) | The Fund’s portfolio turnover rate is calculated in accordance with regulatory requirements, without regard to transactions involving short term investments and certain derivatives. If such transactions were included, the Fund’s portfolio turnover rate may be higher. |
| | |
| 14 | | The accompanying notes are an integral part of these financial statements. |
ACTIVE EQUITY MULTI-MANAGER FUNDS
|
Financial Highlights (continued) Selected Share Data for a Share Outstanding Throughout Each Year |
| | | | | | | | | | | | | | | | | | | | | | | | | | | | | |
| | | | | Multi-Manager U.S. Small Cap Equity Fund | | |
| | | |
| | | | | Class P Shares | | |
| | | |
| | | | | Year Ended October 31, | | |
| | | | | 2024 | | 2023 | | 2022 | | 2021 | | 2020 | | |
| | | | | | | |
| | Per Share Data | | | | | | | | | | | | | | | | | | | | | | | | | | | |
| | | | | | | |
| | | Net asset value, beginning of year | | | $ | 11.56 | | | | $ | 12.23 | | | | $ | 17.45 | | | | $ | 12.14 | | | | $ | 13.31 | | | |
| | |
| | | | | | | |
| | Net investment income(a) | | | | 0.07 | | | | | 0.07 | | | | | 0.05 | | | | | 0.03 | (b) | | | | 0.05 | | | |
| | | | | | | |
| | Net realized and unrealized gain (loss) | | | | 2.94 | | | | | (0.68 | ) | | | | (2.47 | ) | | | | 5.31 | | | | | (0.79 | ) | | |
| | |
| | | | | | | |
| | Total from investment operations | | | | 3.01 | | | | | (0.61 | ) | | | | (2.42 | ) | | | | 5.34 | | | | | (0.74 | ) | | |
| | |
| | | | | | | |
| | Distributions to shareholders from net investment income | | | | (0.08 | ) | | | | (0.06 | ) | | | | (0.03 | ) | | | | (0.03 | ) | | | | (0.08 | ) | | |
| | | | | | | |
| | Distributions to shareholders from net realized gains | | | | — | | | | | — | | | | | (2.77 | ) | | | | — | | | | | (0.35 | ) | | |
| | |
| | | | | | | |
| | Total distributions | | | | (0.08 | ) | | | | (0.06 | ) | | | | (2.80 | ) | | | | (0.03 | ) | | | | (0.43 | ) | | |
| | |
| | | | | | | |
| | Net asset value, end of year | | | $ | 14.49 | | | | $ | 11.56 | | | | $ | 12.23 | | | | $ | 17.45 | | | | $ | 12.14 | | | |
| | |
| | | | | | | |
| | Total return(c) | | | | 26.12 | % | | | | (5.00 | )% | | | | (15.77 | )% | | | | 44.07 | % | | | | (5.88 | )% | | |
| | |
| | | | | | | |
| | Net assets, end of year (in 000s) | | | $ | 549,969 | | | | $ | 721,615 | | | | $ | 680,833 | | | | $ | 647,500 | | | | $ | 441,314 | | | |
| | | | | | | |
| | Ratio of net expenses to average net assets | | | | 0.71 | % | | | | 0.71 | % | | | | 0.73 | % | | | | 0.75 | % | | | | 0.77 | % | | |
| | | | | | | |
| | Ratio of total expenses to average net assets | | | | 0.89 | % | | | | 0.89 | % | | | | 0.90 | % | | | | 0.92 | % | | | | 0.95 | % | | |
| | | | | | | |
| | Ratio of net investment income to average net assets | | | | 0.51 | % | | | | 0.58 | % | | | | 0.35 | % | | | | 0.17 | %(b) | | | | 0.44 | % | | |
| | | | | | | |
| | Portfolio turnover rate(d) | | | | 69 | % | | | | 62 | % | | | | 57 | % | | | | 105 | % | | | | 85 | % | | |
| | |
| | (a) | Calculated based on the average shares outstanding methodology. |
| | (b) | Reflects income recognized from special dividends which amounted to $0.02 per share and 0.12% of average net assets. |
| | (c) | Assumes investment at the NAV at the beginning of the year, reinvestment of all dividends and distributions, a complete redemption of the investment at the NAV at the end of the year and no sales or redemption charges (if any). Total returns would be reduced if a sales or redemption charge was taken into account. Returns do not reflect the impact of taxes to shareholders relating to Fund distributions or the redemption of Fund shares. |
| | (d) | The Fund’s portfolio turnover rate is calculated in accordance with regulatory requirements, without regard to transactions involving short term investments and certain derivatives. If such transactions were included, the Fund’s portfolio turnover rate may be higher. |
| | |
| The accompanying notes are an integral part of these financial statements. | | 15 |
ACTIVE EQUITY MULTI-MANAGER FUNDS
|
Notes to Financial Statements October 31, 2024 |
Goldman Sachs Trust II (the “Trust”) is a Delaware statutory trust registered under the Investment Company Act of 1940, as amended (the “Act”), as an open-end management investment company. The following table lists those series of the Trust that are included in this report (collectively, the “Funds” or individually a “Fund”), along with their corresponding share classes and respective diversification status under the Act:
| | | | |
| Fund | | Share Classes Offered | | Diversified/ Non-diversified |
| | |
| Multi-Manager International Equity | | Class P | | Diversified |
| | |
| Multi-Manager U.S. Small Cap Equity | | Class P | | Diversified |
Goldman Sachs Asset Management, L.P. (“GSAM”), an affiliate of Goldman Sachs & Co. LLC (“Goldman Sachs”), serves as investment adviser to the Funds pursuant to a management agreement (the “Agreement”) with the Trust. As of October 31, 2024, GSAM had sub-advisory agreements (the “Sub-Advisory Agreements”) for the Multi-Manager International Equity Fund with Causeway Capital Management LLC, Massachusetts Financial Services Company, doing business as MFS Investment Management, and WCM Investment Management, LLC and for the Multi-Manager U.S. Small Cap Equity Fund with Boston Partners Global Investors, Inc., Brown Advisory LLC, Victory Capital Management, Inc., and Westfield Capital Management Company, L.P., (the “Underlying Managers”). Pursuant to the terms of the Sub-Advisory Agreements, the Underlying Managers are responsible for making investment decisions and managing the investments of the applicable Fund. GSAM compensates the Underlying Managers directly in accordance with the terms of the applicable Sub-Advisory Agreements. The Funds are not charged any separate or additional investment advisory fees by the Underlying Managers.
|
|
2. SIGNIFICANT ACCOUNTING POLICIES |
The financial statements have been prepared in accordance with accounting principles generally accepted in the United States of America (“GAAP”) and require management to make estimates and assumptions that may affect the reported amounts and disclosures. Actual results may differ from those estimates and assumptions. Each Fund is an investment company under GAAP and follows the accounting and reporting guidance applicable to investment companies.
A. Investment Valuation — The Funds’ valuation policy is to value investments at fair value.
B. Investment Income and Investments — Investment income includes interest income, dividend income and securities lending income, if any. Interest income is accrued daily and adjusted for amortization of premiums and accretion of discounts. Dividend income is recognized on ex-dividend date or, for certain foreign securities, as soon as such information is obtained subsequent to the ex-dividend date. Non-cash dividends, if any, are recorded at the fair market value of the securities received. Investment transactions are reflected on trade date. Realized gains and losses are calculated using identified cost. Investment transactions are recorded on the following business day for daily net asset value (“NAV”) calculations. Investment income is recorded net of any foreign withholding taxes, less any amounts reclaimable. The Funds may file withholding tax reclaims in certain jurisdictions to recover a portion of amounts previously withheld. These reclaims, if any, are recorded when the amount is known and there are no significant uncertainties on collectability. Such amounts recovered, if any, are reflected as other income in the Statements of Operations. Any foreign capital gains tax is accrued daily based upon net unrealized gains, and is payable upon sale of such investments. Distributions received from the Funds’ investments in U.S. real estate investment trusts (“REITs”) may be characterized as ordinary income, net capital gain and/or a return of capital. A return of capital is recorded by the Funds as a reduction to the cost basis of the REIT.
For derivative contracts, unrealized gains and losses are recorded daily and become realized gains and losses upon disposition or termination of the contract.
C. Expenses — Expenses incurred directly by a Fund are charged to the Fund, and certain expenses incurred by the Trust are allocated across the applicable Funds on a straight-line and/or pro-rata basis, depending upon the nature of the expenses, and are accrued daily.
ACTIVE EQUITY MULTI-MANAGER FUNDS
|
|
2. SIGNIFICANT ACCOUNTING POLICIES (continued) |
D. Federal Taxes and Distributions to Shareholders — It is each Fund’s policy to comply with the requirements of the Internal Revenue Code of 1986, as amended (the “Code”), applicable to regulated investment companies and to distribute each year substantially all of its investment company taxable income and capital gains to its shareholders. Accordingly, each Fund is not required to make any provisions for the payment of federal income tax. Distributions to shareholders are recorded on the ex-dividend date. Income and capital gains distributions, if any, are declared and paid annually.
Net capital losses, if any, are carried forward to future fiscal years and may be used to the extent allowed by the Code to offset any future capital gains. Losses that are carried forward will retain their character as either short-term or long-term capital losses. Utilization of capital loss carryforwards will reduce the requirement of future capital gains distributions.
The characterization of distributions to shareholders for financial reporting purposes is determined in accordance with federal income tax rules, which may differ from GAAP. The source of each Fund’s distributions may be shown in the accompanying financial statements as either from distributable earnings or capital. Certain components of the Funds’ net assets on the Statements of Assets and Liabilities reflect permanent GAAP/tax differences based on the appropriate tax character.
E. Foreign Currency Translation — The accounting records and reporting currency of a Fund are maintained in U.S. dollars. Assets and liabilities denominated in foreign currencies are translated into U.S. dollars using the current exchange rates at the close of each business day. The effect of changes in foreign currency exchange rates on investments is included within net realized and unrealized gain (loss) on investments. Changes in the value of other assets and liabilities as a result of fluctuations in foreign exchange rates are included in the Statements of Operations within net change in unrealized gain (loss) on foreign currency translation. Transactions denominated in foreign currencies are translated into U.S. dollars on the date the transaction occurred, the effects of which are included within net realized gain (loss) on foreign currency transactions.
F. Commission Recapture — GSAM, on behalf of certain Funds, may direct portfolio trades, subject to seeking best execution, to various brokers who have agreed to rebate a portion of the commissions generated. Such rebates are made directly to a Fund as cash payments and are included in net realized gain (loss) from investments on the Statements of Operations.
|
|
3. INVESTMENTS AND FAIR VALUE MEASUREMENTS |
U.S. GAAP defines the fair value of a financial instrument as the amount that would be received to sell an asset or paid to transfer a liability in an orderly transaction between market participants at the measurement date (i.e., the exit price); the Funds’ policy is to use the market approach. GAAP establishes a fair value hierarchy that prioritizes the inputs to valuation techniques used to measure fair value. The hierarchy gives the highest priority to unadjusted quoted prices in active markets for identical assets or liabilities (Level 1 measurements) and the lowest priority to unobservable inputs (Level 3 measurements). The level in the fair value hierarchy within which the fair value measurement in its entirety falls shall be determined based on the lowest level input that is significant to the fair value measurement in its entirety. The levels used for classifying investments are not necessarily an indication of the risk associated with investing in these investments. The three levels of the fair value hierarchy are described below:
Level 1 — Unadjusted quoted prices in active markets that are accessible at the measurement date for identical, unrestricted assets or liabilities;
Level 2 — Quoted prices in markets that are not active or financial instruments for which significant inputs are observable (including, but not limited to, quoted prices for similar investments, interest rates, foreign exchange rates, volatility and credit spreads), either directly or indirectly;
Level 3 — Prices or valuations that require significant unobservable inputs (including GSAM’s assumptions in determining fair value measurement).
The Board of Trustees (“Trustees”) has approved Valuation Procedures that govern the valuation of the portfolio investments held by the Funds, including investments for which market quotations are not readily available. With respect to the Funds’ investments that do not have readily available market quotations, the Trustees have designated GSAM as the valuation designee to perform fair valuations pursuant to Rule 2a-5 under the Investment Company Act of 1940 (the “Valuation Designee”). GSAM has day-to-day
ACTIVE EQUITY MULTI-MANAGER FUNDS
|
Notes to Financial Statements (continued) October 31, 2024 |
|
|
3. INVESTMENTS AND FAIR VALUE MEASUREMENTS (continued) |
responsibility for implementing and maintaining internal controls and procedures related to the valuation of the Funds’ investments. To assess the continuing appropriateness of pricing sources and methodologies, GSAM regularly performs price verification procedures and issues challenges as necessary to third party pricing vendors or brokers, and any differences are reviewed in accordance with the Valuation Procedures.
A. Level 1 and Level 2 Fair Value Investments — The valuation techniques and significant inputs used in determining the fair values for investments classified as Level 1 and Level 2 are as follows:
Equity Securities — Equity securities traded on a United States (“U.S.”) securities exchange or the NASDAQ system, or those located on certain foreign exchanges, including but not limited to the Americas, are valued daily at their last sale price or official closing price on the principal exchange or system on which they are traded. If there is no sale or official closing price or such price is believed by GSAM to not represent fair value, equity securities will be valued at the valid closing bid price for long positions and at the valid closing ask price for short positions (i.e., where there is sufficient volume, during normal exchange trading hours). If no valid bid/ask price is available, the equity security will be valued pursuant to the Valuation Procedures and consistent with applicable regulatory guidance. To the extent these investments are actively traded, they are classified as Level 1 of the fair value hierarchy, otherwise they are generally classified as Level 2. Certain equity securities containing unique attributes may be classified as Level 2.
Unlisted equity securities for which market quotations are available are valued at the last sale price on the valuation date, or if no sale occurs, at the last bid price for long positions or the last ask price for short positions, and are generally classified as Level 2. Securities traded on certain foreign securities exchanges are valued daily at fair value determined by an independent fair value service (if available) under the Valuation Procedures and consistent with applicable regulatory guidance. The independent fair value service takes into account multiple factors including, but not limited to, movements in the securities markets, certain depositary receipts, futures contracts and foreign currency exchange rates that have occurred subsequent to the close of the foreign securities exchange. These investments are generally classified as Level 2 of the fair value hierarchy.
Underlying Funds (including Money Market Funds) — Underlying funds (“Underlying Funds”) include exchange-traded funds (“ETFs”) and other investment companies. Investments in the Underlying Funds (except ETFs) are valued at the NAV per share on the day of valuation. ETFs are valued daily at the last sale price or official closing price on the principal exchange or system on which the investment is traded. Because the Funds invest in Underlying Funds that fluctuate in value, the Funds’ shares will correspondingly fluctuate in value. Underlying Funds are generally classified as Level 1 of the fair value hierarchy. To the extent that underlying ETFs are actively traded, they are classified as Level 1 of the fair value hierarchy, otherwise they are generally classified as Level 2. For information regarding an Underlying Fund’s accounting policies and investment holdings, please see the Underlying Fund’s shareholder report.
Derivative Contracts — A derivative is an instrument whose value is derived from underlying assets, indices, reference rates or a combination of these factors. A Fund enters into derivative transactions to hedge against changes in interest rates, securities prices, and/or currency exchange rates, to increase total return, or to gain access to certain markets or attain exposure to other underliers. For financial reporting purposes, cash collateral that has been pledged to cover obligations of a Fund and cash collateral received, if any, is reported separately on the Statements of Assets and Liabilities as either due to broker/receivable for collateral on certain derivative contracts. Non-cash collateral pledged by a Fund, if any, is noted in the Schedules of Investments.
Exchange-traded derivatives, including futures and options contracts, are generally valued at the last sale or settlement price on the exchange where they are principally traded. Exchange-traded options without settlement prices are generally valued at the midpoint of the bid and ask prices on the exchange where they are principally traded (or, in the absence of two-way trading, at the last bid price for long positions and the last ask price for short positions). Exchange-traded derivatives typically fall within Level 1 of the fair value hierarchy. Over-the-counter (“OTC”) and centrally cleared derivatives are valued using market transactions and other market evidence, including market-based inputs to models, calibration to market-clearing transactions, broker or dealer quotations, or other alternative pricing sources. Where models are used, the selection of a particular model to value OTC and centrally cleared derivatives depends upon the contractual terms of, and specific risks inherent in, the instrument, as well as the availability of pricing information in the market. Valuation models require a variety of inputs, including contractual terms, market
ACTIVE EQUITY MULTI-MANAGER FUNDS
|
|
3. INVESTMENTS AND FAIR VALUE MEASUREMENTS (continued) |
prices, yield curves, credit curves, measures of volatility, voluntary and involuntary prepayment rates, loss severity rates and correlations of such inputs. For OTC and centrally cleared derivatives that trade in liquid markets, model inputs can generally be verified and model selection does not involve significant management judgment. OTC and centrally cleared derivatives are classified within Level 2 of the fair value hierarchy when significant inputs are corroborated by market evidence.
i. Forward Contracts — A forward contract is a contract between two parties to buy or sell an asset at a specified price on a future date. A forward contract settlement can occur on a cash or delivery basis. Forward contracts are marked-to-market daily using independent vendor prices, and the change in value, if any, is recorded as an unrealized gain or loss. Cash and certain investments may be used to collateralize forward contracts.
A forward foreign currency exchange contract is a forward contract in which a Fund agrees to receive or deliver a fixed quantity of one currency for another, at a pre-determined price at a future date. All forward foreign currency exchange contracts are marked to market daily by using the outright forward rates or interpolating based upon maturity dates, where available. Non-deliverable forward foreign currency exchange contracts are settled with the counterparty in cash without the delivery of foreign currency.
B. Level 3 Fair Value Investments — To the extent that significant inputs to valuation models and other alternative pricing sources are unobservable, or if quotations are not readily available, or if GSAM believes that such quotations do not accurately reflect fair value, the fair value of a Fund’s investments may be determined under the Valuation Procedures. GSAM, consistent with its procedures and applicable regulatory guidance, may make an adjustment to the most recent valuation prices of either domestic or foreign securities in light of significant events to reflect what it believes to be the fair value of the securities at the time of determining a Fund’s NAV. To the extent investments are valued using single source broker quotations obtained directly from the broker or passed through from third party pricing vendors, such investments are classified as Level 3 investments.
C. Fair Value Hierarchy — The following is a summary of the Funds’ investments and derivatives classified in the fair value hierarchy as of October 31, 2024:
| | | | | | | | | | | | |
| MULTI-MANAGER INTERNATIONAL EQUITY | | | | | | | | | | | | |
| | | |
| Investment Type | | Level 1 | | | Level 2 | | | Level 3 | |
|
| |
| | | |
Assets | | | | | | | | | | | | |
| | | |
Common Stock and/or Other Equity Investments(a) | | | | | | | | | | | | |
| | | |
Asia | | $ | 51,651,860 | | | $ | 287,738,119 | | | $ | — | |
| | | |
Europe | | | 78,630,870 | | | | 969,955,986 | | | | — | |
| | | |
North America | | | 121,814,888 | | | | 7,860,016 | | | | — | |
| | | |
South America | | | 11,629,705 | | | | — | | | | — | |
| | | |
Investment Company | | | 57,892,238 | | | | — | | | | — | |
|
| |
| | | |
Total | | $ | 321,619,561 | | | $ | 1,265,554,121 | | | $ | — | |
|
| |
| | | |
Derivative Type | | | | | | | | | | | | |
|
| |
| | | |
Liabilities(b) | | | | | | | | | | | | |
| | | |
Forward Foreign Currency Exchange Contracts | | $ | — | | | $ | (436 | ) | | $ | — | |
|
| |
| | (a) | Amounts are disclosed by continent to highlight the impact of time zone differences between local market close and the calculation of NAV. Security valuations are based on the principal exchange or system on which they are traded, which may differ from country of domicile. The Funds utilize fair value model prices provided by an independent fair value service for international equities, resulting in a Level 2 classification. |
| | (b) | Amount shown represents unrealized gain (loss) at period end. |
ACTIVE EQUITY MULTI-MANAGER FUNDS
|
Notes to Financial Statements (continued) October 31, 2024 |
|
|
3. INVESTMENTS AND FAIR VALUE MEASUREMENTS (continued) |
| | | | | | | | | | | | |
| MULTI-MANAGER U.S. SMALL CAP EQUITY | | | | | | | | | | | | |
| | | |
| Investment Type | | Level 1 | | | Level 2 | | | Level 3 | |
|
| |
| | | |
Assets | | | | | | | | | | | | |
| | | |
Common Stock and/or Other Equity Investments(a) | | | | | | | | | | | | |
| | | |
Asia | | $ | 2,903,079 | | | $ | — | | | $ | — | |
| | | |
Europe | | | 20,586,333 | | | | — | | | | — | |
| | | |
North America | | | 501,492,543 | | | | — | | | | — | |
| | | |
Investment Company | | | 24,476,895 | | | | — | | | | — | |
|
| |
| | | |
Total | | $ | 549,458,850 | | | $ | — | | | $ | — | |
|
| |
| | (a) | Amounts are disclosed by continent to highlight the impact of time zone differences between local market close and the calculation of NAV. Security valuations are based on the principal exchange or system on which they are traded, which may differ from country of domicile. The Funds utilize fair value model prices provided by an independent fair value service for international equities, resulting in a Level 2 classification. |
For further information regarding security characteristics, see the Schedules of Investments.
|
|
4. INVESTMENTS IN DERIVATIVES |
The following table sets forth, by certain risk types, the gross value of derivative contracts (not considered to be hedging instruments for accounting disclosure purposes) as of October 31, 2024. These instruments were used as part of the Multi-Manager International Equity Fund’s investment strategies and to obtain and/or manage exposure related to the risks below. The values in the table below excludes the effects of cash collateral received or posted pursuant to these derivative contracts, and therefore are not representative of the Funds’ net exposure.
| | | | | | | | |
| Multi-Manager International Equity |
| | | | |
| Risk | | Statements of Assets and Liabilities | | Assets | | Statements of Assets and Liabilities | | Liabilities |
| | | | |
| Currency | | — | | $— | | Payable for unrealized loss on forward foreign currency exchange contracts | | $(436) |
The following table sets forth, by certain risk types, the Multi-Manager International Equity Fund’s gains (losses) related to these derivatives and their indicative volumes for the fiscal year ended October 31, 2024. These gains (losses) should be considered in the context that these derivative contracts may have been executed to create investment opportunities and/or economically hedge certain investments, and accordingly, certain gains (losses) on such derivative contracts may offset certain (losses) gains attributable to investments. These gains (losses) are included in “Net realized gain (loss)” or “Net change in unrealized gain (loss)” on the Statements of Operations:
| | | | | | |
| Multi-Manager International Equity |
| | | |
| Risk | | Statements of Operations | | Net Realized Gain | | Net Change in Unrealized Gain (Loss) |
| | | |
| Currency | | Net realized gain from forward foreign currency exchange contracts/Net unrealized loss on forward foreign currency exchange contracts | | $23,985 | | $(436) |
ACTIVE EQUITY MULTI-MANAGER FUNDS
|
|
4. INVESTMENTS IN DERIVATIVES (continued) |
For the fiscal year ended October 31, 2024, the relevant values for each derivative type were as follows:
| | | | |
| | | | | Average Notional Amounts(a) |
| | |
| | | | |
| | |
| Fund | | | | Forward
Contracts |
|
|
| | |
Multi-Manager International Equity | | | | $392,487 |
|
|
| | (a) | Amounts disclosed represent average notional amounts for forward contracts, based on absolute values, which is indicative of volume for this derivative type, for the months that the Fund held such derivatives for the fiscal year ended October 31, 2024. |
|
|
5. AGREEMENTS AND AFFILIATED TRANSACTIONS |
A. Management Agreement — Under the Agreement, GSAM manages the Funds, subject to the general supervision of the Trustees.
As compensation for the services rendered pursuant to the Agreement, the assumption of the expenses related thereto and administration of the Funds’ business affairs, including providing facilities, GSAM is entitled to a management fee, accrued daily and paid monthly, equal to an annual percentage rate of each Fund’s average daily net assets.
For the fiscal year ended October 31, 2024, contractual and effective net management fees with GSAM were at the following rates:
| | | | |
| | |
| Fund | | Contractual Management Rate | | Effective Net
Management
Rate#* |
|
|
| | |
Multi-Manager International Equity | | 0.60% | | 0.41% |
|
|
| | |
Multi-Manager U.S. Small Cap Equity | | 0.75 | | 0.57 |
|
|
| | * | GSAM has agreed to waive a portion of its management fee for each Fund in order to achieve an effective net management fee rate that is equal to the actual cost of fees paid to the Fund’s Underlying Managers. These arrangements will remain in effect through at least February 28, 2025, and prior to such date, GSAM may not terminate the applicable arrangement without the approval of the Trustees. |
| | # | Effective Net Management Rate includes impact of management fee waivers of underlying funds, if any. |
The Funds invest in Institutional Shares of the Goldman Sachs Financial Square Government Fund, which is an affiliated Underlying Fund. GSAM has agreed to waive a portion of its management fee payable by the Funds in an amount equal to the management fee it earns as an investment adviser to the affiliated Underlying Funds in which the Funds invest. For the fiscal year ended October 31, 2024, the management fees waived by GSAM for each Fund was as follows:
| | |
| Fund | | Management
Fee Waived |
|
|
| |
Multi-Manager International Equity | | $66,627 |
|
|
| |
Multi-Manager U.S. Small Cap Equity | | 54,664 |
|
|
B. Transfer Agency Agreement — Goldman Sachs also serves as the transfer agent of the Funds for a fee pursuant to the Transfer Agency Agreement. The fees charged for such transfer agency services are accrued daily and paid monthly at annual rates as follows: 0.02% of the average daily net assets of Class P Shares.
C. Other Expense Agreements and Affiliated Transactions — GSAM has agreed to reduce or limit certain “Other Expenses” of the Funds (excluding acquired fund fees and expenses, transfer agency fees and expenses, service fees and shareholder administration fees (as applicable), taxes, interest, brokerage fees, expenses of shareholder meetings, litigation and indemnification, and extraordinary expenses) to the extent such expenses exceed, on an annual basis, a percentage rate of the average daily net assets of each Fund. Such Other Expense reimbursements, if any, are accrued daily and paid monthly. In addition,
ACTIVE EQUITY MULTI-MANAGER FUNDS
|
Notes to Financial Statements (continued) October 31, 2024 |
|
|
5. AGREEMENTS AND AFFILIATED TRANSACTIONS (continued) |
the Funds are not obligated to reimburse GSAM for prior fiscal year expense reimbursements, if any. The Total Annual Operating Expense limitations as an annual percentage rate of average daily net assets for the Multi-Manager International Equity and Multi-Manager U.S. Small Cap Equity Funds are 0.57% and 0.80%, respectively. These Other Expense limitations will remain in place through at least February 28, 2025, and prior to such date GSAM may not terminate the arrangements without the approval of the Trustees. In addition, the Funds have entered into certain offset arrangements with the transfer agent, which may result in a reduction of the Funds’ expenses and are received irrespective of the application of the “Other Expense” limitations described above.
For the fiscal year ended October 31, 2024, these expense reductions, including any fee waivers, were as follows:
| | | | |
| |
| Fund | | Management
Fee Waiver | |
|
| |
| |
Multi-Manager International Equity | | | $2,789,454 | |
|
| |
| |
Multi-Manager U.S. Small Cap Equity | | | 1,501,203 | |
|
| |
D. Line of Credit Facility — As of October 31, 2024, the Funds participated in a $1,150,000,000 committed, unsecured revolving line of credit facility (the “facility”) together with other funds of the Trust and certain registered investment companies having management agreements with GSAM or its affiliates. This facility is to be used for temporary emergency purposes, or to allow for an orderly liquidation of securities to meet redemption requests. The interest rate on borrowings is based on the federal funds rate. The facility also requires a fee to be paid by the Funds based on the amount of the commitment that has not been utilized. For the fiscal year ended October 31, 2024, the Funds did not have any borrowings under the facility. Prior to April 16, 2024, the facility was $1,110,000,000.
E. Other Transactions with Affiliates — For the fiscal year ended October 31, 2024, Goldman Sachs earned $5,172 and $4,768 in brokerage commissions from portfolio transactions on behalf of the Multi-Manager International Equity and Multi-Manager U.S. Small Cap Equity Funds, respectively.
The following table provides information about the Funds’ investments in the Goldman Sachs Financial Square Government Fund as of and for the fiscal year ended October 31, 2024:
| | | | | | | | | | | | | | | | | | | | | | | | | | |
| Fund | | Underlying Fund | | Beginning
Value as of
October 31,
2023 | | | Purchases at Cost | | | Proceeds from Sales | | | Ending
Value as of
October 31,
2024 | | | Shares as of
October 31,
2024 | | | Dividend
Income | |
|
| |
| | | | | | | |
Multi-Manager International Equity | | Goldman Sachs Financial Square Government Fund — Institutional Shares | | $ | 40,942,755 | | | $ | 896,814,440 | | | $ | (879,864,957 | ) | | $ | 57,892,238 | | | | 57,892,238 | | | $ | 2,128,041 | |
|
| |
| | | | | | | |
Multi-Manager U.S. Small Cap Equity | | Goldman Sachs Financial Square Government Fund — Institutional Shares | | | 36,290,923 | | | | 535,101,973 | | | | (546,916,001 | ) | | | 24,476,895 | | | | 24,476,895 | | | | 1,769,104 | |
|
| |
|
|
6. PORTFOLIO SECURITIES TRANSACTIONS |
The cost of purchases and proceeds from sales and maturities of long-term securities for the fiscal year ended October 31, 2024, were as follows:
| | | | | | | | |
| Fund | | Purchases | | | Sales | |
|
| |
| | |
Multi-Manager International Equity | | $ | 1,062,056,405 | | | $ | 974,126,133 | |
|
| |
| | |
Multi-Manager U.S. Small Cap Equity | | | 534,274,442 | | | | 870,571,676 | |
|
| |
ACTIVE EQUITY MULTI-MANAGER FUNDS
The tax character of distributions paid during the fiscal year ended October 31, 2024 was as follows:
| | | | | | | | |
| | | Multi-Manager
International
Equity Fund | | | Multi-Manager
U.S. Small Cap
Equity Fund | |
|
| |
| | |
Distributions paid from: | | | | | | | | |
| | |
Ordinary income | | | $22,657,088 | | | | $5,116,836 | |
|
| |
| | |
Total taxable distributions | | | $22,657,088 | | | | $5,116,836 | |
|
| |
The tax character of distributions paid during the fiscal year ended October 31, 2023 was as follows:
| | | | | | | | |
| | | Multi-Manager
International
Equity Fund | | | Multi-Manager
U.S. Small Cap
Equity Fund | |
|
| |
| | |
Distributions paid from: | | | | | | | | |
| | |
Ordinary income | | | $16,119,210 | | | | $3,365,968 | |
|
| |
| | |
Total taxable distributions | | | $16,119,210 | | | | $3,365,968 | |
|
| |
As of October 31, 2024, the components of accumulated earnings (losses) on a tax basis were as follows:
| | | | | | | | |
| | | Multi-Manager
International
Equity Fund | | | Multi-Manager
U.S. Small Cap
Equity Fund | |
|
| |
| | |
Undistributed ordinary income — net | | | $ 50,857,788 | | | | $ 18,599,056 | |
| | |
Undistributed long-term capital gains | | | 66,446,747 | | | | 39,655,107 | |
|
| |
| | |
Total Undistributed Earnings | | | $117,304,535 | | | | $ 58,254,163 | |
|
| |
| | |
Capital loss carryforwards(1) : | | | | | | | | |
| | |
Unrealized gains (loss) — net | | | $288,281,160 | | | | $ 85,582,592 | |
|
| |
| | |
Total accumulated earnings (loss) net | | | $405,585,695 | | | | $143,836,755 | |
|
| |
| | (1) | The Multi-Manager International Equity and Multi-Manager U.S. Small Cap Equity Funds utilized $2,335,362 and $11,529,935, respectively, of capital losses in the current fiscal year. |
As of October 31, 2024, the Funds’ aggregate security unrealized gains and losses based on cost for U.S. federal income tax purposes were as follows:
| | | | | | | | |
| | | Multi-Manager
International
Equity Fund | | | Multi-Manager
U.S. Small Cap
Equity Fund | |
|
| |
| | |
Tax Cost | | | $1,298,657,764 | | | | $463,876,258 | |
|
| |
| | |
Gross unrealized gain | | | 332,725,940 | | | | 103,401,705 | |
| | |
Gross unrealized loss | | | (44,444,780 | ) | | | (17,819,113 | ) |
|
| |
| | |
Net unrealized gain | | | $ 288,281,160 | | | | $ 85,582,592 | |
|
| |
The difference between GAAP-basis and tax basis unrealized gains (losses) is attributable primarily to wash sales, net mark to market gains/(losses) on foreign currency contracts, and differences in the tax treatment of passive foreign investment company investments.
ACTIVE EQUITY MULTI-MANAGER FUNDS
|
Notes to Financial Statements (continued) October 31, 2024 |
|
|
7. TAX INFORMATION (continued) |
GSAM has reviewed the Funds’ tax positions for all open tax years (the current and prior three years, as applicable) and has concluded that no provision for income tax is required in the Funds’ financial statements. Such open tax years remain subject to examination and adjustment by tax authorities.
The Funds’ risks include, but are not limited to, the following:
Asset Allocation Risk — The Funds’ allocations to the various asset classes and to the Underlying Managers may cause the Funds to underperform other funds with a similar investment objective.
Derivatives Risk — The Funds’ use of derivatives and other similar instruments (collectively referred to in this paragraph as “derivatives”) may result in loss, including due to adverse market movements. Derivatives, which may pose risks in addition to and greater than those associated with investing directly in securities, currencies or other assets and instruments, may increase market exposure and be illiquid or less liquid, volatile, difficult to price and leveraged so that small changes in the value of the underlying assets or instruments may produce disproportionate losses to the Funds. Certain derivatives are also subject to counterparty risk, which is the risk that the other party in the transaction will not, or lacks the capacity or authority to, fulfill its contractual obligations, liquidity risk, which includes the risk that the Funds will not be able to exit the derivative when it is advantageous to do so, and risks arising from margin requirements, which include the risk that the Funds will be required to pay additional margin or set aside additional collateral to maintain open derivative positions. The use of derivatives is a highly specialized activity that involves investment techniques and risks different from those associated with investments in more traditional securities and instruments. Losses from derivatives can also result from a lack of correlation between changes in the value of derivative instruments and the portfolio assets (if any) being hedged.
Foreign and Emerging Countries Risk — Investing in foreign markets may involve special risks and considerations not typically associated with investing in the U.S. Foreign securities may be subject to risk of loss because of more or less foreign government regulation; less public information; less stringent investor protections; less stringent accounting, corporate governance, financial reporting and disclosure standards; and less economic, political and social stability in the countries in which a Fund invests. The imposition of sanctions, exchange controls (including repatriation restrictions), confiscation of assets and property, trade restrictions (including tariffs) and other government restrictions by the U.S. or other governments, or from problems in registration, settlement or custody, may also result in losses. The type and severity of sanctions and other similar measures, including counter sanctions and other retaliatory actions, that may be imposed could vary broadly in scope, and their impact is impossible to predict. For example, the imposition of sanctions and other similar measures could, among other things, cause a decline in the value and/or liquidity of securities issued by the sanctioned country or companies located in or economically tied to the sanctioned country and increase market volatility and disruption in the sanctioned country and throughout the world. Sanctions and other similar measures could limit or prevent a Fund from buying and selling securities (in the sanctioned country and other markets), significantly delay or prevent the settlement of securities transactions, and significantly impact a Fund’s liquidity and performance. Foreign risk also involves the risk of negative foreign currency exchange rate fluctuations, which may cause the value of securities denominated in such foreign currency (or other instruments through which a Fund has exposure to foreign currencies) to decline in value. Currency exchange rates may fluctuate significantly over short periods of time. To the extent that a Fund also invests in securities of issuers located in, or economically tied to, emerging markets, these risks may be more pronounced.
Geographic Risk — If a Fund focuses its investments in securities of issuers located in a particular country or geographic region, the Fund may be subjected, to a greater extent than if its investments were less focused, to the risks of volatile economic cycles and/or conditions and developments that may be particular to that country or region, such as: adverse securities markets; adverse exchange rates; adverse social, political, regulatory, economic, business, environmental or other developments; or natural disasters.
ACTIVE EQUITY MULTI-MANAGER FUNDS
|
|
8. OTHER RISKS (continued) |
Index/Tracking Error Risk — To the extent that an index-tracking strategy or implementation of a sub-strategy by a transition manager is used with respect to a portion of a Fund’s assets, including through investment in an ETF that seeks to track an index or implementation of an index-tracking strategy, the Fund will be negatively affected by general declines in the securities and asset classes represented in the relevant index. There is no guarantee that the Fund, or relevant portion of the Fund, will achieve a high degree of correlation to the relevant index. Market disruptions and regulatory restrictions could have an adverse effect on the Fund’s ability, or the ability of an ETF in which it invests, to adjust its exposure to the required levels in order for the relevant portion of the Fund to track the relevant index. In addition, because that portion of the Fund is not “actively” managed, unless a specific security is removed from the relevant index, the Fund or an ETF in which it invests generally would not sell a security because the security’s issuer was in financial trouble. At times when an index-tracking strategy is used with respect to a portion of the Fund’s assets, the Fund’s performance could be lower than funds that may actively shift all of their portfolio assets to take advantage of market opportunities or to lessen the impact of a market decline or a decline in the value of one or more issuers.
Investment Style Risk — Different investment styles (e.g., “growth”, “value” or “quantitative”) tend to shift in and out of favor depending upon market and economic conditions and investor sentiment. The Funds may outperform or underperform other funds that invest in similar asset classes but employ different investment styles.
Investments in Other Investment Companies Risk — As a shareholder of another investment company, including an exchange-traded fund (“ETF”), a Fund will indirectly bear its proportionate share of any net management fees and other expenses paid by such other investment companies, in addition to the fees and expenses regularly borne by the Fund. ETFs are subject to risks that do not apply to conventional mutual funds, including but not limited to the following: (i) the market price of the ETF’s shares may trade at a premium or a discount to their NAV; and (ii) an active trading market for an ETF’s shares may not develop or be maintained.
Large Shareholder Transactions Risk — A Fund may experience adverse effects when certain large shareholders, such as other funds, institutional investors (including those trading by use of non-discretionary mathematical formulas), financial intermediaries (who may make investment decisions on behalf of underlying clients and/or include a Fund in their investment model), individuals, accounts and Goldman Sachs affiliates, purchase or redeem large amounts of shares of a Fund. Such large shareholder redemptions, which may occur rapidly or unexpectedly, may cause a Fund to sell portfolio securities at times when it would not otherwise do so, which may negatively impact a Fund’s NAV and liquidity. These transactions may also accelerate the realization of taxable income to shareholders if such sales of investments resulted in gains, and may also increase transaction costs. In addition, a large redemption could result in a Fund’s current expenses being allocated over a smaller asset base, leading to an increase in a Fund’s expense ratio. Similarly, large Fund share purchases may adversely affect a Fund’s performance to the extent that the Fund is delayed in investing new cash or otherwise maintains a larger cash position than it ordinarily would.
Liquidity Risk — A Fund may make investments that are illiquid or that may become less liquid in response to market developments or adverse investor perceptions. Illiquid investments may be more difficult to value. Liquidity risk may also refer to the risk that a Fund will not be able to pay redemption proceeds within the allowable time period or without significant dilution to remaining investors’ interests because of unusual market conditions, declining prices of the securities sold, an unusually high volume of redemption requests, or other reasons. To meet redemption requests, a Fund may be forced to sell investments at an unfavorable time and/or under unfavorable conditions. If a Fund is forced to sell securities at an unfavorable time and/or under unfavorable conditions, such sales may adversely affect a Fund’s NAV and dilute remaining investors’ interests. Liquidity risk may be the result of, among other things, the reduced number and capacity of traditional market participants to make a market in fixed income securities or the lack of an active market. The potential for liquidity risk may be magnified by a rising interest rate environment or other circumstances where investor redemptions from fixed income funds may be higher than normal, potentially causing increased supply in the market due to selling activity. These risks may be more pronounced in connection with the Funds’ investments in securities of issuers located in emerging market countries. Redemptions by large shareholders may have a negative impact on a Fund’s liquidity.
ACTIVE EQUITY MULTI-MANAGER FUNDS
|
Notes to Financial Statements (continued) October 31, 2024 |
|
|
8. OTHER RISKS (continued) |
Market and Credit Risks — In the normal course of business, a Fund trades financial instruments and enters into financial transactions where risk of potential loss exists due to changes in the market (market risk). The value of the securities in which a Fund invests may go up or down in response to the prospects of individual companies, particular sectors or governments and/or general economic conditions throughout the world due to increasingly interconnected global economies and financial markets. Events such as war, military conflict, acts of terrorism, social unrest, natural disasters, recessions, inflation, rapid interest rate changes, supply chain disruptions, sanctions, the spread of infectious illness or other public health threats could also significantly impact a Fund and its investments. Additionally, a Fund may also be exposed to credit risk in the event that an issuer or guarantor fails to perform or that an institution or entity with which a Fund has unsettled or open transactions defaults.
Mid-Cap and Small-Cap Risk — Investments in mid-capitalization and small-capitalization companies involve greater risks than those associated with larger, more established companies. These securities may be subject to more abrupt or erratic price movements and may lack sufficient market liquidity, and these issuers often face greater business risks.
Multi-Manager Approach Risk — The Funds’ performance depends on the ability of the Investment Adviser in selecting, overseeing, and allocating Fund assets to the Underlying Managers. The Underlying Managers’ investment styles may not always be complementary. The Funds’ multi-manager approach may result in the Fund investing a significant percentage of its assets in certain types of investments, which could be beneficial or detrimental to the Funds’ performance depending on the performance of those investments and the overall market environment. The Funds’ Underlying Managers may underperform the market generally or underperform other investment managers that could have been selected for the Funds. Because the Funds’ Underlying Managers may trade with counterparties, prime brokers, clearing brokers or futures commission merchants on terms that are different than those on which the Investment Adviser would trade, and because each Underlying Manager applies its own risk analysis in evaluating potential counterparties for the Funds, the Funds may be subject to greater counterparty risk than if they were managed directly by the Investment Adviser.
Under the Trust’s organizational documents, its Trustees, officers, employees and agents are indemnified, to the extent permitted by the Act and state law, against certain liabilities that may arise out of performance of their duties to the Funds. Additionally, in the course of business, the Funds enter into contracts that contain a variety of indemnification clauses. The Funds’ maximum exposure under these arrangements is unknown, as this would involve future claims that may be made against the Funds that have not yet occurred. However, GSAM believes the risk of loss under these arrangements to be remote.
Subsequent events have been evaluated through the date of issuance, and GSAM has concluded that there is no impact requiring adjustment or disclosure in the financial statements.
ACTIVE EQUITY MULTI-MANAGER FUNDS
|
|
11. SUMMARY OF SHARE TRANSACTIONS |
Share activity is as follows:
| | | | | | | | | | | | | | | | |
| | | Multi-Manager International Equity Fund | |
| | |
| | | For the Fiscal Year Ended
October 31, 2024 | | | For the Fiscal Year Ended
October 31, 2023 | |
| | | | |
| | | | |
| | | Shares | | | Dollars | | | Shares | | | Dollars | |
| | | | |
| | | | |
| Class P Shares | | | | | | | | | | | | | | | | |
| | | | |
Shares sold | | | 17,335,647 | | | | $ 255,706,702 | | | | 10,853,620 | | | | $ 143,090,181 | |
| | | | |
Reinvestment of distributions | | | 1,650,188 | | | | 22,657,088 | | | | 1,364,878 | | | | 16,119,210 | |
| | | | |
Shares redeemed | | | (12,988,352 | ) | | | (190,703,467 | ) | | | (20,159,485 | ) | | | (256,849,962 | ) |
|
| |
| | | | |
| NET INCREASE (DECREASE) | | | 5,997,483 | | | | $ 87,660,323 | | | | (7,940,987 | ) | | | $ (97,640,571 | ) |
|
| |
| |
| | | Multi-Manager U.S. Small Cap Equity Fund | |
| | |
| | | For the Fiscal Year Ended
October 31, 2024 | | | For the Fiscal Year Ended
October 31, 2023 | |
| | | | |
| | | | |
| | | Shares | | | Dollars | | | Shares | | | Dollars | |
| | | | |
| | | | |
| Class P Shares | | | | | | | | | | | | | | | | |
| | | | |
Shares sold | | | 8,746,296 | | | | $ 121,492,031 | | | | 11,178,433 | | | | $139,489,002 | |
| | | | |
Reinvestment of distributions | | | 383,571 | | | | 5,116,836 | | | | 284,048 | | | | 3,365,968 | |
| | | | |
Shares redeemed | | | (33,568,277 | ) | | | (478,327,989 | ) | | | (4,731,818 | ) | | | (59,610,549 | ) |
|
| |
| | | | |
| NET INCREASE (DECREASE) | | | (24,438,410) | | | | $(351,719,122 | ) | | | 6,730,663 | | | | $ 83,244,421 | |
|
| |
Report of Independent Registered Public
Accounting Firm
To the Board of Trustees of Goldman Sachs Trust II and Shareholders of Multi-Manager International Equity Fund and Multi-Manager U.S. Small Cap Equity Fund
Opinions on the Financial Statements
We have audited the accompanying statements of assets and liabilities, including the schedules of investments, of Multi-Manager International Equity Fund and Multi-Manager U.S. Small Cap Equity Fund (two of the funds constituting Goldman Sachs Trust II, hereafter collectively referred to as the “Funds”) as of October 31, 2024, the related statements of operations for the year ended October 31, 2024, the statements of changes in net assets for each of the two years in the period ended October 31, 2024, including the related notes, and the financial highlights for each of the five years in the period ended October 31, 2024 (collectively referred to as the “financial statements”). In our opinion, the financial statements present fairly, in all material respects, the financial position of each of the Funds as of October 31, 2024, the results of each of their operations for the year then ended, the changes in each of their net assets for each of the two years in the period ended October 31, 2024 and each of the financial highlights for each of the five years in the period ended October 31, 2024 in conformity with accounting principles generally accepted in the United States of America.
Basis for Opinions
These financial statements are the responsibility of the Funds’ management. Our responsibility is to express an opinion on the Funds’ financial statements based on our audits. We are a public accounting firm registered with the Public Company Accounting Oversight Board (United States) (PCAOB) and are required to be independent with respect to the Funds in accordance with the U.S. federal securities laws and the applicable rules and regulations of the Securities and Exchange Commission and the PCAOB.
We conducted our audits of these financial statements in accordance with the standards of the PCAOB. Those standards require that we plan and perform the audit to obtain reasonable assurance about whether the financial statements are free of material misstatement, whether due to error or fraud.
Our audits included performing procedures to assess the risks of material misstatement of the financial statements, whether due to error or fraud, and performing procedures that respond to those risks. Such procedures included examining, on a test basis, evidence regarding the amounts and disclosures in the financial statements. Our audits also included evaluating the accounting principles used and significant estimates made by management, as well as evaluating the overall presentation of the financial statements. Our procedures included confirmation of securities owned as of October 31, 2024 by correspondence with the custodian, transfer agent and brokers; when replies were not received from brokers, we performed other auditing procedures. We believe that our audits provide a reasonable basis for our opinions.
/s/ PricewaterhouseCoopers LLP
Boston, Massachusetts
December 20, 2024
We have served as the auditor of one or more investment companies in the Goldman Sachs fund complex since 2000.
ACTIVE EQUITY MULTI-MANAGER FUNDS
Statement Regarding Basis for Approval of Management Agreement and Sub-Advisory Agreements (Unaudited)
Background
The Multi-Manager International Equity Fund and Multi-Manager U.S. Small Cap Equity Fund (the “Funds”) are investment portfolios of Goldman Sachs Trust II (the “Trust”). The Board of Trustees (the “Board”) oversees the management of the Trust and reviews the investment performance and expenses of the Funds at regularly scheduled meetings held throughout the year. Each Fund employs a “manager of managers” structure, whereby Goldman Sachs Asset Management, L.P. (the “Investment Adviser”) is responsible for selecting sub-advisers (the “Sub-Advisers”) (subject to Board approval), allocating the Fund’s assets among them, and overseeing their day-to-day management of Fund assets. The Board determines annually whether to approve the continuance of the Trust’s investment management agreement (the “Management Agreement”) with the Investment Adviser on behalf of the Funds.
The Management Agreement was most recently approved for continuation until June 30, 2025 by the Board, including those Trustees who are not parties to the Management Agreement or “interested persons” (as defined in the Investment Company Act of 1940, as amended) of any party thereto (the “Independent Trustees”), at a meeting held on June 11-12, 2024 (the “Annual Meeting”). At the Annual Meeting, the Board also considered the sub-advisory agreements (each a “Designated Sub-Advisory Agreement” and, together with the Management Agreement, the “Agreements”) between the Investment Adviser and (i) each of Causeway Capital Management LLC, Massachusetts Financial Services Company (d/b/a MFS Investment Management), and WCM Investment Management (on behalf of Multi-Manager International Equity Fund); and (ii) each of Boston Partners Global Investors, Inc., Brown Advisory LLC, Victory Capital Management, Inc., and Westfield Capital Management Company, L.P. (on behalf of Multi-Manager U.S. Small Cap Equity Fund) (each, a “Designated Sub-Adviser” and collectively, the “Designated Sub-Advisers”).
The review process undertaken by the Trustees spans the course of the year and culminates with the Annual Meeting. To assist the Trustees in their deliberations, the Trustees have established a Contract Review Committee (the “Committee”), comprised of the Independent Trustees. The Committee held five meetings over the course of the year since the Management Agreement was last approved. At those Committee meetings, regularly scheduled Board or other committee meetings, and/or the Annual Meeting, matters relevant to the renewal of the Management Agreement and the Designated Sub-Advisory Agreements were considered by the Board, or the Independent Trustees, as applicable. With respect to each Fund, such matters included:
| | (a) | the nature and quality of the advisory, administrative, and other services provided to the Fund by the Investment Adviser and its affiliates, and the Designated Sub-Advisers, including, as applicable, information about: |
| | (i) | the structure, staff, and capabilities of the Investment Adviser and the Designated Sub-Advisers and the Designated Sub-Advisers’ portfolio management teams; |
| | (ii) | the groups within the Investment Adviser and its affiliates that support the portfolio management teams or provide other types of necessary services, including fund services groups (e.g., accounting and financial reporting, tax, shareholder services, and operations); controls and risk management groups (e.g., legal, compliance, valuation oversight, credit risk management, internal audit, compliance testing, market risk analysis, finance, and central funding); sales and distribution support groups, and others (e.g., information technology and training); |
| | (iii) | trends in employee headcount; |
| | (iv) | the Investment Adviser’s financial resources and ability to hire and retain talented personnel and strengthen its operations; and |
| | (v) | the parent company’s support of the Investment Adviser and its mutual fund business, as expressed by the firm’s senior management; |
| | (b) | information on the investment performance of the Fund, including comparisons to the performance of similar mutual funds, as provided by a third-party mutual fund data provider engaged as part of the contract review process (the “Outside Data Provider”), benchmark performance indices, and information on general investment outlooks in the markets in which the Fund invests; |
| | (c) | information provided by the Investment Adviser indicating the Investment Adviser’s views on whether the Fund’s peer group and/or benchmark index had high, medium, or low relevance given the Fund’s particular investment strategy; |
| | (d) | the terms of the Agreements and other agreements with affiliated service providers entered into by the Trust on behalf of the Fund; |
| | (e) | fee and expense information for the Fund, including: |
| | (i) | the relative management fee and expense levels of the Fund as compared to those of comparable funds managed by other advisers, as provided by the Outside Data Provider; |
| | (ii) | the Fund’s expense trends over time; and |
ACTIVE EQUITY MULTI-MANAGER FUNDS
Statement Regarding Basis for Approval of Management Agreement and Sub-Advisory Agreements (Unaudited) (continued)
| | (iii) | to the extent the Investment Adviser manages other types of accounts (such as bank collective trusts, private wealth management accounts, institutional separate accounts, sub-advised mutual funds, and non-U.S. funds) having investment objectives and policies similar to those of the Fund, comparative information on the advisory fees charged and services provided to those accounts by the Investment Adviser; |
| | (f) | with respect to the extensive investment performance and expense comparison data provided by the Outside Data Provider, its processes in producing that data for the Fund; |
| | (g) | the undertakings of the Investment Adviser and its affiliates to implement fee waivers and expense limitations; |
| | (h) | information relating to the profitability of the Management Agreement and the transfer agency arrangements of the Fund to the Investment Adviser and its affiliates; |
| | (i) | whether the Fund’s existing management fee schedule adequately addressed any economies of scale; |
| | (j) | a summary of the “fall-out” benefits derived by the Investment Adviser and its affiliates from their relationships with the Fund, including the fees received by the Investment Adviser’s affiliates from the Fund for transfer agency, portfolio trading, distribution and other services; |
| | (k) | a summary of potential benefits derived by the Fund as a result of its relationship with the Investment Adviser; |
| | (l) | with respect to the Investment Adviser, portfolio manager ownership of Fund shares; the manner in which portfolio manager compensation is determined; information on the Designated Sub-Advisers’ compensation arrangements; and the number and types of accounts managed by the portfolio managers; |
| | (m) | the nature and quality of the services provided to the Fund by its unaffiliated service providers (as well as the Designated Sub-Advisers), and the Investment Adviser’s general oversight and evaluation (including reports on due diligence) of those service providers as part of the administrative services provided under the Management Agreement; and |
| | (n) | the Investment Adviser’s and Designated Sub-Advisers’ processes and policies addressing various types of potential conflicts of interest; their approaches to risk management; the annual review of the effectiveness of the Fund’s compliance program; and periodic compliance reports. |
The Trustees also received an overview of the Funds’ distribution arrangements. They received information regarding the Funds’ assets and share purchase and redemption activity. Information was also provided to the Trustees relating to revenue sharing payments made by and services provided by the Investment Adviser and its affiliates to intermediaries that promote the sale, distribution, and/or servicing of Fund shares.
The presentations made at the Board and Committee meetings and at the Annual Meeting encompassed the Funds and other mutual funds for which the Board has responsibility. In evaluating the Agreements at the Annual Meeting, the Trustees relied upon their knowledge, resulting from their meetings and other interactions throughout the year, of the Investment Adviser and its affiliates and Designated Sub-Advisers, their respective services, and the Funds. In conjunction with these meetings, the Trustees received written materials and oral presentations on the topics covered, and the Investment Adviser addressed the questions and concerns of the Trustees, including concerns regarding the investment performance of certain of the funds they oversee. In addition, the Trustees periodically received written materials and oral presentations from the Funds’ various sub-advisers, including the Designated Sub-Advisers. The Independent Trustees were advised by their independent legal counsel regarding their responsibilities and other regulatory requirements related to the approval and continuation of mutual fund investment management agreements under applicable law. In addition, the Investment Adviser and its affiliates provided the Independent Trustees with a written response to a formal request for information sent on behalf of the Independent Trustees by their independent legal counsel. The Trustees reviewed a written response prepared by each Designated Sub-Adviser to a similar request for information submitted to the Designated Sub-Adviser by the Investment Adviser. During the course of their deliberations, the Independent Trustees met in executive sessions with their independent legal counsel, without representatives of the Investment Adviser or its affiliates present.
Nature, Extent, and Quality of the Services Provided Under the Management Agreement
As part of their review, the Trustees considered the nature, extent, and quality of the services provided to the Funds by the Investment Adviser. In this regard, the Trustees considered both the investment advisory services and non-advisory services that are provided by the Investment Adviser and its affiliates. The Trustees noted the Investment Adviser’s commitment to maintaining high quality systems and expending substantial resources to respond to ongoing changes to the market, regulatory and control environment in which the Funds and their service providers operate, including developments associated with geopolitical events and economic sanctions, as well as the efforts of the Investment Adviser and its affiliates to combat cyber security risks. They also noted the transition in the leadership and changes in personnel of various of the Investment Adviser’s portfolio management teams that had occurred in recent periods, and the ongoing recruitment efforts aimed at bringing high quality investment talent to the Investment Adviser. The Trustees also considered information regarding the Investment Adviser’s and the Funds’ various
ACTIVE EQUITY MULTI-MANAGER FUNDS
Statement Regarding Basis for Approval of Management Agreement and Sub-Advisory Agreements (Unaudited) (continued)
sub-advisers’ efforts relating to business continuity planning. The Trustees concluded that the Investment Adviser continued to commit substantial financial and operational resources to the Funds and expressed confidence that the Investment Adviser would continue to do so in the future. The Trustees also recognized that the Investment Adviser had made significant commitments to address regulatory compliance requirements applicable to the Funds and the Investment Adviser and its affiliates. In addition, the Trustees reviewed the sub-adviser oversight process that the Investment Adviser had employed, which included areas such as investment analytics, risk management, and compliance.
Investment Performance
The Trustees also considered the investment performance of the Funds. In this regard, they compared the investment performance of each Fund to its peers using rankings compiled by the Outside Data Provider as of December 31, 2023, and information prepared by the Investment Adviser comparing each Fund’s investment performance to its benchmark index as of March 31, 2024. The information on each Fund’s investment performance provided for the one-, three-, and five-year periods ending on the applicable dates. As part of this review, they considered the investment performance trends of the Funds over time, and reviewed the investment performance of each Fund in light of its investment objective and policies and market conditions. The Trustees considered the Investment Adviser’s representations that each Fund had significant differences from its Outside Data Provider peer group that caused it to be an imperfect basis for comparison.
In addition, the Trustees considered materials prepared and presentations made by the Investment Adviser’s senior management and the Sub-Advisers’ portfolio management personnel in which Fund performance was assessed. The Trustees also considered the Investment Adviser’s periodic reports with respect to the Funds’ risk profiles, and how the Investment Adviser’s approach to risk monitoring and management influences portfolio management.
The Trustees noted that the Multi-Manager International Equity Fund had placed in the top half of its performance peer group for the one-, three-, and five-year periods ended December 31, 2023, and had outperformed its benchmark index for the three- and five-year periods and had underperformed for the one-year period ended March 31, 2024. They noted that the Multi-Manager U.S. Small Cap Equity Fund had placed in the third quartile of its performance peer group for the one-year period and in the fourth quartile for the three- and five-year periods ended December 31, 2023, and had outperformed its benchmark index for the three-year period and underperformed for the one- and five-year periods ended March 31, 2024.
Costs of Services Provided and Competitive Information
The Trustees considered the contractual terms of the Management Agreement and the fee rates payable by each Fund thereunder. In this regard, the Trustees considered information on the services rendered by the Investment Adviser to the Funds, which included both advisory and administrative services that were directed to the needs and operations of the Funds as registered mutual funds.
In particular, the Trustees reviewed analyses prepared by the Outside Data Provider regarding the expense rankings of the Funds, as well as additional information provided by the Investment Adviser throughout the year. The analyses provided a comparison of each Fund’s management fee to those of a relevant peer group and category universe; an expense analysis which compared each Fund’s overall net and gross expenses to a peer group and a category universe; and data comparing each Fund’s net expenses to the peer and category medians. The analyses also compared each Fund’s other expenses and fee waivers/ reimbursements to those of the peer group and category medians. The Trustees also considered comparative fee information for services provided by the Investment Adviser to collective investment vehicles having investment objectives and policies similar to those of the Funds. The Trustees considered that services provided to the Funds differed in various significant respects from the services provided to these collective investment vehicles, which generally operated under less stringent regulatory and financial reporting requirements and required fewer services from the Investment Adviser. The Trustees concluded that the comparisons provided by the Outside Data Provider and the Investment Adviser were useful in evaluating the reasonableness of the management fees and total expenses paid by the Funds.
In addition. the Trustees considered the Investment Adviser’s undertakings to implement fee waivers and expense limitations. In this regard the Trustees noted that shareholders that are invested in the Funds consist of institutional clients that have entered into a separate management agreement with the Investment Adviser and pay a single management fee for the Investment Adviser’s management of their accounts, and that the Investment Adviser waives a portion of the management fee with respect to each Fund in order to achieve an effective net management fee rate that is equal to the actual cost of fees paid to the Fund’s sub-advisers. In addition, the Trustees noted that shareholders are able to redeem their shares at any time if shareholders believe that the Fund fees and expenses are too high or if they are dissatisfied with the performance of the Fund.
ACTIVE EQUITY MULTI-MANAGER FUNDS
Statement Regarding Basis for Approval of Management Agreement and Sub-Advisory Agreements (Unaudited) (continued)
Profitability
The Trustees reviewed each Fund’s contribution to the Investment Adviser’s revenues and pre-tax profit margins. In this regard the Trustees noted that they had received, among other things, profitability analyses and summaries, revenue and expense schedules by Fund and by function (i.e., investment management, transfer agency and distribution and service), and information on the Investment Adviser’s expense allocation methodology. They observed that the profitability and expense figures are substantially similar to those used by the Investment Adviser for many internal purposes, including compensation decisions among various business groups, and are thus subject to a vigorous internal debate about how certain revenue and expenses should be allocated. The Trustees also noted that the internal audit group within the Goldman Sachs organization periodically audits the expense allocation methodology and that the internal audit group was satisfied with the reasonableness, consistency, and accuracy of the Investment Adviser’s expense allocation methodology. Profitability data for each Fund was provided for 2023 and 2022, and the Trustees considered this information in relation to the Investment Adviser’s overall profitability.
Economies of Scale
The Trustees considered the information that had been provided regarding whether there have been economies of scale with respect to the management of the Funds. The Trustees also considered that the Funds are offered to the Investment Adviser’s institutional clients as part of an investment program whereby the Funds and other funds act as core “building blocks” for the client’s portfolio. The Trustees considered the Investment Adviser’s representations that its clients benefit from this investment model with increased liquidity, increased investment oversight, access to new investment strategies, economies of scale, and reduced complexity in managing client portfolios. The Trustees noted that, pursuant to the model, clients pay a management fee for the Investment Adviser’s management of their accounts, and that the fund-level management fees in excess of the weighted average sub-advisory fees are waived in order to avoid charging two layers of management fees.
The Trustees considered that there are no breakpoints in the fee rate payable under the Management Agreement for each of the Funds. The Trustees considered the amounts of assets in the Funds; the Funds’ recent purchase and redemption activity; the information provided by the Investment Adviser relating to the costs of the services provided by the Investment Adviser and its affiliates and the profits realized by them (if any); information comparing the fee rates charged by the Investment Adviser with fee rates charged to other funds in the peer groups; and the Investment Adviser’s undertakings to waive a portion of its management fee and to limit certain expenses of the Funds that exceed specified levels. The Trustees also considered the relationship between the advisory and sub-advisory fee rate schedules.
Other Benefits to the Investment Adviser and Its Affiliates
The Trustees also considered the other benefits derived by the Investment Adviser and its affiliates from their relationships with the Funds, as stated above, including: (a) transfer agency fees received by Goldman Sachs & Co. LLC (“Goldman Sachs”); (b) brokerage and futures commissions earned by Goldman Sachs for executing securities transactions (in its capacity as clearing broker) and futures transactions on behalf of the Funds; (c) the Investment Adviser’s ability to leverage the infrastructure designed to service the Funds on behalf of its other clients; (d) the Investment Adviser’s ability to cross-market other products and services to Fund shareholders; (e) Goldman Sachs’ retention of fees earned by the Investment Adviser and certain affiliates directly from certain clients who invest in the Funds in connection with a broader advisory arrangement; (f) the Investment Adviser’s ability to negotiate better pricing with the Funds’ custodian on behalf of its other clients, as a result of the relationship with the Funds; (g) the investment of cash in money market funds managed by the Investment Adviser that will result in increased assets under management for those money market funds; and (h) the possibility that the working relationship between the Investment Adviser and the Funds’ third-party service providers (including the Funds’ sub-advisers) may cause those service providers to be more likely to do business with other areas of Goldman Sachs. In the course of considering the foregoing, the Independent Trustees requested and received further information quantifying certain of these fall-out benefits.
Other Benefits to the Funds and Their Shareholders
The Trustees also noted that the Funds receive certain other potential benefits as a result of their relationship with the Investment Adviser, including: (a) enhanced servicing from vendors due to the volume of business generated by the Investment Adviser and its affiliates; (b) the advantages received from the Investment Adviser’s knowledge and experience gained from managing other accounts and products; (c) the Investment Adviser’s ability to hire and retain qualified personnel to provide services to the Funds because of the reputation of the Goldman Sachs organization; (d) the Funds’ access, through the Investment Adviser, to certain firm-wide resources (e.g., proprietary risk management systems and databases), subject to certain restrictions; (e) the Funds’ ability to aggregate assets managed by certain sub-advisers with those of other clients of the Investment Adviser for
ACTIVE EQUITY MULTI-MANAGER FUNDS
Statement Regarding Basis for Approval of Management Agreement and Sub-Advisory Agreements (Unaudited) (continued)
purposes of applying breakpoints in a sub-advisory agreement; and (f) the Funds’ access to certain affiliated distribution channels. In addition, the Trustees noted the competitive nature of the mutual fund marketplace, and considered that many of the Funds’ shareholders invested in the Funds in part because of the Funds’ relationship with the Investment Adviser and that those shareholders have a general expectation that the relationship will continue.
Conclusion
In connection with their consideration of the Management Agreement, the Trustees gave weight to each of the factors described above, but did not identify any particular factor as controlling their decision. After deliberation and consideration of all of the information provided, including the factors described above, the Trustees concluded, in the exercise of their business judgment, that the management fees paid by each of the Funds were reasonable in light of the services provided to it by the Investment Adviser, the Investment Adviser’s costs and each Fund’s current and reasonably foreseeable asset levels. The Trustees unanimously concluded that the Investment Adviser’s continued management likely would benefit each Fund and its shareholders and that the Management Agreement should be approved and continued with respect to each Fund until June 30, 2025.
Designated Sub-Advisory Agreements
Nature, Extent, and Quality of the Services Provided Under the Designated Sub-Advisory Agreements and Performance
In evaluating the Designated Sub-Advisory Agreements, the Trustees relied upon materials furnished and presentations made by the Investment Adviser and the Designated Sub-Advisers. In evaluating the nature, extent, and quality of services provided by each Designated Sub-Adviser, the Trustees considered information on the services provided to the Funds by their respective Designated Sub-Advisers, including information about each Designated Sub-Adviser’s (a) personnel and compensation structure; (b) track record in managing the Fund and, if applicable, other funds and/or accounts with investment strategies similar to those employed on behalf of the Funds; (c) policies and procedures in place to address potential conflicts of interest; and (d) compliance program and code of ethics. In this regard, they also considered assessments provided by the Investment Adviser of each Designated Sub-Adviser, the Designated Sub-Adviser’s investment strategies and personnel, and its compliance program. The Trustees also considered information regarding each Designated Sub-Adviser’s efforts related to business continuity planning. The Trustees also reviewed the operations and investment performance of each Designated Sub-Adviser’s respective sleeve of the applicable Fund since its inception, including a comparison of each Designated Sub-Adviser to relevant benchmark indices based on various metrics.
Costs of Services Provided
The Trustees reviewed the terms of each Designated Sub-Advisory Agreement, including the schedule of fees payable to the Designated Sub-Advisers. They considered any breakpoints in the sub-advisory fee rate payable under each Designated Sub-Advisory Agreement. The Trustees noted that the compensation paid to each Designated Sub-Adviser is paid by the Investment Adviser, not by the Funds. The Trustees considered that certain Designated Sub-Advisers had agreed to reduce their sub-advisory fee rate, which benefited shareholders of the applicable Funds in light of the existing management fee waiver arrangement. The Trustees reviewed the blended average of all sub-advisory fees paid by the Investment Adviser with respect to each Fund in light of the overall management fee paid by each Fund. They also considered the Investment Adviser’s undertaking to waive a portion of its management fee which is in excess of the weighted average of each Fund’s sub-advisory fees.
Conclusion
In connection with their consideration of the Designated Sub-Advisory Agreements, the Trustees gave weight to various factors, but did not identify any particular factor as controlling their decision. After deliberation and consideration of the information provided, including the factors described above, the Trustees, including the Independent Trustees, unanimously concluded, in the exercise of their business judgment, that the sub-advisory fees paid by the Investment Adviser to each Designated Sub-Adviser were reasonable in light of the factors considered, and that each Designated Sub-Advisory Agreement should be approved and continued until June 30, 2025.
|
| |
| Goldman Sachs Trust II – Active Equity Multi-Manager Funds – Tax Information (Unaudited) |
| |
For the year ended October 31, 2024, 0.28% and 77.35% of the dividends paid from net investment company taxable income by the Multi-Manager International Equity and Multi-Manager U.S. Small Cap Equity Funds qualify for the dividends received deduction available to corporations. |
| |
For the year ended October 31, 2024, 100% and 100% of the dividends paid from net investment company taxable income by the Multi-Manager International Equity and Multi-Manager U.S. Small Cap Equity Funds qualify for the reduced tax rate under the Jobs and Growth Tax Relief and Reconciliation Act of 2003. |
| |
From distributions paid during the year ended October 31, 2024, the total amount of income received by the Multi-Manager International Equity Fund from sources within foreign countries and possessions of the United States was $0.2324 per share, all of which is attributable to qualified passive income. The percentage of net investment income dividends paid from foreign sources by the Multi-Manager International Equity Fund was 93.23%. The total amount of taxes paid by the Multi-Manager International Equity Fund to such countries was $0.0248 per share. |
TRUSTEES Gregory G. Weaver, Chair Cheryl K. Beebe Dwight L. Bush Kathryn A. Cassidy John G. Chou Joaquin Delgado Eileen H. Dowling Lawrence Hughes John F. Killian Steven D. Krichmar Michael Latham James A. McNamara Lawrence W. Stranghoener Paul C. Wirth OFFICERS James A. McNamara, President Joseph F. DiMaria, Principal Financial Officer, Principal Accounting Officer and Treasurer Robert Griffith, Secretary GOLDMAN SACHS & CO. LLC Distributor and Transfer Agent GOLDMAN SACHS ASSET MANAGEMENT, L.P. Investment Adviser 200 West Street, New York, New York 10282 (C) 2024 Goldman Sachs. All rights reserved. MMGRFDSAR-24
Goldman Sachs Funds Annual Financial Statements October 31, 2024 Goldman Sachs Multi-Strategy Alternatives Fund Goldman Sachs Asset Management
Goldman Sachs Multi-Strategy Alternatives Fund
GOLDMAN SACHS MULTI-STRATEGY ALTERNATIVES FUND
|
Consolidated Schedule of Investments October 31, 2024 |
| | | | | | | | |
| | | Shares | | Description | | Value | |
| |
| | Common Stocks(a) – 0.0% | |
| |
| | Oil, Gas & Consumable Fuels – 0.0% | |
| | 39,366 | | Gazprom PJSC | | $ | — | |
| | 3,021 | | LUKOIL PJSC | | | — | |
| | 27,893 | | Rosneft Oil Co. PJSC | | | — | |
| | | | | | | | |
| | | | | — | |
| | | |
| | |
| | TOTAL COMMON STOCKS (Cost $621,979) | | $ | — | |
| | | |
| | | |
| | | Shares | | Dividend Rate | | Value | |
| |
| | Investment Company(b) – 92.0% | |
| |
| | Goldman Sachs Financial Square Government Fund —
Institutional Shares | |
| | 59,498,130 | | 4.766% | | $ | 59,498,130 | |
| | (Cost $59,498,130) | |
| | | |
| | |
| | TOTAL INVESTMENTS – 92.0% (Cost $60,120,109) | | $ | 59,498,130 | |
| | | |
| | |
| | OTHER ASSETS IN EXCESS OF LIABILITIES – 8.0% | | | 5,172,411 | |
| | | |
| | |
| | NET ASSETS – 100.0% | | $ | 64,670,541 | |
| | | |
The percentage shown for each investment category reflects the value of investments in that category as a percentage of net assets.
| (a) | Significant unobservable inputs were used in the valuation of this portfolio security; i.e., Level 3. |
| (b) | Represents an affiliated issuer. |
|
|
ADDITIONAL INVESTMENT INFORMATION |
FORWARD FOREIGN CURRENCY EXCHANGE CONTRACTS — At October 31, 2024, the Fund had the following forward foreign currency exchange contracts:
FORWARD FOREIGN CURRENCY EXCHANGE CONTRACTS WITH UNREALIZED GAIN
| | | | | | | | | | | | | | | | | | | | | | | | | | | | | | | | |
| Counterparty | | Currency Purchased | | | Currency Sold | | | Settlement Date | | | | | | Unrealized Gain | |
|
| |
| | | | | | | | | |
MS & Co. Int. PLC | | AUD | | | 11,920,000 | | | | | | | USD | | | 7,833,921 | | | | | | | | 12/18/24 | | | | | | | | $ 14,367 | |
| | CHF | | | 17,990,000 | | | | | | | USD | | | 20,843,324 | | | | | | | | 12/18/24 | | | | | | | | 105,998 | |
| | EUR | | | 510,000 | | | | | | | USD | | | 552,360 | | | | | | | | 12/18/24 | | | | | | | | 3,578 | |
| | JPY | | | 420,670,000 | | | | | | | USD | | | 2,762,831 | | | | | | | | 12/18/24 | | | | | | | | 24,209 | |
| | SEK | | | 118,380,000 | | | | | | | USD | | | 11,138,529 | | | | | | | | 12/18/24 | | | | | | | | 2,103 | |
| | USD | | | 42,144,764 | | | | | | | AUD | | | 62,070,000 | | | | | | | | 12/18/24 | | | | | | | | 1,277,049 | |
| | USD | | | 18,640,265 | | | | | | | CAD | | | 25,090,000 | | | | | | | | 12/18/24 | | | | | | | | 590,064 | |
| | USD | | | 28,781,150 | | | | | | | CHF | | | 24,160,000 | | | | | | | | 12/18/24 | | | | | | | | 646,874 | |
| | USD | | | 4,151,856 | | | | | | | EUR | | | 3,770,000 | | | | | | | | 12/18/24 | | | | | | | | 42,271 | |
| | USD | | | 36,926,014 | | | | | | | GBP | | | 27,690,000 | | | | | | | | 12/18/24 | | | | | | | | 1,224,709 | |
| | USD | | | 549,601 | | | | | | | JPY | | | 80,040,000 | | | | | | | | 12/18/24 | | | | | | | | 19,317 | |
| | USD | | | 22,530,582 | | | | | | | NOK | | | 244,280,000 | | | | | | | | 12/18/24 | | | | | | | | 318,372 | |
| | USD | | | 21,142,751 | | | | | | | NZD | | | 34,030,000 | | | | | | | | 12/18/24 | | | | | | | | 793,199 | |
| | USD | | | 3,696,456 | | | | | | | SEK | | | 38,070,000 | | | | | | | | 12/18/24 | | | | | | | | 113,724 | |
|
| |
| | | | | | | | | |
TOTAL | | | | | | | | | | | | | | | | | | | | | | | | | | | | | | | $5,175,834 | |
|
| |
| | |
| The accompanying notes are an integral part of these financial statements. | | 1 |
GOLDMAN SACHS MULTI-STRATEGY A LTERNATIVES FUND
|
Consolidated Schedule of Investments (continued) October 31, 2024 |
|
|
ADDITIONAL INVESTMENT INFORMATION (continued) |
FORWARD FOREIGN CURRENCY EXCHANGE CONTRACTS WITH UNREALIZED LOSS
| | | | | | | | | | | | | | | | | | | | | | | | | | | | |
| Counterparty | | Currency Purchased | | | Currency Sold | | | Settlement Date | | | | Unrealized Loss | |
|
| |
| | | | | | | | | |
MS & Co. Int. PLC | | AUD | | | 30,050,000 | | | | | | | USD | | | 20,203,305 | | | | | | | 12/18/24 | | | | $ | (417,984 | ) |
| | CAD | | | 25,090,000 | | | | | | | USD | | | 18,620,013 | | | | | | | 12/18/24 | | | | | (569,812 | ) |
| | EUR | | | 21,100,000 | | | | | | | USD | | | 23,471,697 | | | | | | | 12/18/24 | | | | | (471,102 | ) |
| | GBP | | | 19,520,000 | | | | | | | USD | | | 25,696,863 | | | | | | | 12/18/24 | | | | | (529,315 | ) |
| | JPY | | | 3,539,360,000 | | | | | | | USD | | | 24,823,136 | | | | | | | 12/18/24 | | | | | (1,374,023 | ) |
| | NOK | | | 144,550,000 | | | | | | | USD | | | 13,667,553 | | | | | | | 12/18/24 | | | | | (523,723 | ) |
| | NZD | | | 29,460,000 | | | | | | | USD | | | 18,509,883 | | | | | | | 12/18/24 | | | | | (893,138 | ) |
| | SEK | | | 320,810,000 | | | | | | | USD | | | 31,370,385 | | | | | | | 12/18/24 | | | | | (1,179,254 | ) |
| | USD | | | 1,835,003 | | | | | | | CHF | | | 1,580,000 | | | | | | | 12/18/24 | | | | | (4,904 | ) |
| | USD | | | 327,777 | | | | | | | JPY | | | 49,500,000 | | | | | | | 12/18/24 | | | | | (172 | ) |
| | USD | | | 9,617,527 | | | | | | | NZD | | | 16,110,000 | | | | | | | 12/18/24 | | | | | (16,070 | ) |
|
| |
| | | | | | | | | |
TOTAL | | | | | | | | | | | | | | | | | | | | | | | | | | $ | (5,979,497 | ) |
|
| |
FUTURES CONTRACTS — At October 31, 2024, the Fund had the following futures contracts:
| | | | | | | | | | | | | | | | | | | | | | |
| Description | | Number of
Contracts | | Expiration
Date | | | | Notional
Amount | | | | | | Unrealized Appreciation/ (Depreciation) | |
|
| |
| | | | | | | |
Long position contracts: | | | | | | | | | | | | | | | | | | | | | | |
Brent Crude | | | 2 | | | | | 11/29/24 | | | | $ | 145,620 | | | | | | | $ | (2,220 | ) |
Coffee | | | 18 | | | | | 12/18/25 | | | | | 1,583,888 | | | | | | | | 43,581 | |
Copper | | | 23 | | | | | 03/27/25 | | | | | 2,522,813 | | | | | | | | (37,680 | ) |
Corn | | | 98 | | | | | 03/14/25 | | | | | 2,087,400 | | | | | | | | 47,825 | |
Cotton No.2 | | | 18 | | | | | 12/06/24 | | | | | 626,130 | | | | | | | | (12,999 | ) |
Cotton No.2 | | | 16 | | | | | 03/07/25 | | | | | 574,640 | | | | | | | | (12,035 | ) |
Gasoline RBOB | | | 1 | | | | | 11/29/24 | | | | | 82,900 | | | | | | | | (6,576 | ) |
Gasoline RBOB | | | 10 | | | | | 09/30/25 | | | | | 809,256 | | | | | | | | (39,362 | ) |
Gold 100 Oz | | | 2 | | | | | 12/27/24 | | | | | 549,860 | | | | | | | | (6,395 | ) |
Japan 10 Year Government Bond | | | 22 | | | | | 12/13/24 | | | | | 20,877,847 | | | | | | | | (44,557 | ) |
KC HRW Wheat | | | 24 | | | | | 07/14/25 | | | | | 723,000 | | | | | | | | 17,855 | |
Korea 10 Year Government Bonds | | | 304 | | | | | 12/17/24 | | | | | 25,604,290 | | | | | | | | (198,428 | ) |
Lead | | | 53 | | | | | 11/18/24 | | | | | 2,636,936 | | | | | | | | (82,911 | ) |
Lead | | | 9 | | | | | 03/17/25 | | | | | 459,196 | | | | | | | | (41,737 | ) |
Lead | | | 17 | | | | | 02/17/25 | | | | | 862,801 | | | | | | | | (67,102 | ) |
Lead | | | 8 | | | | | 04/14/25 | | | | | 410,474 | | | | | | | | (30,511 | ) |
Lead | | | 7 | | | | | 05/19/25 | | | | | 361,265 | | | | | | | | (34,906 | ) |
Lead | | | 11 | | | | | 12/16/24 | | | | | 550,954 | | | | | | | | (19,384 | ) |
Lead | | | 7 | | | | | 08/18/25 | | | | | 366,384 | | | | | | | | (507 | ) |
Lead | | | 7 | | | | | 09/15/25 | | | | | 367,784 | | | | | | | | (10,553 | ) |
Lean Hogs | | | 26 | | | | | 02/14/25 | | | | | 886,080 | | | | | | | | 99,087 | |
Live Cattle | | | 21 | | | | | 02/28/25 | | | | | 1,568,910 | | | | | | | | 50,792 | |
Low Sulphur Gas Oil | | | 15 | | | | | 12/12/24 | | | | | 1,002,375 | | | | | | | | (136,075 | ) |
Natural Gas | | | 19 | | | | | 11/26/24 | | | | | 514,330 | | | | | | | | (84,830 | ) |
Natural Gas | | | 31 | | | | | 03/27/25 | | | | | 815,920 | | | | | | | | (74,020 | ) |
Nickel | | | 56 | | | | | 11/18/24 | | | | | 5,210,567 | | | | | | | | (395,839 | ) |
Nickel | | | 30 | | | | | 02/17/25 | | | | | 2,837,776 | | | | | | | | (621,947 | ) |
Nickel | | | 5 | | | | | 12/16/24 | | | | | 467,721 | | | | | | | | (53,275 | ) |
Nickel | | | 16 | | | | | 05/19/25 | | | | | 1,535,672 | | | | | | | | (196,224 | ) |
Nickel | | | 1 | | | | | 01/13/25 | | | | | 94,023 | | | | | | | | (2,822 | ) |
Nickel | | | 12 | | | | | 08/18/25 | | | | | 1,166,070 | | | | | | | | (35,805 | ) |
NY Harbor ULSD | | | 8 | | | | | 02/28/25 | | | | | 750,019 | | | | | | | | (112,984 | ) |
NY Harbor ULSD | | | 4 | | | | | 11/29/24 | | | | | 375,430 | | | | | | | | (28,967 | ) |
| | |
| 2 | | The accompanying notes are an integral part of these financial statements. |
GOLDMAN SACHS MULTI-STRATEGY ALTERNATIVES FUND
|
|
ADDITIONAL INVESTMENT INFORMATION (continued) |
FUTURES CONTRACTS (continued)
| | | | | | | | | | | | | | | | | | | | | | | | | | |
| Description | | Number of
Contracts | | Expiration
Date | | | | | | Notional
Amount | | | | | | Unrealized Appreciation/ (Depreciation) | |
|
| |
| | | | | | | |
Long position contracts: | | | | | | | | | | | | | | | | | | | | | | | | | | |
Primary Aluminum | | | 149 | | | | | | 12/16/24 | | | | | | | $ | 9,712,155 | | | | | | | $ | 1,022,247 | |
Primary Aluminum | | | 44 | | | | | | 02/17/25 | | | | | | | | 2,884,354 | | | | | | | | 279,294 | |
Primary Aluminum | | | 34 | | | | | | 11/18/24 | | | | | | | | 2,211,003 | | | | | | | | 125,031 | |
Primary Aluminum | | | 34 | | | | | | 01/13/25 | | | | | | | | 2,221,509 | | | | | | | | 93,042 | |
Primary Aluminum | | | 67 | | | | | | 05/19/25 | | | | | | | | 4,419,722 | | | | | | | | 192,877 | |
Primary Aluminum | | | 30 | | | | | | 09/15/25 | | | | | | | | 1,996,350 | | | | | | | | (4,167 | ) |
Soybean Oil | | | 34 | | | | | | 12/13/24 | | | | | | | | 1,018,300 | | | | | | | | (52,070 | ) |
Soybean Oil | | | 128 | | | | | | 07/14/25 | | | | | | | | 4,611,099 | | | | | | | | 13,949 | |
Sugar 11 | | | 47 | | | | | | 04/30/25 | | | | | | | | 1,108,072 | | | | | | | | 118,260 | |
Wheat | | | 39 | | | | | | 07/14/25 | | | | | | | | 1,183,650 | | | | | | | | 28,341 | |
WTI Crude | | | 41 | | | | | | 11/20/24 | | | | | | | | 2,839,660 | | | | | | | | (151,050 | ) |
Zinc | | | 169 | | | | | | 11/18/24 | | | | | | | | 12,819,622 | | | | | | | | 2,258,804 | |
Zinc | | | 23 | | | | | | 02/17/25 | | | | | | | | 1,743,400 | | | | | | | | 254,369 | |
Zinc | | | 21 | | | | | | 03/17/25 | | | | | | | | 1,590,750 | | | | | | | | 119,939 | |
Zinc | | | 20 | | | | | | 04/14/25 | | | | | | | | 1,513,380 | | | | | | | | 17,062 | |
Zinc | | | 21 | | | | | | 06/16/25 | | | | | | | | 1,586,944 | | | | | | | | 128,241 | |
Zinc | | | 18 | | | | | | 08/18/25 | | | | | | | | 1,359,450 | | | | | | | | 50,968 | |
Zinc | | | 16 | | | | | | 09/15/25 | | | | | | | | 1,208,300 | | | | | | | | (26,203 | ) |
|
| |
| | | | | | | |
| Total | | | | | | | | | | | | | | | | | | | | | | | | $ | 2,337,423 | |
|
| |
| | | | | | | |
Short position contracts: | | | | | | | | | | | | | | | | | | | | | | | | | | |
10 Year U.S. Treasury Notes | | | (228 | ) | | | | | 12/19/24 | | | | | | | | (25,186,875 | ) | | | | | | | 800,531 | |
Australian 10 Year Government Bonds | | | (274 | ) | | | | | 12/16/24 | | | | | | | | (20,167,745 | ) | | | | | | | 812,534 | |
Cattle Feeder | | | (7 | ) | | | | | 01/30/25 | | | | | | | | (844,638 | ) | | | | | | | 10,238 | |
Cocoa | | | (6 | ) | | | | | 12/13/24 | | | | | | | | (440,040 | ) | | | | | | | 5,570 | |
Coffee | | | (19 | ) | | | | | 12/18/24 | | | | | | | | (1,752,038 | ) | | | | | | | (21,113 | ) |
Copper | | | (27 | ) | | | | | 12/27/24 | | | | | | | | (2,929,500 | ) | | | | | | | (78,262 | ) |
Corn | | | (102 | ) | | | | | 12/13/24 | | | | | | | | (2,094,825 | ) | | | | | | | (48,263 | ) |
Gasoline RBOB | | | (10 | ) | | | | | 12/31/24 | | | | | | | | (820,554 | ) | | | | | | | 38,067 | |
KC HRW Wheat | | | (56 | ) | | | | | 12/13/24 | | | | | | | | (1,593,900 | ) | | | | | | | (18,038 | ) |
Lead | | | (53 | ) | | | | | 11/18/24 | | | | | | | | (2,636,936 | ) | | | | | | | 131,954 | |
Lead | | | (17 | ) | | | | | 02/17/25 | | | | | | | | (862,801 | ) | | | | | | | 41,406 | |
Lead | | | (9 | ) | | | | | 03/17/25 | | | | | | | | (459,196 | ) | | | | | | | 59,862 | |
Lead | | | (8 | ) | | | | | 04/14/25 | | | | | | | | (410,474 | ) | | | | | | | 40,416 | |
Lead | | | (7 | ) | | | | | 01/13/25 | | | | | | | | (352,723 | ) | | | | | | | 9,637 | |
Lead | | | (7 | ) | | | | | 05/19/25 | | | | | | | | (361,265 | ) | | | | | | | 4,362 | |
Lead | | | (7 | ) | | | | | 08/18/25 | | | | | | | | (366,384 | ) | | | | | | | 10,589 | |
Lean Hogs | | | (28 | ) | | | | | 12/13/24 | | | | | | | | (938,560 | ) | | | | | | | (47,539 | ) |
Live Cattle | | | (31 | ) | | | | | 12/31/24 | | | | | | | | (2,310,120 | ) | | | | | | | (9,490 | ) |
Low Sulphur Gas Oil | | | (14 | ) | | | | | 01/10/25 | | | | | | | | (933,800 | ) | | | | | | | 32,325 | |
Natural Gas | | | (22 | ) | | | | | 12/27/24 | | | | | | | | (652,960 | ) | | | | | | | 67,030 | |
Nickel | | | (56 | ) | | | | | 11/18/24 | | | | | | | | (5,210,567 | ) | | | | | | | 576,595 | |
Nickel | | | (30 | ) | | | | | 02/17/25 | | | | | | | | (2,837,776 | ) | | | | | | | 485,133 | |
Nickel | | | (16 | ) | | | | | 05/19/25 | | | | | | | | (1,535,672 | ) | | | | | | | 66,101 | |
Nickel | | | (12 | ) | | | | | 01/13/25 | | | | | | | | (1,128,273 | ) | | | | | | | 127,208 | |
Nickel | | | (1 | ) | | | | | 08/18/25 | | | | | | | | (97,173 | ) | | | | | | | 6,926 | |
NY Harbor ULSD | | | (8 | ) | | | | | 12/31/24 | | | | | | | | (753,211 | ) | | | | | | | 22,831 | |
Primary Aluminum | | | (149 | ) | | | | | 12/16/24 | | | | | | | | (9,712,155 | ) | | | | | | | (1,050,581 | ) |
Primary Aluminum | | | (44 | ) | | | | | 02/17/25 | | | | | | | | (2,884,354 | ) | | | | | | | (22,336 | ) |
Primary Aluminum | | | (34 | ) | | | | | 11/18/24 | | | | | | | | (2,211,003 | ) | | | | | | | (215,285 | ) |
Primary Aluminum | | | (67 | ) | | | | | 05/19/25 | | | | | | | | (4,419,722 | ) | | | | | | | (174,169 | ) |
| | |
| The accompanying notes are an integral part of these financial statements. | | 3 |
GOLDMAN SACHS MULTI-STRATEGY ALTERNATIVES FUND
|
Consolidated Schedule of Investments (continued) October 31, 2024 |
|
|
ADDITIONAL INVESTMENT INFORMATION (continued) |
FUTURES CONTRACTS (continued)
| | | | | | | | | | | | | | | | | | | | | | | | | | |
| Description | | Number of Contracts | | Expiration Date | | | | | | Notional Amount | | | | | | Unrealized Appreciation/ (Depreciation) | |
|
| |
| | | | | | | |
Short position contracts: | | | | | | | | | | | | | | | | | | | | | | | | | | |
Primary Aluminum | | | (63 | ) | | | | | 01/13/25 | | | | | | | $ | (4,116,326 | ) | | | | | | $ | (211,179 | ) |
Primary Aluminum | | | (1 | ) | | | | | 09/15/25 | | | | | | | | (66,545 | ) | | | | | | | 1,707 | |
Silver | | | (1 | ) | | | | | 12/27/24 | | | | | | | | (163,980 | ) | | | | | | | (21,230 | ) |
Soybean Oil | | | (32 | ) | | | | | 12/13/24 | | | | | | | | (866,688 | ) | | | | | | | (56,622 | ) |
Soybean Oil | | | (111 | ) | | | | | 01/14/25 | | | | | | | | (3,689,169 | ) | | | | | | | (8,617 | ) |
Sugar 11 | | | (44 | ) | | | | | 02/28/25 | | | | | | | | (1,120,627 | ) | | | | | | | (86,061 | ) |
Wheat | | | (22 | ) | | | | | 12/13/24 | | | | | | | | (627,550 | ) | | | | | | | (21,075 | ) |
WTI Crude | | | (39 | ) | | | | | 12/19/24 | | | | | | | | (2,683,590 | ) | | | | | | | 145,950 | |
Zinc | | | (169 | ) | | | | | 11/18/24 | | | | | | | | (12,819,622 | ) | | | | | | | (2,064,171 | ) |
Zinc | | | (23 | ) | | | | | 02/17/25 | | | | | | | | (1,743,400 | ) | | | | | | | (134,889 | ) |
Zinc | | | (21 | ) | | | | | 03/17/25 | | | | | | | | (1,590,750 | ) | | | | | | | (20,477 | ) |
Zinc | | | (20 | ) | | | | | 04/14/25 | | | | | | | | (1,513,380 | ) | | | | | | | (120,032 | ) |
Zinc | | | (15 | ) | | | | | 01/13/25 | | | | | | | | (1,136,404 | ) | | | | | | | 18,218 | |
Zinc | | | (21 | ) | | | | | 06/16/25 | | | | | | | | (1,586,944 | ) | | | | | | | (67,882 | ) |
Zinc | | | (18 | ) | | | | | 08/18/25 | | | | | | | | (1,359,450 | ) | | | | | | | 30,855 | |
|
| |
| | | | | | | |
| Total | | | | | | | | | | | | | | | | | | | | | | | | $ | (951,266 | ) |
|
| |
| | | | | | | |
| TOTAL FUTURES CONTRACTS | | | | | | | | | | | | | | | | | | | | | | | | $ | 1,386,157 | |
|
| |
| | |
|
|
| Currency Abbreviations: |
| AUD | | —Australian Dollar |
| CAD | | —Canadian Dollar |
| CHF | | —Swiss Franc |
| EUR | | —Euro |
| GBP | | —British Pound |
| JPY | | —Japanese Yen |
| NOK | | —Norwegian Krone |
| NZD | | —New Zealand Dollar |
| SEK | | —Swedish Krona |
| USD | | —U.S. Dollar |
|
|
| |
| | | |
|
|
| Abbreviation: |
| MS & Co. Int. PLC—Morgan Stanley & Co. International PLC |
|
|
| | |
| 4 | | The accompanying notes are an integral part of these financial statements. |
GOLDMAN SACHS MULTI-STRATEGY ALTERNATIVES FUND
|
Consolidated Statement of Assets and Liabilities(a) October 31, 2024 |
| | | | | | | | |
| | | |
| | Assets: | | | | | | |
| | | |
| | Investments in affiliated issuers, at value (cost $59,498,130) | | $ | 59,498,130 | | | |
| | Investments in unaffiliated issuers, at value (cost $621,979) | | | — | | | |
| | Cash | | | 2,332,804 | | | |
| | Unrealized gain on forward foreign currency exchange contracts | | | 5,175,834 | | | |
| | Variation margin on futures contracts | | | 112,941 | | | |
| | Unrealized gain on futures contracts | | | 6,152,840 | | | |
| | Receivables: | | | | | | |
| | Collateral on certain derivative contracts(b) | | | 3,816,848 | | | |
| | Dividends | | | 242,764 | | | |
| | Due from broker | | | 107,526 | | | |
| | Foreign tax reclaims | | | 40,279 | | | |
| | Other assets | | | 52,046 | | | |
| | |
| | | |
| | Total assets | | | 77,532,012 | | | |
| | |
| | | | | | | | |
| | | |
| | Liabilities: | | | | | | |
| | | |
| | Unrealized loss on forward foreign currency exchange contracts | | | 5,979,497 | | | |
| | Unrealized loss on futures contracts | | | 5,704,892 | | | |
| | Payables: | | | | | | |
| | Investments purchased | | | 242,829 | | | |
| | Due to investment adviser | | | 156,220 | | | |
| | Management fees | | | 17,778 | | | |
| | Fund shares redeemed | | | 9,099 | | | |
| | Distribution and Service fees and Transfer Agency fees | | | 2,150 | | | |
| | Accrued expenses | | | 749,006 | | | |
| | |
| | | |
| | Total liabilities | | | 12,861,471 | | | |
| | |
| | | | | | | | |
| | | |
| | Net Assets: | | | | | | |
| | | |
| | Paid-in capital | | | 104,409,777 | | | |
| | Total distributable loss | | | (39,739,236 | ) | | |
| | |
| | | |
| | NET ASSETS | | $ | 64,670,541 | | | |
| | | Net Assets: | | | | | | |
| | | Class A | | $ | 6,183,115 | | | |
| | | Class C | | | 146,330 | | | |
| | | Institutional | | | 16,033,218 | | | |
| | | Investor | | | 2,914,798 | | | |
| | | Class R6 | | | 11,133 | | | |
| | | Class P | | | 39,381,947 | | | |
| | | Total Net Assets | | $ | 64,670,541 | | | |
| | | Shares Outstanding $0.001 par value (unlimited number of shares authorized): | | | | | | |
| | | Class A | | | 583,178 | | | |
| | | Class C | | | 14,323 | | | |
| | | Institutional | | | 1,483,795 | | | |
| | | Investor | | | 271,443 | | | |
| | | Class R6 | | | 1,028 | | | |
| | | Class P | | | 3,644,532 | | | |
| | | Net asset value, offering and redemption price per share:(c) | | | | | | |
| | | Class A | | | $10.60 | | | |
| | | Class C | | | 10.22 | | | |
| | | Institutional | | | 10.81 | | | |
| | | Investor | | | 10.74 | | | |
| | | Class R6 | | | 10.83 | | | |
| | | Class P | | | 10.81 | | | |
| | (a) | Statement of Assets and Liabilities for the Fund is consolidated and includes the balances of the wholly-owned subsidiary, Cayman Commodity- MMA IV, LLC. Accordingly, all interfund balances and transactions have been eliminated. |
| | (b) | Includes segregated cash of $2,636,848 and $1,180,000 relating to initial margin requirements and/or collateral on futures and forward foreign currency, respectively. |
| | (c) | Maximum public offering price per share for Class A Shares is $11.22. At redemption, Class C Shares may be subject to a contingent deferred sales charge, assessed on the amount equal to the lesser of the current net asset value (“NAV”) or the original purchase price of the shares. |
| | |
| The accompanying notes are an integral part of these financial statements. | | 5 |
GOLDMAN SACHS MULTI-STRATEGY ALTERNATIVES FUND
|
Consolidated Statement of Operations(a) For the Fiscal Year Ended October 31, 2024 |
| | | | | | |
| | |
| | | Investment Income: | | | | |
| | |
| | Dividends — affiliated issuers | | $ | 3,888,237 | |
| | Interest | | | 157,543 | |
| | | |
| | |
| | Total investment income | | | 4,045,780 | |
| | | |
| | | | | | |
| | |
| | Expenses: | | | | |
| | |
| | Management fees | | | 699,501 | |
| | Custody, accounting and administrative services | | | 661,156 | |
| | Professional fees | | | 473,896 | |
| | Registration fees | | | 115,812 | |
| | Transfer Agency fees(b) | | | 40,011 | |
| | Trustee fees | | | 27,486 | |
| | Printing and mailing costs | | | 23,516 | |
| | Distribution and Service (12b-1) fees(b) | | | 19,164 | |
| | Service fees — Class C | | | 691 | |
| | Other | | | 49,227 | |
| | | |
| | |
| | Total expenses | | | 2,110,460 | |
| | | |
| | |
| | Less — expense reductions | | | (1,459,847) | |
| | | |
| | |
| | Net expenses | | | 650,613 | |
| | | |
| | |
| | NET INVESTMENT INCOME | | | 3,395,167 | |
| | | |
| | | | | | |
| | |
| | Realized and unrealized gain (loss): | | | | |
| | |
| | Net realized gain (loss) from: | | | | |
| | Investments — unaffiliated issuers (including commission recapture of $535) | | | 84,212 | |
| | Futures contracts | | | (8,200,113) | |
| | Written options | | | 2,345 | |
| | Forward foreign currency exchange contracts | | | 898,013 | |
| | Foreign currency transactions | | | (54,885) | |
| | Net change in unrealized gain (loss) on: | | | | |
| | Futures contracts | | | 3,669,821 | |
| | Forward foreign currency exchange contracts | | | (965,413) | |
| | Foreign currency translation | | | (52,033) | |
| | | |
| | |
| | Net realized and unrealized loss | | | (4,618,053) | |
| | | |
| | |
| | NET DECREASE IN NET ASSETS RESULTING FROM OPERATIONS | | $ | (1,222,886) | |
| | | |
| | (a) | Statement of Operations for the Fund is consolidated and includes the balances of the wholly-owned subsidiary, Cayman Commodity- MMA IV, LLC. Accordingly, all interfund balances and transactions have been eliminated. |
| | (b) | Class specific Distribution and/or Service (12b-1) and Transfer Agency fees were as follows: |
| | | | | | | | | | | | | | | | | | | | | | | | | | | | | | | | | | | | | | | | | | | | | | | | | | | | | |
| | |
| Distribution and/or Service (12b-1) Fees | | Transfer Agency Fees | | |
| | | | | | | | | | |
Class A | | Class C | | Class R | | Class A | | Class C | | Institutional | | Investor | | Class R6 | | Class R | | Class P | | |
| | | | | | | | | | |
| | | $17,021 | | | | | $2,072 | | | | | $71 | | | | | $10,213 | | | | | $414 | | | | | $8,268 | | | | | $5,786 | | | | | $4 | | | | | $21 | | | | | $15,305 | | | | | | |
| | |
| 6 | | The accompanying notes are an integral part of these financial statements. |
GOLDMAN SACHS MULTI-STRATEGY ALTERNATIVES FUND
|
| Consolidated Statements of Changes in Net Assets(a) |
| | | | | | | | | | | | | | | | |
| | | | | Multi-Strategy Alternatives Fund(a) | | | |
| | | | | |
| | | | | For the Fiscal Year Ended October 31, 2024 | | | | | | For the Fiscal Year Ended October 31, 2023 | | | |
| | | | | |
| | From operations: | | | | | | | | | | | | | | |
| | | | | |
| | Net investment income | | | $ 3,395,167 | | | | | | | | $ 1,659,237 | | | |
| | | | | |
| | Net realized gain (loss) | | | (7,270,428 | ) | | | | | | | 967,616 | | | |
| | | | | |
| | Net change in unrealized gain (loss) | | | 2,652,375 | | | | | | | | (3,952,838 | ) | | |
| | |
| | | | | |
| | Net decrease in net assets resulting from operations | | | (1,222,886 | ) | | | | | | | (1,325,985 | ) | | |
| | |
| | | | | | | | | | | | | | | | |
| | | | | |
| | Distributions to shareholders: | | | | | | | | | | | | | | |
| | | | | |
| | From distributable earnings: | | | | | | | | | | | | | | |
| | | | | |
| | Class A Shares | | | (235,940 | ) | | | | | | | (19,132 | ) | | |
| | | | | |
| | Class C Shares | | | (1,187 | ) | | | | | | | — | | | |
| | | | | |
| | Institutional Shares | | | (883,239 | ) | | | | | | | (170,765 | ) | | |
| | | | | |
| | Investor Shares | | | (151,781 | ) | | | | | | | (25,221 | ) | | |
| | | | | |
| | Class R6 Shares | | | (387 | ) | | | | | | | (185 | ) | | |
| | | | | |
| | Class R Shares(b) | | | (875 | ) | | | | | | | — | | | |
| | | | | |
| | Class P Shares | | | (2,093,131 | ) | | | | | | | (484,761 | ) | | |
| | |
| | | | | |
| | Total distributions to shareholders | | | (3,366,540 | ) | | | | | | | (700,064 | ) | | |
| | |
| | | | | | | | | | | | | | | | |
| | | | | |
| | From share transactions: | | | | | | | | | | | | | | |
| | | | | |
| | Proceeds from sales of shares | | | 2,516,194 | | | | | | | | 7,328,573 | | | |
| | | | | |
| | Reinvestment of distributions | | | 3,304,758 | | | | | | | | 692,421 | | | |
| | | | | |
| | Cost of shares redeemed | | | (37,132,808 | ) | | | | | | | (56,413,500 | ) | | |
| | |
| | | | | |
| | Net decrease in net assets resulting from share transactions | | | (31,311,856 | ) | | | | | | | (48,392,506 | ) | | |
| | |
| | | | | |
| | TOTAL DECREASE | | | (35,901,282 | ) | | | | | | | (50,418,555 | ) | | |
| | |
| | | | | | | | | | | | | | | | |
| | | | | |
| | Net assets: | | | | | | | | | | | | | | |
| | | | | |
| | Beginning of year | | | 100,571,823 | | | | | | | | 150,990,378 | | | |
| | |
| | | | | |
| | End of year | | | $ 64,670,541 | | | | | | | | $100,571,823 | | | |
| | |
| | (a) | Statements of Changes in Net Assets for the Fund is consolidated and includes the balances of the wholly-owned subsidiary, Cayman Commodity — MMA IV, LLC. Accordingly, all interfund balances and transactions have been eliminated. |
| | (b) | At the close of business on April 16, 2024, Class R Shares of the Fund were liquidated. |
| | |
| The accompanying notes are an integral part of these financial statements. | | 7 |
GOLDMAN SACHS MULTI-STRATEGY ALTERNATIVES FUND
|
Consolidated Financial Highlights Selected Share Data for a Share Outstanding Throughout Each Year |
| | | | | | | | | | | | | | | | | | | | | | | | | | | |
| | | | | Multi-Strategy Alternatives Fund |
| | |
| | | | | Class A Shares |
| | |
| | | | | Year Ended October 31, |
| | | | | | |
| | | | | 2024 | | 2023 | | 2022 | | 2021 | | 2020 |
| | | | | | |
| | Per Share Data | | | | | | | | | | | | | | | | | | | | | | | | | |
| | | | | | |
| | Net asset value, beginning of year | | | $ | 11.06 | | | | $ | 11.22 | | | | $ | 11.86 | | | | $ | 10.66 | | | | $ | 10.48 | |
| | | |
| | | | | | |
| | Net investment income (loss)(a) | | | | 0.41 | | | | | 0.11 | | | | | (0.14 | ) | | | | (0.07 | ) | | | | (0.01) | |
| | | | | | |
| | Net realized and unrealized gain (loss) | | | | (0.51 | ) | | | | (0.25 | ) | | | | (0.50 | ) | | | | 1.27 | | | | | 0.25 | |
| | | |
| | | | | | |
| | Total from investment operations | | | | (0.10 | ) | | | | (0.14 | ) | | | | (0.64 | ) | | | | 1.20 | | | | | 0.24 | |
| | | |
| | | | | | |
| | Distributions to shareholders from net investment income | | | | (0.36 | ) | | | | (0.02 | ) | | | | — | | | | | — | | | | | (0.06) | |
| | | |
| | | | | | |
| | Net asset value, end of year | | | $ | 10.60 | | | | $ | 11.06 | | | | $ | 11.22 | | | | $ | 11.86 | | | | $ | 10.66 | |
| | | |
| | | | | | |
| | Total return(b) | | | | (1.02 | )% | | | | (1.30 | )% | | | | (5.31 | )% | | | | 11.26 | % | | | | 2.33% | |
| | | |
| | | | | | |
| | Net assets, end of year (in 000s) | | | $ | 6,183 | | | | $ | 7,876 | | | | $ | 8,666 | | | | $ | 7,943 | | | | $ | 8,015 | |
| | | | | | |
| | Ratio of net expenses to average net assets (including dividend and interest payments and other expenses relating to securities sold short) | | | | 1.07 | % | | | | 2.02 | % | | | | 2.18 | % | | | | 2.15 | % | | | | 2.13% | |
| | | | | | |
| | Ratio of net expenses to average net assets (excluding dividend and interest payments and other expenses relating to securities sold short) | | | | 1.07 | % | | | | 1.95 | % | | | | 2.08 | % | | | | 2.08 | % | | | | 2.07% | |
| | | | | | |
| | Ratio of total expenses to average net assets (including dividend and interest payments and other expenses relating to securities sold short) | | | | 2.85 | % | | | | 3.53 | % | | | | 3.38 | % | | | | 3.36 | % | | | | 4.32% | |
| | | | | | |
| | Ratio of total expenses to average net assets (excluding dividend and interest payments and other expenses relating to securities sold short) | | | | 2.85 | % | | | | 3.46 | % | | | | 3.29 | % | | | | 3.30 | % | | | | 4.27% | |
| | | | | | |
| | Ratio of net investment income (loss) to average net assets | | | | 3.83 | % | | | | 1.00 | % | | | | (1.21 | )% | | | | (0.63 | )% | | | | (0.17)% | |
| | | | | | |
| | Portfolio turnover rate(c) | | | | — | %(d) | | | | 242 | % | | | | 236 | % | | | | 269 | % | | | | 222% | |
| | | |
| | (a) | Calculated based on the average shares outstanding methodology. |
| | (b) | Assumes investment at the NAV at the beginning of the year, reinvestment of all dividends and distributions, a complete redemption of the investment at the NAV at the end of the year and no sales or redemption charges (if any). Total returns would be reduced if a sales or redemption charge was taken into account. Returns do not reflect the impact of taxes to shareholders relating to Fund distributions or the redemption of Fund shares. |
| | (c) | The Fund’s portfolio turnover rate is calculated in accordance with regulatory requirements, without regard to transactions involving short term investments and certain derivatives. If such transactions were included, the Fund’s portfolio turnover rate may be higher. |
| | (d) | There were no long-term transactions for the fiscal year ended October 31, 2024. |
| | |
| 8 | | The accompanying notes are an integral part of these financial statements. |
GOLDMAN SACHS MULTI-STRATEGY ALTERNATIVES FUND
|
Consolidated Financial Highlights (continued) Selected Share Data for a Share Outstanding Throughout Each Year |
| | | | | | | | | | | | | | | | | | | | | | | | | | | |
| | | | | Multi-Strategy Alternatives Fund |
| | |
| | | | | Class C Shares |
| | |
| | | | | Year Ended October 31, |
| | | | | | |
| | | | | 2024 | | 2023 | | 2022 | | 2021 | | 2020 |
| | | | | | |
| | Per Share Data | | | | | | | | | | | | | | | | | | | | | | | | | |
| | | | | | |
| | Net asset value, beginning of year | | | $ | 10.44 | | | | $ | 10.64 | | | | $ | 11.34 | | | | $ | 10.26 | | | | $ | 10.11 | |
| | | |
| | | | | | |
| | Net investment income (loss)(a) | | | | 0.33 | | | | | 0.00 | | | | | (0.24 | ) | | | | (0.15 | ) | | | | (0.09) | |
| | | | | | |
| | Net realized and unrealized gain (loss) | | | | (0.52 | ) | | | | (0.20 | ) | | | | (0.46 | ) | | | | 1.23 | | | | | 0.24 | |
| | | |
| | | | | | |
| | Total from investment operations | | | | (0.19 | ) | | | | (0.20 | ) | | | | (0.70 | ) | | | | 1.08 | | | | | 0.15 | |
| | | |
| | | | | | |
| | Distributions to shareholders from net investment income | | | | (0.03 | ) | | | | — | | | | | — | | | | | — | | | | | — | |
| | | |
| | | | | | |
| | Net asset value, end of year | | | $ | 10.22 | | | | $ | 10.44 | | | | $ | 10.64 | | | | $ | 11.34 | | | | $ | 10.26 | |
| | | |
| | | | | | |
| | Total return(b) | | | | (1.81 | )% | | | | (1.97 | )% | | | | (6.08 | )% | | | | 10.53 | % | | | | 1.48% | |
| | | |
| | | | | | |
| | Net assets, end of year (in 000s) | | | $ | 146 | | | | $ | 542 | | | | $ | 1,810 | | | | $ | 3,544 | | | | $ | 5,045 | |
| | | | | | |
| | Ratio of net expenses to average net assets (including dividend and interest payments and other expenses relating to securities sold short) | | | | 1.79 | % | | | | 2.85 | % | | | | 2.93 | % | | | | 2.89 | % | | | | 2.88% | |
| | | | | | |
| | Ratio of net expenses to average net assets (excluding dividend and interest payments and other expenses relating to securities sold short) | | | | 1.79 | % | | | | 2.76 | % | | | | 2.83 | % | | | | 2.84 | % | | | | 2.82% | |
| | | | | | |
| | Ratio of total expenses to average net assets (including dividend and interest payments and other expenses relating to securities sold short) | | | | 3.36 | % | | | | 4.36 | % | | | | 4.11 | % | | | | 4.15 | % | | | | 5.09% | |
| | | | | | |
| | Ratio of total expenses to average net assets (excluding dividend and interest payments and other expenses relating to securities sold short) | | | | 3.36 | % | | | | 4.27 | % | | | | 4.01 | % | | | | 4.09 | % | | | | 5.03% | |
| | | | | | |
| | Ratio of net investment income (loss) to average net assets | | | | 3.13 | % | | | | 0.03 | % | | | | (2.16 | )% | | | | (1.39 | )% | | | | (0.92)% | |
| | | | | | |
| | Portfolio turnover rate(c) | | | | — | %(d) | | | | 242 | % | | | | 236 | % | | | | 269 | % | | | | 222% | |
| | | |
| | (a) | Calculated based on the average shares outstanding methodology. |
| | (b) | Assumes investment at the NAV at the beginning of the year, reinvestment of all dividends and distributions, a complete redemption of the investment at the NAV at the end of the year and no sales or redemption charges (if any). Total returns would be reduced if a sales or redemption charge was taken into account. Returns do not reflect the impact of taxes to shareholders relating to Fund distributions or the redemption of Fund shares. |
| | (c) | The Fund’s portfolio turnover rate is calculated in accordance with regulatory requirements, without regard to transactions involving short term investments and certain derivatives. If such transactions were included, the Fund’s portfolio turnover rate may be higher. |
| | (d) | There were no long-term transactions for the fiscal year ended October 31, 2024. |
| | |
| The accompanying notes are an integral part of these financial statements. | | 9 |
GOLDMAN SACHS MULTI-STRATEGY ALTERNATIVES FUND
|
Consolidated Financial Highlights (continued) Selected Share Data for a Share Outstanding Throughout Each Year |
| | | | | | | | | | | | | | | | | | | | | | | | | | | |
| | | | | Multi-Strategy Alternatives Fund |
| | |
| | | | | Institutional Shares |
| | |
| | | | | Year Ended October 31, |
| | | | | | |
| | | | | 2024 | | 2023 | | 2022 | | 2021 | | 2020 |
| | | | | | |
| | Per Share Data | | | | | | | | | | | | | | | | | | | | | | | | | |
| | | | | | |
| | Net asset value, beginning of year | | | $ | 11.27 | | | | $ | 11.42 | | | | $ | 12.04 | | | | $ | 10.78 | | | | $ | 10.62 | |
| | | |
| | | | | | |
| | Net investment income (loss)(a) | | | | 0.45 | | | | | 0.14 | | | | | (0.11 | ) | | | | (0.03 | ) | | | | 0.01 | |
| | | | | | |
| | Net realized and unrealized gain (loss) | | | | (0.52 | ) | | | | (0.23 | ) | | | | (0.51 | ) | | | | 1.29 | | | | | 0.26 | |
| | | |
| | | | | | |
| | Total from investment operations | | | | (0.07 | ) | | | | (0.09 | ) | | | | (0.62 | ) | | | | 1.26 | | | | | 0.27 | |
| | | |
| | | | | | |
| | Distributions to shareholders from net investment income | | | | (0.39 | ) | | | | (0.06 | ) | | | | — | | | | | — | | | | | (0.11) | |
| | | |
| | | | | | |
| | Net asset value, end of year | | | $ | 10.81 | | | | $ | 11.27 | | | | $ | 11.42 | | | | $ | 12.04 | | | | $ | 10.78 | |
| | | |
| | | | | | |
| | Total return(b) | | | | (0.77 | )% | | | | (0.92 | )% | | | | (5.07 | )% | | | | 11.58 | % | | | | 2.66% | |
| | | |
| | | | | | |
| | Net assets, end of year (in 000s) | | | $ | 16,033 | | | | $ | 26,614 | | | | $ | 35,165 | | | | $ | 54,438 | | | | $ | 67,354 | |
| | | | | | |
| | Ratio of net expenses to average net assets (including dividend and interest payments and other expenses relating to securities sold short) | | | | 0.76 | % | | | | 1.73 | % | | | | 1.86 | % | | | | 1.82 | % | | | | 1.81% | |
| | | | | | |
| | Ratio of net expenses to average net assets (excluding dividend and interest payments and other expenses relating to securities sold short) | | | | 0.76 | % | | | | 1.66 | % | | | | 1.76 | % | | | | 1.76 | % | | | | 1.75% | |
| | | | | | |
| | Ratio of total expenses to average net assets (including dividend and interest payments and other expenses relating to securities sold short) | | | | 2.42 | % | | | | 3.18 | % | | | | 3.00 | % | | | | 3.00 | % | | | | 3.94% | |
| | | | | | |
| | Ratio of total expenses to average net assets (excluding dividend and interest payments and other expenses relating to securities sold short) | | | | 2.42 | % | | | | 3.10 | % | | | | 2.90 | % | | | | 2.94 | % | | | | 3.88% | |
| | | | | | |
| | Ratio of net investment income (loss) to average net assets | | | | 4.14 | % | | | | 1.26 | % | | | | (0.98 | )% | | | | (0.28 | )% | | | | 0.14% | |
| | | | | | |
| | Portfolio turnover rate(c) | | | | — | %(d) | | | | 242 | % | | | | 236 | % | | | | 269 | % | | | | 222% | |
| | | |
| | (a) | Calculated based on the average shares outstanding methodology. |
| | (b) | Assumes investment at the NAV at the beginning of the year, reinvestment of all dividends and distributions, a complete redemption of the investment at the NAV at the end of the year and no sales or redemption charges (if any). Total returns would be reduced if a sales or redemption charge was taken into account. Returns do not reflect the impact of taxes to shareholders relating to Fund distributions or the redemption of Fund shares. |
| | (c) | The Fund’s portfolio turnover rate is calculated in accordance with regulatory requirements, without regard to transactions involving short term investments and certain derivatives. If such transactions were included, the Fund’s portfolio turnover rate may be higher. |
| | (d) | There were no long-term transactions for the fiscal year ended October 31, 2024. |
| | |
| 10 | | The accompanying notes are an integral part of these financial statements. |
GOLDMAN SACHS MULTI-STRATEGY ALTERNATIVES FUND
|
Consolidated Financial Highlights (continued) Selected Share Data for a Share Outstanding Throughout Each Year |
| | | | | | | | | | | | | | | | | | | | | | | | | | | |
| | | | | Multi-Strategy Alternatives Fund |
| | |
| | | | | Investor Shares |
| | |
| | | | | Year Ended October 31, |
| | | | | | |
| | | | | 2024 | | 2023 | | 2022 | | 2021 | | 2020 |
| | | | | | |
| | | Per Share Data | | | | | | | | | | | | | | | | | | | | | | | | | |
| | | | | | |
| | Net asset value, beginning of year | | | $ | 11.20 | | | | $ | 11.35 | | | | $ | 11.97 | | | | $ | 10.73 | | | | $ | 10.56 | |
| | | |
| | | | | | |
| | Net investment income (loss)(a) | | | | 0.44 | | | | | 0.14 | | | | | (0.12 | ) | | | | (0.04 | ) | | | | 0.01 | |
| | | | | | |
| | Net realized and unrealized gain (loss) | | | | (0.52 | ) | | | | (0.24 | ) | | | | (0.50 | ) | | | | 1.28 | | | | | 0.26 | |
| | | |
| | | | | | |
| | Total from investment operations | | | | (0.08 | ) | | | | (0.10 | ) | | | | (0.62 | ) | | | | 1.24 | | | | | 0.27 | |
| | | |
| | | | | | |
| | Distributions to shareholders from net investment income | | | | (0.38 | ) | | | | (0.05 | ) | | | | — | | | | | — | | | | | (0.10) | |
| | | |
| | | | | | |
| | Net asset value, end of year | | | $ | 10.74 | | | | $ | 11.20 | | | | $ | 11.35 | | | | $ | 11.97 | | | | $ | 10.73 | |
| | | |
| | | | | | |
| | Total return(b) | | | | (0.84 | )% | | | | (1.00 | )% | | | | (5.10 | )% | | | | 11.56 | % | | | | 2.59% | |
| | | |
| | | | | | |
| | Net assets, end of year (in 000s) | | | $ | 2,915 | | | | $ | 4,537 | | | | $ | 5,853 | | | | $ | 7,478 | | | | $ | 10,061 | |
| | | | | | |
| | Ratio of net expenses to average net assets (including dividend and interest payments and other expenses relating to securities sold short) | | | | 0.82 | % | | | | 1.79 | % | | | | 1.93 | % | | | | 1.89 | % | | | | 1.88% | |
| | | | | | |
| | Ratio of net expenses to average net assets (excluding dividend and interest payments and other expenses relating to securities sold short) | | | | 0.82 | % | | | | 1.72 | % | | | | 1.83 | % | | | | 1.83 | % | | | | 1.82% | |
| | | | | | |
| | Ratio of total expenses to average net assets (including dividend and interest payments and other expenses relating to securities sold short) | | | | 2.58 | % | | | | 3.30 | % | | | | 3.12 | % | | | | 3.10 | % | | | | 4.07% | |
| | | | | | |
| | Ratio of total expenses to average net assets (excluding dividend and interest payments and other expenses relating to securities sold short) | | | | 2.58 | % | | | | 3.22 | % | | | | 3.02 | % | | | | 3.04 | % | | | | 4.02% | |
| | | | | | |
| | Ratio of net investment income (loss) to average net assets | | | | 4.08 | % | | | | 1.22 | % | | | | (1.07 | )% | | | | (0.38 | )% | | | | 0.07% | |
| | | | | | |
| | Portfolio turnover rate(c) | | | | — | %(d) | | | | 242 | % | | | | 236 | % | | | | 269 | % | | | | 222% | |
| | | |
| | (a) | Calculated based on the average shares outstanding methodology. |
| | (b) | Assumes investment at the NAV at the beginning of the year, reinvestment of all dividends and distributions, a complete redemption of the investment at the NAV at the end of the year and no sales or redemption charges (if any). Total returns would be reduced if a sales or redemption charge was taken into account. Returns do not reflect the impact of taxes to shareholders relating to Fund distributions or the redemption of Fund shares. |
| | (c) | The Fund’s portfolio turnover rate is calculated in accordance with regulatory requirements, without regard to transactions involving short term investments and certain derivatives. If such transactions were included, the Fund’s portfolio turnover rate may be higher. |
| | (d) | There were no long-term transactions for the fiscal year ended October 31, 2024. |
| | |
| The accompanying notes are an integral part of these financial statements. | | 11 |
GOLDMAN SACHS MULTI-STRATEGY ALTERNATIVES FUND
|
Consolidated Financial Highlights (continued) Selected Share Data for a Share Outstanding Throughout Each Year |
| | | | | | | | | | | | | | | | | | | | | | | | | | | |
| | | | | Multi-Strategy Alternatives Fund |
| | |
| | | | | Class R6 Shares |
| | |
| | | | | Year Ended October 31, |
| | | | | | |
| | | | | 2024 | | 2023 | | 2022 | | 2021 | | 2020 |
| | | | | | |
| | | Per Share Data | | | | | | | | | | | | | | | | | | | | | | | | | |
| | | | | | |
| | Net asset value, beginning of year | | | $ | 11.29 | | | | $ | 11.44 | | | | $ | 12.05 | | | | $ | 10.79 | | | | $ | 10.63 | |
| | | |
| | | | | | |
| | Net investment income (loss)(a) | | | | 0.45 | | | | | 0.13 | | | | | (0.10 | ) | | | | (0.04 | ) | | | | 0.02 | |
| | | | | | |
| | Net realized and unrealized gain (loss) | | | | (0.52 | ) | | | | (0.22 | ) | | | | (0.51 | ) | | | | 1.30 | | | | | 0.25 | |
| | | |
| | | | | | |
| | Total from investment operations | | | | (0.07 | ) | | | | (0.09 | ) | | | | (0.61 | ) | | | | 1.26 | | | | | 0.27 | |
| | | |
| | | | | | |
| | Distributions to shareholders from net investment income | | | | (0.39 | ) | | | | (0.06 | ) | | | | — | | | | | — | | | | | (0.11) | |
| | | |
| | | | | | |
| | Net asset value, end of year | | | $ | 10.83 | | | | $ | 11.29 | | | | $ | 11.44 | | | | $ | 12.05 | | | | $ | 10.79 | |
| | | |
| | | | | | |
| | Total return(b) | | | | (0.80 | )% | | | | (0.81 | )% | | | | (5.06 | )% | | | | 11.68 | % | | | | 2.60% | |
| | | |
| | | | | | |
| | Net assets, end of year (in 000s) | | | $ | 11 | | | | $ | 11 | | | | $ | 37 | | | | $ | 12 | | | | $ | 11 | |
| | | | | | |
| | Ratio of net expenses to average net assets (including dividend and interest payments and other expenses relating to securities sold short) | | | | 0.77 | % | | | | 1.80 | % | | | | 1.87 | % | | | | 1.83 | % | | | | 1.81% | |
| | | | | | |
| | Ratio of net expenses to average net assets (excluding dividend and interest payments and other expenses relating to securities sold short) | | | | 0.77 | % | | | | 1.70 | % | | | | 1.77 | % | | | | 1.76 | % | | | | 1.76% | |
| | | | | | |
| | Ratio of total expenses to average net assets (including dividend and interest payments and other expenses relating to securities sold short) | | | | 2.49 | % | | | | 3.24 | % | | | | 3.01 | % | | | | 2.96 | % | | | | 3.93% | |
| | | | | | |
| | Ratio of total expenses to average net assets (excluding dividend and interest payments and other expenses relating to securities sold short) | | | | 2.49 | % | | | | 3.14 | % | | | | 2.91 | % | | | | 2.89 | % | | | | 3.88% | |
| | | | | | |
| | Ratio of net investment income (loss) to average net assets | | | | 4.12 | % | | | | 1.12 | % | | | | (0.91 | )% | | | | (0.30 | )% | | | | 0.12% | |
| | | | | | |
| | Portfolio turnover rate(c) | | | | — | %(d) | | | | 242 | % | | | | 236 | % | | | | 269 | % | | | | 222% | |
| | | |
| | (a) | Calculated based on the average shares outstanding methodology. |
| | (b) | Assumes investment at the NAV at the beginning of the year, reinvestment of all dividends and distributions, a complete redemption of the investment at the NAV at the end of the year and no sales or redemption charges (if any). Total returns would be reduced if a sales or redemption charge was taken into account. Returns do not reflect the impact of taxes to shareholders relating to Fund distributions or the redemption of Fund shares. |
| | (c) | The Fund’s portfolio turnover rate is calculated in accordance with regulatory requirements, without regard to transactions involving short term investments and certain derivatives. If such transactions were included, the Fund’s portfolio turnover rate may be higher. |
| | (d) | There were no long-term transactions for the fiscal year ended October 31, 2024. |
| | |
| 12 | | The accompanying notes are an integral part of these financial statements. |
GOLDMAN SACHS MULTI-STRATEGY ALTERNATIVES FUND
|
Consolidated Financial Highlights (continued) Selected Share Data for a Share Outstanding Throughout Each Year |
| | | | | | | | | | | | | | | | | | | | | | | | | | | |
| | | | | Multi-Strategy Alternatives Fund |
| | |
| | | | | Class P Shares |
| | |
| | | | | Year Ended October 31, |
| | | | | | |
| | | | | 2024 | | 2023 | | 2022 | | 2021 | | 2020 |
| | | | | | |
| | | Per Share Data | | | | | | | | | | | | | | | | | | | | | | | | | |
| | | | | | |
| | Net asset value, beginning of year | | | $ | 11.27 | | | | $ | 11.42 | | | | $ | 12.04 | | | | $ | 10.78 | | | | $ | 10.62 | |
| | | |
| | | | | | |
| | Net investment income (loss)(a) | | | | 0.45 | | | | | 0.14 | | | | | (0.11 | ) | | | | (0.03 | ) | | | | 0.02 | |
| | | | | | |
| | Net realized and unrealized gain (loss) | | | | (0.52 | ) | | | | (0.23 | ) | | | | (0.51 | ) | | | | 1.29 | | | | | 0.25 | |
| | | |
| | | | | | |
| | Total from investment operations | | | | (0.07 | ) | | | | (0.09 | ) | | | | (0.62 | ) | | | | 1.26 | | | | | 0.27 | |
| | | |
| | | | | | |
| | Distributions to shareholders from net investment income | | | | (0.39 | ) | | | | (0.06 | ) | | | | — | | | | | — | | | | | (0.11) | |
| | | |
| | | | | | |
| | Net asset value, end of year | | | $ | 10.81 | | | | $ | 11.27 | | | | $ | 11.42 | | | | $ | 12.04 | | | | $ | 10.78 | |
| | | |
| | | | | | |
| | Total return(b) | | | | (0.76 | )% | | | | (0.91 | )% | | | | (5.07 | )% | | | | 11.69 | % | | | | 2.60% | |
| | | |
| | | | | | |
| | Net assets, end of year (in 000s) | | | $ | 39,382 | | | | $ | 60,963 | | | | $ | 99,431 | | | | $ | 103,080 | | | | $ | 59,182 | |
| | | | | | |
| | Ratio of net expenses to average net assets (including dividend and interest payments and other expenses relating to securities sold short) | | | | 0.75 | % | | | | 1.75 | % | | | | 1.85 | % | | | | 1.81 | % | | | | 1.80% | |
| | | | | | |
| | Ratio of net expenses to average net assets (excluding dividend and interest payments and other expenses relating to securities sold short) | | | | 0.75 | % | | | | 1.66 | % | | | | 1.75 | % | | | | 1.76 | % | | | | 1.74% | |
| | | | | | |
| | Ratio of total expenses to average net assets (including dividend and interest payments and other expenses relating to securities sold short) | | | | 2.43 | % | | | | 3.19 | % | | | | 2.99 | % | | | | 2.91 | % | | | | 3.93% | |
| | | | | | |
| | Ratio of total expenses to average net assets (excluding dividend and interest payments and other expenses relating to securities sold short) | | | | 2.43 | % | | | | 3.11 | % | | | | 2.89 | % | | | | 2.85 | % | | | | 3.88% | |
| | | | | | |
| | Ratio of net investment income (loss) to average net assets | | | | 4.14 | % | | | | 1.24 | % | | | | (0.93 | )% | | | | (0.29 | )% | | | | 0.15% | |
| | | | | | |
| | Portfolio turnover rate(c) | | | | — | %(d) | | | | 242 | % | | | | 236 | % | | | | 269 | % | | | | 222% | |
| | | |
| | (a) | Calculated based on the average shares outstanding methodology. |
| | (b) | Assumes investment at the NAV at the beginning of the year, reinvestment of all dividends and distributions, a complete redemption of the investment at the NAV at the end of the year and no sales or redemption charges (if any). Total returns would be reduced if a sales or redemption charge was taken into account. Returns do not reflect the impact of taxes to shareholders relating to Fund distributions or the redemption of Fund shares. |
| | (c) | The Fund’s portfolio turnover rate is calculated in accordance with regulatory requirements, without regard to transactions involving short term investments and certain derivatives. If such transactions were included, the Fund’s portfolio turnover rate may be higher. |
| | (d) | There were no long-term transactions for the fiscal year ended October 31, 2024. |
| | |
| The accompanying notes are an integral part of these financial statements. | | 13 |
GOLDMAN SACHS MULTI-STRATEGY ALTERNATIVES FUND
|
Consolidated Notes to Financial Statements October 31, 2024 |
Goldman Sachs Trust II (the “Trust”) is a Delaware statutory trust registered under the Investment Company Act of 1940, as amended (the “Act”), as an open-end management investment company. The Trust includes the Goldman Sachs Multi-Strategy Alternatives Fund (the “Fund”). The Fund is a diversified portfolio and currently offers seven classes of shares: Class A, Class C, Institutional, Investor, Class R6 and Class P Shares.
Class A Shares are sold with a front-end sales charge of up to 5.50%. Class C Shares are sold with a contingent deferred sales charge (“CDSC”) of 1.00%, which is imposed on redemptions made within 12 months of purchase. Institutional, Investor, Class R6, and Class P Shares are not subject to a sales charge.
Goldman Sachs Asset Management, L.P. (“GSAM”), an affiliate of Goldman Sachs & Co. LLC (“Goldman Sachs”), serves as investment adviser to the Fund pursuant to a management agreement (the “Agreement”) with the Trust.
At the close of business on April 16, 2024, Class R Shares of the Fund were liquidated.
|
|
2. SIGNIFICANT ACCOUNTING POLICIES |
The financial statements have been prepared in accordance with accounting principles generally accepted in the United States of America (“GAAP”) and require management to make estimates and assumptions that may affect the reported amounts and disclosures. Actual results may differ from those estimates and assumptions. The Fund is an investment company under GAAP and follows the accounting and reporting guidance applicable to investment companies.
A. Basis of Consolidation for the Goldman Sachs Multi-Strategy Alternatives Fund — The Cayman Commodity — MMA IV, LLC (the “Subsidiary”), a Cayman Islands exempted company, is currently a wholly-owned subsidiary of the Fund. The Subsidiary acts as an investment vehicle for the Fund to enable the Fund to gain exposure to certain types of commodity-linked derivative instruments. The Fund is the sole shareholder of the Subsidiary and it is intended that the Fund will remain the sole shareholder and will continue to control the Subsidiary. All inter-fund balances and transactions have been eliminated in consolidation. As of October 31, 2024, the Fund’s net assets were $64,670,541 of which, $11,089,875 or 17.1%, represented the Subsidiary’s net assets.
B. Investment Valuation — The Fund’s valuation policy is to value investments at fair value.
C. Investment Income and Investments — Investment income includes interest income, dividend income and securities lending income, if any. Interest income is accrued daily and adjusted for amortization of premiums and accretion of discounts. Dividend income is recognized on ex-dividend date or, for certain foreign securities, as soon as such information is obtained subsequent to the ex-dividend date. Non-cash dividends, if any, are recorded at the fair market value of the securities received. Investment transactions are reflected on trade date. Realized gains and losses are calculated using identified cost. Investment transactions are recorded on the following business day for daily net asset value (“NAV”) calculations. Investment income is recorded net of any foreign withholding taxes, less any amounts reclaimable. The Fund may file withholding tax reclaims in certain jurisdictions to recover a portion of amounts previously withheld. Any foreign capital gains tax is accrued daily based upon net unrealized gains, and is payable upon sale of such investments.
For derivative contracts, unrealized gains and losses are recorded daily and become realized gains and losses upon disposition or termination of the contract.
D. Class Allocations and Expenses — Investment income, realized and unrealized gain (loss), if any, and non-class specific expenses of the Fund are allocated daily based upon the proportion of net assets of each class. Non-class specific expenses directly incurred by the Fund are charged to the Fund, while such expenses incurred by the Trust are allocated across the Fund on a straight-line and/or pro-rata basis depending upon the nature of the expenses. Class specific expenses, where applicable, are borne by the respective share classes and include Distribution and Service, Transfer Agency and Service fees.
GOLDMAN SACHS MULTI-STRATEGY ALTERNATIVES FUND
|
|
2. SIGNIFICANT ACCOUNTING POLICIES (continued) |
E. Federal Taxes and Distributions to Shareholders — It is the Fund’s policy to comply with the requirements of the Internal Revenue Code of 1986, as amended (the “Code”), applicable to regulated investment companies and to distribute each year substantially all of its investment company taxable income and capital gains to its shareholders. Accordingly, the Fund is not required to make any provisions for the payment of federal income tax. Distributions to shareholders are recorded on the ex-dividend date. Income and capital gains distributions, if any, are declared and paid annually.
The Subsidiary is classified as a controlled foreign corporation under the Code. Therefore, the Fund is required to increase its taxable income by its share of the Subsidiary’s income. Net losses of the Subsidiary cannot be deducted by the Fund in the current period nor carried forward to offset taxable income in future periods.
Net capital losses, if any, are carried forward to future fiscal years and may be used to the extent allowed by the Code to offset any future capital gains. Losses that are carried forward will retain their character as either short-term or long-term capital losses. Utilization of capital loss carryforwards will reduce the requirement of future capital gains distributions.
The characterization of distributions to shareholders for financial reporting purposes is determined in accordance with federal income tax rules, which may differ from GAAP. The source of the Fund’s distributions may be shown in the accompanying financial statements as either from distributable earnings or capital. Certain components of the Fund’s net assets on the Consolidated Statement of Assets and Liabilities reflect permanent GAAP/tax differences based on the appropriate tax character.
F. Foreign Currency Translation — The accounting records and reporting currency of the Fund are maintained in U.S. dollars. Assets and liabilities denominated in foreign currencies are translated into U.S. dollars using the current exchange rates at the close of each business day. The effect of changes in foreign currency exchange rates on investments is included within net realized and unrealized gain (loss) on investments. Changes in the value of other assets and liabilities as a result of fluctuations in foreign exchange rates are included in the Consolidated Statement of Operations within net change in unrealized gain (loss) on foreign currency translation. Transactions denominated in foreign currencies are translated into U.S. dollars on the date the transaction occurred, the effects of which are included within net realized gain (loss) on foreign currency transactions.
G. Commission Recapture — GSAM, on behalf of certain Funds, may direct portfolio trades, subject to seeking best execution, to various brokers who have agreed to rebate a portion of the commissions generated. Such rebates are made directly to the Fund as cash payments and are included in net realized gain (loss) from investments on the Consolidated Statement of Operations.
|
|
3. INVESTMENTS AND FAIR VALUE MEASUREMENTS |
U.S. GAAP defines the fair value of a financial instrument as the amount that would be received to sell an asset or paid to transfer a liability in an orderly transaction between market participants at the measurement date (i.e., the exit price); the Fund’s policy is to use the market approach. GAAP establishes a fair value hierarchy that prioritizes the inputs to valuation techniques used to measure fair value. The hierarchy gives the highest priority to unadjusted quoted prices in active markets for identical assets or liabilities (Level 1 measurements) and the lowest priority to unobservable inputs (Level 3 measurements). The level in the fair value hierarchy within which the fair value measurement in its entirety falls shall be determined based on the lowest level input that is significant to the fair value measurement in its entirety. The levels used for classifying investments are not necessarily an indication of the risk associated with investing in these investments. The three levels of the fair value hierarchy are described below:
Level 1 — Unadjusted quoted prices in active markets that are accessible at the measurement date for identical, unrestricted assets or liabilities;
Level 2 — Quoted prices in markets that are not active or financial instruments for which significant inputs are observable (including, but not limited to, quoted prices for similar investments, interest rates, foreign exchange rates, volatility and credit spreads), either directly or indirectly;
Level 3 — Prices or valuations that require significant unobservable inputs (including GSAM’s assumptions in determining fair value measurement).
GOLDMAN SACHS MULTI-STRATEGY ALTERNATIVES FUND
|
Consolidated Notes to Financial Statements (continued) October 31, 2024 |
|
|
3. INVESTMENTS AND FAIR VALUE MEASUREMENTS (continued) |
The Board of Trustees (“Trustees”) has approved Valuation Procedures that govern the valuation of the portfolio investments held by the Fund, including investments for which market quotations are not readily available. With respect to the Fund’s investments that do not have readily available market quotations, the Trustees have designated GSAM as the valuation designee to perform fair valuations pursuant to Rule 2a-5 under the Investment Company Act of 1940 (the “Valuation Designee”). GSAM has day-to-day responsibility for implementing and maintaining internal controls and procedures related to the valuation of the Fund’s investments. To assess the continuing appropriateness of pricing sources and methodologies, GSAM regularly performs price verification procedures and issues challenges as necessary to third party pricing vendors or brokers, and any differences are reviewed in accordance with the Valuation Procedures.
A. Level 1 and Level 2 Fair Value Investments — The valuation techniques and significant inputs used in determining the fair values for investments classified as Level 1 and Level 2 are as follows:
Money Market Funds — Investments in the Goldman Sachs Financial Square Government Fund (“Underlying Money Market Fund”) are valued at the NAV per share of the Institutional Share class on the day of valuation. These investments are generally classified as Level 1 of the fair value hierarchy. For information regarding the Underlying Money Market Fund’s accounting policies and investment holdings, please see the Underlying Money Market Fund’s shareholder report.
Derivative Contracts — A derivative is an instrument whose value is derived from underlying assets, indices, reference rates or a combination of these factors. The Fund enters into derivative transactions to hedge against changes in interest rates, securities prices, and/or currency exchange rates, to increase total return, or to gain access to certain markets or attain exposure to other underliers. For financial reporting purposes, cash collateral that has been pledged to cover obligations of the Fund and cash collateral received, if any, is reported separately on the Consolidated Statement of Assets and Liabilities as either due to broker/receivable for collateral on certain derivative contracts. Non-cash collateral pledged by the Fund, if any, is noted in the Consolidated Schedule of Investments.
Exchange-traded derivatives, including futures and options contracts, are generally valued at the last sale or settlement price on the exchange where they are principally traded. Exchange-traded options without settlement prices are generally valued at the midpoint of the bid and ask prices on the exchange where they are principally traded (or, in the absence of two-way trading, at the last bid price for long positions and the last ask price for short positions). Exchange-traded derivatives typically fall within Level 1 of the fair value hierarchy. Over-the-counter (“OTC”) and centrally cleared derivatives are valued using market transactions and other market evidence, including market-based inputs to models, calibration to market-clearing transactions, broker or dealer quotations, or other alternative pricing sources. Where models are used, the selection of a particular model to value OTC and centrally cleared derivatives depends upon the contractual terms of, and specific risks inherent in, the instrument, as well as the availability of pricing information in the market. Valuation models require a variety of inputs, including contractual terms, market prices, yield curves, credit curves, measures of volatility, voluntary and involuntary prepayment rates, loss severity rates and correlations of such inputs. For OTC and centrally cleared derivatives that trade in liquid markets, model inputs can generally be verified and model selection does not involve significant management judgment. OTC and centrally cleared derivatives are classified within Level 2 of the fair value hierarchy when significant inputs are corroborated by market evidence.
i. Forward Contracts — A forward contract is a contract between two parties to buy or sell an asset at a specified price on a future date. A forward contract settlement can occur on a cash or delivery basis. Forward contracts are marked-to-market daily using independent vendor prices, and the change in value, if any, is recorded as an unrealized gain or loss. Cash and certain investments may be used to collateralize forward contracts.
A forward foreign currency exchange contract is a forward contract in which the Fund agrees to receive or deliver a fixed quantity of one currency for another, at a pre-determined price at a future date. All forward foreign currency exchange contracts are marked to market daily by using the outright forward rates or interpolating based upon maturity dates, where available. Non-deliverable forward foreign currency exchange contracts are settled with the counterparty in cash without the delivery of foreign currency.
GOLDMAN SACHS MULTI-STRATEGY ALTERNATIVES FUND
|
|
3. INVESTMENTS AND FAIR VALUE MEASUREMENTS (continued) |
ii. Futures Contracts — Futures contracts are contracts to buy or sell a standardized quantity of a specified commodity or security. Upon entering into a futures contract, a Fund deposits cash or securities in an account on behalf of the broker in an amount sufficient to meet the initial margin requirement. Subsequent payments are made or received by the Fund equal to the daily change in the contract value and are recorded as variation margin receivable or payable with a corresponding offset to unrealized gains or losses.
B. Level 3 Fair Value Investments — To the extent that significant inputs to valuation models and other alternative pricing sources are unobservable, or if quotations are not readily available, or if GSAM believes that such quotations do not accurately reflect fair value, the fair value of the Fund’s investments may be determined under the Valuation Procedures. GSAM, consistent with its procedures and applicable regulatory guidance, may make an adjustment to the most recent valuation prices of either domestic or foreign securities in light of significant events to reflect what it believes to be the fair value of the securities at the time of determining the Fund’s NAV. To the extent investments are valued using single source broker quotations obtained directly from the broker or passed through from third party pricing vendors, such investments are classified as Level 3 investments.
C. Fair Value Hierarchy — The following is a summary of the Fund’s investments and derivatives classified in the fair value hierarchy as of October 31, 2024:
| | | | | | | | | | | | |
| Investment Type | | Level 1 | | | Level 2 | | | Level 3 | |
|
| |
| | | |
Assets | | | | | | | | | | | | |
| | | |
Common Stock and/or Other Equity Investments(a) | | | | | | | | | | | | |
| | | |
Asia | | $ | — | | | $ | — | | | $ | — | |
| | | |
Investment Company | | | 59,498,130 | | | | — | | | | — | |
|
| |
| | | |
Total | | $ | 59,498,130 | | | $ | — | | | $ | — | |
|
| |
| | | |
| Derivative Type | | | | | | | | | |
|
| |
| | | |
Assets(b) | | | | | | | | | | | | |
| | | |
Forward Foreign Currency Exchange Contracts | | $ | — | | | $ | 5,175,834 | | | $ | — | |
| | | |
Futures Contracts | | | 8,507,609 | | | | — | | | | — | |
|
| |
| | | |
Total | | $ | 8,507,609 | | | $ | 5,175,834 | | | $ | — | |
|
| |
| | | |
Liabilities(b) | | | | | | | | | | | | |
| | | |
Forward Foreign Currency Exchange Contracts | | $ | — | | | $ | (5,979,497 | ) | | $ | — | |
| | | |
Futures Contracts | | | (7,121,452 | ) | | | — | | | | — | |
|
| |
| | | |
Total | | $ | (7,121,452 | ) | | $ | (5,979,497 | ) | | $ | — | |
|
| |
| | (a) | Amounts are disclosed by continent to highlight the impact of time zone differences between local market close and the calculation of net asset value. Security valuations are based on the principal exchange or system on which they are traded, which may differ from country of domicile. |
| | (b) | Amount shown represents unrealized gain (loss) at period end. |
For further information regarding security characteristics, see the Consolidated Schedule of Investments.
|
|
4. INVESTMENTS IN DERIVATIVES |
The following table sets forth, by certain risk types, the gross value of derivative contracts (not considered to be hedging instruments for accounting disclosure purposes) as of October 31, 2024. These instruments were used as part of the Fund’s investment strategies and to obtain and/or manage exposure related to the risks below. The values in the tables below exclude the effects of cash collateral received or posted pursuant to these derivative contracts, and therefore are not representative of the Fund’s net exposure.
GOLDMAN SACHS MULTI-STRATEGY ALTERNATIVES FUND
|
Consolidated Notes to Financial Statements (continued) October 31, 2024 |
|
|
4. INVESTMENTS IN DERIVATIVES (continued) |
| | | | | | | | | | | | |
| Multi-Strategy Alternatives Fund | | | | | | | | | | |
| Risk | | Consolidated Statement of Assets and Liabilities | | Assets | | | Consolidated Statement of Assets and Liabilities | | Liabilities | |
| | | | |
| Commodity | | Variation margin on futures contracts | | $ | 6,894,544 | (a) | | Variation margin on futures contracts | | $ | (6,878,467 | )(a) |
| | | | |
| Currency | | Receivable for unrealized gain on forward foreign currency contracts | | | 5,175,834 | | | Payable for unrealized loss on forward foreign currency contracts | | | (5,979,497) | |
| | | | |
| Interest rate | | Variation margin on futures contracts | | | 1,613,065 | (a) | | Variation margin on futures contracts | | | (242,985) | (a) |
| | | | |
Total | | | | $ | 13,683,443 | | | | | $ | (13,100,949) | |
| | (a) | Includes unrealized gain (loss) on futures contracts described in the Additional Investment Information sections of the Consolidated Schedule of Investments. Only current day’s variation margin is reported within the Consolidated Statement of Assets and Liabilities. |
The following table sets forth, by certain risk types, the Fund’s gains (losses) related to these derivatives and their indicative volumes for the fiscal year ended October 31, 2024. These gains (losses) should be considered in the context that these derivative contracts may have been executed to create investment opportunities and/or economically hedge certain investments, and accordingly, certain gains (losses) on such derivative contracts may offset certain (losses) gains attributable to investments. These gains (losses) are included in “Net realized gain (loss)” or “Net change in unrealized gain (loss)” on the Consolidated Statement of Operations:
| | | | | | | | | | | | |
| Multi-Strategy Alternatives Fund | | | | | | | | | | |
| Risk | | Consolidated Statement of Operations | | Net Realized Gain (Loss) | | Net Change in
Unrealized
Gain (Loss) |
| | | |
| Commodity | | Net realized gain (loss) from futures contracts/Net change in unrealized gain (loss) on futures contracts | | | $ | (7,730,948 | ) | | | $ | 945,952 | |
| | | |
| Currency | | Net realized gain (loss) from forward foreign currency exchange contracts/Net change in unrealized gain (loss) on forward foreign currency exchange contracts | | | | 898,013 | | | | | (965,413 | ) |
| | | |
| Equity | | Net realized gain (loss) from written options | | | | 2,345 | | | | | — | |
| | | |
| Interest rate | | Net realized gain (loss) from futures contracts/Net change in unrealized gain (loss) on futures contracts | | | | (469,165 | ) | | | | 2,723,869 | |
| | | |
Total | | | | | $ | (7,299,755 | ) | | | $ | 2,704,408 | |
For the fiscal year ended October 31, 2024, the relevant values for each derivative type were as follows:
| | | | | | | | |
| | | | | Average Number of Contracts, Notional Amounts(a) | | | | |
| | | | |
| | | Futures Contracts | | | | Forward Contracts | | |
| | | | |
| | | 4,804 | | | | $447,994,365 | | |
| | (a) | Amounts disclosed represent average number of contracts for Futures and Notional amounts for forwards contracts, which is indicative of volume for this derivative type, for the months that the Fund held such derivatives during the fiscal year ended October 31, 2024. |
In order to better define its contractual rights and to secure rights that will help the Fund mitigate its counterparty risk, the Fund may enter into an International Swaps and Derivatives Association, Inc. Master Agreement (“ISDA Master Agreement”) or similar agreement with its derivatives counterparties. An ISDA Master Agreement is a bilateral agreement between the Fund and a counterparty that governs OTC derivatives (including forward foreign currency exchange contracts, and certain options and swaps), and typically contains, among other things, collateral posting terms and netting provisions in the event of a default and/or
GOLDMAN SACHS MULTI-STRATEGY ALTERNATIVES FUND
|
|
4. INVESTMENTS IN DERIVATIVES (continued) |
termination event. The provisions of the ISDA Master Agreement typically permit a single net payment in the event of a default (close-out netting) or similar event, including the bankruptcy or insolvency of the counterparty.
Collateral and margin requirements differ between exchange traded derivatives and OTC derivatives. Margin requirements are established by the broker or clearing house for exchange-traded and centrally cleared derivatives (financial futures contracts, options and centrally cleared swaps) pursuant to governing agreements for those instrument types. Brokers can ask for margin in excess of the minimum in certain circumstances. Collateral terms are contract-specific for OTC derivatives. For derivatives traded under an ISDA Master Agreement, the collateral requirements are typically calculated by netting the marked to market amount for each transaction under such agreement and comparing that amount to the value of any collateral currently pledged by the Fund and the counterparty. Additionally, the Fund may be required to post initial margin to the counterparty, the terms of which would be outlined in the confirmation of the OTC transaction.
Generally, the amount of collateral due from or to a counterparty must exceed a minimum transfer amount threshold before a transfer is required to be made. To the extent amounts due to the Fund from its counterparties are not fully collateralized, contractually or otherwise, the Fund bears the risk of loss from counterparty nonperformance. The Fund attempts to mitigate counterparty risk by only entering into agreements with counterparties that the Investment Adviser believes to be of good standing and by monitoring the financial stability of those counterparties.
Additionally, the netting of assets and liabilities and the offsetting of collateral pledged or received are based on contractual netting/set-off provisions in the ISDA Master Agreement or similar agreements. However, in the event of a default or insolvency of a counterparty, a court could determine that such rights are not enforceable due to the restrictions or prohibitions against the right of setoff that may be imposed in accordance with a particular jurisdiction’s bankruptcy or insolvency laws.
The following table sets forth the Fund’s net exposure for derivative instruments that are subject to enforceable master netting arrangements or similar agreements as of October 31, 2024:
Multi-Strategy Alternatives Fund
| | | | | | | | | | |
| | | Derivative Assets(1) | | Derivative Liabilities(1) | | | | | | |
| | | | | |
| Counterparty | | Forward Currency Contracts | | Forward Currency Contracts | | Net Derivative Asset (Liabilities) | | Collateral (Received) Pledged(1) | | Net Amount(2) |
|
|
| | | | | |
MS & Co. Int. PLC | | $5,175,834 | | $(5,979,497) | | $(803,663) | | $803,663 | | $— |
|
|
| | (1) | Gross amounts available for offset but not netted in the Consolidated Statement of Assets and Liabilities. |
| | (2) | Net amount represents the net amount due (to) from counterparty in the event of a default based on the contractual set-off rights under the agreement. Net amount excludes any over-collateralized amounts. |
|
|
5. AGREEMENTS AND AFFILIATED TRANSACTIONS |
A. Management Agreement — Under the Agreement, GSAM manages the Fund, subject to the general supervision of the Trustees.
As compensation for the services rendered pursuant to the Agreement, the assumption of the expenses related thereto and administration of the Fund’s business affairs, including providing facilities, GSAM is entitled to a management fee, accrued daily and paid monthly, equal to an annual percentage rate of the Fund’s average daily net assets. For the fiscal year ended October 31, 2024, contractual and effective net management fees with GSAM were at the following rates:
| | | | | | | | | | | | | | | | | | | | | | | | | | | | | | |
| | | | Contractual Management Rate | | | Effective Rate | | | Effective Net Management Rate^(a) | | | | |
| | | | First $2 billion | | | Next $3 billion | | | Next $3 billion | | | Over $8 billion | |
|
| | |
| | | | | | | |
| | | | | 0.75% | | | | 0.68% | | | | 0.64% | | | | 0.63% | | | | 0.75% | | | | 0.59% | | | | | |
|
| | |
| | ^ | Effective Net Management Rate includes the impact of management fee waivers of affiliated underlying funds, if any. |
| | (a) | Reflects combined management fees paid to GSAM under the Agreement and the Subsidiary Agreements as defined below after waivers. |
GOLDMAN SACHS MULTI-STRATEGY ALTERNATIVES FUND
|
Consolidated Notes to Financial Statements (continued) October 31, 2024 |
|
|
5. AGREEMENTS AND AFFILIATED TRANSACTIONS (continued) |
The Fund invests in Institutional Shares of the Goldman Sachs Financial Square Government Fund, which is an affiliated Underlying Fund. GSAM has agreed to waive a portion of its management fee payable by the Fund in an amount equal to the management fee it earns as an investment adviser to the affiliated Underlying Fund in which the Fund invests. For the fiscal year ended October 31, 2024, GSAM waived $157,251 of the Fund’s management fee.
GSAM also provides management services to the Subsidiary pursuant to a Subsidiary Management Agreement (the “Subsidiary Agreement”) and is entitled to a management fee accrued daily and paid monthly, equal to an annual percentage rate of 0.42% of the Subsidiary’s average daily net assets. In consideration of the Subsidiary’s management fee, and for as long as the Subsidiary Agreement remains in effect, GSAM has contractually agreed to waive irrevocably a portion of the Fund’s management fee in an amount equal to the management fee accrued and paid to GSAM by the Subsidiary under the Subsidiary Agreement. For the fiscal year ended October 31, 2024, GSAM waived $67,719 of the Fund’s management fee.
B. Distribution and/or Service (12b-1) Plans — The Trust, on behalf of Class A Shares of the Fund, has adopted Distribution and Service Plans subject to Rule 12b-1 under the Act. Under the Distribution and Service Plans, Goldman Sachs, which serves as distributor (the “Distributor”), is entitled to a fee accrued daily and paid monthly for distribution services and personal and account maintenance services, which may then be paid by Goldman Sachs to authorized dealers. These fees are equal to an annual percentage rate of the average daily net assets attributable to Class A Shares of the Fund, as applicable, as set forth below.
The Trust, on behalf of Class C Shares of the Fund, has adopted a Distribution Plan subject to Rule 12b-1 under the Act. Under the Distribution Plan, Goldman Sachs as Distributor is entitled to a fee accrued daily and paid monthly for distribution services, which may then be paid by Goldman Sachs to authorized dealers. These fees are equal to an annual percentage rate of the average daily net assets attributable to Class C Shares of the Fund, as set forth below.
| | | | |
| | | Distribution and/or Service Plan Rates |
| | |
| | | Class A* | | Class C |
|
|
| | |
Distribution and/or Service Plan | | 0.25% | | 0.75% |
|
|
| | * | With respect to Class A Shares, the Distributor at its discretion may use compensation for distribution services paid under the Distribution and/or Service Plan to compensate service organizations for personal and account maintenance services and expenses as long as such total compensation does not exceed the maximum cap on “service fees” imposed by the Financial Industry Regulatory Authority. |
C. Distribution Agreement — Goldman Sachs, as Distributor of the shares of the Fund pursuant to a Distribution Agreement, may retain a portion of the Class A Shares’ front end sales charge and Class C Shares’ CDSC. During the fiscal year ended October 31, 2024, Goldman Sachs retained the following amounts:
| | |
| | | Front End
Sales Charge |
| |
Fund | | Class A |
| |
Multi-Strategy Alternatives Fund | | $9 |
During the fiscal year ended October 31, 2024, Goldman Sachs did not retain any portion of Class C Shares’ CDSC.
D. Service Plan — The Trust, on behalf of the Fund, has adopted a Service Plan to allow Class C Shares to compensate service organizations (including Goldman Sachs) for providing varying levels of personal and account maintenance services to their customers who are beneficial owners of such shares. The Service Plan provides for compensation to the service organizations equal to an annual percentage rate of 0.25% of the average daily net assets attributable to Class C Shares of the Fund.
E. Transfer Agency Agreement — Goldman Sachs also serves as the transfer agent of the Fund for a fee pursuant to the Transfer Agency Agreement. The fees charged for such transfer agency services are accrued daily and paid monthly at annual rates as follows: 0.15% of the average daily net assets of Class A, Class C and Investor Shares; 0.04% of the average daily net assets of Institutional Shares; and 0.03% of the average daily net assets of Class R6 and Class P Shares. Goldman Sachs has agreed to waive
GOLDMAN SACHS MULTI-STRATEGY ALTERNATIVES FUND
|
|
5. AGREEMENTS AND AFFILIATED TRANSACTIONS (continued) |
a portion of the transfer agency fees equal to 0.06% of the average daily net assets attributable to Class A, Class C and Investor Shares of the Fund through at least February 28, 2025 (the “TA Fee Waiver”). Prior to such date, Goldman Sachs may not terminate the arrangement without approval of the Board of Trustees.
F. Other Expense Agreements and Affiliated Transactions — GSAM has agreed to reduce or limit certain “Other Expenses” of the Fund (excluding acquired fund fees and expenses, transfer agency fees and expenses, service fees and shareholder administration fees (as applicable), taxes, interest, brokerage fees, expenses of shareholder meetings, litigation and indemnification, and extraordinary expenses) to 0.064% of the average daily net assets of the Fund. These Other Expense limitations will remain in place through at least February 28, 2025, and prior to such date GSAM may not terminate the arrangements without the approval of the Trustees.
In addition, the Fund has entered into certain offset arrangements with the transfer agent, which may result in a reduction of the Fund’s expenses and are received irrespective of the application of the “Other Expense” limitations described above. For the fiscal year ended October 31, 2024, these expense reductions, including any fee waivers and Other Expense reimbursements, were as follows:
| | | | | | | | | | | | | | |
Fund | | Management
Fee Waiver | | | | Transfer Agency
Waivers/Credits | | | | Other
Expense Reimbursements | | | | Total
Expense
Reductions |
| | | | | | | |
| Multi-Strategy Alternatives Fund | | $157,251 | | | | $6,631 | | | | $1,295,965 | | | | $1,459,847 |
G. Line of Credit Facility — As of October 31, 2024, the Fund participated in a $1,150,000,000 committed, unsecured revolving line of credit facility (the “facility”) together with other funds of the Trust and certain registered investment companies having management agreements with GSAM or its affiliates. This facility is to be used for temporary emergency purposes, or to allow for an orderly liquidation of securities to meet redemption requests. The interest rate on borrowings is based on the federal funds rate. The facility also requires a fee to be paid by the Fund based on the amount of the commitment that has not been utilized. For the fiscal year ended October 31, 2024, the Fund did not have any borrowings under the facility. Prior to April 16, 2024, the facility was $1,110,000,000.
H. Other Transactions with Affiliates — For the fiscal year ended October 31, 2024, Goldman Sachs did not earn any brokerage commissions from portfolio transactions, on behalf of the Fund.
As of October 31, 2024, The Goldman Sachs Group, Inc. was the beneficial owner of approximately 100% of Class R6 Shares of the Fund.
The table below shows the transaction in and earnings from investments in the Goldman Sachs Financial Square Government Fund for the fiscal year ended October 31, 2024.
| | | | | | | | | | | | | | |
| Fund | | Underlying Fund | | Beginning
Value as of October 31, 2023 | | Purchases
at Cost | | Proceeds
from Sales | | Ending
Value as of October 31, 2024 | | Shares as of
October 31, 2024 | | Dividend
Income |
| | | | | | | |
Multi-Strategy Alternatives Fund | | Goldman Sachs Financial Square Government Fund — Institutional Shares | | $84,998,501 | | $58,569,401 | | $(84,069,772) | | $59,498,130 | | 59,498,130 | | $3,888,237 |
|
|
6. PORTFOLIO SECURITIES TRANSACTIONS |
For the fiscal year ended October 31, 2024, there were no purchases and proceeds from sales and maturities of long-term securities for the Fund.
GOLDMAN SACHS MULTI-STRATEGY ALTERNATIVES FUND
|
Consolidated Notes to Financial Statements (continued) October 31, 2024 |
The tax character of distributions paid during the fiscal year ended October 31, 2024 was as follows:
| | | | |
Distributions paid from: | | | | |
| |
Ordinary income | | $ | 3,366,540 | |
| |
| |
Total taxable distributions | | $ | 3,366,540 | |
| |
The tax character of distributions paid during the fiscal year ended October 31, 2023 was as follows:
| | | | |
Distributions paid from: | | | | |
| |
Ordinary income | | $ | 700,064 | |
| |
| |
Total taxable distributions | | $ | 700,064 | |
| |
As of October 31, 2024, the components of accumulated earnings (losses) on a tax basis were as follows:
| | | | |
| |
| |
Undistributed ordinary income — net | | $ | 2,922,756 | |
| |
| |
Capital loss carryforwards(1) : | | | | |
| |
Perpetual Short-Term | | | (41,032,619) | |
| |
Perpetual Long-Term | | | (1,000,057) | |
| |
| |
Total capital loss carryforwards | | | (42,032,676) | |
| |
| |
Timing differences (Straddles, Misc. Tax Adjustment) | | $ | (968,372) | |
| |
Unrealized gains (loss) — net | | | 339,056 | |
| |
| |
Total accumulated earnings (loss) net | | $ | (39,739,236) | |
| |
| | (1) | The Fund utilized $1,062,087 of capital losses in the current fiscal year. |
As of October 31, 2024, the Fund’s aggregate security unrealized gains and losses based on cost for U.S. federal income tax purposes were as follows:
| | | | |
| |
| |
Tax Cost | | $ | 59,686,687 | |
| |
| |
Gross unrealized gain | | | 961,035 | |
| |
Gross unrealized loss | | | (621,979) | |
| |
| |
Net unrealized gain | | $ | 339,056 | |
| |
The difference between GAAP-basis and tax basis unrealized gains (losses) is attributable primarily to wash sales, net mark to market gains/(losses) on regulated futures contracts, net mark to market gains/(losses) on foreign currency contracts, and differences in the tax treatment of underlying fund investments.
The Fund reclassed $6,453,959 from paid in capital to distributable earnings for the year ending October 31, 2024. In order to present certain components of the Funds’ capital accounts on a tax-basis, certain reclassifications have been recorded to the Funds’ accounts. These reclassifications have no impact on the net asset value of the Funds’ and result primarily from differences in the tax treatment of underlying fund investments.
GSAM has reviewed the Fund’s tax positions for all open tax years (the current and prior three years, as applicable) and has concluded that no provision for income tax is required in the Fund’s financial statements. Such open tax years remain subject to examination and adjustment by tax authorities.
GOLDMAN SACHS MULTI-STRATEGY ALTERNATIVES FUND
The Fund’s risks include, but are not limited to, the following:
Derivatives Risk — The Fund’s use of derivatives and other similar instruments (collectively referred to in this paragraph as “derivatives”) may result in loss, including due to adverse market movements. Derivatives, which may pose risks in addition to and greater than those associated with investing directly in securities, currencies or other assets and instruments, may increase market exposure and be illiquid or less liquid, volatile, difficult to price and leveraged so that small changes in the value of the underlying assets or instruments may produce disproportionate losses to the Fund. Certain derivatives are also subject to counterparty risk, which is the risk that the other party in the transaction will not, or lacks the capacity or authority to, fulfill its contractual obligations, liquidity risk, which includes the risk that the Fund will not be able to exit the derivative when it is advantageous to do so, and risks arising from margin requirements, which include the risk that the Fund will be required to pay additional margin or set aside additional collateral to maintain open derivative positions. The use of derivatives is a highly specialized activity that involves investment techniques and risks different from those associated with investments in more traditional securities and instruments. Losses from derivatives can also result from a lack of correlation between changes in the value of derivative instruments and the portfolio assets (if any) being hedged.
Foreign and Emerging Countries Risk — Investing in foreign markets may involve special risks and considerations not typically associated with investing in the U.S. Foreign securities may be subject to risk of loss because of more or less foreign government regulation; less public information; less stringent investor protections; less stringent accounting, corporate governance, financial reporting and disclosure standards; and less economic, political and social stability in the countries in which the Fund invests. The imposition of sanctions, exchange controls (including repatriation restrictions), confiscation of assets and property, trade restrictions (including tariffs) and other government restrictions by the U.S. or other governments, or from problems in registration, settlement or custody, may also result in losses. The type and severity of sanctions and other similar measures, including counter sanctions and other retaliatory actions, that may be imposed could vary broadly in scope, and their impact is impossible to predict. For example, the imposition of sanctions and other similar measures could, among other things, cause a decline in the value and/or liquidity of securities issued by the sanctioned country or companies located in or economically tied to the sanctioned country and increase market volatility and disruption in the sanctioned country and throughout the world. Sanctions and other similar measures could limit or prevent the Fund from buying and selling securities (in the sanctioned country and other markets), significantly delay or prevent the settlement of securities transactions, and significantly impact the Fund’s liquidity and performance. Foreign risk also involves the risk of negative foreign currency exchange rate fluctuations, which may cause the value of securities denominated in such foreign currency (or other instruments through which the Fund has exposure to foreign currencies) to decline in value. Currency exchange rates may fluctuate significantly over short periods of time. To the extent that the Fund also invests in securities of issuers located in, or economically tied to, emerging markets, these risks may be more pronounced.
Geographic Risk — If the Fund focuses its investments in securities of issuers located in a particular country or geographic region, the Fund may be subjected, to a greater extent than if its investments were less focused, to the risks of volatile economic cycles and/or conditions and developments that may be particular to that country or region, such as: adverse securities markets; adverse exchange rates; adverse social, political, regulatory, economic, business, environmental or other developments; or natural disasters.
Interest Rate Risk — When interest rates increase, fixed income securities or instruments held by the Fund will generally decline in value. Long-term fixed income securities or instruments will normally have more price volatility because of this risk than short-term fixed income securities or instruments. A wide variety of market factors can cause interest rates to rise, including central bank monetary policy, rising inflation and changes in general economic conditions. Changing interest rates may have unpredictable effects on the markets, may result in heightened market volatility and may detract from Fund performance. In addition, changes in monetary policy may exacerbate the risks associated with changing interest rates. Funds with longer average portfolio durations will generally be more sensitive to changes in interest rates than funds with a shorter average portfolio duration. Fluctuations in interest rates may also affect the liquidity of fixed income securities and instruments held by the Fund. A sudden or unpredictable
GOLDMAN SACHS MULTI-STRATEGY ALTERNATIVES FUND
|
Consolidated Notes to Financial Statements (continued) October 31, 2024 |
|
|
8. OTHER RISKS (continued) |
increase in interest rates may cause volatility in the market and may decrease the liquidity of the Fund’s investments, which would make it harder for the Fund to sell its investments at an advantageous time.
Investment Style Risk — Different investment styles (e.g., “growth”, “value” or “quantitative”) tend to shift in and out of favor depending upon market and economic conditions and investor sentiment. The Fund may outperform or underperform other funds that invest in similar asset classes but employ different investment styles.
Large Shareholder Transactions Risk — The Fund may experience adverse effects when certain large shareholders, such as other funds, institutional investors (including those trading by use of non-discretionary mathematical formulas), financial intermediaries (who may make investment decisions on behalf of underlying clients and/or include the Fund in their investment model), individuals, accounts and Goldman Sachs affiliates, purchase or redeem large amounts of shares of the Fund. Such large shareholder redemptions, which may occur rapidly or unexpectedly, may cause the Fund to sell portfolio securities at times when it would not otherwise do so, which may negatively impact the Fund’s NAV and liquidity. These transactions may also accelerate the realization of taxable income to shareholders if such sales of investments resulted in gains, and may also increase transaction costs. In addition, a large redemption could result in the Fund’s current expenses being allocated over a smaller asset base, leading to an increase in the Fund’s expense ratio. Similarly, large Fund share purchases may adversely affect the Fund’s performance to the extent that the Fund is delayed in investing new cash or otherwise maintains a larger cash position than it ordinarily would.
Liquidity Risk — The Fund may make investments that are illiquid or that may become less liquid in response to market developments or adverse investor perceptions. Illiquid investments may be more difficult to value. Liquidity risk may also refer to the risk that the Fund will not be able to pay redemption proceeds within the allowable time period or without significant dilution to remaining investors’ interests because of unusual market conditions, declining prices of the securities sold, an unusually high volume of redemption requests, or other reasons. To meet redemption requests, the Fund may be forced to sell investments at an unfavorable time and/or under unfavorable conditions. If the Fund is forced to sell securities at an unfavorable time and/or under unfavorable conditions, such sales may adversely affect the Fund’s NAV and dilute remaining investors’ interests. These risks may be more pronounced in connection with the Fund’s investments in securities of issuers located in emerging market countries. Redemptions by large shareholders may have a negative impact on the Fund’s liquidity.
Market and Credit Risks — In the normal course of business, the Fund trades financial instruments and enters into financial transactions where risk of potential loss exists due to changes in the market (market risk). The value of the securities in which the Fund invests may go up or down in response to the prospects of individual companies, particular sectors or governments and/or general economic conditions throughout the world due to increasingly interconnected global economies and financial markets. Events such as war, military conflict, acts of terrorism, social unrest, natural disasters, recessions, inflation, rapid interest rate changes, supply chain disruptions, sanctions, the spread of infectious illness or other public health threats could also significantly impact the Fund and its investments. Additionally, the Fund may also be exposed to credit risk in the event that an issuer or guarantor fails to perform or that an institution or entity with which the Fund has unsettled or open transactions defaults.
Short Position Risk — The Fund may enter into a short position through a futures contract, an option or swap agreement or through short sales of any instrument that the Fund may purchase for investment. Taking short positions involves leverage of the Fund’s assets and presents various risks, including counterparty risk. If the value of the underlying instrument or market in which the Fund has taken a short position increases, then the Fund will incur a loss equal to the increase in value from the time that the short position was entered into plus any related interest payments or other fees. Taking short positions involves the risk that losses may be disproportionate, may exceed the amount invested, and may be unlimited. To the extent that the Fund uses the proceeds it receives from a short position to take additional long positions, the risks associated with the short position, including leverage risks, may be heightened, because doing so increases the exposure of the Fund to the markets and therefore could magnify changes to the Fund’s NAV.
Tax Risk — The Fund will seek to gain exposure to the commodity markets primarily through investments in the Subsidiary and/ or commodity index-linked structured notes, as applicable. Historically, the Internal Revenue Service (“IRS”) issued private letter rulings (“PLRs”) in which the IRS specifically concluded that income and gains from investments in commodity index-linked
GOLDMAN SACHS MULTI-STRATEGY ALTERNATIVES FUND
|
|
8. OTHER RISKS (continued) |
structured notes (the “Notes Rulings”) or a wholly-owned foreign subsidiary that invests in commodity-linked instruments are “qualifying income” for purposes of compliance with Subchapter M of the Code. However, the Fund has not received a PLR, and is not able to rely on PLRs issued to other taxpayers. Treasury regulations generally treat the Fund’s income inclusion with respect to a subsidiary as qualifying income either if (A) there is a current distribution out of the earnings and profits of the subsidiary that are attributable to such income inclusion or (B) such inclusion is derived with respect to the Fund’s business of investing in stock, securities, or currencies.
The IRS also issued a revenue procedure, which states that the IRS will not in the future issue PLRs that would require a determination of whether an asset (such as a commodity index-linked note) is a “security” under the Investment Company Act of 1940. In connection with issuing such revenue procedure, the IRS has revoked the Notes Ruling on a prospective basis. In light of the revocation of the Notes Rulings, the Fund has limited its investments in commodity index-linked structured notes. The Fund has obtained an opinion of counsel that the Fund’s income from investments in the Subsidiary should constitute “qualifying income.” However, no assurances can be provided that the IRS would not be able to successfully assert that the Fund’s income from such investments was not “qualifying income,” in which case the Fund would fail to qualify as a regulated investment company (“RIC”) under Subchapter M of the Code if over 10% of its gross income was derived from these investments. If the Fund failed to qualify as a RIC, it would be subject to federal and state income tax on all of its taxable income at regular corporate tax rates with no deduction for any distributions paid to shareholders, which would significantly adversely affect the returns to, and could cause substantial losses for, Fund shareholders.
Under the Trust’s organizational documents, its Trustees, officers, employees and agents are indemnified, to the extent permitted by the Act and state law, against certain liabilities that may arise out of performance of their duties to the Fund. Additionally, in the course of business, the Fund enters into contracts that contain a variety of indemnification clauses. The Fund’s maximum exposure under these arrangements is unknown, as this would involve future claims that may be made against the Fund that have not yet occurred. However, GSAM believes the risk of loss under these arrangements to be remote.
Subsequent events have been evaluated through the date of issuance, and GSAM has concluded that there is no impact requiring adjustment or disclosure in the financial statements.
GOLDMAN SACHS MULTI-STRATEGY ALTERNATIVES FUND
|
Consolidated Notes to Financial Statements (continued) October 31, 2024 |
|
|
11. SUMMARY OF SHARE TRANSACTIONS |
Share activity is as follows:
| | | | | | | | | | | | | | | | | | | | |
| | | Multi-Strategy Alternatives Fund | |
| | | |
| | | For the Fiscal Year Ended October 31, 2024 | | | | | | For the Fiscal Year Ended October 31, 2023 | |
| |
| | | | |
| | | | | |
| | | Shares | | | Dollars | | | | | | Shares | | | Dollars | |
| |
| | | | |
| | | | | |
Class A Shares | | | | | | | | | | | | | | | | | | | | |
| | | | | |
Shares sold | | | 43,380 | | | $ | 473,137 | | | | | | | | 147,853 | | | $ | 1,646,506 | |
| | | | | |
Reinvestment of distributions | | | 20,637 | | | | 230,923 | | | | | | | | 1,655 | | | | 18,502 | |
| | | | | |
Shares redeemed | | | (193,122 | ) | | | (2,098,306) | | | | | | | | (209,620 | ) | | | (2,342,229 | ) |
|
| |
| | | | | |
| | | (129,105 | ) | | | (1,394,246 | ) | | | | | | | (60,112 | ) | | | (677,221 | ) |
|
| |
| | | | | |
Class C Shares | | | | | | | | | | | | | | | | | | | | |
| | | | | |
Shares sold | | | — | | | | — | | | | | | | | 2,316 | | | | 24,403 | |
| | | | | |
Reinvestment of distributions | | | 108 | | | | 1,171 | | | | | | | | — | | | | — | |
| | | | | |
Shares redeemed | | | (37,726 | ) | | | (397,977 | ) | | | | | | | (120,429 | ) | | | (1,267,292 | ) |
|
| |
| | | | | |
| | | (37,618 | ) | | | (396,806 | ) | | | | | | | (118,113 | ) | | | (1,242,889 | ) |
|
| |
| | | | | |
Institutional Shares | | | | | | | | | | | | | | | | | | | | |
| | | | | |
Shares sold | | | 110,702 | | | | 1,208,825 | | | | | | | | 258,269 | | | | 2,933,294 | |
| | | | | |
Reinvestment of distributions | | | 72,629 | | | | 826,520 | | | | | | | | 14,428 | | | | 163,755 | |
| | | | | |
Shares redeemed | | | (1,061,924 | ) | | | (11,535,306 | ) | | | | | | | (988,807 | ) | | | (11,214,686 | ) |
|
| |
| | | | | |
| | | (878,593 | ) | | | (9,499,961 | ) | | | | | | | (716,110 | ) | | | (8,117,637 | ) |
|
| |
| | | | | |
Investor Shares | | | | | | | | | | | | | | | | | | | | |
| | | | | |
Shares sold | | | 20,220 | | | | 219,737 | | | | | | | | 72,337 | | | | 814,913 | |
| | | | | |
Reinvestment of distributions | | | 13,417 | | | | 151,751 | | | | | | | | 2,234 | | | | 25,218 | |
| | | | | |
Shares redeemed | | | (167,437 | ) | | | (1,794,483 | ) | | | | | | | (185,030 | ) | | | (2,074,466 | ) |
|
| |
| | | | | |
| | | (133,800 | ) | | | (1,422,995 | ) | | | | | | | (110,459 | ) | | | (1,234,335 | ) |
|
| |
| | | | | |
Class R6 Shares | | | | | | | | | | | | | | | | | | | | |
| | | | | |
Reinvestment of distributions | | | 34 | | | | 387 | | | | | | | | 16 | | | | 185 | |
| | | | | |
Shares redeemed | | | — | | | | — | | | | | | | | (2,246 | ) | | | (25,364 | ) |
|
| |
| | | | | |
| | | 34 | | | | 387 | | | | | | | | (2,230 | ) | | | (25,179 | ) |
|
| |
| | | | | |
Class R Shares(a) | | | | | | | | | | | | | | | | | | | | |
| | | | | |
Shares sold | | | 705 | | | | 7,561 | | | | | | | | — | | | | — | |
| | | | | |
Reinvestment of distributions | | | 80 | | | | 875 | | | | | | | | — | | | | — | |
| | | | | |
Shares redeemed | | | (3,410 | ) | | | (34,985 | ) | | | | | | | — | | | | — | |
|
| |
| | | | | |
| | | (2,625 | ) | | | (26,549 | ) | | | | | | | — | | | | — | |
|
| |
| | | | | |
Class P Shares | | | | | | | | | | | | | | | | | | | | |
| | | | | |
Shares sold | | | 55,447 | | | | 606,934 | | | | | | | | 169,134 | | | | 1,909,457 | |
| | | | | |
Reinvestment of distributions | | | 184,092 | | | | 2,093,131 | | | | | | | | 42,710 | | | | 484,761 | |
| | | | | |
Shares redeemed | | | (2,006,392 | ) | | | (21,271,751 | ) | | | | | | | (3,504,125 | ) | | | (39,489,463 | ) |
|
| |
| | | | | |
| | | (1,766,853 | ) | | | (18,571,686 | ) | | | | | | | (3,292,281 | ) | | | (37,095,245 | ) |
|
| |
| | | | | |
NET DECREASE | | | (2,948,560 | ) | | $ | (31,311,856 | ) | | | | | | | (4,299,305 | ) | | $ | (48,392,506 | ) |
|
| |
| | (a) | At the close of business on April 16, 2024, Class R Shares of the Fund were liquidated. |
Report of Independent Registered Public Accounting Firm
To the Board of Trustees of Goldman Sachs Trust II and Shareholders of Goldman Sachs Multi-Strategy Alternatives Fund
Opinion on the Consolidated Financial Statements
We have audited the accompanying consolidated statement of assets and liabilities, including the consolidated schedule of investments, of Goldman Sachs Multi-Strategy Alternatives Fund and its subsidiary (one of the funds constituting Goldman Sachs Trust II, referred to hereafter as the “Fund”) as of October 31, 2024, the related consolidated statement of operations for the year ended October 31, 2024, the consolidated statement of changes in net assets for each of the two years in the period ended October 31, 2024, including the related notes, and the consolidated financial highlights for each of the five years in the period ended October 31, 2024 (collectively referred to as the “consolidated financial statements”). In our opinion, the consolidated financial statements present fairly, in all material respects, the financial position of the Fund as of October 31, 2024, the results of its operations for the year then ended, the changes in its net assets for each of the two years in the period ended October 31, 2024 and the financial highlights for each of the five years in the period ended October 31, 2024 in conformity with accounting principles generally accepted in the United States of America.
Basis for Opinion
These consolidated financial statements are the responsibility of the Fund’s management. Our responsibility is to express an opinion on the Fund’s consolidated financial statements based on our audits. We are a public accounting firm registered with the Public Company Accounting Oversight Board (United States) (PCAOB) and are required to be independent with respect to the Fund in accordance with the U.S. federal securities laws and the applicable rules and regulations of the Securities and Exchange Commission and the PCAOB.
We conducted our audits of these consolidated financial statements in accordance with the standards of the PCAOB. Those standards require that we plan and perform the audit to obtain reasonable assurance about whether the consolidated financial statements are free of material misstatement, whether due to error or fraud.
Our audits included performing procedures to assess the risks of material misstatement of the consolidated financial statements, whether due to error or fraud, and performing procedures that respond to those risks. Such procedures included examining, on a test basis, evidence regarding the amounts and disclosures in the consolidated financial statements. Our audits also included evaluating the accounting principles used and significant estimates made by management, as well as evaluating the overall presentation of the consolidated financial statements. Our procedures included confirmation of securities owned as of October 31, 2024 by correspondence with the custodian, transfer agent and brokers; when replies were not received from brokers, we performed other auditing procedures. We believe that our audits provide a reasonable basis for our opinion.
/s/ PricewaterhouseCoopers LLP
Boston, Massachusetts
December 20, 2024
We have served as the auditor of one or more investment companies in the Goldman Sachs fund complex since 2000.
GOLDMAN SACHS MULTI-STRATEGY ALTERNATIVES FUND
Statement Regarding Basis for Approval of Management Agreement (Unaudited)
Background
The Goldman Sachs Multi-Strategy Alternatives Fund (the “Fund”) is an investment portfolio of Goldman Sachs Trust II (the “Trust”). The Board of Trustees (the “Board”) oversees the management of the Trust and reviews the investment performance and expenses of the Fund at regularly scheduled meetings held throughout the year. In addition, the Board determines annually whether to approve the continuance of the Trust’s investment management agreement (the “Management Agreement”) with Goldman Sachs Asset Management, L.P. (the “Investment Adviser”) on behalf of the Fund.
The Management Agreement was most recently approved for continuation until June 30, 2025 by the Board, including those Trustees who are not parties to the Management Agreement or “interested persons” (as defined in the Investment Company Act of 1940, as amended) of any party thereto (the “Independent Trustees”), at a meeting held on June 11-12, 2024 (the “Annual Meeting”).
The review process undertaken by the Trustees spans the course of the year and culminates with the Annual Meeting. To assist the Trustees in their deliberations, the Trustees have established a Contract Review Committee (the “Committee”), comprised of the Independent Trustees. The Committee held five meetings over the course of the year since the Management Agreement was last approved. At those Committee meetings, regularly scheduled Board or other committee meetings, and/or the Annual Meeting, matters relevant to the renewal of the Management Agreement were considered by the Board, or the Independent Trustees, as applicable. With respect to the Fund, such matters included:
| | (a) | the nature and quality of the advisory, administrative, and other services provided to the Fund by the Investment Adviser and its affiliates, including information about: |
| | (i) | the structure, staff, and capabilities of the Investment Adviser and its portfolio management teams; |
| | (ii) | the groups within the Investment Adviser and its affiliates that support the portfolio management teams or provide other types of necessary services, including fund services groups (e.g., accounting and financial reporting, tax, shareholder services, and operations); controls and risk management groups (e.g., legal, compliance, valuation oversight, credit risk management, internal audit, compliance testing, market risk analysis, finance, and central funding); sales and distribution support groups, and others (e.g., information technology and training); |
| | (iii) | trends in employee headcount; |
| | (iv) | the Investment Adviser’s financial resources and ability to hire and retain talented personnel and strengthen its operations; and |
| | (v) | the parent company’s support of the Investment Adviser and its mutual fund business, as expressed by the firm’s senior management; |
| | (b) | information on the investment performance of the Fund, including comparisons to the performance of similar mutual funds, as provided by a third-party mutual fund data provider engaged as part of the contract review process (the “Outside Data Provider”), and a benchmark performance index; and information on general investment outlooks in the markets in which the Fund invests; |
| | (c) | information provided by the Investment Adviser indicating the Investment Adviser’s views on whether the Fund’s peer group and/or benchmark index had high, medium, or low relevance given the Fund’s particular investment strategy; |
| | (d) | the terms of the Management Agreement and other agreements with affiliated service providers entered into by the Trust on behalf of the Fund; |
| | (e) | fee and expense information for the Fund, including: |
| | (i) | the relative management fee and expense levels of the Fund as compared to those of comparable funds managed by other advisers, as provided by the Outside Data Provider; |
| | (ii) | the Fund’s expense trends over time; and |
| | (iii) | to the extent the Investment Adviser manages other types of accounts (such as bank collective trusts, private wealth management accounts, institutional separate accounts, sub-advised mutual funds, and non-U.S. funds) having investment objectives and policies similar to those of the Fund, comparative information on the advisory fees charged and services provided to those accounts by the Investment Adviser; |
| | (f) | with respect to the extensive investment performance and expense comparison data provided by the Outside Data Provider, its processes in producing that data for the Fund; |
| | (g) | the undertakings of the Investment Adviser and its affiliates to implement fee waivers and an expense limitation; |
| | (h) | information relating to the profitability of the Management Agreement and the transfer agency and distribution and service arrangements of the Fund to the Investment Adviser and its affiliates; |
| | (i) | whether the Fund’s existing management fee schedule adequately addressed any economies of scale; |
| | (j) | a summary of the “fall-out” benefits derived by the Investment Adviser and its affiliates from their relationships with the Fund, including the fees received by the Investment Adviser’s affiliates from the Fund for transfer agency, portfolio trading, distribution and other services; |
| | (k) | a summary of potential benefits derived by the Fund as a result of its relationship with the Investment Adviser; |
GOLDMAN SACHS MULTI-STRATEGY ALTERNATIVES FUND
Statement Regarding Basis for Approval of Management Agreement (Unaudited) (continued)
| | (l) | portfolio manager ownership of Fund shares; the manner in which portfolio manager compensation is determined; and the number and types of accounts managed by the portfolio managers; |
| | (m) | the nature and quality of the services provided to the Fund by its unaffiliated service providers, and the Investment Adviser’s general oversight and evaluation (including reports on due diligence) of those service providers as part of the administrative services provided under the Management Agreement; and |
| | (n) | the Investment Adviser’s processes and policies addressing various types of potential conflicts of interest; its approach to risk management; the annual review of the effectiveness of the Fund’s compliance program; and periodic compliance reports. |
The Trustees also received an overview of the Fund’s distribution arrangements. They received information regarding the Fund’s assets, share purchase and redemption activity, and payment of distribution and service fees. Information was also provided to the Trustees relating to revenue sharing payments made by and services provided by the Investment Adviser and its affiliates to intermediaries that promote the sale, distribution, and/or servicing of Fund shares. The Independent Trustees also discussed the broad range of other investment choices that are available to Fund investors, including the availability of comparable funds managed by other advisers.
The presentations made at the Board and Committee meetings and at the Annual Meeting encompassed the Fund and other mutual funds for which the Board has responsibility. In evaluating the Management Agreement at the Annual Meeting, the Trustees relied upon their knowledge, resulting from their meetings and other interactions throughout the year, of the Investment Adviser and its affiliates, their services, and the Fund. In conjunction with these meetings, the Trustees received written materials and oral presentations on the topics covered, and the Investment Adviser addressed the questions and concerns of the Trustees, including concerns regarding the investment performance of certain of the funds they oversee. The Independent Trustees were advised by their independent legal counsel regarding their responsibilities and other regulatory requirements related to the approval and continuation of mutual fund investment management agreements under applicable law. In addition, the Investment Adviser and its affiliates provided the Independent Trustees with a written response to a formal request for information sent on behalf of the Independent Trustees by their independent legal counsel. During the course of their deliberations, the Independent Trustees met in executive sessions with their independent legal counsel, without representatives of the Investment Adviser or its affiliates present.
Nature, Extent, and Quality of the Services Provided Under the Management Agreement
As part of their review, the Trustees considered the nature, extent, and quality of the services provided to the Fund by the Investment Adviser. In this regard, the Trustees considered both the investment advisory services and non-advisory services that are provided by the Investment Adviser and its affiliates. The Trustees noted the Investment Adviser’s commitment to maintaining high quality systems and expending substantial resources to respond to ongoing changes to the market, regulatory and control environment in which the Fund and their service providers operate, including developments associated with geopolitical events and economic sanctions, as well as the efforts of the Investment Adviser and its affiliates to combat cyber security risks. They also noted the transition in the leadership and changes in personnel of various of the Investment Adviser’s portfolio management teams that had occurred in recent periods, and the ongoing recruitment efforts aimed at bringing high quality investment talent to the Investment Adviser. The Trustees also considered information regarding the Investment Adviser’s efforts relating to business continuity planning. The Trustees concluded that the Investment Adviser continued to commit substantial financial and operational resources to the Fund and expressed confidence that the Investment Adviser would continue to do so in the future. The Trustees also recognized that the Investment Adviser had made significant commitments to address regulatory compliance requirements applicable to the Fund and the Investment Adviser and its affiliates.
Investment Performance
The Trustees also considered the investment performance of the Fund. In this regard, they compared the investment performance of the Fund to its peers using rankings and ratings compiled by the Outside Data Provider as of December 31, 2023, and updated performance information prepared by the Investment Adviser using the peer group identified by the Outside Data Provider as of March 31, 2024. The information on the Fund’s investment performance was provided for the one-, three-, five-, and ten-year periods ending on the applicable dates. As part of this review, they considered the investment performance trends of the Fund over time, and reviewed the investment performance of the Fund in light of its investment objective and policies and market conditions.
In addition, the Trustees considered materials prepared and presentations made by the Investment Adviser’s senior management and portfolio management personnel in which Fund performance was assessed. The Trustees also considered the Investment Adviser’s periodic reports with respect to the Fund’s risk profile, and how the Investment Adviser’s approach to risk
GOLDMAN SACHS MULTI-STRATEGY ALTERNATIVES FUND
Statement Regarding Basis for Approval of Management Agreement (Unaudited) (continued)
monitoring and management influences portfolio management. They noted the efforts of the Fund’s portfolio management team to continue to enhance the investment models used in managing the Fund.
They observed that the Fund’s Institutional Shares had placed in the fourth quartile of the Fund’s performance peer group for the one-, three-, five-, and ten-year periods, and had underperformed the Fund’s U.S. Treasury-based benchmark index for the one-, three-, five-, and ten-year periods ended March 31, 2024. The Trustees noted that, on September 22, 2023, the Fund was repositioned from allocating assets among the Fund’s previous sub-advisers to being managed solely by the Investment Adviser’s Quantitative Investment Strategies Team.
Costs of Services Provided and Competitive Information
The Trustees considered the contractual terms of the Management Agreement and the fee rates payable by the Fund thereunder. In this regard, the Trustees considered information on the services rendered by the Investment Adviser to the Fund, which included both advisory and administrative services that were directed to the needs and operations of the Fund as a registered mutual fund.
In particular, the Trustees reviewed analyses prepared by the Outside Data Provider regarding the expense rankings of the Fund, as well as additional information provided by the Investment Adviser throughout the year. The analyses provided a comparison of the Fund’s management fee and breakpoints to those of a relevant peer group and category universe; an expense analysis which compared the Fund’s overall net and gross expenses to a peer group and a category universe; and data comparing the Fund’s net expenses to the peer and category medians. The analyses also compared the Fund’s other expenses and fee waivers/reimbursements to those of the peer group and category medians. The Trustees concluded that the comparisons provided by the Outside Data Provider were useful in evaluating the reasonableness of the management fees and total expenses paid by the Fund.
In addition, the Trustees considered the Investment Adviser’s undertakings to implement fee waivers and/or expense limitations. They noted that the Investment Adviser had agreed to waive a portion of its management fee in an amount equal to the entire management fee paid to the Investment Adviser as the investment adviser to the Fund’s wholly-owned subsidiary. The Trustees also considered, to the extent that the Investment Adviser manages other types of accounts having investment objectives and policies similar to those of the Fund, comparative fee information for services provided by the Investment Adviser to those accounts, and information that indicated that services provided to the Fund differed in various significant respects from the services provided to other types of accounts which, in many cases, operated under less stringent legal and regulatory structures, required fewer services from the Investment Adviser to a smaller number of client contact points, and were less time-intensive.
In addition, the Trustees noted that shareholders are able to redeem their shares at any time if shareholders believe that the Fund fees and expenses are too high or if they are dissatisfied with the performance of the Fund.
Profitability
The Trustees reviewed the Fund’s contribution to the Investment Adviser’s revenues and pre-tax profit margins. In this regard the Trustees noted that they had received, among other things, profitability analyses and summaries, revenue and expense schedules by Fund and by function (i.e., investment management, transfer agency and distribution and service), and information on the Investment Adviser’s expense allocation methodology. They observed that the profitability and expense figures are substantially similar to those used by the Investment Adviser for many internal purposes, including compensation decisions among various business groups, and are thus subject to a vigorous internal debate about how certain revenue and expenses should be allocated. The Trustees also noted that the internal audit group within the Goldman Sachs organization periodically audits the expense allocation methodology and that the internal audit group was satisfied with the reasonableness, consistency, and accuracy of the Investment Adviser’s expense allocation methodology. Profitability data for the Fund was provided for 2023 and 2022, and the Trustees considered this information in relation to the Investment Adviser’s overall profitability.
Economies of Scale
The Trustees considered the information that had been provided regarding whether there have been economies of scale with respect to the management of the Fund. The Trustees also considered the breakpoints in the fee rate payable under the Management Agreement for the Fund at the following annual percentage rates of the average daily net assets of the Fund:
GOLDMAN SACHS MULTI-STRATEGY ALTERNATIVES FUND
Statement Regarding Basis for Approval of Management Agreement (Unaudited) (continued)
| | |
Average Daily Net Assets | | Management Fee Annual Rate |
| |
First $2 billion | | 0.75% |
| |
Next $3 billion | | 0.68 |
| |
Next $3 billion | | 0.64 |
| |
Over $8 billion | | 0.63 |
The Trustees noted that the breakpoints were designed to share potential economies of scale, if any, with the Fund and its shareholders as assets under management reach those asset levels. The Trustees considered the amounts of assets in the Fund; the Fund’s recent share purchase and redemption activity; the information provided by the Investment Adviser relating to the costs of the services provided by the Investment Adviser and its affiliates and the realized profits; information comparing fee rates charged by the Investment Adviser with fee rates charged to other funds in the peer group; and the Investment Adviser’s undertakings to waive a portion of its management fee and to limit certain expenses of the Fund that exceed a specified level, as well as Goldman Sachs & Co. LLC’s (“Goldman Sachs”) undertaking to waive a portion of the transfer agency fees paid by the Fund’s Class A, Class C, Investor and Class R Shares. Upon reviewing these matters at the Annual Meeting, the Trustees concluded that the fee breakpoints represented a means of assuring that benefits of scalability, if any, would be passed along to shareholders at the specified asset levels.
Other Benefits to the Investment Adviser and Its Affiliates
The Trustees also considered the other benefits derived by the Investment Adviser and its affiliates from their relationships with the Fund as stated above, including: (a) transfer agency fees received by Goldman Sachs; (b) brokerage and futures commissions earned by Goldman Sachs for executing securities and futures transactions on behalf of the Fund; (c) trading efficiencies resulting from aggregation of orders of the Fund with those for other funds or accounts managed by the Investment Adviser; (d) fees earned by the Investment Adviser for managing the fund in which the Fund’s securities lending cash collateral is invested; (e) the Investment Adviser’s ability to leverage the infrastructure designed to service the Fund on behalf of its other clients; (f) the Investment Adviser’s ability to cross-market other products and services to Fund shareholders; (g) Goldman Sachs’ retention of certain fees as Fund Distributor; (h) the Investment Adviser’s ability to negotiate better pricing with the Fund’s custodian on behalf of its other clients, as a result of the relationship with the Fund; (i) the investment of cash and cash collateral in money market funds managed by the Investment Adviser that will result in increased assets under management for those money market funds; (j) the investment in exchange-traded funds (“ETFs”) managed by the Investment Adviser that will result in increased assets under management for those ETFs and may facilitate the development of the Investment Adviser’s ETF advisory business; and (k) the possibility that the working relationship between the Investment Adviser and the Fund’s third-party service providers may cause those service providers to be more likely to do business with other areas of Goldman Sachs. In the course of considering the foregoing, the Independent Trustees requested and received further information quantifying certain of these fall-out benefits.
Other Benefits to the Fund and Its Shareholders
The Trustees also noted that the Fund receives certain other potential benefits as a result of its relationship with the Investment Adviser, including: (a) trading efficiencies resulting from aggregation of orders of the Fund with those of other funds or accounts managed by the Investment Adviser; (b) enhanced servicing from vendors due to the volume of business generated by the Investment Adviser and its affiliates; (c) enhanced servicing from broker-dealers due to the volume of business generated by the Investment Adviser and its affiliates; (d) the Investment Adviser’s ability to negotiate favorable terms with derivatives counterparties on behalf of the Fund as a result of the size and reputation of the Goldman Sachs organization; (e) the advantages received from the Investment Adviser’s knowledge and experience gained from managing other accounts and products; (f) the Investment Adviser’s ability to hire and retain qualified personnel to provide services to the Fund because of the reputation of the Goldman Sachs organization; (g) the Fund’s access, through the Investment Adviser, to certain firm-wide resources (e.g., proprietary risk management systems and databases), subject to certain restrictions; and (h) the Fund’s access to certain affiliated distribution channels. In addition, the Trustees noted the competitive nature of the mutual fund marketplace, and considered that many of the Fund’s shareholders invested in the Fund in part because of the Fund’s relationship with the Investment Adviser and that those shareholders have a general expectation that the relationship will continue.
GOLDMAN SACHS MULTI-STRATEGY ALTERNATIVES FUND
Statement Regarding Basis for Approval of Management Agreement (Unaudited) (continued)
Conclusion
In connection with their consideration of the Management Agreement, the Trustees gave weight to each of the factors described above, but did not identify any particular factor as controlling their decision. After deliberation and consideration of all of the information provided, including the factors described above, the Trustees concluded, in the exercise of their business judgment, that the management fees paid by the Fund were reasonable in light of the services provided to it by the Investment Adviser, the Investment Adviser’s costs and the Fund’s current and reasonably foreseeable asset levels. The Trustees unanimously concluded that the Investment Adviser’s continued management likely would benefit the Fund and its shareholders and that the Management Agreement should be approved and continued with respect to the Fund until June 30, 2025.
Goldman Sachs Multi-Strategy Alternatives Fund - Tax Information (Unaudited)
For the year ended October 31, 2024, 4.09% of the dividends paid from net investment company taxable income by the Multi-Strategy Alternatives Fund qualify for the dividends received deduction available to corporations.
For the year ended October 31, 2024, 23.02% of the dividends paid from net investment company taxable income by the Multi-Strategy Alternatives Fund qualify for the reduced tax rate under the Jobs and Growth Tax Relief and Reconciliation Act of 2003.
For the year ended October 31, 2024, 0.13% of the dividends paid from net investment company taxable income by the Multi-Strategy Alternatives Fund qualify as section 199A dividends.

Goldman Sachs Funds Annual Financial Statements October 31, 2024 Strategic Multi-Asset Class Funds Goldman Sachs Multi-Manager Global Equity Fund Goldman Sachs Multi-Manager Non-Core Fixed Income Fund Goldman Sachs Multi-Manager Real Assets Strategy Fund
Strategic Multi-Asset Class Funds
TABLE OF CONTENTS
GOLDMAN SACHS MULTI-MANAGER GLOBAL EQUITY FUND
|
Schedule of Investments October 31, 2024 |
| | | | | | | | |
| | | Shares | | Description | | Value | |
| |
| | Common Stocks – 91.3% | |
| |
| | Argentina* – 0.0% | |
| | 5,105 | | Grupo Financiero Galicia SA ADR (Banks) | | $ | 269,136 | |
| | | |
| |
| | Australia – 0.2% | |
| | 12,683 | | AUB Group Ltd. (Insurance) | | | 265,800 | |
| | 321,336 | | Bellevue Gold Ltd.* (Metals & Mining) | | | 340,996 | |
| | 296,609 | | De Grey Mining Ltd.* (Metals & Mining) | | | 295,267 | |
| | 24,441 | | Flight Centre Travel Group Ltd. (Hotels, Restaurants & Leisure) | | | 255,630 | |
| | 35,157 | | GrainCorp Ltd. Class A (Consumer Staples Distribution & Retail) | | | 207,742 | |
| | 167,678 | | HomeCo Daily Needs REIT (Retail REITs) | | | 132,982 | |
| | 234,093 | | Mirvac Group (Diversified REITs) | | | 327,247 | |
| | 10,953 | | Seven Group Holdings Ltd. (Trading Companies & Distributors) | | | 298,416 | |
| | 80,817 | | Stockland (Diversified REITs) | | | 273,292 | |
| | 119,694 | | Ventia Services Group Pty. Ltd. (Construction & Engineering) | | | 359,478 | |
| | | | | | | | |
| | | | | | | 2,756,850 | |
| | | |
| |
| | Austria – 0.1% | |
| | 4,927 | | ANDRITZ AG (Machinery) | | | 297,458 | |
| | 5,621 | | BAWAG Group AG(a) (Banks) | | | 435,681 | |
| | 6,096 | | Erste Group Bank AG (Banks) | | | 344,825 | |
| | 11,939 | | Wienerberger AG (Construction Materials) | | | 360,571 | |
| | | | | | | | |
| | | | | | | 1,438,535 | |
| | | |
| |
| | Belgium – 0.2% | |
| | 29,996 | | Anheuser-Busch InBev SA (Beverages) | | | 1,778,504 | |
| | 9,598 | | KBC Group NV (Banks) | | | 699,129 | |
| | | | | | | | |
| | | | | | | 2,477,633 | |
| | | |
| |
| | Bermuda – 0.2% | |
| | 22,000 | | Arch Capital Group Ltd.* (Insurance) | | | 2,168,320 | |
| | 4,512 | | Assured Guaranty Ltd. (Insurance) | | | 376,571 | |
| | 5,060 | | Axis Capital Holdings Ltd. (Insurance) | | | 395,996 | |
| | | | | | | | |
| | | | | | | 2,940,887 | |
| | | |
| |
| | Brazil – 0.6% | |
| | 151,263 | | Banco Bradesco SA ADR (Banks) | | | 373,620 | |
| | 22,100 | | Banco BTG Pactual SA (Capital Markets) | | | 124,322 | |
| | 186,400 | | Banco do Brasil SA (Banks) | | | 848,987 | |
| | 62,150 | | BRF SA* (Food Products) | | | 281,997 | |
| | 164,200 | | Embraer SA* (Aerospace & Defense) | | | 1,377,020 | |
| | 5,480 | | Embraer SA ADR* (Aerospace & Defense) | | | 183,689 | |
| | 23,900 | | Lojas Renner SA (Specialty Retail) | | | 76,774 | |
| | | |
| | | | | | | | |
| | | Shares | | Description | | Value | |
| |
| | Common Stocks (continued) | |
| |
| | Brazil (continued) | |
| | 18,200 | | Marfrig Global Foods SA* (Food Products) | | $ | 49,397 | |
| | 178,973 | | NU Holdings Ltd. Class A* (Banks) | | | 2,700,702 | |
| | 91,700 | | TIM SA (Wireless Telecommunication Services) | | | 263,002 | |
| | 82,000 | | WEG SA (Electrical Equipment) | | | 767,531 | |
| | | | | | | | |
| | | | | | | 7,047,041 | |
| | | |
| |
| | Canada – 1.5% | |
| | 21,800 | | Alamos Gold, Inc. Class A (Metals & Mining) | | | 440,431 | |
| | 16,400 | | ARC Resources Ltd. (Oil, Gas & Consumable Fuels) | | | 271,616 | |
| | 9,950 | | ATS Corp.* (Machinery) | | | 298,210 | |
| | 22,847 | | Barrick Gold Corp. (Metals & Mining) | | | 441,565 | |
| | 7,300 | | Canadian Apartment Properties REIT (Residential REITs) | | | 243,220 | |
| | 11,798 | | Canadian National Railway Co. (Ground Transportation) | | | 1,273,240 | |
| | 38,770 | | Canadian Natural Resources Ltd. (Oil, Gas & Consumable Fuels) | | | 1,318,461 | |
| | 50,549 | | Canadian Pacific Kansas City Ltd. (Ground Transportation) | | | 3,899,977 | |
| | 10,180 | | Capital Power Corp. (Independent Power and Renewable Electricity Producers) | | | 412,874 | |
| | 46,400 | | Capstone Copper Corp.* (Metals & Mining) | | | 320,919 | |
| | 6,760 | | Celestica, Inc.* (Electronic Equipment, Instruments & Components) | | | 462,594 | |
| | 10,274 | | Descartes Systems Group, Inc.* (Software) | | | 1,067,642 | |
| | 14,300 | | Element Fleet Management Corp. (Commercial Services & Supplies) | | | 292,604 | |
| | 8,150 | | Empire Co. Ltd. Class A (Consumer Staples Distribution & Retail) | | | 235,132 | |
| | 13,320 | | Filo Corp.* (Metals & Mining) | | | 306,895 | |
| | 7,510 | | Gildan Activewear, Inc. (Textiles, Apparel & Luxury Goods) | | | 367,531 | |
| | 4,324 | | Intact Financial Corp. (Insurance) | | | 825,763 | |
| | 9,200 | | Keyera Corp. (Oil, Gas & Consumable Fuels) | | | 282,538 | |
| | 4,085 | | Methanex Corp. (Chemicals) | | | 160,009 | |
| | 21,100 | | Osisko Gold Royalties Ltd. (Metals & Mining) | | | 424,622 | |
| | 10,300 | | Quebecor, Inc. Class B (Diversified Telecommunication Services) | | | 256,474 | |
| | 36,441 | | Shopify, Inc. Class A* (IT Services) | | | 2,850,051 | |
| | 3,470 | | Stantec, Inc. (Construction & Engineering) | | | 281,468 | |
| | 27,584 | | Suncor Energy, Inc. (Oil, Gas & Consumable Fuels) | | | 1,041,272 | |
| | | |
| | |
| The accompanying notes are an integral part of these financial statements. | | 1 |
GOLDMAN SACHS MULTI-MANAGER GLOBAL EQUITY FUND
|
Schedule of Investments (continued) October 31, 2024 |
| | | | | | | | |
| | | Shares | | Description | | Value | |
| |
| | Common Stocks (continued) | |
| |
| | Canada (continued) | |
| | 2,417 | | Toromont Industries Ltd. (Trading Companies & Distributors) | | $ | 213,517 | |
| | 18,608 | | Toronto-Dominion Bank (Banks) | | | 1,028,662 | |
| | 62,900 | | Veren, Inc. (Oil, Gas & Consumable Fuels) | | | 323,908 | |
| | | | | | | | |
| | | | | | | 19,341,195 | |
| | | |
| |
| | Cayman Islands* – 0.1% | |
| | 21,565 | | Legend Biotech Corp. ADR (Biotechnology) | | | 970,856 | |
| | | |
| |
| | Chile – 0.0% | |
| | 1,434,400 | | Banco de Chile (Banks) | | | 166,617 | |
| | 54,828 | | Cencosud SA (Consumer Staples Distribution & Retail) | | | 112,829 | |
| | | | | | | | |
| | | | | | | 279,446 | |
| | | |
| |
| | China – 2.7% | |
| | 38,050 | | AAC Technologies Holdings, Inc. (Electronic Equipment, Instruments & Components) | | | 153,684 | |
| | 103,200 | | Alibaba Group Holding Ltd. (Broadline Retail) | | | 1,262,374 | |
| | 358,100 | | Aluminum Corp. of China Ltd. Class H (Metals & Mining) | | | 228,164 | |
| | 4,940 | | Anker Innovations Technology Co. Ltd. Class A (Technology Hardware, Storage & Peripherals) | | | 55,635 | |
| | 12,750 | | ANTA Sports Products Ltd. (Textiles, Apparel & Luxury Goods) | | | 136,083 | |
| | 5,334 | | Atour Lifestyle Holdings Ltd. ADR (Hotels, Restaurants & Leisure) | | | 139,751 | |
| | 19,300 | | Avary Holding Shenzhen Co. Ltd. Class A (Electronic Equipment, Instruments & Components) | | | 101,515 | |
| | 59,600 | | Baidu, Inc. Class A* (Interactive Media & Services) | | | 680,085 | |
| | 180,400 | | Baoshan Iron & Steel Co. Ltd. Class A (Metals & Mining) | | | 165,420 | |
| | 418,000 | | BOE Technology Group Co. Ltd. Class A (Electronic Equipment, Instruments & Components) | | | 274,125 | |
| | 2,700 | | BYD Co. Ltd. Class A (Automobiles) | | | 111,161 | |
| | 954,650 | | China CITIC Bank Corp. Ltd. Class H (Banks) | | | 594,981 | |
| | 767,000 | | China Construction Bank Corp. Class H (Banks) | | | 595,373 | |
| | 184,550 | | China Everbright Bank Co. Ltd. Class H (Banks) | | | 62,381 | |
| | 493,200 | | China Feihe Ltd.(a) (Food Products) | | | 372,240 | |
| | 971,400 | | China Jinmao Holdings Group Ltd. (Real Estate Management & Development) | | | 150,802 | |
| | | |
| | | | | | | | |
| | | Shares | | Description | | Value | |
| |
| | Common Stocks (continued) | |
| |
| | China (continued) | |
| | 44,200 | | China Merchants Securities Co. Ltd. Class A (Capital Markets) | | $ | 119,485 | |
| | 832,200 | | China Minsheng Banking Corp. Ltd. Class A (Banks) | | | 441,830 | |
| | 393,300 | | China National Building Material Co. Ltd. Class H (Construction Materials) | | | 167,326 | |
| | 26,850 | | China Pacific Insurance Group Co. Ltd. Class H (Insurance) | | | 93,246 | |
| | 497,000 | | China Petroleum & Chemical Corp. Class H (Oil, Gas & Consumable Fuels) | | | 279,955 | |
| | 193,000 | | China Resources Pharmaceutical Group Ltd.(a) (Pharmaceuticals) | | | 136,543 | |
| | 234,650 | | China Taiping Insurance Holdings Co. Ltd. (Insurance) | | | 404,173 | |
| | 164,550 | | CITIC Ltd. (Industrial Conglomerates) | | | 193,282 | |
| | 64,550 | | CMOC Group Ltd. Class H (Metals & Mining) | | | 53,432 | |
| | 9,400 | | Dong-E-E-Jiao Co. Ltd. Class A (Pharmaceuticals) | | | 77,794 | |
| | 60,600 | | Dongyue Group Ltd. (Chemicals) | | | 49,392 | |
| | 16,500 | | Eastroc Beverage Group Co. Ltd. Class A (Beverages) | | | 491,091 | |
| | 38,300 | | Fuyao Glass Industry Group Co. Ltd. Class H(a) (Automobile Components) | | | 271,703 | |
| | 332,100 | | Geely Automobile Holdings Ltd. (Automobiles) | | | 583,798 | |
| | 87,200 | | Giant Biogene Holding Co. Ltd.(a) (Personal Products) | | | 591,420 | |
| | 26,400 | | GoerTek, Inc. Class A (Electronic Equipment, Instruments & Components) | | | 86,598 | |
| | 20,300 | | Great Wall Motor Co. Ltd. Class A (Automobiles) | | | 74,686 | |
| | 155,400 | | Guotai Junan Securities Co. Ltd. Class A (Capital Markets) | | | 414,040 | |
| | 176,400 | | Henan Pinggao Electric Co. Ltd. Class A (Electrical Equipment) | | | 451,275 | |
| | 60,700 | | Hoyuan Green Energy Co. Ltd. Class A (Semiconductors & Semiconductor Equipment) | | | 202,954 | |
| | 61,300 | | Huatai Securities Co. Ltd. Class A (Capital Markets) | | | 151,783 | |
| | 796,850 | | Industrial & Commercial Bank of China Ltd. Class H (Banks) | | | 477,995 | |
| | 301,150 | | JD Logistics, Inc.*(a) (Air Freight & Logistics) | | | 612,804 | |
| | 66,700 | | JD.com, Inc. Class A (Broadline Retail) | | | 1,352,625 | |
| | 74,550 | | Kingsoft Corp. Ltd. (Entertainment) | | | 256,918 | |
| | 484,700 | | Lenovo Group Ltd. (Technology Hardware, Storage & Peripherals) | | | 639,143 | |
| | | |
| | |
| 2 | | The accompanying notes are an integral part of these financial statements. |
GOLDMAN SACHS MULTI-MANAGER GLOBAL EQUITY FUND
| | | | | | | | |
| | | Shares | | Description | | Value | |
| |
| | Common Stocks (continued) | |
| |
| | China (continued) | |
| | 126,500 | | Li Ning Co. Ltd. (Textiles, Apparel & Luxury Goods) | | $ | 258,112 | |
| | 242,900 | | Meituan Class B*(a) (Hotels, Restaurants & Leisure) | | | 5,739,817 | |
| | 27,700 | | Midea Group Co. Ltd. Class A (Household Durables) | | | 277,446 | |
| | 8,500 | | NAURA Technology Group Co. Ltd. Class A (Semiconductors & Semiconductor Equipment) | | | 467,521 | |
| | 67,850 | | NetEase, Inc. (Entertainment) | | | 1,091,625 | |
| | 3,099 | | PDD Holdings, Inc. ADR* (Broadline Retail) | | | 373,708 | |
| | 440,850 | | People’s Insurance Co. Group of China Ltd. Class H (Insurance) | | | 222,521 | |
| | 173,000 | | PetroChina Co. Ltd. Class A (Oil, Gas & Consumable Fuels) | | | 196,576 | |
| | 98,150 | | Pop Mart International Group
Ltd.(a) (Specialty Retail) | | | 887,363 | |
| | 4,643 | | Qifu Technology, Inc. ADR (Consumer Finance) | | | 152,337 | |
| | 7,900 | | Rockchip Electronics Co. Ltd. Class A (Semiconductors & Semiconductor Equipment) | | | 97,776 | |
| | 44,500 | | Sanan Optoelectronics Co. Ltd. Class A (Semiconductors & Semiconductor Equipment) | | | 85,707 | |
| | 56,400 | | Shenzhen Envicool Technology Co. Ltd. Class A (Machinery) | | | 256,389 | |
| | 12,200 | | Shenzhen Goodix Technology Co. Ltd. Class A (Semiconductors & Semiconductor Equipment) | | | 153,569 | |
| | 109,250 | | Sinopharm Group Co. Ltd. Class H (Health Care Providers & Services) | | | 272,173 | |
| | 168,216 | | Tencent Holdings Ltd. (Interactive Media & Services) | | | 8,771,134 | |
| | 8,070 | | Trip.com Group Ltd. ADR* (Hotels, Restaurants & Leisure) | | | 519,708 | |
| | 17,700 | | Trip.com Group Ltd.* (Hotels, Restaurants & Leisure) | | | 1,139,074 | |
| | 21,600 | | Weichai Power Co. Ltd. Class H (Machinery) | | | 32,639 | |
| | 71,000 | | Weichai Power Co. Ltd. Class A (Machinery) | | | 133,193 | |
| | 22,000 | | Wuliangye Yibin Co. Ltd. Class A (Beverages) | | | 453,868 | |
| | 6,000 | | Yealink Network Technology Corp. Ltd. Class A (Communications Equipment) | | | 32,830 | |
| | | | | | | | |
| | | | | | | 35,374,151 | |
| | | |
| |
| | Colombia – 0.0% | |
| | 11,109 | | Bancolombia SA ADR (Banks) | | | 354,488 | |
| | | |
| | | | | | | | |
| | | Shares | | Description | | Value | |
| |
| | Common Stocks (continued) | |
| |
| | Denmark – 0.7% | |
| | 8,826 | | Bavarian Nordic AS* (Biotechnology) | | $ | 277,880 | |
| | 12,754 | | Carlsberg AS Class B (Beverages) | | | 1,409,491 | |
| | 4,175 | | NKT AS* (Electrical Equipment) | | | 391,435 | |
| | 59,021 | | Novo Nordisk AS Class B (Pharmaceuticals) | | | 6,620,090 | |
| | 3,758 | | Royal Unibrew AS (Beverages) | | | 282,722 | |
| | 417 | | Sydbank AS (Banks) | | | 19,901 | |
| | 1,620 | | Zealand Pharma AS* (Biotechnology) | | | 187,017 | |
| | | | | | | | |
| | | | | | | 9,188,536 | |
| | | |
| |
| | France – 3.6% | |
| | 23,833 | | Air Liquide SA (Chemicals) | | | 4,273,287 | |
| | 189,767 | | Alstom SA* (Machinery) | | | 4,174,202 | |
| | 33,311 | | AXA SA (Insurance) | | | 1,250,738 | |
| | 13,109 | | BNP Paribas SA (Banks) | | | 895,266 | |
| | 13,289 | | Capgemini SE (IT Services) | | | 2,305,386 | |
| | 50,876 | | Carrefour SA (Consumer Staples Distribution & Retail) | | | 807,958 | |
| | 39,752 | | Cie de Saint-Gobain SA (Building Products) | | | 3,604,906 | |
| | 29,111 | | Cie Generale des Etablissements Michelin SCA (Automobile Components) | | | 983,821 | |
| | 21,127 | | Danone SA (Food Products) | | | 1,509,281 | |
| | 20,450 | | Dassault Systemes SE (Software) | | | 699,905 | |
| | 26,879 | | Edenred SE (Financial Services) | | | 869,338 | |
| | 19,282 | | Elis SA (Commercial Services & Supplies) | | | 438,651 | |
| | 96,795 | | Engie SA (Multi-Utilities) | | | 1,622,430 | |
| | 8,129 | | EssilorLuxottica SA (Health Care Equipment & Supplies) | | | 1,906,721 | |
| | 2,548 | | Gecina SA (Office REITs) | | | 272,300 | |
| | 13,372 | | Kering SA (Textiles, Apparel & Luxury Goods) | | | 3,339,931 | |
| | 10,097 | | Legrand SA (Electrical Equipment) | | | 1,139,632 | |
| | 3,420 | | L’Oreal SA (Personal Products) | | | 1,283,082 | |
| | 3,142 | | LVMH Moet Hennessy Louis Vuitton SE (Textiles, Apparel & Luxury Goods) | | | 2,091,693 | |
| | 10,069 | | Pernod Ricard SA (Beverages) | | | 1,256,294 | |
| | 9,969 | | Rexel SA (Trading Companies & Distributors) | | | 274,660 | |
| | 12,940 | | Safran SA (Aerospace & Defense) | | | 2,929,170 | |
| | 14,981 | | Sanofi SA (Pharmaceuticals) | | | 1,583,189 | |
| | 21,159 | | Schneider Electric SE (Electrical Equipment) | | | 5,481,210 | |
| | 7,587 | | Sodexo SA (Hotels, Restaurants & Leisure) | | | 658,570 | |
| | 1,293 | | Sopra Steria Group (IT Services) | | | 248,675 | |
| | 8,632 | | SPIE SA (Commercial Services & Supplies) | | | 312,423 | |
| | 11,921 | | Technip Energies NV (Energy Equipment & Services) | | | 297,636 | |
| | | |
| | |
| The accompanying notes are an integral part of these financial statements. | | 3 |
GOLDMAN SACHS MULTI-MANAGER GLOBAL EQUITY FUND
|
Schedule of Investments (continued) October 31, 2024 |
| | | | | | | | |
| | | Shares | | Description | | Value | |
| |
| | Common Stocks (continued) | |
| |
| | France (continued) | |
| | 19,640 | | Vallourec SACA* (Energy Equipment & Services) | | $ | 323,358 | |
| | 75,879 | | Worldline SA*(a) (Financial Services) | | | 537,866 | |
| | | | | | | | |
| | | | | | | 47,371,579 | |
| | | |
| |
| | Germany – 1.7% | |
| | 2,287 | | Allianz SE (Insurance) | | | 719,959 | |
| | 15,019 | | Beiersdorf AG (Personal Products) | | | 2,027,471 | |
| | 11,327 | | Deutsche Boerse AG (Capital Markets) | | | 2,631,016 | |
| | 61,115 | | Deutsche Telekom AG (Diversified Telecommunication Services) | | | 1,847,721 | |
| | 4,682 | | Fraport AG Frankfurt Airport Services Worldwide* (Transportation Infrastructure) | | | 253,354 | |
| | 3,357 | | Gerresheimer AG (Life Sciences Tools & Services) | | | 282,726 | |
| | 60,024 | | Infineon Technologies AG (Semiconductors & Semiconductor Equipment) | | | 1,898,237 | |
| | 7,812 | | KION Group AG (Machinery) | | | 303,320 | |
| | 44,427 | | Lanxess AG (Chemicals) | | | 1,290,167 | |
| | 11,020 | | Merck KGaA (Pharmaceuticals) | | | 1,821,884 | |
| | 2,583 | | MTU Aero Engines AG (Aerospace & Defense) | | | 844,230 | |
| | 34,728 | | RWE AG (Independent Power and Renewable Electricity Producers) | | | 1,125,520 | |
| | 22,649 | | SAP SE (Software) | | | 5,288,199 | |
| | 3,353 | | Scout24 SE(a) (Interactive Media & Services) | | | 289,650 | |
| | 17,358 | | Siemens Energy AG* (Electrical Equipment) | | | 712,947 | |
| | 3,837 | | Stroeer SE & Co. KGaA (Media) | | | 227,673 | |
| | 19,455 | | TAG Immobilien AG* (Real Estate Management & Development) | | | 323,416 | |
| | | | | | | | |
| | | | | | | 21,887,490 | |
| | | |
| |
| | Greece – 0.1% | |
| | 94,950 | | Alpha Services & Holdings SA (Banks) | | | 143,026 | |
| | 112,850 | | Eurobank Ergasias Services & Holdings SA Class A (Banks) | | | 233,511 | |
| | 78,129 | | National Bank of Greece SA (Banks) | | | 612,119 | |
| | 76,320 | | Piraeus Financial Holdings SA (Banks) | | | 287,561 | |
| | | | | | | | |
| | | | | | | 1,276,217 | |
| | | |
| |
| | Hong Kong – 0.3% | |
| | 222,500 | | AIA Group Ltd. (Insurance) | | | 1,756,041 | |
| | 310,550 | | Kunlun Energy Co. Ltd. (Gas Utilities) | | | 294,514 | |
| | 120,300 | | Link REIT (Retail REITs) | | | 560,528 | |
| | | |
| | | | | | | | |
| | | Shares | | Description | | Value | |
| |
| | Common Stocks (continued) | |
| |
| | Hong Kong (continued) | |
| | 8,000 | | Orient Overseas International Ltd. (Marine Transportation) | | $ | 109,050 | |
| | 754,400 | | Sino Biopharmaceutical Ltd. (Pharmaceuticals) | | | 342,699 | |
| | 24,800 | | Techtronic Industries Co. Ltd. (Machinery) | | | 358,743 | |
| | 129,500 | | Yue Yuen Industrial Holdings Ltd. (Textiles, Apparel & Luxury Goods) | | | 272,225 | |
| | | | | | | | |
| | | | | | | 3,693,800 | |
| | | |
| |
| | India – 2.0% | |
| | 6,550 | | ABB India Ltd. (Electrical Equipment) | | | 576,922 | |
| | 56,497 | | Adani Ports & Special Economic Zone Ltd. (Transportation Infrastructure) | | | 921,786 | |
| | 8,650 | | Anant Raj Ltd. (Real Estate Management & Development) | | | 75,728 | |
| | 8,117 | | Bajaj Auto Ltd. (Automobiles) | | | 948,018 | |
| | 850 | | Bajaj Holdings & Investment Ltd. (Financial Services) | | | 103,297 | |
| | 80,450 | | Bank of Baroda (Banks) | | | 239,242 | |
| | 497,950 | | Bharat Electronics Ltd. (Aerospace & Defense) | | | 1,680,879 | |
| | 27,799 | | Bharti Airtel Ltd. (Wireless Telecommunication Services) | | | 532,086 | |
| | 18,926 | | Central Depository Services India Ltd. (Capital Markets) | | | 346,868 | |
| | 14,049 | | Chambal Fertilisers & Chemicals Ltd. (Chemicals) | | | 80,497 | |
| | 110,500 | | Coal India Ltd. (Oil, Gas & Consumable Fuels) | | | 592,717 | |
| | 2,950 | | Colgate-Palmolive India Ltd. (Personal Products) | | | 107,292 | |
| | 14,878 | | Cummins India Ltd. (Machinery) | | | 617,140 | |
| | 3,355 | | Dixon Technologies India Ltd. (Household Durables) | | | 559,747 | |
| | 28,704 | | DLF Ltd. (Real Estate Management & Development) | | | 279,022 | |
| | 8,750 | | Dr. Reddy’s Laboratories Ltd. (Pharmaceuticals) | | | 132,350 | |
| | 7,900 | | Eicher Motors Ltd. (Automobiles) | | | 458,497 | |
| | 113,500 | | Federal Bank Ltd. (Banks) | | | 274,534 | |
| | 2,300 | | Godrej Properties Ltd.* (Real Estate Management & Development) | | | 78,282 | |
| | 13,702 | | Gujarat Narmada Valley Fertilizers & Chemicals Ltd. (Chemicals) | | | 101,621 | |
| | 23,600 | | HCL Technologies Ltd. (IT Services) | | | 493,821 | |
| | 2,050 | | HDFC Asset Management Co.
Ltd.(a) (Capital Markets) | | | 104,614 | |
| | 65,986 | | HDFC Bank Ltd. (Banks) | | | 1,356,323 | |
| | 14,600 | | Hindalco Industries Ltd. (Metals & Mining) | | | 118,470 | |
| | | |
| | |
| 4 | | The accompanying notes are an integral part of these financial statements. |
GOLDMAN SACHS MULTI-MANAGER GLOBAL EQUITY FUND
| | | | | | | | |
| | | Shares | | Description | | Value | |
| |
| | Common Stocks (continued) | |
| |
| | India (continued) | |
| | 5,800 | | Hindustan Aeronautics Ltd. (Aerospace & Defense) | | $ | 291,867 | |
| | 57,270 | | ICICI Bank Ltd. ADR (Banks) | | | 1,741,581 | |
| | 77,750 | | ICICI Bank Ltd. (Banks) | | | 1,192,650 | |
| | 24,750 | | Indian Bank (Banks) | | | 174,206 | |
| | 66,703 | | Indian Hotels Co. Ltd. (Hotels, Restaurants & Leisure) | | | 534,944 | |
| | 15,700 | | InterGlobe Aviation Ltd.*(a) (Passenger Airlines) | | | 754,220 | |
| | 100,200 | | Jio Financial Services Ltd.* (Financial Services) | | | 383,247 | |
| | 9,750 | | Lupin Ltd. (Pharmaceuticals) | | | 252,981 | |
| | 19,251 | | Mahindra & Mahindra Ltd. (Automobiles) | | | 621,662 | |
| | 2,350 | | Mahindra & Mahindra Ltd. GDR (Automobiles) | | | 77,080 | |
| | 5,990 | | MakeMyTrip Ltd.* (Hotels, Restaurants & Leisure) | | | 607,925 | |
| | 37,095 | | Max Healthcare Institute Ltd. (Health Care Providers & Services) | | | 447,787 | |
| | 13,050 | | Motilal Oswal Financial Services Ltd. (Capital Markets) | | | 144,959 | |
| | 1,700 | | Multi Commodity Exchange of India Ltd. (Capital Markets) | | | 131,162 | |
| | 6,350 | | Natco Pharma Ltd. (Pharmaceuticals) | | | 105,398 | |
| | 1,000 | | Nuvama Wealth Management Ltd. (Capital Markets) | | | 82,849 | |
| | 105,450 | | Oil & Natural Gas Corp. Ltd. (Oil, Gas & Consumable Fuels) | | | 332,560 | |
| | 19,463 | | PB Fintech Ltd.* (Insurance) | | | 393,239 | |
| | 1,200 | | Persistent Systems Ltd. (IT Services) | | | 76,406 | |
| | 7,972 | | Polycab India Ltd. (Electrical Equipment) | | | 611,419 | |
| | 152,250 | | Punjab National Bank (Banks) | | | 176,838 | |
| | 4,709 | | Reliance Industries Ltd.* (Oil, Gas & Consumable Fuels) | | | 74,459 | |
| | 180,666 | | Samvardhana Motherson International Ltd. (Automobile Components) | | | 387,092 | |
| | 5,189 | | Siemens Ltd. (Industrial Conglomerates) | | | 429,268 | |
| | 350 | | Solar Industries India Ltd. (Chemicals) | | | 42,444 | |
| | 22,178 | | Tata Consultancy Services Ltd. (IT Services) | | | 1,043,188 | |
| | 9,100 | | Tata Motors Ltd. (Automobiles) | | | 90,008 | |
| | 99,000 | | Tata Power Co. Ltd. (Electric Utilities) | | | 516,044 | |
| | 3,900 | | Torrent Power Ltd. (Electric Utilities) | | | 84,368 | |
| | 8,500 | | Trent Ltd. (Specialty Retail) | | | 718,275 | |
| | 12,030 | | TVS Motor Co. Ltd. (Automobiles) | | | 356,086 | |
| | | |
| | | | | | | | |
| | | Shares | | Description | | Value | |
| |
| | Common Stocks (continued) | |
| |
| | India (continued) | |
| | 2,905 | | UltraTech Cement Ltd. (Construction Materials) | | $ | 381,473 | |
| | 26,600 | | United Spirits Ltd. (Beverages) | | | 457,714 | |
| | 70,825 | | Varun Beverages Ltd. (Beverages) | | | 503,479 | |
| | 51,600 | | Vedanta Ltd. (Metals & Mining) | | | 284,041 | |
| | 13,150 | | Zensar Technologies Ltd. (IT Services) | | | 109,570 | |
| | 418,781 | | Zomato Ltd.* (Hotels, Restaurants & Leisure) | | | 1,201,485 | |
| | 7,450 | | Zydus Lifesciences Ltd. (Pharmaceuticals) | | | 88,491 | |
| | | | | | | | |
| | | | | | | 26,682,218 | |
| | | |
| |
| | Indonesia – 0.2% | |
| | 2,494,450 | | Adaro Energy Indonesia Tbk. PT (Oil, Gas & Consumable Fuels) | | | 574,131 | |
| | 555,800 | | Bank Central Asia Tbk. PT (Banks) | | | 362,979 | |
| | 1,555,300 | | Bank Mandiri Persero Tbk. PT (Banks) | | | 660,254 | |
| | 704,250 | | Chandra Asri Pacific Tbk. PT (Chemicals) | | | 392,621 | |
| | | | | | | | |
| | | | | | | 1,989,985 | |
| | | |
| |
| | Ireland – 1.9% | |
| | 5,112 | | Accenture PLC Class A (IT Services) | | | 1,762,720 | |
| | 194,554 | | AIB Group PLC (Banks) | | | 1,043,012 | |
| | 20,205 | | Aon PLC Class A (Insurance) | | | 7,412,608 | |
| | 21,309 | | Bank of Ireland Group PLC (Banks) | | | 197,496 | |
| | 82,035 | | Experian PLC (Professional Services) | | | 4,003,784 | |
| | 10,390 | | ICON PLC* (Life Sciences Tools & Services) | | | 2,307,723 | |
| | 6,194 | | Linde PLC (Chemicals) | | | 2,825,393 | |
| | 41,906 | | Medtronic PLC (Health Care Equipment & Supplies) | | | 3,740,111 | |
| | 40,268 | | Ryanair Holdings PLC ADR (Passenger Airlines) | | | 1,782,262 | |
| | 2,795 | | Weatherford International PLC (Energy Equipment & Services) | | | 220,805 | |
| | | | | | | | |
| | | | | | | 25,295,914 | |
| | | |
| |
| | Israel* – 0.2% | |
| | 17,612 | | Cellebrite DI Ltd. (Software) | | | 319,658 | |
| | 8,678 | | Check Point Software Technologies Ltd. (Software) | | | 1,503,116 | |
| | 1,149 | | CyberArk Software Ltd. (Software) | | | 317,722 | |
| | 1,508 | | Nova Ltd. (Semiconductors & Semiconductor Equipment) | | | 279,432 | |
| | | | | | | | |
| | | | | | | 2,419,928 | |
| | | |
| |
| | Italy – 1.0% | |
| | 31,772 | | Banca Mediolanum SpA (Financial Services) | | | 392,728 | |
| | | |
| | |
| The accompanying notes are an integral part of these financial statements. | | 5 |
GOLDMAN SACHS MULTI-MANAGER GLOBAL EQUITY FUND
|
Schedule of Investments (continued) October 31, 2024 |
| | | | | | | | |
| | | Shares | | Description | | Value | |
| |
| | Common Stocks (continued) | |
| |
| | Italy (continued) | |
| | 65,321 | | Banca Monte dei Paschi di Siena SpA (Banks) | | $ | 358,482 | |
| | 20,796 | | BFF Bank SpA(a) (Financial Services) | | | 203,070 | |
| | 3,726 | | Brunello Cucinelli SpA (Textiles, Apparel & Luxury Goods) | | | 368,579 | |
| | 8,414 | | Buzzi SpA (Construction Materials) | | | 329,642 | |
| | 309,891 | | Enel SpA (Electric Utilities) | | | 2,350,236 | |
| | 84,375 | | Eni SpA (Oil, Gas & Consumable Fuels) | | | 1,285,300 | |
| | 9,671 | | ERG SpA (Independent Power and Renewable Electricity Producers) | | | 217,190 | |
| | 6,560 | | Ferrari NV (Automobiles) | | | 3,131,541 | |
| | 83,439 | | Hera SpA (Multi-Utilities) | | | 319,200 | |
| | 437,461 | | Intesa Sanpaolo SpA (Banks) | | | 1,872,337 | |
| | 40,686 | | UniCredit SpA (Banks) | | | 1,799,915 | |
| | | | | | | | |
| | | | | | | 12,628,220 | |
| | | |
| |
| | Japan – 3.6% | |
| | 10,900 | | ABC-Mart, Inc. (Specialty Retail) | | | 213,572 | |
| | 14,400 | | ADEKA Corp. (Chemicals) | | | 259,785 | |
| | 19,900 | | Air Water, Inc. (Chemicals) | | | 250,323 | |
| | 14,216 | | Allegro MicroSystems, Inc.* (Semiconductors & Semiconductor Equipment) | | | 296,261 | |
| | 33,400 | | Amada Co. Ltd. (Machinery) | | | 329,154 | |
| | 10,800 | | Amano Corp. (Electronic Equipment, Instruments & Components) | | | 311,497 | |
| | 18,100 | | Amvis Holdings, Inc. (Health Care Providers & Services) | | | 234,962 | |
| | 20,300 | | Asics Corp. (Textiles, Apparel & Luxury Goods) | | | 354,578 | |
| | 8,800 | | Canon Marketing Japan, Inc. (Electronic Equipment, Instruments & Components) | | | 264,344 | |
| | 37,900 | | Chiba Bank Ltd. (Banks) | | | 276,583 | |
| | 49,300 | | Concordia Financial Group Ltd. (Banks) | | | 244,198 | |
| | 16,000 | | Credit Saison Co. Ltd. (Consumer Finance) | | | 359,876 | |
| | 12,600 | | Daikin Industries Ltd. (Building Products) | | | 1,512,715 | |
| | 99,600 | | Denso Corp. (Automobile Components) | | | 1,414,668 | |
| | 81,000 | | FANUC Corp. (Machinery) | | | 2,149,037 | |
| | 19,800 | | Food & Life Cos. Ltd. (Hotels, Restaurants & Leisure) | | | 390,448 | |
| | 24,000 | | Fuji Media Holdings, Inc. (Media) | | | 271,306 | |
| | 87,800 | | Fujitsu Ltd. (IT Services) | | | 1,688,029 | |
| | 10,600 | | Fuso Chemical Co. Ltd. (Chemicals) | | | 258,528 | |
| | 4,900 | | GMO Payment Gateway, Inc. (Financial Services) | | | 293,496 | |
| | | |
| | | | | | | | |
| | | Shares | | Description | | Value | |
| |
| | Common Stocks (continued) | |
| |
| | Japan (continued) | |
| | 8,100 | | H2O Retailing Corp. (Consumer Staples Distribution & Retail) | | $ | 108,396 | |
| | 138,000 | | Hitachi Ltd. (Industrial Conglomerates) | | | 3,467,231 | |
| | 5,300 | | Hoya Corp. (Health Care Equipment & Supplies) | | | 709,108 | |
| | 10,800 | | IDOM, Inc. (Specialty Retail) | | | 74,704 | |
| | 39,000 | | INFRONEER Holdings, Inc. (Construction & Engineering) | | | 293,174 | |
| | 11,300 | | Internet Initiative Japan, Inc. (Diversified Telecommunication Services) | | | 216,971 | |
| | 748 | | Invincible Investment Corp. (Hotel & Resort REITs) | | | 304,674 | |
| | 9,000 | | JINS Holdings, Inc. (Specialty Retail) | | | 366,829 | |
| | 15,800 | | Kajima Corp. (Construction & Engineering) | | | 272,163 | |
| | 13,600 | | Kamigumi Co. Ltd. (Transportation Infrastructure) | | | 283,854 | |
| | 336 | | KDX Realty Investment Corp. (Diversified REITs) | | | 319,622 | |
| | 16,200 | | Kinden Corp. (Construction & Engineering) | | | 335,765 | |
| | 15,700 | | KOMEDA Holdings Co. Ltd. (Hotels, Restaurants & Leisure) | | | 297,116 | |
| | 11,800 | | Kose Corp. (Personal Products) | | | 648,479 | |
| | 9,700 | | Kotobuki Spirits Co. Ltd. (Food Products) | | | 130,976 | |
| | 88,000 | | Kyocera Corp. (Electronic Equipment, Instruments & Components) | | | 892,470 | |
| | 13,000 | | Kyushu Railway Co. (Ground Transportation) | | | 342,037 | |
| | 85,400 | | Mebuki Financial Group, Inc. (Banks) | | | 319,430 | |
| | 4,200 | | Menicon Co. Ltd. (Health Care Equipment & Supplies) | | | 46,214 | |
| | 90,800 | | Mitsubishi Electric Corp. (Electrical Equipment) | | | 1,597,402 | |
| | 153,000 | | Mitsubishi Heavy Industries Ltd. (Machinery) | | | 2,159,893 | |
| | 432 | | Mitsui Fudosan Logistics Park, Inc. (Industrial REITs) | | | 287,628 | |
| | 8,900 | | Monogatari Corp. (Hotels, Restaurants & Leisure) | | | 209,311 | |
| | 54,700 | | Murata Manufacturing Co. Ltd. (Electronic Equipment, Instruments & Components) | | | 955,670 | |
| | 14,200 | | NET One Systems Co. Ltd. (IT Services) | | | 344,759 | |
| | 10,300 | | Nifco, Inc. (Automobile Components) | | | 239,281 | |
| | 10,200 | | Nintendo Co. Ltd. (Entertainment) | | | 538,794 | |
| | 24,400 | | NOF Corp. (Chemicals) | | | 396,414 | |
| | | |
| | |
| 6 | | The accompanying notes are an integral part of these financial statements. |
GOLDMAN SACHS MULTI-MANAGER GLOBAL EQUITY FUND
| | | | | | | | |
| | | Shares | | Description | | Value | |
| |
| | Common Stocks (continued) | |
| |
| | Japan (continued) | |
| | 74,100 | | Olympus Corp. (Health Care Equipment & Supplies) | | $ | 1,304,329 | |
| | 7,700 | | Organo Corp. (Machinery) | | | 359,786 | |
| | 190,800 | | Renesas Electronics Corp. (Semiconductors & Semiconductor Equipment) | | | 2,556,399 | |
| | 29,800 | | Rengo Co. Ltd. (Containers & Packaging) | | | 180,497 | |
| | 16,200 | | Rohto Pharmaceutical Co. Ltd. (Personal Products) | | | 364,295 | |
| | 8,500 | | Sankyu, Inc. (Air Freight & Logistics) | | | 295,244 | |
| | 3,300 | | SCREEN Holdings Co. Ltd. (Semiconductors & Semiconductor Equipment) | | | 210,674 | |
| | 177,800 | | Seven & i Holdings Co. Ltd. (Consumer Staples Distribution & Retail) | | | 2,560,308 | |
| | 32,700 | | Shin-Etsu Chemical Co. Ltd. (Chemicals) | | | 1,198,257 | |
| | 4,800 | | SMC Corp. (Machinery) | | | 2,037,822 | |
| | 14,300 | | Socionext, Inc. (Semiconductors & Semiconductor Equipment) | | | 266,225 | |
| | 15,500 | | Sojitz Corp. (Trading Companies & Distributors) | | | 316,769 | |
| | 5,100 | | Sompo Holdings, Inc. (Insurance) | | | 109,339 | |
| | 91,800 | | Sony Group Corp. (Household Durables) | | | 1,615,452 | |
| | 30,700 | | Sumitomo Mitsui Financial Group, Inc. (Banks) | | | 651,286 | |
| | 10,300 | | Sumitomo Osaka Cement Co. Ltd. (Construction Materials) | | | 253,805 | |
| | 6,500 | | Suzuken Co. Ltd. (Health Care Providers & Services) | | | 212,511 | |
| | 7,200 | | SWCC Corp. (Electrical Equipment) | | | 252,498 | |
| | 35,400 | | Takeda Pharmaceutical Co. Ltd. (Pharmaceuticals) | | | 987,702 | |
| | 15,500 | | TechnoPro Holdings, Inc. (Professional Services) | | | 276,650 | |
| | 59,200 | | Terumo Corp. (Health Care Equipment & Supplies) | | | 1,127,482 | |
| | 11,100 | | TIS, Inc. (IT Services) | | | 276,795 | |
| | 37,200 | | Tohoku Electric Power Co., Inc. (Electric Utilities) | | | 364,891 | |
| | 21,400 | | Tokyo Tatemono Co. Ltd. (Real Estate Management & Development) | | | 349,458 | |
| | 16,000 | | Towa Corp. (Semiconductors & Semiconductor Equipment) | | | 204,860 | |
| | 5,600 | | Toyo Suisan Kaisha Ltd. (Food Products) | | | 328,965 | |
| | 8,400 | | U-Next Holdings Co. Ltd. (Diversified Telecommunication Services) | | | 267,957 | |
| | | |
| | | | | | | | |
| | | Shares | | Description | | Value | |
| |
| | Common Stocks (continued) | |
| |
| | Japan (continued) | |
| | 14,300 | | Yamazaki Baking Co. Ltd. (Food Products) | | $ | 290,413 | |
| | 30,600 | | ZOZO, Inc. (Specialty Retail) | | | 992,219 | |
| | | | | | | | |
| | | | | | | 47,744,613 | |
| | | |
| |
| | Jordan – 0.0% | |
| | 10,218 | | Hikma Pharmaceuticals PLC (Pharmaceuticals) | | | 244,719 | |
| | | |
| |
| | Luxembourg – 0.1% | |
| | 56,814 | | ArcelorMittal SA (Metals & Mining) | | | 1,405,254 | |
| | 5,713 | | Orion SA (Chemicals) | | | 85,638 | |
| | 2,982 | | Ternium SA ADR (Metals & Mining) | | | 101,716 | |
| | | | | | | | |
| | | | | | | 1,592,608 | |
| | | |
| |
| | Macau – 0.0% | |
| | 223,200 | | MGM China Holdings Ltd. (Hotels, Restaurants & Leisure) | | | 289,658 | |
| | | |
| |
| | Malaysia – 0.2% | |
| | 52,000 | | AMMB Holdings Bhd. (Banks) | | | 60,368 | |
| | 497,900 | | CIMB Group Holdings Bhd. (Banks) | | | 902,856 | |
| | 163,000 | | Gamuda Bhd. (Construction & Engineering) | | | 316,443 | |
| | 13,150 | | Hong Leong Bank Bhd. (Banks) | | | 61,349 | |
| | 154,150 | | Malayan Banking Bhd. (Banks) | | | 369,160 | |
| | 93,400 | | Press Metal Aluminium Holdings Bhd. (Metals & Mining) | | | 100,523 | |
| | 522,400 | | Public Bank Bhd. (Banks) | | | 525,682 | |
| | 377,993 | | RHB Bank Bhd. (Banks) | | | 552,515 | |
| | | | | | | | |
| | | | | | | 2,888,896 | |
| | | |
| |
| | Mexico – 0.2% | |
| | 7,810 | | BBB Foods, Inc. Class A* (Consumer Staples Distribution & Retail) | | | 249,451 | |
| | 21,085 | | Cemex SAB de CV ADR (Construction Materials) | | | 110,064 | |
| | 121,250 | | Corp. Inmobiliaria Vesta SAB de CV (Real Estate Management & Development) | | | 316,858 | |
| | 21,050 | | Gruma SAB de CV Class B (Food Products) | | | 363,613 | |
| | 1,650 | | Grupo Aeroportuario del Sureste SAB de CV Class B (Transportation Infrastructure) | | | 44,131 | |
| | 27,700 | | Grupo Mexico SAB de CV (Metals & Mining) | | | 144,927 | |
| | 2,120 | | Southern Copper Corp. (Metals & Mining) | | | 232,246 | |
| | 10,570 | | Vista Energy SAB de CV ADR* (Oil, Gas & Consumable Fuels) | | | 527,020 | |
| | | | | | | | |
| | | | | | | 1,988,310 | |
| | | |
| | |
| The accompanying notes are an integral part of these financial statements. | | 7 |
GOLDMAN SACHS MULTI-MANAGER GLOBAL EQUITY FUND
|
Schedule of Investments (continued) October 31, 2024 |
| | | | | | | | |
| | | Shares | | Description | | Value | |
| |
| | Common Stocks (continued) | |
| |
| | Netherlands – 1.4% | |
| | 1,290 | | Adyen NV*(a) (Financial Services) | | $ | 1,970,680 | |
| | 43,040 | | Akzo Nobel NV (Chemicals) | | | 2,746,531 | |
| | 3,331 | | Argenx SE ADR* (Biotechnology) | | | 1,952,965 | |
| | 2,887 | | ASM International NV (Semiconductors & Semiconductor Equipment) | | | 1,612,410 | |
| | 5,698 | | ASML Holding NV (Semiconductors & Semiconductor Equipment) | | | 3,832,190 | |
| | 6,886 | | ASR Nederland NV (Insurance) | | | 326,389 | |
| | 11,338 | | Expro Group Holdings NV* (Energy Equipment & Services) | | | 144,560 | |
| | 11,854 | | Heineken NV (Beverages) | | | 972,226 | |
| | 154,277 | | ING Groep NV (Banks) | | | 2,618,140 | |
| | 77,905 | | Koninklijke Philips NV* (Health Care Equipment & Supplies) | | | 2,049,588 | |
| | 16,519 | | SBM Offshore NV (Energy Equipment & Services) | | | 302,376 | |
| | | | | | | | |
| | | | | | | 18,528,055 | |
| | | |
| |
| | Norway – 0.0% | |
| | 84,862 | | Var Energi ASA (Oil, Gas & Consumable Fuels) | | | 267,644 | |
| | | |
| |
| | Peru – 0.0% | |
| | 1,993 | | Credicorp Ltd. (Banks) | | | 366,971 | |
| | | |
| |
| | Philippines – 0.0% | |
| | 43,550 | | International Container Terminal Services, Inc. (Transportation Infrastructure) | | | 296,778 | |
| | | |
| |
| | Poland – 0.1% | |
| | 2,350 | | Alior Bank SA (Banks) | | | 51,352 | |
| | 1,300 | | Bank Polska Kasa Opieki SA (Banks) | | | 45,482 | |
| | 50,300 | | Powszechna Kasa Oszczednosci Bank Polski SA (Banks) | | | 698,880 | |
| | | | | | | | |
| | | | | | | 795,714 | |
| | | |
| |
| | Portugal – 0.1% | |
| | 49,572 | | Galp Energia SGPS SA (Oil, Gas & Consumable Fuels) | | | 847,279 | |
| | 195,071 | | Sonae SGPS SA (Consumer Staples Distribution & Retail) | | | 192,879 | |
| | | | | | | | |
| | | | | | | 1,040,158 | |
| | | |
| |
| | Romania – 0.0% | |
| | 9,650 | | NEPI Rockcastle NV (Real Estate Management & Development) | | | 75,739 | |
| | | |
| |
| | Russia(b) – 0.0% | |
| | 61,284 | | Gazprom PJSC (Oil, Gas & Consumable Fuels) | | | — | |
| | 5,200 | | LUKOIL PJSC ADR* (Oil, Gas & Consumable Fuels) | | | — | |
| | | |
| | | | | | | | |
| | | Shares | | Description | | Value | |
| |
| | Common Stocks (continued) | |
| |
| | Russia(b) (continued) | |
| | 2,390 | | Magnit PJSC (Consumer Staples Distribution & Retail) | | $ | — | |
| | 3,393 | | Novolipetsk Steel PJSC GDR* (Metals & Mining) | | | — | |
| | 5,614 | | PhosAgro PJSC GDR* (Chemicals) | | | — | |
| | 36 | | PhosAgro PJSC* (Chemicals) | | | — | |
| | 19,000 | | Surgutneftegas PJSC ADR* (Oil, Gas & Consumable Fuels) | | | — | |
| | 23,847 | | VTB Bank PJSC GDR* (Banks) | | | — | |
| | | | | | | | |
| | | | | | | — | |
| | | |
| |
| | Singapore – 0.5% | |
| | 175,600 | | CapitaLand Ascendas REIT (Industrial REITs) | | | 355,855 | |
| | 56,950 | | DBS Group Holdings Ltd. (Banks) | | | 1,651,253 | |
| | 30,937 | | Sea Ltd. ADR* (Entertainment) | | | 2,909,625 | |
| | 69,900 | | Sembcorp Industries Ltd. (Multi-Utilities) | | | 265,190 | |
| | 41,700 | | United Overseas Bank Ltd. (Banks) | | | 1,013,687 | |
| | | | | | | | |
| | | | | | | 6,195,610 | |
| | | |
| |
| | South Africa – 0.2% | |
| | 2,158 | | Capitec Bank Holdings Ltd. (Banks) | | | 389,844 | |
| | 32,950 | | Clicks Group Ltd. (Consumer Staples Distribution & Retail) | | | 703,369 | |
| | 88,750 | | FirstRand Ltd. (Financial Services) | | | 389,940 | |
| | 45,794 | | Harmony Gold Mining Co. Ltd. ADR (Metals & Mining) | | | 496,407 | |
| | 35,515 | | Investec Ltd. (Capital Markets) | | | 276,989 | |
| | 24,000 | | Sasol Ltd. (Chemicals) | | | 134,893 | |
| | 9,100 | | Standard Bank Group Ltd. (Banks) | | | 125,285 | |
| | | | | | | | |
| | | | | | | 2,516,727 | |
| | | |
| |
| | South Korea – 1.6% | |
| | 300 | | Alteogen, Inc.* (Biotechnology) | | | 81,223 | |
| | 1,785 | | Chong Kun Dang Pharmaceutical Corp. (Pharmaceuticals) | | | 132,302 | |
| | 182,797 | | Coupang, Inc.* (Broadline Retail) | | | 4,714,335 | |
| | 2,400 | | GS Holdings Corp. (Industrial Conglomerates) | | | 71,487 | |
| | 1,500 | | Hankook Tire & Technology Co. Ltd. (Automobile Components) | | | 38,203 | |
| | 2,498 | | Hanwha Aerospace Co. Ltd. (Aerospace & Defense) | | | 660,954 | |
| | 34,550 | | Hanwha Life Insurance Co. Ltd. (Insurance) | | | 73,714 | |
| | 4,800 | | HD Hyundai Co. Ltd. (Oil, Gas & Consumable Fuels) | | | 276,954 | |
| | 3,544 | | HD Hyundai Electric Co. Ltd. (Electrical Equipment) | | | 829,486 | |
| | 550 | | HD Korea Shipbuilding & Offshore Engineering Co. Ltd. (Machinery) | | | 72,771 | |
| | 950 | | Hyundai Glovis Co. Ltd. (Air Freight & Logistics) | | | 83,583 | |
| | | |
| | |
| 8 | | The accompanying notes are an integral part of these financial statements. |
GOLDMAN SACHS MULTI-MANAGER GLOBAL EQUITY FUND
| | | | | | | | |
| | | Shares | | Description | | Value | |
| |
| | Common Stocks (continued) | |
| |
| | South Korea (continued) | |
| | 1,300 | | Hyundai Mobis Co. Ltd. (Automobile Components) | | $ | 233,652 | |
| | 3,000 | | Hyundai Rotem Co. Ltd. (Machinery) | | | 134,628 | |
| | 16,550 | | Hyundai Steel Co. (Metals & Mining) | | | 302,519 | |
| | 20,182 | | KB Financial Group, Inc. (Banks) | | | 1,313,219 | |
| | 950 | | KCC Corp. (Chemicals) | | | 180,074 | |
| | 11,424 | | Kia Corp. (Automobiles) | | | 755,457 | |
| | 1,850 | | Korea Gas Corp.* (Gas Utilities) | | | 52,322 | |
| | 6,400 | | Korea Investment Holdings Co. Ltd. (Capital Markets) | | | 355,193 | |
| | 1,000 | | Krafton, Inc.* (Entertainment) | | | 239,070 | |
| | 7,250 | | KT Corp. (Diversified Telecommunication Services) | | | 231,167 | |
| | 550 | | LG H&H Co. Ltd. (Personal Products) | | | 131,668 | |
| | 1,100 | | LigaChem Biosciences, Inc.* (Life Sciences Tools & Services) | | | 102,111 | |
| | 2,350 | | LS Corp. (Electrical Equipment) | | | 176,546 | |
| | 2,950 | | NAVER Corp. (Interactive Media & Services) | | | 360,849 | |
| | 5,300 | | Poongsan Corp. (Metals & Mining) | | | 265,091 | |
| | 869 | | Samsung Biologics Co. Ltd.*(a) (Life Sciences Tools & Services) | | | 628,495 | |
| | 7,650 | | Samsung E&A Co. Ltd.* (Construction & Engineering) | | | 98,455 | |
| | 72,778 | | Samsung Electronics Co. Ltd. (Technology Hardware, Storage & Peripherals) | | | 3,090,226 | |
| | 3,272 | | Samsung Electronics Co. Ltd. GDR (Technology Hardware, Storage & Peripherals) | | | 3,459,092 | |
| | 13,079 | | Shinhan Financial Group Co. Ltd. (Banks) | | | 487,195 | |
| | 10,281 | | SK Hynix, Inc. (Semiconductors & Semiconductor Equipment) | | | 1,345,925 | |
| | 1 | | SK Innovation Co. Ltd.* (Oil, Gas & Consumable Fuels) | | | 84 | |
| | 950 | | SK Telecom Co. Ltd. (Wireless Telecommunication Services) | | | 38,987 | |
| | 41,505 | | Woori Financial Group, Inc. (Banks) | | | 462,076 | |
| | | | | | | | |
| | | | | | | 21,479,113 | |
| | | |
| |
| | Spain – 0.2% | |
| | 2,329 | | Aena SME SA(a) (Transportation Infrastructure) | | | 516,153 | |
| | 27,378 | | Amadeus IT Group SA (Hotels, Restaurants & Leisure) | | | 1,984,721 | |
| | 5,986 | | CIE Automotive SA (Automobile Components) | | | 160,626 | |
| | | |
| | | | | | | | |
| | | Shares | | Description | | Value | |
| |
| | Common Stocks (continued) | |
| |
| | Spain (continued) | |
| | 3,602 | | Laboratorios Farmaceuticos Rovi SA (Pharmaceuticals) | | $ | 305,990 | |
| | | | | | | | |
| | | | | | | 2,967,490 | |
| | | |
| |
| | Sweden – 0.1% | |
| | 12,206 | | AAK AB (Food Products) | | | 350,394 | |
| | 25,434 | | Castellum AB* (Real Estate Management & Development) | | | 318,503 | |
| | 15,076 | | Electrolux AB Class B* (Household Durables) | | | 126,528 | |
| | 13,681 | | Saab AB Class B (Aerospace & Defense) | | | 280,991 | |
| | 30,213 | | Securitas AB Class B (Commercial Services & Supplies) | | | 355,422 | |
| | 8,893 | | Trelleborg AB Class B (Machinery) | | | 295,827 | |
| | | | | | | | |
| | | | | | | 1,727,665 | |
| | | |
| |
| | Switzerland – 1.1% | |
| | 14,757 | | Cie Financiere Richemont SA Class A (Textiles, Apparel & Luxury Goods) | | | 2,148,625 | |
| | 22,669 | | Julius Baer Group Ltd. (Capital Markets) | | | 1,382,164 | |
| | 21,169 | | Novartis AG (Pharmaceuticals) | | | 2,296,969 | |
| | 3,073 | | PSP Swiss Property AG (Real Estate Management & Development) | | | 436,396 | |
| | 3,011 | | Sika AG (Chemicals) | | | 838,615 | |
| | 2,983 | | Sonova Holding AG (Health Care Equipment & Supplies) | | | 1,091,592 | |
| | 762 | | Tecan Group AG (Life Sciences Tools & Services) | | | 192,536 | |
| | 117,391 | | UBS Group AG (Capital Markets) | | | 3,590,754 | |
| | 475 | | VAT Group AG(a) (Machinery) | | | 197,787 | |
| | 3,413 | | Zurich Insurance Group AG (Insurance) | | | 2,012,321 | |
| | | | | | | | |
| | | | | | | 14,187,759 | |
| | | |
| |
| | Taiwan – 3.1% | |
| | 55,000 | | Accton Technology Corp. (Communications Equipment) | | | 924,202 | |
| | 25,350 | | Arcadyan Technology Corp. (Communications Equipment) | | | 123,317 | |
| | 41,050 | | Asia Optical Co., Inc. (Electronic Equipment, Instruments & Components) | | | 128,593 | |
| | 7,030 | | ASPEED Technology, Inc. (Semiconductors & Semiconductor Equipment) | | | 891,454 | |
| | 21,950 | | Asustek Computer, Inc. (Technology Hardware, Storage & Peripherals) | | | 387,591 | |
| | 211,300 | | AUO Corp. (Electronic Equipment, Instruments & Components) | | | 108,861 | |
| | | |
| | |
| The accompanying notes are an integral part of these financial statements. | | 9 |
GOLDMAN SACHS MULTI-MANAGER GLOBAL EQUITY FUND
|
Schedule of Investments (continued) October 31, 2024 |
| | | | | | | | |
| | | Shares | | Description | | Value | |
| |
| | Common Stocks (continued) | |
| |
| | Taiwan (continued) | |
| | 7,500 | | Bizlink Holding, Inc. (Electrical Equipment) | | $ | 108,116 | |
| | 600,600 | | Cathay Financial Holding Co. Ltd. (Insurance) | | | 1,268,434 | |
| | 531,400 | | Compal Electronics, Inc. (Technology Hardware, Storage & Peripherals) | | | 583,343 | |
| | 70,450 | | Delta Electronics, Inc. (Electronic Equipment, Instruments & Components) | | | 870,119 | |
| | 51,200 | | E Ink Holdings, Inc. (Electronic Equipment, Instruments & Components) | | | 479,191 | |
| | 9,800 | | Eclat Textile Co. Ltd. (Textiles, Apparel & Luxury Goods) | | | 163,808 | |
| | 278,650 | | Fubon Financial Holding Co. Ltd. (Insurance) | | | 778,397 | |
| | 178,600 | | Gigabyte Technology Co. Ltd. (Technology Hardware, Storage & Peripherals) | | | 1,407,672 | |
| | 142,000 | | Hon Hai Precision Industry Co. Ltd. (Electronic Equipment, Instruments & Components) | | | 910,181 | |
| | 396,000 | | Innolux Corp. (Electronic Equipment, Instruments & Components) | | | 190,911 | |
| | 9,000 | | International Games System Co. Ltd. (Entertainment) | | | 283,970 | |
| | 5,750 | | Lotes Co. Ltd. (Electronic Equipment, Instruments & Components) | | | 292,436 | |
| | 51,450 | | MediaTek, Inc. (Semiconductors & Semiconductor Equipment) | | | 2,002,854 | |
| | 10,050 | | MPI Corp. (Semiconductors & Semiconductor Equipment) | | | 247,529 | |
| | 112,350 | | Pegatron Corp. (Technology Hardware, Storage & Peripherals) | | | 340,664 | |
| | 3,550 | | PharmaEssentia Corp.* (Biotechnology) | | | 69,426 | |
| | 83,650 | | Pou Chen Corp. (Textiles, Apparel & Luxury Goods) | | | 97,801 | |
| | 16,550 | | Raydium Semiconductor Corp. (Semiconductors & Semiconductor Equipment) | | | 173,566 | |
| | 34,800 | | Realtek Semiconductor Corp. (Semiconductors & Semiconductor Equipment) | | | 510,602 | |
| | 6,864 | | Silicon Motion Technology Corp. ADR (Semiconductors & Semiconductor Equipment) | | | 369,352 | |
| | 309,100 | | Taishin Financial Holding Co. Ltd. (Banks) | | | 164,231 | |
| | 399,410 | | Taiwan Business Bank (Banks) | | | 192,130 | |
| | | |
| | | | | | | | |
| | | Shares | | Description | | Value | |
| |
| | Common Stocks (continued) | |
| |
| | Taiwan (continued) | |
| | 424,355 | | Taiwan Semiconductor Manufacturing Co. Ltd. (Semiconductors & Semiconductor Equipment) | | $ | 13,307,553 | |
| | 66,150 | | Taiwan Semiconductor Manufacturing Co. Ltd. ADR (Semiconductors & Semiconductor Equipment) | | | 12,604,221 | |
| | 48,500 | | United Microelectronics Corp. (Semiconductors & Semiconductor Equipment) | | | 69,973 | |
| | 5,500 | | Wiwynn Corp. (Technology Hardware, Storage & Peripherals) | | | 312,688 | |
| | 134,222 | | Yuanta Financial Holding Co. Ltd. (Financial Services) | | | 134,620 | |
| | | | | | | | |
| | | | | | | 40,497,806 | |
| | | |
| |
| | Thailand – 0.3% | |
| | 134,950 | | Bangkok Bank PCL (Banks) | | | 587,330 | |
| | 705,400 | | Bangkok Dusit Medical Services PCL NVDR (Health Care Providers & Services) | | | 574,999 | |
| | 87,350 | | Bumrungrad Hospital PCL (Health Care Providers & Services) | | | 704,970 | |
| | 205,500 | | CP ALL PCL NVDR (Consumer Staples Distribution & Retail) | | | 385,185 | |
| | 103,350 | | Kasikornbank PCL (Banks) | | | 447,939 | |
| | 788,800 | | Krung Thai Bank PCL (Banks) | | | 479,095 | |
| | 2,685,600 | | TMBThanachart Bank PCL (Banks) | | | 141,701 | |
| | | | | | | | |
| | | | | | | 3,321,219 | |
| | | |
| |
| | Turkey – 0.0% | |
| | 10,472 | | Eldorado Gold Corp.* (Metals & Mining) | | | 181,899 | |
| | 9,600 | | Mavi Giyim Sanayi Ve Ticaret AS Class B(a) (Textiles, Apparel & Luxury Goods) | | | 21,364 | |
| | | | | | | | |
| | | | | | | 203,263 | |
| | | |
| |
| | United Arab Emirates – 0.2% | |
| | 216,172 | | Abu Dhabi Commercial Bank PJSC (Banks) | | | 525,454 | |
| | 744,858 | | Emaar Properties PJSC (Real Estate Management & Development) | | | 1,761,097 | |
| | 114,647 | | Emirates NBD Bank PJSC (Banks) | | | 593,047 | |
| | | | | | | | |
| | | | | | | 2,879,598 | |
| | | |
| |
| | United Kingdom – 4.7% | |
| | 49,910 | | 3i Group PLC (Capital Markets) | | | 2,046,695 | |
| | 4,301 | | 4imprint Group PLC (Media) | | | 283,310 | |
| | 32,822 | | AstraZeneca PLC (Pharmaceuticals) | | | 4,670,360 | |
| | 64,693 | | B&M European Value Retail SA (Broadline Retail) | | | 323,659 | |
| | 55,573 | | Balfour Beatty PLC (Construction & Engineering) | | | 318,738 | |
| | | |
| | |
| 10 | | The accompanying notes are an integral part of these financial statements. |
GOLDMAN SACHS MULTI-MANAGER GLOBAL EQUITY FUND
| | | | | | | | |
| | | Shares | | Description | | Value | |
| |
| | Common Stocks (continued) | |
| |
| | United Kingdom (continued) | |
| | 1,188,233 | | Barclays PLC (Banks) | | $ | 3,642,533 | |
| | 39,785 | | Beazley PLC (Insurance) | | | 387,835 | |
| | 8,091 | | Bellway PLC (Household Durables) | | | 295,878 | |
| | 11,282 | | Berkeley Group Holdings PLC (Household Durables) | | | 643,806 | |
| | 502,285 | | BP PLC (Oil, Gas & Consumable Fuels) | | | 2,456,585 | |
| | 61,702 | | Breedon Group PLC (Construction Materials) | | | 350,071 | |
| | 47,502 | | British American Tobacco PLC (Tobacco) | | | 1,661,102 | |
| | 90,690 | | British Land Co. PLC (Diversified REITs) | | | 466,687 | |
| | 151,036 | | Compass Group PLC (Hotels, Restaurants & Leisure) | | | 4,905,108 | |
| | 8,971 | | Computacenter PLC (IT Services) | | | 252,422 | |
| | 117,184 | | ConvaTec Group PLC(a) (Health Care Equipment & Supplies) | | | 323,244 | |
| | 5,060 | | Cranswick PLC (Food Products) | | | 330,798 | |
| | 104,530 | | Diageo PLC (Beverages) | | | 3,228,071 | |
| | 6,930 | | Diploma PLC (Trading Companies & Distributors) | | | 380,968 | |
| | 53,614 | | DS Smith PLC (Containers & Packaging) | | | 376,941 | |
| | 5,878 | | Endava PLC ADR* (IT Services) | | | 139,015 | |
| | 4 | | Flutter Entertainment PLC* (Hotels, Restaurants & Leisure) | | | 931 | |
| | 118,353 | | GSK PLC (Pharmaceuticals) | | | 2,137,287 | |
| | 31,131 | | IG Group Holdings PLC (Capital Markets) | | | 360,205 | |
| | 15,092 | | IMI PLC (Machinery) | | | 321,449 | |
| | 16,786 | | Intermediate Capital Group PLC (Capital Markets) | | | 445,910 | |
| | 183,868 | | JD Sports Fashion PLC (Specialty Retail) | | | 294,830 | |
| | 19,154 | | JET2 PLC (Passenger Airlines) | | | 355,986 | |
| | 239,793 | | Kingfisher PLC (Specialty Retail) | | | 906,850 | |
| | 327,131 | | Legal & General Group PLC (Insurance) | | | 917,565 | |
| | 12,603 | | London Stock Exchange Group PLC (Capital Markets) | | | 1,708,158 | |
| | 122,477 | | Man Group PLC (Capital Markets) | | | 313,443 | |
| | 19,899 | | National Grid PLC (Multi-Utilities) | | | 249,855 | |
| | 119,586 | | NatWest Group PLC (Banks) | | | 566,629 | |
| | 9,591 | | Nomad Foods Ltd. (Food Products) | | | 168,322 | |
| | 341,554 | | Prudential PLC (Insurance) | | | 2,843,385 | |
| | 51,897 | | Reckitt Benckiser Group PLC (Household Products) | | | 3,148,282 | |
| | 72,932 | | RELX PLC (Professional Services) | | | 3,352,212 | |
| | 14,018 | | Rio Tinto PLC (Metals & Mining) | | | 905,955 | |
| | 1,220,575 | | Rolls-Royce Holdings PLC* (Aerospace & Defense) | | | 8,422,453 | |
| | 63,934 | | Segro PLC (Industrial REITs) | | | 647,804 | |
| | 132,200 | | Serco Group PLC (Commercial Services & Supplies) | | | 298,707 | |
| | | |
| | | | | | | | |
| | | Shares | | Description | | Value | |
| |
| | Common Stocks (continued) | |
| |
| | United Kingdom (continued) | |
| | 31,670 | | Shell PLC (Oil, Gas & Consumable Fuels) | | $ | 1,065,912 | |
| | 38,015 | | Smith & Nephew PLC (Health Care Equipment & Supplies) | | | 472,634 | |
| | 100,695 | | Standard Chartered PLC (Banks) | | | 1,167,698 | |
| | 251,640 | | Tesco PLC (Consumer Staples Distribution & Retail) | | | 1,111,160 | |
| | 174,077 | | Tritax Big Box REIT PLC (Industrial REITs) | | | 316,718 | |
| | 12,860 | | Weir Group PLC (Machinery) | | | 346,321 | |
| | 66,240 | | WH Smith PLC (Specialty Retail) | | | 1,127,454 | |
| | 7,007 | | Whitbread PLC (Hotels, Restaurants & Leisure) | | | 272,621 | |
| | | | | | | | |
| | | | | | | 61,730,562 | |
| | | |
| |
| | United States – 56.0% | |
| | 81,059 | | Abbott Laboratories (Health Care Equipment & Supplies) | | | 9,189,659 | |
| | 15,192 | | AbbVie, Inc. (Biotechnology) | | | 3,097,193 | |
| | 831 | | Abercrombie & Fitch Co. Class A* (Specialty Retail) | | | 109,517 | |
| | 1,052 | | Addus HomeCare Corp.* (Health Care Providers & Services) | | | 130,890 | |
| | 17,760 | | Adeia, Inc. (Software) | | | 220,757 | |
| | 12,679 | | Adobe, Inc.* (Software) | | | 6,061,576 | |
| | 1,501 | | Adtalem Global Education, Inc.* (Diversified Consumer Services) | | | 121,461 | |
| | 4,157 | | Advanced Energy Industries, Inc. (Electronic Equipment, Instruments & Components) | | | 451,159 | |
| | 19,023 | | Advanced Micro Devices, Inc.* (Semiconductors & Semiconductor Equipment) | | | 2,740,644 | |
| | 8,831 | | Affirm Holdings, Inc.* (Financial Services) | | | 387,239 | |
| | 6,376 | | Agios Pharmaceuticals, Inc.* (Biotechnology) | | | 283,286 | |
| | 304,585 | | AGNC Investment Corp. (Mortgage Real Estate Investment Trusts (REITs)) | | | 2,835,686 | |
| | 6,716 | | Agree Realty Corp. (Retail REITs) | | | 498,663 | |
| | 4,174 | | Allison Transmission Holdings, Inc. (Machinery) | | | 446,034 | |
| | 19,354 | | Allstate Corp. (Insurance) | | | 3,609,908 | |
| | 124,773 | | Alphabet, Inc. Class A (Interactive Media & Services) | | | 21,349,908 | |
| | 163,949 | | Amazon.com, Inc.* (Broadline Retail) | | | 30,560,094 | |
| | 148,213 | | American International Group, Inc. (Insurance) | | | 11,246,402 | |
| | 11,377 | | Ameris Bancorp (Banks) | | | 705,260 | |
| | 3,273 | | Amkor Technology, Inc. (Semiconductors & Semiconductor Equipment) | | | 83,298 | |
| | | |
| | |
| The accompanying notes are an integral part of these financial statements. | | 11 |
GOLDMAN SACHS MULTI-MANAGER GLOBAL EQUITY FUND
|
Schedule of Investments (continued) October 31, 2024 |
| | | | | | | | |
| | | Shares | | Description | | Value | |
| |
| | Common Stocks (continued) | |
| |
| | United States (continued) | |
| | 78,434 | | Amphenol Corp. Class A (Electronic Equipment, Instruments & Components) | | $ | 5,256,647 | |
| | 143,145 | | Antero Resources Corp.* (Oil, Gas & Consumable Fuels) | | | 3,704,593 | |
| | 2,708 | | Appfolio, Inc. Class A* (Software) | | | 562,912 | |
| | 71,180 | | Apple, Inc. (Technology Hardware, Storage & Peripherals) | | | 16,080,274 | |
| | 7,425 | | Archrock, Inc. (Energy Equipment & Services) | | | 148,649 | |
| | 21,219 | | Arcutis Biotherapeutics, Inc.* (Biotechnology) | | | 176,330 | |
| | 1,108 | | Arrow Electronics, Inc.* (Electronic Equipment, Instruments & Components) | | | 131,486 | |
| | 15,442 | | Artivion, Inc.* (Health Care Equipment & Supplies) | | | 406,588 | |
| | 2,044 | | Asbury Automotive Group, Inc.* (Specialty Retail) | | | 465,705 | |
| | 1,493 | | Ashland, Inc. (Chemicals) | | | 126,263 | |
| | 27,724 | | Atlassian Corp. Class A* (Software) | | | 5,227,083 | |
| | 4,084 | | Atmus Filtration Technologies, Inc. (Machinery) | | | 159,031 | |
| | 13,714 | | AtriCure, Inc.* (Health Care Equipment & Supplies) | | | 455,031 | |
| | 107,053 | | Aurora Innovation, Inc.* (Software) | | | 556,140 | |
| | 15,405 | | Avient Corp. (Chemicals) | | | 718,027 | |
| | 6,335 | | Avnet, Inc. (Electronic Equipment, Instruments & Components) | | | 343,420 | |
| | 2,007 | | Axcelis Technologies, Inc.* (Semiconductors & Semiconductor Equipment) | | | 171,217 | |
| | 1,982 | | Axos Financial, Inc.* (Banks) | | | 134,221 | |
| | 6,006 | | Azenta, Inc.* (Life Sciences Tools & Services) | | | 246,787 | |
| | 1,713 | | AZZ, Inc. (Building Products) | | | 130,496 | |
| | 3,797 | | Balchem Corp. (Chemicals) | | | 635,352 | |
| | 15,109 | | Baldwin Insurance Group, Inc.* (Insurance) | | | 698,942 | |
| | 199,099 | | Bank of America Corp. (Banks) | | | 8,326,320 | |
| | 4,764 | | Beacon Roofing Supply, Inc.* (Trading Companies & Distributors) | | | 438,621 | |
| | 7,183 | | Beazer Homes USA, Inc.* (Household Durables) | | | 220,949 | |
| | 46,480 | | Becton Dickinson & Co. (Health Care Equipment & Supplies) | | | 10,857,263 | |
| | 1,494 | | Belden, Inc. (Electronic Equipment, Instruments & Components) | | | 170,122 | |
| | 2,758 | | BellRing Brands, Inc.* (Personal Products) | | | 181,559 | |
| | 18,171 | | Berkshire Hathaway, Inc. Class B* (Financial Services) | | | 8,193,667 | |
| | 35,212 | | BGC Group, Inc. Class A (Capital Markets) | | | 329,936 | |
| | | |
| | | | | | | | |
| | | Shares | | Description | | Value | |
| |
| | Common Stocks (continued) | |
| |
| | United States (continued) | |
| | 39,715 | | BioCryst Pharmaceuticals, Inc.* (Biotechnology) | | $ | 318,117 | |
| | 11,771 | | Boeing Co.* (Aerospace & Defense) | | | 1,757,528 | |
| | 967 | | Booking Holdings, Inc. (Hotels, Restaurants & Leisure) | | | 4,521,934 | |
| | 3,698 | | Boot Barn Holdings, Inc.* (Specialty Retail) | | | 460,586 | |
| | 17,798 | | Bowlero Corp. Class A (Hotels, Restaurants & Leisure) | | | 184,565 | |
| | 3,042 | | Boyd Gaming Corp. (Hotels, Restaurants & Leisure) | | | 210,780 | |
| | 2,172 | | Brady Corp. Class A (Commercial Services & Supplies) | | | 154,516 | |
| | 894 | | Brinker International, Inc.* (Hotels, Restaurants & Leisure) | | | 91,823 | |
| | 4,283 | | Brink’s Co. (Commercial Services & Supplies) | | | 440,250 | |
| | 17,837 | | Builders FirstSource, Inc.* (Building Products) | | | 3,057,262 | |
| | 4,944 | | Byline Bancorp, Inc. (Banks) | | | 133,043 | |
| | 2,017 | | Cactus, Inc. Class A (Energy Equipment & Services) | | | 119,588 | |
| | 3,932 | | Cadence Bank (Banks) | | | 131,447 | |
| | 2,897 | | Caleres, Inc. (Specialty Retail) | | | 86,475 | |
| | 76,241 | | CarMax, Inc.* (Specialty Retail) | | | 5,518,324 | |
| | 12,328 | | Cars.com, Inc.* (Interactive Media & Services) | | | 197,125 | |
| | 7,254 | | Catalyst Pharmaceuticals, Inc.* (Biotechnology) | | | 158,137 | |
| | 15,929 | | Caterpillar, Inc. (Machinery) | | | 5,992,490 | |
| | 10,962 | | Cathay General Bancorp (Banks) | | | 504,033 | |
| | 8,755 | | CBIZ, Inc.* (Professional Services) | | | 603,482 | |
| | 19,948 | | Central Garden & Pet Co. Class A* (Household Products) | | | 581,285 | |
| | 8,196 | | Champion Homes, Inc.* (Household Durables) | | | 723,133 | |
| | 19,354 | | ChampionX Corp. (Energy Equipment & Services) | | | 546,170 | |
| | 30,679 | | Charles Schwab Corp. (Capital Markets) | | | 2,172,994 | |
| | 2,913 | | Chart Industries, Inc.* (Machinery) | | | 351,657 | |
| | 38,000 | | Chipotle Mexican Grill, Inc.* (Hotels, Restaurants & Leisure) | | | 2,119,260 | |
| | 2,729 | | Chord Energy Corp. (Oil, Gas & Consumable Fuels) | | | 341,398 | |
| | 14,010 | | Cigna Group (Health Care Providers & Services) | | | 4,410,488 | |
| | 3,850 | | Clearfield, Inc.* (Communications Equipment) | | | 138,331 | |
| | 1,776 | | Coca-Cola Consolidated, Inc. (Beverages) | | | 1,996,686 | |
| | 5,453 | | Cohen & Steers, Inc. (Capital Markets) | | | 538,593 | |
| | | |
| | |
| 12 | | The accompanying notes are an integral part of these financial statements. |
GOLDMAN SACHS MULTI-MANAGER GLOBAL EQUITY FUND
| | | | | | | | |
| | | Shares | | Description | | Value | |
| |
| | Common Stocks (continued) | |
| |
| | United States (continued) | |
| | 6,463 | | Columbia Banking System, Inc. (Banks) | | $ | 184,260 | |
| | 14,960 | | Comfort Systems USA, Inc. (Construction & Engineering) | | | 5,849,958 | |
| | 2,208 | | Commercial Metals Co. (Metals & Mining) | | | 118,790 | |
| | 2,692 | | Concentrix Corp. (Professional Services) | | | 114,437 | |
| | 91,308 | | ConocoPhillips (Oil, Gas & Consumable Fuels) | | | 10,001,878 | |
| | 116,150 | | Corteva, Inc. (Chemicals) | | | 7,075,858 | |
| | 6,537 | | Cousins Properties, Inc. (Office REITs) | | | 200,228 | |
| | 5,207 | | Crinetics Pharmaceuticals, Inc.* (Biotechnology) | | | 291,384 | |
| | 33,561 | | Danaher Corp. (Life Sciences Tools & Services) | | | 8,244,595 | |
| | 10,498 | | Deere & Co. (Machinery) | | | 4,248,436 | |
| | 27,467 | | Diamondback Energy, Inc. (Oil, Gas & Consumable Fuels) | | | 4,855,342 | |
| | 3,588 | | Dime Community Bancshares, Inc. (Banks) | | | 107,891 | |
| | 42,516 | | Dominion Energy, Inc. (Multi-Utilities) | | | 2,530,977 | |
| | 39,750 | | DoorDash, Inc. Class A* (Hotels, Restaurants & Leisure) | | | 6,228,825 | |
| | 4,198 | | Ducommun, Inc.* (Aerospace & Defense) | | | 246,800 | |
| | 35,629 | | Dynatrace, Inc.* (Software) | | | 1,916,840 | |
| | 18,355 | | Eaton Corp. PLC (Electrical Equipment) | | | 6,086,151 | |
| | 10,040 | | Ecovyst, Inc.* (Chemicals) | | | 66,866 | |
| | 7,808 | | Eli Lilly & Co. (Pharmaceuticals) | | | 6,478,610 | |
| | 2,472 | | Employers Holdings, Inc. (Insurance) | | | 120,436 | |
| | 5,720 | | Enact Holdings, Inc. (Financial Services) | | | 194,995 | |
| | 4,217 | | Enerpac Tool Group Corp. (Machinery) | | | 186,054 | |
| | 3,058 | | EnerSys (Electrical Equipment) | | | 296,198 | |
| | 7,436 | | Entegris, Inc. (Semiconductors & Semiconductor Equipment) | | | 778,624 | |
| | 3,610 | | EPAM Systems, Inc.* (IT Services) | | | 681,026 | |
| | 8,188 | | Equifax, Inc. (Professional Services) | | | 2,169,984 | |
| | 6,316 | | Essent Group Ltd. (Financial Services) | | | 379,023 | |
| | 7,343 | | Evolent Health, Inc. Class A* (Health Care Technology) | | | 171,459 | |
| | 25,372 | | Extra Space Storage, Inc. (Specialized REITs) | | | 4,143,248 | |
| | 1,066 | | Fair Isaac Corp.* (Software) | | | 2,124,655 | |
| | 2,801 | | Federal Agricultural Mortgage Corp. Class C (Financial Services) | | | 513,339 | |
| | 29,562 | | Ferguson Enterprises, Inc. (Trading Companies & Distributors) | | | 5,815,110 | |
| | | |
| | | | | | | | |
| | | Shares | | Description | | Value | |
| |
| | Common Stocks (continued) | |
| |
| | United States (continued) | |
| | 12,139 | | First Advantage Corp.* (Professional Services) | | $ | 219,959 | |
| | 3,289 | | First American Financial Corp. (Insurance) | | | 210,989 | |
| | 2,283 | | First Industrial Realty Trust, Inc. (Industrial REITs) | | | 119,835 | |
| | 16,598 | | First Watch Restaurant Group, Inc.* (Hotels, Restaurants & Leisure) | | | 282,083 | |
| | 3,470 | | FirstCash Holdings, Inc. (Consumer Finance) | | | 359,041 | |
| | 44,715 | | Fiserv, Inc.* (Financial Services) | | | 8,849,098 | |
| | 31,072 | | Flywire Corp.* (Financial Services) | | | 541,274 | |
| | 4,369 | | Fox Factory Holding Corp.* (Automobile Components) | | | 157,240 | |
| | 83,112 | | Freeport-McMoRan, Inc. (Metals & Mining) | | | 3,741,702 | |
| | 7,442 | | Frontdoor, Inc.* (Diversified Consumer Services) | | | 369,793 | |
| | 833 | | FTI Consulting, Inc.* (Professional Services) | | | 162,502 | |
| | 9,000 | | Gates Industrial Corp. PLC* (Machinery) | | | 174,645 | |
| | 150,429 | | General Motors Co. (Automobiles) | | | 7,635,776 | |
| | 8,817 | | Glacier Bancorp, Inc. (Banks) | | | 459,807 | |
| | 2,600 | | Globant SA* (IT Services) | | | 545,714 | |
| | 9,768 | | Globus Medical, Inc. Class A* (Health Care Equipment & Supplies) | | | 718,339 | |
| | 5,645 | | Grand Canyon Education, Inc.* (Diversified Consumer Services) | | | 773,986 | |
| | 3,601 | | Granite Construction, Inc. (Construction & Engineering) | | | 302,664 | |
| | 3,662 | | Griffon Corp. (Building Products) | | | 230,267 | |
| | 628 | | Group 1 Automotive, Inc. (Specialty Retail) | | | 228,793 | |
| | 3,767 | | Hackett Group, Inc. (IT Services) | | | 91,613 | |
| | 2,699 | | Haemonetics Corp.* (Health Care Equipment & Supplies) | | | 192,061 | |
| | 12,211 | | Halozyme Therapeutics, Inc.* (Biotechnology) | | | 617,510 | |
| | 4,609 | | Hancock Whitney Corp. (Banks) | | | 240,037 | |
| | 33,121 | | Hartford Financial Services Group, Inc. (Insurance) | | | 3,657,883 | |
| | 15,359 | | HCA Healthcare, Inc. (Health Care Providers & Services) | | | 5,509,888 | |
| | 9,199 | | HealthEquity, Inc.* (Health Care Providers & Services) | | | 784,215 | |
| | 9,176 | | Heritage Commerce Corp. (Banks) | | | 89,099 | |
| | 41,346 | | Hillman Solutions Corp.* (Machinery) | | | 438,268 | |
| | 5,395 | | Home BancShares, Inc. (Banks) | | | 147,230 | |
| | 9,048 | | Home Depot, Inc. (Specialty Retail) | | | 3,562,650 | |
| | 15,210 | | Horace Mann Educators Corp. (Insurance) | | | 566,420 | |
| | | |
| | |
| The accompanying notes are an integral part of these financial statements. | | 13 |
GOLDMAN SACHS MULTI-MANAGER GLOBAL EQUITY FUND
|
Schedule of Investments (continued) October 31, 2024 |
| | | | | | | | |
| | | Shares | | Description | | Value | |
| |
| | Common Stocks (continued) | |
| |
| | United States (continued) | |
| | 4,422 | | Houlihan Lokey, Inc. (Capital Markets) | | $ | 763,989 | |
| | 23,160 | | Howmet Aerospace, Inc. (Aerospace & Defense) | | | 2,309,515 | |
| | 5,151 | | HubSpot, Inc.* (Software) | | | 2,857,723 | |
| | 1,341 | | Huron Consulting Group, Inc.* (Professional Services) | | | 155,194 | |
| | 3,544 | | ICF International, Inc. (Professional Services) | | | 597,483 | |
| | 1,335 | | ICU Medical, Inc.* (Health Care Equipment & Supplies) | | | 227,925 | |
| | 4,298 | | IDACORP, Inc. (Electric Utilities) | | | 444,757 | |
| | 22,885 | | Independence Realty Trust, Inc. (Residential REITs) | | | 449,004 | |
| | 6,128 | | Independent Bank Corp. (Banks) | | | 385,451 | |
| | 27,484 | | Ingersoll Rand, Inc. (Machinery) | | | 2,638,464 | |
| | 8,072 | | Insmed, Inc.* (Biotechnology) | | | 543,084 | |
| | 407 | | Installed Building Products, Inc. (Household Durables) | | | 88,278 | |
| | 18,656 | | Intapp, Inc.* (Software) | | | 935,972 | |
| | 59,595 | | Intercontinental Exchange, Inc. (Capital Markets) | | | 9,289,073 | |
| | 3,826 | | InterDigital, Inc. (Software) | | | 575,583 | |
| | 4,038 | | International Money Express, Inc.* (Financial Services) | | | 71,028 | |
| | 48,392 | | International Paper Co. (Containers & Packaging) | | | 2,687,692 | |
| | 7,441 | | Intra-Cellular Therapies, Inc.* (Pharmaceuticals) | | | 630,625 | |
| | 23,480 | | Intuit, Inc. (Software) | | | 14,329,844 | |
| | 12,254 | | Intuitive Surgical, Inc.* (Health Care Equipment & Supplies) | | | 6,174,055 | |
| | 3,735 | | ITT, Inc. (Machinery) | | | 523,348 | |
| | 18,487 | | Janus International Group, Inc.* (Building Products) | | | 136,064 | |
| | 81,250 | | JBS SA (Food Products) | | | 506,117 | |
| | 32,895 | | JPMorgan Chase & Co. (Banks) | | | 7,300,058 | |
| | 9,146 | | Kelly Services, Inc. Class A (Professional Services) | | | 182,829 | |
| | 237,792 | | KeyCorp (Banks) | | | 4,101,912 | |
| | 1,341 | | Knife River Corp.* (Construction Materials) | | | 130,506 | |
| | 725,975 | | Kosmos Energy Ltd.* (Oil, Gas & Consumable Fuels) | | | 2,729,666 | |
| | 17,519 | | L3Harris Technologies, Inc. (Aerospace & Defense) | | | 4,335,427 | |
| | 22,372 | | Labcorp Holdings, Inc. (Health Care Providers & Services) | | | 5,106,856 | |
| | 2,002 | | Lantheus Holdings, Inc.* (Health Care Equipment & Supplies) | | | 219,900 | |
| | 18,206 | | Laureate Education, Inc. (Diversified Consumer Services) | | | 312,779 | |
| | 7,661 | | La-Z-Boy, Inc. (Household Durables) | | | 291,501 | |
| | | |
| | | | | | | | |
| | | Shares | | Description | | Value | |
| |
| | Common Stocks (continued) | |
| |
| | United States (continued) | |
| | 4,069 | | Liberty Media Corp.-Liberty Live Class A* (Entertainment) | | $ | 230,875 | |
| | 4,523 | | LiveRamp Holdings, Inc.* (Software) | | | 113,211 | |
| | 11,404 | | Lululemon Athletica, Inc.* (Textiles, Apparel & Luxury Goods) | | | 3,397,252 | |
| | 7,918 | | MACOM Technology Solutions Holdings, Inc.* (Semiconductors & Semiconductor Equipment) | | | 889,983 | |
| | 26,396 | | Magnite, Inc.* (Media) | | | 329,422 | |
| | 27,928 | | Magnolia Oil & Gas Corp. Class A (Oil, Gas & Consumable Fuels) | | | 706,020 | |
| | 6,549 | | Martin Marietta Materials, Inc. (Construction Materials) | | | 3,879,235 | |
| | 19,523 | | Mastercard, Inc. Class A (Financial Services) | | | 9,753,496 | |
| | 14,540 | | Matador Resources Co. (Oil, Gas & Consumable Fuels) | | | 757,679 | |
| | 1,010 | | Matson, Inc. (Marine Transportation) | | | 156,439 | |
| | 1,548 | | Medpace Holdings, Inc.* (Life Sciences Tools & Services) | | | 486,413 | |
| | 2,516 | | Merchants Bancorp (Financial Services) | | | 92,941 | |
| | 1,319 | | Meritage Homes Corp. (Household Durables) | | | 239,003 | |
| | 34,403 | | Meta Platforms, Inc. Class A (Interactive Media & Services) | | | 19,526,455 | |
| | 92,228 | | Microsoft Corp. (Software) | | | 37,476,848 | |
| | 6,597 | | Minerals Technologies, Inc. (Chemicals) | | | 496,688 | |
| | 6,340 | | Monday.com Ltd.* (Software) | | | 1,863,136 | |
| | 1,786 | | MongoDB, Inc.* (IT Services) | | | 482,934 | |
| | 13,765 | | Monolithic Power Systems, Inc. (Semiconductors & Semiconductor Equipment) | | | 10,451,764 | |
| | 56,733 | | Nasdaq, Inc. (Capital Markets) | | | 4,193,703 | |
| | 6,699 | | Natera, Inc.* (Biotechnology) | | | 810,311 | |
| | 5,666 | | National Health Investors, Inc. (Health Care REITs) | | | 434,299 | |
| | 28,613 | | Nestle SA (Food Products) | | | 2,703,717 | |
| | 5,739 | | Netflix, Inc.* (Entertainment) | | | 4,338,856 | |
| | 13,620 | | Newpark Resources, Inc.* (Energy Equipment & Services) | | | 90,709 | |
| | 1,858 | | Nexstar Media Group, Inc. (Media) | | | 326,859 | |
| | 1,815 | | Northeast Bank (Banks) | | | 161,281 | |
| | 11,289 | | Northwestern Energy Group, Inc. (Multi-Utilities) | | | 603,510 | |
| | 4,690 | | Novanta, Inc.* (Electronic Equipment, Instruments & Components) | | | 798,426 | |
| | 268,309 | | NVIDIA Corp. (Semiconductors & Semiconductor Equipment) | | | 35,620,703 | |
| | 376 | | NVR, Inc.* (Household Durables) | | | 3,441,457 | |
| | | |
| | |
| 14 | | The accompanying notes are an integral part of these financial statements. |
GOLDMAN SACHS MULTI-MANAGER GLOBAL EQUITY FUND
| | | | | | | | |
| | | Shares | | Description | | Value | |
| |
| | Common Stocks (continued) | |
| |
| | United States (continued) | |
| | 29,559 | | OceanFirst Financial Corp. (Banks) | | $ | 537,974 | |
| | 55,664 | | Olaplex Holdings, Inc.* (Personal Products) | | | 99,082 | |
| | 11,224 | | Old National Bancorp (Banks) | | | 216,174 | |
| | 63,645 | | ON Semiconductor Corp.* (Semiconductors & Semiconductor Equipment) | | | 4,486,336 | |
| | 5,733 | | O’Reilly Automotive, Inc.* (Specialty Retail) | | | 6,610,952 | |
| | 5,197 | | Organon & Co. (Pharmaceuticals) | | | 97,600 | |
| | 1,804 | | OSI Systems, Inc.* (Electronic Equipment, Instruments & Components) | | | 238,507 | |
| | 5,071 | | Oxford Industries, Inc. (Textiles, Apparel & Luxury Goods) | | | 368,256 | |
| | 18,291 | | Pacific Premier Bancorp, Inc. (Banks) | | | 466,603 | |
| | 22,758 | | Paragon 28, Inc.* (Health Care Equipment & Supplies) | | | 120,617 | |
| | 5,910 | | Parker-Hannifin Corp. (Machinery) | | | 3,747,354 | |
| | 4,359 | | Patrick Industries, Inc. (Automobile Components) | | | 549,147 | |
| | 4,452 | | Peapack-Gladstone Financial Corp. (Banks) | | | 143,087 | |
| | 11,134 | | Pediatrix Medical Group, Inc.* (Health Care Providers & Services) | | | 137,171 | |
| | 1,967 | | PennyMac Financial Services, Inc. (Financial Services) | | | 196,071 | |
| | 2,774 | | Penumbra, Inc.* (Health Care Equipment & Supplies) | | | 634,885 | |
| | 21,411 | | PepsiCo, Inc. (Beverages) | | | 3,555,939 | |
| | 9,779 | | Perdoceo Education Corp. (Diversified Consumer Services) | | | 218,561 | |
| | 16,290 | | Perella Weinberg Partners (Capital Markets) | | | 329,547 | |
| | 214,442 | | Pfizer, Inc. (Pharmaceuticals) | | | 6,068,709 | |
| | 3,855 | | Photronics, Inc.* (Semiconductors & Semiconductor Equipment) | | | 87,894 | |
| | 19,344 | | Phreesia, Inc.* (Health Care Technology) | | | 353,802 | |
| | 1,361 | | Portland General Electric Co. (Electric Utilities) | | | 64,511 | |
| | 3,128 | | Preferred Bank (Banks) | | | 263,909 | |
| | 16,240 | | Primoris Services Corp. (Construction & Engineering) | | | 1,016,949 | |
| | 9,917 | | Progyny, Inc.* (Health Care Providers & Services) | | | 149,251 | |
| | 19,408 | | Qiagen NV* (Life Sciences Tools & Services) | | | 822,481 | |
| | 2,938 | | RBC Bearings, Inc.* (Machinery) | | | 823,668 | |
| | 22,179 | | Redwood Trust, Inc. (Mortgage Real Estate Investment Trusts (REITs)) | | | 162,350 | |
| | 26,673 | | Regal Rexnord Corp. (Electrical Equipment) | | | 4,442,121 | |
| | | |
| | | | | | | | |
| | | Shares | | Description | | Value | |
| |
| | Common Stocks (continued) | |
| |
| | United States (continued) | |
| | 5,808 | | Resideo Technologies, Inc.* (Building Products) | | $ | 114,243 | |
| | 8,048 | | Revolve Group, Inc.* (Specialty Retail) | | | 199,751 | |
| | 17,408 | | Roche Holding AG (Pharmaceuticals) | | | 5,394,799 | |
| | 23,443 | | Ross Stores, Inc. (Specialty Retail) | | | 3,275,456 | |
| | 5,164 | | Ryman Hospitality Properties, Inc. (Hotel & Resort REITs) | | | 552,806 | |
| | 1,567 | | S&T Bancorp, Inc. (Banks) | | | 59,515 | |
| | 16,450 | | Saia, Inc.* (Ground Transportation) | | | 8,037,634 | |
| | 21,202 | | SBA Communications Corp. (Specialized REITs) | | | 4,865,223 | |
| | 39,899 | | Schlumberger NV (Energy Equipment & Services) | | | 1,598,753 | |
| | 9,430 | | Schneider National, Inc. Class B (Ground Transportation) | | | 266,680 | |
| | 1,181 | | Science Applications International Corp. (Professional Services) | | | 170,406 | |
| | 17,811 | | Seacoast Banking Corp. of Florida (Banks) | | | 475,554 | |
| | 12,467 | | Select Water Solutions, Inc. (Energy Equipment & Services) | | | 132,150 | |
| | 4,561 | | Sensata Technologies Holding PLC (Electrical Equipment) | | | 156,625 | |
| | 15,864 | | ServiceNow, Inc.* (Software) | | | 14,800,953 | |
| | 13,410 | | Sherwin-Williams Co. (Chemicals) | | | 4,811,106 | |
| | 3,083 | | Shift4 Payments, Inc. Class A* (Financial Services) | | | 278,827 | |
| | 21,901 | | Shoals Technologies Group, Inc. Class A* (Electrical Equipment) | | | 118,484 | |
| | 13,801 | | Silgan Holdings, Inc. (Containers & Packaging) | | | 714,064 | |
| | 3,401 | | Silicon Laboratories, Inc.* (Semiconductors & Semiconductor Equipment) | | | 353,228 | |
| | 4,283 | | Simply Good Foods Co.* (Food Products) | | | 144,166 | |
| | 3,874 | | Six Flags Entertainment Corp. (Hotels, Restaurants & Leisure) | | | 152,674 | |
| | 31,075 | | SLM Corp. (Consumer Finance) | | | 684,582 | |
| | 20,691 | | Smurfit WestRock PLC (Containers & Packaging) | | | 1,065,586 | |
| | 1,501 | | SouthState Corp. (Banks) | | | 146,393 | |
| | 8,352 | | Spotify Technology SA* (Entertainment) | | | 3,216,355 | |
| | 8,045 | | SpringWorks Therapeutics, Inc.* (Biotechnology) | | | 242,396 | |
| | 6,877 | | SPX Technologies, Inc.* (Machinery) | | | 986,781 | |
| | 69,758 | | SS&C Technologies Holdings, Inc. (Professional Services) | | | 4,878,177 | |
| | 20,523 | | STAG Industrial, Inc. (Industrial REITs) | | | 765,097 | |
| | 19,676 | | Stagwell, Inc.* (Media) | | | 122,188 | |
| | | |
| | |
| The accompanying notes are an integral part of these financial statements. | | 15 |
GOLDMAN SACHS MULTI-MANAGER GLOBAL EQUITY FUND
|
Schedule of Investments (continued) October 31, 2024 |
| | | | | | | | |
| | | Shares | | Description | | Value | |
| |
| | Common Stocks (continued) | |
| |
| | United States (continued) | |
| | 40,219 | | Starbucks Corp. (Hotels, Restaurants & Leisure) | | $ | 3,929,396 | |
| | 7,360 | | STERIS PLC (Health Care Equipment & Supplies) | | | 1,632,816 | |
| | 4,657 | | Sterling Infrastructure, Inc.* (Construction & Engineering) | | | 719,274 | |
| | 6,201 | | Steven Madden Ltd. (Textiles, Apparel & Luxury Goods) | | | 278,859 | |
| | 7,842 | | Stifel Financial Corp. (Capital Markets) | | | 812,588 | |
| | 2,242 | | StoneX Group, Inc.* (Capital Markets) | | | 201,870 | |
| | 18,729 | | Stryker Corp. (Health Care Equipment & Supplies) | | | 6,672,768 | |
| | 15,656 | | Supernus Pharmaceuticals, Inc.* (Pharmaceuticals) | | | 533,400 | |
| | 85,499 | | Sysco Corp. (Consumer Staples Distribution & Retail) | | | 6,408,150 | |
| | 934 | | Talen Energy Corp.* (Independent Power and Renewable Electricity Producers) | | | 169,390 | |
| | 8,036 | | Tandem Diabetes Care, Inc.* (Health Care Equipment & Supplies) | | | 252,089 | |
| | 31,214 | | Target Corp. (Consumer Staples Distribution & Retail) | | | 4,683,349 | |
| | 2,441 | | Taylor Morrison Home Corp.* (Household Durables) | | | 167,209 | |
| | 11,840 | | TEGNA, Inc. (Media) | | | 194,531 | |
| | 3,000 | | Texas Capital Bancshares, Inc.* (Banks) | | | 231,130 | |
| | 36,457 | | Texas Instruments, Inc. (Semiconductors & Semiconductor Equipment) | | | 7,406,604 | |
| | 5,396 | | Texas Roadhouse, Inc. (Hotels, Restaurants & Leisure) | | | 1,031,284 | |
| | 12,040 | | TopBuild Corp.* (Household Durables) | | | 4,254,695 | |
| | 11,224 | | Tradeweb Markets, Inc. Class A (Capital Markets) | | | 1,425,448 | |
| | 12,279 | | Tri Pointe Homes, Inc.* (Household Durables) | | | 496,440 | |
| | 4,123 | | U.S. Physical Therapy, Inc. (Health Care Providers & Services) | | | 330,582 | |
| | 6,276 | | UFP Industries, Inc. (Building Products) | | | 767,806 | |
| | 4,523 | | Ultra Clean Holdings, Inc.* (Semiconductors & Semiconductor Equipment) | | | 151,294 | |
| | 5,404 | | UMB Financial Corp. (Banks) | | | 592,981 | |
| | 23,685 | | Union Pacific Corp. (Ground Transportation) | | | 5,496,578 | |
| | 13,684 | | UnitedHealth Group, Inc. (Health Care Providers & Services) | | | 7,724,618 | |
| | 2,723 | | Universal Corp. (Tobacco) | | | 138,655 | |
| | | |
| | | | | | | | |
| | | Shares | | Description | | Value | |
| |
| | Common Stocks (continued) | |
| |
| | United States (continued) | |
| | 30,037 | | Utz Brands, Inc. (Food Products) | | $ | 517,237 | |
| | 664 | | Valmont Industries, Inc. (Construction & Engineering) | | | 206,956 | |
| | 14,783 | | Veracyte, Inc.* (Biotechnology) | | | 498,778 | |
| | 47,780 | | Viavi Solutions, Inc.* (Communications Equipment) | | | 440,532 | |
| | 4,941 | | Victoria’s Secret & Co.* (Specialty Retail) | | | 149,515 | |
| | 11,165 | | Viper Energy, Inc. (Oil, Gas & Consumable Fuels) | | | 579,463 | |
| | 35,407 | | Visa, Inc. Class A (Financial Services) | | | 10,262,719 | |
| | 11,341 | | Vita Coco Co., Inc.* (Beverages) | | | 335,807 | |
| | 17,240 | | Vivid Seats, Inc. Class A* (Entertainment) | | | 70,167 | |
| | 3,257 | | Voya Financial, Inc. (Financial Services) | | | 261,537 | |
| | 85,040 | | Walt Disney Co. (Entertainment) | | | 8,180,848 | |
| | 8,720 | | Waste Connections, Inc. (Commercial Services & Supplies) | | | 1,541,260 | |
| | 25,028 | | Waste Management, Inc. (Commercial Services & Supplies) | | | 5,402,294 | |
| | 78,289 | | Wells Fargo & Co. (Banks) | | | 5,082,522 | |
| | 4,698 | | Western Alliance Bancorp (Banks) | | | 390,921 | |
| | 175 | | White Mountains Insurance Group Ltd. (Insurance) | | | 314,499 | |
| | 3,646 | | WillScot Holdings Corp.* (Construction & Engineering) | | | 120,828 | |
| | 4,200 | | Wintrust Financial Corp. (Banks) | | | 486,738 | |
| | 9,208 | | World Kinect Corp. (Oil, Gas & Consumable Fuels) | | | 240,789 | |
| | 3,925 | | Zions Bancorp NA (Banks) | | | 204,336 | |
| | 52,740 | | Zoetis, Inc. (Pharmaceuticals) | | | 9,428,857 | |
| | | | | | | | |
| | | | | | | 736,442,317 | |
| | | |
| |
| | Uruguay* – 0.3% | |
| | 2,002 | | MercadoLibre, Inc. (Broadline Retail) | | | 4,078,434 | |
| | | |
| | TOTAL COMMON STOCKS (Cost $978,847,780) | | $ | 1,200,031,531 | |
| | | |
| | | | | | | | |
| | | Shares | | Dividend Rate | | Value | |
| |
| | Preferred Stocks – 0.1% | |
| |
| | Brazil – 0.1% | |
| | |
| | Banco Bradesco SA (Banks) | | | | |
| | 75,700 | | 10.503% | | $ | 188,173 | |
| | |
| | Cia Energetica de Minas Gerais (Electric Utilities) | | | | |
| | 17,550 | | 14.033 | | | 34,518 | |
| | |
| | Gerdau SA (Metals & Mining) | | | | |
| | 20,400 | | 4.781 | | | 64,578 | |
| | |
| | Itausa SA (Banks) | | | | |
| | 553,705 | | 6.475 | | | 1,016,245 | |
| | | |
| | |
| 16 | | The accompanying notes are an integral part of these financial statements. |
GOLDMAN SACHS MULTI-MANAGER GLOBAL EQUITY FUND
| | | | | | | | |
| | | Shares | | Dividend Rate | | Value | |
| |
| | Preferred Stocks (continued) | |
| |
| | Brazil (continued) | |
| | |
| | Metalurgica Gerdau SA (Metals & Mining) | | | | |
| | 73,800 | | 12.171% | | $ | 131,108 | |
| | |
| | Petroleo Brasileiro SA (Oil, Gas & Consumable Fuels) | | | | |
| | 32,000 | | 13.605 | | | 198,779 | |
| | | | | | | | |
| | | | | | | 1,633,401 | |
| | | |
| |
| | South Korea – 0.0% | |
| | |
| | Samsung Electronics Co. Ltd. (Technology Hardware, Storage & Peripherals) | | | | |
| | 13,733 | | 3.014 | | | 472,419 | |
| | | |
| | TOTAL PREFERRED STOCKS (Cost $2,312,368) | | $ | 2,105,820 | |
| | | |
| | | | | | | | |
| | | Shares | | Description | | Value | |
| |
| | Exchange Traded Funds – 0.2% | |
| | | |
| | 13,100 | | iShares Core MSCI Emerging Markets ETF | | $ | 728,622 | |
| | 42,255 | | iShares MSCI Saudi Arabia ETF | | | 1,772,175 | |
| | | |
| | TOTAL EXCHANGE TRADED FUNDS (Cost $2,478,474) | | $ | 2,500,797 | |
| | | |
| | | | | | | | |
| | | Shares | | Dividend Rate | | Value | |
| |
| | Investment Companies(c) – 8.8% | |
| |
| | Goldman Sachs Financial Square Government Fund — Class R6 | |
| | 50,789,613 | | 4.766% | | $ | 50,789,613 | |
| |
| | Goldman Sachs Financial Square Government Fund — Institutional Shares | |
| | 64,685,562 | | 4.766 | | | 64,685,562 | |
| | | |
| | TOTAL INVESTMENT COMPANIES – 8.8% (Cost $ 115,475,175) | | $ | 115,475,175 | |
| | | |
| | TOTAL INVESTMENTS – 100.4% (Cost $ 1,099,113,797) | | $ | 1,320,113,323 | |
| | | |
| | LIABILITIES IN EXCESS OF OTHER
ASSETS – (0.4)% | | | (5,514,774 | ) |
| | | |
| | NET ASSETS – 100.0% | | $ | 1,314,598,549 | |
| | | |
The percentage shown for each investment category reflects the value of investments in that category as a percentage of net assets.
| | * | Non-income producing security. |
| | (a) | Exempt from registration under Rule 144A of the Securities Act of 1933. |
| | (b) | Significant unobservable inputs were used in the valuation of this portfolio security; i.e., Level 3. |
| | (c) | Represents an affiliated issuer. |
|
|
| SECTOR ALLOCATION AS OF OCTOBER 31, 2024 |
| | | | | |
| Sector | | |
| % of Total
Market Value |
|
| |
Information Technology | | | | 19.8% | |
Financials | | | | 15.8 | |
Industrials | | | | 12.8 | |
Consumer Discretionary | | | | 11.8 | |
Health Care | | | | 11.5 | |
Investment Companies | | | | 8.7 | |
Communication Services | | | | 5.9 | |
Consumer Staples | | | | 4.1 | |
Materials | | | | 3.9 | |
Energy | | | | 3.0 | |
Real Estate | | | | 1.6 | |
Utilities | | | | 0.9 | |
Exchange Traded Funds | | | | 0.2 | |
| |
| | | | | 100.0% | |
| | |
| The accompanying notes are an integral part of these financial statements. | | 17 |
GOLDMAN SACHS MULTI-MANAGER GLOBAL EQUITY FUND
|
Schedule of Investments (continued) October 31, 2024 |
|
|
ADDITIONAL INVESTMENT INFORMATION |
FORWARD FOREIGN CURRENCY EXCHANGE CONTRACTS — At October 31, 2024, the Fund had the following forward foreign currency exchange contracts:
FORWARD FOREIGN CURRENCY EXCHANGE CONTRACTS WITH UNREALIZED GAIN
| | | | | | | | | | | | | | | | | | | | |
| Counterparty | | Currency Purchased | | | Currency Sold | | | Settlement
Date | | | Unrealized
Gain | |
|
| |
| | | | | | |
BNP Paribas SA | | CHF | | | 8,520,000 | | | USD | | | 9,839,056 | | | | 11/04/24 | | | $ | 32,145 | |
| | DKK | | | 25,870,000 | | | USD | | | 3,752,331 | | | | 11/04/24 | | | | 20,964 | |
| | EUR | | | 30,010,000 | | | USD | | | 32,458,468 | | | | 11/04/24 | | | | 191,284 | |
| | JPY | | | 3,257,000,000 | | | USD | | | 21,193,885 | | | | 11/05/24 | | | | 256,053 | |
| | NOK | | | 6,100,000 | | | USD | | | 554,402 | | | | 11/04/24 | | | | 155 | |
| | SGD | | | 1,620,000 | | | USD | | | 1,225,792 | | | | 11/04/24 | | | | 1,263 | |
| | USD | | | 7,825,991 | | | AUD | | | 11,380,000 | | | | 11/04/24 | | | | 336,403 | |
| | USD | | | 7,519,180 | | | AUD | | | 11,380,000 | | | | 12/03/24 | | | | 27,426 | |
| | USD | | | 10,079,620 | | | CHF | | | 8,520,000 | | | | 11/04/24 | | | | 208,418 | |
| | USD | | | 3,888,822 | | | DKK | | | 25,870,000 | | | | 11/04/24 | | | | 115,527 | |
| | USD | | | 33,626,418 | | | EUR | | | 30,010,000 | | | | 11/04/24 | | | | 976,666 | |
| | USD | | | 15,300,690 | | | GBP | | | 11,445,000 | | | | 11/04/24 | | | | 543,018 | |
| | USD | | | 14,862,308 | | | GBP | | | 11,445,000 | | | | 12/03/24 | | | | 105,335 | |
| | USD | | | 1,708,699 | | | HKD | | | 13,270,000 | | | | 12/03/24 | | | | 585 | |
| | USD | | | 353,985 | | | ILS | | | 1,320,000 | | | | 12/03/24 | | | | 250 | |
| | USD | | | 22,683,346 | | | JPY | | | 3,257,000,000 | | | | 11/05/24 | | | | 1,233,407 | |
| | USD | | | 584,608 | | | NOK | | | 6,100,000 | | | | 11/04/24 | | | | 30,051 | |
| | USD | | | 189,430 | | | NZD | | | 300,000 | | | | 11/04/24 | | | | 10,115 | |
| | USD | | | 179,646 | | | NZD | | | 300,000 | | | | 12/03/24 | | | | 292 | |
| | USD | | | 3,328,384 | | | SEK | | | 33,600,000 | | | | 11/04/24 | | | | 174,201 | |
| | USD | | | 3,174,282 | | | SEK | | | 33,600,000 | | | | 12/03/24 | | | | 15,372 | |
| | USD | | | 1,263,168 | | | SGD | | | 1,620,000 | | | | 11/04/24 | | | | 36,113 | |
Brown Brothers Harriman & Co. | | ZAR | | | 731,335 | | | USD | | | 41,388 | | | | 11/04/24 | | | | 79 | |
| | ZAR | | | 848,409 | | | USD | | | 48,087 | | | | 11/05/24 | | | | 14 | |
JPMorgan Securities, Inc. | | CHF | | | 2,990,000 | | | USD | | | 3,452,908 | | | | 11/04/24 | | | | 11,281 | |
| | DKK | | | 9,060,000 | | | USD | | | 1,314,113 | | | | 11/04/24 | | | | 7,342 | |
| | EUR | | | 11,090,000 | | | USD | | | 11,994,815 | | | | 11/04/24 | | | | 70,688 | |
| | JPY | | | 1,278,000,000 | | | USD | | | 8,316,176 | | | | 11/05/24 | | | | 100,471 | |
| | NOK | | | 2,300,000 | | | USD | | | 209,037 | | | | 11/04/24 | | | | 58 | |
| | SGD | | | 560,000 | | | USD | | | 423,731 | | | | 11/04/24 | | | | 437 | |
| | USD | | | 2,702,649 | | | AUD | | | 3,930,000 | | | | 11/04/24 | | | | 116,174 | |
| | USD | | | 2,596,694 | | | AUD | | | 3,930,000 | | | | 12/03/24 | | | | 9,471 | |
| | USD | | | 3,537,331 | | | CHF | | | 2,990,000 | | | | 11/04/24 | | | | 73,142 | |
| | USD | | | 1,361,914 | | | DKK | | | 9,060,000 | | | | 11/04/24 | | | | 40,459 | |
| | USD | | | 12,426,424 | | | EUR | | | 11,090,000 | | | | 11/04/24 | | | | 360,921 | |
| | USD | | | 5,474,559 | | | GBP | | | 4,095,000 | | | | 11/04/24 | | | | 194,291 | |
| | USD | | | 5,317,706 | | | GBP | | | 4,095,000 | | | | 12/03/24 | | | | 37,689 | |
| | USD | | | 627,081 | | | HKD | | | 4,870,000 | | | | 12/03/24 | | | | 215 | |
| | USD | | | 139,449 | | | ILS | | | 520,000 | | | | 12/03/24 | | | | 99 | |
| | USD | | | 8,900,619 | | | JPY | | | 1,278,000,000 | | | | 11/05/24 | | | | 483,971 | |
| | USD | | | 220,426 | | | NOK | | | 2,300,000 | | | | 11/04/24 | | | | 11,331 | |
| | USD | | | 69,458 | | | NZD | | | 110,000 | | | | 11/04/24 | | | | 3,709 | |
| | USD | | | 65,870 | | | NZD | | | 110,000 | | | | 12/03/24 | | | | 107 | |
| | USD | | | 1,173,850 | | | SEK | | | 11,850,000 | | | | 11/04/24 | | | | 61,437 | |
| | USD | | | 1,119,501 | | | SEK | | | 11,850,000 | | | | 12/03/24 | | | | 5,421 | |
| | USD | | | 436,651 | | | SGD | | | 560,000 | | | | 11/04/24 | | | | 12,483 | |
State Street Bank and Trust | | JPY | | | 1,837,583 | | | USD | | | 12,030 | | | | 11/05/24 | | | | 73 | |
| | SGD | | | 21,405 | | | USD | | | 16,178 | | | | 11/04/24 | | | | 35 | |
|
| |
| | | | | | |
| TOTAL | | | | | | | | | | | | | | | | | | $ | 5,916,441 | |
|
| |
| | |
| 18 | | The accompanying notes are an integral part of these financial statements. |
GOLDMAN SACHS MULTI-MANAGER GLOBAL EQUITY FUND
|
|
ADDITIONAL INVESTMENT INFORMATION (continued) |
FORWARD FOREIGN CURRENCY EXCHANGE CONTRACTS WITH UNREALIZED LOSS
| | | | | | | | | | | | | | | | | | | | |
| Counterparty | | Currency Purchased | | | Currency Sold | | | Settlement
Date | | | Unrealized
Loss | |
|
| |
| | | | | | |
BNP Paribas SA | | AUD | | | 11,380,000 | | | USD | | | 7,516,870 | | | | 11/04/24 | | | $ | (27,283 | ) |
| | GBP | | | 11,445,000 | | | USD | | | 14,862,969 | | | | 11/04/24 | | | | (105,297 | ) |
| | HKD | | | 13,270,000 | | | USD | | | 1,707,816 | | | | 11/04/24 | | | | (703 | ) |
| | ILS | | | 1,320,000 | | | USD | | | 353,742 | | | | 11/04/24 | | | | (331 | ) |
| | NZD | | | 300,000 | | | USD | | | 179,620 | | | | 11/04/24 | | | | (305 | ) |
| | SEK | | | 33,600,000 | | | USD | | | 3,169,599 | | | | 11/04/24 | | | | (15,416 | ) |
| | USD | | | 1,053,073 | | | AUD | | | 1,600,000 | | | | 12/03/24 | | | | (249 | ) |
| | USD | | | 11,182,448 | | | CHF | | | 9,650,000 | | | | 12/03/24 | | | | (33,051 | ) |
| | USD | | | 3,757,923 | | | DKK | | | 25,870,000 | | | | 12/03/24 | | | | (20,911 | ) |
| | USD | | | 37,212,274 | | | EUR | | | 34,340,000 | | | | 12/03/24 | | | | (192,367 | ) |
| | USD | | | 1,759,912 | | | GBP | | | 1,365,000 | | | | 12/03/24 | | | | (95 | ) |
| | USD | | | 1,706,065 | | | HKD | | | 13,270,000 | | | | 11/04/24 | | | | (1,047 | ) |
| | USD | | | 450,438 | | | HKD | | | 3,500,000 | | | | 12/03/24 | | | | (83 | ) |
| | USD | | | 351,926 | | | ILS | | | 1,320,000 | | | | 11/04/24 | | | | (1,484 | ) |
| | USD | | | 85,628 | | | ILS | | | 320,000 | | | | 12/03/24 | | | | (126 | ) |
| | USD | | | 24,837,033 | | | JPY | | | 3,797,000,000 | | | | 12/03/24 | | | | (261,150 | ) |
| | USD | | | 654,508 | | | NOK | | | 7,200,000 | | | | 12/03/24 | | | | (150 | ) |
| | USD | | | 17,932 | | | NZD | | | 30,000 | | | | 12/03/24 | | | | (3 | ) |
| | USD | | | 514,564 | | | SEK | | | 5,475,000 | | | | 12/03/24 | | | | (169 | ) |
| | USD | | | 1,386,648 | | | SGD | | | 1,830,000 | | | | 12/03/24 | | | | (1,273 | ) |
JPMorgan Securities, Inc. | | AUD | | | 3,930,000 | | | USD | | | 2,595,896 | | | | 11/04/24 | | | | (9,422 | ) |
| | GBP | | | 4,095,000 | | | USD | | | 5,317,943 | | | | 11/04/24 | | | | (37,675 | ) |
| | HKD | | | 4,870,000 | | | USD | | | 626,757 | | | | 11/04/24 | | | | (258 | ) |
| | ILS | | | 520,000 | | | USD | | | 139,353 | | | | 11/04/24 | | | | (130 | ) |
| | NZD | | | 110,000 | | | USD | | | 65,861 | | | | 11/04/24 | | | | (112 | ) |
| | SEK | | | 11,850,000 | | | USD | | | 1,117,850 | | | | 11/04/24 | | | | (5,437 | ) |
| | USD | | | 3,463,762 | | | CHF | | | 2,990,000 | | | | 12/03/24 | | | | (11,300 | ) |
| | USD | | | 1,316,072 | | | DKK | | | 9,060,000 | | | | 12/03/24 | | | | (7,323 | ) |
| | USD | | | 12,009,180 | | | EUR | | | 11,090,000 | | | | 12/03/24 | | | | (70,536 | ) |
| | USD | | | 626,114 | | | HKD | | | 4,870,000 | | | | 11/04/24 | | | | (384 | ) |
| | USD | | | 138,638 | | | ILS | | | 520,000 | | | | 11/04/24 | | | | (585 | ) |
| | USD | | | 8,346,253 | | | JPY | | | 1,278,000,000 | | | | 12/03/24 | | | | (101,331 | ) |
| | USD | | | 209,073 | | | NOK | | | 2,300,000 | | | | 12/03/24 | | | | (54 | ) |
| | USD | | | 424,297 | | | SGD | | | 560,000 | | | | 12/03/24 | | | | (422 | ) |
State Street Bank and Trust | | USD | | | 639,023 | | | JPY | | | 97,651,669 | | | | 11/05/24 | | | | (4,090 | ) |
|
| |
| | | | | | |
| TOTAL | | | | | | | | | | | | | | | | | | $ | (910,552 | ) |
|
| |
FUTURES CONTRACTS — At October 31, 2024, the Fund had the following futures contracts:
| | | | | | | | | | | | | | | | |
| Description | | Number of
Contracts | | | Expiration
Date | | | Notional
Amount | | | Unrealized
Appreciation/
(Depreciation) | |
|
| |
| | | | |
Long position contracts: | | | | | | | | | | | | | | | | |
S&P 500 E-Mini Index | | | 246 | | | | 12/20/24 | | | $ | 70,583,550 | | | $ | 588,515 | |
S&P Toronto Stock Exchange 60 Index | | | 171 | | | | 12/19/24 | | | | 35,549,725 | | | | 628,242 | |
|
| |
| | | | |
| TOTAL FUTURES CONTRACTS | | | | | | | | | | | | | | $ | 1,216,757 | |
|
| |
| | |
| The accompanying notes are an integral part of these financial statements. | | 19 |
GOLDMAN SACHS MULTI-MANAGER GLOBAL EQUITY FUND
|
Schedule of Investments (continued) October 31, 2024 |
|
|
ADDITIONAL INVESTMENT INFORMATION (continued) |
| | |
|
|
| Currency Abbreviations: |
| AUD | | —Australian Dollar |
| CHF | | —Swiss Franc |
| DKK | | —Denmark Krone |
| EUR | | —Euro |
| GBP | | —British Pound |
| HKD | | —Hong Kong Dollar |
| ILS | | —Israeli Shekel |
| JPY | | —Japanese Yen |
| NOK | | —Norwegian Krone |
| NZD | | —New Zealand Dollar |
| SEK | | —Swedish Krona |
| SGD | | —Singapore Dollar |
| USD | | —U.S. Dollar |
| ZAR | | —South African Rand |
|
|
| | |
|
|
| Investment Abbreviations: |
| ADR | | —American Depositary Receipt |
| CP | | —Commercial Paper |
| ETF | | —Exchange Traded Fund |
| GDR | | —Global Depository Receipt |
| MSCI | | —Morgan Stanley Capital International |
| PLC | | —Public Limited Company |
| REIT | | —Real Estate Investment Trust |
| SPX | | —S&P 500 Index |
|
|
| | |
| 20 | | The accompanying notes are an integral part of these financial statements. |
GOLDMAN SACHS MULTI-MANAGER NON-CORE FIXED INCOME FUND
|
Schedule of Investments October 31, 2024 |
| | | | | | | | | | | | | | | | |
| | | | | Principal Amount | | | Interest
Rate | | | Maturity
Date | | Value | |
| |
| | Sovereign Debt Obligations – 36.5% | |
| |
| | Brazil Real – 2.5% | |
| | Brazil Notas do Tesouro Nacional | |
| | BRL | | | 37,000,000 | | | | 10.000 | % | | 01/01/25 | | $ | 6,383,905 | |
| | | | | 154,346,000 | | | | 10.000 | | | 01/01/27 | | | 25,318,989 | |
| | | | | 33,546,000 | | | | 10.000 | | | 01/01/29 | | | 5,292,527 | |
| | | | | 21,132,000 | | | | 10.000 | | | 01/01/33 | | | 3,168,852 | |
| | | | | | | | | | | | | | | | |
| | | | | | | | | | | | | | | 40,164,273 | |
| | | |
| |
| | Chilean Peso – 0.4% | |
| | Bonos de la Tesoreria de la Republica | |
| | CLP | | | 607,542,720 | | | | 1.900 | | | 09/01/30 | | | 610,136 | |
| | | | | 75,942,840 | | | | 2.000 | | | 03/01/35 | | | 75,931 | |
| | | | | 1,177,114,020 | | | | 3.400 | (a) | | 10/01/39 | | | 1,381,315 | |
| | Bonos de la Tesoreria de la Republica en pesos | |
| | | | | 190,000,000 | | | | 4.500 | | | 03/01/26 | | | 196,537 | |
| | | | | 635,000,000 | | | | 5.000 | (a) | | 10/01/28 | | | 651,950 | |
| | | | | 2,375,000,000 | | | | 4.700 | (a) | | 09/01/30 | | | 2,345,282 | |
| | | | | 600,000,000 | | | | 6.000 | (a) | | 04/01/33 | | | 633,955 | |
| | | | | 1,350,000,000 | | | | 5.000 | | | 03/01/35 | | | 1,346,016 | |
| | | | | | | | | | | | | | | | |
| | | | | | | | | | | | | | | 7,241,122 | |
| | | |
| |
| | Chinese Yuan Renminbi – 0.8% | |
| | China Government Bonds | |
| | CNY | | | 8,020,000 | | | | 2.800 | | | 03/25/30 | | | 1,177,895 | |
| | | | | 9,100,000 | | | | 1.870 | | | 09/15/31 | | | 1,265,256 | |
| | | | | 21,670,000 | | | | 2.880 | | | 02/25/33 | | | 3,228,221 | |
| | | | | 30,990,000 | | | | 2.270 | | | 05/25/34 | | | 4,401,339 | |
| | | | | 1,140,000 | | | | 3.530 | | | 10/18/51 | | | 196,486 | |
| | | | | 6,150,000 | | | | 3.120 | | | 10/25/52 | | | 997,824 | |
| | | | | 12,000,000 | | | | 3.000 | | | 10/15/53 | | | 1,928,786 | |
| | | | | | | | | | | | | | | | |
| | | | | | | | | | | | | | | 13,195,807 | |
| | | |
| |
| | Colombia Peso – 1.2% | |
| | Colombia TES | |
| | COP | | | 18,000,000,000 | | | | 6.000 | | | 04/28/28 | | | 3,612,152 | |
| | | | | 13,083,600,000 | | | | 7.750 | | | 09/18/30 | | | 2,633,831 | |
| | | | | 19,565,100,000 | | | | 7.000 | | | 06/30/32 | | | 3,603,666 | |
| | | | | 24,467,200,000 | | | | 13.250 | | | 02/09/33 | | | 6,216,916 | |
| | | | | 1,205,400,000 | | | | 7.250 | | | 10/18/34 | | | 212,717 | |
| | | | | 5,507,600,000 | | | | 6.250 | | | 07/09/36 | | | 850,733 | |
| | | | | 9,556,000,000 | | | | 9.250 | | | 05/28/42 | | | 1,793,835 | |
| | | | | 1,447,800,000 | | | | 7.250 | | | 10/26/50 | | | 211,570 | |
| | | | | | | | | | | | | | | | |
| | | | | | | | | | | | | | | 19,135,420 | |
| | | |
| |
| | Czech Republic Koruna – 1.7% | |
| | Czech Republic Government Bonds | |
| | CZK | | | 108,780,000 | | | | 5.750 | | | 03/29/29 | | | 5,053,341 | |
| | | | | 44,920,000 | | | | 0.950 | | | 05/15/30 | | | 1,653,390 | |
| | | | | 33,360,000 | | | | 5.000 | | | 09/30/30 | | | 1,519,174 | |
| | | | | 115,810,000 | | | | 1.200 | | | 03/13/31 | | | 4,220,668 | |
| | | | | 86,770,000 | | | | 1.750 | | | 06/23/32 | | | 3,180,987 | |
| | | | | 70,190,000 | | | | 3.000 | | | 03/03/33 | | | 2,780,942 | |
| | | | | 106,650,000 | | | | 2.000 | | | 10/13/33 | | | 3,858,897 | |
| | | | | 22,750,000 | | | | 4.900 | | | 04/14/34 | | | 1,033,721 | |
| | | | | 99,590,000 | | | | 3.500 | | | 05/30/35 | | | 4,029,876 | |
| | | | | | | | | | | | | | | | |
| | | | | | | | | | | | | | | 27,330,996 | |
| | | |
| | | | | | | | | | | | | | | | |
| | | | | Principal Amount | | | Interest
Rate | | | Maturity
Date | | Value | |
| |
| | Sovereign Debt Obligations – (continued) | |
| |
| | Dominican Peso – 0.2% | |
| | Dominican Republic Central Bank Notes | |
| | DOP | | | 39,000,000 | | | | 10.500 | % | | 01/17/25 | | $ | 645,173 | |
| | Dominican Republic International Bonds (a)(b) | | | | |
| | | | | 176,650,000 | | | | 10.750 | | | 06/01/36 | | | 3,086,218 | |
| | | | | | | | | | | | | | | | |
| | | | | | | | | | | | | | | 3,731,391 | |
| | | |
| |
| | Egyptian Pound – 0.9% | |
| | Egypt Treasury Bills (c) | | | | |
| | EGP | | | 42,825,000 | | | | 0.000 | | | 11/26/24 | | | 859,719 | |
| | | | | 78,800,000 | | | | 0.000 | | | 12/03/24 | | | 1,572,024 | |
| | | | | 238,125,000 | | | | 0.000 | | | 12/10/24 | | | 4,723,729 | |
| | | | | 345,100,000 | | | | 0.000 | | | 12/17/24 | | | 6,807,459 | |
| | | | | | | | | | | | | | | | |
| | | | | | | | | | | | | | | 13,962,931 | |
| | | |
| |
| | Hungarian Forint – 1.1% | |
| | Hungary Government Bonds | | | | |
| | HUF | | | 918,510,000 | | | | 5.500 | | | 06/24/25 | | | 2,449,194 | |
| | | | | 425,000,000 | | | | 9.500 | | | 10/21/26 | | | 1,195,661 | |
| | | | | 310,510,000 | | | | 2.750 | | | 12/22/26 | | | 769,645 | |
| | | | | 474,880,000 | | | | 3.000 | | | 10/27/27 | | | 1,145,096 | |
| | | | | 550,000,000 | | | | 6.750 | | | 10/22/28 | | | 1,468,088 | |
| | | | | 2,115,940,000 | | | | 2.000 | | | 05/23/29 | | | 4,631,321 | |
| | | | | 132,020,000 | | | | 3.250 | | | 10/22/31 | | | 284,611 | |
| | | | | 125,000,000 | | | | 4.750 | | | 11/24/32 | | | 290,916 | |
| | | | | 518,390,000 | | | | 4.750 | | | 11/24/32 | | | 1,206,461 | |
| | | | | 2,353,630,000 | | | | 2.250 | | | 04/20/33 | | | 4,442,416 | |
| | | | | | | | | | | | | | | | |
| | | | | | | | | | | | | | | 17,883,409 | |
| | | |
| |
| | Indian Rupee – 1.1% | |
| | India Government Bonds | | | | |
| | INR | | | 150,630,000 | | | | 7.320 | | | 11/13/30 | | | 1,835,913 | |
| | | | | 728,120,000 | | | | 7.180 | | | 08/14/33 | | | 8,842,563 | |
| | | | | 620,880,000 | | | | 7.100 | | | 04/08/34 | | | 7,516,387 | |
| | | | | | | | | | | | | | | | |
| | | | | | | | | | | | | | | 18,194,863 | |
| | | |
| |
| | Indonesia Rupiah – 2.9% | |
| | Indonesia Treasury Bonds | | | | |
| | IDR | | | 24,713,000,000 | | | | 6.375 | | | 08/15/28 | | | 1,561,194 | |
| | | | | 21,730,000,000 | | | | 9.000 | | | 03/15/29 | | | 1,502,894 | |
| | | | | 139,670,000,000 | | | | 6.875 | | | 04/15/29 | | | 8,956,203 | |
| | | | | 53,855,000,000 | | | | 7.000 | | | 09/15/30 | | | 3,472,524 | |
| | | | | 51,105,000,000 | | | | 6.375 | | | 04/15/32 | | | 3,186,126 | |
| | | | | 52,887,000,000 | | | | 7.500 | | | 08/15/32 | | | 3,498,017 | |
| | | | | 55,465,000,000 | | | | 7.000 | | | 02/15/33 | | | 3,570,746 | |
| | | | | 193,420,000,000 | | | | 6.625 | | | 02/15/34 | | | 12,155,555 | |
| | | | | 12,373,000,000 | | | | 8.375 | | | 03/15/34 | | | 865,702 | |
| | | | | 20,868,000,000 | | | | 7.500 | | | 06/15/35 | | | 1,389,130 | |
| | | | | 90,880,000,000 | | | | 6.750 | | | 07/15/35 | | | 5,764,496 | |
| | | | | 4,000,000,000 | | | | 7.125 | | | 06/15/38 | | | 257,265 | |
| | | | | 19,262,000,000 | | | | 6.875 | | | 08/15/51 | | | 1,208,861 | |
| | | | | | | | | | | | | | | | |
| | | | | | | | | | | | | | | 47,388,713 | |
| | | |
| |
| | Malaysia Ringgit – 2.7% | |
| | Malaysia Government Bonds | | | | |
| | MYR | | | 14,000,000 | | | | 3.882 | | | 03/14/25 | | | 3,204,270 | |
| | | |
| | |
| The accompanying notes are an integral part of these financial statements. | | 21 |
GOLDMAN SACHS MULTI-MANAGER NON-CORE FIXED INCOME FUND
|
Schedule of Investments (continued) October 31, 2024 |
| | | | | | | | | | | | | | | | |
| | | | | Principal Amount | | | Interest Rate | | | Maturity Date | | Value | |
| |
| | Sovereign Debt Obligations – (continued) | |
| |
| | Malaysia Ringgit – (continued) | |
| | MYR | | | 6,855,000 | | | | 3.906 | % | | 07/15/26 | | $ | 1,577,558 | |
| | | | | 11,214,000 | | | | 3.519 | | | 04/20/28 | | | 2,552,792 | |
| | | | | 15,324,000 | | | | 3.733 | | | 06/15/28 | | | 3,511,502 | |
| | | | | 19,596,000 | | | | 3.885 | | | 08/15/29 | | | 4,514,509 | |
| | | | | 18,169,000 | | | | 2.632 | | | 04/15/31 | | | 3,852,293 | |
| | | | | 15,403,000 | | | | 3.582 | | | 07/15/32 | | | 3,439,945 | |
| | | | | 5,863,000 | | | | 4.642 | | | 11/07/33 | | | 1,405,232 | |
| | | | | 23,919,000 | | | | 4.762 | | | 04/07/37 | | | 5,838,880 | |
| | | | | 24,959,000 | | | | 4.893 | | | 06/08/38 | | | 6,197,002 | |
| | | | | 14,795,000 | | | | 4.054 | | | 04/18/39 | | | 3,387,984 | |
| | | | | 9,894,000 | | | | 3.757 | | | 05/22/40 | | | 2,167,801 | |
| | | | | 7,455,000 | | | | 4.065 | | | 06/15/50 | | | 1,658,469 | |
| | | | | 4,288,000 | | | | 4.457 | | | 03/31/53 | | | 1,011,337 | |
| | | | | | | | | | | | | | | | |
| | | | | | | | | | | | | | | 44,319,574 | |
| | | |
| |
| | Mexican Peso – 2.7% | |
| | Mexico Bonos | |
| | MXN | | | 161,000,000 | | | | 10.000 | | | 12/05/24 | | | 8,041,029 | |
| | | | | 104,500,000 | | | | 7.500 | | | 06/03/27 | | | 4,941,718 | |
| | | | | 7,892,900 | | | | 8.500 | | | 03/01/29 | | | 374,287 | |
| | | | | 147,052,600 | | | | 7.750 | | | 05/29/31 | | | 6,584,002 | |
| | | | | 215,919,400 | | | | 7.500 | | | 05/26/33 | | | 9,211,065 | |
| | | | | 183,772,800 | | | | 7.750 | | | 11/23/34 | | | 7,839,010 | |
| | | | | 23,534,700 | | | | 10.000 | | | 11/20/36 | | | 1,170,175 | |
| | | | | 73,747,300 | | | | 8.500 | | | 11/18/38 | | | 3,222,323 | |
| | | | | 66,975,200 | | | | 7.750 | | | 11/13/42 | | | 2,640,850 | |
| | | | | | | | | | | | | | | | |
| | | | | | | | | | | | | | | 44,024,459 | |
| | | |
| |
| | Nigerian Naira(c) –0.1% | |
| | Nigeria OMO Bills | |
| | NGN | | | 2,362,405,000 | | | | 0.000 | | | 05/20/25 | | | 1,220,056 | |
| | | |
| |
| | Peru Nuevo Sol – 1.3% | |
| | Peru Government Bonds | |
| | PEN | | | 5,002,000 | | | | 6.150 | | | 08/12/32 | | | 1,297,130 | |
| | | | | 8,519,000 | | | | 7.300 | (a) | | 08/12/33 | | | 2,350,965 | |
| | | | | 4,896,000 | | | | 5.400 | | | 08/12/34 | | | 1,166,723 | |
| | | | | 8,018,000 | | | | 7.600 | (a) | | 08/12/39 | | | 2,181,396 | |
| | Peru Government International Bonds | |
| | | | | 10,177,000 | | | | 5.940 | | | 02/12/29 | | | 2,761,936 | |
| | | | | 3,931,000 | | | | 6.950 | | | 08/12/31 | | | 1,080,429 | |
| | | | | 26,300,000 | | | | 6.950 | | | 08/12/31 | | | 7,228,510 | |
| | | | | 9,935,000 | | | | 6.900 | | | 08/12/37 | | | 2,572,804 | |
| | | | | | | | | | | | | | | | |
| | | | | | | | | | | | | | | 20,639,893 | |
| | | |
| |
| | Philippine Peso – 0.2% | |
| | Philippines Government Bonds | |
| | PHP | | | 18,170,000 | | | | 6.750 | | | 09/15/32 | | | 327,494 | |
| | | | | 203,830,000 | | | | 6.250 | | | 01/25/34 | | | 3,567,973 | |
| | | | | | | | | | | | | | | | |
| | | | | | | | | | | | | | | 3,895,467 | |
| | | |
| |
| | Polish Zloty – 1.1% | |
| | Republic of Poland Government Bonds | |
| | PLN | | | 3,889,000 | | | | 2.500 | | | 07/25/26 | | | 931,536 | |
| | | | | 6,625,000 | | | | 0.250 | | | 10/25/26 | | | 1,509,760 | |
| | | | | 9,065,000 | | | | 2.500 | | | 07/25/27 | | | 2,116,673 | |
| | | |
| | | | | | | | | | | | | | | | |
| | | | | Principal Amount | | | Interest Rate | | | Maturity Date | | Value | |
| |
| | Sovereign Debt Obligations – (continued) | |
| |
| | Polish Zloty – (continued) | |
| | PLN | | | 1,500,000 | | | | 7.500 | % | | 07/25/28 | | $ | 400,473 | |
| | | | | 9,490,000 | | | | 2.750 | | | 10/25/29 | | | 2,085,322 | |
| | | | | 21,108,000 | | | | 1.250 | | | 10/25/30 | | | 4,117,293 | |
| | | | | 10,753,000 | | | | 1.750 | | | 04/25/32 | | | 2,041,707 | |
| | | | | 10,234,000 | | | | 6.000 | | | 10/25/33 | | | 2,573,559 | |
| | | | | 8,404,000 | | | | 5.000 | | | 10/25/34 | | | 1,950,651 | |
| | | | | | | | | | | | | | | | |
| | | | | | | | | | | | | | | 17,726,974 | |
| | | |
| |
| | Romania New Leu – 0.6% | |
| | Romania Government Bonds | | | | |
| | RON | | | 7,930,000 | | | | 5.800 | | | 07/26/27 | | | 1,712,209 | |
| | | | | 14,900,000 | | | | 4.150 | | | 01/26/28 | | | 3,051,966 | |
| | | | | 26,290,000 | | | | 6.700 | | | 02/25/32 | | | 5,662,808 | |
| | | | | | | | | | | | | | | | |
| | | | | | | | | | | | | | | 10,426,983 | |
| | | |
| |
| | South African Rand – 3.3% | |
| | Republic of South Africa Government Bonds | | | | |
| | ZAR | | | 53,309,896 | | | | 10.500 | | | 12/21/26 | | | 3,146,773 | |
| | | | | 130,600,000 | | | | 8.000 | | | 01/31/30 | | | 7,017,046 | |
| | | | | 155,706,341 | | | | 8.250 | | | 03/31/32 | | | 8,072,287 | |
| | | | | 182,860,807 | | | | 8.875 | | | 02/28/35 | | | 9,284,231 | |
| | | | | 85,288,619 | | | | 6.250 | | | 03/31/36 | | | 3,435,697 | |
| | | | | 167,915,289 | | | | 8.500 | | | 01/31/37 | | | 7,971,619 | |
| | | | | 149,657,617 | | | | 9.000 | | | 01/31/40 | | | 7,120,176 | |
| | | | | 184,165,637 | | | | 8.750 | | | 01/31/44 | | | 8,350,313 | |
| | | | | | | | | | | | | | | | |
| | | | | | | | | | | | | | | 54,398,142 | |
| | | |
| |
| | Thailand Baht – 1.6% | |
| | Thailand Government Bonds | |
| | THB | | | 101,491,000 | | | | 2.650 | | | 06/17/28 | | | 3,053,753 | |
| | | | | 111,504,000 | | | | 1.600 | | | 12/17/29 | | | 3,197,665 | |
| | | | | 61,547,000 | | | | 2.000 | | | 12/17/31 | | | 1,784,808 | |
| | | | | 231,049,000 | | | | 3.350 | | | 06/17/33 | | | 7,330,816 | |
| | | | | 26,161,000 | | | | 1.585 | | | 12/17/35 | | | 706,316 | |
| | | | | 110,248,000 | | | | 3.300 | | | 06/17/38 | | | 3,501,260 | |
| | | | | 207,109,000 | | | | 3.450 | | | 06/17/43 | | | 6,615,121 | |
| | | | | | | | | | | | | | | | |
| | | | | | | | | | | | | | | 26,189,739 | |
| | | |
| |
| | Turkish Lira – 0.5% | |
| | Turkiye Government Bonds | | | | |
| | TRY | | | 239,092,477 | | | | 31.080 | | | 11/08/28 | | | 6,743,992 | |
| | | | | 23,119,781 | | | | 26.200 | | | 10/05/33 | | | 624,509 | |
| | | | | | | | | | | | | | | | |
| | | | | | | | | | | | | | | 7,368,501 | |
| | | |
| |
| | United States Dollar – 9.5% | |
| | Abu Dhabi Government International Bonds | | | | |
| | $ | | | 512,000 | | | | 1.700 | | | 03/02/31 | | | 430,351 | |
| | | | | 1,733,000 | | | | 3.125 | | | 09/30/49 | | | 1,206,601 | |
| | | | | 715,000 | | | | 5.500 | (a) | | 04/30/54 | | | 726,619 | |
| | Angola Government International Bonds | |
| | | | | 2,603,000 | | | | 8.000 | | | 11/26/29 | | | 2,380,118 | |
| | Argentina Republic Government International Bonds (b) | |
| | | | | 437,354 | | | | 1.000 | | | 07/09/29 | | | 312,708 | |
| | | | | 2,098,060 | | | | 0.750 | (d) | | 07/09/30 | | | 1,406,749 | |
| | | | | 979,070 | | | | 4.125 | (d) | | 07/09/35 | | | 540,936 | |
| | | |
| | |
| 22 | | The accompanying notes are an integral part of these financial statements. |
GOLDMAN SACHS MULTI-MANAGER NON-CORE FIXED INCOME FUND
| | | | | | | | | | | | | | | | |
| | | Principal Amount | | | Interest Rate | | | Maturity Date | | Value | |
| |
| | Sovereign Debt Obligations – (continued) | |
| |
| | United States Dollar – (continued) | |
| | $ | | | 4,250,118 | | | | 3.500 | %(d) | | 07/09/41 | | $ | 2,178,185 | |
| | Bahrain Government International Bonds | |
| | | | | 979,000 | | | | 6.750 | | | 09/20/29 | | | 1,001,028 | |
| | | | | 1,501,000 | | | | 5.450 | | | 09/16/32 | | | 1,400,613 | |
| | Benin Government International Bonds (a) | |
| | | | | 216,000 | | | | 7.960 | | | 02/13/38 | | | 211,140 | |
| | Bolivia Government International Bonds | |
| | | | | 409,000 | | | | 4.500 | | | 03/20/28 | | | 257,670 | |
| | Brazil Government International Bonds | |
| | | | | 1,086,000 | | | | 3.875 | | | 06/12/30 | | | 987,435 | |
| | | | | 700,000 | | | | 6.125 | | | 01/22/32 | | | 704,200 | |
| | | | | 2,768,000 | | | | 7.125 | | | 05/13/54 | | | 2,762,879 | |
| | CBB International Sukuk Programme Co. WLL | |
| | | | | 3,432,000 | | | | 3.950 | | | 09/16/27 | | | 3,287,212 | |
| | Chile Government International Bonds (b) | |
| | | | | 1,681,000 | | | | 4.850 | | | 01/22/29 | | | 1,681,840 | |
| | | | | 962,383 | | | | 4.950 | | | 01/05/36 | | | 942,231 | |
| | | | | 304,000 | | | | 3.500 | | | 01/25/50 | | | 220,874 | |
| | China Government International Bonds | |
| | | | | 1,937,000 | | | | 1.950 | | | 12/03/24 | | | 1,931,576 | |
| | | | | 1,288,000 | | | | 0.550 | | | 10/21/25 | | | 1,239,584 | |
| | | | | 656,000 | | | | 1.250 | | | 10/26/26 | | | 620,346 | |
| | Colombia Government International Bonds (b) | |
| | | | | 2,409,000 | | | | 7.750 | | | 11/07/36 | | | 2,381,296 | |
| | | | | 730,000 | | | | 8.750 | | | 11/14/53 | | | 742,045 | |
| | | | | 2,366,000 | | | | 8.375 | | | 11/07/54 | | | 2,303,597 | |
| | Costa Rica Government International Bonds (b) | |
| | | | | 1,516,000 | | | | 6.550 | | | 04/03/34 | | | 1,573,324 | |
| | | | | 313,000 | | | | 7.300 | (a) | | 11/13/54 | | | 330,841 | |
| | | | | 200,000 | | | | 7.300 | | | 11/13/54 | | | 211,400 | |
| | Dominican Republic International Bonds (b) | |
| | | | | 982,000 | | | | 5.500 | | | 02/22/29 | | | 962,360 | |
| | | | | 4,620,000 | | | | 7.050 | | | 02/03/31 | | | 4,816,812 | |
| | Ecuador Government International Bonds | |
| | | | | 1,616,920 | | | | 0.000 | (c) | | 07/31/30 | | | 881,221 | |
| | | | | 947,411 | | | | 6.900 | (d) | | 07/31/30 | | | 651,345 | |
| | | | | 1,559,591 | | | | 5.500 | (d) | | 07/31/35 | | | 860,894 | |
| | Egypt Government International Bonds | |
| | | | | 3,358,000 | | | | 7.300 | | | 09/30/33 | | | 2,832,272 | |
| | | | | 2,728,000 | | | | 8.500 | | | 01/31/47 | | | 2,156,839 | |
| | El Salvador Government International Bonds | |
| | | | | 179,000 | | | | 9.250 | (a)(b) | | 04/17/30 | | | 177,434 | |
| | | | | 305,000 | | | | 8.250 | | | 04/10/32 | | | 283,650 | |
| | | | | 643,000 | | | | 7.125 | (b) | | 01/20/50 | | | 490,609 | |
| | | | | 282,000 | | | | 9.500 | (b) | | 07/15/52 | | | 266,490 | |
| | Ethiopia International Bonds (e) | |
| | | | | 200,000 | | | | 6.625 | | | 12/11/24 | | | 155,688 | |
| | Export-Import Bank of India | |
| | | | | 1,632,000 | | | | 2.250 | | | 01/13/31 | | | 1,390,260 | |
| | Gabon Government International Bonds | |
| | | | | 200,000 | | | | 6.950 | | | 06/16/25 | | | 194,313 | |
| | | | | 200,000 | | | | 7.000 | (a)(b) | | 11/24/31 | | | 159,563 | |
| | | | | 200,000 | | | | 7.000 | (b) | | 11/24/31 | | | 159,563 | |
| | Ghana Government International Bonds (a) | |
| | | | | 115,232 | | | | 0.000 | (c) | | 07/03/26 | | | 107,051 | |
| | | |
| | | | | | | | | | | | | | | | |
| | | Principal Amount | | | Interest Rate | | | Maturity Date | | Value | |
| |
| | Sovereign Debt Obligations – (continued) | |
| |
| | United States Dollar – (continued) | |
| | $ | | | 871,442 | | | | 5.000 | %(d) | | 07/03/29 | | $ | 748,351 | |
| | | | | 222,944 | | | | 0.000 | (c) | | 01/03/30 | | | 168,880 | |
| | | | | 1,253,148 | | | | 5.000 | (d) | | 07/03/35 | | | 869,371 | |
| | Guatemala Government Bonds (b) | |
| | | | | 1,646,000 | | | | 6.600 | | | 06/13/36 | | | 1,669,661 | |
| | | | | 494,000 | | | | 6.600 | (a) | | 06/13/36 | | | 501,101 | |
| | Hazine Mustesarligi Varlik Kiralama AS | |
| | | | | 793,000 | | | | 8.509 | | | 01/14/29 | | | 857,183 | |
| | | | | 2,759,000 | | | | 8.509 | (a) | | 01/14/29 | | | 2,982,307 | |
| | Honduras Government International Bonds (b) | |
| | | | | 259,000 | | | | 5.625 | | | 06/24/30 | | | 231,805 | |
| | Hungary Government International Bonds | |
| | | | | 200,000 | | | | 6.125 | (a) | | 05/22/28 | | | 205,000 | |
| | | | | 2,824,000 | | | | 6.125 | | | 05/22/28 | | | 2,894,600 | |
| | | | | 750,000 | | | | 5.500 | (a) | | 03/26/36 | | | 722,578 | |
| | | | | 858,000 | | | | 5.500 | | | 03/26/36 | | | 826,629 | |
| | | | | 810,000 | | | | 3.125 | | | 09/21/51 | | | 498,515 | |
| | Indonesia Government International Bonds | |
| | | | | 971,000 | | | | 4.550 | (b) | | 01/11/28 | | | 968,269 | |
| | | | | 1,752,000 | | | | 4.400 | (b) | | 03/10/29 | | | 1,732,837 | |
| | | | | 1,762,000 | | | | 2.850 | | | 02/14/30 | | | 1,602,869 | |
| | | | | 2,381,000 | | | | 3.550 | (b) | | 03/31/32 | | | 2,178,615 | |
| | | | | 1,944,000 | | | | 5.650 | (b) | | 01/11/53 | | | 2,013,255 | |
| | Ivory Coast Government International Bonds | |
| | | | | 990,000 | | | | 8.250 | (a) | | 01/30/37 | | | 985,357 | |
| | | | | 471,000 | | | | 8.250 | | | 01/30/37 | | | 468,791 | |
| | Jordan Government International Bonds | |
| | | | | 811,000 | | | | 7.500 | (a) | | 01/13/29 | | | 821,138 | |
| | | | | 886,000 | | | | 7.500 | | | 01/13/29 | | | 897,075 | |
| | Kazakhstan Government International Bonds (a) | |
| | | | | 1,065,000 | | | | 4.714 | | | 04/09/35 | | | 1,031,452 | |
| | Latvia Government International Bonds (a) | |
| | | | | 357,000 | | | | 5.125 | | | 07/30/34 | | | 354,837 | |
| | Lebanon Government International Bonds (e) | |
| | | | | 275,000 | | | | 6.100 | | | 10/04/22 | | | 22,688 | |
| | | | | 1,247,000 | | | | 6.600 | | | 11/27/26 | | | 102,878 | |
| | | | | 1,564,000 | | | | 7.000 | | | 03/20/28 | | | 129,030 | |
| | | | | 1,259,000 | | | | 6.650 | | | 11/03/28 | | | 103,868 | |
| | Mexico Government International Bonds | |
| | | | | 1,353,000 | | | | 4.600 | | | 01/23/46 | | | 1,028,280 | |
| | Mongolia Government International Bonds | |
| | | | | 200,000 | | | | 8.650 | | | 01/19/28 | | | 212,688 | |
| | | | | 271,000 | | | | 7.875 | (a) | | 06/05/29 | | | 285,228 | |
| | | | | 200,000 | | | | 7.875 | | | 06/05/29 | | | 210,500 | |
| | Nigeria Government International Bonds | |
| | | | | 1,140,000 | | | | 8.375 | | | 03/24/29 | | | 1,097,774 | |
| | | | | 3,068,000 | | | | 7.375 | | | 09/28/33 | | | 2,589,576 | |
| | Oman Government International Bonds | |
| | | | | 3,010,000 | | | | 6.750 | | | 10/28/27 | | | 3,128,519 | |
| | | | | 500,000 | | | | 7.000 | | | 01/25/51 | | | 532,813 | |
| | Oriental Republic of Uruguay (b) | |
| | | | | 1,006,046 | | | | 5.250 | | | 09/10/60 | | | 950,713 | |
| | Pakistan Government International Bonds | |
| | | | | 711,000 | | | | 6.000 | | | 04/08/26 | | | 666,563 | |
| | | | | 838,000 | | | | 6.875 | | | 12/05/27 | | | 757,866 | |
| | | |
| | | | |
| | The accompanying notes are an integral part of these financial statements. | | 23 |
GOLDMAN SACHS MULTI-MANAGER NON-CORE FIXED INCOME FUND
|
Schedule of Investments (continued) October 31, 2024 |
| | | | | | | | | | | | | | | | |
| | | Principal Amount | | | Interest Rate | | | Maturity Date | | Value | |
| |
| | Sovereign Debt Obligations – (continued) | |
| |
| | United States Dollar – (continued) | |
| | $ | | | 315,000 | | | | 8.875 | % | | 04/08/51 | | $ | 250,425 | |
| | Panama Government International Bonds (b) | |
| | | | | 1,994,000 | | | | 2.252 | | | 09/29/32 | | | 1,458,611 | |
| | | | | 5,295,000 | | | | 4.500 | | | 04/16/50 | | | 3,515,245 | |
| | Paraguay Government International Bonds (b) | |
| | | | | 200,000 | | | | 4.950 | | | 04/28/31 | | | 194,563 | |
| | | | | 1,146,000 | | | | 5.850 | (a) | | 08/21/33 | | | 1,155,168 | |
| | | | | 200,000 | | | | 5.850 | | | 08/21/33 | | | 201,600 | |
| | Peru Government International Bonds (b) | |
| | | | | 1,156,000 | | | | 2.783 | | | 01/23/31 | | | 1,002,830 | |
| | | | | 873,000 | | | | 5.375 | | | 02/08/35 | | | 858,596 | |
| | | | | 1,322,000 | | | | 5.875 | | | 08/08/54 | | | 1,308,264 | |
| | Philippines Government International Bonds | |
| | | | | 3,028,000 | | | | 5.170 | | | 10/13/27 | | | 3,079,097 | |
| | | | | 3,442,000 | | | | 1.950 | | | 01/06/32 | | | 2,839,650 | |
| | Qatar Government International Bonds | |
| | | | | 5,328,000 | | | | 4.500 | | | 04/23/28 | | | 5,341,320 | |
| | | | | 436,000 | | | | 4.750 | (a) | | 05/29/34 | | | 441,723 | |
| | Republic of Azerbaijan International Bonds | |
| | | | | 33,000 | | | | 5.125 | | | 09/01/29 | | | 32,293 | |
| | | | | 532,000 | | | | 5.125 | | | 09/01/29 | | | 520,610 | |
| | | | | 628,000 | | | | 3.500 | | | 09/01/32 | | | 544,790 | |
| | Republic of Kenya Government International Bonds | |
| | | | | 1,405,000 | | | | 9.750 | (a) | | 02/16/31 | | | 1,411,589 | |
| | | | | 220,000 | | | | 9.750 | | | 02/16/31 | | | 221,032 | |
| | Republic of Poland Government International Bonds (b) | |
| | | | | 595,000 | | | | 4.625 | | | 03/18/29 | | | 595,720 | |
| | | | | 1,648,000 | | | | 5.125 | | | 09/18/34 | | | 1,628,685 | |
| | | | | 3,459,000 | | | | 5.500 | | | 03/18/54 | | | 3,338,661 | |
| | Republic of South Africa Government International Bonds | |
| | | | | 2,634,000 | | | | 4.300 | | | 10/12/28 | | | 2,489,130 | |
| | | | | 2,836,000 | | | | 5.750 | | | 09/30/49 | | | 2,208,535 | |
| | Republic of Turkiye | |
| | | | | 3,266,000 | | | | 6.500 | | | 01/03/35 | | | 3,094,535 | |
| | Republic of Uzbekistan International Bonds (a) | |
| | | | | 793,000 | | | | 6.900 | | | 02/28/32 | | | 780,362 | |
| | Romania Government International Bonds | |
| | | | | 2,612,000 | | | | 5.750 | (a) | | 03/24/35 | | | 2,457,108 | |
| | | | | 3,898,000 | | | | 4.000 | | | 02/14/51 | | | 2,623,841 | |
| | Saudi Government International Bonds | |
| | | | | 402,000 | | | | 4.750 | | | 01/16/30 | | | 399,613 | |
| | | | | 4,686,000 | | | | 4.750 | (a) | | 01/16/30 | | | 4,658,177 | |
| | | | | 3,412,000 | | | | 5.750 | | | 01/16/54 | | | 3,302,176 | |
| | Senegal Government International Bonds | |
| | | | | 1,135,000 | | | | 6.750 | | | 03/13/48 | | | 798,756 | |
| | Serbia International Bonds (a) | |
| | | | | 1,206,000 | | | | 6.000 | | | 06/12/34 | | | 1,206,000 | |
| | Sri Lanka Government International Bonds (e) | |
| | | | | 2,776,000 | | | | 6.750 | | | 04/18/28 | | | 1,745,410 | |
| | | | | 339,000 | | | | 5.750 | | | 04/18/49 | | | 206,790 | |
| | Trinidad & Tobago Government International Bonds (b) | |
| | | | | 686,000 | | | | 5.950 | (a) | | 01/14/31 | | | 680,855 | |
| | | | | 400,000 | | | | 5.950 | | | 01/14/31 | | | 397,000 | |
| | Turkiye Government International Bonds | |
| | | | | 1,261,000 | | | | 7.125 | | | 07/17/32 | | | 1,262,967 | |
| | | |
| | | | | | | | | | | | | | | | |
| | | Principal Amount | | | Interest Rate | | | Maturity Date | | Value | |
| |
| | Sovereign Debt Obligations – (continued) | |
| |
| | United States Dollar – (continued) | |
| | Ukraine Government International Bonds (d) | |
| | $ | | | 351,182 | | | | 1.750 | % | | 02/01/29 | | $ | 210,182 | |
| | | | | 389,589 | | | | 1.750 | (a) | | 02/01/29 | | | 233,169 | |
| | | | | 285,086 | | | | 3.000 | | | 02/01/35 | | | 138,267 | |
| | | | | 528,556 | | | | 0.000 | (a)(c) | | 02/01/35 | | | 256,350 | |
| | | | | 3,204,118 | | | | 1.750 | (a) | | 02/01/35 | | | 1,465,884 | |
| | Uruguay Government International Bonds (b) | |
| | | | | 695,262 | | | | 4.375 | | | 01/23/31 | | | 684,181 | |
| | | | | 2,503,159 | | | | 5.750 | | | 10/28/34 | | | 2,636,922 | |
| | Venezuela Government International Bonds (e) | |
| | | | | 757,000 | | | | 7.750 | | | 10/13/19 | | | 92,354 | |
| | | | | 1,864,900 | | | | 9.250 | | | 05/07/28 | | | 270,411 | |
| | | | | 1,286,400 | | | | 11.950 | | | 08/05/31 | | | 199,392 | |
| | Zambia Government International Bonds (a) | |
| | | | | 435,628 | | | | 5.750 | (d) | | 06/30/33 | | | 381,196 | |
| | | | | 405,779 | | | | 0.500 | | | 12/31/53 | | | 217,599 | |
| | | |
| | | | | | | | | | | | | | | 153,606,856 | |
| | | |
| |
| | Uruguayan Peso – 0.1% | |
| | Uruguay Government International Bonds (b) | |
| | UYU | | | 10,463,571 | | | | 9.750 | | | 07/20/33 | | | 256,947 | |
| | | | | 28,346,369 | | | | 3.400 | | | 05/16/45 | | | 684,846 | |
| | | | | | | | | | | | | | | | |
| | | | | | | | | | | | | | | 941,793 | |
| | | |
| | |
| | TOTAL SOVEREIGN DEBT OBLIGATIONS (Cost $592,043,049) | | $ | 592,987,362 | |
| | | |
| | | | | | | | | | | | | | | | |
| |
| | Corporate Obligations – 31.8% | |
| |
| | Advertising(a)(b) – 0.1% | |
| | CMG Media Corp. | |
| | $ | | | 1,710,000 | | | | 8.875 | % | | 12/15/27 | | $ | 1,247,052 | |
| | Summer BC Holdco A SARL | |
| | EUR | | | 282,930 | | | | 9.250 | | | 10/31/27 | | | 308,804 | |
| | Summer BC Holdco B SARL | |
| | | | | 442,000 | | | | 5.750 | | | 10/31/26 | | | 479,261 | |
| | | | | | | | | | | | | | | | |
| | | | | | | | | | | | | | | 2,035,117 | |
| | | |
| |
| | Aerospace & Defense(a)(b) – 0.3% | |
| | Bombardier, Inc. | |
| | $ | | | 562,000 | | | | 7.875 | | | 04/15/27 | | | 562,809 | |
| | | | | 325,000 | | | | 7.250 | | | 07/01/31 | | | 336,004 | |
| | Rolls-Royce PLC | |
| | GBP | | | 450,000 | | | | 5.750 | | | 10/15/27 | | | 586,166 | |
| | Spirit AeroSystems, Inc. | |
| | $ | | | 820,000 | | | | 9.750 | | | 11/15/30 | | | 910,799 | |
| | TransDigm, Inc. | |
| | | | | 1,675,000 | | | | 7.125 | | | 12/01/31 | | | 1,736,137 | |
| | | | | | | | | | | | | | | | |
| | | | | | | | | | | | | | | 4,131,915 | |
| | | |
| |
| | Airlines(a) – 0.3% | |
| | Air Canada (b) | |
| | | | | 925,000 | | | | 3.875 | | | 08/15/26 | | | 895,400 | |
| | | |
| | |
| 24 | | The accompanying notes are an integral part of these financial statements. |
GOLDMAN SACHS MULTI-MANAGER NON-CORE FIXED INCOME FUND
| | | | | | | | | | | | | | | | |
| | | Principal Amount | | | Interest Rate | | | Maturity Date | | Value | |
| |
| | Corporate Obligations – (continued) | |
| |
| | Airlines(a) – (continued) | |
| | American Airlines, Inc./AAdvantage Loyalty IP Ltd. | |
| | $ | | | 350,000 | | | | 5.500 | % | | 04/20/26 | | $ | 349,136 | |
| | Azul Secured Finance LLP (b) | |
| | | | | 484,000 | | | | 11.930 | | | 08/28/28 | | | 471,295 | |
| | Grupo Aeromexico SAB de CV (b) | |
| | | | | 272,000 | | | | 8.625 | | | 11/15/31 | | | 270,980 | |
| | Spirit Loyalty Cayman Ltd./Spirit IP Cayman Ltd. (b) | |
| | | | | 887,000 | | | | 8.000 | | | 09/20/25 | | | 551,350 | |
| | | | | 335,000 | | | | 8.000 | | | 09/20/25 | | | 209,543 | |
| | United Airlines, Inc. (b) | |
| | | | | 345,000 | | | | 4.375 | | | 04/15/26 | | | 338,962 | |
| | | | | 730,000 | | | | 4.625 | | | 04/15/29 | | | 699,026 | |
| | VistaJet Malta Finance PLC/Vista Management Holding, Inc. (b) | |
| | | | | 347,000 | | | | 9.500 | | | 06/01/28 | | | 340,858 | |
| | | | | 1,334,000 | | | | 6.375 | | | 02/01/30 | | | 1,140,957 | |
| | | | | | | | | | | | | | | | |
| | | | | | | | | | | | | | | 5,267,507 | |
| | | |
| |
| | Apparel(a)(b) – 0.1% | |
| | Hanesbrands, Inc. | |
| | | | | 580,000 | | | | 9.000 | | | 02/15/31 | | | 622,578 | |
| | Wolverine World Wide, Inc. | |
| | | | | 1,314,000 | | | | 4.000 | | | 08/15/29 | | | 1,123,404 | |
| | | | | | | | | | | | | | | | |
| | | | | | | | | | | | | | | 1,745,982 | |
| | | |
| |
| | Automotive(b) – 0.3% | |
| | Adient Global Holdings Ltd. (a) | |
| | | | | 513,000 | | | | 8.250 | | | 04/15/31 | | | 531,063 | |
| | Clarios Global LP/Clarios U.S. Finance Co. (a) | |
| | | | | 569,000 | | | | 8.500 | | | 05/15/27 | | | 572,135 | |
| | Dana Financing Luxembourg SARL | |
| | EUR | | | 554,000 | | | | 8.500 | | | 07/15/31 | | | 645,013 | |
| | Dealer Tire LLC/DT Issuer LLC (a) | |
| | $ | | | 919,000 | | | | 8.000 | | | 02/01/28 | | | 906,079 | |
| | IHO Verwaltungs GmbH (a)(f) (PIK 7.750%, Cash 7.000%) | |
| | EUR | | | 1,000,000 | | | | 7.000 | | | 11/15/31 | | | 1,096,658 | |
| | Tenneco, Inc. (a) | |
| | $ | | | 1,142,000 | | | | 8.000 | | | 11/17/28 | | | 1,056,693 | |
| | | | | | | | | | | | | | | | |
| | | | | | | | | | | | | | | 4,807,641 | |
| | | |
| |
| | Banks – 1.7% | |
| | Banca Monte dei Paschi di Siena SpA (b)(g) (5 yr. EURIBOR ICE Swap + 5.005%) | |
| | EUR | | | 1,680,000 | | | | 7.708 | | | 01/18/28 | | | 2,005,593 | |
| | Banco de Credito e Inversiones SA (a)(b)(g) (5 yr. CMT + 3.767%) | |
| | $ | | | 1,726,000 | | | | 7.500 | | | 12/12/34 | | | 1,721,046 | |
| | Banco de Sabadell SA (b)(g) (5 yr. EUR Swap + 6.830%) | |
| | EUR | | | 1,000,000 | | | | 9.375 | | | 07/18/28 | | | 1,207,402 | |
| | Banco Santander SA (b)(g) (5 yr. CMT + 3.911%) | |
| | $ | | | 600,000 | | | | 8.000 | | | 02/01/34 | | | 622,032 | |
| | Barclays PLC (b)(g) (5 yr. GBP Swap + 4.881%) | |
| | GBP | | | 1,072,000 | | | | 8.500 | | | 06/15/30 | | | 1,416,848 | |
| | (5 yr. GBP Swap + 5.639%) | |
| | | | | 1,628,000 | | | | 9.250 | | | 09/15/28 | | | 2,204,187 | |
| | | |
| | | | | | | | | | | | | | | | |
| | | Principal Amount | | | Interest Rate | | | Maturity Date | | Value | |
| |
| | Corporate Obligations – (continued) | |
| |
| | Banks – (continued) | |
| | BBVA Bancomer SA (a)(b)(g) (5 yr. CMT + 4.214%) | |
| | $ | | | 1,100,000 | | | | 8.125 | % | | 01/08/39 | | $ | 1,133,000 | |
| | CaixaBank SA (b)(g) | |
| | (-1X 5 yr. EUR Swap + 3.857%) | |
| | EUR | | | 800,000 | | | | 3.625 | | | 09/14/28 | | | 774,626 | |
| | (5 yr. EURIBOR ICE Swap + 5.295%) | |
| | | | | 600,000 | | | | 7.500 | | | 01/16/30 | | | 699,726 | |
| | Commerzbank AG (b)(g) (5 yr. EURIBOR ICE Swap + 5.129%) | |
| | | | | 600,000 | | | | 7.875 | | | 10/09/31 | | | 705,678 | |
| | Deutsche Bank AG (b)(g) | |
| | (5 yr. EURIBOR ICE Swap + 5.692%) | |
| | | | | 600,000 | | | | 6.750 | | | 10/30/28 | | | 650,202 | |
| | (5 yr. EURIBOR ICE Swap + 6.940%) | |
| | | | | 1,000,000 | | | | 10.000 | | | 12/01/27 | | | 1,191,097 | |
| | Development Bank of Kazakhstan JSC (a) | |
| | $ | | | 461,000 | | | | 5.250 | | | 10/23/29 | | | 459,847 | |
| | Freedom Mortgage Corp. (a)(b) | |
| | | | | 1,050,000 | | | | 6.625 | | | 01/15/27 | | | 1,037,967 | |
| | | | | 1,392,000 | | | | 12.000 | | | 10/01/28 | | | 1,504,655 | |
| | Intesa Sanpaolo SpA (b)(g) | |
| | (1 yr. CMT + 2.750%) | |
| | | | | 1,760,000 | | | | 4.950 | (a) | | 06/01/42 | | | 1,362,222 | |
| | (-1X 5 yr. EUR Swap + 5.848%) | |
| | EUR | | | 621,000 | | | | 5.500 | | | 03/01/28 | | | 666,205 | |
| | (-1X 5 yr. EUR Swap + 6.086%) | |
| | | | | 1,020,000 | | | | 5.875 | | | 09/01/31 | | | 1,096,657 | |
| | Lloyds Banking Group PLC (b)(g) | |
| | (5 yr. U.K. Government Bond + 5.143%) | |
| | GBP | | | 650,000 | | | | 8.500 | | | 03/27/28 | | | 864,293 | |
| | (5 yr. U.K. Government Bond + 5.883%) | |
| | | | | 400,000 | | | | 8.500 | | | 09/27/27 | | | 532,002 | |
| | Metro Bank Holdings PLC (a)(b)(g) (1 yr. U.K. Government Bond +7.814%) | |
| | | | | 1,020,000 | | | | 12.000 | | | 04/30/29 | | | 1,369,493 | |
| | Societe Generale SA (b)(g) | |
| | (5 yr. CMT + 4.514%) | |
| | $ | | | 810,000 | | | | 5.375 | | | 11/18/30 | | | 686,848 | |
| | (5 yr. CMT + 5.385%) | |
| | | | | 602,000 | | | | 9.375 | | | 11/22/27 | | | 627,230 | |
| | (5 yr. EUR Swap + 5.228%) | |
| | EUR | | | 800,000 | | | | 7.875 | | | 01/18/29 | | | 904,033 | |
| | UniCredit SpA (b)(g) | |
| | (-1X 5 yr. EUR Swap + 4.606%) | |
| | | | | 921,000 | | | | 4.450 | | | 12/03/27 | | | 955,484 | |
| | (5 yr. USD ICE Swap + 3.703%) | |
| | $ | | | 1,525,000 | | | | 5.861 | (a) | | 06/19/32 | | | 1,518,458 | |
| | | | | | | | | | | | | | | | |
| | | | | | | | | | | | | | | 27,916,831 | |
| | | |
| |
| | Biotechnology(b) – 0.1% | |
| | Biocon Biologics Global PLC (a) | |
| | | | | 738,000 | | | | 6.670 | | | 10/09/29 | | | 726,653 | |
| | Cidron Aida Finco SARL | |
| | EUR | | | 1,048,000 | | | | 5.000 | | | 04/01/28 | | | 1,110,072 | |
| | | | | | | | | | | | | | | | |
| | | | | | | | | | | | | | | 1,836,725 | |
| | | |
| | |
| The accompanying notes are an integral part of these financial statements. | | 25 |
GOLDMAN SACHS MULTI-MANAGER NON-CORE FIXED INCOME FUND
|
Schedule of Investments (continued) October 31, 2024 |
| | | | | | | | | | | | | | | | |
| | | Principal Amount | | | Interest Rate | | | Maturity Date | | Value | |
| |
| | Corporate Obligations – (continued) | |
| |
| | Building Materials(a)(b) – 0.6% | |
| | AmeriTex HoldCo Intermediate LLC | |
| | $ | | | 1,370,000 | | | | 10.250 | % | | 10/15/28 | | $ | 1,442,048 | |
| | Builders FirstSource, Inc. | |
| | | | | 787,000 | | | | 6.375 | | | 03/01/34 | | | 792,643 | |
| | Camelot Return Merger Sub, Inc. | |
| | | | | 1,601,000 | | | | 8.750 | | | 08/01/28 | | | 1,609,773 | |
| | CP Atlas Buyer, Inc. | |
| | | | | 1,300,000 | | | | 7.000 | | | 12/01/28 | | | 1,189,851 | |
| | EMRLD Borrower LP/Emerald Co-Issuer, Inc. | |
| | | | | 787,000 | | | | 6.625 | | | 12/15/30 | | | 799,828 | |
| | Sisecam U.K. PLC | |
| | | | | 609,000 | | | | 8.625 | | | 05/02/32 | | | 621,180 | |
| | Smyrna Ready Mix Concrete LLC | |
| | | | | 875,000 | | | | 8.875 | | | 11/15/31 | | | 919,573 | |
| | Standard Industries, Inc. | |
| | | | | 1,150,000 | | | | 4.375 | | | 07/15/30 | | | 1,058,276 | |
| | Summit Materials LLC/Summit Materials Finance Corp. | |
| | | | | 563,000 | | | | 5.250 | | | 01/15/29 | | | 558,130 | |
| | | | | 415,000 | | | | 7.250 | | | 01/15/31 | | | 431,451 | |
| | Wilsonart LLC | |
| | | | | 643,000 | | | | 11.000 | | | 08/15/32 | | | 633,715 | |
| | | | | | | | | | | | | | | | |
| | | | | | | | | | | | | | | 10,056,468 | |
| | | |
| |
| | Chemicals – 1.3% | |
| | ASP Unifrax Holdings, Inc. (a)(b)(f) (PIK 1.250%, Cash 5.850%) | |
| | | | | 1,310,892 | | | | 7.100 | | | 09/30/29 | | | 777,765 | |
| | Avient Corp. (a)(b) | |
| | | | | 329,000 | | | | 6.250 | | | 11/01/31 | | | 330,592 | |
| | Axalta Coating Systems Dutch Holding B BV (a)(b) | |
| | | | | 1,345,000 | | | | 7.250 | | | 02/15/31 | | | 1,407,677 | |
| | Axalta Coating Systems LLC (a)(b) | |
| | | | | 5,000 | | | | 3.375 | | | 02/15/29 | | | 4,599 | |
| | Braskem Netherlands Finance BV (a)(b) | |
| | | | | 1,056,000 | | | | 8.000 | | | 10/15/34 | | | 1,051,121 | |
| | Cerdia Finanz GmbH (a)(b) | |
| | | | | 1,100,000 | | | | 9.375 | | | 10/03/31 | | | 1,131,020 | |
| | CF Industries, Inc. | |
| | | | | 792,000 | | | | 5.150 | | | 03/15/34 | | | 776,025 | |
| | Chemours Co. (a)(b) | |
| | | | | 922,000 | | | | 5.750 | | | 11/15/28 | | | 853,551 | |
| | | | | 999,000 | | | | 4.625 | | | 11/15/29 | | | 865,963 | |
| | Cornerstone Chemical Co. LLC (a)(b)(h) | |
| | | | | 1,000,000 | | | | 10.250 | (e) | | 09/01/27 | | | 1,000,000 | |
| | (PIK 10.000%, Cash 5.000%) | |
| | | | | 1,285,963 | | | | 15.000 | (f) | | 12/06/28 | | | 1,285,963 | |
| | Herens Midco SARL (a)(b) | |
| | EUR | | | 200,000 | | | | 5.250 | | | 05/15/29 | | | 165,084 | |
| | INEOS Finance PLC (b) | |
| | | | | 553,000 | | | | 6.375 | | | 04/15/29 | | | 622,549 | |
| | Innophos Holdings, Inc. (a)(b) | |
| | $ | | | 715,000 | | | | 9.375 | | | 02/15/28 | | | 674,588 | |
| | Iris Holdings, Inc. (a)(b)(f) (PIK 9.500%, Cash 8.750%) | |
| | | | | 615,000 | | | | 8.750 | | | 02/15/26 | | | 574,755 | |
| | Lune Holdings SARL (a)(b) | |
| | EUR | | | 200,000 | | | | 5.625 | | | 11/15/28 | | | 179,788 | |
| | | |
| | | | | | | | | | | | | | | | |
| | | Principal Amount | | | Interest Rate | | | Maturity Date | | Value | |
| |
| | Corporate Obligations – (continued) | |
| |
| | Chemicals – (continued) | |
| | Monitchem HoldCo 3 SA (a)(b) | |
| | EUR | | | 400,000 | | | | 8.750 | % | | 05/01/28 | | $ | 440,935 | |
| | NOVA Chemicals Corp. (a)(b) | |
| | $ | | | 740,000 | | | | 4.250 | | | 05/15/29 | | | 673,489 | |
| | OCI NV (a)(b) | |
| | | | | 1,124,000 | | | | 6.700 | | | 03/16/33 | | | 1,122,280 | |
| | OCP SA (a)(b) | |
| | | | | 1,542,000 | | | | 7.500 | | | 05/02/54 | | | 1,595,014 | |
| | Rain Carbon, Inc. (a)(b) | |
| | | | | 855,000 | | | | 12.250 | | | 09/01/29 | | | 910,558 | |
| | Rain CII Carbon LLC/CII Carbon Corp. (a)(b) | |
| | | | | 14,000 | | | | 7.250 | | | 04/01/25 | | | 13,752 | |
| | SCIH Salt Holdings, Inc. (a)(b) | |
| | | | | 1,197,000 | | | | 4.875 | | | 05/01/28 | | | 1,145,828 | |
| | | | | 556,000 | | | | 6.625 | | | 05/01/29 | | | 539,087 | |
| | Tronox, Inc. (a)(b) | |
| | | | | 2,488,000 | | | | 4.625 | | | 03/15/29 | | | 2,255,297 | |
| | Vibrantz Technologies, Inc. (a)(b) | |
| | | | | 830,000 | | | | 9.000 | | | 02/15/30 | | | 777,511 | |
| | WR Grace Holdings LLC (a)(b) | |
| | | | | 578,000 | | | | 5.625 | | | 08/15/29 | | | 533,702 | |
| | | | | | | | | | | | | | | | |
| | | | | | | | | | | | | | | 21,708,493 | |
| | | |
| |
| | Commercial Services(b) –1.3% | |
| | ADT Security Corp. (a) | |
| | | | | 547,000 | | | | 4.125 | | | 08/01/29 | | | 511,483 | |
| | Albion Financing 1 SARL/Aggreko Holdings, Inc. (a) | |
| | EUR | | | 575,000 | | | | 5.250 | | | 10/15/26 | | | 630,303 | |
| | Allied Universal Holdco LLC (a) | |
| | $ | | | 2,000,000 | | | | 7.875 | | | 02/15/31 | | | 2,036,020 | |
| | Avis Budget Car Rental LLC/Avis Budget Finance, Inc. (a) | |
| | | | | 606,000 | | | | 8.000 | | | 02/15/31 | | | 619,205 | |
| | BCP V Modular Services Finance II PLC (a) | |
| | EUR | | | 615,000 | | | | 4.750 | | | 11/30/28 | | | 646,823 | |
| | BCP V Modular Services Finance PLC (a) | |
| | | | | 280,000 | | | | 6.750 | | | 11/30/29 | | | 263,822 | |
| | Boels Topholding BV | |
| | | | | 475,000 | | | | 5.750 | (a) | | 05/15/30 | | | 533,019 | |
| | | | | 520,000 | | | | 5.750 | | | 05/15/30 | | | 583,515 | |
| | Boost Newco Borrower LLC/GTCR W Dutch Finance Sub BV | |
| | GBP | | | 926,000 | | | | 8.500 | | | 01/15/31 | | | 1,286,569 | |
| | Cerved Group SpA (a) | |
| | EUR | | | 691,000 | | | | 6.000 | | | 02/15/29 | | | 720,698 | |
| | Champions Financing, Inc. (a) | |
| | $ | | | 684,000 | | | | 8.750 | | | 02/15/29 | | | 690,505 | |
| | CPI CG, Inc. (a) | |
| | | | | 605,000 | | | | 10.000 | | | 07/15/29 | | | 636,835 | |
| | Garda World Security Corp. (a) | |
| | | | | 862,000 | | | | 8.375 | | | 11/15/32 | | | 861,681 | |
| | House of HR Group BV (a) | |
| | EUR | | | 550,000 | | | | 9.000 | | | 11/03/29 | | | 597,712 | |
| | Kapla Holding SAS (a) | |
| | | | | 650,000 | | | | 3.375 | | | 12/15/26 | | | 701,798 | |
| | Korn Ferry (a) | |
| | $ | | | 1,265,000 | | | | 4.625 | | | 12/15/27 | | | 1,232,932 | |
| | | |
| | |
| 26 | | The accompanying notes are an integral part of these financial statements. |
GOLDMAN SACHS MULTI-MANAGER NON-CORE FIXED INCOME FUND
| | | | | | | | | | | | | | | | |
| | | Principal Amount | | | Interest Rate | | | Maturity Date | | Value | |
| |
| | Corporate Obligations – (continued) | |
| |
| | Commercial Services(b) – (continued) | |
| | Loxam SAS (a) | |
| | EUR | | | 700,000 | | | | 4.500 | % | | 04/15/27 | | $ | 740,486 | |
| | Neptune Bidco U.S., Inc. (a) | |
| | $ | | | 598,000 | | | | 9.290 | | | 04/15/29 | | | 559,190 | |
| | Q-Park Holding I BV (a) | |
| | EUR | | | 600,000 | | | | 5.125 | | | 03/01/29 | | | 671,994 | |
| | Sabre GLBL, Inc. (a) | |
| | $ | | | 1,345,000 | | | | 11.250 | | | 12/15/27 | | | 1,383,776 | |
| | Service Corp. International | |
| | | | | 680,000 | | | | 5.750 | | | 10/15/32 | | | 669,222 | |
| | StoneMor, Inc. (a) | |
| | | | | 975,000 | | | | 8.500 | | | 05/15/29 | | | 868,111 | |
| | United Rentals North America, Inc. | |
| | | | | 535,000 | | | | 5.250 | | | 01/15/30 | | | 525,600 | |
| | | | | 595,000 | | | | 4.000 | | | 07/15/30 | | | 549,120 | |
| | Verisure Holding AB (a) | |
| | EUR | | | 100,000 | | | | 3.250 | | | 02/15/27 | | | 107,005 | |
| | | | | 461,000 | | | | 7.125 | | | 02/01/28 | | | 521,486 | |
| | Wand NewCo 3, Inc. (a) | |
| | $ | | | 1,892,550 | | | | 7.625 | | | 01/30/32 | | | 1,954,777 | |
| | | | | | | | | | | | | | | | |
| | | | | | | | | | | | | | | 21,103,687 | |
| | | |
| |
| | Computers – 0.3% | |
| | Ahead DB Holdings LLC (a)(b) | |
| | | | | 529,000 | | | | 6.625 | | | 05/01/28 | | | 513,326 | |
| | Amentum Holdings, Inc. (a)(b) | |
| | | | | 344,000 | | | | 7.250 | | | 08/01/32 | | | 356,587 | |
| | CA Magnum Holdings (a)(b) | |
| | | | | 1,800,000 | | | | 5.375 | | | 10/31/26 | | | 1,766,250 | |
| | Endo Design LLC (a)(h) | |
| | | | | 1,183,000 | | | | 9.500 | | | 07/31/27 | | | — | |
| | | | | 946,000 | | | | 6.000 | (e) | | 06/30/28 | | | — | |
| | Entorian Technologies, Inc. (a)(e)(h)(i) | |
| | | | | 835,000 | | | | 8.750 | | | 10/15/26 | | | — | |
| | Lutech SpA (a)(b) | |
| | EUR | | | 500,000 | | | | 5.000 | | | 05/15/27 | | | 541,150 | |
| | McAfee Corp. (a)(b) | |
| | $ | | | 1,745,000 | | | | 7.375 | | | 02/15/30 | | | 1,683,942 | |
| | Seagate HDD Cayman (b) | |
| | | | | 552,000 | | | | 3.375 | | | 07/15/31 | | | 457,001 | |
| | | | | | | | | | | | | | | | |
| | | | | | | | | | | | | | | 5,318,256 | |
| | | |
| |
| | Distribution & Wholesale(a)(b) –0.1% | |
| | American Builders & Contractors Supply Co., Inc. | |
| | | | | 453,000 | | | | 4.000 | | | 01/15/28 | | | 430,590 | |
| | Green Bidco SA | |
| | EUR | | | 295,000 | | | | 10.250 | | | 07/15/28 | | | 295,231 | |
| | H&E Equipment Services, Inc. | |
| | $ | | | 1,143,000 | | | | 3.875 | | | 12/15/28 | | | 1,055,904 | |
| | | | | | | | | | | | | | | | |
| | | | | | | | | | | | | | | 1,781,725 | |
| | | |
| |
| | Diversified Financial Services – 1.2% | |
| | Bach Bidco SpA (a)(b)(g) (3 mo. EUR EURIBOR + 4.250%) | |
| | EUR | | | 575,000 | | | | 7.429 | | | 10/15/28 | | | 627,270 | |
| | | |
| | | | | | | | | | | | | | | | |
| | | Principal Amount | | | Interest Rate | | | Maturity Date | | Value | |
| |
| | Corporate Obligations – (continued) | |
| |
| | Diversified Financial Services – (continued) | |
| | Bread Financial Holdings, Inc. (a)(b) | |
| | $ | | | 626,000 | | | | 9.750 | % | | 03/15/29 | | $ | 660,493 | |
| | CI Financial Corp. (a)(b) | |
| | | | | 1,780,000 | | | | 7.500 | | | 05/30/29 | | | 1,852,873 | |
| | Coinbase Global, Inc. (a)(b) | |
| | | | | 766,000 | | | | 3.375 | | | 10/01/28 | | | 684,046 | |
| | Finance of America Funding LLC (a)(b) | |
| | | | | 1,810,000 | | | | 7.875 | | | 11/15/25 | | | 1,531,061 | |
| | Focus Financial Partners LLC (a)(b) | |
| | | | | 900,000 | | | | 6.750 | | | 09/15/31 | | | 894,213 | |
| | Freedom Mortgage Holdings LLC (a)(b) | |
| | | | | 494,000 | | | | 9.250 | | | 02/01/29 | | | 506,478 | |
| | Jefferies Finance LLC/JFIN Co-Issuer Corp. (a)(b) | |
| | | | | 774,000 | | | | 5.000 | | | 08/15/28 | | | 714,464 | |
| | | | | 795,000 | | | | 6.625 | | | 10/15/31 | | | 791,001 | |
| | Kane Bidco Ltd. (b) | |
| | EUR | | | 300,000 | | | | 5.000 | (a) | | 02/15/27 | | | 324,935 | |
| | GBP | | | 213,000 | | | | 6.500 | | | 02/15/27 | | | 272,673 | |
| | Macquarie Airfinance Holdings Ltd. (a)(b) | |
| | $ | | | 705,000 | | | | 6.400 | | | 03/26/29 | | | 726,834 | |
| | | | | 105,000 | | | | 6.500 | | | 03/26/31 | | | 108,884 | |
| | Midcap Financial Issuer Trust (a)(b) | |
| | | | | 1,948,000 | | | | 6.500 | | | 05/01/28 | | | 1,842,983 | |
| | | | | 775,000 | | | | 5.625 | | | 01/15/30 | | | 686,673 | |
| | Nationstar Mortgage Holdings, Inc. (a)(b) | |
| | | | | 500,000 | | | | 5.000 | | | 02/01/26 | | | 495,225 | |
| | | | | 1,418,000 | | | | 5.500 | | | 08/15/28 | | | 1,385,414 | |
| | Navient Corp. | |
| | | | | 900,000 | | | | 5.625 | | | 08/01/33 | | | 776,871 | |
| | OneMain Finance Corp. (b) | |
| | | | | 377,000 | | | | 3.500 | | | 01/15/27 | | | 359,760 | |
| | | | | 775,000 | | | | 3.875 | | | 09/15/28 | | | 715,387 | |
| | | | | 91,000 | | | | 9.000 | | | 01/15/29 | | | 96,301 | |
| | | | | 1,565,000 | | | | 5.375 | | | 11/15/29 | | | 1,499,082 | |
| | | | | 700,000 | | | | 4.000 | | | 09/15/30 | | | 616,147 | |
| | PennyMac Financial Services, Inc. (a)(b) | |
| | | | | 555,000 | | | | 4.250 | | | 02/15/29 | | | 517,998 | |
| | PRA Group, Inc. (a)(b) | |
| | | | | 867,000 | | | | 8.875 | | | 01/31/30 | | | 900,033 | |
| | United Wholesale Mortgage LLC (a)(b) | |
| | | | | 345,000 | | | | 5.500 | | | 11/15/25 | | | 343,599 | |
| | Voyager Aviation Holdings LLC (a)(b)(e) | |
| | | | | 729,562 | | | | 8.500 | | | 05/09/26 | | | 106,005 | |
| | | | | | | | | | | | | | | | |
| | | | | | | | | | | | | | | 20,036,703 | |
| | | |
| |
| | Electrical – 1.4% | |
| | Abu Dhabi National Energy Co. PJSC (a) | |
| | | | | 1,409,000 | | | | 4.750 | | | 03/09/37 | | | 1,359,685 | |
| | AES Andes SA (a)(b)(g) (5 yr. CMT + 3.835%) | |
| | | | | 600,000 | | | | 8.150 | | | 06/10/55 | | | 612,000 | |
| | Buffalo Energy Mexico Holdings/Buffalo Energy Infrastructure/ Buffalo Energy (a)(b) | |
| | | | | 692,000 | | | | 7.875 | | | 02/15/39 | | | 713,369 | |
| | Calpine Corp. (a)(b) | |
| | | | | 443,000 | | | | 4.500 | | | 02/15/28 | | | 426,706 | |
| | | |
| | |
| The accompanying notes are an integral part of these financial statements. | | 27 |
GOLDMAN SACHS MULTI-MANAGER NON-CORE FIXED INCOME FUND
|
Schedule of Investments (continued) October 31, 2024 |
| | | | | | | | | | | | | | | | |
| | | Principal Amount | | | Interest Rate | | | Maturity Date | | Value | |
| |
| | Corporate Obligations – (continued) | |
| |
| | Electrical – (continued) | |
| | $ | | | 1,000,000 | | | | 5.125 | % | | 03/15/28 | | $ | 977,930 | |
| | | | | 755,000 | | | | 4.625 | | | 02/01/29 | | | 717,114 | |
| | Comision Federal de Electricidad (a)(b) | | | | |
| | | | | 1,545,000 | | | | 6.450 | | | 01/24/35 | | | 1,490,925 | |
| | Electricite de France SA (b)(g) (-1X 5 yr. EUR Swap + 3.970%) | |
| | EUR | | | 1,400,000 | | | | 3.375 | | | 06/15/30 | | | 1,402,925 | |
| | Eskom Holdings SOC Ltd. (j) | | | | |
| | ZAR | | | 17,000,000 | | | | 7.500 | | | 09/15/33 | | | 755,471 | |
| | FIEMEX Energia - Banco Actinver SA Institucion de Banca Multiple (a)(b) | |
| | $ | | | 1,247,000 | | | | 7.250 | | | 01/31/41 | | | 1,246,532 | |
| | Lightning Power LLC (a)(b) | | | | |
| | | | | 1,100,000 | | | | 7.250 | | | 08/15/32 | | | 1,144,891 | |
| | Mazoon Assets Co. SAOC (a) | | | | |
| | | | | 916,000 | | | | 5.250 | | | 10/09/31 | | | 911,603 | |
| | NRG Energy, Inc. (a)(b) | | | | |
| | | | | 732,000 | | | | 5.750 | | | 07/15/29 | | | 725,667 | |
| | | | | 3,665,000 | | | | 3.625 | | | 02/15/31 | | | 3,245,981 | |
| | (5 yr. CMT + 5.920%) | | | | |
| | | | | 781,000 | | | | 10.250 | (g) | | 03/15/28 | | | 862,365 | |
| | PG&E Corp. (b) | | | | |
| | | | | 1,000,000 | | | | 5.250 | | | 07/01/30 | | | 975,080 | |
| | Termocandelaria Power SA (a)(b) | | | | |
| | | | | 1,000,000 | | | | 7.750 | | | 09/17/31 | | | 1,002,500 | |
| | Vistra Corp. (a)(b)(g) (5 yr. CMT + 5.740%) | | | | |
| | | | | 1,395,000 | | | | 7.000 | | | 12/15/26 | | | 1,408,518 | |
| | Vistra Operations Co. LLC (a)(b) | | | | |
| | | | | 1,000,000 | | | | 5.000 | | | 07/31/27 | | | 987,420 | |
| | | | | 400,000 | | | | 4.375 | | | 05/01/29 | | | 381,092 | |
| | | | | 29,000 | | | | 4.300 | | | 07/15/29 | | | 27,781 | |
| | | | | 550,000 | | | | 7.750 | | | 10/15/31 | | | 581,059 | |
| | | | | | | | | | | | | | | | |
| | | | | | | | | | | | | | | 21,956,614 | |
| | | |
| |
| | Electrical Components & Equipment(a)(b) – 0.0% | |
| | Belden, Inc. | | | | |
| | EUR | | | 751,000 | | | | 3.375 | | | 07/15/31 | | | 769,928 | |
| | | |
| |
| | Electronics(a)(b) – 0.1% | |
| | Coherent Corp. | | | | |
| | $ | | | 750,000 | | | | 5.000 | | | 12/15/29 | | | 719,160 | |
| | Sensata Technologies BV | | | | |
| | | | | 1,365,000 | | | | 4.000 | | | 04/15/29 | | | 1,275,511 | |
| | | | | | | | | | | | | | | | |
| | | | | | | | | | | | | | | 1,994,671 | |
| | | |
| |
| | Energy-Alternate Sources(a)(b) – 0.2% | |
| | Cullinan Holdco SCSp | | | | |
| | EUR | | | 700,000 | | | | 4.625 | | | 10/15/26 | | | 666,095 | |
| | Enviva Partners LP/Enviva Partners Finance Corp. (e) | |
| | $ | | | 994,000 | | | | 6.500 | | | 01/15/26 | | | 252,734 | |
| | FS Luxembourg SARL | | | | |
| | | | | 780,000 | | | | 8.875 | | | 02/12/31 | | | 796,052 | |
| | TerraForm Power Operating LLC | |
| | | | | 1,102,000 | | | | 5.000 | | | 01/31/28 | | | 1,077,095 | |
| | | | | 250,000 | | | | 4.750 | | | 01/15/30 | | | 233,765 | |
| | | | | | | | | | | | | | | | |
| | | | | | | | | | | | | | | 3,025,741 | |
| | | |
| | | | | | | | | | | | | | | | |
| | | Principal Amount | | | Interest Rate | | | Maturity Date | | Value | |
| |
| | Corporate Obligations – (continued) | |
| |
| | Engineering & Construction(a)(b) – 0.2% | |
| | Artera Services LLC | | | | |
| | $ | | | 275,000 | | | | 8.500 | % | | 02/15/31 | | $ | 272,572 | |
| | Assemblin Caverion Group AB | | | | |
| | EUR | | | 225,000 | | | | 6.250 | | | 07/01/30 | | | 252,135 | |
| | (3 mo. EUR EURIBOR + 3.500%) | | | | |
| | | | | 246,000 | | | | 6.826 | (g) | | 07/01/31 | | | 267,228 | |
| | Global Infrastructure Solutions, Inc. | | | | |
| | $ | | | 1,208,000 | | | | 5.625 | | | 06/01/29 | | | 1,177,824 | |
| | Kingston Airport Revenue Finance Ltd. | | | | |
| | | | | 922,000 | | | | 6.750 | | | 12/15/36 | | | 933,405 | |
| | | | | | | | | | | | | | | | |
| | | | | | | | | | | | | | | 2,903,164 | |
| | | |
| |
| | Entertainment(b) – 0.9% | |
| | 888 Acquisitions Ltd. (a) | | | | |
| | EUR | | | 1,296,000 | | | | 7.558 | | | 07/15/27 | | | 1,376,440 | |
| | Allwyn Entertainment Financing U.K. PLC | | | | |
| | | | | 750,000 | | | | 7.250 | (a) | | 04/30/30 | | | 863,741 | |
| | | | | 770,000 | | | | 7.250 | | | 04/30/30 | | | 886,775 | |
| | Allwyn International AS (a) | | | | |
| | | | | 550,000 | | | | 3.875 | | | 02/15/27 | | | 594,523 | |
| | Banijay Entertainment SAS (a) | | | | |
| | | | | 475,000 | | | | 7.000 | | | 05/01/29 | | | 541,348 | |
| | Boyne USA, Inc. (a) | | | | |
| | $ | | | 601,000 | | | | 4.750 | | | 05/15/29 | | | 572,705 | |
| | Caesars Entertainment, Inc. (a) | | | | |
| | | | | 389,000 | | | | 4.625 | | | 10/15/29 | | | 364,590 | |
| | | | | 1,140,000 | | | | 7.000 | | | 02/15/30 | | | 1,168,511 | |
| | Churchill Downs, Inc. (a) | | | | |
| | | | | 505,000 | | | | 4.750 | | | 01/15/28 | | | 489,795 | |
| | Cirsa Finance International SARL (a) | | | | |
| | EUR | | | 1,040,000 | | | | 4.500 | | | 03/15/27 | | | 1,124,789 | |
| | | | | 400,000 | | | | 6.500 | | | 03/15/29 | | | 457,477 | |
| | Flutter Treasury DAC (a) | | | | |
| | | | | 509,000 | | | | 5.000 | | | 04/29/29 | | | 567,988 | |
| | $ | | | 670,000 | | | | 6.375 | | | 04/29/29 | | | 685,651 | |
| | International Game Technology PLC (a) | | | | |
| | EUR | | | 1,250,000 | | | | 2.375 | | | 04/15/28 | | | 1,293,756 | |
| | $ | | | 375,000 | | | | 5.250 | | | 01/15/29 | | | 368,048 | |
| | Jacobs Entertainment, Inc. (a) | | | | |
| | | | | 970,000 | | | | 6.750 | | | 02/15/29 | | | 954,538 | |
| | | | | 150,000 | | | | 6.750 | | | 02/15/29 | | | 146,442 | |
| | LHMC Finco 2 SARL (a)(f) (PIK 8.000%, Cash 7.250%) | | | | |
| | EUR | | | 157,259 | | | | 7.250 | | | 10/02/25 | | | 171,122 | |
| | Live Nation Entertainment, Inc. (a) | | | | |
| | $ | | | 625,000 | | | | 4.750 | | | 10/15/27 | | | 607,888 | |
| | Loarre Investments SARL (a) | | | | |
| | EUR | | | 800,000 | | | | 6.500 | | | 05/15/29 | | | 896,358 | |
| | Pinewood Finco PLC (a) | | | | |
| | GBP | | | 400,000 | | | | 6.000 | | | 03/27/30 | | | 516,961 | |
| | Wynn Resorts Finance LLC/Wynn Resorts Capital Corp. (a) | |
| | $ | | | 500,000 | | | | 6.250 | | | 03/15/33 | | | 497,785 | |
| | | | | | | | | | | | | | | | |
| | | | | | | | | | | | | | | 15,147,231 | |
| | | |
| | |
| 28 | | The accompanying notes are an integral part of these financial statements. |
GOLDMAN SACHS MULTI-MANAGER NON-CORE FIXED INCOME FUND
| | | | | | | | | | | | | | | | |
| | | Principal Amount | | | Interest
Rate | | | Maturity Date | | Value | |
| |
| | Corporate Obligations – (continued) | |
| |
| | Environmental(a)(b) – 0.1% | |
| | Clean Harbors, Inc. | | | | |
| | $ | | | 398,000 | | | | 4.875 | % | | 07/15/27 | | $ | 392,102 | |
| | GFL Environmental, Inc. | |
| | | | | 450,000 | | | | 3.500 | | | 09/01/28 | | | 421,848 | |
| | | | | 700,000 | | | | 4.375 | | | 08/15/29 | | | 655,949 | |
| | Madison IAQ LLC | |
| | | | | 449,000 | | | | 4.125 | | | 06/30/28 | | | 425,095 | |
| | | | | | | | | | | | | | | | |
| | | | | | | | | | | | | | | 1,894,994 | |
| | | |
| |
| | Food & Drug Retailing – 0.6% | |
| | Bellis Acquisition Co. PLC (a)(b) | |
| | GBP | | | 843,000 | | | | 8.125 | | | 05/14/30 | | | 1,073,985 | |
| | Iceland Bondco PLC (a)(b) | |
| | | | | 238,400 | | | | 4.625 | | | 03/15/25 | | | 305,588 | |
| | (3 mo. EUR EURIBOR + 5.500%) | |
| | EUR | | | 200,000 | | | | 9.042 | (g) | | 12/15/27 | | | 221,209 | |
| | Lamb Weston Holdings, Inc. (a)(b) | |
| | $ | | | 946,000 | | | | 4.125 | | | 01/31/30 | | | 878,285 | |
| | MARB BondCo PLC (b) | |
| | | | | 1,428,000 | | | | 3.950 | | | 01/29/31 | | | 1,232,364 | |
| | Minerva Luxembourg SA (a)(b) | |
| | | | | 1,064,000 | | | | 8.875 | | | 09/13/33 | | | 1,111,880 | |
| | New Albertsons LP | |
| | | | | 1,050,000 | | | | 8.700 | | | 05/01/30 | | | 1,146,726 | |
| | | | | 387,000 | | | | 8.000 | | | 05/01/31 | | | 409,709 | |
| | Nomad Foods Bondco PLC (a)(b) | |
| | EUR | | | 807,000 | | | | 2.500 | | | 06/24/28 | | | 833,441 | |
| | Performance Food Group, Inc. (a)(b) | |
| | $ | | | 390,000 | | | | 6.125 | | | 09/15/32 | | | 391,973 | |
| | Picard Groupe SAS (a)(b) | |
| | EUR | | | 550,000 | | | | 6.375 | | | 07/01/29 | | | 612,112 | |
| | Sigma Holdco BV (a)(b) | |
| | | | | 313,968 | | | | 5.750 | | | 05/15/26 | | | 337,506 | |
| | Simmons Foods, Inc./Simmons Prepared Foods, Inc./Simmons Pet Food, Inc./Simmons Feed (a)(b) | |
| | $ | | | 1,065,000 | | | | 4.625 | | | 03/01/29 | | | 987,692 | |
| | | | | | | | | | | | | | | | |
| | | | | | | | | | | | | | | 9,542,470 | |
| | | |
| |
| | Food Service(a)(b) – 0.0% | |
| | Aramark Services, Inc. | |
| | | | | 350,000 | | | | 5.000 | | | 04/01/25 | | | 349,412 | |
| | | |
| |
| | Forest Products & Paper(a)(b) – 0.3% | |
| | Domtar Corp. | |
| | | | | 3,537,000 | | | | 6.750 | | | 10/01/28 | | | 3,235,825 | |
| | LD Celulose International GmbH | |
| | | | | 687,000 | | | | 7.950 | | | 01/26/32 | | | 702,114 | |
| | WEPA Hygieneprodukte GmbH | |
| | EUR | | | 566,000 | | | | 5.625 | | | 01/15/31 | | | 634,604 | |
| | | | | | | | | | | | | | | | |
| | | | | | | | | | | | | | | 4,572,543 | |
| | | |
| |
| | Hand/Machine Tools(a)(b) – 0.0% | |
| | IMA Industria Macchine Automatiche SpA | |
| | | | | 360,000 | | | | 3.750 | | | 01/15/28 | | | 380,892 | |
| | | |
| | | | | | | | | | | | | | | | |
| | | Principal Amount | | | Interest
Rate | | | Maturity Date | | Value | |
| |
| | Corporate Obligations – (continued) | |
| |
| | Health Care Providers & Services(a)(b) – 0.1% | |
| | Kedrion SpA | |
| | $ | | | 1,250,000 | | | | 6.500 | % | | 09/01/29 | | $ | 1,175,150 | |
| | | |
| |
| | Healthcare Providers & Services(a)(b) – 1.2% | |
| | Akumin, Inc. | |
| | | | | 15,000 | | | | 8.000 | | | 08/01/28 | | | 12,190 | |
| | (PIK 9.000%, Cash 8.000%) | |
| | | | | 1,590,000 | | | | 9.000 | (f) | | 08/01/27 | | | 1,363,504 | |
| | Avantor Funding, Inc. | |
| | EUR | | | 195,000 | | | | 3.875 | | | 07/15/28 | | | 211,042 | |
| | CAB SELAS | |
| | | | | 835,000 | | | | 3.375 | | | 02/01/28 | | | 842,303 | |
| | Charles River Laboratories International, Inc. | |
| | $ | | | 850,000 | | | | 4.000 | | | 03/15/31 | | | 760,444 | |
| | CHS/Community Health Systems, Inc. | |
| | | | | 2,049,000 | | | | 5.625 | | | 03/15/27 | | | 1,997,755 | |
| | | | | 903,000 | | | | 10.875 | | | 01/15/32 | | | 968,540 | |
| | DaVita, Inc. | |
| | | | | 1,100,000 | | | | 3.750 | | | 02/15/31 | | | 957,209 | |
| | Embecta Corp. | |
| | | | | 900,000 | | | | 5.000 | | | 02/15/30 | | | 815,886 | |
| | Ephios Subco 3 SARL | |
| | EUR | | | 300,000 | | | | 7.875 | | | 01/31/31 | | | 354,405 | |
| | Fortrea Holdings, Inc. | |
| | $ | | | 695,000 | | | | 7.500 | | | 07/01/30 | | | 684,200 | |
| | Global Medical Response, Inc. (f) | |
| | | | | 1,722,268 | | | | 10.000 | | | 10/31/28 | | | 1,722,010 | |
| | IQVIA, Inc. | |
| | EUR | | | 600,000 | | | | 2.250 | | | 03/15/29 | | | 614,555 | |
| | LifePoint Health, Inc. | |
| | $ | | | 437,000 | | | | 4.375 | | | 02/15/27 | | | 424,069 | |
| | | | | 1,745,000 | | | | 9.875 | | | 08/15/30 | | | 1,908,629 | |
| | | | | 372,000 | | | | 10.000 | | | 06/01/32 | | | 397,158 | |
| | Medline Borrower LP | |
| | | | | 1,911,000 | | | | 3.875 | | | 04/01/29 | | | 1,788,792 | |
| | Molina Healthcare, Inc. | |
| | | | | 893,000 | | | | 4.375 | | | 06/15/28 | | | 856,941 | |
| | | | | 650,000 | | | | 3.875 | | | 11/15/30 | | | 588,607 | |
| | Radiology Partners, Inc. (f) | |
| | | | | 676,652 | | | | 9.781 | | | 02/15/30 | | | 639,984 | |
| | (PIK 4.275%, Cash 3.500%) | |
| | | | | 1,372,102 | | | | 7.775 | | | 01/31/29 | | | 1,361,084 | |
| | RAY Financing LLC | |
| | EUR | | | 500,000 | | | | 6.500 | | | 07/15/31 | | | 562,965 | |
| | | | | | | | | | | | | | | | |
| | | | | | | | | | | | | | | 19,832,272 | |
| | | |
| |
| | Home Builders(a)(b) – 0.1% | |
| | Brookfield Residential Properties, Inc./Brookfield Residential U.S. LLC | |
| | $ | | | 950,000 | | | | 4.875 | | | 02/15/30 | | | 884,517 | |
| | | |
| |
| | Home Furnishings(a)(b) – 0.0% | |
| | Flos B&b Italia SpA | |
| | EUR | | | 300,000 | | | | 10.000 | | | 11/15/28 | | | 351,733 | |
| | | |
| | |
| The accompanying notes are an integral part of these financial statements. | | 29 |
GOLDMAN SACHS MULTI-MANAGER NON-CORE FIXED INCOME FUND
|
Schedule of Investments (continued) October 31, 2024 |
| | | | | | | | | | | | | | | | |
| | | Principal Amount | | | Interest Rate | | | Maturity Date | | Value | |
| |
| | Corporate Obligations – (continued) | |
| |
| | Insurance – 1.0% | |
| | Acrisure LLC/Acrisure Finance, Inc. (a)(b) | |
| | $ | | | 959,000 | | | | 8.250 | % | | 02/01/29 | | $ | 974,833 | |
| | | | | 200,000 | | | | 7.500 | | | 11/06/30 | | | 203,124 | |
| | Alliant Holdings Intermediate LLC/Alliant Holdings Co-Issuer (a)(b) | |
| | | | | 150,000 | | | | 4.250 | | | 10/15/27 | | | 142,289 | |
| | | | | 3,000,000 | | | | 6.750 | | | 10/15/27 | | | 2,988,810 | |
| | | | | 1,469,000 | | | | 7.000 | | | 01/15/31 | | | 1,479,812 | |
| | | | | 2,250,000 | | | | 7.375 | | | 10/01/32 | | | 2,233,755 | |
| | APH Somerset Investor 2 LLC/APH2 Somerset Investor 2 LLC/APH3 Somerset Inves (a)(b) | |
| | | | | 868,000 | | | | 7.875 | | | 11/01/29 | | | 867,097 | |
| | Ardonagh Finco Ltd. (a)(b) | |
| | | | | 775,000 | | | | 7.750 | | | 02/15/31 | | | 794,801 | |
| | Ardonagh Group Finance Ltd. (a)(b) | |
| | | | | 1,050,000 | | | | 8.875 | | | 02/15/32 | | | 1,075,032 | |
| | Athora Holding Ltd. (b) | |
| | EUR | | | 640,000 | | | | 5.875 | | | 09/10/34 | | | 698,422 | |
| | Genworth Holdings, Inc. | |
| | $ | | | 940,000 | | | | 6.500 | | | 06/15/34 | | | 932,950 | |
| | Howden U.K. Refinance PLC/Howden U.K. Refinance 2 PLC/Howden U.S. Refinance LLC (a)(b) | |
| | | | | 2,025,000 | | | | 7.250 | | | 02/15/31 | | | 2,066,836 | |
| | | | | 575,000 | | | | 8.125 | | | 02/15/32 | | | 582,280 | |
| | Panther Escrow Issuer LLC (a)(b) | |
| | | | | 846,000 | | | | 7.125 | | | 06/01/31 | | | 864,079 | |
| | | | | | | | | | | | | | | | |
| | | | | | | | | | | | | | | 15,904,120 | |
| | | |
| |
| | Internet – 0.5% | |
| | ANGI Group LLC (a)(b) | |
| | | | | 1,679,000 | | | | 3.875 | | | 08/15/28 | | | 1,520,620 | |
| | Cablevision Lightpath LLC (a)(b) | |
| | | | | 750,000 | | | | 5.625 | | | 09/15/28 | | | 697,350 | |
| | Engineering - Ingegneria Informatica - SpA (a)(b) | |
| | EUR | | | 650,000 | | | | 5.875 | | | 09/30/26 | | | 694,798 | |
| | Go Daddy Operating Co. LLC/GD Finance Co., Inc. (a)(b) | |
| | $ | | | 817,000 | | | | 3.500 | | | 03/01/29 | | | 753,405 | |
| | Ocado Group PLC (a)(b) | |
| | GBP | | | 700,000 | | | | 3.875 | | | 10/08/26 | | | 846,996 | |
| | Rakuten Group, Inc. (a) | |
| | $ | | | 500,000 | | | | 9.750 | | | 04/15/29 | | | 539,040 | |
| | United Group BV (b) | |
| | EUR | | | 500,000 | | | | 3.625 | (a) | | 02/15/28 | | | 524,214 | |
| | | | | 1,257,000 | | | | 5.250 | (a) | | 02/01/30 | | | 1,326,173 | |
| | (3 mo. EUR EURIBOR + 4.250%) | |
| | | | | 610,000 | | | | 7.792 | (g) | | 02/15/31 | | | 661,869 | |
| | | | | | | | | | | | | | | | |
| | | | | | | | | | | | | | | 7,564,465 | |
| | | |
| |
| | Investment Companies – 0.3% | |
| | Abu Dhabi Developmental Holding Co. PJSC (a)(b) | |
| | $ | | | 420,000 | | | | 5.250 | | | 10/02/54 | | | 395,325 | |
| | Blackstone Private Credit Fund (b) | |
| | | | | 1,200,000 | | | | 2.625 | | | 12/15/26 | | | 1,130,664 | |
| | Blue Owl Capital Corp. (b) | |
| | | | | 962,000 | | | | 3.400 | | | 07/15/26 | | | 926,704 | |
| | | |
| | | | | | | | | | | | | | | | |
| | | Principal Amount | | | Interest Rate | | | Maturity Date | | Value | |
| |
| | Corporate Obligations – (continued) | |
| |
| | Investment Companies – (continued) | |
| | Icahn Enterprises LP/Icahn Enterprises Finance Corp. (b) | |
| | $ | | | 1,175,000 | | | | 5.250 | % | | 05/15/27 | | $ | 1,094,689 | |
| | Khazanah Global Sukuk Bhd. | |
| | | | | 696,000 | | | | 4.687 | | | 06/01/28 | | | 692,687 | |
| | | | | | | | | | | | | | | | |
| | | | | | | | | | | | | | | 4,240,069 | |
| | | |
| |
| | Iron/Steel – 0.4% | |
| | Baffinland Iron Mines Corp./Baffinland Iron Mines LP (a)(b) | |
| | | | | 1,360,000 | | | | 8.750 | | | 07/15/26 | | | 1,232,840 | |
| | Cleveland-Cliffs, Inc. (a)(b) | |
| | | | | 771,000 | | | | 7.375 | | | 05/01/33 | | | 776,798 | |
| | CSN Resources SA (b) | |
| | | | | 890,000 | | | | 8.875 | | | 12/05/30 | | | 892,448 | |
| | Mineral Resources Ltd. (a)(b) | |
| | | | | 365,000 | | | | 8.125 | | | 05/01/27 | | | 367,460 | |
| | | | | 500,000 | | | | 8.000 | | | 11/01/27 | | | 512,235 | |
| | | | | 973,000 | | | | 9.250 | | | 10/01/28 | | | 1,025,046 | |
| | | | | 640,000 | | | | 8.500 | | | 05/01/30 | | | 660,685 | |
| | Samarco Mineracao SA (b)(f) (PIK 9.049%, Cash 9.000%) | |
| | | | | 1,459,619 | | | | 9.000 | | | 06/30/31 | | | 1,380,551 | |
| | Tacora Resources, Inc. (h) | |
| | | | | 27,984 | | | | 13.000 | | | 09/18/31 | | | 27,984 | |
| | | | | | | | | | | | | | | | |
| | | | | | | | | | | | | | | 6,876,047 | |
| | | |
| |
| | Leisure Time(b) – 0.4% | |
| | Carnival Corp. | |
| | | | | 350,000 | | | | 4.000 | (a) | | 08/01/28 | | | 333,802 | |
| | EUR | | | 1,000,000 | | | | 5.750 | (a) | | 01/15/30 | | | 1,154,744 | |
| | | | | 540,000 | | | | 5.750 | | | 01/15/30 | | | 625,565 | |
| | Carnival Holdings Bermuda Ltd. (a) | |
| | $ | | | 670,000 | | | | 10.375 | | | 05/01/28 | | | 719,084 | |
| | Deuce Finco PLC (a) | |
| | GBP | | | 250,000 | | | | 5.500 | | | 06/15/27 | | | 315,322 | |
| | (3 mo. EUR EURIBOR + 4.750%) | |
| | EUR | | | 200,000 | | | | 8.231 | (g) | | 06/15/27 | | | 218,638 | |
| | NCL Corp. Ltd. (a) | |
| | $ | | | 700,000 | | | | 5.875 | | | 03/15/26 | | | 699,048 | |
| | | | | 200,000 | | | | 8.125 | | | 01/15/29 | | | 211,714 | |
| | Pinnacle Bidco PLC (a) | |
| | GBP | | | 350,000 | | | | 10.000 | | | 10/11/28 | | | 481,374 | |
| | Viking Cruises Ltd. (a) | |
| | $ | | | 1,200,000 | | | | 5.875 | | | 09/15/27 | | | 1,192,596 | |
| | Viking Ocean Cruises Ship VII Ltd. (a) | |
| | | | | 370,000 | | | | 5.625 | | | 02/15/29 | | | 365,094 | |
| | | | | | | | | | | | | | | | |
| | | | | | | | | | | | | | | 6,316,981 | |
| | | |
| |
| | Lodging(b) – 0.7% | |
| | Genting New York LLC/GENNY Capital, Inc. (a) | |
| | | | | 1,200,000 | | | | 7.250 | | | 10/01/29 | | | 1,216,224 | |
| | Hilton Domestic Operating Co., Inc. (a) | |
| | | | | 1,030,000 | | | | 3.750 | | | 05/01/29 | | | 959,775 | |
| | | | | 1,215,000 | | | | 4.000 | | | 05/01/31 | | | 1,107,169 | |
| | Melco Resorts Finance Ltd. | |
| | | | | 950,000 | | | | 5.375 | (a) | | 12/04/29 | | | 873,406 | |
| | | | | 1,367,000 | | | | 7.625 | (a) | | 04/17/32 | | | 1,384,293 | |
| | | |
| | |
| 30 | | The accompanying notes are an integral part of these financial statements. |
GOLDMAN SACHS MULTI-MANAGER NON-CORE FIXED INCOME FUND
| | | | | | | | | | | | | | | | |
| | | Principal Amount | | | Interest
Rate | | | Maturity Date | | Value | |
| |
| | Corporate Obligations – (continued) | |
| |
| | Lodging(b) – (continued) | |
| | $ | | | 540,000 | | | | 7.625 | % | | 04/17/32 | | $ | 547,738 | |
| | MGM Resorts International | |
| | | | | 530,000 | | | | 6.500 | | | 04/15/32 | | | 530,064 | |
| | Station Casinos LLC (a) | |
| | | | | 403,000 | | | | 4.625 | | | 12/01/31 | | | 366,170 | |
| | Studio City Finance Ltd. (a) | |
| | | | | 1,550,000 | | | | 5.000 | | | 01/15/29 | | | 1,397,003 | |
| | Wynn Las Vegas LLC/Wynn Las Vegas Capital Corp. (a) | |
| | | | | 1,602,000 | | | | 5.250 | | | 05/15/27 | | | 1,590,289 | |
| | Wynn Macau Ltd. (a) | |
| | | | | 1,475,000 | | | | 5.125 | | | 12/15/29 | | | 1,367,347 | |
| | | | | | | | | | | | | | | | |
| | | | | | | | | | | | | | | 11,339,478 | |
| | | |
| |
| | Machinery - Construction & Mining(a)(b) – 0.1% | |
| | BWX Technologies, Inc. | |
| | | | | 1,334,000 | | | | 4.125 | | | 06/30/28 | | | 1,272,676 | |
| | | |
| |
| | Machinery-Diversified(a)(b) – 0.2% | |
| | Chart Industries, Inc. | |
| | | | | 250,000 | | | | 7.500 | | | 01/01/30 | | | 259,750 | |
| | | | | 565,000 | | | | 9.500 | | | 01/01/31 | | | 606,624 | |
| | Mangrove Luxco III SARL (g) (3 mo. EUR EURIBOR + 5.000%) | |
| | EUR | | | 1,368,000 | | | | 8.179 | | | 07/15/29 | | | 1,502,431 | |
| | TK Elevator Holdco GmbH | |
| | | | | 450,000 | | | | 6.625 | | | 07/15/28 | | | 489,747 | |
| | | | | | | | | | | | | | | | |
| | | | | | | | | | | | | | | 2,858,552 | |
| | | |
| |
| | Media – 2.5% | |
| | Altice Financing SA (a)(b) | |
| | | | | 300,000 | | | | 2.250 | | | 01/15/25 | | | 323,404 | |
| | $ | | | 625,000 | | | | 9.625 | | | 07/15/27 | | | 607,081 | |
| | | | | 2,968,000 | | | | 5.000 | | | 01/15/28 | | | 2,510,869 | |
| | | | | 767,000 | | | | 5.750 | | | 08/15/29 | | | 626,209 | |
| | AMC Networks, Inc. (a)(b) | |
| | | | | 611,000 | | | | 10.250 | | | 01/15/29 | | | 629,024 | |
| | Beasley Mezzanine Holdings LLC (a)(b) | |
| | | | | 1,112,000 | | | | 9.200 | | | 08/01/28 | | | 552,497 | |
| | CCO Holdings LLC/CCO Holdings Capital Corp. (a)(b) | |
| | | | | 410,000 | | | | 5.000 | | | 02/01/28 | | | 396,769 | |
| | | | | 1,025,000 | | | | 5.375 | | | 06/01/29 | | | 980,156 | |
| | | | | 2,109,000 | | | | 6.375 | | | 09/01/29 | | | 2,088,437 | |
| | | | | 2,590,000 | | | | 4.500 | | | 08/15/30 | | | 2,311,575 | |
| | | | | 650,000 | | | | 4.250 | | | 02/01/31 | | | 564,083 | |
| | | | | 1,328,000 | | | | 7.375 | | | 03/01/31 | | | 1,350,231 | |
| | | | | 820,000 | | | | 4.250 | | | 01/15/34 | | | 656,361 | |
| | CSC Holdings LLC (a)(b) | |
| | | | | 721,000 | | | | 5.500 | | | 04/15/27 | | | 641,690 | |
| | | | | 425,000 | | | | 7.500 | | | 04/01/28 | | | 280,050 | |
| | | | | 590,000 | | | | 11.750 | | | 01/31/29 | | | 575,468 | |
| | | | | 951,000 | | | | 6.500 | | | 02/01/29 | | | 803,291 | |
| | | | | 2,293,000 | | | | 5.750 | | | 01/15/30 | | | 1,213,341 | |
| | | | | 94,000 | | | | 4.125 | | | 12/01/30 | | | 69,297 | |
| | Diamond Sports Group LLC/Diamond Sports Finance Co. (a)(b)(e) | |
| | | | | 1,620,000 | | | | 5.375 | | | 08/15/26 | | | 10,951 | |
| | | | | 1,274,000 | | | | 6.625 | | | 08/15/27 | | | 8,077 | |
| | | |
| | | | | | | | | | | | | | | | |
| | | Principal Amount | | | Interest
Rate | | | Maturity Date | | Value | |
| |
| | Corporate Obligations – (continued) | |
| |
| | Media – (continued) | |
| | Directv Financing LLC (a)(b) | |
| | $ | | | 1,348,000 | | | | 8.875 | % | | 02/01/30 | | $ | 1,331,905 | |
| | DISH DBS Corp. | |
| | | | | 435,000 | | | | 7.750 | | | 07/01/26 | | | 367,523 | |
| | | | | 2,843,000 | | | | 5.250 | (a)(b) | | 12/01/26 | | | 2,631,452 | |
| | | | | 1,408,000 | | | | 5.750 | (a)(b) | | 12/01/28 | | | 1,232,268 | |
| | | | | 790,000 | | | | 5.125 | | | 06/01/29 | | | 524,710 | |
| | DISH Network Corp. (a)(b) | |
| | | | | 680,000 | | | | 11.750 | | | 11/15/27 | | | 715,870 | |
| | Gray Television, Inc. (a)(b) | |
| | | | | 435,000 | | | | 7.000 | | | 05/15/27 | | | 423,729 | |
| | | | | 1,551,000 | | | | 10.500 | | | 07/15/29 | | | 1,611,210 | |
| | | | | 2,416,000 | | | | 4.750 | | | 10/15/30 | | | 1,526,429 | |
| | | | | 665,000 | | | | 5.375 | | | 11/15/31 | | | 398,448 | |
| | Liberty Interactive LLC (b) | |
| | | | | 2,710,000 | | | | 4.000 | | | 11/15/29 | | | 928,175 | |
| | | | | 149,907 | | | | 3.750 | | | 02/15/30 | | | 51,718 | |
| | McGraw-Hill Education, Inc. (a)(b) | |
| | | | | 450,000 | | | | 5.750 | | | 08/01/28 | | | 441,338 | |
| | Nexstar Media, Inc. (a)(b) | |
| | | | | 556,000 | | | | 4.750 | | | 11/01/28 | | | 522,623 | |
| | Paramount Global (b)(g) (5 yr. CMT + 3.999%) | |
| | | | | 1,347,000 | | | | 6.375 | | | 03/30/62 | | | 1,247,443 | |
| | Scripps Escrow II, Inc. (a)(b) | |
| | | | | 2,096,000 | | | | 3.875 | | | 01/15/29 | | | 1,630,038 | |
| | Sinclair Television Group, Inc. (a)(b) | |
| | | | | 805,000 | | | | 5.500 | | | 03/01/30 | | | 554,484 | |
| | | | | 798,000 | | | | 4.125 | | | 12/01/30 | | | 610,462 | |
| | Sirius XM Radio, Inc. (a)(b) | |
| | | | | 300,000 | | | | 3.125 | | | 09/01/26 | | | 288,030 | |
| | Spanish Broadcasting System, Inc. (a)(b) | |
| | | | | 1,225,000 | | | | 9.750 | | | 03/01/26 | | | 809,517 | |
| | TEGNA, Inc. (b) | |
| | | | | 993,000 | | | | 4.625 | | | 03/15/28 | | | 936,310 | |
| | Telenet Finance Luxembourg Notes SARL (a)(b) | |
| | | | | 1,000,000 | | | | 5.500 | | | 03/01/28 | | | 973,100 | |
| | Univision Communications, Inc. (a)(b) | |
| | | | | 390,000 | | | | 4.500 | | | 05/01/29 | | | 346,476 | |
| | | | | 645,000 | | | | 7.375 | | | 06/30/30 | | | 619,000 | |
| | Urban One, Inc. (a)(b) | |
| | | | | 1,215,000 | | | | 7.375 | | | 02/01/28 | | | 901,457 | |
| | Virgin Media Secured Finance PLC (a)(b) | |
| | | | | 222,000 | | | | 4.500 | | | 08/15/30 | | | 194,434 | |
| | Virgin Media Vendor Financing Notes III DAC (a)(b) | |
| | GBP | | | 635,000 | | | | 4.875 | | | 07/15/28 | | | 761,723 | |
| | Virgin Media Vendor Financing Notes IV DAC (a)(b) | |
| | $ | | | 709,000 | | | | 5.000 | | | 07/15/28 | | | 677,620 | |
| | Ziggo BV (a)(b) | |
| | EUR | | | 600,000 | | | | 2.875 | | | 01/15/30 | | | 604,321 | |
| | | | | | | | | | | | | | | | |
| | | | | | | | | | | | | | | 41,060,674 | |
| | | |
| |
| | Metal Fabricate & Hardware(a)(b) – 0.1% | |
| | Vallourec SACA | |
| | $ | | | 995,000 | | | | 7.500 | | | 04/15/32 | | | 1,042,561 | |
| | | |
| | |
| The accompanying notes are an integral part of these financial statements. | | 31 |
GOLDMAN SACHS MULTI-MANAGER NON-CORE FIXED INCOME FUND
|
Schedule of Investments (continued) October 31, 2024 |
| | | | | | | | | | | | | | | | |
| | | Principal Amount | | | Interest
Rate | | | Maturity Date | | Value | |
| |
| | Corporate Obligations – (continued) | |
| |
| | Mining – 0.9% | |
| | Aris Mining Corp. (a)(b) | |
| | $ | | | 275,000 | | | | 8.000 | % | | 10/31/29 | | $ | 276,001 | |
| | Compass Minerals International, Inc. (a)(b) | |
| | | | | 502,000 | | | | 6.750 | | | 12/01/27 | | | 495,012 | |
| | Corp. Nacional del Cobre de Chile (b) | |
| | | | | 2,198,000 | | | | 5.950 | | | 01/08/34 | | | 2,224,788 | |
| | Eldorado Gold Corp. (a)(b) | |
| | | | | 1,450,000 | | | | 6.250 | | | 09/01/29 | | | 1,429,874 | |
| | First Quantum Minerals Ltd. (a)(b) | |
| | | | | 2,500,000 | | | | 9.375 | | | 03/01/29 | | | 2,649,025 | |
| | | | | 1,150,000 | | | | 8.625 | | | 06/01/31 | | | 1,158,625 | |
| | FMG Resources August 2006 Pty. Ltd. (a)(b) | |
| | | | | 179,000 | | | | 4.500 | | | 09/15/27 | | | 174,530 | |
| | | | | 409,000 | | | | 4.375 | | | 04/01/31 | | | 372,117 | |
| | Freeport-McMoRan, Inc. (b) | |
| | | | | 320,000 | | | | 4.625 | | | 08/01/30 | | | 312,080 | |
| | | | | 795,000 | | | | 5.400 | | | 11/14/34 | | | 795,334 | |
| | Mountain Province Diamonds, Inc. (a)(b)(h) | |
| | | | | 2,861,000 | | | | 9.000 | | | 12/15/25 | | | 2,697,923 | |
| | Navoi Mining & Metallurgical Combinat (a) | |
| | | | | 1,024,000 | | | | 6.700 | | | 10/17/28 | | | 1,026,048 | |
| | Northwest Acquisitions ULC/Dominion Finco, Inc. (a)(b)(e) | |
| | | | | 1,260,000 | | | | 7.125 | | | 11/01/22 | | | 13 | |
| | Novelis Corp. (a)(b) | |
| | | | | 400,000 | | | | 4.750 | | | 01/30/30 | | | 374,580 | |
| | WE Soda Investments Holding PLC (b) | |
| | | | | 880,000 | | | | 9.375 | | | 02/14/31 | | | 905,300 | |
| | | | | | | | | | | | | | | | |
| | | | | | | | | | | | | | | 14,891,250 | |
| | | |
| |
| | Miscellaneous Manufacturing(a)(b) – 0.0% | |
| | Amsted Industries, Inc. | |
| | | | | 357,000 | | | | 4.625 | | | 05/15/30 | | | 332,570 | |
| | LSB Industries, Inc. | |
| | | | | 360,000 | | | | 6.250 | | | 10/15/28 | | | 348,617 | |
| | | | | | | | | | | | | | | | |
| | | | | | | | | | | | | | | 681,187 | |
| | | |
| |
| | Office & Business Equipment(a)(b) – 0.1% | |
| | Pitney Bowes, Inc. | |
| | | | | 420,000 | | | | 6.875 | | | 03/15/27 | | | 415,636 | |
| | | | | 560,000 | | | | 7.250 | | | 03/15/29 | | | 550,312 | |
| | Xerox Holdings Corp. | |
| | | | | 646,000 | | | | 8.875 | | | 11/30/29 | | | 562,679 | |
| | | | | | | | | | | | | | | | |
| | | | | | | | | | | | | | | 1,528,627 | |
| | | |
| |
| | Oil Field Services – 3.6% | |
| | Adnoc Murban Rsc Ltd. (a)(b) | |
| | | | | 3,414,000 | | | | 4.500 | | | 09/11/34 | | | 3,243,300 | |
| | | | | 1,468,000 | | | | 5.125 | | | 09/11/54 | | | 1,365,240 | |
| | Aethon United BR LP/Aethon United Finance Corp. (a)(b) | |
| | | | | 820,000 | | | | 7.500 | | | 10/01/29 | | | 825,371 | |
| | Apache Corp. (b) | |
| | | | | 1,434,000 | | | | 5.100 | | | 09/01/40 | | | 1,241,141 | |
| | Archrock Partners LP/Archrock Partners Finance Corp. (a)(b) | |
| | | | | 444,000 | | | | 6.250 | | | 04/01/28 | | | 444,835 | |
| | | | | 457,000 | | | | 6.625 | | | 09/01/32 | | | 458,983 | |
| | | |
| | | | | | | | | | | | | | | | |
| | | Principal Amount | | | Interest
Rate | | | Maturity Date | | Value | |
| |
| | Corporate Obligations – (continued) | |
| |
| | Oil Field Services – (continued) | |
| | Ascent Resources Utica Holdings LLC/ARU Finance Corp. (a)(b) | |
| | $ | | | 500,000 | | | | 8.250 | % | | 12/31/28 | | $ | 510,250 | |
| | | | | 178,000 | | | | 6.625 | | | 10/15/32 | | | 176,339 | |
| | Chesapeake Energy Corp. (b)(e)(i) | |
| | | | | 195,000 | | | | 7.000 | | | 10/01/24 | | | 4,144 | |
| | | | | 935,000 | | | | 7.500 | | | 10/01/26 | | | 19,869 | |
| | CITGO Petroleum Corp. (a)(b) | |
| | | | | 1,074,000 | | | | 6.375 | | | 06/15/26 | | | 1,075,364 | |
| | | | | 1,559,000 | | | | 8.375 | | | 01/15/29 | | | 1,621,750 | |
| | Civitas Resources, Inc. (a)(b) | |
| | | | | 460,000 | | | | 8.625 | | | 11/01/30 | | | 483,377 | |
| | CNX Resources Corp. (a)(b) | |
| | | | | 1,175,000 | | | | 6.000 | | | 01/15/29 | | | 1,164,907 | |
| | Comstock Resources, Inc. (a)(b) | |
| | | | | 1,329,000 | | | | 6.750 | | | 03/01/29 | | | 1,272,770 | |
| | Ecopetrol SA (b) | |
| | | | | 2,658,000 | | | | 7.750 | | | 02/01/32 | | | 2,592,613 | |
| | | | | 825,000 | | | | 8.875 | | | 01/13/33 | | | 843,315 | |
| | EDO Sukuk Ltd. | |
| | | | | 923,000 | | | | 5.662 | (a) | | 07/03/31 | | | 937,131 | |
| | | | | 250,000 | | | | 5.662 | | | 07/03/31 | | | 253,828 | |
| | Energean Israel Finance Ltd. (a)(b) | |
| | | | | 1,270,240 | | | | 8.500 | | | 09/30/33 | | | 1,204,213 | |
| | Greenfire Resources Ltd. (a)(b) | |
| | | | | 2,213,000 | | | | 12.000 | | | 10/01/28 | | | 2,373,442 | |
| | Guara Norte SARL (a) | |
| | | | | 745,335 | | | | 5.198 | | | 06/15/34 | | | 704,826 | |
| | Kosmos Energy Ltd. (a)(b) | |
| | | | | 1,565,000 | | | | 7.750 | | | 05/01/27 | | | 1,534,189 | |
| | Kraken Oil & Gas Partners LLC (a)(b) | |
| | | | | 950,000 | | | | 7.625 | | | 08/15/29 | | | 938,591 | |
| | Moss Creek Resources Holdings, Inc. (a)(b) | |
| | | | | 858,000 | | | | 8.250 | | | 09/01/31 | | | 841,518 | |
| | Nabors Industries, Inc. (a)(b) | |
| | | | | 175,000 | | | | 9.125 | | | 01/31/30 | | | 181,311 | |
| | | | | 175,000 | | | | 8.875 | | | 08/15/31 | | | 165,813 | |
| | NewCo Holding USD 20 SARL (a)(b) | |
| | | | | 370,000 | | | | 9.375 | | | 11/07/29 | | | 369,075 | |
| | Permian Resources Operating LLC (a)(b) | |
| | | | | 500,000 | | | | 8.000 | | | 04/15/27 | | | 513,840 | |
| | | | | 500,000 | | | | 9.875 | | | 07/15/31 | | | 552,175 | |
| | Petrobras Global Finance BV (b) | |
| | | | | 1,192,000 | | | | 6.000 | | | 01/13/35 | | | 1,154,678 | |
| | Petroleos de Venezuela SA (e) | |
| | | | | 4,204,523 | | | | 6.000 | | | 11/15/26 | | | 409,941 | |
| | | | | 3,726,536 | | | | 6.000 | | | 05/16/49 | | | 361,474 | |
| | Petroleos del Peru SA | |
| | | | | 2,582,000 | | | | 5.625 | | | 06/19/47 | | | 1,678,300 | |
| | Petroleos Mexicanos | |
| | | | | 1,478,000 | | | | 5.950 | (b) | | 01/28/31 | | | 1,271,080 | |
| | | | | 1,066,000 | | | | 6.375 | | | 01/23/45 | | | 744,868 | |
| | | | | 7,029,000 | | | | 6.750 | | | 09/21/47 | | | 5,014,840 | |
| | Petronas Capital Ltd. (b) | |
| | | | | 1,204,000 | | | | 3.500 | | | 04/21/30 | | | 1,123,777 | |
| | | | | 938,000 | | | | 2.480 | | | 01/28/32 | | | 794,486 | |
| | | |
| | |
| 32 | | The accompanying notes are an integral part of these financial statements. |
GOLDMAN SACHS MULTI-MANAGER NON-CORE FIXED INCOME FUND
| | | | | | | | | | | | | | | | |
| | | Principal Amount | | | Interest
Rate | | | Maturity Date | | Value | |
| |
| | Corporate Obligations – (continued) | |
| |
| | Oil Field Services – (continued) | |
| | $ | | | 2,217,000 | | | | 3.404 | % | | 04/28/61 | | $ | 1,529,797 | |
| | Saudi Arabian Oil Co. (b) | |
| | | | | 534,000 | | | | 5.875 | (a) | | 07/17/64 | | | 512,806 | |
| | | | | 200,000 | | | | 5.875 | | | 07/17/64 | | | 192,062 | |
| | Strathcona Resources Ltd. (a)(b) | |
| | | | | 1,370,000 | | | | 6.875 | | | 08/01/26 | | | 1,359,670 | |
| | Sunoco LP (a)(b) | |
| | | | | 345,000 | | | | 7.250 | | | 05/01/32 | | | 359,431 | |
| | TGNR Intermediate Holdings LLC (a)(b) | |
| | | | | 1,217,000 | | | | 5.500 | | | 10/15/29 | | | 1,150,442 | |
| | Transocean Titan Financing Ltd. (a)(b) | |
| | | | | 370,000 | | | | 8.375 | | | 02/01/28 | | | 381,244 | |
| | Transocean, Inc. | |
| | | | | 632,000 | | | | 8.250 | (a)(b) | | 05/15/29 | | | 635,084 | |
| | | | | 918,850 | | | | 8.750 | (a)(b) | | 02/15/30 | | | 951,322 | |
| | | | | 946,000 | | | | 8.500 | (a)(b) | | 05/15/31 | | | 952,991 | |
| | | | | 1,295,000 | | | | 6.800 | | | 03/15/38 | | | 1,074,669 | |
| | Valaris Ltd. (a)(b) | |
| | | | | 1,845,000 | | | | 8.375 | | | 04/30/30 | | | 1,871,660 | |
| | Var Energi ASA (b)(g) (5 yr. EURIBOR ICE Swap + 4.765%) | |
| | EUR | | | 1,160,000 | | | | 7.862 | | | 11/15/83 | | | 1,386,707 | |
| | Vital Energy, Inc. (a)(b) | |
| | $ | | | 1,363,000 | | | | 7.875 | | | 04/15/32 | | | 1,310,088 | |
| | Wintershall Dea Finance 2 BV (b)(g) (-1X 5 yr. EUR Swap + 3.319%) | |
| | EUR | | | 1,100,000 | | | | 3.000 | | | 07/20/28 | | | 1,104,153 | |
| | Yinson Boronia Production BV (a)(b) | |
| | $ | | | 1,480,000 | | | | 8.947 | | | 07/31/42 | | | 1,565,692 | |
| | YPF SA (a)(b) | |
| | | | | 1,355,000 | | | | 9.500 | | | 01/17/31 | | | 1,422,072 | |
| | | | | | | | | | | | | | | | |
| | | | | | | | | | | | | | | 58,226,854 | |
| | | |
| |
| | Packaging(b) – 0.6% | |
| | ARD Finance SA (a)(f) | |
| | (PIK 5.750%, Cash 5.000%) | |
| | EUR | | | 271,000 | | | | 5.000 | | | 06/30/27 | | | 57,633 | |
| | (PIK 7.250%, Cash 6.500%) | |
| | $ | | | 135,000 | | | | 6.500 | | | 06/30/27 | | | 29,539 | |
| | Ardagh Metal Packaging Finance USA LLC/Ardagh Metal | |
| | Packaging Finance PLC (a) | |
| | EUR | | | 400,000 | | | | 2.000 | | | 09/01/28 | | | 396,393 | |
| | Ardagh Packaging Finance PLC/Ardagh Holdings USA, Inc. (a) | |
| | $ | | | 765,000 | | | | 4.125 | | | 08/15/26 | | | 665,688 | |
| | | | | 453,000 | | | | 5.250 | | | 08/15/27 | | | 271,795 | |
| | | | | 328,000 | | | | 5.250 | | | 08/15/27 | | | 196,731 | |
| | Ball Corp. | |
| | EUR | | | 1,065,000 | | | | 1.500 | | | 03/15/27 | | | 1,119,286 | |
| | $ | | | 949,000 | | | | 2.875 | | | 08/15/30 | | | 825,545 | |
| | Canpack SA/Canpack U.S. LLC (a) | |
| | EUR | | | 532,000 | | | | 2.375 | | | 11/01/27 | | | 557,885 | |
| | Fiber Bidco SpA (a) | |
| | | | | 250,000 | | | | 6.125 | | | 06/15/31 | | | 271,984 | |
| | (3 mo. EUR EURIBOR + 4.000%) | |
| | | | | 250,000 | | | | 7.345 | (g) | | 01/15/30 | | | 273,781 | |
| | | |
| | | | | | | | | | | | | | | | |
| | | Principal Amount | | | Interest
Rate | | | Maturity Date | | Value | |
| |
| | Corporate Obligations – (continued) | |
| |
| | Packaging(b) – (continued) | |
| | Graphic Packaging International LLC (a) | |
| | $ | | | 375,000 | | | | 3.750 | % | | 02/01/30 | | $ | 342,938 | |
| | Intelligent Packaging Ltd. Finco, Inc./Intelligent Packaging Ltd. Co-Issuer LLC (a) | |
| | | | | 1,481,000 | | | | 6.000 | | | 09/15/28 | | | 1,460,755 | |
| | OI European Group BV (a) | |
| | | | | 469,000 | | | | 4.750 | | | 02/15/30 | | | 424,801 | |
| | Sealed Air Corp./Sealed Air Corp. U.S. (a) | |
| | | | | 1,324,000 | | | | 6.125 | | | 02/01/28 | | | 1,336,512 | |
| | Trident TPI Holdings, Inc. (a)(g) | |
| | | | | 1,061,000 | | | | 12.750 | | | 12/31/28 | | | 1,164,352 | |
| | | | | | | | | | | | | | | | |
| | | | | | | | | | | | | | | 9,395,618 | |
| | | |
| |
| | Pharmaceuticals – 0.6% | |
| | 1375209 BC Ltd. (a)(b) | |
| | | | | 300,000 | | | | 9.000 | | | 01/30/28 | | | 299,112 | |
| | Bausch Health Cos., Inc. (a) | |
| | | | | 850,000 | | | | 11.000 | | | 09/30/28 | | | 782,264 | |
| | | | | 500,000 | | | | 5.250 | (b) | | 02/15/31 | | | 269,250 | |
| | Bayer AG (b)(g) | |
| | (5 yr. EUR Swap + 3.432%) | |
| | EUR | | | 700,000 | | | | 6.625 | | | 09/25/83 | | | 794,737 | |
| | (5 yr. EUR Swap + 3.896%) | |
| | | | | 500,000 | | | | 7.000 | | | 09/25/83 | | | 580,625 | |
| | Bormioli Pharma SpA (a)(b)(g) (3 mo. EUR EURIBOR + 5.500%) | |
| | | | | 550,000 | | | | 9.042 | | | 05/15/28 | | | 600,021 | |
| | Cheplapharm Arzneimittel GmbH (a)(b) | |
| | | | | 650,000 | | | | 4.375 | | | 01/15/28 | | | 699,889 | |
| | $ | | | 622,000 | | | | 5.500 | | | 01/15/28 | | | 600,255 | |
| | Endo Finance Holdings, Inc. (a)(b) | |
| | | | | 350,000 | | | | 8.500 | | | 04/15/31 | | | 374,322 | |
| | Grifols SA (a)(b) | |
| | EUR | | | 122,749 | | | | 1.625 | | | 02/15/25 | | | 131,977 | |
| | $ | | | 1,090,000 | | | | 4.750 | | | 10/15/28 | | | 1,006,484 | |
| | Nidda Healthcare Holding GmbH (a)(b) | |
| | EUR | | | 198,179 | | | | 7.500 | | | 08/21/26 | | | 222,480 | |
| | | | | 110,000 | | | | 5.625 | | | 02/21/30 | | | 120,453 | |
| | (3 mo. EUR EURIBOR + 3.750%) | |
| | | | | 455,000 | | | | 6.888 | (g) | | 10/23/30 | | | 495,649 | |
| | Option Care Health, Inc. (a)(b) | |
| | $ | | | 700,000 | | | | 4.375 | | | 10/31/29 | | | 643,489 | |
| | Organon & Co./Organon Foreign Debt Co-Issuer BV (a)(b) | |
| | | | | 685,000 | | | | 5.125 | | | 04/30/31 | | | 624,583 | |
| | Par Pharmaceutical, Inc. (a)(h)(i) | |
| | | | | 344,000 | | | | 7.500 | | | 04/01/27 | | | — | |
| | Rossini SARL (b) | |
| | EUR | | | 594,000 | | | | 6.750 | | | 12/31/29 | | | 679,696 | |
| | Teva Pharmaceutical Finance Netherlands II BV (b) | |
| | | | | 600,000 | | | | 4.375 | | | 05/09/30 | | | 648,936 | |
| | | | | 420,000 | | | | 7.875 | | | 09/15/31 | | | 543,657 | |
| | | | | | | | | | | | | | | | |
| | | | | | | | | | | | | | | 10,117,879 | |
| | | |
| |
| | Pipelines – 1.3% | |
| | CQP Holdco LP/BIP-V Chinook Holdco LLC (a)(b) | |
| | $ | | | 978,000 | | | | 7.500 | | | 12/15/33 | | | 1,036,044 | |
| | | |
| | |
| The accompanying notes are an integral part of these financial statements. | | 33 |
GOLDMAN SACHS MULTI-MANAGER NON-CORE FIXED INCOME FUND
|
Schedule of Investments (continued) October 31, 2024 |
| | | | | | | | | | | | | | | | |
| | | Principal Amount | | | Interest
Rate | | | Maturity Date | | Value | |
| |
| | Corporate Obligations – (continued) | |
| |
| | Pipelines – (continued) | |
| | Energy Transfer LP (b) | |
| | $ | | | 540,000 | | | | 5.750 | % | | 04/01/25 | | $ | 540,011 | |
| | EnLink Midstream LLC (b) | |
| | | | | 502,000 | | | | 5.375 | | | 06/01/29 | | | 505,755 | |
| | EnLink Midstream Partners LP (b) | |
| | | | | 71,000 | | | | 5.600 | | | 04/01/44 | | | 66,336 | |
| | | | | 549,000 | | | | 5.450 | | | 06/01/47 | | | 499,799 | |
| | EQM Midstream Partners LP (b) | |
| | | | | 200,000 | | | | 6.000 | (a) | | 07/01/25 | | | 200,298 | |
| | | | | 1,191,000 | | | | 6.500 | | | 07/15/48 | | | 1,199,254 | |
| | Genesis Energy LP/Genesis Energy Finance Corp. (b) | |
| | | | | 900,000 | | | | 8.000 | | | 01/15/27 | | | 916,110 | |
| | | | | 650,000 | | | | 8.875 | | | 04/15/30 | | | 669,500 | |
| | | | | 500,000 | | | | 7.875 | | | 05/15/32 | | | 499,540 | |
| | Greensaif Pipelines Bidco SARL (a) | |
| | | | | 200,000 | | | | 5.853 | | | 02/23/36 | | | 200,314 | |
| | ITT Holdings LLC (a)(b) | |
| | | | | 1,988,000 | | | | 6.500 | | | 08/01/29 | | | 1,837,190 | |
| | New Fortress Energy, Inc. (a)(b) | |
| | | | | 1,135,000 | | | | 6.500 | | | 09/30/26 | | | 1,049,818 | |
| | NGL Energy Operating LLC/NGL Energy Finance Corp. (a)(b) | |
| | | | | 593,000 | | | | 8.125 | | | 02/15/29 | | | 597,086 | |
| | Prairie Acquiror LP (a)(b) | |
| | | | | 853,000 | | | | 9.000 | | | 08/01/29 | | | 864,669 | |
| | QazaqGaz NC JSC | |
| | | | | 929,000 | | | | 4.375 | | | 09/26/27 | | | 891,840 | |
| | Summit Midstream Holdings LLC (a)(b) | |
| | | | | 700,000 | | | | 8.625 | | | 10/31/29 | | | 723,191 | |
| | Tallgrass Energy Partners LP/Tallgrass Energy Finance Corp. (a)(b) | |
| | | | | 522,000 | | | | 7.375 | | | 02/15/29 | | | 523,409 | |
| | | | | 2,822,000 | | | | 6.000 | | | 12/31/30 | | | 2,648,645 | |
| | Venture Global Calcasieu Pass LLC (a)(b) | |
| | | | | 1,980,000 | | | | 3.875 | | | 11/01/33 | | | 1,719,115 | |
| | Venture Global LNG, Inc. (a)(b) | |
| | | | | 1,107,000 | | | | 9.500 | | | 02/01/29 | | | 1,223,943 | |
| | (5 yr. CMT + 5.440%) | |
| | | | | 850,000 | | | | 9.000 | (g) | | 09/30/29 | | | 849,643 | |
| | Western Midstream Operating LP (b) | |
| | | | | 1,300,000 | | | | 5.250 | | | 02/01/50 | | | 1,132,040 | |
| | | | | | | | | | | | | | | | |
| | | | | | | | | | | | | | | 20,393,550 | |
| | | |
| |
| | Real Estate(b) – 0.2% | |
| | Heimstaden Bostad Treasury BV | |
| | EUR | | | 1,062,000 | | | | 1.625 | | | 10/13/31 | | | 973,641 | |
| | Howard Hughes Corp. (a) | |
| | $ | | | 1,300,000 | | | | 4.375 | | | 02/01/31 | | | 1,164,852 | |
| | Kennedy-Wilson, Inc. | |
| | | | | 535,000 | | | | 4.750 | | | 03/01/29 | | | 490,846 | |
| | NEINOR HOMES SLU | |
| | EUR | | | 143,000 | | | | 5.875 | | | 02/15/30 | | | 155,081 | |
| | Samhallsbyggnadsbolaget i Norden AB | |
| | | | | 550,000 | | | | 3.000 | | | 01/14/25 | | | 585,783 | |
| | | |
| | | | | | | | | | | | | | | | |
| | | Principal Amount | | | Interest
Rate | | | Maturity Date | | Value | |
| |
| | Corporate Obligations – (continued) | |
| |
| | Real Estate(b) – (continued) | |
| | EUR | | | 500,000 | | | | 2.375 | %(d) | | 09/04/26 | | $ | 467,629 | |
| | | | | | | | | | | | | | | | |
| | | | | | | | | | | | | | | 3,837,832 | |
| | | |
| |
| | Real Estate Investment Trust – 1.0% | |
| | Apollo Commercial Real Estate Finance, Inc. (a)(b) | |
| | $ | | | 2,350,000 | | | | 4.625 | | | 06/15/29 | | | 2,040,153 | |
| | Brandywine Operating Partnership LP (b) | |
| | | | | 997,000 | | | | 8.300 | | | 03/15/28 | | | 1,042,403 | |
| | | | | 546,000 | | | | 8.875 | | | 04/12/29 | | | 591,728 | |
| | Brookfield Property REIT, Inc./BPR Cumulus LLC/BPR Nimbus LLC/GGSI Sellco LLC (a)(b) | |
| | | | | 1,621,000 | | | | 4.500 | | | 04/01/27 | | | 1,562,206 | |
| | Diversified Healthcare Trust (b) | |
| | | | | 1,000,000 | | | | 0.000 | (a)(c) | | 01/15/26 | | | 920,580 | |
| | | | | 300,000 | | | | 4.750 | | | 02/15/28 | | | 265,074 | |
| | | | | 2,505,000 | | | | 4.375 | | | 03/01/31 | | | 2,025,743 | |
| | HAT Holdings I LLC/HAT Holdings II LLC (a) | |
| | | | | 506,000 | | | | 3.375 | (b) | | 06/15/26 | | | 488,685 | |
| | | | | 126,000 | | | | 3.750 | | | 09/15/30 | | | 110,545 | |
| | Iron Mountain U.K. PLC (a)(b) | |
| | GBP | | | 400,000 | | | | 3.875 | | | 11/15/25 | | | 509,498 | |
| | Iron Mountain, Inc. (a)(b) | |
| | $ | | | 935,000 | | | | 4.875 | | | 09/15/29 | | | 899,638 | |
| | | | | 175,000 | | | | 4.500 | | | 02/15/31 | | | 162,524 | |
| | Ladder Capital Finance Holdings LLLP/Ladder Capital Finance Corp. (a)(b) | |
| | | | | 883,000 | | | | 4.250 | | | 02/01/27 | | | 854,576 | |
| | | | | 650,000 | | | | 4.750 | | | 06/15/29 | | | 619,366 | |
| | RLJ Lodging Trust LP (a)(b) | |
| | | | | 141,000 | | | | 3.750 | | | 07/01/26 | | | 136,743 | |
| | | | | 249,000 | | | | 4.000 | | | 09/15/29 | | | 224,491 | |
| | Service Properties Trust (b) | |
| | | | | 880,000 | | | | 5.500 | | | 12/15/27 | | | 832,920 | |
| | | | | 485,000 | | | | 4.375 | | | 02/15/30 | | | 367,649 | |
| | Starwood Property Trust, Inc. (a)(b) | |
| | | | | 700,000 | | | | 3.625 | | | 07/15/26 | | | 672,000 | |
| | Uniti Group LP/Uniti Fiber Holdings, Inc./CSL Capital LLC (a)(b) | |
| | | | | 325,000 | | | | 6.000 | | | 01/15/30 | | | 272,045 | |
| | Uniti Group LP/Uniti Group Finance 2019, Inc./CSL Capital
LLC (a)(b) | |
| | | | | 1,400,000 | | | | 10.500 | | | 02/15/28 | | | 1,492,526 | |
| | | | | 175,000 | | | | 6.500 | | | 02/15/29 | | | 150,418 | |
| | | | | | | | | | | | | | | | |
| | | | | | | | | | | | | | | 16,241,511 | |
| | | |
| |
| | Retailing – 1.4% | |
| | 1011778 BC ULC/New Red Finance, Inc. (a)(b) | |
| | | | | 750,000 | | | | 3.875 | | | 01/15/28 | | | 714,450 | |
| | | | | 450,000 | | | | 4.375 | | | 01/15/28 | | | 433,188 | |
| | Agrifarma SpA (a)(b) | |
| | EUR | | | 343,000 | | | | 4.500 | | | 10/31/28 | | | 369,666 | |
| | Asbury Automotive Group, Inc. (b) | |
| | $ | | | 782,000 | | | | 4.500 | | | 03/01/28 | | | 755,545 | |
| | | | | 138,000 | | | | 4.625 | (a) | | 11/15/29 | | | 129,225 | |
| | Bath & Body Works, Inc. | |
| | | | | 256,000 | | | | 9.375 | (a) | | 07/01/25 | | | 262,380 | |
| | | |
| | |
| 34 | | The accompanying notes are an integral part of these financial statements. |
GOLDMAN SACHS MULTI-MANAGER NON-CORE FIXED INCOME FUND
| | | | | | | | | | | | | | | | |
| | | Principal Amount | | | Interest Rate | | | Maturity Date | | Value | |
| |
| | Corporate Obligations – (continued) | |
| |
| | Retailing – (continued) | |
| | $ | | | 145,000 | | | | 5.250 | % | | 02/01/28 | | $ | 143,038 | |
| | | | | 795,000 | | | | 6.875 | | | 11/01/35 | | | 806,591 | |
| | | | | 250,000 | | | | 6.750 | | | 07/01/36 | | | 250,647 | |
| | BCPE Ulysses Intermediate, Inc. (a)(b)(f) (PIK 8.500%, Cash 7.750%) | |
| | | | | 1,013,667 | | | | 7.750 | | | 04/01/27 | | | 988,650 | |
| | Bloomin’ Brands, Inc./OSI Restaurant Partners LLC (a)(b) | |
| | | | | 700,000 | | | | 5.125 | | | 04/15/29 | | | 649,530 | |
| | CD&R Firefly Bidco PLC (a)(b) | |
| | GBP | | | 100,000 | | | | 8.625 | | | 04/30/29 | | | 135,471 | |
| | Constellation Automotive Financing PLC (a)(b) | |
| | | | | 400,000 | | | | 4.875 | | | 07/15/27 | | | 455,682 | |
| | Cougar JV Subsidiary LLC (a)(b) | |
| | $ | | | 361,000 | | | | 8.000 | | | 05/15/32 | | | 377,267 | |
| | Doman Building Materials Group Ltd. (a)(b) | |
| | CAD | | | 1,590,000 | | | | 5.250 | | | 05/15/26 | | | 1,131,962 | |
| | eG Global Finance PLC (a)(b) | |
| | EUR | | | 650,000 | | | | 11.000 | | | 11/30/28 | | | 779,990 | |
| | Ferrellgas LP/Ferrellgas Finance Corp. (a)(b) | |
| | $ | | | 976,000 | | | | 5.375 | | | 04/01/26 | | | 969,334 | |
| | | | | 573,000 | | | | 5.875 | | | 04/01/29 | | | 535,004 | |
| | Fertitta Entertainment LLC/Fertitta Entertainment Finance Co.,
Inc. (a)(b) | |
| | | | | 910,000 | | | | 4.625 | | | 01/15/29 | | | 849,803 | |
| | Global Auto Holdings Ltd./AAG FH U.K. Ltd. (a)(b) | |
| | | | | 1,012,000 | | | | 8.375 | | | 01/15/29 | | | 948,497 | |
| | | | | 612,000 | | | | 8.750 | | | 01/15/32 | | | 558,419 | |
| | Kohl’s Corp. (b) | |
| | | | | 220,000 | | | | 4.625 | | | 05/01/31 | | | 181,993 | |
| | | | | 260,000 | | | | 5.550 | | | 07/17/45 | | | 175,937 | |
| | LBM Acquisition LLC (a)(b) | |
| | | | | 1,671,000 | | | | 6.250 | | | 01/15/29 | | | 1,543,787 | |
| | LCM Investments Holdings II LLC (a)(b) | |
| | | | | 1,154,000 | | | | 4.875 | | | 05/01/29 | | | 1,090,172 | |
| | Macy’s Retail Holdings LLC (b) | |
| | | | | 493,000 | | | | 6.125 | (a) | | 03/15/32 | | | 469,725 | |
| | | | | 670,000 | | | | 4.500 | | | 12/15/34 | | | 559,577 | |
| | Neiman Marcus Group Ltd. LLC (e)(h)(i) | |
| | | | | 605,000 | | | | 8.000 | | | 10/15/21 | | | 21,189 | |
| | Papa John’s International, Inc. (a)(b) | |
| | | | | 404,000 | | | | 3.875 | | | 09/15/29 | | | 368,585 | |
| | PetSmart, Inc./PetSmart Finance Corp. (a)(b) | |
| | | | | 500,000 | | | | 4.750 | | | 02/15/28 | | | 475,375 | |
| | QVC, Inc. (a)(b) | |
| | | | | 498,000 | | | | 6.875 | | | 04/15/29 | | | 428,429 | |
| | Rite Aid Corp. | |
| | | | | 348,000 | | | | 7.500 | (a)(e)(h)(i) | | 07/01/25 | | | — | |
| | | | | 97,124 | | | | 0.000 | (a)(c)(e)(h)(i) | | 10/18/25 | | | — | |
| | | | | 97,037 | | | | 15.000 | | | 08/30/31 | | | 65,015 | |
| | | | | 46,035 | | | | 15.000 | | | 08/30/31 | | | 16,112 | |
| | | | | 34,147 | | | | 0.000 | (c)(h) | | 08/30/34 | | | 19,805 | |
| | | | | 30,396 | | | | 12.000 | (h) | | 08/30/34 | | | 24,641 | |
| | (3 mo. USD Term SOFR + 7.000%) | |
| | | | | 34,147 | | | | 12.057 | (a) | | 08/30/31 | | | 32,440 | |
| | | |
| | | | | | | | | | | | | | | | |
| | | Principal Amount | | | Interest Rate | | | Maturity Date | | Value | |
| |
| | Corporate Obligations – (continued) | |
| |
| | Retailing – (continued) | |
| | Specialty Building Products Holdings LLC/SBP Finance Corp. (a)(b) | |
| | $ | | | 650,000 | | | | 7.750 | % | | 10/15/29 | | $ | 662,519 | |
| | Staples, Inc. (a)(b) | |
| | | | | 475,000 | | | | 10.750 | | | 09/01/29 | | | 459,710 | |
| | Victoria’s Secret & Co. (a)(b) | |
| | | | | 1,945,000 | | | | 4.625 | | | 07/15/29 | | | 1,711,989 | |
| | Walgreens Boots Alliance, Inc. (b) | |
| | | | | 700,000 | | | | 4.800 | | | 11/18/44 | | | 515,928 | |
| | White Cap Parent LLC (a)(b)(f) (PIK 9.000%, Cash 8.250%) | |
| | | | | 822,000 | | | | 8.250 | | | 03/15/26 | | | 822,247 | |
| | Yum! Brands, Inc. | |
| | | | | 260,000 | | | | 5.375 | (b) | | 04/01/32 | | | 253,027 | |
| | | | | 285,000 | | | | 6.875 | | | 11/15/37 | | | 317,065 | |
| | | | | | | | | | | | | | | | |
| | | | | | | | | | | | | | | 22,459,606 | |
| | | |
| |
| | Semiconductors(a)(b) – 0.2% | |
| | BE Semiconductor Industries NV | |
| | EUR | | | 400,000 | | | | 4.500 | | | 07/15/31 | | | 446,278 | |
| | Entegris, Inc. | |
| | $ | | | 1,000,000 | | | | 4.750 | | | 04/15/29 | | | 968,270 | |
| | | | | 145,000 | | | | 3.625 | | | 05/01/29 | | | 132,762 | |
| | ON Semiconductor Corp. | |
| | | | | 751,000 | | | | 3.875 | | | 09/01/28 | | | 704,708 | |
| | Synaptics, Inc. | |
| | | | | 1,150,000 | | | | 4.000 | | | 06/15/29 | | | 1,055,413 | |
| | | | | | | | | | | | | | | | |
| | | | | | | | | | | | | | | 3,307,431 | |
| | | |
| |
| | Software(a)(b) – 0.7% | |
| | Central Parent LLC/CDK Global II LLC/CDK Financing Co., Inc. | |
| | | | | 1,319,000 | | | | 8.000 | | | 06/15/29 | | | 1,348,625 | |
| | Central Parent, Inc./CDK Global, Inc. | |
| | | | | 1,000,000 | | | | 7.250 | | | 06/15/29 | | | 1,003,310 | |
| | Cloud Software Group, Inc. | |
| | | | | 1,930,000 | | | | 6.500 | | | 03/31/29 | | | 1,883,429 | |
| | | | | 1,918,000 | | | | 9.000 | | | 09/30/29 | | | 1,918,000 | |
| | | | | 620,000 | | | | 8.250 | | | 06/30/32 | | | 637,255 | |
| | Elastic NV | |
| | | | | 819,000 | | | | 4.125 | | | 07/15/29 | | | 758,124 | |
| | PTC, Inc. | |
| | | | | 651,000 | | | | 4.000 | | | 02/15/28 | | | 622,421 | |
| | Rocket Software, Inc. | |
| | | | | 1,891,000 | | | | 9.000 | | | 11/28/28 | | | 1,970,308 | |
| | SS&C Technologies, Inc. | |
| | | | | 1,000,000 | | | | 6.500 | | | 06/01/32 | | | 1,017,050 | |
| | | | | | | | | | | | | | | | |
| | | | | | | | | | | | | | | 11,158,522 | |
| | | |
| |
| | Telecommunication Services – 1.9% | |
| | Altice France Holding SA (a)(b) | |
| | | | | 422,000 | | | | 10.500 | | | 05/15/27 | | | 127,980 | |
| | Altice France SA (a)(b) | |
| | EUR | | | 275,000 | | | | 3.375 | | | 01/15/28 | | | 228,599 | |
| | $ | | | 697,000 | | | | 5.500 | | | 01/15/28 | | | 539,129 | |
| | | | | 2,058,000 | | | | 5.500 | | | 10/15/29 | | | 1,554,119 | |
| | | |
| | |
| The accompanying notes are an integral part of these financial statements. | | 35 |
GOLDMAN SACHS MULTI-MANAGER NON-CORE FIXED INCOME FUND
|
Schedule of Investments (continued) October 31, 2024 |
| | | | | | | | | | | | | | | | |
| | | Principal Amount | | | Interest Rate | | | Maturity Date | | Value | |
| |
| | Corporate Obligations – (continued) | |
| |
| | Telecommunication Services – (continued) | |
| | CommScope LLC (a)(b) | |
| | $ | | | 529,000 | | | | 6.000 | % | | 03/01/26 | | $ | 516,770 | |
| | | | | 1,380,000 | | | | 8.250 | | | 03/01/27 | | | 1,303,976 | |
| | | | | 395,000 | | | | 7.125 | | | 07/01/28 | | | 345,388 | |
| | | | | 1,106,000 | | | | 4.750 | | | 09/01/29 | | | 923,753 | |
| | Connect Finco SARL/Connect U.S. Finco LLC (a)(b) | |
| | | | | 475,000 | | | | 9.000 | | | 09/15/29 | | | 451,392 | |
| | Iliad Holding SASU (a)(b) | |
| | | | | 155,000 | | | | 6.500 | | | 10/15/26 | | | 156,170 | |
| | EUR | | | 500,000 | | | | 5.625 | | | 10/15/28 | | | 552,794 | |
| | $ | | | 1,717,000 | | | | 7.000 | | | 10/15/28 | | | 1,740,935 | |
| | | | | 1,103,000 | | | | 8.500 | | | 04/15/31 | | | 1,179,526 | |
| | Intelsat Jackson Holdings SA (a)(b) | |
| | | | | 940,000 | | | | 6.500 | | | 03/15/30 | | | 884,888 | |
| | Kaixo Bondco Telecom SA (a)(b) | |
| | EUR | | | 200,000 | | | | 5.125 | | | 09/30/29 | | | 217,557 | |
| | Level 3 Financing, Inc. (a)(b) | |
| | $ | | | 375,000 | | | | 10.500 | | | 04/15/29 | | | 418,009 | |
| | | | | 1,570,000 | | | | 4.875 | | | 06/15/29 | | | 1,342,758 | |
| | | | | 585,000 | | | | 3.750 | | | 07/15/29 | | | 427,576 | |
| | | | | 1,358,628 | | | | 11.000 | | | 11/15/29 | | | 1,533,198 | |
| | | | | 270,000 | | | | 4.500 | | | 04/01/30 | | | 216,551 | |
| | | | | 1,027,000 | | | | 10.500 | | | 05/15/30 | | | 1,125,068 | |
| | | | | 530,000 | | | | 3.875 | | | 10/15/30 | | | 405,265 | |
| | | | | 300,000 | | | | 10.750 | | | 12/15/30 | | | 336,150 | |
| | Lorca Telecom Bondco SA (a)(b) | |
| | EUR | | | 450,000 | | | | 4.000 | | | 09/18/27 | | | 488,778 | |
| | Lumen Technologies, Inc. (a)(b) | |
| | $ | | | 750,000 | | | | 4.125 | | | 04/15/29 | | | 658,770 | |
| | Odido Group Holding BV (a)(b) | |
| | EUR | | | 500,000 | | | | 5.500 | | | 01/15/30 | | | 533,193 | |
| | Odido Holding BV (a)(b) | |
| | | | | 170,000 | | | | 3.750 | | | 01/15/29 | | | 180,374 | |
| | Ooredoo International Finance Ltd. (a) | |
| | $ | | | 554,000 | | | | 4.625 | | | 10/10/34 | | | 538,765 | |
| | Optics Bidco SpA (a)(b) | |
| | | | | 306,000 | | | | 6.000 | | | 09/30/34 | | | 299,198 | |
| | SoftBank Group Corp. (b) | |
| | EUR | | | 1,379,000 | | | | 3.375 | | | 07/06/29 | | | 1,417,492 | |
| | | | | 542,000 | | | | 3.875 | | | 07/06/32 | | | 543,298 | |
| | TDC Net AS (b) | |
| | | | | 921,000 | | | | 6.500 | | | 06/01/31 | | | 1,105,275 | |
| | Telecom Italia Capital SA | |
| | $ | | | 20,000 | | | | 6.000 | | | 09/30/34 | | | 19,420 | |
| | Telecom Italia SpA (b) | |
| | EUR | | | 1,395,000 | | | | 6.875 | | | 02/15/28 | | | 1,649,851 | |
| | Telesat Canada/Telesat LLC (a)(b) | |
| | $ | | | 552,000 | | | | 5.625 | | | 12/06/26 | | | 250,349 | |
| | Viasat, Inc. (a)(b) | |
| | | | | 1,207,000 | | | | 7.500 | | | 05/30/31 | | | 792,540 | |
| | Vmed O2 U.K. Financing I PLC (a)(b) | |
| | | | | 1,730,000 | | | | 4.250 | | | 01/31/31 | | | 1,487,973 | |
| | | | | 1,742,000 | | | | 7.750 | | | 04/15/32 | | | 1,743,864 | |
| | | |
| | | | | | | | | | | | | | | | |
| | | Principal Amount | | | Interest Rate | | | Maturity Date | | Value | |
| |
| | Corporate Obligations – (continued) | |
| |
| | Telecommunication Services – (continued) | |
| | Windstream Services LLC/Windstream Escrow Finance Corp. (a)(b) | |
| | $ | | | 1,370,000 | | | | 7.750 | % | | 08/15/28 | | $ | 1,377,439 | |
| | Zayo Group Holdings, Inc. (a)(b) | |
| | | | | 1,565,000 | | | | 4.000 | | | 03/01/27 | | | 1,392,991 | |
| | | | | | | | | | | | | | | | |
| | | | | | | | | | | | | | | 31,007,121 | |
| | | |
| |
| | Transportation – 0.1% | |
| | SGL Group ApS (b)(g) (3 mo. EUR EURIBOR + 4.750%) | |
| | EUR | | | 340,000 | | | | 7.951 | | | 04/22/30 | | | 371,791 | |
| | Transnet SOC Ltd. (a) | |
| | $ | | | 527,000 | | | | 8.250 | | | 02/06/28 | | | 536,717 | |
| | XPO, Inc. (a)(b) | |
| | | | | 500,000 | | | | 6.250 | | | 06/01/28 | | | 507,615 | |
| | | | | | | | | | | | | | | | |
| | | | | | | | | | | | | | | 1,416,123 | |
| | | |
| |
| | Water Utilities(a)(b) – 0.1% | |
| | Aegea Finance SARL | |
| | | | | 616,000 | | | | 6.750 | | | 05/20/29 | | | 610,995 | |
| | | | | 921,000 | | | | 9.000 | | | 01/20/31 | | | 978,563 | |
| | | | | | | | | | | | | | | | |
| | | | | | | | | | | | | | | 1,589,558 | |
| | | |
| | |
| | TOTAL CORPORATE OBLIGATIONS (Cost $518,009,426) | | $ | 517,256,674 | |
| | | |
| | | | | | | | | | | | | | | | |
| |
| | Bank Loans(k) – 23.7% | |
| |
| | Aerospace & Defense – 0.8% | |
| | Bleriot U.S. Bidco, Inc.(g) (3 mo. USD Term SOFR + 3.250%) | |
| | $ | | | 2,986,672 | | | | 7.854 | % | | 10/31/30 | | $ | 2,992,526 | |
| | Cobham Ultra SeniorCo SARL(g) (6 mo. USD Term SOFR + 3.750%) | |
| | | | | 927,324 | | | | 9.245 | | | 08/03/29 | | | 901,053 | |
| | Dynasty Acquisition Co., Inc. (l) | |
| | | | | 2,000,000 | | | | 0.000 | | | 10/25/31 | | $ | 2,000,000 | |
| | | | | 45,240 | | | | 0.000 | | | 08/24/28 | | $ | 45,218 | |
| | Kaman Corp.(g) (3 mo. USD Term SOFR + 3.500%) | |
| | | | | 1,045,000 | | | | 8.104 | | | 04/21/31 | | | 1,048,595 | |
| | Propulsion (BC) Finco SARL(g) (3 mo. USD Term SOFR + | |
| | | | | 3.750 | %) | | | | | | | | | | |
| | | | | 815,180 | | | | 7.867 | | | 09/14/29 | | | 817,389 | |
| | Spirit Aerosystems, Inc.(g) (3 mo. USD Term SOFR + 4.250%) | |
| | | | | 1,737,342 | | | | 9.085 | | | 01/15/27 | | | 1,743,857 | |
| | TransDigm, Inc. (g) | |
| | (g) (3 mo. USD Term SOFR + 2.500%) | |
| | | | | 500,000 | | | | 7.320 | | | 01/19/32 | | | 500,155 | |
| | (3 mo. USD Term SOFR + 2.750%) | |
| | | | | 485,788 | | | | 7.354 | | | 03/22/30 | | | 486,638 | |
| | (3 mo. USD Term SOFR + 2.750%) | |
| | | | | 3,156,495 | | | | 7.104 | | | 02/28/31 | | | 3,159,084 | |
| | | | | | | | | | | | | | | | |
| | | | | | | | | | | | | | | 13,694,515 | |
| | | |
| | |
| 36 | | The accompanying notes are an integral part of these financial statements. |
GOLDMAN SACHS MULTI-MANAGER NON-CORE FIXED INCOME FUND
| | | | | | | | | | | | | | | | |
| | | Principal Amount | | | Interest
Rate | | | Maturity Date | | Value | |
| |
| | Bank Loans(k) – (continued) | |
| |
| | Airlines(g) – 0.0% | |
| | American Airlines, Inc.(3 mo. USD Term SOFR + 4.750%) | |
| | $ | | | 506,100 | | | | 9.629 | % | | 04/20/28 | | $ | 520,256 | |
| | | |
| |
| | Apparel(g) – 0.1% | |
| | Varsity Brands, Inc.(3 mo. USD Term SOFR + 3.750%) | |
| | | | | 775,000 | | | | 8.821 | | | 08/26/31 | | | 771,451 | |
| | | |
| |
| | Auto Parts & Equipment(g) – 0.0% | |
| | Autokiniton U.S. Holdings, Inc.(1 mo. USD Term SOFR + 4.000%) | |
| | | | | 260,402 | | | | 8.800 | | | 04/06/28 | | | 260,310 | |
| | Clarios Global LP(1 mo. USD Term SOFR + 2.500%) | |
| | | | | 448,875 | | | | 7.185 | | | 05/06/30 | | | 449,037 | |
| | | | | | | | | | | | | | | | |
| | | | | | | | | | | | | | | 709,347 | |
| | | |
| |
| | Beverages(g) – 0.0% | |
| | Naked Juice LLC(3 mo. USD Term SOFR + 3.250%) | |
| | | | | 854,308 | | | | 7.954 | | | 01/24/29 | | | 637,792 | |
| | | |
| |
| | Building Materials(g) – 0.6% | |
| | Chamberlain Group, Inc. | |
| | (g) (1 mo. USD Term SOFR + 3.250%) | |
| | | | | 2,093,269 | | | | 8.035 | | | 11/03/28 | | | 2,088,831 | |
| | (1 mo. USD Term SOFR + 3.500%) | |
| | | | | 997,494 | | | | 8.185 | | | 11/03/28 | | | 996,666 | |
| | Cornerstone Building Brands, Inc. | |
| | (1 mo. USD Term SOFR + 0.000%) | |
| | | | | 620,582 | | | | 10.429 | | | 08/01/28 | | | 623,170 | |
| | (1 mo. USD Term SOFR + 0.000%) | |
| | | | | 500,000 | | | | 9.304 | | | 05/15/31 | | | 496,250 | |
| | CP Atlas Buyer, Inc.(1 mo. USD Term SOFR + 3.750%) | |
| | | | | 791,324 | | | | 8.535 | | | 11/23/27 | | | 769,476 | |
| | Emrld Borrower LP(3 mo. USD Term SOFR + 2.500%) | |
| | | | | 600,000 | | | | 7.557 | | | 08/04/31 | | | 599,142 | |
| | Icebox Holdco III, Inc. (g) | |
| | (3 mo. USD Term SOFR + 3.750%) | |
| | | | | 1,618,300 | | | | 8.615 | | | 12/22/28 | | | 1,621,439 | |
| | (3 mo. USD Term SOFR + 3.750%) | |
| | | | | 1,500,000 | | | | 11.615 | | | 12/21/29 | | | 1,510,005 | |
| | Tamko Building Products LLC(1 mo. USD Term SOFR + 1.750%) | |
| | | | | 250,000 | | | | 7.495 | | | 09/20/30 | | | 250,000 | |
| | Wilsonart LLC(3 mo. USD Term SOFR + 4.250%) | |
| | | | | 454,781 | | | | 8.854 | | | 08/05/31 | | | 449,383 | |
| | | | | | | | | | | | | | | | |
| | | | | | | | | | | | | | | 9,404,362 | |
| | | |
| |
| | Chemicals(g) – 0.4% | |
| | AAP Buyer, Inc.(3 mo. USD Term SOFR + 3.250%) | |
| | | | | 435,126 | | | | 7.854 | | | 09/09/31 | | | 436,213 | |
| | Aruba Investments Holdings LLC | |
| | (1 mo. USD Term SOFR + 4.000%) | |
| | | | | 456,727 | | | | 8.785 | | | 11/24/27 | | | 455,700 | |
| | (1 mo. USD Term SOFR + 7.750%) | |
| | | | | 424,596 | | | | 12.535 | | | 11/24/28 | | | 402,458 | |
| | Derby Buyer LLC(1 mo. USD Term SOFR + 3.500%) | |
| | | | | 421,403 | | | | 8.350 | | | 11/01/30 | | | 421,470 | |
| | | |
| | | | | | | | | | | | | | | | |
| | | Principal Amount | | | Interest
Rate | | | Maturity Date | | Value | |
| |
| | Bank Loans(k) – (continued) | |
| |
| | Chemicals(g) – (continued) | |
| | Eastman Chemical Co.(3 mo. USD Term SOFR + 5.250%) | |
| | $ | | | 1,664,944 | | | | 10.115 | % | | 11/01/28 | | $ | 1,397,720 | |
| | Lonza Group AG(3 mo. USD Term SOFR + 3.925%) | |
| | | | | 704,117 | | | | 8.629 | | | 07/03/28 | | | 684,268 | |
| | Polar U.S. Borrower LLC(1 mo. USD Term SOFR + 5.500%) | |
| | | | | 1,626,260 | | | | 10.343 | | | 10/16/28 | | | 1,215,629 | |
| | SCIH Salt Holdings, Inc.(3 mo. USD Term SOFR + 3.500%) | |
| | | | | 1,029,447 | | | | 8.085 | | | 03/16/27 | | | 1,031,383 | |
| | | | | | | | | | | | | | | | |
| | | | | | | | | | | | | | | 6,044,841 | |
| | | |
| |
| | Commercial Services – 2.2% | |
| | AlixPartners LLP(g) (1 mo. USD Term SOFR + 2.500%) | |
| | | | | 986,018 | | | | 7.300 | | | 02/04/28 | | | 987,004 | |
| | Allied Universal Holdco LLC(g) (1 mo. USD Term SOFR + 3.750%) | |
| | | | | 2,853,228 | | | | 8.535 | | | 05/12/28 | | | 2,846,323 | |
| | American Auto Auction Group LLC(g) (3 mo. USD Term SOFR + 5.000%) | |
| | | | | 380,444 | | | | 9.754 | | | 12/30/27 | | | 382,464 | |
| | Ankura Consulting Group LLC(g) (1 mo. USD Term SOFR + 4.250%) | |
| | | | | 617,648 | | | | 8.935 | | | 03/17/28 | | | 620,866 | |
| | Anticimex International AB | |
| | (g) (3 mo. USD Term SOFR + 3.150%) | |
| | | | | 2,486,357 | | | | 8.480 | | | 11/16/28 | | | 2,486,556 | |
| | (3 mo. USD Term SOFR + 3.400%) | |
| | | | | 119,375 | | | | 8.730 | | | 11/16/28 | | | 119,599 | |
| | Archkey Solutions LLC (l) | |
| | | | | 74,483 | | | | 0.000 | | | 06/26/31 | | | 74,265 | |
| | | | | 645,517 | | | | 0.000 | | | 09/26/31 | | | 643,632 | |
| | Armorica Lux SARL(g) (3 mo. EUR EURIBOR + 4.925%) | |
| | EUR | | | 600,000 | | | | 7.981 | | | 07/28/28 | | | 602,305 | |
| | AVSC Holding Corp. (l) | |
| | $ | | | 196,556 | | | | 0.000 | | | 09/01/25 | | | 194,836 | |
| | | | | 90,000 | | | | 0.000 | | | 10/15/26 | | | 90,464 | |
| | (g) (1 mo. USD Term SOFR + 1.000%) | |
| | | | | 350,876 | | | | 9.285 | | | 10/15/26 | | | 350,711 | |
| | (1 mo. USD Term SOFR + 3.500%) | |
| | | | | 1,457,145 | | | | 8.285 | | | 03/03/25 | | | 1,450,544 | |
| | Belfor Holdings, Inc.(g) (1 mo. USD Term SOFR + 3.750%) | |
| | | | | 710,046 | | | | 8.435 | | | 11/01/30 | | | 712,709 | |
| | Belron Finance LLC(l) | |
| | | | | 1,500,000 | | | | 0.000 | | | 10/16/31 | | | 1,504,995 | |
| | Boost Newco Borrower LLC(g) (3 mo. USD Term SOFR + 2.500%) | |
| | | | | 240,000 | | | | 7.104 | | | 01/31/31 | | | 240,451 | |
| | Conservice Midco LLC(g) (1 mo. USD Term SOFR + 3.500%) | |
| | | | | 2,056,239 | | | | 8.185 | | | 05/13/27 | | | 2,065,061 | |
| | Creative Artists Agency LLC(g) (1 mo. USD Term SOFR + 3.500%) | |
| | | | | 1,092,635 | | | | 7.435 | | | 10/01/31 | | | 1,092,263 | |
| | Ensemble RCM LLC(g) (3 mo. USD Term SOFR + 3.000%) | |
| | | | | 1,123,081 | | | | 7.585 | | | 08/01/29 | | | 1,124,070 | |
| | Envision Healthcare Corp.(g) (1 mo. USD Term SOFR + 4.250%) | |
| | | | | 1,900,000 | | | | 13.068 | | | 12/30/27 | | | 1,919,000 | |
| | | |
| | |
| The accompanying notes are an integral part of these financial statements. | | 37 |
GOLDMAN SACHS MULTI-MANAGER NON-CORE FIXED INCOME FUND
|
Schedule of Investments (continued) October 31, 2024 |
| | | | | | | | | | | | | | | | |
| | | Principal Amount | | | Interest
Rate | | | Maturity Date | | Value | |
| |
| | Bank Loans(k) – (continued) | |
| |
| | Commercial Services – (continued) | |
| | Fugue Finance BV | |
| | (g) (3 mo. USD Term SOFR + 3.750%) | |
| | $ | | | 359,100 | | | | 8.807 | % | | 02/26/31 | | $ | 360,673 | |
| | (3 mo. USD Term SOFR + 4.000%) | |
| | | | | 445,489 | | | | 9.057 | | | 01/31/28 | | | 447,231 | |
| | Grant Thornton Advisors LLC(g) (1 mo. USD Term SOFR + 3.250%) | |
| | | | | 2,420,000 | | | | 7.935 | | | 06/02/31 | | | 2,420,194 | |
| | Hertz Corp. (1 mo. USD Term SOFR + 3.250%) | |
| | | | | 435,574 | | | | 8.300 | (g) | | 06/30/28 | | $ | 386,642 | |
| | KUEHG Corp.(l) | |
| | | | | 400,050 | | | | 0.000 | | | 06/12/30 | | | 400,450 | |
| | Mavis Tire Express Services Corp.(g) (1 mo. USD Term SOFR + 3.500%) | |
| | $ | | | 2,699,320 | | | | 8.185 | | | 05/04/28 | | | 2,703,531 | |
| | Mister Car Wash Holdings, Inc.(g) (1 mo. USD Term SOFR + 3.000%) | |
| | | | | 568,575 | | | | 7.685 | | | 03/27/31 | | | 568,734 | |
| | OMNIA Partners LLC(g) (3 mo. USD Term SOFR + 3.250%) | |
| | | | | 300,000 | | | | 7.867 | | | 07/25/30 | | | 300,438 | |
| | PG Investment Co. 59 SARL(g) (3 mo. USD Term SOFR + 3.000%) | |
| | | | | 1,628,437 | | | | 7.604 | | | 03/26/31 | | | 1,630,880 | |
| | R1 RCM, Inc.(g) (1 mo. USD Term SOFR + 3.000%) | |
| | | | | 297,722 | | | | 7.685 | | | 06/21/29 | | | 295,122 | |
| | Spin Holdco, Inc.(g) (3 mo. USD Term SOFR + 4.000%) | |
| | | | | 1,089,875 | | | | 9.256 | | | 03/04/28 | | | 943,353 | |
| | Spring Education Group, Inc.(g) (3 mo. USD Term SOFR + 4.000%) | |
| | | | | 596,371 | | | | 8.604 | | | 10/04/30 | | | 599,352 | |
| | Teneo Holdings LLC(g) (1 mo. USD Term SOFR + 4.750%) | |
| | | | | 555,610 | | | | 9.435 | | | 03/13/31 | | | 555,610 | |
| | Wand NewCo 3, Inc.(g) (1 mo. USD Term SOFR + 3.250%)–(3 mo. USD Term SOFR + 3.250%) | |
| | | | | 3,725,662 | | | | 7.854– | | | | | | | |
| | | | | | | | | 7.935 | | | 01/30/31 | | | 3,724,582 | |
| | XPLOR T1 LLC(g) (3 mo. USD Term SOFR + 4.250%) | |
| | | | | 530,000 | | | | 8.854 | | | 06/24/31 | | | 532,650 | |
| | | | | | | | | | | | | | | | |
| | | | | | | | | | | | | | | 35,377,560 | |
| | | |
| |
| | Computers – 0.5% | |
| | Access CIG LLC(g) (3 mo. USD Term SOFR + 5.000%) | |
| | | | | 1,699,019 | | | | 9.585 | | | 08/18/28 | | | 1,702,960 | |
| | Idemia Group(g) (3 mo. USD Term SOFR + 4.250%) | |
| | | | | 496,705 | | | | 8.854 | | | 09/30/28 | | | 500,430 | |
| | Imprivata, Inc.(g) (3 mo. USD Term SOFR + 3.500%) | |
| | | | | 397,997 | | | | 8.085 | | | 09/17/27 | | | 399,271 | |
| | Magenta Buyer LLC(g) (3 mo. USD Term SOFR + 5.000%) | |
| | | | | 1,277 | | | | 9.847 | | | 07/27/28 | | | 383 | |
| | Magenta Security Holdings LLC (g) | |
| | (g) (3 mo. USD Term SOFR + 5.750%) | |
| | | | | 790,270 | | | | 11.595 | | | 07/27/28 | | | 739,234 | |
| | (3 mo. USD Term SOFR + 6.250%) | |
| | | | | 228,946 | | | | 10.835 | | | 07/27/28 | | | 232,265 | |
| | | |
| | | | | | | | | | | | | | | | |
| | | Principal Amount | | | Interest
Rate | | | Maturity Date | | Value | |
| |
| | Bank Loans(k) – (continued) | |
| |
| | Computers – (continued) | |
| | (3 mo. USD Term SOFR + 6.250%) | |
| | $ | | | 609,343 | | | | 6.345 | % | | 07/27/28 | | $ | 426,035 | |
| | (3 mo. USD Term SOFR + 5.500%) | |
| | | | | 191,954 | | | | 6.345 | | | 07/27/28 | | | 67,904 | |
| | Peraton Corp. | |
| | (g) (3 mo. USD Term SOFR + 8.000%) | |
| | | | | 375,000 | | | | 13.221 | | | 02/01/29 | | | 342,000 | |
| | (3 mo. USD Term SOFR + 7.750%) | |
| | | | | 1,161,339 | | | | 12.971 | | | 02/01/29 | | | 1,056,238 | |
| | Verifone Systems, Inc.(g) (3 mo. USD Term SOFR + 4.000%) | |
| | | | | 2,014,945 | | | | 9.333 | | | 08/20/25 | | | 1,863,623 | |
| | | | | | | | | | | | | | | | |
| | | | | | | | | | | | | | | 7,330,343 | |
| | | |
| |
| | Distribution & Wholesale – 0.4% | |
| | BCPE Empire Holdings, Inc. | |
| | (l) (1 mo. USD Term SOFR + 0.000%) | |
| | | | | 3,000,000 | | | | 8.185 | | | 12/11/28 | | | 2,999,580 | |
| | (1 mo. USD Term SOFR + 3.500%) | |
| | | | | 498,747 | | | | 8.185 | | | 12/11/28 | | | 498,677 | |
| | Core & Main LP(g) (1 mo. USD Term SOFR + 2.000%) | |
| | | | | 357,672 | | | | 6.718 | | | 07/27/28 | | | 356,628 | |
| | Fluid-Flow Products, Inc.(g) (1 mo. USD Term SOFR + 3.750%) | |
| | | | | 746,144 | | | | 8.550 | | | 03/31/28 | | | 746,144 | |
| | Gloves Buyer, Inc.(l) | |
| | | | | 498,708 | | | | 0.000 | | | 12/29/27 | | | 496,214 | |
| | OptiGroup(g) (1 mo. EUR EURIBOR + 5.250%) | |
| | EUR | | | 570,000 | | | | 8.395 | | | 03/16/29 | | | 581,266 | |
| | Windsor Holdings III LLC(g) (1 mo. USD Term SOFR + 3.500%) | |
| | $ | | | 1,230,647 | | | | 8.259 | | | 08/01/30 | | | 1,234,647 | |
| | | | | | | | | | | | | | | | |
| | | | | | | | | | | | | | | 6,913,156 | |
| | | |
| |
| | Diversified Financial Services – 0.7% | |
| | Apex Group Treasury LLC (g) | |
| | (6 mo. USD Term SOFR + 3.750%) | |
| | | | | 2,332,824 | | | | 8.963 | | | 07/27/28 | | | 2,337,793 | |
| | (6 mo. USD Term SOFR + 3.750%) | |
| | | | | 1,484,403 | | | | 9.076 | | | 07/27/28 | | | 1,486,882 | |
| | Avolon TLB Borrower 1 U.S. LLC(g) (1 mo. USD Term SOFR + 1.750%) | |
| | | | | 411,888 | | | | 6.509 | | | 06/24/30 | | | 411,418 | |
| | Deerfield Dakota Holding LLC | |
| | (g) (3 mo. USD Term SOFR + 3.750%) | |
| | | | | 1,314,707 | | | | 8.354 | | | 04/09/27 | | | 1,295,736 | |
| | (3 mo. USD Term SOFR + 6.750%) | |
| | | | | 3,797,000 | | | | 11.615 | | | 04/07/28 | | | 3,711,567 | |
| | Ditech Holding Corp.(h)(l) | |
| | | | | 183,349 | | | | 0.000 | | | 06/30/25 | | | — | |
| | Edelman Financial Center LLC(g) (1 mo. USD Term SOFR + 5.250%) | |
| | | | | 495,226 | | | | 9.935 | | | 10/06/28 | | | 495,692 | |
| | HighTower Holdings LLC(g) (3 mo. USD Term SOFR + 3.500%) | |
| | | | | 771,090 | | | | 8.748 | | | 04/21/28 | | | 771,668 | |
| | | |
| | |
| 38 | | The accompanying notes are an integral part of these financial statements. |
GOLDMAN SACHS MULTI-MANAGER NON-CORE FIXED INCOME FUND
| | | | | | | | | | | | | | | | |
| | | Principal Amount | | | Interest
Rate | | | Maturity Date | | Value | |
| |
| | Bank Loans(k) – (continued) | |
| |
| | Diversified Financial Services – (continued) | |
| | Summit Acquisition, Inc.(g)(h) (3 mo. USD Term SOFR + 3.750%) | |
| | $ | | | 455,000 | | | | 8.397 | % | | 10/16/31 | | $ | 455,569 | |
| | | | | | | | | | | | | | | | |
| | | | | | | | | | | | | | | 10,966,325 | |
| | | |
| |
| | Electrical – 0.2% | |
| | Lackawanna Energy Center LLC (1 mo. USD Term SOFR + 4.250%) | |
| | | | | 683,913 | | | | 8.935 | (h)(l) | | 08/06/29 | | $ | 684,767 | |
| | Lightstone Holdco LLC (3 mo. USD Term SOFR + 5.750%) | |
| | | | | 914,556 | | | | 10.335 | (g) | | 01/29/27 | | $ | 924,031 | |
| | Nautilus Power LLC(l) | |
| | | | | 460,000 | | | | 0.000 | | | 11/16/26 | | | 457,290 | |
| | South Field LLC (3 mo. USD Term SOFR + 3.750%) | |
| | | | | 440,000 | | | | 8.354 | (g) | | 08/29/31 | | $ | 439,635 | |
| | Talen Energy Supply LLC (3 mo. USD Term SOFR + 3.500%) | |
| | | | | 495,945 | | | | 8.596 | (g) | | 05/17/30 | | $ | 496,645 | |
| | | | | | | | | | | | | | | | |
| | | | | | | | | | | | | | | 3,002,368 | |
| | | |
| |
| | Electronics(g) – 0.2% | |
| | II-VI, Inc.(1 mo. USD Term SOFR + 2.500%) | |
| | | | | 373,374 | | | | 7.185 | | | 07/02/29 | | | 372,907 | |
| | Roper Industrial Products Investment Co. LLC(3 mo. USD Term SOFR + 3.250%) | |
| | | | | 2,861,681 | | | | 7.854 | | | 11/22/29 | | | 2,861,224 | |
| | | | | | | | | | | | | | | | |
| | | | | | | | | | | | | | | 3,234,131 | |
| | | |
| |
| | Energy-Alternate Sources – 0.1% | |
| | CPV Fairview LLC(g) (1 mo. USD Term SOFR + 3.500%) | |
| | | | | 320,000 | | | | 8.185 | | | 08/14/31 | | | 320,349 | |
| | Enviva Partners LP/Fin C (g) | |
| | (1 mo. USD Term SOFR + 8.000%) | |
| | | | | 136,356 | | | | 12.804 | | | 12/13/24 | | | 214,988 | |
| | (1 mo. USD Term SOFR + 8.000%)–(3 mo. USD Term SOFR + 8.000%) | |
| | | | | 181,807 | | | | 12.632 | – | | | | | | |
| | | | | | | | | 12.656 | | | 12/13/24 | | | 183,529 | |
| | (g)(h) (3 mo. U.S. (Fed) Prime Rate + 7.000%) | |
| | | | | 304,776 | | | | 15.000 | | | 06/30/27 | | | 304,809 | |
| | (3 mo. USD Term SOFR + 8.000%) | |
| | | | | 90,904 | | | | 13.016 | | | 12/13/24 | | | 143,325 | |
| | Esdec Solar Group BV(g)(h) (3 mo. USD Term SOFR + 5.000%) | |
| | | | | 149,706 | | | | 9.865 | | | 08/30/28 | | | 140,724 | |
| | | | | | | | | | | | | | | | |
| | | | | | | | | | | | | | | 1,307,724 | |
| | | |
| |
| | Engineering & Construction(g) – 0.8% | |
| | AAL Delaware Holdco, Inc.(1 mo. USD Term SOFR + 3.500%) | |
| | | | | 1,500,000 | | | | 8.185 | | | 07/30/31 | | | 1,506,255 | |
| | Artera Services LLC(3 mo. USD Term SOFR + 3.500%) | |
| | | | | 630,684 | | | | 9.104 | | | 02/15/31 | | | 622,933 | |
| | Brown Group Holding LLC(1 mo. USD Term SOFR + 2.750%) | |
| | | | | 2,704,791 | | | | 7.435 | | | 07/01/31 | | | 2,701,762 | |
| | Cube Industrials Buyer, Inc.(3 mo. USD Term SOFR + 3.500%) | |
| | | | | 955,000 | | | | 8.132 | | | 10/09/31 | | | 955,401 | |
| | | |
| | | | | | | | | | | | | | | | |
| | | Principal Amount | | | Interest
Rate | | | Maturity Date | | Value | |
| |
| | Bank Loans(k) – (continued) | |
| |
| | Engineering & Construction(g) – (continued) | |
| | KKR Apple Bidco LLC | |
| | (1 mo. USD Term SOFR + 2.750%) | |
| | $ | | | 243,125 | | | | 7.550 | % | | 09/22/28 | | $ | 243,004 | |
| | (1 mo. USD Term SOFR + 3.500%) | |
| | | | | 3,312,138 | | | | 8.185 | | | 09/22/28 | | | 3,317,769 | |
| | Service Logic Acquisition, Inc.(3 mo. USD Term SOFR + 3.500%) | |
| | | | | 1,184,510 | | | | 8.085 | | | 10/29/27 | | | 1,188,217 | |
| | Tutor Perini Corp.(1 mo. USD Term SOFR + 4.750%) | |
| | | | | 1,001,661 | | | | 9.550 | | | 08/18/27 | | | 1,000,409 | |
| | Wrench Group LLC(3 mo. USD Term SOFR + 4.000%) | |
| | | | | 733,158 | | | | 8.865 | | | 10/30/28 | | | 721,552 | |
| | | | | | | | | | | | | | | | |
| | | | | | | | | | | | | | | 12,257,302 | |
| | | |
| |
| | Entertainment – 0.4% | |
| | Caesars Entertainment, Inc. (g) | |
| | (1 mo. USD Term SOFR + 2.750%) | |
| | | | | 668,897 | | | | 7.435 | | | 02/06/30 | | | 668,615 | |
| | (1 mo. USD Term SOFR + 2.750%) | |
| | | | | 223,875 | | | | 7.435 | | | 02/06/31 | | | 223,770 | |
| | Churchill Downs, Inc.(g) (1 mo. USD Term SOFR + 2.000%) | |
| | | | | 33,225 | | | | 6.785 | | | 03/17/28 | | | 33,184 | |
| | East Valley Tourist Development Authority(g)(h) (1 mo. USD Term SOFR + 7.500%) | |
| | | | | 1,017,531 | | | | 12.300 | | | 11/23/26 | | | 998,198 | |
| | ECL Entertainment LLC(g) (1 mo. USD Term SOFR + 4.000%) | |
| | | | | 1,083,559 | | | | 8.685 | | | 08/31/30 | | | 1,084,242 | |
| | Ontario Gaming GTA LP(g) (3 mo. USD Term SOFR + 4.250%) | |
| | | | | 640,523 | | | | 8.893 | | | 08/01/30 | | | 640,177 | |
| | SeaWorld Parks & Entertainment, Inc.(g) (1 mo. USD Term SOFR + 2.500%) | |
| | | | | 991,853 | | | | 7.185 | | | 08/25/28 | | | 989,998 | |
| | UFC Holdings LLC(g) (3 mo. USD Term SOFR + 2.750%) | |
| | | | | 935,729 | | | | 7.637 | | | 04/29/26 | | | 936,216 | |
| | William Morris Endeavor Entertainment LLC(g) (1 mo. USD Term SOFR + 2.750%) | |
| | | | | 1,293,082 | | | | 7.550 | | | 05/18/25 | | | 1,292,681 | |
| | | | | | | | | | | | | | | | |
| | | | | | | | | | | | | | | 6,867,081 | |
| | | |
| |
| | Environmental – 0.2% | |
| | Filtration Group Corp.(g) (1 mo. USD Term SOFR + 4.250%) | |
| | | | | 2,075,219 | | | | 8.300 | | | 10/21/28 | | | 2,077,813 | |
| | Geosyntec Consultants(g) (1 mo. USD Term SOFR + 3.750%) | |
| | | | | 700,000 | | | | 8.435 | | | 07/31/31 | | | 700,875 | |
| | Tidal Waste & Recycling Holdings LLC(h)(l) | |
| | | | | 500,000 | | | | 0.000 | | | 09/30/31 | | | 500,000 | |
| | WIN Waste Innovations Holdings, Inc.(g) (1 mo. USD Term SOFR + 2.750%) | |
| | | | | 399,986 | | | | 7.550 | | | 03/24/28 | | | 380,079 | |
| | | | | | | | | | | | | | | | |
| | | | | | | | | | | | | | | 3,658,767 | |
| | | |
| |
| | Food & Drug Retailing – 0.5% | |
| | 8th Avenue Food & Provisions, Inc. (g) | |
| | (1 mo. USD Term SOFR + 3.750%) | |
| | | | | 280,000 | | | | 12.550 | | | 10/01/26 | | | 245,818 | |
| | | |
| | |
| The accompanying notes are an integral part of these financial statements. | | 39 |
GOLDMAN SACHS MULTI-MANAGER NON-CORE FIXED INCOME FUND
|
Schedule of Investments (continued) October 31, 2024 |
| | | | | | | | | | | | | | | | |
| | | Principal Amount | | | Interest
Rate | | | Maturity Date | | Value | |
| |
| | Bank Loans(k) – (continued) | |
| |
| | Food & Drug Retailing – (continued) | |
| | (1 mo. USD Term SOFR + 3.750%) | |
| | $ | | | 3,924,907 | | | | 8.550 | % | | 10/01/25 | | $ | 3,849,666 | |
| | (g) (1 mo. USD Term SOFR + 4.750%) | |
| | | | | 620,222 | | | | 9.550 | | | 10/01/25 | | | 608,593 | |
| | B&G Foods, Inc.(g) (3 mo. USD Term SOFR + 3.500%) | |
| | | | | 500,000 | | | | 8.557 | | | 10/10/29 | | | 498,250 | |
| | Chobani LLC(g) (1 mo. USD Term SOFR + 3.250%) | |
| | | | | 751,540 | | | | 8.050 | | | 10/25/27 | | | 753,607 | |
| | Fiesta Purchaser, Inc.(g) (1 mo. USD Term SOFR + 4.000%) | |
| | | | | 623,438 | | | | 8.685 | | | 02/12/31 | | | 624,734 | |
| | Nomad Foods U.S. LLC(g) (6 mo. USD Term SOFR + 2.500%) | |
| | | | | 637,013 | | | | 6.968 | | | 11/12/29 | | | 636,618 | |
| | Quirch Foods Holdings LLC(g) (3 mo. USD Term SOFR + 5.000%) | |
| | | | | 646,393 | | | | 9.887 | | | 10/27/27 | | | 612,865 | |
| | Solina Bidco(g) (3 mo. USD Term SOFR + 3.750%) | |
| | | | | 653,362 | | | | 8.699 | | | 03/07/29 | | | 656,224 | |
| | Upfield BV(g) (6 mo. USD Term SOFR + 4.250%) | |
| | | | | 448 | | | | 9.765 | | | 01/03/28 | | | 447 | |
| | | | | | | | | | | | | | | | |
| | | | | | | | | | | | | | | 8,486,822 | |
| | | |
| |
| | Food Service – 0.1% | |
| | Aramark Services, Inc.(g) (1 mo. USD Term SOFR + 2.000%) | |
| | | | | 721,348 | | | | 6.685 | | | 06/22/30 | | | 721,124 | |
| | Golden State Foods LLC(l) | |
| | | | | 610,000 | | | | 0.000 | | | 09/23/31 | | | 610,000 | |
| | | | | | | | | | | | | | | | |
| | | | | | | | | | | | | | | 1,331,124 | |
| | | |
| |
| | Hand/Machine Tools(g) – 0.0% | |
| | Alliance Laundry Systems LLC(1 mo. USD Term SOFR + 3.500%) | |
| | | | | 637,903 | | | | 8.185 | | | 08/19/31 | | | 638,790 | |
| | | |
| |
| | Health Care Products – 0.8% | |
| | Bausch & Lomb Corp. (g) | |
| | (1 mo. USD Term SOFR + 3.250%) | |
| | | | | 2,278,240 | | | | 8.095 | | | 05/10/27 | | $ | 2,275,871 | |
| | (g) (1 mo. USD Term SOFR + 4.000%) | |
| | | | | 2,609,336 | | | | 8.685 | | | 09/29/28 | | | 2,612,597 | |
| | Carestream Health, Inc.(g) (3 mo. USD Term SOFR + 7.500%) | |
| | | | | 1,229,116 | | | | 12.204 | | | 09/30/27 | | | 1,113,886 | |
| | Confluent Medical Technologies, Inc.(g) (3 mo. USD Term SOFR + 3.250%) | |
| | | | | 1,054,954 | | | | 7.848 | | | 02/16/29 | | | 1,058,910 | |
| | Curia Global, Inc.(g) (1 mo. USD Term SOFR + 3.750%)–(3 mo. USD Term SOFR + 3.750%) | |
| | | | | 1,800,241 | | | | 8.435– | | | | | | | |
| | | | | | | | | 8.535 | | | 08/30/26 | | | 1,709,941 | |
| | Hanger, Inc. | |
| | | | | 640,000 | | | | 0.000 | (l) | | 10/23/31 | | $ | 640,268 | |
| | ICU Medical, Inc.(g) (3 mo. USD Term SOFR + 2.500%) | |
| | | | | 685,562 | | | | 7.254 | | | 01/08/29 | | | 684,898 | |
| | Lifescan Global Corp.(g) (3 mo. USD Term SOFR + 6.500%) | |
| | | | | 2,962,285 | | | | 11.728 | | | 12/31/26 | | | 1,184,914 | |
| | | |
| | | | | | | | | | | | | | | | |
| | | Principal Amount | | | Interest
Rate | | | Maturity Date | | Value | |
| |
| | Bank Loans(k) – (continued) | |
| |
| | Health Care Products – (continued) | |
| | Medline Borrower LP(l) | |
| | $ | | | 1,000,000 | | | | 0.000 | % | | 10/23/28 | | $ | 999,770 | |
| | (1 mo. USD Term SOFR + 2.750%) | |
| | | | | 1,219,423 | | | | 7.435 | (g) | | 10/23/28 | | $ | 1,220,240 | |
| | Vyaire Medical, Inc.(g) (3 mo. U.S. (Fed) Prime Rate + 5.750%) | |
| | | | | 363,906 | | | | 13.750 | | | 04/16/25 | | | 211,066 | |
| | | | | | | | | | | | | | | | |
| | | | | | | | | | | | | | | 13,712,361 | |
| | | |
| |
| | Health Care Services – 1.1% | |
| | Cambrex Corp.(g) (1 mo. USD Term SOFR + 3.500%) | |
| | | | | 1,084,923 | | | | 8.285 | | | 12/04/26 | | | 1,080,345 | |
| | Catalent Pharma Solutions, Inc. (g) | |
| | (1 mo. USD Term SOFR + 3.000%) | |
| | | | | 1,147,029 | | | | 6.859 | | | 02/22/28 | | | 1,145,950 | |
| | (1 mo. USD Term SOFR + 3.000%) | |
| | | | | 412,925 | | | | 7.745 | | | 02/22/28 | | | 412,925 | |
| | Charlotte Buyer, Inc.(g) (1 mo. USD Term SOFR + 4.750%) | |
| | | | | 730,957 | | | | 9.573 | | | 02/11/28 | | | 736,622 | |
| | Da Vinci Purchaser Corp.(g) (1 mo. USD Term SOFR + 3.500%) | |
| | | | | 948,084 | | | | 8.185 | | | 01/08/27 | | | 948,140 | |
| | Electron BidCo, Inc.(g) (1 mo. USD Term SOFR + 3.000%) | |
| | | | | 510,200 | | | | 7.800 | | | 11/01/28 | | | 511,068 | |
| | eResearchTechnology, Inc.(g) (1 mo. USD Term SOFR + 4.000%) | |
| | | | | 1,504,998 | | | | 8.685 | | | 02/04/27 | | | 1,507,090 | |
| | Global Medical Response, Inc.(g) (1 mo. USD Term SOFR + 5.500%) | |
| | | | | 1,046,762 | | | | 10.259 | | | 10/31/28 | | | 1,041,529 | |
| | HomeVI SAS(l) | |
| | EUR | | | 500,000 | | | | 0.000 | | | 10/31/29 | | | 531,083 | |
| | LifePoint Health, Inc. | |
| | (g) (3 mo. USD Term SOFR + 3.750%) | |
| | $ | | | 992,085 | | | | 8.406 | | | 05/17/31 | | | 992,006 | |
| | (3 mo. USD Term SOFR + 4.000%) | |
| | | | | 92,500 | | | | 8.632 | | | 05/17/31 | | | 92,573 | |
| | MDVIP, Inc.(g) (1 mo. USD Term SOFR + 3.250%) | |
| | | | | 918,407 | | | | 8.036 | | | 10/16/28 | | | 916,975 | |
| | Pluto Acquisition I, Inc. | |
| | (g) (3 mo. USD Term SOFR + 4.000%) | |
| | | | | 877,887 | | | | 9.132 | | | 09/20/28 | | | 803,266 | |
| | (3 mo. USD Term SOFR + 5.500%) | |
| | | | | 238,343 | | | | 10.253 | | | 06/20/28 | | | 239,237 | |
| | Precision Medicine Group LLC(g) (3 mo. USD Term SOFR + 3.000%) | |
| | | | | 794,592 | | | | 7.704 | | | 11/18/27 | | | 791,946 | |
| | Radnet Management, Inc.(g) (3 mo. USD Term SOFR + 2.500%) | |
| | | | | 837,900 | | | | 7.132 | | | 04/18/31 | | | 838,947 | |
| | Resonetics LLC(g) (3 mo. USD Term SOFR + 3.750%) | |
| | | | | 1,115,000 | | | | 8.367 | | | 06/18/31 | | | 1,116,962 | |
| | Select Medical Corp.(g) (1 mo. USD Term SOFR + 3.000%) | |
| | | | | 119,625 | | | | 7.685 | | | 03/06/27 | | | 120,023 | |
| | Surgery Center Holdings, Inc.(g) (1 mo. USD Term SOFR + 2.750%) | |
| | | | | 1,105,491 | | | | 7.495 | | | 12/19/30 | | | 1,107,657 | |
| | | |
| | |
| 40 | | The accompanying notes are an integral part of these financial statements. |
GOLDMAN SACHS MULTI-MANAGER NON-CORE FIXED INCOME FUND
| | | | | | | | | | | | | | | | |
| | | Principal Amount | | | Interest
Rate | | | Maturity Date | | Value | |
| |
| | Bank Loans(k) – (continued) | |
| |
| | Health Care Services – (continued) | |
| | Team Health Holdings, Inc.(g) (1 mo. USD Term SOFR + 5.250%)–(3 mo. USD Term SOFR + 5.250%) | |
| | $ | | | 3,725,357 | | | | 9.835– | | | | | | | |
| | | | | | | | | 9.935 | % | | 03/02/27 | | $ | 3,642,058 | |
| | | | | | | | | | | | | | | | |
| | | | | | | | | | | | | | | 18,576,402 | |
| | | |
| |
| | Home Furnishings(g) – 0.1% | |
| | AI Aqua Merger Sub, Inc.(1 mo. USD Term SOFR + 3.500%) | |
| | | | | 1,059,380 | | | | 8.357 | | | 07/31/28 | | | 1,061,032 | |
| | Weber-Stephen Products LLC(1 mo. USD Term SOFR + 3.250%) | |
| | | | | 582,036 | | | | 8.050 | | | 10/30/27 | | | 549,733 | |
| | | | | | | | | | | | | | | | |
| | | | | | | | | | | | | | | 1,610,765 | |
| | | |
| |
| | Insurance – 1.9% | |
| | Acrisure LLC | |
| | (g) (1 mo. USD Term SOFR + 3.000%) | |
| | | | | 467,920 | | | | 7.759 | | | 02/16/27 | | | 466,676 | |
| | (1 mo. USD Term SOFR + 3.250%) | |
| | | | | 2,962,678 | | | | 8.009 | (g) | | 11/06/30 | | $ | 2,955,271 | |
| | Alliant Holdings Intermediate LLC(g) (1 mo. USD Term SOFR + 3.500%) | |
| | | | | 1,275,000 | | | | 7.759 | | | 09/19/31 | | | 1,268,625 | |
| | AmWINS Group, Inc.(g) (1 mo. USD Term SOFR + 2.250%) | |
| | | | | 678,342 | | | | 7.050 | | | 02/19/28 | | | 677,678 | |
| | Amynta Agency Borrower, Inc.(g) (1 mo. USD Term SOFR + 3.750%) | |
| | | | | 997,500 | | | | 8.435 | | | 02/28/28 | | | 999,435 | |
| | AssuredPartners, Inc.(g) (1 mo. USD Term SOFR + 3.500%) | |
| | | | | 4,796,167 | | | | 8.185 | | | 02/14/31 | | | 4,802,690 | |
| | Asurion LLC (g) | |
| | (g) (1 mo. USD Term SOFR + 5.250%) | |
| | | | | 276,000 | | | | 10.050 | | | 01/20/29 | | | 262,694 | |
| | (1 mo. USD Term SOFR + 3.250%) | |
| | | | | 157,786 | | | | 8.050 | | | 12/23/26 | | | 157,735 | |
| | (1 mo. USD Term SOFR + 3.250%) | |
| | | | | 371,598 | | | | 8.050 | | | 07/31/27 | | | 368,287 | |
| | Broadstreet Partners, Inc.(g) (1 mo. USD Term SOFR + 3.250%) | |
| | | | | 3,433,497 | | | | 7.935 | | | 06/13/31 | | | 3,429,377 | |
| | Cross Financial Corp.(h)(l) | |
| | | | | 290,000 | | | | 0.000 | | | 10/24/31 | | | 290,000 | |
| | (1 mo. USD Term SOFR + 3.500%) | |
| | | | | 352,322 | | | | 7.935– | | | | | | | |
| | | | | | | | | 8.747 | | | 09/15/27 | | | 352,322 | |
| | Howden Group Holdings Ltd. (g) | |
| | (1 mo. USD Term SOFR + 3.500%) | |
| | | | | 4,288,441 | | | | 8.185 | | | 04/18/30 | | $ | 4,302,292 | |
| | (1 mo. USD Term SOFR + 3.500%) | |
| | | | | 338,612 | | | | 8.185 | | | 02/15/31 | | | 339,299 | |
| | HUB International Ltd.(g) (3 mo. USD Term SOFR + 2.750%) | |
| | | | | 557,628 | | | | 7.367 | | | 06/20/30 | | | 558,632 | |
| | IMA Financial Group, Inc.(g) (1 mo. USD Term SOFR + 3.250%) | |
| | | | | 3,111,477 | | | | 7.935 | | | 11/01/28 | | | 3,107,587 | |
| | Ryan Specialty Group LLC(g) (1 mo. USD Term SOFR + 2.250%) | |
| | | | | 497,416 | | | | 6.935 | | | 09/15/31 | | | 496,421 | |
| | | |
| | | | | | | | | | | | | | | | |
| | | Principal Amount | | | Interest
Rate | | | Maturity Date | | Value | |
| |
| | Bank Loans(k) – (continued) | |
| |
| | Insurance – (continued) | |
| | Sedgwick Claims Management Services, Inc.(g) (3 mo. USD Term SOFR + 3.000%) | |
| | $ | | | 1,044,408 | | | | 7.585 | % | | 07/31/31 | | $ | 1,044,554 | |
| | USI, Inc. (g) | |
| | (3 mo. USD Term SOFR + 0.000%) | |
| | | | | 3,881,497 | | | | 7.354 | | | 09/27/30 | | $ | 3,879,091 | |
| | (g) (3 mo. USD Term SOFR + 2.750%) | |
| | | | | 498,747 | | | | 7.354 | | | 11/22/29 | | | 498,498 | |
| | | | | | | | | | | | | | | | |
| | | | | | | | | | | | | | | 30,257,164 | |
| | | |
| |
| | Internet(g) – 0.4% | |
| | CNT Holdings I Corp. (3 mo. USD Term SOFR + 3.500%) | |
| | | | | 3,674,574 | | | | 8.085 | | | 11/08/27 | | $ | 3,681,006 | |
| | MH Sub I LLC(1 mo. USD Term SOFR + 3.750%) | |
| | | | | 487,223 | | | | 8.935 | | | 05/03/28 | | | 483,992 | |
| | Polaris Purchaser, Inc.(3 mo. USD Term SOFR + 4.000%) | |
| | | | | 732,143 | | | | 8.604 | | | 03/03/31 | | | 735,804 | |
| | Proofpoint, Inc.(1 mo. USD Term SOFR + 3.250%) | |
| | | | | 955,498 | | | | 7.685 | | | 08/31/28 | | | 955,698 | |
| | PUG LLC(1 mo. USD Term SOFR + 0.000%) | |
| | | | | 953,842 | | | | 9.435 | | | 03/15/30 | | | 951,057 | |
| | | | | | | | | | | | | | | | |
| | | | | | | | | | | | | | | 6,807,557 | |
| | | |
| |
| | Investment Companies(g) – 0.1% | |
| | BEP Intermediate Holdco LLC(1 mo. USD Term SOFR + 3.750%) | |
| | | | | 712,215 | | | | 8.435 | | | 04/25/31 | | | 715,776 | |
| | | |
| |
| | Leisure Time – 0.8% | |
| | Alterra Mountain Co. | |
| | (g) (1 mo. USD Term SOFR + 3.250%) | |
| | | | | 2,857,828 | | | | 7.935 | | | 08/17/28 | | | 2,856,943 | |
| | (1 mo. USD Term SOFR + 3.500%) | |
| | | | | 2,838,601 | | | | 8.185 | | | 05/31/30 | | | 2,838,601 | |
| | Bulldog Purchaser, Inc.(g) (3 mo. USD Term SOFR + 4.250%) | |
| | | | | 453,412 | | | | 8.854 | | | 06/27/31 | | | 454,640 | |
| | ClubCorp Holdings, Inc. (3 mo. USD Term SOFR + 5.000%) | |
| | | | | 5,518,246 | | | | 9.865 | (g) | | 09/18/26 | | $ | 5,522,827 | |
| | GSM Holdings, Inc.(l) | |
| | | | | 272,388 | | | | 0.000 | | | 09/30/31 | | | 217,910 | |
| | Recess Holdings, Inc.(g) (3 mo. USD Term SOFR + 4.500%) | |
| | | | | 1,065,274 | | | | 9.085 | | | 02/20/30 | | | 1,070,429 | |
| | Sabre GLBL, Inc.(g) (1 mo. USD Term SOFR + 5.000%) | |
| | | | | 165,000 | | | | 9.785 | | | 06/30/28 | | | 155,689 | |
| | | | | | | | | | | | | | | | |
| | | | | | | | | | | | | | | 13,117,039 | |
| | | |
| |
| | Lodging – 0.2% | |
| | Fertitta Entertainment LLC(l) | |
| | | | | 465,000 | | | | 0.000 | | | 01/27/29 | | | 465,019 | |
| | Four Seasons Hotels Ltd.(g) (1 mo. USD Term SOFR + 2.000%) | |
| | | | | 720,710 | | | | 6.435 | | | 11/30/29 | | | 719,809 | |
| | Station Casinos LLC(g) (1 mo. USD Term SOFR + 2.250%) | |
| | | | | 1,161,580 | | | | 6.935 | | | 03/14/31 | | | 1,159,071 | |
| | | |
| | |
| The accompanying notes are an integral part of these financial statements. | | 41 |
GOLDMAN SACHS MULTI-MANAGER NON-CORE FIXED INCOME FUND
|
Schedule of Investments (continued) October 31, 2024 |
| | | | | | | | | | | | | | | | |
| | | Principal Amount | | | Interest
Rate | | | Maturity Date | | Value | |
| |
| | Bank Loans(k) – (continued) | |
| |
| | Lodging – (continued) | |
| | Wyndham Hotels & Resorts, Inc.(g) (1 mo. USD Term SOFR + 1.750%) | |
| | $ | | | 199,471 | | | | 6.435 | % | | 05/24/30 | | $ | 199,253 | |
| | | | | | | | | | | | | | | | |
| | | | | | | | | | | | | | | 2,543,152 | |
| | | |
| | Machinery - Construction & Mining(g) – 0.1% | |
| | Wec U.S. Holdings Ltd.(1 mo. USD Term SOFR + 2.750%) | |
| | | | | 1,571,405 | | | | 7.595 | | | 01/27/31 | | | 1,572,175 | |
| | | |
| | Machinery - Diversified(g) – 1.2% | |
| | CD&R Hydra Buyer, Inc.(1 mo. USD Term SOFR + 0.000%) | |
| | | | | 1,172,895 | | | | 8.785 | | | 03/25/31 | | | 1,169,377 | |
| | Chart Industries, Inc.(3 mo. USD Term SOFR + 2.500%) | |
| | | | | 1,095,969 | | | | 7.092 | | | 03/15/30 | | | 1,096,659 | |
| | Eagle Parent Corp.(3 mo. USD Term SOFR + 4.250%) | |
| | | | | 158,779 | | | | 8.854 | | | 04/02/29 | | | 154,164 | |
| | Engineered Machinery Holdings, Inc.(3 mo. USD Term SOFR + 6.500%) | |
| | | | | 1,325,000 | | | | 11.365 | | | 05/21/29 | | | 1,325,835 | |
| | INNIO Group Holding GmbH(3 mo. USD Term SOFR + 3.250%) | |
| | | | | 298,655 | | | | 7.897 | | | 11/02/28 | | | 299,216 | |
| | Pro Mach Group, Inc.(1 mo. USD Term SOFR + 4.500%) | |
| | | | | 3,125,000 | | | | 8.185 | | | 08/31/28 | | | 3,135,625 | |
| | Project Castle, Inc.(3 mo. U.S. (Fed) Prime Rate + 4.500%)–(3 mo. USD Term SOFR + 5.500%) | |
| | | | | 892,164 | | | | 9.762– | | | | | | | |
| | | | | | | | | 12.500 | | | 06/01/29 | | | 811,986 | |
| | SPX Flow, Inc. (1 mo. USD Term SOFR + 4.500%) | |
| | | | | 2,892,562 | | | | 8.185 | | | 04/05/29 | | $ | 2,897,045 | |
| | Star U.S. Bidco LLC(1 mo. USD Term SOFR + 2.750%) | |
| | | | | 1,491,054 | | | | 8.435 | | | 03/17/27 | | | 1,496,645 | |
| | Titan Acquisition Ltd.(6 mo. USD Term SOFR + 5.000%) | |
| | | | | 3,059,993 | | | | 10.326 | | | 02/15/29 | | | 3,061,156 | |
| | TK Elevator U.S. Newco, Inc.(6 mo. USD Term SOFR + 3.500%) | |
| | | | | 3,528,004 | | | | 8.588 | | | 04/30/30 | | | 3,535,731 | |
| | Victory Buyer LLC(1 mo. USD Term SOFR + 2.750%) | |
| | | | | 1,029,825 | | | | 8.582 | | | 11/19/28 | | | 984,451 | |
| | | | | | | | | | | | | | | | |
| | | | | | | | | | | | | | | 19,967,890 | |
| | | |
| | Media – 0.4% | |
| | Century DE Buyer LLC(g) (3 mo. USD Term SOFR + 4.000%) | |
| | | | | 1,117,937 | | | | 8.605 | | | 10/30/30 | | | 1,119,569 | |
| | Diamond Sports Group LLC(Fixed + 5.000%) | |
| | | | | 165,343 | | | | 5.000 | | | 12/02/24 | | | 174,024 | |
| | EW Scripps Co.(g) (1 mo. USD Term SOFR + 2.563%) | |
| | | | | 252,838 | | | | 7.362 | | | 05/01/26 | | | 248,287 | |
| | Gray Television, Inc. | |
| | (g) (1 mo. USD Term SOFR + 3.000%) | |
| | | | | 280,000 | | | | 7.959 | | | 12/01/28 | | | 262,693 | |
| | (1 mo. USD Term SOFR + 5.250%) | |
| | | | | 264,337 | | | | 10.094 | | | 06/04/29 | | | 255,953 | |
| | NEP Group, Inc. (g) | |
| | (3 mo. USD Term SOFR + 1.500%) | |
| | | | | 156,550 | | | | 8.865 | | | 08/19/26 | | | 151,658 | |
| | | |
| | | | | | | | | | | | | | | | |
| | | Principal Amount | | | Interest
Rate | | | Maturity Date | | Value | |
| |
| | Bank Loans(k) – (continued) | |
| |
| | Media – (continued) | |
| | (3 mo. USD Term SOFR + 1.500%) | |
| | $ | | | 2,138,354 | | | | 8.115 | % | | 08/19/26 | | $ | 2,064,580 | |
| | Sinclair Television Group, Inc.(g) (1 mo. USD Term SOFR + 2.500%) | |
| | | | | 398,696 | | | | 7.300 | | | 09/30/26 | | | 384,243 | |
| | United Talent Agency LLC(g) (1 mo. USD Term SOFR + 3.750%) | |
| | | | | 1,052,263 | | | | 8.568 | | | 07/07/28 | | | 1,057,525 | |
| | Virgin Media Bristol LLC(g) (6 mo. USD Term SOFR + 3.175%) | |
| | | | | 775,000 | | | | 7.724 | | | 03/31/31 | | | 751,750 | |
| | WideOpenWest Finance LLC | |
| | (g) (3 mo. USD Term SOFR + 3.000%) | |
| | | | | 286,788 | | | | 7.920 | | | 12/11/28 | | | 246,638 | |
| | (3 mo. USD Term SOFR + 7.000%) | |
| | | | | 232,092 | | | | 11.920 | | | 12/11/28 | | | 239,054 | |
| | | | | | | | | | | | | | | | |
| | | | | | | | | | | | | | | 6,955,974 | |
| | | |
| | Metal Fabricate & Hardware(g) – 0.3% | |
| | Crosby U.S. Acquisition Corp.(1 mo. USD Term SOFR + 4.000%) | |
| | | | | 4,471,288 | | | | 8.185 | | | 08/16/29 | | | 4,490,067 | |
| | | |
| | Mining(h) – 0.0% | |
| | Dominion Diamond(Fixed + 10.000%) | |
| | | | | 467,153 | | | | 10.000 | | | 06/30/26 | | | 467,153 | |
| | | |
| | Miscellaneous Manufacturing(g) – 0.1% | |
| | LTI Holdings, Inc.(1 mo. USD Term SOFR + 3.500%) | |
| | | | | 500,000 | | | | 9.435 | | | 07/19/29 | | | 496,665 | |
| | Rohm Holding GmbH(6 mo. USD Term SOFR + 5.500%) | |
| | | | | 742,638 | | | | 10.588 | | | 01/31/29 | | | 696,223 | |
| | | | | | | | | | | | | | | | |
| | | | | | | | | | | | | | | 1,192,888 | |
| | | |
| | Oil & Gas Services(g) – 0.0% | |
| | BANGL LLC(3 mo. USD Term SOFR + 4.500%) | |
| | | | | 288,546 | | | | 9.092 | | | 02/01/29 | | | 288,667 | |
| | | |
| | Packaging – 1.6% | |
| | Brook & Whittle Holding Corp.(g) (3 mo. USD Term SOFR + 4.000%) | |
| | | | | 1,580,630 | | | | 9.207 | | | 12/14/28 | | | 1,441,013 | |
| | Charter NEX U.S., Inc. (1 mo. USD Term SOFR + 3.000%) | |
| | | | | 4,605,863 | | | | 7.685 | (g) | | 12/01/27 | | $ | 4,604,296 | |
| | LABL, Inc.(g) (1 mo. USD Term SOFR + 5.000%) | |
| | | | | 5,529,468 | | | | 9.785 | | | 10/29/28 | | | 5,398,862 | |
| | Pregis TopCo Corp. (g) | |
| | (1 mo. USD Term SOFR + 4.000%) | |
| | | | | 3,476,016 | | | | 8.685 | | | 07/31/26 | | | 3,483,976 | |
| | (1 mo. USD Term SOFR + 4.000%) | |
| | | | | 248,082 | | | | 8.800 | | | 07/31/26 | | | 248,392 | |
| | Pretium Packaging LLC | |
| | (g) (3 mo. USD Term SOFR + 5.000%) | |
| | | | | 1,139,830 | | | | 10.248 | | | 10/02/28 | | | 1,159,595 | |
| | (3 mo. USD Term SOFR + 4.600%) | |
| | | | | 3,901,776 | | | | 9.848 | | | 10/02/28 | | | 3,171,403 | |
| | Proampac PG Borrower LLC(g) (3 mo. USD Term SOFR + 4.000%) | |
| | | | | 3,608,311 | | | | 8.656 | | | 09/15/28 | | | 3,617,331 | |
| | | |
| | |
| 42 | | The accompanying notes are an integral part of these financial statements. |
GOLDMAN SACHS MULTI-MANAGER NON-CORE FIXED INCOME FUND
| | | | | | | | | | | | | | | | |
| | | Principal Amount | | | Interest Rate | | | Maturity Date | | Value | |
| |
| | Bank Loans(k) – (continued) | |
| | |
| | Packaging – (continued) | | | | |
| | Trident TPI Holdings, Inc. | |
| | (g) (6 mo. USD Term SOFR + 4.000%) | |
| | $ | | | 1,129,403 | | | | 8.188 | % | | 09/15/28 | | $ | 1,131,719 | |
| | (3 mo. USD Term SOFR + 4.000%) | |
| | | | | 2,240,606 | | | | 8.604 | | | 09/15/28 | | | 2,244,341 | |
| | | | | | | | | | | | | | | | |
| | | | | | | | | | | | | | | 26,500,928 | |
| | | |
| |
| | Pharmaceuticals – 0.9% | |
| | Curium Bidco SARL(g) (3 mo. USD Term SOFR + 4.250%) | |
| | | | | 1,615,934 | | | | 8.092 | | | 07/31/29 | | | 1,617,953 | |
| | Gainwell Acquisition Corp. | |
| | (g) (3 mo. USD Term SOFR + 8.000%) | |
| | | | | 750,000 | | | | 12.684 | | | 10/02/28 | | | 635,625 | |
| | (3 mo. USD Term SOFR + 4.000%) | |
| | | | | 711,016 | | | | 8.704 | | | 10/01/27 | | | 681,864 | |
| | Grifols Worldwide Operations USA, Inc.(g) (3 mo. USD Term SOFR + 2.000%) | |
| | | | | 612,144 | | | | 6.735 | | | 11/15/27 | | | 594,067 | |
| | Lannett Co., Inc.(h) | |
| | | | | 401,669 | | | | 0.000 | | | 06/16/30 | | | 401,669 | |
| | MI Opco Holdings, Inc.(g) (1 mo. USD Term SOFR + 7.250%) | |
| | | | | 88,161 | | | | 12.035 | | | 03/31/28 | | | 87,206 | |
| | Midwest Veterinary Partners LLC(g) (3 mo. USD Term SOFR + 3.750%) | |
| | | | | 1,367,888 | | | | 8.387 | | | 04/27/28 | | | 1,367,751 | |
| | Option Care Health, Inc.(g) (1 mo. USD Term SOFR + 2.250%) | |
| | | | | 605,233 | | | | 6.935 | | | 10/27/28 | | | 606,292 | |
| | Packaging Coordinators Midco, Inc. (3 mo. USD Term SOFR + 3.250%) | |
| | | | | 3,911,443 | | | | 7.835 | (g) | | 11/30/27 | | $ | 3,913,634 | |
| | Pathway Vet Alliance LLC(g) (1 mo. USD Term SOFR + 3.750%) | |
| | | | | 2,273,948 | | | | 8.550 | | | 03/31/27 | | | 1,963,168 | |
| | Sharp Services LLC(g) (3 mo. USD Term SOFR + 3.250%) | |
| | | | | 968,289 | | | | 7.876 | | | 12/31/28 | | | 965,869 | |
| | Southern Veterinary Partners LLC(g) (6 mo. USD Term SOFR + 3.250%) | |
| | | | | 2,310,838 | | | | 7.995 | | | 10/05/27 | | | 2,307,950 | |
| | | | | | | | | | | | | | | | |
| | | | | | | | | | | | | | | 15,143,048 | |
| | | |
| |
| | Pipelines(g) – 0.6% | |
| | Brazos Delaware II LLC(6 mo. USD Term SOFR + 3.500%) | |
| | | | | 788,895 | | | | 8.255 | | | 02/11/30 | | | 789,597 | |
| | CPPIB Capital, Inc.(3 mo. USD Term SOFR + 3.250%) | |
| | | | | 475,000 | | | | 7.854 | | | 08/20/31 | | | 476,188 | |
| | CQP Holdco LP(3 mo. USD Term SOFR + 2.250%) | |
| | | | | 412,928 | | | | 6.854 | | | 12/31/30 | | | 412,577 | |
| | Epic Y-Grade Services LP(3 mo. USD Term SOFR + 5.750%) | |
| | | | | 1,400,000 | | | | 10.601 | | | 06/29/29 | | | 1,395,842 | |
| | Freeport LNG Investments LLLP | |
| | (3 mo. USD Term SOFR + 5.000%) | |
| | | | | 1,178,619 | | | | 7.879 | | | 11/16/26 | | | 1,174,788 | |
| | (3 mo. USD Term SOFR + 3.500%) | |
| | | | | 106,649 | | | | 8.379 | | | 12/21/28 | | | 106,007 | |
| | | |
| | | | | | | | | | | | | | | | |
| | | Principal Amount | | | Interest Rate | | | Maturity Date | | Value | |
| |
| | Bank Loans(k) – (continued) | |
| |
| | Pipelines(g) – (continued) | |
| | GIP Pilot Acquisition Partners LP(3 mo. USD Term SOFR + 0.025%) | |
| | $ | | | 917,226 | | | | 7.090 | % | | 10/04/30 | | $ | 915,318 | |
| | M6 ETX Holdings II Midco LLC(1 mo. USD Term SOFR + 4.500%) | |
| | | | | 958,765 | | | | 9.285 | | | 09/19/29 | | | 958,315 | |
| | Prairie ECI Acquiror LP(1 mo. USD Term SOFR + 4.750%) | |
| | | | | 977,470 | | | | 9.435 | | | 08/01/29 | | | 978,164 | |
| | TransMontaigne Operating Co. LP(1 mo. USD Term SOFR + 3.250%) | |
| | | | | 646,675 | | | | 7.935 | | | 11/17/28 | | | 647,024 | |
| | Traverse Midstream Partners LLC (3 mo. USD Term SOFR + 3.500%) | |
| | | | | 2,245,525 | | | | 8.085 | | | 02/16/28 | | $ | 2,249,275 | |
| | | | | | | | | | | | | | | | |
| | | | | | | | | | | | | | | 10,103,095 | |
| | | |
| |
| | Real Estate(g) – 0.3% | |
| | CoreLogic, Inc.(1 mo. USD Term SOFR + 3.500%) | |
| | | | | 3,733,334 | | | | 8.300 | | | 06/02/28 | | | 3,707,984 | |
| | Forest City Enterprises LP(1 mo. USD Term SOFR + 3.500%) | |
| | | | | 1,035,960 | | | | 8.311 | | | 12/08/25 | | | 997,278 | |
| | | | | | | | | | | | | | | | |
| | | | | | | | | | | | | | | 4,705,262 | |
| | | |
| |
| | Real Estate Investment Trust(g)(h) – 0.1% | |
| | CHPPR Midco, Inc.(3 mo. USD Term SOFR + 8.750%) | |
| | | | | 847,615 | | | | 13.418 | | | 12/31/29 | | | 852,913 | |
| | | |
| |
| | Retailing(g) – 0.4% | |
| | IRB Holding Corp.(1 mo. USD Term SOFR + 2.750%) | |
| | | | | 812,293 | | | | 7.535 | | | 12/15/27 | | | 811,789 | |
| | Johnstone Supply LLC(1 mo. USD Term SOFR + 0.000%) | |
| | | | | 286,000 | | | | 7.851 | | | 06/09/31 | | | 285,488 | |
| | Kodiak Building Partners, Inc.(1 mo. USD Term SOFR + 3.750%) | |
| | | | | 267,928 | | | | 8.435 | | | 03/12/28 | | | 268,767 | |
| | LBM Acquisition LLC(1 mo. USD Term SOFR + 3.750%) | |
| | | | | 736,404 | | | | 8.668 | | | 06/06/31 | | | 725,174 | |
| | Les Schwab Tire Centers(1 mo. USD Term SOFR + 3.000%) | |
| | | | | 1,064,504 | | | | 7.685 | | | 04/23/31 | | | 1,064,408 | |
| | PetSmart, Inc.(1 mo. USD Term SOFR + 3.750%) | |
| | | | | 1,097,165 | | | | 8.535 | | | 02/11/28 | | | 1,089,913 | |
| | Raising Cane’s Restaurants LLC(1 mo. USD Term SOFR + 2.000%) | |
| | | | | 630,000 | | | | 6.781 | | | 09/18/31 | | | 628,948 | |
| | Specialty Building Products Holdings LLC(1 mo. USD Term SOFR + 3.750%) | |
| | | | | 493,785 | | | | 8.535 | | | 10/15/28 | | | 488,733 | |
| | Whatabrands LLC(1 mo. USD Term SOFR + 0.000%) | |
| | | | | 1,697,087 | | | | 7.435 | | | 08/03/28 | | | 1,695,950 | |
| | | | | | | | | | | | | | | | |
| | | | | | | | | | | | | | | 7,059,170 | |
| | | |
| |
| | Semiconductors(g) – 0.0% | |
| | Ultra Clean Holdings, Inc.(1 mo. USD Term SOFR + 3.250%) | |
| | | | | 561,704 | | | | 7.935 | | | 02/28/28 | | | 563,810 | |
| | | |
| | |
| The accompanying notes are an integral part of these financial statements. | | 43 |
GOLDMAN SACHS MULTI-MANAGER NON-CORE FIXED INCOME FUND
|
Schedule of Investments (continued) October 31, 2024 |
| | | | | | | | | | | | | | | | |
| | | Principal Amount | | | Interest Rate | | | Maturity Date | | Value | |
| |
| | Bank Loans(k) – (continued) | |
| |
| | Software – 3.4% | |
| | Applied Systems, Inc. | |
| | (g) (3 mo. USD Term SOFR + 3.000%) | |
| | $ | | | 611,921 | | | | 7.604 | % | | 02/24/31 | | $ | 613,029 | |
| | (3 mo. USD Term SOFR + 5.250%) | |
| | | | | 6,073,000 | | | | 9.854 | | | 02/23/32 | | | 6,238,489 | |
| | AppLovin Corp.(g) (1 mo. USD Term SOFR + 2.500%) | |
| | | | | 363,175 | | | | 7.185 | | | 08/16/30 | | | 363,440 | |
| | Avaya, Inc.(g) (1 mo. USD Term SOFR + 7.500%) | |
| | | | | 2,538,619 | | | | 12.185 | | | 08/01/28 | | | 2,133,506 | |
| | Bracket Intermediate Holding Corp.(g) (3 mo. USD Term SOFR + 5.000%) | |
| | | | | 876,477 | | | | 9.704 | | | 05/08/28 | | | 877,441 | |
| | CCC Intelligent Solutions, Inc.(g) (1 mo. USD Term SOFR + 2.250%) | |
| | | | | 772,692 | | | | 7.050 | | | 09/21/28 | | | 772,368 | |
| | Central Parent, Inc.(g) (3 mo. USD Term SOFR + 3.250%) | |
| | | | | 3,436,250 | | | | 7.854 | | | 07/06/29 | | | 3,407,557 | |
| | Cloud Software Group, Inc. | |
| | (g) (3 mo. USD Term SOFR + 4.000%) | |
| | | | | 780,179 | | | | 8.604 | | | 03/30/29 | | | 779,828 | |
| | (3 mo. USD Term SOFR + 4.500%) | |
| | | | | 190,000 | | | | 9.104 | | | 03/21/31 | | | 189,911 | |
| | CommerceHub, Inc.(g) (3 mo. USD Term SOFR + 4.000%) | |
| | | | | 678,957 | | | | 8.797 | | | 12/29/27 | | | 631,091 | |
| | ConnectWise LLC(l) | |
| | | | | 974,482 | | | | 0.000 | | | 09/29/28 | | | 973,030 | |
| | Darktrace PLC (l) | |
| | | | | 650,000 | | | | 0.000 | | | 07/02/31 | | | 643,682 | |
| | | | | 250,000 | | | | 0.000 | | | 10/09/32 | | | 242,658 | |
| | Drake Software LLC(g) (1 mo. USD Term SOFR + 4.250%) | |
| | | | | 275,000 | | | | 8.935 | | | 06/26/31 | | | 269,500 | |
| | DTI Holdco, Inc.(g) (1 mo. USD Term SOFR + 0.000%) | |
| | | | | 448,855 | | | | 9.435 | | | 04/26/29 | | | 450,049 | |
| | Dun & Bradstreet Corp.(g) (1 mo. USD Term SOFR + 0.000%) | |
| | | | | 472,625 | | | | 7.468 | | | 01/18/29 | | | 473,362 | |
| | Epicor Software Corp. | |
| | (g) (1 mo. USD Term SOFR + 1.000%) | |
| | | | | 296,891 | | | | 8.073 | | | 05/30/31 | | | 297,678 | |
| | (1 mo. USD Term SOFR + 3.250%) | |
| | | | | 2,530,424 | | | | 7.935 | (g) | | 05/30/31 | | $ | 2,537,129 | |
| | Genesys Cloud Services Holdings II LLC(g) (1 mo. USD Term SOFR + 3.000%) | |
| | | | | 990,807 | | | | 7.685 | | | 12/01/27 | | | 992,511 | |
| | Idera, Inc.(g) (3 mo. USD Term SOFR + 3.500%) | |
| | | | | 253,241 | | | | 8.748 | | | 03/02/28 | | | 248,810 | |
| | Instructure Holdings, Inc. (l) | |
| | | | | 300,000 | | | | 0.000 | | | 09/11/31 | | | 297,843 | |
| | | | | 215,000 | | | | 0.000 | | | 09/10/32 | | | 217,688 | |
| | (g) (3 mo. USD Term SOFR + 2.750%) | |
| | | | | 574,112 | | | | 8.074 | | | 10/30/28 | | | 573,756 | |
| | iSolved, Inc.(g) (1 mo. USD Term SOFR + 3.500%) | |
| | | | | 1,061,128 | | | | 8.185 | | | 10/15/30 | | | 1,063,781 | |
| | Marcel LUX IV SARL(g) (1 mo. USD Term SOFR + 4.000%) | |
| | | | | 1,020,879 | | | | 8.840 | | | 11/11/30 | | | 1,023,431 | |
| | | |
| | | | | | | | | | | | | | | | |
| | | Principal Amount | | | Interest Rate | | | Maturity Date | | Value | |
| |
| | Bank Loans(k) – (continued) | |
| |
| | Software – (continued) | |
| | Mavenir Systems, Inc.(g) (3 mo. USD Term SOFR + 4.750%) | |
| | $ | | | 732,917 | | | | 10.073 | % | | 08/18/28 | | $ | 502,964 | |
| | Modena Buyer LLC(l) | |
| | | | | 85,502 | | | | 0.000 | | | 07/01/31 | | | 81,761 | |
| | Mosel Bidco SE(g) (3 mo. USD Term SOFR + 4.500%) | |
| | | | | 820,000 | | | | 9.104 | | | 09/16/30 | | | 825,125 | |
| | Motus LLC(g) (3 mo. USD Term SOFR + 4.000%) | |
| | | | | 863,176 | | | | 8.704 | | | 12/11/28 | | | 864,255 | |
| | Open Text Corp.(g) (1 mo. USD Term SOFR + 2.250%) | |
| | | | | 1,388,785 | | | | 6.935 | | | 01/31/30 | | | 1,392,520 | |
| | Particle Investments SARL(g) (1 mo. USD Term SOFR + 4.000%) | |
| | | | | 287,332 | | | | 8.685 | | | 03/28/31 | | | 287,872 | |
| | Pegasus Bidco Ltd.(g) (3 mo. USD Term SOFR + 4.500%) | |
| | | | | 340,000 | | | | 9.104 | | | 08/16/31 | | | 339,150 | |
| | PointClickCare Technologies, Inc. | |
| | (g) (3 mo. USD Term SOFR + 3.000%) | |
| | | | | 967,608 | | | | 7.604 | | | 12/29/27 | | | 966,398 | |
| | | | | 2,472,811 | | | | 0.000 | | | 10/10/31 | | | 2,475,902 | |
| | Polaris Newco LLC (3 mo. USD Term SOFR + 4.000%) | |
| | | | | 4,334,956 | | | | 8.847 | (g) | | 06/02/28 | | $ | 4,302,010 | |
| | Project Boost Purchaser LLC | |
| | (g) (3 mo. USD Term SOFR + 3.500%) | |
| | | | | 1,433,633 | | | | 8.147 | | | 07/16/31 | | | 1,434,937 | |
| | (3 mo. USD Term SOFR + 5.250%) | |
| | | | | 1,250,000 | | | | 9.897 | | | 07/16/32 | | | 1,255,212 | |
| | Quest Software U.S. Holdings, Inc.(g) (3 mo. USD Term SOFR + 4.250%) | |
| | | | | 2,128,538 | | | | 8.985 | | | 02/01/29 | | | 1,077,573 | |
| | Quickbase, Inc.(g) (1 mo. USD Term SOFR + 4.000%) | |
| | | | | 381,976 | | | | 8.685 | | | 10/02/28 | | | 381,976 | |
| | RealPage, Inc. | |
| | (g) (1 mo. USD Term SOFR + 6.500%) | |
| | | | | 545,000 | | | | 11.300 | | | 04/23/29 | | | 530,694 | |
| | (1 mo. USD Term SOFR + 3.000%) | |
| | | | | 199,486 | | | | 7.800 | | | 04/24/28 | | | 196,444 | |
| | Sophia LP | |
| | (g) (1 mo. USD Term SOFR + 8.000%) | |
| | | | | 1,416,667 | | | | 12.785 | | | 10/09/28 | | | 1,416,667 | |
| | (1 mo. USD Term SOFR + 3.500%) | |
| | | | | 3,317,811 | | | | 8.285 | (g) | | 10/09/29 | | $ | 3,329,655 | |
| | SS&C Technologies, Inc.(g) (1 mo. USD Term SOFR + 2.000%) | |
| | | | | 647,726 | | | | 6.685 | | | 05/09/31 | | | 647,538 | |
| | UKG, Inc.(g) (3 mo. USD Term SOFR + 3.000%) | |
| | | | | 4,496,463 | | | | 7.617 | | | 02/10/31 | | | 4,500,151 | |
| | VS Buyer LLC(g) (1 mo. USD Term SOFR + 3.250%) | |
| | | | | 558,600 | | | | 8.036 | | | 04/11/31 | | | 558,600 | |
| | Waystar Technologies, Inc.(g) (1 mo. USD Term SOFR + 2.750%) | |
| | | | | 239,073 | | | | 7.435 | | | 10/22/29 | | | 239,771 | |
| | Zelis Payments Buyer, Inc.(g) (1 mo. USD Term SOFR + 2.750%) | |
| | | | | 1,019,996 | | | | 7.435 | | | 09/28/29 | | | 1,008,521 | |
| | | | | | | | | | | | | | | | |
| | | | | | | | | | | | | | | 54,927,264 | |
| | | |
| | |
| 44 | | The accompanying notes are an integral part of these financial statements. |
GOLDMAN SACHS MULTI-MANAGER NON-CORE FIXED INCOME FUND
| | | | | | | | | | | | | | | | |
| | | Principal Amount | | | Interest Rate | | | Maturity Date | | Value | |
| |
| | Bank Loans(k) – (continued) | |
| |
| | Telecommunications(g) – 0.5% | |
| | Altice France SA | |
| | (3 mo. USD LIBOR + 4.000%) | |
| | $ | | | 211,648 | | | | 9.380 | % | | 08/14/26 | | $ | 178,798 | |
| | (3 mo. USD Term SOFR + 5.500%) | |
| | | | | 181,880 | | | | 10.147 | | | 08/15/28 | | | 145,178 | |
| | (6 mo. USD LIBOR + 3.688%) | |
| | | | | 230,157 | | | | 8.370 | | | 01/31/26 | | | 196,046 | |
| | Crown Subsea Communications Holding, Inc.(1 mo. USD Term SOFR + 4.000%) | |
| | | | | 498,750 | | | | 8.685 | | | 04/27/28 | | | 501,089 | |
| | Delta TopCo, Inc. | |
| | (6 mo. USD Term SOFR + 3.500%) | |
| | | | | 857,700 | | | | 8.198 | | | 11/30/29 | | | 857,760 | |
| | (6 mo. USD Term SOFR + 3.500%) | |
| | | | | 231,000 | | | | 9.948 | | | 11/29/30 | | | 233,310 | |
| | Ensono LP(1 mo. USD Term SOFR + 4.000%) | |
| | | | | 1,160,975 | | | | 8.800 | | | 05/26/28 | | | 1,156,331 | |
| | Iridium Satellite LLC(1 mo. USD Term SOFR + 2.250%) | |
| | | | | 744,375 | | | | 6.935 | | | 09/20/30 | | | 734,981 | |
| | Level 3 Financing, Inc. | |
| | (1 mo. USD Term SOFR + 6.560%) | |
| | | | | 229,159 | | | | 11.278 | (g) | | 04/15/29 | | | 233,972 | |
| | (1 mo. USD Term SOFR + 6.560%) | |
| | | | | 230,841 | | | | 11.278 | | | 04/15/30 | | | 235,294 | |
| | Lumen Technologies, Inc. | |
| | (1 mo. USD Term SOFR + 2.350%) | |
| | | | | 55,724 | | | | 7.182 | | | 04/15/29 | | | 50,542 | |
| | (1 mo. USD Term SOFR + 2.350%) | |
| | | | | 56,974 | | | | 7.182 | | | 04/15/30 | | | 51,020 | |
| | Numericable Group SA(6 mo. USD LIBOR + 2.750%) | |
| | | | | 56,710 | | | | 7.432 | | | 07/31/25 | | | 52,275 | |
| | Nuuday AS(6 mo. EUR EURIBOR + 6.500%) | |
| | EUR | | | 400,000 | | | | 9.897 | | | 02/03/28 | | | 438,093 | |
| | Syniverse Holdings, Inc.(3 mo. USD Term SOFR + 5.000%) | |
| | | | $ | 1,000,000 | | | | 11.604 | | | 05/13/27 | | | 993,500 | |
| | Zayo Group Holdings, Inc.(1 mo. USD Term SOFR + 3.000%) | |
| | | | | 1,233,112 | | | | 7.800 | | | 03/09/27 | | | 1,156,757 | |
| | | | | | | | | | | | | | | | |
| | | | | | | | | | | | | | | 7,214,946 | |
| | | |
| | Transportation – 0.2% | |
| | Genesee & Wyoming, Inc. (New)(g) (3 mo. USD Term SOFR + 2.000%) | |
| | | | | 305,000 | | | | 6.604 | | | 04/10/31 | | | 304,180 | |
| | Kenan Advantage Group, Inc.(g) (1 mo. USD Term SOFR + 3.250%) | |
| | | | | 1,737,479 | | | | 7.935 | | | 01/25/29 | | | 1,734,577 | |
| | LaserShip, Inc. | |
| | (g)(h) (3 mo. USD Term SOFR + 7.000%) | |
| | | | | 248,125 | | | | 12.354 | | | 09/29/27 | | | 111,656 | |
| | (3 mo. USD Term SOFR + 4.500%) | |
| | | | | 767,648 | | | | 9.365 | | | 05/07/28 | | | 313,968 | |
| | | |
| | | | | | | | | | | | | | | | |
| | | Principal Amount | | | Interest Rate | | | Maturity Date | | Value | |
| |
| | Bank Loans(k) – (continued) | |
| |
| | Transportation – (continued) | |
| | Third Coast Infrastructure LLC(l) | |
| | $ | | | 485,000 | | | | 0.000 | % | | 09/25/30 | | $ | 478,938 | |
| | | | | | | | | | | | | | | | |
| | | | | | | | | | | | | | | 2,943,319 | |
| | | |
| | |
| | TOTAL BANK LOANS (Cost $388,770,510) | | $ | 385,442,842 | |
| | | |
| | | | | | | | | | | | | | | | |
| | | Shares | | | Description | | Value | |
| |
| | Common Stocks(e) – 0.3% | |
| | |
| | Chemicals(h) – 0.1% | | | | |
| | | | | | | | | 80,232 | | | Cornerstone Chemical Reorg Equity | | $ | 1,644,756 | |
| | | |
| |
| | Commercial Services & Supplies(h) – 0.0% | |
| | | | | | | | | 1,565 | | | Monitronics International, Inc. | | | — | |
| | | |
| |
| | Diversified Consumer Services – 0.0% | |
| | | | | | | | | 7,679 | | | Premier Brands Group Holding | | | 10,881 | |
| | | |
| |
| | Energy Equipment & Services(i) – 0.0% | |
| | | | | | | | | 17,933 | | | Parker Drilling Co. | | | 300,378 | |
| | | |
| |
| | Financial Services(h) – 0.0% | |
| | | | | | | | | 240 | | | Voyager Aviation Holdings LLC | | | — | |
| | | |
| |
| | Health Care Equipment & Supplies – 0.0% | |
| | | | | | | | | 47,389 | | | Envision Parent, Inc. | | | 487,206 | |
| | | |
| |
| | Health Care Providers & Services – 0.0% | |
| | | | | | | | | 4,117 | | | Air Methods Corp. | | | 107,738 | |
| | | |
| |
| | Media – 0.0% | |
| | | | | | | | | 2,505 | | | Audacy Class A | | | 50,100 | |
| | | |
| |
| | Metals & Mining – 0.0% | |
| | | | | | | | | 627 | | | Arctic Canadian Diamond Co. Ltd.(h) | | | 92,148 | |
| | | | | | | | | 1,239,530 | | | Burgundy Diamond Mines Ltd. | | | 89,731 | |
| | | | | | | | | 7,732 | | | Tacora Restructure(h) | | | 7,732 | |
| | | | | | | | | | | | | | | | |
| | | | | | | | | | | | | | | 189,611 | |
| | | |
| |
| | Pharmaceuticals – 0.0% | |
| | | | | | | | | 6,203 | | | Endo, Inc. | | | 154,560 | |
| | | | | | | | | 65,267 | | | Lannett Co., Inc.(h) | | | 142,935 | |
| | | | | | | | | | | | | | | | |
| | | | | | | | | | | | | | | 297,495 | |
| | | |
| |
| | Professional Services – 0.0% | |
| | | | | | | | | 61,506 | | | Avaya Holdings Corp.(i) | | | 317,801 | |
| | | | | | | | | 865 | | | Skillsoft Corp. | | | 13,209 | |
| | | | | | | | | | | | | | | | |
| | | | | | | | | | | | | | | 331,010 | |
| | | |
| |
| | Real Estate Management & Development(h) – 0.1% | |
| | | | | | | | | 48,279 | | | WeWork, Inc. Class A | | | 625,899 | |
| | | |
| | |
| The accompanying notes are an integral part of these financial statements. | | 45 |
GOLDMAN SACHS MULTI-MANAGER NON-CORE FIXED INCOME FUND
|
Schedule of Investments (continued) October 31, 2024 |
| | | | | | | | | | | | | | |
| | | Shares | | |
Description | | Value | |
| |
| | Common Stocks(e) – (continued) | |
| |
| | Semiconductors & Semiconductor Equipment – 0.0% | |
| | | | | | | 18,377 | | | Bright Bidco BV | | $ | 8,362 | |
| | | |
| |
| | Specialty Retail(h) – 0.1% | |
| | | | | | | 7,504 | | | GTRC Reorg Equity | | | 917,439 | |
| | | | | | | 343 | | | Rite Aid Corp. | | | 3 | |
| | | | | | | | | | | | | | |
| | | | | | | | | | | | | 917,442 | |
| | | |
| |
| | Wireless Telecommunication Services – 0.0% | |
| | | | | | | 5,606 | | | IQOR US, Inc. | | | 8,342 | |
| | | | | | | 14,518 | | | Windstream Corp. | | | 273,417 | |
| | | | | | | | | | | | | | |
| | | | | | | | | | | | | 281,759 | |
| | | |
| | |
| | TOTAL COMMON STOCKS
(Cost $8,730,252) | | $ | 5,252,637 | |
| | | |
| | | | | | | | | | | | | | | | |
| | | Principal Amount | | | Interest Rate | | | Maturity Date | | Value | |
| |
| | Asset-Backed Securities(a)(b)(g) – 0.1% | |
| |
| | Collateralized Loan Obligations – 0.1% | |
| | Benefit Street Partners CLO XXXIII Ltd. Series 2023-33A, Class E (3 mo. USD Term SOFR + 6.980%) | |
| | $ | | | 250,000 | | | | 11.606 | % | | 01/25/36 | | $ | 254,129 | |
| | Carlyle U.S. CLO Ltd. Series 2021-4A, Class E (3 mo. USD Term SOFR + 6.862%) | |
| | | | | 250,000 | | | | 11.479 | | | 04/20/34 | | | 251,543 | |
| | OHA Credit Funding 17 Ltd. Series 2024-17A, Class D1 (3 mo. USD Term SOFR + 3.300%) | |
| | | | | 250,000 | | | | 7.917 | | | 04/20/37 | | | 252,915 | |
| | Palmer Square CLO Ltd. Series 2015-2A, Class DR2 (3 mo. USD Term SOFR + 6.012%) | |
| | | | | 250,000 | | | | 10.629 | | | 07/20/30 | | | 250,915 | |
| | | | | | | | | | | | | | | | |
| | | | | | | | | | | | | | | 1,009,502 | |
| | | |
| | |
| | TOTAL ASSET-BACKED SECURITIES
(Cost $983,163) | | $ | 1,009,502 | |
| | | |
| | | | | | | | | | | | | | | | |
| | | Units | | | Expiration
Date | | Value | |
| |
| | Warrants(e) – 0.0% | |
| | Audacy | |
| | | | | | | | | 3,036 | | | 12/31/99 | | $ | 303 | |
| | Avation PLC | |
| | | | | | | | | 20,510 | | | 10/31/26 | | | 14,546 | |
| | Guitar Center, Inc.(h) | |
| | | | | | | | | 3,973 | | | 12/31/99 | | | 137,235 | |
| | | |
| | |
| | TOTAL WARRANTS
(Cost $ 379,871) | | $ | 152,084 | |
| | | |
| | | | | | | | | | | | | | | | |
| | | Shares | | | Dividend
Rate | | Value | |
| |
| | Preferred Stocks(e)(h) – 0.0% | |
| |
| | Financial Services – 0.0% | |
| | Voyager Aviation Holdings LLC | |
| | | | | | | | | 1,441 | | | 0.000% | | $ | — | |
| | | |
| | Specialty Retail – 0.0% | |
| | Guitar Center, Inc. | |
| | | | | | | | | 103 | | | 0.000 | | | 9,743 | |
| | | |
| | |
| | TOTAL PREFERRED STOCKS
(Cost $84,145) | | $ | 9,743 | |
| | | |
| | | | | | | | | | | | | | | | |
| | | Principal Amount | | | Interest Rate | | | Maturity Date | | Value | |
| |
| | U.S. Treasury Obligations(c) – 0.9% | |
| |
| | U.S. Treasury Bills | |
| | $ | | | 2,650,000 | | | | 0.000 | % | | 12/03/24 | | $ | 2,639,223 | |
| | | | | 8,500,000 | | | | 0.000 | | | 12/03/24 | | | 8,465,433 | |
| | | | | 2,700,000 | | | | 0.000 | | | 12/03/24 | | | 2,689,020 | |
| | | |
| | |
| | TOTAL U.S. TREASURY OBLIGATIONS
(Cost $13,793,159) | | $ | 13,793,676 | |
| | | |
| | | | | | | | | | | | | | | | |
| | | Shares | | | Dividend
Rate | | Value | |
| |
| | Investment Company(m) – 5.6% | |
| |
| | Goldman Sachs Financial Square Government Fund — Institutional Shares | |
| | | | | | | | | 91,077,387 | | | 4.766% | | $ | 91,077,387 | |
| | (Cost $ 91,077,387) | |
| | | |
| | TOTAL INVESTMENTS – 98.9% (Cost $ 1,613,870,962) | | $ | 1,606,981,907 | |
| | | |
| | OTHER ASSETS IN EXCESS OF
LIABILITIES – 1.1% | | | 18,271,828 | |
| | | |
| | NET ASSETS – 100.0% | | $ | 1,625,253,735 | |
| | | |
| | |
| The percentage shown for each investment category reflects the value of investments in that category as a percentage of net assets. |
| |
| (a) | | Exempt from registration under Rule 144A of the Securities Act of 1933. |
| |
| (b) | | Security with “Call” features with resetting interest rates. Maturity dates disclosed are the final maturity dates. |
| |
| (c) | | Issued with a zero coupon. Income is recognized through the accretion of discount. |
| |
| (d) | | Coupon changes periodically based upon a predetermined schedule. Interest rate disclosed is that which is in effect on October 31, 2024. |
| |
| (e) | | Security is currently in default and/or non-income producing. |
| |
| (f) | | Pay-in-kind securities. |
| |
| (g) | | Variable rate security. Except for floating rate notes (for which final maturity is disclosed), maturity date disclosed is the next interest reset date. Interest rate disclosed is that which is in effect on October 31, 2024. |
| | |
| 46 | | The accompanying notes are an integral part of these financial statements. |
GOLDMAN SACHS MULTI-MANAGER NON-CORE FIXED INCOME FUND
| | |
| |
| (h) | | Significant unobservable inputs were used in the valuation of this portfolio security; i.e., Level 3. |
| |
| (i) | | Restricted securities are not registered under the Securities Act of 1933, as amended, and are subject to legal restrictions on resale. These securities generally may be resold in transactions exempt from registration or to the public if the securities are subsequently registered. Disposal of these securities may involve time consuming negotiations and prompt sale at an acceptable price may be difficult. Total market value of Restricted securities amounts to $663,381, which represents approximately 0.0% of the Fund’s net assets as of October 31, 2024. See additional details below: |
| | | | | | | | |
| Restricted Security | | Acquisition
Date | | | Cost | |
|
| |
Avaya Holdings Corp. | | | 05/01/23 | | | $ | 132,475 | |
Avaya Holdings Corp. | | | 05/01/23 | | | | 668,883 | |
Chesapeake Energy Corp. | | | 12/06/19 | | | | 42,991 | |
Chesapeake Energy Corp. | | | 06/21/19 | | | | 316,924 | |
Entorian Technologies, Inc. | | | 04/23/24 | | | | — | |
Neiman Marcus Group Ltd. LLC | | | 04/23/18 | | | | 605,000 | |
Par Pharmaceutical, Inc. | | | 04/23/24 | | | | — | |
Parker Drilling Co. | | | 04/16/20 | | | | 335,637 | |
Rite Aid Corp. | | | 09/04/24 | | | | — | |
Rite Aid Corp. | | | 09/04/24 | | | | — | |
|
| |
| | |
| |
| (j) | | Guaranteed by a foreign government until maturity. Total market value of these securities amounts to $755,471, which represents approximately 0% of the Fund’s net assets as of October 31, 2024. |
| |
| (k) | | Bank Loans often require prepayments from excess cash flows or permit the borrower to repay at its election. The degree to which borrowers repay, whether as a contractual requirement or at their election, cannot be predicted with accuracy. As a result, the actual remaining maturity may be substantially less than the stated maturities shown. As bank loan positions may involve multiple underlying tranches for which the aggregate position is presented, the stated interest rate represents the weighted average interest rate of all contracts on October 31, 2024. Bank Loans typically have rates of interest which are predetermined either daily, monthly, quarterly or semi-annually by reference to a base lending rate, plus a premium. These base lending rates are primarily the Secured Overnight Financing Rate (“SOFR”), and secondarily the prime rate offered by one or more major United States banks (the “Prime Rate”) and the certificate of deposit (“CD”) rate or other base lending rates used by commercial lenders. |
| |
| (l) | | This position represents an unsettled loan commitment at period end. Certain details associated with this purchase are not known prior to the settlement date, including coupon rate. |
| |
| (m) | | Represents an affiliated issuer. |
|
|
ADDITIONAL INVESTMENT INFORMATION |
UNFUNDED LOAN COMMITMENTS — At October 31, 2024, the Fund had unfunded loan commitments which could be extended at the option of the borrowers, pursuant to the following loan agreements:
| | | | | | | | | | | | | | | | | | | | |
| Borrower | | Principal
Amount | | | | | | Current Value | | | | | | Unrealized
Gain (Loss) | |
|
| |
Enviva Partners LP/Fin C, due 12/13/24 | | | $45,452 | | | | | | | | $44,867 | | | | | | | | $223 | |
Enviva Partners LP/Fin C, due 06/30/27 | | | 780 | | | | | | | | 746 | | | | | | | | — | |
|
| |
TOTAL | | | $46,232 | | | | | | | | $45,613 | | | | | | | | $223 | |
|
| |
FORWARD FOREIGN CURRENCY EXCHANGE CONTRACTS — At October 31, 2024, the Fund had the following forward foreign currency exchange contracts:
FORWARD FOREIGN CURRENCY EXCHANGE CONTRACTS WITH UNREALIZED GAIN
| | | | | | | | | | | | | | | | | | | | | | | | | | | | |
| Counterparty | | Currency
Purchased | | | | | | Currency
Sold | | | | | | Settlement
Date | | | | Unrealized Gain | |
|
| |
| | | | | | | | | |
Barclays Bank PLC | | EUR | | | 25,675,000 | | | | | | | USD | | | 27,891,207 | | | | | | | 01/30/25 | | | | $ | 148,714 | |
| | IDR | | | 10,245,810,000 | | | | | | | USD | | | 649,188 | | | | | | | 12/18/24 | | | | | 1,910 | |
| | PLN | | | 1,330,000 | | | | | | | USD | | | 330,289 | | | | | | | 12/18/24 | | | | | 1,407 | |
| | TRY | | | 40,360,000 | | | | | | | USD | | | 1,067,132 | | | | | | | 12/18/24 | | | | | 52,985 | |
| | TRY | | | 118,859,100 | | | | | | | USD | | | 2,683,000 | | | | | | | 03/03/25 | | | | | 375,907 | |
| | TRY | | | 44,370,000 | | | | | | | USD | | | 1,069,904 | | | | | | | 03/19/25 | | | | | 54,702 | |
| | TRY | | | 58,000,000 | | | | | | | USD | | | 1,263,868 | | | | | | | 06/18/25 | | | | | 85,483 | |
| | USD | | | 178,581 | | | | | | | AUD | | | 266,000 | | | | | | | 12/12/24 | | | | | 3,452 | |
| | USD | | | 576,158 | | | | | | | CLP | | | 520,000,000 | | | | | | | 12/18/24 | | | | | 35,460 | |
| | USD | | | 1,589,226 | | | | | | | CNH | | | 11,200,000 | | | | | | | 12/18/24 | | | | | 11,330 | |
| | USD | | | 1,222,107 | | | | | | | CZK | | | 27,570,000 | | | | | | | 12/18/24 | | | | | 36,108 | |
| | USD | | | 2,306,019 | | | | | | | HUF | | | 854,750,000 | | | | | | | 12/18/24 | | | | | 34,227 | |
| | USD | | | 601,073 | | | | | | | IDR | | | 9,424,397,564 | | | | | | | 12/18/24 | | | | | 2,173 | |
| | USD | | | 806,172 | | | | | | | PLN | | | 3,100,000 | | | | | | | 12/18/24 | | | | | 33,045 | |
| | USD | | | 317,281 | | | | | | | THB | | | 10,200,000 | | | | | | | 12/18/24 | | | | | 13,984 | |
| | USD | | | 2,291,294 | | | | | | | ZAR | | | 40,230,000 | | | | | | | 12/18/24 | | | | | 19,093 | |
| | ZAR | | | 6,490,000 | | | | | | | USD | | | 365,948 | | | | | | | 12/18/24 | | | | | 609 | |
| | |
| The accompanying notes are an integral part of these financial statements. | | 47 |
GOLDMAN SACHS MULTI-MANAGER NON-CORE FIXED INCOME FUND
|
Schedule of Investments (continued) October 31, 2024 |
|
|
ADDITIONAL INVESTMENT INFORMATION (continued) |
FORWARD FOREIGN CURRENCY EXCHANGE CONTRACTS WITH UNREALIZED GAIN (continued)
| | | | | | | | | | | | | | | | | | | | | | | | | | | | |
| Counterparty | | Currency
Purchased | | | Currency
Sold | | | Settlement
Date | | | | Unrealized Gain | |
|
| |
| | | | | | | | | |
BNP Paribas SA | | PLN | | | 17,130,724 | | | | | | | USD | | | 4,250,800 | | | | | | | 12/17/24 | | | | $ | 21,723 | |
| | TRY | | | 88,072,673 | | | | | | | USD | | | 1,835,096 | | | | | | | 03/03/25 | | | | | 431,504 | |
| | USD | | | 4,614,593 | | | | | | | CZK | | | 106,711,161 | | | | | | | 12/17/24 | | | | | 24,324 | |
| | USD | | | 9,650,575 | | | | | | | KRW | | | 12,816,928,300 | | | | | | | 12/11/24 | | | | | 313,573 | |
| | USD | | | 4,399,100 | | | | | | | PLN | | | 17,341,692 | | | | | | | 12/17/24 | | | | | 73,960 | |
| | USD | | | 29,580,200 | | | | | | | THB | | | 989,096,812 | | | | | | | 11/12/24 | | | | | 244,927 | |
BofA Securities LLC | | PLN | | | 13,167,572 | | | | | | | USD | | | 3,259,300 | | | | | | | 12/17/24 | | | | | 24,785 | |
| | USD | | | 12,155,974 | | | | | | | PHP | | | 705,727,240 | | | | | | | 11/21/24 | | | | | 48,609 | |
Citibank NA | | EUR | | | 775,000 | | | | | | | USD | | | 841,742 | | | | | | | 01/15/25 | | | | | 4,113 | |
| | INR | | | 541,750,000 | | | | | | | USD | | | 6,427,969 | | | | | | | 12/18/24 | | | | | 2,298 | |
| | MXN | | | 21,350,000 | | | | | | | USD | | | 1,055,995 | | | | | | | 12/18/24 | | | | | 1,975 | |
| | THB | | | 38,927,500 | | | | | | | USD | | | 1,157,007 | | | | | | | 12/18/24 | | | | | 499 | |
| | USD | | | 12,923,634 | | | | | | | BRL | | | 72,178,289 | | | | | | | 12/03/24 | | | | | 487,454 | |
| | USD | | | 1,100,698 | | | | | | | CAD | | | 1,486,198 | | | | | | | 01/15/25 | | | | | 30,390 | |
| | USD | | | 502,892 | | | | | | | CNH | | | 3,529,476 | | | | | | | 12/18/24 | | | | | 5,647 | |
| | USD | | | 14,664,788 | | | | | | | COP | | | 62,223,409,315 | | | | | | | 12/18/24 | | | | | 696,632 | |
| | USD | | | 1,439,695 | | | | | | | EUR | | | 1,300,000 | | | | | | | 01/15/25 | | | | | 20,842 | |
| | USD | | | 954,988 | | | | | | | GBP | | | 727,977 | | | | | | | 01/15/25 | | | | | 16,499 | |
| | USD | | | 8,322,009 | | | | | | | HUF | | | 2,971,450,000 | | | | | | | 12/18/24 | | | | | 424,360 | |
| | USD | | | 3,045,562 | | | | | | | IDR | | | 47,401,134,415 | | | | | | | 12/18/24 | | | | | 33,327 | |
| | USD | | | 1,022,862 | | | | | | | INR | | | 86,140,000 | | | | | | | 12/18/24 | | | | | 429 | |
| | USD | | | 4,923,650 | | | | | | | KRW | | | 6,582,920,000 | | | | | | | 12/18/24 | | | | | 125,841 | |
| | USD | | | 7,265,293 | | | | | | | MXN | | | 143,770,000 | | | | | | | 12/18/24 | | | | | 140,976 | |
| | USD | | | 4,800,582 | | | | | | | SGD | | | 6,290,000 | | | | | | | 12/18/24 | | | | | 26,574 | |
| | ZAR | | | 57,430,000 | | | | | | | USD | | | 3,235,492 | | | | | | | 12/18/24 | | | | | 8,168 | |
HSBC Bank PLC | | INR | | | 27,100,000 | | | | | | | USD | | | 321,534 | | | | | | | 12/18/24 | | | | | 127 | |
| | KRW | | | 6,445,930,000 | | | | | | | USD | | | 4,684,883 | | | | | | | 12/18/24 | | | | | 13,084 | |
| | THB | | | 134,782,500 | | | | | | | USD | | | 4,000,518 | | | | | | | 12/18/24 | | | | | 7,227 | |
| | TRY | | | 79,000,000 | | | | | | | USD | | | 2,023,922 | | | | | | | 12/18/24 | | | | | 168,576 | |
| | TRY | | | 70,000,000 | | | | | | | USD | | | 1,652,619 | | | | | | | 03/19/25 | | | | | 121,607 | |
| | TRY | | | 75,470,000 | | | | | | | USD | | | 1,668,638 | | | | | | | 06/18/25 | | | | | 87,146 | |
| | USD | | | 518,597 | | | | | | | CZK | | | 11,710,000 | | | | | | | 12/18/24 | | | | | 14,860 | |
| | USD | | | 1,366,505 | | | | | | | HUF | | | 502,660,000 | | | | | | | 12/18/24 | | | | | 30,513 | |
| | USD | | | 1,956,550 | | | | | | | IDR | | | 30,449,790,000 | | | | | | | 12/18/24 | | | | | 21,535 | |
| | USD | | | 3,459,585 | | | | | | | MXN | | | 69,080,000 | | | | | | | 12/18/24 | | | | | 36,425 | |
| | USD | | | 722,958 | | | | | | | PLN | | | 2,820,000 | | | | | | | 12/18/24 | | | | | 19,662 | |
| | USD | | | 4,748,545 | | | | | | | SGD | | | 6,110,000 | | | | | | | 12/18/24 | | | | | 111,155 | |
JPMorgan Securities, Inc. | | TRY | | | 470,296,160 | | | | | | | USD | | | 12,929,637 | | | | | | | 12/20/24 | | | | | 95,468 | |
| | TRY | | | 50,927,692 | | | | | | | USD | | | 1,071,711 | | | | | | | 03/03/25 | | | | | 238,943 | |
| | USD | | | 6,539,100 | | | | | | | CZK | | | 149,067,553 | | | | | | | 12/17/24 | | | | | 126,836 | |
| | USD | | | 1,781,524 | | | | | | | EGP | | | 88,357,360 | | | | | | | 12/11/24 | | | | | 12,378 | |
| | USD | | | 5,600,000 | | | | | | | PLN | | | 21,988,400 | | | | | | | 12/17/24 | | | | | 115,938 | |
MS & Co. Int. PLC | | EUR | | | 106,541 | | | | | | | USD | | | 115,000 | | | | | | | 11/15/24 | | | | | 965 | |
| | USD | | | 1,311,092 | | | | | | | GBP | | | 1,003,033 | | | | | | | 11/15/24 | | | | | 17,759 | |
| | USD | | | 6,858,800 | | | | | | | THB | | | 230,112,740 | | | | | | | 12/11/24 | | | | | 20,332 | |
| | ZAR | | | 113,977,260 | | | | | | | USD | | | 6,103,200 | | | | | | | 11/07/24 | | | | | 357,445 | |
Standard Chartered Bank | | CNH | | | 3,500,000 | | | | | | | USD | | | 491,430 | | | | | | | 12/18/24 | | | | | 1,662 | |
| | PEN | | | 1,280,000 | | | | | | | USD | | | 338,822 | | | | | | | 12/18/24 | | | | | 214 | |
| | PLN | | | 2,110,000 | | | | | | | USD | | | 524,919 | | | | | | | 12/18/24 | | | | | 1,307 | |
| | TRY | | | 11,000,000 | | | | | | | USD | | | 281,665 | | | | | | | 12/18/24 | | | | | 23,620 | |
| | USD | | | 1,790,789 | | | | | | | BRL | | | 10,055,280 | | | | | | | 12/03/24 | | | | | 58,283 | |
| | USD | | | 4,069,267 | | | | | | | CNH | | | 28,629,047 | | | | | | | 12/18/24 | | | | | 35,906 | |
| | USD | | | 12,007,175 | | | | | | | CZK | | | 272,560,000 | | | | | | | 12/18/24 | | | | | 282,264 | |
| | USD | | | 4,770,405 | | | | | | | KRW | | | 6,375,980,000 | | | | | | | 12/18/24 | | | | | 123,419 | |
| | |
| 48 | | The accompanying notes are an integral part of these financial statements. |
GOLDMAN SACHS MULTI-MANAGER NON-CORE FIXED INCOME FUND
|
|
ADDITIONAL INVESTMENT INFORMATION (continued) |
FORWARD FOREIGN CURRENCY EXCHANGE CONTRACTS WITH UNREALIZED GAIN (continued)
| | | | | | | | | | | | | | | | | | | | | | | | | | | | | | | | |
| Counterparty | | Currency
Purchased | | | | | | Currency
Sold | | | | | | Settlement
Date | | | | | | Unrealized
Gain | |
|
| |
| | | | | | | | | |
Standard Chartered Bank (continued) | | USD | | | 2,623,247 | | | | | | | MXN | | | 51,700,000 | | | | | | | | 12/18/24 | | | | | | | $ | 61,328 | |
| | USD | | | 4,141,584 | | | | | | | MYR | | | 17,710,000 | | | | | | | | 12/18/24 | | | | | | | | 90,530 | |
| | USD | | | 664,540 | | | | | | | PEN | | | 2,500,000 | | | | | | | | 12/18/24 | | | | | | | | 2,362 | |
| | USD | | | 4,010,643 | | | | | | | PHP | | | 227,610,000 | | | | | | | | 12/18/24 | | | | | | | | 106,178 | |
| | USD | | | 267,175 | | | | | | | ZAR | | | 4,720,000 | | | | | | | | 12/18/24 | | | | | | | | 589 | |
|
| |
| | | | | | | | | |
| TOTAL | | | | | | | | | | | | | | | | | | | | | | | | | | | | | | $ | 6,525,661 | |
|
| |
|
| FORWARD FOREIGN CURRENCY EXCHANGE CONTRACTS WITH UNREALIZED LOSS | |
| Counterparty | | Currency
Purchased | | | | | | Currency
Sold | | | | | | Settlement
Date | | | | | | Unrealized
Loss | |
|
| |
| | | | | | | | | |
Barclays Bank PLC | | BRL | | | 3,650,000 | | | | | | | USD | | | 639,359 | | | | | | | | 12/03/24 | | | | | | | $ | (10,471 | ) |
| | CLP | | | 1,705,790,000 | | | | | | | USD | | | 1,823,867 | | | | | | | | 12/18/24 | | | | | | | | (50,180 | ) |
| | CNH | | | 57,540,075 | | | | | | | USD | | | 8,144,961 | | | | | | | | 11/22/24 | | | | | | | | (53,088 | ) |
| | CNH | | | 2,200,000 | | | | | | | USD | | | 316,242 | | | | | | | | 12/18/24 | | | | | | | | (6,298 | ) |
| | COP | | | 4,135,770,000 | | | | | | | USD | | | 975,261 | | | | | | | | 12/18/24 | | | | | | | | (46,847 | ) |
| | HUF | | | 82,000,000 | | | | | | | USD | | | 230,508 | | | | | | | | 12/18/24 | | | | | | | | (12,565 | ) |
| | MXN | | | 151,970,000 | | | | | | | USD | | | 7,740,560 | | | | | | | | 12/18/24 | | | | | | | | (209,904 | ) |
| | MYR | | | 10,287,491 | | | | | | | USD | | | 2,392,829 | | | | | | | | 12/20/24 | | | | | | | | (39,430 | ) |
| | PLN | | | 5,790,521 | | | | | | | USD | | | 1,497,814 | | | | | | | | 12/09/24 | | | | | | | | (53,098 | ) |
| | PLN | | | 2,700,000 | | | | | | | USD | | | 697,843 | | | | | | | | 12/18/24 | | | | | | | | (24,474 | ) |
| | RON | | | 31,860,000 | | | | | | | USD | | | 7,067,067 | | | | | | | | 12/18/24 | | | | | | | | (110,056 | ) |
| | THB | | | 240,025,606 | | | | | | | USD | | | 7,229,578 | | | | | | | | 11/12/24 | | | | | | | | (110,743 | ) |
| | THB | | | 562,546,104 | | | | | | | USD | | | 16,880,097 | | | | | | | | 12/11/24 | | | | | | | | (162,406 | ) |
| | USD | | | 3,269,576 | | | | | | | EUR | | | 3,000,000 | | | | | | | | 01/30/25 | | | | | | | | (6,754 | ) |
| | USD | | | 565,205 | | | | | | | IDR | | | 8,914,301,099 | | | | | | | | 12/18/24 | | | | | | | | (1,279 | ) |
| | USD | | | 1,095,975 | | | | | | | TRY | | | 44,370,000 | | | | | | | | 03/19/25 | | | | | | | | (28,631 | ) |
| | USD | | | 1,296,774 | | | | | | | TRY | | | 58,000,000 | | | | | | | | 06/18/25 | | | | | | | | (52,577 | ) |
| | ZAR | | | 3,440,000 | | | | | | | USD | | | 199,201 | | | | | | | | 12/18/24 | | | | | | | | (4,909 | ) |
BNP Paribas SA | | CZK | | | 439,943,696 | | | | | | | USD | | | 19,256,807 | | | | | | | | 12/17/24 | | | | | | | | (332,267 | ) |
| | PHP | | | 335,782,078 | | | | | | | USD | | | 5,830,056 | | | | | | | | 11/21/24 | | | | | | | | (69,422 | ) |
| | THB | | | 157,134,709 | | | | | | | USD | | | 4,735,211 | | | | | | | | 11/12/24 | | | | | | | | (74,808 | ) |
| | USD | | | 3,259,300 | | | | | | | CZK | | | 75,902,578 | | | | | | | | 12/17/24 | | | | | | | | (5,712 | ) |
| | USD | | | 3,082,218 | | | | | | | ZAR | | | 54,725,393 | | | | | | | | 11/07/24 | | | | | | | | (19,816 | ) |
| | USD | | | 4,919,700 | | | | | | | ZAR | | | 87,514,575 | | | | | | | | 11/29/24 | | | | | | | | (32,022 | ) |
BofA Securities LLC | | CNH | | | 74,839,500 | | | | | | | USD | | | 10,590,745 | | | | | | | | 11/22/24 | | | | | | | | (66,051 | ) |
| | EGP | | | 37,688,825 | | | | | | | USD | | | 781,439 | | | | | | | | 12/11/24 | | | | | | | | (26,810 | ) |
| | KRW | | | 6,408,464,150 | | | | | | | USD | | | 4,807,550 | | | | | | | | 12/11/24 | | | | | | | | (139,049 | ) |
| | NGN | | | 6,592,760,000 | | | | | | | USD | | | 4,462,000 | | | | | | | | 11/06/24 | | | | | | | | (534,896 | ) |
| | NGN | | | 8,432,889,000 | | | | | | | USD | | | 5,657,700 | | | | | | | | 11/12/24 | | | | | | | | (630,846 | ) |
| | PHP | | | 184,683,612 | | | | | | | USD | | | 3,210,772 | | | | | | | | 11/21/24 | | | | | | | | (42,364 | ) |
| | PLN | | | 21,152,188 | | | | | | | USD | | | 5,301,000 | | | | | | | | 12/17/24 | | | | | | | | (25,496 | ) |
| | THB | | | 157,995,336 | | | | | | | USD | | | 4,764,636 | | | | | | | | 01/08/25 | | | | | | | | (59,710 | ) |
| | USD | | | 6,505,969 | | | | | | | THB | | | 219,600,534 | | | | | | | | 11/12/24 | | | | | | | | (7,086 | ) |
Citibank NA | | BRL | | | 46,050,000 | | | | | | | USD | | | 8,253,199 | | | | | | | | 12/03/24 | | | | | | | | (318,873 | ) |
| | CAD | | | 1,464,705 | | | | | | | USD | | | 1,080,224 | | | | | | | | 01/15/25 | | | | | | | | (25,395 | ) |
| | CNH | | | 6,080,000 | | | | | | | USD | | | 866,772 | | | | | | | | 12/18/24 | | | | | | | | (10,200 | ) |
| | COP | | | 55,757,520,031 | | | | | | | USD | | | 13,160,573 | | | | | | | | 12/18/24 | | | | | | | | (643,904 | ) |
| | EUR | | | 6,530,000 | | | | | | | USD | | | 7,290,908 | | | | | | | | 12/18/24 | | | | | | | | (172,714 | ) |
| | EUR | | | 1,896,878 | | | | | | | USD | | | 2,097,498 | | | | | | | | 01/15/25 | | | | | | | | (27,198 | ) |
| | GBP | | | 176,997 | | | | | | | USD | | | 232,030 | | | | | | | | 01/15/25 | | | | | | | | (3,850 | ) |
| | HUF | | | 1,304,250,000 | | | | | | | USD | | | 3,621,634 | | | | | | | | 12/18/24 | | | | | | | | (155,141 | ) |
| | |
| The accompanying notes are an integral part of these financial statements. | | 49 |
GOLDMAN SACHS MULTI-MANAGER NON-CORE FIXED INCOME FUND
|
Schedule of Investments (continued) October 31, 2024 |
|
|
ADDITIONAL INVESTMENT INFORMATION (continued) |
FORWARD FOREIGN CURRENCY EXCHANGE CONTRACTS WITH UNREALIZED LOSS (continued)
| | | | | | | | | | | | | | | | | | | | | | | | | | | | |
| Counterparty | | Currency
Purchased | | | Currency
Sold | | | Settlement
Date | | | | Unrealized Loss | |
|
| |
| | | | | | | | | |
Citibank NA (continued) | | IDR | | | 38,285,714,627 | | | | | | | USD | | | 2,480,674 | | | | | | | 12/18/24 | | | | $ | (47,703 | ) |
| | INR | | | 157,640,000 | | | | | | | USD | | | 1,871,542 | | | | | | | 12/18/24 | | | | | (444 | ) |
| | MXN | | | 105,468,800 | | | | | | | USD | | | 5,308,958 | | | | | | | 12/18/24 | | | | | (82,603 | ) |
| | PEN | | | 9,630,999 | | | | | | | USD | | | 2,589,113 | | | | | | | 12/18/24 | | | | | (38,137 | ) |
| | PLN | | | 990,000 | | | | | | | USD | | | 258,063 | | | | | | | 12/18/24 | | | | | (11,161 | ) |
| | SGD | | | 11,850,000 | | | | | | | USD | | | 9,128,938 | | | | | | | 12/18/24 | | | | | (134,982 | ) |
| | TWD | | | 42,987,500 | | | | | | | USD | | | 1,371,212 | | | | | | | 12/18/24 | | | | | (18,000 | ) |
| | USD | | | 582,984 | | | | | | | CNH | | | 4,143,481 | | | | | | | 12/18/24 | | | | | (764 | ) |
| | USD | | | 2,161,000 | | | | | | | EUR | | | 1,986,253 | | | | | | | 01/15/25 | | | | | (6,848 | ) |
| | USD | | | 212,000 | | | | | | | GBP | | | 164,460 | | | | | | | 01/15/25 | | | | | (17 | ) |
| | USD | | | 15,396,590 | | | | | | | ZAR | | | 277,300,000 | | | | | | | 12/18/24 | | | | | (265,385 | ) |
| | ZAR | | | 75,800,000 | | | | | | | USD | | | 4,334,093 | | | | | | | 12/18/24 | | | | | (52,890 | ) |
HSBC Bank PLC | | BRL | | | 85,419,590 | | | | | | | USD | | | 15,222,504 | | | | | | | 12/03/24 | | | | | (504,873 | ) |
| | CNH | | | 21,075,000 | | | | | | | USD | | | 3,005,447 | | | | | | | 12/18/24 | | | | | (36,327 | ) |
| | EUR | | | 604,639 | | | | | | | USD | | | 670,373 | | | | | | | 12/18/24 | | | | | (11,271 | ) |
| | HUF | | | 306,840,000 | | | | | | | USD | | | 817,536 | | | | | | | 11/04/24 | | | | | (43 | ) |
| | HUF | | | 113,370,000 | | | | | | | USD | | | 313,485 | | | | | | | 12/18/24 | | | | | (12,166 | ) |
| | INR | | | 180,000,000 | | | | | | | USD | | | 2,140,360 | | | | | | | 12/18/24 | | | | | (3,862 | ) |
| | PEN | | | 8,640,000 | | | | | | | USD | | | 2,294,131 | | | | | | | 12/18/24 | | | | | (5,644 | ) |
| | PLN | | | 48,120,000 | | | | | | | USD | | | 12,227,388 | | | | | | | 12/18/24 | | | | | (226,460 | ) |
| | SGD | | | 550,000 | | | | | | | USD | | | 424,149 | | | | | | | 12/18/24 | | | | | (6,708 | ) |
| | THB | | | 14,230,000 | | | | | | | USD | | | 430,436 | | | | | | | 12/18/24 | | | | | (7,308 | ) |
| | TWD | | | 142,962,500 | | | | | | | USD | | | 4,538,676 | | | | | | | 12/18/24 | | | | | (38,329 | ) |
| | USD | | | 697,133 | | | | | | | PEN | | | 2,660,000 | | | | | | | 12/18/24 | | | | | (7,424 | ) |
| | USD | | | 603,290 | | | | | | | THB | | | 20,310,000 | | | | | | | 12/18/24 | | | | | (626 | ) |
| | USD | | | 466,199 | | | | | | | TRY | | | 18,131,520 | | | | | | | 12/18/24 | | | | | (37,008 | ) |
| | USD | | | 1,681,171 | | | | | | | TRY | | | 70,000,000 | | | | | | | 03/19/25 | | | | | (93,056 | ) |
| | USD | | | 1,719,575 | | | | | | | TRY | | | 75,470,000 | | | | | | | 06/18/25 | | | | | (36,210 | ) |
| | USD | | | 5,811,392 | | | | | | | TWD | | | 185,950,000 | | | | | | | 12/18/24 | | | | | (42,167 | ) |
| | USD | | | 1,777,519 | | | | | | | ZAR | | | 31,610,000 | | | | | | | 12/18/24 | | | | | (7,820 | ) |
| | ZAR | | | 19,020,000 | | | | | | | USD | | | 1,080,355 | | | | | | | 12/18/24 | | | | | (6,100 | ) |
JPMorgan Securities, Inc. | | CNH | | | 89,798,625 | | | | | | | USD | | | 12,708,894 | | | | | | | 11/22/24 | | | | | (80,495 | ) |
| | EGP | | | 68,510,408 | | | | | | | USD | | | 1,406,591 | | | | | | | 12/11/24 | | | | | (34,833 | ) |
| | KRW | | | 6,408,464,150 | | | | | | | USD | | | 4,807,550 | | | | | | | 12/11/24 | | | | | (139,049 | ) |
| | PHP | | | 185,261,551 | | | | | | | USD | | | 3,210,772 | | | | | | | 11/21/24 | | | | | (32,449 | ) |
| | RON | | | 12,800,541 | | | | | | | USD | | | 2,833,577 | | | | | | | 12/16/24 | | | | | (38,216 | ) |
| | USD | | | 327,074 | | | | | | | EGP | | | 17,841,873 | | | | | | | 12/11/24 | | | | | (30,167 | ) |
| | USD | | | 4,879,477 | | | | | | | THB | | | 164,813,214 | | | | | | | 11/12/24 | | | | | (8,660 | ) |
MS & Co. Int. PLC | | EUR | | | 4,664,066 | | | | | | | USD | | | 5,111,107 | | | | | | | 11/15/24 | | | | | (34,486 | ) |
| | GBP | | | 23,011 | | | | | | | USD | | | 30,000 | | | | | | | 11/15/24 | | | | | (329 | ) |
| | PLN | | | 4,890,044 | | | | | | | USD | | | 1,270,326 | | | | | | | 12/17/24 | | | | | (50,715 | ) |
| | THB | | | 157,280,032 | | | | | | | USD | | | 4,735,211 | | | | | | | 11/12/24 | | | | | (70,498 | ) |
| | USD | | | 500,000 | | | | | | | EUR | | | 460,087 | | | | | | | 11/15/24 | | | | | (784 | ) |
| | USD | | | 5,614,554 | | | | | | | THB | | | 189,575,411 | | | | | | | 11/12/24 | | | | | (7,997 | ) |
| | USD | | | 3,236,497 | | | | | | | ZAR | | | 59,251,867 | | | | | | | 11/07/24 | | | | | (122,114 | ) |
Standard Chartered Bank | | CNH | | | 21,075,000 | | | | | | | USD | | | 3,006,342 | | | | | | | 12/18/24 | | | | | (37,222 | ) |
| | HUF | | | 37,130,000 | | | | | | | USD | | | 100,116 | | | | | | | 12/18/24 | | | | | (1,430 | ) |
| | IDR | | | 233,227,522,650 | | | | | | | USD | | | 15,073,193 | | | | | | | 12/18/24 | | | | | (252,111 | ) |
| | MXN | | | 24,691,200 | | | | | | | USD | | | 1,229,169 | | | | | | | 12/18/24 | | | | | (5,631 | ) |
| | MYR | | | 21,810,000 | | | | | | | USD | | | 5,222,348 | | | | | | | 12/18/24 | | | | | (233,443 | ) |
| | PEN | | | 26,970,000 | | | | | | | USD | | | 7,155,490 | | | | | | | 12/18/24 | | | | | (11,915 | ) |
| | PHP | | | 268,560,000 | | | | | | | USD | | | 4,655,065 | | | | | | | 12/18/24 | | | | | (48,136 | ) |
| | THB | | | 85,480,000 | | | | | | | USD | | | 2,549,891 | | | | | | | 12/18/24 | | | | | (8,151 | ) |
| | USD | | | 1,874,677 | | | | | | | BRL | | | 10,890,000 | | | | | | | 12/03/24 | | | | | (1,649 | ) |
| | |
| 50 | | The accompanying notes are an integral part of these financial statements. |
GOLDMAN SACHS MULTI-MANAGER NON-CORE FIXED INCOME FUND
|
|
ADDITIONAL INVESTMENT INFORMATION (continued) |
FORWARD FOREIGN CURRENCY EXCHANGE CONTRACTS WITH UNREALIZED LOSS (continued)
| | | | | | | | | | | | | | | | | | | | | | | | | | | | | | | | |
| Counterparty | | Currency
Purchased | | | | | | Currency
Sold | | | | | | Settlement
Date | | | | | | Unrealized
Loss | |
|
| |
| | | | | | | | | |
Standard Chartered Bank (continued) | | USD | | | 602,919 | | | | | | | CNH | | | 4,282,839 | | | | | | | | 12/18/24 | | | | | | | $ | (463 | ) |
| | USD | | | 16,392,409 | | | | | | | PEN | | | 62,197,719 | | | | | | | | 12/18/24 | | | | | | | | (81,975 | ) |
|
| |
| | | | | | | | | |
| TOTAL | | | | | | | | | | | | | | | | | | | | | | | | | | | | | | $ | (7,482,594 | ) |
|
| |
SWAP CONTRACTS — At October 31, 2024, the Fund had the following swap contracts:
OVER THE COUNTER INTEREST RATE SWAP CONTRACTS
| | | | | | | | | | | | | | | | |
| Payments Made by the Fund | | Payments
Received by
the Fund | | Counterparty | | Termination
Date | | Notional
Amount
(000s) | | | Unrealized
Appreciation/
(Depreciation)* | |
|
| |
12M CNRR(a) | | 1.967%(a) | | Barclays Bank PLC | | 06/24/29 | | CNY | | | 15,450 | | | | $ 20,690 | |
12M CNRR(a) | | 1.806(a) | | Citibank NA | | 12/18/29 | | | | | 8,000 | (b) | | | 1,947 | |
6M MIBOR(c) | | 5.991(c) | | Citibank NA | | 12/18/29 | | INR | | | 280,000 | (b) | | | (39,984 | ) |
6M MIBOR(c) | | 6.283(c) | | Citibank NA | | 12/18/29 | | | | | 265,630 | (b) | | | 292 | |
4.955(c) | | 6M CLICP(c) | | Citibank NA | | 10/17/34 | | CLP | | | 2,890,000 | | | | 63,456 | |
4.925(c) | | 6M CLICP(c) | | Citibank NA | | 10/18/34 | | | | | 1,650,000 | (b) | | | 40,321 | |
1M BID Average(d) | | 11.545(d) | | HSBC Bank PLC | | 01/04/27 | | BRL | | | 37,673 | | | | (119,479 | ) |
12M CNRR(a) | | 1.978(a) | | HSBC Bank PLC | | 06/17/29 | | CNY | | | 20,000 | | | | 28,102 | |
6M BUBOR(c) | | 6.550(e) | | HSBC Bank PLC | | 06/18/34 | | HUF | | | 340,000 | | | | (19,934 | ) |
|
| |
| | | | | | |
| TOTAL | | | | | | | | | | | | | | | $ (24,589 | ) |
|
| |
| | (a) | Payments made quarterly. |
| | (b) | Represents forward starting interest rate swaps whose effective dates of commencement of accruals and cash flows occur subsequent to October 31, 2024. |
| | (c) | Payments made semi-annually. |
| | (d) | Payments made at maturity. |
| | (e) | Payments made annually. |
| | * | There are no upfront payments on the swap contracts, therefore the unrealized gain (loss) on the swap contracts is equal to their market value. |
OVER-THE-COUNTER CREDIT DEFAULT SWAP CONTRACTS
| | | | | | | | | | | | | | | | | | | | | | | | |
| Reference Obligation/Index | | Financing Rate
Received/(Paid)
by the Fund(a) | | Credit
Spread
at October 31,
2024(b) | | Counterparty | | Termination
Date | | | Notional
Amount
(000s) | | | Value | | | Upfront
Premiums
(Received)
Paid | | | Unrealized
Appreciation/
(Depreciation) |
|
|
| | | | | | | | |
Protection Sold: | | | | | | | | | | | | | | | | | | | | | | | | |
American Airlines Group, Inc., 3.750%, 03/01/25 | | 5.000% | | 5.252% | | Citibank NA | | | 06/20/28 | | | | $630 | | | | $(1,172) | | | | $(36,094) | | | $34,922 |
|
|
| | (a) | Payments made quarterly. |
| | (b) | Credit spread on the referenced obligation, together with the term of the swap contract, are indicators of payment/performance risk. The likelihood of a credit event occurring which would require a fund or its counterparty to make a payment or otherwise be required to perform under the swap contract is generally greater as the credit spread and the term of the swap contract increase. |
| | |
| The accompanying notes are an integral part of these financial statements. | | 51 |
GOLDMAN SACHS MULTI-MANAGER NON-CORE FIXED INCOME FUND
|
Schedule of Investments (continued) October 31, 2024 |
|
|
ADDITIONAL INVESTMENT INFORMATION (continued) |
CENTRALLY CLEARED CREDIT DEFAULT SWAP CONTRACTS
| | | | | | | | | | | | | | | | | | | | | | | | |
| Referenced Obligation/Index | | Financing Rate
Received/(Paid)
by the Fund(a) | | Credit
Spread
at October 31,
2024(b) | | Termination
Date | | | Notional
Amount
(000s) | | | Value | | | Upfront
Premiums
(Received)
Paid | | | Unrealized
Appreciation/
(Depreciation) | |
|
| |
| | | | | | | |
Protection Sold: | | | | | | | | | | | | | | | | | | | | | | | | |
CDX.NA.HY Index 43 | | 5.000% | | 3.358% | | | 12/20/29 | | | | $46,720 | | | | $3,481,850 | | | | $3,265,520 | | | | $216,330 | |
|
| |
| | (a) | Payments made quarterly. |
| | (b) | Credit spread on the referenced obligation, together with the term of the swap contract, are indicators of payment/performance risk. The likelihood of a credit event occurring which would require a fund or its counterparty to make a payment or otherwise be required to perform under the swap contract is generally greater as the credit spread and the term of the swap contract increase. |
PURCHASED OPTIONS CONTRACTS — At October 31, 2024, the Fund had the following purchased options:
OVER-THE-COUNTER OPTIONS ON FOREIGN CURRENCY
| | | | | | | | | | | | | | | | | | | | | | | | | | | | | | |
| Description | | Counterparty | | Exercise
Price | | | Expiration
Date | | | Number of
Contracts | | | Notional
Amount | | | Market
Value | | | Premiums Paid
(Received) by
Fund | | | Unrealized
Appreciation/
(Depreciation) | |
|
| |
| | | | | |
Purchased option contracts | | | | | | | | | | | | | | | | | | | | | |
Puts | | | | | | | | | | | | | | | | | | | | | | | | | | | | | | |
Put EUR/Call USD | | Barclays Bank PLC | | | $19.143 | | | | 12/05/2024 | | | | 10,000,000 | | | | $10,000,000 | | | | $ 3,731 | | | | $165,955 | | | | $(162,224) | |
Put MXN/Call USD | | Capital Securities Corp. | | | 21.330 | | | | 03/13/2025 | | | | 4,900,000 | | | | 4,900,000 | | | | 95,641 | | | | 119,312 | | | | (23,671) | |
|
| |
| | | | | | | | |
| | | | | | | | | | | | | 14,900,000 | | | | $14,900,000 | | | | $99,372 | | | | $285,267 | | | | $(185,895) | |
|
| |
| | |
|
|
| Currency Abbreviations: |
| AUD | | —Australian Dollar |
| BRL | | —Brazil Real |
| CAD | | —Canadian Dollar |
| CLP | | —Chilean Peso |
| CNH | | —Chinese Yuan Renminbi Offshore |
| CNY | | —Chinese Yuan Renminbi |
| COP | | —Colombia Peso |
| CZK | | —Czech Republic Koruna |
| DOP | | —Dominican Republic Peso |
| EGP | | —Egypt Pound |
| EUR | | —Euro |
| GBP | | —British Pound |
| HUF | | —Hungarian Forint |
| IDR | | —Indonesia Rupiah |
| INR | | —Indian Rupee |
| KRW | | —South Korean Won |
| MXN | | —Mexican Peso |
| MYR | | —Malaysia Ringgit |
| NGN | | —Nigeria Naira |
| PEN | | —Peru Nuevo Sol |
| PHP | | —Philippines Peso |
| PLN | | —Polish Zloty |
| RON | | —Romania New Leu |
| SGD | | —Singapore Dollar |
| THB | | —Thailand Baht |
| TRY | | —Turkish Lira |
| TWD | | —Taiwan Dollar |
| USD | | —U.S. Dollar |
| UYU | | —Uruguay Peso |
| ZAR | | —South African Rand |
|
|
| | |
| 52 | | The accompanying notes are an integral part of these financial statements. |
GOLDMAN SACHS MULTI-MANAGER NON-CORE FIXED INCOME FUND
|
|
ADDITIONAL INVESTMENT INFORMATION (continued) |
| | |
|
|
| Investment Abbreviations: |
| CLO | | —Collateralized Loan Obligation |
| CMT | | —Constant Maturity Treasury Indexes |
| EURIBOR | | —Euro Interbank Offered Rate |
| ICE | | —Inter-Continental Exchange |
| LIBOR | | —London Interbank Offered Rate |
| LLC | | —Limited Liability Company |
| LP | | —Limited Partnership |
| PIK | | —Payment in kind |
| PLC | | —Public Limited Company |
| REIT | | —Real Estate Investment Trust |
| SOFR | | —Secured Overnight Financing Rate |
| SPX | | —S&P 500 Index |
|
|
| | |
|
|
| Abbreviations: |
| 1M BID Avg | | —1 Month Brazilian Interbank Deposit Average |
| BofA Securities LLC | | —Bank of America Securities LLC |
| BUBOR | | —Budapest Interbank Offered Rate |
| CDX.NA.HY Ind 43 | | —CDX North America High Yield Index 43 |
| CLICP | | —Sinacofi Chile Interbank Rate |
| CNRR | | —China Fixing Repo Rate |
| MIBOR | | —Mumbai Interbank Offered Rate |
| MS & Co. Int. PLC | | —Morgan Stanley & Co. International PLC |
|
|
| | |
| The accompanying notes are an integral part of these financial statements. | | 53 |
GOLDMAN SACHS MULTI-MANAGER REAL ASSETS STRATEGY FUND
|
Schedule of Investments October 31, 2024 |
| | | | | | | | |
| | | Shares | |
Description | | Value | |
| |
| | | Common Stocks – 97.2% | |
| |
| | Australia – 4.0% | |
| | 202,351 | | APA Group (Gas Utilities) | | $ | 926,515 | |
| | 443,160 | | Aurizon Holdings Ltd. (Ground Transportation) | | | 982,604 | |
| | 848,704 | | Cleanaway Waste Management Ltd. | | | | |
| | | | (Commercial Services & Supplies) | | | 1,519,512 | |
| | 603,142 | | Goodman Group (Industrial REITs) | | | 14,402,724 | |
| | 1,226,409 | | Mirvac Group (Diversified REITs) | | | 1,714,441 | |
| | 906,518 | | National Storage REIT (Specialized REITs) | | | 1,491,400 | |
| | 309,882 | | NEXTDC Ltd.* (IT Services) | | | 3,310,184 | |
| | 2,185,071 | | Scentre Group (Retail REITs) | | | 5,009,638 | |
| | 2,144,004 | | Stockland (Diversified REITs) | | | 7,250,209 | |
| | | | | | | | |
| | | | | | | 36,607,227 | |
| | | |
| | |
| | Belgium – 0.3% | | | | |
| | 53,569 | | Shurgard Self Storage Ltd. (Specialized REITs) | | | 2,294,047 | |
| | | |
| | | |
| | Brazil – 0.5% | | | | | | |
| | 135,656 | | Cia de Saneamento Basico do Estado de Sao Paulo SABESP ADR (Water Utilities) | | | 2,155,574 | |
| | 559,480 | | Cia Paranaense de Energia - Copel (Electric Utilities) | | | 842,960 | |
| | 757,400 | | Santos Brasil Participacoes SA (Transportation Infrastructure) | | | 1,654,753 | |
| | | | | | | | |
| | | | | | | 4,653,287 | |
| | | |
| | |
| | Canada – 7.8% | | | | |
| | 111,855 | | Allied Properties Real Estate Investment Trust (Office REITs) | | | 1,475,761 | |
| | 87,212 | | Canadian Apartment Properties REIT (Residential REITs) | | | 2,905,710 | |
| | 11,288 | | Canadian National Railway Co. (Ground Transportation) | | | 1,218,911 | |
| | 155,323 | | Chartwell Retirement Residences (Health Care Providers & Services) | | | 1,745,829 | |
| | 531,316 | | Enbridge, Inc. (Oil, Gas & Consumable Fuels) | | | 21,460,992 | |
| | 110,932 | | First Capital Real Estate Investment Trust (Retail REITs) | | | 1,416,577 | |
| | 53,236 | | GFL Environmental, Inc. (Commercial Services & Supplies) | | | 2,225,265 | |
| | 115,840 | | InterRent Real Estate Investment Trust (Residential REITs) | | | 947,619 | |
| | 141,980 | | Keyera Corp. (Oil, Gas & Consumable Fuels) | | | 4,360,301 | |
| | 100,696 | | Killam Apartment Real Estate Investment Trust (Residential REITs) | | | 1,352,401 | |
| | 359,174 | | Pembina Pipeline Corp. (Oil, Gas & Consumable Fuels) | | | 15,026,312 | |
| | 73,221 | | South Bow Corp.* (Oil, Gas & Consumable Fuels) | | | 1,828,487 | |
| | 323,955 | | TC Energy Corp. (Oil, Gas & Consumable Fuels) | | | 15,067,566 | |
| | | | | | | | |
| | | | | | | 71,031,731 | |
| | | |
| | | | | | | | |
| | | Shares | |
Description | | Value | |
| |
| | | Common Stocks (continued) | |
| | |
| | China – 0.7% | | | | |
| | 11,766,000 | | China Tower Corp. Ltd. Class H(a) (Diversified Telecommunication Services) | | $ | 1,587,597 | |
| | 683,500 | | ENN Energy Holdings Ltd. (Gas Utilities) | | | 4,815,455 | |
| | | | | | | | |
| | | | | | | 6,403,052 | |
| | | |
| | |
| | France – 3.9% | | | | |
| | 29,740 | | Eiffage SA (Construction & Engineering) | | | 2,768,010 | |
| | 35,149 | | Engie SA (Multi-Utilities) | | | 589,150 | |
| | 16,915 | | Gecina SA (Office REITs) | | | 1,807,673 | |
| | 225,315 | | Klepierre SA (Retail REITs) | | | 7,203,679 | |
| | 50,941 | | Unibail-Rodamco-Westfield* (Retail REITs) | | | 4,165,562 | |
| | 166,711 | | Vinci SA (Construction & Engineering) | | | 18,675,080 | |
| | | | | | | | |
| | | | | | | 35,209,154 | |
| | | |
| | |
| | Germany – 1.4% | | | | |
| | 141,648 | | E.ON SE (Multi-Utilities) | | | 1,911,550 | |
| | 326,695 | | Vonovia SE (Real Estate | | | | |
| | | | Management & Development) | | | 10,710,936 | |
| | | | | | | | |
| | | | | | | 12,622,486 | |
| | | |
| | |
| | Hong Kong – 2.1% | | | | |
| | 257,700 | | China Resources Gas Group Ltd. (Gas Utilities) | | | 993,595 | |
| | 150,500 | | CLP Holdings Ltd. (Electric Utilities) | | | 1,278,437 | |
| | 1,773,200 | | Hong Kong & China Gas Co. Ltd. (Gas Utilities) | | | 1,373,460 | |
| | 896,000 | | Kunlun Energy Co. Ltd. (Gas Utilities) | | | 849,732 | |
| | 1,427,293 | | Link REIT (Retail REITs) | | | 6,650,354 | |
| | 127,500 | | Power Assets Holdings Ltd. (Electric Utilities) | | | 849,311 | |
| | 538,765 | | Sun Hung Kai Properties Ltd. (Real Estate Management & Development) | | | 5,833,729 | |
| | 420,969 | | Swire Properties Ltd. (Real Estate Management & Development) | | | 856,755 | |
| | 288,000 | | Wharf Real Estate Investment Co. Ltd. (Real Estate Management & Development) | | | 865,898 | |
| | | | | | | | |
| | | | | | | 19,551,271 | |
| | | |
| | |
| | Italy – 0.6% | | | | |
| | 120,121 | | Enel SpA (Electric Utilities) | | | 911,007 | |
| | 283,841 | | Italgas SpA (Gas Utilities) | | | 1,741,252 | |
| | 604,170 | | Snam SpA (Gas Utilities) | | | 2,902,375 | |
| | | | | | | | |
| | | | | | | 5,554,634 | |
| | | |
| | |
| | Japan – 5.0% | | | | |
| | 484 | | Advance Residence Investment Corp. (Residential REITs) | | | 972,606 | |
| | 93,200 | | Chubu Electric Power Co., Inc. (Electric Utilities) | | | 1,071,349 | |
| | | |
| | |
| 54 | | The accompanying notes are an integral part of these financial statements. |
GOLDMAN SACHS MULTI-MANAGER REAL ASSETS STRATEGY FUND
| | | | | | | | |
| | | Shares | |
Description | | Value | |
| |
| | | Common Stocks (continued) | |
| |
| | Japan (continued) | |
| | 885 | | Daiwa House REIT Investment Corp. (Diversified REITs) | | $ | 1,347,993 | |
| | 4,570 | | GLP J-Reit (Industrial REITs) | | | 4,018,495 | |
| | 6,446 | | Invincible Investment Corp. (Hotel & Resort REITs) | | | 2,625,577 | |
| | 29,600 | | Japan Airport Terminal Co. Ltd. (Transportation Infrastructure) | | | 1,084,311 | |
| | 1,976 | | Japan Hotel REIT Investment Corp. (Hotel & Resort REITs) | | | 911,132 | |
| | 2,701 | | Japan Metropolitan Fund Invest (Retail REITs) | | | 1,657,770 | |
| | 319,584 | | Mitsubishi Estate Co. Ltd. (Real Estate Management & Development) | | | 4,726,017 | |
| | 1,232,771 | | Mitsui Fudosan Co. Ltd. (Real Estate Management & Development) | | | 10,518,432 | |
| | 598 | | Nippon Accommodations Fund, Inc. (Residential REITs) | | | 2,394,713 | |
| | 5,505 | | Nippon Building Fund, Inc. (Office REITs) | | | 4,728,199 | |
| | 1,548 | | Nippon Prologis REIT, Inc. (Industrial REITs) | | | 2,490,550 | |
| | 991 | | Nomura Real Estate Master Fund, Inc. (Diversified REITs) | | | 935,518 | |
| | 2,838 | | Sekisui House Reit, Inc. (Diversified REITs) | | | 1,349,449 | |
| | 32,606 | | Sumitomo Realty & Development Co. Ltd. (Real Estate Management & Development) | | | 967,216 | |
| | 154,700 | | Tokyo Gas Co. Ltd. (Gas Utilities) | | | 3,816,895 | |
| | | | | | | | |
| | | | | | | 45,616,222 | |
| | | |
| | |
| | Luxembourg – 0.1% | | | | |
| | 264,196 | | SES SA (Media) | | | 1,055,875 | |
| | | |
| | |
| | Malaysia – 0.1% | | | | |
| | 258,900 | | Tenaga Nasional Bhd. (Electric Utilities) | | | 828,257 | |
| | | |
| | |
| | Mexico – 0.6% | | | | |
| | 13,480 | | Grupo Aeroportuario del Pacifico SAB de CV ADR (Transportation Infrastructure) | | | 2,346,733 | |
| | 80,807 | | Grupo Aeroportuario del Sureste SAB de CV Class B (Transportation Infrastructure) | | | 2,161,247 | |
| | 2,850 | | Grupo Aeroportuario del Sureste SAB de CV ADR (Transportation Infrastructure) | | | 767,448 | |
| | 151,424 | | Prologis Property Mexico SA de CV (Industrial REITs) | | | 506,803 | |
| | | | | | | | |
| | | | | | | 5,782,231 | |
| | | |
| | |
| | Netherlands – 0.2% | | | | |
| | 34,301 | | Koninklijke Vopak NV (Oil, Gas & Consumable Fuels) | | | 1,581,231 | |
| | | |
| | |
| | New Zealand – 0.1% | | | | |
| | 226,090 | | Auckland International Airport Ltd. (Transportation Infrastructure) | | | 986,478 | |
| | | |
| | | | | | | | |
| | | Shares | |
Description | | Value | |
| |
| | | Common Stocks (continued) | |
| |
| | Philippines – 0.2% | |
| | 261,030 | | International Container Terminal Services, Inc. (Transportation Infrastructure) | | $ | 1,778,831 | |
| | | |
| | |
| | Singapore – 1.5% | | | | |
| | 938,490 | | CapitaLand Ascendas REIT (Industrial REITs) | | | 1,901,857 | |
| | 2,351,811 | | CapitaLand Integrated Commercial Trust (Retail REITs) | | | 3,573,055 | |
| | 850,316 | | CapitaLand Investment Ltd. (Real Estate Management & Development) | | | 1,796,367 | |
| | 2,113,071 | | Frasers Logistics & Commercial Trust (Industrial REITs) | | | 1,702,881 | |
| | 389,500 | | Keppel DC REIT (Specialized REITs) | | | 670,901 | |
| | 1,330,600 | | Mapletree Industrial Trust (Industrial REITs) | | | 2,402,686 | |
| | 1,664,539 | | Mapletree Logistics Trust (Industrial REITs) | | | 1,660,224 | |
| | | | | | | | |
| | | | | | | 13,707,971 | |
| | | |
| | |
| | Spain – 3.3% | | | | |
| | 27,059 | | Aena SME SA(a) (Transportation Infrastructure) | | | 5,996,818 | |
| | 395,047 | | Cellnex Telecom SA*(a) (Diversified Telecommunication Services) | | | 14,508,399 | |
| | 446,185 | | Merlin Properties Socimi SA (Diversified REITs) | | | 4,978,663 | |
| | 41,061 | | Naturgy Energy Group SA (Gas Utilities) | | | 1,022,370 | |
| | 199,495 | | Redeia Corp. SA (Electric Utilities) | | | 3,693,781 | |
| | | | | | | | |
| | | | | | | 30,200,031 | |
| | | |
| | |
| | Sweden – 1.0% | | | | |
| | 49,662 | | Catena AB (Real Estate Management & Development) | | | 2,276,424 | |
| | 293,890 | | Fastighets AB Balder Class B* (Real Estate Management & Development) | | | 2,286,326 | |
| | 92,034 | | Sagax AB Class B (Real Estate Management & Development) | | | 2,217,914 | |
| | 236,861 | | Wihlborgs Fastigheter AB (Real Estate Management & Development) | | | 2,489,849 | |
| | | | | | | | |
| | | | | | | 9,270,513 | |
| | | |
| | |
| | Switzerland – 0.1% | | | | |
| | 4,415 | | PSP Swiss Property AG (Real Estate Management & Development) | | | 626,974 | |
| | 5,982 | | Swiss Prime Site AG (Real Estate Management & Development) | | | 648,937 | |
| | | | | | | | |
| | | | | | | 1,275,911 | |
| | | |
| | |
| | United Kingdom – 5.1% | | | | |
| | 75,737 | | Big Yellow Group PLC (Specialized REITs) | | | 1,179,722 | |
| | 556,159 | | British Land Co. PLC (Diversified REITs) | | | 2,861,969 | |
| | 723,281 | | Grainger PLC (Real Estate Management & Development) | | | 2,117,082 | |
| | 1,905,582 | | National Grid PLC (Multi-Utilities) | | | 23,926,772 | |
| | | |
| | |
| The accompanying notes are an integral part of these financial statements. | | 55 |
GOLDMAN SACHS MULTI-MANAGER REAL ASSETS STRATEGY FUND
|
Schedule of Investments (continued) October 31, 2024 |
| | | | | | | | |
| | | Shares | |
Description | | Value | |
| |
| | | Common Stocks (continued) | |
| |
| | United Kingdom (continued) | |
| | 45,020 | | Pennon Group PLC (Water Utilities) | | $ | 316,088 | |
| | 179,602 | | Safestore Holdings PLC (Specialized REITs) | | | 1,873,112 | |
| | 520,993 | | Segro PLC (Industrial REITs) | | | 5,278,899 | |
| | 42,990 | | Severn Trent PLC (Water Utilities) | | | 1,422,204 | |
| | 1,071,215 | | Tritax Big Box REIT PLC (Industrial REITs) | | | 1,948,984 | |
| | 396,959 | | UNITE Group PLC (Residential REITs) | | | 4,490,423 | |
| | 109,077 | | United Utilities Group PLC (Water Utilities) | | | 1,439,538 | |
| | | | | | | | |
| | | | | | | 46,854,793 | |
| | | |
| | |
| | United States – 58.6% | | | | |
| | 49,955 | | Agree Realty Corp. (Retail REITs) | | | 3,709,159 | |
| | 13,295 | | Alexandria Real Estate Equities, Inc. (Health Care REITs) | | | 1,483,057 | |
| | 24,117 | | Alliant Energy Corp. (Electric Utilities) | | | 1,447,020 | |
| | 13,941 | | Ameren Corp. (Multi-Utilities) | | | 1,214,400 | |
| | 222,262 | | American Healthcare REIT, Inc. (Health Care REITs) | | | 5,912,169 | |
| | 225,203 | | American Homes 4 Rent Class A (Residential REITs) | | | 7,936,154 | |
| | 152,027 | | American Tower Corp. (Specialized REITs) | | | 32,463,846 | |
| | 233,445 | | Americold Realty Trust, Inc. (Industrial REITs) | | | 5,994,868 | |
| | 68,931 | | Atmos Energy Corp. (Gas Utilities) | | | 9,566,244 | |
| | 41,366 | | AvalonBay Communities, Inc. (Residential REITs) | | | 9,167,119 | |
| | 155,656 | | Brixmor Property Group, Inc. (Retail REITs) | | | 4,194,929 | |
| | 269,446 | | Broadstone Net Lease, Inc. (Diversified REITs) | | | 4,739,555 | |
| | 152,765 | | CareTrust REIT, Inc. (Health Care REITs) | | | 4,990,833 | |
| | 228,434 | | CenterPoint Energy, Inc. (Multi-Utilities) | | | 6,745,656 | |
| | 36,679 | | Cheniere Energy, Inc. (Oil, Gas & Consumable Fuels) | | | 7,019,627 | |
| | 19,212 | | Consolidated Edison, Inc. (Multi-Utilities) | | | 1,953,476 | |
| | 32,393 | | COPT Defense Properties (Office REITs) | | | 1,043,055 | |
| | 73,085 | | Cousins Properties, Inc. (Office REITs) | | | 2,238,594 | |
| | 108,556 | | Crown Castle, Inc. (Specialized REITs) | | | 11,668,684 | |
| | 32,912 | | CubeSmart (Specialized REITs) | | | 1,574,510 | |
| | 86,208 | | Digital Realty Trust, Inc. (Specialized REITs) | | | 15,364,852 | |
| | 62,192 | | DT Midstream, Inc. (Oil, Gas & Consumable Fuels) | | | 5,606,609 | |
| | 118,160 | | Edison International (Electric Utilities) | | | 9,736,384 | |
| | 31,681 | | Equinix, Inc. (Specialized REITs) | | | 28,768,882 | |
| | | |
| | | | | | | | |
| | | Shares | |
Description | | Value | |
| |
| | | Common Stocks (continued) | |
| |
| | United States (continued) | |
| | 74,030 | | Equity LifeStyle Properties, Inc. (Residential REITs) | | $ | 5,190,984 | |
| | 69,136 | | Equity Residential (Residential REITs) | | | 4,865,100 | |
| | 184,377 | | Essential Properties Realty Trust, Inc. (Diversified REITs) | | | 5,842,907 | |
| | 88,188 | | Essential Utilities, Inc. (Water Utilities) | | | 3,404,057 | |
| | 28,122 | | Essex Property Trust, Inc. (Residential REITs) | | | 7,982,711 | |
| | 20,137 | | Evergy, Inc. (Electric Utilities) | | | 1,217,080 | |
| | 59,503 | | Eversource Energy (Electric Utilities) | | | 3,918,273 | |
| | 343,700 | | Exelon Corp. (Electric Utilities) | | | 13,507,410 | |
| | 94,056 | | Extra Space Storage, Inc. (Specialized REITs) | | | 15,359,345 | |
| | 62,892 | | Gaming & Leisure Properties, Inc. (Specialized REITs) | | | 3,156,549 | |
| | 184,524 | | Healthpeak Properties, Inc. (Health Care REITs) | | | 4,142,564 | |
| | 115,173 | | Host Hotels & Resorts, Inc. (Hotel & Resort REITs) | | | 1,985,583 | |
| | 20,594 | | InvenTrust Properties Corp. (Retail REITs) | | | 606,493 | |
| | 193,373 | | Invitation Homes, Inc. (Residential REITs) | | | 6,073,846 | |
| | 53,530 | | Iron Mountain, Inc. (Specialized REITs) | | | 6,623,267 | |
| | 120,059 | | Kilroy Realty Corp. (Office REITs) | | | 4,828,773 | |
| | 210,474 | | Kinder Morgan, Inc. (Oil, Gas & Consumable Fuels) | | | 5,158,718 | |
| | 28,504 | | Kinetik Holdings, Inc. (Oil, Gas & Consumable Fuels) | | | 1,387,290 | |
| | 41,704 | | Lineage, Inc. (Industrial REITs) | | | 3,087,764 | |
| | 231,149 | | LXP Industrial Trust (Industrial REITs) | | | 2,182,047 | |
| | 10,563 | | Marriott Vacations Worldwide Corp. (Hotels, Restaurants & Leisure) | | | 813,668 | |
| | 20,681 | | Mid-America Apartment Communities, Inc. (Residential REITs) | | | 3,129,863 | |
| | 20,836 | | National Health Investors, Inc. (Health Care REITs) | | | 1,597,079 | |
| | 315,016 | | NiSource, Inc. (Multi-Utilities) | | | 11,075,963 | |
| | 193,406 | | NNN REIT, Inc. (Retail REITs) | | | 8,401,557 | |
| | 8,040 | | Norfolk Southern Corp. (Ground Transportation) | | | 2,013,457 | |
| | 3,097 | | Omega Healthcare Investors, Inc. (Health Care REITs) | | | 131,530 | |
| | 7,260 | | ONE Gas, Inc. (Gas Utilities) | | | 517,420 | |
| | 97,402 | | ONEOK, Inc. (Oil, Gas & Consumable Fuels) | | | 9,436,306 | |
| | 884,028 | | PG&E Corp. (Electric Utilities) | | | 17,875,046 | |
| | 170,662 | | Piedmont Office Realty Trust, Inc. Class A (Office REITs) | | | 1,696,380 | |
| | 34,536 | | Pinnacle West Capital Corp. (Electric Utilities) | | | 3,032,606 | |
| | 65,676 | | PPL Corp. (Electric Utilities) | | | 2,138,411 | |
| | 208,647 | | Prologis, Inc. (Industrial REITs) | | | 23,564,592 | |
| | | |
| | |
| 56 | | The accompanying notes are an integral part of these financial statements. |
GOLDMAN SACHS MULTI-MANAGER REAL ASSETS STRATEGY FUND
| | | | | | | | |
| | | Shares | |
Description | | Value | |
| |
| | | Common Stocks (continued) | |
| |
| | United States (continued) | |
| | 13,383 | | Public Service Enterprise Group, Inc. (Multi-Utilities) | | $ | 1,196,574 | |
| | 12,791 | | Public Storage (Specialized REITs) | | | 4,209,006 | |
| | 12,168 | | Realty Income Corp. (Retail REITs) | | | 722,414 | |
| | 126,877 | | Regency Centers Corp. (Retail REITs) | | | 9,064,093 | |
| | 136,765 | | Retail Opportunity Investments Corp. (Retail REITs) | | | 2,119,857 | |
| | 87,300 | | Rexford Industrial Realty, Inc. (Industrial REITs) | | | 3,744,297 | |
| | 36,846 | | Ryman Hospitality Properties, Inc. (Hotel & Resort REITs) | | | 3,944,364 | |
| | 189,333 | | Sabra Health Care REIT, Inc. (Health Care REITs) | | | 3,673,060 | |
| | 33,786 | | SBA Communications Corp. (Specialized REITs) | | | 7,752,873 | |
| | 139,980 | | Sempra (Multi-Utilities) | | | 11,670,133 | |
| | 52,061 | | Simon Property Group, Inc. (Retail REITs) | | | 8,804,556 | |
| | 34,361 | | SL Green Realty Corp. (Office REITs) | | | 2,598,035 | |
| | 62,270 | | STAG Industrial, Inc. (Industrial REITs) | | | 2,321,426 | |
| | 29,664 | | Sun Communities, Inc. (Residential REITs) | | | 3,935,820 | |
| | 75,743 | | Targa Resources Corp. (Oil, Gas & Consumable Fuels) | | | 12,646,051 | |
| | 27,728 | | Terreno Realty Corp. (Industrial REITs) | | | 1,662,294 | |
| | 105,938 | | UDR, Inc. (Residential REITs) | | | 4,469,524 | |
| | 175,391 | | Ventas, Inc. (Health Care REITs) | | | 11,486,357 | |
| | 310,867 | | Veris Residential, Inc. (Residential REITs) | | | 5,119,979 | |
| | 286,698 | | VICI Properties, Inc. (Specialized REITs) | | | 9,105,528 | |
| | 55,510 | | Vornado Realty Trust (Office REITs) | | | 2,298,669 | |
| | 6,076 | | Waste Connections, Inc. (Commercial | | | | |
| | | | Services & Supplies) | | | 1,074,073 | |
| | 214,830 | | Welltower, Inc. (Health Care REITs) | | | 28,976,270 | |
| | 434,676 | | Williams Cos., Inc. (Oil, Gas & Consumable Fuels) | | | 22,763,982 | |
| | | | | | | | |
| | | | | | | 535,843,556 | |
| | | |
| | |
| | TOTAL COMMON STOCKS
(Cost $746,084,475) | | $ | 888,708,789 | |
| | | |
| | | | | | | | | | | | | | |
| | | | | Shares | | | Dividend
Rate | | Value | |
| |
| | Investment Company(b) – 2.4% | |
| |
| | Goldman Sachs Financial Square Government Fund — Institutional Shares | |
| | | | | 22,153,421 | | | 4.766% | | $ | 22,153,421 | |
| | (Cost $ 22,153,421) | |
| | | |
| | TOTAL INVESTMENTS – 99.6%
(Cost $768,237,896) | | $ | 910,862,210 | |
| | | |
| | |
| | OTHER ASSETS IN EXCESS OF
LIABILITIES – 0.4% | | | 3,634,165 | |
| | | |
| | |
| | NET ASSETS – 100.0% | | $ | 914,496,375 | |
| | | |
| | |
| The percentage shown for each investment category reflects the value of investments in that category as a percentage of net assets. |
| |
| * | | Non-income producing security. |
| |
| (a) | | Exempt from registration under Rule 144A of the Securities Act of 1933. |
| |
| (b) | | Represents an affiliated issuer. |
| | | | | | | | |
| |
| | SECTOR ALLOCATION AS OF OCTOBER 31, 2024 |
| | | | | |
| Sector | | |
| % of Total
Market Value |
|
| |
Real Estate | | | | 58.8% | |
| |
Utilities | | | | 17.5 | |
| |
Energy | | | | 13.5 | |
| |
Industrials | | | | 5.2 | |
| |
Investment Company | | | | 2.4 | |
| |
Communication Services | | | | 1.9 | |
| |
Information Technology | | | | 0.4 | |
| |
Health Care | | | | 0.2 | |
| |
Consumer Discretionary | | | | 0.1 | |
| |
| | | | | | |
| | | | 100.0% | |
| |
| | | | | | |
|
|
ADDITIONAL INVESTMENT INFORMATION |
FORWARD FOREIGN CURRENCY EXCHANGE CONTRACTS — At October 31, 2024, the Fund had the following forward foreign currency exchange contracts:
FORWARD FOREIGN CURRENCY EXCHANGE CONTRACTS WITH UNREALIZED GAIN
| | | | | | | | | | | | | | | | | | | | | | | | | | | | |
| Counterparty | | Currency
Purchased | | | | | | Currency Sold | | | | | | Settlement
Date | | | | Unrealized
Gain | |
|
| |
| | | | | | | | | |
State Street Bank and Trust | | SGD | | | 37,484 | | | | | | | USD | | | 28,331 | | | | | | | 11/04/24 | | | | | $60 | |
|
| |
| | |
| The accompanying notes are an integral part of these financial statements. | | 57 |
GOLDMAN SACHS MULTI-MANAGER REAL ASSETS STRATEGY FUND
|
Schedule of Investments (continued) October 31, 2024 |
|
|
ADDITIONAL INVESTMENT INFORMATION (continued) |
FORWARD FOREIGN CURRENCY EXCHANGE CONTRACTS WITH UNREALIZED LOSS
| | | | | | | | | | | | | | | | | | |
| Counterparty | | Currency
Purchased | | | Currency Sold | | | Settlement Date | | Unrealized
Loss | |
|
| |
| | | | | | |
State Street Bank and Trust | | USD | | | 87,699 | | | SGD | | | 116,285 | | | 11/01/24 | | | $(367) | |
|
| |
FUTURES CONTRACTS — At October 31, 2024, the Fund had the following futures contracts:
| | | | | | | | | | | | |
| Description | | Number of
Contracts | | Expiration
Date | | Notional
Amount | | | Unrealized
Appreciation/
(Depreciation) | |
|
| |
| | | | |
Long position contracts: | | | | | | | | | | | | |
Dow Jones U.S. Real Estate Index | | 482 | | 12/20/24 | | | $18,214,780 | | | | $(879,630) | |
|
| |
| | |
|
|
| Currency Abbreviations: |
| SGD | | —Singapore Dollar |
| USD | | —U.S. Dollar |
|
|
| | |
|
|
| Investment Abbreviations: |
| ADR | | —American Depositary Receipt |
| PLC | | —Public Limited Company |
| REIT | | —Real Estate Investment Trust |
|
|
| | |
| 58 | | The accompanying notes are an integral part of these financial statements. |
GOLDMAN SACHS STRATEGIC MULTI-ASSET CLASS FUNDS
|
Statements of Assets and Liabilities October 31, 2024 |
| | | | | | | | | | | | | | | | |
| | | | | Multi-Manager
Global Equity
Fund | | | Multi-Manager
Non-Core Fixed
Income Fund | | | Multi-Manager
Real Assets
Strategy Fund | | | |
| | | | | |
| | Assets: | | | | | | | | | | | | | | |
| | | | | |
| | Investments in unaffiliated issuers, at value (cost $983,638,622, $1,522,793,575 and $746,084,475, respectively) | | $ | 1,204,638,148 | | | $ | 1,515,904,520 | | | $ | 888,708,789 | | | |
| | Investments in affiliated issuers, at value (cost $115,475,175, $91,077,387 and $22,153,421, respectively) | | | 115,475,175 | | | | 91,077,387 | | | | 22,153,421 | | | |
| | Purchased options, at value (premium paid $0, $285,267 and $0, respectively) | | | — | | | | 99,372 | | | | — | | | |
| | Cash | | | 1,897,311 | | | | 8,035,282 | | | | 1,580,936 | | | |
| | Foreign currencies, at value (cost $514,212, $5,061,732 and $528,998, respectively) | | | 428,816 | | | | 4,828,931 | | | | 530,058 | | | |
| | Unrealized gain on swap contracts | | | — | | | | 189,730 | | | | — | | | |
| | Unrealized gain on forward foreign currency exchange contracts | | | 5,916,441 | | | | 6,525,661 | | | | 60 | | | |
| | Unrealized gain on unfunded loan commitment | | | — | | | | 223 | | | | — | | | |
| | Receivables: | | | | | | | | | | | | | | |
| | Investments sold | | | 52,468,678 | | | | 87,721,158 | | | | 19,348,257 | | | |
| | Collateral on certain derivative contracts(a) | | | 5,723,866 | | | | 8,133,358 | | | | 1,113,420 | | | |
| | Interest and dividends | | | 1,364,746 | | | | 22,491,404 | | | | 1,451,976 | | | |
| | Investments sold on an extended-settlement basis | | | 1,037,661 | | | | 8,539,289 | | | | 236,329 | | | |
| | Foreign tax reclaims | | | 684,607 | | | | 326,281 | | | | 101,879 | | | |
| | Reimbursement from investment adviser | | | 94,712 | | | | — | | | | — | | | |
| | Due from broker - upfront payment | | | — | | | | 6,532 | | | | — | | | |
| | Other assets | | | 110,391 | | | | 19,222 | | | | 16,215 | | | |
| | |
| | | | | |
| | Total assets | | | 1,389,840,552 | | | | 1,753,898,350 | | | | 935,241,340 | | | |
| | |
| | | | | | | | | | | | | | | | |
| | | | | |
| | Liabilities: | | | | | | | | | | | | | | |
| | | | | |
| | Variation margin on futures contracts | | | 1,678,517 | | | | — | | | | 308,463 | | | |
| | Unrealized loss on forward foreign currency exchange contracts | | | 910,552 | | | | 7,482,594 | | | | 367 | | | |
| | Unrealized loss on swap contracts | | | — | | | | 179,397 | | | | — | | | |
| | Variation margin on swaps contracts | | | — | | | | 288,001 | | | | — | | | |
| | Payables: | | | | | | | | | | | | | | |
| | Fund shares redeemed | | | 59,115,000 | | | | 53,457,500 | | | | 17,189,000 | | | |
| | Investments purchased | | | 8,803,194 | | | | 54,003,508 | | | | 2,473,098 | | | |
| | Due to broker | | | 2,240,000 | | | | 1,530,013 | | | | — | | | |
| | Foreign Capital Gains taxes | | | 800,565 | | | | — | | | | — | | | |
| | Investments purchased on an extended-settlement basis | | | 394,689 | | | | 10,383,050 | | | | 63,359 | | | |
| | Management fees | | | 223,308 | | | | 285,845 | | | | 227,703 | | | |
| | Transfer Agency fees | | | 12,296 | | | | 15,076 | | | | 8,651 | | | |
| | Income distributions | | | — | | | | 39,026 | | | | — | | | |
| | Upfront payments received on swap contracts | | | — | | | | 36,094 | | | | — | | | |
| | Accrued expenses | | | 1,063,882 | | | | 944,511 | | | | 474,324 | | | |
| | |
| | | | | |
| | Total liabilities | | | 75,242,003 | | | | 128,644,615 | | | | 20,744,965 | | | |
| | |
| | | | | | | | | | | | | | | | |
| | | | | |
| | Net Assets: | | | | | | | | | | | | | | |
| | | | | |
| | Paid-in capital | | | 1,073,046,607 | | | | 1,821,679,833 | | | | 784,577,002 | | | |
| | Total distributable earnings (loss) | | | 241,551,942 | | | | (196,426,098 | ) | | | 129,919,373 | | | |
| | |
| | | | | |
| | NET ASSETS | | | $1,314,598,549 | | | | $1,625,253,735 | | | | $914,496,375 | | | |
| | |
| | | | | |
| | Shares Outstanding $0.001 par value (unlimited number of shares authorized): | | | 111,405,976 | | | | 213,946,373 | | | | 88,442,782 | | | |
| | Net asset value, offering and redemption price per share: | | $ | 11.80 | | | $ | 7.60 | | | $ | 10.34 | | | |
| | |
| | (a) | Segregated for initial margin and/or collateral as follows: |
| | | | | | | | | | | | | | |
| Fund | | Futures | | | Swaps | | | Forwards | | | |
Multi-Manager Global Equity Fund | | $ | 5,723,866 | | | $ | — | | | $ | — | | | |
Multi-Manager Non-Core Fixed Income Fund | | | — | | | | 7,483,358 | | | | 650,000 | | | |
Multi-Manager Real Assets Strategy Fund | | | 1,113,420 | | | | — | | | | — | | | |
| | |
| The accompanying notes are an integral part of these financial statements. | | 59 |
GOLDMAN SACHS STRATEGIC MULTI-ASSET CLASS FUNDS
|
Statements of Operations For the Fiscal Year Ended October 31, 2024 |
| | | | | | | | | | | | | | | | |
| | | | | Multi-Manager
Global Equity
Fund | | | Multi-Manager
Non-Core Fixed
Income Fund | | | Multi-Manager
Real Assets
Strategy Fund | | | |
| | | | | |
| | Investment Income: | | | | | | | | | | | | | | |
| | | | | |
| | Dividends — unaffiliated issuers (net of tax withholding of $798,686, $0 and $1,459,199,respectively) | | $ | 15,012,014 | | | $ | 311,678 | | | $ | 27,160,865 | | | |
| | | | | |
| | Dividends — affiliated issuers | | | 4,263,725 | | | | 5,576,511 | | | | 1,067,188 | | | |
| | | | | |
| | Interest (net of foreign withholding taxes of $2, $681,058 and $0, respectively) | | | — | | | | 110,863,979 | | | | 53,134 | | | |
| | |
| | Total investment income | | | 19,275,739 | | | | 116,752,168 | | | | 28,281,187 | | | |
| | |
| | | | | | | | | | | | | | | | |
| | | | | |
| | Expenses: | | | | | | | | | | | | | | |
| | | | | |
| | Management fees | | | 10,941,885 | | | | 12,480,191 | | | | 8,052,123 | | | |
| | | | | |
| | Custody, accounting and administrative services | | | 1,658,865 | | | | 1,299,692 | | | | 705,344 | | | |
| | | | | |
| | Professional fees | | | 395,470 | | | | 392,356 | | | | 255,785 | | | |
| | | | | |
| | Transfer Agency fees | | | 214,731 | | | | 293,652 | | | | 161,104 | | | |
| | | | | |
| | Registration fees | | | 41,973 | | | | 38,172 | | | | 30,421 | | | |
| | | | | |
| | Trustee fees | | | 30,558 | | | | 31,379 | | | | 29,576 | | | |
| | | | | |
| | Printing and mailing costs | | | 25,266 | | | | 30,447 | | | | 21,053 | | | |
| | | | | |
| | Prime broker fees | | | 8,293 | | | | 459 | | | | — | | | |
| | | | | |
| | Other | | | 88,364 | | | | 71,251 | | | | 28,585 | | | |
| |
| | |
| | | | | |
| | Total expenses | | | 13,405,405 | | | | 14,637,599 | | | | 9,283,991 | | | |
| |
| | |
| | | | | |
| | Less — expense reductions | | | (8,038,867 | ) | | | (6,895,630 | ) | | | (3,717,926 | ) | | |
| |
| | |
| | | | | |
| | Net expenses | | | 5,366,538 | | | | 7,741,969 | | | | 5,566,065 | | | |
| |
| | |
| | | | | |
| | NET INVESTMENT INCOME | | | 13,909,201 | | | | 109,010,199 | | | | 22,715,122 | | | |
| | |
| | | | | | | | | | | | | | | | |
| | | | | |
| | Realized and unrealized gain (loss): | | | | | | | | | | | | | | |
| | | | | |
| | Net realized gain (loss) from: | | | | | | | | | | | | | | |
| | | | | |
| | Investments — unaffiliated issuers (including commission recapture of $29,321, $0 and $12,420, respectively) | | | 15,638,033 | | | | (23,044,293 | ) | | | 4,045,884 | | | |
| | | | | |
| | Purchased options | | | — | | | | (363,117 | ) | | | — | | | |
| | | | | |
| | Futures contracts | | | 13,562,476 | | | | (55,320 | ) | | | 3,093,143 | | | |
| | | | | |
| | Written options | | | — | | | | 131,580 | | | | — | | | |
| | | | | |
| | Swap contracts | | | — | | | | 4,540,599 | | | | — | | | |
| | | | | |
| | Forward foreign currency exchange contracts | | | (3,524,993 | ) | | | 3,619,358 | | | | 19,868 | | | |
| | | | | |
| | Foreign currency transactions | | | (890,963 | ) | | | (278,876 | ) | | | (61,472 | ) | | |
| | | | | |
| | Net change in unrealized gain (loss) on: | | | | | | | | | | | | | | |
| | | | | |
| | Investments — unaffiliated issuers (including the effects of foreign capital gains tax of $(635,557), $(122,027) and $0, respectively) | | | 191,832,732 | | | | 69,128,064 | | | | 166,766,597 | | | |
| | | | | |
| | Unfunded loan commitment | | | — | | | | 223 | | | | — | | | |
| | | | | |
| | Purchased options | | | — | | | | (60,156 | ) | | | — | | | |
| | | | | |
| | Futures contracts | | | 5,401,962 | | | | 80,178 | | | | 449,876 | | | |
| | | | | |
| | Written options | | | — | | | | (55,965 | ) | | | — | | | |
| | | | | |
| | Swap contracts | | | — | | | | 184,025 | | | | — | | | |
| | | | | |
| | Forward foreign currency exchange contracts | | | 3,975,294 | | | | (60,482 | ) | | | (307 | ) | | |
| | | | | |
| | Foreign currency translation | | | (127,593 | ) | | | (387,257 | ) | | | (15,882 | ) | | |
| | |
| | | | | |
| | Net realized and unrealized gain | | | 225,866,948 | | | | 53,378,561 | | | | 174,297,707 | | | |
| | |
| | | | | |
| | NET INCREASE IN NET ASSETS RESULTING FROM OPERATIONS | | $ | 239,776,149 | | | $ | 162,388,760 | | | $ | 197,012,829 | | | |
| | |
| | |
| 60 | | The accompanying notes are an integral part of these financial statements. |
GOLDMAN SACHS STRATEGIC MULTI-ASSET CLASS FUNDS
|
Statements of Changes in Net Assets |
| | | | | | | | | | | | | | | | | | | | |
| | | | | Multi-Manager Global Equity Fund | | | Multi-Manager Non-Core Fixed Income Fund | | | |
| | | | | | |
| | | | | For the Fiscal
Year Ended
October 31, 2024 | | | For the Fiscal
Year Ended
October 31, 2023 | | | For the Fiscal
Year Ended
October 31, 2024 | | | For the Fiscal
Year Ended
October 31, 2023 | | | |
| | | | | | |
| | From operations: | | | | | | | | | | | | | | | | | | |
| | | | | | |
| | Net investment income | | $ | 13,909,201 | | | $ | 8,347,911 | | | $ | 109,010,199 | | | $ | 83,044,960 | | | |
| | | | | | |
| | Net realized gain (loss) | | | 24,784,553 | | | | (8,743,420 | ) | | | (15,450,069 | ) | | | (64,556,135 | ) | | |
| | | | | | |
| | Net change in unrealized gain | | | 201,082,395 | | | | 30,341,779 | | | | 68,828,630 | | | | 81,014,697 | | | |
| | |
| | | | | | |
| | Net increase in net assets resulting from operations | | | 239,776,149 | | | | 29,946,270 | | | | 162,388,760 | | | | 99,503,522 | | | |
| | |
| | | | | | | | | | | | | | | | | | | | |
| | | | | | |
| | Distributions to shareholders: | | | | | | | | | | | | | | | | | | |
| | | | | | |
| | From distributable earnings | | | (10,768,945 | ) | | | (39,162,975 | ) | | | (111,334,449 | ) | | | (81,470,590 | ) | | |
| | | | | | |
| | From return of capital | | | — | | | | — | | | | — | | | | (3,475,605 | ) | | |
| | |
| | | | | | |
| | Total distributions to shareholders | | | (10,768,945 | ) | | | (39,162,975 | ) | | | (111,334,449 | ) | | | (84,946,195 | ) | | |
| | |
| | | | | | | | | | | | | | | | | | | | |
| | | | | | |
| | From share transactions: | | | | | | | | | | | | | | | | | | |
| | | | | | |
| | Proceeds from sales of shares | | | 603,550,395 | | | | 511,675,000 | | | | 809,497,000 | | | | 424,368,538 | | | |
| | | | | | |
| | Reinvestment of distributions | | | 10,768,945 | | | | 39,162,975 | | | | 111,049,666 | | | | 84,946,195 | | | |
| | | | | | |
| | Cost of shares redeemed | | | (290,198,440 | ) | | | (152,480,805 | ) | | | (417,022,512 | ) | | | (438,813,157 | ) | | |
| | |
| | | | | | |
| | Net increase in net assets resulting from share transactions | | | 324,120,900 | | | | 398,357,170 | | | | 503,524,154 | | | | 70,501,576 | | | |
| | |
| | | | | | |
| | TOTAL INCREASE | | | 553,128,104 | | | | 389,140,465 | | | | 554,578,465 | | | | 85,058,903 | | | |
| | |
| | | | | | | | | | | | | | | | | | | | |
| | | | | | |
| | Net assets: | | | | | | | | | | | | | | | | | | |
| | | | | | |
| | Beginning of year | | | 761,470,445 | | | | 372,329,980 | | | | 1,070,675,270 | | | | 985,616,367 | | | |
| | |
| | End of year | | $ | 1,314,598,549 | | | $ | 761,470,445 | | | $ | 1,625,253,735 | | | $ | 1,070,675,270 | | | |
| | |
| | |
| The accompanying notes are an integral part of these financial statements. | | 61 |
GOLDMAN SACHS STRATEGIC MULTI-ASSET CLASS FUNDS
|
Statements of Changes in Net Assets (continued) |
| | | | | | | | | | | | | | |
| | | | | Multi-Manager Real Assets Strategy Fund | | | | |
| | | | |
| | | | | For the Fiscal
Year Ended
October 31, 2024 | | | For the Fiscal
Year Ended
October 31, 2023 | | | | |
| | | | |
| | From operations: | | | | | | | | | | | | |
| | | | |
| | Net investment income | | | $ 22,715,122 | | | | $ 12,539,205 | | | | | |
| | | | |
| | Net realized gain (loss) | | | 7,097,423 | | | | (17,572,776 | ) | | | | |
| | | | |
| | Net change in unrealized gain (loss) | | | 167,200,284 | | | | (20,639,834 | ) | | | | |
| | | |
| | | | |
| | Net increase (decrease) in net assets resulting from operations | | | 197,012,829 | | | | (25,673,405 | ) | | | | |
| | | |
| | | | | | | | | | | | | | |
| | | | |
| | Distributions to shareholders: | | | | | | | | | | | | |
| | | | |
| | From distributable earnings | | | (15,471,294 | ) | | | (25,978,821 | ) | | | | |
| | | |
| | | | | | | | | | | | | | |
| | | | |
| | From share transactions: | | | | | | | | | | | | |
| | | | |
| | Proceeds from sales of shares | | | 357,847,599 | | | | 205,108,061 | | | | | |
| | | | |
| | Reinvestment of distributions | | | 15,471,294 | | | | 25,890,049 | | | | | |
| | | | |
| | Cost of shares redeemed | | | (212,893,728 | ) | | | (22,035,027 | ) | | | | |
| | | |
| | | | |
| | Net increase in net assets resulting from share transactions | | | 160,425,165 | | | | 208,963,083 | | | | | |
| | | |
| | | | |
| | TOTAL INCREASE | | | 341,966,700 | | | | 157,310,857 | | | | | |
| | | |
| | | | | | | | | | | | | | |
| | | | |
| | Net assets: | | | | | | | | | | | | |
| | | | |
| | Beginning of year | | | 572,529,675 | | | | 415,218,818 | | | | | |
| | | |
| | | | |
| | End of year | | | $ 914,496,375 | | | | $572,529,675 | | | | | |
| | | |
| | |
| 62 | | The accompanying notes are an integral part of these financial statements. |
GOLDMAN SACHS STRATEGIC MULTI-ASSET CLASS FUNDS
|
Financial Highlights Selected Share Data for a Share Outstanding Throughout Each Year |
| | | | | | | | | | | | | | | | | | | | | | | | | | | |
| | | | | Multi-Manager Global Equity Fund |
| | |
| | | | | Class R6 Shares |
| | |
| | | | | Year Ended October 31, |
| | | | | | |
| | | | | 2024 | | 2023 | | 2022 | | 2021 | | 2020 |
| | | | | | |
| | Per Share Data | | | | | | | | | | | | | | | | | | | | | | | | | |
| | | | | | |
| | Net asset value, beginning of year | | | $ | 9.22 | | | | $ | 9.09 | | | | $ | 14.91 | | | | $ | 10.64 | | | | $ | 10.97 | |
| | | |
| | | | | | |
| | Net investment income(a) | | | | 0.14 | | | | | 0.14 | | | | | 0.13 | | | | | 0.14 | | | | | 0.14 | |
| | | | | | |
| | Net realized and unrealized gain (loss) | | | | 2.57 | | | | | 0.74 | | | | | (2.39 | ) | | | | 4.37 | | | | | 0.15 | |
| | | |
| | | | | | |
| | Total from investment operations | | | | 2.71 | | | | | 0.88 | | | | | (2.26 | ) | | | | 4.51 | | | | | 0.29 | |
| | | |
| | | | | | |
| | Distributions to shareholders from net investment income | | | | (0.13 | ) | | | | (0.31 | ) | | | | (0.18 | ) | | | | (0.09 | ) | | | | (0.33) | |
| | | | | | |
| | Distributions to shareholders from net realized gains | | | | — | | | | | (0.44 | ) | | | | (3.38 | ) | | | | (0.15 | ) | | | | (0.29) | |
| | | |
| | | | | | |
| | Total distributions | | | | (0.13 | ) | | | | (0.75 | ) | | | | (3.56 | ) | | | | (0.24 | ) | | | | (0.62) | |
| | | |
| | | | | | |
| | Net asset value, end of year | | | $ | 11.80 | | | | $ | 9.22 | | | | $ | 9.09 | | | | $ | 14.91 | | | | $ | 10.64 | |
| | | |
| | | | | | |
| | Total return(b) | | | | 29.62 | % | | | | 10.10 | % | | | | (19.61 | )% | | | | 42.93 | % | | | | 2.60% | |
| | | |
| | | | | | |
| | Net assets, end of year (in 000s) | | | $ | 1,314,599 | | | | $ | 761,470 | | | | $ | 372,330 | | | | $ | 526,397 | | | | $ | 527,449 | |
| | | | | | |
| | Ratio of net expenses to average net assets | | | | 0.50 | % | | | | 0.53 | % | | | | 0.52 | % | | | | 0.51 | % | | | | 0.46% | |
| | | | | | |
| | Ratio of total expenses to average net assets | | | | 1.25 | % | | | | 1.40 | % | | | | 1.48 | % | | | | 1.31 | % | | | | 1.53% | |
| | | | | | |
| | Ratio of net investment income to average net assets | | | | 1.30 | % | | | | 1.43 | % | | | | 1.19 | % | | | | 1.07 | % | | | | 1.34% | |
| | | | | | |
| | Portfolio turnover rate(c) | | | | 66 | % | | | | 60 | % | | | | 90 | % | | | | 83 | % | | | | 79% | |
| | | |
| | (a) | Calculated based on the average shares outstanding methodology. |
| | (b) | Assumes investment at the NAV at the beginning of the year, reinvestment of all dividends and distributions, a complete redemption of the investment at the NAV at the end of the year and no sales or redemption charges (if any). Total returns would be reduced if a sales or redemption charge was taken into account. Returns do not reflect the impact of taxes to shareholders relating to Fund distributions or the redemption of Fund shares. |
| | (c) | The Fund’s portfolio turnover rate is calculated in accordance with regulatory requirements, without regard to transactions involving short term investments and certain derivatives. If such transactions were included, the Fund’s portfolio turnover rate may be higher. |
| | |
| The accompanying notes are an integral part of these financial statements. | | 63 |
GOLDMAN SACHS STRATEGIC MULTI-ASSET CLASS FUNDS
|
Financial Highlights (continued) Selected Share Data for a Share Outstanding Throughout Each Year |
| | | | | | | | | | | | | | | | | | | | | | | | | | | |
| | | | | Multi-Manager Non-Core Fixed Income Fund |
| | |
| | | | | Class R6 Shares |
| | |
| | | | | Year Ended October 31, |
| | | | | | |
| | | | | 2024 | | 2023 | | 2022 | | 2021 | | 2020 |
| | | | | | |
| | Per Share Data | | | | | | | | | | | | | | | | | | | | | | | | | |
| | | | | | |
| | Net asset value, beginning of year | | | $ | 7.26 | | | | $ | 7.13 | | | | $ | 8.91 | | | | $ | 8.70 | | | | $ | 9.06 | |
| | | |
| | | | | | |
| | Net investment income(a) | | | | 0.56 | | | | | 0.56 | | | | | 0.43 | | | | | 0.43 | | | | | 0.45 | |
| | | | | | |
| | Net realized and unrealized gain (loss) | | | | 0.36 | | | | | 0.14 | | | | | (1.77 | ) | | | | 0.22 | | | | | (0.35) | |
| | | |
| | | | | | |
| | Total from investment operations | | | | 0.92 | | | | | 0.70 | | | | | (1.34 | ) | | | | 0.65 | | | | | 0.10 | |
| | | |
| | | | | | |
| | Distributions to shareholders from net investment income | | | | (0.58 | ) | | | | (0.55 | ) | | | | (0.24 | ) | | | | (0.41 | ) | | | | (0.40) | |
| | | | | | |
| | Distributions to shareholders from return of capital | | | | — | | | | | (0.02 | ) | | | | (0.20 | ) | | | | (0.03 | ) | | | | (0.06) | |
| | | |
| | | | | | |
| | Total distributions | | | | (0.58 | ) | | | | (0.57 | ) | | | | (0.44 | ) | | | | (0.44 | ) | | | | (0.46) | |
| | | |
| | | | | | |
| | Net asset value, end of year | | | $ | 7.60 | | | | $ | 7.26 | | | | $ | 7.13 | | | | $ | 8.91 | | | | $ | 8.70 | |
| | | |
| | | | | | |
| | Total return(b) | | | | 12.94 | % | | | | 9.89 | % | | | | (15.42 | )% | | | | 7.47 | % | | | | 1.21% | |
| | | |
| | | | | | |
| | Net assets, end of year (in 000s) | | | $ | 1,625,254 | | | | $ | 1,070,675 | | | | $ | 985,616 | | | | $ | 1,425,079 | | | | $ | 940,024 | |
| | | | | | |
| | Ratio of net expenses to average net assets | | | | 0.53 | % | | | | 0.57 | % | | | | 0.56 | % | | | | 0.55 | % | | | | 0.60% | |
| | | | | | |
| | Ratio of total expenses to average net assets | | | | 1.00 | % | | | | 1.02 | % | | | | 1.02 | % | | | | 0.98 | % | | | | 1.04% | |
| | | | | | |
| | Ratio of net investment income to average net assets | | | | 7.42 | % | | | | 7.47 | % | | | | 5.32 | % | | | | 4.69 | % | | | | 5.20% | |
| | | | | | |
| | Portfolio turnover rate(c) | | | | 123 | % | | | | 101 | % | | | | 78 | % | | | | 96 | % | | | | 102% | |
| | | |
| | (a) | Calculated based on the average shares outstanding methodology. |
| | (b) | Assumes investment at the NAV at the beginning of the year, reinvestment of all dividends and distributions, a complete redemption of the investment at the NAV at the end of the year and no sales or redemption charges (if any). Total returns would be reduced if a sales or redemption charge was taken into account. Returns do not reflect the impact of taxes to shareholders relating to Fund distributions or the redemption of Fund shares. |
| | (c) | The Fund’s portfolio turnover rate is calculated in accordance with regulatory requirements, without regard to transactions involving short term investments and certain derivatives. If such transactions were included, the Fund’s portfolio turnover rate may be higher. |
| | |
| 64 | | The accompanying notes are an integral part of these financial statements. |
GOLDMAN SACHS STRATEGIC MULTI-ASSET CLASS FUNDS
|
Financial Highlights (continued) Selected Share Data for a Share Outstanding Throughout Each Year |
| | | | | | | | | | | | | | | | | | | | | | | | | | | |
| | | | | Multi-Manager Real Assets Strategy Fund |
| | |
| | | | | Class R6 Shares |
| | |
| | | | | Year Ended October 31, |
| | | | | | |
| | | | | 2024 | | 2023 | | 2022 | | 2021 | | 2020 |
| | | | | | |
| | Per Share Data | | | | | | | | | | | | | | | | | | | | | | | | | |
| | | | | | |
| | Net asset value, beginning of year | | | $ | 8.21 | | | | $ | 8.95 | | | | $ | 11.76 | | | | $ | 8.93 | | | | $ | 10.78 | |
| | | |
| | | | | | |
| | Net investment income(a) | | | | 0.27 | | | | | 0.23 | | | | | 0.20 | | | | | 0.22 | | | | | 0.19 | |
| | | | | | |
| | Net realized and unrealized gain (loss) | | | | 2.08 | | | | | (0.44 | ) | | | | (2.40 | ) | | | | 2.76 | | | | | (1.51) | |
| | | |
| | | | | | |
| | Total from investment operations | | | | 2.35 | | | | | (0.21 | ) | | | | (2.20 | ) | | | | 2.98 | | | | | (1.32) | |
| | | |
| | | | | | |
| | Distributions to shareholders from net investment income | | | | (0.22 | ) | | | | (0.11 | ) | | | | (0.35 | ) | | | | (0.15 | ) | | | | (0.35) | |
| | | | | | |
| | Distributions to shareholders from net realized gains | | | | — | | | | | (0.42 | ) | | | | (0.26 | ) | | | | — | | | | | (0.18) | |
| | | |
| | | | | | |
| | Total distributions | | | | (0.22 | ) | | | | (0.53 | ) | | | | (0.61 | ) | | | | (0.15 | ) | | | | (0.53) | |
| | | |
| | | | | | |
| | Net asset value, end of year | | | $ | 10.34 | | | | $ | 8.21 | | | | $ | 8.95 | | | | $ | 11.76 | | | | $ | 8.93 | |
| | | |
| | | | | | |
| | Total return(b) | | | | 28.99 | % | | | | (2.88 | )% | | | | (19.78 | )% | | | | 33.70 | % | | | | (12.86)% | |
| | | |
| | | | | | |
| | Net assets, end of year (in 000s) | | | $ | 914,496 | | | | $ | 572,530 | | | | $ | 415,219 | | | | $ | 733,307 | | | | $ | 459,950 | |
| | | | | | |
| | Ratio of net expenses to average net assets | | | | 0.69 | % | | | | 0.76 | % | | | | 0.74 | % | | | | 0.69 | % | | | | 0.77% | |
| | | | | | |
| | Ratio of total expenses to average net assets | | | | 1.15 | % | | | | 1.22 | % | | | | 1.21 | % | | | | 1.16 | % | | | | 1.21% | |
| | | | | | |
| | Ratio of net investment income to average net assets | | | | 2.82 | % | | | | 2.56 | % | | | | 1.87 | % | | | | 2.08 | % | | | | 2.02% | |
| | | | | | |
| | Portfolio turnover rate(c) | | | | 85 | % | | | | 73 | % | | | | 104 | % | | | | 96 | % | | | | 92% | |
| | | |
| | (a) | Calculated based on the average shares outstanding methodology. |
| | (b) | Assumes investment at the NAV at the beginning of the year, reinvestment of all dividends and distributions, a complete redemption of the investment at the NAV at the end of the year and no sales or redemption charges (if any). Total returns would be reduced if a sales or redemption charge was taken into account. Returns do not reflect the impact of taxes to shareholders relating to Fund distributions or the redemption of Fund shares. |
| | (c) | The Fund’s portfolio turnover rate is calculated in accordance with regulatory requirements, without regard to transactions involving short term investments and certain derivatives. If such transactions were included, the Fund’s portfolio turnover rate may be higher. |
| | |
| The accompanying notes are an integral part of these financial statements. | | 65 |
GOLDMAN SACHS STRATEGIC MULTI-ASSET CLASS FUNDS
|
Notes to Financial Statements October 31, 2024 |
Goldman Sachs Trust II (the “Trust”) is a Delaware statutory trust registered under the Investment Company Act of 1940, as amended (the “Act”), as an open-end management investment company. The following table lists those series of the Trust that are included in this report (collectively, the “Funds” or individually a “Fund”), along with their corresponding share classes and respective diversification status under the Act:
| | | | |
| Fund | | Share Classes Offered | | Diversified/ Non-Diversified |
| | |
| Goldman Sachs Multi-Manager Global Equity Fund | | Class R6 | | Diversified |
| | |
| Goldman Sachs Multi-Manager Non-Core Fixed Income Fund | | Class R6 | | Diversified |
| | |
| Goldman Sachs Multi-Manager Real Assets Strategy Fund | | Class R6 | | Diversified |
Goldman Sachs Asset Management, L.P. (“GSAM”), an affiliate of Goldman Sachs & Co. LLC (“Goldman Sachs”), serves as investment adviser to the Funds pursuant to management agreements (each, an “Agreement”) with the Trust. As of October 31, 2024, GSAM had sub-advisory agreements (the “Sub-Advisory Agreements”) for the Multi-Manager Global Equity Fund with Axiom Investors LLC, Boston Partners Global Investors, Inc., Causeway Capital Management LLC, Diamond Hill Capital Management Inc., GW&K Investment Management, LLC, Massachusetts Financial Services Company, doing business as MFS Investment Management, Principal Global Investors, LLC, T. Rowe Price Associates, Inc., Vaughan Nelson Investment Management, L.P., LLC, WCM Investment Management, LLC and Wellington Management Company LLP; for the Multi-Manager Non-Core Fixed Income Fund with Ares Capital Management II LLC, Aristotle Pacific Capital, LLC (formerly Pacific Asset Management LLC), Brigade Capital Management, LP, Marathon Asset Management, L.P., Ninety One North America, Inc., RBC Global Asset Management (UK) Limited, doing business as RBC BlueBay Asset Management (formerly BlueBay Asset Management LLP), RBC Global Asset Management (U.S.) Inc., doing business as RBC Global Asset Management and TCW Investment Management Company LLC; and for the Multi-Manager Real Assets Strategy Fund with Cohen & Steers Capital Management, Inc., Principal Real Estate Investors, LLC, PGIM Real Estate, a business unit of PGIM, Inc., and RREEF America L.L.C. (the “Underlying Managers”). Pursuant to the terms of the Sub-Advisory Agreements, the Underlying Managers are responsible for making investment decisions and managing the investments of the Fund. GSAM compensates the Underlying Managers directly in accordance with the terms of the Sub-Advisory Agreements. The Funds are not charged any separate or additional investment advisory fees by the Underlying Managers.
|
|
2. SIGNIFICANT ACCOUNTING POLICIES |
The financial statements have been prepared in accordance with accounting principles generally accepted in the United States of America (“GAAP”) and require management to make estimates and assumptions that may affect the reported amounts and disclosures. Actual results may differ from those estimates and assumptions. Each Fund is an investment company under GAAP and follows the accounting and reporting guidance applicable to investment companies.
A. Investment Valuation — The Funds’ valuation policy is to value investments at fair value.
B. Investment Income and Investments — Investment income includes interest income, dividend income and securities lending income, if any. Interest income is accrued daily and adjusted for amortization of premiums and accretion of discounts. Dividend income is recognized on ex-dividend date or, for certain foreign securities, as soon as such information is obtained subsequent to the ex-dividend date. Non-cash dividends, if any, are recorded at the fair market value of the securities received. Investment transactions are reflected on trade date. Realized gains and losses are calculated using identified cost. Investment transactions are recorded on the following business day for daily net asset value (“NAV”) calculations.
Investment income is recorded net of any foreign withholding taxes, less any amounts reclaimable. The Funds may file withholding tax reclaims in certain jurisdictions to recover a portion of amounts previously withheld. These reclaims, if any, are recorded when the amount is known and there are no significant uncertainties on collectability. Such amounts recovered, if any, are reflected as other income in the Statements of Operations. Any foreign capital gains tax is accrued daily based upon net unrealized
GOLDMAN SACHS STRATEGIC MULTI-ASSET CLASS FUNDS
|
|
2. SIGNIFICANT ACCOUNTING POLICIES (continued) |
gains, and is payable upon sale of such investments. Distributions received from the Funds’ investments in U.S. real estate investment trusts (“REITs”) may be characterized as ordinary income, net capital gain and/ or a return of capital. A return of capital is recorded by the Funds as a reduction to the cost basis of the REIT. For derivative contracts, unrealized gains and losses are recorded daily and become realized gains and losses upon disposition or termination of the contract. Upfront payments, if any, are made or received upon entering into a swap agreement and are reflected in the Statements of Assets and Liabilities. Upfront payments are recognized over the contract’s term/event as realized gains or losses, with the exception of forward starting swap contracts whose realized gains or losses are recognized from the effective start date.
C. Expenses — Expenses incurred directly by a Fund are charged to the Fund, and certain expenses incurred by the Trust are allocated across the applicable Funds on a straight-line and/or pro-rata basis, depending upon the nature of the expenses, and are accrued daily.
D. Federal Taxes and Distributions to Shareholders — It is each Fund’s policy to comply with the requirements of the Internal Revenue Code of 1986, as amended (the “Code”), applicable to regulated investment companies and to distribute each year substantially all of its investment company taxable income and capital gains to its shareholders. Accordingly, each Fund is not required to make any provisions for the payment of federal income tax. Distributions to shareholders are recorded on the ex-dividend date. Income and capital gains distributions, if any, are declared and paid according to the following schedule:
| | | | |
| Fund | | Income Distributions Declared/Paid | | Capital Gains Distributions Declared/Paid |
| | |
| Multi-Manager Global Equity Fund, Multi-Manager Real Assets Strategy Fund | | Annually | | Annually |
| | |
| Multi-Manager Non-Core Fixed Income Fund | | Daily/Monthly | | Annually |
Net capital losses, if any, are carried forward to future fiscal years and may be used to the extent allowed by the Code to offset any future capital gains. Losses that are carried forward will retain their character as either short-term or long-term capital losses. Utilization of capital loss carryforwards will reduce the requirement of future capital gains distributions.
The characterization of distributions to shareholders for financial reporting purposes is determined in accordance with federal income tax rules, which may differ from GAAP. The source of each Fund’s distributions may be shown in the accompanying financial statements as either from distributable earnings or capital. Certain components of the Funds’ net assets on the Statements of Assets and Liabilities reflect permanent GAAP/tax differences based on the appropriate tax character.
E. Foreign Currency Translation — The accounting records and reporting currency of a Fund are maintained in U.S. dollars. Assets and liabilities denominated in foreign currencies are translated into U.S. dollars using the current exchange rates at the close of each business day. The effect of changes in foreign currency exchange rates on investments is included within net realized and unrealized gain (loss) on investments. Changes in the value of other assets and liabilities as a result of fluctuations in foreign exchange rates are included in the Statements of Operations within net change in unrealized gain (loss) on foreign currency translation. Transactions denominated in foreign currencies are translated into U.S. dollars on the date the transaction occurred, the effects of which are included within net realized gain (loss) on foreign currency transactions.
F. Commission Recapture — GSAM, on behalf of certain Funds, may direct portfolio trades, subject to seeking best execution, to various brokers who have agreed to rebate a portion of the commissions generated. Such rebates are made directly to a Fund as cash payments and are included in net realized gain (loss) from investments on the Statements of Operations.
|
|
3. INVESTMENTS AND FAIR VALUE MEASUREMENTS |
U.S. GAAP defines the fair value of a financial instrument as the amount that would be received to sell an asset or paid to transfer a liability in an orderly transaction between market participants at the measurement date (i.e., the exit price); the Funds’ policy is to use the market approach. GAAP establishes a fair value hierarchy that prioritizes the inputs to valuation techniques used to measure fair value. The hierarchy gives the highest priority to unadjusted quoted prices in active markets for identical assets or
GOLDMAN SACHS STRATEGIC MULTI-ASSET CLASS FUNDS
|
Notes to Financial Statements (continued) October 31, 2024 |
|
|
3. INVESTMENTS AND FAIR VALUE MEASUREMENTS (continued) |
liabilities (Level 1 measurements) and the lowest priority to unobservable inputs (Level 3 measurements). The level in the fair value hierarchy within which the fair value measurement in its entirety falls shall be determined based on the lowest level input that is significant to the fair value measurement in its entirety. The levels used for classifying investments are not necessarily an indication of the risk associated with investing in these investments. The three levels of the fair value hierarchy are described below:
Level 1 — Unadjusted quoted prices in active markets that are accessible at the measurement date for identical, unrestricted assets or liabilities;
Level 2 — Quoted prices in markets that are not active or financial instruments for which significant inputs are observable (including, but not limited to, quoted prices for similar investments, interest rates, foreign exchange rates, volatility and credit spreads), either directly or indirectly;
Level 3 — Prices or valuations that require significant unobservable inputs (including GSAM’s assumptions in determining fair value measurement).
The Board of Trustees (“Trustees”) has approved Valuation Procedures that govern the valuation of the portfolio investments held by the Funds, including investments for which market quotations are not readily available. With respect to the Funds’ investments that do not have readily available market quotations, the Trustees have designated GSAM as the valuation designee to perform fair valuations pursuant to Rule 2a-5 under the Investment Company Act of 1940 (the “Valuation Designee”). GSAM has day-to-day responsibility for implementing and maintaining internal controls and procedures related to the valuation of the Funds’ investments. To assess the continuing appropriateness of pricing sources and methodologies, GSAM regularly performs price verification procedures and issues challenges as necessary to third party pricing vendors or brokers, and any differences are reviewed in accordance with the Valuation Procedures.
A. Level 1 and Level 2 Fair Value Investments — The valuation techniques and significant inputs used in determining the fair values for investments classified as Level 1 and Level 2 are as follows:
Equity Securities — Equity securities traded on a United States (“U.S.”) securities exchange or the NASDAQ system, or those located on certain foreign exchanges, including but not limited to the Americas, are valued daily at their last sale price or official closing price on the principal exchange or system on which they are traded. If there is no sale or official closing price or such price is believed by GSAM to not represent fair value, equity securities will be valued at the valid closing bid price for long positions and at the valid closing ask price for short positions (i.e., where there is sufficient volume, during normal exchange trading hours). If no valid bid/ask price is available, the equity security will be valued pursuant to the Valuation Procedures and consistent with applicable regulatory guidance. To the extent these investments are actively traded, they are classified as Level 1 of the fair value hierarchy, otherwise they are generally classified as Level 2. Certain equity securities containing unique attributes may be classified as Level 2.
Unlisted equity securities for which market quotations are available are valued at the last sale price on the valuation date, or if no sale occurs, at the last bid price for long positions or the last ask price for short positions, and are generally classified as Level 2. Securities traded on certain foreign securities exchanges are valued daily at fair value determined by an independent fair value service (if available) under the Valuation Procedures and consistent with applicable regulatory guidance. The independent fair value service takes into account multiple factors including, but not limited to, movements in the securities markets, certain depositary receipts, futures contracts and foreign currency exchange rates that have occurred subsequent to the close of the foreign securities exchange. These investments are generally classified as Level 2 of the fair value hierarchy.
Underlying Funds (including Money Market Funds) — Underlying funds (“Underlying Funds”) include exchange-traded funds (“ETFs”) and other investment companies. Investments in the Underlying Funds (except ETFs) are valued at the NAV per share on the day of valuation. ETFs are valued daily at the last sale price or official closing price on the principal exchange or system on which the investment is traded. Because the Funds invest in Underlying Funds that fluctuate in value, the Funds’ shares will correspondingly fluctuate in value. Underlying Funds are generally classified as Level 1 of the fair value hierarchy. To the extent that underlying ETFs are actively traded, they are classified as Level 1 of the fair value hierarchy, otherwise they are
GOLDMAN SACHS STRATEGIC MULTI-ASSET CLASS FUNDS
|
|
3. INVESTMENTS AND FAIR VALUE MEASUREMENTS (continued) |
generally classified as Level 2. For information regarding an Underlying Fund’s accounting policies and investment holdings, please see the Underlying Fund’s shareholder report.
Debt Securities — Debt securities for which market quotations are readily available are valued daily on the basis of quotations supplied by dealers or an independent pricing service. The pricing services may use valuation models or matrix pricing, which consider: (i) yield or price with respect to bonds that are considered comparable in characteristics such as rating, interest rate and maturity date or (ii) quotations from securities dealers to determine current value. With the exception of treasury securities of G7 countries, which are generally classified as Level 1, these investments are generally classified as Level 2 of the fair value hierarchy.
i. Bank Loans — Bank loans (“Loans”) are interests in amounts owed by corporate, governmental, or other borrowers to lenders or lending syndicates. Loans are arranged through private negotiations between the borrower and one or more financial institutions (“Lenders”). A Fund’s investments in Loans are in the form of either participations in Loans (“Participations”) or assignments of all or a portion of Loans from third parties (“Assignments”). With respect to Participations, a Fund has the right to receive payments of principal, interest and any fees to which it is entitled from the Lender selling the Participations and only upon receipt by the Lender of the payments from the borrower. A Fund generally has no right to enforce compliance by the borrower with the terms of the loan agreement with respect to Participations. Conversely, assignments result in a Fund having a direct contractual relationship with the borrower, and the Fund may be permitted to enforce compliance by the borrower with the terms of the loan agreement.
Derivative Contracts — A derivative is an instrument whose value is derived from underlying assets, indices, reference rates or a combination of these factors. A Fund enters into derivative transactions to hedge against changes in interest rates, securities prices, and/or currency exchange rates, to increase total return, or to gain access to certain markets or attain exposure to other underliers. For financial reporting purposes, cash collateral that has been pledged to cover obligations of a Fund and cash collateral received, if any, is reported separately on the Statements of Assets and Liabilities as either due to broker/receivable for collateral on certain derivative contracts. Non-cash collateral pledged by a Fund, if any, is noted in the Schedules of Investments.
Exchange-traded derivatives, including futures and options contracts, are generally valued at the last sale or settlement price on the exchange where they are principally traded. Exchange-traded options without settlement prices are generally valued at the midpoint of the bid and ask prices on the exchange where they are principally traded (or, in the absence of two-way trading, at the last bid price for long positions and the last ask price for short positions). Exchange-traded derivatives typically fall within Level 1 of the fair value hierarchy. Over-the-counter (“OTC”) and centrally cleared derivatives are valued using market transactions and other market evidence, including market-based inputs to models, calibration to market-clearing transactions, broker or dealer quotations, or other alternative pricing sources. Where models are used, the selection of a particular model to value OTC and centrally cleared derivatives depends upon the contractual terms of, and specific risks inherent in, the instrument, as well as the availability of pricing information in the market. Valuation models require a variety of inputs, including contractual terms, market prices, yield curves, credit curves, measures of volatility, voluntary and involuntary prepayment rates, loss severity rates and correlations of such inputs. For OTC and centrally cleared derivatives that trade in liquid markets, model inputs can generally be verified and model selection does not involve significant management judgment. OTC and centrally cleared derivatives are classified within Level 2 of the fair value hierarchy when significant inputs are corroborated by market evidence.
i. Forward Contracts — A forward contract is a contract between two parties to buy or sell an asset at a specified price on a future date. A forward contract settlement can occur on a cash or delivery basis. Forward contracts are marked-to-market daily using independent vendor prices, and the change in value, if any, is recorded as an unrealized gain or loss. Cash and certain investments may be used to collateralize forward contracts.
A forward foreign currency exchange contract is a forward contract in which a Fund agrees to receive or deliver a fixed quantity of one currency for another, at a pre-determined price at a future date. All forward foreign currency exchange contracts are marked to market daily by using the outright forward rates or interpolating based upon maturity dates, where available. Non-deliverable forward foreign currency exchange contracts are settled with the counterparty in cash without the delivery of foreign currency.
GOLDMAN SACHS STRATEGIC MULTI-ASSET CLASS FUNDS
|
Notes to Financial Statements (continued) October 31, 2024 |
|
|
3. INVESTMENTS AND FAIR VALUE MEASUREMENTS (continued) |
ii. Futures Contracts — Futures contracts are contracts to buy or sell a standardized quantity of a specified commodity or security. Upon entering into a futures contract, a Fund deposits cash or securities in an account on behalf of the broker in an amount sufficient to meet the initial margin requirement. Subsequent payments are made or received by a Fund equal to the daily change in the contract value and are recorded as variation margin receivable or payable with a corresponding offset to unrealized gains or losses.
iii. Options — When a Fund writes call or put options, an amount equal to the premium received is recorded as a liability and is subsequently marked-to-market to reflect the current value of the option written. Swaptions are options on swap contracts.
Upon the purchase of a call option or a put option by a Fund, the premium paid is recorded as an investment and subsequently marked-to-market to reflect the current value of the option. Certain options may be purchased with premiums to be determined on a future date. The premiums for these options are based upon implied volatility parameters at specified terms.
iv. Swap Contracts — Bilateral swap contracts are agreements in which a Fund and a counterparty agree to exchange periodic payments on a specified notional amount or make a net payment upon termination. Bilateral swap transactions are privately negotiated in the OTC market and payments are settled through direct payments between a Fund and the counterparty. By contrast, certain swap transactions are subject to mandatory central clearing. These swaps are executed through a derivatives clearing member (“DCM”), acting in an agency capacity, and submitted to a central counterparty (“CCP”) (“centrally cleared swaps”), in which case all payments are settled with the CCP through the DCM. Swaps are marked-to-market daily using pricing vendor quotations, counterparty or clearinghouse prices or model prices, and the change in value, if any, is recorded as an unrealized gain or loss. Upon entering into a swap contract, a Fund is required to satisfy an initial margin requirement by delivering cash or securities to the counterparty (or in some cases, segregated in a triparty account on behalf of the counterparty), which can be adjusted by any mark-to-market gains or losses pursuant to bilateral or centrally cleared arrangements. For centrally cleared swaps the daily change in valuation, if any, is recorded as a receivable or payable for variation margin.
An interest rate swap is an agreement that obligates two parties to exchange a series of cash flows at specified intervals, based upon or calculated by reference to changes in interest rates on a specified notional principal amount. The payment flows are usually netted against each other, with the difference being paid by one party to the other.
A credit default swap is an agreement that involves one party (the buyer of protection) making a stream of payments to another party (the seller of protection) in exchange for the right to receive protection on a reference security or obligation, including a group of assets or exposure to the performance of an index. A Fund’s investment in credit default swaps may involve greater risks than if the Fund had invested in the referenced obligation directly. Credit events are contract specific but may include bankruptcy, failure to pay, restructuring and obligation acceleration. If a Fund buys protection through a credit default swap and no credit event occurs, its payments are limited to the periodic payments previously made to the counterparty. Upon the occurrence of a specified credit event, a Fund, as a buyer of credit protection, is entitled to receive an amount equal to the notional amount of the swap and deliver to the seller the defaulted reference obligation in a physically settled trade. A Fund may also receive a net settlement amount in the form of cash or securities equal to the notional amount of the swap reduced by the recovery value of the reference obligation in a cash settled trade.
As a seller of protection, a Fund generally receives a payment stream throughout the term of the swap, provided that there is no credit event. In addition, if a Fund sells protection through a credit default swap, a Fund could suffer a loss because the value of the referenced obligation and the premium payments received may be less than the notional amount of the swap paid to the buyer of protection. Upon the occurrence of a specified credit event, a Fund, as a seller of credit protection, may be required to take possession of the defaulted reference obligation and pay the buyer an amount equal to the notional amount of the swap in a physically settled trade. A Fund may also pay a net settlement amount in the form of cash or securities equal to
GOLDMAN SACHS STRATEGIC MULTI-ASSET CLASS FUNDS
|
|
3. INVESTMENTS AND FAIR VALUE MEASUREMENTS (continued) |
the notional amount of the swap reduced by the recovery value of the reference obligation in a cash settled trade. Recovery values are at times established through the credit event auction process in which market participants are ensured that a transparent price has been set for the defaulted security or obligation. In addition, a Fund is entitled to a return of any assets, which have been pledged as collateral to the counterparty upon settlement.
The maximum potential amount of future payments (undiscounted) that a Fund as seller of protection could be required to make under a credit default swap would be an amount equal to the notional amount of the agreement. These potential amounts would be partially offset by any recovery values of the respective referenced obligations or net amounts received from a settlement of a credit default swap for the same reference security or obligation where a Fund bought credit protection.
B. Level 3 Fair Value Investments — To the extent that significant inputs to valuation models and other alternative pricing sources are unobservable, or if quotations are not readily available, or if GSAM believes that such quotations do not accurately reflect fair value, the fair value of a Fund’s investments may be determined under the Valuation Procedures. GSAM, consistent with its procedures and applicable regulatory guidance, may make an adjustment to the most recent valuation prices of either domestic or foreign securities in light of significant events to reflect what it believes to be the fair value of the securities at the time of determining a Fund’s NAV. To the extent investments are valued using single source broker quotations obtained directly from the broker or passed through from third party pricing vendors, such investments are classified as Level 3 investments.
C. Fair Value Hierarchy — The following is a summary of the Funds’ investments and derivatives classified in the fair value hierarchy as of October 31, 2024:
| | | | | | | | | | | | |
| MULTI-MANAGER GLOBAL EQUITY FUND | | | | | | | | | | | | |
| | | |
| Investment Type | | Level 1 | | | Level 2 | | | Level 3 | |
|
| |
| | | |
Assets | | | | | | | | | | | | |
| | | |
Common Stock and/or Other Equity Investments(a) | | | | | | | | | | | | |
| | | |
Africa | | $ | 1,476,765 | | | $ | 1,039,962 | | | $ | — | |
| | | |
Asia | | | 28,063,132 | | | | 164,794,183 | | | | — | |
| | | |
Australia and Oceania | | | — | | | | 2,756,850 | | | | — | |
| | | |
Europe | | | 39,387,499 | | | | 204,470,863 | | | | — | |
| | | |
North America | | | 746,585,656 | | | | 2,087,708 | | | | — | |
| | | |
South America | | | 9,089,467 | | | | 279,446 | | | | — | |
| | | |
Preferred Stocks | | | — | | | | 2,105,820 | | | | — | |
| | | |
Exchange Traded Funds | | | 2,500,797 | | | | — | | | | — | |
| | | |
Investment Companies | | | 115,475,175 | | | | — | | | | — | |
|
| |
| | | |
Total | | $ | 942,578,491 | | | $ | 377,534,832 | | | $ | — | |
|
| |
| | | |
| Derivative Type | | | | | | | | | |
|
| |
| | | |
Assets(b) | | | | | | | | | | | | |
| | | |
Forward Foreign Currency Exchange Contracts | | $ | — | | | $ | 5,916,441 | | | $ | — | |
| | | |
Futures Contracts | | | 1,216,757 | | | | — | | | | — | |
|
| |
| | | |
Total | | $ | 1,216,757 | | | $ | 5,916,441 | | | $ | — | |
|
| |
| | | |
Liabilities(b) | | | | | | | | | | | | |
| | | |
Forward Foreign Currency Exchange Contracts | | $ | — | | | $ | (910,552 | ) | | $ | — | |
|
| |
| | (a) | Amounts are disclosed by continent to highlight the impact of time zone differences between local market close and the calculation of NAV. Security valuations are based on the principal exchange or system on which they are traded, which may differ from country of domicile. The Funds utilize fair value model prices provided by an independent fair value service for international equities, resulting in a Level 2 classification. |
| | (b) | Amount shown represents unrealized gain (loss) at period end. |
GOLDMAN SACHS STRATEGIC MULTI-ASSET CLASS FUNDS
|
Notes to Financial Statements (continued) October 31, 2024 |
|
|
3. INVESTMENTS AND FAIR VALUE MEASUREMENTS (continued) |
| | | | | | | | | | | | |
| MULTI-MANAGER NON-CORE FIXED INCOME FUND | | | | | | | | | | | | |
| | | |
| Investment Type | | Level 1 | | | Level 2 | | | Level 3 | |
|
| |
| | | |
Assets | | | | | | | | | | | | |
| | | |
Fixed Income | | | | | | | | | | | | |
| | | |
Sovereign Debt Obligations | | $ | — | | | $ | 592,987,362 | | | $ | — | |
| | | |
Corporate Obligations | | | — | | | | 512,179,169 | | | | 5,077,505 | |
| | | |
Bank Loans | | | — | | | | 380,558,296 | | | | 4,884,546 | |
| | | |
U.S. Treasury Obligations | | | 13,793,676 | | | | — | | | | — | |
| | | |
Asset-Backed Securities | | | — | | | | 1,009,502 | | | | — | |
| | | |
Common Stock and/or Other Equity Investments(a) | | | | | | | | | | | | |
| | | |
Europe | | | 89,731 | | | | — | | | | — | |
| | | |
North America | | | 63,309 | | | | 1,668,685 | | | | 3,430,912 | |
| | | |
Warrants | | | 303 | | | | 14,546 | | | | 137,235 | |
| | | |
Preferred Stocks | | | — | | | | — | | | | 9,743 | |
| | | |
Investment Company | | | 91,077,387 | | | | — | | | | — | |
| |
| | | |
Total | | $ | 105,024,406 | | | $ | 1,488,417,560 | | | $ | 13,539,941 | |
|
| |
| | | |
Liabilities | | | | | | | | | | | | |
| | | |
Fixed Income | | | | | | | | | | | | |
| | | |
Unfunded Loan Committments | | $ | — | | | $ | 223 | | | $ | — | |
| |
| | | |
| Derivative Type | | | | | | | | | |
|
| |
| | | |
Assets | | | | | | | | | | | | |
| | | |
Forward Foreign Currency Exchange Contracts(b) | | $ | — | | | $ | 6,525,661 | | | $ | — | |
| | | |
Interest Rate Swap Contracts(b) | | | — | | | | 154,808 | | | | — | |
| | | |
Credit Default Swap Contracts(b) | | | — | | | | 251,252 | | | | — | |
| | | |
Purchased Option Contracts | | | — | | | | 99,372 | | | | — | |
| |
| | | |
Total | | $ | — | | | $ | 7,031,093 | | | $ | — | |
|
| |
| | | |
Liabilities(b) | | | | | | | | | | | | |
| | | |
Forward Foreign Currency Exchange Contracts | | $ | — | | | $ | (7,482,594 | ) | | $ | — | |
| | | |
Interest Rate Swap Contracts | | | — | | | | (179,397 | ) | | | — | |
| | | |
Total | | $ | — | | | $ | (7,661,991 | ) | | $ | — | |
|
| |
| | (a) | Amounts are disclosed by continent to highlight the impact of time zone differences between local market close and the calculation of NAV. Security valuations are based on the principal exchange or system on which they are traded, which may differ from country of domicile. The Funds utilize fair value model prices provided by an independent fair value service for international equities, resulting in a Level 2 classification. |
| | (b) | Amount shown represents unrealized gain (loss) at period end. |
GOLDMAN SACHS STRATEGIC MULTI-ASSET CLASS FUNDS
|
|
3. INVESTMENTS AND FAIR VALUE MEASUREMENTS (continued) |
| | | | | | | | | | | | |
| MULTI-MANAGER REAL ASSETS STRATEGY FUND | | | | | | | | | | | | |
| | | |
| Investment Type | | Level 1 | | | Level 2 | | | Level 3 | |
|
| |
| | | |
Assets | | | | | | | | | | | | |
| | | |
Common Stock and/or Other Equity Investments(a) | | | | | | | | | | | | |
| | | |
Asia | | $ | 6,507,030 | | | $ | 81,378,574 | | | $ | — | |
| | | |
Australia and Oceania | | | 986,478 | | | | 36,607,227 | | | | — | |
| | | |
Europe | | | 5,561,876 | | | | 140,356,799 | | | | — | |
| | | |
North America | | | 612,657,518 | | | | — | | | | — | |
| | | |
South America | | | 4,653,287 | | | | — | | | | — | |
| | | |
Investment Company | | | 22,153,421 | | | | — | | | | — | |
|
| |
| | | |
Total | | $ | 652,519,610 | | | $ | 258,342,600 | | | $ | — | |
|
| |
| | | |
| Derivative Type | | | | | | | | | |
|
| |
| | | |
Assets(b) | | | | | | | | | | | | |
| | | |
Forward Foreign Currency Exchange Contracts | | $ | — | | | $ | 60 | | | $ | — | |
|
| |
| | | |
Liabilities(b) | | | | | | | | | | | | |
| | | |
Forward Foreign Currency Exchange Contracts | | $ | — | | | $ | (367 | ) | | $ | — | |
| | | |
Futures Contracts | | | (879,630 | ) | | | — | | | | — | |
|
| |
| | | |
Total | | $ | (879,630 | ) | | $ | (367 | ) | | $ | — | |
|
| |
| | (a) | Amounts are disclosed by continent to highlight the impact of time zone differences between local market close and the calculation of NAV. Security valuations are based on the principal exchange or system on which they are traded, which may differ from country of domicile. The Funds utilize fair value model prices provided by an independent fair value service for international equities, resulting in a Level 2 classification. |
| | (b) | Amount shown represents unrealized gain (loss) at period end. |
For further information regarding security characteristics, see the Schedules of Investments.
|
|
4. INVESTMENTS IN DERIVATIVES |
The following tables set forth, by certain risk types, the gross value of derivative contracts (not considered to be hedging instruments for accounting disclosure purposes) as of October 31, 2024. These instruments were used as part of the Funds’ investment strategies and to obtain and/or manage exposure related to the risks below. The values in the tables below exclude the effects of cash collateral received or posted pursuant to these derivative contracts, and therefore are not representative of the Funds’ net exposure.
| | | | | | | | | | | | |
| Multi-Manager Global Equity Fund | | | | | | | | | | |
| | | | |
| Risk | | Statements of Assets and Liabilities | | Assets | | | Statements of Assets and Liabilities | | Liabilities | |
| | | | |
| Currency | | Receivable for unrealized gain on forward foreign currency exchange contracts | | $ | 5,916,441 | | | Payable for unrealized loss on forward foreign currency exchange contracts | | $ | (910,552 | ) |
| | | | |
| Equity | | Variation margin on futures contracts | | | 1,216,757 | (a) | | | | | — | |
| | | | |
Total | | | | $ | 7,133,198 | | | | | $ | (910,552 | ) |
GOLDMAN SACHS STRATEGIC MULTI-ASSET CLASS FUNDS
|
Notes to Financial Statements (continued) October 31, 2024 |
|
|
4. INVESTMENTS IN DERIVATIVES ( continued) |
| | | | | | | | | | | | |
| Multi-Manager Non-Core Fixed Income Fund | | | | | | | | | | |
| | | | |
| Risk | | Statements of Assets and Liabilities | | Assets | | | Statements of Assets and Liabilities | | Liabilities | |
| | | | |
| Credit | | Receivable for unrealized gain on swap
contracts; Variation margin on Swap
contracts | | $ | 251,252 | (a) | | | | $ | — | |
| | | | |
| Currency | | Receivable for unrealized gain on forward
foreign currency contracts; Purchased
options at value | | | 6,625,033 | | | Payable for unrealized loss on forward
foreign currency contracts | | | (7,482,594 | ) |
| | | | |
| Interest rate | | Receivable for unrealized gain on swap
contracts | | | 154,808 | | | Payable for unrealized loss on swap
contracts | | | (179,397 | ) |
| | | | |
Total | | | | $ | 7,031,093 | | | | | $ | (7,661,991 | ) |
| | | |
| Multi-Manager Real Assets Strategy Fund | | | | | | | | | | |
| | | | |
| Risk | | Statements of Assets and Liabilities | | Assets | | | Statements of Assets and Liabilities | | Liabilities | |
| | | | |
| Currency | | Receivable for unrealized gain on forward
foreign currency exchange
contracts | | $ | 60 | | | Payable for unrealized loss on forward
foreign currency exchange contracts | | $ | (367 | ) |
| | | | |
| Equity | | — | | | — | | | Variation margin on futures contracts | | | (879,630 | )(a) |
| | | | |
Total | | | | $ | 60 | | | | | $ | (879,997 | ) |
| | (a) | Includes unrealized gain (loss) on futures contracts and centrally cleared swaps described in the Additional Investment Information sections of the Schedules of Investments. Only current day’s variation margin is reported within the Statements of Assets and Liabilities. |
The following tables set forth, by certain risk types, the Funds’ gains (losses) related to these derivatives and their indicative volumes for the fiscal year ended October 31, 2024. These gains (losses) should be considered in the context that these derivative contracts may have been executed to create investment opportunities and/or economically hedge certain investments, and accordingly, certain gains (losses) on such derivative contracts may offset certain (losses) gains attributable to investments. These gains (losses) are included in “Net realized gain (loss)” or “Net change in unrealized gain (loss)” on the Statements of Operations:
| | | | | | | | | | | | |
| Multi-Manager Global Equity Fund | | | | | | | | | | |
| | | |
| Risk | | Statements of Operations | | Net Realized Gain (Loss) | | Net Change in
Unrealized
Gain (Loss) |
| | | |
| Currency | | Net realized gain (loss) from forward foreign currency exchange contracts/Net unrealized gain(loss) on forward foreign currency exchange contracts | | | $ | (3,524,993 | ) | | | $ | 3,975,294 | |
| | | |
| Equity | | Net realized gain (loss) from futures contracts/Net change in unrealized gain (loss) on futures contracts | | | | 13,562,476 | | | | | 5,401,962 | |
| | | |
Total | | | | | $ | 10,037,483 | | | | $ | 9,377,256 | |
GOLDMAN SACHS STRATEGIC MULTI-ASSET CLASS FUNDS
|
|
4. INVESTMENTS IN DERIVATIVES ( continued) |
| | | | | | | | | | | | |
| Multi-Manager Non-Core Fixed Income Fund | | | | | | | | | | |
| | | |
| Risk | | Statements of Operations | | Net Realized Gain (Loss) | | Net Change in
Unrealized
Gain (Loss) |
| | | |
| Credit | | Net realized gain (loss) from swap contracts/ Net change in unrealized gain (loss) on swap contracts | | | $ | 4,277,065 | | | | $ | 208,614 | |
| | | |
| Currency | | Net realized gain (loss) from purchased options, written options and forward foreign currency exchange contracts/ Net change in unrealized gain (loss) on purchased options, written options and forward foreign currency exchange contracts | | | | 3,387,821 | | | | | (176,603 | ) |
| | | |
| Interest rate | | Net realized gain (loss) from futures contracts and swap contracts / Net change in unrealized gain (loss) on futures contracts and swap contracts | | | | 208,214 | | | | | 55,589 | |
| | | |
Total | | | | | $ | 7,873,100 | | | | $ | 87,600 | |
| | |
| Multi-Manager Real Assets Strategy Fund | | | | | | | | | | |
| | | |
| Risk | | Statements of Operations | | Net Realized Gain (Loss) | | Net Change in
Unrealized
Gain (Loss) |
| | | |
| Currency | | Net realized gain (loss) from forward foreign currency exchange contracts/Net change in unrealized gain (loss) on forward foreign currency exchange contracts | | | $ | 19,868 | | | | $ | (307 | ) |
| | | |
| Equity | | Net realized gain (loss) from futures contracts/Net change in unrealized gain (loss) on futures contracts | | | | 3,093,143 | | | | | 449,876 | |
| | | |
Total | | | | | $ | 3,113,011 | | | | $ | 449,569 | |
For the fiscal year ended October 31, 2024, the relevant values for each derivative type were as follows:
| | | | | | | | | | | | | | | | | | | | |
| | | Average Number of Contracts(a) | |
| |
| | | | |
| | | | | |
| Fund | | Futures Contracts | | | Forward Contracts | | | Swap Agreements | | | Purchased Options | | | Written Options | |
|
| |
| | | | | |
Multi-Manager Global Equity Fund | | | 376 | | | $ | 359,820,923 | | | $ | — | | | | — | | | | — | |
|
| |
| | | | | |
Multi-Manager Non-Core Fixed Income Fund | | | — | | | | 377,130,782 | | | | 59,979,446 | | | | 28,807,175 | | | | 37,066,000 | |
|
| |
| | | | | |
Multi-Manager Real Assets Strategy Fund | | | 461 | | | | 989,638 | | | | — | | | | — | | | | — | |
|
| |
| | (a) | Amounts disclosed represent average number of contracts for futures contracts, notional amounts for forward contracts, swaptions, swap agreements, purchased and written swaptions, or shares/units outstanding for purchased options and written options, based on absolute values, which is indicative of volume for this derivative type, for the months that the Fund held such derivatives during the fiscal year ended October 31, 2024. |
|
|
5. AGREEMENTS AND AFFILIATED TRANSACTIONS |
A. Management Agreement — Under the Agreement, GSAM manages the Funds, subject to the general supervision of the Trustees.
As compensation for the services rendered pursuant to the Agreement, the assumption of the expenses related thereto and administration of the Funds’ business affairs, including providing facilities, GSAM is entitled to a management fee, accrued daily and paid monthly, equal to an annual percentage rate of each Fund’s average daily net assets.
GOLDMAN SACHS STRATEGIC MULTI-ASSET CLASS FUNDS
|
Notes to Financial Statements (continued) October 31, 2024 |
|
|
5. AGREEMENTS AND AFFILIATED TRANSACTIONS ( continued) |
For the fiscal year ended October 31, 2024, contractual and effective net management fees with GSAM were at the following rates:
| | | | | | | | | | | | | | |
| | | Contractual Management Rate | | | | |
| | | | | | | |
| Fund | | First
$1 billion | | Next
$1 billion | | Next
$3 billion | | Next
$3 billion | | Over
$8 billion | | Effective Rate | | Effective Net
Management Rate^* |
|
|
| | | | | | | |
Multi-Manager Global Equity Fund | | 1.03% | | 0.93% | | 0.89% | | 0.87% | | 0.84% | | 1.03% | | 0.41% |
|
|
| | | | | | | |
Multi-Manager Non-Core Fixed Income Fund | | 0.85 | | 0.85 | | 0.77 | | 0.73 | | 0.71 | | 0.85 | | 0.41 |
|
|
| | | | | | | |
Multi-Manager Real Assets Strategy Fund | | 1.00 | | 0.90 | | 0.86 | | 0.84 | | 0.82 | | 1.00 | | 0.54 |
|
|
| | * | GSAM has agreed to waive a portion of its management fee for each Fund in order to achieve an effective net management fee rate that is equal to the actual cost of fees paid to the Fund’s Underlying Managers. These arrangements will remain in effect through at least February 28, 2025, and prior to such date GSAM may not terminate the arrangements without the approval of the Board of Trustees. |
| | ^ | Effective Net Management Rate includes the impact of management fee waivers of affiliated underlying funds, if any. |
The Funds invest in Institutional Shares and/or Class R6 Shares of the Goldman Sachs Financial Square Government Fund, which is an affiliated Underlying Fund. GSAM has agreed to waive a portion of its management fee payable by the Funds in an amount equal to the management fee it earns as an investment adviser to the affiliated Underlying Fund in which the Funds invest. For the fiscal year ended October 31, 2024, GSAM waived $132,106, $177,060 and $33,548 of the Multi-Manager Global Equity, Multi-Manager Non-Core Fixed Income and Multi-Manager Real Assets Strategy Funds’ management fees, respectively.
B. Transfer Agency Agreement — Goldman Sachs also serves as the transfer agent of the Funds for a fee pursuant to the Transfer Agency Agreement. The fees charged for such transfer agency services are accrued daily and paid monthly at annual rates of 0.02% of the average daily net assets of Class R6 Shares.
C. Other Expense Agreements and Affiliated Transactions — GSAM has agreed to reduce or limit each Fund’s “Total Annual Operating Expenses” (excluding acquired fund fees and expenses, taxes, interest, brokerage fees, expenses of shareholder meetings, litigation and indemnification, and extraordinary expenses) to the extent such expenses exceed, on an annual basis, a percentage rate of the average daily net assets of each Fund. Such Total Annual Operating Expense reimbursements, if any, are accrued daily and paid monthly. In addition, the Funds are not obligated to reimburse GSAM for prior fiscal year expense reimbursements, if any. The Total Annual Operating Expense limitations as an annual percentage rate of average daily net assets for the Multi-Manager Global Equity Fund, Multi-Manager Non-Core Fixed Income Fund and Multi-Manager Real Assets Strategy Fund are 0.75%, 0.70%, and 0.90%, respectively. In addition, GSAM has agreed to reduce or limit certain “Other Expenses” of the Multi-Manager Global Equity Fund (excluding acquired fund fees and expenses, transfer agency fees and expenses, service fees, taxes, interest, brokerage fees, expenses of shareholder meetings, litigation and indemnification, and extraordinary expenses) to 0.10% of its average daily net assets. The Total Annual Operating Expenses and Other Expense limitations will remain in place through at least February 28, 2025, and prior to such date GSAM may not terminate the arrangements without the approval of the Trustees. In addition, the Funds have entered into certain offset arrangements with the transfer agent, which may result in a reduction of the Funds’ expenses and are received irrespective of the application of the “Other Expense” limitations described above.
GOLDMAN SACHS STRATEGIC MULTI-ASSET CLASS FUNDS
|
|
5. AGREEMENTS AND AFFILIATED TRANSACTIONS ( continued) |
For the fiscal year ended October 31, 2024, these expense reductions, including any fee waivers and Other Expense reimbursements, were as follows:
| | | | | | | | | | | | |
| | | |
| Fund | | Management
Fee Waiver | | | Other
Expense
Reimbursements | | | Total
Expense
Reductions | |
| | | |
Multi-Manager Global Equity Fund | | | $6,874,603 | | | | $1,164,264 | | | | $8,038,867 | |
|
| |
| | | |
Multi-Manager Non-Core Fixed Income Fund | | | 6,895,630 | | | | — | | | | 6,895,630 | |
|
| |
| | | |
Multi-Manager Real Assets Strategy Fund | | | 3,717,926 | | | | — | | | | 3,717,926 | |
|
| |
D. Line of Credit Facility — As of October 31, 2024, the Funds participated in a $1,150,000,000 committed, unsecured revolving line of credit facility (the “facility”) together with other funds of the Trust and certain registered investment companies having management agreements with GSAM or its affiliates. This facility is to be used for temporary emergency purposes, or to allow for an orderly liquidation of securities to meet redemption requests. The interest rate on borrowings is based on the federal funds rate. The facility also requires a fee to be paid by the Funds based on the amount of the commitment that has not been utilized. For the fiscal year ended October 31, 2024, the Funds did not have any borrowings under the facility. Prior to April 16, 2024, the facility was $1,110,000,000.
E. Other Transactions with Affiliates — For the fiscal year ended October 31, 2024, Goldman Sachs earned $1,435, $29, and $3,559 in brokerage commissions from portfolio transactions, including futures transactions executed with Goldman Sachs as the Futures Commission Merchant, on behalf of the Multi-Manager Global Equity Fund, Multi-Manager Non-Core Fixed Income Fund and Multi-Manager Real Assets Strategy Fund, respectively.
The following table provides information about the Funds’ investments in the Goldman Sachs Financial Square Government Fund as of and for the fiscal year ended October 31, 2024:
| | | | | | | | | | | | | | | | | | | | | | | | | | |
| Fund | | Underlying Fund | | Market Value as of
October 31,
2023 | | | Purchases at Cost | | | Proceeds from Sales | | | Market
Value as of
October 31,
2024 | | | Shares as of
October 31,
2024 | | | Dividend
Income | |
|
| |
| | | | | | | |
Multi-Manager Global Equity Fund | | Goldman Sachs Financial Square Government Fund — Class R6 | | | $24,443,593 | | | $ | 118,258,420 | | | $ | (91,912,400 | ) | | $ | 50,789,613 | | | | 50,789,613 | | | $ | 1,969,193 | |
|
| |
| | | | | | | |
| | Goldman Sachs Financial Square Government Fund — Institutional Shares | | | 35,857,520 | | | | 668,314,057 | | | | (639,486,015 | ) | | | 64,685,562 | | | | 64,685,562 | | | | 2,294,532 | |
|
| |
| | | | | | | |
Multi-Manager Non-Core Fixed Income Fund | | Goldman Sachs Financial Square Government Fund — Institutional Shares | | | 78,435,092 | | | | 1,797,328,877 | | | | (1,784,686,582 | ) | | | 91,077,387 | | | | 91,077,387 | | | | 5,576,511 | |
|
| |
| | | | | | | |
Multi-Manager Real Assets Strategy Fund | | Goldman Sachs Financial Square Government Fund — Institutional Shares | | | 12,559,159 | | | | 433,016,887 | | | | (423,422,625 | ) | | | 22,153,421 | | | | 22,153,421 | | | | 1,067,188 | |
|
| |
GOLDMAN SACHS STRATEGIC MULTI-ASSET CLASS FUNDS
|
Notes to Financial Statements (continued) October 31, 2024 |
|
|
6. PORTFOLIO SECURITIES TRANSACTIONS |
The cost of purchases and proceeds from sales and maturities of long-term securities for the fiscal year ended October 31, 2024, were as follows:
| | | | | | | | | | | | | | | | |
| | | | |
| Fund | | Purchases of
Government
Securities | | | Purchases
Excluding
Government
Securities | | | Sales of
Government
Securities | | | Sales Excluding
Government
Securities | |
| | | | |
Multi-Manager Global Equity Fund | | $ | — | | | $ | 954,997,747 | | | $ | — | | | $ | 649,458,444 | |
|
| |
| | | | |
Multi-Manager Non-Core Fixed Income Fund | | | 17,414,357 | | | | 2,030,589,255 | | | | 17,679,000 | | | | 1,624,431,375 | |
|
| |
| | | | |
Multi-Manager Real Assets Strategy Fund | | | — | | | | 839,156,395 | | | | — | | | | 658,366,854 | |
|
| |
The tax character of distributions paid during the fiscal year ended October 31, 2024 was as follows:
| | | | | | | | | | | | |
| | | |
| | | Multi-Manager
Global Equity | | | Multi-Manager Non-Core Fixed Income | | | Multi-Manager
Real Assets
Strategy | |
| | | |
Distributions paid from: | | | | | | | | | | | | |
| | | |
Ordinary income | | | $10,768,945 | | | | $111,334,449 | | | | $15,471,294 | |
|
| |
| | | |
Total taxable distributions | | | $10,768,945 | | | | $111,334,449 | | | | $15,471,294 | |
|
| |
The tax character of distributions paid during the fiscal year ended October 31, 2023 was as follows:
| | | | | | | | | | | | |
| | | |
| | | Multi-Manager
Global Equity | | | Multi-Manager
Non-Core
Fixed Income | | | Multi-Manager
Real Assets
Strategy | |
| | | |
Distributions paid from: | | | | | | | | | | | | |
| | | |
Ordinary income | | | $16,854,234 | | | | $81,470,590 | | | | $ 5,471,176 | |
| | | |
Net long-term capital gains | | | 22,308,741 | | | | — | | | | 20,507,645 | |
|
| |
| | | |
Total taxable distributions | | | $39,162,975 | | | | $81,470,590 | | | | $25,978,821 | |
|
| |
| | | |
Tax return of capital | | | $ — | | | | $ 3,475,605 | | | | $ — | |
|
| |
GOLDMAN SACHS STRATEGIC MULTI-ASSET CLASS FUNDS
|
|
7. TAX INFORMATION (continued) |
As of October 31, 2024, the components of accumulated earnings (losses) on a tax basis were as follows:
| | | | | | | | | | | | |
| | | |
| | | Multi-Manager
Global Equity | | | Multi-Manager
Non-Core
Fixed Income | | | Multi-Manager
Real Assets
Strategy | |
| | | |
Undistributed ordinary income — net | | $ | 17,751,585 | | | $ | 225,166 | | | $ | 20,028,994 | |
| | | |
Undistributed long-term capital gains | | | 25,074,904 | | | | — | | | | — | |
|
| |
| | | |
Total Undistributed Earnings | | $ | 42,826,489 | | | $ | 225,166 | | | $ | 20,028,994 | |
|
| |
| | | |
Capital loss carryforwards(1) : | | | | | | | | | | | | |
| | | |
Perpetual Short-Term | | | — | | | | (71,643,724 | ) | | | — | |
| | | |
Perpetual Long-Term | | | — | | | | (101,515,213 | ) | | | (3,764,291 | ) |
|
| |
| | | |
Total capital loss carryforwards | | | — | | | | (173,158,937 | ) | | | (3,764,291 | ) |
|
| |
| | | |
Timing differences (Dividends Payable/Defaulted Bonds/Straddles) | | $ | (35,012 | ) | | $ | (6,367,800 | ) | | $ | — | |
| | | |
Unrealized gains (loss) — net | | | 198,760,465 | | | | (17,124,527 | ) | | | 113,654,670 | |
|
| |
| | | |
Total accumulated earnings (loss) net | | $ | 241,551,942 | | | $ | (196,426,098 | ) | | $ | 129,919,373 | |
|
| |
| | (1) | The Multi-Manager Global Equity and Multi-Manager Real Assets Strategy Funds utilized $5,253,091 and $12,066,478, respectively, of capital losses in the current fiscal year. |
As of October 31, 2024, the Funds’ aggregate security unrealized gains and losses based on cost for U.S. federal income tax purposes were as follows:
| | | | | | | | | | | | |
| | | |
| | | Multi-Manager
Global Equity | | | Multi-Manager
Non-Core Fixed
Income | | | Multi-Manager
Real Assets
Strategy | |
| | | |
Tax Cost | | $ | 1,126,644,474 | | | $ | 1,622,621,771 | | | $ | 796,284,135 | |
|
| |
| | | |
Gross unrealized gain | | | 219,401,300 | | | | 32,737,537 | | | | 122,981,584 | |
| | | |
Gross unrealized loss | | | (20,640,835 | ) | | | (49,862,064 | ) | | | (9,326,914 | ) |
|
| |
| | | |
Net unrealized gain (loss) on securities | | $ | 198,760,465 | | | $ | (17,124,527 | ) | | $ | 113,654,670 | |
|
| |
The difference between GAAP-basis and tax basis unrealized gains (losses) is attributable primarily to wash sales, net mark to market gains (losses) on regulated futures contracts, net mark to market gains (losses) on foreign currency contracts, partnership investments, and differences in the tax treatment of swap transactions, material modification of debt securities, market discount accretion and premium amortization and differences in the tax treatment of passive foreign investment company investments.
The Multi-Manager Non-Core Fixed Income Fund reclassed $70,298 from paid-in capital to distributable earnings for the year ending October 31, 2024. In order to present certain components of the Fund’s capital accounts on a tax-basis, certain reclassifications have been recorded to the Funds’ accounts. These reclassifications have no impact on the net asset value of the Fund’s and result primarily from differences in the tax treatment of underlying fund investments.
GSAM has reviewed the Funds’ tax positions for all open tax years (the current and prior three years, as applicable) and have concluded that no provision for income tax is required in the Funds’ financial statements. Such open tax years remain subject to examination and adjustment by tax authorities.
GOLDMAN SACHS STRATEGIC MULTI-ASSET CLASS FUNDS
|
Notes to Financial Statements (continued) October 31, 2024 |
The Funds’ risks include, but are not limited to, the following:
Asset Allocation Risk — The Funds’ allocations to the various asset classes and to the Underlying Managers may cause the Funds to underperform other funds with a similar investment objective.
Derivatives Risk — The Funds’ use of derivatives and other similar instruments (collectively referred to in this paragraph as “derivatives”) may result in loss, including due to adverse market movements. Derivatives, which may pose risks in addition to and greater than those associated with investing directly in securities, currencies or other assets and instruments, may increase market exposure and be illiquid or less liquid, volatile, difficult to price and leveraged so that small changes in the value of the underlying assets or instruments may produce disproportionate losses to the Funds. Certain derivatives are also subject to counterparty risk, which is the risk that the other party in the transaction will not, or lacks the capacity or authority to, fulfill its contractual obligations, liquidity risk, which includes the risk that the Funds will not be able to exit the derivative when it is advantageous to do so, and risks arising from margin requirements, which include the risk that the Funds will be required to pay additional margin or set aside additional collateral to maintain open derivative positions. The use of derivatives is a highly specialized activity that involves investment techniques and risks different from those associated with investments in more traditional securities and instruments. Losses from derivatives can also result from a lack of correlation between changes in the value of derivative instruments and the portfolio assets (if any) being hedged.
Floating and Variable Rate Obligations Risk — Floating rate and variable rate obligations are debt instruments issued by companies or other entities with interest rates that reset periodically (typically, daily, monthly, quarterly, or semi-annually) in response to changes in the market rate of interest on which the interest rate is based. Such market rates are generally the Secured Overnight Financing Rate (“SOFR”), a term SOFR rate published by CME Group Benchmark Administration Limited (CBA) calculated using certain derivatives markets (“Term SOFR”), the Prime Rate of a designated U.S. bank, the Federal Funds Rate, or another base lending rate used by commercial lenders. For floating and variable rate obligations, there may be a lag between an actual change in the underlying interest rate benchmark and the reset time for an interest payment of such an obligation, which could harm or benefit a Fund, depending on the interest rate environment or other circumstances. In a rising interest rate environment, for example, a floating or variable rate obligation that does not reset immediately would prevent a Fund from taking full advantage of rising interest rates in a timely manner. However, in a declining interest rate environment, the Fund may benefit from a lag due to an obligation’s interest rate payment not being immediately impacted by a decline in interest rates.
Some floating or variable rate obligations or investments of a Fund may have previously referenced the London Interbank Offered Rate (“LIBOR”). As a result of benchmark reforms, publication of all LIBOR settings has ceased. Public and private sector actors have worked to establish alternative reference rates, like SOFR or Term SOFR, to be used in place of LIBOR. There is no assurance that any such alternative reference rate will be similar to or produce the same value or economic equivalence as LIBOR or that it will have the same volume or liquidity as did LIBOR which may affect the value, volatility, liquidity or return on certain of a Fund’s floating and variable rate obligations and investments and result in costs incurred in connection with changing reference rates used for positions, closing out positions and entering into new trades. Certain of a Fund’s obligations or investments may have transitioned from LIBOR. The transition from LIBOR to alternative reference rates may result in operational issues for a Fund or its obligations or investments. Any pricing adjustments to a Fund’s obligations or investments resulting from use of an alternative reference rate may also adversely affect the Fund’s performance and/or NAV. No assurances can be given as to the impact of the LIBOR transition (and the timing of any such impact) on a Fund and its obligations and investments.
Foreign and Emerging Countries Risk — Investing in foreign markets may involve special risks and considerations not typically associated with investing in the U.S. Foreign securities may be subject to risk of loss because of more or less foreign government regulation; less public information; less stringent investor protections; less stringent accounting, corporate governance, financial reporting and disclosure standards; and less economic, political and social stability in the countries in which a Fund invests. The imposition of sanctions, exchange controls (including repatriation restrictions), confiscation of assets and property, trade restrictions (including tariffs) and other government restrictions by the U.S. or other governments, or from problems in registration, settlement or custody, may also result in losses. The type and severity of sanctions and other similar measures, including counter sanctions and other retaliatory actions, that may be imposed could vary broadly in scope, and their impact is
GOLDMAN SACHS STRATEGIC MULTI-ASSET CLASS FUNDS
|
|
8. OTHER RISKS (continued) |
impossible to predict. For example, the imposition of sanctions and other similar measures could, among other things, cause a decline in the value and/or liquidity of securities issued by the sanctioned country or companies located in or economically tied to the sanctioned country and increase market volatility and disruption in the sanctioned country and throughout the world. Sanctions and other similar measures could limit or prevent a Fund from buying and selling securities (in the sanctioned country and other markets), significantly delay or prevent the settlement of securities transactions, and significantly impact a Fund’s liquidity and performance. Foreign risk also involves the risk of negative foreign currency exchange rate fluctuations, which may cause the value of securities denominated in such foreign currency (or other instruments through which a Fund has exposure to foreign currencies) to decline in value. Currency exchange rates may fluctuate significantly over short periods of time. To the extent that a Fund also invests in securities of issuers located in, or economically tied to, emerging markets, these risks may be more pronounced.
Geographic Risk — If a Fund focuses its investments in securities of issuers located in a particular country or geographic region, the Fund may be subjected, to a greater extent than if its investments were less focused, to the risks of volatile economic cycles and/or conditions and developments that may be particular to that country or region, such as: adverse securities markets; adverse exchange rates; adverse social, political, regulatory, economic, business, environmental or other developments; or natural disasters.
Index/Tracking Error Risk — To the extent that an index-tracking strategy or implementation of a sub-strategy by a transition manager is used with respect to a portion of a Fund’s assets, including through investment in an ETF that seeks to track an index or implementation of an index-tracking strategy, the Fund will be negatively affected by general declines in the securities and asset classes represented in the relevant index. There is no guarantee that the Fund, or relevant portion of the Fund, will achieve a high degree of correlation to the relevant index. Market disruptions and regulatory restrictions could have an adverse effect on the Fund’s ability, or the ability of an ETF in which it invests, to adjust its exposure to the required levels in order for the relevant portion of the Fund to track the relevant index. In addition, because that portion of the Fund is not “actively” managed, unless a specific security is removed from the relevant index, the Fund or an ETF in which it invests generally would not sell a security because the security’s issuer was in financial trouble. At times when an index-tracking strategy is used with respect to a portion of the Fund’s assets, the Fund’s performance could be lower than funds that may actively shift all of their portfolio assets to take advantage of market opportunities or to lessen the impact of a market decline or a decline in the value of one or more issuers.
Interest Rate Risk — When interest rates increase, fixed income securities or instruments held by a Fund will generally decline in value. Long-term fixed income securities or instruments will normally have more price volatility because of this risk than short-term fixed income securities or instruments. A wide variety of market factors can cause interest rates to rise, including central bank monetary policy, rising inflation and changes in general economic conditions. Changing interest rates may have unpredictable effects on the markets, may result in heightened market volatility and may detract from Fund performance. In addition, changes in monetary policy may exacerbate the risks associated with changing interest rates. Funds with longer average portfolio durations will generally be more sensitive to changes in interest rates than funds with a shorter average portfolio duration. Fluctuations in interest rates may also affect the liquidity of fixed income securities and instruments held by the Funds. A sudden or unpredictable increase in interest rates may cause volatility in the market and may decrease the liquidity of a Fund’s investments, which would make it harder for the Fund to sell its investments at an advantageous time.
Large Shareholder Transactions Risk — A Fund may experience adverse effects when certain large shareholders, such as other funds, institutional investors (including those trading by use of non-discretionary mathematical formulas), financial intermediaries (who may make investment decisions on behalf of underlying clients and/or include a Fund in their investment model), individuals, accounts and Goldman Sachs affiliates, purchase or redeem large amounts of shares of a Fund. Such large shareholder redemptions, which may occur rapidly or unexpectedly, may cause a Fund to sell portfolio securities at times when it would not otherwise do so, which may negatively impact a Fund’s NAV and liquidity. These transactions may also accelerate the realization of taxable income to shareholders if such sales of investments resulted in gains, and may also increase transaction costs. In addition, a large redemption could result in a Fund’s current expenses being allocated over a smaller asset base, leading to an increase in a Fund’s expense ratio. Similarly, large Fund share purchases may adversely affect a Fund’s performance to the extent that the Fund is delayed in investing new cash or otherwise maintains a larger cash position than it ordinarily would.
GOLDMAN SACHS STRATEGIC MULTI-ASSET CLASS FUNDS
|
Notes to Financial Statements (continued) October 31, 2024 |
|
|
8. OTHER RISKS (continued) |
Liquidity Risk — A Fund may make investments that are illiquid or that may become less liquid in response to market developments or adverse investor perceptions. Illiquid investments may be more difficult to value. Liquidity risk may also refer to the risk that a Fund will not be able to pay redemption proceeds within the allowable time period or without significant dilution to remaining investors’ interests because of unusual market conditions, declining prices of the securities sold, an unusually high volume of redemption requests, or other reasons. To meet redemption requests, a Fund may be forced to sell investments at an unfavorable time and/or under unfavorable conditions. If a Fund is forced to sell securities at an unfavorable time and/or under unfavorable conditions, such sales may adversely affect a Fund’s NAV and dilute remaining investors’ interests. Liquidity risk may be the result of, among other things, the reduced number and capacity of traditional market participants to make a market in fixed income securities or the lack of an active market. The potential for liquidity risk may be magnified by a rising interest rate environment or other circumstances where investor redemptions from fixed income funds may be higher than normal, potentially causing increased supply in the market due to selling activity. These risks may be more pronounced in connection with the Funds’ investments in securities of issuers located in emerging market countries. Redemptions by large shareholders may have a negative impact on a Fund’s liquidity.
Loan-Related Investments Risk — In addition to risks generally associated with debt investments (e.g., interest rate risk and default risk), loan-related investments such as loan participations and assignments are subject to other risks. Although a loan obligation may be fully collateralized at the time of acquisition, the collateral may decline in value, be or become illiquid or less liquid, or lose all or substantially all of its value subsequent to investment. Many loan investments are subject to legal or contractual restrictions on resale and certain loan investments may be or become illiquid or less liquid and more difficult to value, particularly in the event of a downgrade of the loan or the borrower. There is less readily available, reliable information about most loan investments than is the case for many other types of securities. Substantial increases in interest rates may cause an increase in loan obligation defaults. With respect to loan participations, a Fund may not always have direct recourse against a borrower if the borrower fails to pay scheduled principal and/or interest; may be subject to greater delays, expenses and risks than if a Fund had purchased a direct obligation of the borrower; and may be regarded as the creditor of the agent lender (rather than the borrower), subjecting a Fund to the creditworthiness of that lender as well. Investors in loans, such as a Fund, may not be entitled to rely on the anti-fraud protections of the federal securities laws, although they may be entitled to certain contractual remedies. The market for loan obligations may be subject to irregular trading activity, wide bid/ask spreads and extended trade settlement periods. Because transactions in many loans are subject to extended trade settlement periods, a Fund may not receive the proceeds from the sale of a loan for a period after the sale. As a result, sale proceeds related to the sale of loans may not be available to make additional investments or to meet a Fund’s redemption obligations for a period after the sale of the loans, and, as a result, a Fund may have to sell other investments or engage in borrowing transactions, such as borrowing from its credit facility, if necessary to raise cash to meet its obligations.
Senior Loans hold the most senior position in the capital structure of a business entity, and are typically secured with specific collateral, but are nevertheless usually rated below investment grade. Because Second Lien Loans are subordinated or unsecured and thus lower in priority of payment to Senior Loans, they are subject to the additional risk that the cash flow of the borrower and property securing the loan or debt, if any, may be insufficient to meet scheduled payments after giving effect to the senior secured obligations of the borrower. Second Lien Loans generally have greater price volatility than Senior Loans and may be less liquid.
Market and Credit Risks — In the normal course of business, a Fund trades financial instruments and enters into financial transactions where risk of potential loss exists due to changes in the market (market risk). The value of the securities in which a Fund invests may go up or down in response to the prospects of individual companies, particular sectors or governments and/or general economic conditions throughout the world due to increasingly interconnected global economies and financial markets. Events such as war, military conflict, acts of terrorism, social unrest, natural disasters, recessions, inflation, rapid interest rate changes, supply chain disruptions, sanctions, the spread of infectious illness or other public health threats could also significantly impact a Fund and its investments. Additionally, a Fund may also be exposed to credit risk in the event that an issuer or guarantor fails to perform or that an institution or entity with which a Fund has unsettled or open transactions defaults.
GOLDMAN SACHS STRATEGIC MULTI-ASSET CLASS FUNDS
|
|
8. OTHER RISKS (continued) |
Multi-Manager Approach Risk — The Funds’ performance depends on the ability of the Investment Adviser in selecting, overseeing, and allocating Fund assets to the Underlying Managers. The Underlying Managers’ investment styles may not always be complementary. The Funds’ multi-manager approach may result in the Fund investing a significant percentage of its assets in certain types of investments, which could be beneficial or detrimental to the Funds’ performance depending on the performance of those investments and the overall market environment. The Funds’ Underlying Managers may underperform the market generally or underperform other investment managers that could have been selected for the Funds. Because the Funds’ Underlying Managers may trade with counterparties, prime brokers, clearing brokers or futures commission merchants on terms that are different than those on which the Investment Adviser would trade, and because each Underlying Manager applies its own risk analysis in evaluating potential counterparties for the Funds, the Funds may be subject to greater counterparty risk than if they were managed directly by the Investment Adviser.
Under the Trust’s organizational documents, its Trustees, officers, employees and agents are indemnified, to the extent permitted by the Act and state law, against certain liabilities that may arise out of performance of their duties to the Funds. Additionally, in the course of business, the Funds enter into contracts that contain a variety of indemnification clauses. The Funds’ maximum exposure under these arrangements is unknown, as this would involve future claims that may be made against the Funds that have not yet occurred. However, GSAM believes the risk of loss under these arrangements to be remote.
Subsequent events have been evaluated through the date of issuance, and GSAM concluded that there is no impact requiring adjustment or disclosure in the financial statements.
|
|
11. SUMMARY OF SHARE TRANSACTIONS |
Share activity is as follows:
| | | | | | | | | | | | | | | | |
| | | Multi-Manager Global Equity Fund | |
| | |
| | | For the Fiscal Year Ended
October 31, 2024 | | | For the Fiscal Year Ended
October 31, 2023 | |
| |
| | | | |
| | | | |
| | | Shares | | | Dollars | | | Shares | | | Dollars | |
| |
| | | | |
| | | | |
Class R6 Shares | | | | | | | | | | | | | | | | |
| | | | |
Shares sold | | | 53,921,020 | | | $ | 603,550,395 | | | | 53,170,599 | | | $ | 511,675,000 | |
| | | | |
Reinvestment of distributions | | | 1,057,853 | | | | 10,768,945 | | | | 4,380,658 | | | | 39,162,975 | |
| | | | |
Shares redeemed | | | (26,192,671 | ) | | | (290,198,440 | ) | | | (15,911,348 | ) | | | (152,480,805 | ) |
|
| |
| | | | |
NET INCREASE | | | 28,786,202 | | | $ | 324,120,900 | | | | 41,639,909 | | | $ | 398,357,170 | |
|
| |
| | | | | | | | | | | | | | | | |
| | | Multi-Manager Non-Core Fixed Income Fund | |
| | |
| | | For the Fiscal Year Ended
October 31, 2024 | | | For the Fiscal Year Ended
October 31, 2023 | |
| |
| | | | |
| | | | |
| | | Shares | | | Dollars | | | Shares | | | Dollars | |
| |
| | | | |
| | | | |
Class R6 Shares | | | | | | | | | | | | | | | | |
| | | | |
Shares sold | | | 106,820,086 | | | $ | 809,497,000 | | | | 56,584,724 | | | $ | 424,368,538 | |
| | | | |
Reinvestment of distributions | | | 14,615,540 | | | | 111,049,666 | | | | 11,392,098 | | | | 84,946,195 | |
| | | | |
Shares redeemed | | | (54,874,570 | ) | | | (417,022,512 | ) | | | (58,849,100 | ) | | | (438,813,157 | ) |
|
| |
| | | | |
NET INCREASE | | | 66,561,056 | | | $ | 503,524,154 | | | | 9,127,722 | | | $ | 70,501,576 | |
|
| |
GOLDMAN SACHS STRATEGIC MULTI-ASSET CLASS FUNDS
|
Notes to Financial Statements (continued) October 31, 2024 |
|
|
11. SUMMARY OF SHARE TRANSACTIONS (continued) |
| | | | | | | | | | | | | | | | |
| | | Multi-Manager Real Assets Strategy Fund | |
| | |
| | | For the Fiscal Year Ended
October 31, 2024 | | | For the Fiscal Year Ended
October 31, 2023 | |
| |
| | | | |
| | | | |
| | | Shares | | | Dollars | | | Shares | | | Dollars | |
| |
| | | | |
| | | | |
Class R6 Shares | | | | | | | | | | | | | | | | |
| | | | |
Shares sold | | | 38,407,902 | | | $ | 357,847,599 | | | | 22,983,417 | | | $ | 205,108,061 | |
| | | | |
Reinvestment of distributions | | | 1,692,702 | | | | 15,471,294 | | | | 2,825,332 | | | | 25,890,049 | |
| | | | |
Shares redeemed | | | (21,353,668 | ) | | | (212,893,728 | ) | | | (2,520,809 | ) | | | (22,035,027 | ) |
|
| |
| | | | |
NET INCREASE | | | 18,746,936 | | | $ | 160,425,165 | | | | 23,287,940 | | | $ | 208,963,083 | |
|
| |
Report of Independent Registered Public Accounting Firm
To the Board of Trustees of Goldman Sachs Trust II and Shareholders of Goldman Sachs Multi-Manager Global Equity Fund, Goldman Sachs Multi-Manager Non-Core Fixed Income Fund and Goldman Sachs Multi-Manager Real Assets Strategy Fund
Opinions on the Financial Statements
We have audited the accompanying statements of assets and liabilities, including the schedules of investments, of Goldman Sachs Multi-Manager Global Equity Fund, Goldman Sachs Multi-Manager Non-Core Fixed Income Fund and Goldman Sachs Multi-Manager Real Assets Strategy Fund (three of the funds constituting Goldman Sachs Trust II, hereafter collectively referred to as the “Funds”) as of October 31, 2024, the related statements of operations for the year ended October 31, 2024, the statements of changes in net assets for each of the two years in the period ended October 31, 2024, including the related notes, and the financial highlights for each of the five years in the period ended October 31, 2024 (collectively referred to as the “financial statements”). In our opinion, the financial statements present fairly, in all material respects, the financial position of each of the Funds as of October 31, 2024, the results of each of their operations for the year then ended, the changes in each of their net assets for each of the two years in the period ended October 31, 2024 and each of the financial highlights for each of the five years in the period ended October 31, 2024 in conformity with accounting principles generally accepted in the United States of America.
Basis for Opinions
These financial statements are the responsibility of the Funds’ management. Our responsibility is to express an opinion on the Funds’ financial statements based on our audits. We are a public accounting firm registered with the Public Company Accounting Oversight Board (United States) (PCAOB) and are required to be independent with respect to the Funds in accordance with the U.S. federal securities laws and the applicable rules and regulations of the Securities and Exchange Commission and the PCAOB.
We conducted our audits of these financial statements in accordance with the standards of the PCAOB. Those standards require that we plan and perform the audit to obtain reasonable assurance about whether the financial statements are free of material misstatement, whether due to error or fraud.
Our audits included performing procedures to assess the risks of material misstatement of the financial statements, whether due to error or fraud, and performing procedures that respond to those risks. Such procedures included examining, on a test basis, evidence regarding the amounts and disclosures in the financial statements. Our audits also included evaluating the accounting principles used and significant estimates made by management, as well as evaluating the overall presentation of the financial statements. Our procedures included confirmation of securities owned as of October 31, 2024 by correspondence with the custodian, transfer agent, agent banks and brokers; when replies were not received from agent banks and brokers, we performed other auditing procedures. We believe that our audits provide a reasonable basis for our opinions.
/s/ PricewaterhouseCoopers LLP
Boston, Massachusetts
December 20, 2024
We have served as the auditor of one or more investment companies in the Goldman Sachs fund complex since 2000.
GOLDMAN SACHS STRATEGIC MULTI-ASSET CLASS FUNDS
Statement Regarding Basis for Approval of Management Agreement and Sub-Advisory
Agreements (Unaudited)
Background
The Goldman Sachs Multi-Manager Global Equity Fund, Goldman Sachs Multi-Manager Non-Core Fixed Income Fund, and Goldman Sachs Multi-Manager Real Assets Strategy Fund (the “Funds”) are investment portfolios of Goldman Sachs Trust II (the “Trust”). The Board of Trustees oversees the management of the Trust and reviews the investment performance and expenses of the Funds at regularly scheduled meetings held throughout the year. Each Fund employs a “manager of managers” structure, whereby Goldman Sachs Asset Management, L.P. (the “Investment Adviser”) is responsible for selecting sub-advisers (subject to Board approval), allocating the Fund’s assets among them, and overseeing their day-to-day management of Fund assets. The Board of Trustees determines annually whether to approve the continuance of the Trust’s investment management agreement (the “Management Agreement”) with the Investment Adviser on behalf of the Funds.
The Management Agreement was most recently approved for continuation until June 30, 2025 by the Board of Trustees, including those Trustees who are not parties to the Management Agreement or “interested persons” (as defined in the Investment Company Act of 1940, as amended) of any party thereto (the “Independent Trustees”) at a meeting held on June 11-12, 2024 (the “Annual Meeting”). At the Annual Meeting, the Board also considered the sub-advisory agreements (each a “Designated Sub-Advisory Agreement” and, together with the Management Agreement, the “Agreements”) between the Investment Adviser and (i) each of Axiom Investors LLC, Boston Partners Global Investors, Inc., Causeway Capital Management LLC, Diamond Hill Capital Management Inc., GW&K Investment Management, LLC, Massachusetts Financial Services Company (d/b/a MFS Investment Management), Principal Global Investors, LLC, T. Rowe Price Associates, Inc., Vaughan Nelson Investment Management, L.P., WCM Investment Management, and Wellington Management Company LLP (on behalf of Goldman Sachs Multi-Manager Global Equity Fund); (ii) each of Ares Capital Management II LLC, Aristotle Pacific Capital, LLC, Brigade Capital Management, LP, Marathon Asset Management, L.P., Ninety One North America, Inc, RBC Global Asset Management (U.K.) Limited (d/b/a RBC BlueBay Asset Management), RBC Global Asset Management (U.S.) Inc. (d/b/a RBC Global Asset Management) and TCW Investment Management Company LLC (on behalf of Goldman Sachs Multi-Manager Non-Core Fixed Income Fund); and (iii) each of Cohen & Steers Capital Management, Inc., Principal Real Estate Investors, LLC, PGIM Real Estate, a business unit of PGIM, Inc., and RREEF America L.L.C. (on behalf of Goldman Sachs Multi-Manager Real Assets Strategy Fund) (each, a “Designated Sub-Adviser” and collectively, the “Designated Sub-Advisers”).
The review process undertaken by the Trustees spans the course of the year and culminates with the Annual Meeting. To assist the Trustees in their deliberations, the Trustees have established a Contract Review Committee (the “Committee”), comprised of the Independent Trustees. The Committee held five meetings over the course of the year since the Management Agreement was last approved. At those Committee meetings, regularly scheduled Board or other committee meetings, and/or the Annual Meeting, matters relevant to the renewal of the Management Agreement and the Designated Sub-Advisory Agreements were considered by the Board, or the Independent Trustees, as applicable. With respect to each Fund, such matters included:
| | (a) | the nature and quality of the advisory, administrative, and other services provided to the Fund by the Investment Adviser and its affiliates, and the Designated Sub-Advisers, including, as applicable, information about: |
| | (i) | the structure, staff, and capabilities of the Investment Adviser and the Designated Sub-Advisers and the Designated Sub-Advisers’ portfolio management teams; |
| | (ii) | the groups within the Investment Adviser and its affiliates that support the portfolio management teams or provide other types of necessary services, including fund services groups (e.g., accounting and financial reporting, tax, shareholder services, and operations); controls and risk management groups (e.g., legal, compliance, valuation oversight, credit risk management, internal audit, compliance testing, market risk analysis, finance, and central funding); sales and distribution support groups, and others (e.g., information technology and training); |
| | (iii) | trends in employee headcount; |
| | (iv) | the Investment Adviser’s financial resources and ability to hire and retain talented personnel and strengthen its operations; and |
| | (v) | the parent company’s support of the Investment Adviser and its mutual fund business, as expressed by the firm’s senior management; |
| | (b) | information on the investment performance of the Fund, including comparisons to the performance of similar mutual funds, as provided by a third-party mutual fund data provider engaged as part of the contract review process (the “Outside Data Provider”), benchmark performance indices, and information on general investment outlooks in the markets in which the Fund invests; |
| | (c) | information provided by the Investment Adviser indicating the Investment Adviser’s views on whether the Fund’s peer group and/or benchmark index had high, medium, or low relevance given the Fund’s particular investment strategy; |
| | (d) | the terms of the Agreements and other agreements with affiliated service providers entered into by the Trust on behalf of the Fund; |
GOLDMAN SACHS STRATEGIC MULTI-ASSET CLASS FUNDS
Statement Regarding Basis for Approval of Management Agreement and Sub-Advisory
Agreements (Unaudited) (continued)
| | (e) | fee and expense information for the Fund, including: |
| | (i) | the relative management fee and expense levels of the Fund as compared to those of comparable funds managed by other advisers, as provided by the Outside Data Provider; |
| | (ii) | the Fund’s expense trends over time; and |
| | (iii) | to the extent the Investment Adviser manages other types of accounts (such as bank collective trusts, private wealth management accounts, institutional separate accounts, sub-advised mutual funds, and non-U.S. funds) having investment objectives and policies similar to those of the Fund, comparative information on the advisory fees charged and services provided to those accounts by the Investment Adviser; |
| | (f) | with respect to the extensive investment performance and expense comparison data provided by the Outside Data Provider, its processes in producing that data for the Fund; |
| | (g) | the undertakings of the Investment Adviser and its affiliates to implement fee waivers and expense limitations; |
| | (h) | information relating to the profitability of the Management Agreement and the transfer agency arrangements of the Fund to the Investment Adviser and its affiliates; |
| | (i) | whether the Fund’s existing management fee schedule adequately addressed any economies of scale; |
| | (j) | a summary of the “fall-out” benefits derived by the Investment Adviser and its affiliates from their relationships with the Fund, including the fees received by the Investment Adviser’s affiliates from the Fund for transfer agency, portfolio trading, distribution and other services; |
| | (k) | a summary of potential benefits derived by the Fund as a result of its relationship with the Investment Adviser; |
| | (l) | with respect to the Investment Adviser, portfolio manager ownership of Fund shares; the manner in which portfolio manager compensation is determined; information on the Designated Sub-Advisers’ compensation arrangements; and the number and types of accounts managed by the portfolio managers; |
| | (m) | the nature and quality of the services provided to the Fund by its unaffiliated service providers (as well as the Designated Sub-Advisers), and the Investment Adviser’s general oversight and evaluation (including reports on due diligence) of those service providers as part of the administrative services provided under the Management Agreement; and |
| | (n) | the Investment Adviser’s and Designated Sub-Advisers’ processes and policies addressing various types of potential conflicts of interest; their approaches to risk management; the annual review of the effectiveness of the Fund’s compliance program; and periodic compliance reports. |
The Trustees also received an overview of the Funds’ distribution arrangements. They received information regarding the Funds’ assets and share purchase and redemption activity. Information was also provided to the Trustees relating to revenue sharing payments made by and services provided by the Investment Adviser and its affiliates to intermediaries that promote the sale, distribution, and/or servicing of Fund shares.
The presentations made at the Board and Committee meetings and at the Annual Meeting encompassed the Funds and other mutual funds for which the Board has responsibility. In evaluating the Agreements at the Annual Meeting, the Trustees relied upon their knowledge, resulting from their meetings and other interactions throughout the year, of the Investment Adviser and its affiliates and Designated Sub-Advisers, their services, and the Funds. In conjunction with these meetings, the Trustees received written materials and oral presentations on the topics covered, and the Investment Adviser addressed the questions and concerns of the Trustees, including concerns regarding the investment performance of certain of the funds they oversee. In addition, the Trustees periodically received written materials and oral presentations from the Funds’ various sub-advisers, including the Designated Sub-Advisers. The Independent Trustees were advised by their independent legal counsel regarding their responsibilities and other regulatory requirements related to the approval and continuation of mutual fund investment management agreements under applicable law. In addition, the Investment Adviser and its affiliates provided the Independent Trustees with a written response to a formal request for information sent on behalf of the Independent Trustees by their independent legal counsel. The Trustees reviewed a written response prepared by each Designated Sub-Adviser to a similar request for information submitted to the Designated Sub-Adviser by the Investment Adviser. During the course of their deliberations, the Independent Trustees met in executive sessions with their independent legal counsel, without representatives of the Investment Adviser or its affiliates present.
Nature, Extent, and Quality of the Services Provided Under the Management Agreement
As part of their review, the Trustees considered the nature, extent, and quality of the services provided to the Funds by the Investment Adviser. In this regard, the Trustees considered both the investment advisory services and non-advisory services that are provided by the Investment Adviser and its affiliates. The Trustees noted the Investment Adviser’s commitment to maintaining high quality systems and expending substantial resources to respond to ongoing changes to the market, regulatory and control environment in which the Funds and their service providers operate, including developments associated with geopolitical events
GOLDMAN SACHS STRATEGIC MULTI-ASSET CLASS FUNDS
Statement Regarding Basis for Approval of Management Agreement and Sub-Advisory
Agreements (Unaudited) (continued)
and economic sanctions, as well as the efforts of the Investment Adviser and its affiliates to combat cyber security risks. They also noted the transition in the leadership and changes in personnel of various of the Investment Adviser’s portfolio management teams that had occurred in recent periods, and the ongoing recruitment efforts aimed at bringing high quality investment talent to the Investment Adviser. The Trustees also considered information regarding the Investment Adviser’s and the Funds’ various sub-advisers’ efforts relating to business continuity planning. The Trustees concluded that the Investment Adviser continued to commit substantial financial and operational resources to the Funds and expressed confidence that the Investment Adviser would continue to do so in the future. The Trustees also recognized that the Investment Adviser had made significant commitments to address regulatory compliance requirements applicable to the Funds and the Investment Adviser and its affiliates. In addition, the Trustees reviewed the sub-adviser oversight process that the Investment Adviser had employed, which included areas such as investment analytics, risk management, and compliance.
Investment Performance
The Trustees also considered the investment performance of the Funds. In this regard, they compared the investment performance of each Fund to its peers using rankings compiled by the Outside Data Provider as of December 31, 2023, and information prepared by the Investment Adviser comparing each Fund’s investment performance to its benchmark index as of March 31, 2024. The information on each Fund’s investment performance was provided for the one-, three-, and five-year periods ending on the applicable dates. As part of this review, they considered the investment performance trends of the Funds over time, and reviewed the investment performance of each Fund in light of its investment objective and policies and market conditions. The Trustees considered the Investment Adviser’s representations that each Fund had significant differences from its Outside Data Provider peer group that caused it to be an imperfect basis for comparison. The Trustees also received information comparing the performance of the Goldman Sachs Multi-Manager Global Equity Fund to that of comparable unregistered funds and separate accounts managed by the Investment Adviser. They considered that the unregistered funds and separate accounts provide an imperfect performance comparison because they are not subject to the requirements of the Investment Company Act of 1940, as amended.
In addition, the Trustees considered materials prepared and presentations made by the Investment Adviser’s senior management and the Designated Sub-Advisers’ portfolio management personnel in which Fund performance was assessed. The Trustees also considered the Investment Adviser’s periodic reports with respect to the Funds’ risk profiles, and how the Investment Adviser’s approach to risk monitoring and management influences portfolio management.
The Trustees noted that the Goldman Sachs Multi-Manager Global Equity Fund had placed in the top half of its performance peer group for the one-, three-, and five-year periods ended December 31, 2023, and had outperformed its benchmark index for the one-, three-, and five-year periods ended March 31, 2024. They observed that Goldman Sachs Multi-Manager Non-Core Fixed Income Fund had placed in the top half of its performance peer group for the one- and five-year periods and in the fourth quartile for the three-year period ended December 31, 2023, and had outperformed its composite benchmark index for the one- and five-year periods and underperformed for the three-year period ended March 31, 2024. The Trustees noted that the Goldman Sachs Multi-Manager Real Assets Strategy Fund had placed in the third quartile of its performance peer group for the one-, three-, and five-year periods ended December 31, 2023, and had outperformed its composite benchmark index for the one-, three-, and five-year periods ended March 31, 2024.
Costs of Services Provided and Competitive Information
The Trustees considered the contractual terms of the Management Agreement and the fee rates payable by each Fund thereunder. In this regard, the Trustees considered information on the services rendered by the Investment Adviser to the Funds, which included both advisory and administrative services that were directed to the needs and operations of the Funds as registered mutual funds.
In particular, the Trustees reviewed analyses prepared by the Outside Data Provider regarding the expense rankings of the Funds, as well as additional information provided by the Investment Adviser throughout the year. The analyses provided a comparison of each Fund’s management fee and breakpoints to those of a relevant peer group and category universe; an expense analysis which compared each Fund’s overall net and gross expenses to a peer group and a category universe; and data comparing each Fund’s net expenses to the peer and category medians. The analyses also compared each Fund’s other expenses and fee waivers/reimbursements to those of the peer group and category medians. With respect to the Goldman Sachs Multi-Manager Global Equity Fund, the Trustees also considered comparative fee information for services provided by the Investment Adviser to collective investment vehicles having investment objectives and policies similar to those of the Fund. The Trustees considered that services provided to the Funds differed in various significant respects from the services provided to these collective investment
GOLDMAN SACHS STRATEGIC MULTI-ASSET CLASS FUNDS
Statement Regarding Basis for Approval of Management Agreement and Sub-Advisory
Agreements (Unaudited) (continued)
vehicles, which generally operated under less stringent regulatory and financial reporting requirements and required fewer services from the Investment Adviser. The Trustees concluded that the comparisons provided by the Outside Data Provider and the Investment Adviser were useful in evaluating the reasonableness of the management fees and total expenses paid by the Funds.
In addition, the Trustees considered the Investment Adviser’s undertakings to implement fee waivers and expense limitations. In this regard the Trustees noted that shareholders that are invested in the Funds consist of institutional clients that have entered into a separate management agreement with the Investment Adviser and pay a single management fee for the Investment Adviser’s management of their accounts, and that the Investment Adviser waives a portion of the management fee with respect to each Fund in order to achieve an effective net management fee rate that is equal to the actual cost of fees paid to the Fund’s sub-advisers. In addition, the Trustees noted that shareholders are able to redeem their shares at any time if shareholders believe that the Fund fees and expenses are too high or if they are dissatisfied with the performance of the Fund.
Profitability
The Trustees reviewed each Fund’s contribution to the Investment Adviser’s revenues and pre-tax profit margins. In this regard the Trustees noted that they had received, among other things, profitability analyses and summaries, revenue and expense schedules by Fund and by function (i.e., investment management, transfer agency and distribution and service), and information on the Investment Adviser’s expense allocation methodology. They observed that the profitability and expense figures are substantially similar to those used by the Investment Adviser for many internal purposes, including compensation decisions among various business groups, and are thus subject to a vigorous internal debate about how certain revenue and expenses should be allocated. The Trustees also noted that the internal audit group within the Goldman Sachs organization periodically audits the expense allocation methodology and that the internal audit group was satisfied with the reasonableness, consistency, and accuracy of the Investment Adviser’s expense allocation methodology. Profitability data for each Fund was provided for 2023 and 2022, and the Trustees considered this information in relation to the Investment Adviser’s overall profitability.
Economies of Scale
The Trustees considered the information that had been provided regarding whether there have been economies of scale with respect to the management of the Funds. The Trustees also considered that the Funds are offered to the Investment Adviser’s institutional clients as part of an investment program whereby the Funds and other funds act as core “building blocks” for the client’s portfolio. The Trustees considered the Investment Adviser’s representations that its clients benefit from this investment model with increased liquidity, increased investment oversight, access to new investment strategies, economies of scale, and reduced complexity in managing client portfolios. The Trustees noted that, pursuant to the model, clients pay a management fee for the Investment Adviser’s management of their accounts, and that the fund-level management fees in excess of the weighted average sub-advisory fees are waived in order to avoid charging two layers of management fees. The Trustees also considered the breakpoints in the fee rate payable under the Management Agreement for each of the Funds at the following annual percentage rates of the average daily net assets of the Funds:
| | | | | | |
| Average Daily Net Assets | | Goldman Sachs
Multi-Manager
Global Equity
Fund | | Goldman Sachs
Multi-Manager
Non-Core Fixed
Income Fund | | Goldman Sachs
Multi-Manager
Real Assets
Strategy Fund |
| | | |
First $1 billion | | 1.03% | | 0.85% | | 1.00% |
| | | |
Next $1 billion | | 0.93 | | 0.85 | | 0.90 |
| | | |
Next $3 billion | | 0.89 | | 0.77 | | 0.86 |
| | | |
Next $3 billion | | 0.87 | | 0.73 | | 0.84 |
| | | |
Over $8 billion | | 0.84 | | 0.71 | | 0.82 |
The Trustees noted that the breakpoints were designed to share potential economies of scale, if any, with the Funds and their shareholders as assets under management reach those asset levels. The Trustees considered the amounts of assets in the Funds; the Funds’ recent purchase and redemption activity; the information provided by the Investment Adviser relating to the costs of the services provided by the Investment Adviser and its affiliates and the profits realized by them (if any); information comparing the fee rates charged by the Investment Adviser with fee rates charged to other funds in the peer groups; and the Investment Adviser’s undertakings to waive a portion of its management fee and to limit certain expenses of the Funds that exceed specified levels. The Trustees also considered the relationship between the advisory and sub-advisory fee rate schedules. Upon reviewing these matters
GOLDMAN SACHS STRATEGIC MULTI-ASSET CLASS FUNDS
Statement Regarding Basis for Approval of Management Agreement and Sub-Advisory
Agreements (Unaudited) (continued)
at the Annual Meeting, the Trustees concluded that the fee breakpoints represented a means of assuring that benefits of scalability, if any, would be passed along to shareholders at the specified asset levels.
Other Benefits to the Investment Adviser and Its Affiliates
The Trustees also considered the other benefits derived by the Investment Adviser and its affiliates from their relationships with the Funds as stated above, including: (a) transfer agency fees received by Goldman Sachs & Co. LLC (“Goldman Sachs”); (b) brokerage and futures commissions earned by Goldman Sachs for executing securities transactions (in its capacity as clearing broker) and futures transactions on behalf of the Funds; (c) the Investment Adviser’s ability to leverage the infrastructure designed to service the Funds on behalf of its other clients; (d) the Investment Adviser’s ability to cross-market other products and services to Fund shareholders; (e) Goldman Sachs’ retention of fees earned by the Investment Adviser and certain affiliates directly from certain clients who invest in the Funds in connection with a broader advisory agreement; (f) the Investment Adviser’s ability to negotiate better pricing with the Funds’ custodian on behalf of its other clients, as a result of the relationship with the Funds; (g) the investment of cash in money market funds managed by the Investment Adviser that will result in increased assets under management for those money market funds; and (h) the possibility that the working relationship between the Investment Adviser and the Funds’ third-party service providers (including the Funds’ sub-advisers) may cause those service providers to be more likely to do business with other areas of Goldman Sachs. In the course of considering the foregoing, the Independent Trustees requested and received further information quantifying certain of these fall-out benefits.
Other Benefits to the Funds and Their Shareholders
The Trustees also noted that the Funds receive certain other potential benefits as a result of their relationship with the Investment Adviser, including: (a) enhanced servicing from vendors due to the volume of business generated by the Investment Adviser and its affiliates; (b) the advantages received from the Investment Adviser’s knowledge and experience gained from managing other accounts and products; (c) the Investment Adviser’s ability to hire and retain qualified personnel to provide services to the Funds because of the reputation of the Goldman Sachs organization; (d) the Funds’ access, through the Investment Adviser, to certain firm-wide resources (e.g., proprietary risk management systems and databases), subject to certain restrictions; (e) the Funds’ ability to aggregate assets managed by certain sub-advisers with those of other clients of the Investment Adviser for purposes of applying breakpoints in a sub-advisory agreement; and (f) the Funds’ access to certain affiliated distribution channels.
Conclusion
In connection with their consideration of the Management Agreement, the Trustees gave weight to each of the factors described above, but did not identify any particular factor as controlling their decision. After deliberation and consideration of all of the information provided, including the factors described above, the Trustees concluded, in the exercise of their business judgment, that the management fees paid by each of the Funds were reasonable in light of the services provided to it by the Investment Adviser, the Investment Adviser’s costs and each Fund’s current and reasonably foreseeable asset levels. The Trustees unanimously concluded that the Investment Adviser’s continued management likely would benefit each Fund and its shareholders, and that the Management Agreement should be approved and continued with respect to each Fund until June 30, 2025.
Designated Sub-Advisory Agreements
Nature, Extent, and Quality of the Services Provided Under the Designated Sub-Advisory Agreements and Performance
In evaluating the Designated Sub-Advisory Agreements, the Trustees relied upon materials furnished and presentations made by the Investment Adviser and the Designated Sub-Advisers. In evaluating the nature, extent, and quality of services provided by each Designated Sub-Adviser, the Trustees considered information on the services provided to the Funds by their respective Designated Sub-Advisers, including information about each Designated Sub-Adviser’s (a) personnel and compensation structure; (b) track record in managing the Fund and, if applicable, other funds and/or accounts with investment strategies similar to those employed on behalf of the Funds; (c) policies and procedures in place to address potential conflicts of interest; and (d) compliance program and code of ethics. In this regard, they also considered assessments provided by the Investment Adviser of each Designated Sub-Adviser, the Designated Sub-Adviser’s investment strategies and personnel, and its compliance program. The Trustees also considered information regarding each Designated Sub-Adviser’s efforts relating to business continuity planning. The Trustees also reviewed the operations and investment performance of each Designated Sub-Adviser’s respective sleeve of the applicable Fund since its inception, including a comparison of each Designated Sub-Adviser to relevant benchmark indices based on various metrics.
GOLDMAN SACHS STRATEGIC MULTI-ASSET CLASS FUNDS
Statement Regarding Basis for Approval of Management Agreement and Sub-Advisory
Agreements (Unaudited) (continued)
Costs of Services Provided
The Trustees reviewed the terms of each Designated Sub-Advisory Agreement, including the schedule of fees payable to the Designated Sub-Advisers. They considered any breakpoints in the sub-advisory fee rate payable under each Designated Sub-Advisory Agreement. The Trustees noted that the compensation paid to each Designated Sub-Adviser is paid by the Investment Adviser, not by the Funds. The Trustees considered that certain Designated Sub-Advisers had agreed to reduce their sub-advisory fee rate, which benefited shareholders of the applicable Funds in light of the existing management fee waiver arrangement. The Trustees reviewed the blended average of all sub-advisory fees paid by the Investment Adviser with respect to each Fund in light of the overall management fee paid by each Fund. They also considered the Investment Adviser’s undertaking to waive a portion of its management fee which is in excess of the weighted average of each Fund’s sub-advisory fees.
Conclusion
In connection with their consideration of the Designated Sub-Advisory Agreements, the Trustees gave weight to various factors, but did not identify any particular factor as controlling their decision. After deliberation and consideration of the information provided, including the factors described above, the Trustees, including the Independent Trustees, unanimously concluded, in the exercise of their business judgment, that the sub-advisory fees paid by the Investment Adviser to each Designated Sub-Adviser were reasonable in light of the factors considered, and that each Designated Sub-Advisory Agreement should be approved and continued until June 30, 2025.
Goldman Sachs Trust II – Strategic Multi-Asset Class Funds - Tax Information (Unaudited)
For the year ended October 31, 2024, 33.33% and 18.74% of the dividends paid from net investment company taxable income by the Multi-Manager Global Equity Fund and Multi-Manager Real Assets Strategy Fund, respectively, qualify for the dividends received deduction available to corporations.
For the year ended October 31, 2024, 1.84% and 40.68% of the dividends paid from net investment company taxable income by the Multi-Manager Global Equity Fund and Multi-Manager Real Assets Strategy Fund qualify as section 199A dividends.
For the year ended October 31, 2024, 86.47%, 0.72%, and 55.02% of the dividends paid from net investment company taxable income by the Multi-Manager Global Equity Fund, Multi-Manager Non-Core Fixed Income Fund, and Multi-Manager Real Assets Strategy Fund, respectively, qualify for the reduced tax rate under the Jobs and Growth Tax Relief and Reconciliation Act of 2003.
For the year ended October 31, 2024, the Multi-Manager Non-Core Fixed Income Fund designated 93.97% of the dividends paid from net investment company taxable income as section 163(j) Interest Dividends.
TRUSTEES Gregory G. Weaver, Chair Cheryl K. Beebe Dwight L. Bush Kathryn A. Cassidy John G. Chou Joaquin Delgado Eileen H. Dowling Lawrence Hughes John F. Killian Steven D. Krichmar Michael Latham James A. McNamara Lawrence W. Stranghoener PaulC.Wirth GOLDMAN SACHS & CO. LLC Distributor and Transfer Agent GOLDMAN SACHS ASSET MANAGEMENT, L.P. Investment Adviser 200 West Street, New York, New York 10282 OFFICERS James A. McNamara, President Joseph F. DiMaria, Principal Financial Officer, Principal Accounting Officer and Treasurer Robert Griffith, Secretary (C) 2024 Goldman Sachs. All rights reserved. SMACAR-24
| ITEM 8. | CHANGES IN AND DISAGREEMENTS WITH ACCOUNTANTS FOR OPEN-END MANAGEMENT INVESTMENT COMPANIES. |
Not applicable.
| ITEM 9. | PROXY DISCLOSURES FOR OPEN-END MANAGEMENT INVESTMENT COMPANIES. |
Not applicable.
| ITEM 10. | REMUNERATION PAID TO DIRECTORS, OFFICERS, AND OTHERS OF OPEN-END MANAGEMENT INVESTMENT COMPANIES. |
The aggregate remuneration paid to the Funds’ trustees, officers and others, if any, is included in Item 7 of this report.
| ITEM 11. | STATEMENT REGARDING BASIS FOR APPROVAL OF INVESTMENT ADVISORY CONTRACT. |
The Funds’ statement regarding the basis for approval of their investment advisory contracts is included in Item 7 of this report.
| ITEM 12. | DISCLOSURE OF PROXY VOTING POLICIES AND PROCEDURES FOR CLOSED-END MANAGEMENT INVESTMENT COMPANIES. |
Not applicable.
| ITEM 13. | PORTFOLIO MANAGERS OF CLOSED-END MANAGEMENT INVESTMENT COMPANIES. |
Not applicable.
| ITEM 14. | PURCHASES OF EQUITY SECURITIES BY CLOSED-END MANAGEMENT INVESTMENT COMPANY AND AFFILIATED PURCHASERS. |
Not applicable.
| ITEM 15. | SUBMISSION OF MATTERS TO A VOTE OF SECURITY HOLDERS. |
There have been no material changes to the procedures by which shareholders may recommend nominees to the registrant’s board of trustees.
| ITEM 16. | CONTROLS AND PROCEDURES. |
| | (a) | The registrant’s principal executive and principal financial officers, or persons performing similar functions, have concluded that the registrant’s disclosure controls and procedures (as defined in Rule 30a-3(c) under the Investment Company Act of 1940, as amended (the “1940 Act”)) are effective as of a date within 90 days of the filing of this report that includes the disclosure required by this paragraph, based on the evaluation of these controls and procedures required by Rule 30a-3(b) under the 1940 Act and 15d-15(b) under the Securities Exchange Act of 1934, as amended. |
| | (b) | There were no changes in the registrant’s internal control over financial reporting (as defined in Rule 30a-3(d) under the 1940 Act) that occurred during the period covered by this report that have materially affected, or are reasonably likely to materially affect, the registrant’s internal control over financial reporting. |
| ITEM 17. | DISCLOSURE OF SECURITIES LENDING ACTIVITIES FOR CLOSED-END MANAGEMENT INVESTMENT COMPANIES. |
Not applicable.
| ITEM 18. | RECOVERY OF ERRONEOUSLY AWARDED COMPENSATION. |
SIGNATURES
Pursuant to the requirements of the Securities Exchange Act of 1934 and the Investment Company Act of 1940, the registrant has duly caused this report to be signed on its behalf by the undersigned, thereunto duly authorized.
| | | | |
| | | | Goldman Sachs Trust II |
| | |
| By: | | | | /s/ James A. McNamara |
| | |
| | | | James A. McNamara |
| | | | President/Chief Executive Officer |
| | | | Goldman Sachs Trust II |
| | |
| Date: | | | | January 3, 2025 |
Pursuant to the requirements of the Securities Exchange Act of 1934 and the Investment Company Act of 1940, this report has been signed below by the following persons on behalf of the registrant and in the capacities and on the dates indicated.
| | | | |
| | |
| By: | | | | /s/ James A. McNamara |
| | |
| | | | James A. McNamara |
| | | | President/Chief Executive Officer |
| | | | Goldman Sachs Trust II |
| | |
| Date: | | | | January 3, 2025 |
| | |
| By: | | | | /s/ Joseph F. DiMaria |
| | |
| | | | Joseph F. DiMaria |
| | | | Principal Financial Officer |
| | | | Goldman Sachs Trust II |
| | |
| Date: | | | | January 3, 2025 |