UNITED STATES
SECURITIES AND EXCHANGE COMMISSION
Washington, D.C. 20549
FORM N-CSR
CERTIFIED SHAREHOLDER REPORT OF REGISTERED
MANAGEMENT INVESTMENT COMPANIES
Investment Company Act file number 811-22781
Goldman Sachs Trust II
(Exact name of registrant as specified in charter)
200 West Street
15th Floor
New York, New York 10282
(Address of principal executive offices) (Zip code)
Copies to:
| | |
Robert Griffith, Esq. Goldman Sachs & Co. LLC 200 West Street New York, NY 10282 | | Stephen H. Bier, Esq. Dechert LLP 1095 Avenue of the Americas New York, NY 10036 |
(Name and address of agents for service)
Registrant’s telephone number, including area code: (212) 902-1000
Date of fiscal year end: October 31
Date of reporting period: October 31, 2024
| ITEM 1. | REPORTS TO STOCKHOLDERS. |
The Annual Report to Shareholders for the Goldman Sachs GQG Partners International Opportunities Fund (the “Fund”), a series of the registrant, is filed herewith.
Annual Shareholder Report
October 31, 2024
GS GQG Partners International Opportunities Fund
This annual shareholder report contains important information about Goldman Sachs GQG Partners International Opportunities Fund (the "Fund") for the period of November 1, 2023 to October 31, 2024. You can find additional information about the Fund at am.gs.com or dfinview.com/GoldmanSachs. You can also request this information by contacting us at 1-800-526-7384.
What were the Fund costs for the period?
Based on a hypothetical $10,000 investment.
| Class | Costs of a $10,000 investment | Costs paid as a percentage of a $10,000 investment |
|---|
| A | $127 | 1.11% |
How did the Fund perform and what affected its performance?
International and emerging markets equities generated double-digit gains, as inflation decelerated in the U.S. and Europe and developed markets central banks began cutting interest rates. Strong corporate earnings also bolstered stock prices, especially in the information technology and communication services sectors.
Top Contributors to Performance:
Stock selection added most to the Fund’s performance versus the MSCI ACWI ex USA Index (Index), with the largest relative contributors coming from the information technology, utilities and consumer staples sectors.
In information technology, the Fund was helped by investments in companies that benefited from advancements in generative artificial intelligence. Notable contributors included out-of-Index positions in U.S. semiconductor maker NVIDIA and U.K.-based computer processor developer ARM Holdings.
In utilities, the Fund owned stocks that benefited from friendly regulatory environments and, within the power industry, from an imbalance between supply and demand.
In consumer staples, an out-of-Index position in tobacco company Philip Morris International contributed positively to relative returns, as investors generally rotated out of defensive stocks in anticipation of looser central bank monetary policy.
Top Detractors from Performance:
Sector allocation decisions broadly held back the Fund’s relative performance.
An overweight position in energy detracted most, as investor sentiment weakened in response to increased crude oil supply, driven by rising production.
An underweight in financials was a drag on the Fund’s relative returns, as the sector rallied on investor optimism about central bank rate cuts, which were expected to drive an increase in loan growth.
Top individual detractors were French oil and gas producer TotalEnergies, Swiss mining company Glencore and Brazil’s state-owned oil and gas company Petroleo Brasileiro.
The above represents countries.
KEY
SS–Security Selection
OW–Overweight
UW–Underweight
Goldman Sachs GQG Partners International Opportunities Fund
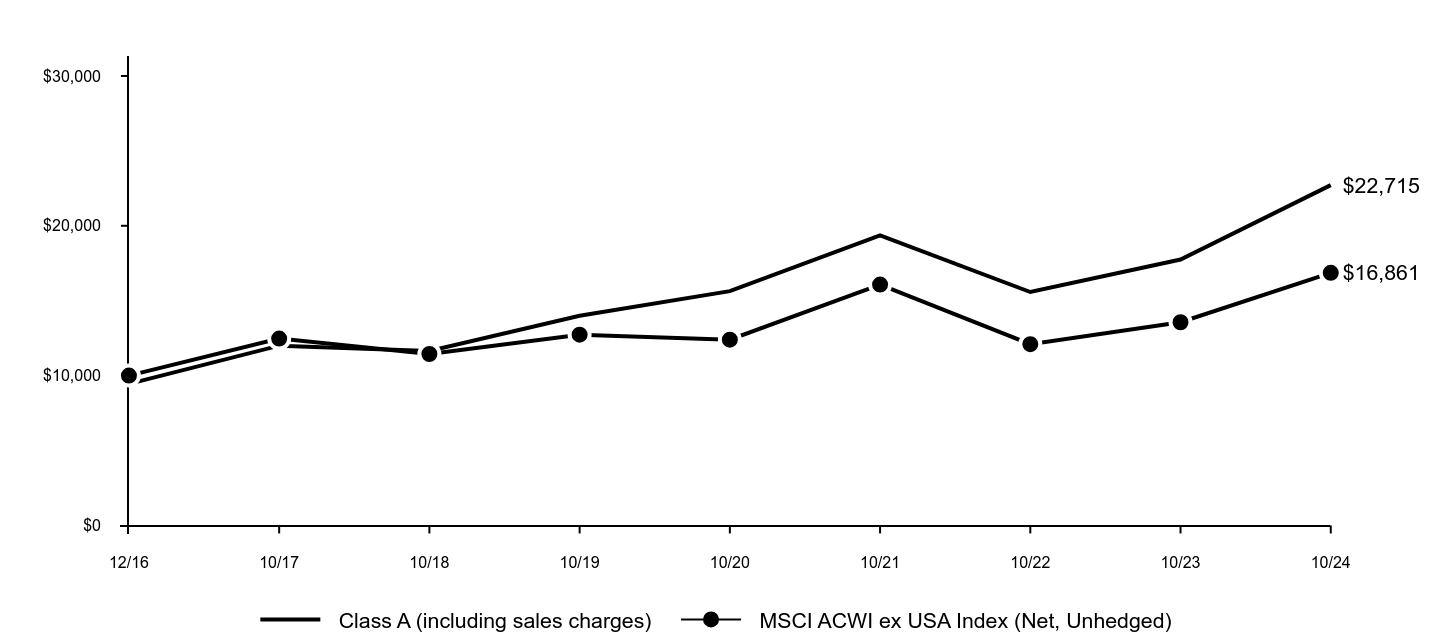
The following graph assumes an initial $10,000 investment in the Fund and compares the initial and subsequent account values at the end of each of the most recently completed 10 fiscal years of the Fund's share class (or less if the share class has been in operation for less than 10 years). The Fund's performance reflects applicable sales charges, if any. For comparative purposes, the performance of the Fund's benchmark and any additional performance benchmark(s) are also shown.
| Class A (including sales charges) | MSCI ACWI ex USA Index (Net, Unhedged) |
|---|
| 12/16 | $9,450 | $10,000 |
| 10/17 | $11,998 | $12,469 |
| 10/18 | $11,649 | $11,442 |
| 10/19 | $14,000 | $12,731 |
| 10/20 | $15,637 | $12,399 |
| 10/21 | $19,366 | $16,076 |
| 10/22 | $15,580 | $12,101 |
| 10/23 | $17,748 | $13,561 |
| 10/24 | $22,715 | $16,861 |
Average Annual Total Returns (%)
| AATR | 1 Year | 5 Years | Since Inception 12/15/16 |
|---|
| Class A excluding sales charges | 27.99% | 10.15% | 11.76% |
| Class A including sales charges | 20.95% | 8.91% | 10.97% |
| MSCI ACWI ex USA Index (Net, Unhedged) | 24.33% | 5.77% | 6.85% |
Performance data quoted above represents past performance. Past performance does not guarantee future results.
The Fund’s investment return and principal value will fluctuate so that an investor’s shares, when redeemed, may be worth more or less than their original cost. Current performance may be lower or higher than the performance quoted above. Please visit our web site at: am.gs.com to obtain the most recent month-end returns. Performance reflects applicable fee waivers and/or expense limitations in effect during the periods shown and in their absence, performance would be reduced. The graph and table do not reflect the deduction of taxes that a shareholder would pay on Fund distributions or redemption of Fund shares.
Goldman Sachs GQG Partners International Opportunities Fund
| Total Net Assets | $48,180,575,966 |
| # of Portfolio Holdings | 67 |
| Portfolio Turnover Rate | 88% |
| Total Net Advisory Fees Paid | $294,734,596 |
What did the Fund invest in?
The table below shows the investment makeup of the Fund, representing the percentage of total net assets of the Fund. Figures in the table below may not sum to 100% due to the exclusion of other assets and liabilities and may not represent the Fund’s market exposure due to the exclusion of certain derivatives, if any. These allocations may not be representative of the Fund’s future investments.
| Consumer Staples | 16.7% |
| Health Care | 16.6% |
| Financials | 14.8% |
| Energy | 12.6% |
| Information Technology | 11.2% |
| Industrials | 8.9% |
| Utilities | 8.6% |
| Communication Services | 4.2% |
| Materials | 2.5% |
| Other | 3.9% |
Goldman Sachs GQG Partners International Opportunities Fund
If you wish to view additional information about the Fund, including the documents and other information listed below, please visit dfinview.com/GoldmanSachs or call 1-800-526-7384.
prospectus
financial information
fund holdings
proxy voting information
Goldman Sachs & Co. LLC is the distributor of the GS GQG Partners International Opportunities Fund. Goldman Sachs Asset Management, LP is the investment adviser to the Fund. GQG Partners is the sub-adviser to the Fund.
The MSCI information may only be used for your internal use, may not be reproduced or redisseminated in any form and may not be used as a basis for or a component of any financial instruments or products or indices. None of the MSCI information is intended to constitute investment advice or a recommendation to make (or refrain from making) any kind of investment decision and may not be relied on as such. Historical data and analysis should not be taken as an indication or guarantee of any future performance analysis, forecast or prediction. The MSCI information is provided on an “as is” basis and the user of this information assumes the entire risk of any use made of this information. MSCI, each of its affiliates and each other person involved in or related to compiling, computing or creating any MSCI information (collectively, the “MSCI Parties”) expressly disclaims all warranties (including, without limitation, any warranties of originality, accuracy, completeness, timeliness, non-infringement, merchantability and fitness for a particular purpose) with respect to this information. Without limiting any of the foregoing, in no event shall any MSCI Party have any liability for any direct, indirect, special, incidental, punitive, consequential, lost profits) or any other damages. (www.msci.com).
The Global Industry Classification Standard (GICS) was developed by and is the exclusive property and a service mark of Morgan Stanley Capital International Inc. (MSCI) and Standard & Poor’s, a division of The McGraw-Hill Companies, Inc. (S&P) and is licensed for use by Goldman Sachs. Neither MSCI, S&P nor any other party involved in making or compiling the GICS or any GICS classifications makes any express or implied warranties or representations with respect to such standard or classification (or the results to be obtained by the use thereof), and all such parties hereby expressly disclaim all warranties of originality, accuracy, completeness, merchantability or fitness for a particular purpose with respect to any of such standard or classification. Without limiting any of the foregoing, in no event shall MSCI, S&P, any of their affiliates or any third party involved in making or compiling the GICS or any GICS classifications have any liability for any direct, indirect, special, punitive, consequential or any other damages (including lost profits) even if notified of the possibility of such damages.
© 2024 Goldman Sachs. All rights reserved.
No Bank Guarantee
May Lose Value
Not FDIC Insured
Goldman Sachs GQG Partners International Opportunities Fund
Annual Shareholder Report
October 31, 2024
GS GQG Partners International Opportunities Fund
This annual shareholder report contains important information about Goldman Sachs GQG Partners International Opportunities Fund (the "Fund") for the period of November 1, 2023 to October 31, 2024. You can find additional information about the Fund at am.gs.com or dfinview.com/GoldmanSachs. You can also request this information by contacting us at 1-800-526-7384.
What were the Fund costs for the period?
Based on a hypothetical $10,000 investment.
| Class | Costs of a $10,000 investment | Costs paid as a percentage of a $10,000 investment |
|---|
| C | $212 | 1.86% |
How did the Fund perform and what affected its performance?
International and emerging markets equities generated double-digit gains, as inflation decelerated in the U.S. and Europe and developed markets central banks began cutting interest rates. Strong corporate earnings also bolstered stock prices, especially in the information technology and communication services sectors.
Top Contributors to Performance:
Stock selection added most to the Fund’s performance versus the MSCI ACWI ex USA Index (Index), with the largest relative contributors coming from the information technology, utilities and consumer staples sectors.
In information technology, the Fund was helped by investments in companies that benefited from advancements in generative artificial intelligence. Notable contributors included out-of-Index positions in U.S. semiconductor maker NVIDIA and U.K.-based computer processor developer ARM Holdings.
In utilities, the Fund owned stocks that benefited from friendly regulatory environments and, within the power industry, from an imbalance between supply and demand.
In consumer staples, an out-of-Index position in tobacco company Philip Morris International contributed positively to relative returns, as investors generally rotated out of defensive stocks in anticipation of looser central bank monetary policy.
Top Detractors from Performance:
Sector allocation decisions broadly held back the Fund’s relative performance.
An overweight position in energy detracted most, as investor sentiment weakened in response to increased crude oil supply, driven by rising production.
An underweight in financials was a drag on the Fund’s relative returns, as the sector rallied on investor optimism about central bank rate cuts, which were expected to drive an increase in loan growth.
Top individual detractors were French oil and gas producer TotalEnergies, Swiss mining company Glencore and Brazil’s state-owned oil and gas company Petroleo Brasileiro.
The above represents countries.
KEY
SS–Security Selection
OW–Overweight
UW–Underweight
Goldman Sachs GQG Partners International Opportunities Fund
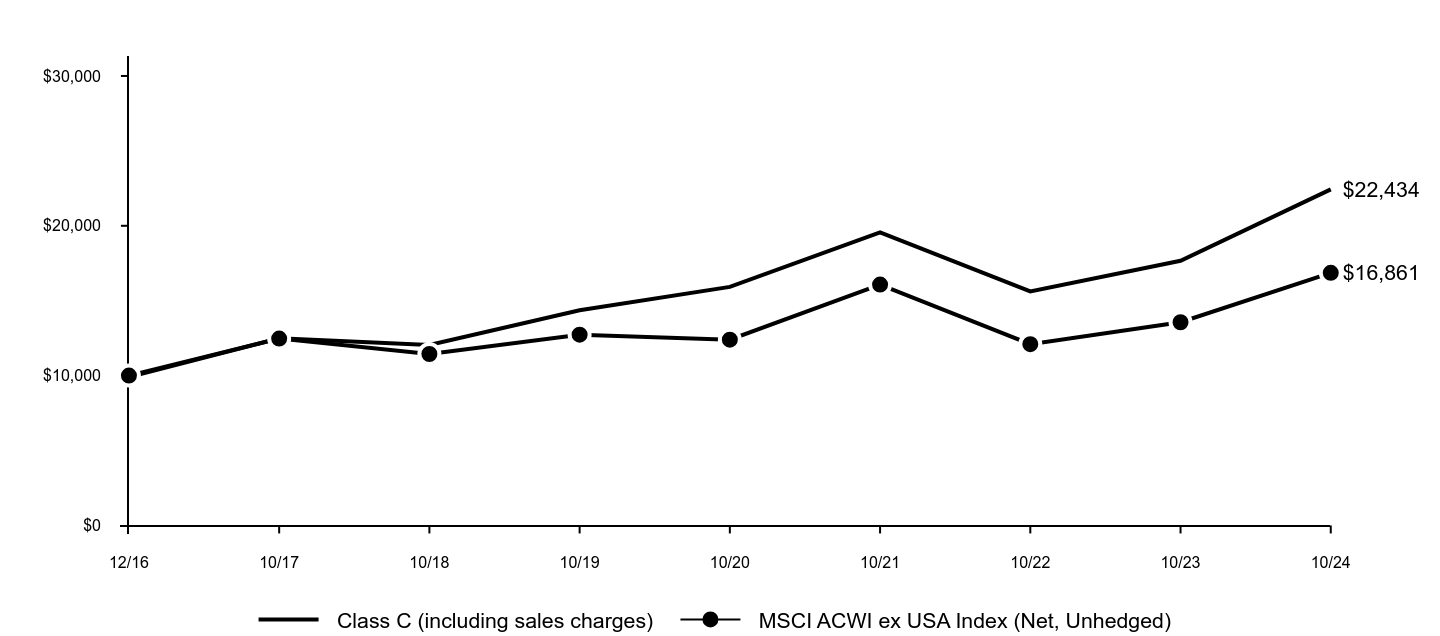
The following graph assumes an initial $10,000 investment in the Fund and compares the initial and subsequent account values at the end of each of the most recently completed 10 fiscal years of the Fund's share class (or less if the share class has been in operation for less than 10 years). The Fund's performance reflects applicable sales charges, if any. For comparative purposes, the performance of the Fund's benchmark and any additional performance benchmark(s) are also shown.
| Class C (including sales charges) | MSCI ACWI ex USA Index (Net, Unhedged) |
|---|
| 12/16 | $9,900 | $10,000 |
| 10/17 | $12,487 | $12,469 |
| 10/18 | $12,041 | $11,442 |
| 10/19 | $14,358 | $12,731 |
| 10/20 | $15,923 | $12,399 |
| 10/21 | $19,557 | $16,076 |
| 10/22 | $15,622 | $12,101 |
| 10/23 | $17,663 | $13,561 |
| 10/24 | $22,434 | $16,861 |
Average Annual Total Returns (%)
| AATR | 1 Year | 5 Years | Since Inception 12/15/16 |
|---|
| Class C excluding sales charges | 27.01% | 9.32% | 10.93% |
| Class C including sales charges | 25.99% | 9.32% | 10.93% |
| MSCI ACWI ex USA Index (Net, Unhedged) | 24.33% | 5.77% | 6.85% |
Performance data quoted above represents past performance. Past performance does not guarantee future results.
The Fund’s investment return and principal value will fluctuate so that an investor’s shares, when redeemed, may be worth more or less than their original cost. Current performance may be lower or higher than the performance quoted above. Please visit our web site at: am.gs.com to obtain the most recent month-end returns. Performance reflects applicable fee waivers and/or expense limitations in effect during the periods shown and in their absence, performance would be reduced. The graph and table do not reflect the deduction of taxes that a shareholder would pay on Fund distributions or redemption of Fund shares.
Goldman Sachs GQG Partners International Opportunities Fund
| Total Net Assets | $48,180,575,966 |
| # of Portfolio Holdings | 67 |
| Portfolio Turnover Rate | 88% |
| Total Net Advisory Fees Paid | $294,734,596 |
What did the Fund invest in?
The table below shows the investment makeup of the Fund, representing the percentage of total net assets of the Fund. Figures in the table below may not sum to 100% due to the exclusion of other assets and liabilities and may not represent the Fund’s market exposure due to the exclusion of certain derivatives, if any. These allocations may not be representative of the Fund’s future investments.
| Consumer Staples | 16.7% |
| Health Care | 16.6% |
| Financials | 14.8% |
| Energy | 12.6% |
| Information Technology | 11.2% |
| Industrials | 8.9% |
| Utilities | 8.6% |
| Communication Services | 4.2% |
| Materials | 2.5% |
| Other | 3.9% |
Goldman Sachs GQG Partners International Opportunities Fund
If you wish to view additional information about the Fund, including the documents and other information listed below, please visit dfinview.com/GoldmanSachs or call 1-800-526-7384.
prospectus
financial information
fund holdings
proxy voting information
Goldman Sachs & Co. LLC is the distributor of the GS GQG Partners International Opportunities Fund. Goldman Sachs Asset Management, LP is the investment adviser to the Fund. GQG Partners is the sub-adviser to the Fund.
The MSCI information may only be used for your internal use, may not be reproduced or redisseminated in any form and may not be used as a basis for or a component of any financial instruments or products or indices. None of the MSCI information is intended to constitute investment advice or a recommendation to make (or refrain from making) any kind of investment decision and may not be relied on as such. Historical data and analysis should not be taken as an indication or guarantee of any future performance analysis, forecast or prediction. The MSCI information is provided on an “as is” basis and the user of this information assumes the entire risk of any use made of this information. MSCI, each of its affiliates and each other person involved in or related to compiling, computing or creating any MSCI information (collectively, the “MSCI Parties”) expressly disclaims all warranties (including, without limitation, any warranties of originality, accuracy, completeness, timeliness, non-infringement, merchantability and fitness for a particular purpose) with respect to this information. Without limiting any of the foregoing, in no event shall any MSCI Party have any liability for any direct, indirect, special, incidental, punitive, consequential, lost profits) or any other damages. (www.msci.com).
The Global Industry Classification Standard (GICS) was developed by and is the exclusive property and a service mark of Morgan Stanley Capital International Inc. (MSCI) and Standard & Poor’s, a division of The McGraw-Hill Companies, Inc. (S&P) and is licensed for use by Goldman Sachs. Neither MSCI, S&P nor any other party involved in making or compiling the GICS or any GICS classifications makes any express or implied warranties or representations with respect to such standard or classification (or the results to be obtained by the use thereof), and all such parties hereby expressly disclaim all warranties of originality, accuracy, completeness, merchantability or fitness for a particular purpose with respect to any of such standard or classification. Without limiting any of the foregoing, in no event shall MSCI, S&P, any of their affiliates or any third party involved in making or compiling the GICS or any GICS classifications have any liability for any direct, indirect, special, punitive, consequential or any other damages (including lost profits) even if notified of the possibility of such damages.
© 2024 Goldman Sachs. All rights reserved.
No Bank Guarantee
May Lose Value
Not FDIC Insured
Goldman Sachs GQG Partners International Opportunities Fund
Annual Shareholder Report
October 31, 2024
GS GQG Partners International Opportunities Fund
This annual shareholder report contains important information about Goldman Sachs GQG Partners International Opportunities Fund (the "Fund") for the period of November 1, 2023 to October 31, 2024. You can find additional information about the Fund at am.gs.com or dfinview.com/GoldmanSachs. You can also request this information by contacting us at 1-800-621-2550.
What were the Fund costs for the period?
Based on a hypothetical $10,000 investment.
| Class | Costs of a $10,000 investment | Costs paid as a percentage of a $10,000 investment |
|---|
| P | $84 | 0.73% |
How did the Fund perform and what affected its performance?
International and emerging markets equities generated double-digit gains, as inflation decelerated in the U.S. and Europe and developed markets central banks began cutting interest rates. Strong corporate earnings also bolstered stock prices, especially in the information technology and communication services sectors.
Top Contributors to Performance:
Stock selection added most to the Fund’s performance versus the MSCI ACWI ex USA Index (Index), with the largest relative contributors coming from the information technology, utilities and consumer staples sectors.
In information technology, the Fund was helped by investments in companies that benefited from advancements in generative artificial intelligence. Notable contributors included out-of-Index positions in U.S. semiconductor maker NVIDIA and U.K.-based computer processor developer ARM Holdings.
In utilities, the Fund owned stocks that benefited from friendly regulatory environments and, within the power industry, from an imbalance between supply and demand.
In consumer staples, an out-of-Index position in tobacco company Philip Morris International contributed positively to relative returns, as investors generally rotated out of defensive stocks in anticipation of looser central bank monetary policy.
Top Detractors from Performance:
Sector allocation decisions broadly held back the Fund’s relative performance.
An overweight position in energy detracted most, as investor sentiment weakened in response to increased crude oil supply, driven by rising production.
An underweight in financials was a drag on the Fund’s relative returns, as the sector rallied on investor optimism about central bank rate cuts, which were expected to drive an increase in loan growth.
Top individual detractors were French oil and gas producer TotalEnergies, Swiss mining company Glencore and Brazil’s state-owned oil and gas company Petroleo Brasileiro.
The above represents countries.
KEY
SS–Security Selection
OW–Overweight
UW–Underweight
Goldman Sachs GQG Partners International Opportunities Fund
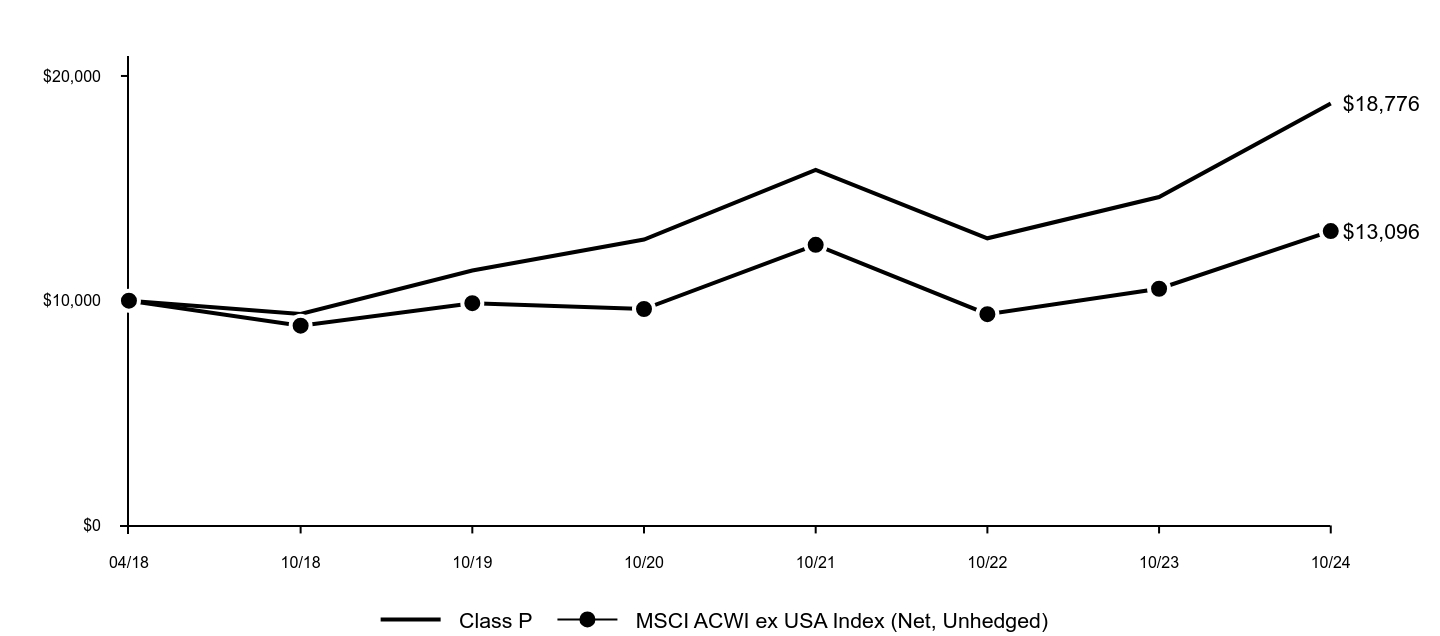
The following graph assumes an initial $10,000 investment in the Fund and compares the initial and subsequent account values at the end of each of the most recently completed 10 fiscal years of the Fund's share class (or less if the share class has been in operation for less than 10 years). The Fund's performance reflects applicable sales charges, if any. For comparative purposes, the performance of the Fund's benchmark and any additional performance benchmark(s) are also shown.
| Class P | MSCI ACWI ex USA Index (Net, Unhedged) |
|---|
| 04/18 | $10,000 | $10,000 |
| 10/18 | $9,408 | $8,887 |
| 10/19 | $11,346 | $9,889 |
| 10/20 | $12,721 | $9,630 |
| 10/21 | $15,818 | $12,487 |
| 10/22 | $12,777 | $9,399 |
| 10/23 | $14,614 | $10,533 |
| 10/24 | $18,776 | $13,096 |
Average Annual Total Returns (%)
| AATR | 1 Year | 5 Years | Since Inception 4/16/18 |
|---|
| Class P | 28.48% | 10.59% | 10.09% |
| MSCI ACWI ex USA Index (Net, Unhedged) | 24.33% | 5.77% | 4.20% |
Performance data quoted above represents past performance. Past performance does not guarantee future results.
The Fund’s investment return and principal value will fluctuate so that an investor’s shares, when redeemed, may be worth more or less than their original cost. Current performance may be lower or higher than the performance quoted above. Please visit our web site at: am.gs.com to obtain the most recent month-end returns. Performance reflects applicable fee waivers and/or expense limitations in effect during the periods shown and in their absence, performance would be reduced. The graph and table do not reflect the deduction of taxes that a shareholder would pay on Fund distributions or redemption of Fund shares.
Goldman Sachs GQG Partners International Opportunities Fund
| Total Net Assets | $48,180,575,966 |
| # of Portfolio Holdings | 67 |
| Portfolio Turnover Rate | 88% |
| Total Net Advisory Fees Paid | $294,734,596 |
What did the Fund invest in?
The table below shows the investment makeup of the Fund, representing the percentage of total net assets of the Fund. Figures in the table below may not sum to 100% due to the exclusion of other assets and liabilities and may not represent the Fund’s market exposure due to the exclusion of certain derivatives, if any. These allocations may not be representative of the Fund’s future investments.
| Consumer Staples | 16.7% |
| Health Care | 16.6% |
| Financials | 14.8% |
| Energy | 12.6% |
| Information Technology | 11.2% |
| Industrials | 8.9% |
| Utilities | 8.6% |
| Communication Services | 4.2% |
| Materials | 2.5% |
| Other | 3.9% |
Goldman Sachs GQG Partners International Opportunities Fund
If you wish to view additional information about the Fund, including the documents and other information listed below, please visit dfinview.com/GoldmanSachs or call 1-800-621-2550.
prospectus
financial information
fund holdings
proxy voting information
Goldman Sachs & Co. LLC is the distributor of the GS GQG Partners International Opportunities Fund. Goldman Sachs Asset Management, LP is the investment adviser to the Fund. GQG Partners is the sub-adviser to the Fund.
The MSCI information may only be used for your internal use, may not be reproduced or redisseminated in any form and may not be used as a basis for or a component of any financial instruments or products or indices. None of the MSCI information is intended to constitute investment advice or a recommendation to make (or refrain from making) any kind of investment decision and may not be relied on as such. Historical data and analysis should not be taken as an indication or guarantee of any future performance analysis, forecast or prediction. The MSCI information is provided on an “as is” basis and the user of this information assumes the entire risk of any use made of this information. MSCI, each of its affiliates and each other person involved in or related to compiling, computing or creating any MSCI information (collectively, the “MSCI Parties”) expressly disclaims all warranties (including, without limitation, any warranties of originality, accuracy, completeness, timeliness, non-infringement, merchantability and fitness for a particular purpose) with respect to this information. Without limiting any of the foregoing, in no event shall any MSCI Party have any liability for any direct, indirect, special, incidental, punitive, consequential, lost profits) or any other damages. (www.msci.com).
The Global Industry Classification Standard (GICS) was developed by and is the exclusive property and a service mark of Morgan Stanley Capital International Inc. (MSCI) and Standard & Poor’s, a division of The McGraw-Hill Companies, Inc. (S&P) and is licensed for use by Goldman Sachs. Neither MSCI, S&P nor any other party involved in making or compiling the GICS or any GICS classifications makes any express or implied warranties or representations with respect to such standard or classification (or the results to be obtained by the use thereof), and all such parties hereby expressly disclaim all warranties of originality, accuracy, completeness, merchantability or fitness for a particular purpose with respect to any of such standard or classification. Without limiting any of the foregoing, in no event shall MSCI, S&P, any of their affiliates or any third party involved in making or compiling the GICS or any GICS classifications have any liability for any direct, indirect, special, punitive, consequential or any other damages (including lost profits) even if notified of the possibility of such damages.
© 2024 Goldman Sachs. All rights reserved.
No Bank Guarantee
May Lose Value
Not FDIC Insured
Goldman Sachs GQG Partners International Opportunities Fund
Annual Shareholder Report
October 31, 2024
GS GQG Partners International Opportunities Fund
This annual shareholder report contains important information about Goldman Sachs GQG Partners International Opportunities Fund (the "Fund") for the period of November 1, 2023 to October 31, 2024. You can find additional information about the Fund at am.gs.com or dfinview.com/GoldmanSachs. You can also request this information by contacting us at 1-800-621-2550.
What were the Fund costs for the period?
Based on a hypothetical $10,000 investment.
| Class | Costs of a $10,000 investment | Costs paid as a percentage of a $10,000 investment |
|---|
| R | $156 | 1.36% |
How did the Fund perform and what affected its performance?
International and emerging markets equities generated double-digit gains, as inflation decelerated in the U.S. and Europe and developed markets central banks began cutting interest rates. Strong corporate earnings also bolstered stock prices, especially in the information technology and communication services sectors.
Top Contributors to Performance:
Stock selection added most to the Fund’s performance versus the MSCI ACWI ex USA Index (Index), with the largest relative contributors coming from the information technology, utilities and consumer staples sectors.
In information technology, the Fund was helped by investments in companies that benefited from advancements in generative artificial intelligence. Notable contributors included out-of-Index positions in U.S. semiconductor maker NVIDIA and U.K.-based computer processor developer ARM Holdings.
In utilities, the Fund owned stocks that benefited from friendly regulatory environments and, within the power industry, from an imbalance between supply and demand.
In consumer staples, an out-of-Index position in tobacco company Philip Morris International contributed positively to relative returns, as investors generally rotated out of defensive stocks in anticipation of looser central bank monetary policy.
Top Detractors from Performance:
Sector allocation decisions broadly held back the Fund’s relative performance.
An overweight position in energy detracted most, as investor sentiment weakened in response to increased crude oil supply, driven by rising production.
An underweight in financials was a drag on the Fund’s relative returns, as the sector rallied on investor optimism about central bank rate cuts, which were expected to drive an increase in loan growth.
Top individual detractors were French oil and gas producer TotalEnergies, Swiss mining company Glencore and Brazil’s state-owned oil and gas company Petroleo Brasileiro.
The above represents countries.
KEY
SS–Security Selection
OW–Overweight
UW–Underweight
Goldman Sachs GQG Partners International Opportunities Fund
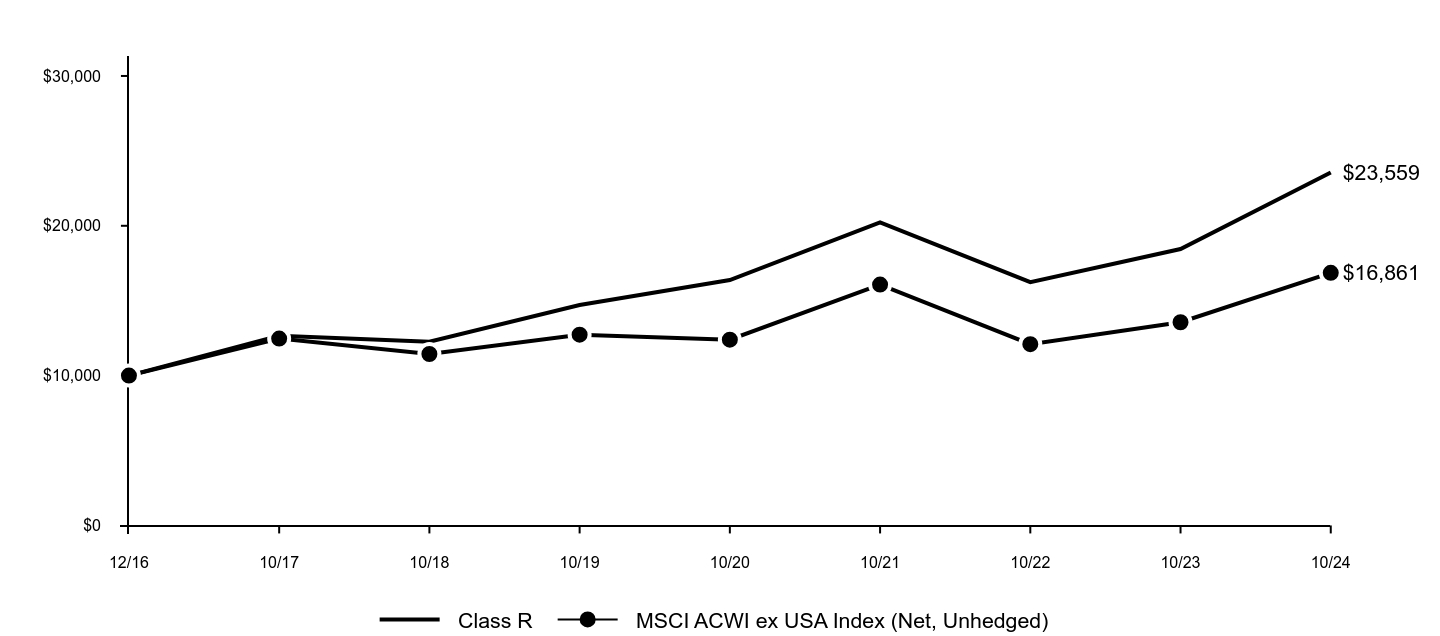
The following graph assumes an initial $10,000 investment in the Fund and compares the initial and subsequent account values at the end of each of the most recently completed 10 fiscal years of the Fund's share class (or less if the share class has been in operation for less than 10 years). The Fund's performance reflects applicable sales charges, if any. For comparative purposes, the performance of the Fund's benchmark and any additional performance benchmark(s) are also shown.
| Class R | MSCI ACWI ex USA Index (Net, Unhedged) |
|---|
| 12/16 | $10,000 | $10,000 |
| 10/17 | $12,665 | $12,469 |
| 10/18 | $12,265 | $11,442 |
| 10/19 | $14,708 | $12,731 |
| 10/20 | $16,378 | $12,399 |
| 10/21 | $20,231 | $16,076 |
| 10/22 | $16,239 | $12,101 |
| 10/23 | $18,452 | $13,561 |
| 10/24 | $23,559 | $16,861 |
Average Annual Total Returns (%)
| AATR | 1 Year | 5 Years | Since Inception 12/15/16 |
|---|
| Class R | 27.68% | 9.87% | 11.48% |
| MSCI ACWI ex USA Index (Net, Unhedged) | 24.33% | 5.77% | 6.85% |
Performance data quoted above represents past performance. Past performance does not guarantee future results.
The Fund’s investment return and principal value will fluctuate so that an investor’s shares, when redeemed, may be worth more or less than their original cost. Current performance may be lower or higher than the performance quoted above. Please visit our web site at: am.gs.com to obtain the most recent month-end returns. Performance reflects applicable fee waivers and/or expense limitations in effect during the periods shown and in their absence, performance would be reduced. The graph and table do not reflect the deduction of taxes that a shareholder would pay on Fund distributions or redemption of Fund shares.
Goldman Sachs GQG Partners International Opportunities Fund
| Total Net Assets | $48,180,575,966 |
| # of Portfolio Holdings | 67 |
| Portfolio Turnover Rate | 88% |
| Total Net Advisory Fees Paid | $294,734,596 |
What did the Fund invest in?
The table below shows the investment makeup of the Fund, representing the percentage of total net assets of the Fund. Figures in the table below may not sum to 100% due to the exclusion of other assets and liabilities and may not represent the Fund’s market exposure due to the exclusion of certain derivatives, if any. These allocations may not be representative of the Fund’s future investments.
| Consumer Staples | 16.7% |
| Health Care | 16.6% |
| Financials | 14.8% |
| Energy | 12.6% |
| Information Technology | 11.2% |
| Industrials | 8.9% |
| Utilities | 8.6% |
| Communication Services | 4.2% |
| Materials | 2.5% |
| Other | 3.9% |
Goldman Sachs GQG Partners International Opportunities Fund
If you wish to view additional information about the Fund, including the documents and other information listed below, please visit dfinview.com/GoldmanSachs or call 1-800-621-2550.
prospectus
financial information
fund holdings
proxy voting information
Goldman Sachs & Co. LLC is the distributor of the GS GQG Partners International Opportunities Fund. Goldman Sachs Asset Management, LP is the investment adviser to the Fund. GQG Partners is the sub-adviser to the Fund.
The MSCI information may only be used for your internal use, may not be reproduced or redisseminated in any form and may not be used as a basis for or a component of any financial instruments or products or indices. None of the MSCI information is intended to constitute investment advice or a recommendation to make (or refrain from making) any kind of investment decision and may not be relied on as such. Historical data and analysis should not be taken as an indication or guarantee of any future performance analysis, forecast or prediction. The MSCI information is provided on an “as is” basis and the user of this information assumes the entire risk of any use made of this information. MSCI, each of its affiliates and each other person involved in or related to compiling, computing or creating any MSCI information (collectively, the “MSCI Parties”) expressly disclaims all warranties (including, without limitation, any warranties of originality, accuracy, completeness, timeliness, non-infringement, merchantability and fitness for a particular purpose) with respect to this information. Without limiting any of the foregoing, in no event shall any MSCI Party have any liability for any direct, indirect, special, incidental, punitive, consequential, lost profits) or any other damages. (www.msci.com).
The Global Industry Classification Standard (GICS) was developed by and is the exclusive property and a service mark of Morgan Stanley Capital International Inc. (MSCI) and Standard & Poor’s, a division of The McGraw-Hill Companies, Inc. (S&P) and is licensed for use by Goldman Sachs. Neither MSCI, S&P nor any other party involved in making or compiling the GICS or any GICS classifications makes any express or implied warranties or representations with respect to such standard or classification (or the results to be obtained by the use thereof), and all such parties hereby expressly disclaim all warranties of originality, accuracy, completeness, merchantability or fitness for a particular purpose with respect to any of such standard or classification. Without limiting any of the foregoing, in no event shall MSCI, S&P, any of their affiliates or any third party involved in making or compiling the GICS or any GICS classifications have any liability for any direct, indirect, special, punitive, consequential or any other damages (including lost profits) even if notified of the possibility of such damages.
© 2024 Goldman Sachs. All rights reserved.
No Bank Guarantee
May Lose Value
Not FDIC Insured
Goldman Sachs GQG Partners International Opportunities Fund
Annual Shareholder Report
October 31, 2024
GS GQG Partners International Opportunities Fund
This annual shareholder report contains important information about Goldman Sachs GQG Partners International Opportunities Fund (the "Fund") for the period of November 1, 2023 to October 31, 2024. You can find additional information about the Fund at am.gs.com or dfinview.com/GoldmanSachs. You can also request this information by contacting us at 1-800-621-2550.
What were the Fund costs for the period?
Based on a hypothetical $10,000 investment.
| Class | Costs of a $10,000 investment | Costs paid as a percentage of a $10,000 investment |
|---|
| R6 | $84 | 0.73% |
How did the Fund perform and what affected its performance?
International and emerging markets equities generated double-digit gains, as inflation decelerated in the U.S. and Europe and developed markets central banks began cutting interest rates. Strong corporate earnings also bolstered stock prices, especially in the information technology and communication services sectors.
Top Contributors to Performance:
Stock selection added most to the Fund’s performance versus the MSCI ACWI ex USA Index (Index), with the largest relative contributors coming from the information technology, utilities and consumer staples sectors.
In information technology, the Fund was helped by investments in companies that benefited from advancements in generative artificial intelligence. Notable contributors included out-of-Index positions in U.S. semiconductor maker NVIDIA and U.K.-based computer processor developer ARM Holdings.
In utilities, the Fund owned stocks that benefited from friendly regulatory environments and, within the power industry, from an imbalance between supply and demand.
In consumer staples, an out-of-Index position in tobacco company Philip Morris International contributed positively to relative returns, as investors generally rotated out of defensive stocks in anticipation of looser central bank monetary policy.
Top Detractors from Performance:
Sector allocation decisions broadly held back the Fund’s relative performance.
An overweight position in energy detracted most, as investor sentiment weakened in response to increased crude oil supply, driven by rising production.
An underweight in financials was a drag on the Fund’s relative returns, as the sector rallied on investor optimism about central bank rate cuts, which were expected to drive an increase in loan growth.
Top individual detractors were French oil and gas producer TotalEnergies, Swiss mining company Glencore and Brazil’s state-owned oil and gas company Petroleo Brasileiro.
The above represents countries.
KEY
SS–Security Selection
OW–Overweight
UW–Underweight
Goldman Sachs GQG Partners International Opportunities Fund
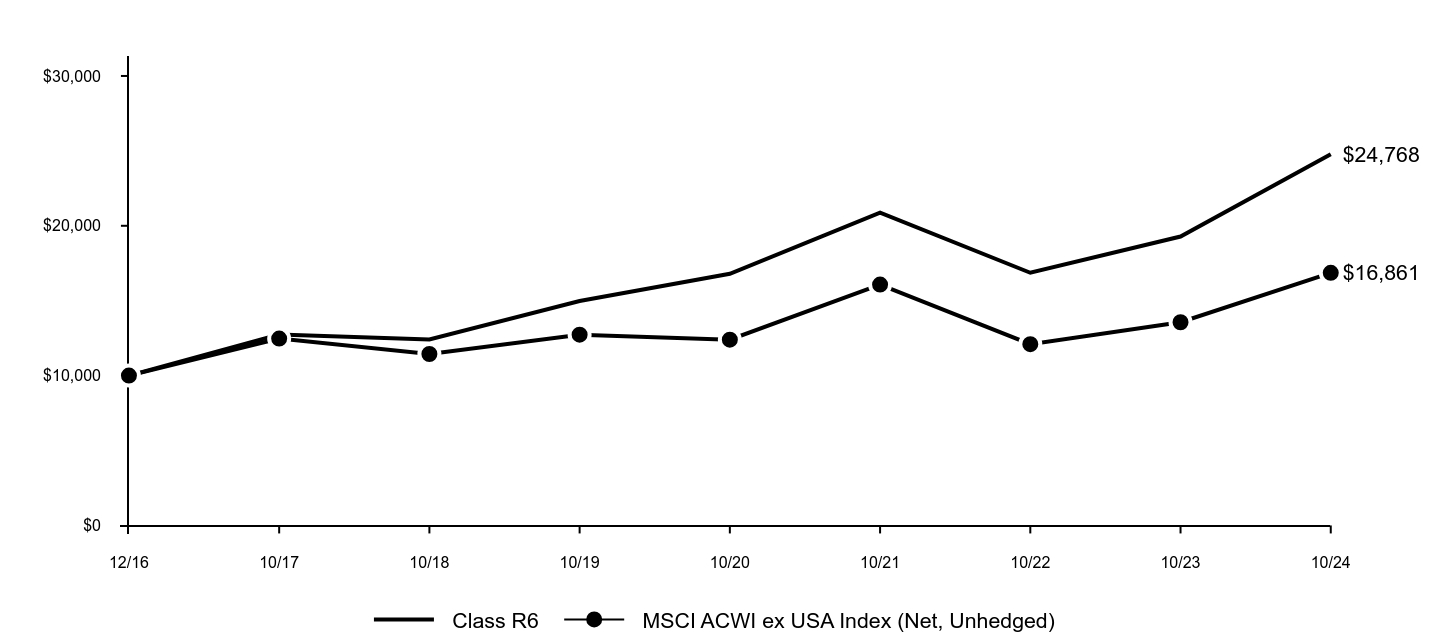
The following graph assumes an initial $10,000 investment in the Fund and compares the initial and subsequent account values at the end of each of the most recently completed 10 fiscal years of the Fund's share class (or less if the share class has been in operation for less than 10 years). The Fund's performance reflects applicable sales charges, if any. For comparative purposes, the performance of the Fund's benchmark and any additional performance benchmark(s) are also shown.
| Class R6 | MSCI ACWI ex USA Index (Net, Unhedged) |
|---|
| 12/16 | $10,000 | $10,000 |
| 10/17 | $12,739 | $12,469 |
| 10/18 | $12,418 | $11,442 |
| 10/19 | $14,983 | $12,731 |
| 10/20 | $16,796 | $12,399 |
| 10/21 | $20,879 | $16,076 |
| 10/22 | $16,865 | $12,101 |
| 10/23 | $19,284 | $13,561 |
| 10/24 | $24,768 | $16,861 |
Average Annual Total Returns (%)
| AATR | 1 Year | 5 Years | Since Inception 12/15/16 |
|---|
| Class R6 | 28.48% | 10.58% | 12.20% |
| MSCI ACWI ex USA Index (Net, Unhedged) | 24.33% | 5.77% | 6.85% |
Performance data quoted above represents past performance. Past performance does not guarantee future results.
The Fund’s investment return and principal value will fluctuate so that an investor’s shares, when redeemed, may be worth more or less than their original cost. Current performance may be lower or higher than the performance quoted above. Please visit our web site at: am.gs.com to obtain the most recent month-end returns. Performance reflects applicable fee waivers and/or expense limitations in effect during the periods shown and in their absence, performance would be reduced. The graph and table do not reflect the deduction of taxes that a shareholder would pay on Fund distributions or redemption of Fund shares.
Goldman Sachs GQG Partners International Opportunities Fund
| Total Net Assets | $48,180,575,966 |
| # of Portfolio Holdings | 67 |
| Portfolio Turnover Rate | 88% |
| Total Net Advisory Fees Paid | $294,734,596 |
What did the Fund invest in?
The table below shows the investment makeup of the Fund, representing the percentage of total net assets of the Fund. Figures in the table below may not sum to 100% due to the exclusion of other assets and liabilities and may not represent the Fund’s market exposure due to the exclusion of certain derivatives, if any. These allocations may not be representative of the Fund’s future investments.
| Consumer Staples | 16.7% |
| Health Care | 16.6% |
| Financials | 14.8% |
| Energy | 12.6% |
| Information Technology | 11.2% |
| Industrials | 8.9% |
| Utilities | 8.6% |
| Communication Services | 4.2% |
| Materials | 2.5% |
| Other | 3.9% |
Goldman Sachs GQG Partners International Opportunities Fund
If you wish to view additional information about the Fund, including the documents and other information listed below, please visit dfinview.com/GoldmanSachs or call 1-800-621-2550.
prospectus
financial information
fund holdings
proxy voting information
Goldman Sachs & Co. LLC is the distributor of the GS GQG Partners International Opportunities Fund. Goldman Sachs Asset Management, LP is the investment adviser to the Fund. GQG Partners is the sub-adviser to the Fund.
The MSCI information may only be used for your internal use, may not be reproduced or redisseminated in any form and may not be used as a basis for or a component of any financial instruments or products or indices. None of the MSCI information is intended to constitute investment advice or a recommendation to make (or refrain from making) any kind of investment decision and may not be relied on as such. Historical data and analysis should not be taken as an indication or guarantee of any future performance analysis, forecast or prediction. The MSCI information is provided on an “as is” basis and the user of this information assumes the entire risk of any use made of this information. MSCI, each of its affiliates and each other person involved in or related to compiling, computing or creating any MSCI information (collectively, the “MSCI Parties”) expressly disclaims all warranties (including, without limitation, any warranties of originality, accuracy, completeness, timeliness, non-infringement, merchantability and fitness for a particular purpose) with respect to this information. Without limiting any of the foregoing, in no event shall any MSCI Party have any liability for any direct, indirect, special, incidental, punitive, consequential, lost profits) or any other damages. (www.msci.com).
The Global Industry Classification Standard (GICS) was developed by and is the exclusive property and a service mark of Morgan Stanley Capital International Inc. (MSCI) and Standard & Poor’s, a division of The McGraw-Hill Companies, Inc. (S&P) and is licensed for use by Goldman Sachs. Neither MSCI, S&P nor any other party involved in making or compiling the GICS or any GICS classifications makes any express or implied warranties or representations with respect to such standard or classification (or the results to be obtained by the use thereof), and all such parties hereby expressly disclaim all warranties of originality, accuracy, completeness, merchantability or fitness for a particular purpose with respect to any of such standard or classification. Without limiting any of the foregoing, in no event shall MSCI, S&P, any of their affiliates or any third party involved in making or compiling the GICS or any GICS classifications have any liability for any direct, indirect, special, punitive, consequential or any other damages (including lost profits) even if notified of the possibility of such damages.
© 2024 Goldman Sachs. All rights reserved.
No Bank Guarantee
May Lose Value
Not FDIC Insured
Goldman Sachs GQG Partners International Opportunities Fund
Annual Shareholder Report
October 31, 2024
GS GQG Partners International Opportunities Fund
GSIMX: Institutional Class
This annual shareholder report contains important information about Goldman Sachs GQG Partners International Opportunities Fund (the "Fund") for the period of November 1, 2023 to October 31, 2024. You can find additional information about the Fund at am.gs.com or dfinview.com/GoldmanSachs. You can also request this information by contacting us at 1-800-621-2550.
What were the Fund costs for the period?
Based on a hypothetical $10,000 investment.
| Class | Costs of a $10,000 investment | Costs paid as a percentage of a $10,000 investment |
|---|
| Institutional | $86 | 0.75% |
How did the Fund perform and what affected its performance?
International and emerging markets equities generated double-digit gains, as inflation decelerated in the U.S. and Europe and developed markets central banks began cutting interest rates. Strong corporate earnings also bolstered stock prices, especially in the information technology and communication services sectors.
Top Contributors to Performance:
Stock selection added most to the Fund’s performance versus the MSCI ACWI ex USA Index (Index), with the largest relative contributors coming from the information technology, utilities and consumer staples sectors.
In information technology, the Fund was helped by investments in companies that benefited from advancements in generative artificial intelligence. Notable contributors included out-of-Index positions in U.S. semiconductor maker NVIDIA and U.K.-based computer processor developer ARM Holdings.
In utilities, the Fund owned stocks that benefited from friendly regulatory environments and, within the power industry, from an imbalance between supply and demand.
In consumer staples, an out-of-Index position in tobacco company Philip Morris International contributed positively to relative returns, as investors generally rotated out of defensive stocks in anticipation of looser central bank monetary policy.
Top Detractors from Performance:
Sector allocation decisions broadly held back the Fund’s relative performance.
An overweight position in energy detracted most, as investor sentiment weakened in response to increased crude oil supply, driven by rising production.
An underweight in financials was a drag on the Fund’s relative returns, as the sector rallied on investor optimism about central bank rate cuts, which were expected to drive an increase in loan growth.
Top individual detractors were French oil and gas producer TotalEnergies, Swiss mining company Glencore and Brazil’s state-owned oil and gas company Petroleo Brasileiro.
The above represents countries.
KEY
SS–Security Selection
OW–Overweight
UW–Underweight
Goldman Sachs GQG Partners International Opportunities Fund
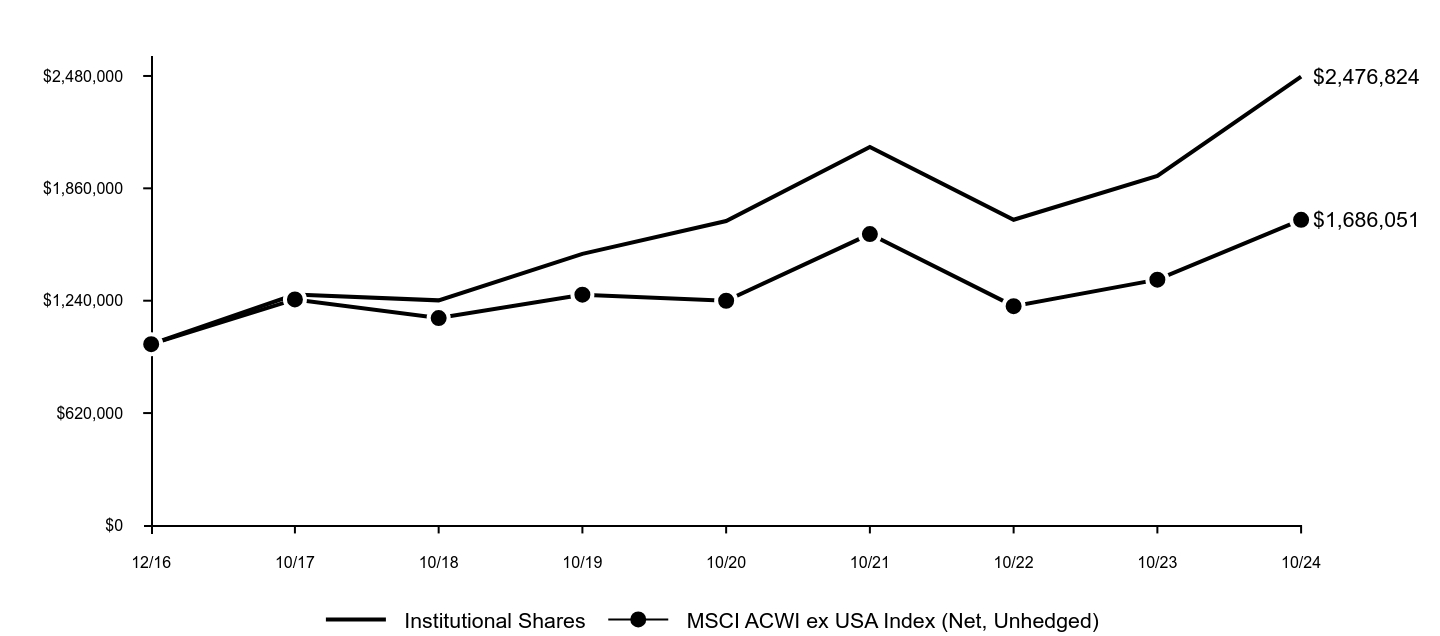
The following graph assumes an initial $1,000,000 investment in the Fund and compares the initial and subsequent account values at the end of each of the most recently completed 10 fiscal years of the Fund's share class (or less if the share class has been in operation for less than 10 years). The Fund's performance reflects applicable sales charges, if any. For comparative purposes, the performance of the Fund's benchmark and any additional performance benchmark(s) are also shown.
| Institutional Shares | MSCI ACWI ex USA Index (Net, Unhedged) |
|---|
| 12/16 | $1,000,000 | $1,000,000 |
| 10/17 | $1,273,901 | $1,246,900 |
| 10/18 | $1,241,846 | $1,144,155 |
| 10/19 | $1,498,335 | $1,273,102 |
| 10/20 | $1,679,598 | $1,239,874 |
| 10/21 | $2,087,935 | $1,607,620 |
| 10/22 | $1,686,471 | $1,210,056 |
| 10/23 | $1,928,389 | $1,356,110 |
| 10/24 | $2,476,824 | $1,686,051 |
Average Annual Total Returns (%)
| AATR | 1 Year | 5 Years | Since Inception 12/15/16 |
|---|
| Institutional Shares | 28.44% | 10.56% | 12.19% |
| MSCI ACWI ex USA Index (Net, Unhedged) | 24.33% | 5.77% | 6.85% |
Performance data quoted above represents past performance. Past performance does not guarantee future results.
The Fund’s investment return and principal value will fluctuate so that an investor’s shares, when redeemed, may be worth more or less than their original cost. Current performance may be lower or higher than the performance quoted above. Please visit our web site at: am.gs.com to obtain the most recent month-end returns. Performance reflects applicable fee waivers and/or expense limitations in effect during the periods shown and in their absence, performance would be reduced. The graph and table do not reflect the deduction of taxes that a shareholder would pay on Fund distributions or redemption of Fund shares.
Goldman Sachs GQG Partners International Opportunities Fund
| Total Net Assets | $48,180,575,966 |
| # of Portfolio Holdings | 67 |
| Portfolio Turnover Rate | 88% |
| Total Net Advisory Fees Paid | $294,734,596 |
What did the Fund invest in?
The table below shows the investment makeup of the Fund, representing the percentage of total net assets of the Fund. Figures in the table below may not sum to 100% due to the exclusion of other assets and liabilities and may not represent the Fund’s market exposure due to the exclusion of certain derivatives, if any. These allocations may not be representative of the Fund’s future investments.
| Consumer Staples | 16.7% |
| Health Care | 16.6% |
| Financials | 14.8% |
| Energy | 12.6% |
| Information Technology | 11.2% |
| Industrials | 8.9% |
| Utilities | 8.6% |
| Communication Services | 4.2% |
| Materials | 2.5% |
| Other | 3.9% |
Goldman Sachs GQG Partners International Opportunities Fund
If you wish to view additional information about the Fund, including the documents and other information listed below, please visit dfinview.com/GoldmanSachs or call 1-800-621-2550.
prospectus
financial information
fund holdings
proxy voting information
Goldman Sachs & Co. LLC is the distributor of the GS GQG Partners International Opportunities Fund. Goldman Sachs Asset Management, LP is the investment adviser to the Fund. GQG Partners is the sub-adviser to the Fund.
The MSCI information may only be used for your internal use, may not be reproduced or redisseminated in any form and may not be used as a basis for or a component of any financial instruments or products or indices. None of the MSCI information is intended to constitute investment advice or a recommendation to make (or refrain from making) any kind of investment decision and may not be relied on as such. Historical data and analysis should not be taken as an indication or guarantee of any future performance analysis, forecast or prediction. The MSCI information is provided on an “as is” basis and the user of this information assumes the entire risk of any use made of this information. MSCI, each of its affiliates and each other person involved in or related to compiling, computing or creating any MSCI information (collectively, the “MSCI Parties”) expressly disclaims all warranties (including, without limitation, any warranties of originality, accuracy, completeness, timeliness, non-infringement, merchantability and fitness for a particular purpose) with respect to this information. Without limiting any of the foregoing, in no event shall any MSCI Party have any liability for any direct, indirect, special, incidental, punitive, consequential, lost profits) or any other damages. (www.msci.com).
The Global Industry Classification Standard (GICS) was developed by and is the exclusive property and a service mark of Morgan Stanley Capital International Inc. (MSCI) and Standard & Poor’s, a division of The McGraw-Hill Companies, Inc. (S&P) and is licensed for use by Goldman Sachs. Neither MSCI, S&P nor any other party involved in making or compiling the GICS or any GICS classifications makes any express or implied warranties or representations with respect to such standard or classification (or the results to be obtained by the use thereof), and all such parties hereby expressly disclaim all warranties of originality, accuracy, completeness, merchantability or fitness for a particular purpose with respect to any of such standard or classification. Without limiting any of the foregoing, in no event shall MSCI, S&P, any of their affiliates or any third party involved in making or compiling the GICS or any GICS classifications have any liability for any direct, indirect, special, punitive, consequential or any other damages (including lost profits) even if notified of the possibility of such damages.
© 2024 Goldman Sachs. All rights reserved.
No Bank Guarantee
May Lose Value
Not FDIC Insured
Goldman Sachs GQG Partners International Opportunities Fund
Annual Shareholder Report
October 31, 2024
GS GQG Partners International Opportunities Fund
This annual shareholder report contains important information about Goldman Sachs GQG Partners International Opportunities Fund (the "Fund") for the period of November 1, 2023 to October 31, 2024. You can find additional information about the Fund at am.gs.com or dfinview.com/GoldmanSachs. You can also request this information by contacting us at 1-800-621-2550.
What were the Fund costs for the period?
Based on a hypothetical $10,000 investment.
| Class | Costs of a $10,000 investment | Costs paid as a percentage of a $10,000 investment |
|---|
| Investor | $99 | 0.86% |
How did the Fund perform and what affected its performance?
International and emerging markets equities generated double-digit gains, as inflation decelerated in the U.S. and Europe and developed markets central banks began cutting interest rates. Strong corporate earnings also bolstered stock prices, especially in the information technology and communication services sectors.
Top Contributors to Performance:
Stock selection added most to the Fund’s performance versus the MSCI ACWI ex USA Index (Index), with the largest relative contributors coming from the information technology, utilities and consumer staples sectors.
In information technology, the Fund was helped by investments in companies that benefited from advancements in generative artificial intelligence. Notable contributors included out-of-Index positions in U.S. semiconductor maker NVIDIA and U.K.-based computer processor developer ARM Holdings.
In utilities, the Fund owned stocks that benefited from friendly regulatory environments and, within the power industry, from an imbalance between supply and demand.
In consumer staples, an out-of-Index position in tobacco company Philip Morris International contributed positively to relative returns, as investors generally rotated out of defensive stocks in anticipation of looser central bank monetary policy.
Top Detractors from Performance:
Sector allocation decisions broadly held back the Fund’s relative performance.
An overweight position in energy detracted most, as investor sentiment weakened in response to increased crude oil supply, driven by rising production.
An underweight in financials was a drag on the Fund’s relative returns, as the sector rallied on investor optimism about central bank rate cuts, which were expected to drive an increase in loan growth.
Top individual detractors were French oil and gas producer TotalEnergies, Swiss mining company Glencore and Brazil’s state-owned oil and gas company Petroleo Brasileiro.
The above represents countries.
KEY
SS–Security Selection
OW–Overweight
UW–Underweight
Goldman Sachs GQG Partners International Opportunities Fund
The following graph assumes an initial $10,000 investment in the Fund and compares the initial and subsequent account values at the end of each of the most recently completed 10 fiscal years of the Fund's share class (or less if the share class has been in operation for less than 10 years). The Fund's performance reflects applicable sales charges, if any. For comparative purposes, the performance of the Fund's benchmark and any additional performance benchmark(s) are also shown.
| Investor Shares | MSCI ACWI ex USA Index (Net, Unhedged) |
|---|
| 12/16 | $10,000 | $10,000 |
| 10/17 | $12,718 | $12,469 |
| 10/18 | $12,382 | $11,442 |
| 10/19 | $14,911 | $12,731 |
| 10/20 | $16,706 | $12,399 |
| 10/21 | $20,730 | $16,076 |
| 10/22 | $16,719 | $12,101 |
| 10/23 | $19,096 | $13,561 |
| 10/24 | $24,506 | $16,861 |
Average Annual Total Returns (%)
| AATR | 1 Year | 5 Years | Since Inception 12/15/16 |
|---|
| Investor Shares | 28.33% | 10.43% | 12.04% |
| MSCI ACWI ex USA Index (Net, Unhedged) | 24.33% | 5.77% | 6.85% |
Performance data quoted above represents past performance. Past performance does not guarantee future results.
The Fund’s investment return and principal value will fluctuate so that an investor’s shares, when redeemed, may be worth more or less than their original cost. Current performance may be lower or higher than the performance quoted above. Please visit our web site at: am.gs.com to obtain the most recent month-end returns. Performance reflects applicable fee waivers and/or expense limitations in effect during the periods shown and in their absence, performance would be reduced. The graph and table do not reflect the deduction of taxes that a shareholder would pay on Fund distributions or redemption of Fund shares.
Goldman Sachs GQG Partners International Opportunities Fund
| Total Net Assets | $48,180,575,966 |
| # of Portfolio Holdings | 67 |
| Portfolio Turnover Rate | 88% |
| Total Net Advisory Fees Paid | $294,734,596 |
What did the Fund invest in?
The table below shows the investment makeup of the Fund, representing the percentage of total net assets of the Fund. Figures in the table below may not sum to 100% due to the exclusion of other assets and liabilities and may not represent the Fund’s market exposure due to the exclusion of certain derivatives, if any. These allocations may not be representative of the Fund’s future investments.
| Consumer Staples | 16.7% |
| Health Care | 16.6% |
| Financials | 14.8% |
| Energy | 12.6% |
| Information Technology | 11.2% |
| Industrials | 8.9% |
| Utilities | 8.6% |
| Communication Services | 4.2% |
| Materials | 2.5% |
| Other | 3.9% |
Goldman Sachs GQG Partners International Opportunities Fund
If you wish to view additional information about the Fund, including the documents and other information listed below, please visit dfinview.com/GoldmanSachs or call 1-800-621-2550.
prospectus
financial information
fund holdings
proxy voting information
Goldman Sachs & Co. LLC is the distributor of the GS GQG Partners International Opportunities Fund. Goldman Sachs Asset Management, LP is the investment adviser to the Fund. GQG Partners is the sub-adviser to the Fund.
The MSCI information may only be used for your internal use, may not be reproduced or redisseminated in any form and may not be used as a basis for or a component of any financial instruments or products or indices. None of the MSCI information is intended to constitute investment advice or a recommendation to make (or refrain from making) any kind of investment decision and may not be relied on as such. Historical data and analysis should not be taken as an indication or guarantee of any future performance analysis, forecast or prediction. The MSCI information is provided on an “as is” basis and the user of this information assumes the entire risk of any use made of this information. MSCI, each of its affiliates and each other person involved in or related to compiling, computing or creating any MSCI information (collectively, the “MSCI Parties”) expressly disclaims all warranties (including, without limitation, any warranties of originality, accuracy, completeness, timeliness, non-infringement, merchantability and fitness for a particular purpose) with respect to this information. Without limiting any of the foregoing, in no event shall any MSCI Party have any liability for any direct, indirect, special, incidental, punitive, consequential, lost profits) or any other damages. (www.msci.com).
The Global Industry Classification Standard (GICS) was developed by and is the exclusive property and a service mark of Morgan Stanley Capital International Inc. (MSCI) and Standard & Poor’s, a division of The McGraw-Hill Companies, Inc. (S&P) and is licensed for use by Goldman Sachs. Neither MSCI, S&P nor any other party involved in making or compiling the GICS or any GICS classifications makes any express or implied warranties or representations with respect to such standard or classification (or the results to be obtained by the use thereof), and all such parties hereby expressly disclaim all warranties of originality, accuracy, completeness, merchantability or fitness for a particular purpose with respect to any of such standard or classification. Without limiting any of the foregoing, in no event shall MSCI, S&P, any of their affiliates or any third party involved in making or compiling the GICS or any GICS classifications have any liability for any direct, indirect, special, punitive, consequential or any other damages (including lost profits) even if notified of the possibility of such damages.
© 2024 Goldman Sachs. All rights reserved.
No Bank Guarantee
May Lose Value
Not FDIC Insured
Goldman Sachs GQG Partners International Opportunities Fund
| | (a) | As of the end of the period covered by this report, the registrant has adopted a code of ethics that applies to the registrant’s principal executive officer, principal financial officer, principal accounting officer or controller, or persons performing similar functions, regardless of whether these individuals are employed by the registrant or a third party (the “Code of Ethics”). |
| | (c) | During the period covered by this report, no amendments were made to the provisions of the Code of Ethics. |
| | (d) | During the period covered by this report, the registrant did not grant any waivers, including an implicit waiver, from any provision of the Code of Ethics. |
| | (f) | A copy of the Code of Ethics is available as provided in Item 19(a)(1) of this report. |
| ITEM 3. | AUDIT COMMITTEE FINANCIAL EXPERT. |
The registrant’s board of trustees has determined that the registrant has at least one “audit committee financial expert” (as defined in Item 3 of Form N-CSR) serving on its audit committee. Kathryn A. Cassidy and Michael Latham are each an “audit committee financial expert” and “independent” (as each term is defined in Item 3 of Form N-CSR).
| ITEM 4. | PRINCIPAL ACCOUNTANT FEES AND SERVICES. |
Table 1 — Items 4(a) - 4(d). The accountant fees below reflect the aggregate fees billed by all of the Funds of the Goldman Sachs Trust II and includes the Goldman Sachs Funds to which this certified shareholder report relates.
| | | | | | | | | | | | |
| | | 2024 | | 2023 | | Description of Services Rendered |
| | | |
| | | | | | | | | | | | |
| | | |
Audit Fees: | | | | | | | | | | | | |
| | | |
• PricewaterhouseCoopers LLP
(“PwC”) | | | $ | 414,639 | | | | $ | 490,622 | | | Financial Statement audits. |
| | | |
Audit-Related Fees: | | | | | | | | | | | | |
| | | |
• PwC | | | $ | 44,100 | | | | $ | 100,800 | | | Other attest services. |
| | | |
Tax Fees: | | | | | | | | | | | | |
| | | |
• PwC | | | $ | 0 | | | | $ | 0 | | | |
Table 2 — Items 4(b)(c) & (d). Non-Audit Services to the Goldman Sachs Trust II’s service affiliates* that were pre-approved by the Audit Committee of the Goldman Sachs Trust II pursuant to Rule 2-01(c)(7)(ii) of Regulation S-X.
| | | | | | | | | | | | |
| | | 2024 | | 2023 | | Description of Services Rendered |
| | | |
| | | | | | | | | | | | |
| | | |
Audit-Related Fees: | | | | | | | | | | | | |
| | | |
• PwC | | | $ | 2,122,312 | | | | $ | 2,075,449 | | | Internal control review performed in accordance with Statement on Standards for Attestation Engagements No. 16 and semi-annual updates related to withholding tax accrual for non-US jurisdictions. These fees are borne by the Funds’ Adviser. |
| * | These include the advisor (excluding sub-advisors) and any entity controlling, controlled by or under common control with the advisor that provides ongoing services to the registrant (hereinafter referred to as “service affiliates”). |
Item 4(e)(1) — Audit Committee Pre-Approval Policies and Procedures
Pre-Approval of Audit and Non-Audit Services Provided to the Funds of the Goldman Sachs Trust II. The Audit and Non-Audit Services Pre-Approval Policy (the “Policy”) adopted by the Audit Committee of Goldman Sachs Trust II (“GST II”) sets forth the procedures and the conditions pursuant to which services performed by an independent auditor for GST II may be pre-approved. Services may be pre-approved specifically by the Audit Committee as a whole or, in certain circumstances, by the Audit Committee Chairman or the person designated as the Audit Committee Financial Expert. In addition, subject to specified cost limitations, certain services may be pre-approved under the provisions of the Policy. The Policy provides that the Audit Committee will consider whether the services provided by an independent auditor are consistent with the Securities and Exchange Commission’s rules on auditor independence. The Policy provides for periodic review and pre-approval by the Audit Committee of the services that may be provided by the independent auditor.
De Minimis Waiver. The pre-approval requirements of the Policy may be waived with respect to the provision of non-audit services that are permissible for an independent auditor to perform, provided (1) the aggregate amount of all such services provided constitutes no more than five percent of the total amount of revenues subject to pre-approval that was paid to the independent auditors during the fiscal year in which the services are provided; (2) such services were not recognized by GST II at the time of the engagement to be non-audit services; and (3) such services are promptly brought to the attention of the Audit Committee and approved prior to the completion of the audit by the Audit Committee or by one or more members of the Audit Committee to whom authority to grant such approvals has been delegated by the Audit Committee, pursuant to the pre-approval provisions of the Policy.
Pre-Approval of Non-Audit Services Provided to GST II’s Investment Advisers. The Policy provides that, in addition to requiring pre-approval of audit and non-audit services provided to GST II, the Audit Committee will pre-approve those non-audit services provided to GST II’s investment advisers (and entities controlling, controlled by or under common control with the investment advisers that provide ongoing services to GST II) where the engagement relates directly to the operations or financial reporting of GST II.
Item 4(e)(2) – 0% of the audit-related fees, tax fees and other fees listed in Table 1 were approved by GST II’s Audit Committee pursuant to the “de minimis” exception of Rule 2-01(c)(7)(i)(C) of Regulation S-X. In addition, 0% of the non-audit services to the GST II’s service affiliates listed in Table 2 were approved by GST II’s Audit Committee pursuant to the “de minimis” exception of Rule 2-01 (c)(7)(i)(C) of Regulation S-X.
Item 4(f) – Not applicable.
Item 4(g) Aggregate Non-Audit Fees Disclosure
The aggregate non-audit fees billed to GST II by PwC for the twelve months ended October 31, 2024 and October 31, 2023 were approximately $44,100 and $100,800, respectively. The aggregate non-audit fees billed to GST II’s adviser and service affiliates by PwC for non-audit services for the twelve months ended December 31, 2023 and December 31, 2022 were approximately $18.0 million and $17.1 million, respectively. With regard to the aggregate non-audit fees billed to GST II’s adviser and service affiliates, the 2023 and 2022 amounts include fees for non-audit services required to be pre-approved [see Table 2] and fees for non-audit services that did not require pre-approval since they did not directly relate to GST II’s operations or financial reporting.
Item 4(h) — GST II’s Audit Committee has considered whether the provision of non-audit services to GST II’s investment adviser and service affiliates that did not require pre-approval pursuant to paragraph (c)(7)(ii) of Rule 2-01 of Regulation S-X is compatible with maintaining the auditors’ independence.
Item 4(i) – Not applicable.
Item 4(j) – Not applicable.
| ITEM 5. | AUDIT COMMITTEE OF LISTED REGISTRANTS. |
Not applicable.
Schedule of Investments is included in Item 7 of this report.
| ITEM 7. | FINANCIAL STATEMENTS AND FINANCIAL HIGHLIGHTS FOR OPEN-END MANAGEMENT INVESTMENT COMPANIES. |
Goldman Sachs Funds Annual Financial Statements October 31, 2024 Goldman Sachs GQG Partners International Opportunities Fund
Goldman Sachs GQG Partners International Opportunities Fund
GOLDMAN SACHS GQG PARTNERS INTERNATIONAL OPPORTUNITIES FUND
|
Schedule of Investments October 31, 2024 |
| | | | | | | | |
| | | Shares | | Description | | Value | |
| |
| | Common Stocks – 93.4% | |
| |
| | Australia* – 2.5% | |
| | 226,343,241 | | Glencore PLC (Metals & Mining) | | $ | 1,187,088,468 | |
| |
| | | |
| |
| | Belgium – 1.3% | |
| | 10,477,984 | | Anheuser-Busch InBev SA (Beverages) | | | 621,253,971 | |
| |
| | | |
| |
| | Brazil – 1.9% | |
| | 68,239,535 | | Petroleo Brasileiro SA ADR (Oil, Gas & Consumable Fuels) | | | 917,821,746 | |
| |
| | | |
| |
| | Canada – 6.1% | |
| | 150,570 | | Constellation Software, Inc. (Software) | | | 454,088,019 | |
| | 36,348,660 | | Enbridge, Inc. (Oil, Gas & Consumable Fuels) | | | 1,468,200,264 | |
| | 1,320,414 | | Imperial Oil Ltd. (Oil, Gas & Consumable Fuels) | | | 98,531,989 | |
| | 1,277,378 | | Intact Financial Corp. (Insurance) | | | 243,943,556 | |
| | 1,113,476 | | Loblaw Cos. Ltd. (Consumer | | | | |
| | | | Staples Distribution & Retail) | | | 140,780,921 | |
| | 4,374,511 | | Royal Bank of Canada (Banks) | | | 529,050,818 | |
| | | |
| | | | | | | | |
| | | | | | | 2,934,595,567 | |
| |
| | | |
| |
| | China – 0.3% | |
| | 203,311,000 | | Industrial & Commercial Bank of China Ltd. Class H (Banks) | | | 121,957,336 | |
| |
| | | |
| |
| | Denmark – 7.4% | |
| | 3,458,328 | | Novo Nordisk AS ADR (Pharmaceuticals) | | | 387,159,819 | |
| | 28,446,716 | | Novo Nordisk AS Class B (Pharmaceuticals) | | | 3,190,725,607 | |
| | | |
| | | | | | | | |
| | | | | | | 3,577,885,426 | |
| |
| | | |
| |
| | France – 7.3% | |
| | 4,417,266 | | BNP Paribas SA (Banks) | | | 301,672,684 | |
| | 2,919,546 | | Pernod Ricard SA (Beverages) | | | 364,267,514 | |
| | 7,207,453 | | Sanofi SA (Pharmaceuticals) | | | 761,681,965 | |
| | 1,961,995 | | Thales SA (Aerospace & Defense) | | | 316,270,628 | |
| | 28,430,183 | | TotalEnergies SE (Oil, Gas & Consumable Fuels) | | | 1,784,154,460 | |
| | | |
| | | | | | | | |
| | | | | | | 3,528,047,251 | |
| |
| | | |
| |
| | Germany – 7.5% | |
| | 1,868,382 | | Commerzbank AG (Banks) | | | 33,136,910 | |
| | 2,141,256 | | Deutsche Boerse AG (Capital Markets) | | | 497,367,245 | |
| | 19,954,581 | | Deutsche Telekom AG (Diversified Telecommunication Services) | | | 603,297,056 | |
| | 10,435,725 | | SAP SE (Software) | | | 2,436,584,042 | |
| | 190,755 | | SAP SE ADR (Software) | | | 44,567,998 | |
| | | |
| | | | | | | | |
| | | | | | | 3,614,953,251 | |
| |
| | | |
| | | | | | | | |
| | | Shares | | Description | | Value | |
| |
| | Common Stocks (continued) | |
| |
| | India – 14.9% | |
| | 33,741,816 | | Adani Energy Solutions Ltd.* (Electric Utilities) | | $ | 390,073,586 | |
| | 24,300,861 | | Adani Enterprises Ltd. (Trading Companies & Distributors) | | | 849,933,619 | |
| | 40,886,936 | | Adani Green Energy Ltd.* (Independent Power and Renewable Electricity Producers) | | | 774,384,819 | |
| | 55,744,582 | | Adani Ports & Special Economic Zone Ltd. (Transportation Infrastructure) | | | 909,509,599 | |
| | 128,274,197 | | Adani Power Ltd.* (Independent Power and Renewable Electricity Producers) | | | 900,632,941 | |
| | 23,146,245 | | Bharti Airtel Ltd. (Wireless Telecommunication Services) | | | 443,030,076 | |
| | 214,539,668 | | GMR Airports Infrastructure Ltd.* (Transportation Infrastructure) | | | 201,418,248 | |
| | 35,001,485 | | ICICI Bank Ltd. ADR (Banks) | | | 1,064,395,159 | |
| | 146,676,651 | | ITC Ltd. (Tobacco) | | | 851,001,597 | |
| | 28,181,280 | | JSW Energy Ltd. (Independent Power and Renewable Electricity Producers) | | | 227,177,360 | |
| | 58,221,841 | | State Bank of India (Banks) | | | 566,571,863 | |
| | | |
| | | | | | | | |
| | | | | | | 7,178,128,867 | |
| |
| | | |
| |
| | Indonesia – 0.8% | |
| | 608,808,898 | | Bank Central Asia Tbk. PT (Banks) | | | 397,597,401 | |
| |
| | | |
| |
| | Italy – 2.7% | |
| | 102,179,373 | | Enel SpA (Electric Utilities) | | | 774,935,796 | |
| | 74,751,961 | | Intesa Sanpaolo SpA (Banks) | | | 319,939,034 | |
| | 5,195,487 | | UniCredit SpA (Banks) | | | 229,844,067 | |
| | | |
| | | | | | | | |
| | | | | | | 1,324,718,897 | |
| |
| | | |
| |
| | Netherlands – 1.7% | |
| | 4,305,757 | | Airbus SE (Aerospace & Defense) | | | 656,805,326 | |
| | 271,322 | | ASML Holding NV (Semiconductors & Semiconductor Equipment) | | | 182,635,258 | |
| | | |
| | | | | | | | |
| | | | | | | 839,440,584 | |
| |
| | | |
| |
| | Russia(a) – 0.0% | |
| | 48,039,056 | | Gazprom PJSC (Oil, Gas & Consumable Fuels) | | | — | |
| | 3,681,622 | | LUKOIL PJSC (Oil, Gas & Consumable Fuels) | | | — | |
| | 34,154,161 | | Rosneft Oil Co. PJSC (Oil, Gas & Consumable Fuels) | | | — | |
| | | |
| | | | | | | | |
| | | | | | | — | |
| |
| | | |
| | |
| The accompanying notes are an integral part of these financial statements. | | 1 |
GOLDMAN SACHS GQG PARTNERS INTERNATIONAL OPPORTUNITIES FUND
|
Schedule of Investments (continued) October 31, 2024 |
| | | | | | | | |
| | | Shares | | Description | | Value | |
| |
| | Common Stocks (continued) | |
| |
| | Spain – 2.4% | |
| | 107,117,554 | | CaixaBank SA(b) (Banks) | | $ | 652,748,516 | |
| | 32,393,350 | | Iberdrola SA (Electric Utilities) | | | 481,188,052 | |
| | | |
| | | | | | | | |
| | | | | | | 1,133,936,568 | |
| |
| | | |
| |
| | Switzerland – 3.1% | |
| | 13,546,127 | | Novartis AG (Pharmaceuticals) | | | 1,469,839,440 | |
| |
| | | |
| |
| | Taiwan – 3.0% | |
| | 46,176,951 | | Taiwan Semiconductor Manufacturing Co. Ltd. (Semiconductors & Semiconductor Equipment) | | | 1,448,085,245 | |
| |
| | | |
| |
| | United Arab Emirates* – 1.1% | |
| | 4,648,706 | | International Holding Co. PJSC | | | | |
| | | | (Industrial Conglomerates) | | | 512,451,793 | |
| |
| | | |
| |
| | United Kingdom – 13.4% | |
| | 15,898,919 | | AstraZeneca PLC (Pharmaceuticals) | | | 2,262,314,198 | |
| | 22,274,782 | | British American Tobacco PLC (Tobacco) | | | 778,929,185 | |
| | 6,339,560 | | British American Tobacco PLC ADR (Tobacco) | | | 221,757,809 | |
| | 12,885,241 | | BT Group PLC (Diversified Telecommunication Services) | | | 23,007,743 | |
| | 78,264,732 | | HSBC Holdings PLC (Banks) | | | 718,315,298 | |
| | 50,971,631 | | National Grid PLC (Multi-Utilities) | | | 640,007,400 | |
| | 124,117,740 | | Rolls-Royce Holdings PLC* (Aerospace & Defense) | | | 856,461,763 | |
| | 22,160,182 | | Shell PLC (Oil, Gas & Consumable Fuels) | | | 745,841,747 | |
| | 3,822,122 | | Unilever PLC ADR (Personal Products) | | | 232,805,451 | |
| | | |
| | | | | | | | |
| | | | | | | 6,479,440,594 | |
| |
| | | |
| |
| | United States – 16.0% | |
| | 2,742,887 | | Chubb Ltd. (Insurance) | | | 774,701,004 | |
| | 1,737,448 | | Meta Platforms, Inc. Class A (Interactive Media & Services) | | | 986,140,736 | |
| | 11,399,851 | | Nestle SA (Food Products) | | | 1,077,201,617 | |
| | 6,663,253 | | NVIDIA Corp. (Semiconductors & Semiconductor Equipment) | | | 884,613,468 | |
| | 20,876,139 | | Philip Morris International, Inc. (Tobacco) | | | 2,770,263,645 | |
| | 6,430,496 | | Procter & Gamble Co. (Household Products) | | | 1,062,189,329 | |
| | 4,008,320 | | Schlumberger NV (Energy Equipment & Services) | | | 160,613,383 | |
| | | |
| | | | | | | | |
| | | | | | | 7,715,723,182 | |
| |
| | | |
| | |
| | TOTAL COMMON STOCKS
(Cost $37,906,179,963) | | $ | 45,002,965,587 | |
| |
| | | |
| | | | | | | | |
| | | Shares | | Dividend Rate | | Value | |
| |
| | Preferred Stocks – 3.5% | |
| |
| | Brazil – 3.5% | |
| | Itau Unibanco Holding SA (Banks) | |
| | 125,319,056 | | 6.710% | | $ | 759,167,836 | |
| | Petroleo Brasileiro SA (Oil, Gas & Consumable Fuels) | |
| | 149,028,263 | | 13.605 | | | 925,739,059 | |
| |
| | | |
| | |
| | TOTAL PREFERRED STOCKS
(Cost $1,484,231,521) | | $ | 1,684,906,895 | |
| |
| | | |
| | | | |
| |
| | Investment Company(c) –3.9% | |
| |
| | Goldman Sachs Financial Square Government Fund — Institutional Shares | |
| | 1,897,466,943 | | 4.766% | | $ | 1,897,466,943 | |
| | (Cost $1,897,466,943) | | | | |
| |
| | | |
| | | | |
| | | |
| | | Shares | | Dividend Rate | | Value | |
| |
| | Securities Lending Reinvestment Vehicle(c) – 0.2% | |
| |
| | Goldman Sachs Financial Square Government Fund — Institutional Shares | |
| | 69,900,000 | | 4.766% | | $ | 69,900,000 | |
| | (Cost $69,900,000) | | | | |
| |
| | | |
| | |
| | TOTAL INVESTMENTS – 101.0%
(Cost $41,357,778,427) | | $ | 48,655,239,425 | |
| |
| | | |
| | |
| | LIABILITIES IN EXCESS OF OTHER
ASSETS – (1.0)% | | | (474,663,459 | ) |
| |
| | | |
| | |
| | NET ASSETS – 100.0% | | $ | 48,180,575,966 | |
| |
| | | |
The percentage shown for each investment category reflects the value of investments in that category as a percentage of net assets.
| | |
| |
| * | | Non-income producing security. |
| |
| (a) | | Significant unobservable inputs were used in the valuation of this portfolio security; i.e., Level 3. |
| |
| (b) | | All or a portion of security is on loan. |
| |
| (c) | | Represents an affiliated issuer. |
| | |
| 2 | | The accompanying notes are an integral part of these financial statements. |
GOLDMAN SACHS GQG PARTNERS INTERNATIONAL OPPORTUNITIES FUND
|
|
| SECTOR ALLOCATION AS OF OCTOBER 31, 2024 |
| | | | |
| |
| Sector | |
| % of Total
Market Value |
|
| |
Consumer Staples | | | 16.7% | |
| |
Health Care | | | 16.6 | |
| |
Financials | | | 14.8 | |
| |
Energy | | | 12.6 | |
| |
Information Technology | | | 11.2 | |
| |
Industrials | | | 8.9 | |
| |
Utilities | | | 8.6 | |
| |
Communication Services | | | 4.2 | |
| |
Investment Company | | | 3.9 | |
| |
Materials | | | 2.5 | |
| |
| | | | | |
| |
| | | 100.0% | |
| | | | | |
| | |
| |
| Investment Abbreviations: |
| ADR | | —American Depositary Receipt |
| PLC | | —Public Limited Company |
| | |
| The accompanying notes are an integral part of these financial statements. | | 3 |
GOLDMAN SACHS GQG PARTNERS INTERNATIONAL OPPORTUNITIES FUND
|
Statement of Assets and Liabilities October 31, 2024 |
| | | | | | | | | | |
| | | |
| | | Assets: | | | | | | | | |
| | | |
| | Investments in unaffiliated issuers, at value (cost $39,390,411,484)(a),(b) | | | $46,687,872,482 | | | | | |
| | Investments in affiliated issuers, at value (cost $1,897,466,943) | | | 1,897,466,943 | | | | | |
| | Investments in affiliated securities lending reinvestment vehicle, at value which equals cost | | | 69,900,000 | | | | | |
| | Cash | | | 38,579,254 | | | | | |
| | Receivables: | | | | | | | | |
| | Investments sold | | | 129,940,249 | | | | | |
| | Dividends | | | 92,212,900 | | | | | |
| | Fund shares sold | | | 54,658,163 | | | | | |
| | Foreign tax reclaims | | | 37,077,355 | | | | | |
| | Investments sold on an extended-settlement basis | | | 20,980,809 | | | | | |
| | Reimbursement from investment adviser | | | 4,431,857 | | | | | |
| | Other assets | | | 46,372,718 | | | | | |
| | | |
| | | |
| | Total assets | | | 49,079,492,730 | | | | | |
| | | |
| | | | |
| | | |
| | Liabilities: | | | | | | | | |
| | | |
| | Foreign currency overdraft, at value (identified cost $608,186) | | | 609,394 | | | | | |
| | Payables: | | | | | | | | |
| | Foreign Capital Gains taxes | | | 361,983,099 | | | | | |
| | Due to shareholders upon reprocessing | | | 144,345,676 | | | | | |
| | Investments purchased on an extended-settlement basis | | | 140,377,593 | | | | | |
| | Investments purchased | | | 140,032,609 | | | | | |
| | Payable upon return of securities loaned | | | 69,900,000 | | | | | |
| | Fund shares redeemed | | | 22,240,783 | | | | | |
| | Management fees | | | 12,432,715 | | | | | |
| | Distribution and Service fees and Transfer Agency fees | | | 1,226,566 | | | | | |
| | Accrued expenses | | | 5,768,329 | | | | | |
| | | |
| | | |
| | Total liabilities | | | 898,916,764 | | | | | |
| | | |
| | | | |
| | | |
| | Net Assets: | | | | | | | | |
| | | |
| | Paid-in capital | | | 38,680,153,204 | | | | | |
| | Total distributable earnings | | | 9,500,422,762 | | | | | |
| | | |
| | | |
| | NET ASSETS | | | $48,180,575,966 | | | | | |
| | | Net Assets: | | | | | | | | |
| | | Class A | | | $ 633,767,074 | | | | | |
| | | Class C | | | 143,643,218 | | | | | |
| | | Institutional | | | 29,932,139,640 | | | | | |
| | | Investor | | | 10,146,054,981 | | | | | |
| | | Class R6 | | | 3,299,255,555 | | | | | |
| | | Class R | | | 6,745,260 | | | | | |
| | | Class P | | | 4,018,970,238 | | | | | |
| | | | |
| | | Total Net Assets | | | $48,180,575,966 | | | | | |
| | | Shares Outstanding $0.001 par value (unlimited number of shares authorized): | | | | | | | | |
| | | Class A | | | 28,855,015 | | | | | |
| | | Class C | | | 6,767,743 | | | | | |
| | | Institutional | | | 1,349,579,884 | | | | | |
| | | Investor | | | 459,538,874 | | | | | |
| | | Class R6 | | | 148,795,779 | | | | | |
| | | Class R | | | 312,154 | | | | | |
| | | Class P | | | 181,292,583 | | | | | |
| | | Net asset value, offering and redemption price per share:(c) | | | | | | | | |
| | | Class A | | | $21.96 | | | | | |
| | | Class C | | | 21.22 | | | | | |
| | | Institutional | | | 22.18 | | | | | |
| | | Investor | | | 22.08 | | | | | |
| | | Class R6 | | | 22.17 | | | | | |
| | | Class R | | | 21.61 | | | | | |
| | | Class P | | | 22.17 | | | | | |
| | (a) | Investments — unaffiliated issuers (including the effects of the net change in foreign capital gains tax liability of $361,983,099. |
| | (b) | Includes loaned securities having market value of $67,970,388. |
| | (c) | Maximum public offering price per share for Class A Shares is $23.24. At redemption, Class C Shares may be subject to a contingent deferred sales charge, assessed on the amount equal to the lesser of the current net asset value (“NAV”) or the original purchase price of the shares. |
| | |
| 4 | | The accompanying notes are an integral part of these financial statements. |
GOLDMAN SACHS GQG PARTNERS INTERNATIONAL OPPORTUNITIES FUND
|
Statement of Operations For the Fiscal Year Ended October 31, 2024 |
| | | | | | | | | | |
| | | |
| | | Investment Income: | | | | | | | | |
| | | |
| | Dividends — unaffiliated issuers (net of tax withholding of $86,904,863) | | $ | 1,101,338,498 | | | | | |
| | | |
| | Dividends — affiliated issuers | | | 74,363,205 | | | | | |
| | | |
| | Securities lending income, net of rebates received or paid to borrowers | | | 3,671,908 | | | | | |
| | | |
| | Interest | | | 269,623 | | | | | |
| | | |
| | | |
| | Total investment income | | | 1,179,643,234 | | | | | |
| | | |
| | | | | | | | | | |
| | | |
| | Expenses: | | | | | | | | |
| | | |
| | Management fees | | | 296,911,208 | | | | | |
| | | |
| | Transfer Agency fees(a) | | | 26,613,957 | | | | | |
| | | |
| | Custody, accounting and administrative services | | | 10,057,317 | | | | | |
| | | |
| | Printing and mailing costs | | | 2,809,424 | | | | | |
| | | |
| | Distribution and Service (12b-1) fees(a) | | | 2,425,214 | | | | | |
| | | |
| | Registration fees | | | 1,081,981 | | | | | |
| | | |
| | Service fees — Class C | | | 322,333 | | | | | |
| | | |
| | Professional fees | | | 298,356 | | | | | |
| | | |
| | Trustee fees | | | 143,410 | | | | | |
| | | |
| | Other | | | 232,574 | | | | | |
| | | |
| | | |
| | Total expenses | | | 340,895,774 | | | | | |
| | | |
| | | |
| | Less — expense reductions | | | (11,706,551 | ) | | | | |
| | | |
| | | |
| | Net expenses | | | 329,189,223 | | | | | |
| | | |
| | | |
| | NET INVESTMENT INCOME | | | 850,454,011 | | | | | |
| | | |
| | | | | | | | | | |
| | | |
| | Realized and unrealized gain (loss): | | | | | | | | |
| | | |
| | Net realized gain (loss) from: | | | | | | | | |
| | | |
| | Investments — unaffiliated issuers | | | 3,424,126,450 | | | | | |
| | | |
| | Foreign currency transactions | | | (17,966,779 | ) | | | | |
| | | |
| | Net change in unrealized gain on: | | | | | | | | |
| | | |
| | Investments — unaffiliated issuers (including the effects of foreign capital gains tax of $(361,983,099)) | | | 4,250,688,794 | | | | | |
| | | |
| | Foreign currency translation | | | 607,993 | | | | | |
| | | |
| | | |
| | Net realized and unrealized gain | | | 7,657,456,458 | | | | | |
| | | |
| | | |
| | NET INCREASE IN NET ASSETS RESULTING FROM OPERATIONS | | $ | 8,507,910,469 | | | | | |
| | | |
| | (a) | Class specific Distribution and/or Service (12b-1) and Transfer Agency fees were as follows: |
| | | | | | | | | | | | | | | | | | | | |
| | | Distribution and/or Service (12b-1) Fees | | Transfer Agency Fees |
| | | | | | | | | | |
Fund | | Class A | | Class C | | Class R | | Class A | | Class C | | Institutional | | Investor | | Class R6 | | Class R | | Class P |
| | | | | | | | | | |
Goldman Sachs GQG Partners International Opportunities Fund | | $1,431,444 | | $967,000 | | $26,770 | | $850,934 | | $191,608 | | $10,518,840 | | $13,205,992 | | $743,468 | | $7,959 | | $1,095,156 |
| | |
| The accompanying notes are an integral part of these financial statements. | | 5 |
GOLDMAN SACHS GQG PARTNERS INTERNATIONAL OPPORTUNITIES FUND
|
| Statements of Changes in Net Assets |
| | | | | | | | | | | | | | |
| | | | | Goldman Sachs GQG Partners
International Opportunities Fund | | | | |
| | | | |
| | | | | For the Fiscal
Year Ended
October 31, 2024 | | | For the Fiscal
Year Ended
October 31, 2023 | | | | |
| | | | |
| | | From operations: | | | | | | | | | | | | |
| | | | |
| | Net investment income | | | $ 850,454,011 | | | | $ 956,592,730 | | | | | |
| | | | |
| | Net realized gain (loss) | | | 3,406,159,671 | | | | (597,557,706 | ) | | | | |
| | | | |
| | Net change in unrealized gain | | | 4,251,296,787 | | | | 2,834,177,527 | | | | | |
| | | |
| | | | |
| | Net increase in net assets resulting from operations | | | 8,507,910,469 | | | | 3,193,212,551 | | | | | |
| | | |
| | | | | | | | | | | | | | |
| | | | |
| | Distributions to shareholders: | | | | | | | | | | | | |
| | | | |
| | From distributable earnings: | | | | | | | | | | | | |
| | | | |
| | Class A Shares | | | (9,160,064 | ) | | | (17,547,803 | ) | | | | |
| | | | |
| | Class C Shares | | | (1,553,079 | ) | | | (3,133,597 | ) | | | | |
| | | | |
| | Institutional Shares | | | (500,086,208 | ) | | | (728,324,807 | ) | | | | |
| | | | |
| | Investor Shares | | | (161,590,923 | ) | | | (226,000,395 | ) | | | | |
| | | | |
| | Class R6 Shares | | | (44,181,574 | ) | | | (49,848,199 | ) | | | | |
| | | | |
| | Class R Shares | | | (80,187 | ) | | | (62,600 | ) | | | | |
| | | | |
| | Class P Shares | | | (72,034,034 | ) | | | (103,698,041 | ) | | | | |
| | | |
| | | | |
| | Total distributions to shareholders | | | (788,686,069 | ) | | | (1,128,615,442 | ) | | | | |
| | | |
| | | | | | | | | | | | | | |
| | | | |
| | From share transactions: | | | | | | | | | | | | |
| | | | |
| | Proceeds from sales of shares | | | 17,701,872,359 | | | | 11,522,771,367 | | | | | |
| | | | |
| | Reinvestment of distributions | | | 690,217,338 | | | | 964,823,979 | | | | | |
| | | | |
| | Cost of shares redeemed | | | (7,344,911,840 | ) | | | (7,377,067,709 | ) | | | | |
| | | |
| | | | |
| | Net increase in net assets resulting from share transactions | | | 11,047,177,857 | | | | 5,110,527,637 | | | | | |
| | | |
| | | | |
| | TOTAL INCREASE | | | 18,766,402,257 | | | | 7,175,124,746 | | | | | |
| | | |
| | | | | | | | | | | | | | |
| | | | |
| | Net assets: | | | | | | | | | | | | |
| | | | |
| | Beginning of year | | | 29,414,173,709 | | | | 22,239,048,963 | | | | | |
| | | |
| | | | |
| | End of year | | | $48,180,575,966 | | | | $29,414,173,709 | | | | | |
| | | |
| | |
| 6 | | The accompanying notes are an integral part of these financial statements. |
GOLDMAN SACHS GQG PARTNERS INTERNATIONAL OPPORTUNITIES FUND
|
Financial Highlights Selected Share Data for a Share Outstanding Throughout Each Year |
| | | | | | | | | | | | | | | | | | | | | | |
| | | |
| | | | | Goldman Sachs GQG Partners International Opportunities Fund | | |
| | | |
| | | | | Class A Shares | | |
| | | |
| | | | | Year Ended October 31, | | |
| | | | | | | |
| | | | | 2024 | | | 2023 | | | 2022 | | | 2021 | | | 2020 | | |
| | | | | | | |
| | | Per Share Data | | | | | | | | | | | | | | | | | | | | |
| | | | | | |
| | Net asset value, beginning of year | | $ | 17.52 | | | $ | 16.07 | | | $ | 20.36 | | | $ | 16.44 | | | $ 14.78 |
| | |
| | | | | | |
| | Net investment income(a) | | | 0.37 | | | | 0.57 | | | | 0.75 | | | | 0.28 | | | 0.04 |
| | | | | | |
| | Net realized and unrealized gain (loss) | | | 4.47 | | | | 1.62 | | | | (4.67 | ) | | | 3.64 | | | 1.68 |
| | |
| | | | | | |
| | Total from investment operations | | | 4.84 | | | | 2.19 | | | | (3.92 | ) | | | 3.92 | | | 1.72 |
| | |
| | | | | | |
| | Distributions to shareholders from net investment income | | | (0.40 | ) | | | (0.74 | ) | | | (0.37 | ) | | | — | | | (0.06) |
| | |
| | | | | | |
| | Net asset value, end of year | | $ | 21.96 | | | $ | 17.52 | | | $ | 16.07 | | | $ | 20.36 | | | $ 16.44 |
| | |
| | | | | | |
| | Total return(b) | | | 27.99 | % | | | 13.91 | % | | | (19.55 | )% | | | 23.84 | % | | 11.66% |
| | |
| | | | | | |
| | Net assets, end of year (in 000s) | | $ | 633,767 | | | $ | 401,254 | | | $ | 417,464 | | | $ | 479,794 | | | $252,603 |
| | | | | | |
| | Ratio of net expenses to average net assets | | | 1.11 | % | | | 1.13 | % | | | 1.14 | % | | | 1.15 | % | | 1.17% |
| | | | | | |
| | Ratio of total expenses to average net assets | | | 1.13 | % | | | 1.16 | % | | | 1.17 | % | | | 1.19 | % | | 1.20% |
| | | | | | |
| | Ratio of net investment income to average net assets | | | 1.70 | % | | | 3.26 | % | | | 4.17 | % | | | 1.47 | % | | 0.23% |
| | | | | | |
| | Portfolio turnover rate(c) | | | 88 | % | | | 62 | % | | | 137 | % | | | 94 | % | | 72% |
| | |
| | (a) | Calculated based on the average shares outstanding methodology. |
| | (b) | Assumes investment at the NAV at the beginning of the year, reinvestment of all dividends and distributions, a complete redemption of the investment at the NAV at the end of the year and no sales or redemption charges (if any). Total returns would be reduced if a sales or redemption charge was taken into account. Returns do not reflect the impact of taxes to shareholders relating to Fund distributions or the redemption of Fund shares. |
| | (c) | The Fund’s portfolio turnover rate is calculated in accordance with regulatory requirements, without regard to transactions involving short term investments. If such transactions were included, the Fund’s portfolio turnover rate may be higher. |
| | |
| The accompanying notes are an integral part of these financial statements. | | 7 |
GOLDMAN SACHS GQG PARTNERS INTERNATIONAL OPPORTUNITIES FUND
|
Financial Highlights (continued) Selected Share Data for a Share Outstanding Throughout Each Year |
| | | | | | | | | | | | | | | | | | | | | | |
| | | |
| | | | | Goldman Sachs GQG Partners International Opportunities Fund | | |
| | | |
| | | | | Class C Shares | | |
| | | |
| | | | | Year Ended October 31, | | |
| | | | | | | |
| | | | | 2024 | | | 2023 | | | 2022 | | | 2021 | | | 2020 | | |
| | | | | | | |
| | Per Share Data | | | | | | | | | | | | | | | | | | | | |
| | | | | | |
| | Net asset value, beginning of year | | $ | 16.96 | | | $ | 15.58 | | | $ | 19.76 | | | $ | 16.08 | | | $ 14.50 |
| | |
| | | | | | |
| | Net investment income (loss)(a) | | | 0.20 | | | | 0.42 | | | | 0.59 | | | | 0.13 | | | (0.08) |
| | | | | | |
| | Net realized and unrealized gain (loss) | | | 4.34 | | | | 1.58 | | | | (4.53 | ) | | | 3.55 | | | 1.66 |
| | |
| | | | | | |
| | Total from investment operations | | | 4.54 | | | | 2.00 | | | | (3.94 | ) | | | 3.68 | | | 1.58 |
| | |
| | | | | | |
| | Distributions to shareholders from net investment income | | | (0.28 | ) | | | (0.62 | ) | | | (0.24 | ) | | | — | | | — |
| | |
| | | | | | |
| | Net asset value, end of year | | $ | 21.22 | | | $ | 16.96 | | | $ | 15.58 | | | $ | 19.76 | | | $ 16.08 |
| | |
| | | | | | |
| | Total return(b) | | | 27.01 | % | | | 13.06 | % | | | (20.12 | )% | | | 22.82 | % | | 10.87% |
| | |
| | | | | | |
| | Net assets, end of year (in 000s) | | $ | 143,643 | | | $ | 93,751 | | | $ | 78,662 | | | $ | 97,057 | | | $61,784 |
| | | | | | |
| | Ratio of net expenses to average net assets | | | 1.86 | % | | | 1.88 | % | | | 1.89 | % | | | 1.90 | % | | 1.92% |
| | | | | | |
| | Ratio of total expenses to average net assets | | | 1.88 | % | | | 1.91 | % | | | 1.92 | % | | | 1.94 | % | | 1.95% |
| | | | | | |
| | Ratio of net investment income (loss) to average net assets | | | 0.93 | % | | | 2.48 | % | | | 3.36 | % | | | 0.69 | % | | (0.51)% |
| | | | | | |
| | Portfolio turnover rate(c) | | | 88 | % | | | 62 | % | | | 137 | % | | | 94 | % | | 72% |
| | |
| | (a) | Calculated based on the average shares outstanding methodology. |
| | (b) | Assumes investment at the NAV at the beginning of the year, reinvestment of all dividends and distributions, a complete redemption of the investment at the NAV at the end of the year and no sales or redemption charges (if any). Total returns would be reduced if a sales or redemption charge was taken into account. Returns do not reflect the impact of taxes to shareholders relating to Fund distributions or the redemption of Fund shares. |
| | (c) | The Fund’s portfolio turnover rate is calculated in accordance with regulatory requirements, without regard to transactions involving short term investments. If such transactions were included, the Fund’s portfolio turnover rate may be higher. |
| | |
| 8 | | The accompanying notes are an integral part of these financial statements. |
GOLDMAN SACHS GQG PARTNERS INTERNATIONAL OPPORTUNITIES FUND
|
Financial Highlights (continued) Selected Share Data for a Share Outstanding Throughout Each Year |
| | | | | | | | | | | | | | | | | | | | | | |
| | | |
| | | | | Goldman Sachs GQG Partners International Opportunities Fund | | |
| | | |
| | | | | Institutional Shares | | |
| | | |
| | | | | Year Ended October 31, | | |
| | | | | | | |
| | | | | 2024 | | | 2023 | | | 2022 | | | 2021 | | | 2020 | | |
| | | | | | | |
| | Per Share Data | | | | | | | | | | | | | | | | | | | | |
| | | | | | |
| | Net asset value, beginning of year | | $ | 17.69 | | | $ | 16.23 | | | $ | 20.55 | | | $ | 16.56 | | | $ 14.87 |
| | |
| | | | | | |
| | Net investment income(a) | | | 0.45 | | | | 0.63 | | | | 0.82 | | | | 0.35 | | | 0.09 |
| | | | | | |
| | Net realized and unrealized gain (loss) | | | 4.51 | | | | 1.64 | | | | (4.70 | ) | | | 3.67 | | | 1.70 |
| | |
| | | | | | |
| | Total from investment operations | | | 4.96 | | | | 2.27 | | | | (3.88 | ) | | | 4.02 | | | 1.79 |
| | |
| | | | | | |
| | Distributions to shareholders from net investment income | | | (0.47 | ) | | | (0.81 | ) | | | (0.44 | ) | | | (0.03 | ) | | (0.10) |
| | |
| | | | | | |
| | Net asset value, end of year | | $ | 22.18 | | | $ | 17.69 | | | $ | 16.23 | | | $ | 20.55 | | | $ 16.56 |
| | |
| | | | | | |
| | Total return(b) | | | 28.44 | % | | | 14.34 | % | | | (19.23 | )% | | | 24.31 | % | | 12.06% |
| | |
| | | | | | |
| | Net assets, end of year (in 000s) | | $ | 29,932,140 | | | $ | 18,487,029 | | | $ | 14,193,048 | | | $ | 14,481,792 | | | $8,683,860 |
| | | | | | |
| | Ratio of net expenses to average net assets | | | 0.75 | % | | | 0.77 | % | | | 0.76 | % | | | 0.77 | % | | 0.79% |
| | | | | | |
| | Ratio of total expenses to average net assets | | | 0.78 | % | | | 0.79 | % | | | 0.79 | % | | | 0.81 | % | | 0.82% |
| | | | | | |
| | Ratio of net investment income to average net assets | | | 2.04 | % | | | 3.58 | % | | | 4.54 | % | | | 1.83 | % | | 0.55% |
| | | | | | |
| | Portfolio turnover rate(c) | | | 88 | % | | | 62 | % | | | 137 | % | | | 94 | % | | 72% |
| | |
| | (a) | Calculated based on the average shares outstanding methodology. |
| | (b) | Assumes investment at the NAV at the beginning of the year, reinvestment of all dividends and distributions, a complete redemption of the investment at the NAV at the end of the year and no sales or redemption charges (if any). Total returns would be reduced if a sales or redemption charge was taken into account. Returns do not reflect the impact of taxes to shareholders relating to Fund distributions or the redemption of Fund shares. |
| | (c) | The Fund’s portfolio turnover rate is calculated in accordance with regulatory requirements, without regard to transactions involving short term investments. If such transactions were included, the Fund’s portfolio turnover rate may be higher. |
| | |
| The accompanying notes are an integral part of these financial statements. | | 9 |
GOLDMAN SACHS GQG PARTNERS INTERNATIONAL OPPORTUNITIES FUND
|
Financial Highlights (continued) Selected Share Data for a Share Outstanding Throughout Each Year |
| | | | | | | | | | | | | | | | | | | | | | |
| | | |
| | | | | Goldman Sachs GQG Partners International Opportunities Fund | | |
| | | |
| | | | | Investor Shares | | |
| | | |
| | | | | Year Ended October 31, | | |
| | | | | | | |
| | | | | 2024 | | | 2023 | | | 2022 | | | 2021 | | | 2020 | | |
| | | | | | | |
| | Per Share Data | | | | | | | | | | | | | | | | | | | | |
| | | | | | |
| | Net asset value, beginning of year | | $ | 17.61 | | | $ | 16.16 | | | $ | 20.47 | | | $ | 16.51 | | | $ 14.82 |
| | |
| | | | | | |
| | Net investment income(a) | | | 0.42 | | | | 0.61 | | | | 0.80 | | | | 0.33 | | | 0.08 |
| | | | | | |
| | Net realized and unrealized gain (loss) | | | 4.50 | | | | 1.63 | | | | (4.69 | ) | | | 3.64 | | | 1.70 |
| | |
| | | | | | |
| | Total from investment operations | | | 4.92 | | | | 2.24 | | | | (3.89 | ) | | | 3.97 | | | 1.78 |
| | |
| | | | | | |
| | Distributions to shareholders from net investment income | | | (0.45 | ) | | | (0.79 | ) | | | (0.42 | ) | | | (0.01 | ) | | (0.09) |
| | |
| | | | | | |
| | Net asset value, end of year | | $ | 22.08 | | | $ | 17.61 | | | $ | 16.16 | | | $ | 20.47 | | | $ 16.51 |
| | |
| | | | | | |
| | Total return(b) | | | 28.33 | % | | | 14.21 | % | | | (19.35 | )% | | | 24.09 | % | | 12.00% |
| | |
| | | | | | |
| | Net assets, end of year (in 000s) | | $ | 10,146,055 | | | $ | 6,227,601 | | | $ | 4,425,913 | | | $ | 4,169,364 | | | $2,488,875 |
| | | | | | |
| | Ratio of net expenses to average net assets | | | 0.86 | % | | | 0.88 | % | | | 0.89 | % | | | 0.90 | % | | 0.92% |
| | | | | | |
| | Ratio of total expenses to average net assets | | | 0.88 | % | | | 0.91 | % | | | 0.92 | % | | | 0.94 | % | | 0.95% |
| | | | | | |
| | Ratio of net investment income to average net assets | | | 1.93 | % | | | 3.45 | % | | | 4.42 | % | | | 1.70 | % | | 0.48% |
| | | | | | |
| | Portfolio turnover rate(c) | | | 88 | % | | | 62 | % | | | 137 | % | | | 94 | % | | 72% |
| | |
| | (a) | Calculated based on the average shares outstanding methodology. |
| | (b) | Assumes investment at the NAV at the beginning of the year, reinvestment of all dividends and distributions, a complete redemption of the investment at the NAV at the end of the year and no sales or redemption charges (if any). Total returns would be reduced if a sales or redemption charge was taken into account. Returns do not reflect the impact of taxes to shareholders relating to Fund distributions or the redemption of Fund shares. |
| | (c) | The Fund’s portfolio turnover rate is calculated in accordance with regulatory requirements, without regard to transactions involving short term investments. If such transactions were included, the Fund’s portfolio turnover rate may be higher. |
| | |
| 10 | | The accompanying notes are an integral part of these financial statements. |
GOLDMAN SACHS GQG PARTNERS INTERNATIONAL OPPORTUNITIES FUND
|
Financial Highlights (continued) Selected Share Data for a Share Outstanding Throughout Each Year |
| | | | | | | | | | | | | | | | | | | | | | |
| | | |
| | | | | Goldman Sachs GQG Partners International Opportunities Fund | | |
| | | |
| | | | | Class R6 Shares | | |
| | | |
| | | | | Year Ended October 31, | | |
| | | | | | | |
| | | | | 2024 | | | 2023 | | | 2022 | | | 2021 | | | 2020 | | |
| | | | | | | |
| | Per Share Data | | | | | | | | | | | | | | | | | | | | |
| | | | | | |
| | Net asset value, beginning of year | | $ | 17.68 | | | $ | 16.23 | | | $ | 20.55 | | | $ | 16.56 | | | $ 14.87 |
| | |
| | | | | | |
| | Net investment income(a) | | | 0.44 | | | | 0.62 | | | | 0.83 | | | | 0.38 | | | 0.07 |
| | | | | | |
| | Net realized and unrealized gain (loss) | | | 4.52 | | | | 1.65 | | | | (4.71 | ) | | | 3.64 | | | 1.72 |
| | |
| | | | | | |
| | Total from investment operations | | | 4.96 | | | | 2.27 | | | | (3.88 | ) | | | 4.02 | | | 1.79 |
| | |
| | | | | | |
| | Distributions to shareholders from net investment income | | | (0.47 | ) | | | (0.82 | ) | | | (0.44 | ) | | | (0.03 | ) | | (0.10) |
| | |
| | | | | | |
| | Net asset value, end of year | | $ | 22.17 | | | $ | 17.68 | | | $ | 16.23 | | | $ | 20.55 | | | $ 16.56 |
| | |
| | | | | | |
| | Total return(b) | | | 28.48 | % | | | 14.31 | % | | | (19.17 | )% | | | 24.27 | % | | 12.09% |
| | |
| | | | | | |
| | Net assets, end of year (in 000s) | | $ | 3,299,256 | | | $ | 1,565,411 | | | $ | 1,023,099 | | | $ | 757,796 | | | $391,507 |
| | | | | | |
| | Ratio of net expenses to average net assets | | | 0.73 | % | | | 0.75 | % | | | 0.74 | % | | | 0.75 | % | | 0.77% |
| | | | | | |
| | Ratio of total expenses to average net assets | | | 0.77 | % | | | 0.78 | % | | | 0.78 | % | | | 0.80 | % | | 0.81% |
| | | | | | |
| | Ratio of net investment income to average net assets | | | 2.01 | % | | | 3.48 | % | | | 4.63 | % | | | 1.97 | % | | 0.42% |
| | | | | | |
| | Portfolio turnover rate(c) | | | 88 | % | | | 62 | % | | | 137 | % | | | 94 | % | | 72% |
| | |
| | (a) | Calculated based on the average shares outstanding methodology. |
| | (b) | Assumes investment at the NAV at the beginning of the year, reinvestment of all dividends and distributions, a complete redemption of the investment at the NAV at the end of the year and no sales or redemption charges (if any). Total returns would be reduced if a sales or redemption charge was taken into account. Returns do not reflect the impact of taxes to shareholders relating to Fund distributions or the redemption of Fund shares. |
| | (c) | The Fund’s portfolio turnover rate is calculated in accordance with regulatory requirements, without regard to transactions involving short term investments. If such transactions were included, the Fund’s portfolio turnover rate may be higher. |
| | |
| The accompanying notes are an integral part of these financial statements. | | 11 |
GOLDMAN SACHS GQG PARTNERS INTERNATIONAL OPPORTUNITIES FUND
|
Financial Highlights (continued) Selected Share Data for a Share Outstanding Throughout Each Year |
| | | | | | | | | | | | | | | | | | | | | | |
| | | |
| | | | | Goldman Sachs GQG Partners International Opportunities Fund | | |
| | | |
| | | | | Class R Shares | | |
| | | |
| | | | | Year Ended October 31, | | |
| | | | | | | |
| | | | | 2024 | | | 2023 | | | 2022 | | | 2021 | | | 2020 | | |
| | | | | | | |
| | Per Share Data | | | | | | | | | | | | | | | | | | | | |
| | | | | | |
| | Net asset value, beginning of year | | | $17.27 | | | | $15.88 | | | | $ 20.11 | | | | $16.28 | | | $14.69 |
| | |
| | | | | | |
| | Net investment income(a) | | | 0.30 | | | | 0.48 | | | | 0.69 | | | | 0.22 | | | 0.01 |
| | | | | | |
| | Net realized and unrealized gain (loss) | | | 4.42 | | | | 1.64 | | | | (4.61 | ) | | | 3.61 | | | 1.65 |
| | |
| | | | | | |
| | Total from investment operations | | | 4.72 | | | | 2.12 | | | | (3.92 | ) | | | 3.83 | | | 1.66 |
| | |
| | | | | | |
| | Distributions to shareholders from net investment income | | | (0.38 | ) | | | (0.73 | ) | | | (0.31 | ) | | | — | | | (0.07) |
| | |
| | | | | | |
| | Net asset value, end of year | | | $21.61 | | | | $17.27 | | | | $ 15.88 | | | | $20.11 | | | $16.28 |
| | |
| | | | | | |
| | Total return(b) | | | 27.68 | % | | | 13.63 | % | | | (19.73 | )% | | | 23.53 | % | | 11.32% |
| | |
| | | | | | |
| | Net assets, end of year (in 000s) | | | $6,745 | | | | $3,570 | | | | $ 1,215 | | | | $1,095 | | | $ 735 |
| | | | | | |
| | Ratio of net expenses to average net assets | | | 1.36 | % | | | 1.38 | % | | | 1.39 | % | | | 1.40 | % | | 1.42% |
| | | | | | |
| | Ratio of total expenses to average net assets | | | 1.39 | % | | | 1.41 | % | | | 1.42 | % | | | 1.44 | % | | 1.45% |
| | | | | | |
| | Ratio of net investment income to average net assets | | | 1.40 | % | | | 2.74 | % | | | 3.88 | % | | | 1.19 | % | | 0.07% |
| | | | | | |
| | Portfolio turnover rate(c) | | | 88 | % | | | 62 | % | | | 137 | % | | | 94 | % | | 72% |
| | |
| | (a) | Calculated based on the average shares outstanding methodology. |
| | (b) | Assumes investment at the NAV at the beginning of the year, reinvestment of all dividends and distributions, a complete redemption of the investment at the NAV at the end of the year and no sales or redemption charges (if any). Total returns would be reduced if a sales or redemption charge was taken into account. Returns do not reflect the impact of taxes to shareholders relating to Fund distributions or the redemption of Fund shares. |
| | (c) | The Fund’s portfolio turnover rate is calculated in accordance with regulatory requirements, without regard to transactions involving short term investments. If such transactions were included, the Fund’s portfolio turnover rate may be higher. |
| | |
| 12 | | The accompanying notes are an integral part of these financial statements. |
GOLDMAN SACHS GQG PARTNERS INTERNATIONAL OPPORTUNITIES FUND
|
Financial Highlights (continued) Selected Share Data for a Share Outstanding Throughout Each Year |
| | | | | | | | | | | | | | | | | | | | | | |
| | | |
| | | | | Goldman Sachs GQG Partners International Opportunities Fund | | |
| | | |
| | | | | Class P Shares | | |
| | | |
| | | | | Year Ended October 31, | | |
| | | | | | | |
| | | | | 2024 | | | 2023 | | | 2022 | | | 2021 | | | 2020 | | |
| | | | | | | |
| | Per Share Data | | | | | | | | | | | | | | | | | | | | |
| | | | | | |
| | Net asset value, beginning of year | | $ | 17.68 | | | $ | 16.22 | | | $ | 20.54 | | | $ | 16.55 | | | $ 14.86 |
| | |
| | | | | | |
| | Net investment income(a) | | | 0.45 | | | | 0.64 | | | | 0.83 | | | | 0.37 | | | 0.10 |
| | | | | | |
| | Net realized and unrealized gain (loss) | | | 4.51 | | | | 1.63 | | | | (4.71 | ) | | | 3.65 | | | 1.69 |
| | |
| | | | | | |
| | Total from investment operations | | | 4.96 | | | | 2.27 | | | | (3.88 | ) | | | 4.02 | | | 1.79 |
| | |
| | | | | | |
| | Distributions to shareholders from net investment income | | | (0.47 | ) | | | (0.81 | ) | | | (0.44 | ) | | | (0.03 | ) | | (0.10) |
| | |
| | | | | | |
| | Net asset value, end of year | | $ | 22.17 | | | $ | 17.68 | | | $ | 16.22 | | | $ | 20.54 | | | $ 16.55 |
| | |
| | | | | | |
| | Total return(b) | | | 28.48 | % | | | 14.38 | % | | | (19.22 | )% | | | 24.34 | % | | 12.08% |
| | |
| | | | | | |
| | Net assets, end of year (in 000s) | | $ | 4,018,970 | | | $ | 2,635,558 | | | $ | 2,099,648 | | | $ | 2,330,569 | | | $1,186,744 |
| | | | | | |
| | Ratio of net expenses to average net assets | | | 0.73 | % | | | 0.75 | % | | | 0.74 | % | | | 0.75 | % | | 0.77% |
| | | | | | |
| | Ratio of total expenses to average net assets | | | 0.77 | % | | | 0.78 | % | | | 0.78 | % | | | 0.80 | % | | 0.81% |
| | | | | | |
| | Ratio of net investment income to average net assets | | | 2.07 | % | | | 3.60 | % | | | 4.55 | % | | | 1.90 | % | | 0.61% |
| | | | | | |
| | Portfolio turnover rate(c) | | | 88 | % | | | 62 | % | | | 137 | % | | | 94 | % | | 72% |
| | |
| | (a) | Calculated based on the average shares outstanding methodology. |
| | (b) | Assumes investment at the NAV at the beginning of the year, reinvestment of all dividends and distributions, a complete redemption of the investment at the NAV at the end of the year and no sales or redemption charges (if any). Total returns would be reduced if a sales or redemption charge was taken into account. Returns do not reflect the impact of taxes to shareholders relating to Fund distributions or the redemption of Fund shares. |
| | (c) | The Fund’s portfolio turnover rate is calculated in accordance with regulatory requirements, without regard to transactions involving short term investments. If such transactions were included, the Fund’s portfolio turnover rate may be higher. |
| | |
| The accompanying notes are an integral part of these financial statements. | | 13 |
GOLDMAN SACHS GQG PARTNERS INTERNATIONAL OPPORTUNITIES FUND
|
Notes to Financial Statements October 31, 2024 |
Goldman Sachs Trust II (the “Trust”) is a Delaware statutory trust registered under the Investment Company Act of 1940, as amended (the “Act”), as an open-end management investment company. The Trust includes the Goldman Sachs GQG Partners International Opportunities Fund (the “Fund”). The Fund is a diversified portfolio that currently offers seven classes of shares: Class A, Class C, Institutional, Investor, Class R6, Class R and Class P Shares.
Class A Shares are sold with a front-end sales charge of up to 5.50%. Class C Shares are sold with a contingent deferred sales charge (“CDSC”) of 1.00%, which is imposed on redemptions made within 12 months of purchase. Institutional, Investor, Class R6, Class R, and Class P Shares are not subject to a sales charge.
Goldman Sachs Asset Management, L.P. (“GSAM”), an affiliate of Goldman Sachs & Co. LLC (“Goldman Sachs”), serves as investment adviser to the Fund pursuant to a management agreement (the “Agreement”) with the Trust.
GQG Partners LLC (“GQG Partners” or the “Sub-Adviser”) serves as the sub-adviser to the Fund. GSAM compensates the Sub-Adviser directly in accordance with the terms of the Sub-Advisory Agreement. The Fund is not charged any separate or additional investment advisory fees by the Sub-Adviser.
|
|
2. SIGNIFICANT ACCOUNTING POLICIES |
The financial statements have been prepared in accordance with accounting principles generally accepted in the United States of America (“GAAP”) and require management to make estimates and assumptions that may affect the reported amounts and disclosures. Actual results may differ from those estimates and assumptions. The Fund is an investment company under GAAP and follows the accounting and reporting guidance applicable to investment companies.
A. Investment Valuation — The Fund’s valuation policy is to value investments at fair value.
B. Investment Income and Investments — Investment income includes interest income, dividend income and securities lending income, if any. Interest income is accrued daily and adjusted for amortization of premiums and accretion of discounts. Dividend income is recognized on ex-dividend date or, for certain foreign securities, as soon as such information is obtained subsequent to the ex-dividend date. Non-cash dividends, if any, are recorded at the fair market value of the securities received. Investment transactions are reflected on trade date. Realized gains and losses are calculated using identified cost. Investment transactions are recorded on the following business day for daily net asset value (“NAV”) calculations. Investment income is recorded net of any foreign withholding taxes, less any amounts reclaimable. The Fund may file withholding tax reclaims in certain jurisdictions to recover a portion of amounts previously withheld. Any foreign capital gains tax is accrued daily based upon net unrealized gains, and is payable upon sale of such investments.
C. Class Allocations and Expenses — Investment income, realized and unrealized gain (loss), if any, and non-class specific expenses of the Fund are allocated daily based upon the proportion of net assets of each class. Non-class specific expenses directly incurred by the Fund are charged to the Fund, while such expenses incurred by the Trust are allocated across the Fund on a straight-line and/or pro-rata basis depending upon the nature of the expenses. Class specific expenses, where applicable, are borne by the respective share classes and include Distribution and Service, Transfer Agency and Service fees.
D. Federal Taxes and Distributions to Shareholders — It is the Fund’s policy to comply with the requirements of the Internal Revenue Code of 1986, as amended (the “Code”), applicable to regulated investment companies and to distribute each year substantially all of its investment company taxable income and capital gains to its shareholders. Accordingly, the Fund is not required to make any provisions for the payment of federal income tax. Distributions to shareholders are recorded on the ex-dividend date. Income and capital gains distributions, if any, are declared and paid annually.
Net capital losses, if any, are carried forward to future fiscal years and may be used to the extent allowed by the Code to offset any future capital gains. Losses that are carried forward will retain their character as either short-term or long-term capital losses. Utilization of capital loss carryforwards will reduce the requirement of future capital gains distributions.
GOLDMAN SACHS GQG PARTNERS INTERNATIONAL OPPORTUNITIES FUND
|
|
2. SIGNIFICANT ACCOUNTING POLICIES (continued) |
The characterization of distributions to shareholders for financial reporting purposes is determined in accordance with federal income tax rules, which may differ from GAAP. The source of the Fund’s distributions may be shown in the accompanying financial statements as either from distributable earnings or capital. Certain components of the Fund’s net assets on the Statement of Assets and Liabilities reflect permanent GAAP/tax differences based on the appropriate tax character.
E. Foreign Currency Translation — The accounting records and reporting currency of the Fund are maintained in U.S. dollars. Assets and liabilities denominated in foreign currencies are translated into U.S. dollars using the current exchange rates at the close of each business day. The effect of changes in foreign currency exchange rates on investments is included within net realized and unrealized gain (loss) on investments. Changes in the value of other assets and liabilities as a result of fluctuations in foreign exchange rates are included in the Statement of Operations within net change in unrealized gain (loss) on foreign currency translation. Transactions denominated in foreign currencies are translated into U.S. dollars on the date the transaction occurred, the effects of which are included within net realized gain (loss) on foreign currency transactions.
|
|
3. INVESTMENTS AND FAIR VALUE MEASUREMENTS |
U.S. GAAP defines the fair value of a financial instrument as the amount that would be received to sell an asset or paid to transfer a liability in an orderly transaction between market participants at the measurement date (i.e., the exit price); the Fund’s policy is to use the market approach. GAAP establishes a fair value hierarchy that prioritizes the inputs to valuation techniques used to measure fair value. The hierarchy gives the highest priority to unadjusted quoted prices in active markets for identical assets or liabilities (Level 1 measurements) and the lowest priority to unobservable inputs (Level 3 measurements). The level in the fair value hierarchy within which the fair value measurement in its entirety falls shall be determined based on the lowest level input that is significant to the fair value measurement in its entirety. The levels used for classifying investments are not necessarily an indication of the risk associated with investing in these investments. The three levels of the fair value hierarchy are described below:
Level 1 — Unadjusted quoted prices in active markets that are accessible at the measurement date for identical, unrestricted assets or liabilities;
Level 2 — Quoted prices in markets that are not active or financial instruments for which significant inputs are observable (including, but not limited to, quoted prices for similar investments, interest rates, foreign exchange rates, volatility and credit spreads), either directly or indirectly;
Level 3 — Prices or valuations that require significant unobservable inputs (including GSAM’s assumptions in determining fair value measurement).
The Board of Trustees (“Trustees”) has approved Valuation Procedures that govern the valuation of the portfolio investments held by the Fund, including investments for which market quotations are not readily available. With respect to the Fund’s investments that do not have readily available market quotations, the Trustees have designated GSAM as the valuation designee to perform fair valuations pursuant to Rule 2a-5 under the Investment Company Act of 1940 (the “Valuation Designee”). GSAM has day-to-day responsibility for implementing and maintaining internal controls and procedures related to the valuation of the Fund’s investments. To assess the continuing appropriateness of pricing sources and methodologies, GSAM regularly performs price verification procedures and issues challenges as necessary to third party pricing vendors or brokers, and any differences are reviewed in accordance with the Valuation Procedures.
A. Level 1 and Level 2 Fair Value Investments — The valuation techniques and significant inputs used in determining the fair values for investments classified as Level 1 and Level 2 are as follows:
Equity Securities — Equity securities traded on a United States (“U.S.”) securities exchange or the NASDAQ system, or those located on certain foreign exchanges, including but not limited to the Americas, are valued daily at their last sale price or official closing price on the principal exchange or system on which they are traded. If there is no sale or official closing price or such price is believed by GSAM to not represent fair value, equity securities will be valued at the valid closing bid price for long positions and at the valid closing ask price for short positions (i.e., where there is sufficient volume, during normal exchange trading hours).
GOLDMAN SACHS GQG PARTNERS INTERNATIONAL OPPORTUNITIES FUND
|
Notes to Financial Statements (continued) October 31, 2024 |
|
|
3. INVESTMENTS AND FAIR VALUE MEASUREMENTS (continued) |
If no valid bid/ask price is available, the equity security will be valued pursuant to the Valuation Procedures and consistent with applicable regulatory guidance. To the extent these investments are actively traded, they are classified as Level 1 of the fair value hierarchy, otherwise they are generally classified as Level 2. Certain equity securities containing unique attributes may be classified as Level 2.
Unlisted equity securities for which market quotations are available are valued at the last sale price on the valuation date, or if no sale occurs, at the last bid price for long positions or the last ask price for short positions, and are generally classified as Level 2. Securities traded on certain foreign securities exchanges are valued daily at fair value determined by an independent fair value service (if available) under the Valuation Procedures and consistent with applicable regulatory guidance. The independent fair value service takes into account multiple factors including, but not limited to, movements in the securities markets, certain depositary receipts, futures contracts and foreign currency exchange rates that have occurred subsequent to the close of the foreign securities exchange. These investments are generally classified as Level 2 of the fair value hierarchy.
Money Market Funds — Investments in the Goldman Sachs Financial Square Government Fund (“Underlying Money Market Fund”) are valued at the NAV per share of the Institutional Share class on the day of valuation. These investments are generally classified as Level 1 of the fair value hierarchy. For information regarding the Underlying Money Market Fund’s accounting policies and investment holdings, please see the Underlying Money Market Fund’s shareholder report.
B. Level 3 Fair Value Investments — To the extent that significant inputs to valuation models and other alternative pricing sources are unobservable, or if quotations are not readily available, or if GSAM believes that such quotations do not accurately reflect fair value, the fair value of the Fund’s investments may be determined under the Valuation Procedures. GSAM, consistent with its procedures and applicable regulatory guidance, may make an adjustment to the most recent valuation prices of either domestic or foreign securities in light of significant events to reflect what it believes to be the fair value of the securities at the time of determining the Fund’s NAV. To the extent investments are valued using single source broker quotations obtained directly from the broker or passed through from third party pricing vendors, such investments are classified as Level 3 investments.
C. Fair Value Hierarchy — The following is a summary of the Fund’s investments classified in the fair value hierarchy as of October 31, 2024:
| | | | | | | | | | | | |
| Investment Type | | Level 1 | | | Level 2 | | | Level 3 | |
|
| |
| | | |
Assets | | | | | | | | | | | | |
| | | |
Common Stock and/or Other Equity Investments(a) | | | | | | | | | | | | |
| | | |
Asia | | $ | 1,974,444,353 | | | $ | 7,683,776,289 | | | $ | — | |
| | | |
Europe | | | 1,660,992,081 | | | | 23,967,514,990 | | | | — | |
| | | |
North America | | | 8,798,416,128 | | | | — | | | | — | |
| | | |
South America | | | 917,821,746 | | | | — | | | | — | |
| | | |
Preferred Stocks | | | — | | | | 1,684,906,895 | | | | — | |
| | | |
Securities Lending Reinvestment Vehicle | | | 69,900,000 | | | | — | | | | — | |
| | | |
Investment Company | | | 1,897,466,943 | | | | — | | | | — | |
|
| |
| | | |
Total | | $ | 15,319,041,251 | | | $ | 33,336,198,174 | | | $ | — | |
|
| |
| | (a) | Amounts are disclosed by continent to highlight the impact of time zone differences between local market close and the calculation of NAV. Security valuations are based on the principal exchange or system on which they are traded, which may differ from country of domicile. The Fund utilizes fair value model prices provided by an independent fair value service for international equities, resulting in a Level 2 classification. |
For further information regarding security characteristics, see the Schedule of Investments.
|
|
4. AGREEMENTS AND AFFILIATED TRANSACTIONS |
A. Management Agreement — Under the Agreement, GSAM manages the Fund, subject to the general supervision of the Trustees.
GOLDMAN SACHS GQG PARTNERS INTERNATIONAL OPPORTUNITIES FUND
|
|
4. AGREEMENTS AND AFFILIATED TRANSACTIONS (continued) |
As compensation for the services rendered pursuant to the Agreement, the assumption of the expenses related thereto and administration of the Fund’s business affairs, including providing facilities, GSAM is entitled to a management fee, accrued daily and paid monthly, equal to an annual percentage rate of the Fund’s average daily net assets. For the fiscal year ended October 31, 2024, contractual and effective net management fees with GSAM were at the following rates:
| | | | | | | | | | | | | | | | | | | | | | | | | | | | |
| | | Contractual Management Rate | | Effective Rate | | Effective Net
Management
Rate^ | |
| Fund | | First
$1 billion | | Next
$1 billion | | Next
$3 billion | | Next
$3 billion | | Over
$8 billion |
|
| |
| | | | | | | |
| Goldman Sachs GQG Partners International Opportunities Fund | | | 0.85 | % | | | 0.77 | % | | | 0.73 | % | | | 0.71 | % | | | 0.70 | % | | | 0.70 | % | | | 0.70% | |
|
| |
| | ^ | Effective Net Management Rate includes the impact of management fee waivers of affiliated underlying funds, if any. |
The Fund invests in Institutional Shares of the Goldman Sachs Financial Square Government Fund, which is an affiliated Underlying Fund. GSAM has agreed to waive a portion of its management fee payable by the Fund in an amount equal to the management fee it earns as an investment adviser to the affiliated Underlying Fund in which the Fund invests, except those management fees it earns from the Fund’s investments of cash collateral received in connection with securities lending transactions in the Goldman Sachs Financial Square Government Fund. For the fiscal year ended October 31, 2024, GSAM waived $2,176,612 of the Fund’s management fee.
B. Distribution and/or Service (12b-1) Plans — The Trust, on behalf of Class A and Class R Shares of the Fund, has adopted Distribution and Service Plans subject to Rule 12b-1 under the Act. Under the Distribution and Service Plans, Goldman Sachs, which serves as distributor (the “Distributor”), is entitled to a fee accrued daily and paid monthly for distribution services and personal and account maintenance services, which may then be paid by Goldman Sachs to authorized dealers. These fees are equal to an annual percentage rate of the average daily net assets attributable to Class A or Class R Shares of the Fund, as applicable, as set forth below.
The Trust, on behalf of Class C Shares of the Fund, has adopted a Distribution Plan subject to Rule 12b-1 under the Act. Under the Distribution Plan, Goldman Sachs as Distributor is entitled to a fee accrued daily and paid monthly for distribution services, which may then be paid by Goldman Sachs to authorized dealers. These fees are equal to an annual percentage rate of the average daily net assets attributable to Class C Shares of the Fund, as set forth below.
| | | | | | | | | | |
| | | Distribution and/or Service Plan Rates | |
| | | |
| | | Class A* | | | Class C | | Class R* | |
|
| |
| | | |
Distribution and/or Service Plan | | | 0.25% | | | 0.75% | | | 0.50% | |
|
| |
| | * | With respect to Class A and Class R Shares, the Distributor at its discretion may use compensation for distribution services paid under the Distribution Plan to compensate service organizations for personal and account maintenance services and expenses as long as such total compensation does not exceed the maximum cap on “service fees” imposed by the Financial Industry Regulatory Authority. |
C. Distribution Agreement — Goldman Sachs, as Distributor of the shares of the Fund pursuant to a Distribution Agreement, may retain a portion of the Class A Shares’ front end sales charge and Class C Shares’ CDSC. During the fiscal year ended October 31, 2024, Goldman Sachs retained the following amounts:
| | |
| | | Front End |
| | | Sales Charge |
| |
| Fund | | Class A |
|
|
| |
Goldman Sachs GQG Partners International Opportunities Fund | | $134,739 |
|
|
During the fiscal year ended October 31, 2024, Goldman Sachs did not retain any portion of Class C Shares’ CDSC.
GOLDMAN SACHS GQG PARTNERS INTERNATIONAL OPPORTUNITIES FUND
|
Notes to Financial Statements (continued) October 31, 2024 |
|
|
4. AGREEMENTS AND AFFILIATED TRANSACTIONS (continued) |
D. Service Plan — The Trust, on behalf of the Fund, has adopted a Service Plan to allow Class C Shares to compensate service organizations (including Goldman Sachs) for providing varying levels of personal and account maintenance services to their customers who are beneficial owners of such shares. The Service Plan provides for compensation to the service organizations equal to an annual percentage rate of 0.25% of the average daily net assets attributable to Class C Shares of the Fund.
E. Transfer Agency Agreement — Goldman Sachs also serves as the transfer agent of the Fund for a fee pursuant to the Transfer Agency Agreement. The fees charged for such transfer agency services are accrued daily and paid monthly at annual rates as follows: 0.15% of the average daily net assets of Class A, Class C, Investor and Class R Shares; 0.03% of the average daily net assets of Class R6 and Class P Shares; and 0.04% of the average daily net assets of Institutional Shares. Goldman Sachs has agreed to waive a portion of its transfer agency fee equal to 0.01% as an annual percentage rate of the average daily net assets attributable to Class R6 and Class P Shares of the Fund. This arrangement will remain in effect through at least February 28, 2025, and prior to such date Goldman Sachs may not terminate the arrangement without the approval of the Trustees.
F. Other Expense Agreements and Affiliated Transactions — GSAM has agreed to reduce or limit certain “Other Expenses” of the Fund (excluding acquired fund fees and expenses, transfer agency fees and expenses, service fees and shareholder administration fees (as applicable), taxes, interest, brokerage fees, expenses of shareholder meetings, litigation and indemnification and extraordinary expenses) to the extent such expenses exceed, on an annual basis, a percentage rate of the average daily net assets of the Fund. Such Other Expense reimbursements, if any, are accrued daily and paid monthly. In addition, the Fund is not obligated to reimburse GSAM for prior fiscal year expense reimbursements, if any. The Other Expense limitation as an annual percentage rate of average daily net assets for the Fund is 0.014%. The Other Expense limitation will remain in place through at least February 28, 2025, and prior to such date GSAM may not terminate the arrangement without the approval of the Trustees. In addition, the Fund has entered into certain offset arrangements with the transfer agent, which may result in a reduction of the Fund’s expenses and are received irrespective of the application of the “Other Expense” limitations described above.
GSAM may voluntarily waive a portion of any payments under the Fund’s Distribution and Service Plan, Service Plan and Transfer Agency Agreement, and these waivers are in addition to what is stipulated in any contractual fee waiver arrangements (as applicable). These temporary waivers may be modified or terminated at any time at the option of Goldman Sachs without shareholder approval.
For the fiscal year ended October 31, 2024, these expense reductions, including any fee waivers and Other Expense reimbursements, were as follows:
| | | | | | | | |
| | | | |
| Fund | | Management
Fee Waiver | | Transfer Agency
Waivers/Credits | | Other Expense Reimbursements | | Total Expense
Reductions |
|
|
| | | | |
| Goldman Sachs GQG Partners International Opportunities Fund | | $2,176,612 | | $662,083 | | $8,867,856 | | $11,706,551 |
|
|
G. Line of Credit Facility — As of October 31, 2024, the Fund participated in a $1,150,000,000 committed, unsecured revolving line of credit facility (the “facility”) together with other funds of the Trust and certain registered investment companies having management agreements with GSAM or its affiliates. This facility is to be used for temporary emergency purposes, or to allow for an orderly liquidation of securities to meet redemption requests. The interest rate on borrowings is based on the federal funds rate. The facility also requires a fee to be paid by the Fund based on the amount of the commitment that has not been utilized. For the fiscal year ended October 31, 2024, the Fund did not have any borrowings under the facility. Prior to April 16, 2024, the facility was $1,110,000,000.
H. Other Transactions with Affiliates — For the fiscal year ended October 31, 2024, Goldman Sachs earned $56,759 of brokerage commissions from portfolio transactions, on behalf of the Fund.
GOLDMAN SACHS GQG PARTNERS INTERNATIONAL OPPORTUNITIES FUND
|
|
4. AGREEMENTS AND AFFILIATED TRANSACTIONS (continued) |
The table below provides information about the Fund’s investments in the Goldman Sachs Financial Square Government Fund for the fiscal year ended October 31, 2024:
| | | | | | | | | | | | | | | | | | | | | | | | | | |
| | | | | | | |
| Fund | | Underlying Fund | | Beginning
Value as of
October 31, 2023 | | | Purchases at Cost | | | Proceeds from Sales | | | Ending Value as of
October 31, 2024 | | | Shares as of
October 31, 2024 | | | Dividend
Income | |
|
| |
| | | | | | | |
Goldman Sachs GQG Partners International Opportunities Fund | | Goldman Sachs
Financial Square
Government Fund —
Institutional Shares | | $ | 716,742,511 | | | $ | 18,461,642,275 | | | $ | (17,280,917,843 | ) | | $ | 1,897,466,943 | | | | 1,897,466,943 | | | $ | 74,363,205 | |
|
| |
|
|
5. PORTFOLIO SECURITIES TRANSACTIONS |
The cost of purchases and proceeds from sales and maturities of long-term securities for the fiscal year ended October 31, 2024, were $45,380,410,866 and $35,765,837,869, respectively.
Pursuant to exemptive relief granted by the Securities and Exchange Commission (“SEC”) and the terms and conditions contained therein, the Fund may lend its securities through a securities lending agent, Goldman Sachs Agency Lending (“GSAL”), a wholly-owned subsidiary of Goldman Sachs, to certain qualified borrowers including Goldman Sachs and affiliates. In accordance with the Fund’s securities lending procedures, the Fund receives cash collateral at least equal to the market value of the securities on loan. The market value of the loaned securities is determined at the close of business of the Fund, at their last sale price or official closing price on the principal exchange or system on which they are traded, and any additional required collateral is delivered to the Fund on the next business day. As with other extensions of credit, the Fund may experience delay in the recovery of its securities or incur a loss should the borrower of the securities breach its agreement with the Fund or become insolvent at a time when the collateral is insufficient to cover the cost of repurchasing securities on loan. Dividend income received from securities on loan may not be subject to withholding taxes and therefore withholding taxes paid may differ from the amounts listed in the Statement of Operations. Loans of securities are terminable at any time and as such 1) the remaining contractual maturities of the outstanding securities lending transactions are considered to be overnight and continuous and 2) the borrower, after notice, is required to return borrowed securities within the standard time period for settlement of securities transactions.
The Fund invests the cash collateral received in connection with securities lending transactions in the Goldman Sachs Financial Square Government Fund (“Government Money Market Fund”), an affiliated series of the Goldman Sachs Trust. The Government Money Market Fund is registered under the Act as an open end investment company, is subject to Rule 2a-7 under the Act, and is managed by GSAM, for which GSAM may receive a management fee of up to 0.16% on an annualized basis of the average daily net assets of the Government Money Market Fund.
In the event of a default by a borrower with respect to any loan, GSAL will exercise any and all remedies provided under the applicable borrower agreement to make the Fund whole. These remedies include purchasing replacement securities by applying the collateral held from the defaulting broker against the purchase cost of the replacement securities. If GSAL is unable to purchase replacement securities, GSAL will indemnify the Fund by paying the Fund an amount equal to the market value of the securities loaned minus the value of cash collateral received from the borrower for the loan, subject to an exclusion for any shortfalls resulting from a loss of value in such cash collateral due to reinvestment risk. The Fund’s master netting agreements with certain borrowers provide the right, in the event of a default (including bankruptcy or insolvency), for the non-defaulting party to liquidate the collateral and calculate net exposure to the defaulting party or request additional collateral. However, in the event of a default by a borrower, a resolution authority could determine that such rights are not enforceable due to the restrictions or prohibitions against the right of set-off that may be imposed in accordance with a particular jurisdiction’s bankruptcy or insolvency laws. The Fund’s loaned securities were all subject to enforceable Securities Lending Agreements and the value of the collateral was at least equal to the value of the cash received. The amounts of the Fund’s overnight and continuous agreements, which represent the gross
GOLDMAN SACHS GQG PARTNERS INTERNATIONAL OPPORTUNITIES FUND
|
Notes to Financial Statements (continued) October 31, 2024 |
|
|
6. SECURITIES LENDING (continued) |
amounts of recognized liabilities for securities lending transactions outstanding as of October 31, 2024, are disclosed as “Payable upon return of securities loaned” on the Statement of Assets and Liabilities, where applicable.
Both the Fund and GSAL received compensation relating to the lending of the Fund’s securities. The amounts earned, if any, by the Fund for the fiscal year ended October 31, 2024, are reported under Investment Income on the Statement of Operations.
The table below details securities lending activity with affiliates of Goldman Sachs:
| | | | | | |
| | | For the Fiscal Year Ended October 31, 2024 | | Amounts Payable to Goldman Sachs Upon Return of Securities Loaned as of October 31, 2024 |
| Fund | | Earnings of GSAL Relating to Securities Loaned | | Amounts Received by the Funds from Lending to Goldman Sachs |
|
|
| | | |
| Goldman Sachs GQG Partners International Opportunities Fund | | $411,904 | | $3,707,190 | | $— |
|
|
The following table provides information about the Fund’s investment in the Government Money Market Fund for the fiscal year ended October 31, 2024:
| | | | | | | | | | | | | | | | |
| | | | |
| Fund | | Beginning Value as of
October 31, 2023 | | | Purchases at cost | | | Proceeds from Sales | | | Ending Value as of
October 31, 2024 | |
|
| |
| | | | |
| Goldman Sachs GQG Partners International Opportunities Fund | | | $254,172,800 | | | | $5,550,964,377 | | | | $(5,735,237,177) | | | | $69,900,000 | |
|
| |
The tax character of distributions paid during the fiscal year ended October 31, 2024 was as follows:
| | | | |
| |
Distributions paid from: | | | | |
| |
Ordinary income | | | $788,686,069 | |
|
| |
| |
Total taxable distributions | | | $788,686,069 | |
|
| |
The tax character of distributions paid during the fiscal year ended October 31, 2023 was as follows:
| | | | |
| |
Distributions paid from: | | | | |
| |
Ordinary income | | | $1,128,615,442 | |
|
| |
| |
Total taxable distributions | | | $1,128,615,442 | |
|
| |
As of October 31, 2024, the components of accumulated earnings (losses) on a tax basis were as follows:
| | | | |
| |
| |
Undistributed ordinary income — net | | | $ 743,608,744 | |
| |
Undistributed long-term capital gains | | | 1,885,576,211 | |
|
| |
| |
Total Undistributed Earnings | | | $2,629,184,955 | |
|
| |
| |
Capital loss carryforwards(1): | | | | |
| |
Unrealized gains (loss) — net | | | $6,871,237,807 | |
|
| |
| |
Total accumulated earnings (loss) net | | | $9,500,422,762 | |
|
| |
| | (1) | The Fund utilized $1,517,023,040 of capital losses in the current fiscal year. |
GOLDMAN SACHS GQG PARTNERS INTERNATIONAL OPPORTUNITIES FUND
|
|
7. TAX INFORMATION (continued) |
As of October 31, 2024, the Fund’s aggregate security unrealized gains and losses based on cost for U.S. federal income tax purposes were as follows:
| | | | |
| |
| |
Tax Cost | | | $41,421,381,954 | |
|
| |
| |
Gross unrealized gain | | | 8,378,536,166 | |
| |
Gross unrealized loss | | | (1,507,298,359) | |
|
| |
| |
Net unrealized gain | | | $ 6,871,237,807 | |
|
| |
The difference between GAAP-basis and tax basis unrealized gains (losses) is attributable primarily to wash sales and non-shareholder capital contributions.
The Fund reclassed $45,303,028 from paid in capital to distributable earnings for the year ending October 31, 2024. In order to present certain components of the Fund’s capital accounts on a tax-basis, certain reclassifications have been recorded to the Fund’s accounts. These reclassifications have no impact on the net asset value of the Fund’s and result primarily from non-shareholder capital contributions.
GSAM has reviewed the Fund’s tax positions for all open tax years (the current and prior three years, as applicable) and has concluded that no provision for income tax is required in the Fund’s financial statements. Such open tax years remain subject to examination and adjustment by tax authorities.
The Fund’s risks include, but are not limited to, the following:
Depositary Receipts Risk - Foreign securities may trade in the form of depositary receipts, which include American Depositary Receipts (“ADRs”) and Global Depositary Receipts (“GDRs”) (collectively “Depositary Receipts”). To the extent the Fund acquires Depositary Receipts through banks which do not have a contractual relationship with the foreign issuer of the security underlying the Depositary Receipts to issue and service such unsponsored Depositary Receipts, there may be an increased possibility that the Fund would not become aware of and be able to respond to corporate actions such as stock splits or rights offerings involving the foreign issuer in a timely manner. In addition, the lack of information may result in inefficiencies in the valuation of such instruments. Investment in Depositary Receipts does not eliminate all the risks inherent in investing in securities of non-U.S. issuers. The market value of Depositary Receipts is dependent upon the market value of the underlying securities and fluctuations in the relative value of the currencies in which the Depositary Receipts and the underlying securities are quoted. The issuers of Depositary Receipts may discontinue issuing new Depositary Receipts and withdraw existing Depositary Receipts at any time, which may result in costs and delays in the distribution of the underlying assets to the Fund and may negatively impact the Fund’s performance.
Foreign and Emerging Countries Risk — Investing in foreign markets may involve special risks and considerations not typically associated with investing in the U.S. Foreign securities may be subject to risk of loss because of more or less foreign government regulation; less public information; less stringent investor protections; less stringent accounting, corporate governance, financial reporting and disclosure standards; and less economic, political and social stability in the countries in which the Fund invests. The imposition of sanctions, exchange controls (including repatriation restrictions), confiscation of assets and property, trade restrictions (including tariffs) and other government restrictions by the U.S. or other governments, or from problems in registration, settlement or custody, may also result in losses. The type and severity of sanctions and other similar measures, including counter sanctions and other retaliatory actions, that may be imposed could vary broadly in scope, and their impact is impossible to predict. For example, the imposition of sanctions and other similar measures could, among other things, cause a decline in the value and/or liquidity of securities issued by the sanctioned country or companies located in or economically tied to the sanctioned country and increase market volatility and disruption in the sanctioned country and throughout the world. Sanctions and other similar measures could limit or prevent the Fund from buying and selling securities (in the sanctioned country and other markets), significantly delay or prevent the settlement of securities transactions, and significantly impact the Fund’s liquidity and
GOLDMAN SACHS GQG PARTNERS INTERNATIONAL OPPORTUNITIES FUND
|
Notes to Financial Statements (continued) October 31, 2024 |
|
|
8. OTHER RISKS (continued) |
performance. Foreign risk also involves the risk of negative foreign currency exchange rate fluctuations, which may cause the value of securities denominated in such foreign currency (or other instruments through which the Fund has exposure to foreign currencies) to decline in value. Currency exchange rates may fluctuate significantly over short periods of time. To the extent that the Fund also invests in securities of issuers located in, or economically tied to, emerging markets, these risks may be more pronounced.
Geographic Risk— If the Fund focuses its investments in securities of issuers located in a particular country or geographic region, the Fund may be subjected, to a greater extent than if its investments were less focused, to the risks of volatile economic cycles and/or conditions and developments that may be particular to that country or region, such as: adverse securities markets; adverse exchange rates; adverse social, political, regulatory, economic, business, environmental or other developments; or natural disasters.
Investment Style Risk — Different investment styles (e.g., “growth”, “value” or “quantitative”) tend to shift in and out of favor depending upon market and economic conditions and investor sentiment. The Fund may outperform or underperform other funds that invest in similar asset classes but employ different investment styles.
Investments in Other Investment Companies Risk — As a shareholder of another investment company, the Fund will indirectly bear its proportionate share of any net management fees and other expenses paid by such other investment companies, in addition to the fees and expenses regularly borne by the Fund.
Large Shareholder Transactions Risk — The Fund may experience adverse effects when certain large shareholders, such as other funds, institutional investors (including those trading by use of non-discretionary mathematical formulas), financial intermediaries (who may make investment decisions on behalf of underlying clients and/or include the Fund in their investment model), individuals, accounts and Goldman Sachs affiliates, purchase or redeem large amounts of shares of the Fund. Such large shareholder redemptions, which may occur rapidly or unexpectedly, may cause the Fund to sell portfolio securities at times when it would not otherwise do so, which may negatively impact the Fund’s NAV and liquidity. These transactions may also accelerate the realization of taxable income to shareholders if such sales of investments resulted in gains, and may also increase transaction costs. In addition, a large redemption could result in the Fund’s current expenses being allocated over a smaller asset base, leading to an increase in the Fund’s expense ratio. Similarly, large Fund share purchases may adversely affect the Fund’s performance to the extent that the Fund is delayed in investing new cash or otherwise maintains a larger cash position than it ordinarily would.
Market and Credit Risks — In the normal course of business, the Fund trades financial instruments and enters into financial transactions where risk of potential loss exists due to changes in the market (market risk). The value of the securities in which the Fund invests may go up or down in response to the prospects of individual companies, particular sectors or governments and/or general economic conditions throughout the world due to increasingly interconnected global economies and financial markets. Events such as war, military conflict, acts of terrorism, social unrest, natural disasters, recessions, inflation, rapid interest rate changes, supply chain disruptions, sanctions, the spread of infectious illness or other public health threats could also significantly impact the Fund and its investments. Additionally, the Fund may also be exposed to credit risk in the event that an issuer or guarantor fails to perform or that an institution or entity with which the Fund has unsettled or open transactions defaults.
Mid-Cap and Small-Cap Risk — Investments in mid-capitalization and small-capitalization companies involve greater risks than those associated with larger, more established companies. These securities may be subject to more abrupt or erratic price movements and may lack sufficient market liquidity, and these issuers often face greater business risks.
Under the Trust’s organizational documents, its Trustees, officers, employees and agents are indemnified, to the extent permitted by the Act and state law, against certain liabilities that may arise out of performance of their duties to the Fund. Additionally, in the course of business, the Fund enters into contracts that contain a variety of indemnification clauses. The Fund’s maximum exposure
GOLDMAN SACHS GQG PARTNERS INTERNATIONAL OPPORTUNITIES FUND
|
|
9. INDEMNIFICATIONS (continued) |
under these arrangements is unknown, as this would involve future claims that may be made against the Fund that have not yet occurred. However, GSAM believes the risk of loss under these arrangements to be remote.
Management has identified an error in the accounting for the accrual of foreign capital gains taxes on net unrealized capital gains relating to Indian securities, which resulted in an overstatement of the Fund’s net assets and net unrealized gains beginning on March 6, 2023. As of December 6, 2023, the error became material, requiring reprocessing of shareholder accounts impacted by more than an established threshold under the Fund’s NAV error correction policy. The Fund intends to reprocess shareholder transactions effected from December 6, 2023 through December 11, 2024, (the “Error Period”), which will generally include issuing additional shares to shareholders who purchased shares of the Fund during the Error Period, net of any redemption proceeds overdistributed to impacted shareholders. The Statement of Assets and Liabilities as of October 31, 2024 includes a liability of $144,345,676 for future shares to be issued to the impacted shareholders and an asset of $45,303,028 (which is included within Other Assets), which reflects the value of overdistributed redemption proceeds. Such amounts reflect management’s current estimate of the impact of the planned remediation of the error. The impact to the Fund’s financial statements for the fiscal year ended October 31, 2023 was not material.
Subsequent events have been evaluated through the date of issuance, and GSAM has concluded that there is no impact requiring adjustment or disclosure in the financial statements.
GOLDMAN SACHS GQG PARTNERS INTERNATIONAL OPPORTUNITIES FUND
|
Notes to Financial Statements (continued) October 31, 2024 |
|
|
12. SUMMARY OF SHARE TRANSACTIONS |
Share activity is as follows:
| | | | | | | | | | | | | | | | |
| | | Goldman Sachs GQG Partners
International Opportunities Fund | |
| | |
| | | For the Fiscal Year Ended October 31, 2024 | | | For the Fiscal Year Ended October 31, 2023 | |
| |
| | | | |
| | | | |
| | | Shares | | | Dollars | | | Shares | | | Dollars | |
| |
| | | | |
| | | | |
Class A Shares | | | | | | | | | | | | | | | | |
| | | | |
Shares sold | | | 16,208,411 | | | $ | 350,174,066 | | | | 10,461,811 | | | $ | 182,944,586 | |
| | | | |
Reinvestment of distributions | | | 410,492 | | | | 7,869,138 | | | | 935,354 | | | | 15,367,872 | |
| | | | |
Shares redeemed | | | (10,662,971 | ) | | | (230,615,609 | ) | | | (14,468,795 | ) | | | (249,865,871 | ) |
|
| |
| | | | |
| | | 5,955,932 | | | | 127,427,595 | | | | (3,071,630 | ) | | | (51,553,413 | ) |
|
| |
| | | | |
Class C Shares | | | | | | | | | | | | | | | | |
| | | | |
Shares sold | | | 2,018,978 | | | | 42,512,618 | | | | 1,147,063 | | | | 19,518,625 | |
| | | | |
Reinvestment of distributions | | | 74,767 | | | | 1,394,408 | | | | 175,877 | | | | 2,815,789 | |
| | | | |
Shares redeemed | | | (853,654 | ) | | | (17,743,731 | ) | | | (843,516 | ) | | | (14,247,182 | ) |
|
| |
| | | | |
| | | 1,240,091 | | | | 26,163,295 | | | | 479,424 | | | | 8,087,232 | |
|
| |
| | | | |
Institutional Shares | | | | | | | | | | | | | | | | |
| | | | |
Shares sold | | | 478,585,866 | | | | 10,387,932,944 | | | | 398,800,485 | | | | 6,984,402,392 | |
| | | | |
Reinvestment of distributions | | | 21,490,569 | | | | 414,767,977 | | | | 34,889,014 | | | | 577,064,288 | |
| | | | |
Shares redeemed | | | (195,760,134 | ) | | | (4,231,101,047 | ) | | | (262,903,339 | ) | | | (4,592,681,744 | ) |
|
| |
| | | | |
| | | 304,316,301 | | | | 6,571,599,874 | | | | 170,786,160 | | | | 2,968,784,936 | |
|
| |
| | | | |
Investor Shares | | | | | | | | | | | | | | | | |
| | | | |
Shares sold | | | 189,651,266 | | | | 4,140,805,786 | | | | 169,576,947 | | | | 2,967,354,806 | |
| | | | |
Reinvestment of distributions | | | 8,402,211 | | | | 161,574,520 | | | | 13,711,437 | | | | 225,964,484 | |
| | | | |
Shares redeemed | | | (92,138,531 | ) | | | (1,997,782,545 | ) | | | (103,470,716 | ) | | | (1,814,437,962 | ) |
|
| |
| | | | |
| | | 105,914,946 | | | | 2,304,597,761 | | | | 79,817,668 | | | | 1,378,881,328 | |
|
| |
| | | | |
Class R6 Shares | | | | | | | | | | | | | | | | |
| | | | |
Shares sold | | | 81,530,512 | | | | 1,805,699,349 | | | | 41,030,062 | | | | 730,249,395 | |
| | | | |
Reinvestment of distributions | | | 1,684,659 | | | | 32,497,074 | | | | 2,410,823 | | | | 39,850,905 | |
| | | | |
Shares redeemed | | | (22,949,594 | ) | | | (504,146,864 | ) | | | (17,960,800 | ) | | | (310,270,416 | ) |
|
| |
| | | | |
| | | 60,265,577 | | | | 1,334,049,559 | | | | 25,480,085 | | | | 459,829,884 | |
|
| |
| | | | |
Class R Shares | | | | | | | | | | | | | | | | |
| | | | |
Shares sold | | | 151,694 | | | | 3,288,504 | | | | 152,241 | | | | 2,645,518 | |
| | | | |
Reinvestment of distributions | | | 4,243 | | | | 80,187 | | | | 3,857 | | | | 62,600 | |
| | | | |
Shares redeemed | | | (50,475 | ) | | | (1,087,634 | ) | | | (25,914 | ) | | | (451,004 | ) |
|
| |
| | | | |
| | | 105,462 | | | | 2,281,057 | | | | 130,184 | | | | 2,257,114 | |
|
| |
| | | | |
Class P Shares | | | | | | | | | | | | | | | | |
| | | | |
Shares sold | | | 45,274,775 | | | | 971,459,092 | | | | 36,213,294 | | | | 635,656,045 | |
| | | | |
Reinvestment of distributions | | | 3,734,268 | | | | 72,034,034 | | | | 6,277,121 | | | | 103,698,041 | |
| | | | |
Shares redeemed | | | (16,804,408 | ) | | | (362,434,410 | ) | | | (22,828,772 | ) | | | (395,113,530 | ) |
|
| |
| | | | |
| | | 32,204,635 | | | | 681,058,716 | | | | 19,661,643 | | | | 344,240,556 | |
|
| |
| | | | |
NET INCREASE | | | 510,002,944 | | | $ | 11,047,177,857 | | | | 293,283,534 | | | $ | 5,110,527,637 | |
| |
Report of Independent Registered Public Accounting Firm
To the Board of Trustees of Goldman Sachs Trust II and Shareholders of Goldman Sachs GQG Partners International Opportunities Fund
Opinion on the Financial Statements
We have audited the accompanying statement of assets and liabilities, including the schedule of investments, of Goldman Sachs GQG Partners International Opportunities Fund (one of the funds constituting Goldman Sachs Trust II, referred to hereafter as the “Fund”) as of October 31, 2024, the related statement of operations for the year ended October 31, 2024, the statement of changes in net assets for each of the two years in the period ended October 31, 2024, including the related notes, and the financial highlights for each of the five years in the period ended October 31, 2024 (collectively referred to as the “financial statements”). In our opinion, the financial statements present fairly, in all material respects, the financial position of the Fund as of October 31, 2024, the results of its operations for the year then ended, the changes in its net assets for each of the two years in the period ended October 31, 2024 and the financial highlights for each of the five years in the period ended October 31, 2024 in conformity with accounting principles generally accepted in the United States of America.
Basis for Opinion
These financial statements are the responsibility of the Fund’s management. Our responsibility is to express an opinion on the Fund’s financial statements based on our audits. We are a public accounting firm registered with the Public Company Accounting Oversight Board (United States) (PCAOB) and are required to be independent with respect to the Fund in accordance with the U.S. federal securities laws and the applicable rules and regulations of the Securities and Exchange Commission and the PCAOB.
We conducted our audits of these financial statements in accordance with the standards of the PCAOB. Those standards require that we plan and perform the audit to obtain reasonable assurance about whether the financial statements are free of material misstatement, whether due to error or fraud.
Our audits included performing procedures to assess the risks of material misstatement of the financial statements, whether due to error or fraud, and performing procedures that respond to those risks. Such procedures included examining, on a test basis, evidence regarding the amounts and disclosures in the financial statements. Our audits also included evaluating the accounting principles used and significant estimates made by management, as well as evaluating the overall presentation of the financial statements. Our procedures included confirmation of securities owned as of October 31, 2024 by correspondence with the custodian, transfer agent and brokers; when replies were not received from brokers, we performed other auditing procedures. We believe that our audits provide a reasonable basis for our opinion.
/s/ PricewaterhouseCoopers LLP
Boston, Massachusetts
December 27, 2024
We have served as the auditor of one or more investment companies in the Goldman Sachs fund complex since 2000.
GOLDMAN SACHS GQG PARTNERS INTERNATIONAL OPPORTUNITIES FUND
Statement Regarding Basis for Approval of Management Agreement and Sub-Advisory Agreement (Unaudited)
Background
The Goldman Sachs GQG Partners International Opportunities Fund (the “Fund”) is an investment portfolio of Goldman Sachs Trust II (the “Trust”). The Board of Trustees (the “Board”) oversees the management of the Trust and reviews the investment performance and expenses of the Fund at regularly scheduled meetings held throughout the year. In addition, the Board determines annually whether to approve the continuance of the Trust’s investment management agreement (the “Management Agreement”) with Goldman Sachs Asset Management, L.P. (the “Investment Adviser”) on behalf of the Fund.
The Management Agreement was most recently approved for continuation until June 30, 2025 by the Board, including those Trustees who are not parties to the Management Agreement or “interested persons” (as defined in the Investment Company Act of 1940, as amended) of any party thereto (the “Independent Trustees”), at a meeting held on June 11-12, 2024 (the “Annual Meeting”). At the Annual Meeting, the Board also considered the sub-advisory agreement (the “Sub-Advisory Agreement” and, together with the Management Agreement, the “Agreements”) between the Investment Adviser and GQG Partners LLC (the “Sub-Adviser”).
The review process undertaken by the Trustees spans the course of the year and culminates with the Annual Meeting. To assist the Trustees in their deliberations, the Trustees have established a Contract Review Committee (the “Committee”), comprised of the Independent Trustees. The Committee held five meetings over the course of the year since the Management Agreement was last approved. At those Committee meetings, regularly scheduled Board or other committee meetings, and/or the Annual Meeting, matters relevant to the renewal of the Management Agreement and the Sub-Advisory Agreement were considered by the Board, or the Independent Trustees, as applicable. With respect to the Fund, such matters included:
| | (a) | the nature and quality of the advisory, administrative, and other services provided to the Fund by the Investment Adviser and its affiliates and the Sub-Adviser, including, as applicable, information about: |
| | (i) | the structure, staff, and capabilities of the Investment Adviser and the Sub-Adviser and the Sub-Adviser’s portfolio management teams; |
| | (ii) | the groups within the Investment Adviser and its affiliates that support the portfolio management teams or provide other types of necessary services, including fund services groups (e.g., accounting and financial reporting, tax, shareholder services, and operations); controls and risk management groups (e.g., legal, compliance, valuation oversight, credit risk management, internal audit, compliance testing, market risk analysis, finance, and central funding); sales and distribution support groups, and others (e.g., information technology and training); |
| | (iii) | trends in employee headcount; |
| | (iv) | the Investment Adviser’s financial resources and ability to hire and retain talented personnel and strengthen its operations; and |
| | (v) | the parent company’s support of the Investment Adviser and its mutual fund business, as expressed by the firm’s senior management; |
| | (b) | information on the investment performance of the Fund, including comparisons to the performance of similar mutual funds, as provided by a third-party mutual fund data provider engaged as part of the contract review process (the “Outside Data Provider”), and a benchmark performance index; and information on general investment outlooks in the markets in which the Fund invests; |
| | (c) | information provided by the Investment Adviser indicating the Investment Adviser’s views on whether the Fund’s peer group and/or benchmark index had high, medium, or low relevance given the Fund’s particular investment strategy; |
| | (d) | the terms of the Agreements and other agreements with affiliated service providers entered into by the Trust on behalf of the Fund; |
| | (e) | fee and expense information for the Fund, including: |
| | (i) | the relative management fee and expense levels of the Fund as compared to those of comparable funds managed by other advisers, as provided by the Outside Data Provider; and |
| | (ii) | the Fund’s expense trends over time; |
| | (f) | with respect to the extensive investment performance and expense comparison data provided by the Outside Data Provider, its processes in producing that data for the Fund; |
| | (g) | the undertakings of the Investment Adviser and its affiliates to implement fee waivers and an expense limitation; |
| | (h) | information relating to the profitability of the Management Agreement and the transfer agency and distribution and service arrangements of the Fund to the Investment Adviser and its affiliates; |
| | (i) | whether the Fund’s existing management fee schedule adequately addressed any economies of scale; |
| | (j) | a summary of the “fall-out” benefits derived by the Investment Adviser and its affiliates from their relationships with the Fund, including the fees received by the Investment Adviser’s affiliates from the Fund for transfer agency, securities lending, portfolio trading, distribution and other services; |
GOLDMAN SACHS GQG PARTNERS INTERNATIONAL OPPORTUNITIES FUND
Statement Regarding Basis for Approval of Management Agreement and Sub-Advisory Agreement (Unaudited) (continued)
| | (k) | a summary of potential benefits derived by the Fund as a result of its relationship with the Investment Adviser; |
| | (l) | portfolio manager ownership of Fund shares; the manner in which portfolio manager compensation is determined; information on the Sub-Adviser’s compensation arrangements; and the number and types of accounts managed by the portfolio managers; |
| | (m) | the nature and quality of the services provided to the Fund by its unaffiliated service providers (as well as the Sub-Adviser), and the Investment Adviser’s general oversight and evaluation (including reports on due diligence) of those service providers as part of the administrative services provided under the Management Agreement; and |
| | (n) | the Investment Adviser’s and Sub-Adviser’s processes and policies addressing various types of potential conflicts of interest; their approaches to risk management; the annual review of the effectiveness of the Fund’s compliance program; and periodic compliance reports. |
The Trustees also received an overview of the Fund’s distribution arrangements. They received information regarding the Fund’s assets, share purchase and redemption activity, and payment of distribution and service fees. Information was also provided to the Trustees relating to revenue sharing payments made by and services provided by the Investment Adviser and its affiliates to intermediaries that promote the sale, distribution, and/or servicing of Fund shares. The Independent Trustees also discussed the broad range of other investment choices that are available to Fund investors, including the availability of comparable funds managed by other advisers
The presentations made at the Board and Committee meetings and at the Annual Meeting encompassed the Fund and other mutual funds for which the Board has responsibility. In evaluating the Agreements at the Annual Meeting, the Trustees relied upon their knowledge, resulting from their meetings and other interactions throughout the year, of the Investment Adviser and its affiliates and the Sub-Adviser, their respective services, and the Fund. In conjunction with these meetings, the Trustees received written materials and oral presentations on the topics covered, and the Investment Adviser addressed the questions and concerns of the Trustees, including concerns regarding the investment performance of certain of the funds they oversee. In addition, the Trustees periodically received written materials and oral presentations from the Sub-Adviser. The Independent Trustees were advised by their independent legal counsel regarding their responsibilities and other regulatory requirements related to the approval and continuation of mutual fund investment management agreements under applicable law. In addition, the Investment Adviser and its affiliates provided the Independent Trustees with a written response to a formal request for information sent on behalf of the Independent Trustees by their independent legal counsel. The Trustees reviewed a written response prepared by the Sub-Adviser to a similar request for information submitted to the Sub-Adviser by the Investment Adviser. During the course of their deliberations, the Independent Trustees met in executive sessions with their independent legal counsel, without representatives of the Investment Adviser or its affiliates present.
Nature, Extent, and Quality of the Services Provided Under the Management Agreement
As part of their review, the Trustees considered the nature, extent, and quality of the services provided to the Fund by the Investment Adviser. In this regard, the Trustees considered both the investment advisory services and non-advisory services that are provided by the Investment Adviser and its affiliates. The Trustees noted the Investment Adviser’s commitment to maintaining high quality systems and expending substantial resources to respond to ongoing changes to the market, regulatory and control environment in which the Fund and its service providers operate, including developments associated with geopolitical events and economic sanctions, as well as the efforts of the Investment Adviser and its affiliates to combat cyber security risks. They also noted the transition in the leadership and changes in personnel of various of the Investment Adviser’s portfolio management teams that had occurred in recent periods, and the ongoing recruitment efforts aimed at bringing high quality investment talent to the Investment Adviser. The Trustees also considered information regarding the Investment Adviser’s and the Sub-Adviser’s efforts relating to business continuity planning. The Trustees concluded that the Investment Adviser continued to commit substantial financial and operational resources to the Fund and expressed confidence that the Investment Adviser would continue to do so in the future. The Trustees also recognized that the Investment Adviser had made significant commitments to address regulatory compliance requirements applicable to the Fund and the Investment Adviser and its affiliates. In addition, the Trustees reviewed the Sub-Adviser oversight process that the Investment Adviser had employed, which included areas such as investment analytics, risk management and compliance.
Investment Performance
The Trustees also considered the investment performance of the Fund. In this regard, they compared the investment performance of the Fund to its peers using rankings and ratings compiled by the Outside Data Provider as of December 31, 2023, and updated performance information prepared by the Investment Adviser using the peer group identified by the Outside Data
GOLDMAN SACHS GQG PARTNERS INTERNATIONAL OPPORTUNITIES FUND
Statement Regarding Basis for Approval of Management Agreement and Sub-Advisory Agreement (Unaudited) (continued)
Provider as of March 31, 2024. The information on the Fund’s investment performance prepared by the Outside Data Provider was provided for the one-, three-, and five-year periods ending on the applicable dates. The Trustees also reviewed the Fund’s investment performance relative to its performance benchmark. As part of this review, they considered the investment performance trends of the Fund over time, and reviewed the investment performance of the Fund in light of its investment objective and policies and market conditions.
In addition, the Trustees considered materials prepared and presentations made by the Investment Adviser’s senior management and the Sub-Adviser’s portfolio management personnel in which Fund performance was assessed. The Trustees also considered the Investment Adviser’s periodic reports with respect to the Fund’s risk profile, and how the Investment Adviser’s approach to risk monitoring and management influences portfolio management.
The Trustees noted that the Fund’s Institutional Shares had placed in the top half of the Fund’s performance peer group and had outperformed the Fund’s primary benchmark index for the one-, three-, and five-year periods ended March 31, 2024.
Costs of Services Provided and Competitive Information
The Trustees considered the contractual terms of the Management Agreement, the fee rates payable by the Fund thereunder, and the net amount retained by the Investment Adviser after payment of sub-advisory fees. In this regard, the Trustees considered information on the services rendered by the Investment Adviser to the Fund, which included both advisory and administrative services that were directed to the needs and operations of the Fund as a registered mutual fund.
In particular, the Trustees reviewed analyses prepared by the Outside Data Provider regarding the expense rankings of the Fund, as well as additional information provided by the Investment Adviser throughout the year. The analyses provided a comparison of the Fund’s management fee and breakpoints to those of a relevant peer group and category universe; an expense analysis which compared the Fund’s overall net and gross expenses to a peer group and a category universe; and data comparing the Fund’s net expenses to the peer and category medians. The analyses also compared the Fund’s other expenses and fee waivers/reimbursements to those of the peer group and category medians. The Trustees concluded that the comparisons provided by the Outside Data Provider and the Investment Adviser were useful in evaluating the reasonableness of the management fees and total expenses paid by the Fund.
The Trustees considered the Investment Adviser’s undertakings to implement fee waivers and an expense limitation. In addition, the Trustees noted that shareholders are able to redeem their shares at any time if shareholders believe that the Fund fees and expenses are too high or if they are dissatisfied with the performance of the Fund.
Profitability
The Trustees reviewed the Fund’s contribution to the Investment Adviser’s revenues and pre-tax profit margins. In this regard the Trustees noted that they had received, among other things, profitability analyses and summaries, revenue and expense schedules by Fund and by function (i.e., investment management, transfer agency and distribution and service), and information on the Investment Adviser’s expense allocation methodology. They observed that the profitability and expense figures are substantially similar to those used by the Investment Adviser for many internal purposes, including compensation decisions among various business groups, and are thus subject to a vigorous internal debate about how certain revenue and expenses should be allocated. The Trustees also noted that the internal audit group within the Goldman Sachs organization periodically audits the expense allocation methodology and that the internal audit group was satisfied with the reasonableness, consistency, and accuracy of the Investment Adviser’s expense allocation methodology. Profitability data for the Fund was provided for 2023 and 2022, and the Trustees considered this information in relation to the Investment Adviser’s overall profitability.
Economies of Scale
The Trustees considered the information that had been provided regarding whether there have been economies of scale with respect to the management of the Fund. The Trustees also considered the breakpoints in the fee rate payable under the Management Agreement for the Fund at the following annual percentage rates of the average daily net assets of the Fund:
GOLDMAN SACHS GQG PARTNERS INTERNATIONAL OPPORTUNITIES FUND
Statement Regarding Basis for Approval of Management Agreement and Sub-Advisory Agreement (Unaudited) (continued)
| | | | | |
| | | GQG Partners |
Average Daily Net Assets | | International Opportunities Fund Management Fee Annual Rate |
| |
First $1 billion | | | | 0.85 | % |
| |
Next $1 billion | | | | 0.77 | |
| |
Next $3 billion | | | | 0.73 | |
| |
Next $3 billion | | | | 0.71 | |
| |
Over $8 billion | | | | 0.70 | |
The Trustees noted that the breakpoints were designed to share potential economies of scale, if any, with the Fund and its shareholders as assets under management reach those asset levels. The Trustees considered the amounts of assets in the Fund; the Fund’s recent share purchase and redemption activity; the information provided by the Investment Adviser relating to the costs of the services provided by the Investment Adviser and its affiliates and their realized profits; information comparing fee rates charged by the Investment Adviser with fee rates charged to other funds in the peer group; and the Investment Adviser’s undertakings to waive a portion of its management fee and certain fees and to limit certain expenses of the Fund that exceed a specified level, as well as Goldman Sachs & Co. LLC’s (“Goldman Sachs”) undertaking to waive a portion of the transfer agency fees paid by the Fund’s Class R6 Shares. The Trustees also considered the relationship between the advisory and sub-advisory fee rate schedules. Upon reviewing these matters at the Annual Meeting, the Trustees concluded that the fee breakpoints represented a means of assuring that benefits of scalability, if any, would be passed along to shareholders at the specified asset levels. They also noted that the Investment Adviser had passed along savings to shareholders of the Fund, which had asset levels above the highest breakpoint.
Other Benefits to the Investment Adviser and Its Affiliates
The Trustees also considered the other benefits derived by the Investment Adviser and its affiliates from their relationships with the Fund as stated above, including: (a) transfer agency fees received by Goldman Sachs; (b) brokerage and futures commissions earned by Goldman Sachs for executing securities transactions (in its capacity as clearing broker) and futures transactions on behalf of the Fund; (c) fees earned by Goldman Sachs Agency Lending (“GSAL”), an affiliate of the Investment Adviser, as securities lending agent (and fees earned by the Investment Adviser for managing the fund in which the Fund’s cash collateral is invested); (d) the Investment Adviser’s ability to leverage the infrastructure designed to service the Fund on behalf of its other clients; (e) the Investment Adviser’s ability to cross-market other products and services to Fund shareholders; (f) Goldman Sachs’ retention of certain fees as Fund Distributor; (g) the Investment Adviser’s ability to negotiate better pricing with the Fund’s custodian on behalf of its other clients, as a result of the relationship with the Fund; (h) the investment of cash and cash collateral in money market funds managed by the Investment Adviser that will result in increased assets under management for those money market funds; and (i) the possibility that the working relationship between the Investment Adviser and the Fund’s third-party service providers, including the Sub-Adviser, may cause those service providers to be more likely to do business with other areas of Goldman Sachs. In the course of considering the foregoing, the Independent Trustees requested and received further information quantifying certain of these fall-out benefits.
Other Benefits to the Fund and Its Shareholders
The Trustees also noted that the Fund receives certain other potential benefits as a result of their relationship with the Investment Adviser, including: (a) enhanced servicing from vendors due to the volume of business generated by the Investment Adviser and its affiliates; (b) the advantages received from the Investment Adviser’s knowledge and experience gained from managing other accounts and products; (c) the Investment Adviser’s ability to hire and retain qualified personnel to provide services to the Fund because of the reputation of the Goldman Sachs organization; (d) the Fund’s access, through the Investment Adviser, to certain firm-wide resources (e.g., proprietary risk management systems and databases), subject to certain restrictions; (e) the Fund’s ability to participate in the securities lending program administered by GSAL, as measured by the revenue received by the Fund in connection with the program; and (f) the Fund’s access to certain affiliated distribution channels.
Conclusion
In connection with their consideration of the Management Agreement, the Trustees gave weight to each of the factors described above, but did not identify any particular factor as controlling their decision. After deliberation and consideration of all of the information provided, including the factors described above, the Trustees concluded, in the exercise of their business judgment, that the management fees paid by the Fund were reasonable in light of the services provided to it by the Investment
GOLDMAN SACHS GQG PARTNERS INTERNATIONAL OPPORTUNITIES FUND
Statement Regarding Basis for Approval of Management Agreement and Sub-Advisory Agreement (Unaudited) (continued)
Adviser, the Investment Adviser’s costs and the Fund’s current and reasonably foreseeable asset levels. The Trustees unanimously concluded that the Investment Adviser’s continued management likely would benefit the Fund and its shareholders, the factors considered, and that the Management Agreement should be approved and continued with respect to the Fund until June 30, 2025.
Sub-Advisory Agreement with GQG Partners LLC
Nature, Extent, and Quality of the Services Provided Under the Sub-Advisory Agreement
In evaluating the Sub-Advisory Agreement, the Trustees relied upon materials furnished and presentations made by the Investment Adviser and Sub-Adviser. In evaluating the nature, extent, and quality of services provided by the Sub-Adviser, the Trustees considered information on the services provided to the Fund by the Sub-Adviser, including information about the Sub-Adviser’s (a) personnel and compensation structure; (b) track record in managing the Fund and other funds and/or accounts with investment strategies similar to those employed on behalf of the Fund; (c) policies and procedures in place to address potential conflicts of interest; and (d) compliance program and code of ethics. In this regard, they also considered assessments provided by the Investment Adviser of the Sub-Adviser, the Sub-Adviser’s investment strategies and personnel, and its compliance program. The Trustees also considered information regarding the Sub-Adviser’s efforts relating to business continuity planning.
Costs of Services Provided
The Trustees reviewed the terms of the Sub-Advisory Agreement, including the schedule of fees payable to the Sub-Adviser. They considered the breakpoints in the sub-advisory fee rate payable under the Sub-Advisory Agreement. The Trustees noted that the compensation paid to the Sub-Adviser is paid by the Investment Adviser, not by the Fund. They also considered the expense limitations that substantially reduce the fees retained by the Investment Adviser, and that the retention of the Sub-Adviser does not directly increase the fees incurred by the Fund for advisory services. They considered the Investment Adviser’s belief that the relationship between the management fees paid by the Fund and the sub-advisory fees paid by the Investment Adviser is appropriate given the level of services the Investment Adviser provides to the Fund and significant differences in cost drivers and risks associated with the respective services offered by the Investment Adviser and the Sub-Adviser.
Conclusion
In connection with their consideration of the Sub-Advisory Agreement, the Trustees gave weight to various factors, but did not identify any particular factor as controlling their decision. After deliberation and consideration of the information provided, including the factors described above, the Trustees, including the Independent Trustees, unanimously concluded, in the exercise of their business judgment, that the sub-advisory fees paid by the Investment Adviser to the Sub-Adviser were reasonable in light of the factors considered, and that the Sub-Advisory Agreement should be approved and continued until June 30, 2025.
|
| |
| Goldman Sachs GQG Partners International Opportunities Fund - Tax Information (Unaudited) |
| |
For the year ended October 31, 2024, 5.12% of the dividends paid from net investment company taxable income by the Goldman Sachs GQG Partners International Opportunities Fund qualify for the dividends received deduction available to corporations. |
| |
For the year ended October 31, 2024, 100% of the dividends paid from net investment company taxable income by the GQG Partners International Opportunities Fund qualify for the reduced tax rate under the Jobs and Growth Tax Relief and Reconciliation Act of 2003. |
| |
From distributions paid during the year ended October 31, 2024, the total amount of income received by the Goldman Sachs GQG Partners International Opportunities Fund from sources within foreign countries and possessions of the United States was $0.5224 per share, all of which is attributable to qualified passive income. The percentage of net investment income dividends paid from foreign sources by the Goldman Sachs GQG Partners International Opportunities Fund was 85.42%. The total amount of taxes paid by the Goldman Sachs GQG Partners International Opportunities Fund to such countries was $0.0397 per share. |
(This page intentionally left blank)
(This page intentionally left blank)
TRUSTEES OFFICERS Gregory G. Weaver, Chair James A. McNamara, President Cheryl K. Beebe Joseph F. DiMaria, Principal Financial Officer, Principal Dwight L. Bush Accounting Officer and Treasurer Kathryn A. Cassidy Robert Griffith, Secretary John G. Chou Joaquin Delgado Eileen H. Dowling Lawrence Hughes John F. Killian Steven D. Krichmar Michael Latham James A. McNamara Lawrence W. Stranghoener PaulC.Wirth GOLDMAN SACHS & CO. LLC Distributor and Transfer Agent GOLDMAN SACHS ASSET MANAGEMENT, L.P. Investment Adviser 200 West Street, New York, New York 10282 © 2024 Goldman Sachs. All rights reserved. GQGPIOAR-24
| ITEM 8. | CHANGES IN AND DISAGREEMENTS WITH ACCOUNTANTS FOR OPEN-END MANAGEMENT INVESTMENT COMPANIES. |
Not applicable.
| ITEM 9. | PROXY DISCLOSURES FOR OPEN-END MANAGEMENT INVESTMENT COMPANIES. |
Not applicable.
| ITEM 10. | REMUNERATION PAID TO DIRECTORS, OFFICERS, AND OTHERS OF OPEN-END MANAGEMENT INVESTMENT COMPANIES. |
The aggregate remuneration paid to the Fund’s trustees, officers and others, if any, is included in Item 7 of this report.
| ITEM 11. | STATEMENT REGARDING BASIS FOR APPROVAL OF INVESTMENT ADVISORY CONTRACT. |
The Fund’s statement regarding the basis for approval of its investment advisory contracts is included in Item 7 of this report.
| ITEM 12. | DISCLOSURE OF PROXY VOTING POLICIES AND PROCEDURES FOR CLOSED-END MANAGEMENT INVESTMENT COMPANIES. |
Not applicable.
| ITEM 13. | PORTFOLIO MANAGERS OF CLOSED-END MANAGEMENT INVESTMENT COMPANIES. |
Not applicable.
| ITEM 14. | PURCHASES OF EQUITY SECURITIES BY CLOSED-END MANAGEMENT INVESTMENT COMPANY AND AFFILIATED PURCHASERS. |
Not applicable.
| ITEM 15. | SUBMISSION OF MATTERS TO A VOTE OF SECURITY HOLDERS. |
There have been no material changes to the procedures by which shareholders may recommend nominees to the registrant’s board of trustees.
| ITEM 16. | CONTROLS AND PROCEDURES. |
| | (a) | The registrant maintains disclosure controls and procedures (as defined in Rule 30a-3(c) under the Investment Company Act of 1940, as amended (the “1940 Act”)) that are designed to ensure that the information required to be disclosed by the registrant has been recorded, processed, summarized and reported within the time period specified in the Commission’s rules and forms and that the information required to be disclosed by the registrant has been accumulated and communicated to the registrant’s principal executive officer and principal financial officer in order to allow timely decisions regarding required disclosure. Within 90 days prior to the filing of the date of the Shareholder Report on Form N-CSR, the principal executive officer and principal financial officer of the registrant carried out an evaluation of the effectiveness of the design and operation of the registrant’s disclosure controls and procedures. Based upon such evaluation, the principal executive officer and principal financial officer concluded that the disclosure controls and procedures related to the Fund were not effective due to a material weakness in the design and operating effectiveness of controls over the accounting for the accrual of foreign capital gains taxes. More specifically the design and operating effectiveness of controls related to the Fund failed to adequately monitor when the amount of available capital loss carry forwards and the unrealized losses were insufficient to cover the amount of net unrealized capital gains on Indian securities, which would trigger the recording of a deferred tax liability for foreign capital gains. |
The registrant is implementing enhancements to its disclosure controls and procedures to remediate the material weakness described above. Management has reconfirmed with the fund administration team the process to be used in the accounting for the accruals of foreign capital gains taxes relating to Indian securities and adopted additional review procedures surrounding the accounting of such accruals.
| | (b) | Other than the enhancements to controls noted above, there have been no changes in the registrant’s internal controls over financial reporting (as defined in Rule 30a-3(d) under the 1940 Act) during the period covered by this report that materially affected, or are reasonably likely to materially affect, the registrant’s internal control over financial reporting. |
| ITEM 17. | DISCLOSURE OF SECURITIES LENDING ACTIVITIES FOR CLOSED-END MANAGEMENT INVESTMENT COMPANIES. |
Not applicable.
| ITEM 18. | RECOVERY OF ERRONEOUSLY AWARDED COMPENSATION. |
SIGNATURES
Pursuant to the requirements of the Securities Exchange Act of 1934 and the Investment Company Act of 1940, the registrant has duly caused this report to be signed on its behalf by the undersigned, thereunto duly authorized.
| | | | |
| | | | Goldman Sachs Trust II |
| | |
| By: | | | | /s/ James A. McNamara |
| | |
| | | | James A. McNamara |
| | | | President/Chief Executive Officer |
| | | | Goldman Sachs Trust II |
| | |
| Date: | | | | January 8, 2025 |
Pursuant to the requirements of the Securities Exchange Act of 1934 and the Investment Company Act of 1940, this report has been signed below by the following persons on behalf of the registrant and in the capacities and on the dates indicated.
| | | | |
| | |
| By: | | | | /s/ James A. McNamara |
| | |
| | | | James A. McNamara |
| | | | President/Chief Executive Officer |
| | | | Goldman Sachs Trust II |
| | |
| Date: | | | | January 8, 2025 |
| | |
| By: | | | | /s/ Joseph F. DiMaria |
| | |
| | | | Joseph F. DiMaria |
| | | | Principal Financial Officer |
| | | | Goldman Sachs Trust II |
| | |
| Date: | | | | January 8, 2025 |