UNITED STATES
SECURITIES AND EXCHANGE COMMISSION
Washington, D.C. 20549
FORM N-CSR
CERTIFIED SHAREHOLDER REPORT OF REGISTERED
MANAGEMENT INVESTMENT COMPANIES
Investment Company Act file number 811-22838
The KP Funds
(Exact name of registrant as specified in charter)
CT Corporation
101 Federal Street
Boston, MA 02110
(Address of principal executive offices) (Zip code)
SEI Investments
One Freedom Valley Drive
Oaks, PA 19456
(Name and address of agent for service)
Registrant’s telephone number, including area code: (855) 457-3637
Date of fiscal year end: December 31, 2016
Date of reporting period: December 31, 2016
| Item 1. | Reports to Stockholders. |
| | |
| The KP Funds | |  |

KP Retirement Path 2015 Fund: KPRAX
KP Retirement Path 2020 Fund: KPRBX
KP Retirement Path 2025 Fund: KPRCX
KP Retirement Path 2030 Fund: KPRDX
KP Retirement Path 2035 Fund: KPREX
KP Retirement Path 2040 Fund: KPRFX
KP Retirement Path 2045 Fund: KPRGX
KP Retirement Path 2050 Fund: KPRHX
KP Retirement Path 2055 Fund: KPRIX
KP Retirement Path 2060 Fund: KPRJX
KP Large Cap Equity Fund: KPLCX
KP Small Cap Equity Fund: KPSCX
KP International Equity Fund: KPIEX
KP Fixed Income Fund: KPFIX
Annual Report
December 31, 2016
| | |
| THE KP FUNDS | | December 31, 2016 |
The Funds file their complete schedules of investments with the Securities and Exchange Commission (the “Commission”) for the first and third quarters of each fiscal year on Form N-Q within sixty days after period end. The Funds’ Forms N-Q are available on the Commission’s website at http://www.sec.gov, and may be reviewed and copied at the Commission’s Public Reference Room in Washington, D.C. Information on the operation of the Public Reference Room may be obtained by calling 1-800-SEC-0330.
A description of the policies and procedures that the Funds use to determine how to vote proxies relating to portfolio securities, as well as information relating to how the Funds voted proxies relating to portfolio securities during the most recent 12-month period ended June 30, is available (i) without charge, upon request, by calling 855-457-3637 (855-4KPFNDS); and (ii) on the Commission’s website at http://www.sec.gov.
| | |
| THE KP FUNDS | | December 31, 2016 |
Dear Shareholder,
The US economic picture continued to improve through 2016 with solid GDP growth, incremental improvement on the employment and wage front, and a benign inflationary environment. Performance across the major asset classes was positive, ranging from modestly positive for US bonds and developed Non-US stocks, to strongly positive for US Stocks, commodities and emerging markets. Fixed income returns were positive for the year with the Bloomberg Barclays Aggregate Index returning 2.65%. Large Cap US stocks as measured by the Russell 1000 Index returned 12.05% for the year. Non-US equity markets did not fare as well with the MSCI ACWI ex-US Developed Markets Equity Index gaining 4.50% for the year and the MSCI Emerging Markets Equity Index returned 11.60%. Returns for inflation sensitive (or real) assets were also strongly positive. US REITs (as measured by the NAREIT Composite Index) returned 9.37% for the year, while Commodities (as measured by the Bloomberg Commodity Index) increased by 11.40%.
The KP Retirement Path Funds were launched during the early part of January 2014 to provide participants in KP-sponsored defined contribution plans with diversified exposure to all of these asset classes, as well as a number of others including small cap US equity, natural resource equity, global listed infrastructure, Treasury Inflation Protected Securities, floating rate notes, emerging market debt, and short term bonds. Each of the 10 KP Retirement Path Funds is designed with a specific retirement date in mind, and the asset allocation is automatically adjusted over time to help shareholders achieve the appropriate balance between long-term capital growth, inflation protection, and current income for each stage of their savings and investing career.
Since the KP Retirement Path Funds’ inception we have been pleased with the performance of the operational infrastructure that was assembled to coordinate the activities of the 19 different investment management organizations responsible for the management of the Funds’ assets. We have also been satisfied from an investment performance perspective. In terms of absolute performance, fiscal year 2016 was generally characterized by positive returns across the major asset classes. Consequently the returns for the KP Retirement Path Funds were all positive for the year, ranging from 5.24% (2015 Fund) to 8.28% (2055 Fund). The Funds underperformed their strategic benchmarks in fiscal year 2016, due to challenging market conditions for active management, and as a result, modestly trail their benchmarks by between 0.07%-0.45% since their inception in January of 2014 (through December 31, 2016).
We continue to believe that the KP Retirement Path Funds are well-designed and include a diverse set of complementary asset classes and strategies managed by a highly capable team of sub-advisors. We remain confident that the Funds are well-positioned to achieve their objectives going into 2017 and beyond.
Respectfully Submitted,
| | | | |
 | |  | | |
| | |
| Gregory C. Allen | | Ivan S. Cliff, CFA | | |
| Portfolio Manager | | Portfolio Manager | | |
| President, Director of Research | | Director of Investment Research | | |
The performance data quoted represents past performance. Past performance does not guarantee future results. The investment return and principal value of an investment will fluctuate so that an investor’s shares, when redeemed, may be worth less than their original cost and current performance may be lower than the performance quoted. Returns greater than one year are average annual total returns. For performance data current to the most recent month end, please call 855-4-KPFNDS.
1
| | |
| THE KP FUNDS | | December 31, 2016 |
| | |
| MANAGEMENT DISCUSSION AND FUND PERFORMANCE (Unaudited): | | |
Performance for the KP Retirement Path Funds for Fiscal Year 2016 was positive across the board on an absolute basis, but was negative on a relative basis compared to the Funds’ strategic benchmarks. In order to better understand the sources of underperformance for the year it is helpful to review the design of the Funds.
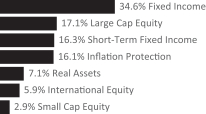
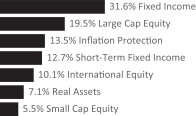
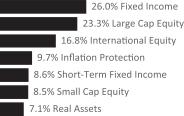
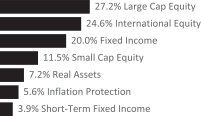
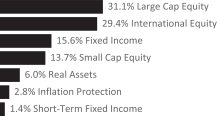
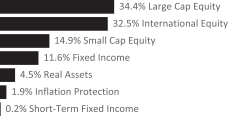
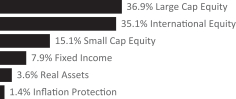
Each of the KP Retirement Path Funds is itself a “fund-of-funds”. This means that each of the Funds is composed of a collection of sub-funds, each with a specific purpose that contributes to the overall design. At the highest level these sub-funds can be grouped into six major categories which include: large cap US equities, small cap US equities, international equities, broad fixed income, real (or inflation sensitive) assets, and short term fixed income. Each of the KP Retirement Path Funds varies its exposure to these asset categories over time to ensure that it is achieving the appropriate balance of capital appreciation, current income, inflation protection, and capital preservation. The 2060 Fund, for example, is primarily invested in large cap US equity, small cap US equity, and international equity. The 2015 Fund, on the other hand, has a much greater emphasis on broad fixed income, real assets, and short term fixed income.
The performance of each Fund is compared to its own strategic benchmark. The strategic benchmarks are designed to reflect the target asset allocation for each Fund, while also assuming that each of the underlying asset classes is implemented using a passive index. While Management makes extensive use of passive strategies in the Funds’ implementation to keep costs low, we also employ a number of active strategies in our attempt to add value relative to the strategic benchmarks. Management does not attempt to add value by trying to time markets using tactical asset allocation. Instead we have designed a sophisticated rebalancing algorithm that keeps the Funds very close to their strategic asset allocation targets over time. As a result, virtually all of the relative performance of the Funds versus their strategic benchmarks can be explained by the relative performance of the strategies within each of the six underlying asset classes. Given this understanding, we can now put the relative performance of the KP Retirement Path Funds into perspective by examining the relative performance of each of the underlying asset classes.
The KP Retirement Path Funds achieve their large cap US equity exposure through the use of the KP Large Cap Equity Fund. This Fund is benchmarked to the Russell 1000 Index. The Fund employs five strategies including: a passive S&P 500 index strategy; an active large cap growth strategy; an active large cap value strategy; and two active large cap blend strategies. The Fund returned 10.04% for the year versus 12.05% for the benchmark. This underperformance of -2.01% at the Fund level was largely explained by the underperformance of the active large cap growth strategy, the active large cap value strategy, and one of the active large cap blend strategies. These strategies trailed their benchmarks for the year by -3.80%, -2.55% and -1.74% respectively. Because large cap is a significant part of the asset allocation for all of the KP Retirement Path Funds, this was a meaningful source of underperformance across the entire fund family.
The KP Retirement Path Funds achieve their small cap US equity exposure through the use of the KP Small Cap Equity Fund. This Fund is benchmarked to the Russell 2000 Index. The Fund employs seven strategies including a passive Russell 2000 strategy, two active small cap growth strategies, two active small cap value strategies, and two active small cap blend strategies. The Fund returned 18.38% for the year versus 21.31% for the benchmark. The underperformance of -2.93% was largely explained by the underperformance of the two active growth strategies and one of the actively managed value strategies. Because small cap is a relatively small part of the asset allocation for the KP Retirement Path Funds, this contributed to, but was not a significant source of relative underperformance across the fund family.
The KP Retirement Path Funds achieve their international equity exposure through the use of the KP International Equity Fund. This Fund is benchmarked to the MSCI ACWI ex-US Index. The Fund employs four strategies including a passive MSCI EAFE strategy, an active MSCI EAFE strategy, an active MSCI ACWI ex-US strategy, and an active emerging markets strategy. The Fund returned 3.03% for the year versus 4.50% for the benchmark. This underperformance of -1.47% was primarily attributable to the active ACWI ex-US strategy which trailed its benchmark by -3.30%, outweighing the outperformance of the active emerging markets strategy, which outperformed its benchmark by 2.43%. Because international equity is a large part of the asset allocation for the KP Retirement Path Funds, this was a significant source of relative underperformance across the fund family.
The KP Retirement Path Funds achieve their broad fixed income exposure through the use of the KP Fixed Income Fund. This Fund is benchmarked to the Bloomberg Barclays Capital US Aggregate Bond Index. The Fund employs four strategies including a passive Bloomberg Barclays Intermediate Government/Credit Index strategy, an active Bloomberg Barclays Aggregate strategy, an active emerging markets debt strategy, and an active bank loan strategy.
2
| | |
| THE KP FUNDS | | December 31, 2016 |
| | |
| MANAGEMENT DISCUSSION AND FUND PERFORMANCE (Unaudited): | | |
The KP Fixed Income Fund returned 4.08% for the year versus 2.65% for the benchmark. This outperformance of 1.43% was primarily due to the outperformance of the active Bloomberg Barclays Aggregate strategy, which outperformed its benchmark by 1.02%, as well as the contributions of the active emerging markets debt and active bank loan strategies. Because fixed income is a large part of the asset allocation for the KP Retirement Path Funds, this outperformance had a positive impact on the relative performance of the KP Retirement Path Fund series.
The KP Retirement Path Funds achieve their real assets exposure through the use of a diversified collection of non-affiliated sub-funds each specializing in a different inflation-sensitive strategy. Collectively these strategies returned 9.10% over the measurement period versus 10.03% for their composite benchmark. The seven underlying real assets funds had a wide range of returns, from 3.08% for the international real estate fund to 25.01% for the global natural resources fund. Because real assets are a relatively small part of the asset allocation for the KP Retirement Path Funds, they had only a modest impact on the relative performance across the series.
The KP Retirement Path Funds achieve their short term fixed income exposure through the use of low-cost index strategies. These sub-funds performed in line with their benchmarks and did not have a material effect on the relative performance across the series.
To determine if one of these funds is an appropriate investment for you, carefully consider the fund’s investment objectives, risk factors, charges, and expenses before investing. This and other information may be found in the fund’s summary and full prospectuses, which may be obtained by calling (855)4-KPFNDS or by visiting the website at www.kp-funds.com. Please read the prospectus carefully before investing.
The KP Retirement Path Funds and the KP Core Funds are mutual funds. They are part of The KP Funds Series Trust, an open-end management investment company that offers shares of diversified portfolios. The funds are advised by Callan Associates Inc., a registered investment advisor. They are administered by SEI Investments Global Funds Services and distributed by SEI investments Distribution Co., which are not affiliated with Callan Associates.
Only participants in the Kaiser Permanente defined contribution plans and 403(b) plans can invest in the funds.
There can be no assurance that a Fund will achieve its stated objectives. An investor may experience losses, at any time, including near, at or after the Fund’s target year. In addition, there is no guarantee that an investor’s investment in the fund will provide any income at or through the years following the Fund’s target year in amounts adequate to meet the investor’s goals or retirement needs.
Investing involves risk including loss of principal. Bond and bond funds are subject to interest rate risk and will decline in value as interest rates rise. Mortgage-backed securities are subject to pre-payment and extension risk and therefore react differently to changes in interest rates than other bonds. Small movements in interest rates may quickly and significantly reduce the value of certain mortgage-backed securities. Non-investment grade bonds involve greater risks of default and are more volatile than investment grade securities, due to the speculative nature of the investment. International investments involve risk of capital loss from unfavorable fluctuation in currency values, from differences in generally accepted accounting principles or from social, economic or political instability in other nations. These risks are heightened when investing in emerging markets or in a single state.
Currency risk is the risk that foreign currencies will decline in value relative to the U.S. dollar or, in the case of hedging positions, that the U.S. dollar will decline in value relative to the currency hedged. In either event, the dollar value of an investment in the Underlying Fund would be adversely affected. The use of leverage by the fund managers may accelerate the velocity of potential losses. Furthermore, the use of derivatives are often more volatile than other investments and magnify the Fund’s gains or losses. Diversification does not protect against market loss.
The performance data quoted represents past performance. Past performance does not guarantee future results. The investment return and principal value of an investment will fluctuate so that an investor’s shares, when redeemed, may be worth less than their original cost and current performance may be lower than the performance quoted. Returns greater than one year are average annual total returns. For performance data current to the most recent month end, please call 855-4-KPFNDS.
3
| | |
| THE KP FUNDS | | December 31, 2016 |
| | |
| MANAGEMENT DISCUSSION AND FUND PERFORMANCE (Unaudited): | | |
Definition of Comparative Indices
The Russell 1000 Index measures the performance of the large-cap segment of the U.S. equity universe. It is a subset of the Russell 3000® Index and includes approximately 1,000 of the largest securities based on a combination of their market cap and current index membership. The Russell 1000 represents approximately 92% of the Russell 3000 Index.
The Russell 2000 Index measures the performance of the small-cap segment of the U.S. equity universe. The Russell 2000 Index is a subset of the Russell 3000® Index representing approximately 8% of the total market capitalization of that index. It includes approximately 2,000 of the smallest securities based on a combination of their market cap and current index membership.
The MSCI ACWI ex-US Index captures large, mid and small cap representation across 22 of 23 Developed Markets countries (excluding the United States) and 23 Emerging Markets countries. With 6,092 constituents, the index covers approximately 99% of the global equity opportunity set outside the US.
The MSCI EAFE Index captures large, mid, small and micro cap representation across 21 Developed Markets countries (excluding Canada and the United States).
The MSCI Emerging Markets Equity Index is a free float-adjusted market capitalization index that is designed to measure equity market performance in the global emerging markets.
The Bloomberg Barclays U.S. Aggregate Bond Index is a broad-based and measures the performance of the U.S. investment grade bond market. It invests in a wide spectrum of public, investment-grade, taxable, fixed income securities in the United States – including government, corporate, and international dollar-denominated bonds, as well as mortgage-backed and asset-backed securities, all with maturities of more than 1 year.
The FTSE NAREIT Composite Index is a headline index that consists of all REITs included in the FTSE NAREIT All REITs Index that also meet the minimum size and liquidity criteria. The FTSE NAREIT Composite Index is free float adjusted.
The S&P 500 Index is based on market capitalizations of 500 large companies having common stock listed on the New York Stock Exchange or NASDAQ.
4
| | |
| THE KP FUNDS | | December 31, 2016 |
| | |
| KP Retirement Path 2015 Fund | | |
| MANAGEMENT DISCUSSION AND FUND PERFORMANCE (Unaudited): | | |
Growth of a $10,000 Investment
| | | | | | | | |
| | | AVERAGE ANNUAL TOTAL RETURNS
FOR THE YEAR ENDED
DECEMBER 31, 2016 | |
| | | 1 Year | | | Annualized Inception
to Date* | |
KP Retirement Path 2015 Fund, Institutional Class | | | 5.24 | % | | | 3.07 | % |
S&P 500 Index | | | 11.96 | % | | | 9.05 | % |
Custom Retirement 2015 Fund Benchmark | | | 5.33 | % | | | 3.14 | % |
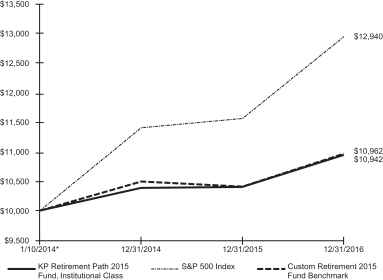
| * | The Fund commenced operations on January 10, 2014. |
The performance data quoted herein represents past performance and the return and value of an investment in the Fund will fluctuate so that, when redeemed, may be worth less than its original cost.
The Fund’s performance assumes the reinvestment of dividends and capital gains. Index returns assume reinvestment of dividends and, unlike a Fund’s returns, do not reflect any fees or expenses. If such fees and expenses were included in the index returns, the performance would have been lower. Please note that one cannot invest directly in an unmanaged index.
There are no assurances that the Fund will meet its stated objectives. The Fund’s holdings and allocations are subject to change because it is actively managed and should not be considered recommendations to buy individual securities.
Returns shown do not reflect the deduction of taxes that a shareholder would pay on Fund distributions or the redemption of Fund shares.
See definition of comparative indices on page 4.
5
| | |
| THE KP FUNDS | | December 31, 2016 |
| | |
| KP Retirement Path 2020 Fund | | |
| MANAGEMENT DISCUSSION AND FUND PERFORMANCE (Unaudited): | | |
Growth of a $10,000 Investment
| | | | | | | | |
| | | AVERAGE ANNUAL TOTAL RETURNS
FOR THE YEAR ENDED
DECEMBER 31, 2016 | |
| | | 1 Year | | | Annualized Inception
to Date* | |
KP Retirement Path 2020 Fund, Institutional Class | | | 5.92 | % | | | 3.26 | % |
S&P 500 Index | | | 11.96 | % | | | 9.05 | % |
Custom Retirement 2020 Fund Benchmark | | | 6.23 | % | | | 3.37 | % |

| * | The Fund commenced operations on January 10, 2014. |
The performance data quoted herein represents past performance and the return and value of an investment in the Fund will fluctuate so that, when redeemed, may be worth less than its original cost.
The Fund’s performance assumes the reinvestment of dividends and capital gains. Index returns assume reinvestment of dividends and, unlike a Fund’s returns, do not reflect any fees or expenses. If such fees and expenses were included in the index returns, the performance would have been lower. Please note that one cannot invest directly in an unmanaged index.
There are no assurances that the Fund will meet its stated objectives. The Fund’s holdings and allocations are subject to change because it is actively managed and should not be considered recommendations to buy individual securities.
Returns shown do not reflect the deduction of taxes that a shareholder would pay on Fund distributions or the redemption of Fund shares.
See definition of comparative indices on page 4.
6
| | |
| THE KP FUNDS | | December 31, 2016 |
| | |
| KP Retirement Path 2025 Fund | | |
| MANAGEMENT DISCUSSION AND FUND PERFORMANCE (Unaudited): | | |
Growth of a $10,000 Investment
| | | | | | | | |
| | | AVERAGE ANNUAL TOTAL RETURNS
FOR THE YEAR ENDED
DECEMBER 31, 2016 | |
| | | 1 Year | | | Annualized Inception
to Date* | |
KP Retirement Path 2025 Fund, Institutional Class | | | 6.64 | % | | | 3.40 | % |
S&P 500 Index | | | 11.96 | % | | | 9.05 | % |
Custom Retirement 2025 Fund Benchmark | | | 7.37 | % | | | 3.60 | % |

| * | The Fund commenced operations on January 10, 2014. |
The performance data quoted herein represents past performance and the return and value of an investment in the Fund will fluctuate so that, when redeemed, may be worth less than its original cost.
The Fund’s performance assumes the reinvestment of dividends and capital gains. Index returns assume reinvestment of dividends and, unlike a Fund’s returns, do not reflect any fees or expenses. If such fees and expenses were included in the index returns, the performance would have been lower. Please note that one cannot invest directly in an unmanaged index.
There are no assurances that the Fund will meet its stated objectives. The Fund’s holdings and allocations are subject to change because it is actively managed and should not be considered recommendations to buy individual securities.
Returns shown do not reflect the deduction of taxes that a shareholder would pay on Fund distributions or the redemption of Fund shares.
See definition of comparative indices on page 4.
7
| | |
| THE KP FUNDS | | December 31, 2016 |
| | |
| KP Retirement Path 2030 Fund | | |
| MANAGEMENT DISCUSSION AND FUND PERFORMANCE (Unaudited): | | |
Growth of a $10,000 Investment
| | | | | | | | |
| | | AVERAGE ANNUAL TOTAL RETURNS
FOR THE YEAR ENDED
DECEMBER 31, 2016 | |
| | | 1 Year | | | Annualized Inception
to Date* | |
KP Retirement Path 2030 Fund, Institutional Class | | | 7.32 | % | | | 3.51 | % |
S&P 500 Index | | | 11.96 | % | | | 9.05 | % |
Custom Retirement 2030 Fund Benchmark | | | 8.55 | % | | | 3.80 | % |

| * | The Fund commenced operations on January 10, 2014. |
The performance data quoted herein represents past performance and the return and value of an investment in the Fund will fluctuate so that, when redeemed, may be worth less than its original cost.
The Fund’s performance assumes the reinvestment of dividends and capital gains. Index returns assume reinvestment of dividends and, unlike a Fund’s returns, do not reflect any fees or expenses. If such fees and expenses were included in the index returns, the performance would have been lower. Please note that one cannot invest directly in an unmanaged index.
There are no assurances that the Fund will meet its stated objectives. The Fund’s holdings and allocations are subject to change because it is actively managed and should not be considered recommendations to buy individual securities.
Returns shown do not reflect the deduction of taxes that a shareholder would pay on Fund distributions or the redemption of Fund shares.
See definition of comparative indices on page 4.
8
| | |
| THE KP FUNDS | | December 31, 2016 |
| | |
| KP Retirement Path 2035 Fund | | |
| MANAGEMENT DISCUSSION AND FUND PERFORMANCE (Unaudited): | | |
Growth of a $10,000 Investment
| | | | | | | | |
| | | AVERAGE ANNUAL TOTAL RETURNS
FOR THE YEAR ENDED
DECEMBER 31, 2016 | |
| | | 1 Year | | | Annualized Inception
to Date* | |
KP Retirement Path 2035 Fund, Institutional Class | | | 7.91 | % | | | 3.66 | % |
S&P 500 Index | | | 11.96 | % | | | 9.05 | % |
Custom Retirement 2035 Fund Index | | | 9.33 | % | | | 4.03 | % |

| * | The Fund commenced operations on January 10, 2014. |
The performance data quoted herein represents past performance and the return and value of an investment in the Fund will fluctuate so that, when redeemed, may be worth less than its original cost.
The Fund’s performance assumes the reinvestment of dividends and capital gains. Index returns assume reinvestment of dividends and, unlike a Fund’s returns, do not reflect any fees or expenses. If such fees and expenses were included in the index returns, the performance would have been lower. Please note that one cannot invest directly in an unmanaged index.
There are no assurances that the Fund will meet its stated objectives. The Fund’s holdings and allocations are subject to change because it is actively managed and should not be considered recommendations to buy individual securities.
Returns shown do not reflect the deduction of taxes that a shareholder would pay on Fund distributions or the redemption of Fund shares.
See definition of comparative indices on page 4.
9
| | |
| THE KP FUNDS | | December 31, 2016 |
| | |
| KP Retirement Path 2040 Fund | | |
| MANAGEMENT DISCUSSION AND FUND PERFORMANCE (Unaudited): | | |
Growth of a $10,000 Investment
| | | | | | | | |
| | | AVERAGE ANNUAL TOTAL RETURNS
FOR THE YEAR ENDED
DECEMBER 31, 2016 | |
| | | 1 Year | | | Annualized Inception
to Date* | |
KP Retirement Path 2040 Fund, Institutional Class | | | 8.14 | % | | | 3.74 | % |
S&P 500 Index | | | 11.96 | % | | | 9.05 | % |
Custom Retirement 2040 Fund Benchmark | | | 9.77 | % | | | 4.14 | % |

| * | The Fund commenced operations on January 10, 2014. |
The performance data quoted herein represents past performance and the return and value of an investment in the Fund will fluctuate so that, when redeemed, may be worth less than its original cost.
The Fund’s performance assumes the reinvestment of dividends and capital gains. Index returns assume reinvestment of dividends and, unlike a Fund’s returns, do not reflect any fees or expenses. If such fees and expenses were included in the index returns, the performance would have been lower. Please note that one cannot invest directly in an unmanaged index.
There are no assurances that the Fund will meet its stated objectives. The Fund’s holdings and allocations are subject to change because it is actively managed and should not be considered recommendations to buy individual securities.
Returns shown do not reflect the deduction of taxes that a shareholder would pay on Fund distributions or the redemption of Fund shares.
See definition of comparative indices on page 4.
10
| | |
| THE KP FUNDS | | December 31, 2016 |
| | |
| KP Retirement Path 2045 Fund | | |
| MANAGEMENT DISCUSSION AND FUND PERFORMANCE (Unaudited): | | |
Growth of a $10,000 Investment
| | | | | | | | |
| | | AVERAGE ANNUAL TOTAL RETURNS
FOR THE YEAR ENDED
DECEMBER 31, 2016 | |
| | | 1 Year | | | Annualized Inception
to Date* | |
KP Retirement Path 2045 Fund, Institutional Class | | | 8.15 | % | | | 3.72 | % |
S&P 500 Index | | | 11.96 | % | | | 9.05 | % |
Custom Retirement 2045 Fund Benchmark | | | 9.97 | % | | | 4.17 | % |

| * | The Fund commenced operations on January 10, 2014. |
The performance data quoted herein represents past performance and the return and value of an investment in the Fund will fluctuate so that, when redeemed, may be worth less than its original cost.
The Fund’s performance assumes the reinvestment of dividends and capital gains. Index returns assume reinvestment of dividends and, unlike a Fund’s returns, do not reflect any fees or expenses. If such fees and expenses were included in the index returns, the performance would have been lower. Please note that one cannot invest directly in an unmanaged index.
There are no assurances that the Fund will meet its stated objectives. The Fund’s holdings and allocations are subject to change because it is actively managed and should not be considered recommendations to buy individual securities.
Returns shown do not reflect the deduction of taxes that a shareholder would pay on Fund distributions or the redemption of Fund shares.
See definition of comparative indices on page 4.
11
| | |
| THE KP FUNDS | | December 31, 2016 |
| | |
| KP Retirement Path 2050 Fund | | |
| MANAGEMENT DISCUSSION AND FUND PERFORMANCE (Unaudited): | | |
Growth of a $10,000 Investment
| | | | | | | | |
| | | AVERAGE ANNUAL TOTAL RETURNS
FOR THE YEAR ENDED
DECEMBER 31, 2016 | |
| | | 1 Year | | | Annualized Inception
to Date* | |
KP Retirement Path 2050 Fund, Institutional Class | | | 8.25 | % | | | 3.74 | % |
S&P 500 Index | | | 11.96 | % | | | 9.05 | % |
Custom Retirement 2050 Fund Benchmark | | | 10.01 | % | | | 4.19 | % |

| * | The Fund commenced operations on January 10, 2014. |
The performance data quoted herein represents past performance and the return and value of an investment in the Fund will fluctuate so that, when redeemed, may be worth less than its original cost.
The Fund’s performance assumes the reinvestment of dividends and capital gains. Index returns assume reinvestment of dividends and, unlike a Fund’s returns, do not reflect any fees or expenses. If such fees and expenses were included in the index returns, the performance would have been lower. Please note that one cannot invest directly in an unmanaged index.
There are no assurances that the Fund will meet its stated objectives. The Fund’s holdings and allocations are subject to change because it is actively managed and should not be considered recommendations to buy individual securities.
Returns shown do not reflect the deduction of taxes that a shareholder would pay on Fund distributions or the redemption of Fund shares.
See definition of comparative indices on page 4.
12
| | |
| THE KP FUNDS | | December 31, 2016 |
| | |
| KP Retirement Path 2055 Fund | | |
| MANAGEMENT DISCUSSION AND FUND PERFORMANCE (Unaudited): | | |
Growth of a $10,000 Investment
| | | | | | | | |
| | | AVERAGE ANNUAL TOTAL RETURNS
FOR THE YEAR ENDED
DECEMBER 31, 2016 | |
| | | 1 Year | | | Annualized Inception
to Date* | |
KP Retirement Path 2055 Fund, Institutional Class | | | 8.28 | % | | | 3.78 | % |
S&P 500 Index | | | 11.96 | % | | | 9.05 | % |
Custom Retirement 2055 Fund Benchmark | | | 10.01 | % | | | 4.19 | % |
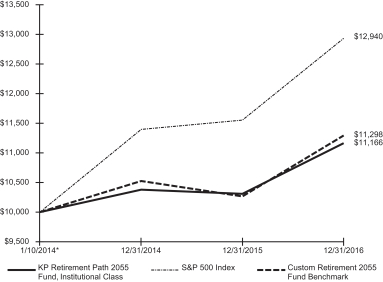
| * | The Fund commenced operations on January 10, 2014. |
The performance data quoted herein represents past performance and the return and value of an investment in the Fund will fluctuate so that, when redeemed, may be worth less than its original cost.
The Fund’s performance assumes the reinvestment of dividends and capital gains. Index returns assume reinvestment of dividends and, unlike a Fund’s returns, do not reflect any fees or expenses. If such fees and expenses were included in the index returns, the performance would have been lower. Please note that one cannot invest directly in an unmanaged index.
There are no assurances that the Fund will meet its stated objectives. The Fund’s holdings and allocations are subject to change because it is actively managed and should not be considered recommendations to buy individual securities.
Returns shown do not reflect the deduction of taxes that a shareholder would pay on Fund distributions or the redemption of Fund shares.
See definition of comparative indices on page 4.
13
| | |
| THE KP FUNDS | | December 31, 2016 |
| | |
| KP Retirement Path 2060 Fund | | |
| MANAGEMENT DISCUSSION AND FUND PERFORMANCE (Unaudited): | | |
Growth of a $10,000 Investment
| | | | | | | | |
| | | AVERAGE ANNUAL TOTAL RETURNS
FOR THE YEAR ENDED
DECEMBER 31, 2016 | |
| | | 1 Year | | | Annualized Inception
to Date* | |
KP Retirement Path 2060 Fund, Institutional Class | | | 8.18 | % | | | 3.81 | % |
S&P 500 Index | | | 11.96 | % | | | 9.05 | % |
Custom Retirement 2060 Fund Benchmark | | | 10.01 | % | | | 4.19 | % |

| * | The Fund commenced operations on January 10, 2014. |
The performance data quoted herein represents past performance and the return and value of an investment in the Fund will fluctuate so that, when redeemed, may be worth less than its original cost.
The Fund’s performance assumes the reinvestment of dividends and capital gains. Index returns assume reinvestment of dividends and, unlike a Fund’s returns, do not reflect any fees or expenses. If such fees and expenses were included in the index returns, the performance would have been lower. Please note that one cannot invest directly in an unmanaged index.
There are no assurances that the Fund will meet its stated objectives. The Fund’s holdings and allocations are subject to change because it is actively managed and should not be considered recommendations to buy individual securities.
Returns shown do not reflect the deduction of taxes that a shareholder would pay on Fund distributions or the redemption of Fund shares.
See definition of comparative indices on page 4.
14
| | |
| THE KP FUNDS | | December 31, 2016 |
| | |
| KP Large Cap Equity Fund | | |
| MANAGEMENT DISCUSSION AND FUND PERFORMANCE (Unaudited): | | |
Growth of a $10,000 Investment
| | | | | | | | |
| | | AVERAGE ANNUAL TOTAL RETURNS
FOR THE YEAR ENDED
DECEMBER 31, 2016 | |
| | | 1 Year | | | Annualized Inception
to Date* | |
KP Large Cap Equity Fund, Institutional Class | | | 10.04 | % | | | 8.07 | % |
Russell 1000 Index | | | 12.05 | % | | | 8.72 | % |
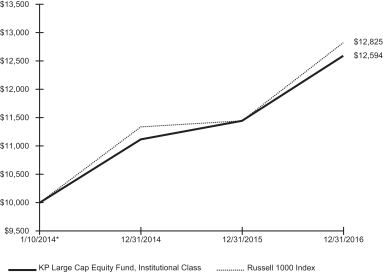
| * | The Fund commenced operations on January 10, 2014. |
The performance data quoted herein represents past performance and the return and value of an investment in the Fund will fluctuate so that, when redeemed, may be worth less than its original cost.
The Fund’s performance assumes the reinvestment of dividends and capital gains. Index returns assume reinvestment of dividends and, unlike a Fund’s returns, do not reflect any fees or expenses. If such fees and expenses were included in the index returns, the performance would have been lower. Please note that one cannot invest directly in an unmanaged index.
There are no assurances that the Fund will meet its stated objectives. The Fund’s holdings and allocations are subject to change because it is actively managed and should not be considered recommendations to buy individual securities.
Returns shown do not reflect the deduction of taxes that a shareholder would pay on Fund distributions or the redemption of Fund shares.
See definition of comparative indices on page 4.
15
| | |
| THE KP FUNDS | | December 31, 2016 |
| | |
| KP Small Cap Equity Fund | | |
| MANAGEMENT DISCUSSION AND FUND PERFORMANCE (Unaudited): | | |
Growth of a $10,000 Investment
| | | | | | | | |
| | | AVERAGE ANNUAL TOTAL RETURNS
FOR THE YEAR ENDED
DECEMBER 31, 2016 | |
| | | 1 Year | | | Annualized Inception
to Date* | |
KP Small Cap Equity Fund, Institutional Class | | | 18.38 | % | | | 5.53 | % |
Russell 2000 Index | | | 21.31 | % | | | 6.77 | % |
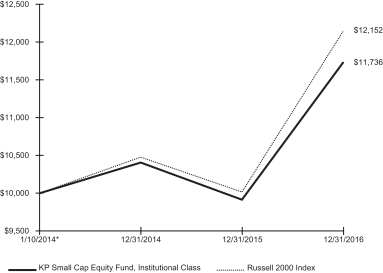
| * | The Fund commenced operations on January 10, 2014. |
The performance data quoted herein represents past performance and the return and value of an investment in the Fund will fluctuate so that, when redeemed, may be worth less than its original cost.
The Fund’s performance assumes the reinvestment of dividends and capital gains. Index returns assume reinvestment of dividends and, unlike a Fund’s returns, do not reflect any fees or expenses. If such fees and expenses were included in the index returns, the performance would have been lower. Please note that one cannot invest directly in an unmanaged index.
There are no assurances that the Fund will meet its stated objectives. The Fund’s holdings and allocations are subject to change because it is actively managed and should not be considered recommendations to buy individual securities.
Returns shown do not reflect the deduction of taxes that a shareholder would pay on Fund distributions or the redemption of Fund shares.
See definition of comparative indices on page 4.
16
| | |
| THE KP FUNDS | | December 31, 2016 |
| | |
| KP International Equity Fund | | |
| MANAGEMENT DISCUSSION AND FUND PERFORMANCE (Unaudited): | | |
Growth of a $10,000 Investment
| | | | | | | | |
| | | AVERAGE ANNUAL TOTAL RETURNS
FOR THE YEAR ENDED
DECEMBER 31, 2016 | |
| | | 1 Year | | | Annualized Inception
to Date* | |
KP International Equity Fund, Institutional Class | | | 3.03 | % | | | -1.26 | % |
MSCI ACWI ex-US Index | | | 4.50 | % | | | -1.46 | % |
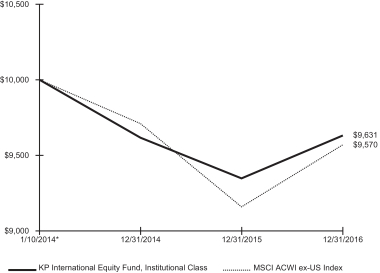
| * | The Fund commenced operations on January 10, 2014. |
The performance data quoted herein represents past performance and the return and value of an investment in the Fund will fluctuate so that, when redeemed, may be worth less than its original cost.
The Fund’s performance assumes the reinvestment of dividends and capital gains. Index returns assume reinvestment of dividends and, unlike a Fund’s returns, do not reflect any fees or expenses. If such fees and expenses were included in the index returns, the performance would have been lower. Please note that one cannot invest directly in an unmanaged index.
There are no assurances that the Fund will meet its stated objectives. The Fund’s holdings and allocations are subject to change because it is actively managed and should not be considered recommendations to buy individual securities.
Returns shown do not reflect the deduction of taxes that a shareholder would pay on Fund distributions or the redemption of Fund shares.
See definition of comparative indices on page 4.
17
| | |
| THE KP FUNDS | | December 31, 2016 |
| | |
| KP Fixed Income Fund | | |
| MANAGEMENT DISCUSSION AND FUND PERFORMANCE (Unaudited): | | |
Growth of a $10,000 Investment
| | | | | | | | |
| | | AVERAGE ANNUAL TOTAL RETURNS
FOR THE YEAR ENDED
DECEMBER 31, 2016 | |
| | | 1 Year | | | Annualized Inception
to Date* | |
KP Fixed Income Fund, Institutional Class | | | 4.08 | % | | | 2.45 | % |
Bloomberg Barclays U.S. Aggregate Bond Index | | | 2.65 | % | | | 2.81 | % |
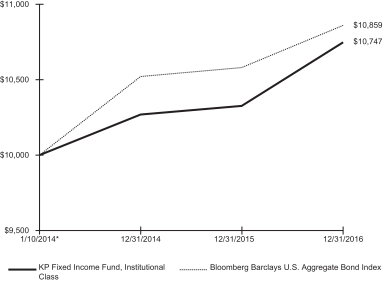
| * | The Fund commenced operations on January 10, 2014. |
The performance data quoted herein represents past performance and the return and value of an investment in the Fund will fluctuate so that, when redeemed, may be worth less than its original cost.
The Fund’s performance assumes the reinvestment of dividends and capital gains. Index returns assume reinvestment of dividends and, unlike a Fund’s returns, do not reflect any fees or expenses. If such fees and expenses were included in the index returns, the performance would have been lower. Please note that one cannot invest directly in an unmanaged index.
There are no assurances that the Fund will meet its stated objectives. The Fund’s holdings and allocations are subject to change because it is actively managed and should not be considered recommendations to buy individual securities.
Returns shown do not reflect the deduction of taxes that a shareholder would pay on Fund distributions or the redemption of Fund shares.
See definition of comparative indices on page 4.
18
| | |
| THE KP FUNDS | | December 31, 2016 |
| | |
| KP Retirement Path 2015 Fund | | |
|
| SECTOR WEIGHTINGS† (unaudited) |
| † | Percentages based on total investments. |
| | | | | | | | |
| Description | | Shares | | | Value
(000) | |
| | | | | | | | |
AFFILIATED REGISTERED INVESTMENT COMPANIES — 60.5% | |
KP Fixed Income Fund | | | 16,214,841 | | | $ | 159,878 | |
KP International Equity Fund | | | 3,047,966 | | | | 27,218 | |
KP Large Cap Equity Fund | | | 7,082,856 | | | | 79,257 | |
KP Small Cap Equity Fund | | | 1,174,846 | | | | 13,182 | |
| | | | | | | | |
Total Affiliated Registered Investment Companies
(Cost $275,051) (000) | | | | 279,535 | |
| | | | | | | | |
UNAFFILIATED REGISTERED INVESTMENT COMPANIES — 39.5% | |
DFA Commodity Strategy Portfolio | | | 756,610 | | | | 4,532 | |
DFA International Real Estate Securities Portfolio | | | 990,626 | | | | 4,656 | |
Lazard Global Listed Infrastructure Portfolio | | | 333,137 | | | | 4,721 | |
T. Rowe Price Institutional Floating Rate Fund | | | 450,337 | | | | 4,539 | |
| | | | | | | | |
| Description | | Shares | | | Value
(000) | |
T. Rowe Price New Era Fund | | | 134,193 | | | $ | 4,517 | |
Vanguard Inflation-Protected Securities Fund | | | 1,344,077 | | | | 13,952 | |
Vanguard REIT Index Fund | | | 545,584 | | | | 9,870 | |
Vanguard Short-Term Bond Index Fund | | | 7,230,717 | | | | 75,416 | |
Vanguard Short-Term Inflation-Protected Securities Index Fund | | | 2,458,350 | | | | 60,598 | |
| | | | | | | | |
Total Unaffiliated Registered Investment Companies
(Cost $181,992) (000) | | | | 182,801 | |
| | | | | | | | |
Total Investments — 100.0% (Cost $457,043) (000) | | | | | | $ | 462,336 | |
| | | | | | | | |
Percentages are based on Net Assets of $462,303 (000).
REIT — Real Estate Investment Trust
As of December 31, 2016, all of the Fund’s investments were considered Level 1 in accordance with the authoritative guidance on fair value measurements and disclosure under U.S. generally accepted accounting principles.
For the year ended December 31, 2016, there were no transfers between Level 1, Level 2 and Level 3 assets and liabilities. All transfers, if any, are recognized by the Fund at the end of the year. During the year ended December 31, 2016, there were no Level 3 investments.
For further financial information on individual registered investment companies, available upon request at no charge, please go to the Securities Exchange Commission’s website at http://www.sec.gov or the individual registered investment company’s website.
The following is a summary of the transactions with affiliates for the year ended December 31, 2016 (000):
| | | | | | | | | | | | | | | | | | | | | | | | | | | | | | | | |
| | | Value
12/31/2015 | | | Purchases
at Cost | | | Proceeds
from Sales | | | Change in
Unrealized
Appreciation
(Depreciation) | | | Realized
Gain | | | Value
12/31/2016 | | | Dividend
Income | | | Capital Gain
Distributions | |
| KP Fixed Income Fund | | $ | 169,178 | | | $ | 43,159 | | | $ | (54,283 | ) | | $ | 474 | | | $ | 1,350 | | | $ | 159,878 | | | $ | 3,587 | | | $ | 1,632 | |
| KP International Equity Fund | | | 28,750 | | | | 3,455 | | | | (5,290 | ) | | | 745 | | | | (442 | ) | | | 27,218 | | | | 527 | | | | 2 | |
| KP Large Cap Equity Fund | | | 80,962 | | | | 11,416 | | | | (17,849 | ) | | | 2,757 | | | | 1,971 | | | | 79,257 | | | | 1,190 | | | | 1,852 | |
| KP Small Cap Equity Fund | | | 13,967 | | | | 1,197 | | | | (4,273 | ) | | | 2,038 | | | | 253 | | | | 13,182 | | | | 93 | | | | 1 | |
The accompanying notes are an integral part of the financial statements.
19
| | |
| THE KP FUNDS | | December 31, 2016 |
| | |
| KP Retirement Path 2020 Fund | | |
|
| SECTOR WEIGHTINGS† (unaudited) |
| † | Percentages based on total investments. |
| | | | | | | | |
| Description | | Shares | | | Value
(000) | |
| | | | | | | | |
AFFILIATED REGISTERED INVESTMENT COMPANIES — 66.7% | |
KP Fixed Income Fund | | | 24,682,990 | | | $ | 243,375 | |
KP International Equity Fund | | | 8,759,334 | | | | 78,221 | |
KP Large Cap Equity Fund | | | 13,469,916 | | | | 150,728 | |
KP Small Cap Equity Fund | | | 3,775,488 | | | | 42,361 | |
| | | | | | | | |
Total Affiliated Registered Investment Companies
(Cost $503,018) (000) | | | | 514,685 | |
| | | | | | | | |
UNAFFILIATED REGISTERED INVESTMENT COMPANIES — 33.3% | |
DFA Commodity Strategy Portfolio | | | 1,278,040 | | | | 7,655 | |
DFA International Real Estate Securities Portfolio | | | 1,672,743 | | | | 7,862 | |
Lazard Global Listed Infrastructure Portfolio | | | 562,213 | | | | 7,967 | |
T. Rowe Price Institutional Floating Rate Fund | | | 760,072 | | | | 7,662 | |
| | | | | | | | |
| Description | | Shares | | | Value
(000) | |
| | | | | | | | |
T. Rowe Price New Era Fund | | | 226,552 | | | $ | 7,626 | |
Vanguard Inflation-Protected Securities Fund | | | 2,213,281 | | | | 22,974 | |
Vanguard REIT Index Fund | | | 897,357 | | | | 16,232 | |
Vanguard Short-Term Bond Index Fund | | | 9,408,784 | | | | 98,134 | |
Vanguard Short-Term Inflation-Protected Securities Index Fund | | | 3,301,063 | | | | 81,371 | |
| | | | | | | | |
Total Unaffiliated Registered Investment Companies
(Cost $256,728) (000) | | | | 257,483 | |
| | | | | | | | |
Total Investments — 100.0% (Cost $759,746) (000) | | | | | | $ | 772,168 | |
| | | | | | | | |
Percentages are based on Net Assets of $772,111 (000).
REIT — Real Estate Investment Trust
As of December 31, 2016, all of the Fund’s investments were considered Level 1 in accordance with the authoritative guidance on fair value measurements and disclosure under U.S. generally accepted accounting principles.
For the year ended December 31, 2016, there were no transfers between Level 1, Level 2 and Level 3 assets and liabilities. All transfers, if any, are recognized by the Fund at the end of the year. During the year ended December 31, 2016, there were no Level 3 investments.
For further financial information on individual registered investment companies, available upon request at no charge, please go to the Securities Exchange Commission’s website at http://www.sec.gov or the individual registered investment company’s website.
The following is a summary of the transactions with affiliates for the year ended December 31, 2016 (000):
| | | | | | | | | | | | | | | | | | | | | | | | | | | | | | | | |
| | | Value
12/31/2015 | | | Purchases
at Cost | | | Proceeds
from Sales | | | Change in
Unrealized
Appreciation
(Depreciation) | | | Realized
Gain | | | Value
12/31/2016 | | | Dividend
Income | | | Capital Gain
Distributions | |
| KP Fixed Income Fund | | $ | 221,728 | | | $ | 62,025 | | | $ | (41,800 | ) | | $ | 300 | | | $ | 1,122 | | | $ | 243,375 | | | $ | 5,462 | | | $ | 2,436 | |
| KP International Equity Fund | | | 77,118 | | | | 10,689 | | | | (10,466 | ) | | | 1,738 | | | | (858 | ) | | | 78,221 | | | | 1,515 | | | | 4 | |
| KP Large Cap Equity Fund | | | 140,979 | | | | 23,016 | | | | (22,091 | ) | | | 6,259 | | | | 2,565 | | | | 150,728 | | | | 2,263 | | | | 3,450 | |
| KP Small Cap Equity Fund | | | 40,717 | | | | 5,279 | | | | (10,865 | ) | | | 6,449 | | | | 781 | | | | 42,361 | | | | 299 | | | | 3 | |
The accompanying notes are an integral part of the financial statements.
20
| | |
| THE KP FUNDS | | December 31, 2016 |
| | |
| KP Retirement Path 2025 Fund | | |
| | |
| SECTOR WEIGHTINGS† (unaudited) |
| † | Percentages based on total investments. |
| | | | | | | | |
| Description | | Shares | | | Value
(000) | |
AFFILIATED REGISTERED INVESTMENT COMPANIES — 74.6% | |
KP Fixed Income Fund | | | 22,269,190 | | | $ | 219,574 | |
KP International Equity Fund | | | 15,826,252 | | | | 141,328 | |
KP Large Cap Equity Fund | | | 17,532,940 | | | | 196,194 | |
KP Small Cap Equity Fund | | | 6,389,394 | | | | 71,689 | |
| | | | | | | | |
Total Affiliated Registered Investment Companies
(Cost $613,106) (000) | | | | 628,785 | |
| | | | | | | | |
UNAFFILIATED REGISTERED INVESTMENT COMPANIES — 25.4% | |
DFA Commodity Strategy Portfolio | | | 1,403,964 | | | | 8,410 | |
DFA International Real Estate Securities Portfolio | | | 1,837,304 | | | | 8,635 | |
Lazard Global Listed Infrastructure Portfolio | | | 617,349 | | | | 8,748 | |
T. Rowe Price Institutional Floating Rate Fund | | | 834,796 | | | | 8,415 | |
| | | | | | | | |
| Description | | Shares | | | Value
(000) | |
T. Rowe Price New Era Fund | | | 248,830 | | | $ | 8,376 | |
Vanguard Inflation-Protected Securities Fund | | | 2,388,264 | | | | 24,790 | |
Vanguard REIT Index Fund | | | 967,758 | | | | 17,506 | |
Vanguard Short-Term Bond Index Fund | | | 6,980,292 | | | | 72,804 | |
Vanguard Short-Term Inflation-Protected Securities Index Fund | | | 2,285,156 | | | | 56,330 | |
| | | | | | | | |
Total Unaffiliated Registered Investment Companies
(Cost $213,652) (000) | | | | 214,014 | |
| | | | | | | | |
Total Investments — 100.0% (Cost $826,758) (000) | | | | | | $ | 842,799 | |
| | | | | | | | |
Percentages are based on Net Assets of $842,733 (000).
REIT — Real Estate Investment Trust
As of December 31, 2016, all of the Fund’s investments were considered Level 1 in accordance with the authoritative guidance on fair value measurements and disclosure under U.S. generally accepted accounting principles.
For the year ended December 31, 2016, there were no transfers between Level 1, Level 2 and Level 3 assets and liabilities. All transfers, if any, are recognized by the Fund at the end of the year. During the year ended December 31, 2016, there were no Level 3 investments.
For further financial information on individual registered investment companies, available upon request at no charge, please go to the Securities Exchange Commission’s website at http://www.sec.gov or the individual registered investment company’s website.
The following is a summary of the transactions with affiliates for the year ended December 31, 2016 (000):
| | | | | | | | | | | | | | | | | | | | | | | | | | | | | | | | |
| | | Value
12/31/2015 | | | Purchases
at Cost | | | Proceeds
from Sales | | | Change in
Unrealized
Appreciation
(Depreciation) | | | Realized
Gain | | | Value
12/31/2016 | | | Dividend
Income | | | Capital Gain
Distributions | |
| KP Fixed Income Fund | | $ | 181,849 | | | $ | 59,047 | | | $ | (21,783 | ) | | $ | (146 | ) | | $ | 607 | | | $ | 219,574 | | | $ | 4,916 | | | $ | 2,187 | |
| KP International Equity Fund | | | 127,484 | | | | 22,587 | | | | (10,258 | ) | | | 2,387 | | | | (872 | ) | | | 141,328 | | | | 2,734 | | | | 4 | |
| KP Large Cap Equity Fund | | | 173,397 | | | | 34,621 | | | | (23,009 | ) | | | 8,435 | | | | 2,750 | | | | 196,194 | | | | 2,942 | | | | 4,446 | |
| KP Small Cap Equity Fund | | | 63,440 | | | | 10,512 | | | | (14,059 | ) | | | 10,708 | | | | 1,088 | | | | 71,689 | | | | 509 | | | | 3 | |
The accompanying notes are an integral part of the financial statements.
21
| | |
| THE KP FUNDS | | December 31, 2016 |
| | |
| KP Retirement Path 2030 Fund | | |
| | |
| SECTOR WEIGHTINGS† (unaudited) |
| † | Percentages based on total investments. |
| | | | | | | | |
| Description | | Shares | | | Value
(000) | |
AFFILIATED REGISTERED INVESTMENT COMPANIES — 83.3% | |
KP Fixed Income Fund | | | 15,736,861 | | | $ | 155,165 | |
KP International Equity Fund | | | 21,299,009 | | | | 190,200 | |
KP Large Cap Equity Fund | | | 18,820,111 | | | | 210,598 | |
KP Small Cap Equity Fund | | | 7,936,998 | | | | 89,053 | |
| | | | | | | | |
Total Affiliated Registered Investment Companies (Cost $627,844) (000) | | | | 645,016 | |
| | | | | | | | |
UNAFFILIATED REGISTERED INVESTMENT COMPANIES — 16.7% | |
DFA Commodity Strategy Portfolio | | | 1,293,764 | | | | 7,750 | |
DFA International Real Estate Securities Portfolio | | | 1,692,858 | | | | 7,956 | |
Lazard Global Listed Infrastructure Portfolio | | | 568,687 | | | | 8,058 | |
T. Rowe Price Institutional Floating Rate Fund | | | 769,270 | | | | 7,754 | |
| | | | | | | | |
| Description | | Shares | | | Value
(000) | |
T. Rowe Price New Era Fund | | | 229,281 | | | $ | 7,718 | |
Vanguard Inflation-Protected Securities Fund | | | 2,173,147 | | | | 22,557 | |
Vanguard REIT Index Fund | | | 880,398 | | | | 15,926 | |
Vanguard Short-Term Bond Index Fund | | | 2,887,031 | | | | 30,112 | |
Vanguard Short-Term Inflation-Protected Securities Index Fund | | | 856,168 | | | | 21,105 | |
| | | | | | | | |
Total Unaffiliated Registered Investment Companies
(Cost $129,042) (000) | | | | 128,936 | |
| | | | | | | | |
Total Investments — 100.0%
(Cost $756,886) (000) | | | $ | 773,952 | |
| | | | | | | | |
Percentages are based on Net Assets of $773,892 (000).
REIT — Real Estate Investment Trust
As of December 31, 2016, all of the Fund’s investments were considered Level 1 in accordance with the authoritative guidance on fair value measurements and disclosure under U.S. generally accepted accounting principles.
For the year ended December 31, 2016, there were no transfers between Level 1, Level 2 and Level 3 assets and liabilities. All transfers, if any, are recognized by the Fund at the end of the year. During the year ended December 31, 2016, there were no Level 3 investments.
For further financial information on individual registered investment companies, available upon request at no charge, please go to the Securities Exchange Commission’s website at http://www.sec.gov or the individual registered investment company’s website.
The following is a summary of the transactions with affiliates for the year ended December 31, 2016 (000):
| | | | | | | | | | | | | | | | | | | | | | | | | | | | | | | | |
| | | Value
12/31/2015 | | | Purchases
at Cost | | | Proceeds
from Sales | | | Change in
Unrealized
Appreciation
(Depreciation) | | | Realized
Gain
(Loss) | | | Value
12/31/2016 | | | Dividend
Income | | | Capital Gain
Distributions | |
| KP Fixed Income Fund | | $ | 123,062 | | | $ | 40,614 | | | $ | (8,602 | ) | | $ | (149 | ) | | $ | 240 | | | $ | 155,165 | | | $ | 3,474 | | | $ | 1,540 | |
| KP International Equity Fund | | | 166,221 | | | | 32,558 | | | | (10,642 | ) | | | 2,931 | | | | (868 | ) | | | 190,200 | | | | 3,679 | | | | 5 | |
| KP Large Cap Equity Fund | | | 179,313 | | | | 39,662 | | | | (20,152 | ) | | | 9,327 | | | | 2,448 | | | | 210,598 | | | | 3,158 | | | | 4,737 | |
| KP Small Cap Equity Fund | | | 75,370 | | | | 14,066 | | | | (14,758 | ) | | | 13,174 | | | | 1,201 | | | | 89,053 | | | | 634 | | | | 3 | |
The accompanying notes are an integral part of the financial statements.
22
| | |
| THE KP FUNDS | | December 31, 2016 |
| | |
| KP Retirement Path 2035 Fund | | |
| | |
| SECTOR WEIGHTINGS† (unaudited) |
| † | Percentages based on total investments. |
| | | | | | | | |
| Description | | Shares | | | Value
(000) | |
AFFILIATED REGISTERED INVESTMENT COMPANIES — 89.8% | |
KP Fixed Income Fund | | | 13,395,753 | | | $ | 132,082 | |
KP International Equity Fund | | | 27,810,752 | | | | 248,350 | |
KP Large Cap Equity Fund | | | 23,555,958 | | | | 263,591 | |
KP Small Cap Equity Fund | | | 10,329,943 | | | | 115,902 | |
| | | | | | | | |
Total Affiliated Registered Investment Companies (Cost $737,541) (000) | | | | 759,925 | |
| | | | | | | | |
UNAFFILIATED REGISTERED INVESTMENT COMPANIES — 10.2% | |
DFA Commodity Strategy Portfolio | | | 1,183,792 | | | | 7,091 | |
DFA International Real Estate Securities Portfolio | | | 1,549,040 | | | | 7,280 | |
Lazard Global Listed Infrastructure Portfolio | | | 520,396 | | | | 7,374 | |
T. Rowe Price Institutional Floating Rate Fund | | | 703,997 | | | | 7,096 | |
| | | | | | | | |
| Description | | Shares | | | Value
(000) | |
T. Rowe Price New Era Fund | | | 209,809 | | | $ | 7,062 | |
Vanguard Inflation-Protected Securities Fund | | | 1,994,998 | | | | 20,709 | |
Vanguard REIT Index Fund | | | 807,949 | | | | 14,617 | |
Vanguard Short-Term Bond Index Fund | | | 1,104,357 | | | | 11,518 | |
Vanguard Short-Term Inflation-Protected Securities Index Fund | | | 133,649 | | | | 3,294 | |
| | | | | | | | |
Total Unaffiliated Registered Investment Companies
(Cost $86,227) (000) | | | | 86,041 | |
| | | | | | | | |
Total Investments — 100.0%
(Cost $823,768) (000) | | | $ | 845,966 | |
| | | | | | | | |
Percentages are based on Net Assets of $845,902 (000).
REIT — Real Estate Investment Trust
As of December 31, 2016, all of the Fund’s investments were considered Level 1 in accordance with the authoritative guidance on fair value measurements and disclosure under U.S. generally accepted accounting principles.
For the year ended December 31, 2016, there were no transfers between Level 1, Level 2 and Level 3 assets and liabilities. All transfers, if any, are recognized by the Fund at the end of the year. During the year ended December 31, 2016 , there were no Level 3 investments.
For further financial information on individual registered investment companies, available upon request at no charge, please go to the Securities Exchange Commission’s website at http://www.sec.gov or the individual registered investment company’s website.
The following is a summary of the transactions with affiliates for the year ended December 31, 2016 (000):
| | | | | | | | | | | | | | | | | | | | | | | | | | | | | | | | |
| | | Value
12/31/2015 | | | Purchases
at Cost | | | Proceeds
from Sales | | | Change in
Unrealized
Appreciation
(Depreciation) | | | Realized
Gain
(Loss) | | | Value
12/31/2016 | | | Dividend
Income | | | Capital Gain
Distributions | |
| KP Fixed Income Fund | | $ | 105,958 | | | $ | 32,742 | | | $ | (6,721 | ) | | $ | (55 | ) | | $ | 158 | | | $ | 132,082 | | | $ | 2,957 | | | $ | 1,312 | |
| KP International Equity Fund | | | 207,592 | | | | 49,619 | | | | (11,372 | ) | | | 3,576 | | | | (1,065 | ) | | | 248,350 | | | | 4,802 | | | | 5 | |
| KP Large Cap Equity Fund | | | 221,641 | | | | 51,398 | | | | (24,004 | ) | | | 11,829 | | | | 2,727 | | | | 263,591 | | | | 3,952 | | | | 5,928 | |
| KP Small Cap Equity Fund | | | 94,783 | | | | 18,965 | | | | (16,222 | ) | | | 17,146 | | | | 1,230 | | | | 115,902 | | | | 828 | | | | 3 | |
The accompanying notes are an integral part of the financial statements.
23
| | |
| THE KP FUNDS | | December 31, 2016 |
| | |
| KP Retirement Path 2040 Fund | | |
|
| SECTOR WEIGHTINGS† (unaudited) |
| † | Percentages based on total investments. |
| | | | | | | | |
| Description | | Shares | | | Value
(000) | |
AFFILIATED REGISTERED INVESTMENT COMPANIES — 93.4% | |
KP Fixed Income Fund | | | 9,004,996 | | | $ | 88,789 | |
KP International Equity Fund | | | 27,799,420 | | | | 248,249 | |
KP Large Cap Equity Fund | | | 23,397,105 | | | | 261,814 | |
KP Small Cap Equity Fund | | | 10,125,391 | | | | 113,607 | |
| | | | | | | | |
Total Affiliated Registered Investment Companies
(Cost $691,018) (000) | | | | 712,459 | |
| | | | | | | | |
UNAFFILIATED REGISTERED INVESTMENT COMPANIES — 6.6% | |
DFA Commodity Strategy Portfolio | | | 813,488 | | | | 4,873 | |
DFA International Real Estate Securities Portfolio | | | 1,064,420 | | | | 5,003 | |
Lazard Global Listed Infrastructure Portfolio | | | 357,571 | | | | 5,067 | |
| | | | | | | | |
| Description | | Shares | | | Value
(000) | |
T. Rowe Price Institutional Floating Rate Fund | | | 483,775 | | | $ | 4,876 | |
T. Rowe Price New Era Fund | | | 144,173 | | | | 4,853 | |
Vanguard Inflation-Protected Securities Fund | | | 1,367,829 | | | | 14,198 | |
Vanguard REIT Index Fund | | | 553,835 | | | | 10,018 | |
Vanguard Short-Term Bond Index Fund | | | 141,952 | | | | 1,481 | |
| | | | | | | | |
Total Unaffiliated Registered Investment Companies
(Cost $50,419) (000) | | | | 50,369 | |
| | | | | | | | |
Total Investments — 100.0%
(Cost $741,437) (000) | | | | | | $ | 762,828 | |
| | | | | | | | |
Percentages are based on Net Assets of $762,771 (000).
REIT — Real Estate Investment Trust
As of December 31, 2016, all of the Fund’s investments were considered Level 1 in accordance with the authoritative guidance on fair value measurements and disclosure under U.S. generally accepted accounting principles.
For the year ended December 31, 2016, there were no transfers between Level 1, Level 2 and Level 3 assets and liabilities. All transfers, if any, are recognized by the Fund at the end of the period. During the year ended December 31, 2016, there were no Level 3 investments.
For further financial information on individual registered investment companies, available upon request at no charge, please go to the Securities Exchange Commission’s website at http://www.sec.gov or the individual registered investment company’s website.
The following is a summary of the transactions with affiliates for the year ended December 31, 2016 (000):
| | | | | | | | | | | | | | | | | | | | | | | | | | | | | | | | |
| | | Value
12/31/2015 | | | Purchases
at Cost | | | Proceeds
from Sales | | | Change in
Unrealized
Appreciation
(Depreciation) | | | Realized
Gain
(Loss) | | | Value
12/31/2016 | | | Dividend
Income | | | Capital Gain
Distributions | |
| KP Fixed Income Fund | | $ | 68,440 | | | $ | 24,571 | | | $ | (4,162 | ) | | $ | (164 | ) | | $ | 104 | | | $ | 88,789 | | | $ | 1,988 | | | $ | 883 | |
| KP International Equity Fund | | | 202,440 | | | | 54,956 | | | | (11,683 | ) | | | 3,587 | | | | (1,051 | ) | | | 248,249 | | | | 4,803 | | | | 5 | |
| KP Large Cap Equity Fund | | | 214,291 | | | | 54,990 | | | | (21,775 | ) | | | 11,860 | | | | 2,448 | | | | 261,814 | | | | 3,926 | | | | 5,868 | |
| KP Small Cap Equity Fund | | | 89,769 | | | | 20,239 | | | | (14,212 | ) | | | 16,735 | | | | 1,076 | | | | 113,607 | | | | 813 | | | | 3 | |
The accompanying notes are an integral part of the financial statements.
24
| | |
| THE KP FUNDS | | December 31, 2016 |
| | |
| KP Retirement Path 2045 Fund | | |
|
| SECTOR WEIGHTINGS† (unaudited) |

| † | Percentages based on total investments. |
| | | | | | | | |
| Description | | Shares | | | Value
(000) | |
| | | | | | | | |
AFFILIATED REGISTERED INVESTMENT COMPANIES — 94.8% | |
KP Fixed Income Fund | | | 4,607,533 | | | $ | 45,430 | |
KP International Equity Fund | | | 20,844,282 | | | | 186,139 | |
KP Large Cap Equity Fund | | | 17,478,130 | | | | 195,581 | |
KP Small Cap Equity Fund | | | 7,204,456 | | | | 80,834 | |
| | | | | | | | |
Total Affiliated Registered Investment Companies
(Cost $493,750) (000) | | | | 507,984 | |
| | | | | | | | |
UNAFFILIATED REGISTERED INVESTMENT COMPANIES — 5.2% | |
DFA Commodity Strategy Portfolio | | | 464,802 | | | | 2,784 | |
DFA International Real Estate Securities Portfolio | | | 608,295 | | | | 2,859 | |
Lazard Global Listed Infrastructure Portfolio | | | 204,326 | | | | 2,895 | |
| | | | | | | | |
| Description | | Shares | | | Value
(000) | |
| | | | | | | | |
T. Rowe Price Institutional Floating Rate Fund | | | 276,379 | | | $ | 2,786 | |
T. Rowe Price New Era Fund | | | 82,369 | | | | 2,773 | |
Vanguard Inflation-Protected Securities Fund | | | 779,286 | | | | 8,089 | |
Vanguard REIT Index Fund | | | 315,471 | | | | 5,707 | |
| | | | | | | | |
Total Unaffiliated Registered Investment Companies
(Cost $27,896) (000) | | | | 27,893 | |
| | | | | | | | |
Total Investments — 100.0% (Cost $521,646) (000) | | | | | | $ | 535,877 | |
| | | | | | | | |
Percentages are based on Net Assets of $535,836 (000).
REIT — Real Estate Investment Trust
As of December 31, 2016, all of the Fund’s investments were considered Level 1 in accordance with the authoritative guidance on fair value measurements and disclosure under U.S. generally accepted accounting principles.
For the year ended December 31, 2016, there were no transfers between Level 1, Level 2 and Level 3 assets and liabilities. All transfers, if any, are recognized by the Fund at the end of the period. During the year ended December 31, 2016, there were no Level 3 investments.
For further financial information on individual registered investment companies, available upon request at no charge, please go to the Securities Exchange Commission’s website at http://www.sec.gov or the individual registered investment company’s website.
The following is a summary of the transactions with affiliates for the year ended December 31, 2016 (000):
| | | | | | | | | | | | | | | | | | | | | | | | | | | | | | | | |
| | | Value
12/31/2015 | | | Purchases
at Cost | | | Proceeds
from Sales | | | Change in
Unrealized
Appreciation
(Depreciation) | | | Realized
Gain
(Loss) | | | Value
12/31/2016 | | | Dividend
Income | | | Capital Gain
Distributions | |
| KP Fixed Income Fund | | $ | 33,738 | | | $ | 14,294 | | | $ | (2,517 | ) | | $ | (145 | ) | | $ | 60 | | | $ | 45,430 | | | $ | 1,018 | | | $ | 451 | |
| KP International Equity Fund | | | 145,354 | | | | 49,376 | | | | (10,431 | ) | | | 2,792 | | | | (952 | ) | | | 186,139 | | | | 3,603 | | | | 5 | |
| KP Large Cap Equity Fund | | | 153,047 | | | | 48,699 | | | | (16,654 | ) | | | 8,668 | | | | 1,821 | | | | 195,581 | | | | 2,935 | | | | 4,364 | |
| KP Small Cap Equity Fund | | | 60,686 | | | | 17,508 | | | | (9,824 | ) | | | 11,765 | | | | 699 | | | | 80,834 | | | | 608 | | | | 2 | |
The accompanying notes are an integral part of the financial statements.
25
| | |
| THE KP FUNDS | | December 31, 2016 |
| | |
| KP Retirement Path 2050 Fund | | |
|
| SECTOR WEIGHTINGS† (unaudited) |

| † | Percentages based on total investments. |
| | | | | | | | |
| Description | | Shares | | | Value
(000) | |
| | | | | | | | |
AFFILIATED REGISTERED INVESTMENT COMPANIES — 95.0% | |
KP Fixed Income Fund | | | 2,060,748 | | | $ | 20,319 | |
KP International Equity Fund | | | 10,135,424 | | | | 90,509 | |
KP Large Cap Equity Fund | | | 8,492,941 | | | | 95,036 | |
KP Small Cap Equity Fund | | | 3,462,738 | | | | 38,852 | |
| | | | | | | | |
Total Affiliated Registered Investment Companies
(Cost $239,279) (000) | | | | 244,716 | |
| | | | | | | | |
UNAFFILIATED REGISTERED INVESTMENT COMPANIES — 5.0% | |
DFA Commodity Strategy Portfolio | | | 216,731 | | | | 1,298 | |
DFA International Real Estate Securities Portfolio | | | 283,547 | | | | 1,333 | |
Lazard Global Listed Infrastructure Portfolio | | | 95,217 | | | | 1,349 | |
| | | | | | | | |
| Description | | Shares | | | Value
(000) | |
| | | | | | | | |
T. Rowe Price Institutional Floating Rate Fund | | | 128,789 | | | $ | 1,298 | |
T. Rowe Price New Era Fund | | | 38,395 | | | | 1,292 | |
Vanguard Inflation-Protected Securities Fund | | | 357,288 | | | | 3,709 | |
Vanguard REIT Index Fund | | | 144,546 | | | | 2,615 | |
| | | | | | | | |
Total Unaffiliated Registered Investment Companies
(Cost $12,736) (000) | | | | 12,894 | |
| | | | | | | | |
Total Investments — 100.0% (Cost $252,015) (000) | | | | | | $ | 257,610 | |
| | | | | | | | |
Percentages are based on Net Assets of $257,588 (000).
REIT — Real Estate Investment Trust
As of December 31, 2016, all of the Fund’s investments were considered Level 1 in accordance with the authoritative guidance on fair value measurements and disclosure under U.S. generally accepted accounting principles.
For the year ended December 31, 2016 , there were no transfers between Level 1, Level 2 and Level 3 assets and liabilities. All transfers, if any, are recognized by the Fund at the end of the period. During the year ended December 31, 2016, there were no Level 3 investments.
For further financial information on individual registered investment companies, available upon request at no charge, please go to the Securities Exchange Commission’s website at http://www.sec.gov or the individual registered investment company’s website.
The following is a summary of the transactions with affiliates for the year ended December 31, 2016 (000):
| | | | | | | | | | | | | | | | | | | | | | | | | | | | | | | | |
| | | Value
12/31/2015 | | | Purchases
at Cost | | | Proceeds
from Sales | | | Change in
Unrealized
Appreciation
(Depreciation) | | | Realized
Gain
(Loss) | | | Value
12/31/2016 | | | Dividend
Income | | | Capital Gain
Distributions | |
| KP Fixed Income Fund | | $ | 14,013 | | | $ | 8,060 | | | $ | (1,686 | ) | | $ | (117 | ) | | $ | 49 | | | $ | 20,319 | | | $ | 455 | | | $ | 201 | |
| KP International Equity Fund | | | 60,493 | | | | 34,391 | | | | (5,277 | ) | | | 1,348 | | | | (446 | ) | | | 90,509 | | | | 1,751 | | | | 2 | |
| KP Large Cap Equity Fund | | | 63,855 | | | | 33,735 | | | | (7,454 | ) | | | 4,074 | | | | 826 | | | | 95,036 | | | | 1,426 | | | | 2,097 | |
| KP Small Cap Equity Fund | | | 25,226 | | | | 12,532 | | | | (4,804 | ) | | | 5,538 | | | | 360 | | | | 38,852 | | | | 281 | | | | 1 | |
The accompanying notes are an integral part of the financial statements.
26
| | |
| THE KP FUNDS | | December 31, 2016 |
| | |
| KP Retirement Path 2055 Fund | | |
|
| SECTOR WEIGHTINGS† (unaudited) |

| † | Percentages based on total investments. |
| | | | | | | | |
| Description | | Shares | | | Value
(000) | |
| | | | | | | | |
AFFILIATED REGISTERED INVESTMENT COMPANIES — 95.0% | |
KP Fixed Income Fund | | | 438,801 | | | $ | 4,327 | |
KP International Equity Fund | | | 2,157,139 | | | | 19,263 | |
KP Large Cap Equity Fund | | | 1,807,341 | | | | 20,224 | |
KP Small Cap Equity Fund | | | 736,673 | | | | 8,265 | |
| | | | | | | | |
Total Affiliated Registered Investment Companies
(Cost $51,094) (000) | | | | 52,079 | |
| | | | | | | | |
UNAFFILIATED REGISTERED INVESTMENT COMPANIES — 5.0% | |
DFA Commodity Strategy Portfolio | | | 47,263 | | | | 283 | |
DFA International Real Estate Securities Portfolio | | | 61,800 | | | | 290 | |
Lazard Global Listed Infrastructure Portfolio | | | 20,741 | | | | 294 | |
| | | | | | | | |
| Description | | Shares | | | Value
(000) | |
T. Rowe Price Institutional Floating Rate Fund | | | 28,063 | | | $ | 283 | |
T. Rowe Price New Era Fund | | | 8,367 | | | | 282 | |
Vanguard Inflation-Protected Securities Fund | | | 74,220 | | | | 770 | |
Vanguard REIT Index Fund | | | 29,978 | | | | 543 | |
| | | | | | | | |
Total Unaffiliated Registered Investment Companies
(Cost $2,734) (000) | | | | | | | 2,745 | |
| | | | | | | | |
Total Investments — 100.0%
(Cost $53,828) (000) | | | | | | $ | 54,824 | |
| | | | | | | | |
Percentages are based on Net Assets of $54,819 (000).
REIT — Real Estate Investment Trust
As of December 31, 2016, all of the Fund’s investments were considered Level 1 in accordance with the authoritative guidance on fair value measurements and disclosure under U.S. generally accepted accounting principles.
For the year ended December 31, 2016, there were no transfers between Level 1, Level 2 and Level 3 assets and liabilities. All transfers, if any, are recognized by the Fund at the end of the period. During the year ended December 31, 2016, there were no Level 3 investments.
For further financial information on individual registered investment companies, available upon request at no charge, please go to the Securities Exchange Commission’s website at http://www.sec.gov or the individual registered investment company’s website.
The following is a summary of the transactions with affiliates for the year ended December 31, 2016 (000):
| | | | | | | | | | | | | | | | | | | | | | | | | | | | | | | | |
| | | Value
12/31/2015 | | | Purchases
at Cost | | | Proceeds
from Sales | | | Change in
Unrealized
Appreciation
(Depreciation) | | | Realized
Gain
(Loss) | | | Value
12/31/2016 | | | Dividend
Income | | | Capital Gain
Distributions | |
| KP Fixed Income Fund | | $ | 2,212 | | | $ | 2,621 | | | $ | (459 | ) | | $ | (50 | ) | | $ | 3 | | | $ | 4,327 | | | $ | 97 | | | $ | 42 | |
| KP International Equity Fund | | | 9,504 | | | | 11,286 | | | | (1,698 | ) | | | 456 | | | | (285 | ) | | | 19,263 | | | | 372 | | | | 1 | |
| KP Large Cap Equity Fund | | | 10,050 | | | | 11,409 | | | | (2,187 | ) | | | 869 | | | | 83 | | | | 20,224 | | | | 302 | | | | 432 | |
| KP Small Cap Equity Fund | | | 3,953 | | | | 4,387 | | | | (1,264 | ) | | | 1,142 | | | | 47 | | | | 8,265 | | | | 62 | | | | — | |
The accompanying notes are an integral part of the financial statements.
27
| | |
| THE KP FUNDS | | December 31, 2016 |
| | |
| KP Retirement Path 2060 Fund | | |
|
| SECTOR WEIGHTINGS† (unaudited) |
| † | Percentages based on total investments. |
| | | | | | | | |
| Description | | Shares | | | Value
(000) | |
AFFILIATED REGISTERED INVESTMENT COMPANIES — 95.0% | |
KP Fixed Income Fund | | | 72,858 | | | $ | 718 | |
KP International Equity Fund | | | 357,991 | | | | 3,197 | |
KP Large Cap Equity Fund | | | 299,937 | | | | 3,356 | |
KP Small Cap Equity Fund | | | 122,154 | | | | 1,371 | |
| | | | | | | | |
Total Affiliated Registered Investment Companies
(Cost $8,346) (000) | | | | | | | 8,642 | |
| | | | | | | | |
UNAFFILIATED REGISTERED INVESTMENT COMPANIES — 5.0% | |
DFA Commodity Strategy Portfolio | | | 8,028 | | | | 48 | |
DFA International Real Estate Securities Portfolio | | | 10,486 | | | | 49 | |
| | | | | | | | |
| Description | | Shares | | | Value
(000) | |
Lazard Global Listed Infrastructure Portfolio | | | 3,519 | | | $ | 50 | |
T. Rowe Price Institutional Floating Rate Fund | | | 4,771 | | | | 48 | |
T. Rowe Price New Era Fund | | | 1,420 | | | | 48 | |
Vanguard Inflation-Protected Securities Fund | | | 12,004 | | | | 125 | |
Vanguard REIT Index Fund | | | 4,856 | | | | 88 | |
| | | | | | | | |
Total Unaffiliated Registered Investment Companies
(Cost $455) (000) | | | | | | | 456 | |
| | | | | | | | |
Total Investments — 100.0%
(Cost $8,801) (000) | | | | | | $ | 9,098 | |
| | | | | | | | |
Percentages are based on Net Assets of $9,097 (000).
REIT — Real Estate Investment Trust
As of December 31, 2016, all of the Fund’s investments were considered Level 1 in accordance with the authoritative guidance on fair value measurements and disclosure under U.S. generally accepted accounting principles.
For the year ended December 31, 2016, there were no transfers between Level 1, Level 2 and Level 3 assets and liabilities. All transfers, if any, are recognized by the Fund at the end of the period. During the year ended December 31, 2016, there were no Level 3 investments.
For further financial information on individual registered investment companies, available upon request at no charge, please go to the Securities Exchange Commission’s website at http://www.sec.gov or the individual registered investment company’s website.
The following is a summary of the transactions with affiliates for the year ended December 31, 2016 (000):
| | | | | | | | | | | | | | | | | | | | | | | | | | | | | | | | |
| | | Value
12/31/2015 | | | Purchases
at Cost | | | Proceeds
from Sales | | | Change in
Unrealized
Appreciation
(Depreciation) | | | Realized
Gain
(Loss) | | | Value
12/31/2016 | | | Dividend
Income | | | Capital Gain
Distributions | |
| KP Fixed Income Fund | | $ | 467 | | | $ | 539 | | | $ | (286 | ) | | $ | (6 | ) | | $ | 4 | | | $ | 718 | | | $ | 16 | | | $ | 7 | |
| KP International Equity Fund | | | 2,017 | | | | 2,328 | | | | (1,180 | ) | | | 151 | | | | (119 | ) | | | 3,197 | | | | 62 | | | | — | |
| KP Large Cap Equity Fund | | | 2,133 | | | | 2,374 | | | | (1,313 | ) | | | 207 | | | | (45 | ) | | | 3,356 | | | | 51 | | | | 73 | |
| KP Small Cap Equity Fund | | | 841 | | | | 923 | | | | (587 | ) | | | 232 | | | | (38 | ) | | | 1,371 | | | | 10 | | | | — | |
The accompanying notes are an integral part of the financial statements.
28
| | |
| THE KP FUNDS | | December 31, 2016 |
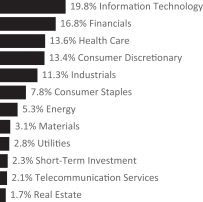
| † | Percentages based on total investments. |
| | | | | | | | |
| Description | | Shares | | | Value
(000) | |
COMMON STOCK — 97.6% | |
Consumer Discretionary — 13.1% | |
Advance Auto Parts | | | 5,301 | | | $ | 897 | |
Amazon.com* | | | 45,544 | | | | 34,152 | |
AMC Networks, Cl A* | | | 24,582 | | | | 1,287 | |
AutoNation* | | | 1,013 | | | | 49 | |
AutoZone* | | | 432 | | | | 341 | |
Bed Bath & Beyond | | | 2,374 | | | | 96 | |
Best Buy | | | 33,344 | | | | 1,423 | |
BorgWarner | | | 3,097 | | | | 122 | |
Brinker International | | | 19,207 | | | | 951 | |
Brunswick | | | 6,161 | | | | 336 | |
CarMax* | | | 2,689 | | | | 173 | |
Carnival | | | 32,251 | | | | 1,679 | |
CBS, Cl B | | | 34,462 | | | | 2,192 | |
Charter Communications, Cl A* | | | 3,300 | | | | 950 | |
Chipotle Mexican Grill, Cl A* | | | 451 | | | | 170 | |
Coach | | | 3,989 | | | | 140 | |
Comcast, Cl A | | | 147,276 | | | | 10,169 | |
Darden Restaurants | | | 7,311 | | | | 532 | |
Delphi Automotive PLC | | | 40,789 | | | | 2,747 | |
Dick’s Sporting Goods | | | 9,362 | | | | 497 | |
Discovery Communications, Cl A* | | | 5,486 | | | | 148 | |
Dollar General | | | 52,314 | | | | 3,875 | |
Dollar Tree* | | | 3,701 | | | | 286 | |
DR Horton | | | 46,253 | | | | 1,264 | |
Expedia | | | 1,880 | | | | 213 | |
Ferrari | | | 29,360 | | | | 1,707 | |
Foot Locker | | | 5,223 | | | | 370 | |
| | | | | | | | |
| Description | | Shares | | | Value
(000) | |
Ford Motor | | | 131,590 | | | $ | 1,596 | |
Fossil Group* | | | 700 | | | | 18 | |
GameStop, Cl A | | | 24,040 | | | | 607 | |
Gap | | | 3,562 | | | | 80 | |
Garmin | | | 1,949 | | | | 95 | |
General Motors | | | 54,097 | | | | 1,885 | |
Genuine Parts | | | 9,074 | | | | 867 | |
GNC Holdings, Cl A | | | 8,556 | | | | 94 | |
Goodyear Tire & Rubber | | | 56,038 | | | | 1,730 | |
H&R Block | | | 3,576 | | | | 82 | |
Hanesbrands | | | 51,698 | | | | 1,115 | |
Harley-Davidson | | | 27,255 | | | | 1,590 | |
Harman International Industries | | | 1,103 | | | | 123 | |
Hasbro | | | 7,896 | | | | 614 | |
Hilton Worldwide Holdings | | | 159,515 | | | | 4,339 | |
Home Depot | | | 72,128 | | | | 9,671 | |
Hyatt Hotels, Cl A* | | | 14,666 | | | | 810 | |
International Game Technology | | | 68,479 | | | | 1,748 | |
Interpublic Group of Companies | | | 76,995 | | | | 1,802 | |
John Wiley & Sons, Cl A | | | 21,941 | | | | 1,196 | |
Johnson Controls International | | | 142,107 | | | | 5,853 | |
Kohl’s | | | 2,551 | | | | 126 | |
L Brands | | | 3,725 | | | | 245 | |
Las Vegas Sands | | | 15,162 | | | | 810 | |
Lear | | | 12,559 | | | | 1,662 | |
Leggett & Platt | | | 2,046 | | | | 100 | |
Lennar, Cl A | | | 2,695 | | | | 116 | |
Liberty Braves Group, Cl A* | | | 572 | | | | 12 | |
Liberty SiriusXM Group, Cl A* | | | 5,727 | | | | 198 | |
Live Nation Entertainment* | | | 12,271 | | | | 326 | |
LKQ* | | | 4,400 | | | | 135 | |
Lowe’s | | | 60,984 | | | | 4,337 | |
Macy’s | | | 21,120 | | | | 756 | |
Marriott International, Cl A | | | 4,834 | | | | 400 | |
Mattel | | | 4,790 | | | | 132 | |
McDonald’s | | | 30,972 | | | | 3,770 | |
MGM Resorts International* | | | 209,318 | | | | 6,035 | |
Michael Kors Holdings* | | | 5,108 | | | | 220 | |
Michaels* | | | 43,117 | | | | 882 | |
Mohawk Industries* | | | 1,001 | | | | 200 | |
Murphy USA* | | | 4,259 | | | | 262 | |
Netflix* | | | 28,366 | | | | 3,512 | |
Newell Brands | | | 17,797 | | | | 795 | |
News, Cl A | | | 8,268 | | | | 96 | |
NIKE, Cl B | | | 20,432 | | | | 1,039 | |
Nordstrom | | | 1,949 | | | | 93 | |
The accompanying notes are an integral part of the financial statements.
29
| | |
| THE KP FUNDS | | December 31, 2016 |
| | | | | | | | |
| Description | | Shares | | | Value
(000) | |
Omnicom Group | | | 71,147 | | | $ | 6,055 | |
O’Reilly Automotive* | | | 7,369 | | | | 2,052 | |
priceline.com* | | | 10,999 | | | | 16,125 | |
PulteGroup | | | 4,802 | | | | 88 | |
PVH | | | 15,761 | | | | 1,422 | |
Ralph Lauren, Cl A | | | 804 | | | | 73 | |
Ross Stores | | | 37,872 | | | | 2,484 | |
Royal Caribbean Cruises | | | 2,400 | | | | 197 | |
Scripps Networks Interactive, Cl A | | | 1,491 | | | | 106 | |
Signet Jewelers | | | 1,100 | | | | 104 | |
Staples | | | 23,452 | | | | 212 | |
Starbucks | | | 81,064 | | | | 4,501 | |
Target | | | 44,310 | | | | 3,201 | |
TEGNA | | | 30,648 | | | | 656 | |
Tesla Motors* | | | 18,650 | | | | 3,985 | |
Tiffany | | | 1,692 | | | | 131 | |
Time Warner | | | 45,909 | | | | 4,432 | |
TJX | | | 26,722 | | | | 2,008 | |
Toll Brothers* | | | 14,663 | | | | 455 | |
TopBuild* | | | 20,706 | | | | 737 | |
Tractor Supply | | | 32,597 | | | | 2,471 | |
TripAdvisor* | | | 1,793 | | | | 83 | |
Tupperware Brands | | | 8,196 | | | | 431 | |
Twenty-First Century Fox, Cl A | | | 27,068 | | | | 753 | |
Ulta Salon Cosmetics & Fragrance* | | | 900 | | | | 229 | |
Under Armour, Cl A* | | | 5,620 | | | | 152 | |
Urban Outfitters* | | | 39,440 | | | | 1,123 | |
Vail Resorts | | | 6,797 | | | | 1,096 | |
VF | | | 5,014 | | | | 268 | |
Viacom, Cl B | | | 4,921 | | | | 173 | |
Walt Disney | | | 58,100 | | | | 6,055 | |
Whirlpool | | | 4,551 | | | | 827 | |
Wyndham Worldwide | | | 5,800 | | | | 443 | |
Wynn Resorts | | | 1,291 | | | | 112 | |
Yum! Brands | | | 23,859 | | | | 1,511 | |
| | | | | | | | |
| | | | | | | 193,691 | |
| | | | | | | | |
Consumer Staples — 7.8% | |
Altria Group | | | 77,807 | | | | 5,261 | |
Archer-Daniels-Midland | | | 120,884 | | | | 5,518 | |
Brown-Forman, Cl B | | | 2,964 | | | | 133 | |
Bunge | | | 11,586 | | | | 837 | |
Campbell Soup | | | 19,044 | | | | 1,152 | |
Church & Dwight | | | 3,700 | | | | 164 | |
Clorox | | | 1,925 | | | | 231 | |
Coca-Cola | | | 126,506 | | | | 5,245 | |
Colgate-Palmolive | | | 13,431 | | | | 879 | |
| | | | | | | | |
| Description | | Shares | | | Value
(000) | |
ConAgra Foods | | | 10,715 | | | $ | 424 | |
Constellation Brands, Cl A | | | 2,662 | | | | 408 | |
Costco Wholesale | | | 18,147 | | | | 2,906 | |
Coty, Cl A | | | 74,042 | | | | 1,356 | |
CVS Health | | | 103,928 | | | | 8,201 | |
Danone | | | 18,626 | | | | 1,180 | |
Diageo PLC | | | 107,759 | | | | 2,802 | |
Dr Pepper Snapple Group | | | 12,943 | | | | 1,174 | |
Energizer Holdings | | | 6,072 | | | | 271 | |
Estee Lauder, Cl A | | | 3,471 | | | | 266 | |
General Mills | | | 82,609 | | | | 5,103 | |
Herbalife* | | | 10,834 | | | | 522 | |
Hershey | | | 2,161 | | | | 224 | |
Hormel Foods | | | 4,370 | | | | 152 | |
Ingredion | | | 11,338 | | | | 1,417 | |
JM Smucker | | | 21,059 | | | | 2,697 | |
Kellogg | | | 3,803 | | | | 280 | |
Kimberly-Clark | | | 8,853 | | | | 1,010 | |
Kraft Heinz | | | 9,139 | | | | 798 | |
Kroger | | | 37,419 | | | | 1,291 | |
McCormick | | | 1,830 | | | | 171 | |
Mead Johnson Nutrition, Cl A | | | 12,880 | | | | 911 | |
Molson Coors Brewing, Cl B | | | 7,632 | | | | 743 | |
Mondelez International, Cl A | | | 23,694 | | | | 1,050 | |
Monster Beverage* | | | 6,320 | | | | 280 | |
Nestle | | | 63,087 | | | | 4,526 | |
Nu Skin Enterprises, Cl A | | | 17,663 | | | | 844 | |
PepsiCo | | | 90,915 | | | | 9,512 | |
Philip Morris International | | | 191,446 | | | | 17,515 | |
Pilgrim’s Pride | | | 45,876 | | | | 871 | |
Procter & Gamble | | | 153,869 | | | | 12,937 | |
Reynolds American | | | 22,063 | | | | 1,236 | |
Rite Aid* | | | 11,397 | | | | 94 | |
Sysco | | | 27,789 | | | | 1,539 | |
Tyson Foods, Cl A | | | 42,919 | | | | 2,647 | |
Walgreens Boots Alliance | | | 15,291 | | | | 1,265 | |
Wal-Mart Stores | | | 110,332 | | | | 7,626 | |
Whole Foods Market | | | 4,549 | | | | 140 | |
| | | | | | | | |
| | | | | | | 115,809 | |
| | | | | | | | |
Energy — 5.3% | |
Anadarko Petroleum | | | 20,056 | | | | 1,399 | |
Apache | | | 20,771 | | | | 1,318 | |
Baker Hughes | | | 12,209 | | | | 793 | |
Cabot Oil & Gas | | | 6,634 | | | | 155 | |
Chesapeake Energy* | | | 12,881 | | | | 90 | |
Chevron | | | 94,384 | | | | 11,109 | |
The accompanying notes are an integral part of the financial statements.
30
| | |
| THE KP FUNDS | | December 31, 2016 |
| | | | | | | | |
| Description | | Shares | | | Value
(000) | |
Cimarex Energy | | | 1,400 | | | $ | 190 | |
Concho Resources* | | | 2,300 | | | | 305 | |
ConocoPhillips | | | 101,317 | | | | 5,080 | |
CONSOL Energy | | | 10,227 | | | | 186 | |
Devon Energy | | | 9,960 | | | | 455 | |
Diamond Offshore Drilling | | | 28,410 | | | | 503 | |
Dril-Quip* | | | 3,929 | | | | 236 | |
Ensco, Cl A | | | 173,533 | | | | 1,687 | |
EOG Resources | | | 43,840 | | | | 4,432 | |
EQT | | | 2,463 | | | | 161 | |
Exxon Mobil | | | 197,558 | | | | 17,832 | |
FMC Technologies* | | | 13,781 | | | | 490 | |
Frank’s International | | | 10,237 | | | | 126 | |
Halliburton | | | 13,279 | | | | 718 | |
Helmerich & Payne | | | 1,687 | | | | 131 | |
Hess | | | 4,096 | | | | 255 | |
HollyFrontier | | | 3,142 | | | | 103 | |
Kinder Morgan | | | 90,508 | | | | 1,874 | |
Marathon Oil | | | 13,314 | | | | 231 | |
Marathon Petroleum | | | 44,413 | | | | 2,236 | |
Murphy Oil | | | 5,454 | | | | 170 | |
Nabors Industries | | | 81,898 | | | | 1,343 | |
National Oilwell Varco | | | 5,946 | | | | 223 | |
Newfield Exploration* | | | 2,837 | | | | 115 | |
Noble Energy | | | 6,726 | | | | 256 | |
Occidental Petroleum | | | 54,730 | | | | 3,898 | |
Oceaneering International | | | 19,803 | | | | 559 | |
ONEOK | | | 3,360 | | | | 193 | |
PBF Energy, Cl A | | | 12,606 | | | | 351 | |
Phillips 66 | | | 22,891 | | | | 1,978 | |
Pioneer Natural Resources | | | 4,295 | | | | 773 | |
QEP Resources | | | 25,544 | | | | 470 | |
Range Resources | | | 3,085 | | | | 106 | |
Rice Energy* | | | 8,770 | | | | 187 | |
Rowan, Cl A | | | 12,450 | | | | 235 | |
Schlumberger | | | 104,806 | | | | 8,799 | |
Southwestern Energy* | | | 95,806 | | | | 1,037 | |
Spectra Energy | | | 19,427 | | | | 798 | |
Superior Energy Services | | | 24,208 | | | | 409 | |
Tesoro | | | 11,915 | | | | 1,042 | |
Transocean | | | 5,391 | | | | 80 | |
Valero Energy | | | 28,636 | | | | 1,956 | |
Williams | | | 35,763 | | | | 1,114 | |
World Fuel Services | | | 10,486 | | | | 481 | |
| | | | | | | | |
| | | | | | | 78,668 | |
| | | | | | | | |
| | | | | | | | |
| Description | | Shares | | | Value
(000) | |
Financials — 16.9% | |
Affiliated Managers Group | | | 800 | | | $ | 116 | |
Aflac | | | 19,797 | | | | 1,378 | |
Allied World Assurance Holdings | | | 24,299 | | | | 1,305 | |
Allstate | | | 27,957 | | | | 2,072 | |
American Express | | | 65,259 | | | | 4,834 | |
American Financial Group | | | 8,523 | | | | 751 | |
American International Group | | | 32,778 | | | | 2,141 | |
American National Insurance | | | 4,116 | | | | 513 | |
Ameriprise Financial | | | 19,067 | | | | 2,115 | |
AmTrust Financial Services | | | 21,546 | | | | 590 | |
Aon PLC | | | 42,757 | | | | 4,769 | |
Arthur J Gallagher | | | 2,500 | | | | 130 | |
Aspen Insurance Holdings | | | 32,465 | | | | 1,786 | |
Assurant | | | 927 | | | | 86 | |
Assured Guaranty | | | 45,735 | | | | 1,727 | |
Axis Capital Holdings | | | 16,561 | | | | 1,081 | |
Bank of America | | | 477,103 | | | | 10,544 | |
Bank of New York Mellon | | | 101,261 | | | | 4,798 | |
BB&T | | | 14,083 | | | | 662 | |
Berkshire Hathaway, Cl B* | | | 58,953 | | | | 9,608 | |
BlackRock, Cl A | | | 8,805 | | | | 3,351 | |
Capital One Financial | | | 34,802 | | | | 3,036 | |
Charles Schwab | | | 18,523 | | | | 731 | |
Chimera Investment‡ | | | 79,811 | | | | 1,358 | |
Chubb | | | 49,134 | | | | 6,492 | |
Cincinnati Financial | | | 2,157 | | | | 163 | |
Citigroup | | | 206,202 | | | | 12,255 | |
Citizens Financial Group | | | 58,882 | | | | 2,098 | |
CME Group, Cl A | | | 22,314 | | | | 2,574 | |
CNA Financial | | | 4,900 | | | | 203 | |
Comerica | | | 5,300 | | | | 361 | |
Cullen | | | 4,025 | | | | 355 | |
Discover Financial Services | | | 44,088 | | | | 3,178 | |
Donnelley Financial Solutions* | | | 3,709 | | | | 85 | |
E*TRADE Financial* | | | 3,901 | | | | 135 | |
Everest Re Group | | | 5,305 | | | | 1,148 | |
Federated Investors, Cl B | | | 30,034 | | | | 849 | |
Fifth Third Bancorp | | | 31,281 | | | | 844 | |
First American Financial | | | 10,749 | | | | 394 | |
First Horizon National | | | 37,840 | | | | 757 | |
First Republic Bank | | | 5,999 | | | | 553 | |
Franklin Resources | | | 51,627 | | | | 2,043 | |
Goldman Sachs Group | | | 37,155 | | | | 8,897 | |
Hanover Insurance Group | | | 16,244 | | | | 1,478 | |
Hartford Financial Services Group | | | 21,919 | | | | 1,044 | |
The accompanying notes are an integral part of the financial statements.
31
| | |
| THE KP FUNDS | | December 31, 2016 |
| | | | | | | | |
| Description | | Shares | | | Value
(000) | |
Huntington Bancshares | | | 17,048 | | | $ | 225 | |
Intercontinental Exchange | | | 83,210 | | | | 4,695 | |
Invesco | | | 15,234 | | | | 462 | |
JPMorgan Chase | | | 311,297 | | | | 26,862 | |
KeyCorp | | | 55,803 | | | | 1,020 | |
Leucadia National | | | 5,247 | | | | 122 | |
Lincoln National | | | 12,027 | | | | 797 | |
Loews | | | 3,933 | | | | 184 | |
M&T Bank | | | 2,324 | | | | 364 | |
Marsh & McLennan | | | 7,801 | | | | 527 | |
MetLife | | | 109,487 | | | | 5,900 | |
Moody’s | | | 20,101 | | | | 1,895 | |
Morgan Stanley | | | 217,836 | | | | 9,204 | |
Morningstar | | | 588 | | | | 43 | |
MSCI, Cl A | | | 7,410 | | | | 584 | |
Nasdaq | | | 53,517 | | | | 3,592 | |
Navient | | | 56,938 | | | | 936 | |
Northern Trust | | | 3,092 | | | | 275 | |
Old Republic International | | | 17,577 | | | | 334 | |
People’s United Financial | | | 4,954 | | | | 96 | |
PNC Financial Services Group | | | 67,279 | | | | 7,869 | |
Popular | | | 46,481 | | | | 2,037 | |
Principal Financial Group | | | 25,935 | | | | 1,501 | |
Progressive | | | 9,062 | | | | 322 | |
Prudential Financial | | | 38,121 | | | | 3,967 | |
Regions Financial | | | 54,069 | | | | 776 | |
Reinsurance Group of America, Cl A | | | 1,639 | | | | 206 | |
S&P Global | | | 26,736 | | | | 2,875 | |
State Street | | | 89,303 | | | | 6,941 | |
SunTrust Banks | | | 101,070 | | | | 5,544 | |
Synchrony Financial | | | 47,403 | | | | 1,719 | |
Synovus Financial | | | 43,325 | | | | 1,780 | |
T Rowe Price Group | | | 3,555 | | | | 268 | |
TCF Financial | | | 43,821 | | | | 858 | |
TD Ameritrade Holding | | | 98,471 | | | | 4,293 | |
Thomson Reuters | | | 42,532 | | | | 1,862 | |
Torchmark | | | 1,687 | | | | 124 | |
Travelers | | | 70,305 | | | | 8,607 | |
Unum Group | | | 27,169 | | | | 1,194 | |
US Bancorp | | | 180,234 | | | | 9,259 | |
Validus Holdings | | | 9,472 | | | | 521 | |
Voya Financial | | | 25,590 | | | | 1,004 | |
Wells Fargo | | | 331,264 | | | | 18,256 | |
Western Alliance Bancorp* | | | 23,750 | | | | 1,157 | |
Willis Towers Watson | | | 1,849 | | | | 226 | |
WR Berkley | | | 23,371 | | | | 1,554 | |
| | | | | | | | |
| Description | | Shares | | | Value
(000) | |
XL Group | | | 3,893 | | | $ | 145 | |
Zions Bancorporation | | | 13,402 | | | | 577 | |
| | | | | | | | |
| | | | | | | 248,947 | |
| | | | | | | | |
Health Care — 13.7% | |
Abbott Laboratories | | | 133,120 | | | | 5,113 | |
AbbVie | | | 24,873 | | | | 1,558 | |
Aetna | | | 45,365 | | | | 5,626 | |
Agilent Technologies | | | 33,632 | | | | 1,532 | |
Alexion Pharmaceuticals* | | | 35,181 | | | | 4,304 | |
Allergan | | | 26,984 | | | | 5,667 | |
Allscripts Healthcare Solutions* | | | 27,247 | | | | 278 | |
AmerisourceBergen, Cl A | | | 9,212 | | | | 720 | |
Amgen | | | 24,645 | | | | 3,603 | |
Anthem | | | 28,893 | | | | 4,154 | |
Baxter International | | | 73,282 | | | | 3,249 | |
Becton Dickinson & Company | | | 9,691 | | | | 1,604 | |
Biogen* | | | 15,579 | | | | 4,418 | |
Boston Scientific* | | | 27,482 | | | | 594 | |
Bristol-Myers Squibb | | | 95,575 | | | | 5,585 | |
Bruker | | | 45,317 | | | | 960 | |
Cardinal Health | | | 32,744 | | | | 2,357 | |
Celgene* | | | 30,767 | | | | 3,561 | |
Centene* | | | 36,300 | | | | 2,051 | |
Cerner* | | | 4,715 | | | | 223 | |
Charles River Laboratories International* | | | 8,137 | | | | 620 | |
Cigna | | | 35,222 | | | | 4,698 | |
Cooper | | | 800 | | | | 140 | |
CR Bard | | | 8,150 | | | | 1,831 | |
Danaher | | | 123,340 | | | | 9,601 | |
DaVita* | | | 2,248 | | | | 144 | |
Dentsply Sirona | | | 11,486 | | | | 663 | |
Edwards Lifesciences* | | | 3,282 | | | | 308 | |
Eli Lilly | | | 14,655 | | | | 1,078 | |
Endo International* | | | 3,200 | | | | 53 | |
Envision Healthcare* | | | 1,666 | | | | 106 | |
Express Scripts Holding* | | | 54,098 | | | | 3,721 | |
Gilead Sciences | | | 54,936 | | | | 3,934 | |
HCA Holdings* | | | 4,500 | | | | 333 | |
Henry Schein* | | | 1,200 | | | | 182 | |
Hologic* | | | 38,592 | | | | 1,548 | |
Humana | | | 23,741 | | | | 4,844 | |
Illumina* | | | 7,313 | | | | 936 | |
Incyte* | | | 7,100 | | | | 712 | |
Intuitive Surgical* | | | 9,704 | | | | 6,154 | |
Johnson & Johnson | | | 203,050 | | | | 23,393 | |
The accompanying notes are an integral part of the financial statements.
32
| | |
| THE KP FUNDS | | December 31, 2016 |
| | | | | | | | |
| Description | | Shares | | | Value
(000) | |
Laboratory Corp of America Holdings* | | | 1,652 | | | $ | 212 | |
LifePoint Health* | | | 7,857 | | | | 446 | |
Mallinckrodt* | | | 3,508 | | | | 175 | |
McKesson | | | 30,250 | | | | 4,249 | |
Medtronic | | | 118,539 | | | | 8,444 | |
Merck | | | 209,595 | | | | 12,339 | |
Mettler-Toledo International* | | | 1,992 | | | | 834 | |
Mylan* | | | 7,167 | | | | 273 | |
Novartis | | | 9,078 | | | | 661 | |
Patterson | | | 1,145 | | | | 47 | |
PerkinElmer | | | 1,596 | | | | 83 | |
Perrigo | | | 2,032 | | | | 169 | |
Pfizer | | | 404,311 | | | | 13,131 | |
Quest Diagnostics | | | 2,154 | | | | 198 | |
Regeneron Pharmaceuticals* | | | 1,129 | | | | 415 | |
ResMed | | | 20,904 | | | | 1,297 | |
Roche Holding | | | 3,650 | | | | 834 | |
St. Jude Medical | | | 43,206 | | | | 3,465 | |
Stryker | | | 33,384 | | | | 4,000 | |
Teleflex | | | 3,240 | | | | 522 | |
Thermo Fisher Scientific | | | 26,665 | | | | 3,762 | |
UnitedHealth Group | | | 85,897 | | | | 13,747 | |
Universal Health Services, Cl B | | | 9,623 | | | | 1,024 | |
Varian Medical Systems* | | | 12,634 | | | | 1,134 | |
Vertex Pharmaceuticals* | | | 36,708 | | | | 2,704 | |
VWR* | | | 17,441 | | | | 437 | |
Waters* | | | 7,308 | | | | 982 | |
WellCare Health Plans* | | | 24,430 | | | | 3,349 | |
Zimmer Biomet Holdings | | | 3,098 | | | | 320 | |
Zoetis, Cl A | | | 7,472 | | | | 400 | |
| | | | | | | | |
| | | | | | | 201,809 | |
| | | | | | | | |
Industrials — 11.3% | |
3M | | | 62,296 | | | | 11,124 | |
Acuity Brands | | | 700 | | | | 162 | |
AECOM* | | | 14,602 | | | | 531 | |
Alaska Air Group | | | 73,391 | | | | 6,512 | |
Allegion | | | 1,456 | | | | 93 | |
Allison Transmission Holdings | | | 22,214 | | | | 748 | |
American Airlines Group | | | 138,950 | | | | 6,488 | |
AMETEK | | | 3,327 | | | | 162 | |
Arconic | | | 6,955 | | | | 129 | |
Boeing | | | 86,614 | | | | 13,484 | |
BWX Technologies, Cl W | | | 19,006 | | | | 755 | |
Canadian National Railway | | | 21,122 | | | | 1,424 | |
Carlisle | | | 12,792 | | | | 1,411 | |
Caterpillar | | | 8,788 | | | | 815 | |
| | | | | | | | |
| Description | | Shares | | | Value
(000) | |
CH Robinson Worldwide | | | 2,064 | | | $ | 151 | |
Chicago Bridge & Iron | | | 30,886 | | | | 981 | |
Cintas | | | 1,376 | | | | 159 | |
Copa Holdings, Cl A | | | 1,733 | | | | 157 | |
Crane | | | 9,308 | | | | 671 | |
CSX | | | 63,808 | | | | 2,293 | |
Cummins | | | 14,255 | | | | 1,948 | |
Deere | | | 4,367 | | | | 450 | |
Delta Air Lines | | | 55,462 | | | | 2,728 | |
Dover | | | 2,197 | | | | 165 | |
Dun & Bradstreet | | | 6,439 | | | | 781 | |
Eaton PLC | | | 45,961 | | | | 3,084 | |
Emerson Electric | | | 15,039 | | | | 838 | |
Equifax | | | 10,598 | | | | 1,253 | |
Expeditors International of Washington | | | 2,558 | | | | 135 | |
Fastenal | | | 4,576 | | | | 215 | |
FedEx | | | 23,166 | | | | 4,314 | |
Flowserve | | | 1,943 | | | | 93 | |
Fluor | | | 1,985 | | | | 104 | |
Fortive | | | 53,117 | | | | 2,849 | |
Fortune Brands Home & Security | | | 2,200 | | | | 118 | |
General Dynamics | | | 5,143 | | | | 888 | |
General Electric | | | 233,568 | | | | 7,381 | |
HD Supply Holdings* | | | 7,050 | | | | 300 | |
Hertz Global Holdings* | | | 3,773 | | | | 81 | |
Honeywell International | | | 64,684 | | | | 7,494 | |
Huntington Ingalls Industries | | | 21,497 | | | | 3,960 | |
Illinois Tool Works | | | 26,016 | | | | 3,186 | |
Ingersoll-Rand | | | 52,008 | | | | 3,903 | |
ITT | | | 2,331 | | | | 90 | |
Jacobs Engineering Group | | | 16,184 | | | | 922 | |
JB Hunt Transport Services | | | 1,200 | | | | 116 | |
JetBlue Airways* | | | 44,389 | | | | 995 | |
Kansas City Southern | | | 10,415 | | | | 884 | |
L-3 Communications Holdings, Cl 3 | | | 15,646 | | | | 2,380 | |
Lockheed Martin | | | 17,417 | | | | 4,353 | |
LSC Communications | | | 24,410 | | | | 724 | |
ManpowerGroup | | | 5,687 | | | | 505 | |
Masco | | | 27,455 | | | | 868 | |
MSC Industrial Direct, Cl A | | | 13,194 | | | | 1,219 | |
Nielsen Holdings | | | 4,800 | | | | 201 | |
Norfolk Southern | | | 19,260 | | | | 2,081 | |
Northrop Grumman | | | 28,864 | | | | 6,713 | |
Oshkosh | | | 13,841 | | | | 894 | |
Owens Corning | | | 17,302 | | | | 892 | |
PACCAR | | | 11,044 | | | | 706 | |
The accompanying notes are an integral part of the financial statements.
33
| | |
| THE KP FUNDS | | December 31, 2016 |
| | | | | | | | |
| Description | | Shares | | | Value
(000) | |
Parker-Hannifin | | | 15,280 | | | $ | 2,139 | |
Pentair PLC | | | 22,737 | | | | 1,275 | |
Pitney Bowes | | | 8,297 | | | | 126 | |
Quanta Services* | | | 55,497 | | | | 1,934 | |
Raytheon | | | 16,674 | | | | 2,368 | |
Regal Beloit | | | 14,904 | | | | 1,032 | |
Republic Services, Cl A | | | 19,999 | | | | 1,141 | |
Robert Half International | | | 2,142 | | | | 104 | |
Rockwell Automation | | | 7,272 | | | | 977 | |
Rockwell Collins | | | 2,036 | | | | 189 | |
Roper Technologies | | | 1,473 | | | | 270 | |
RR Donnelley & Sons | | | 40,456 | | | | 660 | |
Ryder System | | | 1,765 | | | | 131 | |
Snap-on | | | 929 | | | | 159 | |
Southwest Airlines | | | 17,935 | | | | 894 | |
Spirit AeroSystems Holdings, Cl A | | | 54,336 | | | | 3,171 | |
Stanley Black & Decker | | | 19,199 | | | | 2,202 | |
Stericycle* | | | 1,321 | | | | 102 | |
Textron | | | 41,357 | | | | 2,008 | |
Timken | | | 22,903 | | | | 909 | |
TransDigm Group | | | 800 | | | | 199 | |
Trinity Industries | | | 13,462 | | | | 374 | |
Union Pacific | | | 51,443 | | | | 5,334 | |
United Continental Holdings* | | | 35,852 | | | | 2,613 | |
United Parcel Service, Cl B | | | 58,022 | | | | 6,652 | |
United Rentals* | | | 10,232 | | | | 1,080 | |
United Technologies | | | 61,895 | | | | 6,785 | |
Valmont Industries | | | 2,272 | | | | 320 | |
Verisk Analytics, Cl A* | | | 2,500 | | | | 203 | |
Waste Management | | | 14,719 | | | | 1,044 | |
WESCO International* | | | 9,561 | | | | 636 | |
WW Grainger | | | 865 | | | | 201 | |
Xylem | | | 2,922 | | | | 145 | |
| | | | | | | | |
| | | | | | | 166,438 | |
| | | | | | | | |
Information Technology — 19.8% | |
Accenture PLC, Cl A | | | 87,076 | | | | 10,199 | |
Activision Blizzard | | | 17,856 | | | | 645 | |
Adobe Systems* | | | 12,592 | | | | 1,296 | |
Akamai Technologies* | | | 12,758 | | | | 851 | |
Alibaba Group Holding ADR* | | | 40,100 | | | | 3,521 | |
Alliance Data Systems | | | 880 | | | | 201 | |
Alphabet, Cl C* | | | 46,650 | | | | 36,557 | |
Amdocs | | | 30,652 | | | | 1,786 | |
Amphenol, Cl A | | | 4,752 | | | | 319 | |
Analog Devices | | | 4,642 | | | | 337 | |
Apple | | | 255,538 | | | | 29,596 | |
| | | | | | | | |
| Description | | Shares | | | Value
(000) | |
Applied Materials | | | 124,220 | | | $ | 4,009 | |
Arrow Electronics* | | | 17,658 | | | | 1,259 | |
ASML Holding, Cl G | | | 33,800 | | | | 3,792 | |
Autodesk* | | | 2,808 | | | | 208 | |
Automatic Data Processing | | | 6,968 | | | | 716 | |
Avnet | | | 9,925 | | | | 473 | |
Broadcom, Cl A | | | 6,132 | | | | 1,084 | |
Brocade Communications Systems | | | 5,336 | | | | 67 | |
CA | | | 49,248 | | | | 1,565 | |
Cadence Design Systems* | | | 21,107 | | | | 532 | |
CDW | | | 10,585 | | | | 551 | |
Cisco Systems | | | 248,272 | | | | 7,503 | |
Citrix Systems* | | | 22,019 | | | | 1,967 | |
Cognizant Technology Solutions, Cl A* | | | 38,815 | | | | 2,175 | |
CommScope Holding* | | | 28,300 | | | | 1,053 | |
CoreLogic* | | | 24,063 | | | | 886 | |
Corning | | | 22,351 | | | | 542 | |
CSRA | | | 2,557 | | | | 81 | |
Dell Technologies — VMware Inc, Cl V* | | | 16,588 | | | | 912 | |
Dolby Laboratories, Cl A | | | 11,532 | | | | 521 | |
DST Systems | | | 7,908 | | | | 847 | |
eBay* | | | 72,095 | | | | 2,141 | |
Electronic Arts* | | | 4,578 | | | | 361 | |
F5 Networks* | | | 16,667 | | | | 2,412 | |
Facebook, Cl A* | | | 205,410 | | | | 23,632 | |
Fidelity National Information Services | | | 38,687 | | | | 2,926 | |
First Solar* | | | 1,023 | | | | 33 | |
Fiserv* | | | 26,364 | | | | 2,802 | |
FLIR Systems | | | 1,947 | | | | 71 | |
Genpact* | | | 19,836 | | | | 483 | |
Global Payments | | | 13,282 | | | | 922 | |
Harris | | | 1,786 | | | | 183 | |
Hewlett Packard Enterprise | | | 87,157 | | | | 2,017 | |
HP | | | 119,590 | | | | 1,775 | |
IAC | | | 3,309 | | | | 214 | |
Intel | | | 203,895 | | | | 7,395 | |
International Business Machines | | | 42,831 | | | | 7,110 | |
Intuit | | | 24,145 | | | | 2,767 | |
Jabil Circuit | | | 26,040 | | | | 616 | |
Juniper Networks | | | 43,831 | | | | 1,239 | |
KLA-Tencor | | | 27,283 | | | | 2,147 | |
Lam Research | | | 2,529 | | | | 267 | |
Linear Technology | | | 3,808 | | | | 237 | |
Marvell Technology Group | | | 24,785 | | | | 344 | |
MasterCard, Cl A | | | 14,538 | | | | 1,501 | |
The accompanying notes are an integral part of the financial statements.
34
| | |
| THE KP FUNDS | | December 31, 2016 |
| | | | | | | | |
| Description | | Shares | | | Value
(000) | |
Maxim Integrated Products | | | 19,192 | | | $ | 740 | |
Microchip Technology | | | 3,446 | | | | 221 | |
Micron Technology* | | | 55,031 | | | | 1,206 | |
Microsoft | | | 523,746 | | | | 32,546 | |
Motorola Solutions | | | 2,385 | | | | 198 | |
NCR* | | | 22,163 | | | | 899 | |
NetApp | | | 4,394 | | | | 155 | |
Nuance Communications* | | | 24,207 | | | | 361 | |
NVIDIA | | | 22,599 | | | | 2,412 | |
NXP Semiconductors* | | | 53,510 | | | | 5,245 | |
Oracle | | | 123,461 | | | | 4,747 | |
Palo Alto Networks* | | | 6,200 | | | | 775 | |
Paychex | | | 4,867 | | | | 296 | |
PayPal Holdings* | | | 167,531 | | | | 6,612 | |
Qorvo* | | | 1,800 | | | | 95 | |
QUALCOMM | | | 74,033 | | | | 4,827 | |
Red Hat* | | | 52,128 | | | | 3,633 | |
salesforce.com* | | | 95,587 | | | | 6,544 | |
Seagate Technology | | | 4,269 | | | | 163 | |
ServiceNow* | | | 44,195 | | | | 3,285 | |
Skyworks Solutions | | | 2,700 | | | | 202 | |
Symantec | | | 9,437 | | | | 225 | |
Synopsys* | | | 15,641 | | | | 921 | |
TE Connectivity | | | 5,415 | | | | 375 | |
Tencent Holdings ADR | | | 115,500 | | | | 2,797 | |
Teradata* | | | 47,809 | | | | 1,299 | |
Teradyne | | | 60,274 | | | | 1,531 | |
Texas Instruments | | | 109,906 | | | | 8,020 | |
Total System Services | | | 12,617 | | | | 619 | |
Vantiv, Cl A* | | | 9,785 | | | | 583 | |
VeriSign* | | | 1,457 | | | | 111 | |
Versum Materials* | | | 27,577 | | | | 774 | |
Viavi Solutions* | | | 70,196 | | | | 574 | |
Visa, Cl A | | | 169,535 | | | | 13,226 | |
VMware, Cl A* | | | 13,293 | | | | 1,047 | |
Western Digital | | | 4,401 | | | | 299 | |
Western Union | | | 33,779 | | | | 734 | |
Workday, Cl A* | | | 22,500 | | | | 1,487 | |
Xerox | | | 210,877 | | | | 1,841 | |
Xilinx | | | 3,980 | | | | 240 | |
Yahoo!* | | | 13,145 | | | | 508 | |
Zynga, Cl A* | | | 140,401 | | | | 361 | |
| | | | | | | | |
| | | | | | | 292,380 | |
| | | | | | | | |
Materials — 3.1% | |
AdvanSix* | | | 23,242 | | | | 515 | |
Air Products & Chemicals | | | 3,268 | | | | 470 | |
| | | | | | | | |
| Description | | Shares | | | Value
(000) | |
Albemarle | | | 1,800 | | | $ | 155 | |
Ashland Global Holdings | | | 2,251 | | | | 246 | |
Avery Dennison | | | 3,540 | | | | 249 | |
Ball | | | 2,652 | | | | 199 | |
Cabot | | | 42,206 | | | | 2,133 | |
Celanese, Cl A | | | 10,431 | | | | 821 | |
CF Industries Holdings | | | 3,550 | | | | 112 | |
Crown Holdings* | | | 58,999 | | | | 3,102 | |
Dow Chemical | | | 79,711 | | | | 4,561 | |
Eastman Chemical | | | 16,134 | | | | 1,213 | |
Ecolab | | | 4,009 | | | | 470 | |
EI du Pont de Nemours | | | 53,592 | | | | 3,934 | |
FMC | | | 2,132 | | | | 121 | |
Freeport-McMoRan* | | | 19,048 | | | | 251 | |
Graphic Packaging Holding | | | 62,789 | | | | 784 | |
Huntsman | | | 79,028 | | | | 1,508 | |
International Flavors & Fragrances | | | 1,242 | | | | 146 | |
International Paper | | | 30,150 | | | | 1,600 | |
LyondellBasell Industries, Cl A | | | 45,588 | | | | 3,910 | |
Martin Marietta Materials | | | 1,000 | | | | 221 | |
Monsanto | | | 22,350 | | | | 2,351 | |
Mosaic | | | 4,981 | | | | 146 | |
Newmont Mining | | | 42,570 | | | | 1,450 | |
Nucor | | | 26,931 | | | | 1,603 | |
PPG Industries | | | 62,314 | | | | 5,905 | |
Praxair | | | 4,314 | | | | 505 | |
Reliance Steel & Aluminum | | | 19,110 | | | | 1,520 | |
Sealed Air | | | 2,742 | | | | 124 | |
Sherwin-Williams | | | 7,839 | | | | 2,107 | |
Steel Dynamics | | | 29,668 | | | | 1,056 | |
Vulcan Materials | | | 20,127 | | | | 2,519 | |
WestRock | | | 3,978 | | | | 202 | |
| | | | | | | | |
| | | | | | | 46,209 | |
| | | | | | | | |
Real Estate — 1.7% | | | | | | | | |
American Tower, Cl A‡ | | | 7,899 | | | | 835 | |
Apartment Investment & Management, Cl A‡ | | | 24,256 | | | | 1,102 | |
AvalonBay Communities‡ | | | 2,112 | | | | 374 | |
Boston Properties‡ | | | 7,735 | | | | 973 | |
Brixmor Property Group‡ | | | 15,927 | | | | 389 | |
Camden Property Trust‡ | | | 1,489 | | | | 125 | |
CBRE Group, Cl A* | | | 17,745 | | | | 559 | |
Columbia Property Trust‡ | | | 9,578 | | | | 207 | |
Corporate Office Properties Trust‡ | | | 3,064 | | | | 96 | |
Crown Castle International | | | 24,782 | | | | 2,150 | |
DDR‡ | | | 5,649 | | | | 86 | |
The accompanying notes are an integral part of the financial statements.
35
| | |
| THE KP FUNDS | | December 31, 2016 |
| | | | | | | | |
| Description | | Shares | | | Value
(000) | |
Digital Realty Trust‡ | | | 2,300 | | | $ | 226 | |
Duke Realty‡ | | | 35,979 | | | | 956 | |
Equinix‡ | | | 1,094 | | | | 391 | |
Equity LifeStyle Properties | | | 18,342 | | | | 1,322 | |
Equity Residential‡ | | | 16,633 | | | | 1,071 | |
Essex Property Trust‡ | | | 1,032 | | | | 240 | |
Extra Space Storage‡ | | | 1,800 | | | | 139 | |
Federal Realty Investment Trust‡ | | | 1,100 | | | | 156 | |
General Growth Properties‡ | | | 62,925 | | | | 1,572 | |
HCP‡ | | | 6,695 | | | | 199 | |
Host Hotels & Resorts‡ | | | 10,618 | | | | 200 | |
Iron Mountain‡ | | | 3,886 | | | | 126 | |
Kilroy Realty‡ | | | 13,649 | | | | 999 | |
Kimco Realty‡ | | | 27,841 | | | | 700 | |
Lamar Advertising, Cl A | | | 1,193 | | | | 80 | |
Life Storage‡ | | | 5,946 | | | | 507 | |
Macerich‡ | | | 1,845 | | | | 131 | |
Mid-America Apartment Communities‡ | | | 18,688 | | | | 1,830 | |
Outfront Media‡ | | | 31,969 | | | | 795 | |
Prologis‡ | | | 26,741 | | | | 1,412 | |
Public Storage‡ | | | 2,298 | | | | 514 | |
Realty Income‡ | | | 18,644 | | | | 1,072 | |
Retail Properties of America, Cl A‡ | | | 12,691 | | | | 195 | |
Simon Property Group‡ | | | 11,146 | | | | 1,980 | |
SL Green Realty‡ | | | 1,600 | | | | 172 | |
UDR‡ | | | 3,700 | | | | 135 | |
Ventas‡ | | | 5,313 | | | | 332 | |
Vornado Realty Trust‡ | | | 2,503 | | | | 261 | |
Welltower‡ | | | 5,403 | | | | 362 | |
Weyerhaeuser‡ | | | 11,282 | | | | 339 | |
| | | | | | | | |
| | | | | | | 25,310 | |
| | | | | | | | |
Telecommunication Services — 2.1% | |
AT&T | | | 265,374 | | | | 11,286 | |
CenturyLink | | | 43,357 | | | | 1,031 | |
Frontier Communications | | | 18,642 | | | | 63 | |
Level 3 Communications* | | | 8,466 | | | | 477 | |
SBA Communications, Cl A* | | | 11,607 | | | | 1,199 | |
T-Mobile US* | | | 50,400 | | | | 2,899 | |
Verizon Communications | | | 256,411 | | | | 13,687 | |
| | | | | | | | |
| | | | | | | 30,642 | |
| | | | | | | | |
Utilities — 2.8% | |
AES | | | 10,137 | | | | 118 | |
Alliant Energy | | | 3,200 | | | | 121 | |
Ameren | | | 66,383 | | | | 3,482 | |
American Electric Power | | | 64,261 | | | | 4,046 | |
| | | | | | | | |
| Description | | Shares | | | Value
(000) | |
American Water Works | | | 2,800 | | | $ | 203 | |
Avangrid | | | 19,257 | | | | 729 | |
CenterPoint Energy | | | 72,668 | | | | 1,791 | |
CMS Energy | | | 4,464 | | | | 186 | |
Consolidated Edison | | | 21,922 | | | | 1,615 | |
Dominion Resources | | | 9,415 | | | | 721 | |
DTE Energy | | | 16,210 | | | | 1,597 | |
Duke Energy | | | 46,662 | | | | 3,622 | |
Edison International | | | 16,551 | | | | 1,191 | |
Entergy | | | 38,589 | | | | 2,835 | |
Eversource Energy | | | 4,949 | | | | 273 | |
Exelon | | | 36,357 | | | | 1,290 | |
FirstEnergy | | | 73,657 | | | | 2,281 | |
Great Plains Energy | | | 29,818 | | | | 815 | |
Hawaiian Electric Industries | | | 29,575 | | | | 978 | |
NextEra Energy | | | 7,154 | | | | 855 | |
NiSource | | | 4,946 | | | | 109 | |
NRG Energy | | | 4,564 | | | | 56 | |
PG&E | | | 25,082 | | | | 1,524 | |
Pinnacle West Capital | | | 23,747 | | | | 1,853 | |
PPL | | | 14,855 | | | | 506 | |
Public Service Enterprise Group | | | 82,373 | | | | 3,615 | |
SCANA | | | 21,151 | | | | 1,550 | |
Sempra Energy | | | 3,796 | | | | 382 | |
Southern | | | 14,737 | | | | 725 | |
Vectren | | | 11,920 | | | | 622 | |
WEC Energy Group | | | 4,920 | | | | 289 | |
Xcel Energy | | | 44,860 | | | | 1,826 | |
| | | | | | | | |
| | | | | | | 41,806 | |
| | | | | | | | |
Total Common Stock
(Cost $1,271,492) (000) | | | | | | | 1,441,709 | |
| | | | | | | | |
PREFERRED STOCK — 0.3% | |
Air BNB, Ser D* (A)(B) | | | 11,406 | | | | 1,198 | |
Air BNB, Ser E* (A)(B) | | | 6,939 | | | | 729 | |
Dropbox, Cl A* (A)(B) | | | 29,866 | | | | 287 | |
Dropbox, Cl C* (A)(B) | | | 1,097 | | | | 12 | |
Flipkart Online Services* (A)(B) | | | 5,739 | | | | 535 | |
Magic Leap, Ser C* (A)(B) | | | 13,521 | | | | 311 | |
Snapchat, Ser F* (A)(B) | | | 12,575 | | | | 386 | |
Uber Technologies* (A)(B) | | | 28,993 | | | | 1,414 | |
| | | | | | | | |
Total Preferred Stock
(Cost $4,163) (000) | | | | | | | 4,872 | |
| | | | | | | | |
The accompanying notes are an integral part of the financial statements.
36
| | |
| THE KP FUNDS | | December 31, 2016 |
| | | | | | | | |
| Description | | Shares | | | Value
(000) | |
SHORT-TERM INVESTMENT — 2.3% | |
State Street Institutional Treasury Money Market Fund, Cl Institutional, 0.406%, (C) | | | 33,232,775 | | | $ | 33,233 | |
| | | | | | | | |
Total Short-Term Investment
(Cost $33,233) (000) | | | | | | | 33,233 | |
| | | | | | | | |
Total Investments — 100.2%
(Cost $1,308,888) (000) | | | | | | $ | 1,479,814 | |
| | | | | | | | |
Percentages are based on net assets of $1,476,628 (000).
A list of the open futures contracts held by the Fund at December 31, 2016, is as follows (000):
| | | | | | |
| Type of Contract | | Number of
Contracts
Long | | Expiration
Date | | Unrealized
Depreciation |
| S&P 500 Index E-MINI | | 129 | | Mar-2017 | | $(107) |
| | | | | | |
For the year ended December 31, 2016, the monthly average value of futures contracts held was $13,898 (000).
| * | Non-income producing security. |
| ‡ | Real Estate Investment Trust |
| (B) | Security is fair valued using methods determined in good faith by the Fair Value Committee of the Board of Trustees. The total value of such securities as of December 31, 2016, was $4,872 (000) and represented 0.33% of net assets. |
| (C) | The rate reported is the 7-day effective yield as of December 31, 2016. |
ADR — American Depositary Receipt
Cl — Class
PLC — Public Limited Company
S&P — Standard & Poor’s
The following is a list of the level of inputs used as of December 31, 2016, in valuing the Fund’s investments and other financial instruments carried at value (000):
| | | | | | | | | | | | | | | | |
| Investments in Securities | | Level 1 | | | Level 2 | | | Level 3^ | | | Total | |
Common Stock | | $ | 1,441,709 | | | $ | — | | | $ | — | | | $ | 1,441,709 | |
Preferred Stock | | | — | | | | — | | | | 4,872 | | | | 4,872 | |
Short-Term Investment | | | 33,233 | | | | — | | | | — | | | | 33,233 | |
| | | | | | | | | | | | | | | | |
Total Investments in Securities | | $ | 1,474,942 | | | $ | — | | | $ | 4,872 | | | $ | 1,479,814 | |
| | | | | | | | | | | | | | | | |
| | | | |
| Other Financial Instruments | | Level 1 | | | Level 2 | | | Level 3^ | | | Total | |
Futures** | | | | | | | | | | | | | |
Unrealized Depreciation | | $ | (107 | ) | | $ | — | | | $ | — | | | $ | (107 | ) |
| | | | | | | | | | | | | | | | |
Total Other Financial Instruments | | $ | (107 | ) | | $ | — | | | $ | — | | | $ | (107 | ) |
| | | | | | | | | | | | | | | | |
| ** | Futures contracts are valued at the unrealized depreciation on the instrument. |
| ^ | A reconciliation of Level 3 investments and disclosures of significant unobservable inputs are presented when the Fund has a significant amount of Level 3 investments at the beginning and/or end of the year in relation to net assets. Management has concluded that Level 3 investments are not material in relation to net assets. |
For the year ended December 31, 2016, there were no transfers between Level 1 and Level 2 assets and liabilities. For the year ended December 31, 2016 there were no transfers in and out of Level 3. All transfers, if any, are recognized by the Fund at the end of the year.
Amounts designated as “—” are $0 or have been rounded to $0.
The accompanying notes are an integral part of the financial statements.
37
| | |
| THE KP FUNDS | | December 31, 2016 |
|
| SECTOR WEIGHTINGS† (unaudited) |
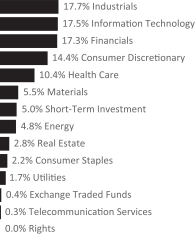
| † | Percentages based on total investments. |
| | | | | | | | |
| Description | | Shares | | | Value
(000) | |
COMMON STOCK — 95.0% | |
Consumer Discretionary — 14.4% | |
1-800-Flowers.com, Cl A* | | | 179,137 | | | $ | 1,918 | |
A H Belo, Cl A | | | 45,261 | | | | 287 | |
Aaron’s | | | 5,614 | | | | 180 | |
Abercrombie & Fitch, Cl A | | | 5,561 | | | | 67 | |
Acushnet Holdings* | | | 63,997 | | | | 1,261 | |
AMC Entertainment Holdings, Cl A | | | 3,409 | | | | 115 | |
American Axle & Manufacturing Holdings* | | | 6,575 | | | | 127 | |
American Eagle Outfitters | | | 14,211 | | | | 216 | |
American Public Education* | | | 1,265 | | | | 31 | |
America’s Car-Mart* | | | 700 | | | | 31 | |
Apollo Education Group, Cl A* | | | 6,975 | | | | 69 | |
Arctic Cat | | | 1,070 | | | | 16 | |
Asbury Automotive Group* | | | 1,632 | | | | 101 | |
Ascena Retail Group* | | | 14,130 | | | | 87 | |
Ascent Capital Group, Cl A* | | | 833 | | | | 14 | |
At Home Group* | | | 680 | | | | 10 | |
Barnes & Noble | | | 5,162 | | | | 58 | |
Barnes & Noble Education* | | | 4,226 | | | | 48 | |
Bassett Furniture Industries | | | 900 | | | | 27 | |
Beazer Homes USA* | | | 2,571 | | | | 34 | |
Belmond, Cl A* | | | 6,834 | | | | 91 | |
Big 5 Sporting Goods | | | 1,500 | | | | 26 | |
Big Lots | | | 3,803 | | | | 191 | |
Biglari Holdings* | | | 84 | | | | 40 | |
| | | | | | | | |
| Description | | Shares | | | Value
(000) | |
BJ’s Restaurants* | | | 1,906 | | | $ | 75 | |
Bloomin’ Brands | | | 82,661 | | | | 1,490 | |
Blue Nile | | | 901 | | | | 37 | |
Bob Evans Farms | | | 1,621 | | | | 86 | |
Bojangles’* | | | 107,117 | | | | 1,998 | |
Boot Barn Holdings* | | | 1,000 | | | | 13 | |
BorgWarner | | | 76,800 | | | | 3,028 | |
Boyd Gaming* | | | 7,066 | | | | 143 | |
Bravo Brio Restaurant Group* | | | 78,284 | | | | 297 | |
Bridgepoint Education* | | | 1,200 | | | | 12 | |
Bright Horizons Family Solutions* | | | 3,741 | | | | 262 | |
Buckle | | | 2,338 | | | | 53 | |
Buffalo Wild Wings* | | | 1,612 | | | | 249 | |
Build-A-Bear Workshop, Cl A* | | | 1,000 | | | | 14 | |
Burlington Stores* | | | 45,264 | | | | 3,835 | |
Caesars Acquisition, Cl A* | | | 3,890 | | | | 53 | |
Caesars Entertainment* | | | 4,607 | | | | 39 | |
Caleres | | | 52,422 | | | | 1,720 | |
Callaway Golf | | | 7,700 | | | | 84 | |
Cambium Learning Group* | | | 1,200 | | | | 6 | |
Camping World Holdings, Cl A | | | 1,000 | | | | 33 | |
Capella Education | | | 924 | | | | 81 | |
Career Education* | | | 5,459 | | | | 55 | |
Carriage Services, Cl A | | | 1,300 | | | | 37 | |
Carrols Restaurant Group* | | | 2,805 | | | | 43 | |
Carter’s | | | 22,217 | | | | 1,919 | |
Cato, Cl A | | | 2,086 | | | | 63 | |
Cavco Industries* | | | 692 | | | | 69 | |
Central European Media Enterprises, Cl A* | | | 6,400 | | | | 16 | |
Century Casinos* | | | 1,741 | | | | 14 | |
Century Communities* | | | 1,243 | | | | 26 | |
Cheesecake Factory | | | 3,872 | | | | 232 | |
Chegg* | | | 6,574 | | | | 49 | |
Cherokee* | | | 87,561 | | | | 919 | |
Chico’s FAS | | | 62,650 | | | | 902 | |
Children’s Place | | | 1,601 | | | | 162 | |
Churchill Downs | | | 1,153 | | | | 173 | |
Chuy’s Holdings* | | | 52,896 | | | | 1,716 | |
Cinemark Holdings | | | 31,070 | | | | 1,192 | |
Citi Trends | | | 1,300 | | | | 24 | |
ClubCorp Holdings | | | 156,595 | | | | 2,247 | |
Collectors Universe | | | 611 | | | | 13 | |
Columbia Sportswear | | | 36,703 | | | | 2,139 | |
Conn’s* | | | 1,657 | | | | 21 | |
Container Store Group* | | | 1,500 | | | | 10 | |
Cooper Tire & Rubber | | | 4,728 | | | | 184 | |
The accompanying notes are an integral part of the financial statements.
38
| | |
| THE KP FUNDS | | December 31, 2016 |
| | | | | | | | |
| Description | | Shares | | | Value
(000) | |
Cooper-Standard Holdings* | | | 1,270 | | | $ | 131 | |
Core-Mark Holding | | | 3,904 | | | | 168 | |
Cracker Barrel Old Country Store | | | 1,635 | | | | 273 | |
Crocs* | | | 6,019 | | | | 41 | |
CSS Industries | | | 800 | | | | 22 | |
Culp | | | 879 | | | | 33 | |
Daily Journal* | | | 150 | | | | 36 | |
Dana | | | 12,703 | | | | 241 | |
Dave & Buster’s Entertainment* | | | 42,861 | | | | 2,413 | |
Deckers Outdoor* | | | 2,775 | | | | 154 | |
Del Frisco’s Restaurant Group* | | | 155,434 | | | | 2,643 | |
Del Taco Restaurants* | | | 92,529 | | | | 1,307 | |
Delta Apparel* | | | 700 | | | | 15 | |
Denny’s* | | | 6,191 | | | | 79 | |
Destination XL Group* | | | 2,800 | | | | 12 | |
DeVry Education Group | | | 49,285 | | | | 1,538 | |
DineEquity | | | 1,429 | | | | 110 | |
Dixie Group* | | | 191,535 | | | | 690 | |
Dorman Products* | | | 20,116 | | | | 1,470 | |
DSW, Cl A | | | 75,414 | | | | 1,708 | |
Duluth Holdings, Cl B* | | | 800 | | | | 20 | |
El Pollo Loco Holdings* | | | 1,656 | | | | 20 | |
Eldorado Resorts* | | | 2,500 | | | | 42 | |
Empire Resorts* | | | 272 | | | | 6 | |
Entercom Communications, Cl A | | | 2,107 | | | | 32 | |
Entravision Communications, Cl A | | | 5,437 | | | | 38 | |
Eros International, Cl A* | | | 2,416 | | | | 32 | |
Escalade | | | 800 | | | | 11 | |
Ethan Allen Interiors | | | 2,017 | | | | 74 | |
Etsy* | | | 8,574 | | | | 101 | |
EW Scripps, Cl A* | | | 4,863 | | | | 94 | |
Expedia | | | 4,900 | | | | 555 | |
Express* | | | 260,695 | | | | 2,805 | |
Federal-Mogul Holdings* | | | 2,600 | | | | 27 | |
Fiesta Restaurant Group* | | | 96,016 | | | | 2,867 | |
Finish Line, Cl A | | | 125,430 | | | | 2,359 | |
Five Below* | | | 4,577 | | | | 183 | |
Flexsteel Industries | | | 530 | | | | 33 | |
Fogo De Chao* | | | 406 | | | | 6 | |
Fossil Group* | | | 3,426 | | | | 89 | |
Fox Factory Holding* | | | 1,827 | | | | 51 | |
Francesca’s Holdings* | | | 3,122 | | | | 56 | |
Fred’s, Cl A | | | 2,885 | | | | 54 | |
FTD* | | | 1,424 | | | | 34 | |
Gaia, Cl A* | | | 700 | | | | 6 | |
Gannett | | | 9,601 | | | | 93 | |
| | | | | | | | |
| Description | | Shares | | | Value
(000) | |
Genesco* | | | 1,678 | | | $ | 104 | |
Gentherm* | | | 6,702 | | | | 227 | |
G-III Apparel Group* | | | 3,512 | | | | 104 | |
Global Eagle Entertainment* | | | 4,300 | | | | 28 | |
GNC Holdings, Cl A | | | 5,606 | | | | 62 | |
Golden Entertainment | | | 841 | | | | 10 | |
GoPro, Cl A* | | | 8,252 | | | | 72 | |
Grand Canyon Education* | | | 21,498 | | | | 1,257 | |
Gray Television* | | | 5,237 | | | | 57 | |
Green Brick Partners* | | | 1,896 | | | | 19 | |
Group 1 Automotive | | | 1,780 | | | | 139 | |
Guess? | | | 4,996 | | | | 60 | |
Habit Restaurants, Cl A* | | | 128,207 | | | | 2,212 | |
Haverty Furniture | | | 1,522 | | | | 36 | |
Helen of Troy* | | | 2,390 | | | | 202 | |
Hemisphere Media Group, Cl A* | | | 700 | | | | 8 | |
Hibbett Sports* | | | 1,866 | | | | 70 | |
Hooker Furniture | | | 926 | | | | 35 | |
Horizon Global* | | | 1,490 | | | | 36 | |
Houghton Mifflin Harcourt* | | | 10,131 | | | | 110 | |
Hovnanian Enterprises, Cl A* | | | 9,898 | | | | 27 | |
HSN | | | 51,258 | | | | 1,758 | |
Iconix Brand Group* | | | 3,823 | | | | 36 | |
ILG | | | 9,667 | | | | 176 | |
IMAX* | | | 51,037 | | | | 1,602 | |
Installed Building Products* | | | 1,643 | | | | 68 | |
International Speedway, Cl A | | | 2,152 | | | | 79 | |
Intrawest Resorts Holdings* | | | 1,315 | | | | 23 | |
iRobot* | | | 27,999 | | | | 1,636 | |
Isle of Capri Casinos* | | | 2,042 | | | | 50 | |
J Alexander’s Holdings* | | | 1,174 | | | | 13 | |
Jack in the Box | | | 19,517 | | | | 2,179 | |
JAKKS Pacific* | | | 1,500 | | | | 8 | |
Jamba* | | | 1,200 | | | | 12 | |
John Wiley & Sons, Cl A | | | 15,056 | | | | 821 | |
Johnson Outdoors, Cl A | | | 400 | | | | 16 | |
K12* | | | 2,761 | | | | 47 | |
KB Home | | | 6,814 | | | | 108 | |
Kirkland’s* | | | 191,152 | | | | 2,964 | |
Kona Grill* | | | 209,870 | | | | 2,635 | |
La Quinta Holdings* | | | 6,928 | | | | 98 | |
Lands’ End* | | | 1,400 | | | | 21 | |
La-Z-Boy, Cl Z | | | 4,207 | | | | 131 | |
LCI Industries | | | 2,024 | | | | 218 | |
LGI Homes* | | | 1,261 | | | | 36 | |
Libbey | | | 1,793 | | | | 35 | |
The accompanying notes are an integral part of the financial statements.
39
| | |
| THE KP FUNDS | | December 31, 2016 |
| | | | | | | | |
| Description | | Shares | | | Value
(000) | |
Liberty Braves Group, Cl A* | | | 3,318 | | | $ | 68 | |
Liberty Media Group, Cl C* | | | 5,639 | | | | 177 | |
Liberty Tax | | | 400 | | | | 5 | |
Liberty TripAdvisor Holdings, Cl A* | | | 5,929 | | | | 89 | |
LifeLock* | | | 7,222 | | | | 173 | |
Lifetime Brands | | | 900 | | | | 16 | |
Lindblad Expeditions Holdings* | | | 116,798 | | | | 1,104 | |
Lions Gate Entertainment, Cl A* | | | 40,623 | | | | 1,093 | |
Lithia Motors, Cl A | | | 16,372 | | | | 1,585 | |
Loral Space & Communications* | | | 1,051 | | | | 43 | |
Luby’s* | | | 2,000 | | | | 9 | |
Lumber Liquidators Holdings* | | | 2,150 | | | | 34 | |
M/I Homes* | | | 1,933 | | | | 49 | |
Malibu Boats, Cl A* | | | 109,439 | | | | 2,088 | |
Marcus | | | 1,519 | | | | 48 | |
Marine Products | | | 1,132 | | | | 16 | |
MarineMax* | | | 2,019 | | | | 39 | |
Marriott Vacations Worldwide | | | 1,915 | | | | 162 | |
MCBC Holdings | | | 800 | | | | 12 | |
MDC Holdings | | | 129,022 | | | | 3,310 | |
MDC Partners, Cl A | | | 4,183 | | | | 27 | |
Media General* | | | 9,318 | | | | 175 | |
Meredith | | | 20,790 | | | | 1,230 | |
Meritage Homes* | | | 3,123 | | | | 109 | |
Metaldyne Performance Group | | | 48,325 | | | | 1,109 | |
Modine Manufacturing* | | | 24,268 | | | | 362 | |
Monarch Casino & Resort* | | | 867 | | | | 22 | |
Monro Muffler Brake | | | 12,216 | | | | 699 | |
Motorcar Parts of America* | | | 1,494 | | | | 40 | |
Movado Group | | | 1,351 | | | | 39 | |
MSG Networks* | | | 4,861 | | | | 105 | |
NACCO Industries, Cl A | | | 317 | | | | 29 | |
Nathan’s Famous* | | | 248 | | | | 16 | |
National CineMedia | | | 5,026 | | | | 74 | |
Nautilus* | | | 2,504 | | | | 46 | |
New Home* | | | 1,000 | | | | 12 | |
New Media Investment Group | | | 3,972 | | | | 64 | |
New York Times, Cl A | | | 10,652 | | | | 142 | |
Nexstar Broadcasting Group, Cl A | | | 18,986 | | | | 1,202 | |
Noodles, Cl A* | | | 800 | | | | 3 | |
Nordstrom | | | 25,500 | | | | 1,221 | |
Norwegian Cruise Line Holdings* | | | 19,500 | | | | 829 | |
Nutrisystem | | | 2,378 | | | | 82 | |
Office Depot | | | 47,179 | | | | 213 | |
Ollie’s Bargain Outlet Holdings* | | | 1,651 | | | | 47 | |
Overstock.com* | | | 1,000 | | | | 18 | |
| | | | | | | | |
| Description | | Shares | | | Value
(000) | |
Oxford Industries | | | 75,331 | | | $ | 4,529 | |
Panera Bread, Cl A* | | | 4,900 | | | | 1,005 | |
Papa John’s International | | | 2,319 | | | | 198 | |
Party City Holdco* | | | 2,200 | | | | 31 | |
Penn National Gaming* | | | 6,087 | | | | 84 | |
Perry Ellis International* | | | 1,000 | | | | 25 | |
PetMed Express | | | 1,619 | | | | 37 | |
Pier 1 Imports | | | 410,677 | | | | 3,506 | |
Pinnacle Entertainment* | | | 4,444 | | | | 64 | |
Planet Fitness, Cl A | | | 2,400 | | | | 48 | |
Polaris Industries | | | 33,630 | | | | 2,771 | |
Popeyes Louisiana Kitchen* | | | 32,578 | | | | 1,970 | |
Potbelly* | | | 2,100 | | | | 27 | |
PVH | | | 6,600 | | | | 596 | |
Radio One, Cl D* | | | 3,100 | | | | 9 | |
Reading International, Cl A* | | | 1,400 | | | | 23 | |
Red Lion Hotels* | | | 1,500 | | | | 13 | |
Red Robin Gourmet Burgers* | | | 1,116 | | | | 63 | |
Red Rock Resorts, Cl A | | | 2,455 | | | | 57 | |
Regis* | | | 3,034 | | | | 44 | |
Rent-A-Center, Cl A | | | 4,238 | | | | 48 | |
RH* | | | 3,161 | | | | 97 | |
Royal Caribbean Cruises | | | 33,400 | | | | 2,741 | |
Ruby Tuesday* | | | 5,200 | | | | 17 | |
Ruth’s Hospitality Group | | | 2,601 | | | | 48 | |
Saga Communications, Cl A | | | 300 | | | | 15 | |
Salem Media Group, Cl A | | | 1,400 | | | | 9 | |
Scholastic | | | 2,209 | | | | 105 | |
Scientific Games, Cl A* | | | 46,111 | | | | 646 | |
Sears Holdings* | | | 919 | | | | 9 | |
Sears Hometown and Outlet Stores* | | | 1,400 | | | | 7 | |
SeaWorld Entertainment | | | 134,813 | | | | 2,553 | |
Select Comfort* | | | 3,783 | | | | 86 | |
Sequential Brands Group* | | | 3,205 | | | | 15 | |
Shake Shack, Cl A* | | | 1,282 | | | | 46 | |
Shoe Carnival | | | 1,168 | | | | 32 | |
Shutterfly* | | | 2,956 | | | | 148 | |
Sinclair Broadcast Group, Cl A | | | 5,645 | | | | 188 | |
Skechers U.S.A., Cl A* | | | 31,845 | | | | 783 | |
Smith & Wesson Holding* | | | 4,476 | | | | 94 | |
Sonic | | | 3,843 | | | | 102 | |
Sonic Automotive, Cl A | | | 2,284 | | | | 52 | |
Sotheby’s | | | 4,209 | | | | 168 | |
Spartan Motors | | | 2,716 | | | | 25 | |
Speedway Motorsports | | | 900 | | | | 20 | |
Sportsman’s Warehouse Holdings* | | | 2,108 | | | | 20 | |
The accompanying notes are an integral part of the financial statements.
40
| | |
| THE KP FUNDS | | December 31, 2016 |
| | | | | | | | |
| Description | | Shares | | | Value
(000) | |
Stage Stores | | | 2,581 | | | $ | 11 | |
Standard Motor Products | | | 1,754 | | | | 93 | |
Stein Mart | | | 272,529 | | | | 1,493 | |
Steven Madden* | | | 5,257 | | | | 188 | |
Stoneridge* | | | 2,192 | | | | 39 | |
Strattec Security | | | 272 | | | | 11 | |
Strayer Education* | | | 861 | | | | 69 | |
Sturm Ruger | | | 1,515 | | | | 80 | |
Superior Industries International | | | 2,051 | | | | 54 | |
Superior Uniform Group | | | 700 | | | | 14 | |
Tailored Brands | | | 3,992 | | | | 102 | |
Taylor Morrison Home, Cl A* | | | 2,482 | | | | 48 | |
Tenneco* | | | 47,606 | | | | 2,974 | |
Texas Roadhouse, Cl A | | | 5,641 | | | | 272 | |
Tile Shop Holdings* | | | 2,660 | | | | 52 | |
Tilly’s, Cl A* | | | 900 | | | | 12 | |
Time | | | 8,789 | | | | 157 | |
TopBuild* | | | 3,147 | | | | 112 | |
Tower International | | | 1,675 | | | | 47 | |
Townsquare Media, Cl A* | | | 900 | | | | 9 | |
TRI Pointe Group* | | | 12,738 | | | | 146 | |
tronc | | | 2,178 | | | | 30 | |
Tuesday Morning* | | | 3,666 | | | | 20 | |
UCP, Cl A* | | | 600 | | | | 7 | |
Ulta Salon Cosmetics & Fragrance* | | | 8,440 | | | | 2,152 | |
Unifi* | | | 1,279 | | | | 42 | |
Unique Fabricating | | | 700 | | | | 10 | |
Universal Electronics* | | | 1,157 | | | | 75 | |
Vail Resorts | | | 14,100 | | | | 2,274 | |
Vera Bradley* | | | 1,656 | | | | 19 | |
Vince Holding* | | | 2,154 | | | | 9 | |
Vista Outdoor* | | | 85,270 | | | | 3,146 | |
Vitamin Shoppe* | | | 1,973 | | | | 47 | |
Wayfair, Cl A* | | | 2,576 | | | | 90 | |
WCI Communities* | | | 1,900 | | | | 45 | |
Weight Watchers International* | | | 2,400 | | | | 27 | |
West Marine* | | | 1,300 | | | | 14 | |
Weyco Group | | | 500 | | | | 16 | |
William Lyon Homes, Cl A* | | | 1,953 | | | | 37 | |
Wingstop, Cl A | | | 1,285 | | | | 38 | |
Winmark | | | 200 | | | | 25 | |
Winnebago Industries | | | 2,189 | | | | 69 | |
Wolverine World Wide | | | 94,084 | | | | 2,064 | |
Workhorse Group* | | | 934 | | | | 7 | |
World Wrestling Entertainment, Cl A | | | 62,883 | | | | 1,157 | |
ZAGG* | | | 280,896 | | | | 1,993 | |
| | | | | | | | |
| Description | | Shares | | | Value
(000) | |
Zoe’s Kitchen* | | | 1,560 | | | $ | 37 | |
Zumiez* | | | 25,773 | | | | 563 | |
| | | | | | | | |
| | | | | | | 134,500 | |
| | | | | | | | |
Consumer Staples — 2.2% | |
AdvancePierre Foods Holdings | | | 1,858 | | | | 55 | |
Alico | | | 200 | | | | 5 | |
Alliance One International* | | | 681 | | | | 13 | |
Amplify Snack Brands* | | | 2,600 | | | | 23 | |
Andersons | | | 40,568 | | | | 1,814 | |
Avon Products* | | | 37,598 | | | | 189 | |
B&G Foods | | | 5,600 | | | | 245 | |
Boston Beer, Cl A* | | | 721 | | | | 122 | |
Calavo Growers | | | 1,264 | | | | 78 | |
Cal-Maine Foods | | | 2,526 | | | | 112 | |
Central Garden & Pet* | | | 3,558 | | | | 111 | |
Chefs’ Warehouse* | | | 56,430 | | | | 893 | |
Coca-Cola Bottling Consolidated | | | 385 | | | | 69 | |
Craft Brew Alliance* | | | 1,100 | | | | 19 | |
Darling Ingredients* | | | 14,024 | | | | 181 | |
Dean Foods | | | 7,830 | | | | 171 | |
elf Beauty* | | | 800 | | | | 23 | |
Farmer Brothers* | | | 661 | | | | 24 | |
Flowers Foods | | | 60,092 | | | | 1,200 | |
Fresh Del Monte Produce | | | 2,763 | | | | 168 | |
Freshpet* | | | 1,800 | | | | 18 | |
Herbalife* | | | 13,871 | | | | 668 | |
HRG Group* | | | 10,147 | | | | 158 | |
Ingles Markets, Cl A | | | 1,142 | | | | 55 | |
Inter Parfums | | | 37,827 | | | | 1,240 | |
Inventure Foods* | | | 129,326 | | | | 1,274 | |
J&J Snack Foods | | | 1,283 | | | | 171 | |
John B Sanfilippo & Son | | | 707 | | | | 50 | |
Lancaster Colony | | | 1,601 | | | | 226 | |
Landec* | | | 2,400 | | | | 33 | |
Lifevantage* | | | 1,400 | | | | 11 | |
Lifeway Foods* | | | 300 | | | | 3 | |
Limoneira | | | 900 | | | | 19 | |
Medifast | | | 854 | | | | 36 | |
MGP Ingredients | | | 1,024 | | | | 51 | |
National Beverage | | | 956 | | | | 49 | |
Natural Grocers by Vitamin Cottage* | | | 700 | | | | 8 | |
Natural Health Trends | | | 600 | | | | 15 | |
Nature’s Sunshine Products | | | 800 | | | | 12 | |
Nu Skin Enterprises, Cl A | | | 14,223 | | | | 680 | |
Nutraceutical International | | | 700 | | | | 24 | |
Oil-Dri Corp of America | | | 407 | | | | 16 | |
The accompanying notes are an integral part of the financial statements.
41
| | |
| THE KP FUNDS | | December 31, 2016 |
| | | | | | | | |
| Description | | Shares | | | Value
(000) | |
Omega Protein* | | | 1,786 | | | $ | 45 | |
Orchids Paper Products | | | 738 | | | | 19 | |
Performance Food Group* | | | 3,058 | | | | 73 | |
PriceSmart | | | 1,715 | | | | 143 | |
Primo Water* | | | 1,724 | | | | 21 | |
Revlon, Cl A* | | | 1,000 | | | | 29 | |
Sanderson Farms | | | 1,710 | | | | 161 | |
Seaboard* | | | 948 | | | | 3,747 | |
Seneca Foods, Cl A* | | | 535 | | | | 21 | |
Smart & Final Stores* | | | 2,000 | | | | 28 | |
Snyder’s-Lance | | | 102,706 | | | | 3,939 | |
SpartanNash | | | 3,017 | | | | 119 | |
SUPERVALU* | | | 21,717 | | | | 101 | |
Synutra International* | | | 2,500 | | | | 13 | |
Tootsie Roll Industries | | | 1,406 | | | | 56 | |
Turning Point Brands* | | | 400 | | | | 5 | |
United Natural Foods* | | | 4,232 | | | | 202 | |
Universal | | | 9,871 | | | | 630 | |
USANA Health Sciences* | | | 848 | | | | 52 | |
Vector Group | | | 7,927 | | | | 180 | |
Village Super Market, Cl A | | | 597 | | | | 18 | |
WD-40 | | | 1,206 | | | | 141 | |
Weis Markets | | | 783 | | | | 52 | |
| | | | | | | | |
| | | | | | | 20,127 | |
| | | | | | | | |
Energy – 4.9% | |
Abraxas Petroleum* | | | 10,600 | | | | 27 | |
Adams Resources & Energy | | | 200 | | | | 8 | |
Alon USA Energy | | | 2,800 | | | | 32 | |
Approach Resources* | | | 248,539 | | | | 833 | |
Archrock | | | 5,683 | | | | 75 | |
Ardmore Shipping | | | 146,526 | | | | 1,084 | |
Atwood Oceanics | | | 4,974 | | | | 65 | |
Bill Barrett* | | | 193,414 | | | | 1,352 | |
Bristow Group | | | 2,744 | | | | 56 | |
California Resources* | | | 2,589 | | | | 55 | |
Callon Petroleum* | | | 62,854 | | | | 966 | |
Capital Product Partners (A) | | | 129,946 | | | | 413 | |
CARBO Ceramics | | | 2,259 | | | | 24 | |
Carrizo Oil & Gas* | | | 5,275 | | | | 197 | |
Clayton Williams Energy* | | | 500 | | | | 60 | |
Clean Energy Fuels* | | | 7,158 | | | | 20 | |
Cobalt International Energy* | | | 33,325 | | | | 41 | |
Contango Oil & Gas* | | | 1,841 | | | | 17 | |
CVR Energy | | | 1,292 | | | | 33 | |
Dawson Geophysical* | | | 1,647 | | | | 13 | |
Delek US Holdings | | | 90,531 | | | | 2,179 | |
| | | | | | | | |
| Description | | Shares | | | Value
(000) | |
Denbury Resources* | | | 28,724 | | | $ | 106 | |
DHT Holdings | | | 7,496 | | | | 31 | |
Diamondback Energy* | | | 14,000 | | | | 1,415 | |
Dorian LPG* | | | 1,800 | | | | 15 | |
Eclipse Resources* | | | 432,002 | | | | 1,153 | |
Emerge Energy Services (A) | | | 75,820 | | | | 933 | |
EP Energy, Cl A* | | | 3,161 | | | | 21 | |
Era Group* | | | 1,600 | | | | 27 | |
Erin Energy* | | | 2,700 | | | | 8 | |
Evolution Petroleum | | | 2,100 | | | | 21 | |
EXCO Resources* | | | 12,700 | | | | 11 | |
Exterran* | | | 2,587 | | | | 62 | |
Fairmount Santrol Holdings* | | | 7,873 | | | | 93 | |
Forum Energy Technologies* | | | 4,904 | | | | 108 | |
Frontline | | | 5,481 | | | | 39 | |
GasLog | | | 3,341 | | | | 54 | |
Gastar Exploration* | | | 425,876 | | | | 660 | |
Gener8 Maritime* | | | 3,206 | | | | 14 | |
Geospace Technologies* | | | 1,114 | | | | 23 | |
Golar LNG | | | 8,064 | | | | 185 | |
Green Plains | | | 2,956 | | | | 82 | |
Helix Energy Solutions Group* | | | 9,219 | | | | 81 | |
Hornbeck Offshore Services* | | | 2,900 | | | | 21 | |
Independence Contract Drilling* | | | 2,448 | | | | 16 | |
International Seaways* | | | 1,266 | | | | 18 | |
Isramco* | | | 39 | | | | 5 | |
Jones Energy, Cl A* | | | 441,895 | | | | 2,209 | |
Key Energy Services* | | | 14,844 | | | | 472 | |
Mammoth Energy Services* | | | 900 | | | | 14 | |
Matador Resources* | | | 7,089 | | | | 183 | |
Matrix Service* | | | 2,171 | | | | 49 | |
McDermott International* | | | 20,671 | | | | 153 | |
Natural Gas Services Group* | | | 1,100 | | | | 35 | |
Navios Maritime Acquisition | | | 6,900 | | | | 12 | |
Newfield Exploration* | | | 56,100 | | | | 2,272 | |
Newpark Resources* | | | 6,773 | | | | 51 | |
Nordic American Tankers | | | 7,900 | | | | 66 | |
Northern Oil and Gas* | | | 5,000 | | | | 14 | |
Oasis Petroleum* | | | 57,990 | | | | 878 | |
Oceaneering International | | | 218,871 | | | | 6,175 | |
Oil States International* | | | 4,373 | | | | 171 | |
Overseas Shipholding Group, Cl A | | | 3,800 | | | | 15 | |
Pacific Ethanol* | | | 2,500 | | | | 24 | |
Panhandle Oil and Gas, Cl A | | | 1,252 | | | | 29 | |
Par Pacific Holdings* | | | 2,509 | | | | 36 | |
Parker Drilling* | | | 9,869 | | | | 26 | |
The accompanying notes are an integral part of the financial statements.
42
| | |
| THE KP FUNDS | | December 31, 2016 |
| | | | | | | | |
| Description | | Shares | | | Value
(000) | |
Parsley Energy, Cl A* | | | 17,300 | | | $ | 610 | |
PBF Energy, Cl A | | | 94,825 | | | | 2,644 | |
PDC Energy* | | | 24,716 | | | | 1,794 | |
PHI* | | | 1,000 | | | | 18 | |
Pioneer Energy Services* | | | 6,774 | | | | 46 | |
Renewable Energy Group* | | | 3,400 | | | | 33 | |
Resolute Energy* | | | 46,493 | | | | 1,915 | |
REX American Resources* | | | 462 | | | | 46 | |
RigNet* | | | 1,100 | | | | 25 | |
Ring Energy* | | | 291,172 | | | | 3,783 | |
RPC | | | 36,047 | | | | 714 | |
RSP Permian* | | | 8,224 | | | | 367 | |
Sanchez Energy* | | | 60,062 | | | | 542 | |
Scorpio Tankers | | | 13,350 | | | | 60 | |
SEACOR Holdings* | | | 1,302 | | | | 93 | |
Seadrill* | | | 30,879 | | | | 105 | |
SemGroup, Cl A | | | 5,638 | | | | 235 | |
Ship Finance International | | | 4,895 | | | | 73 | |
Smart Sand* | | | 1,200 | | | | 20 | |
Synergy Resources* | | | 15,908 | | | | 142 | |
Teekay | | | 4,003 | | | | 32 | |
Teekay Tankers, Cl A | | | 9,514 | | | | 22 | |
Tesco | | | 3,775 | | | | 31 | |
TETRA Technologies* | | | 345,606 | | | | 1,735 | |
Tidewater | | | 4,200 | | | | 14 | |
Unit* | | | 4,133 | | | | 111 | |
US Silica Holdings | | | 45,718 | | | | 2,591 | |
W&T Offshore* | | | 2,600 | | | | 7 | |
Western Refining | | | 15,344 | | | | 581 | |
Westmoreland Coal* | | | 1,724 | | | | 30 | |
Whiting Petroleum* | | | 48,000 | | | | 577 | |
Willbros Group* | | | 4,500 | | | | 15 | |
WPX Energy* | | | 47,545 | | | | 693 | |
| | | | | | | | |
| | | | | | | 45,340 | |
| | | | | | | | |
Financials — 17.3% | | | | | | | | |
1st Source | | | 1,278 | | | | 57 | |
Access National | | | 700 | | | | 19 | |
ACNB | | | 487 | | | | 15 | |
Allegiance Bancshares* | �� | | 897 | | | | 32 | |
Altisource Residential‡ | | | 4,273 | | | | 47 | |
Ambac Financial Group* | | | 3,679 | | | | 83 | |
American Equity Investment Life Holding | | | 62,359 | | | | 1,406 | |
American Financial Group | | | 37,905 | | | | 3,340 | |
American National Bankshares | | | 670 | | | | 23 | |
Ameris Bancorp | | | 2,917 | | | | 127 | |
| | | | | | | | |
| Description | | Shares | | | Value
(000) | |
AMERISAFE | | | 1,547 | | | $ | 96 | |
Ames National | | | 700 | | | | 23 | |
Anworth Mortgage Asset‡ | | | 7,818 | | | | 40 | |
Apollo Commercial Real Estate Finance | | | 5,891 | | | | 98 | |
Ares Commercial Real Estate‡ | | | 2,400 | | | | 33 | |
Argo Group International Holdings | | | 2,464 | | | | 162 | |
Arlington Asset Investment, Cl A | | | 1,842 | | | | 27 | |
ARMOUR Residential‡ | | | 3,001 | | | | 65 | |
Arrow Financial | | | 955 | | | | 39 | |
Associated Capital Group | | | 367 | | | | 12 | |
Assurant | | | 32,470 | | | | 3,015 | |
Astoria Financial | | | 7,880 | | | | 147 | |
Atlantic Capital Bancshares* | | | 1,414 | | | | 27 | |
Atlas Financial Holdings* | | | 900 | | | | 16 | |
B. Riley Financial | | | 759 | | | | 14 | |
Baldwin & Lyons, Cl B | | | 700 | | | | 18 | |
Banc of California | | | 3,985 | | | | 69 | |
BancFirst | | | 669 | | | | 62 | |
Banco Latinoamericano de Comercio Exterior, Cl E | | | 2,472 | | | | 73 | |
Bancorp* | | | 80,428 | | | | 632 | |
BancorpSouth | | | 7,382 | | | | 229 | |
Bank Mutual | | | 83,798 | | | | 793 | |
Bank of Hawaii | | | 35,460 | | | | 3,145 | |
Bank of Marin Bancorp | | | 500 | | | | 35 | |
Bank of NT Butterfield & Son | | | 1,000 | | | | 31 | |
Bank of the Ozarks | | | 7,445 | | | | 392 | |
BankFinancial | | | 1,240 | | | | 18 | |
Bankwell Financial Group | | | 467 | | | | 15 | |
Banner | | | 2,570 | | | | 143 | |
Bar Harbor Bankshares | | | 500 | | | | 24 | |
Bear State Financial | | | 1,400 | | | | 14 | |
Beneficial Bancorp | | | 5,734 | | | | 106 | |
Berkshire Hills Bancorp | | | 36,316 | | | | 1,338 | |
BGC Partners, Cl A | | | 18,584 | | | | 190 | |
Blue Capital Reinsurance Holdings | | | 600 | | | | 11 | |
Blue Hills Bancorp | | | 2,013 | | | | 38 | |
BNC Bancorp | | | 3,314 | | | | 106 | |
BofI Holding* | | | 5,130 | | | | 146 | |
Boston Private Financial Holdings | | | 6,686 | | | | 111 | |
Bridge Bancorp | | | 18,565 | | | | 704 | |
Brookline Bancorp | | | 62,586 | | | | 1,026 | |
Bryn Mawr Bank | | | 1,360 | | | | 57 | |
BSB Bancorp* | | | 659 | | | | 19 | |
C&F Financial | | | 300 | | | | 15 | |
Calamos Asset Management, Cl A | | | 1,300 | | | | 11 | |
California First National Bancorp | | | 400 | | | | 6 | |
The accompanying notes are an integral part of the financial statements.
43
| | |
| THE KP FUNDS | | December 31, 2016 |
| | | | | | | | |
| Description | | Shares | | | Value
(000) | |
Camden National | | | 1,247 | | | $ | 55 | |
Capital Bank Financial, Cl A | | | 1,993 | | | | 78 | |
Capital City Bank Group | | | 800 | | | | 16 | |
Capitol Federal Financial | | | 10,890 | | | | 179 | |
Capstar Financial Holdings* | | | 30,812 | | | | 677 | |
Capstead Mortgage | | | 7,801 | | | | 79 | |
Cardinal Financial | | | 23,630 | | | | 775 | |
Carolina Financial | | | 836 | | | | 26 | |
Cascade Bancorp* | | | 2,506 | | | | 20 | |
Cathay General Bancorp | | | 6,327 | | | | 241 | |
CenterState Banks | | | 3,787 | | | | 95 | |
Central Pacific Financial | | | 2,472 | | | | 78 | |
Central Valley Community Bancorp | | | 900 | | | | 18 | |
Century Bancorp, Cl A | | | 243 | | | | 15 | |
Charter Financial | | | 1,159 | | | | 19 | |
Chemical Financial | | | 28,382 | | | | 1,537 | |
Chemung Financial | | | 300 | | | | 11 | |
Citizens, Cl A* | | | 3,793 | | | | 37 | |
Citizens & Northern | | | 1,000 | | | | 26 | |
City Holding | | | 1,191 | | | | 81 | |
Clifton Bancorp | | | 1,788 | | | | 30 | |
CNB Financial | | | 1,200 | | | | 32 | |
CNO Financial Group | | | 15,037 | | | | 288 | |
CoBiz Financial | | | 193,226 | | | | 3,264 | |
Codorus Valley Bancorp | | | 840 | | | | 24 | |
Cohen & Steers | | | 37,056 | | | | 1,245 | |
Colony Capital, Cl A‡ | | | 9,602 | | | | 194 | |
Columbia Banking System | | | 32,416 | | | | 1,448 | |
Comerica | | | 16,400 | | | | 1,117 | |
Commerce Bancshares | | | 53,970 | | | | 3,120 | |
Community Bank System | | | 3,671 | | | | 227 | |
Community Trust Bancorp | | | 1,244 | | | | 62 | |
ConnectOne Bancorp | | | 2,319 | | | | 60 | |
County Bancorp | | | 500 | | | | 13 | |
Cowen Group, Cl A* | | | 2,251 | | | | 35 | |
Crawford, Cl B | | | 1,000 | | | | 13 | |
CU Bancorp* | | | 1,400 | | | | 50 | |
Customers Bancorp* | | | 76,633 | | | | 2,745 | |
CVB Financial | | | 8,632 | | | | 198 | |
CYS Investments‡ | | | 12,377 | | | | 96 | |
Diamond Hill Investment Group | | | 248 | | | | 52 | |
Dime Community Bancshares | | | 2,553 | | | | 51 | |
Donegal Group, Cl A | | | 700 | | | | 12 | |
Dynex Capital‡ | | | 3,664 | | | | 25 | |
E*TRADE Financial* | | | 68,800 | | | | 2,384 | |
Eagle Bancorp* | | | 53,134 | | | | 3,239 | |
| | | | | | | | |
| Description | | Shares | | | Value
(000) | |
eHealth* | | | 1,500 | | | $ | 16 | |
EMC Insurance Group | | | 682 | | | | 20 | |
Employers Holdings | | | 2,620 | | | | 104 | |
Encore Capital Group* | | | 1,945 | | | | 56 | |
Enova International* | | | 2,272 | | | | 29 | |
Enstar Group* | | | 971 | | | | 192 | |
Enterprise Bancorp | | | 826 | | | | 31 | |
Enterprise Financial Services | | | 1,567 | | | | 67 | |
Equity Bancshares, Cl A* | | | 500 | | | | 17 | |
ESSA Bancorp | | | 667 | | | | 10 | |
Essent Group* | | | 115,552 | | | | 3,741 | |
EverBank Financial | | | 8,800 | | | | 171 | |
Evercore Partners, Cl A | | | 3,328 | | | | 229 | |
EZCORP, Cl A* | | | 4,134 | | | | 44 | |
Farmers Capital Bank | | | 601 | | | | 25 | |
Farmers National Banc | | | 2,029 | | | | 29 | |
FB Financial* | | | 700 | | | | 18 | |
FBL Financial Group, Cl A | | | 803 | | | | 63 | |
FBR | | | 700 | | | | 9 | |
FCB Financial Holdings, Cl A* | | | 2,447 | | | | 117 | |
Federal Agricultural Mortgage, Cl C | | | 701 | | | | 40 | |
Federated National Holding | | | 1,027 | | | | 19 | |
Fidelity & Guaranty Life | | | 972 | | | | 23 | |
Fidelity Southern | | | 1,812 | | | | 43 | |
Fifth Street Asset Management, Cl A | | | 300 | | | | 2 | |
Financial Engines | | | 36,825 | | | | 1,353 | |
Financial Institutions | | | 1,200 | | | | 41 | |
First Bancorp | | | 2,507 | | | | 74 | |
First BanCorp* | | | 9,713 | | | | 64 | |
First Busey | | | 2,528 | | | | 78 | |
First Business Financial Services | | | 600 | | | | 14 | |
First Citizens BancShares, Cl A | | | 647 | | | | 230 | |
First Commonwealth Financial | | | 7,234 | | | | 103 | |
First Community Bancshares | | | 1,276 | | | | 38 | |
First Community Financial Partners* | | | 1,110 | | | | 13 | |
First Connecticut Bancorp | | | 45,899 | | | | 1,040 | |
First Defiance Financial | | | 719 | | | | 36 | |
First Financial | | | 817 | | | | 43 | |
First Financial Bancorp | | | 43,439 | | | | 1,236 | |
First Financial Bankshares | | | 5,438 | | | | 246 | |
First Financial Northwest | | | 900 | | | | 18 | |
First Foundation* | | | 1,078 | | | | 31 | |
First Horizon National | | | 131,770 | | | | 2,637 | |
First Internet Bancorp | | | 500 | | | | 16 | |
First Interstate BancSystem, Cl A | | | 1,609 | | | | 68 | |
First Merchants | | | 40,196 | | | | 1,513 | |
The accompanying notes are an integral part of the financial statements.
44
| | |
| THE KP FUNDS | | December 31, 2016 |
| | | | | | | | |
| Description | | Shares | | | Value
(000) | |
First Mid-Illinois Bancshares | | | 600 | | | $ | 20 | |
First Midwest Bancorp | | | 67,070 | | | | 1,692 | |
First NBC Bank Holding* | | | 38,549 | | | | 281 | |
First Northwest Bancorp* | | | 906 | | | | 14 | |
First of Long Island | | | 1,745 | | | | 50 | |
First Republic Bank | | | 22,900 | | | | 2,110 | |
FirstCash | | | 20,192 | | | | 948 | |
Flagstar Bancorp* | | | 1,709 | | | | 46 | |
Flushing Financial | | | 2,269 | | | | 67 | |
FNB | | | 292,065 | | | | 4,681 | |
FNFV Group* | | | 5,372 | | | | 74 | |
Franklin Financial Network* | | | 1,065 | | | | 45 | |
Fulton Financial | | | 14,449 | | | | 272 | |
GAIN Capital Holdings | | | 2,900 | | | | 19 | |
GAMCO Investors, Cl A | | | 358 | | | | 11 | |
Genworth Financial, Cl A* | | | 43,008 | | | | 164 | |
German American Bancorp | | | 1,159 | | | | 61 | |
Glacier Bancorp | | | 6,496 | | | | 235 | |
Global Indemnity* | | | 700 | | | | 27 | |
Great Ajax‡ | | | 1,400 | | | | 19 | |
Great Southern Bancorp | | | 876 | | | | 48 | |
Great Western Bancorp | | | 55,131 | | | | 2,403 | |
Green Bancorp* | | | 1,689 | | | | 26 | |
Green Dot, Cl A* | | | 3,485 | | | | 82 | |
Greenhill | | | 2,269 | | | | 63 | |
Greenlight Capital, Cl A* | | | 2,399 | | | | 55 | |
Guaranty Bancorp | | | 96,310 | | | | 2,331 | |
Hallmark Financial Services* | | | 1,100 | | | | 13 | |
Hancock Holding | | | 40,657 | | | | 1,752 | |
Hanmi Financial | | | 2,562 | | | | 89 | |
Hannon Armstrong Sustainable Infrastructure Capital‡ | | | 103,247 | | | | 1,961 | |
Hanover Insurance Group | | | 19,177 | | | | 1,745 | |
HarborOne Bancorp* | | | 1,194 | | | | 23 | |
HCI Group | | | 700 | | | | 28 | |
Heartland Financial USA | | | 1,993 | | | | 96 | |
Hennessy Advisors | | | 300 | | | | 10 | |
Heritage Commerce | | | 161,006 | | | | 2,323 | |
Heritage Financial | | | 126,666 | | | | 3,262 | |
Heritage Insurance Holdings | | | 2,300 | | | | 36 | |
Heritage Oaks Bancorp | | | 67,410 | | | | 831 | |
Hilltop Holdings | | | 6,404 | | | | 191 | |
Hingham Institution for Savings | | | 100 | | | | 20 | |
Home Bancorp | | | 470 | | | | 18 | |
Home BancShares | | | 10,184 | | | | 283 | |
HomeStreet* | | | 1,930 | | | | 61 | |
HomeTrust Bancshares* | | | 1,351 | | | | 35 | |
| | | | | | | | |
| Description | | Shares | | | Value
(000) | |
Hope Bancorp | | | 10,933 | | | $ | 239 | |
Horace Mann Educators | | | 93,949 | | | | 4,021 | |
Horizon Bancorp | | | 1,601 | | | | 45 | |
Houlihan Lokey, Cl A | | | 996 | | | | 31 | |
IBERIABANK | | | 36,085 | | | | 3,022 | |
Impac Mortgage Holdings* | | | 800 | | | | 11 | |
Independence Holding | | | 500 | | | | 10 | |
Independent Bank | | | 49,130 | | | | 3,380 | |
Independent Bank Group | | | 907 | | | | 57 | |
Infinity Property & Casualty | | | 881 | | | | 77 | |
International Bancshares | | | 4,673 | | | | 191 | |
International. FCStone* | | | 1,230 | | | | 49 | |
Invesco Mortgage Capital‡ | | | 9,640 | | | | 141 | |
Investment Technology Group | | | 2,688 | | | | 53 | |
Investors Bancorp | | | 24,903 | | | | 347 | |
Investors Title | | | 100 | | | | 16 | |
James River Group Holdings | | | 1,165 | | | | 48 | |
Janus Capital Group | | | 12,344 | | | | 164 | |
KCG Holdings, Cl A* | | | 4,284 | | | | 57 | |
Kearny Financial | | | 7,535 | | | | 117 | |
Kemper | | | 3,394 | | | | 150 | |
Kinsale Capital Group | | | 545 | | | | 19 | |
Ladder Capital, Cl A‡ | | | 3,129 | | | | 43 | |
Ladenburg Thalmann Financial Services* | | | 8,400 | | | | 20 | |
Lake Sunapee Bank Group | | | 640 | | | | 15 | |
Lakeland Bancorp | | | 3,170 | | | | 62 | |
Lakeland Financial | | | 1,969 | | | | 93 | |
LCNB | | | 719 | | | | 17 | |
LegacyTexas Financial Group | | | 3,791 | | | | 163 | |
LendingClub* | | | 28,134 | | | | 148 | |
LendingTree* | | | 519 | | | | 53 | |
Live Oak Bancshares | | | 1,597 | | | | 30 | |
Macatawa Bank | | | 2,160 | | | | 22 | |
Maiden Holdings | | | 5,928 | | | | 103 | |
MainSource Financial Group | | | 1,884 | | | | 65 | |
Manning & Napier, Cl A | | | 1,600 | | | | 12 | |
MarketAxess Holdings | | | 3,919 | | | | 576 | |
Marlin Business Services | | | 800 | | | | 17 | |
MB Financial | | | 6,392 | | | | 302 | |
MBIA* | | | 10,745 | | | | 115 | |
MBT Financial | | | 1,453 | | | | 16 | |
Medley Management, Cl A | | | 300 | | | | 3 | |
Mercantile Bank | | | 1,298 | | | | 49 | |
Merchants Bancshares | | | 470 | | | | 25 | |
Meridian Bancorp | | | 3,940 | | | | 74 | |
Meta Financial Group | | | 672 | | | | 69 | |
The accompanying notes are an integral part of the financial statements.
45
| | |
| THE KP FUNDS | | December 31, 2016 |
| | | | | | | | |
| Description | | Shares | | | Value
(000) | |
MGIC Investment* | | | 28,576 | | | $ | 292 | |
Middleburg Financial | | | 383 | | | | 13 | |
Midland States Bancorp | | | 301 | | | | 11 | |
MidWestOne Financial Group | | | 674 | | | | 25 | |
Moelis, Cl A | | | 1,518 | | | | 51 | |
Mortgage Investment Trust | | | 2,294 | | | | 39 | |
MTGE Investment‡ | | | 3,757 | | | | 59 | |
MutualFirst Financial | | | 444 | | | | 15 | |
National Bank Holdings, Cl A | | | 103,801 | | | | 3,310 | |
National Bankshares | | | 600 | | | | 26 | |
National Commerce* | | | 700 | | | | 26 | |
National General Holdings | | | 3,954 | | | | 99 | |
National Western Life Group, Cl A | | | 193 | | | | 60 | |
Nationstar Mortgage Holdings* | | | 2,642 | | | | 48 | |
Navigators Group | | | 917 | | | | 108 | |
NBT Bancorp | | | 3,628 | | | | 152 | |
Nelnet, Cl A | | | 1,652 | | | | 84 | |
New Residential Investment‡ | | | 20,354 | | | | 320 | |
New York Mortgage Trust‡ | | | 8,986 | | | | 59 | |
NewStar Financial* | | | 2,200 | | | | 20 | |
Nicolet Bankshares* | | | 620 | | | | 30 | |
NMI Holdings, Cl A* | | | 4,034 | | | | 43 | |
Northfield Bancorp | | | 3,437 | | | | 69 | |
Northrim BanCorp | | | 550 | | | | 17 | |
Northwest Bancshares | | | 61,880 | | | | 1,117 | |
OceanFirst Financial | | | 2,300 | | | | 69 | |
Ocwen Financial* | | | 8,217 | | | | 44 | |
OFG Bancorp | | | 3,533 | | | | 46 | |
Old Line Bancshares | | | 683 | | | | 16 | |
Old National Bancorp | | | 150,461 | | | | 2,731 | |
Old Second Bancorp | | | 2,347 | | | | 26 | |
OM Asset Management | | | 158,862 | | | | 2,303 | |
On Deck Capital* | | | 3,918 | | | | 18 | |
OneBeacon Insurance Group, Cl A | | | 33,174 | | | | 532 | |
Oppenheimer Holdings, Cl A | | | 704 | | | | 13 | |
Opus Bank | | | 48,737 | | | | 1,465 | |
Orchid Island Capital, Cl A‡ | | | 1,968 | | | | 21 | |
Oritani Financial | | | 3,151 | | | | 59 | |
Orrstown Financial Services | | | 604 | | | | 14 | |
Owens Realty Mortgage‡ | | | 1,000 | | | | 19 | |
Pacific Continental | | | 1,698 | | | | 37 | |
Pacific Mercantile Bancorp* | | | 1,600 | | | | 12 | |
Pacific Premier Bancorp* | | | 11,579 | | | | 409 | |
PacWest Bancorp | | | 24,027 | | | | 1,308 | |
Park National | | | 1,139 | | | | 136 | |
Park Sterling | | | 257,242 | | | | 2,776 | |
| | | | | | | | |
| Description | | Shares | | | Value
(000) | |
Patriot National* | | | 800 | | | $ | 4 | |
Peapack Gladstone Financial | | | 1,284 | | | | 40 | |
Penns Woods Bancorp | | | 352 | | | | 18 | |
PennyMac Financial Services, Cl A* | | | 1,100 | | | | 18 | |
PennyMac Mortgage Investment Trust‡ | | | 5,566 | | | | 91 | |
Peoples Bancorp | | | 1,328 | | | | 43 | |
Peoples Financial Services | | | 600 | | | | 29 | |
People’s Utah Bancorp | | | 1,061 | | | | 28 | |
PHH* | | | 4,326 | | | | 66 | |
PICO Holdings* | | | 1,900 | | | | 29 | |
Pinnacle Financial Partners | | | 3,671 | | | | 254 | |
Piper Jaffray* | | | 1,183 | | | | 86 | |
PJT Partners | | | 1,447 | | | | 45 | |
PRA Group* | | | 3,944 | | | | 154 | |
Preferred Bank | | | 991 | | | | 52 | |
Premier Financial Bancorp | | | 990 | | | | 20 | |
Primerica | | | 59,464 | | | | 4,111 | |
PrivateBancorp | | | 40,834 | | | | 2,213 | |
Prosperity Bancshares | | | 27,277 | | | | 1,958 | |
Provident Bancorp* | | | 360 | | | | 6 | |
Provident Financial Holdings | | | 539 | | | | 11 | |
Provident Financial Services | | | 5,226 | | | | 148 | |
Pzena Investment Management, Cl A | | | 1,600 | | | | 18 | |
QCR Holdings | | | 972 | | | | 42 | |
Radian Group | | | 90,489 | | | | 1,628 | |
Redwood Trust‡ | | | 6,229 | | | | 95 | |
Regional Management* | | | 900 | | | | 24 | |
Renasant | | | 3,495 | | | | 148 | |
Republic Bancorp, Cl A | | | 789 | | | | 31 | |
Republic First Bancorp* | | | 4,646 | | | | 39 | |
Resource Capital‡ | | | 2,658 | | | | 22 | |
RLI | | | 3,245 | | | | 205 | |
S&T Bancorp | | | 2,789 | | | | 109 | |
Safeguard Scientifics* | | | 1,644 | | | | 22 | |
Safety Insurance Group | | | 1,175 | | | | 87 | |
Sandy Spring Bancorp | | | 1,922 | | | | 77 | |
Seacoast Banking Corp of Florida* | | | 2,418 | | | | 53 | |
Selective Insurance Group | | | 4,849 | | | | 209 | |
ServisFirst Bancshares | | | 3,943 | | | | 148 | |
Shore Bancshares | | | 1,024 | | | | 16 | |
SI Financial Group | | | 909 | | | | 14 | |
Sierra Bancorp | | | 951 | | | | 25 | |
Silvercrest Asset Management Group, Cl A | | | 700 | | | | 9 | |
Simmons First National, Cl A | | | 2,506 | | | | 156 | |
Solar Capital | | | 46,163 | | | | 961 | |
South State | | | 2,020 | | | | 177 | |
The accompanying notes are an integral part of the financial statements.
46
| | |
| THE KP FUNDS | | December 31, 2016 |
| | | | | | | | |
| Description | | Shares | | | Value
(000) | |
Southern First Bancshares* | | | 468 | | | $ | 17 | |
Southern Missouri Bancorp | | | 477 | | | | 17 | |
Southern National Bancorp of Virginia | | | 62,365 | | | | 1,019 | |
Southside Bancshares | | | 2,302 | | | | 87 | |
Southwest Bancorp | | | 68,582 | | | | 1,989 | |
State Auto Financial | | | 20,865 | | | | 559 | |
State Bank Financial | | | 85,013 | | | | 2,283 | |
State National | | | 2,492 | | | | 35 | |
Sterling Bancorp | | | 10,797 | | | | 253 | |
Stewart Information Services | | | 1,867 | | | | 86 | |
Stifel Financial* | | | 26,842 | | | | 1,341 | |
Stock Yards Bancorp | | | 1,735 | | | | 81 | |
Stonegate Bank | | | 31,830 | | | | 1,328 | |
Stonegate Mortgage* | | | 68,720 | | | | 411 | |
Suffolk Bancorp | | | 1,000 | | | | 43 | |
Summit Financial Group | | | 680 | | | | 19 | |
Sun Bancorp | | | 940 | | | | 24 | |
Sunshine Bancorp* | | | 19,128 | | | | 328 | |
Synovus Financial | | | 39,240 | | | | 1,612 | |
TCF Financial | | | 120,695 | | | | 2,364 | |
Territorial Bancorp | | | 684 | | | | 22 | |
Texas Capital Bancshares* | | | 10,156 | | | | 796 | |
Third Point Reinsurance* | | | 5,397 | | | | 62 | |
Tiptree Financial | | | 1,866 | | | | 11 | |
Tompkins Financial | | | 1,185 | | | | 112 | |
Towne Bank | | | 4,778 | | | | 159 | |
TriCo Bancshares | | | 1,652 | | | | 56 | |
TriState Capital Holdings* | | | 1,791 | | | | 40 | |
Triumph Bancorp* | | | 1,400 | | | | 37 | |
Trupanion* | | | 1,175 | | | | 18 | |
TrustCo Bank | | | 7,457 | | | | 65 | |
Trustmark | | | 5,753 | | | | 205 | |
UMB Financial | | | 29,922 | | | | 2,308 | |
Umpqua Holdings | | | 78,668 | | | | 1,477 | |
Union Bankshares | | | 4,033 | | | | 147 | |
United Bankshares | | | 5,594 | | | | 259 | |
United Community Banks | | | 5,994 | | | | 178 | |
United Community Financial | | | 4,100 | | | | 37 | |
United Financial Bancorp | | | 4,095 | | | | 74 | |
United Fire Group | | | 1,764 | | | | 87 | |
United Insurance Holdings | | | 1,402 | | | | 21 | |
Universal Insurance Holdings | | | 2,671 | | | | 76 | |
Univest Corp of Pennsylvania | | | 2,025 | | | | 63 | |
Valley National Bancorp | | | 21,106 | | | | 246 | |
Veritex Holdings* | | | 674 | | | | 18 | |
Virtu Financial, Cl A | | | 2,058 | | | | 33 | |
| | | | | | | | |
| Description | | Shares | | | Value
(000) | |
Virtus Investment Partners | | | 477 | | | $ | 56 | |
Waddell & Reed Financial, Cl A | | | 6,802 | | | | 133 | |
Walker & Dunlop* | | | 2,248 | | | | 70 | |
Walter Investment Management* | | | 2,201 | | | | 10 | |
Washington Federal | | | 7,626 | | | | 262 | |
Washington Trust Bancorp | | | 1,216 | | | | 68 | |
WashingtonFirst Bankshares | | | 23,361 | | | | 677 | |
Waterstone Financial | | | 2,078 | | | | 38 | |
Webster Financial | | | 7,697 | | | | 418 | |
WesBanco | | | 54,291 | | | | 2,338 | |
West Bancorporation | | | 1,400 | | | | 35 | |
Westamerica Bancorporation | | | 6,639 | | | | 418 | |
Western Alliance Bancorp* | | | 32,855 | | | | 1,600 | |
Western Asset Mortgage Capital‡ | | | 3,343 | | | | 34 | |
Western New England Bancorp | | | 2,500 | | | | 23 | |
Westwood Holdings Group | | | 652 | | | | 39 | |
Wins Finance Holdings* | | | 100 | | | | 18 | |
Wintrust Financial | | | 4,306 | | | | 312 | |
WisdomTree Investments | | | 9,388 | | | | 105 | |
WMIH* | | | 16,581 | | | | 26 | |
World Acceptance* | | | 494 | | | | 32 | |
WSFS Financial | | | 2,339 | | | | 108 | |
Xenith Bankshares* | | | 630 | | | | 18 | |
Yadkin Financial | | | 4,270 | | | | 146 | |
Zions Bancorporation | | | 60,500 | | | | 2,604 | |
| | | | | | | | |
| | | | | | | 161,569 | |
| | | | | | | | |
Health Care — 10.5% | |
AAC Holdings* | | | 1,000 | | | | 7 | |
Abaxis | | | 1,791 | | | | 95 | |
ABIOMED* | | | 15,160 | | | | 1,708 | |
Acadia Healthcare* | | | 9,447 | | | | 313 | |
Accelerate Diagnostics* | | | 1,881 | | | | 39 | |
Acceleron Pharma* | | | 2,238 | | | | 57 | |
Accuray* | | | 7,069 | | | | 33 | |
AcelRx Pharmaceuticals* | | | 3,700 | | | | 10 | |
Aceto | | | 2,376 | | | | 52 | |
Achillion Pharmaceuticals* | | | 9,568 | | | | 40 | |
Aclaris Therapeutics* | | | 1,075 | | | | 29 | |
Acorda Therapeutics* | | | 3,511 | | | | 66 | |
Adamas Pharmaceuticals* | | | 1,363 | | | | 23 | |
Addus HomeCare* | | | 600 | | | | 21 | |
Adeptus Health, Cl A* | | | 1,300 | | | | 10 | |
Aduro Biotech* | | | 2,896 | | | | 33 | |
Advaxis* | | | 2,927 | | | | 21 | |
Adverum Biotechnologies* | | | 1,400 | | | | 4 | |
Aerie Pharmaceuticals* | | | 2,467 | | | | 93 | |
The accompanying notes are an integral part of the financial statements.
47
| | |
| THE KP FUNDS | | December 31, 2016 |
| | | | | | | | |
| Description | | Shares | | | Value
(000) | |
Aevi Genomic Medicine* | | | 2,219 | | �� | $ | 11 | |
Agenus* | | | 6,400 | | | | 26 | |
Agile Therapeutics* | | | 1,100 | | | | 6 | |
Aimmune Therapeutics* | | | 2,146 | | | | 44 | |
Air Methods* | | | 2,906 | | | | 93 | |
Akebia Therapeutics* | | | 2,934 | | | | 31 | |
Albany Molecular Research* | | | 2,300 | | | | 43 | |
Alder Biopharmaceuticals* | | | 3,825 | | | | 80 | |
Align Technology* | | | 29,678 | | | | 2,853 | |
Almost Family* | | | 700 | | | | 31 | |
AMAG Pharmaceuticals* | | | 2,848 | | | | 99 | |
Amedisys* | | | 2,284 | | | | 97 | |
American Renal Associates Holdings* | | | 48,953 | | | | 1,042 | |
Amicus Therapeutics* | | | 11,634 | | | | 58 | |
AMN Healthcare Services* | | | 4,047 | | | | 156 | |
Amphastar Pharmaceuticals* | | | 2,906 | | | | 54 | |
Ampio Pharmaceuticals* | | | 4,600 | | | | 4 | |
Analogic | | | 1,017 | | | | 84 | |
Anavex Life Sciences* | | | 2,500 | | | | 10 | |
AngioDynamics* | | | 2,203 | | | | 37 | |
ANI Pharmaceuticals* | | | 647 | | | | 39 | |
Anika Therapeutics* | | | 1,151 | | | | 56 | |
Anthera Pharmaceuticals* | | | 3,900 | | | | 3 | |
Applied Genetic Technologies* | | | 1,300 | | | | 12 | |
Aptevo Therapeutics* | | | 1,689 | | | | 4 | |
Aratana Therapeutics* | | | 2,724 | | | | 20 | |
Ardelyx* | | | 2,550 | | | | 36 | |
Arena Pharmaceuticals* | | | 20,022 | | | | 28 | |
Argos Therapeutics* | | | 1,000 | | | | 5 | |
ARIAD Pharmaceuticals* | | | 15,101 | | | | 188 | |
Array BioPharma* | | | 14,322 | | | | 126 | |
Arrowhead Pharmaceuticals* | | | 6,000 | | | | 9 | |
Asterias Biotherapeutics* | | | 1,600 | | | | 7 | |
Atara Biotherapeutics* | | | 1,897 | | | | 27 | |
Athersys* | | | 8,000 | | | | 12 | |
AtriCure* | | | 2,566 | | | | 50 | |
Atrion | | | 111 | | | | 56 | |
Audentes Therapeutics* | | | 469 | | | | 9 | |
Avexis* | | | 595 | | | | 28 | |
Avinger* | | | 1,100 | | | | 4 | |
AxoGen* | | | 2,500 | | | | 23 | |
Axovant Sciences* | | | 1,996 | | | | 25 | |
Axsome Therapeutics* | | | 1,400 | | | | 9 | |
Bellicum Pharmaceuticals* | | | 1,711 | | | | 23 | |
BioCryst Pharmaceuticals* | | | 5,998 | | | | 38 | |
Bio-Path Holdings* | | | 8,700 | | | | 12 | |
| | | | | | | | |
| Description | | Shares | | | Value
(000) | |
BioScrip* | | | 9,900 | | | $ | 10 | |
BioSpecifics Technologies* | | | 500 | | | | 28 | |
BioTelemetry* | | | 2,203 | | | | 49 | |
BioTime* | | | 6,000 | | | | 22 | |
Bluebird Bio* | | | 9,969 | | | | 615 | |
Blueprint Medicines* | | | 1,634 | | | | 46 | |
Cambrex* | | | 2,726 | | | | 147 | |
Cantel Medical | | | 8,372 | | | | 659 | |
Capital Senior Living* | | | 2,297 | | | | 37 | |
Cara Therapeutics* | | | 1,715 | | | | 16 | |
Cardiovascular Systems* | | | 55,314 | | | | 1,339 | |
Castlight Health, Cl B* | | | 3,000 | | | | 15 | |
Catalent* | | | 8,492 | | | | 229 | |
Celldex Therapeutics* | | | 8,604 | | | | 30 | |
Cellular Biomedicine Group* | | | 993 | | | | 13 | |
Cempra* | | | 3,645 | | | | 10 | |
Cerus* | | | 8,271 | | | | 36 | |
Charles River Laboratories International* | | | 10,227 | | | | 779 | |
Chemed | | | 10,470 | | | | 1,679 | |
ChemoCentryx* | | | 1,879 | | | | 14 | |
Chimerix* | | | 4,000 | | | | 18 | |
ChromaDex* | | | 3,000 | | | | 10 | |
Cidara Therapeutics* | | | 1,400 | | | | 15 | |
Civitas Solutions* | | | 1,233 | | | | 25 | |
Clearside Biomedical* | | | 673 | | | | 6 | |
Clovis Oncology* | | | 2,595 | | | | 115 | |
Coherus Biosciences* | | | 26,532 | | | | 746 | |
Collegium Pharmaceutical* | | | 1,606 | | | | 25 | |
Community Health Systems* | | | 9,014 | | | | 50 | |
Computer Programs & Systems | | | 915 | | | | 22 | |
Concert Pharmaceuticals* | | | 1,346 | | | | 14 | |
ConforMIS* | | | 2,920 | | | | 24 | |
CONMED | | | 2,252 | | | | 99 | |
Corcept Therapeutics* | | | 6,100 | | | | 44 | |
Corindus Vascular Robotics* | | | 2,500 | | | | 2 | |
CorVel* | | | 900 | | | | 33 | |
Corvus Pharmaceuticals* | | | 271 | | | | 4 | |
Cotiviti Holdings* | | | 1,033 | | | | 36 | |
Cross Country Healthcare* | | | 82,249 | | | | 1,284 | |
CryoLife | | | 79,183 | | | | 1,516 | |
Curis* | | | 9,800 | | | | 30 | |
Cutera* | | | 1,000 | | | | 17 | |
Cynosure, Cl A* | | | 17,902 | | | | 816 | |
Cytokinetics* | | | 3,000 | | | | 36 | |
CytomX Therapeutics* | | | 1,668 | | | | 18 | |
CytRx* | | | 8,500 | | | | 3 | |
The accompanying notes are an integral part of the financial statements.
48
| | |
| THE KP FUNDS | | December 31, 2016 |
| | | | | | | | |
| Description | | Shares | | | Value
(000) | |
Depomed* | | | 72,083 | | | $ | 1,299 | |
Dermira* | | | 2,009 | | | | 61 | |
Dimension Therapeutics* | | | 1,300 | | | | 6 | |
Diplomat Pharmacy* | | | 3,734 | | | | 47 | |
Durect* | | | 10,400 | | | | 14 | |
Dynavax Technologies* | | | 3,174 | | | | 13 | |
Eagle Pharmaceuticals* | | | 12,283 | | | | 974 | |
Edge Therapeutics* | | | 1,327 | | | | 17 | |
Editas Medicine* | | | 561 | | | | 9 | |
Egalet* | | | 1,809 | | | | 14 | |
Eiger BioPharmaceuticals* | | | 400 | | | | 5 | |
Emergent BioSolutions* | | | 2,652 | | | | 87 | |
Enanta Pharmaceuticals* | | | 1,275 | | | | 43 | |
Endocyte* | | | 2,600 | | | | 7 | |
Endologix* | | | 6,619 | | | | 38 | |
Ensign Group | | | 3,899 | | | | 87 | |
Entellus Medical* | | | 612 | | | | 12 | |
Envision Healthcare* | | | 31,236 | | | | 1,977 | |
Enzo Biochem* | | | 3,240 | | | | 22 | |
Epizyme* | | | 3,286 | | | | 40 | |
Esperion Therapeutics* | | | 1,200 | | | | 15 | |
Evolent Health, Cl A* | | | 1,306 | | | | 19 | |
Exact Sciences* | | | 8,632 | | | | 115 | |
Exactech* | | | 852 | | | | 23 | |
Exelixis* | | | 111,581 | | | | 1,663 | |
FibroGen* | | | 4,276 | | | | 92 | |
Five Prime Therapeutics* | | | 2,203 | | | | 110 | |
Flex Pharma* | | | 1,300 | | | | 7 | |
Flexion Therapeutics* | | | 2,397 | | | | 46 | |
Fluidigm* | | | 2,298 | | | | 17 | |
Fortress Biotech* | | | 3,600 | | | | 10 | |
Foundation Medicine* | | | 1,202 | | | | 21 | |
Fulgent Genetics* | | | 700 | | | | 8 | |
Galena Biopharma* | | | 1,090 | | | | 2 | |
Genesis Healthcare, Cl A* | | | 4,000 | | | | 17 | |
GenMark Diagnostics* | | | 3,878 | | | | 47 | |
Genomic Health* | | | 1,525 | | | | 45 | |
Geron* | | | 12,328 | | | | 26 | |
Glaukos* | | | 1,365 | | | | 47 | |
Global Blood Therapeutics* | | | 1,500 | | | | 22 | |
Globus Medical, Cl A* | | | 5,995 | | | | 149 | |
GlycoMimetics* | | | 1,300 | | | | 8 | |
Haemonetics* | | | 4,370 | | | | 176 | |
Halozyme Therapeutics* | | | 8,903 | | | | 88 | |
Halyard Health* | | | 4,004 | | | | 148 | |
HealthEquity* | | | 3,691 | | | | 150 | |
| | | | | | | | |
| Description | | Shares | | | Value
(000) | |
HealthSouth | | | 140,845 | | | $ | 5,809 | |
HealthStream* | | | 2,101 | | | | 53 | |
Healthways* | | | 46,947 | | | | 1,068 | |
Heron Therapeutics* | | | 2,595 | | | | 34 | |
Heska* | | | 500 | | | | 36 | |
HMS Holdings* | | | 7,219 | | | | 131 | |
Horizon Pharma* | | | 13,750 | | | | 222 | |
ICON* | | | 11,445 | | | | 861 | |
ICU Medical* | | | 9,291 | | | | 1,369 | |
Idera Pharmaceuticals* | | | 7,300 | | | | 11 | |
IDEXX Laboratories* | | | 33,520 | | | | 3,932 | |
Ignyta* | | | 2,407 | | | | 13 | |
Immune Design* | | | 1,000 | | | | 6 | |
ImmunoGen* | | | 7,845 | | | | 16 | |
Immunomedics* | | | 8,700 | | | | 32 | |
Impax Laboratories* | | | 52,092 | | | | 690 | |
INC Research Holdings, Cl A* | | | 3,536 | | | | 186 | |
Infinity Pharmaceuticals* | | | 4,000 | | | | 5 | |
Innoviva* | | | 6,601 | | | | 71 | |
Inogen* | | | 1,332 | | | | 89 | |
Inotek Pharmaceuticals* | | | 1,800 | | | | 11 | |
Inovio Pharmaceuticals* | | | 5,419 | | | | 38 | |
Insmed* | | | 5,056 | | | | 67 | |
Insulet* | | | 4,924 | | | | 186 | |
Insys Therapeutics* | | | 1,918 | | | | 18 | |
Integer Holdings* | | | 2,497 | | | | 74 | |
Integra LifeSciences Holdings* | | | 20,065 | | | | 1,721 | |
Intellia Therapeutics* | | | 700 | | | | 9 | |
Intersect ENT* | | | 34,394 | | | | 416 | |
Intra-Cellular Therapies, Cl A* | | | 27,395 | | | | 413 | |
Invacare | | | 2,588 | | | | 34 | |
Invitae* | | | 2,858 | | | | 23 | |
InVivo Therapeutics Holdings* | | | 3,200 | | | | 13 | |
iRadimed* | | | 200 | | | | 2 | |
iRhythm Technologies* | | | 700 | | | | 21 | |
IRIDEX* | | | 800 | | | | 11 | |
Ironwood Pharmaceuticals, Cl A* | | | 11,053 | | | | 169 | |
K2M Group Holdings* | | | 122,543 | | | | 2,456 | |
Kadmon Holdings* | | | 1,300 | | | | 7 | |
Karyopharm Therapeutics* | | | 2,000 | | | | 19 | |
Keryx Biopharmaceuticals* | | | 6,447 | | | | 38 | |
Kindred Healthcare | | | 464,372 | | | | 3,645 | |
Kite Pharma* | | | 3,350 | | | | 150 | |
La Jolla Pharmaceutical* | | | 1,200 | | | | 21 | |
Landauer | | | 780 | | | | 38 | |
Lannett* | | | 2,262 | | | | 50 | |
The accompanying notes are an integral part of the financial statements.
49
| | |
| THE KP FUNDS | | December 31, 2016 |
| | | | | | | | |
| Description | | Shares | | | Value
(000) | |
LeMaitre Vascular | | | 1,200 | | | $ | 30 | |
Lexicon Pharmaceuticals* | | | 51,654 | | | | 714 | |
LHC Group* | | | 1,224 | | | | 56 | |
Ligand Pharmaceuticals* | | | 1,628 | | | | 165 | |
Lion Biotechnologies* | | | 4,700 | | | | 33 | |
Lipocine* | | | 1,700 | | | | 6 | |
Loxo Oncology* | | | 1,089 | | | | 35 | |
Luminex* | | | 3,243 | | | | 66 | |
MacroGenics* | | | 2,603 | | | | 53 | |
Magellan Health* | | | 2,030 | | | | 153 | |
MannKind* | | | 26,479 | | | | 17 | |
Masimo* | | | 3,482 | | | | 235 | |
Medicines* | | | 5,745 | | | | 195 | |
MediciNova* | | | 2,425 | | | | 15 | |
Medidata Solutions* | | | 23,591 | | | | 1,172 | |
MEDNAX* | | | 23,994 | | | | 1,599 | |
Medpace Holdings* | | | 665 | | | | 24 | |
Meridian Bioscience | | | 3,405 | | | | 60 | |
Merit Medical Systems* | | | 92,657 | | | | 2,455 | |
Merrimack Pharmaceuticals* | | | 9,965 | | | | 41 | |
Mettler-Toledo International* | | | 2,885 | | | | 1,208 | |
MiMedx Group* | | | 8,348 | | | | 74 | |
Minerva Neurosciences* | | | 1,700 | | | | 20 | |
Mirati Therapeutics* | | | 1,000 | | | | 5 | |
Molina Healthcare* | | | 3,692 | | | | 200 | |
Momenta Pharmaceuticals* | | | 5,307 | | | | 80 | |
MyoKardia* | | | 1,052 | | | | 14 | |
Myovant Sciences* | | | 1,200 | | | | 15 | |
Myriad Genetics* | | | 5,513 | | | | 92 | |
NanoString Technologies* | | | 9,361 | | | | 209 | |
NantHealth* | | | 541 | | | | 5 | |
NantKwest* | | | 1,300 | | | | 7 | |
Natera* | | | 2,130 | | | | 25 | |
National HealthCare | | | 914 | | | | 69 | |
National Research, Cl A | | | 800 | | | | 15 | |
Natus Medical* | | | 2,656 | | | | 92 | |
Nektar Therapeutics, Cl A* | | | 12,169 | | | | 149 | |
Neogen* | | | 3,107 | | | | 205 | |
NeoGenomics* | | | 146,910 | | | | 1,259 | |
Neos Therapeutics* | | | 1,122 | | | | 7 | |
Neurocrine Biosciences* | | | 9,200 | | | | 356 | |
Nevro* | | | 26,424 | | | | 1,920 | |
NewLink Genetics* | | | 1,841 | | | | 19 | |
Nobilis Health* | | | 5,800 | | | | 12 | |
Novan* | | | 500 | | | | 14 | |
Novavax* | | | 22,049 | | | | 28 | |
| | | | | | | | |
| Description | | Shares | | | Value
(000) | |
Novocure* | | | 4,136 | | | $ | 32 | |
NuVasive* | | | 56,442 | | | | 3,802 | |
NxStage Medical* | | | 5,450 | | | | 143 | |
Obalon Therapeutics* | | | 900 | | | | 8 | |
Ocular Therapeutix* | | | 2,000 | | | | 17 | |
Omeros* | | | 3,303 | | | | 33 | |
Omnicell* | | | 2,906 | | | | 99 | |
OncoMed Pharmaceuticals* | | | 1,800 | | | | 14 | |
Ophthotech* | | | 2,490 | | | | 12 | |
OraSure Technologies* | | | 4,426 | | | | 39 | |
Organovo Holdings* | | | 9,130 | | | | 31 | |
Orthofix International* | | | 1,430 | | | | 52 | |
Osiris Therapeutics* | | | 1,600 | | | | 8 | |
Otonomy* | | | 1,962 | | | | 31 | |
OvaScience* | | | 2,563 | | | | 4 | |
Owens & Minor | | | 5,330 | | | | 188 | |
Oxford Immunotec Global* | | | 1,900 | | | | 28 | |
Pacific Biosciences of California* | | | 6,558 | | | | 25 | |
Pacira Pharmaceuticals* | | | 2,976 | | | | 96 | |
Paratek Pharmaceuticals* | | | 1,600 | | | | 25 | |
PAREXEL International* | | | 37,258 | | | | 2,449 | |
PDL BioPharma | | | 14,931 | | | | 32 | |
Penumbra* | | | 2,180 | | | | 139 | |
Pfenex* | | | 1,487 | | | | 13 | |
PharmAthene* | | | 5,088 | | | | 17 | |
PharMerica* | | | 2,412 | | | | 61 | |
Phibro Animal Health, Cl A | | | 1,530 | | | | 45 | |
Portola Pharmaceuticals, Cl A* | | | 4,022 | | | | 90 | |
PRA Health Sciences* | | | 29,086 | | | | 1,603 | |
Prestige Brands Holdings* | | | 27,203 | | | | 1,417 | |
Progenics Pharmaceuticals* | | | 5,684 | | | | 49 | |
Protagonist Therapeutics* | | | 620 | | | | 14 | |
Proteostasis Therapeutics* | | | 700 | | | | 9 | |
Prothena* | | | 2,971 | | | | 146 | |
Providence Service* | | | 33,377 | | | | 1,270 | |
PTC Therapeutics* | | | 2,716 | | | | 30 | |
Puma Biotechnology* | | | 2,300 | | | | 71 | |
Quality Systems | | | 4,173 | | | | 55 | |
Quidel* | | | 58,334 | | | | 1,250 | |
Quorum Health* | | | 2,422 | | | | 18 | |
Ra Pharmaceuticals* | | | 900 | | | | 14 | |
Radius Health* | | | 2,577 | | | | 98 | |
RadNet* | | | 3,200 | | | | 21 | |
Reata Pharmaceuticals, Cl A* | | | 464 | | | | 10 | |
REGENXBIO* | | | 1,654 | | | | 31 | |
Regulus Therapeutics* | | | 2,500 | | | | 6 | |
The accompanying notes are an integral part of the financial statements.
50
| | |
| THE KP FUNDS | | December 31, 2016 |
| | | | | | | | |
| Description | | Shares | | | Value
(000) | |
Repligen* | | | 2,757 | | | $ | 85 | |
Retrophin* | | | 2,957 | | | | 56 | |
Revance Therapeutics* | | | 1,669 | | | | 35 | |
Rigel Pharmaceuticals* | | | 8,000 | | | | 19 | |
Rockwell Medical* | | | 3,913 | | | | 26 | |
RTI Surgical* | | | 4,100 | | | | 13 | |
Sage Therapeutics* | | | 2,461 | | | | 126 | |
Sangamo BioSciences* | | | 6,333 | | | | 19 | |
Sarepta Therapeutics* | | | 4,095 | | | | 112 | |
SciClone Pharmaceuticals* | | | 4,092 | | | | 44 | |
Second Sight Medical Products* | | | 1,282 | | | | 3 | |
Select Medical Holdings* | | | 8,717 | | | | 116 | |
Selecta Biosciences* | | | 400 | | | | 7 | |
Senseonics Holdings* | | | 2,900 | | | | 8 | |
Seres Therapeutics* | | | 1,456 | | | | 14 | |
Sorrento Therapeutics* | | | 2,100 | | | | 10 | |
Spark Therapeutics* | | | 1,561 | | | | 78 | |
Spectranetics* | | | 42,805 | | | | 1,049 | |
Spectrum Pharmaceuticals* | | | 6,799 | | | | 30 | |
STAAR Surgical* | | | 3,500 | | | | 38 | |
Stemline Therapeutics* | | | 1,300 | | | | 14 | |
Sucampo Pharmaceuticals, Cl A* | | | 2,100 | | | | 28 | |
Supernus Pharmaceuticals* | | | 52,376 | | | | 1,322 | |
Surgery Partners* | | | 1,520 | | | | 24 | |
Surgical Care Affiliates* | | | 2,192 | | | | 101 | |
Surmodics* | | | 1,100 | | | | 28 | |
Syndax Pharmaceuticals* | | | 300 | | | | 2 | |
Synergy Pharmaceuticals* | | | 14,815 | | | | 90 | |
Synthetic Biologics* | | | 7,900 | | | | 6 | |
Syros Pharmaceuticals* | | | 380 | | | | 5 | |
T2 Biosystems* | | | 1,700 | | | | 9 | |
Tabula Rasa HealthCare* | | | 700 | | | | 10 | |
Tactile Systems Technology* | | | 340 | | | | 6 | |
Tandem Diabetes Care* | | | 2,000 | | | | 4 | |
Team Health Holdings* | | | 5,781 | | | | 251 | |
Teladoc* | | | 1,694 | | | | 28 | |
Teligent* | | | 3,381 | | | | 22 | |
TESARO* | | | 21,524 | | | | 2,894 | |
Tetraphase Pharmaceuticals* | | | 3,000 | | | | 12 | |
TG Therapeutics* | | | 3,200 | | | | 15 | |
TherapeuticsMD* | | | 12,255 | | | | 71 | |
Theravance Biopharma* | | | 3,462 | | | | 110 | |
Titan Pharmaceuticals* | | | 2,000 | | | | 8 | |
Tokai Pharmaceuticals* | | | 1,000 | | | | 1 | |
TransEnterix* | | | 5,800 | | | | 8 | |
Trevena* | | | 3,653 | | | | 21 | |
| | | | | | | | |
| Description | | Shares | | | Value
(000) | |
Triple-S Management, Cl B* | | | 1,903 | | | $ | 39 | |
Trovagene* | | | 1,700 | | | | 4 | |
Ultragenyx Pharmaceutical* | | | 10,371 | | | | 728 | |
Universal American* | | | 3,749 | | | | 37 | |
US Physical Therapy | | | 988 | | | | 69 | |
Utah Medical Products | | | 300 | | | | 22 | |
Vanda Pharmaceuticals* | | | 88,782 | | | | 1,415 | |
Vascular Solutions* | | | 1,376 | | | | 77 | |
Veracyte* | | | 1,300 | | | | 10 | |
Versartis* | | | 2,559 | | | | 38 | |
Vital Therapies* | | | 1,934 | | | | 8 | |
Vocera Communications* | | | 72,799 | | | | 1,345 | |
Voyager Therapeutics* | | | 958 | | | | 12 | |
vTv Therapeutics, Cl A* | | | 1,400 | | | | 7 | |
VWR* | | | 124,870 | | | | 3,124 | |
WaVe Life Sciences* | | | 604 | | | | 16 | |
WellCare Health Plans* | | | 23,200 | | | | 3,180 | |
Wright Medical Group* | | | 49,381 | | | | 1,135 | |
XBiotech* | | | 1,428 | | | | 14 | |
Xencor* | | | 3,126 | | | | 82 | |
Zafgen* | | | 2,600 | | | | 8 | |
Zeltiq Aesthetics* | | | 24,248 | | | | 1,055 | |
ZIOPHARM Oncology* | | | 9,924 | | | | 53 | |
Zogenix* | | | 2,026 | | | | 25 | |
| | | | | | | | |
| | | | | | | 97,619 | |
| | | | | | | | |
Industrials — 17.8% | |
AAON | | | 3,299 | | | | 109 | |
AAR | | | 45,949 | | | | 1,519 | |
ABM Industries | | | 4,759 | | | | 194 | |
Acacia Research | | | 4,419 | | | | 29 | |
ACCO Brands* | | | 8,682 | | | | 113 | |
Actuant, Cl A | | | 5,034 | | | | 131 | |
Advanced Disposal Services* | | | 1,800 | | | | 40 | |
Advanced Drainage Systems | | | 2,836 | | | | 58 | |
Advisory Board* | | | 3,345 | | | | 111 | |
Aegion, Cl A* | | | 2,854 | | | | 68 | |
AerCap Holdings* | | | 37,516 | | | | 1,561 | |
Aerojet Rocketdyne Holdings* | | | 4,865 | | | | 87 | |
Aerovironment* | | | 1,672 | | | | 45 | |
Air Transport Services Group* | | | 3,964 | | | | 63 | |
Aircastle | | | 3,899 | | | | 81 | |
Alamo Group | | | 770 | | | | 59 | |
Albany International, Cl A | | | 18,880 | | | | 874 | |
Allegiant Travel, Cl A | | | 1,127 | | | | 188 | |
Allied Motion Technologies | | | 600 | | | | 13 | |
Altra Industrial Motion | | | 31,120 | | | | 1,148 | |
The accompanying notes are an integral part of the financial statements.
51
| | |
| THE KP FUNDS | | December 31, 2016 |
| | | | | | | | |
| Description | | Shares | | | Value
(000) | |
Ameresco, Cl A* | | | 1,900 | | | $ | 10 | |
American Railcar Industries | | | 700 | | | | 32 | |
American Superconductor* | | | 1,200 | | | | 9 | |
American Woodmark* | | | 1,129 | | | | 85 | |
AMETEK | | | 48,000 | | | | 2,332 | |
Apogee Enterprises | | | 2,433 | | | | 130 | |
Applied Industrial Technologies | | | 3,100 | | | | 184 | |
Aqua Metals* | | | 1,100 | | | | 14 | |
ARC Document Solutions* | | | 3,500 | | | | 18 | |
ArcBest | | | 36,528 | | | | 1,010 | |
Argan | | | 1,092 | | | | 77 | |
Armstrong Flooring* | | | 1,911 | | | | 38 | |
Astec Industries | | | 25,586 | | | | 1,726 | |
Astronics, Cl A* | | | 1,578 | | | | 53 | |
Atkore International Group* | | | 992 | | | | 24 | |
Atlas Air Worldwide Holdings* | | | 2,003 | | | | 104 | |
AZZ | | | 12,585 | | | | 804 | |
Babcock & Wilcox Enterprises* | | | 3,734 | | | | 62 | |
Barnes Group | | | 38,946 | | | | 1,847 | |
Barrett Business Services | | | 600 | | | | 38 | |
Beacon Roofing Supply* | | | 5,095 | | | | 235 | |
Blue Bird* | | | 400 | | | | 6 | |
BMC Stock Holdings* | | | 11,002 | | | | 215 | |
Brady, Cl A | | | 3,914 | | | | 147 | |
Briggs & Stratton | | | 3,469 | | | | 77 | |
Brink’s | | | 3,852 | | | | 159 | |
Builders FirstSource* | | | 6,848 | | | | 75 | |
BWX Technologies, Cl W | | | 35,495 | | | | 1,409 | |
Caesarstone* | | | 1,946 | | | | 56 | |
CAI International* | | | 60,498 | | | | 525 | |
Casella Waste Systems, Cl A* | | | 79,234 | | | | 983 | |
CBIZ* | | | 4,031 | | | | 55 | |
CEB | | | 39,185 | | | | 2,375 | |
CECO Environmental | | | 2,390 | | | | 33 | |
Celadon Group | | | 371,576 | | | | 2,657 | |
Chart Industries* | | | 2,497 | | | | 90 | |
CIRCOR International | | | 1,346 | | | | 87 | |
CLARCOR | | | 3,989 | | | | 329 | |
Cogint* | | | 1,900 | | | | 7 | |
Columbus McKinnon | | | 65,085 | | | | 1,760 | |
Comfort Systems USA | | | 3,029 | | | | 101 | |
Commercial Vehicle Group* | | | 155,265 | | | | 859 | |
Continental Building Products* | | | 2,877 | | | | 66 | |
Costamare | | | 2,161 | | | | 12 | |
Covanta Holding | | | 119,136 | | | | 1,859 | |
Covenant Transportation Group, Cl A* | | | 148,402 | | | | 2,870 | |
| | | | | | | | |
| Description | | Shares | | | Value
(000) | |
CPI Aerostructures* | | | 129,480 | | | $ | 1,198 | |
CRA International | | | 651 | | | | 24 | |
CSW Industrials* | | | 1,177 | | | | 43 | |
Cubic | | | 2,058 | | | | 99 | |
Curtiss-Wright | | | 3,718 | | | | 366 | |
Deluxe | | | 50,064 | | | | 3,585 | |
DigitalGlobe* | | | 116,196 | | | | 3,328 | |
DMC Global | | | 1,145 | | | | 18 | |
Douglas Dynamics | | | 1,807 | | | | 61 | |
Ducommun* | | | 900 | | | | 23 | |
DXP Enterprises* | | | 52,295 | | | | 1,817 | |
Dycom Industries* | | | 37,566 | | | | 3,016 | |
Echo Global Logistics* | | | 78,757 | | | | 1,973 | |
EMCOR Group | | | 60,750 | | | | 4,300 | |
Encore Wire | | | 1,651 | | | | 72 | |
Energous* | | | 1,210 | | | | 20 | |
Energy Recovery* | | | 2,873 | | | | 30 | |
EnerSys | | | 3,659 | | | | 286 | �� |
Engility Holdings* | | | 1,472 | | | | 50 | |
Ennis | | | 2,090 | | | | 36 | |
EnPro Industries | | | 1,763 | | | | 119 | |
ESCO Technologies | | | 2,075 | | | | 118 | |
Essendant | | | 3,043 | | | | 64 | |
Esterline Technologies* | | | 2,520 | | | | 225 | |
ExOne* | | | 892 | | | | 8 | |
Exponent | | | 2,191 | | | | 132 | |
Federal Signal | | | 4,900 | | | | 76 | |
Forward Air | | | 22,337 | | | | 1,058 | |
Franklin Covey* | | | 834 | | | | 17 | |
Franklin Electric | | | 3,939 | | | | 153 | |
FreightCar America | | | 1,000 | | | | 15 | |
FTI Consulting* | | | 3,549 | | | | 160 | |
FuelCell Energy* | | | 2,250 | | | | 4 | |
G&K Services, Cl A | | | 1,675 | | | | 162 | |
GATX | | | 56,568 | | | | 3,482 | |
Gencor Industries* | | | 633 | | | | 10 | |
Generac Holdings* | | | 5,571 | | | | 227 | |
General Cable | | | 3,961 | | | | 75 | |
Genesee & Wyoming, Cl A* | | | 60,043 | | | | 4,168 | |
Gibraltar Industries* | | | 2,575 | | | | 107 | |
Global Brass & Copper Holdings | | | 1,725 | | | | 59 | |
GMS* | | | 700 | | | | 20 | |
Gorman-Rupp | | | 1,439 | | | | 45 | |
GP Strategies* | | | 17,401 | | | | 498 | |
Graham | | | 900 | | | | 20 | |
Granite Construction | | | 47,801 | | | | 2,629 | |
The accompanying notes are an integral part of the financial statements.
52
| | |
| THE KP FUNDS | | December 31, 2016 |
| | | | | | | | |
| Description | | Shares | | | Value
(000) | |
Great Lakes Dredge & Dock* | | | 5,100 | | | $ | 21 | |
Greenbrier | | | 2,215 | | | | 92 | |
Griffon | | | 2,470 | | | | 65 | |
H&E Equipment Services | | | 2,578 | | | | 60 | |
Hardinge | | | 1,200 | | | | 13 | |
Harsco | | | 163,860 | | | | 2,228 | |
Hawaiian Holdings* | | | 4,407 | | | | 251 | |
HC2 Holdings* | | | 2,700 | | | | 16 | |
Healthcare Services Group | | | 6,000 | | | | 235 | |
Heartland Express | | | 3,762 | | | | 77 | |
Heidrick & Struggles International | | | 1,600 | | | | 39 | |
Heritage-Crystal Clean* | | | 1,100 | | | | 17 | |
Herman Miller | | | 5,115 | | | | 175 | |
Hill International* | | | 2,100 | | | | 9 | |
Hillenbrand | | | 5,039 | | | | 193 | |
HNI | | | 3,865 | | | | 216 | |
Hub Group, Cl A* | | | 2,738 | | | | 120 | |
Hudson Technologies* | | | 109,792 | | | | 879 | |
Hurco | | | 500 | | | | 17 | |
Huron Consulting Group* | | | 1,765 | | | | 89 | |
Hyster-Yale Materials Handling | | | 770 | | | | 49 | |
ICF International* | | | 1,474 | | | | 81 | |
IES Holdings* | | | 639 | | | | 12 | |
InnerWorkings* | | | 176,559 | | | | 1,739 | |
Insperity | | | 1,282 | | | | 91 | |
Insteel Industries | | | 1,431 | | | | 51 | |
Interface, Cl A | | | 134,684 | | | | 2,498 | |
ITT | | | 129,427 | | | | 4,991 | |
John Bean Technologies | | | 19,566 | | | | 1,682 | |
Joy Global | | | 8,403 | | | | 235 | |
Kadant | | | 876 | | | | 54 | |
Kaman | | | 2,191 | | | | 107 | |
KBR | | | 292,468 | | | | 4,882 | |
Kelly Services, Cl A | | | 2,397 | | | | 55 | |
Kennametal | | | 41,302 | | | | 1,291 | |
KEYW Holding* | | | 2,931 | | | | 35 | |
Kforce | | | 2,002 | | | | 46 | |
Kimball International, Cl B | | | 3,015 | | | | 53 | |
Kirby* | | | 37,660 | | | | 2,505 | |
KLX* | | | 24,437 | | | | 1,102 | |
Knight Transportation | | | 5,715 | | | | 189 | |
Knoll | | | 3,925 | | | | 110 | |
Korn | | | 91,048 | | | | 2,680 | |
Kratos Defense & Security Solutions* | | | 5,300 | | | | 39 | |
Lawson Products* | | | 600 | | | | 14 | |
Layne Christensen* | | | 1,478 | | | | 16 | |
| | | | | | | | |
| Description | | Shares | | | Value
(000) | |
Lindsay | | | 866 | | | $ | 65 | |
LSI Industries | | | 1,942 | | | | 19 | |
Lydall* | | | 1,357 | | | | 84 | |
Manitowoc | | | 10,387 | | | | 62 | |
Marten Transport | | | 110,814 | | | | 2,582 | |
Masonite International* | | | 2,595 | | | | 171 | |
MasTec* | | | 46,780 | | | | 1,789 | |
Matson | | | 3,707 | | | | 131 | |
Matthews International, Cl A | | | 29,535 | | | | 2,270 | |
McGrath RentCorp | | | 130,496 | | | | 5,115 | |
Mercury Systems* | | | 126,812 | | | | 3,832 | |
Meritor* | | | 17,175 | | | | 213 | |
Middleby* | | | 21,500 | | | | 2,769 | |
Milacron Holdings* | | | 1,187 | | | | 22 | |
Miller Industries | | | 900 | | | | 24 | |
Mistras Group* | | | 1,401 | | | | 36 | |
Mobile Mini | | | 3,618 | | | | 109 | |
Moog, Cl A* | | | 46,200 | | | | 3,034 | |
MRC Global* | | | 8,011 | | | | 162 | |
MSA Safety | | | 2,653 | | | | 184 | |
Mueller Industries | | | 4,835 | | | | 193 | |
Mueller Water Products, Cl A | | | 13,312 | | | | 177 | |
Multi-Color | | | 1,110 | | | | 86 | |
MYR Group* | | | 1,300 | | | | 49 | |
National Presto Industries | | | 402 | | | | 43 | |
Navigant Consulting* | | | 3,883 | | | | 102 | |
Navistar International* | | | 4,240 | | | | 133 | |
NCI Building Systems* | | | 2,400 | | | | 38 | |
Neff, Cl A* | | | 700 | | | | 10 | |
NL Industries* | | | 1,200 | | | | 10 | |
NN | | | 2,143 | | | | 41 | |
NOW* | | | 9,133 | | | | 187 | |
NV5 Global* | | | 599 | | | | 20 | |
Old Dominion Freight Line* | | | 13,440 | | | | 1,153 | |
Omega Flex | | | 200 | | | | 11 | |
On Assignment* | �� | | 69,281 | | | | 3,058 | |
Orbital ATK | | | 19,377 | | | | 1,700 | |
Orion Group Holdings* | | | 2,300 | | | | 23 | |
Oshkosh | | | 19,595 | | | | 1,266 | |
PAM Transportation Services* | | | 200 | | | | 5 | |
Park-Ohio Holdings | | | 700 | | | | 30 | |
Patrick Industries* | | | 1,185 | | | | 90 | |
PGT Innovations* | | | 129,160 | | | | 1,480 | |
Pitney Bowes | | | 141,460 | | | | 2,149 | |
Plug Power* | | | 15,992 | | | | 19 | |
Ply Gem Holdings* | | | 1,900 | | | | 31 | |
The accompanying notes are an integral part of the financial statements.
53
| | |
| THE KP FUNDS | | December 31, 2016 |
| | | | | | | | |
| Description | | Shares | | | Value
(000) | |
Powell Industries | | | 710 | | | $ | 28 | |
Power Solutions International* | | | 400 | | | | 3 | |
Preformed Line Products | | | 205 | | | | 12 | |
Primoris Services | | | 106,777 | | | | 2,432 | |
Proto Labs* | | | 2,014 | | | | 103 | |
Quad | | | 2,368 | | | | 64 | |
Quanex Building Products | | | 2,796 | | | | 57 | |
Quanta Services* | | | 47,015 | | | | 1,638 | |
Radiant Logistics* | | | 474,300 | | | | 1,850 | |
Raven Industries | | | 2,963 | | | | 75 | |
RBC Bearings* | | | 13,999 | | | | 1,299 | |
Resources Connection | | | 2,900 | | | | 56 | |
Revolution Lighting Technologies* | | | 213,648 | | | | 1,175 | |
Rexnord* | | | 7,098 | | | | 139 | |
Roadrunner Transportation Systems* | | | 2,589 | | | | 27 | |
RPX* | | | 4,055 | | | | 44 | |
Rush Enterprises, Cl A* | | | 2,944 | | | | 94 | |
Saia* | | | 2,058 | | | | 91 | |
Scorpio Bulkers* | | | 4,755 | | | | 24 | |
Simpson Manufacturing | | | 3,549 | | | | 155 | |
SiteOne Landscape Supply* | | | 950 | | | | 33 | |
SkyWest | | | 4,293 | | | | 156 | |
Snap-on | | | 18,600 | | | | 3,185 | |
SP Plus* | | | 51,223 | | | | 1,442 | |
Sparton* | | | 800 | | | | 19 | |
Spirit Airlines* | | | 61,395 | | | | 3,553 | |
SPX* | | | 3,394 | | | | 81 | |
SPX FLOW* | | | 23,217 | | | | 744 | |
Standex International | | | 1,038 | | | | 91 | |
Steelcase, Cl A | | | 7,377 | | | | 132 | |
Sun Hydraulics | | | 1,900 | | | | 76 | |
Sunrun* | | | 5,164 | | | | 27 | |
Supreme Industries, Cl A | | | 1,059 | | | | 17 | |
Swift Transportation, Cl A* | | | 57,074 | | | | 1,390 | |
TASER International* | | | 4,264 | | | | 103 | |
Team* | | | 2,360 | | | | 93 | |
Teledyne Technologies* | | | 2,894 | | | | 356 | |
Tennant | | | 1,430 | | | | 102 | |
Terex | | | 74,221 | | | | 2,340 | |
Tetra Tech | | | 4,929 | | | | 213 | |
Textainer Group Holdings | | | 306,110 | | | | 2,281 | |
Thermon Group Holdings* | | | 2,612 | | | | 50 | |
Titan International | | | 3,614 | | | | 41 | |
Titan Machinery* | | | 24,460 | | | | 356 | |
TPI Composites* | | | 491 | | | | 8 | |
TRC* | | | 1,600 | | | | 17 | |
| | | | | | | | |
| Description | | Shares | | | Value
(000) | |
Trex* | | | 2,521 | | | $ | 162 | |
TriMas* | | | 3,681 | | | | 87 | |
TriNet Group* | | | 3,440 | | | | 88 | |
Triton International | | | 3,275 | | | | 52 | |
Triumph Group | | | 4,027 | | | | 107 | |
TrueBlue* | | | 3,439 | | | | 85 | |
Tutor Perini* | | | 3,084 | | | | 86 | |
UniFirst | | | 1,290 | | | | 185 | |
Univar* | | | 46,306 | | | | 1,314 | |
Universal Forest Products | | | 1,693 | | | | 173 | |
Universal Logistics Holdings | | | 800 | | | | 13 | |
US Ecology | | | 1,783 | | | | 88 | |
USA Truck* | | | 600 | | | | 5 | |
Vectrus* | | | 873 | | | | 21 | |
Veritiv* | | | 673 | | | | 36 | |
Viad | | | 1,643 | | | | 72 | |
Vicor* | | | 1,300 | | | | 20 | |
VSE | | | 703 | | | | 27 | |
Wabash National | | | 110,063 | | | | 1,741 | |
Wabtec | | | 14,322 | | | | 1,189 | |
WageWorks* | | | 21,361 | | | | 1,549 | |
Watts Water Technologies, Cl A | | | 2,378 | | | | 155 | |
Werner Enterprises | | | 3,649 | | | | 98 | |
Wesco Aircraft Holdings* | | | 4,545 | | | | 68 | |
WESCO International* | | | 14,375 | | | | 957 | |
West | | | 3,529 | | | | 87 | |
Willis Lease Finance* | | | 400 | | | | 10 | |
Woodward | | | 4,425 | | | | 306 | |
XPO Logistics* | | | 8,199 | | | | 354 | |
YRC Worldwide* | | | 2,658 | | | | 35 | |
| | | | | | | | |
| | | | | | | 165,769 | |
| | | | | | | | |
Information Technology — 17.5% | |
2U* | | | 2,995 | | | | 90 | |
3D Systems* | | | 9,195 | | | | 122 | |
8x8* | | | 101,489 | | | | 1,451 | |
A10 Networks* | | | 3,599 | | | | 30 | |
Acacia Communications* | | | 428 | | | | 26 | |
ACI Worldwide* | | | 51,361 | | | | 932 | |
Actua* | | | 3,207 | | | | 45 | |
Acxiom* | | | 54,693 | | | | 1,466 | |
ADTRAN | | | 100,113 | | | | 2,237 | |
Advanced Energy Industries* | | | 34,340 | | | | 1,880 | |
Advanced Micro Devices* | | | 63,811 | | | | 724 | |
Aerohive Networks* | | | 2,200 | | | | 13 | |
Agilysys* | | | 1,400 | | | | 15 | |
Alarm.com Holdings* | | | 842 | | | | 23 | |
The accompanying notes are an integral part of the financial statements.
54
| | |
| THE KP FUNDS | | December 31, 2016 |
| | | | | | | | |
| Description | | Shares | | | Value
(000) | |
ALJ Regional Holdings* | | | 1,900 | | | $ | 8 | |
Alpha & Omega Semiconductor* | | | 1,483 | | | | 32 | |
Ambarella* | | | 2,739 | | | | 148 | |
Amber Road* | | | 1,446 | | | | 13 | |
American Software, Cl A | | | 2,106 | | | | 22 | |
Amkor Technology* | | | 8,177 | | | | 86 | |
Angie’s List* | | | 3,246 | | | | 27 | |
Anixter International* | | | 2,474 | | | | 201 | |
Appfolio, Cl A* | | | 700 | | | | 17 | |
Applied Micro Circuits* | | | 6,199 | | | | 51 | |
Applied Optoelectronics* | | | 1,347 | | | | 32 | |
Apptio, Cl A* | | | 800 | | | | 15 | |
Aspen Technology* | | | 27,119 | | | | 1,483 | |
Autobytel* | | | 900 | | | | 12 | |
Avid Technology* | | | 2,800 | | | | 12 | |
AVX | | | 3,800 | | | | 59 | |
Axcelis Technologies* | | | 2,380 | | | | 35 | |
Badger Meter | | | 2,291 | | | | 85 | |
Bankrate* | | | 4,168 | | | | 46 | |
Barracuda Networks* | | | 46,397 | | | | 994 | |
Bazaarvoice* | | | 374,233 | | | | 1,815 | |
Bel Fuse, Cl B | | | 756 | | | | 23 | |
Belden | | | 42,450 | | | | 3,174 | |
Benchmark Electronics* | | | 35,510 | | | | 1,083 | |
Benefitfocus* | | | 1,051 | | | | 31 | |
Black Box | | | 1,300 | | | | 20 | |
Blackbaud | | | 3,955 | | | | 253 | |
Blackhawk Network Holdings, Cl A* | | | 34,892 | | | | 1,315 | |
Blackline* | | | 800 | | | | 22 | |
Blucora* | | | 3,202 | | | | 47 | |
Booz Allen Hamilton Holding, Cl A | | | 35,300 | | | | 1,273 | |
Bottomline Technologies* | | | 52,261 | | | | 1,308 | |
Box, Cl A* | | | 3,986 | | | | 55 | |
Brightcove* | | | 2,600 | | | | 21 | |
BroadSoft* | | | 2,402 | | | | 99 | |
Brooks Automation | | | 5,548 | | | | 95 | |
Cabot Microelectronics | | | 25,371 | | | | 1,603 | |
CACI International, Cl A* | | | 7,372 | | | | 916 | |
CalAmp* | | | 65,346 | | | | 948 | |
Calix* | | | 3,500 | | | | 27 | |
Callidus Software* | | | 4,978 | | | | 84 | |
Carbonite* | | | 1,600 | | | | 26 | |
Cardtronics* | | | 3,844 | | | | 210 | |
Care.com* | | | 1,100 | | | | 9 | |
Cass Information Systems | | | 895 | | | | 66 | |
Cavium* | | | 5,484 | | | | 342 | |
| | | | | | | | |
| Description | | Shares | | | Value
(000) | |
CEVA* | | | 1,609 | | | $ | 54 | |
ChannelAdvisor* | | | 1,895 | | | | 27 | |
Ciena* | | | 11,517 | | | | 281 | |
Cimpress* | | | 2,141 | | | | 196 | |
Cirrus Logic* | | | 5,332 | | | | 301 | |
Clearfield* | | | 900 | | | | 19 | |
Cognex | | | 19,700 | | | | 1,253 | |
Coherent* | | | 8,267 | | | | 1,136 | |
Cohu | | | 80,049 | | | | 1,113 | |
CommScope Holding* | | | 75,800 | | | | 2,819 | |
CommVault Systems* | | | 51,367 | | | | 2,640 | |
comScore* | | | 4,090 | | | | 129 | |
Comtech Telecommunications | | | 19,746 | | | | 234 | |
Control4* | | | 1,641 | | | | 17 | |
Convergys | | | 7,595 | | | | 187 | |
Cornerstone OnDemand* | | | 4,299 | | | | 182 | |
Coupa Software* | | | 700 | | | | 18 | |
CPI Card Group | | | 1,500 | | | | 6 | |
Cray* | | | 3,288 | | | | 68 | |
CSG Systems International | | | 2,747 | | | | 133 | |
CSRA | | | 46,360 | | | | 1,476 | |
CTS | | | 2,558 | | | | 57 | |
Cypress Semiconductor | | | 201,735 | | | | 2,308 | |
CYREN* | | | 286,618 | | | | 616 | |
Daktronics | | | 3,200 | | | | 34 | |
Datalink* | | | 1,700 | | | | 19 | |
DHI Group* | | | 4,097 | | | | 26 | |
Diebold Nixdorf | | | 192,680 | | | | 4,847 | |
Digi International* | | | 2,116 | | | | 29 | |
Digimarc* | | | 800 | | | | 24 | |
Diodes* | | | 3,110 | | | | 80 | |
DSP Group* | | | 1,900 | | | | 25 | |
DST Systems | | | 27,540 | | | | 2,951 | |
EarthLink Holdings | | | 8,582 | | | | 48 | |
Eastman Kodak* | | | 1,500 | | | | 23 | |
Ebix | | | 2,059 | | | | 117 | |
Electro Scientific Industries* | | | 2,245 | | | | 13 | |
Electronics For Imaging* | | | 47,856 | | | | 2,099 | |
Ellie Mae* | | | 2,793 | | | | 234 | |
EMCORE | | | 2,400 | | | | 21 | |
Endurance International Group Holdings* | | | 4,900 | | | | 46 | |
EnerNOC* | | | 2,300 | | | | 14 | |
Entegris* | | | 12,060 | | | | 216 | |
Envestnet* | | | 3,383 | | | | 119 | |
EPAM Systems* | | | 4,106 | | | | 264 | |
ePlus* | | | 516 | | | | 59 | |
The accompanying notes are an integral part of the financial statements.
55
| | |
| THE KP FUNDS | | December 31, 2016 |
| | | | | | | | |
| Description | | Shares | | | Value
(000) | |
Euronet Worldwide* | | | 29,337 | | | $ | 2,125 | |
Everbridge* | | | 900 | | | | 17 | |
EVERTEC | | | 5,189 | | | | 92 | |
Exa* | | | 1,132 | | | | 17 | |
Exar* | | | 3,334 | | | | 36 | |
ExlService Holdings* | | | 2,786 | | | | 141 | |
Extreme Networks* | | | 8,440 | | | | 42 | |
Fabrinet* | | | 2,847 | | | | 115 | |
Fair Isaac | | | 2,631 | | | | 314 | |
FARO Technologies* | | | 1,355 | | | | 49 | |
Finisar* | | | 8,982 | | | | 272 | |
Five9* | | | 160,364 | | | | 2,275 | |
FLIR Systems | | | 45,633 | | | | 1,651 | |
FormFactor* | | | 5,614 | | | | 63 | |
Forrester Research | | | 811 | | | | 35 | |
Gartner* | | | 8,381 | | | | 847 | |
Gigamon* | | | 2,784 | | | | 127 | |
GigPeak* | | | 4,800 | | | | 12 | |
Global Sources* | | | 1,000 | | | | 9 | |
Globant* | | | 2,099 | | | | 70 | |
Glu Mobile* | | | 9,800 | | | | 19 | |
Gogo* | | | 30,234 | | | | 279 | |
GrubHub* | | | 29,697 | | | | 1,117 | |
GTT Communications* | | | 54,324 | | | | 1,562 | |
Guidance Software* | | | 1,700 | | | | 12 | |
Hackett Group | | | 2,000 | | | | 35 | |
Harmonic* | | | 6,927 | | | | 35 | |
Hortonworks* | | | 305,375 | | | | 2,537 | |
HubSpot* | | | 2,357 | | | | 111 | |
II-VI* | | | 5,091 | | | | 151 | |
Immersion* | | | 2,352 | | | | 25 | |
Imperva* | | | 2,342 | | | | 90 | |
Impinj* | | | 17,416 | | | | 615 | |
Infinera* | | | 45,731 | | | | 388 | |
Information Services Group* | | | 3,200 | | | | 12 | |
Inphi* | | | 29,199 | | | | 1,303 | |
Insight Enterprises* | | | 23,809 | | | | 963 | |
Instructure* | | | 900 | | | | 18 | |
Integrated Device Technology* | | | 11,309 | | | | 266 | |
InterDigital | | | 2,930 | | | | 268 | |
Intersil, Cl A | | | 11,442 | | | | 255 | |
InterXion Holding* | | | 21,915 | | | | 769 | |
Intralinks Holdings* | | | 3,378 | | | | 46 | |
InvenSense, Cl A* | | | 6,677 | | | | 85 | |
Itron* | | | 58,897 | | | | 3,703 | |
Ixia* | | | 5,240 | | | | 84 | |
| | | | | | | | |
| Description | | Shares | | | Value
(000) | |
IXYS | | | 2,200 | | | $ | 26 | |
j2 Global | | | 3,946 | | | | 323 | |
Jive Software* | | | 4,714 | | | | 21 | |
Kimball Electronics* | | | 2,450 | | | | 45 | |
Knowles* | | | 67,218 | | | | 1,123 | |
Kopin* | | | 5,200 | | | | 15 | |
KVH Industries* | | | 1,300 | | | | 15 | |
Lattice Semiconductor* | | | 9,797 | | | | 72 | |
Limelight Networks* | | | 7,400 | | | | 19 | |
Lionbridge Technologies* | | | 4,658 | | | | 27 | |
Liquidity Services* | | | 34,918 | | | | 340 | |
Littelfuse | | | 1,884 | | | | 286 | |
LivePerson* | | | 4,351 | | | | 33 | |
Logitech International | | | 36,185 | | | | 896 | |
LogMeIn | | | 16,788 | | | | 1,621 | |
Lumentum Holdings* | | | 22,785 | | | | 881 | |
MACOM Technology Solutions Holdings* | | | 1,902 | | | | 88 | |
ManTech International, Cl A | | | 2,019 | | | | 85 | |
Marchex, Cl B | | | 2,200 | | | | 6 | |
Marin Software* | | | 354,246 | | | | 832 | |
Match Group* | | | 50,000 | | | | 855 | |
Mattersight* | | | 318,885 | | | | 1,180 | |
MAXIMUS | | | 5,462 | | | | 305 | |
MaxLinear, Cl A* | | | 4,561 | | | | 99 | |
Maxwell Technologies* | | | 2,572 | | | | 13 | |
MeetMe* | | | 3,370 | | | | 17 | |
Mentor Graphics | | | 8,953 | | | | 330 | |
Mesa Laboratories | | | 245 | | | | 30 | |
Methode Electronics | | | 3,125 | | | | 129 | |
Micron Technology* | | | 138,700 | | | | 3,040 | |
Microsemi* | | | 109,852 | | | | 5,930 | |
MicroStrategy, Cl A* | | | 812 | | | | 160 | |
MINDBODY, Cl A* | | | 55,076 | | | | 1,173 | |
Mitek Systems* | | | 2,404 | | | | 15 | |
MKS Instruments | | | 21,248 | | | | 1,262 | |
MobileIron* | | | 3,500 | | | | 13 | |
Mobileye* | | | 112,220 | | | | 4,279 | |
Model N* | | | 234,693 | | | | 2,077 | |
MoneyGram International* | | | 2,486 | | | | 29 | |
Monolithic Power Systems | | | 22,101 | | | | 1,811 | |
Monotype Imaging Holdings | | | 3,313 | | | | 66 | |
MTS Systems | | | 1,367 | | | | 78 | |
Nanometrics* | | | 1,932 | | | | 48 | |
NCI, Cl A | | | 700 | | | | 10 | |
NeoPhotonics* | | | 2,517 | | | | 27 | |
NETGEAR* | | | 2,770 | | | | 151 | |
The accompanying notes are an integral part of the financial statements.
56
| | |
| THE KP FUNDS | | December 31, 2016 |
| | | | | | | | |
| Description | | Shares | | | Value
(000) | |
Netlist* | | | 398,357 | | | $ | 406 | |
NetScout Systems* | | | 7,635 | | | | 241 | |
NeuStar, Cl A* | | | 4,632 | | | | 155 | |
New Relic* | | | 1,793 | | | | 51 | |
NIC | | | 5,440 | | | | 130 | |
Nimble Storage* | | | 5,141 | | | | 41 | |
Novanta* | | | 83,031 | | | | 1,744 | |
Numerex, Cl A* | | | 1,400 | | | | 10 | |
NVE | | | 400 | | | | 29 | |
Oclaro* | | | 109,429 | | | | 978 | |
ON Semiconductor* | | | 75,815 | | | | 967 | |
OSI Systems* | | | 1,430 | | | | 109 | |
Park City Group* | | | 1,100 | | | | 14 | |
Park Electrochemical | | | 1,578 | | | | 29 | |
Paycom Software* | | | 3,759 | | | | 171 | |
Paylocity Holding* | | | 1,760 | | | | 53 | |
PC Connection | | | 927 | | | | 26 | |
PDF Solutions* | | | 36,294 | | | | 818 | |
Pegasystems | | | 2,946 | | | | 106 | |
Perficient* | | | 2,880 | | | | 50 | |
PFSweb* | | | 1,200 | | | | 10 | |
Photronics* | | | 5,331 | | | | 60 | |
Planet Payment* | | | 3,457 | | | | 14 | |
Plantronics | | | 2,838 | | | | 155 | |
Plexus* | | | 2,852 | | | | 154 | |
Power Integrations | | | 2,344 | | | | 159 | |
Progress Software | | | 4,290 | | | | 137 | |
Proofpoint* | | | 9,331 | | | | 659 | |
PROS Holdings* | | | 31,967 | | | | 688 | |
Pure Storage, Cl A* | | | 5,566 | | | | 63 | |
Q2 Holdings* | | | 2,088 | | | | 60 | |
QAD, Cl A | | | 769 | | | | 23 | |
Qualys* | | | 2,221 | | | | 70 | |
Quantenna Communications* | | | 800 | | | | 15 | |
QuickLogic* | | | 178,226 | | | | 248 | |
QuinStreet* | | | 2,600 | | | | 10 | |
Quotient Technology* | | | 5,235 | | | | 56 | |
Radisys* | | | 264,988 | | | | 1,174 | |
Rambus* | | | 9,318 | | | | 128 | |
Rapid7* | | | 1,625 | | | | 20 | |
RealNetworks* | | | 2,200 | | | | 11 | |
RealPage* | | | 29,672 | | | | 890 | |
Reis | | | 723 | | | | 16 | |
RetailMeNot* | | | 3,400 | | | | 32 | |
Rightside Group* | | | 1,200 | | | | 10 | |
RingCentral, Cl A* | | | 90,987 | | | | 1,874 | |
| | | | | | | | |
| Description | | Shares | | | Value
(000) | |
Rogers* | | | 25,758 | | | $ | 1,978 | |
Rosetta Stone* | | | 1,576 | | | | 14 | |
Rubicon Project* | | | 3,040 | | | | 23 | |
Rudolph Technologies* | | | 2,446 | | | | 57 | |
Sanmina* | | | 6,262 | | | | 230 | |
Sapiens International | | | 2,047 | | | | 29 | |
ScanSource* | | | 2,051 | | | | 83 | |
Science Applications International | | | 3,555 | | | | 301 | |
Seachange International* | | | 208,054 | | | | 479 | |
SecureWorks, Cl A* | | | 600 | | | | 6 | |
Semtech* | | | 5,521 | | | | 174 | |
ServiceNow* | | | 41,935 | | | | 3,117 | |
ServiceSource International* | | | 4,983 | | | | 28 | |
SharpSpring* | | | 113,193 | | | | 597 | |
Shopify, Cl A* | | | 49,640 | | | | 2,128 | |
ShoreTel* | | | 419,963 | | | | 3,002 | |
Shutterstock* | | | 1,549 | | | | 74 | |
Sigma Designs* | | | 2,928 | | | | 18 | |
Silicom | | | 459 | | | | 19 | |
Silicon Laboratories* | | | 3,518 | | | | 229 | |
Silver Spring Networks* | | | 3,094 | | | | 41 | |
Sonus Networks* | | | 3,896 | | | | 25 | |
SPS Commerce* | | | 1,353 | | | | 95 | |
Square, Cl A* | | | 104,275 | | | | 1,421 | |
Stamps.com* | | | 23,114 | | | | 2,649 | |
Stratasys* | | | 4,006 | | | | 66 | |
Super Micro Computer* | | | 3,157 | | | | 89 | |
Sykes Enterprises* | | | 3,160 | | | | 91 | |
Synaptics* | | | 2,998 | | | | 161 | |
Synchronoss Technologies* | | | 3,814 | | | | 146 | |
SYNNEX | | | 2,488 | | | | 301 | |
Syntel | | | 2,637 | | | | 52 | |
Systemax | | | 1,100 | | | | 10 | |
Take-Two Interactive Software* | | | 56,158 | | | | 2,768 | |
Tangoe* | | | 2,257 | | | | 18 | |
Tech Data* | | | 2,981 | | | | 252 | |
TechTarget* | | | 1,400 | | | | 12 | |
Telenav* | | | 226,272 | | | | 1,595 | |
TeleTech Holdings | | | 1,341 | | | | 41 | |
Tessera Holding | | | 101,931 | | | | 4,506 | |
TiVo* | | | 40,725 | | | | 851 | |
Trade Desk, Cl A* | | | 600 | | | | 17 | |
Travelport Worldwide | | | 9,896 | | | | 140 | |
Trimble* | | | 34,600 | | | | 1,043 | |
TrueCar* | | | 4,438 | | | | 55 | |
TTM Technologies* | | | 5,919 | | | | 81 | |
The accompanying notes are an integral part of the financial statements.
57
| | |
| THE KP FUNDS | | December 31, 2016 |
| | | | | | | | |
| Description | | Shares | | | Value
(000) | |
Ubiquiti Networks* | | | 2,224 | | | $ | 129 | |
Ultra Clean Holdings* | | | 2,800 | | | | 27 | |
Ultratech* | | | 1,904 | | | | 46 | |
Unisys* | | | 4,102 | | | | 61 | |
Universal Display* | | | 31,465 | | | | 1,771 | |
USA Technologies* | | | 3,700 | | | | 16 | |
Vantiv, Cl A* | | | 14,800 | | | | 882 | |
Varonis Systems* | | | 17,065 | | | | 457 | |
VASCO Data Security International* | | | 2,463 | | | | 34 | |
Veeco Instruments* | | | 15,029 | | | | 438 | |
VeriFone Systems* | | | 46,211 | | | | 819 | |
Verint Systems* | | | 5,302 | | | | 187 | |
ViaSat* | | | 13,031 | | | | 863 | |
Viavi Solutions* | | | 20,050 | | | | 164 | |
VirnetX Holding* | | | 3,600 | | | | 8 | |
Virtusa* | | | 2,259 | | | | 57 | |
Vishay Intertechnology | | | 204,586 | | | | 3,314 | |
Vishay Precision Group* | | | 900 | | | | 17 | |
Web.com Group* | | | 3,472 | | | | 73 | |
WebMD Health, Cl A* | | | 3,192 | | | | 158 | |
WEX* | | | 9,555 | | | | 1,066 | |
Wix.com* | | | 26,440 | | | | 1,178 | |
Workiva, Cl A* | | | 1,794 | | | | 24 | |
Xactly* | | | 1,864 | | | | 21 | |
Xcerra* | | | 4,322 | | | | 33 | |
XO Group* | | | 2,075 | | | | 40 | |
Yelp, Cl A* | | | 31,225 | | | | 1,191 | |
Zebra Technologies, Cl A* | | | 15,540 | | | | 1,333 | |
Zendesk* | | | 6,946 | | | | 147 | |
Zix* | | | 4,700 | | | | 23 | |
| | | | | | | | |
| | | | | | | 163,366 | |
| | | | | | | | |
Materials — 5.5% | |
A Schulman | | | 51,263 | | | | 1,715 | |
AEP Industries | | | 330 | | | | 38 | |
AgroFresh Solutions* | | | 2,300 | | | | 6 | |
AK Steel Holding* | | | 26,073 | | | | 266 | |
Alamos Gold, Cl A | | | 60,980 | | | | 417 | |
Albemarle | | | 20,000 | | | | 1,722 | |
Allegheny Technologies | | | 55,049 | | | | 877 | |
American Vanguard | | | 2,305 | | | | 44 | |
Ampco-Pittsburgh | | | 699 | | | | 12 | |
AptarGroup | | | 38,230 | | | | 2,809 | |
Avery Dennison | | | 37,445 | | | | 2,629 | |
Balchem | | | 2,683 | | | | 225 | |
Berry Plastics Group* | | | 25,430 | | | | 1,239 | |
Boise Cascade* | | | 7,306 | | | | 164 | |
| | | | | | | | |
| Description | | Shares | | | Value
(000) | |
Calgon Carbon | | | 4,114 | | | $ | 70 | |
Carpenter Technology | | | 53,444 | | | | 1,933 | |
Century Aluminum* | | | 4,074 | | | | 35 | |
Chase | | | 577 | | | | 48 | |
Chemours | | | 15,583 | | | | 344 | |
Chemtura* | | | 5,441 | | | | 181 | |
Clearwater Paper* | | | 1,385 | | | | 91 | |
Cliffs Natural Resources* | | | 18,852 | | | | 159 | |
Codexis* | | | 2,734 | | | | 13 | |
Coeur Mining* | | | 15,331 | | | | 139 | |
Commercial Metals | | | 93,977 | | | | 2,047 | |
Compass Minerals International | | | 38,376 | | | | 3,007 | |
Deltic Timber | | | 867 | | | | 67 | |
Ferro* | | | 6,797 | | | | 97 | |
Ferroglobe PLC* | | | 5,340 | | | | 58 | |
Ferroglobe Representation* (C) | | | 5,900 | | | | — | |
Flotek Industries* | | | 4,471 | | | | 42 | |
Forterra* | | | 1,500 | | | | 32 | |
FutureFuel | | | 2,038 | | | | 28 | |
GCP Applied Technologies* | | | 109,543 | | | | 2,930 | |
Gold Resource | | | 4,083 | | | | 18 | |
Graphic Packaging Holding | | | 213,480 | | | | 2,664 | |
Greif, Cl A | | | 2,558 | | | | 139 | |
Handy & Harman* | | | 200 | | | | 5 | |
Hawkins | | | 785 | | | | 42 | |
Haynes International | | | 28,145 | | | | 1,210 | |
HB Fuller | | | 4,277 | | | | 207 | |
Headwaters* | | | 6,226 | | | | 146 | |
Hecla Mining | | | 32,607 | | | | 171 | |
Ingevity* | | | 3,635 | | | | 199 | |
Innophos Holdings | | | 1,579 | | | | 83 | |
Innospec | | | 2,021 | | | | 138 | |
Kaiser Aluminum | | | 1,446 | | | | 112 | |
KapStone Paper and Packaging | | | 7,381 | | | | 163 | |
KMG Chemicals | | | 800 | | | | 31 | |
Koppers Holdings* | | | 1,661 | | | | 67 | |
Kraton* | | | 31,933 | | | | 909 | |
Kronos Worldwide | | | 165,033 | | | | 1,970 | |
Louisiana-Pacific* | | | 12,288 | | | | 233 | |
LSB Industries* | | | 1,685 | | | | 14 | |
Materion | | | 1,625 | | | | 64 | |
Mercer International | | | 124,436 | | | | 1,324 | |
Minerals Technologies | | | 2,955 | | | | 228 | |
Multi Packaging Solutions International* | | | 79,801 | | | | 1,138 | |
Myers Industries | | | 1,772 | | | | 25 | |
Neenah Paper | | | 1,355 | | | | 115 | |
Olin | | | 14,084 | | | | 361 | |
The accompanying notes are an integral part of the financial statements.
58
| | |
| THE KP FUNDS | | December 31, 2016 |
| | | | | | | | |
| Description | | Shares | | | Value
(000) | |
Olympic Steel | | | 749 | | | $ | 18 | |
OMNOVA Solutions* | | | 3,469 | | | | 35 | |
PH Glatfelter | | | 3,550 | | | | 85 | |
PolyOne | | | 155,947 | | | | 4,998 | |
Quaker Chemical | | | 1,107 | | | | 142 | |
Rayonier Advanced Materials | | | 3,515 | | | | 54 | |
Real Industry* | | | 2,140 | | | | 13 | |
Ryerson Holding* | | | 1,000 | | | | 13 | |
Schnitzer Steel Industries, Cl A | | | 2,131 | | | | 55 | |
Schweitzer-Mauduit International | | | 2,473 | | | | 113 | |
Sensient Technologies | | | 17,187 | | | | 1,351 | |
Silgan Holdings | | | 57,757 | | | | 2,957 | |
Stepan | | | 1,681 | | | | 137 | |
Stillwater Mining* | | | 10,450 | | | | 168 | |
Summit Materials, Cl A* | | | 6,590 | | | | 157 | |
SunCoke Energy* | | | 5,265 | | | | 60 | |
TerraVia Holdings* | | | 6,500 | | | | 7 | |
TimkenSteel* | | | 3,221 | | | | 50 | |
Trecora Resources* | | | 1,600 | | | | 22 | |
Tredegar | | | 2,076 | | | | 50 | |
Trinseo | | | 2,347 | | | | 139 | |
Tronox, Cl A | | | 5,266 | | | | 54 | |
UFP Technologies* | | | 523 | | | | 13 | |
United States Lime & Minerals | | | 200 | | | | 15 | |
US Concrete* | | | 27,469 | | | | 1,800 | |
Valhi | | | 2,200 | | | | 8 | |
Westlake Chemical | | | 59,950 | | | | 3,357 | |
Worthington Industries | | | 3,846 | | | | 182 | |
| | | | | | | | |
| | | | | | | 51,313 | |
| | | | | | | | |
Real Estate — 2.9% | |
Acadia Realty Trust‡ | | | 6,816 | | | | 223 | |
Agree Realty‡ | | | 2,158 | | | | 99 | |
Alexander & Baldwin | | | 3,983 | | | | 179 | |
Alexander’s‡ | | | 175 | | | | 75 | |
Altisource Portfolio Solutions* | | | 1,064 | | | | 28 | |
American Assets Trust‡ | | | 3,349 | | | | 144 | |
Armada Hoffler Properties‡ | | | 2,719 | | | | 40 | |
Ashford Hospitality Prime‡ | | | 2,067 | | | | 28 | |
Ashford Hospitality Trust‡ | | | 6,384 | | | | 50 | |
AV Homes* | | | 1,000 | | | | 16 | |
Bluerock Residential Growth, Cl A‡ | | | 1,533 | | | | 21 | |
Brandywine Realty Trust‡ | | | 93,491 | | | | 1,543 | |
CareTrust‡ | | | 5,502 | | | | 84 | |
CatchMark Timber Trust, Cl A‡ | | | 3,171 | | | | 36 | |
CBL & Associates Properties‡ | | | 14,426 | | | | 166 | |
Cedar Realty Trust | | | 6,741 | | | | 44 | |
| | | | | | | | |
| Description | | Shares | | | Value
(000) | |
Chatham Lodging Trust‡ | | | 3,065 | | | $ | 63 | |
Chesapeake Lodging Trust‡ | | | 5,093 | | | | 132 | |
City Office REIT‡ | | | 2,000 | | | | 26 | |
Colony Starwood Homes‡ | | | 5,560 | | | | 160 | |
Community Healthcare Trust‡ | | | 1,030 | | | | 24 | |
Consolidated-Tomoka Land | | | 300 | | | | 16 | |
CorEnergy Infrastructure Trust‡ | | | 976 | | | | 34 | |
CoreSite Realty‡ | | | 2,858 | | | | 227 | |
Cousins Properties‡ | | | 28,847 | | | | 245 | |
CyrusOne‡ | | | 20,030 | | | | 896 | |
DiamondRock Hospitality‡ | | | 17,138 | | | | 198 | |
DuPont Fabros Technology | | | 6,294 | | | | 276 | |
Easterly Government Properties‡ | | | 2,657 | | | | 53 | |
EastGroup Properties‡ | | | 2,697 | | | | 199 | |
Education Realty Trust‡ | | | 6,261 | | | | 265 | |
Farmland Partners‡ | | | 1,200 | | | | 13 | |
FelCor Lodging Trust‡ | | | 42,504 | | | | 340 | |
First Industrial Realty Trust‡ | | | 9,788 | | | | 275 | |
First Potomac Realty Trust‡ | | | 4,736 | | | | 52 | |
Forestar Group* | | | 2,791 | | | | 37 | |
Four Corners Property Trust‡ | | | 4,935 | | | | 101 | |
Franklin Street Properties‡ | | | 8,531 | | | | 111 | |
FRP Holdings* | | | 500 | | | | 19 | |
GEO Group‡ | | | 6,332 | | | | 228 | |
Getty Realty‡ | | | 2,140 | | | | 55 | |
Gladstone Commercial‡ | | | 2,225 | | | | 45 | |
Global Medical REIT‡ | | | 1,240 | | | | 11 | |
Global Net Lease‡ | | | 13,933 | | | | 109 | |
Government Properties Income Trust‡ | | | 5,727 | | | | 109 | |
Gramercy Property Trust‡ | | | 35,309 | | | | 324 | |
Healthcare Realty Trust‡ | | | 9,526 | | | | 289 | |
Hersha Hospitality Trust, Cl A‡ | | | 3,382 | | | | 73 | |
HFF, Cl A | | | 2,931 | | | | 89 | |
Hudson Pacific Properties | | | 9,141 | | | | 318 | |
Independence Realty Trust‡ | | | 5,275 | | | | 47 | |
InfraREIT‡ | | | 3,253 | | | | 58 | |
Investors Real Estate Trust‡ | | | 9,895 | | | | 71 | |
iStar‡* | | | 5,601 | | | | 69 | |
Kennedy-Wilson Holdings | | | 7,060 | | | | 145 | |
Kite Realty Group Trust‡ | | | 7,069 | | | | 166 | |
LaSalle Hotel Properties‡ | | | 8,917 | | | | 272 | |
Lexington Realty Trust‡ | | | 19,615 | | | | 212 | |
LTC Properties‡ | | | 3,225 | | | | 152 | |
Mack-Cali Realty | | | 7,614 | | | | 221 | |
Marcus & Millichap* | | | 1,300 | | | | 35 | |
MedEquities Realty Trust‡ | | | 75,719 | | | | 840 | |
The accompanying notes are an integral part of the financial statements.
59
| | |
| THE KP FUNDS | | December 31, 2016 |
| | | | | | | | |
| Description | | Shares | | | Value
(000) | |
Medical Properties Trust | | | 24,657 | | | $ | 303 | |
Monmouth Real Estate Investment, Cl A‡ | | | 5,751 | | | | 88 | |
Monogram Residential Trust‡ | | | 14,411 | | | | 156 | |
National Health Investors‡ | | | 3,177 | | | | 236 | |
National Storage Affiliates Trust | | | 2,868 | | | | 63 | |
New Senior Investment Group‡ | | | 6,234 | | | | 61 | |
New York‡ | | | 14,149 | | | | 143 | |
NexPoint Residential Trust‡ | | | 1,467 | | | | 33 | |
NorthStar Realty Europe‡ | | | 4,870 | | | | 61 | |
One Liberty Properties‡ | | | 1,079 | | | | 27 | |
Outfront Media‡ | | | 222,351 | | | | 5,529 | |
Parkway‡* | | | 3,456 | | | | 77 | |
Pebblebrook Hotel Trust‡ | | | 6,107 | | | | 182 | |
Pennsylvania‡ | | | 5,579 | | | | 106 | |
Physicians Realty Trust‡ | | | 11,526 | | | | 219 | |
Potlatch | | | 47,679 | | | | 1,985 | |
Preferred Apartment Communities, Cl A‡ | | | 2,000 | | | | 30 | |
PS Business Parks | | | 1,683 | | | | 196 | |
QTS Realty Trust, Cl A‡ | | | 45,636 | | | | 2,265 | |
RAIT Financial Trust‡ | | | 7,497 | | | | 25 | |
Ramco-Gershenson Properties Trust‡ | | | 6,434 | | | | 107 | |
RE/MAX Holdings, Cl A | | | 1,450 | | | | 81 | |
Retail Opportunity Investments‡ | | | 9,184 | | | | 194 | |
Rexford Industrial Realty‡ | | | 5,623 | | | | 130 | |
RLJ Lodging Trust‡ | | | 10,388 | | | | 254 | |
RMR Group | | | 565 | | | | 22 | |
Ryman Hospitality Properties‡ | | | 3,704 | | | | 233 | |
Sabra Health Care‡ | | | 5,536 | | | | 135 | |
Saul Centers‡ | | | 784 | | | | 52 | |
Select Income‡ | | | 5,435 | | | | 137 | |
Seritage Growth Properties‡ | | | 2,039 | | | | 87 | |
Silver Bay Realty Trust‡ | | | 2,715 | | | | 47 | |
St. Joe* | | | 4,125 | | | | 78 | |
STAG Industrial‡ | | | 52,591 | | | | 1,255 | |
Stratus Properties* | | | 600 | | | | 20 | |
Summit Hotel Properties‡ | | | 7,069 | | | | 113 | |
Sunstone Hotel Investors‡ | | | 18,257 | | | | 278 | |
Tejon Ranch* | | | 1,137 | | | | 29 | |
Terreno Realty‡ | | | 3,690 | | | | 105 | |
Tier REIT‡ | | | 3,900 | | | | 68 | |
Trinity Place Holdings* | | | 1,582 | | | | 15 | |
UMH Properties‡ | | | 1,991 | | | | 30 | |
Universal Health Realty Income Trust‡ | | | 1,015 | | | | 67 | |
Urban Edge Properties‡ | | | 7,658 | | | | 211 | |
Urstadt Biddle Properties, Cl A‡ | | | 2,390 | | | | 58 | |
| | | | | | | | |
| Description | | Shares | | | Value
(000) | |
Washington‡ | | | 6,267 | | | $ | 205 | |
Washington Prime Group‡ | | | 15,887 | | | | 165 | |
Whitestone, Cl B‡ | | | 2,137 | | | | 31 | |
Xenia Hotels & Resorts‡ | | | 8,839 | | | | 172 | |
| | | | | | | | |
| | | | | | | 26,640 | |
| | | | | | | | |
Telecommunication Services — 0.3% | |
ATN International | | | 861 | | | | 69 | |
Boingo Wireless* | | | 3,100 | | | | 38 | |
Cincinnati Bell* | | | 3,436 | | | | 77 | |
Cogent Communications Holdings | | | 3,557 | | | | 147 | |
Consolidated Communications Holdings | | | 4,057 | | | | 109 | |
FairPoint Communications* | | | 1,733 | | | | 32 | |
General Communication, Cl A* | | | 2,364 | | | | 46 | |
Globalstar* | | | 33,082 | | | | 52 | |
Hawaiian Telcom Holdco* | | | 600 | | | | 15 | |
IDT, Cl B | | | 1,500 | | | | 28 | |
Inteliquent | | | 2,663 | | | | 61 | |
Intelsat* | | | 2,400 | | | | 6 | |
Iridium Communications* | | | 6,736 | | | | 65 | |
Lumos Networks* | | | 1,545 | | | | 24 | |
NII Holdings* | | | 5,600 | | | | 12 | |
ORBCOMM* | | | 5,279 | | | | 44 | |
pdvWireless* | | | 800 | | | | 18 | |
Shenandoah Telecommunications | | | 3,778 | | | | 103 | |
Spok Holdings | | | 1,800 | | | | 37 | |
Straight Path Communications* | | | 800 | | | | 27 | |
Vonage Holdings* | | | 210,081 | | | | 1,440 | |
Windstream Holdings | | | 7,842 | | | | 57 | |
| | | | | | | | |
| | | | | | | 2,507 | |
| | | | | | | | |
Utilities — 1.7% | |
ALLETE | | | 32,904 | | | | 2,112 | |
American States Water | | | 3,127 | | | | 142 | |
AquaVenture Holdings* | | | 10,428 | | | | 257 | |
Artesian Resources, Cl A | | | 700 | | | | 22 | |
Atlantic Power | | | 9,958 | | | | 25 | |
Atlantica Yield | | | 4,807 | | | | 93 | |
Avista | | | 5,401 | | | | 216 | |
Black Hills | | | 4,317 | | | | 265 | |
California Water Service Group | | | 4,114 | | | | 139 | |
Chesapeake Utilities | | | 1,290 | | | | 86 | |
Connecticut Water Service | | | 885 | | | | 49 | |
Consolidated Water | | | 1,400 | | | | 15 | |
Delta Natural Gas | | | 558 | | | | 16 | |
Dynegy, Cl A* | | | 355,181 | | | | 3,005 | |
El Paso Electric | | | 3,455 | | | | 161 | |
The accompanying notes are an integral part of the financial statements.
60
| | |
| THE KP FUNDS | | December 31, 2016 |
| | | | | | | | |
| Description | | Shares | | | Value
(000) | |
Empire District Electric | | | 38,325 | | | $ | 1,306 | |
Genie Energy, Cl B | | | 1,200 | | | | 7 | |
Global Water Resources | | | 1,000 | | | | 9 | |
IDACORP | | | 4,228 | | | | 341 | |
MGE Energy | | | 2,985 | | | | 195 | |
Middlesex Water | | | 1,296 | | | | 56 | |
New Jersey Resources | | | 7,212 | | | | 256 | |
Northwest Natural Gas | | | 2,326 | | | | 139 | |
NorthWestern | | | 4,149 | | | | 236 | |
NRG Yield, Cl A | | | 8,037 | | | | 126 | |
ONE Gas | | | 4,356 | | | | 279 | |
Ormat Technologies | | | 3,322 | | | | 178 | |
Otter Tail | | | 3,253 | | | | 133 | |
Pattern Energy Group, Cl A | | | 5,417 | | | | 103 | |
PNM Resources | | | 6,818 | | | | 234 | |
Portland General Electric | | | 7,512 | | | | 325 | |
SJW Group | | | 1,333 | | | | 75 | |
South Jersey Industries | | | 6,808 | | | | 229 | |
Southwest Gas Holdings | | | 3,968 | | | | 304 | |
Spark Energy, Cl A | | | 500 | | | | 15 | |
Spire | | | 3,810 | | | | 246 | |
Suburban Propane Partners (A) | | | 112,460 | | | | 3,382 | |
TerraForm Global, Cl A | | | 7,462 | | | | 29 | |
TerraForm Power, Cl A* | | | 7,142 | | | | 91 | |
Unitil | | | 15,874 | | | | 719 | |
Vivint Solar* | | | 1,800 | | | | 5 | |
WGL Holdings | | | 4,224 | | | | 322 | |
York Water | | | 1,050 | | | | 40 | |
| | | | | | | | |
| | | | | | | 15,983 | |
| | | | | | | | |
Total Common Stock
(Cost $795,167) (000) | | | | | | | 884,733 | |
| | | | | | | | |
EXCHANGE TRADED FUNDS — 0.4% | |
iShares Russell 2000 | | | 13,251 | | | | 1,787 | |
iShares Russell 2000 Value | | | 13,376 | | | | 1,592 | |
| | | | | | | | |
Total Exchange Traded Funds
(Cost $2,995) (000) | | | | | | | 3,379 | |
| | | | | | | | |
RIGHTS — 0.0%* | |
| | | Number of
Rights | | | | |
Chelsea Therapeutics International† | | | 2,000 | | | | — | |
Durata Therapeutics† | | | 900 | | | | — | |
Dyax, Expires 12/31/2019 | | | 12,613 | | | | — | |
Leap Wireless† | | | 2,300 | | | | — | |
Tobira Therapeutics, Expires 12/31/2028 | | | 900 | | | | — | |
| | | | | | | | |
Total Rights
(Cost $12) (000) | | | | | | | — | |
| | | | | | | | |
| | | | | | | | |
| Description | | Shares | | | Value
(000) | |
SHORT-TERM INVESTMENT — 5.0% | |
State Street Institutional Treasury Money Market Fund, Cl Institutional, 0.406% (B) | | | 46,103,998 | | | $ | 46,104 | |
| | | | | | | | |
Total Short-Term Investment (Cost $46,104) (000) | | | | | | | 46,104 | |
| | | | | | | | |
Total Investments — 100.4% (Cost $844,278) (000) | | | | | | $ | 934,216 | |
| | | | | | | | |
Percentages are based on net assets of $930,815 (000).
A list of the open futures contracts held by the Fund at December 31, 2016, is as follows (000):
| | | | | | |
| Type of Contract | | Number of
Contracts
Long | | Expiration
Date | | Unrealized
Depreciation |
| Russell 2000 Index E-MINI | | 235 | | Mar-2017 | | $(197) |
| | | | | | |
For the year ended December 31, 2016, the monthly average value of futures contracts held was $13,232 (000).
| * | Non-income producing security. |
| ‡ | Real Estate Investment Trust |
| † | Expiration date is unavailable. |
| (A) | Security considered Master Limited Partnership. At December 31, 2016, this security amounted to $4,728 (000) or 0.5% of Net Assets. |
| (B) | The rate reported is the 7-day effective yield as of December 31, 2016. |
| (C) | Security is fair valued using methods determined in good faith by the Fair Value Committee of the Board of Trustees. The total value of such securities as of December 31, 2016, was $0 (000) and represented 0.00% of net assets. |
Cl — Class
The following is a list of the level of inputs used as of December 31, 2016, in valuing the Fund’s investments and other financial instruments carried at value (000):
| | | | | | | | | | | | | | | | |
| Investments in Securities | | Level 1 | | | Level 2 | | | Level 3^ | | | Total | |
Common Stock | | $ | 884,733 | | | $ | — | | | $ | — | | | $ | 884,733 | |
Exchange Traded Funds | | | 3,379 | | | | — | | | | — | | | | 3,379 | |
Rights | | | — | | | | — | | | | — | | | | — | |
Short-Term Investment | | | 46,104 | | | | — | | | | — | | | | 46,104 | |
| | | | | | | | | | | | | | | | |
Total Investments in Securities | | $ | 934,216 | | | $ | — | | | $ | — | | | $ | 934,216 | |
| | | | | | | | | | | | | | | | |
| | | | |
| Other Financial Instruments | | Level 1 | | | Level 2 | | | Level 3^ | | | Total | |
Futures Contracts** | | | | | | | | | | | | | | | | |
Unrealized Depreciation | | $ | (197 | ) | | $ | — | | | $ | — | | | $ | (197 | ) |
| | | | | | | | | | | | | | | | |
Total Other Financial Instruments | | $ | (197 | ) | | $ | — | | | $ | — | | | $ | (197 | ) |
| | | | | | | | | | | | | | | | |
| ** | Futures contracts are valued at the unrealized depreciation on the instrument. |
| ^ | A reconciliation of Level 3 investments and disclosures of significant unobservable inputs are presented when the Fund has a significant amount of Level 3 investments at the beginning and/or end of the year in relation to net assets. Management has concluded that Level 3 investments are not material in relation to net assets. |
The accompanying notes are an integral part of the financial statements.
61
| | |
| THE KP FUNDS | | December 31, 2016 |
For the year ended December 31, 2016, there were no transfers between Level 1 and Level 2 assets and liabilities. For the year ended December 31, 2016, there were transfers between Level 1 and Level 3 assets and liabilities due to changes in the availability of observable inputs used to determine fair value. All transfers, if any, are recognized by the Fund at the end of the year.
Amounts designated as “—” are $0 or have been rounded to $0.
The accompanying notes are an integral part of the financial statements.
62
| | |
| THE KP FUNDS | | December 31, 2016 |
| | |
| KP International Equity Fund | | |
|
| SECTOR WEIGHTINGS† (unaudited) |
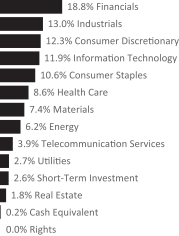
| † | Percentages based on total investments. |
| | | | | | | | |
| Description | | Shares | | | Value
(000) | |
| | | | | | | | |
COMMON STOCK — 95.9% | |
Australia — 2.9% | |
AGL Energy | | | 20,699 | | | $ | 330 | |
ALS | | | 104,942 | | | | 457 | |
Alumina | | | 740,245 | | | | 978 | |
Amcor | | | 53,806 | | | | 580 | |
AMP | | | 86,178 | | | | 313 | |
APA Group | | | 33,336 | | | | 206 | |
Aristocrat Leisure | | | 15,559 | | | | 174 | |
Asaleo Care | | | 134,146 | | | | 143 | |
ASX | | | 5,787 | | | | 208 | |
Aurizon Holdings | | | 59,781 | | | | 218 | |
AusNet Services | | | 56,942 | | | | 65 | |
Australia & New Zealand Banking Group | | | 88,970 | | | | 1,953 | |
Bank of Queensland | | | 11,372 | | | | 97 | |
Bendigo & Adelaide Bank | | | 13,797 | | | | 127 | |
BHP Billiton | | | 117,017 | | | | 2,117 | |
BlueScope Steel | | | 162,215 | | | | 1,087 | |
Boral | | | 35,384 | | | | 138 | |
Brambles | | | 47,548 | | | | 425 | |
Caltex Australia | | | 7,573 | | | | 166 | |
Challenger | | | 16,280 | | | | 132 | |
CIMIC Group | | | 2,989 | | | | 75 | |
Cleanaway Waste Management | | | 687,267 | | | | 610 | |
Coca-Cola Amatil | | | 141,447 | | | | 1,033 | |
Cochlear | | | 1,677 | | | | 148 | |
| | | | | | | | |
| Description | | Shares | | | Value
(000) | |
| | | | | | | | |
Commonwealth Bank of Australia | | | 52,093 | | | $ | 3,099 | |
Computershare | | | 14,270 | | | | 128 | |
Cover-More Group | | | 66,489 | | | | 93 | |
Crown Resorts | | | 10,292 | | | | 86 | |
CSL | | | 13,894 | | | | 1,007 | |
Dexus Property Group‡ | | | 27,819 | | | | 193 | |
Domino’s Pizza Enterprises | | | 1,846 | | | | 87 | |
DUET Group | | | 72,969 | | | | 144 | |
DuluxGroup | | | 47,182 | | | | 212 | |
Fairfax Media | | | 628,614 | | | | 404 | |
Flight Centre Travel Group | | | 1,602 | | | | 36 | |
Fortescue Metals Group | | | 45,363 | | | | 193 | |
Goodman Group‡ | | | 54,981 | | | | 283 | |
GPT Group‡ | | | 53,804 | | | | 195 | |
GUD Holdings | | | 27,985 | | | | 211 | |
Harvey Norman Holdings | | | 17,063 | | | | 63 | |
Healthscope | | | 49,589 | | | | 82 | |
Iluka Resources | | | 62,724 | | | | 329 | |
Incitec Pivot | | | 50,632 | | | | 132 | |
Insurance Australia Group | | | 70,855 | | | | 306 | |
Lend Lease Group | | | 15,979 | | | | 169 | |
Macquarie Group | | | 9,159 | | | | 576 | |
Medibank | | | 79,322 | | | | 161 | |
Metcash | | | 182,013 | | | | 299 | |
Mirvac Group‡ | | | 109,918 | | | | 169 | |
National Australia Bank | | | 80,766 | | | | 1,788 | |
Newcrest Mining | | | 61,193 | | | | 894 | |
Oil Search | | | 39,334 | | | | 204 | |
Orica | | | 172,909 | | | | 2,207 | |
Origin Energy | | | 52,832 | | | | 251 | |
Orora | | | 37,168 | | | | 80 | |
Premier Investments | | | 3,000 | | | | 31 | |
Qantas Airways | | | 16,683 | | | | 40 | |
QBE Insurance Group | | | 41,146 | | | | 369 | |
Ramsay Health Care | | | 4,122 | | | | 203 | |
REA Group | | | 1,468 | | | | 59 | |
Rio Tinto PLC | | | 12,685 | | | | 548 | |
Santos | | | 96,011 | | | | 279 | |
Scentre Group‡ | | | 159,320 | | | | 533 | |
SEEK | | | 9,870 | | | | 106 | |
Sigma Pharmaceuticals | | | 205,328 | | | | 191 | |
Sonic Healthcare | | | 11,828 | | | | 183 | |
South32 | | | 115,509 | | | | 229 | |
Spotless Group Holdings | | | 233,135 | | | | 167 | |
Stockland‡ | | | 70,074 | | | | 232 | |
Suncorp Group | | | 39,409 | | | | 385 | |
The accompanying notes are an integral part of the financial statements.
63
| | |
| THE KP FUNDS | | December 31, 2016 |
| | |
| KP International Equity Fund | | |
| | | | | | | | |
| Description | | Shares | | | Value
(000) | |
| | | | | | | | |
Sydney Airport | | | 32,109 | | | $ | 139 | |
Tabcorp Holdings | | | 25,505 | | | | 89 | |
Tatts Group | | | 44,051 | | | | 142 | |
Telstra | | | 128,143 | | | | 471 | |
TPG Telecom | | | 9,905 | | | | 49 | |
Transurban Group | | | 61,182 | | | | 455 | |
Treasury Wine Estates | | | 22,144 | | | | 171 | |
Vicinity Centres‡ | | | 100,524 | | | | 217 | |
Vocus Communications | | | 14,238 | | | | 40 | |
Wesfarmers | | | 34,284 | | | | 1,042 | |
Westfield‡ | | | 60,445 | | | | 409 | |
Westpac Banking | | | 101,666 | | | | 2,392 | |
Woodside Petroleum | | | 22,686 | | | | 510 | |
Woolworths | | | 38,215 | | | | 665 | |
| | | | | | | | |
| | | | | | | 36,207 | |
| | | | | | | | |
Austria — 0.1% | | | | | | | | |
ANDRITZ | | | 6,802 | | | | 342 | |
Erste Group Bank | | | 8,766 | | | | 256 | |
Oesterreichische Post | | | 9,241 | | | | 310 | |
OMV | | | 4,318 | | | | 153 | |
Raiffeisen Bank International | | | 3,314 | | | | 61 | |
Voestalpine | | | 3,444 | | | | 135 | |
Wienerberger | | | 30,008 | | | | 521 | |
| | | | | | | | |
| | | | | | | 1,778 | |
| | | | | | | | |
Belgium — 0.7% | | | | | | | | |
Ageas | | | 5,622 | | | | 223 | |
Anheuser-Busch InBev | | | 40,124 | | | | 4,247 | |
Colruyt | | | 1,889 | | | | 93 | |
Groupe Bruxelles Lambert | | | 2,414 | | | | 203 | |
KBC Group | | | 56,169 | | | | 3,478 | |
Proximus | | | 4,562 | | | | 131 | |
Solvay | | | 2,159 | | | | 253 | |
Telenet Group Holding* | | | 1,509 | | | | 84 | |
UCB | | | 3,676 | | | | 236 | |
Umicore | | | 2,857 | | | | 163 | |
| | | | | | | | |
| | | | | | | 9,111 | |
| | | | | | | | |
Brazil — 1.5% | | | | | | | | |
AES Tiete Energia | | | 42,200 | | | | 182 | |
Ambev ADR | | | 462,901 | | | | 2,273 | |
B2W Cia Digital* | | | 66,168 | | | | 207 | |
Banco do Brasil | | | 122,000 | | | | 1,053 | |
Banco Santander Brasil ADR | | | 38,782 | | | | 345 | |
BTG Pactual Group | | | 97,024 | | | | 434 | |
Cia de Saneamento Basico do Estado de Sao Paulo | | | 150,600 | | | | 1,332 | |
| | | | | | | | |
| Description | | Shares | | | Value
(000) | |
| | | | | | | | |
Cia de Saneamento de Minas Gerais-COPASA | | | 45,300 | | | $ | 508 | |
Cia Energetica de Minas Gerais ADR | | | 278,359 | | | | 635 | |
Cosan Industria e Comercio | | | 34,200 | | | | 401 | |
Direcional Engenharia | | | 25,600 | | | | 36 | |
EDP - Energias do Brasil | | | 181,200 | | | | 746 | |
Equatorial Energia | | | 23,200 | | | | 388 | |
Fibria Celulose | | | 34,000 | | | | 333 | |
Fleury | | | 10,100 | | | | 111 | |
Grendene | | | 139,500 | | | | 753 | |
JBS | | | 600,500 | | | | 2,103 | |
LPS Brasil Consultoria de Imoveis* | | | 143,535 | | | | 172 | |
MRV Engenharia e Participacoes | | | 472,900 | | | | 1,589 | |
Natura Cosmeticos | | | 121,227 | | | | 857 | |
Porto Seguro | | | 121,834 | | | | 1,007 | |
Positivo Informatica* | | | 56,200 | | | | 48 | |
Raia Drogasil | | | 80,900 | | | | 1,521 | |
Tim Participacoes | | | 157,203 | | | | 378 | |
TOTVS | | | 72,800 | | | | 538 | |
| | | | | | | | |
| | | | | | | 17,950 | |
| | | | | | | | |
Canada — 1.6% | | | | | | | | |
Brookfield Asset Management, Cl A | | | 56,188 | | | | 1,854 | |
Canadian Natural Resources | | | 82,945 | | | | 2,643 | |
Element Financial | | | 194,199 | | | | 1,802 | |
Fairfax Financial Holdings | | | 3,621 | | | | 1,749 | |
Loblaw | | | 60,873 | | | | 3,212 | |
PrairieSky Royalty | | | 33,497 | | | | 797 | |
Ritchie Bros Auctioneers | | | 17,916 | | | | 608 | |
Rogers Communications, Cl B | | | 45,240 | | | | 1,745 | |
Suncor Energy | | | 150,003 | | | | 4,904 | |
| | | | | | | | |
| | | | | | | 19,314 | |
| | | | | | | | |
Chile — 0.3% | | | | | | | | |
CAP | | | 11,219 | | | | 80 | |
Cia Cervecerias Unidas | | | 77,469 | | | | 809 | |
Cia Sud Americana de Vapores* | | | 5,047,221 | | | | 131 | |
Enaex | | | 2,463 | | | | 24 | |
Enersis Americas ADR | | | 1,650,868 | | | | 663 | |
Enersis Chile ADR | | | 1,650,868 | | | | 370 | |
Inversiones La Construccion | | | 4,669 | | | | 61 | |
Quinenco | | | 487,604 | | | | 1,146 | |
Sociedad Quimica y Minera de Chile ADR | | | 2,413 | | | | 69 | |
| | | | | | | | |
| | | | | | | 3,353 | |
| | | | | | | | |
China — 3.0% | | | | | | | | |
Agricultural Bank of China, Cl H | | | 4,839,000 | | | | 1,984 | |
Ajisen China Holdings | | | 778,000 | | | | 317 | |
The accompanying notes are an integral part of the financial statements.
64
| | |
| THE KP FUNDS | | December 31, 2016 |
| | |
| KP International Equity Fund | | |
| | | | | | | | |
| Description | | Shares | | | Value
(000) | |
| | | | | | | | |
Alibaba Group Holding ADR* | | | 31,333 | | | $ | 2,751 | |
Baidu ADR* | | | 6,274 | | | | 1,032 | |
Bank of China, Cl H | | | 12,607,000 | | | | 5,593 | |
Bank of Communications, Cl H | | | 732,000 | | | | 530 | |
BYD Electronic International | | | 1,381,500 | | | | 1,087 | |
CECEP COSTIN New Materials Group | | | 1,134,000 | | | | 88 | |
Changyou.com ADR* | | | 2,671 | | | | 57 | |
China Construction Bank, Cl H | | | 10,115,000 | | | | 7,786 | |
China Petroleum & Chemical, Cl H | | | 2,004,000 | | | | 1,421 | |
China Railway Group, Cl H | | | 211,000 | | | | 174 | |
China Shenhua Energy, Cl H | | | 135,000 | | | | 254 | |
China Telecom, Cl H | | | 5,234,000 | | | | 2,416 | |
Chongqing Rural Commercial Bank, Cl H | | | 391,000 | | | | 229 | |
Goodbaby International Holdings | | | 361,000 | | | | 173 | |
Harbin Electric, Cl H | | | 444,000 | | | | 207 | |
Leju Holdings ADR* | | | 9,889 | | | | 47 | |
Li Ning* | | | 1,269,291 | | | | 797 | |
NetEase ADR | | | 18,731 | | | | 4,033 | |
PetroChina, Cl H | | | 2,200,000 | | | | 1,640 | |
Powerlong Real Estate Holdings | | | 306,000 | | | | 90 | |
ReneSola ADR* | | | 35,493 | | | | 23 | |
Shenzhou International Group Holdings | | | 35,579 | | | | 225 | |
Sinotruk Hong Kong | | | 697,000 | | | | 498 | |
TravelSky Technology, Cl H | | | 157,000 | | | | 330 | |
Tsingtao Brewery, Cl H | | | 116,000 | | | | 438 | |
Want Want China Holdings | | | 1,300,996 | | | | 834 | |
Weibo ADR* | | | 37,649 | | | | 1,529 | |
Xingda International Holdings | | | 139,000 | | | | 63 | |
Yangzijiang Shipbuilding Holdings | | | 47,000 | | | | 26 | |
Yingde Gases Group | | | 135,000 | | | | 50 | |
Yirendai ADR* | | | 2,983 | | | | 62 | |
| | | | | | | | |
| | | | | | | 36,784 | |
| | | | | | | | |
Colombia — 0.1% | | | | | | | | |
Almacenes Exito | | | 67,436 | | | | 335 | |
Bancolombia ADR | | | 20,338 | | | | 746 | |
| | | | | | | | |
| | | | | | | 1,081 | |
| | | | | | | | |
Cyprus — 0.1% | | | | | | | | |
Global Ports Investments GDR* | | | 137,334 | | | | 549 | |
| | | | | | | | |
Czech Republic — 0.0% | | | | | | | | |
Komercni Banka | | | 6,477 | | | | 223 | |
| | | | | | | | |
Denmark — 1.7% | | | | | | | | |
AP Moeller - Maersk, Cl B | | | 302 | | | | 472 | |
Carlsberg, Cl B | | | 33,799 | | | | 2,917 | |
| | | | | | | | |
| Description | | Shares | | | Value
(000) | |
| | | | | | | | |
Chr Hansen Holding | | | 2,970 | | | $ | 164 | |
Coloplast, Cl B | | | 33,502 | | | | 2,260 | |
Danske Bank | | | 27,244 | | | | 826 | |
DONG Energy* (A) (B) | | | 2,412 | | | | 91 | |
DSV | | | 5,536 | | | | 246 | |
Genmab* | | | 1,721 | | | | 286 | |
GN Store Nord | | | 54,127 | | | | 1,121 | |
ISS | | | 11,470 | | | | 387 | |
Novo Nordisk, Cl B | | | 194,789 | | | | 7,026 | |
Novozymes, Cl B | | | 6,885 | | | | 238 | |
Pandora | | | 3,335 | | | | 436 | |
TDC | | | 23,000 | | | | 118 | |
Topdanmark* | | | 8,331 | | | | 212 | |
Tryg | | | 3,665 | | | | 66 | |
Vestas Wind Systems | | | 41,747 | | | | 2,713 | |
William Demant Holding* | | | 58,874 | | | | 1,024 | |
| | | | | | | | |
| | | | | | | 20,603 | |
| | | | | | | | |
Egypt — 0.0% | | | | | | | | |
Telecom Egypt(C) | | | 129,194 | | | | 84 | |
| | | | | | | | |
Finland — 0.8% | | | | | | | | |
Amer Sports | | | 11,800 | | | | 314 | |
Elisa | | | 4,124 | | | | 134 | |
Fortum | | | 13,292 | | | | 204 | |
Kone, Cl B | | | 10,106 | | | | 453 | |
Metso | | | 13,785 | | | | 393 | |
Neste | | | 3,742 | | | | 144 | |
Nokia | | | 139,054 | | | | 672 | |
Nokian Renkaat | | | 18,098 | | | | 675 | |
Orion, Cl B | | | 2,888 | | | | 129 | |
Sampo, Cl A | | | 67,991 | | | | 3,047 | |
Stora Enso, Cl R | | | 16,549 | | | | 178 | |
Tikkurila | | | 113,942 | | | | 2,256 | |
UPM-Kymmene | | | 16,014 | | | | 393 | |
Wartsila, Cl B | | | 13,010 | | | | 585 | |
| | | | | | | | |
| | | | | | | 9,577 | |
| | | | | | | | |
France — 7.3% | | | | | | | | |
Accor | | | 5,117 | | | | 191 | |
Aeroports de Paris | | | 913 | | | | 98 | |
Air France-KLM* | | | 65,671 | | | | 358 | |
Air Liquide | | | 77,875 | | | | 8,661 | |
Alstom | | | 4,508 | | | | 124 | |
Arkema | | | 2,055 | | | | 201 | |
Atos | | | 2,594 | | | | 274 | |
AXA | | | 92,276 | | | | 2,330 | |
BNP Paribas | | | 56,086 | | | | 3,575 | |
The accompanying notes are an integral part of the financial statements.
65
| | |
| THE KP FUNDS | | December 31, 2016 |
| | |
| KP International Equity Fund | | |
| | | | | | | | |
| Description | | Shares | | | Value
(000) | |
| | | | | | | | |
Bollore | | | 24,884 | | | $ | 88 | |
Bouygues | | | 6,064 | | | | 217 | |
Bureau Veritas | | | 7,658 | | | | 148 | |
Capital Gemini | | | 4,906 | | | | 414 | |
Carrefour | | | 17,002 | | | | 410 | |
Casino Guichard Perrachon | | | 1,610 | | | | 77 | |
Christian Dior | | | 1,671 | | | | 350 | |
Cie de Saint-Gobain | | | 15,231 | | | | 710 | |
Cie Generale des Etablissements Michelin | | | 5,450 | | | | 606 | |
CNP Assurances | | | 4,932 | | | | 91 | |
Credit Agricole | | | 33,692 | | | | 418 | |
Danone | | | 109,658 | | | | 6,949 | |
Dassault Aviation | | | 76 | | | | 85 | |
Dassault Systemes | | | 31,615 | | | | 2,409 | |
Edenred | | | 32,044 | | | | 634 | |
Eiffage | | | 1,725 | | | | 120 | |
Electricite de France | | | 7,417 | | | | 76 | |
Elis | | | 6,309 | | | | 113 | |
Engie | | | 283,706 | | | | 3,619 | |
Essilor International | | | 6,190 | | | | 699 | |
Eurazeo | | | 1,259 | | | | 74 | |
Eurofins Scientific | | | 2,616 | | | | 1,115 | |
Eutelsat Communications | | | 5,156 | | | | 100 | |
Fonciere Des Regions‡ | | | 973 | | | | 85 | |
Gecina‡ | | | 1,235 | | | | 171 | |
Groupe Eurotunnel | | | 78,261 | | | | 744 | |
Hermes International | | | 2,186 | | | | 898 | |
ICADE‡ | | | 1,092 | | | | 78 | |
Iliad | | | 795 | | | | 153 | |
Imerys | | | 2,763 | | | | 210 | |
Ingenico Group | | | 1,570 | | | | 125 | |
JCDecaux | | | 10,645 | | | | 313 | |
Kering | | | 2,268 | | | | 509 | |
Klepierre‡ | | | 6,398 | | | | 252 | |
LafargeHolcim | | | 4,252 | | | | 223 | |
Lagardere | | | 3,357 | | | | 93 | |
Legrand | | | 68,248 | | | | 3,876 | |
L’Oreal | | | 24,331 | | | | 4,441 | |
LVMH Moet Hennessy Louis Vuitton | | | 37,172 | | | | 7,098 | |
Natixis | | | 28,469 | | | | 161 | |
Neopost | | | 11,472 | | | | 359 | |
Nokia | | | 38,724 | | | | 186 | |
Numericable-SFR* | | | 3,372 | | | | 95 | |
Orange | | | 60,768 | | | | 923 | |
Pernod Ricard | | | 71,713 | | | | 7,772 | |
Peugeot* | | | 14,136 | | | | 231 | |
| | | | | | | | |
| Description | | Shares | | | Value
(000) | |
| | | | | | | | |
Publicis Groupe | | | 5,875 | | | $ | 405 | |
Remy Cointreau | | | 719 | | | | 61 | |
Renault | | | 5,754 | | | | 511 | |
Rexel | | | 8,909 | | | | 147 | |
Safran | | | 9,346 | | | | 673 | |
Sanofi | | | 40,262 | | | | 3,259 | |
Schneider Electric | | | 118,334 | | | | 8,236 | |
SCOR | | | 4,628 | | | | 160 | |
SEB | | | 648 | | | | 88 | |
Societe BIC | | | 850 | | | | 116 | |
Societe Generale | | | 23,351 | | | | 1,149 | |
Sodexo | | | 2,739 | | | | 315 | |
Suez | | | 9,222 | | | | 136 | |
Technip | | | 5,842 | | | | 417 | |
Thales | | | 9,262 | | | | 898 | |
TOTAL | | | 76,331 | | | | 3,915 | |
Unibail-Rodamco‡ | | | 2,967 | | | | 707 | |
Valeo | | | 7,147 | | | | 411 | |
Vallourec | | | 23,983 | | | | 165 | |
Veolia Environnement | | | 13,952 | | | | 238 | |
Vicat | | | 3,515 | | | | 213 | |
Vinci | | | 15,412 | | | | 1,050 | |
Virbac | | | 335 | | | | 59 | |
Vivendi | | | 31,422 | | | | 598 | |
Wendel | | | 854 | | | | 103 | |
Zodiac Aerospace | | | 42,778 | | | | 983 | |
| | | | | | | | |
| | | | | | | 89,343 | |
| | | | | | | | |
Germany — 6.3% | |
adidas | | | 12,013 | | | | 1,899 | |
Allianz | | | 13,886 | | | | 2,295 | |
Axel Springer | | | 14,398 | | | | 699 | |
BASF | | | 47,388 | | | | 4,405 | |
Bayer | | | 120,469 | | | | 12,572 | |
Bayerische Motoren Werke | | | 23,749 | | | | 2,219 | |
Beiersdorf | | | 68,946 | | | | 5,850 | |
Brenntag | | | 20,445 | | | | 1,136 | |
Commerzbank | | | 32,083 | | | | 244 | |
Continental | | | 3,288 | | | | 636 | |
Covestro(A) (B) | | | 2,130 | | | | 146 | |
CTS Eventim & KGaA | | | 14,733 | | | | 464 | |
Daimler | | | 29,259 | | | | 2,178 | |
Deutsche Bank | | | 41,185 | | | | 748 | |
Deutsche Boerse* | | | 5,779 | | | | 465 | |
Deutsche Lufthansa | | | 7,203 | | | | 93 | |
Deutsche Post | | | 29,544 | | | | 971 | |
Deutsche Telekom | | | 181,125 | | | | 3,119 | |
The accompanying notes are an integral part of the financial statements.
66
| | |
| THE KP FUNDS | | December 31, 2016 |
| | |
| KP International Equity Fund | | |
| | | | | | | | |
| Description | | Shares | | | Value
(000) | |
| | | | | | | | |
Deutsche Wohnen | | | 9,833 | | | $ | 309 | |
E.ON | | | 59,994 | | | | 423 | |
Evonik Industries | | | 4,917 | | | | 147 | |
Fielmann | | | 3,672 | | | | 243 | |
Fraport Frankfurt Airport Services Worldwide | | | 1,196 | | | | 71 | |
Fresenius & KGaA | | | 12,478 | | | | 975 | |
Fresenius Medical Care & KGaA | | | 34,687 | | | | 2,938 | |
GEA Group | | | 9,962 | | | | 401 | |
Gerresheimer | | | 2,237 | | | | 166 | |
Hannover Rueck | | | 3,529 | | | | 382 | |
HeidelbergCement | | | 4,462 | | | | 416 | |
Henkel & KGaA | | | 3,188 | | | | 332 | |
Hochtief | | | 642 | | | | 90 | |
HUGO BOSS | | | 1,864 | | | | 114 | |
Infineon Technologies | | | 33,868 | | | | 589 | |
Innogy* (A) (B) | | | 3,965 | | | | 138 | |
K+S | | | 5,595 | | | | 134 | |
LANXESS | | | 2,671 | | | | 175 | |
Linde | | | 20,243 | | | | 3,327 | |
MAN | | | 1,078 | | | | 107 | |
Merck KGaA | | | 40,701 | | | | 4,248 | |
METRO | | | 5,155 | | | | 171 | |
MTU Aero Engines | | | 14,586 | | | | 1,686 | |
Muenchener Rueckversicherungs-Gesellschaft in Muenchen | | | 4,905 | | | | 927 | |
OSRAM Licht | | | 2,584 | | | | 136 | |
ProSiebenSat.1 Media | | | 58,952 | | | | 2,272 | |
RWE | | | 14,656 | | | | 182 | |
SAP | | | 112,992 | | | | 9,851 | |
Siemens | | | 23,237 | | | | 2,857 | |
Stabilus* | | | 12,746 | | | | 685 | |
Symrise | | | 11,522 | | | | 701 | |
Telefonica Deutschland Holding | | | 21,807 | | | | 93 | |
ThyssenKrupp | | | 10,718 | | | | 255 | |
TUI | | | 108,158 | | | | 1,541 | |
United Internet | | | 3,564 | | | | 139 | |
Volkswagen | | | 944 | | | | 136 | |
Vonovia | | | 13,963 | | | | 454 | |
Zalando* (A) (B) | | | 2,652 | | | | 101 | |
| | | | | | | | |
| | | | | | | 78,051 | |
| | | | | | | | |
Greece — 0.2% | |
Aegean Airlines | | | 27,543 | | | | 184 | |
Alpha Bank AE* | | | 52,119 | | | | 104 | |
Athens Water Supply & Sewage | | | 11,513 | | | | 68 | |
Fourlis Holdings* | | | 23,951 | | | | 103 | |
Grivalia Properties REIC AE‡ | | | 67,213 | | | | 541 | |
| | | | | | | | |
| Description | | Shares | | | Value
(000) | |
| | | | | | | | |
Hellenic Petroleum | | | 22,366 | | | $ | 104 | |
JUMBO | | | 24,932 | | | | 395 | |
Motor Oil Hellas Corinth Refineries | | | 68,639 | | | | 946 | |
OPAP | | | 19,401 | | | | 172 | |
Public Power | | | 54,106 | | | | 165 | |
| | | | | | | | |
| | | | | | | 2,782 | |
| | | | | | | | |
Hong Kong — 4.3% | |
AIA Group | | | 1,573,800 | | | | 8,879 | |
Angang Steel, Cl H | | | 362,000 | | | | 216 | |
ASM Pacific Technology | | | 7,700 | | | | 82 | |
Bank of East Asia | | | 35,791 | | | | 137 | |
BOC Hong Kong Holdings | | | 113,500 | | | | 406 | |
C C Land Holdings | | | 123,000 | | | | 36 | |
Cathay Pacific Airways | | | 38,000 | | | | 50 | |
Chaowei Power Holdings | | | 50,000 | | | | 43 | |
Cheung Kong Infrastructure Holdings | | | 19,000 | | | | 151 | |
Cheung Kong Property Holdings | | | 90,722 | | | | 556 | |
China High Speed Transmission Equipment Group | | | 97,000 | | | | 114 | |
China Lesso Group Holdings | | | 80,000 | | | | 52 | |
China Mengniu Dairy | | | 497,000 | | | | 958 | |
China Merchants Holdings International | | | 45,543 | | | | 113 | |
China Mobile | | | 650,000 | | | | 6,890 | |
China National Materials | | | 221,000 | | | | 52 | |
China Overseas Grand Oceans Group | | | 273,000 | | | | 89 | |
China Resources Beer Holdings | | | 385,073 | | | | 765 | |
China Resources Land | | | 252,000 | | | | 568 | |
China Sunshine Paper Holdings | | | 134,000 | | | | 24 | |
CIFI Holdings Group | | | 368,000 | | | | 99 | |
CK Hutchison Holdings | | | 217,384 | | | | 2,464 | |
CLP Holdings | | | 50,000 | | | | 459 | |
CNOOC | | | 496,780 | | | | 621 | |
Daphne International Holdings | | | 432,000 | | | | 43 | |
Esprit Holdings | | | 1,453,877 | | | | 1,141 | |
First Pacific | | | 752,000 | | | | 526 | |
Future Land Development Holdings | | | 282,000 | | | | 58 | |
Galaxy Entertainment Group | | | 70,000 | | | | 305 | |
Geely Automobile Holdings | | | 2,150,000 | | | | 2,054 | |
Global Brands Group Holding* | | | 6,426,000 | | | | 854 | |
Guangdong Yueyun Transportation Company, Cl H | | | 214,500 | | | | 116 | |
Guangnan Holdings | | | 210,000 | | | | 25 | |
Hang Lung Group | | | 25,000 | | | | 87 | |
Hang Lung Properties | | | 68,000 | | | | 144 | |
The accompanying notes are an integral part of the financial statements.
67
| | |
| THE KP FUNDS | | December 31, 2016 |
| | |
| KP International Equity Fund | | |
| | | | | | | | |
| Description | | Shares | | | Value
(000) | |
| | | | | | | | |
Hang Seng Bank | | | 22,900 | | | $ | 426 | |
Henderson Land Development | | | 31,075 | | | | 165 | |
Hisense Kelon Electrical Holdings, Cl A | | | 137,000 | | | | 112 | |
HK Electric Investments & HK Electric Investments(A) (B) | | | 73,703 | | | | 61 | |
HKT Trust | | | 77,740 | | | | 95 | |
Hong Kong & China Gas | | | 233,652 | | | | 414 | |
Hong Kong Exchanges and Clearing | | | 35,286 | | | | 834 | |
Hongkong & Shanghai Hotels | | | 273,972 | | | | 304 | |
Hysan Development | | | 18,000 | | | | 74 | |
Industrial & Commercial Bank of China, Cl H | | | 10,130,000 | | | | 6,075 | |
Jardine Matheson Holdings | | | 32,600 | | | | 1,801 | |
Kerry Properties | | | 20,000 | | | | 54 | |
Kingboard Chemical Holdings | | | 1,033,000 | | | | 3,131 | |
Kingboard Laminates Holdings | | | 2,356,000 | | | | 2,315 | |
Li & Fung | | | 2,840,000 | | | | 1,249 | |
Link‡ | | | 68,500 | | | | 445 | |
Longfor Properties | | | 133,000 | | | | 169 | |
Melco Crown Entertainment ADR | | | 5,891 | | | | 94 | |
MGM China Holdings | | | 29,600 | | | | 61 | |
MTR* | | | 43,180 | | | | 210 | |
New World Development | | | 189,863 | | | | 201 | |
NWS Holdings | | | 49,000 | | | | 80 | |
PCCW | | | 120,136 | | | | 65 | |
Power Assets Holdings | | | 42,500 | | | | 375 | |
Scud Group* (C) | | | 252,000 | | | | — | |
Shangri-La Asia | | | 40,000 | | | | 42 | |
Sino Land | | | 93,046 | | | | 139 | |
Sinopec Shanghai Petrochemical, Cl H | | | 3,076,000 | | | | 1,666 | |
SJM Holdings | | | 62,000 | | | | 49 | |
SmarTone Telecommunications Holdings | | | 83,447 | | | | 112 | |
Stella International Holdings | | | 102,448 | | | | 165 | |
Sun Hung Kai Properties | | | 42,893 | | | | 542 | |
Swire Pacific, Cl A | | | 16,000 | | | | 153 | |
Swire Properties | | | 35,800 | | | | 99 | |
Techtronic Industries | | | 41,500 | | | | 149 | |
Television Broadcasts | | | 93,800 | | | | 308 | |
Tianneng Power International | | | 410,000 | | | | 376 | |
Tingyi Cayman Islands Holding | | | 511,014 | | | | 621 | |
Top Spring International Holdings | | | 55,000 | | | | 21 | |
Weiqiao Textile, Cl H | | | 196,500 | | | | 123 | |
Welling Holding | | | 244,000 | | | | 45 | |
WH Group(A) (B) | | | 231,101 | | | | 187 | |
| | | | | | | | |
| Description | | Shares | | | Value
(000) | |
| | | | | | | | |
Wharf Holdings | | | 40,000 | | | $ | 266 | |
Wheelock | | | 24,000 | | | | 135 | |
Wynn Macau | | | 46,800 | | | | 74 | |
Yue Yuen Industrial Holdings | | | 21,500 | | | | 78 | |
Zhongsheng Group Holdings | | | 131,500 | | | | 118 | |
| | | | | | | | |
| | | | | | | 53,455 | |
| | | | | | | | |
India — 1.9% | |
Axis Bank | | | 46,879 | | | | 311 | |
Bank of Baroda* | | | 87,731 | | | | 198 | |
Bharat Petroleum | | | 184,533 | | | | 1,728 | |
Bharti Airtel | | | 82,489 | | | | 371 | |
CESC | | | 92,826 | | | | 873 | |
Exide Industries | | | 72,057 | | | | 192 | |
GAIL India | | | 21,965 | | | | 142 | |
Gujarat Alkalies & Chemicals | | | 29,821 | | | | 152 | |
Gujarat Narmada Valley Fertilizers & Chemicals | | | 55,910 | | | | 175 | |
Hindalco Industries | | | 671,594 | | | | 1,535 | |
Housing Development Finance | | | 178,716 | | | | 3,325 | |
Indian Bank | | | 18,056 | | | | 59 | |
Indian Oil | | | 412,264 | | | | 1,975 | |
Infosys ADR | | | 144,838 | | | | 2,148 | |
Jindal Stainless Hisar* | | | 44,257 | | | | 58 | |
JK Tyre & Industries | | | 46,816 | | | | 78 | |
Kalyani Steels* | | | 19,852 | | | | 81 | |
Kirloskar Ferrous Industries | | | 29,669 | | | | 29 | |
Mangalore Refinery & Petrochemicals* | | | 318,006 | | | | 460 | |
National Aluminium | | | 89,269 | | | | 86 | |
NMDC | | | 69,826 | | | | 127 | |
NOCIL | | | 70,524 | | | | 70 | |
Rain Industries | | | 52,329 | | | | 42 | |
Sundram Fasteners | | | 17,639 | | | | 75 | |
Tata Consultancy Services | | | 151,047 | | | | 5,265 | |
Tata Motors ADR | | | 86,922 | | | | 2,989 | |
Thirumalai Chemicals | | | 2,634 | | | | 30 | |
Tinplate of India | | | 69,685 | | | | 77 | |
WNS Holdings ADR* | | | 23,786 | | | | 655 | |
| | | | | | | | |
| | | | | | | 23,306 | |
| | | | | | | | |
Indonesia — 0.7% | |
Adaro Energy | | | 1,540,100 | | | | 194 | |
Bank CIMB Niaga* | | | 783,900 | | | | 49 | |
Bank Negara Indonesia Persero | | | 3,771,200 | | | | 1,547 | |
Bank Pembangunan Daerah Jawa Barat Dan Banten | | | 3,081,400 | | | | 775 | |
Bank Pembangunan Daerah Jawa Timur | | | 467,000 | | | | 20 | |
The accompanying notes are an integral part of the financial statements.
68
| | |
| THE KP FUNDS | | December 31, 2016 |
| | |
| KP International Equity Fund | | |
| | | | | | | | |
| Description | | Shares | | | Value
(000) | |
| | | | | | | | |
Bank Tabungan Negara Persero | | | 8,193,200 | | | $ | 1,058 | |
Delta Dunia Makmur* | | | 5,031,800 | | | | 190 | |
Japfa Comfeed Indonesia | | | 739,500 | | | | 80 | |
Telekomunikasi Indonesia Persero | | | 12,669,200 | | | | 3,743 | |
Timah Persero | | | 1,643,700 | | | | 131 | |
United Tractors | | | 152,900 | | | | 241 | |
XL Axiata* | | | 750,575 | | | | 129 | |
| | | | | | | | |
| | | | | | | 8,157 | |
| | | | | | | | |
Ireland — 0.8% | |
Bank of Ireland* | | | 5,151,473 | | | | 1,269 | |
CRH | | | 30,187 | | | | 1,048 | |
DCC | | | 15,379 | | | | 1,145 | |
Experian | | | 216,141 | | | | 4,193 | |
Irish Continental Group | | | 72,829 | | | | 345 | |
Kerry Group, Cl A | | | 4,857 | | | | 347 | |
Paddy Power Betfair | | | 9,689 | | | | 1,035 | |
Ryanair Holdings ADR* | | | 845 | | | | 70 | |
| | | | | | | | |
| | | | | | | 9,452 | |
| | | | | | | | |
Israel — 0.5% | | | | | | | | |
Azrieli Group(C) | | | 1,299 | | | | 56 | |
Bank Hapoalim(C) | | | 30,817 | | | | 183 | |
Bank Leumi Le-Israel*(C) | | | 41,836 | | | | 173 | |
Bezeq The Israeli Telecommunication(C) | | | 59,320 | | | | 113 | |
Check Point Software Technologies* | | | 44,333 | | | | 3,745 | |
Elbit Systems(C) | | | 674 | | | | 68 | |
Frutarom Industries(C) | | | 1,099 | | | | 56 | |
Israel Chemicals(C) | | | 15,975 | | | | 66 | |
Mizrahi Tefahot Bank(C) | | | 4,336 | | | | 64 | |
Mobileye* | | | 5,248 | | | | 200 | |
NICE-Systems(C) | | | 1,744 | | | | 119 | |
Taro Pharmaceutical Industries* | | | 445 | | | | 47 | |
Teva Pharmaceutical Industries(C) | | | 26,173 | | | | 939 | |
| | | | | | | | |
| | | | | | | 5,829 | |
| | | | | | | | |
Italy — 1.6% | | | | | | | | |
Assicurazioni Generali | | | 35,013 | | | | 520 | |
Atlantia | | | 12,004 | | | | 281 | |
CNH Industrial | | | 204,244 | | | | 1,777 | |
Davide Campari-Milano | | | 19,762 | | | | 193 | |
Enel | | | 232,157 | | | | 1,023 | |
Eni | | | 278,898 | | | | 4,542 | |
EXOR | | | 3,240 | | | | 140 | |
Ferrari | | | 3,536 | | | | 206 | |
Fiat Chrysler Automobiles | | | 27,247 | | | | 249 | |
Intesa Sanpaolo | | | 493,685 | | | | 1,255 | |
| | | | | | | | |
| Description | | Shares | | | Value
(000) | |
| | | | | | | | |
Leonardo-Finmeccanica* | | | 11,801 | | | $ | 166 | |
Luxottica Group | | | 80,130 | | | | 4,310 | |
Mediobanca | | | 16,505 | | | | 135 | |
Piaggio & C | | | 493,669 | | | | 824 | |
Poste Italiane(A) (B) | | | 15,695 | | | | 104 | |
Prysmian | | | 5,753 | | | | 148 | |
Saipem | | | 2,313,750 | | | | 1,303 | |
Snam | | | 71,398 | | | | 294 | |
Technogym* (A) (B) | | | 8,655 | | | | 40 | |
Telecom Italia | | | 472,020 | | | | 388 | |
Terna Rete Elettrica Nazionale | | | 43,990 | | | | 202 | |
UniCredit | | | 410,438 | | | | 1,181 | |
UnipolSai | | | 34,993 | | | | 75 | |
| | | | | | | | |
| | | | | | | 19,356 | |
| | | | | | | | |
Japan — 16.3% | | | | | | | | |
ABC-Mart | | | 1,000 | | | | 57 | |
Acom* | | | 12,600 | | | | 55 | |
Aeon | | | 19,000 | | | | 270 | |
Aeon Delight | | | 1,500 | | | | 42 | |
AEON Financial Service | | | 12,600 | | | | 224 | |
Aeon Mall | | | 3,200 | | | | 45 | |
Aida Engineering | | | 4,500 | | | | 43 | |
Air Water | | | 4,600 | | | | 83 | |
Aisin Seiki | | | 5,600 | | | | 243 | |
Ajinomoto | | | 16,100 | | | | 324 | |
Alfresa Holdings | | | 73,500 | | | | 1,216 | |
Alps Electric | | | 5,400 | | | | 131 | |
Amada Holdings | | | 10,000 | | | | 112 | |
ANA Holdings | | | 34,000 | | | | 92 | |
Aozora Bank | | | 36,000 | | | | 127 | |
Asahi Glass | | | 30,000 | | | | 204 | |
Asahi Group Holdings | | | 11,900 | | | | 376 | |
Asahi Kasei | | | 37,000 | | | | 323 | |
Asics | | | 4,800 | | | | 96 | |
Astellas Pharma | | | 65,600 | | | | 911 | |
Azbil | | | 14,900 | | | | 419 | |
Bank of Kyoto | | | 9,000 | | | | 67 | |
Benesse Holdings | | | 2,100 | | | | 58 | |
Bridgestone | | | 26,900 | | | | 970 | |
Brother Industries | | | 7,100 | | | | 128 | |
Calbee | | | 2,200 | | | | 69 | |
Canon | | | 32,500 | | | | 916 | |
Casio Computer | | | 22,700 | | | | 321 | |
Central Japan Railway | | | 4,440 | | | | 731 | |
Chiba Bank | | | 20,000 | | | | 123 | |
Chubu Electric Power | | | 18,800 | | | | 263 | |
The accompanying notes are an integral part of the financial statements.
69
| | |
| THE KP FUNDS | | December 31, 2016 |
| | |
| KP International Equity Fund | | |
| | | | | | | | |
| Description | | Shares | | | Value
(000) | |
| | | | | | | | |
Chugai Pharmaceutical | | | 6,700 | | | $ | 192 | |
Chugoku Bank | | | 5,300 | | | | 76 | |
Chugoku Electric Power | | | 7,900 | | | | 93 | |
Concordia Financial Group | | | 34,300 | | | | 165 | |
Credit Saison | | | 4,300 | | | | 76 | |
CYBERDYNE* | | | 3,000 | | | | 42 | |
Dai Nippon Printing | | | 16,000 | | | | 158 | |
Daicel | | | 8,600 | | | | 95 | |
Daifuku | | | 8,900 | | | | 190 | |
Dai-ichi Life Holdings | | | 188,900 | | | | 3,146 | |
Daiichi Sankyo | | | 18,500 | | | | 379 | |
Daikin Industries | | | 37,800 | | | | 3,472 | |
Daito Trust Construction | | | 2,100 | | | | 316 | |
Daiwa House Industry | | | 22,000 | | | | 602 | |
Daiwa House Investment‡ | | | 41 | | | | 104 | |
Daiwa Securities Group | | | 50,000 | | | | 308 | |
Dena | | | 3,000 | | | | 66 | |
Denso | | | 139,500 | | | | 6,042 | |
Dentsu | | | 6,400 | | | | 301 | |
Don Quijote Holdings | | | 3,500 | | | | 130 | |
East Japan Railway | | | 33,400 | | | | 2,886 | |
Eisai | | | 7,520 | | | | 432 | |
Electric Power Development | | | 4,300 | | | | 99 | |
FamilyMart | | | 2,500 | | | | 166 | |
FANUC | | | 26,480 | | | | 4,490 | |
Fast Retailing | | | 1,600 | | | | 573 | |
Fuji Electric | | | 17,000 | | | | 88 | |
Fuji Heavy Industries | | | 26,700 | | | | 1,090 | |
Fuji Media Holdings | | | 85,000 | | | | 1,191 | |
FUJIFILM Holdings | | | 86,500 | | | | 3,283 | |
Fujitsu | | | 56,000 | | | | 311 | |
Fukuoka Financial Group | | | 53,000 | | | | 235 | |
Hachijuni Bank | | | 12,000 | | | | 70 | |
Hakuhodo DY Holdings | | | 5,800 | | | | 71 | |
Hamamatsu Photonics | | | 4,300 | | | | 113 | |
Hankyu Hanshin Holdings | | | 7,000 | | | | 225 | |
Hikari Tsushin | | | 600 | | | | 56 | |
Hino Motors | | | 7,000 | | | | 71 | |
Hirose Electric | | | 900 | | | | 112 | |
Hiroshima Bank | | | 15,000 | | | | 70 | |
Hisamitsu Pharmaceutical | | | 1,800 | | | | 90 | |
Hitachi | | | 570,000 | | | | 3,083 | |
Hitachi Capital | | | 7,500 | | | | 185 | |
Hitachi Chemical | | | 3,300 | | | | 83 | |
Hitachi Construction Machinery | | | 3,100 | | | | 67 | |
Hitachi High-Technologies | | | 2,000 | | | | 81 | |
Hitachi Metals | | | 6,300 | | | | 85 | |
| | | | | | | | |
| Description | | Shares | | | Value
(000) | |
| | | | | | | | |
Hokuriku Electric Power | | | 5,000 | | | $ | 56 | |
Honda Motor | | | 49,600 | | | | 1,449 | |
Hoshizaki Electric | | | 1,500 | | | | 119 | |
Hoya | | | 214,900 | | | | 9,031 | |
Hulic | | | 8,800 | | | | 78 | |
Idemitsu Kosan | | | 2,800 | | | | 74 | |
IHI | | | 44,000 | | | | 114 | |
Iida Group Holdings | | | 4,000 | | | | 76 | |
Inpex | | | 27,700 | | | | 277 | |
Isetan Mitsukoshi Holdings | | | 82,800 | | | | 892 | |
Isuzu Motors | | | 17,700 | | | | 224 | |
ITOCHU | | | 61,100 | | | | 811 | |
J Front Retailing | | | 7,400 | | | | 100 | |
Japan Airlines | | | 10,200 | | | | 298 | |
Japan Airport Terminal | | | 1,400 | | | | 51 | |
Japan Exchange Group | | | 15,700 | | | | 224 | |
Japan Post Bank | | | 12,200 | | | | 146 | |
Japan Post Holdings | | | 94,000 | | | | 1,173 | |
Japan Prime Realty Investment‡ | | | 23 | | | | 91 | |
Japan Real Estate Investment‡ | | | 38 | | | | 207 | |
Japan Retail Fund Investment‡ | | | 77 | | | | 156 | |
Japan Tobacco | | | 152,900 | | | | 5,029 | |
JFE Holdings | | | 60,500 | | | | 922 | |
JGC | | | 6,000 | | | | 109 | |
JSR | | | 5,800 | | | | 91 | |
JTEKT | | | 6,700 | | | | 107 | |
JX Holdings | | | 61,800 | | | | 262 | |
Kajima | | | 27,000 | | | | 187 | |
Kakaku.com | | | 4,400 | | | | 73 | |
Kamigumi | | | 7,000 | | | | 67 | |
Kaneka | | | 9,000 | | | | 73 | |
Kansai Electric Power* | | | 20,500 | | | | 224 | |
Kansai Paint | | | 6,500 | | | | 120 | |
Kao | | | 48,000 | | | | 2,275 | |
Kawasaki Heavy Industries | | | 42,000 | | | | 132 | |
KDDI | | | 60,300 | | | | 1,527 | |
Keihan Holdings | | | 15,000 | | | | 99 | |
Keikyu | | | 14,000 | | | | 162 | |
Keio | | | 17,000 | | | | 140 | |
Keisei Electric Railway | | | 4,000 | | | | 97 | |
Keyence | | | 1,500 | | | | 1,029 | |
Kikkoman | | | 5,000 | | | | 160 | |
Kintetsu Group Holdings | | | 53,000 | | | | 202 | |
Kirin Holdings | | | 175,100 | | | | 2,848 | |
Kobe Steel | | | 9,600 | | | | 92 | |
Koito Manufacturing | | | 3,200 | | | | 169 | |
Komatsu | | | 27,600 | | | | 625 | |
The accompanying notes are an integral part of the financial statements.
70
| | |
| THE KP FUNDS | | December 31, 2016 |
| | |
| KP International Equity Fund | | |
| | | | | | | | |
| Description | | Shares | | | Value
(000) | |
| | | | | | | | |
Konami Holdings | | | 2,800 | | | $ | 113 | |
Konica Minolta | | | 13,800 | | | | 137 | |
Kose | | | 900 | | | | 75 | |
Kubota | | | 221,600 | | | | 3,165 | |
Kuraray | | | 10,400 | | | | 156 | |
Kurita Water Industries | | | 3,100 | | | | 68 | |
Kyocera | | | 100,500 | | | | 4,999 | |
Kyowa Hakko Kirin | | | 7,400 | | | | 102 | |
Kyushu Electric Power | | | 12,500 | | | | 136 | |
Kyushu Financial Group | | | 10,000 | | | | 68 | |
Lawson | | | 2,000 | | | | 140 | |
LINE* | | | 1,000 | | | | 34 | |
Lion | | | 7,000 | | | | 115 | |
LIXIL Group | | | 65,700 | | | | 1,492 | |
M3 | | | 5,900 | | | | 149 | |
Mabuchi Motor | | | 1,500 | | | | 78 | |
Maeda | | | 13,000 | | | | 113 | |
Makita | | | 3,300 | | | | 221 | |
Marubeni | | | 48,100 | | | | 273 | |
Marui Group | | | 20,400 | | | | 298 | |
Maruichi Steel Tube | | | 1,700 | | | | 55 | |
Matsumotokiyoshi Holdings | | | 4,300 | | | | 212 | |
Mazda Motor | | | 16,600 | | | | 272 | |
McDonald’s Holdings Japan | | | 2,100 | | | | 55 | |
Mebuki Financial Group | | | 29,100 | | | | 108 | |
Medipal Holdings | | | 5,000 | | | | 79 | |
MEIJI Holdings | | | 3,400 | | | | 266 | |
Minebea | | | 10,200 | | | | 96 | |
Miraca Holdings | | | 1,700 | | | | 76 | |
MISUMI Group | | | 7,900 | | | | 130 | |
Mitsubishi | | | 72,960 | | | | 1,555 | |
Mitsubishi Chemical Holdings | | | 40,800 | | | | 265 | |
Mitsubishi Electric | | | 58,900 | | | | 821 | |
Mitsubishi Estate | | | 91,000 | | | | 1,812 | |
Mitsubishi Gas Chemical | | | 5,500 | | | | 94 | |
Mitsubishi Heavy Industries | | | 370,000 | | | | 1,686 | |
Mitsubishi Logistics | | | 46,000 | | | | 650 | |
Mitsubishi Materials | | | 3,400 | | | | 104 | |
Mitsubishi Motors | | | 20,400 | | | | 116 | |
Mitsubishi Tanabe Pharma | | | 6,700 | | | | 131 | |
Mitsubishi UFJ Financial Group | | | 449,100 | | | | 2,768 | |
Mitsubishi UFJ Lease & Finance | | | 12,400 | | | | 64 | |
Mitsui | | | 51,000 | | | | 701 | |
Mitsui Chemicals | | | 27,000 | | | | 121 | |
Mitsui Fudosan | | | 27,000 | | | | 625 | |
Mitsui OSK Lines | | | 33,000 | | | | 91 | |
Mixi | | | 1,200 | | | | 44 | |
| | | | | | | | |
| Description | | Shares | | | Value
(000) | |
| | | | | | | | |
Mizuho Financial Group | | | 1,537,900 | | | $ | 2,761 | |
MS&AD Insurance Group Holdings | | | 85,600 | | | | 2,654 | |
Murata Manufacturing | | | 5,800 | | | | 777 | |
Nabtesco | | | 3,500 | | | | 81 | |
Nagoya Railroad | | | 27,000 | | | | 131 | |
Namco Bandai Holdings | | | 65,900 | | | | 1,819 | |
NEC | | | 463,000 | | | | 1,228 | |
Nexon | | | 5,100 | | | | 74 | |
NGK Insulators | | | 7,800 | | | | 151 | |
NGK Spark Plug | | | 5,400 | | | | 120 | |
NH Foods | | | 18,000 | | | | 486 | |
Nidec | | | 7,300 | | | | 630 | |
Nikon | | | 53,300 | | | | 829 | |
Nintendo | | | 3,800 | | | | 798 | |
Nippon Building Fund‡ | | | 41 | | | | 227 | |
Nippon Electric Glass | | | 13,000 | | | | 70 | |
Nippon Express | | | 25,000 | | | | 135 | |
Nippon Paint Holdings | | | 4,800 | | | | 131 | |
Nippon Prologis‡ | | | 46 | | | | 94 | |
Nippon Signal | | | 3,700 | | | | 31 | |
Nippon Steel & Sumitomo Metal | | | 24,200 | | | | 541 | |
Nippon Suisan Kaisha | | | 77,200 | | | | 371 | |
Nippon Telegraph & Telephone | | | 109,200 | | | | 4,589 | |
Nippon Television Holdings | | | 51,820 | | | | 941 | |
Nippon Yusen | | | 49,000 | | | | 91 | |
Nissan Chemical Industries | | | 11,300 | | | | 378 | |
Nissan Motor | | | 104,000 | | | | 1,046 | |
Nisshin Seifun Group | | | 6,100 | | | | 92 | |
Nissin Foods Holdings | | | 1,700 | | | | 89 | |
Nitori Holdings | | | 2,400 | | | | 274 | |
Nitto Denko | | | 5,000 | | | | 384 | |
NOK | | | 2,500 | | | | 51 | |
Nomura | | | 4,600 | | | | 67 | |
Nomura Holdings | | | 327,600 | | | | 1,932 | |
Nomura Real Estate Holdings | | | 3,600 | | | | 61 | |
Nomura Real Estate Master Fund‡ | | | 119 | | | | 180 | |
Nomura Research Institute | | | 4,070 | | | | 124 | |
NSK | | | 13,300 | | | | 154 | |
NTT Data | | | 42,900 | | | | 2,074 | |
NTT DOCOMO | | | 42,200 | | | | 962 | |
NTT Urban Development | | | 72,300 | | | | 637 | |
Obayashi | | | 195,600 | | | | 1,869 | |
Obic | | | 5,460 | | | | 239 | |
Odakyu Electric Railway | | | 8,500 | | | | 168 | |
Oji Holdings | | | 25,000 | | | | 102 | |
Olympus | | | 8,500 | | | | 294 | |
Omron | | | 12,000 | | | | 460 | |
The accompanying notes are an integral part of the financial statements.
71
| | |
| THE KP FUNDS | | December 31, 2016 |
| | |
| KP International Equity Fund | | |
| | | | | | | | |
| Description | | Shares | | | Value
(000) | |
| | | | | | | | |
Ono Pharmaceutical | | | 12,000 | | | $ | 262 | |
Onward Holdings | | | 60,000 | | | | 420 | |
Oracle Japan | | | 1,200 | | | | 60 | |
Oriental Land | | | 6,400 | | | | 362 | |
ORIX | | | 39,600 | | | | 618 | |
Osaka Gas | | | 54,000 | | | | 208 | |
OSG | | | 2,700 | | | | 53 | |
Otsuka | | | 1,500 | | | | 70 | |
Otsuka Holdings | | | 32,200 | | | | 1,404 | |
Panasonic | | | 65,900 | | | | 671 | |
Park24 | | | 3,100 | | | | 84 | |
Penta-Ocean Construction | | | 20,500 | | | | 99 | |
Pola Orbis Holdings | | | 600 | | | | 50 | |
Rakuten | | | 27,100 | | | | 266 | |
Recruit Holdings | | | 11,000 | | | | 442 | |
Resona Holdings | | | 384,240 | | | | 1,971 | |
Ricoh | | | 19,300 | | | | 163 | |
Rinnai | | | 1,000 | | | | 81 | |
Rohm | | | 2,600 | | | | 150 | |
Ryohin Keikaku | | | 1,500 | | | | 294 | |
Sankyo | | | 1,500 | | | | 48 | |
Santen Pharmaceutical | | | 10,700 | | | | 131 | |
Sawai Pharmaceutical | | | 4,000 | | | | 215 | |
SBI Holdings | | | 6,700 | | | | 85 | |
SCSK | | | 5,100 | | | | 178 | |
Secom | | | 18,800 | | | | 1,375 | |
Sega Sammy Holdings | | | 5,800 | | | | 86 | |
Seibu Holdings | | | 5,000 | | | | 90 | |
Seiko Epson | | | 8,400 | | | | 178 | |
Sekisui Chemical | | | 25,400 | | | | 405 | |
Sekisui House | | | 17,600 | | | | 293 | |
Senko | | | 5,500 | | | | 37 | |
Seven & i Holdings | | | 80,400 | | | | 3,064 | |
Seven Bank | | | 16,300 | | | | 47 | |
Sharp* | | | 46,000 | | | | 106 | |
Shimadzu | | | 7,000 | | | | 112 | |
Shimamura | | | 600 | | | | 75 | |
Shimano | | | 2,200 | | | | 345 | |
Shimizu | | | 100,000 | | | | 915 | |
Shin-Etsu Chemical | | | 39,800 | | | | 3,088 | |
Shinsei Bank | | | 52,000 | | | | 87 | |
Shionogi | | | 8,960 | | | | 429 | |
Shiseido | | | 36,200 | | | | 916 | |
Shizuoka Bank | | | 15,000 | | | | 126 | |
SHO-BOND Holdings | | | 1,700 | | | | 71 | |
Showa Shell Sekiyu | | | 6,000 | | | | 56 | |
SMC | | | 1,700 | | | | 406 | |
| | | | | | | | |
| Description | | Shares | | | Value
(000) | |
| | | | | | | | |
SoftBank Group | | | 49,200 | | | $ | 3,268 | |
Sohgo Security Services | | | 2,100 | | | | 81 | |
Sompo Holdings | | | 41,500 | | | | 1,406 | |
Sony | | | 38,400 | | | | 1,075 | |
Sony Financial Holdings | | | 4,700 | | | | 73 | |
Stanley Electric | | | 4,500 | | | | 123 | |
Start Today | | | 4,800 | | | | 83 | |
Sumitomo | | | 35,600 | | | | 419 | |
Sumitomo Chemical | | | 171,200 | | | | 814 | |
Sumitomo Dainippon Pharma | | | 73,800 | | | | 1,269 | |
Sumitomo Electric Industries | | | 58,300 | | | | 842 | |
Sumitomo Heavy Industries | | | 16,000 | | | | 103 | |
Sumitomo Metal Mining | | | 15,000 | | | | 193 | |
Sumitomo Mitsui Financial Group | | | 97,200 | | | | 3,710 | |
Sumitomo Mitsui Trust Holdings | | | 38,700 | | | | 1,385 | |
Sumitomo Realty & Development | | | 11,000 | | | | 292 | |
Sumitomo Rubber Industries | | | 5,100 | | | | 81 | |
Sundrug | | | 1,000 | | | | 69 | |
Suntory Beverage & Food | | | 9,500 | | | | 395 | |
Suruga Bank | | | 4,900 | | | | 109 | |
Suzuken | | | 2,200 | | | | 72 | |
Suzuki Motor | | | 10,500 | | | | 370 | |
Sysmex | | | 4,520 | | | | 262 | |
T&D Holdings | | | 16,800 | | | | 222 | |
Tadano | | | 5,700 | | | | 72 | |
Taiheiyo Cement | | | 37,000 | | | | 117 | |
Taisei | | | 31,000 | | | | 217 | |
Taisho Pharmaceutical Holdings | | | 1,100 | | | | 91 | |
Taiyo Nippon Sanso | | | 4,000 | | | | 46 | |
Takashimaya | | | 9,000 | | | | 74 | |
Takeda Pharmaceutical | | | 21,700 | | | | 898 | |
TDK | | | 6,400 | | | | 440 | |
TechnoPro Holdings | | | 3,000 | | | | 96 | |
Teijin | | | 5,200 | | | | 105 | |
Temp Holdings | | | 12,200 | | | | 189 | |
Terumo | | | 170,200 | | | | 6,284 | |
THK | | | 3,600 | | | | 80 | |
Tobu Railway | | | 29,000 | | | | 144 | |
Toho | | | 3,300 | | | | 93 | |
Toho Gas | | | 12,000 | | | | 98 | |
Tohoku Electric Power | | | 90,700 | | | | 1,145 | |
Tokio Marine Holdings | | | 28,500 | | | | 1,170 | |
Tokyo Electric Power Holdings* | | | 41,800 | | | | 169 | |
Tokyo Electron | | | 11,000 | | | | 1,039 | |
Tokyo Gas | | | 112,000 | | | | 506 | |
Tokyo Tatemono | | | 6,300 | | | | 84 | |
Tokyu | | | 32,000 | | | | 235 | |
The accompanying notes are an integral part of the financial statements.
72
| | |
| THE KP FUNDS | | December 31, 2016 |
| | |
| KP International Equity Fund | | |
| | | | | | | | |
| Description | | Shares | | | Value
(000) | |
| | | | | | | | |
Tokyu Fudosan Holdings | | | 15,800 | | | $ | 93 | |
TonenGeneral Sekiyu | | | 9,000 | | | | 95 | |
Toppan Printing | | | 15,000 | | | | 143 | |
Toray Industries | | | 45,000 | | | | 364 | |
Toshiba | | | 121,000 | | | | 292 | |
TOTO | | | 4,200 | | | | 166 | |
Toyo Seikan Group Holdings | | | 62,900 | | | | 1,174 | |
Toyo Suisan Kaisha | | | 20,800 | | | | 754 | |
Toyoda Gosei | | | 1,700 | | | | 40 | |
Toyota Industries | | | 6,100 | | | | 291 | |
Toyota Motor | | | 111,700 | | | | 6,574 | |
Toyota Tsusho | | | 6,300 | | | | 164 | |
Trend Micro | | | 3,200 | | | | 114 | |
Tsuruha Holdings | | | 1,100 | | | | 104 | |
Unicharm | | | 11,700 | | | | 256 | |
United Urban Investment‡ | | | 83 | | | | 126 | |
USS | | | 6,400 | | | | 102 | |
West Japan Railway | | | 49,500 | | | | 3,037 | |
Yahoo Japan | | | 42,800 | | | | 164 | |
Yakult Honsha | | | 2,600 | | | | 121 | |
Yamada Denki | | | 161,100 | | | | 868 | |
Yamaguchi Financial Group | | | 6,000 | | | | 65 | |
Yamaha | | | 5,000 | | | | 153 | |
Yamaha Motor | | | 8,000 | | | | 176 | |
Yamato Holdings | | | 59,620 | | | | 1,212 | |
Yamazaki Baking | | | 4,000 | | | | 77 | |
Yaskawa Electric | | | 7,400 | | | | 115 | |
Yokogawa Electric | | | 7,000 | | | | 101 | |
Yokohama Rubber | | | 3,600 | | | | 65 | |
| | | | | | | | |
| | | | | | | 200,898 | |
| | | | | | | | |
Luxembourg — 0.3% | |
Altice, Cl B* | | | 14,195 | | | | 281 | |
ArcelorMittal | | | 130,329 | | | | 963 | |
Millicom International Cellular | | | 10,107 | | | | 432 | |
O’Key Group GDR | | | 88,214 | | | | 229 | |
RTL Group | | | 1,188 | | | | 87 | |
SES, Cl A | | | 10,614 | | | | 235 | |
Tenaris | | | 14,530 | | | | 260 | |
Ternium ADR | | | 66,433 | | | | 1,603 | |
| | | | | | | | |
| | | | | | | 4,090 | |
| | | | | | | | |
Macau — 0.0% | | | | | | | | |
Sands China | | | 74,400 | | | | 323 | |
| | | | | | | | |
Malaysia — 0.8% | | | | | | | | |
Allianz Malaysia | | | 9,000 | | | | 20 | |
Brem Holding* | | | 213,616 | | | | 38 | |
Evergreen Fibreboard | | | 1,335,000 | | | | 286 | |
| | | | | | | | |
| Description | | Shares | | | Value
(000) | |
| | | | | | | | |
Eversendai | | | 174,800 | | | $ | 22 | |
Heineken Malaysia | | | 10,000 | | | | 37 | |
HeveaBoard | | | 137,300 | | | | 46 | |
Hong Leong Bank | | | 17,900 | | | | 54 | |
Hong Leong Industries | | | 5,500 | | | | 12 | |
Hua Yang | | | 68,800 | | | | 17 | |
Insas | | | 330,800 | | | | 53 | |
JCY International | | | 2,674,100 | | | | 292 | |
K&N Kenanga Holdings* | | | 85,500 | | | | 8 | |
KSL Holdings* | | | 551,500 | | | | 124 | |
Land & General | | | 42,966 | | | | 3 | |
Lii Hen Industries | | | 73,300 | | | | 52 | |
Malaysian Pacific Industries | | | 39,000 | | | | 64 | |
Muda Holdings | | | 27,100 | | | | 9 | |
Oldtown | | | 106,500 | | | | 45 | |
Padini Holdings | | | 633,700 | | | | 360 | |
Petron Malaysia Refining & Marketing | | | 146,900 | | | | 136 | |
Petronas Dagangan | | | 45,500 | | | | 241 | |
Public Bank | | | 413,400 | | | | 1,817 | |
Scientex | | | 39,400 | | | | 59 | |
Shell Refining Federation of Malaya* | | | 63,000 | | | | 29 | |
Sunway | | | 42,300 | | | | 29 | |
Sunway Construction Group | | | 214,880 | | | | 82 | |
Ta Ann Holdings | | | 54,740 | | | | 48 | |
Tenaga Nasional | | | 1,235,100 | | | | 3,827 | |
Top Glove | | | 744,800 | | | | 888 | |
Tropicana | | | 1,047 | | | | — | |
Unisem | | | 1,138,600 | | | | 599 | |
VS Industry | | | 1,579,200 | | | | 496 | |
WTK Holdings | | | 144,300 | | | | 32 | |
| | | | | | | | |
| | | | | | | 9,825 | |
| | | | | | | | |
Mexico — 0.5% | | | | | | | | |
Alpek, Cl A | | | 733,432 | | | | 876 | |
America Movil, Cl L ADR | | | 23,016 | | | | 289 | |
Axtel* | | | 163,891 | | | | 28 | |
Cemex ADR* | | | 144,082 | | | | 1,156 | |
Controladora Vuela Cia de Aviacion, Cl A* | | | 80,585 | | | | 121 | |
Credito Real SOFOM ER | | | 38,420 | | | | 51 | |
Gruma, Cl B | | | 46,229 | | | | 587 | |
Grupo Aeromexico* | | | 276,892 | | | | 520 | |
Grupo Financiero Interacciones, Cl O | | | 94,593 | | | | 369 | |
Grupo Mexico | | | 231,526 | | | | 630 | |
Grupo Simec, Cl B* | | | 9,691 | | | | 46 | |
The accompanying notes are an integral part of the financial statements.
73
| | |
| THE KP FUNDS | | December 31, 2016 |
| | |
| KP International Equity Fund | | |
| | | | | | | | |
| Description | | Shares | | | Value
(000) | |
| | | | | | | | |
Industrias Bachoco ADR | | | 62,581 | | | $ | 268 | |
Industrias CH, Cl B* | | | 37,465 | | | | 239 | |
Industrias Penoles | | | 11,387 | | | | 211 | |
OHL Mexico | | | 805,976 | | | | 793 | |
Prologis Property Mexico‡ | | | 210,533 | | | | 302 | |
Vitro | | | 28,769 | | | | 90 | |
| | | | | | | | |
| | | | | | | 6,576 | |
| | | | | | | | |
Netherlands — 4.2% | | | | | | | | |
ABN AMRO Group(A) (B) | | | 8,216 | | | | 182 | |
Aegon | | | 55,637 | | | | 306 | |
AerCap Holdings* | | | 4,904 | | | | 204 | |
Airbus Group | | | 34,364 | | | | 2,273 | |
Akzo Nobel | | | 105,655 | | | | 6,605 | |
ASML Holding | | | 13,554 | | | | 1,522 | |
Boskalis Westminster | | | 24,003 | | | | 834 | |
Coca-Cola European Partners | | | 6,492 | | | | 205 | |
Gemalto | | | 2,323 | | | | 134 | |
Heineken | | | 42,972 | | | | 3,223 | |
Heineken Holding | | | 3,013 | | | | 210 | |
ING Groep | | | 594,419 | | | | 8,366 | |
James Hardie Industries | | | 13,011 | | | | 206 | |
Koninklijke Ahold Delhaize | | | 85,619 | | | | 1,805 | |
Koninklijke DSM | | | 5,565 | | | | 334 | |
Koninklijke KPN | | | 404,822 | | | | 1,199 | |
Koninklijke Philips | | | 63,297 | | | | 1,932 | |
Koninklijke Vopak | | | 2,152 | | | | 102 | |
NN Group | | | 9,669 | | | | 328 | |
NXP Semiconductors* | | | 8,959 | | | | 878 | |
QIAGEN* | | | 6,415 | | | | 180 | |
Randstad Holding | | | 118,984 | | | | 6,454 | |
Relx | | | 149,110 | | | | 2,510 | |
Royal Dutch Shell, Cl A | | | 309,316 | | | | 8,740 | |
STMicroelectronics | | | 19,131 | | | | 217 | |
Unilever | | | 49,507 | | | | 2,038 | |
Wolters Kluwer | | | 9,260 | | | | 336 | |
| | | | | | | | |
| | | | | | | 51,323 | |
| | | | | | | | |
New Zealand — 0.1% | | | | | | | | |
Auckland International Airport | | | 27,258 | | | | 118 | |
Contact Energy | | | 21,645 | | | | 70 | |
Fletcher Building | | | 20,690 | | | | 152 | |
Mercury NZ | | | 21,271 | | | | 44 | |
Meridian Energy | | | 36,344 | | | | 66 | |
Ryman Healthcare | | | 10,544 | | | | 59 | |
Spark New Zealand | | | 262,777 | | | | 623 | |
| | | | | | | | |
| | | | | | | 1,132 | |
| | | | | | | | |
| | | | | | | | |
| Description | | Shares | | | Value
(000) | |
| | | | | | | | |
Norway — 0.3% | | | | | | | | |
DNB | | | 58,145 | | | $ | 865 | |
Gjensidige Forsikring | | | 6,126 | | | | 97 | |
Marine Harvest | | | 11,023 | | | | 199 | |
Norsk Hydro | | | 38,906 | | | | 186 | |
Orkla | | | 23,750 | | | | 215 | |
Schibsted, Cl A | | | 28,168 | | | | 621 | |
Statoil | | | 70,170 | | | | 1,287 | |
Telenor | | | 23,024 | | | | 344 | |
Yara International | | | 5,240 | | | | 206 | |
| | | | | | | | |
| | | | | | | 4,020 | |
| | | | | | | | |
Panama — 0.0% | | | | | | | | |
Avianca Holdings ADR | | | 3,928 | | | | 38 | |
| | | | | | | | |
Peru — 0.3% | | | | | | | | |
Cia de Minas Buenaventura ADR | | | 39,493 | | | | 445 | |
Credicorp | | | 19,637 | | | | 3,100 | |
| | | | | | | | |
| | | | | | | 3,545 | |
| | | | | | | | |
Philippines — 0.1% | | | | | | | | |
Cebu Air(C) | | | 270,790 | | | | 507 | |
Energy Development(C) | | | 4,530,600 | | | | 469 | |
Lopez Holdings(C) | | | 1,862,000 | | | | 292 | |
Pepsi-Cola Products Philippines(C) | | | 352,000 | | | | 23 | |
San Miguel(C) | | | 144,580 | | | | 268 | |
Vista Land & Lifescapes(C) | | | 567,600 | | | | 57 | |
| | | | | | | | |
| | | | | | | 1,616 | |
| | | | | | | | |
Poland — 0.5% | | | | | | | | |
Amica Wronki | | | 957 | | | | 43 | |
AmRest Holdings* | | | 3,010 | | | | 213 | |
Asseco Poland | | | 16,913 | | | | 218 | |
Bank Pekao | | | 3,214 | | | | 97 | |
CD Projekt* | | | 75,756 | | | | 945 | |
Grupa Lotos* | | | 60,862 | | | | 556 | |
ING Bank Slaski | | | 1,489 | | | | 57 | |
Polski Koncern Naftowy Orlen | | | 112,309 | | | | 2,289 | |
Polskie Gornictwo Naftowe i Gazownictwo | | | 1,337,820 | | | | 1,800 | |
Trakcja | | | 32,009 | | | | 108 | |
| | | | | | | | |
| | | | | | | 6,326 | |
| | | | | | | | |
Portugal — 0.0% | | | | | | | | |
Banco Espirito Santo* (C) | | | 46,916 | | | | — | |
EDP-Energias de Portugal | | | 69,227 | | | | 211 | |
Galp Energia | | | 14,605 | | | | 218 | |
Jeronimo Martins | | | 7,369 | | | | 114 | |
| | | | | | | | |
| | | | | | | 543 | |
| | | | | | | | |
Qatar — 0.3% | | | | | | | | |
Barwa Real Estate(C) | | | 142,526 | | | | 1,302 | |
The accompanying notes are an integral part of the financial statements.
74
| | |
| THE KP FUNDS | | December 31, 2016 |
| | |
| KP International Equity Fund | | |
| | | | | | | | |
| Description | | Shares | | | Value
(000) | |
| | | | | | | | |
Doha Bank QSC(C) | | | 7,860 | | | $ | 75 | |
Mannai | | | 830 | | | | 18 | |
Ooredoo QSC(C) | | | 63,688 | | | | 1,783 | |
Qatar Fuel QSC | | | 4,233 | | | | 169 | |
Qatar General Insurance & Reinsurance SAQ | | | 2,023 | | | | 26 | |
Qatar Islamic Bank SAQ(C) | | | 7,532 | | | | 215 | |
Qatar National Bank SAQ(C) | | | 5,474 | | | | 245 | |
Qatar Navigation QSC(C) | | | 7,158 | | | | 188 | |
United Development QSC | | | 36,420 | | | | 207 | |
| | | | | | | | |
| | | | | | | 4,228 | |
| | | | | | | | |
Russia — 0.8% | | | | | | | | |
Gazprom PAO ADR | | | 80,104 | | | | 405 | |
Globaltrans Investment GDR | | | 23,919 | | | | 151 | |
Lukoil PJSC ADR | | | 4,853 | | | | 272 | |
Magnitogorsk Iron & Steel Works GDR | | | 93,326 | | | | 651 | |
Sberbank of Russia PJSC ADR | | | 401,165 | | | | 4,644 | |
Tatneft PJSC ADR | | | 2,685 | | | | 111 | |
Yandex, Cl A* | | | 158,146 | | | | 3,183 | |
| | | | | | | | |
| | | | | | | 9,417 | |
| | | | | | | | |
Singapore — 1.0% | | | | | | | | |
Ascendas‡ | | | 68,800 | | | | 108 | |
CapitaLand | | | 74,000 | | | | 154 | |
CapitaLand Commercial Trust‡ | | | 58,000 | | | | 59 | |
CapitaLand Mall Trust‡ | | | 74,000 | | | | 96 | |
City Developments | | | 11,000 | | | | 63 | |
ComfortDelGro | | | 65,000 | | | | 111 | |
Dairy Farm International Holdings | | | 24,400 | | | | 175 | |
DBS Group Holdings | | | 491,983 | | | | 5,892 | |
Genting Singapore | | | 185,000 | | | | 116 | |
GL | | | 283,300 | | | | 148 | |
Global Logistic Properties | | | 79,000 | | | | 120 | |
Golden Agri-Resources | | | 209,000 | | | | 62 | |
Great Eastern Holdings | | | 55,500 | | | | 778 | |
Haw Par | | | 15,400 | | | | 97 | |
Hongkong Land Holdings | | | 34,400 | | | | 219 | |
Hutchison Port Holdings Trust, Cl U | | | 145,000 | | | | 63 | |
Jardine Cycle & Carriage | | | 2,933 | | | | 84 | |
Keppel | | | 43,600 | | | | 174 | |
Oversea-Chinese Banking | | | 94,072 | | | | 579 | |
SATS | | | 19,300 | | | | 65 | |
Sembcorp Industries | | | 31,000 | | | | 61 | |
Singapore Airlines | | | 16,000 | | | | 107 | |
Singapore Exchange | | | 23,000 | | | | 114 | |
Singapore Press Holdings | | | 45,000 | | | | 110 | |
Singapore Technologies Engineering | | | 44,000 | | | | 98 | |
| | | | | | | | |
| Description | | Shares | | | Value
(000) | |
| | | | | | | | |
Singapore Telecommunications | | | 777,800 | | | $ | 1,960 | |
StarHub | | | 15,000 | | | | 29 | |
Suntec‡ | | | 74,000 | | | | 84 | |
United Industrial | | | 24,483 | | | | 47 | |
United Overseas Bank | | | 54,121 | | | | 762 | |
UOL Group | | | 15,482 | | | | 64 | |
Wilmar International | | | 57,000 | | | | 141 | |
| | | | | | | | |
| | | | | | | 12,740 | |
| | | | | | | | |
South Africa — 1.1% | | | | | | | | |
African Bank Investments (C) | | | 638,711 | | | | — | |
Anglo American Platinum* | | | 13,654 | | | | 263 | |
Blue Label Telecoms | | | 171,180 | | | | 227 | |
Cashbuild | | | 1,633 | | | | 41 | |
Cie Financiere Richemont | | | 67,650 | | | | 447 | |
Clicks Group | | | 29,599 | | | | 249 | |
FirstRand | | | 338,014 | | | | 1,309 | |
Gold Fields ADR | | | 178,860 | | | | 538 | |
Grindrod | | | 207,895 | | | | 204 | |
Harmony Gold Mining ADR | | | 80,885 | | | | 179 | |
Investec | | | 51,677 | | | | 341 | |
JSE | | | 24,113 | | | | 288 | |
KAP Industrial Holdings | | | 106,914 | | | | 58 | |
Kumba Iron Ore | | | 10,620 | | | | 123 | |
Liberty Holdings | | | 21,367 | | | | 173 | |
MMI Holdings | | | 60,998 | | | | 105 | |
Mondi | | | 34,127 | | | | 696 | |
MTN Group | | | 53,691 | | | | 493 | |
Murray & Roberts Holdings | | | 249,229 | | | | 209 | |
Old Mutual | | | 186,910 | | | | 468 | |
Peregrine Holdings | | | 228,876 | | | | 501 | |
Randgold Resources | | | 2,718 | | | | 215 | |
Sappi* | | | 223,035 | | | | 1,461 | |
Sasol | | | 17,311 | | | | 503 | |
Sibanye Gold | | | 393,345 | | | | 727 | |
Standard Bank Group | | | 287,389 | | | | 3,174 | |
Telkom | | | 123,009 | | | | 663 | |
Wilson Bayly Holmes-Ovcon | | | 12,103 | | | | 136 | |
| | | | | | | | |
| | | | | | | 13,791 | |
| | | | | | | | |
South Korea — 4.5% | | | | | | | | |
Aekyung Petrochemical(C) | | | 5,130 | | | | 54 | |
Autech*,(C) | | | 7,427 | | | | 57 | |
CJ*,(C) | | | 4,611 | | | | 714 | |
CJ O Shopping*,(C) | | | 812 | | | | 110 | |
CKH Food & Health*,(C) | | | 122,645 | | | | 196 | |
Dae Han Flour Mills*,(C) | | | 104 | | | | 16 | |
Daeduck*,(C) | | | 4,514 | | | | 48 | |
The accompanying notes are an integral part of the financial statements.
75
| | |
| THE KP FUNDS | | December 31, 2016 |
| | |
| KP International Equity Fund | | |
| | | | | | | | |
| Description | | Shares | | | Value
(000) | |
| | | | | | | | |
Daehan Steel*,(C) | | | 13,793 | | | $ | 109 | |
DK UIL*,(C) | | | 3,201 | | | | 28 | |
Dongkuk Steel Mill*,(C) | | | 6,065 | | | | 56 | |
Dongyang E&P*,(C) | | | 10,103 | | | | 110 | |
DRB Industrial(C) | | | 2,970 | | | | 30 | |
GMB Korea*,(C) | | | 5,250 | | | | 22 | |
GS Home Shopping*,(C) | | | 865 | | | | 123 | |
Hana Financial Group(C) | | | 38,535 | | | | 996 | |
Hanwha Chemical*,(C) | | | 14,580 | | | | 299 | |
Hanwha Life Insurance*,(C) | | | 13,768 | | | | 74 | |
Hite Jinro*,(C) | | | 13,520 | | | | 236 | |
Humax*,(C) | | | 4,750 | | | | 54 | |
Hyosung*,(C) | | | 4,014 | | | | 484 | |
Hyundai BNG Steel*,(C) | | | 4,528 | | | | 47 | |
Hyundai Engineering & Construction*,(C) | | | 6,224 | | | | 221 | |
Hyundai Heavy Industries*,(C) | | | 1,114 | | | | 135 | |
Hyundai Motor(C) | | | 9,539 | | | | 1,153 | |
Jahwa Electronics*,(C) | | | 7,284 | | | | 103 | |
Kangnam Jevisco*,(C) | | | 920 | | | | 28 | |
KB Financial Group*,(C) | | | 11,109 | | | | 394 | |
Kia Motors(C) | | | 63,165 | | | | 2,055 | |
KISCO*,(C) | | | 1,295 | | | | 40 | |
Korea Electric Power*,(C) | | | 81,358 | | | | 2,968 | |
Korea Petrochemical Industries*,(C) | | | 6,580 | | | | 1,505 | |
Kortek*,(C) | | | 8,267 | | | | 96 | |
KT(C) | | | 71,014 | | | | 1,729 | |
KT Skylife*,(C) | | | 9,103 | | | | 131 | |
Kwangju Bank*,(C) | | | 5,257 | | | | 47 | |
Kyungchang Industrial*,(C) | | | 16,273 | | | | 73 | |
LG*,(C) | | | 5,181 | | | | 257 | |
LG Display ADR | | | 177,864 | | | | 2,285 | |
LG Display(C) | | | 22,171 | | | | 578 | |
LG Electronics(C) | | | 62,833 | | | | 2,693 | |
LG Uplus*,(C) | | | 67,559 | | | | 641 | |
Lotte Chemical*,(C) | | | 7,875 | | | | 2,411 | |
Lotte Shopping*,(C) | | | 4,347 | | | | 797 | |
Mirae Asset Life Insurance* | | | 12,467 | | | | 53 | |
Mobase(C) | | | 5,272 | | | | 38 | |
Moorim Paper*,(C) | | | 35,210 | | | | 78 | |
NAVER(C) | | | 3,465 | | | | 2,227 | |
Poongsan*,(C) | | | 5,230 | | | | 176 | |
POSCO(C) | | | 2,315 | | | | 492 | |
PSK*,(C) | | | 5,764 | | | | 65 | |
RedcapTour*,(C) | | | 1,671 | | | | 25 | |
S-1, Cl 1,(C) | | | 2,688 | | | | 195 | |
Saeron Automotive*,(C) | | | 4,310 | | | | 30 | |
| | | | | | | | |
| Description | | Shares | | | Value
(000) | |
| | | | | | | | |
Sam Young Electronics*,(C) | | | 8,260 | | | $ | 83 | |
Samchully*,(C) | | | 548 | | | | 46 | |
Samji Electronics*,(C) | | | 9,600 | | | | 89 | |
Samsung Electronics(C) | | | 9,460 | | | | 14,124 | |
Samsung Fire & Marine Insurance(C) | | | 343 | | | | 76 | |
SeAH Holdings*,(C) | | | 225 | | | | 24 | |
Sejong Industrial*,(C) | | | 3,340 | | | | 26 | |
Seoyon*,(C) | | | 3,086 | | | | 27 | |
Seoyon E-Hwa*,(C) | | | 4,880 | | | | 57 | |
Seoyon Electronics*,(C) | | | 8,015 | | | | 20 | |
Sewon Precision Industry(C) | | | 657 | | | | 10 | |
Shindaeyang Paper*,(C) | | | 1,116 | | | | 22 | |
Shinhan Financial Group*,(C) | | | 46,580 | | | | 1,744 | |
SK Hynix(C) | | | 133,029 | | | | 4,934 | |
SK Innovation*,(C) | | | 24,748 | | | | 3,004 | |
S-Oil(C) | | | 30,886 | | | | 2,167 | |
Tongyang Life Insurance*,(C) | | | 12,378 | | | | 131 | |
Woori Bank | | | 106,196 | | | | 1,121 | |
| | | | | | | | |
| | | | | | | 55,287 | |
| | | | | | | | |
Spain — 1.5% | | | | | | | | |
Abertis Infraestructuras | | | 18,728 | | | | 262 | |
Acerinox | | | 52,298 | | | | 694 | |
ACS Actividades de Construccion y Servicios | | | 5,567 | | | | 176 | |
Aena(A) (B) | | | 1,965 | | | | 268 | |
Amadeus IT Group, Cl A | | | 111,948 | | | | 5,088 | |
Banco Bilbao Vizcaya Argentaria | | | 200,112 | | | | 1,351 | |
Banco de Sabadell | | | 157,919 | | | | 220 | |
Banco Popular Espanol | | | 97,275 | | | | 94 | |
Banco Santander | | | 460,467 | | | | 2,403 | |
Bankia | | | 138,441 | | | | 142 | |
Bankinter | | | 19,874 | | | | 154 | |
CaixaBank | | | 98,992 | | | | 327 | |
Distribuidora Internacional de Alimentacion | | | 17,963 | | | | 88 | |
Enagas | | | 6,803 | | | | 173 | |
Endesa | | | 9,501 | | | | 201 | |
Ferrovial | | | 14,404 | | | | 258 | |
Gas Natural SDG | | | 10,489 | | | | 198 | |
Grifols | | | 8,957 | | | | 178 | |
Iberdrola | | | 164,619 | | | | 1,080 | |
Industria de Diseno Textil | | | 33,200 | | | | 1,133 | |
International Consolidated Airlines Group | | | 24,405 | | | | 132 | |
Mapfre | | | 31,811 | | | | 97 | |
Mediaset Espana Comunicacion | | | 40,245 | | | | 472 | |
Red Electrica | | | 12,598 | | | | 238 | |
The accompanying notes are an integral part of the financial statements.
76
| | |
| THE KP FUNDS | | December 31, 2016 |
| | |
| KP International Equity Fund | | |
| | | | | | | | |
| Description | | Shares | | | Value
(000) | |
| | | | | | | | |
Repsol | | | 32,927 | | | $ | 465 | |
Telefonica | | | 141,667 | | | | 1,315 | |
Viscofan | | | 14,940 | | | | 737 | |
Zardoya Otis | | | 6,262 | | | | 53 | |
| | | | | | | | |
| | | | | | | 17,997 | |
| | | | | | | | |
Sweden — 1.7% | | | | | | | | |
Alfa Laval | | | 8,655 | | | | 143 | |
Assa Abloy, Cl B | | | 150,555 | | | | 2,794 | |
Atlas Copco, Cl A | | | 32,045 | | | | 938 | |
Boliden | | | 7,969 | | | | 208 | |
Electrolux | | | 6,928 | | | | 173 | |
Getinge, Cl B | | | 6,038 | | | | 97 | |
Hennes & Mauritz, Cl B | | | 164,384 | | | | 4,572 | |
Hexagon, Cl B | | | 7,532 | | | | 269 | |
Husqvarna, Cl B | | | 11,887 | | | | 92 | |
ICA Gruppen | | | 2,500 | | | | 76 | |
Industrivarden, Cl C | | | 4,708 | | | | 88 | |
Investor, Cl B | | | 13,635 | | | | 509 | |
Kinnevik | | | 6,796 | | | | 163 | |
L E Lundbergforetagen, Cl B | | | 1,090 | | | | 67 | |
Lundin Petroleum* | | | 5,676 | | | | 123 | |
Modern Times Group, Cl B | | | 13,787 | | | | 409 | |
Nordea Bank | | | 139,379 | | | | 1,550 | |
Oriflame Holding | | | 1,600 | | | | 48 | |
Sandvik | | | 110,878 | | | | 1,372 | |
Securitas, Cl B | | | 9,089 | | | | 143 | |
Skandinaviska Enskilda Banken, Cl A | | | 45,481 | | | | 477 | |
Skanska, Cl B | | | 10,260 | | | | 242 | |
SKF, Cl B | | | 11,487 | | | | 211 | |
Svenska Cellulosa, Cl B | | | 18,207 | | | | 514 | |
Svenska Handelsbanken, Cl A | | | 168,468 | | | | 2,342 | |
Swedbank, Cl A | | | 27,060 | | | | 654 | |
Swedish Match | | | 16,044 | | | | 510 | |
Tele2, Cl B | | | 10,996 | | | | 88 | |
Telefonaktiebolaget LM Ericsson, Cl B | | | 171,430 | | | | 1,007 | |
Telia | | | 75,698 | | | | 305 | |
Volvo, Cl B | | | 46,129 | | | | 539 | |
| | | | | | | | |
| | | | | | | 20,723 | |
| | | | | | | | |
Switzerland — 6.5% | | | | | | | | |
ABB | | | 57,283 | | | | 1,208 | |
Actelion | | | 2,884 | | | | 624 | |
Adecco Group | | | 25,927 | | | | 1,696 | |
Aryzta | | | 2,672 | | | | 118 | |
Baloise Holding | | | 1,447 | | | | 182 | |
Barry Callebaut | | | 66 | | | | 81 | |
Chocoladefabriken Lindt & Sprungli | | | 33 | | | | 337 | |
| | | | | | | | |
| Description | | Shares | | | Value
(000) | |
| | | | | | | | |
Cie Financiere Richemont | | | 35,555 | | | $ | 2,354 | |
Coca-Cola | | | 5,556 | | | | 121 | |
Credit Suisse Group | | | 60,479 | | | | 868 | |
DKSH Holding | | | 2,209 | | | | 152 | |
Dufry* | | | 1,374 | | | | 171 | |
EMS-Chemie Holding | | | 246 | | | | 125 | |
Galenica | | | 110 | | | | 124 | |
Geberit | | | 6,700 | | | | 2,686 | |
Givaudan | | | 276 | | | | 506 | |
Helvetia Holding | | | 264 | | | | 142 | |
Julius Baer Group | | | 6,521 | | | | 290 | |
Kuehne + Nagel International | | | 12,113 | | | | 1,601 | |
LafargeHolcim | | | 9,343 | | | | 492 | |
Logitech International | | | 36,811 | | | | 918 | |
Lonza Group | | | 1,539 | | | | 266 | |
Nestle | | | 257,812 | | | | 18,496 | |
Novartis | | | 168,214 | | | | 12,241 | |
Pargesa Holding | | | 1,038 | | | | 68 | |
Partners Group Holding | | | 506 | | | | 237 | |
Roche Holding | | | 67,417 | | | | 15,400 | |
Schindler Holding | | | 1,822 | | | | 320 | |
SGS | | | 160 | | | | 326 | |
Sika | | | 63 | | | | 303 | |
Sonova Holding | | | 6,110 | | | | 740 | |
Swatch Group | | | 2,298 | | | | 366 | |
Swiss Life Holding | | | 936 | | | | 265 | |
Swiss Prime Site | | | 2,169 | | | | 178 | |
Swiss Re | | | 9,870 | | | | 935 | |
Swisscom | | | 794 | | | | 356 | |
Syngenta* | | | 2,818 | | | | 1,113 | |
UBS Group | | | 628,761 | | | | 9,849 | |
Zurich Insurance Group | | | 15,164 | | | | 4,177 | |
| | | | | | | | |
| | | | | | | 80,432 | |
| | | | | | | | |
Taiwan — 2.4% | | | | | | | | |
Advanced Semiconductor Engineering ADR | | | 29,894 | | | | 151 | |
AU Optronics ADR | | | 725,037 | | | | 2,567 | |
Chroma ATE | | | 170,000 | | | | 398 | |
Delta Electronics | | | 124,516 | | | | 616 | |
Hon Hai Precision Industry GDR | | | 503,361 | | | | 1,669 | |
Ruentex Industries | | | 219,082 | | | | 365 | |
Silicon Motion Technology ADR | | | 50,544 | | | | 2,147 | |
Taiwan Semiconductor Manufacturing | | | 1,004,398 | | | | 20,160 | |
Teco Electric and Machinery | | | 1,021,387 | | | | 884 | |
Yungtay Engineering | | | 589,000 | | | | 820 | |
| | | | | | | | |
| | | | | | | 29,777 | |
| | | | | | | | |
The accompanying notes are an integral part of the financial statements.
77
| | |
| THE KP FUNDS | | December 31, 2016 |
| | |
| KP International Equity Fund | | |
| | | | | | | | |
| Description | | Shares | | | Value
(000) | |
| | | | | | | | |
Thailand — 1.3% | | | | | | | | |
Advanced Information Technology | | | 233,000 | | | $ | 161 | |
AP Thailand NVDR | | | 1,321,800 | | | | 277 | |
Asia Aviation | | | 779,900 | | | | 132 | |
Bangchak Petroleum NVDR | | | 260,200 | | | | 243 | |
Bangkok Bank | | | 223,400 | | | | 1,006 | |
Banpu NVDR | | | 1,345,100 | | | | 721 | |
Cal-Comp Electronics Thailand NVDR | | | 1,336,719 | | | | 101 | |
Dhipaya Insurance NVDR | | | 16,800 | | | | 24 | |
GFPT NVDR | | | 1,194,100 | | | | 491 | |
Hana Microelectronics NVDR | | | 655,700 | | | | 722 | |
Indorama Ventures | | | 202,700 | | | | 190 | |
IRPC NVDR | | | 4,200,000 | | | | 563 | |
Kasikornbank PLC | | | 74,900 | | | | 371 | |
KCE Electronics NVDR | | | 101,500 | | | | 346 | |
KGI Securities Thailand NVDR | | | 902,000 | | | | 98 | |
Krung Thai Bank NVDR | | | 757,700 | | | | 375 | |
MCS Steel NVDR | | | 224,800 | | | | 108 | |
MFEC NVDR | | | 216,800 | | | | 32 | |
MK Real Estate Development NVDR | | | 71,900 | | | | 8 | |
Polyplex Thailand NVDR | | | 159,000 | | | | 68 | |
Pruksa Holding NVDR | | | 102,900 | | | | 65 | |
PTG Energy | | | 196,400 | | | | 180 | |
PTT NVDR | | | 343,100 | | | | 3,565 | |
PTT Exploration & Production NVDR | | | 88,800 | | | | 239 | |
PTT Global Chemical NVDR | | | 1,262,200 | | | | 2,220 | |
SC Asset NVDR | | | 371,588 | | | | 35 | |
Siam Cement NVDR | | | 13,500 | | | | 187 | |
Siamgas & Petrochemicals NVDR | | | 624,900 | | | | 213 | |
SNC Former NVDR | | | 76,300 | | | | 32 | |
Sri Trang Agro-Industry NVDR | | | 106,400 | | | | 69 | |
Star Petroleum Refining NVDR | | | 1,491,400 | | | | 516 | |
SVI NVDR | | | 172,800 | | | | 25 | |
Syntec Construction NVDR | | | 2,826,500 | | | | 410 | |
Thai Airways International NVDR | | | 465,900 | | | | 295 | |
Thai Oil NVDR | | | 172,100 | | | | 347 | |
Thai Storage Battery NVDR | | | 4,900 | | | | 18 | |
Thai Vegetable Oil NVDR | | | 176,300 | | | | 199 | |
Thanachart Capital NVDR | | | 118,600 | | | | 146 | |
Tipco Asphalt NVDR | | | 1,445,500 | | | | 767 | |
Tisco Financial Group NVDR | | | 77,900 | | | | 131 | |
TMB Bank NVDR | | | 4,978,700 | | | | 292 | |
Vanachai Group NVDR | | | 221,100 | | | | 88 | |
| | | | | | | | |
| | | | | | | 16,076 | |
| | | | | | | | |
| | | | | | | | |
| Description | | Shares | | | Value
(000) | |
| | | | | | | | |
Turkey — 0.9% | | | | | | | | |
Albaraka Turk Katilim Bankasi | | | 44,267 | | | $ | 15 | |
Anadolu Cam Sanayii* | | | 327,928 | | | | 245 | |
Arcelik | | | 29,206 | | | | 176 | |
Baticim Bati Anadolu Cimento Sanayii | | | 21,859 | | | | 41 | |
Dogan Sirketler Grubu Holding* | | | 372,395 | | | | 80 | |
EGE Seramik Sanayi ve Ticaret* | | | 22,722 | | | | 20 | |
Emlak Konut Gayrimenkul Yatirim Ortakligi‡ | | | 388,613 | | | | 329 | |
Eregli Demir ve Celik Fabrikalari | | | 504,929 | | | | 736 | |
Haci Omer Sabanci Holding | | | 474,835 | | | | 1,232 | |
Indeks Bilgisayar Sistemleri Muhendislik Sanayi ve Ticaret | | | 20,606 | | | | 48 | |
Izmir Demir Celik Sanayi* | | | 57,810 | | | | 43 | |
Kordsa Global Endustriyel Iplik ve Kord Bezi Sanayi ve Ticaret | | | 69,396 | | | | 127 | |
Kutahya Porselen Sanayi* | | | 16,321 | | | | 34 | |
Logo Yazilim Sanayi Ve Ticaret* | | | 3,014 | | | | 46 | |
Selcuk Ecza Deposu Ticaret ve Sanayi A.S. | | | 85,387 | | | | 74 | |
Torunlar Gayrimenkul Yatirim Ortakligi‡ | | | 412,027 | | | | 485 | |
Turkiye Garanti Bankasi | | | 1,599,100 | | | | 3,456 | |
Turkiye Halk Bankasi | | | 244,795 | | | | 648 | |
Turkiye Is Bankasi, Cl C | | | 919,209 | | | | 1,351 | |
Turkiye Sise ve Cam Fabrikalari | | | 137,460 | | | | 150 | |
Turkiye Vakiflar Bankasi TAO, Cl D | | | 674,952 | | | | 832 | |
Vestel Beyaz Esya Sanayi ve Ticaret | | | 112,100 | | | | 382 | |
Yapi ve Kredi Bankasi | | | 204,733 | | | | 199 | |
| | | | | | | | |
| | | | | | | 10,749 | |
| | | | | | | | |
United Arab Emirates — 0.2% | | | | | | | | |
Aldar Properties PJSC(C) | | | 2,491,013 | | | | 1,784 | |
National Central Cooling PJSC(C) | | | 265,588 | | | | 145 | |
Union National Bank PJSC(C) | | | 43,378 | | | | 54 | |
| | | | | | | | |
| | | | | | | 1,983 | |
| | | | | | | | |
United Kingdom — 12.8% | | | | | | | | |
3i Group | | | 172,824 | | | | 1,500 | |
Aberdeen Asset Management | | | 25,907 | | | | 82 | |
Admiral Group | | | 44,261 | | | | 997 | |
Amec Foster Wheeler | | | 41,536 | | | | 241 | |
Anglo American | | | 84,907 | | | | 1,206 | |
Anglo American PLC | | | 41,915 | | | | 599 | |
Antofagasta | | | 36,245 | | | | 302 | |
Ashtead Group | | | 14,607 | | | | 284 | |
Associated British Foods | | | 10,918 | | | | 369 | |
AstraZeneca | | | 38,431 | | | | 2,102 | |
The accompanying notes are an integral part of the financial statements.
78
| | |
| THE KP FUNDS | | December 31, 2016 |
| | |
| KP International Equity Fund | | |
| | | | | | | | |
| Description | | Shares | | | Value
(000) | |
| | | | | | | | |
Auto Trader Group(A) (B) | | | 77,972 | | | $ | 393 | |
Aviva | | | 121,206 | | | | 727 | |
Babcock International Group | | | 7,596 | | | | 89 | |
BAE Systems | | | 268,240 | | | | 1,955 | |
Barclays PLC | | | 1,948,213 | | | | 5,366 | |
Barratt Developments | | | 61,336 | | | | 349 | |
Berendsen | | | 26,498 | | | | 284 | |
Berkeley Group Holdings | | | 3,930 | | | | 136 | |
BGEO Group | | | 13,500 | | | | 496 | |
BHP Billiton | | | 103,960 | | | | 1,674 | |
BP | | | 932,153 | | | | 5,855 | |
British American Tobacco | | | 58,734 | | | | 3,346 | |
British Land‡ | | | 29,207 | | | | 227 | |
BT Group, Cl A | | | 256,799 | | | | 1,161 | |
Bunzl | | | 82,257 | | | | 2,138 | |
Burberry Group | | | 12,925 | | | | 238 | |
Capita | | | 139,805 | | | | 915 | |
Carnival | | | 23,181 | | | | 1,179 | |
Centrica | | | 187,971 | | | | 542 | |
Close Brothers Group | | | 9,102 | | | | 162 | |
Cobham | | | 52,054 | | | | 105 | |
Compass Group PLC | | | 619,739 | | | | 11,465 | |
ConvaTec Group* (A) (B) | | | 208,561 | | | | 601 | |
Croda International | | | 3,795 | | | | 149 | |
Daily Mail & General Trust, Cl A | | | 76,423 | | | | 732 | |
Devro | | | 85,007 | | | | 199 | |
Diageo PLC | | | 331,545 | | | | 8,621 | |
Direct Line Insurance Group | | | 41,186 | | | | 187 | |
Dixons Carphone | | | 28,571 | | | | 125 | |
easyJet | | | 35,171 | | | | 436 | |
Fresnillo | | | 6,491 | | | | 98 | |
G4S | | | 405,355 | | | | 1,175 | |
GKN | | | 51,283 | | | | 210 | |
GlaxoSmithKline | | | 148,075 | | | | 2,850 | |
Glencore | | | 641,264 | | | | 2,192 | |
GVC Holdings* | | | 55,138 | | | | 437 | |
Hammerson‡ | | | 22,676 | | | | 160 | |
Hargreaves Lansdown | | | 7,990 | | | | 119 | |
Hays PLC | | | 491,488 | | | | 904 | |
Hikma Pharmaceuticals | | | 4,246 | | | | 99 | |
HomeServe | | | 132,343 | | | | 1,011 | |
HSBC Holdings PLC | | | 753,550 | | | | 6,091 | |
IG Group Holdings | | | 91,779 | | | | 559 | |
IMI | | | 15,288 | | | | 196 | |
Imperial Brands | | | 29,168 | | | | 1,273 | |
Inchcape | | | 20,533 | | | | 178 | |
Informa PLC | | | 84,890 | | | | 711 | |
| | | | | | | | |
| Description | | Shares | | | Value
(000) | |
| | | | | | | | |
Inmarsat | | | 13,097 | | | $ | 121 | |
InterContinental Hotels Group | | | 5,496 | | | | 246 | |
International Personal Finance | | | 128,029 | | | | 272 | |
Intertek Group | | | 56,919 | | | | 2,442 | |
Intu Properties‡ | | | 28,296 | | | | 98 | |
Investec | | | 19,819 | | | | 131 | |
ITV | | | 708,758 | | | | 1,803 | |
J Sainsbury | | | 49,104 | | | | 151 | |
Johnson Matthey | | | 5,639 | | | | 222 | |
Jupiter Fund Management | | | 67,021 | | | | 366 | |
Just Eat* | | | 66,937 | | | | 481 | |
Kingfisher | | | 66,918 | | | | 289 | |
Land Securities Group‡ | | | 24,266 | | | | 319 | |
Legal & General Group | | | 178,087 | | | | 543 | |
Lloyds Banking Group | | | 3,515,606 | | | | 2,708 | |
London Stock Exchange Group | | | 9,474 | | | | 340 | |
Lukoil PJSC ADR | | | 8,255 | | | | 463 | |
Marks & Spencer Group | | | 46,658 | | | | 201 | |
McCarthy & Stone(A) (B) | | | 40,610 | | | | 81 | |
Mediclinic International | | | 10,645 | | | | 101 | |
Meggitt | | | 23,369 | | | | 132 | |
Merlin Entertainments(A) (B) | | | 248,112 | | | | 1,373 | |
Millennium & Copthorne Hotels | | | 16,637 | | | | 94 | |
Mondi | | | 10,700 | | | | 220 | |
Moneysupermarket.com Group | | | 125,799 | | | | 456 | |
National Express Group | | | 30,885 | | | | 135 | |
National Grid | | | 154,911 | | | | 1,817 | |
NEX Group | | | 80,022 | | | | 458 | |
Next | | | 4,088 | | | | 251 | |
Non-Standard Finance(A) (B) | | | 156,295 | | | | 111 | |
Northgate | | | 19,937 | | | | 121 | |
Novolipetsk Steel PJSC GDR | | | 4,682 | | | | 87 | |
Old Mutual | | | 151,054 | | | | 386 | |
Paddy Power Betfair | | | 9,812 | | | | 1,061 | |
Pagegroup | | | 30,587 | | | | 147 | |
Pearson | | | 23,919 | | | | 241 | |
Persimmon | | | 9,221 | | | | 202 | |
Petrofac | | | 16,599 | | | | 178 | |
Pets at Home Group | | | 120,331 | | | | 354 | |
Playtech | | | 6,981 | | | | 71 | |
Provident Financial | | | 42,717 | | | | 1,500 | |
Prudential PLC | | | 178,869 | | | | 3,587 | |
Reckitt Benckiser Group PLC | | | 126,968 | | | | 10,775 | |
RELX | | | 117,786 | | | | 2,103 | |
Rightmove | | | 48,145 | | | | 2,316 | |
Rio Tinto PLC | | | 136,211 | | | | 5,301 | |
Rolls-Royce Holdings PLC | | | 372,030 | | | | 3,063 | |
The accompanying notes are an integral part of the financial statements.
79
| | |
| THE KP FUNDS | | December 31, 2016 |
| | |
| KP International Equity Fund | | |
| | | | | | | | |
| Description | | Shares | | | Value
(000) | |
| | | | | | | | |
Rotork | | | 40,304 | | | $ | 120 | |
Royal Bank of Scotland Group* | | | 102,813 | | | | 285 | |
Royal Mail | | | 27,041 | | | | 154 | |
RSA Insurance Group | | | 30,458 | | | | 220 | |
Sage Group | | | 31,389 | | | | 253 | |
Schroders | | | 3,883 | | | | 143 | |
Segro‡ | | | 25,003 | | | | 141 | |
Serco Group PLC | | | 515,848 | | | | 911 | |
Severn Trent | | | 7,059 | | | | 193 | |
Shire | | | 27,374 | | | | 1,580 | |
Sky PLC | | | 59,769 | | | | 730 | |
Smith & Nephew | | | 39,737 | | | | 598 | |
Smiths Group PLC | | | 119,477 | | | | 2,085 | |
South32 | | | 39,607 | | | | 79 | |
Spectris | | | 22,047 | | | | 628 | |
SSE | | | 30,133 | | | | 577 | |
SSP Group | | | 209,187 | | | | 998 | |
St. James’s Place | | | 56,740 | | | | 709 | |
Stagecoach Group | | | 153,244 | | | | 408 | |
Standard Chartered PLC | | | 196,516 | | | | 1,607 | |
Standard Life | | | 57,558 | | | | 264 | |
Tate & Lyle | | | 13,078 | | | | 114 | |
Taylor Wimpey | | | 97,757 | | | | 185 | |
Tesco | | | 432,075 | | | | 1,101 | |
Thomas Cook Group* | | | 525,028 | | | | 564 | |
TP ICAP | | | 65,398 | | | | 349 | |
Travis Perkins | | | 7,259 | | | | 130 | |
Unilever | | | 85,767 | | | | 3,480 | |
United Utilities Group | | | 19,868 | | | | 221 | |
Vodafone Group PLC | | | 976,424 | | | | 2,405 | |
Weir Group | | | 6,592 | | | | 153 | |
WH Smith | | | 50,723 | | | | 974 | |
Whitbread | | | 5,338 | | | | 248 | |
William Hill | | | 26,546 | | | | 95 | |
WM Morrison Supermarkets | | | 64,281 | | | | 183 | |
Wolseley | | | 7,558 | | | | 462 | |
Worldpay Group (A) (B) | | | 52,384 | | | | 174 | |
WPP PLC | | | 493,825 | | | | 11,053 | |
| | | | | | | | |
| | | | | | | 158,289 | |
| | | | | | | | |
United States — 1.1% | | | | | | | | |
Consumer Discretionary — 0.6% | | | | | | | | |
Delphi Automotive PLC | | | 21,474 | | | | 1,446 | |
Yum China Holdings* | | | 131,058 | | | | 3,423 | |
Yum! Brands | | | 27,177 | | | | 1,721 | |
| | | | | | | | |
| | | | | | | 6,590 | |
| | | | | | | | |
| | | | | | | | |
| Description | | Shares | | | Value
(000) | |
| | | | | | | | |
Consumer Staples — 0.0% | | | | | | | | |
Gruma, Cl B | | | 27,136 | | | $ | 343 | |
| | | | | | | | |
Health Care — 0.0% | | | | | | | | |
Teva Pharmaceutical Industries ADR | | | 1,623 | | | | 59 | |
| | | | | | | | |
Industrials — 0.5% | | | | | | | | |
Canadian National Railway | | | 93,004 | | | | 6,269 | |
| | | | | | | | |
Information Technology — 0.0% | | | | | | | | |
ChipMOS TECHNOLOGIES INC ADR | | | 10,743 | | | | 152 | |
Genpact* | | | 7,497 | | | | 182 | |
Phoenix New Media ADR* | | | 7,968 | | | | 25 | |
| | | | | | | | |
| | | | | | | 359 | |
| | | | | | | | |
| | | | | | | 13,620 | |
| | | | | | | | |
Total Common Stock
(Cost $1,209,506) (000) | | | | | | | 1,181,709 | |
| | | | | | | | |
PREFERRED STOCK — 0.8% | | | | | | | | |
Alpargatas(A) | | | 405,498 | | | | 1,247 | |
Banco Bradesco, Cl Preference(A) | | | 33,498 | | | | 298 | |
Banco do Estado do Rio Grande do Sul(A) | | | 189,200 | | | | 600 | |
Bayerische Motoren Werke, Cl Preference(A) | | | 1,598 | | | | 122 | |
Centrais Eletricas Brasileiras*,(A) | | | 105,800 | | | | 843 | |
Cia Brasileira de Distribuicao, Cl Preference(A) | | | 18,665 | | | | 314 | |
Cia de Gas de Sao Paulo - COMGAS, Cl A(A) | | | 15,855 | | | | 224 | |
Cia Energetica de Minas Gerais(A) | | | 267,700 | | | | 634 | |
Cia Energetica de Sao Paulo, Cl Preference(A) | | | 75,800 | | | | 314 | |
Cia Paranaense de Energia(A) | | | 62,100 | | | | 522 | |
CJ*,(A) (C) | | | 1,220 | | | | 75 | |
Embotelladora Andina(A) | | | 14,922 | | | | 56 | |
FUCHS PETROLUB(A) | | | 2,067 | | | | 87 | |
Gerdau(A) | | | 237,400 | | | | 787 | |
Henkel & KGaA(A) | | | 5,325 | | | | 635 | |
Itausa - Investimentos Itau(A) | | | 286,577 | | | | 729 | |
Metalurgica Gerdau, Cl Preference*,(A) | | | 225,600 | | | | 333 | |
Porsche Automobil Holding(A) | | | 4,462 | | | | 243 | |
Schaeffler, Cl Preference(A) | | | 5,146 | | | | 76 | |
Volkswagen(A) | | | 12,976 | | | | 1,821 | |
| | | | | | | | |
Total Preferred Stock
(Cost $10,359) (000) | | | | | | | 9,960 | |
| | | | | | | | |
The accompanying notes are an integral part of the financial statements.
80
| | |
| THE KP FUNDS | | December 31, 2016 |
| | |
| KP International Equity Fund | | |
| | | | | | | | |
| Description | | Number of
Rights | | | Value
(000) | |
RIGHTS — 0.0% | | | | | | | | |
Repsol *(C) (D) | | | 32,927 | | | $ | 12 | |
| | | | | | | | |
Total Rights
(Cost $–) (000) | | | | | | | 12 | |
| | | | | | | | |
SHORT-TERM INVESTMENT — 2.6% | |
| | |
| | | Shares | | | | |
State Street Institutional Treasury Money Market Fund, Cl Institutional, 0.406%, (E) | | | 31,883,212 | | | | 31,883 | |
| | | | | | | | |
Total Short-Term Investment
(Cost $31,883) (000) | | | | | | | 31,883 | |
| | | | | | | | |
Total Investments — 99.3%
(Cost $1,251,748) (000) | | | | | | $ | 1,223,564 | |
| | | | | | | | |
Percentages are based on net assets of $1,232,730 (000).
A list of the open futures contracts held by the Fund at December 31, 2016, is as follows:
| | | | | | | | | | | | |
| Type of Contract | | Number of
Contracts
Long | | | Expiration
Date | | | Unrealized
Depreciation | |
| E-MINI MSCI Future | | | 343 | | | | Mar-2017 | | | $ | (129 | ) |
| | | | | | | | | | | | |
For the year ended December 31, 2016, the monthly average value of futures contracts held was $18,300 (000).
| ‡ | Real Estate Investment Trust |
| * | Non-income producing security. |
| (B) | Security sold within terms of a private placement memorandum, exempt from registration under Section 144A of the Securities Act of 1933, as amended, and may be sold only to dealers in that program or other “accredited investors.” These securities have been determined to be liquid under guidelines established by the Board of Trustees. |
| (C) | Security is fair valued using methods determined in good faith by the Fair Value Pricing Committee of the Board of Trustees. The total market value of such securities as of December 31, 2016 was $61,243 (000) and represented 5.0% of net assets. |
| (D) | Expiration date not available. |
| (E) | The rate reported is the 7-day effective yield as of December 31, 2016. |
ADR — American Depositary Receipt
Cl — Class
GDR — Global Depositary Receipt
NGN — Nigerian Naira
NOK — Norwegian Krone
PLC — Public Limited Company
REIT — Real Estate Investment Trust
The following is a list of the level of inputs used as of December 31, 2016, there in valuing the Fund’s investments and other financial instruments carried at value (000):
| | | | | | | | | | | | | | | | |
| Investments In Securities | | Level 1 | | | Level 2 | | | Level 3^ | | | Total | |
Common Stock | |
Australia | | $ | 36,207 | | | $ | — | | | $ | — | | | $ | 36,207 | |
Austria | | | 1,778 | | | | — | | | | — | | | | 1,778 | |
Belgium | | | 9,111 | | | | — | | | | — | | | | 9,111 | |
Brazil | | | 17,950 | | | | — | | | | — | | | | 17,950 | |
Canada | | | 19,314 | | | | — | | | | — | | | | 19,314 | |
Chile | | | 3,353 | | | | — | | | | — | | | | 3,353 | |
China | | | 36,784 | | | | — | | | | — | | | | 36,784 | |
Colombia | | | 1,081 | | | | — | | | | — | | | | 1,081 | |
Cyprus | | | 549 | | | | — | | | | — | | | | 549 | |
Czech Republic | | | 223 | | | | — | | | | — | | | | 223 | |
Denmark | | | 20,603 | | | | — | | | | — | | | | 20,603 | |
Egypt | | | — | | | | 84 | | | | — | | | | 84 | |
Finland | | | 9,577 | | | | — | | | | — | | | | 9,577 | |
France | | | 89,343 | | | | — | | | | — | | | | 89,343 | |
Germany | | | 78,051 | | | | — | | | | — | | | | 78,051 | |
Greece | | | 2,782 | | | | — | | | | — | | | | 2,782 | |
Hong Kong | | | 53,455 | | | | — | | | | — | | | | 53,455 | |
India | | | 23,306 | | | | — | | | | — | | | | 23,306 | |
Indonesia | | | 8,157 | | | | — | | | | — | | | | 8,157 | |
Ireland | | | 9,452 | | | | — | | | | — | | | | 9,452 | |
Israel | | | 3,991 | | | | 1,838 | | | | — | | | | 5,829 | |
Italy | | | 19,356 | | | | — | | | | — | | | | 19,356 | |
Japan | | | 200,898 | | | | — | | | | — | | | | 200,898 | |
Luxembourg | | | 4,090 | | | | — | | | | — | | | | 4,090 | |
Macau | | | 323 | | | | — | | | | — | | | | 323 | |
Malaysia | | | 9,825 | | | | — | | | | — | | | | 9,825 | |
Mexico | | | 6,576 | | | | — | | | | — | | | | 6,576 | |
Netherlands | | | 51,323 | | | | — | | | | — | | | | 51,323 | |
New Zealand | | | 1,132 | | | | — | | | | — | | | | 1,132 | |
Norway | | | 4,020 | | | | — | | | | — | | | | 4,020 | |
Panama | | | 38 | | | | — | | | | — | | | | 38 | |
Peru | | | 3,545 | | | | — | | | | — | | | | 3,545 | |
Philippines | | | — | | | | 1,616 | | | | — | | | | 1,616 | |
Poland | | | 6,326 | | | | — | | | | — | | | | 6,326 | |
Portugal | | | 543 | | | | — | | | | — | | | | 543 | |
Qatar | | | 420 | | | | 3,808 | | | | — | | | | 4,228 | |
Russia | | | 9,417 | | | | — | | | | — | | | | 9,417 | |
Singapore | | | 12,740 | | | | — | | | | — | | | | 12,740 | |
South Africa | | | 13,791 | | | | — | | | | — | | | | 13,791 | |
South Korea | | | 3,460 | | | | 51,827 | | | | — | | | | 55,287 | |
Spain | | | 17,997 | | | | — | | | | — | | | | 17,997 | |
Sweden | | | 20,723 | | | | — | | | | — | | | | 20,723 | |
Switzerland | | | 80,432 | | | | — | | | | — | | | | 80,432 | |
Taiwan | | | 29,777 | | | | — | | | | — | | | | 29,777 | |
Thailand | | | 16,076 | | | | — | | | | — | | | | 16,076 | |
Turkey | | | 10,749 | | | | — | | | | — | | | | 10,749 | |
United Arab Emirates | | | — | | | | 1,983 | | | | — | | | | 1,983 | |
United Kingdom | | | 158,289 | | | | — | | | | — | | | | 158,289 | |
United States | | | 13,620 | | | | — | | | | — | | | | 13,620 | |
| | | | | | | | | | | | | | | | |
Total Common Stock | | | 1,120,553 | | | | 61,156 | | | | — | | | | 1,181,709 | |
| | | | |
Preferred Stock | | | 9,885 | | | | 75 | | | | — | | | | 9,960 | |
Rights | | | — | | | | 12 | | | | — | | | | 12 | |
Short-Term Investment | | | 31,883 | | | | — | | | | — | | | | 31,883 | |
| | | | | | | | | | | | | | | | |
Total Investments in Securities | | $ | 1,162,321 | | | $ | 61,243 | | | $ | — | | | $ | 1,223,564 | |
| | | | | | | | | | | | | | | | |
The accompanying notes are an integral part of the financial statements.
81
| | |
| THE KP FUNDS | | December 31, 2016 |
| | |
| KP International Equity Fund | | |
| | | | | | | | | | | | | | | | |
| Other Financial Instruments | | Level 1 | | | Level 2 | | | Level 3^ | | | Total | |
Futures | | | | | | | | | | | | | | | | |
Unrealized Depreciation** | | $ | (129 | ) | | $ | — | | | $ | — | | | $ | (129 | ) |
| | | | | | | | | | | | | | | | |
Total Other Financial Instruments | | $ | (129 | ) | | $ | — | | | $ | — | | | $ | (129 | ) |
| | | | | | | | | | | | | | | | |
| ** | Futures contracts are valued at the unrealized depreciation on the instrument. |
| ^ | As of December 31, 2016, the Fund held several Level 3 securities that were deemed worthless or $0 value. A reconciliation of Level 3 investments and disclosures of significant unobservable inputs are presented when the Fund has a significant amount of Level 3 investments in at the beginning and/or end of the year in relation to net assets. Management has concluded that Level 3 investments are not material in relation to net assets. |
For the year ended December 31, 2016, there were transfers between Level 1 and Level 2 assets and liabilities. Changes in the classifications between Levels 1 and 2 occur when foreign equity securities are fair valued using other observable market based inputs in place of the closing exchange price due to events occurring after the close of the exchange or market on which the investment is principally traded. Transfers, if any, between levels are considered to have occurred as of the end of the year.
For the year ended December 31, 2016, securities with a total value of $912,179 (000) transferred from Level 2 to Level 1 as a result of fair valuation of foreign equity securities. There were no other significant transfers between Level 1 and Level 2 assets for the year ended December 31, 2016.
Amounts designated as “—” are $0 or have been rounded to $0.
The accompanying notes are an integral part of the financial statements.
82
| | |
| THE KP FUNDS | | December 31, 2016 |
|
| SECTOR WEIGHTINGS† (unaudited) |
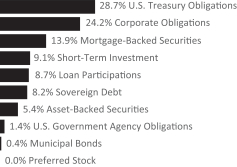
| † | Percentages based on total investments. |
| | | | | | | | |
| Description | | Face Amount
(000) | | | Value
(000) | |
| | | | | | | | |
U.S. TREASURY OBLIGATIONS — 31.5% | |
U.S. Treasury Bonds | |
4.750%, 02/15/37-02/15/37 | | $ | 7,543 | | | $ | 9,820 | |
3.000%, 05/15/45-05/15/45 | | | 4,618 | | | | 4,556 | |
2.875%, 08/15/45-08/15/45 | | | 6,857 | | | | 6,598 | |
2.500%, 02/15/46-05/15/46 | | | 476 | | | | 423 | |
2.250%, 08/15/46-08/15/46 | | | 4,243 | | | | 3,568 | |
U.S. Treasury Notes | |
8.000%, 11/15/21-11/15/21 | | | 1,000 | | | | 1,281 | |
3.625%, 02/15/20-02/15/21 | | | 3,950 | | | | 4,220 | |
3.500%, 05/15/20-05/15/20 | | | 750 | | | | 797 | |
3.375%, 11/15/19-11/15/19 | | | 1,000 | | | | 1,055 | |
3.125%, 05/15/19-05/15/19 | | | 1,500 | | | | 1,564 | |
2.750%, 11/15/23-02/15/24 | | | 2,750 | | | | 2,840 | |
2.625%, 08/15/20-11/15/20 | | | 2,750 | | | | 2,843 | |
2.500%, 08/15/23-05/15/24 | | | 3,100 | | | | 3,150 | |
2.375%, 08/15/24-08/15/24 | | | 2,400 | | | | 2,411 | |
2.250%, 03/31/21-11/15/25 | | | 6,250 | | | | 6,268 | |
2.125%, 08/15/21-05/15/25 | | | 7,375 | | | | 7,326 | |
2.000%, 07/31/20-11/15/26 | | | 29,704 | | | | 29,335 | |
1.875%, 11/30/21-10/31/22 | | | 4,000 | | | | 3,963 | |
1.750%, 09/30/19-05/15/23 | | | 25,172 | | | | 24,930 | |
1.625%, 03/31/19-05/15/26 | | | 36,975 | | | | 36,208 | |
1.500%, 08/31/18-08/15/26 | | | 27,211 | | | | 26,358 | |
1.375%, 06/30/18-08/31/23 | | | 53,984 | | | | 53,464 | |
1.250%, 11/15/18-07/31/23 | | | 27,177 | | | | 26,545 | |
1.125%, 01/15/19-09/30/21 | | | 30,453 | | | | 29,519 | |
1.000%, 03/15/18-11/15/19 | | | 18,074 | | | | 18,022 | |
0.875%, 01/31/18-09/15/19 | | | 15,883 | | | | 15,799 | |
0.750%, 01/31/18-08/15/19 | | | 9,354 | | | | 9,291 | |
0.625%, 04/30/18-06/30/18 | | | 5,000 | | | | 4,973 | |
| | | | | | | | |
Total U.S. Treasury Obligations (Cost $342,312) (000) | | | | | | | 337,127 | |
| | | | | | | | |
CORPORATE OBLIGATIONS — 26.7% | |
Consumer Discretionary — 1.9% | | | | | | | | |
21st Century Fox America | | | | | | | | |
6.400%, 12/15/35 | | | 196 | | | | 234 | |
| | | | | | | | |
| Description | | Face Amount
(000) | | | Value
(000) | |
| | | | | | | | |
4.500%, 02/15/21 | | $ | 100 | | | $ | 107 | |
3.700%, 09/15/24 | | | 120 | | | | 122 | |
Amazon.com | | | | | | | | |
3.300%, 12/05/21 | | | 200 | | | | 207 | |
American Honda Finance | | | | | | | | |
2.450%, 09/24/20 | | | 100 | | | | 100 | |
1.700%, 02/22/19 | | | 225 | | | | 218 | |
Atento Luxco | | | | | | | | |
7.375%, 01/29/20 (A) | | | 220 | | | | 221 | |
AutoZone | | | | | | | | |
2.500%, 04/15/21 | | | 100 | | | | 99 | |
Bed Bath & Beyond | | | | | | | | |
3.749%, 08/01/24 | | | 25 | | | | 25 | |
CBS | | | | | | | | |
3.375%, 03/01/22 | | | 150 | | | | 153 | |
Charter Communications Operating | | | | | | | | |
6.484%, 10/23/45 | | | 287 | | | | 332 | |
6.384%, 10/23/35 | | | 310 | | | | 354 | |
4.464%, 07/23/22 | | | 100 | | | | 104 | |
3.579%, 07/23/20 | | | 1,488 | | | | 1,518 | |
Cleveland Clinic Foundation | | | | | | | | |
4.858%, 01/01/14 | | | 378 | | | | 359 | |
Comcast | | | | | | | | |
4.500%, 01/15/43 | | | 487 | | | | 502 | |
3.375%, 02/15/25 | | | 275 | | | | 277 | |
3.150%, 03/01/26 | | | 50 | | | | 50 | |
3.125%, 07/15/22 | | | 150 | | | | 153 | |
2.750%, 03/01/23 | | | 100 | | | | 99 | |
Council of Europe Development Bank | | | | | | | | |
1.750%, 11/14/19 | | | 100 | | | | 100 | |
1.125%, 05/31/18 | | | 150 | | | | 149 | |
Delphi | | | | | | | | |
4.150%, 03/15/24 | | | 40 | | | | 41 | |
Delphi Automotive | | | | | | | | |
3.150%, 11/19/20 | | | 100 | | | | 102 | |
Diageo Investment | | | | | | | | |
2.875%, 05/11/22 | | | 100 | | | | 101 | |
Discovery Communications | | | | | | | | |
5.050%, 06/01/20 | | | 100 | | | | 107 | |
Dollar General | | | | | | | | |
4.150%, 11/01/25 | | | 25 | | | | 26 | |
DR Horton | | | | | | | | |
4.000%, 02/15/20 | | | 35 | | | | 36 | |
3.750%, 03/01/19 | | | 25 | | | | 25 | |
Expedia | | | | | | | | |
4.500%, 08/15/24 | | | 100 | | | | 102 | |
Ford Motor | | | | | | | | |
5.291%, 12/08/46 | | | 908 | | | | 920 | |
4.346%, 12/08/26 | | | 45 | | | | 45 | |
Ford Motor Credit | | | | | | | | |
5.875%, 08/02/21 | | | 200 | | | | 221 | |
2.375%, 03/12/19 | | | 400 | | | | 400 | |
2.240%, 06/15/18 | | | 200 | | | | 200 | |
The accompanying notes are an integral part of the financial statements.
83
| | |
| THE KP FUNDS | | December 31, 2016 |
| | | | | | | | |
| Description | | Face Amount
(000) | | | Value
(000) | |
| | | | | | | | |
General Motors | | | | | | | | |
6.250%, 10/02/43 | | $ | 887 | | | $ | 981 | |
3.500%, 10/02/18 | | | 200 | | | | 204 | |
General Motors Financial | | | | | | | | |
4.300%, 07/13/25 | | | 100 | | | | 99 | |
4.000%, 01/15/25 | | | 150 | | | | 146 | |
3.700%, 05/09/23 | | | 100 | | | | 98 | |
3.150%, 01/15/20 | | | 150 | | | | 151 | |
3.100%, 01/15/19 | | | 100 | | | | 101 | |
2.350%, 10/04/19 | | | 50 | | | | 50 | |
Grupo Televisa | | | | | | | | |
7.250%, 05/14/43 (MXN) | | | 2,840 | | | | 102 | |
Home Depot | | | | | | | | |
4.400%, 04/01/21 | | | 100 | | | | 108 | |
2.625%, 06/01/22 | | | 100 | | | | 101 | |
2.000%, 06/15/19 | | | 200 | | | | 200 | |
Kohl’s | | | | | | | | |
4.000%, 11/01/21 | | | 100 | | | | 105 | |
Latam Airlines Pass-Through Trust | | | | | | | | |
4.200%, 11/15/27 | | | 438 | | | | 431 | |
Lear | | | | | | | | |
5.250%, 01/15/25 | | | 45 | | | | 47 | |
Lowe’s | | | | | | | | |
4.625%, 04/15/20 | | | 100 | | | | 107 | |
2.500%, 04/15/26 | | | 50 | | | | 47 | |
1.150%, 04/15/19 | | | 20 | | | | 20 | |
Macy’s Retail Holdings | | | | | | | | |
3.625%, 06/01/24 | | | 100 | | | | 98 | |
Magna International | | | | | | | | |
3.625%, 06/15/24 | | | 50 | | | | 50 | |
Marriott International | | | | | | | | |
3.125%, 10/15/21 | | | 250 | | | | 243 | |
Mattel | | | | | | | | |
2.350%, 05/06/19 | | | 100 | | | | 100 | |
McDonald’s | | | | | | | | |
5.350%, 03/01/18 | | | 100 | | | | 104 | |
3.375%, 05/26/25 | | | 100 | | | | 101 | |
2.750%, 12/09/20 | | | 20 | | | | 20 | |
Minerva Luxembourg | | | | | | | | |
6.500%, 09/20/26 (A) | | | 380 | | | | 366 | |
NBCUniversal Media | | | | | | | | |
4.375%, 04/01/21 | | | 100 | | | | 108 | |
Newell Brands | | | | | | | | |
5.500%, 04/01/46 | | | 850 | | | | 976 | |
4.000%, 12/01/24 | | | 50 | | | | 51 | |
3.150%, 04/01/21 | | | 150 | | | | 153 | |
Omnicom Group | | | | | | | | |
4.450%, 08/15/20 | | | 100 | | | | 106 | |
3.600%, 04/15/26 | | | 100 | | | | 99 | |
O’Reilly Automotive | | | | | | | | |
3.550%, 03/15/26 | | | 50 | | | | 50 | |
QVC | | | | | | | | |
4.450%, 02/15/25 | | | 65 | | | | 62 | |
| | | | | | | | |
| Description | | Face Amount
(000) | | | Value
(000) | |
| | | | | | | | |
Scripps Networks Interactive | | | | | | | | |
2.750%, 11/15/19 | | $ | 100 | | | $ | 101 | |
Staples | | | | | | | | |
2.750%, 01/12/18 | | | 100 | | | | 100 | |
Starbucks | | | | | | | | |
3.850%, 10/01/23 | | | 150 | | | | 160 | |
Target | | | | | | | | |
2.900%, 01/15/22 | | | 200 | | | | 204 | |
Time Warner | | | | | | | | |
4.875%, 03/15/20 | | | 100 | | | | 107 | |
4.750%, 03/29/21 | | | 100 | | | | 107 | |
3.600%, 07/15/25 | | | 100 | | | | 99 | |
2.100%, 06/01/19 | | | 100 | | | | 100 | |
Time Warner Cable | | | | | | | | |
8.250%, 04/01/19 | | | 200 | | | | 225 | |
7.300%, 07/01/38 | | | 238 | | | | 293 | |
4.000%, 09/01/21 | | | 100 | | | | 102 | |
TJX | | | | | | | | |
2.750%, 06/15/21 | | | 100 | | | | 102 | |
Toyota Motor Credit | | | | | | | | |
4.250%, 01/11/21 | | | 100 | | | | 108 | |
2.750%, 05/17/21 | | | 100 | | | | 101 | |
2.250%, 10/18/23 | | | 50 | | | | 48 | |
2.100%, 01/17/19 | | | 150 | | | | 151 | |
1.550%, 07/13/18 | | | 1,975 | | | | 1,952 | |
1.200%, 04/06/18 | | | 50 | | | | 50 | |
USJ Acucar e Alcool | | | | | | | | |
9.875%, 11/09/21 (A) | | | 289 | | | | 230 | |
Viacom | | | | | | | | |
4.250%, 09/01/23 | | | 100 | | | | 100 | |
3.450%, 10/04/26 | | | 576 | | | | 533 | |
2.200%, 04/01/19 | | | 100 | | | | 99 | |
Walt Disney | | | | | | | | |
3.150%, 09/17/25 | | | 100 | | | | 102 | |
2.550%, 02/15/22 | | | 100 | | | | 100 | |
1.850%, 05/30/19 | | | 150 | | | | 151 | |
Wesleyan University | | | | | | | | |
4.781%, 07/01/16 | | | 649 | | | | 614 | |
Whirlpool | | | | | | | | |
4.000%, 03/01/24 | | | 60 | | | | 62 | |
Wyndham Worldwide | | | | | | | | |
4.250%, 03/01/22 | | | 50 | | | | 52 | |
| | | | | | | | |
| | | | | | | 19,747 | |
| | | | | | | | |
Consumer Staples — 1.9% | | | | | | | | |
Altria Group | | | | | | | | |
9.250%, 08/06/19 | | | 200 | | | | 236 | |
Anheuser-Busch InBev Finance | | | | | | | | |
4.900%, 02/01/46 | | | 1,243 | | | | 1,344 | |
4.700%, 02/01/36 | | | 729 | | | | 767 | |
3.650%, 02/01/26 | | | 300 | | | | 305 | |
2.650%, 02/01/21 | | | 215 | | | | 216 | |
2.150%, 02/01/19 | | | 200 | | | | 201 | |
1.900%, 02/01/19 | | | 200 | | | | 200 | |
1.250%, 01/17/18 | | | 100 | | | | 100 | |
The accompanying notes are an integral part of the financial statements.
84
| | |
| THE KP FUNDS | | December 31, 2016 |
| | | | | | | | |
| Description | | Face Amount
(000) | | | Value
(000) | |
| | | | | | | | |
Anheuser-Busch InBev Worldwide | | | | | | | | |
7.750%, 01/15/19 | | $ | 100 | | | $ | 111 | |
5.375%, 01/15/20 | | | 100 | | | | 109 | |
3.750%, 01/15/22 | | | 200 | | | | 209 | |
2.500%, 07/15/22 | | | 100 | | | | 99 | |
Bunge Finance | | | | | | | | |
3.250%, 08/15/26 | | | 120 | | | | 115 | |
Clorox | | | | | | | | |
3.500%, 12/15/24 | | | 50 | | | | 51 | |
Coca-Cola | | | | | | | | |
3.300%, 09/01/21 | | | 100 | | | | 104 | |
3.200%, 11/01/23 | | | 100 | | | | 103 | |
2.875%, 10/27/25 | | | 50 | | | | 49 | |
2.550%, 06/01/26 | | | 50 | | | | 47 | |
2.450%, 11/01/20 | | | 50 | | | | 51 | |
1.875%, 10/27/20 | | | 50 | | | | 50 | |
1.375%, 05/30/19 | | | 50 | | | | 50 | |
Coca-Cola Femsa | | | | | | | | |
2.375%, 11/26/18 | | | 150 | | | | 151 | |
Colgate-Palmolive | | | | | | | | |
1.750%, 03/15/19 | | | 100 | | | | 100 | |
Constellation Brands | | | | | | | | |
6.000%, 05/01/22 | | | 20 | | | | 23 | |
4.250%, 05/01/23 | | | 50 | | | | 52 | |
3.875%, 11/15/19 | | | 10 | | | | 10 | |
3.750%, 05/01/21 | | | 15 | | | | 15 | |
Costco Wholesale | | | | | | | | |
1.700%, 12/15/19 | | | 100 | | | | 100 | |
CVS Health | | | | | | | | |
5.125%, 07/20/45 | | | 240 | | | | 268 | |
4.000%, 12/05/23 | | | 150 | | | | 158 | |
3.875%, 07/20/25 | | | 120 | | | | 124 | |
3.375%, 08/12/24 | | | 100 | | | | 100 | |
2.875%, 06/01/26 | | | 50 | | | | 48 | |
2.250%, 12/05/18 | | | 150 | | | | 151 | |
2.125%, 06/01/21 | | | 50 | | | | 49 | |
CVS Pass-Through Trust | | | | | | | | |
4.704%, 01/10/36 (A) | | | 721 | | | | 761 | |
Dr Pepper Snapple Group | | | | | | | | |
3.400%, 11/15/25 | | | 150 | | | | 150 | |
General Mills | | | | | | | | |
5.650%, 02/15/19 | | | 100 | | | | 108 | |
Hershey | | | | | | | | |
2.300%, 08/15/26 | | | 50 | | | | 46 | |
Ingredion | | | | | | | | |
3.200%, 10/01/26 | | | 50 | | | | 49 | |
JM Smucker | | | | | | | | |
2.500%, 03/15/20 | | | 100 | | | | 100 | |
Kellogg | | | | | | | | |
4.000%, 12/15/20 | | | 100 | | | | 105 | |
Kimberly-Clark | | | | | | | | |
2.750%, 02/15/26 | | | 100 | | | | 97 | |
Kraft Heinz Foods | | | | | | | | |
5.200%, 07/15/45 | | | 682 | | | | 714 | |
| | | | | | | | |
| Description | | Face Amount
(000) | | | Value
(000) | |
| | | | | | | | |
4.375%, 06/01/46 | | $ | 394 | | | $ | 371 | |
3.950%, 07/15/25 | | | 150 | | | | 152 | |
3.500%, 06/06/22 | | | 225 | | | | 229 | |
2.000%, 07/02/18 | | | 735 | | | | 735 | |
Kroger | | | | | | | | |
3.300%, 01/15/21 | | | 100 | | | | 103 | |
2.950%, 11/01/21 | | | 150 | | | | 151 | |
Mead Johnson Nutrition | | | | | | | | |
3.000%, 11/15/20 | | | 30 | | | | 30 | |
Molson Coors Brewing | | | | | | | | |
3.000%, 07/15/26 | | | 225 | | | | 213 | |
1.450%, 07/15/19 | | | 25 | | | | 24 | |
Mondelez International Holdings Netherlands BV | | | | | | | | |
2.000%, 10/28/21 (A) | | | 1,687 | | | | 1,613 | |
1.625%, 10/28/19 (A) | | | 1,203 | | | | 1,176 | |
PepsiCo | | | | | | | | |
3.600%, 03/01/24 | | | 100 | | | | 104 | |
2.850%, 02/24/26 | | | 100 | | | | 99 | |
2.375%, 10/06/26 | | | 200 | | | | 189 | |
1.250%, 04/30/18 | | | 100 | | | | 100 | |
Philip Morris International | | | | | | | | |
4.500%, 03/26/20 | | | 100 | | | | 107 | |
3.375%, 08/11/25 | | | 100 | | | | 101 | |
1.875%, 02/25/21 | | | 200 | | | | 196 | |
Procter & Gamble | | | | | | | | |
3.100%, 08/15/23 | | | 100 | | | | 103 | |
2.450%, 11/03/26 | | | 50 | | | | 48 | |
1.900%, 11/01/19 | | | 100 | | | | 101 | |
Reynolds American | | | | | | | | |
8.125%, 06/23/19 | | | 100 | | | | 114 | |
4.450%, 06/12/25 | | | 150 | | | | 159 | |
2.300%, 06/12/18 | | | 3,807 | | | | 3,831 | |
Sigma Alimentos | | | | | | | | |
4.125%, 05/02/26 (A) | | | 270 | | | | 256 | |
Sysco | | | | | | | | |
2.600%, 10/01/20 | | | 50 | | | | 50 | |
2.500%, 07/15/21 | | | 35 | | | | 35 | |
1.900%, 04/01/19 | | | 30 | | | | 30 | |
Tyson Foods | | | | | | | | |
4.500%, 06/15/22 | | | 150 | | | | 160 | |
Unilever Capital | | | | | | | | |
4.250%, 02/10/21 | | | 150 | | | | 161 | |
Walgreens Boots Alliance | | | | | | | | |
4.800%, 11/18/44 | | | 395 | | | | 406 | |
3.450%, 06/01/26 | | | 65 | | | | 64 | |
3.300%, 11/18/21 | | | 100 | | | | 102 | |
3.100%, 06/01/23 | | | 30 | | | | 30 | |
2.700%, 11/18/19 | | | 100 | | | | 101 | |
2.600%, 06/01/21 | | | 30 | | | | 30 | |
1.750%, 05/30/18 | | | 35 | | | | 35 | |
Wal-Mart Stores | | | | | | | | |
4.250%, 04/15/21 | | | 125 | | | | 135 | |
3.300%, 04/22/24 | | | 100 | | | | 103 | |
1.125%, 04/11/18 | | | 200 | | | | 200 | |
| | | | | | | | |
| | | | | | | 19,943 | |
| | | | | | | | |
The accompanying notes are an integral part of the financial statements.
85
| | |
| THE KP FUNDS | | December 31, 2016 |
| | | | | | | | |
| Description | | Face Amount
(000) | | | Value
(000) | |
| | | | | | | | |
Energy — 3.2% | | | | | | | | |
Anadarko Petroleum | | | | | | | | |
6.950%, 06/15/19 | | $ | 274 | | | $ | 304 | |
6.600%, 03/15/46 | | | 327 | | | | 403 | |
5.550%, 03/15/26 | | | 100 | | | | 112 | |
4.500%, 07/15/44 | | | 515 | | | | 484 | |
Apache | | | | | | | | |
3.250%, 04/15/22 | | | 100 | | | | 102 | |
Baker Hughes | | | | | | | | |
7.500%, 11/15/18 | | | 150 | | | | 165 | |
Boardwalk Pipelines | | | | | | | | |
4.950%, 12/15/24 | | | 50 | | | | 51 | |
BP Capital Markets | | | | | | | | |
3.535%, 11/04/24 | | | 250 | | | | 254 | |
3.245%, 05/06/22 | | | 1,980 | | | | 2,022 | |
3.062%, 03/17/22 | | | 100 | | | | 101 | |
2.750%, 05/10/23 | | | 100 | | | | 98 | |
2.237%, 05/10/19 | | | 100 | | | | 101 | |
2.112%, 09/16/21 | | | 100 | | | | 98 | |
1.676%, 05/03/19 | | | 20 | | | | 20 | |
Canadian Natural Resources | | | | | | | | |
5.900%, 02/01/18 | | | 495 | | | | 515 | |
Chevron | | | | | | | | |
2.954%, 05/16/26 | | | 50 | | | | 49 | |
2.566%, 05/16/23 | �� | | 50 | | | | 49 | |
2.355%, 12/05/22 | | | 150 | | | | 147 | |
2.193%, 11/15/19 | | | 90 | | | | 91 | |
2.100%, 05/16/21 | | | 50 | | | | 50 | |
1.961%, 03/03/20 | | | 50 | | | | 50 | |
1.718%, 06/24/18 | | | 300 | | | | 301 | |
1.561%, 05/16/19 | | | 50 | | | | 50 | |
CNOOC Curtis Funding No. 1 | | | | | | | | |
4.500%, 10/03/23 (A) | | | 950 | | | | 998 | |
CNOOC Finance 2015 USA | | | | | | | | |
3.500%, 05/05/25 | | | 200 | | | | 194 | |
Columbia Pipeline Group | | | | | | | | |
2.450%, 06/01/18 | | | 100 | | | | 101 | |
ConocoPhillips | | | | | | | | |
6.500%, 02/01/39 | | | 489 | | | | 619 | |
6.000%, 01/15/20 | | | 100 | | | | 110 | |
4.200%, 03/15/21 | | | 50 | | | | 53 | |
3.350%, 11/15/24 | | | 200 | | | | 199 | |
Devon Energy | | | | | | | | |
3.250%, 05/15/22 | | | 100 | | | | 99 | |
Ecopetrol | | | | | | | | |
5.875%, 09/18/23 | | | 100 | | | | 106 | |
Emera US Finance | | | | | | | | |
2.700%, 06/15/21 (A) | | | 150 | | | | 148 | |
Enable Midstream Partners | | | | | | | | |
2.400%, 05/15/19 | | | 50 | | | | 49 | |
Enbridge Energy Partners | | | | | | | | |
5.875%, 10/15/25 | | | 100 | | | | 112 | |
Encana | | | | | | | | |
6.500%, 05/15/19 | | | 801 | | | | 865 | |
3.900%, 11/15/21 | | | 50 | | | | 50 | |
| | | | | | | | |
| Description | | Face Amount
(000) | | | Value
(000) | |
| | | | | | | | |
Energy Transfer Partners | | | | | | | | |
6.625%, 10/15/36 | | $ | 704 | | | $ | 763 | |
4.050%, 03/15/25 | | | 150 | | | | 148 | |
3.600%, 02/01/23 | | | 100 | | | | 98 | |
2.500%, 06/15/18 | | | 150 | | | | 151 | |
EnLink Midstream Partners | | | | | | | | |
5.600%, 04/01/44 | | | 482 | | | | 464 | |
5.050%, 04/01/45 | | | 190 | | | | 172 | |
2.700%, 04/01/19 | | | 800 | | | | 801 | |
Enterprise Products Operating | | | | | | | | |
3.350%, 03/15/23 | | | 100 | | | | 102 | |
2.850%, 04/15/21 | | | 30 | | | | 30 | |
2.550%, 10/15/19 | | | 200 | | | | 202 | |
EOG Resources | | | | | | | | |
3.150%, 04/01/25 | | | 100 | | | | 98 | |
2.625%, 03/15/23 | | | 100 | | | | 97 | |
Exxon Mobil | | | | | | | | |
3.043%, 03/01/26 | | | 50 | | | | 50 | |
2.726%, 03/01/23 | | | 35 | | | | 35 | |
2.709%, 03/06/25 | | | 150 | | | | 146 | |
2.222%, 03/01/21 | | | 20 | | | | 20 | |
1.819%, 03/15/19 | | | 250 | | | | 251 | |
1.708%, 03/01/19 | | | 50 | | | | 50 | |
1.439%, 03/01/18 | | | 30 | | | | 30 | |
Fermaca Enterprises | | | | | | | | |
6.375%, 03/30/38 (A) | | | 191 | | | | 188 | |
Halliburton | | | | | | | | |
3.500%, 08/01/23 | | | 100 | | | | 102 | |
Husky Energy | | | | | | | | |
4.000%, 04/15/24 | | | 100 | | | | 102 | |
Kinder Morgan | | | | | | | | |
5.300%, 12/01/34 | | | 840 | | | | 853 | |
3.050%, 12/01/19 | | | 710 | | | | 720 | |
Kinder Morgan Energy Partners | | | | | | | | |
3.950%, 09/01/22 | | | 250 | | | | 257 | |
3.500%, 03/01/21 | | | 20 | | | | 20 | |
Magellan Midstream Partners | | | | | | | | |
4.250%, 02/01/21 | | | 100 | | | | 106 | |
Marathon Oil | | | | | | | | |
2.800%, 11/01/22 | | | 150 | | | | 143 | |
Marathon Petroleum | | | | | | | | |
3.400%, 12/15/20 | | | 100 | | | | 102 | |
MPLX | | | | | | | | |
4.875%, 12/01/24 | | | 100 | | | | 103 | |
4.500%, 07/15/23 | | | 2,250 | | | | 2,285 | |
4.000%, 02/15/25 | | | 25 | | | | 24 | |
Nabors Industries | | | | | | | | |
5.100%, 09/15/23 | | | 100 | | | | 100 | |
National Oilwell Varco | | | | | | | | |
2.600%, 12/01/22 | | | 100 | | | | 93 | |
Noble Energy | | | | | | | | |
8.250%, 03/01/19 | | | 1,230 | | | | 1,382 | |
4.150%, 12/15/21 | | | 100 | | | | 104 | |
Occidental Petroleum | | | | | | | | |
3.400%, 04/15/26 | | | 70 | | | | 71 | |
3.125%, 02/15/22 | | | 100 | | | | 102 | |
The accompanying notes are an integral part of the financial statements.
86
| | |
| THE KP FUNDS | | December 31, 2016 |
| | | | | | | | |
| Description | | Face Amount
(000) | | | Value
(000) | |
| | | | | | | | |
Odebrecht Drilling Norbe VIII | | | | | | | | |
6.350%, 06/30/21 (A) | | $ | 300 | | | $ | 134 | |
ONEOK Partners | | | | | | | | |
3.375%, 10/01/22 | | | 100 | | | | 100 | |
Pertamina Persero | | | | | | | | |
6.450%, 05/30/44 (A) | | | 370 | | | | 375 | |
6.000%, 05/03/42 (A) | | | 250 | | | | 240 | |
5.250%, 05/23/21 (A) | | | 265 | | | | 279 | |
Petrobras Global Finance BV | | | | | | | | |
4.375%, 05/20/23 | | | 790 | | | | 690 | |
Petroleos de Venezuela | | | | | | | | |
9.000%, 11/17/21 | | | 660 | | | | 350 | |
8.500%, 10/27/20 (A) | | | 245 | | | | 182 | |
6.000%, 11/15/26 (A) | | | 665 | | | | 256 | |
5.375%, 04/12/27 | | | 365 | | | | 136 | |
Petroleos Mexicanos | | | | | | | | |
8.000%, 05/03/19 | | | 250 | | | | 274 | |
6.875%, 08/04/26 (A) | | | 50 | | | | 53 | |
6.750%, 09/21/47 (A) | | | 318 | | | | 300 | |
6.375%, 02/04/21 (A) | | | 240 | | | | 226 | |
5.625%, 01/23/46 | | | 879 | | | | 730 | |
5.500%, 02/04/19 (A) | | | 290 | | | | 267 | |
4.875%, 01/24/22 | | | 350 | | | | 351 | |
4.625%, 09/21/23 (A) | | | 200 | | | | 195 | |
3.500%, 07/23/20 | | | 755 | | | | 699 | |
Petronas Capital | | | | | | | | |
4.500%, 03/18/45 (A) | | | 200 | | | | 201 | |
Phillips 66 Partners | | | | | | | | |
3.605%, 02/15/25 | | | 25 | | | | 24 | |
Pioneer Natural Resources | | | | | | | | |
3.450%, 01/15/21 | | | 100 | | | | 102 | |
Plains All American Pipeline | | | | | | | | |
6.650%, 01/15/37 | | | 841 | | | | 918 | |
4.650%, 10/15/25 | | | 150 | | | | 155 | |
3.850%, 10/15/23 | | | 150 | | | | 148 | |
Regency Energy Partners | | | | | | | | |
4.500%, 11/01/23 | | | 100 | | | | 101 | |
Schlumberger Investment | | | | | | | | |
3.650%, 12/01/23 | | | 100 | | | | 105 | |
Shell International Finance | | | | | | | | |
3.250%, 05/11/25 | | | 150 | | | | 150 | |
2.875%, 05/10/26 | | | 100 | | | | 97 | |
2.000%, 11/15/18 | | | 200 | | | | 201 | |
1.875%, 05/10/21 | | | 150 | | | | 147 | |
1.625%, 11/10/18 | | | 200 | | | | 200 | |
Sinopec Group Overseas Development | | | | | | | | |
3.500%, 05/03/26 (A) | | | 580 | | | | 562 | |
Spectra Energy Partners | | | | | | | | |
3.500%, 03/15/25 | | | 100 | | | | 98 | |
State Oil of the Azerbaijan Republic | | | | | | | | |
4.750%, 03/13/23 | | | 505 | | | | 490 | |
Statoil | | | | | | | | |
3.700%, 03/01/24 | | | 100 | | | | 105 | |
| | | | | | | | |
| Description | | Face Amount
(000) | | | Value
(000) | |
| | | | | | | | |
2.450%, 01/17/23 | | $ | 125 | | | $ | 122 | |
2.250%, 11/08/19 | | | 150 | | | | 151 | |
Suncor Energy | | | | | | | | |
6.100%, 06/01/18 | | | 1,040 | | | | 1,101 | |
Sunoco Logistics Partners Operations | | | | | | | | |
4.400%, 04/01/21 | | | 100 | | | | 105 | |
Total Capital Canada | | | | | | | | |
2.750%, 07/15/23 | | | 100 | | | | 99 | |
Total Capital International | | | | | | | | |
2.700%, 01/25/23 | | | 100 | | | | 99 | |
2.100%, 06/19/19 | | | 100 | | | | 100 | |
TransCanada PipeLines | | | | | | | | |
4.875%, 01/15/26 | | | 100 | | | | 111 | |
2.500%, 08/01/22 | | | 100 | | | | 98 | |
1.625%, 11/09/17 | | | 671 | | | | 670 | |
Ultrapar International | | | | | | | | |
5.250%, 10/06/26 (A) | | | 450 | | | | 441 | |
Valero Energy | | | | | | | | |
9.375%, 03/15/19 | | | 29 | | | | 34 | |
3.650%, 03/15/25 | | | 100 | | | | 99 | |
Western Gas Partners | | | | | | | | |
2.600%, 08/15/18 | | | 100 | | | | 100 | |
Williams Partners | | | | | | | | |
6.300%, 04/15/40 | | | 874 | | | | 933 | |
5.250%, 03/15/20 | | | 250 | | | | 267 | |
3.600%, 03/15/22 | | | 100 | | | | 101 | |
| | | | | | | | |
| | | | | | | 34,157 | |
| | | | | | | | |
Financials — 8.9% | | | | | | | | |
Aflac | | | | | | | | |
3.625%, 06/15/23 | | | 100 | | | | 104 | |
African Development Bank | | | | | | | | |
1.375%, 02/12/20 | | | 100 | | | | 99 | |
1.125%, 09/20/19 | | | 100 | | | | 98 | |
0.875%, 03/15/18 | | | 150 | | | | 149 | |
AIA Group | | | | | | | | |
2.250%, 03/11/19 (A) | | | 424 | | | | 425 | |
Alleghany | | | | | | | | |
4.950%, 06/27/22 | | | 100 | | | | 108 | |
Allstate | | | | | | | | |
5.750%, 08/15/53 (B) | | | 200 | | | | 207 | |
American Express Credit | | | | | | | | |
2.375%, 05/26/20 | | | 100 | | | | 100 | |
2.250%, 08/15/19 | | | 250 | | | | 250 | |
1.875%, 11/05/18 | | | 150 | | | | 150 | |
American International Group | | | | | | | | |
4.800%, 07/10/45 | | | 400 | | | | 415 | |
4.500%, 07/16/44 | | | 290 | | | | 286 | |
3.375%, 08/15/20 | | | 150 | | | | 154 | |
3.300%, 03/01/21 | | | 150 | | | | 154 | |
2.300%, 07/16/19 | | | 100 | | | | 101 | |
Ameriprise Financial | | | | | | | | |
5.300%, 03/15/20 | | | 100 | | | | 108 | |
Andina de Fomento | | | | | | | | |
4.375%, 06/15/22 | | | 100 | | | | 106 | |
The accompanying notes are an integral part of the financial statements.
87
| | |
| THE KP FUNDS | | December 31, 2016 |
| | | | | | | | |
| Description | | Face Amount
(000) | | | Value
(000) | |
Aon | | | | | | | | |
5.000%, 09/30/20 | | $ | 100 | | | $ | 108 | |
Ares Capital | | | | | | | | |
3.875%, 01/15/20 | | | 60 | | | | 61 | |
Asian Development Bank | | | | | | | | |
2.000%, 01/22/25 | | | 100 | | | | 96 | |
1.750%, 03/21/19 | | | 100 | | | | 100 | |
1.625%, 08/26/20 | | | 300 | | | | 296 | |
1.375%, 01/15/19 | | | 100 | | | | 100 | |
1.125%, 06/05/18 | | | 150 | | | | 150 | |
1.000%, 08/16/19 | | | 100 | | | | 98 | |
0.875%, 04/26/18 | | | 100 | | | | 99 | |
Assurant | | | | | | | | |
4.000%, 03/15/23 | | | 74 | | | | 75 | |
Australia & New Zealand Banking Group NY | | | | | | | | |
2.700%, 11/16/20 | | | 250 | | | | 251 | |
2.550%, 11/23/21 | | | 250 | | | | 248 | |
Banco de Costa Rica | | | | | | | | |
5.250%, 08/12/18 (A) | | | 540 | | | | 545 | |
Banco Internacional del Peru SAA Interbank | | | | | | | | |
6.625%, 03/19/29 (A) (B) | | | 130 | | | | 137 | |
Banco Nacional de Costa Rica | | | | | | | | |
5.875%, 04/25/21 (A) | | | 210 | | | | 212 | |
4.875%, 11/01/18 (A) | | | 350 | | | | 352 | |
Bank of America | | | | | | | | |
5.700%, 01/24/22 | | | 100 | | | | 112 | |
4.450%, 03/03/26 | | | 130 | | | | 134 | |
4.200%, 08/26/24 | | | 165 | | | | 168 | |
4.125%, 01/22/24 | | | 1,978 | | | | 2,056 | |
4.100%, 07/24/23 | | | 100 | | | | 105 | |
4.000%, 01/22/25 | | | 100 | | | | 100 | |
3.950%, 04/21/25 | | | 200 | | | | 199 | |
3.500%, 04/19/26 | | | 50 | | | | 49 | |
3.248%, 10/21/27 | | | 2,249 | | | | 2,147 | |
2.650%, 04/01/19 | | | 450 | | | | 455 | |
2.625%, 10/19/20 | | | 350 | | | | 350 | |
2.503%, 10/21/22 | | | 100 | | | | 97 | |
2.250%, 04/21/20 | | | 250 | | | | 249 | |
2.151%, 11/09/20 | | | 100 | | | | 99 | |
2.050%, 12/07/18 | | | 405 | | | | 407 | |
2.000%, 01/11/18 | | | 150 | | | | 150 | |
1.750%, 06/05/18 | | | 250 | | | | 250 | |
Bank of Montreal | | | | | | | | |
2.100%, 12/12/19 | | | 65 | | | | 65 | |
1.800%, 07/31/18 | | | 50 | | | | 50 | |
1.400%, 04/10/18 | | | 200 | | | | 200 | |
Bank of New York Mellon | | | | | | | | |
3.550%, 09/23/21 | | | 100 | | | | 104 | |
3.000%, 02/24/25 | | | 100 | | | | 98 | |
2.500%, 04/15/21 | | | 100 | | | | 100 | |
2.450%, 11/27/20 | | | 100 | | | | 97 | |
2.100%, 08/01/18 | | | 200 | | | | 202 | |
Bank of Nova Scotia | | | | | | | | |
2.800%, 07/21/21 | | | 100 | | | | 101 | |
2.450%, 03/22/21 | | | 50 | | | | 50 | |
| | | | | | | | |
| Description | | Face Amount
(000) | | | Value
(000) | |
| | | | | | | | |
2.050%, 10/30/18 | | $ | 100 | | | $ | 100 | |
1.950%, 01/15/19 | | | 50 | | | | 50 | |
1.650%, 06/14/19 | | | 50 | | | | 49 | |
Barclays | | | | | | | | |
4.375%, 01/12/26 | | | 200 | | | | 204 | |
3.650%, 03/16/25 | | | 200 | | | | 193 | |
2.875%, 06/08/20 | | | 250 | | | | 248 | |
Barrick North America Finance | | | | | | | | |
4.400%, 05/30/21 | | | 37 | | | | 39 | |
BB&T | | | | | | | | |
2.450%, 01/15/20 | | | 100 | | | | 101 | |
2.050%, 05/10/21 | | | 300 | | | | 294 | |
Berkshire Hathaway | | | | | | | | |
3.125%, 03/15/26 | | | 200 | | | | 198 | |
3.000%, 02/11/23 | | | 150 | | | | 152 | |
Berkshire Hathaway Finance | | | | | | | | |
1.700%, 03/15/19 | | | 100 | | | | 100 | |
1.300%, 08/15/19 | | | 1,201 | | | | 1,186 | |
BGEO Group JSC | | | | | | | | |
6.000%, 07/26/23 (A) | | | 350 | | | | 350 | |
BlackRock | | | | | | | | |
5.000%, 12/10/19 | | | 100 | | | | 109 | |
BMCE Bank | | | | | | | | |
6.250%, 11/27/18 | | | 200 | | | | 206 | |
BNP Paribas | | | | | | | | |
4.250%, 10/15/24 | | | 200 | | | | 200 | |
2.375%, 05/21/20 | | | 200 | | | | 199 | |
BOC Aviation | | | | | | | | |
3.875%, 04/27/26 (A) | | | 200 | | | | 193 | |
BPCE | | | | | | | | |
2.500%, 07/15/19 | | | 250 | | | | 251 | |
Canadian Imperial Bank of Commerce | | | | | | | | |
1.600%, 09/06/19 | | | 50 | | | | 50 | |
Capital One | | | | | | | | |
1.650%, 02/05/18 | | | 1,737 | | | | 1,734 | |
Capital One Bank USA | | | | | | | | |
2.150%, 11/21/18 | | | 250 | | | | 250 | |
Capital One Financial | | | | | | | | |
4.200%, 10/29/25 | | | 100 | | | | 100 | |
3.750%, 07/28/26 | | | 100 | | | | 97 | |
3.200%, 02/05/25 | | | 50 | | | | 48 | |
2.450%, 04/24/19 | | | 100 | | | | 101 | |
Charles Schwab | | | | | | | | |
4.450%, 07/22/20 | | | 100 | | | | 107 | |
Chubb | | | | | | | | |
5.750%, 05/15/18 | | | 100 | | | | 106 | |
Chubb INA Holdings | | | | | | | | |
3.350%, 05/15/24 | | | 100 | | | | 102 | |
Citigroup | | | | | | | | |
4.400%, 06/10/25 | | | 200 | | | | 204 | |
4.125%, 07/25/28 | | | 1,261 | | | | 1,245 | |
3.750%, 06/16/24 | | | 100 | | | | 102 | |
3.500%, 05/15/23 | | | 100 | | | | 100 | |
3.400%, 05/01/26 | | | 100 | | | | 97 | |
The accompanying notes are an integral part of the financial statements.
88
| | |
| THE KP FUNDS | | December 31, 2016 |
| | | | | | | | |
| Description | | Face Amount
(000) | | | Value
(000) | |
| | | | | | | | |
3.300%, 04/27/25 | | $ | 100 | | | $ | 98 | |
3.200%, 10/21/26 | | | 818 | | | | 782 | |
2.900%, 12/08/21 | | | 100 | | | | 100 | |
2.700%, 03/30/21 | | | 1,673 | | | | 1,669 | |
2.650%, 10/26/20 | | | 100 | | | | 100 | |
2.500%, 07/29/19 | | | 100 | | | | 101 | |
2.400%, 02/18/20 | | | 100 | | | | 100 | |
2.150%, 07/30/18 | | | 70 | | | | 70 | |
1.800%, 02/05/18 | | | 500 | | | | 500 | |
1.700%, 04/27/18 | | | 100 | | | | 100 | |
Citigroup Global Markets Holdings | | | | | |
24.750%, 03/03/21 (A) (B) (GHS) | | | 1,060 | | | | 284 | |
0.00%, 03/03/21 (A) (B) (GHS) | | | 1,000 | | | | 268 | |
Citizens Financial Group | | | | | | | | |
4.300%, 12/03/25 | | | 100 | | | | 102 | |
2.375%, 07/28/21 | | | 30 | | | | 29 | |
CME Group | | | | | | | | |
3.000%, 03/15/25 | | | 150 | | | | 150 | |
CNA Financial | | | | | | | | |
5.875%, 08/15/20 | | | 100 | | | | 110 | |
Comerica | | | | | | | | |
2.125%, 05/23/19 | | | 50 | | | | 50 | |
Commonwealth Bank of Australia | | | | | | | | |
2.250%, 03/13/19 | | | 250 | | | | 251 | |
Cooperatieve Rabobank UA | | | | | | | | |
3.875%, 02/08/22 | | | 100 | | | | 106 | |
3.750%, 07/21/26 | | | 685 | | | | 671 | |
2.250%, 01/14/20 | | | 250 | | | | 250 | |
1.375%, 08/09/19 | | | 250 | | | | 246 | |
Credit Suisse Group Funding Guernsey | | | | | | | | |
3.450%, 04/16/21 | | | 250 | | | | 252 | |
3.125%, 12/10/20 | | | 250 | | | | 249 | |
Credit Suisse New York | | | | | | | | |
3.625%, 09/09/24 | | | 250 | | | | 252 | |
1.700%, 04/27/18 | | | 250 | | | | 249 | |
Deutsche Bank | | | | | | | | |
3.700%, 05/30/24 | | | 85 | | | | 83 | |
2.950%, 08/20/20 | | | 100 | | | | 98 | |
1.875%, 02/13/18 | | | 250 | | | | 249 | |
Development Bank of Kazakhstan | | | | | | | | |
4.125%, 12/10/22 (A) | | | 470 | | | | 452 | |
Discover Bank | | | | | | | | |
2.000%, 02/21/18 | | | 250 | | | | 250 | |
European Bank for Reconstruction & Development | | | | | | | | |
1.750%, 11/26/19 | | | 150 | | | | 150 | |
1.500%, 03/16/20 | | | 200 | | | | 199 | |
European Investment Bank | | | | | | | | |
3.250%, 01/29/24 | | | 250 | | | | 261 | |
2.250%, 08/15/22 | | | 250 | | | | 249 | |
2.125%, 10/15/21 | | | 300 | | | | 294 | |
1.875%, 03/15/19 | | | 150 | | | | 151 | |
| | | | | | | | |
| Description | | Face Amount
(000) | | | Value
(000) | |
1.750%, 06/17/19 | | $ | 300 | | | $ | 301 | |
1.625%, 12/18/18 | | | 300 | | | | 297 | |
1.375%, 06/15/20 | | | 250 | | | | 243 | |
1.250%, 05/15/18 | | | 550 | | | | 544 | |
1.125%, 08/15/18 | | | 550 | | | | 543 | |
Export Credit Bank of Turkey | | | | | | | | |
5.875%, 04/24/19 (A) | | | 200 | | | | 204 | |
5.375%, 02/08/21 (A) | | | 725 | | | | 709 | |
Fifth Third Bancorp | | | | | | | | |
2.875%, 07/27/20 | | | 250 | | | | 253 | |
Financiera de Desarrollo | | | | | | | | |
4.750%, 02/08/22 (A) | | | 440 | | | | 460 | |
FMS Wertmanagement AoeR | | | | | | | | |
1.750%, 03/17/20 | | | 200 | | | | 200 | |
1.375%, 06/08/21 | | | 200 | | | | 193 | |
FS Investment | | | | | | | | |
4.250%, 01/15/20 | | | 30 | | | | 30 | |
Global Bank | | | | | | | | |
4.500%, 10/20/21 (A) | | | 390 | | | | 380 | |
Goldman Sachs Group | | | | | | | | |
6.150%, 04/01/18 | | | 500 | | | | 526 | |
5.750%, 01/24/22 | | | 300 | | | | 337 | |
4.750%, 10/21/45 | | | 1,315 | | | | 1,388 | |
4.000%, 03/03/24 | | | 200 | | | | 208 | |
3.750%, 05/22/25 | | | 350 | | | | 351 | |
3.625%, 01/22/23 | | | 726 | | | | 742 | |
2.750%, 09/15/20 | | | 75 | | | | 75 | |
2.625%, 04/25/21 | | | 100 | | | | 99 | |
2.600%, 04/23/20 | | | 100 | | | | 100 | |
2.550%, 10/23/19 | | | 200 | | | | 201 | |
2.350%, 11/15/27 | | | 45 | | | | 44 | |
2.300%, 12/13/19 | | | 85 | | | | 85 | |
Hanover Insurance Group | | | | | | | | |
4.500%, 04/15/26 | | | 100 | | | | 100 | |
Hartford Financial Services Group | | | | | | | | |
5.125%, 04/15/22 | | | 100 | | | | 111 | |
HSBC Finance | | | | | | | | |
6.676%, 01/15/21 | | | 100 | | | | 112 | |
HSBC Holdings | | | | | | | | |
4.375%, 11/23/26 | | | 570 | | | | 574 | |
4.250%, 08/18/25 | | | 200 | | | | 202 | |
4.000%, 03/30/22 | | | 100 | | | | 104 | |
3.900%, 05/25/26 | | | 1,197 | | | | 1,205 | |
3.600%, 05/25/23 | | | 250 | | | | 252 | |
3.400%, 03/08/21 | | | 1,794 | | | | 1,824 | |
2.950%, 05/25/21 | | | 200 | | | | 200 | |
2.650%, 01/05/22 | | | 200 | | | | 195 | |
HSBC USA | | | | | | | | |
2.625%, 09/24/18 | | | 150 | | | | 152 | |
2.000%, 08/07/18 | | | 100 | | | | 100 | |
Huntington National Bank | | | | | | | | |
2.000%, 06/30/18 | | | 250 | | | | 250 | |
IDBI Bank | | | | | | | | |
4.125%, 04/23/20 | | | 210 | | | | 211 | |
The accompanying notes are an integral part of the financial statements.
89
| | |
| THE KP FUNDS | | December 31, 2016 |
| | | | | | | | |
| Description | | Face Amount
(000) | | | Value
(000) | |
| | | | | | | | |
Industrial & Commercial Bank of China | | | | | | | | |
2.905%, 11/13/20 | | $ | 250 | | | $ | 250 | |
ING Bank | | | | | | | | |
2.000%, 11/26/18 (A) | | | 1,495 | | | | 1,494 | |
Inter-American Development Bank | | | | | |
2.125%, 11/09/20 | | | 375 | | | | 373 | |
2.000%, 06/02/26 | | | 150 | | | | 141 | |
1.875%, 06/16/20 | | | 450 | | | | 449 | |
1.750%, 04/14/22 | | | 150 | | | | 147 | |
1.000%, 05/13/19 | | | 100 | | | | 99 | |
Intercontinental Exchange | | | | | | | | |
4.000%, 10/15/23 | | | 150 | | | | 157 | |
International Bank for Reconstruction & Development | | | | | | | | |
2.500%, 11/25/24 | | | 250 | | | | 248 | |
2.250%, 06/24/21 | | | 50 | | | | 50 | |
2.125%, 02/13/23 | | | 100 | | | | 99 | |
1.875%, 03/15/19 | | | 400 | | | | 397 | |
1.750%, 04/19/23 | | | 200 | | | | 193 | |
1.625%, 03/09/21 | | | 350 | | | | 342 | |
1.375%, 05/24/21 | | | 400 | | | | 388 | |
1.250%, 07/26/19 | | | 100 | | | | 99 | |
1.000%, 06/15/18 | | | 300 | | | | 299 | |
0.875%, 07/19/18 | | | 250 | | | | 248 | |
International Finance | | | | | | | | |
1.625%, 07/16/20 | | | 100 | | | | 100 | |
1.250%, 07/16/18 | | | 100 | | | | 100 | |
1.125%, 07/20/21 | | | 100 | | | | 95 | |
0.875%, 06/15/18 | | | 300 | | | | 298 | |
Intesa Sanpaolo | | | | | | | | |
5.250%, 01/12/24 | | | 250 | | | | 263 | |
Jefferies Group | | | | | | | | |
6.875%, 04/15/21 | | | 100 | | | | 114 | |
JPMorgan Chase | | | | | | | | |
6.000%, 01/15/18 | | | 300 | | | | 313 | |
4.350%, 08/15/21 | | | 250 | | | | 268 | |
3.625%, 05/13/24 | | | 1,495 | | | | 1,455 | |
3.375%, 05/01/23 | | | 200 | | | | 199 | |
3.300%, 04/01/26 | | | 100 | | | | 98 | |
3.200%, 06/15/26 | | | 100 | | | | 98 | |
3.125%, 01/23/25 | | | 150 | | | | 147 | |
2.950%, 10/01/26 | | | 1,625 | | | | 1,551 | |
2.750%, 06/23/20 | | | 300 | | | | 303 | |
2.700%, 05/18/23 | | | 100 | | | | 98 | |
2.550%, 10/29/20 | | | 530 | | | | 529 | |
2.400%, 06/07/21 | | | 1,280 | | | | 1,268 | |
2.250%, 01/23/20 | | | 1,653 | | | | 1,649 | |
1.800%, 01/25/18 | | | 250 | | | | 250 | |
1.700%, 03/01/18 | | | 250 | | | | 250 | |
JPMorgan Chase Bank | | | | | | | | |
8.375%, 03/17/34 (A) (IDR) | | | 3,000,000 | | | | 224 | |
KeyBank | | | | | | | | |
3.400%, 05/20/26 | | | 250 | | | | 243 | |
KeyCorp | | | | | | | | |
5.100%, 03/24/21 | | | 150 | | | | 164 | |
| | | | | | | | |
| Description | | Face Amount
(000) | | | Value
(000) | |
| | | | | | | | |
KFW | | | | | | | | |
2.500%, 11/20/24 | | $ | 150 | | | $ | 149 | |
2.125%, 01/17/23 | | | 250 | | | | 246 | |
1.875%, 04/01/19 | | | 550 | | | | 550 | |
1.500%, 04/20/20 | | | 600 | | | | 589 | |
1.250%, 09/30/19 | | | 150 | | | | 148 | |
1.000%, 01/26/18 | | | 1,000 | | | | 995 | |
0.875%, 04/19/18 | | | 100 | | | | 100 | |
Landwirtschaftliche Rentenbank | | | | | | | | |
2.375%, 06/10/25 | | | 100 | | | | 98 | |
1.750%, 04/15/19 | | | 100 | | | | 101 | |
1.000%, 04/04/18 | | | 200 | | | | 199 | |
Lazard Group | | | | | | | | |
3.750%, 02/13/25 | | | 50 | | | | 49 | |
Liberty Mutual Group | | | | | | | | |
4.850%, 08/01/44 (A) | | | 238 | | | | 235 | |
Lima Metro Line 2 Finance | | | | | | | | |
5.875%, 07/05/34 (A) | | | 230 | | | | 243 | |
Lincoln National | | | | | | | | |
3.625%, 12/12/26 | | | 100 | | | | 100 | |
Lloyds Banking Group | | | | | | | | |
4.650%, 03/24/26 | | | 250 | | | | 253 | |
4.582%, 12/10/25 | | | 200 | | | | 201 | |
Loews | | | | | | | | |
2.625%, 05/15/23 | | | 100 | | | | 97 | |
Magyar Export-Import Bank | | | | | | | | |
4.000%, 01/30/20 (A) | | | 450 | | | | 461 | |
Marsh & McLennan | | | | | | | | |
2.350%, 09/10/19 | | | 75 | | | | 75 | |
MetLife | | | | | | | | |
3.600%, 04/10/24 | | | 150 | | | | 153 | |
Metropolitan Life Global Funding I | | | | | |
3.450%, 12/18/26 (A) | | | 2,054 | | | | 2,073 | |
1.300%, 04/10/17 (A) | | | 2,266 | | | | 2,267 | |
Mitsubishi UFJ Financial Group | | | | | | | | |
3.850%, 03/01/26 | | | 200 | | | | 205 | |
Moody’s | | | | | | | | |
2.750%, 07/15/19 | | | 100 | | | | 101 | |
Morgan Stanley | | | | | | | | |
4.875%, 11/01/22 | | | 100 | | | | 107 | |
4.000%, 07/23/25 | | | 100 | | | | 102 | |
3.875%, 01/27/26 | | | 200 | | | | 202 | |
3.700%, 10/23/24 | | | 150 | | | | 152 | |
3.125%, 07/27/26 | | | 1,043 | | | | 996 | |
2.800%, 06/16/20 | | | 100 | | | | 101 | |
2.650%, 01/27/20 | | | 100 | | | | 100 | |
2.625%, 11/17/21 | | | 120 | | | | 119 | |
2.500%, 01/24/19 | | | 250 | | | | 253 | |
2.375%, 07/23/19 | | | 550 | | | | 552 | |
1.875%, 01/05/18 | | | 200 | | | | 200 | |
MUFG Americas Holdings | | | | | | | | |
3.000%, 02/10/25 | | | 200 | | | | 192 | |
Nasdaq | | | | | | | | |
5.250%, 01/16/18 | | | 85 | | | | 88 | |
National Australia Bank | | | | | | | | |
2.625%, 07/23/20 | | | 250 | | | | 251 | |
The accompanying notes are an integral part of the financial statements.
90
| | |
| THE KP FUNDS | | December 31, 2016 |
| | | | | | | | |
| Description | | Face Amount
(000) | | | Value
(000) | |
| | | | | | | | |
National Rural Utilities Cooperative Finance | | | | | | | | |
10.375%, 11/01/18 | | $ | 150 | | | $ | 173 | |
2.700%, 02/15/23 | | | 100 | | | | 99 | |
National Savings Bank | | | | | | | | |
8.875%, 09/18/18 (A) | | | 490 | | | | 518 | |
Nomura Holdings | | | | | | | | |
2.750%, 03/19/19 | | | 150 | | | | 151 | |
Nordic Investment Bank | | | | | | | | |
1.125%, 03/19/18 | | | 200 | | | | 200 | |
Oesterreichische Kontrollbank | | | | | | | | |
1.875%, 01/20/21 | | | 150 | | | | 148 | |
1.125%, 05/29/18 | | | 150 | | | | 150 | |
Pelabuhan Indonesia III Persero | | | | | | | | |
4.875%, 10/01/24 (A) | | | 200 | | | | 201 | |
PNC Bank | | | | | | | | |
3.250%, 06/01/25 | | | 250 | | | | 250 | |
2.400%, 10/18/19 | | | 250 | | | | 252 | |
1.800%, 11/05/18 | | | 250 | | | | 250 | |
Pricoa Global Funding I | | | | | | | | |
1.900%, 09/21/18 (A) | | | 736 | | | | 738 | |
Principal Financial Group | | | | | | | | |
3.400%, 05/15/25 | | | 100 | | | | 99 | |
Private Export Funding | | | | | | | | |
3.250%, 06/15/25 | | | 100 | | | | 103 | |
2.250%, 03/15/20 | | | 200 | | | | 203 | |
Prudential Financial | | | | | | | | |
7.375%, 06/15/19 | | | 100 | | | | 113 | |
5.625%, 06/15/43 (B) | | | 100 | | | | 104 | |
5.375%, 05/15/45 (B) | | | 100 | | | | 102 | |
Regions Financial | | | | | | | | |
3.200%, 02/08/21 | | | 50 | | | | 51 | |
Royal Bank of Canada | | | | | | | | |
2.200%, 07/27/18 | | | 150 | | | | 151 | |
2.150%, 03/15/19 | | | 200 | | | | 201 | |
2.000%, 12/10/18 | | | 50 | | | | 50 | |
1.625%, 04/15/19 | | | 150 | | | | 149 | |
1.500%, 07/29/19 | | | 1,253 | | | | 1,237 | |
Royal Bank of Scotland Group | | | | | | | | |
4.800%, 04/05/26 | | | 200 | | | | 200 | |
S&P Global | | | | | | | | |
4.000%, 06/15/25 | | | 100 | | | | 103 | |
Santander Holdings USA | | | | | | | | |
2.700%, 05/24/19 | | | 50 | | | | 50 | |
2.650%, 04/17/20 | | | 100 | | | | 99 | |
Santander UK | | | | | | | | |
2.375%, 03/16/20 | | | 100 | | | | 99 | |
Santander UK Group Holdings | | | | | | | | |
3.125%, 01/08/21 | | | 100 | | | | 100 | |
Standard Chartered Bank | | | | | | | | |
10.750%, 03/03/21 (A) (LKR) | | | 76,000 | | | | 486 | |
7.280%, 06/05/19 (A) (INR) | | | 25,000 | | | | 376 | |
Sumitomo Mitsui Banking | | | | | | | | |
1.950%, 07/23/18 | | | 250 | | | | 250 | |
| | | | | | | | |
| Description | | Face Amount
(000) | | | Value
(000) | |
| | | | | | | | |
Sumitomo Mitsui Financial Group | | | | | | | | |
3.784%, 03/09/26 | | $ | 50 | | | $ | 51 | |
2.934%, 03/09/21 | | | 250 | | | | 252 | |
2.632%, 07/14/26 | | | 100 | | | | 93 | |
SunTrust Banks | | | | | | | | |
2.900%, 03/03/21 | | | 50 | | | | 51 | |
2.500%, 05/01/19 | | | 50 | | | | 50 | |
Svensk Exportkredit | | | | | | | | |
1.875%, 06/17/19 | | | 200 | | | | 200 | |
Svenska Handelsbanken | | | | | | | | |
1.625%, 03/21/18 | | | 250 | | | | 250 | |
Synchrony Financial | | | | | | | | |
4.500%, 07/23/25 | | | 100 | | | | 103 | |
3.000%, 08/15/19 | | | 100 | | | | 101 | |
TD Ameritrade Holding | | | | | | | | |
2.950%, 04/01/22 | | | 200 | | | | 202 | |
Toronto-Dominion Bank | | | | | | | | |
2.500%, 12/14/20 | | | 100 | | | | 100 | |
2.125%, 07/02/19 | | | 150 | | | | 150 | |
1.950%, 04/02/20 (A) | | | 473 | | | | 471 | |
1.800%, 07/13/21 | | | 100 | | | | 97 | |
1.625%, 03/13/18 | | | 150 | | | | 150 | |
Travelers | | | | | | | | |
3.900%, 11/01/20 | | | 100 | | | | 106 | |
UBS | | | | | | | | |
2.350%, 03/26/20 | | | 250 | | | | 249 | |
1.375%, 06/01/17 | | | 1,334 | | | | 1,334 | |
Unum Group | | | | | | | | |
4.000%, 03/15/24 | | | 50 | | | | 50 | |
US Bancorp | | | | | | | | |
2.950%, 07/15/22 | | | 300 | | | | 302 | |
2.375%, 07/22/26 | | | 250 | | | | 231 | |
1.950%, 11/15/18 | | | 100 | | | | 101 | |
Voya Financial | | | | | | | | |
2.900%, 02/15/18 | | | 77 | | | | 78 | |
WEA Finance | | | | | | | | |
4.750%, 09/17/44‡ (A) | | | 715 | | | | 707 | |
Wells Fargo | | | | | | | | |
4.900%, 11/17/45 | | | 449 | | | | 461 | |
4.750%, 12/07/46 | | | 545 | | | | 553 | |
4.125%, 08/15/23 | | | 200 | | | | 207 | |
3.550%, 09/29/25 | | | 100 | | | | 100 | |
3.300%, 09/09/24 | | | 100 | | | | 99 | |
3.000%, 01/22/21 | | | 1,623 | | | | 1,553 | |
2.550%, 12/07/20 | | | 85 | | | | 85 | |
2.100%, 07/26/21 | | | 150 | | | | 146 | |
Wells Fargo Bank | | | | | | | | |
1.750%, 05/24/19 | | | 250 | | | | 249 | |
Westpac Banking | | | | | | | | |
2.850%, 05/13/26 | | | 200 | | | | 192 | |
2.700%, 08/19/26 | | | 100 | | | | 95 | |
2.600%, 11/23/20 | | | 150 | | | | 151 | |
2.250%, 01/17/19 | | | 100 | | | | 100 | |
2.000%, 08/19/21 | | | 2,725 | | | | 2,645 | |
1.600%, 08/19/19 | | | 100 | | | | 99 | |
The accompanying notes are an integral part of the financial statements.
91
| | |
| THE KP FUNDS | | December 31, 2016 |
| | | | | | | | |
| Description | | Face Amount
(000) | | | Value
(000) | |
| | | | | | | | |
XLIT | | | | | | | | |
5.750%, 10/01/21 | | $ | 74 | | | $ | 82 | |
| | | | | | | | |
| | | | | | | 95,086 | |
| | | | | | | | |
Health Care — 2.3% | | | | | | | | |
Abbott Laboratories | | | | | | | | |
4.900%, 11/30/46 | | | 608 | | | | 624 | |
3.750%, 11/30/26 | | | 100 | | | | 99 | |
3.400%, 11/30/23 | | | 50 | | | | 50 | |
2.900%, 11/30/21 | | | 1,586 | | | | 1,581 | |
2.550%, 03/15/22 | | | 150 | | | | 147 | �� |
2.350%, 11/22/19 | | | 70 | | | | 70 | |
AbbVie | | | | | | | | |
4.450%, 05/14/46 | | | 464 | | | | 444 | |
3.200%, 11/06/22 | | | 400 | | | | 386 | |
2.850%, 05/14/23 | | | 50 | | | | 49 | |
2.300%, 05/14/21 | | | 50 | | | | 49 | |
1.800%, 05/14/18 | | | 3,128 | | | | 3,130 | |
Actavis Funding | | | | | | | | |
3.800%, 03/15/25 | | | 190 | | | | 190 | |
3.450%, 03/15/22 | | | 2,890 | | | | 2,933 | |
3.000%, 03/12/20 | | | 55 | | | | 56 | |
2.350%, 03/12/18 | | | 80 | | | | 81 | |
Aetna | | | | | | | | |
4.375%, 06/15/46 | | | 448 | | | | 450 | |
3.200%, 06/15/26 | | | 205 | | | | 203 | |
2.800%, 06/15/23 | | | 25 | | | | 24 | |
2.750%, 11/15/22 | | | 150 | | | | 147 | |
2.400%, 06/15/21 | | | 25 | | | | 25 | |
1.900%, 06/07/19 | | | 35 | | | | 35 | |
1.700%, 06/07/18 | | | 30 | | | | 30 | |
Agilent Technologies | | | | | | | | |
3.050%, 09/22/26 | | | 65 | | | | 62 | |
AmerisourceBergen | | | | | | | | |
3.400%, 05/15/24 | | | 100 | | | | 101 | |
Amgen | | | | | | | | |
5.700%, 02/01/19 | | | 250 | | | | 269 | |
3.625%, 05/22/24 | | | 150 | | | | 152 | |
Anthem | | | | | | | | |
3.300%, 01/15/23 | | | 200 | | | | 200 | |
AstraZeneca | | | | | | | | |
2.375%, 11/16/20 | | | 150 | | | | 150 | |
1.950%, 09/18/19 | | | 100 | | | | 100 | |
Baxalta | | | | | | | | |
3.600%, 06/23/22 | | | 100 | | | | 101 | |
Baxter International | | | | | | | | |
2.600%, 08/15/26 | | | 100 | | | | 92 | |
Becton Dickinson | | | | | | | | |
3.125%, 11/08/21 | | | 200 | | | | 205 | |
Biogen | | | | | | | | |
3.625%, 09/15/22 | | | 100 | | | | 103 | |
Boston Scientific | | | | | | | | |
3.375%, 05/15/22 | | | 100 | | | | 102 | |
2.850%, 05/15/20 | | | 100 | | | | 101 | |
Bristol-Myers Squibb | | | | | | | | |
2.000%, 08/01/22 | | | 100 | | | | 97 | |
| | | | | | | | |
| Description | | Face Amount
(000) | | | Value
(000) | |
| | | | | | | | |
Cardinal Health | | | | | | | | |
3.200%, 03/15/23 | | $ | 100 | | | $ | 101 | |
Celgene | | | | | | | | |
3.875%, 08/15/25 | | | 100 | | | | 102 | |
2.250%, 05/15/19 | | | 100 | | | | 100 | |
2.125%, 08/15/18 | | | 100 | | | | 100 | |
Cigna | | | | | | | | |
4.000%, 02/15/22 | | | 100 | | | | 104 | |
CR Bard | | | | | | | | |
3.000%, 05/15/26 | | | 50 | | | | 48 | |
Danaher | | | | | | | | |
3.350%, 09/15/25 | | | 30 | | | | 31 | |
1.650%, 09/15/18 | | | 120 | | | | 120 | |
Eli Lilly | | | | | | | | |
1.250%, 03/01/18 | | | 100 | | | | 100 | |
Express Scripts Holding | | | | | | | | |
4.750%, 11/15/21 | | | 100 | | | | 107 | |
3.900%, 02/15/22 | | | 150 | | | | 156 | |
Gilead Sciences | | | | | | | | |
3.500%, 02/01/25 | | | 100 | | | | 101 | |
2.950%, 03/01/27 | | | 2,506 | | | | 2,398 | |
2.550%, 09/01/20 | | | 200 | | | | 202 | |
2.500%, 09/01/23 | | | 35 | | | | 34 | |
2.350%, 02/01/20 | | | 20 | | | | 20 | |
1.950%, 03/01/22 | | | 15 | | | | 15 | |
1.850%, 09/04/18 | | | 20 | | | | 20 | |
GlaxoSmithKline Capital | | | | | | | | |
2.850%, 05/08/22 | | | 100 | | | | 101 | |
2.800%, 03/18/23 | | | 125 | | | | 125 | |
Howard Hughes Medical Institute | | | | | | | | |
3.500%, 09/01/23 | | | 150 | | | | 158 | |
Humana | | | | | | | | |
3.850%, 10/01/24 | | | 100 | | | | 102 | |
Johnson & Johnson | | | | | | | | |
2.450%, 12/05/21 | | | 300 | | | | 293 | |
Laboratory Corp of America Holdings | | | | | | | | |
2.625%, 02/01/20 | | | 100 | | | | 100 | |
McKesson | | | | | | | | |
2.284%, 03/15/19 | | | 100 | | | | 100 | |
Medtronic | | | | | | | | |
4.625%, 03/15/45 | | | 491 | | | | 531 | |
3.500%, 03/15/25 | | | 100 | | | | 103 | |
2.750%, 04/01/23 | | | 100 | | | | 99 | |
2.500%, 03/15/20 | | | 150 | | | | 152 | |
1.375%, 04/01/18 | | | 75 | | | | 75 | |
Merck | | | | | | | | |
2.750%, 02/10/25 | | | 200 | | | | 196 | |
1.850%, 02/10/20 | | | 150 | | | | 150 | |
Millennium Health LLC | | | | | | | | |
0.000%, 04/16/21 (B) (C) (G) | | | 7 | | | | 1 | |
Mylan | | | | | | | | |
3.950%, 06/15/26 | | | 200 | | | | 187 | |
3.750%, 12/15/20 (A) | | | 100 | | | | 101 | |
The accompanying notes are an integral part of the financial statements.
92
| | |
| THE KP FUNDS | | December 31, 2016 |
| | | | | | | | |
| Description | | Face Amount
(000) | | | Value
(000) | |
| | | | | | | | |
New York and Presbyterian Hospital | | | | | | | | |
4.763%, 08/01/16 | | $ | 545 | | | $ | 510 | |
Novartis Capital | | | | | | | | |
3.400%, 05/06/24 | | | 100 | | | | 103 | |
3.000%, 11/20/25 | | | 50 | | | | 50 | |
Novartis Securities Investment | | | | | | | | |
5.125%, 02/10/19 | | | 100 | | | | 107 | |
Perrigo | | | | | | | | |
4.000%, 11/15/23 | | | 200 | | | | 198 | |
Pfizer | | | | | | | | |
5.200%, 08/12/20 | | | 100 | | | | 111 | |
4.125%, 12/15/46 | | | 1,245 | | | | 1,266 | |
3.000%, 06/15/23 | | | 100 | | | | 102 | |
1.500%, 06/15/18 | | | 100 | | | | 100 | |
Quest Diagnostics | | | | | | | | |
2.500%, 03/30/20 | | | 150 | | | | 150 | |
Sanofi | | | | | | | | |
1.250%, 04/10/18 | | | 125 | | | | 125 | |
Shire Acquisitions Investments Ireland DAC | | | | | | | | |
3.200%, 09/23/26 | | | 60 | | | | 56 | |
2.875%, 09/23/23 | | | 1,063 | | | | 1,008 | |
2.400%, 09/23/21 | | | 100 | | | | 97 | |
1.900%, 09/23/19 | | | 100 | | | | 99 | |
St. Jude Medical | | | | | | | | |
2.800%, 09/15/20 | | | 150 | | | | 151 | |
Stryker | | | | | | | | |
3.500%, 03/15/26 | | | 25 | | | | 25 | |
3.375%, 11/01/25 | | | 50 | | | | 50 | |
2.000%, 03/08/19 | | | 30 | | | | 30 | |
Teva Pharmaceutical Finance | | | | | | | | |
2.950%, 12/18/22 | | | 150 | | | | 145 | |
Teva Pharmaceutical Finance Netherlands III BV | | | | | | | | |
2.800%, 07/21/23 | | | 65 | | | | 61 | |
2.200%, 07/21/21 | | | 250 | | | | 239 | |
1.700%, 07/19/19 | | | 20 | | | | 20 | |
1.400%, 07/20/18 | | | 50 | | | | 50 | |
Thermo Fisher Scientific | | | | | | | | |
3.600%, 08/15/21 | | | 100 | | | | 104 | |
2.950%, 09/19/26 | | | 30 | | | | 28 | |
2.400%, 02/01/19 | | | 150 | | | | 151 | |
UnitedHealth Group | | | | | | | | |
3.750%, 07/15/25 | | | 50 | | | | 52 | |
3.350%, 07/15/22 | | | 100 | | | | 103 | |
2.875%, 03/15/22 | | | 100 | | | | 101 | |
2.700%, 07/15/20 | | | 130 | | | | 132 | |
2.300%, 12/15/19 | | | 50 | | | | 51 | |
1.900%, 07/16/18 | | | 60 | | | | 60 | |
Zimmer Biomet Holdings | | | | | | | | |
3.150%, 04/01/22 | | | 200 | | | | 199 | |
Zoetis | | | | | | | | |
3.250%, 02/01/23 | | | 50 | | | | 50 | |
| | | | | | | | |
| | | | | | | 24,955 | |
| | | | | | | | |
| | | | | | | | |
| Description | | Face Amount
(000) | | | Value
(000) | |
| | | | | | | | |
Industrials — 1.7% | | | | | | | | |
3M | | | | | | | | |
1.625%, 06/15/19 | | $ | 100 | | | $ | 100 | |
ABB Finance USA | | | | | | | | |
2.875%, 05/08/22 | | | 150 | | | | 152 | |
AerCap Ireland Capital | | | | | | | | |
4.625%, 10/30/20 | | | 225 | | | | 234 | |
4.500%, 05/15/21 | | | 496 | | | | 514 | |
3.750%, 05/15/19 | | | 175 | | | | 178 | |
Air Lease | | | | | | | | |
3.375%, 01/15/19 | | | 150 | | | | 153 | |
2.125%, 01/15/20 | | | 50 | | | | 49 | |
American Airlines Pass-Through Trust | | | | | | | | |
4.950%, 01/15/23 | | | 160 | | | | 170 | |
Boeing | | | | | | | | |
2.350%, 10/30/21 | | | 150 | | | | 151 | |
Burlington Northern Santa Fe | | | | | | | | |
3.750%, 04/01/24 | | | 200 | | | | 210 | |
3.050%, 03/15/22 | | | 100 | | | | 103 | |
Canadian National Railway | | | | | | | | |
5.550%, 03/01/19 | | | 100 | | | | 108 | |
Canadian Pacific Railway | | | | | | | | |
2.900%, 02/01/25 | | | 100 | | | | 98 | |
Caterpillar | | | | | | | | |
3.900%, 05/27/21 | | | 50 | | | | 53 | |
3.400%, 05/15/24 | | | 100 | | | | 103 | |
Caterpillar Financial Services | | | | | | | | |
2.450%, 09/06/18 | | | 150 | | | | 152 | |
1.350%, 05/18/19 | | | 200 | | | | 197 | |
CSX | | | | | | | | |
3.800%, 11/01/46 | | | 1,004 | | | | 931 | |
Deere | | | | | | | | |
2.600%, 06/08/22 | | | 150 | | | | 149 | |
Dover | | | | | | | | |
4.300%, 03/01/21 | | | 100 | | | | 107 | |
DP World | | | | | | | | |
6.850%, 07/02/37 (A) | | | 510 | | | | 544 | |
Eaton | | | | | | | | |
2.750%, 11/02/22 | | | 200 | | | | 198 | |
Emerson Electric | | | | | | | | |
2.625%, 02/15/23 | | | 100 | | | | 99 | |
FedEx | | | | | | | | |
3.200%, 02/01/25 | | | 200 | | | | 200 | |
Fortive | | | | | | | | |
3.150%, 06/15/26 (A) | | | 150 | | | | 148 | |
GATX | | | | | | | | |
2.500%, 07/30/19 | | | 150 | | | | 150 | |
GE Capital International Funding Unlimited Co | | | | | | | | |
4.418%, 11/15/35 | | | 1,267 | | | | 1,328 | |
2.342%, 11/15/20 | | | 250 | | | | 250 | |
General Dynamics | | | | | | | | |
2.250%, 11/15/22 | | | 100 | | | | 99 | |
The accompanying notes are an integral part of the financial statements.
93
| | |
| THE KP FUNDS | | December 31, 2016 |
| | | | | | | | |
| Description | | Face Amount
(000) | | | Value
(000) | |
| | | | | | | | |
General Electric | | | | | | | | |
4.650%, 10/17/21 | | $ | 150 | | | $ | 164 | |
3.450%, 05/15/24 | | | 100 | | | | 103 | |
Georgian Oil and Gas JSC | | | | | | | | |
6.750%, 04/26/21 (A) | | | 200 | | | | 208 | |
Georgian Railway | | | | | | | | |
7.750%, 07/11/22 (A) | | | 900 | | | | 958 | |
Honeywell International | | | | | | | | |
4.250%, 03/01/21 | | | 125 | | | | 135 | |
Illinois Tool Works | | | | | | | | |
1.950%, 03/01/19 | | | 100 | | | | 101 | |
Ingersoll-Rand Global Holding | | | | | | | | |
4.250%, 06/15/23 | | | 100 | | | | 106 | |
John Deere Capital | | | | | | | | |
3.350%, 06/12/24 | | | 100 | | | | 102 | |
2.800%, 03/04/21 | | | 150 | | | | 151 | |
1.350%, 01/16/18 | | | 100 | | | | 100 | |
Johnson Controls International | | | | | | | | |
3.625%, 07/02/24 (C) | | | 43 | | | | 44 | |
Kazakhstan Temir Zholy Finance | | | | | | | | |
6.375%, 10/06/20 (A) | | | 730 | | | | 782 | |
Koninklijke Philips | | | | | | | | |
5.750%, 03/11/18 | | | 100 | | | | 105 | |
L3 Technologies | | | | | | | | |
5.200%, 10/15/19 | | | 125 | | | | 134 | |
Lockheed Martin | | | | | | | | |
2.900%, 03/01/25 | | | 100 | | | | 98 | |
2.500%, 11/23/20 | | | 150 | | | | 151 | |
Masco | | | | | | | | |
4.375%, 04/01/26 | | | 15 | | | | 15 | |
Mexico City Airport Trust | | | | | | | | |
4.250%, 10/31/26 (A) | | | 200 | | | | 196 | |
Norfolk Southern | | | | | | | | |
3.250%, 12/01/21 | | | 100 | | | | 103 | |
2.900%, 06/15/26 | | | 35 | | | | 33 | |
Northrop Grumman | | | | | | | | |
3.500%, 03/15/21 | | | 100 | | | | 104 | |
3.250%, 08/01/23 | | | 50 | | | | 51 | |
Owens Corning | | | | | | | | |
4.200%, 12/01/24 | | | 100 | | | | 102 | |
PACCAR Financial | | | | | | | | |
1.300%, 05/10/19 | | | 20 | | | | 20 | |
Parker-Hannifin | | | | | | | | |
3.300%, 11/21/24 | | | 150 | | | | 152 | |
Pentair Finance | | | | | | | | |
3.625%, 09/15/20 | | | 100 | | | | 102 | |
Pitney Bowes | | | | | | | | |
4.625%, 03/15/24 | | | 100 | | | | 98 | |
Precision Castparts | | | | | | | | |
2.500%, 01/15/23 | | | 150 | | | | 148 | |
Raytheon | | | | | | | | |
2.500%, 12/15/22 | | | 150 | | | | 149 | |
Red de Carreteras de Occidente | | | | | | | | |
9.000%, 06/10/28 (A) (MXN) | | | 6,100 | | | | 270 | |
| | | | | | | | |
| Description | | Face Amount
(000) | | | Value
(000) | |
| | | | | | | | |
Republic Services | | | | | | | | |
3.550%, 06/01/22 | | $ | 150 | | | $ | 156 | |
Roper Technologies | | | | | | | | |
2.800%, 12/15/21 | | | 308 | | | | 308 | |
2.050%, 10/01/18 | | | 100 | | | | 100 | |
Ryder System | | | | | | | | |
2.550%, 06/01/19 | | | 95 | | | | 96 | |
Southwest Airlines | | | | | | | | |
2.750%, 11/06/19 | | | 50 | | | | 50 | |
Stanley Black & Decker | | | | | | | | |
2.900%, 11/01/22 | | | 100 | | | | 100 | |
TTX | | | | | | | | |
2.250%, 02/01/19 (A) | | | 922 | | | | 921 | |
Union Pacific | | | | | | | | |
3.646%, 02/15/24 | | | 100 | | | | 104 | |
3.250%, 08/15/25 | | | 100 | | | | 102 | |
United Airlines 2014-2 Class A Pass Through Trust | | | | | | | | |
3.750%, 09/03/26 | | | 94 | | | | 95 | |
United Parcel Service | | | | | | | | |
5.125%, 04/01/19 | | | 100 | | | | 107 | |
3.125%, 01/15/21 | | | 45 | | | | 47 | |
United Technologies | | | | | | | | |
3.100%, 06/01/22 | | | 100 | | | | 103 | |
2.650%, 11/01/26 | | | 130 | | | | 125 | |
1.950%, 11/01/21 | | | 50 | | | | 49 | |
1.778%, 05/04/18 (C) | | | 3,974 | | | | 3,975 | |
1.500%, 11/01/19 | | | 50 | | | | 49 | |
Verisk Analytics | | | | | | | | |
4.000%, 06/15/25 | | | 50 | | | | 51 | |
Waste Management | | | | | | | | |
3.500%, 05/15/24 | | | 100 | | | | 103 | |
| | | | | | | | |
| | | | | | | 18,554 | |
| | | | | | | | |
Information Technology — 1.2% | | | | | | | | |
Activision Blizzard | | | | | | | | |
3.400%, 09/15/26 (A) | | | 50 | | | | 47 | |
Alibaba Group Holding | | | | | | | | |
2.500%, 11/28/19 | | | 250 | | | | 251 | |
Alphabet | | | | | | | | |
3.375%, 02/25/24 | | | 100 | | | | 104 | |
Apple | | | | | | | | |
3.850%, 08/04/46 | | | 1,584 | | | | 1,518 | |
3.450%, 05/06/24 | | | 100 | | | | 103 | |
3.250%, 02/23/26 | | | 135 | | | | 135 | |
2.700%, 05/13/22 | | | 200 | | | | 201 | |
2.450%, 08/04/26 | | | 50 | | | | 47 | |
2.400%, 05/03/23 | | | 200 | | | | 195 | |
2.250%, 02/23/21 | | | 50 | | | | 50 | |
2.100%, 05/06/19 | | | 300 | | | | 303 | |
1.700%, 02/22/19 | | | 20 | | | | 20 | |
1.550%, 08/04/21 | | | 50 | | | | 48 | |
1.000%, 05/03/18 | | | 100 | | | | 100 | |
Applied Materials | | | | | | | | |
2.625%, 10/01/20 | | | 50 | | | | 50 | |
The accompanying notes are an integral part of the financial statements.
94
| | |
| THE KP FUNDS | | December 31, 2016 |
| | | | | | | | |
| Description | | Face Amount
(000) | | | Value
(000) | |
| | | | | | | | |
Arrow Electronics | | | | | | | | |
3.500%, 04/01/22 | | $ | 100 | | | $ | 99 | |
Automatic Data Processing | | | | | | | | |
2.250%, 09/15/20 | | | 50 | | | | 50 | |
Baidu | | | | | | | | |
4.125%, 06/30/25 | | | 310 | | | | 313 | |
3.250%, 08/06/18 | | | 200 | | | | 203 | |
Cisco Systems | | | | | | | | |
4.950%, 02/15/19 | | | 100 | | | | 107 | |
4.450%, 01/15/20 | | | 200 | | | | 214 | |
3.625%, 03/04/24 | | | 100 | | | | 104 | |
3.500%, 06/15/25 | | | 50 | | | | 52 | |
2.950%, 02/28/26 | | | 50 | | | | 50 | |
2.500%, 09/20/26 | | | 100 | | | | 95 | |
1.850%, 09/20/21 | | | 100 | | | | 98 | |
Corning | | | | | | | | |
1.500%, 05/08/18 | | | 100 | | | | 100 | |
Diamond 1 Finance | | | | | | | | |
8.350%, 07/15/46 (A) | | | 304 | | | | 374 | |
8.100%, 07/15/36 (A) | | | 309 | | | | 368 | |
6.020%, 06/15/26 (A) | | | 60 | | | | 65 | |
5.450%, 06/15/23 (A) | | | 85 | | | | 90 | |
4.420%, 06/15/21 (A) | | | 100 | | | | 103 | |
3.480%, 06/01/19 (A) | | | 265 | | | | 271 | |
eBay | | | | | | | | |
2.875%, 08/01/21 | | | 150 | | | | 150 | |
Fidelity National Information Services | | | | | | | | |
5.000%, 10/15/25 | | | 100 | | | | 109 | |
3.500%, 04/15/23 | | | 150 | | | | 152 | |
Fiserv | | | | | | | | |
2.700%, 06/01/20 | | | 100 | | | | 100 | |
Harris | | | | | | | | |
2.700%, 04/27/20 | | | 35 | | | | 35 | |
Hewlett Packard Enterprise | | | | | | | | |
4.900%, 10/15/25 | | | 100 | | | | 103 | |
3.600%, 10/15/20 | | | 150 | | | | 152 | |
2.850%, 10/05/18 | | | 100 | | | | 101 | |
HP | | | | | | | | |
4.650%, 12/09/21 | | | 100 | | | | 107 | |
Intel | | | | | | | | |
3.700%, 07/29/25 | | | 25 | | | | 26 | |
3.300%, 10/01/21 | | | 100 | | | | 104 | |
2.700%, 12/15/22 | | | 250 | | | | 251 | |
2.450%, 07/29/20 | | | 60 | | | | 61 | |
International Business Machines | | | | | | | | |
3.450%, 02/19/26 | | | 50 | | | | 51 | |
2.875%, 11/09/22 | | | 150 | | | | 151 | |
2.250%, 02/19/21 | | | 50 | | | | 50 | |
1.875%, 08/01/22 | | | 150 | | | | 144 | |
1.125%, 02/06/18 | | | 100 | | | | 100 | |
Juniper Networks | | | | | | | | |
4.500%, 03/15/24 | | | 50 | | | | 51 | |
Keysight Technologies | | | | | | | | |
3.300%, 10/30/19 | | | 100 | | | | 102 | |
| | | | | | | | |
| Description | | Face Amount
(000) | | | Value
(000) | |
| | | | | | | | |
KLA-Tencor | | | | | | | | |
3.375%, 11/01/19 | | $ | 150 | | | $ | 154 | |
Lam Research | | | | | | | | |
2.800%, 06/15/21 | | | 50 | | | | 50 | |
Mastercard | | | | | | | | |
2.950%, 11/21/26 | | | 50 | | | | 49 | |
Microsoft | | | | | | | | |
4.000%, 02/08/21 | | | 150 | | | | 161 | |
3.625%, 12/15/23 | | | 100 | | | | 105 | |
3.125%, 11/03/25 | | | 200 | | | | 202 | |
2.400%, 08/08/26 | | | 100 | | | | 95 | |
2.375%, 02/12/22 | | | 200 | | | | 199 | |
1.625%, 12/06/18 | | | 150 | | | | 151 | |
Motorola Solutions | | | | | | | | |
3.500%, 09/01/21 | | | 100 | | | | 101 | |
NetApp | | | | | | | | |
3.375%, 06/15/21 | | | 50 | | | | 51 | |
NVIDIA | | | | | | | | |
2.200%, 09/16/21 | | | 250 | | | | 244 | |
Oracle | | | | | | | | |
4.000%, 07/15/46 | | | 536 | | | | 513 | |
3.850%, 07/15/36 | | | 922 | | | | 900 | |
2.950%, 05/15/25 | | | 100 | | | | 98 | |
2.650%, 07/15/26 | | | 300 | | | | 285 | |
2.500%, 05/15/22 | | | 150 | | | | 149 | |
2.400%, 09/15/23 | | | 50 | | | | 48 | |
2.375%, 01/15/19 | | | 150 | | | | 152 | |
2.250%, 10/08/19 | | | 200 | | | | 202 | |
1.900%, 09/15/21 | | | 90 | | | | 88 | |
QUALCOMM | | | | | | | | |
3.000%, 05/20/22 | | | 100 | | | | 101 | |
1.400%, 05/18/18 | | | 100 | | | | 100 | |
Seagate HDD Cayman | | | | | | | | |
4.750%, 01/01/25 | | | 100 | | | | 95 | |
Telefonaktiebolaget LM Ericsson | | | | | | | | |
4.125%, 05/15/22 | | | 50 | | | | 50 | |
Texas Instruments | | | | | | | | |
1.000%, 05/01/18 | | | 100 | | | | 100 | |
Total System Services | | | | | | | | |
4.800%, 04/01/26 | | | 100 | | | | 108 | |
Tyco Electronics Group | | | | | | | | |
2.350%, 08/01/19 | | | 50 | | | | 50 | |
Visa | | | | | | | | |
3.150%, 12/14/25 | | | 200 | | | | 201 | |
2.800%, 12/14/22 | | | 100 | | | | 101 | |
2.200%, 12/14/20 | | | 100 | | | | 100 | |
Xerox | | | | | | | | |
4.500%, 05/15/21 | | | 150 | | | | 156 | |
Xilinx | | | | | | | | |
2.125%, 03/15/19 | | | 50 | | | | 50 | |
| | | | | | | | |
| | | | | | | 13,237 | |
| | | | | | | | |
Materials — 0.7% | | | | | | | | |
Air Products & Chemicals | | | | | | | | |
3.350%, 07/31/24 | | | 100 | | | | 103 | |
The accompanying notes are an integral part of the financial statements.
95
| | |
| THE KP FUNDS | | December 31, 2016 |
| | | | | | | | |
| Description | | Face Amount
(000) | | | Value
(000) | |
| | | | | | | | |
Airgas | | | | | | | | |
3.650%, 07/15/24 | | $ | 100 | | | $ | 104 | |
Barrick | | | | | | | | |
4.100%, 05/01/23 | | | 32 | | | | 33 | |
Barrick PD Australia Finance Pty | | | | | | | | |
5.950%, 10/15/39 | | | 396 | | | | 419 | |
BHP Billiton Finance USA | | | | | | | | |
6.500%, 04/01/19 | | | 125 | | | | 137 | |
Celanese US Holdings | | | | | | | | |
5.875%, 06/15/21 | | | 20 | | | | 22 | |
4.625%, 11/15/22 | | | 20 | | | | 21 | |
Dow Chemical | | | | | | | | |
8.550%, 05/15/19 | | | 225 | | | | 258 | |
DuPont (E.I.) De Nemours | | | | | | | | |
4.625%, 01/15/20 | | | 100 | | | | 107 | |
2.800%, 02/15/23 | | | 100 | | | | 98 | |
Eastman Chemical | | | | | | | | |
3.600%, 08/15/22 | | | 150 | | | | 154 | |
Ecolab | | | | | | | | |
3.250%, 01/14/23 | | | 100 | | | | 102 | |
Goldcorp | | | | | | | | |
3.700%, 03/15/23 | | | 50 | | | | 49 | |
International Paper | | | | | | | | |
7.950%, 06/15/18 | | | 74 | | | | 80 | |
LyondellBasell Industries | | | | | | | | |
5.000%, 04/15/19 | | | 200 | | | | 211 | |
4.625%, 02/26/55 | | | 871 | | | | 810 | |
Mexichem | | | | | | | | |
5.875%, 09/17/44 (A) | | | 490 | | | | 437 | |
Monsanto | | | | | | | | |
2.125%, 07/15/19 | | | 100 | | | | 100 | |
Nacional del Cobre de Chile | | | | | | | | |
4.875%, 11/04/44 (A) | | | 152 | | | | 149 | |
3.875%, 11/03/21 (A) | | | 1,274 | | | | 1,300 | |
Newmont Mining | | | | | | | | |
3.500%, 03/15/22 | | | 100 | | | | 102 | |
Packaging Corp of America | | | | | | | | |
3.650%, 09/15/24 | | | 100 | | | | 100 | |
Potash Corp of Saskatchewan | | | | | | | | |
3.625%, 03/15/24 | | | 100 | | | | 99 | |
PPG Industries | | | | | | | | |
2.300%, 11/15/19 | | | 100 | | | | 100 | |
Praxair | | | | | | | | |
3.000%, 09/01/21 | | | 150 | | | | 153 | |
Rio Tinto Finance USA | | | | | | | | |
3.750%, 06/15/25 | | | 200 | | | | 206 | |
Sherwin-Williams | | | | | | | | |
3.450%, 08/01/25 | | | 100 | | | | 99 | |
Southern Copper | | | | | | | | |
3.875%, 04/23/25 | | | 30 | | | | 30 | |
Vale Overseas | | | | | | | | |
6.875%, 11/21/36 | | | 770 | | | | 758 | |
4.375%, 01/11/22 | | | 250 | | | | 246 | |
| | | | | | | | |
| Description | | Face Amount
(000) | | | Value
(000) | |
| | | | | | | | |
Vulcan Materials | | | | | | | | |
7.500%, 06/15/21 | | $ | 50 | | | $ | 59 | |
Westlake Chemical | | | | | | | | |
5.000%, 08/15/46 (A) | | | 570 | | | | 563 | |
3.600%, 08/15/26 (A) | | | 100 | | | | 96 | |
WestRock RKT | | | | | | | | |
4.450%, 03/01/19 | | | 100 | | | | 104 | |
| | | | | | | | |
| | | | | | | 7,409 | |
| | | | | | | | |
Real Estate — 0.7% | | | | | | | | |
Alexandria Real Estate Equities | | | | | | | | |
2.750%, 01/15/20‡ | | | 50 | | | | 50 | |
American Tower | | | | | | | | |
4.700%, 03/15/22‡ | | | 150 | | | | 160 | |
3.400%, 02/15/19‡ | | | 100 | | | | 102 | |
2.250%, 01/15/22‡ | | | 50 | | | | 48 | |
AvalonBay Communities | | | | | | | | |
3.500%, 11/15/24‡ | | | 100 | | | | 101 | |
Boston Properties | | | | | | | | |
3.850%, 02/01/23 | | | 100 | | | | 103 | |
3.700%, 11/15/18‡ | | | 100 | | | | 103 | |
2.750%, 10/01/26‡ | | | 2,319 | | | | 2,120 | |
Brixmor Operating Partnership | | | | | | | | |
3.875%, 08/15/22‡ | | | 30 | | | | 31 | |
3.250%, 09/15/23‡ | | | 100 | | | | 97 | |
Camden Property Trust | | | | | | | | |
3.500%, 09/15/24‡ | | | 100 | | | | 99 | |
CBL & Associates | | | | | | | | |
5.250%, 12/01/23‡ | | | 150 | | | | 148 | |
Crown Castle International | | | | | | | | |
5.250%, 01/15/23‡ | | | 100 | | | | 108 | |
3.700%, 06/15/26‡ | | | 35 | | | | 34 | |
2.250%, 09/01/21‡ | | | 55 | | | | 53 | |
DDR | | | | | | | | |
3.500%, 01/15/21‡ | | | 100 | | | | 102 | |
Digital Realty Trust | | | | | | | | |
3.625%, 10/01/22‡ | | | 100 | | | | 101 | |
Duke Realty | | | | | | | | |
3.750%, 12/01/24‡ | | | 100 | | | | 101 | |
EPR Properties | | | | | | | | |
4.750%, 12/15/26‡ | | | 50 | | | | 50 | |
ERP Operating | | | | | | | | |
4.625%, 12/15/21 | | | 120 | | | | 130 | |
Essex Portfolio | | | | | | | | |
3.375%, 04/15/26‡ | | | 100 | | | | 97 | |
HCP | | | | | | | | |
5.375%, 02/01/21‡ | | | 200 | | | | 218 | |
Hospitality Properties Trust | | | | | | | | |
5.250%, 02/15/26‡ | | | 100 | | | | 101 | |
5.000%, 08/15/22‡ | | | 100 | | | | 106 | |
Host Hotels & Resorts | | | | | | | | |
3.750%, 10/15/23‡ | | | 100 | | | | 98 | |
Kimco Realty | | | | | | | | |
4.250%, 04/01/45‡ | | | 350 | | | | 336 | |
3.200%, 05/01/21‡ | | | 50 | | | | 51 | |
The accompanying notes are an integral part of the financial statements.
96
| | |
| THE KP FUNDS | | December 31, 2016 |
| | | | | | | | |
| Description | | Face Amount
(000) | | | Value
(000) | |
| | | | | | | | |
Liberty Property | | | | | | | | |
4.125%, 06/15/22‡ | | $ | 100 | | | $ | 104 | |
National Retail Properties | | | | | | | | |
4.000%, 11/15/25‡ | | | 35 | | | | 36 | |
3.600%, 12/15/26‡ | | | 100 | | | | 98 | |
Omega Healthcare Investors | | | | | | | | |
4.375%, 08/01/23‡ | | | 50 | | | | 50 | |
Realty Income | | | | | | | | |
3.250%, 10/15/22‡ | | | 100 | | | | 101 | |
Senior Housing Properties Trust | | | | | | | | |
3.250%, 05/01/19‡ | | | 150 | | | | 150 | |
Simon Property Group | | | | | | | | |
3.375%, 10/01/24‡ | | | 125 | | | | 126 | |
3.300%, 01/15/26‡ | | | 100 | | | | 100 | |
2.200%, 02/01/19‡ | | | 150 | | | | 151 | |
UDR | | | | | | | | |
4.625%, 01/10/22‡ | | | 719 | | | | 770 | |
4.000%, 10/01/25‡ | | | 50 | | | | 51 | |
Ventas Realty | | | | | | | | |
4.250%, 03/01/22‡ | | | 100 | | | | 106 | |
3.750%, 05/01/24‡ | | | 50 | | | | 51 | |
2.700%, 04/01/20‡ | | | 100 | | | | 100 | |
VEREIT Operating Partnership | | | | | | | | |
4.875%, 06/01/26‡ | | | 20 | | | | 20 | |
4.600%, 02/06/24‡ | | | 15 | | | | 15 | |
4.125%, 06/01/21‡ | | | 10 | | | | 10 | |
3.000%, 02/06/19‡ | | | 25 | | | | 25 | |
Vornado Realty | | | | | | | | |
2.500%, 06/30/19‡ | | | 100 | | | | 100 | |
Weingarten Realty Investors | | | | | | | | |
3.250%, 08/15/26‡ | | | 50 | | | | 47 | |
Welltower | | | | | | | | |
5.250%, 01/15/22‡ | | | 100 | | | | 110 | |
Weyerhaeuser | | | | | | | | |
4.625%, 09/15/23‡ | | | 100 | | | | 107 | |
WP Carey | | | | | | | | |
4.600%, 04/01/24‡ | | | 50 | | | | 51 | |
| | | | | | | | |
| | | | | | | 7,327 | |
| | | | | | | | |
Telecommunication Services — 1.3% | |
America Movil | | | | | | | | |
5.000%, 03/30/20 | | | 200 | | | | 214 | |
AT&T | | | | | | | | |
5.150%, 03/15/42 | | | 191 | | | | 190 | |
5.000%, 03/01/21 | | | 200 | | | | 215 | |
4.500%, 03/09/48 | | | 404 | | | | 363 | |
4.300%, 12/15/42 | | | 429 | | | | 384 | |
4.125%, 02/17/26 | | | 200 | | | | 203 | |
3.600%, 02/17/23 | | | 3,653 | | | | 3,684 | |
3.400%, 05/15/25 | | | 150 | | | | 145 | |
3.000%, 06/30/22 | | | 195 | | | | 191 | |
2.625%, 12/01/22 | | | 125 | | | | 120 | |
2.450%, 06/30/20 | | | 250 | | | | 248 | |
2.300%, 03/11/19 | | | 230 | | | | 231 | |
British Telecommunications | | | | | | | | |
2.350%, 02/14/19 | | | 140 | | | | 141 | |
| | | | | | | | |
| Description | | Face Amount
(000) | | | Value
(000) | |
| | | | | | | | |
Deutsche Telekom International Finance | | | | | | | | |
6.750%, 08/20/18 | | $ | 100 | | | $ | 108 | |
Digicel | | | | | | | | |
6.000%, 04/15/21 (A) | | | 280 | | | | 253 | |
Orange | | | | | | | | |
4.125%, 09/14/21 | | | 100 | | | | 106 | |
RELX Capital | | | | | | | | |
3.125%, 10/15/22 | | | 100 | | | | 99 | |
Rogers Communications | | | | | | | | |
6.800%, 08/15/18 | | | 50 | | | | 54 | |
2.900%, 11/15/26 | | | 50 | | | | 47 | |
Telefonica Emisiones | | | | | | | | |
3.192%, 04/27/18 | | | 250 | | | | 254 | |
Thomson Reuters | | | | | | | | |
6.500%, 07/15/18 | | | 100 | | | | 107 | |
3.350%, 05/15/26 | | | 100 | | | | 97 | |
Verizon Communications | | | | | | | | |
5.150%, 09/15/23 | | | 3,068 | | | | 3,392 | |
4.862%, 08/21/46 | | | 191 | | | | 194 | |
4.500%, 09/15/20 | | | 250 | | | | 267 | |
4.272%, 01/15/36 | | | 1,641 | | | | 1,571 | |
3.650%, 09/14/18 | | | 150 | | | | 155 | |
2.625%, 02/21/20 | | | 235 | | | | 225 | |
1.750%, 08/15/21 | | | 50 | | | | 48 | |
Vodafone Group | | | | | | | | |
2.500%, 09/26/22 | | | 100 | | | | 96 | |
1.500%, 02/19/18 | | | 150 | | | | 149 | |
| | | | | | | | |
| | | | | | | 13,551 | |
| | | | | | | | |
Utilities — 2.9% | | | | | | | | |
Abengoa Transmision | | | | | | | | |
6.875%, 04/30/43 (A) | | | 249 | | | | 256 | |
American Water Capital | | | | | | | | |
3.400%, 03/01/25 | | | 100 | | | | 102 | |
Arizona Public Service | | | | | | | | |
3.150%, 05/15/25 | | | 50 | | | | 50 | |
Berkshire Hathaway Energy | | | | | | | | |
3.750%, 11/15/23 | | | 100 | | | | 105 | |
CenterPoint Energy Houston Electric | | | | | | | | |
2.250%, 08/01/22 | | | 100 | | | | 98 | |
Cleco Corporate Holdings | | | | | | | | |
3.743%, 05/01/26 (A) | | | 100 | | | | 98 | |
CMS Energy | | | | | | | | |
6.250%, 02/01/20 | | | 100 | | | | 111 | |
3.000%, 05/15/26 | | | 40 | | | | 38 | |
Comision Federal de Electricidad | | | | | | | | |
4.875%, 01/15/24 (A) | | | 215 | | | | 214 | |
4.750%, 02/23/27 (A) | | | 200 | | | | 192 | |
Consolidated Edison Company of New York | | | | | | | | |
5.850%, 04/01/18 | | | 100 | | | | 105 | |
Consolidated Edison of New York | | | | | | | | |
5.700%, 12/01/36 | | | 575 | | | | 686 | |
The accompanying notes are an integral part of the financial statements.
97
| | |
| THE KP FUNDS | | December 31, 2016 |
| | | | | | | | |
| Description | | Face Amount
(000) | | | Value
(000) | |
| | | | | | | | |
Delmarva Power & Light | | | | | | | | |
4.150%, 05/15/45 | | $ | 798 | | | $ | 818 | |
Dominion Gas Holdings | | | | | | | | |
4.600%, 12/15/44 | | | 167 | | | | 166 | |
2.800%, 11/15/20 | | | 150 | | | | 152 | |
2.500%, 12/15/19 | | | 1,300 | | | | 1,314 | |
Dominion Resources | | | | | | | | |
2.962%, 07/01/19 | | | 1,226 | | | | 1,241 | |
1.900%, 06/15/18 | | | 200 | | | | 200 | |
DTE Energy | | | | | | | | |
2.400%, 12/01/19 | | | 100 | | | | 101 | |
Duke Energy | | | | | | | | |
5.050%, 09/15/19 | | | 200 | | | | 216 | |
3.950%, 10/15/23 | | | 150 | | | | 157 | |
2.100%, 06/15/18 | | | 50 | | | | 50 | |
Duke Energy Carolinas | | | | | | | | |
2.950%, 12/01/26 | | | 50 | | | | 49 | |
Enel Generacion Chile | | | | | | | | |
4.250%, 04/15/24 | | | 50 | | | | 50 | |
Entergy | | | | | | | | |
5.125%, 09/15/20 | | | 100 | | | | 108 | |
4.000%, 07/15/22 | | | 50 | | | | 52 | |
Entergy Louisiana | | | | | | | | |
2.400%, 10/01/26 | | | 100 | | | | 93 | |
Exelon | | | | | | | | |
5.625%, 06/15/35 | | | 243 | | | | 269 | |
3.400%, 04/15/26 | | | 100 | | | | 98 | |
2.850%, 06/15/20 | | | 200 | | | | 202 | |
1.550%, 06/09/17 | | | 778 | | | | 777 | |
FirstEnergy Transmission | | | | | | | | |
5.450%, 07/15/44 (A) | | | 654 | | | | 694 | |
Fortis | | | | | | | | |
3.055%, 10/04/26 (A) | | | 1,758 | | | | 1,644 | |
2.100%, 10/04/21 (A) | | | 877 | | | | 848 | |
ITC Holdings | | | | | | | | |
5.300%, 07/01/43 | | | 657 | | | | 719 | |
3.650%, 06/15/24 | | | 25 | | | | 25 | |
Jersey Central Power & Light | | | | | | | | |
4.700%, 04/01/24 (A) | | | 1,243 | | | | 1,323 | |
Kansas City Power & Light | | | | | | | | |
3.650%, 08/15/25 | | | 100 | | | | 100 | |
Listrindo Capital BV | | | | | | | | |
4.950%, 09/14/26 (A) | | | 250 | | | | 244 | |
Majapahit Holding BV | | | | | | | | |
7.750%, 01/20/20 (A) | | | 190 | | | | 213 | |
Metropolitan Edison | | | | | | | | |
7.700%, 01/15/19 | | | 100 | | | | 110 | |
MidAmerican Energy | | | | | | | | |
2.400%, 03/15/19 | | | 138 | | | | 140 | |
NextEra Energy Capital Holdings | | | | | | | | |
2.700%, 09/15/19 | | | 1,402 | | | | 1,420 | |
2.056%, 09/01/17 | | | 1,418 | | | | 1,424 | |
NiSource Finance | | | | | | | | |
6.400%, 03/15/18 | | | 105 | | | | 111 | |
| | | | | | | | |
| Description | | Face Amount
(000) | | | Value
(000) | |
| | | | | | | | |
Northern States Power | | | | | | | | |
2.600%, 05/15/23 | | $ | 100 | | | $ | 99 | |
2.200%, 08/15/20 | | | 50 | | | | 50 | |
NSTAR Electric | | | | | | | | |
2.700%, 06/01/26 | | | 50 | | | | 48 | |
2.375%, 10/15/22 | | | 100 | | | | 98 | |
Oncor Electric Delivery | | | | | | | | |
7.000%, 09/01/22 | | | 100 | | | | 122 | |
ONE Gas | | | | | | | | |
2.070%, 02/01/19 | | | 74 | | | | 74 | |
Pacific Gas & Electric | | | | | | | | |
3.500%, 10/01/20 | | | 150 | | | | 156 | |
2.950%, 03/01/26 | | | 50 | | | | 49 | |
PECO Energy | | | | | | | | |
3.150%, 10/15/25 | | | 100 | | | | 100 | |
Perusahaan Gas Negara Persero | | | | | | | | |
5.125%, 05/16/24 (A) | | | 450 | | | | 462 | |
PPL Capital Funding | | | | | | | | |
3.500%, 12/01/22 | | | 150 | | | | 153 | |
Progress Energy | | | | | | | | |
7.750%, 03/01/31 | | | 1,354 | | | | 1,863 | |
PSEG Power | | | | | | | | |
3.000%, 06/15/21 | | | 50 | | | | 50 | |
Public Service Electric & Gas | | | | | | | | |
3.050%, 11/15/24 | | | 25 | | | | 25 | |
2.300%, 09/15/18 | | | 100 | | | | 101 | |
Puget Energy | | | | | | | | |
6.500%, 12/15/20 | | | 100 | | | | 113 | |
Sempra Energy | | | | | | | | |
9.800%, 02/15/19 | | | 2,664 | | | | 3,086 | |
3.750%, 11/15/25 | | | 100 | | | | 101 | |
3.550%, 06/15/24 | | | 100 | | | | 101 | |
Southern | | | | | | | | |
4.400%, 07/01/46 | | | 676 | | | | 668 | |
2.750%, 06/15/20 | | | 100 | | | | 101 | |
2.450%, 09/01/18 | | | 200 | | | | 202 | |
2.350%, 07/01/21 | | | 936 | | | | 920 | |
1.850%, 07/01/19 | | | 100 | | | | 100 | |
Southern California Edison | | | | | | | | |
3.500%, 10/01/23 | | | 150 | | | | 156 | |
Southern Gas Capital | | | | | | | | |
3.250%, 06/15/26 | | | 30 | | | | 29 | |
Southwestern Electric Power | | | | | | | | |
2.750%, 10/01/26 | | | 50 | | | | 47 | |
State Grid Overseas Investment | | | | | | | | |
2.875%, 05/18/26 (A) | | | 260 | | | | 245 | |
State Grid Overseas Investment 2013 | | | | | | | | |
3.125%, 05/22/23 (A) | | | 515 | | | | 512 | |
Trinidad Generation UnLtd | | | | | | | | |
5.250%, 11/04/27 (A) | | | 200 | | | | 194 | |
Union Electric | | | | | | | | |
3.500%, 04/15/24 | | | 150 | | | | 154 | |
The accompanying notes are an integral part of the financial statements.
98
| | |
| THE KP FUNDS | | December 31, 2016 |
| | | | | | | | |
| Description | | Face Amount
(000) | | | Value
(000) | |
| | | | | | | | |
Virginia Electric & Power | | | | | | | | |
4.000%, 11/15/46 | | $ | 558 | | | $ | 556 | |
3.100%, 05/15/25 | | | 100 | | | | 100 | |
WEC Energy Group | | | | | | | | |
1.650%, 06/15/18 | | | 1,109 | | | | 1,108 | |
Wisconsin Public Service | | | | | | | | |
1.650%, 12/04/18 | | | 30 | | | | 30 | |
Xcel Energy | | | | | | | | |
3.350%, 12/01/26 | | | 100 | | | | 100 | |
2.600%, 03/15/22 | | | 777 | | | | 774 | |
1.200%, 06/01/17 | | | 1,015 | | | | 1,014 | |
| | | | | | | | |
| | | | | | | 31,044 | |
| | | | | | | | |
Total Corporate Obligations
(Cost $287,598) (000) | | | | | | | 285,010 | |
| | | | | | | | |
MORTGAGE-BACKED SECURITIES — 15.3% | |
Agency Mortgage-Backed Obligations — 13.9% | |
FHLMC | | | | | | | | |
4.500%, 08/01/40-04/01/46 | | | 3,837 | | | | 4,151 | |
4.000%, 07/01/24-10/01/46 | | | 8,586 | | | | 9,062 | |
3.500%, 01/01/41-08/01/46 | | | 9,907 | | | | 10,165 | |
3.000%, 01/15/43-01/15/43 | | | 9,000 | | | | 8,937 | |
FNMA | | | | | | | | |
5.500%, 07/01/34-03/01/41 | | | 2,837 | | | | 3,181 | |
5.000%, 12/01/34-02/01/41 | | | 1,262 | | | | 1,393 | |
4.500%, 01/01/30-08/01/40 | | | 6,217 | | | | 6,693 | |
4.000%, 02/01/32-08/01/46 | | | 19,180 | | | | 20,207 | |
3.500%, 01/01/41-06/01/46 | | | 24,241 | | | | 24,883 | |
3.000%, 01/16/26-01/15/43 | | | 29,420 | | | | 29,432 | |
2.500%, 01/01/26-01/01/26 | | | 7,485 | | | | 7,497 | |
GNMA | | | | | | | | |
4.000%, 01/01/40-01/01/40 | | | 7,200 | | | | 7,644 | |
3.500%, 01/15/41-01/15/41 | | | 14,845 | | | | 15,436 | |
| | | | | | | | |
| | | | | | | 148,681 | |
| | | | | | | | |
Non-Agency Mortgage-Backed Obligations — 1.4% | |
Alternative Loan Trust,
Ser 2003-22CB, Cl 3A1 | | | | | | | | |
6.000%, 12/25/33-12/25/33 | | | 960 | | | | 962 | |
5.750%, 10/25/33-10/25/33 | | | 78 | | | | 80 | |
BAMLL Commercial Mortgage Securities Trust,
Ser 2012-PARK, Cl A | | | | | | | | |
2.959%, 12/10/30-12/10/30 (A) | | | 829 | | | | 834 | |
Citigroup Commercial Mortgage Trust,
Ser 2013-GC17, Cl A4 | | | | | | | | |
4.131%, 11/10/46-11/10/46 | | | 356 | | | | 382 | |
3.720%, 11/10/26-11/10/26 | | | 418 | | | | 432 | |
Citigroup Mortgage Loan Trust, Ser 2015-2, Cl 1A1
0.734%, 06/25/47-06/25/47 (A)(B) | | | 469 | | | | 406 | |
COMM Mortgage Trust,
Ser 2013-CCRE9, Cl A4
4.238%, 07/10/45-07/10/45 (B) | | | 444 | | | | 481 | |
3.983%, 10/10/46-10/10/46 | | | 610 | | | | 647 | |
| | | | | | | | |
| Description | | Face Amount
(000) | | | Value
(000) | |
| | | | | | | | |
3.902%, 07/10/50-07/10/50 | | $ | 23 | | | $ | 24 | |
3.759%, 08/10/48-08/10/48 | | | 540 | | | | 564 | |
3.708%, 07/10/48-07/10/48 | | | 330 | | | | 342 | |
2.941%, 01/10/46-01/10/46 | | | 170 | | | | 172 | |
Commercial Mortgage Trust,
Ser 2015-3BP, Cl A
3.178%, 02/10/35-02/10/35 (A) | | | 13 | | | | 13 | |
Credit Suisse First Boston Mortgage Securities,
Ser 2003-27, Cl 4A4 | | | | | | | | |
5.750%, 11/25/33-11/25/33 | | | 95 | | | | 99 | |
CSAIL Commercial Mortgage Trust,
Ser 2016-C7, Cl A5 | | | | | | | | |
3.502%, 11/15/49-11/15/49 | | | 429 | | | | 430 | |
CSMC Trust,
Ser 2014-USA, Cl A2
3.953%, 09/15/37-09/15/37 (A) | | | 302 | | | | 308 | |
GS Mortgage Securities II,
Ser 2015-GC30, Cl A4 | | | | | | | | |
3.382%, 05/10/50-05/10/50 | | | 59 | | | | 60 | |
GS Mortgage Securities Trust, Ser 2013-GC16, Cl A4 | | | | | | | | |
4.271%, 11/10/46-11/10/46 | | | 18 | | | | 19 | |
3.135%, 06/10/46-06/10/46 | | | 159 | | | | 162 | |
2.954%, 11/05/34-11/05/34 (A) | | | 946 | | | | 946 | |
2.933%, 06/05/31-06/05/31 (A) | | | 1,475 | | | | 1,496 | |
GSR Mortgage Loan Trust,
Ser 2005-4F, Cl 6A1 | | | | | | | | |
6.500%, 02/25/35-02/25/35 | | | 102 | | | | 103 | |
HarborView Mortgage Loan Trust,
Ser 2004-3, Cl 1A | | | | | | | | |
2.944%, 05/19/34-05/19/34 (B) | | | 58 | | | | 59 | |
JPMorgan Mortgage Trust,
Ser 2005-A1, Cl 6T1 | | | | | | | | |
3.147%, 02/25/35-02/25/35 (B) | | | 279 | | | | 275 | |
3.048%, 06/25/35-06/25/35 (B) | | | 160 | | | | 160 | |
2.915%, 04/25/35-04/25/35 (B) | | | 75 | | | | 74 | |
2.770%, 11/25/33-11/25/33 (B) | | | 193 | | | | 183 | |
MLCC Mortgage Investors,
Ser 2006-2, Cl 2A | | | | | | | | |
2.689%, 05/25/36-05/25/36 (B) | | | 353 | | | | 341 | |
Morgan Stanley Bank of America Merrill Lynch Trust,
Ser 2013-C12, Cl A4 | | | | | | | | |
4.259%, 10/15/46-10/15/46 (B) | | | 327 | | | | 352 | |
4.220%, 07/15/46-07/15/46 (B) | | | 250 | | | | 267 | |
4.064%, 01/15/24-01/15/24 | | | 122 | | | | 129 | |
3.787%, 01/15/47-01/15/47 | | | 224 | | | | 234 | |
3.249%, 02/15/48-02/15/48 | | | 444 | | | | 447 | |
3.102%, 10/15/26-10/15/26 | | | 404 | | | | 396 | |
Morgan Stanley Capital I Trust, Ser 2014-CPT, Cl A | | | | | | | | |
3.350%, 07/13/29-07/13/29 (A) | | | 662 | | | | 684 | |
The accompanying notes are an integral part of the financial statements.
99
| | |
| THE KP FUNDS | | December 31, 2016 |
| | | | | | | | |
| Description | | Face Amount
(000) | | | Value
(000) | |
| | | | | | | | |
Structured Adjustable Rate Mortgage Loan Trust,
Ser 2004-6, Cl 1A | | | | | | | | |
2.993%, 06/25/34-06/25/34 (B) | | $ | 329 | | | $ | 325 | |
Wedgewood Real Estate Trust,
Ser 2016-1, Cl A1
3.450%, 07/15/46-07/15/46 (A)(B) | | | 3 | | | | 3 | |
Wells Fargo Commercial Mortgage Trust,
Ser 2016-C37, Cl A5 | | | | | | | | |
3.794%, 11/15/26-11/15/26 | | | 407 | | | | 421 | |
3.789%, 12/15/47-12/15/47 | | | 366 | | | | 381 | |
3.640%, 12/15/59-12/15/59 | | | 398 | | | | 406 | |
3.617%, 09/15/57-09/15/57 | | | 96 | | | | 99 | |
Wells Fargo Mortgage Backed Securities Trust,
Ser 2003-J, Cl 1A9 | | | | | | | | |
3.065%, 10/25/33-10/25/33 (B) | | | 730 | | | | 730 | |
2.987%, 06/25/35-06/25/35 (B) | | | 184 | | | | 189 | |
| | | | | | | | |
| | | | | | | 15,117 | |
| | | | | | | | |
Total Mortgage-Backed Securities
(Cost $165,081) (000) | | | | 163,798 | |
| | | | | | | | |
LOAN PARTICIPATIONS — 9.5% | |
Aerospace/Defense — 0.1% | | | | | | | | |
Transdigm Inc., Extended Term Loan F, 1st Lien | | | | | | | | |
3.750%, 06/09/23 | | | 498 | | | | 502 | |
Transdigm Inc., Term Loan D, 1st Lien | | | | | | | | |
3.750%, 06/04/21 | | | 136 | | | | 137 | |
Transdigm Inc., Tranche D Term Loan, 1st Lien | | | | | | | | |
3.750%, 06/04/21 | | | 10 | | | | 10 | |
| | | | | | | | |
| | | | | | | 649 | |
| | | | | | | | |
Airlines — 0.1% | | | | | | | | |
American Airlines, Inc., 2015 Term Loan (New), 1st Lien | | | | | | | | |
3.256%, 06/27/20 | | | 750 | | | | 753 | |
| | | | | | | | |
Automotive — 0.1% | | | | | | | | |
Chrysler Group LLC, Term Loan B, 1st Lien | | | | | | | | |
3.500%, 05/24/17 | | | 158 | | | | 158 | |
Horizon Global Corp., Term Loan B, 1st Lien | | | | | | | | |
7.000%, 06/30/21 | | | 543 | | | | 552 | |
MPG Holdco I Inc., Term Loan B-1, 1st Lien | | | | | | | | |
3.750%, 10/20/21 | | | 194 | | | | 195 | |
TI Group Automotive Systems LLC, Initial Term Loan, 1st Lien | | | | | | | | |
4.500%, 06/30/22 | | | 622 | | | | 629 | |
| | | | | | | | |
| | | | | | | 1,534 | |
| | | | | | | | |
| | | | | | | | |
| Description | | Face Amount
(000) | | | Value
(000) | |
Broadcasting — 0.1% | | | | | | | | |
Mission Broadcasting, Term Loan B | | | | | | | | |
3.000%, 09/26/23 | | $ | 61 | | | $ | 61 | |
Nexstar Broadcasting, Term Loan B | | | | | | | | |
3.000%, 09/26/23 | | | 680 | | | | 685 | |
| | | | | | | | |
| | | | | | | 746 | |
| | | | | | | | |
Building Materials — 0.4% | | | | | | | | |
American Builders & Contractors Supply Company Inc., Term Loan B, 1st Lien | | | | | | | | |
3.520%, 09/23/23 | | | 621 | | | | 627 | |
C.H.I. Overhead Doors, Inc., Initial Term Loan, | | | | | | | | |
4.500%, 07/29/22 | | | 499 | | | | 499 | |
Headwaters Inc., Term Loan B, 1st Lien | | | | | | | | |
4.000%, 03/24/22 | | | 24 | | | | 24 | |
Jeld-Wen, Inc., Replacement Term B-2 Loan, 1st Lien | | | | | | | | |
4.750%, 07/01/22 | | | 1,248 | | | | 1,262 | |
PGT Inc., Initial Term Loan, 1st Lien | | | | | | | | |
6.750%, 02/16/22 | | | 650 | | | | 648 | |
PGT, Inc., Initial Term Loan, 1st Lien | | | | | | | | |
6.750%, 02/16/22 | | | 83 | | | | 83 | |
Priso Acquisition Corp., Initial Term Loan, 1st Lien | | | | | | | | |
4.500%, 05/09/22 | | | 744 | | | | 749 | |
Quikrete Holdings, Inc., Initial Loan, | | | | | | | | |
4.000%, 11/03/23 | | | 500 | | | | 505 | |
SRS Distribution Inc., Initial Term Loan, 1st Lien | | | | | | | | |
5.250%, 08/25/22 | | | 237 | | | | 240 | |
SRS Distribution Inc., Tranche B-1 Loan, 1st Lien | | | | | | | | |
5.250%, 08/25/22 | | | 50 | | | | 51 | |
Tecomet Inc., Initial Term Loan, 1st Lien | | | | | | | | |
5.750%, 11/25/21 | | | 98 | | | | 98 | |
| | | | | | | | |
| | | | | | | 4,786 | |
| | | | | | | | |
Chemicals — 0.9% | | | | | | | | |
Allnex (Luxembourg) & Cy SCA, Term Loan B-2, 1st Lien | | | | | | | | |
5.130%, 09/13/23 | | | 427 | | | | 429 | |
Allnex (Luxembourg) & Cy SCA, Term Loan B-3, 1st Lien | | | | | | | | |
5.130%, 06/02/23 | | | 321 | | | | 323 | |
ASP Chromaflo Intermediate Holdings, Inc., Initial Tranche B-1 Term Loan, | | | | | | | | |
5.000%, 11/03/23 | | | 190 | | | | 191 | |
ASP Chromaflo Intermediate Holdings, Inc., Initial Tranche B-2 Term Loan, | | | | | | | | |
5.000%, 11/03/23 | | | 247 | | | | 248 | |
The accompanying notes are an integral part of the financial statements.
100
| | |
| THE KP FUNDS | | December 31, 2016 |
| | | | | | | | |
| Description | | Face Amount
(000) | | | Value
(000) | |
Berry Plastics Corp., Term Loan D, 1st Lien | | | | | | | | |
3.500%, 02/08/20 | | $ | 970 | | | $ | 976 | |
Entegris Inc., Term Loan B, 1st Lien | | | | | | | | |
3.500%, 04/30/21 | | | 13 | | | | 13 | |
Huntsman International LLC, 2023 Term B Loan, 1st Lien | | | | | | | | |
3.963%, 04/01/23 | | | 480 | | | | 484 | |
3.783%, 04/01/23 | | | 178 | | | | 180 | |
Ineos Styrolution US Holding LLC, Initial Term Loan, 1st Lien | | | | | | | | |
4.750%, 09/30/21 | | | 331 | | | | 335 | |
Ineos US Finance LLC, Initial Term Loan, 1st Lien | | | | | | | | |
3.750%, 05/04/18 | | | 805 | | | | 807 | |
IPS Corp., 1st Lien | | | | | | | | |
0.217%, 12/14/23 | | | 500 | | | | 497 | |
IPS Corp., 2nd Lien | | | | | | | | |
0.254%, 12/14/24 | | | 250 | | | | 246 | |
Nexeo Solutions LLC, Initial Term Loan, 1st Lien | | | | | | | | |
5.250%, 06/09/23 | | | 746 | | | | 752 | |
Ravago Holdings America Inc., Initial Term Loan, 1st Lien | | | | | | | | |
5.000%, 07/13/23 | | | 672 | | | | 678 | |
SIG Combibloc Holdings SCA, Initial Term Loan, 1st Lien | | | | | | | | |
4.000%, 03/11/22 | | | 768 | | | | 773 | |
Solenis International LP, Initial Term Loan, 1st Lien | | | | | | | | |
4.250%, 07/31/21 | | | 489 | | | | 489 | |
Tricorbraun Holdings, Inc., Closing Date Term Loan, 1st Lien | | | | | | | | |
4.750%, 11/30/23 | | | 545 | | | | 551 | |
Tricorbraun Holdings, Inc., Delayed Draw Term Loan, | | | | | | | | |
3.750%, 11/29/17 | | | 55 | | | | 55 | |
Tronox Pigments (Netherlands) B. V., New Term Loan, 1st Lien | | | | | | | | |
4.500%, 03/19/20 | | | 750 | | | | 753 | |
Univar USA Inc., Initial Term Loan, 1st Lien | | | | | | | | |
4.250%, 07/01/22 | | | 718 | | | | 724 | |
US Farathane LLC, Term Loan B-2, 1st Lien | | | | | | | | |
5.750%, 12/23/21 | | | 481 | | | | 481 | |
| | | | | | | | |
| | | | | | | 9,985 | |
| | | | | | | | |
Computers & Electronics — 1.6% | |
AF Borrower LLC, Initial Term Loan, 1st Lien | | | | | | | | |
6.250%, 01/28/22 | | | 744 | | | | 746 | |
| | | | | | | | |
| Description | | Face Amount
(000) | | | Value
(000) | |
Applied Systems 1/14 Cov-Lite TL | | | | | | | | |
4.000%, 01/25/21 | | $ | 748 | | | $ | 755 | |
Aricent Technologies, Initial Term Loan, 1st lien | | | | | | | | |
5.500%, 04/14/21 | | | 200 | | | | 193 | |
Aricent Technologies, Initial Term Loan, 2nd Lien | | | | | | | | |
9.500%, 04/14/22 | | | 550 | | | | 467 | |
Avago Technologies Cayman Holdings Ltd., Term B-3 Loan, 1st Lien | | | | | | | | |
3.704%, 02/01/23 | | | 858 | | | | 870 | |
Campaign Monitor Finance Property Limited, Initial Term Loan, 1st Lien | | | | | | | | |
6.250%, 03/18/21 | | | 48 | | | | 46 | |
Dell, Term Loan A1 | | | | | | | | |
2.610%, 12/31/18 | | | 1,000 | | | | 999 | |
Electrical Components International Inc., Initial Term Loan, 1st Lien | | | | | | | | |
5.750%, 05/28/21 | | | 496 | | | | 496 | |
Epicor Software Corp., Term Loan B, 1st Lien | | | | | | | | |
4.750%, 06/01/22 | | | 748 | | | | 750 | |
Global Healthcare Exchange LLC, Term Loan B, 1st Lien | | | | | | | | |
5.250%, 08/15/22 | | | 99 | | | | 99 | |
Hyland Software Inc., Initial Term Loan, 1st Lien | | | | | | | | |
4.750%, 07/01/22 | | | 585 | | | | 588 | |
Infor (US) Inc., Term Loan B, 1st Lien | | | | | | | | |
3.750%, 06/03/20 | | | 686 | | | | 686 | |
Internet Brands 7/14 TL | | | | | | | | |
4.750%, 07/08/21 | | | 500 | | | | 502 | |
ION Trading Technologies S.A.R.L., Term Loan B-1, 1st Lien | | | | | | | | |
4.250%, 08/11/23 | | | 137 | | | | 137 | |
Kronos Incorporated, Initial Term Loan, | | | | | | | | |
5.000%, 10/20/23 | | | 799 | | | | 808 | |
Landslide Holdings Inc., Initial Term Loan, 1st Lien | | | | | | | | |
5.500%, 09/27/22 | | | 231 | | | | 234 | |
MA Financeco LLC, Term Loan B-2, 1st Lien | | | | | | | | |
4.520%, 11/19/21 | | | 195 | | | | 197 | |
Magic Newco LLC, Initial Term Loan, 1st Lien | | | | | | | | |
5.000%, 12/12/18 | | | 485 | | | | 489 | |
Mediware Information Systems Inc., Initial Term Loan, 1st Lien | | | | | | | | |
5.750%, 09/28/23 | | | 246 | | | | 247 | |
The accompanying notes are an integral part of the financial statements.
101
| | |
| THE KP FUNDS | | December 31, 2016 |
| | | | | | | | |
| Description | | Face Amount
(000) | | | Value
(000) | |
MH Sub I LLC, Initial Term Loan, 1st Lien | | | | | | | | |
4.750%, 07/08/21 | | $ | 122 | | | $ | 123 | |
Microsemi Corp., Term Loan B, 1st Lien | | | | | | | | |
3.750%, 12/17/22 | | | 634 | | | | 639 | |
MRI Software LLC, Initial Term Loan, 1st Lien | | | | | | | | |
5.250%, 06/23/21 | | | 498 | | | | 493 | |
NXP BV, Term Loan F, 1st Lien | | | | | | | | |
3.405%, 12/07/20 | | | 413 | | | | 415 | |
Oberthur, Term Loan B-1, 1st Lien | | | | | | | | |
0.000%, 12/14/23 (D) | | | 242 | | | | 244 | |
Oberthur, Term Loan B-2, 1st Lien | | | | | | | | |
0.000%, 12/14/23 (D) | | | 392 | | | | 396 | |
ON Semiconductor Corporation, 2016 New Replacement Term Loan, | | | | | | | | |
4.020%, 03/31/23 | | | 866 | | | | 876 | |
Onex Carestream Finance LP, Initial Term Loan, 1st Lien | | | | | | | | |
5.000%, 06/07/19 | | | 433 | | | | 419 | |
Quintiles IMS Incorporated, Term B Dollar Loan, 1st Lien | | | | | | | | |
3.500%, 03/17/21 | | | 547 | | | | 550 | |
Spectrum Brands, Inc., 2016 Replacement USD Term Loan, | | | | | | | | |
5.250%, 06/23/22 | | | — | | | | — | |
3.618%, 06/23/22 | | | 197 | | | | 199 | |
3.497%, 06/23/22 | | | 458 | | | | 464 | |
SS&C European Hodlings, Term Loan B-2, 1st Lien | | | | | | | | |
4.000%, 07/08/22 | | | 48 | | | | 49 | |
SS&C Technologies Inc., Term Loan B-1, 1st Lien | | | | | | | | |
4.000%, 07/08/22 | | | 470 | | | | 476 | |
Sungard Availability Services Capital, Inc., Initial Term Loan, 1st Lien | | | | | | | | |
6.000%, 03/29/19 | | | 500 | | | | 483 | |
TV Borrower US LLC, Intial Term Loan, 1st Lien | | | | | | | | |
6.000%, 01/08/21 | | | 489 | | | | 487 | |
Wall Street Systems Delaware Inc., Initial Term Loan, 1st Lien | | | | | | | | |
4.750%, 04/09/21 | | | 699 | | | | 699 | |
Western Digital Corp., Term Loan B, 1st Lien | | | | | | | | |
4.500%, 04/29/23 | | | 398 | | | | 404 | |
| | | | | | | | |
| | | | | | | 16,725 | |
| | | | | | | | |
| | | | | | | | |
| Description | | Face Amount
(000) | | | Value
(000) | |
Consumer Nondurables — 0.1% | |
Coty Inc., New Term B USD Loan, 1st Lien | | | | | | | | |
3.092%, 10/27/22 | | $ | 99 | | | $ | 99 | |
Galleria Co., Term Loan B, 1st Lien | | | | | | | | |
3.750%, 01/26/23 | | | 175 | | | | 176 | |
NM Z Parent Inc. (aka Zep Inc.), 2016 Term Loan, 1st Lien | | | | | | | | |
5.000%, 06/27/22 | | | 246 | | | | 248 | |
Prestige Brands Inc., Term Loan B-3, 1st Lien | | | | | | | | |
3.500%, 09/03/21 | | | 653 | | | | 657 | |
| | | | | | | | |
| | | | | | | 1,180 | |
| | | | | | | | |
Educational Services — 0.0% | |
Education Management II LLC, Term Loan A, 1st Lien | | | | | | | | |
5.500%, 07/02/20 | | | 129 | | | | 30 | |
Education Management II LLC, Term Loan B, 1st Lien | | | | | | | | |
2.000%, 07/02/20 | | | 242 | | | | 8 | |
| | | | | | | | |
| | | | | | | 38 | |
| | | | | | | | |
Entertainment & Leisure — 0.3% | |
AMC Entertainment Inc., Initial Term Loan, 1st Lien | | | | | | | | |
4.000%, 12/15/22 | | | 721 | | | | 728 | |
BC Equity Ventures LLC, Initial Term Loan, 1st Lien | | | | | | | | |
7.500%, 08/24/22 | | | 499 | | | | 501 | |
ClubCorp Club Operations Inc. , Term Loan B, 1st Lien | | | | | | | | |
4.000%, 12/15/22 | | | 868 | | | | 877 | |
Intrawest | | | | | | | | |
4.500%, 12/09/20 | | | 750 | | | | 759 | |
| | | | | | | | |
| | | | | | | 2,865 | |
| | | | | | | | |
Financial Services — 0.3% | |
Altisource Solutions S.A R.L., Term Loan B, 1st Lien | | | | | | | | |
4.500%, 12/09/20 | | | 435 | | | | 425 | |
Bats Global Markets Inc., Term Loan B, 1st Lien | | | | | | | | |
4.106%, 06/30/23 | | | 451 | | | | 453 | |
Citco III Limited, Initial Term Loan , 1st Lien | | | | | | | | |
4.250%, 06/29/18 | | | 969 | | | | 971 | |
Duff & Phelps Investment Management Co., Initial Term Loan, 1st Lien | | | | | | | | |
4.750%, 03/14/20 | | | 497 | | | | 501 | |
NXT Capital, Inc. (NXT Capital, LLC), Term Loan, 1st Lien | | | | | | | | |
5.500%, 11/23/22 | | | 750 | | | | 757 | |
The accompanying notes are an integral part of the financial statements.
102
| | |
| THE KP FUNDS | | December 31, 2016 |
| | | | | | | | |
| Description | | Face Amount
(000) | | | Value
(000) | |
Walter Investment Management Corp., Initial Term Loan, 1st Lien | | | | | | | | |
4.750%, 12/18/20 | | $ | 475 | | | $ | 450 | |
| | | | | | | | |
| | | | | | | 3,557 | |
| | | | | | | | |
Food & Beverage — 0.4% | |
B&G Foods Inc., Term Loan B, 1st Lien | | | | | | | | |
3.750%, 11/02/22 | | | 597 | | | | 605 | |
Constellation Brands, Term Loan B | | | | | | | | |
4.750%, 11/15/23 | | | 500 | | | | 505 | |
Del Monte Foods Inc., Initial Term Loan, 1st Lien | | | | | | | | |
6.000%, 02/18/21 | | | 1 | | | | 1 | |
4.250%, 02/18/21 | | | 485 | | | | 444 | |
Pinnacle Foods Group LLC, Term Loan G, 1st Lien | | | | | | | | |
3.387%, 04/29/20 | | | 871 | | | | 878 | |
US Foods Inc., Term Loan B, 1st Lien | | | | | | | | |
3.750%, 06/27/23 | | | 1,490 | | | | 1,505 | |
| | | | | | | | |
| | | | | | | 3,938 | |
| | | | | | | | |
Forest Products — 0.1% | |
LBM Borrower, 1st Lien | | | | | | | | |
6.250%, 08/20/22 | | | 131 | | | | 130 | |
LBM, 1st Lien | | | | | | | | |
6.250%, 08/20/22 | | | 313 | | | | 310 | |
Prolamina, Term Loan, 1st Lien | | | | | | | | |
5.000%, 11/17/23 | | | 500 | | | | 505 | |
Prolamina, Term Loan, 2nd Lien | | | | | | | | |
9.500%, 11/18/24 | | | 125 | | | | 125 | |
| | | | | | | | |
| | | | | | | 1,070 | |
| | | | | | | | |
Gaming & Hotels — 0.1% | |
Amaya Holdings BV, Term Loan B, 1st Lien | | | | | | | | |
5.000%, 08/01/21 | | | 252 | | | | 253 | |
Hilton Worldwide Finance LLC, Initial Term Loan, 1st Lien | | | | | | | | |
3.500%, 10/26/20 | | | 47 | | | | 47 | |
Hilton Worldwide Holdings Inc., Extended Term Loan, 1st Lien | | | | | | | | |
3.256%, 10/25/23 | | | 638 | | | | 645 | |
MGM Growth Properties Operating Partnership LP, Term Loan B, 1st Lien | | | | | | | | |
3.520%, 04/25/23 | | | 268 | | | | 271 | |
| | | | | | | | |
| | | | | | | 1,216 | |
| | | | | | | | |
Gaming And Hotels — 0.1% | | | | | | | | |
Four Seasons Holdings Inc., Term Loan 2013, 1st Lien | | | | | | | | |
3.750%, 11/30/23 | | | 750 | | | | 758 | |
| | | | | | | | |
| | | | | | | | |
| Description | | Face Amount
(000) | | | Value
(000) | |
Health Care — 0.9% | | | | | | | | |
ABB/Con-Cise Optical Group LLC, Initial Term Loan, | | | | | | | | |
7.750%, 06/15/23 | | $ | 3 | | | $ | 3 | |
6.000%, 06/15/23 | | | 85 | | | | 86 | |
ABB/Con-cise Optical Group LLC, Initial Term Loan, 1st Lien | | | | | | | | |
6.000%, 06/15/23 | | | 662 | | | | 670 | |
Alere Inc., Term Loan B, 1st Lien | | | | | | | | |
4.250%, 06/20/22 | | | 131 | | | | 131 | |
Alliance HealthCare Services Inc., Initial Term Loan, 1st Lien | | | | | | | | |
4.250%, 06/03/19 | | | 479 | | | | 472 | |
Alvogen Pharma US Inc., Initial Term Loan, 1st Lien | | | | | | | | |
6.000%, 04/01/22 | | | 337 | | | | 325 | |
AMAG Pharmaceuticals Inc., Initial Term Loan, 1st Lien | | | | | | | | |
4.750%, 08/17/21 | | | 483 | | | | 482 | |
Amneal Pharmaceuticals LLC, Term Loan B, 1st Lien | | | | | | | | |
6.250%, 11/01/19 | | | 2 | | | | 2 | |
4.500%, 11/01/19 | | | 557 | | | | 557 | |
CHS/Community Health Systems Inc., Term Loan G, 1st Lien | | | | | | | | |
3.750%, 12/31/19 | | | 837 | | | | 811 | |
Drumm Investors LLC, Initial Term Loan, 1st Lien | | | | | | | | |
9.500%, 05/04/18 | | | 517 | | | | 505 | |
Endo Luxembourg Finance Company I S.à r.l., Term Loan B, 1st Lien | | | | | | | | |
3.750%, 09/26/22 | | | 216 | | | | 217 | |
HCA Inc., Tranche B-6 Term Loan, | | | | | | | | |
3.856%, 03/01/23 | | | 1,000 | | | | 1,012 | |
Iasis Healthcare LLC , Term Loan B-2, 1st Lien | | | | | | | | |
4.500%, 05/03/18 | | | 632 | | | | 626 | |
JLL/Delta Dutch Newco BV, Initial Term Loan, 1st Lien | | | | | | | | |
4.250%, 03/11/21 | | | 488 | | | | 491 | |
Kinetic Concepts Inc., Term Loan F, 1st Lien | | | | | | | | |
5.000%, 11/04/20 | | | 488 | | | | 488 | |
Surgery Center Holdings, Inc., Initial Term Loan, 1st Lien | | | | | | | | |
4.750%, 11/03/20 | | | 497 | | | | 501 | |
Surgical Care Affliates, 1st Lien | | | | | | | | |
3.750%, 03/17/22 | | | 748 | | | | 752 | |
Valeant Pharmaceuticals International Inc., Delayed Draw Term Loan A, 1st Lien | | | | | | | | |
4.500%, 04/01/20 | | | 122 | | | | 120 | |
The accompanying notes are an integral part of the financial statements.
103
| | |
| THE KP FUNDS | | December 31, 2016 |
| | | | | | | | |
| Description | | Face Amount
(000) | | | Value
(000) | |
Valeant Pharmaceuticals International Inc., Term Loan E, 1st Lien | | | | | | | | |
5.250%, 08/05/20 | | $ | 833 | | | $ | 830 | |
Zest Anchors, 1st Lien | | | | | | | | |
0.000%, 08/16/20 (D) | | | 500 | | | | 501 | |
| | | | | | | | |
| | | | | | | 9,582 | |
| | | | | | | | |
Home Furnishings — 0.1% | | | | | | | | |
Serta Simmons Bedding, LLC, Initial Term Loan, | | | | | | | | |
4.500%, 10/20/23 | | | 826 | | | | 834 | |
| | | | | | | | |
| | | | | | | 834 | |
| | | | | | | | |
Insurance — 0.5% | | | | | | | | |
Acrisure LLC, Term Loan | | | | | | | | |
0.500%, 11/02/23 | | | 116 | | | | 117 | |
Acrisure LLC, Term Loan B, 1st Lien | | | | | | | | |
5.750%, 11/02/23 | | | 634 | | | | 641 | |
Alliant Holdings Intermediate LLC, Initial Term Loan, 1st Lien | | | | | | | | |
4.753%, 08/12/22 | | | 197 | | | | 198 | |
Alliant Holdings Intermediate LLC, Term Loan B-2, 1st Lien | | | | | | | | |
5.250%, 08/12/22 | | | 498 | | | | 502 | |
Hub International 10/13 (USD), Term Loan | | | | | | | | |
4.000%, 10/02/20 | | | 598 | | | | 603 | |
National Financial Partners Corp., Initial Term Loan, 1st Lien | | | | | | | | |
4.500%, 07/01/20 | | | 842 | | | | 848 | |
NFP Corp., Term Loan B, 1st Lien | | | | | | | | |
4.500%, 12/09/23 | | | 821 | | | | 827 | |
Sedgwick Claims Management Services Inc., Initial Term Loan, 1st Lien | | | | | | | | |
4.250%, 03/01/21 | | | 746 | | | | 753 | |
USI Inc., Term Loan B, 1st Lien | | | | | | | | |
4.250%, 12/27/19 | | | 789 | | | | 792 | |
| | | | | | | | |
| | | | | | | 5,281 | |
| | | | | | | | |
Leasing — 0.1% | | | | | | | | |
Fly Funding II S.à r.l., Loan, 1st Lien | | | | | | | | |
3.640%, 08/09/19 | | | 739 | | | | 744 | |
| | | | | | | | |
Machinery — 0.2% | | | | | | | | |
Blount International Inc., Initial Term Loan | | | | | | | | |
8.750%, 04/12/23 | | | 1 | | | | 1 | |
Blount International Inc., Initial Term Loan, 1st Lien | | | | | | | | |
7.250%, 04/12/23 | | | 498 | | | | 502 | |
| | | | | | | | |
| Description | | Face Amount
(000) | | | Value
(000) | |
CPM Holdings Inc., Term Loan B, 1st Lien | | | | | | | | |
6.000%, 04/01/22 | | $ | 422 | | | $ | 426 | |
Culligan Term Loan | | | | | | | | |
5.000%, 11/17/23 | | | 250 | | | | 252 | |
Douglas Dynamics LLC, Initial Term Loan, 1st Lien | | | | | | | | |
5.250%, 12/31/21 | | | 448 | | | | 450 | |
Safway Group Holding LLC , Term Loan B, 1st Lien | | | | | | | | |
5.750%, 08/21/23 | | | 748 | | | | 758 | |
SiteOne Landscape Supply, LLC, Tranche B Term Loan, 1st Lien | | | | | | | | |
0.164%, 04/29/22 | | | 342 | | | | 344 | |
| | | | | | | | |
| | | | | | | 2,733 | |
| | | | | | | | |
Media — 0.5% | | | | | | | | |
Charter Communications Operationg, Term Loan H, 1st Lien | | | | | | | | |
3.005%, 01/15/24 | | | 199 | | | | 200 | |
0.000%, 01/14/22 (D) | | | 746 | | | | 750 | |
CSC Holdings, LLC (fka CSC Holdings, Inc.), 2016 Extended Term Loan, | | | | | | | | |
3.876%, 10/11/24 | | | 263 | | | | 266 | |
| | | | | | | | |
Entravision Communications | | | | | | | | |
0.000%, 05/31/20 (D) | | | 20 | | | | 19 | |
Entravision Communications Corp., Term Loan B, 1st Lien | | | | | | | | |
3.500%, 05/29/20 | | | 273 | | | | 272 | |
Lions Gate, Term Loan B, 1st Lien | | | | | | | | |
3.750%, 10/13/23 | | | 1,000 | | | | 1,005 | |
MCC Iowa LLC, Term Loan J, 1st Lien | | | | | | | | |
3.750%, 06/18/21 | | | 73 | | | | 74 | |
Mission Broadcasting Inc., Term Loan B2, 1st Lien | | | | | | | | |
3.750%, 10/01/20 | | | 456 | | | | 459 | |
Nexstar Broadcasting Inc., Term Loan B-2, 1st Lien | | | | | | | | |
3.750%, 10/01/20 | | | 518 | | | | 521 | |
Raycom TV Broadcasting LLC, Term Loan B, 1st Lien | | | | | | | | |
3.750%, 08/04/21 | | | 987 | | | | 980 | |
Ziggo BV, Term Loan B-1, 1st Lien | | | | | | | | |
3.500%, 01/15/22 | | | 296 | | | | 297 | |
Ziggo BV, Term Loan B-2, 1st Lien | | | | | | | | |
3.500%, 01/15/22 | | | 175 | | | | 176 | |
The accompanying notes are an integral part of the financial statements.
104
| | |
| THE KP FUNDS | | December 31, 2016 |
| | | | | | | | |
| Description | | Face Amount
(000) | | | Value
(000) | |
Ziggo BV, Term Loan B-3, 1st Lien | | | | | | | | |
3.701%, 01/15/22 | | $ | 54 | | | $ | 55 | |
| | | | | | | | |
| | | | | | | 5,074 | |
| | | | | | | | |
Metals & Mining — 0.0% | | | | | | | | |
Novelis Inc., Initial Term Loan, 1st Lien | | | | | | | | |
3.894%, 06/02/22 | | | 246 | | | | 248 | |
| | | | | | | | |
Oil & Gas — 0.1% | | | | | | | | |
Drillships Ocean Ventures Inc., Initial Term Loan, 1st Lien | | | | | | | | |
5.500%, 07/25/21 | | | 98 | | | | 77 | |
Energy Transfer Equity LP, Initial Term Loan, 1st Lien | | | | | | | | |
3.387%, 12/02/19 | | | 275 | | | | 275 | |
Philadelphia Energy Solutions Refining and Marketing LLC, Term Loan B, 1st Lien | | | | | | | | |
6.250%, 04/04/18 | | | 696 | | | | 550 | |
Seadrill Operating LP, Initial Term Loan, 1st Lien | | | | | | | | |
4.000%, 02/21/21 | | | 364 | | | | 248 | |
Western Refining Inc., Term Loan B-2, 1st Lien | | | | | | | | |
5.500%, 05/26/23 | | | 559 | | | | 561 | |
| | | | | | | | |
| | | | | | | 1,711 | |
| | | | | | | | |
Personal Services — 0.0% | | | | | | | | |
William Morris Endeavor Entertainment LLC, Initial Term Loan, 1st Lien | | | | | | | | |
5.250%, 05/06/21 | | | 497 | | | | 502 | |
| | | | | | | | |
| | | | | | | 502 | |
| | | | | | | | |
Printing & Publishing — 0.1% | |
DH Publishing, L.P., Term B-4 Loan, 1st Lien | | | | | | | | |
3.385%, 08/22/22 | | | 994 | | | | 999 | |
| | | | | | | | |
Professional & Business Services — 1.0% | |
Albany Molecular Research Inc., Initial Term Loan, 1st Lien | | | | | | | | |
6.006%, 07/16/21 | | | 497 | | | | 502 | |
Bright Horizons Family Solutions LLC (fka Bright Horizons Family Solutions, Inc.), Effective Date Incremental Term Loan, | | | | | | | | |
3.500%, 11/30/23 | | | 972 | | | | 980 | |
Camelot U.S. Acquisition 1 Co., Initial Term Loan, 1st Lien | | | | | | | | |
4.750%, 10/03/23 | | | 399 | | | | 403 | |
Emdeon Business Services LLC, Term Loan B-2, 1st Lien | | | | | | | | |
3.750%, 11/02/18 | | | 746 | | | | 747 | |
| | | | | | | | |
| Description | | Face Amount
(000) | | | Value
(000) | |
Evertec, Term Loan A | | | | | | | | |
3.106%, 01/20/17 | | $ | 1,157 | | | $ | 1,145 | |
ExamWorks Group Inc., Initial Term Loan, 1st Lien | | | | | | | | |
4.750%, 07/27/23 | | | 348 | | | | 350 | |
Explorer Holdings Inc., Initial Term Loan, 1st Lien | | | | | | | | |
6.000%, 04/12/23 | | | 254 | | | | 259 | |
Global Payments Inc., Term B Loan, 1st Lien | | | | | | | | |
3.106%, 04/21/23 | | | 388 | | | | 392 | |
Hamilton Lane Advisors LLC, Term Loan B, 1st Lien | | | | | | | | |
4.250%, 07/01/22 | | | 47 | | | | 47 | |
Harbourvest Partners LP, Initial Term Loan, 1st Lien | | | | | | | | |
3.380%, 02/04/21 | | | 356 | | | | 355 | |
Heartland Dental Care Inc., Term Loan B-1, 1st Lien | | | | | | | | |
5.500%, 12/21/18 | | | 746 | | | | 746 | |
IG Investments Holdings LLC, Term Loan B, 1st Lien | | | | | | | | |
6.000%, 10/29/21 | | | 269 | | | | 271 | |
Infinity Acquisition LLC, Initial Term Loan, 1st Lien | | | | | | | | |
4.250%, 08/06/21 | | | 1,159 | | | | 1,115 | |
LPL Holdings Inc., Extended Term Loan B, 1st Lien | | | | | | | | |
4.250%, 03/29/21 | | | 743 | | | | 749 | |
Nielsen Finance LLC, Term Loan B-3, 1st Lien | | | | | | | | |
3.154%, 10/04/23 | | | 750 | | | | 758 | |
NSAM LP, Term Loan B, 1st Lien | | | | | | | | |
4.762%, 01/30/23 | | | 748 | | | | 748 | |
Sai Globa, Term Loan B, 1st Lien | | | | | | | | |
0.000%, 12/06/23 (D) | | | 500 | | | | 504 | |
West Corporation, Refinanced Term B-12 Loan, | | | | | | | | |
3.270%, 06/17/23 | | | 746 | | | | 747 | |
| | | | | | | | |
| | | | | | | 10,818 | |
| | | | | | | | |
Real Estate — 0.2% | | | | | | | | |
DTZ US Borrower LLC, Initial Term Loan, 1st Lien | | | | | | | | |
4.250%, 11/04/21 | | | 806 | | | | 810 | |
iStar Inc., Initial Term Loan, 1st Lien | | | | | | | | |
5.500%, 07/01/20 | | | 499 | | | | 504 | |
RE/MAX, LLC (fka RE/MAX International, LLC), Term Loan, 1st Lien | | | | | | | | |
3.713%, 12/15/23 | | | 500 | | | | 500 | |
| | | | | | | | |
| | | | | | | 1,814 | |
| | | | | | | | |
The accompanying notes are an integral part of the financial statements.
105
| | |
| THE KP FUNDS | | December 31, 2016 |
| | | | | | | | |
| Description | | Face Amount
(000) | | | Value
(000) | |
Retail Food & Drug — 0.1% | | | | | | | | |
BJ’s Wholesale Club Inc., Replacement Loan, 1st Lien | | | | | | | | |
4.500%, 09/26/19 | | $ | 726 | | | $ | 732 | |
Smart & Final Inc., Initial Term Loan, 1st Lien | | | | | | | | |
4.338%, 11/15/22 | | | 384 | | | | 383 | |
Smart & Final Stores LLC, Term Loan, 1st Lien | | | | | | | | |
4.250%, 11/15/22 | | | 234 | | | | 234 | |
| | | | | | | | |
| | | | | | | 1,349 | |
| | | | | | | | |
Retailing — 0.4% | | | | | | | | |
1011778 B.C. Unlimited Liability Company, Term Loan B, 1st Lien | | | | | | | | |
3.750%, 12/10/21 | | | 518 | | | | 522 | |
Brickman Group Holdings Inc., Initial Term Loan, 1st Lien | | | | | | | | |
4.000%, 12/18/20 | | | 423 | | | | 424 | |
Brickman Group Ltd. LLC, The, Initial Term Loan, 1st Lien | | | | | | | | |
4.000%, 12/18/20 | | | 63 | | | | 63 | |
Dollar Tree Inc., Term Loan B, 1st Lien | | | | | | | | |
3.250%, 07/06/22 | | | 59 | | | | 59 | |
HD Supply, Inc., Term B-2 Loan, 1st Lien | | | | | | | | |
3.630%, 10/17/23 | | | 748 | | | | 753 | |
KFC Holding Co., Term Loan B, 1st Lien | | | | | | | | |
3.486%, 06/16/23 | | | 746 | | | | 756 | |
Landry’s Inc., Term Loan B, 1st Lien | | | | | | | | |
4.000%, 10/04/23 | | | 277 | | | | 280 | |
Leslie’s Poolmart Inc., Term Loan B, 1st Lien | | | | | | | | |
5.250%, 08/16/23 | | | 498 | | | | 504 | |
Pilot Travel Centers LLC, Term Loan B, 1st Lien | | | | | | | | |
3.520%, 05/25/23 | | | 126 | | | | 127 | |
Trugreen Limited Partnership, Initial Term Loan, 1st Lien | | | | | | | | |
6.500%, 04/07/23 | | | 499 | | | | 505 | |
| | | | | | | | |
| | | | | | | 3,993 | |
| | | | | | | | |
Steel — 0.1% | |
FMG Resources Property LTD, Initial Term Loan, 1st Lien | | | | | | | | |
3.750%, 06/30/19 | | | 400 | | | | 401 | |
Zekelman Industries Inc., Term Loan B, 1st Lien | | | | | | | | |
6.000%, 06/14/21 | | | 844 | | | | 851 | |
| | | | | | | | |
| | | | | | | 1,252 | |
| | | | | | | | |
| | | | | | | | |
| Description | | Face Amount
(000) | | | Value
(000) | |
Telecommunications — 0.4% | |
Ciena Corporation, 2016 Term Loan, 1st Lien | | | | | | | | |
4.250%, 04/25/21 | | $ | 498 | | | $ | 500 | |
Commscope Inc., Tranche 5 Term Loan, 1st Lien | | | | | | | | |
3.270%, 12/29/22 | | | 99 | | | | 100 | |
DigitalGlobe, 1st Lien | | | | | | | | |
3.508%, 12/22/23 | | | 600 | | | | 604 | |
Genesys Telecommunications Laboratories, 1st Lien | | | | | | | | |
6.250%, 11/17/23 | | | 686 | | | | 697 | |
LTS Buyer LLC, Initial Term Loan, 1st Lien | | | | | | | | |
4.248%, 04/13/20 | | | 742 | | | | 746 | |
Mitel US Holdings Inc., Initial Term Loan, 1st Lien | | | | | | | | |
5.500%, 04/29/22 | | | 247 | | | | 249 | |
SBA Senior Finance II LLC, Incremental Term Loan B, 1st Lien | | | | | | | | |
3.250%, 03/24/21 | | | 734 | | | | 737 | |
Syniverse Holdings Inc., Term Loan B, 1st Lien | | | | | | | | |
4.000%, 04/23/19 | | | 391 | | | | 340 | |
Telenet Financing USD LLC, Term Loan AF Facility, | | | | | | | | |
3.704%, 01/31/25 | | | 500 | | | | 504 | |
| | | | | | | | |
| | | | | | | 4,477 | |
| | | | | | | | |
| | | | | | | | |
Transportation — 0.1% | |
Envision Healthcare Corporation (fka Emergency Medical Services Corporation), Initial Term Loan, 1st Lien | | | | | | | | |
3.750%, 12/01/23 | | | 674 | | | | 681 | |
| | | | | | | | |
Total Loan Participations
(Cost $101,555) (000) | | | | | | | 101,892 | |
| | | | | | | | |
SOVEREIGN DEBT — 9.0% | |
1MDB Global Investments | | | | | | | | |
4.400%, 03/09/23 | | | 1,000 | | | | 839 | |
Abu Dhabi Government International Bond | | | | | | | | |
3.125%, 05/03/26 (A) | | | 640 | | | | 628 | |
Argentine Bonos del Tesoro | | | | | | | | |
18.200%, 10/03/21 (ARS) | | | 3,980 | | | | 254 | |
Argentine Republic Government International Bond | | | | | | | | |
8.280%, 12/31/33 | | | 1,584 | | | | 1,691 | |
7.500%, 04/22/26 (A) | | | 885 | | | | 929 | |
7.125%, 07/06/36 (A) | | | 560 | | | | 533 | |
6.875%, 04/22/21 (A) | | | 350 | | | | 373 | |
2.500%, 03/31/19 (C) | | | 1,364 | | | | 839 | |
The accompanying notes are an integral part of the financial statements.
106
| | |
| THE KP FUNDS | | December 31, 2016 |
| | | | | | | | |
| Description | | Face Amount
(000) | | | Value
(000) | |
Armenia International Bond | | | | | | | | |
7.150%, 03/26/25 (A) | | $ | 200 | | | $ | 210 | |
6.000%, 09/30/20 (A) | | | 1,381 | | | | 1,423 | |
Azerbaijan Government International Bond | | | | | | | | |
4.750%, 03/18/24 (A) | | | 1,620 | | | | 1,608 | |
Banco Nacional de Desenvolvimento Economico e Social | | | | | | | | |
6.500%, 06/10/19 (A) | | | 560 | | | | 595 | |
Banque Centrale de Tunisie | | | | | | | | |
5.750%, 01/30/25 (A) | | | 1,230 | | | | 1,144 | |
Brazil Notas do Tesouro Nacional | | | | | | | | |
10.000%, 01/01/21 (BRL) | | | 930 | | | | 275 | |
Brazil Notas do Tesouro Nacional Serie F | | | | | | | | |
10.000%, 01/01/23 (BRL) | | | 1,670 | | | | 482 | |
Brazilian Government International Bond | | | | | | | | |
5.625%, 01/07/41 | | | 150 | | | | 133 | |
5.000%, 01/27/45 | | | 590 | | | | 479 | |
4.875%, 01/22/21 | | | 190 | | | | 196 | |
4.250%, 01/07/25 | | | 1,105 | | | | 1,033 | |
2.625%, 01/05/23 | | | 1,025 | | | | 912 | |
Buenos Aires Argentina | | | | | | | | |
7.500%, 06/01/27 (A) | | | 310 | | | | 316 | |
Canada Government International Bond | | | | | | | | |
1.625%, 02/27/19 | | | 100 | | | | 100 | |
1.125%, 03/19/18 | | | 150 | | | | 150 | |
Chile Government International Bond | | | | | | | | |
3.125%, 01/21/26 | | | 107 | | | | 105 | |
Colombia Government International Bond | | | | | | | | |
7.375%, 03/18/19 | | | 795 | | | | 956 | |
6.125%, 01/18/41 | | | 600 | | | | 648 | |
4.500%, 01/28/26 | | | 340 | | | | 350 | |
4.375%, 07/12/21 | | | 200 | | | | 209 | |
4.000%, 02/26/24 | | | 770 | | | | 778 | |
Costa Rica Government International Bond | | | | | | | | |
7.158%, 03/12/45 (A) | | | 780 | | | | 723 | |
7.000%, 04/04/44 (A) | | | 780 | | | | 713 | |
Croatia Government International Bond | | | | | | | | |
6.750%, 11/05/19 | | | 1,105 | | | | 1,199 | |
6.375%, 03/24/21 (A) | | | 660 | | | | 717 | |
6.000%, 01/26/24 (A) | | | 200 | | | | 217 | |
Dominican Republic International Bond | | | | | | | | |
7.500%, 05/06/21 (A) | | | 1,030 | | | | 1,118 | |
7.450%, 04/30/44 (A) | | | 915 | | | | 921 | |
6.875%, 01/29/26 (A) | | | 480 | | | | 499 | |
6.850%, 01/27/45 (A) | | | 250 | | | | 236 | |
6.600%, 01/28/24 (A) | | | 290 | | | | 302 | |
5.500%, 01/27/25 (A) | | | 150 | | | | 145 | |
| | | | | | | | |
| Description | | Face Amount
(000) | | | Value
(000) | |
Ecuador Government International Bond | | | | | | | | |
10.750%, 03/28/22 (A) | | $ | 590 | | | $ | 640 | |
7.950%, 06/20/24 (A) | | | 860 | | | | 822 | |
El Salvador Government International Bond | | | | | | | | |
7.650%, 06/15/35 (A) | | | 885 | | | | 821 | |
7.375%, 12/01/19 (A) | | | 215 | | | | 222 | |
6.375%, 01/18/27 (A) | | | 150 | | | | 138 | |
5.875%, 01/30/25 (A) | | | 365 | | | | 334 | |
Export Development Canada | | | | | | | | |
1.000%, 06/15/18 | | | 300 | | | | 298 | |
Export-Import Bank of Korea | | | | | | | | |
4.000%, 01/14/24 | | | 200 | | | | 209 | |
2.875%, 01/21/25 | | | 200 | | | | 193 | |
Georgia Government International Bond | | | | | | | | |
6.875%, 04/12/21 (A) | | | 860 | | | | 936 | |
Ghana Government International Bond | | | | | | | | |
10.750%, 10/14/30 (A) | | | 420 | | | | 496 | |
9.250%, 09/15/22 (A) | | | 490 | | | | 523 | |
8.125%, 01/18/26 (A) | | | 325 | | | | 320 | |
7.875%, 08/07/23 (A) | | | 730 | | | | 718 | |
Guatemala Government International Bond | | | | | | | | |
5.750%, 06/06/22 (A) | | | 420 | | | | 451 | |
4.500%, 05/03/26 (A) | | | 640 | | | | 615 | |
Hashemite Kingdom of Jordan Government AID Bond | | | | | | | | |
2.503%, 10/30/20 | | | 200 | | | | 205 | |
Honduras Government International Bond | | | | | | | | |
8.750%, 12/16/20 (A) | | | 1,415 | | | | 1,575 | |
7.500%, 03/15/24 (A) | | | 405 | | | | 433 | |
Hungary Government International Bond | | | | | | | | |
6.375%, 03/29/21 | | | 1,850 | | | | 2,071 | |
6.250%, 01/29/20 | | | 600 | | | | 656 | |
5.750%, 11/22/23 | | | 680 | | | | 754 | |
5.375%, 03/25/24 | | | 1,140 | | | | 1,243 | |
Indonesia Government International Bond | | | | | | | | |
8.500%, 10/12/35 (A) | | | 1,120 | | | | 1,519 | |
5.875%, 01/15/24 (A) | | | 1,320 | | | | 1,456 | |
5.375%, 10/17/23 (A) | | | 200 | | | | 217 | |
5.250%, 01/17/42 (A) | | | 480 | | | | 481 | |
4.125%, 01/15/25 (A) | | | 650 | | | | 644 | |
3.700%, 01/08/22 (A) | | | 210 | | | | 211 | |
Israel Government International Bond | | | | | | | | |
3.150%, 06/30/23 | | | 200 | | | | 203 | |
Ivory Coast Government International Bond | | | | | | | | |
6.375%, 03/03/28 (A) | | | 435 | | | | 424 | |
5.750%, 12/31/32 (A) | | | 605 | | | | 559 | |
5.375%, 07/23/24 (A) | | | 450 | | | | 433 | |
The accompanying notes are an integral part of the financial statements.
107
| | |
| THE KP FUNDS | | December 31, 2016 |
| | | | | | | | |
| Description | | Face Amount
(000) | | | Value
(000) | |
Jamaica Government International Bond | | | | | | | | |
8.000%, 03/15/39 | | $ | 150 | | | $ | 166 | |
7.625%, 07/09/25 | | | 470 | | | | 537 | |
6.750%, 04/28/28 | | | 690 | | | | 755 | |
Japan Bank for International Cooperation | | | | | | | | |
2.375%, 04/20/26 | | | 200 | | | | 192 | |
1.750%, 11/13/18 | | | 400 | | | | 396 | |
Jordan Government International Bond | | | | | | | | |
5.750%, 01/31/27 (A) | | | 370 | | | | 351 | |
KazAgro National Management Holding | | | | | | | | |
4.625%, 05/24/23 (A) | | | 300 | | | | 281 | |
Kazakhstan Government International Bond | | | | | | | | |
6.500%, 07/21/45 (A) | | | 340 | | | | 389 | |
3.875%, 10/14/24 (A) | | | 670 | | | | 672 | |
Kenya Government International Bond | | | | | | | | |
6.875%, 06/24/24 (A) | | | 270 | | | | 254 | |
5.875%, 06/24/19 (A) | | | 1,358 | | | | 1,388 | |
Korea Development Bank | | | | | | | | |
2.500%, 03/11/20 | | | 400 | | | | 398 | |
Korea International Bond | | | | | | | | |
7.125%, 04/16/19 | | | 100 | | | | 112 | |
Kreditanstalt fuer Wiederaufbau | | | | | | | | |
2.000%, 11/30/21 | | | 350 | | | | 347 | |
Lebanon Government International Bond | | | | | | | | |
6.750%, 11/29/27 | | | 215 | | | | 207 | |
6.650%, 11/03/28 | | | 535 | | | | 513 | |
6.600%, 11/27/26 | | | 265 | | | | 255 | |
6.375%, 03/09/20 | | | 215 | | | | 215 | |
6.200%, 02/26/25 | | | 390 | | | | 369 | |
6.100%, 10/04/22 | | | 355 | | | | 344 | |
6.000%, 01/27/23 | | | 355 | | | | 341 | |
5.450%, 11/28/19 | | | 370 | | | | 360 | |
5.150%, 11/12/18 | | | 215 | | | | 213 | |
Mexico Government International Bond | | | | | | | | |
6.050%, 01/11/40 | | | 160 | | | | 173 | |
5.550%, 01/21/45 | | | 283 | | | | 289 | |
4.350%, 01/15/47 | | | 1,078 | | | | 925 | |
4.125%, 01/21/26 | | | 400 | | | | 397 | |
4.000%, 10/02/23 | | | 500 | | | | 501 | |
3.500%, 01/21/21 | | | 250 | | | | 254 | |
Morocco Government International Bond | | | | | | | | |
4.250%, 12/11/22 (A) | | | 200 | | | | 204 | |
Nigeria Government International Bond | | | | | | | | |
6.750%, 01/28/21 (A) | | | 510 | | | | 514 | |
Panama Government International Bond | | | | | | | | |
9.375%, 04/01/29 | | | 290 | | | | 409 | |
| | | | | | | | |
| Description | | Face Amount
(000) | | | Value
(000) | |
6.700%, 01/26/36 | | $ | 1,085 | | | $ | 1,317 | |
5.200%, 01/30/20 | | | 100 | | | | 107 | |
3.875%, 03/17/28 | | | 690 | | | | 674 | |
3.750%, 03/16/25 | | | 530 | | | | 526 | |
Paraguay Government International Bond | | | | | | | | |
6.100%, 08/11/44 (A) | | | 570 | | | | 579 | |
5.000%, 04/15/26 (A) | | | 200 | | | | 203 | |
Peruvian Government International Bond | | | | | | | | |
7.350%, 07/21/25 | | | 190 | | | | 244 | |
6.550%, 03/14/37 | | | 615 | | | | 772 | |
5.625%, 11/18/50 | | | 520 | | | | 589 | |
Philippine Government International Bond | | | | | | | | |
7.750%, 01/14/31 | | | 419 | | | | 589 | |
6.375%, 10/23/34 | | | 810 | | | | 1,053 | |
5.500%, 03/30/26 | | | 200 | | | | 236 | |
4.200%, 01/21/24 | | | 200 | | | | 215 | |
3.700%, 03/01/41 | | | 210 | | | | 201 | |
Poland Government International Bond | | | | | | | | |
6.375%, 07/15/19 | | | 200 | | | | 222 | |
4.000%, 01/22/24 | | | 125 | | | | 128 | |
3.000%, 03/17/23 | | | 150 | | | | 147 | |
Province of British Columbia Canada | | | | | | | | |
2.000%, 10/23/22 | | | 100 | | | | 98 | |
Province of Manitoba Canada | | | | | | | | |
2.050%, 11/30/20 | | | 150 | | | | 150 | |
1.125%, 06/01/18 | | | 100 | | | | 100 | |
Province of Ontario Canada | | | | | | | | |
2.450%, 06/29/22 | | | 200 | | | | 200 | |
2.000%, 01/30/19 | | | 250 | | | | 252 | |
1.875%, 05/21/20 | | | 150 | | | | 149 | |
1.625%, 01/18/19 | | | 100 | | | | 100 | |
1.250%, 06/17/19 | | | 150 | | | | 148 | |
Province of Quebec Canada | | | | | | | | |
2.875%, 10/16/24 | | | 100 | | | | 101 | |
2.625%, 02/13/23 | | | 200 | | | | 200 | |
2.500%, 04/20/26 | | | 100 | | | | 96 | |
Provincia de Cordoba | | | | | | | | |
7.125%, 06/10/21 (A) | | | 410 | | | | 421 | |
Qatar Government International Bond | | | | | | | | |
4.625%, 06/02/46 (A) | | | 174 | | | | 174 | |
2.375%, 06/02/21 (A) | | | 1,248 | | | | 1,221 | |
Romanian Government International Bond | | | | | | | | |
6.750%, 02/07/22 (A) | | | 570 | | | | 649 | |
6.125%, 01/22/44 (A) | | | 800 | | | | 934 | |
4.875%, 01/22/24 (A) | | | 820 | | | | 867 | |
4.375%, 08/22/23 (A) | | | 490 | | | | 504 | |
Russian Foreign Bond-Eurobond | | | | | | | | |
5.625%, 04/04/42 (A) | | | 400 | | | | 430 | |
4.875%, 09/16/23 (A) | | | 200 | | | | 211 | |
The accompanying notes are an integral part of the financial statements.
108
| | |
| THE KP FUNDS | | December 31, 2016 |
| | | | | | | | |
| Description | | Face Amount
(000) | | | Value
(000) | |
Saudi Government International Bond | | | | | | | | |
4.500%, 10/26/46 (A) | | $ | 321 | | | $ | 308 | |
2.375%, 10/26/21 (A) | | | 1,200 | | | | 1,165 | |
Senegal Government International Bond | | | | | | | | |
8.750%, 05/13/21 (A) | | | 825 | | | | 921 | |
6.250%, 07/30/24 (A) | | | 740 | | | | 737 | |
Serbia Government International Bond | | | | | | | | |
7.250%, 09/28/21 (A) | | | 875 | | | | 976 | |
5.875%, 12/03/18 (A) | | | 590 | | | | 617 | |
South Africa Government International Bond | | | | | | | | |
5.875%, 09/16/25 | | | 200 | | | | 213 | |
5.500%, 03/09/20 | | | 150 | | | | 159 | |
4.875%, 04/14/26 | | | 240 | | | | 239 | |
4.300%, 10/12/28 | | | 1,310 | | | | 1,215 | |
Sri Lanka Government International Bond | | | | | | | | |
6.850%, 11/03/25 (A) | | | 245 | | | | 240 | |
6.825%, 07/18/26 (A) | | | 430 | | | | 423 | |
6.250%, 10/04/20 (A) | | | 730 | | | | 744 | |
6.000%, 01/14/19 (A) | | | 310 | | | | 319 | |
5.875%, 07/25/22 (A) | | | 1,255 | | | | 1,233 | |
5.125%, 04/11/19 (A) | | | 310 | | | | 313 | |
Turkey Government International Bond | | | | | | | | |
8.000%, 02/14/34 | | | 386 | | | | 441 | |
7.375%, 02/05/25 | | | 440 | | | | 482 | |
6.875%, 03/17/36 | | | 480 | | | | 494 | |
5.625%, 03/30/21 | | | 750 | | | | 769 | |
4.875%, 04/16/43 | | | 240 | | | | 193 | |
4.250%, 04/14/26 | | | 740 | | | | 658 | |
Ukraine Government AID Bonds | | | | | | | | |
1.471%, 09/29/21 | | | 200 | | | | 195 | |
Ukraine Government International Bond | | | | | | | | |
7.750%, 09/01/19 (A) | | | 3,775 | | | | 3,676 | |
0.000%, 05/31/40 (A) (B) | | | 314 | | | | 94 | |
Ukreximbank Via Biz Finance | | | | | | | | |
9.625%, 04/27/22 (A) | | | 815 | | | | 797 | |
Uruguay Government International Bond | | | | | | | | |
5.100%, 06/18/50 | | | 976 | | | | 878 | |
4.500%, 08/14/24 | | | 344 | | | | 359 | |
4.375%, 10/27/27 | | | 1,310 | | | | 1,313 | |
Venezuela Government International Bond | | | | | | | | |
9.250%, 09/15/27 | | | 180 | | | | 91 | |
7.750%, 10/13/19 | | | 515 | | | | 286 | |
7.650%, 04/21/25 | | | 752 | | | | 342 | |
7.000%, 12/01/18 | | | 492 | | | | 267 | |
6.000%, 12/09/20 | | | 780 | | | | 376 | |
Vietnam Government International Bond | | | | | | | | |
6.750%, 01/29/20 (A) | | | 200 | | | | 217 | |
4.800%, 11/19/24 (A) | | | 225 | | | | 221 | |
| | | | | | | | |
| Description | | Face Amount
(000) | | | Value
(000) | |
Zambia Government International Bond | | | | | | | | |
8.970%, 07/30/27 (A) | | $ | 200 | | | $ | 197 | |
8.500%, 04/14/24 (A) | | | 905 | | | | 883 | |
| | | | | | | | |
| | | | | | | 96,377 | |
| | | | | | | | |
Total Sovereign Debt
(Cost $96,925) (000) | | | | | | | 96,377 | |
| | | | | | | | |
ASSET-BACKED SECURITIES — 5.9% | |
Automotive — 4.2% | | | | | | | | |
Americredit Automobile Receivables Trust,
Ser 2016-4, Cl C | | | | | | | | |
2.410%, 07/08/22-07/08/22 | | | 854 | | | | 845 | |
AmeriCredit Automobile Receivables Trust, Ser 2016-3, Cl D | | | | | | | | |
2.710%, 09/08/22-09/08/22 | | | 382 | | | | 377 | |
2.240%, 04/08/22-04/08/22 | | | 1,062 | | | | 1,036 | |
1.285%, 06/10/19-06/10/19 (B) | | | 1,149 | | | | 1,152 | |
1.279%, 04/08/19-04/08/19 (B) | | | 809 | | | | 810 | |
Capital Auto Receivables Asset Trust, Ser 2016-3, Cl A2A | | | | | | | | |
1.360%, 04/22/19-04/22/19 | | | 906 | | | | 905 | |
CarFinance Capital Auto Trust, Ser 2015-1A, Cl A | | | | | | | | |
1.750%, 06/15/21-06/15/21 (A) | | | 610 | | | | 611 | |
CarMax Auto Owner Trust, Ser 2016-4, Cl A3 | | | | | | | | |
1.400%, 08/15/21-08/15/21 | | | 1,451 | | | | 1,435 | |
Chrysler Capital Auto Receivables Trust, Ser 2016-BA, Cl A3 | | | | | | | | |
1.640%, 07/15/21-07/15/21 (A) | | | 1,694 | | | | 1,681 | |
CPS Auto Receivables Trust, Ser 2016-B, Cl A | | | | | | | | |
2.070%, 11/15/19-11/15/19 (A) | | | 961 | | | | 962 | |
1.770%, 06/17/19-06/17/19 (A) | | | 647 | | | | 648 | |
1.650%, 11/15/19-11/15/19 (A) | | | 59 | | | | 59 | |
1.620%, 01/15/20-01/15/20 (A) | | | 2,019 | | | | 2,004 | |
1.530%, 07/15/19-07/15/19 (A) | | | 16 | | | | 16 | |
1.490%, 04/15/19-04/15/19 (A) | | | 56 | | | | 56 | |
1.210%, 08/15/18-08/15/18 (A) | | | 15 | | | | 15 | |
CPS Auto Trust, Ser 2016-D, Cl A | | | | | | | | |
1.500%, 06/15/20-06/15/20 (A) | | | 1,847 | | | | 1,843 | |
Drive Auto Receivables Trust, Ser 2016-BA, Cl A2 | | | | | | | | |
1.380%, 03/15/17-03/15/17 (A) | | | 929 | | | | 929 | |
DT Auto Owner Trust,
Ser 2016-3A, Cl A | | | | | | | | |
1.750%, 11/15/19-11/15/19 (A) | | | 949 | | | | 949 | |
1.660%, 03/15/19-03/15/19 (A) | | | 296 | | | | 296 | |
1.440%, 11/15/19-11/15/19 (A) | | | 1,894 | | | | 1,891 | |
Exeter Automobile Receivables Trust, Ser 2016-1A, Cl A | | | | | | | | |
2.800%, 07/15/20-07/15/20 (A) | | | 279 | | | | 279 | |
1.840%, 11/16/20-11/16/20 (A) | | | 2,025 | | | | 2,019 | |
The accompanying notes are an integral part of the financial statements.
109
| | |
| THE KP FUNDS | | December 31, 2016 |
| | | | | | | | |
| Description | | Face Amount
(000) | | | Value
(000) | |
1.600%, 06/17/19-06/17/19 (A) | | $ | 6 | | | $ | 6 | |
1.540%, 11/15/19-11/15/19 (A) | | | 9 | | | | 9 | |
1.320%, 01/15/19-01/15/19 (A) | | | 39 | | | | 39 | |
First Investors Auto Owner Trust, Ser 2016-2A, Cl A1 | | | | | | | | |
1.536%, 11/16/20-11/16/20 (A) | | | 1,116 | | | | 1,114 | |
1.440%, 10/15/19-10/15/19 (A) | | | 15 | | | | 15 | |
Flagship Credit Auto Trust,
Ser 2015-3, Cl A | | | | | | | | |
2.380%, 10/15/20-10/15/20 (A) | | | 336 | | | | 337 | |
2.280%, 05/15/20-05/15/20 (A) | | | 391 | | | | 392 | |
1.630%, 06/15/20-06/15/20 (A) | | | 7 | | | | 7 | |
1.600%, 12/15/19-12/15/19 (A) | | | 1,629 | | | | 1,627 | |
1.470%, 03/16/20-03/16/20 (A) | | | 1,147 | | | | 1,146 | |
1.430%, 12/16/19-12/16/19 (A) | | | 32 | | | | 32 | |
1.210%, 04/15/19-04/15/19 (A) | | | 46 | | | | 46 | |
Ford Credit Auto Owner Trust, Ser 2016-2, Cl A | | | | | | | | |
2.030%, 12/15/27-12/15/27 (A) | | | 959 | | | | 944 | |
1.400%, 02/15/22-02/15/22 | | | 1,467 | | | | 1,442 | |
1.220%, 03/15/21-03/15/21 | | | 2,094 | | | | 2,078 | |
Ford Credit Floorplan Master Owner Trust A, Ser 2016-5, Cl A1 | | | | | | | | |
1.950%, 11/15/21-11/15/21 | | | 769 | | | | 769 | |
Honda Auto Receivables Owner Trust, Ser 2016-4, Cl A4 | | | | | | | | |
1.650%, 01/18/23-01/18/23 | | | 1,286 | | | | 1,265 | |
1.470%, 12/18/20-12/18/20 | | | 1,825 | | | | 1,811 | |
1.330%, 11/18/22-11/18/22 | | | 1,992 | | | | 1,966 | |
Prestige Auto Receivables Trust, Ser 2016-2A, Cl C | | | | | | | | |
2.880%, 11/15/22-11/15/22 (A) | | | 223 | | | | 220 | |
Santander Drive Auto Receivables Trust,
Ser 2016-3, Cl C | | | | | | | | |
2.460%, 03/15/22-03/15/22 | | | 1,090 | | | | 1,085 | |
1.830%, 01/15/20-01/15/20 | | | 1,003 | | | | 1,004 | |
1.820%, 05/15/19-05/15/19 | | | 65 | | | | 65 | |
1.200%, 12/17/18-12/17/18 | | | 95 | | | | 95 | |
1.144%, 12/17/18-12/17/18 (B) | | | 92 | | | | 92 | |
Toyota Auto Receivables Owner Trust, Ser 2016-D, Cl A3 | | | | | | | | |
1.230%, 10/15/20-10/15/20 | | | 4,354 | | | | 4,326 | |
United Auto Credit Securitization Trust, Ser 2016-2, Cl A | | | | | | | | |
1.670%, 12/10/17-12/10/17 (A) | | | 1,695 | | | | 1,693 | |
| | | | | | | | |
| | | | | | | 44,443 | |
| | | | | | | | |
Credit Card — 1.1% | |
Capital One Multi-Asset Execution Trust, Ser 2016-A6, Cl A | | | | | | | | |
1.820%, 09/15/22-09/15/22 | | | 2,579 | | | | 2,571 | |
1.154%, 02/15/22-02/15/22 (B) | | | 2,306 | | | | 2,314 | |
Chase Issuance Trust, Ser 2016-A3, Cl A3 | | | | | | | | |
1.254%, 06/15/23-06/15/23 (B) | | | 2,387 | | | | 2,393 | |
| | | | | | | | |
| Description | | Face Amount
(000) | | | Value
(000) | |
Discover Card Execution Note Trust, Ser 2016-A4, Cl A4 | | | | | | | | |
1.390%, 03/15/22-03/15/22 | | $ | 2,704 | | | $ | 2,672 | |
World Financial Network Credit Card Master Trust, Ser 2016-B, Cl A | | | | | | | | |
1.440%, 06/15/22-06/15/22 | | | 2,349 | | | | 2,339 | |
| | | | | | | | |
| | | | | | | 12,289 | |
| | | | | | | | |
Other Asset-Backed Securities — 0.6% | |
Ajax Mortgage Loan Trust, Ser 2016-C, Cl A | | | | | | | | |
4.000%, 10/25/57-10/25/57 (A) | | | 794 | | | | 796 | |
Bayview Opportunity Master Fund IIa Trust, Ser 2016-RPL3, Cl A1 | | | | | | | | |
3.475%, 07/28/31-07/28/31 (A) | | | 229 | | | | 227 | |
Bayview Opportunity Master Fund IIIa Trust, Ser 2016-RN3, Cl A1 | | | | | | | | |
3.598%, 09/28/31-09/28/31 (A) | | | 440 | | | | 439 | |
Bayview Opportunity Master Fund Trust, Ser 2016-LT1, Cl A1 | | | | | | | | |
3.475%, 10/28/31-10/28/31 (A) | | | 137 | | | | 136 | |
NYMT Residential, Ser 2016-RP1A, Cl A | | | | | | | | |
4.000%, 03/25/21-03/25/21 (A) | | | 246 | | | | 245 | |
US Residential Opportunity Fund III Trust,
Ser 2016-1III, Cl A | | | | | | | | |
3.475%, 07/27/36-07/27/36 (A) | | | 281 | | | | 280 | |
VOLT XLV,
Ser 2016-NPL5, Cl A1 | | | | | | | | |
4.000%, 05/25/46-05/25/46 (A) | | | 600 | | | | 601 | |
VOLT XLVIII,
Ser 2016-NPL8, Cl A1 | | | | | | | | |
3.500%, 07/25/46-07/25/46 (A) | | | 548 | | | | 546 | |
VOLT XXII,
Ser 2015-NPL4, Cl A1 | | | | | | | | |
3.500%, 02/25/55-02/25/55 (A) | | | 124 | | | | 124 | |
VOLT XXVI,
Ser 2014-NPL6, Cl A1 | | | | | | | | |
3.125%, 09/25/43-09/25/43 (A) | | | 1,056 | | | | 1,055 | |
VOLT XXVII,
Ser 2014-NPL7, Cl A1 | | | | | | | | |
3.375%, 08/27/57-08/27/57 (A) | | | 279 | | | | 279 | |
VOLT XXX,
Ser 2015-NPL1, Cl A1 | | | | | | | | |
3.625%, 10/25/57-10/25/57 (A) | | | 505 | | | | 505 | |
VOLT XXXI,
Ser 2015-NPL2, Cl A1 | | | | | | | | |
3.375%, 02/25/55-02/25/55 (A) | | | 491 | | | | 492 | |
VOLT XXXIV,
Ser 2015-NPL7, Cl A1 | | | | | | | | |
3.250%, 02/25/55-02/25/55 (A) | | | 213 | | | | 212 | |
VOLT XXXV,
Ser 2016-NPL9, Cl A1 | | | | | | | | |
3.500%, 09/25/46-09/25/46 (A) | | | 559 | | | | 558 | |
The accompanying notes are an integral part of the financial statements.
110
| | |
| THE KP FUNDS | | December 31, 2016 |
| | | | | | | | |
| Description | | Face Amount
(000) | | | Value
(000) | |
VOLT XXXVI,
Ser 2015-NP10, Cl A1 | | | | | | | | |
3.625%, 07/25/45-07/25/45 (A) | | $ | 75 | | | $ | 75 | |
VOLT XXXVIII,
Ser 2015-NP12, Cl A1 | | | | | | | | |
3.875%, 09/25/45-09/25/45 (A) | | | 140 | | | | 140 | |
| | | | | | | | |
| | | | | | | 6,710 | |
| | | | | | | | |
Total Asset-Backed Securities
(Cost $63,724) (000) | | | | | | | 63,442 | |
| | | | | | | | |
U.S. GOVERNMENT AGENCY OBLIGATIONS — 1.6% | |
FFCB | | | | | | | | |
1.420%, 06/29/20-06/29/20 | | | 100 | | | | 98 | |
1.370%, 10/13/20-10/13/20 | | | 100 | | | | 97 | |
1.150%, 02/22/19-02/22/19 | | | 200 | | | | 199 | |
1.100%, 03/14/18-06/01/18 | | | 350 | | | | 350 | |
0.750%, 04/18/18-04/18/18 | | | 100 | | | | 99 | |
FHLB | | | | | | | | |
4.125%, 03/13/20-03/13/20 | | | 750 | | | | 808 | |
1.875%, 11/29/21-11/29/21 | | | 150 | | | | 149 | |
1.625%, 06/14/19-06/14/19 | | | 400 | | | | 402 | |
1.375%, 11/15/19-02/18/21 | | | 325 | | | | 321 | |
1.250%, 01/16/19-01/16/19 | | | 250 | | | | 250 | |
1.150%, 06/22/18-06/22/18 | | | 200 | | | | 199 | |
1.125%, 06/21/19-06/21/19 | | | 300 | | | | 298 | |
1.000%, 09/26/19-09/26/19 | | | 250 | | | | 247 | |
0.875%, 10/01/18-08/05/19 | | | 250 | | | | 248 | |
0.625%, 08/07/18-08/07/18 | | | 200 | | | | 198 | |
FHLMC | | | | | | | | |
6.250%, 07/15/32-07/15/32 | | | 705 | | | | 970 | |
2.375%, 01/13/22-01/13/22 | | | 2,243 | | | | 2,280 | |
1.330%, 12/30/20-12/30/20 | | | 400 | | | | 386 | |
1.250%, 08/01/19-10/02/19 | | | 700 | | | | 697 | |
1.125%, 04/15/19-04/15/19 | | | 300 | | | | 299 | |
1.050%, 05/17/18-05/17/18 | | | 250 | | | | 249 | |
1.000%, 05/11/18-05/11/18 | | | 150 | | | | 149 | |
0.750%, 01/12/18-04/09/18 | | | 850 | | | | 847 | |
FNMA | |
2.625%, 09/06/24-09/06/24 | | | 1,260 | | | | 1,272 | |
2.125%, 04/24/26-04/24/26 | | | 200 | | | | 189 | |
1.875%, 02/19/19-12/28/20 | | | 631 | | | | 638 | |
1.750%, 06/20/19-06/20/19 | | | 300 | | | | 303 | |
1.500%, 06/22/20-11/30/20 | | | 427 | | | | 423 | |
1.400%, 06/13/19-06/13/19 | | | 250 | | | | 249 | |
1.375%, 01/28/19-10/07/21 | | | 450 | | | | 444 | |
1.125%, 07/20/18-07/20/18 | | | 250 | | | | 250 | |
1.000%, 02/26/19-08/28/19 | | | 750 | | | | 744 | |
0.875%, 02/08/18-05/21/18 | | | 1,000 | | | | 998 | |
Tennessee Valley Authority | |
4.250%, 09/15/65-09/15/65 | | | 843 | | | | 868 | |
3.500%, 12/15/42-12/15/42 | | | 782 | | | | 764 | |
| | | | | | | | |
Total U.S. Government Agency Obligations
(Cost $16,790) (000) | | | | 16,982 | |
| | | | | | | | |
| | | | | | | | |
| Description | | Face Amount
(000) | | | Value
(000) | |
MUNICIPAL BONDS — 0.5% | |
Alabama Economic Settlement Authority | | | | | | | | |
3.163%, 09/15/25 | | $ | 603 | | | $ | 606 | |
California State | | | | | | | | |
7.350%, 11/01/39 | | | 211 | | | | 299 | |
7.300%, 10/01/39 | | | 835 | | | | 1,179 | |
California State, Department of Water Resources, Power Supply Revenue | | | | | | | | |
2.000%, 05/01/22 | | | 100 | | | | 97 | |
Commonwealth Financing Authority | | | | | | | | |
4.144%, 06/01/38 | | | 320 | | | | 308 | |
Florida State, Hurricane Catastrophe Fund RB | | | | | | | | |
2.995%, 07/01/20 | | | 150 | | | | 154 | |
Illinois State GO | | | | | | | | |
5.665%, 03/01/18 | | | 200 | | | | 207 | |
New Jersey State, Transportation Trust Fund RB | | | | | | | | |
5.754%, 12/15/28 | | | 1,250 | | | | 1,303 | |
South Carolina State, Public Service Authority | | | | | | | | |
2.388%, 12/01/23 | | | 100 | | | | 97 | |
University of California RB | | | | | | | | |
4.767%, 05/15/15 | | | 569 | | | | 541 | |
| | | | | | | | |
| | | | | | | 4,791 | |
| | | | | | | | |
Total Municipal Bonds
(Cost $4,864) (000) | | | | | | | 4,791 | |
| | | | | | | | |
PREFERRED STOCK — 0.0% | |
Education Management* (E) (G) | | | 1,550,903 | | | | 7 | |
| | | | | | | | |
Total Preferred Stock
(Cost $188) (000) | | | | | | | 7 | |
| | | | | | | | |
SHORT-TERM INVESTMENT — 9.9% | |
State Street Institutional Treasury Money Market Fund, Cl Institutional, 0.406% (F) | | | 106,195,271 | | | | 106,196 | |
| | | | | | | | |
Total Short-Term Investment (Cost $106,196) (000) | | | | | | | 106,196 | |
| | | | | | | | |
Total Investments — 109.9% (Cost $1,185,233) (000) | | | | | | $ | 1,175,622 | |
| | | | | | | | |
Percentages are based on net assets of $1,069,341 (000).
A list of the open futures contracts held by the Fund at December 31, 2016, is as follow s (000):
| | | | | | |
| Type of Contract | | Number of
Contracts
Long (Short) | | Expiration
Date | | Unrealized
Appreciation |
| U.S. 10-Year Treasury Note | | (61) | | Mar-2017 | | $64 |
| | | | | | |
The accompanying notes are an integral part of the financial statements.
111
| | |
| THE KP FUNDS | | December 31, 2016 |
For the year ended December 31, 2016, the monthly average value of futures contracts held was $(1,265) (000).
A list of the open forward foreign currency contracts held by the Fund at December 31, 2016 is as follows (000):
| | | | | | | | | | | | | | | | | | |
Counterparty | | Maturity
Date | | Currency
to Deliver | | | Currency
to Receive | | | Unrealized
Appreciation/
(Depreciation) | |
| Barclays Capital | | 2/14/17 | | KRW | | | 662,000 | | | USD | | | 563 | | | $ | 14 | |
| Barclays Capital | | 2/23/17 | | CNH | | | 9,044 | | | USD | | | 1,350 | | | | 74 | |
| Barclays Capital | | 3/16/17 | | INR | | | 26,570 | | | USD | | | 391 | | | | 3 | |
| Barclays Capital | | 2/17/17 | | USD | | | 379 | | | BRL | | | 1,248 | | | | (1 | ) |
| BNP Paribas | | 1/24/17 | | EUR | | | 262 | | | USD | | | 275 | | | | (1 | ) |
| BNP Paribas | | 2/24/16 | | USD | | | 370 | | | ARS | | | 5,890 | | | | (10 | ) |
| Citi | | 2/7/17 | | ARS | | | 5,890 | | | USD | | | 350 | | | | (10 | ) |
| Citi | | 2/14/17 | | KRW | | | 623,000 | | | USD | | | 533 | | | | 17 | |
| Credit Suisse | | 2/21/17 | | MXN | | | 8,160 | | | USD | | | 397 | | | | 7 | |
| HSBC | | 1/24/17 | | JPY | | | 57,200 | | | USD | | | 519 | | | | 29 | |
| HSBC | | 2/15/17 | | MYR | | | 2,257 | | | USD | | | 516 | | | | 14 | |
| State Street | | 2/17/17 | | BRL | | | 2,499 | | | USD | | | 706 | | | | (52 | ) |
| State Street | | 2/19/16 | | USD | | | 357 | | | BRL | | | 1,251 | | | | 23 | |
| UBS Securities | | 2/19/16 | | GBP | | | 888 | | | USD | | | 1,088 | | | | (8 | ) |
| | | | | | | | | | | | | | | | | | |
| | | | | | | | | | | | | | | | $ | 99 | |
| | | | | | | | | | | | | | | | | | |
For the year ended December 31, 2016, the average monthly notional amount of forward foreign currency contracts purchased and sold were $6,234 and $(1,984), respectively.
| ‡ | Real Estate Investment Trust |
| * | Non-income producing security. |
| (1) | In U.S. Dollars unless otherwise indicated. |
| (A) | Security sold within terms of a private placement memorandum, exempt from registration under Section 144A of the Securities Act of 1933, as amended, and may be sold only to dealers in that program or other “accredited investors.” These securities have been determined to be liquid under guidelines established by the Board of Trustees. |
| (B) | Variable rate security-Rate disclosed is the rate in effect on December 31, 2016. |
| (C) | Step Bonds-The rate reflected on the Schedule of Investments is the effective yield on December 31, 2016. The coupon on a step bond changes on a specified date. |
| (D) | Unsettled bank loan. Interest rate not available. |
| (E) | Interest rate not available. |
| (F) | The rate reported is the 7-day effective yield as of December 31, 2016. |
| (G) | Security is fair valued using methods determined in good faith by the Fair Value Committee of the Board of Trustees. The total value of such securities as of December 31, 2016, was $8 (000) and represented 0.00% of net assets. |
ARS — Argentina Peso
BRL — Brazilian Real
Cl — Class
CNH — Chinese Yuan
EUR — Euro
FFCB — Federal Farm Credit Bank
FHLB — Federal Home Loan Bank
FHLMC — Federal Home Loan Mortgage Corporation
FNMA — Federal National Mortgage Association
GBP — British Pound
GHS — Ghana Cedi
GNMA — Government National Mortgage Association
GO — General Obligation
IDR — Indonesian Rupiah
INR — Indian Rupee
JPY — Japanese Yen
KRW — Korean Won
LKR — Sri Lanka Rupee
LLC — Limited Liability Company
L.P. — Limited Partnership
Ltd. — Limited
MXN — Mexican Peso
MYR — Malaysia Ringgit
RB — Revenue Bond
Ser — Series
USD — U.S. Dollar
The following is a list of the level of inputs used as of December 31, 2016, in valuing the Fund’s investments and other financial instruments carried at value (000):
| | | | | | | | | | | | | | | | |
| Investments in Securities | | Level 1 | | | Level 2 | | | Level 3^ | | | Total | |
U.S. Treasury Obligations | | $ | — | | | $ | 337,127 | | | $ | — | | | $ | 337,127 | |
Corporate Obligations | | | — | | | | 285,009 | | | | 1 | | | | 285,010 | |
Mortgage-Backed Securities | | | — | | | | 163,798 | | | | — | | | | 163,798 | |
Loan Participations | | | — | | | | 101,892 | | | | — | | | | 101,892 | |
Sovereign Debt | | | — | | | | 96,377 | | | | — | | | | 96,377 | |
Asset-Backed Securities | | | — | | | | 63,442 | | | | — | | | | 63,442 | |
U.S. Government Agency Obligations | | | — | | | | 16,982 | | | | — | | | | 16,982 | |
Preferred Stock | | | — | | | | — | | | | 7 | | | | 7 | |
Municipal Bonds | | | — | | | | 4,791 | | | | — | | | | 4,791 | |
Short-Term Investment | | | 106,196 | | | | — | | | | — | | | | 106,196 | |
| | | | | | | | | | | | | | | | |
Total Investments in Securities | | $ | 106,196 | | | $ | 1,069,418 | | | $ | 8 | | | $ | 1,175,622 | |
| | | | | | | | | | | | | | | | |
| | | | |
Other Financial
Instruments | | Level 1 | | | Level 2 | | | Level 3^ | | | Total | |
Futures Contracts* | | | | | | | | | | | | | | | | |
Unrealized Appreciation | | $ | 64 | | | $ | — | | | $ | — | | | $ | 64 | |
Forward Currency Contracts* | | | | | | | | | | | | | | | | |
Unrealized Appreciation | | | — | | | | 181 | | | | — | | | | 181 | |
Unrealized Depreciation | | | — | | | | (82 | ) | | | — | | | | (82 | ) |
| | | | | | | | | | | | | | | | |
Total Other Financial Instruments | | $ | 64 | | | $ | 99 | | | $ | — | | | $ | 163 | |
| | | | | | | | | | | | | | | | |
| ^ | A reconciliation of Level 3 investments and disclosures of significant unobservable inputs are presented when the Fund has a significant amount of Level 3 investments at the beginning and/or end of the year in relation to net assets. Management has concluded that Level 3 investments are not material in relation to net assets. |
| * | Futures contracts and Forward foreign currency contracts are valued at the unrealized appreciation/(depreciation) on the instrument. |
For the year ended December 31, 2016, there were no transfers between Level 1 and Level 2 assets and liabilities. For the year ended December 31, 2016, securities with the total market value of $38 (000) were transferred between Level 3 and Level 2. Changes in the classification between Level 2 and Level 3 are due to the availability of observable inputs to determine value. All transfers, if any, are recognized by the Fund at the end of the year.
Amounts designated as “—” are $0 or have been rounded to $0.
The accompanying notes are an integral part of the financial statements.
112
| | |
| THE KP FUNDS | | December 31, 2016 |
|
| STATEMENTS OF ASSETS AND LIABILITIES (000) |
| | | | | | | | | | | | | | | | |
| | | KP
Retirement
Path 2015
Fund | | | KP
Retirement
Path 2020
Fund | | | KP
Retirement
Path 2025
Fund | | | KP
Retirement
Path 2030
Fund | |
| | | | | | | | | | | | | | | | |
Assets: | | | | | | | | | | | | | | | | |
Affiliated Investments at Cost | | $ | 275,051 | | | $ | 503,018 | | | $ | 613,106 | | | $ | 627,844 | |
Unaffiliated Investments at Cost | | | 181,992 | | | | 256,728 | | | | 213,652 | | | | 129,042 | |
| | | | | | | | | | | | | | | | |
Affiliated Investments at Fair Value | | $ | 279,535 | | | $ | 514,685 | | | $ | 628,785 | | | $ | 645,016 | |
Unaffiliated Investments at Fair Value | | | 182,801 | | | | 257,483 | | | | 214,014 | | | | 128,936 | |
Receivable for Investment Securities Sold | | | 173 | | | | 203 | | | | 117 | | | | 70 | |
Dividends Receivable | | | 99 | | | | 129 | | | | 95 | | | | 39 | |
Prepaid Expenses | | | 18 | | | | 27 | | | | 29 | | | | 27 | |
| | | | | | | | | | | | | | | | |
Total Assets | | | 462,626 | | | | 772,527 | | | | 843,040 | | | | 774,088 | |
| | | | | | | | | | | | | | | | |
Liabilities: | | | | | | | | | | | | | | | | |
Payable for Capital Shares Redeemed | | | 171 | | | | 200 | | | | 114 | | | | 67 | |
Cash Overdraft | | | 100 | | | | 130 | | | | 99 | | | | 44 | |
Payable due to Administrator | | | 10 | | | | 17 | | | | 18 | | | | 17 | |
Payable due to Adviser | | | 7 | | | | 10 | | | | 8 | | | | 5 | |
Chief Compliance Officer Fees Payable | | | 1 | | | | 2 | | | | 2 | | | | 2 | |
Other Accrued Expenses | | | 34 | | | | 57 | | | | 66 | | | | 61 | |
| | | | | | | | | | | | | | | | |
Total Liabilities | | | 323 | | | | 416 | | | | 307 | | | | 196 | |
| | | | | | | | | | | | | | | | |
Net Assets | | $ | 462,303 | | | $ | 772,111 | | | $ | 842,733 | | | $ | 773,892 | |
| | | | | | | | | | | | | | | | |
NET ASSETS: | | | | | | | | | | | | | | | | |
Paid-in Capital | | $ | 456,197 | | | $ | 757,653 | | | $ | 823,584 | | | $ | 753,399 | |
Distributions in Excess of Net Investment Income | | | — | | | | — | | | | — | | | | — | |
Accumulated Net Realized Gain on Investments | | | 813 | | | | 2,036 | | | | 3,108 | | | | 3,427 | |
Net Unrealized Appreciation on Investments | | | 5,293 | | | | 12,422 | | | | 16,041 | | | | 17,066 | |
| | | | | | | | | | | | | | | | |
Net Assets | | $ | 462,303 | | | $ | 772,111 | | | $ | 842,733 | | | $ | 773,892 | |
| | | | | | | | | | | | | | | | |
Institutional Class Shares: | | | | | | | | | | | | | | | | |
Net Assets | | $ | 462,303 | | | $ | 772,111 | | | $ | 842,733 | | | $ | 773,892 | |
Outstanding Shares of Beneficial Interest
(unlimited authorization — no par value)† | | | 46,404,739 | | | | 76,433,567 | | | | 82,988,826 | | | | 76,219,432 | |
Net Asset Value, Offering and Redemption Price Per Share* | | $ | 9.96 | | | $ | 10.10 | | | $ | 10.15 | | | $ | 10.15 | |
| | | | | | | | | | | | | | | | |
| | † | Shares are presented unrounded. |
| | * | The net asset value is calculated by dividing the unrounded net assets by the unrounded shares. |
The accompanying notes are an integral part of the financial statements.
113
| | |
| THE KP FUNDS | | December 31, 2016 |
|
| STATEMENTS OF ASSETS AND LIABILITIES (000) |
| | | | | | | | | | | | |
| | | KP
Retirement
Path 2035
Fund | | | KP
Retirement
Path 2040
Fund | | | KP
Retirement
Path 2045
Fund | |
| | | | | | | | | | | | |
Assets: | | | | | | | | | | | | |
Affiliated Investments at Cost | | $ | 737,541 | | | $ | 691,018 | | | $ | 493,750 | |
Unaffiliated Investments at Cost | | | 86,227 | | | | 50,419 | | | | 27,896 | |
| | | | | | | | | | | | |
Affiliated Investments at Fair Value | | $ | 759,925 | | | $ | 712,459 | | | $ | 507,984 | |
Unaffiliated Investments at Fair Value | | | 86,041 | | | | 50,369 | | | | 27,893 | |
Receivable for Investment Securities Sold | | | 289 | | | | 98 | | | | 149 | |
Dividends Receivable | | | 15 | | | | 2 | | | | — | |
Prepaid Expenses | | | 29 | | | | 26 | | | | 18 | |
| | | | | | | | | | | | |
Total Assets | | | 846,299 | | | | 762,954 | | | | 536,044 | |
| | | | | | | | | | | | |
Liabilities: | | | | | | | | | | | | |
Payable for Capital Shares Redeemed | | | 286 | | | | 96 | | | | 147 | |
Cash Overdraft | | | 19 | | | | 5 | | | | 2 | |
Payable due to Administrator | | | 18 | | | | 16 | | | | 12 | |
Payable due to Adviser | | | 3 | | | | 2 | | | | 1 | |
Chief Compliance Officer Fees Payable | | | 2 | | | | 2 | | | | 1 | |
Other Accrued Expenses | | | 69 | | | | 62 | | | | 45 | |
| | | | | | | | | | | | |
Total Liabilities | | | 397 | | | | 183 | | | | 208 | |
| | | | | | | | | | | | |
Net Assets | | $ | 845,902 | | | $ | 762,771 | | | $ | 535,836 | |
| | | | | | | | | | | | |
NET ASSETS: | | | | | | | | | | | | |
Paid-in Capital | | $ | 819,512 | | | $ | 737,240 | | | $ | 518,832 | |
Undistributed/(Distributions in Excess of) Net Investment Income | | | — | | | | — | | | | 39 | |
Accumulated Net Realized Gain on Investments | | | 4,192 | | | | 4,140 | | | | 2,734 | |
Net Unrealized Appreciation on Investments | | | 22,198 | | | | 21,391 | | | | 14,231 | |
| | | | | | | | | | | | |
Net Assets | | $ | 845,902 | | | $ | 762,771 | | | $ | 535,836 | |
| | | | | | | | | | | | |
Institutional Class Shares: | | | | | | | | | | | | |
Net Assets | | $ | 845,902 | | | $ | 762,771 | | | $ | 535,836 | |
Outstanding Shares of Beneficial Interest
(unlimited authorization — no par value)† | | | 83,013,728 | | | | 74,681,656 | | | | 52,507,360 | |
Net Asset Value, Offering and Redemption Price Per Share* | | $ | 10.19 | | | $ | 10.21 | | | $ | 10.20 | |
| | | | | | | | | | | | |
| | † | Shares are presented unrounded. |
| | * | The net asset value is calculated by dividing the unrounded net assets by the unrounded shares. |
Amounts designated as “—” are $0 or have been rounded to $0.
The accompanying notes are an integral part of the financial statements.
114
| | |
| THE KP FUNDS | | December 31, 2016 |
|
| STATEMENTS OF ASSETS AND LIABILITIES (000) |
| | | | | | | | | | | | |
| | | KP
Retirement
Path 2050
Fund | | | KP
Retirement
Path 2055
Fund | | | KP
Retirement
Path 2060
Fund | |
| | | | | | | | | | | | |
Assets: | | | | | | | | | | | | |
Affiliated Investments at Cost | | $ | 239,279 | | | $ | 51,094 | | | $ | 8,346 | |
Unaffiliated Investments at Cost | | | 12,736 | | | | 2,734 | | | | 455 | |
| | | | | | | | | | | | |
Affiliated Investments at Fair Value | | $ | 244,716 | | | $ | 52,079 | | | $ | 8,642 | |
Unaffiliated Investments at Fair Value | | | 12,894 | | | | 2,745 | | | | 456 | |
Receivable for Capital Shares Sold | | | 4 | | | | — | | | | — | |
Receivable for Investment Securities Sold | | | — | | | | 18 | | | | — | |
Prepaid Expenses | | | 8 | | | | 2 | | | | — | |
| | | | | | | | | | | | |
Total Assets | | | 257,622 | | | | 54,844 | | | | 9,098 | |
| | | | | | | | | | | | |
Liabilities: | | | | | | | | | | | | |
Payable due to Administrator | | | 5 | | | | 1 | | | | — | |
Payable for Investment Securities Purchased | | | 3 | | | | — | | | | — | |
Cash Overdraft | | | 1 | | | | — | | | | — | |
Chief Compliance Officer Fees Payable | | | 1 | | | | — | | | | — | |
Payable for Capital Shares Redeemed | | | — | | | | 18 | | | | — | |
Other Accrued Expenses | | | 24 | | | | 6 | | | | 1 | |
| | | | | | | | | | | | |
Total Liabilities | | | 34 | | | | 25 | | | | 1 | |
| | | | | | | | | | | | |
Net Assets | | $ | 257,588 | | | $ | 54,819 | | | $ | 9,097 | |
| | | | | | | | | | | | |
NET ASSETS: | | | | | | | | | | | | |
Paid-in Capital | | $ | 250,734 | | | $ | 53,814 | | | $ | 9,112 | |
Distributions in Excess of Net Investment Income | | | — | | | | — | | | | — | |
Accumulated Net Realized Gain/(Loss) on Investments | | | 1,259 | | | | 9 | | | | (312 | ) |
Net Unrealized Appreciation on Investments | | | 5,595 | | | | 996 | | | | 297 | |
| | | | | | | | | | | | |
Net Assets | | $ | 257,588 | | | $ | 54,819 | | | $ | 9,097 | |
| | | | | | | | | | | | |
Institutional Class Shares: | | | | | | | | | | | | |
Net Assets | | $ | 257,588 | | | $ | 54,819 | | | $ | 9,097 | |
Outstanding Shares of Beneficial Interest
(unlimited authorization — no par value)† | | | 25,143,261 | | | | 5,364,437 | | | | 885,465 | |
Net Asset Value, Offering and Redemption Price Per Share* | | $ | 10.24 | | | $ | 10.22 | | | $ | 10.27 | |
| | | | | | | | | | | | |
| | † | Shares are presented unrounded. |
| | * | The net asset value is calculated by dividing the unrounded net assets by the unrounded shares. |
Amounts designated as “—” are $0 or have been rounded to $0.
The accompanying notes are an integral part of the financial statements.
115
| | |
| THE KP FUNDS | | December 31, 2016 |
|
| STATEMENTS OF ASSETS AND LIABILITIES (000) |
| | | | | | | | | | | | | | | | |
| | | KP
Large Cap
Equity Fund | | | KP
Small Cap
Equity Fund | | | KP
International
Equity Fund | | | KP
Fixed
Income
Fund | |
| | | | | | | | | | | | | | | | |
Assets: | | | | | | | | | | | | | | | | |
Investments at Cost | | $ | 1,308,888 | | | $ | 844,278 | | | $ | 1,251,748 | | | $ | 1,185,233 | |
Cost of Foreign Currency | | | — | | | | — | | | | 9,859 | | | | 6 | |
| | | | | | | | | | | | | | | | |
Investments at Fair Value | | $ | 1,479,814 | | | $ | 934,216 | | | $ | 1,223,564 | | | $ | 1,175,622 | |
Cash | | | 23 | | | | 929 | | | | — | | | | 1,887 | |
Foreign Currency at Value | | | — | | | | — | | | | 9,877 | | | | 6 | |
Dividends and Interest Receivable | | | 1,697 | | | | 651 | | | | 1,693 | | | | 6,672 | |
Receivable for Investment Securities Sold | | | 888 | | | | 1,875 | | | | 18 | | | | 14,204 | |
Cash Collateral for Futures Contracts | | | 539 | | | | 715 | | | | 1,961 | | | | 104 | |
Reclaims Receivable | | | 171 | | | | 6 | | | | 1,700 | | | | 22 | |
Receivable for Capital Shares Sold | | | 1 | | | | 62 | | | | 1 | | | | — | |
Unrealized Appreciation on Forward Foreign Currency Contracts | | | — | | | | — | | | | — | | | | 181 | |
Prepaid Expenses | | | 5 | | | | 4 | | | | 5 | | | | 2 | |
| | | | | | | | | | | | | | | | |
Total Assets | | | 1,483,138 | | | | 938,458 | | | | 1,238,819 | | | | 1,198,700 | |
| | | | | | | | | | | | | | | | |
Liabilities: | | | | | | | | | | | | | | | | |
Payable for Investment Securities Purchased | | | 5,669 | | | | 7,015 | | | | 4,866 | | | | 128,514 | |
Payable for Capital Shares Redeemed | | | 299 | | | | 112 | | | | 239 | | | | 372 | |
Payable due to Sub-Advisers | | | 288 | | | | 335 | | | | 336 | | | | 175 | |
Payable due to Adviser | | | 59 | | | | 37 | | | | 48 | | | | 42 | |
Payable due to Administrator | | | 47 | | | | 30 | | | | 38 | | | | 33 | |
Chief Compliance Officer Fees Payable | | | 2 | | | | 1 | | | | 2 | | | | 1 | |
Unrealized Depreciation on Forward Foreign Currency Contracts | | | — | | | | — | | | | — | | | | 82 | |
Accrued Foreign Capital Gains Tax | | | — | | | | — | | | | 242 | | | | — | |
Other Accrued Expenses | | | 146 | | | | 113 | | | | 318 | | | | 140 | |
| | | | | | | | | | | | | | | | |
Total Liabilities | | | 6,510 | | | | 7,643 | | | | 6,089 | | | | 129,359 | |
| | | | | | | | | | | | | | | | |
Net Assets | | $ | 1,476,628 | | | $ | 930,815 | | | $ | 1,232,730 | | | $ | 1,069,341 | |
| | | | | | | | | | | | | | | | |
NET ASSETS: | | | | | | | | | | | | | | | | |
Paid-in Capital | | $ | 1,305,003 | | | $ | 840,212 | | | $ | 1,307,578 | | | $ | 1,083,370 | |
Undistributed/(Distributions in Excess of) Net Investment Income | | | 449 | | | | 767 | | | | (1,055 | ) | | | 216 | |
Accumulated Net Realized Gain/(Loss) on Investments | | | 367 | | | | 95 | | | | (45,103 | ) | | | (4,798 | ) |
Net Unrealized Appreciation/(Depreciation) on Investments | | | 170,926 | | | | 89,938 | | | | (28,184 | ) | | | (9,611 | ) |
Net Unrealized Appreciation/(Depreciation) on Futures Contracts | | | (107 | ) | | | (197 | ) | | | (129 | ) | | | 64 | |
Net Unrealized Appreciation/(Depreciation) on Forward Contracts and Foreign Currency Transactions and Translation of other Assets and Liabilities Denominated in Foreign Currencies | | | (10 | ) | | | — | | | | (135 | ) | | | 100 | |
Accumulated Foreign Capital Gains Tax on Appreciated Securities | | | — | | | | — | | | | (242 | ) | | | — | |
| | | | | | | | | | | | | | | | |
Net Assets | | $ | 1,476,628 | | | $ | 930,815 | | | $ | 1,232,730 | | | $ | 1,069,341 | |
| | | | | | | | | | | | | | | | |
Institutional Class Shares: | | | | | | | | | | | | | | | | |
Net Assets | | $ | 1,476,628 | | | $ | 930,815 | | | $ | 1,232,730 | | | $ | 1,069,341 | |
Outstanding Shares of Beneficial Interest
(unlimited authorization — no par value)† | | | 131,937,234 | | | | 82,954,600 | | | | 138,037,569 | | | | 108,484,572 | |
Net Asset Value, Offering and Redemption Price Per Share* | | $ | 11.19 | | | $ | 11.22 | | | $ | 8.93 | | | $ | 9.86 | |
| | | | | | | | | | | | | | | | |
| | † | Shares are presented unrounded. |
| | * | The net asset value is calculated by dividing the unrounded net assets by the unrounded shares. |
Amounts designated as “—” are $0 or have been rounded to $0.
The accompanying notes are an integral part of the financial statements.
116
| | |
| THE KP FUNDS | | For the year ended December 31, 2016 |
| | |
|
| STATEMENTS OF OPERATIONS (000) |
| | | | | | | | | | | | | | | | |
| | | KP
Retirement
Path 2015
Fund | | | KP
Retirement
Path 2020
Fund | | | KP
Retirement
Path 2025
Fund | | | KP
Retirement
Path 2030
Fund | |
Investment Income: | | | | | | | | | | | | | | | | |
Income Distributions from Affiliated Registered Investment Companies | | $ | 5,397 | | | $ | 9,539 | | | $ | 11,101 | | | $ | 10,945 | |
Income Distributions from Unaffiliated Registered Investment Companies | | | 3,119 | | | | 4,388 | | | | 3,952 | | | | 2,836 | |
| | | | | | | | | | | | | | | | |
Total Investment Income | | | 8,516 | | | | 13,927 | | | | 15,053 | | | | 13,781 | |
| | | | | | | | | | | | | | | | |
Expenses: | | | | | | | | | | | | | | | | |
Administration Fees | | | 123 | | | | 190 | | | | 198 | | | | 178 | |
Investment Advisory Fees | | | 94 | | | | 118 | | | | 93 | | | | 53 | |
Trustees’ Fees | | | 13 | | | | 20 | | | | 21 | | | | 19 | |
Chief Compliance Officer Fees | | | 6 | | | | 9 | | | | 9 | | | | 8 | |
Custodian Fees/Transfer Agent Fees | | | 48 | | | | 75 | | | | 80 | | | | 72 | |
Professional Fees | | | 36 | | | | 55 | | | | 57 | | | | 51 | |
Printing Fees | | | 34 | | | | 54 | | | | 56 | | | | 51 | |
Registration Fees | | | 27 | | | | 43 | | | | 49 | | | | 45 | |
Other Fees | | | 9 | | | | 14 | | | | 14 | | | | 12 | |
| | | | | | | | | | | | | | | | |
Total Expenses | | | 390 | | | | 578 | | | | 577 | | | | 489 | |
| | | | | | | | | | | | | | | | |
Net Investment Income | | | 8,126 | | | | 13,349 | | | | 14,476 | | | | 13,292 | |
| | | | | | | | | | | | | | | | |
Net Realized and Unrealized Gain/(Loss) on Investments: | | | | | | | | | | | | | | | | |
Net Realized Gain on Affiliated Investments | | | 3,132 | | | | 3,610 | | | | 3,573 | | | | 3,021 | |
Net Realized Loss on Unaffiliated Investments | | | (1,603 | ) | | | (2,096 | ) | | | (2,132 | ) | | | (1,861 | ) |
Distributions of Realized Gains from Affiliated Registered Investment Company Shares | | | 3,487 | | | | 5,893 | | | | 6,640 | | | | 6,285 | |
Distributions of Realized Gains from Unaffiliated Registered Investment Company Shares | | | 520 | | | | 859 | | | | 933 | | | | 849 | |
Net Change in Unrealized Appreciation on Affiliated Investments | | | 6,014 | | | | 14,746 | | | | 21,384 | | | | 25,283 | |
Net Change in Unrealized Appreciation on Unaffiliated Investments | | | 5,292 | | | | 6,779 | | | | 6,179 | | | | 4,966 | |
| | | | | | | | | | | | | | | | |
Net Realized and Unrealized Gain on Investments | | | 16,842 | | | | 29,791 | | | | 36,577 | | | | 38,543 | |
| | | | | | | | | | | | | | | | |
Net Increase in Net Assets Resulting from Operations | | $ | 24,968 | | | $ | 43,140 | | | $ | 51,053 | | | $ | 51,835 | |
| | | | | | | | | | | | | | | | |
The accompanying notes are an integral part of the financial statements.
117
| | |
| THE KP FUNDS | | For the year ended December 31, 2016 |
| | |
|
| STATEMENTS OF OPERATIONS (000) |
| | | | | | | | | | | | |
| | | KP
Retirement
Path 2035
Fund | | | KP
Retirement
Path 2040
Fund | | | KP
Retirement
Path 2045
Fund | |
Investment Income: | | | | | | | | | | | | |
Income Distributions from Affiliated Registered Investment Companies | | $ | 12,539 | | | $ | 11,530 | | | $ | 8,164 | |
Income Distributions from Unaffiliated Registered Investment Companies | | | 2,261 | | | | 1,448 | | | | 917 | |
| | | | | | | | | | | | |
Total Investment Income | | | 14,800 | | | | 12,978 | | | | 9,081 | |
| | | | | | | | | | | | |
Expenses: | | | | | | | | | | | | |
Administration Fees | | | 193 | | | | 172 | | | | 118 | |
Investment Advisory Fees | | | 35 | | | | 21 | | | | 12 | |
Trustees’ Fees | | | 20 | | | | 18 | | | | 12 | |
Chief Compliance Officer Fees | | | 9 | | | | 8 | | | | 6 | |
Custodian Fees/Transfer Agent Fees | | | 79 | | | | 70 | | | | 49 | |
Professional Fees | | | 55 | | | | 48 | | | | 33 | |
Printing Fees | | | 55 | | | | 49 | | | | 34 | |
Registration Fees | | | 50 | | | | 46 | | | | 33 | |
Other Fees | | | 14 | | | | 12 | | | | 9 | |
| | | | | | | | | | | | |
Total Expenses | | | 510 | | | | 444 | | | | 306 | |
| | | | | | | | | | | | |
Net Investment Income | | | 14,290 | | | | 12,534 | | | | 8,775 | |
| | | | | | | | | | | | |
Net Realized and Unrealized Gain/(Loss) on Investments: | | | | | | | | | | | | |
Net Realized Gain on Affiliated Investments | | | 3,050 | | | | 2,577 | | | | 1,628 | |
Net Realized Loss on Unaffiliated Investments | | | (1,724 | ) | | | (1,151 | ) | | | (799 | ) |
Distributions of Realized Gains from Affiliated Registered Investment Company Shares | | | 7,248 | | | | 6,759 | | | | 4,822 | |
Distributions of Realized Gains from Unaffiliated Registered Investment Company Shares | | | 775 | | | | 532 | | | | 304 | |
Net Change in Unrealized Appreciation on Affiliated Investments | | | 32,496 | | | | 32,018 | | | | 23,080 | |
Net Change in Unrealized Appreciation on Unaffiliated Investments | | | 4,154 | | | | 2,765 | | | | 1,635 | |
| | | | | | | | | | | | |
Net Realized and Unrealized Gain on Investments | | | 45,999 | | | | 43,500 | | | | 30,670 | |
| | | | | | | | | | | | |
Net Increase in Net Assets Resulting from Operations | | $ | 60,289 | | | $ | 56,034 | | | $ | 39,445 | |
| | | | | | | | | | | | |
The accompanying notes are an integral part of the financial statements.
118
| | |
| THE KP FUNDS | | For the year ended December 31, 2016 |
| | |
|
| STATEMENTS OF OPERATIONS (000) |
| | | | | | | | | | | | |
| | | KP
Retirement
Path 2050
Fund | | | KP
Retirement
Path 2055
Fund | | | KP
Retirement
Path 2060
Fund | |
| | | | | | | | | | | | |
Investment Income: | | | | | | | | | | | | |
Income Distributions from Affiliated Registered Investment Companies | | $ | 3,913 | | | $ | 833 | | | $ | 139 | |
Income Distributions from Unaffiliated Registered Investment Companies | | | 377 | | | | 78 | | | | 13 | |
| | | | | | | | | | | | |
Total Investment Income | | | 4,290 | | | | 911 | | | | 152 | |
| | | | | | | | | | | | |
Expenses: | | | | | | | | | | | | |
Administration Fees | | | 53 | | | | 10 | | | | 2 | |
Investment Advisory Fees | | | 5 | | | | 1 | | | | — | |
Trustees’ Fees | | | 5 | | | | 1 | | | | — | |
Chief Compliance Officer Fees | | | 3 | | | | 1 | | | | — | |
Custodian Fees/Transfer Agent Fees | | | 22 | | �� | | 4 | | | | 1 | |
Registration Fees | | | 18 | | | | 4 | | | | 1 | |
Printing Fees | | | 16 | | | | 3 | | | | — | |
Professional Fees | | | 15 | | | | 3 | | | | — | |
Other Fees | | | 4 | | | | 1 | | | | — | |
| | | | | | | | | | | | |
Total Expenses | | | 141 | | | | 28 | | | | 4 | |
| | | | | | | | | | | | |
Net Investment Income | | | 4,149 | | | | 883 | | | | 148 | |
| | | | | | | | | | | | |
Net Realized and Unrealized Gain/(Loss) on Investments: | | | | | | | | | | | | |
Net Realized Gain/(Loss) on Affiliated Investments | | | 789 | | | | (152 | ) | | | (198 | ) |
Net Realized Gain/(Loss) on Unaffiliated Investments | | | (453 | ) | | | (57 | ) | | | 1 | |
Distributions of Realized Gains from Affiliated Registered Investment Company Shares | | | 2,301 | | | | 475 | | | | 80 | |
Distributions of Realized Gains from Unaffiliated Registered Investment Company Shares | | | 141 | | | | 30 | | | | 5 | |
Net Change in Unrealized Appreciation on Affiliated Investments | | | 10,843 | | | | 2,417 | | | | 584 | |
Net Change in Unrealized Appreciation on Unaffiliated Investments | | | 855 | | | | 114 | | | | 13 | |
| | | | | | | | | | | | |
Net Realized and Unrealized Gain on Investments | | | 14,476 | | | | 2,827 | | | | 485 | |
| | | | | | | | | | | | |
Net Increase in Net Assets Resulting from Operations | | $ | 18,625 | | | $ | 3,710 | | | $ | 633 | |
| | | | | | | | | | | | |
Amounts designated as “—” are $0 or have been rounded to $0.
The accompanying notes are an integral part of the financial statements.
119
| | |
| THE KP FUNDS | | For the year ended December 31, 2016 |
| | |
|
| STATEMENTS OF OPERATIONS (000) |
| | | | | | | | | | | | | | | | |
| | | KP
Large Cap
Equity Fund | | | KP
Small Cap
Equity Fund | | | KP
International
Equity Fund | | | KP
Fixed
Income
Fund | |
| | | | | | | | | | | | | | | | |
Investment Income: | | | | | | | | | | | | | | | | |
Dividend Income | | $ | 26,641 | | | $ | 11,377 | | | $ | 32,945 | | | $ | 363 | |
Interest Income | | | 105 | | | | — | | | | — | | | | 26,632 | |
Less: Foreign Taxes Withheld | | | (48 | ) | | | (5 | ) | | | (2,838 | ) | | | 5 | |
| | | | | | | | | | | | | | | | |
Total Investment Income | | | 26,698 | | | | 11,372 | | | | 30,107 | | | | 27,000 | |
| | | | | | | | | | | | | | | | |
Expenses: | | | | | | | | | | | | | | | | |
Sub-Advisory Fees | | | 3,100 | | | | 3,386 | | | | 3,752 | | | | 1,951 | |
Investment Advisory Fees | | | 656 | | | | 402 | | | | 544 | | | | 492 | |
Administration Fees | | | 501 | | | | 307 | | | | 416 | | | | 376 | |
Trustees’ Fees | | | 16 | | | | 10 | | | | 13 | | | | 12 | |
Chief Compliance Officer Fees | | | 7 | | | | 4 | | | | 6 | | | | 5 | |
Custodian Fees/Transfer Agent Fees | | | 196 | | | | 91 | | | | 370 | | | | 93 | |
Professional Fees | | | 58 | | | | 34 | | | | 48 | | | | 53 | |
Registration Fees | | | 21 | | | | 20 | | | | 18 | | | | 9 | |
Printing Fees | | | 20 | | | | 34 | | | | 17 | | | | 16 | |
Other Fees | | | 15 | | | | 34 | | | | 233 | | | | 220 | |
| | | | | | | | | | | | | | | | |
Total Expenses | | | 4,590 | | | | 4,322 | | | | 5,417 | | | | 3,227 | |
| | | | | | | | | | | | | | | | |
Net Investment Income | | | 22,108 | | | | 7,050 | | | | 24,690 | | | | 23,773 | |
| | | | | | | | | | | | | | | | |
Net Realized and Unrealized Gain/(Loss) on Investments: | | | | | | | | | | | | | | | | |
Net Realized Gain/(Loss) on Investments | | | 29,276 | | | | 8,625 | | | | (24,591 | ) | | | 8,970 | |
Net Realized Gain/(Loss) on Futures Contracts | | | 1,545 | | | | 2,493 | | | | (652 | ) | | | — | |
Net Realized Loss on Forward Contracts and Foreign Currency Transactions and Translation of other Assets and Liabilities Denominated in Foreign Currencies | | | (5 | ) | | | — | | | | (753 | ) | | | (94 | ) |
Net Change in Unrealized Appreciation on Investments | | | 84,716 | | | | 131,000 | | | | 38,262 | | | | 5,518 | |
Net Change in Unrealized Appreciation/(Depreciation) on Futures Contracts | | | (145 | ) | | | (190 | ) | | | (177 | ) | | | 64 | |
Net Change in Unrealized Appreciation/(Depreciation) on Forward Contracts and Foreign Currency Transactions and Translation of other Assets and Liabilities Denominated in Foreign Currencies | | | (2 | ) | | | — | | | | (29 | ) | | | 75 | |
| | | | | | | | | | | | | | | | |
Net Realized and Unrealized Gain on Investments, Futures Contracts, Forward Contracts, Foreign Currency Transactions and Translation of other Assets and Liabilities Denominated in Foreign Currencies | | | 115,385 | | | | 141,928 | | | | 12,060 | | | | 14,533 | |
| | | | | | | | | | | | | | | | |
Net Increase in Net Assets Resulting from Operations | | $ | 137,493 | | | $ | 148,978 | | | $ | 36,750 | | | $ | 38,306 | |
| | | | | | | | | | | | | | | | |
Amounts designated as “—” are $0 or have been rounded to $0.
The accompanying notes are an integral part of the financial statements.
120
|
| STATEMENTS OF CHANGES IN NET ASSETS (000) |
| | | | | | | | | | | | | | | | |
| | | KP Retirement Path 2015 Fund | | | KP Retirement Path 2020 Fund | |
| | | Year ended
December 31,
2016 | | | Year ended
December 31,
2015 | | | Year ended
December 31,
2016 | | | Year ended
December 31,
2015 | |
Operations: | | | | | | | | | | | | | | | | |
Net Investment Income | | $ | 8,126 | | | $ | 7,423 | | | $ | 13,349 | | | $ | 11,056 | |
Net Realized Gain on Affiliated and Unaffiliated Investments | | | 1,529 | | | | 3,020 | | | | 1,514 | | | | 1,377 | |
Distributions of Realized Gains from Affiliated and Unaffiliated Registered Investment Company Shares | | | 4,007 | | | | 4,653 | | | | 6,752 | | | | 7,888 | |
Net Change in Unrealized Appreciation/(Depreciation) on Affiliated and Unaffiliated Investments | | | 11,306 | | | | (14,165 | ) | | | 21,525 | | | | (21,838 | ) |
| | | | | | | | | | | | | | | | |
Net Increase/(Decrease) in Net Assets Resulting from Operations | | | 24,968 | | | | 931 | | | | 43,140 | | | | (1,517 | ) |
| | | | | | | | | | | | | | | | |
Distributions to Shareholders: | | | | | | | | | | | | | | | | |
Investment Income | | | (9,953 | ) | | | (9,480 | ) | | | (16,115 | ) | | | (14,348 | ) |
Net Realized Gains | | | (4,267 | ) | | | (6,305 | ) | | | (6,369 | ) | | | (5,418 | ) |
| | | | | | | | | | | | | | | | |
Total Distributions to Shareholders | | | (14,220 | ) | | | (15,785 | ) | | | (22,484 | ) | | | (19,766 | ) |
| | | | | | | | | | | | | | | | |
Capital Share Transactions: | | | | | | | | | | | | | | | | |
Institutional Shares: | | | | | | | | | | | | | | | | |
Issued | | | 38,233 | | | | 44,355 | | | | 88,216 | | | | 88,183 | |
Reinvestment of Distributions | | | 14,219 | | | | 15,784 | | | | 22,484 | | | | 19,766 | |
Redeemed | | | (84,189 | ) | | | (84,059 | ) | | | (66,991 | ) | | | (58,071 | ) |
| | | | | | | | | | | | | | | | |
Increase/(Decrease) in Net Assets from Capital Share Transactions | | | (31,737 | ) | | | (23,920 | ) | | | 43,709 | | | | 49,878 | |
| | | | | | | | | | | | | | | | |
Total Increase/(Decrease) in Net Assets | | | (20,989 | ) | | | (38,774 | ) | | | 64,365 | | | | 28,595 | |
| | | | | | | | | | | | | | | | |
Net Assets: | | | | | | | | | | | | | | | | |
Beginning of Year or Period | | | 483,292 | | | | 522,066 | | | | 707,746 | | | | 679,151 | |
| | | | | | | | | | | | | | | | |
End of Year or Period | | $ | 462,303 | | | $ | 483,292 | | | $ | 772,111 | | | $ | 707,746 | |
| | | | | | | | | | | | | | | | |
Distributions in Excess of Net Investment Income | | $ | — | | | $ | — | | | $ | — | | | $ | — | |
| | | | | | | | | | | | | | | | |
Share Transactions: | | | | | | | | | | | | | | | | |
Institutional Shares: | | | | | | | | | | | | | | | | |
Issued | | | 3,836 | | | | 4,357 | | | | 8,792 | | | | 8,601 | |
Reinvestment of Distributions | | | 1,418 | | | | 1,602 | | | | 2,214 | | | | 1,997 | |
Redeemed | | | (8,375 | ) | | | (8,251 | ) | | | (6,639 | ) | | | (5,688 | ) |
| | | | | | | | | | | | | | | | |
Net Increase/(Decrease) in Shares Outstanding from Share Transactions | | | (3,121 | ) | | | (2,292 | ) | | | 4,367 | | | | 4,910 | |
| | | | | | | | | | | | | | | | |
Amounts designated as “—” are $0.
The accompanying notes are an integral part of the financial statements.
121
|
| STATEMENTS OF CHANGES IN NET ASSETS (000) |
| | | | | | | | | | | | | | | | |
| | | KP Retirement Path 2025 Fund | | | KP Retirement Path 2030 Fund | |
| | | Year ended
December 31,
2016 | | | Year ended
December 31,
2015 | | | Year ended
December 31,
2016 | | | Year ended
December 31,
2015 | |
Operations: | | | | | | | | | | | | | | | | |
Net Investment Income | | $ | 14,476 | | | $ | 11,534 | | | $ | 13,292 | | | $ | 10,669 | |
Net Realized Gain on Affiliated and Unaffiliated Investments | | | 1,441 | | | | 1,057 | | | | 1,160 | | | | 1,693 | |
Distributions of Realized Gains from Affiliated and Unaffiliated Registered Investment Company Shares | | | 7,573 | | | | 9,366 | | | | 7,134 | | | | 9,454 | |
Net Change in Unrealized Appreciation/(Depreciation) on Affiliated and Unaffiliated Investments | | | 27,563 | | | | (25,838 | ) | | | 30,249 | | | | (27,138 | ) |
| | | | | | | | | | | | | | | | |
Net Increase/(Decrease) in Net Assets Resulting from Operations | | | 51,053 | | | | (3,881 | ) | | | 51,835 | | | | (5,322 | ) |
| | | | | | | | | | | | | | | | |
Distributions to Shareholders: | | | | | | | | | | | | | | | | |
Investment Income | | | (17,023 | ) | | | (15,214 | ) | | | (15,171 | ) | | | (14,233 | ) |
Net Realized Gains | | | (8,060 | ) | | | (3,797 | ) | | | (8,679 | ) | | | (3,526 | ) |
| | | | | | | | | | | | | | | | |
Total Distributions to Shareholders | | | (25,083 | ) | | | (19,011 | ) | | | (23,850 | ) | | | (17,759 | ) |
| | | | | | | | | | | | | | | | |
Capital Share Transactions: | | | | | | | | | | | | | | | | |
Institutional Shares: | | | | | | | | | | | | | | | | |
Issued | | | 116,073 | | | | 112,478 | | | | 115,617 | | | | 104,506 | |
Reinvestment of Distributions | | | 25,082 | | | | 19,011 | | | | 23,850 | | | | 17,759 | |
Redeemed | | | (43,150 | ) | | | (39,842 | ) | | | (32,733 | ) | | | (40,424 | ) |
| | | | | | | | | | | | | | | | |
Increase in Net Assets from Capital Share Transactions | | | 98,005 | | | | 91,647 | | | | 106,734 | | | | 81,841 | |
| | | | | | | | | | | | | | | | |
Total Increase in Net Assets | | | 123,975 | | | | 68,755 | | | | 134,719 | | | | 58,760 | |
| | | | | | | | | | | | | | | | |
Net Assets: | | | | | | | | | | | | | | | | |
Beginning of Year or Period | | | 718,758 | | | | 650,003 | | | | 639,173 | | | | 580,413 | |
| | | | | | | | | | | | | | | | |
End of Year or Period | | $ | 842,733 | | | $ | 718,758 | | | $ | 773,892 | | | $ | 639,173 | |
| | | | | | | | | | | | | | | | |
Distributions in Excess of Net Investment Income | | $ | — | | | $ | — | | | $ | — | | | $ | — | |
| | | | | | | | | | | | | | | | |
Share Transactions: | | | | | | | | | | | | | | | | |
Institutional Shares: | | | | | | | | | | | | | | | | |
Issued | | | 11,583 | | | | 10,958 | | | | 11,636 | | | | 10,178 | |
Reinvestment of Distributions | | | 2,458 | | | | 1,923 | | | | 2,339 | | | | 1,805 | |
Redeemed | | | (4,301 | ) | | | (3,911 | ) | | | (3,278 | ) | | | (3,973 | ) |
| | | | | | | | | | | | | | | | |
Net Increase in Shares Outstanding from Share Transactions | | | 9,740 | | | | 8,970 | | | | 10,697 | | | | 8,010 | |
| | | | | | | | | | | | | | | | |
Amounts designated as “—” are $0.
The accompanying notes are an integral part of the financial statements.
122
|
| STATEMENTS OF CHANGES IN NET ASSETS (000) |
| | | | | | | | | | | | | | | | |
| | | KP Retirement Path 2035 Fund | | | KP Retirement Path 2040 Fund | |
| | | Year ended
December 31,
2016 | | | Year ended
December 31,
2015 | | | Year ended
December 31,
2016 | | | Year ended
December 31,
2015 | |
Operations: | | | | | | | | | | | | | | | | |
Net Investment Income | | $ | 14,290 | | | $ | 11,522 | | | $ | 12,534 | | | $ | 9,975 | |
Net Realized Gain on Affiliated and Unaffiliated Investments | | | 1,326 | | | | 2,079 | | | | 1,426 | | | | 1,957 | |
Distributions of Realized Gains from Affiliated and Unaffiliated Registered Investment Company Shares | | | 8,023 | | | | 11,369 | | | | 7,291 | | | | 10,691 | |
Net Change in Unrealized Appreciation/(Depreciation) on Affiliated and Unaffiliated Investments | | | 36,650 | | | | (31,395 | ) | | | 34,783 | | | | (28,540 | ) |
| | | | | | | | | | | | | | | | |
Net Increase/(Decrease) in Net Assets Resulting from Operations | | | 60,289 | | | | (6,425 | ) | | | 56,034 | | | | (5,917 | ) |
| | | | | | | | | | | | | | | | |
Distributions to Shareholders: | | | | | | | | | | | | | | | | |
Investment Income | | | (15,935 | ) | | | (15,663 | ) | | | (13,659 | ) | | | (13,742 | ) |
Net Realized Gains | | | (10,502 | ) | | | (3,735 | ) | | | (10,209 | ) | | | (3,217 | ) |
| | | | | | | | | | | | | | | | |
Total Distributions to Shareholders | | | (26,437 | ) | | | (19,398 | ) | | | (23,868 | ) | | | (16,959 | ) |
| | | | | | | | | | | | | | | | |
Capital Share Transactions: | | | | | | | | | | | | | | | | |
Institutional Shares: | | | | | | | | | | | | | | | | |
Issued | | | 131,864 | | | | 120,532 | | | | 130,554 | | | | 115,819 | |
Reinvestment of Distributions | | | 26,437 | | | | 19,398 | | | | 23,868 | | | | 16,959 | |
Redeemed | | | (38,161 | ) | | | (42,797 | ) | | | (35,450 | ) | | | (41,543 | ) |
| | | | | | | | | | | | | | | | |
Increase in Net Assets from Capital Share Transactions | | | 120,140 | | | | 97,133 | | | | 118,972 | | | | 91,235 | |
| | | | | | | | | | | | | | | | |
Total Increase in Net Assets | | | 153,992 | | | | 71,310 | | | | 151,138 | | | | 68,359 | |
| | | | | | | | | | | | | | | | |
Net Assets: | | | | | | | | | | | | | | | | |
Beginning of Year or Period | | | 691,910 | | | | 620,600 | | | | 611,633 | | | | 543,274 | |
| | | | | | | | | | | | | | | | |
End of Year or Period | | $ | 845,902 | | | $ | 691,910 | | | $ | 762,771 | | | $ | 611,633 | |
| | | | | | | | | | | | | | | | |
Distributions in Excess of Net Investment Income | | $ | — | | | $ | — | | | $ | — | | | $ | — | |
| | | | | | | | | | | | | | | | |
Share Transactions: | | | | | | | | | | | | | | | | |
Institutional Shares: | | | | | | | | | | | | | | | | |
Issued | | | 13,338 | | | | 11,721 | | | | 13,235 | | | | 11,245 | |
Reinvestment of Distributions | | | 2,587 | | | | 1,971 | | | | 2,333 | | | | 1,722 | |
Redeemed | | | (3,872 | ) | | | (4,194 | ) | | | (3,590 | ) | | | (4,068 | ) |
| | | | | | | | | | | | | | | | |
Net Increase in Shares Outstanding from Share Transactions | | | 12,053 | | | | 9,498 | | | | 11,978 | | | | 8,899 | |
| | | | | | | | | | | | | | | | |
Amounts designated as “—” are $0.
The accompanying notes are an integral part of the financial statements.
123
|
| STATEMENTS OF CHANGES IN NET ASSETS (000) |
| | | | | | | | | | | | | | | | |
| | | KP Retirement Path 2045 Fund | | | KP Retirement Path 2050 Fund | |
| | | Year ended
December 31,
2016 | | | Year ended
December 31,
2015 | | | Year ended
December 31,
2016 | | | Year ended
December 31,
2015 | |
Operations: | | | | | | | | | | | | | | | | |
Net Investment Income | | $ | 8,775 | | | $ | 6,756 | | | $ | 4,149 | | | $ | 2,757 | |
Net Realized Gain on Affiliated and Unaffiliated Investments | | | 829 | | | | 1,679 | | | | 336 | | | | 481 | |
Distributions of Realized Gains from Affiliated and Unaffiliated Registered Investment Company Shares | | | 5,126 | | | | 7,437 | | | | 2,442 | | | | 3,056 | |
Net Change in Unrealized Appreciation/(Depreciation) on Affiliated and Unaffiliated Investments | | | 24,715 | | | | (19,985 | ) | | | 11,698 | | | | (8,471 | ) |
| | | | | | | | | | | | | | | | |
Net Increase/(Decrease) in Net Assets Resulting from Operations | | | 39,445 | | | | (4,113 | ) | | | 18,625 | | | | (2,177 | ) |
| | | | | | | | | | | | | | | | |
Distributions to Shareholders: | | | | | | | | | | | | | | | | |
Investment Income | | | (9,281 | ) | | | (9,217 | ) | | | (4,419 | ) | | | (3,794 | ) |
Net Realized Gains | | | (7,428 | ) | | | (2,563 | ) | | | (3,080 | ) | | | (858 | ) |
| | | | | | | | | | | | | | | | |
Total Distributions to Shareholders | | | (16,709 | ) | | | (11,780 | ) | | | (7,499 | ) | | | (4,652 | ) |
| | | | | | | | | | | | | | | | |
Capital Share Transactions: | | | | | | | | | | | | | | | | |
Institutional Shares: | | | | | | | | | | | | | | | | |
Issued | | | 112,696 | | | | 97,671 | | | | 81,707 | | | | 62,948 | |
Reinvestment of Distributions | | | 16,708 | | | | 11,780 | | | | 7,499 | | | | 4,652 | |
Redeemed | | | (29,789 | ) | | | (34,826 | ) | | | (15,001 | ) | | | (12,902 | ) |
| | | | | | | | | | | | | | | | |
Increase in Net Assets from Capital Share Transactions | | | 99,615 | | | | 74,625 | | | | 74,205 | | | | 54,698 | |
| | | | | | | | | | | | | | | | |
Total Increase in Net Assets | | | 122,351 | | | | 58,732 | | | | 85,331 | | | | 47,869 | |
| | | | | | | | | | | | | | | | |
Net Assets: | | | | | | | | | | | | | | | | |
Beginning of Year or Period | | | 413,485 | | | | 354,753 | | | | 172,257 | | | | 124,388 | |
| | | | | | | | | | | | | | | | |
End of Year or Period | | $ | 535,836 | | | $ | 413,485 | | | $ | 257,588 | | | $ | 172,257 | |
| | | | | | | | | | | | | | | | |
Undistributed/(Distributions in Excess of) Net Investment Income | | $ | 39 | | | $ | — | | | $ | — | | | $ | — | |
| | | | | | | | | | | | | | | | |
Share Transactions: | | | | | | | | | | | | | | | | |
Institutional Shares: | | | | | | | | | | | | | | | | |
Issued | | | 11,444 | | | | 9,501 | | | | 8,265 | | | | 6,121 | |
Reinvestment of Distributions | | | 1,636 | | | | 1,196 | | | | 731 | | | | 471 | |
Redeemed | | | (3,026 | ) | | | (3,405 | ) | | | (1,511 | ) | | | (1,260 | ) |
| | | | | | | | | | | | | | | | |
Net Increase in Shares Outstanding from Share Transactions | | | 10,054 | | | | 7,292 | | | | 7,485 | | | | 5,332 | |
| | | | | | | | | | | | | | | | |
Amounts designated as “—” are $0 or have been rounded to $0.
The accompanying notes are an integral part of the financial statements.
124
|
| STATEMENTS OF CHANGES IN NET ASSETS (000) |
| | | | | | | | | | | | | | | | |
| | | KP Retirement Path 2055 Fund | | | KP Retirement Path 2060 Fund | |
| | | Year ended
December 31,
2016 | | | Year ended
December 31,
2015 | | | Year ended
December 31,
2016 | | | Year ended
December 31,
2015 | |
Operations: | | | | | | | | | | | | | | | | |
Net Investment Income | | $ | 883 | | | $ | 431 | | | $ | 148 | | | $ | 90 | |
Net Realized Gain/(Loss) on Affiliated and Unaffiliated Investments | | | (209 | ) | | | 148 | | | | (197 | ) | | | (71 | ) |
Distributions of Realized Gains from Affiliated and Unaffiliated Registered Investment Company Shares | | | 505 | | | | 470 | | | | 85 | | | | 101 | |
Net Change in Unrealized Appreciation/(Depreciation) on Affiliated and Unaffiliated Investments | | | 2,531 | | | | (1,473 | ) | | | 597 | | | | (251 | ) |
| | | | | | | | | | | | | | | | |
Net Increase/(Decrease) in Net Assets Resulting from Operations | | | 3,710 | | | | (424 | ) | | | 633 | | | | (131 | ) |
| | | | | | | | | | | | | | | | |
Distributions to Shareholders: | | | | | | | | | | | | | | | | |
Investment Income | | | (940 | ) | | | (585 | ) | | | (157 | ) | | | (124 | ) |
Net Realized Gains | | | (476 | ) | | | (236 | ) | | | (99 | ) | | | (34 | ) |
| | | | | | | | | | | | | | | | |
Total Distributions to Shareholders | | | (1,416 | ) | | | (821 | ) | | | (256 | ) | | | (158 | ) |
| | | | | | | | | | | | | | | | |
Capital Share Transactions: | | | | | | | | | | | | | | | | |
Institutional Shares: | | | | | | | | | | | | | | | | |
Issued | | | 28,855 | | | | 18,896 | | | | 6,088 | | | | 7,797 | |
Reinvestment of Distributions | | | 1,416 | | | | 821 | | | | 256 | | | | 158 | |
Redeemed | | | (4,834 | ) | | | (4,042 | ) | | | (3,372 | ) | | | (4,370 | ) |
| | | | | | | | | | | | | | | | |
Increase in Net Assets from Capital Share Transactions | | | 25,437 | | | | 15,675 | | | | 2,972 | | | | 3,585 | |
| | | | | | | | | | | | | | | | |
Total Increase in Net Assets | | | 27,731 | | | | 14,430 | | | | 3,349 | | | | 3,296 | |
| | | | | | | | | | | | | | | | |
Net Assets: | | | | | | | | | | | | | | | | |
Beginning of Year or Period | | | 27,088 | | | | 12,658 | | | | 5,748 | | | | 2,452 | |
| | | | | | | | | | | | | | | | |
End of Year or Period | | $ | 54,819 | | | $ | 27,088 | | | $ | 9,097 | | | $ | 5,748 | |
| | | | | | | | | | | | | | | | |
Distributions in Excess of Net Investment Income | | $ | — | | | $ | — | | | $ | — | | | $ | — | |
| | | | | | | | | | | | | | | | |
Share Transactions: | | | | | | | | | | | | | | | | |
Institutional Shares: | | | | | | | | | | | | | | | | |
Issued | | | 2,927 | | | | 1,844 | | | | 614 | | | | 758 | |
Reinvestment of Distributions | | | 138 | | | | 84 | | | | 25 | | | | 16 | |
Redeemed | | | (494 | ) | | | (392 | ) | | | (342 | ) | | | (428 | ) |
| | | | | | | | | | | | | | | | |
Net Increase in Shares Outstanding from Share Transactions | | | 2,571 | | | | 1,536 | | | | 297 | | | | 346 | |
| | | | | | | | | | | | | | | | |
Amounts designated as “—” are $0 or have been rounded to $0.
The accompanying notes are an integral part of the financial statements.
125
|
| STATEMENTS OF CHANGES IN NET ASSETS (000) |
| | | | | | | | | | | | | | | | |
| | | KP Large Cap Equity Fund | | | KP Small Cap Equity Fund | |
| | | Year ended
December 31,
2016 | | | Year ended
December 31,
2015 | | | Year ended
December 31,
2016 | | | Year ended
December 31,
2015 | |
Operations: | | | | | | | | | | | | | | | | |
Net Investment Income | | $ | 22,108 | | | $ | 16,873 | | | $ | 7,050 | | | $ | 5,024 | |
Net Realized Gain on Investments and Futures Contracts | | | 30,821 | | | | 45,451 | | | | 11,118 | | | | 14,222 | |
Net Realized Loss on Forward Contracts and Foreign Currency Transactions and Translation of other Assets and Liabilities Denominated in Foreign Currencies | | | (5 | ) | | | (17 | ) | | | — | | | | — | |
Net Change in Unrealized Appreciation/(Depreciation) on Investments and Futures Contracts | | | 84,571 | | | | (25,022 | ) | | | 130,810 | | | | (73,228 | ) |
Net Change in Unrealized Depreciation on Forward Contracts and Foreign Currency Transactions and Translation of other Assets and Liabilities Denominated in Foreign Currencies | | | (2 | ) | | | (2 | ) | | | — | | | | — | |
| | | | | | | | | | | | | | | | |
Net Increase/(Decrease) in Net Assets Resulting from Operations | | | 137,493 | | | | 37,283 | | | | 148,978 | | | | (53,982 | ) |
| | | | | | | | | | | | | | | | |
Distributions to Shareholders: | | | | | | | | | | | | | | | | |
Investment Income | | | (22,148 | ) | | | (16,965 | ) | | | (7,022 | ) | | | (5,273 | ) |
Net Realized Gains | | | (33,245 | ) | | | (47,635 | ) | | | — | | | | (17,173 | ) |
Return of Capital | | | — | | | | — | | | | — | | | | (66 | ) |
| | | | | | | | | | | | | | | | |
Total Distributions to Shareholders | | | (55,393 | ) | | | (64,600 | ) | | | (7,022 | ) | | | (22,512 | ) |
| | | | | | | | | | | | | | | | |
Capital Share Transactions: | | | | | | | | | | | | | | | | |
Institutional Shares: | | | | | | | | | | | | | | | | |
Issued | | | 255,927 | | | | 160,689 | | | | 130,410 | | | | 475,373 | |
Reinvestment of Distributions | | | 55,394 | | | | 64,600 | | | | 7,022 | | | | 22,512 | |
Redeemed | | | (156,489 | ) | | | (101,156 | ) | | | (129,425 | ) | | | (88,779 | ) |
| | | | | | | | | | | | | | | | |
Increase in Net Assets from Capital Share Transactions | | | 154,832 | | | | 124,133 | | | | 8,007 | | | | 409,106 | |
| | | | | | | | | | | | | | | | |
Total Increase in Net Assets | | | 236,932 | | | | 96,816 | | | | 149,963 | | | | 332,612 | |
| | | | | | | | | | | | | | | | |
Net Assets: | | | | | | | | | | | | | | | | |
Beginning of Year or Period | | | 1,239,696 | | | | 1,142,880 | | | | 780,852 | | | | 448,240 | |
| | | | | | | | | | | | | | | | |
End of Year or Period | | $ | 1,476,628 | | | $ | 1,239,696 | | | $ | 930,815 | | | $ | 780,852 | |
| | | | | | | | | | | | | | | | |
Undistributed/(Distributions in Excess of) Net Investment Income | | $ | 449 | | | $ | — | | | $ | 767 | | | $ | (1 | ) |
| | | | | | | | | | | | | | | | |
Share Transactions: | | | | | | | | | | | | | | | | |
Institutional Shares: | | | | | | | | | | | | | | | | |
Issued | | | 23,953 | | | | 14,766 | | | | 13,210 | | | | 44,433 | |
Reinvestment of Distributions | | | 4,879 | | | | 6,040 | | | | 624 | | | | 2,336 | |
Redeemed | | | (14,288 | ) | | | (9,072 | ) | | | (12,661 | ) | | | (8,431 | ) |
| | | | | | | | | | | | | | | | |
Net Increase in Shares Outstanding from Share Transactions | | | 14,544 | | | | 11,734 | | | | 1,173 | | | | 38,338 | |
| | | | | | | | | | | | | | | | |
Amounts designated as “—” are $0 or have been rounded to $0.
The accompanying notes are an integral part of the financial statements.
126
|
| STATEMENTS OF CHANGES IN NET ASSETS (000) |
| | | | | | | | | | | | | | | | |
| | | KP International Equity Fund | | | KP Fixed Income Fund | |
| | | Year ended
December 31,
2016 | | | Year ended
December 31,
2015 | | | Year ended
December 31,
2016 | | | Year ended
December 31,
2015 | |
Operations: | | | | | | | | | | | | | | | | |
Net Investment Income | | $ | 24,690 | | | $ | 21,598 | | | $ | 23,773 | | | $ | 18,769 | |
Net Realized Gain/(Loss) on Investments and Futures Contracts | | | (25,243 | ) | | | (12,664 | ) | | | 8,970 | | | | 1,858 | |
Net Realized Gain/(Loss) on Forward Contracts and Foreign Currency Transactions and Translation of other Assets and Liabilities Denominated in Foreign Currencies | | | (753 | ) | | | (291 | ) | | | (94 | ) | | | 182 | |
Net Change in Unrealized Appreciation/(Depreciation) on Investments and Futures Contracts | | | 38,085 | | | | (37,923 | ) | | | 5,582 | | | | (16,719 | ) |
Net Change in Unrealized Appreciation/(Depreciation) on Forward Contracts and Foreign Currency Transactions and Translation of other Assets and Liabilities Denominated in Foreign Currencies | | | (29 | ) | | | 9 | | | | 75 | | | | (29 | ) |
Change in Accrued Foreign Capital Gains Tax on Appreciated Securities | | | — | | | | (39 | ) | | | — | | | | — | |
| | | | | | | | | | | | | | | | |
Net Increase/(Decrease) in Net Assets Resulting from Operations | | | 36,750 | | | | (29,310 | ) | | | 38,306 | | | | 4,061 | |
| | | | | | | | | | | | | | | | |
Distributions to Shareholders: | | | | | | | | | | | | | | | | |
Investment Income | | | (23,849 | ) | | | (22,352 | ) | | | (23,968 | ) | | | (19,468 | ) |
Net Realized Gains | | | — | | | | — | | | | (10,691 | ) | | | (4,913 | ) |
Return of Capital | | | — | | | | (658 | ) | | | — | | | | (4 | ) |
| | | | | | | | | | | | | | | | |
Total Distributions to Shareholders | | | (23,849 | ) | | | (23,010 | ) | | | (34,659 | ) | | | (24,385 | ) |
| | | | | | | | | | | | | | | | |
Capital Share Transactions: | | | | | | | | | | | | | | | | |
Institutional Shares: | | | | | | | | | | | | | | | | |
Issued | | | 247,397 | | | | 220,291 | | | | 253,012 | | | | 180,722 | |
Reinvestment of Distributions | | | 23,848 | | | | 23,010 | | | | 34,659 | | | | 24,385 | |
Redeemed | | | (78,329 | ) | | | (104,173 | ) | | | (142,299 | ) | | | (90,369 | ) |
| | | | | | | | | | | | | | | | |
Increase in Net Assets from Capital Share Transactions | | | 192,916 | | | | 139,128 | | | | 145,372 | | | | 114,738 | |
| | | | | | | | | | | | | | | | |
Total Increase in Net Assets | | | 205,817 | | | | 86,808 | | | | 149,019 | | | | 94,414 | |
| | | | | | | | | | | | | | | | |
Net Assets: | | | | | | | | | | | | | | | | |
Beginning of Year or Period | | | 1,026,913 | | | | 940,105 | | | | 920,322 | | | | 825,908 | |
| | | | | | | | | | | | | | | | |
End of Year or Period | | $ | 1,232,730 | | | $ | 1,026,913 | | | $ | 1,069,341 | | | $ | 920,322 | |
| | | | | | | | | | | | | | | | |
Undistributed/(Distributions in Excess of) Net Investment Income | | $ | (1,055 | ) | | $ | (1,724 | ) | | $ | 216 | | | $ | 3 | |
| | | | | | | | | | | | | | | | |
Share Transactions: | | | | | | | | | | | | | | | | |
Institutional Shares: | | | | | | | | | | | | | | | | |
Issued | | | 28,040 | | | | 23,353 | | | | 24,893 | | | | 17,893 | |
Reinvestment of Distributions | | | 2,696 | | | | 2,562 | | | | 3,509 | | | | 2,484 | |
Redeemed | | | (8,871 | ) | | | (10,862 | ) | | | (13,957 | ) | | | (8,964 | ) |
| | | | | | | | | | | | | | | | |
Net Increase in Shares Outstanding from Share Transactions | | | 21,865 | | | | 15,053 | | | | 14,445 | | | | 11,413 | |
| | | | | | | | | | | | | | | | |
Amounts designated as “—” are $0 or have been rounded to $0.
The accompanying notes are an integral part of the financial statements.
127
For the year or period ended December 31,
For a share outstanding throughout the periods
| | | | | | | | | | | | | | | | | | | | | | | | | | | | | | | | | | | | | | | | | | | | | | | | | | | | |
| | | Net Asset
Value,
Beginning
of Year
or Period | | | Net
Investment
Income† | | | Net Realized
and
Unrealized
Gain/
(Loss) on
Investments | | | Total
from
Operations | | | Distributions
from
Investment
Income | | | Distributions
from
Net Realized
Capital
Gains | | | Total
Distributions | | | Net Asset
Value, End
of Year
or Period | | | Total
Return‡ | | | Net Assets
End of Year
or Period (000) | | | Ratio of
Expenses
to Average
Net Assets†† | | | Ratio of Net
Investment
Income to
Average
Net Assets | | | Portfolio
Turnover‡ | |
| | | | | | | | | | | | | | | | | | | | | | | | | | | | | | | | | | | | | | | | | | | | | | | | | | | | |
KP Retirement Path 2015 Fund* - Institutional Shares | |
2016 | | $ | 9.76 | | | $ | 0.17 | | | $ | 0.34 | | | $ | 0.51 | | | $ | (0.22 | ) | | $ | (0.09 | ) | | $ | (0.31 | ) | | $ | 9.96 | | | | 5.24 | % | | $ | 462,303 | | | | 0.08 | % | | | 1.69 | % | | | 15 | % |
2015 | | $ | 10.07 | | | $ | 0.15 | | | $ | (0.13 | ) | | $ | 0.02 | | | $ | (0.20 | ) | | $ | (0.13 | ) | | $ | (0.33 | ) | | $ | 9.76 | | | | 0.14 | % | | $ | 483,292 | | | | 0.08 | % | | | 1.45 | % | | | 24 | % |
2014@ | | $ | 10.00 | | | $ | 0.18 | | | $ | 0.20 | | | $ | 0.38 | | | $ | (0.24 | ) | | $ | (0.07 | ) | | $ | (0.31 | ) | | $ | 10.07 | | | | 3.82 | % | | $ | 522,066 | | | | 0.10 | % | | | 1.81 | % | | | 23 | % |
| | | | | | | | | | | | | | | | | | | | | | | | | | | | | | | | | | | | | | | | | | | | | | | | | | | | |
KP Retirement Path 2020 Fund* - Institutional Shares | |
2016 | | $ | 9.82 | | | $ | 0.18 | | | $ | 0.40 | | | $ | 0.58 | | | $ | (0.21 | ) | | $ | (0.09 | ) | | $ | (0.30 | ) | | $ | 10.10 | | | | 5.92 | % | | $ | 772,111 | | | | 0.08 | % | | | 1.79 | % | | | 13 | % |
2015 | | $ | 10.11 | | | $ | 0.16 | | | $ | (0.17 | ) | | $ | (0.01 | ) | | $ | (0.20 | ) | | $ | (0.08 | ) | | $ | (0.28 | ) | | $ | 9.82 | | | | (0.10 | )% | | $ | 707,746 | | | | 0.07 | % | | | 1.56 | % | | | 19 | % |
2014@ | | $ | 10.00 | | | $ | 0.19 | | | $ | 0.21 | | | $ | 0.40 | | | $ | (0.25 | ) | | $ | (0.04 | ) | | $ | (0.29 | ) | | $ | 10.11 | | | | 3.96 | % | | $ | 679,151 | | | | 0.09 | % | | | 1.92 | % | | | 11 | % |
| | | | | | | | | | | | | | | | | | | | | | | | | | | | | | | | | | | | | | | | | | | | | | | | | | | | |
KP Retirement Path 2025 Fund* - Institutional Shares | |
2016 | | $ | 9.81 | | | $ | 0.19 | | | $ | 0.46 | | | $ | 0.65 | | | $ | (0.21 | ) | | $ | (0.10 | ) | | $ | (0.31 | ) | | $ | 10.15 | | | | 6.64 | % | | $ | 842,733 | | | | 0.07 | % | | | 1.87 | % | | | 10 | % |
2015 | | $ | 10.11 | | | $ | 0.17 | | | $ | (0.21 | ) | | $ | (0.04 | ) | | $ | (0.21 | ) | | $ | (0.05 | ) | | $ | (0.26 | ) | | $ | 9.81 | | | | (0.35 | )% | | $ | 718,758 | | | | 0.07 | % | | | 1.64 | % | | | 12 | % |
2014@ | | $ | 10.00 | | | $ | 0.20 | | | $ | 0.20 | | | $ | 0.40 | | | $ | (0.26 | ) | | $ | (0.03 | ) | | $ | (0.29 | ) | | $ | 10.11 | | | | 3.92 | % | | $ | 650,003 | | | | 0.09 | % | | | 1.98 | % | | | 8 | % |
| | | | | | | | | | | | | | | | | | | | | | | | | | | | | | | | | | | | | | | | | | | | | | | | | | | | |
KP Retirement Path 2030 Fund* - Institutional Shares | |
2016 | | $ | 9.76 | | | $ | 0.19 | | | $ | 0.52 | | | $ | 0.71 | | | $ | (0.20 | ) | | $ | (0.12 | ) | | $ | (0.32 | ) | | $ | 10.15 | | | | 7.32 | % | | $ | 773,892 | | | | 0.07 | % | | | 1.91 | % | | | 9 | % |
2015 | | $ | 10.09 | | | $ | 0.17 | | | $ | (0.22 | ) | | $ | (0.05 | ) | | $ | (0.22 | ) | | $ | (0.06 | ) | | $ | (0.28 | ) | | $ | 9.76 | | | | (0.52 | )% | | $ | 639,173 | | | | 0.07 | % | | | 1.70 | % | | | 9 | % |
2014@ | | $ | 10.00 | | | $ | 0.20 | | | $ | 0.17 | | | $ | 0.37 | | | $ | (0.26 | ) | | $ | (0.02 | ) | | $ | (0.28 | ) | | $ | 10.09 | | | | 3.78 | % | | $ | 580,413 | | | | 0.08 | % | | | 2.02 | % | | | 8 | % |
| | | | | | | | | | | | | | | | | | | | | | | | | | | | | | | | | | | | | | | | | | | | | | | | | | | | |
KP Retirement Path 2035 Fund* - Institutional Shares | |
2016 | | $ | 9.75 | | | $ | 0.19 | | | $ | 0.58 | | | $ | 0.77 | | | $ | (0.20 | ) | | $ | (0.13 | ) | | $ | (0.33 | ) | | $ | 10.19 | | | | 7.91 | % | | $ | 845,902 | | | | 0.07 | % | | | 1.89 | % | | | 9 | % |
2015 | | $ | 10.10 | | | $ | 0.18 | | | $ | (0.25 | ) | | $ | (0.07 | ) | | $ | (0.23 | ) | | $ | (0.05 | ) | | $ | (0.28 | ) | | $ | 9.75 | | | | (0.70 | )% | | $ | 691,910 | | | | 0.06 | % | | | 1.71 | % | | | 7 | % |
2014@ | | $ | 10.00 | | | $ | 0.20 | | | $ | 0.19 | | | $ | 0.39 | | | $ | (0.27 | ) | | $ | (0.02 | ) | | $ | (0.29 | ) | | $ | 10.10 | | | | 3.86 | % | | $ | 620,600 | | | | 0.08 | % | | | 2.01 | % | | | 7 | % |
| | | | | | | | | | | | | | | | | | | | | | | | | | | | | | | | | | | | | | | | | | | | | | | | | | | | |
KP Retirement Path 2040 Fund* - Institutional Shares | |
2016 | | $ | 9.75 | | | $ | 0.18 | | | $ | 0.61 | | | $ | 0.79 | | | $ | (0.19 | ) | | $ | (0.14 | ) | | $ | (0.33 | ) | | $ | 10.21 | | | | 8.14 | % | | $ | 762,771 | | | | 0.07 | % | | | 1.86 | % | | | 8 | % |
2015 | | $ | 10.10 | | | $ | 0.17 | | | $ | (0.25 | ) | | $ | (0.08 | ) | | $ | (0.22 | ) | | $ | (0.05 | ) | | $ | (0.27 | ) | | $ | 9.75 | | | | (0.73 | )% | | $ | 611,633 | | | | 0.06 | % | | | 1.68 | % | | | 7 | % |
2014@ | | $ | 10.00 | | | $ | 0.20 | | | $ | 0.20 | | | $ | 0.40 | | | $ | (0.27 | ) | | $ | (0.03 | ) | | $ | (0.30 | ) | | $ | 10.10 | | | | 3.91 | % | | $ | 543,274 | | | | 0.08 | % | | | 2.02 | % | | | 8 | % |
| | | | | | | | | | | | | | | | | | | | | | | | | | | | | | | | | | | | | | | | | | | | | | | | | | | | |
KP Retirement Path 2045 Fund* - Institutional Shares | |
2016 | | $ | 9.74 | | | $ | 0.19 | | | $ | 0.60 | | | $ | 0.79 | | | $ | (0.18 | ) | | $ | (0.15 | ) | | $ | (0.33 | ) | | $ | 10.20 | | | | 8.15 | % | | $ | 535,836 | | | | 0.07 | % | | | 1.89 | % | | | 9 | % |
2015 | | $ | 10.09 | | | $ | 0.18 | | | $ | (0.25 | ) | | $ | (0.07 | ) | | $ | (0.22 | ) | | $ | (0.06 | ) | | $ | (0.28 | ) | | $ | 9.74 | | | | (0.66 | )% | | $ | 413,485 | | | | 0.06 | % | | | 1.71 | % | | | 9 | % |
2014@ | | $ | 10.00 | | | $ | 0.21 | | | $ | 0.17 | | | $ | 0.38 | | | $ | (0.27 | ) | | $ | (0.02 | ) | | $ | (0.29 | ) | | $ | 10.09 | | | | 3.76 | % | | $ | 354,753 | | | | 0.08 | % | | | 2.06 | % | | | 8 | % |
| | | | | | | | | | | | | | | | | | | | | | | | | | | | | | | | | | | | | | | | | | | | | | | | | | | | |
KP Retirement Path 2050 Fund* - Institutional Shares | |
2016 | | $ | 9.75 | | | $ | 0.20 | | | $ | 0.60 | | | $ | 0.80 | | | $ | (0.18 | ) | | $ | (0.13 | ) | | $ | (0.31 | ) | | $ | 10.24 | | | | 8.25 | % | | $ | 257,588 | | | | 0.07 | % | | | 1.98 | % | | | 10 | % |
2015 | | $ | 10.09 | | | $ | 0.19 | | | $ | (0.26 | ) | | $ | (0.07 | ) | | $ | (0.22 | ) | | $ | (0.05 | ) | | $ | (0.27 | ) | | $ | 9.75 | | | | (0.70 | )% | | $ | 172,257 | | | | 0.06 | % | | | 1.82 | % | | | 9 | % |
2014@ | | $ | 10.00 | | | $ | 0.22 | | | $ | 0.16 | | | $ | 0.38 | | | $ | (0.27 | ) | | $ | (0.02 | ) | | $ | (0.29 | ) | | $ | 10.09 | | | | 3.76 | % | | $ | 124,388 | | | | 0.08 | % | | | 2.19 | % | | | 10 | % |
| | | | | | | | | | | | | | | | | | | | | | | | | | | | | | | | | | | | | | | | | | | | | | | | | | | | |
KP Retirement Path 2055 Fund* - Institutional Shares | |
2016 | | $ | 9.70 | | | $ | 0.22 | | | $ | 0.58 | | | $ | 0.80 | | | $ | (0.18 | ) | | $ | (0.10 | ) | | $ | (0.28 | ) | | $ | 10.22 | | | | 8.28 | % | | $ | 54,819 | | | | 0.07 | % | | | 2.26 | % | | | 16 | % |
2015 | | $ | 10.07 | | | $ | 0.23 | | | $ | (0.30 | ) | | $ | (0.07 | ) | | $ | (0.21 | ) | | $ | (0.09 | ) | | $ | (0.30 | ) | | $ | 9.70 | | | | (0.66 | )% | | $ | 27,088 | | | | 0.06 | % | | | 2.19 | % | | | 21 | % |
2014@ | | $ | 10.00 | | | $ | 0.24 | | | $ | 0.15 | | | $ | 0.39 | | | $ | (0.27 | ) | | $ | (0.05 | ) | | $ | (0.32 | ) | | $ | 10.07 | | | | 3.81 | % | | $ | 12,658 | | | | 0.10 | % | | | 2.44 | % | | | 28 | % |
| | | | | | | | | | | | | | | | | | | | | | | | | | | | | | | | | | | | | | | | | | | | | | | | | | | | |
KP Retirement Path 2060 Fund* - Institutional Shares | |
2016 | | $ | 9.78 | | | $ | 0.21 | | | $ | 0.59 | | | $ | 0.80 | | | $ | (0.18 | ) | | $ | (0.13 | ) | | $ | (0.31 | ) | | $ | 10.27 | | | | 8.18 | % | | $ | 9,097 | | | | 0.07 | % | | | 2.10 | % | | | 51 | % |
2015 | | $ | 10.12 | | | $ | 0.22 | | | $ | (0.28 | ) | | $ | (0.06 | ) | | $ | (0.22 | ) | | $ | (0.06 | ) | | $ | (0.28 | ) | | $ | 9.78 | | | | (0.60 | )% | | $ | 5,748 | | | | 0.06 | % | | | 2.09 | % | | | 100 | % |
2014@ | | $ | 10.00 | | | $ | 0.20 | | | $ | 0.19^ | | | $ | 0.39 | | | $ | (0.27 | ) | | $ | — | | | $ | (0.27 | ) | | $ | 10.12 | | | | 3.92 | % | | $ | 2,452 | | | | 0.15 | % | | | 1.98 | % | | | 340 | % |
The accompanying notes are an integral part of the financial statements.
128
For the year or period ended December 31,
For a share outstanding throughout the periods
| | | | | | | | | | | | | | | | | | | | | | | | | | | | | | | | | | | | | | | | | | | | | | | | | | | | | | | | |
| | | Net Asset
Value,
Beginning
of Year
or Period | | | Net
Investment
Income† | | | Net Realized
and
Unrealized
Gain/
(Loss) on
Investments | | | Total
from
Operations | | | Distributions
from
Investment
Income | | | Distributions
from
Net Realized
Capital
Gains | | | Return of
Capital | | | Total
Distributions | | | Net Asset
Value, End
of Year
or Period | | | Total
Return‡ | | | Net Assets
End of Year
or Period (000) | | | Ratio of
Expenses
to Average
Net Assets†† | | | Ratio of Net
Investment
Income to
Average
Net Assets | | | Portfolio
Turnover‡ | |
KP Large Cap Equity Fund* - Institutional Shares | |
2016 | | $ | 10.56 | | | $ | 0.18 | | | $ | 0.88 | | | $ | 1.06 | | | $ | (0.17 | ) | | $ | (0.26 | ) | | $ | — | | | $ | (0.43 | ) | | $ | 11.19 | | | | 10.04 | % | | $ | 1,476,628 | | | | 0.34 | % | | | 1.65 | % | | | 50 | % |
2015 | | $ | 10.82 | | | $ | 0.15 | | | $ | 0.17 | | | $ | 0.32 | | | $ | (0.15 | ) | | $ | (0.43 | ) | | $ | — | | | $ | (0.58 | ) | | $ | 10.56 | | | | 2.91 | % | | $ | 1,239,696 | | | | 0.35 | % | | | 1.38 | % | | | 126 | % |
2014@ | | $ | 10.00 | | | $ | 0.16 | | | $ | 0.96 | | | $ | 1.12 | | | $ | (0.15 | ) | | $ | (0.15 | ) | | $ | — | | | $ | (0.30 | ) | | $ | 10.82 | | | | 11.21 | % | | $ | 1,142,880 | | | | 0.35 | % | | | 1.62 | % | | | 126 | % |
| | | | | | | | | | | | | | | | | | | | | | | | | | | | | | | | | | | | | | | | | | | | | | | | | | | | | | | | |
KP Small Cap Equity Fund* - Institutional Shares | |
2016 | | $ | 9.55 | | | $ | 0.08 | | | $ | 1.68 | | | $ | 1.76 | | | $ | (0.09 | ) | | $ | — | | | $ | — | | | $ | (0.09 | ) | | $ | 11.22 | | | | 18.38 | % | | $ | 930,815 | | | | 0.53 | % | | | 0.86 | % | | | 91 | % |
2015 | | $ | 10.32 | | | $ | 0.07 | | | $ | (0.55 | ) | | $ | (0.48 | ) | | $ | (0.07 | ) | | $ | (0.22 | ) | | $ | — | (1) | | $ | (0.29 | ) | | $ | 9.55 | | | | (4.73 | )% | | $ | 780,852 | | | | 0.55 | % | | | 0.68 | % | | | 154 | % |
2014@ | | $ | 10.00 | | | $ | 0.09 | | | $ | 0.32 | | | $ | 0.41 | | | $ | (0.09 | ) | | $ | — | | | $ | — | | | $ | (0.09 | ) | | $ | 10.32 | | | | 4.06 | % | | $ | 448,240 | | | | 0.59 | % | | | 0.97 | % | | | 212 | % |
| | | | | | | | | | | | | | | | | | | | | | | | | | | | | | | | | | | | | | | | | | | | | | | | | | | | | | | | |
KP International Equity Fund* - Institutional Shares | |
2016 | | $ | 8.84 | | | $ | 0.20 | | | $ | 0.07 | | | $ | 0.27 | | | $ | (0.18 | ) | | $ | — | | | $ | — | | | $ | (0.18 | ) | | $ | 8.93 | | | | 3.03 | % | | $ | 1,232,730 | | | | 0.49 | % | | | 2.22 | % | | | 23 | % |
2015 | | $ | 9.30 | | | $ | 0.20 | | | $ | (0.46 | ) | | $ | (0.26 | ) | | $ | (0.19 | ) | | $ | — | | | $ | (0.01 | ) | | $ | (0.20 | ) | | $ | 8.84 | | | | (2.79 | )% | | $ | 1,026,913 | | | | 0.50 | % | | | 2.13 | % | | | 21 | % |
2014@ | | $ | 10.00 | | | $ | 0.26 | | | $ | (0.64 | ) | | $ | (0.38 | ) | | $ | (0.22 | ) | | $ | (0.08 | ) | | $ | (0.02 | ) | | $ | (0.32 | ) | | $ | 9.30 | | | | (3.83 | )% | | $ | 940,105 | | | | 0.54 | % | | | 2.61 | % | | | 115 | % |
| | | | | | | | | | | | | | | | | | | | | | | | | | | | | | | | | | | | | | | | | | | | | | | | | | | | | | | | |
KP Fixed Income Fund* - Institutional Shares | |
2016 | | $ | 9.79 | | | $ | 0.24 | | | $ | 0.16 | | | $ | 0.40 | | | $ | (0.23 | ) | | $ | (0.10 | ) | | $ | — | | | $ | (0.33 | ) | | $ | 9.86 | | | | 4.08 | % | | $ | 1,069,341 | | | | 0.32 | % | | | 2.37 | % | | | 484 | % |
2015 | | $ | 10.00 | | | $ | 0.21 | | | $ | (0.16 | ) | | $ | 0.05 | | | $ | (0.21 | ) | | $ | (0.05 | ) | | $ | — | (1) | | $ | (0.26 | ) | | $ | 9.79 | | | | 0.57 | % | | $ | 920,322 | | | | 0.34 | % | | | 2.10 | % | | | 533 | % |
2014@ | | $ | 10.00 | | | $ | 0.20 | | | $ | 0.07 | | | $ | 0.27 | | | $ | (0.18 | ) | | $ | (0.09 | ) | | $ | — | | | $ | (0.27 | ) | | $ | 10.00 | | | | 2.68 | % | | $ | 825,908 | | | | 0.36 | % | | | 1.99 | % | | | 496 | % |
| * | Commenced operations on January 10, 2014. |
| @ | For the period ended December 31, 2014. All ratios for the period have been annualized. |
| † | Per share calculations were performed using the average shares method. |
| †† | Ratio does not include the expenses of the underlying funds, as applicable. |
| ‡ | Total return and portfolio turnover are for the period indicated and have not been annualized. Returns shown do not reflect the deduction of taxes that a shareholder would pay of Fund distributions or the redemption of Fund shares. |
| ^ | The amount shown for a share outstanding throughout the period does not accord with the aggregate net realized and unrealized losses on investments for the period because of the sales and repurchases of Fund shares in relation to fluctuating market value of the investments of the Fund. |
| (1) | Amount less than $0.01 per share. |
Amounts designated as “—” are $0 or have been rounded to $0.
The accompanying notes are an integral part of the financial statements.
129
| | |
| THE KP FUNDS | | December 31, 2016 |
|
| NOTES TO FINANCIAL STATEMENTS |
1. Organization:
The KP Funds (the “Trust”), was organized on March 25, 2013 as a statutory trust under the laws of the Commonwealth of Massachusetts. The Trust is an open-end registered management investment company comprised of fourteen funds: KP Retirement Path 2015 Fund, KP Retirement Path 2020 Fund, KP Retirement Path 2025 Fund, KP Retirement Path 2030 Fund, KP Retirement Path 2035 Fund, KP Retirement Path 2040 Fund, KP Retirement Path 2045 Fund, KP Retirement Path 2050 Fund, KP Retirement Path 2055 Fund, and KP Retirement Path 2060 Fund (collectively, the “Target Date Funds”); and the KP Large Cap Equity Fund, KP Small Cap Equity Fund, KP International Equity Fund, and KP Fixed Income Fund (collectively, the “Asset Class Funds” and collectively with the Target Date Funds, the “Funds” and each a “Fund”). The investment objective of the Target Date Funds is to seek a balance of long-term capital growth, inflation protection, and current income. The investment objective of KP Large Cap Equity, KP Small Cap Equity and KP International Equity Funds is to seek long-term capital appreciation. The investment objective of KP Fixed Income Fund is to provide current income consistent with the preservation of capital. The Funds are diversified for purposes of the Investment Company Act of 1940, as amended (the “1940 Act”). The assets of each Fund of the Trust are segregated, and a shareholder’s interest is limited to the Fund in which shares are held. The Funds are registered to offer Institutional Class Shares.
Callan Associates Inc. serves as the Funds’ investment adviser (the “Adviser”). The Adviser will engage a number of sub-advisers (the “Sub-Advisers”) to manage a portion of the Asset Class Funds’ assets. On September 3, 2013, the Trust was seeded with an issuance of 10,000 shares of the Institutional Class Shares of the KP Fixed Income Fund at an aggregate purchase price of $100,000. The Funds commenced operations on January 10, 2014.
2. Significant Accounting Policies:
The following is a summary of significant accounting policies followed by the Trust. The Funds are investment companies in conformity with accounting principles generally accepted in the United States of America (“U.S. GAAP”). Therefore, the Funds follow the accounting and reporting guidance for investment companies.
Use of Estimates in the Preparation of Financial Statements — The preparation of financial statements in conformity with U.S. GAAP requires management to make estimates and assumptions that affect the fair value of assets, the reported amount of assets and liabilities and disclosure of contingent assets and liabilities at the date of the financial statements and the reported amounts of increases and decreases in net assets from operations during the reporting period. Actual results could differ from those estimates and such differences could be material.
Security Valuation — Securities listed on a securities exchange, market or automated quotation system for which quotations are readily available (except for securities traded on NASDAQ), including securities traded over the counter, are valued at the last quoted sale price on an exchange or market (foreign or domestic) on which they are traded on valuation date (or at approximately 4:00 pm ET if a security’s primary exchange is normally open at that time), or, if there is no such reported sale on the valuation date, at the most recent quoted bid price. For securities traded on NASDAQ, the NASDAQ Official Closing Price will be used. If available, debt securities are priced based upon valuations provided by independent, third-party pricing agents. Such values generally reflect the last reported sales price if the security is actively traded. The third-party pricing agents may also value debt securities at an evaluated bid price by employing methodologies that utilize actual market transactions, broker-supplied valuations, or other methodologies designed to identify the market value for such securities. Such methodologies generally consider such factors as security prices, yields, maturities, call features, ratings and developments relating to specific securities in arriving at valuations. On the first day a new debt security purchase is recorded, if a price is not available on the automated pricing feeds from our primary and secondary pricing vendors nor is it available from an independent broker, the security may be valued at its purchase price. Each day thereafter, the debt security will be valued according to the Trusts’ Fair Value Procedures until an independent source can be secured. Debt obligations with remaining maturities of sixty days or less may be valued at their amortized cost, provided that it is determined the amortized cost continues to approximate fair value. Should existing credit, liquidity or interest rate conditions in the relevant markets and issuer specific circumstances suggest that amortized cost does not approximate fair value, then the amortized cost method may not be used. The prices for foreign securities are reported in local currency and converted to U.S. dollars using currency exchange rates.
Investments in open-end and closed-end registered investment companies that do not trade on an exchange are valued at the end of day net asset value per share. Investments in open-end and closed-end registered investment
130
| | |
| THE KP FUNDS | | December 31, 2016 |
companies that trade on an exchange are valued at the last sales price or official closing price as of the close of the customary trading session on the exchange where the security is principally traded.
Securities for which market prices are not available through the above methods are valued in accordance with Fair Value Procedures established by the Funds’ Board of Trustees (the “Board”). The Funds’ Fair Value Procedures are implemented through a Fair Value Pricing Committee (the “Committee”) designated by the Funds’ Board. Some of the more common reasons that may necessitate that a security be valued using Fair Value Procedures include: the security’s trading has been halted or suspended; the security has been delisted from a national exchange; the security’s primary trading market is temporarily closed at a time when under normal conditions it would be open; or the security’s primary pricing source is not able or willing to provide a price. When a security is valued in accordance with the Fair Value Procedures, the Committee will determine the value after taking into consideration relevant information reasonably available to the Committee. As of December 31, 2016, KP Large Cap Equity, KP International Equity and KP Fixed Income Funds had securities valued in accordance with fair value procedures. Refer to the schedule of investments for further details.
For securities that principally trade on a foreign market or exchange, a significant gap in time can exist between the time of a particular security’s last trade and the time at which the Fund calculates its net asset value. The closing prices of such securities may no longer reflect their market value at the time the Fund calculates its net asset value if an event that could materially affect the value of those securities (a “Significant Event”) has occurred between the time of the security’s last close and the time that the Fund calculates net asset value. A Significant Event may relate to a single issuer or to an entire market sector. If the Adviser of the Fund becomes aware of a Significant Event that has occurred with respect to a security or group of securities after the closing of the exchange or market on which the security or securities principally trade, but before the time at which the Fund calculates its net asset value, it may request that a Committee meeting be called.
KP International Equity Fund uses MarkIt Fair Value (“MarkIt”) as a third party fair valuation vendor. MarkIt provides a fair value for foreign securities held by KP International Equity Fund based on certain factors and methodologies (involving, generally, tracking valuation correlations between the U.S. market and each non-U.S. security) applied by MarkIt in the event that there is a movement in the U.S. market that exceeds a specific threshold established by the Committee. The Committee establishes a “confidence interval” which is used to determine the level of correlation between the value of a foreign security and movements in the U.S. market before a particular security is fair valued when the threshold is exceeded. In the event that the threshold established by the Committee is exceeded on a specific day, KP International Equity Fund values its non-U.S. securities that exceed the applicable “confidence interval” based upon the fair values provided by MarkIt. In such event, it is not necessary to hold a Committee meeting. In the event that the Adviser believes that the fair values provided by MarkIt are not reliable, the Adviser may contact SEI Global Fund Services (the “Administrator”) to request that a meeting of the Committee be held.
If a local market in which KP International Equity Fund owns securities is closed for one or more days, the Fund shall value all securities held in that corresponding currency based on the fair value prices provided by MarkIt using the predetermined confidence interval discussed above.
In accordance with the authoritative guidance on fair value measurement under U.S. GAAP, the Funds disclose fair value of their investments in a hierarchy that prioritizes the inputs to valuation techniques used to measure the fair value. The objective of a fair value measurement is to determine the price that would be received to sell an asset or paid to transfer a liability in an orderly transaction between market participants at the measurement date (an exit price). Accordingly, the fair value hierarchy gives the highest priority to quoted prices (unadjusted) in active markets for identical assets or liabilities (Level 1) and the lowest priority to unobservable inputs (Level 3). The three levels of the fair value hierarchy are described below:
| | • | | Level 1 — Unadjusted quoted prices in active markets for identical, unrestricted assets or liabilities that the Funds have the ability to access at the measurement date; |
| | • | | Level 2 — Other significant observable inputs (including quoted prices for similar securities, interest rates, prepayment speeds, credit risk, referenced indices, quoted prices in inactive markets, adjusted quoted prices in active markets, adjusted quoted prices on foreign equity securities that were adjusted in accordance with pricing procedures approved by the Board, etc.); and |
| | • | | Level 3 — Prices, inputs or exotic modeling techniques which are both significant to the fair value measurement and unobservable (supported by little or no market activity). |
131
| | |
| THE KP FUNDS | | December 31, 2016 |
Investments are classified within the level of the lowest significant input considered in determining fair value. Investments classified within Level 3 whose fair value measurement considers several inputs may include Level 1 or Level 2 inputs as components of the overall fair value measurement. For the year ended December 31, 2016, there have been no significant changes to the Funds’ fair value methodologies.
Federal Income Taxes — It is each Fund’s intention to continue to qualify as a regulated investment company for Federal income tax purposes by complying with the appropriate provisions of Subchapter M of the Internal Revenue Code of 1986, as amended, and to distribute substantially all of its income to shareholders. Accordingly, no provision for Federal income taxes has been made in the financial statements.
The Funds evaluate tax positions taken or expected to be taken in the course of preparing the Funds’ tax returns to determine whether it is “more-likely-than-not” (i.e., greater than 50-percent) that each tax position will be sustained upon examination by a taxing authority based on the technical merits of the position. Tax positions not deemed to meet the more-likely-than-not threshold are recorded as a tax benefit or expense in the current year. The Funds did not record any tax provision in the current period. However, management’s conclusions regarding tax positions taken may be subject to review and adjustment at a later date based on factors including, but not limited to, examination by tax authorities (i.e., the last 3 open tax year ends, as applicable), on-going analysis of and changes to tax laws, regulations and interpretations thereof.
KP International Equity Fund may be subject to taxes imposed by countries in which it invests. Such taxes are generally based on either income or gains earned or repatriated. KP International Equity Fund accrues and applies such taxes to net investment income, net realized gains and net unrealized gains as income and/or capital gains are earned. Tax is monitoring and accruing foreign capital gains of $242 (000), please refer to the Statement of Assets and Liabilities.
As of and during the year ended December 31, 2016, the Funds did not have a liability for any unrecognized tax benefits. The Funds recognize interest and penalties, if any, related to unrecognized tax benefits as income tax expense in the Statements of Operations. During the year ended December 31, 2016 the Funds did not incur any interest or penalties.
Security Transactions and Investment Income — Security transactions are accounted for on trade date for financial reporting purposes. Costs used in determining realized gains and losses on the sales of investment securities are based on the specific identification method. Dividend income is recorded on the ex-dividend date, and interest income is recognized on the accrual basis from settlement date and includes the amortization of premiums and the accretion of discount calculated using the effective interest method. Realized gains (losses) on paydowns of mortgage-backed and asset-backed securities are recorded as an adjustment to interest income.
Foreign Currency Translation — The books and records of the Funds are maintained in U.S. dollars. Investment securities and other assets and liabilities denominated in a foreign currency are translated into U.S. dollars on the date of valuation. The Funds do not isolate that portion of realized or unrealized gains and losses resulting from changes in the foreign exchange rate from fluctuations arising from changes in the market prices of the securities. These gains and losses are included in net realized and gains and losses on investments and net change in unrealized appreciation (depreciation) on investments on the Statement of Operations. Net realized and unrealized gains and losses on foreign currency transactions represent net foreign exchange gains or losses from foreign currency exchange contracts, disposition of foreign currencies, currency gains or losses realized between trade and settlement dates on securities transactions and the difference between the amount of the investment income and foreign withholding taxes recorded on the Funds’ books and the U.S. dollar equivalent amounts actually received or paid.
Forward Foreign Currency Exchange Contracts — The Funds may enter into forward foreign currency exchange contracts to protect the value of securities held and related receivables and payables against changes in future foreign exchange rates. A forward currency contract is an agreement between two parties to buy and sell currency at a set price on a future date. The market value of the contract will fluctuate with changes in currency exchange rates. The contract is marked-to-market daily using the current forward rate and the change in market value is recorded by the Funds as unrealized gain or loss. The Funds recognize realized gains or losses when the contract is closed, equal to the difference between the value of the contract at the time it was opened and the value at the time it was closed. Any realized or unrealized gains (losses) during the year are presented on the Statements of Operations. As of and during the year ended December 31, 2016, KP Fixed Income Fund held forward foreign currency contracts.
132
| | |
| THE KP FUNDS | | December 31, 2016 |
Futures Contracts — To the extent consistent with its investment objective and strategies, the Funds may use futures contracts for tactical hedging purposes as well as to enhance the Fund’s returns. Initial margin deposits of cash or securities are made upon entering into futures contracts. The contracts are marked to market daily and the resulting changes in value are accounted for as unrealized gains and losses. Variation margin payments are paid or received, depending upon whether unrealized gains or losses are incurred. When the contract is closed, the Funds record a realized gain or loss equal to the difference between the proceeds from (or cost of) the closing transaction and the amount invested in the contract.
Risks of entering into futures contracts include the possibility that there will be an imperfect price correlation between the futures and the underlying securities. Second, it is possible that a lack of liquidity for futures contracts could exist in the secondary market, resulting in an inability to close a position prior to its maturity date. Third, the futures contract involves the risk that a Fund could lose more than the original margin deposit required to initiate a futures transaction.
Finally, the risk exists that losses could exceed amounts disclosed on the Statements of Assets and Liabilities. Refer to each Fund’s Schedule of Investments for details regarding open futures contracts as of December 31, 2016, if applicable.
Master Netting Arrangements — A fund is subject to various netting arrangements with select counterparties (“Master Agreements”). Master Agreements govern the terms of certain transactions, and reduce the counterparty risk associated with relevant transactions by specifying credit protection mechanisms and providing standardization that improves legal certainty. Since different types of transactions have different mechanics and are sometimes traded out of different legal entities of a particular counterparty organization, each type of transaction may be covered by a different Master Agreement, resulting in the need for multiple agreements with a single counterparty. As the Master Agreements are specific to unique operations of different asset types, they allow a fund to close out and net its total exposure to a specific counterparty entity in the event of a default with respect to all the transactions governed under a single agreement with a specific counterparty entity.
Master Agreements can also help limit counterparty risk by specifying collateral posting arrangements at pre arranged exposure levels. Under the Master Agreements, collateral is routinely transferred if the total net exposure to certain transactions (net of existing collateral already in place) governed under the relevant Master Agreement with a counterparty in a given account exceeds a specified threshold, which typically ranges from zero to $250,000 depending on the counterparty and the type of Master Agreement. United States Treasury Securities and U.S. dollar cash are generally the preferred forms of collateral. Securities and cash pledged as collateral are reflected as assets in the Statement of Assets and Liabilities as either a component of investments at value (securities) or deposits due from counterparties (cash). Cash collateral received is not typically held in a segregated account and as such is reflected as a liability in the Statement of Assets and Liabilities as deposits due to counterparties. The market value of any securities received as collateral is not reflected as a component of net asset value. A fund’s overall exposure to counterparty risk can change substantially within a short period, as it is affected by each transaction subject to the relevant Master Agreement.
It is the Funds’ policy to present the variation margin of the futures contracts separately on the Statements of Assets and Liabilities as the Funds do not have master netting agreements with the counterparties to the futures contracts. Refer to each Fund’s Schedule of Investments for details regarding futures contracts as of December 31, 2016, if applicable.
International Swaps and Derivatives Association, Inc. Master Agreements and Credit Support Annexes (“ISDA Master Agreements”) generally govern OTC financial derivative transactions entered into by a fund and select counterparties. ISDA Master Agreements maintain provisions for general obligations, representations, agreements, collateral and events of default or termination. Events of termination include conditions that may entitle counterparties to elect to terminate early and cause settlement of all outstanding transactions under the applicable ISDA Master Agreement. Any election to terminate early could be material to the financial statements. In limited circumstances, the ISDA Master Agreement may contain additional provisions that add additional counterparty protection beyond coverage of existing daily exposure if the counterparty has a decline in credit quality below a predefined level. These amounts, if any, may be segregated with a third party custodian.
As of December 31, 2016, there were no securities pledged as collateral for financial derivative instruments as governed by ISDA master agreements.
133
| | |
| THE KP FUNDS | | December 31, 2016 |
The following is a summary by counterparty of the market value of OTC financial derivative instruments and collateral (received)/pledged for the KP Fixed Income Fund as of December 31, 2016 (000):
| | | | | | | | | | | | | | | | | | | | | | | | | | | | | | | | | | | |
| | | Financial Derivative Assets | | Financial Derivative Liabilities | | | | | | |
| Counterparty | | Forward
Foreign
Currency
Contracts | | Total
Over the
Counter | | Forward
Foreign
Currency
Contracts | | Total
Over the
Counter | | Net Market
Value of OTC
Derivatives | | Collateral
(Received)/
Pledged | | Net
Exposures† |
Barclays | | | $ | 91 | | | | $ | 91 | | | | $ | (1 | ) | | | $ | (1 | ) | | | $ | 90 | | | | $ | — | | | | $ | 90 | |
BNP Paribas | | | | — | | | | | — | | | | | (11 | ) | | | | (11 | ) | | | | (11 | ) | | | | — | | | | | (11 | ) |
Citi | | | | 17 | | | | | 17 | | | | | (10 | ) | | | | (10 | ) | | | | 7 | | | | | — | | | | | 7 | |
Credit Suisse | | | | 7 | | | | | 7 | | | | | — | | | | | — | | | | | 7 | | | | | — | | | | | 7 | |
HSBC | | | | 43 | | | | | 43 | | | | | — | | | | | — | | | | | 43 | | | | | — | | | | | 43 | |
State Street | | | | 23 | | | | | 23 | | | | | (52 | ) | | | | (52 | ) | | | | (29 | ) | | | | — | | | | | (29 | ) |
UBS Securities | | | | — | | | | | — | | | | | (8 | ) | | | | (8 | ) | | | | (8 | ) | | | | — | | | | | (8 | ) |
| | | | | | | | | | | | | | | | | | | | | | | | | |
Total over the counter | | | $ | 181 | | | | $ | 181 | | | | $ | (82 | ) | | | $ | (82 | ) | | | | | | | | | | | | | | | |
| | | | | | | | | | | | | | | | | | | | | | | | | |
| † | Net Exposure represents the net receivable/(payable) that would be due from/to the counterparty in the event of default. Exposure from OTC financial derivative instruments can only be netted across transactions governed under the same master agreement with the same legal entity. |
Participation Notes (“P-Notes”) — To the extent consistent with its Investment Objective and Strategies, a Fund may acquire P-Notes issued by participating banks or broker-dealers. P-Notes are participation interest notes that are designed to offer a return linked to a particular underlying equity, debt, currency or market. The P-Notes in which the Fund may invest will typically have a maturity of one year. When purchasing a P-Note, the posting of margin is not required because the full cost of the P-Note (plus commission) is paid at the time of purchase. When the P-Note matures, the issuer will pay to, or receive from, the purchaser the difference between the minimal value of the underlying instrument at the time of purchase and that instrument’s value at maturity. Investments in P-Notes involve the same risks associated with a direct investment in the underlying foreign companies of foreign securities markets that they seek to replicate. In addition, there can be no assurance that the trading price of P-Notes will equal the underlying value of the foreign companies or foreign securities markets that they seek to replicate. The holder of a participation note that is linked to a particular underlying security is entitled to receive any dividends paid in connection with an underlying security or instrument. However, the holder of a participation note does not receive voting rights as it would if it directly owned the underlying security or instrument. P-Notes are generally traded over the counter. P-Notes constitute general unsecured contractual obligations of the banks or broker-dealers that issue them and the counterparty. There is also counterparty risk associated with these investments because the Fund is relying on the creditworthiness of such counterparty and has no rights under a participation note against the issuer of the underlying security. In addition, the Fund will incur transaction costs as a result of investments in P-Notes.
Investments in Real Estate Investment Trusts (“REITs”) — Dividend income is recorded based on the income included in distributions received from the REIT investments using published REIT reclassifications including some management estimates when actual amounts are not available. Distributions received in excess of this estimated amount are recorded as a reduction of the cost of investments or reclassified to capital gains. The actual amounts of income, return of capital, and capital gains are only determined by each REIT after its fiscal year-end, and may differ from the estimated amounts.
Master Limited Partnerships (“MLPs”) — Entities commonly referred to as “MLPs” are generally organized under state law as limited partnerships or limited liability companies. The Fund intends to invest in MLPs receiving partnership taxation treatment under the Internal Revenue Code of 1986 (the “Code”), and whose interests or “units” are traded on securities exchanges like shares of corporate stock. To be treated as a partnership for U.S. federal income tax purposes, an MLP whose units are traded on a securities exchange must receive at least 90% of its income from qualifying sources such as interest, dividends, real estate rents, gain from the sale or disposition of real property, income and gain from mineral or natural resources activities, income and gain from the transportation or storage of certain fuels, and, in certain circumstances, income and gain from commodities or futures, forwards and options with respect to commodities. Mineral or natural resources activities include exploration, development, production, processing, mining, refining, marketing and transportation (including pipelines) of oil and gas, minerals, geothermal energy, fertilizer, timber or industrial source carbon dioxide. An MLP consists of a general partner and limited partners (or in the case of MLPs organized as limited liability companies, a managing
134
| | |
| THE KP FUNDS | | December 31, 2016 |
member and members). The general partner or managing member typically controls the operations and management of the MLP and has an ownership stake in the partnership. The limited partners or members, through their ownership of limited partner or member interests, provide capital to the entity, are intended to have no role in the operation and management of the entity and receive cash distributions. The MLPs themselves generally do not pay U.S. federal income taxes. Thus, unlike investors in corporate securities, direct MLP investors are generally not subject to double taxation (i.e., corporate level tax and tax on corporate dividends). Currently, most MLPs operate in the energy and/or natural resources sector.
Expenses — Expenses of the Trust can be directly attributed to a particular Fund are borne by that Fund. Expenses which cannot be directly attributed to a Fund are apportioned among the Funds of the Trust based on the number of funds and/or relative net assets. In addition to the expenses reflected on the Statement of Operations, the Target Date Funds indirectly bear expenses of the underlying funds (registered investment companies) in which they invest. Because each of the underlying funds have varied expense and fee levels, and the Target Date Funds may own different amounts of shares of these funds at different times, the amount of fees and expenses incurred indirectly will vary.
Dividends and Distributions to Shareholders — The Funds will distribute substantially all of their net investment income and net realized capital gains, if any, at least annually. All dividends and distributions are recorded on ex-dividend date.
3. Administration, Distribution, Transfer Agent and Custody Agreements:
The Funds and the Administrator are parties to an Administration Agreement under which the Administrator provides administrative services to the Funds. For these services, the Administrator is paid an asset based fee which will vary depending on the average daily net assets of the Funds. For the year ended December 31, 2016, the Funds were charged as follows for these services (000):
| | | | | | | | | | |
| Fund | | Administration Fee | | | Fund | | Administration Fee | |
KP Retirement Path 2015 Fund | | $ | 123 | | | KP Retirement Path 2050 Fund | | $ | 54 | |
KP Retirement Path 2020 Fund | | $ | 190 | | | KP Retirement Path 2055 Fund | | $ | 10 | |
KP Retirement Path 2025 Fund | | $ | 198 | | | KP Retirement Path 2060 Fund | | $ | 2 | |
KP Retirement Path 2030 Fund | | $ | 178 | | | KP Large Cap Equity Fund | | $ | 501 | |
KP Retirement Path 2035 Fund | | $ | 193 | | | KP Small Cap Equity Fund | | $ | 307 | |
KP Retirement Path 2040 Fund | | $ | 172 | | | KP International Equity Fund | | $ | 416 | |
KP Retirement Path 2045 Fund | | $ | 118 | | | KP Fixed Income Fund | | $ | 376 | |
The Trust and SEI Investments Distribution Co. (the “Distributor”) are parties to a Distribution Agreement. The Distributor receives no fees under the agreement.
Certain officers of the Trust are also officers of the Administrator, which is a wholly-owned subsidiary of SEI Investments Company, and/or the Distributor. Such officers are paid no fees by the Trust, other than the Chief Compliance Officer (“CCO”) as described below, for serving as officers of the Trust.
A portion of the services provided by the CCO and his staff, whom are employees of the Administrator, are paid for by the Trust as incurred. The services include regulatory oversight of the Trust’s Advisors and service providers as required by SEC regulations. The CCO’s services and fees have been approved by and are reviewed by the Board.
Northeast Retirement Services, Inc. serves as the Transfer Agent and dividend disbursing agent for the Funds under a transfer agency agreement.
State Street Bank and Trust Company serves as custodian (the “Custodian”) for the Funds. The Custodian plays no role in determining the investment policies of the Funds or which securities are to be purchased and sold by the Funds.
135
| | |
| THE KP FUNDS | | December 31, 2016 |
4. Investment Advisory Agreements:
The Trust will pay to the Adviser as compensation for the Adviser’s services rendered, a fee (the “Advisory Fee”), determined in accordance with the calculation methodology set forth below. The Advisory Fee will be computed and accrued daily on an estimated basis by the Administrator and paid monthly in arrears based on a final determination by the Administrator.
Effective November 30, 2016, the Advisory Fee payable by each Fund for any particular period will equal its pro rata portion of the total fee calculated by applying the Effective Fee Rate (defined below) to the Fund Asset Base (defined below), with each Fund’s pro rata portion determined by dividing the net assets of such Fund that are included in the Fund Asset Base by the total Fund Asset Base. The “Effective Fee Rate” will be determined by applying the following fee schedule to the Fund Asset Base:
0.05% on the first $4,000,000,000 of the Fund Asset Base;
0.04% on the Fund Asset Base between $4,000,000,001 and $7,000,000,000;
0.03% on the Fund Asset Base between $7,000,000,001 and $10,000,000,000; and
0.025% on the Fund Asset Base over $10,000,000,000.
The “Fund Asset Base” equals the Asset Class Funds’ Asset Base (defined below) plus the Target Date Funds’ Asset Base (defined below). The “Asset Class Funds’ Asset Base” equals the sum of the net assets of each Asset Class Fund. The “Target Date Funds’ Asset Base” equals the sum of the net assets of each Target Date Fund invested in investment companies to which the Adviser does not serve as investment adviser. The Fund Asset Base will be estimated daily and determined monthly based on the preceding methodology, in all cases based on the net assets as of the close of business on the preceding day in the case of the daily estimate and based on the average daily net assets average daily net assets in the month for the monthly calculation.
The Effective Fee Rate determined at the beginning of a month shall be used throughout the month for purposes of the daily estimate, and shall be recalculated for the month to make the final determination. In the event that the estimated daily fee for a Fund differs from the final determination by an amount sufficient to require an adjustment to the Net Asset Value of the Fund for any day, such difference shall be treated as a pricing error under the Trust’s policy.
Prior to November 30, 2016, the Advisory Fee was calculated daily and paid monthly at the rates listed below:
| | |
| Fund | | Annual Advisory Fee |
| KP Retirement Path 2015 Fund | | 0.00% of the Fund’s average daily net assets invested in Affiliated Underlying Funds.1 0.05% of the Fund’s average daily net assets invested in Unaffiliated Underlying Funds.2 |
| KP Retirement Path 2020 Fund | | 0.00% of the Fund’s average daily net assets invested in Affiliated Underlying Funds.1 0.05% of the Fund’s average daily net assets invested in Unaffiliated Underlying Funds.2 |
| KP Retirement Path 2025 Fund | | 0.00% of the Fund’s average daily net assets invested in Affiliated Underlying Funds.1 0.05% of the Fund’s average daily net assets invested in Unaffiliated Underlying Funds.2 |
| KP Retirement Path 2030 Fund | | 0.00% of the Fund’s average daily net assets invested in Affiliated Underlying Funds.1 0.05% of the Fund’s average daily net assets invested in Unaffiliated Underlying Funds.2 |
| KP Retirement Path 2035 Fund | | 0.00% of the Fund’s average daily net assets invested in Affiliated Underlying Funds.1 0.05% of the Fund’s average daily net assets invested in Unaffiliated Underlying Funds.2 |
| KP Retirement Path 2040 Fund | | 0.00% of the Fund’s average daily net assets invested in Affiliated Underlying Funds.1 0.05% of the Fund’s average daily net assets invested in Unaffiliated Underlying Funds.2 |
| KP Retirement Path 2045 Fund | | 0.00% of the Fund’s average daily net assets invested in Affiliated Underlying Funds.1 0.05% of the Fund’s average daily net assets invested in Unaffiliated Underlying Funds.2 |
| KP Retirement Path 2050 Fund | | 0.00% of the Fund’s average daily net assets invested in Affiliated Underlying Funds.1 0.05% of the Fund’s average daily net assets invested in Unaffiliated Underlying Funds.2 |
| KP Retirement Path 2055 Fund | | 0.00% of the Fund’s average daily net assets invested in Affiliated Underlying Funds.1 0.05% of the Fund’s average daily net assets invested in Unaffiliated Underlying Funds.2 |
| KP Retirement Path 2060 Fund | | 0.00% of the Fund’s average daily net assets invested in Affiliated Underlying Funds.1 0.05% of the Fund’s average daily net assets invested in Unaffiliated Underlying Funds.2 |
| KP Large Cap Equity Fund | | 0.05% of the Fund’s average daily net assets. |
| KP Small Cap Equity Fund | | 0.05% of the Fund’s average daily net assets. |
| KP International Equity Fund | | 0.05% of the Fund’s average daily net assets. |
| KP Fixed Income Fund | | 0.05% of the Fund’s average daily net assets. |
| 1 | “Affiliated Underlying Funds” are Underlying Funds to which the Adviser serves as investment adviser. |
| 2 | “Unaffiliated Underlying Funds” are Underlying Funds to which the Adviser does not serve as investment adviser. |
136
| | |
| THE KP FUNDS | | December 31, 2016 |
The Adviser has entered into sub-advisory agreements with each sub-adviser under which the sub-adviser makes investment decisions for the assets it has been allocated to manage. For its service, each sub-adviser receives a fee based on the specified percentage of that portion of the Fund’s assets allocated to that sub-adviser. The total fees paid to sub-advisors directly are labeled as “Sub-Advisory Fees” on the Statements of Operations.
As of December 31, 2016, the Adviser has entered into investment sub-advisory agreements with the following parties:
| | |
| Investment Sub-Adviser | | |
| KP Large Cap Equity Fund | | KP International Equity Fund |
| AQR Capital Management, LLC | | Acadian Asset Management LLC |
| MFS Investment Management | | Marathon Asset Management LLP |
| PanAgora Asset Management, Inc. | | MFS Investment Management |
| SSgA Funds Management, Inc. | | SSgA Funds Management, Inc. |
| T.Rowe Price | | |
| |
| KP Small Cap Equity Fund | | KP Fixed Income Fund |
| Aristotle Capital Boston, LLC | | Credit Suisse Asset Management |
| CastleArk Management, LLC | | Loomis, Sayles & Company, LP |
| Columbus Circle Investors | | Payden & Rygel |
| DePrince Race & Zollo, Inc. | | SSgA Funds Management, Inc. |
| PENN Capital Management Company, Inc. | | |
| SSgA Funds Management, Inc. | | |
| Walthausen & Co., LLC | | |
5. Investment Transactions:
For the year ended December 31, 2016, the Funds had purchases and sales of investment securities other than long-term U.S. Government and short-term securities as follows (000):
| | | | | | | | |
| | | Purchases | | | Sales and
Maturities | |
KP Retirement Path 2015 Fund | | $ | 70,252 | | | $ | 104,357 | |
KP Retirement Path 2020 Fund | | | 139,907 | | | | 99,070 | |
KP Retirement Path 2025 Fund | | | 175,746 | | | | 81,336 | |
KP Retirement Path 2030 Fund | | | 167,325 | | | | 64,561 | |
KP Retirement Path 2035 Fund | | | 181,456 | | | | 65,973 | |
KP Retirement Path 2040 Fund | | | 171,478 | | | | 56,951 | |
KP Retirement Path 2045 Fund | | | 139,719 | | | | 43,162 | |
KP Retirement Path 2050 Fund | | | 95,131 | | | | 21,942 | |
KP Retirement Path 2055 Fund | | | 31,857 | | | | 6,469 | |
KP Retirement Path 2060 Fund | | | 6,556 | | | | 3,612 | |
KP Large Cap Equity Fund | | | 774,096 | | | | 662,105 | |
KP Small Cap Equity Fund | | | 715,324 | | | | 716,630 | |
KP International Equity Fund | | | 441,289 | | | | 249,213 | |
KP Fixed Income Fund | | | 813,857 | | | | 773,284 | |
In addition, KP Fixed Income Fund had purchases and sales of long-term U.S. Government securities of $3,681 (000) and $3,598 (000), respectively.
6. Federal Tax Information:
Dividends from net investment income and distributions from net realized capital gains are determined in accordance with U.S. Federal income tax regulations, which may differ from those amounts determined under U.S. GAAP. These book/tax differences are either temporary or permanent in nature. To the extent these differences are permanent, they are charged or credited to paid-in capital, undistributed net investment income or accumulated net realized gain, as appropriate, in the period that the differences arise.
137
| | |
| THE KP FUNDS | | December 31, 2016 |
The following permanent differences primarily attributable to the reclassification of short-term capital gains from affiliated registered investment companies, return of capital, REIT adjustments, PFIC gain reclass, paydowns distribution reclass and foreign exchange gain/(loss), have been reclassified to/from the following accounts during the year ended December 31, 2016 (000):
| | | | | | | | | | | | |
| | | Paid-in
Capital | | | Undistributed
Net Investment
Income/(Loss) | | | Accumulated
Net Realized
Gain/(Loss) | |
KP Retirement Path 2015 Fund | | $ | — | | | $ | 1,827 | | | $ | (1,827 | ) |
KP Retirement Path 2020 Fund | | | — | | | | 2,766 | | | | (2,766 | ) |
KP Retirement Path 2025 Fund | | | — | | | | 2,547 | | | | (2,547 | ) |
KP Retirement Path 2030 Fund | | | — | | | | 1,879 | | | | (1,879 | ) |
KP Retirement Path 2035 Fund | | | — | | | | 1,645 | | | | (1,645 | ) |
KP Retirement Path 2040 Fund | | | — | | | | 1,125 | | | | (1,125 | ) |
KP Retirement Path 2045 Fund | | | — | | | | 545 | | | | (545 | ) |
KP Retirement Path 2050 Fund | | | — | | | | 270 | | | | (270 | ) |
KP Retirement Path 2055 Fund | | | — | | | | 57 | | | | (57 | ) |
KP Retirement Path 2060 Fund | | | — | | | | 9 | | | | (9 | ) |
KP Large Cap Equity Fund | | | — | | | | 489 | | | | (489 | ) |
KP Small Cap Equity Fund | | | (390 | ) | | | 740 | | | | (350 | ) |
KP International Equity Fund | | | — | | | | (172 | ) | | | 172 | |
KP Fixed Income Fund | | | — | | | | 408 | | | | (408 | ) |
These reclassifications have no impact on net assets or net asset value per share of the Funds.
The tax character of dividends and distributions declared during the year or period ended December 31, 2016 and December 31, 2015 were as follows (000):
| | | | | | | | | | | | | | | | | | | | |
| | | Year | | | Ordinary
Income | | | Long-Term
Capital Gain | | | Return of
Capital | | | Total | |
KP Retirement Path 2015 Fund | | | 2016 | | | $ | 10,031 | | | $ | 4,189 | | | $ | — | | | $ | 14,220 | |
| | | 2015 | | | | 11,020 | | | | 4,765 | | | | — | | | | 15,785 | |
KP Retirement Path 2020 Fund | | | 2016 | | | | 16,016 | | | | 6,468 | | | | — | | | | 22,484 | |
| | | 2015 | | | | 15,668 | | | | 4,098 | | | | — | | | | 19,766 | |
KP Retirement Path 2025 Fund | | | 2016 | | | | 16,914 | | | | 8,169 | | | | — | | | | 25,083 | |
| | | 2015 | | | | 15,988 | | | | 3,023 | | | | — | | | | 19,011 | |
KP Retirement Path 2030 Fund | | | 2016 | | | | 15,070 | | | | 8,780 | | | | — | | | | 23,850 | |
| | | 2015 | | | | 14,973 | | | | 2,786 | | | | — | | | | 17,759 | |
KP Retirement Path 2035 Fund | | | 2016 | | | | 15,839 | | | | 10,598 | | | | — | | | | 26,437 | |
| | | 2015 | | | | 16,303 | | | | 3,095 | | | | — | | | | 19,398 | |
KP Retirement Path 2040 Fund | | | 2016 | | | | 13,607 | | | | 10,261 | | | | — | | | | 23,868 | |
| | | 2015 | | | | 14,264 | | | | 2,695 | | | | — | | | | 16,959 | |
KP Retirement Path 2045 Fund | | | 2016 | | | | 9,281 | | | | 7,428 | | | | — | | | | 16,709 | |
| | | 2015 | | | | 9,604 | | | | 2,176 | | | | — | | | | 11,780 | |
KP Retirement Path 2050 Fund | | | 2016 | | | | 4,402 | | | | 3,097 | | | | — | | | | 7,499 | |
| | | 2015 | | | | 3,870 | | | | 782 | | | | — | | | | 4,652 | |
KP Retirement Path 2055 Fund | | | 2016 | | | | 946 | | | | 470 | | | | — | | | | 1,416 | |
| | | 2015 | | | | 615 | | | | 206 | | | | — | | | | 821 | |
KP Retirement Path 2060 Fund | | | 2016 | | | | 162 | | | | 94 | | | | — | | | | 256 | |
| | | 2015 | | | | 157 | | | | 1 | | | | — | | | | 158 | |
KP Large Cap Equity Fund | | | 2016 | | | | 22,452 | | | | 32,941 | | | | — | | | | 55,393 | |
| | | 2015 | | | | 30,483 | | | | 34,117 | | | | — | | | | 64,600 | |
KP Small Cap Equity Fund | | | 2016 | | | | 7,022 | | | | — | | | | — | | | | 7,022 | |
| | | 2015 | | | | 12,927 | | | | 9,519 | | | | 66 | | | | 22,512 | |
KP International Equity Fund | | | 2016 | | | | 23,849 | | | | — | | | | — | | | | 23,849 | |
| | | 2015 | | | | 22,352 | | | | — | | | | 658 | | | | 23,010 | |
KP Fixed Income Fund | | | 2016 | | | | 34,544 | | | | 115 | | | | — | | | | 34,659 | |
| | | 2015 | | | | 24,223 | | | | 158 | | | | 4 | | | | 24,385 | |
138
| | |
| THE KP FUNDS | | December 31, 2016 |
As of December 31, 2016, the components of distributable earnings/(accumulated losses) on a tax basis were as follows (000):
| | | | | | | | | | | | | | | | | | | | | | | | |
| | | Undistributed
Ordinary Income | | | Undistributed
Long-Term
Capital Gain | | | Capital Loss
Carryforwards | | | Post
October
Losses | | | Unrealized
Appreciation/
(Depreciation) | | | Total Distributable
Earnings/
(Accumulated
Losses) | |
KP Retirement Path 2015 Fund | | $ | — | | | $ | 2,805 | | | $ | — | | | $ | — | | | $ | 3,301 | | | $ | 6,106 | |
KP Retirement Path 2020 Fund | | | — | | | | 4,849 | | | | — | | | | — | | | | 9,609 | | | | 14,458 | |
KP Retirement Path 2025 Fund | | | — | | | | 5,847 | | | | — | | | | — | | | | 13,302 | | | | 19,149 | |
KP Retirement Path 2030 Fund | | | — | | | | 5,905 | | | | — | | | | — | | | | 14,588 | | | | 20,493 | |
KP Retirement Path 2035 Fund | | | — | | | | 7,011 | | | | — | | | | — | | | | 19,379 | | | | 26,390 | |
KP Retirement Path 2040 Fund | | | — | | | | 6,565 | | | | — | | | | — | | | | 18,966 | | | | 25,531 | |
KP Retirement Path 2045 Fund | | | 39 | | | | 4,873 | | | | — | | | | — | | | | 12,092 | | | | 17,004 | |
KP Retirement Path 2050 Fund | | | — | | | | 2,361 | | | | — | | | | — | | | | 4,493 | | | | 6,854 | |
KP Retirement Path 2055 Fund | | | 13 | | | | 445 | | | | — | | | | — | | | | 547 | | | | 1,005 | |
KP Retirement Path 2060 Fund | | | — | | | | 71 | | | | — | | | | — | | | | (86 | ) | | | (15 | ) |
KP Large Cap Equity Fund | | | 3,152 | | | | 14,015 | | | | — | | | | — | | | | 154,458 | | | | 171,625 | |
KP Small Cap Equity Fund | | | 1,474 | | | | 4,652 | | | | — | | | | — | | | | 84,477 | | | | 90,603 | |
KP International Equity Fund | | | 720 | | | | — | | | | (21,564 | ) | | | (2,370 | ) | | | (51,634 | ) | | | (74,848 | ) |
KP Fixed Income Fund | | | 319 | | | | — | | | | — | | | | (3,132 | ) | | | (11,216 | ) | | | (14,029 | ) |
Post-October losses represent losses realized on investment transactions from November 1, 2016 through December 31, 2016, that, in accordance with Federal income tax regulations, the Funds elect to defer and treat as having arisen in the following fiscal year.
For Federal income tax purposes, capital loss carryforwards may be carried forward and applied against all future capital gains. Under the Regulated Investment Company Modernization Act of 2010, Funds are permitted to carry forward capital losses incurred in taxable years beginning after December 22, 2010 for an unlimited period. Additionally, post-enactment capital losses that are carried forward will retain their character as either short-term or long-term capital losses rather than being considered all short-term as under previous law. Capital loss carryforwards, all of which are not subject to expiration, are as follows (000):
| | | | | | | | | | | | |
| | | Short-Term | | | Long-Term | | | Total
Capital Loss
Carryforwards | |
KP International Equity Fund | | $ | 5,657 | | | $ | 15,907 | | | $ | 21,564 | |
The Federal tax cost and aggregate gross unrealized appreciation and depreciation on investments for Federal income tax purposes at December 31, 2016, were as follows (000):
| | | | | | | | | | | | | | | | |
| | | Federal
Tax Cost | | | Aggregated Gross
Unrealized
Appreciation | | | Aggregated Gross
Unrealized
Depreciation | | | Net Unrealized
Appreciation/
(Depreciation) | |
KP Retirement Path 2015 Fund | | $ | 459,035 | | | $ | 9,112 | | | $ | (5,811 | ) | | $ | 3,301 | |
KP Retirement Path 2020 Fund | | | 762,559 | | | | 21,137 | | | | (11,528 | ) | | | 9,609 | |
KP Retirement Path 2025 Fund | | | 829,497 | | | | 28,176 | | | | (14,874 | ) | | | 13,302 | |
KP Retirement Path 2030 Fund | | | 759,364 | | | | 30,793 | | | | (16,205 | ) | | | 14,588 | |
KP Retirement Path 2035 Fund | | | 826,587 | | | | 37,935 | | | | (18,556 | ) | | | 19,379 | |
KP Retirement Path 2040 Fund | | | 743,862 | | | | 39,169 | | | | (20,203 | ) | | | 18,966 | |
KP Retirement Path 2045 Fund | | | 523,785 | | | | 25,917 | | | | (13,825 | ) | | | 12,092 | |
KP Retirement Path 2050 Fund | | | 253,117 | | | | 10,388 | | | | (5,895 | ) | | | 4,493 | |
KP Retirement Path 2055 Fund | | | 54,277 | | | | 1,572 | | | | (1,025 | ) | | | 547 | |
KP Retirement Path 2060 Fund | | | 9,184 | | | | 324 | | | | (410 | ) | | | (86 | ) |
KP Large Cap Equity Fund | | | 1,325,346 | | | | 198,341 | | | | (43,873 | ) | | | 154,468 | |
KP Small Cap Equity Fund | | | 849,543 | | | | 128,467 | | | | (43,794 | ) | | | 84,673 | |
KP International Equity Fund | | | 1,274,690 | | | | 82,893 | | | | (134,019 | ) | | | (51,126 | ) |
KP Fixed Income Fund | | | 1,186,793 | | | | 3,592 | | | | (14,763 | ) | | | (11,171 | ) |
139
| | |
| THE KP FUNDS | | December 31, 2016 |
7. Risks:
As with all mutual funds, a shareholder of a fund is subject to the risk that his or her investment could lose money. The Funds are subject to the principal risks noted below, any of which may adversely affect the fund’s net asset value and ability to meet its investment objective. A more complete description of principal risks is included in the prospectus under the heading “Principal Risks”.
Credit Risk — Credit risk is the risk that the issuer of a security or the counterparty to a contract will default or otherwise become unable to honor a financial obligation.
Fixed Income Market Risk — Fixed income market risk is the risk that the prices of a fund’s fixed income securities, including structured notes, respond to economic developments, particularly interest rate changes, as well as to perceptions about the creditworthiness of individual issuers, including governments and their agencies. In the case of foreign securities, price fluctuations will reflect international economic and political events, as well as changes in currency valuations relative to the U.S. dollar.
Interest Rate Risk — Interest rate risk is the risk that the value of fixed income securities, including U.S. Government securities, will fall due to rising interest rates.
Derivatives Risk — A fund’s use of futures contracts and forward contracts is subject to market risk, leverage risk, correlation risk and liquidity risk. Leverage risk is the risk that the use of leverage may amplify the effects of market volatility on a fund’s share price and may also cause a fund to liquidate portfolio positions when it would not be advantageous to do so in order to satisfy its obligations. Liquidity risk is the risk that certain securities may be difficult or impossible to sell at the time and the price that a fund would like. A fund may have to lower the price, sell other securities instead or forego an investment opportunity, any of which could have a negative effect on a fund’s management or performance. Correlation risk is the risk that changes in the value of the derivative may not correlate perfectly with the underlying asset, rate or index. A fund’s use of forward contracts is also subject to credit risk and valuation risk. Credit risk is described above. Valuation risk is the risk that the derivative may be difficult to value and/or valued incorrectly. Each of these risks could cause a fund to lose more than the principal amount invested in a derivative instrument.
Foreign Currency Risk — Foreign currency risk may arise from unanticipated movements in the value of a foreign currency relative to the U.S. dollar. Risks may also arise upon entering into these contracts from the potential inability of counterparties to meet the terms of their contracts and are generally limited to the amount of unrealized gain on the contracts at the date of default.
Foreign Investment Risk — The risk that non-U.S. securities may be subject to additional risks due to, among other things, political, social and economic developments abroad, currency movements, and different legal, regulatory and tax environments. These additional risks may be heightened with respect to emerging market countries since political turmoil and rapid changes in economic conditions are more likely to occur in these countries.
8. Indemnifications:
In the normal course of business, the Funds enter into contracts with third-party service providers that contain a variety of representations and warranties and that provide general indemnifications. Additionally, under the Funds’ organizational documents, the officers and trustees are indemnified against certain liabilities arising out of the performance of their duties to the Funds. The Funds’ maximum exposure under these arrangements is unknown, as it involves possible future claims that may or may not be made against the Funds. Based on experience, the Adviser is of the view that the risk of loss to the Funds in connection with the Funds’ indemnification obligation is remote; however, there can be no assurance that such obligations will not result in material liabilities that adversely affect the Funds.
140
| | |
| THE KP FUNDS | | December 31, 2016 |
9. Other:
At December 31, 2016, the percentage of total shares outstanding held by shareholders each owning 10% or greater of the aggregate total shares outstanding for each Fund, which are comprised of an omnibus account that are held on behalf of various individual shareholders, was as follows:
| | | | | | | | | | | | | | | | |
| | | Number of
affiliated
shareholders | | | % of
outstanding
shares held | | | Number of
non-affiliated
shareholders | | | % of
outstanding
shares held | |
KP Retirement Path 2015 Fund | | | — | | | | 0% | | | | 1 | | | | 100% | |
KP Retirement Path 2020 Fund | | | — | | | | 0% | | | | 1 | | | | 100% | |
KP Retirement Path 2025 Fund | | | — | | | | 0% | | | | 1 | | | | 100% | |
KP Retirement Path 2030 Fund | | | — | | | | 0% | | | | 1 | | | | 100% | |
KP Retirement Path 2035 Fund | | | — | | | | 0% | | | | 1 | | | | 100% | |
KP Retirement Path 2040 Fund | | | — | | | | 0% | | | | 1 | | | | 100% | |
KP Retirement Path 2045 Fund | | | — | | | | 0% | | | | 1 | | | | 100% | |
KP Retirement Path 2050 Fund | | | — | | | | 0% | | | | 1 | | | | 100% | |
KP Retirement Path 2055 Fund | | | — | | | | 0% | | | | 1 | | | | 100% | |
KP Retirement Path 2060 Fund | | | — | | | | 0% | | | | 1 | | | | 100% | |
KP Large Cap Equity Fund | | | 6 | | | | 87% | | | | — | | | | 0% | |
KP Small Cap Equity Fund | | | 3 | | | | 25% | | | | 1 | | | | 38% | |
KP International Equity Fund | | | 5 | | | | 82% | | | | — | | | | 0% | |
KP Fixed Income Fund | | | 5 | | | | 85% | | | | — | | | | 0% | |
10. Subsequent Events:
The Funds have evaluated the need for additional disclosures and/or adjustments resulting from subsequent events through the date the financial statements were issued. Based on this evaluation, no additional disclosures and/or adjustments were required to the financial statements.
141
| | |
| THE KP FUNDS | | December 31, 2016 |
|
| REPORT OF INDEPENDENT REGISTERED PUBLIC ACCOUNTING FIRM |
To the Board of Trustees of The KP Funds and the Shareholders of the Funds, as defined:
In our opinion, the accompanying statements of assets and liabilities, including the schedules of investments, and the related statements of operations and of changes in net assets and the financial highlights present fairly, in all material respects, the financial position of KP Retirement Path 2015 Fund, KP Retirement Path 2020 Fund, KP Retirement Path 2025 Fund, KP Retirement Path 2030 Fund, KP Retirement Path 2035 Fund, KP Retirement Path 2040 Fund, KP Retirement Path 2045 Fund, KP Retirement Path 2050 Fund, KP Retirement Path 2055 Fund, KP Retirement Path 2060 Fund, KP Large Cap Equity Fund, KP Small Cap Equity Fund, KP International Equity Fund and KP Fixed Income Fund (constituting The KP Funds, hereafter referred to as the “Funds”) as of December 31, 2016, the results of each of their operations for the year then ended, the changes in each of their net assets for each of the two years in the period then ended and the financial highlights for each of the periods indicated, in conformity with accounting principles generally accepted in the United States of America. These financial statements and financial highlights (hereafter referred to as “financial statements”) are the responsibility of the Funds’ management. Our responsibility is to express an opinion on these financial statements based on our audits. We conducted our audits of these financial statements in accordance with the standards of the Public Company Accounting Oversight Board (United States). Those standards require that we plan and perform the audit to obtain reasonable assurance about whether the financial statements are free of material misstatement. An audit includes examining, on a test basis, evidence supporting the amounts and disclosures in the financial statements, assessing the accounting principles used and significant estimates made by management, and evaluating the overall financial statement presentation. We believe that our audits, which included confirmation of securities as of December 31, 2016 by correspondence with the custodian, brokers, and the transfer agent of the investee funds, provide a reasonable basis for our opinion.
PricewaterhouseCoopers LLP
Philadelphia, Pennsylvania
February 28, 2017
142
This page is intentionally left blank.
| | |
| THE KP FUNDS | | December 31, 2016 |
|
| TRUSTEES AND OFFICERS OF THE TRUST (Unaudited) |
Set forth below are the names, ages, position with the Trust, term of office, length of time served and the principal occupations for the last five years of each of the persons currently serving as Trustees and Officers of the Trust. Trustees who are deemed not to be “interested persons” of the Trust are referred to as “Independent Board Members.” Messrs. Nesher and Doran are Trustees who may be deemed to be “interested” persons of
| | | | |
| | |
Name, Address, Age1 | | Position(s) Held with the Trust and Length of Time Served2 | | Principal Occupation(s) During the Past 5 Years |
INTERESTED
BOARD MEMBERS3,4 | | | | |
| | |
ROBERT A. NESHER 70 yrs. old | | Chairman
of the Board
of Trustees (Since 1991) | | SEI employee 1974 to present; currently performs various services on behalf of SEI Investments for which Mr. Nesher is compensated. |
WILLIAM M. DORAN 1701 Market Street Philadelphia, PA 19103 76 yrs. old | | Trustee (Since 1991) | | Self-Employed Consultant since 2003. Partner at Morgan, Lewis & Bockius LLP (law firm) from 1976 to 2003, counsel to the Trust, SEI Investments, SIMC, the Administrator and the Distributor. |
| 1 | Unless otherwise noted, the business address of each trustee is SEI Investments Company, 1 Freedom Value Drive, Oaks, Pennsylvania 19456 |
| 2 | Each Trustee shall hold office during the lifetime of this trust until the election and qualification of his or her successor, or until he or she sooner dies, resigns, or is removed in accordance with the Trust’s Declaration of Trust. |
| 3 | Denotes Trustees who may be deemed to be “interested” persons of the Fund as that term is defined in the 1940 Act by virtue of their affiliation with the Distributor and/or its affiliates. |
| 4 | Board Members oversee 14 funds in the KP Funds Trust. |
| 5 | Directorships of Companies required to report to the securities and Exchange Commission under the Securities Exchange act of 1934 (i.e., “public companies”) or other investment companies under the 1940 act. |
144
| | |
| THE KP FUNDS | | December 31, 2016 |
the Fund as that term is defined in the 1940 Act by virtue of their affiliation with the Trust’s Distributor. The Trust’s Statement of Additional Information (“SAI”) includes additional information about the Trustees and Officers. The SAI may be obtained without charge by calling 1-855-457-3637. The following chart lists Trustees and Officers as of December 31, 2016.
|
|
Other Directorships
Held by
Board Member5 |
|
Current Directorships: Trustee of The Advisors’ Inner Circle Fund, The Advisors’ Inner Circle Fund II, Bishop Street Funds, SEI Daily Income Trust, SEI Institutional International Trust, SEI Institutional Investments Trust, SEI Institutional Managed Trust, SEI Asset Allocation Trust, SEI Tax Exempt Trust, Adviser Managed Trust, New Covenant Funds and SEI Insurance Products Trust. President and Director of SEI Structured Credit Fund, L.P. Director of SEI Global Master Fund plc, SEI Global Assets Fund plc, SEI Global Investments Fund plc, SEI Investments – Global Funds Services, Limited, SEI Investments Global, Limited, SEI Investments (Europe) Ltd., SEI Investments – Unit Trust Management (UK) Limited, SEI Multi-Strategy Funds PLC and SEI Global Nominee Ltd. Former Directorships: Director of SEI Opportunity Fund, L.P. to 2010. Director of SEI Alpha Strategy Portfolios, LP to 2013. Trustee of SEI Liquid Asset Trust to 2016. |
Current Directorships: Trustee of The Advisors’ Inner Circle Fund, The Advisors’ Inner Circle Fund II, The Advisors’ Inner Circle Fund III, Winton Series Trust, Winton Diversified Opportunities Fund (closed-end investment company), Gallery Trust, Bishop Street Funds, SEI Daily Income Trust, SEI Institutional International Trust, SEI Institutional Investments Trust, SEI Institutional Managed Trust, SEI Asset Allocation Trust and SEI Tax Exempt Trust, Adviser Managed Trust, New Covenant Funds and SEI Insurance Products Trust and SEI Catholic Values Trust. Director of SEI Investments (Europe), Limited, SEI Investments – Global Funds Services, Limited, SEI Investments Global, Limited, SEI Investments (Asia), Limited, SEI Global Nominee Ltd. and SEI Investments – Unit Trust Management (UK) Limited. Director of the Distributor since 2003. Former Directorships: Director of SEI Alpha Strategy Portfolios, LP to 2013. Trustee of O’Connor EQUUS (closed-end investment company) to 2016. Trustee of SEI Liquid Asset Trust to 2016. |
145
| | |
| THE KP FUNDS | | December 31, 2016 |
|
| TRUSTEES AND OFFICERS OF THE TRUST (Unaudited) |
| | | | |
| | |
Name, Address, Age1 | | Position(s) Held
with the Trust and Length of Time Served2 | | Principal Occupation(s) During the Past 5 Years |
| INDEPENDENT | | | | |
| BOARD MEMBERS3,4 | | | | |
| | |
JOHN K. DARR 72 yrs. old | | Trustee (Since 2008) | | Retired. CEO, Office of Finance, Federal Home Loan Banks, from 1992 to 2007. |
JOSEPH T. GRAUSE JR. 64 yrs. old | | Trustee (Since 2011) | | Self-employed consultant since January 2012. Director of Endowments and Foundations, Morningstar Investment Management, Morningstar, Inc., February 2010 to May 2011; Director of International Consulting and Chief Executive Officer of Morningstar Associates Europe Limited, Morningstar, Inc., May 2007 to February 2010; Country Manager — Morningstar UK Limited, Morningstar, Inc., June 2005 to May 2007. |
MITCHELL A. JOHNSON 74 yrs. old | | Trustee (Since 2005) | | Retired. Private investor since 1994. |
BETTY L. KRIKORIAN 73 yrs. old | | Trustee (Since 2005) | | Vice President, Compliance, AARP Financial Inc. from 2008 to 2010. Self-Employed Legal and Financial Services Consultant since 2003. Counsel (in-house) for State Street Bank from 1995 to 2003. |
| 1 | Unless otherwise noted, the business address of each trustee is SEI Investments Company, 1 Freedom Value Drive, Oaks, Pennsylvania 19456 |
| 2 | Each Trustee shall hold office during the lifetime of this trust until the election and qualification of his or her successor, or until he or she sooner dies, resigns, or is removed in accordance with the Trust’s Declaration of Trust. |
| 3 | Denotes Trustees who may be deemed to be “interested” persons of the Fund as that term is defined in the 1940 Act by virtue of their affiliation with the Distributor and/or its affiliates. |
| 4 | Board Members oversee 14 funds in the KP Funds Trust. |
| 5 | Directorships of Companies required to report to the securities and Exchange Commission under the Securities Exchange act of 1934 (i.e., “public companies”) or other investment companies under the 1940 act. |
146
| | |
| THE KP FUNDS | | December 31, 2016 |
|
|
Other Directorships Held by Board Member5 |
|
|
|
Current Directorships: Trustee of The Advisors’ Inner Circle Fund, The Advisors’ Inner Circle Fund II and Bishop Street Funds. Director, Federal Home Loan Banks of Pittsburgh, Meals on Wheels, Lewes/Rehoboth Beach and West Rehoboth Land Trust.
|
Current Directorships: Trustee of The Advisors’ Inner Circle Fund, The Advisors’ Inner Circle Fund II and Bishop Street Funds. Director, The Korea Fund, Inc.
|
Current Directorships: Trustee of The Advisors’ Inner Circle Fund, The Advisors’ Inner Circle Fund II, Bishop Street Funds, SEI Asset Allocation Trust, SEI Daily Income Trust, SEI Institutional International Trust, SEI Institutional Managed Trust, SEI Institutional Investments Trust, SEI Tax Exempt Trust, Adviser Managed Trust, New Covenant Funds and SEI Insurance Products Trust. Director, Federal Agricultural Mortgage Corporation (Farmer Mac) since 1997. Former Directorships: Director of SEI Alpha Strategy Portfolios, LP to 2013. Trustee of SEI Liquid Asset Trust to 2016. |
Current Directorships: Trustee of The Advisors’ Inner Circle Fund, The Advisors’ Inner Circle Fund II and Bishop Street Funds.
|
147
| | |
| THE KP FUNDS | | December 31, 2016 |
|
| TRUSTEES AND OFFICERS OF THE TRUST (Unaudited) |
| | | | |
| | |
Name, Address, Age1 | | Position(s) Held
with the Trust and Length of Time Served2 | | Principal Occupation(s) During the Past 5 Years |
INDEPENDENT BOARD MEMBERS3,4 | | |
| | |
BRUCE R. SPECA 60 yrs. old | | Trustee (Since 2011) | | Global Head of Asset Allocation, Manulife Asset Management (subsidiary of Manulife Financial), June 2010 to May 2011; Executive Vice President – Investment Management Services, John Hancock Financial Services (subsidiary of Manulife Financial), June 2003 to June 2010. |
GEORGE J. SULLIVAN, JR. 73 yrs. old | | Trustee Lead Independent Trustee (Since 1999) | | Retired since January 2012. Self-employed Consultant, Newfound Consultants Inc. April 1997 to December 2011. |
| OFFICERS | | | | |
| | |
MICHAEL BEATTIE 51 yrs. old | | President (Since 2011) | | Director of Client Service at SEI from 2004 to 2011. Vice President at SEI from 2009 to November 2011. |
STEPHEN CONNORS 32 yrs. old | | Treasurer, Controller and Chief Financial Officer (Since 2015) | | Director, SEI Investments, Fund Accounting since 2014. Audit Manager, Deloitte & Touche LLP, from 2011 to 2014. Audit Supervisor, BBD, LLP (formerly Briggs, Bunting & Dougherty, LLP), from 2007 to 2011. |
| 1 | Unless otherwise noted, the business address of each trustee is SEI Investments Company, 1 Freedom Value Drive, Oaks, Pennsylvania 19456 |
| 2 | Each Trustee shall hold office during the lifetime of this trust until the election and qualification of his or her successor, or until he or she sooner dies, resigns, or is removed in accordance with the Trust’s Declaration of Trust. |
| 3 | Denotes Trustees who may be deemed to be “interested” persons of the Fund as that term is defined in the 1940 Act by virtue of their affiliation with the Distributor and/or its affiliates. |
| 4 | Board Members oversee 14 funds in the KP Funds Trust. |
| 5 | Directorships of Companies required to report to the securities and Exchange Commission under the Securities Exchange act of 1934 (i.e., “public companies”) or other investment companies under the 1940 act. |
148
| | |
| THE KP FUNDS | | December 31, 2016 |
|
|
Other Directorships Held by Board Member/Officer5 |
|
Current Directorships: Trustee of The Advisors’ Inner Circle Fund, The Advisors’ Inner Circle Fund II and Bishop Street Funds.
|
Current Directorships: Trustee/ Director of State Street Navigator Securities Lending Trust, The Advisors’ Inner Circle Fund, The Advisors’ Inner Circle Fund II, Bishop Street Funds, SEI Structured Credit Fund, LP, SEI Daily Income Trust, SEI Institutional International Trust, SEI Institutional Investments Trust, SEI Institutional Managed Trust, SEI Asset Allocation Trust, SEI Tax Exempt Trust, Adviser Managed Trust, New Covenant Funds and SEI Insurance Products Trust. Member of the independent review committee for SEI’s Canadian-registered mutual funds. Former Directorships: Director of SEI Opportunity Fund, L.P. to 2010. Director of SEI Alpha Strategy Portfolios, LP to 2013. Trustee of SEI Liquid Asset Trust to 2016. |
|
None. |
None. |
149
| | |
| THE KP FUNDS | | December 31, 2016 |
|
| TRUSTEES AND OFFICERS OF THE TRUST (Unaudited) |
| | | | |
| | |
Name, Address, Age1 | | Position(s) Held
with the Trust and
Length of Time
Served2 | | Principal Occupation(s) During the Past 5 Years |
| OFFICERS (continued) | | | | |
| | |
RUSSELL EMERY 55 yrs. old | | Chief Compliance Officer (Since 2006) | | Chief Compliance Officer of SEI Structured Credit Fund, LP since June 2007. Chief Compliance Officer of SEI Alpha Strategy Portfolios, LP from June 2007 to September 2013. Chief Compliance Officer of The Advisors’ Inner Circle Fund, The Advisors’ Inner Circle Fund II, Bishop Street Funds, The Advisors’ Inner Circle Fund III, Winton Series Trust, Winton Diversified Opportunities Fund (closed-end investment company), Gallery Trust, SEI Institutional Managed Trust, SEI Asset Allocation Trust, SEI Institutional International Trust, SEI Institutional Investments Trust, SEI Daily Income Trust, SEI Tax Exempt Trust, Adviser Managed Trust, New Covenant Funds, SEI Insurance Products Trust and SEI Catholic Values Trust. Chief Compliance Officer of SEI Opportunity Fund, L.P. until 2010. Chief Compliance Officer of O’Connor EQUUS (closed-end investment company) to 2016. Chief Compliance Officer of SEI Liquid Asset Trust to 2016. |
DIANNE M. DESCOTEAUX 39 yrs. old | | Vice President and Secretary (Since 2011) | | Counsel at SEI Investments since 2010. Associate at Morgan, Lewis & Bockius LLP from 2006 to 2010. |
BRIDGET E. SUDALL 36 yrs. old | | Anti-Money Laundering Compliance Officer and Privacy Officer (since 2015) | | Senior Associate and AML Officer, Morgan Stanley Alternative Investment Partners from April 2011 to March 2015. Investor Services Team Lead, Morgan Stanley Alternative Investment Partners from 2007 to 2011. |
LISA WHITTAKER 38 yrs. old | | Vice President and Assistant Secretary (since 2013) | | Attorney, SEI Investments Company (2012-present). Associate Counsel, The Glenmede Trust Company (2011-2012). Associate, Drinker Biddle & Reath LLP (2006-2011). |
JOHN Y. KIM 35 yrs. old | | Vice President and Assistant Secretary (since 2014) | | Attorney, SEI Investments Company (2014-present). Associate Stradley Ronon Stevens & Young (2009-2014). |
| 1 | Unless otherwise noted, the business address of each trustee is SEI Investments Company, 1 Freedom Value Drive, Oaks, Pennsylvania 19456 |
| 2 | Each Trustee shall hold office during the lifetime of this trust until the election and qualification of his or her successor, or until he or she sooner dies, resigns, or is removed in accordance with the Trust’s Declaration of Trust. |
150
| | |
| THE KP FUNDS | | December 31, 2016 |
|
|
Other Directorships Held by Officer |
|
|
None. |
None |
None. |
None. |
None. |
151
| | |
| THE KP FUNDS | | December 31, 2016 |
|
| DISCLOSURE OF FUND EXPENSES (Unaudited) |
All mutual funds have operating expenses. As a shareholder of a mutual fund, your investment is affected by these ongoing costs, which include (among others) costs for portfolio management, administrative services, and shareholder reports like this one. It is important for you to understand the impact of these costs on your investment returns.
Operating expenses such as these are deducted from the mutual fund‘s gross income and directly reduce your final investment return. These expenses are expressed as a percentage of the mutual fund’s average net assets; this percentage is known as the mutual fund’s expense ratio.
The following examples use the expense ratio and are intended to help you understand the ongoing costs (in dollars) of investing in your Fund and to compare these costs with those of other mutual funds. The examples are based on an investment of $1,000 invested on July 1, 2016 and held for the six-month period ended December 31, 2016.
The table on the next page illustrates your Fund’s costs in two ways:
• Actual Fund Return. This section helps you to estimate the actual expenses after fee waivers that your Fund incurred over the period. The “Expenses Paid During Period” column shows the actual dollar expense cost incurred by a $1,000 investment in the Fund, and the “Ending Account Value” number is derived from deducting that expense cost from the Fund’s gross investment return.
You can use this information, together with the actual amount you invested in your Fund, to estimate the expenses you paid over that period. Simply divide your actual starting account value by $1,000 to arrive at a ratio (for example, an $8,600 account value divided by $1,000 = 8.6), then multiply that ratio by the number shown for your Fund under “Expenses Paid During Period.”
• Hypothetical 5% Return. This section helps you compare your Fund’s costs with those of other mutual funds. It assumes that your Fund had an annual 5% return before expenses during the year, but that the expense ratio (Column 3) is unchanged. This example is useful in making comparisons because the Securities and Exchange Commission requires all mutual funds to make this 5% calculation. You can assess your Fund’s comparative cost by comparing the hypothetical result for your Fund in the “Expense Paid During Period” column with those that appear in the same charts in the shareholder reports for other mutual funds.
NOTE: Because the return is set at 5% for comparison purposes — NOT your Fund’s actual return — the account values shown do not apply to your specific investment
152
| | |
| THE KP FUNDS | | December 31, 2016 |
|
| DISCLOSURE OF FUND EXPENSES (Unaudited) (Continued) |
| | | | | | | | | | | | | | | | |
| | | Beginning
Account
Value
7/1/2016 | | | Ending
Account
Value
12/31/2016 | | | Annualized
Expense
Ratios | | | Expenses Paid
During
Period* | |
KP Retirement Path 2015 Fund | |
Actual Fund Return | | $ | 1,000.00 | | | $ | 1,015.00 | | | | 0.08 | % | | $ | 0.41 | |
Hypothetical 5% Return | | $ | 1,000.00 | | | $ | 1,024.80 | | | | 0.08 | % | | $ | 0.41 | |
KP Retirement Path 2020 Fund | |
Actual Fund Return | | $ | 1,000.00 | | | $ | 1,023.70 | | | | 0.08 | % | | $ | 0.41 | |
Hypothetical 5% Return | | $ | 1,000.00 | | | $ | 1,024.80 | | | | 0.08 | % | | $ | 0.41 | |
KP Retirement Path 2025 Fund | |
Actual Fund Return | | $ | 1,000.00 | | | $ | 1,035.80 | | | | 0.08 | % | | $ | 0.41 | |
Hypothetical 5% Return | | $ | 1,000.00 | | | $ | 1,024.80 | | | | 0.08 | % | | $ | 0.41 | |
KP Retirement Path 2030 Fund | |
Actual Fund Return | | $ | 1,000.00 | | | $ | 1,049.50 | | | | 0.07 | % | | $ | 0.36 | |
Hypothetical 5% Return | | $ | 1,000.00 | | | $ | 1,024.85 | | | | 0.07 | % | | $ | 0.36 | |
KP Retirement Path 2035 Fund | |
Actual Fund Return | | $ | 1,000.00 | | | $ | 1,059.50 | | | | 0.07 | % | | $ | 0.36 | |
Hypothetical 5% Return | | $ | 1,000.00 | | | $ | 1,024.85 | | | | 0.07 | % | | $ | 0.36 | |
KP Retirement Path 2040 Fund | |
Actual Fund Return | | $ | 1,000.00 | | | $ | 1,066.10 | | | | 0.07 | % | | $ | 0.36 | |
Hypothetical 5% Return | | $ | 1,000.00 | | | $ | 1,024.85 | | | | 0.07 | % | | $ | 0.36 | |
KP Retirement Path 2045 Fund | |
Actual Fund Return | | $ | 1,000.00 | | | $ | 1,069.40 | | | | 0.07 | % | | $ | 0.37 | |
Hypothetical 5% Return | | $ | 1,000.00 | | | $ | 1,024.85 | | | | 0.07 | % | | $ | 0.36 | |
| | | | | | | | | | | | | | | | |
| | | Beginning Account Value
7/1/2016 | | | Ending
Account
Value
12/31/2016 | | | Annualized
Expense
Ratios | | | Expenses Paid
During
Period* | |
KP Retirement Path 2050 Fund | |
Actual Fund Return | | $ | 1,000.00 | | | $ | 1,069.40 | | | | 0.07 | % | | $ | 0.37 | |
Hypothetical 5% Return | | $ | 1,000.00 | | | $ | 1,024.85 | | | | 0.07 | % | | $ | 0.36 | |
KP Retirement Path 2055 Fund | |
Actual Fund Return | | $ | 1,000.00 | | | $ | 1,070.70 | | | | 0.08 | % | | $ | 0.42 | |
Hypothetical 5% Return | | $ | 1,000.00 | | | $ | 1,024.80 | | | | 0.08 | % | | $ | 0.41 | |
KP Retirement Path 2060 Fund | |
Actual Fund Return | | $ | 1,000.00 | | | $ | 1,069.80 | | | | 0.08 | % | | $ | 0.42 | |
Hypothetical 5% Return | | $ | 1,000.00 | | | $ | 1,024.80 | | | | 0.08 | % | | $ | 0.41 | |
KP Large Cap Equity Fund | |
Actual Fund Return | | $ | 1,000.00 | | | $ | 1,086.00 | | | | 0.34 | % | | $ | 1.79 | |
Hypothetical 5% Return | | $ | 1,000.00 | | | $ | 1,023.49 | | | | 0.34 | % | | $ | 1.73 | |
KP Small Cap Equity Fund | |
Actual Fund Return | | $ | 1,000.00 | | | $ | 1,161.90 | | | | 0.52 | % | | $ | 2.83 | |
Hypothetical 5% Return | | $ | 1,000.00 | | | $ | 1,022.58 | | | | 0.52 | % | | $ | 2.65 | |
KP International Equity Fund | |
Actual Fund Return | | $ | 1,000.00 | | | $ | 1,044.50 | | | | 0.48 | % | | $ | 2.47 | |
Hypothetical 5% Return | | $ | 1,000.00 | | | $ | 1,022.79 | | | | 0.48 | % | | $ | 2.45 | |
KP Fixed Income Fund | |
Actual Fund Return | | $ | 1,000.00 | | | $ | 987.30 | | | | 0.32 | % | | $ | 1.60 | |
Hypothetical 5% Return | | $ | 1,000.00 | | | $ | 1,023.59 | | | | 0.32 | % | | $ | 1.63 | |
| * | Expenses are equal to the Fund’s annualized expense ratio multiplied by the average account value over the period, multiplied by 184/365 (to reflect the one-half year period shown). |
153
| | |
| THE KP FUNDS | | December 31, 2016 |
|
| APPROVAL OF INVESTMENT ADVISORY AGREEMENT (Unaudited) |
Pursuant to Section 15 of the Investment Company Act of 1940 (the “1940 Act”), the Funds’ advisory and sub-advisory agreements must be renewed after their initial two-year term: (i) by the vote of the Board of Trustees (the “Board” or the “Trustees”) of KP Funds (the “Trust”) or by a vote of a majority of the shareholders of the Funds; and (ii) by the vote of a majority of the Trustees who are not parties to the agreements or “interested persons” of any party thereto, as defined in the 1940 Act (the “Independent Trustees”), cast in person at a meeting called for the purpose of voting on such renewal.
A Board meeting was held on November 17, 2016 to decide whether to renew the following agreements (the “Agreements”) for additional one-year terms:
| | • | | the advisory agreement between Callan Associates Inc. (the “Adviser”) and the Trust, on behalf of the KP Large Cap Equity Fund, KP Small Cap Equity Fund, KP International Equity Fund, KP Fixed Income Fund, KP Retirement Path 2015 Fund, KP Retirement Path 2020 Fund, KP Retirement Path 2025 Fund, KP Retirement Path 2030 Fund, KP Retirement Path 2035 Fund, KP Retirement Path 2040 Fund, KP Retirement Path 2045 Fund, KP Retirement Path 2050 Fund, KP Retirement Path 2055 Fund and KP Retirement Path 2060 Fund; and |
| | • | | the sub-advisory agreements between: the Adviser and SSgA Funds Management, Inc. (“SSgA”) on behalf of the KP Large Cap Equity Fund, KP Small Cap Equity Fund, KP International Equity Fund, and KP Fixed Income Fund; the Adviser and T. Rowe Price Associates, Inc. (“T. Rowe Price”) on behalf of the KP Large Cap Equity Fund; the Adviser and Marathon Asset Management LLP (“Marathon”) on behalf of the KP International Equity Fund; the Adviser and Columbus Circle Investors (“CCI”) on behalf of the KP Small Cap Equity Fund; the Adviser and MFS Investment Management (“MFS”) on behalf of the KP Large Cap Equity Fund and the KP International Equity Fund; the Adviser and DePrince Race & Zollo, Inc. (“DRZ”) on behalf of the KP Small Cap Equity Fund; the Adviser and Walthausen & Co., LLC (“Walthausen”) on behalf of the KP Small Cap Equity Fund; the Adviser and CastleArk Management LLC (“CastleArk”) on behalf of the KP Small Cap Equity Fund; the Adviser and Acadian Asset Management LLC (“Acadian”) on behalf of the KP International Equity Fund; the Adviser and Payden & Rygel on behalf of the KP Fixed Income Fund; the Adviser and Loomis, Sayles & Company, L.P. (“Loomis Sayles”) on behalf of the KP Fixed Income Fund; the Adviser and Aristotle Capital Boston, LLC (“Aristotle”) on behalf of the KP Small Cap Equity Fund; and the Adviser and PENN Capital Management Company, Inc. (“PENN Capital”) on behalf of the KP Small Cap Equity Fund (each of SSgA, T. Rowe Price, Marathon, CCI, MFS, DRZ, Walthausen, CastleArk, Acadian, Payden & Rygel, Loomis Sayles, Aristotle, and PENN Capital a “Sub-Adviser” and, collectively, the “Sub-Advisers”). |
In preparation for the meeting, the Trustees requested that the Adviser and the Sub-Advisers furnish information necessary to evaluate the terms of the Agreements. Prior to the meeting, the Independent Trustees of the Funds met to review and discuss the information provided and submitted a request for additional information to the Adviser and the Sub-Advisers, and information was provided in response to this request. The Trustees used this information, as well as other information that the Adviser, the Sub-Advisers and other service providers of the Funds presented or submitted to the Board at the meeting and other meetings held during the prior year, to help them decide whether to renew the Agreements for an additional year.
Specifically, the Board requested and received written materials from the Adviser, the Sub-Advisers and other service providers of the Funds regarding: (i) the nature, extent and quality of the Adviser’s and the Sub-Advisers’ services; (ii) the Adviser’s and the Sub-Advisers’ investment management personnel; (iii) the Adviser’s and the Sub-Advisers’ operations and financial condition; (iv) the Adviser’s and the Sub-Advisers’ brokerage practices (including any soft dollar arrangements) and investment strategies; (v) the Funds’ advisory fees paid to the Adviser and the Sub-Advisers and overall fees and operating expenses compared with peer groups of mutual funds; (vi) the level of the Adviser’s and the Sub-Advisers’ profitability from their relationship with the Funds, including both direct and indirect benefits accruing to the Adviser and the Sub-Advisers and their affiliates; (vii) the Adviser’s and the Sub-Advisers’ potential economies of scale; (viii) the Adviser’s and the Sub-Advisers’ compliance program, including a description of material compliance matters and material compliance violations; (ix) the Adviser’s and the Sub-Advisers’ policies on and compliance procedures for personal securities transactions; and (x) the Funds’ performance compared with peer groups of mutual funds and the Funds’ benchmark indices.
154
| | |
| THE KP FUNDS | | December 31, 2016 |
|
| APPROVAL OF INVESTMENT ADVISORY AGREEMENT (Unaudited) (Continued) |
Representatives from the Adviser and the Sub-Advisers, along with other Fund service providers, presented additional information and participated in question and answer sessions at the Board meeting to help the Trustees evaluate the Adviser’s and the Sub-Advisers’ services, fees and other aspects of the Agreements. The Independent Trustees received advice from independent counsel and met in executive sessions outside the presence of Fund management and the Adviser and the Sub-Advisers.
At the Board meeting, the Trustees, including all of the Independent Trustees, based on their evaluation of the information provided by the Adviser, the Sub-Advisers and other service providers of the Funds, renewed the Agreements. In considering the renewal of the Agreements, the Board considered various factors that they determined were relevant, including: (i) the nature, extent and quality of the services provided by the Adviser and the Sub-Advisers; (ii) the investment performance of the Funds and the Adviser and the Sub-Advisers; (iii) the costs of the services provided and profits realized by the Adviser and the Sub-Advisers from their relationship with the Funds, including both direct and indirect benefits accruing to the Adviser and the Sub-Advisers and their affiliates; (iv) the extent to which economies of scale are being realized by the Adviser and the Sub-Advisers; and (v) whether fee levels reflect such economies of scale for the benefit of Fund investors, as discussed in further detail below.
Nature, Extent and Quality of Services Provided by the Adviser and the Sub-Advisers
In considering the nature, extent and quality of the services provided by the Adviser and the Sub-Advisers, the Board reviewed the portfolio management services provided by the Adviser and the Sub-Advisers to the Funds, including the quality and continuity of the Adviser’s and the Sub-Advisers’ portfolio management personnel, the resources of the Adviser and the Sub-Advisers, and the Adviser’s and the Sub-Advisers’ compliance history and compliance program. The Trustees reviewed the terms of the Agreements. The Trustees also reviewed the Adviser’s and the Sub-Advisers’ investment and risk management approaches for the Funds. The Trustees considered that the Adviser supervises and monitors the performance of the Sub-Advisers. The most recent investment adviser registration forms (“Form ADV”) for the Adviser and the Sub-Advisers were provided to the Board, as were the responses of the Adviser and the Sub-Advisers to a detailed series of questions which included, among other things, information about the investment advisory services provided by the Adviser and the Sub-Advisers to the Funds.
The Trustees also considered other services provided to the Funds by the Adviser and the Sub-Advisers such as selecting broker-dealers for executing portfolio transactions, monitoring adherence to the Funds’ investment restrictions, and monitoring compliance with various Fund policies and procedures and with applicable securities laws and regulations. Based on the factors above, as well as those discussed below, the Board concluded, within the context of its full deliberations, that the nature, extent and quality of the services provided to the Funds by the Adviser and the Sub-Advisers were sufficient to support renewal of the Agreements.
Investment Performance of the Funds, the Adviser and the Sub-Advisers
The Board was provided with regular reports regarding the Funds’ performance over various time periods, including since their inception, and information regarding the Funds’ performance since the Agreements were last renewed. The Trustees also reviewed reports prepared by the Funds’ administrator comparing the Funds’ performance to their benchmark indices and peer groups of mutual funds as classified by Lipper, an independent provider of investment company data, over various periods of time. Representatives from the Adviser and the Sub-Advisers provided information regarding and led discussions of factors impacting the performance of the Funds, outlining current market conditions and explaining their expectations and strategies for the future. The Trustees determined that the Funds’ performance was satisfactory, or, where the Funds’ performance was materially below their benchmarks and/or peer groups, the Trustees were satisfied by the reasons for the underperformance and/or the steps taken by the Adviser and the Sub-Advisers in an effort to improve the performance of the Funds. Based on this information, the Board concluded, within the context of its full deliberations, that the investment results that the Adviser and the Sub-Advisers had been able to achieve for the Funds were sufficient to support renewal of the Agreements.
Costs of Advisory Services, Profitability and Economies of Scale
In considering the advisory fees payable by the Funds to the Adviser, as well as the fees payable to the Sub-Advisers, the Trustees reviewed, among other things, a report of the advisory fees paid to the Adviser and the Sub-Advisers. The Trustees also reviewed reports prepared by the Funds’ administrator comparing the Funds’ net and
155
| | |
| THE KP FUNDS | | December 31, 2016 |
|
| APPROVAL OF INVESTMENT ADVISORY AGREEMENT (Unaudited) (Continued) |
gross expense ratios and advisory fees to those paid by peer groups of mutual funds as classified by Lipper. The Trustees reviewed the management fees charged by certain Sub-Advisers to other clients with comparable mandates. The Trustees considered any differences in management fees and took into account the respective demands, resources and complexity associated with the Funds and other client accounts as well as the extensive regulatory, compliance and tax regimes to which the Funds are subject. The Trustees also considered that the fees payable to the Sub-Advisers reflected arms-length negotiations between the Adviser and the Sub-Advisers. The Board concluded, within the context of its full deliberations, that the advisory fees were reasonable in light of the nature and quality of the services rendered by the Adviser and the Sub-Advisers.
The Trustees reviewed the costs of services provided by and the profits realized by the Adviser and the Sub-Advisers from their relationship with the Funds, including both direct benefits and indirect benefits, such as research and brokerage services received under soft dollar arrangements, accruing to the Adviser and the Sub-Advisers and their affiliates. The Trustees considered how the Adviser’s and the Sub-Advisers’ profitability was affected by factors such as their organizational structures and methods for allocating expenses. The Trustees concluded that the profit margins of the Adviser and the Sub-Advisers with respect to the management of the Funds were not unreasonable. The Board also considered the Adviser’s and the Sub-Advisers’ commitment to managing the Funds.
The Trustees considered the Adviser’s and Sub-Advisers’ views relating to economies of scale in connection with the Funds as Fund assets grow and the extent to which the benefits of any such economies of scale are shared with the Funds and Fund shareholders. The Board considered the existence of any economies of scale and whether those were passed along to the Funds’ shareholders through a graduated advisory fee schedule or other means, including fee waivers. The Trustees recognized that economies of scale are difficult to identify and quantify and are rarely identifiable on a fund-by-fund basis. Based on this evaluation, the Board concluded that the advisory fees were reasonable in light of the information that was provided to the Trustees by the Adviser and the Sub-Advisers with respect to economies of scale.
Renewal of the Agreements
Based on the Board’s deliberations and its evaluation of the information described above and other factors and information it believed relevant in the exercise of its reasonable business judgment, the Board, including all of the Independent Trustees, with the assistance of Fund counsel and Independent Trustees’ counsel, unanimously concluded that the terms of the Agreements, including the fees payable thereunder, were fair and reasonable and agreed to renew the Agreements for another year. In its deliberations, the Board did not identify any absence of information as material to its decision, or any particular factor (or conclusion with respect thereto) or single piece of information that was all-important, controlling or determinative of its decision, but considered all of the factors together, and each Trustee may have attributed different weights to the various factors (and conclusions with respect thereto) and information.
156
| | |
| THE KP FUNDS | | December 31, 2016 |
|
| NOTICE TO SHAREHOLDERS (Unaudited) |
For shareholders that do not have a December 31, 2016 taxable year end, this notice is for informational purposes only. For shareholders with a December 31, 2016 tax year end, please consult your tax adviser as to the pertinence of this notice.
For the fiscal period ended December 31, 2016 the Funds are designating the following with regard to distributions paid during the period:
| | | | | | | | | | | | | | | | | | | | |
| Fund | | | | | Return of
Capital
(Tax Basis) | | | Long-Term
Capital Gains
Distributions
(Tax Basis) | | | Ordinary
Income
Distributions
(Tax Basis) | | | Total
Distributions
(Tax Basis) | |
KP Retirement Path 2015 Fund | | | | | | | 0.00% | | | | 29.45% | | | | 70.55% | | | | 100.00% | |
KP Retirement Path 2020 Fund | | | | | | | 0.00% | | | | 28.77% | | | | 71.23% | | | | 100.00% | |
KP Retirement Path 2025 Fund | | | | | | | 0.00% | | | | 32.57% | | | | 67.43% | | | | 100.00% | |
KP Retirement Path 2030 Fund | | | | | | | 0.00% | | | | 36.82% | | | | 63.18% | | | | 100.00% | |
KP Retirement Path 2035 Fund | | | | | | | 0.00% | | | | 40.09% | | | | 59.91% | | | | 100.00% | |
KP Retirement Path 2040 Fund | | | | | | | 0.00% | | | | 42.99% | | | | 57.01% | | | | 100.00% | |
KP Retirement Path 2045 Fund | | | | | | | 0.00% | | | | 44.46% | | | | 55.54% | | | | 100.00% | |
KP Retirement Path 2050 Fund | | | | | | | 0.00% | | | | 41.30% | | | | 58.70% | | | | 100.00% | |
KP Retirement Path 2055 Fund | | | | | | | 0.00% | | | | 33.18% | | | | 66.82% | | | | 100.00% | |
KP Retirement Path 2060 Fund | | | | | | | 0.00% | | | | 36.80% | | | | 63.20% | | | | 100.00% | |
KP Large Cap Equity Fund | | | | | | | 0.00% | | | | 59.47% | | | | 40.53% | | | | 100.00% | |
KP Small Cap Equity Fund | | | | | | | 0.00% | | | | 0.00% | | | | 100.00% | | | | 100.00% | |
KP International Equity Fund | | | | | | | 0.00% | | | | 0.00% | | | | 100.00% | | | | 100.00% | |
KP Fixed Income Fund | | | | | | | 0.00% | | | | 0.33% | | | | 99.67% | | | | 100.00% | |
| | | | |
| | | | | | | | | | | | Foreign Investors | |
| Fund | | Corporate
Dividends
Received
Deduction(1) | | | Qualifying
Dividend
Income(2) | | | U.S.
Government
Interest(3) | | | Interest
Related
Dividends(4) | | | Short-Term
Capital
Gains
Dividends(5) | |
KP Retirement Path 2015 Fund | | | 0.00% | | | | 0.00% | | | | 0.00% | | | | 0.00% | | | | 100.00% | |
KP Retirement Path 2020 Fund | | | 0.00% | | | | 0.00% | | | | 0.00% | | | | 0.00% | | | | 0.00% | |
KP Retirement Path 2025 Fund | | | 0.00% | | | | 0.00% | | | | 0.00% | | | | 0.00% | | | | 0.00% | |
KP Retirement Path 2030 Fund | | | 0.00% | | | | 0.00% | | | | 0.00% | | | | 0.00% | | | | 0.00% | |
KP Retirement Path 2035 Fund | | | 0.00% | | | | 0.00% | | | | 0.00% | | | | 0.00% | | | | 0.00% | |
KP Retirement Path 2040 Fund | | | 0.00% | | | | 0.00% | | | | 0.00% | | | | 0.00% | | | | 0.00% | |
KP Retirement Path 2045 Fund | | | 0.00% | | | | 0.00% | | | | 0.00% | | | | 0.00% | | | | 0.00% | |
KP Retirement Path 2050 Fund | | | 0.00% | | | | 0.00% | | | | 0.00% | | | | 0.00% | | | | 0.00% | |
KP Retirement Path 2055 Fund | | | 0.00% | | | | 0.00% | | | | 0.00% | | | | 0.00% | | | | 100.00% | |
KP Retirement Path 2060 Fund | | | 0.00% | | | | 0.00% | | | | 0.00% | | | | 0.00% | | | | 100.00% | |
KP Large Cap Equity Fund | | | 0.00% | | | | 0.00% | | | | 0.00% | | | | 0.00% | | | | 100.00% | |
KP Small Cap Equity Fund | | | 0.00% | | | | 0.00% | | | | 0.00% | | | | 0.00% | | | | 0.00% | |
KP International Equity Fund | | | 0.00% | | | | 0.00% | | | | 0.00% | | | | 0.00% | | | | 0.00% | |
KP Fixed Income Fund | | | 0.00% | | | | 0.00% | | | | 0.00% | | | | 0.00% | | | | 100.00% | |
| (1) | Qualifying dividends represent dividends which qualify for the corporate dividends received deduction and is reflected as a percentage of ordinary income distributions (the total of short term capital gain and net investment income distributions). |
| (2) | The percentage in this column represents the amount of “Qualifying Dividend Income” as created by the Jobs and Growth Relief Reconciliation Act of 2003 and its reflected as a percentage of ordinary income distributions (the total of short term capital gain and net investment income distributions). It is the intention of each of the aforementioned funds to designate the maximum amount permitted by law. |
| (3) | “U.S. Government Interest represents the amount of interest that was derived from U.S. Government obligations and distributed during the fiscal year. This amount is reflected as a percentage of total ordinary income distributions (the total of short term capital gain and net investment income distributions). Generally, interest from direct U.S. Government obligations is exempt from state income tax. However, for shareholders of the Funds who are residents of California, Connecticut and New York, the statutory threshold requirements were not satisfied to permit exemption of these amounts from state income. |
157
| | |
| THE KP FUNDS | | December 31, 2016 |
|
| NOTICE TO SHAREHOLDERS (Unaudited) (Continued) |
| (4) | The percentage in this column represents the amount of “Interest Related Dividends” and is reflected as a percentage of ordinary income distribution. Interest related dividends are exempt from U.S. withholding tax when paid for foreign investors. |
| (5) | The percentage in this column represents the amount of “Short-Term Capital Gain Dividends” and is reflected as a percentage of short-term capital gain distribution that is exempt from U.S. withholding tax when paid to foreign investors. |
158
The KP Funds
Investment Adviser
Callan Associates Inc.
600 Montgomery Street, Suite 800
San Francisco, CA 94111
Administrator
SEI Investments
Global Funds Services
One Freedom Valley Drive
Oaks, Pennsylvania 19456
Distributor
SEI Investments Distribution Co.
One Freedom Valley Drive
Oaks, Pennsylvania 19456
Legal Counsel
Morgan, Lewis & Bockius LLP
1701 Market Street
Philadelphia, Pennsylvania 19103-2921
More information about the Funds is available, without charge, through the following:
Statement of Additional Information (“SAI”): The SAI includes detailed information about the Funds. The SAI is on file with the SEC and is incorporated by reference into this prospectus. This means that the SAI, for legal purposes, is a part of this prospectus.
Annual and Semi-Annual Reports: These reports list the Funds’ holdings and contain information from the Adviser about investment strategies, and recent market conditions and trends and their impact on Fund performance. The reports also contain detailed financial information about the Funds.
To Obtain an SAI, Annual or Semi-Annual Report, or More Information:
| | |
| By Telephone: | | 855-457-3637 (855-4KPFNDS) |
| |
| By Mail: | | The KP Funds |
| | c/o SEI Investments |
| | One Freedom Valley Drive |
| | Oaks, PA 19546 |
| |
| By Internet: | | www.kp-funds.com |
From the SEC: You can also obtain the SAI or the Annual and Semi-Annual Reports, as well as other information about The KP Funds, from the EDGAR Database on the SEC’s website at: http://www.sec.gov. You may review and copy documents at the SEC Public Reference Room in Washington, DC (for information on the operation of the Public Reference Room, call 202-551-8090). You may request documents by mail from the SEC, upon payment of a duplicating fee, by writing to: U.S. Securities and Exchange Commission, Public Reference Section, Washington, DC 20549-1520. You may also obtain this information, upon payment of a duplicating fee, by e-mailing the SEC at the following address: publicinfo@sec.gov.
The Trust’s Investment Company Act registration number is 811-22838
KPF-AR-001-0300
The Registrant has adopted a code of ethics that applies to the Registrant’s principal executive officer, principal financial officer, controller or principal accounting officer, and any person who performs a similar function. . There have been no amendments to or waivers granted to this code of ethics.
| Item 3. | Audit Committee Financial Expert. |
(a)(1) The Registrant’s board of trustees has determined that the Registrant has at least one audit committee financial expert serving on the audit committee.
(a)(2) The audit committee financial experts are John Darr and George Sullivan, and they are independent as defined in Form N-CSR Item 3(a)(2).
| Item 4. | Principal Accountant Fees and Services. |
Fees billed by PricewaterhouseCoopers LLP (“PwC”) related to the Trust
PwC billed the Trust aggregate fees for services rendered to the Trust for the last fiscal year were as follows:
| | | | | | | | | | | | | | | | | | | | | | | | | | |
| | | 2016 | | | 2015 | |
| | | | | All fees and
services to
the Trust
that were
pre-
approved | | | All fees and
services to
service
affiliates that
were pre-
approved | | | All other
fees and
services to
service
affiliates that
did not
require pre-
approval | | | All fees and
services to
the Trust
that were
pre-
approved | | | All fees and
services to
service
affiliates that
were pre-
approved | | | All other
fees and
services to
service
affiliates that
did not
require pre-
approval | |
(a) | | Audit Fees | | $ | 216,900 | | | $ | 0 | | | $ | 0 | | | $ | 210,650 | | | $ | 0 | | | $ | 0 | |
(b) | | Audit-Related Fees | | | N/A | | | $ | 0 | | | $ | 0 | | | | N/A | | | $ | 0 | | | $ | 0 | |
(c) | | Tax Fees | | | N/A | | | $ | 0 | | | $ | 0 | | | | N/A | | | $ | 0 | | | $ | 0 | |
(d) | | All Other Fees | | | N/A | | | $ | 0 | | | $ | 0 | | | | N/A | | | $ | 0 | | | $ | 0 | |
(e)(1)
All requests or applications for services to be provided by the independent auditor shall be submitted to the Chief Financial Officer (“CFO”) of the Registrant and must include a detailed description of the services proposed to be rendered. The Registrant ‘s CFO will determine whether such services (1) require specific pre-approval, (2) are included within the list of services that have received the general pre-approval of the audit committee or (3) have been previously pre-approved in connection with the independent auditor’s annual engagement letter for the applicable year or otherwise.
Requests or applications to provide services that require specific pre-approval by the audit committee will be submitted to the audit committee by the CFO. The audit committee will be informed by the CFO on a quarterly basis of all services rendered by the independent auditor. The audit committee has delegated specific pre-approval authority to either the audit committee chair or financial experts, provided that the estimated fee for any such proposed pre-approved service does not exceed $100,000 and any pre-approval decisions are reported to the audit committee at its next regularly scheduled meeting.
All services to be provided by the independent auditor shall be provided pursuant to a signed written engagement letter with the Registrant, the investment advisor or applicable control affiliate (except that matters as to which an engagement letter would be impractical because of timing issues or because the matter is small may not be the subject of an engagement letter) that sets forth both the services to be provided by the independent auditor and the total fees to be paid to the independent auditor for those services.
In addition, the audit committee has determined to take additional measures on an annual basis to meet its responsibility to oversee the work of the independent auditor and to assure the auditor’s independence from the Registrant, such as reviewing a formal written statement from the independent auditor delineating all relationships between the independent auditor and the Registrant, and discussing with the independent auditor its methods and procedures for ensuring independence.
(e)(2) Percentage of fees billed applicable to non-audit services approved pursuant to the “de minimus” exception of Rule 2-01(c)(7)(i)(C) were as follows (PwC):
| | | | | | | | |
| | | 2016 | | | 2015 | |
Audit-Related Fees | | | 0 | % | | | 0 | % |
Tax Fees | | | 0 | % | | | 0 | % |
All Other Fees | | | 0 | % | | | 0 | % |
(f) Not applicable.
(g) The aggregate non-audit fees and services billed by PwC for services rendered to the Registrant, and rendered to the Registrant’s investment adviser (not including any sub-adviser whose role is primarily portfolio management and is subcontracted with or overseen by another investment adviser), and any entity controlling, controlled by, or under common control with the adviser that provides ongoing services to the Registrant for the last two fiscal years were $0 and $0 for 2016 and 2015, respectively.
(h) During the past fiscal year, all non-audit services provided by Registrant’s principal accountant to either Registrant’s investment adviser or to any entity controlling, controlled by, or under common control with Registrant’s investment adviser that provides ongoing services to Registrant were pre-approved by the audit committee of Registrant’s Board of Trustees. Included in the audit committee’s pre-approval was the review and consideration as to whether the provision of these non-audit services is compatible with maintaining the principal accountant’s independence.
| Item 5. | Audit Committee of Listed Registrants. |
Not applicable to open-end management investment companies.
| Item 6. | Schedule of Investments. |
Schedule of Investments is included as part of the Report to Shareholders filed under Item 1 of this form.
| Item 7. | Disclosure of Proxy Voting Policies and Procedures for Closed-End Management Investment Companies. |
Not applicable to open-end management investment companies.
| Item 8. | Portfolio Managers of Closed-End Management Investment Companies. |
Not applicable. Effective for closed-end management investment companies for fiscal years ending on or after December 31, 2005.
| Item 9. | Purchases of Equity Securities by Closed-End Management Company and Affiliated Purchasers. |
Not applicable to open-end management investment companies.
| Item 10. | Submission of Matters to a Vote of Security Holders. |
There have been no changes to the procedures by which shareholders may recommend nominees to the Registrant’s Board of Trustees during the period covered by this report.
| Item 11. | Controls and Procedures. |
(a) The Registrant’s principal executive and principal financial officers, or persons performing similar functions, have concluded that the Registrant’s disclosure controls and procedures (as defined in Rule 30a-3(c) under the Act (17 CFR 270.30a-3(c))) as of a date within 90 days of the filing date of the report, are effective based on the evaluation of these controls and procedures required by Rule 30a-3(b) under the Act (17 CFR 270.30a-3(b)) and Rules 13a-15(b) or 15d-15(b) under the Exchange Act (17 CFR 240.13a-15(b) or 240.15d-15(b)).
(b) There has been no change in the Registrant’s internal control over financial reporting (as defined in Rule 30a-3(d) under the Act (17 CFR 270.30a-3(d)) that occurred during the second fiscal quarter of the period covered by this report that has materially affected, or is reasonably likely to materially affect, the Registrant’s internal control over financial reporting.
(a)(1) Code of Ethics attached hereto.
(a)(2) A separate certification for the principal executive officer and the principal financial officer of the Registrant as required by Rule 30a-2(a) under the Investment Company Act of 1940, as amended (17 CFR 270.30a-2(a)), are filed herewith.
(b) Officer certifications as required by Rule 30a-2(b) under the Investment Company Act of 1940, as amended (17 CFR 270.30a-2(b)) also accompany this filing as an exhibit.
SIGNATURES
Pursuant to the requirements of the Securities Exchange Act of 1934 and the Investment Company Act of 1940, the registrant has duly caused this report to be signed on its behalf by the undersigned, thereunto duly authorized.
| | | | | | |
| (Registrant) | | | | | | The KP Funds |
| | | |
| By (Signature and Title)* | | | | | | /s/ Michael Beattie |
| | | | | | Michael Beattie,
President |
Date: March 8, 2017
Pursuant to the requirements of the Securities Exchange Act of 1934 and the Investment Company Act of 1940, this report has been signed below by the following persons on behalf of the registrant and in the capacities and on the dates indicated.
| | | | | | |
| By (Signature and Title)* | | | | | | /s/ Michael Beattie |
| | | | | | Michael Beattie,
President |
Date: March 8, 2017
| | | | | | |
| By (Signature and Title)* | | | | | | /s/ Stephen Connors |
| | | | | | Stephen Connors, |
| | | | | | Treasurer, Controller and CFO |
Date: March 8, 2017
| * | Print the name and title of each signing officer under his or her signature. |