UNITED STATES
SECURITIES AND EXCHANGE COMMISSION
Washington, D.C. 20549
FORM N-CSR
CERTIFIED SHAREHOLDER REPORT OF REGISTERED MANAGEMENT
INVESTMENT COMPANIES
Investment Company Act file number 811-22838
The KP Funds
(Exact name of registrant as specified in charter)
SEI Investments
One Freedom Valley Drive
Oaks, PA 19456
(Address of principal executive offices) (Zip code)
SEI Investments
One Freedom Valley Drive
Oaks, PA 19456
(Name and address of agent for service)
Registrant’s telephone number, including area code: (855) 457-3637
Date of fiscal year end: December 31, 2019
Date of reporting period: December 31, 2019
| Item 1. | Reports to Stockholders. |
A copy of the report transmitted to stockholders pursuant to Rule 30e-1 under the Investment Company Act or 1940, as amended (the “Act”) (17 CFR § 270.30e-1), is attached hereto.
| | |
| The KP Funds | |  |

KP Retirement Path Retirement Income Fund (formerly, KP Retirement Path 2015 Fund): KPRAX
KP Retirement Path 2020 Fund:KPRBX
KP Retirement Path 2025 Fund:KPRCX
KP Retirement Path 2030 Fund:KPRDX
KP Retirement Path 2035 Fund:KPREX
KP Retirement Path 2040 Fund:KPRFX
KP Retirement Path 2045 Fund:KPRGX
KP Retirement Path 2050 Fund:KPRHX
KP Retirement Path 2055 Fund:KPRIX
KP Retirement Path 2060 Fund:KPRJX
KP Retirement Path 2065 Fund:KPRKX
KP Large Cap Equity Fund:KPLCX
KP Small Cap Equity Fund:KPSCX
KP International Equity Fund:KPIEX
KP Fixed Income Fund:KPFIX
Beginning on March 1, 2021, as permitted by regulations adopted by the Securities and Exchange Commission, paper copies of the Funds’ shareholder reports will no longer be sent by mail, unless you specifically request paper copies of the reports from the Funds or from your financial intermediary, such as a broker-dealer or bank. Instead, the reports will be made available on a website, and you will be notified by mail each time a report is posted and provided with a website link to access the report.
If you already elected to receive shareholder reports electronically, you will not be affected by this change and you need not take any action. You may elect to receive shareholder reports and other communications from the Funds electronically by contacting your financial intermediary, or, if you are a direct investor, by calling 1-855-457-3637.
You may elect to receive all future reports in paper free of charge. If you invest through a financial intermediary, you can follow the instructions included with this disclosure, if applicable, or you can contact your financial intermediary to inform it that you wish to continue receiving paper copies of your shareholder reports. If you invest directly with the Funds, you can inform the Funds that you wish to continue receiving paper copies of your shareholder reports by calling 1-855-457-3637. Your election to receive reports in paper will apply to all funds held with your financial intermediary if you invest through a financial intermediary or all KP Funds if you invest directly with the Funds.
Annual Report
December 31, 2019
| | |
| THE KP FUNDS | | December 31, 2019 |
The Funds file their complete schedules of investments with the Securities and Exchange Commission (the “Commission”) for the first and third quarters of each fiscal year on FormN-Q or as an exhibit to its reports onForm N-PORT within sixty days after period end. The Funds’ FormsN-Q and FormN-PORT reports are available on the Commission’s website at http://www.sec.gov, and may be reviewed and copied at the Commission’s Public Reference Room in Washington, D.C. Information on the operation of the Public Reference Room may be obtained by calling1-800-SEC-0330.
A description of the policies and procedures that the Funds use to determine how to vote proxies relating to portfolio securities, as well as information relating to how the Funds voted proxies relating to portfolio securities during the most recent12-month period ended June 30, is available (i) without charge, upon request, by calling855-457-3637 (855-4KPFNDS); and (ii) on the Commission’s website at http://www.sec.gov.
| | |
| THE KP FUNDS | | December 31, 2019 |
Dear Shareholder,
2019 was a strong positive year across most of the major capital markets. Large Cap US stocks (as measured by the Russell 1000 Index) were up 31.43% for the year.Non-US stocks (as measured by the MSCI ACWIex-US IMI Equity Index) posted a return of 21.63% for the year. The US fixed income market produced strong returns with the U.S. Bloomberg Barclays Aggregate Index up 8.72%. US listed real estate (as measured by the MSCI US REIT Index) returned 25.84% for the year, while Commodities (as measured by the Bloomberg Commodity Total Return Index) were up 7.69%.
On the back of these strong markets, the returns for the KP Retirement Path Funds fell in a range between 14.12% for the Retirement Income Fund (lowest equity exposure) to 23.73% for the 2060 Fund (highest equity exposure). While the absolute performance was strong in 2019, most of the KP Retirement Path Funds trailed their strategic benchmarks for the year. Underperformance ranged from 0.51% for the 2040 Fund to 0.11% for the 2025 Fund. The 2020 Fund and the Retirement Income Fund modestly outperformed their benchmarks.
The KP Retirement Path Funds’ underperformance relative to strategic benchmarks in 2019 was explained entirely by the underperformance of the US Large Cap portfolio which was unable to keep pace with the Russell 1000 index (29.32% for the portfolio versus 31.43% for the index). All of the othersub-portfolios employed within the KP Retirement Path Funds (US Small Cap Equity,Non-US Equity, Fixed Income, and Real Assets) outperformed their respective benchmarks for the year. Over the period since their inception (January, 2014), all of the KP Retirement Path Funds are ahead of their strategic benchmarksnet-of-fees.
Downside risk control and inflation protection were purposefully built into the KP Retirement Path Funds to protect participants during adverse markets. This means that during a strong equity market like we experienced in 2019, the Funds are not expected to keep pace with target date fund families that employ higher equity exposure, but the Funds have exhibited smaller losses during adverse markets over the life of the Funds.
In general we have been pleased with the performance of the 21 different investment management organizations that are responsible for the management of the 33 separate strategies that make up the KP Retirement Path Funds. We are also pleased with the operational infrastructure that supports the Funds which has become increasingly efficient every year. Overall, we continue to believe that the KP Retirement Path Funds are well-designed to meet the retirement savings needs of participants in Kaiser Permanente sponsored defined contribution plans.
Respectfully Submitted,
| | | | |
 | |  | |  |
| | |
Gregory C. Allen Portfolio Manager CEO, President, Chief Research Officer | | Ivan S. Cliff, CFA Portfolio Manager Director of Research | | Mark Anderson Portfolio Manager Senior Vice President |
The performance data quoted represents past performance. Past performance does not guarantee future results. The investment return and principal value of an investment will fluctuate so that an investor’s shares, when redeemed, may be worth less than their original cost and current performance may be lower than the performance quoted. Returns greater than one year are average annual total returns. For performance data current to the most recent month end, please call855-4-KPFNDS.
1
| | |
| THE KP FUNDS | | December 31, 2019 |
| | |
| MANAGEMENT DISCUSSION AND FUND PERFORMANCE (Unaudited): | | |
Performance for the KP Retirement Path Funds for Fiscal Year 2019 was positive across the board on an absolute basis; however, relative to the Funds’ strategic benchmarks, almost all of the Funds underperformed with the exception of the KP Retirement Path 2020 Fund and the KP Retirement Path Retirement Income Fund. In order to better understand the sources of underperformance for the year, it is helpful to review the design of the Funds.
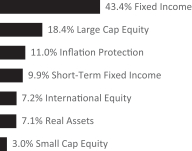
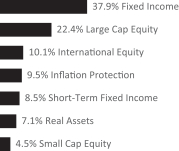
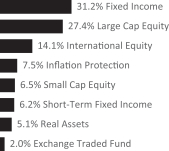
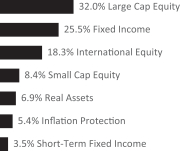
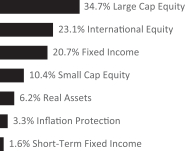
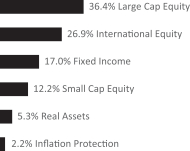
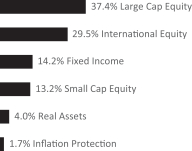
Each of the KP Retirement Path Funds is itself a“fund-of-funds”. This means that each of the Funds is composed of a collection ofsub-funds, each with a specific purpose that contributes to the overall design. At the highest level thesesub-funds can be grouped into six major categories which include: large cap US equities, small cap US equities, international equities, broad fixed income, real (or inflation sensitive) assets, and short-term fixed income. Each of the KP Retirement Path Funds varies its exposure to these asset categories over time to ensure that it is achieving the appropriate balance of capital appreciation, current income, inflation protection, and capital preservation. The 2060 Fund, for example, is primarily invested in large cap US equity, small cap US equity, and international equity. The Retirement Income Fund, on the other hand, has a much greater emphasis on broad fixed income, real assets, and short-term fixed income.
The performance of each Fund is compared to its own strategic benchmark. The strategic benchmarks are designed to reflect the target asset allocation for each Fund, while also assuming that each of the underlying asset classes is implemented using a passive index. While Management makes extensive use of passive strategies in the Funds’ implementation to keep costs low, we also employ a number of active strategies in our pursuit of adding value relative to the strategic benchmarks. Management does not attempt to add value by trying to time markets using tactical asset allocation. As a result, most of the relative performance of the Funds versus their strategic benchmarks can be explained by the relative performance of the strategies within each of the six underlying asset classes. Given this understanding, we can now put the relative performance of the KP Retirement Path Funds into perspective by examining the relative performance of each of the underlying asset classes.
The KP Retirement Path Funds achieve their large cap US equity exposure through the use of the KP Large Cap Equity Fund. This Fund is benchmarked to the Russell 1000 Index. The Fund employs five strategies including: a passive S&P 500 index strategy; an active large cap growth strategy; an active large cap value strategy; and two active large cap blend strategies. The Fund returned 29.32% for the year versus 31.43% for the benchmark. The underperformance of 2.11% at the Fund level was largely explained by the underperformance of the active large cap growth strategy and the two active large cap blend strategies outweighing the outperformance of the active large cap value strategy. The large cap growth strategy underperformed its benchmark for the year by 7.13% and the two large cap blend strategies trailed by 4.90% and 1.99% respectively, while the large cap value outperformed its benchmark by 4.11%. Large cap equity is a significant part of the asset allocation for all of the KP Retirement Path Funds and the Large Cap fund had a negative impact across the entire fund family versus the respective benchmarks.
The KP Retirement Path Funds achieve their small cap US equity exposure through the use of the KP Small Cap Equity Fund. This Fund is benchmarked to the Russell 2000 Index. The Fund employs seven strategies including a passive S&P 600 strategy, two active small cap growth strategies, two active small cap value strategies, and two active small cap blend strategies. The Fund returned 25.67% for the year versus 25.52% for the benchmark. The outperformance of 0.15% was largely explained by the outperformance of the active value strategies and one of the active blend strategies, which balanced out the underperformance of the active growth strategies and the other active blend strategy. The value strategies beat their benchmarks by a range of 5.12% and 6.49% respectively, while the growth strategies underperformed by 5.19% and 5.81%. Small cap is a relatively small part of the asset allocation for the KP Retirement Path Funds, and in combination with the small outperformance versus its index, this had a small positive impact to the relative performance across the fund family.
The KP Retirement Path Funds achieve their international equity exposure through the use of the KP International Equity Fund. This Fund is benchmarked to the MSCI ACWIex-US IMI Index. The Fund employs eight strategies including one MSCI Worldex-US passive strategy and seven active strategies including two active MSCI EAFE strategies, an active MSCI ACWIex-US strategy, two active emerging markets strategies and two active international small cap strategies. The Fund returned 22.87% for the year versus 21.63% for the benchmark. This outperformance of 1.24% was largely attributable to an active EAFE strategy which outpaced its benchmark by 6.69%, the active MSCI ACWIex-US strategy, which was up 2.79% versus its benchmark, and one of the emerging markets strategies, which outpaced its benchmark by 11.82%. These results outweighed the underperformance of one of the active MSCI EAFE strategies, which trailed its benchmark by 3.19% and one of the emerging markets strategies, which
2
| | |
| THE KP FUNDS | | December 31, 2019 |
| | |
| MANAGEMENT DISCUSSION AND FUND PERFORMANCE (Unaudited): | | |
underperformed its benchmarks by 2.73%. Because international equity is a large part of the asset allocation for the KP Retirement Path Funds, this strong performance had a material positive impact across the Fund series.
The KP Retirement Path Funds achieve their broad fixed income exposure through the use of the KP Fixed Income Fund. This Fund is benchmarked to the Bloomberg Barclays Capital US Aggregate Bond Index. The Fund employs four strategies including a passive Bloomberg Barclays Capital US Aggregate Bond Index strategy, an active Bloomberg Barclays Aggregate strategy, an active emerging markets debt strategy, and an active bank loan strategy. The KP Fixed Income Fund returned 9.57% for the year versus 8.72% for the benchmark. This outperformance of 0.85% was primarily due to the outperformance of the active emerging markets debt strategy, which outperformed its benchmark by 2.67% and had a higher return on an absolute basis relative to the overall Bloomberg Barclays Capital US Aggregate Bond Index. Because fixed income is a large part of the asset allocation for the KP Retirement Path Funds, especially closer to retirement, this outperformance had a positive impact on the relative performance of the KP Retirement Path Fund series.
The KP Retirement Path Funds achieve their real assets exposure through the use of a diversified collection ofnon-affiliatedsub-funds each specializing in a different inflation-sensitive strategy. Collectively these strategies returned 15.94% over the measurement period versus 15.82% for their composite benchmark, resulting in relative outperformance of 0.12%. The seven underlying real assets funds had a wide range of returns, from 7.96% for the commodities fund to 28.10% for the US REIT fund. Because real assets are a relatively small part of the asset allocation for the KP Retirement Path Funds, they had a positive but de minimis impact on the relative performance across the series.
The KP Retirement Path Funds achieve their short-term fixed income exposure through the use oflow-cost index strategies. Thesesub-funds performed in line with their benchmarks and did not have a material effect on the relative performance across the series.
The tables that follow detail the performance of each of the KP Retirement Path Funds for the periods ended December 31, 2019.
To determine if one of these funds is an appropriate investment for you, carefully consider the fund’s investment objectives, risk factors, charges, and expenses before investing. This and other information may be found in the fund’s summary and full prospectuses, which may be obtained by calling(855)4-KPFNDS or by visiting the website atwww.kp-funds.com. Please read the prospectus carefully before investing.
The KP Retirement Path Funds and the KP Core Funds are mutual funds. They are part of The KP Funds Series Trust, anopen-end management investment company that offers shares of diversified portfolios. The funds are advised by Callan LLC, a registered investment advisor. They are administered by SEI Investments Global Funds Services and distributed by SEI investments Distribution Co., which are not affiliated with Callan LLC.
Only participants in the Kaiser Permanente defined contribution plans and 403(b) plans can invest in the funds.
There can be no assurance that a Fund will achieve its stated objectives. An investor may experience losses, at any time, including near, at or after the Fund’s target year. In addition, there is no guarantee that an investor’s investment in the fund will provide any income at or through the years following the Fund’s target year in amounts adequate to meet the investor’s goals or retirement needs.
Investing involves risk including loss of principal. Bond and bond funds are subject to interest rate risk and will decline in value as interest rates rise. Mortgage-backed securities are subject topre-payment and extension risk and therefore react differently to changes in interest rates than other bonds. Small movements in interest rates may quickly and significantly reduce the value of certain mortgage-backed securities.Non-investment grade bonds involve greater risks of default and are more volatile than investment grade securities, due to the speculative nature of the investment. International investments involve risk of capital loss from unfavorable fluctuation in currency values, from differences in generally accepted accounting principles or from social, economic or political instability in other nations. These risks are heightened when investing in emerging markets or in a single state.
Currency risk is the risk that foreign currencies will decline in value relative to the U.S. dollar or, in the case of hedging positions, that the U.S. dollar will decline in value relative to the currency hedged. In either event, the dollar value of an investment in the Underlying Fund would be adversely affected. The use of leverage by the fund managers may accelerate the velocity of potential losses. Furthermore, the use of derivatives are often more volatile than other investments and magnify the Fund’s gains or losses. Diversification does not protect against market loss.
The performance data quoted represents past performance. Past performance does not guarantee future results. The investment return and principal value of an investment will fluctuate so that an investor’s shares, when redeemed, may be worth less than their original cost and current performance may be lower than the performance quoted. Returns greater than one year are average annual total returns. For performance data current to the most recent month end, please call855-4-KPFNDS.
3
| | |
| THE KP FUNDS | | December 31, 2019 |
| | |
| MANAGEMENT DISCUSSION AND FUND PERFORMANCE (Unaudited): | | |
Definition of Comparitive Indices
The MSCI ACWIex-US Investable Market Index (IMI) captures large, mid and small cap representation across 22 of 23 Developed Markets countries (excluding the United States) and 24 Emerging Markets countries. With 6,278con-stituents, the index covers approximately 99% of the global equity opportunity set outside the US.
The MSCI US REIT Index is a free float-adjusted market capitalization weighted index that is comprised of equity Real Estate Investment Trusts (REITs). The index is based on the MSCI USA Investable Market Index (IMI), its parent index, which captures the large, mid and small cap segments of the USA market. With 151 constituents, it represents about 99% of the US REIT universe and securities are classified under the Equity REITs Industry (under the Real Estate Sector) according to the Global Industry Classification Standard (GICS®), have core real estate exposure (i.e., only selected Specialized REITs are eligible) and carry REIT tax status.
The Bloomberg Barclays U.S. Aggregate Bond Index is a broad-based index and measures the performance of the U.S. investment grade bond market. It invests in a wide spectrum of public, investment-grade, taxable, fixed income securities in the United States—including government and corporate, as well as mortgage-backed and asset-backed securities, all with maturities of more than 1 year.
The Bloomberg Commodity Total Return index is calculated on an excess return basis and reflects returns on a fully collateralized investment in commodity futures price movements. The index rebalances annually weighted 2/3 by trading volume and 1/3 by world production and weight-caps are applied at the commodity, sector and group level for diversification. Roll period typically occurs from 6th-10th business day based on the roll schedule. The Index further combines these returns with the returns on cash collateral invested in 13 week (3 Month) U.S. Treasury Bills to produce the fully collateralized returns.
The Russell 1000 Index measures the performance of thelarge-cap segment of the U.S. equity universe. It is asub-set of the Russell 3000® Index and includes approximately 1,000 of the largest securities based on a combination of their market cap and current index membership. The Russell 1000 represents approximately 92% of the Russell 3000 Index.
The Russell 2000 Index measures the performance of thesmall-cap segment of the U.S. equity universe. TheRus-sell 2000 Index is a subset of the Russell 3000® Index representing approximately 8% of the total marketcapital-ization of that index. It includes approximately 2,000 of the smallest securities based on a combination of their market cap and current index membership.
The S&P 500 Index is based on market capitalizations of 500 large companies having common stock listed on the New York Stock Exchange or NASDAQ.
The components of the Custom Retirement Income Fund Benchmark were as follows: Russell 1000 Index (19.20%), Russell 2000 Index (3.40%), MSCI ACWI ex US IMI Net Dividend Index (7.80%), Bloomberg Barclays US Aggregate Bond Index (42.40%), S&P Globalex-U.S. REIT Net Dividend Index (1.00%), MSCI US REIT Index (2.00%), S&P Global Infrastructure Index (1.00%), S&P Global Natural Resources Index (1.00%), Bloomberg Commodity Index (1.00%), S&P/LSTA Leveraged Loan Index (1.00%), Bloomberg Barclays US TIPS Index (3.00%), Bloomberg Barclays US TIPS0-5 Year Index (7.60%) and3-Month US Treasury Bills (9.60%).
The components of the Custom Retirement 2020 Fund Benchmark were as follows: Russell 1000 Index (23.00%), Russell 2000 Index (4.80%), MSCI ACWI ex US IMI Net Dividend Index (10.60%), Bloomberg Barclays US Aggregate Bond Index (37.20%), S&P Globalex-U.S. REIT Net Dividend Index (1.00%), MSCI US REIT Index (2.00%), S&P Global Infrastructure Index (1.00%), S&P Global Natural Resources Index (1.00%), Bloomberg Commodity Index (1.00%), S&P/LSTA Leveraged Loan Index (1.00%), Bloomberg Barclays US TIPS Index (3.00%), Bloomberg Barclays US TIPS0-5 Year Index (6.20%) and3-Month US Treasury Bills (8.20%).
The components of the Custom Retirement 2025 Fund Benchmark were as follows: Russell 1000 Index (28.00%), Russell 2000 Index (6.80%), MSCI ACWI ex US IMI Net Dividend Index (14.60%), Bloomberg Barclays US Aggregate Bond Index (30.60%), S&P Globalex-U.S. REIT Net Dividend Index (1.00%), MSCI US REIT Index (2.00%), S&P Global Infrastructure Index (1.00%), S&P Global Natural Resources Index (1.00%), Bloomberg Commodity Index (1.00%), S&P/LSTA Leveraged Loan Index (1.00%), Bloomberg Barclays US TIPS Index (3.00%), Bloomberg Barclays US TIPS0-5 Year Index (4.20%) and3-Month US Treasury Bills (5.80%).
4
| | |
| THE KP FUNDS | | December 31, 2019 |
| | |
| MANAGEMENT DISCUSSION AND FUND PERFORMANCE (Unaudited): | | |
The components of the Custom Retirement 2030 Fund Benchmark were as follows: Russell 1000 Index (32.20%), Russell 2000 Index (8.80%), MSCI ACWI ex US IMI Net Dividend Index (19.00%), Bloomberg Barclays US Aggregate Bond Index (25.00%), S&P Globalex-U.S. REIT Net Dividend Index (0.96%), MSCI US REIT Index (1.92%), S&P Global Infrastructure Index (0.96%), S&P Global Natural Resources Index (0.96%), Bloomberg Commodity Index (0.96%), S&P/LSTA Leveraged Loan Index (0.96%), Bloomberg Barclays US TIPS Index (2.88%), Bloomberg Barclays US TIPS0-5 Year Index (2.20%) and3-Month US Treasury Bills (3.20%).
The components of the Custom Retirement 2035 Fund Benchmark were as follows: Russell 1000 Index (34.80%), Russell 2000 Index (10.80%), MSCI ACWI ex US IMI Net Dividend Index (23.60%), Bloomberg Barclays US Aggregate Bond Index (20.40%), S&P Globalex-U.S. REIT Net Dividend Index (0.86%), MSCI US REIT Index (1.72%), S&P Global Infrastructure Index (0.86%), S&P Global Natural Resources Index (0.86%), Bloomberg Commodity Index (0.86%), S&P/LSTA Leveraged Loan Index (0.86%), Bloomberg Barclays US TIPS Index (2.58%), Bloomberg Barclays US TIPS0-5 Year Index (0.60%) and3-Month US Treasury Bills (1.20%).
The components of the Custom Retirement 2040 Fund Benchmark were as follows: Russell 1000 Index (36.40%), Russell 2000 Index (12.40%), MSCI ACWI ex US IMI Net Dividend Index (27.20%), Bloomberg Barclays US Aggregate Bond Index (16.80%), S&P Globalex-U.S. REIT Net Dividend Index (0.72%), MSCI US REIT Index (1.44%), S&P Global Infrastructure Index (0.72%), S&P Global Natural Resources Index (0.72%), Bloomberg Commodity Index (0.72%), S&P/LSTA Leveraged Loan Index (0.72%), Bloomberg Barclays US TIPS Index (2.16%), Bloomberg Barclays US TIPS0-5 Year Index (0.00%) and3-Month US Treasury Bills (0.00%).
The components of the Custom Retirement 2045 Fund Benchmark were as follows: Russell 1000 Index (37.40%), Russell 2000 Index (13.40%), MSCI ACWI ex US IMI Net Dividend Index (29.40%), Bloomberg Barclays US Aggregate Bond Index (14.20%), S&P Globalex-U.S. REIT Net Dividend Index (0.56%), MSCI US REIT Index (1.12%), S&P Global Infrastructure Index (0.56%), S&P Global Natural Resources Index (0.56%), Bloomberg Commodity Index (0.56%), S&P/LSTA Leveraged Loan Index (0.56%), Bloomberg Barclays US TIPS Index (1.68%), Bloomberg Barclays US TIPS0-5 Year Index (0.00%) and3-Month US Treasury Bills (0.00%).
The components of the Custom Retirement 2050 Fund Benchmark were as follows: Russell 1000 Index (38.40%), Russell 2000 Index (14.00%), MSCI ACWI ex US IMI Net Dividend Index (30.40%), Bloomberg Barclays US Aggregate Bond Index (12.20%), S&P Globalex-U.S. REIT Net Dividend Index (0.50%), MSCI US REIT Index (1.00%), S&P Global Infrastructure Index (0.50%), S&P Global Natural Resources Index (0.50%), Bloomberg Commodity Index (0.50%), S&P/LSTA Leveraged Loan Index (0.50%), Bloomberg Barclays US TIPS Index (1.50%), Bloomberg Barclays US TIPS0-5 Year Index (0.00%) and3-Month US Treasury Bills (0.00%).
The components of the Custom Retirement 2055 Fund Benchmark were as follows: Russell 1000 Index (39.00%), Russell 2000 Index (14.00%), MSCI ACWI ex US IMI Net Dividend Index (31.00%), Bloomberg Barclays US Aggregate Bond Index (11.00%), S&P Globalex-U.S. REIT Net Dividend Index (0.50%), MSCI US REIT Index (1.00%), S&P Global Infrastructure Index (0.50%), S&P Global Natural Resources Index (0.50%), Bloomberg Commodity Index (0.50%), S&P/LSTA Leveraged Loan Index (0.50%), Bloomberg Barclays US TIPS Index (1.50%), Bloomberg Barclays US TIPS0-5 Year Index (0.00%) and3-Month US Treasury Bills (0.00%).
The components of the Custom Retirement 2060 Fund Benchmark were as follows: Russell 1000 Index (39.00%), Russell 2000 Index (14.00%), MSCI ACWI ex US IMI Net Dividend Index (31.00%), Bloomberg Barclays US Aggregate Bond Index (11.00%), S&P Globalex-U.S. REIT Net Dividend Index (0.50%), MSCI US REIT Index (1.00%), S&P Global Infrastructure Index (0.50%), S&P Global Natural Resources Index (0.50%), Bloomberg Commodity Index (0.50%), S&P/LSTA Leveraged Loan Index (0.50%), Bloomberg Barclays US TIPS Index (1.50%), Bloomberg Barclays US TIPS0-5 Year Index (0.00%) and3-Month US Treasury Bills (0.00%).
5
| | |
| THE KP FUNDS | | December 31, 2019 |
| | |
| KP Retirement Path Retirement Income Fund | | |
| MANAGEMENT DISCUSSION AND FUND PERFORMANCE (Unaudited): | | |
Growth of a $10,000 Investment
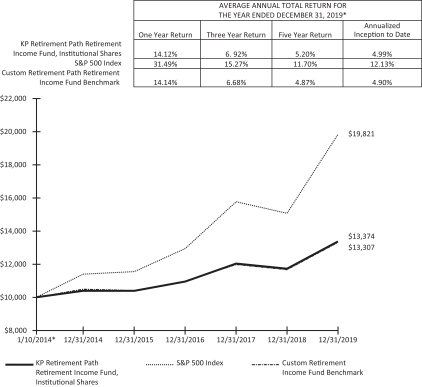
| * | The Fund commenced operations on January 10, 2014. |
The performance data quoted herein represents past performance and the return and value of an investment in the Fund will fluctuate so that, when redeemed, may be worth less than its original cost.
The Fund’s performance assumes the reinvestment of dividends and capital gains. Index returns assume reinvestment of dividends and, unlike a Fund’s returns, do not reflect any fees or expenses. If such fees and expenses were included in the index returns, the performance would have been lower. Please note that one cannot invest directly in an unmanaged index.
There are no assurances that the Fund will meet its stated objectives. The Fund’s holdings and allocations are subject to change because it is actively managed and should not be considered recommendations to buy individual securities.
Returns shown do not reflect the deduction of taxes that a shareholder would pay on Fund distributions or the redemption of Fund shares.
See definition of comparative indices on page 4.
6
| | |
| THE KP FUNDS | | December 31, 2019 |
| | |
| KP Retirement Path 2020 Fund | | |
| MANAGEMENT DISCUSSION AND FUND PERFORMANCE (Unaudited): | | |
Growth of a $10,000 Investment
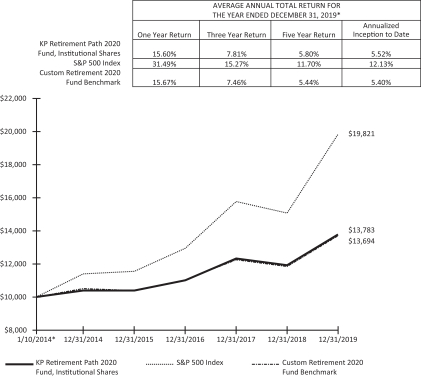
| * | The Fund commenced operations on January 10, 2014. |
The performance data quoted herein represents past performance and the return and value of an investment in the Fund will fluctuate so that, when redeemed, may be worth less than its original cost.
The Fund’s performance assumes the reinvestment of dividends and capital gains. Index returns assume reinvestment of dividends and, unlike a Fund’s returns, do not reflect any fees or expenses. If such fees and expenses were included in the index returns, the performance would have been lower. Please note that one cannot invest directly in an unmanaged index.
There are no assurances that the Fund will meet its stated objectives. The Fund’s holdings and allocations are subject to change because it is actively managed and should not be considered recommendations to buy individual securities.
Returns shown do not reflect the deduction of taxes that a shareholder would pay on Fund distributions or the redemption of Fund shares.
See definition of comparative indices on page 4.
7
| | |
| THE KP FUNDS | | December 31, 2019 |
| | |
| KP Retirement Path 2025 Fund | | |
| MANAGEMENT DISCUSSION AND FUND PERFORMANCE (Unaudited): | | |
Growth of a $10,000 Investment
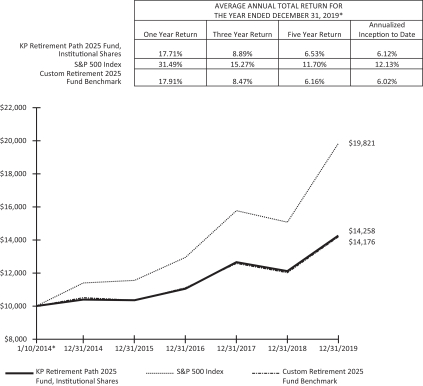
| * | The Fund commenced operations on January 10, 2014. |
The performance data quoted herein represents past performance and the return and value of an investment in the Fund will fluctuate so that, when redeemed, may be worth less than its original cost.
The Fund’s performance assumes the reinvestment of dividends and capital gains. Index returns assume reinvestment of dividends and, unlike a Fund’s returns, do not reflect any fees or expenses. If such fees and expenses were included in the index returns, the performance would have been lower. Please note that one cannot invest directly in an unmanaged index.
There are no assurances that the Fund will meet its stated objectives. The Fund’s holdings and allocations are subject to change because it is actively managed and should not be considered recommendations to buy individual securities.
Returns shown do not reflect the deduction of taxes that a shareholder would pay on Fund distributions or the redemption of Fund shares.
See definition of comparative indices on page 4.
8
| | |
| THE KP FUNDS | | December 31, 2019 |
| | |
| KP Retirement Path 2030 Fund | | |
| MANAGEMENT DISCUSSION AND FUND PERFORMANCE (Unaudited): | | |
Growth of a $10,000 Investment
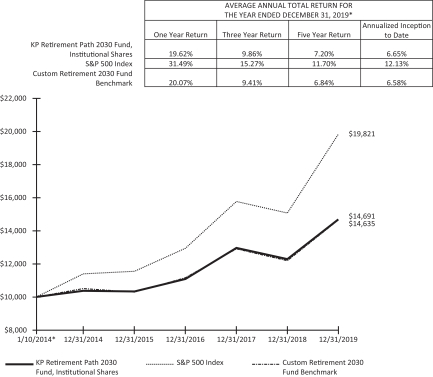
| * | The Fund commenced operations on January 10, 2014. |
The performance data quoted herein represents past performance and the return and value of an investment in the Fund will fluctuate so that, when redeemed, may be worth less than its original cost.
The Fund’s performance assumes the reinvestment of dividends and capital gains. Index returns assume reinvestment of dividends and, unlike a Fund’s returns, do not reflect any fees or expenses. If such fees and expenses were included in the index returns, the performance would have been lower. Please note that one cannot invest directly in an unmanaged index.
There are no assurances that the Fund will meet its stated objectives. The Fund’s holdings and allocations are subject to change because it is actively managed and should not be considered recommendations to buy individual securities.
Returns shown do not reflect the deduction of taxes that a shareholder would pay on Fund distributions or the redemption of Fund shares.
See definition of comparative indices on page 4.
9
| | |
| THE KP FUNDS | | December 31, 2019 |
| | |
| KP Retirement Path 2035 Fund | | |
| MANAGEMENT DISCUSSION AND FUND PERFORMANCE (Unaudited): | | |
Growth of a $10,000 Investment
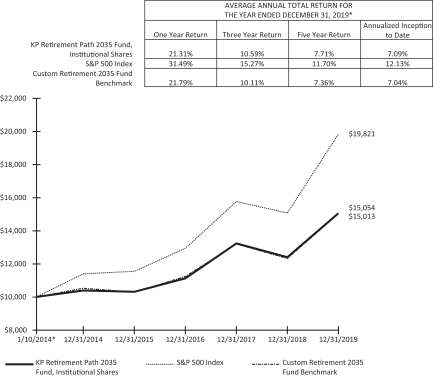
| * | The Fund commenced operations on January 10, 2014. |
The performance data quoted herein represents past performance and the return and value of an investment in the Fund will fluctuate so that, when redeemed, may be worth less than its original cost.
The Fund’s performance assumes the reinvestment of dividends and capital gains. Index returns assume reinvestment of dividends and, unlike a Fund’s returns, do not reflect any fees or expenses. If such fees and expenses were included in the index returns, the performance would have been lower. Please note that one cannot invest directly in an unmanaged index.
There are no assurances that the Fund will meet its stated objectives. The Fund’s holdings and allocations are subject to change because it is actively managed and should not be considered recommendations to buy individual securities.
Returns shown do not reflect the deduction of taxes that a shareholder would pay on Fund distributions or the redemption of Fund shares.
See definition of comparative indices on page 4.
10
| | |
| THE KP FUNDS | | December 31, 2019 |
| | |
| KP Retirement Path 2040 Fund | | |
| MANAGEMENT DISCUSSION AND FUND PERFORMANCE (Unaudited): | | |
Growth of a $10,000 Investment
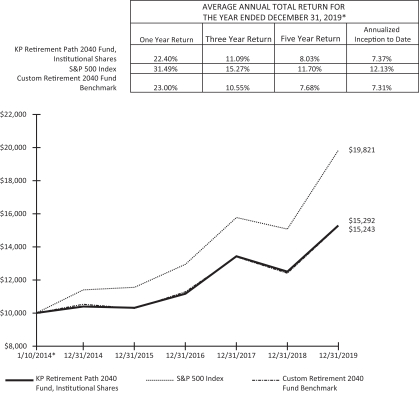
| * | The Fund commenced operations on January 10, 2014. |
The performance data quoted herein represents past performance and the return and value of an investment in the Fund will fluctuate so that, when redeemed, may be worth less than its original cost.
The Fund’s performance assumes the reinvestment of dividends and capital gains. Index returns assume reinvestment of dividends and, unlike a Fund’s returns, do not reflect any fees or expenses. If such fees and expenses were included in the index returns, the performance would have been lower. Please note that one cannot invest directly in an unmanaged index.
There are no assurances that the Fund will meet its stated objectives. The Fund’s holdings and allocations are subject to change because it is actively managed and should not be considered recommendations to buy individual securities.
Returns shown do not reflect the deduction of taxes that a shareholder would pay on Fund distributions or the redemption of Fund shares.
See definition of comparative indices on page 4.
11
| | |
| THE KP FUNDS | | December 31, 2019 |
| | |
| KP Retirement Path 2045 Fund | | |
| MANAGEMENT DISCUSSION AND FUND PERFORMANCE (Unaudited): | | |
Growth of a $10,000 Investment
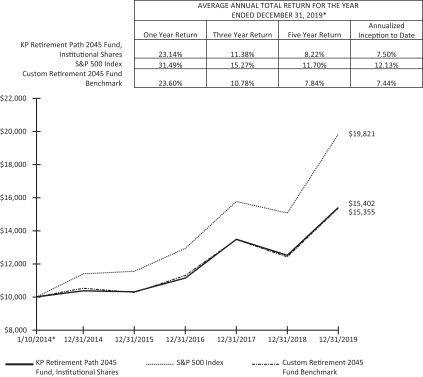
| * | The Fund commenced operations on January 10, 2014. |
The performance data quoted herein represents past performance and the return and value of an investment in the Fund will fluctuate so that, when redeemed, may be worth less than its original cost.
The Fund’s performance assumes the reinvestment of dividends and capital gains. Index returns assume reinvestment of dividends and, unlike a Fund’s returns, do not reflect any fees or expenses. If such fees and expenses were included in the index returns, the performance would have been lower. Please note that one cannot invest directly in an unmanaged index.
There are no assurances that the Fund will meet its stated objectives. The Fund’s holdings and allocations are subject to change because it is actively managed and should not be considered recommendations to buy individual securities.
Returns shown do not reflect the deduction of taxes that a shareholder would pay on Fund distributions or the redemption of Fund shares.
See definition of comparative indices on page 4.
12
| | |
| THE KP FUNDS | | December 31, 2019 |
| | |
| KP Retirement Path 2050 Fund | | |
| MANAGEMENT DISCUSSION AND FUND PERFORMANCE (Unaudited): | | |
Growth of a $10,000 Investment
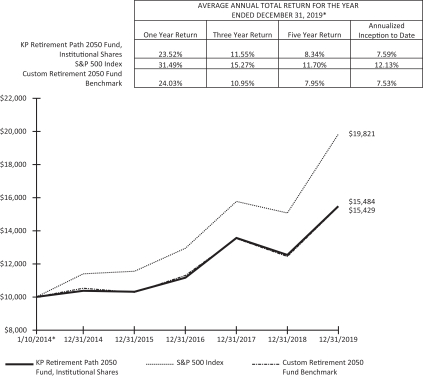
| * | The Fund commenced operations on January 10, 2014. |
The performance data quoted herein represents past performance and the return and value of an investment in the Fund will fluctuate so that, when redeemed, may be worth less than its original cost.
The Fund’s performance assumes the reinvestment of dividends and capital gains. Index returns assume reinvestment of dividends and, unlike a Fund’s returns, do not reflect any fees or expenses. If such fees and expenses were included in the index returns, the performance would have been lower. Please note that one cannot invest directly in an unmanaged index.
There are no assurances that the Fund will meet its stated objectives. The Fund’s holdings and allocations are subject to change because it is actively managed and should not be considered recommendations to buy individual securities.
Returns shown do not reflect the deduction of taxes that a shareholder would pay on Fund distributions or the redemption of Fund shares.
See definition of comparative indices on page 4.
13
| | |
| THE KP FUNDS | | December 31, 2019 |
| | |
| KP Retirement Path 2055 Fund | | |
| MANAGEMENT DISCUSSION AND FUND PERFORMANCE (Unaudited): | | |
Growth of a $10,000 Investment

| * | The Fund commenced operations on January 10, 2014. |
The performance data quoted herein represents past performance and the return and value of an investment in the Fund will fluctuate so that, when redeemed, may be worth less than its original cost.
The Fund’s performance assumes the reinvestment of dividends and capital gains. Index returns assume reinvestment of dividends and, unlike a Fund’s returns, do not reflect any fees or expenses. If such fees and expenses were included in the index returns, the performance would have been lower. Please note that one cannot invest directly in an unmanaged index.
There are no assurances that the Fund will meet its stated objectives. The Fund’s holdings and allocations are subject to change because it is actively managed and should not be considered recommendations to buy individual securities.
Returns shown do not reflect the deduction of taxes that a shareholder would pay on Fund distributions or the redemption of Fund shares.
See definition of comparative indices on page 4.
14
| | |
| THE KP FUNDS | | December 31, 2019 |
| | |
| KP Retirement Path 2060 Fund | | |
| MANAGEMENT DISCUSSION AND FUND PERFORMANCE (Unaudited): | | |
Growth of a $10,000 Investment

| * | The Fund commenced operations on January 10, 2014. |
The performance data quoted herein represents past performance and the return and value of an investment in the Fund will fluctuate so that, when redeemed, may be worth less than its original cost.
The Fund’s performance assumes the reinvestment of dividends and capital gains. Index returns assume reinvestment of dividends and, unlike a Fund’s returns, do not reflect any fees or expenses. If such fees and expenses were included in the index returns, the performance would have been lower. Please note that one cannot invest directly in an unmanaged index.
There are no assurances that the Fund will meet its stated objectives. The Fund’s holdings and allocations are subject to change because it is actively managed and should not be considered recommendations to buy individual securities.
Returns shown do not reflect the deduction of taxes that a shareholder would pay on Fund distributions or the redemption of Fund shares.
See definition of comparative indices on page 4.
15
| | |
| THE KP FUNDS | | December 31, 2019 |
| | |
| KP Retirement Path 2065 Fund | | |
| MANAGEMENT DISCUSSION AND FUND PERFORMANCE (Unaudited): | | |
Growth of a $10,000 Investment
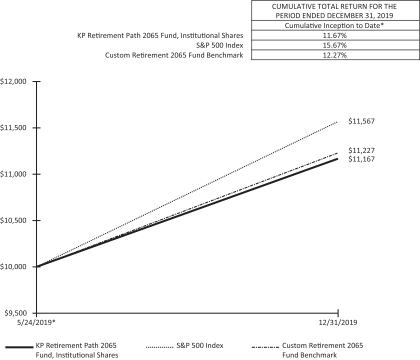
| * | The Fund commenced operations on May 24, 2019. |
The performance data quoted herein represents past performance and the return and value of an investment in the Fund will fluctuate so that, when redeemed, may be worth less than its original cost.
The Fund’s performance assumes the reinvestment of dividends and capital gains. Index returns assume reinvestment of dividends and, unlike a Fund’s returns, do not reflect any fees or expenses. If such fees and expenses were included in the index returns, the performance would have been lower. Please note that one cannot invest directly in an unmanaged index.
There are no assurances that the Fund will meet its stated objectives. The Fund’s holdings and allocations are subject to change because it is actively managed and should not be considered recommendations to buy individual securities.
Returns shown do not reflect the deduction of taxes that a shareholder would pay on Fund distributions or the redemption of Fund shares.
See definition of comparative indices on page 4
16
| | |
| THE KP FUNDS | | December 31, 2019 |
| | |
| KP Large Cap Equity Fund | | |
| MANAGEMENT DISCUSSION AND FUND PERFORMANCE (Unaudited): | | |
Growth of a $10,000 Investment
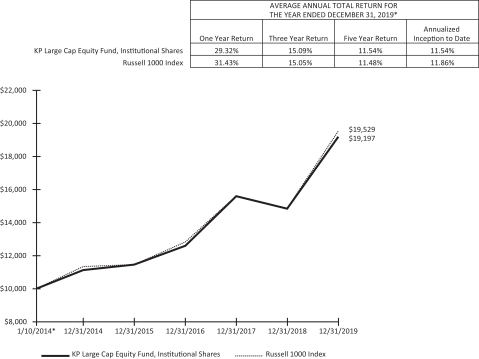
| * | The Fund commenced operations on January 10, 2014. |
The performance data quoted herein represents past performance and the return and value of an investment in the Fund will fluctuate so that, when redeemed, may be worth less than its original cost.
The Fund’s performance assumes the reinvestment of dividends and capital gains. Index returns assume reinvestment of dividends and, unlike a Fund’s returns, do not reflect any fees or expenses. If such fees and expenses were included in the index returns, the performance would have been lower. Please note that one cannot invest directly in an unmanaged index.
There are no assurances that the Fund will meet its stated objectives. The Fund’s holdings and allocations are subject to change because it is actively managed and should not be considered recommendations to buy individual securities.
Returns shown do not reflect the deduction of taxes that a shareholder would pay on Fund distributions or the redemption of Fund shares.
See definition of comparative indices on page 4.
17
| | |
| THE KP FUNDS | | December 31, 2019 |
| | |
| KP Small Cap Equity Fund | | |
| MANAGEMENT DISCUSSION AND FUND PERFORMANCE (Unaudited): | | |
Growth of a $10,000 Investment
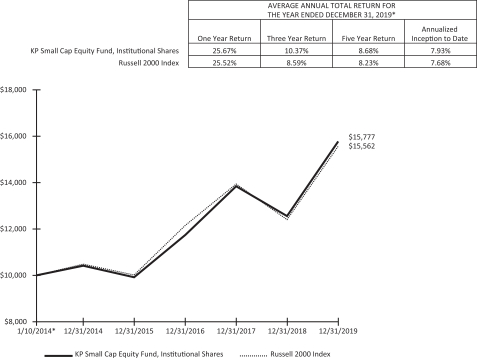
| * | The Fund commenced operations on January 10, 2014. |
The performance data quoted herein represents past performance and the return and value of an investment in the Fund will fluctuate so that, when redeemed, may be worth less than its original cost.
The Fund’s performance assumes the reinvestment of dividends and capital gains. Index returns assume reinvestment of dividends and, unlike a Fund’s returns, do not reflect any fees or expenses. If such fees and expenses were included in the index returns, the performance would have been lower. Please note that one cannot invest directly in an unmanaged index.
There are no assurances that the Fund will meet its stated objectives. The Fund’s holdings and allocations are subject to change because it is actively managed and should not be considered recommendations to buy individual securities.
Returns shown do not reflect the deduction of taxes that a shareholder would pay on Fund distributions or the redemption of Fund shares.
See definition of comparative indices on page 4.
18
| | |
| THE KP FUNDS | | December 31, 2019 |
| | |
| KP International Equity Fund | | |
| MANAGEMENT DISCUSSION AND FUND PERFORMANCE (Unaudited): | | |
Growth of a $10,000 Investment
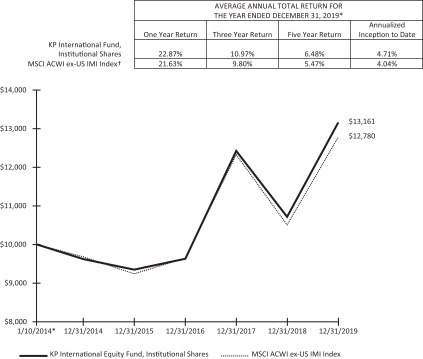
| * | The Fund commenced operations on January 10, 2014. |
| † | The Fund changed it’s benchmark index to the MSCI ACWIex-US IMI Index as of April 1, 2017. The Fund utilized the MSCI ACWIex-US Index as it’s benchmark index through March 31, 2017. The performance data above are reflective of this change. |
The performance data quoted herein represents past performance and the return and value of an investment in the Fund will fluctuate so that, when redeemed, may be worth less than its original cost.
The Fund’s performance assumes the reinvestment of dividends and capital gains. Index returns assume reinvestment of dividends and, unlike a Fund’s returns, do not reflect any fees or expenses. If such fees and expenses were included in the index returns, the performance would have been lower. Please note that one cannot invest directly in an unmanaged index.
There are no assurances that the Fund will meet its stated objectives. The Fund’s holdings and allocations are subject to change because it is actively managed and should not be considered recommendations to buy individual securities.
Returns shown do not reflect the deduction of taxes that a shareholder would pay on Fund distributions or the redemption of Fund shares.
See definition of comparative indices on page 4.
19
| | |
| THE KP FUNDS | | December 31, 2019 |
| | |
| KP Fixed Income Fund | | |
| MANAGEMENT DISCUSSION AND FUND PERFORMANCE (Unaudited): | | |
Growth of a $10,000 Investment

| * | The Fund commenced operations on January 10, 2014. |
The performance data quoted herein represents past performance and the return and value of an investment in the Fund will fluctuate so that, when redeemed, may be worth less than its original cost.
The Fund’s performance assumes the reinvestment of dividends and capital gains. Index returns assume reinvestment of dividends and, unlike a Fund’s returns, do not reflect any fees or expenses. If such fees and expenses were included in the index returns, the performance would have been lower. Please note that one cannot invest directly in an unmanaged index.
There are no assurances that the Fund will meet its stated objectives. The Fund’s holdings and allocations are subject to change because it is actively managed and should not be considered recommendations to buy individual securities.
Returns shown do not reflect the deduction of taxes that a shareholder would pay on Fund distributions or the redemption of Fund shares.
See definition of comparative indices on page 4.
20
| | |
| THE KP FUNDS | | December 31, 2019 |
| | |
| KP Retirement Path Retirement Income Fund | | |
|
| SECTOR WEIGHTINGS† (unaudited) |
| † | Percentages based on total investments. |
| | | | | | | | |
| Description | | Shares | | | Value
(000) | |
AFFILIATED REGISTERED INVESTMENT
COMPANIES — 72.0% | |
| | |
KP Fixed Income Fund | | | 19,561,932 | | | $ | 200,120 | |
| | |
KP International Equity Fund | | | 3,070,808 | | | | 33,195 | |
| | |
KP Large Cap Equity Fund | | | 6,089,377 | | | | 84,703 | |
| | |
KP Small Cap Equity Fund | | | 1,246,875 | | | | 14,052 | |
| | | | | | | | |
| | |
Total Affiliated Registered
Investment Companies
(Cost $314,770) (000) | | | | | | | 332,070 | |
| | | | | | | | |
UNAFFILIATED REGISTERED INVESTMENT COMPANIES — 28.0% | |
| | |
DFA Commodity Strategy Portfolio, Cl Institutional | | | 847,387 | | | | 4,695 | |
| | |
DFA International Real Estate Securities, Cl Institutional | | | 918,816 | | | | 4,585 | |
| | |
DFA Real Estate Securities Portfolio, Cl Institutional | | | 223,561 | | | | 9,147 | |
| | |
Lazard Global Listed Infrastructure Portfolio, Cl Institutional | | | 299,622 | | | | 4,728 | |
| | |
T. Rowe Price Institutional Floating Rate Fund, Cl Institutional | | | 462,755 | | | | 4,577 | |
| | |
T. Rowe Price New Era Fund, Cl Institutional | | | 140,662 | | | | 4,839 | |
| | |
Vanguard Inflation-Protected Securities Fund, Cl Institutional | | | 1,305,348 | | | | 13,758 | |
| | |
Vanguard Short-Term Bond Index Fund, Cl Institutional | | | 4,335,404 | | | | 45,825 | |
| | | | | | | | |
| Description | | Shares | | | Value
(000) | |
| | |
Vanguard Short-Term Inflation-Protected Securities Index Fund, Cl Institutional | | | 1,490,760 | | | $ | 36,822 | |
| | | | | | | | |
| | |
Total Unaffiliated Registered Investment Companies
(Cost $125,942) (000) | | | | | | | 128,976 | |
| | | | | | | | |
| | |
Total Investments In
Securities — 100.0%
(Cost $440,712) (000) | | | | | | $ | 461,046 | |
| | | | | | | | |
Percentages are based on Net Assets of $461,025 (000).
Cl — Class
As of December 31, 2019, all of the Fund’s investments were considered Level 1 in accordance with the authoritative guidance on fair value measurements and disclosure under U.S. generally accepted accounting principles.
For the year ended December 31, 2019, there were no transfers in or out of Level 3.
For further financial information on individual registered investment companies, available upon request at no charge, please go to the Securities Exchange Commission’s website at http://www.sec.gov or the individual registered investment company’s website.
The accompanying notes are an integral part of the financial statements.
21
| | |
| THE KP FUNDS | | December 31, 2019 |
| | |
| KP Retirement Path Retirement Income Fund | | |
The following is a summary of the transactions with affiliates for the year ended December 31, 2019 (000):
| | | | | | | | | | | | | | | | | | | | | | | | | | | | | | | | | | | | |
| | | Value
12/31/2018 | | | Purchases
at Cost | | | Proceeds
from Sales | | | Change in
Unrealized
Appreciation
(Depreciation) | | | Realized
Gain
(Loss) | | | Value
12/31/2019 | | | Shares | | | Income | | | Capital
Gain
Distributions | |
| KP Fixed Income Fund | | $ | 200,468 | | | $ | 43,806 | | | $ | (55,076 | ) | | $ | 10,548 | | | $ | 374 | | | $ | 200,120 | | | | 19,561,932 | | | $ | 6,136 | | | $ | 1,224 | |
| KP International Equity Fund | | | 32,947 | | | | 5,057 | | | | (10,910 | ) | | | 5,103 | | | | 998 | | | | 33,195 | | | | 3,070,808 | | | | 793 | | | | 136 | |
| KP Large Cap Equity Fund | | | 78,597 | | | | 16,460 | | | | (28,471 | ) | | | 12,950 | | | | 5,167 | | | | 84,703 | | | | 6,089,377 | | | | 1,164 | | | | 2,959 | |
| KP Small Cap Equity Fund | | | 12,946 | | | | 3,712 | | | | (5,464 | ) | | | 2,477 | | | | 381 | | | | 14,052 | | | | 1,246,875 | | | | 106 | | | | 385 | |
| | | | | | | | | | | | | | | | | | | | | | | | | | | | | | | | | | | | |
Totals | | $ | 324,958 | | | $ | 69,035 | | | $ | (99,921 | ) | | $ | 31,078 | | | $ | 6,920 | | | $ | 332,070 | | | | 29,968,992 | | | $ | 8,199 | | | $ | 4,704 | |
| | | | | | | | | | | | | | | | | | | | | | | | | | | | | | | | | | | | |
The accompanying notes are an integral part of the financial statements.
22
| | |
| THE KP FUNDS | | December 31, 2019 |
| | |
| KP Retirement Path 2020 Fund | | |
|
| SECTOR WEIGHTINGS† (unaudited) |
| † | Percentages based on total investments. |
| | | | | | | | |
| Description | | Shares | | | Value
(000) | |
AFFILIATED REGISTERED INVESTMENT COMPANIES — 74.9% | |
| | |
KP Fixed Income Fund | | | 39,590,675 | | | $ | 405,013 | |
| | |
KP International Equity Fund | | | 9,911,771 | | | | 107,146 | |
| | |
KP Large Cap Equity Fund | | | 17,155,788 | | | | 238,637 | |
| | |
KP Small Cap Equity Fund | | | 4,215,710 | | | | 47,511 | |
| | | | | | | | |
| |
Total Affiliated Registered
Investment Companies
(Cost $752,286) (000) | | | | 798,307 | |
| | | | | | | | |
UNAFFILIATED REGISTERED INVESTMENT COMPANIES — 25.1% | |
| | |
DFA Commodity Strategy Portfolio, Cl Institutional | | | 1,955,173 | | | | 10,832 | |
| | |
DFA International Real Estate Securities, Cl Institutional | | | 2,119,275 | | | | 10,575 | |
| | |
DFA Real Estate Securities Portfolio, Cl Institutional | | | 515,675 | | | | 21,102 | |
| | |
Lazard Global Listed Infrastructure Portfolio, Cl Institutional | | | 691,411 | | | | 10,910 | |
| | |
T. Rowe Price Institutional Floating Rate Fund, Cl Institutional | | | 1,067,643 | | | | 10,559 | |
| | |
T. Rowe Price New Era Fund, Cl Institutional | | | 324,594 | | | | 11,166 | |
| | |
Vanguard Inflation-Protected Securities Fund, Cl Institutional | | | 2,999,119 | | | | 31,611 | |
| | |
Vanguard Short-Term Bond Index Fund, Cl Institutional | | | 8,567,899 | | | | 90,563 | |
| | | | | | | | |
| Description | | Shares | | | Value
(000) | |
| | |
Vanguard Short-Term Inflation-Protected Securities Index Fund, Cl Institutional | | | 2,825,587 | | | $ | 69,791 | |
| | | | | | | | |
| | |
Total Unaffiliated Registered
Investment Companies
(Cost $261,102) (000) | | | | | | | 267,109 | |
| | | | | | | | |
| | |
Total Investments In Securities — 100.0%
(Cost $1,013,388) (000) | | | | | | $ | 1,065,416 | |
| | | | | | | | |
Percentages are based on Net Assets of $1,065,370 (000).
Cl — Class
As of December 31, 2019, all of the Fund’s investments were considered Level 1 in accordance with the authoritative guidance on fair value measurements and disclosure under U.S. generally accepted accounting principles.
For the year ended December 31, 2019, there were no transfers in or out of Level 3.
For further financial information on individual registered investment companies, available upon request at no charge, please go to the Securities Exchange Commission’s website at http://www.sec.gov or the individual registered investment company’s website.
The accompanying notes are an integral part of the financial statements.
23
| | |
| THE KP FUNDS | | December 31, 2019 |
| | |
| KP Retirement Path 2020 Fund | | |
The following is a summary of the transactions with affiliates for the year ended December 31, 2019 (000):
| | | | | | | | | | | | | | | | | | | | | | | | | | | | | | | | | | | | |
| | | Value
12/31/2018 | | | Purchases
at Cost | | | Proceeds
from Sales | | | Change in
Unrealized
Appreciation
(Depreciation) | | | Realized
Gain
(Loss) | | | Value
12/31/2019 | | | Shares | | | Income | | | Capital
Gain
Distributions | |
| KP Fixed Income Fund | | $ | 384,055 | | | $ | 95,346 | | | $ | (94,696 | ) | | $ | 19,250 | | | $ | 1,058 | | | $ | 405,013 | | | | 39,590,675 | | | $ | 12,415 | | | $ | 2,478 | |
| KP International Equity Fund | | | 97,325 | | | | 16,219 | | | | (25,113 | ) | | | 17,561 | | | | 1,154 | | | | 107,146 | | | | 9,911,771 | | | | 2,559 | | | | 440 | |
| KP Large Cap Equity Fund | | | 204,684 | | | | 47,794 | | | | (62,581 | ) | | | 34,224 | | | | 14,516 | | | | 238,637 | | | | 17,155,788 | | | | 3,279 | | | | 8,340 | |
| KP Small Cap Equity Fund | | | 39,739 | | | | 11,539 | | | | (12,722 | ) | | | 7,749 | | | | 1,206 | | | | 47,511 | | | | 4,215,710 | | | | 360 | | | | 1,300 | |
| | | | | | | | | | | | | | | | | | | | | | | | | | | | | | | | | | | | |
Totals | | $ | 725,803 | | | $ | 170,898 | | | $ | (195,112 | ) | | $ | 78,784 | | | $ | 17,934 | | | $ | 798,307 | | | | 70,873,944 | | | $ | 18,613 | | | $ | 12,558 | |
| | | | | | | | | | | | | | | | | | | | | | | | | | | | | | | | | | | | |
The accompanying notes are an integral part of the financial statements.
24
| | |
| THE KP FUNDS | | December 31, 2019 |
| | |
| KP Retirement Path 2025 Fund | | |
|
| SECTOR WEIGHTINGS† (unaudited) |
| † | Percentages based on total investments. |
| | | | | | | | |
| Description | | Shares | | | Value
(000) | |
AFFILIATED REGISTERED INVESTMENT COMPANIES — 79.3% | |
| | |
KP Fixed Income Fund | | | 44,450,849 | | | $ | 454,732 | |
| | |
KP International Equity Fund | | | 18,949,449 | | | | 204,844 | |
| | |
KP Large Cap Equity Fund | | | 28,590,247 | | | | 397,690 | |
| | |
KP Small Cap Equity Fund | | | 8,326,097 | | | | 93,835 | |
| | | | | | | | |
| |
Total Affiliated Registered
Investment Companies
(Cost $1,072,164) (000) | | | | 1,151,101 | |
| | | | | | | | |
UNAFFILIATED REGISTERED INVESTMENT COMPANIES — 20.7% | |
| | |
DFA Commodity Strategy Portfolio, Cl Institutional | | | 2,665,438 | | | | 14,767 | |
| | |
DFA International Real Estate Securities, Cl Institutional | | | 2,889,360 | | | | 14,418 | |
| | |
DFA Real Estate Securities Portfolio, Cl Institutional | | | 702,938 | | | | 28,764 | |
| | |
Lazard Global Listed Infrastructure Portfolio, Cl Institutional | | | 942,718 | | | | 14,876 | |
| | |
T. Rowe Price Institutional Floating Rate Fund, Cl Institutional | | | 1,455,736 | | | | 14,397 | |
| | |
T. Rowe Price New Era Fund, Cl Institutional | | | 442,557 | | | | 15,224 | |
| | |
Vanguard Inflation-Protected Securities Fund, Cl Institutional | | | 4,037,086 | | | | 42,551 | |
| | |
Vanguard Short-Term Bond Index Fund, Cl Institutional | | | 8,585,223 | | | | 90,746 | |
| | | | | | | | |
| Description | | Shares | | | Value
(000) | |
| | |
Vanguard Short-Term Inflation-Protected Securities Index Fund, Cl Institutional | | | 2,650,987 | | | $ | 65,479 | |
| | | | | | | | |
| | |
Total Unaffiliated Registered
Investment Companies
(Cost $294,296) (000) | | | | | | | 301,222 | |
| | | | | | | | |
| | |
Total Investments In Securities — 100.0%
(Cost $1,366,460) (000) | | | | | | $ | 1,452,323 | |
| | | | | | | | |
Percentages are based on Net Assets of $1,452,260 (000).
Cl — Class
As of December 31, 2019, all of the Fund’s investments were considered Level 1 in accordance with the authoritative guidance on fair value measurements and disclosure under U.S. generally accepted accounting principles.
For the year ended December 31, 2019, there were no transfers in or out of Level 3.
For further financial information on individual registered investment companies, available upon request at no charge, please go to the Securities Exchange Commission’s website at http://www.sec.gov or the individual registered investment company’s website.
The accompanying notes are an integral part of the financial statements.
25
| | |
| THE KP FUNDS | | December 31, 2019 |
| | |
| KP Retirement Path 2025 Fund | | |
The following is a summary of the transactions with affiliates for the year ended December 31, 2019 (000):
| | | | | | | | | | | | | | | | | | | | | | | | | | | | | | | | | | | | |
| | | Value
12/31/2018 | | | Purchases
at Cost | | | Proceeds
from Sales | | | Change in
Unrealized
Appreciation
(Depreciation) | | | Realized
Gain
(Loss) | | | Value
12/31/2019 | | | Shares | | | Income | | | Capital
Gain
Distributions | |
| KP Fixed Income Fund | | $ | 395,872 | | | $ | 109,698 | | | $ | (71,382 | ) | | $ | 20,186 | | | $ | 358 | | | $ | 454,732 | | | | 44,450,849 | | | $ | 13,904 | | | $ | 2,761 | |
| KP International Equity Fund | | | 166,937 | | | | 32,370 | | | | (27,486 | ) | | | 31,432 | | | | 1,591 | | | | 204,844 | | | | 18,949,449 | | | | 4,885 | | | | 836 | |
| KP Large Cap Equity Fund | | | 310,376 | | | | 80,477 | | | | (68,093 | ) | | | 56,731 | | | | 18,199 | | | | 397,690 | | | | 28,590,247 | | | | 5,454 | | | | 13,824 | |
| KP Small Cap Equity Fund | | | 70,134 | | | | 22,605 | | | | (14,926 | ) | | | 14,651 | | | | 1,371 | | | | 93,835 | | | | 8,326,097 | | | | 708 | | | | 2,554 | |
| | | | | | | | | | | | | | | | | | | | | | | | | | | | | | | | | | | | |
Totals | | $ | 943,319 | | | $ | 245,150 | | | $ | (181,887 | ) | | $ | 123,000 | | | $ | 21,519 | | | $ | 1,151,101 | | | | 100,316,642 | | | $ | 24,951 | | | $ | 19,975 | |
| | | | | | | | | | | | | | | | | | | | | | | | | | | | | | | | | | | | |
The accompanying notes are an integral part of the financial statements.
26
| | |
| THE KP FUNDS | | December 31, 2019 |
| | |
| KP Retirement Path 2030 Fund | | |
|
| SECTOR WEIGHTINGS† (unaudited) |
| † | Percentages based on total investments. |
| | | | | | | | |
| Description | | Shares | | | Value
(000) | |
AFFILIATED REGISTERED INVESTMENT COMPANIES — 84.2% | |
| | |
KP Fixed Income Fund | | | 36,603,989 | | | $ | 374,459 | |
| | |
KP International Equity Fund | | | 24,900,778 | | | | 269,177 | |
| | |
KP Large Cap Equity Fund | | | 33,708,282 | | | | 468,882 | |
| | |
KP Small Cap Equity Fund | | | 11,009,114 | | | | 124,073 | |
| | | | | | | | |
| | |
Total Affiliated Registered
Investment Companies
(Cost $1,142,498) (000) | | | | | | | 1,236,591 | |
| | | | | | | | |
UNAFFILIATED REGISTERED INVESTMENT COMPANIES — 15.8% | |
| | |
DFA Commodity Strategy Portfolio, Cl Institutional | | | 2,632,268 | | | | 14,583 | |
| | |
DFA International Real Estate Securities, Cl Institutional | | | 2,853,849 | | | | 14,241 | |
| | |
DFA Real Estate Securities Portfolio, Cl Institutional | | | 694,346 | | | | 28,413 | |
| | |
Lazard Global Listed Infrastructure Portfolio, Cl Institutional | | | 930,858 | | | | 14,689 | |
| | |
T. Rowe Price Institutional Floating Rate Fund, Cl Institutional | | | 1,437,654 | | | | 14,218 | |
| | |
T. Rowe Price New Era Fund, Cl Institutional | | | 437,009 | | | | 15,033 | |
| | |
Vanguard Inflation-Protected Securities Fund, Cl Institutional | | | 3,983,446 | | | | 41,985 | |
| | |
Vanguard Short-Term Bond Index Fund, Cl Institutional | | | 4,862,993 | | | | 51,402 | |
| | | | | | | | |
| Description | | Shares | | | Value
(000) | |
| | |
Vanguard Short-Term Inflation-Protected Securities Index Fund, Cl Institutional | | | 1,508,608 | | | $ | 37,263 | |
| | | | | | | | |
| | |
Total Unaffiliated Registered Investment Companies
(Cost $225,938) (000) | | | | | | | 231,827 | |
| | | | | | | | |
| | |
Total Investments In Securities — 100.0%
(Cost $1,368,436) (000) | | | | | | $ | 1,468,418 | |
| | | | | | | | |
Percentages are based on Net Assets of $1,468,354 (000).
Cl — Class
As of December 31, 2019, all of the Fund’s investments were considered Level 1 in accordance with the authoritative guidance on fair value measurements and disclosure under U.S. generally accepted accounting principles.
For the year ended December 31, 2019, there were no transfers in or out of Level 3.
For further financial information on individual registered investment companies, available upon request at no charge, please go to the Securities Exchange Commission’s website at http://www.sec.gov or the individual registered investment company’s website.
The accompanying notes are an integral part of the financial statements.
27
| | |
| THE KP FUNDS | | December 31, 2019 |
| | |
| KP Retirement Path 2030 Fund | | |
The following is a summary of the transactions with affiliates for the year ended December 31, 2019 (000):
| | | | | | | | | | | | | | | | | | | | | | | | | | | | | | | | | | | | |
| | | Value
12/31/2018 | | | Purchases
at Cost | | | Proceeds
from Sales | | | Change in
Unrealized
Appreciation
(Depreciation) | | | Realized
Gain
(Loss) | | | Value
12/31/2019 | | | Shares | | | Income | | | Capital
Gain
Distributions | |
| KP Fixed Income Fund | | $ | 317,485 | | | $ | 95,769 | | | $ | (55,016 | ) | | $ | 16,400 | | | $ | (179 | ) | | $ | 374,459 | | | | 36,603,989 | | | $ | 11,452 | | | $ | 2,274 | |
| KP International Equity Fund | | | 212,987 | | | | 42,815 | | | | (28,925 | ) | | | 40,758 | | | | 1,542 | | | | 269,177 | | | | 24,900,778 | | | | 6,419 | | | | 1,098 | |
| KP Large Cap Equity Fund | | | 349,937 | | | | 95,862 | | | | (61,487 | ) | | | 67,918 | | | | 16,652 | | | | 468,882 | | | | 33,708,282 | | | | 6,431 | | | | 16,293 | |
| KP Small Cap Equity Fund | | | 89,027 | | | | 29,792 | | | | (15,093 | ) | | | 18,995 | | | | 1,352 | | | | 124,073 | | | | 11,009,114 | | | | 938 | | | | 3,376 | |
| | | | | | | | | | | | | | | | | | | | | | | | | | | | | | | | | | | | |
Totals | | $ | 969,436 | | | $ | 264,238 | | | $ | (160,521 | ) | | $ | 144,071 | | | $ | 19,367 | | | $ | 1,236,591 | | | | 106,222,163 | | | $ | 25,240 | | | $ | 23,041 | |
| | | | | | | | | | | | | | | | | | | | | | | | | | | | | | | | | | | | |
The accompanying notes are an integral part of the financial statements.
28
| | |
| THE KP FUNDS | | December 31, 2019 |
| | |
| KP Retirement Path 2035 Fund | | |
|
| SECTOR WEIGHTINGS† (unaudited) |
| † | Percentages based on total investments. |
| | | | | | | | |
| Description | | Shares | | | Value
(000) | |
AFFILIATED REGISTERED INVESTMENT COMPANIES — 88.9% | |
| | |
KP Fixed Income Fund | | | 33,491,072 | | | $ | 342,614 | |
| | |
KP International Equity Fund | | | 35,412,456 | | | | 382,809 | |
| | |
KP Large Cap Equity Fund | | | 41,203,576 | | | | 573,141 | |
| | |
KP Small Cap Equity Fund | | | 15,304,961 | | | | 172,487 | |
| | | | | | | | |
| |
Total Affiliated Registered
Investment Companies
(Cost $1,348,684) (000) | | | | 1,471,051 | |
| | | | | | | | |
UNAFFILIATED REGISTERED INVESTMENT COMPANIES — 11.1% | |
| | |
DFA Commodity Strategy Portfolio, Cl Institutional | | | 2,653,854 | | | | 14,702 | |
| | |
DFA International Real Estate Securities, Cl Institutional | | | 2,876,953 | | | | 14,356 | |
| | |
DFA Real Estate Securities Portfolio, Cl Institutional | | | 699,990 | | | | 28,644 | |
| | |
Lazard Global Listed Infrastructure Portfolio, Cl Institutional | | | 938,524 | | | | 14,810 | |
| | |
T. Rowe Price Institutional Floating Rate Fund, Cl Institutional | | | 1,449,387 | | | | 14,334 | |
| | |
T. Rowe Price New Era Fund, Cl Institutional | | | 440,611 | | | | 15,157 | |
| | |
Vanguard Inflation-Protected Securities Fund, Cl Institutional | | | 4,017,684 | | | | 42,346 | |
| | |
Vanguard Short-Term Bond Index Fund, Cl Institutional | | | 2,427,927 | | | | 25,663 | |
| | | | | | | | |
| Description | | Shares | | | Value
(000) | |
| | |
Vanguard Short-Term Inflation-Protected Securities Index Fund, Cl Institutional | | | 521,316 | | | $ | 12,877 | |
| | | | | | | | |
| | |
Total Unaffiliated Registered
Investment Companies
(Cost $177,497) (000) | | | | | | | 182,889 | |
| | | | | | | | |
| | |
Total Investments In
Securities — 100.0%
(Cost $1,526,181) (000) | | | | | | $ | 1,653,940 | |
| | | | | | | | |
Percentages are based on Net Assets of $1,653,869 (000).
Cl — Class
As of December 31, 2019, all of the Fund’s investments were considered Level 1 in accordance with the authoritative guidance on fair value measurements and disclosure under U.S. generally accepted accounting principles.
For the year ended December 31, 2019, there were no transfers in or out of Level 3.
For further financial information on individual registered investment companies, available upon request at no charge, please go to the Securities Exchange Commission’s website at http://www.sec.gov or the individual registered investment company’s website.
The accompanying notes are an integral part of the financial statements.
29
| | |
| THE KP FUNDS | | December 31, 2019 |
| | |
| KP Retirement Path 2035 Fund | | |
The following is a summary of the transactions with affiliates for the year ended December 31, 2019 (000):
| | | | | | | | | | | | | | | | | | | | | | | | | | | | | | | | | | | | |
| | | Value
12/31/2018 | | | Purchases
at Cost | | | Proceeds
from Sales | | | Change in
Unrealized
Appreciation
(Depreciation) | | | Realized
Gain
(Loss) | | | Value
12/31/2019 | | | Shares | | | Income | | | Capital
Gain
Distributions | |
| KP Fixed Income Fund | | $ | 287,371 | | | $ | 90,245 | | | $ | (49,582 | ) | | $ | 14,908 | | | $ | (328 | ) | | $ | 342,614 | | | | 33,491,072 | | | $ | 10,476 | | | $ | 2,083 | |
| KP International Equity Fund | | | 293,919 | | | | 60,721 | | | | (30,557 | ) | | | 57,076 | | | | 1,650 | | | | 382,809 | | | | 35,412,456 | | | | 9,127 | | | | 1,563 | |
| KP Large Cap Equity Fund | | | 420,244 | | | | 115,774 | | | | (64,421 | ) | | | 83,915 | | | | 17,629 | | | | 573,141 | | | | 41,203,576 | | | | 7,859 | | | | 19,929 | |
| KP Small Cap Equity Fund | | | 121,373 | | | | 40,873 | | | | (17,496 | ) | | | 26,158 | | | | 1,579 | | | | 172,487 | | | | 15,304,961 | | | | 1,303 | | | | 4,696 | |
| | | | | | | | | | | | | | | | | | | | | | | | | | | | | | | | | | | | |
Totals | | $ | 1,122,907 | | | $ | 307,613 | | | $ | (162,056 | ) | | $ | 182,057 | | | $ | 20,530 | | | $ | 1,471,051 | | | | 125,412,065 | | | $ | 28,765 | | | $ | 28,271 | |
| | | | | | | | | | | | | | | | | | | | | | | | | | | | | | | | | | | | |
The accompanying notes are an integral part of the financial statements.
30
| | |
| THE KP FUNDS | | December 31, 2019 |
| | |
| KP Retirement Path 2040 Fund | | |
|
| SECTOR WEIGHTINGS† (unaudited) |
| † | Percentages based on total investments. |
| | | | | | | | |
| Description | | Shares | | | Value
(000) | |
AFFILIATED REGISTERED INVESTMENT COMPANIES — 92.5% | |
| | |
KP Fixed Income Fund | | | 25,322,521 | | | $ | 259,049 | |
| | |
KP International Equity Fund | | | 38,075,069 | | | | 411,591 | |
| | |
KP Large Cap Equity Fund | | | 39,962,434 | | | | 555,878 | |
| | |
KP Small Cap Equity Fund | | | 16,546,341 | | | | 186,477 | |
| | | | | | | | |
| | |
Total Affiliated Registered Investment Companies
(Cost $1,290,490) (000) | | | | | | | 1,412,995 | |
| | | | | | | | |
UNAFFILIATED REGISTERED INVESTMENT COMPANIES — 7.5% | |
| | |
DFA Commodity Strategy Portfolio, Cl Institutional | | | 2,113,364 | | | | 11,708 | |
| | |
DFA International Real Estate Securities, Cl Institutional | | | 2,291,761 | | | | 11,436 | |
| | |
DFA Real Estate Securities Portfolio, Cl Institutional | | | 557,723 | | | | 22,823 | |
| | |
Lazard Global Listed Infrastructure Portfolio, Cl Institutional | | | 747,150 | | | | 11,790 | |
| | |
T. Rowe Price Institutional Floating Rate Fund, Cl Institutional | | | 1,154,333 | | | | 11,416 | |
| | |
T. Rowe Price New Era Fund, Cl Institutional | | | 350,769 | | | | 12,066 | |
| | |
Vanguard Inflation-Protected Securities Fund, Cl Institutional | | | 3,194,004 | | | | 33,665 | |
| | | | | | | | |
| | |
Total Unaffiliated Registered Investment Companies
(Cost $111,055) (000) | | | | | | | 114,904 | |
| | | | | | | | |
| | |
Total Investments In Securities — 100.0%
(Cost $1,401,545) (000) | | | | | | $ | 1,527,899 | |
| | | | | | | | |
Percentages are based on Net Assets of $1,527,834 (000).
Cl — Class
As of December 31, 2019, all of the Fund’s investments were considered Level 1 in accordance with the authoritative guidance on fair value measurements and disclosure under U.S. generally accepted accounting principles.
For the year ended December 31, 2019, there were no transfers in or out of Level 3.
For further financial information on individual registered investment companies, available upon request at no charge, please go to the Securities Exchange Commission’s website at http://www.sec.gov or the individual registered investment company’s website.
The accompanying notes are an integral part of the financial statements.
31
| | |
| THE KP FUNDS | | December 31, 2019 |
| | |
| KP Retirement Path 2040 Fund | | |
The following is a summary of the transactions with affiliates for the year ended December 31, 2019 (000):
| | | | | | | | | | | | | | | | | | | | | | | | | | | | | | | | | | | | |
| | | Value
12/31/2018 | | | Purchases
at Cost | | | Proceeds
from Sales | | | Change in
Unrealized
Appreciation
(Depreciation) | | | Realized
Gain
(Loss) | | | Value
12/31/2019 | | | Shares | | | Income | | | Capital
Gain
Distributions | |
| KP Fixed Income Fund | | $ | 216,689 | | | $ | 70,542 | | | $ | (39,071 | ) | | $ | 11,348 | | | $ | (459 | ) | | $ | 259,049 | | | | 25,322,521 | | | $ | 7,922 | | | $ | 1,574 | |
| KP International Equity Fund | | | 310,602 | | | | 67,927 | | | | (29,057 | ) | | | 60,895 | | | | 1,224 | | | | 411,591 | | | | 38,075,069 | | | | 9,813 | | | | 1,679 | |
| KP Large Cap Equity Fund | | | 403,097 | | | | 114,995 | | | | (59,342 | ) | | | 80,994 | | | | 16,134 | | | | 555,878 | | | | 39,962,434 | | | | 7,623 | | | | 19,314 | |
| KP Small Cap Equity Fund | | | 127,786 | | | | 46,228 | | | | (16,726 | ) | | | 27,849 | | | | 1,340 | | | | 186,477 | | | | 16,546,341 | | | | 1,409 | | | | 5,073 | |
| | | | | | | | | | | | | | | | | | | | | | | | | | | | | | | | | | | | |
Totals | | $ | 1,058,174 | | | $ | 299,692 | | | $ | (144,196 | ) | | $ | 181,086 | | | $ | 18,239 | | | $ | 1,412,995 | | | | 119,906,365 | | | $ | 26,767 | | | $ | 27,640 | |
| | | | | | | | | | | | | | | | | | | | | | | | | | | | | | | | | | | | |
The accompanying notes are an integral part of the financial statements.
32
| | |
| THE KP FUNDS | | December 31, 2019 |
| | |
| KP Retirement Path 2045 Fund | | |
|
| SECTOR WEIGHTINGS† (unaudited) |
| † | Percentages based on total investments. |
| | | | | | | | |
| Description | | Shares | | | Value
(000) | |
AFFILIATED REGISTERED INVESTMENT COMPANIES — 94.3% | |
| | |
KP Fixed Income Fund | | | 16,850,320 | | | $ | 172,379 | |
| | |
KP International Equity Fund | | | 33,140,429 | | | | 358,248 | |
| | |
KP Large Cap Equity Fund | | | 32,564,984 | | | | 452,979 | |
| | |
KP Small Cap Equity Fund | | | 14,196,487 | | | | 159,994 | |
| | | | | | | | |
| | |
Total Affiliated Registered Investment Companies
(Cost $1,051,324) (000) | | | | | | | 1,143,600 | |
| | | | | | | | |
UNAFFILIATED REGISTERED INVESTMENT COMPANIES — 5.7% | |
| | |
DFA Commodity Strategy Portfolio, Cl Institutional | | | 1,280,427 | | | | 7,094 | |
| | |
DFA International Real Estate Securities, Cl Institutional | | | 1,388,221 | | | | 6,927 | |
| | |
DFA Real Estate Securities Portfolio, Cl Institutional | | | 337,792 | | | | 13,822 | |
| | |
Lazard Global Listed Infrastructure Portfolio, Cl Institutional | | | 452,780 | | | | 7,145 | |
| | |
T. Rowe Price Institutional Floating Rate Fund, Cl Institutional | | | 699,356 | | | | 6,917 | |
| | |
T. Rowe Price New Era Fund, Cl Institutional | | | 212,566 | | | | 7,312 | |
| | |
Vanguard Inflation-Protected Securities Fund, Cl Institutional | | | 1,928,285 | | | | 20,324 | |
| | | | | | | | |
| | |
Total Unaffiliated Registered Investment Companies
(Cost $67,408) (000) | | | | | | | 69,541 | |
| | | | | | | | |
| | |
Total Investments In Securities — 100.0%
(Cost $1,118,732) (000) | | | | | | $ | 1,213,141 | |
| | | | | | | | |
Percentages are based on Net Assets of $1,213,088 (000).
Cl — Class
As of December 31, 2019, all of the Fund’s investments were considered Level 1 in accordance with the authoritative guidance on fair value measurements and disclosure under U.S. generally accepted accounting principles.
For the year ended December 31, 2019, there were no transfers in or out of Level 3.
For further financial information on individual registered investment companies, available upon request at no charge, please go to the Securities Exchange Commission’s website at http://www.sec.gov or the individual registered investment company’s website.
The accompanying notes are an integral part of the financial statements.
33
| | |
| THE KP FUNDS | | December 31, 2019 |
| | |
| KP Retirement Path 2045 Fund | | |
The following is a summary of the transactions with affiliates for the year ended December 31, 2019 (000):
| | | | | | | | | | | | | | | | | | | | | | | | | | | | | | | | | | | | |
| | | Value
12/31/2018 | | | Purchases
at Cost | | | Proceeds
from Sales | | | Change in
Unrealized
Appreciation
(Depreciation) | | | Realized
Gain
(Loss) | | | Value
12/31/2019 | | | Shares | | | Income | | | Capital
Gain
Distributions | |
| KP Fixed Income Fund | | $ | 140,263 | | | $ | 51,546 | | | $ | (26,431 | ) | | $ | 7,505 | | | $ | (504 | ) | | $ | 172,379 | | | | 16,850,320 | | | $ | 5,269 | | | $ | 1,046 | |
| KP International Equity Fund | | | 257,387 | | | | 72,083 | | | | (23,482 | ) | | | 52,293 | | | | (33 | ) | | | 358,248 | | | | 33,140,429 | | | | 8,536 | | | | 1,460 | |
| KP Large Cap Equity Fund | | | 317,525 | | | | 104,242 | | | | (45,846 | ) | | | 64,525 | | | | 12,533 | | | | 452,979 | | | | 32,564,984 | | | | 6,208 | | | | 15,719 | |
| KP Small Cap Equity Fund | | | 105,932 | | | | 43,222 | | | | (13,508 | ) | | | 23,310 | | | | 1,038 | | | | 159,994 | | | | 14,196,487 | | | | 1,208 | | | | 4,346 | |
| | | | | | | | | | | | | | | | | | | | | | | | | | | | | | | | | | | | |
Totals | | $ | 821,107 | | | $ | 271,093 | | | | (109,267 | ) | | $ | 147,633 | | | $ | 13,034 | | | $ | 1,143,600 | | | | 96,752,220 | | | $ | 21,221 | | | $ | 22,571 | |
| | | | | | | | | | | | | | | | | | | | | | | | | | | | | | | | | | | | |
The accompanying notes are an integral part of the financial statements.
34
| | |
| THE KP FUNDS | | December 31, 2019 |
| | |
| KP Retirement Path 2050 Fund | | |
|
| SECTOR WEIGHTINGS† (unaudited) |
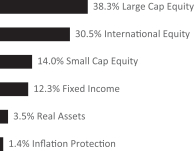
| † | Percentages based on total investments. |
| | | | | | | | |
| Description | | Shares | | | Value
(000) | |
AFFILIATED REGISTERED INVESTMENT COMPANIES — 95.1% | |
| | |
KP Fixed Income Fund | | | 9,134,586 | | | $ | 93,447 | |
| | |
KP International Equity Fund | | | 21,527,736 | | | | 232,715 | |
| | |
KP Large Cap Equity Fund | | | 21,003,614 | | | | 292,160 | |
| | |
KP Small Cap Equity Fund | | | 9,456,718 | | | | 106,577 | |
| | | | | | | | |
| | |
Total Affiliated Registered Investment Companies
(Cost $674,911) (000) | | | | | | | 724,899 | |
| | | | | | | | |
UNAFFILIATED REGISTERED INVESTMENT COMPANIES — 4.9% | |
| | |
DFA Commodity Strategy Portfolio, Cl Institutional | | | 694,739 | | | | 3,849 | |
| | |
DFA International Real Estate Securities, Cl Institutional | | | 753,053 | | | | 3,758 | |
| | |
DFA Real Estate Securities Portfolio, Cl Institutional | | | 183,175 | | | | 7,495 | |
| | |
Lazard Global Listed Infrastructure Portfolio, Cl Institutional | | | 245,773 | | | | 3,878 | |
| | |
T. Rowe Price Institutional Floating Rate Fund, Cl Institutional | | | 379,451 | | | | 3,753 | |
| | |
T. Rowe Price New Era Fund, Cl Institutional | | | 115,380 | | | | 3,969 | |
| | |
Vanguard Inflation-Protected Securities Fund, Cl Institutional | | | 1,039,377 | | | | 10,955 | |
| | | | | | | | |
| | |
Total Unaffiliated Registered Investment Companies
(Cost $36,660) (000) | | | | | | | 37,657 | |
| | | | | | | | |
| | |
Total Investments In Securities — 100.0%
(Cost $711,571) (000) | | | | | | $ | 762,556 | |
| | | | | | | | |
Percentages are based on Net Assets of $762,520 (000).
Cl — Class
As of December 31, 2019, all of the Fund’s investments were considered Level 1 in accordance with the authoritative guidance on fair value measurements and disclosure under U.S. generally accepted accounting principles.
For the year ended December 31, 2019, there were no transfers in or out of Level 3.
For further financial information on individual registered investment companies, available upon request at no charge, please go to the Securities Exchange Commission’s website at http://www.sec.gov or the individual registered investment company’s website.
The accompanying notes are an integral part of the financial statements.
35
| | |
| THE KP FUNDS | | December 31, 2019 |
| | |
| KP Retirement Path 2050 Fund | | |
The following is a summary of the transactions with affiliates for the year ended December 31, 2019 (000):
| | | | | | | | | | | | | | | | | | | | | | | | | | | | | | | | | | | | |
| | | Value
12/31/2018 | | | Purchases
at Cost | | | Proceeds
from Sales | | | Change in
Unrealized
Appreciation
(Depreciation) | | | Realized
Gain
(Loss) | | | Value
12/31/2019 | | | Shares | | | Income | | | Capital
Gain
Distributions | |
| KP Fixed Income Fund | | $ | 70,886 | | | $ | 33,360 | | | $ | (14,318 | ) | | $ | 3,749 | | | $ | (230 | ) | | $ | 93,447 | | | | 9,134,586 | | | $ | 2,853 | | | $ | 566 | |
| KP International Equity Fund | | | 156,804 | | | | 60,097 | | | | (16,842 | ) | | | 32,031 | | | | 625 | | | | 232,715 | | | | 21,527,736 | | | | 5,539 | | | | 946 | |
| KP Large Cap Equity Fund | | | 192,103 | | | | 82,965 | | | | (30,390 | ) | | | 41,682 | | | | 5,800 | | | | 292,160 | | | | 21,003,614 | | | | 3,999 | | | | 10,116 | |
| KP Small Cap Equity Fund | | | 65,283 | | | | 35,308 | | | | (9,259 | ) | | | 14,880 | | | | 365 | | | | 106,577 | | | | 9,456,718 | | | | 804 | | | | 2,889 | |
| | | | | | | | | | | | | | | | | | | | | | | | | | | | | | | | | | | | |
Totals | | $ | 485,076 | | | $ | 211,730 | | | $ | (70,809 | ) | | $ | 92,342 | | | $ | 6,560 | | | $ | 724,899 | | | | 61,122,654 | | | $ | 13,195 | | | $ | 14,517 | |
| | | | | | | | | | | | | | | | | | | | | | | | | | | | | | | | | | | | |
The accompanying notes are an integral part of the financial statements.
36
| | |
| THE KP FUNDS | | December 31, 2019 |
| | |
KP Retirement Path 2055 Fund | | |
|
| SECTOR WEIGHTINGS† (unaudited) |

| † | Percentages based on total investments. |
| | | | | | | | |
| Description | | Shares | | | Value
(000) | |
AFFILIATED REGISTERED INVESTMENT COMPANIES — 95.1% | |
| | |
KP Fixed Income Fund | | | 2,968,297 | | | $ | 30,366 | |
| | |
KP International Equity Fund | | | 8,222,830 | | | | 88,889 | |
| | |
KP Large Cap Equity Fund | | | 7,979,630 | | | | 110,996 | |
| | |
KP Small Cap Equity Fund | | | 3,519,265 | | | | 39,662 | |
| | | | | | | | |
| | |
Total Affiliated Registered Investment Companies
(Cost $257,926) (000) | | | | | | | 269,913 | |
| | | | | | | | |
UNAFFILIATED REGISTERED INVESTMENT COMPANIES — 4.9% | |
| | |
DFA Commodity Strategy Portfolio, Cl Institutional | | | 259,446 | | | | 1,437 | |
| | |
DFA International Real Estate Securities, Cl Institutional | | | 281,272 | | | | 1,404 | |
| | |
DFA Real Estate Securities Portfolio, Cl Institutional | | | 68,396 | | | | 2,798 | |
| | |
Lazard Global Listed Infrastructure Portfolio, Cl Institutional | | | 91,800 | | | | 1,449 | |
| | |
T. Rowe Price Institutional Floating Rate Fund, Cl Institutional | | | 141,717 | | | | 1,402 | |
| | |
T. Rowe Price New Era Fund, Cl Institutional | | | 43,095 | | | | 1,482 | |
| | |
Vanguard Inflation-Protected Securities Fund, Cl Institutional | | | 383,646 | | | | 4,044 | |
| | | | | | | | |
| |
Total Unaffiliated Registered
Investment Companies
(Cost $13,691) (000) | | | | 14,016 | |
| | | | | | | | |
| |
Total Investments In
Securities — 100.0%
(Cost $271,617) (000) | | | $ | 283,929 | |
| | | | | | | | |
Percentages are based on Net Assets of $283,913 (000).
Cl — Class
As of December 31, 2019, all of the Fund’s investments were considered Level 1 in accordance with the authoritative guidance on fair value measurements and disclosure under U.S. generally accepted accounting principles.
For the year ended December 31, 2019, there were no transfers in or out of Level 3.
For further financial information on individual registered investment companies, available upon request at no charge, please go to the Securities Exchange Commission’s website at http://www.sec.gov or the individual registered investment company’s website.
The accompanying notes are an integral part of the financial statements.
37
| | |
| THE KP FUNDS | | December 31, 2019 |
| | |
| KP Retirement Path 2055 Fund | | |
The following is a summary of the transactions with affiliates for the year ended December 31, 2019 (000):
| | | | | | | | | | | | | | | | | | | | | | | | | | | | | | | | | | | | |
| | | Value
12/31/2018 | | | Purchases
at Cost | | | Proceeds
from Sales | | | Change in
Unrealized
Appreciation
(Depreciation) | | | Realized
Gain
(Loss) | | | Value
12/31/2019 | | | Shares | | | Income | | | Capital
Gain
Distributions | |
| KP Fixed Income Fund | | $ | 20,678 | | | $ | 13,543 | | | $ | (4,882 | ) | | $ | 1,049 | | | $ | (22 | ) $ | | | 30,366 | | | | 2,968,297 | | | $ | 925 | | | $ | 183 | |
| KP International Equity Fund | | | 51,895 | | | | 32,646 | | | | (7,138 | ) | | | 10,543 | | | | 943 | | | | 88,889 | | | | 8,222,830 | | | | 2,111 | | | | 359 | |
| KP Large Cap Equity Fund | | | 63,325 | | | | 43,101 | | | | (11,791 | ) | | | 13,955 | | | | 2,406 | | | | 110,996 | | | | 7,979,630 | | | | 1,516 | | | | 3,825 | |
| KP Small Cap Equity Fund | | | 21,226 | | | | 16,984 | | | | (3,686 | ) | | | 4,931 | | | | 207 | | | | 39,662 | | | | 3,519,265 | | | | 299 | | | | 1,070 | |
| | | | | | | | | | | | | | | | | | | | | | | | | | | | | | | | | | | | |
Totals | | $ | 157,124 | | | $ | 106,274 | | | $ | (27,497 | ) | | $ | 30,478 | | | $ | 3,534 | | | $ | 269,913 | | | | 22,690,022 | | | $ | 4,851 | | | $ | 5,437 | |
| | | | | | | | | | | | | | | | | | | | | | | | | | | | | | | | | | | | |
The accompanying notes are an integral part of the financial statements.
38
| | |
| THE KP FUNDS | | December 31, 2019 |
| | |
| KP Retirement Path 2060 Fund | | |
|
| SECTOR WEIGHTINGS† (unaudited) |

| † | Percentages based on total investments. |
| | | | | | | | |
| Description | | Shares | | | Value
(000) | |
AFFILIATED REGISTERED INVESTMENT COMPANIES — 95.1% | |
| | |
KP Fixed Income Fund | | | 608,291 | | | $ | 6,223 | |
| | |
KP International Equity Fund | | | 1,684,819 | | | | 18,213 | |
| | |
KP Large Cap Equity Fund | | | 1,635,018 | | | | 22,743 | |
| | |
KP Small Cap Equity Fund | | | 721,095 | | | | 8,127 | |
| | | | | | | | |
| | |
Total Affiliated Registered Investment Companies
(Cost $53,412) (000) | | | | | | | 55,306 | |
| | | | | | | | |
UNAFFILIATED REGISTERED INVESTMENT COMPANIES — 4.9% | |
| | |
DFA Commodity Strategy Portfolio, Cl Institutional | | | 53,368 | | | | 296 | |
| | |
DFA International Real Estate Securities, Cl Institutional | | | 57,867 | | | | 289 | |
| | |
DFA Real Estate Securities Portfolio, Cl Institutional | | | 14,074 | | | | 575 | |
| | |
Lazard Global Listed Infrastructure Portfolio, Cl Institutional | | | 18,882 | | | | 298 | |
| | |
T. Rowe Price Institutional Floating Rate Fund, Cl Institutional | | | 29,156 | | | | 288 | |
| | |
T. Rowe Price New Era Fund, Cl Institutional | | | 8,862 | | | | 305 | |
| | |
Vanguard Inflation-Protected Securities Fund, Cl Institutional | | | 77,872 | | | | 821 | |
| | | | | | | | |
| | |
Total Unaffiliated Registered
Investment Companies
(Cost $2,803) (000) | | | | | | | 2,872 | |
| | | | | | | | |
| | |
Total Investments In
Securities — 100.0%
(Cost $56,215) (000) | | | | | | $ | 58,178 | |
| | | | | | | | |
Percentages are based on Net Assets of 58,175 (000).
Cl — Class
As of December 31, 2019, all of the Fund’s investments were considered Level 1 in accordance with the authoritative guidance on fair value measurements and disclosure under U.S. generally accepted accounting principles.
For the year ended December 31, 2019, there were no transfers in or out of Level 3.
For further financial information on individual registered investment companies, available upon request at no charge, please go to the Securities Exchange Commission’s website at http://www.sec.gov or the individual registered investment company’s website.
The accompanying notes are an integral part of the financial statements.
39
| | |
| THE KP FUNDS | | December 31, 2019 |
| | |
| KP Retirement Path 2060 Fund | | |
The following is a summary of the transactions with affiliates for the year ended December 31, 2019 (000):
| | | | | | | | | | | | | | | | | | | | | | | | | | | | | | | | | | | | |
| | | Value
12/31/2018 | | | Purchases
at Cost | | | Proceeds
from Sales | | | Change in
Unrealized
Appreciation
(Depreciation) | | | Realized
Gain
(Loss) | | | Value
12/31/2019 | | | Shares | | | Income | | | Capital
Gain
Distributions | |
| KP Fixed Income Fund | | $ | 4,226 | | | $ | 3,285 | | | $ | (1,502 | ) | | $ | 229 | | | $ | (15 | ) | | $ | 6,223 | | | | 608,291 | | | $ | 190 | | | $ | 38 | |
| KP International Equity Fund | | | 10,591 | | | | 8,146 | | | | (2,870 | ) | | | 2,474 | | | | (128 | ) | | | 18,213 | | | | 1,684,819 | | | | 433 | | | | 74 | |
| KP Large Cap Equity Fund | | | 12,924 | | | | 10,666 | | | | (4,189 | ) | | | 3,183 | | | | 159 | | | | 22,743 | | | | 1,635,018 | | | | 311 | | | | 783 | |
| KP Small Cap Equity Fund | | | 4,331 | | | | 4,141 | | | | (1,394 | ) | | | 1,245 | | | | (196 | ) | | | 8,127 | | | | 721,095 | | | | 61 | | | | 219 | |
| | | | | | | | | | | | | | | | | | | | | | | | | | | | | | | | | | | | |
Totals | | $ | 32,072 | | | $ | 26,238 | | | $ | (9,955 | ) | | $ | 7,131 | | | $ | (180 | ) | | $ | 55,306 | | | | 4,649,223 | | | $ | 995 | | | $ | 1,114 | |
| | | | | | | | | | | | | | | | | | | | | | | | | | | | | | | | | | | | |
The accompanying notes are an integral part of the financial statements.
40
| | |
| THE KP FUNDS | | December 31, 2019 |
| | |
| KP Retirement Path 2065 Fund | | |
|
| SECTOR WEIGHTINGS† (unaudited) |

| † | Percentages based on total investments. |
| | | | | | | | |
| Description | | Shares | | | Value
(000) | |
AFFILIATED REGISTERED INVESTMENT COMPANIES — 95.2% | |
| | |
KP Fixed Income Fund | | | 140,560 | | | $ | 1,438 | |
| | |
KP International Equity Fund | | | 389,351 | | | | 4,209 | |
| | |
KP Large Cap Equity Fund | | | 377,815 | | | | 5,255 | |
| | |
KP Small Cap Equity Fund | | | 166,655 | | | | 1,878 | |
| | | | | | | | |
| | |
Total Affiliated Registered
Investment Companies
(Cost $12,071) (000) | | | | | | | 12,780 | |
| | | | | | | | |
UNAFFILIATED REGISTERED INVESTMENT COMPANIES — 4.9% | |
| | |
DFA Commodity Strategy Portfolio, Cl Institutional | | | 12,318 | | | | 68 | |
| | |
DFA International Real Estate Securities, Cl Institutional | | | 13,348 | | | | 67 | |
| | |
DFA Real Estate Securities Portfolio, Cl Institutional | | | 3,251 | | | | 133 | |
| | |
Lazard Global Listed Infrastructure Portfolio, Cl Institutional | | | 4,355 | | | | 69 | |
| | |
T. Rowe Price Institutional Floating Rate Fund, Cl Institutional | | | 6,726 | | | | 67 | |
| | |
T. Rowe Price New Era Fund, Cl Institutional | | | 2,046 | | | | 70 | |
| | |
Vanguard Inflation-Protected Securities Fund, Cl Institutional | | | 18,061 | | | | 190 | |
| | | | | | | | |
| | |
Total Unaffiliated Registered
Investment Companies
(Cost $652) (000) | | | | | | | 664 | |
| | | | | | | | |
| | |
Total Investments In
Securities — 100.1%
(Cost $12,723) (000) | | | | | | $ | 13,444 | |
| | | | | | | | |
Percentages are based on Net Assets of $13,425 (000).
Cl — Class
As of December 31, 2019, all of the Fund’s investments were considered Level 1 in accordance with the authoritative guidance on fair value measurements and disclosure under U.S. generally accepted accounting principles.
For the year ended December 31, 2019, there were no transfers in or out of Level 3.
For further financial information on individual registered investment companies, available upon request at no charge, please go to the Securities Exchange Commission’s website at http://www.sec.gov or the individual registered investment company’s website.
The accompanying notes are an integral part of the financial statements.
41
| | |
| THE KP FUNDS | | December 31, 2019 |
| | |
| KP Retirement Path 2065 Fund | | |
The following is a summary of the transactions with affiliates for the period ended December 31, 2019 (000):
| | | | | | | | | | | | | | | | | | | | | | | | | | | | | | | | | | | | |
| | | Value
12/31/2018 | | | Purchases
at Cost | | | Proceeds
from Sales | | | Change in
Unrealized
Appreciation
(Depreciation) | | | Realized
Gain
(Loss) | | | Value
12/31/2019 | | | Shares | | | Income | | | Capital
Gain
Distributions | |
| KP Fixed Income Fund | | $ | — | | | $ | 1,693 | | | $ | (259 | ) | | $ | (5 | ) | | $ | 9 | | | $ | 1,438 | | | | 140,560 | | | $ | 44 | | | $ | 9 | |
| KP International Equity Fund | | | — | | | | 4,271 | | | | (390 | ) | | | 304 | | | | 24 | | | | 4,209 | | | | 389,351 | | | | 99 | | | | 17 | |
| KP Large Cap Equity Fund | | | — | | | | 5,430 | | | | (531 | ) | | | 317 | | | | 39 | | | | 5,255 | | | | 377,815 | | | | 71 | | | | 183 | |
| KP Small Cap Equity Fund | | | — | | | | 1,952 | | | | (176 | ) | | | 93 | | | | 9 | | | | 1,878 | | | | 166,655 | | | | 14 | | | | 51 | |
| | | | | | | | | | | | | | | | | | | | | | | | | | | | | | | | | | | | |
Totals | | $ | — | | | $ | 13,346 | | | $ | (1,356 | ) | | $ | 709 | | | $ | 81 | | | $ | 12,780 | | | | 1,074,381 | | | $ | 228 | | | $ | 260 | |
| | | | | | | | | | | | | | | | | | | | | | | | | | | | | | | | | | | | |
Amounts designated as “—“ are $0 or have been rounded to $0.
The accompanying notes are an integral part of the financial statements.
42
| | |
| THE KP FUNDS | | December 31, 2019 |
|
| SECTOR WEIGHTINGS† (unaudited) |
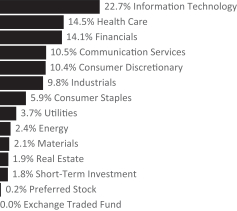
| † | Percentages based on total investments. |
| | | | | | | | |
| Description | | Shares | | | Value
(000) | |
COMMON STOCK — 97.8% | |
|
Communication Services — 10.5% | |
| | |
Activision Blizzard | | | 75,962 | | | $ | 4,514 | |
| | |
Alphabet, Cl A* | | | 51,975 | | | | 69,615 | |
| | |
Alphabet, Cl C* | | | 32,363 | | | | 43,270 | |
| | |
AMC Networks, Cl A* | | | 42,682 | | | | 1,686 | |
| | |
AT&T | | | 381,231 | | | | 14,899 | |
| | |
CenturyLink | | | 31,130 | | | | 411 | |
| | |
Charter Communications, Cl A* | | | 5,173 | | | | 2,509 | |
| | |
Comcast, Cl A | | | 636,562 | | | | 28,626 | |
| | |
Discovery, Cl A* | | | 5,793 | | | | 190 | |
| | |
Discovery, Cl C* | | | 70,960 | | | | 2,164 | |
| | |
DISH Network, Cl A* | | | 7,986 | | | | 283 | |
| | |
Electronic Arts* | | | 59,542 | | | | 6,401 | |
| | |
Facebook, Cl A* | | | 381,100 | | | | 78,221 | |
| | |
Fox | | | 11,168 | | | | 414 | |
| | |
Fox | | | 5,776 | | | | 210 | |
| | |
IAC* | | | 19,967 | | | | 4,974 | |
| | |
Interpublic Group of Companies | | | 14,426 | | | | 333 | |
| | |
Live Nation Entertainment* | | | 4,600 | | | | 329 | |
| | |
Netflix* | | | 37,910 | | | | 12,267 | |
| | |
News, Cl A | | | 14,068 | | | | 199 | |
| | |
News, Cl B | | | 5,200 | | | | 75 | |
| | |
Omnicom Group | | | 17,290 | | | | 1,401 | |
| | |
Sinclair Broadcast Group, Cl A | | | 19,939 | | | | 665 | |
| | |
Spotify Technology* | | | 42,622 | | | | 6,374 | |
| | |
Take-Two Interactive Software* | | | 18,929 | | | | 2,317 | |
| | |
Tencent Holdings ADR | | | 285,504 | | | | 13,707 | |
| | | | | | | | |
| Description | | Shares | | | Value
(000) | |
| | |
Tencent Music Entertainment Group ADR* | | | 181,219 | | | $ | 2,128 | |
| | |
T-Mobile US* | | | 10,100 | | | | 792 | |
| | |
TripAdvisor | | | 35,702 | | | | 1,085 | |
| | |
Twitter* | | | 24,690 | | | | 791 | |
| | |
Verizon Communications | | | 351,368 | | | | 21,574 | |
| | |
ViacomCBS, Cl B | | | 88,503 | | | | 3,714 | |
| | |
Walt Disney | | | 58,177 | | | | 8,414 | |
| | | | | | | | |
| | | | | | | 334,552 | |
| | | | | | | | |
|
Consumer Discretionary — 10.4% | |
| | |
Advance Auto Parts | | | 14,810 | | | | 2,372 | |
| | |
Alibaba Group Holding ADR* | | | 74,702 | | | | 15,844 | |
| | |
Amazon.com* | | | 53,038 | | | | 98,006 | |
| | |
Aptiv | | | 151,199 | | | | 14,359 | |
| | |
Aramark | | | 14,808 | | | | 643 | |
| | |
AutoZone* | | | 3,795 | | | | 4,521 | |
| | |
Best Buy | | | 44,367 | | | | 3,895 | |
| | |
Booking Holdings* | | | 6,478 | | | | 13,304 | |
| | |
BorgWarner | | | 6,497 | | | | 282 | |
| | |
Capri Holdings* | | | 5,413 | | | | 207 | |
| | |
CarMax* | | | 5,290 | | | | 464 | |
| | |
Carnival | | | 12,707 | | | | 646 | |
| | |
Carvana, Cl A* | | | 18,100 | | | | 1,666 | |
| | |
Chipotle Mexican Grill, Cl A* | | | 1,168 | | | | 978 | |
| | |
Darden Restaurants | | | 12,835 | | | | 1,399 | |
| | |
Dollar General | | | 65,377 | | | | 10,198 | |
| | |
Dollar Tree* | | | 7,601 | | | | 715 | |
| | |
DR Horton | | | 10,695 | | | | 564 | |
| | |
eBay | | | 189,763 | | | | 6,852 | |
| | |
Expedia Group | | | 4,480 | | | | 485 | |
| | |
Extended Stay America | | | 38,102 | | | | 566 | |
| | |
Ford Motor | | | 148,739 | | | | 1,383 | |
| | |
Gap | | | 8,162 | | | | 144 | |
| | |
Garmin | | | 8,518 | | | | 831 | |
| | |
General Motors | | | 107,742 | | | | 3,943 | |
| | |
Genuine Parts | | | 4,615 | | | | 490 | |
| | |
Graham Holdings, Cl B | | | 876 | | | | 560 | |
| | |
H&R Block | | | 7,576 | | | | 178 | |
| | |
Hanesbrands | | | 41,060 | | | | 610 | |
| | |
Harley-Davidson | | | 21,405 | | | | 796 | |
| | |
Hasbro | | | 4,401 | | | | 465 | |
| | |
Hilton Worldwide Holdings | | | 87,027 | | | | 9,652 | |
| | |
Home Depot | | | 90,313 | | | | 19,723 | |
| | |
Kohl’s | | | 41,792 | | | | 2,129 | |
| | |
L Brands | | | 8,325 | | | | 151 | |
| | |
Las Vegas Sands | | | 22,734 | | | | 1,570 | |
The accompanying notes are an integral part of the financial statements.
43
| | |
| THE KP FUNDS | | December 31, 2019 |
| | | | | | | | |
| Description | | Shares | | | Value
(000) | |
| | |
Lear | | | 27,150 | | | $ | 3,725 | |
| | |
Leggett & Platt | | | 4,746 | | | | 241 | |
| | |
Lennar, Cl A | | | 9,095 | | | | 507 | |
| | |
LKQ* | | | 9,700 | | | | 346 | |
| | |
Lowe’s | | | 54,529 | | | | 6,530 | |
| | |
Lululemon Athletica* | | | 30,487 | | | | 7,063 | |
| | |
Macy’s | | | 10,642 | | | | 181 | |
| | |
Marriott International, Cl A | | | 8,764 | | | | 1,327 | |
| | |
McDonald’s | | | 28,774 | | | | 5,686 | |
| | |
MGM Resorts International | | | 16,600 | | | | 552 | |
| | |
Mohawk Industries* | | | 1,901 | | | | 259 | |
| | |
Newell Brands | | | 13,100 | | | | 252 | |
| | |
NIKE, Cl B | | | 116,794 | | | | 11,832 | |
| | |
Nordstrom | | | 3,749 | | | | 153 | |
| | |
Norwegian Cruise Line Holdings* | | | 112,850 | | | | 6,592 | |
| | |
NVR* | | | 686 | | | | 2,613 | |
| | |
O’Reilly Automotive* | | | 7,670 | | | | 3,361 | |
| | |
Planet Fitness, Cl A* | | | 19,617 | | | | 1,465 | |
| | |
PulteGroup | | | 88,398 | | | | 3,430 | |
| | |
PVH | | | 2,642 | | | | 278 | |
| | |
Qurate Retail* | | | 74,357 | | | | 627 | |
| | |
Ralph Lauren, Cl A | | | 17,094 | | | | 2,004 | |
| | |
Restaurant Brands International | | | 44,494 | | | | 2,837 | |
| | |
Ross Stores | | | 89,870 | | | | 10,463 | |
| | |
Royal Caribbean Cruises | | | 5,492 | | | | 733 | |
| | |
Skechers U.S.A., Cl A* | | | 118,834 | | | | 5,132 | |
| | |
Starbucks | | | 105,249 | | | | 9,254 | |
| | |
Tapestry | | | 62,770 | | | | 1,693 | |
| | |
Target | | | 53,131 | | | | 6,812 | |
| | |
Tiffany | | | 3,492 | | | | 467 | |
| | |
TJX | | | 80,835 | | | | 4,936 | |
| | |
Tractor Supply | | | 32,089 | | | | 2,998 | |
| | |
Ulta Beauty* | | | 7,378 | | | | 1,868 | |
| | |
Under Armour, Cl A* | | | 6,400 | | | | 138 | |
| | |
Under Armour, Cl C* | | | 6,520 | | | | 125 | |
| | |
Vail Resorts | | | 4,925 | | | | 1,181 | |
| | |
VF | | | 10,414 | | | | 1,038 | |
| | |
Whirlpool | | | 5,434 | | | | 802 | |
| | |
Wynn Resorts | | | 14,977 | | | | 2,080 | |
| | |
Yum! Brands | | | 9,711 | | | | 978 | |
| | | | | | | | |
| | | | | | | 333,150 | |
| | | | | | | | |
|
Consumer Staples — 5.9% | |
| | |
Altria Group | | | 109,136 | | | | 5,447 | |
| | |
Archer-Daniels-Midland | | | 103,505 | | | | 4,797 | |
| | |
Brown-Forman, Cl B | | | 6,405 | | | | 433 | |
| | |
Bunge | | | 35,699 | | | | 2,054 | |
| | | | | | | | |
| Description | | Shares | | | Value
(000) | |
| | |
Bunge | | | 45,066 | | | $ | 2,594 | |
| | |
Campbell Soup | | | 5,813 | | | | 287 | |
| | |
Church & Dwight | | | 33,851 | | | | 2,381 | |
| | |
Clorox | | | 4,025 | | | | 618 | |
| | |
Coca-Cola | | | 156,362 | | | | 8,655 | |
| | |
Colgate-Palmolive | | | 101,627 | | | | 6,996 | |
| | |
Conagra Brands | | | 15,442 | | | | 529 | |
| | |
Constellation Brands, Cl A | | | 5,362 | | | | 1,017 | |
| | |
Costco Wholesale | | | 15,447 | | | | 4,540 | |
| | |
Coty, Cl A | | | 9,699 | | | | 109 | |
| | |
Danone | | | 30,059 | | | | 2,492 | |
| | |
Diageo | | | 191,358 | | | | 8,112 | |
| | |
Estee Lauder, Cl A | | | 19,842 | | | | 4,098 | |
| | |
General Mills | | | 28,492 | | | | 1,526 | |
| | |
Hershey | | | 4,756 | | | | 699 | |
| | |
Hormel Foods | | | 8,770 | | | | 396 | |
| | |
Ingredion | | | 21,716 | | | | 2,019 | |
| | |
JM Smucker | | | 22,011 | | | | 2,292 | |
| | |
Kellogg | | | 7,915 | | | | 547 | |
| | |
Kimberly-Clark | | | 43,299 | | | | 5,956 | |
| | |
Kraft Heinz | | | 19,835 | | | | 637 | |
| | |
Kroger | | | 84,745 | | | | 2,457 | |
| | |
Lamb Weston Holdings | | | 5,100 | | | | 439 | |
| | |
McCormick | | | 3,911 | | | | 664 | |
| | |
Molson Coors Brewing, Cl B | | | 37,105 | | | | 2,000 | |
| | |
Mondelez International, Cl A | | | 46,417 | | | | 2,557 | |
| | |
Monster Beverage* | | | 92,776 | | | | 5,896 | |
| | |
Nestle | | | 88,394 | | | | 9,570 | |
| | |
PepsiCo | | | 104,661 | | | | 14,304 | |
| | |
Philip Morris International | | | 166,155 | | | | 14,138 | |
| | |
Pilgrim’s Pride* | | | 13,130 | | | | 430 | |
| | |
Post Holdings* | | | 15,052 | | | | 1,642 | |
| | |
Procter & Gamble | | | 232,523 | | | | 29,042 | |
| | |
Reckitt Benckiser Group | | | 29,825 | | | | 2,421 | |
| | |
Sysco | | | 61,178 | | | | 5,233 | |
| | |
Tyson Foods, Cl A | | | 112,206 | | | | 10,215 | |
| | |
Walgreens Boots Alliance | | | 41,668 | | | | 2,457 | |
| | |
Walmart | | | 136,391 | | | | 16,209 | |
| | | | | | | | |
| | | | | | | 188,905 | |
| | | | | | | | |
|
Energy — 2.4% | |
| | |
Apache | | | 12,896 | | | | 330 | |
| | |
Baker Hughes, Cl A | | | 22,823 | | | | 585 | |
| | |
Cabot Oil & Gas | | | 15,334 | | | | 267 | |
| | |
Chevron | | | 148,832 | | | | 17,936 | |
| | |
Cimarex Energy | | | 3,836 | | | | 201 | |
| | |
Concho Resources | | | 43,423 | | | | 3,803 | |
The accompanying notes are an integral part of the financial statements.
44
| | |
| THE KP FUNDS | | December 31, 2019 |
| | | | | | | | |
| Description | | Shares | | | Value
(000) | |
| | |
ConocoPhillips | | | 112,902 | | | $ | 7,342 | |
| | |
Devon Energy | | | 57,787 | | | | 1,501 | |
| | |
Diamondback Energy | | | 5,700 | | | | 529 | |
| | |
EOG Resources | | | 67,579 | | | | 5,660 | |
| | |
Exxon Mobil | | | 200,467 | | | | 13,989 | |
| | |
Halliburton | | | 27,936 | | | | 684 | |
| | |
Helmerich & Payne | | | 3,887 | | | | 177 | |
| | |
Hess | | | 8,196 | | | | 548 | |
| | |
HollyFrontier | | | 5,250 | | | | 266 | |
| | |
Kinder Morgan | | | 62,462 | | | | 1,322 | |
| | |
Marathon Oil | | | 161,140 | | | | 2,188 | |
| | |
Marathon Petroleum | | | 21,086 | | | | 1,270 | |
| | |
National Oilwell Varco | | | 13,246 | | | | 332 | |
| | |
Noble Energy | | | 15,016 | | | | 373 | |
| | |
Occidental Petroleum | | | 28,628 | | | | 1,180 | |
| | |
ONEOK | | | 13,182 | | | | 997 | |
| | |
Phillips 66 | | | 14,445 | | | | 1,609 | |
| | |
Pioneer Natural Resources | | | 21,855 | | | | 3,308 | |
| | |
Schlumberger | | | 52,082 | | | | 2,094 | |
| | |
Suncor Energy | | | 143,215 | | | | 4,694 | |
| | |
TechnipFMC | | | 13,112 | | | | 281 | |
| | |
Valero Energy | | | 33,257 | | | | 3,114 | |
| | |
Williams | | | 38,792 | | | | 920 | |
| | | | | | | | |
| | | | | | | 77,500 | |
| | | | | | | | |
|
Financials — 14.1% | |
| | |
Aflac | | | 58,604 | | | | 3,100 | |
| | |
Allstate | | | 88,453 | | | | 9,947 | |
| | |
American Express | | | 66,012 | | | | 8,218 | |
| | |
American Financial Group | | | 23,865 | | | | 2,617 | |
| | |
American International Group | | | 27,956 | | | | 1,435 | |
| | |
American National Insurance | | | 2,901 | | | | 341 | |
| | |
Ameriprise Financial | | | 19,636 | | | | 3,271 | |
| | |
Aon | | | 71,923 | | | | 14,981 | |
| | |
Arch Capital Group* | | | 25,569 | | | | 1,097 | |
| | |
Arthur J Gallagher | | | 5,938 | | | | 565 | |
| | |
Associated Banc-Corp | | | 74,497 | | | | 1,642 | |
| | |
Assurant | | | 1,927 | | | | 253 | |
| | |
Assured Guaranty | | | 48,269 | | | | 2,366 | |
| | |
Athene Holding, Cl A* | | | 46,223 | | | | 2,174 | |
| | |
Axis Capital Holdings | | | 8,781 | | | | 522 | |
| | |
Bank of America | | | 477,888 | | | | 16,831 | |
| | |
Bank of New York Mellon | | | 125,075 | | | | 6,295 | |
| | |
BankUnited | | | 14,359 | | | | 525 | |
| | |
Berkshire Hathaway, Cl B* | | | 108,279 | | | | 24,525 | |
| | |
BlackRock, Cl A | | | 14,557 | | | | 7,318 | |
| | |
Capital One Financial | | | 62,995 | | | | 6,483 | |
| | | | | | | | |
| Description | | Shares | | | Value
(000) | |
| | |
Cboe Global Markets | | | 3,500 | | | $ | 420 | |
| | |
Charles Schwab | | | 116,999 | | | | 5,564 | |
| | |
Chubb | | | 90,803 | | | | 14,134 | |
| | |
Cincinnati Financial | | | 4,787 | | | | 503 | |
| | |
CIT Group | | | 25,612 | | | | 1,169 | |
| | |
Citigroup | | | 267,041 | | | | 21,334 | |
| | |
Citizens Financial Group | | | 86,899 | | | | 3,529 | |
| | |
CME Group, Cl A | | | 11,510 | | | | 2,310 | |
| | |
CNA Financial | | | 22,684 | | | | 1,016 | |
| | |
Comerica | | | 60,515 | | | | 4,342 | |
| | |
Discover Financial Services | | | 42,076 | | | | 3,569 | |
| | |
E*TRADE Financial | | | 7,875 | | | | 357 | |
| | |
Evercore, Cl A | | | 13,544 | | | | 1,013 | |
| | |
Everest Re Group | | | 10,950 | | | | 3,031 | |
| | |
Fidelity National Financial | | | 21,440 | | | | 972 | |
| | |
Fifth Third Bancorp | | | 83,479 | | | | 2,566 | |
| | |
First American Financial | | | 25,021 | | | | 1,459 | |
| | |
First Citizens BancShares, Cl A | | | 4,742 | | | | 2,524 | |
| | |
First Republic Bank | | | 5,377 | | | | 632 | |
| | |
Franklin Resources | | | 10,632 | | | | 276 | |
| | |
Globe Life | | | 3,487 | | | | 367 | |
| | |
Goldman Sachs Group | | | 57,238 | | | | 13,161 | |
| | |
Hanover Insurance Group | | | 24,737 | | | | 3,381 | |
| | |
Hartford Financial Services Group | | | 70,932 | | | | 4,311 | |
| | |
Huntington Bancshares | | | 32,976 | | | | 497 | |
| | |
Intercontinental Exchange | | | 69,580 | | | | 6,440 | |
| | |
Invesco | | | 14,873 | | | | 267 | |
| | |
JPMorgan Chase | | | 372,089 | | | | 51,869 | |
| | |
KeyCorp | | | 31,934 | | | | 646 | |
| | |
Lincoln National | | | 6,957 | | | | 411 | |
| | |
Loews | | | 8,233 | | | | 432 | |
| | |
LPL Financial Holdings | | | 19,844 | | | | 1,831 | |
| | |
M&T Bank | | | 4,224 | | | | 717 | |
| | |
MarketAxess Holdings | | | 1,200 | | | | 455 | |
| | |
Marsh & McLennan | | | 92,411 | | | | 10,296 | |
| | |
Mercury General | | | 34,029 | | | | 1,658 | |
| | |
MetLife | | | 237,198 | | | | 12,090 | |
| | |
MGIC Investment | | | 396,899 | | | | 5,624 | |
| | |
Moody’s | | | 26,783 | | | | 6,359 | |
| | |
Morgan Stanley | | | 40,403 | | | | 2,065 | |
| | |
Morningstar | | | 588 | | | | 89 | |
| | |
MSCI, Cl A | | | 2,700 | | | | 697 | |
| | |
Nasdaq | | | 66,246 | | | | 7,095 | |
| | |
Northern Trust | | | 6,868 | | | | 730 | |
| | |
Old Republic International | | | 8,671 | | | | 194 | |
| | |
PacWest Bancorp | | | 4,991 | | | | 191 | |
The accompanying notes are an integral part of the financial statements.
45
| | |
| THE KP FUNDS | | December 31, 2019 |
| | | | | | | | |
| Description | | Shares | | | Value
(000) | |
| | |
People’s United Financial | | | 16,454 | | | $ | 278 | |
| | |
PNC Financial Services Group | | | 68,922 | | | | 11,002 | |
| | |
Popular | | | 129,516 | | | | 7,609 | |
| | |
Principal Financial Group | | | 9,077 | | | | 499 | |
| | |
Progressive | | | 58,142 | | | | 4,209 | |
| | |
Prudential Financial | | | 12,854 | | | | 1,205 | |
| | |
Raymond James Financial | | | 3,900 | | | | 349 | |
| | |
Regions Financial | | | 160,888 | | | | 2,761 | |
| | |
Reinsurance Group of America, Cl A | | | 21,882 | | | | 3,568 | |
| | |
S&P Global | | | 11,502 | | | | 3,141 | |
| | |
Santander Consumer USA Holdings | | | 36,998 | | | | 865 | |
| | |
Signature Bank | | | 1,217 | | | | 166 | |
| | |
State Street | | | 72,420 | | | | 5,728 | |
| | |
SVB Financial Group* | | | 1,600 | | | | 402 | |
| | |
Synchrony Financial | | | 202,298 | | | | 7,285 | |
| | |
Synovus Financial | | | 4,486 | | | | 176 | |
| | |
T Rowe Price Group | | | 30,665 | | | | 3,736 | |
| | |
TD Ameritrade Holding | | | 45,803 | | | | 2,276 | |
| | |
Travelers | | | 103,889 | | | | 14,228 | |
| | |
Truist Financial | | | 235,175 | | | | 13,245 | |
| | |
Umpqua Holdings | | | 41,663 | | | | 737 | |
| | |
Unum Group | | | 13,989 | | | | 408 | |
| | |
US Bancorp | | | 257,712 | | | | 15,280 | |
| | |
Voya Financial | | | 7,261 | | | | 443 | |
| | |
Wells Fargo | | | 517,256 | | | | 27,828 | |
| | |
White Mountains Insurance Group | | | 226 | | | | 252 | |
| | |
Willis Towers Watson | | | 4,122 | | | | 832 | |
| | |
Wintrust Financial | | | 31,832 | | | | 2,257 | |
| | |
WR Berkley | | | 5,200 | | | | 359 | |
| | |
XP, Cl A* | | | 16,170 | | | | 623 | |
| | |
Zions Bancorp | | | 38,459 | | | | 1,997 | |
| | | | | | | | |
| | | | | | | 450,843 | |
| | | | | | | | |
|
Health Care — 14.4% | |
| | |
Abbott Laboratories | | | 222,324 | | | | 19,311 | |
| | |
AbbVie | | | 99,223 | | | | 8,785 | |
| | |
ABIOMED* | | | 3,144 | | | | 536 | |
| | |
Agilent Technologies | | | 53,906 | | | | 4,599 | |
| | |
Alexion Pharmaceuticals* | | | 88,363 | | | | 9,556 | |
| | |
Align Technology* | | | 9,177 | | | | 2,561 | |
| | |
Allergan | | | 32,035 | | | | 6,124 | |
| | |
AmerisourceBergen, Cl A | | | 22,848 | | | | 1,943 | |
| | |
Amgen | | | 22,612 | | | | 5,451 | |
| | |
Anthem | | | 14,369 | | | | 4,340 | |
| | |
Avantor* | | | 189,772 | | | | 3,444 | |
| | |
Baxter International | | | 63,177 | | | | 5,283 | |
| | |
Becton Dickinson | | | 48,636 | | | | 13,228 | |
| | | | | | | | |
| Description | | Shares | | | Value
(000) | |
| | |
Biogen* | | | 34,387 | | | $ | 10,204 | |
| | |
Boston Scientific* | | | 44,828 | | | | 2,027 | |
| | |
Bristol-Myers Squibb | | | 101,257 | | | | 6,500 | |
| | |
Cardinal Health | | | 33,139 | | | | 1,676 | |
| | |
Centene* | | | 94,311 | | | | 5,929 | |
| | |
Cerner | | | 10,158 | | | | 746 | |
| | |
Charles River Laboratories International* | | | 1,384 | | | | 211 | |
| | |
Cigna | | | 134,718 | | | | 27,549 | |
| | |
Cooper | | | 5,743 | | | | 1,845 | |
| | |
CVS Health | | | 41,908 | | | | 3,113 | |
| | |
Danaher | | | 87,740 | | | | 13,466 | |
| | |
DaVita* | | | 3,348 | | | | 251 | |
| | |
DENTSPLY SIRONA | | | 7,849 | | | | 444 | |
| | |
Edwards Lifesciences* | | | 6,682 | | | | 1,559 | |
| | |
Eli Lilly | | | 29,489 | | | | 3,876 | |
| | |
Exelixis* | | | 74,818 | | | | 1,318 | |
| | |
Gilead Sciences | | | 139,981 | | | | 9,096 | |
| | |
HCA Healthcare | | | 76,523 | | | | 11,311 | |
| | |
Henry Schein* | | | 5,153 | | | | 344 | |
| | |
Hill-Rom Holdings | | | 16,331 | | | | 1,854 | |
| | |
Hologic* | | | 63,117 | | | | 3,295 | |
| | |
Humana* | | | 29,383 | | | | 10,769 | |
| | |
IDEXX Laboratories* | | | 2,712 | | | | 708 | |
| | |
Illumina* | | | 4,751 | | | | 1,576 | |
| | |
Incyte* | | | 31,382 | | | | 2,740 | |
| | |
Insulet* | | | 8,960 | | | | 1,534 | |
| | |
Integra LifeSciences Holdings* | | | 26,347 | | | | 1,536 | |
| | |
Intuitive Surgical* | | | 23,203 | | | | 13,716 | |
| | |
IQVIA Holdings* | | | 5,800 | | | | 896 | |
| | |
Jazz Pharmaceuticals* | | | 5,188 | | | | 774 | |
| | |
Johnson & Johnson | | | 319,969 | | | | 46,674 | |
| | |
Laboratory Corp of America Holdings* | | | 3,103 | | | | 525 | |
| | |
Masimo* | | | 11,201 | | | | 1,770 | |
| | |
McKesson | | | 81,388 | | | | 11,258 | |
| | |
MEDNAX* | | | 37,983 | | | | 1,056 | |
| | |
Medtronic | | | 267,066 | | | | 30,299 | |
| | |
Merck | | | 222,259 | | | | 20,214 | |
| | |
Mettler-Toledo International* | | | 800 | | | | 635 | |
| | |
Mylan* | | | 141,381 | | | | 2,842 | |
| | |
Novartis | | | 13,993 | | | | 1,329 | |
| | |
PerkinElmer | | | 3,496 | | | | 339 | |
| | |
Perrigo | | | 4,232 | | | | 219 | |
| | |
Pfizer | | | 621,124 | | | | 24,336 | |
| | |
Quest Diagnostics | | | 4,262 | | | | 455 | |
| | |
Regeneron Pharmaceuticals* | | | 7,012 | | | | 2,633 | |
| | |
ResMed | | | 4,574 | | | | 709 | |
The accompanying notes are an integral part of the financial statements.
46
| | |
| THE KP FUNDS | | December 31, 2019 |
| | | | | | | | |
| Description | | Shares | | | Value
(000) | |
| | |
Roche Holding | | | 7,975 | | | $ | 2,587 | |
| | |
STERIS | | | 2,700 | | | | 412 | |
| | |
Stryker | | | 70,110 | | | | 14,719 | |
| | |
Teleflex | | | 3,959 | | | | 1,490 | |
| | |
Thermo Fisher Scientific | | | 62,467 | | | | 20,294 | |
| | |
United Therapeutics* | | | 2,594 | | | | 229 | |
| | |
UnitedHealth Group | | | 81,568 | | | | 23,979 | |
| | |
Universal Health Services, Cl B | | | 2,600 | | | | 373 | |
| | |
Varian Medical Systems* | | | 4,178 | | | | 593 | |
| | |
Veeva Systems, Cl A* | | | 18,209 | | | | 2,561 | |
| | |
Vertex Pharmaceuticals* | | | 71,765 | | | | 15,713 | |
| | |
Waters* | | | 2,159 | | | | 504 | |
| | |
WellCare Health Plans* | | | 1,600 | | | | 528 | |
| | |
Zimmer Biomet Holdings | | | 30,876 | | | | 4,622 | |
| | |
Zoetis, Cl A | | | 15,372 | | | | 2,035 | |
| | | | | | | | |
| | | | | | | 461,956 | |
| | | | | | | | |
|
Industrials — 9.8% | |
| | |
3M | | | 46,518 | | | | 8,207 | |
| | |
Acuity Brands | | | 7,573 | | | | 1,045 | |
| | |
AGCO | | | 11,600 | | | | 896 | |
| | |
Alaska Air Group | | | 25,643 | | | | 1,737 | |
| | |
Allegion | | | 3,256 | | | | 406 | |
| | |
Allison Transmission Holdings | | | 57,894 | | | | 2,797 | |
| | |
American Airlines Group | | | 13,749 | | | | 394 | |
| | |
AMETEK | | | 7,262 | | | | 724 | |
| | |
AO Smith | | | 5,200 | | | | 248 | |
| | |
Arconic | | | 13,555 | | | | 417 | |
| | |
Armstrong World Industries | | | 16,690 | | | | 1,568 | |
| | |
Boeing | | | 100,412 | | | | 32,710 | |
| | |
Canadian National Railway | | | 32,490 | | | | 2,939 | |
| | |
Caterpillar | | | 39,513 | | | | 5,835 | |
| | |
CH Robinson Worldwide | | | 4,264 | | | | 333 | |
| | |
Cintas | | | 2,676 | | | | 720 | |
| | |
Clean Harbors* | | | 8,516 | | | | 730 | |
| | |
Copa Holdings, Cl A | | | 1,631 | | | | 176 | |
| | |
Copart* | | | 6,400 | | | | 582 | |
| | |
CoStar Group* | | | 10,265 | | | | 6,142 | |
| | |
Crane | | | 17,711 | | | | 1,530 | |
| | |
CSX | | | 25,704 | | | | 1,860 | |
| | |
Cummins | | | 37,577 | | | | 6,725 | |
| | |
Curtiss-Wright | | | 4,128 | | | | 582 | |
| | |
Deere | | | 10,167 | | | | 1,762 | |
| | |
Delta Air Lines | | | 101,093 | | | | 5,912 | |
| | |
Dover | | | 4,663 | | | | 537 | |
| | |
Eaton | | | 125,899 | | | | 11,925 | |
| | |
Emerson Electric | | | 19,718 | | | | 1,504 | |
| | | | | | | | |
| Description | | Shares | | | Value
(000) | |
| | |
Equifax | | | 38,242 | | | $ | 5,359 | |
| | |
Expeditors International of Washington | | | 5,958 | | | | 465 | |
| | |
Fastenal | | | 18,318 | | | | 677 | |
| | |
FedEx | | | 7,666 | | | | 1,159 | |
| | |
Flowserve | | | 4,743 | | | | 236 | |
| | |
Fortive | | | 9,439 | | | | 721 | |
| | |
Fortune Brands Home & Security | | | 5,200 | | | | 340 | |
| | |
Gardner Denver Holdings* | | | 45,538 | | | | 1,670 | |
| | |
General Dynamics | | | 10,805 | | | | 1,906 | |
| | |
General Electric | | | 281,176 | | | | 3,138 | |
| | |
HD Supply Holdings* | | | 20,146 | | | | 810 | |
| | |
Honeywell International | | | 142,628 | | | | 25,245 | |
| | |
Hubbell, Cl B | | | 12,579 | | | | 1,859 | |
| | |
Huntington Ingalls Industries | | | 10,761 | | | | 2,700 | |
| | |
IDEX | | | 10,904 | | | | 1,876 | |
| | |
IHS Markit* | | | 12,851 | | | | 968 | |
| | |
Illinois Tool Works | | | 63,436 | | | | 11,395 | |
| | |
Ingersoll-Rand | | | 69,286 | | | | 9,210 | |
| | |
ITT | | | 41,270 | | | | 3,050 | |
| | |
Jacobs Engineering Group | | | 4,730 | | | | 425 | |
| | |
JB Hunt Transport Services | | | 26,018 | | | | 3,038 | |
| | |
JetBlue Airways* | | | 115,074 | | | | 2,154 | |
| | |
Johnson Controls International | | | 188,390 | | | | 7,669 | |
| | |
Kansas City Southern | | | 3,192 | | | | 489 | |
| | |
L3Harris Technologies | | | 23,531 | | | | 4,656 | |
| | |
Lockheed Martin | | | 33,178 | | | | 12,919 | |
| | |
ManpowerGroup | | | 5,668 | | | | 550 | |
| | |
Masco | | | 21,460 | | | | 1,030 | |
| | |
Nielsen Holdings | | | 13,000 | | | | 264 | |
| | |
Norfolk Southern | | | 23,324 | | | | 4,528 | |
| | |
Northrop Grumman | | | 51,223 | | | | 17,619 | |
| | |
nVent Electric | | | 20,088 | | | | 514 | |
| | |
Old Dominion Freight Line | | | 2,300 | | | | 437 | |
| | |
Oshkosh | | | 66,801 | | | | 6,323 | |
| | |
PACCAR | | | 22,490 | | | | 1,779 | |
| | |
Parker-Hannifin | | | 18,414 | | | | 3,790 | |
| | |
Pentair | | | 27,665 | | | | 1,269 | |
| | |
Quanta Services | | | 5,476 | | | | 223 | |
| | |
Raytheon | | | 13,908 | | | | 3,056 | |
| | |
Regal Beloit | | | 20,237 | | | | 1,733 | |
| | |
Republic Services, Cl A | | | 6,771 | | | | 607 | |
| | |
Robert Half International | | | 8,653 | | | | 546 | |
| | |
Rockwell Automation | | | 3,742 | | | | 758 | |
| | |
Rollins | | | 5,250 | | | | 174 | |
| | |
Roper Technologies | | | 3,373 | | | | 1,195 | |
| | |
Snap-on | | | 2,029 | | | | 344 | |
The accompanying notes are an integral part of the financial statements.
47
| | |
| THE KP FUNDS | | December 31, 2019 |
| | | | | | | | |
| Description | | Shares | | | Value
(000) | |
| | |
Southwest Airlines | | | 72,605 | | | $ | 3,919 | |
| | |
Spirit AeroSystems Holdings, Cl A | | | 45,520 | | | | 3,318 | |
| | |
Stanley Black & Decker | | | 44,292 | | | | 7,341 | |
| | |
Teledyne Technologies* | | | 7,270 | | | | 2,519 | |
| | |
Textron | | | 8,014 | | | | 357 | |
| | |
Timken | | | 21,188 | | | | 1,193 | |
| | |
TransDigm Group | | | 1,600 | | | | 896 | |
| | |
Uber Technologies* | | | 37,963 | | | | 1,129 | |
| | |
Union Pacific | | | 63,589 | | | | 11,496 | |
| | |
United Airlines Holdings* | | | 67,739 | | | | 5,967 | |
| | |
United Parcel Service, Cl B | | | 22,450 | | | | 2,628 | |
| | |
United Rentals* | | | 2,429 | | | | 405 | |
| | |
United Technologies | | | 81,344 | | | | 12,182 | |
| | |
Verisk Analytics, Cl A | | | 16,467 | | | | 2,459 | |
| | |
Waste Management | | | 30,326 | | | | 3,456 | |
| | |
WESCO International* | | | 29,780 | | | | 1,769 | |
| | |
Westinghouse Air Brake Technologies | | | 6,390 | | | | 497 | |
| | |
WW Grainger | | | 1,565 | | | | 530 | |
| | |
Xylem | | | 6,322 | | | | 498 | |
| | | | | | | | |
| | | | | | | 314,375 | |
| | | | | | | | |
|
Information Technology — 22.6% | |
| | |
Accenture, Cl A | | | 94,292 | | | | 19,855 | |
| | |
Adobe* | | | 37,414 | | | | 12,340 | |
| | |
Advanced Micro Devices* | | | 132,500 | | | | 6,076 | |
| | |
Akamai Technologies* | | | 32,620 | | | | 2,818 | |
| | |
Alliance Data Systems | | | 11,624 | | | | 1,304 | |
| | |
Amdocs | | | 65,795 | | | | 4,750 | |
| | |
Amphenol, Cl A | | | 9,560 | | | | 1,035 | |
| | |
Analog Devices | | | 65,259 | | | | 7,755 | |
| | |
ANSYS* | | | 2,634 | | | | 678 | |
| | |
Apple | | | 373,351 | | | | 109,635 | |
| | |
Applied Materials | | | 142,422 | | | | 8,693 | |
| | |
Arista Networks* | | | 1,900 | | | | 386 | |
| | |
Arrow Electronics* | | | 51,615 | | | | 4,374 | |
| | |
ASML Holding, Cl G | | | 27,792 | | | | 8,225 | |
| | |
Aspen Technology* | | | 16,776 | | | | 2,029 | |
| | |
Atlassian, Cl A* | | | 4,254 | | | | 512 | |
| | |
Autodesk* | | | 7,005 | | | | 1,285 | |
| | |
Automatic Data Processing | | | 13,968 | | | | 2,382 | |
| | |
Avnet | | | 115,154 | | | | 4,887 | |
| | |
Black Knight* | | | 27,246 | | | | 1,757 | |
| | |
Booz Allen Hamilton Holding, Cl A | | | 30,757 | | | | 2,188 | |
| | |
Broadcom | | | 25,638 | | | | 8,102 | |
| | |
Broadridge Financial Solutions | | | 3,596 | | | | 444 | |
| | |
CACI International, Cl A* | | | 8,231 | | | | 2,058 | |
| | | | | | | | |
| Description | | Shares | | | Value
(000) | |
| | |
Cadence Design Systems* | | | 58,833 | | | $ | 4,081 | |
| | |
CDW | | | 24,688 | | | | 3,526 | |
| | |
Ciena* | | | 38,727 | | | | 1,653 | |
| | |
Cisco Systems | | | 355,205 | | | | 17,036 | |
| | |
Citrix Systems | | | 4,342 | | | | 482 | |
| | |
Cognizant Technology Solutions, Cl A | | | 85,593 | | | | 5,308 | |
| | |
Corning | | | 24,923 | | | | 726 | |
| | |
Dell Technologies, Cl C* | | | 17,277 | | | | 888 | |
| | |
Dropbox, Cl A* | | | 106,704 | | | | 1,911 | |
| | |
DXC Technology | | | 40,770 | | | | 1,533 | |
| | |
EPAM Systems* | | | 6,879 | | | | 1,459 | |
| | |
F5 Networks* | | | 9,004 | | | | 1,257 | |
| | |
Fidelity National Information Services | | | 117,201 | | | | 16,301 | |
| | |
Fiserv* | | | 92,509 | | | | 10,697 | |
| | |
FleetCor Technologies* | | | 2,803 | | | | 806 | |
| | |
FLIR Systems | | | 5,047 | | | | 263 | |
| | |
Fortinet* | | | 28,217 | | | | 3,012 | |
| | |
Gartner* | | | 2,867 | | | | 442 | |
| | |
Global Payments | | | 103,408 | | | | 18,878 | |
| | |
Hewlett Packard Enterprise | | | 41,645 | | | | 661 | |
| | |
HP | | | 75,350 | | | | 1,548 | |
| | |
Intel | | | 313,243 | | | | 18,748 | |
| | |
International Business Machines | | | 66,281 | | | | 8,884 | |
| | |
Intuit | | | 96,149 | | | | 25,184 | |
| | |
IPG Photonics* | | | 1,300 | | | | 188 | |
| | |
Jabil | | | 66,521 | | | | 2,749 | |
| | |
Jack Henry & Associates | | | 2,700 | | | | 393 | |
| | |
Juniper Networks | | | 10,780 | | | | 266 | |
| | |
Keysight Technologies* | | | 28,517 | | | | 2,927 | |
| | |
KLA | | | 5,076 | | | | 904 | |
| | |
Lam Research | | | 23,535 | | | | 6,882 | |
| | |
Leidos Holdings | | | 4,300 | | | | 421 | |
| | |
Manhattan Associates* | | | 12,004 | | | | 957 | |
| | |
Marvell Technology Group | | | 228,528 | | | | 6,070 | |
| | |
Mastercard, Cl A | | | 65,888 | | | | 19,674 | |
| | |
Maxim Integrated Products | | | 38,602 | | | | 2,374 | |
| | |
Microchip Technology | | | 7,646 | | | | 801 | |
| | |
Micron Technology* | | | 136,511 | | | | 7,342 | |
| | |
Microsoft | | | 803,561 | | | | 126,722 | |
| | |
Motorola Solutions | | | 5,250 | | | | 846 | |
| | |
National Instruments | | | 14,745 | | | | 624 | |
| | |
NetApp | | | 7,594 | | | | 473 | |
| | |
NortonLifeLock | | | 19,937 | | | | 509 | |
| | |
NVIDIA | | | 32,596 | | | | 7,670 | |
| | |
NXP Semiconductors | | | 20,529 | | | | 2,613 | |
| | |
Okta, Cl A* | | | 10,403 | | | | 1,200 | |
The accompanying notes are an integral part of the financial statements.
48
| | |
| THE KP FUNDS | | December 31, 2019 |
| | | | | | | | |
| Description | | Shares | | | Value
(000) | |
| | |
Oracle | | | 188,205 | | | $ | 9,971 | |
| | |
Paychex | | | 10,267 | | | | 873 | |
| | |
Paycom Software* | | | 4,207 | | | | 1,114 | |
| | |
Paylocity Holding* | | | 12,704 | | | | 1,535 | |
| | |
PayPal Holdings* | | | 165,761 | | | | 17,930 | |
| | |
Perspecta | | | 40,912 | | | | 1,082 | |
| | |
Proofpoint* | | | 14,841 | | | | 1,703 | |
| | |
Qorvo* | | | 41,298 | | | | 4,800 | |
| | |
QUALCOMM | | | 103,436 | | | | 9,126 | |
| | |
salesforce.com* | | | 93,583 | | | | 15,220 | |
| | |
Seagate Technology | | | 7,469 | | | | 444 | |
| | |
ServiceNow* | | | 27,197 | | | | 7,678 | |
| | |
Skyworks Solutions | | | 27,604 | | | | 3,337 | |
| | |
Slack Technologies, Cl A* | | | 75,437 | | | | 1,696 | |
| | |
Splunk* | | | 51,614 | | | | 7,730 | |
| | |
SS&C Technologies Holdings | | | 8,573 | | | | 526 | |
| | |
Synopsys* | | | 21,085 | | | | 2,935 | |
| | |
TE Connectivity | | | 10,763 | | | | 1,032 | |
| | |
Texas Instruments | | | 144,967 | | | | 18,598 | |
| | |
VeriSign* | | | 17,570 | | | | 3,385 | |
| | |
Visa, Cl A | | | 239,062 | | | | 44,920 | |
| | |
VMware, Cl A* | | | 42,032 | | | | 6,380 | |
| | |
Western Digital | | | 10,401 | | | | 660 | |
| | |
Western Union | | | 13,363 | | | | 358 | |
| | |
Workday, Cl A* | | | 25,866 | | | | 4,254 | |
| | |
Xerox Holdings | | | 67,167 | | | | 2,476 | |
| | |
Xilinx | | | 11,053 | | | | 1,081 | |
| | |
Zebra Technologies, Cl A* | | | 10,684 | | | | 2,729 | |
| | |
Zoom Video Communications, Cl A* | | | 1,306 | | | | 89 | |
| | | | | | | | |
| | | | | | | 725,119 | |
| | | | | | | | |
|
Materials — 2.1% | |
| | |
Air Products & Chemicals | | | 7,118 | | | | 1,673 | |
| | |
Albemarle | | | 4,100 | | | | 300 | |
| | |
Amcor | | | 51,640 | | | | 560 | |
| | |
Avery Dennison | | | 2,668 | | | | 349 | |
| | |
Ball | | | 10,561 | | | | 683 | |
| | |
Berry Global Group* | | | 36,351 | | | | 1,726 | |
| | |
Cabot | | | 17,210 | | | | 818 | |
| | |
Celanese, Cl A | | | 3,900 | | | | 480 | |
| | |
CF Industries Holdings | | | 43,073 | | | | 2,056 | |
| | |
Corteva | | | 46,239 | | | | 1,367 | |
| | |
Domtar | | | 30,549 | | | | 1,168 | |
| | |
Dow | | | 23,852 | | | | 1,305 | |
| | |
DuPont de Nemours | | | 107,537 | | | | 6,904 | |
| | |
Eastman Chemical | | | 27,234 | | | | 2,159 | |
| | |
Ecolab | | | 8,067 | | | | 1,557 | |
| | | | | | | | |
| Description | | Shares | | | Value
(000) | |
| | |
FMC | | | 4,132 | | | $ | 412 | |
| | |
Freeport-McMoRan | | | 46,148 | | | | 605 | |
| | |
International Flavors & Fragrances | | | 3,342 | | | | 431 | |
| | |
International Paper | | | 67,478 | | | | 3,107 | |
| | |
Linde | | | 17,417 | | | | 3,708 | |
| | |
LyondellBasell Industries, Cl A | | | 54,044 | | | | 5,106 | |
| | |
Martin Marietta Materials | | | 2,000 | | | | 559 | |
| | |
Mosaic | | | 12,681 | | | | 274 | |
| | |
NewMarket | | | 5,476 | | | | 2,664 | |
| | |
Newmont Goldcorp | | | 26,230 | | | | 1,140 | |
| | |
Nucor | | | 9,642 | | | | 543 | |
| | |
Packaging Corp of America | | | 3,282 | | | | 368 | |
| | |
PPG Industries | | | 91,589 | | | | 12,226 | |
| | |
Sealed Air | | | 5,942 | | | | 237 | |
| | |
Sherwin-Williams | | | 18,052 | | | | 10,534 | |
| | |
Steel Dynamics | | | 51,676 | | | | 1,759 | |
| | |
Vulcan Materials | | | 4,227 | | | | 609 | |
| | |
Westrock | | | 8,878 | | | | 381 | |
| | | | | | | | |
| | | | | | | 67,768 | |
| | | | | | | | |
|
Real Estate — 1.9% | |
| | |
Alexandria Real Estate Equities‡ | | | 3,600 | | | | 582 | |
| | |
American Tower, Cl A‡ | | | 27,133 | | | | 6,236 | |
| | |
Apartment Investment & Management, Cl A‡ | | | 5,556 | | | | 287 | |
| | |
AvalonBay Communities‡ | | | 15,334 | | | | 3,216 | |
| | |
Boston Properties‡ | | | 19,076 | | | | 2,630 | |
| | |
Camden Property Trust‡ | | | 15,573 | | | | 1,652 | |
| | |
CBRE Group, Cl A* | | | 47,211 | | | | 2,894 | |
| | |
Corporate Office Properties Trust‡ | | | 52,163 | | | | 1,533 | |
| | |
Cousins Properties‡ | | | 40,308 | | | | 1,661 | |
| | |
Crown Castle International‡ | | | 13,373 | | | | 1,901 | |
| | |
Digital Realty Trust‡ | | | 6,700 | | | | 802 | |
| | |
Douglas Emmett‡ | | | 39,309 | | | | 1,726 | |
| | |
Duke Realty‡ | | | 65,595 | | | | 2,274 | |
| | |
Equinix‡ | | | 2,771 | | | | 1,617 | |
| | |
Equity Commonwealth‡ | | | 52,397 | | | | 1,720 | |
| | |
Equity LifeStyle Properties‡ | | | 26,218 | | | | 1,845 | |
| | |
Equity Residential‡ | | | 16,493 | | | | 1,335 | |
| | |
Essex Property Trust‡ | | | 2,132 | | | | 641 | |
| | |
Extra Space Storage‡ | | | 4,100 | | | | 433 | |
| | |
Federal Realty Investment Trust‡ | | | 2,400 | | | | 309 | |
| | |
Gaming and Leisure Properties‡ | | | 44,178 | | | | 1,902 | |
| | |
Healthpeak Properties‡ | | | 15,595 | | | | 538 | |
| | |
Host Hotels & Resorts‡ | | | 23,118 | | | | 429 | |
| | |
Iron Mountain‡ | | | 9,986 | | | | 318 | |
| | |
Kimco Realty‡ | | | 14,545 | | | | 301 | |
The accompanying notes are an integral part of the financial statements.
49
| | |
| THE KP FUNDS | | December 31, 2019 |
| | | | | | | | |
| Description | | Shares | | | Value
(000) | |
| | |
Medical Properties Trust‡ | | | 87,990 | | | $ | 1,857 | |
| | |
Mid-America Apartment Communities‡ | | | 14,067 | | | | 1,855 | |
| | |
Outfront Media‡ | | | 22,645 | | | | 607 | |
| | |
Park Hotels & Resorts‡ | | | 22,994 | | | | 595 | |
| | |
Prologis‡ | | | 49,993 | | | | 4,456 | |
| | |
Public Storage‡ | | | 13,742 | | | | 2,927 | |
| | |
Realty Income‡ | | | 10,200 | | | | 751 | |
| | |
Regency Centers‡ | | | 5,300 | | | | 334 | |
| | |
Retail Properties of America, Cl A‡ | | | 24,010 | | | | 322 | |
| | |
SBA Communications, Cl A‡ | | | 3,635 | | | | 876 | |
| | |
Simon Property Group‡ | | | 9,903 | | | | 1,475 | |
| | |
SL Green Realty‡ | | | 2,800 | | | | 257 | |
| | |
UDR‡ | | | 10,300 | | | | 481 | |
| | |
Ventas‡ | | | 11,913 | | | | 688 | |
| | |
Vornado Realty Trust‡ | | | 48,065 | | | | 3,196 | |
| | |
Welltower‡ | | | 12,983 | | | | 1,062 | |
| | |
Weyerhaeuser‡ | | | 23,787 | | | | 718 | |
| | | | | | | | |
| | | | | | | 61,239 | |
| | | | | | | | |
|
Utilities — 3.7% | |
| | |
AES | | | 20,996 | | | | 418 | |
| | |
Alliant Energy | | | 8,300 | | | | 454 | |
| | |
Ameren | | | 7,841 | | | | 602 | |
| | |
American Electric Power | | | 71,723 | | | | 6,779 | |
| | |
American Water Works | | | 5,782 | | | | 710 | |
| | |
Atmos Energy | | | 3,700 | | | | 414 | |
| | |
CenterPoint Energy | | | 17,647 | | | | 481 | |
| | |
CMS Energy | | | 9,064 | | | | 570 | |
| | |
Consolidated Edison | | | 98,894 | | | | 8,947 | |
| | |
Dominion Energy | | | 26,430 | | | | 2,189 | |
| | |
DTE Energy | | | 34,821 | | | | 4,522 | |
| | |
Duke Energy | | | 163,747 | | | | 14,935 | |
| | |
Edison International | | | 11,401 | | | | 860 | |
| | |
Entergy | | | 6,354 | | | | 761 | |
| | |
Evergy | | | 8,300 | | | | 540 | |
| | |
Eversource Energy | | | 10,305 | | | | 877 | |
| | |
Exelon | | | 209,618 | | | | 9,557 | |
| | |
FirstEnergy | | | 177,394 | | | | 8,621 | |
| | |
IDACORP | | | 14,068 | | | | 1,503 | |
| | |
NextEra Energy | | | 46,763 | | | | 11,324 | |
| | |
NiSource | | | 11,746 | | | | 327 | |
| | |
NRG Energy | | | 8,864 | | | | 352 | |
| | |
Pinnacle West Capital | | | 97,275 | | | | 8,748 | |
| | |
PPL | | | 23,124 | | | | 830 | |
| | |
Public Service Enterprise Group | | | 80,708 | | | | 4,766 | |
| | |
Sempra Energy | | | 34,665 | | | | 5,251 | |
| | | | | | | | |
| Description | | Shares | | | Value
(000) | |
| | |
Southern | | | 279,438 | | | $ | 17,800 | |
| | |
Vistra Energy | | | 28,315 | | | | 651 | |
| | |
WEC Energy Group | | | 10,120 | | | | 933 | |
| | |
Xcel Energy | | | 59,726 | | | | 3,792 | |
| | | | | | | | |
| | | | | | | 118,514 | |
| | | | | | | | |
| |
Total Common Stock
(Cost $2,469,669) (000) | | | | 3,133,921 | |
| | | | | | | | |
PREFERRED STOCK — 0.2% | |
| | |
Air BNB, Ser D* (A) (B) | | | 11,406 | | | | 1,357 | |
| | |
Air BNB, Ser E* (A) (B) | | | 6,939 | | | | 826 | |
| | |
Aurora Innovation (B) | | | 42,480 | | | | 393 | |
| | |
Magic Leap* (A) (B) | | | 5,553 | | | | 135 | |
| | |
Magic Leap, Ser C* (A) (B) | | | 13,521 | | | | 311 | |
| | |
Rivian Automotive* (B) | | | 160,906 | | | | 1,729 | |
| | |
Stripe, Inc.* (B) | | | 15,136 | | | | 237 | |
| | |
Uipath Inc. (B) | | | 17,452 | | | | 687 | |
| | | | | | | | |
| | |
Total Preferred Stock
(Cost $4,618) (000) | | | | | | | 5,675 | |
| | | | | | | | |
EXCHANGE TRADED FUND — 0.0% | |
| | |
iShares Russell 1000 ETF | | | 3,541 | | | | 632 | |
| | | | | | | | |
| | |
Total Exchange Traded Fund
(Cost $624) (000) | | | | | | | 632 | |
| | | | | |
SHORT-TERM INVESTMENT — 1.7% | |
| | |
State Street Institutional Treasury Money Market Fund, Cl Premier, 1.520% (C) | | | 55,548,569 | | | | 55,548 | |
| | | | | | | | |
| | |
Total Short-Term Investment
(Cost $55,548) (000) | | | | | | | 55,548 | |
| | | | | | | | |
| | |
Total Investments In
Securities — 99.7%
(Cost $2,530,459) (000) | | | | | | $ | 3,195,776 | |
| | | | | | | | |
Percentages are based on net assets of $3,203,820 (000).
A list of the open futures contracts held by the Fund at December 31, 2019, is as follows (000):
| | | | | | | | | | |
Type of
Contract | | Number of
Contracts
Long | | Expiration
Date | | Notional
Amount | | Value | | Unrealized
Appreciation |
S&P 500 IndexE-MINI | | 230 | | Mar-2020 | | $36,771 | | $37,158 | | $387 |
| | | | | | | | | | |
| * | Non-income producing security. |
| ‡ | Real Estate Investment Trust |
| (A) | Level 3 security in accordance with fair value hierarchy. |
| (B) | There is currently no rate available. |
| (C) | The rate reported is the7-day effective yield as of December 31, 2019. |
ADR — American Depositary Receipt
Cl — Class
ETF — Exchanged Traded Fund
S&P — Standard & Poor’s
Ser — Series
The accompanying notes are an integral part of the financial statements.
50
| | |
| THE KP FUNDS | | December 31, 2019 |
The following is a list of the level of inputs used as of December 31, 2019, in valuing the Fund’s investments and other financial instruments carried at value (000):
| | | | | | | | | | | | | | | | |
| Investments in Securities | | Level 1 | | | Level 2 | | | Level 3^ | | | Total | |
Common Stock | | $ | 3,133,921 | | | $ | — | | | $ | — | | | $ | 3,133,921 | |
Preferred Stock | | | — | | | | 3,046 | | | | 2,629 | | | | 5,675 | |
Exchange Traded Fund | | | 632 | | | | — | | | | — | | | | 632 | |
Short-Term Investment | | | 55,548 | | | | — | | | | — | | | | 55,548 | |
| | | | | | | | | | | | | | | | |
Total Investments in Securities | | $ | 3,190,101 | | | $ | 3,046 | | | $ | 2,629 | | | $ | 3,195,776 | |
| | | | | | | | | | | | | | | | |
| | | | |
| Other Financial Instruments | | Level 1 | | | Level 2 | | | Level 3 | | | Total | |
Futures Contracts** | | | | | | | | | | | | | |
Unrealized Appreciation | | $ | 387 | | | $ | — | | | $ | — | | | $ | 387 | |
| | | | | | | | | | | | | | | | |
Total Other Financial Instruments | | $ | 387 | | | $ | — | | | $ | — | | | $ | 387 | |
| | | | | | | | | | | | | | | | |
| ** | Futures contracts are valued at the unrealized appreciation on the instrument. |
| ^ | A reconciliation of Level 3 investments and disclosures of significant unobservable inputs are presented when the Fund has a significant amount of Level 3 investments at the beginning and/or end of the year in relation to net assets. Management has concluded that Level 3 investments are not material in relation to net assets. |
For the year ended December 31, 2019, there were no transfers in or out of Level 3.
Amounts designated as “—“ are $0 or have been rounded to $0.
The accompanying notes are an integral part of the financial statements.
51
| | |
| THE KP FUNDS | | December 31, 2019 |
|
| SECTOR WEIGHTINGS† (unaudited) |
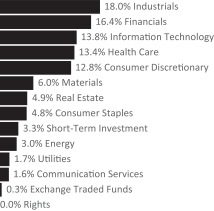
| † | Percentages based on total investments. |
| | | | | | | | |
| Description | | Shares | | | Value
(000) | |
COMMON STOCK — 96.5% | |
|
Communication Services — 1.6% | |
| | |
ATN International | | | 26,452 | | | $ | 1,465 | |
| | |
Beasley Broadcast Group, Cl A | | | 132,800 | | | | 410 | |
| | |
Care.com* | | | 10,096 | | | | 152 | |
| | |
Cincinnati Bell* | | | 16,333 | | | | 171 | |
| | |
Cogent Communications Holdings | | | 14,362 | | | | 945 | |
| | |
Consolidated Communications Holdings | | | 23,015 | | | | 89 | |
| | |
EW Scripps, Cl A | | | 270,567 | | | | 4,251 | |
| | |
Gannett | | | 42,363 | | | | 270 | |
| | |
Glu Mobile* | | | 38,900 | | | | 235 | |
| | |
Iridium Communications* | | | 33,661 | | | | 829 | |
| | |
John Wiley & Sons, Cl A | | | 13,601 | | | | 660 | |
| | |
Marcus | | | 7,870 | | | | 250 | |
| | |
Meredith | | | 44,328 | | | | 1,439 | |
| | |
ORBCOMM* | | | 282,680 | | | | 1,190 | |
| | |
QuinStreet* | | | 16,183 | | | | 248 | |
| | |
Roku, Cl A* | | | 11,067 | | | | 1,482 | |
| | |
Scholastic | | | 10,702 | | | | 412 | |
| | |
Sea ADR* | | | 43,882 | | | | 1,765 | |
| | |
Shenandoah Telecommunications | | | 16,400 | | | | 682 | |
| | |
Spok Holdings | | | 5,700 | | | | 70 | |
| | |
TechTarget* | | | 7,916 | | | | 207 | |
| | |
Vonage Holdings* | | | 79,585 | | | | 590 | |
| | |
World Wrestling Entertainment, Cl A | | | 24,489 | | | | 1,589 | |
| | |
Zynga, Cl A* | | | 447,690 | | | | 2,740 | |
| | | | | | | | |
| | | | | | | 22,141 | |
| | | | | | | | |
| | | | | | | | |
| Description | | Shares | | | Value
(000) | |
| |
Consumer Discretionary — 12.8% | | | | | |
| | |
1-800-Flowers.com, Cl A* | | | 146,563 | | | $ | 2,125 | |
| | |
Aaron’s | | | 36,515 | | | | 2,085 | |
| | |
Abercrombie & Fitch, Cl A | | | 21,929 | | | | 379 | |
| | |
American Axle & Manufacturing Holdings* | | | 38,699 | | | | 416 | |
| | |
American Public Education* | | | 5,586 | | | | 153 | |
| | |
Asbury Automotive Group* | | | 6,683 | | | | 747 | |
| | |
Aspen Group* | | | 316,021 | | | | 2,528 | |
| | |
Barnes & Noble Education* | | | 14,280 | | | | 61 | |
| | |
Big Lots | | | 107,139 | | | | 3,077 | |
| | |
BJ’s Restaurants | | | 38,988 | | | | 1,480 | |
| | |
Bloomin’ Brands | | | 159,878 | | | | 3,529 | |
| | |
Boot Barn Holdings* | | | 40,201 | | | | 1,790 | |
| | |
Brunswick | | | 99,667 | | | | 5,978 | |
| | |
Buckle | | | 9,715 | | | | 263 | |
| | |
Burlington Stores* | | | 18,932 | | | | 4,317 | |
| | |
Caleres | | | 14,694 | | | | 349 | |
| | |
Callaway Golf | | | 122,771 | | | | 2,603 | |
| | |
Career Education* | | | 24,087 | | | | 443 | |
| | |
CarMax* | | | 38,636 | | | | 3,387 | |
| | |
Carrols Restaurant Group* | | | 397,407 | | | | 2,802 | |
| | |
Carter’s | | | 30,839 | | | | 3,372 | |
| | |
Cato, Cl A | | | 7,745 | | | | 135 | |
| | |
Cavco Industries* | | | 33,013 | | | | 6,450 | |
| | |
Century Communities* | | | 9,007 | | | | 246 | |
| | |
Chegg* | | | 49,840 | | | | 1,889 | |
| | |
Chewy, Cl A* | | | 66,799 | | | | 1,937 | |
| | |
Chico’s FAS | | | 39,295 | | | | 150 | |
| | |
Children’s Place | | | 5,363 | | | | 335 | |
| | |
Chuy’s Holdings* | | | 73,588 | | | | 1,907 | |
| | |
Conn’s* | | | 6,300 | | | | 78 | |
| | |
Cooper Tire & Rubber | | | 243,369 | | | | 6,997 | |
| | |
Cooper-Standard Holdings* | | | 5,812 | | | | 193 | |
| | |
Core-Mark Holding | | | 16,056 | | | | 437 | |
| | |
Crocs* | | | 107,651 | | | | 4,510 | |
| | |
Dana | | | 133,133 | | | | 2,423 | |
| | |
Dave & Buster’s Entertainment | | | 10,686 | | | | 429 | |
| | |
Designer Brands, Cl A | | | 105,812 | | | | 1,665 | |
| | |
Dine Brands Global | | | 5,996 | | | | 501 | |
| | |
Dorman Products* | | | 10,163 | | | | 770 | |
| | |
El Pollo Loco Holdings* | | | 6,956 | | | | 105 | |
| | |
Eldorado Resorts* | | | 31,155 | | | | 1,858 | |
| | |
Ethan Allen Interiors | | | 8,234 | | | | 157 | |
| | |
Everi Holdings* | | | 119,751 | | | | 1,608 | |
| | |
Express* | | | 21,547 | | | | 105 | |
| | |
Extended Stay America | | | 245,879 | | | | 3,654 | |
The accompanying notes are an integral part of the financial statements.
52
| | |
| THE KP FUNDS | | December 31, 2019 |
| | | | | | | | |
| Description | | Shares | | | Value
(000) | |
| | |
Fiesta Restaurant Group* | | | 7,920 | | | $ | 78 | |
| | |
Five Below* | | | 6,907 | | | | 883 | |
| | |
Floor & Decor Holdings, Cl A* | | | 23,063 | | | | 1,172 | |
| | |
Fossil Group* | | | 16,354 | | | | 129 | |
| | |
Fox Factory Holding* | | | 13,335 | | | | 928 | |
| | |
GameStop, Cl A | | | 22,813 | | | | 139 | |
| | |
Garrett Motion* | | | 26,079 | | | | 261 | |
| | |
Genesco* | | | 5,254 | | | | 252 | |
| | |
Gentherm* | | | 11,543 | | | | 512 | |
| | |
G-III Apparel Group* | | | 24,350 | | | | 816 | |
| | |
Golden Entertainment* | | | 128,244 | | | | 2,465 | |
| | |
Group 1 Automotive | | | 6,047 | | | | 605 | |
| | |
Guess? | | | 14,912 | | | | 334 | |
| | |
Habit Restaurants, Cl A* | | | 400,363 | | | | 4,176 | |
| | |
Haverty Furniture | | | 6,212 | | | | 125 | |
| | |
Helen of Troy* | | | 12,575 | | | | 2,261 | |
| | |
Hibbett Sports* | | | 6,084 | | | | 171 | |
| | |
Installed Building Products* | | | 7,310 | | | | 503 | |
| | |
iRobot* | | | 9,740 | | | | 493 | |
| | |
JC Penney* | | | 105,754 | | | | 118 | |
| | |
Kontoor Brands | | | 16,108 | | | | 676 | |
| | |
La-Z-Boy, Cl Z | | | 16,120 | | | | 507 | |
| | |
LCI Industries | | | 62,395 | | | | 6,684 | |
| | |
LGI Homes* | | | 6,851 | | | | 484 | |
| | |
Liquidity Services* | | | 54,527 | | | | 325 | |
| | |
Lithia Motors, Cl A | | | 24,256 | | | | 3,566 | |
| | |
Lovesac* | | | 186,120 | | | | 2,987 | |
| | |
Lululemon Athletica* | | | 8,383 | | | | 1,942 | |
| | |
Lumber Liquidators Holdings* | | | 9,359 | | | | 91 | |
| | |
M/I Homes* | | | 9,655 | | | | 380 | |
| | |
MarineMax* | | | 7,634 | | | | 127 | |
| | |
MDC Holdings | | | 161,698 | | | | 6,170 | |
| | |
Meritage Homes* | | | 12,509 | | | | 764 | |
| | |
Michaels* | | | 28,700 | | | | 232 | |
| | |
Monarch Casino & Resort* | | | 3,994 | | | | 194 | |
| | |
Monro | | | 48,754 | | | | 3,813 | |
| | |
Motorcar Parts of America* | | | 6,244 | | | | 138 | |
| | |
Movado Group | | | 5,476 | | | | 119 | |
| | |
Office Depot | | | 187,657 | | | | 514 | |
| | |
Oxford Industries | | | 5,905 | | | | 445 | |
| | |
Papa John’s International | | | 61,058 | | | | 3,856 | |
| | |
PetMed Express | | | 7,116 | | | | 167 | |
| | |
Red Robin Gourmet Burgers* | | | 4,320 | | | | 143 | |
| | |
Regis* | | | 8,137 | | | | 145 | |
| | |
Rent-A-Center, Cl A | | | 16,703 | | | | 482 | |
| | |
Revolve Group, Cl A* | | | 211,704 | | | | 3,887 | |
| | | | | | | | |
| Description | | Shares | | | Value
(000) | |
| | |
Ruth’s Hospitality Group | | | 9,380 | | | $ | 204 | |
| | |
Scientific Games, Cl A* | | | 39,665 | | | | 1,062 | |
| | |
Shake Shack, Cl A* | | | 10,595 | | | | 631 | |
| | |
Shoe Carnival | | | 3,168 | | | | 118 | |
| | |
Shutterstock* | | | 6,549 | | | | 281 | |
| | |
Signet Jewelers | | | 18,193 | | | | 396 | |
| | |
Skyline Champion* | | | 60,575 | | | | 1,920 | |
| | |
Sleep Number* | | | 9,999 | | | | 492 | |
| | |
Sonic Automotive, Cl A | | | 8,462 | | | | 262 | |
| | |
Sonos* | | | 88,125 | | | | 1,377 | |
| | |
Stamps.com* | | | 5,608 | | | | 468 | |
| | |
Standard Motor Products | | | 6,936 | | | | 369 | |
| | |
Steven Madden | | | 26,872 | | | | 1,156 | |
| | |
Strategic Education | | | 7,565 | | | | 1,202 | |
| | |
Sturm Ruger | | | 74,428 | | | | 3,500 | |
| | |
Tailored Brands | | | 18,581 | | | | 77 | |
| | |
TopBuild* | | | 27,327 | | | | 2,817 | |
| | |
Tupperware Brands | | | 17,047 | | | | 146 | |
| | |
Unifi* | | | 5,179 | | | | 131 | |
| | |
Universal Electronics* | | | 4,852 | | | | 254 | |
| | |
Vera Bradley* | | | 8,362 | | | | 99 | |
| | |
Vista Outdoor* | | | 19,201 | | | | 144 | |
| | |
Visteon* | | | 18,360 | | | | 1,590 | |
| | |
Wendy’s | | | 77,655 | | | | 1,725 | |
| | |
William Lyon Homes, Cl A* | | | 11,148 | | | | 223 | |
| | |
Wingstop, Cl A | | | 10,283 | | | | 887 | |
| | |
Winnebago Industries | | | 86,764 | | | | 4,597 | |
| | |
Wolverine World Wide | | | 103,754 | | | | 3,501 | |
| | |
Wyndham Destinations | | | 152,810 | | | | 7,899 | |
| | |
Wyndham Hotels & Resorts | | | 13,405 | | | | 842 | |
| | |
Zumiez* | | | 7,073 | | | | 244 | |
| | | | | | | | |
| | | | | | | 174,296 | |
| | | | | | | | |
|
Consumer Staples — 4.8% | |
| | |
Andersons | | | 303,212 | | | | 7,665 | |
| | |
Avon Products | | | 153,127 | | | | 864 | |
| | |
B&G Foods | | | 23,014 | | | | 413 | |
| | |
Calavo Growers | | | 5,680 | | | | 515 | |
| | |
Cal-Maine Foods | | | 10,547 | | | | 451 | |
| | |
Casey’s General Stores | | | 28,764 | | | | 4,573 | |
| | |
Central Garden & Pet* | | | 3,708 | | | | 115 | |
| | |
Central Garden & Pet, Cl A* | | | 14,200 | | | | 417 | |
| | |
Chefs’ Warehouse* | | | 53,247 | | | | 2,029 | |
| | |
Coca-Cola Consolidated | | | 1,609 | | | | 457 | |
| | |
Darling Ingredients* | | | 283,407 | | | | 7,958 | |
| | |
elf Beauty* | | | 77,960 | | | | 1,257 | |
| | |
Energizer Holdings | | | 136,552 | | | | 6,858 | |
The accompanying notes are an integral part of the financial statements.
53
| | |
| THE KP FUNDS | | December 31, 2019 |
| | | | | | | | |
| Description | | Shares | | | Value
(000) | |
| | |
Fresh Del Monte Produce | | | 10,700 | | | $ | 374 | |
| | |
Freshpet* | | | 20,345 | | | | 1,202 | |
| | |
Herbalife Nutrition* | | | 43,375 | | | | 2,068 | |
| | |
Inter Parfums | | | 6,059 | | | | 441 | |
| | |
J&J Snack Foods | | | 5,162 | | | | 951 | |
| | |
John B Sanfilippo & Son | | | 2,999 | | | | 274 | |
| | |
Landec* | | | 360,144 | | | | 4,073 | |
| | |
Medifast | | | 4,026 | | | | 441 | |
| | |
MGP Ingredients | | | 4,580 | | | | 222 | |
| | |
National Beverage* | | | 4,000 | | | | 204 | |
| | |
Nu Skin Enterprises, Cl A | | | 31,554 | | | | 1,293 | |
| | |
Performance Food Group* | | | 65,791 | | | | 3,387 | |
| | |
PriceSmart | | | 7,800 | | | | 554 | |
| | |
Sanderson Farms | | | 45,610 | | | | 8,037 | |
| | |
Seneca Foods, Cl A* | | | 2,535 | | | | 103 | |
| | |
Simply Good Foods* | | | 62,565 | | | | 1,786 | |
| | |
SpartanNash | | | 12,968 | | | | 185 | |
| | |
TreeHouse Foods* | | | 17,156 | | | | 832 | |
| | |
United Natural Foods* | | | 17,695 | | | | 155 | |
| | |
Universal | | | 68,773 | | | | 3,924 | |
| | |
USANA Health Sciences* | | | 4,415 | | | | 347 | |
| | |
Vector Group | | | 39,495 | | | | 529 | |
| | |
WD-40 | | | 4,731 | | | | 918 | |
| | | | | | | | |
| | | | | | | 65,872 | |
| | | | | | | | |
|
Energy — 3.0% | |
| | |
Archrock | | | 44,245 | | | | 444 | |
| | |
Ardmore Shipping* | | | 257,491 | | | | 2,330 | |
| | |
Bonanza Creek Energy* | | | 6,231 | | | | 145 | |
| | |
Callon Petroleum* | | | 135,400 | | | | 654 | |
| | |
Capital Product Partners (A) | | | 34,901 | | | | 469 | |
| | |
CONSOL Energy* | | | 9,031 | | | | 131 | |
| | |
Delek US Holdings | | | 39,268 | | | | 1,317 | |
| | |
Denbury Resources* | | | 165,633 | | | | 234 | |
| | |
Diamond Offshore Drilling* | | | 21,581 | | | | 155 | |
| | |
Diamond S Shipping* | | | 23,978 | | | | 401 | |
| | |
DMC Global | | | 5,095 | | | | 229 | |
| | |
Dril-Quip* | | | 12,661 | | | | 594 | |
| | |
Era Group* | | | 6,300 | | | | 64 | |
| | |
Euronav | | | 321,683 | | | | 4,034 | |
| | |
Exterran* | | | 10,082 | | | | 79 | |
| | |
Frank’s International* | | | 446,553 | | | | 2,309 | |
| | |
Geospace Technologies* | | | 4,516 | | | | 76 | |
| | |
Green Plains | | | 12,712 | | | | 196 | |
| | |
Gulfport Energy* | | | 51,390 | | | | 156 | |
| | |
Helix Energy Solutions Group* | | | 48,979 | | | | 472 | |
| | |
Helmerich & Payne | | | 32,920 | | | | 1,496 | |
| | | | | | | | |
| Description | | Shares | | | Value
(000) | |
| | |
HighPoint Resources* | | | 36,406 | | | $ | 61 | |
| | |
Jagged Peak Energy* | | | 20,000 | | | | 170 | |
| | |
KLX Energy Services Holdings* | | | 7,804 | | | | 50 | |
| | |
Laredo Petroleum* | | | 60,000 | | | | 172 | |
| | |
Matrix Service* | | | 9,565 | | | | 219 | |
| | |
McDermott International* | | | 60,500 | | | | 41 | |
| | |
Nabors Industries | | | 116,991 | | | | 337 | |
| | |
Newpark Resources* | | | 32,089 | | | | 201 | |
| | |
NexTier Oilfield Solutions* | | | 159,072 | | | | 1,066 | |
| | |
Noble* | | | 80,561 | | | | 98 | |
| | |
Northern Oil and Gas* | | | 212,068 | | | | 496 | |
| | |
Oasis Petroleum* | | | 100,400 | | | | 327 | |
| | |
Oceaneering International* | | | 301,732 | | | | 4,499 | |
| | |
Oil States International* | | | 21,070 | | | | 344 | |
| | |
Par Pacific Holdings* | | | 12,804 | | | | 298 | |
| | |
PDC Energy* | | | 20,150 | | | | 527 | |
| | |
Penn Virginia* | | | 4,820 | | | | 146 | |
| | |
ProPetro Holding* | | | 28,987 | | | | 326 | |
| | |
QEP Resources | | | 82,896 | | | | 373 | |
| | |
Range Resources | | | 72,627 | | | | 352 | |
| | |
Renewable Energy Group* | | | 13,435 | | | | 362 | |
| | |
REX American Resources* | | | 1,878 | | | | 154 | |
| | |
Ring Energy* | | | 252,213 | | | | 666 | |
| | |
RPC | | | 136,993 | | | | 718 | |
| | |
SEACOR Holdings* | | | 6,100 | | | | 263 | |
| | |
SM Energy | | | 36,513 | | | | 410 | |
| | |
Southwestern Energy* | | | 187,900 | | | | 455 | |
| | |
SRC Energy* | | | 82,446 | | | | 340 | |
| | |
Talos Energy* | | | 6,900 | | | | 208 | |
| | |
TETRA Technologies* | | | 41,276 | | | | 81 | |
| | |
US Silica Holdings | | | 24,403 | | | | 150 | |
| | |
Valaris, Cl A | | | 68,841 | | | | 452 | |
| | |
Whiting Petroleum* | | | 31,987 | | | | 235 | |
| | |
World Fuel Services | | | 230,750 | | | | 10,019 | |
| | | | | | | | |
| | | | | | | 40,601 | |
| | | | | | | | |
|
Financials — 16.4% | |
| | |
Alerus Financial | | | 9,259 | | | | 212 | |
| | |
Allegiance Bancshares* | | | 6,900 | | | | 259 | |
| | |
Amalgamated Bank, Cl A | | | 77,081 | | | | 1,499 | |
| | |
Ambac Financial Group* | | | 15,630 | | | | 337 | |
| | |
American Equity Investment Life Holding | | | 71,011 | | | | 2,125 | |
| | |
Ameris Bancorp | | | 22,636 | | | | 963 | |
| | |
AMERISAFE | | | 98,296 | | | | 6,491 | |
| | |
Apollo Commercial Real Estate Finance‡ | | | 49,537 | | | | 906 | |
The accompanying notes are an integral part of the financial statements.
54
| | |
| THE KP FUNDS | | December 31, 2019 |
| | | | | | | | |
| Description | | Shares | | | Value
(000) | |
| | |
ARMOUR Residential‡ | | | 20,587 | | | $ | 368 | |
| | |
Assetmark Financial Holdings* | | | 434 | | | | 13 | |
| | |
Atlantic Union Bankshares | | | 20,858 | | | | 783 | |
| | |
Axos Financial* | | | 18,223 | | | | 552 | |
| | |
Banc of California | | | 15,536 | | | | 267 | |
| | |
Bank of Hawaii | | | 62,853 | | | | 5,981 | |
| | |
Banner | | | 32,077 | | | | 1,815 | |
| | |
Berkshire Hills Bancorp | | | 57,798 | | | | 1,900 | |
| | |
Blucora* | | | 16,802 | | | | 439 | |
| | |
Boston Private Financial Holdings | | | 28,870 | | | | 347 | |
| | |
Brookline Bancorp | | | 27,409 | | | | 451 | |
| | |
Byline Bancorp | | | 87,962 | | | | 1,721 | |
| | |
Cadence BanCorp, Cl A | | | 44,700 | | | | 810 | |
| | |
Capstar Financial Holdings | | | 142,467 | | | | 2,372 | |
| | |
Capstead Mortgage‡ | | | 33,532 | | | | 266 | |
| | |
Carolina Financial | | | 36,962 | | | | 1,598 | |
| | |
Central Pacific Financial | | | 9,958 | | | | 295 | |
| | |
City Holding | | | 5,778 | | | | 474 | |
| | |
Columbia Banking System | | | 181,036 | | | | 7,365 | |
| | |
Community Bank System | | | 17,918 | | | | 1,271 | |
| | |
Community Bankers Trust | | | 331,114 | | | | 2,940 | |
| | |
Customers Bancorp* | | | 97,061 | | | | 2,311 | |
| | |
CVB Financial | | | 431,401 | | | | 9,310 | |
| | |
Dime Community Bancshares | | | 10,488 | | | | 219 | |
| | |
Donnelley Financial Solutions* | | | 11,384 | | | | 119 | |
| | |
Eagle Bancorp | | | 11,851 | | | | 576 | |
| | |
Eagle Bancorp Montana | | | 40,204 | | | | 860 | |
| | |
eHealth* | | | 6,912 | | | | 664 | |
| | |
Employers Holdings | | | 10,901 | | | | 455 | |
| | |
Encore Capital Group* | | | 9,525 | | | | 337 | |
| | |
Enova International* | | | 11,866 | | | | 286 | |
| | |
Entegra Financial* | | | 80,201 | | | | 2,419 | |
| | |
Essent Group | | | 111,270 | | | | 5,785 | |
| | |
Evans Bancorp | | | 56,745 | | | | 2,275 | |
| | |
EZCORP, Cl A* | | | 17,434 | | | | 119 | |
| | |
FB Financial | | | 47,755 | | | | 1,891 | |
| | |
FGL Holdings | | | 44,900 | | | | 478 | |
| | |
First American Financial | | | 73,900 | | | | 4,310 | |
| | |
First BanCorp | | | 74,923 | | | | 793 | |
| | |
First Bancorp NC | | | 50,854 | | | | 2,030 | |
| | |
First Busey | | | 105,087 | | | | 2,890 | |
| | |
First Commonwealth Financial | | | 34,340 | | | | 498 | |
| | |
First Community | | | 79,014 | | | | 1,708 | |
| | |
First Financial Bancorp | | | 81,356 | | | | 2,070 | |
| | |
First Hawaiian | | | 139,700 | | | | 4,030 | |
| | |
First Midwest Bancorp | | | 38,388 | | | | 885 | |
| | | | | | | | |
| Description | | Shares | | | Value
(000) | |
| | |
Flagstar Bancorp | | | 11,800 | | | $ | 451 | |
| | |
FNB | | | 364,057 | | | | 4,624 | |
| | |
Franklin Financial Network | | | 4,659 | | | | 160 | |
| | |
Glacier Bancorp | | | 29,721 | | | | 1,367 | |
| | |
Granite Point Mortgage Trust‡ | | | 19,068 | | | | 350 | |
| | |
Great Western Bancorp | | | 19,810 | | | | 688 | |
| | |
Greenhill | | | 6,019 | | | | 103 | |
| | |
Hamilton Lane, Cl A | | | 24,172 | | | | 1,441 | |
| | |
Hancock Whitney | | | 42,018 | | | | 1,844 | |
| | |
Hanmi Financial | | | 10,928 | | | | 219 | |
| | |
HCI Group | | | 2,200 | | | | 100 | |
| | |
Heritage Financial | | | 180,046 | | | | 5,095 | |
| | |
HomeStreet* | | | 8,580 | | | | 292 | |
| | |
Hope Bancorp | | | 44,212 | | | | 657 | |
| | |
Horace Mann Educators | | | 76,967 | | | | 3,360 | |
| | |
Independent Bank | | | 11,835 | | | | 985 | |
| | |
International. FCStone* | | | 5,618 | | | | 274 | |
| | |
Invesco Mortgage Capital‡ | | | 49,249 | | | | 820 | |
| | |
Investar Holding | | | 44,032 | | | | 1,057 | |
| | |
James River Group Holdings | | | 53,174 | | | | 2,191 | |
| | |
Kinsale Capital Group | | | 7,100 | | | | 722 | |
| | |
KKR Real Estate Finance Trust‡ | | | 8,200 | | | | 167 | |
| | |
Malvern Bancorp* | | | 30,257 | | | | 699 | |
| | |
Meta Financial Group | | | 11,899 | | | | 434 | |
| | |
National Bank Holdings, Cl A | | | 95,690 | | | | 3,370 | |
| | |
NBT Bancorp | | | 15,127 | | | | 614 | |
| | |
New York Mortgage Trust‡ | | | 98,601 | | | | 614 | |
| | |
NMI Holdings, Cl A* | | | 23,393 | | | | 776 | |
| | |
Northfield Bancorp | | | 15,711 | | | | 266 | |
| | |
Northwest Bancshares | | | 34,334 | | | | 571 | |
| | |
OFG Bancorp | | | 17,830 | | | | 421 | |
| | |
Old National Bancorp | | | 113,058 | | | | 2,068 | |
| | |
Old Point Financial | | | 23,186 | | | | 637 | |
| | |
OneMain Holdings, Cl A | | | 48,140 | | | | 2,029 | |
| | |
Opus Bank | | | 112,492 | | | | 2,910 | |
| | |
Origin Bancorp | | | 43,176 | | | | 1,634 | |
| | |
Orrstown Financial Services | | | 32,754 | | | | 741 | |
| | |
Pacific Premier Bancorp | | | 21,030 | | | | 686 | |
| | |
PacWest Bancorp | | | 214,263 | | | | 8,200 | |
| | |
PennyMac Mortgage Investment Trust‡ | | | 34,658 | | | | 773 | |
| | |
Pinnacle Financial Partners | | | 84,809 | | | | 5,428 | |
| | |
Piper Jaffray | | | 5,027 | | | | 402 | |
| | |
PRA Group* | | | 15,549 | | | | 564 | |
| | |
Preferred Bank | | | 4,867 | | | | 292 | |
| | |
Primerica | | | 26,555 | | | | 3,467 | |
| | |
ProAssurance | | | 29,593 | | | | 1,070 | |
The accompanying notes are an integral part of the financial statements.
55
| | |
| THE KP FUNDS | | December 31, 2019 |
| | | | | | | | |
| Description | | Shares | | | Value
(000) | |
| | |
Prosperity Bancshares | | | 41,477 | | | $ | 2,982 | |
| | |
Provident Financial Services | | | 20,702 | | | | 510 | |
| | |
Ready Capital‡ | | | 10,600 | | | | 163 | |
| | |
Redwood Trust‡ | | | 39,192 | | | | 648 | |
| | |
Reliant Bancorp | | | 32,953 | | | | 733 | |
| | |
S&T Bancorp | | | 13,226 | | | | 533 | |
| | |
Safety Insurance Group | | | 5,134 | | | | 475 | |
| | |
Sandy Spring Bancorp | | | 100,956 | | | | 3,824 | |
| | |
Seacoast Banking Corp of Florida* | | | 17,809 | | | | 544 | |
| | |
ServisFirst Bancshares | | | 15,919 | | | | 600 | |
| | |
Shore Bancshares | | | 142,024 | | | | 2,466 | |
| | |
Simmons First National, Cl A | | | 39,561 | | | | 1,060 | |
| | |
SmartFinancial | | | 90,580 | | | | 2,142 | |
| | |
Solar Capital | | | 86,363 | | | | 1,781 | |
| | |
South Plains Financial | | | 31,709 | | | | 662 | |
| | |
Southern First Bancshares* | | | 52,340 | | | | 2,224 | |
| | |
Southern National Bancorp of Virginia | | | 96,441 | | | | 1,577 | |
| | |
Southside Bancshares | | | 10,843 | | | | 403 | |
| | |
State Auto Financial | | | 26,940 | | | | 836 | |
| | |
Sterling Bancorp | | | 270,380 | | | | 5,700 | |
| | |
Stewart Information Services | | | 90,901 | | | | 3,708 | |
| | |
Stifel Financial | | | 17,990 | | | | 1,091 | |
| | |
SVB Financial Group* | | | 18,639 | | | | 4,679 | |
| | |
Synovus Financial | | | 50,240 | | | | 1,969 | |
| | |
TCF Financial | | | 113,817 | | | | 5,327 | |
| | |
Texas Capital Bancshares* | | | 22,516 | | | | 1,278 | |
| | |
Third Point Reinsurance* | | | 27,531 | | | | 290 | |
| | |
Tompkins Financial | | | 4,300 | | | | 393 | |
| | |
Triumph Bancorp* | | | 8,500 | | | | 323 | |
| | |
TrustCo Bank | | | 33,345 | | | | 289 | |
| | |
Umpqua Holdings | | | 82,786 | | | | 1,465 | |
| | |
United Community Banks | | | 27,257 | | | | 842 | |
| | |
United Fire Group | | | 7,384 | | | | 323 | |
| | |
United Insurance Holdings | | | 6,802 | | | | 86 | |
| | |
Universal Insurance Holdings | | | 10,841 | | | | 303 | |
| | |
Valley National Bancorp | | | 200,855 | | | | 2,300 | |
| | |
Veritex Holdings | | | 93,993 | | | | 2,738 | |
| | |
Virtus Investment Partners | | | 2,306 | | | | 281 | |
| | |
Waddell & Reed Financial, Cl A | | | 24,849 | | | | 416 | |
| | |
Walker & Dunlop | | | 9,950 | | | | 644 | |
| | |
WesBanco | | | 75,052 | | | | 2,836 | |
| | |
Westamerica Bancorporation | | | 31,594 | | | | 2,141 | |
| | |
Western Alliance Bancorp | | | 38,615 | | | | 2,201 | |
| | |
WisdomTree Investments | | | 41,365 | | | | 200 | |
| | |
World Acceptance* | | | 1,908 | | | | 165 | |
| | | | | | | | |
| | | | | | | 223,922 | |
| | | | | | | | |
| | | | | | | | |
| Description | | Shares | | | Value
(000) | |
|
Health Care — 13.5% | |
| | |
Acadia Healthcare* | | | 66,877 | | | $ | 2,222 | |
| | |
ACADIA Pharmaceuticals* | | | 55,169 | | | | 2,360 | |
| | |
Acorda Therapeutics* | | | 13,418 | | | | 27 | |
| | |
Addus HomeCare* | | | 30,063 | | | | 2,923 | |
| | |
Akorn* | | | 33,464 | | | | 50 | |
| | |
Allscripts Healthcare Solutions* | | | 456,874 | | | | 4,484 | |
| | |
Alphatec Holdings* | | | 276,582 | | | | 1,962 | |
| | |
AMAG Pharmaceuticals* | | | 11,874 | | | | 145 | |
| | |
Amedisys* | | | 25,653 | | | | 4,282 | |
| | |
AMN Healthcare Services* | | | 77,633 | | | | 4,837 | |
| | |
Amphastar Pharmaceuticals* | | | 11,903 | | | | 230 | |
| | |
AngioDynamics* | | | 76,983 | | | | 1,232 | |
| | |
ANI Pharmaceuticals* | | | 3,241 | | | | 200 | |
| | |
Anika Therapeutics* | | | 4,764 | | | | 247 | |
| | |
Arrowhead Pharmaceuticals* | | | 7,300 | | | | 463 | |
| | |
Axogen* | | | 106,229 | | | | 1,900 | |
| | |
BioDelivery Sciences International* | | | 186,177 | | | | 1,177 | |
| | |
BioTelemetry* | | | 11,827 | | | | 548 | |
| | |
Cardiovascular Systems* | | | 12,111 | | | | 588 | |
| | |
Catalent* | | | 36,280 | | | | 2,043 | |
| | |
Charles River Laboratories International* | | | 17,036 | | | | 2,602 | |
| | |
Chemed | | | 6,166 | | | | 2,708 | |
| | |
Community Health Systems* | | | 39,474 | | | | 114 | |
| | |
Computer Programs & Systems | | | 4,077 | | | | 108 | |
| | |
CONMED | | | 63,568 | | | | 7,109 | |
| | |
Corcept Therapeutics* | | | 35,341 | | | | 428 | |
| | |
CorVel* | | | 3,166 | | | | 277 | |
| | |
Covetrus* | | | 33,300 | | | | 440 | |
| | |
CRISPR Therapeutics* | | | 13,175 | | | | 802 | |
| | |
Cross Country Healthcare* | | | 179,908 | | | | 2,091 | |
| | |
CryoLife* | | | 129,323 | | | | 3,503 | |
| | |
CryoPort* | | | 47,681 | | | | 785 | |
| | |
Cutera* | | | 5,000 | | | | 179 | |
| | |
Cytokinetics* | | | 20,293 | | | | 215 | |
| | |
DexCom* | | | 32,861 | | | | 7,188 | |
| | |
Diplomat Pharmacy* | | | 18,983 | | | | 76 | |
| | |
Eagle Pharmaceuticals* | | | 3,458 | | | | 208 | |
| | |
Emergent BioSolutions* | | | 15,245 | | | | 822 | |
| | |
Enanta Pharmaceuticals* | | | 5,597 | | | | 346 | |
| | |
Encompass Health | | | 80,967 | | | | 5,609 | |
| | |
Endo International* | | | 70,827 | | | | 332 | |
| | |
Ensign Group | | | 17,466 | | | | 792 | |
| | |
Exact Sciences* | | | 43,730 | | | | 4,044 | |
| | |
Flexion Therapeutics* | | | 45,480 | | | | 941 | |
| | |
GenMark Diagnostics* | | | 664,801 | | | | 3,198 | |
The accompanying notes are an integral part of the financial statements.
56
| | |
| THE KP FUNDS | | December 31, 2019 |
| | | | | | | | |
| Description | | Shares | | | Value
(000) | |
| | |
Global Blood Therapeutics* | | | 5,680 | | | $ | 451 | |
| | |
Haemonetics* | | | 32,494 | | | | 3,734 | |
| | |
Hanger* | | | 13,100 | | | | 362 | |
| | |
HealthStream* | | | 8,943 | | | | 243 | |
| | |
Heska* | | | 2,440 | | | | 234 | |
| | |
HMS Holdings* | | | 118,206 | | | | 3,499 | |
| | |
Horizon Therapeutics* | | | 94,223 | | | | 3,411 | |
| | |
Innoviva* | | | 23,604 | | | | 334 | |
| | |
Inogen* | | | 6,300 | | | | 430 | |
| | |
Inspire Medical Systems* | | | 92,952 | | | | 6,898 | |
| | |
Insulet* | | | 28,407 | | | | 4,863 | |
| | |
Integer Holdings* | | | 11,369 | | | | 914 | |
| | |
Integra LifeSciences Holdings* | | | 17,780 | | | | 1,036 | |
| | |
Invacare | | | 11,143 | | | | 101 | |
| | |
Lannett* | | | 11,185 | | | | 99 | |
| | |
Lantheus Holdings* | | | 13,649 | | | | 280 | |
| | |
LeMaitre Vascular | | | 5,720 | | | | 206 | |
| | |
LHC Group* | | | 24,881 | | | | 3,428 | |
| | |
Luminex | | | 14,598 | | | | 338 | |
| | |
Magellan Health* | | | 7,616 | | | | 596 | |
| | |
Masimo* | | | 13,155 | | | | 2,079 | |
| | |
Medicines* | | | 25,570 | | | | 2,172 | |
| | |
MEDNAX* | | | 52,466 | | | | 1,458 | |
| | |
Medpace Holdings* | | | 9,308 | | | | 782 | |
| | |
Meridian Bioscience | | | 15,156 | | | | 148 | |
| | |
Merit Medical Systems* | | | 266,464 | | | | 8,319 | |
| | |
Mesa Laboratories | | | 8,990 | | | | 2,242 | |
| | |
Mirati Therapeutics* | | | 7,400 | | | | 954 | |
| | |
Momenta Pharmaceuticals* | | | 39,277 | | | | 775 | |
| | |
MyoKardia* | | | 25,345 | | | | 1,847 | |
| | |
Myriad Genetics* | | | 25,844 | | | | 704 | |
| | |
Natera* | | | 75,186 | | | | 2,533 | |
| | |
Natus Medical* | | | 11,935 | | | | 394 | |
| | |
Neogen* | | | 18,221 | | | | 1,189 | |
| | |
NeoGenomics* | | | 114,020 | | | | 3,335 | |
| | |
Neurocrine Biosciences* | | | 17,915 | | | | 1,926 | |
| | |
NextGen Healthcare* | | | 16,663 | | | | 268 | |
| | |
Novocure* | | | 16,900 | | | | 1,424 | |
| | |
Omnicell* | | | 14,342 | | | | 1,172 | |
| | |
OraSure Technologies* | | | 21,752 | | | | 175 | |
| | |
Orthofix Medical* | | | 6,644 | | | | 307 | |
| | |
Owens & Minor | | | 21,240 | | | | 110 | |
| | |
Oxford Immunotec Global* | | | 282,056 | | | | 4,682 | |
| | |
Pacira BioSciences* | | | 14,500 | | | | 657 | |
| | |
Pennant Group* | | | 8,883 | | | | 294 | |
| | |
Penumbra* | | | 12,037 | | | | 1,977 | |
| | | | | | | | |
| Description | | Shares | | | Value
(000) | |
| | |
PetIQ, Cl A* | | | 78,224 | | | $ | 1,960 | |
| | |
Phibro Animal Health, Cl A | | | 6,758 | | | | 168 | |
| | |
Prestige Consumer Healthcare* | | | 57,188 | | | | 2,316 | |
| | |
Progenics Pharmaceuticals* | | | 30,849 | | | | 157 | |
| | |
Providence Service* | | | 37,171 | | | | 2,200 | |
| | |
Quidel* | | | 34,267 | | | | 2,571 | |
| | |
R1 RCM* | | | 337,944 | | | | 4,387 | |
| | |
RadNet* | | | 14,300 | | | | 290 | |
| | |
Reata Pharmaceuticals, Cl A* | | | 6,629 | | | | 1,355 | |
| | |
Recro Pharma* | | | 56,147 | | | | 1,029 | |
| | |
REGENXBIO* | | | 10,774 | | | | 441 | |
| | |
Repligen* | | | 22,790 | | | | 2,108 | |
| | |
Sage Therapeutics* | | | 12,660 | | | | 914 | |
| | |
Select Medical Holdings* | | | 37,458 | | | | 874 | |
| | |
Spectrum Pharmaceuticals* | | | 38,837 | | | | 141 | |
| | |
Supernus Pharmaceuticals* | | | 51,573 | | | | 1,223 | |
| | |
Surmodics* | | | 4,673 | | | | 194 | |
| | |
Tabula Rasa HealthCare* | | | 6,715 | | | | 327 | |
| | |
Tactile Systems Technology* | | | 6,611 | | | | 446 | |
| | |
Tandem Diabetes Care* | | | 61,930 | | | | 3,692 | |
| | |
Teladoc Health* | | | 26,075 | | | | 2,183 | |
| | |
Tivity Health* | | | 15,121 | | | | 308 | |
| | |
Turning Point Therapeutics* | | | 18,286 | | | | 1,139 | |
| | |
US Physical Therapy | | | 4,412 | | | | 505 | |
| | |
Vanda Pharmaceuticals* | | | 18,344 | | | | 301 | |
| | |
Varex Imaging* | | | 13,177 | | | | 393 | |
| | |
Vericel* | | | 54,045 | | | | 940 | |
| | |
Xencor* | | | 17,243 | | | | 593 | |
| | | | | | | | |
| | | | | | | 183,372 | |
| | | | | | | | |
|
Industrials — 18.0% | |
| | |
AAON | | | 14,202 | | | | 702 | |
| | |
AAR | | | 83,247 | | | | 3,754 | |
| | |
ABM Industries | | | 23,027 | | | | 868 | |
| | |
Actuant, Cl A | | | 18,712 | | | | 487 | |
| | |
Advanced Drainage Systems | | | 28,961 | | | | 1,125 | |
| | |
AECOM* | | | 35,095 | | | | 1,514 | |
| | |
Aegion, Cl A* | | | 10,735 | | | | 240 | |
| | |
AerCap Holdings* | | | 60,402 | | | | 3,713 | |
| | |
Aerojet Rocketdyne Holdings* | | | 25,105 | | | | 1,146 | |
| | |
AeroVironment* | | | 48,089 | | | | 2,969 | |
| | |
Air Transport Services Group* | | | 75,260 | | | | 1,766 | |
| | |
Alamo Group | | | 3,295 | | | | 414 | |
| | |
Albany International, Cl A | | | 43,967 | | | | 3,338 | |
| | |
Allegiant Travel, Cl A | | | 4,539 | | | | 790 | |
| | |
Altra Industrial Motion | | | 73,167 | | | | 2,649 | |
| | |
American Woodmark* | | | 5,386 | | | | 563 | |
The accompanying notes are an integral part of the financial statements.
57
| | |
| THE KP FUNDS | | December 31, 2019 |
| | | | | | | | |
| Description | | Shares | | | Value
(000) | |
| | |
Apogee Enterprises | | | 9,158 | | | $ | 298 | |
| | |
Applied Industrial Technologies | | | 13,312 | | | | 888 | |
| | |
ArcBest | | | 9,021 | | | | 249 | |
| | |
Arcosa | | | 16,716 | | | | 745 | |
| | |
ASGN* | | | 40,803 | | | | 2,896 | |
| | |
Astec Industries | | | 7,873 | | | | 331 | |
| | |
Atlas Air Worldwide Holdings* | | | 9,160 | | | | 253 | |
| | |
AZZ | | | 22,922 | | | | 1,053 | |
| | |
Barnes Group | | | 36,570 | | | | 2,266 | |
| | |
Brady, Cl A | | | 17,175 | | | | 983 | |
| | |
Briggs & Stratton | | | 14,029 | | | | 93 | |
| | |
BrightView Holdings* | | | 165,340 | | | | 2,789 | |
| | |
Brink’s | | | 20,980 | | | | 1,902 | |
| | |
Builders FirstSource* | | | 64,640 | | | | 1,642 | |
| | |
CAI International* | | | 87,420 | | | | 2,533 | |
| | |
Casella Waste Systems, Cl A* | | | 43,851 | | | | 2,018 | |
| | |
Chart Industries* | | | 12,346 | | | | 833 | |
| | |
CIRCOR International* | | | 6,952 | | | | 321 | |
| | |
Clean Harbors* | | | 84,585 | | | | 7,253 | |
| | |
Colfax* | | | 57,640 | | | | 2,097 | |
| | |
Columbus McKinnon | | | 45,419 | | | | 1,818 | |
| | |
Comfort Systems USA | | | 12,774 | | | | 637 | |
| | |
Construction Partners, Cl A* | | | 156,891 | | | | 2,647 | |
| | |
Continental Building Products* | | | 80,161 | | | | 2,920 | |
| | |
CoStar Group* | | | 1,473 | | | | 881 | |
| | |
Covanta Holding | | | 184,141 | | | | 2,733 | |
| | |
CPI Aerostructures* | | | 376,205 | | | | 2,532 | |
| | |
Cubic | | | 10,859 | | | | 690 | |
| | |
DXP Enterprises* | | | 5,581 | | | | 222 | |
| | |
Dycom Industries* | | | 35,800 | | | | 1,688 | |
| | |
Echo Global Logistics* | | | 9,446 | | | | 196 | |
| | |
EMCOR Group | | | 58,977 | | | | 5,090 | |
| | |
Encore Wire | | | 7,278 | | | | 418 | |
| | |
EnerSys | | | 18,055 | | | | 1,351 | |
| | |
EnPro Industries | | | 34,835 | | | | 2,330 | |
| | |
ESCO Technologies | | | 9,055 | | | | 838 | |
| | |
Exponent | | | 18,033 | | | | 1,244 | |
| | |
Federal Signal | | | 79,124 | | | | 2,552 | |
| | |
Forrester Research | | | 3,478 | | | | 145 | |
| | |
Forward Air | | | 9,880 | | | | 691 | |
| | |
Foundation Building Materials* | | | 6,100 | | | | 118 | |
| | |
Franklin Electric | | | 13,191 | | | | 756 | |
| | |
FTI Consulting* | | | 8,002 | | | | 885 | |
| | |
Gardner Denver Holdings* | | | 20,375 | | | | 747 | |
| | |
GATX | | | 61,658 | | | | 5,108 | |
| | |
Generac Holdings* | | | 6,630 | | | | 667 | |
| | | | | | | | |
| Description | | Shares | | | Value
(000) | |
| | |
Gibraltar Industries* | | | 34,591 | | | $ | 1,745 | |
| | |
GMS* | | | 14,236 | | | | 385 | |
| | |
Granite Construction | | | 93,920 | | | | 2,599 | |
| | |
Greenbrier | | | 11,183 | | | | 363 | |
| | |
Griffon | | | 14,834 | | | | 302 | |
| | |
Harsco* | | | 88,807 | | | | 2,043 | |
| | |
Hawaiian Holdings | | | 16,263 | | | | 476 | |
| | |
Heartland Express | | | 66,655 | | | | 1,403 | |
| | |
Heidrick & Struggles International | | | 6,392 | | | | 208 | |
| | |
Herc Holdings* | | | 34,470 | | | | 1,687 | |
| | |
Hillenbrand | | | 25,828 | | | | 860 | |
| | |
Hub Group, Cl A* | | | 126,832 | | | | 6,505 | |
| | |
Huron Consulting Group* | | | 31,567 | | | | 2,169 | |
| | |
InnerWorkings* | | | 271,329 | | | | 1,495 | |
| | |
Insteel Industries | | | 6,585 | | | | 141 | |
| | |
Interface, Cl A | | | 152,056 | | | | 2,523 | |
| | |
ITT | | | 109,540 | | | | 8,096 | |
| | |
JELD-WEN Holding* | | | 46,600 | | | | 1,091 | |
| | |
John Bean Technologies | | | 10,929 | | | | 1,231 | |
| | |
Kaman | | | 9,732 | | | | 642 | |
| | |
Kansas City Southern | | | 25,146 | | | | 3,851 | |
| | |
Kelly Services, Cl A | | | 11,464 | | | | 259 | |
| | |
Kennametal | | | 45,676 | | | | 1,685 | |
| | |
Kirby* | | | 77,099 | | | | 6,903 | |
| | |
Knight-Swift Transportation Holdings, Cl A | | | 33,990 | | | | 1,218 | |
| | |
Korn Ferry | | | 19,404 | | | | 823 | |
| | |
Lindsay | | | 3,749 | | | | 360 | |
| | |
Luxfer Holdings | | | 169,435 | | | | 3,136 | |
| | |
Lydall* | | | 5,857 | | | | 120 | |
| | |
Marten Transport | | | 13,363 | | | | 287 | |
| | |
Masco | | | 81,366 | | | | 3,905 | |
| | |
Matson | | | 14,811 | | | | 604 | |
| | |
Matthews International, Cl A | | | 54,473 | | | | 2,079 | |
| | |
McGrath RentCorp | | | 81,817 | | | | 6,262 | |
| | |
Mercury Systems* | | | 37,121 | | | | 2,565 | |
| | |
Mobile Mini | | | 15,568 | | | | 590 | |
| | |
Moog, Cl A | | | 82,079 | | | | 7,004 | |
| | |
MSC Industrial Direct, Cl A | | | 29,216 | | | | 2,293 | |
| | |
Mueller Industries | | | 171,063 | | | | 5,431 | |
| | |
Mueller Water Products, Cl A | | | 217,963 | | | | 2,611 | |
| | |
MYR Group* | | | 5,618 | | | | 183 | |
| | |
National Presto Industries | | | 1,785 | | | | 158 | |
| | |
Nordson | | | 10,585 | | | | 1,724 | |
| | |
Oshkosh | | | 59,719 | | | | 5,652 | |
| | |
Owens Corning | | | 36,751 | | | | 2,393 | |
| | |
Park Aerospace | | | 6,557 | | | | 107 | |
The accompanying notes are an integral part of the financial statements.
58
| | |
| THE KP FUNDS | | December 31, 2019 |
| | | | | | | | |
| Description | | Shares | | | Value
(000) | |
| | |
Patrick Industries | | | 7,792 | | | $ | 409 | |
| | |
PGT Innovations* | | | 19,862 | | | | 296 | |
| | |
Pitney Bowes | | | 59,508 | | | | 240 | |
| | |
Powell Industries | | | 2,912 | | | | 143 | |
| | |
Primoris Services | | | 189,170 | | | | 4,207 | |
| | |
Proto Labs* | | | 9,333 | | | | 948 | |
| | |
Quanex Building Products | | | 11,626 | | | | 199 | |
| | |
Quanta Services | | | 19,300 | | | | 786 | |
| | |
Raven Industries | | | 12,458 | | | | 429 | |
| | |
Resources Connection | | | 10,139 | | | | 166 | |
| | |
RR Donnelley & Sons | | | 25,000 | | | | 99 | |
| | |
Ryder System | | | 91,338 | | | | 4,961 | |
| | |
Saia* | | | 29,146 | | | | 2,714 | |
| | |
Simpson Manufacturing | | | 14,190 | | | | 1,138 | |
| | |
SkyWest | | | 17,531 | | | | 1,133 | |
| | |
SP Plus* | | | 71,793 | | | | 3,046 | |
| | |
Spartan Motors | | | 74,618 | | | | 1,349 | |
| | |
SPX* | | | 34,887 | | | | 1,775 | |
| | |
SPX FLOW* | | | 14,699 | | | | 718 | |
| | |
Standex International | | | 4,308 | | | | 342 | |
| | |
Team* | | | 111,369 | | | | 1,779 | |
| | |
Tennant | | | 6,309 | | | | 492 | |
| | |
Tetra Tech | | | 20,696 | | | | 1,783 | |
| | |
Titan International | | | 16,981 | | | | 61 | |
| | |
Titan Machinery* | | | 187,680 | | | | 2,774 | |
| | |
TransUnion | | | 39,936 | | | | 3,419 | |
| | |
Trex* | | | 25,490 | | | | 2,291 | |
| | |
Triumph Group | | | 17,166 | | | | 434 | |
| | |
TrueBlue* | | | 13,945 | | | | 336 | |
| | |
UniFirst | | | 5,360 | | | | 1,083 | |
| | |
Univar Solutions* | | | 46,775 | | | | 1,134 | |
| | |
Universal Forest Products | | | 21,123 | | | | 1,008 | |
| | |
US Ecology | | | 8,875 | | | | 514 | |
| | |
US Xpress Enterprises, Cl A* | | | 194,486 | | | | 978 | |
| | |
Veritiv* | | | 4,372 | | | | 86 | |
| | |
Viad | | | 7,007 | | | | 473 | |
| | |
Vicor* | | | 6,285 | | | | 294 | |
| | |
Wabash National | | | 105,782 | | | | 1,554 | |
| | |
Watts Water Technologies, Cl A | | | 9,523 | | | | 950 | |
| | |
Westinghouse Air Brake Technologies | | | 22,798 | | | | 1,774 | |
| | |
Woodward | | | 13,640 | | | | 1,616 | |
| | | | | | | | |
| | | | | | | 245,483 | |
| | | | | | | | |
|
Information Technology — 13.8% | |
| | |
3D Systems* | | | 40,572 | | | | 355 | |
| | |
8x8* | | | 34,692 | | | | 635 | |
| | | | | | | | |
| Description | | Shares | | | Value
(000) | |
| | |
ACI Worldwide* | | | 75,686 | | | $ | 2,867 | |
| | |
ADTRAN | | | 17,118 | | | | 169 | |
| | |
Advanced Energy Industries* | | | 52,604 | | | | 3,745 | |
| | |
Agilysys* | | | 6,775 | | | | 172 | |
| | |
Akoustis Technologies* | | | 84,411 | | | | 675 | |
| | |
Alarm.com Holdings* | | | 12,706 | | | | 546 | |
| | |
Alpha & Omega Semiconductor* | | | 300 | | | | 4 | |
| | |
Ambarella* | | | 32,052 | | | | 1,941 | |
| | |
Anaplan* | | | 52,183 | | | | 2,734 | |
| | |
Anixter International* | | | 10,473 | | | | 965 | |
| | |
Applied Optoelectronics* | | | 5,966 | | | | 71 | |
| | |
Arlo Technologies* | | | 24,961 | | | | 105 | |
| | |
Aspen Technology* | | | 17,354 | | | | 2,099 | |
| | |
Axcelis Technologies* | | | 10,990 | | | | 265 | |
| | |
Badger Meter | | | 10,063 | | | | 653 | |
| | |
Bel Fuse, Cl B | | | 3,256 | | | | 67 | |
| | |
Belden | | | 32,258 | | | | 1,774 | |
| | |
Benchmark Electronics | | | 66,466 | | | | 2,284 | |
| | |
Bottomline Technologies DE* | | | 74,630 | | | | 4,000 | |
| | |
Brooks Automation | | | 69,498 | | | | 2,916 | |
| | |
Cabot Microelectronics | | | 8,085 | | | | 1,167 | |
| | |
CACI International, Cl A* | | | 6,030 | | | | 1,507 | |
| | |
CalAmp* | | | 122,068 | | | | 1,169 | |
| | |
Cardtronics* | | | 12,724 | | | | 568 | |
| | |
CEVA* | | | 7,502 | | | | 202 | |
| | |
Cloudera* | | | 125,575 | | | | 1,460 | |
| | |
Coherent* | | | 3,550 | | | | 591 | |
| | |
Cohu | | | 14,509 | | | | 332 | |
| | |
Comtech Telecommunications | | | 8,462 | | | | 300 | |
| | |
CSG Systems International | | | 11,504 | | | | 596 | |
| | |
CTS | | | 11,159 | | | | 335 | |
| | |
Daktronics | | | 13,088 | | | | 80 | |
| | |
Diebold Nixdorf* | | | 27,200 | | | | 287 | |
| | |
Digi International* | | | 10,016 | | | | 178 | |
| | |
Diodes* | | | 31,313 | | | | 1,765 | |
| | |
DocuSign, Cl A* | | | 11,734 | | | | 870 | |
| | |
DSP Group* | | | 8,100 | | | | 128 | |
| | |
Ebix | | | 7,640 | | | | 255 | |
| | |
Entegris | | | 34,700 | | | | 1,738 | |
| | |
ePlus* | | | 4,761 | | | | 401 | |
| | |
Euronet Worldwide* | | | 15,310 | | | | 2,412 | |
| | |
Everbridge* | | | 38,269 | | | | 2,988 | |
| | |
EVERTEC | | | 20,611 | | | | 702 | |
| | |
ExlService Holdings* | | | 11,782 | | | | 818 | |
| | |
Extreme Networks* | | | 41,499 | | | | 306 | |
| | |
Fabrinet* | | | 12,724 | | | | 825 | |
The accompanying notes are an integral part of the financial statements.
59
| | |
| THE KP FUNDS | | December 31, 2019 |
| | | | | | | | |
| Description | | Shares | | | Value
(000) | |
| | |
FARO Technologies* | | | 5,892 | | | $ | 297 | |
| | |
Five9* | | | 53,349 | | | | 3,499 | |
| | |
FormFactor* | | | 25,996 | | | | 675 | |
| | |
Gartner* | | | 3,652 | | | | 563 | |
| | |
Harmonic* | | | 31,362 | | | | 245 | |
| | |
Ichor Holdings* | | | 7,928 | | | | 264 | |
| | |
Infinera* | | | 70,560 | | | | 560 | |
| | |
Inphi* | | | 29,593 | | | | 2,191 | |
| | |
Insight Enterprises* | | | 33,574 | | | | 2,360 | |
| | |
InterXion Holding* | | | 16,870 | | | | 1,414 | |
| | |
Itron* | | | 80,209 | | | | 6,734 | |
| | |
Jabil | | | 35,800 | | | | 1,480 | |
| | |
KBR | | | 138,175 | | | | 4,214 | |
| | |
KEMET | | | 90,617 | | | | 2,451 | |
| | |
Keysight Technologies* | | | 40,928 | | | | 4,200 | |
| | |
Knowles* | | | 176,768 | | | | 3,739 | |
| | |
Kulicke & Soffa Industries | | | 21,997 | | | | 598 | |
| | |
Lattice Semiconductor* | | | 119,184 | | | | 2,281 | |
| | |
Littelfuse | | | 3,635 | | | | 695 | |
| | |
LivePerson* | | | 67,122 | | | | 2,484 | |
| | |
Lumentum Holdings* | | | 42 | | | | 3 | |
| | |
MACOM Technology Solutions Holdings* | | | 109,337 | | | | 2,908 | |
| | |
Manhattan Associates* | | | 29,233 | | | | 2,331 | |
| | |
ManTech International, Cl A | | | 9,256 | | | | 739 | |
| | |
MaxLinear, Cl A* | | | 22,468 | | | | 477 | |
| | |
Methode Electronics | | | 12,751 | | | | 502 | |
| | |
MicroStrategy, Cl A* | | | 2,816 | | | | 402 | |
| | |
MKS Instruments | | | 22,774 | | | | 2,505 | |
| | |
Model N* | | | 35,967 | | | | 1,261 | |
| | |
MTS Systems | | | 97,991 | | | | 4,707 | |
| | |
Napco Security Technologies* | | | 41,393 | | | | 1,217 | |
| | |
NCR* | | | 187,725 | | | | 6,600 | |
| | |
NETGEAR* | | | 10,652 | | | | 261 | |
| | |
NIC | | | 84,371 | | | | 1,886 | |
| | |
nLight* | | | 30,392 | | | | 616 | |
| | |
Novanta* | | | 29,774 | | | | 2,633 | |
| | |
Nuance Communications* | | | 183,646 | | | | 3,274 | |
| | |
Nutanix, Cl A* | | | 45,416 | | | | 1,420 | |
| | |
Okta, Cl A* | | | 6,715 | | | | 775 | |
| | |
ON Semiconductor* | | | 110,058 | | | | 2,683 | |
| | |
OneSpan* | | | 11,393 | | | | 195 | |
| | |
Onto Innovation* | | | 16,716 | | | | 611 | |
| | |
OSI Systems* | | | 5,856 | | | | 590 | |
| | |
Paycom Software* | | | 3,586 | | | | 949 | |
| | |
PDF Solutions* | | | 9,311 | | | | 157 | |
| | |
Perficient* | | | 11,207 | | | | 516 | |
| | | | | | | | |
| Description | | Shares | | | Value
(000) | |
| | |
Perspecta | | | 153,932 | | | $ | 4,070 | |
| | |
Photronics* | | | 23,432 | | | | 369 | |
| | |
Plantronics | | | 185,996 | | | | 5,085 | |
| | |
Plexus* | | | 10,056 | | | | 774 | |
| | |
Power Integrations | | | 10,248 | | | | 1,014 | |
| | |
Progress Software | | | 15,451 | | | | 642 | |
| | |
Pure Storage, Cl A* | | | 52,860 | | | | 904 | |
| | |
Q2 Holdings* | | | 47,831 | | | | 3,878 | |
| | |
Qualys* | | | 11,725 | | | | 978 | |
| | |
Qumu* | | | 42,657 | | | | 111 | |
| | |
Rambus* | | | 38,446 | | | | 530 | |
| | |
Rapid7* | | | 61,379 | | | | 3,438 | |
| | |
RingCentral, Cl A* | | | 42,477 | | | | 7,165 | |
| | |
Rogers* | | | 20,961 | | | | 2,614 | |
| | |
Sanmina* | | | 24,148 | | | | 827 | |
| | |
ScanSource* | | | 8,883 | | | | 328 | |
| | |
Silicon Laboratories* | | | 12,075 | | | | 1,400 | |
| | |
SMART Global Holdings* | | | 4,678 | | | | 178 | |
| | |
SPS Commerce* | | | 12,080 | | | | 670 | |
| | |
Sykes Enterprises* | | | 13,204 | | | | 488 | |
| | |
Teradyne | | | 22,776 | | | | 1,553 | |
| | |
TiVo | | | 98,177 | | | | 833 | |
| | |
Tower Semiconductor* | | | 74,280 | | | | 1,787 | |
| | |
TTEC Holdings | | | 31,873 | | | | 1,263 | |
| | |
TTM Technologies* | | | 33,625 | | | | 506 | |
| | |
Tyler Technologies* | | | 9,922 | | | | 2,977 | |
| | |
Ultra Clean Holdings* | | | 13,834 | | | | 325 | |
| | |
Unisys* | | | 18,400 | | | | 218 | |
| | |
Universal Display | | | 4,100 | | | | 845 | |
| | |
Varonis Systems* | | | 22,168 | | | | 1,723 | |
| | |
Veeco Instruments* | | | 16,483 | | | | 242 | |
| | |
Viavi Solutions* | | | 353,218 | | | | 5,298 | |
| | |
Virtusa* | | | 10,502 | | | | 476 | |
| | |
Xperi | | | 16,929 | | | | 313 | |
| | |
Zebra Technologies, Cl A* | | | 9,100 | | | | 2,325 | |
| | | | | | | | |
| | | | | | | 188,331 | |
| | | | | | | | |
|
Materials — 6.0% | |
| | |
AdvanSix* | | | 9,560 | | | | 191 | |
| | |
AK Steel Holding* | | | 110,285 | | | | 363 | |
| | |
Alamos Gold, Cl A | | | 99,735 | | | | 600 | |
| | |
American Vanguard | | | 9,509 | | | | 185 | |
| | |
Balchem | | | 11,172 | | | | 1,135 | |
| | |
Boise Cascade | | | 13,596 | | | | 497 | |
| | |
Cabot | | | 65,985 | | | | 3,136 | |
| | |
Century Aluminum* | | | 17,992 | | | | 135 | |
| | |
Clearwater Paper* | | | 5,951 | | | | 127 | |
The accompanying notes are an integral part of the financial statements.
60
| | |
| THE KP FUNDS | | December 31, 2019 |
| | | | | | | | |
| Description | | Shares | | | Value
(000) | |
| | |
Cleveland-Cliffs | | | 94,300 | | | $ | 792 | |
| | |
Compass Minerals International | | | 157,055 | | | | 9,574 | |
| | |
Constellium, Cl A* | | | 59,068 | | | | 792 | |
| | |
Crown Holdings* | | | 80,988 | | | | 5,875 | |
| | |
Ferro* | | | 162,052 | | | | 2,403 | |
| | |
Fortuna Silver Mines* | | | 1,241,807 | | | | 5,067 | |
| | |
FutureFuel | | | 9,250 | | | | 115 | |
| | |
GCP Applied Technologies* | | | 18,666 | | | | 424 | |
| | |
Graphic Packaging Holding | | | 93,045 | | | | 1,549 | |
| | |
Hawkins | | | 3,378 | | | | 155 | |
| | |
Haynes International | | | 4,432 | | | | 159 | |
| | |
HB Fuller | | | 34,113 | | | | 1,759 | |
| | |
Huntsman | | | 50,235 | | | | 1,214 | |
| | |
Innophos Holdings | | | 65,355 | | | | 2,090 | |
| | |
Innospec | | | 8,547 | | | | 884 | |
| | |
Kaiser Aluminum | | | 5,549 | | | | 615 | |
| | |
Koppers Holdings* | | | 6,998 | | | | 268 | |
| | |
Kraton* | | | 70,757 | | | | 1,792 | |
| | |
Livent* | | | 50,100 | | | | 428 | |
| | |
Louisiana-Pacific | | | 219,098 | | | | 6,501 | |
| | |
LSB Industries* | | | 6,185 | | | | 26 | |
| | |
Materion | | | 7,035 | | | | 418 | |
| | |
Mercer International | | | 14,484 | | | | 178 | |
| | |
Myers Industries | | | 11,856 | | | | 198 | |
| | |
Neenah | | | 5,855 | | | | 412 | |
| | |
O-I Glass, Cl I | | | 415,679 | | | | 4,959 | |
| | |
Olin | | | 148,173 | | | | 2,556 | |
| | |
Olympic Steel | | | 2,849 | | | | 51 | |
| | |
PH Glatfelter | | | 201,880 | | | | 3,694 | |
| | |
PolyOne | | | 50,600 | | | | 1,862 | |
| | |
Quaker Chemical | | | 4,431 | | | | 729 | |
| | |
Rayonier Advanced Materials | | | 15,947 | | | | 61 | |
| | |
Sandstorm Gold* | | | 364,919 | | | | 2,719 | |
| | |
Schweitzer-Mauduit International | | | 10,578 | | | | 444 | |
| | |
Silgan Holdings | | | 152,522 | | | | 4,740 | |
| | |
Stepan | | | 7,060 | | | | 723 | |
| | |
Summit Materials, Cl A* | | | 35,185 | | | | 841 | |
| | |
SunCoke Energy | | | 31,685 | | | | 197 | |
| | |
Tecnoglass | | | 173,718 | | | | 1,433 | |
| | |
TimkenSteel* | | | 13,208 | | | | 104 | |
| | |
Tredegar | | | 8,505 | | | | 190 | |
| | |
Trinseo | | | 14,100 | | | | 525 | |
| | |
US Concrete* | | | 5,406 | | | | 225 | |
| | |
Valvoline | | | 40,124 | | | | 859 | |
| | |
Warrior Met Coal | | | 17,892 | | | | 378 | |
| | |
WR Grace | | | 54,222 | | | | 3,787 | |
| | | | | | | | |
| | | | | | | 81,134 | |
| | | | | | | | |
| | | | | | | | |
| Description | | Shares | | | Value
(000) | |
|
Real Estate — 4.9% | |
| | |
Acadia Realty Trust‡ | | | 29,315 | | | $ | 760 | |
| | |
Agree Realty‡ | | | 14,508 | | | | 1,018 | |
| | |
Alpine Income Property Trust‡ | | | 56,828 | | | | 1,081 | |
| | |
American Assets Trust‡ | | | 16,575 | | | | 761 | |
| | |
Armada Hoffler Properties‡ | | | 18,190 | | | | 334 | |
| | |
CareTrust‡ | | | 32,955 | | | | 680 | |
| | |
CatchMark Timber Trust, Cl A‡ | | | 190,547 | | | | 2,186 | |
| | |
CBL & Associates Properties‡ | | | 62,781 | | | | 66 | |
| | |
Cedar Realty Trust‡ | | | 30,354 | | | | 90 | |
| | |
Chatham Lodging Trust‡ | | | 16,153 | | | | 296 | |
| | |
Community Healthcare Trust‡ | | | 52,826 | | | | 2,264 | |
| | |
DiamondRock Hospitality‡ | | | 69,606 | | | | 771 | |
| | |
Easterly Government Properties‡ | | | 257,550 | | | | 6,112 | |
| | |
Essential Properties Realty Trust‡ | | | 28,300 | | | | 702 | |
| | |
Four Corners Property Trust‡ | | | 23,620 | | | | 666 | |
| | |
Franklin Street Properties‡ | | | 36,856 | | | | 315 | |
| | |
GEO Group‡ | | | 201,928 | | | | 3,354 | |
| | |
Getty Realty‡ | | | 11,730 | | | | 386 | |
| | |
Global Net Lease‡ | | | 31,110 | | | | 631 | |
| | |
Hannon Armstrong Sustainable Infrastructure Capital‡ | | | 56,060 | | | | 1,804 | |
| | |
Hersha Hospitality Trust, Cl A‡ | | | 13,073 | | | | 190 | |
| | |
Independence Realty Trust‡ | | | 31,506 | | | | 444 | |
| | |
Industrial Logistics Properties Trust‡ | | | 270,930 | | | | 6,074 | |
| | |
Innovative Industrial Properties, Cl A‡ | | | 40,737 | | | | 3,091 | |
| | |
iStar‡ | | | 77,918 | | | | 1,131 | |
| | |
Kite Realty Group Trust‡ | | | 28,735 | | | | 561 | |
| | |
Lexington Realty Trust, Cl B‡ | | | 85,992 | | | | 913 | |
| | |
LTC Properties‡ | | | 13,719 | | | | 614 | |
| | |
Marcus & Millichap* | | | 8,180 | | | | 305 | |
| | |
National Storage Affiliates Trust‡ | | | 20,676 | | | | 695 | |
| | |
Office Properties Income Trust‡ | | | 16,763 | | | | 539 | |
| | |
Omega Healthcare Investors‡ | | | 39,270 | | | | 1,663 | |
| | |
Pennsylvania Real Estate Investment Trust‡ | | | 19,799 | | | | 105 | |
| | |
Postal Realty Trust, Cl A | | | 124,589 | | | | 2,112 | |
| | |
QTS Realty Trust, Cl A‡ | | | 62,572 | | | | 3,396 | |
| | |
Rayonier‡ | | | 141,569 | | | | 4,638 | |
| | |
RE/MAX Holdings, Cl A | | | 6,324 | | | | 243 | |
| | |
Realogy Holdings | | | 39,775 | | | | 385 | |
| | |
Retail Opportunity Investments‡ | | | 275,280 | | | | 4,861 | |
| | |
RLJ Lodging Trust‡ | | | 197,463 | | | | 3,499 | |
| | |
RPT Realty‡ | | | 27,591 | | | | 415 | |
| | |
Safehold‡ | | | 4,200 | | | | 169 | |
| | |
Saul Centers‡ | | | 4,186 | | | | 221 | |
| | |
St. Joe* | | | 10,900 | | | | 216 | |
The accompanying notes are an integral part of the financial statements.
61
| | |
| THE KP FUNDS | | December 31, 2019 |
| | | | | | | | |
| Description | | Shares | | | Value
(000) | |
| | |
STAG Industrial‡ | | | 74,418 | | | $ | 2,349 | |
| | |
Summit Hotel Properties‡ | | | 36,442 | | | | 450 | |
| | |
Uniti Group‡ | | | 67,100 | | | | 551 | |
| | |
Universal Health Realty Income Trust‡ | | | 4,388 | | | | 515 | |
| | |
Urstadt Biddle Properties, Cl A‡ | | | 10,500 | | | | 261 | |
| | |
Washington‡ | | | 27,818 | | | | 812 | |
| | |
Washington Prime Group‡ | | | 62,936 | | | | 229 | |
| | |
Whitestone, Cl B‡ | | | 14,293 | | | | 195 | |
| | |
Xenia Hotels & Resorts‡ | | | 38,837 | | | | 839 | |
| | | | | | | | |
| | | | | | | 66,958 | |
| | | | | | | | |
|
Utilities — 1.7% | |
| | |
ALLETE | | | 38,354 | | | | 3,113 | |
| | |
American States Water | | | 66,305 | | | | 5,745 | |
| | |
Avista | | | 54,045 | | | | 2,599 | |
| | |
California Water Service Group | | | 16,692 | | | | 861 | |
| | |
El Paso Electric | | | 14,161 | | | | 961 | |
| | |
Middlesex Water | | | 26,960 | | | | 1,714 | |
| | |
National Fuel Gas | | | 59,122 | | | | 2,751 | |
| | |
Northwest Natural Holding | | | 10,504 | | | | 774 | |
| | |
South Jersey Industries | | | 75,517 | | | | 2,491 | |
| | |
Unitil | | | 42,723 | | | | 2,641 | |
| | | | | | | | |
| | | | | | | 23,650 | |
| | | | | | | | |
| | |
Total Common Stock
(Cost $1,186,547) (000) | | | | | | | 1,315,760 | |
| | | | | | | | |
EXCHANGE TRADED FUNDS — 0.3% | |
| | |
iShares Russell 2000 ETF | | | 13,795 | | | | 2,285 | |
| | |
iShares Russell 2000 Value ETF | | | 17,847 | | | | 2,295 | |
| | | | | | | | |
| | |
Total Exchange Traded Funds
(Cost $4,316) (000) | | | | | | | 4,580 | |
| | | | | | | | |
| | |
| | | Number of
Rights | | | | |
RIGHTS* — 0.0% | |
| | |
A Schulman (B) ‡‡ | | | 8,148 | | | | 4 | |
| | |
Media General (B) ‡‡ | | | 9,318 | | | | 1 | |
| | |
Tobira Therapeutics, Expires 12/31/2028 (B) | | | 900 | | | | 11 | |
| | | | | | | | |
| | |
Total Rights
(Cost $—) (000) | | | | | | | 16 | |
| | | | | | | | |
| | | | | | | | |
| Description | | Shares | | | Value
(000) | |
SHORT-TERM INVESTMENT — 3.5% | |
| | |
State Street Institutional Treasury Money Market Fund, Cl Premier, 1.520% (C) | | | 47,923,302 | | | $ | 47,923 | |
| | | | | | | | |
| | |
Total Short-Term Investment
(Cost $47,923) (000) | | | | | | | 47,923 | |
| | | | | | | | |
| | |
Total Investments In
Securities — 100.3%
(Cost $1,238,786) (000) | | | | | | $ | 1,368,279 | |
| | | | | | | | |
Percentages are based on net assets of $1,364,106 (000).
A list of the open futures contracts held by the Fund at December 31, 2019, is as follows (000):
| | | | | | | | | | | | | | | | | | | | |
Type of
Contract | | Number of
Contracts
Long | | | Expiration
Date | | | Notional
Amount | | | Value | | | Unrealized
Appreciation | |
Russell 2000 IndexE-MINI | | | 64 | | | | Mar-2020 | | | $ | 5,345 | | | $ | 5,346 | | | $ | 1 | |
| | | | | | | | | | | | | | | | | | | | |
| * | Non-income producing security. |
| ‡ | Real Estate Investment Trust |
| ‡‡ | Expiration date not available. |
| (A) | Security considered Master Limited Partnership. At December 31, 2019, this security amounted to $469 (000) or 0.0% of Net Assets. |
| (B) | Level 3 security in accordance with fair value hierarchy. |
| (C) | The rate reported is the7-day effective yield as of December 31, 2019. |
ADR — American Depositary Receipt
Cl — Class
ETF — Exchange Traded Fund
The following is a list of the level of inputs used as of December 31, 2019, in valuing the Fund’s investments and other financial instruments carried at value (000):
| | | | | | | | | | | | | | | | |
| Investments in Securities | | Level 1 | | | Level 2 | | | Level 3^ | | | Total | |
Common Stock | | $ | 1,315,760 | | | $ | — | | | $ | — | | | $ | 1,315,760 | |
Exchange Traded Funds | | | 4,580 | | | | — | | | | — | | | | 4,580 | |
Rights | | | — | | | | — | | | | 16 | | | | 16 | |
Short-Term Investment | | | 47,923 | | | | — | | | | — | | | | 47,923 | |
| | | | | | | | | | | | | | | | |
Total Investments in Securities | | $ | 1,368,263 | | | $ | — | | | $ | 16 | | | $ | 1,368,279 | |
| | | | | | | | | | | | | | | | |
| | | | |
| Other Financial Instruments | | Level 1 | | | Level 2 | | | Level 3 | | | Total | |
Futures Contracts** | | | | | | | | | | | | | |
Unrealized Appreciation | | $ | 1 | | | $ | — | | | $ | — | | | $ | 1 | |
| | | | | | | | | | | | | | | | |
Total Other Financial Instruments | | $ | 1 | | | $ | — | | | $ | — | | | $ | 1 | |
| | | | | | | | | | | | | | | | |
| ** | Futures contracts are valued at the unrealized appreciation on the instrument. |
| ^ | A reconciliation of Level 3 investments and disclosures of significant unobservable inputs are presented when the Fund has a significant amount of Level 3 investments at the beginning and/or end of the year in relation to net assets. Management has concluded that Level 3 investments are not material in relation to net assets. |
For the year ended December 31, 2019, there were no transfers in or out of Level 3.
Amounts designated as “—“ are $0 or have been rounded to $0.
The accompanying notes are an integral part of the financial statements.
62
| | |
| THE KP FUNDS | | December 31, 2019 |
| | |
| KP International Equity Fund | | |
|
| SECTOR WEIGHTINGS† (unaudited) |
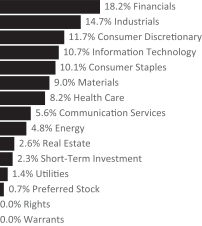
| † | Percentages based on total investments. |
| | | | | | | | |
| Description | | Shares | | | Value
(000) | |
COMMON STOCK — 96.2% | |
|
Australia — 3.4% | |
| | |
Adairs | | | 26,659 | | | $ | 43 | |
| | |
Adelaide Brighton | | | 706,770 | | | | 1,715 | |
| | |
AGL Energy | | | 15,678 | | | | 226 | |
| | |
Alkane Resources* | | | 22,541 | | | | 9 | |
| | |
ALS | | | 148,685 | | | | 958 | |
| | |
Altium | | | 13,725 | | | | 334 | |
| | |
Alumina | | | 534,175 | | | | 862 | |
| | |
Amcor | | | 139,748 | | | | 1,527 | |
| | |
AMP | | | 76,692 | | | | 103 | |
| | |
APA Group | | | 30,621 | | | | 239 | |
| | |
Appen | | | 24,168 | | | | 381 | |
| | |
Aristocrat Leisure | | | 14,286 | | | | 337 | |
| | |
Asaleo Care* | | | 326,263 | | | | 243 | |
| | |
ASX | | | 4,644 | | | | 256 | |
| | |
Aurizon Holdings | | | 51,945 | | | | 191 | |
| | |
AusNet Services | | | 55,542 | | | | 66 | |
| | |
Austal | | | 300,820 | | | | 806 | |
| | |
Australia & New Zealand Banking Group | | | 226,161 | | | | 3,910 | |
| | |
Australian Finance Group | | | 51,007 | | | | 98 | |
| | |
Auswide Bank | | | 19,058 | | | | 78 | |
| | |
Baby Bunting Group | | | 83,100 | | | | 196 | |
| | |
Beach Energy | | | 335,756 | | | | 591 | |
| | |
Bendigo & Adelaide Bank | | | 12,425 | | | | 85 | |
| | |
BHP Group | | | 94,462 | | | | 2,581 | |
| | |
BlueScope Steel | | | 222,747 | | | | 2,354 | |
| | | | | | | | |
| Description | | Shares | | | Value
(000) | |
| | |
Boral | | | 29,759 | | | $ | 94 | |
| | |
Brambles | | | 185,830 | | | | 1,528 | |
| | |
Bravura Solutions | | | 43,280 | | | | 158 | |
| | |
Caltex Australia | | | 22,569 | | | | 538 | |
| | |
carsales.com | | | 83,235 | | | | 971 | |
| | |
Centuria Metropolitan‡ | | | 153,965 | | | | 313 | |
| | |
Challenger | | | 14,109 | | | | 80 | |
| | |
Champion Iron* | | | 138,307 | | | | 260 | |
| | |
Charter Hall Group‡ | | | 68,007 | | | | 529 | |
| | |
CIMIC Group | | | 2,687 | | | | 62 | |
| | |
Class | | | 38,788 | | | | 56 | |
| | |
Cleanaway Waste Management | | | 1,014,292 | | | | 1,431 | |
| | |
Clinuvel Pharmaceuticals | | | 10,104 | | | | 202 | |
| | |
Clover | | | 53,721 | | | | 102 | |
| | |
Coca-Cola Amatil | | | 165,390 | | | | 1,284 | |
| | |
Cochlear | | | 1,498 | | | | 236 | |
| | |
Codan | | | 36,349 | | | | 190 | |
| | |
Coles Group | | | 28,196 | | | | 294 | |
| | |
Commonwealth Bank of Australia | | | 43,339 | | | | 2,430 | |
| | |
Computershare | | | 11,272 | | | | 133 | |
| | |
Cromwell Property Group‡ | | | 841,218 | | | | 695 | |
| | |
Crown Resorts | | | 8,439 | | | | 71 | |
| | |
CSL | | | 11,094 | | | | 2,147 | |
| | |
CSR | | | 260,215 | | | | 831 | |
| | |
Data#3 | | | 62,123 | | | | 162 | |
| | |
Dexus‡ | | | 26,214 | | | | 215 | |
| | |
Dicker Data | | | 59,299 | | | | 287 | |
| | |
Domain Holdings Australia | | | 141,520 | | | | 367 | |
| | |
EML Payments* | | | 148,624 | | | | 473 | |
| | |
Evolution Mining | | | 152,381 | | | | 406 | |
| | |
Flight Centre Travel Group | | | 1,715 | | | | 53 | |
| | |
Fortescue Metals Group | | | 33,167 | | | | 249 | |
| | |
Goodman Group‡ | | | 40,724 | | | | 382 | |
| | |
GPT Group‡ | | | 50,728 | | | | 199 | |
| | |
GUD Holdings | | | 66,652 | | | | 519 | |
| | |
GWA Group | | | 115,148 | | | | 268 | |
| | |
Harvey Norman Holdings | | | 13,109 | | | | 37 | |
| | |
Healius | | | 43,125 | | | | 84 | |
| | |
IDP Education | | | 24,768 | | | | 298 | |
| | |
Iluka Resources | | | 162,609 | | | | 1,061 | |
| | |
Imdex | | | 28,505 | | | | 30 | |
| | |
Incitec Pivot | | | 39,492 | | | | 88 | |
| | |
Independence Group NL | | | 282,613 | | | | 1,238 | |
| | |
Infomedia | | | 21,957 | | | | 32 | |
| | |
Ingenia Communities Group‡ | | | 96,385 | | | | 335 | |
| | |
Insurance Australia Group | | | 57,437 | | | | 309 | |
| | |
Integrated Research | | | 12,768 | | | | 29 | |
The accompanying notes are an integral part of the financial statements.
63
| | |
| THE KP FUNDS | | December 31, 2019 |
| | |
| KP International Equity Fund | | |
| | | | | | | | |
| Description | | Shares | | | Value
(000) | |
| | |
IPH | | | 62,843 | | | $ | 362 | |
| | |
IVE Group | | | 37,823 | | | | 64 | |
| | |
James Hardie Industries | | | 11,487 | | | | 225 | |
| | |
JB Hi-Fi | | | 30,586 | | | | 808 | |
| | |
Jumbo Interactive | | | 13,542 | | | | 142 | |
| | |
Jupiter Mines | | | 2,226,306 | | | | 437 | |
| | |
Karoon Energy* | | | 151,134 | | | | 122 | |
| | |
Kina Securities | | | 58,214 | | | | 61 | |
| | |
Lend Lease Group | | | 14,440 | | | | 178 | |
| | |
Lovisa Holdings | | | 6,241 | | | | 54 | |
| | |
Macquarie Group | | | 7,873 | | | | 761 | |
| | |
Magellan Financial Group | | | 4,396 | | | | 176 | |
| | |
Medibank | | | 70,763 | | | | 157 | |
| | |
Metcash | | | 163,275 | | | | 294 | |
| | |
Mirvac Group‡ | | | 94,031 | | | | 210 | |
| | |
Mount Gibson Iron | | | 150,446 | | | | 101 | |
| | |
National Australia Bank | | | 162,592 | | | | 2,810 | |
| | |
National Storage‡ | | | 194,804 | | | | 251 | |
| | |
Newcrest Mining | | | 71,781 | | | | 1,524 | |
| | |
Nine Entertainment Holdings | | | 353,004 | | | | 444 | |
| | |
Northern Star Resources | | | 65,883 | | | | 523 | |
| | |
NRW Holdings | | | 51,310 | | | | 116 | |
| | |
Oil Search | | | 316,346 | | | | 1,610 | |
| | |
Orica | | | 102,594 | | | | 1,582 | |
| | |
Origin Energy | | | 42,238 | | | | 250 | |
| | |
OZ Minerals | | | 25,643 | | | | 190 | |
| | |
People Infrastructure | | | 53,721 | | | | 122 | |
| | |
Perenti Global | | | 137,212 | | | | 156 | |
| | |
Perseus Mining* | | | 674,767 | | | | 549 | |
| | |
Pro Medicus | | | 68,589 | | | | 1,076 | |
| | |
Qantas Airways | | | 17,789 | | | | 89 | |
| | |
QBE Insurance Group | | | 150,794 | | | | 1,363 | |
| | |
Ramelius Resources | | | 105,266 | | | | 91 | |
| | |
Ramsay Health Care | | | 4,212 | | | | 214 | |
| | |
REA Group | | | 1,203 | | | | 87 | |
| | |
Red 5* | | | 454,540 | | | | 105 | |
| | |
Regional Express Holdings | | | 12,432 | | | | 10 | |
| | |
Regis Healthcare | | | 30,065 | | | | 52 | |
| | |
Regis Resources | | | 38,420 | | | | 117 | |
| | |
Rio Tinto | | | 9,023 | | | | 636 | |
| | |
RPMGlobal Holdings* | | | 30,125 | | | | 18 | |
| | |
Sandfire Resources NL | | | 78,333 | | | | 329 | |
| | |
Santos | | | 42,409 | | | | 243 | |
| | |
Saracen Mineral Holdings* | | | 189,795 | | | | 441 | |
| | |
Scentre Group‡ | | | 131,824 | | | | 354 | |
| | |
SEEK | | | 8,496 | | | | 134 | |
| | |
Select Harvests | | | 3,767 | | | | 22 | |
| | | | | | | | |
| Description | | Shares | | | Value
(000) | |
| | |
Service Stream | | | 75,075 | | | $ | 140 | |
| | |
Sigma Healthcare | | | 163,548 | | | | 67 | |
| | |
Sonic Healthcare | | | 11,664 | | | | 235 | |
| | |
South32 | | | 119,442 | | | | 226 | |
| | |
Stockland‡ | | | 62,070 | | | | 201 | |
| | |
Suncorp Group | | | 31,717 | | | | 288 | |
| | |
Super Retail Group | | | 32,393 | | | | 230 | |
| | |
Sydney Airport | | | 25,667 | | | | 156 | |
| | |
Tabcorp Holdings | | | 46,879 | | | | 149 | |
| | |
Technology One | | | 160,999 | | | | 937 | |
| | |
Telstra | | | 99,854 | | | | 248 | |
| | |
TPG Telecom | | | 10,268 | | | | 48 | |
| | |
Transurban Group | | | 67,113 | | | | 702 | |
| | |
Treasury Wine Estates | | | 18,636 | | | | 212 | |
| | |
Unibail-Rodamco-Westfield‡ | | | 13,660 | | | | 107 | |
| | |
VGI Partners | | | 879 | | | | 8 | |
| | |
Vicinity Centres‡ | | | 74,158 | | | | 130 | |
| | |
Vita Group | | | 96,528 | | | | 81 | |
| | |
Washington H Soul Pattinson | | | 3,578 | | | | 54 | |
| | |
Wesfarmers | | | 27,618 | | | | 803 | |
| | |
Western Areas | | | 61,536 | | | | 131 | |
| | |
Westpac Banking | | | 85,302 | | | | 1,450 | |
| | |
Whitehaven Coal | | | 56,486 | | | | 105 | |
| | |
WiseTech Global | | | 3,487 | | | | 57 | |
| | |
Woodside Petroleum | | | 23,077 | | | | 557 | |
| | |
Woolworths Group | | | 166,300 | | | | 4,221 | |
| | |
Worley | | | 7,708 | | | | 83 | |
| | | | | | | | |
| | | | | | | 71,231 | |
| | | | | | | | |
|
Austria — 0.2% | |
| | |
ANDRITZ | | | 8,782 | | | | 380 | |
| | |
BAWAG Group* | | | 11,956 | | | | 543 | |
| | |
Erste Group Bank* | | | 7,575 | | | | 287 | |
| | |
EVN | | | 9,618 | | | | 187 | |
| | |
IMMOFINANZ | | | 11,832 | | | | 317 | |
| | |
Oesterreichische Post | | | 11,075 | | | | 428 | |
| | |
OMV | | | 3,831 | | | | 215 | |
| | |
Porr Ag | | | 4,414 | | | | 77 | |
| | |
Raiffeisen Bank International | | | 4,038 | | | | 102 | |
| | |
S IMMO | | | 19,448 | | | | 487 | |
| | |
Telekom Austria, Cl A* | | | 16,999 | | | | 139 | |
| | |
Verbund | | | 1,907 | | | | 96 | |
| | |
Vienna Insurance Group Wiener Versicherung Gruppe | | | 8,905 | | | | 255 | |
| | |
Voestalpine | | | 2,635 | | | | 74 | |
| | |
Wienerberger | | | 35,563 | | | | 1,053 | |
| | | | | | | | |
| | | | | | | 4,640 | |
| | | | | | | | |
The accompanying notes are an integral part of the financial statements.
64
| | |
| THE KP FUNDS | | December 31, 2019 |
| | |
| KP International Equity Fund | | |
| | | | | | | | |
| Description | | Shares | | | Value
(000) | |
|
Belgium — 0.7% | |
| | |
Ackermans & van Haaren | | | 4,483 | | | $ | 702 | |
| | |
Aedifica‡ | | | 3,259 | | | | 414 | |
| | |
Ageas | | | 4,284 | | | | 253 | |
| | |
AGFA-Gevaert* | | | 6,867 | | | | 36 | |
| | |
Anheuser-Busch InBev | | | 35,446 | | | | 2,891 | |
| | |
Barco | | | 3,131 | | | | 769 | |
| | |
Befimmo‡ | | | 6,104 | | | | 370 | |
| | |
Brederode | | | 692 | | | | 58 | |
| | |
Colruyt | | | 1,327 | | | | 69 | |
| | |
D’ieteren | | | 2,498 | | | | 175 | |
| | |
Groupe Bruxelles Lambert | | | 2,100 | | | | 221 | |
| | |
Home Invest Belgium‡ | | | 200 | | | | 26 | |
| | |
KBC Ancora | | | 17,723 | | | | 891 | |
| | |
KBC Group | | | 85,617 | | | | 6,440 | |
| | |
Ontex Group | | | 4,740 | | | | 100 | |
| | |
Orange Belgium | | | 2,252 | | | | 52 | |
| | |
Proximus | | | 3,760 | | | | 108 | |
| | |
Solvay | | | 1,901 | | | | 220 | |
| | |
Telenet Group Holding | | | 3,498 | | | | 157 | |
| | |
UCB | | | 3,030 | | | | 241 | |
| | |
Umicore | | | 4,710 | | | | 229 | |
| | | | | | | | |
| | | | | | | 14,422 | |
| | | | | | | | |
|
Brazil — 2.1% | |
| | |
Alupar Investimento | | | 5,341 | | | | 37 | |
| | |
Ambev ADR* | | | 440,187 | | | | 2,051 | |
| | |
B3 - Brasil Bolsa Balcao | | | 265,100 | | | | 2,832 | |
| | |
Banco Bradesco ADR | | | 807,064 | | | | 7,223 | |
| | |
Banco BTG Pactual* | | | 11,700 | | | | 221 | |
| | |
Banco do Brasil* | | | 68,500 | | | | 899 | |
| | |
BB Seguridade Participacoes | | | 49,400 | | | | 463 | |
| | |
BR Malls Participacoes | | | 54,000 | | | | 243 | |
| | |
Cia de Saneamento Basico do Estado de Sao Paulo* | | | 17,600 | | | | 265 | |
| | |
Cia de Saneamento do Parana | | | 6,100 | | | | 154 | |
| | |
Cosan, Cl A* | | | 3,726 | | | | 85 | |
| | |
Embraer | | | 54,233 | | | | 266 | |
| | |
Enauta Participacoes | | | 25,000 | | | | 100 | |
| | |
Grendene | | | 43,500 | | | | 133 | |
| | |
IRB Brasil Resseguros S | | | 632,700 | | | | 6,126 | |
| | |
JBS | | | 224,900 | | | | 1,442 | |
| | |
JHSF Participacoes | | | 63,400 | | | | 112 | |
| | |
LOG Commercial Properties e Participacoes | | | 6,313 | | | | 51 | |
| | |
LPS Brasil Consultoria de Imoveis* | | | 62,884 | | | | 149 | |
| | |
MRV Engenharia e Participacoes | | | 251,800 | | | | 1,349 | |
| | |
Natura & Holding | | | 162,454 | | | | 1,562 | |
| | | | | | | | |
| Description | | Shares | | | Value
(000) | |
| | |
Odontoprev | | | 327,000 | | | $ | 1,371 | |
| | |
Petrobras Distribuidora | | | 214,080 | | | | 1,600 | |
| | |
Porto Seguro | | | 109,855 | | | | 1,713 | |
| | |
Positivo Tecnologia* | | | 6,728 | | | | 17 | |
| | |
Qualicorp Consultoria e Corretora de Seguros | | | 66,000 | | | | 609 | |
| | |
Raia Drogasil* | | | 82,000 | | | | 2,276 | |
| | |
Rumo* | | | 200,700 | | | | 1,302 | |
| | |
Sul America | | | 169,700 | | | | 2,528 | |
| | |
TOTVS* | | | 263,000 | | | | 4,220 | |
| | |
Trisul | | | 15,508 | | | | 59 | |
| | |
WEG | | | 310,200 | | | | 2,673 | |
| | |
YDUQS Part | | | 11,700 | | | | 138 | |
| | | | | | | | |
| | | | | | | 44,269 | |
| | | | | | | | |
|
Canada — 4.1% | |
| | |
Acadian Timber | | | 1,600 | | | | 21 | |
| | |
Aecon Group | | | 11,500 | | | | 155 | |
| | |
Agnico Eagle Mines | | | 5,930 | | | | 365 | |
| | |
Aimia* | | | 116,660 | | | | 323 | |
| | |
Air Canada, Cl B* | | | 3,300 | | | | 123 | |
| | |
Algoma Central | | | 1,074 | | | | 11 | |
| | |
Algonquin Power & Utilities | | | 12,700 | | | | 180 | |
| | |
Alimentation Couche-Tard, Cl B | | | 72,505 | | | | 2,300 | |
| | |
AltaGas | | | 7,300 | | | | 111 | |
| | |
Atco, Cl I | | | 1,700 | | | | 65 | |
| | |
Atlantic Power* | | | 32,200 | | | | 75 | |
| | |
Aurora Cannabis* | | | 18,600 | | | | 40 | |
| | |
Bank of Montreal | | | 15,600 | | | | 1,209 | |
| | |
Bank of Nova Scotia | | | 80,853 | | | | 4,567 | |
| | |
Barrick Gold | | | 148,883 | | | | 2,766 | |
| | |
Bausch Health* | | | 8,100 | | | | 242 | |
| | |
BCE | | | 22,355 | | | | 1,036 | |
| | |
BlackBerry* | | | 133,278 | | | | 857 | |
| | |
Boardwalk‡ | | | 928 | | | | 33 | |
| | |
Bombardier, Cl B* | | | 56,700 | | | | 84 | |
| | |
Boyd Group Income Fund | | | 1,900 | | | | 296 | |
| | |
Brookfield Asset Management, Cl A | | | 78,234 | | | | 4,520 | |
| | |
BSR Real Estate Investment Trust‡ | | | 1,786 | | | | 21 | |
| | |
CAE | | | 90,886 | | | | 2,407 | |
| | |
Cameco | | | 9,800 | | | | 87 | |
| | |
Canadian Apartment Properties‡ | | | 1,900 | | | | 78 | |
| | |
Canadian Imperial Bank of Commerce | | | 10,900 | | | | 907 | |
| | |
Canadian National Railway | | | 79,166 | | | | 7,160 | |
| | |
Canadian National Railway | | | 17,600 | | | | 1,592 | |
| | |
Canadian Natural Resources | | | 100,458 | | | | 3,250 | |
| | |
Canadian Pacific Railway | | | 10,179 | | | | 2,595 | |
The accompanying notes are an integral part of the financial statements.
65
| | |
| THE KP FUNDS | | December 31, 2019 |
| | |
| KP International Equity Fund | | |
| | | | | | | | |
| Description | | Shares | | | Value
(000) | |
| | |
Canadian Tire, Cl A | | | 1,500 | | | $ | 161 | |
| | |
Canadian Utilities, Cl A | | | 3,000 | | | | 90 | |
| | |
Canadian Western Bank | | | 11,400 | | | | 280 | |
| | |
Canopy Growth* | | | 4,800 | | | | 101 | |
| | |
CCL Industries, Cl B | | | 3,800 | | | | 162 | |
| | |
Celestica* | | | 30,290 | | | | 251 | |
| | |
Cenovus Energy | | | 25,000 | | | | 254 | |
| | |
CGI, Cl A* | | | 5,800 | | | | 485 | |
| | |
CI Financial | | | 5,200 | | | | 87 | |
| | |
Cogeco Communications | | | 2,997 | | | | 261 | |
| | |
Computer Modelling Group | | | 41,000 | | | | 260 | |
| | |
Constellation Software | | | 2,459 | | | | 2,388 | |
| | |
CRH Medical* | | | 19,321 | | | | 67 | |
| | |
Cronos Group* | | | 4,700 | | | | 36 | |
| | |
Dollarama | | | 7,500 | | | | 258 | |
| | |
Dorel Industries, Cl B* | | | 7,800 | | | | 36 | |
| | |
Dream Hard Asset Alternatives Trust | | | 5,100 | | | | 30 | |
| | |
Dream Office‡ | | | 12,765 | | | | 306 | |
| | |
ECN Capital | | | 6,000 | | | | 22 | |
| | |
Emera | | | 5,700 | | | | 245 | |
| | |
Empire | | | 4,600 | | | | 108 | |
| | |
Enbridge | | | 49,500 | | | | 1,968 | |
| | |
Encana | | | 30,000 | | | | 140 | |
| | |
Enerflex | | | 18,447 | | | | 174 | |
| | |
Fairfax Financial Holdings | | | 8,071 | | | | 3,790 | |
| | |
First Capital Real Estate Investment Trust‡ | | | 5,000 | | | | 80 | |
| | |
First Quantum Minerals | | | 17,500 | | | | 177 | |
| | |
Fortis | | | 10,785 | | | | 447 | |
| | |
Franco-Nevada | | | 13,826 | | | | 1,428 | |
| | |
George Weston | | | 1,940 | | | | 154 | |
| | |
Gildan Activewear | | | 28,649 | | | | 847 | |
| | |
Great-West Lifeco | | | 6,500 | | | | 166 | |
| | |
H&R Real Estate Investment Trust‡ | | | 4,100 | | | | 67 | |
| | |
Hardwoods Distribution | | | 2,800 | | | | 35 | |
| | |
Heroux-Devtek* | | | 7,820 | | | | 115 | |
| | |
High Liner Foods | | | 24,000 | | | | 152 | |
| | |
Husky Energy | | | 8,400 | | | | 67 | |
| | |
Hydro One | | | 7,600 | | | | 147 | |
| | |
iA Financial | | | 23,700 | | | | 1,302 | |
| | |
IGM Financial | | | 1,900 | | | | 55 | |
| | |
Imperial Oil | | | 6,300 | | | | 167 | |
| | |
Intact Financial | | | 3,400 | | | | 368 | |
| | |
Inter Pipeline | | | 54,623 | | | | 948 | |
| | |
Keyera | | | 4,900 | | | | 128 | |
| | |
Kinross Gold* | | | 31,400 | | | | 149 | |
| | |
Kirkland Lake Gold | | | 4,700 | | | | 207 | |
| | | | | | | | |
| Description | | Shares | | | Value
(000) | |
| | |
Loblaw | | | 35,202 | | | $ | 1,816 | |
| | |
Lundin Mining | | | 15,200 | | | | 91 | |
| | |
Magna International | | | 20,800 | | | | 1,140 | |
| | |
Manulife Financial | | | 47,700 | | | | 968 | |
| | |
Martinrea International | | | 30,900 | | | | 341 | |
| | |
Methanex | | | 1,500 | | | | 58 | |
| | |
Metro, Cl A | | | 6,510 | | | | 269 | |
| | |
Morguard North American Residential Real Estate Investment Trust‡ | | | 16,100 | | | | 229 | |
| | |
National Bank of Canada | | | 8,300 | | | | 461 | |
| | |
Nexus Real Estate Investment Trust‡ | | | 36,000 | | | | 60 | |
| | |
Nutrien | | | 14,209 | | | | 680 | |
| | |
Onex | | | 2,000 | | | | 127 | |
| | |
Open Text | | | 6,700 | | | | 295 | |
| | |
Parkland Fuel | | | 3,600 | | | | 132 | |
| | |
Pembina Pipeline | | | 12,672 | | | | 470 | |
| | |
Plaza Retail‡ | | | 8,900 | | | | 31 | |
| | |
Polaris Infrastructure | | | 10,200 | | | | 96 | |
| | |
Power Corp of Canada | | | 7,031 | | | | 181 | |
| | |
Power Financial | | | 6,200 | | | | 167 | |
| | |
PrairieSky Royalty | | | 70,975 | | | | 832 | |
| | |
PRO Real Estate Investment Trust‡ | | | 18,200 | | | | 103 | |
| | |
Quebecor, Cl B | | | 4,500 | | | | 115 | |
| | |
Restaurant Brands International | | | 6,600 | | | | 420 | |
| | |
RioCan‡ | | | 3,900 | | | | 80 | |
| | |
Ritchie Bros Auctioneers | | | 4,153 | | | | 178 | |
| | |
Ritchie Bros Auctioneers | | | 31,928 | | | | 1,370 | |
| | |
Rogers Communications, Cl B | | | 24,177 | | | | 1,201 | |
| | |
Royal Bank of Canada | | | 35,100 | | | | 2,777 | |
| | |
Saputo | | | 6,000 | | | | 186 | |
| | |
Shaw Communications, Cl B | | | 11,218 | | | | 228 | |
| | |
Shopify, Cl A* | | | 2,400 | | | | 955 | |
| | |
SmartCentres‡ | | | 2,200 | | | | 53 | |
| | |
Spin Master* | | | 27,949 | | | | 851 | |
| | |
Stantec | | | 3,671 | | | | 104 | |
| | |
Stars Group* | | | 5,300 | | | | 138 | |
| | |
Sun Life Financial | | | 14,400 | | | | 657 | |
| | |
Suncor Energy | | | 195,389 | | | | 6,405 | |
| | |
TC Energy | | | 44,182 | | | | 2,354 | |
| | |
Teck Resources, Cl B | | | 11,700 | | | | 203 | |
| | |
TELUS | | | 4,700 | | | | 182 | |
| | |
Thomson Reuters | | | 5,040 | | | | 361 | |
| | |
TMX Group | | | 700 | | | | 61 | |
| | |
Toronto-Dominion Bank | | | 44,500 | | | | 2,496 | |
| | |
Total Energy Services | | | 20,428 | | | | 101 | |
| | |
Transcontinental, Cl A | | | 1,900 | | | | 23 | |
| | |
West Fraser Timber | | | 1,300 | | | | 57 | |
The accompanying notes are an integral part of the financial statements.
66
| | |
| THE KP FUNDS | | December 31, 2019 |
| | |
| KP International Equity Fund | | |
| | | | | | | | |
| Description | | Shares | | | Value
(000) | |
| | |
Wheaton Precious Metals | | | 11,169 | | | $ | 332 | |
| | |
WSP Global | | | 2,700 | | | | 184 | |
| | | | | | | | |
| | | | | | | 87,261 | |
| | | | | | | | |
|
Chile — 0.1% | |
| | |
CAP | | | 11,219 | | | | 85 | |
| | |
Cia Cervecerias Unidas | | | 70,994 | | | | 696 | |
| | |
Cia Sud Americana de Vapores* | | | 16,951,282 | | | | 617 | |
| | |
Colbun | | | 384,866 | | | | 61 | |
| | |
Enaex | | | 26,268 | | | | 262 | |
| | |
Enel Americas | | | 1,010,685 | | | | 224 | |
| | |
Quinenco | | | 541,734 | | | | 1,107 | |
| | | | | | | | |
| | | | | | | 3,052 | |
| | | | | | | | |
|
China — 3.0% | |
| | |
Alibaba Group Holding ADR* | | | 66,414 | | | | 14,087 | |
| | |
Anhui Conch Cement, Cl H | | | 405,780 | | | | 2,958 | |
| | |
Asia Cement China Holdings | | | 28,000 | | | | 42 | |
| | |
Autohome ADR* | | | 9,894 | | | | 792 | |
| | |
Baidu ADR* | | | 30,800 | | | | 3,893 | |
| | |
Bank of Communications, Cl H | | | 3,439,506 | | | | 2,445 | |
| | |
BeiGene ADR* | | | 900 | | | | 149 | |
| | |
CECEP COSTIN New Materials Group* | | | 1,134,000 | | | | — | |
| | |
Changyou.com ADR* | | | 20,909 | | | | 205 | |
| | |
China International Travel Service, Cl A | | | 217,950 | | | | 2,783 | |
| | |
China Telecom ADR | | | 7,941 | | | | 327 | |
| | |
Huazhu Group ADR | | | 98,061 | | | | 3,929 | |
| | |
JD.com ADR* | | | 71,101 | | | | 2,505 | |
| | |
Jiangsu Hengrui Medicine, Cl A | | | 119,567 | | | | 1,502 | |
| | |
Kweichow Moutai, Cl A | | | 15,200 | | | | 2,582 | |
| | |
Midea Group, Cl A | | | 299,800 | | | | 2,507 | |
| | |
Momo ADR* | | | 7,233 | | | | 242 | |
| | |
NetEase ADR | | | 20,258 | | | | 6,212 | |
| | |
New Oriental Education & Technology Group ADR* | | | 1,610 | | | | 195 | |
| | |
PetroChina, Cl H | | | 2,749,842 | | | | 1,380 | |
| | |
Qudian ADR* | | | 17,657 | | | | 83 | |
| | |
TAL Education Group ADR* | | | 45,895 | | | | 2,212 | |
| | |
TravelSky Technology, Cl H | | | 778,000 | | | | 1,899 | |
| | |
Tsingtao Brewery, Cl H | | | 232,427 | | | | 1,561 | |
| | |
Vipshop Holdings ADR* | | | 138,917 | | | | 1,968 | |
| | |
Xiwang Special Steel | | | 548,000 | | | | 34 | |
| | |
Yum China Holdings | | | 109,416 | | | | 5,254 | |
| | |
Zhangzhou Pientzehuang Pharmaceutical, Cl A | | | 107,400 | | | | 1,694 | |
| | | | | | | | |
| | | | | | | 63,440 | |
| | | | | | | | |
| | | | | | | | |
| Description | | Shares | | | Value
(000) | |
|
Colombia — 0.1% | |
| | |
Bancolombia ADR | | | 23,786 | | | $ | 1,303 | |
| | |
Ecopetrol ADR | | | 27,040 | | | | 540 | |
| | |
Grupo Aval Acciones y Valores ADR | | | 19,709 | | | | 172 | |
| | | | | | | | |
| | | | | | | 2,015 | |
| | | | | | | | |
|
Cypress — 0.0% | |
| | |
QIWI ADR | | | 8,864 | | | | 172 | |
| | | | | | | | |
| | |
Czech Republic — 0.0% | | | | | | | | |
| | |
Komercni Banka | | | 15,497 | | | | 567 | |
| | | | | | | | |
| | |
Denmark — 1.7% | | | | | | | | |
| | |
ALK-Abello* | | | 2,327 | | | | 571 | |
| | |
AP Moeller - Maersk, Cl A | | | 101 | | | | 137 | |
| | |
AP Moeller - Maersk, Cl B | | | 166 | | | | 239 | |
| | |
Carlsberg, Cl B | | | 30,472 | | | | 4,546 | |
| | |
Chr Hansen Holding | | | 2,717 | | | | 216 | |
| | |
Coloplast, Cl B | | | 31,048 | | | | 3,848 | |
| | |
Danske Bank | | | 24,931 | | | | 403 | |
| | |
Demant* | | | 47,734 | | | | 1,504 | |
| | |
DSV PANALPINA | | | 5,354 | | | | 617 | |
| | |
Genmab* | | | 1,611 | | | | 358 | |
| | |
GN Store Nord | | | 53,099 | | | | 2,498 | |
| | |
H Lundbeck | | | 1,960 | | | | 75 | |
| | |
H+H International, Cl B* | | | 3,440 | | | | 64 | |
| | |
ISS | | | 3,609 | | | | 87 | |
| | |
Novo Nordisk, Cl B | | | 213,059 | | | | 12,372 | |
| | |
Novozymes, Cl B | | | 5,122 | | | | 250 | |
| | |
Orsted | | | 17,356 | | | | 1,797 | |
| | |
Pandora | | | 2,445 | | | | 106 | |
| | |
Per Aarsleff Holding | | | 3,853 | | | | 124 | |
| | |
SimCorp | | | 8,925 | | | | 1,015 | |
| | |
Spar Nord Bank | | | 25,771 | | | | 248 | |
| | |
Topdanmark | | | 1,030 | | | | 51 | |
| | |
Tryg | | | 2,764 | | | | 82 | |
| | |
Vestas Wind Systems | | | 37,740 | | | | 3,805 | |
| | | | | | | | |
| | | | | | | 35,013 | |
| | | | | | | | |
|
Finland — 0.7% | |
| | |
Elisa | | | 3,712 | | | | 205 | |
| | |
Fiskars Abp | | | 1,923 | | | | 24 | |
| | |
Fortum | | | 10,653 | | | | 263 | |
| | |
Huhtamaki | | | 10,198 | | | | 473 | |
| | |
Kemira | | | 46,139 | | | | 688 | |
| | |
Kone, Cl B | | | 8,381 | | | | 548 | |
| | |
Metso | | | 2,427 | | | | 96 | |
| | |
Neste | | | 10,484 | | | | 365 | |
| | |
Nokia* | | | 139,081 | | | | 516 | |
The accompanying notes are an integral part of the financial statements.
67
| | |
| THE KP FUNDS | | December 31, 2019 |
| | |
| KP International Equity Fund | | |
| | | | | | | | |
| Description | | Shares | | | Value
(000) | |
| | |
Nokian Renkaat | | | 157,480 | | | $ | 4,529 | |
| | |
Nordea Bank Abp | | | 3,302 | | | | 27 | |
| | |
Orion, Cl B | | | 2,841 | | | | 131 | |
| | |
Sampo, Cl A | | | 59,962 | | | | 2,618 | |
| | |
Stora Enso, Cl R | | | 15,174 | | | | 221 | |
| | |
Terveystalo* | | | 7,304 | | | | 92 | |
| | |
Tikkurila | | | 103,736 | | | | 1,695 | |
| | |
Tokmanni Group | | | 10,550 | | | | 150 | |
| | |
UPM-Kymmene | | | 13,184 | | | | 457 | |
| | |
Wartsila, Cl B | | | 55,692 | | | | 615 | |
| | | | | | | | |
| | | | | | | 13,713 | |
| | | | | | | | |
|
France — 6.9% | |
| | |
Accor | | | 4,280 | | | | 200 | |
| | |
Aeroports de Paris | | | 686 | | | | 136 | |
| | |
Air France-KLM* | | | 17,307 | | | | 193 | |
| | |
Air Liquide | | | 148,201 | | | | 20,978 | |
| | |
Airbus Group | | | 26,827 | | | | 3,927 | |
| | |
Akka Technologies | | | 2,090 | | | | 154 | |
| | |
Alstom* | | | 4,957 | | | | 235 | |
| | |
Alten | | | 6,603 | | | | 833 | |
| | |
Amundi | | | 1,408 | | | | 110 | |
| | |
Arkema | | | 1,600 | | | | 170 | |
| | |
Atos | | | 2,557 | | | | 213 | |
| | |
AXA | | | 94,045 | | | | 2,649 | |
| | |
Bigben Interactive | | | 13,371 | | | | 240 | |
| | |
BioMerieux | | | 952 | | | | 85 | |
| | |
BNP Paribas | | | 58,170 | | | | 3,447 | |
| | |
Bollore | | | 22,028 | | | | 96 | |
| | |
Bollore | | | 128 | | | | 1 | |
| | |
Bouygues | | | 5,335 | | | | 227 | |
| | |
Bureau Veritas | | | 7,497 | | | | 196 | |
| | |
Capital Gemini | | | 3,926 | | | | 480 | |
| | |
Carrefour | | | 15,107 | | | | 253 | |
| | |
Casino Guichard Perrachon | | | 1,370 | | | | 64 | |
| | |
Catana Group* | | | 31,342 | | | | 152 | |
| | |
Cie de Saint-Gobain | | | 12,134 | | | | 497 | |
| | |
Cie Generale des Etablissements Michelin SCA | | | 4,213 | | | | 516 | |
| | |
CNP Assurances | | | 4,404 | | | | 88 | |
| | |
Coface* | | | 23,591 | | | | 290 | |
| | |
Covivio‡ | | | 1,216 | | | | 138 | |
| | |
Credit Agricole | | | 28,552 | | | | 414 | |
| | |
Criteo ADR* | | | 5,700 | | | | 99 | |
| | |
Danone | | | 76,369 | | | | 6,331 | |
| | |
Dassault Aviation | | | 62 | | | | 81 | |
| | |
Dassault Systemes | | | 15,026 | | | | 2,470 | |
| | | | | | | | |
| Description | | Shares | | | Value
(000) | |
| | |
Edenred | | | 39,194 | | | $ | 2,027 | |
| | |
Eiffage | | | 1,871 | | | | 214 | |
| | |
Electricite de France | | | 16,057 | | | | 179 | |
| | |
Elis* | | | 64,717 | | | | 1,343 | |
| | |
Engie | | | 289,142 | | | | 4,670 | |
| | |
EssilorLuxottica | | | 51,100 | | | | 7,784 | |
| | |
Eurazeo | | | 7,760 | | | | 531 | |
| | |
Eurofins Scientific | | | 2,826 | | | | 1,566 | |
| | |
Eutelsat Communications | | | 4,495 | | | | 73 | |
| | |
Faurecia | | | 1,901 | | | | 102 | |
| | |
Focus Home Interactive* | | | 244 | | | | 7 | |
| | |
Gaztransport Et Technigaz | | | 9,772 | | | | 936 | |
| | |
Gecina‡ | | | 1,179 | | | | 210 | |
| | |
Getlink | | | 58,698 | | | | 1,021 | |
| | |
Hermes International | | | 1,944 | | | | 1,453 | |
| | |
ICADE‡ | | | 705 | | | | 77 | |
| | |
Iliad | | | 670 | | | | 87 | |
| | |
Imerys | | | 2,349 | | | | 99 | |
| | |
Ingenico Group | | | 1,592 | | | | 173 | |
| | |
Innate Pharma* | | | 20,038 | | | | 134 | |
| | |
Ipsen | | | 996 | | | | 88 | |
| | |
JCDecaux | | | 16,346 | | | | 504 | |
| | |
Kaufman & Broad | | | 1,631 | | | | 68 | |
| | |
Kering | | | 1,850 | | | | 1,214 | |
| | |
Klepierre‡ | | | 4,650 | | | | 177 | |
| | |
Korian | | | 11,679 | | | | 549 | |
| | |
LafargeHolcim | | | 69 | | | | 4 | |
| | |
Lagardere | | | 63,718 | | | | 1,388 | |
| | |
Legrand | | | 77,718 | | | | 6,333 | |
| | |
L’Oreal | | | 20,526 | | | | 6,078 | |
| | |
LVMH Moet Hennessy Louis Vuitton | | | 23,668 | | | | 10,997 | |
| | |
Mersen | | | 8,853 | | | | 339 | |
| | |
Metropole Television | | | 10,913 | | | | 205 | |
| | |
Natixis | | | 23,654 | | | | 105 | |
| | |
Nexans | | | 6,487 | | | | 316 | |
| | |
Orange | | | 48,571 | | | | 715 | |
| | |
Pernod Ricard | | | 41,963 | | | | 7,503 | |
| | |
Peugeot | | | 14,559 | | | | 348 | |
| | |
Publicis Groupe | | | 5,407 | | | | 245 | |
| | |
Quadient | | | 8,519 | | | | 206 | |
| | |
Remy Cointreau | | | 508 | | | | 62 | |
| | |
Renault | | | 4,985 | | | | 236 | |
| | |
Rexel | | | 48,992 | | | | 651 | |
| | |
Safran | | | 7,997 | | | | 1,235 | |
| | |
Sanofi | | | 27,592 | | | | 2,774 | |
| | |
Sartorius Stedim Biotech | | | 632 | | | | 105 | |
| | |
Schneider Electric | | | 138,640 | | | | 14,229 | |
The accompanying notes are an integral part of the financial statements.
68
| | |
| THE KP FUNDS | | December 31, 2019 |
| | |
| KP International Equity Fund | | |
| | | | | | | | |
| Description | | Shares | | | Value
(000) | |
| | |
SCOR | | | 4,101 | | | $ | 172 | |
| | |
SEB | | | 623 | | | | 93 | |
| | |
Seche Environnement | | | 1,348 | | | | 57 | |
| | |
SES, Cl A | | | 9,380 | | | | 132 | |
| | |
Societe Generale | | | 19,952 | | | | 694 | |
| | |
Sodexo | | | 2,231 | | | | 265 | |
| | |
SOITEC* | | | 2,723 | | | | 286 | |
| | |
Somfy | | | 662 | | | | 65 | |
| | |
Sopra Steria Group | | | 1,409 | | | | 227 | |
| | |
STMicroelectronics | | | 16,892 | | | | 454 | |
| | |
Suez | | | 8,607 | | | | 130 | |
| | |
TechnipFMC | | | 12,825 | | | | 272 | |
| | |
Teleperformance | | | 4,571 | | | | 1,114 | |
| | |
Thales | | | 8,104 | | | | 841 | |
| | |
TOTAL | | | 211,931 | | | | 11,696 | |
| | |
Ubisoft Entertainment* | | | 2,183 | | | | 151 | |
| | |
Valeo | | | 6,096 | | | | 215 | |
| | |
Veolia Environnement | | | 13,340 | | | | 355 | |
| | |
Vicat | | | 3,969 | | | | 180 | |
| | |
Vinci | | | 12,481 | | | | 1,386 | |
| | |
Virbac* | | | 286 | | | | 76 | |
| | |
Vivendi | | | 20,747 | | | | 600 | |
| | |
Wendel | | | 695 | | | | 92 | |
| | |
Worldline* | | | 2,546 | | | | 180 | |
| | | | | | | | |
| | | | | | | 145,056 | |
| | | | | | | | |
| | |
Germany — 5.4% | | | | | | | | |
| | |
adidas | | | 11,062 | | | | 3,613 | |
| | |
Affimed* | | | 41,977 | | | | 115 | |
| | |
Allianz | | | 10,393 | | | | 2,547 | |
| | |
alstria office‡ | | | 24,997 | | | | 471 | |
| | |
Amadeus Fire | | | 2,156 | | | | 358 | |
| | |
Aroundtown | | | 23,956 | | | | 215 | |
| | |
Atoss Software | | | 70 | | | | 11 | |
| | |
BASF | | | 120,656 | | | | 9,153 | |
| | |
Bauer | | | 3,014 | | | | 51 | |
| | |
Bayer | | | 117,361 | | | | 9,582 | |
| | |
Bayerische Motoren Werke | | | 90,201 | | | | 7,416 | |
| | |
Beiersdorf | | | 64,139 | | | | 7,681 | |
| | |
Borussia Dortmund GmbH & KGaA | | | 2,047 | | | | 20 | |
| | |
Brenntag | | | 25,771 | | | | 1,410 | |
| | |
Carl Zeiss Meditec | | | 1,022 | | | | 131 | |
| | |
Commerzbank | | | 25,737 | | | | 160 | |
| | |
CompuGroup Medical | | | 3,632 | | | | 261 | |
| | |
Continental | | | 2,724 | | | | 351 | |
| | |
Corestate Capital Holding | | | 12,602 | | | | 533 | |
| | |
Covestro | | | 4,529 | | | | 212 | |
| | |
CropEnergies | | | 11,741 | | | | 145 | |
| | | | | | | | |
| Description | | Shares | | | Value
(000) | |
| | |
CTS Eventim & KGaA | | | 23,641 | | | $ | 1,489 | |
| | |
Daimler | | | 22,211 | | | | 1,233 | |
| | |
Delivery Hero* | | | 2,862 | | | | 227 | |
| | |
Dermapharm Holding | | | 4,882 | | | | 218 | |
| | |
Deutsche Bank | | | 48,637 | | | | 380 | |
| | |
Deutsche Boerse | | | 27,828 | | | | 4,387 | |
| | |
Deutsche Lufthansa | | | 5,900 | | | | 109 | |
| | |
Deutsche Post | | | 24,123 | | | | 924 | |
| | |
Deutsche Telekom | | | 142,124 | | | | 2,321 | |
| | |
Deutsche Wohnen | | | 8,930 | | | | 367 | |
| | |
DIC Asset | | | 39,234 | | | | 702 | |
| | |
Draegerwerk & KGaA | | | 908 | | | | 41 | |
| | |
E.ON | | | 55,336 | | | | 592 | |
| | |
Encavis | | | 39,465 | | | | 416 | |
| | |
Evonik Industries | | | 4,295 | | | | 132 | |
| | |
Evotec* | | | 9,857 | | | | 257 | |
| | |
Fraport Frankfurt Airport Services Worldwide | | | 944 | | | | 81 | |
| | |
Freenet | | | 6,645 | | | | 152 | |
| | |
Fresenius & KGaA | | | 10,298 | | | | 581 | |
| | |
Fresenius Medical Care & KGaA | | | 31,460 | | | | 2,337 | |
| | |
GEA Group | | | 10,687 | | | | 353 | |
| | |
Gerresheimer | | | 14,357 | | | | 1,118 | |
| | |
GFT Technologies | | | 1,700 | | | | 22 | |
| | |
Hamburger Hafen und Logistik | | | 4,931 | | | | 136 | |
| | |
Hannover Rueck | | | 4,067 | | | | 787 | |
| | |
HeidelbergCement | | | 3,746 | | | | 275 | |
| | |
HelloFresh* | | | 53,725 | | | | 1,129 | |
| | |
Henkel & KGaA | | | 45,759 | | | | 4,327 | |
| | |
Hochtief | | �� | 557 | | | | 72 | |
| | |
Hornbach Holding & KGaA | | | 2,890 | | | | 209 | |
| | |
Infineon Technologies | | | 30,418 | | | | 695 | |
| | |
IVU Traffic Technologies | | | 5,518 | | | | 77 | |
| | |
KION Group | | | 1,675 | | | | 116 | |
| | |
Kloeckner | | | 37,906 | | | | 269 | |
| | |
Knorr-Bremse | | | 1,228 | | | | 126 | |
| | |
LANXESS | | | 1,951 | | | | 132 | |
| | |
Linde | | | 18,056 | | | | 3,863 | |
| | |
LPKF Laser & Electronics* | | | 13,154 | | | | 233 | |
| | |
Medios* | | | 354 | | | | 10 | |
| | |
Merck KGaA | | | 38,281 | | | | 4,536 | |
| | |
METRO | | | 4,050 | | | | 65 | |
| | |
MTU Aero Engines | | | 9,957 | | | | 2,854 | |
| | |
Muenchener Rueckversicherungs-Gesellschaft in Muenchen | | | 3,522 | | | | 1,039 | |
| | |
New Work | | | 431 | | | | 141 | |
| | |
Nexus | | | 1,524 | | | | 59 | |
The accompanying notes are an integral part of the financial statements.
69
| | |
| THE KP FUNDS | | December 31, 2019 |
| | |
| KP International Equity Fund | | |
| | | | | | | | |
| Description | | Shares | | | Value
(000) | |
| | |
ProSiebenSat.1 Media | | | 98,471 | | | $ | 1,546 | |
| | |
Puma | | | 1,922 | | | | 147 | |
| | |
QIAGEN* | | | 70,699 | | | | 2,424 | |
| | |
RWE | | | 14,442 | | | | 445 | |
| | |
SAP | | | 137,081 | | | | 18,600 | |
| | |
Siemens | | | 18,730 | | | | 2,454 | |
| | |
Siemens Healthineers | | | 3,921 | | | | 188 | |
| | |
Software | | | 15,610 | | | | 545 | |
| | |
Stabilus | | | 12,707 | | | | 870 | |
| | |
Symrise, Cl A | | | 3,230 | | | | 341 | |
| | |
Telefonica Deutschland Holding | | | 22,709 | | | | 66 | |
| | |
ThyssenKrupp* | | | 10,582 | | | | 144 | |
| | |
Traffic Systems | | | 619 | | | | 16 | |
| | |
TUI | | | 33,040 | | | | 425 | |
| | |
Uniper | | | 5,228 | | | | 173 | |
| | |
United Internet | | | 3,313 | | | | 110 | |
| | |
Volkswagen | | | 752 | | | | 147 | |
| | |
Vonovia | | | 12,755 | | | | 688 | |
| | |
Wirecard | | | 2,906 | | | | 353 | |
| | |
Wuestenrot & Wuerttembergische | | | 11,868 | | | | 258 | |
| | |
Zalando* | | | 3,202 | | | | 162 | |
| | |
zooplus* | | | 1,249 | | | | 120 | |
| | | | | | | | |
| | | | | | | 114,247 | |
| | | | | | | | |
|
Greece — 0.4% | |
| | |
Aegean Airlines | | | 27,543 | | | | 260 | |
| | |
Costamare | | | 7,305 | | | | 70 | |
| | |
Eurobank Ergasias* | | | 3,065,162 | | | | 3,163 | |
| | |
Fourlis Holdings* | | | 73,735 | | | | 479 | |
| | |
Hellenic Petroleum | | | 8,507 | | | | 84 | |
| | |
Hellenic Telecommunications Organization | | | 63,322 | | | | 1,013 | |
| | |
JUMBO | | | 78,074 | | | | 1,624 | |
| | |
Motor Oil Hellas Corinth Refineries | | | 58,239 | | | | 1,347 | |
| | |
Tsakos Energy Navigation | | | 15,883 | | | | 69 | |
| | | | | | | | |
| | | | | | | 8,109 | |
| | | | | | | | |
|
Hong Kong — 6.5% | |
| | |
Agile Group Holdings | | | 132,000 | | | | 199 | |
| | |
Agricultural Bank of China, Cl H | | | 5,177,000 | | | | 2,279 | |
| | |
AIA Group | | | 1,901,800 | | | | 19,963 | |
| | |
Ajisen China Holdings | | | 655,000 | | | | 233 | |
| | |
Analogue Holdings | | | 34,000 | | | | 4 | |
| | |
ASM Pacific Technology | | | 7,700 | | | | 107 | |
| | |
BAIC Motor, Cl H | | | 589,239 | | | | 334 | |
| | |
Bank of China, Cl H | | | 6,227,000 | | | | 2,661 | |
| | |
Bank of East Asia | | | 37,013 | | | | 83 | |
| | |
Beijing North Star, Cl H | | | 45,571 | | | | 15 | |
| | | | | | | | |
| Description | | Shares | | | Value
(000) | |
| | |
BOC Hong Kong Holdings | | | 92,000 | | | $ | 319 | |
| | |
Bosideng International Holdings | | | 344,000 | | | | 124 | |
| | |
Brightoil Petroleum Holdings* | | | 155,000 | | | | 7 | |
| | |
Budweiser Brewing APAC* | | | 31,700 | | | | 107 | |
| | |
Cafe de Coral Holdings | | | 163,500 | | | | 387 | |
| | |
Champion‡ | | | 257,000 | | | | 170 | |
| | |
Chanjet Information Technology, Cl H | | | 800 | | | | 1 | |
| | |
China Aoyuan Group | | | 658,199 | | | | 1,073 | |
| | |
China Construction Bank, Cl H | | | 5,721,000 | | | | 4,941 | |
| | |
China Everbright Bank, Cl H | | | 489,000 | | | | 227 | |
| | |
China Meidong Auto Holdings | | | 42,000 | | | | 55 | |
| | |
China Mengniu Dairy | | | 167,000 | | | | 675 | |
| | |
China Minsheng Banking, Cl H | | | 430,127 | | | | 325 | |
| | |
China Mobile | | | 939,000 | | | | 7,893 | |
| | |
China National Building Material, Cl H | | | 1,162,168 | | | | 1,298 | |
| | |
China Overseas Grand Oceans Group | | | 93,000 | | | | 64 | |
| | |
China Pacific Insurance Group, Cl H | | | 553,000 | | | | 2,179 | |
| | |
China Resources Cement Holdings | | | 352,000 | | | | 448 | |
| | |
China SCE Group Holdings | | | 434,000 | | | | 253 | |
| | |
China Unicom Hong Kong | | | 888,000 | | | | 836 | |
| | |
China Vanke, Cl H | | | 676,577 | | | | 2,886 | |
| | |
CIFI Holdings Group | | | 280,000 | | | | 237 | |
| | |
CITIC | | | 383,000 | | | | 512 | |
| | |
CITIC Telecom International Holdings | | | 410,000 | | | | 149 | |
| | |
CK Asset Holdings | | | 64,138 | | | | 463 | |
| | |
CK Hutchison Holdings | | | 243,384 | | | | 2,321 | |
| | |
CK Infrastructure Holdings | | | 16,500 | | | | 117 | |
| | |
CK Life Sciences Int’l Holdings | | | 652,926 | | | | 73 | |
| | |
CLP Holdings | | | 137,500 | | | | 1,446 | |
| | |
CNOOC | | | 2,668,000 | | | | 4,438 | |
| | |
Convoy Global Holdings* | | | 402,000 | | | | 2 | |
| | |
Country Garden Holdings | | | 91,621 | | | | 147 | |
| | |
Dah Sing Banking Group | | | 51,600 | | | | 69 | |
| | |
Dah Sing Financial Holdings | | | 8,073 | | | | 32 | |
| | |
Dynam Japan Holdings | | | 96,200 | | | | 126 | |
| | |
Edvantage Group Holdings | | | 212,000 | | | | 116 | |
| | |
Esprit Holdings* | | | 1,918,777 | | | | 387 | |
| | |
First Pacific | | | 641,857 | | | | 218 | |
| | |
Galaxy Entertainment Group* | | | 54,000 | | | | 397 | |
| | |
Goodbaby International Holdings* | | | 326,000 | | | | 72 | |
| | |
Guangnan Holdings | | | 210,000 | | | | 21 | |
| | |
Haier Electronics Group | | | 785,416 | | | | 2,454 | |
| | |
Hang Lung Properties | | | 50,000 | | | | 110 | |
The accompanying notes are an integral part of the financial statements.
70
| | |
| THE KP FUNDS | | December 31, 2019 |
| | |
| KP International Equity Fund | | |
| | | | | | | | |
| Description | | Shares | | | Value
(000) | |
| | |
Hang Seng Bank | | | 18,900 | | | $ | 391 | |
| | |
Henderson Land Development | | | 37,708 | | | | 185 | |
| | |
Hengdeli Holdings | | | 424,000 | | | | 18 | |
| | |
HK Electric Investments & HK Electric Investments | | | 67,158 | | | | 66 | |
| | |
HKR International | | | 193,600 | | | | 80 | |
| | |
HKT Trust | | | 87,740 | | | | 124 | |
| | |
Hong Kong & China Gas | | | 250,228 | | | | 489 | |
| | |
Hong Kong Exchanges and Clearing | | | 29,172 | | | | 947 | |
| | |
Hongkong & Shanghai Hotels | | | 262,249 | | | | 281 | |
| | |
HSBC Holdings | | | 1,168,657 | | | | 9,126 | |
| | |
Industrial & Commercial Bank of China, Cl H | | | 5,281,000 | | | | 4,066 | |
| | |
IRC* | | | 2,784,000 | | | | 42 | |
| | |
Johnson Electric Holdings | | | 304,070 | | | | 692 | |
| | |
K Wah International Holdings | | | 231,000 | | | | 129 | |
| | |
Kaisa Group Holdings | | | 72,275 | | | | 35 | |
| | |
Kaisa Prosperity Holdings | | | 104,026 | | | | 280 | |
| | |
Kerry Properties | | | 14,500 | | | | 46 | |
| | |
Kingboard Holdings | | | 255,340 | | | | 809 | |
| | |
Lenovo Group | | | 2,540,000 | | | | 1,705 | |
| | |
Leyou Technologies Holdings* | | | 410,000 | | | | 123 | |
| | |
Li & Fung | | | 662,000 | | | | 72 | |
| | |
Li Ning | | | 441,500 | | | | 1,323 | |
| | |
Link‡ | | | 52,000 | | | | 551 | |
| | |
L’Occitane International | | | 140,385 | | | | 333 | |
| | |
Logan Property Holdings | | | 884,000 | | | | 1,483 | |
| | |
Longfor Group Holdings | | | 192,000 | | | | 899 | |
| | |
Lonking Holdings | | | 320,000 | | | | 96 | |
| | |
Melco International Development | | | 140,000 | | | | 393 | |
| | |
Melco Resorts & Entertainment ADR | | | 4,873 | | | | 118 | |
| | |
Metallurgical Corp of China, Cl H | | | 62,000 | | | | 14 | |
| | |
MTR | | | 39,877 | | | | 236 | |
| | |
New World Development | | | 181,459 | | | | 249 | |
| | |
Nine Dragons Paper Holdings | | | 179,000 | | | | 186 | |
| | |
Nissin Foods | | | 61,000 | | | | 48 | |
| | |
NWS Holdings | | | 42,252 | | | | 59 | |
| | |
PCCW | | | 114,136 | | | | 68 | |
| | |
Pentamaster International | | | 140,000 | | | | 34 | |
| | |
Perfect Shape Medical | | | 664,716 | | | | 262 | |
| | |
PICC Property & Casualty, Cl H | | | 70,000 | | | | 84 | |
| | |
Pico Far East Holdings | | | 18,000 | | | | 6 | |
| | |
Ping An Insurance Group of China, Cl H | | | 958,500 | | | | 11,329 | |
| | |
Poly Property Group | | | 111,374 | | | | 46 | |
| | |
Polytec Asset Holdings | | | 415,000 | | | | 53 | |
| | | | | | | | |
| Description | | Shares | | | Value
(000) | |
| | |
Power Assets Holdings | | | 33,000 | | | $ | 241 | |
| | |
Q Technology Group* | | | 236,000 | | | | 391 | |
| | |
Sands China | | | 60,400 | | | | 323 | |
| | |
Scud Group* | | | 252,000 | | | | 10 | |
| | |
Shenzhou International Group Holdings | | | 213,000 | | | | 3,114 | |
| | |
Shimao Property Holdings | | | 119,000 | | | | 461 | |
| | |
Shui On Land | | | 287,500 | | | | 63 | |
| | |
Shun Tak Holdings | | | 736,000 | | | | 351 | |
| | |
Sino Land | | | 70,614 | | | | 103 | |
| | |
Sinotruk Hong Kong | | | 611,126 | | | | 1,303 | |
| | |
SJM Holdings | | | 44,000 | | | | 50 | |
| | |
SmarTone Telecommunications Holdings | | | 66,447 | | | | 51 | |
| | |
Stella International Holdings | | | 662,448 | | | | 1,063 | |
| | |
Sun Hung Kai Properties | | | 38,893 | | | | 595 | |
| | |
Sunac China Holdings | | | 123,000 | | | | 735 | |
| | |
Sunlight‡ | | | 84,000 | | | | 54 | |
| | |
Swire Pacific, Cl A | | | 13,000 | | | | 121 | |
| | |
Swire Properties | | | 28,600 | | | | 95 | |
| | |
Tai Hing Group Holdings | | | 88,000 | | | | 19 | |
| | |
Techtronic Industries | | | 34,000 | | | | 277 | |
| | |
Television Broadcasts | | | 146,500 | | | | 230 | |
| | |
Tencent Holdings | | | 240,600 | | | | 11,597 | |
| | |
Tencent Music Entertainment Group ADR* | | | 203,125 | | | | 2,384 | |
| | |
Texwinca Holdings | | | 58,342 | | | | 14 | |
| | |
Tianyun International Holdings | | | 328,000 | | | | 42 | |
| | |
Times China Holdings | | | 403,000 | | | | 804 | |
| | |
Times Neighborhood* | | | 103,846 | | | | 65 | |
| | |
Tingyi Cayman Islands Holding | | | 807,014 | | | | 1,377 | |
| | |
Town Health International Medical Group | | | 154,000 | | | | 7 | |
| | |
Trip.com Group ADR* | | | 11,918 | | | | 400 | |
| | |
United Laboratories International Holdings | | | 154,000 | | | | 112 | |
| | |
Vitasoy International Holdings | | | 18,000 | | | | 65 | |
| | |
VTech Holdings | | | 13,200 | | | | 130 | |
| | |
Want Want China Holdings | | | 1,652,996 | | | | 1,545 | |
| | |
Weichai Power, Cl H | | | 765,000 | | | | 1,615 | |
| | |
WH Group | | | 229,101 | | | | 237 | |
| | |
Wharf Real Estate Investment | | | 31,000 | | | | 189 | |
| | |
Wheelock | | | 19,000 | | | | 127 | |
| | |
Wynn Macau | | | 38,000 | | | | 94 | |
| | |
Xinyi Glass Holdings | | | 1,910,000 | | | | 2,530 | |
| | |
Yue Yuen Industrial Holdings | | | 413,000 | | | | 1,219 | |
| | |
Zhongsheng Group Holdings | | | 151,500 | | | | 620 | |
| | | | | | | | |
| | | | | | | 136,452 | |
| | | | | | | | |
The accompanying notes are an integral part of the financial statements.
71
| | |
| THE KP FUNDS | | December 31, 2019 |
| | |
| KP International Equity Fund | | |
| | | | | | | | |
| Description | | Shares | | | Value
(000) | |
|
Hungary — 0.1% | |
| | |
OTP Bank Nyrt | | | 38,899 | | | $ | 2,033 | |
| | | | | | | | |
| | |
India — 2.7% | | | | | | | | |
| | |
Asian Paints | | | 69,437 | | | | 1,736 | |
| | |
Avanti Feeds | | | 10,989 | | | | 90 | |
| | |
Axis Bank | | | 165,612 | | | | 1,750 | |
| | |
Bajaj Finance | | | 44,229 | | | | 2,625 | |
| | |
Bata India | | | 7,214 | | | | 177 | |
| | |
Bharti Airtel* | | | 181,613 | | | | 1,159 | |
| | |
Birlasoft | | | 5,074 | | | | 5 | |
| | |
Britannia Industries | | | 40,906 | | | | 1,735 | |
| | |
Gujarat State Petronet | | | 36,137 | | | | 111 | |
| | |
HCL Technologies | | | 3,564 | | | | 28 | |
| | |
HDFC Bank | | | 192,894 | | | | 3,438 | |
| | |
HDFC Bank ADR | | | 3,684 | | | | 233 | |
| | |
HDFC Life Insurance | | | 232,268 | | | | 2,037 | |
| | |
HEG | | | 10,386 | | | | 155 | |
| | |
Hindustan Unilever | | | 10,075 | | | | 271 | |
| | |
Housing Development Finance | | | 207,682 | | | | 7,020 | |
| | |
IndusInd Bank | | | 99,135 | | | | 2,097 | |
| | |
Infosys ADR | | | 509,900 | | | | 5,262 | |
| | |
Infosys | | | 276,815 | | | | 2,836 | |
| | |
JK Paper | | | 13,433 | | | | 23 | |
| | |
KPIT Technologies | | | 66,647 | | | | 88 | |
| | |
Manappuram Finance | | | 252,043 | | | | 626 | |
| | |
Maruti Suzuki India | | | 12,372 | | | | 1,277 | |
| | |
Motherson Sumi Systems | | | 987,202 | | | | 2,027 | |
| | |
Mphasis | | | 21,511 | | | | 278 | |
| | |
MRF | | | 2,216 | | | | 2,059 | |
| | |
Muthoot Finance* | | | 29,185 | | | | 311 | |
| | |
Oil & Natural Gas | | | 120,753 | | | | 218 | |
| | |
Petronet LNG | | | 464,261 | | | | 1,743 | |
| | |
Power Finance* | | | 324,487 | | | | 536 | |
| | |
Redington India | | | 5,025 | | | | 8 | |
| | |
Reliance Industries | | | 127,191 | | | | 2,698 | |
| | |
Shriram Transport Finance | | | 27,169 | | | | 446 | |
| | |
Sobha | | | 5,342 | | | | 30 | |
| | |
Tata Consultancy Services | | | 227,231 | | | | 6,883 | |
| | |
UPL | | | 288,176 | | | | 2,360 | |
| | |
Vodafone Idea* | | | 6,496,326 | | | | 560 | |
| | |
Wipro | | | 551,567 | | | | 1,899 | |
| | |
WNS Holdings ADR* | | | 2,386 | | | | 158 | |
| | | | | | | | |
| | | | | | | 56,993 | |
| | | | | | | | |
|
Indonesia — 0.5% | |
| | |
Bank Negara Indonesia Persero | | | 2,554,700 | | | | 1,438 | |
| | |
Bank Pembangunan Daerah Jawa Timur | | | 467,000 | | | | 23 | |
| | | | | | | | |
| Description | | Shares | | | Value
(000) | |
| | |
Bank Rakyat Indonesia Persero | | | 12,602,700 | | | $ | 3,979 | |
| | |
Media Nusantara Citra | | | 6,311,243 | | | | 740 | |
| | |
Mitra Pinasthika Mustika | | | 462,700 | | | | 22 | |
| | |
Perusahaan Gas Negara | | | 1,639,600 | | | | 256 | |
| | |
Puradelta Lestari | | | 2,315,300 | | | | 49 | |
| | |
Telekomunikasi Indonesia Persero | | | 11,216,700 | | | | 3,199 | |
| | |
Unilever Indonesia | | | 508,400 | | | | 1,538 | |
| | | | | | | | |
| | | | | | | 11,244 | |
| | | | | | | | |
|
Ireland — 0.9% | |
| | |
AC Immune* | | | 6,943 | | | | 59 | |
| | |
AerCap Holdings* | | | 2,902 | | | | 178 | |
| | |
AIB Group | | | 22,258 | | | | 78 | |
| | |
Bank of Ireland Group | | | 171,043 | | | | 936 | |
| | |
CRH | | | 238,710 | | | | 9,551 | |
| | |
Fly Leasing ADR* | | | 26,900 | | | | 528 | |
| | |
Irish Continental Group | | | 90,054 | | | | 489 | |
| | |
Paddy Power Betfair | | | 5,723 | | | | 696 | |
| | |
Ryanair Holdings ADR* | | | 61,156 | | | | 5,358 | |
| | |
Smurfit Kappa Group | | | 5,885 | | | | 226 | |
| | | | | | | | |
| | | | | | | 18,099 | |
| | | | | | | | |
|
Israel — 0.6% | |
| | |
Alony Hetz Properties & Investments | | | 16,065 | | | | 254 | |
| | |
Ashtrom Group | | | 8,787 | | | | 132 | |
| | |
AudioCodes | | | 24,000 | | | | 616 | |
| | |
Azrieli Group | | | 961 | | | | 70 | |
| | |
Bank Hapoalim | | | 27,109 | | | | 225 | |
| | |
Bank Leumi Le-Israel | | | 35,476 | | | | 258 | |
| | |
Blue Square Real Estate | | | 570 | | | | 40 | |
| | |
Camtek* | | | 5,747 | | | | 62 | |
| | |
Check Point Software Technologies* | | | 39,264 | | | | 4,357 | |
| | |
CyberArk Software* | | | 1,600 | | | | 187 | |
| | |
Elbit Systems | | | 561 | | | | 87 | |
| | |
Elco | | | 2,727 | | | | 97 | |
| | |
First International Bank of Israel | | | 13,139 | | | | 380 | |
| | |
Formula Systems 1985 | | | 3,243 | | | | 221 | |
| | |
Industrial Buildings* | | | 600,881 | | | | 1,641 | |
| | |
International Flavors & Fragrances | | | 0 | | | | — | |
| | |
Israel Chemicals | | | 15,929 | | | | 75 | |
| | |
Israel Discount Bank, Cl A | | | 337,472 | | | | 1,565 | |
| | |
Isramco Negev 2 | | | 45,531 | | | | 8 | |
| | |
Isras Investment | | | 163 | | | | 36 | |
| | |
Magic Software Enterprises | | | 3,542 | | | | 34 | |
| | |
Malam - Team | | | 550 | | | | 104 | |
| | |
Melisron | | | 4,004 | | | | 256 | |
The accompanying notes are an integral part of the financial statements.
72
| | |
| THE KP FUNDS | | December 31, 2019 |
| | |
| KP International Equity Fund | | |
| | | | | | | | |
| Description | | Shares | | | Value
(000) | |
| | |
Mizrahi Tefahot Bank | | | 3,633 | | | $ | 97 | |
| | |
Naphtha Israel Petroleum | | | 39,166 | | | | 234 | |
| | |
NICE-Systems* | | | 1,607 | | | | 249 | |
| | |
Norstar Holdings | | | 1,304 | | | | 28 | |
| | |
Oil Refineries | | | 351,599 | | | | 177 | |
| | |
One Software Technologies | | | 492 | | | | 38 | |
| | |
Perion Network* | | | 11,171 | | | | 69 | |
| | |
Prashkovsky Investments and Construction | | | 2,908 | | | | 58 | |
| | |
S.R Accord | | | 941 | | | | 16 | |
| | |
Sapiens International | | | 4,688 | | | | 108 | |
| | |
Shikun & Binui | | | 92,340 | | | | 425 | |
| | |
Silicom* | | | 1,618 | | | | 54 | |
| | |
Teva Pharmaceutical Industries ADR* | | | 22,253 | | | | 218 | |
| | |
Teva Pharmaceutical Industries* | | | 4,022 | | | | 40 | |
| | |
Wix.com* | | | 1,200 | | | | 147 | |
| | | | | | | | |
| | | | | | | 12,663 | |
| | | | | | | | |
|
Italy — 1.6% | |
| | |
A2A | | | 119,285 | | | | 224 | |
| | |
ACEA | | | 25,756 | | | | 533 | |
| | |
Amplifon | | | 13,969 | | | | 402 | |
| | |
Anima Holding | | | 47,545 | | | | 246 | |
| | |
Ascopiave | | | 13,940 | | | | 60 | |
| | |
Assicurazioni Generali | | | 27,066 | | | | 559 | |
| | |
ASTM | | | 13,419 | | | | 406 | |
| | |
Atlantia | | | 12,313 | | | | 287 | |
| | |
Avio | | | 22,214 | | | | 346 | |
| | |
Azimut Holding | | | 52,377 | | | | 1,248 | |
| | |
B&C Speakers | | | 1,422 | | | | 22 | |
| | |
Banca Carige* (A) | | | 2,052,741 | | | | 1 | |
| | |
Banca Farmafactoring | | | 27,598 | | | | 166 | |
| | |
Banca Generali | | | 60,006 | | | | 1,948 | |
| | |
Banca Mediolanum | | | 20,623 | | | | 204 | |
| | |
Banca Sistema | | | 112,431 | | | | 233 | |
| | |
BasicNet | | | 8,739 | | | | 51 | |
| | |
Buzzi Unicem | | | 12,865 | | | | 324 | |
| | |
Cerved Group | | | 11,242 | | | | 110 | |
| | |
CNH Industrial | | | 195,204 | | | | 2,144 | |
| | |
Davide Campari-Milano | | | 71,420 | | | | 652 | |
| | |
El.En. | | | 4,939 | | | | 183 | |
| | |
Elica* | | | 16,618 | | | | 57 | |
| | |
Enel | | | 198,826 | | | | 1,579 | |
| | |
Eni | | | 265,338 | | | | 4,118 | |
| | |
ERG | | | 7,407 | | | | 160 | |
| | |
Esprinet | | | 6,594 | | | | 38 | |
| | |
Eurotech* | | | 55,505 | | | | 526 | |
| | | | | | | | |
| Description | | Shares | | | Value
(000) | |
| | |
EXOR | | | 2,815 | | | $ | 218 | |
| | |
Ferrari | | | 2,996 | | | | 496 | |
| | |
Fiat Chrysler Automobiles | | | 26,828 | | | | 394 | |
| | |
Fiera Milano | | | 23,270 | | | | 143 | |
| | |
Fine Foods & Pharmaceuticals NTM | | | 4,852 | | | | 65 | |
| | |
FinecoBank Banca Fineco | | | 15,893 | | | | 190 | |
| | |
Hera | | | 142,941 | | | | 626 | |
| | |
Immobiliare Grande Distribuzione SIIQ‡ | | | 34,727 | | | | 241 | |
| | |
Intesa Sanpaolo | | | 2,096,383 | | | | 5,521 | |
| | |
Iren | | | 548,321 | | | | 1,701 | |
| | |
Leonardo-Finmeccanica | | | 9,295 | | | | 109 | |
| | |
Mediobanca Banca di Credito Finanziario | | | 14,452 | | | | 159 | |
| | |
Moncler | | | 4,305 | | | | 194 | |
| | |
Pharmanutra | | | 641 | | | | 17 | |
| | |
Piaggio & C | | | 66,905 | | | | 207 | |
| | |
Pirelli & C | | | 11,293 | | | | 65 | |
| | |
Poste Italiane | | | 12,115 | | | | 137 | |
| | |
Prysmian | | | 5,570 | | | | 135 | |
| | |
Recordati | | | 2,394 | | | | 101 | |
| | |
Safilo Group* | | | 71,395 | | | | 89 | |
| | |
Saipem* | | | 257,485 | | | | 1,263 | |
| | |
Sesa | | | 3,358 | | | | 180 | |
| | |
Snam | | | 52,573 | | | | 277 | |
| | |
Societa Cattolica di Assicurazioni SC | | | 47,748 | | | | 390 | |
| | |
Telecom Italia | | | 152,166 | | | | 93 | |
| | |
Telecom Italia* | | | 210,551 | | | | 132 | |
| | |
Tenaris | | | 10,866 | | | | 123 | |
| | |
Terna Rete Elettrica Nazionale | | | 36,524 | | | | 244 | |
| | |
Tinexta Spa | | | 11,170 | | | | 146 | |
| | |
UniCredit | | | 130,847 | | | | 1,912 | |
| | |
Unipol Gruppo | | | 295,722 | | | | 1,694 | |
| | | | | | | | |
| | | | | | | 34,089 | |
| | | | | | | | |
|
Japan — 14.8% | |
| | |
77 Bank | | | 40,200 | | | | 669 | |
| | |
A&D | | | 5,300 | | | | 51 | |
| | |
ABC-Mart | | | 3,200 | | | | 218 | |
| | |
Acom | | | 12,100 | | | | 55 | |
| | |
Adastria | | | 18,000 | | | | 411 | |
| | |
Advantest | | | 5,100 | | | | 286 | |
| | |
Aeon | | | 16,200 | | | | 335 | |
| | |
Aeon Delight | | | 3,700 | | | | 133 | |
| | |
AEON Financial Service | | | 20,000 | | | | 315 | |
| | |
Aeon Mall | | | 2,100 | | | | 37 | |
| | |
AGC | | | 4,800 | | | | 171 | |
The accompanying notes are an integral part of the financial statements.
73
| | |
| THE KP FUNDS | | December 31, 2019 |
| | |
| KP International Equity Fund | | |
| | | | | | | | |
| Description | | Shares | | | Value
(000) | |
| | |
Air Water | | | 4,300 | | | $ | 63 | |
| | |
Aisin Seiki | | | 4,100 | | | | 152 | |
| | |
Ajinomoto | | | 11,500 | | | | 192 | |
| | |
Akatsuki | | | 2,400 | | | | 129 | |
| | |
Alfresa Holdings | | | 34,200 | | | | 695 | |
| | |
Alps Alpine | | | 5,300 | | | | 120 | |
| | |
Altech | | | 10,549 | | | | 190 | |
| | |
Amada Holdings | | | 7,500 | | | | 85 | |
| | |
ANA Holdings | | | 2,600 | | | | 87 | |
| | |
Anest Iwata | | | 6,200 | | | | 60 | |
| | |
Aozora Bank | | | 2,800 | | | | 74 | |
| | |
Arata | | | 2,200 | | | | 91 | |
| | |
Arcs | | | 14,300 | | | | 301 | |
| | |
Asahi | | | 7,900 | | | | 102 | |
| | |
Asahi Group Holdings | | | 14,300 | | | | 654 | |
| | |
Asahi Intecc | | | 4,500 | | | | 132 | |
| | |
Asahi Kasei | | | 31,300 | | | | 352 | |
| | |
Asia Pile Holdings | | | 4,100 | | | | 23 | |
| | |
Asics | | | 30,600 | | | | 508 | |
| | |
Astellas Pharma | | | 59,500 | | | | 1,017 | |
| | |
Avex | | | 16,000 | | | | 185 | |
| | |
Awa Bank | | | 4,100 | | | | 92 | |
| | |
Azbil | | | 11,100 | | | | 312 | |
| | |
Bank of Kyoto | | | 3,500 | | | | 150 | |
| | |
Bank of Nagoya | | | 1,800 | | | | 56 | |
| | |
Bank of Okinawa | | | 1,700 | | | | 57 | |
| | |
Bank of Saga | | | 1,188 | | | | 19 | |
| | |
Bank of the Ryukyus | | | 5,600 | | | | 61 | |
| | |
BayCurrent Consulting | | | 3,900 | | | | 199 | |
| | |
Bell System24 Holdings | | | 11,300 | | | | 177 | |
| | |
Benesse Holdings | | | 2,100 | | | | 55 | |
| | |
B-Lot | | | 3,100 | | | | 58 | |
| | |
Bridgestone | | | 32,600 | | | | 1,212 | |
| | |
Brother Industries | | | 5,800 | | | | 119 | |
| | |
Bunka Shutter | | | 82,400 | | | | 727 | |
| | |
Business Brain Showa-Ota | | | 100 | | | | 2 | |
| | |
Business Engineering | | | 805 | | | | 23 | |
| | |
CAC Holdings | | | 19,800 | | | | 284 | |
| | |
Calbee | | | 5,200 | | | | 170 | |
| | |
Canon | | | 169,400 | | | | 4,629 | |
| | |
Capcom | | | 30,400 | | | | 843 | |
| | |
Career Design Center | | | 5,600 | | | | 70 | |
| | |
Casio Computer | | | 26,900 | | | | 539 | |
| | |
Central Japan Railway | | | 3,540 | | | | 712 | |
| | |
Chiba Bank | | | 35,600 | | | | 205 | |
| | |
Chiba Kogyo Bank | | | 32,700 | | | | 119 | |
| | |
Chubu Electric Power | | | 15,400 | | | | 218 | |
| | | | | | | | |
| Description | | Shares | | | Value
(000) | |
| | |
Chugai Pharmaceutical | | | 5,500 | | | $ | 508 | |
| | |
Chugoku Bank | | | 13,100 | | | | 133 | |
| | |
Chugoku Electric Power | | | 7,100 | | | | 93 | |
| | |
Coca-Cola Bottlers Japan Holdings | | | 3,400 | | | | 87 | |
| | |
Computer Engineering & Consulting | | | 20,000 | | | | 377 | |
| | |
Computer Institute of Japan | | | 9,400 | | | | 84 | |
| | |
Concordia Financial Group | | | 75,700 | | | | 311 | |
| | |
CONEXIO | | | 6,900 | | | | 103 | |
| | |
Cota | | | 1,600 | | | | 23 | |
| | |
Credit Saison | | | 27,900 | | | | 484 | |
| | |
Creo | | | 4,900 | | | | 79 | |
| | |
Cube System | | | 7,300 | | | | 53 | |
| | |
CyberAgent | | | 2,600 | | | | 91 | |
| | |
Cybozu | | | 15,800 | | | | 215 | |
| | |
Dai Nippon Printing | | | 6,400 | | | | 173 | |
| | |
Daicel | | | 6,500 | | | | 62 | |
| | |
Daido Metal | | | 21,800 | | | | 152 | |
| | |
Daifuku | | | 8,500 | | | | 514 | |
| | |
Daihen | | | 6,700 | | | | 221 | |
| | |
Dai-ichi Life Holdings | | | 108,000 | | | | 1,784 | |
| | |
Daiichi Sankyo | | | 13,800 | | | | 912 | |
| | |
Daiken Medical | | | 1,200 | | | | 7 | |
| | |
Daiki Aluminium Industry | | | 34,000 | | | | 237 | |
| | |
Daikin Industries | | | 50,300 | | | | 7,093 | |
| | |
Daikoku Denki | | | 2,400 | | | | 36 | |
| | |
Daiseki | | | 3,600 | | | | 104 | |
| | |
Daito Pharmaceutical | | | 4,000 | | | | 117 | |
| | |
Daito Trust Construction | | | 1,700 | | | | 210 | |
| | |
Daitron | | | 1,700 | | | | 30 | |
| | |
Daiwa House Industry | | | 24,100 | | | | 745 | |
| | |
Daiwa House Investment, Cl A‡ | | | 43 | | | | 112 | |
| | |
Daiwa Office Investment‡ | | | 177 | | | | 1,359 | |
| | |
Daiwa Securities Group | | | 70,200 | | | | 354 | |
| | |
DCM Holdings | | | 13,800 | | | | 134 | |
| | |
DD Holdings | | | 3,600 | | | | 52 | |
| | |
Denki Kogyo | | | 6,100 | | | | 182 | |
| | |
Denso | | | 214,400 | | | | 9,727 | |
| | |
Dentsu Group | | | 5,600 | | | | 193 | |
| | |
Digital Garage* | | | 5,800 | | | | 242 | |
| | |
Dip | | | 8,300 | | | | 245 | |
| | |
Disco | | | 700 | | | | 165 | |
| | |
DMS | | | 454 | | | | 9 | |
| | |
Doshisha | | | 6,300 | | | | 105 | |
| | |
Doutor Nichires Holdings | | | 5,600 | | | | 111 | |
| | |
Duskin | | | 19,000 | | | | 526 | |
| | |
East Japan Railway | | | 16,600 | | | | 1,500 | |
| | |
Ebara Jitsugyo | | | 4,400 | | | | 90 | |
The accompanying notes are an integral part of the financial statements.
74
| | |
| THE KP FUNDS | | December 31, 2019 |
| | |
| KP International Equity Fund | | |
| | | | | | | | |
| Description | | Shares | | | Value
(000) | |
| | |
EDION | | | 35,700 | | | $ | 397 | |
| | |
Eisai | | | 6,220 | | | | 466 | |
| | |
EJ Holdings | | | 1,200 | | | | 19 | |
| | |
Elecom | | | 6,300 | | | | 255 | |
| | |
Electric Power Development | | | 3,900 | | | | 95 | |
| | |
Exedy | | | 8,100 | | | | 183 | |
| | |
FamilyMart | | | 5,900 | | | | 142 | |
| | |
FANUC | | | 16,080 | | | | 2,970 | |
| | |
Fast Retailing | | | 1,400 | | | | 835 | |
| | |
Feed One | | | 14,100 | | | | 24 | |
| | |
Ferrotec Holdings | | | 22,600 | | | | 189 | |
| | |
FJ Next | | | 21,000 | | | | 221 | |
| | |
Foster Electric | | | 16,200 | | | | 285 | |
| | |
France Bed Holdings | | | 11,400 | | | | 101 | |
| | |
F-Tech | | | 8,100 | | | | 59 | |
| | |
Fuji Electric | | | 3,100 | | | | 94 | |
| | |
Fuji Heavy Industries | | | 15,200 | | | | 376 | |
| | |
Fuji Media Holdings | | | 59,200 | | | | 841 | |
| | |
Fuji Oil | | | 4,300 | | | | 10 | |
| | |
Fuji Soft | | | 4,600 | | | | 177 | |
| | |
FUJIFILM Holdings | | | 8,900 | | | | 426 | |
| | |
Fujikura | | | 32,000 | | | | 132 | |
| | |
Fujimi | | | 2,400 | | | | 68 | |
| | |
Fujitsu | | | 4,800 | | | | 451 | |
| | |
Fukui Computer Holdings | | | 12,500 | | | | 406 | |
| | |
Fukuoka Financial Group | | | 60,600 | | | | 1,157 | |
| | |
FULLCAST Holdings | | | 4,200 | | | | 95 | |
| | |
Funai Soken Holdings | | | 2,500 | | | | 57 | |
| | |
Furukawa | | | 13,900 | | | | 183 | |
| | |
Furusato Industries | | | 1,400 | | | | 23 | |
| | |
Furyu | | | 19,700 | | | | 194 | |
| | |
Future | | | 10,200 | | | | 169 | |
| | |
Fuyo General Lease | | | 4,500 | | | | 303 | |
| | |
Gakujo | | | 1,100 | | | | 23 | |
| | |
GLOBERIDE | | | 5,400 | | | | 134 | |
| | |
Glory | | | 13,600 | | | | 411 | |
| | |
GMO Payment Gateway | | | 1,000 | | | | 69 | |
| | |
Godo Steel | | | 16,200 | | | | 418 | |
| | |
Goldcrest | | | 39,000 | | | | 746 | |
| | |
Gree* | | | 44,900 | | | | 203 | |
| | |
gremz | | | 200 | | | | 4 | |
| | |
GS Yuasa | | | 3,400 | | | | 73 | |
| | |
Gunma Bank | | | 26,400 | | | | 93 | |
| | |
Hachijuni Bank | | | 66,100 | | | | 288 | |
| | |
Hagiwara Electric Holdings | | | 700 | | | | 18 | |
| | |
Hakuhodo DY Holdings | | | 5,300 | | | | 85 | |
| | |
Hamakyorex | | | 1,000 | | | | 33 | |
| | | | | | | | |
| Description | | Shares | | | Value
(000) | |
| | |
Hamamatsu Photonics | | | 3,700 | | | $ | 151 | |
| | |
Hankyu Hanshin Holdings | | | 5,700 | | | | 244 | |
| | |
Heiwado | | | 4,200 | | | | 79 | |
| | |
Hiday Hidaka | | | 1,300 | | | | 24 | |
| | |
Hikari Tsushin | | | 500 | | | | 125 | |
| | |
Hino Motors | | | 6,400 | | | | 68 | |
| | |
Hioki EE | | | 1,600 | | | | 56 | |
| | |
Hirose Electric | | | 10,180 | | | | 1,302 | |
| | |
Hiroshima Bank | | | 21,100 | | | | 103 | |
| | |
Hisamitsu Pharmaceutical | | | 1,400 | | | | 68 | |
| | |
Hitachi | | | 198,300 | | | | 8,354 | |
| | |
Hitachi Chemical | | | 2,500 | | | | 105 | |
| | |
Hitachi Construction Machinery | | | 2,400 | | | | 72 | |
| | |
Hitachi High-Technologies | | | 6,800 | | | | 480 | |
| | |
Hitachi Metals | | | 5,300 | | | | 78 | |
| | |
Hitachi Zosen | | | 39,300 | | | | 148 | |
| | |
Hochiki | | | 1,800 | | | | 29 | |
| | |
Hokkaido Electric Power | | | 53,500 | | | | 260 | |
| | |
Hokuetsu | | | 57,400 | | | | 296 | |
| | |
Hokuetsu Industries | | | 4,800 | | | | 58 | |
| | |
Hokuhoku Financial Group | | | 16,100 | | | | 169 | |
| | |
Hokuto | | | 10,500 | | | | 191 | |
| | |
Honda Motor | | | 265,400 | | | | 7,512 | |
| | |
Honeys Holdings | | | 13,800 | | | | 227 | |
| | |
Hoshizaki Electric | | | 5,700 | | | | 508 | |
| | |
Hosiden | | | 17,100 | | | | 216 | |
| | |
Hoya | | | 120,400 | | | | 11,515 | |
| | |
Hulic | | | 6,900 | | | | 83 | |
| | |
Hyakujushi Bank | | | 5,200 | | | | 103 | |
| | |
IDEA Consultants | | | 8,300 | | | | 232 | |
| | |
Idemitsu Kosan | | | 5,122 | | | | 141 | |
| | |
IHI | | | 3,500 | | | | 82 | |
| | |
Iida Group Holdings | | | 3,300 | | | | 58 | |
| | |
Imagineer | | | 6,600 | | | | 67 | |
| | |
Inaba Denki Sangyo | | | 2,600 | | | | 66 | |
| | |
Inabata | | | 11,300 | | | | 169 | |
| | |
Ines | | | 7,900 | | | | 99 | |
| | |
Inpex | | | 121,900 | | | | 1,267 | |
| | |
Intage Holdings | | | 9,200 | | | | 79 | |
| | |
Internet Initiative Japan | | | 15,400 | | | | 416 | |
| | |
I-O Data Device, Cl O | | | 1,200 | | | | 12 | |
| | |
Isetan Mitsukoshi Holdings | | | 8,600 | | | | 77 | |
| | |
Isuzu Motors | | | 14,300 | | | | 169 | |
| | |
ITOCHU | | | 50,000 | | | | 1,161 | |
| | |
Itochu Techno-Solutions | | | 8,500 | | | | 240 | |
| | |
Itoki | | | 6,400 | | | | 31 | |
| | |
Iwaki | | | 6,400 | | | | 27 | |
The accompanying notes are an integral part of the financial statements.
75
| | |
| THE KP FUNDS | | December 31, 2019 |
| | |
| KP International Equity Fund | | |
| | | | | | | | |
| Description | | Shares | | | Value
(000) | |
| | |
Iyo Bank | | | 16,600 | | | $ | 94 | |
| | |
J Front Retailing | | | 5,200 | | | | 73 | |
| | |
Jaccs | | | 10,100 | | | | 258 | |
| | |
Jafco* | | | 9,900 | | | | 388 | |
| | |
Japan‡ | | | 34 | | | | 226 | |
| | |
Japan Airlines | | | 2,600 | | | | 81 | |
| | |
Japan Airport Terminal | | | 1,100 | | | | 61 | |
| | |
Japan Aviation Electronics Industry | | | 2,500 | | | | 50 | |
| | |
Japan Exchange Group | | | 26,000 | | | | 458 | |
| | |
Japan Petroleum Exploration | | | 6,100 | | | | 165 | |
| | |
Japan Post Bank | | | 9,300 | | | | 89 | |
| | |
Japan Post Holdings | | | 130,200 | | | | 1,223 | |
| | |
Japan Post Insurance | | | 5,500 | | | | 93 | |
| | |
Japan Prime‡ | | | 18 | | | | 79 | |
| | |
Japan Pulp & Paper | | | 800 | | | | 31 | |
| | |
Japan Retail Fund Investment‡ | | | 61 | | | | 131 | |
| | |
Japan Securities Finance | | | 36,100 | | | | 172 | |
| | |
Japan Tobacco | | | 193,300 | | | | 4,308 | |
| | |
Jeol | | | 1,500 | | | | 45 | |
| | |
JFE Holdings | | | 12,500 | | | | 161 | |
| | |
JGC Holdings | | | 5,800 | | | | 93 | |
| | |
JMS | | | 1,100 | | | | 8 | |
| | |
Joshin Denki | | | 2,800 | | | | 67 | |
| | |
JSR | | | 4,400 | | | | 81 | |
| | |
JTEKT | | | 4,600 | | | | 54 | |
| | |
Juroku Bank | | | 12,400 | | | | 291 | |
| | |
JX Holdings | | | 76,400 | | | | 347 | |
| | |
Kadokawa | | | 10,500 | | | | 201 | |
| | |
Kajima | | | 10,400 | | | | 138 | |
| | |
Kakaku.com | | | 3,600 | | | | 92 | |
| | |
Kaken Pharmaceutical | | | 2,200 | | | | 122 | |
| | |
Kamigumi | | | 8,600 | | | | 189 | |
| | |
Kanamoto | | | 21,400 | | | | 552 | |
| | |
Kandenko | | | 57,400 | | | | 550 | |
| | |
Kanematsu | | | 24,300 | | | | 326 | |
| | |
Kansai Electric Power | | | 50,100 | | | | 581 | |
| | |
Kansai Paint | | | 4,500 | | | | 110 | |
| | |
Kanto Denka Kogyo | | | 27,900 | | | | 260 | |
| | |
Kao | | | 28,800 | | | | 2,377 | |
| | |
KAWADA TECHNOLOGIES | | | 1,300 | | | | 80 | |
| | |
Kawai Musical Instruments Manufacturing | | | 2,600 | | | | 94 | |
| | |
Kawasaki Heavy Industries | | | 3,200 | | | | 70 | |
| | |
KDDI | | | 73,800 | | | | 2,203 | |
| | |
Keihan Holdings | | | 2,200 | | | | 107 | |
| | |
Keikyu | | | 5,100 | | | | 98 | |
| | |
Keio | | | 2,400 | | | | 145 | |
| | | | | | | | |
| Description | | Shares | | | Value
(000) | |
| | |
Keisei Electric Railway | | | 3,400 | | | $ | 132 | |
| | |
Keiyo Bank | | | 9,200 | | | | 53 | |
| | |
Kewpie | | | 17,200 | | | | 387 | |
| | |
Key Coffee | | | 7,200 | | | | 153 | |
| | |
Keyence | | | 4,500 | | | | 1,584 | |
| | |
KFC Holdings Japan | | | 2,400 | | | | 70 | |
| | |
Kikkoman | | | 3,400 | | | | 167 | |
| | |
Kintetsu Group Holdings | | | 4,300 | | | | 233 | |
| | |
Kirin Holdings | | | 100,500 | | | | 2,193 | |
| | |
Kita-Nippon Bank | | | 700 | | | | 14 | |
| | |
Kito | | | 2,900 | | | | 46 | |
| | |
Kiyo Bank | | | 3,900 | | | | 59 | |
| | |
KNT-CT Holdings* | | | 7,600 | | | | 103 | |
| | |
Kobayashi Pharmaceutical | | | 1,300 | | | | 110 | |
| | |
Koito Manufacturing | | | 8,200 | | | | 381 | |
| | |
Kojima | | | 28,600 | | | | 138 | |
| | |
Komatsu | | | 157,900 | | | | 3,800 | |
| | |
Komeri | | | 10,700 | | | | 230 | |
| | |
Konami Holdings | | | 2,400 | | | | 99 | |
| | |
Konica Minolta | | | 12,000 | | | | 78 | |
| | |
Kose | | | 2,000 | | | | 292 | |
| | |
Kourakuen Holdings | | | 3,700 | | | | 70 | |
| | |
K’s Holdings | | | 23,100 | | | | 302 | |
| | |
Kubota | | | 560,800 | | | | 8,801 | |
| | |
Kumiai Chemical Industry | | | 39,300 | | | | 361 | |
| | |
Kuraray | | | 7,300 | | | | 89 | |
| | |
Kureha | | | 12,600 | | | | 757 | |
| | |
Kurita Water Industries | | | 2,300 | | | | 68 | |
| | |
Kyocera | | | 97,200 | | | | 6,626 | |
| | |
Kyodo Printing | | | 900 | | | | 25 | |
| | |
Kyokuto Kaihatsu Kogyo | | | 2,300 | | | | 34 | |
| | |
Kyowa Kirin | | | 6,100 | | | | 143 | |
| | |
Kyushu Electric Power | | | 10,200 | | | | 88 | |
| | |
Kyushu Financial Group | | | 16,900 | | | | 73 | |
| | |
Kyushu Railway | | | 3,700 | | | | 124 | |
| | |
Lawson | | | 1,100 | | | | 62 | |
| | |
Legs | | | 6,700 | | | | 102 | |
| | |
Life | | | 4,200 | | | | 100 | |
| | |
LINE* | | | 1,500 | | | | 74 | |
| | |
Lion | | | 13,800 | | | | 268 | |
| | |
LIXIL Group | | | 30,000 | | | | 519 | |
| | |
LIXIL VIVA | | | 3,200 | | | | 57 | |
| | |
M3* | | | 11,000 | | | | 332 | |
| | |
Mabuchi Motor | | | 3,400 | | | | 129 | |
| | |
Maeda | | | 36,000 | | | | 351 | |
| | |
Makita | | | 12,500 | | | | 433 | |
The accompanying notes are an integral part of the financial statements.
76
| | |
| THE KP FUNDS | | December 31, 2019 |
| | |
| KP International Equity Fund | | |
| | | | | | | | |
| Description | | Shares | | | Value
(000) | |
| | |
Mamezou Holdings | | | 13,700 | | | $ | 185 | |
| | |
Mandom | | | 6,300 | | | | 173 | |
| | |
Marubeni | | | 38,900 | | | | 287 | |
| | |
Marubun | | | 3,700 | | | | 22 | |
| | |
Marudai Food | | | 3,500 | | | | 73 | |
| | |
Marui Group | | | 19,400 | | | | 474 | |
| | |
Maruichi Steel Tube | | | 1,200 | | | | 34 | |
| | |
Maruzen Showa Unyu | | | 800 | | | | 23 | |
| | |
Marvelous | | | 8,300 | | | | 55 | |
| | |
Matsumotokiyoshi Holdings | | | 6,700 | | | | 259 | |
| | |
Max | | | 12,400 | | | | 248 | |
| | |
Mazda Motor | | | 13,100 | | | | 112 | |
| | |
McDonald’s Holdings Japan | | | 1,500 | | | | 72 | |
| | |
Mebuki Financial Group | | | 136,900 | | | | 350 | |
| | |
Medipal Holdings | | | 23,400 | | | | 516 | |
| | |
Megmilk Snow Brand | | | 10,200 | | | | 232 | |
| | |
Meidensha | | | 14,000 | | | | 309 | |
| | |
MEIJI Holdings | | | 5,900 | | | | 399 | |
| | |
Meiko Network Japan | | | 5,300 | | | | 50 | |
| | |
Meitec | | | 12,100 | | | | 681 | |
| | |
Meiwa Estate | | | 3,800 | | | | 22 | |
| | |
Menicon | | | 9,900 | | | | 415 | |
| | |
Mercari* | | | 1,900 | | | | 39 | |
| | |
METAWATER | | | 1,000 | | | | 40 | |
| | |
Micronics Japan | | | 28,200 | | | | 315 | |
| | |
Mimasu Semiconductor Industry | | | 18,600 | | | | 372 | |
| | |
Minebea | | | 9,500 | | | | 196 | |
| | |
Mirai‡ | | | 415 | | | | 233 | |
| | |
MISUMI Group | | | 6,600 | | | | 164 | |
| | |
Mitsubishi | | | 58,560 | | | | 1,550 | |
| | |
Mitsubishi Chemical Holdings | | | 30,700 | | | | 229 | |
| | |
Mitsubishi Electric | | | 44,400 | | | | 603 | |
| | |
Mitsubishi Estate | | | 88,300 | | | | 1,686 | |
| | |
Mitsubishi Gas Chemical | | | 4,200 | | | | 64 | |
| | |
Mitsubishi Heavy Industries | | | 8,000 | | | | 311 | |
| | |
Mitsubishi Logisnext | | | 6,100 | | | | 77 | |
| | |
Mitsubishi Logistics | | | 7,500 | | | | 196 | |
| | |
Mitsubishi Materials | | | 2,500 | | | | 68 | |
| | |
Mitsubishi Motors | | | 16,000 | | | | 67 | |
| | |
Mitsubishi Shokuhin | | | 6,100 | | | | 173 | |
| | |
Mitsubishi Tanabe Pharma | | | 5,000 | | | | 92 | |
| | |
Mitsubishi UFJ Financial Group | | | 300,800 | | | | 1,627 | |
| | |
Mitsubishi UFJ Lease & Finance | | | 11,800 | | | | 76 | |
| | |
Mitsuboshi Belting | | | 3,000 | | | | 58 | |
| | |
Mitsui | | | 40,300 | | | | 715 | |
| | |
Mitsui Chemicals | | | 4,200 | | | | 103 | |
| | |
Mitsui E&S Holdings* | | | 16,000 | | | | 130 | |
| | | | | | | | |
| Description | | Shares | | | Value
(000) | |
| | |
Mitsui Fudosan | | | 22,000 | | | $ | 538 | |
| | |
Mitsui Matsushima Holdings | | | 6,300 | | | | 70 | |
| | |
Mitsui OSK Lines | | | 2,600 | | | | 71 | |
| | |
Mitsui-Soko Holdings | | | 29,800 | | | | 563 | |
| | |
Mixi | | | 8,600 | | | | 163 | |
| | |
Miyazaki Bank | | | 900 | | | | 22 | |
| | |
Mizuho Financial Group | | | 942,900 | | | | 1,450 | |
| | |
Mizuno | | | 3,400 | | | | 86 | |
| | |
MonotaRO | | | 2,800 | | | | 75 | |
| | |
MS&AD Insurance Group Holdings | | | 22,500 | | | | 743 | |
| | |
Murata Manufacturing | | | 14,000 | | | | 859 | |
| | |
Nabtesco | | | 2,800 | | | | 83 | |
| | |
Nagoya Railroad | | | 4,300 | | | | 133 | |
| | |
Nakabayashi | | | 4,800 | | | | 27 | |
| | |
Nakamoto Packs | | | 900 | | | | 13 | |
| | |
Namco Bandai Holdings | | | 23,100 | | | | 1,403 | |
| | |
Nanto Bank | | | 5,700 | | | | 145 | |
| | |
Nasu Denki Tekko | | | 1,400 | | | | 210 | |
| | |
NEC | | | 24,600 | | | | 1,017 | |
| | |
NEC Capital Solutions | | | 1,300 | | | | 30 | |
| | |
NET One Systems | | | 24,800 | | | | 634 | |
| | |
Nexon* | | | 19,600 | | | | 260 | |
| | |
NGK Insulators | | | 6,500 | | | | 113 | |
| | |
NGK Spark Plug | | | 4,300 | | | | 83 | |
| | |
NH Foods | | | 1,900 | | | | 79 | |
| | |
NichiiGakkan | | | 16,800 | | | | 254 | |
| | |
Nidec | | | 5,400 | | | | 736 | |
| | |
Nihon Chouzai | | | 1,700 | | | | 60 | |
| | |
Nihon House Holdings | | | 17,300 | | | | 79 | |
| | |
Nihon Kohden | | | 122,400 | | | | 3,398 | |
| | |
Nihon Unisys | | | 23,500 | | | | 735 | |
| | |
Nikkiso | | | 22,900 | | | | 299 | |
| | |
Nikkon Holdings | | | 13,900 | | | | 348 | |
| | |
Nikon | | | 7,300 | | | | 89 | |
| | |
Nintendo | | | 2,700 | | | | 1,088 | |
| | |
Nippon Antenna | | | 300 | | | | 3 | |
| | |
Nippon Building Fund‡ | | | 34 | | | | 249 | |
| | |
Nippon Carbide Industries | | | 1,500 | | | | 21 | |
| | |
Nippon Carbon | | | 10,000 | | | | 373 | |
| | |
Nippon Electric Glass | | | 5,400 | | | | 120 | |
| | |
Nippon Express | | | 1,800 | | | | 106 | |
| | |
Nippon Kanzai | | | 4,100 | | | | 74 | |
| | |
Nippon Paint Holdings | | | 3,800 | | | | 196 | |
| | |
Nippon Parking Development | | | 70,700 | | | | 100 | |
| | |
Nippon Pillar Packing | | | 5,300 | | | | 74 | |
| | |
Nippon Prologis‡ | | | 46 | | | | 117 | |
The accompanying notes are an integral part of the financial statements.
77
| | |
| THE KP FUNDS | | December 31, 2019 |
| | |
| KP International Equity Fund | | |
| | | | | | | | |
| Description | | Shares | | | Value
(000) | |
| | |
Nippon Sheet Glass | | | 65,100 | | | $ | 412 | |
| | |
Nippon Shinyaku | | | 1,100 | | | | 95 | |
| | |
Nippon Shokubai | | | 5,900 | | | | 366 | |
| | |
Nippon Signal | | | 12,800 | | | | 171 | |
| | |
Nippon Steel | | | 28,000 | | | | 422 | |
| | |
Nippon Suisan Kaisha | | | 38,700 | | | | 231 | |
| | |
Nippon Telegraph & Telephone | | | 110,000 | | | | 2,793 | |
| | |
Nippon Television Holdings | | | 44,820 | | | | 599 | |
| | |
Nippon Yusen | | | 3,700 | | | | 67 | |
| | |
Nishi-Nippon Financial Holdings | | | 61,500 | | | | 480 | |
| | |
Nissan Chemical | | | 14,000 | | | | 588 | |
| | |
Nissan Motor | | | 57,500 | | | | 334 | |
| | |
Nisshin Oillio Group | | | 12,200 | | | | 423 | |
| | |
Nisshin Seifun Group | | | 5,000 | | | | 87 | |
| | |
Nissin Electric | | | 37,200 | | | | 460 | |
| | |
Nissin Foods Holdings | | | 1,500 | | | | 111 | |
| | |
Nisso | | | 3,100 | | | | 32 | |
| | |
Nitori Holdings | | | 1,900 | | | | 300 | |
| | |
Nitto Denko | | | 96,800 | | | | 5,441 | |
| | |
Nitto Kogyo | | | 13,200 | | | | 306 | |
| | |
Nohmi Bosai | | | 9,300 | | | | 209 | |
| | |
Nojima | | | 5,900 | | | | 123 | |
| | |
Nomura | | | 28,900 | | | | 384 | |
| | |
Nomura Holdings | | | 228,100 | | | | 1,172 | |
| | |
Nomura Real Estate Holdings | | | 3,400 | | | | 81 | |
| | |
Nomura Real Estate Master Fund‡ | | | 107 | | | | 183 | |
| | |
Nomura Research Institute | | | 17,100 | | | | 366 | |
| | |
Noritake | | | 3,100 | | | | 132 | |
| | |
Noritz | | | 4,500 | | | | 60 | |
| | |
North Pacific Bank | | | 87,400 | | | | 195 | |
| | |
NS Solutions | | | 8,300 | | | | 273 | |
| | |
NSD | | | 29,800 | | | | 491 | |
| | |
NSK | | | 8,100 | | | | 77 | |
| | |
NTT Data | | | 99,100 | | | | 1,329 | |
| | |
NTT DOCOMO | | | 51,400 | | | | 1,432 | |
| | |
Obayashi | | | 92,200 | | | | 1,025 | |
| | |
Obic | | | 3,760 | | | | 507 | |
| | |
Odakyu Electric Railway | | | 6,900 | | | | 161 | |
| | |
Oji Holdings | | | 72,700 | | | | 394 | |
| | |
Oki Electric Industry | | | 23,700 | | | | 329 | |
| | |
Olympus | | | 531,100 | | | | 8,301 | |
| | |
Omron | | | 108,600 | | | | 6,308 | |
| | |
One REIT‡ | | | 164 | | | | 541 | |
| | |
Ono Pharmaceutical | | | 9,700 | | | | 222 | |
| | |
Onward Holdings | | | 54,200 | | | | 323 | |
| | |
Oracle Japan* | | | 2,400 | | | | 218 | |
| | | | | | | | |
| Description | | Shares | | | Value
(000) | |
| | |
Organo | | | 14,100 | | | $ | 867 | |
| | |
Oriental Land | | | 4,900 | | | | 669 | |
| | |
ORIX | | | 32,700 | | | | 542 | |
| | |
Orix JREIT‡ | | | 64 | | | | 139 | |
| | |
Osaka Gas | | | 9,800 | | | | 188 | |
| | |
Osaki Electric | | | 8,700 | | | | 55 | |
| | |
OSJB Holdings | | | 14,800 | | | | 37 | |
| | |
Otsuka | | | 6,700 | | | | 268 | |
| | |
Otsuka Holdings | | | 28,100 | | | | 1,255 | |
| | |
Oyo | | | 5,500 | | | | 77 | |
| | |
Pan Pacific International Holdings | | | 11,600 | | | | 193 | |
| | |
Panasonic | | | 54,500 | | | | 511 | |
| | |
Park24 | | | 2,600 | | | | 64 | |
| | |
Pasco | | | 2,000 | | | | 37 | |
| | |
PCA | | | 2,800 | | | | 131 | |
| | |
Penta-Ocean Construction | | | 64,900 | | | | 402 | |
| | |
PeptiDream* | | | 2,400 | | | | 123 | |
| | |
Persol Holdings | | | 16,300 | | | | 305 | |
| | |
Pigeon | | | 2,700 | | | | 99 | |
| | |
Pola Orbis Holdings | | | 2,000 | | | | 48 | |
| | |
Pressance | | | 9,700 | | | | 119 | |
| | |
Prima Meat Packers | | | 6,300 | | | | 146 | |
| | |
Proto | | | 7,200 | | | | 79 | |
| | |
PS Mitsubishi Construction | | | 37,400 | | | | 251 | |
| | |
Punch Industry | | | 4,400 | | | | 20 | |
| | |
Rakuten* | | | 20,100 | | | | 171 | |
| | |
Rasa | | | 4,800 | | | | 43 | |
| | |
Recruit Holdings | | | 33,100 | | | | 1,237 | |
| | |
Relia | | | 86,700 | | | | 1,101 | |
| | |
Renesas Electronics* | | | 114,000 | | | | 776 | |
| | |
Resona Holdings | | | 375,840 | | | | 1,638 | |
| | |
Resorttrust | | | 3,800 | | | | 64 | |
| | |
Restar Holdings | | | 12,600 | | | | 233 | |
| | |
Ricoh | | | 17,300 | | | | 188 | |
| | |
Ricoh Leasing | | | 4,200 | | | | 159 | |
| | |
Riken Technos | | | 10,900 | | | | 53 | |
| | |
Rinnai | | | 3,900 | | | | 305 | |
| | |
Riso Kyoiku | | | 67,000 | | | | 237 | |
| | |
Rohm | | | 8,300 | | | | 662 | |
| | |
Roland DG | | | 14,400 | | | | 287 | |
| | |
Round One | | | 7,600 | | | | 74 | |
| | |
Ryohin Keikaku | | | 14,300 | | | | 333 | |
| | |
Ryoyo Electro | | | 7,800 | | | | 145 | |
| | |
Saizeriya | | | 27,400 | | | | 669 | |
| | |
SAMTY | | | 21,700 | | | | 447 | |
| | |
San ju San Financial Group | | | 1,700 | | | | 27 | |
The accompanying notes are an integral part of the financial statements.
78
| | |
| THE KP FUNDS | | December 31, 2019 |
| | |
| KP International Equity Fund | | |
| | | | | | | | |
| Description | | Shares | | | Value
(000) | |
| | |
Sangetsu | | | 7,100 | | | $ | 134 | |
| | |
San-In Godo Bank | | | 8,300 | | | | 51 | |
| | |
Sanki Engineering | | | 31,100 | | | | 439 | |
| | |
Sankyo | | | 1,300 | | | | 43 | |
| | |
Sankyo Tateyama | | | 14,800 | | | | 166 | |
| | |
Sanshin Electronics | | | 5,100 | | | | 84 | |
| | |
Santen Pharmaceutical | | | 9,400 | | | | 179 | |
| | |
Sato Holdings | | | 7,600 | | | | 238 | |
| | |
Sawai Pharmaceutical | | | 2,500 | | | | 159 | |
| | |
SBI Holdings | | | 6,000 | | | | 126 | |
| | |
Scala | | | 23,200 | | | | 166 | |
| | |
SCSK | | | 6,800 | | | | 353 | |
| | |
SEC Carbon | | | 2,500 | | | | 217 | |
| | |
Secom | | | 11,000 | | | | 985 | |
| | |
Sega Sammy Holdings | | | 39,300 | | | | 569 | |
| | |
Seibu Holdings | | | 5,400 | | | | 89 | |
| | |
Seiko Epson | | | 6,400 | | | | 97 | |
| | |
Seiko Holdings | | | 18,800 | | | | 502 | |
| | |
Seikoh Giken | | | 4,500 | | | | 139 | |
| | |
Seino Holdings | | | 17,900 | | | | 242 | |
| | |
Sekisui Chemical | | | 29,300 | | | | 509 | |
| | |
Sekisui House | | | 15,400 | | | | 330 | |
| | |
Sekisui House‡ | | | 1,227 | | | | 1,030 | |
| | |
Senko | | | 21,400 | | | | 182 | |
| | |
Seven & i Holdings | | | 55,600 | | | | 2,040 | |
| | |
Seven Bank | | | 16,800 | | | | 55 | |
| | |
SFP Holdings | | | 4,700 | | | | 103 | |
| | |
SG Holdings | | | 3,700 | | | | 83 | |
| | |
Sharp | | | 5,400 | | | | 83 | |
| | |
Shibaura Mechatronics | | | 2,300 | | | | 84 | |
| | |
Shiga Bank | | | 10,149 | | | | 258 | |
| | |
Shikoku Bank | | | 2,100 | | | | 20 | |
| | |
Shimadzu | | | 11,800 | | | | 371 | |
| | |
Shimamura | | | 500 | | | | 38 | |
| | |
Shimano | | | 2,700 | | | | 439 | |
| | |
Shimizu | | | 45,000 | | | | 458 | |
| | |
Shin Nippon Biomedical Laboratories | | | 14,600 | | | | 84 | |
| | |
Shin-Etsu Chemical | | | 29,400 | | | | 3,235 | |
| | |
Shinsei Bank* | | | 37,700 | | | | 576 | |
| | |
Shionogi | | | 6,660 | | | | 412 | |
| | |
Shiseido | | | 9,700 | | | | 689 | |
| | |
Shizuoka Bank | | | 79,100 | | | | 588 | |
| | |
SHO-BOND Holdings | | | 3,700 | | | | 154 | |
| | |
Showa Denko | | | 3,400 | | | | 90 | |
| | |
Showa Sangyo | | | 5,400 | | | | 154 | |
| | |
Sinko Industries | | | 5,800 | | | | 102 | |
| | | | | | | | |
| Description | | Shares | | | Value
(000) | |
| | |
Sintokogio | | | 9,200 | | | $ | 89 | |
| | |
SK-Electronics | | | 19,900 | | | | 363 | |
| | |
SKY Perfect JSAT Holdings | | | 85,400 | | | | 379 | |
| | |
SMC | | | 1,400 | | | | 639 | |
| | |
Softbank | | | 41,300 | | | | 553 | |
| | |
SoftBank Group | | | 38,300 | | | | 1,658 | |
| | |
Sohgo Security Services | | | 6,300 | | | | 342 | |
| | |
Soiken Holdings | | | 11,300 | | | | 64 | |
| | |
Soliton Systems | | | 2,200 | | | | 26 | |
| | |
Sompo Holdings | | | 27,400 | | | | 1,074 | |
| | |
Sony | | | 41,100 | | | | 2,793 | |
| | |
Sony Financial Holdings | | | 8,900 | | | | 213 | |
| | |
Square Enix Holdings | | | 2,200 | | | | 110 | |
| | |
Stanley Electric | | | 3,500 | | | | 101 | |
| | |
Starts | | | 4,100 | | | | 104 | |
| | |
Sugi Holdings | | | 500 | | | | 26 | |
| | |
SUMCO | | | 6,600 | | | | 109 | |
| | |
Suminoe Textile | | | 700 | | | | 19 | |
| | |
Sumitomo | | | 29,400 | | | | 436 | |
| | |
Sumitomo Chemical | | | 34,600 | | | | 157 | |
| | |
Sumitomo Dainippon Pharma | | | 3,900 | | | | 76 | |
| | |
Sumitomo Densetsu | | | 8,900 | | | | 239 | |
| | |
Sumitomo Electric Industries | | | 35,100 | | | | 528 | |
| | |
Sumitomo Forestry | | | 7,000 | | | | 103 | |
| | |
Sumitomo Heavy Industries | | | 2,500 | | | | 71 | |
| | |
Sumitomo Metal Mining | | | 10,600 | | | | 343 | |
| | |
Sumitomo Mitsui Financial Group | | | 71,400 | | | | 2,629 | |
| | |
Sumitomo Mitsui Trust Holdings | | | 14,600 | | | | 577 | |
| | |
Sumitomo Realty & Development | | | 8,300 | | | | 290 | |
| | |
Sumitomo Riko | | | 17,700 | | | | 160 | |
| | |
Sumitomo Rubber Industries | | | 4,300 | | | | 52 | |
| | |
Sundrug | | | 6,500 | | | | 235 | |
| | |
Suntory Beverage & Food | | | 8,300 | | | | 346 | |
| | |
Sun-Wa Technos | | | 2,000 | | | | 21 | |
| | |
Suzuken | | | 1,700 | | | | 69 | |
| | |
Suzuki Motor | | | 9,100 | | | | 379 | |
| | |
SWCC Showa Holdings | | | 18,900 | | | | 258 | |
| | |
Sysmex | | | 4,120 | | | | 281 | |
| | |
System Research | | | 4,000 | | | | 66 | |
| | |
Systena | | | 33,600 | | | | 547 | |
| | |
T&D Holdings | | | 30,100 | | | | 381 | |
| | |
Taiheiyo Cement | | | 19,800 | | | | 581 | |
| | |
Taiho Kogyo, Cl A | | | 1,858 | | | | 15 | |
| | |
Taiko Pharmaceutical | | | 4,000 | | | | 120 | |
| | |
Taisei | | | 4,800 | | | | 199 | |
| | |
Taisho Pharmaceutical Holdings | | | 900 | | | | 67 | |
The accompanying notes are an integral part of the financial statements.
79
| | |
| THE KP FUNDS | | December 31, 2019 |
| | |
| KP International Equity Fund | | |
| | | | | | | | |
| Description | | Shares | | | Value
(000) | |
| | |
Taiyo Nippon Sanso | | | 2,900 | | | $ | 64 | |
| | |
Takara Standard | | | 6,800 | | | | 122 | |
| | |
Takasago Thermal Engineering | | | 12,500 | | | | 224 | |
| | |
Takashimaya | | | 33,900 | | | | 381 | |
| | |
Takeda Pharmaceutical | | | 40,724 | | | | 1,611 | |
| | |
Takeei | | | 2,800 | | | | 32 | |
| | |
Takuma | | | 7,700 | | | | 92 | |
| | |
Tama Home | | | 37,600 | | | | 569 | |
| | |
Tamron | | | 17,000 | | | | 391 | |
| | |
Tanseisha | | | 38,700 | | | | 468 | |
| | |
TDK | | | 7,500 | | | | 845 | |
| | |
TechMatrix | | | 24,900 | | | | 536 | |
| | |
TechnoPro Holdings | | | 3,000 | | | | 209 | |
| | |
Teijin | | | 4,100 | | | | 77 | |
| | |
Teikoku Tsushin Kogyo | | | 1,600 | | | | 18 | |
| | |
Tekken | | | 8,100 | | | | 209 | |
| | |
Terumo | | | 218,500 | | | | 7,768 | |
| | |
T-Gaia | | | 14,100 | | | | 343 | |
| | |
THK | | | 2,700 | | | | 73 | |
| | |
Tigers Polymer | | | 3,500 | | | | 20 | |
| | |
TIS | | | 17,000 | | | | 999 | |
| | |
Toa | | | 4,200 | | | | 44 | |
| | |
TOA ROAD CORP | | | 400 | | | | 13 | |
| | |
Tobu Railway | | | 5,000 | | | | 181 | |
| | |
TOC | | | 2,300 | | | | 19 | |
| | |
Tochigi Bank | | | 54,900 | | | | 118 | |
| | |
Toho | | | 6,200 | | | | 258 | |
| | |
Toho Gas | | | 1,900 | | | | 78 | |
| | |
Toho Holdings | | | 11,700 | | | | 259 | |
| | |
Tohoku Electric Power | | | 9,800 | | | | 97 | |
| | |
Tokai | | | 2,500 | | | | 65 | |
| | |
TOKAI Holdings | | | 7,100 | | | | 71 | |
| | |
Tokio Marine Holdings | | | 34,600 | | | | 1,930 | |
| | |
Tokyo Century | | | 900 | | | | 48 | |
| | |
Tokyo Dome | | | 29,200 | | | | 291 | |
| | |
Tokyo Electric Power Holdings* | | | 35,500 | | | | 152 | |
| | |
Tokyo Electron | | | 3,900 | | | | 850 | |
| | |
Tokyo Electron Device | | | 6,300 | | | | 157 | |
| | |
Tokyo Gas | | | 18,400 | | | | 446 | |
| | |
Tokyo Keiki | | | 1,900 | | | | 18 | |
| | |
Tokyo Ohka Kogyo | | | 7,100 | | | | 277 | |
| | |
Tokyo Seimitsu | | | 4,800 | | | | 186 | |
| | |
Tokyu | | | 12,900 | | | | 239 | |
| | |
Tokyu Construction | | | 79,800 | | | | 569 | |
| | |
Tokyu Fudosan Holdings | | | 14,000 | | | | 97 | |
| | |
TOMONY Holdings | | | 50,100 | | | | 190 | |
| | | | | | | | |
| Description | | Shares | | | Value
(000) | |
| | |
Tomy | | | 35,400 | | | $ | 459 | |
| | |
Toppan Forms | | | 3,500 | | | | 39 | |
| | |
Toppan Printing | | | 6,400 | | | | 132 | |
| | |
Topre | | | 13,000 | | | | 210 | |
| | |
Toray Industries | | | 40,700 | | | | 276 | |
| | |
Torii Pharmaceutical | | | 7,100 | | | | 199 | |
| | |
Torishima Pump Manufacturing | | | 8,300 | | | | 70 | |
| | |
Tosei | | | 13,300 | | | | 182 | |
| | |
Toshiba | | | 12,200 | | | | 415 | |
| | |
Toshiba TEC | | | 11,400 | | | | 471 | |
| | |
Tosoh | | | 5,900 | | | | 91 | |
| | |
TOTO | | | 3,300 | | | | 139 | |
| | |
Towa Pharmaceutical | | | 16,600 | | | | 431 | |
| | |
Toyo Construction | | | 46,200 | | | | 221 | |
| | |
Toyo Machinery & Metal | | | 7,000 | | | | 35 | |
| | |
Toyo Seikan Group Holdings | | | 29,700 | | | | 512 | |
| | |
Toyo Suisan Kaisha | | | 20,700 | | | | 880 | |
| | |
Toyoda Gosei | | | 1,400 | | | | 35 | |
| | |
Toyota Industries | | | 7,500 | | | | 432 | |
| | |
Toyota Motor | | | 132,900 | | | | 9,368 | |
| | |
Toyota Tsusho | | | 5,500 | | | | 194 | |
| | |
Transaction | | | 18,500 | | | | 173 | |
| | |
Transcosmos* | | | 6,400 | | | | 174 | |
| | |
Treasure Factory | | | 7,300 | | | | 72 | |
| | |
Trend Micro* | | | 3,300 | | | | 169 | |
| | |
Tsumura | | | 10,300 | | | | 303 | |
| | |
Tsuruha Holdings | | | 1,000 | | | | 128 | |
| | |
ULS Group | | | 1,500 | | | | 40 | |
| | |
Unicharm | | | 10,100 | | | | 342 | |
| | |
UNITED | | | 15,100 | | | | 191 | |
| | |
United Urban Investment‡ | | | 73 | | | | 137 | |
| | |
Ushio | | | 10,200 | | | | 151 | |
| | |
USS | | | 16,600 | | | | 314 | |
| | |
V Technology | | | 1,700 | | | | 86 | |
| | |
Vital KSK Holdings | | | 19,800 | | | | 190 | |
| | |
VT Holdings | | | 30,800 | | | | 137 | |
| | |
Waseda Academy | | | 2,200 | | | | 21 | |
| | |
Wealth Management* | | | 4,100 | | | | 73 | |
| | |
Welcia Holdings | | | 1,100 | | | | 70 | |
| | |
West Japan Railway | | | 17,300 | | | | 1,496 | |
| | |
Will Group | | | 25,500 | | | | 291 | |
| | |
World | | | 3,400 | | | | 84 | |
| | |
World Holdings | | | 6,600 | | | | 117 | |
| | |
Xebio Holdings | | | 3,300 | | | | 40 | |
| | |
Yakult Honsha | | | 2,800 | | | | 154 | |
| | |
YAMABIKO | | | 5,600 | | | | 61 | |
The accompanying notes are an integral part of the financial statements.
80
| | |
| THE KP FUNDS | | December 31, 2019 |
| | |
| KP International Equity Fund | | |
| | | | | | | | |
| Description | | Shares | | | Value
(000) | |
| | |
Yamada Denki* | | | 14,200 | | | $ | 76 | |
| | |
Yamaguchi Financial Group | | | 54,000 | | | | 366 | |
| | |
Yamaha | | | 3,700 | | | | 205 | |
| | |
Yamaha Motor | | | 6,500 | | | | 130 | |
| | |
Yamaichi Electronics | | | 3,600 | | | | 56 | |
| | |
Yamanashi Chuo Bank | | | 10,000 | | | | 107 | |
| | |
Yamato Holdings | | | 7,920 | | | | 135 | |
| | |
Yamazaki Baking | | | 3,100 | | | | 55 | |
| | |
Yamazen | | | 3,900 | | | | 39 | |
| | |
Yaskawa Electric | | | 6,200 | | | | 233 | |
| | |
Yokogawa Electric | | | 5,700 | | | | 100 | |
| | |
Yokohama Reito | | | 24,600 | | | | 225 | |
| | |
Yokohama Rubber | | | 2,700 | | | | 52 | |
| | |
Yokowo | | | 3,200 | | | | 95 | |
| | |
Yossix | | | 6,100 | | | | 154 | |
| | |
Z Holdings | | | 68,600 | | | | 289 | |
| | |
ZERIA Pharmaceutical | | | 4,800 | | | | 92 | |
| | |
ZOZO | | | 12,000 | | | | 230 | |
| | | | | | | | |
| | | | | | | 312,668 | |
| | | | | | | | |
| | |
Kenya — 0.0% | | | | | | | | |
| | |
East African Breweries | | | 383,378 | | | | 751 | |
| | | | | | | | |
| | |
Malaysia — 0.1% | | | | | | | | |
| | |
Aeon M | | | 120,400 | | | | 42 | |
| | |
Allianz Malaysia | | | 6,200 | | | | 25 | |
| | |
Astro Malaysia Holdings | | | 104,600 | | | | 32 | |
| | |
Bermaz Auto | | | 230,900 | | | | 118 | |
| | |
Hong Leong Bank | | | 200 | | | | 1 | |
| | |
Hong Leong Industries | | | 5,500 | | | | 14 | |
| | |
Insas | | | 326,100 | | | | 65 | |
| | |
Kenanga Investment Bank | | | 85,500 | | | | 9 | |
| | |
KSL Holdings* | | | 551,500 | | | | 102 | |
| | |
Malaysia Airports Holdings | | | 114,200 | | | | 212 | |
| | |
Malaysian Pacific Industries | | | 17,267 | | | | 49 | |
| | |
MISC | | | 152,100 | | | | 310 | |
| | |
Padini Holdings | | | 148,500 | | | | 118 | |
| | |
Petron Malaysia Refining & Marketing | | | 98,639 | | | | 121 | |
| | |
Sime Darby | | | 867,100 | | | | 471 | |
| | |
Syarikat Takaful Malaysia Keluarga | | | 24,000 | | | | 33 | |
| | |
Tropicana | | | 48 | | | | — | |
| | |
Uchi Technologies | | | 80,529 | | | | 55 | |
| | |
Unisem | | | 23,619 | | | | 12 | |
| | | | | | | | |
| | | | | | | 1,789 | |
| | | | | | | | |
| | |
Mexico — 0.6% | | | | | | | | |
| | |
America Movil | | | 632,302 | | | | 505 | |
| | |
Credito Real SOFOM ER | | | 2,787 | | | | 3 | |
| | | | | | | | |
| Description | | Shares | | | Value
(000) | |
| | |
Fibra Uno Administracion‡ | | | 447,674 | | | $ | 693 | |
| | |
Genomma Lab Internacional, Cl B* | | | 1,836,793 | | | | 1,821 | |
| | |
Gentera | | | 1,384,635 | | | | 1,420 | |
| | |
Grupo Aeroportuario del Pacifico, Cl B | | | 212,249 | | | | 2,523 | |
| | |
Grupo Financiero Banorte, Cl O | | | 330,024 | | | | 1,843 | |
| | |
Grupo Financiero Inbursa, Cl O | | | 590,722 | | | | 725 | |
| | |
Grupo Lala, Cl B | | | 668,204 | | | | 580 | |
| | |
Grupo Televisa ADR | | | 50,263 | | | | 590 | |
| | |
Industrias Bachoco | | | 78,181 | | | | 335 | |
| | |
Kimberly-Clark de Mexico, Cl A | | | 72,892 | | | | 145 | |
| | |
Nemak | | | 1,017,440 | | | | 427 | |
| | |
Vitro | | | 18,814 | | | | 42 | |
| | |
Wal-Mart de Mexico | | | 578,299 | | | | 1,660 | |
| | | | | | | | |
| | | | | | | 13,312 | |
| | | | | | | | |
| | |
Netherlands — 2.7% | | | | | | | | |
| | |
ABN AMRO Bank | | | 9,858 | | | | 179 | |
| | |
Accell Group | | | 2,608 | | | | 75 | |
| | |
Adyen* | | | 270 | | | | 221 | |
| | |
Aegon | | | 46,444 | | | | 212 | |
| | |
AFC Ajax | | | 889 | | | | 21 | |
| | |
Akzo Nobel | | | 66,009 | | | | 6,711 | |
| | |
Altice Europe, Cl A* | | | 16,432 | | | | 106 | |
| | |
Amsterdam Commodities | | | 2,462 | | | | 57 | |
| | |
ArcelorMittal | | | 69,261 | | | | 1,215 | |
| | |
ASM International | | | 15,865 | | | | 1,782 | |
| | |
ASML Holding | | | 12,401 | | | | 3,668 | |
| | |
ASR Nederland | | | 11,193 | | | | 419 | |
| | |
Boskalis Westminster | | | 186,553 | | | | 4,771 | |
| | |
Coca-Cola European Partners | | | 1,470 | | | | 74 | |
| | |
Fugro* | | | 141,530 | | | | 1,584 | |
| | |
Galapagos* | | | 1,056 | | | | 221 | |
| | |
Galapagos ADR* | | | 1,300 | | | | 269 | |
| | |
Heineken | | | 25,957 | | | | 2,763 | |
| | |
Heineken Holding | | | 2,900 | | | | 281 | |
| | |
Hunter Douglas* | | | 175 | | | | 11 | |
| | |
ING Groep | | | 408,358 | | | | 4,896 | |
| | |
Intertrust | | | 15,011 | | | | 291 | |
| | |
Koninklijke Ahold Delhaize | | | 75,638 | | | | 1,892 | |
| | |
Koninklijke DSM | | | 4,469 | | | | 582 | |
| | |
Koninklijke KPN | | | 413,226 | | | | 1,220 | |
| | |
Koninklijke Philips | | | 49,714 | | | | 2,427 | |
| | |
Koninklijke Vopak | | | 1,603 | | | | 87 | |
| | |
NN Group | | | 7,610 | | | | 289 | |
| | |
Pharming Group* | | | 237,710 | | | | 418 | |
| | |
Prosus* | | | 11,874 | | | | 886 | |
The accompanying notes are an integral part of the financial statements.
81
| | |
| THE KP FUNDS | | December 31, 2019 |
| | |
| KP International Equity Fund | | |
| | | | | | | | |
| Description | | Shares | | | Value
(000) | |
| | |
Randstad | | | 70,794 | | | $ | 4,323 | |
| | |
RELX | | | 186,672 | | | | 4,704 | |
| | |
SBM Offshore | | | 343,695 | | | | 6,396 | |
| | |
Signify | | | 3,987 | | | | 125 | |
| | |
Takeaway.com* | | | 1,188 | | | | 110 | |
| | |
Unibail-Rodamco-Westfield‡ | | | 2,728 | | | | 430 | |
| | |
Unilever | | | 35,920 | | | | 2,064 | |
| | |
Van Lanschot Kempen | | | 3,116 | | | | 70 | |
| | |
Wereldhave‡ | | | 11,056 | | | | 250 | |
| | |
Wolters Kluwer | | | 6,903 | | | | 503 | |
| | | | | | | | |
| | | | | | | 56,603 | |
| | | | | | | | |
New Zealand — 0.1% | | | | | | | | |
| | |
a2 Milk* | | | 19,218 | | | | 194 | |
| | |
Auckland International Airport | | | 25,762 | | | | 152 | |
| | |
Fisher & Paykel Healthcare | | | 14,950 | | | | 223 | |
| | |
Fletcher Building | | | 91,551 | | | | 314 | |
| | |
Infratil | | | 82,796 | | | | 281 | |
| | |
Kathmandu Holdings | | | 44,141 | | | | 99 | |
| | |
Mercury NZ | | | 16,588 | | | | 56 | |
| | |
Meridian Energy | | | 32,722 | | | | 110 | |
| | |
Metlifecare | | | 17,435 | | | | 80 | |
| | |
NZX | | | 83,714 | | | | 77 | |
| | |
PGG Wrightson | | | 6,591 | | | | 11 | |
| | |
Property for Industry‡ | | | 32,158 | | | | 53 | |
| | |
Pushpay Holdings* | | | 16,130 | | | | 44 | |
| | |
Ryman Healthcare | | | 9,246 | | | | 102 | |
| | |
Skellerup Holdings | | | 19,474 | | | | 32 | |
| | |
SKY Network Television | | | 158,730 | | | | 76 | |
| | |
Spark New Zealand | | | 167,204 | | | | 487 | |
| | |
Summerset Group Holdings | | | 30,476 | | | | 182 | |
| | |
Trustpower | | | 21,954 | | | | 110 | |
| | |
Vista Group International | | | 20,539 | | | | 50 | |
| | |
Z Energy | | | 32,108 | | | | 95 | |
| | | | | | | | |
| | | | | | | 2,828 | |
| | | | | | | | |
|
Norway — 1.0% | |
| | |
Adevinta, Cl B* | | | 19,893 | | | | 236 | |
| | |
Aker BP | | | 2,445 | | | | 80 | |
| | |
Bakkafrost P | | | 25,074 | | | | 1,857 | |
| | |
DNB | | | 55,193 | | | | 1,031 | |
| | |
Elkem | | | 42,025 | | | | 119 | |
| | |
Equinor | | | 90,577 | | | | 1,809 | |
| | |
Gjensidige Forsikring | | | 4,560 | | | | 96 | |
| | |
Mowi | | | 11,074 | | | | 287 | |
| | |
Norsk Hydro | | | 30,955 | | | | 115 | |
| | |
Opera ADR* | | | 7,683 | | | | 71 | |
| | |
Orkla | | | 17,769 | | | | 180 | |
| | | | | | | | |
| Description | | Shares | | | Value
(000) | |
| | |
Schibsted, Cl A | | | 10,733 | | | $ | 324 | |
| | |
Schibsted, Cl B | | | 11,802 | | | | 338 | |
| | |
SpareBank 1 BV | | | 17,631 | | | | 80 | |
| | |
Sparebank 1 Oestlandet | | | 26,700 | | | | 279 | |
| | |
SpareBank 1 SR-Bank | | | 53,156 | | | | 606 | |
| | |
Sparebanken More | | | 1,457 | | | | 53 | |
| | |
Telenor | | | 17,295 | | | | 310 | |
| | |
TGS NOPEC Geophysical | | | 151,800 | | | | 4,674 | |
| | |
Yara International | | | 182,696 | | | | 7,673 | |
| | | | | | | | |
| | | | | | | 20,218 | |
| | | | | | | | |
|
Peru — 0.1% | |
| | |
Cia de Minas Buenaventura ADR | | | 32,843 | | | | 496 | |
| | |
Credicorp | | | 12,296 | | | | 2,621 | |
| | | | | | | | |
| | | | | | | 3,117 | |
| | | | | | | | |
|
Philippines — 0.0% | |
| | |
First Gen | | | 162,100 | | | | 77 | |
| | |
Lopez Holdings | | | 759,100 | | | | 56 | |
| | |
SSI Group | | | 279,000 | | | | 15 | |
| | | | | | | | |
| | | | | | | 148 | |
| | | | | | | | |
|
Poland — 0.2% | |
| | |
Asseco Poland | | | 12,648 | | | | 212 | |
| | |
Cyfrowy Polsat | | | 10,902 | | | | 80 | |
| | |
Enea* | | | 60,238 | | | | 126 | |
| | |
Energa* | | | 62,376 | | | | 117 | |
| | |
Eurocash | | | 75,722 | | | | 436 | |
| | |
Grupa Lotos | | | 60,862 | | | | 1,341 | |
| | |
Jastrzebska Spolka Weglowa | | | 6,115 | | | | 35 | |
| | |
LPP | | | 440 | | | | 1,023 | |
| | |
Neuca | | | 96 | | | | 10 | |
| | |
Polski Koncern Naftowy Orlen | | | 64,848 | | | | 1,466 | |
| | |
TEN Square Games | | | 193 | | | | 10 | |
| | | | | | | | |
| | | | | | | 4,856 | |
| | | | | | | | |
|
Portugal — 0.2% | |
| | |
Altri SGPS | | | 26,561 | | | | 169 | |
| | |
Banco Espirito Santo* (A) | | | 46,916 | | | | — | |
| | |
EDP-Energias de Portugal | | | 61,372 | | | | 266 | |
| | |
Galp Energia | | | 127,612 | | | | 2,133 | |
| | |
Jeronimo Martins | | | 5,759 | | | | 95 | |
| | |
Mota-Engil SGPS | | | 63,517 | | | | 133 | |
| | |
Sonae SGPS | | | 333,324 | | | | 340 | |
| | | | | | | | |
| | | | | | | 3,136 | |
| | | | | | | | |
|
Qatar — 0.1% | |
| | |
Mannai | | | 7,450 | | | | 6 | |
| | |
Ooredoo QPSC | | | 636,880 | | | | 1,239 | |
| | |
Qatar Islamic Bank SAQ | | | 74,643 | | | | 314 | |
The accompanying notes are an integral part of the financial statements.
82
| | |
| THE KP FUNDS | | December 31, 2019 |
| | |
| KP International Equity Fund | | |
| | | | | | | | |
| Description | | Shares | | | Value
(000) | |
| | |
Qatar National Bank SAQ | | | 134,324 | | | $ | 760 | |
| | |
United Development QSC | | | 170,100 | | | | 71 | |
| | | | | | | | |
| | | | | | | 2,390 | |
| | | | | | | | |
|
Russia — 0.5% | |
| | |
Alrosa PJSC | | | 641,384 | | | | 871 | |
| | |
Lukoil PJSC ADR | | | 6,412 | | | | 633 | |
| | |
Magnit PJSC | | | 8,538 | | | | 471 | |
| | |
Magnitogorsk Iron & Steel Works PJSC GDR | | | 25,410 | | | | 220 | |
| | |
MMC Norilsk Nickel PJSC ADR | | | 65,301 | | | | 1,996 | |
| | |
PhosAgro PJSC GDR | | | 56,063 | | | | 725 | |
| | |
PhosAgro PJSC (LSE Shares) GDR | | | 5,767 | | | | 73 | |
| | |
Polyus PJSC GDR | | | 107 | | | | 6 | |
| | |
Sberbank of Russia PJSC ADR | | | 122,106 | | | | 2,007 | |
| | |
Severstal PJSC GDR | | | 9,322 | | | | 141 | |
| | |
Tatneft PJSC ADR | | | 5,656 | | | | 418 | |
| | |
VEON ADR | | | 23,598 | | | | 60 | |
| | |
Yandex, Cl A* | | | 86,272 | | | | 3,751 | |
| | | | | | | | |
| | | | | | | 11,372 | |
| | | | | | | | |
|
Singapore — 2.1% | |
| | |
Ascendas‡ | | | 66,816 | | | | 148 | |
| | |
Ascott Residence Trust‡ | | | 193,200 | | | | 191 | |
| | |
Asian Pay Television Trust | | | 403,700 | | | | 51 | |
| | |
Best World International | | | 17,700 | | | | 18 | |
| | |
Cache Logistics Trust‡ | | | 218,300 | | | | 116 | |
| | |
CapitaLand | | | 59,600 | | | | 166 | |
| | |
CapitaLand Commercial Trust‡ | | | 59,974 | | | | 89 | |
| | |
CapitaLand Mall Trust‡ | | | 65,900 | | | | 121 | |
| | |
City Developments | | | 11,500 | | | | 94 | |
| | |
ComfortDelGro | | | 59,000 | | | | 104 | |
| | |
Dairy Farm International Holdings | | | 32,100 | | | | 183 | |
| | |
DBS Group Holdings | | | 280,134 | | | | 5,391 | |
| | |
Delfi | | | 1,368,900 | | | | 1,017 | |
| | |
Frasers Property | | | 82,600 | | | | 104 | |
| | |
Frencken Group | | | 314,500 | | | | 216 | |
| | |
Genting Singapore | | | 721,300 | | | | 494 | |
| | |
Great Eastern Holdings | | | 51,200 | | | | 828 | |
| | |
Haw Par | | | 36,612 | | | | 348 | |
| | |
Hi-P International, Cl P | | | 69,800 | | | | 79 | |
| | |
Hongkong Land Holdings | | | 841,900 | | | | 4,840 | |
| | |
Hour Glass | | | 112,000 | | | | 67 | |
| | |
Jardine Cycle & Carriage | | | 2,533 | | | | 57 | |
| | |
Jardine Matheson Holdings | | | 158,400 | | | | 8,807 | |
| | |
Jardine Strategic Holdings | | | 5,800 | | | | 178 | |
| | |
Jumbo Group | | | 71,700 | | | | 20 | |
| | | | | | | | |
| Description | | Shares | | | Value
(000) | |
| | |
Keppel | | | 38,100 | | | $ | 192 | |
| | |
Keppel DC‡ | | | 317,500 | | | | 491 | |
| | |
Mapletree Commercial Trust‡ | | | 720,050 | | | | 1,280 | |
| | |
Oversea-Chinese Banking | | | 80,265 | | | | 655 | |
| | |
Parkway Life‡ | | | 118,700 | | | | 293 | |
| | |
Sasseur Real Estate Investment Trust‡ | | | 279,400 | | | | 184 | |
| | |
SATS | | | 14,900 | | | | 56 | |
| | |
Sembcorp Industries | | | 30,000 | | | | 51 | |
| | |
Silverlake Axis | | | 95,300 | | | | 29 | |
| | |
Singapore Airlines | | | 12,400 | | | | 83 | |
| | |
Singapore Exchange | | | 20,400 | | | | 134 | |
| | |
Singapore Medical Group* | | | 27,700 | | | | 6 | |
| | |
Singapore Press Holdings | | | 46,200 | | | | 75 | |
| | |
Singapore Technologies Engineering | | | 38,700 | | | | 113 | |
| | |
Singapore Telecommunications | | | 1,948,800 | | | | 4,883 | |
| | |
Sunningdale Tech | | | 66,700 | | | | 66 | |
| | |
Suntec‡ | | | 46,100 | | | | 63 | |
| | |
UMS Holdings | | | 442,300 | | | | 339 | |
| | |
United Industrial | | | 18,948 | | | | 40 | |
| | |
United Overseas Bank | | | 481,270 | | | | 9,451 | |
| | |
UOL Group | | | 12,285 | | | | 76 | |
| | |
Venture | | | 82,900 | | | | 999 | |
| | |
Wilmar International | | | 48,500 | | | | 149 | |
| | |
Yangzijiang Shipbuilding Holdings | | | 261,700 | | | | 218 | |
| | |
Yanlord Land Group | | | 159,300 | | | | 143 | |
| | | | | | | | |
| | | | | | | 43,796 | |
| | | | | | | | |
| | |
South Africa — 1.3% | | | | | | | | |
| | |
Alviva Holdings | | | 10,469 | | | | 11 | |
| | |
Anglo American | | | 28,912 | | | | 823 | |
| | |
Anglo American Platinum | | | 41,074 | | | | 3,835 | |
| | |
Astral Foods | | | 1,307 | | | | 20 | |
| | |
Bid | | | 61,725 | | | | 1,455 | |
| | |
Bidvest Group | | | 169,249 | | | | 2,474 | |
| | |
Capitec Bank Holdings | | | 27,388 | | | | 2,828 | |
| | |
Cie Financiere Richemont | | | 77,292 | | | | 604 | |
| | |
Clicks Group | | | 112,517 | | | | 2,062 | |
| | |
DataTec | | | 28,258 | | | | 67 | |
| | |
FirstRand | | | 438,544 | | | | 1,966 | |
| | |
Grindrod | | | 1,330,105 | | | | 478 | |
| | |
Impala Platinum Holdings* | | | 55,454 | | | | 568 | |
| | |
Kumba Iron Ore | | | 3,938 | | | | 117 | |
| | |
Momentum Metropolitan Holdings | | | 121,518 | | | | 189 | |
| | |
Northam Platinum* | | | 45,057 | | | | 398 | |
| | |
Peregrine Holdings | | | 160,578 | | | | 217 | |
| | |
Raubex Group | | | 354,798 | | | | 608 | |
The accompanying notes are an integral part of the financial statements.
83
| | |
| THE KP FUNDS | | December 31, 2019 |
| | |
| KP International Equity Fund | | |
| | | | | | | | |
| Description | | Shares | | | Value
(000) | |
| | |
Standard Bank Group | | | 179,911 | | | $ | 2,162 | |
| | |
Super Group* | | | 130,668 | | | | 265 | |
| | |
Telkom | | | 209,106 | | | | 520 | |
| | |
Tiger Brands | | | 352,156 | | | | 5,299 | |
| | |
Tsogo Sun Gaming | | | 158,038 | | | | 138 | |
| | |
Tsogo Sun Hotels* | | | 148,686 | | | | 42 | |
| | |
Wilson Bayly Holmes-Ovcon | | | 9,970 | | | | 98 | |
| | | | | | | | |
| | | | | | | 27,244 | |
| | | | | | | | |
| | |
South Korea — 2.8% | | | | | | | | |
| | |
Actro | | | 20,828 | | | | 262 | |
| | |
Amore Pacific Group | | | 16,769 | | | | 1,195 | |
| | |
Cheil Worldwide | | | 24,245 | | | | 504 | |
| | |
CJ Hello | | | 45,601 | | | | 238 | |
| | |
Com2uSCorp | | | 2,656 | | | | 245 | |
| | |
Daelim Industrial | | | 5,063 | | | | 395 | |
| | |
Daeyang Electric | | | 3,787 | | | | 46 | |
| | |
Dongyang E&P | | | 10,103 | | | | 141 | |
| | |
Douzone Bizon | | | 20,913 | | | | 1,465 | |
| | |
Fila Korea | | | 5,103 | | | | 233 | |
| | |
Gravity ADR* | | | 417 | | | | 16 | |
| | |
GS Engineering & Construction | | | 16,789 | | | | 450 | |
| | |
GS Home Shopping | | | 1,965 | | | | 253 | |
| | |
Hana Financial Group | | | 32,719 | | | | 1,041 | |
| | |
Hankook Tire & Technology | | | 15,958 | | | | 461 | |
| | |
Hanwha Aerospace* | | | 4,864 | | | | 147 | |
| | |
HDC Hyundai Development -Engineering & Construction, Cl E | | | 3,497 | | | | 77 | |
| | |
Hyundai Glovis | | | 2,881 | | | | 355 | |
| | |
Hyundai Motor | | | 6,905 | | | | 717 | |
| | |
Innocean Worldwide | | | 7,836 | | | | 480 | |
| | |
Interpark | | | 21,256 | | | | 92 | |
| | |
Interpark Holdings | | | 47,727 | | | | 89 | |
| | |
JB Financial Group | | | 9,678 | | | | 46 | |
| | |
Kia Motors | | | 59,695 | | | | 2,280 | |
| | |
Korea Investment Holdings | | | 6,441 | | | | 402 | |
| | |
KT ADR | | | 87,693 | | | | 1,017 | |
| | |
KT | | | 17,542 | | | | 409 | |
| | |
LG | | | 19,854 | | | | 1,265 | |
| | |
LG Display* | | | 24,679 | | | | 346 | |
| | |
LG Electronics | | | 31,796 | | | | 1,975 | |
| | |
LG Household & Health Care | | | 2,862 | | | | 3,113 | |
| | |
LG Innotek | | | 5,842 | | | | 705 | |
| | |
LG Uplus | | | 101,551 | | | | 1,245 | |
| | |
MegaStudyEdu | | | 1,335 | | | | 48 | |
| | |
Moorim Paper | | | 15,148 | | | | 32 | |
| | |
Neowiz* | | | 20,154 | | | | 295 | |
| | | | | | | | |
| Description | | Shares | | | Value
(000) | |
| | |
NHN* | | | 6,396 | | | $ | 369 | |
| | |
NHN KCP | | | 5,900 | | | | 113 | |
| | |
Partron | | | 20,826 | | | | 238 | |
| | |
POSCO | | | 1,529 | | | | 311 | |
| | |
POSCO ADR | | | 90,000 | | | | 4,557 | |
| | |
S-1, Cl 1 | | | 6,064 | | | | 491 | |
| | |
Samsung Electronics | | | 274,275 | | | | 13,201 | |
| | |
Samsung Electronics GDR | | | 6,810 | | | | 8,215 | |
| | |
Samsung Fire & Marine Insurance | | | 6,328 | | | | 1,326 | |
| | |
Samsung SDS | | | 2,933 | | | | 491 | |
| | |
SeAH Holdings | | | 225 | | | | 15 | |
| | |
Seohan | | | 15,917 | | | | 16 | |
| | |
Shinhan Financial Group | | | 54,364 | | | | 2,035 | |
| | |
SK Hynix | | | 55,341 | | | | 4,466 | |
| | |
SK Telecom | | | 9,902 | | | | 2,032 | |
| | |
Tovis | | | 7,623 | | | | 62 | |
| | |
UIL | | | 6,402 | | | | 29 | |
| | |
Youngone Holdings | | | 595 | | | | 25 | |
| | | | | | | | |
| | | | | | | 60,072 | |
| | | | | | | | |
| | |
Spain — 1.4% | | | | | | | | |
| | |
Acerinox* | | | 38,886 | | | | 438 | |
| | |
ACS Actividades de Construccion y Servicios | | | 6,273 | | | | 251 | |
| | |
Aena SME | | | 1,678 | | | | 321 | |
| | |
Amadeus IT Group, Cl A | | | 112,006 | | | | 9,146 | |
| | |
Banco Bilbao Vizcaya Argentaria | | | 162,537 | | | | 908 | |
| | |
Banco de Sabadell | | | 132,426 | | | | 154 | |
| | |
Banco Santander | | | 1,755,949 | | | | 7,347 | |
| | |
Bankia | | | 295,948 | | | | 632 | |
| | |
Bankinter | | | 16,736 | | | | 123 | |
| | |
Bolsas y Mercados Espanoles SHMSF | | | 1,586 | | | | 61 | |
| | |
CaixaBank | | | 90,441 | | | | 284 | |
| | |
Cellnex Telecom* | | | 6,012 | | | | 259 | |
| | |
CIE Automotive | | | 12,924 | | | | 306 | |
| | |
eDreams ODIGEO* | | | 7,047 | | | | 34 | |
| | |
Enagas | | | 5,896 | | | | 150 | |
| | |
Endesa | | | 8,256 | | | | 220 | |
| | |
Faes Farma | | | 75,385 | | | | 423 | |
| | |
Ferrovial | | | 21,212 | | | | 641 | |
| | |
Gestamp Automocion | | | 81,377 | | | | 391 | |
| | |
Grifols | | | 7,151 | | | | 252 | |
| | |
Grupo Empresarial San Jose* | | | 19,563 | | | | 132 | |
| | |
Iberdrola | | | 147,737 | | | | 1,522 | |
| | |
Indra Sistemas* | | | 31,972 | | | | 365 | |
| | |
Industria de Diseno Textil | | | 26,588 | | | | 938 | |
The accompanying notes are an integral part of the financial statements.
84
| | |
| THE KP FUNDS | | December 31, 2019 |
| | |
| KP International Equity Fund | | |
| | | | | | | | |
| Description | | Shares | | | Value
(000) | |
| | |
Mapfre | | | 24,339 | | | $ | 64 | |
| | |
Masmovil Ibercom* | | | 18,333 | | | | 418 | |
| | |
Mediaset Espana Comunicacion | | | 16,938 | | | | 108 | |
| | |
Naturgy Energy Group | | | 6,997 | | | | 176 | |
| | |
Naturhouse Health SAU | | | 5,270 | | | | 12 | |
| | |
Red Electrica | | | 11,255 | | | | 226 | |
| | |
Repsol | | | 35,455 | | | | 554 | |
| | |
Sacyr | | | 110,673 | | | | 323 | |
| | |
Siemens Gamesa Renewable Energy | | | 5,485 | | | | 96 | |
| | |
Talgo* | | | 15,272 | | | | 104 | |
| | |
Telefonica | | | 113,905 | | | | 796 | |
| | |
Viscofan | | | 12,813 | | | | 677 | |
| | | | | | | | |
| | | | | | | 28,852 | |
| | | | | | | | |
| | |
Sweden — 1.8% | | | | | | | | |
| | |
AddNode Group, Cl B | | | 3,262 | | | | 62 | |
| | |
AddTech, Cl B | | | 3,026 | | | | 99 | |
| | |
AF POYRY, Cl B | | | 4,644 | | | | 108 | |
| | |
Alfa Laval | | | 8,209 | | | | 207 | |
| | |
Arjo | | | 89,437 | | | | 430 | |
| | |
Assa Abloy, Cl B | | | 141,511 | | | | 3,307 | |
| | |
Atlas Copco, Cl A | | | 16,534 | | | | 659 | |
| | |
Atlas Copco, Cl B | | | 9,698 | | | | 337 | |
| | |
Avanza Bank Holding | | | 13,100 | | | | 137 | |
| | |
Axfood | | | 20,266 | | | | 451 | |
| | |
Bergman & Beving, Cl B | | | 5,478 | | | | 47 | |
| | |
Biotage | | | 26,498 | | | | 351 | |
| | |
Boliden | | | 6,361 | | | | 169 | |
| | |
Boule Diagnostics | | | 1,122 | | | | 8 | |
| | |
BTS Group, Cl B | | | 574 | | | | 15 | |
| | |
Bufab | | | 4,757 | | | | 66 | |
| | |
Bure Equity | | | 27,252 | | | | 617 | |
| | |
Clas Ohlson, Cl B | | | 36,924 | | | | 445 | |
| | |
Cloetta, Cl B | | | 124,791 | | | | 422 | |
| | |
Dios Fastigheter | | | 46,690 | | | | 428 | |
| | |
Duni | | | 4,065 | | | | 56 | |
| | |
Electrolux | | | 5,219 | | | | 128 | |
| | |
Enea* | | | 3,656 | | | | 71 | |
| | |
Enlabs* | | | 21,395 | | | | 55 | |
| | |
Eolus Vind, Cl B | | | 28,057 | | | | 329 | |
| | |
Epiroc, Cl A | | | 17,209 | | | | 210 | |
| | |
Epiroc, Cl B | | | 10,544 | | | | 125 | |
| | |
Essity, Cl B | | | 115,914 | | | | 3,726 | |
| | |
Evolution Gaming Group | | | 23,193 | | | | 701 | |
| | |
Fastighets Balder, Cl B* | | | 42,189 | | | | 1,962 | |
| | |
Ferronordic | | | 3,314 | | | | 58 | |
| | |
Fortnox | | | 13,561 | | | | 244 | |
| | | | | | | | |
| Description | | Shares | | | Value
(000) | |
| | |
GARO | | | 2,219 | | | $ | 73 | |
| | |
Getinge, Cl B | | | 79,719 | | | | 1,481 | |
| | |
GHP Specialty Care | | | 15,964 | | | | 32 | |
| | |
Hemfosa Fastigheter | | | 57,196 | | | | 741 | |
| | |
Hennes & Mauritz, Cl B | | | 19,889 | | | | 405 | |
| | |
Hexagon, Cl B | | | 6,509 | | | | 364 | |
| | |
Husqvarna, Cl B | | | 9,508 | | | | 76 | |
| | |
ICA Gruppen | | | 2,452 | | | | 114 | |
| | |
Industrivarden, Cl C | | | 3,799 | | | | 92 | |
| | |
Instalco | | | 15,693 | | | | 227 | |
| | |
Intrum | | | 12,817 | | | | 383 | |
| | |
Investor, Cl B | | | 11,217 | | | | 613 | |
| | |
Inwido | | | 74,753 | | | | 570 | |
| | |
Kinnevik | | | 5,617 | | | | 137 | |
| | |
Klovern, Cl B | | | 89,671 | | | | 220 | |
| | |
Kungsleden | | | 22,241 | | | | 234 | |
| | |
L E Lundbergforetagen, Cl B | | | 1,720 | | | | 75 | |
| | |
Lagercrantz Group, Cl B | | | 4,907 | | | | 76 | |
| | |
Lifco, Cl B | | | 3,212 | | | | 196 | |
| | |
Lindab International | | | 70,945 | | | | 906 | |
| | |
Loomis, Cl B | | | 20,153 | | | | 834 | |
| | |
Lundin Petroleum | | | 4,862 | | | | 165 | |
| | |
Millicom International Cellular | | | 9,433 | | | | 453 | |
| | |
Moberg Pharma* | | | 30,769 | | | | 60 | |
| | |
Modern Times Group, Cl B* | | | 15,934 | | | | 190 | |
| | |
Mycronic | | | 7,101 | | | | 140 | |
| | |
Nobia | | | 21,124 | | | | 158 | |
| | |
Nordea Bank Abp | | | 100,852 | | | | 814 | |
| | |
Nordic Entertainment Group, Cl B | | | 23,074 | | | | 745 | |
| | |
NP3 Fastigheter | | | 2,267 | | | | 27 | |
| | |
Nyfosa* | | | 115,205 | | | | 1,007 | |
| | |
Pricer, Cl B | | | 39,505 | | | | 79 | |
| | |
Ratos, Cl B | | | 62,469 | | | | 223 | |
| | |
RaySearch Laboratories* | | | 3,236 | | | | 37 | |
| | |
Recipharm, Cl B | | | 20,707 | | | | 330 | |
| | |
Rejlers, Cl B | | | 2,297 | | | | 29 | |
| | |
Sandvik | | | 95,825 | | | | 1,866 | |
| | |
Sdiptech, Cl B* | | | 1,518 | | | | 12 | |
| | |
Sectra, Cl B | | | 2,019 | | | | 84 | |
| | |
Securitas, Cl B | | | 8,369 | | | | 144 | |
| | |
Sintercast | | | 348 | | | | 7 | |
| | |
Skandinaviska Enskilda Banken, Cl A | | | 40,277 | | | | 379 | |
| | |
Skanska, Cl B | | | 8,888 | | | | 201 | |
| | |
SKF, Cl B | | | 9,670 | | | | 195 | |
| | |
SkiStar | | | 12,571 | | | | 160 | |
| | |
SSAB, Cl A | | | 64,100 | | | | 225 | |
The accompanying notes are an integral part of the financial statements.
85
| | |
| THE KP FUNDS | | December 31, 2019 |
| | |
| KP International Equity Fund | | |
| | | | | | | | |
| Description | | Shares | | | Value
(000) | |
| | |
SSAB, Cl B | | | 34,716 | | | $ | 113 | |
| | |
Stillfront Group* | | | 4,039 | | | | 159 | |
| | |
Svenska Handelsbanken, Cl A | | | 142,591 | | | | 1,535 | |
| | |
Sweco, Cl B | | | 10,370 | | | | 399 | |
| | |
Swedbank, Cl A | | | 22,491 | | | | 335 | |
| | |
Swedish Match | | | 16,035 | | | | 827 | |
| | |
Swedish Orphan Biovitrum* | | | 12,043 | | | | 199 | |
| | |
Systemair | | | 1,174 | | | | 23 | |
| | |
Tele2, Cl B | | | 11,624 | | | | 168 | |
| | |
Telefonaktiebolaget LM Ericsson, Cl B | | | 74,766 | | | | 651 | |
| | |
Telia | | | 68,039 | | | | 293 | |
| | |
Tethys Oil | | | 26,208 | | | | 237 | |
| | |
Trelleborg, Cl B | | | 63,311 | | | | 1,140 | |
| | |
Vitec Software Group, Cl B | | | 4,373 | | | | 86 | |
| | |
Vitrolife | | | 10,263 | | | | 216 | |
| | |
Volvo, Cl B | | | 36,602 | | | | 612 | |
| | |
Wihlborgs Fastigheter | | | 8,344 | | | | 154 | |
| | | | | | | | |
| | | | | | | 38,756 | |
| | | | | | | | |
| | |
Switzerland — 6.8% | | | | | | | | |
| | |
ABB | | | 44,971 | | | | 1,088 | |
| | |
Adecco Group | | | 29,371 | | | | 1,856 | |
| | |
Alcon* | | | 45,822 | | | | 2,592 | |
| | |
ALSO Holding | | | 2,159 | | | | 364 | |
| | |
ams* | | | 8,870 | | | | 360 | |
| | |
Ascom Holding | | | 5,596 | | | | 61 | |
| | |
Baloise Holding | | | 1,268 | | | | 229 | |
| | |
Barry Callebaut | | | 77 | | | | 170 | |
| | |
Belimo Holding | | | 96 | | | | 731 | |
| | |
Cembra Money Bank | | | 3,595 | | | | 394 | |
| | |
Chocoladefabriken Lindt & Spruengli | | | 25 | | | | 194 | |
| | |
Chocoladefabriken Lindt & Spruengli | | | 2 | | | | 176 | |
| | |
Cie Financiere Richemont | | | 173,352 | | | | 13,636 | |
| | |
Clariant | | | 4,562 | | | | 102 | |
| | |
Coca-Cola* | | | 4,620 | | | | 157 | |
| | |
Credit Suisse Group | | | 62,288 | | | | 841 | |
| | |
DKSH Holding | | | 5,050 | | | | 275 | |
| | |
Dufry | | | 982 | | | | 97 | |
| | |
EMS-Chemie Holding | | | 189 | | | | 124 | |
| | |
Galenica* | | | 9,106 | | | | 564 | |
| | |
Geberit | | | 5,830 | | | | 3,271 | |
| | |
Givaudan | | | 225 | | | | 705 | |
| | |
Helvetia Holding | | | 12,008 | | | | 1,698 | |
| | |
Huber + Suhner | | | 1,058 | | | | 84 | |
| | |
Julius Baer Group | | | 60,921 | | | | 3,143 | |
| | |
Kardex | | | 1,154 | | | | 195 | |
| | |
Kuehne + Nagel International | | | 1,290 | | | | 218 | |
| | | | | | | | |
| Description | | Shares | | | Value
(000) | |
| | |
LafargeHolcim | | | 168,677 | | | $ | 9,365 | |
| | |
Landis+Gyr Group* | | | 1,034 | | | | 107 | |
| | |
Lastminute.com* | | | 2,209 | | | | 105 | |
| | |
Logitech International | | | 20,117 | | | | 952 | |
| | |
Lonza Group | | | 1,810 | | | | 660 | |
| | |
Nestle | | | 222,166 | | | | 24,051 | |
| | |
Novartis | | | 231,329 | | | | 21,943 | |
| | |
Pargesa Holding | | | 1,077 | | | | 90 | |
| | |
Partners Group Holding | | | 463 | | | | 425 | |
| | |
Roche Holding | | | 68,983 | | | | 22,386 | |
| | |
Schindler Holding | | | 541 | | | | 133 | |
| | |
Schindler Holding (Cert) | | | 976 | | | | 248 | |
| | |
SGS | | | 128 | | | | 351 | |
| | |
SIG Combibloc Group* | | | 13,416 | | | | 215 | |
| | |
Sika | | | 20,929 | | | | 3,933 | |
| | |
Sonova Holding | | | 4,754 | | | | 1,088 | |
| | |
Straumann Holding | | | 247 | | | | 243 | |
| | |
Swatch Group | | | 1,404 | | | | 74 | |
| | |
Swatch Group BR | | | 22,112 | | | | 6,179 | |
| | |
Swiss Life Holding | | | 813 | | | | 408 | |
| | |
Swiss Prime Site | | | 1,977 | | | | 229 | |
| | |
Swiss Re | | | 7,178 | | | | 806 | |
| | |
Swisscom | | | 643 | | | | 340 | |
| | |
Swissquote Group Holding | | | 1,695 | | | | 85 | |
| | |
Tamedia | | | 514 | | | | 50 | |
| | |
Temenos* | | | 1,651 | | | | 262 | |
| | |
UBS Group | | | 565,886 | | | | 7,145 | |
| | |
Vaudoise Assurances Holding | | | 78 | | | | 46 | |
| | |
Vetropack Holding | | | 98 | | | | 308 | |
| | |
Vifor Pharma | | | 1,185 | | | | 216 | |
| | |
VZ Holding | | | 213 | | | | 65 | |
| | |
Zehnder Group | | | 1,346 | | | | 63 | |
| | |
Zurich Insurance Group | | | 17,416 | | | | 7,145 | |
| | | | | | | | |
| | | | | | | 143,041 | |
| | | | | | | | |
| | |
Taiwan — 2.2% | | | | | | | | |
| | |
AU Optronics ADR | | | 578,712 | | | | 1,893 | |
| | |
ChipMOS Technologies ADR | | | 8,333 | | | | 188 | |
| | |
Chroma ATE | | | 120,000 | | | | 580 | |
| | |
Delta Electronics | | | 238,516 | | | | 1,205 | |
| | |
E.Sun Financial Holding | | | 2,074,723 | | | | 1,931 | |
| | |
Giant Manufacturing | | | 126,414 | | | | 898 | |
| | |
Merida Industry | | | 68,428 | | | | 403 | |
| | |
PChome Online* | | | 150,587 | | | | 476 | |
| | |
Taiwan Semiconductor Manufacturing ADR | | | 447,576 | | | | 26,003 | |
| | |
Taiwan Semiconductor Manufacturing | | | 469,000 | | | | 5,179 | |
The accompanying notes are an integral part of the financial statements.
86
| | |
| THE KP FUNDS | | December 31, 2019 |
| | |
| KP International Equity Fund | | |
| | | | | | | | |
| Description | | Shares | | | Value
(000) | |
| | |
Teco Electric and Machinery | | | 1,260,387 | | | $ | 1,102 | |
| | |
Tripod Technology | | | 99,000 | | | | 414 | |
| | |
Uni-President Enterprises | | | 1,388,000 | | | | 3,436 | |
| | |
United Microelectronics ADR | | | 498,001 | | | | 1,335 | |
| | |
Yungtay Engineering | | | 641,000 | | | | 1,375 | |
| | | | | | | | |
| | | | | | | 46,418 | |
| | | | | | | | |
| | |
Thailand — 0.4% | | | | | | | | |
| | |
Airports of Thailand | | | 780,200 | | | | 1,928 | |
| | |
Bangchak NVDR | | | 160,900 | | | | 150 | |
| | |
Bangkok Bank | | | 48,300 | | | | 258 | |
| | |
Bangkok Bank NVDR | | | 21,200 | | | | 113 | |
| | |
BEC World* | | | 636,600 | | | | 126 | |
| | |
CP ALL | | | 910,200 | | | | 2,195 | |
| | |
Kasikornbank | | | 112,200 | | | | 564 | |
| | |
PTT NVDR | | | 1,380,300 | | | | 2,025 | |
| | | | | | | | |
| | | | | | | 7,359 | |
| | | | | | | | |
| | |
Turkey — 0.5% | | | | | | | | |
| | |
Akbank T.A.S.* | | | 1,085,533 | | | | 1,480 | |
| | |
Albaraka Turk Katilim Bankasi* | | | 44,267 | | | | 11 | |
| | |
Anadolu Cam Sanayii | | | 44,655 | | | | 33 | |
| | |
Arcelik* | | | 39,404 | | | | 138 | |
| | |
Dogan Sirketler Grubu Holding | | | 2,244,390 | | | | 695 | |
| | |
Dogus Otomotiv Servis ve Ticaret | | | 91,794 | | | | 147 | |
| | |
Eregli Demir ve Celik Fabrikalari | | | 535,664 | | | | 814 | |
| | |
Haci Omer Sabanci Holding | | | 648,510 | | | | 1,040 | |
| | |
Tekfen Holding | | | 5,919 | | | | 19 | |
| | |
Turkiye Garanti Bankasi* | | | 1,409,488 | | | | 2,639 | |
| | |
Turkiye Is Bankasi, Cl C* | | | 1,029,411 | | | | 1,109 | |
| | |
Turkiye Sise ve Cam Fabrikalari | | | 246,550 | | | | 218 | |
| | |
Ulker Biskuvi Sanayi* | | | 103,039 | | | | 387 | |
| | |
Vestel Elektronik Sanayi ve Ticaret* | | | 182,299 | | | | 387 | |
| | |
Yapi ve Kredi Bankasi* | | | 1,522,527 | | | | 635 | |
| | | | | | | | |
| | | | | | | 9,752 | |
| | | | | | | | |
| | |
United Arab Emirates — 0.0% | | | | | | | | |
| | |
Abu Dhabi Islamic Bank PJSC | | | 308,336 | | | | 452 | |
| | |
Aldar Properties PJSC | | | 290,415 | | | | 171 | |
| | |
Emirates NBD Bank PJSC | | | 10,430 | | | | 37 | |
| | | | | | | | |
| | | | | | | 660 | |
| | | | | | | | |
| | |
United Kingdom — 14.5% | | | | | | | | |
| | |
3i Group | | | 165,393 | | | | 2,407 | |
| | |
4imprint Group | | | 9,467 | | | | 436 | |
| | |
Admiral Group | | | 42,077 | | | | 1,287 | |
| | |
Aggreko | | | 412,784 | | | | 4,552 | |
| | |
Anglo American | | | 327,791 | | | | 9,436 | |
| | |
Antofagasta | | | 64,830 | | | | 787 | |
| | | | | | | | |
| Description | | Shares | | | Value
(000) | |
| | |
Ashtead Group | | | 11,131 | | | $ | 356 | |
| | |
Associated British Foods | | | 8,872 | | | | 305 | |
| | |
Assura‡ | | | 13 | | | | — | |
| | |
AstraZeneca | | | 32,136 | | | | 3,238 | |
| | |
Atlantica Yield | | | 35,453 | | | | 936 | |
| | |
Auto Trader Group | | | 126,507 | | | | 996 | |
| | |
Avast | | | 129,031 | | | | 774 | |
| | |
AVEVA Group | | | 1,573 | | | | 97 | |
| | |
Aviva | | | 96,547 | | | | 535 | |
| | |
BAE Systems | | | 221,673 | | | | 1,658 | |
| | |
Bank of Ireland Group | | | 11,295 | | | | 62 | |
| | |
Barclays | | | 2,067,683 | | | | 4,920 | |
| | |
Barratt Developments | | | 63,729 | | | | 630 | |
| | |
Barrick Gold | | | 940 | | | | 17 | |
| | |
Begbies Traynor Group | | | 81 | | | | — | |
| | |
Berkeley Group Holdings | | | 80,888 | | | | 5,205 | |
| | |
BHP Group | | | 364,257 | | | | 8,574 | |
| | |
Bovis Homes Group | | | 11,932 | | | | 215 | |
| | |
BP | | | 1,091,871 | | | | 6,821 | |
| | |
British American Tobacco | | | 62,544 | | | | 2,678 | |
| | |
British Land‡ | | | 20,920 | | | | 177 | |
| | |
Britvic | | | 36,253 | | | | 434 | |
| | |
BT Group, Cl A | | | 207,128 | | | | 528 | |
| | |
Bunzl | | | 69,228 | | | | 1,894 | |
| | |
Burberry Group | | | 10,364 | | | | 303 | |
| | |
C&C Group | | | 58,624 | | | | 316 | |
| | |
Capita* | | | 307,380 | | | | 668 | |
| | |
Card Factory | | | 88,652 | | | | 174 | |
| | |
Carnival | | | 128,232 | | | | 6,191 | |
| | |
Cementir Holding | | | 10,344 | | | | 78 | |
| | |
Centrica | | | 153,568 | | | | 182 | |
| | |
Checkit* | | | 37,991 | | | | 17 | |
| | |
Close Brothers Group | | | 13,462 | | | | 285 | |
| | |
Coca-Cola European Partners | | | 11,349 | | | | 577 | |
| | |
Codemasters Group Holdings* | | | 32,388 | | | | 120 | |
| | |
Compass Group | | | 379,801 | | | | 9,509 | |
| | |
Computacenter | | | 8,546 | | | | 201 | |
| | |
ConvaTec Group | | | 425,362 | | | | 1,118 | |
| | |
Countryside Properties | | | 68,141 | | | | 411 | |
| | |
Cranswick | | | 6,236 | | | | 280 | |
| | |
CRH | | | 7,232 | | | | 291 | |
| | |
Croda International | | | 3,344 | | | | 227 | |
| | |
CVS Group | | | 22,061 | | | | 334 | |
| | |
Daily Mail & General Trust, Cl A | | | 20,987 | | | | 230 | |
| | |
Dart Group | | | 78,448 | | | | 1,760 | |
| | |
DCC | | | 17,787 | | | | 1,542 | |
The accompanying notes are an integral part of the financial statements.
87
| | |
| THE KP FUNDS | | December 31, 2019 |
| | |
| KP International Equity Fund | | |
| | | | | | | | |
| Description | | Shares | | | Value
(000) | |
| | |
Devro | | | 89,840 | | | $ | 212 | |
| | |
Diageo | | | 442,289 | | | | 18,751 | |
| | |
Dialog Semiconductor* | | | 19,095 | | | | 970 | |
| | |
Direct Line Insurance Group | | | 35,654 | | | | 148 | |
| | |
Drax Group | | | 296,405 | | | | 1,232 | |
| | |
DS Smith | | | 217,855 | | | | 1,109 | |
| | |
Dunelm Group | | | 115,269 | | | | 1,765 | |
| | |
easyJet | | | 45,187 | | | | 853 | |
| | |
EMIS Group | | | 86,633 | | | | 1,271 | |
| | |
Endava ADR* | | | 3,900 | | | | 182 | |
| | |
Euromoney Institutional Investor | | | 13,531 | | | | 233 | |
| | |
Evraz | | | 12,827 | | | | 69 | |
| | |
Experian | | | 292,395 | | | | 9,885 | |
| | |
FDM Group Holdings | | | 37,741 | | | | 517 | |
| | |
Ferguson | | | 5,695 | | | | 517 | |
| | |
Ferroglobe* | | | 33,786 | | | | 32 | |
| | |
Firstgroup* | | | 201,345 | | | | 334 | |
| | |
Flutter Entertainment | | | 13,797 | | | | 1,686 | |
| | |
Forterra | | | 29,442 | | | | 135 | |
| | |
Future | | | 20,186 | | | | 388 | |
| | |
G4S | | | 383,587 | | | | 1,108 | |
| | |
Games Workshop Group | | | 11,141 | | | | 901 | |
| | |
Gamesys Group* | | | 12,706 | | | | 119 | |
| | |
GCP Student Living‡ | | | 4,387 | | | | 12 | |
| | |
Genel Energy | | | 72,575 | | | | 182 | |
| | |
Georgia Capital* | | | 21,818 | | | | 266 | |
| | |
GlaxoSmithKline | | | 122,178 | | | | 2,879 | |
| | |
Glencore* | | | 753,140 | | | | 2,348 | |
| | |
Global Ports Investments GDR* | | | 220,689 | | | | 839 | |
| | |
Globaltrans Investment GDR | | | 39,129 | | | | 346 | |
| | |
Go-Ahead Group | | | 11,720 | | | | 343 | |
| | |
Grainger | | | 77,424 | | | | 321 | |
| | |
Greggs | | | 59,217 | | | | 1,803 | |
| | |
GVC Holdings | | | 125,141 | | | | 1,466 | |
| | |
Halma | | | 9,107 | | | | 255 | |
| | |
Hargreaves Lansdown | | | 7,211 | | | | 185 | |
| | |
Hays | | | 385,116 | | | | 926 | |
| | |
Hill & Smith Holdings | | | 11,443 | | | | 223 | |
| | |
HomeServe | | | 144,290 | | | | 2,416 | |
| | |
Hon Hai Precision Industry GDR | | | 168,705 | | | | 1,034 | |
| | |
Howden Joinery Group | | | 22,644 | | | | 202 | |
| | |
HSBC Holdings | | | 494,728 | | | | 3,879 | |
| | |
IG Group Holdings | | | 71,178 | | | | 655 | |
| | |
IMI | | | 237,633 | | | | 3,711 | |
| | |
Imperial Brands | | | 23,501 | | | | 582 | |
| | |
Inchcape | | | 71,614 | | | | 670 | |
| | | | | | | | |
| Description | | Shares | | | Value
(000) | |
| | |
Informa | | | 63,597 | | | $ | 722 | |
| | |
IntegraFin Holdings | | | 33,287 | | | | 196 | |
| | |
InterContinental Hotels Group | | | 4,151 | | | | 286 | |
| | |
Intermediate Capital Group | | | 29,743 | | | | 634 | |
| | |
International Personal Finance | | | 205,632 | | | | 439 | |
| | |
Intertek Group | | | 51,115 | | | | 3,963 | |
| | |
Investec | | | 156,828 | | | | 920 | |
| | |
ITV | | | 691,207 | | | | 1,383 | |
| | |
J D Wetherspoon | | | 4,377 | | | | 96 | |
| | |
J Sainsbury | | | 40,642 | | | | 124 | |
| | |
JD Sports Fashion | | | 10,665 | | | | 118 | |
| | |
John Wood Group | | | 56,957 | | | | 300 | |
| | |
Johnson Matthey | | | 4,938 | | | | 196 | |
| | |
Judges Scientific | | | 1,588 | | | | 119 | |
| | |
Jupiter Fund Management | | | 96,581 | | | | 524 | |
| | |
Just Eat* | | | 80,153 | | | | 886 | |
| | |
Kainos Group | | | 8,852 | | | | 87 | |
| | |
Kerry Group, Cl A | | | 3,919 | | | | 488 | |
| | |
Kingfisher | | | 54,348 | | | | 156 | |
| | |
Kingspan Group | | | 3,953 | | | | 241 | |
| | |
Land Securities Group‡ | | | 16,821 | | | | 221 | |
| | |
Legal & General Group | | | 147,090 | | | | 590 | |
| | |
Liontrust Asset Management | | | 233 | | | | 3 | |
| | |
Lloyds Banking Group | | | 12,667,827 | | | | 10,488 | |
| | |
London Stock Exchange Group | | | 7,660 | | | | 786 | |
| | |
LondonMetric Property‡ | | | 66,247 | | | | 208 | |
| | |
Lookers | | | 55,987 | | | | 41 | |
| | |
Lukoil PJSC ADR | | | 196 | | | | 19 | |
| | |
M&G* | | | 136,517 | | | | 429 | |
| | |
Man Group | | | 182,393 | | | | 382 | |
| | |
Marks & Spencer Group | | | 50,558 | | | | 143 | |
| | |
Marston’s | | | 714,660 | | | | 1,204 | |
| | |
McCarthy & Stone | | | 86,711 | | | | 171 | |
| | |
Mediclinic International | | | 24,128 | | | | 132 | |
| | |
Meggitt | | | 17,999 | | | | 157 | |
| | |
Melrose Industries | | | 120,478 | | | | 383 | |
| | |
Micro Focus International ADR | | | 4,526 | | | | 63 | |
| | |
Micro Focus International | | | 4,238 | | | | 60 | |
| | |
Mitchells & Butlers* | | | 60,729 | | | | 370 | |
| | |
Mitie Group | | | 41,024 | | | | 79 | |
| | |
Mondi | | | 11,646 | | | | 273 | |
| | |
Moneysupermarket.com Group | | | 79,090 | | | | 346 | |
| | |
National Express Group | | | 112,285 | | | | 699 | |
| | |
National Grid | | | 84,921 | | | | 1,062 | |
| | |
Next | | | 3,206 | | | | 298 | |
| | |
NMC Health | | | 2,130 | | | | 50 | |
The accompanying notes are an integral part of the financial statements.
88
| | |
| THE KP FUNDS | | December 31, 2019 |
| | |
| KP International Equity Fund | | |
| | | | | | | | |
| Description | | Shares | | | Value
(000) | |
| | |
Nomad Foods* | | | 44,400 | | | $ | 993 | |
| | |
Non-Standard Finance | | | 128,595 | | | | 36 | |
| | |
Ocado Group* | | | 12,023 | | | | 204 | |
| | |
Oxford Instruments | | | 5,840 | | | | 119 | |
| | |
Pagegroup | | | 45,070 | | | | 312 | |
| | |
Patisserie Holdings (A) | | | 3,055 | | | | — | |
| | |
PayPoint | | | 12,245 | | | | 164 | |
| | |
Pearson | | | 18,147 | | | | 153 | |
| | |
Persimmon | | | 7,641 | | | | 273 | |
| | |
Petrofac | | | 19,815 | | | | 101 | |
| | |
Pets at Home Group | | | 345,726 | | | | 1,280 | |
| | |
Phoenix Group Holdings | | | 64,071 | | | | 636 | |
| | |
Playtech | | | 32,539 | | | | 171 | |
| | |
Polar Capital Holdings | | | 9,928 | | | | 72 | |
| | |
Provident Financial | | | 66,309 | | | | 401 | |
| | |
Prudential | | | 150,425 | | | | 2,888 | |
| | |
QinetiQ Group | | | 27,637 | | | | 131 | |
| | |
Rank Group | | | 14,029 | | | | 51 | |
| | |
Rathbone Brothers | | | 7,583 | | | | 214 | |
| | |
Reach | | | 63,430 | | | | 115 | |
| | |
Reckitt Benckiser Group | | | 101,162 | | | | 8,213 | |
| | |
Redrow | | | 59,763 | | | | 590 | |
| | |
RELX | | | 201,039 | | | | 5,075 | |
| | |
Rentokil Initial | | | 44,350 | | | | 266 | |
| | |
Rhi Magnesita | | | 5,626 | | | | 287 | |
| | |
Rightmove | | | 399,382 | | | | 3,352 | |
| | |
Rio Tinto | | | 116,472 | | | | 6,947 | |
| | |
RM | | | 349 | | | | 1 | |
| | |
Robert Walters | | | 1,244 | | | | 9 | |
| | |
Rolls-Royce Holdings | | | 435,395 | | | | 3,940 | |
| | |
Rotork | | | 58,690 | | | | 260 | |
| | |
Royal Bank of Scotland Group | | | 119,987 | | | | 382 | |
| | |
Royal Dutch Shell, Cl A | | | 104,807 | | | | 3,103 | |
| | |
Royal Dutch Shell, Cl B | | | 351,502 | | | | 10,427 | |
| | |
RSA Insurance Group | | | 26,754 | | | | 200 | |
| | |
RWS Holdings | | | 108 | | | | 1 | |
| | |
Sage Group | | | 27,468 | | | | 273 | |
| | |
Samsung Electronics GDR | | | 770 | | | | 919 | |
| | |
Schroders | | | 2,863 | | | | 126 | |
| | |
SDL | | | 8,777 | | | | 69 | |
| | |
Segro‡ | | | 27,197 | | | | 322 | |
| | |
Serco Group* | | | 514,600 | | | | 1,104 | |
| | |
Severn Trent | | | 6,149 | | | | 205 | |
| | |
Sirius Real Estate | | | 249,281 | | | | 292 | |
| | |
Smith & Nephew | | | 39,675 | | | | 963 | |
| | |
Smiths Group | | | 301,419 | | | | 6,735 | |
| | | | | | | | |
| Description | | Shares | | | Value
(000) | |
| | |
Softcat | | | 34,121 | | | $ | 520 | |
| | |
Spectris | | | 151,427 | | | | 5,829 | |
| | |
Spirax-Sarco Engineering | | | 1,913 | | | | 225 | |
| | |
Spirent Communications | | | 10,525 | | | | 35 | |
| | |
SSE | | | 24,726 | | | | 471 | |
| | |
SSP Group | | | 188,180 | | | | 1,620 | |
| | |
St. James’s Place | | | 50,192 | | | | 774 | |
| | |
Standard Chartered | | | 220,049 | | | | 2,076 | |
| | |
Standard Life Aberdeen | | | 57,452 | | | | 250 | |
| | |
State Bank of India GDR* | | | 105,490 | | | | 4,937 | |
| | |
Tate & Lyle | | | 189,651 | | | | 1,911 | |
| | |
Taylor Wimpey | | | 85,702 | | | | 220 | |
| | |
Tesco | | | 3,671,291 | | | | 12,410 | |
| | |
Thomas Cook Group* (A) | | | 693,862 | | | | — | |
| | |
TP ICAP | | | 76,035 | | | | 412 | |
| | |
Travis Perkins | | | 415,212 | | | | 8,810 | |
| | |
TUI | | | 48,587 | | | | 614 | |
| | |
Unilever | | | 64,420 | | | | 3,712 | |
| | |
United Utilities Group | | | 17,592 | | | | 220 | |
| | |
Urban Logistics REIT‡ | | | 11,705 | | | | 23 | |
| | |
Vesuvius | | | 46,914 | | | | 311 | |
| | |
Victrex | | | 35,979 | | | | 1,188 | |
| | |
Vodafone Group | | | 653,882 | | | | 1,271 | |
| | |
Weir Group | | | 287,810 | | | | 5,755 | |
| | |
WH Smith | | | 37,104 | | | | 1,278 | |
| | |
Whitbread | | | 3,185 | | | | 204 | |
| | |
WM Morrison Supermarkets | | | 55,456 | | | | 147 | |
| | |
WPP | | | 303,941 | | | | 4,294 | |
| | | | | | | | |
| | | | | | | 305,156 | |
| | | | | | | | |
| | |
United States — 0.3% | | | | | | | | |
| | |
Copa Holdings, Cl A | | | 36,000 | | | | 3,891 | |
| | |
Freeport-McMoRan | | | 77,430 | | | | 1,016 | |
| | |
Genpact | | | 17,094 | | | | 721 | |
| | |
NXP Semiconductors | | | 6,759 | | | | 860 | |
| | |
PriceSmart | | | 11,980 | | | | 851 | |
| | | | | | | | |
| | | | | | | 7,339 | |
| | | | | | | | |
| | |
Total Common Stock
(Cost $1,808,294) (000) | | | | | | | 2,030,413 | |
| | | | | | | | |
| | |
PREFERRED STOCK (B) — 0.7% | | | | | | | | |
| | |
Alpargatas* | | | 302,872 | | | | 2,500 | |
| | |
Amore Pacific Group* | | | 1,381 | | | | 65 | |
| | |
Banco Bradesco* | | | 79,837 | | | | 718 | |
| | |
Banco do Brasil | | | 103,400 | | | | 556 | |
| | |
Bayerische Motoren Werke | | | 1,275 | | | | 79 | |
| | |
Cia de Transmissao de Energia Eletrica Paulista | | | 103,514 | | | | 581 | |
The accompanying notes are an integral part of the financial statements.
89
| | |
| THE KP FUNDS | | December 31, 2019 |
| | |
| KP International Equity Fund | | |
| | | | | | | | |
| Description | | Shares | | | Value
(000) | |
| | |
Cia Paranaense de Energia | | | 16,900 | | | $ | 290 | |
| | |
Corem Property Group | | | 2,495 | | | | 104 | |
| | |
Einhell Germany | | | 253 | | | | 17 | |
| | |
FUCHS PETROLUB | | | 79,880 | | | | 3,976 | |
| | |
Grupo Aval Acciones y Valores | | | 795,416 | | | | 353 | |
| | |
Henkel & KGaA | | | 4,400 | | | | 457 | |
| | |
Itausa - Investimentos Itau | | | 207,417 | | | | 727 | |
| | |
Porsche Automobil Holding | | | 3,810 | | | | 286 | |
| | |
Sartorius | | | 929 | | | | 200 | |
| | |
Schaeffler | | | 51,601 | | | | 560 | |
| | |
STO & KGaA | | | 969 | | | | 124 | |
| | |
Telefonica Brasil | | | 55,981 | | | | 807 | |
| | |
Volkswagen | | | 10,830 | | | | 2,149 | |
| | | | | | | | |
| | |
Total Preferred Stock
(Cost $10,859) (000) | | | | | | | 14,549 | |
| | | | | | | | |
| | |
| | | Number of
Rights | | | | |
RIGHTS — 0.0% | | | | | | | | |
| | |
Pan American Silver* # (A) | | | 20,581 | | | | 8 | |
| | |
Repsol* # | | | 35,455 | | | | 17 | |
| | |
Times China* # (A) | | | 11,250 | | | | — | |
| | | | | | | | |
| | |
Total Rights
(Cost $—) (000) | | | | | | | 25 | |
| | | | | | | | |
| | |
| | | Number of
Warrants | | | | |
WARRANTS — 0.0% | | | | | | | | |
| | |
Ezion Holdings,
Expires 4/16/2023* (A) | | | 77,880 | | | | — | |
| | | | | | | | |
| | |
Total Warrants
(Cost $—) (000) | | | | | | | — | |
| | | | | | | | |
| | |
| | | Shares | | | | |
SHORT-TERM INVESTMENT — 2.3% | |
| | |
State Street Institutional Treasury Money Market Fund, Cl Premier, 1.520% (C) | | | 48,266,995 | | | | 48,267 | |
| | | | | | | | |
| | |
Total Short-Term Investment
(Cost $48,267) (000) | | | | | | | 48,267 | |
| | | | | | | | |
| | |
Total Investments In Securities — 99.2%
(Cost $1,867,420) (000) | | | | | | $ | 2,093,254 | |
| | | | | | | | |
Percentages are based on net assets of $2,110,101 (000).
A list of the open futures contracts held by the Fund at December 31, 2019, is as follows (000):
| | | | | | | | | | | | | | | | | | |
Type of
Contract | | Number of
Contracts
Long | | | Expiration
Date | | Notional Amount | | | Value | | | Unrealized
Appreciation
| |
MSCI EAFE Index | | | 218 | | | Mar-2020 | | $ | 21,863 | | | $ | 22,198 | | | $ | 335 | |
S&P TSX 60 Index | | | 16 | | | Mar-2020 | | | 2,464 | | | | 2,495 | | | | (2 | ) |
| | | | | | | | | | | | | | | | | | |
| | | | | | | | $ | 24,327 | | | $ | 24,693 | | | $ | 333 | |
| | | | | | | | | | | | | | | | | | |
| * | Non-income producing security. |
| ‡ | Real Estate Investment Trust |
| ‡‡ | Expiration date not available. |
| (A) | Level 3 security in accordance with fair value hierarchy. |
| (B) | There is currently no rate available. |
| (C) | The rate reported is the 7-day effective yield as of December 31, 2019. |
ADR — American Depositary Receipt
Cl — Class
EAFE — Europe, Australasia and Far East
GDR — Global Depositary Receipt
MSCI — Morgan Stanley Capital International
NVDR — Non-Voting Depositary Receipt
LSE — London Stock Exchange
PJSC — Public Joint Stock Company
S&P — Standard & Poor’s
TSX — Toronto Stock Exchange
The following is a list of the level of inputs used as of December 31, 2019, there in valuing the Fund’s investments and other financial instruments carried at value (000):
| | | | | | | | | | | | | | | | |
| Investments In Securities | | Level 1 | | | Level 2 | | | Level 3^ | | | Total | |
Common Stock | | | | | | | | | | | | | | | | |
Australia | | $ | 71,231 | | | $ | — | | | $ | — | | | $ | 71,231 | |
Austria | | | 187 | | | | 4,453 | | | | — | | | | 4,640 | |
Belgium | | | 14,422 | | | | — | | | | — | | | | 14,422 | |
Brazil | | | 44,269 | | | | — | | | | — | | | | 44,269 | |
Canada | | | 87,261 | | | | — | | | | — | | | | 87,261 | |
Chile | | | 3,052 | | | | — | | | | — | | | | 3,052 | |
China | | | 63,440 | | | | — | | | | — | | | | 63,440 | |
Colombia | | | 2,015 | | | | — | | | | — | | | | 2,015 | |
Cypress | | | 172 | | | | — | | | | — | | | | 172 | |
Czech Republic | | | — | | | | 567 | | | | — | | | | 567 | |
Denmark | | | 124 | | | | 34,889 | | | | — | | | | 35,013 | |
Finland | | | — | | | | 13,713 | | | | — | | | | 13,713 | |
France | | | 145,056 | | | | — | | | | — | | | | 145,056 | |
Germany | | | 126 | | | | 114,121 | | | | — | | | | 114,247 | |
Greece | | | 8,109 | | | | — | | | | — | | | | 8,109 | |
Hong Kong | | | 136,452 | | | | — | | | | — | | | | 136,452 | |
Hungary | | | — | | | | 2,033 | | | | — | | | | 2,033 | |
India | | | 56,993 | | | | — | | | | — | | | | 56,993 | |
Indonesia | | | — | | | | 11,244 | | | | — | | | | 11,244 | |
Ireland | | | 18,099 | | | | — | | | | — | | | | 18,099 | |
Israel | | | 12,663 | | | | — | | | | — | | | | 12,663 | |
Italy | | | 2,672 | | | | 31,416 | | | | 1 | | | | 34,089 | |
Japan | | | 19 | | | | 312,649 | | | | — | | | | 312,668 | |
Kenya | | | 751 | | | | — | | | | — | | | | 751 | |
Malaysia | | | 1,789 | | | | — | | | | — | | | | 1,789 | |
Mexico | | | 13,312 | | | | — | | | | — | | | | 13,312 | |
Netherlands | | | 56,603 | | | | — | | | | — | | | | 56,603 | |
New Zealand | | | 2,828 | | | | — | | | | — | | | | 2,828 | |
Norway | | | 2,163 | | | | 18,055 | | | | — | | | | 20,218 | |
Peru | | | 3,117 | | | | — | | | | — | | | | 3,117 | |
Philippines | | | 77 | | | | 71 | | | | — | | | | 148 | |
Poland | | | 1,032 | | | | 3,824 | | | | — | | | | 4,856 | |
The accompanying notes are an integral part of the financial statements.
90
| | |
| THE KP FUNDS | | December 31, 2019 |
| | |
| KP International Equity Fund | | |
| | | | | | | | | | | | | | | | |
| Investments In Securities | | Level 1 | | | Level 2 | | | Level 3^ | | | Total | |
Portugal | | $ | 3,136 | | | $ | — | | | $ | — | | | $ | 3,136 | |
Qatar | | | 2,390 | | | | — | | | | — | | | | 2,390 | |
Russia | | | 11,372 | | | | — | | | | — | | | | 11,372 | |
Singapore | | | 43,796 | | | | — | | | | — | | | | 43,796 | |
South Africa | | | 27,244 | | | | — | | | | — | | | | 27,244 | |
South Korea | | | 13,803 | | | | 46,269 | | | | — | | | | 60,072 | |
Spain | | | 28,852 | | | | — | | | | — | | | | 28,852 | |
Sweden | | | 424 | | | | 38,332 | | | | — | | | | 38,756 | |
Switzerland | | | 570 | | | | 142,471 | | | | — | | | | 143,041 | |
Taiwan | | | 46,418 | | | | — | | | | — | | | | 46,418 | |
Thailand | | | — | | | | 7,359 | | | | — | | | | 7,359 | |
Turkey | | | 9,752 | | | | — | | | | — | | | | 9,752 | |
United Arab Emirates | | | 660 | | | | — | | | | — | | | | 660 | |
United Kingdom | | | 304,186 | | | | 970 | | | | — | | | | 305,156 | |
United States | | | 7,339 | | | | — | | | | — | | | | 7,339 | |
| | | | | | | | | | | | | | | | |
Total Common Stock | | | 1,247,976 | | | | 782,436 | | | | 1 | | | | 2,030,413 | |
| | | | | | | | | | | | | | | | |
Preferred Stock | | | 6,597 | | | | 7,952 | | | | — | | | | 14,549 | |
Rights | | | 17 | | | | — | | | | 8 | | | | 25 | |
Warrants | | | — | | | | — | | | | — | | | | — | |
Short-Term Investment | | | 48,267 | | | | — | | | | — | | | | 48,267 | |
| | | | | | | | | | | | | | | | |
Total Investments in Securities | | $ | 1,302,857 | | | $ | 790,388 | | | $ | 9 | | | $ | 2,093,254 | |
| | | | | | | | | | | | | | | | |
| | | | |
Other Financial
Instruments | | Level 1 | | | Level 2 | | | Level 3 | | | Total | |
Futures Contracts** | | | | | | | | | | | | | |
Unrealized Appreciation | | $ | — | | | $ | 335 | | | $ | — | | | $ | 335 | |
Unrealized Depreciation | | | — | | | | (2 | ) | | | — | | | | (2 | ) |
| | | | | | | | | | | | | | | | |
Total Other Financial Instruments | | $ | — | | | $ | 333 | | | $ | — | | | $ | 333 | |
| | | | | | | | | | | | | | | | |
| ** | Futures contracts are valued at the unrealized appreciation/(depreciation) on the instrument. |
| ^ | A reconciliation of Level 3 investments and disclosures of significant unobservable inputs are presented when the Fund has a significant amount of Level 3 investments in at the beginning and/or end of the year in relation to net assets. Management has concluded that Level 3 investments are not material in relation to net assets. |
For the year ended December 31, 2019, there were no significant transfers in or out of Level 3.
Amounts designated as “—“ are $0 or have been rounded to $0.
The accompanying notes are an integral part of the financial statements.
91
| | |
| THE KP FUNDS | | December 31, 2019 |
|
| SECTOR WEIGHTINGS† (unaudited) |
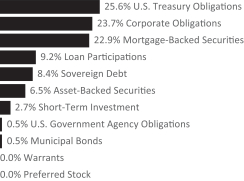
| † | Percentages based on total investments. |
| | | | | | | | |
| Description | | Face Amount
(000) | | | Value
(000) | |
U.S. TREASURY OBLIGATIONS — 26.6% | |
| | |
U.S. Treasury Bonds
5.375%, 02/15/31 | | $ | 1,000 | | | $ | 1,343 | |
5.000%, 05/15/37 | | | 2,240 | | | | 3,175 | |
4.750%, 02/15/37 | | | 10,315 | | | | 14,212 | |
4.625%, 02/15/40 | | | 500 | | | | 692 | |
4.500%, 02/15/36 - 05/15/38 | | | 1,300 | | | | 1,740 | |
4.375%, 02/15/38 - 05/15/41 | | | 5,562 | | | | 7,453 | |
4.250%, 11/15/40 | | | 1,250 | | | | 1,657 | |
3.875%, 08/15/40 | | | 500 | | | | 631 | |
3.750%, 08/15/41 - 11/15/43 | | | 4,050 | | | | 5,069 | |
3.625%, 08/15/43 - 02/15/44 | | | 2,700 | | | | 3,323 | |
3.500%, 02/15/39 | | | 2,420 | | | | 2,905 | |
3.375%, 05/15/44 - 11/15/48 | | | 14,201 | | | | 17,131 | |
3.125%, 02/15/42 - 05/15/48 | | | 13,207 | | | | 15,215 | |
3.000%, 11/15/44 - 02/15/49 | | | 20,790 | | | | 23,431 | |
2.875%, 05/15/43 - 05/15/49 | | | 5,247 | | | | 5,778 | |
2.750%, 08/15/42 - 11/15/47 | | | 19,686 | | | | 21,161 | |
2.500%, 02/15/45 - 05/15/46 | | | 2,000 | | | | 2,046 | |
2.375%, 11/15/49 | | | 1,000 | | | | 1,000 | |
2.250%, 08/15/46 - 08/15/49 | | | 17,134 | | | | 16,671 | |
| | |
U.S. Treasury Notes | | | | | | | | |
3.125%, 11/15/28 | | | 2,700 | | | | 2,971 | |
3.000%, 09/30/25 - 10/31/25 | | | 3,000 | | | | 3,206 | |
2.875%, 10/15/21 - 08/15/28 | | | 26,488 | | | | 27,800 | |
2.750%, 08/15/21 - 02/15/28 | | | 38,599 | | | | 40,100 | |
2.625%, 05/15/21 - 02/15/29 | | | 33,333 | | | | 34,504 | |
2.500%, 02/28/21 - 01/31/25 | | | 34,999 | | | | 36,010 | |
2.375%, 03/15/21 - 05/15/29 | | | 29,835 | | | | 30,645 | |
2.250%, 02/15/21 - 11/15/27 | | | 33,711 | | | | 34,471 | |
2.125%, 08/15/21 - 05/31/26 | | | 22,925 | | | | 23,337 | |
2.000%, 01/15/21 - 11/15/26 | | | 30,992 | | | | 31,366 | |
1.875%, 11/30/21 - 07/31/26 | | | 12,750 | | | | 12,830 | |
1.750%, 02/28/22 - 11/15/29 | | | 63,597 | | | | 63,316 | |
1.625%, 12/31/21 - 08/15/29 | | | 55,294 | | | | 55,040 | |
1.500%, 11/30/21 - 08/15/26 | | | 50,913 | | | | 50,505 | |
1.375%, 01/31/21 - 08/31/26 | | | 8,250 | | | | 8,182 | |
1.250%, 03/31/21 - 08/31/24 | | | 14,003 | | | | 13,850 | |
| | | | | | | | |
| Description | | Face Amount
(000) | | | Value
(000) | |
1.125%, 02/28/21 - 09/30/21 | | $ | 9,500 | | | $ | 9,432 | |
| | | | | | | | |
| |
Total U.S. Treasury Obligations
(Cost $604,467) (000) | | | | 622,198 | |
| | | | | | | | |
CORPORATE OBLIGATIONS — 24.7% | |
|
Communication Services — 1.9% | |
| | |
Activision Blizzard 3.400%, 09/15/26 | | | 50 | | | | 53 | |
| | |
Alphabet
3.375%, 02/25/24 | | | 100 | | | | 106 | |
| | |
America Movil
6.125%, 03/30/40 | | | 250 | | | | 335 | |
| | |
AT&T | | | | | | | | |
5.250%, 03/01/37 | | | 3,073 | | | | 3,671 | |
4.900%, 08/15/37 | | | 150 | | | | 173 | |
4.850%, 03/01/39 | | | 70 | | | | 81 | |
4.500%, 03/09/48 | | | 100 | | | | 110 | |
4.350%, 06/15/45 | | | 600 | | | | 648 | |
4.300%, 02/15/30 | | | 333 | | | | 370 | |
4.125%, 02/17/26 | | | 200 | | | | 217 | |
4.100%, 02/15/28 | | | 253 | | | | 275 | |
3.800%, 03/01/24 | | | 200 | | | | 212 | |
3.800%, 02/15/27 | | | 150 | | | | 160 | |
3.600%, 07/15/25 | | | 2,386 | | | | 2,526 | |
3.400%, 05/15/25 | | | 6,533 | | | | 6,842 | |
3.200%, 03/01/22 | | | 3,050 | | | | 3,122 | |
2.950%, 07/15/26 | | | 200 | | | | 204 | |
2.450%, 06/30/20 | | | 2,002 | | | | 2,009 | |
| | |
Baidu
3.875%, 09/29/23 | | | 200 | | | | 208 | |
| | |
Bell Canada
4.464%, 04/01/48 | | | 15 | | | | 17 | |
4.300%, 07/29/49 | | | 30 | | | | 34 | |
| | |
British Telecommunications
5.125%, 12/04/28 | | | 200 | | | | 230 | |
| | |
Charter Communications Operating
6.484%, 10/23/45 | | | 150 | | | | 186 | |
6.384%, 10/23/35 | | | 150 | | | | 189 | |
5.375%, 04/01/38 | | | 100 | | | | 114 | |
5.375%, 05/01/47 | | | 100 | | | | 112 | |
4.800%, 03/01/50 | | | 2,551 | | | | 2,690 | |
4.500%, 02/01/24 | | | 100 | | | | 108 | |
| | |
Comcast | | | | | | | | |
4.950%, 10/15/58 | | | 25 | | | | 33 | |
4.700%, 10/15/48 | | | 3,164 | | | | 3,907 | |
4.600%, 10/15/38 | | | 614 | | | | 732 | |
4.400%, 08/15/35 | | | 100 | | | | 117 | |
4.250%, 10/15/30 | | | 25 | | | | 29 | |
4.250%, 01/15/33 | | | 500 | | | | 579 | |
4.150%, 10/15/28 | | | 45 | | | | 51 | |
4.000%, 08/15/47 | | | 200 | | | | 220 | |
3.999%, 11/01/49 | | | 300 | | | | 333 | |
3.950%, 10/15/25 | | | 50 | | | | 54 | |
3.900%, 03/01/38 | | | 100 | | | | 111 | |
3.700%, 04/15/24 | | | 55 | | | | 59 | |
3.450%, 10/01/21 | | | 40 | | | | 41 | |
The accompanying notes are an integral part of the financial statements.
92
| | |
| THE KP FUNDS | | December 31, 2019 |
| | | | | | | | |
| Description | | Face Amount
(000) | | | Value
(000) | |
3.375%, 02/15/25 | | $ | 125 | | | $ | 132 | |
3.250%, 11/01/39 | | | 100 | | | | 102 | |
3.150%, 03/01/26 | | | 50 | | | | 52 | |
2.750%, 03/01/23 | | | 100 | | | | 102 | |
2.650%, 02/01/30 | | | 744 | | | | 747 | |
| | |
Discovery Communications | | | | | | | | |
5.300%, 05/15/49 | | | 40 | | | | 47 | |
5.000%, 09/20/37 | | | 150 | | | | 170 | |
4.125%, 05/15/29 | | | 100 | | | | 108 | |
3.800%, 03/13/24 | | | 50 | | | | 53 | |
2.950%, 03/20/23 | | | 50 | | | | 51 | |
| | |
Fox
4.709%, 01/25/29 (A) | | | 200 | | | | 228 | |
| | |
Interpublic Group
5.400%, 10/01/48 | | | 25 | | | | 31 | |
3.750%, 10/01/21 | | | 100 | | | | 103 | |
| | |
NBCUniversal Media
4.375%, 04/01/21 | | | 100 | | | | 103 | |
| | |
Omnicom Group
3.600%, 04/15/26 | | | 100 | | | | 105 | |
| | |
Orange
5.375%, 01/13/42 | | | 200 | | | | 257 | |
4.125%, 09/14/21 | | | 100 | | | | 104 | |
| | |
RELX Capital
3.125%, 10/15/22 | | | 100 | | | | 103 | |
| | |
Rogers Communications 4.350%, 05/01/49 | | | 75 | | | | 84 | |
4.300%, 02/15/48 | | | 40 | | | | 45 | |
2.900%, 11/15/26 | | | 50 | | | | 51 | |
| | |
Telefonica Emisiones
5.462%, 02/16/21 | | | 110 | | | | 114 | |
5.213%, 03/08/47 | | | 150 | | | | 178 | |
4.895%, 03/06/48 | | | 150 | | | | 172 | |
| | |
TELUS
4.600%, 11/16/48 | | | 50 | | | | 59 | |
| | |
Tencent Holdings
2.875%, 02/11/20 (A) | | | 643 | | | | 644 | |
| | |
Thomson Reuters
3.350%, 05/15/26 | | | 100 | | | | 103 | |
| | |
TWDC Enterprises
18 3.700%, 12/01/42 | | | 72 | | | | 79 | |
3.150%, 09/17/25 | | | 100 | | | | 106 | |
| | |
Verizon Communications 5.250%, 03/16/37 | | | 100 | | | | 126 | |
5.012%, 04/15/49 | | | 250 | | | | 320 | |
4.862%, 08/21/46 | | | 250 | | | | 310 | |
4.812%, 03/15/39 | | | 100 | | | | 121 | |
4.522%, 09/15/48 | | | 523 | | | | 628 | |
4.400%, 11/01/34 | | | 400 | | | | 464 | |
4.329%, 09/21/28 | | | 255 | | | | 289 | |
4.272%, 01/15/36 | | | 1,407 | | | | 1,593 | |
4.016%, 12/03/29 | | | 250 | | | | 279 | |
3.875%, 02/08/29 | | | 10 | | | | 11 | |
3.376%, 02/15/25 | | | 150 | | | | 159 | |
2.625%, 08/15/26 | | | 135 | | | | 137 | |
| | |
ViacomCBS
6.875%, 04/30/36 | | | 100 | | | | 134 | |
4.375%, 03/15/43 | | | 495 | | | | 525 | |
| | | | | | | | |
| Description | | Face Amount
(000) | | | Value
(000) | |
3.375%, 03/01/22 | | $ | 150 | | | $ | 153 | |
2.900%, 06/01/23 | | | 100 | | | | 102 | |
| | |
Vodafone Group
4.875%, 06/19/49 | | | 1,546 | | | | 1,793 | |
4.375%, 05/30/28 | | | 200 | | | | 222 | |
4.375%, 02/19/43 | | | 300 | | | | 322 | |
3.750%, 01/16/24 | | | 200 | | | | 211 | |
| | |
Walt Disney
6.400%, 12/15/35 | | | 735 | | | | 1,045 | |
4.500%, 02/15/21 | | | 100 | | | | 103 | |
3.700%, 10/15/25 | | | 20 | | | | 22 | |
2.750%, 09/01/49 | | | 250 | | | | 236 | |
2.000%, 09/01/29 | | | 300 | | | | 291 | |
| | | | | | | | |
| | |
| | | | | | | 45,097 | |
| | | | | | | | |
|
Consumer Discretionary — 1.1% | |
| | |
Alibaba Group Holding 4.000%, 12/06/37 | | | 250 | | | | 268 | |
| | |
Amazon.com
4.800%, 12/05/34 | | | 100 | | | | 126 | |
4.050%, 08/22/47 | | | 150 | | | | 176 | |
3.875%, 08/22/37 | | | 100 | | | | 114 | |
2.800%, 08/22/24 | | | 250 | | | | 259 | |
2.400%, 02/22/23 | | | 150 | | | | 153 | |
| | |
American Honda Finance
2.650%, 02/12/21 | | | 100 | | | | 101 | |
2.600%, 11/16/22 | | | 50 | | | | 51 | |
1.950%, 05/20/22 | | | 125 | | | | 125 | |
| | |
Aptiv
4.150%, 03/15/24 | | | 40 | | | | 42 | |
| | |
AutoNation
3.800%, 11/15/27 | | | 25 | | | | 25 | |
| | |
AutoZone
3.750%, 06/01/27 | | | 100 | | | | 107 | |
| | |
Best Buy
4.450%, 10/01/28 | | | 25 | | | | 28 | |
| | |
Booking Holdings
2.750%, 03/15/23 | | | 50 | | | | 51 | |
| | |
California Institute of Technology
3.650%, 09/01/19 | | | 20 | | | | 19 | |
| | |
Diageo Capital
2.375%, 10/24/29 | | | 200 | | | | 197 | |
| | |
Diageo Investment
2.875%, 05/11/22 | | | 100 | | | | 102 | |
| | |
Dollar General
4.150%, 11/01/25 | | | 25 | | | | 27 | |
4.125%, 05/01/28 | | | 35 | | | | 39 | |
| | |
Dollar Tree
4.200%, 05/15/28 | | | 45 | | | | 48 | |
4.000%, 05/15/25 | | | 100 | | | | 107 | |
| | |
eBay
2.750%, 01/30/23 | | | 250 | | | | 254 | |
| | |
Expedia Group 4.500%, 08/15/24 | | | 100 | | | | 107 | |
| | |
Ford Motor
5.291%, 12/08/46 | | | 150 | | | | 143 | |
4.346%, 12/08/26 | | | 45 | | | | 46 | |
The accompanying notes are an integral part of the financial statements.
93
| | |
| THE KP FUNDS | | December 31, 2019 |
| | | | | | | | |
| Description | | Face Amount
(000) | | | Value
(000) | |
| | |
Ford Motor Credit
5.875%, 08/02/21 | | $ | 2,332 | | | $ | 2,441 | |
5.584%, 03/18/24 | | | 200 | | | | 217 | |
4.542%, 08/01/26 | | | 2,907 | | | | 2,975 | |
3.350%, 11/01/22 | | | 200 | | | | 202 | |
3.339%, 03/28/22 | | | 200 | | | | 202 | |
| | |
GEMS MENASA Cayman
7.125%, 07/31/26 (A) | | | 1,080 | | | | 1,137 | |
| | |
General Motors
6.750%, 04/01/46 | | | 250 | | | | 293 | |
6.250%, 10/02/43 | | | 776 | | | | 872 | |
5.950%, 04/01/49 | | | 774 | | | | 858 | |
5.200%, 04/01/45 | | | 150 | | | | 152 | |
5.150%, 04/01/38 | | | 100 | | | | 102 | |
| | |
General Motors Financial
4.300%, 07/13/25 | | | 100 | | | | 107 | |
4.200%, 11/06/21 | | | 100 | | | | 104 | |
4.000%, 01/15/25 | | | 100 | | | | 105 | |
4.000%, 10/06/26 | | | 50 | | | | 52 | |
3.700%, 05/09/23 | | | 100 | | | | 103 | |
3.550%, 04/09/21 | | | 150 | | | | 153 | |
2.450%, 11/06/20 | | | 2,560 | | | | 2,566 | |
| | |
Grupo Televisa
7.250%, 05/14/43 (MXN) | | | 2,840 | | | | 112 | |
5.000%, 05/13/45 | | | 200 | | | | 209 | |
| | |
Hasbro
3.550%, 11/19/26 | | | 2,259 | | | | 2,275 | |
3.500%, 09/15/27 | | | 30 | | | | 30 | |
3.000%, 11/19/24 | | | 100 | | | | 100 | |
| | |
Home Depot
5.875%, 12/16/36 | | | 150 | | | | 207 | |
4.400%, 04/01/21 | | | 100 | | | | 103 | |
4.250%, 04/01/46 | | | 100 | | | | 118 | |
3.900%, 12/06/28 | | | 40 | | | | 45 | |
3.900%, 06/15/47 | | | 50 | | | | 57 | |
2.950%, 06/15/29 | | | 100 | | | | 104 | |
2.800%, 09/14/27 | | | 50 | | | | 52 | |
2.625%, 06/01/22 | | | 100 | | | | 102 | |
2.000%, 04/01/21 | | | 100 | | | | 100 | |
| | |
Hyatt Hotels
4.375%, 09/15/28 | | | 50 | | | | 54 | |
| | |
Las Vegas Sands
3.900%, 08/08/29 | | | 40 | | | | 42 | |
3.200%, 08/08/24 | | | 45 | | | | 46 | |
2.900%, 06/25/25 | | | 15 | | | | 15 | |
| | |
Lear
5.250%, 01/15/25 | | | 45 | | | | 46 | |
| | |
Leggett & Platt
4.400%, 03/15/29 | | | 50 | | | | 55 | |
| | |
Lowe’s
4.050%, 05/03/47 | | | 100 | | | | 108 | |
3.650%, 04/05/29 | | | 200 | | | | 214 | |
3.100%, 05/03/27 | | | 100 | | | | 104 | |
2.500%, 04/15/26 | | | 50 | | | | 50 | |
| | |
Macy’s Retail Holdings
3.625%, 06/01/24 | | | 100 | | | | 101 | |
| | | | | | | | |
| Description | | Face Amount
(000) | | | Value
(000) | |
| | |
Magna International
3.625%, 06/15/24 | | $ | 50 | | | $ | 53 | |
| | |
Marriott International
4.150%, 12/01/23 | | | 50 | | | | 53 | |
3.125%, 10/15/21 | | | 100 | | | | 102 | |
2.125%, 10/03/22 | | | 15 | | | | 15 | |
| | |
Massachusetts Institute of Technology
2.989%, 07/01/50 | | | 100 | | | | 99 | |
| | |
McDonald’s
4.450%, 03/01/47 | | | 150 | | | | 171 | |
4.450%, 09/01/48 | | | 718 | | | | 823 | |
3.625%, 09/01/49 | | | 1,363 | | | | 1,386 | |
3.500%, 03/01/27 | | | 100 | | | | 107 | |
3.375%, 05/26/25 | | | 100 | | | | 106 | |
3.350%, 04/01/23 | | | 130 | | | | 135 | |
| | |
New York and Presbyterian Hospital
3.954%, 08/01/19 | | | 35 | | | | 35 | |
| | |
Nordstrom
5.000%, 01/15/44 | | | 100 | | | | 98 | |
4.000%, 03/15/27 | | | 30 | | | | 31 | |
| | |
O’Reilly Automotive
4.350%, 06/01/28 | | | 50 | | | | 56 | |
3.550%, 03/15/26 | | | 50 | | | | 53 | |
| | |
President & Fellows of Harvard College
3.150%, 07/15/46 | | | 100 | | | | 102 | |
| | |
QVC
4.450%, 02/15/25 | | | 65 | | | | 67 | |
| | |
Sands China
4.600%, 08/08/23 | | | 200 | | | | 211 | |
| | |
Starbucks
4.500%, 11/15/48 | | | 30 | | | | 35 | |
4.450%, 08/15/49 | | | 100 | | | | 116 | |
2.450%, 06/15/26 | | | 200 | | | | 203 | |
| | |
Target
4.000%, 07/01/42 | | | 200 | | | | 229 | |
3.500%, 07/01/24 | | | 100 | | | | 107 | |
3.375%, 04/15/29 | | | 50 | | | | 54 | |
| | |
Time Warner Cable
7.300%, 07/01/38 | | | 431 | | | | 562 | |
5.875%, 11/15/40 | | | 200 | | | | 230 | |
4.000%, 09/01/21 | | | 100 | | | | 102 | |
| | |
TJX
2.750%, 06/15/21 | | | 100 | | | | 101 | |
| | |
Toyota Motor Credit
4.250%, 01/11/21 | | | 100 | | | | 102 | |
3.650%, 01/08/29 | | | 100 | | | | 109 | |
3.450%, 09/20/23 | | | 50 | | | | 53 | |
2.750%, 05/17/21 | | | 100 | | | | 101 | |
2.700%, 01/11/23 | | | 200 | | | | 204 | |
2.250%, 10/18/23 | | | 50 | | | | 51 | |
| | |
University of Pennsylvania
3.610%, 02/15/19 | | | 100 | | | | 103 | |
The accompanying notes are an integral part of the financial statements.
94
| | |
| THE KP FUNDS | | December 31, 2019 |
| | | | | | | | |
| Description | | Face Amount
(000) | | | Value
(000) | |
| | |
USJ Acucar e Alcool
9.875%, 11/09/21 (A) | | $ | 343 | | | $ | 235 | |
| | |
Whirlpool
4.000%, 03/01/24 | | | 60 | | | | 64 | |
| | | | | | | | |
| | |
| | | | | | | 26,269 | |
| | | | | | | | |
|
Consumer Staples — 1.0% | |
| | |
Adecoagro
6.000%, 09/21/27 (A) | | | 1,045 | | | | 1,046 | |
| | |
Altria Group
6.200%, 02/14/59 | | | 15 | | | | 18 | |
5.950%, 02/14/49 | | | 40 | | | | 48 | |
5.800%, 02/14/39 | | | 165 | | | | 194 | |
5.375%, 01/31/44 | | | 100 | | | | 113 | |
4.800%, 02/14/29 | | | 40 | | | | 45 | |
4.000%, 01/31/24 | | | 300 | | | | 318 | |
3.800%, 02/14/24 | | | 20 | | | | 21 | |
| | |
Anheuser-Busch
4.900%, 02/01/46 | | | 2,560 | | | | 3,036 | |
4.700%, 02/01/36 | | | 150 | | | | 174 | |
| | |
Anheuser-Busch InBev Finance
3.300%, 02/01/23 | | | 225 | | | | 233 | |
| | |
Anheuser-Busch InBev Worldwide
5.800%, 01/23/59 | | | 300 | | | | 410 | |
4.950%, 01/15/42 | | | 500 | | | | 592 | |
4.600%, 04/15/48 | | | 1,536 | | | | 1,758 | |
4.439%, 10/06/48 | | | 100 | | | | 112 | |
4.150%, 01/23/25 | | | 250 | | | | 272 | |
4.000%, 04/13/28 | | | 55 | | | | 61 | |
| | |
Archer-Daniels-Midland
3.750%, 09/15/47 | | | 100 | | | | 109 | |
3.375%, 03/15/22 | | | 60 | | | | 62 | |
| | |
Bunge Finance
3.250%, 08/15/26 | | | 120 | | | | 120 | |
3.000%, 09/25/22 | | | 30 | | | | 30 | |
| | |
Campbell Soup
4.800%, 03/15/48 | | | 110 | | | | 128 | |
4.150%, 03/15/28 | | | 50 | | | | 54 | |
3.650%, 03/15/23 | | | 50 | | | | 52 | |
| | |
Church & Dwight
2.450%, 08/01/22 | | | 100 | | | | 101 | |
| | |
Clorox
3.500%, 12/15/24 | | | 50 | | | | 53 | |
| | |
Coca-Cola
3.300%, 09/01/21 | | | 100 | | | | 103 | |
2.875%, 10/27/25 | | | 50 | | | | 52 | |
2.550%, 06/01/26 | | | 50 | | | | 51 | |
1.750%, 09/06/24 | | | 100 | | | | 99 | |
| | |
Colgate-Palmolive
2.300%, 05/03/22 | | | 200 | | | | 203 | |
| | |
Conagra Brands
5.400%, 11/01/48 | | | 734 | | | | 896 | |
5.300%, 11/01/38 | | | 10 | | | | 12 | |
4.850%, 11/01/28 | | | 25 | | | | 29 | |
4.600%, 11/01/25 | | | 200 | | | | 221 | |
4.300%, 05/01/24 | | | 4,550 | | | | 4,900 | |
| | | | | | | | |
| Description | | Face Amount
(000) | | | Value
(000) | |
3.800%, 10/22/21 | | $ | 20 | | | $ | 21 | |
| | |
Constellation Brands
4.650%, 11/15/28 | | | 30 | | | | 34 | |
4.250%, 05/01/23 | | | 50 | | | | 53 | |
3.750%, 05/01/21 | | | 15 | | | | 15 | |
3.200%, 02/15/23 | | | 150 | | | | 154 | |
2.650%, 11/07/22 | | | 50 | | | | 51 | |
| | |
Costco Wholesale
2.750%, 05/18/24 | | | 150 | | | | 155 | |
| | |
General Mills
4.200%, 04/17/28 | | | 50 | | | | 56 | |
3.700%, 10/17/23 | | | 100 | | | | 105 | |
3.150%, 12/15/21 | | | 150 | | | | 153 | |
| | |
Hershey
2.300%, 08/15/26 | | | 50 | | | | 51 | |
| | |
Ingredion
3.200%, 10/01/26 | | | 50 | | | | 51 | |
| | |
JM Smucker
3.375%, 12/15/27 | | | 150 | | | | 156 | |
| | |
Kellogg
3.400%, 11/15/27 | | | 25 | | | | 26 | |
| | |
Keurig Dr Pepper
5.085%, 05/25/48 | | | 150 | | | | 181 | |
4.985%, 05/25/38 | | | 175 | | | | 207 | |
4.597%, 05/25/28 | | | 50 | | | | 56 | |
| | |
Kimberly-Clark
3.950%, 11/01/28 | | | 10 | | | | 11 | |
2.750%, 02/15/26 | | | 100 | | | | 103 | |
| | |
Kraft Heinz Foods
5.000%, 06/04/42 | | | 150 | | | | 160 | |
4.875%, 10/01/49 (A) | | | 1,189 | | | | 1,255 | |
4.625%, 01/30/29 | | | 50 | | | | 55 | |
4.625%, 10/01/39 (A) | | | 100 | | | | 104 | |
3.950%, 07/15/25 | | | 150 | | | | 159 | |
3.375%, 06/15/21 | | | 115 | | | | 117 | |
| | |
Kroger
3.300%, 01/15/21 | | | 100 | | | | 101 | |
2.650%, 10/15/26 | | | 200 | | | | 202 | |
| | |
McCormick
3.150%, 08/15/24 | | | 100 | | | | 104 | |
| | |
Molson Coors Brewing
4.200%, 07/15/46 | | | 200 | | | | 200 | |
| | |
Mondelez International
4.625%, 05/07/48 | | | 100 | | | | 116 | |
4.125%, 05/07/28 | | | 50 | | | | 55 | |
| | |
PepsiCo
3.600%, 03/01/24 | | | 100 | | | | 107 | |
3.450%, 10/06/46 | | | 200 | | | | 212 | |
3.000%, 10/15/27 | | | 50 | | | | 53 | |
2.850%, 02/24/26 | | | 100 | | | | 104 | |
2.375%, 10/06/26 | | | 200 | | | | 203 | |
2.000%, 04/15/21 | | | 50 | | | | 50 | |
| | |
Philip Morris International
4.500%, 03/20/42 | | | 100 | | | | 114 | |
3.375%, 08/11/25 | | | 100 | | | | 105 | |
2.500%, 11/02/22 | | | 100 | | | | 101 | |
1.875%, 02/25/21 | | | 200 | | | | 200 | |
The accompanying notes are an integral part of the financial statements.
95
| | |
| THE KP FUNDS | | December 31, 2019 |
| | | | | | | | |
| Description | | Face Amount
(000) | | | Value
(000) | |
| | |
Procter & Gamble
3.500%, 10/25/47 | | $ | 100 | | | $ | 113 | |
2.450%, 11/03/26 | | | 50 | | | | 51 | |
2.150%, 08/11/22 | | | 100 | | | | 101 | |
| | |
Reynolds American
4.450%, 06/12/25 | | | 150 | | | | 162 | |
| | |
Sysco
4.450%, 03/15/48 | | | 50 | | | | 57 | |
3.550%, 03/15/25 | | | 50 | | | | 53 | |
2.500%, 07/15/21 | | | 35 | | | | 35 | |
| | |
Tyson Foods
4.875%, 08/15/34 | | | 200 | | | | 239 | |
| | |
Unilever Capital
4.250%, 02/10/21 | | | 150 | | | | 154 | |
3.250%, 03/07/24 | | | 150 | | | | 157 | |
2.200%, 05/05/22 | | | 100 | | | | 101 | |
| | |
Walgreens Boots Alliance
4.800%, 11/18/44 | | | 200 | | | | 203 | |
3.450%, 06/01/26 | | | 165 | | | | 168 | |
| | |
Walmart
4.050%, 06/29/48 | | | 35 | | | | 42 | |
3.950%, 06/28/38 | | | 115 | | | | 133 | |
3.700%, 06/26/28 | | | 100 | | | | 110 | |
3.625%, 12/15/47 | | | 250 | | | | 278 | |
3.400%, 06/26/23 | | | 50 | | | | 53 | |
3.300%, 04/22/24 | | | 100 | | | | 105 | |
3.250%, 07/08/29 | | | 140 | | | | 150 | |
2.650%, 12/15/24 | | | 50 | | | | 52 | |
| | | | | | | | |
| | |
| | | | | | | 23,759 | |
| | | | | | | | |
|
Energy — 3.5% | |
| | |
Abu Dhabi Crude Oil Pipeline
4.600%, 11/02/47 (A) | | | 2,500 | | | | 2,887 | |
| | |
Apache
5.350%, 07/01/49 | | | 50 | | | | 52 | |
4.375%, 10/15/28 | | | 100 | | | | 105 | |
3.250%, 04/15/22 | | | 41 | | | | 42 | |
| | |
Azure Power Solar Energy Pvt 5.650%, 12/24/24 (A) | | | 220 | | | | 225 | |
| | |
Baker Hughes a GE
3.337%, 12/15/27 | | | 100 | | | | 104 | |
3.138%, 11/07/29 | | | 65 | | | | 67 | |
| | |
Boardwalk Pipelines
4.950%, 12/15/24 | | | 50 | | | | 54 | |
| | |
BP Capital Markets
3.561%, 11/01/21 | | | 200 | | | | 206 | |
3.062%, 03/17/22 | | | 200 | | | | 205 | |
2.500%, 11/06/22 | | | 250 | | | | 255 | |
| | |
Canadian Natural Resources 3.900%, 02/01/25 | | | 150 | | | | 160 | |
3.850%, 06/01/27 | | | 100 | | | | 106 | |
| | |
Cenovus Energy
5.250%, 06/15/37 | | | 200 | | | | 222 | |
3.000%, 08/15/22 | | | 20 | | | | 20 | |
| | |
Cheniere Corpus Christi Holdings
7.000%, 06/30/24 | | | 150 | | | | 173 | |
| | | | | | | | |
| Description | | Face Amount
(000) | | | Value
(000) | |
| | |
Chevron
2.954%, 05/16/26 | | $ | 50 | | | $ | 52 | |
2.566%, 05/16/23 | | | 50 | | | | 51 | |
2.355%, 12/05/22 | | | 150 | | | | 152 | |
2.100%, 05/16/21 | | | 50 | | | | 51 | |
| | |
Cimarex Energy
3.900%, 05/15/27 | | | 100 | | | | 104 | |
| | |
CNOOC Finance 2015 USA
3.500%, 05/05/25 | | | 200 | | | | 209 | |
| | |
Concho Resources
4.850%, 08/15/48 | | | 15 | | | | 17 | |
4.375%, 01/15/25 | | | 50 | | | | 52 | |
4.300%, 08/15/28 | | | 10 | | | | 11 | |
| | |
ConocoPhillips
6.500%, 02/01/39 | | | 300 | | | | 437 | |
| | |
Continental Resources
5.000%, 09/15/22 | | | 30 | | | | 30 | |
4.900%, 06/01/44 | | | 993 | | | | 1,054 | |
4.500%, 04/15/23 | | | 40 | | | | 42 | |
4.375%, 01/15/28 | | | 25 | | | | 27 | |
3.800%, 06/01/24 | | | 25 | | | | 26 | |
| | |
Diamondback Energy
3.500%, 12/01/29 | | | 50 | | | | 51 | |
3.250%, 12/01/26 | | | 20 | | | | 20 | |
2.875%, 12/01/24 | | | 30 | | | | 30 | |
| | |
Ecopetrol
7.375%, 09/18/43 | | | 200 | | | | 270 | |
5.875%, 09/18/23 | | | 100 | | | | 111 | |
5.875%, 05/28/45 | | | 615 | | | | 725 | |
| | |
Emera US Finance
4.750%, 06/15/46 | | | 200 | | | | 231 | |
2.700%, 06/15/21 | | | 1,473 | | | | 1,487 | |
| | |
Enable Midstream Partners
4.150%, 09/15/29 | | | 100 | | | | 95 | |
| | |
Enbridge
4.000%, 11/15/49 | | | 100 | | | | 105 | |
3.700%, 07/15/27 | | | 100 | | | | 106 | |
| | |
Enbridge Energy Partners
5.875%, 10/15/25 | | | 100 | | | | 117 | |
| | |
Encana
3.900%, 11/15/21 | | | 50 | | | | 51 | |
| | |
Energy Transfer Operating
6.250%, 04/15/49 | | | 1,162 | | | | 1,402 | |
6.125%, 12/15/45 | | | 150 | | | | 174 | |
6.000%, 06/15/48 | | | 125 | | | | 146 | |
5.800%, 06/15/38 | | | 225 | | | | 255 | |
5.250%, 04/15/29 | | | 50 | | | | 56 | |
4.200%, 04/15/27 | | | 200 | | | | 210 | |
| | |
Energy Transfer Partners
4.500%, 11/01/23 | | | 3,017 | | | | 3,197 | |
| | |
Enterprise Products Operating
6.450%, 09/01/40 | | | 150 | | | | 204 | |
5.950%, 02/01/41 | | | 100 | | | | 129 | |
4.800%, 02/01/49 | | | 25 | | | | 29 | |
4.250%, 02/15/48 | | | 25 | | | | 27 | |
4.200%, 01/31/50 | | | 35 | | | | 38 | |
The accompanying notes are an integral part of the financial statements.
96
| | |
| THE KP FUNDS | | December 31, 2019 |
| | | | | | | | |
| Description | | Face Amount
(000) | | | Value
(000) | |
4.150%, 10/16/28 | | $ | 175 | | | $ | 194 | |
3.500%, 02/01/22 | | | 25 | | | | 26 | |
3.350%, 03/15/23 | | | 100 | | | | 103 | |
2.850%, 04/15/21 | | | 30 | | | | 30 | |
| | |
EOG Resources
3.150%, 04/01/25 | | | 100 | | | | 105 | |
2.625%, 03/15/23 | | | 100 | | | | 102 | |
| | |
EQM Midstream Partners 6.500%, 07/15/48 | | | 100 | | | | 94 | |
| | |
Equinor
3.950%, 05/15/43 | | | 200 | | | | 223 | |
3.700%, 03/01/24 | | | 100 | | | | 107 | |
2.450%, 01/17/23 | | | 125 | | | | 127 | |
| | |
Equities
3.900%, 10/01/27 | | | 50 | | | | 46 | |
| | |
Exxon Mobil
4.114%, 03/01/46 | | | 150 | | | | 176 | |
3.095%, 08/16/49 | | | 25 | | | | 25 | |
3.043%, 03/01/26 | | | 50 | | | | 53 | |
2.995%, 08/16/39 | | | 25 | | | | 25 | |
2.726%, 03/01/23 | | | 35 | | | | 36 | |
2.709%, 03/06/25 | | | 150 | | | | 155 | |
2.440%, 08/16/29 | | | 25 | | | | 25 | |
2.222%, 03/01/21 | | | 20 | | | | 20 | |
2.019%, 08/16/24 | | | 25 | | | | 25 | |
1.902%, 08/16/22 | | | 10 | | | | 10 | |
| | |
Fermaca Enterprises
6.375%, 03/30/38 (A) | | | 988 | | | | 1,075 | |
| | |
Gazprom PJSC Via Gaz Capital
5.150%, 02/11/26 (A) | | | 1,060 | | | | 1,179 | |
| | |
Greenko Dutch BV
5.250%, 07/24/24 (A) | | | 775 | | | | 786 | |
| | |
Halliburton
5.000%, 11/15/45 | | | 100 | | | | 114 | |
3.800%, 11/15/25 | | | 150 | | | | 160 | |
3.500%, 08/01/23 | | | 100 | | | | 104 | |
3.250%, 11/15/21 | | | 3,280 | | | | 3,347 | |
| | |
Hess
7.875%, 10/01/29 | | | 929 | | | | 1,214 | |
5.600%, 02/15/41 | | | 526 | | | | 616 | |
4.300%, 04/01/27 | | | 200 | | | | 213 | |
| | |
Hunt Oil of Peru Sucursal Del Peru
6.375%, 06/01/28 (A) | | | 730 | | | | 804 | |
| | |
Husky Energy
4.000%, 04/15/24 | | | 100 | | | | 105 | |
| | |
KazMunayGas National JSC
5.750%, 04/19/47 (A) | | | 850 | | | | 1,014 | |
| | |
Kinder Morgan
5.550%, 06/01/45 | | | 300 | | | | 357 | |
4.300%, 03/01/28 | | | 100 | | | | 109 | |
| | |
Kinder Morgan Energy Partners
6.375%, 03/01/41 | | | 150 | | | | 188 | |
5.500%, 03/01/44 | | | 100 | | | | 117 | |
3.500%, 03/01/21 | | | 20 | | | | 20 | |
| | |
Magellan Midstream Partners
4.250%, 02/01/21 | | | 100 | | | | 102 | |
| | | | | | | | |
| Description | | Face Amount
(000) | | | Value
(000) | |
3.950%, 03/01/50 | | $ | 25 | | | $ | 26 | |
| | |
Marathon Oil
6.600%, 10/01/37 | | | 150 | | | | 191 | |
| | |
Marathon Petroleum
6.500%, 03/01/41 | | | 250 | | | | 325 | |
3.800%, 04/01/28 | | | 30 | | | | 32 | |
3.400%, 12/15/20 | | | 557 | | | | 563 | |
| | |
MPLX
5.500%, 02/15/49 | | | 1,813 | | | | 2,060 | |
5.200%, 03/01/47 | | | 200 | | | | 216 | |
5.200%, 12/01/47 (A) | | | 150 | | | | 160 | |
4.800%, 02/15/29 | | | 70 | | | | 77 | |
4.125%, 03/01/27 | | | 65 | | | | 68 | |
4.000%, 02/15/25 | | | 25 | | | | 26 | |
3.500%, 12/01/22 (A) | | | 25 | | | | 26 | |
| | |
National Oilwell Varco
2.600%, 12/01/22 | | | 29 | | | | 29 | |
| | |
Newfield Exploration
5.625%, 07/01/24 | | | 200 | | | | 220 | |
| | |
Nexen
6.400%, 05/15/37 | | | 150 | | | | 206 | |
| | |
Noble Energy
6.000%, 03/01/41 | | | 1,169 | | | | 1,407 | |
4.950%, 08/15/47 | | | 100 | | | | 111 | |
| | |
Occidental Petroleum
7.500%, 05/01/31 | | | 100 | | | | 130 | |
6.600%, 03/15/46 | | | 200 | | | | 258 | |
5.550%, 03/15/26 | | | 3,302 | | | | 3,745 | |
4.850%, 03/15/21 | | | 1,571 | | | | 1,618 | |
4.400%, 04/15/46 | | | 200 | | | | 203 | |
4.400%, 08/15/49 | | | 15 | | | | 16 | |
4.300%, 08/15/39 | | | 20 | | | | 20 | |
3.500%, 08/15/29 | | | 45 | | | | 46 | |
3.400%, 04/15/26 | | | 70 | | | | 72 | |
2.900%, 08/15/24 | | | 60 | | | | 61 | |
2.700%, 08/15/22 | | | 45 | | | | 45 | |
| | |
Odebrecht Oil & Gas Finance 0.501%, 01/03/69 (A) (B) | | | 97 | | | | 1 | |
| | |
ONEOK
5.200%, 07/15/48 | | | 75 | | | | 85 | |
4.550%, 07/15/28 | | | 50 | | | | 55 | |
4.450%, 09/01/49 | | | 100 | | | | 104 | |
4.000%, 07/13/27 | | | 30 | | | | 32 | |
| | |
ONEOK Partners
3.375%, 10/01/22 | | | 100 | | | | 103 | |
| | |
Patterson-UTI Energy
5.150%, 11/15/29 | | | 25 | | | | 26 | |
| | |
Pertamina Persero
4.700%, 07/30/49 (A) | | | 960 | | | | 1,021 | |
| | |
Peru LNG Srl
5.375%, 03/22/30 (A) | | | 535 | | | | 527 | |
| | |
Petrobras Global Finance BV
6.900%, 03/19/49 | | | 995 | | | | 1,167 | |
| | |
Petroleos de Venezuela
9.000%, 11/17/21 (C) | | | 660 | | | | 51 | |
8.500%, 10/27/20 (A) | | | 123 | | | | 22 | |
6.000%, 11/15/26 (A) (C) | | | 785 | | | | 61 | |
The accompanying notes are an integral part of the financial statements.
97
| | |
| THE KP FUNDS | | December 31, 2019 |
| | | | | | | | |
| Description | | Face Amount
(000) | | | Value
(000) | |
5.375%, 04/12/27 (C) | | $ | 670 | | | $ | 52 | |
| | |
Petroleos Mexicanos
7.690%, 01/23/50 (A) | | | 2,307 | | | | 2,518 | |
6.875%, 08/04/26 | | | 50 | | | | 55 | |
6.840%, 01/23/30 (A) | | | 753 | | | | 803 | |
6.750%, 09/21/47 | | | 1,843 | | | | 1,846 | |
6.625%, 06/15/35 | | | 480 | | | | 492 | |
6.500%, 03/13/27 | | | 1,975 | | | | 2,097 | |
6.500%, 01/23/29 | | | 685 | | | | 720 | |
6.490%, 01/23/27 (A) | | | 1,386 | | | | 1,475 | |
6.350%, 02/12/48 | | | 200 | | | | 193 | |
5.350%, 02/12/28 | | | 255 | | | | 254 | |
| | |
Phillips 66
4.650%, 11/15/34 | | | 300 | | | | 353 | |
| | |
Phillips 66 Partners
3.605%, 02/15/25 | | | 25 | | | | 26 | |
2.450%, 12/15/24 | | | 100 | | | | 100 | |
| | |
Pioneer Natural Resources 3.450%, 01/15/21 | | | 100 | | | | 101 | |
| | |
Plains All American Pipeline
4.650%, 10/15/25 | | | 6,902 | | | | 7,396 | |
3.850%, 10/15/23 | | | 150 | | | | 155 | |
3.550%, 12/15/29 | | | 100 | | | | 99 | |
| | |
ReNew Power
6.450%, 09/27/22 (A) | | | 280 | | | | 287 | |
| | |
Sabine Pass Liquefaction 5.625%, 02/01/21 | | | 140 | | | | 144 | |
5.625%, 03/01/25 | | | 85 | | | | 96 | |
5.000%, 03/15/27 | | | 300 | | | | 330 | |
| | |
Saudi Arabian Oil
4.250%, 04/16/39 (A) | | | 2,110 | | | | 2,260 | |
| | |
Shell International Finance 4.550%, 08/12/43 | | | 400 | | | | 488 | |
2.875%, 05/10/26 | | | 100 | | | | 104 | |
1.875%, 05/10/21 | | | 200 | | | | 200 | |
| | |
Shell International Finance BV
3.875%, 11/13/28 | | | 100 | | | | 111 | |
3.125%, 11/07/49 | | | 2,031 | | | | 2,006 | |
2.000%, 11/07/24 | | | 2,493 | | | | 2,487 | |
| | |
Sinopec Group Overseas Development 2016
2.750%, 09/29/26 (A) | | | 460 | | | | 457 | |
| | |
Southern Gas Corridor CJSC
6.875%, 03/24/26 (A) | | | 840 | | | | 995 | |
| | |
Spectra Energy Partners
3.500%, 03/15/25 | | | 100 | | | | 105 | |
| | |
Suncor Energy
6.500%, 06/15/38 | | | 150 | | | | 209 | |
| | |
Sunoco Logistics Partners Operations
4.400%, 04/01/21 | | | 100 | | | | 102 | |
| | |
Total Capital
3.883%, 10/11/28 | | | 50 | | | | 56 | |
| | |
Total Capital Canada
2.750%, 07/15/23 | | | 100 | | | | 103 | |
| | | | | | | | |
| Description | | Face Amount
(000) | | | Value
(000) | |
| | |
Total Capital International 3.455%, 02/19/29 | | $ | 25 | | | $ | 27 | |
2.700%, 01/25/23 | | | 100 | | | | 102 | |
| | |
TransCanada PipeLines
5.100%, 03/15/49 | | | 25 | | | | 30 | |
4.875%, 01/15/26 | | | 100 | | | | 112 | |
4.625%, 03/01/34 | | | 300 | | | | 342 | |
4.250%, 05/15/28 | | | 25 | | | | 28 | |
| | |
Transportadora de Gas del Sur
6.750%, 05/02/25 (A) | | | 220 | | | | 194 | |
| | |
Ultrapar International
5.250%, 06/06/29 (A) | | | 870 | | | | 917 | |
| | |
Valero Energy
4.350%, 06/01/28 | | | 70 | | | | 77 | |
4.000%, 04/01/29 | | | 35 | | | | 38 | |
3.650%, 03/15/25 | | | 100 | | | | 106 | |
| | |
Western Midstream Operating
5.300%, 03/01/48 | | | 200 | | | | 175 | |
| | |
Williams
8.750%, 03/15/32 | | | 2,823 | | | | 4,061 | |
5.750%, 06/24/44 | | | 20 | | | | 24 | |
5.100%, 09/15/45 | | | 300 | | | | 334 | |
4.850%, 03/01/48 | | | 25 | | | | 27 | |
4.550%, 06/24/24 | | | 45 | | | | 49 | |
3.700%, 01/15/23 | | | 15 | | | | 15 | |
3.600%, 03/15/22 | | | 100 | | | | 103 | |
| | |
YPF
16.500%, 05/09/22 (ARS) (A) | | | 6,000 | | | | 44 | |
| | | | | | | | |
| | |
| | | | | | | 81,087 | |
| | | | | | | | |
|
Financials — 7.4% | |
| | |
Aflac
4.750%, 01/15/49 | | | 15 | | | | 19 | |
3.625%, 06/15/23 | | | 100 | | | | 105 | |
| | |
Allstate
4.200%, 12/15/46 | | | 200 | | | | 230 | |
| | |
Ally Financial
3.875%, 05/21/24 | | | 150 | | | | 157 | |
| | |
American Express
4.200%, 11/06/25 | | | 105 | | | | 116 | |
3.400%, 02/27/23 | | | 150 | | | | 155 | |
3.125%, 05/20/26 | | | 100 | | | | 104 | |
2.500%, 08/01/22 | | | 100 | | | | 101 | |
2.500%, 07/30/24 | | | 65 | | | | 66 | |
| | |
American Express Credit
2.700%, 03/03/22 | | | 100 | | | | 102 | |
2.250%, 05/05/21 | | | 100 | | | | 100 | |
| | |
American Financial Group
3.500%, 08/15/26 | | | 35 | | | | 36 | |
| | |
American International Group
4.750%, 04/01/48 | | | 150 | | | | 181 | |
4.700%, 07/10/35 | | | 200 | | | | 232 | |
4.500%, 07/16/44 | | | 626 | | | | 722 | |
3.875%, 01/15/35 | | | 200 | | | | 212 | |
3.375%, 08/15/20 | | | 2,095 | | | | 2,114 | |
The accompanying notes are an integral part of the financial statements.
98
| | |
| THE KP FUNDS | | December 31, 2019 |
| | | | | | | | |
| Description | | Face Amount
(000) | | | Value
(000) | |
| | |
Andina de Fomento
4.375%, 06/15/22 | | $ | 100 | | | $ | 105 | |
3.750%, 11/23/23 | | | 90 | | | | 94 | |
| | |
Aon
4.500%, 12/15/28 | | | 50 | | | | 57 | |
2.200%, 11/15/22 | | | 65 | | | | 65 | |
| | |
Ares Capital
4.200%, 06/10/24 | | | 65 | | | | 68 | |
| | |
Assurant
4.000%, 03/15/23 | | | 74 | | | | 77 | |
| | |
Australia & New Zealand Banking Group NY
2.625%, 05/19/22 | | | 250 | | | | 254 | |
| | |
AXA Equitable Holdings
4.350%, 04/20/28 | | | 150 | | | | 163 | |
| | |
Banco del Estado de Chile
2.668%, 01/08/21 (A) | | | 1,738 | | | | 1,739 | |
| | |
Banco Santander
3.306%, 06/27/29 | | | 200 | | | | 206 | |
3.125%, 02/23/23 | | | 200 | | | | 204 | |
| | |
Bank of America
5.000%, 01/21/44 | | | 250 | | | | 326 | |
4.450%, 03/03/26 | | | 130 | | | | 143 | |
4.330%, VAR ICE LIBOR USD 3 Month+1.520%, 03/15/50 | | | 150 | | | | 181 | |
4.271%, VAR ICE LIBOR USD 3 Month+1.310%, 07/23/29 | | | 200 | | | | 222 | |
4.244%, VAR ICE LIBOR USD 3 Month+1.814%, 04/24/38 | | | 100 | | | | 115 | |
4.200%, 08/26/24 | | | 165 | | | | 177 | |
4.183%, 11/25/27 | | | 250 | | | | 271 | |
4.100%, 07/24/23 | | | 100 | | | | 107 | |
4.078%, VAR ICE LIBOR USD 3 Month+1.320%, 04/23/40 | | | 100 | | | | 113 | |
4.000%, 01/22/25 | | | 100 | | | | 107 | |
3.974%, VAR ICE LIBOR USD 3 Month+1.210%, 02/07/30 | | | 40 | | | | 44 | |
3.950%, 04/21/25 | | | 200 | | | | 214 | |
3.946%, VAR ICE LIBOR USD 3 Month+1.190%, 01/23/49 | | | 100 | | | | 114 | |
3.559%, VAR ICE LIBOR USD 3 Month+1.060%, 04/23/27 | | | 6,547 | | | | 6,921 | |
3.550%, VAR ICE LIBOR USD 3 Month+0.780%, 03/05/24 | | | 250 | | | | 260 | |
3.500%, 04/19/26 | | | 50 | | | | 53 | |
3.499%, VAR ICE LIBOR USD 3 Month+0.630%, 05/17/22 | | | 6,394 | | | | 6,523 | |
3.458%, VAR ICE LIBOR USD 3 Month+0.970%, 03/15/25 | | | 100 | | | | 104 | |
| | | | | | | | |
| Description | | Face Amount
(000) | | | Value
(000) | |
3.366%, VAR ICE LIBOR USD 3 Month+0.810%, 01/23/26 | | $ | 200 | | | $ | 209 | |
3.194%, VAR ICE LIBOR USD 3 Month+1.180%, 07/23/30 | | | 100 | | | | 103 | |
3.093%, VAR ICE LIBOR USD 3 Month+1.090%, 10/01/25 | | | 100 | | | | 103 | |
2.884%, VAR ICE LIBOR USD 3 Month+0.012%, 10/22/30 | | | 50 | | | | 50 | |
2.881%, VAR ICE LIBOR USD 3 Month+1.021%, 04/24/23 | | | 200 | | | | 203 | |
2.503%, 10/21/22 | | | 100 | | | | 101 | |
2.456%, VAR ICE LIBOR USD 3 Month+0.870%, 10/22/25 | | | 50 | | | | 50 | |
| | |
Bank of Georgia JSC
11.000%, 06/01/20 (GEL) (A) | | | 870 | | | | 304 | |
6.000%, 07/26/23 (A) | | | 750 | | | | 788 | |
| | |
Bank of Montreal
3.300%, 02/05/24 | | | 100 | | | | 104 | |
3.100%, 04/13/21 | | | 60 | | | | 61 | |
2.500%, 06/28/24 | | | 65 | | | | 66 | |
2.050%, 11/01/22 | | | 80 | | | | 80 | |
| | |
Bank of New York Mellon
3.550%, 09/23/21 | | | 100 | | | | 103 | |
3.450%, 08/11/23 | | | 50 | | | | 52 | |
3.400%, 01/29/28 | | | 50 | | | | 53 | |
3.300%, 08/23/29 | | | 100 | | | | 105 | |
3.000%, 02/24/25 | | | 100 | | | | 104 | |
2.950%, 01/29/23 | | | 50 | | | | 51 | |
2.500%, 04/15/21 | | | 100 | | | | 101 | |
2.450%, 08/17/26 | | | 50 | | | | 51 | |
| | |
Bank of Nova Scotia
3.125%, 04/20/21 | | | 150 | | | | 152 | |
2.800%, 07/21/21 | | | 100 | | | | 102 | |
2.700%, 08/03/26 | | | 200 | | | | 204 | |
2.450%, 03/22/21 | | | 50 | | | | 50 | |
| | |
Banque Federative du Credit Mutuel
2.125%, 11/21/22 (A) | | | 1,048 | | | | 1,049 | |
| | |
Barclays | | | | | | | | |
4.610%, VAR ICE LIBOR USD 3 Month+1.400%, 02/15/23 | | | 200 | | | | 209 | |
4.375%, 01/12/26 | | | 200 | | | | 216 | |
4.338%, VAR ICE LIBOR USD 3 Month+1.356%, 05/16/24 | | | 1,565 | | | | 1,650 | |
| | |
Barclays Bank
2.650%, 01/11/21 | | | 200 | | | | 201 | |
| | |
BAT Capital
4.758%, 09/06/49 | | | 50 | | | | 52 | |
4.540%, 08/15/47 | | | 100 | | | | 100 | |
4.390%, 08/15/37 | | | 150 | | | | 152 | |
The accompanying notes are an integral part of the financial statements.
99
| | |
| THE KP FUNDS | | December 31, 2019 |
| | | | | | | | |
| Description | | Face Amount
(000) | | | Value
(000) | |
3.557%, 08/15/27 | | $ | 100 | | | $ | 102 | |
3.462%, 09/06/29 | | | 50 | | | | 51 | |
3.222%, 08/15/24 | | | 50 | | | | 51 | |
2.789%, 09/06/24 | | | 35 | | | | 35 | |
2.764%, 08/15/22 | | | 50 | | | | 51 | |
| | |
BB&T
3.875%, 03/19/29 | | | 100 | | | | 108 | |
3.750%, 12/06/23 | | | 100 | | | | 106 | |
3.700%, 06/05/25 | | | 50 | | | | 54 | |
2.750%, 04/01/22 | | | 200 | | | | 203 | |
2.500%, 08/01/24 | | | 5,215 | | | | 5,284 | |
2.200%, 03/16/23 | | | 100 | | | | 101 | |
| | |
Berkshire Hathaway
3.125%, 03/15/26 | | | 200 | | | | 211 | |
| | |
Berkshire Hathaway Finance 4.300%, 05/15/43 | | | 200 | | | | 231 | |
4.250%, 01/15/49 | | | 50 | | | | 60 | |
| | |
BlackRock
3.250%, 04/30/29 | | | 100 | | | | 107 | |
3.200%, 03/15/27 | | | 100 | | | | 106 | |
| | |
BNP Paribas
3.250%, 03/03/23 | | | 150 | | | | 156 | |
2.819%, VAR ICE LIBOR USD 3 Month+1.111%, 11/19/25 (A) | | | 4,572 | | | | 4,626 | |
| | |
BOC Aviation
3.000%, 09/11/29 (A) | | | 1,100 | | | | 1,078 | |
| | |
BP Capital Markets America 4.234%, 11/06/28 | | | 100 | | | | 113 | |
3.410%, 02/11/26 | | | 100 | | | | 107 | |
2.112%, 09/16/21 | | | 100 | | | | 100 | |
| | |
BPCE
4.000%, 04/15/24 | | | 250 | | | | 267 | |
| | |
Brighthouse Financial
3.700%, 06/22/27 | | | 50 | | | | 50 | |
| | |
Brookfield Finance
3.900%, 01/25/28 | | | 100 | | | | 107 | |
| | |
Canadian Imperial Bank of Commerce
3.100%, 04/02/24 | | | 100 | | | | 104 | |
2.700%, 02/02/21 | | | 40 | | | | 40 | |
| | |
Capital One Financial
4.250%, 04/30/25 | | | 50 | | | | 54 | |
3.800%, 01/31/28 | | | 100 | | | | 108 | |
3.750%, 07/28/26 | | | 100 | | | | 105 | |
3.450%, 04/30/21 | | | 50 | | | | 51 | |
3.300%, 10/30/24 | | | 100 | | | | 104 | |
3.200%, 02/05/25 | | | 50 | | | | 52 | |
3.050%, 03/09/22 | | | 150 | | | | 153 | |
| | |
Charles Schwab
3.550%, 02/01/24 | | | 100 | | | | 106 | |
| | |
Chubb INA Holdings
3.350%, 05/15/24 | | | 100 | | | | 105 | |
3.350%, 05/03/26 | | | 150 | | | | 160 | |
2.875%, 11/03/22 | | | 150 | | | | 154 | |
| | |
Citigroup
8.125%, 07/15/39 | | | 250 | | | | 417 | |
| | | | | | | | |
| Description | | Face Amount
(000) | | | Value
(000) | |
4.750%, 05/18/46 | | $ | 100 | | | $ | 120 | |
4.450%, 09/29/27 | | | 2,730 | | | | 3,008 | |
4.300%, 11/20/26 | | | 1,425 | | | | 1,552 | |
4.281%, VAR ICE LIBOR USD 3 Month+1.839%, 04/24/48 | | | 100 | | | | 119 | |
4.125%, 07/25/28 | | | 85 | | | | 93 | |
4.075%, VAR ICE LIBOR USD 3 Month+1.192%, 04/23/29 | | | 150 | | | | 164 | |
4.044%, VAR ICE LIBOR USD 3 Month+1.023%, 06/01/24 | | | 50 | | | | 53 | |
3.980%, VAR ICE LIBOR USD 3 Month+1.338%, 03/20/30 | | | 150 | | | | 164 | |
3.887%, VAR ICE LIBOR USD 3 Month+1.563%, 01/10/28 | | | 200 | | | | 215 | |
3.750%, 06/16/24 | | | 100 | | | | 106 | |
3.668%, VAR ICE LIBOR USD 3 Month+1.390%, 07/24/28 | | | 100 | | | | 107 | |
3.500%, 05/15/23 | | | 100 | | | | 104 | |
3.352%, VAR ICE LIBOR USD 3 Month+0.897%, 04/24/25 | | | 100 | | | | 104 | |
3.300%, 04/27/25 | | | 100 | | | | 105 | |
3.142%, VAR ICE LIBOR USD 3 Month+0.722%, 01/24/23 | | | 185 | | | | 189 | |
2.976%, VAR United States Secured Overnight Financing Rate+1.422%, 11/05/30 | | | 4,433 | | | | 4,502 | |
2.900%, 12/08/21 | | | 100 | | | | 102 | |
2.876%, VAR ICE LIBOR USD 3 Month+0.950%, 07/24/23 | | | 3,549 | | | | 3,609 | |
2.750%, 04/25/22 | | | 100 | | | | 101 | |
2.700%, 10/27/22 | | | 300 | | | | 305 | |
| | |
Citigroup Global Markets Holdings
15.920%, 11/19/21 (UAH) (A)(D) | | | 29,000 | | | | 1,321 | |
| | |
Citizens Financial Group
2.850%, 07/27/26 | | | 150 | | | | 153 | |
2.375%, 07/28/21 | | | 30 | | | | 30 | |
| | |
CME Group
3.000%, 03/15/25 | | | 150 | | | | 156 | |
| | |
CNO Financial Group
5.250%, 05/30/29 | | | 100 | | | | 112 | |
| | |
Comerica
4.000%, 02/01/29 | | | 50 | | | | 55 | |
3.700%, 07/31/23 | | | 25 | | | | 26 | |
| | |
Cooperatieve Rabobank UA
5.250%, 05/24/41 | | | 100 | | | | 136 | |
4.625%, 12/01/23 | | | 796 | | | | 863 | |
3.375%, 05/21/25 | | | 250 | | | | 265 | |
The accompanying notes are an integral part of the financial statements.
100
| | |
| THE KP FUNDS | | December 31, 2019 |
| | | | | | | | |
| Description | | Face Amount (000)(1) | | | Value
(000) | |
2.750%, 01/10/23 | | $ | 250 | | | $ | 255 | |
| | |
Credit Suisse Group Funding Guernsey
4.875%, 05/15/45 | | | 250 | | | | 316 | |
| | |
Credit Suisse NY
2.100%, 11/12/21 | | | 250 | | | | 251 | |
| | |
Deutsche Bank NY
| | | | | | | | |
3.961%, VAR United States Secured Overnight Financing Rate+2.581%, 11/26/25 | | | 200 | | | | 204 | |
3.700%, 05/30/24 | | | 85 | | | | 86 | |
3.150%, 01/22/21 | | | 100 | | | | 101 | |
| | |
Development Bank of Kazakhstan JSC
8.950%, 05/04/23 (KZT) (A) | | | 362,000 | | | | 884 | |
| | |
Discover Bank
3.450%, 07/27/26 | | | 250 | | | | 260 | |
| | |
Discover Financial Services
4.100%, 02/09/27 | | | 40 | | | | 43 | |
| | |
E*TRADE Financial
4.500%, 06/20/28 | | | 50 | | | | 54 | |
| | |
Fibria Overseas Finance
5.500%, 01/17/27 | | | 25 | | | | 27 | |
| | |
Fidelity National Financial
4.500%, 08/15/28 | | | 50 | | | | 54 | |
| | |
Fifth Third Bancorp
3.650%, 01/25/24 | | | 100 | | | | 106 | |
| | |
Fifth Third Bank
3.950%, 07/28/25 | | | 200 | | | | 217 | |
| | |
First Republic Bank
4.625%, 02/13/47 | | | 200 | | | | 228 | |
| | |
FMS Wertmanagement
1.375%, 06/08/21 | | | 200 | | | | 199 | |
| | |
Goldman Sachs Group
5.750%, 01/24/22 | | | 350 | | | | 376 | |
5.150%, 05/22/45 | | | 350 | | | | 430 | |
4.411%, VAR ICE LIBOR USD 3 Month+1.430%, 04/23/39 | | | 1,648 | | | | 1,878 | |
4.223%, VAR ICE LIBOR USD 3 Month+1.301%, 05/01/29 | | | 300 | | | | 331 | |
4.017%, VAR ICE LIBOR USD 3 Month+1.373%, 10/31/38 | | | 150 | | | | 163 | |
3.750%, 05/22/25 | | | 100 | | | | 106 | |
3.750%, 02/25/26 | | | 250 | | | | 265 | |
3.691%, VAR ICE LIBOR USD 3 Month+1.510%, 06/05/28 | | | 165 | | | | 175 | |
3.625%, 02/20/24 | | | 30 | | | | 31 | |
3.272%, VAR ICE LIBOR USD 3 Month+1.201%, 09/29/25 | | | 75 | | | | 78 | |
3.200%, 02/23/23 | | | 150 | | | | 154 | |
2.908%, VAR ICE LIBOR USD 3 Month+1.053%, 06/05/23 | | | 100 | | | | 102 | |
| | | | | | | | |
| Description | | Face Amount
(000)(1) | | | Value
(000) | |
2.876%, VAR ICE LIBOR USD 3 Month+0.821%, 10/31/22 | | $ | 3,463 | | | $ | 3,512 | |
2.625%, 04/25/21 | | | 100 | | | | 101 | |
2.600%, 04/23/20 | | | 1,225 | | | | 1,227 | |
2.350%, 11/15/21 | | | 45 | | | | 45 | |
| | |
Hanover Insurance Group 4.500%, 04/15/26 | | | 100 | | | | 108 | |
| | |
Hartford Financial Services Group
5.500%, 03/30/20 | | | 630 | | | | 636 | |
4.400%, 03/15/48 | | | 100 | | | | 115 | |
| | |
HSBC Bank
14.800%, 02/01/23 (EGP) (A) | | | 9,600 | | | | 611 | |
13.423%, 03/09/20 (NGN) (A) (B) | | | 430,000 | | | | 1,159 | |
| | |
HSBC Holdings
5.250%, 03/14/44 | | | 200 | | | | 253 | |
4.583%, VAR ICE LIBOR USD 3 Month+1.535%, 06/19/29 | | | 200 | | | | 224 | |
4.250%, 08/18/25 | | | 200 | | | | 214 | |
4.041%, VAR ICE LIBOR USD 3 Month+1.546%, 03/13/28 | | | 200 | | | | 214 | |
4.000%, 03/30/22 | | | 100 | | | | 104 | |
3.973%, VAR ICE LIBOR USD 3 Month+1.610%, 05/22/30 | | | 1,691 | | | | 1,823 | |
3.803%, VAR ICE LIBOR USD 3 Month+1.211%, 03/11/25 | | | 5,816 | | | | 6,106 | |
3.600%, 05/25/23 | | | 200 | | | | 209 | |
2.950%, 05/25/21 | | | 200 | | | | 202 | |
2.650%, 01/05/22 | | | 300 | | | | 303 | |
| | |
Huntington National Bank
2.500%, 08/07/22 | | | 250 | | | | 253 | |
| | |
ING Groep
4.100%, 10/02/23 | | | 200 | | | | 212 | |
4.050%, 04/09/29 | | | 200 | | | | 220 | |
| | |
Intercontinental Exchange
4.000%, 10/15/23 | | | 150 | | | | 160 | |
| | |
Jefferies Group
6.875%, 04/15/21 | | | 100 | | | | 106 | |
| | |
JPMorgan Chase
5.600%, 07/15/41 | | | 250 | | | | 342 | |
4.350%, 08/15/21 | | | 250 | | | | 260 | |
4.203%, VAR ICE LIBOR USD 3 Month+1.260%, 07/23/29 | | | 100 | | | | 112 | |
4.005%, VAR ICE LIBOR USD 3 Month+1.120%, 04/23/29 | | | 150 | | | | 165 | |
3.964%, VAR ICE LIBOR USD 3 Month+1.380%, 11/15/48 | | | 1,534 | | | | 1,738 | |
3.897%, VAR ICE LIBOR USD 3 Month+1.220%, 01/23/49 | | | 150 | | | | 169 | |
The accompanying notes are an integral part of the financial statements.
101
| | |
| THE KP FUNDS | | December 31, 2019 |
| | | | | | | | |
| Description | | Face Amount
(000)(1) | | | Value
(000) | |
3.882%, VAR ICE LIBOR USD 3 Month+1.360%, 07/24/38 | | $ | 150 | | | $ | 166 | |
3.797%, VAR ICE LIBOR USD 3 Month+0.890%, 07/23/24 | | | 100 | | | | 105 | |
3.702%, VAR ICE LIBOR USD 3 Month+1.160%, 05/06/30 | | | 300 | | | | 323 | |
3.625%, 05/13/24 | | | 100 | | | | 106 | |
3.559%, VAR ICE LIBOR USD 3 Month+0.730%, 04/23/24 | | | 75 | | | | 78 | |
3.540%, VAR ICE LIBOR USD 3 Month+1.380%, 05/01/28 | | | 200 | | | | 213 | |
3.300%, 04/01/26 | | | 100 | | | | 105 | |
3.220%, VAR ICE LIBOR USD 3 Month+1.155%, 03/01/25 | | | 160 | | | | 166 | |
3.200%, 06/15/26 | | | 100 | | | | 104 | |
3.125%, 01/23/25 | | | 150 | | | | 157 | |
2.972%, 01/15/23 | | | 400 | | | | 408 | |
2.776%, VAR ICE LIBOR USD 3 Month+0.935%, 04/25/23 | | | 75 | | | | 76 | |
2.739%, VAR United States Secured Overnight Financing Rate+1.510%, 10/15/30 | | | 2,460 | | | | 2,460 | |
2.700%, 05/18/23 | | | 100 | | | | 102 | |
2.400%, 06/07/21 | | | 50 | | | | 50 | |
2.301%, VAR United States Secured Overnight Financing Rate+1.160%, 10/15/25 | | | 75 | | | | 75 | |
| | |
JPMorgan Chase Bank | | | | | | | | |
8.375%, 03/17/34 (IDR) (A)(D) | | | 3,200,000 | | | | 1,018 | |
8.250%, 05/17/36 (IDR) (A)(D) | | | 9,300,000 | | | | 700 | |
5.625%, 05/17/23 (IDR) (A)(D) | | | 6,000,000 | | | | 1,131 | |
| | |
KeyBank
2.400%, 06/09/22 | | | 250 | | | | 253 | |
| | |
KFW
2.500%, 11/20/24 | | | 300 | | | | 310 | |
| | |
Kreditanstalt fuer Wiederaufbau
2.875%, 04/03/28 | | | 90 | | | | 96 | |
2.625%, 04/12/21 | | | 100 | | | | 101 | |
2.500%, 02/15/22 | | | 400 | | | | 407 | |
2.375%, 12/29/22 | | | 280 | | | | 286 | |
2.125%, 03/07/22 | | | 150 | | | | 152 | |
1.750%, 09/15/21 | | | 200 | | | | 201 | |
1.750%, 08/22/22 | | | 500 | | | | 501 | |
1.375%, 08/05/24 | | | 100 | | | | 98 | |
| | |
Lazard Group
3.750%, 02/13/25 | | | 50 | | | | 53 | |
| | |
LeasePlan
2.875%, 10/24/24 (A) | | | 2,844 | | | | 2,843 | |
| | | | | | | | |
| Description | | Face Amount
(000) | | | Value
(000) | |
| | |
Lincoln National
3.625%, 12/12/26 | | $ | 100 | | | $ | 105 | |
3.050%, 01/15/30 | | | 2,138 | | | | 2,146 | |
| | |
Lloyds Banking Group
4.582%, 12/10/25 | | | 200 | | | | 217 | |
4.450%, 05/08/25 | | | 200 | | | | 218 | |
3.900%, 03/12/24 | | | 200 | | | | 211 | |
2.907%, VAR ICE LIBOR USD 3 Month+0.810%, 11/07/23 | | | 200 | | | | 203 | |
| | |
Loews
2.625%, 05/15/23 | | | 100 | | | | 102 | |
| | |
Manufacturers & Traders Trust
2.625%, 01/25/21 | | | 250 | | | | 252 | |
| | |
Manulife Financial
5.375%, 03/04/46 | | | 50 | | | | 67 | |
| | |
Markel
4.150%, 09/17/50 | | | 25 | | | | 26 | |
3.500%, 11/01/27 | | | 50 | | | | 52 | |
| | |
Marsh & McLennan
4.375%, 03/15/29 | | | 45 | | | | 51 | |
3.750%, 03/14/26 | | | 150 | | | | 161 | |
2.750%, 01/30/22 | | | 30 | | | | 31 | |
| | |
MDGH - GMTN BV
3.700%, 11/07/49 (A) | | | 1,394 | | | | 1,448 | |
| | |
MetLife
6.400%, 12/15/36 | | | 1,497 | | | | 1,834 | |
3.600%, 04/10/24 | | | 100 | | | | 106 | |
3.600%, 11/13/25 | | | 50 | | | | 54 | |
| | |
Mitsubishi UFJ Financial Group
4.153%, 03/07/39 | | | 35 | | | | 40 | |
3.961%, 03/02/28 | | | 225 | | | | 245 | |
3.850%, 03/01/26 | | | 200 | | | | 215 | |
3.741%, 03/07/29 | | | 150 | | | | 162 | |
3.535%, 07/26/21 | | | 30 | | | | 31 | |
3.407%, 03/07/24 | | | 50 | | | | 52 | |
3.287%, 07/25/27 | | | 50 | | | | 52 | |
3.218%, 03/07/22 | | | 1,635 | | | | 1,675 | |
3.195%, 07/18/29 | | | 1,935 | | | | 2,006 | |
2.665%, 07/25/22 | | | 50 | | | | 51 | |
| | |
Mizuho Financial Group | | | | | | | | |
3.922%, VAR ICE LIBOR USD 3 Month+1.000%, 09/11/24 | | | 200 | | | | 210 | |
2.601%, 09/11/22 | | | 200 | | | | 203 | |
| | |
Moody’s
4.250%, 02/01/29 | | | 150 | | | | 170 | |
| | |
Morgan Stanley
6.375%, 07/24/42 | | | 200 | | | | 295 | |
4.875%, 11/01/22 | | | 100 | | | | 107 | |
4.431%, VAR ICE LIBOR USD 3 Month+1.628%, 01/23/30 | | | 150 | | | | 170 | |
3.971%, VAR ICE LIBOR USD 3 Month+1.455%, 07/22/38 | | | 100 | | | | 111 | |
3.875%, 04/29/24 | | | 400 | | | | 425 | |
The accompanying notes are an integral part of the financial statements.
102
| | |
| THE KP FUNDS | | December 31, 2019 |
| | | | | | | | |
| Description | | Face Amount
(000) | | | Value
(000) | |
3.875%, 01/27/26 | | $ | 200 | | | $ | 215 | |
3.737%, VAR ICE LIBOR USD 3 Month+0.847%, 04/24/24 | | | 90 | | | | 94 | |
3.591%, VAR ICE LIBOR USD 3 Month+1.340%, 07/22/28 | | | 150 | | | | 160 | |
3.125%, 01/23/23 | | | 150 | | | | 154 | |
3.125%, 07/27/26 | | | 250 | | | | 258 | |
2.500%, 04/21/21 | | | 250 | | | | 252 | |
| | |
MUFG Americas Holdings 3.000%, 02/10/25 | | | 160 | | | | 163 | |
| | |
Muthoot Finance
6.125%, 10/31/22 (A) | | | 820 | | | | 850 | |
| | |
Nasdaq
3.850%, 06/30/26 | | | 150 | | | | 161 | |
| | |
National Australia Bank
3.375%, 09/20/21 | | | 350 | | | | 358 | |
| | |
National Rural Utilities Cooperative Finance
3.400%, 02/07/28 | | | 100 | | | | 106 | |
2.700%, 02/15/23 | | | 100 | | | | 102 | |
| | |
New York Life Global Funding
3.250%, 08/06/21 (A) | | | 2,012 | | | | 2,058 | |
| | |
Northern Trust
3.650%, 08/03/28 | | | 25 | | | | 27 | |
3.375%, VAR ICE LIBOR USD 3 Month+1.131%, 05/08/32 | | | 63 | | | | 65 | |
| | |
ORIX
4.050%, 01/16/24 | | | 50 | | | | 53 | |
2.900%, 07/18/22 | | | 30 | | | | 31 | |
| | |
Owl Rock Capital
4.000%, 03/30/25 | | | 25 | | | | 25 | |
| | |
PNC Bank
2.500%, 01/22/21 | | | 250 | | | | 252 | |
2.450%, 07/28/22 | | | 250 | | | | 253 | |
| | |
PNC Financial Services Group
3.500%, 01/23/24 | | | 125 | | | | 132 | |
3.450%, 04/23/29 | | | 50 | | | | 53 | |
| | |
PPL Capital
4.700%, 06/01/43 | | | 414 | | | | 462 | |
| | |
Principal Financial Group 3.400%, 05/15/25 | | | 100 | | | | 105 | |
| | |
Progressive
4.125%, 04/15/47 | | | 100 | | | | 116 | |
4.000%, 03/01/29 | | | 50 | | | | 56 | |
| | |
Prudential Financial
4.600%, 05/15/44 | | | 200 | | | | 236 | |
3.700%, 03/13/51 | | | 50 | | | | 53 | |
3.500%, 05/15/24 | | | 200 | | | | 213 | |
| | |
Regions Financial
3.800%, 08/14/23 | | | 50 | | | | 53 | |
2.750%, 08/14/22 | | | 50 | | | | 51 | |
| | |
Reinsurance Group of America
3.900%, 05/15/29 | | | 50 | | | | 53 | |
| | | | | | | | |
| Description | | Face Amount
(000) | | | Value
(000) | |
| | |
RenaissanceRe Holdings
3.600%, 04/15/29 | | $ | 50 | | | $ | 53 | |
| | |
Royal Bank of Canada
3.200%, 04/30/21 | | | 75 | | | | 76 | |
2.800%, 04/29/22 | | | 100 | | | | 102 | |
2.750%, 02/01/22 | | | 250 | | | | 255 | |
2.550%, 07/16/24 | | | 50 | | | | 51 | |
2.250%, 11/01/24 | | | 4,727 | | | | 4,747 | |
| | |
Royal Bank of Scotland Group
6.125%, 12/15/22 | | | 70 | | | | 77 | |
6.100%, 06/10/23 | | | 30 | | | | 33 | |
6.000%, 12/19/23 | | | 60 | | | | 67 | |
5.125%, 05/28/24 | | | 65 | | | | 70 | |
5.076%, VAR ICE LIBOR USD 3 Month+1.905%, 01/27/30 | | | 200 | | | | 230 | |
4.269%, VAR ICE LIBOR USD 3 Month+1.762%, 03/22/25 | | | 200 | | | | 212 | |
| | |
S&P Global
4.000%, 06/15/25 | | | 100 | | | | 109 | |
| | |
Santander Holdings USA 4.450%, 12/03/21 | | | 30 | | | | 31 | |
4.400%, 07/13/27 | | | 25 | | | | 27 | |
3.500%, 06/07/24 | | | 3,024 | | | | 3,112 | |
| | |
Santander UK
2.875%, 06/18/24 | | | 200 | | | | 205 | |
| | |
Santander UK Group Holdings
| | | | | | | | |
3.373%, VAR ICE LIBOR USD 3 Month+1.080%, 01/05/24 | | | 200 | | | | 205 | |
3.125%, 01/08/21 | | | 100 | | | | 101 | |
| | |
Shriram Transport Finance
5.950%, 10/24/22 (A) | | | 1,080 | | | | 1,109 | |
| | |
Standard Chartered Bank | | | | | | | | |
11.000%, 08/05/25 (LKR) (A)(D) | | | 49,000 | | | | 284 | |
10.750%, 03/03/21 (LKR) (A)(D) | | | 75,000 | | | | 423 | |
8.250%, 05/19/36 (IDR) (A)(D) | | | 3,160,000 | | | | 991 | |
| | |
Sumitomo Mitsui Financial Group 3.944%, 07/19/28 | | | 100 | | | | 109 | |
3.784%, 03/09/26 | | | 50 | | | | 53 | |
3.748%, 07/19/23 | | | 100 | | | | 105 | |
3.544%, 01/17/28 | | | 50 | | | | 53 | |
3.446%, 01/11/27 | | | 50 | | | | 52 | |
3.364%, 07/12/27 | | | 100 | | | | 104 | |
3.202%, 09/17/29 | | | 25 | | | | 25 | |
3.102%, 01/17/23 | | | 50 | | | | 51 | |
2.934%, 03/09/21 | | | 250 | | | | 253 | |
2.846%, 01/11/22 | | | 50 | | | | 51 | |
2.784%, 07/12/22 | | | 50 | | | | 51 | |
2.778%, 10/18/22 | | | 50 | | | | 51 | |
2.724%, 09/27/29 | | | 200 | | | | 200 | |
2.696%, 07/16/24 | | | 4,566 | | | | 4,632 | |
| | |
SunTrust Banks
| | | | | | | | |
3.689%, VAR ICE LIBOR USD 3 Month+0.735%, 08/02/24 | | | 150 | | | | 157 | |
2.900%, 03/03/21 | | | 50 | | | | 51 | |
The accompanying notes are an integral part of the financial statements.
103
| | |
| THE KP FUNDS | | December 31, 2019 |
| | | | | | | | |
| Description | | Face Amount
(000) | | | Value
(000) | |
2.700%, 01/27/22 | | $ | 150 | | | $ | 152 | |
| | |
Svensk Exportkredit
2.875%, 05/22/21 | | | 200 | | | | 203 | |
1.625%, 09/12/21 | | | 200 | | | | 200 | |
| | |
Synchrony Financial
4.500%, 07/23/25 | | | 100 | | | | 108 | |
4.375%, 03/19/24 | | | 35 | | | | 37 | |
2.850%, 07/25/22 | | | 30 | | | | 31 | |
| | |
Syngenta Finance
5.676%, 04/24/48 (A) | | | 229 | | | | 239 | |
4.892%, 04/24/25 (A) | | | 2,636 | | | | 2,822 | |
| | |
TBC Bank JSC
5.750%, 06/19/24 (A) | | | 670 | | | | 689 | |
| | |
TC Ziraat Bankasi
5.125%, 05/03/22 (A) | | | 200 | | | | 199 | |
| | |
TD Ameritrade Holding
3.750%, 04/01/24 | | | 100 | | | | 106 | |
3.300%, 04/01/27 | | | 30 | | | | 32 | |
| | |
Toronto-Dominion Bank
3.250%, 06/11/21 | | | 50 | | | | 51 | |
2.650%, 06/12/24 | | | 100 | | | | 103 | |
2.125%, 04/07/21 | | | 50 | | | | 50 | |
1.950%, 04/02/20 (A) | | | 473 | | | | 473 | |
1.800%, 07/13/21 | | | 100 | | | | 100 | |
| | |
Travelers
4.050%, 03/07/48 | | | 100 | | | | 114 | |
| | |
Truist Bank
2.150%, 12/06/24 | | | 4,180 | | | | 4,173 | |
| | |
Union Pacific
3.839%, 03/20/60 (A) | | | 100 | | | | 101 | |
| | |
Unum Group
4.500%, 12/15/49 | | | 100 | | | | 97 | |
4.000%, 03/15/24 | | | 50 | | | | 53 | |
| | |
US Bancorp
3.150%, 04/27/27 | | | 200 | | | | 210 | |
2.625%, 01/24/22 | | | 200 | | | | 203 | |
2.400%, 07/30/24 | | | 100 | | | | 102 | |
2.375%, 07/22/26 | | | 250 | | | | 251 | |
| | |
Voya Financial
3.125%, 07/15/24 | | | 50 | | | | 52 | |
| | |
WEA Finance
3.250%, 10/05/20 (A) | | | 582 | | | | 587 | |
3.150%, 04/05/22 (A) | | | 1,934 | | | | 1,977 | |
| | |
Wells Fargo
4.900%, 11/17/45 | | | 817 | | | | 1,000 | |
4.650%, 11/04/44 | | | 350 | | | | 412 | |
4.150%, 01/24/29 | | | 100 | | | | 111 | |
4.125%, 08/15/23 | | | 200 | | | | 212 | |
3.584%, VAR ICE LIBOR USD 3 Month+1.310%, 05/22/28 | | | 200 | | | | 213 | |
3.550%, 09/29/25 | | | 100 | | | | 106 | |
3.000%, 01/22/21 | | | 100 | | | | 101 | |
3.000%, 02/19/25 | | | 100 | | | | 103 | |
3.000%, 04/22/26 | | | 100 | | | | 103 | |
3.000%, 10/23/26 | | | 250 | | | | 256 | |
| | | | | | | | |
| Description | | Face Amount
(000) | | | Value
(000) | |
2.625%, 07/22/22 | | $ | 7,639 | | | $ | 7,753 | |
2.406%, VAR ICE LIBOR USD 3 Month+0.825%, 10/30/25 | | | 150 | | | | 150 | |
| | |
Wells Fargo Bank
6.600%, 01/15/38 | | | 250 | | | | 362 | |
3.550%, 08/14/23 | | | 250 | | | | 262 | |
2.600%, 01/15/21 | | | 250 | | | | 252 | |
2.082%, VAR ICE LIBOR USD 3 Month+0.650%, 09/09/22 | | | 4,324 | | | | 4,330 | |
| | |
Westpac Banking
4.421%, 07/24/39 | | | 100 | | | | 110 | |
4.322%, VAR USD ICE Swap 11:00 NY 5 Yr+2.236%, 11/23/31 | | | 200 | | | | 212 | |
3.300%, 02/26/24 | | | 50 | | | | 52 | |
2.700%, 08/19/26 | | | 100 | | | | 101 | |
2.000%, 08/19/21 | | | 50 | | | | 50 | |
| | |
Willis North America
4.500%, 09/15/28 | | | 100 | | | | 111 | |
3.600%, 05/15/24 | | | 50 | | | | 52 | |
| | | | | | | | |
| | |
| | | | | | | 174,217 | |
| | | | | | | | |
|
Health Care — 2.0% | |
| | |
Abbott Laboratories
4.900%, 11/30/46 | | | 200 | | | | 263 | |
3.750%, 11/30/26 | | | 100 | | | | 109 | |
3.400%, 11/30/23 | | | 35 | | | | 37 | |
| | |
AbbVie
4.875%, 11/14/48 | | | 402 | | | | 464 | |
4.700%, 05/14/45 | | | 200 | | | | 223 | |
4.500%, 05/14/35 | | | 200 | | | | 225 | |
4.300%, 05/14/36 | | | 150 | | | | 165 | |
4.250%, 11/14/28 | | | 15 | | | | 17 | |
4.250%, 11/21/49 (A) | | | 45 | | | | 48 | |
4.050%, 11/21/39 (A) | | | 973 | | | | 1,023 | |
3.750%, 11/14/23 | | | 35 | | | | 37 | |
3.375%, 11/14/21 | | | 100 | | | | 103 | |
3.200%, 11/06/22 | | | 100 | | | | 103 | |
3.200%, 11/21/29 (A) | | | 105 | | | | 107 | |
2.950%, 11/21/26 (A) | | | 1,011 | | | | 1,029 | |
2.850%, 05/14/23 | | | 50 | | | | 51 | |
2.600%, 11/21/24 (A) | | | 7,243 | | | | 7,302 | |
2.300%, 05/14/21 | | | 50 | | | | 50 | |
2.300%, 11/21/22 (A) | | | 1,993 | | | | 2,003 | |
2.150%, 11/19/21 (A) | | | 200 | | | | 200 | |
| | |
Advocate Health & Hospitals
3.387%, 10/15/49 | | | 358 | | | | 359 | |
| | |
Aetna
2.800%, 06/15/23 | | | 25 | | | | 25 | |
2.750%, 11/15/22 | | | 150 | | | | 153 | |
| | |
Agilent Technologies
3.050%, 09/22/26 | | | 65 | | | | 66 | |
| | |
Allergan Funding SCS
4.550%, 03/15/35 | | | 300 | | | | 328 | |
3.800%, 03/15/25 | | | 190 | | | | 200 | |
The accompanying notes are an integral part of the financial statements.
104
| | |
| THE KP FUNDS | | December 31, 2019 |
| | | | | | | | |
| Description | | Face Amount
(000) | | | Value
(000) | |
| | |
AmerisourceBergen
3.400%, 05/15/24 | | $ | 100 | | | $ | 104 | |
| | |
Amgen
4.563%, 06/15/48 | | | 300 | | | | 349 | |
2.650%, 05/11/22 | | | 200 | | | | 203 | |
1.850%, 08/19/21 | | | 200 | | | | 199 | |
| | |
Anthem
4.650%, 01/15/43 | | | 150 | | | | 169 | |
3.650%, 12/01/27 | | | 65 | | | | 69 | |
3.350%, 12/01/24 | | | 150 | | | | 157 | |
3.300%, 01/15/23 | | | 200 | | | | 207 | |
| | |
Ascension Health
3.106%, 11/15/39 | | | 45 | | | | 44 | |
| | |
AstraZeneca
4.375%, 11/16/45 | | | 100 | | | | 117 | |
4.375%, 08/17/48 | | | 100 | | | | 117 | |
2.375%, 06/12/22 | | | 100 | | | | 101 | |
| | |
Baxter International
2.600%, 08/15/26 | | | 100 | | | | 101 | |
| | |
Becton Dickinson
4.685%, 12/15/44 | | | 157 | | | | 184 | |
3.700%, 06/06/27 | | | 33 | | | | 35 | |
3.125%, 11/08/21 | | | 100 | | | | 102 | |
| | |
Biogen
3.625%, 09/15/22 | | | 100 | | | | 104 | |
| | |
Boston Scientific
4.550%, 03/01/39 | | | 150 | | | | 177 | |
3.375%, 05/15/22 | | | 100 | | | | 103 | |
| | |
Bristol-Myers Squibb
5.000%, 08/15/45 (A) | | | 250 | | | | 321 | |
4.250%, 10/26/49 (A) | | | 716 | | | | 850 | |
4.125%, 06/15/39 (A) | | | 2,296 | | | | 2,650 | |
3.875%, 08/15/25 (A) | | | 100 | | | | 108 | |
3.400%, 07/26/29 (A) | | | 80 | | | | 86 | |
3.250%, 02/20/23 (A) | | | 100 | | | | 103 | |
3.200%, 06/15/26 (A) | | | 250 | | | | 263 | |
2.900%, 07/26/24 (A) | | | 55 | | | | 57 | |
2.875%, 02/19/21 (A) | | | 45 | | | | 45 | |
2.600%, 05/16/22 (A) | | | 50 | | | | 51 | |
2.000%, 08/01/22 | | | 100 | | | | 101 | |
| | |
Cardinal Health
3.200%, 03/15/23 | | | 100 | | | | 103 | |
3.079%, 06/15/24 | | | 150 | | | | 154 | |
| | |
Cigna
4.900%, 12/15/48 | | | 1,087 | | | | 1,298 | |
4.800%, 08/15/38 | | | 230 | | | | 268 | |
4.375%, 10/15/28 | | | 190 | | | | 211 | |
4.000%, 02/15/22 (A) | | | 100 | | | | 103 | |
3.750%, 07/15/23 | | | 55 | | | | 58 | |
3.400%, 09/17/21 | | | 3,806 | | | | 3,896 | |
| | |
CVS Health
5.125%, 07/20/45 | | | 200 | | | | 237 | |
5.050%, 03/25/48 | | | 1,633 | | | | 1,935 | |
4.780%, 03/25/38 | | | 100 | | | | 114 | |
4.300%, 03/25/28 | | | 310 | | | | 339 | |
3.875%, 07/20/25 | | | 120 | | | | 128 | |
3.700%, 03/09/23 | | | 115 | | | | 120 | |
| | | | | | | | |
| Description | | Face Amount
(000) | | | Value
(000) | |
3.350%, 03/09/21 | | $ | 157 | | | $ | 159 | |
3.250%, 08/15/29 | | | 1,668 | | | | 1,695 | |
2.875%, 06/01/26 | | | 200 | | | | 203 | |
2.125%, 06/01/21 | | | 50 | | | | 50 | |
| | |
CVS Pass-Through Trust
4.163%, 08/11/36 (A) | | | 567 | | | | 580 | |
| | |
Danaher
3.350%, 09/15/25 | | | 30 | | | | 32 | |
| | |
DH Europe Finance II Sarl
2.050%, 11/15/22 | | | 200 | | | | 200 | |
| | |
Eli Lilly
3.950%, 05/15/47 | | | 100 | | | | 114 | |
2.350%, 05/15/22 | | | 100 | | | | 101 | |
| | |
Gilead Sciences
4.600%, 09/01/35 | | | 400 | | | | 478 | |
4.500%, 02/01/45 | | | 150 | | | | 174 | |
2.500%, 09/01/23 | | | 35 | | | | 36 | |
1.950%, 03/01/22 | | | 15 | | | | 15 | |
| | |
GlaxoSmithKline Capital
3.875%, 05/15/28 | | | 150 | | | | 166 | |
3.375%, 06/01/29 | | | 100 | | | | 107 | |
2.850%, 05/08/22 | | | 100 | | | | 102 | |
2.800%, 03/18/23 | | | 125 | | | | 128 | |
| | |
HCA
5.500%, 06/15/47
| | | 40 | | | | 46 | |
5.250%, 04/15/25 | | | 35 | | | | 39 | |
5.250%, 06/15/26 | | | 40 | | | | 45 | |
5.250%, 06/15/49 | | | 1,364 | | | | 1,525 | |
5.125%, 06/15/39 | | | 25 | | | | 28 | |
5.000%, 03/15/24 | | | 55 | | | | 60 | |
4.750%, 05/01/23 | | | 35 | | | | 38 | |
4.500%, 02/15/27 | | | 30 | | | | 32 | |
4.125%, 06/15/29 | | | 20 | | | | 21 | |
| | |
Humana
4.950%, 10/01/44 | | | 200 | | | | 236 | |
| | |
Johnson & Johnson
3.625%, 03/03/37 | | | 150 | | | | 166 | |
2.900%, 01/15/28 | | | 150 | | | | 156 | |
2.625%, 01/15/25 | | | 100 | | | | 103 | |
2.450%, 12/05/21 | | | 100 | | | | 101 | |
2.450%, 03/01/26 | | | 200 | | | | 203 | |
| | |
Kaiser Foundation Hospitals
4.875%, 04/01/42 | | | 150 | | | | 186 | |
3.150%, 05/01/27 | | | 25 | | | | 26 | |
| | |
Laboratory Corp of America Holdings
3.250%, 09/01/24 | | | 100 | | | | 104 | |
2.950%, 12/01/29 | | | 50 | | | | 50 | |
| | |
McKesson
2.850%, 03/15/23 | | | 200 | | | | 203 | |
| | |
Medtronic
4.625%, 03/15/45 | | | 163 | | | | 205 | |
4.375%, 03/15/35 | | | 144 | | | | 171 | |
2.750%, 04/01/23 | | | 100 | | | | 102 | |
| | |
Merck
4.150%, 05/18/43 | | | 100 | | | | 119 | |
4.000%, 03/07/49 | | | 35 | | | | 41 | |
The accompanying notes are an integral part of the financial statements.
105
| | |
| THE KP FUNDS | | December 31, 2019 |
| | | | | | | | |
| Description | | Face Amount
(000) | | | Value
(000) | |
3.900%, 03/07/39 | | $ | 50 | | | $ | 57 | |
3.400%, 03/07/29 | | | 50 | | | | 54 | |
2.900%, 03/07/24 | | | 25 | | | | 26 | |
2.750%, 02/10/25 | | | 200 | | | | 208 | |
| | |
Mount Sinai Hospitals Group
3.737%, 07/01/49 | | | 20 | | | | 20 | |
| | |
Mylan
5.250%, 06/15/46 | | | 200 | | | | 225 | |
3.750%, 12/15/20 | | | 10 | | | | 10 | |
| | |
Northwell Healthcare
3.809%, 11/01/49 | | | 702 | | | | 707 | |
| | |
Novartis Capital
4.400%, 05/06/44 | | | 150 | | | | 183 | |
3.400%, 05/06/24 | | | 100 | | | | 106 | |
3.000%, 11/20/25 | | | 50 | | | | 52 | |
2.400%, 05/17/22 | | | 50 | | | | 51 | |
| | |
PerkinElmer
3.300%, 09/15/29 | | | 30 | | | | 31 | |
| | |
Pfizer
4.400%, 05/15/44 | | | 1,254 | | | | 1,498 | |
4.200%, 09/15/48 | | | 15 | | | | 18 | |
4.125%, 12/15/46 | | | 100 | | | | 116 | |
4.100%, 09/15/38 | | | 25 | | | | 29 | |
4.000%, 12/15/36 | | | 250 | | | | 283 | |
4.000%, 03/15/49 | | | 50 | | | | 57 | |
3.900%, 03/15/39 | | | 25 | | | | 28 | |
3.600%, 09/15/28 | | | 100 | | | | 110 | |
3.450%, 03/15/29 | | | 50 | | | | 54 | |
3.200%, 09/15/23 | | | 25 | | | | 26 | |
3.000%, 09/15/21 | | | 20 | | | | 20 | |
3.000%, 06/15/23 | | | 100 | | | | 104 | |
2.950%, 03/15/24 | | | 50 | | | | 52 | |
| | |
Providence St. Joseph Health Obligated Group
2.532%, 10/01/29 | | | 40 | | | | 39 | |
| | |
Quest Diagnostics
4.200%, 06/30/29 | | | 150 | | | | 166 | |
| | |
RWJ Barnabas Health
3.477%, 07/01/49 | | | 25 | | | | 25 | |
| | |
Sanofi
3.375%, 06/19/23 | | | 200 | | | | 210 | |
| | |
Shire Acquisitions Investments Ireland DAC
3.200%, 09/23/26 | | | 60 | | | | 62 | |
2.875%, 09/23/23 | | | 50 | | | | 51 | |
2.400%, 09/23/21 | | | 150 | | | | 151 | |
| | |
SSM Health Care
3.688%, 06/01/23 | | | 20 | | | | 21 | |
| | |
Stanford Health Care
3.795%, 11/15/48 | | | 100 | | | | 108 | |
| | |
Stryker
4.625%, 03/15/46 | | | 100 | | | | 120 | |
3.500%, 03/15/26 | | | 25 | | | | 27 | |
3.375%, 11/01/25 | | | 50 | | | | 53 | |
| | |
Takeda Pharmaceutical
5.000%, 11/26/28 | | | 200 | | | | 233 | |
| | | | | | | | |
| Description | | Face Amount
(000) | | | Value
(000) | |
| | |
Thermo Fisher Scientific
3.200%, 08/15/27 | | $ | 100 | | | $ | 104 | |
3.000%, 04/15/23 | | | 200 | | | | 206 | |
2.950%, 09/19/26 | | | 30 | | | | 31 | |
| | |
UnitedHealth Group
4.750%, 07/15/45 | | | 100 | | | | 123 | |
4.625%, 07/15/35 | | | 200 | | | | 243 | |
4.450%, 12/15/48 | | | 10 | | | | 12 | |
4.250%, 04/15/47 | | | 100 | | | | 116 | |
4.250%, 06/15/48 | | | 50 | | | | 58 | |
3.875%, 12/15/28 | | | 10 | | | | 11 | |
3.850%, 06/15/28 | | | 50 | | | | 55 | |
3.750%, 07/15/25 | | | 50 | | | | 54 | |
3.700%, 12/15/25 | | | 10 | | | | 11 | |
3.500%, 06/15/23 | | | 50 | | | | 52 | |
3.500%, 02/15/24 | | | 10 | | | | 11 | |
3.500%, 08/15/39 | | | 531 | | | | 558 | |
3.350%, 07/15/22 | | | 150 | | | | 155 | |
3.150%, 06/15/21 | | | 50 | | | | 51 | |
2.950%, 10/15/27 | | | 150 | | | | 156 | |
2.875%, 03/15/22 | | | 100 | | | | 102 | |
| | |
Zimmer Biomet Holdings 3.550%, 04/01/25 | | | 150 | | | | 158 | |
| | |
Zoetis
4.450%, 08/20/48 | | | 125 | | | | 145 | |
3.250%, 02/01/23 | | | 50 | | | | 52 | |
3.000%, 09/12/27 | | | 50 | | | | 51 | |
| | | | | | | | |
| | |
| | | | | | | 47,183 | |
| | | | | | | | |
|
Industrials — 1.8% | |
| | |
3M
5.700%, 03/15/37 | | | 150 | | | | 200 | |
4.000%, 09/14/48 | | | 100 | | | | 110 | |
2.000%, 02/14/25 | | | 100 | | | | 100 | |
| | |
ABB Finance USA 3.800%, 04/03/28 | | | 150 | | | | 164 | |
| | |
AerCap Ireland Capital DAC 4.125%, 07/03/23 | | | 150 | | | | 159 | |
3.950%, 02/01/22 | | | 150 | | | | 155 | |
2.875%, 08/14/24 | | | 150 | | | | 151 | |
| | |
Aeropuerto Internacional de Tocumen 6.000%, 11/18/48 (A) | | | 390 | | | | 483 | |
| | |
Air Lease
4.625%, 10/01/28 | | | 100 | | | | 110 | |
3.250%, 03/01/25 | | | 150 | | | | 155 | |
| | |
Aircastle
5.500%, 02/15/22 | | | 15 | | | | 16 | |
5.125%, 03/15/21 | | | 15 | | | | 15 | |
5.000%, 04/01/23 | | | 15 | | | | 16 | |
4.250%, 06/15/26 | | | 35 | | | | 37 | |
4.125%, 05/01/24 | | | 15 | | | | 16 | |
| | |
Allegion US Holding 3.550%, 10/01/27 | | | 50 | | | | 51 | |
| | |
American Airlines Pass-Through Trust
4.950%, 01/15/23 | | | 99 | | | | 104 | |
3.150%, 02/15/32 | | | 40 | | | | 41 | |
The accompanying notes are an integral part of the financial statements.
106
| | |
| THE KP FUNDS | | December 31, 2019 |
| | | | | | | | |
| Description | | Face Amount
(000) | | | Value
(000) | |
| | |
Boeing
3.900%, 05/01/49 | | $ | 25 | | | $ | 27 | |
3.750%, 02/01/50 | | | 50 | | | | 53 | |
3.600%, 05/01/34 | | | 25 | | | | 27 | |
3.450%, 11/01/28 | | | 50 | | | | 53 | |
3.200%, 03/01/29 | | | 25 | | | | 26 | |
3.100%, 05/01/26 | | | 25 | | | | 26 | |
2.950%, 02/01/30 | | | 50 | | | | 51 | |
2.350%, 10/30/21 | | | 150 | | | | 152 | |
2.300%, 08/01/21 | | | 30 | | | | 30 | |
2.125%, 03/01/22 | | | 50 | | | | 50 | |
| | |
Burlington Northern Santa Fe
4.900%, 04/01/44 | | | 200 | | | | 250 | |
4.150%, 12/15/48 | | | 105 | | | | 121 | |
3.750%, 04/01/24 | | | 200 | | | | 213 | |
3.050%, 03/15/22 | | | 100 | | | | 102 | |
| | |
Canadian National Railway
4.450%, 01/20/49 | | | 150 | | | | 187 | |
| | |
Canadian Pacific Railway
4.000%, 06/01/28 | | | 15 | | | | 16 | |
2.900%, 02/01/25 | | | 100 | | | | 103 | |
| | |
Caterpillar
5.200%, 05/27/41 | | | 100 | | | | 130 | |
3.900%, 05/27/21 | | | 50 | | | | 51 | |
3.400%, 05/15/24 | | | 100 | | | | 106 | |
3.250%, 09/19/49 | | | 35 | | | | 35 | |
| | |
Caterpillar Financial Services
3.650%, 12/07/23 | | | 100 | | | | 106 | |
3.450%, 05/15/23 | | | 150 | | | | 157 | |
3.150%, 09/07/21 | | | 55 | | | | 56 | |
| | |
Cintas No. 2
3.700%, 04/01/27 | | | 200 | | | | 217 | |
| | |
CNH Industrial Capital
4.875%, 04/01/21 | | | 10 | | | | 10 | |
4.375%, 04/05/22 | | | 10 | | | | 11 | |
4.200%, 01/15/24 | | | 50 | | | | 53 | |
3.875%, 10/15/21 | | | 10 | | | | 10 | |
| | |
CSX
4.250%, 03/15/29 | | | 65 | | | | 73 | |
3.800%, 03/01/28 | | | 100 | | | | 109 | |
3.800%, 11/01/46 | | | 200 | | | | 209 | |
3.350%, 09/15/49 | | | 100 | | | | 99 | |
3.250%, 06/01/27 | | | 50 | | | | 53 | |
| | |
Deere
2.875%, 09/07/49 | | | 15 | | | | 14 | |
| | |
Delta Air Lines
4.375%, 04/19/28 | | | 50 | | | | 53 | |
3.750%, 10/28/29 | | | 100 | | | | 100 | |
| | |
DP World
4.700%, 09/30/49 (A) | | | 617 | | | | 620 | |
| | |
Eaton
3.103%, 09/15/27 | | | 100 | | | | 104 | |
| | |
Embraer Netherlands Finance BV
5.400%, 02/01/27 | | | 65 | | | | 73 | |
| | |
Emerson Electric
2.625%, 02/15/23 | | | 100 | | | | 103 | |
| | |
Equifax
2.600%, 12/01/24 | | | 50 | | | | 50 | |
| | | | | | | | |
| Description | | Face Amount
(000) | | | Value
(000) | |
| | |
Eskom Holdings SOC
6.750%, 08/06/23 (A) | | $ | 710 | | | $ | 724 | |
6.350%, 08/10/28 (A) | | | 1,560 | | | | 1,671 | |
| | |
FedEx
4.950%, 10/17/48 | | | 1,619 | | | | 1,770 | |
4.750%, 11/15/45 | | | 100 | | | | 105 | |
3.200%, 02/01/25 | | | 200 | | | | 208 | |
| | |
Fluor
4.250%, 09/15/28 | | | 50 | | | | 50 | |
| | |
Fortune Brands Home & Security
4.000%, 09/21/23 | | | 50 | | | | 53 | |
| | |
GATX
3.850%, 03/30/27 | | | 200 | | | | 209 | |
| | |
GE Capital International Funding Unlimited Co
4.418%, 11/15/35 | | | 3,745 | | | | 4,006 | |
2.342%, 11/15/20 | | | 4,169 | | | | 4,172 | |
| | |
General Dynamics
3.750%, 05/15/28 | | | 55 | | | | 61 | |
3.500%, 05/15/25 | | | 200 | | | | 214 | |
2.250%, 11/15/22 | | | 100 | | | | 101 | |
| | |
General Electric
6.875%, 01/10/39 | | | 300 | | | | 401 | |
3.450%, 05/15/24 | | | 100 | | | | 104 | |
2.700%, 10/09/22 | | | 988 | | | | 1,001 | |
| | |
Georgian Oil and Gas JSC
6.750%, 04/26/21 (A) | | | 200 | | | | 207 | |
| | |
Georgian Railway 7.750%, 07/11/22 (A) | | | 1,500 | | | | 1,642 | |
| | |
Hillenbrand
4.500%, 09/15/26 | | | 100 | | | | 105 | |
| | |
Honeywell International
4.250%, 03/01/21 | | | 125 | | | | 129 | |
2.500%, 11/01/26 | | | 150 | | | | 152 | |
| | |
IHS Markit
4.250%, 05/01/29 | | | 85 | | | | 92 | |
| | |
Indonesia Asahan Aluminium Persero
6.757%, 11/15/48 (A) | | | 418 | | | | 539 | |
6.530%, 11/15/28 (A) | | | 380 | | | | 466 | |
5.710%, 11/15/23 (A) | | | 1,210 | | | | 1,334 | |
5.230%, 11/15/21 (A) | | | 1,306 | | | | 1,369 | |
| | |
Ingersoll-Rand Global Holding
4.250%, 06/15/23 | | | 100 | | | | 107 | |
| | |
Ingersoll-Rand Luxembourg Finance
3.800%, 03/21/29 | | | 100 | | | | 107 | |
| | |
Israel Electric
6.875%, 06/21/23 (A) | | | 820 | | | | 930 | |
| | |
John Deere Capital
3.350%, 06/12/24 | | | 100 | | | | 106 | |
3.050%, 01/06/28 | | | 150 | | | | 158 | |
2.800%, 03/04/21 | | | 100 | | | | 101 | |
2.800%, 03/06/23 | | | 50 | | | | 51 | |
2.800%, 09/08/27 | | | 50 | | | | 51 | |
2.650%, 06/24/24 | | | 100 | | | | 103 | |
The accompanying notes are an integral part of the financial statements.
107
| | |
| THE KP FUNDS | | December 31, 2019 |
| | | | | | | | |
| Description | | Face Amount
(000) | | | Value
(000) | |
| | |
Johnson Controls International 4.500%, 02/15/47 | | $ | 150 | | | $ | 162 | |
3.625%, 07/02/24 | | | 40 | | | | 42 | |
| | |
Kansas City Southern
4.700%, 05/01/48 | | | 50 | | | | 59 | |
2.875%, 11/15/29 | | | 15 | | | | 15 | |
| | |
Kennametal
4.625%, 06/15/28 | | | 25 | | | | 26 | |
| | |
L3Harris Technologies
5.054%, 04/27/45 | | | 100 | | | | 124 | |
4.400%, 06/15/28 (A) | | | 150 | | | | 167 | |
| | |
Latam Airlines, Pass-Through Trust
4.500%, 11/15/23 | | | 382 | | | | 383 | |
4.200%, 11/15/27 | | | 808 | | | | 832 | |
| | |
Lockheed Martin
4.700%, 05/15/46 | | | 150 | | | | 191 | |
2.900%, 03/01/25 | | | 100 | | | | 104 | |
| | |
Masco
4.500%, 05/15/47 | | | 100 | | | | 101 | |
4.375%, 04/01/26 | | | 40 | | | | 43 | |
3.500%, 04/01/21 | | | 50 | | | | 51 | |
| | |
Mexico City Airport Trust
5.500%, 07/31/47 (A) | | | 925 | | | | 954 | |
3.875%, 04/30/28 (A) | | | 200 | | | | 204 | |
| | |
MidAmerican Energy
3.150%, 04/15/50 | | | 100 | | | | 99 | |
| | |
Norfolk Southern
5.100%, 08/01/18 | | | 50 | | | | 59 | |
4.150%, 02/28/48 | | | 60 | | | | 68 | |
3.400%, 11/01/49 | | | 50 | | | | 50 | |
3.250%, 12/01/21 | | | 100 | | | | 102 | |
3.150%, 06/01/27 | | | 25 | | | | 26 | |
2.900%, 06/15/26 | | | 35 | | | | 36 | |
| | |
Northrop Grumman
4.030%, 10/15/47 | | | 150 | | | | 168 | |
3.500%, 03/15/21 | | | 100 | | | | 102 | |
3.250%, 08/01/23 | | | 50 | | | | 52 | |
| | |
Owens Corning
4.200%, 12/01/24 | | | 100 | | | | 105 | |
| | |
PACCAR Financial
3.150%, 08/09/21 | | | 100 | | | | 102 | |
| | |
Parker-Hannifin
4.000%, 06/14/49 | | | 20 | | | | 22 | |
3.300%, 11/21/24 | | | 150 | | | | 157 | |
| | |
Pelabuhan Indonesia III Persero
4.500%, 05/02/23 (A) | | | 350 | | | | 370 | |
| | |
Republic Services
3.950%, 05/15/28 | | | 50 | | | | 55 | |
2.900%, 07/01/26 | | | 150 | | | | 154 | |
| | |
Rockwell Automation
3.500%, 03/01/29 | | | 85 | | | | 91 | |
| | |
Rockwell Collins
3.200%, 03/15/24 | | | 150 | | | | 156 | |
| | |
Roper Technologies
2.800%, 12/15/21 | | | 150 | | | | 152 | |
| | | | | | | | |
| Description | | Face Amount
(000) | | | Value
(000) | |
| | |
Ryder System
3.875%, 12/01/23 | | $ | 25 | | | $ | 27 | |
3.500%, 06/01/21 | | | 50 | | | | 51 | |
2.800%, 03/01/22 | | | 30 | | | | 30 | |
2.500%, 09/01/24 | | | 20 | | | | 20 | |
| | |
Stanley Black & Decker
2.900%, 11/01/22 | | | 100 | | | | 102 | |
| | |
Textron
3.650%, 03/15/27 | | | 100 | | | | 104 | |
| | |
Transnet
4.000%, 07/26/22 (A) | | | 425 | | | | 431 | |
| | |
Union Pacific
4.375%, 09/10/38 | | | 910 | | | | 1,043 | |
3.799%, 10/01/51 | | | 200 | | | | 212 | |
3.646%, 02/15/24 | | | 100 | | | | 106 | |
3.600%, 09/15/37 | | | 150 | | | | 157 | |
3.550%, 08/15/39 | | | 70 | | | | 73 | |
| | |
United Airlines, Pass-Through Trust
4.300%, 08/15/25 | | | 75 | | | | 81 | |
3.750%, 09/03/26 | | | 77 | | | | 81 | |
2.700%, 05/01/32 | | | 30 | | | | 30 | |
| | |
United Parcel Service
3.750%, 11/15/47 | | | 150 | | | | 162 | |
3.400%, 03/15/29 | | | 115 | | | | 124 | |
3.400%, 09/01/49 | | | 974 | | | | 987 | |
3.125%, 01/15/21 | | | 45 | | | | 45 | |
3.050%, 11/15/27 | | | 100 | | | | 105 | |
| | |
United Technologies
4.625%, 11/16/48 | | | 215 | | | | 269 | |
4.450%, 11/16/38 | | | 10 | | | | 12 | |
4.125%, 11/16/28 | | | 30 | | | | 34 | |
3.950%, 08/16/25 | | | 15 | | | | 16 | |
3.750%, 11/01/46 | | | 1,068 | | | | 1,164 | |
3.650%, 08/16/23 | | | 20 | | | | 21 | |
3.350%, 08/16/21 | | | 10 | | | | 10 | |
3.100%, 06/01/22 | | | 100 | | | | 103 | |
2.650%, 11/01/26 | | | 130 | | | | 133 | |
2.300%, 05/04/22 | | | 100 | | | | 101 | |
1.950%, 11/01/21 | | | 50 | | | | 50 | |
| | |
Verisk Analytics
4.125%, 03/15/29 | | | 110 | | | | 121 | |
4.000%, 06/15/25 | | | 50 | | | | 54 | |
| | |
Waste Connections
3.500%, 05/01/29 | | | 50 | | | | 53 | |
| | |
Waste Management
4.150%, 07/15/49 | | | 65 | | | | 74 | |
4.000%, 07/15/39 | | | 35 | | | | 39 | |
3.500%, 05/15/24 | | | 100 | | | | 105 | |
3.450%, 06/15/29 | | | 50 | | | | 54 | |
| | |
Westinghouse Air Brake Technologies
4.950%, 09/15/28 | | | 150 | | | | 165 | |
| | | | | | | | |
| | |
| | | | | | | 40,904 | |
| | | | | | | | |
The accompanying notes are an integral part of the financial statements.
108
| | |
| THE KP FUNDS | | December 31, 2019 |
| | | | | | | | |
| Description | | Face Amount
(000) | | | Value
(000) | |
| | |
Information Technology — 1.2% | | | | | | | | |
| | |
Amphenol
4.350%, 06/01/29 | | $ | 25 | | | $ | 28 | |
2.800%, 02/15/30 | | | 50 | | | | 50 | |
| | |
Analog Devices
3.125%, 12/05/23 | | | 150 | | | | 155 | |
| | |
Apple
4.650%, 02/23/46 | | | 300 | | | | 376 | |
4.500%, 02/23/36 | | | 100 | | | | 122 | |
3.850%, 08/04/46 | | | 100 | | | | 113 | |
3.750%, 09/12/47 | | | 150 | | | | 167 | |
3.450%, 05/06/24 | | | 100 | | | | 106 | |
3.000%, 06/20/27 | | | 25 | | | | 26 | |
3.000%, 11/13/27 | | | 100 | | | | 105 | |
2.950%, 09/11/49 | | | 100 | | | | 97 | |
2.850%, 05/06/21 | | | 200 | | | | 203 | |
2.850%, 05/11/24 | | | 250 | | | | 259 | |
2.500%, 02/09/22 | | | 50 | | | | 51 | |
2.400%, 01/13/23 | | | 200 | | | | 203 | |
2.300%, 05/11/22 | | | 100 | | | | 101 | |
2.250%, 02/23/21 | | | 50 | | | | 50 | |
2.150%, 02/09/22 | | | 250 | | | | 252 | |
1.550%, 08/04/21 | | | 50 | | | | 50 | |
| | |
Applied Materials
3.300%, 04/01/27 | | | 125 | | | | 133 | |
| | |
Arrow Electronics
3.500%, 04/01/22 | | | 100 | | | | 103 | |
| | |
Broadcom
4.750%, 04/15/29 (A) | | | 100 | | | | 109 | |
4.250%, 04/15/26 (A) | | | 100 | | | | 106 | |
3.875%, 01/15/27 | | | 100 | | | | 104 | |
3.625%, 01/15/24 | | | 100 | | | | 104 | |
3.625%, 10/15/24 (A) | | | 100 | | | | 104 | |
3.125%, 10/15/22 (A) | | | 25 | | | | 25 | |
3.000%, 01/15/22 | | | 100 | | | | 102 | |
2.200%, 01/15/21 | | | 100 | | | | 100 | |
| | |
Cisco Systems
3.625%, 03/04/24 | | | 100 | | | | 107 | |
3.500%, 06/15/25 | | | 50 | | | | 54 | |
2.950%, 02/28/26 | | | 50 | | | | 52 | |
2.500%, 09/20/26 | | | 100 | | | | 102 | |
2.200%, 09/20/23 | | | 100 | | | | 101 | |
1.850%, 09/20/21 | | | 100 | | | | 100 | |
| | |
Corning
5.350%, 11/15/48 | | | 100 | | | | 126 | |
| | |
Dell International
8.350%, 07/15/46 (A) | | | 736 | | | | 1,014 | |
6.020%, 06/15/26 (A) | | | 260 | | | | 299 | |
5.450%, 06/15/23 (A) | | | 1,847 | | | | 2,004 | |
5.300%, 10/01/29 (A) | | | 50 | | | | 56 | |
4.900%, 10/01/26 (A) | | | 50 | | | | 55 | |
4.420%, 06/15/21 (A) | | | 100 | | | | 103 | |
| | |
Deutsche Telekom International Finance BV
8.750%, 06/15/30 | | | 100 | | | | 147 | |
2.225%, 01/17/20 (A) | | | 1,009 | | | | 1,009 | |
| | |
Fidelity National Information Services
3.000%, 08/15/26 | | | 150 | | | | 155 | |
| | | | | | | | |
| Description | | Face Amount
(000) | | | Value
(000) | |
| | |
Fiserv
4.400%, 07/01/49 | | $ | 1,638 | | | $ | 1,860 | |
3.800%, 10/01/23 | | | 100 | | | | 106 | |
3.500%, 07/01/29 | | | 45 | | | | 47 | |
3.200%, 07/01/26 | | | 150 | | | | 155 | |
2.750%, 07/01/24 | | | 50 | | | | 51 | |
| | |
Flex
4.875%, 06/15/29 | | | 50 | | | | 54 | |
| | |
Genpact Luxembourg Sarl
3.375%, 12/01/24 | | | 25 | | | | 25 | |
| | |
Global Payments
4.150%, 08/15/49 | | | 100 | | | | 107 | |
| | |
Hewlett Packard Enterprise
4.900%, 10/15/25 | | | 100 | | | | 111 | |
| | |
HP
6.000%, 09/15/41 | | | 150 | | | | 166 | |
| | |
IBM Credit
1.800%, 01/20/21 | | | 100 | | | | 100 | |
| | |
Intel
3.734%, 12/08/47 | | | 200 | | | | 220 | |
3.700%, 07/29/25 | | | 25 | | | | 27 | |
3.250%, 11/15/49 | | | 1,616 | | | | 1,625 | |
3.150%, 05/11/27 | | | 100 | | | | 106 | |
2.875%, 05/11/24 | | | 150 | | | | 156 | |
2.600%, 05/19/26 | | | 100 | | | | 103 | |
| | |
International Business Machines
4.250%, 05/15/49 | | | 100 | | | | 114 | |
4.150%, 05/15/39 | | | 100 | | | | 113 | |
4.000%, 06/20/42 | | | 150 | | | | 166 | |
3.625%, 02/12/24 | | | 100 | | | | 106 | |
3.500%, 05/15/29 | | | 130 | | | | 140 | |
3.450%, 02/19/26 | | | 50 | | | | 53 | |
3.300%, 05/15/26 | | | 100 | | | | 106 | |
3.000%, 05/15/24 | | | 150 | | | | 156 | |
2.850%, 05/13/22 | | | 100 | | | | 102 | |
2.800%, 05/13/21 | | | 100 | | | | 101 | |
2.250%, 02/19/21 | | | 50 | | | | 50 | |
1.875%, 08/01/22 | | | 150 | | | | 150 | |
| | |
Juniper Networks
4.500%, 03/15/24 | | | 50 | | | | 54 | |
| | |
Keysight Technologies
3.000%, 10/30/29 | | | 50 | | | | 50 | |
| | |
KLA
4.100%, 03/15/29 | | | 65 | | | | 71 | |
| | |
Lam Research
4.000%, 03/15/29 | | | 30 | | | | 33 | |
3.750%, 03/15/26 | | | 100 | | | | 107 | |
2.800%, 06/15/21 | | | 50 | | | | 51 | |
| | |
Mastercard
3.950%, 02/26/48 | | | 10 | | | | 12 | |
3.650%, 06/01/49 | | | 50 | | | | 56 | |
3.500%, 02/26/28 | | | 5 | | | | 5 | |
2.950%, 11/21/26 | | | 50 | | | | 52 | |
2.950%, 06/01/29 | | | 50 | | | | 52 | |
| | |
Micron Technology
4.663%, 02/15/30 | | | 100 | | | | 110 | |
The accompanying notes are an integral part of the financial statements.
109
| | |
| THE KP FUNDS | | December 31, 2019 |
| | | | | | | | |
| Description | | Face Amount
(000) | | | Value
(000) | |
| | |
Microsoft
4.250%, 02/06/47 | | $ | 500 | | | $ | 613 | |
4.100%, 02/06/37 | | | 200 | | | | 237 | |
3.700%, 08/08/46 | | | 100 | | | | 113 | |
3.450%, 08/08/36 | | | 300 | | | | 329 | |
3.300%, 02/06/27 | | | 160 | | | | 171 | |
3.125%, 11/03/25 | | | 100 | | | | 106 | |
2.875%, 02/06/24 | | | 35 | | | | 36 | |
2.650%, 11/03/22 | | | 150 | | | | 154 | |
2.400%, 02/06/22 | | | 150 | | | | 152 | |
2.400%, 08/08/26 | | | 100 | | | | 101 | |
| | |
Motorola Solutions
4.600%, 05/23/29 | | | 25 | | | | 27 | |
| | |
NetApp
3.375%, 06/15/21 | | | 50 | | | | 51 | |
| | |
NXP BV
5.350%, 03/01/26 (A) | | | 3,300 | | | | 3,727 | |
4.300%, 06/18/29 (A) | | | 1,353 | | | | 1,463 | |
| | |
Oracle
4.000%, 11/15/47 | | | 387 | | | | 433 | |
3.900%, 05/15/35 | | | 200 | | | | 223 | |
3.850%, 07/15/36 | | | 250 | | | | 274 | |
3.800%, 11/15/37 | | | 250 | | | | 273 | |
2.950%, 11/15/24 | | | 200 | | | | 208 | |
2.950%, 05/15/25 | | | 100 | | | | 104 | |
2.500%, 05/15/22 | | | 150 | | | | 152 | |
2.400%, 09/15/23 | | | 200 | | | | 204 | |
1.900%, 09/15/21 | | | 90 | | | | 90 | |
| | |
PayPal Holdings
2.200%, 09/26/22 | | | 200 | | | | 201 | |
| | |
QUALCOMM
4.300%, 05/20/47 | | | 150 | | | | 172 | |
3.250%, 05/20/27 | | | 50 | | | | 53 | |
3.000%, 05/20/22 | | | 100 | | | | 102 | |
2.600%, 01/30/23 | | | 200 | | | | 204 | |
| | |
salesforce.com
3.250%, 04/11/23 | | | 150 | | | | 156 | |
| | |
Seagate HDD Cayman
4.750%, 01/01/25 | | | 49 | | | | 52 | |
| | |
Texas Instruments
4.150%, 05/15/48 | | | 50 | | | | 59 | |
2.750%, 03/12/21 | | | 75 | | | | 76 | |
| | |
Total System Services
4.800%, 04/01/26 | | | 100 | | | | 111 | |
| | |
Trimble
4.150%, 06/15/23 | | | 100 | | | | 106 | |
| | |
Tyco Electronics Group
3.125%, 08/15/27 | | | 25 | | | | 26 | |
| | |
Visa
4.300%, 12/14/45 | | | 150 | | | | 184 | |
3.150%, 12/14/25 | | | 200 | | | | 212 | |
2.800%, 12/14/22 | | | 100 | | | | 103 | |
| | |
VMware
2.950%, 08/21/22 | | | 100 | | | | 102 | |
| | |
Western Union
4.250%, 06/09/23 | | | 50 | | | | 53 | |
| | | | | | | | |
| | |
| | | | | | | 27,230 | |
| | | | | | | | |
| | | | | | | | |
| Description | | Face Amount
(000) | | | Value
(000) | |
| | |
Materials — 0.4% | | | | | | | | |
| | |
Airgas
3.650%, 07/15/24 | | $ | 100 | | | $ | 106 | |
| | |
ArcelorMittal
7.000%, 10/15/39 | | | 21 | | | | 26 | |
6.250%, 02/25/22 | | | 20 | | | | 22 | |
6.125%, 06/01/25 | | | 15 | | | | 17 | |
4.250%, 07/16/29 | | | 100 | | | | 104 | |
| | |
Barrick
5.250%, 04/01/42 | | | 150 | | | | 179 | |
| | |
BHP Billiton Finance USA
5.000%, 09/30/43 | | | 100 | | | | 128 | |
| | |
Celanese US Holdings
5.875%, 06/15/21 | | | 20 | | | | 21 | |
4.625%, 11/15/22 | | | 20 | | | | 21 | |
| | |
CNAC HK Finbridge
4.125%, 03/14/21 | | | 2,000 | | | | 2,033 | |
| | |
Dow Chemical
5.550%, 11/30/48 | | | 50 | | | | 63 | |
4.800%, 11/30/28 | | | 100 | | | | 114 | |
3.150%, 05/15/24 | | | 200 | | | | 207 | |
| | |
DuPont de Nemours
5.419%, 11/15/48 | | | 40 | | | | 49 | |
5.319%, 11/15/38 | | | 35 | | | | 42 | |
4.725%, 11/15/28 | | | 100 | | | | 114 | |
4.205%, 11/15/23 | | | 100 | | | | 107 | |
| | |
Eastman Chemical
3.800%, 03/15/25 | | | 150 | | | | 158 | |
| | |
Ecolab
3.250%, 01/14/23 | | | 100 | | | | 103 | |
| | |
FMC
4.500%, 10/01/49 | | | 100 | | | | 109 | |
| | |
Huntsman International
4.500%, 05/01/29 | | | 20 | | | | 21 | |
| | |
International Paper
5.150%, 05/15/46 | | | 150 | | | | 173 | |
3.650%, 06/15/24 | | | 200 | | | | 210 | |
| | |
LYB International Finance II BV
3.500%, 03/02/27 | | | 100 | | | | 105 | |
| | |
LYB International Finance III
4.200%, 10/15/49 | | | 75 | | | | 78 | |
| | |
LyondellBasell Industries
6.000%, 11/15/21 | | | 1,024 | | | | 1,088 | |
| | |
Martin Marietta Materials
4.250%, 12/15/47 | | | 100 | | | | 104 | |
| | |
Methanex
5.250%, 12/15/29 | | | 25 | | | | 26 | |
| | |
Mosaic
4.050%, 11/15/27 | | | 100 | | | | 104 | |
| | |
Newmont Goldcorp
5.450%, 06/09/44 | | | 100 | | | | 124 | |
3.700%, 03/15/23 | | | 50 | | | | 52 | |
3.500%, 03/15/22 | | | 100 | | | | 103 | |
| | |
Nucor
3.950%, 05/01/28 | | | 150 | | | | 163 | |
The accompanying notes are an integral part of the financial statements.
110
| | |
| THE KP FUNDS | | December 31, 2019 |
| | | | | | | | |
| Description | | Face Amount
(000) | | | Value
(000) | |
| | |
Nutrien
6.125%, 01/15/41 | | $ | 150 | | | $ | 185 | |
3.625%, 03/15/24 | | | 100 | | | | 104 | |
| | |
Packaging Corp of America
3.650%, 09/15/24 | | | 100 | | | | 105 | |
3.400%, 12/15/27 | | | 35 | | | | 37 | |
| | |
PPG Industries
2.400%, 08/15/24 | | | 50 | | | | 50 | |
| | |
Praxair
2.450%, 02/15/22 | | | 200 | | | | 202 | |
| | |
Rio Tinto Finance USA
3.750%, 06/15/25 | | | 200 | | | | 215 | |
| | |
RPM International
4.550%, 03/01/29 | | | 50 | | | | 54 | |
| | |
SASOL Financing USA
5.875%, 03/27/24 | | | 200 | | | | 217 | |
| | |
Sherwin-Williams
3.800%, 08/15/49 | | | 50 | | | | 51 | |
3.450%, 08/01/25 | | | 100 | | | | 105 | |
2.950%, 08/15/29 | | | 50 | | | | 51 | |
| | |
Southern Copper
5.875%, 04/23/45 | | | 150 | | | | 188 | |
3.875%, 04/23/25 | | | 30 | | | | 32 | |
| | |
Steel Dynamics
2.800%, 12/15/24 | | | 25 | | | | 25 | |
| | |
Vale Overseas
6.875%, 11/21/36 | | | 200 | | | | 260 | |
| | |
Westlake Chemical
3.600%, 08/15/26 | | | 100 | | | | 104 | |
| | |
WRKCo
4.650%, 03/15/26 | | | 100 | | | | 110 | |
4.200%, 06/01/32 | | | 50 | | | | 55 | |
| | | | | | | | |
| | |
| | | | | | | 8,224 | |
| | | | | | | | |
|
Real Estate — 0.9% | |
| | |
Alexandria Real Estate Equities
4.000%, 01/15/24 | | | 100 | | | | 107 | |
4.000%, 02/01/50 | | | 50 | | | | 55 | |
3.450%, 04/30/25 | | | 25 | | | | 26 | |
| | |
American Campus Communities Operating Partnership
3.300%, 07/15/26 | | | 100 | | | | 104 | |
| | |
American Tower
4.000%, 06/01/25 | | | 200 | | | | 214 | |
3.375%, 05/15/24 | | | 100 | | | | 104 | |
2.750%, 01/15/27 | | | 100 | | | | 100 | |
2.250%, 01/15/22 | | | 50 | | | | 50 | |
| | |
AvalonBay Communities
3.500%, 11/15/24 | | | 100 | | | | 105 | |
3.300%, 06/01/29 | | | 65 | | | | 69 | |
| | |
Boston Properties
3.850%, 02/01/23 | | | 100 | | | | 105 | |
3.650%, 02/01/26 | | | 150 | | | | 159 | |
| | |
Brandywine Operating Partnership
4.100%, 10/01/24 | | | 50 | | | | 53 | |
| | | | | | | | |
| Description | | Face Amount
(000) | | | Value
(000) | |
| | |
Brixmor Operating Partnership
3.875%, 08/15/22 | | $ | 30 | | | $ | 31 | |
3.250%, 09/15/23 | | | 100 | | �� | | 103 | |
| | |
Camden Property Trust
4.100%, 10/15/28 | | | 10 | | | | 11 | |
3.150%, 07/01/29 | | | 30 | | | | 31 | |
| | |
Crown Castle International
5.250%, 01/15/23 | | | 100 | | | | 109 | |
4.000%, 11/15/49 | | | 10 | | | | 10 | |
3.800%, 02/15/28 | | | 150 | | | | 160 | |
3.700%, 06/15/26 | | | 35 | | | | 37 | |
2.250%, 09/01/21 | | | 55 | | | | 55 | |
| | |
CubeSmart
4.375%, 02/15/29 | | | 15 | | | | 16 | |
| | |
CyrusOne
3.450%, 11/15/29 | | | 100 | | | | 100 | |
| | |
Digital Realty Trust
3.625%, 10/01/22 | | | 100 | | | | 104 | |
3.600%, 07/01/29 | | | 30 | | | | 31 | |
| | |
Duke Realty
3.750%, 12/01/24 | | | 100 | | | | 106 | |
| | |
EPR Properties
4.750%, 12/15/26 | | | 50 | | | | 55 | |
| | |
Equinix
5.875%, 01/15/26 | | | 45 | | | | 48 | |
5.375%, 05/15/27 | | | 35 | | | | 38 | |
2.625%, 11/18/24 | | | 65 | | | | 65 | |
| | |
ERP Operating
4.625%, 12/15/21 | | | 120 | | | | 125 | |
4.150%, 12/01/28 | | | 50 | | | | 56 | |
| | |
Essex Portfolio
3.375%, 04/15/26 | | | 100 | | | | 104 | |
| | |
Federal Realty Investment Trust
3.200%, 06/15/29 | | | 50 | | | | 52 | |
| | |
GLP Capital
5.750%, 06/01/28 | | | 15 | | | | 17 | |
5.375%, 11/01/23 | | | 15 | | | | 16 | |
5.375%, 04/15/26 | | | 25 | | | | 28 | |
5.250%, 06/01/25 | | | 15 | | | | 17 | |
4.000%, 01/15/30 | | | 65 | | | | 66 | |
| | |
Healthcare Trust of America Holdings
3.750%, 07/01/27 | | | 100 | | | | 106 | |
| | |
Healthpeak Properties
3.875%, 08/15/24 | | | 150 | | | | 159 | |
3.250%, 07/15/26 | | | 100 | | | | 104 | |
| | |
Highwoods Realty
4.200%, 04/15/29 | | | 50 | | | | 54 | |
| | |
Host Hotels & Resorts
3.750%, 10/15/23 | | | 100 | | | | 105 | |
| | |
Kilroy Realty
3.450%, 12/15/24 | | | 50 | | | | 52 | |
3.050%, 02/15/30 | | | 4,015 | | | | 3,960 | |
| | |
Kimco Realty
4.450%, 09/01/47 | | | 1,163 | | | | 1,276 | |
3.300%, 02/01/25 | | | 80 | | | | 83 | |
The accompanying notes are an integral part of the financial statements.
111
| | |
| THE KP FUNDS | | December 31, 2019 |
| | | | | | | | |
| Description | | Face Amount
(000) | | | Value
(000) | |
3.200%, 05/01/21 | | $ | 50 | | | $ | 51 | |
| | |
Liberty Property
4.125%, 06/15/22 | | | 100 | | | | 105 | |
| | |
Life Storage
4.000%, 06/15/29 | | | 50 | | | | 53 | |
| | |
Mid-America Apartments 3.950%, 03/15/29 | | | 50 | | | | 55 | |
3.600%, 06/01/27 | | | 25 | | | | 26 | |
| | |
National Retail Properties 4.000%, 11/15/25 | | | 35 | | | | 38 | |
3.600%, 12/15/26 | | | 100 | | | | 105 | |
| | |
Office Properties Income Trust 4.250%, 05/15/24 | | | 50 | | | | 52 | |
| | |
Omega Healthcare Investors 4.375%, 08/01/23 | | | 50 | | | | 53 | |
3.625%, 10/01/29 | | | 100 | | | | 100 | |
| | |
Prologis
3.875%, 09/15/28 | | | 35 | | | | 39 | |
| | |
Public Storage
3.385%, 05/01/29 | | | 30 | | | | 32 | |
| | |
Realty Income
3.875%, 04/15/25 | | | 25 | | | | 27 | |
3.250%, 10/15/22 | | | 100 | | | | 103 | |
3.250%, 06/15/29 | | | 25 | | | | 27 | |
| | |
Regency Centers
3.600%, 02/01/27 | | | 30 | | | | 31 | |
2.950%, 09/15/29 | | | 50 | | | | 50 | |
| | |
Sabra Health Care
3.900%, 10/15/29 | | | 50 | | | | 50 | |
| | |
Service Properties Trust
5.250%, 02/15/26 | | | 100 | | | | 105 | |
5.000%, 08/15/22 | | | 100 | | | | 105 | |
| | |
Simon Property Group
3.375%, 10/01/24 | | | 125 | | | | 132 | |
3.300%, 01/15/26 | | | 100 | | | | 105 | |
3.250%, 09/13/49 | | | 2,288 | | | | 2,226 | |
2.625%, 06/15/22 | | | 250 | | | | 254 | |
| | |
UDR
4.400%, 01/26/29 | | | 25 | | | | 28 | |
4.000%, 10/01/25 | | | 50 | | | | 54 | |
3.100%, 11/01/34 | | | 15 | | | | 15 | |
| | |
Ventas Realty
3.750%, 05/01/24 | | | 50 | | | | 52 | |
2.650%, 01/15/25 | | | 100 | | | | 101 | |
| | |
VEREIT Operating Partnership 4.875%, 06/01/26 | | | 20 | | | | 22 | |
4.625%, 11/01/25 | | | 50 | | | | 55 | |
4.600%, 02/06/24 | | | 15 | | | | 16 | |
| | |
WEA Finance
2.875%, 01/15/27 (A) | | | 8,559 | | | | 8,533 | |
| | |
Welltower
4.950%, 09/01/48 | | | 100 | | | | 120 | |
3.100%, 01/15/30 | | | 30 | | | | 30 | |
2.700%, 02/15/27 | | | 100 | | | | 101 | |
| | |
Weyerhaeuser
4.625%, 09/15/23 | | | 100 | | | | 108 | |
| | | | | | | | |
| Description | | Face Amount
(000) | | | Value
(000) | |
| | |
WP Carey
4.600%, 04/01/24 | | $ | 50 | | | $ | 54 | |
| | | | | | | | |
| | |
| | | | | | | 21,954 | |
| | | | | | | | |
|
Utilities — 3.5% | |
| | |
1MDB Energy
5.990%, 05/11/22 | | | 2,000 | | | | 2,106 | |
| | |
ABY Transmision Sur
6.875%, 04/30/43 (A) | | | 622 | | | | 786 | |
| | |
Adani Transmission
4.250%, 05/21/36 (A) | | | 920 | | | | 929 | |
| | |
AEP Texas
3.450%, 01/15/50 | | | 100 | | | | 100 | |
| | |
AEP Transmission
3.800%, 06/15/49 | | | 50 | | | | 54 | |
3.100%, 12/01/26 | | | 150 | | | | 155 | |
| | |
Alabama Power
4.300%, 07/15/48 | | | 30 | | | | 35 | |
| | |
Ameren
2.500%, 09/15/24 | | | 2,086 | | | | 2,095 | |
| | |
Ameren Illinois
4.500%, 03/15/49 | | | 25 | | | | 31 | |
3.250%, 03/15/50 | | | 714 | | | | 723 | |
| | |
American Electric Power 3.650%, 12/01/21 | | | 35 | | | | 36 | |
| | |
American Water Capital
4.200%, 09/01/48 | | | 100 | | | | 113 | |
3.400%, 03/01/25 | | | 100 | | | | 105 | |
| | |
Arizona Public Service
4.500%, 04/01/42 | | | 100 | | | | 115 | |
3.150%, 05/15/25 | | | 50 | | | | 52 | |
| | |
Atmos Energy
4.125%, 03/15/49 | | | 20 | | | | 23 | |
3.000%, 06/15/27 | | | 65 | | | | 67 | |
| | |
Avangrid
3.800%, 06/01/29 | | | 50 | | | | 53 | |
| | |
Berkshire Hathaway Energy 6.125%, 04/01/36 | | | 200 | | | | 275 | |
3.750%, 11/15/23 | | | 100 | | | | 106 | |
| | |
Black Hills
4.350%, 05/01/33 | | | 30 | | | | 33 | |
3.050%, 10/15/29 | | | 50 | | | | 50 | |
| | |
CenterPoint Energy
4.250%, 11/01/28 | | | 25 | | | | 27 | |
3.850%, 02/01/24 | | | 25 | | | | 26 | |
3.700%, 09/01/49 | | | 25 | | | | 25 | |
3.600%, 11/01/21 | | | 10 | | | | 10 | |
2.950%, 03/01/30 | | | 25 | | | | 25 | |
2.500%, 09/01/22 | | | 50 | | | | 50 | |
| | |
CenterPoint Energy Houston Electric
4.250%, 02/01/49 | | | 25 | | | | 29 | |
2.250%, 08/01/22 | | | 100 | | | | 101 | |
| | |
Cleco Corporate Holdings 3.743%, 05/01/26 | | | 100 | | | | 103 | |
The accompanying notes are an integral part of the financial statements.
112
| | |
| THE KP FUNDS | | December 31, 2019 |
| | | | | | | | |
| Description | | Face Amount
(000) | | | Value
(000) | |
| | |
CMS Energy
3.000%, 05/15/26 | | $ | 40 | | | $ | 41 | |
| | |
Cometa Energia
6.375%, 04/24/35 (A) | | | 1,444 | | | | 1,570 | |
| | |
Connecticut Light & Power 4.000%, 04/01/48 | | | 25 | | | | 29 | |
3.200%, 03/15/27 | | | 25 | | | | 26 | |
| | |
Consolidated Edison of New York
4.450%, 03/15/44 | | | 150 | | | | 174 | |
4.000%, 12/01/28 | | | 100 | | | | 111 | |
3.875%, 06/15/47 | | | 100 | | | | 108 | |
3.800%, 05/15/28 | | | 50 | | | | 55 | |
| | |
Consumers Energy
4.350%, 04/15/49 | | | 100 | | | | 121 | |
| | |
Dominion Energy
5.950%, 06/15/35 | | | 1,229 | | | | 1,564 | |
4.050%, 09/15/42 | | | 150 | | | | 158 | |
3.071%, 08/15/24 | | | 35 | | | | 36 | |
2.750%, 01/15/22 | | | 100 | | | | 102 | |
2.450%, 01/15/23 (A) | | | 2,543 | | | | 2,552 | |
| | |
DTE Electric
3.950%, 03/01/49 | | | 70 | | | | 80 | |
3.750%, 08/15/47 | | | 100 | | | | 110 | |
| | |
DTE Energy
3.400%, 06/15/29 | | | 70 | | | | 72 | |
2.529%, 10/01/24 | | | 2,325 | | | | 2,337 | |
| | |
Duke Energy
3.750%, 09/01/46 | | | 200 | | | | 207 | |
2.650%, 09/01/26 | | | 150 | | | | 151 | |
| | |
Duke Energy Carolinas
5.300%, 02/15/40 | | | 300 | | | | 388 | |
3.700%, 12/01/47 | | | 100 | | | | 108 | |
3.200%, 08/15/49 | | | 25 | | | | 25 | |
3.050%, 03/15/23 | | | 100 | | | | 103 | |
2.950%, 12/01/26 | | | 50 | | | | 52 | |
| | |
Duke Energy Florida
3.800%, 07/15/28 | | | 50 | | | | 55 | |
2.500%, 12/01/29 | | | 50 | | | | 50 | |
| | |
Duke Energy Progress
3.700%, 09/01/28 | | | 50 | | | | 55 | |
3.450%, 03/15/29 | | | 35 | | | | 37 | |
| | |
Edison International
5.750%, 06/15/27 | | | 2,980 | | | | 3,346 | |
3.550%, 11/15/24 | | | 477 | | | | 488 | |
2.400%, 09/15/22 | | | 80 | | | | 80 | |
| | |
Empresa de Transmision Electrica
5.125%, 05/02/49 (A) | | | 400 | | | | 455 | |
| | |
Enel Generacion Chile
4.250%, 04/15/24 | | | 50 | | | | 53 | |
| | |
Entergy
4.000%, 07/15/22 | | | 50 | | | | 52 | |
| | |
Entergy Louisiana
4.200%, 04/01/50 | | | 50 | | | | 58 | |
4.000%, 03/15/33 | | | 130 | | | | 147 | |
| | | | | | | | |
| Description | | Face Amount
(000) | | | Value
(000) | |
| | |
Entergy Texas
3.550%, 09/30/49 | | $ | 25 | | | $ | 26 | |
| | |
Evergy Kansas Central
3.250%, 09/01/49 | | | 50 | | | | 49 | |
| | |
Evergy Metro
3.650%, 08/15/25 | | | 100 | | | | 107 | |
| | |
Eversource Energy
3.300%, 01/15/28 | | | 100 | | | | 103 | |
2.750%, 03/15/22 | | | 3,478 | | | | 3,530 | |
| | |
Exelon
5.100%, 06/15/45 | | | 566 | | | | 683 | |
3.400%, 04/15/26 | | | 100 | | | | 104 | |
| | |
Exelon Generation
5.600%, 06/15/42 | | | 600 | | | | 687 | |
| | |
FirstEnergy
4.250%, 03/15/23 | | | 1,445 | | | | 1,523 | |
3.900%, 07/15/27 | | | 1,533 | | | | 1,640 | |
| | |
FirstEnergy Transmission 5.450%, 07/15/44 (A) | | | 1,217 | | | | 1,536 | |
4.550%, 04/01/49 (A) | | | 1,212 | | | | 1,389 | |
| | |
Florida Power & Light
4.125%, 06/01/48 | | | 50 | | | | 59 | |
3.990%, 03/01/49 | | | 50 | | | | 57 | |
3.700%, 12/01/47 | | | 100 | | | | 109 | |
3.150%, 10/01/49 | | | 236 | | | | 239 | |
| | |
Georgia Power
4.300%, 03/15/42 | | | 200 | | | | 219 | |
| | |
Israel Electric
5.000%, 11/12/24 (A) | | | 364 | | | | 400 | |
| | |
ITC Holdings
3.650%, 06/15/24 | | | 25 | | | | 26 | |
2.700%, 11/15/22 | | | 3,645 | | | | 3,691 | |
| | |
Listrindo Capital BV
4.950%, 09/14/26 (A) | | | 530 | | | | 537 | |
| | |
MidAmerican Energy
4.250%, 07/15/49 | | | 1,175 | | | | 1,411 | |
3.950%, 08/01/47 | | | 100 | | | | 113 | |
| | |
Minejesa Capital BV
5.625%, 08/10/37 (A) | | | 870 | | | | 945 | |
| | |
National Fuel Gas
3.950%, 09/15/27 | | | 50 | | | | 52 | |
| | |
Nevada Power
3.700%, 05/01/29 | | | 40 | | | | 43 | |
| | |
NextEra Energy Capital Holdings
| | | | | | | | |
4.800%, VAR ICE LIBOR USD 3 Month+2.409%, 12/01/77 | | | 200 | | | | 206 | |
3.342%, 09/01/20 | | | 5,136 | | | | 5,181 | |
3.150%, 04/01/24 | | | 100 | | | | 104 | |
2.800%, 01/15/23 | | | 1,415 | | | | 1,447 | |
2.403%, 09/01/21 | | | 2,508 | | | | 2,526 | |
| | |
NiSource
5.800%, 02/01/42 | | | 992 | | | | 1,243 | |
4.375%, 05/15/47 | | | 100 | | | | 111 | |
The accompanying notes are an integral part of the financial statements.
113
| | |
| THE KP FUNDS | | December 31, 2019 |
| | | | | | | | |
| Description | | Face Amount
(000) | | | Value
(000) | |
3.650%, 06/15/23 | | $ | 50 | | | $ | 52 | |
2.650%, 11/17/22 | | | 4,408 | | | | 4,462 | |
| | |
Northern States Power
2.600%, 05/15/23 | | | 100 | | | | 102 | |
| | |
NSTAR Electric
2.375%, 10/15/22 | | | 100 | | | | 101 | |
| | |
Oglethorpe Power
5.050%, 10/01/48 | | | 50 | | | | 59 | |
| | |
Ohio Power
4.000%, 06/01/49 | | | 20 | | | | 22 | |
| | |
Oklahoma Gas & Electric 3.800%, 08/15/28 | | | 25 | | | | 27 | |
3.300%, 03/15/30 | | | 25 | | | | 27 | |
| | |
Oncor Electric Delivery
4.100%, 11/15/48 | | | 50 | | | | 57 | |
3.750%, 04/01/45 | | | 100 | | | | 109 | |
3.700%, 11/15/28 | | | 100 | | | | 110 | |
3.100%, 09/15/49 | | | 884 | | | | 864 | |
| | |
ONE Gas
4.500%, 11/01/48 | | | 45 | | | | 54 | |
| | |
PacifiCorp
4.100%, 02/01/42 | | | 150 | | | | 167 | |
| | |
PECO Energy
3.900%, 03/01/48 | | | 15 | | | | 17 | |
| | |
Perusahaan Listrik Negara 6.150%, 05/21/48 (A) | | | 1,045 | | | | 1,318 | |
5.500%, 11/22/21 (A) | | | 776 | | | | 821 | |
4.875%, 07/17/49 (A) | | | 368 | | | | 398 | |
3.875%, 07/17/29 (A) | | | 450 | | | | 469 | |
| | |
Piedmont Natural Gas
3.500%, 06/01/29 | | | 100 | | | | 107 | |
| | |
Pinnacle West Capital
2.250%, 11/30/20 | | | 1,009 | | | | 1,011 | |
| | |
Power Finance
6.150%, 12/06/28 (A) | | | 1,060 | | | | 1,221 | |
| | |
PPL Capital Funding
4.000%, 09/15/47 | | | 1,814 | | | | 1,858 | |
3.500%, 12/01/22 | | | 150 | | | | 155 | |
3.100%, 05/15/26 | | | 2,041 | | | | 2,078 | |
| | |
PPL Electric Utilities
3.000%, 10/01/49 | | | 35 | | | | 33 | |
| | |
Progress Energy
7.750%, 03/01/31 | | | 1,085 | | | | 1,528 | |
| | |
PSEG Power
3.850%, 06/01/23 | | | 50 | | | | 52 | |
3.000%, 06/15/21 | | | 50 | | | | 51 | |
| | |
Public Service Electric & Gas 3.650%, 09/01/28 | | | 100 | | | | 109 | |
| | |
Public Service Enterprise Group 2.650%, 11/15/22 | | | 150 | | | | 152 | |
| | |
Public Service of Colorado 4.100%, 06/15/48 | | | 65 | | | | 75 | |
3.200%, 03/01/50 | | | 100 | | | | 100 | |
| | |
Public Service of New Hampshire
3.600%, 07/01/49 | | | 25 | | | | 27 | |
| | | | | | | | |
| Description | | Face Amount
(000) | | | Value
(000) | |
| | |
Puget Sound Energy
4.223%, 06/15/48 | | $ | 100 | | | $ | 115 | |
| | |
Ruwais Power PJSC
6.000%, 08/31/36 (A) | | | 540 | | | | 665 | |
| | |
San Diego Gas & Electric 4.300%, 04/01/42 | | | 826 | | | | 889 | |
4.150%, 05/15/48 | | | 636 | | | | 700 | |
3.750%, 06/01/47 | | | 725 | | | | 754 | |
| | |
Sempra Energy
6.000%, 10/15/39 | | | 1,222 | | | | 1,586 | |
3.800%, 02/01/38 | | | 200 | | | | 209 | |
3.750%, 11/15/25 | | | 100 | | | | 106 | |
3.550%, 06/15/24 | | | 100 | | | | 105 | |
2.900%, 02/01/23 | | | 35 | | | | 36 | |
| | |
Southern
4.250%, 07/01/36 | | | 150 | | | | 162 | |
2.350%, 07/01/21 | | | 200 | | | | 201 | |
| | |
Southern California Edison 4.875%, 03/01/49 | | | 314 | | | | 373 | |
4.125%, 03/01/48 | | | 654 | | | | 699 | |
3.650%, 03/01/28 | | | 50 | | | | 53 | |
3.500%, 10/01/23 | | | 150 | | | | 156 | |
2.850%, 08/01/29 | | | 75 | | | | 75 | |
| | |
Southern Gas Capital
3.250%, 06/15/26 | | | 30 | | | | 31 | |
| | |
Southwestern Electric Power 4.100%, 09/15/28 | | | 25 | | | | 27 | |
3.850%, 02/01/48 | | | 100 | | | | 104 | |
2.750%, 10/01/26 | | | 50 | | | | 50 | |
| | |
Southwestern Public Service 4.400%, 11/15/48 | | | 100 | | | | 118 | |
3.750%, 06/15/49 | | | 50 | | | | 54 | |
| | |
State Grid Overseas Investment 2013
3.125%, 05/22/23 (A) | | | 440 | | | | 450 | |
| | |
Tampa Electric
4.450%, 06/15/49 | | | 25 | | | | 30 | |
4.300%, 06/15/48 | | | 25 | | | | 29 | |
| | |
Union Electric
3.500%, 04/15/24 | | | 150 | | | | 158 | |
3.250%, 10/01/49 | | | 150 | | | | 149 | |
| | |
Virginia Electric & Power 3.800%, 04/01/28 | | | 100 | | | | 109 | |
3.500%, 03/15/27 | | | 100 | | | | 107 | |
3.100%, 05/15/25 | | | 100 | | | | 104 | |
2.875%, 07/15/29 | | | 150 | | | | 154 | |
| | |
Washington Gas Light
3.650%, 09/15/49 | | | 25 | | | | 25 | |
| | |
WEC Energy Group
3.375%, 06/15/21 | | | 65 | | | | 66 | |
3.100%, 03/08/22 | | | 25 | | | | 26 | |
| | |
Wisconsin Electric Power 4.300%, 10/15/48 | | | 10 | | | | 12 | |
| | |
Wisconsin Power & Light 3.050%, 10/15/27 | | | 100 | | | | 104 | |
The accompanying notes are an integral part of the financial statements.
114
| | |
| THE KP FUNDS | | December 31, 2019 |
| | | | | | | | |
| Description | | Face Amount
(000) | | | Value
(000) | |
| | |
Xcel Energy
2.400%, 03/15/21 | | $ | 2,057 | | | $ | 2,067 | |
| | | | | | | | |
| | |
| | | | | | | 82,341 | |
| | | | | | | | |
| | |
Total Corporate Obligations (Cost $556,588) (000) | | | | | | | 578,265 | |
| | | | | | | | |
MORTGAGE-BACKED SECURITIES — 23.9% | |
|
Agency Mortgage-Backed Obligations — 21.9% | |
| | |
FHLMC
5.000%, 02/01/39 - 08/01/49 | | | 5,950 | | | | 6,394 | |
4.500%, 05/01/42 - 01/01/49 | | | 7,365 | | | | 7,855 | |
4.000%, 05/01/26 - 03/01/49 | | | 18,288 | | | | 19,309 | |
3.500%, 04/01/32 - 12/01/49 | | | 43,081 | | | | 44,971 | |
3.000%, 11/01/27 - 10/01/49 | | | 23,807 | | | | 24,284 | |
2.500%, 01/01/32 - 12/01/32 | | | 2,452 | | | | 2,482 | |
| | |
FHLMC, Ser 2011-3830, Cl DZ 4.000%, 12/15/30 | | | 888 | | | | 944 | |
| | |
FHLMC, Ser 2013-4212, Cl JP 3.000%, 12/15/40 | | | 423 | | | | 431 | |
| | |
FHLMC, Ser 2017-4681, Cl DA 3.000%, 04/15/45 | | | 877 | | | | 899 | |
| | |
FHLMC, Ser 2018-4821, Cl MA 3.500%, 10/15/53 | | | 2,633 | | | | 2,727 | |
| | |
FHLMC Multifamily Structured Pass Through Certificates, Ser K098, Cl A2 2.425%, 08/25/29 | | | 100 | | | | 100 | |
| | |
FHLMC Multifamily Structured Pass Through Certificates, Ser K099, Cl A2 2.595%, 09/25/29 | | | 100 | | | | 102 | |
| | |
FHLMC Multifamily Structured Pass Through Certificates, Ser K101, Cl A2 2.524%, 10/25/29 | | | 200 | | | | 202 | |
| | |
FHLMC Multifamily Structured Pass-Through Certificates, Ser K029, Cl A2 3.320%, 02/25/23 | | | 1,000 | | | | 1,037 | |
| | |
FHLMC Multifamily Structured Pass-Through Certificates, Ser K055, Cl A2 2.673%, 03/25/26 | | | 400 | | | | 410 | |
| | |
FHLMC Multifamily Structured Pass-Through Certificates, Ser K065, Cl A2 3.243%, 04/25/27 | | | 1,026 | | | | 1,088 | |
| | |
FHLMC Multifamily Structured Pass-Through Certificates, Ser K068, Cl A2 3.244%, 08/25/27 | | | 723 | | | | 767 | |
| | |
FHLMC Multifamily Structured Pass-Through Certificates, Ser K069, Cl A2 3.187%, 09/25/27 (E) | | | 400 | | | | 423 | |
| | | | | | | | |
| Description | | Face Amount
(000) | | | Value
(000) | |
| | |
FHLMC Multifamily Structured Pass-Through Certificates, Ser K070, Cl A2 3.303%, 11/25/27 (E) | | $ | 361 | | | $ | 384 | |
| | |
FHLMC Multifamily Structured Pass-Through Certificates, Ser K072, Cl A2 3.444%, 12/25/27 | | | 100 | | | | 107 | |
| | |
FHLMC Multifamily Structured Pass-Through Certificates, Ser K078, Cl A2 3.854%, 06/25/28 | | | 200 | | | | 220 | |
| | |
FHLMC Multifamily Structured Pass-Through Certificates, Ser K079, Cl A2 3.926%, 06/25/28 | | | 1,505 | | | | 1,668 | |
| | |
FHLMC Multifamily Structured Pass-Through Certificates, Ser K081, Cl A2 3.900%, 08/25/28 (E) | | | 1,244 | | | | 1,377 | |
| | |
FHLMC Multifamily Structured Pass-Through Certificates, Ser K083, Cl A2 4.050%, 09/25/28 (E) | | | 1,092 | | | | 1,222 | |
| | |
FHLMC Multifamily Structured Pass-Through Certificates, Ser K085, Cl A2 4.060%, 10/25/28 (E) | | | 200 | | | | 224 | |
| | |
FHLMC Multifamily Structured Pass-Through Certificates, Ser K086, Cl A2 3.859%, 11/25/28 (E) | | | 120 | | | | 133 | |
| | |
FHLMC Multifamily Structured Pass-Through Certificates, Ser K094, Cl A2 2.903%, 06/25/29 | | | 1,126 | | | | 1,171 | |
| | |
FHLMC Multifamily Structured Pass-Through Certificates, Ser K095, Cl A2 2.785%, 06/25/29 | | | 1,618 | | | | 1,669 | |
| | |
FHLMC Multifamily Structured Pass-Through Certificates, Ser K723, Cl A2 2.454%, 08/25/23 | | | 350 | | | | 354 | |
| | |
FHLMC Multifamily Structured Pass-Through Certificates, Ser K730, Cl A2 3.590%, 01/25/25 (E) | | | 425 | | | | 451 | |
| | |
FNMA
5.500%, 09/01/40 | | | 710 | | | | 797 | |
5.000%, 07/01/41 - 09/01/48 | | | 2,578 | | | | 2,795 | |
4.500%, 01/01/30 - 09/01/49 | | | 18,515 | | | | 19,626 | |
4.000%, 11/01/33 - 10/01/49 | | | 42,174 | | | | 44,243 | |
3.500%, 08/01/31 - 12/01/49 | | | 56,758 | | | | 59,096 | |
3.000%, 02/01/32 - 01/01/50 | | | 61,790 | | | | 63,001 | |
2.500%, 12/01/27 - 12/01/34 | | | 17,949 | | | | 18,146 | |
The accompanying notes are an integral part of the financial statements.
115
| | |
| THE KP FUNDS | | December 31, 2019 |
| | | | | | | | |
| Description | | Face Amount
(000) | | | Value
(000) | |
| | |
FNMA TBA
5.000%, 01/01/38 | | $ | 3,175 | | | $ | 3,394 | |
4.500%, 01/01/38 | | | 13,465 | | | | 14,177 | |
4.000%, 11/15/34 | | | 3,615 | | | | 3,760 | |
3.500%, 01/01/41 | | | 10,895 | | | | 11,208 | |
3.000%, 01/16/26 - 01/15/43 | | | 21,405 | | | | 21,761 | |
2.500%, 01/01/26 | | | 1,800 | | | | 1,816 | |
| | |
FNMA,Ser 2015-M11, Cl A2 2.829%, 04/25/25 (E) | | | 850 | | | | 874 | |
| | |
FNMA,Ser 2016-54, Cl GA 2.500%, 11/25/45 | | | 1,741 | | | | 1,762 | |
| | |
FNMA,Ser 2017-91, Cl PC 3.000%, 06/25/45 | | | 566 | | | | 577 | |
| | |
FNMA,Ser 2018-11, Cl PA 3.000%, 06/25/46 | | | 1,461 | | | | 1,493 | |
| | |
FNMA,Ser 2018-3, Cl PA 3.000%, 04/25/46 | | | 1,863 | | | | 1,903 | |
| | |
FNMA,Ser 2018-44, Cl PA 3.500%, 06/25/44 | | | 1,558 | | | | 1,588 | |
| | |
FNMA,Ser 2018-M12, Cl A2 3.640%, 08/25/30 (E) | | | 100 | | | | 109 | |
| | |
FNMA, Ser M7, Cl A2 3.052%, 03/25/28 (E) | | | 500 | | | | 525 | |
| | |
GNMA TBA
4.500%, 01/15/40 | | | 750 | | | | 784 | |
4.000%, 01/01/40 | | | 5,840 | | | | 6,045 | |
3.500%, 01/15/41 | | | 5,495 | | | | 5,663 | |
3.000%, 01/15/43 | | | 12,025 | | | | 12,354 | |
| | |
GNMA
5.000%, 09/20/46 - 09/20/48 | | | 1,757 | | | | 1,899 | |
4.500%, 12/20/41 - 01/20/49 | | | 4,752 | | | | 5,016 | |
4.000%, 01/20/47 - 07/20/49 | | | 23,431 | | | | 24,354 | |
3.500%, 11/20/44 - 09/20/49 | | | 46,454 | | | | 48,225 | |
3.000%, 06/20/45 - 12/20/49 | | | 11,659 | | | | 12,023 | |
2.500%, 12/20/46 | | | 366 | | | | 368 | |
| | | | | | | | |
| | |
| | | | | | | 512,787 | |
| | | | | | | | |
|
Non-Agency Mortgage-Backed Obligations — 2.0% | |
| | |
Alternative Loan Trust,
Ser 2003-22CB, Cl 3A1 6.000%, 12/25/33 | | | 555 | | | | 562 | |
| | |
BANK, Ser 2017-BNK8, Cl A4 3.488%, 11/15/50 | | | 90 | | | | 96 | |
| | |
BANK, Ser 2017-BNK8, Cl B 3.929%, 11/15/50 (E) | | | 50 | | | | 53 | |
| | |
BANK, Ser 2018-BN13, Cl A5 4.217%, 08/15/61 (E) | | | 1,350 | | | | 1,511 | |
| | |
BANK, Ser 2018-BN14, Cl A4 4.231%, 09/15/60 (E) | | | 96 | | | | 107 | |
| | |
BANK, Ser 2018-BN15, Cl A4 4.407%, 11/15/61 (E) | | | 50 | | | | 57 | |
| | |
BANK, Ser 2019-BN19, Cl A3 3.183%, 08/15/61 | | | 100 | | | | 104 | |
| | |
BANK, Ser 2019-BN21, Cl A5 2.851%, 10/17/52 | | | 993 | | | | 1,009 | |
| | | | | | | | |
| Description | | Face Amount
(000) | | | Value
(000) | |
| | |
BANK, Ser BN24, Cl A3 2.960%, 11/15/62 | | $ | 890 | | | $ | 913 | |
| | |
BBCMS Mortgage Trust,Ser 2018-C2, Cl A5 | | | | | | | | |
4.314%, 12/15/51 | | | 1,011 | | | | 1,137 | |
| | |
Benchmark Mortgage Trust,Ser 2018-B2, Cl A5 3.882%, 02/15/51 (E) | | | 100 | | | | 109 | |
| | |
Benchmark Mortgage Trust,Ser 2018-B6, Cl A4 4.261%, 10/10/51 | | | 50 | | | | 56 | |
| | |
Benchmark Mortgage Trust,Ser 2019-B11, Cl A5 3.542%, 05/15/52 | | | 200 | | | | 215 | |
| | |
Benchmark Mortgage Trust,Ser 2019-B13, Cl A4 2.952%, 08/15/57 | | | 970 | | | | 993 | |
| | |
Benchmark Mortgage Trust,Ser 2019-B9, Cl A5 4.016%, 03/15/52 | | | 57 | | | | 63 | |
| | |
Benchmark Mortgage Trust, Ser B15, Cl A5 2.928%, 12/15/72 | | | 1,125 | | | | 1,150 | |
| | |
Cantor Commercial Real Estate Lending, Ser CF3, Cl A4 3.006%, 01/15/53 | | | 100 | | | | 103 | |
| | |
CD Mortgage Trust,Ser 2017-CD6, Cl A5 3.456%, 11/13/50 | | | 100 | | | | 106 | |
| | |
CD Mortgage Trust,Ser 2019-CD8, Cl A4 2.912%, 08/15/57 | | | 100 | | | | 102 | |
| | |
Citigroup Commercial Mortgage Trust, Ser 2015-GC33, Cl A4 3.778%, 09/10/58 | | | 245 | | | | 262 | |
| | |
Citigroup Commercial Mortgage Trust,Ser 2016-C3, Cl A4 3.154%, 11/15/49 | | | 1,004 | | | | 1,044 | |
| | |
Citigroup Commercial Mortgage Trust,Ser 2016-P6, Cl A5 3.720%, 11/10/26 | | | 914 | | | | 984 | |
| | |
Citigroup Commercial Mortgage Trust,Ser 2017-P7, Cl A4 3.712%, 04/14/50 | | | 500 | | | | 538 | |
| | |
Citigroup Commercial Mortgage Trust,Ser 2018-C5, Cl A4 4.228%, 06/10/51 (E) | | | 100 | | | | 112 | |
| | |
Citigroup Commercial Mortgage Trust, Ser C7, Cl A4 3.102%, 12/15/72 | | | 1,955 | | | | 2,022 | |
| | |
Citigroup Commercial Mortgage Trust, Ser GC43, Cl A4 3.038%, 11/10/52 | | | 985 | | | | 1,015 | |
| | |
Citigroup Mortgage Loan Trust,Ser 2018-A, Cl A1 4.000%, 01/25/68 (A) (E) | | | 591 | | | | 593 | |
The accompanying notes are an integral part of the financial statements.
116
| | |
| THE KP FUNDS | | December 31, 2019 |
| | | | | | | | |
| Description | | Face Amount
(000) | | | Value
(000) | |
| | |
COMM Mortgage Trust, Ser 2013-CCRE9, Cl A4 4.222%, 07/10/45 (E) | | $ | 300 | | | $ | 318 | |
| | |
COMM Mortgage Trust, Ser 2013-CR12, Cl A3 3.765%, 10/10/46 | | | 1,340 | | | | 1,399 | |
| | |
COMM Mortgage Trust,Ser 2013-CR7, Cl A4 3.213%, 03/10/46 | | | 379 | | | | 389 | |
| | |
COMM Mortgage Trust,Ser 2015-DC1, Cl A5 3.350%, 02/10/48 | | | 700 | | | | 729 | |
| | |
COMM Mortgage Trust, Ser 2015-LC23, Cl A4 3.774%, 10/10/48 | | | 1,167 | | | | 1,248 | |
| | |
COMM Mortgage Trust, Ser 2016-CR16, Cl A4 4.051%, 04/10/47 | | | 683 | | | | 725 | |
| | |
Commercial Mortgage Pass-Through Certificates, Ser CR28, Cl A4 3.762%, 02/10/49 | | | 1,365 | | | | 1,457 | |
| | |
Credit Suisse First Boston Mortgage Securities,Ser 2004-AR2, Cl 5A1 4.344%, 03/25/34 (E) | | | 21 | | | | 21 | |
| | |
CSAIL Commercial Mortgage Trust,Ser 2016-C7, Cl A4 3.210%, 11/15/49 | | | 500 | | | | 514 | |
| | |
CSAIL Commercial Mortgage Trust,Ser 2016-C7, Cl A5 3.502%, 11/15/49 | | | 597 | | | | 626 | |
| | |
CSAIL Commercial Mortgage Trust,Ser 2019-C16, Cl A3 3.329%, 06/15/52 | | | 963 | | | | 1,010 | |
| | |
CSFB Mortgage-Backed Pass-Through Certificates,Ser 2003-27, Cl 4A4 5.750%, 11/25/33 | | | 64 | | | | 66 | |
| | |
CSMC Trust, Ser 2018-RPL7, Cl A1
4.000%, 08/26/58 (A) | | | 478 | | | | 481 | |
| | |
GS Mortgage Securities Trust, Ser 2013-GCJ12, Cl A4 3.135%, 06/10/46 | | | 367 | | | | 376 | |
| | |
GS Mortgage Securities Trust, Ser 2014-GC18, Cl A3 3.801%, 01/10/47 | | | 1,424 | | | | 1,480 | |
| | |
GS Mortgage Securities Trust, Ser 2014-GC18, Cl A4 4.074%, 01/10/47 | | | 581 | | | | 617 | |
| | |
GS Mortgage Securities Trust, Ser 2015-GC32, Cl A4 3.764%, 07/10/48 | | | 500 | | | | 534 | |
| | |
GS Mortgage Securities Trust,Ser 2016-GS4, Cl A4 3.442%, 11/10/49 (E) | | | 365 | | | | 385 | |
| | | | | | | | |
| Description | | Face Amount
(000) | | | Value
(000) | |
| | |
GS Mortgage Securities Trust, Ser 2019-GC38, Cl A4 3.968%, 02/10/52 | | $ | 100 | | | $ | 110 | |
| | |
GS Mortgage Securities Trust, Ser 2019-GC42, Cl A4 3.001%, 09/01/52 | | | 100 | | | | 103 | |
| | |
GSR Mortgage Loan Trust,Ser 2005-4F, Cl 6A1 6.500%, 02/25/35 | | | 32 | | | | 32 | |
| | |
HarborView Mortgage Loan Trust,Ser 2004-3, Cl 1A 4.231%, 05/19/34 (E) | | | 25 | | | | 26 | |
| | |
JPMBB Commercial Mortgage Securities Trust,Ser 2014-C19, Cl A3 3.669%, 04/15/47 | | | 500 | | | | 508 | |
| | |
JPMCC Commercial Mortgage Securities Trust,Ser 2017-JP5, Cl A2 3.240%, 03/15/50 | | | 400 | | | | 407 | |
| | |
JPMDB Commercial Mortgage Securities Trust, Ser COR6, Cl A4
3.057%, 11/13/52 | | | 439 | | | | 452 | |
| | |
MLCC Mortgage Investors,Ser 2006-2, Cl 2A 3.925%, 05/25/36 (E) | | | 113 | | | | 115 | |
| | |
Morgan Stanley Bank of America Merrill Lynch Trust,Ser 2014-C19, Cl AS 3.832%, 12/15/47 | | | 500 | | | | 526 | |
| | |
Morgan Stanley Bank of America Merrill Lynch Trust,Ser 2015-C20, Cl A4 3.249%, 02/15/48 | | | 935 | | | | 970 | |
| | |
Morgan Stanley Bank of America Merrill Lynch Trust,Ser 2015-C23, Cl A4 3.719%, 07/15/50 | | | 300 | | | | 319 | |
| | |
Morgan Stanley Bank of America Merrill Lynch Trust,Ser 2015-C24, Cl A4 3.732%, 05/15/48 | | | 1,839 | | | | 1,958 | |
| | |
Morgan Stanley Capital I Trust,Ser 2014-CPT, Cl A 3.350%, 07/13/29 (A) | | | 1,104 | | | | 1,120 | |
| | |
Morgan Stanley Capital I Trust,Ser 2017-HR2, Cl A4 3.587%, 12/15/50 | | | 250 | | | | 268 | |
| | |
Morgan Stanley Capital I Trust,Ser 2019-H7, Cl A4 3.261%, 07/15/52 | | | 100 | | | | 104 | |
| | |
Tharaldson Hotel Portfolio Trust,Ser 2018-THL, Cl A 2.460%, VAR ICE LIBOR USD 1 Month+0.750%, 11/11/34 (A) | | | 293 | | | | 293 | |
The accompanying notes are an integral part of the financial statements.
117
| | |
| THE KP FUNDS | | December 31, 2019 |
| | | | | | | | |
| Description | | Face Amount
(000) | | | Value
(000) | |
| | |
UBS Commercial Mortgage Trust,Ser 2018-C8, Cl A4 3.983%, 02/15/51 | | $ | 300 | | | $ | 329 | |
| | |
UBS Commercial Mortgage Trust, Ser C18, Cl A4 3.035%, 12/15/52 | | | 100 | | | | 102 | |
| | |
Wells Fargo Commercial Mortgage Trust,Ser 2015-C28, Cl A4 3.540%, 05/15/48 | | | 700 | | | | 739 | |
| | |
Wells Fargo Commercial Mortgage Trust,Ser 2015-C31, Cl A4 3.695%, 11/15/48 | | | 985 | | | | 1,051 | |
| | |
Wells Fargo Commercial Mortgage Trust,Ser 2015-P2, Cl A4
3.809%, 12/15/48 | | | 638 | | | | 684 | |
| | |
Wells Fargo Commercial Mortgage Trust,Ser 2016-C34, Cl A4 3.096%, 06/15/49 | | | 1,338 | | | | 1,377 | |
| | |
Wells Fargo Commercial Mortgage Trust,
Ser 2016-LC25, Cl A4 3.640%, 12/15/59 | | | 999 | | | | 1,069 | |
| | |
Wells Fargo Commercial Mortgage Trust,Ser 2017-C42 3.589%, 12/15/50 | | | 1,487 | | | | 1,592 | |
| | |
Wells Fargo Commercial Mortgage Trust,Ser 2019-C49, Cl A4 3.760%, 03/15/52 | | | 394 | | | | 428 | |
| | |
Wells Fargo Commercial Mortgage Trust,Ser 2019-C49, Cl A5 4.023%, 03/15/52 | | | 100 | | | | 110 | |
| | |
Wells Fargo Commercial Mortgage Trust,Ser 2019-C52, Cl A5 2.892%, 08/15/52 | | | 100 | | | | 102 | |
| | |
Wells Fargo Commercial Mortgage Trust,
Ser C54, Cl A4 3.146%, 12/15/52 | | | 1,114 | | | | 1,155 | |
| | |
WFRBS Commercial Mortgage Trust,Ser 2013-C13, Cl A3 2.749%, 05/15/45 | | | 438 | | | | 445 | |
| | |
WFRBS Commercial Mortgage Trust,Ser 2013-C14, Cl A5 3.337%, 06/15/46 | | | 60 | | | | 62 | |
| | |
WFRBS Commercial Mortgage Trust,Ser 2014-C25, Cl A5 3.631%, 11/15/47 | | | 1,387 | | | | 1,464 | |
| | | | | | | | |
| | |
| | | | | | | 45,411 | |
| | | | | | | | |
| |
Total Mortgage-Backed Securities
(Cost $550,805) (000) | | | | 558,198 | |
| | | | | | | | |
| | | | | | | | |
| Description | | Face Amount
(000) | | | Value
(000) | |
LOAN PARTICIPATIONS — 9.5% | |
|
Airlines — 0.1% | |
| | |
American Airlines, Inc., 2017 Replacement Term Loan (New), 1st Lien 3.715%, 10/10/21 | | $ | 495 | | | $ | 496 | |
| | |
American Airlines, Inc., 2018 Replacement Term Loan | | | | | | | | |
3.450%, VAR LIBOR+1.750%, 06/27/25 | | | 1,230 | | | | 1,231 | |
| | | | | | | | |
| | |
| | | | | | | 1,727 | |
| | | | | | | | |
|
Automobile — 0.1% | |
| | |
Belron Finance US LLC, Initial Term B Loan, 1st Lien | | | | | | | | |
4.144%, VAR
LIBOR+2.250%, 11/07/24 | | | 980 | | | | 983 | |
| | |
Panther BF Aggregator 2 L P, Initial Dollar Term Loan, 1st Lien | | | | | | | | |
5.305%, VAR LIBOR+3.500%, 04/30/26 | | | 1,646 | | | | 1,649 | |
| | | | | | | | |
| | |
| | | | | | | 2,632 | |
| | | | | | | | |
|
Automotive — 0.1% | |
| | |
Chassix Inc., Term Loan B 7.438%, 11/15/23 | | | 239 | | | | 219 | |
| | |
Chassix, Inc., Initial Loan, 1st Lien
9.250%, 11/15/23 | | | 1 | | | | 1 | |
7.438%, 11/15/23 | | | 250 | | | | 229 | |
| | |
Dayco Products, LLC, Term Loan, 1st Lien
| | | | | | | | |
6.159%, VAR LIBOR+4.250%, 05/08/23 | | | 683 | | | | 594 | |
| | |
Honeywell Technologies Sàrl, Dollar Tranche B Term Loan 4.600%, 09/19/25 | | | 739 | | | | 735 | |
| | |
TI Group Automotive Systems, LLC, Initial US Term Loan, 1st Lien | | | | | | | | |
4.202%, VAR LIBOR+2.500%, 06/24/22 | | | 1,438 | | | | 1,440 | |
| | | | | | | | |
| | |
| | | | | | | 3,218 | |
| | | | | | | | |
|
Banking — 0.0% | |
| | |
Azalea TopCo, Inc., Initial Term Loan, 1st Lien
| | | | | | | | |
5.202%, VAR LIBOR+3.500%, 07/23/26 | | | 570 | | | | 573 | |
| | | | | | | | |
|
Beverage, Food and Tobacco — 0.0% | |
| | |
K-Mac Holdings Corp., Initial Term Loan, 1st Lien | | | | | | | | |
4.702%, VAR LIBOR+3.000%, 03/07/25 | | | 495 | | | | 487 | |
The accompanying notes are an integral part of the financial statements.
118
| | |
| THE KP FUNDS | | December 31, 2019 |
| | | | | | | | |
| Description | | Face Amount
(000) | | | Value
(000) | |
| | |
K-Mac Holdings Corp., Initial Term Loan, 2nd Lien | | | | | | | | |
8.452%, VAR LIBOR+6.750%, 03/09/26 | | $ | 291 | | | $ | 281 | |
| | | | | | | | |
| | |
| | | | | | | 768 | |
| | | | | | | | |
| |
Broadcasting and Entertainment — 0.3% | | | | | |
| | |
Charter Communications Operating, LLC, TermB-2 Loan, 1st Lien
3.550%, VAR LIBOR+1.750%, 02/01/27 | | | 499 | | | | 502 | |
| | |
CSC Holdings, LLC, March 2017 Refinancing Term Loan, 1st Lien
3.990%, VAR LIBOR+2.250%, 07/17/25 | | | 747 | | | | 747 | |
| | |
Diamond Sports Group, LLC, Term Loan, 1st Lien
5.030%, VAR LIBOR+3.250%, 08/24/26 | | | 1,496 | | | | 1,493 | |
| | |
NEP Group, Inc., Initial Dollar Term Loan, 1st Lien
4.952%, VAR LIBOR+3.250%, 10/20/25 | | | 376 | | | | 369 | |
| | |
NEP Group, Inc., Initial Loan, 2nd Lien
8.702%, VAR LIBOR+7.000%, 10/05/26 | | | 500 | | | | 449 | |
| | |
Numericable U.S. LLC, USDTLB-11 Term Loan, 1st Lien
4.549%, VAR LIBOR+2.750%, 07/31/25 | | | 249 | | | | 247 | |
| | |
Numericable U.S. LLC, USDTLB-12 Term Loan, 1st Lien
5.427%, VAR LIBOR+3.688%, 01/31/26 | | | 1,472 | | | | 1,472 | |
| | |
Technicolor S.A., First Incremental U.S. Term Loan, 1st Lien
4.659%, VAR LIBOR+2.750%, 12/06/23 | | | 486 | | | | 404 | |
| | |
Virgin Media Bristol LLC, N Facility, 1st Lien
4.240%, VAR LIBOR+2.500%, 01/31/28 | | | 1,150 | | | | 1,156 | |
| | |
Ziggo Secured Finance Partnership, Term Loan E Facility, 1st Lien
4.240%, VAR LIBOR+2.500%, 04/15/25 | | | 1,000 | | | | 1,003 | |
| | | | | | | | |
| | |
| | | | | | | 7,842 | |
| | | | | | | | |
| | | | | | | | |
| Description | | Face Amount
(000) | | | Value
(000) | |
| | |
Building Materials — 0.1% | | | | | | | | |
| | |
Beacon Roofing Supply, Inc., Initial Term Loan, 1st Lien
4.049%, VAR LIBOR+2.250%, 01/02/25 | | $ | 979 | | | $ | 982 | |
| | |
Foundation Building Materials Holding Company LLC, Term Loan, 1st Lien
4.799%, 05/09/25 | | | 751 | | | | 754 | |
| | |
Priso Acquisition Corporation (aka PrimeSource Building Products), Term B Loan, 1st Lien
4.859%, VAR LIBOR+3.000%, 05/08/22 | | | 966 | | | | 942 | |
| | | | | | | | |
| | |
| | | | | | | 2,678 | |
| | | | | | | | |
| |
Buildings and Real Estate — 0.2% | | | | | |
| | |
Claros Mortgage Trust, Inc., Initial Term Loan, 1st Lien
4.960%, VAR LIBOR+3.250%, 08/05/26 | | | 408 | | | | 410 | |
| | |
Forest City Enterprises, L.P., Replacement Term Loan,
1st Lien
5.299%, VAR LIBOR+3.500%, 12/08/25 | | | 1,019 | | | | 1,023 | |
| | |
Pike Corporation, Initial Term Loan (2019), 1st Lien
5.050%, VAR LIBOR+3.250%, 07/24/26 | | | 977 | | | | 982 | |
| | |
VICI Properties 1 LLC, Term B Loan, 1st Lien
3.785%, VAR LIBOR+2.000%, 12/20/24 | | | 1,164 | | | | 1,169 | |
| | | | | | | | |
| | |
| | | | | | | 3,584 | |
| | | | | | | | |
|
Cable/Wireless Video — 0.1% | |
| | |
Charter Communications Operating LLC, Term Loan, 1st Lien
3.550%, 04/30/25 | | | 1,405 | | | | 1,414 | |
| | | | | | | | |
|
Cargo Transport — 0.1% | |
| | |
International Seaways Operating Corporation, Term Loan, 1st Lien
7.800%, VAR LIBOR+6.000%, 06/22/22 | | | 417 | | | | 417 | |
| | |
XPO Logistics, Inc., Refinancing Term Loan (2018), 1st Lien
3.702%, VAR LIBOR+2.000%, 02/24/25 | | | 1,046 | | | | 1,052 | |
| | | | | | | | |
| | |
| | | | | | | 1,469 | |
| | | | | | | | |
The accompanying notes are an integral part of the financial statements.
119
| | |
| THE KP FUNDS | | December 31, 2019 |
| | | | | | | | |
| Description | | Face Amount
(000) | | | Value
(000) | |
| | |
Chemicals — 0.7% | | | | | | | | |
| | |
AkzoNobel (Starfruit), Term Loan B
4.960%, VAR LIBOR+3.250%, 10/01/25 | | $ | 1,619 | | | $ | 1,617 | |
| | |
Allnex (Luxembourg) & Cy S.C.A. (f/k/a AI Chem & Cy S.C.A.), TrancheB-2 Term Loan, 1st Lien
5.164%, VAR LIBOR+3.250%, 06/02/23 | | | 689 | | | | 680 | |
4.941%, VAR LIBOR+3.250%, 06/02/23 | | | 2 | | | | 2 | |
| | |
Allnex (Luxembourg) & Cy S.C.A. (f/k/a AI Chem & Cy S.C.A.), TrancheB-3 Term Loan
5.164%, VAR LIBOR+3.250%, 06/02/23 | | | 519 | | | | 513 | |
4.941%, VAR LIBOR+3.250%, 06/02/23 | | | 1 | | | | 1 | |
| | |
Archroma Finance S.a r.l., Facility B2, 1st Lien
5.984%, VAR LIBOR+4.250%, 08/12/24 | | | 800 | | | | 794 | |
5.982%, VAR LIBOR+4.250%, 08/12/24 | | | 6 | | | | 6 | |
| | |
Ascend Performance
Term Loan B (2019)
7.354%, VAR LIBOR+5.250%, 08/14/26 | | | 935 | | | | 942 | |
| | |
ASP Chromaflo Intermediate Holdings, Inc., Initial TrancheB-1 Term Loan
5.202%, VAR LIBOR+3.500%, 11/20/23 | | | 395 | | | | 377 | |
| | |
ASP Chromaflo Intermediate Holdings, Inc., Initial TrancheB-2 Term Loan
5.202%, VAR LIBOR+3.500%, 11/20/23 | | | 513 | | | | 490 | |
| | |
Dubois Chemicals, Term Loan, 1st Lien
6.510%, 09/30/26 | | | 750 | | | | 752 | |
| | |
Ferro Corporation, TrancheB-1 Term Loan, 1st Lien
4.354%, 02/14/24 (E) | | | 761 | | | | 759 | |
| | |
Flint Group, Term Loan, 1st Lien 4.936%, 09/07/21 (E) | | | 729 | | | | 629 | |
| | |
INEOS Styrolution US Holding LLC (fka Styrolution US Holding LLC), New 2024 Dollar Term Loan 4.104%, 03/29/24 (E) | | | 216 | | | | 216 | |
| | |
Messer Industries GmbH, Initial TermB-1 Loan 4.604%, 03/01/26 | | | 871 | | | | 875 | |
| | | | | | | | |
| Description | | Face Amount
(000) | | | Value
(000) | |
| | |
Orion Engineered Carbons GmbH, Initial Dollar Term Loan, 1st Lien
4.104%, VAR LIBOR+2.000%, 07/25/24 | | $ | 1,335 | | | $ | 1,335 | |
| | |
PMHC II, Inc., Initial Term Loan 5.604%, 03/21/25 | | | 235 | | | | 208 | |
5.604%, 03/31/25 | | | 753 | | | | 667 | |
| | |
PQ Corporation, Third Amendment TrancheB-1 Term Loan
4.427%, 02/08/25 (E) | | | 1,376 | | | | 1,382 | |
| | |
Ravago Holdings America, Inc., Term Loan, 1st Lien
4.460%, VAR LIBOR+2.750%, 06/30/23 | | | 308 | | | | 309 | |
| | |
Schenectady International Group, Inc., Initial Term Loan 6.695%, 10/15/25 | | | 30 | | | | 30 | |
| | |
Schenectady International Group, Inc., Initial Term Loan, 1st Lien
6.793%, 10/15/25 (E) | | | 1,308 | | | | 1,299 | |
| | |
Tricorbraun Holdings, Inc., Closing Date Term Loan, 1st Lien
5.854%, 11/30/23 (E) | | | 530 | | | | 524 | |
5.678%, 11/30/23 | | | 48 | | | | 47 | |
| | |
Tronox Limited, Initial Dollar Term Loan
4.854%, VAR LIBOR+2.750%, 09/23/24 | | | 513 | | | | 513 | |
| | |
U.S. Farathane, LLC, TermB-4 Loan, 1st Lien
5.202%, VAR LIBOR+3.500%, 12/31/21 | | | 1,114 | | | | 1,003 | |
| | |
Vantage Specialty Chemicals, Inc., Closing Date Term Loan 5.427%, 10/28/24 | | | 29 | | | | 27 | |
| | |
Vantage Specialty Chemicals, Inc., Closing Date Term Loan, 1st Lien
5.427%, 10/28/24 | | | 321 | | | | 298 | |
5.202%, VAR LIBOR+4.000%, 10/28/24 | | | 381 | | | | 354 | |
| | |
Vantage Specialty Chemicals, Inc., Initial Loan
10.159%, VAR LIBOR+8.250%, 10/20/25 | | | 205 | | | | 176 | |
| | | | | | | | |
| | |
| | | | | | | 16,825 | |
| | | | | | | | |
|
Chemicals, Plastics and Rubber — 0.3% | |
| | |
Acuity Specialty Products, Inc., Initial Term Loan, 1st Lien
6.104%, VAR LIBOR+4.000%, 08/12/24 | | | 973 | | | | 747 | |
The accompanying notes are an integral part of the financial statements.
120
| | |
| THE KP FUNDS | | December 31, 2019 |
| | | | | | | | |
| Description | | Face Amount
(000) | | | Value
(000) | |
| | |
Axalta Coating Systems Dutch Holding B B.V. (Axalta Coating Systems U.S. Holdings, Inc.), TermB-3 Dollar Loan, 1st Lien
3.695%, VAR LIBOR+1.750%, 06/01/24 | | $ | 1,562 | | | $ | 1,564 | |
| | |
Klockner Pentaplast of America, Inc. (fka Kleopatra Acquisition Corp), Dollar Term Loan, 1st Lien
6.177%, VAR LIBOR+4.250%, 06/30/22 | | | 686 | | | | 616 | |
| | |
Nouryon Finance B.V., Initial Dollar Term Loan, 1st Lien
4.960%, VAR LIBOR+3.250%, 10/01/25 | | | 316 | | | | 316 | |
| | |
Solenis Holdings LLC, Initial Dollar Term Loan, 1st Lien
5.909%, VAR LIBOR+4.000%, 06/26/25 | | | 742 | | | | 733 | |
5.702%, VAR LIBOR+4.000%, 06/26/25 | | | 2 | | | | 2 | |
| | |
Tronox Finance LLC, Initial Dollar Term Loan, 1st Lien
4.695%, VAR LIBOR+2.750%, 09/23/24 | | | 727 | | | | 728 | |
| | |
Univar Solutions USA Inc., TermB-3 Loan, 1st Lien
3.952%, VAR LIBOR+2.250%, 07/01/24 | | | 842 | | | | 845 | |
| | |
Wilsonart LLC, Tranche D Term Loan, 1st Lien
5.200%, VAR LIBOR+3.250%, 12/19/23 (F) | | | 488 | | | | 488 | |
| | | | | | | | |
| | |
| | | | | | | 6,039 | |
| | | | | | | | |
|
Commercial Services — 0.0% | |
| | |
Autokiniton US Holdings, Inc., Closing Date Term B Loan, 1st Lien
8.077%, 05/17/25 (E) | | | 575 | | | | 569 | |
| | | | | | | | |
|
Communication Services — 0.6% | |
| | |
Altice Financing S.A., March 2017 Refinancing Term Loan
4.490%, VAR LIBOR+2.750%, 07/15/25 | | | 931 | | | | 927 | |
| | |
Centurylink, Term Loan B
4.549%, VAR LIBOR+2.750%, 01/31/25 | | | 1,837 | | | | 1,843 | |
| | |
Commscope, Inc., Initial Term Loan, 1st Lien
5.049%, VAR LIBOR+3.250%, 04/06/26 | | | 1,472 | | | | 1,480 | |
| | | | | | | | |
| Description | | Face Amount
(000) | | | Value
(000) | |
| | |
CPI International, Inc., Initial Term Loan, 1st Lien 8.952%, 07/25/25 (E) | | $ | 313 | | | $ | 299 | |
| | |
Excelitas Technologies Corp. (fka EXC Holdings III Corp.), Initial USD Term Loan, 1st Lien
5.604%, VAR LIBOR+3.500%, 11/15/24 | | | 980 | | | | 977 | |
| | |
Flight Bidco Inc., Initial Term Loan
5.200%, 07/23/25 | | | 613 | | | | 613 | |
| | |
Flight Bidco Inc., Initial Term Loan, 1st Lien 9.200%, 06/19/26 | | | 556 | | | | 549 | |
| | |
Level 3 Financing, Term Loan, 1st Lien
3.549%, 03/01/27 | | | 2,045 | | | | 2,052 | |
| | |
MTN Infrastructure TopCo, Inc., Initial Term Loan, 1st Lien
4.799%, VAR LIBOR+3.000%, 11/15/24 | | | 990 | | | | 989 | |
| | |
Prometric Holdings Inc. (fka ETS Holdings Inc.), Initial Term Loan, 1st Lien
4.710%, VAR LIBOR+3.000%, 01/17/25 | | | 985 | | | | 981 | |
| | |
SBA Senior Finance II LLC, Initial Term Loan, 1st Lien
3.460%, VAR LIBOR+1.750%, 04/11/25 | | | 1,203 | | | | 1,206 | |
| | |
Sprint Communications, Inc., Initial Term Loan, 1st Lien
4.313%, VAR LIBOR+2.500%, 02/02/24 | | | 1,755 | | | | 1,738 | |
| | |
Zayo Group LLC (Zayo Capital, Inc.), 2017 Incremental RefinancingB-2 Term Facility
3.952%, VAR LIBOR+2.250%, 01/19/24 | | | 1,226 | | | | 1,229 | |
| | | | | | | | |
| | |
| | | | | | | 14,883 | |
| | | | | | | | |
|
Computers & Electronics — 0.6% | |
| | |
Applied Systems, Inc., Initial Term Loan
5.195%, VAR LIBOR+3.000%, 09/19/24 | | | 748 | | | | 751 | |
| | |
Brooks Automation, Inc., Initial Term B Loan 4.460%, 10/04/24 (E) | | | 499 | | | | 498 | |
| | |
CPI International, Inc., Initial Term Loan, 1st Lien
5.202%, VAR LIBOR+3.500%, 07/26/24 | | | 358 | | | | 344 | |
The accompanying notes are an integral part of the financial statements.
121
| | |
| THE KP FUNDS | | December 31, 2019 |
| | | | | | | | |
| Description | | Face Amount
(000) | | | Value
(000) | |
| | |
Cypress Intermediate Holdings III, Inc. (fka Jaguar Holding Inc.), Initial Term Loan
4.550%, VAR LIBOR+3.000%, 04/29/24 | | $ | 1,228 | | | $ | 1,230 | |
| | |
Epicor Software Corporation (fka Eagle Parent Inc.), Term B Loan, 1st Lien
5.050%, VAR LIBOR+3.250%, 06/01/22 | | | 1,717 | | | | 1,725 | |
| | |
Flexera Software LLC (fka Flexera Software, Inc.), Initial Term Loan, 2nd Lien 8.960%, 02/26/26 (G) | | | 250 | | | | 249 | |
| | |
Hyland Software Inc., 1st Lien 5.299%, 07/01/24 | | | 638 | | | | 641 | |
| | |
Infor (US), Inc. (fka Lawson Software Inc.) , TrancheB-6 Term Loan
4.854%, VAR LIBOR+2.750%, 02/01/22 | | | 1,920 | | | | 1,927 | |
| | |
MA Financeco., LLC, TrancheB-2 Term Loan, 1st Lien
4.049%, VAR LIBOR+2.500%, 11/19/21 | | | 181 | | | | 182 | |
| | |
MACOM Technology Solutions Holdings, Inc. (fkaM/A-COM Technology Solutions Holdings, Inc.), Initial Term Loan, 1st Lien
3.952%, VAR LIBOR+2.250%, 05/07/24 | | | 1,056 | | | | 1,003 | |
| | |
Oberthur Technologies Holding S.A.S. (fka OT Frenchco 1 SAS), Facility B1 (USD), 1st Lien
5.854%, VAR LIBOR+3.750%, 01/10/24 | | | 1,361 | | | | 1,342 | |
| | |
Project Alpha, Term Loan B, 1st Lien
6.240%, 04/26/24 | | | 1,131 | | | | 1,138 | |
| | |
Project Ruby Ultimate Parent Corp., New Term Loan
5.202%, VAR LIBOR+3.500%, 02/09/24 | | | 1,556 | | | | 1,540 | |
| | |
Solera, LLC (Solera Finance, Inc.), Dollar Term Loan, 1st Lien
4.549%, VAR LIBOR+2.750%, 03/03/23 | | | 1,902 | | | | 1,904 | |
| | | | | | | | |
| | |
| | | | | | | 14,474 | |
| | | | | | | | |
|
Containers, Packaging and Glass — 0.1% | |
| | |
Berry Global, Inc. (fka Berry Plastics Corporation), Term U Loan, 1st Lien
4.215%, VAR LIBOR+2.500%, 07/01/26 | | | 995 | | | | 997 | |
| | | | | | | | |
| Description | | Face Amount
(000) | | | Value
(000) | |
| | |
Flex Acquisition Company, Inc., Initial Term Loan, 1st Lien
5.099%, VAR LIBOR+3.000%, 12/29/23 | | $ | 1,303 | | | $ | 1,291 | |
4.691%, VAR LIBOR+3.000%, 12/29/23 | | | 24 | | | | 23 | |
| | | | | | | | |
| | |
| | | | | | | 2,311 | |
| | | | | | | | |
|
Diversified/Conglomerate Manufacturing — 0.0% | |
| | |
Filtration Group Corporation, Initial Dollar Term Loan
4.702%, VAR LIBOR+3.000%, 03/28/25 | | | 915 | | | | 918 | |
| | | | | | | | |
|
Diversified/Conglomerate Service — 0.4% | |
| | |
athenahealth, Inc., Term B Loan, 1st Lien
6.912%, VAR LIBOR+4.500%, 02/11/26 | | | 4 | | | | 4 | |
6.401%, VAR LIBOR+4.500%, 02/11/26 | | | 1,527 | | | | 1,533 | |
| | |
Brand Energy & Infrastructure Services, Inc. (fka FR Brand Acquisition Corp), Initial Term Loan, 1st Lien
6.354%, VAR LIBOR+4.250%, 06/21/24 | | | 2 | | | | 2 | |
6.293%, VAR LIBOR+4.250%, 06/21/24 | | | 408 | | | | 407 | |
6.184%, VAR LIBOR+4.250%, 06/14/24 | | | 260 | | | | 259 | |
6.184%, VAR LIBOR+4.250%, 06/21/24 | | | 203 | | | | 202 | |
| | |
PODS, LLC, TrancheB-4 Term Loan, 1st Lien
4.490%, VAR LIBOR+2.750%, 12/06/24 | | | 1,489 | | | | 1,495 | |
| | |
Sedgwick Claims Management Services, Inc. (Lightning Cayman Merger Sub, Ltd.), Initial Term Loan, 1st Lien
5.049%, VAR LIBOR+3.250%, 12/31/25 | | | 897 | | | | 896 | |
| | |
Tempo Acquisition, LLC, Initial Term Loan, 1st Lien
4.549%, VAR LIBOR+2.750%, 05/01/24 | | | 1,403 | | | | 1,414 | |
| | |
USS Ultimate Holdings, Inc., Initial Term Loan, 1st Lien
5.950%, VAR LIBOR+3.750%, 08/09/24 | | | 609 | | | | 610 | |
| | |
WEX Inc., TermB-3 Loan, 1st Lien
3.952%, VAR LIBOR+2.250%, 05/14/26 | | | 1,220 | | | | 1,226 | |
The accompanying notes are an integral part of the financial statements.
122
| | |
| THE KP FUNDS | | December 31, 2019 |
| | | | | | | | |
| Description | | Face Amount
(000) | | | Value
(000) | |
| | |
William Morris Endeavor Entertainment, LLC (IMG Worldwide Holdings, LLC), TermB-1 Loan, 1st Lien
4.680%, VAR LIBOR+2.750%, 05/16/25 | | $ | 59 | | | $ | 58 | |
4.680%, VAR LIBOR+2.750%, 05/18/25 | | | 642 | | | | 638 | |
4.620%, VAR LIBOR+2.750%, 05/16/25 | | | 4 | | | | 4 | |
4.550%, VAR LIBOR+2.750%, 05/18/25 | | | 854 | | | | 849 | |
4.460%, VAR LIBOR+2.750%, 05/16/25 | | | 78 | | | | 78 | |
| | | | | | | | |
| | |
| | | | | | | 9,675 | |
| | | | | | | | |
|
Ecological — 0.1% | |
| | |
Cast & Crew Payroll, LLC, Initial Term Loan, 1st Lien
5.800%, VAR LIBOR+4.000%, 02/09/26 | | | 534 | | | | 536 | |
| | |
Strategic Materials Holding Corp., Initial Term Loan, 1st Lien
5.677%, VAR LIBOR+3.750%, 11/01/24 | | | 735 | | | | 587 | |
| | |
Strategic Materials Holding Corp., Initial Term Loan, 2nd Lien
9.677%, VAR LIBOR+7.750%, 10/31/25 | | | 500 | | | | 340 | |
| | | | | | | | |
| | |
| | | | | | | 1,463 | |
| | | | | | | | |
|
Educational Services — 0.1% | |
| | |
Adtalem Global Education Inc., Term B Loan, 1st Lien 4.702%, 04/09/25 (E) | | | 242 | | | | 241 | |
| | |
Global Education Management Systems Establishment, Term Loan, 1st Lien 6.909%, 07/30/26 | | | 750 | | | | 755 | |
| | |
Learning Care Group (US) No. 2 Inc., Initial Term Loan, 1st Lien 5.195%, 03/13/25 | | | 92 | | | | 93 | |
5.190%, 03/13/25 | | | 221 | | | | 221 | |
5.177%, 03/13/25 | | | 221 | | | | 221 | |
| | |
Learning Care, Term Loan B, 1st Lien
5.435%, 03/13/25 (E) | | | 660 | | | | 661 | |
| | | | | | | | |
| | |
| | | | | | | 2,192 | |
| | | | | | | | |
|
Electronics — 0.7% | |
| | |
Airxcel, Inc., Initial Term Loan, 1st Lien
6.202%, VAR LIBOR+4.500%, 04/25/25 | | | 739 | | | | 722 | |
| | | | | | | | |
| Description | | Face Amount
(000) | | | Value
(000) | |
| | |
Airxcel, Inc., Initial Term Loan, 2nd Lien
10.452%, VAR LIBOR+8.750%, 04/27/26 | | $ | 500 | | | $ | 447 | |
| | |
Almonde Inc., Term Loan
9.446%, VAR LIBOR+7.250%, 06/13/25 | | | 150 | | | | 146 | |
| | |
Aston FinCo S.a r.l., Dollar Term Loan, 1st Lien
6.262%, VAR LIBOR+4.250%, 09/21/26 (G) | | | 650 | | | | 644 | |
| | |
Cohu, Inc., Initial Term B Loan, 1st Lien
5.200%, VAR LIBOR+3.000%, 09/19/25 | | | 1,152 | | | | 1,141 | |
| | |
Flexera Software LLC (fka Flexera Software, Inc.), Initial Term Loan
5.210%, VAR LIBOR+3.500%, 02/26/25 | | | 1,394 | | | | 1,396 | |
| | |
Go Daddy Operating Company, LLC (GD Finance Co, Inc.), TrancheB-2 Term Loan, 1st Lien
3.452%, VAR LIBOR+1.750%, 02/15/24 | | | 982 | | | | 987 | |
| | |
Kronos Incorporated, Incremental Term Loan, 1st Lien
4.909%, VAR LIBOR+3.000%, 11/01/23 | | | 1,261 | | | | 1,266 | |
| | |
MA Financeco., LLC, TrancheB-3 Term Loan, 1st Lien
4.299%, VAR LIBOR+2.500%, 06/21/24 | | | 174 | | | | 174 | |
| | |
Micro Holdings (Internet Brands), Term Loan (2017)
5.549%, VAR LIBOR+3.750%, 09/13/24 | | | 741 | | | | 741 | |
| | |
Micro Holdings (Internet Brands), Term Loan, 2nd Lien
9.299%, VAR LIBOR+7.500%, 09/15/25 | | | 244 | | | | 243 | |
| | |
Microchip Technology Incorporated, Initial Term Loan, 1st Lien
3.800%, VAR LIBOR+2.000%, 05/23/25 | | | 1,196 | | | | 1,202 | |
| | |
Misys Limited, Dollar Term Loan, 1st Lien
5.696%, VAR LIBOR+3.500%, 06/13/24 | | | 499 | | | | 495 | |
| | |
Project Alpha Intermediate Holding, Inc., Term Loan, 1st Lien
5.490%, VAR LIBOR+3.500%, 04/19/24 | | | 248 | | | | 248 | |
The accompanying notes are an integral part of the financial statements.
123
| | |
| THE KP FUNDS | | December 31, 2019 |
| | | | | | | | |
| Description | | Face Amount
(000) | | | Value
(000) | |
| | |
Project Boost Purchaser, LLC, Term Loan, 1st Lien
5.299%, VAR LIBOR+3.500%, 06/01/26 | | $ | 832 | | | $ | 834 | |
| | |
Seattle SpinCo, Inc., Initial Term Loan, 1st Lien
4.299%, VAR LIBOR+2.500%, 06/21/24 | | | 1,176 | | | | 1,177 | |
| | |
SolarWinds Holdings, Inc., 2018 Refinancing Term Loan
4.452%, VAR LIBOR+2.750%, 02/05/24 | | | 497 | | | | 500 | |
| | |
SS&C Technologies Holdings, Inc., TermB-3 Loan, 1st Lien
4.049%, VAR LIBOR+2.250%, 04/16/25 | | | 902 | | | | 908 | |
| | |
SS&C Technologies Holdings, Inc., TermB-4 Loan, 1st Lien
4.049%, VAR LIBOR+2.250%, 04/16/25 | | | 626 | | | | 630 | |
| | |
Ultimate Software Group Inc., The, Initial Term Loan, 1st Lien
5.549%, VAR LIBOR+3.750%, 05/04/26 | | | 1,496 | | | | 1,505 | |
| | |
Vertiv Group Corporation (fka Cortes NP Acquisition Corporation), Term B Loan, 1st Lien
5.927%, VAR LIBOR+4.000%, 11/30/23 | | | 1,203 | | | | 1,199 | |
| | | | | | | | |
| | |
| | | | | | | 16,605 | |
| | | | | | | | |
|
Entertainment & Leisure — 0.2% | |
| | |
AMC Entertainment Holdings, Inc. (fka AMC Entertainment Inc.), TermB-1 Loan, 1st Lien 4.800%, 04/22/26 | | | 1,549 | | | | 1,560 | |
| | |
Callaway Golf Company, Term Loan, 1st Lien 6.236%, 12/17/25 | | | 888 | | | | 897 | |
| | |
Merlin Entertainments, Term Loan 1st Lien
%, 10/16/26 | | | 87 | | | | 88 | |
| | |
Metro-Goldwyn-Mayer Inc., Initial Term Loan
4.210%, 06/27/25 | | | 429 | | | | 429 | |
| | |
Seaworld Parks & Entertainment, Inc. (f/k/a SW Acquisitions Co., Inc.), TermB-5 Loan, 1st Lien
4.702%, 04/01/24 (E) | | | 1,234 | | | | 1,239 | |
| | | | | | | | |
| | |
| | | | | | | 4,213 | |
| | | | | | | | |
| | | | | | | | |
| Description | | Face Amount
(000) | | | Value
(000) | |
| | |
Environmental Services — 0.1% | | | | | | | | |
| | |
GFL Environmental Inc., Effective Date Incremental Term Loan 4.799%, 05/30/25 (E) | | $ | 1,463 | | | $ | 1,464 | |
| | | | | | | | |
|
Financial Services — 0.5% | |
| | |
Achilles Acquisition LLC, Closing Date Term Loan, 1st Lien
5.750%, VAR LIBOR+4.000%, 10/04/25 | | | 993 | | | | 1,000 | |
| | |
Altisource Solutions, Term Loan B, 1st Lien
6.104%, 03/29/24 (E) | | | 545 | | | | 517 | |
| | |
American Builders & Contractors Supply Co., Inc., Restatement Effective Date Term Loan, 1st Lien
3.702%, VAR LIBOR+2.000%, 01/15/27 | | | 1,247 | | | | 1,252 | |
| | |
AssuredPartners, Inc., 2017 September Refinancing Term Loan, 1st Lien
5.202%, VAR LIBOR+3.500%, 10/22/24 | | | 1,225 | | | | 1,228 | |
| | |
BCP Renaissance Parent L.L.C., Initial Term Loan, 1st Lien
5.363%, VAR LIBOR+3.500%, 10/31/24 | | | 459 | | | | 406 | |
| | |
BIFM US Finance, LLC, Term Loan 1st Lien
5.452%, 05/01/26 | | | 997 | | | | 999 | |
| | |
Capital Automotive L.P., Initial TrancheB-2 Term Loan, 1st Lien
4.210%, VAR LIBOR+2.500%, 03/21/24 | | | 1,055 | | | | 1,057 | |
| | |
Citco Funding LLC, 2017 Term Loan, 1st Lien
4.202%, VAR LIBOR+3.000%, 03/23/22 | | | 1,440 | | | | 1,436 | |
| | |
Ditech Holding Corporation (fka Walter Investment Management Corp.), Tranche B Term Loan, 1st Lien
12.000%, VAR LIBOR+6.000%, 06/30/22 (C) | | | 458 | | | | 185 | |
| | |
Hudson River Trading LLC, Repriced Term Loan, 1st Lien 5.202%, 03/20/25 | | | 594 | | | | 597 | |
| | |
Liquidnet Holdings, Inc., Term Loan
4.952%, 07/15/24 | | | 481 | | | | 462 | |
| | |
Newport Group Holdings II, Inc., Initial Term Loan 5.649%, 08/08/25 | | | 441 | | | | 440 | |
The accompanying notes are an integral part of the financial statements.
124
| | |
| THE KP FUNDS | | December 31, 2019 |
| | | | | | | | |
| Description | | Face Amount
(000) | | | Value
(000) | |
| | |
Triton, Term Loan B, 1st Lien 7.702%, 10/31/24 | | $ | 616 | | | $ | 514 | |
| | |
VFH Parent LLC, Initial Term Loan, 1st Lien
5.197%, VAR LIBOR+3.500%, 03/01/26 (F) | | | 1,068 | | | | 1,071 | |
| | |
Virtus Investment 2/17 Term Loan, 1st Lien 4.581%, 03/03/24 (E) | | | 601 | | | | 602 | |
| | | | | | | | |
| | |
| | | | | | | 11,766 | |
| | | | | | | | |
|
Food & Beverage — 0.2% | |
| | |
JBS USA Lux S.A. (fka JBS USA, LLC), New Term Loan, 1st Lien
3.702%, 05/01/26 | | | 667 | | | | 671 | |
| | |
United Natural Foods, Inc., Initial Term Loan, 1st Lien 6.049%, 10/18/25 | | | 1,638 | | | | 1,397 | |
| | |
US Foods (aka U.S. Foodservice), Initial Term Loan, 1st Lien
3.549%, VAR LIBOR+2.500%, 06/27/23 | | | 500 | | | | 501 | |
| | |
US Foods Inc., 1st Lien 3.702%, 08/17/26 (G) | | | 1,465 | | | | 1,471 | |
| | | | | | | | |
| | |
| | | | | | | 4,040 | |
| | | | | | | | |
|
Forest Products — 0.0% | |
| | |
ProAmpac PG Borrower LLC, Initial Term Loan
7.250%, VAR LIBOR+3.500%, 11/17/23 | | | 1 | | | | 1 | |
5.436%, VAR LIBOR+3.500%, 11/17/23 | | | 80 | | | | 79 | |
5.404%, VAR LIBOR+3.500%, 11/17/23 | | | 104 | | | | 103 | |
5.402%, VAR LIBOR+3.500%, 11/17/23 | | | 121 | | | | 119 | |
5.336%, 11/17/23 | | | 178 | | | | 175 | |
| | | | | | | | |
| | |
| | | | | | | 477 | |
| | | | | | | | |
|
Gaming & Hotels — 0.2% | |
| | |
CBAC Borrower, LLC, Term B Loan, 1st Lien
5.799%, VAR LIBOR+4.000%, 07/08/24 | | | 498 | | | | 482 | |
| | |
Eldorado Resorts, Inc. Term Loan B
4.000%, VAR LIBOR+2.250%, 03/15/24 | | | 107 | | | | 107 | |
| | |
Gateway Casinos & Entertainment, Term Loan B (2018)
5.104%, 12/01/23 | | | 1,490 | | | | 1,482 | |
| | | | | | | | |
| Description | | Face Amount
(000) | | | Value
(000) | |
| | |
Golden Nugget, Inc., Initial B Term Loan, 1st Lien
4.716%, VAR LIBOR+2.750%, 10/04/23 | | $ | 733 | | | $ | 734 | |
4.677%, VAR LIBOR+2.750%, 10/04/23 | | | 783 | | | | 785 | |
4.549%, VAR LIBOR+3.250%, 10/04/23 | | | 80 | | | | 80 | |
| | |
Hanjin International Corp., Initial Term Loan
4.202%, VAR LIBOR+2.500%, 09/20/20 | | | 1,000 | | | | 995 | |
| | |
Hilton Worldwide Finance LLC, Refinanced SeriesB-2 Term Loan, 1st Lien 3.542%, 06/22/26 | | | 750 | | | | 755 | |
| | | | | | | | |
| | |
| | | | | | | 5,420 | |
| | | | | | | | |
|
Health Care — 0.7% | |
| | |
Bausch Health Companies Inc., First Incremental Term Loan, 1st Lien
4.515%, VAR LIBOR+2.750%, 11/27/25 | | | 486 | | | | 488 | |
| | |
Bausch Health Companies Inc., Initial Term Loan, 1st Lien
4.740%, VAR LIBOR+3.000%, 06/02/25 | | | 1,501 | | | | 1,509 | |
| | |
Bulldog Purchaser Inc., Initial Term Loan
5.452%, 08/22/25 | | | 1,387 | | | | 1,374 | |
| | |
Carestream Health, Inc., Extended Term Loan 7.299%, 02/28/21 | | | 369 | | | | 362 | |
| | |
Change Healthcare Holdings, Inc. (fka Emdeon Inc.), Closing Date Term Loan, 1st Lien
4.299%, VAR LIBOR+2.500%, 03/01/24 | | | 1,638 | | | | 1,642 | |
| | |
DaVita Inc., Tranche B Term Loan, 1st Lien
3.952%, VAR LIBOR+2.250%, 08/07/26 | | | 1,247 | | | | 1,256 | |
| | |
Endo Luxembourg Finance Company I S.a r.l., Initial Term Loan, 1st Lien
6.000%, VAR LIBOR+4.250%, 04/27/24 | | | 871 | | | | 831 | |
| | |
Grifols Worldwide Operations Limited, Dollar Tranche B Term Loan, 1st Lien
3.740%, VAR LIBOR+2.000%, 11/08/27 | | | 947 | | | | 955 | |
| | |
Lifescan Global Corporation, Initial Term Loan 8.056%, 10/01/24 (E) | | | 251 | | | | 238 | |
The accompanying notes are an integral part of the financial statements.
125
| | |
| THE KP FUNDS | | December 31, 2019 |
| | | | | | | | |
| Description | | Face Amount
(000) | | | Value
(000) | |
| | |
Lifescan Global Corporation, Initial Term Loan, 1st Lien 8.085%, 10/01/24 | | $ | 5 | | | $ | 4 | |
| | |
NVA Holdings, Inc., TermB-3 Loan, 1st Lien
6.500%, VAR Prime Rate by Country+1.750%, 02/02/25 | | | 748 | | | | 747 | |
| | |
Radiology Partners, Term Loan, 1st Lien
10.210%, 07/09/26 | | | 95 | | | | 92 | |
| | |
Radiology Partners, Term Loan, 2nd Lien
10.118%, 07/09/26 | | | 155 | | | | 152 | |
| | |
Select Medical Corporation, Tranche B Term Loan, 1st Lien
6.250%, VAR LIBOR+2.500%, 02/13/24 | | | 1 | | | | 1 | |
4.580%, VAR LIBOR+2.500%, 03/06/25 | | | 998 | | | | 999 | |
| | |
Sotera Health Holdings, LLC, Initial Term Loan, 1st Lien
6.289%, VAR LIBOR+4.500%, 11/20/26 (F) | | | 1,231 | | | | 1,234 | |
| | |
Spectrum Holdings III Corp., Closing Date Term Loan, 2nd Lien
8.702%, VAR LIBOR+7.000%, 01/26/26 | | | 500 | | | | 394 | |
| | |
Surgery Center Holdings, Inc., Initial Term Loan, 1st Lien
5.050%, VAR LIBOR+3.250%, 09/02/24 | | | 1,920 | | | | 1,909 | |
| | |
Syneos Health, Inc. (fka INC Research Holdings, Inc.), Term Loan, 1st Lien 3.202%, 03/25/24 | | | 500 | | | | 495 | |
| | |
Viant Medical Holdings, Inc., Initial Term Loan, 1st Lien
5.854%, VAR LIBOR+3.750%, 06/26/25 | | | 470 | | | | 460 | |
| | | | | | | | |
| | |
| | | | | | | 15,142 | |
| | | | | | | | |
|
Home Furnishings — 0.2% | |
| | |
Al Aqua Merger Sub, Inc., Term Loan, 1st Lien 6.354%, 12/13/23 | | | 807 | | | | 789 | |
| | |
Blount International, Inc., New Refinancing Term Loan, 1st Lien
5.946%, VAR LIBOR+3.750%, 04/12/23 | | | 493 | | | | 493 | |
| | |
Comfort Holding, LLC, Initial Term Loan, 1st Lien
6.452%, VAR LIBOR+4.750%, 02/05/24 | | | 1,084 | | | | 1,076 | |
| | | | | | | | |
| Description | | Face Amount
(000) | | | Value
(000) | |
| | |
Reynolds Group Holdings Inc., Incremental U.S. Term Loan
4.549%, VAR LIBOR+2.750%, 02/05/23 | | $ | 549 | | | $ | 550 | |
| | |
Reynolds Group Holdings Incremental US Term Loans
4.549%, VAR LIBOR+2.750%, 02/05/23 | | | 924 | | | | 926 | |
| | |
Serta Simmons Bedding, LLC, Initial Term Loan, 1st Lien
5.285%, VAR LIBOR+3.500%, 10/20/23 | | | 232 | | | | 149 | |
5.240%, VAR LIBOR+3.500%, 10/20/23 | | | 815 | | | | 523 | |
| | | | | | | | |
| | |
| | | | | | | 4,506 | |
| | | | | | | | |
|
Hotels, Motels, Inns and Gaming — 0.2% | |
| | |
Caesars Resort Collection, LLC (fka Caesars Growth Properties Holdings, LLC), Term B Loan, 1st Lien
4.549%, VAR LIBOR+2.750%, 12/23/24 | | | 1,976 | | | | 1,978 | |
| | |
Eldorado Resorts, Inc., Term Loan, 1st Lien
4.000%, VAR LIBOR+2.250%, 03/15/24 | | | 328 | | | | 328 | |
| | |
MGM Growth Properties Operating Partnership LP, Term B Loan, 1st Lien
3.799%, VAR LIBOR+2.000%, 04/25/23 | | | 734 | | | | 736 | |
| | |
Stars Group Holdings B.V., USD Term Loan, 1st Lien
5.445%, VAR LIBOR+3.500%, 07/10/25 | | | 1,037 | | | | 1,045 | |
| | | | | | | | |
| | |
| | | | | | | 4,087 | |
| | | | | | | | |
|
Housing — 0.1% | |
| | |
DTZ US Borrower LLC, Term Loan B (2018) 4.952%, 08/15/25 | | | 1,490 | | | | 1,490 | |
| | |
Installed Building Products, Term Loan, 1st Lien
%, 04/15/25 | | | 500 | | | | 501 | |
| | | | | | | | |
| | |
| | | | | | | 1,991 | |
| | | | | | | | |
|
Industrial Services – 0.1% | |
| | |
AC Products, Term Loan, 1st Lien
7.299%, 02/15/24 | | | 497 | | | | 493 | |
| | |
Delachaux Group, Facility B2, 1st Lien
6.501%, 04/01/26 | | | 1,250 | | | | 1,228 | |
The accompanying notes are an integral part of the financial statements.
126
| | |
| THE KP FUNDS | | December 31, 2019 |
| | | | | | | | |
| Description | | Face Amount
(000) | | | Value
(000) | |
| | |
SiteOne Landscape Supply, LLC (fka John Deere Landscapes LLC), Tranche E Term Loan 4.460%, 10/24/29 | | $ | 772 | | | $ | 773 | |
| | | | | | | | |
| | |
| | | | | | | 2,494 | |
| | | | | | | | |
|
Insurance — 0.3% | |
| | |
Acrisure, LLC,2017-2 Refinancing Term Loan, 1st Lien
6.195%, VAR LIBOR+4.250%, 11/22/23 | | | 1,064 | | | | 1,065 | |
| | |
Acrisure, LLC,2018-1 Additional Term Loan
5.695%, 11/22/23 (F) | | | 493 | | | | 492 | |
| | |
Alliant Holdings Intermediate, LLC, Initial Term Loan (2018), 1st Lien
4.799%, VAR LIBOR+3.000%, 05/09/25 | | | 1,388 | | | | 1,387 | |
| | |
AmWINS Group, Inc., Term Loan, 1st Lien 4.452%, 01/25/24 (E) | | | 748 | | | | 753 | |
| | |
Hub International, Ltd.,Cov-Lite, Term Loan B, 1st Lien
4.940%, VAR LIBOR+2.750%, 04/25/25 | | | 1,232 | | | | 1,231 | |
| | |
NFP Corp., Term B Loan, 1st Lien
4.702%, VAR LIBOR+3.000%, 01/08/24 | | | 1,678 | | | | 1,669 | |
| | |
Sedgwick Claims Management Services, Inc., Term Loan B, 1st Lien
5.799%, 09/30/26 (G) | | | 266 | | | | 269 | |
| | |
Viant Medical Holdings, Inc., Initial Term Loan 9.854%, 06/26/26 | | | 122 | | | | 115 | |
| | | | | | | | |
| | |
| | | | | | | 6,981 | |
| | | | | | | | |
|
Investment Company — 0.0% | |
| | |
EIG Management Company, LLC, Initial Term Loan 5.452%, 01/31/25 | | | 442 | | | | 441 | |
| | |
StepStone Group, Term Loan B, 1st Lien
5.844%, 03/14/25 | | | 476 | | | | 476 | |
| | | | | | | | |
| | |
| | | | | | | 917 | |
| | | | | | | | |
|
Leasing — 0.0% | |
| | |
FLY Leasing, Term Loan, 1st Lien
3.650%, 08/09/25 | | | 626 | | | | 627 | |
| | | | | | | | |
| | | | | | | | |
| Description | | Face Amount
(000) | | | Value
(000) | |
|
Leisure, Amusement, Motion Pictures, Entertainment — 0.2% | |
| | |
Alterra Mountain Company, Initial Bluebird Term Loan, 1st Lien
4.549%, VAR LIBOR+2.750%, 07/31/24 | | $ | 1,722 | | | $ | 1,735 | |
| | |
Crown Finance US, Inc., Initial Dollar Tranche Term Loan, 1st Lien
4.049%, VAR LIBOR+2.250%, 02/28/25 | | | 1,010 | | | | 1,009 | |
| | |
Motion Acquisition Limited, Facility B1 (USD), 1st Lien
%, VAR LIBOR+3.250%, 10/16/26 | | | 663 | | | | 670 | |
| | |
Topgolf International, Inc., Initial Term Loan, 1st Lien
7.240%, VAR LIBOR+5.500%, 02/08/26 | | | 228 | | | | 229 | |
| | |
UFC Holdings, LLC, Term Loan, 1st Lien
5.050%, VAR LIBOR+3.250%, 04/29/26 | | | 994 | | | | 999 | |
| | | | | | | | |
| | |
| | | | | | | 4,642 | |
| | | | | | | | |
|
Machinery — 0.1% | |
| | |
CPM Holdings, Inc., Initial Term Loan
9.952%, 10/24/26 | | | 247 | | | | 242 | |
5.452%, 10/24/25 | | | 363 | | | | 359 | |
| | |
Douglas Dynamics LLC, 2017 Replacement Term Loan Facility, 1st Lien 4.710%, 12/31/21 (E) | | | 350 | | | | 350 | |
| | |
Graftech International Ltd., Initial Term Loan, 1st Lien
5.202%, VAR LIBOR+3.500%, 02/12/25 | | | 1,470 | | | | 1,464 | |
| | | | | | | | |
| | |
| | | | | | | 2,415 | |
| | | | | | | | |
|
Machinery(Non-Agriculture,Non-Construction andNon-Electronic) — 0.1% | |
| | |
Altra Industrial Motion Corp., Term Loan, 1st Lien
3.702%, VAR LIBOR+2.000%, 09/26/25 | | | 1,331 | | | | 1,334 | |
| | |
Pro Mach Group, Inc., Initial Term Loan, 1st Lien
4.535%, VAR LIBOR+2.750%, 03/07/25 | | | 741 | | | | 733 | |
| | |
Utex Industries, Inc., Initial Term Loan, 1st Lien
5.702%, VAR LIBOR+4.000%, 05/14/21 | | | 545 | | | | 394 | |
| | | | | | | | |
| | |
| | | | | | | 2,461 | |
| | | | | | | | |
The accompanying notes are an integral part of the financial statements.
127
| | |
| THE KP FUNDS | | December 31, 2019 |
| | | | | | | | |
| Description | | Face Amount
(000) | | | Value
(000) | |
| | |
Manufacturing — 0.0% | | | | | | | | |
| | |
LTI Boyd Corporation, Term Loan B
5.202%, VAR LIBOR+3.500%, 09/06/25 | | $ | 861 | | | $ | 771 | |
| | |
Pelican Products, Inc., Term Loan
9.490%, 04/17/26 | | | 88 | | | | 83 | |
5.240%, VAR LIBOR+3.500%, 04/19/25 | | | 68 | | | | 62 | |
| | | | | | | | |
| | |
| | | | | | | 916 | |
| | | | | | | | |
|
Media — 0.0% | |
| | |
Metro-Goldwyn-Mayer Inc., Initial Term Loan
6.210%, 06/29/26 | | | 776 | | | | 771 | |
| | | | | | | | |
|
Metals & Mining — 0.1% | |
| | |
Dynacast International LLC, TermB-2 Loan, 1st Lien
5.195%, VAR LIBOR+3.250%, 01/28/22 | | | 1,226 | | | | 1,189 | |
| | | | | | | | |
|
Oil & Gas — 0.1% | |
| | |
BCP Raptor, LLC, Initial Term Loan, 1st Lien
5.952%, VAR LIBOR+4.250%, 06/24/24 | | | 947 | | | | 871 | |
| | |
Limetree Bay Terminals, LLC (Limetree Bay Financing, LLC), Advance, 1st Lien
5.702%, VAR LIBOR+4.000%, 02/15/24 | | | 722 | | | | 632 | |
| | |
Lower Cadence Holdings LLC, Initial Term Loan, 1st Lien
5.702%, VAR LIBOR+4.000%, 05/08/26 | | | 911 | | | | 899 | |
| | |
PES Holdings, LLC, Tranche C Loan
6.990%, 12/31/22 (G) | | | 601 | | | | 226 | |
| | | | | | | | |
| | |
| | | | | | | 2,628 | |
| | | | | | | | |
|
Personal, Food and Miscellaneous Services — 0.2% | |
| | |
1011778 B.C. Unlimited Liability Company (New Red Finance, Inc.) (aka Burger King/Tim Hortons), TermB-4 Loan, 1st Lien
3.549%, VAR LIBOR+1.750%, 11/14/26 | | | 1,988 | | | | 1,990 | |
| | |
Flynn Restaurant Group LP, Initial Term Loan, 1st Lien
5.202%, VAR LIBOR+3.500%, 06/20/25 | | | 1,021 | | | | 976 | |
| | | | | | | | |
| Description | | Face Amount
(000) | | | Value
(000) | |
| | |
IRB Holding Corp., Term B Loan, 1st Lien
5.216%, VAR LIBOR+3.250%, 02/05/25 | | $ | 1,233 | | | $ | 1,240 | |
| | | | | | | | |
| | |
| | | | | | | 4,206 | |
| | | | | | | | |
|
Printing, Publishing and Broadcasting — 0.0% | |
| | |
Clear Channel Outdoor Holdings, Inc. Term Loan B
5.299%, VAR LIBOR+3.500%, 08/21/26 | | | 1,078 | | | | 1,083 | |
| | | | | | | | |
|
Professional & Business Services — 0.4% | |
| | |
ASGN, Inc., Term Loan 1st Lien 3.452%, 04/02/25 | | | 278 | | | | 278 | |
| | |
Avantor, Inc., InitialB-1 Dollar Term Loan
4.799%, VAR LIBOR+4.000%, 11/21/24 | | | 790 | | | | 797 | |
| | |
Casmar Holdings (Australia) Pty Limited, Initial Term Loan
6.436%, VAR LIBOR+4.500%, 12/20/23 | | | 485 | | | | 426 | |
| | |
Cineworld (Crown Finance) Incremental 2019 Term Loan 4.202%, 09/20/26 | | | 159 | | | | 159 | |
| | |
Focus Financial Partners, LLC, TrancheB-2 Term Loan 4.299%, 07/03/24 (F) | | | 870 | | | | 875 | |
| | |
Fortress Investment, Term Loan B (2018)
3.702%, 12/27/22 (E) | | | 938 | | | | 942 | |
| | |
GHX Ultimate Parent Corporation, Initial Term Loan
5.354%, VAR LIBOR+3.250%, 06/21/24 | | | 984 | | | | 982 | |
| | |
Inovalon Holdings, Inc., Term Loan, 1st Lien
5.250%, VAR LIBOR+3.500%, 04/02/25 | | | 1,406 | | | | 1,413 | |
| | |
KinderCare (KUEHG Corp), Term LoanB-3 5.854%, 02/14/25 | | | 736 | | | | 737 | |
| | |
KUEHG Corp (fka KC MergerSub, Inc.), TermB-3 Loan, 1st Lien 5.854%, 02/14/25 | | | 257 | | | | 258 | |
| | |
Safe Fleet Holdings LLC, Initial Term Loan
4.740%, VAR LIBOR+3.000%, 02/03/25 | | | 737 | | | | 702 | |
| | |
Western Dental Services, Inc., 1st Lien
6.952%, 06/23/23 | | | 1,184 | | | | 1,182 | |
The accompanying notes are an integral part of the financial statements.
128
| | |
| THE KP FUNDS | | December 31, 2019 |
| | | | | | | | |
| Description | | Face Amount
(000) | | | Value
(000) | |
| | |
Western Dental, Incremental Term Loan B, 1st Lien 6.202%, 06/30/23 | | $ | 161 | | | $ | 161 | |
| | | | | | | | |
| | |
| | | | | | | 8,912 | |
| | | | | | | | |
|
Real Estate — 0.1% | |
| | |
Capital Automotive L.P., Initial Tranche B Term Loan
7.710%, VAR LIBOR+6.000%, 03/21/25 | | | 361 | | | | 362 | |
| | |
iStar Inc. (fka iStar Financial Inc.), Loan, 1st Lien
4.514%, VAR LIBOR+3.000%, 07/01/20 | | | 305 | | | | 306 | |
4.454%, VAR LIBOR+3.000%, 07/01/20 | | | 552 | | | | 555 | |
| | |
RHP Hotel Properties, LP, Tranche B Term Loan, 1st Lien
3.710%, VAR LIBOR+2.000%, 05/11/24 | | | 579 | | | | 582 | |
| | | | | | | | |
| | |
| | | | | | | 1,805 | |
| | | | | | | | |
|
Recreation Facilities & Services — 0.0% | |
| | |
Bulldog Purchaser Inc., Term Loan, 1st Lien
%, 09/04/26 | | | 250 | | | | 246 | |
| | | | | | | | |
|
Restaurants — 0.0% | |
| | |
Miller’s Ale House, Inc., Term B Loan, 1st Lien 6.959%, 05/26/25 | | | 978 | | | | 880 | |
6.635%, 05/26/25 (G) | | | 5 | | | | 5 | |
| | |
Miller’s Ale House, Inc., Term Loan, 1st Lien 8.500%, 05/26/25 | | | 3 | | | | 2 | |
| | | | | | | | |
| | |
| | | | | | | 887 | |
| | | | | | | | |
|
Retail Stores — 0.2% | |
| | |
Allied Universal Holdco LLC (f/k/a USAGM Holdco, LLC), Delayed Draw Term Loan, 1st Lien
4.250%, VAR LIBOR+4.250%, 07/10/26 | | | 113 | | | | 113 | |
| | |
Allied Universal Holdco LLC (f/k/a USAGM Holdco, LLC), Initial Term Loan, 1st Lien
6.049%, VAR LIBOR+4.250%, 07/10/26 | | | 1,137 | | | | 1,143 | |
| | |
Belfor Holdings Inc., Initial Term Loan, 1st Lien
5.691%, VAR LIBOR+4.000%, 02/13/26 | | | 348 | | | | 349 | |
| | |
EG Group Limited, Additional Facility Loan (USD), 1st Lien
5.961%, VAR LIBOR+4.000%, 02/07/25 | | | 1,392 | | | | 1,384 | |
| | | | | | | | |
| Description | | Face Amount
(000) | | | Value
(000) | |
| | |
Flynn Restaurant Group LP, Initial Term Loan 8.736%, 06/22/26 | | $ | 532 | | | $ | 487 | |
| | |
Mister Car Wash Holdings, Inc., Delayed Draw Term Loan, 1st Lien
3.500%, VAR UNFND+3.500%, 05/08/26 | | | 38 | | | | 39 | |
| | |
Mister Car Wash Holdings, Inc., Initial Term Loan, 1st Lien
5.410%, VAR LIBOR+3.500%, 05/14/26 | | | 762 | | | | 764 | |
| | |
Trugreen Limited Partnership, Initial Refinancing Term Loan 5.452%, 03/13/26 | | | 1,479 | | | | 1,492 | |
| | | | | | | | |
| | |
| | | | | | | 5,771 | |
| | | | | | | | |
|
Securities & Trusts — 0.1% | |
| | |
Lions Gate Capital Holdings LLC, Term B Loan, 1st Lien
4.049%, VAR LIBOR+2.250%, 03/24/25 | | | 598 | | | | 596 | |
| | |
RPI Finance Trust, Initial Term LoanB-6
3.799%, VAR LIBOR+2.000%, 03/27/23 | | | 688 | | | | 693 | |
| | | | | | | | |
| | |
| | | | | | | 1,289 | |
| | | | | | | | |
|
Shipping & Ship Building — 0.1% | |
| | |
AI Mistral Holdco Limited, Initial Term Loan
4.702%, VAR LIBOR+3.000%, 01/17/24 | | | 979 | | | | 831 | |
| | |
Hornblower Sub, LLC (American Queen Sub, LLC), Term Loan 6.445%, 03/28/25 (E) | | | 884 | | | | 885 | |
| | | | | | | | |
| | |
| | | | | | | 1,716 | |
| | | | | | | | |
| | |
Steel — 0.1% | | | | | | | | |
| | |
Atkore International, Inc., Term Loan (2016)
4.860%, VAR LIBOR+2.750%, 12/22/23 | | | 1,157 | | | | 1,161 | |
| | |
Zekelman Industries, Inc. (fka JMC Steel Group, Inc.), Term Loan, 1st Lien
4.035%, VAR LIBOR+2.250%, 06/14/21 | | | 1,305 | | | | 1,306 | |
| | | | | | | | |
| | |
| | | | | | | 2,467 | |
| | | | | | | | |
|
Technology — 0.1% | |
| | |
Applied Systems Inc., Initial Term Loan, 2nd Lien 8.945%, 09/19/25 (E) | | | 308 | | | | 313 | |
The accompanying notes are an integral part of the financial statements.
129
| | |
| THE KP FUNDS | | December 31, 2019 |
| | | | | | | | |
| Description | | Face Amount
(000) | | | Value
(000) | |
| | |
Kofax, Term Loan, 1st Lien 6.450%, 07/07/23 | | $ | 992 | | | $ | 997 | |
| | | | | | | | |
| | |
| | | | | | | 1,310 | |
| | | | | | | | |
|
Transportation — 0.0% | |
| | |
Agro Merchants North America Holdings, Inc., Effective Date Loan
5.854%, VAR LIBOR+3.750%, 11/15/24 | | | 323 | | | | 318 | |
| | | | | | | | |
|
Utilities — 0.1% | |
| | |
AI Alpine AT BidCo GmbH, Facility B (USD), 1st Lien
4.605%, VAR LIBOR+2.750%, 10/31/25 | | | 990 | | | | 972 | |
4.581%, VAR LIBOR+2.750%, 10/31/25 | | | — | | | | — | |
| | |
Traverse Midstream Partners LLC, Advance, 1st Lien
5.710%, VAR LIBOR+4.000%, 09/27/24 | | | 768 | | | | 690 | |
| | | | | | | | |
| | |
| | | | | | | 1,662 | |
| | | | | | | | |
| |
Total Loan Participations
(Cost $225,439) (000) | | | | 222,678 | |
| | | | | | | | |
|
SOVEREIGN DEBT — 8.7% | |
| | |
1MDB Global Investments 4.400%, 03/09/23 | | | 5,400 | | | | 5,250 | |
| | |
Abu Dhabi Government International Bond 3.125%, 09/30/49 (A) | | | 3,247 | | | | 3,166 | |
2.125%, 09/30/24 (A) | | | 2,407 | | | | 2,399 | |
| | |
African Development Bank 3.000%, 09/20/23 | | | 100 | | | | 105 | |
2.625%, 03/22/21 | | | 125 | | | | 126 | |
2.125%, 11/16/22 | | | 50 | | | | 51 | |
| | |
Angolan Government International Bond 9.500%, 11/12/25 (A) | | | 1,490 | | | | 1,742 | |
9.375%, 05/08/48 (A) | | | 1,685 | | | | 1,846 | |
8.250%, 05/09/28 (A) | | | 1,220 | | | | 1,315 | |
8.000%, 11/26/29 (A) | | | 1,020 | | | | 1,087 | |
| | |
Argentine Republic Government International Bond 8.280%, 12/31/33 | | | 2,676 | | | | 1,653 | |
7.500%, 04/22/26 | | | 2,066 | | | | 1,074 | |
7.125%, 07/06/36 | | | 560 | | | | 266 | |
7.125%, 06/28/17 | | | 420 | | | | 211 | |
6.875%, 01/11/48 | | | 1,090 | | | | 522 | |
5.625%, 01/26/22 | | | 980 | | | | 507 | |
5.250%, 03/31/29 | | | 972 | | | | 474 | |
| | |
Armenia International Bond 7.150%, 03/26/25 (A) | | | 2,415 | | | | 2,831 | |
| | |
Asian Development Bank 3.125%, 09/26/28 | | | 150 | | | | 164 | |
| | | | | | | | |
| Description | | Face Amount
(000)(1) | | | Value
(000) | |
2.750%, 03/17/23 | | $ | 235 | | | $ | 243 | |
2.375%, 08/10/27 | | | 100 | | | | 103 | |
2.000%, 01/22/25 | | | 100 | | | | 101 | |
1.750%, 06/08/21 | | | 200 | | | | 200 | |
1.750%, 09/19/29 | | | 100 | | | | 98 | |
1.625%, 03/16/21 | | | 200 | | | | 200 | |
1.500%, 10/18/24 | | | 150 | | | | 148 | |
| | |
Bahrain Government International Bond 7.000%, 01/26/26 (A) | | | 645 | | | | 760 | |
6.750%, 09/20/29 (A) | | | 1,740 | | | | 2,031 | |
5.625%, 09/30/31 (A) | | | 460 | | | | 493 | |
| | |
Banco Nacional de Desenvolvimento Economico e Social
5.750%, 09/26/23 (A) | | | 440 | | | | 485 | |
| | |
Banque Centrale de Tunisie 5.750%, 01/30/25 (A) | | | 1,610 | | | | 1,500 | |
| | |
Brazil Notas do Tesouro Nacional Serie F 10.000%, 01/01/27 (BRL) | | | 8,000 | | | | 2,345 | |
| | |
Brazilian Government International Bond 5.000%, 01/27/45 | | | 1,130 | | | | 1,174 | |
4.750%, 01/14/50 | | | 1,790 | | | | 1,768 | |
4.500%, 05/30/29 | | | 910 | | | | 964 | |
| | |
Canada Government International Bond 2.000%, 11/15/22 | | | 100 | | | | 101 | |
| | |
Chile Government International Bond
3.240%, 02/06/28 | | | 200 | | | | 210 | |
3.125%, 01/21/26 | | | 107 | | | | 112 | |
| | |
Colombia Government International Bond 7.375%, 09/18/37 | | | 1,345 | | | | 1,910 | |
6.125%, 01/18/41 | | | 1,755 | | | | 2,271 | |
5.000%, 06/15/45 | | | 1,495 | | | | 1,736 | |
4.500%, 03/15/29 | | | 1,070 | | | | 1,187 | |
4.375%, 07/12/21 | | | 200 | | | | 206 | |
4.000%, 02/26/24 | | | 200 | | | | 211 | |
3.875%, 04/25/27 | | | 980 | | | | 1,036 | |
| | |
Costa Rica Government International Bond 7.158%, 03/12/45 (A) | | | 565 | | | | 602 | |
7.000%, 04/04/44 (A) | | | 550 | | | | 579 | |
6.125%, 02/19/31 (A) | | | 1,140 | | | | 1,212 | |
| | |
Council of Europe Development Bank
2.625%, 02/13/23 | | | 30 | | | | 31 | |
2.500%, 02/27/24 | | | 60 | | | | 61 | |
| | |
Development Bank of Kazakhstan JSC 8.950%, 05/04/23 (KZT) | | | 80,000 | | | | 195 | |
| | |
Development Bank of Mongolia 7.250%, 10/23/23 (A) | | | 1,160 | | | | 1,228 | |
| | |
Dominican Republic International Bond
9.750%, 06/05/26 (DOP) (A) | | | 44,900 | | | | 867 | |
The accompanying notes are an integral part of the financial statements.
130
| | |
| THE KP FUNDS | | December 31, 2019 |
| | | | | | | | |
| Description | | Face Amount
(000) | | | Value
(000) | |
7.450%, 04/30/44 (A) | | $ | 950 | | | $ | 1,146 | |
6.875%, 01/29/26 (A) | | | 1,035 | | | | 1,181 | |
6.850%, 01/27/45 (A) | | | 250 | | | | 285 | |
6.600%, 01/28/24 (A) | | | 400 | | | | 445 | |
6.500%, 02/15/48 (A) | | | 1,165 | | | | 1,284 | |
5.950%, 01/25/27 (A) | | | 1,415 | | | | 1,562 | |
5.500%, 01/27/25 (A) | | | 365 | | | | 393 | |
| | |
Ecuador Government International Bond 9.650%, 12/13/26 (A) | | | 355 | | | | 337 | |
8.750%, 06/02/23 (A) | | | 610 | | | | 601 | |
7.950%, 06/20/24 (A) | | | 1,200 | | | | 1,137 | |
7.950%, 06/20/24 | | | 210 | | | | 199 | |
7.875%, 01/23/28 (A) | | | 2,890 | | | | 2,569 | |
| | |
Egypt Government International Bond
8.700%, 03/01/49 (A) | | | 990 | | | | 1,106 | |
8.500%, 01/31/47 (A) | | | 755 | | | | 837 | |
7.903%, 02/21/48 (A) | | | 1,400 | | | | 1,468 | |
7.500%, 01/31/27 (A) | | | 1,465 | | | | 1,632 | |
6.200%, 03/01/24 (A) | | | 420 | | | | 454 | |
5.577%, 02/21/23 (A) | | | 680 | | | | 711 | |
| | |
El Salvador Government International Bond 8.625%, 02/28/29 (A) | | | 700 | | | | 840 | |
7.650%, 06/15/35 (A) | | | 270 | | | | 308 | |
7.625%, 02/01/41 (A) | | | 530 | | | | 604 | |
7.125%, 01/20/50 (A) | | | 1,020 | | | | 1,086 | |
6.375%, 01/18/27 (A) | | | 965 | | | | 1,025 | |
| | |
European Bank for Reconstruction & Development 2.750%, 03/07/23 | | | 100 | | | | 103 | |
1.625%, 09/27/24 | | | 200 | | | | 199 | |
| | |
European Investment Bank 3.250%, 01/29/24 | | | 250 | | | | 265 | |
3.125%, 12/14/23 | | | 150 | | | | 158 | |
2.875%, 12/15/21 | | | 200 | | | | 205 | |
2.875%, 08/15/23 | | | 150 | | | | 156 | |
2.500%, 03/15/23 | | | 295 | | | | 302 | |
2.375%, 05/13/21 | | | 250 | | | | 252 | |
2.375%, 05/24/27 | | | 250 | | | | 258 | |
2.250%, 03/15/22 | | | 150 | | | | 152 | |
2.250%, 06/24/24 | | | 150 | | | | 153 | |
2.125%, 10/15/21 | | | 200 | | | | 202 | |
2.125%, 04/13/26 | | | 100 | | | | 101 | |
2.000%, 12/15/22 | | | 150 | | | | 151 | |
1.375%, 09/15/21 | | | 100 | | | | 100 | |
| | |
Export Development Canada 2.500%, 01/24/23 | | | 100 | | | | 102 | |
2.000%, 05/17/22 | | | 200 | | | | 202 | |
| | |
Export-Import Bank of Korea 2.875%, 01/21/25 | | | 200 | | | | 206 | |
2.500%, 05/10/21 | | | 200 | | | | 201 | |
| | |
Financiera de Desarrollo 4.750%, 07/15/25 (A) | | | 950 | | | | 1,038 | |
| | |
Gabon Government International Bond
6.950%, 06/16/25 (A) | | | 410 | | | | 432 | |
6.375%, 12/12/24 (A) | | | 415 | | | | 433 | |
| | | | | | | | |
| Description | | Face Amount
(000)(1) | | | Value
(000) | |
| | |
Ghana Government International Bond
10.750%, 10/14/30 (A) | | $ | 2,370 | | | $ | 3,031 | |
8.950%, 03/26/51 (A) | | | 445 | | | | 455 | |
8.627%, 06/16/49 (A) | | | 425 | | | | 424 | |
7.875%, 08/07/23 (A) | | | 649 | | | | 712 | |
7.875%, 03/26/27 (A) | | | 570 | | | | 598 | |
7.625%, 05/16/29 (A) | | | 710 | | | | 723 | |
| | |
Guatemala Government Bond 6.125%, 06/01/50 (A) | | | 790 | | | | 931 | |
4.900%, 06/01/30 (A) | | | 470 | | | | 503 | |
4.875%, 02/13/28 (A) | | | 1,150 | | | | 1,223 | |
4.500%, 05/03/26 (A) | | | 1,490 | | | | 1,565 | |
4.375%, 06/05/27 (A) | | | 830 | | | | 859 | |
| | |
Honduras Government International Bond 6.250%, 01/19/27 (A) | | | 480 | | | | 524 | |
| | |
Hungary Government International Bond 7.625%, 03/29/41 | | | 150 | | | | 247 | |
| | |
Indonesia Government International Bond 8.500%, 10/12/35 (A) | | | 970 | | | | 1,526 | |
8.500%, 10/12/35 | | | 260 | | | | 409 | |
6.750%, 01/15/44 (A) | | | 360 | | | | 515 | |
5.250%, 01/17/42 (A) | | | 690 | | | | 830 | |
4.750%, 07/18/47 (A) | | | 580 | | | | 668 | |
4.625%, 04/15/43 (A) | | | 440 | | | | 492 | |
4.450%, 02/11/24 | | | 200 | | | | 215 | |
4.350%, 01/11/48 | | | 200 | | | | 220 | |
3.700%, 01/08/22 (A) | | | 210 | | | | 215 | |
1.400%, 10/30/31 (EUR) | | | 1,040 | | | | 1,158 | |
| | |
Inter-American Development Bank
3.125%, 09/18/28 | | | 150 | | | | 164 | |
2.625%, 04/19/21 | | | 265 | | | | 268 | |
2.375%, 07/07/27 | | | 100 | | | | 103 | |
2.125%, 01/15/25 | | | 125 | | | | 127 | |
2.000%, 07/23/26 | | | 150 | | | | 152 | |
1.875%, 03/15/21 | | | 150 | | | | 150 | |
1.750%, 04/14/22 | | | 150 | | | | 150 | |
1.750%, 09/14/22 | | | 100 | | | | 100 | |
| | |
International Bank for Reconstruction & Development 2.750%, 07/23/21 | | | 250 | | | | 254 | |
2.500%, 03/19/24 | | | 200 | | | | 206 | |
2.500%, 11/25/24 | | | 300 | | | | 310 | |
2.500%, 07/29/25 | | | 150 | | | | 156 | |
2.500%, 11/22/27 | | | 200 | | | | 209 | |
2.250%, 06/24/21 | | | 50 | | | | 50 | |
2.125%, 12/13/21 | | | 200 | | | | 202 | |
2.125%, 02/13/23 | | | 100 | | | | 101 | |
2.000%, 01/26/22 | | | 200 | | | | 201 | |
1.875%, 06/19/23 | | | 100 | | | | 101 | |
1.625%, 03/09/21 | | | 150 | | | | 150 | |
1.500%, 08/28/24 | | | 100 | | | | 99 | |
1.375%, 09/20/21 | | | 300 | | | | 299 | |
| | |
International Finance 2.875%, 07/31/23 | | | 95 | | | | 99 | |
2.000%, 10/24/22 | | | 50 | | | | 51 | |
The accompanying notes are an integral part of the financial statements.
131
| | |
| THE KP FUNDS | | December 31, 2019 |
| | | | | | | | |
| Description | | Face Amount
(000)(1) | | | Value
(000) | |
1.375%, 10/16/24 | | $ | 90 | | | $ | 88 | |
1.125%, 07/20/21 | | | 100 | | | | 99 | |
| | |
Israel Government International Bond
3.150%, 06/30/23 | | | 200 | | | | 208 | |
| | |
Ivory Coast Government International Bond 6.875%, 10/17/40 (EUR) (A) | | | 515 | | | | 602 | |
6.375%, 03/03/28 (A) | | | 585 | | | | 617 | |
6.125%, 06/15/33 (A) | | | 1,460 | | | | 1,471 | |
5.875%, 10/17/31 (EUR) (A) | | | 700 | | | | 815 | |
| | |
Japan Bank for International Cooperation
3.375%, 10/31/23 | | | 200 | | | | 210 | |
2.500%, 06/01/22 | | | 200 | | | | 203 | |
2.375%, 04/20/26 | | | 200 | | | | 203 | |
2.250%, 11/04/26 | | | 200 | | | | 201 | |
2.000%, 10/17/29 | | | 200 | | | | 195 | |
| | |
Jordan Government International Bond
7.375%, 10/10/47 (A) | | | 1,100 | | | | 1,172 | |
| | |
Kenya Government International Bond
8.250%, 02/28/48 (A) | | | 385 | | | | 411 | |
6.875%, 06/24/24 (A) | | | 1,080 | | | | 1,168 | |
| | |
Korea Development Bank 2.500%, 01/13/21 | | | 200 | | | | 201 | |
| | |
Korea Government International Bond
2.750%, 01/19/27 | | | 200 | | | | 204 | |
| | |
Kreditanstalt fuer Wiederaufbau 3.125%, 12/15/21 | | | 150 | | | | 154 | |
2.375%, 03/24/21 | | | 210 | | | | 212 | |
| | |
Landwirtschaftliche Rentenbank 3.125%, 11/14/23 | | | 150 | | | | 158 | |
2.500%, 11/15/27 | | | 150 | | | | 156 | |
| | |
Lebanon Government International Bond 7.000%, 03/23/32 | | | 655 | | | | 291 | |
6.750%, 11/29/27 | | | 675 | | | | 300 | |
6.600%, 11/27/26 | | | 527 | | | | 234 | |
6.200%, 02/26/25 | | | 697 | | | | 308 | |
| | |
Mexican Udibonos 4.000%, 11/30/28 (MXN) | | | 10,863 | | | | 602 | |
4.000%, 11/03/50 (MXN) | | | 30,352 | | | | 1,776 | |
| | |
Mexico Government International Bond
5.550%, 01/21/45 | | | 300 | | | | 369 | |
4.500%, 04/22/29 | | | 200 | | | | 219 | |
4.500%, 01/31/50 | | | 200 | | | | 216 | |
4.350%, 01/15/47 | | | 200 | | | | 211 | |
4.150%, 03/28/27 | | | 975 | | | | 1,045 | |
4.125%, 01/21/26 | | | 200 | | | | 214 | |
3.750%, 01/11/28 | | | 200 | | | | 208 | |
| | |
Mongolia Government International Bond 10.875%, 04/06/21 (A) | | | 2,460 | | | | 2,680 | |
8.750%, 03/09/24 (A) | | | 1,915 | | | | 2,175 | |
| | | | | | | | |
| Description | | Face Amount
(000)(1) | | | Value
(000) | |
5.625%, 05/01/23 (A) | | $ | 745 | | | $ | 767 | |
5.125%, 12/05/22 (A) | | | 1,080 | | | | 1,104 | |
5.125%, 12/05/22 | | | 490 | | | | 501 | |
| | |
Nigeria Government International Bond
8.747%, 01/21/31 (A) | | | 520 | | | | 574 | |
7.875%, 02/16/32 (A) | | | 1,205 | | | | 1,250 | |
7.696%, 02/23/38 (A) | | | 960 | | | | 962 | |
7.625%, 11/21/25 (A) | | | 1,040 | | | | 1,147 | |
7.143%, 02/23/30 (A) | | | 965 | | | | 982 | |
6.500%, 11/28/27 (A) | | | 1,250 | | | | 1,275 | |
| | |
Nordic Investment Bank 1.375%, 10/17/22 | | | 250 | | | | 248 | |
| | |
Oesterreichische Kontrollbank 3.125%, 11/07/23 | | | 100 | | | | 105 | |
2.875%, 03/13/23 | | | 50 | | | | 52 | |
1.875%, 01/20/21 | | | 150 | | | | 150 | |
| | |
Oman Government International Bond
6.750%, 01/17/48 (A) | | | 1,400 | | | | 1,406 | |
6.500%, 03/08/47 (A) | | | 795 | | | | 786 | |
5.375%, 03/08/27 (A) | | | 315 | | | | 325 | |
| | |
Oman Sovereign Sukuk SAOC 4.397%, 06/01/24 (A) | | | 890 | | | | 902 | |
| | |
Panama Government International Bond 9.375%, 04/01/29 | | | 535 | | | | 817 | |
6.700%, 01/26/36 | | | 1,645 | | | | 2,305 | |
4.500%, 05/15/47 | | | 200 | | | | 238 | |
4.300%, 04/29/53 | | | 920 | | | | 1,069 | |
3.875%, 03/17/28 | | | 200 | | | | 218 | |
| | |
Peru Government Bond 6.150%, 08/12/32 (PEN) (A) | | | 3,770 | | | | 1,289 | |
5.940%, 02/12/29 (PEN) (A) | | | 1,390 | | | | 473 | |
5.400%, 08/12/34 (PEN) (A) | | | 4,880 | | | | 1,546 | |
5.350%, 08/12/40 (PEN) (A) | | | 3,680 | | | | 1,123 | |
| | |
Perusahaan Penerbit SBSN Indonesia III
4.400%, 03/01/28 (A) | | | 440 | | | | 480 | |
4.150%, 03/29/27 (A) | | | 1,090 | | | | 1,170 | |
| | |
Peruvian Government International Bond 7.350%, 07/21/25 | | | 100 | | | | 126 | |
6.950%, 08/12/31 (PEN) (A) | | | 1,790 | | | | 651 | |
5.625%, 11/18/50 | | | 150 | | | | 219 | |
| | |
Philippine Government International Bond 5.500%, 03/30/26 | | | 200 | | | | 237 | |
4.200%, 01/21/24 | | | 200 | | | | 215 | |
3.700%, 02/02/42 | | | 300 | | | | 339 | |
| | |
Poland Government International Bond 4.000%, 01/22/24 | | | 125 | | | | 134 | |
3.000%, 03/17/23 | | | 150 | | | | 155 | |
| | |
Province of Alberta Canada 3.300%, 03/15/28 | | | 200 | | | | 216 | |
2.200%, 07/26/22 | | | 100 | | | | 101 | |
The accompanying notes are an integral part of the financial statements.
132
| | |
| THE KP FUNDS | | December 31, 2019 |
| | | | | | | | |
| Description | | Face Amount
(000)(1) | | | Value
(000) | |
| | |
Province of British Columbia Canada
2.000%, 10/23/22 | | $ | 100 | | | $ | 101 | |
| | |
Province of Manitoba Canada 2.125%, 06/22/26 | | | 500 | | | | 502 | |
| | |
Province of New Brunswick Canada
3.625%, 02/24/28 | | | 100 | | | | 110 | |
| | |
Province of Ontario Canada 2.500%, 04/27/26 | | | 500 | | | | 511 | |
2.450%, 06/29/22 | | | 200 | | | | 203 | |
2.300%, 06/15/26 | | | 100 | | | | 101 | |
| | |
Province of Quebec Canada 2.875%, 10/16/24 | | | 100 | | | | 105 | |
2.625%, 02/13/23 | | | 200 | | | | 205 | |
2.500%, 04/20/26 | | | 300 | | | | 308 | |
| | |
Provincia de Buenos Aires 7.875%, 06/15/27 (A) | | | 295 | | | | 125 | |
6.500%, 02/15/23 (A) | | | 450 | | | | 187 | |
| | |
Provincia de Cordoba 7.125%, 06/10/21 (A) | | | 970 | | | | 713 | |
| | |
Qatar Government International Bond
5.103%, 04/23/48 (A) | | | 1,635 | | | | 2,100 | |
4.817%, 03/14/49 (A) | | | 1,627 | | | | 2,013 | |
2.375%, 06/02/21 (A) | | | 1,242 | | | | 1,245 | |
| | |
Republic of Belarus International Bond
7.625%, 06/29/27 (A) | | | 915 | | | | 1,040 | |
6.875%, 02/28/23 (A) | | | 1,210 | | | | 1,290 | |
| | |
Republic of Italy Government International Bond 5.375%, 06/15/33 | | | 300 | | | | 349 | |
2.875%, 10/17/29 | | | 200 | | | | 190 | |
| | |
Republic of Poland Government Bond
2.750%, 04/25/28 (PLN) | | | 4,195 | | | | 1,158 | |
| | |
Republic of South Africa Government International Bond
6.500%, 02/28/41 (ZAR) | | | 21,100 | | | | 1,048 | |
5.875%, 06/22/30 | | | 600 | | | | 648 | |
5.750%, 09/30/49 | | | 850 | | | | 828 | |
4.300%, 10/12/28 | | | 1,870 | | | | 1,833 | |
| | |
Romanian Government International Bond 6.125%, 01/22/44 (A) | | | 130 | | | | 168 | |
| | |
Russian Federal Bond - OFZ 8.150%, 02/03/27 (RUB) | | | 130,500 | | | | 2,350 | |
7.700%, 03/23/33 (RUB) | | | 46,000 | | | | 827 | |
| | |
Russian Foreign Bond -Eurobond
5.625%, 04/04/42 | | | 1,000 | | | | 1,308 | |
5.250%, 06/23/47 (A) | | | 1,200 | | | | 1,502 | |
5.100%, 03/28/35 (A) | | | 1,000 | | | | 1,195 | |
4.750%, 05/27/26 | | | 1,000 | | | | 1,115 | |
4.750%, 05/27/26 (A) | | | 200 | | | | 223 | |
| | | | | | | | |
| Description | | Face Amount
(000)(1) | | | Value
(000) | |
| | |
Senegal Government International Bond 8.750%, 05/13/21 (A) | | $ | 376 | | | $ | 407 | |
6.250%, 05/23/33 (A) | | | 735 | | | | 772 | |
4.750%, 03/13/28 (EUR) (A) | | | 800 | | | | 945 | |
| | |
Sri Lanka Government International Bond 7.850%, 03/14/29 (A) | | | 1,030 | | | | 1,043 | |
7.550%, 03/28/30 (A) | | | 1,905 | | | | 1,885 | |
6.850%, 11/03/25 (A) | | | 620 | | | | 620 | |
6.750%, 04/18/28 (A) | | | 360 | | | | 345 | |
6.200%, 05/11/27 (A) | | | 1,320 | | | | 1,237 | |
5.875%, 07/25/22 (A) | | | 1,030 | | | | 1,029 | |
5.750%, 04/18/23 (A) | | | 1,010 | | | | 997 | |
| | |
Turkey Government International Bond
7.375%, 02/05/25 | | | 716 | | | | 782 | |
7.250%, 12/23/23 | | | 960 | | | | 1,039 | |
6.125%, 10/24/28 | | | 1,035 | | | | 1,047 | |
6.000%, 03/25/27 | | | 1,445 | | | | 1,464 | |
5.625%, 03/30/21 | | | 1,210 | | | | 1,245 | |
4.250%, 04/14/26 | | | 1,250 | | | | 1,166 | |
| | |
Ukraine Government AID Bonds 1.471%, 09/29/21 | | | 200 | | | | 199 | |
| | |
Ukraine Government International Bond 11.670%, 11/22/23 (UAH) (A) | | | 22,650 | | | | 959 | |
8.994%, 02/01/24 (A) | | | 815 | | | | 917 | |
7.750%, 09/01/21 (A) | | | 214 | | | | 226 | |
7.750%, 09/01/22 (A) | | | 2,489 | | | | 2,679 | |
7.750%, 09/01/23 (A) | | | 744 | | | | 808 | |
7.750%, 09/01/24 (A) | | | 449 | | | | 490 | |
7.750%, 09/01/27 (A) | | | 215 | | | | 235 | |
6.750%, 06/20/26 (EUR) (A) | | | 670 | | | | 844 | |
–%, 05/31/40 (A) (E) | | | 644 | | | | 616 | |
| | |
Uruguay Government International Bond 9.875%, 06/20/22 (UYU) (A) | | | 34,150 | | | | 900 | |
8.500%, 03/15/28 (UYU) (A) | | | 5,740 | | | | 132 | |
5.100%, 06/18/50 | | | 2,541 | | | | 3,048 | |
4.975%, 04/20/55 | | | 3,210 | | | | 3,782 | |
4.500%, 08/14/24 | | | 100 | | | | 108 | |
4.375%, 01/23/31 | | | 180 | | | | 201 | |
| | |
Venezuela Government International Bond 7.750%, 10/13/19 (C) | | | 705 | | | | 79 | |
7.650%, 04/21/25 (C) | | | 362 | | | | 42 | |
7.000%, 03/31/38 (C) | | | 422 | | | | 48 | |
| | |
Zambia Government International Bond 8.970%, 07/30/27 (A) | | | 705 | | | | 484 | |
5.375%, 09/20/22 (A) | | | 680 | | | | 462 | |
| | | | | | | | |
| |
Total Sovereign Debt
(Cost $198,818) (000) | | | | 203,619 | |
| | | | | | | | |
The accompanying notes are an integral part of the financial statements.
133
| | |
| THE KP FUNDS | | December 31, 2019 |
| | | | | | | | |
| Description | | Face Amount
(000) | | | Value
(000) | |
ASSET-BACKED SECURITIES — 6.8% | |
|
Automotive – 4.9% | |
| | |
Ally Auto Receivables Trust,Ser 2019-4, Cl A2 1.930%, 10/17/22 | | $ | 2,722 | | | $ | 2,721 | |
| | |
Ally Auto Receivables Trust,Ser 2019-4, Cl A3 1.840%, 06/17/24 | | | 2,172 | | | | 2,168 | |
| | |
Ally Auto Receivables Trust,Ser 2019-4, Cl A4 1.920%, 01/15/25 | | | 716 | | | | 713 | |
| | |
American Credit Acceptance Receivables Trust,Ser 2018-3, Cl B 3.490%, 06/13/22 (A) | | | 316 | | | | 317 | |
| | |
American Credit Acceptance Receivables Trust,Ser 2019-2, Cl A 2.850%, 07/12/22 (A) | | | 2,212 | | | | 2,216 | |
| | |
American Credit Acceptance Receivables Trust,Ser 2019-4, Cl A 2.180%, 02/13/23 (A) | | | 4,777 | | | | 4,777 | |
| | |
Americredit Automobile Receivables Trust,Ser 2018-1, Cl A2A 2.710%, 07/19/21 | | | 10 | | | | 10 | |
| | |
Americredit Automobile Receivables Trust,Ser 2018-2, Cl B 3.450%, 06/18/24 | | | 2,063 | | | | 2,109 | |
| | |
AmeriCredit Automobile Receivables Trust,Ser 2017-4, Cl B 2.360%, 12/19/22 | | | 1,784 | | | | 1,788 | |
| | |
AmeriCredit Automobile Receivables Trust,Ser 2019-3, Cl A2A 2.170%, 01/18/23 | | | 1,197 | | | | 1,198 | |
| | |
BMW Floorplan Master Owner Trust,Ser 2018-1, Cl A2 2.060%, VAR ICE LIBOR
USD 1 Month+0.320%, 05/15/23 (A) | | | 1,721 | | | | 1,724 | |
| | |
Capital One Prime Auto Receivables Trust,Ser 2019-2, Cl A3 1.920%, 05/15/24 | | | 1,252 | | | | 1,250 | |
| | |
Carmax Auto Owner Trust,Ser 2019-4, Cl A3 | | | | | | | | |
2.020%, 11/15/24 | | | 2,285 | | | | 2,290 | |
| | |
CarMax Auto Owner Trust,Ser 2018-2, Cl A4 3.160%, 07/17/23 | | | 731 | | | | 747 | |
| | | | | | | | |
| Description | | Face Amount
(000) | | | Value
(000) | |
| | |
CarMax Auto Owner Trust,Ser 2019-1, Cl A4 3.260%, 08/15/24 | | $ | 2,914 | | | $ | 3,001 | |
| | |
CPS Auto Receivables Trust,Ser 2018-D, Cl A 3.060%, 01/18/22 (A) | | | 808 | | | | 810 | |
| | |
CPS Auto Receivables Trust,Ser 2019-A, Cl A 3.180%, 06/15/22 (A) | | | 1,325 | | | | 1,330 | |
| | |
CPS Auto Receivables Trust,Ser 2019-B, Cl A 2.890%, 05/16/22 (A) | | | 1,330 | | | | 1,334 | |
| | |
CPS Auto Receivables Trust,Ser 2019-C, Cl A 2.550%, 09/15/22 (A) | | | 1,994 | | | | 1,999 | |
| | |
CPS Auto Receivables Trust,Ser 2019-D, Cl A 2.170%, 12/15/22 (A) | | | 3,021 | | | | 3,020 | |
| | |
Credit Acceptance Auto Loan Trust,Ser 2018-1A, Cl A 3.010%, 02/16/27 (A) | | | 2,779 | | | | 2,789 | |
| | |
Credit Acceptance Auto Loan Trust,Ser 2018-3A, Cl A 3.550%, 08/15/27 (A) | | | 835 | | | | 848 | |
| | |
Credit Acceptance Auto Loan Trust,Ser 2019-1A, Cl A 3.330%, 02/15/28 (A) | | | 2,183 | | | | 2,222 | |
| | |
Drive Auto Receivables Trust,Ser 2018-4, Cl B 3.360%, 10/17/22 | | | 1,165 | | | | 1,167 | |
| | |
Drive Auto Receivables Trust,Ser 2018-4, Cl D 4.090%, 01/15/26 | | | 100 | | | | 103 | |
| | |
Drive Auto Receivables Trust,Ser 2019-1, Cl A2A 3.080%, 09/15/21 | | | 36 | | | | 36 | |
| | |
Drive Auto Receivables Trust,Ser 2019-2, Cl B 3.170%, 11/15/23 | | | 1,599 | | | | 1,615 | |
| | |
Drive Auto Receivables Trust,Ser 2019-4, Cl B 2.230%, 01/16/24 | | | 2,180 | | | | 2,181 | |
| | |
DT Auto Owner Trust,Ser 2018-2A, Cl B 3.430%, 05/16/22 (A) | | | 1,264 | | | | 1,266 | |
| | |
DT Auto Owner Trust,Ser 2018-3A, Cl A 3.020%, 02/15/22 (A) | | | 1,092 | | | | 1,094 | |
| | |
DT Auto Owner Trust,Ser 2019-1A, Cl A 3.080%, 09/15/22 (A) | | | 1,514 | | | | 1,519 | |
| | |
DT Auto Owner Trust,Ser 2019-2A, Cl A 2.850%, 09/15/22 (A) | | | 1,708 | | | | 1,713 | |
The accompanying notes are an integral part of the financial statements.
134
| | |
| THE KP FUNDS | | December 31, 2019 |
| | | | | | | | |
| Description | | Face Amount
(000) | | | Value
(000) | |
| | |
DT Auto Owner Trust,Ser 2019-3A, Cl A 2.550%, 08/15/22 (A) | | $ | 915 | | | $ | 917 | |
| | |
DT Auto Owner Trust,Ser 2019-4A, Cl A 2.170%, 05/15/23 (A) | | | 2,899 | | | | 2,900 | |
| | |
Exeter Automobile Receivables Trust,Ser 2018-3A, Cl A 2.900%, 01/18/22 (A) | | | 37 | | | | 37 | |
| | |
Exeter Automobile Receivables Trust,Ser 2019-2A, Cl A 2.930%, 07/15/22 (A) | | | 1,784 | | | | 1,790 | |
| | |
Exeter Automobile Receivables Trust,Ser 2019-4A, Cl A 2.180%, 01/17/23 (A) | | | 1,940 | | | | 1,941 | |
| | |
First Investors Auto Owner Trust,Ser 2018-1A, Cl A1 2.840%, 05/16/22 (A) | | | 97 | | | | 97 | |
| | |
First Investors Auto Owner Trust,Ser 2019-2A, Cl A 2.210%, 09/16/24 (A) | | | 2,074 | | | | 2,074 | |
| | |
Flagship Credit Auto Trust,Ser 2019-1, Cl A 3.110%, 08/15/23 (A) | | | 1,986 | | | | 2,003 | |
| | |
Flagship Credit Auto Trust,Ser 2019-2, Cl A 2.830%, 10/16/23 (A) | | | 3,885 | | | | 3,908 | |
| | |
Flagship Credit Auto Trust,Ser 2019-4, Cl A 2.170%, 06/17/24 (A) | | | 4,878 | | | | 4,880 | |
| | |
Ford Credit Auto Lease Trust,Ser 2019-B, Cl A3 2.220%, 10/15/22 | | | 200 | | | | 201 | |
| | |
Ford Credit Auto Owner Trust,Ser 2017-C, Cl A3 2.010%, 03/15/22 | | | 801 | | | | 802 | |
| | |
Ford Credit Auto Owner Trust,Ser 2019-A, Cl A4 2.850%, 08/15/24 | | | 1,859 | | | | 1,893 | |
| | |
Ford Credit Auto Owner Trust,Ser 2019-B, Cl A3 2.230%, 10/15/23 | | | 100 | | | | 100 | |
| | |
Ford Credit Auto Owner Trust,Ser 2019-C, Cl A4 1.930%, 04/15/25 | | | 3,989 | | | | 3,982 | |
| | |
Ford Credit Floorplan Master Owner Trust,Ser 2017-3, Cl A 2.480%, 09/15/24 | | | 150 | | | | 152 | |
| | |
GM Financial Automobile Leasing Trust,Ser 2019-2, Cl A3
2.670%, 03/21/22 | | | 25 | | | | 25 | |
| | |
GM Financial Consumer Automobile,Ser 2017-1A, Cl A3
1.780%, 10/18/21 (A) | | | 764 | | | | 763 | |
| | | | | | | | |
| Description | | Face Amount
(000) | | | Value
(000) | |
| | |
GM Financial Consumer Automobile Receivables Trust,Ser 2018-1, Cl A3 2.320%, 07/18/22 | | $ | 1,791 | | | $ | 1,795 | |
| | |
GM Financial Consumer Automobile Receivables Trust,Ser 2019-1, Cl A3 2.970%, 11/16/23 | | | 57 | | | | 58 | |
| | |
GM Financial Consumer Automobile Receivables Trust,Ser 2019-3, Cl A3 2.180%, 04/16/24 | | | 100 | | | | 100 | |
| | |
Honda Auto Receivables Owner Trust,Ser 2017-4, Cl A3 2.050%, 11/22/21 | | | 669 | | | | 669 | |
| | |
Honda Auto Receivables Owner Trust,Ser 2019-4, Cl A3 1.830%, 01/18/24 | | | 100 | | | | 100 | |
| | |
Hyundai Auto Receivables Trust,Ser 2019-A, Cl A3 2.660%, 06/15/23 | | | 1,911 | | | | 1,932 | |
| | |
Hyundai Auto Receivables Trust,Ser 2019-B, Cl A3 1.940%, 02/15/24 | | | 55 | | | | 55 | |
| | |
Hyundai Auto Receivables Trust,Ser 2019-B, Cl A4 2.000%, 04/15/25 | | | 1,384 | | | | 1,382 | |
| | |
Mercedes-Benz Auto Receivables Trust,Ser 2019-1, Cl A3 1.940%, 03/15/24 | | | 100 | | | | 100 | |
| | |
Nissan Auto Receivables Owner Trust,Ser 2018-B, Cl A3 3.060%, 03/15/23 | | | 30 | | | | 30 | |
| | |
Nissan Auto Receivables Owner Trust,Ser 2019-A, Cl A2A 2.820%, 01/18/22 | | | 2,060 | | | | 2,067 | |
| | |
Nissan Auto Receivables Owner Trust,Ser 2019-A, Cl A3 2.900%, 10/16/23 | | | 67 | | | | 68 | |
| | |
Nissan Auto Receivables Owner Trust,Ser 2019-C, Cl A3 1.930%, 07/15/24 | | | 1,907 | | | | 1,908 | |
| | |
Santander Drive Auto Receivables Trust,Ser 2018-1, Cl D 3.320%, 03/15/24 | | | 85 | | | | 86 | |
| | |
Santander Drive Auto Receivables Trust,Ser 2019-1, Cl B 3.210%, 09/15/23 | | | 1,548 | | | | 1,561 | |
| | |
Santander Revolving Auto Loan Trust,Ser 2019-A, Cl A 2.510%, 01/26/32 (A) | | | 1,508 | | | | 1,501 | |
The accompanying notes are an integral part of the financial statements.
135
| | |
| THE KP FUNDS | | December 31, 2019 |
| | | | | | | | |
| Description | | Face Amount
(000) | | | Value
(000) | |
| | |
Toyota Auto Receivables Owner Trust,Ser 2019-C, Cl A3 1.910%, 09/15/23 | | $ | 100 | | | $ | 100 | |
| | |
Toyota Auto Receivables Owner Trust,Ser 2019-D, Cl A3 1.920%, 01/16/24 | | | 2,317 | | | | 2,316 | |
| | |
USAA Auto Owner Trust,Ser 2019-1, Cl A4 2.140%, 11/15/24 | | | 1,839 | | | | 1,846 | |
| | |
Westlake Automobile Receivables Trust,Ser 2019-1A, Cl A2A 3.060%, 05/16/22 (A) | | | 2,629 | | | | 2,639 | |
| | |
Westlake Automobile Receivables Trust,Ser 2019-3A, Cl A2 2.150%, 02/15/23 (A) | | | 3,353 | | | | 3,353 | |
| | |
World Omni Auto Receivables Trust,Ser 2018-D, Cl A3 3.330%, 04/15/24 | | | 5,000 | | | | 5,096 | |
| | |
World Omni Auto Receivables Trust,Ser 2019-B, Cl A3 2.590%, 07/15/24 | | | 2,883 | | | | 2,916 | |
| | |
World Omni Auto Receivables Trust,Ser 2019-C, Cl A3 1.960%, 12/16/24 | | | 1,999 | | | | 1,998 | |
| | | | | | | | |
| | |
| | | | | | | 114,216 | |
| | | | | | | | |
|
Credit Card — 1.0% | |
| | |
American Express Credit Account Master Trust,Ser 2017-6, Cl A 2.040%, 05/15/23 | | | 4,274 | | | | 4,280 | |
| | |
American Express Credit Account Master Trust,Ser 2019-1, Cl A 2.870%, 10/15/24 | | | 450 | | | | 460 | |
| | |
American Express Credit Account Master Trust,Ser 2019-3, Cl A 2.000%, 04/15/25 | | | 5,719 | | | | 5,733 | |
| | |
American Express Credit Account Master Trust,Ser 2019-4, Cl A 1.980%, VAR ICE LIBOR
USD 1 Month+0.240%, 04/15/24 | | | 3,360 | | | | 3,364 | |
| | |
BA Credit Card Trust,Ser 2019-A1, Cl A1 1.740%, 01/15/25 | | | 100 | | | | 100 | |
| | |
Capital One Multi-Asset Execution Trust,Ser 2017-A4, Cl A4
1.990%, 07/17/23 | | | 1,177 | | | | 1,178 | |
| | |
Capital One Multi-Asset Execution Trust,Ser 2019-A2, Cl A2
1.720%, 08/15/24 | | | 4,967 | | | | 4,952 | |
| | | | | | | | |
| Description | | Face Amount
(000) | | | Value
(000) | |
| | |
Citibank Credit Card Issuance Trust,Ser 2014-A1, Cl A1 2.880%, 01/23/23 | | $ | 200 | | | $ | 202 | |
| | |
Discover Card Execution Note Trust,Ser 2018-A5, Cl A5 3.320%, 03/15/24 | | | 65 | | | | 66 | |
| | |
Discover Card Execution Note Trust,Ser 2019-A1, Cl A1 3.040%, 07/15/24 | | | 1,282 | | | | 1,313 | |
| | |
Discover Card Execution Note Trust,Ser 2019-A2, Cl A 2.010%, VAR ICE LIBOR
USD 1 Month+0.270%, 12/15/23 | | | 1,613 | | | | 1,614 | |
| | |
Synchrony Credit Card Master Note Trust,Ser 2018-2, Cl A 3.470%, 05/15/26 | | | 200 | | | | 209 | |
| | | | | | | | |
| | |
| | | | | | | 23,471 | |
| | | | | | | | |
|
Other Asset-Backed Securities — 0.9% | |
| | |
Bayview Opportunity Master Fund IVa Trust,Ser 2019-RN2, Cl A1 3.967%, 03/28/34 (A) | | | 362 | | | | 362 | |
| | |
Bayview Opportunity Master Fund Trust IVb,Ser 2019-RN1, Cl A1 4.090%, 02/28/34 (A) | | | 172 | | | | 171 | |
| | |
CLUB Credit Trust,Ser 2018-P3, Cl A
3.820%, 01/15/26 (A) | | | 1,134 | | | | 1,143 | |
| | |
Consumer Loan Underlying Bond Credit Trust,Ser 2019-HP1, Cl A 2.590%, 12/15/26 (A) | | | 1,635 | | | | 1,636 | |
| | |
Consumer Loan Underlying Bond Credit Trust,Ser 2019-P1, Cl A 2.940%, 07/15/26 (A) | | | 1,053 | | | | 1,057 | |
| | |
PRPM,Ser 2019-4A, Cl A1 3.351%, 11/25/24 (A) | | | 2,706 | | | | 2,707 | |
| | |
SoFi Consumer Loan Program Trust,Ser 2019-3, Cl A 2.900%, 05/25/28 (A) | | | 1,998 | | | | 2,010 | |
| | |
Vericrest Opportunity Loan Trust, Ser 2019-NPL3, Cl A1 3.967%, 03/25/49 (A) | | | 1,841 | | | | 1,850 | |
| | |
Vericrest Opportunity Loan Trust, Ser 2019-NPL5, Cl A1A 3.352%, 09/25/49 (A) | | | 2,011 | | | | 2,010 | |
| | |
Vericrest Opportunity Loan Trust, Ser 2019-NPL8, Cl A1A 3.278%, 11/25/49 (A) | | | 3,224 | | | | 3,216 | |
| | |
Verizon Owner Trust,Ser 2019-A, Cl A1A 2.930%, 09/20/23 | | | 1,845 | | | | 1,875 | |
The accompanying notes are an integral part of the financial statements.
136
| | |
| THE KP FUNDS | | December 31, 2019 |
| | | | | | | | |
| Description | | Face Amount
(000) | | | Value
(000) | |
| | |
VOLT LXXII,
Ser 2018-NPL8, Cl A1A 4.213%, 10/26/48 (A) | | $ | 1,367 | | | $ | 1,366 | |
| | |
VOLT LXXV,
Ser 2019-NPL1, Cl A1A 4.336%, 01/25/49 (A) | | | 361 | | | | 363 | |
| | |
VOLT LXXXIII,
Ser 2019-NPL9, Cl A1A 3.327%, 11/26/49 (A) | | | 1,281 | | | | 1,281 | |
| | | | | | | | |
| | |
| | | | | | | 21,047 | |
| | | | | | | | |
| |
Total Asset-Backed Securities
(Cost $158,105) (000) | | | | 158,734 | |
| | | | | | | | |
U.S. GOVERNMENT AGENCY OBLIGATIONS — 0.5% | |
| | |
FFCB
2.870%, 07/30/29 | | | 150 | | | | 150 | |
2.590%, 08/27/29 | | | 100 | | | | 100 | |
2.400%, 06/19/23 | | | 250 | | | | 250 | |
1.840%, 11/14/22 | | | 200 | | | | 200 | |
| | |
FHLB
3.250%, 06/09/28 - 11/16/28 | | | 405 | | | | 442 | |
3.000%, 10/12/21 | | | 400 | | | | 410 | |
2.875%, 06/14/24 | | | 500 | | | | 525 | |
2.500%, 02/13/24 | | | 220 | | | | 227 | |
2.000%, 12/11/24 | | | 250 | | | | 250 | |
1.875%, 11/29/21 | | | 150 | | | | 151 | |
1.625%, 11/19/21 | | | 205 | | | | 205 | |
| | |
FHLMC
6.250%, 07/15/32 | | | 1,279 | | | | 1,842 | |
2.375%, 01/13/22 | | | 250 | | | | 254 | |
2.125%, 09/12/24 | | | 250 | | | | 250 | |
| | |
FNMA
6.625%, 11/15/30 | | | 300 | | | | 428 | |
2.875%, 09/12/23 | | | 500 | | | | 522 | |
2.625%, 09/06/24 | | | 1,399 | | | | 1,456 | |
2.250%, 04/12/22 | | | 2,536 | | | | 2,574 | |
2.125%, 04/24/26 | | | 200 | | | | 203 | |
1.750%, 07/02/24 | | | 200 | | | | 200 | |
1.625%, 10/15/24 | | | 95 | | | | 94 | |
1.375%, 09/06/22 | | | 350 | | | | 348 | |
| | |
Tennessee Valley Authority 5.250%, 09/15/39 | | | 200 | | | | 276 | |
2.875%, 02/01/27 | | | 250 | | | | 262 | |
| | | | | | | | |
| |
Total U.S. Government Agency Obligations
(Cost $11,150) (000) | | | | 11,619 | |
| | | | | | | | |
MUNICIPAL BONDS — 0.5% | |
| | |
Bay Area, Toll Authority RB 6.263%, 04/01/49 | | | 200 | | | | 305 | |
| | |
California State GO 4.600%, 04/01/38 | | | 315 | | | | 349 | |
4.500%, 04/01/33 | | | 25 | | | | 28 | |
3.500%, 04/01/28 | | | 25 | | | | 27 | |
3.375%, 04/01/25 | | | 20 | | | | 21 | |
2.800%, 04/01/21 | | | 15 | | | | 15 | |
| | | | | | | | |
| Description | | Face Amount
(000) | | | Value
(000) | |
| | |
California State, Department of Water Resources, Power Supply Revenue RB 2.000%, 05/01/22 | | $ | 100 | | | $ | 101 | |
| | |
Chicago, O’Hare International Airport RB
4.572%, 01/01/54 | | | 150 | | | | 182 | |
4.472%, 01/01/49 | | | 50 | | | | 60 | |
| | |
Dallas/Fort Worth International Airport RB
2.994%, 11/01/38 | | | 100 | | | | 99 | |
| | |
Houston GO
3.961%, 03/01/47 | | | 150 | | | | 166 | |
| | |
Illinois State GO 5.100%, 06/01/33 | | | 2,045 | | | | 2,205 | |
| | |
Illinois State, Sales Tax Securitization RB 3.820%, 01/01/48 | | | 100 | | | | 101 | |
| | |
New Jersey State, Transportation Trust Fund Authority RB 5.754%, 12/15/28 | | | 1,790 | | | | 2,058 | |
4.131%, 06/15/42 | | | 1,105 | | | | 1,096 | |
4.081%, 06/15/39 | | | 100 | | | | 99 | |
| | |
New York State, Dormitory Authority RB 4.946%, 08/01/48 | | | 100 | | | | 108 | |
3.190%, 02/15/43 | | | 3,075 | | | | 3,086 | |
| | |
Pennsylvania State, Commonwealth Financing Authority RB 3.864%, 06/01/38 | | | 150 | | | | 161 | |
| | |
Port Authority of New York & New Jersey RB 4.031%, 09/01/48 | | | 150 | | | | 169 | |
3.287%, 08/01/69 | | | 50 | | | | 48 | |
| | |
Rutgers The State University of New Jersey
3.270%, 05/01/43 | | | 150 | | | | 148 | |
| | |
State of Texas
3.211%, 04/01/44 | | | 50 | | | | 51 | |
| | |
Texas State, Permanent University Fund - Texas A&M University System RB 3.660%, 07/01/47 | | | 100 | | | | 102 | |
| | |
University of California RB | | | | | | | | |
4.858%, 05/15/12 | | | 200 | | | | 247 | |
3.349%, 07/01/29 | | | 100 | | | | 106 | |
| | |
University of Texas, Taxable Financing System RB | | | | | | | | |
3.354%, 08/15/47 | | | 250 | | | | 260 | |
| | |
Wisconsin State RB | | | | | | | | |
3.154%, 05/01/27 | | | 200 | | | | 208 | |
| | | | | | | | |
| | |
| | | | | | | 11,606 | |
| | | | | | | | |
Total Municipal Bonds
(Cost $11,145) (000) | | | | | | | 11,606 | |
| | | | | | | | |
The accompanying notes are an integral part of the financial statements.
137
| | |
| THE KP FUNDS | | December 31, 2019 |
| | | | | | | | |
| Description | | Number of
Warrants | | | Value
(000) | |
WARRANTS — 0.0% | | | | | | | | |
| | |
Horizon Global# | | | 2,585 | | | | 5 | |
| | | | | | | | |
| |
Total Warrants
(Cost $—) (000) | | | | 5 | |
| | | | | | | | |
PREFERRED STOCK — 0.0% | |
| | |
PES Energy (H) | | | 26,609 | | | | 3 | |
| | | | | | | | |
| |
Total Preferred Stock
(Cost $239) (000) | | | | 3 | |
| | | | | | | | |
| | |
| | | Shares | | | | |
SHORT-TERM INVESTMENT — 2.9% | |
| | |
State Street Institutional Treasury Money Market Fund, Cl Premier,
1.520% (I) | | | 68,281,125 | | | | 68,281 | |
| | | | | | | | |
| |
Total Short-Term Investment
(Cost $68,281) (000) | | | | 68,281 | |
| | | | | | | | |
| |
Total Investments In
Securities — 104.1%
(Cost $2,385,037) (000) | | | $ | 2,435,206 | |
| | | | | | | | |
Percentages are based on net assets of $2,340,221 (000).
A list of the open forward foreign currency contracts held by the Fund at December 31, 2019 is as follows (000):
| | | | | | | | | | | | | | | | | | |
Counterparty | | Maturity
Date | | Currency
to Deliver | | | Currency
to Receive | | | Unrealized
Appreciation
(depreciation) | |
| HSBC | | 01/17/20 | | USD | | | 1,730 | | | EUR | | | 1,550 | | | $ | 11 | |
| HSBC | | 01/17/20 | | EUR | | | 5,508 | | | USD | | | 6,128 | | | | (57 | ) |
| BNP Paribas | | 01/22/20 | | ZAR | | | 15,910 | | | USD | | | 1,049 | | | | (84 | ) |
| BNP Paribas | | 01/24/20 | | PEN | | | 2,239 | | | USD | | | 658 | | | | (17 | ) |
| BNP Paribas | | 01/24/20 | | USD | | | 667 | | | PEN | | | 2,239 | | | | 8 | |
| Barclays PLC | | 01/31/20 | | THB | | | 35,050 | | | USD | | | 1,151 | | | | (20 | ) |
| HSBC | | 03/13/20 | | CLP | | | 857,500 | | | USD | | | 1,158 | | | | 16 | |
| HSBC | | 03/13/20 | | USD | | | 1,118 | | | CLP | | | 857,500 | | | | 23 | |
| Barclays PLC | | 03/18/20 | | PLN | | | 4,510 | | | USD | | | 1,180 | | | | (9 | ) |
| HSBC | | 03/20/20 | | USD | | | 2,270 | | | BRL | | | 9,540 | | | | 94 | |
| HSBC | | 03/25/20 | | RUB | | | 130,860 | | | USD | | | 2,010 | | | | (77 | ) |
| Barclays PLC | | 03/26/20 | | USD | | | 1,818 | | | IDR | | | 25,682,000 | | | | 25 | |
| Barclays PLC | | 03/26/20 | | IDR | | | 55,629,000 | | | USD | | | 3,881 | | | | (111 | ) |
| HSBC | | 04/15/20 | | MXN | | | 3,450 | | | USD | | | 178 | | | | (1 | ) |
| HSBC | | 04/20/20 | | USD | | | 1,223 | | | COP | | | 4,126,000 | | | | 24 | |
| | | | | | | | | | | | | | | | | | |
| | | | | | | | | | | | | | | | $ | (175 | ) |
| | | | | | | | | | | | | | | | | | |
| ‡‡ | Expiration date not available. |
| (1) | In U.S. dollars unless otherwise indicated. |
| (A) | Security sold within terms of a private placement memorandum, exempt from registration under Section 144A of the Securities Act of 1933, as amended, and may be sold only to dealers in that program or other “accredited investors.” The total value of these securities at December 31, 2019 was $324,435 (000) and represents 13.9% of Net Assets. |
| (B) | Zero coupon security. The rate reported on the Schedule of Investments is the effective yield at time of purchase. |
| (C) | Security in default on interest payments. |
| (E) | Variable or floating rate security, the interest rate of which adjusts periodically based on changes in current interest rates and prepayments on the underlying pool of assets. |
| (F) | Unsettled bank loan. Interest rate not available. |
| (G) | Level 3 security in accordance with fair value hierarchy. |
| (H) | There is currently no rate available. |
| (I) | The rate reported is the7-day effective yield as of December 31, 2019. |
AID — Agency for International Development
ARS — Argentine Peso
BRL — Brazilian Real
Cl — Class
CLP — Chilean Peso
DAC — Designated Activity Company
DOP — Dominican Peso
EGP — Egyptian Pound
EUR — Euro
FFCB — Federal Farm Credit Bank
FHLB — Federal Home Loan Bank
FHLMC — Federal Home Loan Mortgage Corporation
FNMA — Federal National Mortgage Association
GEL — Georgian Lari
GNMA — Government National Mortgage Association
GO — General Obligation
ICE — Intercontinental Exchange
IDR — Indonesian Rupiah
JSC — Joint Stock Company
KZT — Kazakhstan Tenge
LIBOR — London Interbank Offered Rate
LKR — Sri Lanka Rupee
LLC — Limited Liability Company
L.P. — Limited Partnership
Ltd. — Limited
MTN — Medium Term Note
MXN — Mexican Peso
NGN — Nigerian Naira
PEN — Peruvian Sol
PLC — Public Limited Company
PLN — Polish Zloty
RB — Revenue Bond
RUB — Russian Ruble
REIT — Real Estate Investment Trust
S&P — Standard & Poor’s
Ser — Series
TBA — To Be Announced
THB — Thai Bat
UAH — Ukrainian Hryvnia
USD — U.S. Dollar
UYU — Uruguayan Peso
VAR — Variable Rate
ZAR — South African Rand
The accompanying notes are an integral part of the financial statements.
138
| | |
| THE KP FUNDS | | December 31, 2019 |
The following is a list of the level of inputs used as of December 31, 2019, in valuing the Fund’s investments and other financial instruments carried at value (000):
| | | | | | | | | | | | | | | | |
Investments
in Securities | | Level 1 | | | Level 2 | | | Level 3^ | | | Total | |
U.S. Treasury Obligations | | $ | — | | | $ | 622,198 | | | $ | — | | | $ | 622,198 | |
Corporate Obligations | | | — | | | | 576,944 | | | | 1,321 | | | | 578,265 | |
Mortgage-Backed Securities | | | — | | | | 558,198 | | | | — | | | | 558,198 | |
Loan Participations | | | — | | | | 222,678 | | | | — | | | | 222,678 | |
Sovereign Debt | | | — | | | | 203,619 | | | | — | | | | 203,619 | |
Asset-Backed Securities | | | — | | | | 158,734 | | | | — | | | | 158,734 | |
Municipal Bonds | | | — | | | | 11,606 | | | | — | | | | 11,606 | |
U.S. Government Agency Obligations | | | — | | | | 11,619 | | | | — | | | | 11,619 | |
Warrants | | | — | | | | 5 | | | | — | | | | 5 | |
Preferred Stock | | | — | | | | 3 | | | | — | | | | 3 | |
Short-Term Investment | | | 68,281 | | | | — | | | | — | | | | 68,281 | |
| | | | | | | | | | | | | | | | |
Total Investments in Securities | | $ | 68,281 | | | $ | 2,365,604 | | | $ | 1,321 | | | $ | 2,435,206 | |
| | | | | | | | | | | | | | | | |
| | | | |
Other Financial
Instruments | | Level 1 | | | Level 2 | | | Level 3 | | | Total | |
Forward Contracts** | | | | | | | | | | | | | | | | |
Unrealized Appreciation | | $ | — | | | $ | 201 | | | $ | — | | | $ | 201 | |
Unrealized Depreciation | | $ | — | | | $ | (376 | ) | | $ | — | | | $ | (376 | ) |
| | | | | | | | | | | | | | | | |
Total Other Financial Instruments | | $ | — | | | $ | (175 | ) | | $ | — | | | $ | (175 | ) |
| | | | | | | | | | | | | | | | |
| ^ | A reconciliation of Level 3 investments and disclosures of significant unobservable inputs are presented when the Fund has a significant amount of Level 3 investments at the beginning and/or end of the year in relation to net assets. Management has concluded that Level 3 investments are not material in relation to net assets. |
| ** | Forward foreign currency contracts are valued at the unrealized appreciation/(depreciation) on the instrument. |
For the year ended December 31, 2019, there were no significant transfers in or out of Level 3.
Amounts designated as “—“ are $0 or have been rounded to $0.
The accompanying notes are an integral part of the financial statements.
139
| | |
| THE KP FUNDS | | December 31, 2019 |
|
| STATEMENTS OF ASSETS AND LIABILITIES |
| | | | | | | | | | | | | | | | |
| | | KP
Retirement
Path
Retirement
Income Fund | | | KP
Retirement
Path 2020
Fund | | | KP
Retirement
Path 2025
Fund | | | KP
Retirement
Path 2030
Fund | |
| | | | | | | | | | | | | | | | |
Assets: | | | | | | | | | | | | | | | | |
Affiliated Investments at Cost | | $ | 314,770 | | | $ | 752,286 | | | $ | 1,072,164 | | | $ | 1,142,498 | |
Unaffiliated Investments at Cost | | | 125,942 | | | | 261,102 | | | | 294,296 | | | | 225,938 | |
| | | | | | | | | | | | | | | | |
Affiliated Investments at Fair Value | | $ | 332,070 | | | $ | 798,307 | | | $ | 1,151,101 | | | $ | 1,236,591 | |
Unaffiliated Investments at Fair Value | | | 128,976 | | | | 267,109 | | | | 301,222 | | | | 231,827 | |
Dividends Receivable | | | 83 | | | | 165 | | | | 165 | | | | 94 | |
Receivable for Investment Securities Sold | | | 63 | | | | — | | | | — | | | | — | |
Receivable for Capital Shares Sold | | | — | | | | 600 | | | | 1,758 | | | | 1,905 | |
Prepaid Expenses | | | 4 | | | | 10 | | | | 13 | | | | 13 | |
| | | | | | | | | | | | | | | | |
| | | | |
Total Assets | | | 461,196 | | | | 1,066,191 | | | | 1,454,259 | | | | 1,470,430 | |
| | | | | | | | | | | | | | | | |
| | | | |
Liabilities: | | | | | | | | | | | | | | | | |
Payable for Investment Securities Purchased | | | 84 | | | | 743 | | | | 1,895 | | | | 1,970 | |
Payable for Capital Shares Redeemed | | | 53 | | | | — | | | | — | | | | — | |
Payable due to Administrator | | | 9 | | | | 21 | | | | 28 | | | | 28 | |
Payable due to Adviser | | | 4 | | | | 9 | | | | 10 | | | | 8 | |
Chief Compliance Officer Fees Payable | | | 1 | | | | 3 | | | | 4 | | | | 4 | |
Other Accrued Expenses | | | 20 | | | | 45 | | | | 62 | | | | 66 | |
| | | | | | | | | | | | | | | | |
| | | | |
Total Liabilities | | | 171 | | | | 821 | | | | 1,999 | | | | 2,076 | |
| | | | | | | | | | | | | | | | |
| | | | |
Net Assets | | $ | 461,025 | | | $ | 1,065,370 | | | $ | 1,452,260 | | | $ | 1,468,354 | |
| | | | | | | | | | | | | | | | |
| | | | |
NET ASSETS: | | | | | | | | | | | | | | | | |
Paid-in Capital | | $ | 437,760 | | | $ | 1,000,776 | | | $ | 1,343,994 | | | $ | 1,343,474 | |
Total Distributable Earnings | | | 23,265 | | | | 64,594 | | | | 108,266 | | | | 124,880 | |
| | | | | | | | | | | | | | | | |
| | | | |
Net Assets | | $ | 461,025 | | | $ | 1,065,370 | | | $ | 1,452,260 | | | $ | 1,468,354 | |
| | | | | | | | | | | | | | | | |
| | | | |
Institutional Class Shares: | | | | | | | | | | | | | | | | |
Net Assets | | $ | 461,025 | | | $ | 1,065,370 | | | $ | 1,452,260 | | | $ | 1,468,354 | |
Outstanding Shares of Beneficial Interest
(unlimited authorization — no par value)† | | | 44,576,479 | | | | 98,836,638 | | | | 129,915,428 | | | | 128,544,926 | |
Net Asset Value, Offering and Redemption Price Per Share* | | $ | 10.34 | | | $ | 10.78 | | | $ | 11.18 | | | $ | 11.42 | |
| | | | | | | | | | | | | | | | |
| | † | Shares are presented unrounded. |
| | * | The net asset value is calculated by dividing the unrounded net assets by the unrounded shares. |
Amounts designated as “—” are $0 or have been rounded to $0.
The accompanying notes are an integral part of the financial statements.
140
| | |
| THE KP FUNDS | | December 31, 2019 |
|
| STATEMENTS OF ASSETS AND LIABILITIES (000) |
| | | | | | | | | | | | |
| | | KP
Retirement
Path 2035
Fund | | | KP
Retirement
Path 2040
Fund | | | KP
Retirement
Path 2045
Fund | |
| | | | | | | | | | | | |
| | | |
Assets: | | | | | | | | | | | | |
Affiliated Investments at Cost | | $ | 1,348,684 | | | $ | 1,290,490 | | | $ | 1,051,324 | |
Unaffiliated Investments at Cost | | | 177,497 | | | | 111,055 | | | | 67,408 | |
| | | | | | | | | | | | |
Affiliated Investments at Fair Value | | $ | 1,471,051 | | | $ | 1,412,995 | | | $ | 1,143,600 | |
Unaffiliated Investments at Fair Value | | | 182,889 | | | | 114,904 | | | | 69,541 | |
Receivable for Capital Shares Sold | | | 2,268 | | | | 2,188 | | | | 2,650 | |
Dividends Receivable | | | 47 | | | | — | | | | — | |
Prepaid Expenses | | | 14 | | | | 13 | | | | 10 | |
| | | | | | | | | | | | |
| | | |
Total Assets | | | 1,656,269 | | | | 1,530,100 | | | | 1,215,801 | |
| | | | | | | | | | | | |
| | | |
Liabilities: | | | | | | | | | | | | |
Payable for Investment Securities Purchased | | | 2,282 | | | | 2,157 | | | | 2,627 | |
Payable due to Administrator | | | 32 | | | | 30 | | | | 23 | |
Payable due to Adviser | | | 6 | | | | 4 | | | | 2 | |
Chief Compliance Officer Fees Payable | | | 5 | | | | 4 | | | | 3 | |
Other Accrued Expenses | | | 75 | | | | 71 | | | | 58 | |
| | | | | | | | | | | | |
| | | |
Total Liabilities | | | 2,400 | | | | 2,266 | | | | 2,713 | |
| | | | | | | | | | | | |
| | | |
Net Assets | | $ | 1,653,869 | | | $ | 1,527,834 | | | $ | 1,213,088 | |
| | | | | | | | | | | | |
| | | |
NET ASSETS: | | | | | | | | | | | | |
Paid-in Capital | | $ | 1,495,369 | | | $ | 1,372,057 | | | $ | 1,094,693 | |
Total Distributable Earnings | | | 158,500 | | | | 155,777 | | | | 118,395 | |
| | | | | | | | | | | | |
| | | |
Net Assets | | $ | 1,653,869 | | | $ | 1,527,834 | | | $ | 1,213,088 | |
| | | | | | | | | | | | |
| | | |
Institutional Class Shares: | | | | | | | | | | | | |
Net Assets | | $ | 1,653,869 | | | $ | 1,527,834 | | | $ | 1,213,088 | |
Outstanding Shares of Beneficial Interest
(unlimited authorization — no par value)† | | | 142,170,347 | | | | 129,793,223 | | | | 102,144,289 | |
Net Asset Value, Offering and Redemption Price Per Share* | | $ | 11.63 | | | $ | 11.77 | | | $ | 11.88 | |
| | | | | | | | | | | | |
| | † | Shares are presented unrounded. |
| | * | The net asset value is calculated by dividing the unrounded net assets by the unrounded shares. |
The accompanying notes are an integral part of the financial statements.
141
| | |
| THE KP FUNDS | | December 31, 2019 |
|
| STATEMENTS OF ASSETS AND LIABILITIES (000) |
| | | | | | | | | | | | | | | | |
| | | KP
Retirement
Path 2050
Fund | | | KP
Retirement
Path 2055
Fund | | | KP
Retirement
Path 2060
Fund | | | KP
Retirement
Path 2065
Fund | |
| | | | | | | | | | | | | | | | |
Assets: | | | | | | | | | | | | | | | | |
Affiliated Investments at Cost | | $ | 674,911 | | | $ | 257,926 | | | $ | 53,412 | | | $ | 12,071 | |
Unaffiliated Investments at Cost | | | 36,660 | | | | 13,691 | | | | 2,803 | | | | 652 | |
| | | | | | | | | | | | | | | | |
Affiliated Investments at Fair Value | | $ | 724,899 | | | $ | 269,913 | | | $ | 55,306 | | | $ | 12,780 | |
Unaffiliated Investments at Fair Value | | | 37,657 | | | | 14,016 | | | | 2,872 | | | | 664 | |
Receivable for Capital Shares Sold | | | 2,263 | | | | 1,486 | | | | 351 | | | | — | |
Receivable for Investment Securities Sold | | | — | | | | — | | | | — | | | | 1 | |
Receivable from Investment Adviser | | | — | | | | — | | | | — | | | | 2 | |
Deferred Offering Costs | | | — | | | | — | | | | — | | | | 4 | |
Prepaid Expenses | | | 6 | | | | 2 | | | | — | | | | 1 | |
| | | | | | | | | | | | | | | | |
| | | | |
Total Assets | | | 764,825 | | | | 285,417 | | | | 58,529 | | | | 13,452 | |
| | | | | | | | | | | | | | | | |
| | | | |
Liabilities: | | | | | | | | | | | | | | | | |
Payable for Investment Securities Purchased | | | 2,248 | | | | 1,481 | | | | 350 | | | | — | |
Payable due to Administrator | | | 15 | | | | 5 | | | | 1 | | | | — | |
Chief Compliance Officer Fees Payable | | | 2 | | | | 1 | | | | — | | | | — | |
Payable due to Adviser | | | 1 | | | | — | | | | — | | | | — | |
Payable for Capital Shares Redeemed | | | — | | | | — | | | | — | | | | 1 | |
Offering Costs Payable | | | — | | | | — | | | | — | | | | 20 | |
Other Accrued Expenses | | | 39 | | | | 17 | | | | 3 | | | | 6 | |
| | | | | | | | | | | | | | | | |
| | | | |
Total Liabilities | | | 2,305 | | | | 1,504 | | | | 354 | | | | 27 | |
| | | | | | | | | | | | | | | | |
| | | | |
Net Assets | | $ | 762,520 | | | $ | 283,913 | | | $ | 58,175 | | | $ | 13,425 | |
| | | | | | | | | | | | | | | | |
| | | | |
NET ASSETS: | | | | | | | | | | | | | | | | |
Paid-in Capital | | $ | 696,642 | | | $ | 265,667 | | | $ | 55,503 | | | $ | 12,386 | |
Total Distributable Earnings | | | 65,878 | | | | 18,246 | | | | 2,672 | | | | 1,039 | |
| | | | | | | | | | | | | | | | |
Net Assets | | $ | 762,520 | | | $ | 283,913 | | | $ | 58,175 | | | $ | 13,425 | |
| | | | | | | | | | | | | | | | |
| | | | |
Institutional Class Shares: | | | | | | | | | | | | | | | | |
Net Assets | | $ | 762,520 | | | $ | 283,913 | | | $ | 58,175 | | | $ | 13,425 | |
Outstanding Shares of Beneficial Interest
(unlimited authorization — no par value)† | | | 63,200,458 | | | | 23,323,519 | | | | 4,864,789 | | | | 1,227,607 | |
Net Asset Value, Offering and Redemption Price Per Share* | | $ | 12.07 | | | $ | 12.17 | | | $ | 11.96 | | | $ | 10.94 | |
| | | | | | | | | | | | | | | | |
| | † | Shares are presented unrounded. |
| | * | The net asset value is calculated by dividing the unrounded net assets by the unrounded shares. |
Amounts designated as “—” are $0 or have been rounded to $0.
The accompanying notes are an integral part of the financial statements.
142
| | |
| THE KP FUNDS | | December 31, 2019 |
|
| STATEMENTS OF ASSETS AND LIABILITIES (000) |
| | | | | | | | | | | | | | | | |
| | | KP Large
Cap Equity
Fund | | | KP Small
Cap Equity
Fund | | | KP
International
Equity Fund | | | KP Fixed
Income
Fund | |
| | | | | | | | | | | | | | | | |
Assets: | | | | | | | | | | | | | | | | |
Investments at Cost | | $ | 2,530,459 | | | $ | 1,238,786 | | | $ | 1,867,420 | | | $ | 2,385,037 | |
Cost of Foreign Currency | | | — | | | | — | | | | 7,468 | | | | 370 | |
| | | | | | | | | | | | | | | | |
Investments at Fair Value | | $ | 3,195,776 | | | $ | 1,368,279 | | | $ | 2,093,254 | | | $ | 2,435,206 | |
Foreign Currency at Value | | | — | | | | — | | | | 7,528 | | | | 374 | |
Receivable for Investment Securities Sold | | | 22,891 | | | | 2,983 | | | | — | | | | 70,544 | |
Receivable for Capital Shares Sold | | | 5,272 | | | | 1,698 | | | | 3,710 | | | | 3,463 | |
Dividends and Interest Receivable | | | 2,668 | | | | 1,060 | | | | 2,834 | | | | 14,304 | |
Cash due from Futures Brokers | | | 1,523 | | | | 192 | | | | 985 | | | | — | |
Reclaims Receivable | | | 279 | | | | 12 | | | | 3,342 | | | | 112 | |
Variation Margin Receivable | | | 90 | | | | 7 | | | | 183 | | | | — | |
Unrealized Appreciation on Forward Foreign Currency Contracts | | | — | | | | — | | | | — | | | | 201 | |
Prepaid Expenses | | | 5 | | | | 8 | | | | 3 | | | | 3 | |
| | | | | | | | | | | | | | | | |
| | | | |
Total Assets | | | 3,228,504 | | | | 1,374,239 | | | | 2,111,839 | | | | 2,524,207 | |
| | | | | | | | | | | | | | | | |
| | | | |
Liabilities: | | | | | | | | | | | | | | | | |
Payable for Investment Securities Purchased | | | 23,725 | | | | 9,393 | | | | 269 | | | | 182,819 | |
Payable due toSub-Advisers | | | 542 | | | | 463 | | | | 603 | | | | 342 | |
Payable due to Adviser | | | 110 | | | | 46 | | | | 71 | | | | 79 | |
Payable due to Administrator | | | 97 | | | | 41 | | | | 63 | | | | 70 | |
Payable for Capital Shares Redeemed | | | 12 | | | | 47 | | | | 5 | | | | 39 | |
Chief Compliance Officer Fees Payable | | | 4 | | | | 2 | | | | 3 | | | | 3 | |
Due to Custodian | | | — | | | | — | | | | — | | | | 12 | |
Unrealized Depreciation on Forward Foreign Currency Contracts | | | — | | | | — | | | | — | | | | 376 | |
Accrued Foreign Capital Gains Tax on Appreciated Securities | | | — | | | | — | | | | 200 | | | | — | |
Other Accrued Expenses | | | 194 | | | | 141 | | | | 524 | | | | 246 | |
| | | | | | | | | | | | | | | | |
| | | | |
Total Liabilities | | | 24,684 | | | | 10,133 | | | | 1,738 | | | | 183,986 | |
| | | | | | | | | | | | | | | | |
| | | | |
Net Assets | | $ | 3,203,820 | | | $ | 1,364,106 | | | $ | 2,110,101 | | | $ | 2,340,221 | |
| | | | | | | | | | | | | | | | |
| | | | |
NET ASSETS: | | | | | | | | | | | | | | | | |
Paid-in Capital | | $ | 2,524,036 | | | $ | 1,237,054 | | | $ | 1,913,786 | | | $ | 2,294,301 | |
Total Distributable Earnings | | | 679,784 | | | | 127,052 | | | | 196,315 | | | | 45,920 | |
| | | | | | | | | | | | | | | | |
| | | | |
Net Assets | | $ | 3,203,820 | | | $ | 1,364,106 | | | $ | 2,110,101 | | | $ | 2,340,221 | |
| | | | | | | | | | | | | | | | |
| | | | |
Institutional Class Shares: | | | | | | | | | | | | | | | | |
Net Assets | | $ | 3,203,820 | | | $ | 1,364,106 | | | $ | 2,110,101 | | | $ | 2,340,221 | |
Outstanding Shares of Beneficial Interest
(unlimited authorization — no par value)† | | | 230,270,765 | | | | 121,010,804 | | | | 195,285,496 | | | | 228,723,091 | |
Net Asset Value, Offering and Redemption Price Per Share* | | $ | 13.91 | | | $ | 11.27 | | | $ | 10.81 | | | $ | 10.23 | |
| | | | | | | | | | | | | | | | |
| | † | Shares are presented unrounded. |
| | * | The net asset value is calculated by dividing the unrounded net assets by the unrounded shares. |
Amounts designated as “—” are $0 or have been rounded to $0.
The accompanying notes are an integral part of the financial statements.
143
| | |
| THE KP FUNDS | | For the year ended December 31, 2019 |
|
| STATEMENTS OF OPERATIONS (000) |
| | | | | | | | | | | | | | | | |
| | | KP
Retirement
Path
Retirement
Income Fund | | | KP
Retirement
Path 2020
Fund | | | KP
Retirement
Path 2025
Fund | | | KP
Retirement
Path 2030
Fund | |
| | | | | | | | | | | | | | | | |
Investment Income: | | | | | | | | | | | | | | | | |
| | | | |
Income Distributions from Affiliated Registered Investment Companies | | $ | 8,199 | | | $ | 18,613 | | | $ | 24,951 | | | $ | 25,240 | |
| | | | |
Income Distributions from Unaffiliated Registered Investment Companies | | | 3,443 | | | | 7,064 | | | | 7,975 | | | | 6,501 | |
| | | | | | | | | | | | | | | | |
| | | | |
Total Investment Income | | | 11,642 | | | | 25,677 | | | | 32,926 | | | | 31,741 | |
| | | | | | | | | | | | | | | | |
| | | | |
Expenses: | | | | | | | | | | | | | | | | |
| | | | |
Administration Fees | | | 110 | | | | 247 | | | | 318 | | | | 315 | |
| | | | |
Investment Advisory Fees | | | 54 | | | | 107 | | | | 112 | | | | 84 | |
| | | | |
Trustees’ Fees | | | 10 | | | | 22 | | | | 28 | | | | 28 | |
| | | | |
Chief Compliance Officer Fees | | | 3 | | | | 7 | | | | 9 | | | | 9 | |
| | | | |
Transfer Agent Fees | | | 42 | | | | 95 | | | | 122 | | | | 121 | |
| | | | |
Professional Fees | | | 24 | | | | 52 | | | | 67 | | | | 66 | |
| | | | |
Printing Fees | | | 21 | | | | 46 | | | | 60 | | | | 60 | |
| | | | |
Registration Fees | | | 20 | | | | 48 | | | | 63 | | | | 66 | |
| | | | |
Custodian Fees | | | 2 | | | | 3 | | | | 4 | | | | 4 | |
| | | | |
Other Fees | | | 14 | | | | 32 | | | | 40 | | | | 39 | |
| | | | | | | | | | | | | | | | |
| | | | |
Total Expenses | | | 300 | | | | 659 | | | | 823 | | | | 792 | |
| | | | | | | | | | | | | | | | |
| | | | |
Net Investment Income | | | 11,342 | | | | 25,018 | | | | 32,103 | | | | 30,949 | |
| | | | | | | | | | | | | | | | |
| | | | |
Net Realized and Unrealized Gain/(Loss) on Investments: | | | | | | | | | | | | | | | | |
| | | | |
Net Realized Gain on Affiliated Investments | | | 6,920 | | | | 17,934 | | | | 21,519 | | | | 19,367 | |
| | | | |
Net Realized Gain on Unaffiliated Investments | | | 391 | | | | 632 | | | | 519 | | | | 477 | |
| | | | |
Distributions of Realized Gains from Affiliated Registered Investment Companies Shares | | | 4,704 | | | | 12,558 | | | | 19,975 | | | | 23,041 | |
| | | | |
Distributions of Realized Gains from Unaffiliated Registered Investment Companies Shares | | | 31 | | | | 67 | | | | 86 | | | | 81 | |
| | | | |
Net Change in Unrealized Appreciation on Affiliated Investments | | | 31,078 | | | | 78,784 | | | | 123,000 | | | | 144,071 | |
| | | | |
Net Change in Unrealized Appreciation on Unaffiliated Investments | | | 6,921 | | | | 14,574 | | | | 17,119 | | | | 14,747 | |
| | | | | | | | | | | | | | | | |
| | | | |
Net Realized and Unrealized Gain on Investments | | | 50,045 | | | | 124,549 | | | | 182,218 | | | | 201,784 | |
| | | | | | | | | | | | | | | | |
| | | | |
Net Increase in Net Assets Resulting from Operations | | $ | 61,387 | | | $ | 149,567 | | | $ | 214,321 | | | $ | 232,733 | |
| | | | | | | | | | | | | | | | |
The accompanying notes are an integral part of the financial statements.
144
| | |
| THE KP FUNDS | | For the year ended December 31, 2019 |
|
| STATEMENTS OF OPERATIONS (000) |
| | | | | | | | | | | | |
| | | KP
Retirement
Path 2035
Fund | | | KP
Retirement
Path 2040
Fund | | | KP
Retirement
Path 2045
Fund | |
| | | | | | | | | | | | |
Investment Income: | | | | | | | | | | | | |
| | | |
Income Distributions from Affiliated Registered Investment Companies | | $ | 28,765 | | | $ | 26,767 | | | $ | 21,221 | |
| | | |
Income Distributions from Unaffiliated Registered Investment Companies | | | 5,565 | | | | 3,877 | | | | 2,341 | |
| | | | | | | | | | | | |
| | | |
Total Investment Income | | | 34,330 | | | | 30,644 | | | | 23,562 | |
| | | | | | | | | | | | |
| | | |
Expenses: | | | | | | | | | | | | |
| | | |
Administration Fees | | | 351 | | | | 322 | | | | 250 | |
| | | |
Investment Advisory Fees | | | 65 | | | | 41 | | | | 25 | |
| | | |
Trustees’ Fees | | | 31 | | | | 28 | | | | 22 | |
| | | |
Chief Compliance Officer Fees | | | 10 | | | | 9 | | | | 7 | |
| | | |
Transfer Agent Fees | | | 135 | | | | 124 | | | | 96 | |
| | | |
Registration Fees | | | 76 | | | | 70 | | | | 58 | |
| | | |
Professional Fees | | | 74 | | | | 68 | | | | 53 | |
| | | |
Printing Fees | | | 67 | | | | 61 | | | | 48 | |
| | | |
Custodian Fees | | | 5 | | | | 4 | | | | 3 | |
| | | |
Other Fees | | | 44 | | | | 40 | | | | 31 | |
| | | | | | | | | | | | |
| | | |
Total Expenses | | | 858 | | | | 767 | | | | 593 | |
| | | | | | | | | | | | |
| | | |
Net Investment Income | | | 33,472 | | | | 29,877 | | | | 22,969 | |
| | | | | | | | | | | | |
| | | |
Net Realized and Unrealized Gain/(Loss) on Investments: | | | | | | | | | | | | |
| | | |
Net Realized Gain on Affiliated Investments | | | 20,530 | | | | 18,239 | | | | 13,034 | |
| | | |
Net Realized Gain on Unaffiliated Investments | | | 463 | | | | 371 | | | | 380 | |
| | | |
Distributions of Realized Gains from Affiliated Registered Investment Companies Shares | | | 28,271 | | | | 27,640 | | | | 22,571 | |
| | | |
Distributions of Realized Gains from Unaffiliated Registered Investment Companies Shares | | | 82 | | | | 63 | | | | 37 | |
| | | |
Net Change in Unrealized Appreciation on Affiliated Investments | | | 182,057 | | | | 181,086 | | | | 147,633 | |
| | | |
Net Change in Unrealized Appreciation on Unaffiliated Investments | | | 13,587 | | | | 9,921 | | | | 5,779 | |
| | | | | | | | | | | | |
| | | |
Net Realized and Unrealized Gain on Investments | | | 244,990 | | �� | | 237,320 | | | | 189,434 | |
| | | | | | | | | | | | |
| | | |
Net Increase in Net Assets Resulting from Operations | | $ | 278,462 | | | $ | 267,197 | | | $ | 212,403 | |
| | | | | | | | | | | | |
The accompanying notes are an integral part of the financial statements.
145
| | |
| THE KP FUNDS | | For the year ended December 31, 2019 |
|
| STATEMENTS OF OPERATIONS (000) |
| | | | | | | | | | | | | | | | |
| | | KP
Retirement
Path 2050
Fund | | | KP
Retirement
Path 2055
Fund | | | KP
Retirement
Path 2060
Fund | | | KP
Retirement
Path 2065
Fund | |
| | | | | | | | | | | | | | | | |
| | | | |
Investment Income: | | | | | | | | | | | | | | | | |
| | | | |
Income Distributions from Affiliated Registered Investment Companies | | $ | 13,195 | | | $ | 4,851 | | | $ | 995 | | | $ | 228 | |
| | | | |
Income Distributions from Unaffiliated Registered Investment Companies | | | 1,266 | | | | 461 | | | | 94 | | | | 20 | |
| | | | | | | | | | | | | | | | |
| | | | |
Total Investment Income | | | 14,461 | | | | 5,312 | | | | 1,089 | | | | 248 | |
| | | | | | | | | | | | | | | | |
| | | | |
Expenses: | | | | | | | | | | | | | | | | |
| | | | |
Administration Fees | | | 153 | | | | 53 | | | | 11 | | | | 2 | |
| | | | |
Investment Advisory Fees | | | 13 | | | | 5 | | | | 1 | | | | — | |
| | | | |
Trustees’ Fees | | | 13 | | | | 4 | | | | 1 | | | | — | |
| | | | |
Chief Compliance Officer Fees | | | 5 | | | | 2 | | | | — | | | | — | |
| | | | |
Transfer Agent Fees | | | 59 | | | | 21 | | | | 4 | | | | 1 | |
| | | | |
Registration Fees | | | 39 | | | | 16 | | | | 3 | | | | 1 | |
| | | | |
Professional Fees | | | 32 | | | | 11 | | | | 2 | | | | — | |
| | | | |
Printing Fees | | | 30 | | | | 10 | | | | 2 | | | | — | |
| | | | |
Custodian Fees | | | 2 | | | | 1 | | | | — | | | | — | |
| | | | |
Offering Costs | | | — | | | | — | | | | — | | | | 20 | |
| | | | |
Other Fees | | | 18 | | | | 6 | | | | 2 | | | | — | |
| | | | | | | | | | | | | | | | |
| | | | |
Total Expenses | | | 364 | | | | 129 | | | | 26 | | | | 24 | |
| | | | | | | | | | | | | | | | |
| | | | |
Reimbursement from Investment Advisor | | | — | | | | — | | | | — | | | | (20 | ) |
| | | | | | | | | | | | | | | | |
| | | | |
Net Expenses | | | 364 | | | | 129 | | | | 26 | | | | 4 | |
| | | | | | | | | | | | | | | | |
| | | | |
Net Investment Income | | | 14,097 | | | | 5,183 | | | | 1,063 | | | | 244 | |
| | | | | | | | | | | | | | | | |
| | | | |
Net Realized and Unrealized Gain/(Loss) on Investments: | | | | | | | | | | | | | | | | |
| | | | |
Net Realized Gain/(Loss) on Affiliated Investments | | | 6,560 | | | | 3,534 | | | | (180 | ) | | | 81 | |
| | | | |
Net Realized Gain on Unaffiliated Investments | | | 247 | | | | 69 | | | | 11 | | | | 3 | |
| | | | |
Distributions of Realized Gains from Affiliated Registered Investment Companies Shares | | | 14,517 | | | | 5,437 | | | | 1,114 | | | | 260 | |
| | | | |
Distributions of Realized Gains from Unaffiliated Registered Investment Companies Shares | | | 19 | | | | 6 | | | | 1 | | | | — | |
| | | | |
Net Change in Unrealized Appreciation on Affiliated Investments | | | 92,342 | | | | 30,478 | | | | 7,131 | | | | 709 | |
| | | | |
Net Change in Unrealized Appreciation on Unaffiliated Investments | | | 3,034 | | | | 1,042 | | | | 215 | | | | 12 | |
| | | | | | | | | | | | | | | | |
| | | | |
Net Realized and Unrealized Gain on Investments | | | 116,719 | | | | 40,566 | | | | 8,292 | | | | 1,065 | |
| | | | | | | | | | | | | | | | |
| | | | |
Net Increase in Net Assets Resulting from Operations | | $ | 130,816 | | | $ | 45,749 | | | $ | 9,355 | | | $ | 1,309 | |
| | | | | | | | | | | | | | | | |
| * | Commenced operations May 24, 2019. |
Amounts designated as “—” are $0 or have been rounded to $0.
The accompanying notes are an integral part of the financial statements.
146
| | |
| THE KP FUNDS | | For the year ended December 31, 2019 |
|
| STATEMENTS OF OPERATIONS (000) |
| | | | | | | | | | | | | | | | |
| | | KP Large
Cap Equity
Fund | | | KP Small
Cap Equity
Fund | | | KP
International
Equity Fund | | | KP Fixed
Income
Fund | |
| | | | | | | | | | | | | | | | |
| | | | |
Investment Income: | | | | | | | | | | | | | | | | |
| | | | |
Dividend Income | | $ | 51,710 | | | $ | 16,505 | | | $ | 59,597 | | | $ | — | |
| | | | |
Interest Income | | | 26 | | | | 4 | | | | — | | | | 76,537 | |
| | | | |
Less: Foreign Taxes Withheld | | | (111 | ) | | | (8 | ) | | | (4,734 | ) | | | — | |
| | | | | | | | | | | | | | | | |
| | | | |
Total Investment Income | | | 51,625 | | | | 16,501 | | | | 54,863 | | | | 76,537 | |
| | | | | | | | | | | | | | | | |
| | | | |
Expenses: | | | | | | | | | | | | | | | | |
| | | | |
Sub-Advisory Fees | | | 5,753 | | | | 5,139 | | | | 5,986 | | | | 3,779 | |
| | | | |
Investment Advisory Fees | | | 1,212 | | | | 523 | | | | 777 | | | | 892 | |
| | | | |
Administration Fees | | | 1,054 | | | | 455 | | | | 675 | | | | 776 | |
| | | | |
Trustees’ Fees | | | 26 | | | | 11 | | | | 17 | | | | 20 | |
| | | | |
Chief Compliance Officer Fees | | | 10 | | | | 4 | | | | 7 | | | | 8 | |
| | | | |
Custodian Fees | | | 156 | | | | 146 | | | | 731 | | | | 197 | |
| | | | |
Professional Fees | | | 80 | | | | 35 | | | | 51 | | | | 57 | |
| | | | |
Registration Fees | | | 62 | | | | 50 | | | | 40 | | | | 23 | |
| | | | |
Printing Fees | | | 52 | | | | 29 | | | | 39 | | | | 33 | |
| | | | |
Transfer Agent Fees | | | 12 | | | | 5 | | | | 8 | | | | 9 | |
| | | | |
Pricing Fees | | | — | | | | 44 | | | | 323 | | | | 329 | |
| | | | |
Other Fees | | | 200 | | | | 44 | | | | 65 | | | | 75 | |
| | | | | | | | | | | | | | | | |
| | | | |
Total Expenses | | | 8,617 | | | | 6,485 | | | | 8,719 | | | | 6,198 | |
| | | | | | | | | | | | | | | | |
| | | | |
Net Investment Income | | | 43,008 | | | | 10,016 | | | | 46,144 | | | | 70,339 | |
| | | | | | | | | | | | | | | | |
| | | | |
Net Realized and Unrealized Gain/(Loss) on Investments: | | | | | | | | | | | | | | | | |
| | | | |
Net Realized Gain on Investments | | | 132,740 | | | | 50,633 | | | | 13,853 | | | | 38,177 | |
| | | | |
Net Realized Gain/(Loss) on Futures Contracts | | | 5,190 | | | | 1,102 | | | | 2,866 | | | | (278 | ) |
| | | | |
Net Realized Loss on Foreign Currency Transactions | | | (7 | ) | | | — | | | | (123 | ) | | | (172 | ) |
| | | | |
Net Realized Gain/(Loss) on Forward Foreign Currency Contracts | | | 3 | | | | — | | | | (44 | ) | | | (221 | ) |
| | | | |
Net Change in Unrealized Appreciation on Investments | | | 544,311 | | | | 210,308 | | | | 314,940 | | | | 82,597 | |
| | | | |
Net Change in Unrealized Appreciation/(Depreciation) on Futures Contracts | | | 990 | | | | (97 | ) | | | 474 | | | | 145 | |
| | | | |
Net Change in Unrealized Appreciation on Foreign Currency Transactions and Translation of other Assets and Liabilities Denominated in Foreign Currencies | | | 4 | | | | — | | | | 33 | | | | 16 | |
| | | | |
Net Change in Unrealized Depreciation on Forward Foreign Currency Contracts | | | — | | | | — | | | | — | | | | (74 | ) |
| | | | |
Change in Accrued Foreign Capital Gains Tax on Appreciated Securities | | | — | | | | — | | | | 83 | | | | — | |
| | | | | | | | | | | | | | | | |
| | | | |
Net Realized and Unrealized Gain on Investments | | | 683,231 | | | | 261,946 | | | | 332,082 | | | | 120,190 | |
| | | | | | | | | | | | | | | | |
| | | | |
Net Increase in Net Assets Resulting from Operations | | $ | 726,239 | | | $ | 271,962 | | | $ | 378,226 | | | $ | 190,529 | |
| | | | | | | | | | | | | | | | |
Amounts designated as “—” are $0 or have been rounded to $0.
The accompanying notes are an integral part of the financial statements.
147
|
| STATEMENTS OF CHANGES IN NET ASSETS (000) |
| | | | | | | | | | | | | | | | |
| | | KP Retirement Path Retirement Income Fund | | | KP Retirement Path 2020 Fund | |
| | | Year Ended
December 31,
2019 | | | Year Ended
December 31,
2018 | | | Year Ended
December 31,
2019 | | | Year Ended
December 31,
2018 | |
Operations: | | | | | | | | | | | | | | | | |
Net Investment Income | | $ | 11,342 | | | $ | 10,539 | | | $ | 25,018 | | | $ | 21,905 | |
Net Realized Gain on Affiliated and Unaffiliated Investments | | | 7,311 | | | | 8,417 | | | | 18,566 | | | | 17,602 | |
Distributions of Realized Gains from Affiliated and Unaffiliated Registered Investment Company Shares | | | 4,735 | | | | 9,134 | | | | 12,625 | | | | 24,876 | |
Net Change in Unrealized Appreciation/(Depreciation) on Affiliated and Unaffiliated Investments | | | 37,999 | | | | (42,070 | ) | | | 93,358 | | | | (101,362 | ) |
| | | | | | | | | | | | | | | | |
Net Increase/(Decrease) in Net Assets Resulting from Operations | | | 61,387 | | | | (13,980 | ) | | | 149,567 | | | | (36,979 | ) |
| | | | | | | | | | | | | | | | |
Distributions: | | | (26,728 | ) | | | (27,862 | ) | | | (62,780 | ) | | | (60,142 | ) |
| | | | | | | | | | | | | | | | |
Capital Share Transactions: | | | | | | | | | | | | | | | | |
Institutional Shares: | | | | | | | | | | | | | | | | |
Issued | | | 22,857 | | | | 101,731 | | | | 83,175 | | | | 240,172 | |
Reinvestment of Distributions | | | 26,728 | | | | 27,862 | | | | 62,780 | | | | 60,142 | |
Redeemed | | | (78,554 | ) | | | (72,103 | ) | | | (144,325 | ) | | | (103,774 | ) |
| | | | | | | | | | | | | | | | |
Increase/(Decrease) in Net Assets from Capital Share Transactions | | | (28,969 | ) | | | 57,490 | | | | 1,630 | | | | 196,540 | |
| | | | | | | | | | | | | | | | |
Total Increase in Net Assets | | | 5,690 | | | | 15,648 | | | | 88,417 | | | | 99,419 | |
| | | | | | | | | | | | | | | | |
Net Assets: | | | | | | | | | | | | | | | | |
Beginning of Year | | | 455,335 | | | | 439,687 | | | | 976,953 | | | | 877,534 | |
| | | | | | | | | | | | | | | | |
End of Year | | $ | 461,025 | | | $ | 455,335 | | | $ | 1,065,370 | | | $ | 976,953 | |
| | | | | | | | | | | | | | | | |
Share Transactions: | | | | | | | | | | | | | | | | |
Institutional Shares: | | | | | | | | | | | | | | | | |
Issued | | | 2,196 | | | | 9,550 | | | | 7,727 | | | | 21,716 | |
Reinvestment of Distributions | | | 2,551 | | | | 2,881 | | | | 5,750 | | | | 6,046 | |
Redeemed | | | (7,558 | ) | | | (6,873 | ) | | | (13,370 | ) | | | (9,540 | ) |
| | | | | | | | | | | | | | | | |
Net Increase/(Decrease) in Shares Outstanding from Share Transactions | | | (2,811 | ) | | | 5,558 | | | | 107 | | | | 18,222 | |
| | | | | | | | | | | | | | | | |
The accompanying notes are an integral part of the financial statements.
148
|
| STATEMENTS OF CHANGES IN NET ASSETS (000) |
| | | | | | | | | | | | | | | | |
| | | KP Retirement Path 2025 Fund | | | KP Retirement Path 2030 Fund | |
| | | Year Ended
December 31,
2019 | | | Year Ended
December 31,
2018 | | | Year Ended
December 31,
2019 | | | Year Ended
December 31,
2018 | |
| | | | |
Operations: | | | | | | | | | | | | | | | | |
Net Investment Income | | $ | 32,103 | | | $ | 25,900 | | | $ | 30,949 | | | $ | 24,039 | |
Net Realized Gain on Affiliated and Unaffiliated Investments | | | 22,038 | | | | 19,079 | | | | 19,844 | | | | 18,897 | |
Distributions of Realized Gains from Affiliated and Unaffiliated Registered Investment Company Shares | | | 20,061 | | | | 39,623 | | | | 23,122 | | | | 46,878 | |
Net Change in Unrealized Appreciation/(Depreciation) on Affiliated and Unaffiliated Investments | | | 140,119 | | | | (142,100 | ) | | | 158,818 | | | | (158,888 | ) |
| | | | | | | | | | | | | | | | |
Net Increase/(Decrease) in Net Assets Resulting from Operations | | | 214,321 | | | | (57,498 | ) | | | 232,733 | | | | (69,074 | ) |
| | | | | | | | | | | | | | | | |
Distributions: | | | (83,365 | ) | | | (74,737 | ) | | | (86,693 | ) | | | (74,951 | ) |
| | | | | | | | | | | | | | | | |
Capital Share Transactions: | | | | | | | | | | | | | | | | |
Institutional Shares: | | | | | | | | | | | | | | | | |
Issued | | | 146,692 | | | | 267,692 | | | | 169,971 | | | | 281,167 | |
Reinvestment of Distributions | | | 83,365 | | | | 74,737 | | | | 86,693 | | | | 74,951 | |
Redeemed | | | (103,713 | ) | | | (76,547 | ) | | | (86,503 | ) | | | (73,319 | ) |
| | | | | | | | | | | | | | | | |
Increase in Net Assets from Capital Share Transactions | | | 126,344 | | | | 265,882 | | | | 170,161 | | | | 282,799 | |
| | | | | | | | | | | | | | | | |
Total Increase in Net Assets | | | 257,300 | | | | 133,647 | | | | 316,201 | | | | 138,774 | |
| | | | | | | | | | | | | | | | |
Net Assets: | | | | | | | | | | | | | | | | |
Beginning of Year | | | 1,194,960 | | | | 1,061,313 | | | | 1,152,153 | | | | 1,013,379 | |
| | | | | | | | | | | | | | | | |
End of Year | | $ | 1,452,260 | | | $ | 1,194,960 | | | $ | 1,468,354 | | | $ | 1,152,153 | |
| | | | | | | | | | | | | | | | |
Share Transactions: | | | | | | | | | | | | | | | | |
Institutional Shares: | | | | | | | | | | | | | | | | |
Issued | | | 13,233 | | | | 23,477 | | | | 15,090 | | | | 24,147 | |
Reinvestment of Distributions | | | 7,368 | | | | 7,399 | | | | 7,501 | | | | 7,385 | |
Redeemed | | | (9,365 | ) | | | (6,821 | ) | | | (7,717 | ) | | | (6,408 | ) |
| | | | | | | | | | | | | | | | |
Net Increase in Shares Outstanding from Share Transactions | | | 11,236 | | | | 24,055 | | | | 14,874 | | | | 25,124 | |
| | | | | | | | | | | | | | | | |
The accompanying notes are an integral part of the financial statements.
149
|
| STATEMENTS OF CHANGES IN NET ASSETS (000) |
| | | | | | | | | | | | | | | | |
| | | KP Retirement Path 2035 Fund | | | KP Retirement Path 2040 Fund | |
| | | Year Ended
December 31,
2019 | | | Year Ended
December 31,
2018 | | | Year Ended
December 31,
2019 | | | Year Ended
December 31,
2018 | |
Operations: | | | | | | | | | | | | | | | | |
Net Investment Income | | $ | 33,472 | | | $ | 25,383 | | | $ | 29,877 | | | $ | 22,264 | |
Net Realized Gain on Affiliated and Unaffiliated Investments | | | 20,993 | | | | 22,290 | | | | 18,610 | | | | 19,591 | |
Distributions of Realized Gains from Affiliated and Unaffiliated Registered Investment Company Shares | | | 28,353 | | | | 59,613 | | | | 27,703 | | | | 59,745 | |
Net Change in Unrealized Appreciation/(Depreciation) on Affiliated and Unaffiliated Investments | | | 195,644 | | | | (195,956 | ) | | | 191,007 | | | | (190,609 | ) |
| | | | | | | | | | | | | | | | |
Net Increase/(Decrease) in Net Assets Resulting from Operations | | | 278,462 | | | | (88,670 | ) | | | 267,197 | | | | (89,009 | ) |
| | | | | | | | | | | | | | | | |
Distributions: | | | (100,286 | ) | | | (86,446 | ) | | | (95,377 | ) | | | (79,249 | ) |
| | | | | | | | | | | | | | | | |
Capital Share Transactions: | | | | | | | | | | | | | | | | |
Institutional Shares: | | | | | | | | | | | | | | | | |
Issued | | | 204,397 | | | | 302,571 | | | | 207,029 | | | | 262,764 | |
Reinvestment of Distributions | | | 100,286 | | | | 86,446 | | | | 95,377 | | | | 79,249 | |
Redeemed | | | (91,468 | ) | | | (84,563 | ) | | | (92,399 | ) | | | (71,446 | ) |
| | | | | | | | | | | | | | | | |
Increase in Net Assets from Capital Share Transactions | | | 213,215 | | | | 304,454 | | | | 210,007 | | | | 270,567 | |
| | | | | | | | | | | | | | | | |
Total Increase in Net Assets | | | 391,391 | | | | 129,338 | | | | 381,827 | | | | 102,309 | |
| | | | | | | | | | | | | | | | |
Net Assets: | | | | | | | | | | | | | | | | |
Beginning of Year | | | 1,262,478 | | | | 1,133,140 | | | | 1,146,007 | | | | 1,043,698 | |
| | | | | | | | | | | | | | | | |
End of Year | | $ | 1,653,869 | | | $ | 1,262,478 | | | $ | 1,527,834 | | | $ | 1,146,007 | |
| | | | | | | | | | | | | | | | |
Share Transactions: | | | | | | | | | | | | | | | | |
Institutional Shares: | | | | | | | | | | | | | | | | |
Issued | | | 17,890 | | | | 25,466 | | | | 17,953 | | | | 21,868 | |
Reinvestment of Distributions | | | 8,522 | | | | 8,475 | | | | 8,010 | | | | 7,749 | |
Redeemed | | | (8,003 | ) | | | (7,218 | ) | | | (8,020 | ) | | | (6,013 | ) |
| | | | | | | | | | | | | | | | |
Net Increase in Shares Outstanding from Share Transactions | | | 18,409 | | | | 26,723 | | | | 17,943 | | | | 23,604 | |
| | | | | | | | | | | | | | | | |
The accompanying notes are an integral part of the financial statements.
150
|
| STATEMENTS OF CHANGES IN NET ASSETS (000) |
| | | | | | | | | | | | | | | | |
| | | KP Retirement Path 2045 Fund | | | KP Retirement Path 2050 Fund | |
| | | Year Ended
December 31,
2019 | | | Year Ended
December 31,
2018 | | | Year Ended
December 31,
2019 | | | Year Ended
December 31,
2018 | |
Operations: | | | | | | | | | | | | | | | | |
Net Investment Income | | $ | 22,969 | | | $ | 16,434 | | | $ | 14,097 | | | $ | 9,445 | |
Net Realized Gain on Affiliated and Unaffiliated Investments | | | 13,414 | | | | 15,157 | | | | 6,807 | | | | 8,156 | |
Distributions of Realized Gains from Affiliated and Unaffiliated Registered Investment Company Shares | | | 22,608 | | | | 48,092 | | | | 14,536 | | | | 29,155 | |
Net Change in Unrealized Appreciation/(Depreciation) on Affiliated and Unaffiliated Investments | | | 153,412 | | | | (151,407 | ) | | | 95,376 | | | | (90,195 | ) |
| | | | | | | | | | | | | | | | |
Net Increase/(Decrease) in Net Assets Resulting from Operations | | | 212,403 | | | | (71,724 | ) | | | 130,816 | | | | (43,439 | ) |
| | | | | | | | | | | | | | | | |
Distributions: | | | (74,041 | ) | | | (60,150 | ) | | | (44,254 | ) | | | (33,669 | ) |
| | | | | | | | | | | | | | | | |
Capital Share Transactions:
Institutional Shares: | | | | | | | | | | | | | | | | |
Issued | | | 198,711 | | | | 234,804 | | | | 169,094 | | | | 174,803 | |
Reinvestment of Distributions | | | 74,041 | | | | 60,149 | | | | 44,254 | | | | 33,669 | |
Redeemed | | | (71,438 | ) | | | (56,528 | ) | | | (49,922 | ) | | | (32,833 | ) |
| | | | | | | | | | | | | | | | |
Increase in Net Assets from Capital Share Transactions | | | 201,314 | | | | 238,425 | | | | 163,426 | | | | 175,639 | |
| | | | | | | | | | | | | | | | |
Total Increase in Net Assets | | | 339,676 | | | | 106,551 | | | | 249,988 | | | | 98,531 | |
| | | | | | | | | | | | | | | | |
Net Assets: | | | | | | | | | | | | | | | | |
Beginning of Year | | | 873,412 | | | | 766,861 | | | | 512,532 | | | | 414,001 | |
| | | | | | | | | | | | | | | | |
End of Year | | $ | 1,213,088 | | | $ | 873,412 | | | $ | 762,520 | | | $ | 512,532 | |
| | | | | | | | | | | | | | | | |
Share Transactions: | | | | | | | | | | | | | | | | |
Institutional Shares: | | | | | | | | | | | | | | | | |
Issued | | | 17,123 | | | | 19,448 | | | | 14,407 | | | | 14,396 | |
Reinvestment of Distributions | | | 6,166 | | | | 5,867 | | | | 3,629 | | | | 3,258 | |
Redeemed | | | (6,164 | ) | | | (4,723 | ) | | | (4,262 | ) | | | (2,710 | ) |
| | | | | | | | | | | | | | | | |
Net Increase in Shares Outstanding from Share Transactions | | | 17,125 | | | | 20,592 | | | | 13,774 | | | | 14,944 | |
| | | | | | | | | | | | | | | | |
The accompanying notes are an integral part of the financial statements.
151
|
| STATEMENTS OF CHANGES IN NET ASSETS (000) |
| | | | | | | | | | | | | | | | |
| | | KP Retirement Path 2055 Fund | | | KP Retirement Path 2060 Fund | |
| | | Year Ended
December 31,
2019 | | | Year Ended
December 31,
2018 | | | Year Ended
December 31,
2019 | | | Year Ended
December 31,
2018 | |
Operations: | | | | | | | | | | | | | | | | |
Net Investment Income | | $ | 5,183 | | | $ | 3,027 | | | $ | 1,063 | | | $ | 618 | |
Net Realized Gain/(Loss) on Affiliated and Unaffiliated Investments | | | 3,603 | | | | 2,590 | | | | (169 | ) | | | 1,359 | |
Distributions of Realized Gains from Affiliated and Unaffiliated Registered Investment Company Shares | | | 5,443 | | | | 9,529 | | | | 1,115 | | | | 1,931 | |
Net Change in Unrealized Appreciation/(Depreciation) on Affiliated and Unaffiliated Investments | | | 31,520 | | | | (29,637 | ) | | | 7,346 | | | | (6,959 | ) |
| | | | | | | | | | | | | | | | |
Net Increase/(Decrease) in Net Assets Resulting from Operations | | | 45,749 | | | | (14,491 | ) | | | 9,355 | | | | (3,051 | ) |
| | | | | | | | | | | | | | | | |
Distributions: | | | (16,148 | ) | | | (9,951 | ) | | | (2,937 | ) | | | (2,711 | ) |
| | | | | | | | | | | | | | | | |
Capital Share Transactions: | | | | | | | | | | | | | | | | |
Institutional Shares: | | | | | | | | | | | | | | | | |
Issued | | | 93,442 | | | | 81,491 | | | | 23,924 | | | | 23,578 | |
Reinvestment of Distributions | | | 16,147 | | | | 9,951 | | | | 2,936 | | | | 2,711 | |
Redeemed | | | (21,277 | ) | | | (12,748 | ) | | | (8,991 | ) | | | (9,624 | ) |
| | | | | | | | | | | | | | | | |
Increase in Net Assets from Capital Share Transactions | | | 88,312 | | | | 78,694 | | | | 17,869 | | | | 16,665 | |
| | | | | | | | | | | | | | | | |
Total Increase in Net Assets | | | 117,913 | | | | 54,252 | | | | 24,287 | | | | 10,903 | |
| | | | | | | | | | | | | | | | |
Net Assets: | | | | | | | | | | | | | | | | |
Beginning of Year | | | 166,000 | | | | 111,748 | | | | 33,888 | | | | 22,985 | |
| | | | | | | | | | | | | | | | |
End of Year | | $ | 283,913 | | | $ | 166,000 | | | $ | 58,175 | | | $ | 33,888 | |
| | | | | | | | | | | | | | | | |
Share Transactions: | | | | | | | | | | | | | | | | |
Institutional Shares: | | | | | | | | | | | | | | | | |
Issued | | | 7,896 | | | | 6,723 | | | | 2,078 | | | | 1,946 | |
Reinvestment of Distributions | | | 1,313 | | | | 957 | | | | 243 | | | | 267 | |
Redeemed | | | (1,798 | ) | | | (1,060 | ) | | | (785 | ) | | | (800 | ) |
| | | | | | | | | | | | | | | | |
Net Increase in Shares Outstanding from Share Transactions | | | 7,411 | | | | 6,620 | | | | 1,536 | | | | 1,413 | |
| | | | | | | | | | | | | | | | |
The accompanying notes are an integral part of the financial statements.
152
|
| STATEMENTS OF CHANGES IN NET ASSETS (000) |
| | | | |
| | | KP
Retirement
Path 2065
Fund | |
| | | Period Ended
December 31,
2019* | |
Operations: | | | | |
Net Investment Income | | $ | 244 | |
Net Realized Gain on Affiliated and Unaffiliated Investments | | | 84 | |
Distributions of Realized Gains from Affiliated and Unaffiliated Registered Investment Company Shares | | | 260 | |
Net Change in Unrealized Appreciation on Affiliated and Unaffiliated Investments | | | 721 | |
| | | | |
Net Increase in Net Assets Resulting from Operations | | | 1,309 | |
| | | | |
Distributions: | | | (270 | ) |
| | | | |
Capital Share Transactions: | | | | |
Institutional Shares: | | | | |
Issued | | | 13,438 | |
Reinvestment of Distributions | | | 270 | |
Redeemed | | | (1,322 | ) |
| | | | |
Increase in Net Assets from Capital Share Transactions | | | 12,386 | |
| | | | |
Total Increase in Net Assets | | | 13,425 | |
| | | | |
Net Assets: | | | | |
Beginning of Year | | | — | |
| | | | |
End of Year | | $ | 13,425 | |
| | | | |
Share Transactions: | | | | |
Institutional Shares: | | | | |
Issued | | | 1,327 | |
Reinvestment of Distributions | | | 25 | |
Redeemed | | | (124 | ) |
| | | | |
Net Increase in Shares Outstanding from Share Transactions | | | 1,228 | |
| | | | |
| * | Commenced operations May 24, 2019. |
The accompanying notes are an integral part of the financial statements.
153
|
| STATEMENTS OF CHANGES IN NET ASSETS (000) |
| | | | | | | | | | | | | | | | |
| | | KP Large Cap Equity Fund | | | KP Small Cap Equity Fund | |
| | | Year Ended
December 31,
2019 | | | Year Ended
December 31,
2018 | | | Year Ended
December 31,
2019 | | | Year Ended
December 31,
2018 | |
Operations: | | | | | | | | | | | | | | | | |
Net Investment Income | | $ | 43,008 | | | $ | 39,546 | | | $ | 10,016 | | | $ | 6,470 | |
Net Realized Gain on Investments and Futures Contracts | | | 137,930 | | | | 148,245 | | | | 51,735 | | | | 113,150 | |
Net Realized Loss on Foreign Currency Transactions | | | (4 | ) | | | (4 | ) | | | — | | | | — | |
Net Change in Unrealized Appreciation/(Depreciation) on Investments and Futures Contracts | | | 545,301 | | | | (323,111 | ) | | | 210,211 | | | | (226,224 | ) |
Net Change in Unrealized Appreciation/(Depreciation) on Forward Contracts and Foreign Currency Transactions and Translation of other Assets and Liabilities Denominated in Foreign Currencies | | | 4 | | | | (2 | ) | | | — | | | | — | |
| | | | | | | | | | | | | | | | |
Net Increase/(Decrease) in Net Assets Resulting from Operations | | | 726,239 | | | | (135,326 | ) | | | 271,962 | | | | (106,604 | ) |
| | | | | | | | | | | | | | | | |
Distributions: | | | (155,200 | ) | | | (199,669 | ) | | | (47,476 | ) | | | (150,617 | ) |
| | | | | | | | | | | | | | | | |
Capital Share Transactions: | | | | | | | | | | | | | | | | |
Institutional Shares: | | | | | | | | | | | | | | | | |
Issued | | | 562,568 | | | | 548,789 | | | | 249,145 | | | | 207,302 | |
Reinvestment of Distributions | | | 155,200 | | | | 199,670 | | | | 47,475 | | | | 150,617 | |
Redeemed | | | (437,139 | ) | | | (312,229 | ) | | | (163,978 | ) | | | (168,878 | ) |
| | | | | | | | | | | | | | | | |
Increase in Net Assets from Capital Share Transactions | | | 280,629 | | | | 436,230 | | | | 132,642 | | | | 189,041 | |
| | | | | | | | | | | | | | | | |
Total Increase/(Decrease) in Net Assets | | | 851,668 | | | | 101,235 | | | | 357,128 | | | | (68,180 | ) |
| | | | | | | | | | | | | | | | |
Net Assets: | | | | | | | | | | | | | | | | |
Beginning of Year | | | 2,352,152 | | | | 2,250,917 | | | | 1,006,978 | | | | 1,075,158 | |
| | | | | | | | | | | | | | | | |
End of Year | | $ | 3,203,820 | | | $ | 2,352,152 | | | $ | 1,364,106 | | | $ | 1,006,978 | |
| | | | | | | | | | | | | | | | |
Share Transactions: | | | | | | | | | | | | | | | | |
Institutional Shares: | | | | | | | | | | | | | | | | |
Issued | | | 43,839 | | | | 40,190 | | | | 23,661 | | | | 16,263 | |
Reinvestment of Distributions | | | 11,050 | | | | 17,723 | | | | 4,187 | | | | 16,495 | |
Redeemed | | | (32,831 | ) | | | (23,060 | ) | | | (15,204 | ) | | | (13,425 | ) |
| | | | | | | | | | | | | | | | |
Net Increase in Shares Outstanding from Share Transactions | | | 22,058 | | | | 34,853 | | | | 12,644 | | | | 19,333 | |
| | | | | | | | | | | | | | | | |
Amounts designated as “—” are $0 or have been rounded to $0.
The accompanying notes are an integral part of the financial statements.
154
|
| STATEMENTS OF CHANGES IN NET ASSETS (000) |
| | | | | | | | | | | | | | | | |
| | | KP International Equity Fund | | | KP Fixed Income Fund | |
| | | Year Ended
December 31,
2019 | | | Year Ended
December 31,
2018 | | | Year Ended
December 31,
2019 | | | Year Ended
December 31,
2018 | |
Operations: | | | | | | | | | | | | | | | | |
Net Investment Income | | $ | 46,144 | | | $ | 33,840 | | | $ | 70,339 | | | $ | 56,674 | |
Net Realized Gain/(Loss) on Investments and Futures Contracts | | | 16,719 | | | | 34,005 | | | | 37,899 | | | | (23,863 | ) |
Net Realized Loss on Foreign Currency Transactions | | | (167 | ) | | | (635 | ) | | | (393 | ) | | | (1,527 | ) |
Net Change in Unrealized Appreciation/(Depreciation) on Investments and Futures Contracts | | | 315,414 | | | | (307,685 | ) | | | 82,742 | | | | (41,199 | ) |
Net Change in Unrealized Appreciation/(Depreciation) on Forward Contracts and Foreign Currency Transactions and Translation of other Assets and Liabilities Denominated in Foreign Currencies | | | 33 | | | | (68 | ) | | | (58 | ) | | | (50 | ) |
Change in Accrued Foreign Capital Gains Tax on Appreciated Securities | | | 83 | | | | 360 | | | | — | | | | — | |
| | | | | | | | | | | | | | | | |
Net Increase/(Decrease) in Net Assets Resulting from Operations | | | 378,226 | | | | (240,183 | ) | | | 190,529 | | | | (9,965 | ) |
| | | | | | | | | | | | | | | | |
Distributions: | | | (58,924 | ) | | | (100,442 | ) | | | (85,819 | ) | | | (55,856 | ) |
| | | | | | | | | | | | | | | | |
Capital Share Transactions: | | | | | | | | | | | | | | | | |
Institutional Shares: | | | | | | | | | | | | | | | | |
Issued | | | 343,428 | | | | 514,071 | | | | 523,009 | | | | 662,327 | |
Reinvestment of Distributions | | | 58,924 | | | | 100,442 | | | | 85,819 | | | | 55,855 | |
Redeemed | | | (202,770 | ) | | | (152,639 | ) | | | (412,217 | ) | | | (195,341 | ) |
| | | | | | | | | | | | | | | | |
Increase in Net Assets from Capital Share Transactions | | | 199,582 | | | | 461,874 | | | | 196,611 | | | | 522,841 | |
| | | | | | | | | | | | | | | | |
Total Increase in Net Assets | | | 518,884 | | | | 121,249 | | | | 301,321 | | | | 457,020 | |
| | | | | | | | | | | | | | | | |
Net Assets: | | | | | | | | | | | | | | | | |
Beginning of Year | | | 1,591,217 | | | | 1,469,968 | | | | 2,038,900 | | | | 1,581,880 | |
| | | | | | | | | | | | | | | | |
End of Year | | $ | 2,110,101 | | | $ | 1,591,217 | | | $ | 2,340,221 | | | $ | 2,038,900 | |
| | | | | | | | | | | | | | | | |
Share Transactions: | | | | | | | | | | | | | | | | |
Institutional Shares: | | | | | | | | | | | | | | | | |
Issued | | | 34,026 | | | | 47,491 | | | | 51,102 | | | | 66,879 | |
Reinvestment of Distributions | | | 5,425 | | | | 11,076 | | | | 8,341 | | | | 5,776 | |
Redeemed | | | (20,011 | ) | | | (13,931 | ) | | | (41,039 | ) | | | (19,771 | ) |
| | | | | | | | | | | | | | | | |
Net Increase in Shares Outstanding from Share Transactions | | | 19,440 | | | | 44,636 | | | | 18,404 | | | | 52,884 | |
| | | | | | | | | | | | | | | | |
Amounts designated as “—” are $0 or have been rounded to $0.
The accompanying notes are an integral part of the financial statements.
155
For the year or period ended December 31,
For a share outstanding throughout the periods
| | | | | | | | | | | | | | | | | | | | | | | | | | | | | | | | | | | | | | | | | | | | | | | | | | | | |
| | | | | | | | | | | | | | |
| | | Net Asset
Value,
Beginning
of Year or
Period | | | Net
Investment
Income† | | | Net Realized
and
Unrealized
Gain/
(Loss) on
Investments | | | Total
from
Operations | | | Distributions
from
Investment
Income | | | Distributions
from
Net Realized
Capital
Gains | | | Total
Distributions | | | Net Asset
Value, End
of Year or
Period | | | Total
Return‡ | | | Net Assets
End of
Year or
Period (000) | | | Ratio of
Expenses
to Average
Net Assets††** | | | Ratio of Net
Investment
Income
to Average
Net Assets | | | Portfolio
Turnover‡ | |
| | | | | | | | | | | | | | | | | | | | | | | | | | | | | | | | | | | | | | | | | | | | | | | | | | | | |
KP Retirement Path Retirement Income Fund - Institutional Shares | |
2019 | | $ | 9.61 | | | $ | 0.25 | | | $ | 1.11 | | | $ | 1.36 | | | $ | (0.29 | ) | | $ | (0.34 | ) | | $ | (0.63 | ) | | $ | 10.34 | | | | 14.12 | % | | $ | 461,025 | | | | 0.06 | % | | | 2.44 | % | | | 18 | % |
2018 | | | 10.51 | | | | 0.25 | | | | (0.54 | ) | | | (0.29 | ) | | | (0.25 | ) | | | (0.36 | ) | | | (0.61 | ) | | | 9.61 | | | | (2.65 | ) | | | 455,335 | | | | 0.07 | | | | 2.43 | | | | 23 | |
2017 | | | 9.96 | | | | 0.20 | | | | 0.80 | | | | 1.00 | | | | (0.24 | ) | | | (0.21 | ) | | | (0.45 | ) | | | 10.51 | | | | 10.03 | | | | 439,687 | | | | 0.07 | | | | 1.89 | | | | 28 | |
2016 | | | 9.76 | | | | 0.17 | | | | 0.34 | | | | 0.51 | | | | (0.22 | ) | | | (0.09 | ) | | | (0.31 | ) | | | 9.96 | | | | 5.24 | | | | 462,303 | | | | 0.08 | | | | 1.69 | | | | 15 | |
2015 | | | 10.07 | | | | 0.15 | | | | (0.13 | ) | | | 0.02 | | | | (0.20 | ) | | | (0.13 | ) | | | (0.33 | ) | | | 9.76 | | | | 0.14 | | | | 483,292 | | | | 0.08 | | | | 1.45 | | | | 24 | |
| | | | | | | | | | | | | | | | | | | | | | | | | | | | | | | | | | | | | | | | | | | | | | | | | | | | |
KP Retirement Path 2020 Fund - Institutional Shares | |
2019 | | $ | 9.90 | | | $ | 0.26 | | | $ | 1.29 | | | $ | 1.55 | | | $ | (0.29 | ) | | $ | (0.38 | ) | | $ | (0.67 | ) | | $ | 10.78 | | | | 15.60 | % | | $ | 1,065,370 | | | | 0.06 | % | | | 2.41 | % | | | 20 | % |
2018 | | | 10.90 | | | | 0.26 | | | | (0.62 | ) | | | (0.36 | ) | | | (0.26 | ) | | | (0.38 | ) | | | (0.64 | ) | | | 9.90 | | | | (3.25 | ) | | | 976,953 | | | | 0.07 | | | | 2.39 | | | | 17 | |
2017 | | | 10.10 | | | | 0.21 | | | | 1.01 | | | | 1.22 | | | | (0.25 | ) | | | (0.17 | ) | | | (0.42 | ) | | | 10.90 | | | | 12.04 | | | | 877,534 | | | | 0.07 | | | | 1.98 | | | | 25 | |
2016 | | | 9.82 | | | | 0.18 | | | | 0.40 | | | | 0.58 | | | | (0.21 | ) | | | (0.09 | ) | | | (0.30 | ) | | | 10.10 | | | | 5.92 | | | | 772,111 | | | | 0.08 | | | | 1.79 | | | | 13 | |
2015 | | | 10.11 | | | | 0.16 | | | | (0.17 | ) | | | (0.01 | ) | | | (0.20 | ) | | | (0.08 | ) | | | (0.28 | ) | | | 9.82 | | | | (0.10 | ) | | | 707,746 | | | | 0.07 | | | | 1.56 | | | | 19 | |
| | | | | | | | | | | | | | | | | | | | | | | | | | | | | | | | | | | | | | | | | | | | | | | | | | | | |
KP Retirement Path 2025 Fund - Institutional Shares | |
2019 | | $ | 10.07 | | | $ | 0.27 | | | $ | 1.52 | | | $ | 1.79 | | | $ | (0.28 | ) | | $ | (0.40 | ) | | $ | (0.68 | ) | | $ | 11.18 | | | | 17.71 | % | | $ | 1,452,260 | | | | 0.06 | % | | | 2.40 | % | | | 16 | % |
2018 | | | 11.22 | | | | 0.26 | | | | (0.75 | ) | | | (0.49 | ) | | | (0.27 | ) | | | (0.39 | ) | | | (0.66 | ) | | | 10.07 | | | | (4.28 | ) | | | 1,194,960 | | | | 0.06 | | | | 2.28 | | | | 13 | |
2017 | | | 10.15 | | | | 0.22 | | | | 1.26 | | | | 1.48 | | | | (0.26 | ) | | | (0.15 | ) | | | (0.41 | ) | | | 11.22 | | | | 14.59 | | | | 1,061,313 | | | | 0.07 | | | | 2.00 | | | | 19 | |
2016 | | | 9.81 | | | | 0.19 | | | | 0.46 | | | | 0.65 | | | | (0.21 | ) | | | (0.10 | ) | | | (0.31 | ) | | | 10.15 | | | | 6.64 | | | | 842,733 | | | | 0.07 | | | | 1.87 | | | | 10 | |
2015 | | | 10.11 | | | | 0.17 | | | | (0.21 | ) | | | (0.04 | ) | | | (0.21 | ) | | | (0.05 | ) | | | (0.26 | ) | | | 9.81 | | | | (0.35 | ) | | | 718,758 | | | | 0.07 | | | | 1.64 | | | | 12 | |
| | | | | | | | | | | | | | | | | | | | | | | | | | | | | | | | | | | | | | | | | | | | | | | | | | | | |
KP Retirement Path 2030 Fund - Institutional Shares | |
2019 | | $ | 10.14 | | | $ | 0.26 | | | $ | 1.72 | | | $ | 1.98 | | | $ | (0.26 | ) | | $ | (0.44 | ) | | $ | (0.70 | ) | | $ | 11.42 | | | | 19.62 | % | | $ | 1,468,354 | | | | 0.06 | % | | | 2.33 | % | | | 14 | % |
2018 | | | 11.44 | | | | 0.25 | | | | (0.85 | ) | | | (0.60 | ) | | | (0.28 | ) | | | (0.42 | ) | | | (0.70 | ) | | | 10.14 | | | | (5.20 | ) | | | 1,152,153 | | | | 0.06 | | | | 2.20 | | | | 12 | |
2017 | | | 10.15 | | | | 0.22 | | | | 1.50 | | | | 1.72 | | | | (0.27 | ) | | | (0.16 | ) | | | (0.43 | ) | | | 11.44 | | | | 16.93 | | | | 1,013,379 | | | | 0.07 | | | | 1.98 | | | | 18 | |
2016 | | | 9.76 | | | | 0.19 | | | | 0.52 | | | | 0.71 | | | | (0.20 | ) | | | (0.12 | ) | | | (0.32 | ) | | | 10.15 | | | | 7.32 | | | | 773,892 | | | | 0.07 | | | | 1.91 | | | | 9 | |
2015 | | | 10.09 | | | | 0.17 | | | | (0.22 | ) | | | (0.05 | ) | | | (0.22 | ) | | | (0.06 | ) | | | (0.28 | ) | | | 9.76 | | | | (0.52 | ) | | | 639,173 | | | | 0.07 | | | | 1.70 | | | | 9 | |
| | | | | | | | | | | | | | | | | | | | | | | | | | | | | | | | | | | | | | | | | | | | | | | | | | | | |
KP Retirement Path 2035 Fund - Institutional Shares | |
2019 | | $ | 10.20 | | | $ | 0.26 | | | $ | 1.92 | | | $ | 2.18 | | | $ | (0.26 | ) | | $ | (0.49 | ) | | $ | (0.75 | ) | | $ | 11.63 | | | | 21.31 | % | | $ | 1,653,869 | | | | 0.06 | % | | | 2.26 | % | | | 12 | % |
2018 | | | 11.68 | | | | 0.24 | | | | (0.98 | ) | | | (0.74 | ) | | | (0.29 | ) | | | (0.45 | ) | | | (0.74 | ) | | | 10.20 | | | | (6.24 | ) | | | 1,262,478 | | | | 0.06 | | | | 2.07 | | | | 12 | |
2017 | | | 10.19 | | | | 0.22 | | | | 1.71 | | | | 1.93 | | | | (0.28 | ) | | | (0.16 | ) | | | (0.44 | ) | | | 11.68 | | | | 18.93 | | | | 1,133,140 | | | | 0.06 | | | | 1.96 | | | | 16 | |
2016 | | | 9.75 | | | | 0.19 | | | | 0.58 | | | | 0.77 | | | | (0.20 | ) | | | (0.13 | ) | | | (0.33 | ) | | | 10.19 | | | | 7.91 | | | | 845,902 | | | | 0.07 | | | | 1.89 | | | | 9 | |
2015 | | | 10.10 | | | | 0.18 | | | | (0.25 | ) | | | (0.07 | ) | | | (0.23 | ) | | | (0.05 | ) | | | (0.28 | ) | | | 9.75 | | | | (0.70 | ) | | | 691,910 | | | | 0.06 | | | | 1.71 | | | | 7 | |
| | | | | | | | | | | | | | | | | | | | | | | | | | | | | | | | | | | | | | | | | | | | | | | | | | | | |
KP Retirement Path 2040 Fund - Institutional Shares | |
2019 | | $ | 10.25 | | | $ | 0.26 | | | $ | 2.04 | | | $ | 2.30 | | | $ | (0.25 | ) | | $ | (0.53 | ) | | $ | (0.78 | ) | | $ | 11.77 | | | | 22.40 | % | | $ | 1,527,834 | | | | 0.06 | % | | | 2.20 | % | | | 12 | % |
2018 | | | 11.83 | | | | 0.23 | | | | (1.06 | ) | | | (0.83 | ) | | | (0.29 | ) | | | (0.46 | ) | | | (0.75 | ) | | | 10.25 | | | | (6.89 | ) | | | 1,146,007 | | | | 0.06 | | | | 1.97 | | | | 11 | |
2017 | | | 10.21 | | | | 0.22 | | | | 1.85 | | | | 2.07 | | | | (0.29 | ) | | | (0.16 | ) | | | (0.45 | ) | | | 11.83 | | | | 20.28 | | | | 1,043,698 | | | | 0.06 | | | | 1.94 | | | | 15 | |
2016 | | | 9.75 | | | | 0.18 | | | | 0.61 | | | | 0.79 | | | | (0.19 | ) | | | (0.14 | ) | | | (0.33 | ) | | | 10.21 | | | | 8.14 | | | | 762,771 | | | | 0.07 | | | | 1.86 | | | | 8 | |
2015 | | | 10.10 | | | | 0.17 | | | | (0.25 | ) | | | (0.08 | ) | | | (0.22 | ) | | | (0.05 | ) | | | (0.27 | ) | | | 9.75 | | | | (0.73 | ) | | | 611,633 | | | | 0.06 | | | | 1.68 | | | | 7 | |
| | | | | | | | | | | | | | | | | | | | | | | | | | | | | | | | | | | | | | | | | | | | | | | | | | | | |
KP Retirement Path 2045 Fund - Institutional Shares | |
2019 | | $ | 10.27 | | | $ | 0.25 | | | $ | 2.12 | | | $ | 2.37 | | | $ | (0.24 | ) | | $ | (0.52 | ) | | $ | (0.76 | ) | | $ | 11.88 | | | | 23.14 | % | | $ | 1,213,088 | | | | 0.06 | % | | | 2.18 | % | | | 11 | % |
2018 | | | 11.90 | | | | 0.23 | | | | (1.11 | ) | | | (0.88 | ) | | | (0.29 | ) | | | (0.46 | ) | | | (0.75 | ) | | | 10.27 | | | | (7.27 | ) | | | 873,412 | | | | 0.06 | | | | 1.94 | | | | 11 | |
2017 | | | 10.20 | | | | 0.22 | | | | 1.92 | | | | 2.14 | | | | (0.29 | ) | | | (0.15 | ) | | | (0.44 | ) | | | 11.90 | | | | 21.00 | | | | 766,861 | | | | 0.06 | | | | 1.93 | | | | 14 | |
2016 | | | 9.74 | | | | 0.19 | | | | 0.60 | | | | 0.79 | | | | (0.18 | ) | | | (0.15 | ) | | | (0.33 | ) | | | 10.20 | | | | 8.15 | | | | 535,836 | | | | 0.07 | | | | 1.89 | | | | 9 | |
2015 | | | 10.09 | | | | 0.18 | | | | (0.25 | ) | | | (0.07 | ) | | | (0.22 | ) | | | (0.06 | ) | | | (0.28 | ) | | | 9.74 | | | | (0.66 | ) | | | 413,485 | | | | 0.06 | | | | 1.71 | | | | 9 | |
| | | | | | | | | | | | | | | | | | | | | | | | | | | | | | | | | | | | | | | | | | | | | | | | | | | | |
KP Retirement Path 2050 Fund - Institutional Shares | |
2019 | | $ | 10.37 | | | $ | 0.26 | | | $ | 2.18 | | | $ | 2.44 | | | $ | (0.24 | ) | | $ | (0.50 | ) | | $ | (0.74 | ) | | $ | 12.07 | | | | 23.52 | % | | $ | 762,520 | | | | 0.06 | % | | | 2.19 | % | | | 12 | % |
2018 | | | 12.01 | | | | 0.24 | | | | (1.16 | ) | | | (0.92 | ) | | | (0.29 | ) | | | (0.43 | ) | | | (0.72 | ) | | | 10.37 | | | | (7.52 | ) | | | 512,532 | | | | 0.06 | | | | 1.96 | | | | 10 | |
2017 | | | 10.24 | | | | 0.23 | | | | 1.97 | | | | 2.20 | | | | (0.29 | ) | | | (0.14 | ) | | | (0.43 | ) | | | 12.01 | | | | 21.52 | | | | 414,001 | | | | 0.06 | | | | 2.02 | | | | 13 | |
2016 | | | 9.75 | | | | 0.20 | | | | 0.60 | | | | 0.80 | | | | (0.18 | ) | | | (0.13 | ) | | | (0.31 | ) | | | 10.24 | | | | 8.25 | | | | 257,588 | | | | 0.07 | | | | 1.98 | | | | 10 | |
2015 | | | 10.09 | | | | 0.19 | | | | (0.26 | ) | | | (0.07 | ) | | | (0.22 | ) | | | (0.05 | ) | | | (0.27 | ) | | | 9.75 | | | | (0.70 | ) | | | 172,257 | | | | 0.06 | | | | 1.82 | | | | 9 | |
| | | | | | | | | | | | | | | | | | | | | | | | | | | | | | | | | | | | | | | | | | | | | | | | | | | | |
The accompanying notes are an integral part of the financial statements.
156
For the year or period ended December 31,
For a share outstanding throughout the periods
| | | | | | | | | | | | | | | | | | | | | | | | | | | | | | | | | | | | | | | | | | | | | | | | | | | | | | | | |
| | | | | | | | | | | | | | | |
| | | Net Asset
Value,
Beginning
of Year or
Period | | | Net
Investment
Income† | | | Net Realized
and
Unrealized
Gain/
(Loss) on
Investments | | | Total
from
Operations | | | Distributions
from
Investment
Income | | | Distributions
from
Net Realized
Capital
Gains | | | Return of
Capital | | | Total
Distributions | | | Net Asset
Value, End
of Year or
Period | | | Total
Return‡ | | | Net Assets
End of
Year or
Period (000) | | | Ratio of
Expenses to
Average
Net Assets††** | | | Ratio of Net
Investment
Income
to Average
Net Assets | | | Portfolio
Turnover‡ | |
| | | | | | | | | | | | | | | | | | | | | | | | | | | | | | | | | | | | | | | | | | | | | | | | | | | | | | | | |
KP Retirement Path 2055 Fund - Institutional Shares | |
2019 | | $ | 10.43 | | | $ | 0.27 | | | $ | 2.21 | | | $ | 2.48 | | | $ | (0.24 | ) | | $ | (0.50 | ) | | $ | — | | | $ | (0.74 | ) | | $ | 12.17 | | | | 23.71 | % | | $ | 283,913 | | | | 0.06 | % | | | 2.30 | % | | | 13 | % |
2018 | | | 12.03 | | | | 0.25 | | | | (1.18 | ) | | | (0.93 | ) | | | (0.30 | ) | | | (0.37 | ) | | | — | | | | (0.67 | ) | | | 10.43 | | | | (7.68 | ) | | | 166,000 | | | | 0.06 | | | | 2.09 | | | | 12 | |
2017 | | | 10.22 | | | | 0.26 | | | | 1.94 | | | | 2.20 | | | | (0.29 | ) | | | (0.10 | ) | | | — | | | | (0.39 | ) | | | 12.03 | | | | 21.59 | | | | 111,748 | | | | 0.06 | | | | 2.24 | | | | 15 | |
2016 | | | 9.70 | | | | 0.22 | | | | 0.58 | | | | 0.80 | | | | (0.18 | ) | | | (0.10 | ) | | | — | | | | (0.28 | ) | | | 10.22 | | | | 8.28 | | | | 54,819 | | | | 0.07 | | | | 2.26 | | | | 16 | |
2015 | | | 10.07 | | | | 0.23 | | | | (0.30 | ) | | | (0.07 | ) | | | (0.21 | ) | | | (0.09 | ) | | | — | | | | (0.30 | ) | | | 9.70 | | | | (0.66 | ) | | | 27,088 | | | | 0.06 | | | | 2.19 | | | | 21 | |
| | | | | | | | | | | | | | | | | | | | | | | | | | | | | | | | | | | | | | | | | | | | | | | | | | | | | | | | |
KP Retirement Path 2060 Fund - Institutional Shares | |
2019 | | $ | 10.18 | | | $ | 0.27 | | | $ | 2.14 | | | $ | 2.41 | | | $ | (0.23 | ) | | $ | (0.40 | ) | | $ | — | | | $ | (0.63 | ) | | $ | 11.96 | | | | 23.73 | % | | $ | 58,175 | | | | 0.06 | % | | | 2.29 | % | | | 23 | % |
2018 | | | 12.00 | | | | 0.25 | | | | (1.18 | ) | | | (0.93 | ) | | | (0.29 | ) | | | (0.60 | ) | | | — | | | | (0.89 | ) | | | 10.18 | | | | (7.65 | ) | | | 33,888 | | | | 0.06 | | | | 2.05 | | | | 36 | |
2017 | | | 10.27 | | | | 0.28 | | | | 1.94 | | | | 2.22 | | | | (0.29 | ) | | | (0.20 | ) | | | — | | | | (0.49 | ) | | | 12.00 | | | | 21.66 | | | | 22,985 | | | | 0.07 | | | | 2.43 | | | | 27 | |
2016 | | | 9.78 | | | | 0.21 | | | | 0.59 | | | | 0.80 | | | | (0.18 | ) | | | (0.13 | ) | | | — | | | | (0.31 | ) | | | 10.27 | | | | 8.18 | | | | 9,097 | | | | 0.07 | | | | 2.10 | | | | 51 | |
2015 | | | 10.12 | | | | 0.22 | | | | (0.28 | ) | | | (0.06 | ) | | | (0.22 | ) | | | (0.06 | ) | | | — | | | | (0.28 | ) | | | 9.78 | | | | (0.60 | ) | | | 5,748 | | | | 0.06 | | | | 2.09 | | | | 100 | |
| | | | | | | | | | | | | | | | | | | | | | | | | | | | | | | | | | | | | | | | | | | | | | | | | | | | | | | | |
KP Retirement Path 2065 Fund* - Institutional Shares | |
2019@ | | $ | 10.00 | | | $ | 0.23 | | | $ | 0.93 | | | $ | 1.16 | | | $ | (0.21 | ) | | $ | (0.01 | ) | | $ | — | | | $ | (0.22 | ) | | $ | 10.94 | | | | 11.67 | % | | $ | 13,425 | | | | 0.06 | %^ | | | 3.61 | % | | | 12 | % |
| | | | | | | | | | | | | | | | | | | | | | | | | | | | | | | | | | | | | | | | | | | | | | | | | | | | | | | | |
KP Large Cap Equity Fund - Institutional Shares | |
2019 | | $ | 11.30 | | | $ | 0.20 | | | $ | 3.11 | | | $ | 3.31 | | | $ | (0.19 | ) | | $ | (0.51 | ) | | $ | — | | | $ | (0.70 | ) | | $ | 13.91 | | | | 29.32 | % | | $ | 3,203,820 | | | | 0.30 | % | | | 1.48 | % | | | 45 | % |
2018 | | | 12.98 | | | | 0.22 | | | | (0.87 | ) | | | (0.65 | ) | | | (0.19 | ) | | | (0.84 | ) | | | — | | | | (1.03 | ) | | | 11.30 | | | | (4.82 | ) | | | 2,352,152 | | | | 0.30 | | | | 1.65 | | | | 49 | |
2017 | | | 11.19 | | | | 0.18 | | | | 2.49 | | | | 2.67 | | | | (0.17 | ) | | | (0.71 | ) | | | — | | | | (0.88 | ) | | | 12.98 | | | | 23.84 | | | | 2,250,917 | | | | 0.31 | | | | 1.47 | | | | 41 | |
2016 | | | 10.56 | | | | 0.18 | | | | 0.88 | | | | 1.06 | | | | (0.17 | ) | | | (0.26 | ) | | | — | | | | (0.43 | ) | | | 11.19 | | | | 10.04 | | | | 1,476,628 | | | | 0.34 | | | | 1.65 | | | | 50 | |
2015 | | | 10.82 | | | | 0.15 | | | | 0.17 | | | | 0.32 | | | | (0.15 | ) | | | (0.43 | ) | | | — | | | | (0.58 | ) | | | 10.56 | | | | 2.91 | | | | 1,239,696 | | | | 0.35 | | | | 1.38 | | | | 126 | |
| | | | | | | | | | | | | | | | | | | | | | | | | | | | | | | | | | | | | | | | | | | | | | | | | | | | | | | | |
KP Small Cap Equity Fund - Institutional Shares | |
2019 | | $ | 9.29 | | | $ | 0.09 | | | $ | 2.30 | | | $ | 2.39 | | | $ | (0.09 | ) | | $ | (0.32 | ) | | $ | — | | | $ | (0.41 | ) | | $ | 11.27 | | | | 25.67 | % | | $ | 1,364,106 | | | | 0.52 | % | | | 0.80 | % | | | 83 | % |
2018 | | | 12.08 | | | | 0.07 | | | | (1.24 | ) | | | (1.17 | ) | | | (0.06 | ) | | | (1.56 | ) | | | — | | | | (1.62 | ) | | | 9.29 | | | | (9.30 | ) | | | 1,006,978 | | | | 0.52 | | | | 0.57 | | | | 85 | |
2017 | | | 11.22 | | | | 0.05 | | | | 1.97 | | | | 2.02 | | | | (0.06 | ) | | | (1.10 | ) | | | — | | | | (1.16 | ) | | | 12.08 | | | | 17.95 | | | | 1,075,158 | | | | 0.53 | | | | 0.41 | | | | 100 | |
2016 | | | 9.55 | | | | 0.08 | | | | 1.68 | | | | 1.76 | | | | (0.09 | ) | | | — | | | | — | | | | (0.09 | ) | | | 11.22 | | | | 18.38 | | | | 930,815 | | | | 0.53 | | | | 0.86 | | | | 91 | |
2015 | | | 10.32 | | | | 0.07 | | | | (0.55 | ) | | | (0.48 | ) | | | (0.07 | ) | | | (0.22 | ) | | | — | (1) | | | (0.29 | ) | | | 9.55 | | | | (4.73 | ) | | | 780,852 | | | | 0.55 | | | | 0.68 | | | | 154 | |
| | | | | | | | | | | | | | | | | | | | | | | | | | | | | | | | | | | | | | | | | | | | | | | | | | | | | | | | |
KP International Equity Fund - Institutional Shares | |
2019 | | $ | 9.05 | | | $ | 0.25 | | | $ | 1.82 | | | $ | 2.07 | | | $ | (0.26 | ) | | $ | (0.05 | ) | | $ | — | | | $ | (0.31 | ) | | $ | 10.81 | | | | 22.87 | % | | $ | 2,110,101 | | | | 0.47 | % | | | 2.48 | % | | | 41 | % |
2018 | | | 11.20 | | | | 0.24 | | | | (1.79 | ) | | | (1.55 | ) | | | (0.19 | ) | | | (0.41 | ) | | | — | | | | (0.60 | ) | | | 9.05 | | | | (13.75 | ) | | | 1,591,217 | | | | 0.47 | | | | 2.19 | | | | 32 | |
2017 | | | 8.93 | | | | 0.21 | | | | 2.37 | | | | 2.58 | | | | (0.26 | ) | | | (0.05 | ) | | | — | | | | (0.31 | ) | | | 11.20 | | | | 28.95 | | | | 1,469,968 | | | | 0.49 | | | | 2.06 | | | | 125 | |
2016 | | | 8.84 | | | | 0.20 | | | | 0.07 | | | | 0.27 | | | | (0.18 | ) | | | — | | | | — | | | | (0.18 | ) | | | 8.93 | | | | 3.03 | | | | 1,232,730 | | | | 0.49 | | | | 2.22 | | | | 23 | |
2015 | | | 9.30 | | | | 0.20 | | | | (0.46 | ) | | | (0.26 | ) | | | (0.19 | ) | | | — | | | | (0.01 | ) | | | (0.20 | ) | | | 8.84 | | | | (2.79 | ) | | | 1,026,913 | | | | 0.50 | | | | 2.13 | | | | 21 | |
| | | | | | | | | | | | | | | | | | | | | | | | | | | | | | | | | | | | | | | | | | | | | | | | | | | | | | | | |
KP Fixed Income Fund - Institutional Shares | |
2019 | | $ | 9.69 | | | $ | 0.34 | | | $ | 0.58 | | | $ | 0.92 | | | $ | (0.32 | ) | | $ | (0.06 | ) | | $ | — | | | $ | (0.38 | ) | | $ | 10.23 | | | | 9.57 | % | | $ | 2,340,221 | | | | 0.29 | % | | | 3.29 | % | | | 325 | % |
2018 | | | 10.05 | | | | 0.31 | | | | (0.40 | ) | | | (0.09 | ) | | | (0.27 | ) | | | — | | | | — | | | | (0.27 | ) | | | 9.69 | | | | (0.86 | ) | | | 2,038,900 | | | | 0.31 | | | | 3.18 | | | | 422 | |
2017 | | | 9.86 | | | | 0.27 | | | | 0.16 | | | | 0.43 | | | | (0.24 | ) | | | — | | | | — | | | | (0.24 | ) | | | 10.05 | | | | 4.41 | | | | 1,581,880 | | | | 0.31 | | | | 2.63 | | | | 547 | |
2016 | | | 9.79 | | | | 0.24 | | | | 0.16 | | | | 0.40 | | | | (0.23 | ) | | | (0.10 | ) | | | — | | | | (0.33 | ) | | | 9.86 | | | | 4.08 | | | | 1,069,341 | | | | 0.32 | | | | 2.37 | | | | 484 | |
2015 | | | 10.00 | | | | 0.21 | | | | (0.16 | ) | | | 0.05 | | | | (0.21 | ) | | | (0.05 | ) | | | — | (1) | | | (0.26 | ) | | | 9.79 | | | | 0.57 | | | | 920,322 | | | | 0.34 | | | | 2.10 | | | | 533 | |
| | | | | | | | | | | | | | | | | | | | | | | | | | | | | | | | | | | | | | | | | | | | | | | | | | | | | | | | |
| * | Commenced operations on May 24, 2019. |
| ** | The expense ratios do not include expenses of the underlying affiliated investment companies. |
| @ | For the period ended May 24, 2019. All ratios for the period have been annualized. |
| † | Per share calculations were performed using the average shares method. |
| †† | Ratio does not include the expenses of the underlying funds, as applicable. |
| ‡ | Total return and portfolio turnover are for the period indicated and have not been annualized. Returns shown do not reflect the deduction of taxes that a shareholder would pay of Fund distributions or the redemption of Fund shares. |
| ^ | The ratio of Expenses to Average Net Assets included the effect of a reimbursement. If these offsets were excluded, the ratio would have been 0.36% |
| (1) | Amount less than $0.01 per share. |
Amounts designated as “—“ are 0 or have been rounded to 0.
The accompanying notes are an integral part of the financial statements.
157
| | |
| THE KP FUNDS | | December 31, 2019 |
|
| NOTES TO FINANCIAL STATEMENTS |
1. Organization
The KP Funds (the “Trust”), was organized on March 25, 2013, as a statutory trust under the laws of the Commonwealth of Massachusetts. The Trust is anopen-end registered management investment company comprised of fifteen funds: KP Path Retirement Income Fund (formerly, KP Retirement Path 2015 Fund), KP Retirement Path 2020 Fund, KP Retirement Path 2025 Fund, KP Retirement Path 2030 Fund, KP Retirement Path 2035 Fund, KP Retirement Path 2040 Fund, KP Retirement Path 2045 Fund, KP Retirement Path 2050 Fund, KP Retirement Path 2055 Fund, KP Retirement Path 2060 Fund, and KP Retirement Path 2065 Fund (collectively, the “Target Date Funds”); and the KP Large Cap Equity Fund, KP Small Cap Equity Fund, KP International Equity Fund, and KP Fixed Income Fund (collectively, the “Asset Class Funds” and collectively with the Target Date Funds, the “Funds” and each a “Fund”). The investment objective of the Target Date Funds is to seek a balance of long-term capital growth, inflation protection, and current income. The investment objective of KP Large Cap Equity, KP Small Cap Equity and KP International Equity Funds is to seek long-term capital appreciation. The investment objective of KP Fixed Income Fund is to provide current income consistent with the preservation of capital. The Funds are diversified for purposes of the Investment Company Act of 1940, as amended (the “1940 Act”). The assets of each Fund of the Trust are segregated, and a shareholder’s interest is limited to the Fund in which shares are held. The Funds are registered to offer Institutional Class Shares.
KP Retirement Path 2065 Fund commenced operations on May 24, 2019.
Callan LLC serves as the Funds’ investment adviser (the “Adviser”). The Adviser has engaged a number ofsub-advisers (the“Sub-Advisers”) to manage a portion of the Asset Class Funds’ assets. On September 3, 2013, the Trust was seeded with an issuance of 10,000 shares of the Institutional Class Shares of the KP Fixed Income Fund at an aggregate purchase price of $100,000.
2. Significant Accounting Policies
The following are significant accounting policies, which are consistently followed in the preparation of its financial statements of the Funds. The Funds are investment companies that apply the accounting and reporting guidance issued in Topic 946 by the U.S. Financial Accounting Standards Board (“FASB”).
Use of Estimates in the Preparation of Financial Statements —The preparation of financial statements in conformity with accounting principles generally accepted in the United States of America (“U.S. GAAP”) requires management to make estimates and assumptions that affect the fair value of assets, the reported amount of assets and liabilities and disclosure of contingent assets and liabilities at the date of the financial statements and the reported amounts of increases and decreases in net assets from operations during the reporting period. Actual results could differ from those estimates and such differences could be material.
Security Valuation —Securities listed on a securities exchange, market or automated quotation system for which quotations are readily available (except for securities traded on NASDAQ), including securities traded over the counter, are valued at the last quoted sale price on an exchange or market (foreign or domestic) on which they are traded on valuation date (or at approximately 4:00 pm ET if a security’s primary exchange is normally open at that time), or, if there is no such reported sale on the valuation date, at the most recent quoted bid price. For securities traded on NASDAQ, the NASDAQ Official Closing Price will be used. If available, debt securities are priced based upon valuations provided by independent, third-party pricing agents. Such values generally reflect the last reported sales price if the security is actively traded. The third-party pricing agents may also value debt securities at an evaluated bid price by employing methodologies that utilize actual market transactions, broker-supplied valuations, or other methodologies designed to identify the market value for such securities. Such methodologies generally consider such factors as security prices, yields, maturities, call features, ratings and developments relating to specific securities in arriving at valuations. On the first day a new debt security purchase is recorded, if a price is not available on the automated pricing feeds from our primary and secondary pricing vendors nor is it available from an independent broker, the security may be valued at its purchase price. Each day thereafter, the debt security will be valued according to the Trusts’ Fair Value Procedures until an independent source can be secured. Debt obligations with remaining maturities of sixty days or less may be valued at their amortized cost, provided that it is determined the amortized cost continues to approximate fair value. Should existing credit, liquidity or interest rate conditions in the relevant markets and issuer specific circumstances suggest that amortized cost does not approx-
158
| | |
| THE KP FUNDS | | December 31, 2019 |
imate fair value, then the amortized cost method may not be used. The prices for foreign securities are reported in local currency and converted to U.S. dollars using currency exchange rates.
Investments inopen-end andclosed-end registered investment companies that do not trade on an exchange are valued at the end of day net asset value per share. Investments inopen-end andclosed-end registered investment companies that trade on an exchange are valued at the last sales price or official closing price as of the close of the customary trading session on the exchange where the security is principally traded.
Securities for which market prices are not available through the above methods are valued in accordance with Fair Value Procedures established by the Funds’ Board of Trustees (the “Board”). The Funds’ Fair Value Procedures are implemented through a Fair Value Pricing Committee (the “Committee”) designated by the Funds’ Board. Some of the more common reasons that may necessitate that a security be valued using Fair Value Procedures include: the security’s trading has been halted or suspended; the security has been delisted from a national exchange; the security’s primary trading market is temporarily closed at a time when under normal conditions it would be open; or the security’s primary pricing source is not able or willing to provide a price. When a security is valued in accordance with the Fair Value Procedures, the Committee will determine the value after taking into consideration relevant information reasonably available to the Committee. As of December 31, 2019, KP Large Cap Equity, KP International Equity, and KP Fixed Income Funds had securities valued in accordance with fair value procedures. Refer to each Funds’ schedule of investments for further details.
For securities that principally trade on a foreign market or exchange, a significant gap in time can exist between the time of a particular security’s last trade and the time at which the Fund calculates its net asset value. The closing prices of such securities may no longer reflect their market value at the time the Fund calculates its net asset value if an event that could materially affect the value of those securities (a “Significant Event”) has occurred between the time of the security’s last close and the time that the Fund calculates net asset value. A Significant Event may relate to a single issuer or to an entire market sector. If the Adviser of the Fund becomes aware of a Significant Event that has occurred with respect to a security or group of securities after the closing of the exchange or market on which the security or securities principally trade, but before the time at which the Fund calculates its net asset value, it may request that a Committee meeting be called.
KP International Equity Fund uses MarkIt Fair Value (“MarkIt”) as a third party fair valuation vendor. MarkIt provides a fair value for foreign securities held by KP International Equity Fund based on certain factors and methodologies (involving, generally, tracking valuation correlations between the U.S. market and eachnon-U.S. security) applied by MarkIt in the event that there is a movement in the U.S. market that exceeds a specific threshold established by the Committee. The Committee establishes a “confidence interval” which is used to determine the level of correlation between the value of a foreign security and movements in the U.S. market before a particular security is fair valued when the threshold is exceeded. In the event that the threshold established by the Committee is exceeded on a specific day, KP International Equity Fund values itsnon-U.S. securities that exceed the applicable “confidence interval” based upon the fair values provided by MarkIt. In such event, it is not necessary to hold a Committee meeting. In the event that the Adviser believes that the fair values provided by MarkIt are not reliable, the Adviser may contact SEI Global Fund Services (the “Administrator”) to request that a meeting of the Committee be held.
If a local market in which KP International Equity Fund owns securities is closed for one or more days, the Fund shall value all securities held in that corresponding currency based on the fair value prices provided by MarkIt using the predetermined confidence interval discussed above.
In accordance with the authoritative guidance on fair value measurement under U.S. GAAP, the Funds disclose fair value of their investments in a hierarchy that prioritizes the inputs to valuation techniques used to measure the fair value. The objective of a fair value measurement is to determine the price that would be received to sell an asset or paid to transfer a liability in an orderly transaction between market participants at the measurement date (an exit price). Accordingly, the fair value hierarchy gives the highest priority to quoted prices (unadjusted) in active markets for identical assets or liabilities (Level 1) and the lowest priority to unobservable inputs (Level 3). The three levels of the fair value hierarchy are described below:
| | • | | Level 1 — Unadjusted quoted prices in active markets for identical, unrestricted assets or liabilities that the Funds have the ability to access at the measurement date; |
| | • | | Level 2 — Other significant observable inputs (including quoted prices for similar securities, interest rates, prepayment speeds, credit risk, referenced indices, quoted prices in inactive markets, adjusted quoted prices |
159
| | |
| THE KP FUNDS | | December 31, 2019 |
| | in active markets, adjusted quoted prices on foreign equity securities that were adjusted in accordance with pricing procedures approved by the Board, etc.); and |
| | • | | Level 3 — Prices, inputs or modeling techniques which are both significant to the fair value measurement and unobservable (supported by little or no market activity). |
Investments are classified within the level of the lowest significant input considered in determining fair value. Investments classified within Level 3 whose fair value measurement considers several inputs may include Level 1 or Level 2 inputs as components of the overall fair value measurement. For the year ended December 31, 2019, there have been no significant changes to the Funds’ fair value methodologies.
Federal Income Taxes— It is each Fund’s intention to continue to qualify as a regulated investment company for Federal income tax purposes by complying with the appropriate provisions of Subchapter M of the Internal Revenue Code of 1986, as amended, and to distribute substantially all of its income to shareholders. Accordingly, no provision for Federal income taxes has been made in the financial statements.
The Funds evaluate tax positions taken or expected to be taken in the course of preparing the Funds’ tax returns to determine whether it is“more-likely-than-not” (i.e., greater than50-percent) that each tax position will be sustained upon examination by a taxing authority based on the technical merits of the position. Tax positions not deemed to meet themore-likely-than-not threshold are recorded as a tax benefit or expense in the current year. The Funds did not record any tax provision in the current period. However, management’s conclusions regarding tax positions taken may be subject to review and adjustment at a later date based on factors including, but not limited to, examination by tax authorities (i.e., the last 2 open tax year ends, as applicable),on-going analysis of and changes to tax laws, regulations and interpretations thereof.
KP International Equity Fund may be subject to taxes imposed by countries in which it invests. Such taxes are generally based on either income or gains earned or repatriated. KP International Equity Fund accrues and applies such taxes to net investment income, net realized gains and net unrealized gains as income and/or capital gains are earned. The Fund is monitoring and accruing foreign capital gains for $200 (000). Please refer to the Statement of Assets and Liabilities for further information.
As of and during the year ended December 31, 2019, the Funds did not have a liability for any unrecognized tax benefits. The Funds recognize interest and penalties, if any, related to unrecognized tax benefits as income tax expense in the Statements of Operations. During the year ended December 31, 2019, the Funds did not incur any interest or penalties.
Security Transactions and Investment Income— Security transactions are accounted for on trade date for financial reporting purposes. Costs used in determining realized gains and losses on the sales of investment securities are based on the specific identification method. Dividend income is recorded on theex-dividend date, and interest income is recognized on the accrual basis from settlement date and includes the amortization of premiums and the accretion of discount calculated using the effective interest method. Realized gains (losses) on paydowns of mortgage-backed and asset-backed securities are recorded as an adjustment to interest income.
Foreign Currency Translation— The books and records of the Funds are maintained in U.S. dollars. Investment securities and other assets and liabilities denominated in a foreign currency are translated into U.S. dollars on the date of valuation. The Funds do not isolate that portion of realized or unrealized gains and losses resulting from changes in the foreign exchange rate from fluctuations arising from changes in the market prices of the securities. These gains and losses are included in net realized and gains and losses on investments and net change in unrealized appreciation (depreciation) on investments on the Statement of Operations. Net realized and unrealized gains and losses on foreign currency transactions represent net foreign exchange gains or losses from foreign currency exchange contracts, disposition of foreign currencies, currency gains or losses realized between trade and settlement dates on securities transactions and the difference between the amount of the investment income and foreign withholding taxes recorded on the Funds’ books and the U.S. dollar equivalent amounts received or paid.
Forward Foreign Currency Exchange Contracts— The Funds may enter into forward foreign currency exchange contracts to protect the value of securities held and related receivables and payables against changes in future foreign exchange rates. A forward currency contract is an agreement between two parties to buy and sell currency at a set price on a future date. The market value of the contract will fluctuate with changes in currency exchange rates. The contract ismarked-to-market daily using the current forward rate and the change in market value is recorded by the Funds as unrealized gain or loss. The Funds recognize realized gains or losses when the contract
160
| | |
| THE KP FUNDS | | December 31, 2019 |
is closed, equal to the difference between the value of the contract at the time it was opened and the value at the time it was closed. Any realized or unrealized gains (losses) during the year are presented on the Statements of Operations. Refer to each Funds’ Schedule of Investments for details regarding open forward foreign currency contracts.
For the year ended December 31, 2019, the average balances of forward foreign currency exchange contracts were as follows (000):
| | | | |
| | | KP Fixed Income Fund | |
Average Quarterly Notional Contracts Purchased | | $ | (9,703 | ) |
Average Quarterly Notional Contracts Sold | | | 19,278 | |
Futures Contracts— To the extent consistent with its investment objective and strategies, the Funds may use futures contracts for tactical hedging purposes as well as to enhance the Fund’s returns. Initial margin deposits of cash or securities are made upon entering into futures contracts. The contracts are marked to market daily and the resulting changes in value are accounted for as unrealized gains and losses. Variation margin payments are paid or received, depending upon whether unrealized gains or losses are incurred. When the contract is closed, the Funds record a realized gain or loss equal to the difference between the proceeds from (or cost of) the closing transaction and the amount invested in the contract.
Risks of entering into futures contracts include the possibility that there will be an imperfect price correlation between the futures and the underlying securities. Second, it is possible that a lack of liquidity for futures contracts could exist in the secondary market, resulting in an inability to close a position prior to its maturity date. Third, the futures contract involves the risk that a Fund could lose more than the original margin deposit required to initiate a futures transaction.
Finally, the risk exists that losses could exceed amounts disclosed on the Statements of Assets and Liabilities. Refer to each Fund’s Schedule of Investments for details regarding open futures contracts as of December 31, 2019, if applicable. For the year ended December 31, 2019, there were no open futures contracts in the KP Fixed Income Fund.
For the year ended December 31, 2019, the average balances of futures contracts were as follows (000):
| | | | | | | | | | | | |
| | | KP Large Cap
Equity Fund | | | KP Small Cap
Equity Fund | | | KP International
Equity Fund | |
Average Quarterly Market Value Balance Long | | $ | 32,349 | | | $ | 4,774 | | | $ | 22,663 | |
Average Quarterly Market Value Balance Short | | | — | | | | — | | | | — | |
Master Netting Arrangements— A fund is subject to various netting arrangements with select counterparties (“Master Agreements”). Master Agreements govern the terms of certain transactions and reduce the counterparty risk associated with relevant transactions by specifying credit protection mechanisms and providing standardization that improves legal certainty. Since different types of transactions have different mechanics and are sometimes traded out of different legal entities of a particular counterparty organization, each type of transaction may be covered by a different Master Agreement, resulting in the need for multiple agreements with a single counterparty. As the Master Agreements are specific to unique operations of different asset types, they allow a fund to close out and net its total exposure to a specific counterparty entity in the event of a default with respect to all the transactions governed under a single agreement with a specific counterparty entity.
Master Agreements can also help limit counterparty risk by specifying collateral posting arrangements atpre-arranged exposure levels. Under the Master Agreements, collateral is routinely transferred if the total net exposure to certain transactions (net of existing collateral already in place) governed under the relevant Master Agreement with a counterparty in a given account exceeds a specified threshold, which typically ranges from zero to $250,000 depending on the counterparty and the type of Master Agreement. United States Treasury Securities and U.S. dollar cash are generally the preferred forms of collateral. Securities and cash pledged as collateral are reflected as assets in the Statement of Assets and Liabilities as either a component of investments at value (securities) or deposits due from counterparties (cash). Cash collateral received is not typically held in a segregated account and as such is reflected as a liability in the Statement of Assets and Liabilities as deposits due to counterparties. The market value of any securities received as collateral is not reflected as a component of net asset value. A fund’s overall exposure to counterparty risk can change substantially within a short period, as it is affected by each transaction subject to the relevant Master Agreement.
161
| | |
| THE KP FUNDS | | December 31, 2019 |
It is the Funds’ policy to present the variation margin of the futures contracts separately on the Statements of Assets and Liabilities as the Funds do not have master netting agreements with the counterparties to the futures contracts. Refer to each Fund’s Schedule of Investments for details regarding futures contracts as of December 31, 2019, if applicable.
International Swaps and Derivatives Association, Inc. Master Agreements and Credit Support Annexes (“ISDA Master Agreements”) generally govern OTC financial derivative transactions entered into by a fund and select counterparties. ISDA Master Agreements maintain provisions for general obligations, representations, agreements, collateral and events of default or termination. Events of termination include conditions that may entitle counterparties to elect to terminate early and cause settlement of all outstanding transactions under the applicable ISDA Master Agreement. Any election to terminate early could be material to the financial statements. In limited circumstances, the ISDA Master Agreement may contain additional provisions that add additional counterparty protection beyond coverage of existing daily exposure if the counterparty has a decline in credit quality below a predefined level. These amounts, if any, may be segregated with a third-party custodian.
As of December 31, 2019, there were no securities pledged as collateral for financial derivative instruments as governed by ISDA master agreements.
The following is a summary by counterparty of the market value of OTC financial derivative instruments and collateral (received)/pledged for the KP Fixed Income Fund as of December 31, 2019 (000):
| | | | | | | | | | | | | | | | | | | | | | | | | | | | |
| | | Financial Derivative Assets | | | Financial Derivative Liabilities | | | | | | | | | | |
| Counterparty | | Forward
Foreign
Currency
Contracts | | | Total
Over the
Counter | | | Forward
Foreign
Currency
Contracts | | | Total
Over the
Counter | | | Net Market
Value of OTC
Derivatives | | | Collateral
(Received)/
Pledged | | | Net
Exposures† | |
| | | | | | | |
Barclays PLC | | $ | 25 | | | $ | 25 | | | $ | (140 | ) | | $ | (140 | ) | | $ | (115 | ) | | $ | — | | | $ | (115 | ) |
| | | | | | | |
BNP Paribas | | | 8 | | | | 8 | | | | (101 | ) | | | (101 | ) | | | (93 | ) | | | — | | | | (93 | ) |
| | | | | | | |
HSBC | | | 168 | | | | 168 | | | | (135 | ) | | | (135 | ) | | | 33 | | | | — | | | | 33 | |
| | | | | | | | | | | | | | | | | | | | |
Total over the counter | | $ | 201 | | | $ | 201 | | | $ | (376 | ) | | $ | (376 | ) | | | | | | | | | | | | |
| | | | | | | | | | | | | | | | | | | | |
| | † | Net Exposure represents the net receivable/(payable) that would be due from/to the counterparty in the event of default. Exposure from OTC financial derivative instruments can only be netted across transactions governed under the same master agreement with the same legal entity. |
Investments in Real Estate Investment Trusts (“REITs”)— Dividend income is recorded based on the income included in distributions received from the REIT investments using published REIT reclassifications including some management estimates when actual amounts are not available. Distributions received in excess of this estimated amount are recorded as a reduction of the cost of investments or reclassified to capital gains. The actual amounts of income, return of capital, and capital gains are only determined by each REIT after its fiscal year end and may differ from the estimated amounts.
Master Limited Partnerships (“MLPs”)— Entities commonly referred to as “MLPs” are generally organized under state law as limited partnerships or limited liability companies. The Fund intends to invest in MLPs receiving partnership taxation treatment under the Internal Revenue Code of 1986 (the “Code”), and whose interests or “units” are traded on securities exchanges like shares of corporate stock. To be treated as a partnership for U.S. federal income tax purposes, an MLP whose units are traded on a securities exchange must receive at least 90% of its income from qualifying sources such as interest, dividends, real estate rents, gain from the sale or disposition of real property, income and gain from mineral or natural resources activities, income and gain from the transportation or storage of certain fuels, and, in certain circumstances, income and gain from commodities or futures, forwards and options with respect to commodities. Mineral or natural resources activities include exploration, development, production, processing, mining, refining, marketing and transportation (including pipelines) of oil and gas, minerals, geothermal energy, fertilizer, timber or industrial source carbon dioxide. An MLP consists of a general partner and limited partners (or in the case of MLPs organized as limited liability companies, a managing member and members). The general partner or managing member typically controls the operations and management of the MLP and has an ownership stake in the partnership. The limited partners or members, through their ownership of limited partner or member interests, provide capital to the entity, are intended to have no role in the operation and management of the entity and receive cash distributions. The MLPs themselves generally do not pay U.S. federal income taxes. Thus, unlike investors in corporate securities, direct MLP investors are generally not
162
| | |
| THE KP FUNDS | | December 31, 2019 |
subject to double taxation (i.e., corporate level tax and tax on corporate dividends). Currently, most MLPs operate in the energy and/or natural resources sector.
Expenses— Expenses of the Trust can be directly attributed to a particular Fund are borne by that Fund. Expenses which cannot be directly attributed to a Fund are apportioned among the Funds of the Trust based on the number of funds and/or relative net assets. In addition to the expenses reflected on the Statement of Operations, the Target Date Funds indirectly bear expenses of the underlying funds (registered investment companies) in which they invest. Because each of the underlying funds have varied expense and fee levels, and the Target Date Funds may own different amounts of shares of these funds at different times, the amount of fees and expenses incurred indirectly will vary.
Offering Costs —Offering costs of the Fund, including costs of printing the initial prospectus, legal, and registration fees, are being amortized to expense over a twelve-month period. As of December 31, 2019, the Retirement Path 2065 Fund had $4,378 remaining to be amortized.
Dividends and Distributions to Shareholders— The Funds will distribute substantially all of their net investment income and net realized capital gains, if any, at least annually. All dividends and distributions are recorded on theex-dividend date.
3. Derivative Transactions:
The following tables include the KP Fixed Income Fund’s exposure by type of risk on derivatives held throughout the period:
The fair value of derivative instruments as of December 31, 2019, is as follows:
| | | | | | | | | | | | |
| | | Asset Derivatives | | | | | Liability Derivatives | | | |
| | | Statement of Assets and
Liability Location | | Fair Value
(000) | | | Statement of Assets and
Liability Location | | Fair Value
(000) | |
Derivatives not accounted for as hedging instruments: | | | | | | | | | | |
Foreign exchange contracts | | Net Assets — Unrealized appreciation on forward foreign currency contracts | | $ | 201 | * | | Net Assets — Unrealized depreciation on forward foreign currency contracts | | $ | 376 | * |
| | | | | | | | | | | | |
Total Derivatives not accounted for as hedging instruments | | | | $ | 201 | | | | | $ | 376 | |
| | | | | | | | | | | | |
| | * | Includes cumulative appreciation/(depreciation) of futures and forward contracts as reported in the Schedule of Investments. |
The effect of derivative instruments on the Statements of Operations for the year ended December 31, 2019, were as follows:
The amount of realized gain/(loss) on derivatives recognized in income:
| | | | | | | | | | | | |
| | | Futures
Contracts | | | Forward Foreign
Currency
Contracts | | | Total | |
Interest rate contracts | | $ | (278 | ) | | $ | — | | | $ | (278 | ) |
Foreign exchange contracts | | | — | | | | (221 | ) | | | (221 | ) |
| | | | | | | | | | | | |
Total | | $ | (278 | ) | | $ | (221 | ) | | $ | (499 | ) |
| | | | | | | | | | | | |
Change in unrealized appreciation/(depreciation) on derivatives recognized in income:
| | | | | | | | | | | | |
| | | Futures
Contracts | | | Forward Foreign
Currency
Contracts | | | Total | |
Interest rate contracts | | $ | 145 | | | $ | — | | | $ | 145 | |
Foreign exchange contracts | | | — | | | | (74 | ) | | | (74 | ) |
| | | | | | | | | | | | |
Total | | $ | 145 | | | $ | (74 | ) | | $ | 71 | |
| | | | | | | | | | | | |
163
| | |
| THE KP FUNDS | | December 31, 2019 |
As of December 31, 2019, the KP Fixed Income Fund’s derivative instruments are not subject to a master netting arrangement. For the derivative exposure of the KP Large Cap Equity Fund, KP Small Cap Equity Fund and KP International Equity Fund refer to each Funds’ Schedule of Investments and Statement of Operations. The derivative risk exposure relates to futures on equity contracts.
4. Administration, Distribution, Transfer Agent and Custody Agreements:
The Funds and the Administrator are parties to an Administration Agreement under which the Administrator provides administrative services to the Funds. For these services, the Administrator is paid an asset-based fee which will vary depending on the average daily net assets of the Funds. For the year ended December 31, 2019, the Funds were charged as follows for these services (000):
| | | | | | | | | | |
| Fund | | Administration Fee | | | Fund | | Administration Fee | |
| | | |
KP Retirement Path Retirement Income Fund | | | $110 | | | KP Retirement Path 2050 Fund | | | $ 153 | |
| | | |
KP Retirement Path 2020 Fund | | | $247 | | | KP Retirement Path 2055 Fund | | | $ 53 | |
| | | |
KP Retirement Path 2025 Fund | | | $318 | | | KP Retirement Path 2060 Fund | | | $ 11 | |
| | | |
KP Retirement Path 2030 Fund | | | $315 | | | KP Retirement Path 2065 Fund | | | $ 2 | |
| | | |
KP Retirement Path 2035 Fund | | | $351 | | | KP Large Cap Equity Fund | | | $1,054 | |
| | | |
KP Retirement Path 2040 Fund | | | $322 | | | KP Small Cap Equity Fund | | | $ 455 | |
| | | |
KP Retirement Path 2045 Fund | | | $250 | | | KP International Equity Fund | | | $ 675 | |
| | | |
| | | | | | KP Fixed Income Fund | | | $ 776 | |
The Trust and SEI Investments Distribution Co. (the “Distributor”) are parties to a Distribution Agreement. The Distributor receives no fees under the agreement.
Northeast Retirement Services, Inc. serves as the Transfer Agent and dividend disbursing agent for the Funds under a transfer agency agreement.
State Street Bank and Trust Company serve as custodian (the “Custodian”) for the Funds. The Custodian plays no role in determining the investment policies of the Funds or which securities are to be purchased and sold by the Funds.
5. Transactions with Affiliates:
Certain officers of the Trust are also officers of the Administrator, which is a wholly-owned subsidiary of SEI Investments Company, and/or the Distributor. Such officers are paid no fees by the Trust, other than the Chief Compliance Officer (“CCO”) as described below, for serving as officers of the Trust.
A portion of the services provided by the CCO and his staff, whom are employees of the Administrator, are paid for by the Trust as incurred. The services include regulatory oversight of the Trust’s Advisors and service providers as required by SEC regulations. The CCO’s services and fees have been approved by and are reviewed by the Board.
6. Investment Advisory Agreements:
The Trust will pay to the Adviser as compensation for the Adviser’s services rendered, a fee (the “Advisory Fee”), determined in accordance with the calculation methodology set forth below. The Advisory Fee will be computed and accrued daily on an estimated basis by the Administrator and paid monthly in arrears based on a final determination by the Administrator.
The Advisory Fee payable by each Fund for any particular period will equal itspro-rata portion of the total fee calculated by applying the Effective Fee Rate (defined below) to the Fund Asset Base (defined below), with each Fund’s pro rata portion determined by dividing the net assets of such Fund that are included in the Fund Asset Base by the total Fund Asset Base. The “Effective Fee Rate” will be determined by applying the following fee schedule to the Fund Asset Base:
0.05% on the first $4,000,000,000 of the Fund Asset Base;
0.04% on the Fund Asset Base between $4,000,000,001 and $7,000,000,000;
0.03% on the Fund Asset Base between $7,000,000,001 and $10,000,000,000; and
0.025% on the Fund Asset Base over $10,000,000,000.
The “Fund Asset Base” equals the Core Funds Asset Base (defined below) plus the Target Date Funds Asset Base (defined below). The “Core Funds Asset Base” equals the sum of the net assets of each Core Fund. The “Target
164
| | |
| THE KP FUNDS | | December 31, 2019 |
Date Funds Asset Base” equals the sum of the net assets of each Target Date Fund invested in investment companies to which the Adviser does not serve as the investment adviser. The Fund Asset Base will be estimated daily and determined monthly based on the preceding methodology, in all cases based on the net assets as of the close of business on the preceding day in the case of the daily estimate and based on the average daily net assets in the month for the monthly calculation.
The Effective Fee Rate determined at the beginning of a month shall be used throughout the month for purposes of the daily estimate, and shall be recalculated for the month to make the final determination. In the event that the estimated daily fee for a Fund differs from the final determination by an amount sufficient to require an adjustment to the Net Asset Value of the Fund for any day, such difference shall be treated as a pricing error under the Trust’s policy.
The Adviser has entered intosub-advisory agreements with eachsub-adviser under which thesub-adviser makes investment decisions for the assets it has been allocated to manage. For its service, eachsub-adviser receives a fee based on the specified percentage of that portion of the Fund’s assets allocated to thatsub-adviser. The total fees paid tosub-advisors directly are labeled as“Sub-Advisory Fees” on the Statements of Operations.
As of December 31, 2019, the Adviser has entered into investmentsub-advisory agreements with the following parties:
| | |
| Investment Sub-Adviser | | |
| KP Large Cap Equity Fund | | KP International Equity Fund |
| AQR Capital Management, LLC | | Acadian Asset Management LLC |
| MFS Investment Management | | Lazard Asset Management LLC |
| PanAgora Asset Management, Inc. | | Marathon Asset Management LLP |
| SSgA Funds Management, Inc. | | MFS Investment Management |
| T. Rowe Price | | Sprucegrove Investment Management Ltd. |
| | SSgA Funds Management, Inc. |
| | William Blair & Company, LLC |
| |
| KP Small Cap Equity Fund | | KP Fixed Income Fund |
| Aristotle Capital Boston, LLC | | Credit Suisse Asset Management |
| CastleArk Management, LLC | | Loomis, Sayles & Company, LP |
| Columbus Circle Investors | | Payden & Rygel |
| DePrince Race & Zollo, Inc. | | SSgA Funds Management, Inc. |
| PENN Capital Management Company, Inc. | | |
| SSgA Funds Management, Inc. | | |
| Walthausen & Co., LLC | | |
7. Investment Transactions:
For the year ended December 31, 2019, the Funds had purchases and sales of investment securities other than long-term U.S. Government and short-term securities as follows (000):
| | | | | | | | |
| | | Purchases | | | Sales and
Maturities | |
KP Retirement Path Retirement Income Fund | | $ | 82,765 | | | $ | 122,389 | |
KP Retirement Path 2020 Fund | | | 203,945 | | | | 227,465 | |
KP Retirement Path 2025 Fund | | | 303,925 | | | | 208,791 | |
KP Retirement Path 2030 Fund | | | 318,706 | | | | 181,172 | |
KP Retirement Path 2035 Fund | | | 355,207 | | | | 180,455 | |
KP Retirement Path 2040 Fund | | | 330,131 | | | | 157,921 | |
KP Retirement Path 2045 Fund | | | 291,159 | | | | 118,306 | |
KP Retirement Path 2050 Fund | | | 224,672 | | | | 76,862 | |
KP Retirement Path 2055 Fund | | | 112,956 | | | | 30,161 | |
KP Retirement Path 2060 Fund | | | 27,819 | | | | 10,708 | |
KP Retirement Path 2065 Fund | | | 14,067 | | | | 1,428 | |
KP Large Cap Equity Fund | | | 1,424,671 | | | | 1,271,804 | |
KP Small Cap Equity Fund | | | 1,073,304 | | | | 993,067 | |
KP International Equity Fund | | | 912,628 | | | | 738,999 | |
KP Fixed Income Fund | | | 1,319,027 | | | | 1,250,389 | |
165
| | |
| THE KP FUNDS | | December 31, 2019 |
In addition, KP Fixed Income Fund had purchases and sales of long-term U.S. Government securities of $5,182,666 (000) and $5,108,530 (000), respectively.
8. Federal Tax Information:
Dividends from net investment income and distributions from net realized capital gains are determined in accordance with U.S. Federal income tax regulations, which may differ from those amounts determined under U.S. GAAP. These book/tax differences are either temporary or permanent in nature. To the extent these differences are permanent, they are charged or credited topaid-in capital, and undistributed earnings, in the period that the differences arise. Permanent differences are primarily attributable to the reclassification of short-term capital gains from affiliated registered investment companies, REIT adjustments, PFIC gain reclass, investment in partnerships, reclass of distributions, paydowns and foreign exchange gain/(loss). None of these permanent differences necessitate a charge to the paid in capital account.
The tax character of dividends and distributions declared during the year or period ended December 31, 2019 and December 31, 2018 were as follows (000):
| | | | | | | | | | | | | | | | | | | | |
| | | Year | | | Ordinary
Income | | | Long-Term
Capital Gain | | | Return of
Capital | | | Total | |
KP Retirement Path Retirement Income Fund | | | 2019 | | | $ | 12,795 | | | $ | 13,933 | | | $ | — | | | $ | 26,728 | |
| | | 2018 | | | | 11,803 | | | | 16,059 | | | | — | | | | 27,862 | |
KP Retirement Path 2020 Fund | | | 2019 | | | | 27,936 | | | | 34,844 | | | | — | | | | 62,780 | |
| | | 2018 | | | | 25,272 | | | | 34,870 | | | | — | | | | 60,142 | |
KP Retirement Path 2025 Fund | | | 2019 | | | | 35,357 | | | | 48,008 | | | | — | | | | 83,365 | |
| | | 2018 | | | | 31,490 | | | | 43,247 | | | | — | | | | 74,737 | |
KP Retirement Path 2030 Fund | | | 2019 | | | | 33,665 | | | | 53,028 | | | | — | | | | 86,693 | |
| | | 2018 | | | | 30,892 | | | | 44,059 | | | | — | | | | 74,951 | |
KP Retirement Path 2035 Fund | | | 2019 | | | | 35,964 | | | | 64,322 | | | | — | | | | 100,286 | |
| | | 2018 | | | | 34,445 | | | | 52,001 | | | | — | | | | 86,446 | |
KP Retirement Path 2040 Fund | | | 2019 | | | | 31,771 | | | | 63,606 | | | | — | | | | 95,377 | |
| | | 2018 | | | | 31,604 | | | | 47,645 | | | | — | | | | 79,249 | |
KP Retirement Path 2045 Fund | | | 2019 | | | | 24,211 | | | | 49,830 | | | | — | | | | 74,041 | |
| | | 2018 | | | | 24,064 | | | | 36,086 | | | | — | | | | 60,150 | |
KP Retirement Path 2050 Fund | | | 2019 | | | | 14,783 | | | | 29,471 | | | | — | | | | 44,254 | |
| | | 2018 | | | | 14,097 | | | | 19,572 | | | | — | | | | 33,669 | |
KP Retirement Path 2055 Fund | | | 2019 | | | | 5,413 | | | | 10,735 | | | | — | | | | 16,148 | |
| | | 2018 | | | | 4,535 | | | | 5,416 | | | | — | | | | 9,951 | |
KP Retirement Path 2060 Fund | | | 2019 | | | | 1,111 | | | | 1,826 | | | | — | | | | 2,937 | |
| | | 2018 | | | | 928 | | | | 1,783 | | | | — | | | | 2,711 | |
KP Retirement Path 2065 Fund* | | | 2019 | | | | 270 | | | | — | | | | — | | | | 270 | |
KP Large Cap Equity Fund | | | 2019 | | | | 43,959 | | | | 111,241 | | | | — | | | | 155,200 | |
| | | 2018 | | | | 46,521 | | | | 153,148 | | | | — | | | | 199,669 | |
KP Small Cap Equity Fund | | | 2019 | | | | 10,310 | | | | 37,166 | | | | — | | | | 47,476 | |
| | | 2018 | | | | 62,717 | | | | 87,900 | | | | — | | | | 150,617 | |
KP International Equity Fund | | | 2019 | | | | 50,315 | | | | 8,610 | | | | — | | | | 58,925 | |
| | | 2018 | | | | 38,316 | | | | 62,126 | | | | — | | | | 100,442 | |
KP Fixed Income Fund | | | 2019 | | | | 85,819 | | | | — | | | | — | | | | 85,819 | |
| | | 2018 | | | | 55,856 | | | | — | | | | — | | | | 55,856 | |
| * | KP Retirement Path 2065 Fund did not commence operations prior to December 31, 2018. |
166
| | |
| THE KP FUNDS | | December 31, 2019 |
As of December 31, 2019, the components of distributable earnings/(accumulated losses) on a tax basis were as follows (000):
| | | | | | | | | | | | | | | | | | | | | | | | | | | | |
| | | Undistributed
Ordinary Income | | | Undistributed
Long-Term
Capital
Gain | | | Capital Loss
Carryforwards | | | Post
October
Losses | | | Unrealized
Appreciation | | | Other
Temporary
Differences | | | Total
Distributable
Earnings | |
KP Retirement Path Retirement Income Fund | | $ | — | | | $ | 4,742 | | | $ | — | | | $ | — | | | $ | 18,521 | | | $ | 2 | | | $ | 23,265 | |
KP Retirement Path 2020 Fund | | | — | | | | 17,347 | | | | — | | | | — | | | | 47,247 | | | | — | | | | 64,594 | |
KP Retirement Path 2025 Fund | | | — | | | | 26,869 | | | | — | | | | — | | | | 81,390 | | | | 7 | | | | 108,266 | |
KP Retirement Path 2030 Fund | | | — | | | | 29,223 | | | | — | | | | — | | | | 95,656 | | | | 1 | | | | 124,880 | |
KP Retirement Path 2035 Fund | | | — | | | | 35,362 | | | | — | | | | — | | | | 123,139 | | | | (1 | ) | | | 158,500 | |
KP Retirement Path 2040 Fund | | | — | | | | 33,213 | | | | — | | | | — | | | | 122,565 | | | | (1 | ) | | | 155,777 | |
KP Retirement Path 2045 Fund | | | — | | | | 27,510 | | | | — | | | | — | | | | 90,885 | | | | — | | | | 118,395 | |
KP Retirement Path 2050 Fund | | | — | | | | 16,578 | | | | — | | | | — | | | | 49,300 | | | | — | | | | 65,878 | |
KP Retirement Path 2055 Fund | | | — | | | | 6,395 | | | | — | | | | — | | | | 11,853 | | | | (2 | ) | | | 18,246 | |
KP Retirement Path 2060 Fund | | | — | | | | 1,154 | | | | — | | | | — | | | | 1,517 | | | | 1 | | | | 2,672 | |
KP Retirement Path 2065 Fund | | | 67 | | | | 251 | | | | — | | | | — | | | | 721 | | | | — | | | | 1,039 | |
KP Large Cap Equity Fund | | | 112 | | | | 41,831 | | | | — | | | | — | | | | 637,839 | | | | 2 | | | | 679,784 | |
KP Small Cap Equity Fund | | | 470 | | | | 8,040 | | | | — | | | | — | | | | 118,540 | | | | 2 | | | | 127,052 | |
KP International Equity Fund | | | 2,123 | | | | 5,857 | | | | — | | | | — | | | | 188,337 | | | | (3 | ) | | | 196,314 | |
KP Fixed Income Fund | | | 4,970 | | | | — | | | | — | | | | — | | | | 46,370 | | | | (5,420 | )* | | | 45,920 | |
| * | Other temporary differences are primarily attributable to straddle loss deferral. |
Post-October losses represent losses realized on investment transactions from November 1, 2019, through December 31, 2019, that, in accordance with Federal income tax regulations, the Funds elect to defer and treat as having arisen in the following fiscal year.
For Federal income tax purposes, capital loss carryforwards may be carried forward and applied against all future capital gains. Additionally, capital losses that are carried forward will retain their character as either short-term or long-term capital losses. As of December 31, 2019, the Funds have no capital loss carry forward to future periods.
During the fiscal year ended December 31, 2019, KP Fixed Income Fund utilized $19,861 in capital loss carry forwards to offset capital gains.
The Federal tax cost and aggregate gross unrealized appreciation and depreciation on investments (including foreign currency and derivatives), if applicable for Federal income tax purposes at December 31, 2019, were as follows (000):
| | | | | | | | | | | | | | | | |
| | | Federal
Tax Cost | | | Aggregated
Gross
Unrealized
Appreciation | | | Aggregated
Gross
Unrealized
Depreciation | | | Net Unrealized
Appreciation | |
KP Retirement Path Retirement Income Fund | | $ | 442,525 | | | $ | 20,567 | | | $ | (2,046 | ) | | $ | 18,521 | |
KP Retirement Path 2020 Fund | | | 1,018,169 | | | | 52,465 | | | | (5,218 | ) | | | 47,247 | |
KP Retirement Path 2025 Fund | | | 1,370,934 | | | | 86,521 | | | | (5,131 | ) | | | 81,390 | |
KP Retirement Path 2030 Fund | | | 1,372,762 | | | | 100,582 | | | | (4,926 | ) | | | 95,656 | |
KP Retirement Path 2035 Fund | | | 1,530,802 | | | | 128,394 | | | | (5,255 | ) | | | 123,139 | |
KP Retirement Path 2040 Fund | | | 1,405,334 | | | | 126,899 | | | | (4,334 | ) | | | 122,565 | |
KP Retirement Path 2045 Fund | | | 1,122,256 | | | | 94,745 | | | | (3,860 | ) | | | 90,885 | |
KP Retirement Path 2050 Fund | | | 713,256 | | | | 51,178 | | | | (1,878 | ) | | | 49,300 | |
KP Retirement Path 2055 Fund | | | 272,076 | | | | 12,452 | | | | (599 | ) | | | 11,853 | |
KP Retirement Path 2060 Fund | | | 56,661 | | | | 1,970 | | | | (453 | ) | | | 1,517 | |
KP Retirement Path 2065 Fund | | | 12,723 | | | | 729 | | | | (8 | ) | | | 721 | |
KP Large Cap Equity Fund | | | 2,557,941 | | | | 705,041 | | | | (67,202 | ) | | | 637,839 | |
KP Small Cap Equity Fund | | | 1,249,739 | | | | 186,686 | | | | (68,146 | ) | | | 118,540 | |
KP International Equity Fund | | | 1,904,790 | | | | 313,576 | | | | (125,239 | ) | | | 188,337 | |
KP Fixed Income Fund | | | 2,388,726 | | | | 64,114 | | | | (17,744 | ) | | | 46,370 | |
167
| | |
| THE KP FUNDS | | December 31, 2019 |
The preceding differences between book and tax cost are primarily due to mark-to-market treatment of passive foreign investment companies, premium amortization on callable bond and wash sales.
9. Risks:
As with all mutual funds, a shareholder of a fund is subject to the risk that his or her investment could lose money. The Funds are subject to the principal risks noted below, any of which may adversely affect the fund’s net asset value and ability to meet its investment objective. A more complete description of principal risks is included in the prospectus under the heading “Principal Risks”.
Allocation Risk (KP Large Cap Equity Fund, KP Small Cap Equity Fund, KP International Equity Fund, KP Fixed Income Fund) — The Adviser’s judgment about, and allocations among,Sub-strategies andsub-advisers may adversely affect the Fund’s performance.
Asset Allocation Risk (Target Date Funds) — The Fund is subject to asset allocation risk, which is the risk that the selection of the Underlying Funds and the allocation of the Fund’s assets among the various asset classes and market segments will cause the Fund to underperform other funds with a similar investment objective.
Asset-Backed Securities Risk (KP Fixed Income Fund) — Payment of principal and interest on asset-backed securities is dependent largely on the cash flows generated by the assets backing the securities, and asset-backed securities may not have the benefit of any security interest in the related assets.
Below Investment Grade Securities (Junk Bonds) Risk (KP Fixed Income Fund) — Fixed income securities rated below investment grade (junk bonds) involve greater risks of default or downgrade and are generally more volatile than investment grade securities because the prospect for repayment of principal and interest of many of these securities is speculative. Because these securities typically offer a higher rate of return to compensate investors for these risks, they are sometimes referred to as “high yield bonds,” but there is no guarantee that an investment in these securities will result in a high rate of return.
Common Stock Risk (KP Large Cap Equity Fund, KP Small Cap Equity Fund, KP International Equity Fund) — The prices of common stock may fall over short or extended periods of time. Common stock generally is subordinate to preferred stock and debt upon the liquidation or bankruptcy of the issuing company.
Convertible and Preferred Securities Risk (KP Large Cap Equity Fund, KP International Equity Fund, KP Fixed Income Fund) — Convertible and preferred securities have many of the same characteristics as stocks, including many of the same risks. In addition, convertible bonds may be more sensitive to changes in interest rates than stocks. Convertible bonds may also have credit ratings below investment grade, meaning that they carry a higher risk of failure by the issuer to pay principal and/or interest when due.
Corporate Fixed Income Securities Risk (KP Large Cap Equity Fund, KP Fixed Income Fund) — Corporate fixed income securities respond to economic developments, especially changes in interest rates, as well as perceptions of the creditworthiness and business prospects of individual issuers.
Credit Risk (KP Fixed Income Fund) — The risk that the issuer of a security or the counterparty to a contract will default or otherwise become unable to honor a financial obligation.
Currency Risk (KP International Equity Fund, KP Fixed Income Fund) — As a result of the Fund’s investments in securities or other instruments denominated in, and/or receiving revenues in, foreign currencies, the Fund will be subject to currency risk. Currency risk is the risk that foreign currencies will decline in value relative to the U.S. dollar or, in the case of hedging positions, that the U.S. dollar will decline in value relative to the currency hedged. In either event, the dollar value of an investment in the Fund would be adversely affected.
Depositary Receipts Risk (KP Large Cap Equity Fund, KP International Equity Fund) — Depositary receipts are certificates evidencing ownership of shares of a foreign issuer that are issued by depositary banks and generally trade on an established market. Depositary receipts are subject to many of the risks associated with investing directly in foreign securities, including, among other things, political, social and economic developments abroad, currency movements, and different legal, regulatory and tax environments.
Derivatives Risk (KP Large Cap Equity Fund, KP Small Cap Equity Fund, KP International Equity Fund, KP Fixed Income Fund) — The Fund’s use of futures contracts, forward contracts, credit-linked notes, structured notes and swaps are subject to market risk, leverage risk, correlation risk, and liquidity risk. Market risk is described below.
168
| | |
| THE KP FUNDS | | December 31, 2019 |
Leverage risk is the risk that the use of leverage may amplify the effects of market volatility on a fund’s share price and may also cause a fund to liquidate portfolio positions when it would not be advantageous to do so in order to satisfy its obligations. Manyover-the-counter derivative instruments will not have liquidity beyond the counterparty to the instrument. Correlation risk is the risk that changes in the value of the derivative may not correlate perfectly with the underlying asset, rate or index. Liquidity risk is described below. The Fund’s use of forward contracts, credit-linked notes, structured notes and swaps is also subject to credit risk and valuation risk. Credit risk is described above and valuation risk is described below. Each of these risks could cause a fund to lose more than the principal amount invested in a derivative instrument. The Fund’s use of derivatives may also increase the amount of taxes payable by shareholders. Both U.S. andnon-U.S. regulators are in the process of adopting and implementing regulations governing derivatives markets, the ultimate impact of which remains unclear.
Exchange-Traded Funds (“ETFs”) Risk (KP Large Cap Equity Fund) — The risks of owning shares of an ETF generally reflect the risks of owning the underlying securities in which the ETF invests, although lack of liquidity in an ETF could result in its value being more volatile than the value of its underlying securities. When the Fund invests in an ETF, in addition to directly bearing the expenses associated with its own operations, it will bear apro-rata portion of the ETF’s expenses.
Extension Risk (KP Fixed Income Fund) — The risk that rising interest rates may extend the duration of a fixed income security, typically reducing the security’s value.
Fixed Income Market Risk (KP Fixed Income Fund) — The prices of the Fund’s fixed income securities respond to economic developments, particularly interest rate changes, as well as to perceptions about the creditworthiness of individual issuers, including governments and their agencies. In the case of foreign securities, price fluctuations will reflect international economic and political events, as well as changes in currency valuations relative to the U.S. dollar.
Foreign Investment/Emerging Markets Risk (KP Large Cap Equity Fund, KP International Equity Fund, KP Fixed Income Fund) — The risk thatnon-U.S. securities may be subject to additional risks due to, among other things, political, social and economic developments abroad, currency movements and different legal, regulatory and tax environments. These additional risks may be heightened with respect to emerging market countries since political turmoil and rapid changes in economic conditions are more likely to occur in these countries.
Foreign Sovereign Debt Securities Risk (KP Fixed Income Fund) — The risk that: (i) the governmental entity that controls the repayment of sovereign debt may not be willing or able to repay the principal and/or interest when it becomes due because of factors such as debt service burden, political constraints, cash flow problems and other national economic factors; (ii) governments may default on their debt securities, which may require holders of such securities to participate in debt rescheduling or additional lending to defaulting governments; and (iii) there may be no bankruptcy proceeding by which defaulted sovereign debt may be collected in whole or in part.
Geographic Concentration Risk (KP International Equity Fund) — Since the Fund focuses its investments in particular foreign countries or geographic regions, it may be more volatile than a more geographically diversified fund. The performance of the Fund will be affected by the political, social and economic conditions in those foreign countries and geographic regions and subject to the related risks.
Growth Investing Risk (KP Large Cap Equity Fund, KP Small Cap Equity Fund, KP International Equity Fund) — An investment in growth stocks may be susceptible to rapid price swings, especially during periods of economic uncertainty. Growth stocks typically have little or no dividend income to cushion the effect of adverse market conditions. In addition, growth stocks may be particularly volatile in the event of earnings disappointments or other financial difficulties experienced by the issuer.
Interest Rate Risk (KP Fixed Income Fund) — The risk that the value of fixed income securities, including U.S. Government securities, will fall due to rising interest rates. Rates associated with rising interest rates are heightened given that interest rates in the U.S. are at, or near, historic lows.
Investment in Europe Risk (KP International Equity Fund) — The European financial markets have recently experienced volatility and adverse trends due to concerns about rising government debt levels of certain European countries, each of which may require external assistance to meet its obligations and run the risk of default on its debt, possiblebail-out by the rest of the European Union (“EU”) or debt restructuring. Assistance given to an EU member state may be dependent on a country’s implementation of reforms in order to curb the risk of default on its debt, and a failure to implement these reforms or increase revenues could result in a deep economic downturn. These events
169
| | |
| THE KP FUNDS | | December 31, 2019 |
may adversely affect the economic and market environment in Europe, which in turn may adversely affect the price or liquidity of high yield securities issued by European issuers and therefore may adversely affect the Fund and its investments in such securities.
Investment in Japan Risk (KP International Equity Fund) — The Japanese economy may be subject to considerable degrees of economic, political and social instability, which could have a negative impact on Japanese securities. In addition, Japan is subject to the risk of natural disasters, such as earthquakes, volcanoes, typhoons and tsunamis.
Investment in Underlying Funds Risk (Target Date Funds) — The value of an investment in the Fund is based primarily on the prices of the Underlying Funds in which the Fund invests. In turn, the price of each Underlying Fund is based on the value of its assets. The Fund, and thus its shareholders, bears its own direct expenses in addition to bearing a proportionate share of expenses of the Underlying Funds, which may make owning shares of the Fund more costly than owning shares of the Underlying Funds directly. Before investing in the Fund, investors should assess the risks associated with the Underlying Funds and the types of investments made by those Under-lying Funds. These risks include any combination of the risks described below, although the Fund’s exposure to a particular risk will be proportionate to the Fund’s overall asset allocation and Underlying Fund allocation.
| | • | | Allocation Risk— With respect to an Underlying Fund that uses a multi-manager structure, the Underlying Fund’s investment adviser’s judgment about, and allocations among,sub-advisers and their investment programs may adversely affect the Underlying Fund’s performance. |
| | • | | Asset-Backed Securities Risk— Payment of principal and interest on asset-backed securities is dependent largely on the cash flows generated by the assets backing the securities, and asset-backed securities may not have the benefit of any security interest in the related assets. |
| | • | | Below Investment Grade Securities (Junk Bonds) Risk— Fixed income securities rated below investment-grade (junk bonds) involve greater risks of default or downgrade and are generally more volatile than investment grade securities because the prospect for repayment of principal and interest of many of these securities is speculative. Because these securities typically offer a higher rate of return to compensate investors for these risks, they are sometimes referred to as “high yield bonds,” but there is no guarantee that an investment in these securities will result in a high rate of return. These risks may be increased in foreign and emerging markets. |
| | • | | Common Stock Risk— The prices of common stock may fall over short or extended periods of time. Common stock generally is subordinate to preferred stock and debt upon the liquidation or bankruptcy of the issuing company. |
| | • | | Convertible and Preferred Securities Risk— Convertible and preferred securities have many of the same characteristics as stocks, including many of the same risks. In addition, convertible bonds may be more sensitive to changes in interest rates than stocks. Convertible bonds may also have credit ratings below investment grade, meaning that they carry a higher risk of failure by the issuer to pay principal and/or interest when due. |
| | • | | Corporate Fixed Income Securities Risk— Corporate fixed income securities respond to economic developments, especially changes in interest rates, as well as perceptions of the creditworthiness and business prospects of individual issuers. |
| | • | | Credit Risk— The risk that the issuer of a security or the counterparty to a contract will default or otherwise become unable to honor a financial obligation. |
| | • | | Currency Risk— As a result of an Underlying Fund’s investments in securities or other instruments denominated in, and/or receiving revenues in, foreign currencies, the Underlying Fund will be subject to currency risk. Currency risk is the risk that foreign currencies will decline in value relative to the U.S. dollar or, in the case of hedging positions, that the U.S. dollar will decline in value relative to the currency hedged. In either event, the dollar value of an investment in the Underlying Fund would be adversely affected. |
| | • | | Depositary Receipts Risk— Depositary receipts are certificates evidencing ownership of shares of a foreign issuer that are issued by depositary banks and generally trade on an established market. Depositary receipts are subject to many of the risks associated with investing directly in foreign securities, including, among other things, political, social and economic developments abroad, currency movements, and different legal, regulatory and tax environments. |
170
| | |
| THE KP FUNDS | | December 31, 2019 |
| | • | | Derivatives Risk— An Underlying Fund’s use of futures contracts, forward contracts, credit-linked notes, structured notes and swaps is subject to market risk, leverage risk, correlation risk and liquidity risk. Market risk and liquidity risk are described below. Manyover-the-counter (“OTC”) derivative instruments will not have liquidity beyond the counterparty to the instrument. Leverage risk is the risk that the use of leverage may amplify the effects of market volatility on the Underlying Fund’s share price and may also cause the Underlying Fund to liquidate portfolio positions when it would not be advantageous to do so in order to satisfy its obligations. Correlation risk is the risk that changes in the value of the derivative may not correlate perfectly with the underlying asset, rate or index. An Underlying Fund’s use of forward contracts, structured notes and swaps is also subject to credit risk and valuation risk. Valuation risk is the risk that the derivative may be difficult to value and/or valued incorrectly. Credit risk is described above. Each of these risks could cause an Underlying Fund to lose more than the principal amount invested in a derivative instrument. An Underlying Fund’s use of derivatives may also increase the amount of taxes payable by shareholders. Both U.S. andnon-U.S. regulators are in the process of adopting and implementing regulations governing derivatives markets, the ultimate impact of which remains unclear. |
| | • | | Extension Risk— The risk that rising interest rates may extend the duration of a fixed income security, typically reducing the security’s value. |
| | • | | Fixed Income Market Risk— The prices of an Underlying Fund’s fixed income securities respond to economic developments, particularly interest rate changes, as well as to perceptions about the creditworthiness of individual issuers, including governments and their agencies. In the case of foreign securities, price fluctuations will reflect international economic and political events, as well as changes in currency valuations relative to the U.S. dollar. |
| | • | | Foreign Investment/Emerging Markets Risk— The risk thatnon-U.S. securities may be subject to additional risks due to, among other things, political, social and economic developments abroad, currency movements and different legal, regulatory and tax environments. These additional risks may be heightened with respect to emerging market countries since political turmoil and rapid changes in economic conditions are more likely to occur in these countries. |
| | • | | Foreign Sovereign Debt Securities Risk— The risk that: (i) the governmental entity that controls the repayment of sovereign debt may not be willing or able to repay the principal and/or interest when it becomes due because of factors such as debt service burden, political constraints, cash flow problems and other national economic factors; (ii) governments may default on their debt securities, which may require holders of such securities to participate in debt rescheduling or additional lending to defaulting governments; and (iii) there may be no bankruptcy proceeding by which defaulted sovereign debt may be collected in whole or in part. |
| | • | | Geographic Concentration Risk— An Underlying Fund that focuses its investments in particular foreign countries or geographic regions may be more volatile than a more geographically diversified fund. The performance of the Underlying Fund will be affected by the political, social and economic conditions in those foreign countries and geographic regions and subject to the related risks. |
| | • | | Growth Investing Risk— An investment in growth stocks may be susceptible to rapid price swings, especially during periods of economic uncertainty. Growth stocks typically have little or no dividend income to cushion the effect of adverse market conditions. In addition, growth stocks may be particularly volatile in the event of earnings disappointments or other financial difficulties experienced by the issuer. |
| | • | | Income Fluctuations Risk— An Underlying Fund’s income distributions may be likely to fluctuate considerably more than the income distributions of other mutual funds, particularly with respect to income fluctuations associated with changes in inflation. |
| | • | | Inflation Protected Securities Risk— The value of inflation protected securities, including TIPS, will generally fluctuate in response to changes in “real” interest rates, generally decreasing when real interest rates rise and increasing when real interest rates fall. Real interest rates represent nominal (or stated) interest rates reduced by the expected impact of inflation. In addition, interest payments on inflation-indexed securities will generally vary up or down along with the rate of inflation. |
| | • | | Interest Rate Risk— The risk that the value of fixed income securities, including U.S. Government securities, will fall due to rising interest rates. Risks associated with rising interest rates are heightened given that interest rates in the U.S. are at, or near, historic lows. |
171
| | |
| THE KP FUNDS | | December 31, 2019 |
| | • | | Large Capitalization Companies Risk— The risk that larger, more established companies may be unable to respond quickly to new competitive challenges such as changes in technology and consumer tastes. Larger companies also may not be able to attain the high growth rates of successful smaller companies. |
| | • | | Liquidity Risk— The risk that certain securities may be difficult or impossible to sell at the time and the price that an Underlying Fund would like. An Underlying Fund may have to accept a lower price to sell a security, sell other securities to raise cash, or give up an investment opportunity, any of which could have a negative effect on Underlying Fund management or performance. |
| | • | | Mortgage-Backed Securities Risk (KP Fixed Income Fund)— Mortgage-backed securities are affected by, among other things, interest rate changes and the possibility of prepayment of the underlying mortgage loans. Mortgage-backed securities are also subject to the risk that underlying borrowers will be unable to meet their obligations. |
| | • | | Mortgage Dollar Rolls Risk (KP Fixed Income Fund)— An Underlying Fund’s use of mortgage dollar rolls may increase its portfolio turnover rate, and may lead to higher transaction costs and increased capital gains for the Underlying Fund. At the time an Underlying Fund enters into a mortgage dollar roll, it will earmark or set aside in a segregated account sufficient cash or liquid assets to cover its obligation under the transaction. Mortgage dollar roll transactions may be considered a borrowing by an Underlying Fund. |
| | • | | Municipal Securities Risk (KP Fixed Income Fund)— There may be economic or political changes that impact the ability of municipal issuers to repay principal and to make interest payments on municipal securities. Changes in the financial condition or credit rating of municipal issuers also may adversely affect the value of an Underlying Fund’s municipal securities. Constitutional or legislative limits on borrowing by municipal issuers may result in reduced supplies of municipal securities. Moreover, certain municipal securities are backed only by a municipal issuer’s ability to levy and collect taxes. |
| | • | | PassiveSub-strategy Risk— A certain portion of an Underlying Fund’s assets (i.e., asub-strategy) may not be actively managed. Instead, suchsub-strategy may be managed to track the performance of an unmanaged index of securities. As a result, thesub-strategy will hold constituent securities of its index regardless of the current or projected performance of a specific security or a particular industry or market sector, which could cause the Underlying Fund’s return to be lower than if thesub-strategy were managed pursuant to an active strategy. In addition, the return of thesub-strategy may not match or achieve a high degree of correlation with the returns of its index due to expenses and transaction costs, the unavailability of securities included in the index for purchase, the timing of cash flows into and out of such portion, and other reasons. |
| | • | | Portfolio Turnover Risk— Due to its investment strategy, an Underlying Fund may buy and sell securities frequently. This may result in higher transaction costs and additional capital gains tax liabilities. |
| | • | | Prepayment Risk (KP Fixed Income Fund)— The risk that, in a declining interest rate environment, fixed income securities with stated interest rates may have the principal paid earlier than expected, requiring an Underlying Fund to invest the proceeds at generally lower interest rates. |
| | • | | Senior Loans/Bank Loans Risk (KP Fixed Income Fund) — With respect to senior loans, including bank loans, an Underlying Fund, as a direct lender to the borrower, assumes the credit risk of the borrower directly, or, through purchase of a participation in a bank loan, assumes both the credit risk of the direct bank lender as well as the borrower. An Underlying Fund may have difficulty in certain cases of disposing of senior loans and bank loans as the market for such instruments is not as liquid as markets for other types of investments. |
| | • | | Small and Medium Capitalization Companies Risk— The risk that small and medium capitalization companies in which an Underlying Fund may invest may be more vulnerable to adverse business or economic events than larger, more established companies. In particular, small and medium capitalization companies may have limited product lines, markets and financial resources and may depend upon a relatively small management group. Therefore, small capitalization and medium capitalization stocks may be more volatile than those of larger companies. Small capitalization and medium capitalization stocks may be tradedover-the-counter or listed on an exchange. The market for small and medium capitalization stocks may be less liquid than the market for larger capitalization stocks. |
172
| | |
| THE KP FUNDS | | December 31, 2019 |
| | • | | U.S. Government Securities Risk (KP Fixed Income Fund) — An Underlying Fund’s investment in U.S. government obligations may include securities issued or guaranteed as to principal and interest by the U.S. government, or its agencies or instrumentalities. Obligations issued by some U.S. government agencies are backed by the U.S. Treasury, while others are backed solely by the ability of the agency to borrow from the U.S. Treasury or by the agency’s own resources. There can be no assurance that the U.S. government would provide financial support to its agencies or instrumentalities (including government-sponsored enterprises) where it is not obligated to do so. In addition, U.S. government securities are not guaranteed against price movements due to changing interest rates. |
Investment Style Risk (KP Large Cap Equity Fund, KP Small Cap Equity Fund, KP International Equity Fund, KP Fixed Income Fund) — The risk that large capitalization equity securities may underperform other segments of the equity markets or the equity markets as a whole.
Large Capitalization Companies Risk (KP Large Cap Equity Fund, KP International Equity Fund) — The risk that larger, more established companies may be unable to respond quickly to new competitive challenges such as changes in technology and consumer tastes. Larger companies also may not be able to attain the high growth rates of successful smaller companies.
Liquidity Risk (KP Small Cap Equity Fund, KP International Equity Fund, KP Fixed Income Fund) — The risk that certain securities may be difficult or impossible to sell at the time and the price that the Fund would like. The Fund may have to accept a lower price to sell a security, sell other securities to raise cash, or give up an investment opportunity, any of which could have a negative effect on Fund management or performance.
Market Risk (KP Large Cap Equity Fund, KP Small Cap Equity Fund, KP International Equity Fund, KP Fixed Income Fund, Target Date Funds) — The risk that the market value of an investment may move up and down, sometimes rapidly and unpredictably.
Model and Data Risk (KP Large Cap Equity Fund) — Quantitative models and information, and data supplied by third parties (“Models and Data”), are used to construct sets of transactions and investments, and to provide risk management insights. When Models and Data prove to be incorrect or incomplete, any decisions made in reliance thereon expose the Fund to potential risks. Some of the models used for the Fund are predictive in nature. The use of predictive models has inherent risks. Because predictive models are usually constructed based on historical data supplied by third parties, the success of relying on such models may depend heavily on the accuracy and reliability of the supplied historical data. The Fund bears the risk that the quantitative models used will not be successful in selecting companies for investment or in determining the weighting of investment positions that will enable the Fund to achieve its investment objective. All models rely on correct market data inputs. If incorrect market data is entered into even a well-founded model, the resulting information will be incorrect. However, even if market data is input correctly, “model prices” will often differ substantially from market prices, especially for instruments with complex characteristics, such as derivative instruments.
Mortgage-Backed Securities Risk (KP Fixed Income Fund) — Mortgage-backed securities are affected by, among other things, interest rate changes and the possibility of prepayment of the underlying mortgage loans. Mortgage-backed securities are also subject to the risk that underlying borrowers will be unable to meet their obligations.
Mortgage Dollar Rolls Risk (KP Fixed Income Fund) — The Fund’s use of mortgage dollar rolls may increase its portfolio turnover rate, and may lead to higher transaction costs and increased capital gains for the Fund. At the time the Fund enters into a mortgage dollar roll, it will earmark or set aside in a segregated account sufficient cash or liquid assets to cover its obligation under the transaction. Mortgage dollar roll transactions may be considered a borrowing by the Fund.
Multi-Manager Risk (KP Large Cap Equity Fund, KP Small Cap Equity Fund, KP International Equity Fund, KP Fixed Income Fund) — The Adviser may be unable to identify and retainsub-advisers who achieve superior investment records relative to other similar investments or effectively allocate the Fund’s assets amongsub-advisers to enhance the return that would typically be expected of any one management style. While the Adviser monitors the investments of eachsub-adviser and monitors the overall management of the Fund, eachsub-adviser makes investment decisions for the assets it manages independently from one another. It is possible that the investment styles used by asub-adviser in an asset class will not always be complementary to those used by others, which could adversely affect the performance of the Fund. A multi-manager fund may, under certain circumstances, incur trading costs that might not occur in a fund that is served by a single adviser.
173
| | |
| THE KP FUNDS | | December 31, 2019 |
Municipal Securities Risk (KP Fixed Income Fund) — There may be economic or political changes that impact the ability of municipal issuers to repay the principal and to make interest payments on municipal securities. Changes in the financial condition or credit rating of municipal issuers also may adversely affect the value of the Fund’s municipal securities. Constitutional or legislative limits on borrowing by municipal issuers may result in reduced supplies of municipal securities. Moreover, certain municipal securities are backed only by a municipal issuer’s ability to levy and collect taxes.
PassiveSub-strategy Risk (KP Large Cap Equity Fund, KP Small Cap Equity Fund, KP International Equity Fund, KP Fixed Income Fund) — The Fund’sSub-strategy managed by SSGA FM is not actively managed. Instead, SSGA FM attempts to track the performance of an unmanaged index of securities. As a result, theSub-strategy will hold constituent securities of its index regardless of the current or projected performance of a specific security or a particular industry or market sector, which could cause the Fund’s return to be lower than if theSub-strategy employed an active strategy. In addition, the Substrategy’s return may not match or achieve a high degree of correlation with the return of its index due to expenses and transaction costs, the unavailability of securities included in the index for purchase, the timing of cash flows into and out of theSub-strategy, and other reasons.
Portfolio Turnover Risk (KP Small Cap Equity Fund, KP Fixed Income Fund, KP Fixed Income Fund) — Due to its investment strategy, the Fund may buy and sell securities frequently. This may result in higher transaction costs and additional capital gains tax liabilities.
Prepayment Risk (KP Fixed Income Fund) — The risk that, in a declining interest rate environment, fixed income securities with stated interest rates may have the principal paid earlier than expected, requiring the Fund to invest the proceeds at generally lower interest rates.
Retirement Income Risk (Target Date Funds) — The Fund is not a complete retirement program and there is no guarantee that the Fund will provide sufficient retirement income to an investor. An investor’s ability to meet his or her retirement goals is dependent upon many factors including the amount the investor saves, the investor’s expected retirement date, the investor’s individual retirement needs, the investor’s other sources of income and other assets, and inflation. The Fund’s glide path (or allocation methodology) will not eliminate the investment volatility that could reduce the number of funds available for an investor to withdraw when the investor intends to begin to withdraw a portion or all of his or her investment in the Fund. The Fund is considered a “through retirement” fund because it continues to grow more conservative through its target date year, reaching its most conservative asset allocation five years after the target date year. The Fund, therefore, provides greater exposure to equity securities during the first five years of an investor’s assumed retirement age and is subject to greater volatility than if it had reached its most conservative allocation during the target date year. This risk is greater for an investor who begins to withdraw a portion or all of his or her investment in the Fund before the Fund reaches its most conservative allocation. Conversely, for an investor who begins to withdraw a portion or all of his or her investment in the Fund sometime after the Fund reaches its most conservative allocation, there is a greater risk that the Fund’s glide path (or allocation methodology) may over-emphasize conservative investments designed to ensure capital conservation and current income, which may ultimately prevent the investor from achieving his or her income and appreciation goals. There can be no assurance that an investor’s investment in the Fund will provide income in amounts adequate to meet the investor’s goals. An investor should consider these and other factors when choosing an overall retirement strategy, including an investment in the Fund.
Rights and Warrants Risk (KP Large Cap Equity Fund) — Rights and warrants are instruments that entitle the holder to buy an equity security at a specific price for a specific period of time. Rights and warrants may be more speculative than other types of investments. The price of a right or warrant may be more volatile than the price of its underlying security, and an investment in a right or warrant may therefore, create greater potential for capital loss than an investment in the underlying security. A right or warrant ceases to have value if it is not exercised prior to its expiration date.
Senior Loans/Bank Loans Risk (KP Fixed Income Fund) — With respect to senior loans, including bank loans, the Fund, as a direct lender to the borrower, assumes the credit risk of the borrower directly, or, through purchase of a participation in a bank loan, assumes both the credit risk of the direct bank lender as well as the borrower. The secondary market for loans is a private, unregulated inter-dealer or inter-bank resale market. Purchases and sales of loans in the secondary market generally are subject to contractual restrictions and may have extended settlement periods.
174
| | |
| THE KP FUNDS | | December 31, 2019 |
Small and Medium Capitalization Companies Risk (KP Small Cap Equity Fund, KP International Equity Fund) —The risk that small and medium capitalization companies in which the Fund invests may be more vulnerable to adverse business or economic events than larger, more established companies. In particular, small and medium capitalization companies may have limited product lines, markets and financial resources and may depend upon a relatively small management group. Therefore, small capitalization and medium capitalization stocks may be more volatile than those of larger companies. Small capitalization and medium capitalization stocks may be tradedover-the-counter or listed on an exchange. The market for small and medium capitalization stocks may be less liquid than the market for larger capitalization stocks.
Tracking Error Risk (KP Large Cap Equity Fund, KP Small Cap Equity Fund, KP International Equity Fund, KP Fixed Income Fund) — The risk that aSub-strategy’s performance may vary substantially from the performance of the benchmark index it tracks as a result of cash flows, Fund expenses, imperfect correlation between theSub-strategy’s investments and the benchmark and other factors.
U.S. Government Securities Risk (KP Fixed Income Fund) — The Fund’s investment in U.S. government obligations may include securities issued or guaranteed as to principal and interest by the U.S. government, or its agencies or instrumentalities. Obligations issued by some U.S. government agencies are backed by the U.S. Treasury, while others are backed solely by the ability of the agency to borrow from the U.S. Treasury or by the agency’s own resources. There can be no assurance that the U.S. government would provide financial support to its agencies or instrumentalities (including government-sponsored enterprises) where it is not obligated to do so. In addition, U.S. government securities are not guaranteed against price movements due to changing interest rates.
Value Investing Risk (KP Large Cap Equity Fund, KP Small Cap Equity Fund, KP International Equity Fund) — Ifasub-adviser’s assessment of a company’s value or prospects for exceeding earnings expectations or market conditions is wrong, the Fund could suffer losses or produce poor performance relative to other funds. In addition, “value stocks” can continue to be undervalued by the market for long periods of time.
Valuation Risk (KP Fixed Income Fund) — The lack of an active trading market may make it difficult to obtain an accurate price for an instrument held by the Fund.
10. Indemnifications:
In the normal course of business, the Funds enter into contracts with third-party service providers that contain a variety of representations and warranties and that provide general indemnifications. Additionally, under the Funds’ organizational documents, the officers and trustees are indemnified against certain liabilities arising out of the performance of their duties to the Funds. The Funds’ maximum exposure under these arrangements is unknown, as it involves possible future claims that may or may not be made against the Funds. Based on experience, the Adviser is of the view that the risk of loss to the Funds in connection with the Funds’ indemnification obligation is remote; however, there can be no assurance that such obligations will not result in material liabilities that adversely affect the Funds.
11. Other:
At December 31, 2019, the percentage of total shares outstanding held by shareholders each owning 10% or greater of the aggregate total shares outstanding for each Fund, which are comprised of either affiliated shareholders, the Target Date Funds, or unaffiliated shareholders, omnibus accounts that are held on behalf of individual shareholders, was as follows:
| | | | | | | | | | | | | | | | |
| | | Number of
affiliated
shareholders | | | % of outstanding
shares held | | | Number of
non-affiliated
shareholders | | | % of outstanding
shares held | |
KP Retirement Path Retirement Income Fund | | | — | | | | 0 | % | | | 1 | | | | 100 | % |
KP Retirement Path 2020 Fund | | | — | | | | 0 | % | | | 1 | | | | 100 | % |
KP Retirement Path 2025 Fund | | | — | | | | 0 | % | | | 1 | | | | 100 | % |
KP Retirement Path 2030 Fund | | | — | | | | 0 | % | | | 1 | | | | 100 | % |
KP Retirement Path 2035 Fund | | | — | | | | 0 | % | | | 1 | | | | 100 | % |
KP Retirement Path 2040 Fund | | | — | | | | 0 | % | | | 1 | | | | 100 | % |
KP Retirement Path 2045 Fund | | | — | | | | 0 | % | | | 1 | | | | 100 | % |
KP Retirement Path 2050 Fund | | | — | | | | 0 | % | | | 1 | | | | 100 | % |
175
| | |
| THE KP FUNDS | | December 31, 2019 |
| | | | | | | | | | | | | | | | |
| | | Number of
affiliated
shareholders | | | % of outstanding
shares held | | | Number of
non-affiliated
shareholders | | | % of outstanding
shares held | |
KP Retirement Path 2055 Fund | | | — | | | | 0 | % | | | 1 | | | | 100 | % |
KP Retirement Path 2060 Fund | | | — | | | | 0 | % | | | 1 | | | | 100 | % |
KP Retirement Path 2065 Fund | | | — | | | | 0 | % | | | 2 | | | | 100 | % |
KP Large Cap Equity Fund | | | 5 | | | | 76 | % | | | — | | | | 0 | % |
KP Small Cap Equity Fund | | | 3 | | | | 38 | % | | | 1 | | | | 30 | % |
KP International Equity Fund | | | 5 | | | | 78 | % | | | — | | | | 0 | % |
KP Fixed Income Fund | | | 5 | | | | 79 | %�� | | | — | | | | 0 | % |
12. Regulatory Matters:
On August 17, 2018, the SEC adopted amendments to RegulationS-X. These changes are effective for periods after November 5, 2018. The updates to Registered Investment Companies were mainly focused on simplifying the presentation of distributable earnings by eliminating the need to present the components of distributable earnings on a book basis in the Statements of Assets and Liabilities. The update also impacted the presentation of undistributed net investment income and distribution to shareholders on the Statements of Changes in Net Assets. The amounts presented in the current Statements of Changes in Net Assets represent the aggregated total distributions of net investment income and realized capital gains, except for distributions classified as return of capital which are still presented separately.
13. New Accounting Pronouncements:
In August 2018, the FASB issued Accounting Standards Update2018-13, Fair Value Measurement (Topic 820). The new guidance includes additions and modifications to disclosures requirements for fair value measurements. For public entities, the amendments are effective for financial statements issued for fiscal years beginning after December 15, 2018, and interim periods within those fiscal years.
In March 2017, the Financial Accounting Standards Board issued an Accounting Standards Update, ASU2017-08, Receivables — Nonrefundable Fees and Other Costs (Subtopic310-20), Premium Amortization on Purchased Callable Debt Securities (the “ASU”) which amends the amortization period for certain purchased callable debt securities held at a premium, shortening such period to the earliest call date. The ASU does not require any accounting change for debt securities held at a discount; the discount continues to be amortized to maturity. The ASU is effective for fiscal years, and interim periods within those fiscal years, beginning after December 15, 2018. The implications of the ASU have been determined to be immaterial to the Funds and have not been reflected within the Financial Statements.
14. Subsequent Events:
The Funds have evaluated the need for additional disclosures and/or adjustments resulting from subsequent events through the date the financial statements were issued. Based on this evaluation, no additional disclosures and/or adjustments were required to the financial statements.
176
| | |
| THE KP FUNDS | | December 31, 2019 |
|
| REPORT OF INDEPENDENT REGISTERED PUBLIC ACCOUNTING FIRM |
TotheBoard of Trustees of The KP Funds andShareholders of KP Retirement Path Retirement Income Fund, KP Retirement Path 2020 Fund, KP Retirement Path 2025 Fund, KP Retirement Path 2030 Fund, KP Retirement Path 2035 Fund, KP Retirement Path 2040 Fund, KP Retirement Path 2045 Fund, KP Retirement Path 2050 Fund, KP Retirement Path 2055 Fund, KP Retirement Path 2060 Fund, KP Retirement Path 2065 Fund, KP Large Cap Equity Fund, KP Small Cap Equity Fund, KP International Equity Fund, and KP Fixed Income Fund
Opinions on the Financial Statements
We have audited the accompanying statements of assets and liabilities, including the schedules of investments, of each of the funds indicated in the table below (constituting The KP Funds, hereafter collectively referred to as the “Funds”) as of December 31, 2019, the related statements of operations and of changes in net assets for each of the periods indicated in the table below, including the related notes,and the financial highlights for each of the periods indicated in the table below (collectively referred to as the “financial statements”). In our opinion, the financial statements present fairly, in all material respects, the financial position of each of the Funds as of December 31, 2019, the results of each of their operations, the changes in each of their net assets, and each of the financial highlights for each of the periods indicated in the table below, in conformity with accounting principles generally accepted in the United States of America.
| | | | | | |
| Fund | | Statements of
operations | | Statements of
changes in net
assets | | Financial
highlights |
KP Retirement Path Retirement Income Fund, KP Retirement Path 2020 Fund, KP Retirement Path 2025 Fund, KP Retirement Path 2030 Fund, KP Retirement Path 2035 Fund, KP Retirement Path 2040 Fund, KP Retirement Path 2045 Fund, KP Retirement Path 2050 Fund, KP Retirement Path 2055 Fund, KP Retirement Path 2060 Fund, KP Large Cap Equity Fund, KP Small Cap Equity Fund, KP International Equity Fund, and KP Fixed Income Fund | | For the year ended
December 31, 2019 | | For the years
ended December 31,
2019 and 2018 | | For the years ended
December 31, 2019,
2018, 2017, 2016
and 2015 |
KP Retirement Path 2065 Fund | | For the period May 24, 2019 (commencement of operations) through December 31, 2019 |
Basis for Opinions
These financial statements are the responsibility of the Funds’ management. Our responsibility is to express an opinion on the Funds’ financial statements based on our audits. We are a public accounting firm registered with the Public Company Accounting Oversight Board (United States) (PCAOB) and are required to be independent with respect to the Funds in accordance with the U.S. federal securities laws and the applicable rules and regulations of the Securities and Exchange Commission and the PCAOB.
We conducted our audits of these financial statements in accordance with the standards of the PCAOB. Those standards require that we plan and perform the audit to obtain reasonable assurance about whether the financial statements are free of material misstatement, whether due to error or fraud.
Our audits included performing procedures to assess the risks of material misstatement of the financial statements, whether due to error or fraud, and performing procedures that respond to those risks. Such procedures included examining, on a test basis, evidence regarding the amounts and disclosures in the financial statements. Our audits also included evaluating the accounting principles used and significant estimates made by management, as well as evaluating the overall presentation of the financial statements. Our procedures included confirmation of securities owned as of December 31, 2019 by correspondence with the custodians, transfer agent and brokers; when replies were not received from brokers, we performed other auditing procedures. We believe that our audits provide a reasonable basis for our opinions.
/s/ PricewaterhouseCoopers LLP
Philadelphia, Pennsylvania
February 27, 2020
We have served as the auditor of one or more investment companies in Callan LLC since 2013.
177
| | |
| THE KP FUNDS | | December 31, 2019 |
|
| TRUSTEES AND OFFICERS OF THE TRUST (Unaudited) |
Set forth below are the names, year of birth, position with the Trust, length of term of office, and the principal occupations for the last five years of each of the persons currently serving as Trustees and Officers of the Trust. Unless otherwise noted, the business address of each Trustee is SEI Investments Company, One Freedom Valley Drive, Oaks, Pennsylvania 19456. Trustees who are deemed not to be “interested persons” of the Trust are referred to as “Independent Trustees.” The Trust’s Statement of Additional Information (“SAI”) includes additional information about the Trustees and Officers. The SAI may be obtained without charge by calling1-855-457-3637. The following chart lists Trustees and Officers as of December 31, 2019:
| | | | | | |
| | | |
Name and Year of Birth | | Position with Trust and Length of Time Served | | Principal Occupations in the Past 5 Years | | Other Directorships Held in the Past 5 Years |
| INTERESTED TRUSTEES | | | | |
| | | |
ROBERT A. NESHER (Born: 1946) | | Chairman of the Board of Trustees1 (Since 2013) | | SEI employee 1974 to present; currently performs various services on behalf of SEI Investments for which Mr. Nesher is compensated. President, Chief Executive Officer and Trustee of SEI Daily Income Trust, SEI Tax Exempt Trust, SEI Institutional Managed Trust, SEI Institutional International Trust, SEI Institutional Investments Trust, SEI Asset Allocation Trust, Adviser Managed Trust, New Covenant Funds, SEI Insurance Products Trust and SEI Catholic Values Trust. President and Director of SEI Structured Credit Fund, LP. Vice Chairman of O’Connor EQUUS(closed-end investment company) to 2016. President, Chief Executive Officer and Trustee of SEI Liquid Asset Trust to 2016. Vice Chairman of Winton Series Trust to 2017. Vice Chairman of Winton Diversified Opportunities Fund(closed-end investment company), The Advisors’ Inner Circle Fund III, Gallery Trust, Schroder Series Trust and Schroder Global Series Trust to 2018. | | Current Directorships: Trustee of The Advisors’ Inner Circle Fund, Bishop Street Funds, The KP Funds, Frost Family of Funds, SEI Daily Income Trust, SEI Institutional International Trust, SEI Institutional Investments Trust, SEI Institutional Managed Trust, SEI Asset Allocation Trust, SEI Tax Exempt Trust, Adviser Managed Trust, New Covenant Funds, SEI Insurance Products Trust and SEI Catholic Values Trust. Director of SEI Structured Credit Fund, LP, SEI Global Master Fund plc, SEI Global Assets Fund plc, SEI Global Investments Fund plc, SEI Investments—Global Funds Services, Limited, SEI Investments Global, Limited, SEI Investments (Europe) Ltd., SEI Investments—Unit Trust Management (UK) Limited, SEI Multi-Strategy Funds PLC and SEI Global Nominee Ltd Former Directorships: Trustee of SEI Liquid Asset Trust to 2016. |
N. JEFFREY KLAUDER (Born: 1952) | | Trustee1 (Since 2018) | | Senior Advisor of SEI Investments since 2018. Executive Vice President and General Counsel of SEI Investments, 2004 to 2018. | | Current Directorships: Trustee of The Advisors’ Inner Circle Fund, Bishop Street Funds and The KP Funds. Director of SEI Private Trust Company; SEI Investments Management Corporation; SEI Trust Company; SEI Investments (South Africa), Limited; SEI Investments (Canada) Company; SEI Global Fund Services Ltd.; SEI Investments Global Limited; SEI Global Master Fund; SEI Global Investments Fund; and SEI Global Assets Fund. |
| 1 | Trustees who are deemed to be “interested persons” (as the term is defined in the 1940 Act) of the Trust are referred to as “Interested Trustees”. Messrs. Nesher and Klauder are deemed Interested Trustees by virtue of their affiliation with the Distributor and/or its affiliates. |
178
| | |
| THE KP FUNDS | | December 31, 2019 |
|
| TRUSTEES AND OFFICERS OF THE TRUST (Unaudited) |
179
| | | | | | |
| | | |
Name and Year of Birth | | Position with Trust and Length of Time Served | | Principal Occupations in Past 5 Years | | Other Directorships Held in the Past 5 Years |
| INDEPENDENT TRUSTEES | | |
| | | |
JOSEPH T. GRAUSE JR. (Born: 1952) | | Trustee (Since 2013)
Lead Independent Trustee
(Since 2018) | | Self-Employed Consultant since 2012. Director of Endowments and Foundations, Morningstar Investment Management, Morningstar, Inc., 2010 to 2011. Director of International Consulting and Chief Executive Officer of Morningstar Associates Europe Limited, Morningstar, Inc., 2007 to 2010. Country Manager – Morningstar UK Limited, Morningstar, Inc., 2005 to 2007. | | Current Directorships: Trustee of The Advisors’ Inner Circle Fund, The Advisors’ Inner Circle Fund II and Bishop Street Funds. Director of The Korea Fund, Inc. |
MITCHELL A. JOHNSON (Born: 1942) | | Trustee (Since 2013) | | Retired. Private Investor since 1994. | | Current Directorships: Trustee of The Advisors’ Inner Circle Fund, The Advisors’ Inner Circle Fund II, Bishop Street Funds, SEI Asset Allocation Trust, SEI Daily Income Trust, SEI Institutional International Trust, SEI Institutional Managed Trust, SEI Institutional Investments Trust, SEI Tax Exempt Trust, Adviser Managed Trust, New Covenant Funds, SEI Insurance Products Trust and SEI Catholic Values Trust. Director of Federal Agricultural Mortgage Corporation (Farmer Mac) since 1997. Former Directorships: Director of SEI Alpha Strategy Portfolios, LP to 2013. Trustee of SEI Liquid Asset Trust to 2016. |
BETTY L. KRIKORIAN (Born: 1943) | | Trustee (Since 2013) | | Vice President, Compliance, AARP Financial Inc., from 2008 to 2010. Self-Employed Legal and Financial Services Consultant since 2003. Counsel(in-house) for State Street Bank from 1995 to 2003. | | Current Directorships: Trustee of The Advisors’ Inner Circle Fund, The Advisors’ Inner Circle Fund II and Bishop Street Funds. |
BRUCE R. SPECA (Born: 1956) | | Trustee (Since 2013) | | Global Head of Asset Allocation, Manulife Asset Management (subsidiary of Manulife Financial), 2010 to 2011. Executive Vice President – Investment Management Services, John Hancock Financial Services (subsidiary of Manulife Financial), 2003 to 2010 | | Current Directorships: Trustee of The Advisors’ Inner Circle Fund, The Advisors’ Inner Circle Fund II and Bishop Street Funds. Director of Stone Harbor Investments Funds, Stone Harbor Emerging Markets Income Fund(closed-end fund) and Stone Harbor Emerging Markets Total Income Fund(closed-end fund). |
| | |
| THE KP FUNDS | | December 31, 2019 |
|
| TRUSTEES AND OFFICERS OF THE TRUST (Unaudited) |
| | | | | | |
| | | |
Name and Year of Birth | | Position with Trust and Length of Time Served | | Principal Occupations in Past 5 Years | | Other Directorships Held in the Past 5 Years |
| INDEPENDENT TRUSTEES (continued) | | |
| | | |
GEORGE J. SULLIVAN, JR. (Born: 1942) | | Trustee (Since 2013) | | Retired since 2012. Self-Employed Consultant, Newfound Consultants Inc., 1997 to 2011. | | Current Directorships: Trustee/Director of The Advisors’ Inner Circle Fund, The Advisors’ Inner Circle Fund II, Bishop Street Funds, SEI Structured Credit Fund, LP, SEI Daily Income Trust, SEI Institutional International Trust, SEI Institutional Investments Trust, SEI Institutional Managed Trust, SEI Asset Allocation Trust, SEI Tax Exempt Trust, Adviser Managed Trust, New Covenant Funds, SEI Insurance Products Trust and SEI Catholic Values Trust. Former Directorships: Director of SEI Opportunity Fund, L.P. to 2010. Director of SEI Alpha Strategy Portfolios, LP to 2013. Trustee of SEI Liquid Asset Trust to 2016. Trustee/ Director of State Street Navigator Securities Lending Trust to 2017. Member of the independent review committee for SEI’s Canadian-registered mutual funds to 2017. |
180
| | |
| THE KP FUNDS | | December 31, 2019 |
|
| TRUSTEES AND OFFICERS OF THE TRUST (Unaudited) |
| | | | |
| | |
| Name and Year of Birth | | Position
with Trust
and Length of
Time Served | | Principal Occupations in
Past 5 Years |
| OFFICERS |
| | |
MICHAEL BEATTIE (Born: 1965) | | President (Since 2013) | | Director of Client Service, SEI Investments, since 2004. |
JAMES BERNSTEIN (Born: 1962) | | Vice President and Assistant Secretary (Since 2017) | | Attorney, SEI Investments, since 2017. Prior Positions: Self-employed consultant, 2017. Associate General Counsel & Vice President, Nationwide Funds Group and Nationwide Mutual Insurance Company, from 2002 to 2016. Assistant General Counsel & Vice President, Market Street Funds and Provident Mutual Insurance Company, from 1999 to 2002. |
JOHN BOURGEOIS (Born: 1973) | | Assistant Treasurer (Since 2017) | | Fund Accounting Manager, SEI Investments, since 2000. |
STEPHEN CONNORS (Born: 1984) | | Treasurer, Controller and Chief Financial Officer (Since 2015) | | Director, SEI Investments, Fund Accounting since 2014. Audit Manager, Deloitte & Touche LLP, from 2011 to 2014. |
DIANNE M. DESCOTEAUX (Born: 1977) | | Vice President and Secretary (Since 2014) | | Counsel at SEI Investments since 2010. Associate at Morgan, Lewis & Bockius LLP, from 2006 to 2010. |
RUSSELL EMERY (Born: 1962) | | Chief Compliance Officer (Since 2014) | | Chief Compliance Officer of SEI Structured Credit Fund, LP since 2007. Chief Compliance Officer of SEI Alpha Strategy Portfolios, LP from 2007 to 2013. Chief Compliance Officer of The Advisors’ Inner Circle Fund, The Advisors’ Inner Circle Fund II, Bishop Street Funds, The Advisors’ Inner Circle Fund III, Gallery Trust, Schroder Series Trust, Schroder Global Series Trust, SEI Institutional Managed Trust, SEI Asset Allocation Trust, SEI Institutional International Trust, SEI Institutional Investments Trust, SEI Daily Income Trust, SEI Tax Exempt Trust, Adviser Managed Trust, New Covenant Funds, SEI Insurance Products Trust and SEI Catholic Values Trust. Chief Compliance Officer of SEI Opportunity Fund, L.P. to 2010. Chief Compliance Officer of O’Connor EQUUS(closed-end investment company) to 2016. Chief Compliance Officer of SEI Liquid Asset Trust to 2016. Chief Compliance Officer of Winton Series Trust to 2017. Chief Compliance Officer of Winton Diversified Opportunities Fund(closed-end investment company) to 2018. |
ROBERT MORROW (Born: 1968) | | Vice President (Since 2017) | | Account Manager, SEI Investments, since 2007. |
BRIDGET E. SUDALL (Born: 1980) | | Anti-Money Laundering Compliance Officer and Privacy Officer (Since 2015) | | Senior Associate and AML Officer, Morgan Stanley Alternative Investment Partners, from 2011 to 2015. Investor Services Team Lead, Morgan Stanley Alternative Investment Partners, from 2007 to 2011. |
181
| | |
| THE KP FUNDS | | December 31, 2019 |
|
| DISCLOSURE OF FUND EXPENSES (Unaudited) |
All mutual funds have operating expenses. As a shareholder of a mutual fund, your investment is affected by these ongoing costs, which include (among others) costs for portfolio management, administrative services, and shareholder reports like this one. It is important for you to understand the impact of these costs on your investment returns.
Operating expenses such as these are deducted from the mutual fund‘s gross income and directly reduce your final investment return. These expenses are expressed as a percentage of the mutual fund’s average net assets; this percentage is known as the mutual fund’s expense ratio.
The following examples use the expense ratio and are intended to help you understand the ongoing costs (in dollars) of investing in your Fund and to compare these costs with those of other mutual funds. The examples are based on an investment of $1,000 invested on July 1, 2019 and held for thesix-month period ended December 31, 2019.
The table on the next page illustrates your Fund’s costs in two ways:
Actual Fund Return. This section helps you to estimate the actual expenses after fee waivers that your Fund incurred over the period. The “Expenses Paid During Period” column shows the actual dollar expense cost incurred by a $1,000 investment in the Fund, and the “Ending Account Value” number is derived from deducting that expense cost from the Fund’s gross investment return.
You can use this information, together with the actual amount you invested in your Fund, to estimate the expenses you paid over that period. Simply divide your actual starting account value by $1,000 to arrive at a ratio (for example, an $8,600 account value divided by $1,000 = 8.6), then multiply that ratio by the number shown for your Fund under “Expenses Paid During Period.”
Hypothetical 5% Return. This section helps you compare your Fund’s costs with those of other mutual funds. It assumes that your Fund had an annual 5% return before expenses during the year, but that the expense ratio (Column 3) is unchanged. This example is useful in making comparisons because the Securities and Exchange Commission requires all mutual funds to make this 5% calculation. You can assess your Fund’s comparative cost by comparing the hypothetical result for your Fund in the “Expense Paid During Period” column with those that appear in the same charts in the shareholder reports for other mutual funds.
NOTE: Because the return is set at 5% for comparison purposes — NOT your Fund’s actual return — the account values shown do not apply to your specific investment.
182
| | |
| THE KP FUNDS | | December 31, 2019 |
|
| DISCLOSURE OF FUND EXPENSES (Unaudited) (Continued) |
| | | | | | | | | | | | | | | | |
| | | Beginning
Account
Value
7/1/2019 | | | Ending
Account
Value
12/31/2019 | | | Annualized
Expense
Ratios | | | Expenses
Paid
During
Period(1) | |
| |
KP Retirement Path Retirement Income Fund | |
Actual Fund Return | | $ | 1,000.00 | | | $ | 1,041.50 | | | | 0.06 | % | | $ | 0.31 | |
Hypothetical 5% Return | | | 1,000.00 | | | | 1,024.90 | | | | 0.06 | | | | 0.31 | |
| |
KP Retirement Path 2020 Fund | |
Actual Fund Return | | $ | 1,000.00 | | | $ | 1,048.10 | | | | 0.06 | % | | $ | 0.31 | |
Hypothetical 5% Return | | | 1,000.00 | | | | 1,024.90 | | | | 0.06 | | | | 0.31 | |
| |
KP Retirement Path 2025 Fund | |
Actual Fund Return | | $ | 1,000.00 | | | $ | 1,054.60 | | | | 0.06 | % | | $ | 0.31 | |
Hypothetical 5% Return | | | 1,000.00 | | | | 1,024.90 | | | | 0.06 | | | | 0.31 | |
| |
KP Retirement Path 2030 Fund | |
Actual Fund Return | | $ | 1,000.00 | | | $ | 1,061.20 | | | | 0.06 | % | | $ | 0.31 | |
Hypothetical 5% Return | | | 1,000.00 | | | | 1,024.90 | | | | 0.06 | | | | 0.31 | |
| |
KP Retirement Path 2035 Fund | |
Actual Fund Return | | $ | 1,000.00 | | | $ | 1,065.70 | | | | 0.06 | % | | $ | 0.31 | |
Hypothetical 5% Return | | | 1,000.00 | | | | 1,024.90 | | | | 0.06 | | | | 0.31 | |
| |
KP Retirement Path 2040 Fund | |
Actual Fund Return | | $ | 1,000.00 | | | $ | 1,144.40 | | | | 0.06 | % | | $ | 0.32 | |
Hypothetical 5% Return | | | 1,000.00 | | | | 1,024.50 | | | | 0.06 | | | | 0.30 | |
| |
KP Retirement Path 2045 Fund | |
Actual Fund Return | | $ | 1,000.00 | | | $ | 1,149.00 | | | | 0.06 | % | | $ | 0.32 | |
Hypothetical 5% Return | | | 1,000.00 | | | | 1,024.50 | | | | 0.06 | | | | 0.30 | |
| |
KP Retirement Path 2050 Fund | |
Actual Fund Return | | $ | 1,000.00 | | | $ | 1,150.40 | | | | 0.06 | % | | $ | 0.32 | |
Hypothetical 5% Return | | | 1,000.00 | | | | 1,024.50 | | | | 0.06 | | | | 0.30 | |
| |
KP Retirement Path 2055 Fund | |
Actual Fund Return | | $ | 1,000.00 | | | $ | 1,152.40 | | | | 0.06 | % | | $ | 0.32 | |
Hypothetical 5% Return | | | 1,000.00 | | | | 1,024.50 | | | | 0.06 | | | | 0.30 | |
| |
KP Retirement Path 2060 Fund | |
Actual Fund Return | | $ | 1,000.00 | | | $ | 1,152.30 | | | | 0.06 | % | | $ | 0.32 | |
Hypothetical 5% Return | | | 1,000.00 | | | | 1,024.50 | | | | 0.06 | | | | 0.30 | |
| |
KP Retirement Path 2065 Fund | |
Actual Fund Return | | $ | 1,000.00 | | | $ | 1,073.80 | | | | 0.06 | % | | $ | 0.31 | |
Hypothetical 5% Return | | | 1,000.00 | | | | 1,024.90 | | | | 0.06 | | | | 0.31 | |
| | | | | | | | | | | | | | | | |
| | | Beginning
Account
Value
7/1/2019 | | | Ending
Account
Value
12/31/2019 | | | Annualized
Expense
Ratios | | | Expenses
Paid
During
Period(1) | |
| |
KP Large Cap Equity Fund | |
Actual Fund Return | | $ | 1,000.00 | | | $ | 1,097.90 | | | | 0.30 | % | | $ | 1.59 | |
Hypothetical 5% Return | | | 1,000.00 | | | | 1,023.69 | | | | 0.30 | | | | 1.53 | |
| |
KP Small Cap Equity Fund | |
Actual Fund Return | | $ | 1,000.00 | | | $ | 1,055.50 | | | | 0.52 | % | | $ | 2.69 | |
Hypothetical 5% Return | | | 1,000.00 | | | | 1,022.58 | | | | 0.52 | | | | 2.65 | |
| |
KP International Equity Fund | |
Actual Fund Return | | $ | 1,000.00 | | | $ | 1,074.30 | | | | 0.49 | % | | $ | 2.56 | |
Hypothetical 5% Return | | | 1,000.00 | | | | 1,022.74 | | | | 0.49 | | | | 2.50 | |
| |
KP Fixed Income Fund | |
Actual Fund Return | | $ | 1,000.00 | | | $ | 1,025.90 | | | | 0.29 | % | | $ | 1.48 | |
Hypothetical 5% Return | | | 1,000.00 | | | | 1,023.74 | | | | 0.29 | | | | 1.48 | |
| (1) | Expenses are equal to the Fund’s annualized expense ratio multiplied by the average account value over the period, multiplied by 184/365 (to reflect theone-half year period shown). |
183
| | |
| THE KP FUNDS | | December 31, 2019 |
|
| APPROVAL OF INVESTMENT ADVISORY AGREEMENT (Unaudited) |
Pursuant to Section 15 of the Investment Company Act of 1940 (the “1940 Act”), the Funds’ advisory andsub-advisory agreements must be renewed at least annually after their initialtwo-year term: (i) by the vote of the Board of Trustees (the “Board” or the “Trustees”) of The KP Funds (the “Trust”) or by a vote of a majority of the shareholders of the Funds; and (ii) by the vote of a majority of the Trustees who are not parties to the agreements or “interested persons” of any party thereto, as defined in the 1940 Act (the “Independent Trustees”), cast in person at a meeting called for the purpose of voting on such renewal.
Board meetings were held on August 20, 2019 and November 19, 2019 to decide whether to renew the following agreements (the “Agreements”) for additionalone-year terms:
| | • | | the investment advisory agreement between Callan Associates Inc. (the “Adviser”) and the Trust, on behalf of the Funds; |
| | • | | thesub-advisory agreements between the Adviser and certainsub-advisers (each, a“Sub-Adviser” and together, the“Sub-Advisers”), pursuant to which theSub-Advisers serve as investmentsub-advisers to the Funds, as set forth in the following table: |
| | |
| Sub-Adviser | | Fund(s) |
Acadian Asset Management LLC | | KP International Equity Fund |
AQR Capital Management, LLC | | KP Large Cap Equity Fund |
Aristotle Capital Boston, LLC | | KP Small Cap Equity Fund |
CastleArk Management LLC | | KP Small Cap Equity Fund |
Columbus Circle Investors | | KP Small Cap Equity Fund |
DePrince Race & Zollo, Inc. | | KP Small Cap Equity Fund |
Loomis, Sayles & Company, L.P. | | KP Fixed Income Fund |
Marathon Asset Management LLP | | KP International Equity Fund |
MFS Investment Management | | KP Large Cap Equity Fund KP International Equity Fund |
PanAgora Asset Management, Inc. | | KP Large Cap Equity Fund |
Payden & Rygel | | KP Fixed Income Fund |
PENN Capital Management Company, Inc. | | KP Small Cap Equity Fund |
SSgA Funds Management, Inc. | | KP Large Cap Equity Fund KP Small Cap Equity Fund KP International Equity Fund KP Fixed Income Fund |
T. Rowe Price Associates, Inc. | | KP Large Cap Equity Fund |
Walthausen & Co., LLC | | KP Small Cap Equity Fund |
William Blair Investment Management, LLC | | KP International Equity Fund |
In preparation for the meetings, the Trustees requested that the Adviser and theSub-Advisers furnish information necessary to evaluate the terms of the Agreements. Prior to the meetings, the Independent Trustees of the Funds met to review and discuss the information provided and submitted a request for additional information to the Adviser and certainSub-Advisers, and information was provided in response to this request. The Trustees used this information, as well as other information that the Adviser, theSub-Advisers and other service providers of the Funds presented or submitted to the Board at the meetings and other meetings held during the prior year, to help them decide whether to renew the Agreements for an additional year.
Specifically, the Board requested and received written materials from the Adviser, theSub-Advisers and other service providers of the Funds regarding: (i) the nature, extent and quality of the Adviser’s and theSub-Advisers’ services; (ii) the Adviser’s and theSub-Advisers’ investment management personnel; (iii) the Adviser’s and theSub-Advisers’ operations and financial condition; (iv) the Adviser’s and theSub-Advisers’ brokerage practices (including any soft dollar arrangements) and investment strategies; (v) the Funds’ advisory fees paid to the Adviser and theSub-Advisers and overall fees and operating expenses compared with peer groups of mutual funds; (vi) the level of the Adviser’s and theSub-Advisers’ profitability from their relationships with the Funds, including both direct and indirect benefits accruing to the Adviser and theSub-Advisers and their affiliates; (vii) the Adviser’s and theSub-Advisers’ potential economies of scale; (viii) the Adviser’s and theSub-Advisers’ compliance programs, including a description of material compliance matters and material compliance violations; (ix) the Adviser’s and the
184
| | |
| THE KP FUNDS | | December 31, 2019 |
|
| APPROVAL OF INVESTMENT ADVISORY AGREEMENT (Unaudited) |
Sub-Advisers’ policies on and compliance procedures for personal securities transactions; and (x) the Funds’ performance compared with peer groups of mutual funds and the Funds’ benchmark indices.
Representatives from the Adviser and certainSub-Advisers, along with other Fund service providers, presented additional information and participated in question and answer sessions at the Board meetings to help the Trustees evaluate the Adviser’s and theSub-Advisers’ services, fees and other aspects of the Agreements. The Independent Trustees received advice from independent counsel and met in executive sessions outside the presence of Fund management, the Adviser and theSub-Advisers.
At the Board meetings, the Trustees, including all of the Independent Trustees, based on their evaluation of the information provided by the Adviser, theSub-Advisers and other service providers of the Funds, renewed the Agreements. In considering the renewal of the Agreements, the Board considered various factors that they determined were relevant, including: (i) the nature, extent and quality of the services provided by the Adviser and theSub-Advisers; (ii) the investment performance of the Funds and the Adviser and theSub-Advisers; (iii) the costs of the services provided and profits realized by the Adviser and theSub-Advisers from their relationships with the Funds, including both direct and indirect benefits accruing to the Adviser and theSub-Advisers and their affiliates; (iv) the extent to which economies of scale are being realized by the Adviser and theSub-Advisers; and (v) whether fee levels reflect such economies of scale for the benefit of Fund investors, as discussed in further detail below.
Nature, Extent and Quality of Services Provided by the Adviser and theSub-Advisers
In considering the nature, extent and quality of the services provided by the Adviser and theSub-Advisers, the Board reviewed the portfolio management services provided by the Adviser and theSub-Advisers to the Funds, including the quality and continuity of the Adviser’s and theSub-Advisers’ portfolio management personnel, the resources of the Adviser and theSub-Advisers, and the Adviser’s and theSub-Advisers’ compliance histories and compliance programs. The Trustees reviewed the terms of the Agreements. The Trustees also reviewed the Adviser’s and theSub-Advisers’ investment and risk management approaches for the Funds. The Trustees considered that the Adviser supervises and monitors the performance of theSub-Advisers. The most recent investment adviser registration forms (“Form ADV”) for the Adviser and theSub-Advisers were available to the Board, as were the responses of the Adviser and theSub-Advisers to a detailed series of questions which included, among other things, information about the investment advisory services provided by the Adviser and theSub-Advisers to the Funds.
The Trustees also considered other services provided to the Funds by the Adviser and theSub-Advisers such as selecting broker-dealers for executing portfolio transactions, monitoring adherence to the Funds’ investment restrictions, and monitoring compliance with various Fund policies and procedures and with applicable securities laws and regulations. Based on the factors above, as well as those discussed below, the Board concluded, within the context of its full deliberations, that the nature, extent and quality of the services provided to the Funds by the Adviser and theSub-Advisers were sufficient to support renewal of the Agreements.
Investment Performance of the Funds, the Adviser and theSub-Advisers
The Board was provided with regular reports regarding the Funds’ performance over various time periods. The Trustees also reviewed reports prepared by the Funds’ administrator comparing the Funds’ performance to their benchmark indices and peer groups of mutual funds as classified by Lipper, an independent provider of investment company data, over various periods of time. Representatives from the Adviser and theSub-Advisers provided information regarding and led discussions of factors impacting the performance of the Funds, outlining current market conditions and explaining their expectations and strategies for the future. The Trustees determined that the Funds’ performance was satisfactory, or, where the Funds’ performance was materially below their benchmarks and/or peer groups, the Trustees were satisfied by the reasons for the underperformance and/or the steps taken by the Adviser and theSub-Advisers in an effort to improve the performance of the Funds. Based on this information, the Board concluded, within the context of its full deliberations, that the investment results that the Adviser and theSub-Advisers had been able to achieve for the Funds were sufficient to support renewal of the Agreements.
185
| | |
| THE KP FUNDS | | December 31, 2019 |
|
| APPROVAL OF INVESTMENT ADVISORY AGREEMENT (Unaudited) |
Costs of Advisory Services, Profitability and Economies of Scale
In considering the advisory fees payable by the Funds to the Adviser and theSub-Advisers, the Trustees reviewed, among other things, a report of the advisory fees paid to the Adviser and theSub-Advisers. The Trustees also reviewed reports prepared by the Funds’ administrator comparing the Funds’ net and gross expense ratios and advisory fees to those paid by peer groups of mutual funds as classified by Lipper. The Trustees reviewed the management fees charged by certainSub-Advisers to other clients with comparable mandates. The Trustees considered any differences in management fees and took into account the respective demands, resources and complexity associated with the Funds and other client accounts as well as the extensive regulatory, compliance and tax regimes to which the Funds are subject. The Trustees also considered that the fees payable to theSub-Advisers reflected arms-length negotiations between the Adviser and theSub-Advisers. The Board concluded, within the context of its full deliberations, that the advisory fees were reasonable in light of the nature and quality of the services rendered by the Adviser and theSub-Advisers.
The Trustees reviewed the costs of services provided by and the profits realized by the Adviser and theSub-Advisers from their relationship with the Funds, including both direct benefits and indirect benefits, such as research and brokerage services received under soft dollar arrangements, accruing to the Adviser and theSub-Advisers and their affiliates. The Trustees considered how the Adviser’s and theSub-Advisers’ profitability was affected by factors such as their organizational structures and methods for allocating expenses. The Trustees concluded that the profit margins of the Adviser and theSub-Advisers with respect to the management of the Funds were not unreasonable. The Board also considered the Adviser’s and theSub-Advisers’ commitment to managing the Funds and Adviser’s willingness to continue its expense limitation arrangements with respect to certain Funds.
The Trustees considered the Adviser’s andSub-Advisers’ views relating to economies of scale in connection with the Funds as Fund assets grow and the extent to which the benefits of any such economies of scale are shared with the Funds and Fund shareholders. The Board considered the existence of any economies of scale and whether those were passed along to the Funds’ shareholders through a graduated advisory fee schedule or other means, including fee waivers. The Trustees recognized that economies of scale are difficult to identify and quantify and are rarely identifiable on afund-by-fund basis. Based on this evaluation, the Board concluded that the advisory fees were reasonable in light of the information that was provided to the Trustees by the Adviser and theSub-Advisers with respect to economies of scale.
Renewal of the Agreements
Based on the Board’s deliberations and its evaluation of the information described above and other factors and information it believed relevant in the exercise of its reasonable business judgment, the Board, including all of the Independent Trustees, with the assistance of Fund counsel and Independent Trustees’ counsel, unanimously concluded that the terms of the Agreements, including the fees payable thereunder, were fair and reasonable and agreed to renew the Agreements for another year. In its deliberations, the Board did not identify any absence of information as material to its decision, or any particular factor (or conclusion with respect thereto) or single piece of information that wasall-important, controlling or determinative of its decision, but considered all of the factors together, and each Trustee may have attributed different weights to the various factors (and conclusions with respect thereto) and information.
186
| | |
| THE KP FUNDS | | December 31, 2019 |
|
| NOTICE TO SHAREHOLDERS (Unaudited) |
For shareholders that do not have a December 31, 2019 taxable year end, this notice is for informational purposes only. For shareholders with a December 31, 2019 tax year end, please consult your tax adviser as to the pertinence of this notice.
For the fiscal period ended December 31, 2019 the Funds are designating the following with regard to distributions paid during the period:
| | | | | | | | | | | | | | | | | | | | | | | | | | | | | | | | | | | | |
| | | | | | | | | | | | | | | | | | | | | | | | Foreign Investors | |
| Fund | | Return of
Capital
(Tax Basis) | | | Long-
Term Capital
Gains
Distributions
(Tax Basis) | | | Ordinary
Income
Distributions
(Tax Basis) | | | Total
Distributions
(Tax Basis) | | | Corporate
Dividends
Received
Deduction(1) | | | Qualifying
Dividend
Income(2) | | | U.S.
Government
Interest(3) | | | Interest
Related
Dividends(4) | | | Short-Term
Capital
Gains
Dividends(5) | |
KP Retirement Path Retirement Income Fund | | | 0.00% | | | | 52.13% | | | | 47.87% | | | | 100.00% | | | | 0.00% | | | | 0.00% | | | | 0.00% | | | | 0.00% | | | | 100.00% | |
KP Retirement Path 2020 Fund | | | 0.00% | | | | 55.50% | | | | 44.50% | | | | 100.00% | | | | 0.00% | | | | 0.00% | | | | 0.00% | | | | 0.00% | | | | 100.00% | |
KP Retirement Path 2025 Fund | | | 0.00% | | | | 57.59% | | | | 42.41% | | | | 100.00% | | | | 0.00% | | | | 0.00% | | | | 0.00% | | | | 0.00% | | | | 100.00% | |
KP Retirement Path 2030 Fund | | | 0.00% | | | | 61.17% | | | | 38.83% | | | | 100.00% | | | | 0.00% | | | | 0.00% | | | | 0.00% | | | | 0.00% | | | | 100.00% | |
KP Retirement Path 2035 Fund | | | 0.00% | | | | 64.14% | | | | 35.86% | | | | 100.00% | | | | 0.00% | | | | 0.00% | | | | 0.00% | | | | 0.00% | | | | 100.00% | |
KP Retirement Path 2040 Fund | | | 0.00% | | | | 66.69% | | | | 33.31% | | | | 100.00% | | | | 0.00% | | | | 0.00% | | | | 0.00% | | | | 0.00% | | | | 100.00% | |
KP Retirement Path 2045 Fund | | | 0.00% | | | | 67.30% | | | | 32.70% | | | | 100.00% | | | | 0.00% | | | | 0.00% | | | | 0.00% | | | | 0.00% | | | | 100.00% | |
KP Retirement Path 2050 Fund | | | 0.00% | | | | 66.59% | | | | 33.41% | | | | 100.00% | | | | 0.00% | | | | 0.00% | | | | 0.00% | | | | 0.00% | | | | 100.00% | |
KP Retirement Path 2055 Fund | | | 0.00% | | | | 66.48% | | | | 33.52% | | | | 100.00% | | | | 0.00% | | | | 0.00% | | | | 0.00% | | | | 0.00% | | | | 100.00% | |
KP Retirement Path 2060 Fund | | | 0.00% | | | | 62.18% | | | | 37.82% | | | | 100.00% | | | | 0.00% | | | | 0.00% | | | | 0.00% | | | | 0.00% | | | | 100.00% | |
KP Retirement Path 2065 Fund | | | 0.00% | | | | 0.00% | | | | 100.00% | | | | 100.00% | | | | 0.00% | | | | 0.00% | | | | 0.00% | | | | 0.00% | | | | 100.00% | |
KP Large Cap Equity Fund | | | 0.00% | | | | 71.68% | | | | 28.32% | | | | 100.00% | | | | 0.00% | | | | 0.00% | | | | 0.00% | | | | 0.00% | | | | 100.00% | |
KP Small Cap Equity Fund | | | 0.00% | | | | 78.28% | | | | 21.72% | | | | 100.00% | | | | 0.00% | | | | 0.00% | | | | 0.00% | | | | 0.00% | | | | 0.00% | |
KP International Equity Fund | | | 0.00% | | | | 14.61% | | | | 85.39% | | | | 100.00% | | | | 0.00% | | | | 0.00% | | | | 0.00% | | | | 0.00% | | | | 0.00% | |
KP Fixed Income Fund | | | 0.00% | | | | 0.00% | | | | 100.00% | | | | 100.00% | | | | 0.00% | | | | 0.00% | | | | 0.00% | | | | 0.00% | | | | 100.00% | |
(1) | Qualifying dividends represent dividends which qualify for the corporate dividends received deduction and is reflected as a percentage of ordinary income distributions (the total of short term capital gain and net investment income distributions). |
| (2) | The percentage in this column represents the amount of “Qualifying Dividend Income” as created by the Jobs and Growth Relief Reconciliation Act of 2003 and its reflected as a percentage of ordinary income distributions (the total of short term capital gain and net investment income distributions). It is the intention of each of the aforementioned funds to designate the maximum amount permitted by law. |
| (3) | “U.S. Government Interest represents the amount of interest that was derived from U.S. Government obligations and distributed during the fiscal year. This amount is reflected as a percentage of total ordinary income distributions (the total of short term capital gain and net investment income distributions). Generally, interest from direct U.S. Government obligations is exempt from state income tax. However, for shareholders of the Funds who are residents of California, Connecticut and New York, the statutory threshold requirements were not satisfied to permit exemption of these amounts from state income. |
| (4) | The percentage in this column represents the amount of “Interest Related Dividends” and is reflected as a percentage of ordinary income distribution. Interest related dividends are exempt from U.S. withholding tax when paid for foreign investors. |
| (5) | The percentage in this column represents the amount of “Short-Term Capital Gain Dividends” and is reflected as a percentage of short-term capital gain distribution that is exempt from U.S. withholding tax when paid to foreign investors. |
187
| | |
| THE KP FUNDS | | December 31, 2019 |
|
| NOTICE TO SHAREHOLDERS (Unaudited) (Continued) |
The following KP Funds designate long term capital gains for December 31, 2019, calendar year end:
| | | | |
| Fund | | Long Term
Capital Gain | |
KP Retirement Path Retirement Income Fund | | $ | 8,478,380 | |
KP Retirement Path 2020 Fund | | | 22,993,659 | |
KP Retirement Path 2025 Fund | | | 35,045,574 | |
KP Retirement Path 2030 Fund | | | 41,144,797 | |
KP Retirement Path 2035 Fund | | | 51,887,613 | |
KP Retirement Path 2040 Fund | | | 51,771,636 | |
KP Retirement Path 2045 Fund | | | 41,666,091 | |
KP Retirement Path 2050 Fund | | | 25,049,386 | |
KP Retirement Path 2055 Fund | | | 8,316,875 | |
KP Retirement Path 2060 Fund | | | 1,704,312 | |
KP Large Cap Equity Fund | | | 15,740,951 | |
KP Small Cap Equity Fund | | | 16,025,660 | |
KP International Equity Fund | | | — | |
KP Fixed Income Fund | | | — | |
188
The KP Funds
Investment Adviser
Callan LLC
600 Montgomery Street,
Suite 800
San Francisco, CA 94111
Administrator
SEI Investments
Global Funds Services
One Freedom Valley Drive
Oaks, Pennsylvania 19456
Distributor
SEI Investments Distribution Co.
One Freedom Valley Drive
Oaks, Pennsylvania 19456
Legal Counsel
Morgan, Lewis & Bockius LLP
1701 Market Street
Philadelphia, Pennsylvania 19103-2921
This information must be preceded or accompanied by a current prospectus for the Funds.
To Obtain a Prospectus, SAI, Annual or Semi-Annual Report, or More Information:
| | |
| By Telephone: | | 855-457-3637 (855-4KPFNDS) |
| |
| By Mail: | | The KP Funds |
| | c/o SEI Investments |
| | One Freedom Valley Drive |
| | Oaks, PA 19546 |
| |
| By Internet: | | www.kp-funds.com |
From the SEC:You can also obtain the Prospectus, SAI or the Annual and Semi-Annual Reports, as well as other information about The KP Funds, from the EDGAR Database on the SEC’s website at: http://www.sec.gov. You may review and copy documents at the SEC Public Reference Room in Washington, DC (for information on the operation of the Public Reference Room, call202-551-8090). You may request documents by mail from the SEC, upon payment of a duplicating fee, by writing to: U.S. Securities and Exchange Commission, Public Reference Section, Washington, DC 20549-1520. You may also obtain this information, upon payment of a duplicating fee, bye-mailing the SEC at the following address: publicinfo@sec.gov.
The Trust’s Investment Company Act registration number is811-22838
KPF-AR-001-0600
The Registrant has adopted a code of ethics that applies to the Registrant’s principal executive officer, principal financial officer, controller or principal accounting officer, and any person who performs a similar function. There have been no amendments to or waivers granted to this code of ethics during the period covered by this report.
| Item 3. | Audit Committee Financial Expert. |
(a)(1) The Registrant’s board of trustees has determined that the Registrant has at least one audit committee financial expert serving on the audit committee.
(a)(2) The Registrant’s audit committee financial experts are Robert Mulhall and George Sullivan, and they are independent as defined in Form N-CSR Item 3 (a)(2).
| Item 4. | Principal Accountant Fees and Services. |
Fees billed by PricewaterhouseCoopers LLP (“PwC”) related to the Trust.
PwC billed the Trust aggregate fees for services rendered to the Trust for the last two fiscal years were as follows:
| | | | | | | | | | | | | | | | | | | | | | | | | | |
| | | 2019 | | | 2018 | |
| | | | | All fees and
services to
the Trust
that were
pre-approved | | | All fees and
services to
service affiliates
that were
pre-approved | | | All other
fees and
services to
service affiliates
that did not
require
pre-approval | | | All fees and
services to
the Trust
that were
pre-approved | | | All fees and
services to
service affiliates
that were
pre-approved | | | All other
fees and
services to
service affiliates
that did not
require
pre-approval | |
(a) | | Audit Fees(1) | | $ | 237,942 | | | $ | 0 | | | $ | 0 | | | $ | 241,155 | | | $ | 0 | | | $ | 0 | |
(b) | | Audit-Related Fees | | | N/A | | | $ | 0 | | | $ | 0 | | | | N/A | | | $ | 0 | | | $ | 0 | |
(c) | | Tax Fees | | | N/A | | | $ | 0 | | | $ | 0 | | | | N/A | | | $ | 0 | | | $ | 0 | |
(d) | | All Other Fees | | | N/A | | | $ | 0 | | | $ | 0 | | | | N/A | | | $ | 0 | | | $ | 0 | |
Notes:
| | (1) | Audit fees include amounts related to the audit of the Trust’s annual financial statements and services normally provided by the accountant in connection with statutory and regulatory filings. |
(e)(1) All requests or applications for services to be provided by the independent auditor shall be submitted to the Chief Financial Officer (“CFO”) of the Registrant and must include a detailed description of the services proposed to be rendered. The Registrant’s CFO will determine whether such services:
(1) require specific pre-approval;
(2) are included within the list of services that have received the general pre-approval of the Audit Committee pursuant to the Policy; or
(3) have been previously pre-approved in connection with the independent auditor’s annual engagement letter for the applicable year or otherwise. In any instance where services require pre-approval, the Audit Committee will consider whether such services are consistent with SEC’s rules and whether the provision of such services would impair the auditor’s independence.
Requests or applications to provide services that require specific pre-approval by the audit committee will be submitted to the audit committee by the CFO. The audit committee will be informed by the CFO on a quarterly basis of all services rendered by the independent auditor. The audit committee has delegated specific pre-approval authority to either the audit committee chair or financial experts, provided that the estimated fee for any such proposed pre-approved service does not exceed $100,000 and any pre-approval decisions are reported to the audit committee at its next regularly-scheduled meeting.
All services to be provided by the independent auditor shall be provided pursuant to a signed written engagement letter with the Registrant, the investment advisor or applicable control affiliate (except that matters as to which an engagement letter would be impractical because of timing issues or because the matter is small may not be the subject of an engagement letter) that sets forth both the services to be provided by the independent auditor and the total fees to be paid to the independent auditor for those services.
In addition, the audit committee has determined to take additional measures on an annual basis to meet its responsibility to oversee the work of the independent auditor and to assure the auditor’s independence from the Registrant, such as reviewing a formal written statement from the independent auditor delineating all relationships between the independent auditor and the Registrant, and discussing with the independent auditor its methods and procedures for ensuring independence.
(e)(2) Percentage of fees billed applicable to non-audit services approved pursuant to the “de minimus” exception of Rule 2-01(c)(7)(i)(C) were as follows (PwC):
| | | | | | | | |
| | | 2019 | | | 2018 | |
Audit-Related Fees | | | 0 | % | | | 0 | % |
Tax Fees | | | 0 | % | | | 0 | % |
All Other Fees | | | 0 | % | | | 0 | % |
(f) Not applicable.
(g) The aggregate non-audit fees and services billed by PwC for services rendered to the Registrant, and rendered to the Registrant’s investment adviser (not including any sub-adviser whose role is primarily portfolio management and is subcontracted with or overseen by another investment adviser), and any entity controlling, controlled by, or under common control with the adviser that provides ongoing services to the Registrant for the last two fiscal years were $0 and $0 for 2019 and 2018, respectively.
(h) During the past fiscal year, all non-audit services provided by Registrant’s principal accountant to either Registrant’s investment adviser or to any entity controlling, controlled by, or under common control with Registrant’s investment adviser that provides ongoing services to Registrant were pre-approved by the audit committee of Registrant’s Board of Trustees. Included in the audit committee’s pre-approval was the review and consideration as to whether the provision of these non-audit services is compatible with maintaining the principal accountant’s independence.
| Item 5. | Audit Committee of Listed Registrants. |
Not applicable to open-end management investment companies.
| Item 6. | Schedule of Investments. |
Schedule of Investments is included as part of the Report to Shareholders filed under Item 1 of this form.
| Item 7. | Disclosure of Proxy Voting Policies and Procedures for Closed-End Management Investment Companies. |
Not applicable to open-end management investment companies.
| Item 8. | Portfolio Managers of Closed-End Management Investment Companies. |
Not applicable. Effective for closed-end management investment companies for fiscal years ending on or after December 31, 2005.
| Item 9. | Purchases of Equity Securities by Closed-End Management Company and Affiliated Purchasers. |
Not applicable to open-end management investment companies.
| Item 10. | Submission of Matters to a Vote of Security Holders. |
There have been no changes to the procedures by which shareholders may recommend nominees to the Registrant’s Board of Trustees during the period covered by this report.
| Item 11. | Controls and Procedures. |
(a) The Registrant’s principal executive and principal financial officers, or persons performing similar functions, have concluded that the Registrant’s disclosure controls and procedures, as defined in Rule 30a-3(c) under the Act (17 CFR § 270.30a-3(c)), as of a date within 90 days of the filing date of the report, are effective based on the evaluation of these controls and procedures required by Rule 30a-3(b) under the Act (17 CFR § 270.30a-3(b)) and Rules 13a-15(b) or 15d-15(b) under the Securities Exchange Act, as amended (17 CFR § 270.30a-15(b) or § 240.15d-15(b)).
(b) There has been no change in the Registrant’s internal control over financial reporting (as defined in Rule 30a-3(d) under the Act (17 CFR § 270.3a-3(d)) that occurred during the period covered by this report that has materially affected, or is reasonably likely to materially affect, the Registrant’s internal control over financial reporting.
| Item 12. | Disclosure of Securities Lending Activities for Closed-End Management Investment Companies. |
Not applicable to open-end management investment companies.
(a)(1) A copy of the Registrant’s Code of Ethics, as required by Item 2 of this Form, accompanies this filing as an exhibit.
(a)(2) A separate certification for the principal executive officer and the principal financial officer of the Registrant, as required by Rule 30a-2(a) under the Act (17 CFR § 270.30a-2(a)), is filed herewith.
(b) Officer certifications, as required by Rule 30a-2(b) under the Act (17 CFR § 270.30a-2(b)), also accompany this filing as an exhibit.
SIGNATURES
Pursuant to the requirements of the Securities Exchange Act of 1934 and the Investment Company Act of 1940, the Registrant has duly caused this report to be signed on its behalf by the undersigned, thereunto duly authorized.
| | | | | | |
| (Registrant) | | | | | | The KP Funds |
| | | |
| By (Signature and Title) | | | | | | /s/ Michael Beattie |
| | | | | | Michael Beattie, President |
Date: March 10, 2020
Pursuant to the requirements of the Securities Exchange Act of 1934 and the Investment Company Act of 1940, this report has been signed below by the following persons on behalf of the registrant and in the capacities and on the dates indicated.
| | | | | | |
By (Signature and Title) | | | | | | /s/ Michael Beattie |
| | | | | | Michael Beattie, President |
Date: March 10, 2020
| | | | | | |
By (Signature and Title) | | | | | | /s/ Stephen Connors |
| | | | | | Stephen Connors, |
| | | | | | Treasurer, Controller, and CFO |
Date: March 10, 2020